Embed Size (px)
Citation preview
CSEC®Mathematics Mathematics
ticsMathema
Mathematics
ticsMathema
MathematicsSYLLABUS SPECIMEN PAPER
MARK SCHEME SUBJECT REPORTS
Macmillan Education
4 Crinan Street, London, N1 9XW
A division of Macmillan Publishers Limited
Companies and representatives throughout the world
www.macmillan-caribbean.com
ISBN 978-0-230-48250-0
© Caribbean Examinations Council (CXC®) 2015
www.cxc.org
www.cxc-store.com
The author has asserted their right to be identified as the author of this work in accordance with the
Copyright, Design and Patents Act 1988.
First published 2014
This revised version published 2016
Permission to copy
The material in this book is copyright. However, the publisher grants permission for copies to be
made without fee. Individuals may make copies for their own use or for use by classes of which they
are in charge; institutions may make copies for use within and by the staff and students of that
institution. For copying in any other circumstances, prior permission in writing must be obtained
from Macmillan Publishers Limited. Under no circumstances may the material in this book be used,
in part or in its entirety, for commercial gain. It must not be sold in any format.
Designed by Macmillan Publishers Limited
Cover design by Macmillan Publishers Limited and Red Giraffe
CSEC® Mathematics Free Resources
LIST OF CONTENTS
CSEC® Mathematics Syllabus Extract 3 CSEC® Mathematics Syllabus 4 CSEC® Mathematics Specimen Papers 77 CSEC® Mathematics Subject Reports
Subject Report 2004 (January) 125 Subject Report 2004 (June) 137
Subject Report 2005 (June) 154
Subject Report 2006 (June) 175
Subject Report 2007 (January) 198
Subject Report 2007 (June) 212
Subject Report 2008 (January) 234
Subject Report 2008 (June)Trinidad & Tobago 247
Subject Report 2008 (June) Rest of Region 261
Subject Report 2009 (January) 285
Subject Report 2010 (January) 300
Subject Report 2010 (June) 312
Subject Report 2011 (January) 327
Subject Report 2011 (June) 340
Subject Report 2012 (January) 350
Subject Report 2012 (June) 363
Subject Report 2013 (January) 376
Subject Report 2013 (June) 389
Subject Report 2014 (January) 399
Subject Report 2014 (June) 412
Subject Report 2015 (January) 422
Subject Report 2015 (June) 434
SUMMARY OF REVISED SYLLABUS AND NEW SYLLABUSES APPROVED BY SUBSEC
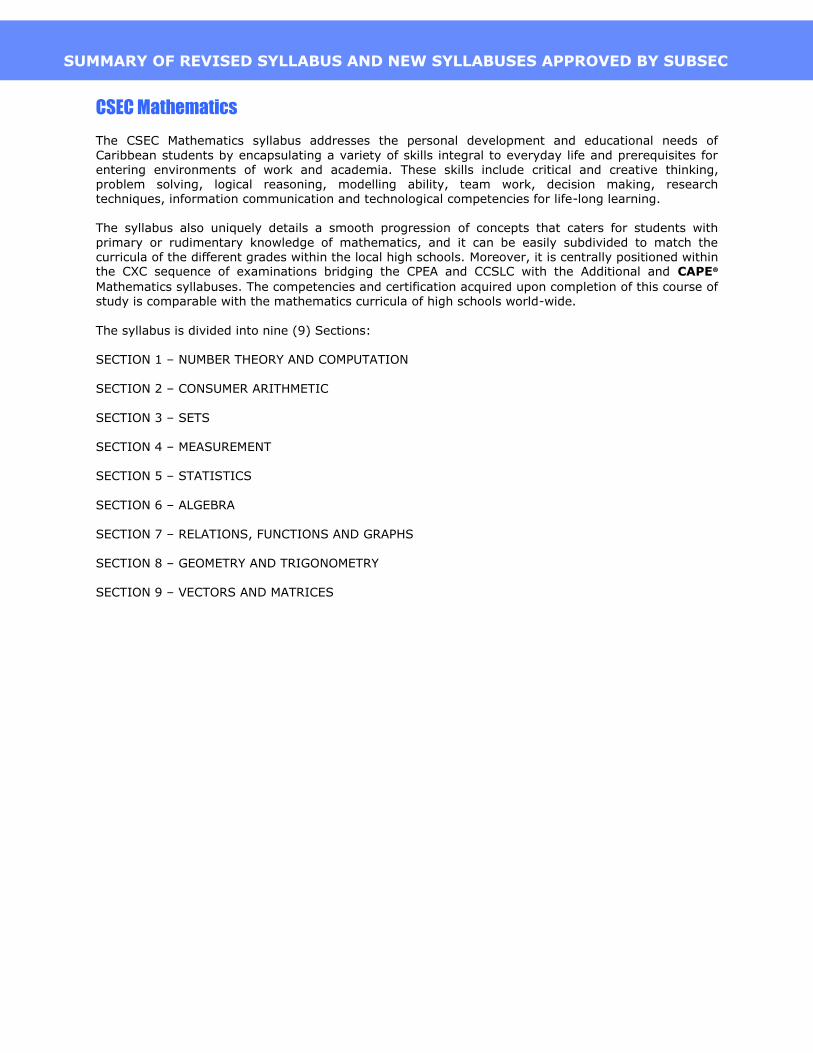
CSEC Mathematics The CSEC Mathematics syllabus addresses the personal development and educational needs of
Caribbean students by encapsulating a variety of skills integral to everyday life and prerequisites for entering environments of work and academia. These skills include critical and creative thinking, problem solving, logical reasoning, modelling ability, team work, decision making, research techniques, information communication and technological competencies for life-long learning. The syllabus also uniquely details a smooth progression of concepts that caters for students with
primary or rudimentary knowledge of mathematics, and it can be easily subdivided to match the curricula of the different grades within the local high schools. Moreover, it is centrally positioned within the CXC sequence of examinations bridging the CPEA and CCSLC with the Additional and CAPE®
Mathematics syllabuses. The competencies and certification acquired upon completion of this course of study is comparable with the mathematics curricula of high schools world-wide.
The syllabus is divided into nine (9) Sections: SECTION 1 – NUMBER THEORY AND COMPUTATION SECTION 2 – CONSUMER ARITHMETIC
SECTION 3 – SETS SECTION 4 – MEASUREMENT SECTION 5 – STATISTICS
SECTION 6 – ALGEBRA SECTION 7 – RELATIONS, FUNCTIONS AND GRAPHS
SECTION 8 – GEOMETRY AND TRIGONOMETRY SECTION 9 – VECTORS AND MATRICES
CXC 10/G/SYLL 17
Effective for examinations from May–June 2017
SYLLABUS
MATHEMATICS
CXC 05/G/SYLL 16
Caribbean Secondary Education Certificate®
CXC 05/G/SYLL 17
Published by the Caribbean Examinations Council All rights reserved. No part of this publication may be reproduced, stored in a retrieval system, or transmitted in any form, or by any means electronic, photocopying, recording or otherwise without prior permission of the author or publisher.
Correspondence related to the syllabus should be addressed to: The Pro-Registrar Caribbean Examinations Council Caenwood Centre 37 Arnold Road, Kingston 5, Jamaica Telephone Number: +1 (876) 630-5200 Facsimile Number: +1 (876) 967-4972 E-mail Address: [email protected] Website: www.cxc.org Copyright © 2016, by Caribbean Examinations Council Prince Road, Pine Plantation Road, St Michael BB11091
CXC 05/G/SYLL 17
Contents
RATIONALE .............................................................................................................................................. 1
AIMS ........................................................................................................................................................ 1
ORGANISATION OF THE SYLLABUS ......................................................................................................... 2
FORMAT OF THE EXAMINATIONS ........................................................................................................... 3
CERTIFICATION AND PROFILE DIMENSIONS ........................................................................................... 4
WEIGHTING OF PAPER AND PROFILES .................................................................................................... 5
REGULATIONS FOR RESIT CANDIDATES .................................................................................................. 5 REGULATIONS FOR PRIVATE CANDIDATES ............................................................................................. 5
SYMBOLS USED ON THE EXAMINATION PAPERS .................................................................................... 6 FORMULAE AND TABLES PROVIDED IN THE EXAMINATION ................................................................... 9 USE OF ELECTRONIC CALCULATORS ..................................................................................................... 10 SECTION 1: NUMBER THEORY AND COMPUTATION ............................................................................ 11 SECTION 2: CONSUMER ARITHMETIC ................................................................................................... 15 SECTION 3: SETS .................................................................................................................................... 18 SECTION 4: MEASUREMENT ................................................................................................................. 20 SECTION 5: STATISTICS .......................................................................................................................... 23 SECTION 6: ALGEBRA ............................................................................................................................ 26 SECTION 7: RELATIONS, FUNCTIONS AND GRAPHS .............................................................................. 30 SECTION 8: GEOMETRY AND TRIGONOMETRY ..................................................................................... 35 SECTION 9: VECTORS AND MATRICES ................................................................................................... 40 GUIDELINES FOR THE SCHOOL-BASED ASSESSMENT............................................................................ 43 RECOMMENDED TEXTS ......................................................................................................................... 52 GLOSSARY OF EXAMINATION TERMS ................................................................................................... 53
GLOSSARY OF MATHEMATICAL TERMS ................................................................................................ 57
CXC 05/G/SYLL 17
This document CXC 05/G/SYLL 16 replaces the syllabus CXC 05/O/SYLL 08 issued in 2008.
Please note that the syllabus has been revised and notable amendments are indicated by italics and vertical lines.
First Published in 1977 Revised in 1981 Revised in 1985 Revised in 1992 Revised in 2001 Revised in 2008 Revised in 2016
CXC 10/G/SYLL 17 1
Mathematics Syllabus
RATIONALE The Caribbean society is an integral part of an ever-changing world. The impact of globalisation on most societies encourages this diverse Caribbean region to revisit the education and career opportunities of our current and future citizens. A common denominator of the Caribbean societies is to create among its citizens a plethora of quality leadership with the acumen required to make meaningful projections and innovations for further development. Further, learning appropriate problem-solving techniques, inherent to the study of mathematics, is vital for such leaders. Mathematics promotes intellectual development, is utilitarian and applicable to all disciplines. Additionally, its aesthetics and epistemological approaches provide solutions fit for any purpose. Therefore, Mathematics is the essential tool to empower people with the knowledge, competencies and attitudes which are precursors for this dynamic world. The syllabus addresses the personal development and educational needs of Caribbean students by encapsulating a variety of skills integral to everyday life and prerequisites for entering environments of work and academia. These skills include critical and creative thinking, problem solving, logical reasoning, modelling ability, team work, decision making, research techniques, information communication and technological competencies for life-long learning. The syllabus also uniquely details a smooth progression of concepts that caters for students with primary or rudimentary knowledge of mathematics, and it can be easily subdivided to match the curricula of the different grades within the local high schools. Moreover, it is centrally positioned within the CXC® sequence of examinations bridging the CPEA and CCSLC with the Additional and CAPE® Mathematics syllabuses. Additionally, the competencies and certification acquired upon completion of this course of study is comparable with the mathematics curricula of high schools world-wide. In consideration of educational support, the syllabus provides teachers with useful approaches and techniques, and it points to resources which are suitable for every learning style. This syllabus will contribute to the development of the Ideal Caribbean Person as articulated by the CARICOM Heads of Government in the following areas: “demonstrate multiple literacies, independent and critical thinking and innovative application of science and technology to problem solving. Such a person should also demonstrate a positive work attitude and value and display creative imagination and entrepreneurship”. In keeping with the UNESCO Pillars of Learning, on completion of this course of study, students will learn to do, learn to be and learn to transform themselves and society.
AIMS This syllabus aims to: 1. make Mathematics relevant to the interests and experiences of students by helping them to
recognise Mathematics in the local and global environment;
CXC 10/G/SYLL 17 2
2. help students appreciate the use of mathematics as a form of communication; 3. help students acquire a range of mathematical techniques and skills and to foster and
maintain the awareness of the importance of accuracy; 4. help students develop positive attitudes, such as open-mindedness, resourcefulness,
persistence and a spirit of enquiry; 5. prepare students for the use of Mathematics in further studies; 6. help students foster a ‘spirit of collaboration’, not only with their peers but with others within
the wider community; 7. help students apply the knowledge and skills acquired to solve problems in everyday situations;
and, 8. integrate Information Communication and Technology (ICT) tools and skills in the teaching and
learning processes.
ORGANISATION OF THE SYLLABUS The syllabus is arranged as a set of topics as outlined below, and each topic is defined by its specific objectives and content/explanatory notes. It is expected that students would be able to master the specific objectives and related content after pursuing a course in Mathematics over five years of secondary schooling. SECTION 1: NUMBER THEORY AND COMPUTATION SECTION 2: CONSUMER ARITHMETIC SECTION 3: SETS SECTION 4: MEASUREMENT SECTION 5: STATISTICS SECTION 6: ALGEBRA SECTION 7: RELATIONS, FUNCTIONS AND GRAPHS SECTION 8: GEOMETRY AND TRIGONOMETRY SECTION 9: VECTORS AND MATRICES
CXC 10/G/SYLL 17 3
FORMAT OF THE EXAMINATIONS The examination will consist of two papers: Paper 01, an objective type paper and Paper 02, an essay or problem solving type paper.
Paper 01 (1 hour 30 minutes)
The Paper will consist of 60 multiple-choice items, from all Sections of the syllabus as outlined below. Sections No. of items Number Theory and Computation 6 Consumer Arithmetic 8 Sets 6 Measurement 8 Statistics 6 Algebra 6 Relations, Functions and Graphs 8 Geometry and Trigonometry 8 Vectors and Matrices 4 Total 60 Each item will be allocated one mark.
Paper 02 (2 hours and 40 minutes)
The Paper consists of ten compulsory structured type questions.
The marks allocated to the topics are:
Sections No. of marks
Number Theory, Consumer Arithmetic and Computation
9
Measurement 9
Statistics 9
Algebra 10
Relations, Functions and Graphs 20
*Investigation 10
Geometry and Trigonometry 21 Vectors and Matrices 12
Total 100
* The investigation question may be set on any combination of objectives in the syllabus.
CXC 10/G/SYLL 17 4
SCHOOL BASED ASSESSMENT: Paper 031 and Paper 032
Paper 031 (20 per cent of Total Assessment) Paper 031 comprises a project. The project requires candidates to demonstrate the practical application of Mathematics in everyday life. In essence it should allow candidates to probe, describe and explain a mathematical area of interest and communicate the findings using mathematical symbols, language and tools. The topic(s) chosen may be from any section or combination of different sections of the syllabus. See Guidelines for School Based Assessment on pages 43 – 47. Paper 032 (Alternative to Paper 031) (1 hour)
This paper is an alternative to Paper 031 and is intended for private candidates. This paper comprises two compulsory questions. The topic(s) tested may be from any section or combination of different sections of the syllabus.
CERTIFICATION AND PROFILE DIMENSIONS
The subject will be examined for certification at the General Proficiency.
In each paper, items and questions will be classified, according to the kind of cognitive demand made, as follows:
Knowledge require the recall of rules, procedures, definitions and facts, that is, items characterised by rote memory as well as simple computations and constructions.
Comprehension requires algorithmic thinking that involves translation from one mathematical mode to another. Use of algorithms and the application of these algorithms to familiar problem situations.
Reasoning requires:
(a) translation of non-routine problems into mathematical symbols and then choosing suitable algorithms to solve the problems;
(b) combination of two or more algorithms to solve problems;
(c) use of an algorithm or part of an algorithm, in a reverse order, to solve a problem;
(d) inferences and generalisations from given data;
(e) justification of results or statement; and,
(f) analysis and synthesis. Candidates’ performance will be reported under Knowledge, Comprehension and Reasoning.
CXC 10/G/SYLL 17 5
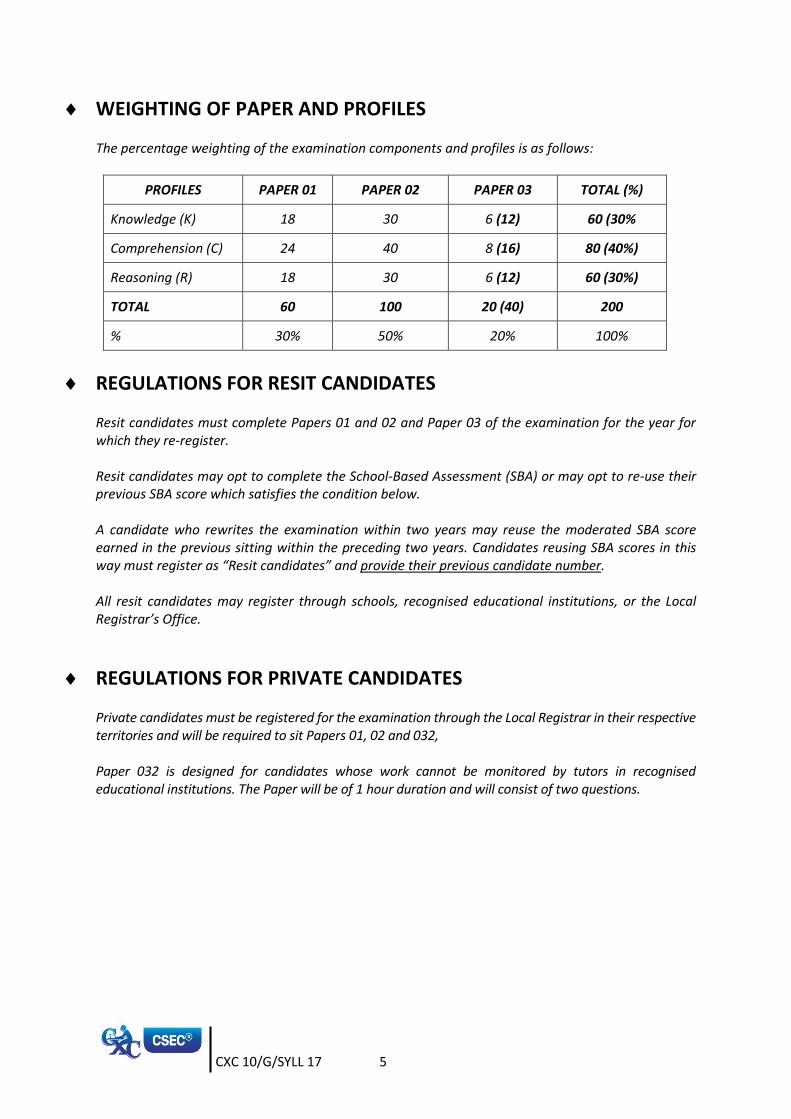
WEIGHTING OF PAPER AND PROFILES The percentage weighting of the examination components and profiles is as follows:
PROFILES PAPER 01 PAPER 02 PAPER 03 TOTAL (%)
Knowledge (K) 18 30 6 (12) 60 (30%
Comprehension (C) 24 40 8 (16) 80 (40%)
Reasoning (R) 18 30 6 (12) 60 (30%)
TOTAL 60 100 20 (40) 200
% 30% 50% 20% 100%
REGULATIONS FOR RESIT CANDIDATES Resit candidates must complete Papers 01 and 02 and Paper 03 of the examination for the year for which they re-register. Resit candidates may opt to complete the School-Based Assessment (SBA) or may opt to re-use their previous SBA score which satisfies the condition below. A candidate who rewrites the examination within two years may reuse the moderated SBA score earned in the previous sitting within the preceding two years. Candidates reusing SBA scores in this way must register as “Resit candidates” and provide their previous candidate number. All resit candidates may register through schools, recognised educational institutions, or the Local Registrar’s Office.
REGULATIONS FOR PRIVATE CANDIDATES
Private candidates must be registered for the examination through the Local Registrar in their respective territories and will be required to sit Papers 01, 02 and 032, Paper 032 is designed for candidates whose work cannot be monitored by tutors in recognised educational institutions. The Paper will be of 1 hour duration and will consist of two questions.
CXC 10/G/SYLL 17 6
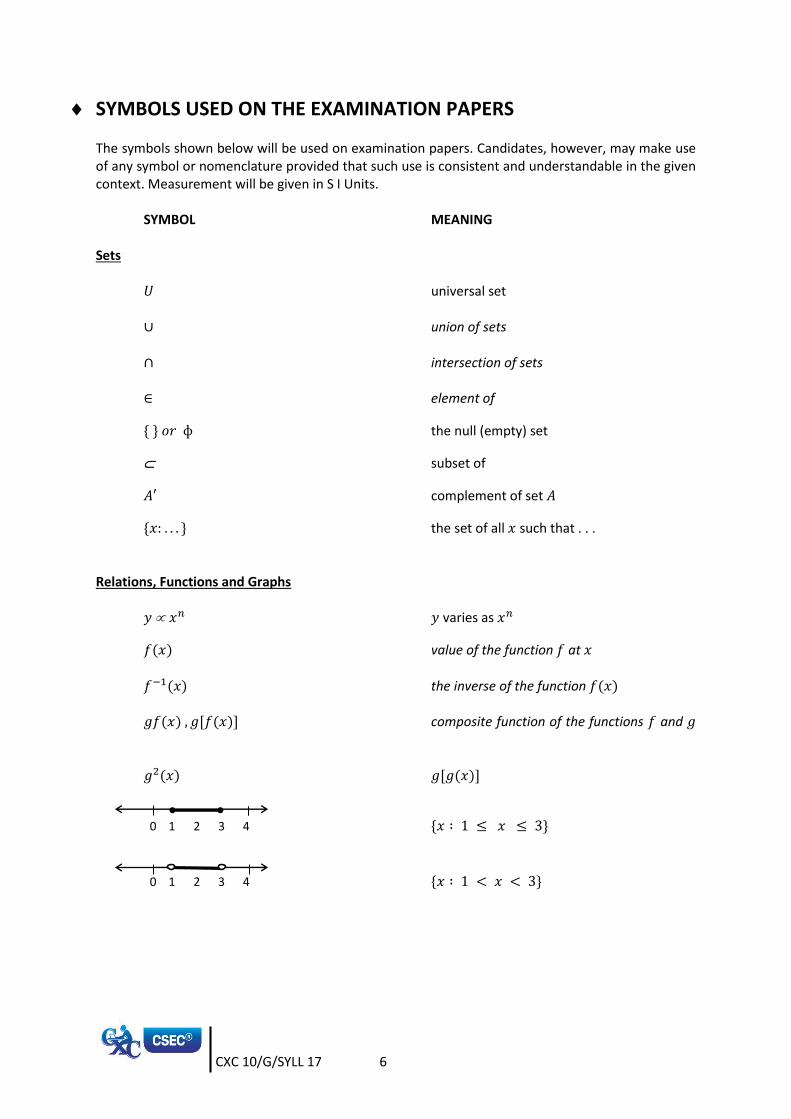
SYMBOLS USED ON THE EXAMINATION PAPERS The symbols shown below will be used on examination papers. Candidates, however, may make use of any symbol or nomenclature provided that such use is consistent and understandable in the given context. Measurement will be given in S I Units. SYMBOL MEANING
Sets
𝑈 universal set ∪ union of sets ∩ intersection of sets ∈ element of
{ } 𝑜𝑟 ф the null (empty) set
subset of
𝐴′ complement of set 𝐴
{𝑥: . . . } the set of all 𝑥 such that . . . Relations, Functions and Graphs
𝑦 𝑥𝑛 𝑦 varies as 𝑥𝑛
𝑓(𝑥) value of the function 𝑓 at 𝑥 𝑓−1(𝑥) the inverse of the function 𝑓(𝑥) 𝑔𝑓(𝑥) , 𝑔[𝑓(𝑥)] composite function of the functions 𝑓 and 𝑔
𝑔2(𝑥) 𝑔[𝑔(𝑥)]
0 1 2 3 4 {𝑥 ∶ 1 ≤ 𝑥 ≤ 3}
0 1 2 3 4 {𝑥 ∶ 1 < 𝑥 < 3}
CXC 10/G/SYLL 17 7
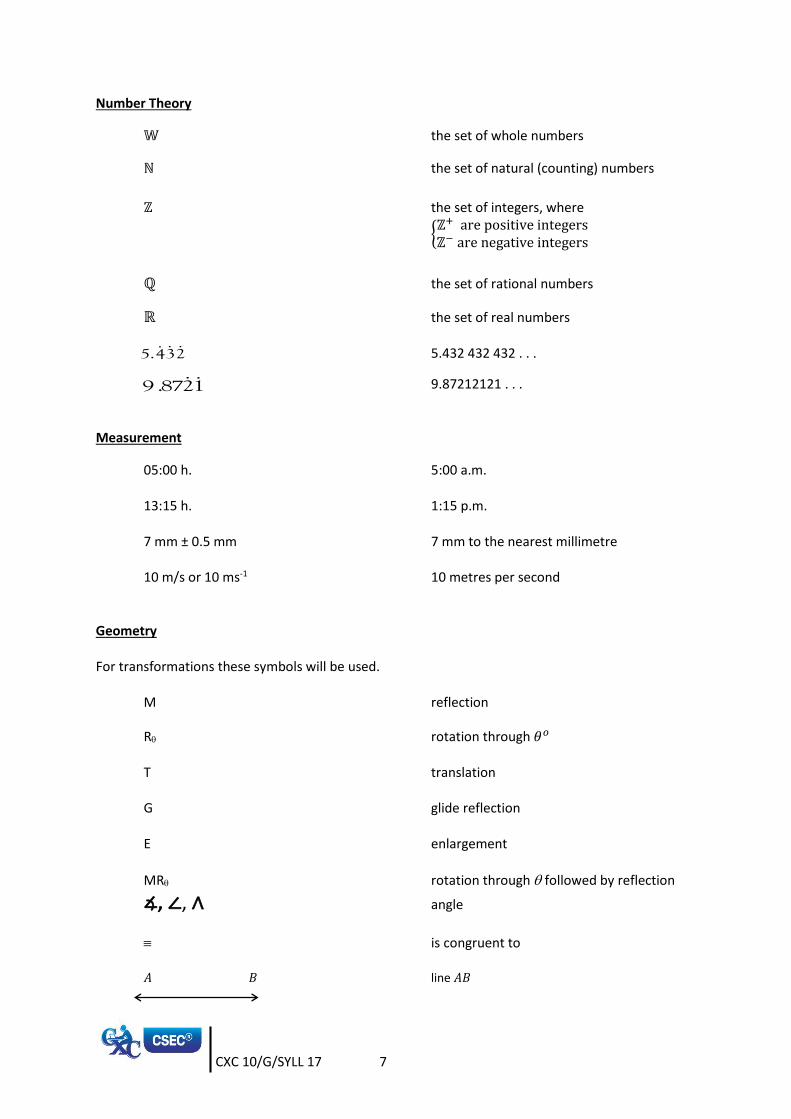
Number Theory
𝕎 the set of whole numbers
ℕ the set of natural (counting) numbers
ℤ the set of integers, where
{ℤ+ are positive integersℤ− are negative integers
ℚ the set of rational numbers
ℝ the set of real numbers
5.432 432 432 . . .
9.87212121 . . . Measurement
05:00 h. 5:00 a.m.
13:15 h. 1:15 p.m.
7 mm ± 0.5 mm 7 mm to the nearest millimetre
10 m/s or 10 ms-1 10 metres per second Geometry
For transformations these symbols will be used.
M reflection
R rotation through 𝜃𝑜
T translation G glide reflection
E enlargement
MR rotation through followed by reflection
∡, ∠, ∧ angle
is congruent to 𝐴 𝐵 line 𝐴𝐵
2345.
128 9 . 7
CXC 10/G/SYLL 17 8
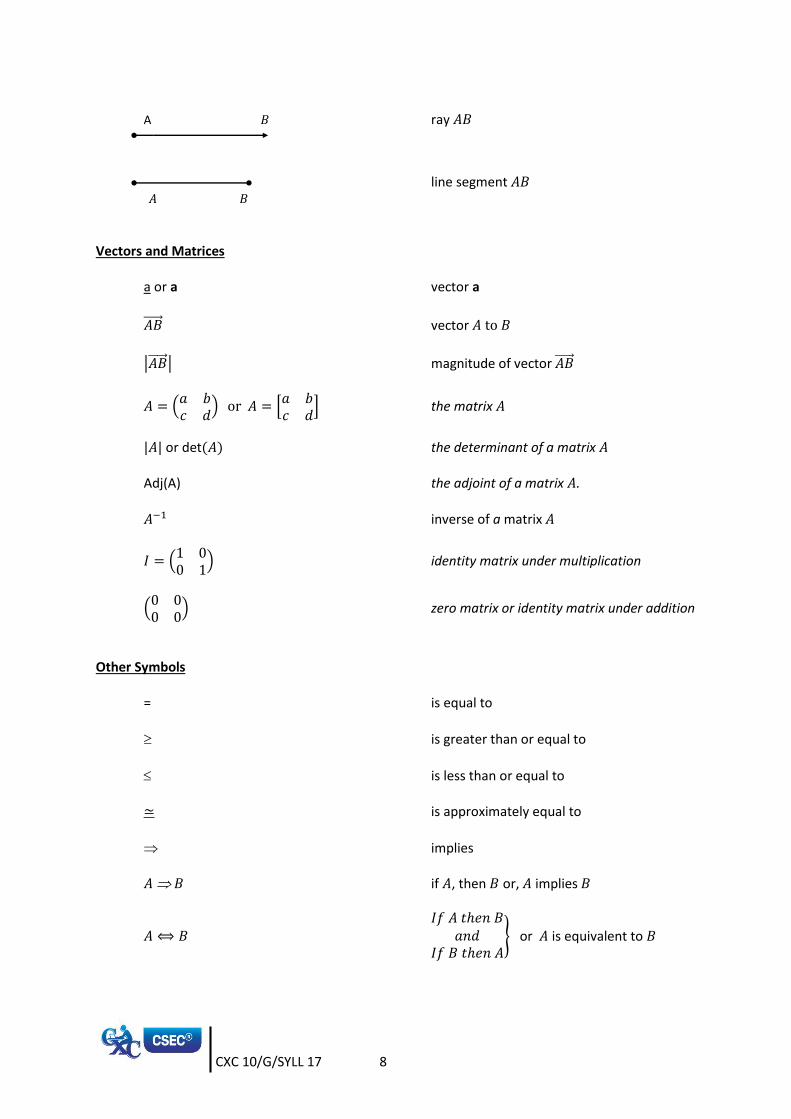
A 𝐵 ray 𝐴𝐵
line segment 𝐴𝐵
𝐴 𝐵
Vectors and Matrices
a or a vector a
𝐴𝐵 vector 𝐴 to 𝐵
|𝐴𝐵 | magnitude of vector 𝐴𝐵
𝐴 = (𝑎 𝑏𝑐 𝑑
) or 𝐴 = [𝑎 𝑏𝑐 𝑑
] the matrix 𝐴
|𝐴| or det(𝐴) the determinant of a matrix 𝐴
Adj(A) the adjoint of a matrix 𝐴. 𝐴−1 inverse of a matrix 𝐴
𝐼 = (1 00 1
) identity matrix under multiplication
(0 00 0
) zero matrix or identity matrix under addition
Other Symbols
= is equal to
is greater than or equal to
is less than or equal to
≃ is approximately equal to
implies 𝐴 𝐵 if 𝐴, then 𝐵 or, 𝐴 implies 𝐵
𝐴 ⟺ 𝐵 𝐼𝑓 𝐴 𝑡ℎ𝑒𝑛 𝐵
𝑎𝑛𝑑𝐼𝑓 𝐵 𝑡ℎ𝑒𝑛 𝐴
} or 𝐴 is equivalent to 𝐵
CXC 10/G/SYLL 17 9
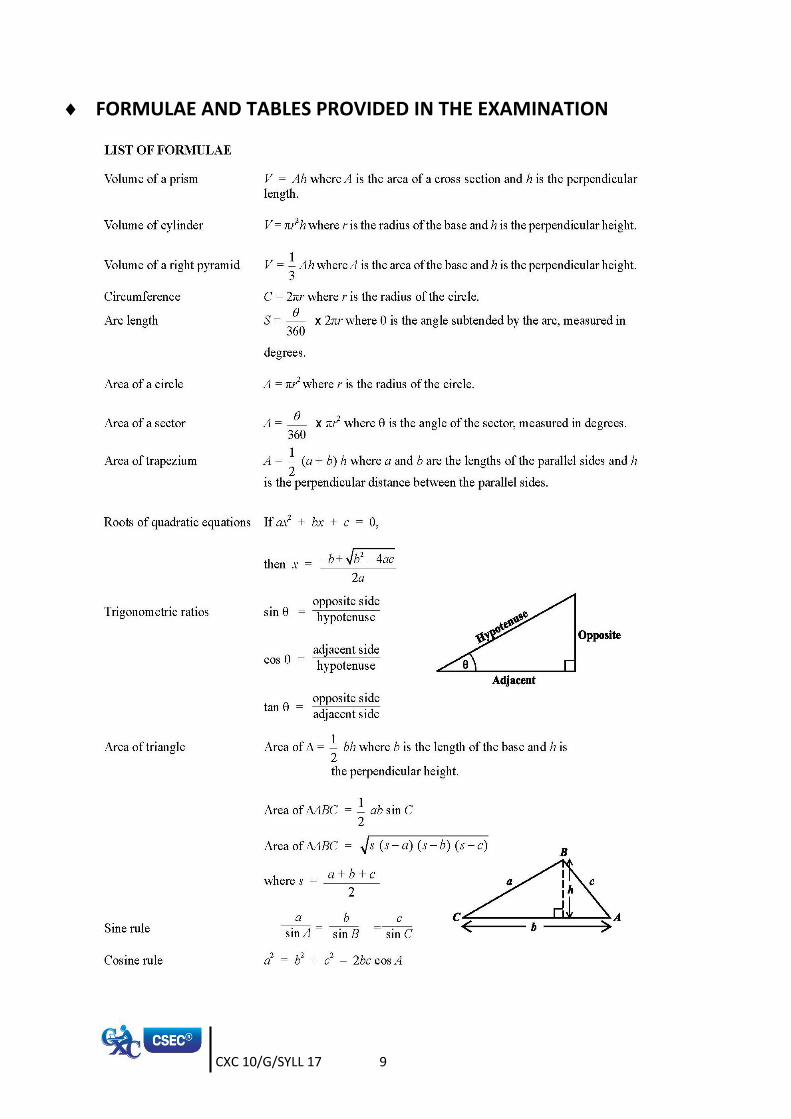
FORMULAE AND TABLES PROVIDED IN THE EXAMINATION
CXC 10/G/SYLL 17 10
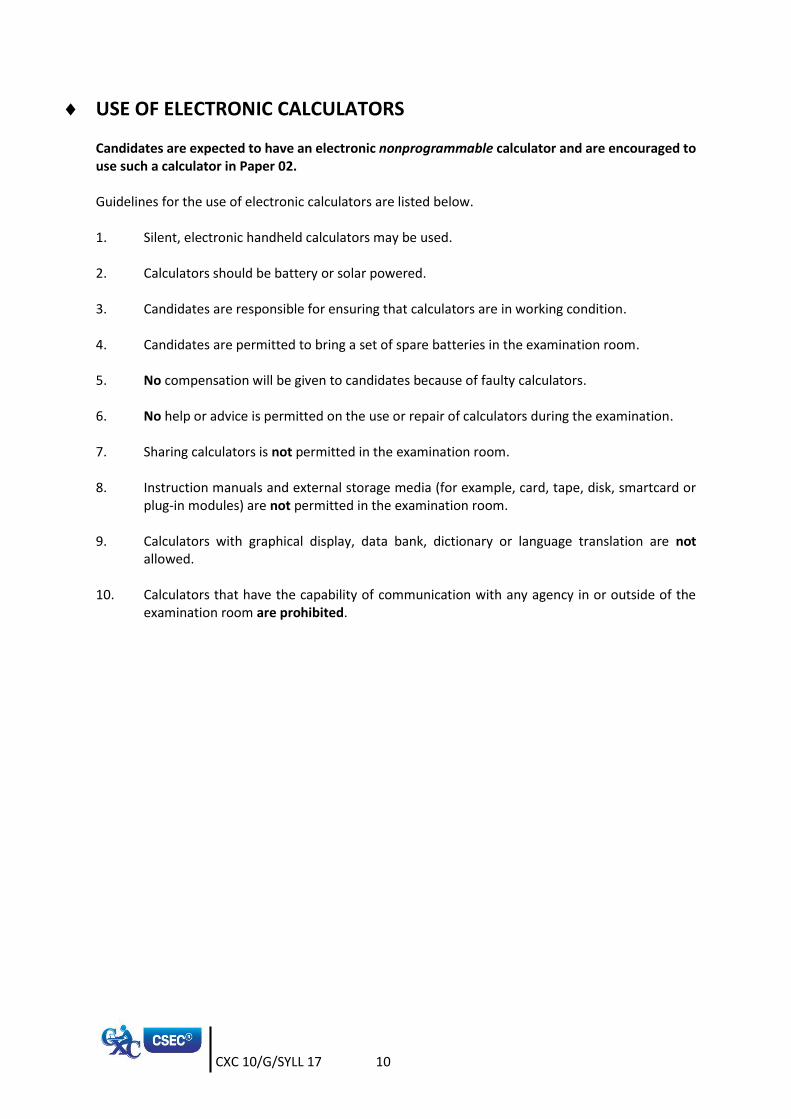
USE OF ELECTRONIC CALCULATORS
Candidates are expected to have an electronic nonprogrammable calculator and are encouraged to use such a calculator in Paper 02. Guidelines for the use of electronic calculators are listed below. 1. Silent, electronic handheld calculators may be used.
2. Calculators should be battery or solar powered. 3. Candidates are responsible for ensuring that calculators are in working condition. 4. Candidates are permitted to bring a set of spare batteries in the examination room. 5. No compensation will be given to candidates because of faulty calculators. 6. No help or advice is permitted on the use or repair of calculators during the examination. 7. Sharing calculators is not permitted in the examination room. 8. Instruction manuals and external storage media (for example, card, tape, disk, smartcard or
plug-in modules) are not permitted in the examination room. 9. Calculators with graphical display, data bank, dictionary or language translation are not
allowed. 10. Calculators that have the capability of communication with any agency in or outside of the
examination room are prohibited.
CXC 10/G/SYLL 17 11
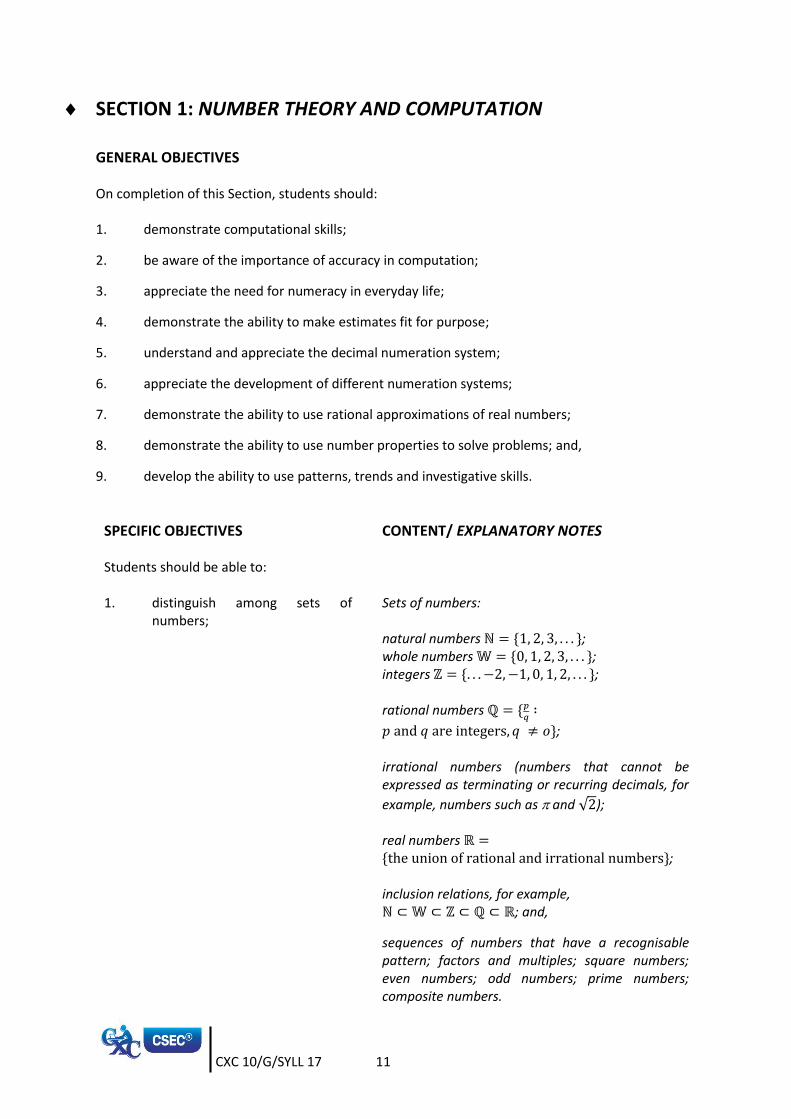
SECTION 1: NUMBER THEORY AND COMPUTATION
GENERAL OBJECTIVES On completion of this Section, students should: 1. demonstrate computational skills;
2. be aware of the importance of accuracy in computation;
3. appreciate the need for numeracy in everyday life;
4. demonstrate the ability to make estimates fit for purpose;
5. understand and appreciate the decimal numeration system;
6. appreciate the development of different numeration systems;
7. demonstrate the ability to use rational approximations of real numbers;
8. demonstrate the ability to use number properties to solve problems; and,
9. develop the ability to use patterns, trends and investigative skills.
SPECIFIC OBJECTIVES CONTENT/ EXPLANATORY NOTES Students should be able to: 1. distinguish among sets of
numbers;
Sets of numbers: natural numbers ℕ = {1, 2, 3, . . . }; whole numbers 𝕎 = {0, 1, 2, 3, . . . }; integers ℤ = {. . . −2,−1, 0, 1, 2, . . . }; rational numbers ℚ = {𝑝
𝑞∶
𝑝 and 𝑞 are integers, 𝑞 ≠ 𝜊}; irrational numbers (numbers that cannot be expressed as terminating or recurring decimals, for
example, numbers such as and √2); real numbers ℝ ={the union of rational and irrational numbers}; inclusion relations, for example, ℕ ⊂ 𝕎 ⊂ ℤ ⊂ ℚ ⊂ ℝ; and,
sequences of numbers that have a recognisable pattern; factors and multiples; square numbers; even numbers; odd numbers; prime numbers; composite numbers.
CXC 10/G/SYLL 17 12
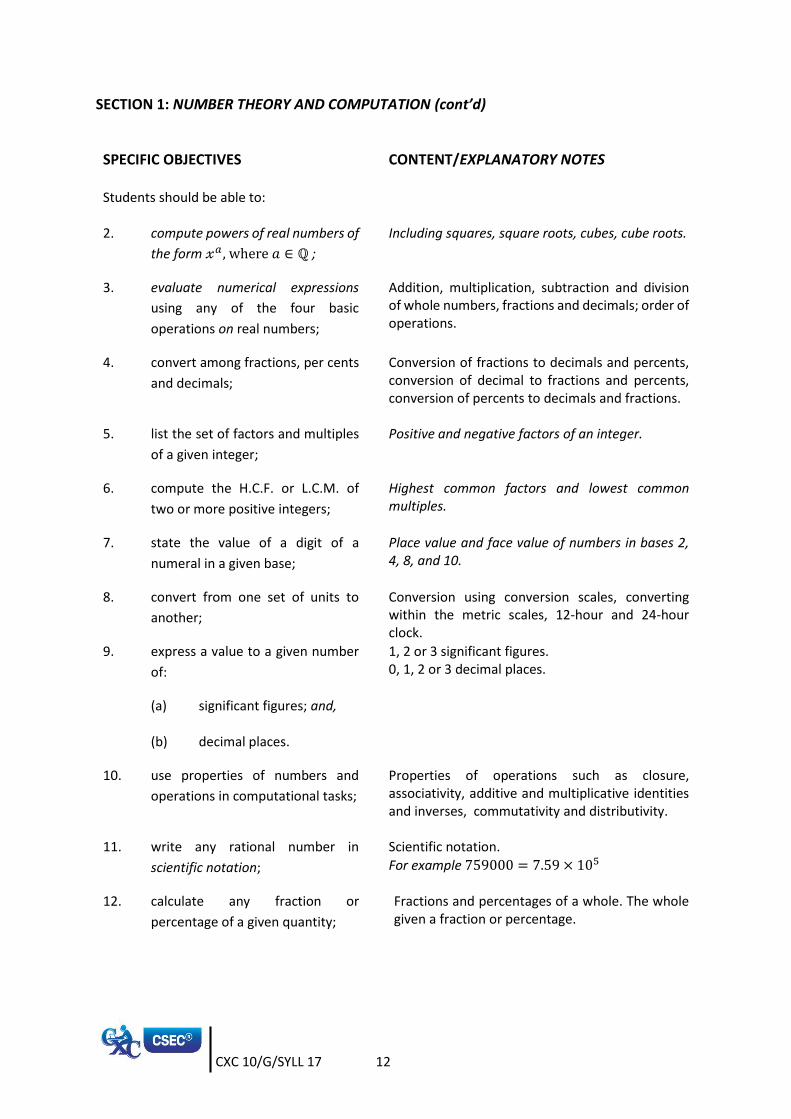
SECTION 1: NUMBER THEORY AND COMPUTATION (cont’d)
SPECIFIC OBJECTIVES CONTENT/EXPLANATORY NOTES Students should be able to: 2. compute powers of real numbers of
the form 𝓍𝑎 , where 𝑎 ∈ ℚ ;
Including squares, square roots, cubes, cube roots.
3. evaluate numerical expressions
using any of the four basic
operations on real numbers;
Addition, multiplication, subtraction and division of whole numbers, fractions and decimals; order of operations.
4. convert among fractions, per cents
and decimals;
Conversion of fractions to decimals and percents, conversion of decimal to fractions and percents, conversion of percents to decimals and fractions.
5. list the set of factors and multiples
of a given integer;
Positive and negative factors of an integer.
6. compute the H.C.F. or L.C.M. of
two or more positive integers;
Highest common factors and lowest common multiples.
7. state the value of a digit of a
numeral in a given base;
Place value and face value of numbers in bases 2, 4, 8, and 10.
8. convert from one set of units to
another;
Conversion using conversion scales, converting within the metric scales, 12-hour and 24-hour clock.
9. express a value to a given number
of:
(a) significant figures; and, (b) decimal places.
1, 2 or 3 significant figures. 0, 1, 2 or 3 decimal places.
10. use properties of numbers and
operations in computational tasks;
Properties of operations such as closure, associativity, additive and multiplicative identities and inverses, commutativity and distributivity.
11. write any rational number in
scientific notation;
Scientific notation.
For example 759000 = 7.59 × 10⁵
12. calculate any fraction or
percentage of a given quantity;
Fractions and percentages of a whole. The whole given a fraction or percentage.
CXC 10/G/SYLL 17 13
SECTION 1: NUMBER THEORY AND COMPUTATION (cont’d)
SPECIFIC OBJECTIVES CONTENT/ EXPLANATORY NOTES Students should be able to: 13. express one quantity as a
fraction or percentage of another;
Comparing two quantities using fractions and percentages.
14. compare quantities; Ratio, proportion and rates.
15. order a set of real numbers;
Rearranging a set of real numbers in ascending or descending order. For example
1.1,7
2, √2, 1.45, 𝜋 in ascending order is
1.1, √2, 1.45, 𝜋,7
2.
16. compute terms of a sequence
given a rule;
17. derive an appropriate rule given the terms of a sequence;
18. divide a quantity in a given ratio; and,
Ratio, proportion of no more than three parts.
19. solve problems involving concepts in number theory and computation.
Including ratio, rates and proportion.
Suggested Teaching and Learning Activities To facilitate students’ attainment of the objectives of this Section, teachers are advised to engage students in the teaching and learning activities listed below. 1. Encourage the use of:
(a) calculators; (b) games and quizzes; (for example, to investigate whether a given number is rational or
irrational);
(c) appropriate software;
(d) examples of computation drawn from current affairs;
(e) the use recipes in teaching ratio and proportion; and,
(f) online demonstrative videos.
CXC 10/G/SYLL 17 14
SECTION 1: NUMBER THEORY AND COMPUTATION (cont’d) 2. Explore the link between mathematics and other disciplines, for example:
(a) Music: the octave; (b) Sciences and Nature: periodic tables, counting petals, leaves and other random
natural events;
(c) Art and Geography: enlargement of photos as compared with ratio and proportion;
(d) Architecture: number patterns and lighting patterns, ratio of width to length to height of a building or building part;
(e) Health and Family Life: nutrition facts of food products; and,
(f) Business Studies: using approximations in transactions, finding percentages of
investments and capital.
3. Engage the students in the history of numbers.
4. Teachers can engage students in the process of “mental computation”. The use of divisibility tests and other ready reckoners and properties such as associativity.
5. In the development of mental computation in the classroom, teachers can provide oral or
written questions and encourage students to explain how they arrived at their answers and to compare their problem-solving strategies with those of their classmates. Below are two examples.
(a) A flight departs on a journey at 0800 hours. After 30 minutes of flying time the journey
is 1
3 complete. Estimate the arrival time of the flight assuming the flight was at
constant speed throughout the journey. (b) In a cricket game, at the end of the fifth over the run rate of a team is 4.6 runs per
over. If the team continues to score at the same rate, determine the projected score at the end of the twentieth over.
CXC 10/G/SYLL 17 15
SECTION 2: CONSUMER ARITHMETIC
GENERAL OBJECTIVES On completion of this Section, students should: 1. develop the ability to perform the calculations required in normal business transactions, and
in computing their own budgets; 2. appreciate the need for both accuracy and speed in calculations; 3. appreciate the advantages and disadvantages of different ways of investing money; 4. appreciate that business arithmetic is indispensable in everyday life; and, 5. demonstrate the ability to use concepts in consumer arithmetic to describe, model and solve
real-world problems.
SPECIFIC OBJECTIVES CONTENT/ EXPLANATORY NOTES
Students should be able to: 1. calculate:
(a) discount;
(b) sales tax;
(c) profit; and,
(d) loss;
2. calculate (a) percentage profit; and,
(b) percentage loss;
3. express a profit, loss, discount, markup and purchase tax, as a percentage of some value;
4. solve problems involving marked price, selling price, cost price, profit, loss or discount;
5. solve problems involving payments by instalments as in the case of hire purchase and mortgages;
CXC 10/G/SYLL 17 16
SECTION 2: CONSUMER ARITHMETIC (cont’d)
SPECIFIC OBJECTIVES CONTENT/ EXPLANATORY NOTES Students should be able to: 6. solve problems involving simple
interest;
Principal, time, rate, amount.
7. solve problems involving compound interest;
Formulae may be used in computing compound interest. The use of calculators is encouraged.
8. solve problems involving appreciation and depreciation;
9. solve problems involving measures and money; and,
Currency conversion.
10. solve problems involving: (a) rates and taxes;
(b) utilities;
(c) invoices and shopping
bills;
(d) salaries and wages; and,
(e) insurance and investments.
Suggested Teaching and Learning Activities To facilitate students’ attainment of the objectives of this Section, teachers are advised to engage students in the teaching and learning activities listed below. 1. Encourage the use of:
(a) calculators;
(b) games and quizzes;
(c) appropriate software (for example, create an excel document to calculate utility bills
and net salary);
(d) examples of consumer arithmetic drawn from current affairs;
(e) online videos;
CXC 10/G/SYLL 17 17
SECTION 2: CONSUMER ARITHMETIC (cont’d)
(f) advertisement clippings for comparing prices; comparing prices and determining best buy; calculating hire purchase; and,
(g) bills and financial forms, for example, calculating utility cost and completing tax forms.
2. Solve problems using the straight line and reducing balance method.
3. Conduct surveys or solve problems based on comparative shopping; finding total price for an item purchased online.
4. Encourage in-class role play of market situations and Cambio.
5. Examine and verifying premiums and interest using amortisation tables.
CXC 10/G/SYLL 17 18
SECTION 3: SETS
GENERAL OBJECTIVES
On completion of this Section, students should:
1. demonstrate the ability to communicate using set language and concepts;
2. demonstrate the ability to reason logically; and,
3. appreciate the importance and utility of sets in analysing and solving real-world problems.
SPECIFIC OBJECTIVES CONTENT/EXPLANATORY NOTES Students should be able to: 1. explain concepts relating to
sets; Examples and non-examples of sets, description of
sets using words, membership of a set, cardinality of a set, finite and infinite sets, universal set, empty set, complement of a set, subsets.
2. represent a set in various
forms; Representation of a set. For example,
(a) Description: the set A comprising the first
three natural numbers.
(b) Set builder notation:
𝐴 = {𝑥: 0 < 𝑥 < 4, 𝑥 ∈ ℕ};
(c) Listing: 𝐴 = {1,2,3}
3. list subsets of a given set; Identifying the subsets as well as determining the number of subsets of a set with n elements.
4. determine elements in
intersections, unions and complements of sets;
Intersection and union of not more than three sets. Apply the result
.
5. describe relationships among
sets using set notation and symbols;
Universal, complement, subsets, equal and equivalent sets, intersection, disjoint sets and union of sets.
6. draw Venn diagrams to
represent relationships among sets;
Not more than 4 sets including the universal set.
7. use Venn diagrams to
represent the relationships among sets; and,
)()()()( BAnBnAnBAn
CXC 10/G/SYLL 17 19
SECTION 3: SETS (cont’d)
8. solve problems in Number Theory, Algebra and Geometry using concepts in Set Theory.
Suggested Teaching and Learning Activities To facilitate students’ attainment of the objectives of this Section, teachers are advised to engage students in the teaching and learning activities listed below. 1. Encourage the use of:
(a) calculators;
(b) games and quizzes;
(c) appropriate software (for example, whiteboard apps for drawing and labelling Venn
diagrams);
(d) examples of sets drawn from current affairs;
(e) the use of recipes in teaching sets; and,
(f) online demonstrative videos.
2. Explore the link between sets and other disciplines, for example:
(a) Music: types of instruments, classification of songs;
(b) Sciences: periodic tables; find the number of elements in a naturally occurring set based on characteristics of other sets;
(c) Art and Geography: classifying regions according to soil type or altitude;
(d) Architecture: classifying buildings according to the style of roof, shape of building,
number of floors, historical design;
(e) Health and family life: use medical records to categorise patients by disease, identify intersections for example hypertension and diabetes; and,
(f) Business studies: types of businesses, types of products and services.
3. Engage in activities which assign students to groups based on their interests (sets) noting those
in more than one group (intersection) and those not in a group (complement). 4. Use graphic organisers for comparing and/or classifying sets of items: the set of real numbers,
plane figures, solids.
CXC 10/G/SYLL 17 20
SECTION 4: MEASUREMENT
GENERAL OBJECTIVES On completion of this Section, students should: 1. understand that the attributes of geometrical objects can be quantified using measurement; 2. appreciate that all measurements are approximate and that the relative accuracy of a
measurement is dependent on the measuring instrument and the measurement process; and, 3. demonstrate the ability to use concepts in measurement to model and solve real-world
problems.
SPECIFIC OBJECTIVES CONTENT/ EXPLANATORY NOTES Students should be able to: 1. convert units of length, mass,
area, volume, capacity;
Refer to Sec 1, SO8.
2. use the appropriate SI unit of measure for area, volume, capacity, mass, temperature and time (24-hour clock) and other derived quantities;
Refer to Sec 1, SO8.
3. determine the perimeter of a plane shape;
Estimating and measuring the perimeter of compound and irregular shapes. Calculating the perimeter of polygons and circles.
4. calculate the length of an arc of a circle;
Perimeter of sector of a circle
5. estimate the area of plane shapes;
Finding the area of plane shapes without using formulae.
6. calculate the area of polygons and circles;
7. calculate the area of a sector of a circle;
8. calculate the area of a triangle given two sides and the angle they form;
Use of formulae. Including given two sides and included angle.
9. calculate the area of a segment
of a circle;
CXC 10/G/SYLL 17 21
SECTION 4: MEASUREMENT (cont’d)
Suggested Teaching and Learning Activities To facilitate students’ attainment of the objectives of this Section, teachers are advised to engage students in the teaching and learning activities listed below. 1. Encourage the use of:
(a) calculators;
(b) games and quizzes;
(c) appropriate software (for example, use of white board software for sketching
diagrams; Mobile apps: Math Ref with list of formulae); and,
(d) online demonstrative videos.
SPECIFIC OBJECTIVES CONTENT/EXPLANATORY NOTES Students should be able to: 10. calculate the surface area of
solids; Prisms including cubes and cylinders; right pyramids
including cones; spheres. Surface area of sphere, 𝐴 = 4𝜋𝑟2.
11. calculate the volume of solids;
Prism including cube and cuboid, cylinder, right pyramid, cone and sphere. Volume of sphere,
𝑉 =4
3𝜋𝑟3
12. solve problems involving the
relations among time, distance and speed;
Average speed.
13. estimate the margin of error for a given measurement;
Sources of error. Maximum and minimum measurements.
14. use scales and scale drawings to determine distances and areas; and,
(Link to Geography)
15. solve problems involving measurement.
Perimeter, area and volume of compound shapes and solids.
CXC 10/G/SYLL 17 22
SECTION 4: MEASUREMENT (cont’d)
2. Explore the link between measurement and other disciplines, for example:
(a) Music: creating music with bottles of water where the height/volume of water results
in a particular tone;
(b) Sciences and nature: area of naturally occurring surfaces; length of the beach or water edge; experiments in calculating speed, distance or time; plot a graph to show the cooling rate of boiling water as time elapse; use various measurement instruments from a science laboratory;
(c) Art and Geography: use of rain gauge, map reading, measuring distances on map including irregular paths;
(d) Architecture: finding the perimeter, area or volume of structures: roof, wall, floor,
room, column, eaves;
(e) Health and family life: experiment to calculate BMI; and,
(f) Business studies: determining amounts to buy given various units of lengths, area and volume.
3. Teacher-made resources: grid for finding area of irregular shapes, rubric for peer to peer assessment by students.
4. Engage students in investigating the value of pi and the area of the circle.
CXC 10/G/SYLL 17 23
SECTION 5: STATISTICS
GENERAL OBJECTIVES On completion of this Section, students should: 1. appreciate the advantages and disadvantages of the various ways of presenting and
representing data; 2. appreciate the necessity for taking precautions in collecting, analysing and interpreting
statistical data, and making inferences; 3. demonstrate the ability to use concepts in statistics and probability to describe, model and
solve real-world problems; and, 4. understand the four levels/scales of measurement that inform the collection of data.
SPECIFIC OBJECTIVES CONTENT/EXPLANATORY NOTES Students should be able to:
1. differentiate between sample
and population attributes; Sample statistics and population parameters.
2. construct a frequency table
for a given set of data; Discrete and continuous variables.
Ungrouped and grouped data.
3. determine class features for a given set of data;
Class interval, class boundaries, class limits, class midpoint, class width.
4. construct statistical diagrams; Pie charts, bar charts, line graphs, histograms with
bars of equal width and frequency polygons.
5. determine measures of central tendency for raw, ungrouped and grouped data;
Ungrouped data: mean, median and mode Grouped data: modal class, median class and the estimate of the mean.
6. determine when it is most
appropriate to use the mean, median and mode as the average for a set of data;
Levels of measurement (measurement scales): nominal, ordinal, interval and ratio. Sets with extreme values or recurring values.
7. determine the measures of dispersion (spread) for raw, ungrouped and grouped data;
Range, interquartile range and semi-interquartile range; estimating these measures for grouped data.
8. use standard deviation to
compare sets of data; No calculation of the standard deviation will be
required.
CXC 10/G/SYLL 17 24
SECTION 5: STATISTICS (cont’d)
Suggested Teaching and Learning Activities To facilitate students’ attainment of the objectives of this Section, teachers are advised to engage students in the teaching and learning activities listed below. 1. Encourage the use of:
(a) calculators;
(b) games and quizzes;
(c) appropriate software (for example, use of applications to generate and solve
statistical problems including charts and calculating measures of central tendencies);
(d) examples of statistics drawn from newspapers, magazines and other sources of current affairs; and,
(e) online demonstrative videos.
SPECIFIC OBJECTIVES CONTENT/EXPLANATORY NOTES Students should be able to: 9. draw cumulative frequency
curve (Ogive); Appropriate scales for axes.
Class boundaries as domain. 10. analyse statistical diagrams; Finding the mean, mode, median, range, quartiles,
interquartile range, semi-interquartile range; trends and patterns.
11. determine the proportion or
percentage of the sample above or below a given value from raw data, frequency table or cumulative frequency curve;
12. identify the sample space for
simple experiment; Including the use of coins, dice and playing cards.
The use of contingency tables. 13. determine experimental and
theoretical probabilities of simple events; and,
The use of contingency tables. Addition for exclusive events; multiplication for independent events.
14. make inference(s) from
statistics. Raw data, tables, diagrams, summary statistics.
CXC 10/G/SYLL 17 25
SECTION 5: STATISTICS (cont’d)
2. Explore the link between statistics and other disciplines, for example: (a) Music: comparing record sales of various artistes, number of weeks artistes are in the
top ten chart;
(b) Sciences: statistics (birth and death rates) on various types of populations: people, plants and animals;
(c) Geography: track rain fall, population count and density;
(d) Art and Architecture: average floor size of rooms in a buildings, house lots;
(e) Health and family life: monitoring weight and height, average amounts of calories,
nutritional facts; and,
(f) Business studies: Gross Domestic Product, predicting sales, purchasing decision.
3. Discuss when it is most appropriate to use Nominal, Ordinal, Interval or Ratio scales.
4. Use the class of students as the population and extract samples to investigate concepts such as bias and sampling, measures of central tendencies and spread.
CXC 10/G/SYLL 17 26
SECTION 6: ALGEBRA
GENERAL OBJECTIVES On completion of this Section, students should: 1. appreciate the use of algebra as a language and a form of communication; 2. appreciate the role of symbols and algebraic techniques in solving problems in mathematics
and related fields; and, 3. demonstrate the ability to reason with abstract entities.
SPECIFIC OBJECTIVES CONTENT/EXPLANATORY NOTES Students should be able to: 1. use symbols to represent
numbers, operations, variables and relations;
Symbolic representation.
2. translate between algebraic
symbols and worded expressions;
3. evaluate arithmetic
operations involving directed numbers;
4. simplify algebraic
expressions using the four basic operations;
5. substitute numbers for variables in algebraic expressions;
6. evaluate expressions
involving binary operations (other than the four basic operations);
Commutative, associative and distributive properties.
7. apply the distributive law to
factorise or expand algebraic expressions;
For example, 𝑥(𝑎 + 𝑏) = 𝑎𝑥 + 𝑏𝑥 𝑎𝑛𝑑
(𝑎 + 𝑏)(𝑥 + 𝑦) = 𝑎𝑥 + 𝑏𝑥 + 𝑎𝑦 + 𝑏𝑦.
CXC 10/G/SYLL 17 27
SECTION 6: ALGEBRA (cont’d)
SPECIFIC OBJECTIVES CONTENT/ EXPLANATORY NOTES Students should be able to: 8. simplify algebraic fractions; The four basic operation on algebraic fractions. 9. use the laws of indices to
manipulate expressions with integral indices;
For m 𝜖 ℤ, n 𝜖 ℤ.
(i) 𝑥𝑚 × 𝑥𝑛 = 𝑥𝑚+𝑛
(ii) nm
n
m
xx
x
(iii) nmnm xx
(iv) mx mx
1
10. solve linear equations in one
unknown;
11. solve simultaneous linear
equations, in two unknowns, algebraically;
12. solve a simple linear
inequality in one unknown;
13. change the subject of
formulae; Including equations involving roots and powers.
14. factorise algebraic
expressions;
Expressions of the type: 𝑎2 − 𝑏2 ;
𝑎𝑥 + 𝑏𝑥 + 𝑎𝑦 + 𝑏𝑦 𝑎𝑥2 + 𝑏𝑥 + 𝑐 where 𝑎, 𝑏, and 𝑐 are integers and 𝑎 ≠ 0
15. rewrite a quadratic
expression in the form 2( )a x h k ;
Completing the square of a quadratic expression.
16. solve quadratic equations
algebraically;
Formula and by methods of factorisation and completing the square.
22 2 baba
CXC 10/G/SYLL 17 28
SECTION 6: ALGEBRA (cont’d)
17. solve word problems;
Linear equation, Linear inequalities, two simultaneous linear equations, quadratic equations. Applications to other subjects for example demand and supply functions of business studies.
18. solve a pair of equations in two variables when one equation is quadratic or non-linear and the other linear;
19. prove two algebraic expressions to be identical;
Equations vs. identities.
20. represent direct and inverse variation symbolically; and,
𝑦 varies directly as 𝑥: 𝑦 ∝ 𝑥, 𝑦 = 𝑘𝑥
𝑦 varies inversely as 𝑥: 𝑦 ∝1
𝑥, 𝑦 =
𝑘
𝑥
21. solve problems involving direct variation and inverse variation.
Suggested Teaching and Learning Activities
To facilitate students’ attainment of the objectives of this Section, teachers are advised to engage students in the teaching and learning activities listed below.
1. Encourage the use of:
(a) calculators;
(b) games and quizzes;
(c) appropriate software (for example, equation solving apps);
(d) examples of algebraic problems drawn from real-life situations; and,
(e) online demonstrative videos.
2. Explore the link between algebra and other disciplines, for example:
(a) Music: the use of music symbols;
(b) Sciences and nature: rearranging scientific formulae;
(c) Architecture: determine the size or amounts of tiles/windows/doors of a floor or wall; and,
(d) Business studies: solving equations to determine profit/loss, demand and supply.
CXC 10/G/SYLL 17 29
SECTION 6: ALGEBRA (cont’d)
3. Introduce students to symbolic representation using examples drawn from everyday life such as safety symbols, road signs and other familiar informational and warning signs.
4. Promote appropriate use of variables. For example, differentiate between 5 𝑚 as an
abbreviation for 5 metres and 5𝑚, where 𝑚 represent the number of mangoes bought. 5. Explore the concept of equality through the use of:
(a) Pan Balance activities with numbers (8 + 4 = 𝑥 – 2) and shapes; and,
(b) Hands-on Algebra.
6. Use manipulatives such as integer chips, algebra tiles and other appropriate materials to develop the understanding of:
(a) Operations with integers.
(b) Simplifying algebraic expressions (adding/subtracting like terms).
(c) Multiplying binomials of power 1.
(d) Solving linear equations with one unknown.
(e) Rearranging an equation/formula.
7. Conduct labs to assist students in the efficient use of calculators. For example: to explore the order of operations, to evaluate expressions with exponents and roots.
CXC 10/G/SYLL 17 30
SECTION 7: RELATIONS, FUNCTIONS AND GRAPHS
GENERAL OBJECTIVES On completion of this Section, students should: 1. appreciate the importance of relations in Mathematics; 2. appreciate that many mathematical relations may be represented in symbolic form, tabular
or pictorial form; and,
3. appreciate the usefulness of concepts in relations, functions and graphs to solve real-world problems.
SPECIFIC OBJECTIVES CONTENT/ EXPLANATORY NOTES Students should be able to: 1. explain basic concepts
associated with relations; Concept of a relation, types of relations, examples
and non-examples of relations, domain, range, image, co-domain.
2. represent a relation in
various ways; Set of ordered pairs, arrow diagrams, graphically,
algebraically. 3. state the characteristics
that define a function; Concept of a function, examples and non-examples of
functions. 4. use functional notation; For example, 𝑓 ∶ 𝑥 𝑥2; or 𝑓(𝑥) = 𝑥2 as well as
𝑦 = 𝑓(𝑥) for given domains. The inverse function 𝑓−1(𝑥). Composite functions 𝑓𝑔 = 𝑓[𝑔(𝑥)].
5. distinguish between a
relation and a function; Ordered pairs, arrow diagram, graphically (vertical
line test). 6. draw graphs of linear
functions; Concept of linear function, types of linear function
(𝑦 = 𝑐; 𝑥 = 𝑘; 𝑦 = 𝑚𝑥 + 𝑐; where 𝑚, 𝑐 and 𝑘 are real numbers).
7. determine the intercepts of
the graph of linear functions;
𝑥-intercepts and 𝑦-intercepts, graphically and algebraically.
8. determine the gradient of a
straight line; Definition of gradient/slope.
CXC 10/G/SYLL 17 31
SECTION 7: RELATIONS, FUNCTIONS AND GRAPHS (cont’d)
SPECIFIC OBJECTIVES CONTENT/ EXPLANATORY NOTES Students should be able to: 9. determine the equation of a
straight line;
Using: (a) the graph of the line; (b) the co-ordinates of two points on the line; (c) the gradient and one point on the line; and, (d) one point on the line or its gradient, and its
relationship to another line. 10. solve problems involving the
gradient of parallel and perpendicular lines;
11. determine from co-ordinates
on a line segment: (a) the length; and, (b) the co-ordinates of
the midpoint.
The concept of magnitude or length, concept of midpoint.
12. solve a pair of simultaneous linear equations in two unknowns graphically;
Intersection of graphs.
13. represent the solution of
linear inequalities in one variable using:
(a) set notation; (b) the number line; and,
(c) graph.
14. draw a graph to represent a linear inequality in two variables;
CXC 10/G/SYLL 17 32
SECTION 7: RELATIONS, FUNCTIONS AND GRAPHS (cont’d)
SPECIFIC OBJECTIVES CONTENT/EXPLANATORY NOTES Students should be able to:
15. use linear programming techniques to graphically solve problems involving two variables;
16. derive the composition of
functions; Composite function of no more than two functions,
for example, 𝑓𝑔, 𝑓2 given 𝑓 and 𝑔. Non-commutativity of composite functions (𝑓𝑔 ≠ 𝑔𝑓) in general.
17. state the relationship
between a function and its inverse;
The concept of the inverse of a function; The composition of inverse functions 𝑓(𝑥) and 𝑓−1(𝑥) is commutative and results in 𝑥.
18. derive the inverse of a
function; 𝑓−1, (𝑓𝑔)−1
19. evaluate a function 𝑓(𝑥) at a
given value of 𝑥;
𝑓(𝑎), 𝑓−1(𝑎), 𝑓𝑔(𝑎), where 𝑎 ∈ ℝ.
20. draw and use the graph of a quadratic function to identify its features:
(a) an element of the
domain that has a given image;
(b) the image of a given
element in the domain;
(c) the maximum or
minimum value of the function; and,
(d) the equation of the
axis of symmetry.
Roots of the equation.
CXC 10/G/SYLL 17 33
SECTION 7: RELATIONS, FUNCTIONS AND GRAPHS (cont’d)
SPECIFIC OBJECTIVES CONTENT/EXPLANATORY NOTES Students should be able to:
21. interpret the graph of a
quadratic function to determine:
Concepts of gradient of a curve at a point, tangent, turning point. Roots of the function.
(a) the interval of the domain for which the elements of the range may be greater than or less than a given point;
(b) an estimate of the
value of the gradient at a given point; and,
(c) intercepts of the
function.
22. determine the equation of the axis of symmetry and the maximum or minimum value of a quadratic function expressed in the form 𝑎(𝑥 + ℎ)2 + 𝑘;
23. sketch the graph of a
quadratic function expressed in the form 𝑦 = 𝑎(𝑥 + ℎ)2 + 𝑘 and determine the number of roots;
24. draw graphs of non-linear
functions; 𝑦 = 𝑎𝑥𝑛 where 𝑛 = −1,−2 and + 3 and 𝑎 is a
constant. Including distance-time and speed-time. 25. interpret graphs of functions;
and, Including distance-time graphs and speed-time
graphs.
26. solve problems involving graphs of linear and non-linear functions.
CXC 10/G/SYLL 17 34
SECTION 7: RELATIONS, FUNCTIONS AND GRAPHS (cont’d) Suggested Teaching and Learning Activities To facilitate students’ attainment of the objectives of this Section, teachers are advised to engage students in the teaching and learning activities listed below.
1. Encourage the use of:
(a) calculators;
(b) games and quizzes;
(c) appropriate software (for example, the use of graphing apps in demonstrating properties of graphs);
(d) examples of functions and graphs obtained from magazines and newspapers; and,
(e) online demonstrative videos.
2. Explore the link between relations, functions and graphs and other disciplines, for example:
(a) Music: create a mapping of the number of beats to the music notes;
(b) Sciences: plot graphs of sound waves, path of a projectile such as a shot putt, 2-dimensional graph of a terrain;
(c) Art and Geography: identifying locations on a map using coordinate systems, the use of GPS technology;
(d) Architecture: gradient of a roof, ramp;
(e) Health and family life: plotting a graph of weight against time and finding the rate using the gradient of a function; and,
(f) Business studies: finding marginal cost using the concept of gradient, break even analysis.
3. Students can be provided with samples of ordered pairs and be required to determine the domain, the range and whether the relation is or is not a function.
4. Encourage students to describe a function based on its properties and not the independent variable.
5. Use functions machines to show input and output.
6. Demonstrate relationships between a function and its inverse: for example doubling will undo halving, geometric interpretation as a reflection in the line 𝑦 = 𝑥.
7. Relate reverse processes of real life situations to functions and their inverses, for example, the route from home to school.
8. Use real life examples of items that fit related categories to identify common characteristics as an analogy to linear programing.
CXC 10/G/SYLL 17 35
SECTION 8: GEOMETRY AND TRIGONOMETRY
GENERAL OBJECTIVES On completion of this Section, students should: 1. appreciate the notion of space as a set of points with subsets of that set (space) having
properties related to other mathematical systems; 2. understand the properties and relationship among geometrical objects; 3. understand the properties of transformations; 4. demonstrate the ability to use geometrical concepts to model and solve real world problems;
and, 5. appreciate the power of trigonometrical methods in solving authentic problems.
SPECIFIC OBJECTIVES CONTENT/EXPLANATORY NOTES Students should be able to:
1. explain concepts relating to geometry;
Points, lines, parallel lines, intersecting lines and perpendicular lines, line segments, rays, curves, planes; types of angles; number of faces, edges and vertices.
2. draw and measure angles
and line segments accurately using appropriate instruments;
3. construct lines, angles, and
polygons using appropriate instruments;
Parallel and perpendicular lines. Bisecting line segments and angles. Constructing a line perpendicular to another line, L, from a point that is not on the line, L. Triangles, quadrilaterals, regular and irregular polygons. Angles include 30𝑜, 45𝑜, 60𝑜, 90𝑜, 120𝑜 and their combinations.
4. identify the type(s) of
symmetry possessed by a given plane figure;
Line(s) of symmetry, rotational symmetry, order of rotational symmetry.
CXC 10/G/SYLL 17 36
SECTION 8: GEOMETRY AND TRIGONOMETRY (cont’d)
SPECIFIC OBJECTIVES CONTENT/EXPLANATORY NOTES Students should be able to: 5. solve geometric problems
using properties of:
(a) lines, angles, and polygons;
(b) congruent triangles; (c) similar figures;
(d) faces, edges and
vertices of solids; and,
(e) classes of solids.
Determining and justifying the measure of angles: adjacent angles, angles at a point, supplementary angles, complementary angles, vertically opposite angles. Parallel lines and transversals, alternate angles, corresponding angles, co-interior angles. Triangles: Equilateral, Isosceles, scalene, obtuse, right, acute. Quadrilaterals: Square, rectangle, rhombus, kite, parallelogram, trapezium. Other polygons. Cases of congruency. Properties of similar triangles Prisms, pyramids, cylinders, cones, sphere.
6. solve geometric problems using properties of circles and circle theorems;
Radius, diameter, chord, circumference, arc, tangent, segment, sector, semicircle, pi.
Determining and justifying angles using the circle theorems:
The angle which an arc of a circle subtends at the centre of a circle is twice the angle it subtends at any point on the remaining part of the circumference.
Angles at the circumference in the same segment of a circle and subtended by the same arc/chord are equal.
The angle at the circumference subtended by the diameter is a right angle.
The opposite angles of a cyclic quadrilateral are supplementary.
CXC 10/G/SYLL 17 37
SECTION 8: GEOMETRY AND TRIGONOMETRY (cont’d)
SPECIFIC OBJECTIVES CONTENT/EXPLANATORY NOTES
Students should be able to:
The exterior angle of a cyclic quadrilateral is equal to the interior opposite angle.
The angle between a tangent to a circle and a chord through the point of contact is equal to the angle in the alternate segment.
A tangent of a circle is perpendicular to the radius/diameter of that circle at the point of contact.
The lengths of two tangents from an external point to the points of contact on the circle are equal.
The line joining the centre of a circle to the midpoint of a chord is perpendicular to the chord.
7. represent translations in a plane using vectors;
Column matrix notation .
8. determine and represent the location of:
(a) the image of an object under a transformation; and,
(b) an object given the image under a transformation.
Translation in the plane.
Reflection in a line in that plane.
Rotation about a point (the centre of rotation) in that plane.
Enlargement in the plane.
9. state the relationship between an object and its image in the plane under geometric transformations;
Orientation, similarity, congruency.
10. describe a transformation given an object and its image;
Translation: vector notation. Reflection: mirror line/ axis of symmetry. Rotation: centre of rotation, angle of rotation, direction of rotation. Enlargement: centre, scale factor 𝑘 such that |𝑘| > 1 or 0 < |𝑘| < 1.
11. locate the image of an object under a combination of transformations;
Combination of any two of:
(a) enlargement;
(b) translation;
(c) rotation; and,
(d) reflection.
y
x
CXC 10/G/SYLL 17 38
SECTION 8: GEOMETRY AND TRIGONOMETRY (cont’d)
SPECIFIC OBJECTIVES CONTENT/EXPLANATORY NOTES Students should be able to: 12. use Pythagoras’ theorem to
solve problems;
13. define the trigonometric
ratios of acute angles in a right triangle;
Sine, Cosine, Tangent.
14. relate objects in the physical world to geometric objects;
Angle of elevation, angle of depression, bearing.
15. apply the trigonometric
ratios to solve problems; Spatial geometry and scale drawing, angles of
elevation and depression. 16. use the sine and cosine rules
to solve problems involving triangles; and,
17. solve problems involving
bearings. Relative position of two points given the bearing of
one point with respect to the other; bearing of one point relative to another point given the position of the points. Bearing written in 3-digit format for example 060𝑜.
Suggested Teaching and Learning Activities To facilitate students’ attainment of the objectives of this Section, teachers are advised to engage students in the teaching and learning activities listed below. 1. Encourage the use of:
(a) calculators;
(b) games and quizzes; (c) appropriate software (for example, 3-D sketching software, 2-D apps such as
Geogebra); (d) Concrete models of geometric figures in common places; and, (e) online demonstrative videos.
CXC 10/G/SYLL 17 39
SECTION 8: GEOMETRY AND TRIGONOMETRY (cont’d)
2. Explore the link between geometry and trigonometry and other disciplines, for example:
(a) Music: Exploring geometric properties of musical instruments;
(b) Sciences: orbital locus of planets, galaxies; geometry in nature: leaves, shells, waves,
spherical objects;
(c) Geography: the use of bearings;
(d) Art and Architecture: geometry of structures, triangles, circles; using geometric figures to create art such as paintings, tessellations; symmetry, similarity and congruency in structures such as the roof; and,
(e) Health and family life: the geometry of postures in exercise and athletics.
3. Explore concepts of elevation, depression, bearings in real life situations. 4. Estimate distances and area using geometry, pictures with a known distance. 5. Engage students in activities of detecting which of two objects is taller. 6. Construction of shapes for art work such as collages. 7. Use instruments and strings to locate points of a defined locus.
CXC 10/G/SYLL 17 40
SECTION 9: VECTORS AND MATRICES
GENERAL OBJECTIVES On completion of this Section, students should: 1. demonstrate the ability to use vector notation and concepts to model and solve real-world
problems;
2. develop awareness of the existence of certain mathematical objects, such as matrices, that do not satisfy the same rules of operation as the real number system; and,
3. appreciate the use of vectors and matrices in representing certain types of linear
transformations in the plane.
SPECIFIC OBJECTIVES CONTENT/EXPLANATORY NOTES
Students should be able to:
1. explain concepts associated with vectors;
Concept of a vector, magnitude, unit vector, direction, scalar.
Scalar multiples: parallel vectors, equal vectors, inverse vectors.
2. simplify expressions involving vectors;
Vector algebra: addition, subtraction, scalar multiplication.
Vector geometry: triangle law, parallelogram law.
3. write the position vector of a
point 𝑃(𝑎, 𝑏) as 𝑂𝑃 = (𝑎𝑏)
where 𝑂 is the origin (0,0);
Displacement and position vectors; including the use of co-ordinates in the x-y plane to identify and determine displacement and position vectors.
4. determine the magnitude of a vector;
Including unit vectors.
5. determine the direction of a vector;
6. use vectors to solve problems in geometry;
Points in a straight line, Parallel lines; displacement, velocity, weight.
7. explain basic concepts associated with matrices;
Concept of a matrix, row, column, square, identity rectangular, order.
8. solve problems involving matrix operations;
Addition and subtraction of matrices of the same order. Scalar multiples.
Multiplication of conformable matrices.
Equality, non-commutativity of matrix multiplication.
CXC 10/G/SYLL 17 41
SECTION 9: VECTORS AND MATRICES (cont’d)
SPECIFIC OBJECTIVES CONTENT/ EXPLANATORY NOTES Students should be able to: 9. evaluate the determinant of
a ‘2 x 2’ matrix;
10. define the multiplicative
inverse of a non-singular square matrix;
Identity for the square matrices.
11. obtain the inverse of a non-
singular ‘2 x 2’ matrix; Determinant and adjoint of a matrix.
12. determine a ‘2 x 2’ matrix
associated with a specified transformation; and,
Transformation which is equivalent to the composition of two linear transformations in a plane (where the origin remains fixed). (a) Reflection in: the 𝑥-axis, 𝑦-axis, the lines 𝑦 = 𝑥 and 𝑦 = – 𝑥.
(b) Rotation in a clockwise and anticlockwise
direction about the origin; the general rotation matrix.
(c) Enlargement with centre at the origin.
13. use matrices to solve simple
problems in Arithmetic, Algebra and Geometry.
Data matrices, equality. Use of matrices to solve linear simultaneous equations with two unknowns. Problems involving determinants are restricted to 2x2 matrices. Matrices of order greater than ‘mxn’ will not be set, where m ≤ 4, n ≤ 4.
Suggested Teaching and Learning Activities To facilitate students’ attainment of the objectives of this Section, teachers are advised to engage students in the teaching and learning activities listed below. 1. Encourage the use of:
(a) calculators;
(b) games and quizzes;
(c) appropriate software (for example, the use of matrix solver apps);
CXC 10/G/SYLL 17 42
SECTION 9: VECTORS AND MATRICES (cont’d)
(d) data matrix that are extracted from sources such as grades spread sheet; and,
(e) online demonstrative videos.
2. Explore the link between vectors and matrices and other disciplines, for example: (a) Sciences & Nature: the effects of a river current as a vector quantity;
(b) Art & Geography: dividing an image/photo into a matrix of smaller images for
enlargement; and, (c) Architecture: representing items in the class room such as a tile on the floor using
vector notation. 3. Tabulate data into matrix form. 4. Finding hidden treasures using clues given as vectors.
5. The use of matrices as operators in transformation.
CXC 10/G/SYLL 17 43
GUIDELINES FOR THE SCHOOL-BASED ASSESSMENT RATIONALE School-Based Assessment (SBA) is an integral part of student assessment in the course covered by this syllabus. It is intended to assist students in acquiring certain knowledge, skills and attitudes that are critical to the subject. The activities for the School-Based Assessment are linked to the “Suggested Practical Activities” and should form part of the learning activities to enable the student to achieve the objectives of the syllabus. During the course of study of the subject, students obtain marks for the competencies they develop and demonstrate in undertaking their SBA assignments. These marks contribute to the final marks and grades that are awarded to students for their performance in the examination. The guidelines provided in this syllabus for selecting appropriate tasks are intended to assist teachers and students in selecting assignments that are valid for the purpose of the SBA. These guidelines are also intended to assist teachers in awarding marks according to the degree of achievement in the SBA component of the course. In order to ensure that the scores awarded by teachers are not out of line with the CXC® standards, the Council undertakes the moderation of a sample of SBA assignments marked by each teacher. School-Based Assessment provides an opportunity to individualise a part of the curriculum to meet the needs of students. It facilitates feedback to the students at various stages of the experience. This helps to build the self-confidence of the students as they proceed with their studies. School-Based Assessment further facilitates the development of critical skills and that allows the students to function more effectively in their chosen vocation. School-Based Assessment’ therefore, makes a significant and unique contribution to the development of relevant skills by the students. It also provides an instrument for testing them and rewarding them for their achievements. The Caribbean Examinations Council seeks to ensure that the School Based Assessment scores are valid and reliable estimates of accomplishment. The guidelines provided in this syllabus are intended to assist in doing so. THE PROJECT The project may require candidates to collect data or demonstrate the application of Mathematics in everyday situations. The length of the report should be maximum 1000 words, not including appropriate quotations, sources, charts, graphs, tables, pictures, references and appendices. The activities related to the Project should be integrated into the classroom instruction so as to enable the candidates to learn and practice the skills needed to complete the project.
Some time in class should be allocated for general discussion of project work; allowing for discussion between teacher and student, and student and student.
CXC 10/G/SYLL 17 44
Role of the Teacher The role of the teacher is to: 1. Guide students in identifying suitable topics for the project for the School Based Assessment.
2. Provide guidance throughout the project and guide the candidate through the SBA by helping to resolve any issues that may arise.
3. Ensure that the project is developed as a continuous exercise that occurs during scheduled class hours as well as outside class times.
4. Assess the project and record the marks. Hardcopies of the completed documents should be kept by both the teacher and the student. The teacher should use the mark scheme provided by CXC® and include comments pertinent to the conduct of the assessment.
Assignment
The School Based Assessment consists of ONE project to be marked by the teacher in accordance with CXC® guidelines.
Why a project? The study of mathematics is essential to everyday life. It pervades almost every aspect of our daily activities: planning a picnic, baking a cake, comparing performances in a 100 metre race, shopping for groceries, all require applying mathematical concepts and principles to investigate, describe, explain or predict some real world phenomena. However, to those engaged in learning mathematics in secondary schools, the links between mathematics and the real world are often not recognised or at least not identified and practised. The purpose of a project is to encourage students to apply mathematical concepts, skills and procedures to investigate, describe and explain real world phenomena, to practise problem-solving, and to evaluate results. And these experiences are to be realised by encouraging all students to: 1. Define problems in personal ways, especially by how the problems were motivated;
2. Discuss the problems with (a) their teachers, (b) their classmates and (c) their parents and knowledgeable adults;
3. Develop ways of solving the problems of interest and of curiosity;
4. Record their problems and the ways they would attempt to find solutions using:
words charts models symbols tables algorithms diagrams figures
5. Develop positive attitudes towards the methods of mathematics, use of mathematics and the
enjoyment associated with knowing mathematics and solving mathematical problems; and,
6. Extend mathematical processes and products to exploring and understanding other subjects on the school curriculum.
CXC 10/G/SYLL 17 45
Sample Areas of Research May Include: Hire Purchase or Cash? 1. An explanation of the advantages and disadvantages of hire purchase, using data collected
from at least two stores. Sports Utility Vehicles versus Cars 2. Comparative analyses of the costs of different types of vehicles, considering fuel economy,
maintenance and features. What features should be included in your project? 1. Explaining the mathematical ideas contained in your project.
2. Carrying our practical tasks, using one or more of the following:
(a) Ruler, compasses, protractor
(b) Drawing, constructing, measuring
(c) Counting, looking for patterns, weighing
(d) Calculators, computers, other technological devices
3. Performing calculations (a) Mentally
(b) With paper and pencil
(c) Using calculators
4. Responding orally to mathematics questions asked by the teacher, peers or other interested persons.
5. Identifying sections of project which:
(a) are to be done inside normal class time and scheduled by teacher; and,
(b) may be done outside normal class time at student’s convenience
CXC 10/G/SYLL 17 46
Guidelines for students (and their teachers) Main Activities for the Project 1. Stating the task(s) you which to undertake - its nature, scope and focus
2. Planning
(a) What you will do?
(b) How you will do it?
(c) What materials you will need?
(d) What procedures you will use?
3. Carrying out the plan, procedures or activities
4. Recording what you did, how you did it, and why you did what you did, using words (including mathematical words and phrases); diagrams, tables, figures or charts
5. Conclusion
(a) Your findings
(b) Comments on your findings
(c) How to improve your findings
(d) Making your findings more useful Seven strategies that students use when they are searching for solutions to problems in mathematics. 1. Using simple numbers
- Replace the original numbers with very simple numbers and try to find a solution. After
the solution has been found, try the solution with the original numbers.
2. Sketch a simple diagram
- Attempt to understand the problem using your insight from geometry and the physical arrangements of the spaces around you.
CXC 10/G/SYLL 17 47
3. Make a table of the results - Try to discover any pattern within the table. You may reduce the size of the table,
rotate the table and view its content from a second perspective.
4. Guess and check
5. Look for patterns
- Try to create patterns by combining numbers in novel ways
6. Use algebraic symbols to express ideas
7. Make full use of calculators:
(a) Explore number ideas, number patterns and number sense
(b) Highlight estimation skills associated with arithmetic operations (such as ×, ÷, √,)
(c) Check calculations associated with a wide range of applications (from real life)
(d) Focus on the processes associated with problem-solving
ASSESSMENT CRITERIA The project will be presented in the form of a report and will have the following parts. 1. Project Title
2. Introduction
3. Method of Data Collection
4. Presentation of Data
5. Analysis of Data
6. Discussion of Findings
7. Conclusion
It will be marked out of a total of 20 marks and the marks will be allocated to each task and profile as outlined below.
CXC 10/G/SYLL 17 48
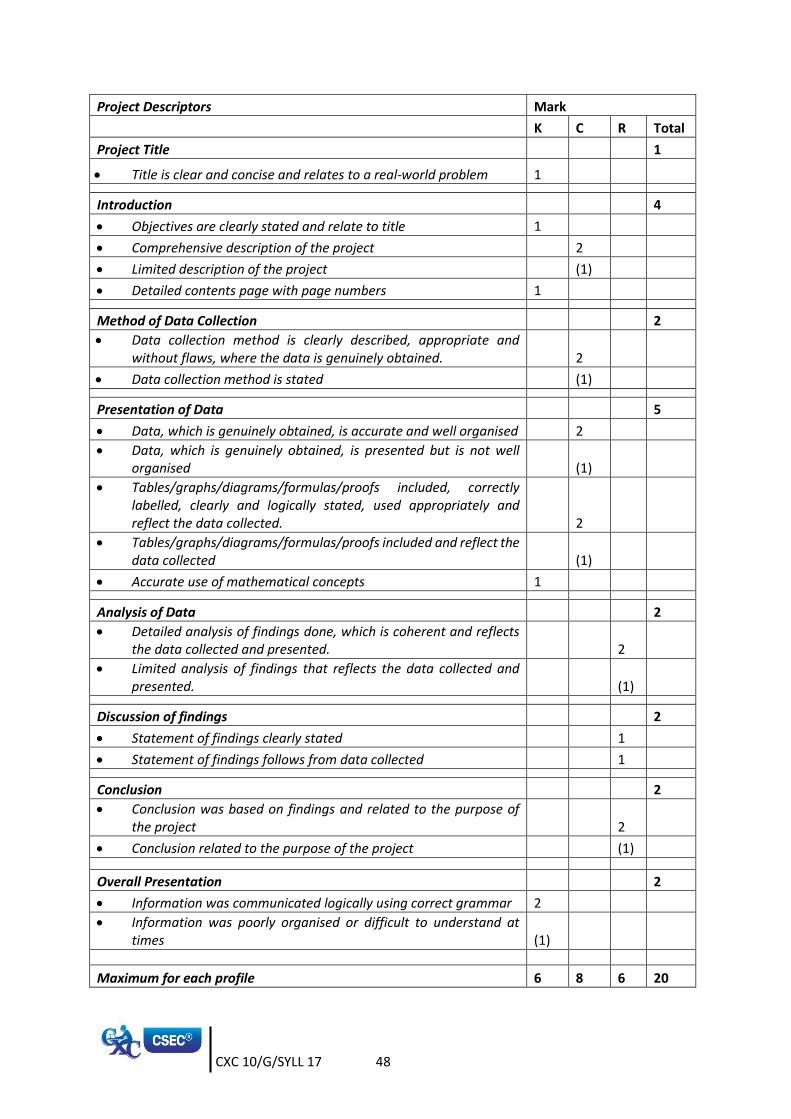
Project Descriptors Mark
K C R Total
Project Title 1
Title is clear and concise and relates to a real-world problem 1
Introduction 4
Objectives are clearly stated and relate to title 1
Comprehensive description of the project 2
Limited description of the project (1)
Detailed contents page with page numbers 1
Method of Data Collection 2
Data collection method is clearly described, appropriate and without flaws, where the data is genuinely obtained. 2
Data collection method is stated (1)
Presentation of Data 5
Data, which is genuinely obtained, is accurate and well organised 2
Data, which is genuinely obtained, is presented but is not well organised (1)
Tables/graphs/diagrams/formulas/proofs included, correctly labelled, clearly and logically stated, used appropriately and reflect the data collected. 2
Tables/graphs/diagrams/formulas/proofs included and reflect the data collected (1)
Accurate use of mathematical concepts 1
Analysis of Data 2
Detailed analysis of findings done, which is coherent and reflects the data collected and presented. 2
Limited analysis of findings that reflects the data collected and presented. (1)
Discussion of findings 2
Statement of findings clearly stated 1
Statement of findings follows from data collected 1
Conclusion 2
Conclusion was based on findings and related to the purpose of the project 2
Conclusion related to the purpose of the project (1)
Overall Presentation 2
Information was communicated logically using correct grammar 2
Information was poorly organised or difficult to understand at times (1)
Maximum for each profile 6 8 6 20
CXC 10/G/SYLL 17 49
EXEMPLAR Project Title: Designing a Basketball Hoop - Why Use a Circle? Introduction: The purpose of this project was to determine the most suitable shape for a
basketball hoop. The number of goals scored using the traditional hoop was compared to the number scored using square, rectangular and hexagonal hoops.
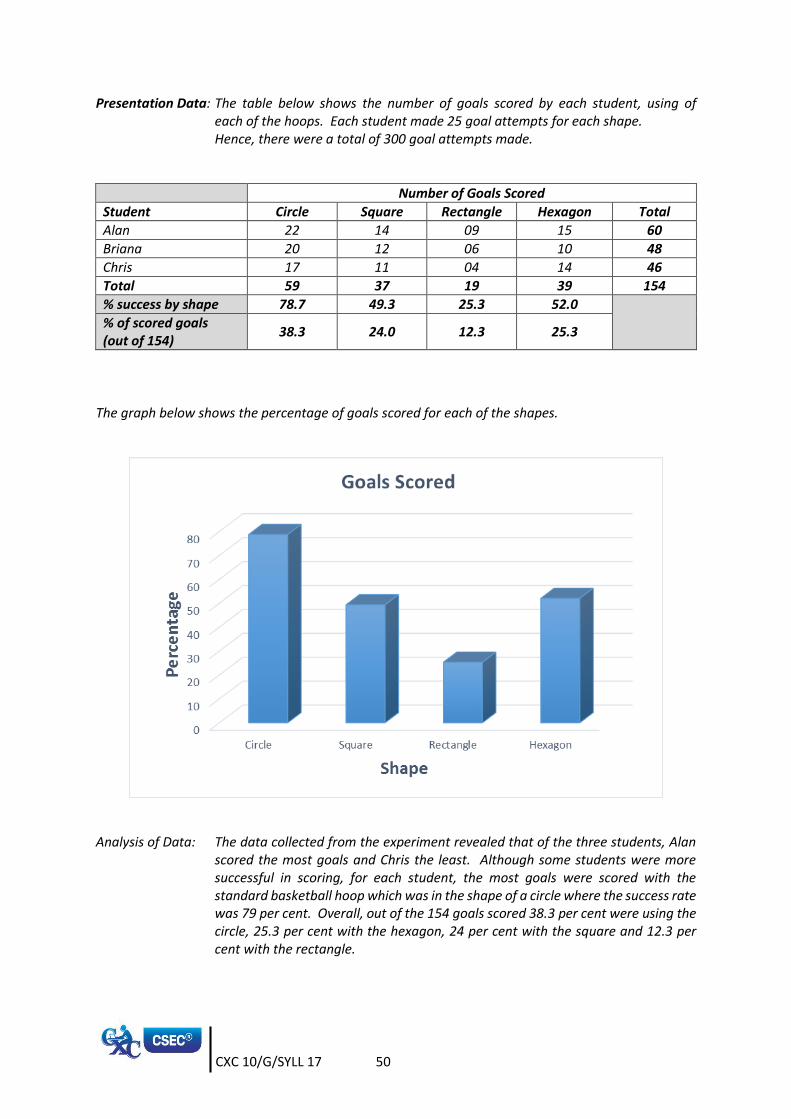
Data Collection: The area enclosed by the circular hoop was calculated and hoops were made using
frames to enclose an area. The dimensions of the frames were calculated to ensure that a standard basketball could pass through each frame.
The area enclosed by a standard basketball hoop is 1641 cm2. Efforts were made
to use dimensions which would give this approximate area. The hoops in the different shapes were made with the enclosed areas shown.
Circle Square Rectangle Hexagon
1641 cm2 1640 cm2 1640 cm2 1644 cm2
Data Collection Sheet
Name of Student: _________________________________________
Shape
No. of goals
Circle
Square
Rectangle
Hexagon
CXC 10/G/SYLL 17 50
Presentation Data: The table below shows the number of goals scored by each student, using of each of the hoops. Each student made 25 goal attempts for each shape. Hence, there were a total of 300 goal attempts made.
Number of Goals Scored
Student Circle Square Rectangle Hexagon Total
Alan 22 14 09 15 60
Briana 20 12 06 10 48
Chris 17 11 04 14 46
Total 59 37 19 39 154
% success by shape 78.7 49.3 25.3 52.0 % of scored goals
(out of 154) 38.3 24.0 12.3 25.3
The graph below shows the percentage of goals scored for each of the shapes.
Analysis of Data: The data collected from the experiment revealed that of the three students, Alan
scored the most goals and Chris the least. Although some students were more successful in scoring, for each student, the most goals were scored with the standard basketball hoop which was in the shape of a circle where the success rate was 79 per cent. Overall, out of the 154 goals scored 38.3 per cent were using the circle, 25.3 per cent with the hexagon, 24 per cent with the square and 12.3 per cent with the rectangle.
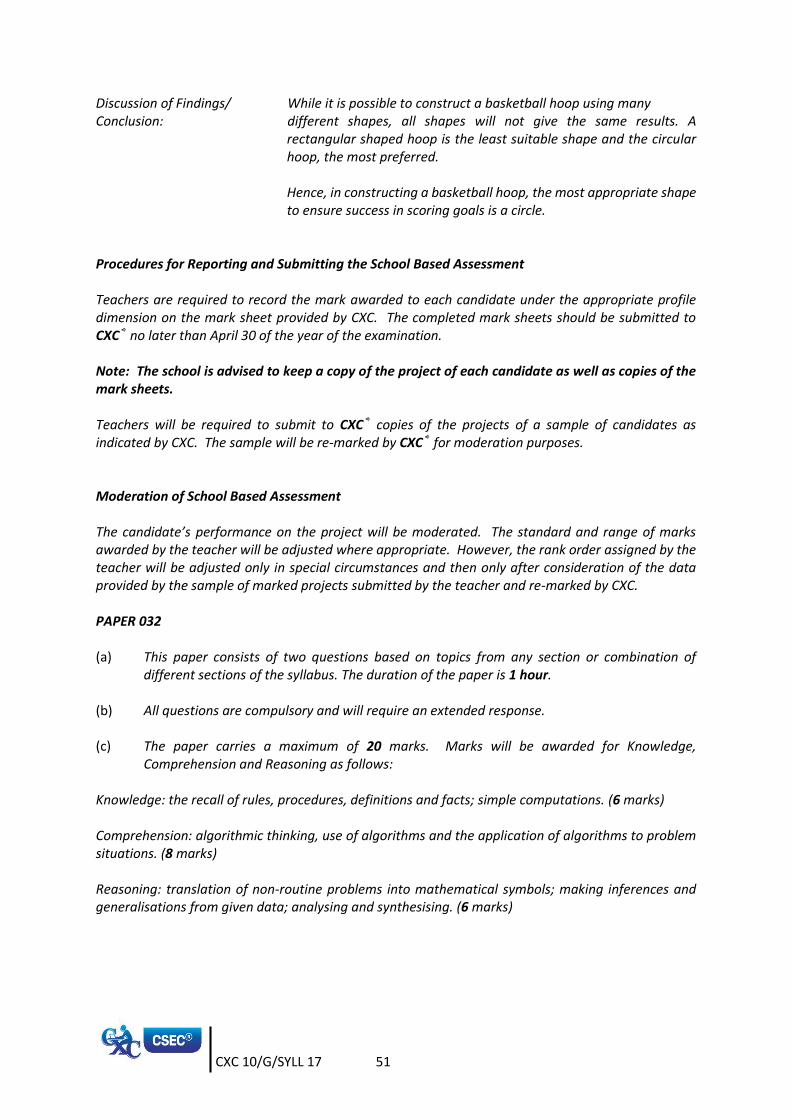
CXC 10/G/SYLL 17 51
Discussion of Findings/ While it is possible to construct a basketball hoop using many Conclusion: different shapes, all shapes will not give the same results. A
rectangular shaped hoop is the least suitable shape and the circular hoop, the most preferred.
Hence, in constructing a basketball hoop, the most appropriate shape to ensure success in scoring goals is a circle.
Procedures for Reporting and Submitting the School Based Assessment Teachers are required to record the mark awarded to each candidate under the appropriate profile dimension on the mark sheet provided by CXC. The completed mark sheets should be submitted to CXC® no later than April 30 of the year of the examination.
Note: The school is advised to keep a copy of the project of each candidate as well as copies of the mark sheets.
Teachers will be required to submit to CXC® copies of the projects of a sample of candidates as indicated by CXC. The sample will be re-marked by CXC® for moderation purposes.
Moderation of School Based Assessment The candidate’s performance on the project will be moderated. The standard and range of marks awarded by the teacher will be adjusted where appropriate. However, the rank order assigned by the teacher will be adjusted only in special circumstances and then only after consideration of the data provided by the sample of marked projects submitted by the teacher and re-marked by CXC. PAPER 032 (a) This paper consists of two questions based on topics from any section or combination of
different sections of the syllabus. The duration of the paper is 1 hour. (b) All questions are compulsory and will require an extended response. (c) The paper carries a maximum of 20 marks. Marks will be awarded for Knowledge,
Comprehension and Reasoning as follows: Knowledge: the recall of rules, procedures, definitions and facts; simple computations. (6 marks) Comprehension: algorithmic thinking, use of algorithms and the application of algorithms to problem situations. (8 marks) Reasoning: translation of non-routine problems into mathematical symbols; making inferences and generalisations from given data; analysing and synthesising. (6 marks)
CXC 10/G/SYLL 17 52
RECOMMENDED TEXTS
Buckwell, G., Solomon, R., and Chung Harris, T.
CXC Mathematics for Today 1. Oxford: Macmillan Education, 2005.
Chandler, S., Smith, E., Ali, F., Layne, C. and Mothersill, A.
Mathematics for CSEC. United Kingdom: Nelson Thorne Limited, 2008.
Golberg, N. Mathematics for the Caribbean 4. Oxford: Oxford
University Press, 2006. Greer and Layne Certificate Mathematics, A Revision Course for the
Caribbean. United Kingdom: Nelson Thrones Limited, 2001.
Layne, Ali, Bostock, Chandler, Shepherd and Ali.
STP Caribbean Mathematics for CXC Book 4. United Kingdom: Nelson Thrones Limited, 2005.
Toolsie, R. Mathematics, A Complete Course Volume 1.
Caribbean Educational Publisher Limited, 2006. Toolsie, R. Mathematics, A Complete Course Volume 2.
Caribbean Educational Publisher Limited, 2006.
Websites http://mathworld.wolfram.com/ http://plus.maths.org/ http://nrich.maths.org/public/ http://mathforum.org/ http://www.ies.co.jp/math/java/
CXC 10/G/SYLL 17 53
Appendix 1A
GLOSSARY OF EXAMINATION TERMS
KEY TO ABBREVIATIONS K - Knowledge C - Comprehension R - Reasoning WORD
DEFINITION NOTES
Analyse examine in detail Annotate add a brief note to a label Simple phrase or a few words only. Apply use knowledge/principles to solve
problems Make inferences/conclusions.
Assess present reasons for the importance of
particular structures, relationships or processes
Compare the advantages and disadvantages or the merits and demerits of a particular structure, relationship or process.
Calculate arrive at the solution to a numerical
problem Steps should be shown; units must
be included. Classify divide into groups according to
observable characteristics
Comment state opinion or view with supporting
reasons
Compare state similarities and differences An explanation of the significance
of each similarity and difference stated may be required for comparisons which are other than structural.
Construct use a specific format to make and/or
draw a graph, histogram, pie chart or other representation using data or material provided or drawn from practical investigations, build (for example, a model), draw scale diagram
Such representations should normally bear a title, appropriate headings and legend.
Deduce make a logical connection between two
or more pieces of information; use data to arrive at a conclusion
CXC 10/G/SYLL 17 54
WORD
DEFINITION NOTES
Define state concisely the meaning of a word or term
This should include the defining equation/formula where relevant.
Demonstrate show; direct attention to...
Derive to deduce, determine or extract from data by a set of logical steps some relationship, formula or result
This relationship may be general or specific.
Describe provide detailed factual information of the appearance or arrangement of a specific structure or a sequence of a specific process
Description may be in words, drawings or diagrams or any appropriate combination. Drawings or diagrams should be annotated to show appropriate detail where necessary.
Determine find the value of a physical quantity
Design plan and present with appropriate practical detail
Where hypotheses are stated or when tests are to be conducted, possible outcomes should be clearly stated and/or the way in which data will be analysed and presented.
Develop expand or elaborate an idea or argument with supporting reasons
Diagram simplified representation showing the relationship between components
Differentiate/ Distinguish (between/ among)
state or explain briefly those differences between or among items which can be used to define the items or place them into separate categories
Discuss present reasoned argument; consider points both for and against; explain the relative merits of a case
Draw make a line representation from specimens or apparatus which shows an accurate relation between the parts
In the case of drawings from specimens, the magnification must always be stated.
Estimate make an approximate quantitative judgement
Evaluate weigh evidence and make judgements based on given criteria
The use of logical supporting reasons for a particular point of view is more important than the view held; usually both sides of an argument should be considered.
Explain give reasons based on recall; account for
CXC 10/G/SYLL 17 55
WORD
DEFINITION NOTES
Find locate a feature or obtain as from a graph
Formulate devise a hypothesis Identify name or point out specific components
or features
Illustrate show clearly by using appropriate
examples or diagrams, sketches
Interpret explain the meaning of Investigate use simple systematic procedures to
observe, record data and draw logical conclusions
Justify explain the correctness of Label add names to identify structures or parts
indicated by pointers
List itemise without detail Measure take accurate quantitative readings using
appropriate instruments
Name give only the name of No additional information is
required. Note write down observations Observe pay attention to details which
characterise a specimen, reaction or change taking place; to examine and note scientifically
Observations may involve all the senses and/or extensions of them but would normally exclude the sense of taste.
Outline give basic steps only Plan prepare to conduct an investigation Predict use information provided to arrive at a
likely conclusion or suggest a possible outcome
Record write an accurate description of the full
range of observations made during a given procedure
This includes the values for any variable being investigated; where appropriate, recorded data may be depicted in graphs, histograms or tables.
CXC 10/G/SYLL 17 56
WORD
DEFINITION NOTES
Relate show connections between; explain how one set of facts or data depend on others or are determined by them
Sketch make a simple freehand diagram
showing relevant proportions and any important details
State provide factual information in concise
terms outlining explanations
Suggest offer an explanation deduced from
information provided or previous knowledge. (... a hypothesis; provide a generalisation which offers a likely explanation for a set of data or observations.)
No correct or incorrect solution is presumed but suggestions must be acceptable within the limits of scientific knowledge.
Use apply knowledge/principles to solve
problems Make inferences/conclusions.
CXC 10/G/SYLL 17 57
Appendix 1B
GLOSSARY OF MATHEMATICAL TERMS
WORD MEANING Abscissa The x-coordinate in a Cartesian coordinate system. Absolute value The absolute value of a real number 𝑥, denoted by |𝑥|, is defined by
|𝑥| = 𝑥 if 𝑥 > 0 and |𝑥| = −𝑥 if 𝑥 < 0. For example, |−4| = 4. Acceleration
The rate of change of velocity with respect to time.
Acute Angle An angle whose measure is greater than 0 degrees and less than 90 degrees. Acute triangle is a triangle with all three of its angles being acute.
Adjacent
Being next to or adjoining Adjacent angles are two angles that have the same vertex and share a common arm. In a right triangle the adjacent side, with respect to an acute angle, is the shorter side which, together with the hypotenuse, forms the given acute angle.
Adjoint Matrix The adjoint of a 2 × 2 matrix 𝐴, denoted 𝐴𝑑𝑗(𝐴), satisfies the following:
If 𝐴 = (𝑎 𝑏𝑐 𝑑
) , then 𝐴𝑑𝑗(𝐴) = (𝑑 −𝑏−𝑐 𝑎
).
Algebraic Expression
A combination of numbers, variables and algebraic operations. For
example 3𝑥4
17+ 5(𝑦 − √16𝑧) is an algebraic expression.
Algebraic Term An algebraic expression that is strictly a multiplication of constants and
variables. For example the algebraic expression 6𝑥3 − 3𝑥2 + 5𝑥 contains three algebraic terms: (6𝑥3), (−3𝑥2) and (5𝑥).
Algorithm A process consisting of a specific sequence of operations to solve a certain types of problems. See Heuristic.
Alternate Interior Angles
Angles located inside a set of parallel lines and on opposite sides of the transversal. Also known as ‘Z-angles’.
Altitude The altitude of a triangle is the perpendicular distance of a vertex to the line of the side opposite. A triangle has three altitudes.
Appreciation An increase in value of an asset that is not due to altering its state.
Approximate To find the value of a quantity within a specified degree of accuracy.
Arc
A portion of a circle; also a portion of any curve. See circle.
Area The area of a plane figure is a measure of how much of that plane is enclosed by the figure.
CXC 10/G/SYLL 17 58
WORD MEANING Arithmetic Mean The average of a set of values found by dividing the sum of the values
by the amount of values.
Arithmetic Sequence A sequence of elements, a1, a2, a3,….., such that the difference of successive terms is a constant d. For example, the sequence {2, 5, 8, 11, 14,… } has common difference 3.
Associative Property A binary operation ∘ on a set 𝑆 is associative if, for all 𝑎, 𝑏 and 𝑐 in 𝑆, (𝑎 ∘ 𝑏) ∘ 𝑐 = 𝑎 ∘ (𝑏 ∘ 𝑐).
Asymptotes Average
A straight line is said to be an asymptote of a curve if the curve has the property of becoming and staying arbitrarily close to the line as the distance from the origin increases to infinity. The average of a set of values is the number which represents the usual or typical value in that set. Average is synonymous with measures of central tendency. These include the mean, mode and median.
Axis of symmetry A line that passes through a figure such that the portion of the figure
on one side of the line is the mirror image of the portion on the other side of the line.
Bar Graph A diagram showing a system of connections or interrelations between two or more things by using bars.
Base 1. The base of a polygon is one of its sides; for example, a side of a triangle.
2. The base of a solid is one of its faces; for example, the flat face of a cylinder.
3. The base of a number system is the number of digits it contains; for example, the base of the binary system is two.
Bimodal
Having two modes, which are equally the most frequently occurring numbers in a list.
Binary Numbers
Numbers written in the base two number system. The digits used are 0 and 1. For example, 110112.
Binomial
An algebraic expression consisting of the sum or difference of two terms.
Bisector
To cut something in half. For example, an angle bisector is a line that divides one angle into two angles of equal size.
Capacity The maximum amount that something can contain.
CXC 10/G/SYLL 17 59
WORD MEANING Cartesian Plane Chord
A plane with a point selected as an origin, some length selected as a unit of distance, and two perpendicular lines that intersect at the origin, with positive and negative directions selected on each line. Traditionally, the lines are called x (drawn from left to right, with positive direction to the right of the origin) and y (drawn from bottom to top, with positive direction upward of the origin). Coordinates of a point are determined by the distance of this point from the lines, and the signs of the coordinates are determined by whether the point is in the positive or in the negative direction from the origin. A line segment that connects two points on a curve. The Diameter of a circle is a special chord that passes through the centre of the circle.
Circle The set of points in a plane that are all a fixed distance from a given point which is called the centre.
The Circumference of a circle is the distance along the circle; it’s a special name for the perimeter of the circle.
Class Interval Non-overlapping intervals, which together contain every piece of data in a survey.
Coefficients
The constant multiplicative factor of a mathematical object. For
example, in the expression 4d+5 +3s, the 4, 5, and 3 are coefficients for the variables d, t2, and s respectively.
Collinear A set of points are said to be collinear if they all lie on the same straight line.
Commutative Property
Reversing the order in which two objects are being added or multiplied will yield the same result. For all real numbers a and b, a+b=b+a and ab=ba.
Complement
The complement of a set A is another set of all the elements outside of set A but within the universal set.
Complementary Angles
Two angles that have a sum of 90 degrees.
Composite Function
A function consisting of two or more functions such that the output of one function is the input of the other function. For example, in the
composite function 𝑓(𝑔(𝑥)) the input of 𝑓 is 𝑔.
Composite Numbers
Numbers that have more than two factors. For example, 6 and 20 are composite numbers while 7 and 41 are not.
Compound Interest A system of calculating interest on the sum of the initial amount invested together with the interest previously awarded; if A is the initial sum invested in an account and r is the rate of interest per period invested, then the total after n periods is 𝐴(1 + 𝑟)𝑛.
2t
CXC 10/G/SYLL 17 60
WORD MEANING Congruent Two shapes in the plane or in space are congruent if they are identical.
That is, if one shape is placed on the other they match exactly.
Coordinates
A unique order of numbers that identifies a point on the coordinate plane. On the Cartesian two dimensional plane the first number in the ordered pair identifies the position with regard to the horizontal (x-axis) while the second number identifies the position relative to the vertical (y-axis).
Coplanar A set of points is coplanar if the points all lie in the same plane.
Corresponding Angles
Two angles in the same relative position on two parallel lines when those lines are cut by a transversal.
Decimal Number A number written in base ten.
Degrees
A degree is a unit of measure of angles where one degree is 1
360 of a
complete revolution.
Depreciation
The rate which the value of an asset diminishes due only to wear and tear.
Diagonal The diagonal of a polygon is a straight line joining two of its nonadjacent vertices.
Discontinuous Graph
A line in a graph that is interrupted, or has breaks in it.
Discrete A set of values are said to be discrete if they are all distinct and separated from each other. For example, the set of shoe sizes where the elements of this set can only take on a limited and distinct set of values.
Disjoint Two sets are disjoint if they have no common elements; their intersection is empty.
Distributive Property Summing two numbers and then multiplying by a third number yields the same value as multiplying both numbers by the third number and then adding. In algebraic terms, for all real numbers 𝑎, 𝑏, and 𝑐, 𝑎(𝑏 + 𝑐) = 𝑎𝑏 + 𝑎𝑐.
Domain of the function f
The set of objects x for which f(x) is defined.
Element of a set A member of or an object in a set. Empty Set The empty set is the set that has no elements; it is denoted with the
symbol ∅.
Equally Likely
In probability, when there are the same chances for more than one event to happen, the events are equally likely to occur. For example, if
CXC 10/G/SYLL 17 61
WORD MEANING
someone flips a fair coin, the chances of getting heads or tails are the same. There are equally likely chances of getting heads or tails.
Equation
A statement that says that two mathematical expressions have the same value.
Equilateral Triangle A triangle with three equal sides. Equilateral triangles have three equal angles of measure 60 degrees.
Estimate The best guess for an unknown quantity arrived at after considering all the information given in a problem.
Event In probability, an event is a set of outcomes of an experiment. For example, the even A may be defined as obtaining two heads from tossing a coin twice.
Expected Value The average amount that is predicted if an experiment is repeated many times.
Experimental Probability
The chances of something happening, based on repeated testing and observing results. It is the ratio of the number of times an event occurred to the number of times tested. For example, to find the experimental probability of winning a game, one must play the game many times, then divide by the number of games won by the total number of games played.
Exponent The power to which a number of variables is raised.
Exponential Function
A function that has the form y=ax, where a is any real number and is called the base.
Exterior Angle The exterior angle of a polygon is an angle formed by a side and a line which is the extension of an adjacent side.
Factors
1. The factors of a whole number are those numbers by which it can be divided without leaving a remainder.
2. The factors of an algebraic expression A are those expressions which, when multiplied together, results in A. For example 𝑥 and (3 − 𝑦) are the factors of 3𝑥 − 𝑥𝑦.
Factorise
The process of rewriting an algebraic expression as a product of its factors. For example, 4𝑥2 − 4𝑦2 when factorised may be written as (2𝑥 − 2𝑦)(2𝑥 + 2𝑦). To factorise completely is to rewrite an expression as a product of prime factors. For example, 4𝑥2 − 4𝑦2 when factorised completely is 4(𝑥 − 𝑦)(𝑥 + 𝑦).
Frequency The number of items occurring in a given category.
Frustum The frustum is a portion of a cone or pyramid bounded by two faces parallel to the base.
CXC 10/G/SYLL 17 62
WORD MEANING Function A correspondence in which each member of one set is mapped unto a
member of another set.
Graph A visual representation of data that displays the relationship among variables, usually cast along x and y axes.
Histogram A bar graph with no spaces between the bars where the area of the bars is proportional to the corresponding frequencies. If the bars have the same width, then the heights are proportional to the frequencies.
Hypotenuse The side of the Right triangle that is opposite the right angle. It is the longest of the three sides.
Identity
1. An equation that is true for every possible value of the variables. For example, 𝑥2 − 1 = (𝑥 − 1)(𝑥 + 1) is an identity while
𝑥2 − 1 = 3 is not, as it is only true for the values ±2.
2. The identity element of an operation is a number such that when operated on with any other number results in the other number. For example, the identity element under addition of real numbers is zero; the identity element under multiplication of 2 x 2 matrices
is (1 00 1
).
Inequality
A relationship between two quantities indicating that one is strictly less than or less than or equal to the other.
Infinity The symbol ∞ indicating a limitless quantity. For example, the result of a nonzero number divided by zero is infinity.
Integers
The set consisting of the positive and negative whole numbers and zero, for example, {… -2, -1, 0, 1, 2,…}.
Intercept Intersection
The x-intercept of a graph is the value of x where the curve crosses the x-axis. The y-intercept of a graph is the y value where the curve crosses the y-axis. The intersection of two sets is the set of elements which are common in both sets.
Inverse The inverse of an element under an operation is another element which when operated on with the first element results in the identity. For example, the inverse of a real number under addition is the negative of that number.
Irrational Number A number that cannot be represented as an exact ratio of two integers. For example, 𝜋 or the square root of 2.
CXC 10/G/SYLL 17 63
WORD MEANING Isosceles Triangle
A triangle that has two equal sides.
Like Terms Two terms are like terms if all parts of both, except for the numerical coefficient, are the same.
Limit The target value that terms in a sequence of numbers are getting closer to. This limit is not necessarily ever reached; the numbers in the sequence eventually get arbitrarily close to the limit.
Line Graph A diagram showing a system of connections or interrelations between two or more things by using lines.
Line symmetry If a figure is divided by a line and both divisions are mirrors of each other, the figure has line symmetry. The line that divides the figure is the line of symmetry.
Linear Equation An equation containing linear expressions.
Linear Expression
An expression of the form 𝑎𝑥 + 𝑏 where 𝑥 is a variable of power one and 𝑎 and 𝑏 are constants, or in more variables, an expression of the form 𝑎𝑥 + 𝑏𝑦 + 𝑐, 𝑎𝑥 + 𝑏𝑦 + 𝑐𝑧 + 𝑑 where 𝑎, 𝑏, 𝑐 and 𝑑 are constants.
Magnitude
The length of a vector.
Matrix A rectangular arrangement of numbers in rows and columns.
Mean In statistics, the average obtained by dividing the sum of two or more quantities by the number of these quantities.
Median In statistics, the quantity designating the middle value in a set of numbers which have been arranged in ascending or descending order.
Mode In statistics, the value that occurs most frequently in a given set of numbers.
Multimodal distribution
A distribution with more than one mode. For example, the set {2, 4, 3, 5, 3, 6, 5, 2, 5, 3} has modal values 3 and 5.
Multiples The product of multiplying a number by a whole number. For example, multiples of 5 are 10, 15, 20 or any number that can be evenly divided by 5.
Natural Numbers The set of the counting numbers, that is, N = {1, 2, 3, 4…}
Negative Numbers Numbers less than zero. In graphing, numbers to the left of zero. Negative numbers are represented by placing a minus sign (-) in front
of the number. For example, −3,−0.5, −14
9 are negative numbers.
CXC 10/G/SYLL 17 64
WORD MEANING Obtuse Angle An angle whose measure is greater than 90 degrees but less than 180
degrees.
Obtuse Triangle
A triangle containing one obtuse angle.
Ordered Pair A set of numbers where the order in which the numbers are written has an agreed-upon meaning. For example, points on the Cartesian plane are represented by ordered pairs such as P(4,7) where 4 is the x-value and 7 the y-value.
Origin In the Cartesian coordinate plane, the origin is the point at which the horizontal and vertical axes intersect, at zero (0,0).
Parallel Given distinct lines in the plane that are infinite in both directions, the lines are parallel if they never meet. Two distinct lines in the coordinate plane are parallel if and only if they have the same slope.
Parallelogram A quadrilateral that contains two pairs of parallel sides.
Pattern Characteristic(s) observed in one item that may be repeated in similar or identical manners in other items.
Percent
A ratio that compares a number to one hundred. The symbol for per cent is %.
Perpendicular Two lines are said to be perpendicular to each other if they form a 90 degrees angle.
Pi The designated name for the ratio of the circumference of a circle to its diameter.
Pie Chart A chart made by plotting the numeric values of a set of quantities as a set of adjacent circular wedges where the arc lengths are proportional to the total amount. All wedges taken together comprise an entire disk.
Pie Graph A diagram showing a system of connections or interrelations between two or more things by using a circle divided into segments that look like pieces of pie.
Polygon A closed plane figure formed by three or more line segments.
Polyhedra Any solid figure with an outer surface composed of polygon faces.
Polynominal An algebraic expression involving a sum of algebraic terms with nonnegative integer powers. For example, 2𝑥3 + 3𝑥2 − 𝑥 + 6 is a polynomial in one variable.
Population
In statistics population is the set of all items under consideration.
Prime A natural number p greater than 1 is prime if and only if the only positive integer factors of p are 1 and p. The first seven primes are 2, 3, 5, 7, 11, 13, 17.
CXC 10/G/SYLL 17 65
WORD MEANING Probability The measure of how likely it is for an event to occur. The probability
of an event is always a number between zero and 1.
Proportion 1. A relationship between two ratios in which the first ratio is always
equal to the second. Usually of the form 𝑎
𝑏=
𝑐
𝑑.
2. The fraction of a part and the whole. If two parts of a whole are in
the ratio 2:7, then the corresponding proportions are 2
9and
7
9
respectively.
Protractor An instrument used for drawing and measuring angles.
Pythagorean Theorem
The Pythagorean Theorem states that the square of the hypotenuse is equal to the sum of the squares of the two sides, or 𝑎 2 + 𝑏 2 =𝑐 2, where 𝑐 is the hypotenuse.
Quadrant The four parts of the coordinate plane divided by the x and y axes. Each of these quadrants has a number designation. First quadrant contains all the points with positive x and positive y coordinates. Second quadrant contains all the points with negative x and positive y coordinates. The third quadrant contains all the points with both coordinates negative. Fourth quadrant contains all the points with positive x and negative y coordinates.
Quadratic Function A function given by a polynomial of degree 2.
Quadrilateral
A polygon that has four sides.
Quartiles Consider a set of numbers arranged in ascending or descending order. The quartiles are the three numbers which divide the set into four parts of equal amount of numbers. The first quartile in a list of numbers is the number such that a quarter of the numbers is below it. The second quartile is the median. The third quartile is the number such that three quarters of the numbers are below it.
Quotient The result of division.
Radical
The radical symbol (√) is used to indicate the taking of a root of a
number. √𝑥𝑞
means the qth root of x; if q=2 then it is usually written as
√𝑥. For example √2435
= 3, √164
= 2. The radical always means to take the positive value. For example, both 5 and −5 satisfy the
equation 𝑥2 = 25, but √25 = 5.
Range The range of a set of numbers is the difference between the largest value in the set and the smallest value in the set. Note that the range is a single number, not many numbers.
Range of Function f The set of all the numbers f(x) for x in the domain of f.
CXC 10/G/SYLL 17 66
WORD MEANING Ratio A comparison expressed as a fraction. For example, the ratio of three
boys to two girls in a class is written as 3
2or 3:2.
Rational Numbers Numbers that can be expressed as the quotient of two integers, for
example, , , , 7 = .
Ray A straight line that begins at a point and continues outward in one
direction.
Real Numbers The union of the set of rational numbers and the set of irrational numbers.
Reciprocal
The reciprocal of a number a is equal to 1
𝒂 where 𝑎 ≠ 0.
Regular Polygon A polygon whose side lengths are all the same and whose interior angle
measures are all the same.
Rhombus A parallelogram with four congruent sides.
Right Angle An angle of 90 degrees.
Right Triangle A triangle containing an angle of 90 degrees.
Rotate
The turning of an object (or co-ordinate system) by an angle about a fixed point.
Root 1. The root of an equation is the same as the solution of that equation. For example, if y=f(x), then the roots are the values of x for which y=0. Graphically, the roots are the x-intercepts of the graph.
2. The nth root of a real number x is a number which, when multiplied by itself n times, gives x. If n is odd then there is one root for every value of x; if n is even there are two roots (one positive and one negative) for positive values of x and no real roots for negative values of x. The positive root is called the Principal root and is represented by the radical sign (√). For example, the principal
square root of 9 is written as √9 = 3 but the square roots of 9 are
±√9 = ±3.
Sample
A group of items chosen from a population.
Sample Space
The set of outcomes of a probability experiment. Also called probability space.
Scalar
A quantity which has size but no direction.
Scalene Triangle
A triangle with no two sides equal. A scalene triangle has no two angles equal.
7
3
5
11
5
13
7
1
CXC 10/G/SYLL 17 67
WORD MEANING Scientific Notation A shorthand way of writing very large or very small numbers. A number
expressed in scientific notation is expressed as a decimal number between 1 and 10 multiplied by a power of 10 (for example, 7000 = 7x10³ or 0.0000019 = 1.9x10⁻⁶).
Sector The sector of a circle is a closed figure formed by an arc and two radii of the circle.
Segment
1. A line segment is a piece of a line with two end points.
2. A segment of a circle is a closed figure formed by an arc and a chord.
Sequence A set of numbers with a prescribed order.
Set A set is a well-defined collection of things, without regard to their order.
Significant Digits The amount of digits required for calculations or measurements to be close enough to the actual value. Some rules in determining the number of digits considered significant in a number: - The leftmost non-zero digit is the first significant digit.
- Zeros between two non-zero digits are significant.
Trailing zeros to the right of the decimal point are considered significant.
Similar
Two figures are said to be similar when all corresponding angles are equal. If two shapes are similar, then the corresponding sides are in the same ratio.
Simple Event
A non-decomposable outcome of a probability experiment.
Simple Interest An interest of a fixed amount calculated on the initial investment.
Simultaneous Equations
A system (set) of equations that must all be true at the same time.
Solid A three dimensional geometric figure that completely encloses a volume of space.
Square Matrix
A matrix with equal number of rows and columns.
Square Root The square root of a positive real number n is the number m such that 𝑚2 = 𝑛. For example, the square roots of 16 are 4 and -4.
Subset A subset of a given set is a collection of things that belong to the original set. For example, the subsets of 𝐴 = {𝑎, 𝑏} are: {𝑎}, {𝑏}, {𝑎, 𝑏}, and the null set.
CXC 10/G/SYLL 17 68
WORD MEANING Surface Area The sum of the areas of the surfaces of a solid.
Statistical Inference The process of estimating unobservable characteristics of a population
using information obtained from a sample.
Symmetry Two points A and B are symmetric with respect to a line if the line is a perpendicular bisector of the segment AB.
Tangent
A line is a tangent to a curve at a point A if it just touches the curve at A in such a way that it remains on one side of the curve at A. A tangent to a circle intersects the circle only once.
Translate In a tessellation, to translate an object means repeating it by sliding it over a certain distance in a certain direction.
Translation A rigid motion of the plane or space of the form X goes to X + V for a fixed vector V.
Transversal In geometry, given two or more lines in the plane a transversal is a line distinct from the original lines and intersects each of the given lines in a single point.
Theoretical Probability
The chances of events happening as determined by calculating results that would occur under ideal circumstances. For example, the theoretical probability of rolling a 4 on a fair four-sided die is ¼ or 25%, because there is one chance in four to roll a 4, and under ideal circumstances one out of every four rolls would be a 4.
Trapezoid A quadrilateral with exactly one pair of parallel sides.
Trigonometry Union of Sets
The study of triangles. Three trigonometric functions defined for either acute angles in the right triangle are: Sine of the angle x is the ratio of the side opposite the angle and the
hypotenuse. In short, sin 𝑥 =𝑂
𝐻;
Cosine of the angle x is the ratio of the short side adjacent to the angle
and the hypotenuse. In short, cos 𝑥 =𝐴
𝐻;
Tangent of the angle x is the ratio of the side opposite the angle and
the short side adjacent to the angle. In short tan 𝑥 =𝑂
𝐴
The union of two or more sets is the set of all the elements contained in all the sets. The symbol for union is U.
Unit Vector
A vector of length 1.
CXC 10/G/SYLL 17 69
WORD MEANING Variable A placeholder in an algebraic expression, for example, in
3𝑥 + 𝑦 = 23, 𝑥 and 𝑦 are variables.
Vector Quantity that has magnitude (length) and direction. It may be represented as a directed line segment.
Velocity The rate of change of position overtime in a given direction is velocity, calculated by dividing directed distance by time.
Venn Diagram A diagram where sets are represented as simple geometric figures, with overlapping and similarity of sets represented by intersections and unions of the figures.
Vertex
The vertex of an angle is the point where the two sides of the angle meet.
Volume A measure of the number of cubic units of space an object occupies.
Western Zone Office 21 June 2016
CARIBBEAN EXAMINATIONS COUNCIL
Caribbean Secondary Education Certificate®
CSEC®
MATHEMATICS
Specimen Papers and Mark Schemes/Keys
Specimen Papers:
Paper 01 Paper 02 Paper 032
Mark Schemes and Key:
Paper 01 Paper 02 Paper 032
The Specimen Papers Paper 01 1. The Paper 01 consists of 60 items. However, there are 30 items in this specimen paper. The
Specimen represents the syllabus topics and the profiles in the same ratio as they will occur on the Paper 01 for the revised syllabus.
2. Vectors and Matrices will be tested on Paper 01. Paper 02 1. The Paper 02 will be marked electronically. The structure of the actual paper has been
modified to allow candidates to write in the spaces following each part of a question. However, in an effort to limit the number of pages in the specimen paper, the spaces for the working were omitted.
2. The topic Sets will no longer be tested on Paper 02.
Paper 032 1. This is a new paper and is designed for candidates whose work cannot be monitored by tutors
in recognised educational institutions. The Paper will be of one hour duration and will consist of two questions.
2. The Paper 032 will be marked electronically and the structure, as presented in the specimen,
will allow candidates to write in the spaces following each part of a question.
C A R I B B E A N E X A M I N A T I O N S C O U N C I L
CARIBBEAN SECONDARY EDUCATION CERTIFICATE®
EXAMINATION
SPECIMENMULTIPLE CHOICE QUESTIONS
FOR
MATHEMATICS
READ THE FOLLOWING DIRECTIONS CAREFULLY
Each item in this test has four suggested answers lettered (A), (B), (C), (D). Read each item you are about to answer and decide which choice is best.
Sample Item
2a + 6a = Sample Answer
(A) 8a A B C D (B) 8a2
(C) 12a (D) 12a2
The best answer to this item is “8a”, so answer space (A) has been shaded.
There are 30 items in this specimen paper. However, the Paper 01 test consists of 60 items.
Copyright © 2015 Caribbean Examinations Council.All rights reserved.
01234010/SPEC 2015
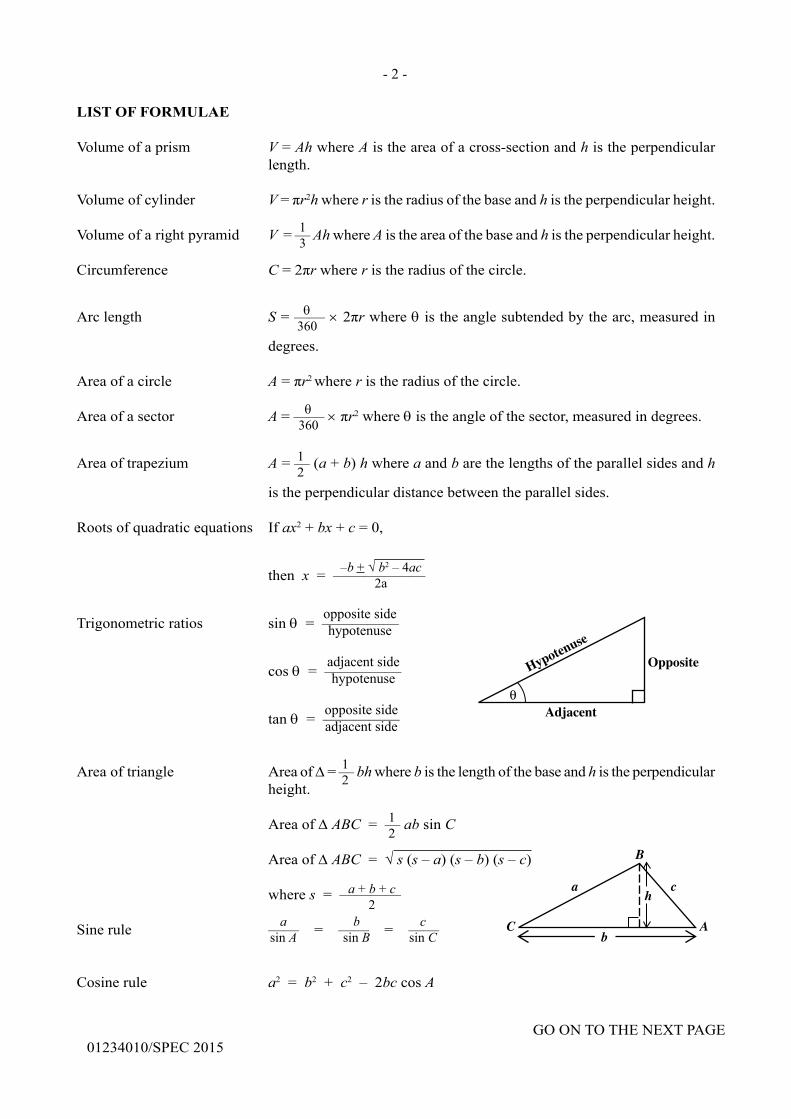
GO ON TO THE NEXT PAGE01234010/SPEC 2015
- 2 -
LIST OF FORMULAE
Volume of a prism V = Ah where A is the area of a cross-section and h is the perpendicular length.
Volume of cylinder V = πr2h where r is the radius of the base and h is the perpendicular height.
Volume of a right pyramid V = — Ah where A is the area of the base and h is the perpendicular height.
Circumference C = 2πr where r is the radius of the circle.
Arc length S = —— × 2πr where θ is the angle subtended by the arc, measured in
degrees.
Area of a circle A = πr2 where r is the radius of the circle.
Area of a sector A = —— × πr2 where θ is the angle of the sector, measured in degrees.
Area of trapezium A = — (a + b) h where a and b are the lengths of the parallel sides and h
is the perpendicular distance between the parallel sides.
Roots of quadratic equations If ax2 + bx + c = 0,
then x = ——————
Trigonometric ratios sin θ = —————
cos θ = —————
tan θ = —————
Area of triangle Area of Δ = — bh where b is the length of the base and h is the perpendicular height.
Area of Δ ABC = — ab sin C
Area of Δ ABC = √ s (s – a) (s – b) (s – c)
where s = ————
Sine rule —— = —— = ——
Cosine rule a2 = b2 + c2 – 2bc cos A
13
12
θ360
θ360
–b + √ b2 – 4ac2a
opposite sidehypotenuse
adjacent sidehypotenuse
opposite sideadjacent side
12
12
a + b + c2
asin A
csin C
bsin B
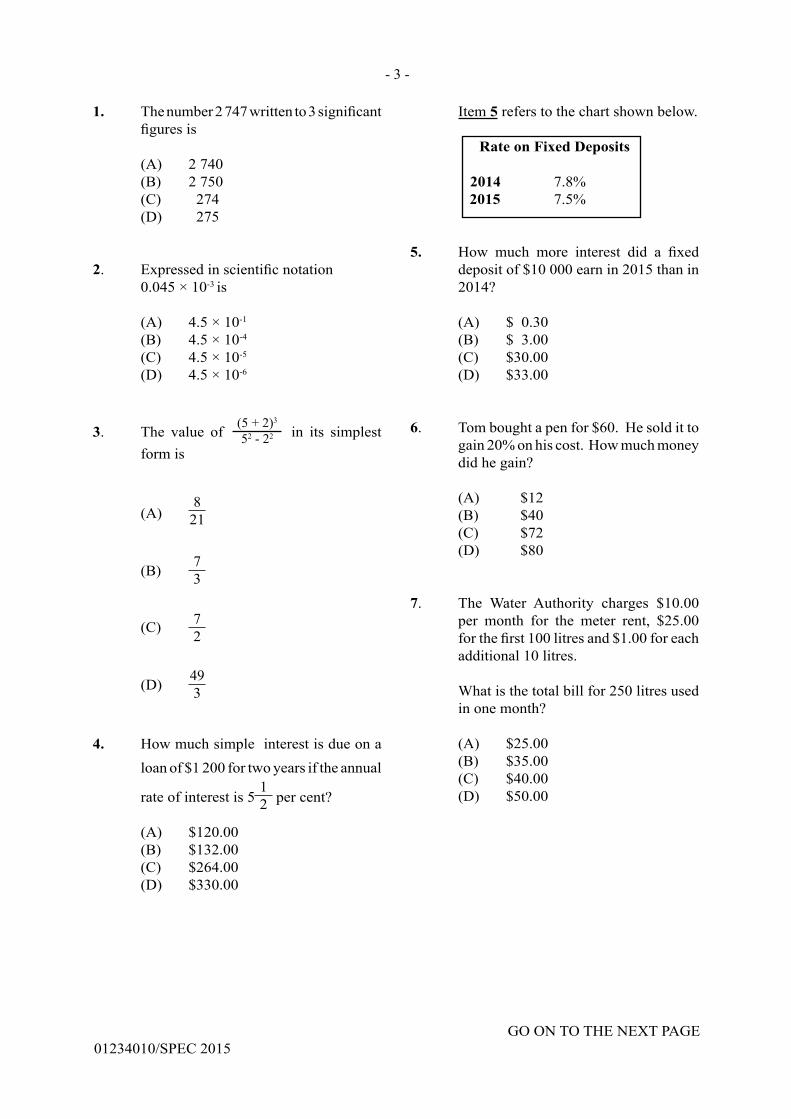
GO ON TO THE NEXT PAGE01234010/SPEC 2015
- 3 -
1. The number 2 747 written to 3 significant figures is
(A) 2 740 (B) 2 750 (C) 274 (D) 275
2. Expressed in scientific notation 0.045 × 10⁻³ is
(A) 4.5 × 10⁻¹
(B) 4.5 × 10⁻⁴
(C) 4.5 × 10⁻⁵
(D) 4.5 × 10⁻⁶
3. The value of (5 + 2)3
52 - 22 in its simplest form is
(A) 8
21
(B) 73
(C) 72
(D) 493
4. How much simple interest is due on a loan of $1 200 for two years if the annual
rate of interest is 512 per cent?
(A) $120.00 (B) $132.00 (C) $264.00 (D) $330.00
Item 5 refers to the chart shown below.
Rate on Fixed Deposits
2014 7.8% 2015 7.5%
5. How much more interest did a fixed deposit of $10 000 earn in 2015 than in 2014?
(A) $ 0.30 (B) $ 3.00 (C) $30.00 (D) $33.00
6. Tom bought a pen for $60. He sold it to gain 20% on his cost. How much money did he gain?
(A) $12(B) $40(C) $72(D) $80
7. The Water Authority charges $10.00 per month for the meter rent, $25.00 for the first 100 litres and $1.00 for each additional 10 litres.
What is the total bill for 250 litres used in one month?
(A) $25.00(B) $35.00(C) $40.00(D) $50.00
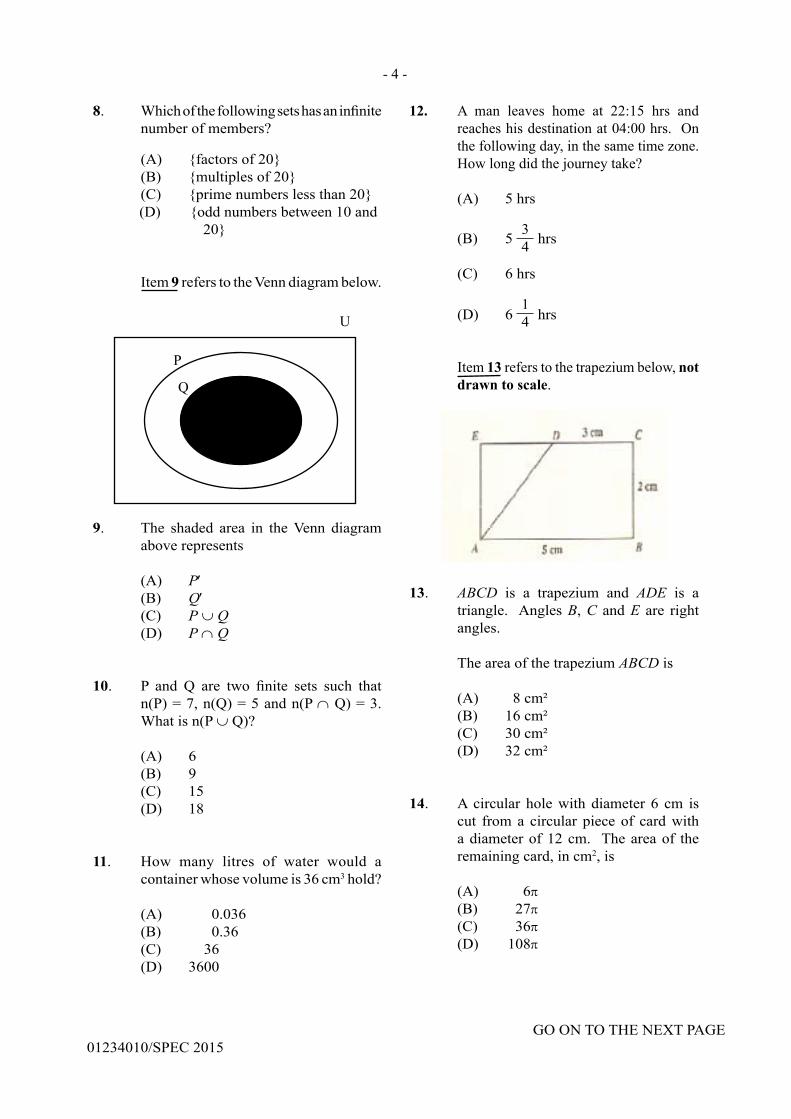
GO ON TO THE NEXT PAGE01234010/SPEC 2015
- 4 -
8. Which of the following sets has an infinite number of members?
(A) {factors of 20} (B) {multiples of 20} (C) {prime numbers less than 20} (D) {odd numbers between 10 and
20}
Item 9 refers to the Venn diagram below.
9. The shaded area in the Venn diagram
above represents
(A) P′ (B) Q′ (C) P ∪ Q (D) P ∩ Q
10. P and Q are two finite sets such that n(P) = 7, n(Q) = 5 and n(P ∩ Q) = 3. What is n(P ∪ Q)?
(A) 6 (B) 9 (C) 15 (D) 18
11. How many litres of water would a container whose volume is 36 cm3 hold?
(A) 0.036 (B) 0.36 (C) 36 (D) 3600
12. A man leaves home at 22:15 hrs and reaches his destination at 04:00 hrs. On the following day, in the same time zone. How long did the journey take?
(A) 5 hrs
(B) 5 34 hrs
(C) 6 hrs
(D) 6 14 hrs
Item 13 refers to the trapezium below, not drawn to scale.
13. ABCD is a trapezium and ADE is a triangle. Angles B, C and E are right angles.
The area of the trapezium ABCD is
(A) 8 cm²(B) 16 cm²(C) 30 cm²(D) 32 cm²
14. A circular hole with diameter 6 cm is
cut from a circular piece of card with a diameter of 12 cm. The area of the remaining card, in cm2, is
(A) 6π (B) 27π (C) 36π (D) 108π
U
P
Q
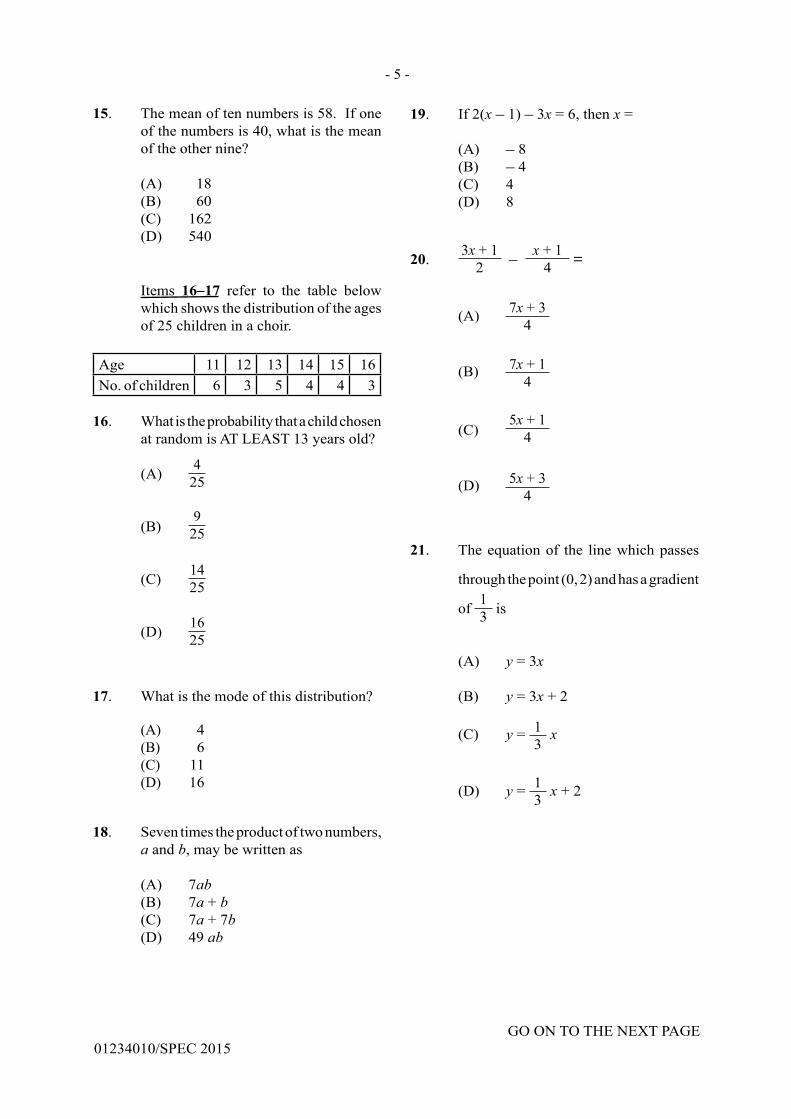
GO ON TO THE NEXT PAGE01234010/SPEC 2015
- 5 -
15. The mean of ten numbers is 58. If one of the numbers is 40, what is the mean of the other nine?
(A) 18 (B) 60 (C) 162 (D) 540
Items 16–17 refer to the table below which shows the distribution of the ages of 25 children in a choir.
Age 11 12 13 14 15 16No. of children 6 3 5 4 4 3
16. What is the probability that a child chosen at random is AT LEAST 13 years old?
(A) 425
(B) 9
25
(C) 1425
(D) 1625
17. What is the mode of this distribution?
(A) 4(B) 6(C) 11(D) 16
18. Seven times the product of two numbers, a and b, may be written as
(A) 7ab (B) 7a + b (C) 7a + 7b (D) 49 ab
19. If 2(x – 1) – 3x = 6, then x =
(A) – 8 (B) – 4 (C) 4 (D) 8
20. 3x + 12 – x + 1
4 =
(A) 7x + 34
(B) 7x + 14
(C)
5x + 14
(D) 5x + 34
21. The equation of the line which passes
through the point (0, 2) and has a gradient
of 13 is
(A) y = 3x (B) y = 3x + 2 (C) y = 1
3 x
(D) y = 1
3 x + 2
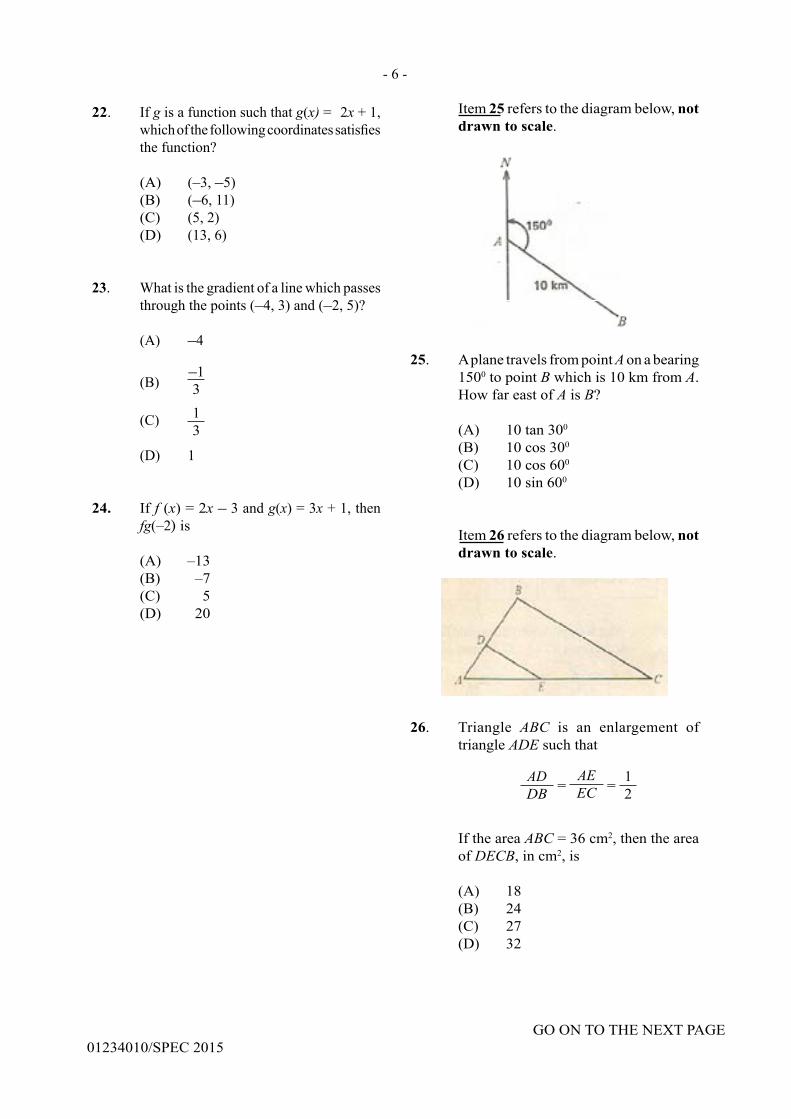
GO ON TO THE NEXT PAGE01234010/SPEC 2015
- 6 -
Item 25 refers to the diagram below, not drawn to scale.
25. A plane travels from point A on a bearing 1500 to point B which is 10 km from A. How far east of A is B?
(A) 10 tan 300
(B) 10 cos 300
(C) 10 cos 600
(D) 10 sin 600
Item 26 refers to the diagram below, not drawn to scale.
26. Triangle ABC is an enlargement of triangle ADE such that
ADDB =
AEEC = 1
2
If the area ABC = 36 cm2, then the area of DECB, in cm2, is
(A) 18 (B) 24 (C) 27 (D) 32
22. If g is a function such that g(x) = 2x + 1, which of the following coordinates satisfies the function?
(A) (–3, –5) (B) (–6, 11) (C) (5, 2) (D) (13, 6)
23. What is the gradient of a line which passes through the points (–4, 3) and (–2, 5)?
(A) –4
(B) –13
(C) 13
(D) 1
24. If f (x) = 2x – 3 and g(x) = 3x + 1, then fg(–2) is
(A) –13(B) –7(C) 5(D) 20
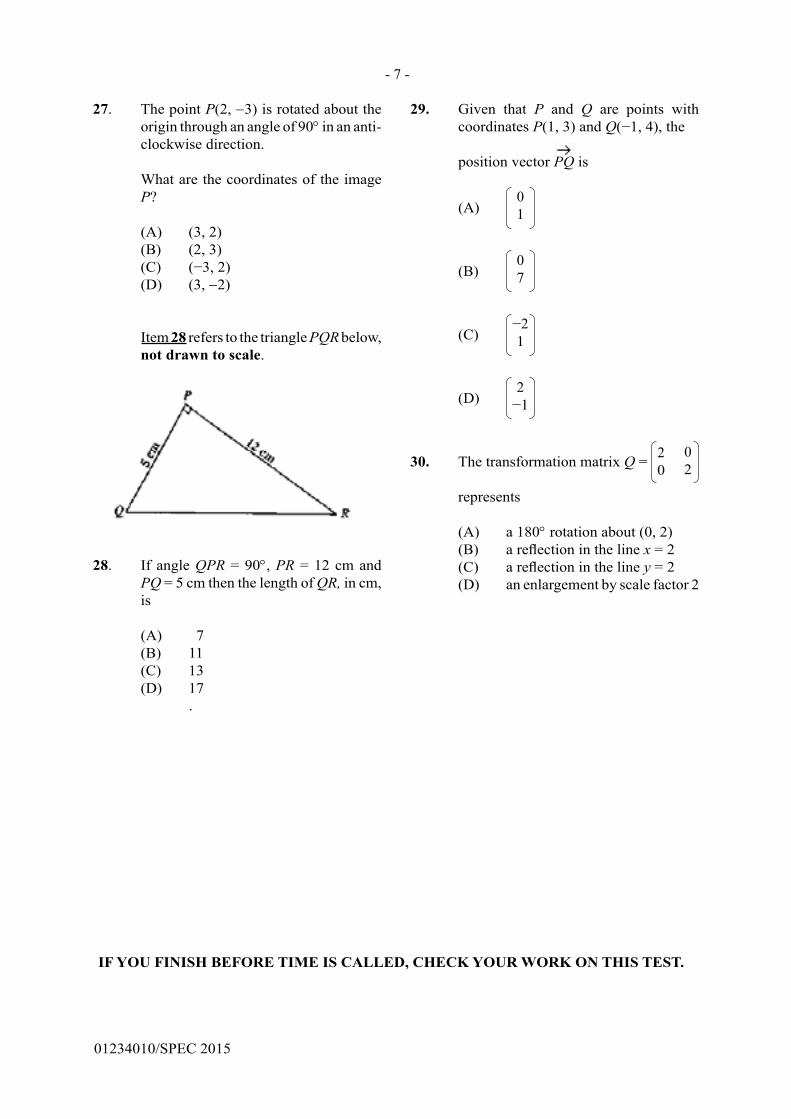
- 7 -
01234010/SPEC 2015
27. The point P(2, −3) is rotated about the origin through an angle of 90° in an anti-clockwise direction.
What are the coordinates of the image P?
(A) (3, 2) (B) (2, 3) (C) (−3, 2) (D) (3, −2)
Item 28 refers to the triangle PQR below, not drawn to scale.
28. If angle QPR = 90°, PR = 12 cm and PQ = 5 cm then the length of QR, in cm, is
(A) 7 (B) 11 (C) 13 (D) 17 .
29. Given that P and Q are points with coordinates P(1, 3) and Q(−1, 4), the
position vector PQ is
(A) 01
(B) 07
(C) −21
(D) 2
−1
30. The transformation matrix Q = 02
20
represents
(A) a 180° rotation about (0, 2) (B) a reflection in the line x = 2 (C) a reflection in the line y = 2 (D) an enlargement by scale factor 2
IF YOU FINISH BEFORE TIME IS CALLED, CHECK YOUR WORK ON THIS TEST.
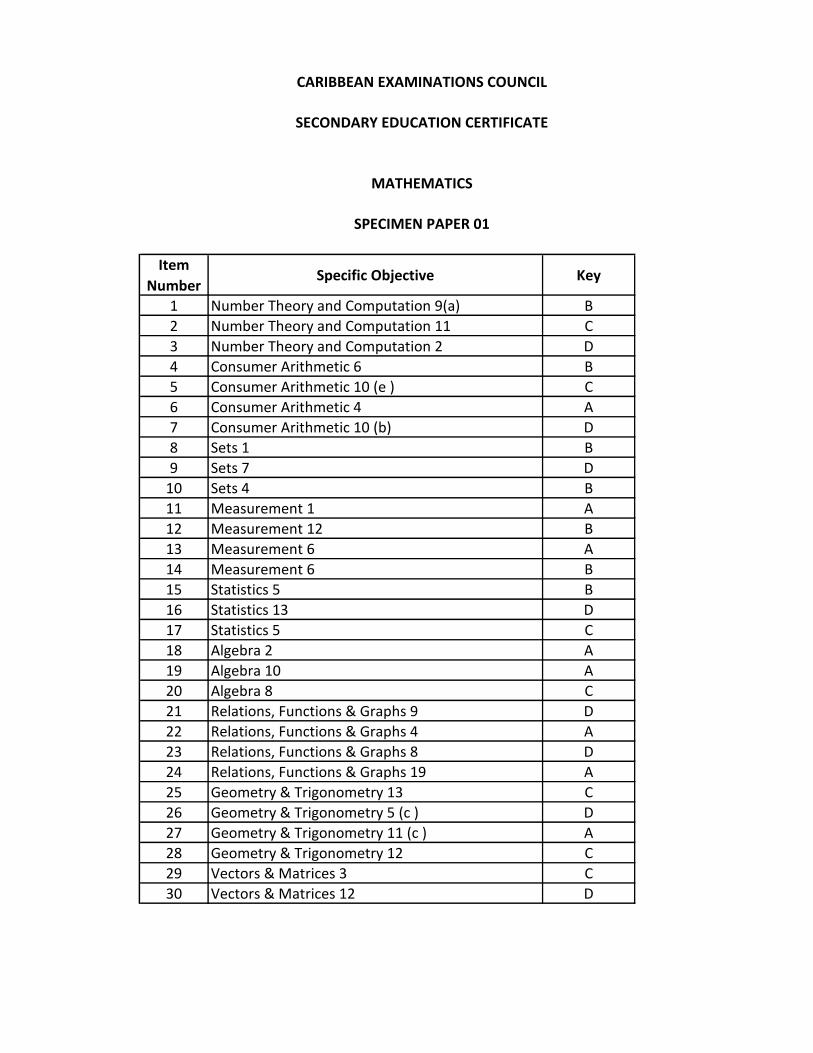
Item
NumberSpecific Objective Key
1 Number Theory and Computation 9(a) B
2 Number Theory and Computation 11 C
3 Number Theory and Computation 2 D
4 Consumer Arithmetic 6 B
5 Consumer Arithmetic 10 (e ) C
6 Consumer Arithmetic 4 A
7 Consumer Arithmetic 10 (b) D
8 Sets 1 B
9 Sets 7 D
10 Sets 4 B
11 Measurement 1 A
12 Measurement 12 B
13 Measurement 6 A
14 Measurement 6 B
15 Statistics 5 B
16 Statistics 13 D
17 Statistics 5 C
18 Algebra 2 A
19 Algebra 10 A
20 Algebra 8 C
21 Relations, Functions & Graphs 9 D
22 Relations, Functions & Graphs 4 A
23 Relations, Functions & Graphs 8 D
24 Relations, Functions & Graphs 19 A
25 Geometry & Trigonometry 13 C
26 Geometry & Trigonometry 5 (c ) D
27 Geometry & Trigonometry 11 (c ) A
28 Geometry & Trigonometry 12 C
29 Vectors & Matrices 3 C
30 Vectors & Matrices 12 D
MATHEMATICS
SPECIMEN PAPER 01
CARIBBEAN EXAMINATIONS COUNCIL
SECONDARY EDUCATION CERTIFICATE
TEST CODE 01234020/SPECFORM TP 01234020/SPEC
C A R I B B E A N E X A M I N A T I O N S C O U N C I L
CARIBBEAN SECONDARY EDUCATION CERTIFICATE®
EXAMINATION
MATHEMATICS
SPECIMEN PAPER
Paper 02 – General Proficiency
2 hours 40 minutes
READ THE FOLLOWING INSTRUCTIONS CAREFULLY.
1. This paper consists of TWO sections: I and II.
2. Section I has SEVEN questions and Section II has THREE questions.
3. Answer ALL questions from the TWO sections.
4. Write your answers in the booklet provided.
5. Do NOT write in the margins.
6. All working must be clearly shown.
7. Unless otherwise stated in the question, any numerical answer that is not exact MUST be written to THREE significant figures.
8. A list of formulae is provided on page 4 of this booklet.
9. If you need to rewrite any answer and there is not enough space to do so on the original page, you must use the extra page(s) provided at the back of this booklet. Remember to draw a line through your original answer.
10. If you use the extra page(s) you MUST write the question number clearly in the box provided at the top of the extra page(s) and, where relevant, include the question part beside the answer.
Examination Materials Permitted
Silent, non-programmable electronic calculator Mathematical instruments
DO NOT TURN THIS PAGE UNTIL YOU ARE TOLD TO DO SO.
Copyright © 2015 Caribbean Examinations CouncilAll rights reserved.
01234020/SPEC 2015
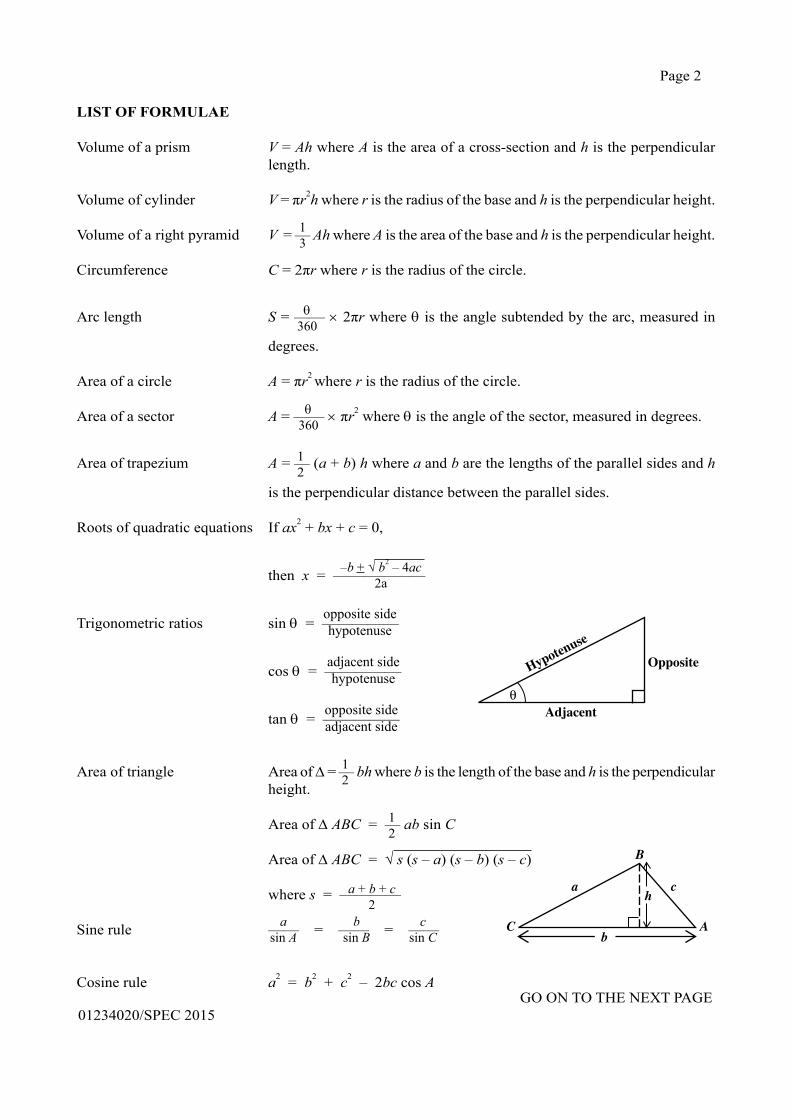
Page 2
GO ON TO THE NEXT PAGE01234020/SPEC 2015
LIST OF FORMULAE
Volume of a prism V = Ah where A is the area of a cross-section and h is the perpendicular length.
Volume of cylinder V = πr2h where r is the radius of the base and h is the perpendicular height.
Volume of a right pyramid V = — Ah where A is the area of the base and h is the perpendicular height.
Circumference C = 2πr where r is the radius of the circle.
Arc length S = —— × 2πr where θ is the angle subtended by the arc, measured in
degrees.
Area of a circle A = πr2 where r is the radius of the circle.
Area of a sector A = —— × πr2 where θ is the angle of the sector, measured in degrees.
Area of trapezium A = — (a + b) h where a and b are the lengths of the parallel sides and h
is the perpendicular distance between the parallel sides.
Roots of quadratic equations If ax2 + bx + c = 0,
then x = ——————
Trigonometric ratios sin θ = —————
cos θ = —————
tan θ = —————
Area of triangle Area of Δ = — bh where b is the length of the base and h is the perpendicular height.
Area of Δ ABC = — ab sin C
Area of Δ ABC = √ s (s – a) (s – b) (s – c)
where s = ————
Sine rule —— = —— = ——
Cosine rule a2 = b2 + c2 – 2bc cos A
13
12
θ360
θ360
–b + √ b2 – 4ac2a
opposite sidehypotenuse
adjacent sidehypotenuse
opposite sideadjacent side
12
12
a + b + c2
asin A
csin C
bsin B
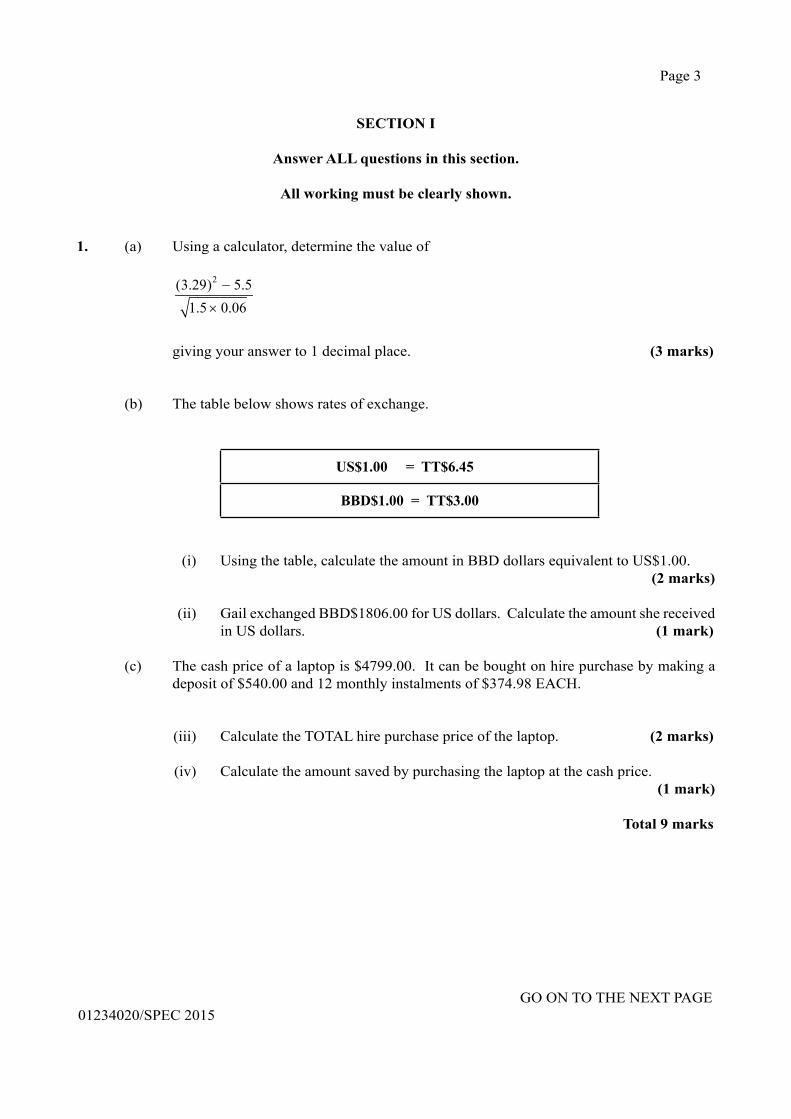
Page 3
GO ON TO THE NEXT PAGE01234020/SPEC 2015
SECTION I
Answer ALL questions in this section.
All working must be clearly shown.
1. (a) Using a calculator, determine the value of
2(3.29) 5.51.5 0.06
−
×
giving your answer to 1 decimal place. (3 marks)
(b) The table below shows rates of exchange.
US$1.00 = TT$6.45
BBD$1.00 = TT$3.00
(i) Using the table, calculate the amount in BBD dollars equivalent to US$1.00.(2 marks)
(ii) Gail exchanged BBD$1806.00 for US dollars. Calculate the amount she received in US dollars. (1 mark)
(c) The cash price of a laptop is $4799.00. It can be bought on hire purchase by making a deposit of $540.00 and 12 monthly instalments of $374.98 EACH.
(iii) Calculate the TOTAL hire purchase price of the laptop. (2 marks)
(iv) Calculate the amount saved by purchasing the laptop at the cash price.(1 mark)
Total 9 marks
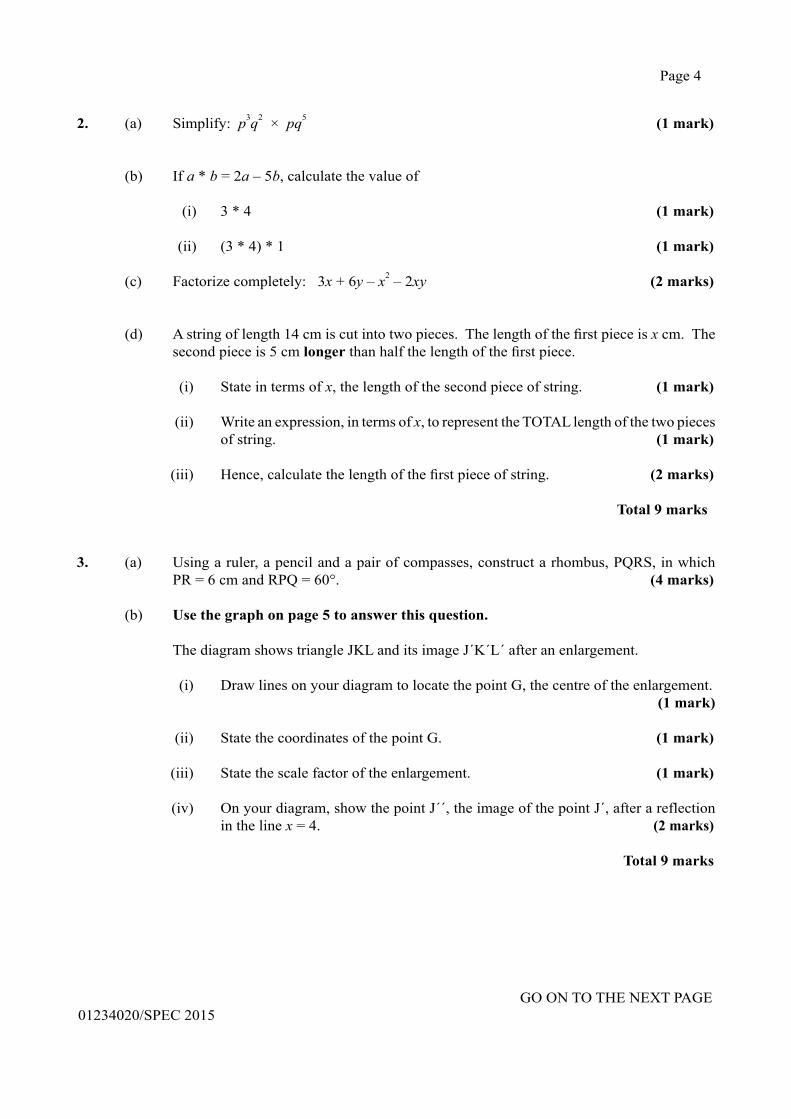
Page 4
GO ON TO THE NEXT PAGE01234020/SPEC 2015
2. (a) Simplify: p3q2 × pq5 (1 mark)
(b) If a * b = 2a – 5b, calculate the value of
(i) 3 * 4 (1 mark) (ii) (3 * 4) * 1 (1 mark)
(c) Factorize completely: 3x + 6y – x2 – 2xy (2 marks)
(d) A string of length 14 cm is cut into two pieces. The length of the first piece is x cm. The second piece is 5 cm longer than half the length of the first piece.
(i) State in terms of x, the length of the second piece of string. (1 mark)
(ii) Write an expression, in terms of x, to represent the TOTAL length of the two pieces of string. (1 mark)
(iii) Hence, calculate the length of the first piece of string. (2 marks)
Total 9 marks
3. (a) Using a ruler, a pencil and a pair of compasses, construct a rhombus, PQRS, in which PR = 6 cm and RPQ = 60°. (4 marks)
(b) Use the graph on page 5 to answer this question.
The diagram shows triangle JKL and its image J´K´L´ after an enlargement.
(i) Draw lines on your diagram to locate the point G, the centre of the enlargement.(1 mark)
(ii) State the coordinates of the point G. (1 mark)
(iii) State the scale factor of the enlargement. (1 mark)
(iv) On your diagram, show the point J´´, the image of the point J´, after a reflection in the line x = 4. (2 marks)
Total 9 marks
E
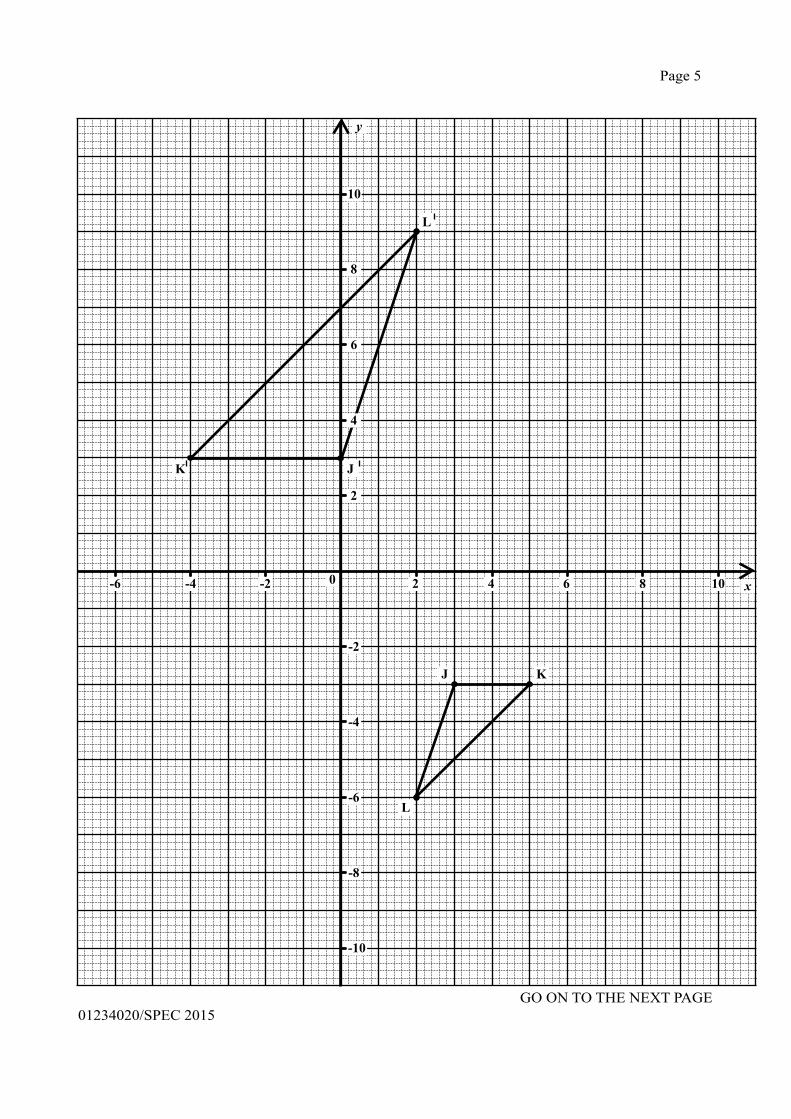
Page 5
GO ON TO THE NEXT PAGE01234020/SPEC 2015
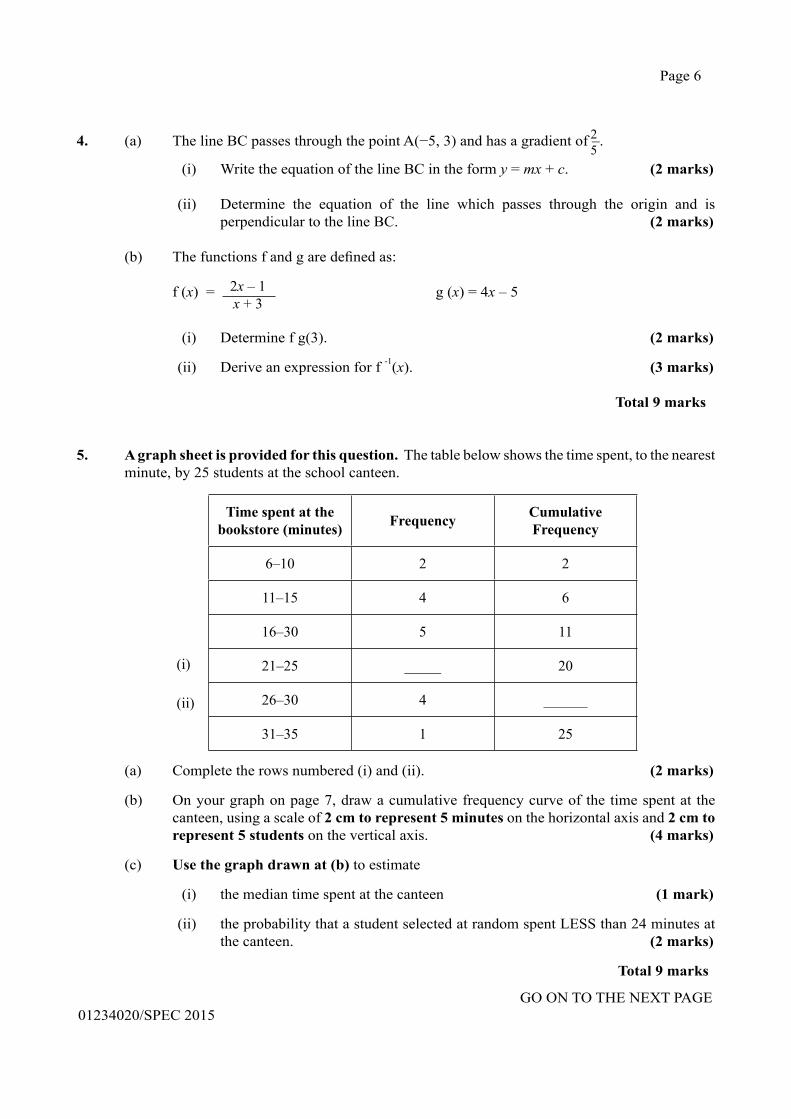
Page 6
GO ON TO THE NEXT PAGE01234020/SPEC 2015
4. (a) The line BC passes through the point A(−5, 3) and has a gradient of –.
(i) Write the equation of the line BC in the form y = mx + c. (2 marks)
(ii) Determine the equation of the line which passes through the origin and is perpendicular to the line BC. (2 marks)
(b) The functions f and g are defined as:
f (x) = g (x) = 4x – 5
(i) Determine f g(3). (2 marks)
(ii) Derive an expression for f -1(x). (3 marks)
Total 9 marks
5. A graph sheet is provided for this question. The table below shows the time spent, to the nearest minute, by 25 students at the school canteen.
Time spent at the bookstore (minutes) Frequency Cumulative
Frequency
6–10 2 2
11–15 4 6
16–30 5 11
21–25 _____ 20
26–30 4 ______
31–35 1 25
(a) Complete the rows numbered (i) and (ii). (2 marks)
(b) On your graph on page 7, draw a cumulative frequency curve of the time spent at the canteen, using a scale of 2 cm to represent 5 minutes on the horizontal axis and 2 cm to represent 5 students on the vertical axis. (4 marks)
(c) Use the graph drawn at (b) to estimate
(i) the median time spent at the canteen (1 mark)
(ii) the probability that a student selected at random spent LESS than 24 minutes at the canteen. (2 marks)
Total 9 marks
25
2x – 1x + 3
(i)
(ii)
Page 7
GO ON TO THE NEXT PAGE01234020/SPEC 2015
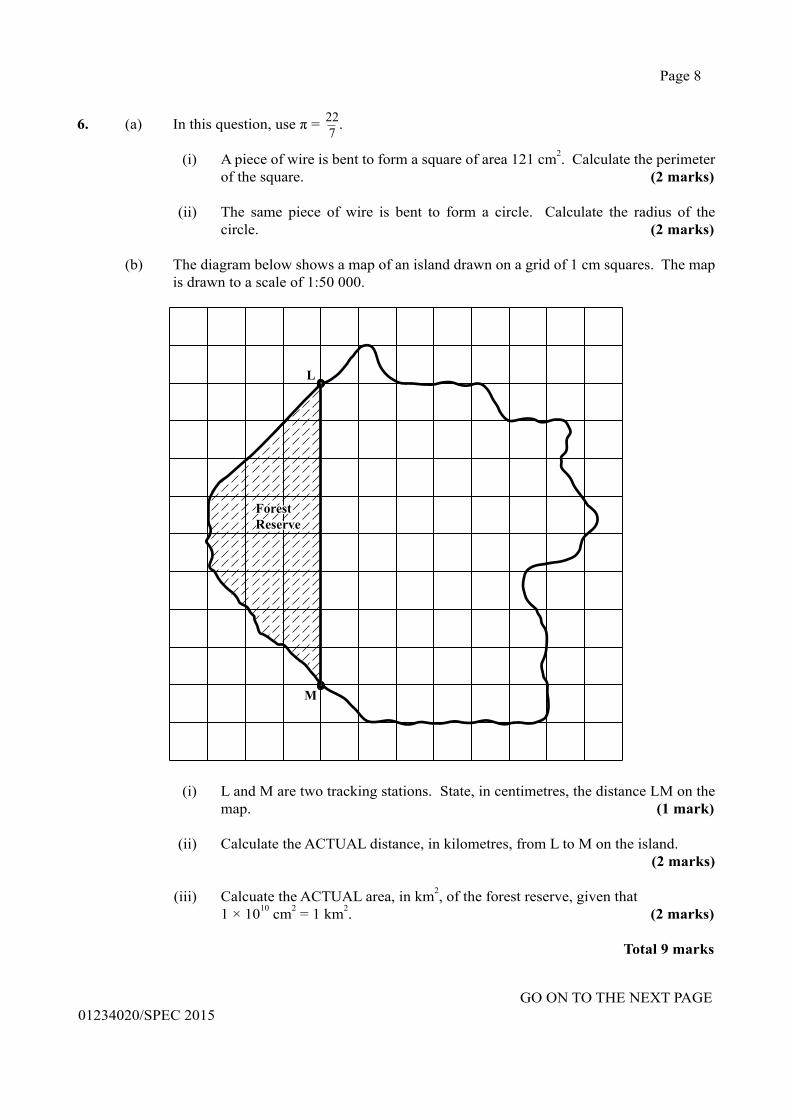
Page 8
GO ON TO THE NEXT PAGE01234020/SPEC 2015
6. (a) In this question, use π = – .
(i) A piece of wire is bent to form a square of area 121 cm2. Calculate the perimeter of the square. (2 marks)
(ii) The same piece of wire is bent to form a circle. Calculate the radius of the circle. (2 marks)
(b) The diagram below shows a map of an island drawn on a grid of 1 cm squares. The map is drawn to a scale of 1:50 000.
(i) L and M are two tracking stations. State, in centimetres, the distance LM on the map. (1 mark)
(ii) Calculate the ACTUAL distance, in kilometres, from L to M on the island.(2 marks)
(iii) Calcuate the ACTUAL area, in km2, of the forest reserve, given that 1 × 1010 cm2 = 1 km2. (2 marks)
Total 9 marks
227
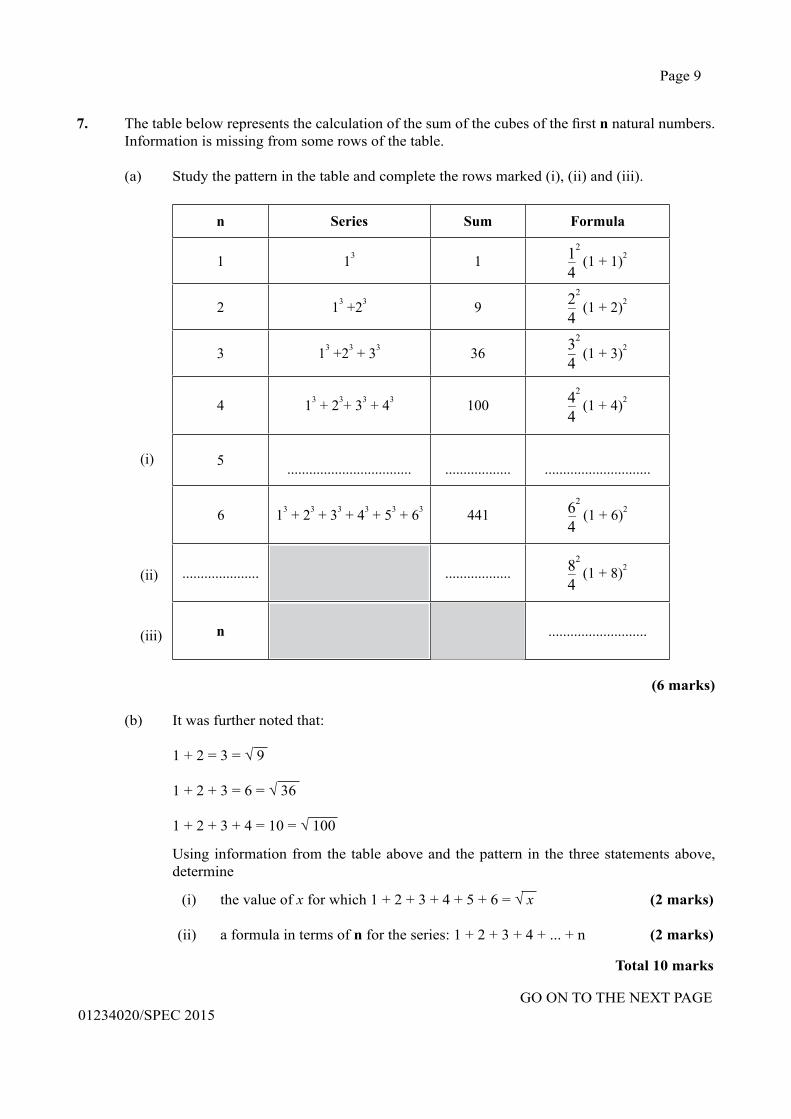
Page 9
GO ON TO THE NEXT PAGE01234020/SPEC 2015
7. The table below represents the calculation of the sum of the cubes of the first n natural numbers. Information is missing from some rows of the table.
(a) Study the pattern in the table and complete the rows marked (i), (ii) and (iii).
n Series Sum Formula
1 13 1 – (1 + 1)2
2 13 +23 9 – (1 + 2)2
3 13 +23 + 33 36 – (1 + 3)2
4 13 + 23+ 33 + 43 100 – (1 + 4)2
5 .................................. .................. .............................
6 13 + 23 + 33 + 43 + 53 + 63 441 – (1 + 6)2
..................... .................. – (1 + 8)2
n ...........................
(6 marks)
(b) It was further noted that:
1 + 2 = 3 = √ 9
1 + 2 + 3 = 6 = √ 36
1 + 2 + 3 + 4 = 10 = √ 100
Using information from the table above and the pattern in the three statements above, determine
(i) the value of x for which 1 + 2 + 3 + 4 + 5 + 6 = √ x (2 marks)
(ii) a formula in terms of n for the series: 1 + 2 + 3 + 4 + ... + n (2 marks)
Total 10 marks
(i)
(ii)
(iii)
12
422
432
4
42
4
62
4
82
4
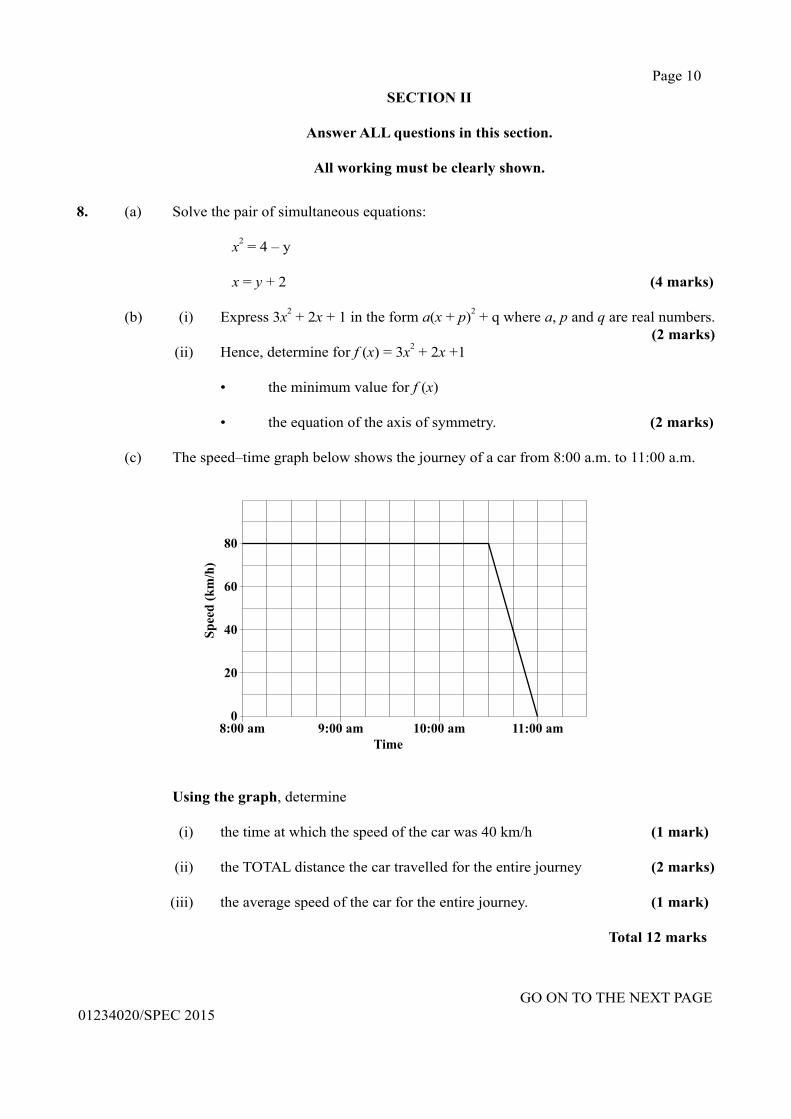
Page 10
GO ON TO THE NEXT PAGE01234020/SPEC 2015
8. (a) Solve the pair of simultaneous equations:
x2 = 4 – y
x = y + 2 (4 marks)
(b) (i) Express 3x2 + 2x + 1 in the form a(x + p)2 + q where a, p and q are real numbers.(2 marks)
(ii) Hence, determine for f (x) = 3x2 + 2x +1
• the minimum value for f (x)
• the equation of the axis of symmetry. (2 marks)
(c) The speed–time graph below shows the journey of a car from 8:00 a.m. to 11:00 a.m.
Using the graph, determine
(i) the time at which the speed of the car was 40 km/h (1 mark)
(ii) the TOTAL distance the car travelled for the entire journey (2 marks)
(iii) the average speed of the car for the entire journey. (1 mark)
Total 12 marks
SECTION II
Answer ALL questions in this section.
All working must be clearly shown.
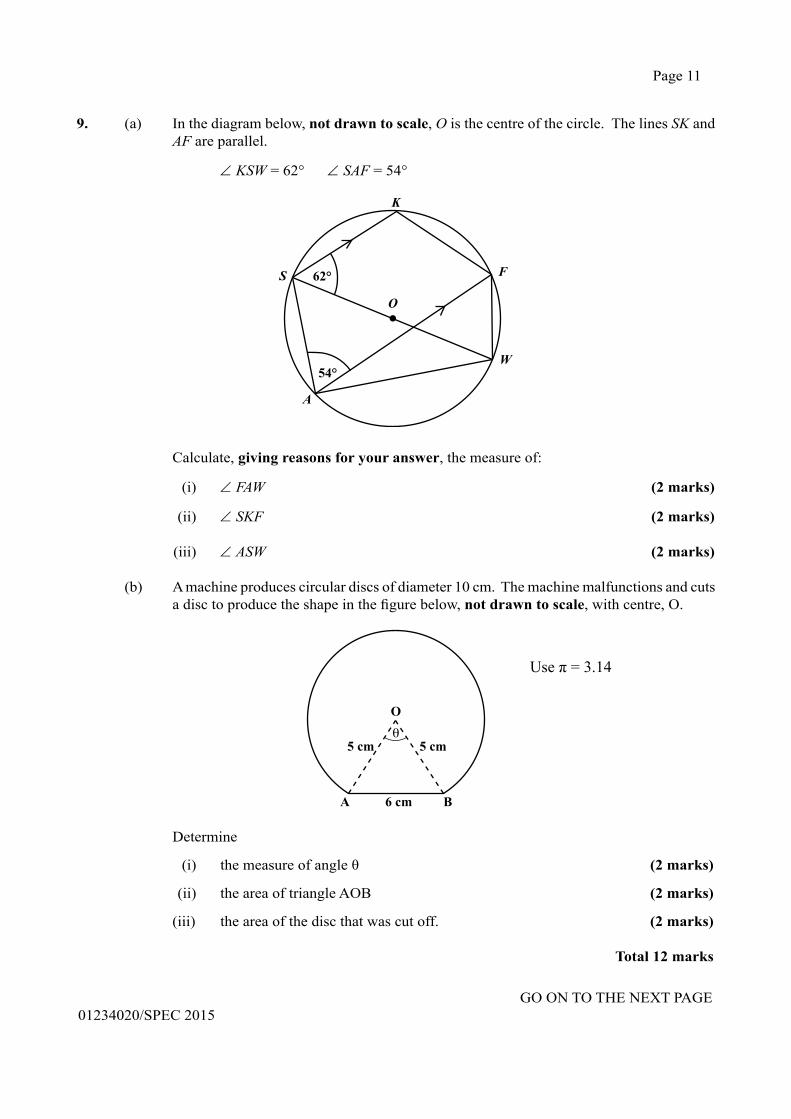
Page 11
GO ON TO THE NEXT PAGE01234020/SPEC 2015
9. (a) In the diagram below, not drawn to scale, O is the centre of the circle. The lines SK and AF are parallel.
∠ KSW = 62° ∠ SAF = 54°
K
F
O
S
A
W
62°
54°
Calculate, giving reasons for your answer, the measure of:
(i) ∠ FAW (2 marks)
(ii) ∠ SKF (2 marks) (iii) ∠ ASW (2 marks)
(b) A machine produces circular discs of diameter 10 cm. The machine malfunctions and cuts a disc to produce the shape in the figure below, not drawn to scale, with centre, O.
Determine
(i) the measure of angle θ (2 marks)
(ii) the area of triangle AOB (2 marks)
(iii) the area of the disc that was cut off. (2 marks)
Total 12 marks
Use π = 3.14
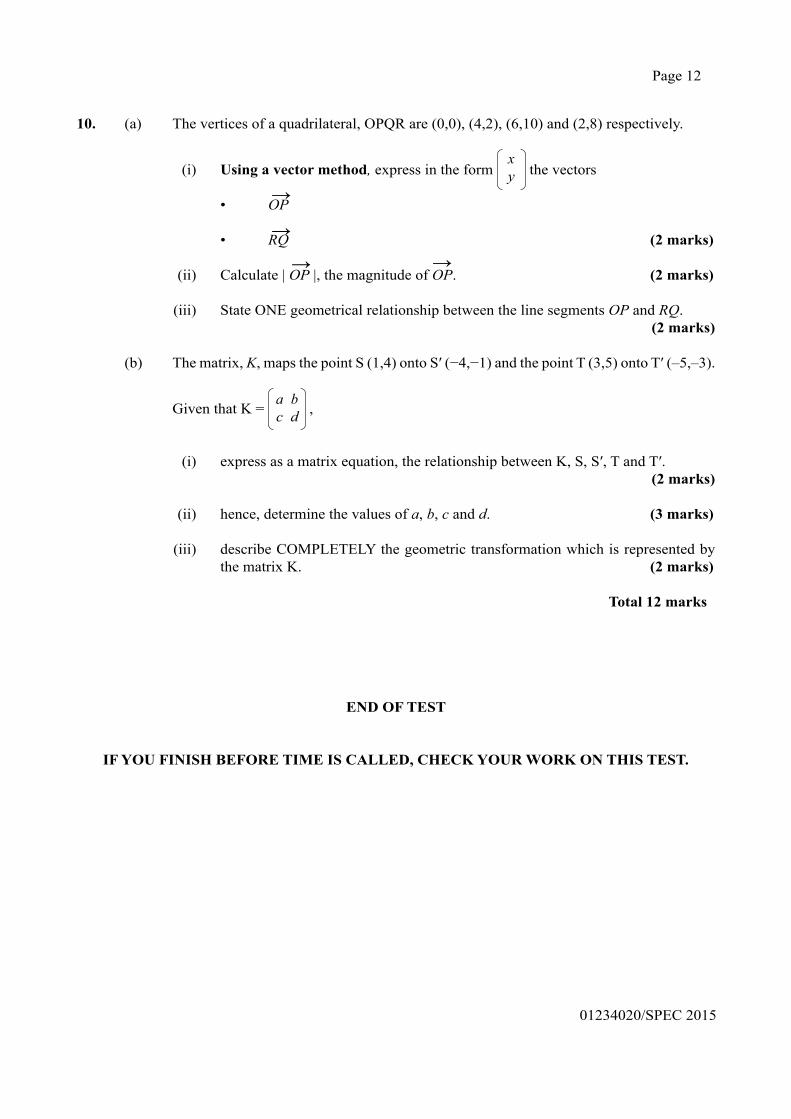
Page 12
01234020/SPEC 2015
10. (a) The vertices of a quadrilateral, OPQR are (0,0), (4,2), (6,10) and (2,8) respectively.
(i) Using a vector method, express in the form xy the vectors
• OP
• RQ (2 marks)
(ii) Calculate | OP |, the magnitude of OP. (2 marks)
(iii) State ONE geometrical relationship between the line segments OP and RQ.(2 marks)
(b) The matrix, K, maps the point S (1,4) onto S′ (−4,−1) and the point T (3,5) onto T′ (–5,–3).
Given that K = ac bd ,
(i) express as a matrix equation, the relationship between K, S, S′, T and T′.(2 marks)
(ii) hence, determine the values of a, b, c and d. (3 marks)
(iii) describe COMPLETELY the geometric transformation which is represented by the matrix K. (2 marks)
Total 12 marks
END OF TEST
IF YOU FINISH BEFORE TIME IS CALLED, CHECK YOUR WORK ON THIS TEST.
→
→
→ →
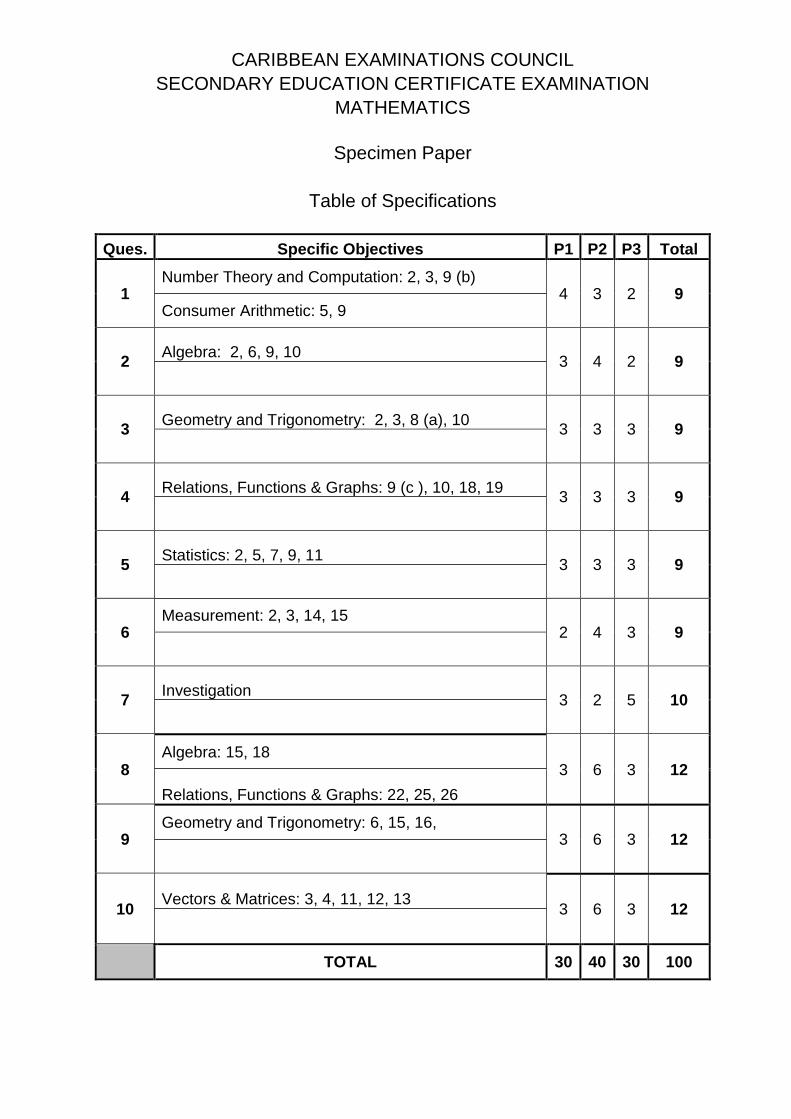
CARIBBEAN EXAMINATIONS COUNCIL
SECONDARY EDUCATION CERTIFICATE EXAMINATION
MATHEMATICS
Specimen Paper
Table of Specifications
Ques. Specific Objectives P1 P2 P3 Total
1 Number Theory and Computation: 2, 3, 9 (b)
4 3 2 9 Consumer Arithmetic: 5, 9
2 Algebra: 2, 6, 9, 10
3 4 2 9
3 Geometry and Trigonometry: 2, 3, 8 (a), 10
3 3 3 9
4 Relations, Functions & Graphs: 9 (c ), 10, 18, 19
3 3 3 9
5 Statistics: 2, 5, 7, 9, 11
3 3 3 9
6 Measurement: 2, 3, 14, 15
2 4 3 9
7 Investigation
3 2 5 10
8 Algebra: 15, 18
3 6 3 12
Relations, Functions & Graphs: 22, 25, 26
9 Geometry and Trigonometry: 6, 15, 16,
3 6 3 12
10 Vectors & Matrices: 3, 4, 11, 12, 13
3 6 3 12
TOTAL 30 40 30 100

01234020/SPECIMEN PAPER/MS/2015
C A R I B B E A N E X A M I N A T I O N S C O U N C I L
CARIBBEAN SECONDARY EDUCATION CERTIFICATE®
EXAMINATION
MATHEMATICS
PAPER 02 – GENERAL PROFICIENCY
MARK SCHEME
SPECIMEN PAPER 2015
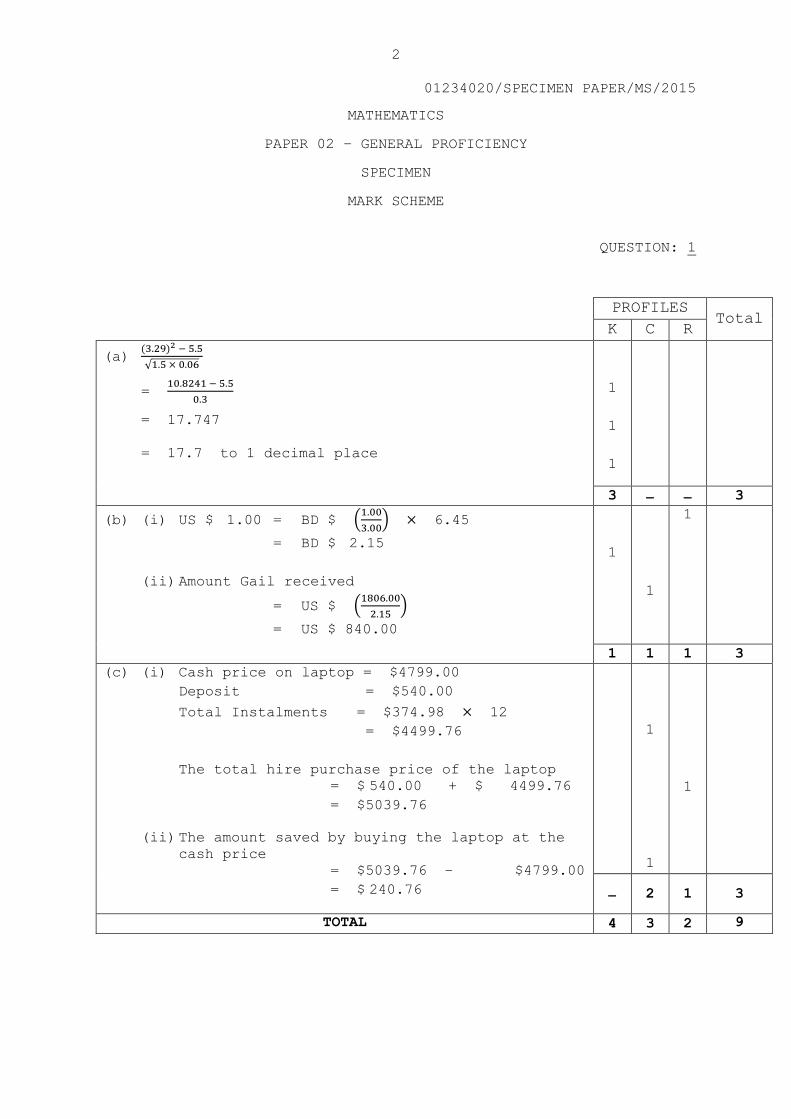
2
01234020/SPECIMEN PAPER/MS/2015
MATHEMATICS
PAPER 02 – GENERAL PROFICIENCY
SPECIMEN
MARK SCHEME
QUESTION: 1
PROFILES Total
K C R
(a) (3.29)2 − 5.5
√1.5 × 0.06
= 10.8241 − 5.5
0.3
= 17.747
= 17.7 to 1 decimal place
1
1
1
3 3
(b) (i) US $ 1.00 = BD $ (1.00
3.00) × 6.45
= BD $ 2.15
(ii) Amount Gail received
= US $ (1806.00
2.15)
= US $ 840.00
1
1
1
1 1 1 3
(c) (i) Cash price on laptop = $4799.00
Deposit = $540.00
Total Instalments = $374.98 × 12
= $4499.76
The total hire purchase price of the laptop
= $ 540.00 + $ 4499.76
= $5039.76
(ii) The amount saved by buying the laptop at the
cash price
= $5039.76 – $4799.00
= $ 240.76
1
1
1
2 1 3
TOTAL 4 3 2 9
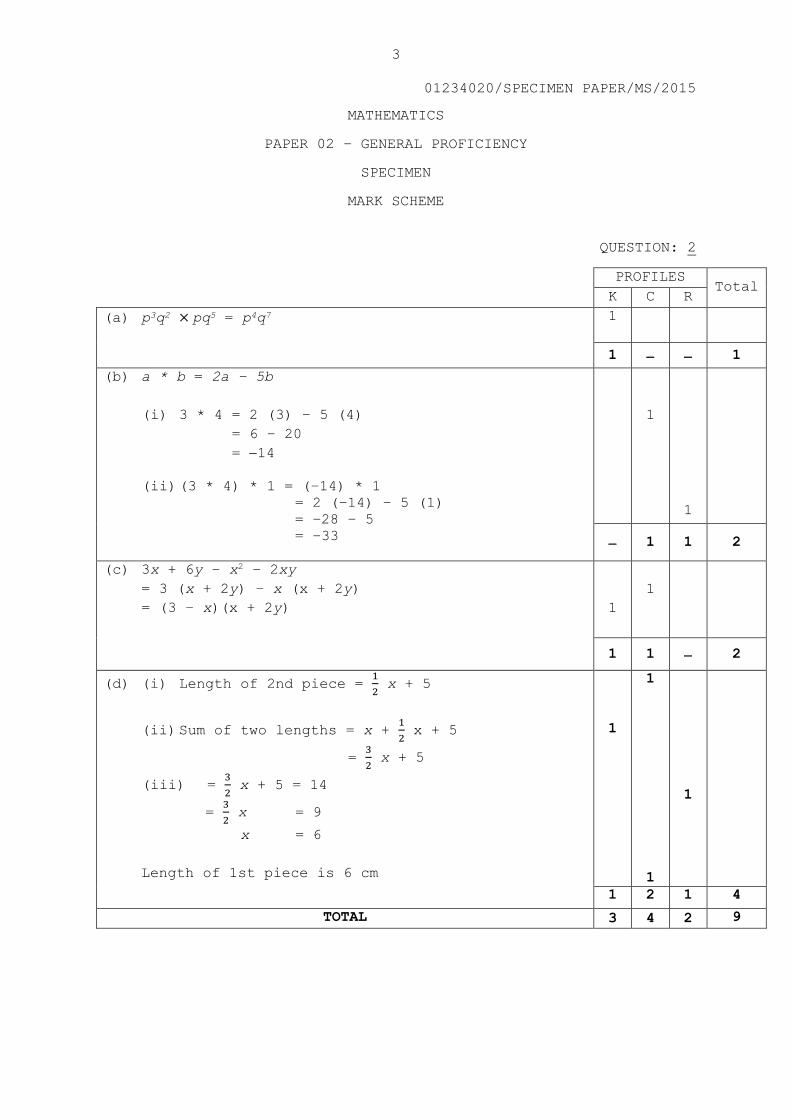
3
01234020/SPECIMEN PAPER/MS/2015
MATHEMATICS
PAPER 02 – GENERAL PROFICIENCY
SPECIMEN
MARK SCHEME
QUESTION: 2
PROFILES Total
K C R
(a) p3q2 × pq5 = p4q7
1
1 1
(b) a * b = 2a – 5b
(i) 3 * 4 = 2 (3) – 5 (4)
= 6 – 20
= 14
(ii) (3 * 4) * 1 = (–14) * 1 = 2 (–14) – 5 (1)
= –28 – 5
= –33
1
1
1 1 2
(c) 3x + 6y – x2 – 2xy
= 3 (x + 2y) – x (x + 2y)
= (3 – x)(x + 2y)
1
1
1 1 2
(d) (i) Length of 2nd piece = 1
2 x + 5
(ii) Sum of two lengths = x + 1
2 x + 5
= 3
2 x + 5
(iii) = 3
2 x + 5 = 14
= 3
2 x = 9
x = 6
Length of 1st piece is 6 cm
1
1
1
1
1 2 1 4
TOTAL 3 4 2 9
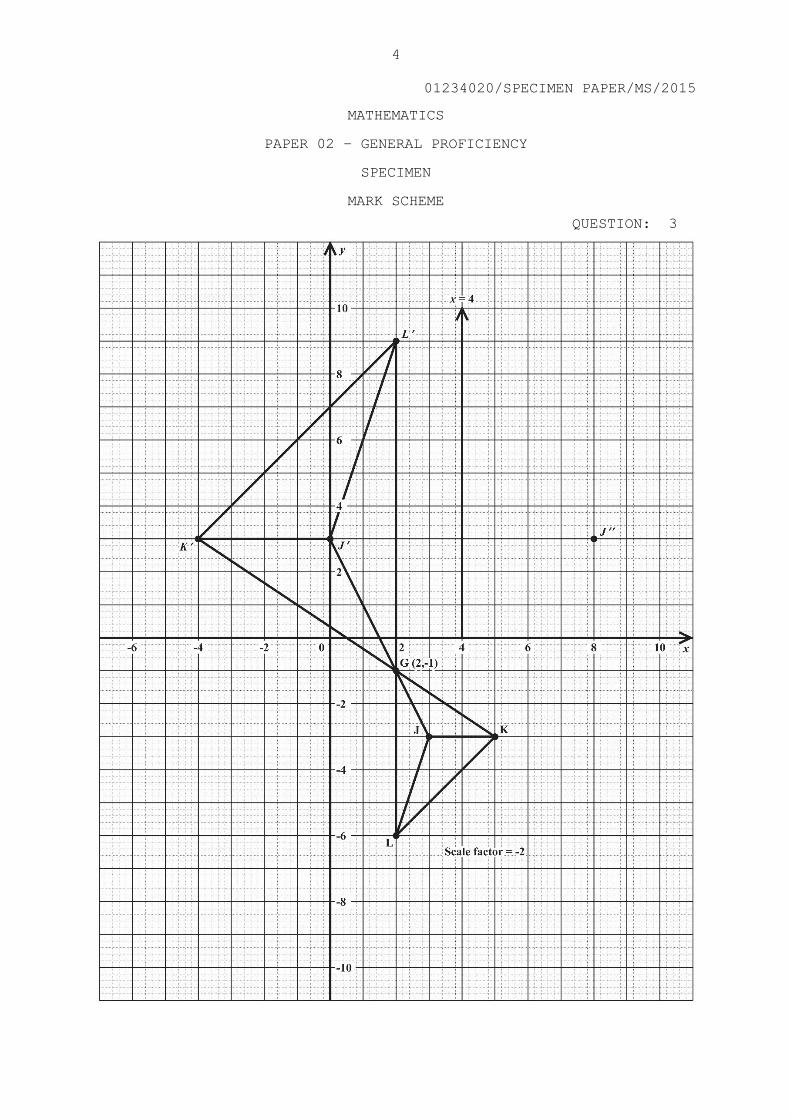
4
01234020/SPECIMEN PAPER/MS/2015
MATHEMATICS
PAPER 02 – GENERAL PROFICIENCY
SPECIMEN
MARK SCHEME
QUESTION: 3
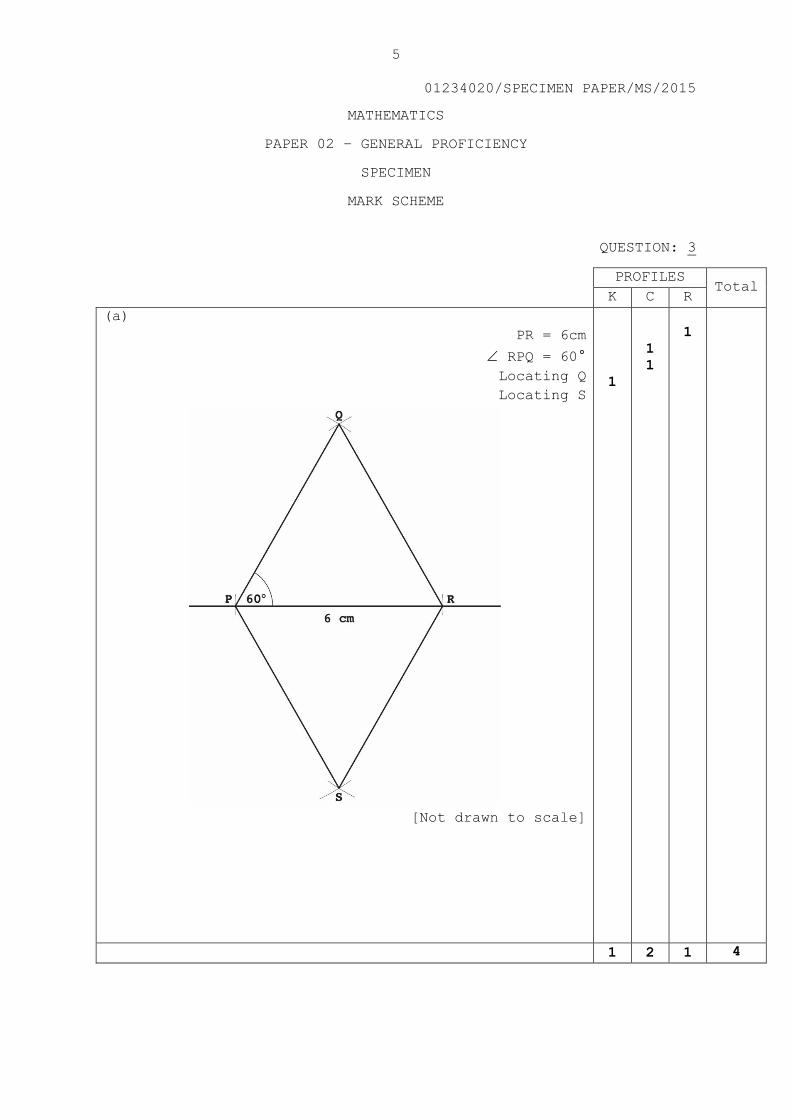
5
01234020/SPECIMEN PAPER/MS/2015
MATHEMATICS
PAPER 02 – GENERAL PROFICIENCY
SPECIMEN
MARK SCHEME
QUESTION: 3
PROFILES Total
K C R
(a)
PR = 6cm
RPQ = 60°
Locating Q
Locating S
[Not drawn to scale]
1
1
1
1
1 2 1 4
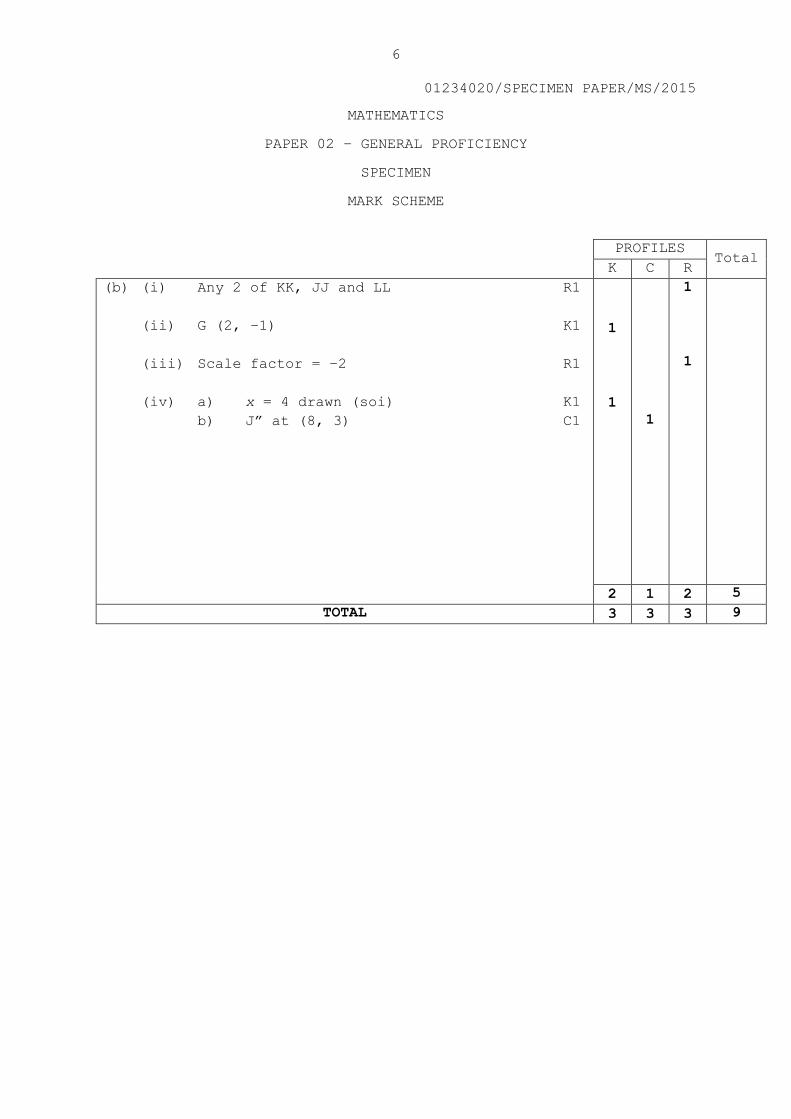
6
01234020/SPECIMEN PAPER/MS/2015
MATHEMATICS
PAPER 02 – GENERAL PROFICIENCY
SPECIMEN
MARK SCHEME
PROFILES
Total K C R
(b) (i) Any 2 of KK, JJ and LL R1
(ii) G (2, –1) K1
(iii) Scale factor = –2 R1
(iv) a) x = 4 drawn (soi) K1
b) J” at (8, 3) C1
1
1
1
1
1
2 1 2 5
TOTAL 3 3 3 9
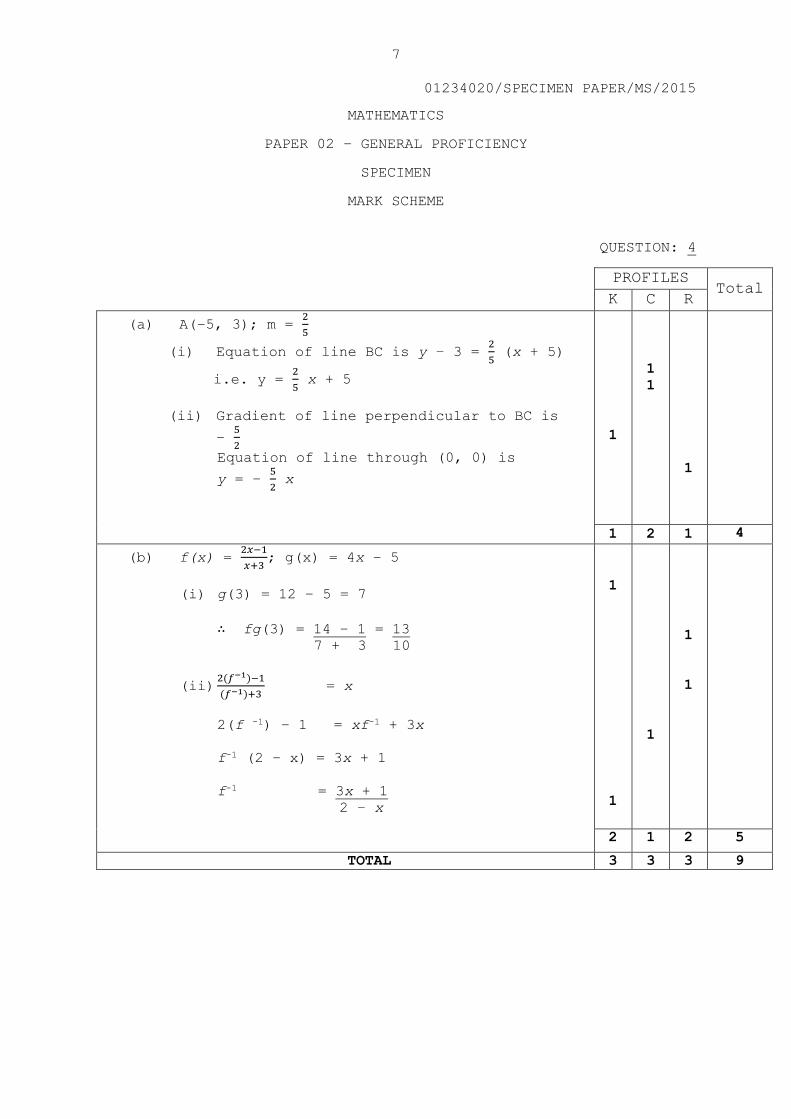
7
01234020/SPECIMEN PAPER/MS/2015
MATHEMATICS
PAPER 02 – GENERAL PROFICIENCY
SPECIMEN
MARK SCHEME
QUESTION: 4
PROFILES Total
K C R
(a) A(–5, 3); m = 2
5
(i) Equation of line BC is y – 3 = 2
5 (x + 5)
i.e. y = 2
5 x + 5
(ii) Gradient of line perpendicular to BC is
– 5
2
Equation of line through (0, 0) is
y = – 5
2 x
1
1
1
1
1 2 1 4
(b) f(x) = 2𝑥−1
𝑥+3; g(x) = 4x – 5
(i) g(3) = 12 – 5 = 7
∴ fg(3) = 14 – 1 = 13 7 + 3 10
(ii) 2(𝑓−1)−1
(𝑓−1)+3 = x
2(f -1) – 1 = xf-1 + 3x
f-1 (2 – x) = 3x + 1
f-1 = 3x + 1
2 – x
1
1
1
1
1
2 1 2 5
TOTAL 3 3 3 9
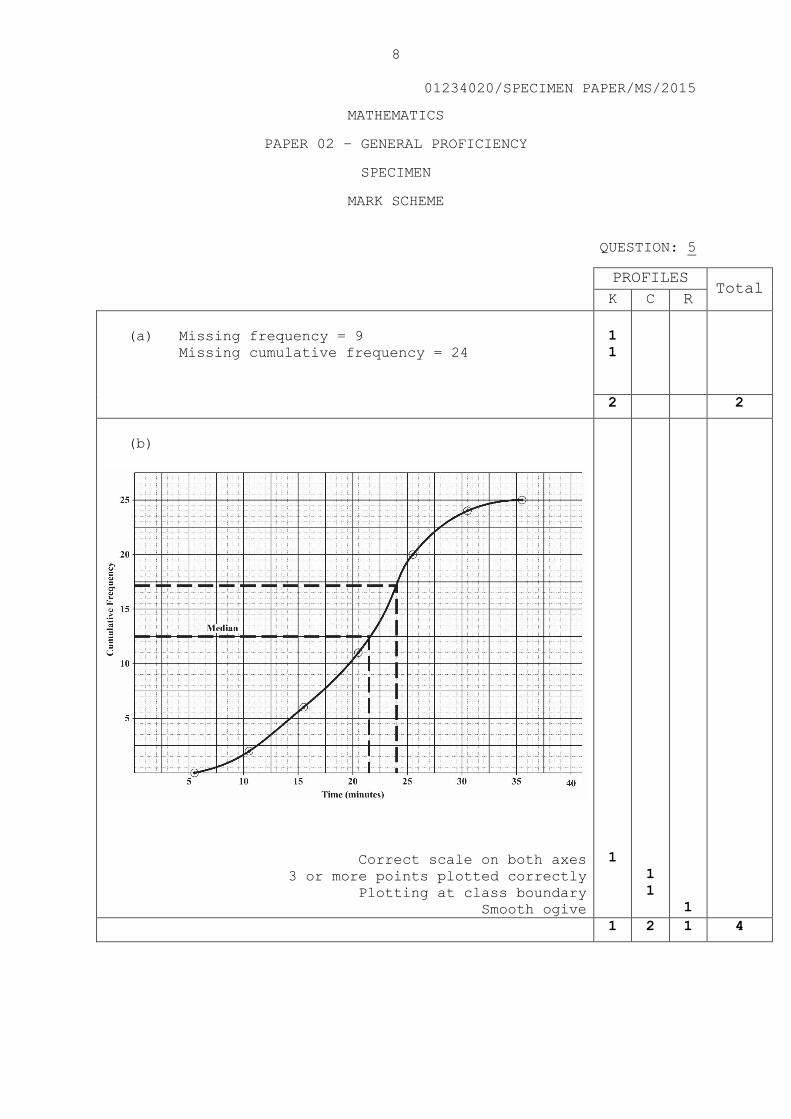
8
01234020/SPECIMEN PAPER/MS/2015
MATHEMATICS
PAPER 02 – GENERAL PROFICIENCY
SPECIMEN
MARK SCHEME
QUESTION: 5
PROFILES Total
K C R
(a) Missing frequency = 9
Missing cumulative frequency = 24
1
1
2 2
(b)
Correct scale on both axes
3 or more points plotted correctly
Plotting at class boundary
Smooth ogive
1
1
1
1
1 2 1 4
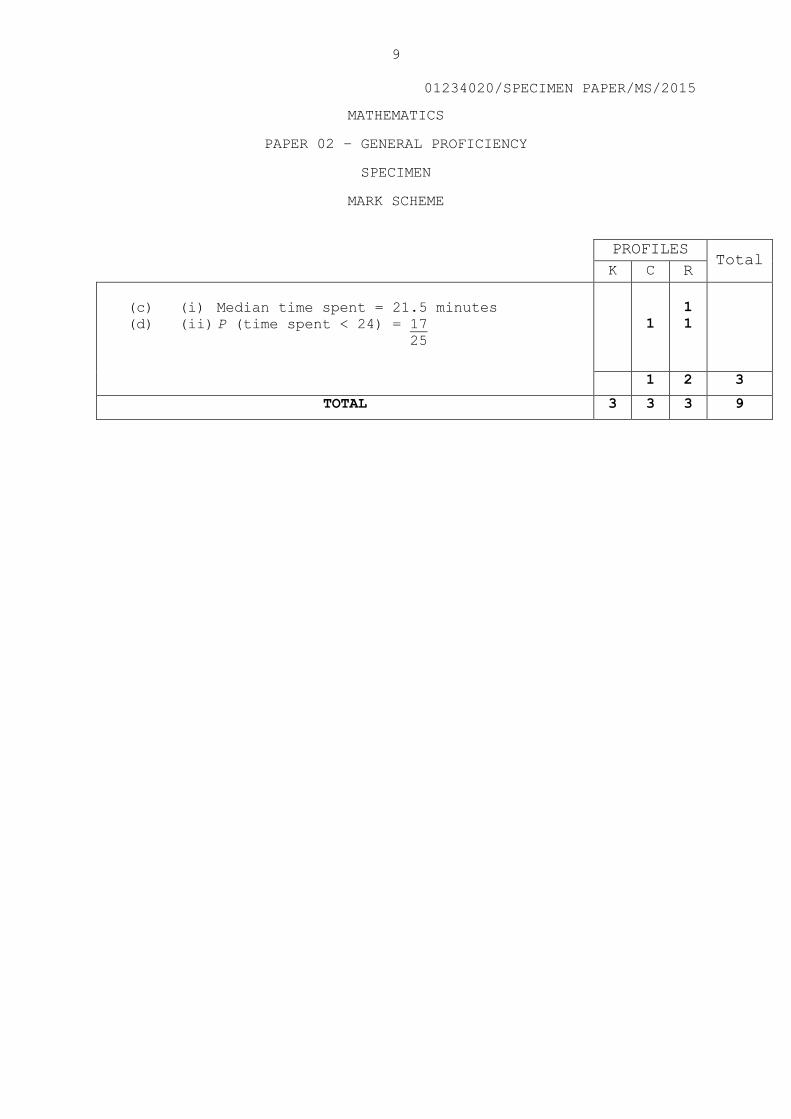
9
01234020/SPECIMEN PAPER/MS/2015
MATHEMATICS
PAPER 02 – GENERAL PROFICIENCY
SPECIMEN
MARK SCHEME
PROFILES
Total K C R
(c) (i) Median time spent = 21.5 minutes
(d) (ii) P (time spent < 24) = 17
25
1
1
1
1 2 3
TOTAL 3 3 3 9
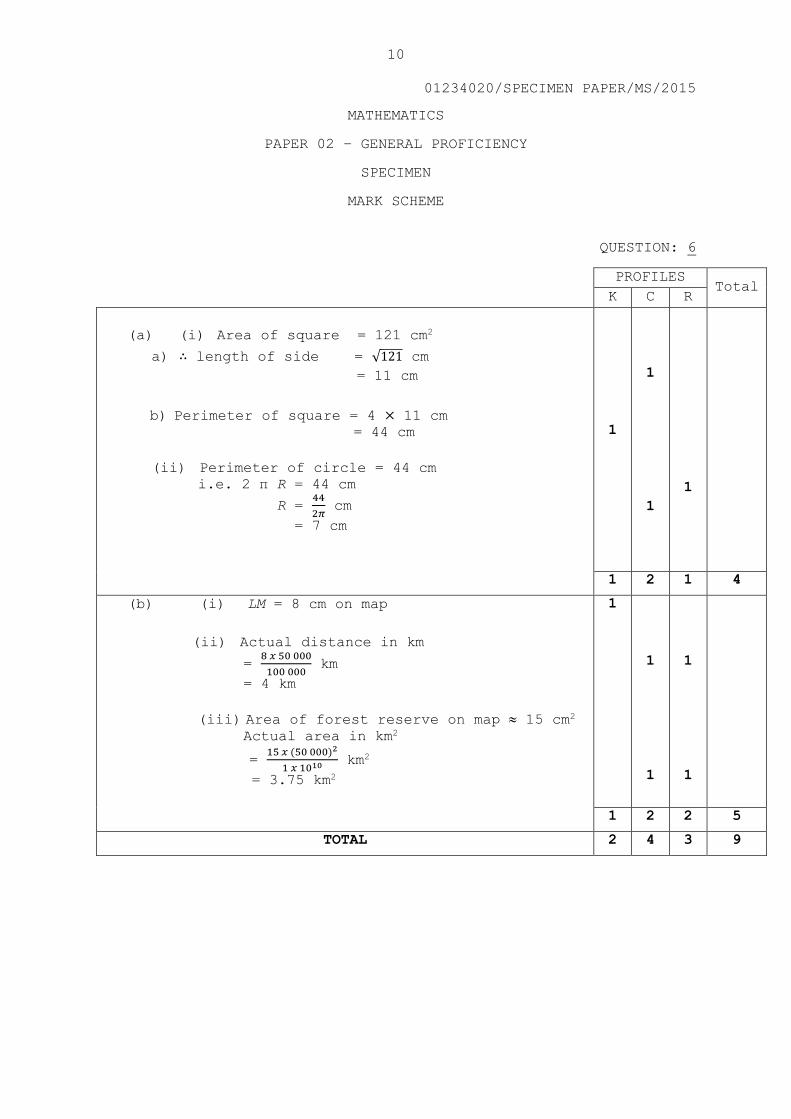
10
01234020/SPECIMEN PAPER/MS/2015
MATHEMATICS
PAPER 02 – GENERAL PROFICIENCY
SPECIMEN
MARK SCHEME
QUESTION: 6
PROFILES Total
K C R
(a) (i) Area of square = 121 cm2
a) ∴ length of side = √121 cm
= 11 cm
b) Perimeter of square = 4 × 11 cm = 44 cm
(ii) Perimeter of circle = 44 cm
i.e. 2 π R = 44 cm
R = 44
2𝜋 cm
= 7 cm [===
1
1
1
1
1 2 1 4
(b) (i) LM = 8 cm on map
(ii) Actual distance in km
= 8 𝑥 50 000
100 000 km
= 4 km
(iii) Area of forest reserve on map 15 cm2 Actual area in km2
= 15 𝑥 (50 000)2
1 𝑥 1010 km2
= 3.75 km2
1
1
1
1
1
1 2 2 5
TOTAL 2 4 3 9
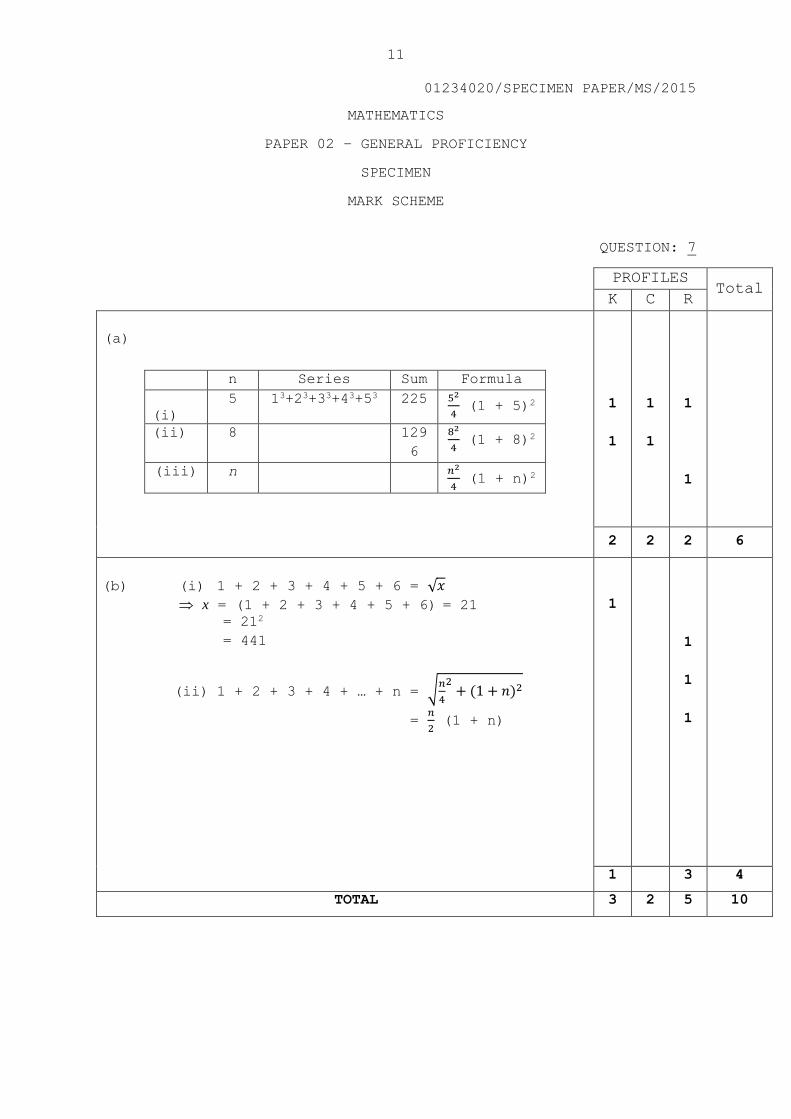
11
01234020/SPECIMEN PAPER/MS/2015
MATHEMATICS
PAPER 02 – GENERAL PROFICIENCY
SPECIMEN
MARK SCHEME
QUESTION: 7
PROFILES Total
K C R
(a)
n Series Sum Formula
(i)
5 13+23+33+43+53 225 52
4 (1 + 5)2
(ii) 8 129
6
82
4 (1 + 8)2
(iii) n 𝑛2
4 (1 + n)2
1
1
1
1
1
1
2 2 2 6
(b) (i) 1 + 2 + 3 + 4 + 5 + 6 = √𝑥
x = (1 + 2 + 3 + 4 + 5 + 6) = 21 = 212
= 441
(ii) 1 + 2 + 3 + 4 + … + n = √𝑛
4
2+ (1 + 𝑛)2
= 𝑛
2 (1 + n)
1
1
1
1
1 3 4
TOTAL 3 2 5 10
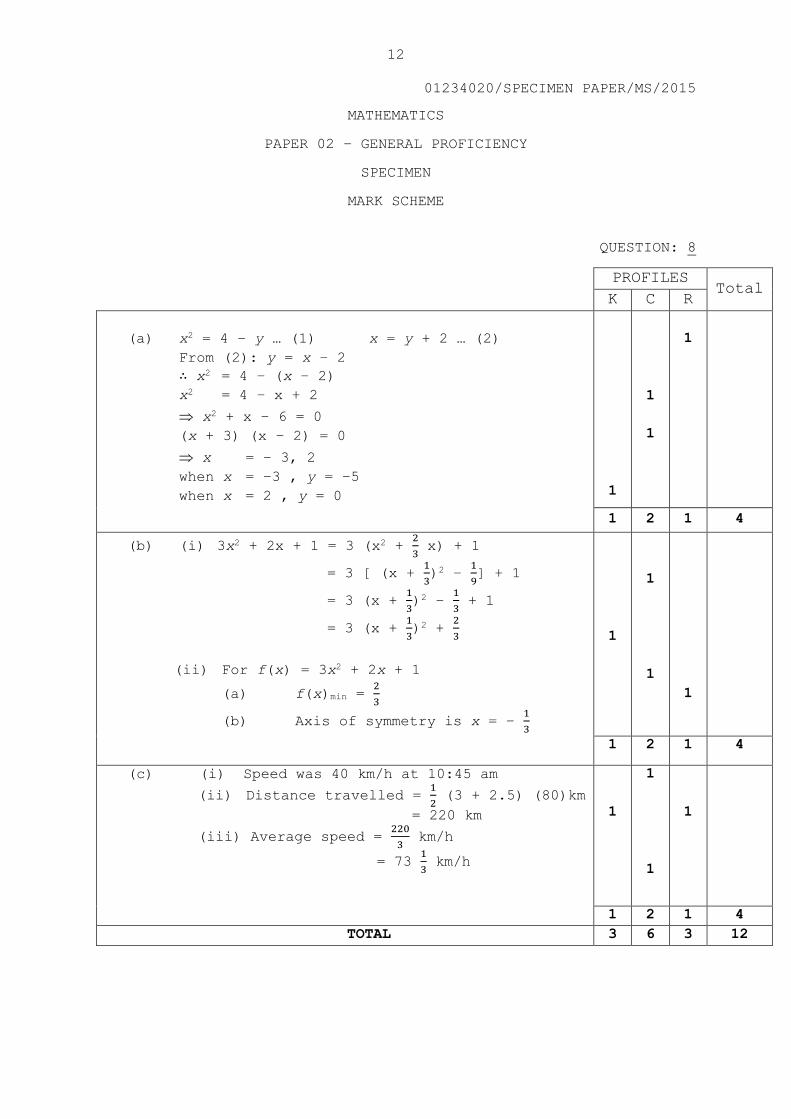
12
01234020/SPECIMEN PAPER/MS/2015
MATHEMATICS
PAPER 02 – GENERAL PROFICIENCY
SPECIMEN
MARK SCHEME
QUESTION: 8
PROFILES Total
K C R
(a) x2 = 4 – y … (1) x = y + 2 … (2)
From (2): y = x – 2
∴ x2 = 4 – (x – 2)
x2 = 4 – x + 2
x2 + x – 6 = 0
(x + 3) (x – 2) = 0
x = – 3, 2
when x = –3 , y = –5
when x = 2 , y = 0
1
1
1
1
1 2 1 4
(b) (i) 3x2 + 2x + 1 = 3 (x2 + 2
3 x) + 1
= 3 [ (x + 1
3)2 –
1
9] + 1
= 3 (x + 1
3)2 –
1
3 + 1 )
= 3 (x + 1
3)2 +
2
3
(ii) For f(x) = 3x2 + 2x + 1
(a) f(x)min = 2
3
(b) Axis of symmetry is x = – 1
3
1
1
1
1
1 2 1 4
(c) (i) Speed was 40 km/h at 10:45 am
(ii) Distance travelled = 1
2 (3 + 2.5) (80)km
= 220 km
(iii) Average speed = 220
3 km/h
= 73 1
3 km/h
1
1
1
1
1 2 1 4
TOTAL 3 6 3 12
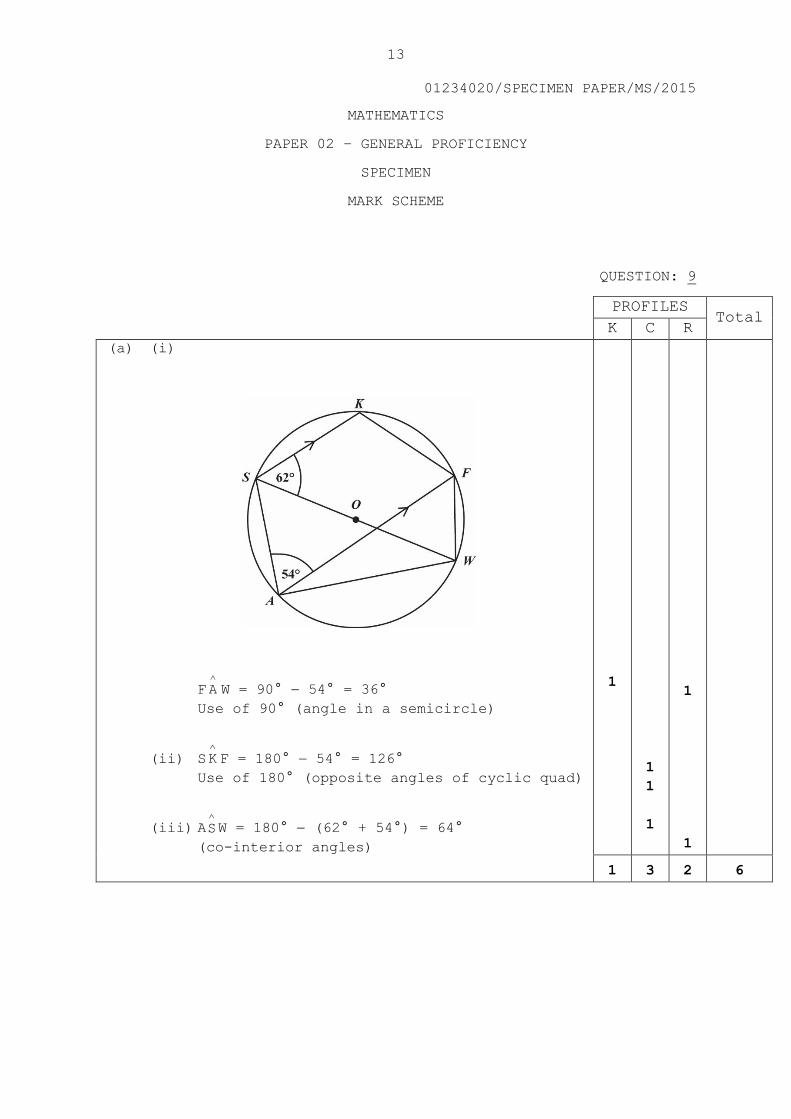
13
01234020/SPECIMEN PAPER/MS/2015
MATHEMATICS
PAPER 02 – GENERAL PROFICIENCY
SPECIMEN
MARK SCHEME
QUESTION: 9
PROFILES Total
K C R
(a) (i)
F A
W = 90° 54° = 36°
Use of 90° (angle in a semicircle)
(ii) SK
F = 180° 54° = 126°
Use of 180° (opposite angles of cyclic quad)
(iii) AS
W = 180° (62° + 54°) = 64°
(co-interior angles)
1
1
1
1
1
1
1 3 2 6
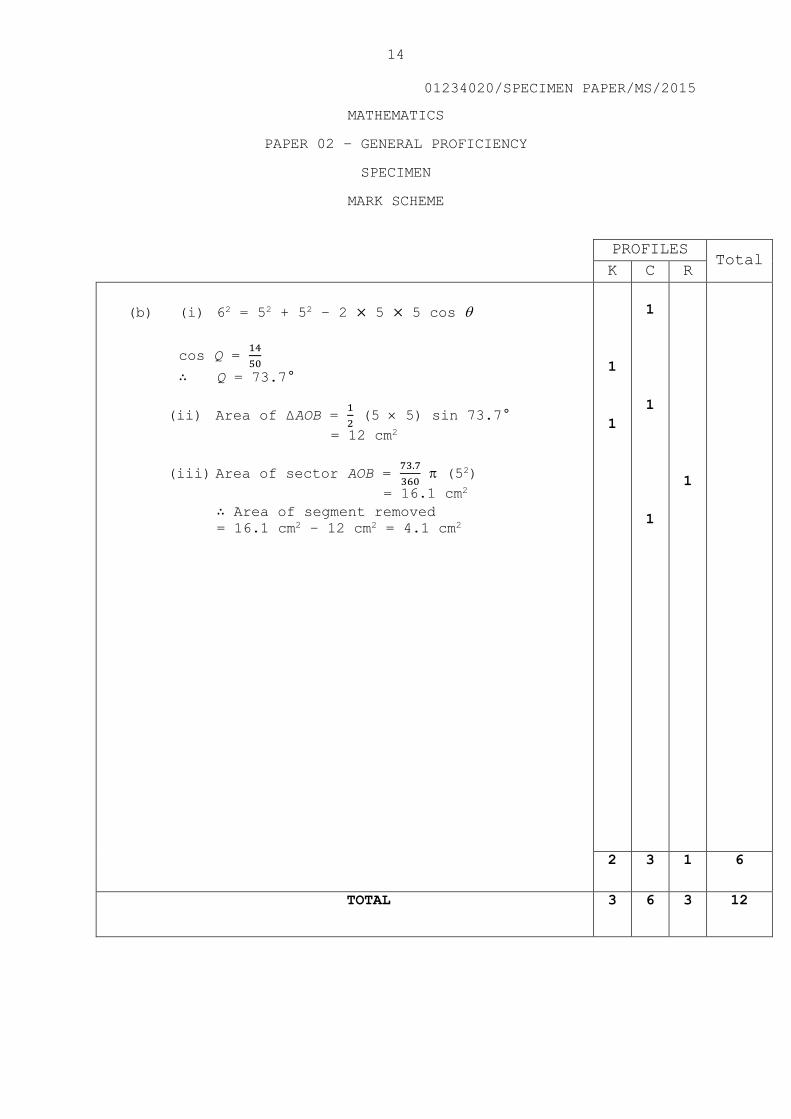
14
01234020/SPECIMEN PAPER/MS/2015
MATHEMATICS
PAPER 02 – GENERAL PROFICIENCY
SPECIMEN
MARK SCHEME
PROFILES Total
K C R
(b) (i) 62 = 52 + 52 – 2 × 5 × 5 cos
cos Q = 14
50
∴ Q = 73.7°
(ii) Area of ΔAOB = 1
2 (5 5) sin 73.7°
= 12 cm2
(iii) Area of sector AOB = 73.7
360 (52)
= 16.1 cm2
∴ Area of segment removed = 16.1 cm2 – 12 cm2 = 4.1 cm2
1
1
1
1
1
1
2 3 1 6
TOTAL 3 6 3 12
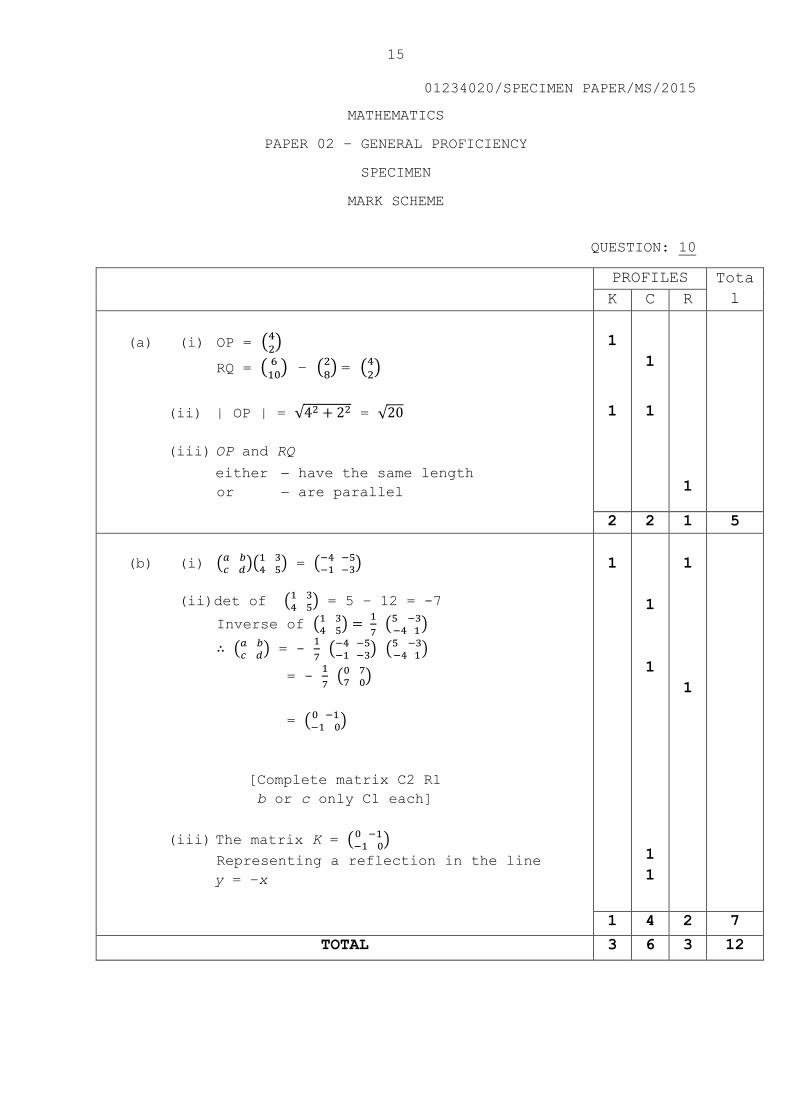
15
01234020/SPECIMEN PAPER/MS/2015
MATHEMATICS
PAPER 02 – GENERAL PROFICIENCY
SPECIMEN
MARK SCHEME
QUESTION: 10
PROFILES Tota
l K C R
(a) (i) OP = (42)
RQ = ( 610
) – (28) = (4
2)
(ii) | PO | = √42 + 22 = √20
(iii) OP and RQ
either have the same length
or are parallel
1
1
1
1
1
2 2 1 5
(b) (i) (𝑎 𝑏𝑐 𝑑
)(1 34 5
) = (−4 −5−1 −3
)
(ii)det of (1 34 5
) = 5 – 12 = -7
Inverse of (1 34 5
) = 1
7 (5 −3
−4 1)
∴ (𝑎 𝑏𝑐 𝑑
) = - 1
7 (−4 −5
−1 −3) (5 −3
−4 1)
= - 1
7 (0 7
7 0)
= (0 −1−1 0
)
[Complete matrix C2 R1
b or c only C1 each]
(iii) The matrix K = (0 −1−1 0
)
Representing a reflection in the line
y = –x
1
1
1
1
1
1
1
1 4 2 7
TOTAL 3 6 3 12
TEST CODE 01234032/SPECFORM TP 01234032/SPEC
C A R I B B E A N E X A M I N A T I O N S C O U N C I L
CARIBBEAN SECONDARY EDUCATION CERTIFICATE®
EXAMINATION
MATHEMATICS
SPECIMEN PAPER
Paper 032 – General Proficiency
2 hours 40 minutes
READ THE FOLLOWING INSTRUCTIONS CAREFULLY.
1. This paper consists of TWO questions.
2. Answer ALL questions.
3. Write your answers in the booklet provided.
4. Do NOT write in the margins.
5. All working MUST be clearly shown.
6. A list of formulae is provided on page 2 of this booklet.
7. If you need to rewrite any answer and there is not enough space to do so on the original page, you must use the extra page(s) provided at the back of this booklet. Remember to draw a line through your original answer.
8. If you use the extra page(s) you MUST write the question number clearly in the box provided at the top of the extra page(s) and, where relevant, include the question part beside the answer.
Examination Materials Permitted
Silent, non-programmable electronic calculator Mathematical instruments
DO NOT TURN THIS PAGE UNTIL YOU ARE TOLD TO DO SO.
Copyright © 2015 Caribbean Examinations CouncilAll rights reserved.
01234020/SPEC 2015

Page 2
GO ON TO THE NEXT PAGE01234032/SPEC 2015
LIST OF FORMULAE
Volume of a prism V = Ah where A is the area of a cross-section and h is the perpendicular length.
Volume of cylinder V = πr2h where r is the radius of the base and h is the perpendicular height.
Volume of a right pyramid V = — Ah where A is the area of the base and h is the perpendicular height.
Circumference C = 2πr where r is the radius of the circle.
Arc length S = —— × 2πr where θ is the angle subtended by the arc, measured in
degrees.
Area of a circle A = πr2 where r is the radius of the circle.
Area of a sector A = —— × πr2 where θ is the angle of the sector, measured in degrees.
Area of trapezium A = — (a + b) h where a and b are the lengths of the parallel sides and h
is the perpendicular distance between the parallel sides.
Roots of quadratic equations If ax2 + bx + c = 0,
then x = ——————
Trigonometric ratios sin θ = —————
cos θ = —————
tan θ = —————
Area of triangle Area of Δ = — bh where b is the length of the base and h is the perpendicular height.
Area of Δ ABC = — ab sin C
Area of Δ ABC = √ s (s – a) (s – b) (s – c)
where s = ————
Sine rule —— = —— = ——
Cosine rule a2 = b2 + c2 – 2bc cos A
13
12
θ360
θ360
–b + √ b2 – 4ac2a
opposite sidehypotenuse
adjacent sidehypotenuse
opposite sideadjacent side
12
12
a + b + c2
asin A
csin C
bsin B
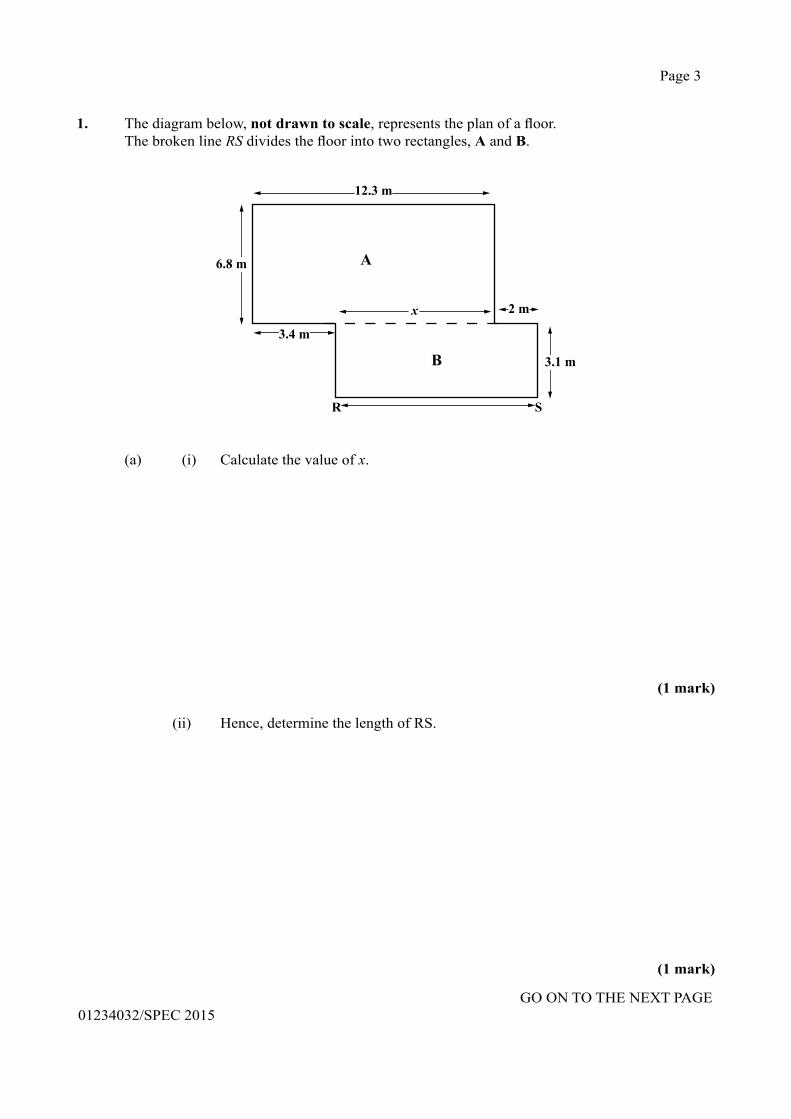
Page 3
GO ON TO THE NEXT PAGE01234032/SPEC 2015
1. The diagram below, not drawn to scale, represents the plan of a floor. The broken line RS divides the floor into two rectangles, A and B.
(a) (i) Calculate the value of x.
(1 mark)
(ii) Hence, determine the length of RS.
(1 mark)
Page 4
GO ON TO THE NEXT PAGE01234032/SPEC 2015
(b) Calculate the area of the entire floor.
(4 marks)
(c) Section A of the floor is to be covered with flooring boards measuring 1 metre by 30 centimetres.
What is the MINIMUM number of flooring boards that would be needed to completely cover Section A?
(4 marks)
Total 10 marks
E
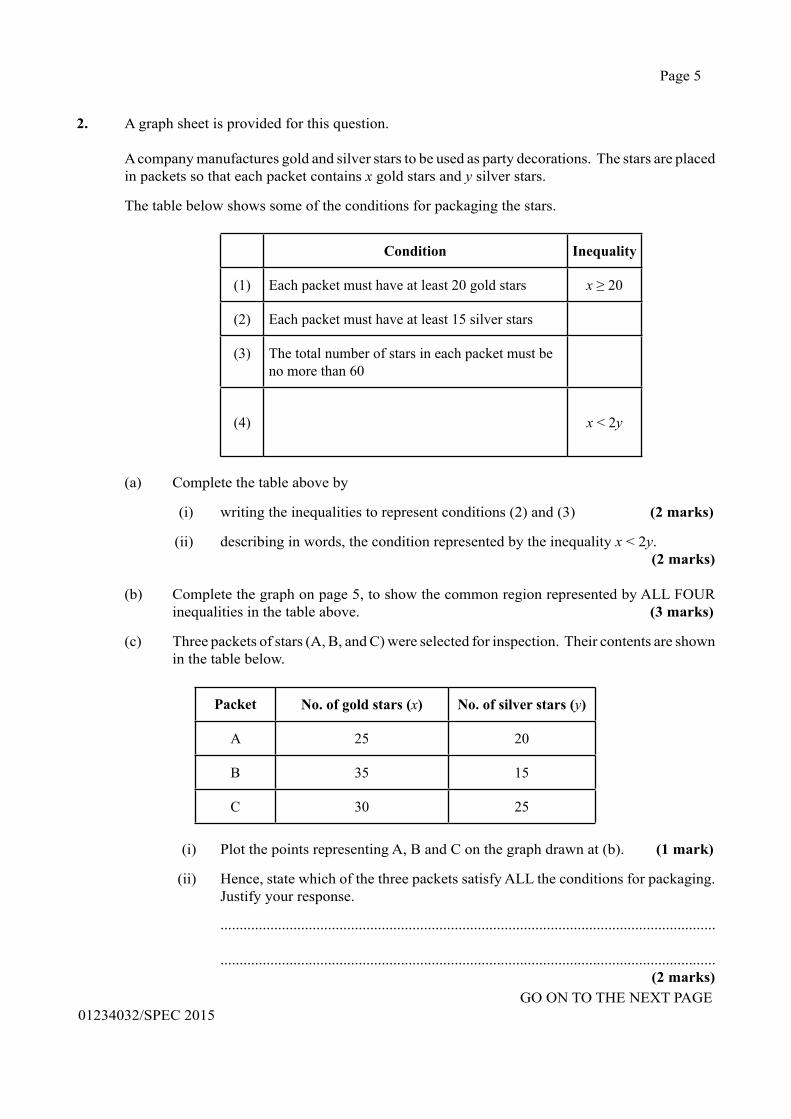
Page 5
GO ON TO THE NEXT PAGE01234032/SPEC 2015
2. A graph sheet is provided for this question.
A company manufactures gold and silver stars to be used as party decorations. The stars are placed in packets so that each packet contains x gold stars and y silver stars.
The table below shows some of the conditions for packaging the stars.
Condition Inequality
(1) Each packet must have at least 20 gold stars x ≥ 20
(2) Each packet must have at least 15 silver stars
(3) The total number of stars in each packet must be no more than 60
(4) x < 2y
(a) Complete the table above by
(i) writing the inequalities to represent conditions (2) and (3) (2 marks)
(ii) describing in words, the condition represented by the inequality x < 2y.(2 marks)
(b) Complete the graph on page 5, to show the common region represented by ALL FOUR inequalities in the table above. (3 marks)
(c) Three packets of stars (A, B, and C) were selected for inspection. Their contents are shown in the table below.
Packet No. of gold stars (x) No. of silver stars (y)
A 25 20
B 35 15
C 30 25
(i) Plot the points representing A, B and C on the graph drawn at (b). (1 mark)
(ii) Hence, state which of the three packets satisfy ALL the conditions for packaging. Justify your response.
.................................................................................................................................
.................................................................................................................................(2 marks)
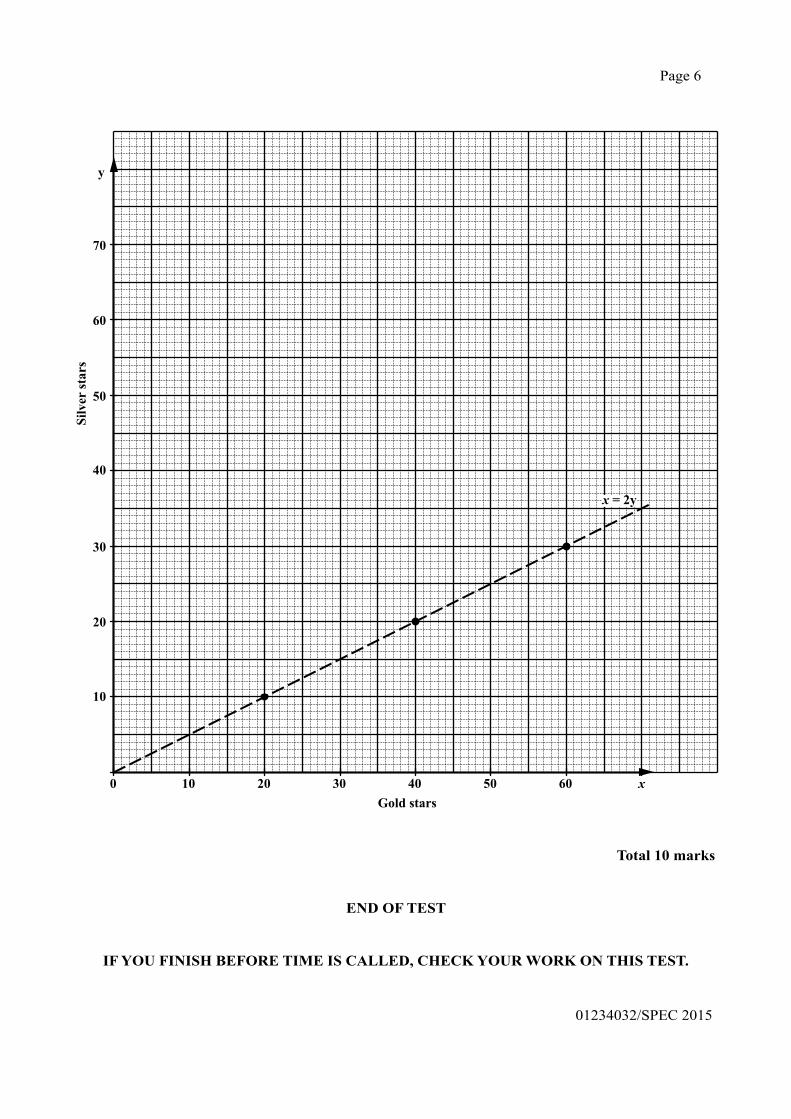
Page 6
01234032/SPEC 2015
Total 10 marks
END OF TEST
IF YOU FINISH BEFORE TIME IS CALLED, CHECK YOUR WORK ON THIS TEST.
01234032/SPECIMEN PAPER/MS/2015
C A R I B B E A N E X A M I N A T I O N S C O U N C I L
CARIBBEAN SECONDARY EDUCATION CERTIFICATE®
EXAMINATION
MATHEMATICS
PAPER 032 – GENERAL PROFICIENCY
MARK SCHEME
SPECIMEN PAPER 2015
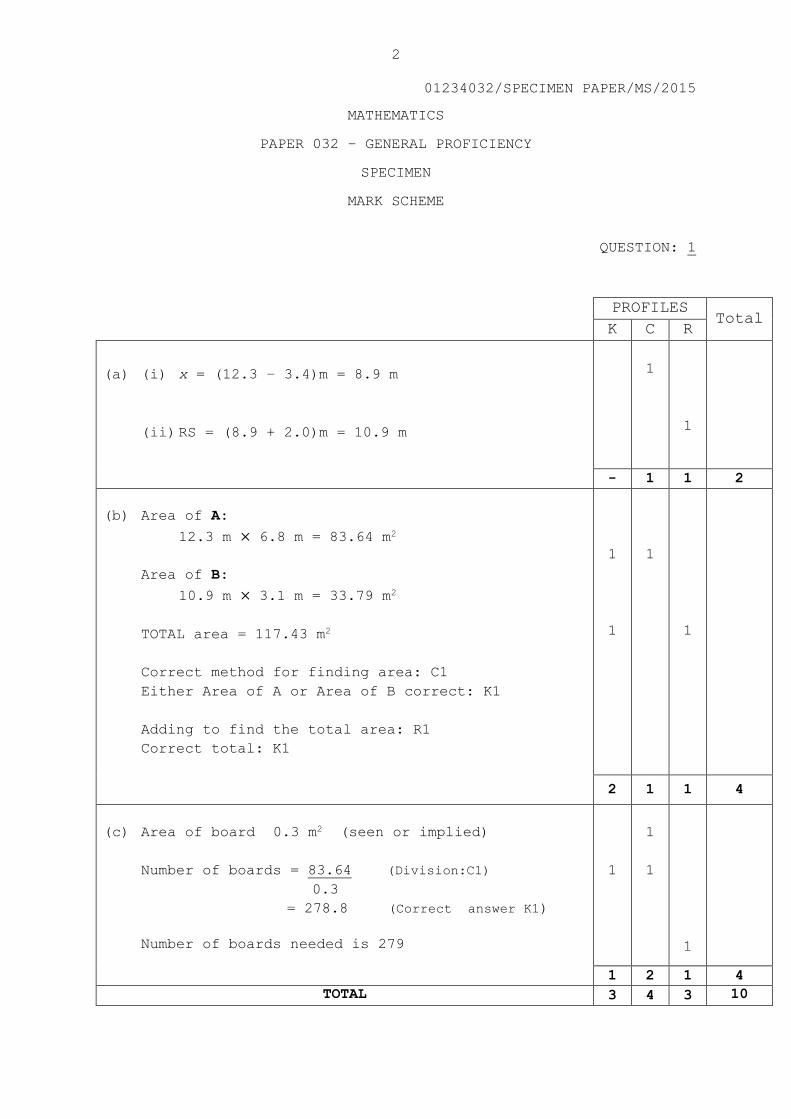
2
01234032/SPECIMEN PAPER/MS/2015
MATHEMATICS
PAPER 032 – GENERAL PROFICIENCY
SPECIMEN
MARK SCHEME
QUESTION: 1
PROFILES Total
K C R
(a) (i) x = (12.3 – 3.4)m = 8.9 m
(ii) RS = (8.9 + 2.0)m = 10.9 m
1
1
- 1 1 2
(b) Area of A:
12.3 m × 6.8 m = 83.64 m2
Area of B:
10.9 m × 3.1 m = 33.79 m2
TOTAL area = 117.43 m2
Correct method for finding area: C1
Either Area of A or Area of B correct: K1
Adding to find the total area: R1
Correct total: K1
1
1
1
1
2 1 1 4
(c) Area of board 0.3 m2 (seen or implied)
Number of boards = 83.64 (Division:C1)
0.3
= 278.8 (Correct answer K1)
Number of boards needed is 279
1
1
1
1
1 2 1 4
TOTAL 3 4 3 10
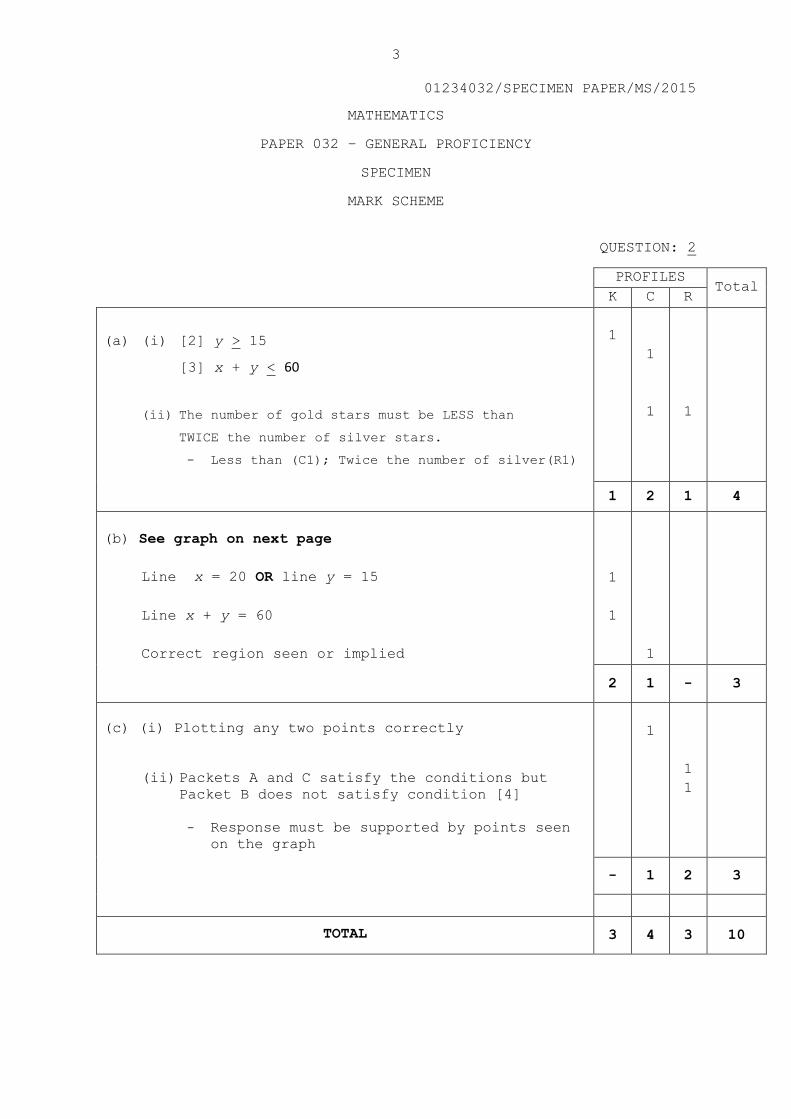
3
01234032/SPECIMEN PAPER/MS/2015
MATHEMATICS
PAPER 032 – GENERAL PROFICIENCY
SPECIMEN
MARK SCHEME
QUESTION: 2
PROFILES Total
K C R
(a) (i) [2] y > 15
[3] x + y < 60
(ii) The number of gold stars must be LESS than
TWICE the number of silver stars.
- Less than (C1); Twice the number of silver(R1)
1
1
1
1
1 2 1 4
(b) See graph on next page
Line x = 20 OR line y = 15
Line x + y = 60
Correct region seen or implied
1
1
1
2 1 - 3
(c) (i) Plotting any two points correctly
(ii) Packets A and C satisfy the conditions but
Packet B does not satisfy condition [4]
- Response must be supported by points seen
on the graph
1
1
1
- 1 2 3
TOTAL 3 4 3 10
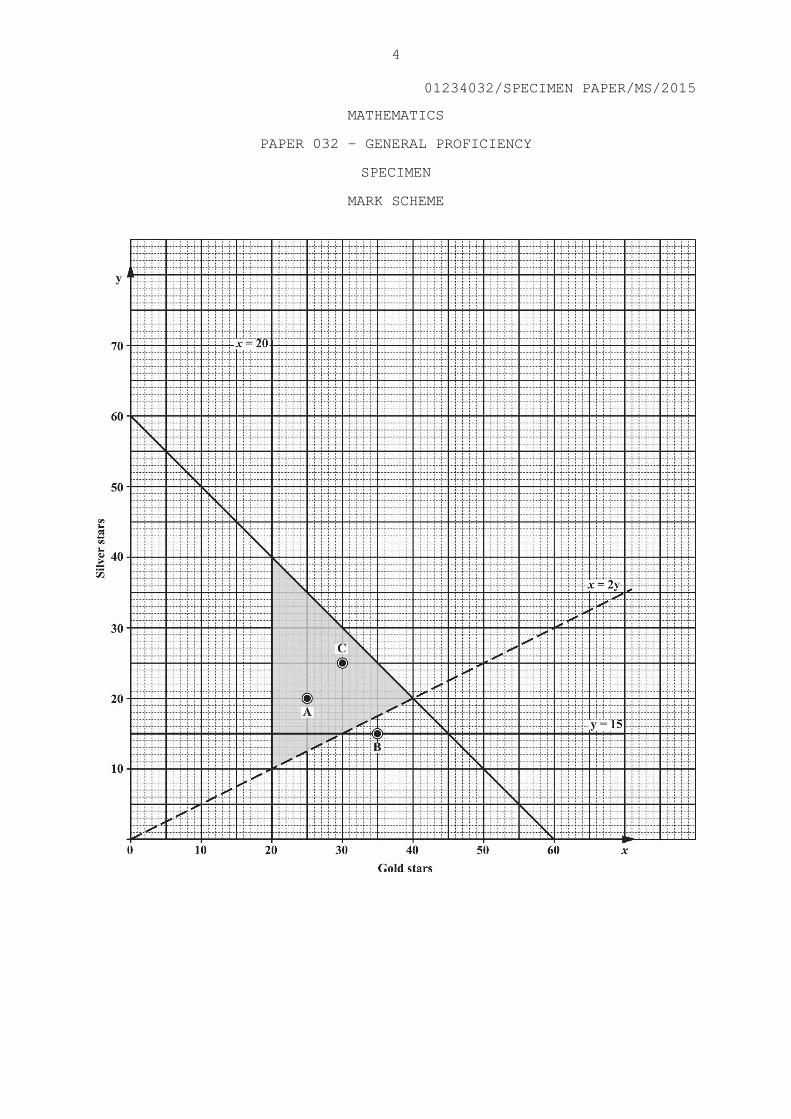
4
01234032/SPECIMEN PAPER/MS/2015
MATHEMATICS
PAPER 032 – GENERAL PROFICIENCY
SPECIMEN
MARK SCHEME
CARIBBEAN EXAMINATIONS COUNCIL
REPORT ON CANDIDATES’ WORK IN THECARIBBEAN SECONDARY EDUCATION CERTIFICATE
JANUARY 2004
MATHEMATICS
Copyright © 2004 Caribbean Examinations CouncilSt Michael, Barbados
All rights reserved
- 2-
MATHEMATICS
CARIBBEAN SECONDARY EXAMINATIONS CERTIFICATE
JANUARY 2004
GENERAL COMMENTS
The General Proficiency Examination is offered in January and June each year. TheBasic Proficiency is offered in June only.
There was a candidate entry of approximately 11,672 in January 2004. There is anoverall improvement in this year’s examination over 2003. The mean mark was 48.21.Fifty-seven per cent of the candidates achieved Grades I -III.
Candidates performed satisfactorily on Number Theory, Algebra and Sets. How-ever, they performed poorly on Measurement, Geometry and Graphs.
DETAILED COMMENTS
The examination consists of two papers.
PAPER 01 - Multiple Choice
Paper 1 consists of 60 multiple choice items. Seven candidates scored full marks,and approximately 85 per cent of the candidates scored more than half the marks.
PAPER 02 - Essay
Paper 2 consists of eight compulsory questions in Section I and six optional ques-tions in Section II, from which candidates are required to answer two. One candidatescored full marks and approximately 26 per cent scored more than half the marks.
Question 1
The question tested the candidates’ ability to:
• perform the basic operations with rational numbers• solve problems involving payments by instalments as in the case of
hire purchase
- 3 -
The question was attempted by all of the candidates and the performance was gener-ally good, with almost 28 per cent of the candidates scoring the full 10 marks. Themean mark was 7.6. Most candidates were able to calculate the cash price of thedining room suite and its total hire purchase price. However, candidates experienceddifficulty calculating the extra cost of buying on hire purchase as a percentage of thecash price. It appears that many of them did not recognise that $880 was given as thecash price of the suite. Several candidates in attempting to divide by a fraction didnot invert the second fraction.
In addition, a number of candidates wrote 1 with no further attempt at sim-plifying.
Solutions:(a) 14
15
(b) $105
(c) (i) $1 056 (ii) 20%
Question 2
The question tested the candidates’ ability to:
• substitute numbers for algebraic symbols in simple algebraic expressions
• change the subject of formulae• solve simultaneous linear equations in two unknowns algebraically• apply the distributive law to remove brackets in algebraic expressions
The question was attempted by 99.9 per cent of the candidates, about 12 per cent ofthese scored the full 12 marks. The mean mark was 6.81. Most candidates knewhow to substitute numbers into algebraic expressions and how to solve a pair ofsimultaneous equations in two unknowns. They however experienced difficulties inchanging the subject of the formula, multiplying by zero, and in computing (-3)3.Some common occurrences were:
2(-3)3 = (2 x –3) x (2 x –3) x (2 x –3) OR 2(-3)3 = 2 x 27
C = 5 (F – 32) = C = 5 F – 32 OR C + 32 = 5 F 9 9 9
3 - 10 15
- 4 -Solutions:
(a) (i) 20 (ii) -54
(b) (i) F = 9 C + 32 (ii) 59oC5
(c) x = 3; y = 4
Question 3
The question tested the candidates’ ability to:
• construct Venn diagrams to show subsets, intersection and union oftwo sets
• list the members of a set from a given description• solve geometric problems using the properties of similar figures
Approximately 99 per cent of candidates attempted this question. The mean markwas 5.19 out of a maximum of 10 marks. Two percent of the candidates scored fullmarks. Most candidates were able to complete correctly labelled Venn diagrams toillustrate the information. Some candidates experienced difficulty in determining thecomplement of the union of the sets P and Q. Many candidates did not attempt Part(b) of the question. Most of those who attempted Part (b) could not calculate thescale factor and most of those who did could not use it in calculating the area of theenlarged figure.
Solutions:
(a) (ii) a) = {2, 5} b) = {4, 6, 7}
(b) (i) 5 (ii) 50 cm2
3
Question 4
The question tested the candidates’ ability to:
• convert units of time within the SI system• solve simple problems involving time, distance and speed• calculate the area of sectors of circles• calculate the volume of a right prism
- 5 -
The question was attempted by 98 per cent of the candidates of whom nearly two percent scored the maximum of 11 marks. The mean mark was 3.71. The candidatesdemonstrated competence in calculating speed, area and volume. The areas of weakperformance included extracting the correct information from the given table, ma-nipulating hours and minutes using consistent units.
Solutions:
(a) (i) 1 hour 36 minutes (ii) 50 km/h
(b) (i) 353 cm2 (ii) 42 400 cm3
Question 5
The question tested the candidates’ ability to:
• interpret and make use of functional notation and their combinations• draw, read and interpret graphs of functions• draw and use graphs of a given quadratic function to determine the
roots of the given function
This question was attempted by approximately 98 per cent of the candidates ofwhom 5 per cent earned the maximum of 13 marks. The mean mark was 7.79. Theareas of good performance included the use of correct scales and plotting points onthe graph. The areas of weak performance included the inability of several candi-dates to determine the composite function, drawing a smooth curve to represent thequadratic function and plotting points to draw the line y = x. Many candidates didnot recognise that the solutions to the quadratic equation were at the points of inter-section of the two graphs.
Solutions:
(a) (i) 5 (ii) 7
(b) (i) 10, -2(iv) x = 0 and x = 4
Question 6
The question tested the candidates’ ability to:
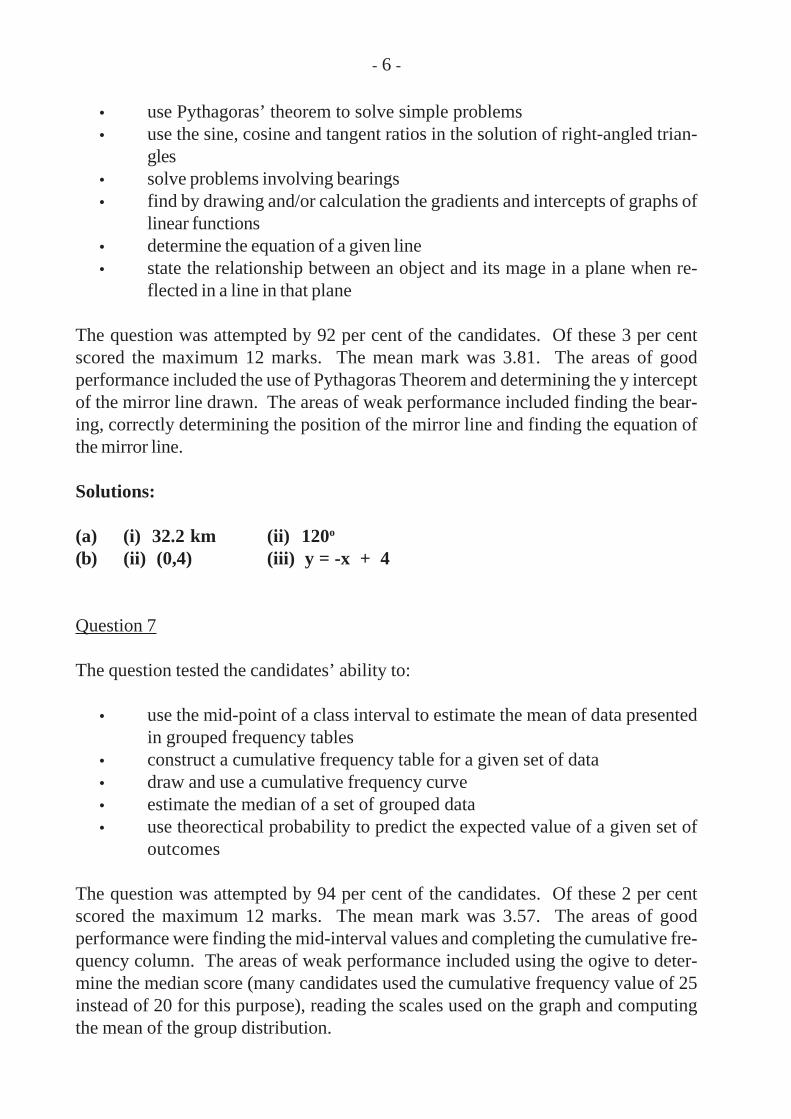
- 6 -
• use Pythagoras’ theorem to solve simple problems• use the sine, cosine and tangent ratios in the solution of right-angled trian-
gles• solve problems involving bearings• find by drawing and/or calculation the gradients and intercepts of graphs of
linear functions• determine the equation of a given line• state the relationship between an object and its mage in a plane when re-
flected in a line in that plane
The question was attempted by 92 per cent of the candidates. Of these 3 per centscored the maximum 12 marks. The mean mark was 3.81. The areas of goodperformance included the use of Pythagoras Theorem and determining the y interceptof the mirror line drawn. The areas of weak performance included finding the bear-ing, correctly determining the position of the mirror line and finding the equation ofthe mirror line.
Solutions:
(a) (i) 32.2 km (ii) 120o
(b) (ii) (0,4) (iii) y = -x + 4
Question 7
The question tested the candidates’ ability to:
• use the mid-point of a class interval to estimate the mean of data presentedin grouped frequency tables
• construct a cumulative frequency table for a given set of data• draw and use a cumulative frequency curve• estimate the median of a set of grouped data• use theorectical probability to predict the expected value of a given set of
outcomes
The question was attempted by 94 per cent of the candidates. Of these 2 per centscored the maximum 12 marks. The mean mark was 3.57. The areas of goodperformance were finding the mid-interval values and completing the cumulative fre-quency column. The areas of weak performance included using the ogive to deter-mine the median score (many candidates used the cumulative frequency value of 25instead of 20 for this purpose), reading the scales used on the graph and computingthe mean of the group distribution.
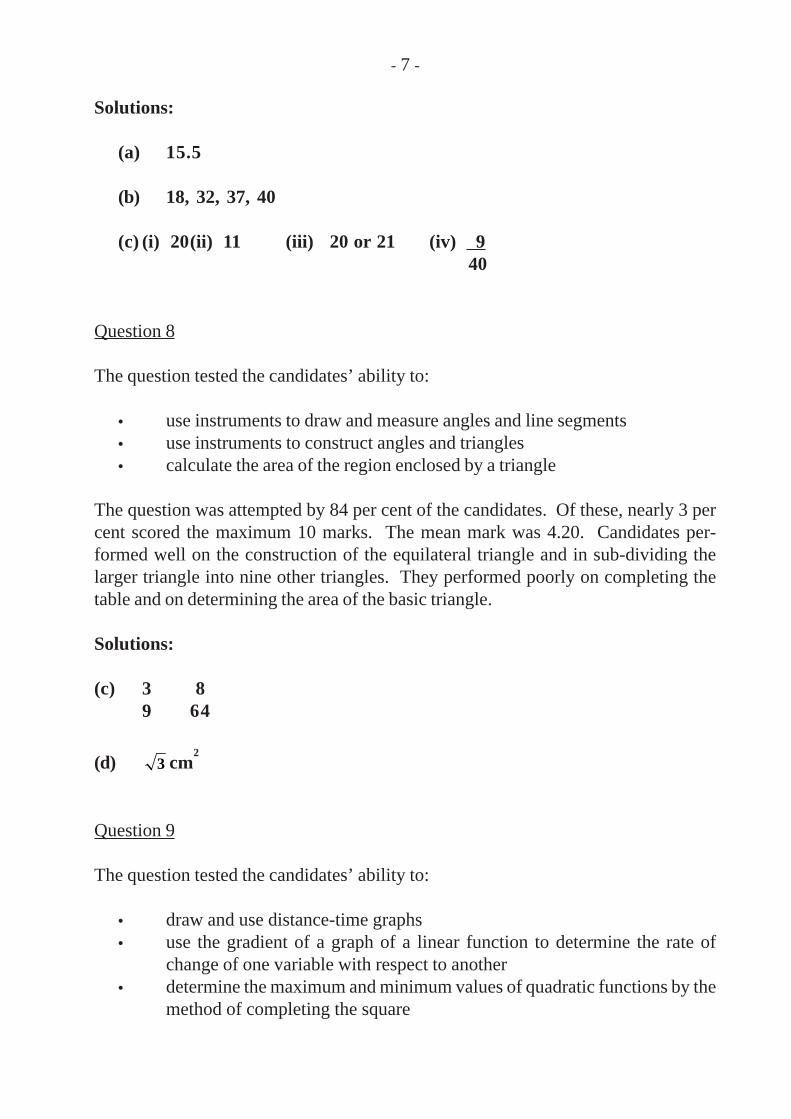
- 7 -
Solutions:
(a) 15.5
(b) 18, 32, 37, 40
(c) (i) 20(ii) 11 (iii) 20 or 21 (iv) 940
Question 8
The question tested the candidates’ ability to:
• use instruments to draw and measure angles and line segments• use instruments to construct angles and triangles• calculate the area of the region enclosed by a triangle
The question was attempted by 84 per cent of the candidates. Of these, nearly 3 percent scored the maximum 10 marks. The mean mark was 4.20. Candidates per-formed well on the construction of the equilateral triangle and in sub-dividing thelarger triangle into nine other triangles. They performed poorly on completing thetable and on determining the area of the basic triangle.
Solutions:
(c) 3 89 64
(d) 3 cm2
Question 9
The question tested the candidates’ ability to:
• draw and use distance-time graphs• use the gradient of a graph of a linear function to determine the rate of
change of one variable with respect to another• determine the maximum and minimum values of quadratic functions by the
method of completing the square
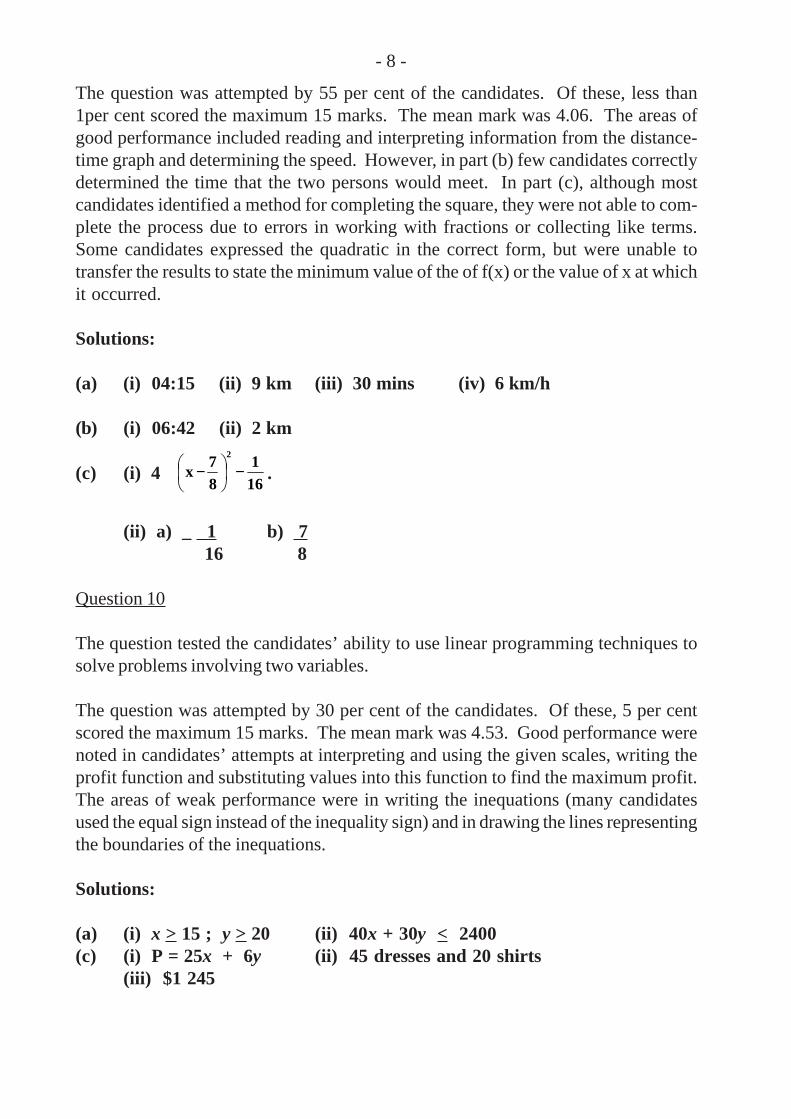
- 8 -
The question was attempted by 55 per cent of the candidates. Of these, less than1per cent scored the maximum 15 marks. The mean mark was 4.06. The areas ofgood performance included reading and interpreting information from the distance-time graph and determining the speed. However, in part (b) few candidates correctlydetermined the time that the two persons would meet. In part (c), although mostcandidates identified a method for completing the square, they were not able to com-plete the process due to errors in working with fractions or collecting like terms.Some candidates expressed the quadratic in the correct form, but were unable totransfer the results to state the minimum value of the of f(x) or the value of x at whichit occurred.
Solutions:
(a) (i) 04:15 (ii) 9 km (iii) 30 mins (iv) 6 km/h
(b) (i) 06:42 (ii) 2 km
(c) (i) 4 161
87
x2
−
− .
(ii) a) _ 1 b) 716 8
Question 10
The question tested the candidates’ ability to use linear programming techniques tosolve problems involving two variables.
The question was attempted by 30 per cent of the candidates. Of these, 5 per centscored the maximum 15 marks. The mean mark was 4.53. Good performance werenoted in candidates’ attempts at interpreting and using the given scales, writing theprofit function and substituting values into this function to find the maximum profit.The areas of weak performance were in writing the inequations (many candidatesused the equal sign instead of the inequality sign) and in drawing the lines representingthe boundaries of the inequations.
Solutions:
(a) (i) x > 15 ; y > 20 (ii) 40x + 30y < 2400(c) (i) P = 25x + 6y (ii) 45 dresses and 20 shirts
(iii) $1 245
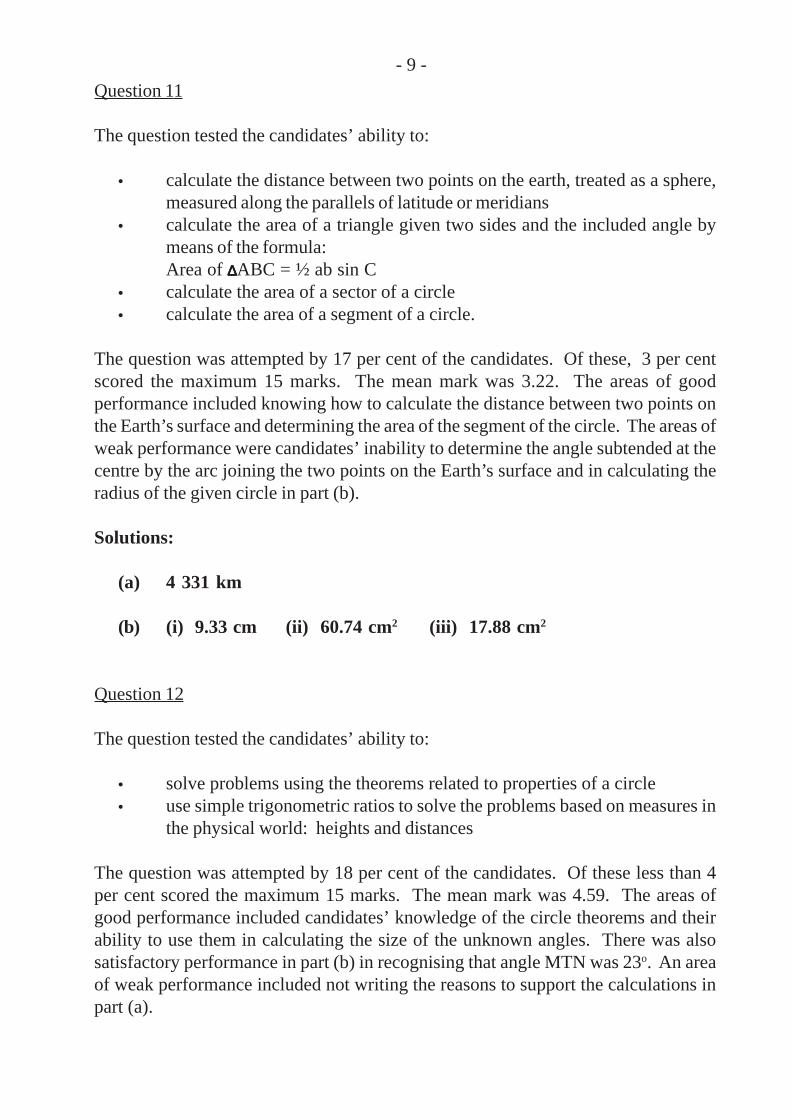
Question 11
The question tested the candidates’ ability to:
• calculate the distance between two points on the earth, treated as a sphere,measured along the parallels of latitude or meridians
• calculate the area of a triangle given two sides and the included angle bymeans of the formula:Area of ∆∆∆∆∆ABC = ½ ab sin C
• calculate the area of a sector of a circle• calculate the area of a segment of a circle.
The question was attempted by 17 per cent of the candidates. Of these, 3 per centscored the maximum 15 marks. The mean mark was 3.22. The areas of goodperformance included knowing how to calculate the distance between two points onthe Earth’s surface and determining the area of the segment of the circle. The areas ofweak performance were candidates’ inability to determine the angle subtended at thecentre by the arc joining the two points on the Earth’s surface and in calculating theradius of the given circle in part (b).
Solutions:
(a) 4 331 km
(b) (i) 9.33 cm (ii) 60.74 cm2 (iii) 17.88 cm2
Question 12
The question tested the candidates’ ability to:
• solve problems using the theorems related to properties of a circle• use simple trigonometric ratios to solve the problems based on measures in
the physical world: heights and distances
The question was attempted by 18 per cent of the candidates. Of these less than 4per cent scored the maximum 15 marks. The mean mark was 4.59. The areas ofgood performance included candidates’ knowledge of the circle theorems and theirability to use them in calculating the size of the unknown angles. There was alsosatisfactory performance in part (b) in recognising that angle MTN was 23o. An areaof weak performance included not writing the reasons to support the calculations inpart (a).
- 9 -
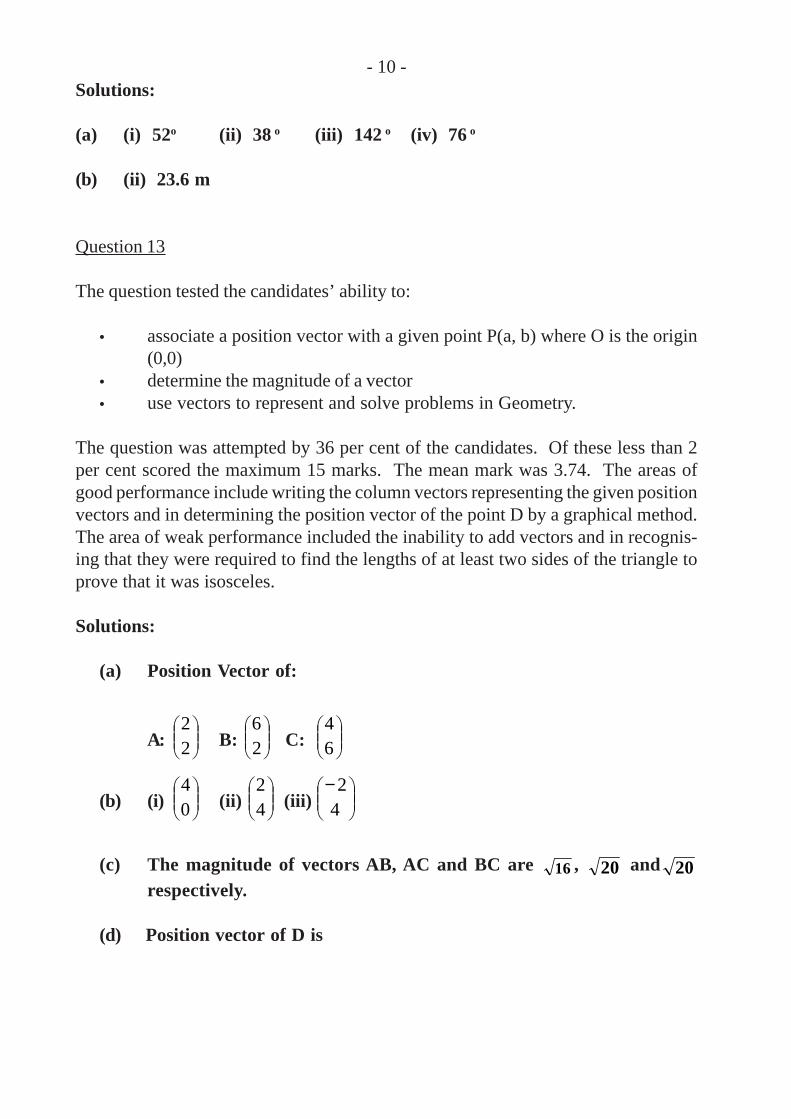
Solutions:
(a) (i) 52o (ii) 38 o (iii) 142 o (iv) 76 o
(b) (ii) 23.6 m
Question 13
The question tested the candidates’ ability to:
• associate a position vector with a given point P(a, b) where O is the origin(0,0)
• determine the magnitude of a vector• use vectors to represent and solve problems in Geometry.
The question was attempted by 36 per cent of the candidates. Of these less than 2per cent scored the maximum 15 marks. The mean mark was 3.74. The areas ofgood performance include writing the column vectors representing the given positionvectors and in determining the position vector of the point D by a graphical method.The area of weak performance included the inability to add vectors and in recognis-ing that they were required to find the lengths of at least two sides of the triangle toprove that it was isosceles.
Solutions:
(a) Position Vector of:
A:
22
B:
26
C:
64
(b) (i)
04
(ii)
42
(iii)
−42
(c) The magnitude of vectors AB, AC and BC are 16 , 20 and 20respectively.
(d) Position vector of D is
- 10 -
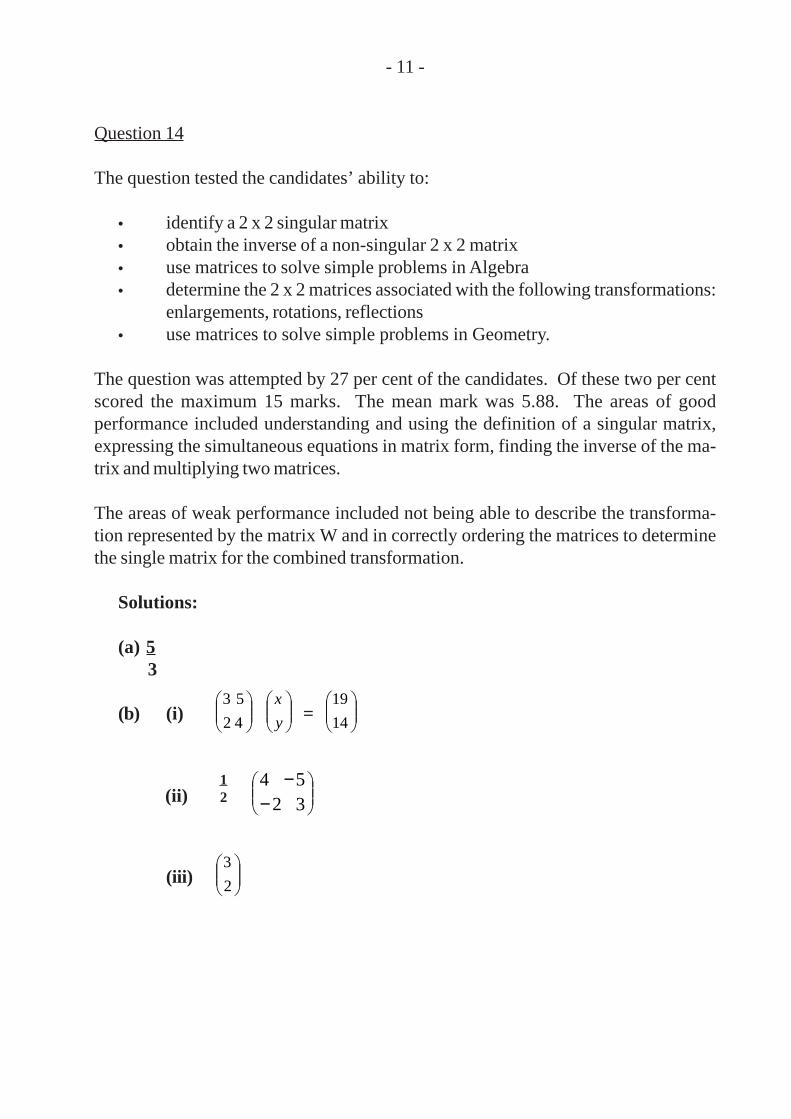
Question 14
The question tested the candidates’ ability to:
• identify a 2 x 2 singular matrix• obtain the inverse of a non-singular 2 x 2 matrix• use matrices to solve simple problems in Algebra• determine the 2 x 2 matrices associated with the following transformations:
enlargements, rotations, reflections• use matrices to solve simple problems in Geometry.
The question was attempted by 27 per cent of the candidates. Of these two per centscored the maximum 15 marks. The mean mark was 5.88. The areas of goodperformance included understanding and using the definition of a singular matrix,expressing the simultaneous equations in matrix form, finding the inverse of the ma-trix and multiplying two matrices.
The areas of weak performance included not being able to describe the transforma-tion represented by the matrix W and in correctly ordering the matrices to determinethe single matrix for the combined transformation.
Solutions:
(a) 5 3
(b) (i)
42
53
y
x =
14
19
(ii)
−
−3254
(iii)
2
3
- 11 -
12
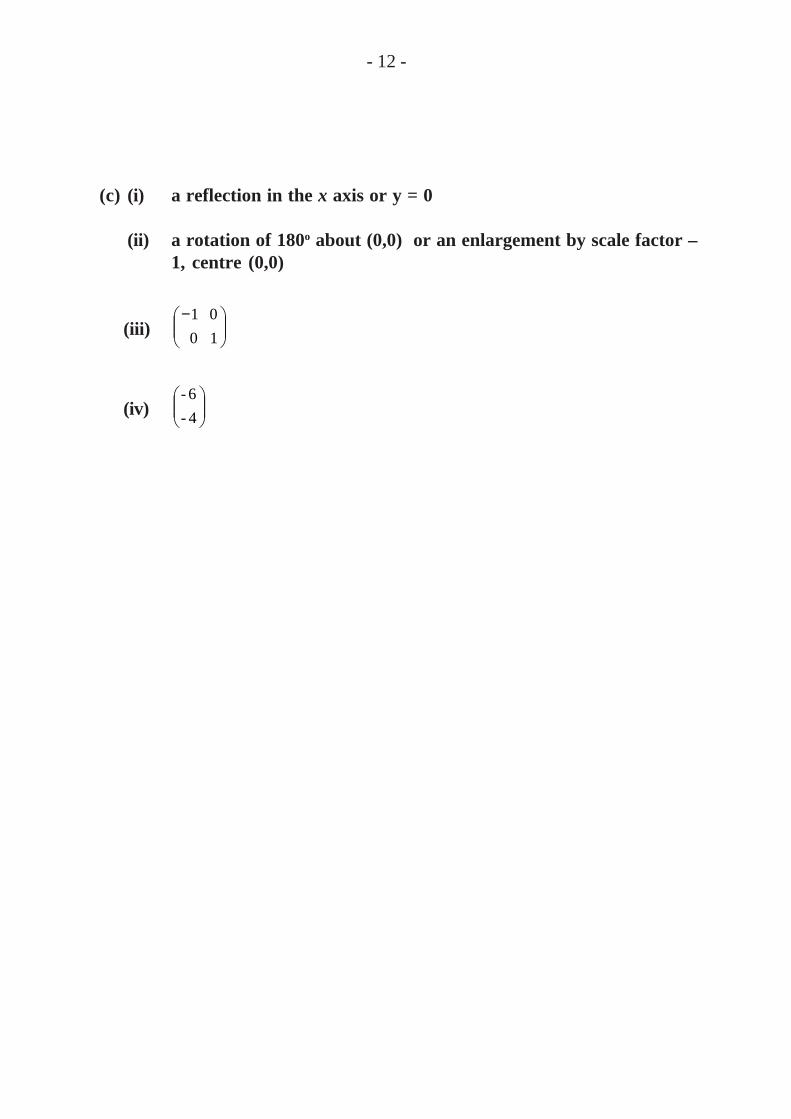
(c) (i) a reflection in the x axis or y = 0
(ii) a rotation of 180o about (0,0) or an enlargement by scale factor –1, centre (0,0)
(iii)
−10
01
(iv)
4-
6-
- 12 -
C A R I B B E A N E X A M I N A T I O N S C O U N C I L
REPORT ON CANDIDATES’ WORK IN THESECONDARY EDUCATION CERTIFICATE EXAMINATION
MAY/JUNE 2004
MATHEMATICS
Copyright © 2004 Caribbean Examinations CouncilSt. Michael, Barbados
All rights reserved
- 2 -
MATHEMATICS
MAY/JUNE 2004
GENERAL COMMENTS
The General Proficiency Mathematics examination is offered in January and June each year, while theBasic Proficiency examination is offered in June only.
In June 2004, approximately 84 786 candidates registered for the General Proficiency examination, anincrease of 1 340 over 2003. Candidate entry for the Basic Proficiency examination decreased from 11 208in 2003 to 7 861 in 2004.
At the General Proficiency level, approximately 35 per cent of the candidates achieved Grades I – III. Thisrepresents a 5 per cent decrease over 2003. Twenty per cent of the candidates at the Basic Proficiency levelachieved Grades I – III compared with 29 per cent in 2003.
DETAILED COMMENTS
General Proficiency
In general, candidates’ work revealed lack of knowledge of certain areas of the syllabus. Poor performancewas noted for algebra, graphs, geometry and trigonometry, vectors and matrices. Candidates continue toexperience difficulty with questions which require the application of mathematical concepts. The generalareas of strength were in computation and set theory.
Six candidates scored full marks on the overall examination compared with one candidate in 2003. Inaddition 115 candidates scored more than 95 per cent of the total marks.
Paper 01 – Multiple Choice
Paper 01 consisted of 60 multiple-choice items. This year, 145 candidates earned full marks compared with58 in 2003. Approximately 71 per cent of the candidates scored at least half the total marks for this paper.
Paper 02 – Essay
Paper 02 consisted of two sections. Section I comprised eight compulsory questions that totalling 90 marks.Section II comprised six optional questions; two each in Relations, Functions and Graphs; Trigonometryand Geometry, Vectors and Matrices. Candidates were required to choose any two questions. Each questionin this section was worth 15 marks.
This year 16 candidates earned full marks on Paper 02 compared with 9 in 2003. Approximately 16 percent of the candidates earned at least half the total marks on this paper.
Compulsory Section
Question 1
Part (a) of the question was designed to test candidates’ ability to perform the following operations
• addition of the squares of decimal numbers• division and subtraction of decimal numbers, and• subtraction and division of mixed fractions
- 3 -
Part (b) of the question tested the candidates’ ability to
• approximate a value to a given number of significant figures
• write a rational number in standard form.
Part (c) of the question tested the candidate’s ability to
• calculate simple interest and the amount due after a given period
• solve a problem involving compound interest.
This question was attempted by all candidates. The mean score was 6.44 out of 12.
Part (a) of the question was fairly well done, particularly the calculation of decimals and fractions. However,some candidates had problems working with mixed numbers.
Many candidates did not follow through to calculate the amount received by adding principal to interest inSection c (i). Many seemed not to have understood the term appreciation and used the depreciation formulain c (ii). Candidates were aware that they were required to invert when they were dividing the fraction ina(iii); however, they were unsure about which fraction was the divisor and which was the dividend.
In Section (b), many candidates had difficulty with approximation in standard form and significant figures.Answers such as 20.0 and 2 were given. In addition, a number of students made the mistake of writing– ∞ – as 3, instead of –.
Recommendation
The difference between depreciation and appreciation should be emphasised. Additionally, more practiceshould be given in approximation. Students must understand which fraction is the divisor and which is thedividend in the division of fractions.
Answer: (a) 22.1, 0.297, – (b) 20, 2.97 x 10⁻¹ (c) $45 600, $45 796
Question 2
This question tested candidates’ ability to
• simplify algebraic fractions• solve quadratic equations• factorize algebraic expression
The question was attempted by 98 per cent of the candidates. The mean score was 2.78 out of 10.
In Part (a) (i) many candidates did not recognise the difference of 2 squares. The factors given for x2 – 1were x(x – 1) and (x – 1)2.
More over, some candidates did not recognise that they had to factorise and attempted to cancel thevariables (x) and the numbers (–1) in the numerator and denominator.
13
1115
511
13
- 4 -
In 2a(ii) candidates had difficulty in factorising the numerator. Most candidates who attempted this question had difficultywith the fraction in which the numerator consisted of two terms. They cancelled “ad hoc” any term in the numerator withthat of the denominator.
e.g. ⇒ 4b + 2a2b
⇒ 4ab2 + 2a
In 2(b), candidates treated the expression as an equation and “cross multiplied” the numerator and denominator of the givenfractions. Candidates also tried to further simplify their results.
e.g. ⇒
⇒ 3p + q
In 2(c), candidates had difficulty in factorising the LHS of the equation. Some who used the formula
encountered problems in stating it properly. x = – b± was stated by many of the candidates who
chose this method of solution. Substitution of values for a, b and c into the equation was not well done. This may be attributedto a lack of exposure to the formula or the candidates’ inability to deal with ‘directed numbers’. Many students attemptedto find the square root of negative numbers. A few candidates attempted to use the completion of squares method; but mostof them were unsuccessful.
Areas of good performance:
– Some candidates were able to combine the skills of factorisation (choosing common factor and differenceof 2 squares) with those of reduction (cancelling the common factor) in numerator and denominator.
– Candidates were able to find the LCM of two terms (one of them non numeric) and use thisresult in combining two fractions.
– Candidates were able to solve quadratic equations using factorisation techniques and theformula method.
Recommendations to Teachers
Teachers need to expose students to a variety of problems, particularly problems that combine skills e.g.factorisation and reduction of terms, LCM of terms that are numeric and non-numeric. A distinction alsoneeds to be made between an expression and an equation.
Answer: (a) (i) x + 1 (b) (c) –, 2
(ii) 4b + 2a
4ab2 + 2a2 b ab
4ab2 + 2a2 b ab
3p2 + 2q 2p
5p2q 2p
3p2 + 2q 2p
√√√√√b2– 4ac 2a
3p2 + 2q 2p
13
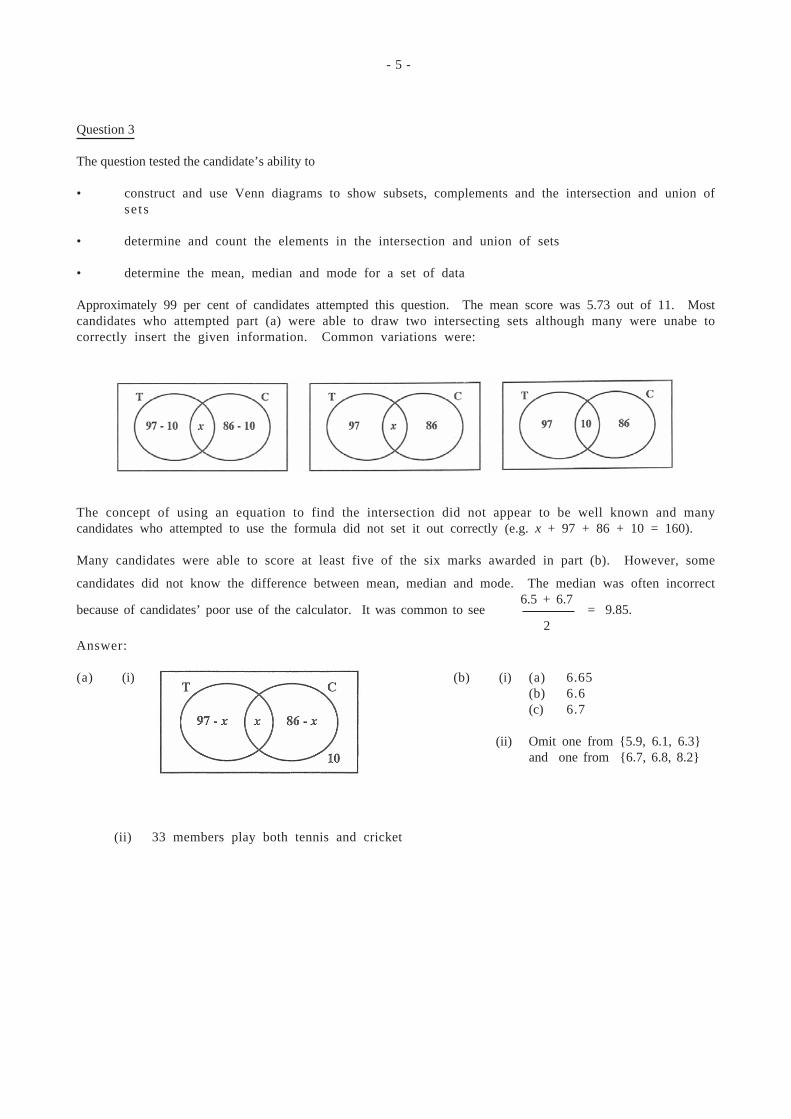
- 5 -
Question 3
The question tested the candidate’s ability to
• construct and use Venn diagrams to show subsets, complements and the intersection and union ofse ts
• determine and count the elements in the intersection and union of sets
• determine the mean, median and mode for a set of data
Approximately 99 per cent of candidates attempted this question. The mean score was 5.73 out of 11. Mostcandidates who attempted part (a) were able to draw two intersecting sets although many were unabe tocorrectly insert the given information. Common variations were:
The concept of using an equation to find the intersection did not appear to be well known and manycandidates who attempted to use the formula did not set it out correctly (e.g. x + 97 + 86 + 10 = 160).
Many candidates were able to score at least five of the six marks awarded in part (b). However, some
candidates did not know the difference between mean, median and mode. The median was often incorrect
because of candidates’ poor use of the calculator. It was common to see = 9.85.
Answer:
(a) (i) (b) (i) (a) 6.65(b) 6.6(c) 6.7
(ii) Omit one from {5.9, 6.1, 6.3}and one from {6.7, 6.8, 8.2}
(ii) 33 members play both tennis and cricket
6.5 + 6.7
2
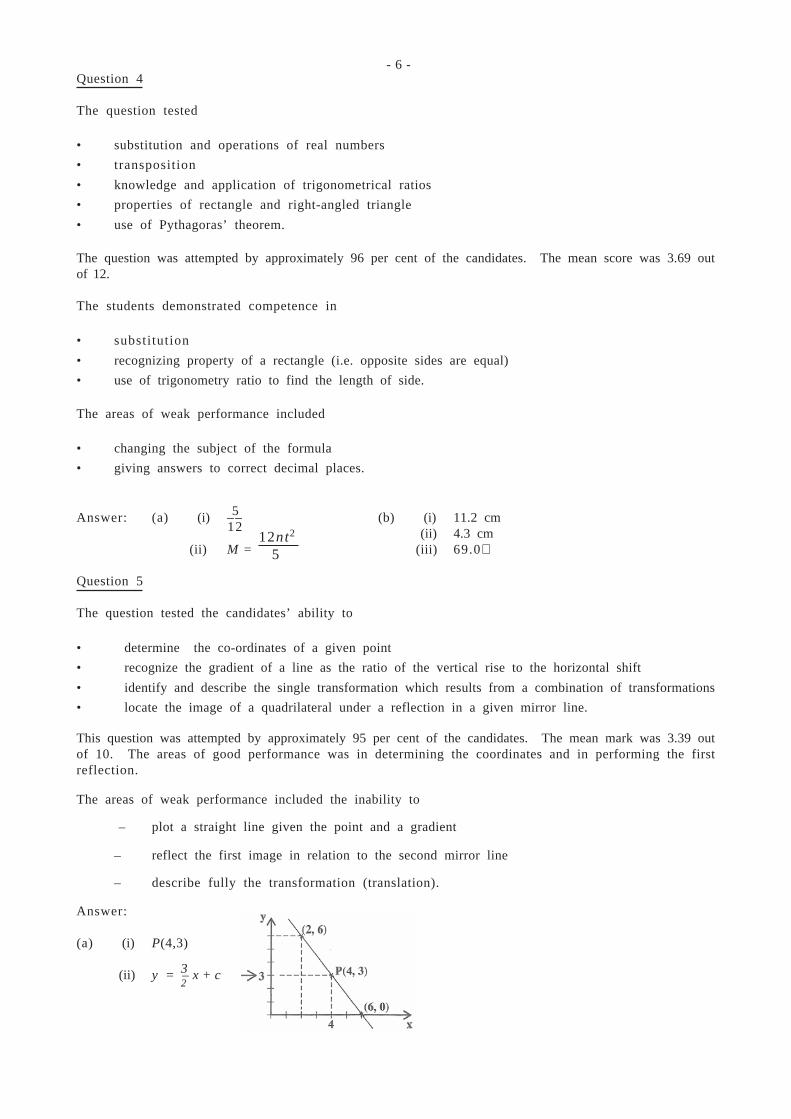
- 6 -Question 4
The question tested
• substitution and operations of real numbers• transposition• knowledge and application of trigonometrical ratios• properties of rectangle and right-angled triangle• use of Pythagoras’ theorem.
The question was attempted by approximately 96 per cent of the candidates. The mean score was 3.69 outof 12.
The students demonstrated competence in
• substitution• recognizing property of a rectangle (i.e. opposite sides are equal)• use of trigonometry ratio to find the length of side.
The areas of weak performance included
• changing the subject of the formula• giving answers to correct decimal places.
Answer: (a) (i) –– (b) (i) 11.2 cm (ii) 4.3 cm
(ii) M = (iii) 69.0⋅
Question 5
The question tested the candidates’ ability to
• determine the co-ordinates of a given point• recognize the gradient of a line as the ratio of the vertical rise to the horizontal shift• identify and describe the single transformation which results from a combination of transformations• locate the image of a quadrilateral under a reflection in a given mirror line.
This question was attempted by approximately 95 per cent of the candidates. The mean mark was 3.39 outof 10. The areas of good performance was in determining the coordinates and in performing the firstreflection.
The areas of weak performance included the inability to
– plot a straight line given the point and a gradient
– reflect the first image in relation to the second mirror line
– describe fully the transformation (translation).
Answer:
(a) (i) P(4,3)
(ii) y = – x + c
12nt2
5
512
32
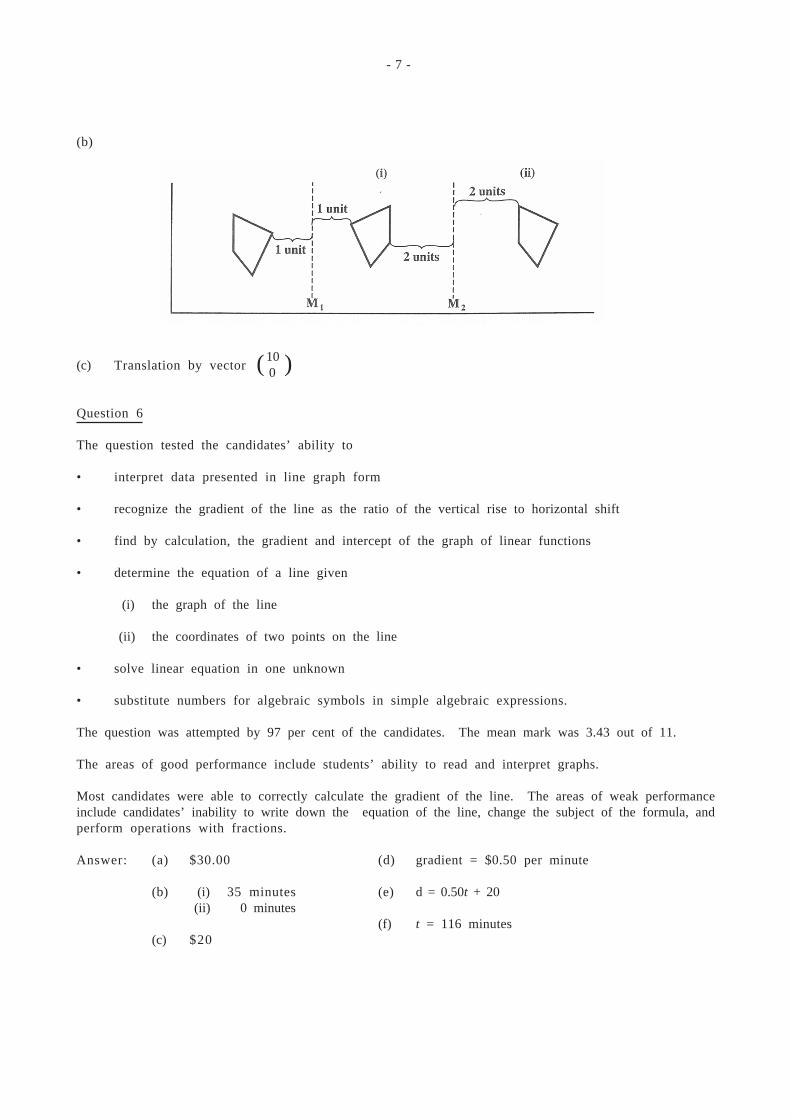
- 7 -
(b)
(c) Translation by vector
Question 6
The question tested the candidates’ ability to
• interpret data presented in line graph form
• recognize the gradient of the line as the ratio of the vertical rise to horizontal shift
• find by calculation, the gradient and intercept of the graph of linear functions
• determine the equation of a line given
(i) the graph of the line
(ii) the coordinates of two points on the line
• solve linear equation in one unknown
• substitute numbers for algebraic symbols in simple algebraic expressions.
The question was attempted by 97 per cent of the candidates. The mean mark was 3.43 out of 11.
The areas of good performance include students’ ability to read and interpret graphs.
Most candidates were able to correctly calculate the gradient of the line. The areas of weak performanceinclude candidates’ inability to write down the equation of the line, change the subject of the formula, andperform operations with fractions.
Answer: (a) $30.00 (d) gradient = $0.50 per minute
(b) (i) 35 minutes (e) d = 0.50t + 20 (ii) 0 minutes
(f) t = 116 minutes(c) $20
10 0 ( )
- 8 -
Question 7
The question tested candidates’ ability to
• find the radius of a circle given the area of the circle
• calculate the circumference of a circle
• calculate the area of a square using the circumference of the circle as the perimeter of the square
• use scales to find the actual distance between two points, on a grid
• perform conversions using a given scale
• measure or calculate the bearing of given positions.
The question was attempted by approximately 87 per cent of the candidates. The mean mark was 2.81out of 12.
The areas of good performance were
– finding the circumference of the circle
– finding the distance between the two points, Rose Hall and South Port.
The areas of weak performances were
– transposing 154 = πr2 to find the radius of the circle
– recognising the circumference of the circle was equal to the perimeter of the square
– inaccuate use of the given scales
(iv) calculating the bearings required or measuring using the protractor to find the bearing.
Answer: (a) (i) a ) 7 cm (b) (i) 5 kmb) 44 cm (ii) 166°
(ii) 121 cm2
Question 8
The question tested candidates’ ability to apply the concept of profit and loss to solve problems involvingbusiness transactions.
Approximately 89 per cent of the candidates attempted this question. The mean score was 4.52 out of 12.
In part (a) many candidates correctly calculated the percentage of chocolate in recipe A.
Part (b) was poorly done by most candidates. In part (c), the majority of candidates converted the requiredratio to a proper fraction and calculated the percentage. Some candidates, however, were unable to findthe correct ratio for the new mixture in part (c).
In part (d), most candidates found the cost of six bottles for $4.40 but were unable to find the cost of 150bottles.
Answer: (a) 40% (c) 37– %
(b) A has 40% (d) (i) $110B has 33–% (ii) $0.88A richer
12
13
- 9 -
OPTIONAL SECTION
Question 9
The question tested the candidates’ ability to
• interpret and use the concept of variation
• find the area of a rectangle
• expand and simplify an algebraic expression
• use factors to solve a quadratic equation
• find the value of an algebraic expression by substituting numerical values.
The question was attempted by about 26 per cent of the candidates. The mean mark was 2.57 out of 15.
The areas of good performance included finding the area of a rectangle, and the factors of a quadraticexpression. In part (a), many candidates had difficulty with the variation; they omitted the constant. Inpart (ii) candidates produced the answer for part (iii) and could not show that 2x2+ 7x – 15 = 0, given thatthe area was 60.
In part (iii), though the candidates got the factors for the expression, they did not solve the equation. Somecandidates tried to use the formula or the method of completing the square but did so incorrectly in manyinstances. In some cases, the values of x were found, but candidates were unable to transfer the results toobtain the values for AK and AM.
Answers:
(a) M = 0.004 n = 5 (b) (i) Area = (3x + 3) (5 + 2x)
(ii) 6x2 + 6x + 15x + 15 = 606x2 + 21x – 45 = 02x2 + 7x – 15 = 0
(iii) x = 1.5 or – 5AK = 7.5 cm AM = 8 cm
Question 10
The question tested candidates ability to:
• Translate algebraic statements into inequalities
• Draw the graphs of their functions
• Identify the region defined by their stated inequalities
• Determine conditions for the maximum profit
Approximately 24 per cent of candidates attempted this question. The mean score was 3.42 out of 15. Mostcandidates were able to translate the algebraic statements into the inequalities x ≥ 10 and y ≥ 5. They knew the relationshipbetween 4x, 8y and 200 but were unable to show the relationship as an inequality.
Most candidates were able to use the correct scale for the graph and more than 90 per cent of those whoattempted the question were able to draw the lines x = 10 and y = 5 and x + y = 60. However, about 50per cent of them encountered difficulty with plotting the line 4x + 5y = 200.
Although most candidates were proficient in identifying the required region and writing the statements forthe profit expressions, many did not show the test to select the maximum profit.
- 10 -
Answer:
(a) (i) x ≥ 10 (ii) x + y ≤ 60y ≥ 5 4x + 8y ≥ 200
Profit statement
(c) (i) For Max. profit he must sell 10 kg of peanuts and50 kg of cashew nuts
(ii) 2x + 5yMax profit $270
Question 11
This question consisted of two parts.
Part (a) required the candidates to calculate the unknown angles in a given diagram using the angleproperties of circles.
Part (b) required candidates to solve a problem on bearing by drawing and calculation.
About 24 per cent of candidates attempted this question. The mean score was 3.33 out of 15.
It was obvious that students need to discover the properties of circles by practice in their classrooms as moststudents failed to score marks for this part of the question.
The majority of the candidates who attempted the question were able to score marks for drawing thediagram using the given information in part (b). However, quite a number of candidates displayed a lackof knowledge of direction; hence they were unable to correctly identify the bearing.
A large number of candidates were aware that they needed to use the Cosine rule to find the distance GH.A few attempted to use Pythagoras’ Theorem to calculate the same distance, but were unsuccessful.
Answer:
(a) (i) a) VZW = 51° ... (angles in the alternate segment are equal)
b) XYZ = 78° ... (exterior angle of a cyclic quadrilateral= interior opposite angle)
(b) GH = 104.4 kmBearing of H from G = 62°
Question 12
This question tested the candidates’ ability to
• express a trigonomic ratio in fractional or ‘surd form’
• use a trigonomic ratio to express the area of a triangle in surd form
• use a trigonomic ratio to find the length of a side of a triangle
• recognise positions on the globe
• calculate distance between two points on the globe.
^
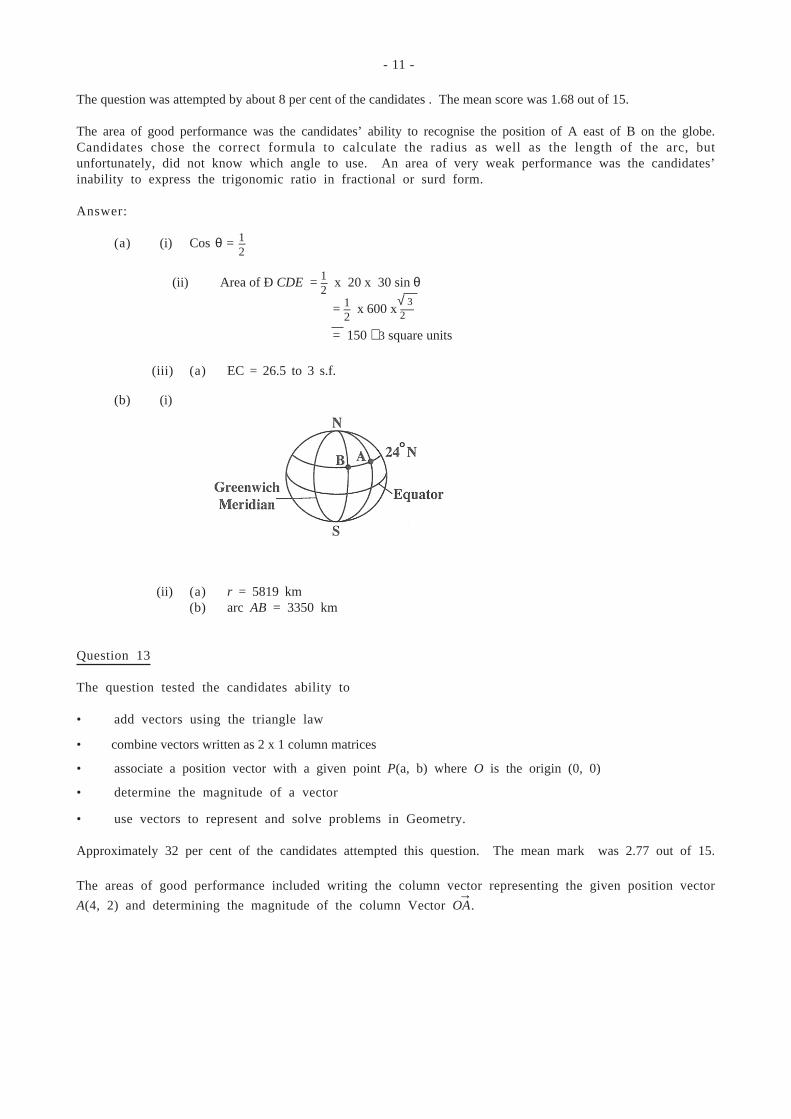
- 11 -
The question was attempted by about 8 per cent of the candidates . The mean score was 1.68 out of 15.
The area of good performance was the candidates’ ability to recognise the position of A east of B on the globe.Candidates chose the correct formula to calculate the radius as well as the length of the arc, butunfortunately, did not know which angle to use. An area of very weak performance was the candidates’inability to express the trigonomic ratio in fractional or surd form.
Answer:
(a) (i) Cos θ = –
(ii) Area of Ð CDE = – x 20 x 30 sin θ
= – x 600 x ––
= 150 3 square units
(iii) (a) EC = 26.5 to 3 s.f.
(b) (i)
(ii) (a) r = 5819 km(b) arc AB = 3350 km
Question 13
The question tested the candidates ability to
• add vectors using the triangle law
• combine vectors written as 2 x 1 column matrices
• associate a position vector with a given point P(a, b) where O is the origin (0, 0)
• determine the magnitude of a vector
• use vectors to represent and solve problems in Geometry.
Approximately 32 per cent of the candidates attempted this question. The mean mark was 2.77 out of 15.
The areas of good performance included writing the column vector representing the given position vectorA(4, 2) and determining the magnitude of the column Vector OA.
12
12
12
√ 3 2
→
- 12 -
The area of weak performance was the candidates’ inability to use a vector approach to find the positionvector of N. Coordinate geometry was frequently used. Others failed to identify the vector ON as OA +– AC but instead wrote ON = – AC.
Answer: (a) (i) O A = (c) (i) OA is parallel to CB
and OA = CB (ii) CB =
(ii) OABC is a parallelogram because one pairof opposite sides is equal and parallel.
(b) OA = √20 = 4.47
(d) (i) OM =
(ii) ON =
M and N coincide OR the diagonals of the parallelogram bisect each other
O RThe diagonals have the same midpoint.
Question 14
The question tested candidates’ ability to
• reflect a given object in the y–axis
• draw the line y = x
• reflect an object in the line y = x
• describe the result of 2 transformations as a single transformation
• reflect an object in the x-axis
• write the matrix of a transformation and
• write a matrix as the result of 2 transformations.
The question was attempted by 52 per cent of the candidates. The mean mark was 2.98 out of 15.
The majority of the candidates who scored marks were able to score for the reflection in the y-axis and thereflection in the x-axis. Many were able to write down the matrices for reflection in the y-axis and reflectionin the line y = x. The responses to section b (i) and (ii) were written in response to section a (i) and (ii)although it was not required in that section. Only a few candidates were able to obtain a single matrix whichrepresented the result of two transformations. The others did not write down the correct order for themultiplication.
Candidates’ poor responses did not suggest misconceptions. They indicated a lack of knowledge of theconcepts.
Answer: (a) (iii) Rotation about (0, 0) 90° clockwise (b) (ii)
(v) –1 0 0 –1
121
242
()42
()
35
35
()()
( )( ) 0 1
–1 0
→→→ → →
→
→
→ →
→ →
→
- 13 -
DETAILED COMMENTS
Basic Proficiency
The Basic examination is designed to provide the average citizen with a working knowledge of the subjectarea. The range of topics tested at the Basic level is narrower than that tested at the General Proficiencylevel.
Candidates continue to demonstrate lack of knowledge of the fundamental concepts being tested at thislevel. The extent of their weakness is evident in their lack of ability to cope with questions requiring higherorder skills.
Approximately 20 per cent of the candidates achieved Grades I - III. This reflected a 9 per cent decline inperformance compared with 2003 where 29 per cent of the candidates achieved Grades I - III.
Paper 01 – Multiple Choice
Paper 01 consisted of 60 multiple-choice items. No candidate earned full marks on this paper. The highestmark was 57 out of 60, this was earned by one candidate. Approximately 35 per cent of the candidates scoredat least half the total marks for this paper.
Paper 02 – Essay
Paper 02 consisted of 10 compulsory questions. Each question was worth 10 marks. The highest scoreearned was 98 out of 100. This was earned by one candidate. Seven candidates earned at least half the totalmarks on this paper.
Question 1
The question tested the candidates’ ability to:
• Perform basic operations with rational numbers
• Approximate a value to a given number of significant figures and express any decimal to a givennumber of decimal places
• Divide a given quantity in a given ratio
The question was attempted by 98.5 per cent of the candidates, with 1.5 per cent scoring the full marks.The mean mark was 3.35.
Most candidates were able to complete the computation and round off as specified, although somecandidates interpreted “exactly” to mean the the nearest whole number and “one significant figure” to bein standard form. In 1(b) although some candidates were able to determine the amount of one share, theydid not use this information to calculate the required shares. Part 1 (c) was not well done since thecandidates could not link the 30% to the 150 fish. Instead, many of them calculated 70% of 150. In part(d), candidates attempted to complete the division first before removing the brackets. Then, to perform thedivision, the candidates inverted the wrong fraction.
Answer: (a) (i) 4.93 (c) 500 fish (ii) 4.9(iii) 5 (d) 1–
(b) $120: $80
12
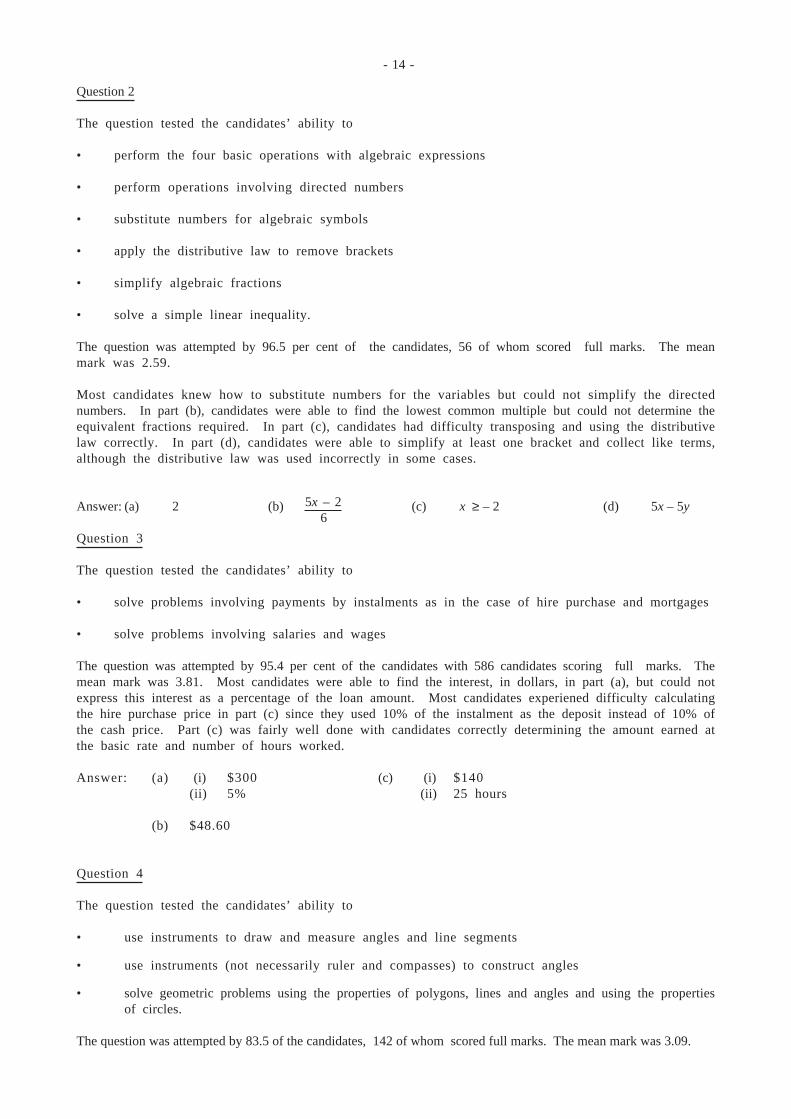
- 14 -
Question 2
The question tested the candidates’ ability to
• perform the four basic operations with algebraic expressions
• perform operations involving directed numbers
• substitute numbers for algebraic symbols
• apply the distributive law to remove brackets
• simplify algebraic fractions
• solve a simple linear inequality.
The question was attempted by 96.5 per cent of the candidates, 56 of whom scored full marks. The meanmark was 2.59.
Most candidates knew how to substitute numbers for the variables but could not simplify the directednumbers. In part (b), candidates were able to find the lowest common multiple but could not determine theequivalent fractions required. In part (c), candidates had difficulty transposing and using the distributivelaw correctly. In part (d), candidates were able to simplify at least one bracket and collect like terms,although the distributive law was used incorrectly in some cases.
Answer: (a) 2 (b) (c) x ≥ – 2 (d) 5x – 5y
Question 3
The question tested the candidates’ ability to
• solve problems involving payments by instalments as in the case of hire purchase and mortgages
• solve problems involving salaries and wages
The question was attempted by 95.4 per cent of the candidates with 586 candidates scoring full marks. Themean mark was 3.81. Most candidates were able to find the interest, in dollars, in part (a), but could notexpress this interest as a percentage of the loan amount. Most candidates experiened difficulty calculatingthe hire purchase price in part (c) since they used 10% of the instalment as the deposit instead of 10% ofthe cash price. Part (c) was fairly well done with candidates correctly determining the amount earned atthe basic rate and number of hours worked.
Answer: (a) (i) $300 (c) (i) $140(ii) 5% (ii) 25 hours
(b) $48.60
Question 4
The question tested the candidates’ ability to
• use instruments to draw and measure angles and line segments
• use instruments (not necessarily ruler and compasses) to construct angles
• solve geometric problems using the properties of polygons, lines and angles and using the propertiesof circles.
The question was attempted by 83.5 of the candidates, 142 of whom scored full marks. The mean mark was 3.09.
5x – 2 6
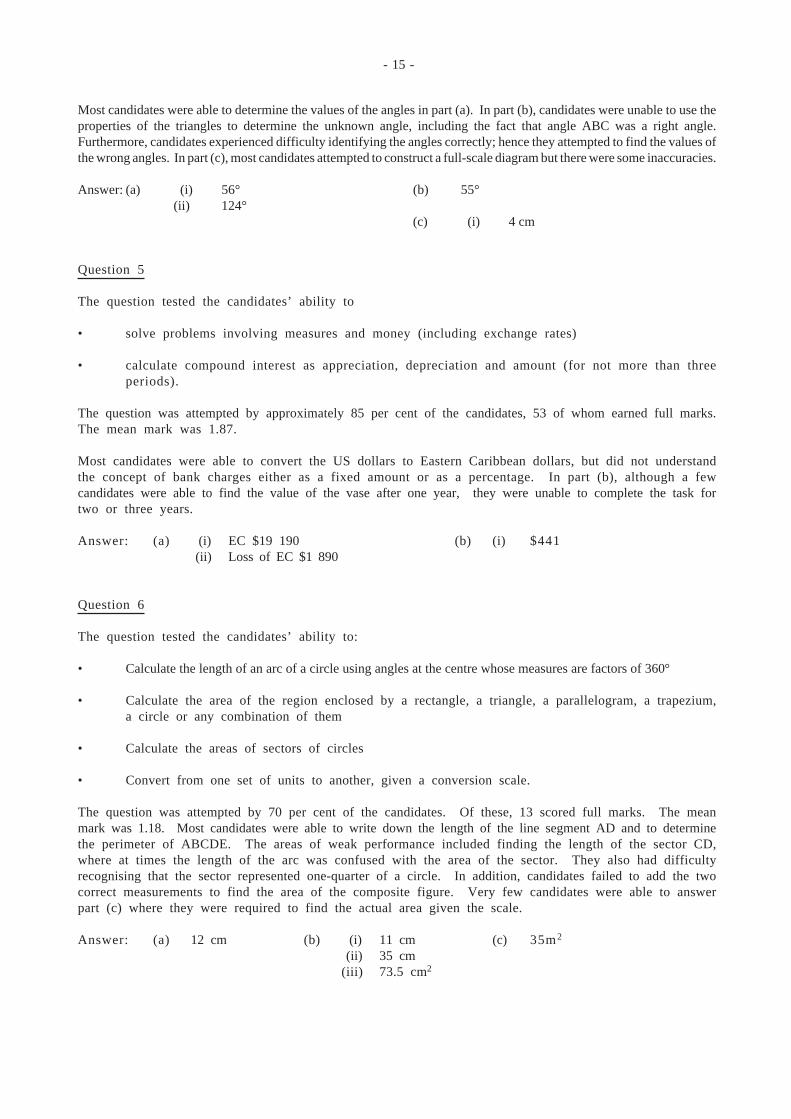
- 15 -
Most candidates were able to determine the values of the angles in part (a). In part (b), candidates were unable to use theproperties of the triangles to determine the unknown angle, including the fact that angle ABC was a right angle.Furthermore, candidates experienced difficulty identifying the angles correctly; hence they attempted to find the values ofthe wrong angles. In part (c), most candidates attempted to construct a full-scale diagram but there were some inaccuracies.
Answer: (a) (i) 56° (b) 55°(ii) 124°
(c) (i) 4 cm
Question 5
The question tested the candidates’ ability to
• solve problems involving measures and money (including exchange rates)
• calculate compound interest as appreciation, depreciation and amount (for not more than threeperiods).
The question was attempted by approximately 85 per cent of the candidates, 53 of whom earned full marks.The mean mark was 1.87.
Most candidates were able to convert the US dollars to Eastern Caribbean dollars, but did not understandthe concept of bank charges either as a fixed amount or as a percentage. In part (b), although a fewcandidates were able to find the value of the vase after one year, they were unable to complete the task fortwo or three years.
Answer: (a) (i) EC $19 190 (b) (i) $441 (ii) Loss of EC $1 890
Question 6
The question tested the candidates’ ability to:
• Calculate the length of an arc of a circle using angles at the centre whose measures are factors of 360°
• Calculate the area of the region enclosed by a rectangle, a triangle, a parallelogram, a trapezium,a circle or any combination of them
• Calculate the areas of sectors of circles
• Convert from one set of units to another, given a conversion scale.
The question was attempted by 70 per cent of the candidates. Of these, 13 scored full marks. The meanmark was 1.18. Most candidates were able to write down the length of the line segment AD and to determinethe perimeter of ABCDE. The areas of weak performance included finding the length of the sector CD,where at times the length of the arc was confused with the area of the sector. They also had difficultyrecognising that the sector represented one-quarter of a circle. In addition, candidates failed to add the twocorrect measurements to find the area of the composite figure. Very few candidates were able to answerpart (c) where they were required to find the actual area given the scale.
Answer: (a) 12 cm (b) (i) 11 cm (c) 35m2
(ii) 35 cm(iii) 73.5 cm2
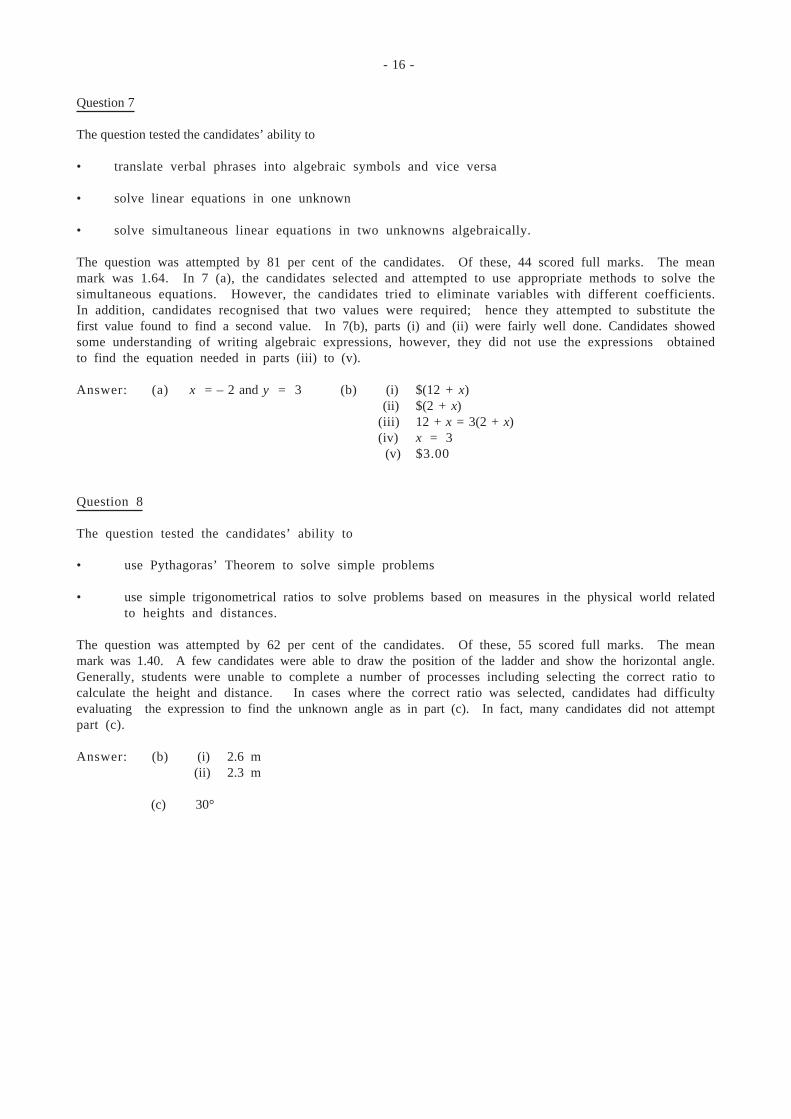
- 16 -
Question 7
The question tested the candidates’ ability to
• translate verbal phrases into algebraic symbols and vice versa
• solve linear equations in one unknown
• solve simultaneous linear equations in two unknowns algebraically.
The question was attempted by 81 per cent of the candidates. Of these, 44 scored full marks. The meanmark was 1.64. In 7 (a), the candidates selected and attempted to use appropriate methods to solve thesimultaneous equations. However, the candidates tried to eliminate variables with different coefficients.In addition, candidates recognised that two values were required; hence they attempted to substitute thefirst value found to find a second value. In 7(b), parts (i) and (ii) were fairly well done. Candidates showedsome understanding of writing algebraic expressions, however, they did not use the expressions obtainedto find the equation needed in parts (iii) to (v).
Answer: (a) x = – 2 and y = 3 (b) (i) $(12 + x) (ii) $(2 + x)(iii) 12 + x = 3(2 + x)(iv) x = 3
(v) $3.00
Question 8
The question tested the candidates’ ability to
• use Pythagoras’ Theorem to solve simple problems
• use simple trigonometrical ratios to solve problems based on measures in the physical world relatedto heights and distances.
The question was attempted by 62 per cent of the candidates. Of these, 55 scored full marks. The meanmark was 1.40. A few candidates were able to draw the position of the ladder and show the horizontal angle.Generally, students were unable to complete a number of processes including selecting the correct ratio tocalculate the height and distance. In cases where the correct ratio was selected, candidates had difficultyevaluating the expression to find the unknown angle as in part (c). In fact, many candidates did not attemptpart (c).
Answer: (b) (i) 2.6 m (ii) 2.3 m
(c) 30°
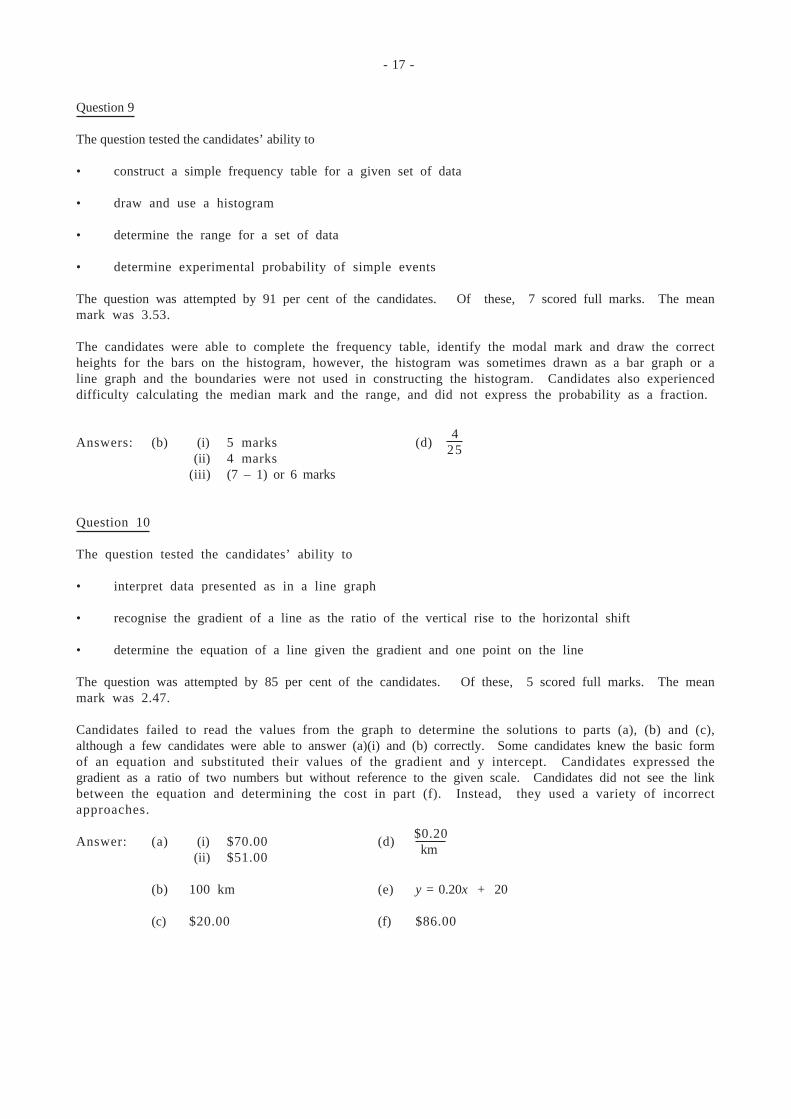
- 17 -
Question 9
The question tested the candidates’ ability to
• construct a simple frequency table for a given set of data
• draw and use a histogram
• determine the range for a set of data
• determine experimental probability of simple events
The question was attempted by 91 per cent of the candidates. Of these, 7 scored full marks. The meanmark was 3.53.
The candidates were able to complete the frequency table, identify the modal mark and draw the correctheights for the bars on the histogram, however, the histogram was sometimes drawn as a bar graph or aline graph and the boundaries were not used in constructing the histogram. Candidates also experienceddifficulty calculating the median mark and the range, and did not express the probability as a fraction.
Answers: (b) (i) 5 marks (d) (ii) 4 marks(iii) (7 – 1) or 6 marks
Question 10
The question tested the candidates’ ability to
• interpret data presented as in a line graph
• recognise the gradient of a line as the ratio of the vertical rise to the horizontal shift
• determine the equation of a line given the gradient and one point on the line
The question was attempted by 85 per cent of the candidates. Of these, 5 scored full marks. The meanmark was 2.47.
Candidates failed to read the values from the graph to determine the solutions to parts (a), (b) and (c),although a few candidates were able to answer (a)(i) and (b) correctly. Some candidates knew the basic formof an equation and substituted their values of the gradient and y intercept. Candidates expressed thegradient as a ratio of two numbers but without reference to the given scale. Candidates did not see the linkbetween the equation and determining the cost in part (f). Instead, they used a variety of incorrectapproaches.
Answer: (a) (i) $70.00 (d) (ii) $51.00
(b) 100 km (e) y = 0.20x + 20
(c) $20.00 (f) $86.00
425
$0.20 km
C A R I B B E A N E X A M I N A T I O N S C O U N C I L
REPORT ON CANDIDATES’ WORK IN THESECONDARY EDUCATION CERTIFICATE EXAMINATION
MAY/JUNE 2005
MATHEMATICS
Copyright © 2005 Caribbean Examinations Council ®St Michael, BarbadosAll rights reserved.
- 2 -
MATHEMATICS
MAY/JUNE 2005
GENERAL COMMENTS
The General Proficiency Mathematics examination is offered in January and May/June each year, while theBasic Proficiency examination is offered in May/June only.
In May/June 2005 approximately 88 559 candidates registered for the General Proficiency examination, anincrease of 3 773 over 2004. Candidate entry for the Basic Proficiency examination decreased from 7 861 in2004 to 6964 in 2005.
At the General Proficiency level, approximately 39 per cent of the candidates achieved Grades I – III. Thisrepresents a 4 per cent increase over 2004. Seventeen per cent of the candidates at the Basic Proficiency levelachieved Grades I – III compared with 20 per cent in 2004.
DETAILED COMMENTS
General Proficiency
In general, candidates continue to show lack of knowledge of basic mathematical concepts. The optionalsection of Paper 02 seemed to have posed the greatest challenge to candidates, particularly the areas of Relation,Function and Graphs; and Geometry and Trigonometry. Candidates did not access most of the marks awardedfor higher order thinking. This indicates the inability to apply mathematical skills in novel situations.
Eleven candidates scored the maximum mark on the overall examination compared with six candidates in 2004.In addition, 351 candidates scored more than 95 per cent of the total marks.
Paper 01 – Multiple Choice
Paper 01 consisted of 60 multiple-choice items. This year, 167 candidates earned the maximum mark comparedwith 145 in 2004. Approximately 71 per cent of the candidates scored at least half the total marks for this paper.
Paper 02 – Essay
Paper 02 consisted of two sections. Section I comprised eight compulsory questions that totalled 90 marks.Section II comprised six optional questions: Two each in Relations, Functions and Graphs; Trigonometry andGeometry; Vectors and Matrices. Candidates were required to choose any two questions. Each question in thissection was worth 15 marks.
This year, 14 candidates earned the maximum mark on Paper 02 compared with 16 in 2004. Approximately 20per cent of the candidates earned at least half the maximum mark on this paper.
- 3 -
Compulsory Section
Question 1
This question tested candidates’ ability to
• perform the basic operations on fractions• solve problems involving invoices and shopping bills• solve problems involving selling price, cost price and profit or loss.
The question was attempted by 99% of the candidates. The mean score was 7.82 out of 11.
Candidates were generally able to deduce unit price and quantity; calculate the difference between cost priceand selling price to obtain profit or loss; obtain an appropriate LCM for the subtraction of two fractions andcalculate 15% of a quantity.
However, some candidates experienced difficulty with writing a mixed number as an improper fraction, e.g.
1— was written as — ; and applying the correct use of decimals to currency, e.g. $16.242 was written as
$16.2 and $37.50 to the nearest cent was written as $37.5.
Recommendations:
Teachers need to
• Continue to reinforce operations on fractions at all levels.• Encourage candidates to reflect on the stages in computations involving fractions when calculators
are used.
Answers:
(a) —– (b) (i) A = $37.50 (ii) ProfitB = $16.95C = 5
Question 2
The question tested candidates’ ability to
• factorize using the distributive law, the difference of squares, and the method of grouping• translate verbal phrases into algebraic symbols in forming expressions and equations• use the distributive property to expand the product of two binomials.
The question was attempted by 99% of the candidates. The mean score was 4.63 out of 12.
Candidates were able to
collect terms in x and apply the distributive property in Part (b). They were also able touse the method of splitting and grouping to factorize the quadratic expression in (a) (iii); sum theirthree sets of points to 39 in Part (c) (ii).
1315
119
19
- 4 -
Candidates experienced difficulty with differentiating between an expression and an equation; identifying thedifference between two squares; differentiating between “twice” and “square”: e.g. 2 (x – 3) was written as(x – 3)2; and translating verbal phrases into algebraic expressions: e.g. 3 points fewer than x points was writtenas 3 – x or as 3 < x.
Recommendations:
• Help candidates to differentiate between expressions and equations.• Remind candidates that marks allotted are usually in proportion to depth of response expected.
Answers:
(a) (i) ab (5a + b) (ii) (3k – 1) (3k + 1) (iii) (2y – 1) (y – 2)(b) bx2 + 7x – 20(c) (i) 2 (x – 3) (ii) x + x – 3 + 2 (x – 3) = 39
Question 3
The question tested candidates’ ability to
• identify the regions in a Venn diagram• associate algebraic expressions with regions• formulate simple linear algebraic equations• solve simple linear equations in one unknown• find the equation of a straight line given the gradient and a pair of coordinates• show that two lines are parallel.
Approximately 93% of the candidates attempted this question. The mean score was 3.46 out of 11.
Most candidates were able to construct an equation in Part (a), in an attempt to find the value of the variable x.However, many were unable to correctly solve the equation.
Some candidates were not familiar with the use of the word “only”, as such they were unable to correctlyidentify the region “drama only” represented by 7 + x.
The majority of the candidates were able to substitute the values y, m and x into the equation of the straight liney = mx + c in Part (b) (i).
Most candidates had the knowledge that parallel lines have the same gradient. However, most of them wereunable to use the skills to show that gradients of the two lines were equal.
Candidates demonstrated a lack of basic computational skills and were unable to correctly manipulate thefractional gradient to find the value of c.
Transposing the equation 2x – 3y = 0 into the form y = mx + c posed a major challenge for the majority of thecandidates.
Some candidates attempted to prove parallelism by plotting the graphs of the two lines. However, they wererarely able to plot correctly the points on the plane.
- 5 -
The following errors were identified in candidates’ work.
(b) (ii) Finding the gradient using two points on the line:
When x = 1 2(1) – 3y = 02 – 3y = 02 = 3y
y = —
When x = 0 2(0) – 3y = 00 = 3y0 = y
Gradient = ———
= —–
= —
Hence lines are parallel.
Recommendations:
• Teachers should use exercises that involve not only Universal set but the different regions andcomplements.
• Teachers should insist that candidates write the equation of the line after finding the values of theintercept and/or gradient.
Answers:
(a) (i) 6 (ii) 13
(b) (i) y = — x + 7
Question 4
The question tested candidates’ ability to
• use scale factors in relation to the area of similar shapes• compare the price of equal areas of pizzas or the areas that could be bought at the same cost• use critical thinking in making judgements related to shopping.
The question was attempted by 94% of the candidates. The mean score was 4.56 out of 10.
Candidates generally knew how to calculate the cost of a whole medium pizza. They made reasonable conclusionsbased on the approaches taken to compare the sizes of the pizza.
23
y2 – y2x2 – x2
2/31
23
23
- 6 -
Most candidates used either circumference or diameter to compare the sizes of the two circles. Some correctlyused the areas but frequently arrived at the wrong conclusion even after calculating the area of the mediumpizza to be 4 times the area of the small pizza.
In Part (b) of the question, the majority of candidates compared either areas only or prices only.
Recommendation:
• Candidates need to use the list of formulae on the question papers. The majority of candidatesused p2r, 2pr2, pd2, 2pr as the formula for area of a circle.
Answers:
(a) The medium pizza is 4 times as large as the small one.(b) The medium slice is the better buy.
Question 5
This question tested candidates’ ability to
• locate the points on a grid to form a triangle• locate the image of an object under a given transformation• state a single transformation that maps an object to an image• use and apply an appropriate trigonometric ratio in finding the angle of elevation in a given right-
angle triangle.
Approximately 93% of the candidates answered this question. The mean score was 5.22 out of 12.
Some candidates were unable to plot a triangle accurately using the coordinate plane. A few had difficultyinterpreting the scale of 1 cm to 1 unit and some inverted the axes.
A significant number of the candidates experienced difficulty reflecting in the line x = 4. Some used the liney = 4 for x = 4; some reflected in the x-axis, and others in the y-axis.
A few candidates preferred to use algebraic methods to locate the image of an object under the given translation.However, they multiplied the matrices instead of adding the column vectors. In general, the candidates showedmastery of translation, however, some had great difficulty interpreting the zero component of the vector andhence used their own vector to translate the figure.
In Part (b), most candidates were not familiar with the glide reflection and hence ended up describing thetransformations instead of giving a single transformation that would map the object onto the image.
Part (c) was very challenging for many of the candidates. Identifying the angle of elevation was the majorproblem. Some candidates made their solutions much more complex than was necessary and attempted variousmethods in arriving at their answers. The sine and cosine rules were quite popular in calculating the requiredangle even though the triangles were right-angled.
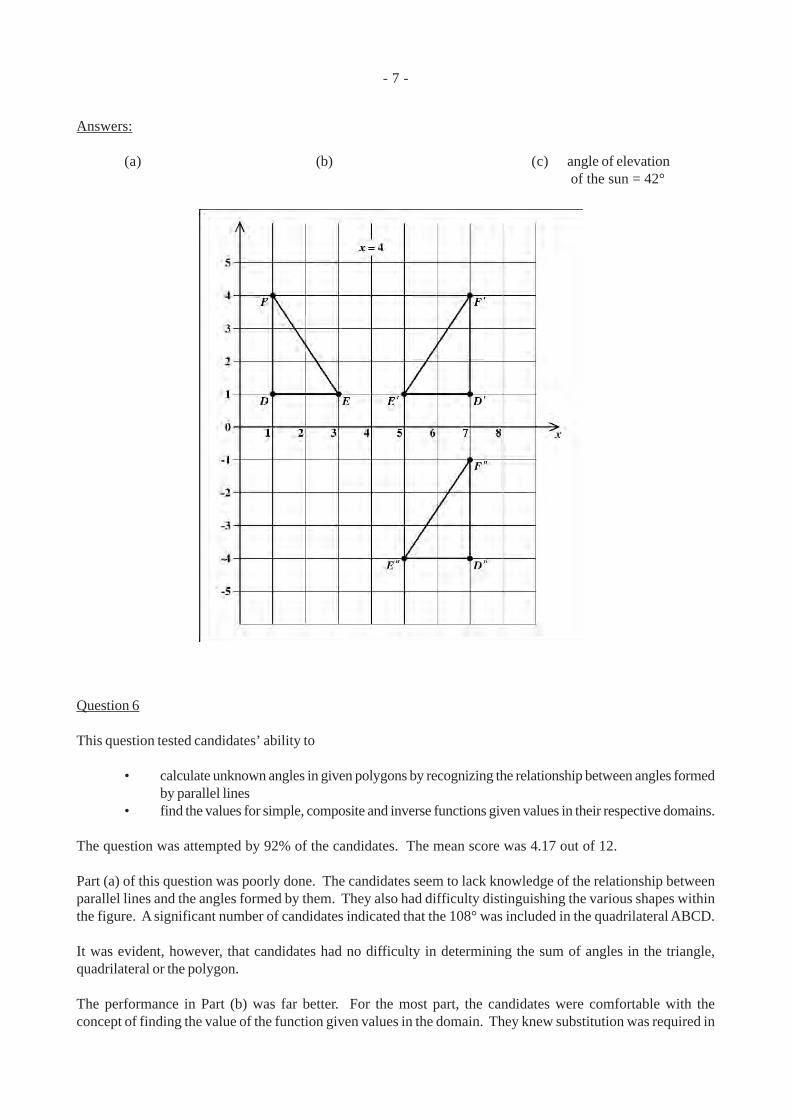
- 7 -
Answers:
(a) (b) (c) angle of elevation of the sun = 42°
Question 6
This question tested candidates’ ability to
• calculate unknown angles in given polygons by recognizing the relationship between angles formedby parallel lines
• find the values for simple, composite and inverse functions given values in their respective domains.
The question was attempted by 92% of the candidates. The mean score was 4.17 out of 12.
Part (a) of this question was poorly done. The candidates seem to lack knowledge of the relationship betweenparallel lines and the angles formed by them. They also had difficulty distinguishing the various shapes withinthe figure. A significant number of candidates indicated that the 108° was included in the quadrilateral ABCD.
It was evident, however, that candidates had no difficulty in determining the sum of angles in the triangle,quadrilateral or the polygon.
The performance in Part (b) was far better. For the most part, the candidates were comfortable with theconcept of finding the value of the function given values in the domain. They knew substitution was required in
- 8 -
determining the function g (x). However, the response was less than clear as many included the g in theiranswers.
E.g. g (x) = x2 implies thatg (3) = g (9)g (–3) = –3 g(–3)2 = –9
Finding inverses and computing composite functions also posed problems for candidates. A significant numberof candidates determined the product, [(fg (x) = (½ x + 5) * (x2)] or the sum of both functions, [(fg (X) = (½ X+ 5) + (x2)], instead of finding the function of a function, (fg (x) = ½ [x2] + 5). While most candidates realizedthat they had to interchange the variables in order to establish the inverse, most had difficulty with transposition.This underscores the difficulty with Algebra that is demonstrated generally.
Recommendations:
• Regular revision of the Euclidean Geometry should help as this was previously done in the lowerforms. There is no alternative but to ensure that the students clearly understand functions. Theyalso need to practise finding inverses and composite functions. The need to practise algebra andcomputation on an ongoing basis cannot be overstated.
Answers:
(a) (i) x = 43° (ii) y = 162°(b) (i) g (3) + g (–3) = 18 (ii) f–1 (6) = 2 (iii) fg (2) = 7
Question 7
This question tested candidates’ ability to
• draw the cumulative frequency curve to represent data given the cumulative frequency table anda scale for each axis
• use the ogive to estimate– the number of persons in the sample having heights below a certain value– the median height– the height that 25% of the persons are less than– the probability that a person chosen at random had a height less than a given value.
About 77% of the candidates attempted the question. The mean score was 3.62 out of 12.
Part (a)
Most candidates showed knowledge of the axes although several of them did not pay attention to the givenscales for each axis. They also failed to recognise the emphasis placed on the condition that the horizontal scaleshould start at 150 cm.
Candidates were not competent at assigning numbers to the axes. Some used the given class intervals; others,the class midpoint, the lower or upper class limit and the lower or upper class boundaries. Even though candidateswould have chosen the incorrect class intervals, they were able to plot a cumulative frequency using theirinterval.
- 9 -
Part (b) presented the greatest difficulty.
In (b) (i) and (ii), depending on the numbering on the axes used in Part (a), candidates were unable to read offcorrectly from their graph. Although the appropriate lines were drawn, they did not read the values indicatedcorrectly.
Candidates were aware that the median had something to do with ‘the middle’. Some simply worked out½ x 400 = 200.
Other responses included the average of any two values, the calculation of the mean, and the middle value of thehighest value on their graph.
About 25% of the candidates drew appropriate lines at 170 cm and at 200 cm but were not successful in readingoff the corresponding values asked for. A few drew lines at 50 to find the median.
For (b) (iii), candidates worked out as 25% x 400 = 100. Difficulty arose in reading off horizontally at 100.
Almost all the candidates who attempted (b) (iv) knew the answer had to be out of 400. Only about 10%obtained the correct answer. Many used the given height 162 and gave their answers as ——. A few wroteanswers that were greater than 1.
Answers:
(b) (i) 270 + 5 (ii) 167 + 1 cm (iii) 162.5 cm (iv) —— or —–
Question 8
This was the Critical Thinking question which was designed to test candidates’ ability to:
• identify number pattern from data given• expand binomial expression• simplify algebraic expression• recognise an identity and prove same.
The question was attempted by approximately 90% of the candidates. The mean score was 5.45 out of 10.
Part (a) of the question was well done by most candidates. Candidates were able to successfully identifying thenumber pattern for 63 and 103 (Parts (i) and (ii) respectively), but had difficulty in obtaining the solution for theabstract n3 (Part (iii).
In some cases, candidates calculated the value of 63 and 103 without using the pattern. They also assumed thatsince there were four spaces between 103 and n3 and therefore substituted n as 14 and arrived at the correctsolution.
Part (b) of the question was poorly done by candidates. The majority of candidates who attempted Part (b) haddifficulty in expanding (a – b)2 but were successful in expanding ab (a + b). For the expansion of (a – b)2 mostcandidates gave a2 – b2 or (a – b) (a + b) as their solution.
There were instances where candidates gave numerical values for a and b and then substituted their values intothe identity to prove the identity.
95400
1980
162400
- 10 -
Recommendations:
• Teachers need to reinforce the differences between a2 – b2 (the difference of two squares) and(a – b)2 (the square of the difference of two terms).
• Encourage more practice in multiplying a binomial expression by a linear expression.• Encourage more practice in proving algebraic identities.
Answers:
(a) (i) 4 x 72 + 3 x 6 + 2 = 216(ii) 8 x 112 + 3 x 10 + 2 = 1000(iii) (n – 2) x (n + 1)2 + (3 x n) + 2
Optional Section
Question 9
The question tested candidates’ ability to
• write a quadratic expression in the form a (x + h)2 + k• deduce the minimum value of a quadratic function and the value of the domain for which this
minimum value occurs• solve a quadratic equation• sketch the graph of a quadratic function.
Approximately 32% of the candidates attempted the question. The mean score was 4.13 out of 15.
Most candidates recognized the given equation as quadratic and set out to solve it by an acceptable method.Candidates, however, faltered in the following areas:
– The coefficients 5, 2 and –7 of 5x2 + 2x – 7 were substituted for a, b and c in a(x + b)2 + c.
– When using the formula to solve 5x2 + 2x – 7 = 0, candidates used x = –2 + √ 4 + 140 andproceeded to divide only the discriminant by 10. 10
– To sketch the curve y = 5x2 + 2x – 7, some candidates generated a table of values instead ofsimply using the roots, the y-intercept and the minimum point.
Answers:
(a) 5 (x + —)2 – 7 —
(b) (i) – 7 — (ii) – —
(c) x = – —, 175
15
15
15
15
- 11 -
Question 10
The question tested candidates’ ability to
• read and interpret speed-time graph and to calculate– acceleration over a given period of time– distance covered over a given period of time
• read and interpret distance-time graph and to calculate average speed and describe specificsituation of an athlete being at rest over a specific period of time.
• write equation of a straight line parallel to the y-axis• write a set of inequalities representing a given region identified by a set of given equations of lines
(on graph).
About 51% of the candidates attempted this question. The mean score was 2.90 out of 15.
In Part (a), candidates knew that they had to find the area under the graph in order to obtain the distancetravelled/covered. However, many candidates used “distance = speed x time”, to find the distance coveredinstead of calculating the actual area under the curve using only the trapezium rule or area of triangle + area ofrectangle.
In Part (b), the candidates knew that somehow acceleration was related to velocity and time but the majorityused the wrong formula. Candidates seemed to have been unsure of the correct units to be used.
The horizontal line in the distance-time graph was associated with “something constant or stationary”, but wereunable to describe the athlete’s situation as “at rest”.
Some responses given by candidates were
• athlete was moving at constant speed• running on the spot• run parallel to the finish line• kept on a straight track• distance did not climb.
In Part (c), candidates had difficulty recognising that equations of lines could simply be ‘read off’ from thegraph. The majority of them tried to calculate the ‘given’ equations of lines using different methods.
Recommendation:
Real life situations should be used to enhance the teaching and learning of Relations, Functions and Graphs.
Answers:
(a) (i) 2 — m/s (ii) 900 m
(b) (i) 6 km/h (ii) athlete stopped (iii) 8 km/h
(c) (i) x = 6(ii) x < 6
y > – — x + 5
y < — x + 5
23
58
16
- 12 -
Question 11
This question tested candidates’ ability to
• solve geometrical problems involving similar triangles and to find areas of similar triangles• use geometry and trigonometry to find angles and distances in a composite diagram involving two
triangles conjoined to form a trapezium.
The question was attempted by approximately 25% of the candidates. The mean score was 1.96 out of 15.
The area of good performance in this question was the calculation of angle S J M.
At least one candidate approached the first part of the question by determining the height of D PQX with QX asbase and then applying the basic sine ratio to find angle P X Q.
A few candidates correctly solved Part (b) of the question by drawing perpendiculars from S to MJ and from Jto MK and then proceeded to use basic trigonometric ratio.
In Part (e), the majority of candidates generally did not know the relationship between the areas of similartriangles. The fewer candidates who knew were unable to apply the relationship between the areas of similartriangles in calculating the area of ∆ YXZ.
In responding to this question, many candidates rounded off the values unnecessarily which resulted in significantdeviations from the expected answers.
Recommendation:
• The teacher should use physical or mathematical models to develop an understanding of therelationship between the areas of similar figures.
Answers:
(a) (i) P X Q = 53° (ii) Area = 54 cm2
(b) (i) a) S J M = 22° b) J K M = 34°
(ii) MJ = 92.7 m JK = 62.1 m
Question 12
The question tested candidates’ ability to
• draw a sketch of the earth showing the location of two places when given their latitude andlongitude
• label on diagram, the equator and the meridian of Greenwich• calculate the shortest distance between two places measured along their common circle of latitude• calculate the shortest distance between two places measured along their common circle of longitude.
About 11% of the candidates attempted this question. The mean score was 5.03 out of 15.
> >
>
>
>
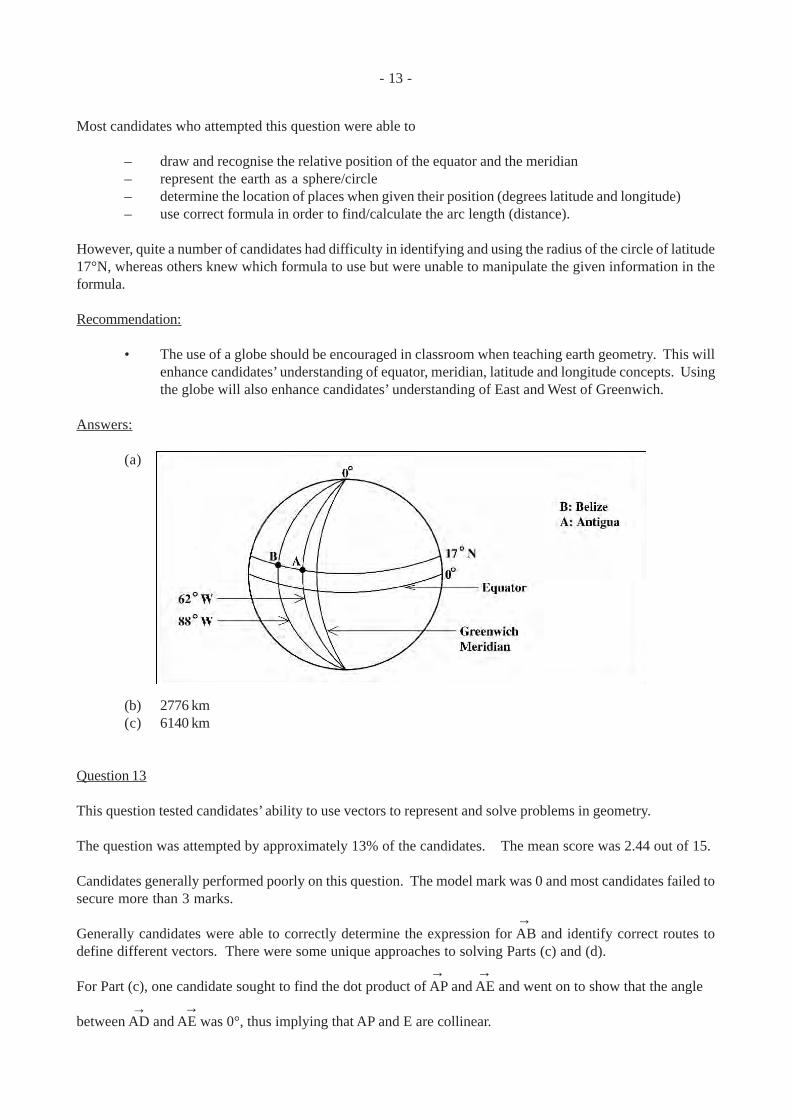
- 13 -
Most candidates who attempted this question were able to
– draw and recognise the relative position of the equator and the meridian– represent the earth as a sphere/circle– determine the location of places when given their position (degrees latitude and longitude)– use correct formula in order to find/calculate the arc length (distance).
However, quite a number of candidates had difficulty in identifying and using the radius of the circle of latitude17°N, whereas others knew which formula to use but were unable to manipulate the given information in theformula.
Recommendation:
• The use of a globe should be encouraged in classroom when teaching earth geometry. This willenhance candidates’ understanding of equator, meridian, latitude and longitude concepts. Usingthe globe will also enhance candidates’ understanding of East and West of Greenwich.
Answers:
(a) B: BelizeA: Antigua
(b) 2776 km(c) 6140 km
Question 13
This question tested candidates’ ability to use vectors to represent and solve problems in geometry.
The question was attempted by approximately 13% of the candidates. The mean score was 2.44 out of 15.
Candidates generally performed poorly on this question. The model mark was 0 and most candidates failed tosecure more than 3 marks.
Generally candidates were able to correctly determine the expression for AB and identify correct routes todefine different vectors. There were some unique approaches to solving Parts (c) and (d).
For Part (c), one candidate sought to find the dot product of AP and AE and went on to show that the angle
between AD and AE was 0°, thus implying that AP and E are collinear.
→
→
→→
→
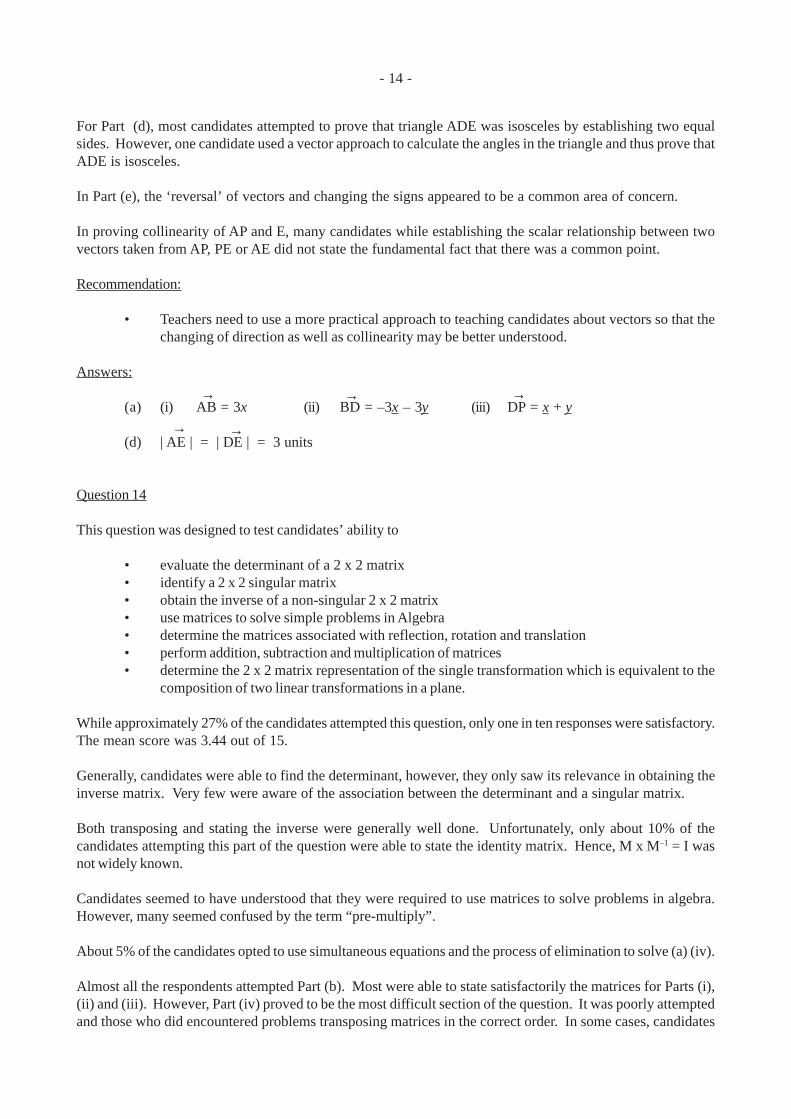
- 14 -
For Part (d), most candidates attempted to prove that triangle ADE was isosceles by establishing two equalsides. However, one candidate used a vector approach to calculate the angles in the triangle and thus prove thatADE is isosceles.
In Part (e), the ‘reversal’ of vectors and changing the signs appeared to be a common area of concern.
In proving collinearity of AP and E, many candidates while establishing the scalar relationship between twovectors taken from AP, PE or AE did not state the fundamental fact that there was a common point.
Recommendation:
• Teachers need to use a more practical approach to teaching candidates about vectors so that thechanging of direction as well as collinearity may be better understood.
Answers:
(a) (i) AB = 3x (ii) BD = –3x – 3y (iii) DP = x + y
(d) | AE | = | DE | = 3 units
Question 14
This question was designed to test candidates’ ability to
• evaluate the determinant of a 2 x 2 matrix• identify a 2 x 2 singular matrix• obtain the inverse of a non-singular 2 x 2 matrix• use matrices to solve simple problems in Algebra• determine the matrices associated with reflection, rotation and translation• perform addition, subtraction and multiplication of matrices• determine the 2 x 2 matrix representation of the single transformation which is equivalent to the
composition of two linear transformations in a plane.
While approximately 27% of the candidates attempted this question, only one in ten responses were satisfactory.The mean score was 3.44 out of 15.
Generally, candidates were able to find the determinant, however, they only saw its relevance in obtaining theinverse matrix. Very few were aware of the association between the determinant and a singular matrix.
Both transposing and stating the inverse were generally well done. Unfortunately, only about 10% of thecandidates attempting this part of the question were able to state the identity matrix. Hence, M x M–1 = I wasnot widely known.
Candidates seemed to have understood that they were required to use matrices to solve problems in algebra.However, many seemed confused by the term “pre-multiply”.
About 5% of the candidates opted to use simultaneous equations and the process of elimination to solve (a) (iv).
Almost all the respondents attempted Part (b). Most were able to state satisfactorily the matrices for Parts (i),(ii) and (iii). However, Part (iv) proved to be the most difficult section of the question. It was poorly attemptedand those who did encountered problems transposing matrices in the correct order. In some cases, candidates
→
→→
→
→
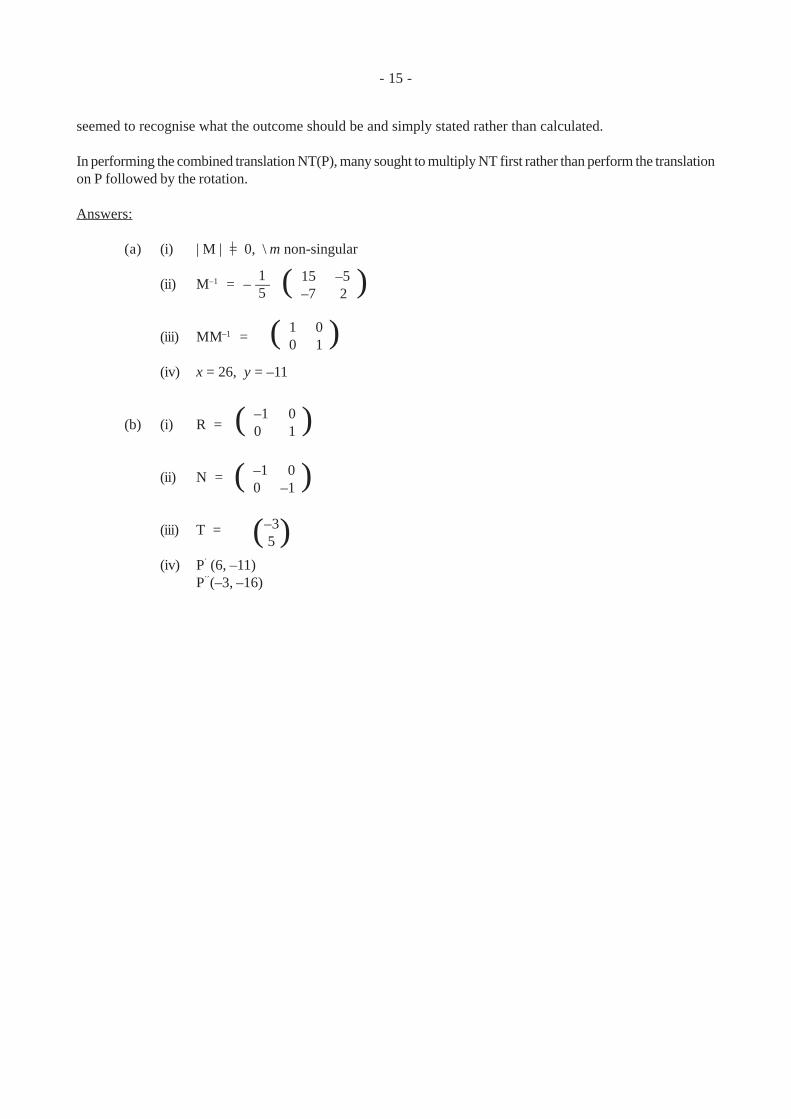
- 15 -
seemed to recognise what the outcome should be and simply stated rather than calculated.
In performing the combined translation NT(P), many sought to multiply NT first rather than perform the translationon P followed by the rotation.
Answers:
(a) (i) | M | = 0, \ m non-singular
(ii) M–1 = – —
(iii) MM–1 =
(iv) x = 26, y = –11
(b) (i) R =
(ii) N =
(iii) T =
(iv) P´ (6, –11)P´´(–3, –16)
15 ( )15 –5
–7 2
( )1 00 1
( )–1 00 –1
( )–1 00 1
( )–3 5
- 16 -
DETAILED COMMENTS
Basic Proficiency
The Basic Proficiency examination is designed to provide the average citizen with a working knowledge of thesubject area. The range of topics tested at the basic level is narrower than that tested at the General Proficiencylevel.
Candidates continue to demonstrate a lack of knowledge of the fundamental concepts being tested at this level.
Approximately 16 per cent of the candidates achieved Grades I - III. This reflected a 4 per cent decline inperformance compared with 2004 where 20 per cent of the candidates achieved Grades I - III.
Paper 01 – Multiple Choice
Paper 01 consisted of 60 multiple-choice items. No candidate earned the maximum mark on this paper. However,one candidate earned 59 out of 60 possible marks. Approximately 45 per cent of the candidates scored at leasthalf the maximum mark for this paper.
Paper 02 – Essay
Paper 02 consisted of 10 compulsory questions. Each question was worth 10 marks. The highest score earnedwas 96 out of 100. This was earned by two candidates. Five candidates earned at least half the total marks onthis paper.
Question 1
The question tested candidates’ ability to
• divide chemicals• write a rational number in standard form• compare quantities in a given ratio• solve problems involving percentages.
The question was attempted by 95% of the candidates. Less than 1% of the candidates scored the maximummark. The mean score was 2.07 out of 10. Thirteen percent of the candidates scored 5 marks or more on thisquestion.
The candidates were generally unable to express a number in standard form or to establish the relationshipbetween the given ratio and the points. Most candidates answered (c) (ii) correctly, where they were requiredto give the least number of points to be scored by Team B, however a number of candidates had difficultyinterpreting the word ‘least’.
Answers:
(a) (i) 0.455 (ii) 4.55 x 10⁻²
(b) 700(c) (i) 54 (ii) 111 points
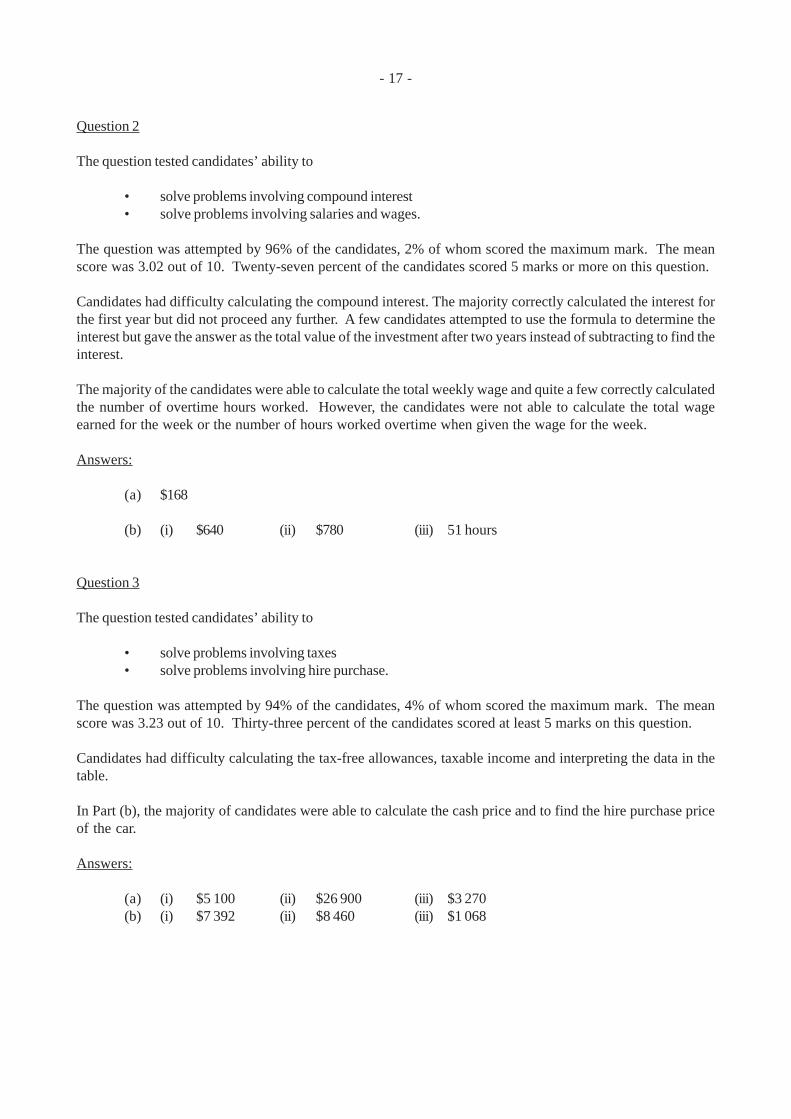
- 17 -
Question 2
The question tested candidates’ ability to
• solve problems involving compound interest• solve problems involving salaries and wages.
The question was attempted by 96% of the candidates, 2% of whom scored the maximum mark. The meanscore was 3.02 out of 10. Twenty-seven percent of the candidates scored 5 marks or more on this question.
Candidates had difficulty calculating the compound interest. The majority correctly calculated the interest forthe first year but did not proceed any further. A few candidates attempted to use the formula to determine theinterest but gave the answer as the total value of the investment after two years instead of subtracting to find theinterest.
The majority of the candidates were able to calculate the total weekly wage and quite a few correctly calculatedthe number of overtime hours worked. However, the candidates were not able to calculate the total wageearned for the week or the number of hours worked overtime when given the wage for the week.
Answers:
(a) $168
(b) (i) $640 (ii) $780 (iii) 51 hours
Question 3
The question tested candidates’ ability to
• solve problems involving taxes• solve problems involving hire purchase.
The question was attempted by 94% of the candidates, 4% of whom scored the maximum mark. The meanscore was 3.23 out of 10. Thirty-three percent of the candidates scored at least 5 marks on this question.
Candidates had difficulty calculating the tax-free allowances, taxable income and interpreting the data in thetable.
In Part (b), the majority of candidates were able to calculate the cash price and to find the hire purchase priceof the car.
Answers:
(a) (i) $5 100 (ii) $26 900 (iii) $3 270(b) (i) $7 392 (ii) $8 460 (iii) $1 068
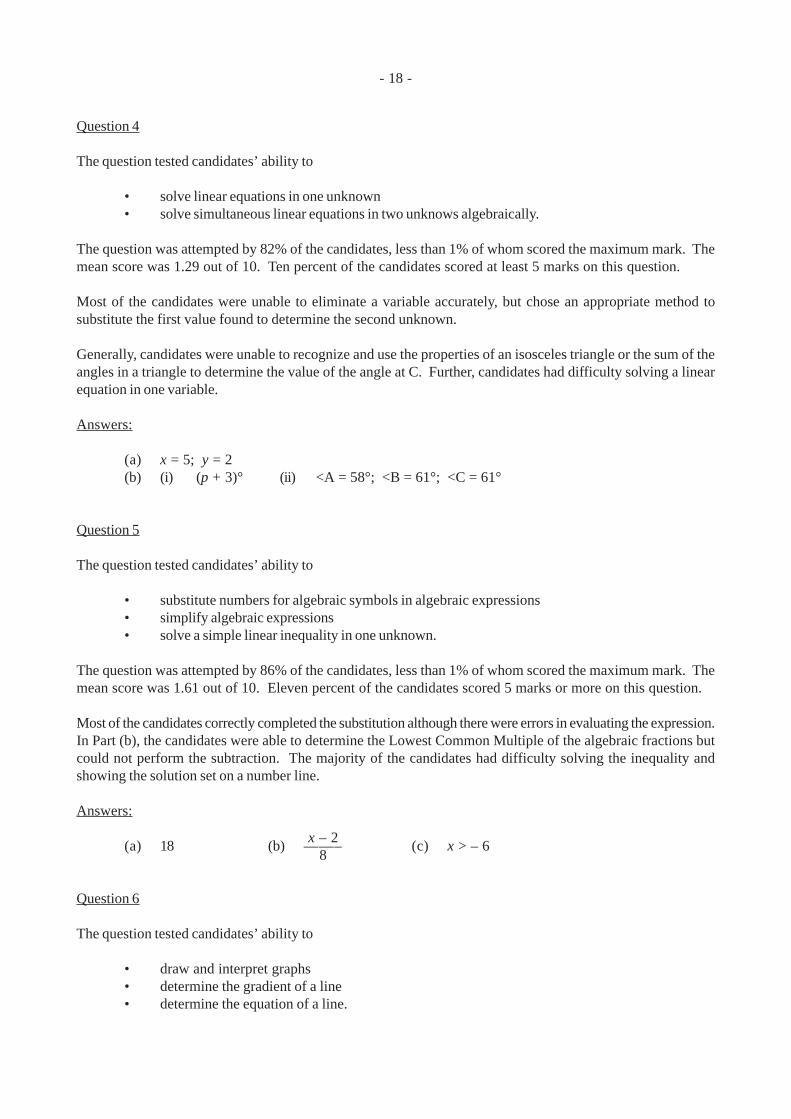
- 18 -
Question 4
The question tested candidates’ ability to
• solve linear equations in one unknown• solve simultaneous linear equations in two unknows algebraically.
The question was attempted by 82% of the candidates, less than 1% of whom scored the maximum mark. Themean score was 1.29 out of 10. Ten percent of the candidates scored at least 5 marks on this question.
Most of the candidates were unable to eliminate a variable accurately, but chose an appropriate method tosubstitute the first value found to determine the second unknown.
Generally, candidates were unable to recognize and use the properties of an isosceles triangle or the sum of theangles in a triangle to determine the value of the angle at C. Further, candidates had difficulty solving a linearequation in one variable.
Answers:
(a) x = 5; y = 2(b) (i) (p + 3)° (ii) <A = 58°; <B = 61°; <C = 61°
Question 5
The question tested candidates’ ability to
• substitute numbers for algebraic symbols in algebraic expressions• simplify algebraic expressions• solve a simple linear inequality in one unknown.
The question was attempted by 86% of the candidates, less than 1% of whom scored the maximum mark. Themean score was 1.61 out of 10. Eleven percent of the candidates scored 5 marks or more on this question.
Most of the candidates correctly completed the substitution although there were errors in evaluating the expression.In Part (b), the candidates were able to determine the Lowest Common Multiple of the algebraic fractions butcould not perform the subtraction. The majority of the candidates had difficulty solving the inequality andshowing the solution set on a number line.
Answers:
(a) 18 (b) ——– (c) x > – 6
Question 6
The question tested candidates’ ability to
• draw and interpret graphs• determine the gradient of a line• determine the equation of a line.
x – 28
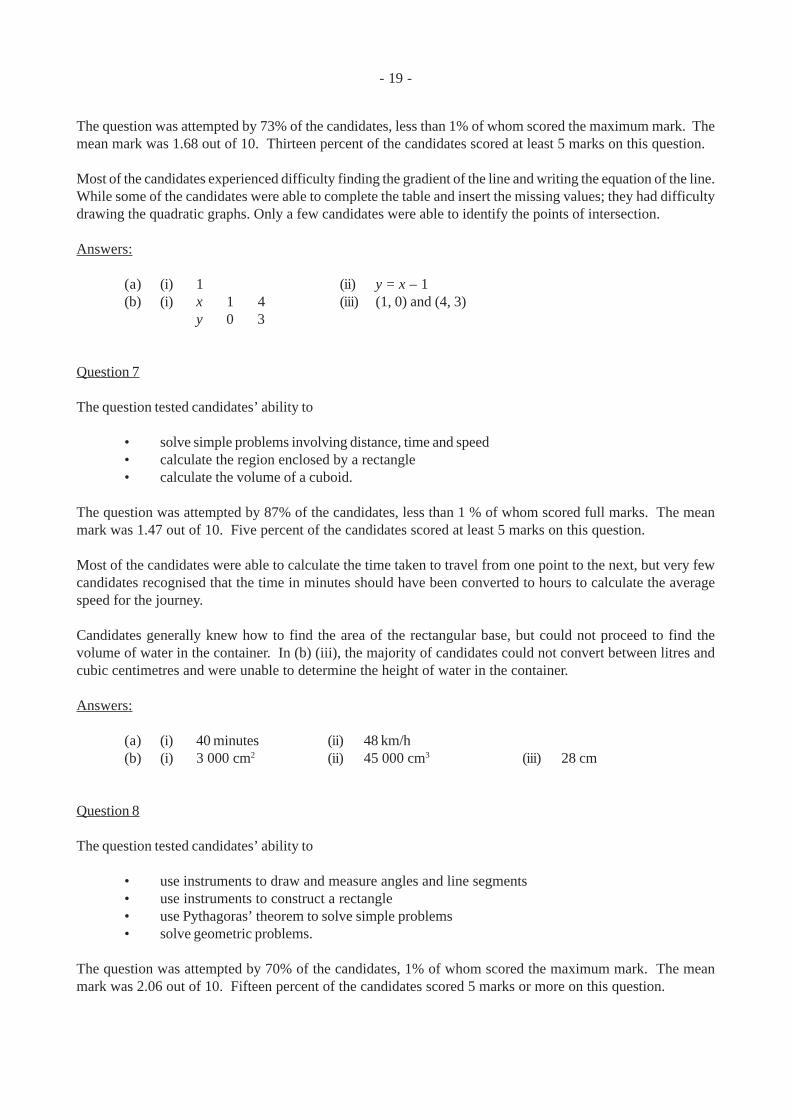
- 19 -
The question was attempted by 73% of the candidates, less than 1% of whom scored the maximum mark. Themean mark was 1.68 out of 10. Thirteen percent of the candidates scored at least 5 marks on this question.
Most of the candidates experienced difficulty finding the gradient of the line and writing the equation of the line.While some of the candidates were able to complete the table and insert the missing values; they had difficultydrawing the quadratic graphs. Only a few candidates were able to identify the points of intersection.
Answers:
(a) (i) 1 (ii) y = x – 1(b) (i) x 1 4 (iii) (1, 0) and (4, 3)
y 0 3
Question 7
The question tested candidates’ ability to
• solve simple problems involving distance, time and speed• calculate the region enclosed by a rectangle• calculate the volume of a cuboid.
The question was attempted by 87% of the candidates, less than 1 % of whom scored full marks. The meanmark was 1.47 out of 10. Five percent of the candidates scored at least 5 marks on this question.
Most of the candidates were able to calculate the time taken to travel from one point to the next, but very fewcandidates recognised that the time in minutes should have been converted to hours to calculate the averagespeed for the journey.
Candidates generally knew how to find the area of the rectangular base, but could not proceed to find thevolume of water in the container. In (b) (iii), the majority of candidates could not convert between litres andcubic centimetres and were unable to determine the height of water in the container.
Answers:
(a) (i) 40 minutes (ii) 48 km/h(b) (i) 3 000 cm2 (ii) 45 000 cm3 (iii) 28 cm
Question 8
The question tested candidates’ ability to
• use instruments to draw and measure angles and line segments• use instruments to construct a rectangle• use Pythagoras’ theorem to solve simple problems• solve geometric problems.
The question was attempted by 70% of the candidates, 1% of whom scored the maximum mark. The meanmark was 2.06 out of 10. Fifteen percent of the candidates scored 5 marks or more on this question.
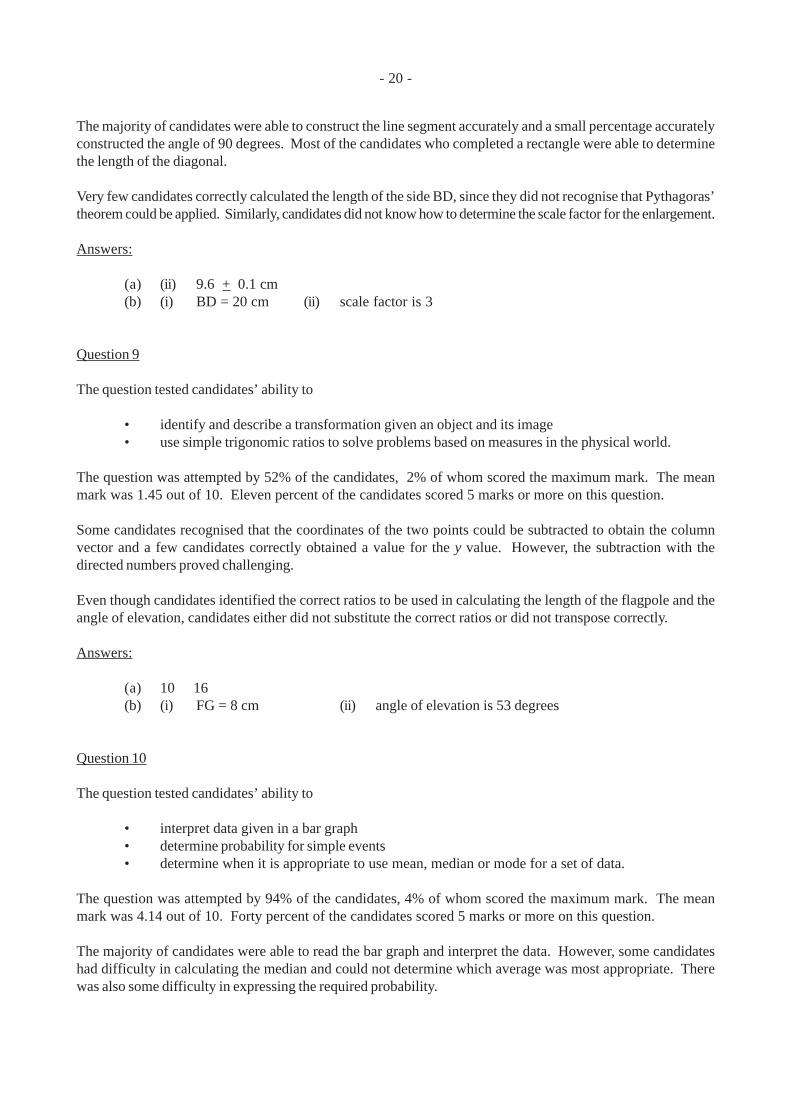
- 20 -
The majority of candidates were able to construct the line segment accurately and a small percentage accuratelyconstructed the angle of 90 degrees. Most of the candidates who completed a rectangle were able to determinethe length of the diagonal.
Very few candidates correctly calculated the length of the side BD, since they did not recognise that Pythagoras’theorem could be applied. Similarly, candidates did not know how to determine the scale factor for the enlargement.
Answers:
(a) (ii) 9.6 + 0.1 cm(b) (i) BD = 20 cm (ii) scale factor is 3
Question 9
The question tested candidates’ ability to
• identify and describe a transformation given an object and its image• use simple trigonomic ratios to solve problems based on measures in the physical world.
The question was attempted by 52% of the candidates, 2% of whom scored the maximum mark. The meanmark was 1.45 out of 10. Eleven percent of the candidates scored 5 marks or more on this question.
Some candidates recognised that the coordinates of the two points could be subtracted to obtain the columnvector and a few candidates correctly obtained a value for the y value. However, the subtraction with thedirected numbers proved challenging.
Even though candidates identified the correct ratios to be used in calculating the length of the flagpole and theangle of elevation, candidates either did not substitute the correct ratios or did not transpose correctly.
Answers:
(a) 10 16(b) (i) FG = 8 cm (ii) angle of elevation is 53 degrees
Question 10
The question tested candidates’ ability to
• interpret data given in a bar graph• determine probability for simple events• determine when it is appropriate to use mean, median or mode for a set of data.
The question was attempted by 94% of the candidates, 4% of whom scored the maximum mark. The meanmark was 4.14 out of 10. Forty percent of the candidates scored 5 marks or more on this question.
The majority of candidates were able to read the bar graph and interpret the data. However, some candidateshad difficulty in calculating the median and could not determine which average was most appropriate. Therewas also some difficulty in expressing the required probability.

- 21 -
Answers:
(a) 12 children (b) 29 children(c) The modal size is 5 (d) The median shoe size is 6(e) (i) 14/50 (ii) 21/50(f) The mode – the size worn by the most children
C A R I B B E A N E X A M I N A T I O N S C O U N C I L
REPORT ON CANDIDATES’ WORK IN THESECONDARY EDUCATION CERTIFICATE EXAMINATION
MAY/JUNE 2006
MATHEMATICS
Copyright © 2006 Caribbean Examinations Council®St. Michael, Barbados
All rights reserved
- 2 -
MATHEMATICS
MAY/JUNE 2006
GENERAL COMMENTS
The General Proficiency Mathematics examination is offered in January and May/June each year,while the Basic Proficiency examination is offered in May/June only.
In May/June 2006 approximately 86 479 candidates registered for the General Proficiency examination,a decrease of 2 080 over 2005. Candidate entry for the Basic Proficiency examination decreased from5 803 in 2005 to in 2006.
At the General Proficiency level, approximately 35 per cent of the candidates achieved Grades I – III.This represents a 4 per cent decrease over 2005, however it is consistent with the performance in2004. Forty per cent of the candidates at the Basic Proficiency level achieved Grades I – III comparedwith 17 per cent in 2005.
DETAILED COMMENTS
General Proficiency
In general, candidates continue to show lack of knowledge of basic mathematical concepts. Theoptional section of Paper 02 seemed to have posed the greatest challenge to candidates, particularlythe areas of Relation. Function and Graphs; and Geometry and Trigonometry.
Six candidates scored the maximum mark on the overall examination compared with 11 candidates in2005. Twenty-six per cent of the candidates scored at least half the available marks compared with 31per cent in 2005.
Paper 01 - Multiple Choice
Paper 01 consisted of 60 multiple-choice items. This year, 84 candidates earned the maximum availablemark compared with 167 in 2005. Approximately 47 per cent of the candidates scored at least half thetotal marks for this paper.
Paper 02 - Essay
Paper 02 consisted of two sections. Section I comprised eight compulsory questions totalling 90marks. Section II comprised six optional questions; Two each in Relations, Functions and Graphs;Trigonometry and Geometry; Vectors and Matrices. Candidates were required to choose any twoquestions. Each questions in this section was worth 15 marks.
This year, 17 candidates earned the maximum available mark on Paper 02 compared with 14 in 2005.Approximately 20 per cent of the candidates earned at least half the maximum mark on this paper in2006 as well as 2005.
- 3 -
Compulsory Section
Question 1
This question tested candidates’ ability to
– perform basic operations with decimals– approximate a value to a given number of significant figures– calculate the percentage of a quantity– express one quantity as a percentage of another– solve problems involving depreciation– convert from one currency to another given a conversion rate.
The question was attempted by 93 per cent of the candidates, 5 per cent of whom scored the maximumavailable mark. The mean mark was 6.42 out of 12.
Many candidates demonstrated good use of the calculator in performing the operations. Those candidateswho neglected to use electronic calculators frequently made conceptual errors in computation, forexample 0.246 ÷ 3 was computed as either 0.0082 or 0.82, and (12.3)2 was computed as 24.6.
Some candidates did not apply the principle of order of operations and chose to ignore the bracketscompletely thereby performing the operations from left to right.
Many candidates showed inaccurate understanding of significant figures. A large number confusedsignificant figures with decimal places and standard form and clearly did not understand the role ofzero in retaining the value of the number.
For example: 151. 208 was incorrectly rounded to 15, 150.000, and 151.21.
Even those candidates who obtained 11 marks, failed to earn the mark for approximation to significantfigures.
In part (b), the majority of candidates understood how to find the value of the car after one year andcomputed 12 per cent of $40 000 correctly.
Calculating the rate of depreciation posed problems for several candidates who gave 85 per cent as therate instead of 15 per cent.
Many candidates demonstrated a poor understanding of depreciation. A common error was the use of24 per cent of $40 000 instead of using the principles of compound interest.
The currency conversion in part (c) was well done by the majority of candidates. However a significantnumber of candidates chose the same operation for both parts of the question.
Solutions:
(a) (i) 151.208 (ii) 150
(b) (i) p= $4 800. (ii) q= 15%
(c) (i) US$600.00 (ii) EC$2 500.
- 4 -
Recommendations
• Teachers need to emphasize the difference between decimal places, significant figures andstandard form. With regards to significant figures, students need to appreciate that when anumber has been rounded its value does not change significantly.
• In the calculating of depreciation, the value of the item reduces with each succeeding year.Hence, interest must be calculated on the reduced value rather than the initial value of theitem.
Question 2
The question tested the candidates’ ability to
– simplify algebraic fractions– factorise quadratic expressions using the distributive law and the difference of two squares– use and apply factorization in simplifying an algebraic fraction– use simultaneous equations to solve a worded problem.
The question was attempted by 92 per cent of the candidates, 3 per cent of whom scored the maximumavailable mark. The mean mark was 4.54 out of 12.
Responses were generally unsatisfactory. Candidates generally demonstrated proficiency in computingL.C.M, factorizing using the difference of two squares and translating the worded problems intolinear equations. In attempting to simplify the algebraic fraction, a significant number of candidateshad difficulty with expanding -3(x-2), they incorrectly obtained -3x-6 while other candidates did notretain the L.C.M in the expression. Some candidates could not factorise x2 – 5x and incorrectly treatedit as a difference of two squares.
Part (b) (ii) was not attempted by many candidates. Only the very able candidates recognized thatfactorisation of both the numerator and denominator was necessary before the expression can besimplified.
In solving the simultaneous equations, those candidates who used the method of elimination did notalways know whether to add or subtract to eliminate a variable while those who used substitutionmade errors in transposing.
Solutions:
(a)
(b) (i) a) x(x – 5)b) (x – 9) (x + 9)
(ii)
(c) $20.00
2x – 915
aa – 1
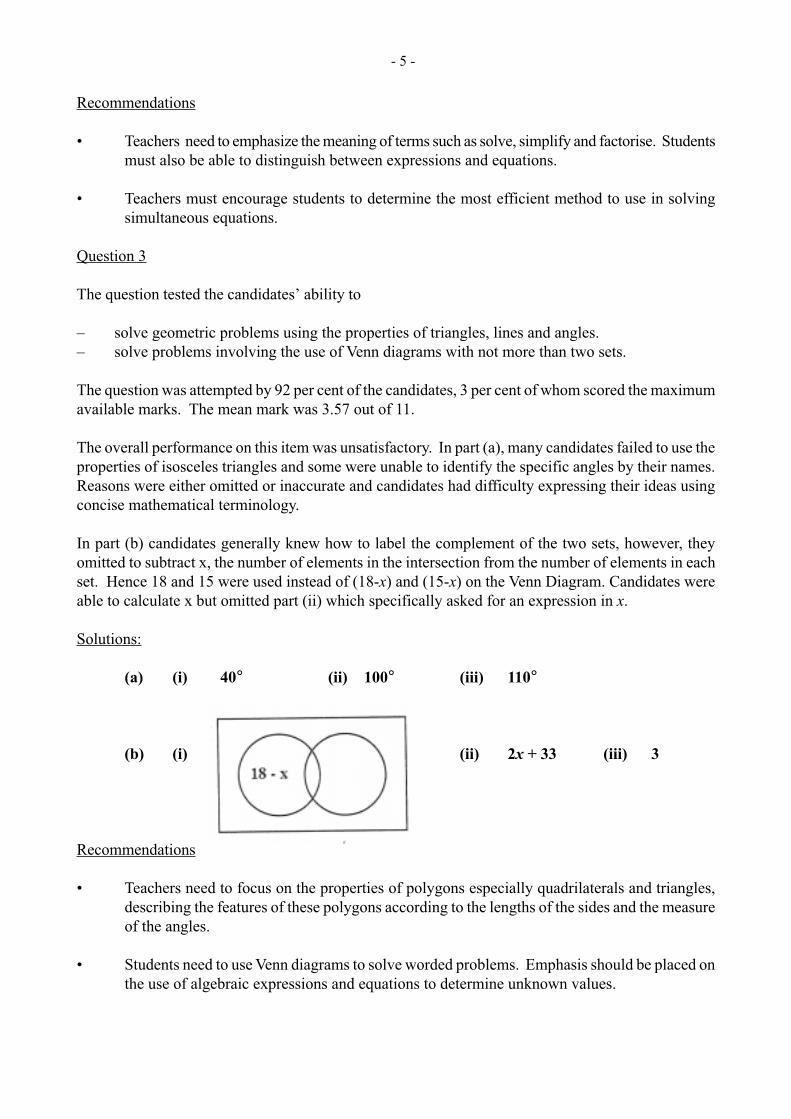
- 5 -
Recommendations
• Teachers need to emphasize the meaning of terms such as solve, simplify and factorise. Studentsmust also be able to distinguish between expressions and equations.
• Teachers must encourage students to determine the most efficient method to use in solvingsimultaneous equations.
Question 3
The question tested the candidates’ ability to
– solve geometric problems using the properties of triangles, lines and angles.– solve problems involving the use of Venn diagrams with not more than two sets.
The question was attempted by 92 per cent of the candidates, 3 per cent of whom scored the maximumavailable marks. The mean mark was 3.57 out of 11.
The overall performance on this item was unsatisfactory. In part (a), many candidates failed to use theproperties of isosceles triangles and some were unable to identify the specific angles by their names.Reasons were either omitted or inaccurate and candidates had difficulty expressing their ideas usingconcise mathematical terminology.
In part (b) candidates generally knew how to label the complement of the two sets, however, theyomitted to subtract x, the number of elements in the intersection from the number of elements in eachset. Hence 18 and 15 were used instead of (18-x) and (15-x) on the Venn Diagram. Candidates wereable to calculate x but omitted part (ii) which specifically asked for an expression in x.
Solutions:
(a) (i) 40° (ii) 100° (iii) 110°
(b) (i) (ii) 2x + 33 (iii) 3
Recommendations
• Teachers need to focus on the properties of polygons especially quadrilaterals and triangles,describing the features of these polygons according to the lengths of the sides and the measureof the angles.
• Students need to use Venn diagrams to solve worded problems. Emphasis should be placed onthe use of algebraic expressions and equations to determine unknown values.
- 6 -
Question 4
The question tested the candidates’ ability to
– use instruments to construct a triangle and an angle of 60°– draw line segments of a given length and measure the length of a line– draw a line perpendicular to a given line– use trigonometric ratios to determine the length of one side of a triangle– calculate the perimeter of a triangle– calculate the area of a triangle.
The question was attempted by 85 per cent of the candidates, 9 per cent of whom scored the maximumavailable mark. The mean mark was 5.9 out of 12.
Candidates generally succeeded in drawing the triangle with the prescribed dimensions and in measuringBC. They were also able to calculate the perimeter and area of triangle ABC.
Generally candidates experienced difficulty with the construction of a 60o angle, locating the point Dand drawing the line through D, perpendicular to AB.
Some common errors were locating D outside of AB; drawing a perpendicular bisector of AB insteadof a line through C, perpendicular to AB; using the ruler to measure lengths in that the initial point ofmeasurement was taken as 1 instead of zero; using a protractor to measure 60° instead of constructingthe angle; and using incorrect values in the formula for finding the area of a triangle.
Solutions:
(b) 7.0 to 0.1 cm
(c) 20 cm
(e) 4.33 cm
(f) 17.3 cm2
Recommendations
• Teachers need to emphasize the difference between draw and construct and ensure that studentscan use instruments properly.
• Since a large number of candidates had problems interpreting directions, teachers must presentopportunities for students to interpret instructions and pose their own instructions so that theygain competence in the proper use of the language of mathematics.
Question 5
The question tested the candidates’ ability to use graphs of a quadratic function to
– determine the elements of the domain that have a given range– determine the roots of the function– determine the minimum point of the function– determine the intervals of the domain for which the elements on the range may be greater than
or less than a given value– estimate the value of the gradient of a curve at a given point given the tangent at the point.
- 7 -
This question was attempted by approximately 62 per cent of the candidates, less than 1 per cent ofwhom obtained the maximum available mark. The mean mark was 2.49 out of 11.
In general, the performance was very unsatisfactory. It was evident from the responses that candidateswere not familiar with interpreting graphs and the majority of them attempted to use calculations toanswer the questions posed.
In attempting to identify the values of a and b which define the domain a ≤ x d ≤ , candidates gavecoordinates or vectors as answers rather than values.
The following incorrect answers were seen:
(-2, 4), (-2,5) and (4, 5)
Part (b) required the candidate to state values of x for which f(x) = 0.
Many candidates used various algebraic methods such as solving by factorisation, completing thesquare, and using the quadratic formula.
Many candidates could identify the coordinates of the minimum point but some reversed the coordinateswhile others wrote them as column matrices.
Some candidates even used to find the minimum value of y and to find the valueof x when it occurs.
Although this question did not require candidates to draw a graph of y = f(x) , many of them redrewthe graph and pointed out the minimum point.
In part (d) candidates were unable to list whole number values for which f(x) < 1. This part wasomitted by a large number of the candidates. Others misinterpreted this question and listed all thewhole numbers in the domain for the function.
Determining the gradient of the function at the point x = 2 posed great difficulty for candidates.
Many candidates demonstrated knowledge of the formula and attempted to use it butthe points chosen were often not on the given tangent.
Careless errors in manipulating negative coordinates were also common. A significant number ofcandidates used the correct formula but interpreted the scales incorrectly.
Solutions:
(a) a = – 2 b = 4
(b) x = – 1 and x = 3
(c) (1, – 4)
(d) 0, 1 ,2, 3
(e) 2
– 2 4
,
4 – 4
ac ba
2 – b
2a
my yx x
= – –
2 1
2 1
- 8 -
Recommendations
• Teachers must caution students to pay attention to specific instructions given in a question.
• Since the majority of candidates opted to use calculations rather than read the graphs, it appearsthat skills in graphical interpretation are not well developed and more time must be devoted tosuch skills rather than merely drawing graphs.
Question 6
The question tested candidates’ ability to
– use Pythagoras’ Theorem to solve simple problems– use trigonometric ratios in the solution of right-angled triangles– solve problems involving bearings– solve quadratic equations
The question was attempted by 77 per cent of the candidates, 4 per cent of whom scored the maximumavailable mark. The mean mark was 2.95 out of 11.
Most of the candidates were able to label the right-angled triangle correctly.
However, a significant number of them applied Pythagoras’ Theorem incorrectly by using x as thehypotenuse. Some common errors were
x = (x+7)2 + 132 and x = (x+7)2 – 132
Squaring (x+7)2 was also a major source of difficulty for many candidates who obtained the followingincorrect results:
x2 + 49 ; 14x + 49 and x2 + 72 .
In solving the quadratic equation, those candidates who chose to use the quadratic formula or completethe square made several errors and were not as successful as those who used factorization.
Few candidates were successful at finding the bearing of F from G. However, the use of inefficientmethods such as the sine or cosine rule instead of the trigonometric ratios could have resulted in lossof valuable time since these methods require lengthy calculations.
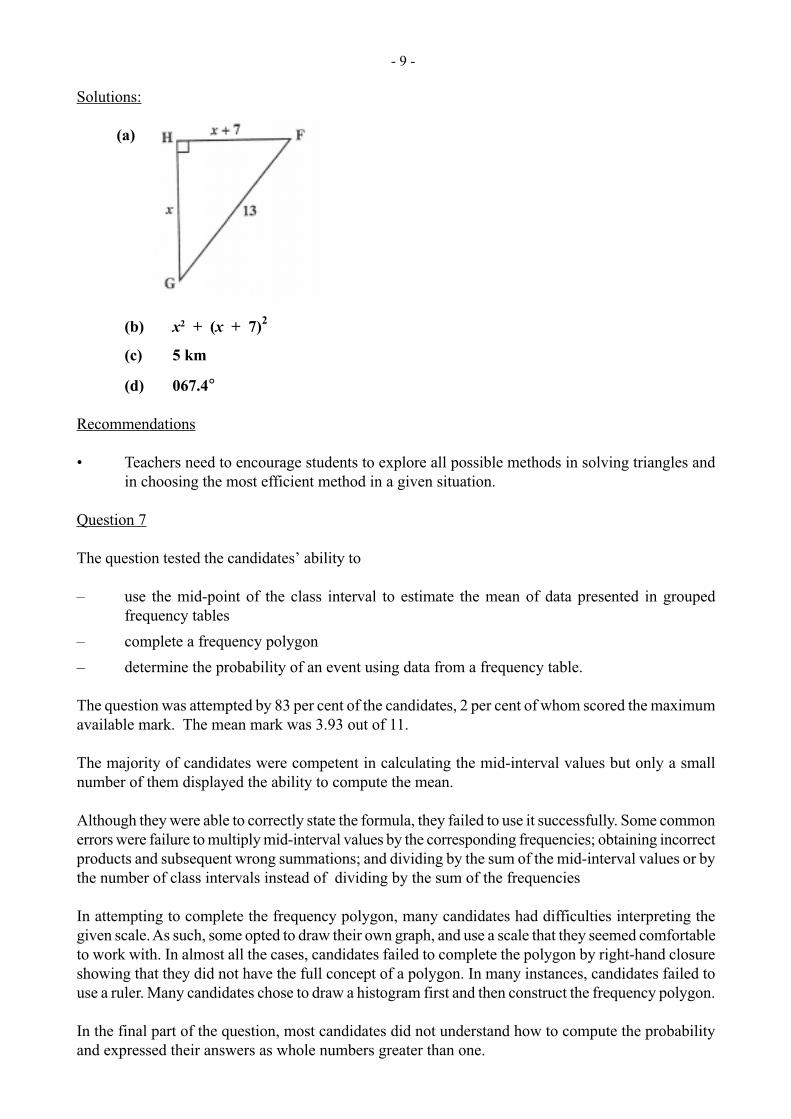
- 9 -
Solutions:
(a)
(b) x2 + (x + 7)2
(c) 5 km
(d) 067.4°
Recommendations
• Teachers need to encourage students to explore all possible methods in solving triangles andin choosing the most efficient method in a given situation.
Question 7
The question tested the candidates’ ability to
– use the mid-point of the class interval to estimate the mean of data presented in groupedfrequency tables
– complete a frequency polygon
– determine the probability of an event using data from a frequency table.
The question was attempted by 83 per cent of the candidates, 2 per cent of whom scored the maximumavailable mark. The mean mark was 3.93 out of 11.
The majority of candidates were competent in calculating the mid-interval values but only a smallnumber of them displayed the ability to compute the mean.
Although they were able to correctly state the formula, they failed to use it successfully. Some commonerrors were failure to multiply mid-interval values by the corresponding frequencies; obtaining incorrectproducts and subsequent wrong summations; and dividing by the sum of the mid-interval values or bythe number of class intervals instead of dividing by the sum of the frequencies
In attempting to complete the frequency polygon, many candidates had difficulties interpreting thegiven scale. As such, some opted to draw their own graph, and use a scale that they seemed comfortableto work with. In almost all the cases, candidates failed to complete the polygon by right-hand closureshowing that they did not have the full concept of a polygon. In many instances, candidates failed touse a ruler. Many candidates chose to draw a histogram first and then construct the frequency polygon.
In the final part of the question, most candidates did not understand how to compute the probabilityand expressed their answers as whole numbers greater than one.
- 10 -
Solutions:
(a) 22, 27, 32
(b) (i) 17.85 kg
(c) 32/100
Recommendations
Teachers need to
• emphasize that a frequency polygon must be closed
• allow students to extract raw data from frequency tables and emphasize that for data in groupedfrequency tables, some assumptions must be made
• vary the scales used in drawing graphics as much as possible the scales in graphs so thatstudents will develop competence in interpreting scales
• use simple experiments to develop the concept of probability so that students appreciate therange of the probability scale.
Question 8
The question tested the candidates’ ability to
– recognize patterns in shapes– recognize number patterns and sequences– predict subsequent steps in a pattern– use algebraic reasoning to generalize a rule for a number pattern.
The question was attempted by 85 per cent of the candidates, 2 per cent of whom scored the maximumavailable marks. The mean mark was 6.13 out of 10.
The performance in this question was generally good. The candidates who performed well were generallyable to draw the next square in the sequence and complete the table of values for n = 4 and n = 7.
Candidates were less successful in using algebraic thinking to generalise a rule for the series.
Solutions:
(ii) a) 40
b) 112
(b) (i) n(n + 1) x 2
(ii) 10; 10 x 11 x 2
Recommendations
• Teachers should give students opportunities to create their own shape patterns and numberpatterns. These patterns should be analyzed so that a general rule emerges; such activities willenable them to develop their reasoning and analytical skills.
- 11 -
Question 9
The question tested the candidates’ ability to
– solve simultaneous equations involving one linear and one quadratic equation– translate verbal statements into algebraic symbols– change the subject of an algebraic equation– solve a problem involving a quadratic equation.
The question was attempted by 26 per cent of the candidates, 6.1 per cent of whom scored the maximumavailable marks. The mean mark was 2.83 out of 15.
In general, this question was poorly done. Many candidates were able to determine the strategy to beused in solving the simultaneous equations. While some experienced problems in eliminating onevariable, the majority of candidates used substitution to find the second variable.
The rest of the question proved to be extremely challenging to the candidates. Candidates wereunable to use the concepts of perimeter and area to write an algebraic expression for the length of thewire. They also had difficulty in solving the quadratic equation using the formula. Some roundedpre-maturely and obtained inaccurate answers.
Solutions:
(a) 2, – 1
(b) (i) 2(3 + 6)
(ii) 13 – 2x
(iii) x2 – 6x + 39
(iv) 3.5, 2.5
Recommendations
Question 10
The question tested the candidates’ ability to
- write inequalities from worded statements- draw graphs of linear inequalities in one or two variables- determine the solution of a set of inequalities- use linear programming techniques to determine the maximum value of an expression.
The question was attempted by 30 per cent of the candidates, 3 per cent of whom scored the maximumavailable mark. Performance was generally fair with a mean mark of 5.37 out of 15.
Candidates were proficient in using the scale and drawing the straight line graphs although some ofthese graphs were derived from incorrect equations. In many cases the direction of the inequalitieswas reversed.
- 12 -
A significant number of candidates were able to identify the region satisfying their inequalities, however,some merely shaded a triangular region whether or not it was consistent with their inequalities.
Candidates were also able to write down the coordinates of their vertices correctly but the majoritytested only one point and as such had no basis for comparison even if they had recognized the maximumpoint.
Solutions:
(i) x + y < 60
(ii) y ≥ 10
(iii) y ≤ 2x
(v) 6x + 5y
(vi) (5, 10) (20, 40) (50, 10)
(vii) The maximum fees was $350.
Recommendations
Students need to be able to differentiate the graph of an inequation in one variable from an inequationin two variables. Students seem to be having a lot of difficulty in drawing lines through the origin,horizontal and vertical lines.
The interpretation of phrases such as no more than, and at most, and at least need to receive particularattention and must be treated as necessary prerequisites for this topic.
Students must show working to justify conclusions, for example, testing a sufficient number of pointsto determine which point gives the maximum.
Question 11
The question tested the candidates’ ability to
– solve practical problems involving heights and distances in three-dimensional situations– use trigonometric ratios to solve problems involving angles of elevation– use theorems in circle geometry to calculate the measure of angles.
The question was attempted by 37 per cent of the candidates, 3 per cent of whom scored the maximumavailable mark. The mean mark was 4.49 out of 15.
Part (a) was generally well done. Candidates showed a reasonable level of proficiency in trigonometry.Most of the candidates labelled the diagram correctly although a significant number had the angles ofelevation aligned with the vertical instead of the horizontal.
In calculating the length of TW, some candidates chose the incorrect trigonometric ratios. Those whoused the cosine rule chose a longer route and exposed themselves to more computational errors.
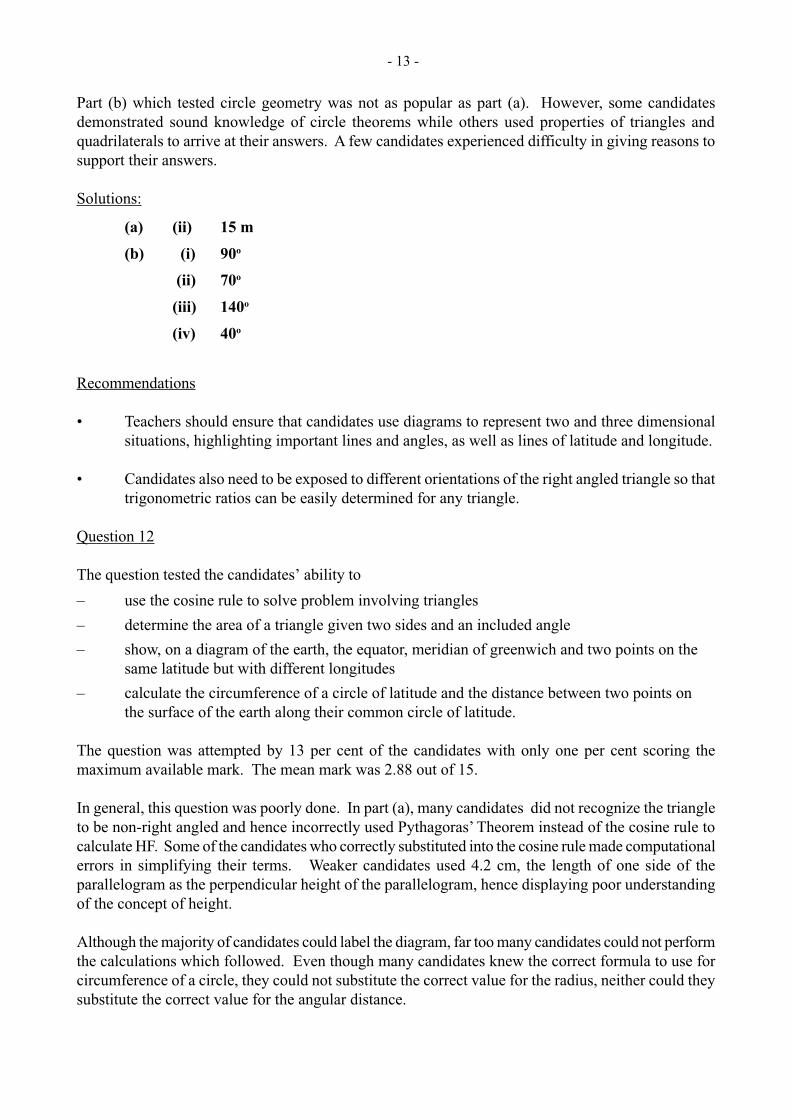
- 13 -
Part (b) which tested circle geometry was not as popular as part (a). However, some candidatesdemonstrated sound knowledge of circle theorems while others used properties of triangles andquadrilaterals to arrive at their answers. A few candidates experienced difficulty in giving reasons tosupport their answers.
Solutions:
(a) (ii) 15 m
(b) (i) 90o
(ii) 70o
(iii) 140o
(iv) 40o
Recommendations
• Teachers should ensure that candidates use diagrams to represent two and three dimensionalsituations, highlighting important lines and angles, as well as lines of latitude and longitude.
• Candidates also need to be exposed to different orientations of the right angled triangle so thattrigonometric ratios can be easily determined for any triangle.
Question 12
The question tested the candidates’ ability to
– use the cosine rule to solve problem involving triangles
– determine the area of a triangle given two sides and an included angle
– show, on a diagram of the earth, the equator, meridian of greenwich and two points on thesame latitude but with different longitudes
– calculate the circumference of a circle of latitude and the distance between two points onthe surface of the earth along their common circle of latitude.
The question was attempted by 13 per cent of the candidates with only one per cent scoring themaximum available mark. The mean mark was 2.88 out of 15.
In general, this question was poorly done. In part (a), many candidates did not recognize the triangleto be non-right angled and hence incorrectly used Pythagoras’ Theorem instead of the cosine rule tocalculate HF. Some of the candidates who correctly substituted into the cosine rule made computationalerrors in simplifying their terms. Weaker candidates used 4.2 cm, the length of one side of theparallelogram as the perpendicular height of the parallelogram, hence displaying poor understandingof the concept of height.
Although the majority of candidates could label the diagram, far too many candidates could not performthe calculations which followed. Even though many candidates knew the correct formula to use forcircumference of a circle, they could not substitute the correct value for the radius, neither could theysubstitute the correct value for the angular distance.
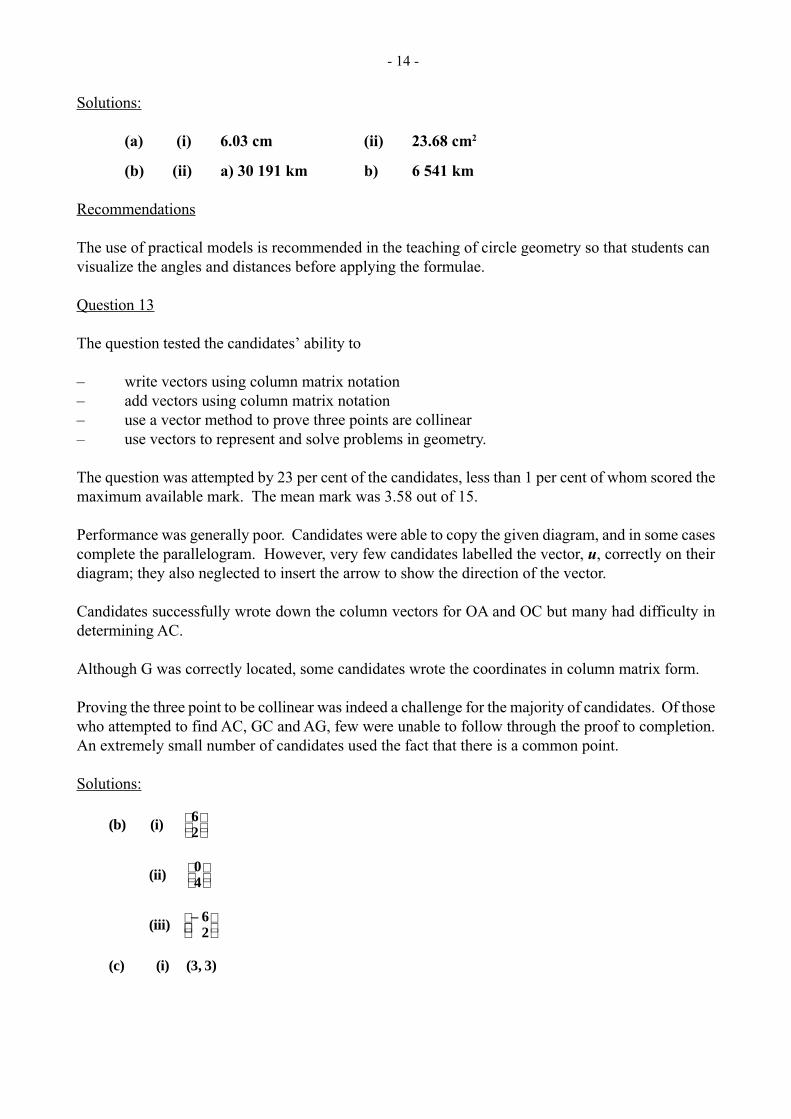
- 14 -
Solutions:
(a) (i) 6.03 cm (ii) 23.68 cm2
(b) (ii) a) 30 191 km b) 6 541 km
Recommendations
The use of practical models is recommended in the teaching of circle geometry so that students canvisualize the angles and distances before applying the formulae.
Question 13
The question tested the candidates’ ability to
– write vectors using column matrix notation– add vectors using column matrix notation– use a vector method to prove three points are collinear– use vectors to represent and solve problems in geometry.
The question was attempted by 23 per cent of the candidates, less than 1 per cent of whom scored themaximum available mark. The mean mark was 3.58 out of 15.
Performance was generally poor. Candidates were able to copy the given diagram, and in some casescomplete the parallelogram. However, very few candidates labelled the vector, u, correctly on theirdiagram; they also neglected to insert the arrow to show the direction of the vector.
Candidates successfully wrote down the column vectors for OA and OC but many had difficulty indetermining AC.
Although G was correctly located, some candidates wrote the coordinates in column matrix form.
Proving the three point to be collinear was indeed a challenge for the majority of candidates. Of thosewho attempted to find AC, GC and AG, few were unable to follow through the proof to completion.An extremely small number of candidates used the fact that there is a common point.
Solutions:
(b) (i) 62
(ii)
04
(iii) – 62
(c) (i) (3, 3)
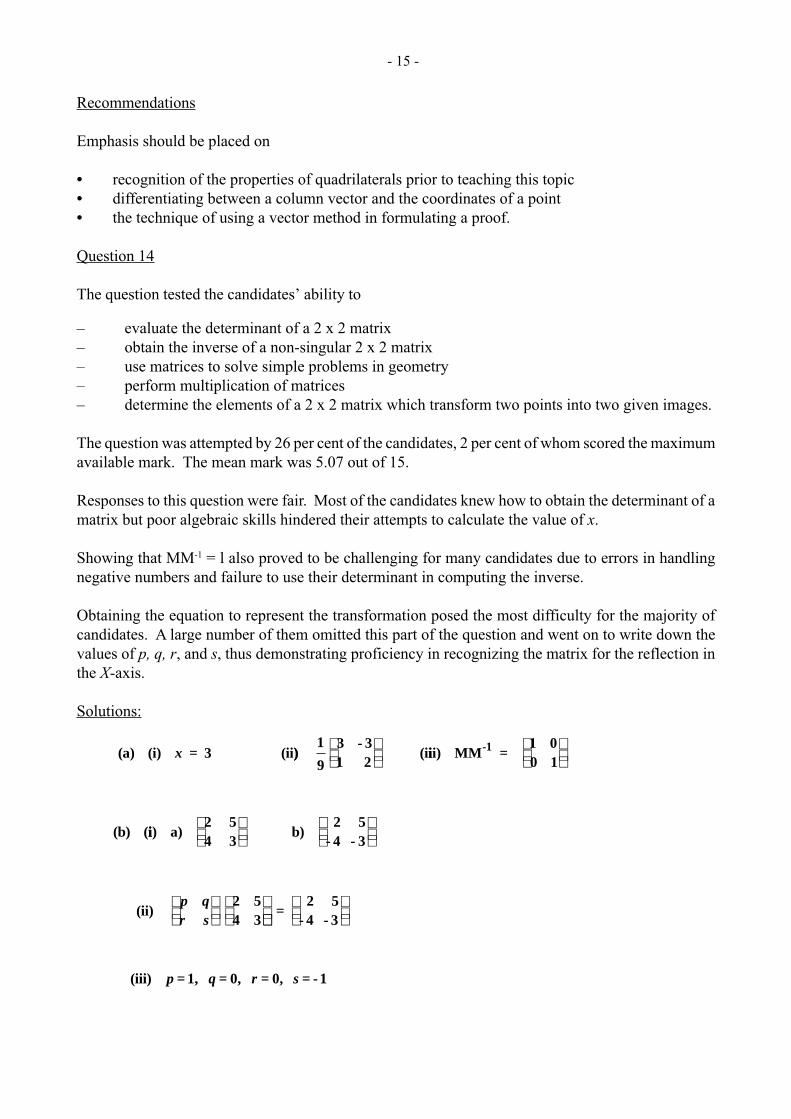
- 15 -
Recommendations
Emphasis should be placed on
• recognition of the properties of quadrilaterals prior to teaching this topic• differentiating between a column vector and the coordinates of a point• the technique of using a vector method in formulating a proof.
Question 14
The question tested the candidates’ ability to
– evaluate the determinant of a 2 x 2 matrix– obtain the inverse of a non-singular 2 x 2 matrix– use matrices to solve simple problems in geometry– perform multiplication of matrices– determine the elements of a 2 x 2 matrix which transform two points into two given images.
The question was attempted by 26 per cent of the candidates, 2 per cent of whom scored the maximumavailable mark. The mean mark was 5.07 out of 15.
Responses to this question were fair. Most of the candidates knew how to obtain the determinant of amatrix but poor algebraic skills hindered their attempts to calculate the value of x.
Showing that MM-1 = l also proved to be challenging for many candidates due to errors in handlingnegative numbers and failure to use their determinant in computing the inverse.
Obtaining the equation to represent the transformation posed the most difficulty for the majority ofcandidates. A large number of them omitted this part of the question and went on to write down thevalues of p, q, r, and s, thus demonstrating proficiency in recognizing the matrix for the reflection inthe X-axis.
Solutions:
(a) (i) = 3 (iix ))1
9
3 - 31 2
(i
iii) MM =
1 00 1
(b) (
-1
ii) a) 2 54 3
b)
2 5- 4 - 3
(ii)
2 54 3
p qr s
=
2 5- 4 - 3
(iii) = 1, = 0, = 0, = - 1p q r s
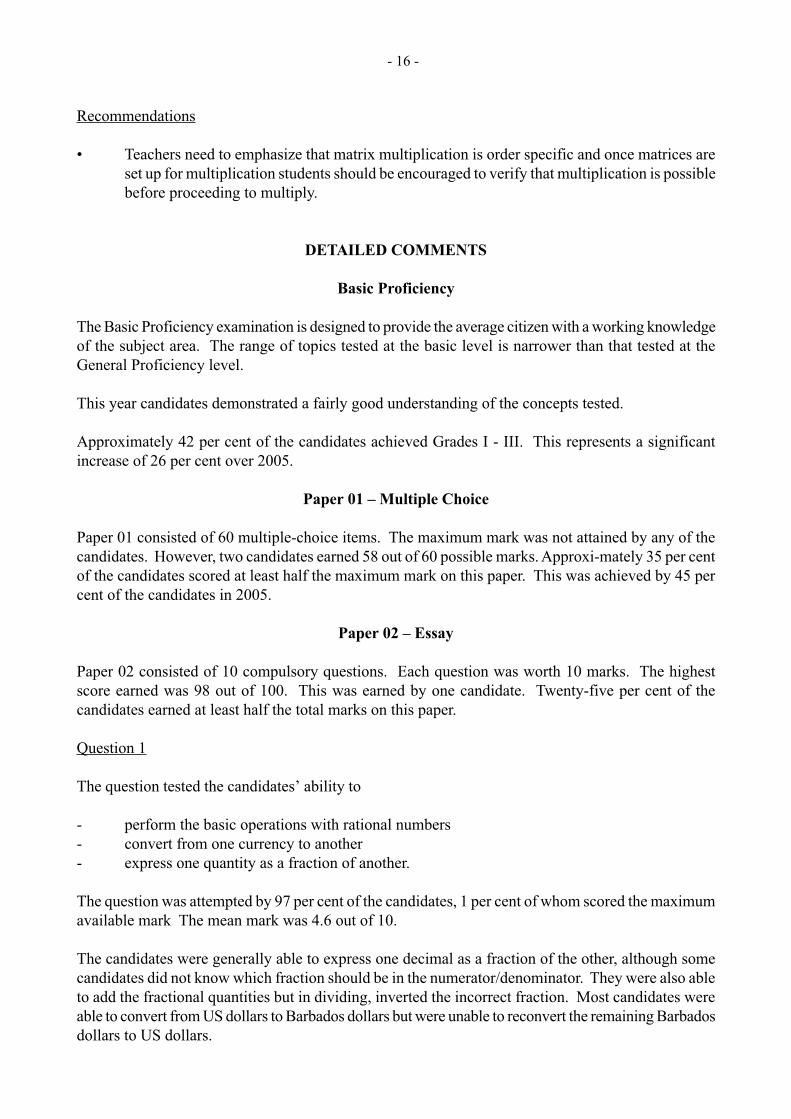
- 16 -
Recommendations
• Teachers need to emphasize that matrix multiplication is order specific and once matrices areset up for multiplication students should be encouraged to verify that multiplication is possiblebefore proceeding to multiply.
DETAILED COMMENTS
Basic Proficiency
The Basic Proficiency examination is designed to provide the average citizen with a working knowledgeof the subject area. The range of topics tested at the basic level is narrower than that tested at theGeneral Proficiency level.
This year candidates demonstrated a fairly good understanding of the concepts tested.
Approximately 42 per cent of the candidates achieved Grades I - III. This represents a significantincrease of 26 per cent over 2005.
Paper 01 – Multiple Choice
Paper 01 consisted of 60 multiple-choice items. The maximum mark was not attained by any of thecandidates. However, two candidates earned 58 out of 60 possible marks. Approxi-mately 35 per centof the candidates scored at least half the maximum mark on this paper. This was achieved by 45 percent of the candidates in 2005.
Paper 02 – Essay
Paper 02 consisted of 10 compulsory questions. Each question was worth 10 marks. The highestscore earned was 98 out of 100. This was earned by one candidate. Twenty-five per cent of thecandidates earned at least half the total marks on this paper.
Question 1
The question tested the candidates’ ability to
- perform the basic operations with rational numbers- convert from one currency to another- express one quantity as a fraction of another.
The question was attempted by 97 per cent of the candidates, 1 per cent of whom scored the maximumavailable mark The mean mark was 4.6 out of 10.
The candidates were generally able to express one decimal as a fraction of the other, although somecandidates did not know which fraction should be in the numerator/denominator. They were also ableto add the fractional quantities but in dividing, inverted the incorrect fraction. Most candidates wereable to convert from US dollars to Barbados dollars but were unable to reconvert the remaining Barbadosdollars to US dollars.
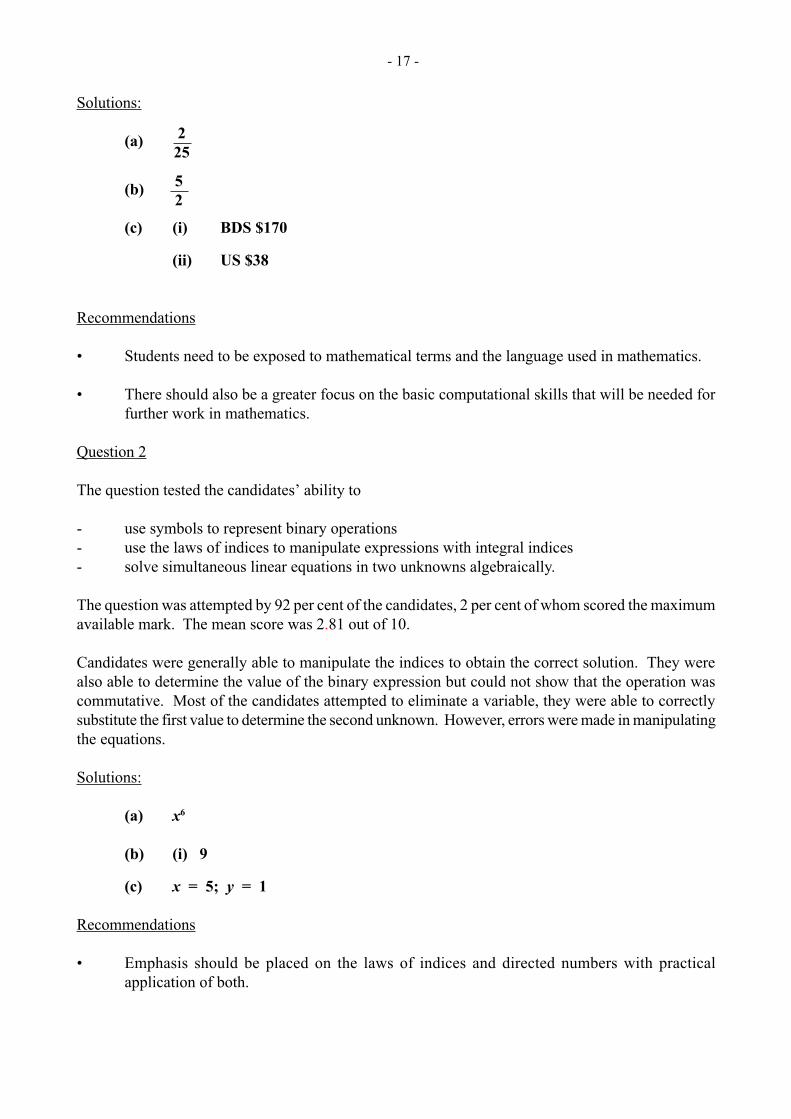
- 17 -
Solutions:
(a)
(b)
(c) (i) BDS $170
(ii) US $38
Recommendations
• Students need to be exposed to mathematical terms and the language used in mathematics.
• There should also be a greater focus on the basic computational skills that will be needed forfurther work in mathematics.
Question 2
The question tested the candidates’ ability to
- use symbols to represent binary operations- use the laws of indices to manipulate expressions with integral indices- solve simultaneous linear equations in two unknowns algebraically.
The question was attempted by 92 per cent of the candidates, 2 per cent of whom scored the maximumavailable mark. The mean score was 2.81 out of 10.
Candidates were generally able to manipulate the indices to obtain the correct solution. They werealso able to determine the value of the binary expression but could not show that the operation wascommutative. Most of the candidates attempted to eliminate a variable, they were able to correctlysubstitute the first value to determine the second unknown. However, errors were made in manipulatingthe equations.
Solutions:
(a) x6
(b) (i) 9
(c) x = 5; y = 1
Recommendations
• Emphasis should be placed on the laws of indices and directed numbers with practicalapplication of both.
225
52
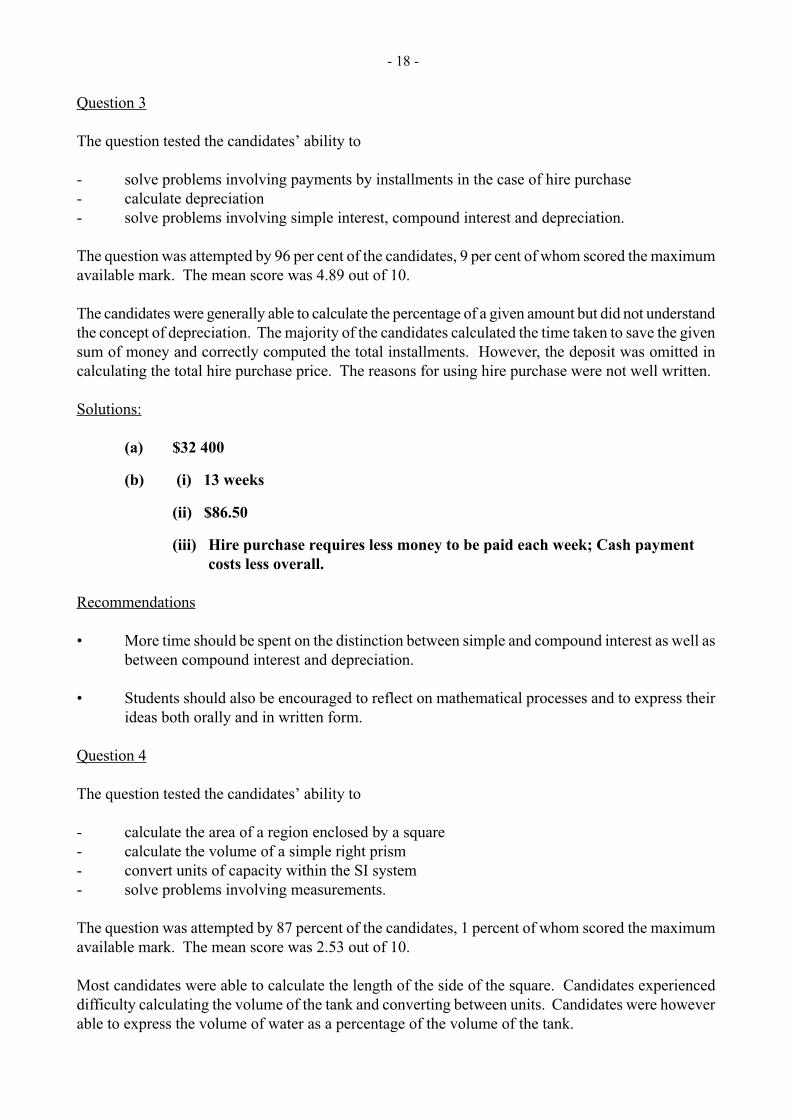
- 18 -
Question 3
The question tested the candidates’ ability to
- solve problems involving payments by installments in the case of hire purchase- calculate depreciation- solve problems involving simple interest, compound interest and depreciation.
The question was attempted by 96 per cent of the candidates, 9 per cent of whom scored the maximumavailable mark. The mean score was 4.89 out of 10.
The candidates were generally able to calculate the percentage of a given amount but did not understandthe concept of depreciation. The majority of the candidates calculated the time taken to save the givensum of money and correctly computed the total installments. However, the deposit was omitted incalculating the total hire purchase price. The reasons for using hire purchase were not well written.
Solutions:
(a) $32 400
(b) (i) 13 weeks
(ii) $86.50
(iii) Hire purchase requires less money to be paid each week; Cash payment costs less overall.
Recommendations
• More time should be spent on the distinction between simple and compound interest as well asbetween compound interest and depreciation.
• Students should also be encouraged to reflect on mathematical processes and to express theirideas both orally and in written form.
Question 4
The question tested the candidates’ ability to
- calculate the area of a region enclosed by a square- calculate the volume of a simple right prism- convert units of capacity within the SI system- solve problems involving measurements.
The question was attempted by 87 percent of the candidates, 1 percent of whom scored the maximumavailable mark. The mean score was 2.53 out of 10.
Most candidates were able to calculate the length of the side of the square. Candidates experienceddifficulty calculating the volume of the tank and converting between units. Candidates were howeverable to express the volume of water as a percentage of the volume of the tank.
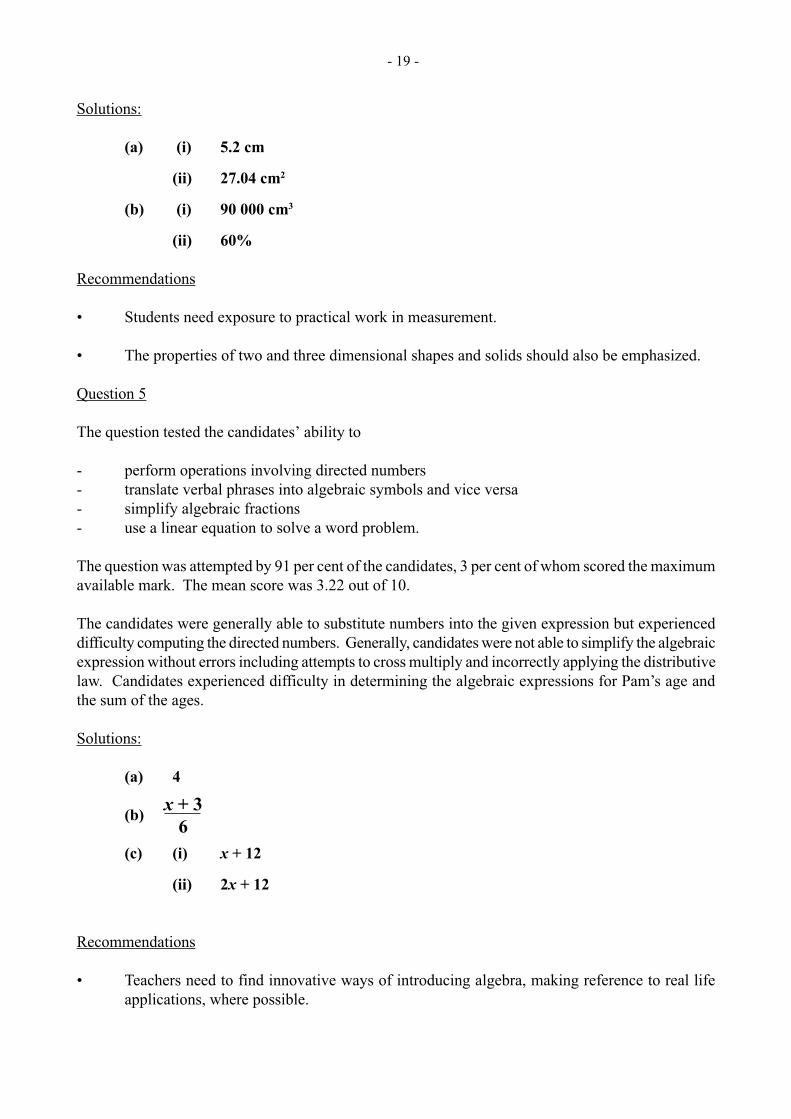
- 19 -
Solutions:
(a) (i) 5.2 cm
(ii) 27.04 cm2
(b) (i) 90 000 cm3
(ii) 60%
Recommendations
• Students need exposure to practical work in measurement.
• The properties of two and three dimensional shapes and solids should also be emphasized.
Question 5
The question tested the candidates’ ability to
- perform operations involving directed numbers- translate verbal phrases into algebraic symbols and vice versa- simplify algebraic fractions- use a linear equation to solve a word problem.
The question was attempted by 91 per cent of the candidates, 3 per cent of whom scored the maximumavailable mark. The mean score was 3.22 out of 10.
The candidates were generally able to substitute numbers into the given expression but experienceddifficulty computing the directed numbers. Generally, candidates were not able to simplify the algebraicexpression without errors including attempts to cross multiply and incorrectly applying the distributivelaw. Candidates experienced difficulty in determining the algebraic expressions for Pam’s age andthe sum of the ages.
Solutions:
(a) 4
(b)
(c) (i) x + 12
(ii) 2x + 12
Recommendations
• Teachers need to find innovative ways of introducing algebra, making reference to real lifeapplications, where possible.
x + 36
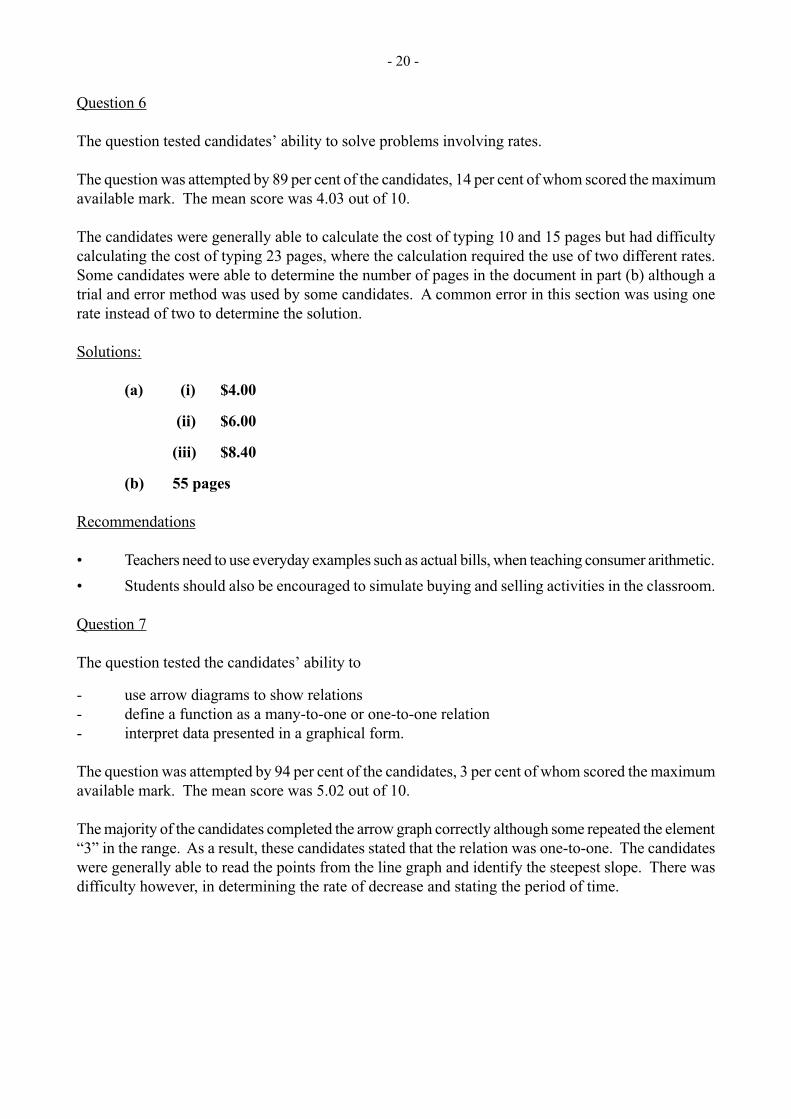
- 20 -
Question 6
The question tested candidates’ ability to solve problems involving rates.
The question was attempted by 89 per cent of the candidates, 14 per cent of whom scored the maximumavailable mark. The mean score was 4.03 out of 10.
The candidates were generally able to calculate the cost of typing 10 and 15 pages but had difficultycalculating the cost of typing 23 pages, where the calculation required the use of two different rates.Some candidates were able to determine the number of pages in the document in part (b) although atrial and error method was used by some candidates. A common error in this section was using onerate instead of two to determine the solution.
Solutions:
(a) (i) $4.00
(ii) $6.00
(iii) $8.40
(b) 55 pages
Recommendations
• Teachers need to use everyday examples such as actual bills, when teaching consumer arithmetic.
• Students should also be encouraged to simulate buying and selling activities in the classroom.
Question 7
The question tested the candidates’ ability to
- use arrow diagrams to show relations- define a function as a many-to-one or one-to-one relation- interpret data presented in a graphical form.
The question was attempted by 94 per cent of the candidates, 3 per cent of whom scored the maximumavailable mark. The mean score was 5.02 out of 10.
The majority of the candidates completed the arrow graph correctly although some repeated the element“3” in the range. As a result, these candidates stated that the relation was one-to-one. The candidateswere generally able to read the points from the line graph and identify the steepest slope. There wasdifficulty however, in determining the rate of decrease and stating the period of time.
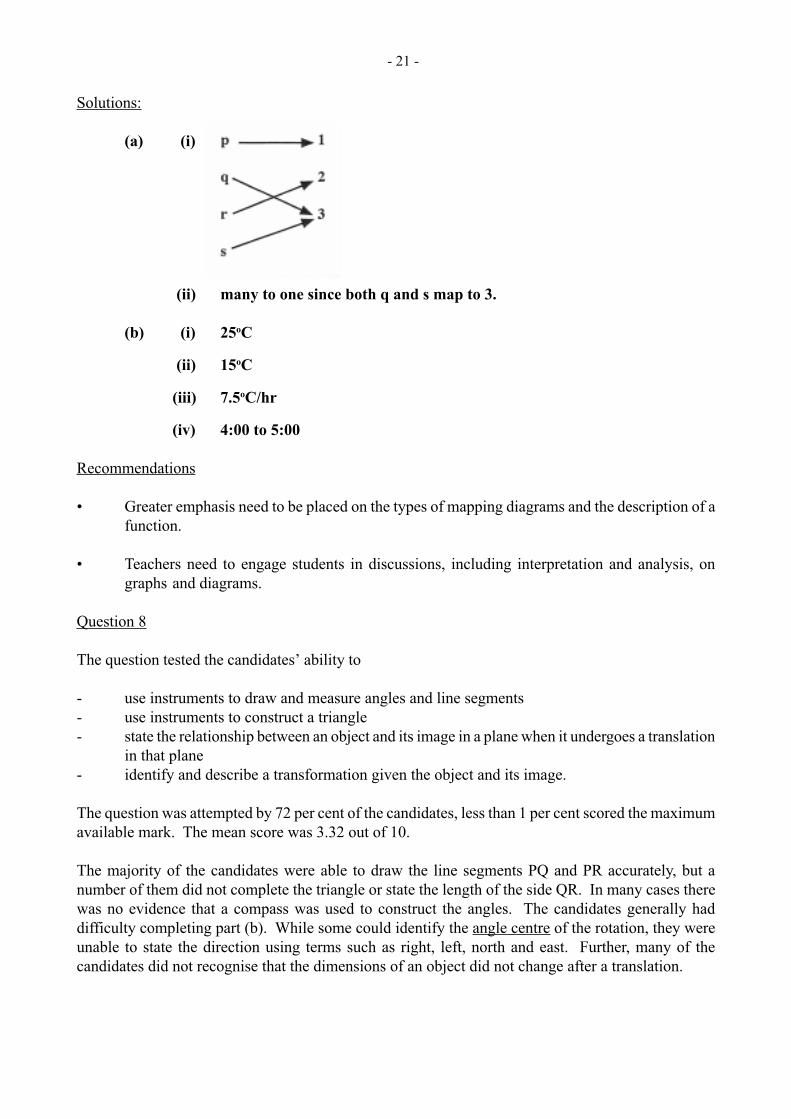
- 21 -
Solutions:
(a) (i)
(ii) many to one since both q and s map to 3.
(b) (i) 25oC
(ii) 15oC
(iii) 7.5oC/hr
(iv) 4:00 to 5:00
Recommendations
• Greater emphasis need to be placed on the types of mapping diagrams and the description of afunction.
• Teachers need to engage students in discussions, including interpretation and analysis, ongraphs and diagrams.
Question 8
The question tested the candidates’ ability to
- use instruments to draw and measure angles and line segments- use instruments to construct a triangle- state the relationship between an object and its image in a plane when it undergoes a translation
in that plane- identify and describe a transformation given the object and its image.
The question was attempted by 72 per cent of the candidates, less than 1 per cent scored the maximumavailable mark. The mean score was 3.32 out of 10.
The majority of the candidates were able to draw the line segments PQ and PR accurately, but anumber of them did not complete the triangle or state the length of the side QR. In many cases therewas no evidence that a compass was used to construct the angles. The candidates generally haddifficulty completing part (b). While some could identify the angle centre of the rotation, they wereunable to state the direction using terms such as right, left, north and east. Further, many of thecandidates did not recognise that the dimensions of an object did not change after a translation.
- 22 -
Solutions:
(a) QR = 7.2 cm
(b) (i) ABC is mapped onto A′′′′′B′′′′′C′′′′′ by a rotation of 90 degrees about theOrigin in a clockwise direction.
(ii) a) A″″″″″B″″″″″ = 6 cm
b) ∠∠∠∠∠C″″″″″A″″″″″B″″″″″ is 90 degrees
Recommendations
• Students need more practice in drawing polygons using geometrical tools with special emphasison constructing angles with the compasses.
• Transformation geometry should be taught both on graph paper and on plain paper so thatstudents become familiar with different orientations without depending on graph lines.
Question 9
The question tested the candidates’ ability to
- draw and use bar charts- determine the mean for a set of data- determine experimental and theoretical probabilities of simple events.
The question was attempted by 95 per cent of the candidates, 4 per cent of whom scored the maximumavailable mark. The mean score was 6.08 out of 10.13 per cent of the candidates scored at least halfthe marks on this question.
The candidates were generally able to calculate how many more chocolates were sold, the total numbersold for the week and the mean number sold for the week, although a few candidates calculated themedian instead of the mean. There was some difficulty computing the probability.
Solutions:
(a) 15
(b) 220
(c) 44
(e)
Recommendations
• Teachers should expose students to more experimental probability conducting simpleexperiments in the classroom.
• The measures of central tendency (mean, median, mode) also need to be clearly defined andsufficient examples and exercises provided so that students can differentiate among them.
35
- 23 -
Question 10
The question tested the candidates’ ability to
- use the properties of perpendicular and parallel lines to solve problems- use Pythagoras’ Theorem to solve problems- use the sine, cosine and tangent ratios in the solution of right-angled triangles- solve problems involving bearings.
The question was attempted by 67 per cent of the candidates, less than 1 per cent of them scored themaximum available mark. The mean mark was 2.09 out of 10..The candidates were generally able to determine the values of the unknown angles. However, theywere unable to use Pythagoras’ theorem correctly, use trigonometric ratios to determine the unknownangle or determine the bearing.
Solutions:
(a) x = 110o ; y = 110o
(b) (i) 15 m
(ii) 58o
(iii) 32o
Recommendations
• Students need more practice in the real life application of Pythagoras’ Theorem, trigonometricratios and bearings to complement the work done in the classroom.
C A R I B B E A N E X A M I N A T I O N S C O U N C I L
REPORT ON CANDIDATES’ WORK IN THE SECONDARY EDUCATION CERTIFICATE EXAMINATION
JANUARY 2007
MATHEMATICS
Copyright © 2007 Caribbean Examinations Council ®St Michael, Barbados
All rights reserved
MATHEMATICS
GENERAL PROFICIENCY EXAMINATION
JANUARY 2007
GENERAL COMMENTS
The General Proficiency Mathematics examination is offered in January and May/June each year. The BasicProficiency is offered in May/June only.
There was a candidate entry of approximately 12 650 in January 2007. This year, forty-four per cent of thecandidates achieved Grades I – III. The mean percentage for the examination was 44.
DETAILED COMMENTS
The examination consists of two papers. Paper 01 consists of 60 multiple choice items. The highest markwas 59 and approximately 61 per cent of the candidates scored at least half the available marks for this paper.
Paper 02 consists of two sections. Section I comprised eight compulsory questions totalling 90 marks. SectionII comprised six optional questions: two each in Relations, Functions and Graphs; Trigonometry and Geometry;Vectors and Matrices. Candidates were required to choose any two questions. Each question was worth 15marks.
This year, two candidates earned the maximum available marks on Paper 02 and approximately 26 per cent ofthe candidates earned at least half the maximum mark on this paper.
Question 1
This question tested candidates’ ability to
- perform basic operations with decimals- approximate a decimal number to the nearest whole number- solve problems involving ratio, rates and proportion.
The question was attempted by 99 per cent of the candidates, 29 per cent of whom scored the maximumavailable mark. The mean score was 9 out of 12.
Generally, performance on this item was good, particularly in part (a) where many candidates demonstratedcompetence in performing the operations on decimals. Incorrect answers were mainly due to careless errorsand in some cases (1.5)2 was computed as 2 x 1.5.
In part (b), the majority of candidates demonstrated a sound understanding of ratio although many did notrecognize that $60.00 represented two shares
2
Using the given rate to calculate the cost of 3 litres of gasoline in part (c) was well done by the majority ofcandidates. However, a significant number of candidates could not calculate the number of litres which couldbe bought with $50.00.
Many candidates had difficulty completing the approximation, since they were unable to round theiranswers to the nearest whole number.
Solutions
(a) (i) 12.2092 (ii) 2.1
(b) $210.00
(c) (i) $17.33 (ii) 14 litres
Recommendations
Teachers need to encourage candidates to show all working by writing their solutions to sub-parts of a question.In addition, the candidates need to be exposed to problems which could be solved using ratio or proportion.There should also be emphasis on approximation, especially rounding to whole numbers.
Question 2
This question tested candidates’ ability to
- perform operations involving directed numbers- substitute numbers for algebraic symbols in simple algebraic expressions- solve linear equations in one unknown- simplify algebraic fractions- solve a simple linear inequality in one unknown.
The question was attempted by 99 per cent of the candidates, 6 per cent of whom scored the maximumavailable mark. The mean score was 6.15 out of 12.
Candidates generally demonstrated proficiency in the substitution in part (a) although some of the weakercandidates could not multiply negative numbers accurately.
In attempting to simplify the algebraic fraction in part (b), a significant number of candidates used an LCM of5 instead of 6 while others incorrectly cross-multiplied and obtained3x + 2x =5. Solving the in-equation proved challenging for candidates. Some treated it as an equation, whileothers solved for –x instead of x.
In part (c), candidates were able to use symbols to represent the cost of 5 muffins although some incorrectlywrote 5m + m or 5m × m. Stating the cost of 6 cupcakes given the cost of three, was more challenging andsome candidates wrote 6c, ignoring the information given. The majority of candidates were successful inwriting an equation to represent the total cost of the muffins and cupcakes.
3
Solutions:
(a) (i) 6 (ii) –12(b) (i) x = 6 (ii) x e” –9
(c) (i) a) $5m b) $4m(ii) 5m + 4m = $31.50
Recommendations
Teachers need to teach candidates to simplify and perform the basic operations on algebraic expressions.Candidates must recognise that the solution to an in-equation is different from the solution of an equation.
Question 3
The question tested candidates’ ability to
- use set notation to describe a given set- draw Venn diagrams to represent information- list the members of the union, intersection and complement of a set- determine the number of elements in the union, intersection and complement of a set.
The question was attempted by 99 per cent of the candidates, less that 1 per cent of whom scored themaximum available mark. The mean mark was 4.15 out of 10.
Candidates generally were able to describe the shaded region in part (a)(i), but parrts (ii) and (iii) werepoorly done with some candidates describing the un-shaded regions instead of the shaded regions.
In part (b), candidates were able to identify odd and even numbers. However, the candidates had difficultyidentifying the prime numbers, with many candidates listing 1 as a prime number.
In part (c), a number of candidates interpreted the numbers in each region on the Venn diagram as elementsinstead of the number of elements. For example, the number of elements in AUB was given as {10, 4, 3}or 3 instead of 17.
Solutions:
(i) A ∪∪ ∪∪ ∪ B (ii) (A ∪∪ ∪∪ ∪ B)′′′′′ or A’ ∩ B’ (iii) A
(c) (i) 17 (ii) 4 (ii) 21 (iv) 25
4
Recommendations
Teachers need to emphasise the importance of set notation in the teaching of sets. In addition, candidatesmust be given opportunities to (i) represent practical situations using Venn diagrams and (ii) shade givenregions. Describing these regions in words is also necessary if a full understanding of the concept is tobe attained.
Question 4
(a) The question tested candidates’ ability to- draw line segments- construct a triangle given the lengths of the sides- measure angles in a polygon- calculate the gradient of a straight line given two points- calculate the coordinates of the mid-point given two points.
The question was attempted by 95 per cent of the candidates, 8 per cent of whom scored the maximumavailable mark. The mean mark was 5.1 out of 11.
Candidates were generally able to draw the triangle with the prescribed dimensions. However, manycandidates did not show the appropriate construction lines. Many candidates experienced difficulty inlocating the point D and hence could not proceed to measure AD. In some instances candidates measuredangle BAC instead of angle ABC.
Part (b) was generally well done with candidates showing strengths in the choice of formula for findingthe gradient and mid-point of a line. However, some of the candidates experienced problems in substitutingvalues in the formula because of failure to define or set up their coordinates in terms of (x
1, x
2) and (y
1,
y2 ). Also writing the mid-point as a coordinate was often omitted.
Solutions:
(iii) a) 7.4 cm b) 680
(i) 1.5 (ii) (4, 7)
Recommendations
Teachers need to teach candidates to develop proper techniques to measure line-segments and anglesand to use the appropriate instruments to construct plane figures. Candidates also need to becomefamiliar with the language and terms used in geometry.
5
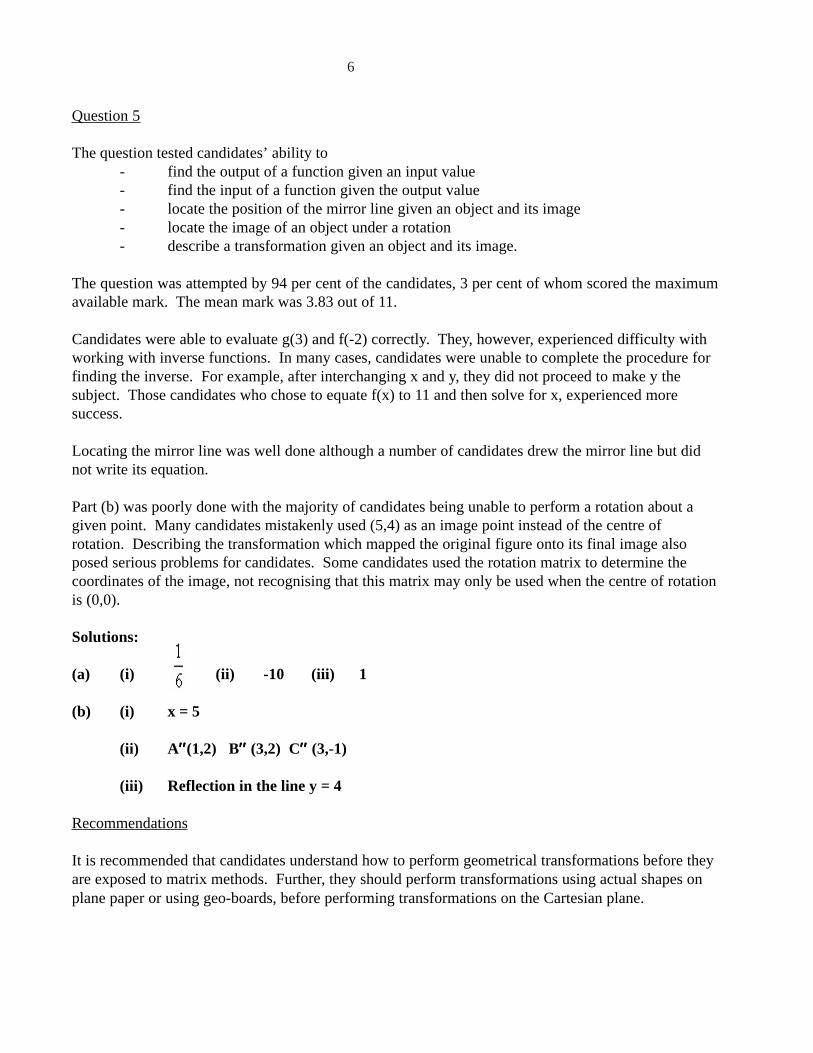
Question 5
The question tested candidates’ ability to- find the output of a function given an input value- find the input of a function given the output value- locate the position of the mirror line given an object and its image- locate the image of an object under a rotation- describe a transformation given an object and its image.
The question was attempted by 94 per cent of the candidates, 3 per cent of whom scored the maximumavailable mark. The mean mark was 3.83 out of 11.
Candidates were able to evaluate g(3) and f(-2) correctly. They, however, experienced difficulty withworking with inverse functions. In many cases, candidates were unable to complete the procedure forfinding the inverse. For example, after interchanging x and y, they did not proceed to make y thesubject. Those candidates who chose to equate f(x) to 11 and then solve for x, experienced moresuccess.
Locating the mirror line was well done although a number of candidates drew the mirror line but didnot write its equation.
Part (b) was poorly done with the majority of candidates being unable to perform a rotation about agiven point. Many candidates mistakenly used (5,4) as an image point instead of the centre ofrotation. Describing the transformation which mapped the original figure onto its final image alsoposed serious problems for candidates. Some candidates used the rotation matrix to determine thecoordinates of the image, not recognising that this matrix may only be used when the centre of rotationis (0,0).
Solutions:
(a) (i) (ii) -10 (iii) 1
(b) (i) x = 5
(ii) A′′′′′′′′′′ (1,2) B′′′′′′′′′′ (3,2) C′′′′′′′′′′ (3,-1)
(iii) Reflection in the line y = 4
Recommendations
It is recommended that candidates understand how to perform geometrical transformations before theyare exposed to matrix methods. Further, they should perform transformations using actual shapes onplane paper or using geo-boards, before performing transformations on the Cartesian plane.
6
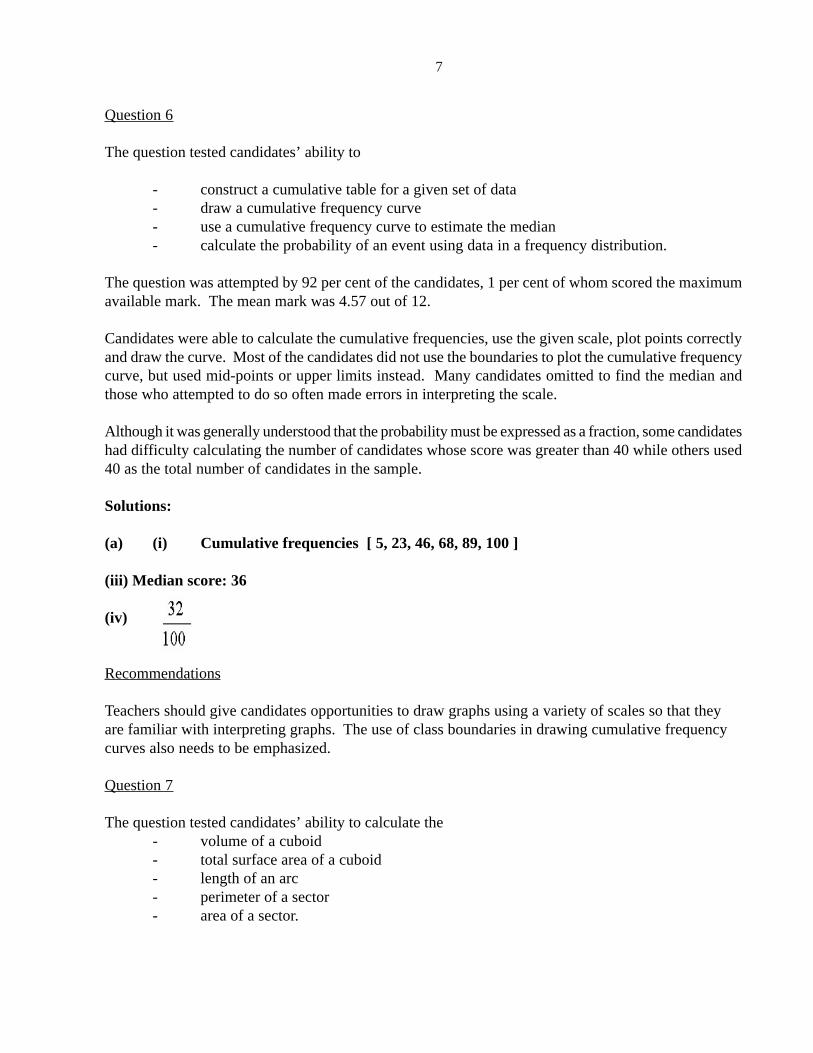
Question 6
The question tested candidates’ ability to
- construct a cumulative table for a given set of data- draw a cumulative frequency curve- use a cumulative frequency curve to estimate the median- calculate the probability of an event using data in a frequency distribution.
The question was attempted by 92 per cent of the candidates, 1 per cent of whom scored the maximumavailable mark. The mean mark was 4.57 out of 12.
Candidates were able to calculate the cumulative frequencies, use the given scale, plot points correctlyand draw the curve. Most of the candidates did not use the boundaries to plot the cumulative frequencycurve, but used mid-points or upper limits instead. Many candidates omitted to find the median andthose who attempted to do so often made errors in interpreting the scale.
Although it was generally understood that the probability must be expressed as a fraction, some candidateshad difficulty calculating the number of candidates whose score was greater than 40 while others used40 as the total number of candidates in the sample.
Solutions:
(a) (i) Cumulative frequencies [ 5, 23, 46, 68, 89, 100 ]
(iii) Median score: 36
(iv)
Recommendations
Teachers should give candidates opportunities to draw graphs using a variety of scales so that theyare familiar with interpreting graphs. The use of class boundaries in drawing cumulative frequencycurves also needs to be emphasized.
Question 7
The question tested candidates’ ability to calculate the- volume of a cuboid- total surface area of a cuboid- length of an arc- perimeter of a sector- area of a sector.
7
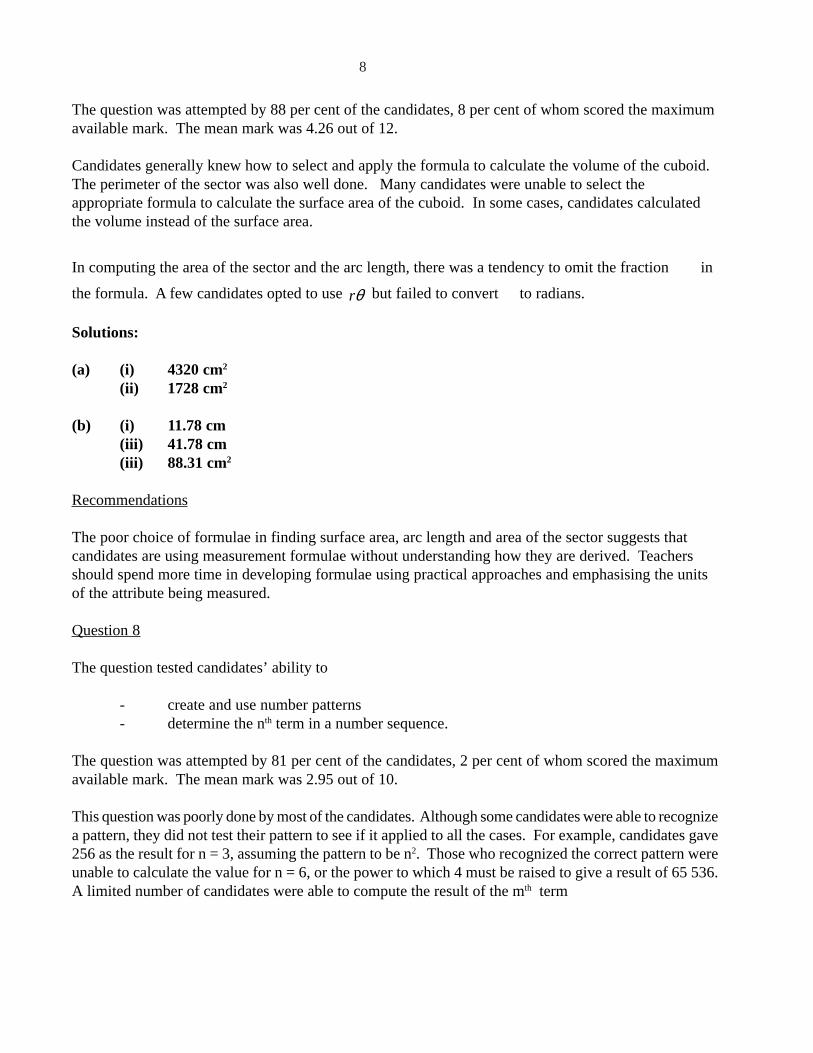
The question was attempted by 88 per cent of the candidates, 8 per cent of whom scored the maximumavailable mark. The mean mark was 4.26 out of 12.
Candidates generally knew how to select and apply the formula to calculate the volume of the cuboid.The perimeter of the sector was also well done. Many candidates were unable to select theappropriate formula to calculate the surface area of the cuboid. In some cases, candidates calculatedthe volume instead of the surface area.
In computing the area of the sector and the arc length, there was a tendency to omit the fraction in
the formula. A few candidates opted to use rθ but failed to convert to radians.
Solutions:
(a) (i) 4320 cm2
(ii) 1728 cm2
(b) (i) 11.78 cm(iii) 41.78 cm(iii) 88.31 cm2
Recommendations
The poor choice of formulae in finding surface area, arc length and area of the sector suggests thatcandidates are using measurement formulae without understanding how they are derived. Teachersshould spend more time in developing formulae using practical approaches and emphasising the unitsof the attribute being measured.
Question 8
The question tested candidates’ ability to
- create and use number patterns- determine the nth term in a number sequence.
The question was attempted by 81 per cent of the candidates, 2 per cent of whom scored the maximumavailable mark. The mean mark was 2.95 out of 10.
This question was poorly done by most of the candidates. Although some candidates were able to recognizea pattern, they did not test their pattern to see if it applied to all the cases. For example, candidates gave256 as the result for n = 3, assuming the pattern to be n2. Those who recognized the correct pattern wereunable to calculate the value for n = 6, or the power to which 4 must be raised to give a result of 65 536.A limited number of candidates were able to compute the result of the mth term
8
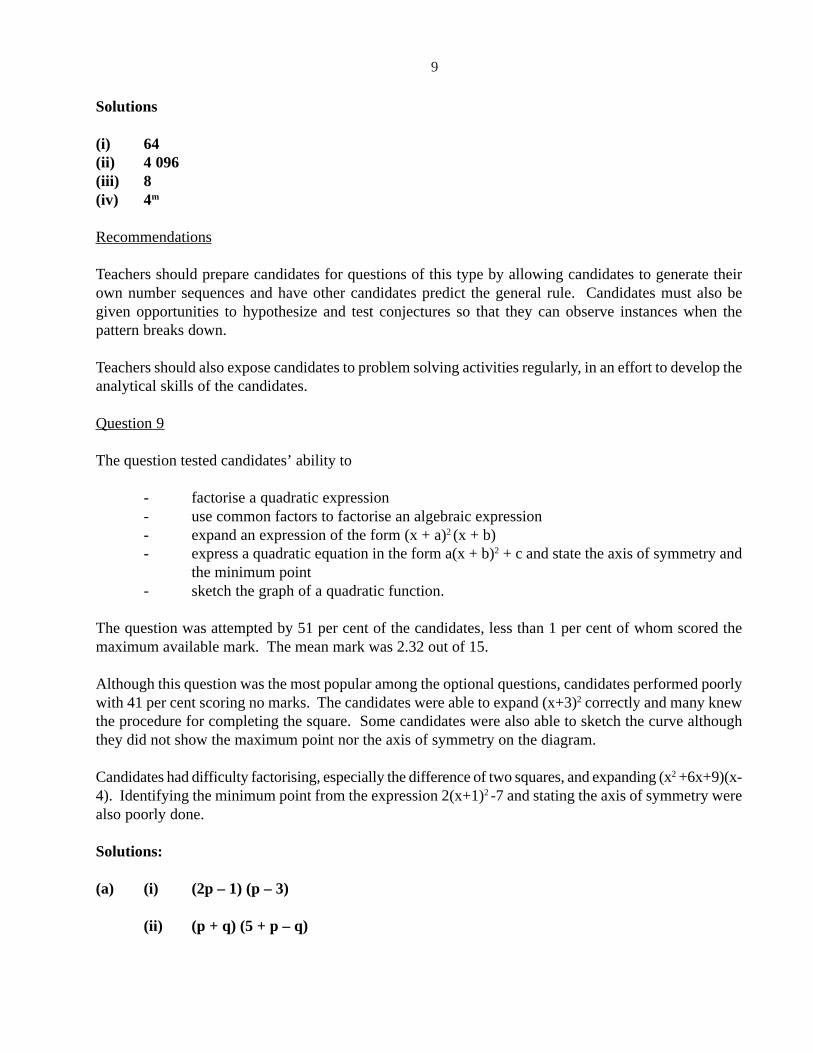
Solutions
(i) 64(ii) 4 096(iii) 8(iv) 4m
Recommendations
Teachers should prepare candidates for questions of this type by allowing candidates to generate theirown number sequences and have other candidates predict the general rule. Candidates must also begiven opportunities to hypothesize and test conjectures so that they can observe instances when thepattern breaks down.
Teachers should also expose candidates to problem solving activities regularly, in an effort to develop theanalytical skills of the candidates.
Question 9
The question tested candidates’ ability to
- factorise a quadratic expression- use common factors to factorise an algebraic expression- expand an expression of the form (x + a)2 (x + b)- express a quadratic equation in the form a(x + b)2 + c and state the axis of symmetry and
the minimum point- sketch the graph of a quadratic function.
The question was attempted by 51 per cent of the candidates, less than 1 per cent of whom scored themaximum available mark. The mean mark was 2.32 out of 15.
Although this question was the most popular among the optional questions, candidates performed poorlywith 41 per cent scoring no marks. The candidates were able to expand (x+3)2 correctly and many knewthe procedure for completing the square. Some candidates were also able to sketch the curve althoughthey did not show the maximum point nor the axis of symmetry on the diagram.
Candidates had difficulty factorising, especially the difference of two squares, and expanding (x2 +6x+9)(x-4). Identifying the minimum point from the expression 2(x+1)2 -7 and stating the axis of symmetry werealso poorly done.
Solutions:
(a) (i) (2p – 1) (p – 3)
(ii) (p + q) (5 + p – q)
9
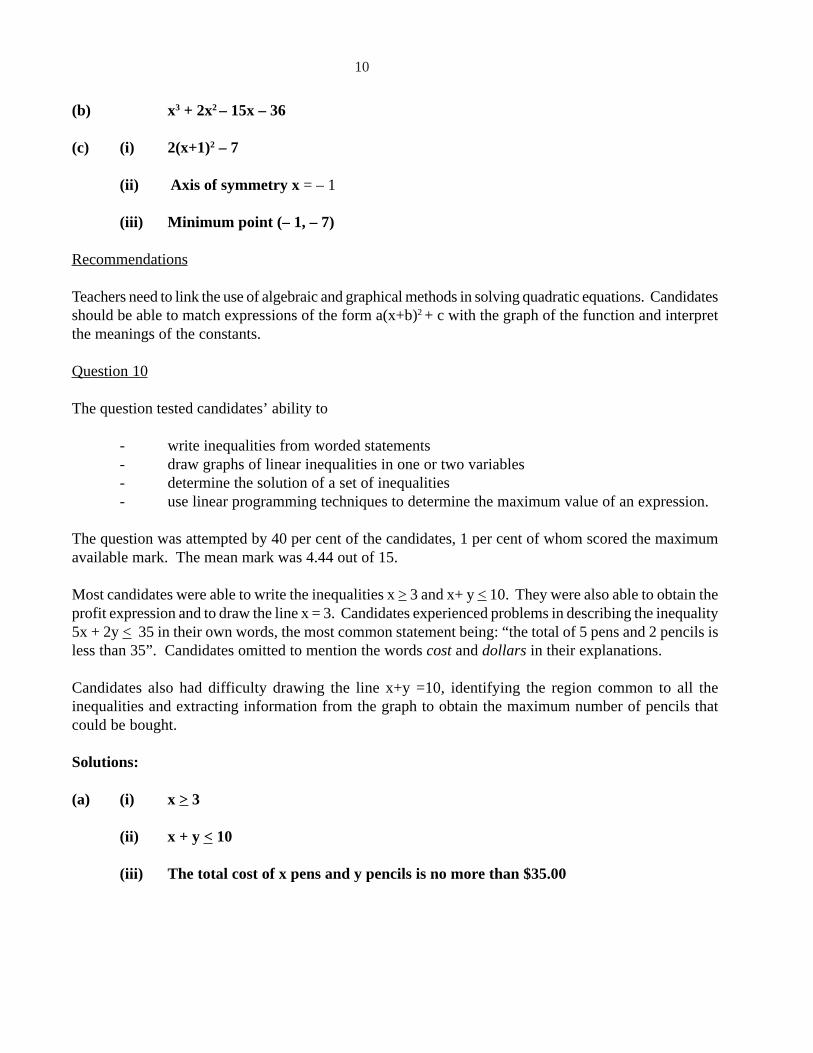
(b) x3 + 2x2 – 15x – 36
(c) (i) 2(x+1)2 – 7
(ii) Axis of symmetry x = – 1
(iii) Minimum point (– 1, – 7)
Recommendations
Teachers need to link the use of algebraic and graphical methods in solving quadratic equations. Candidatesshould be able to match expressions of the form a(x+b)2 + c with the graph of the function and interpretthe meanings of the constants.
Question 10
The question tested candidates’ ability to
- write inequalities from worded statements- draw graphs of linear inequalities in one or two variables- determine the solution of a set of inequalities- use linear programming techniques to determine the maximum value of an expression.
The question was attempted by 40 per cent of the candidates, 1 per cent of whom scored the maximumavailable mark. The mean mark was 4.44 out of 15.
Most candidates were able to write the inequalities x > 3 and x+ y < 10. They were also able to obtain theprofit expression and to draw the line x = 3. Candidates experienced problems in describing the inequality5x + 2y < 35 in their own words, the most common statement being: “the total of 5 pens and 2 pencils isless than 35”. Candidates omitted to mention the words cost and dollars in their explanations.
Candidates also had difficulty drawing the line x+y =10, identifying the region common to all theinequalities and extracting information from the graph to obtain the maximum number of pencils thatcould be bought.
Solutions:
(a) (i) x > 3
(ii) x + y < 10
(iii) The total cost of x pens and y pencils is no more than $35.00
10
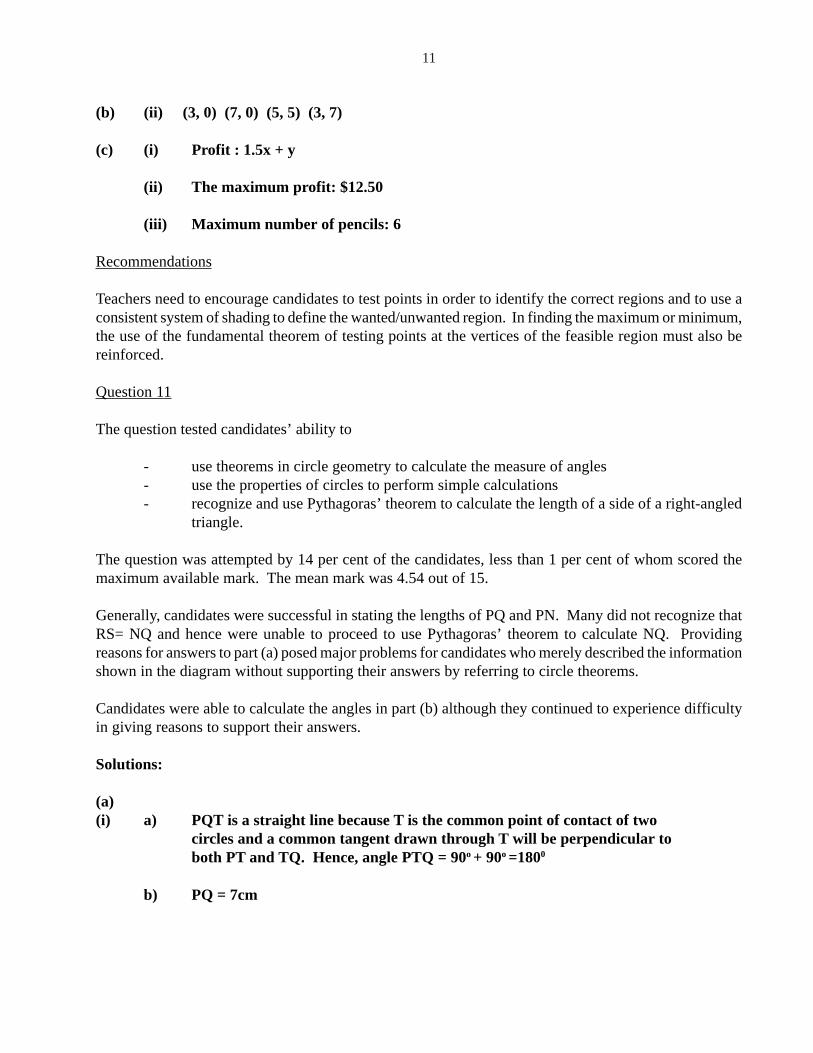
(b) (ii) (3, 0) (7, 0) (5, 5) (3, 7)
(c) (i) Profit : 1.5x + y
(ii) The maximum profit: $12.50
(iii) Maximum number of pencils: 6
Recommendations
Teachers need to encourage candidates to test points in order to identify the correct regions and to use aconsistent system of shading to define the wanted/unwanted region. In finding the maximum or minimum,the use of the fundamental theorem of testing points at the vertices of the feasible region must also bereinforced.
Question 11
The question tested candidates’ ability to
- use theorems in circle geometry to calculate the measure of angles- use the properties of circles to perform simple calculations- recognize and use Pythagoras’ theorem to calculate the length of a side of a right-angled
triangle.
The question was attempted by 14 per cent of the candidates, less than 1 per cent of whom scored themaximum available mark. The mean mark was 4.54 out of 15.
Generally, candidates were successful in stating the lengths of PQ and PN. Many did not recognize thatRS= NQ and hence were unable to proceed to use Pythagoras’ theorem to calculate NQ. Providingreasons for answers to part (a) posed major problems for candidates who merely described the informationshown in the diagram without supporting their answers by referring to circle theorems.
Candidates were able to calculate the angles in part (b) although they continued to experience difficultyin giving reasons to support their answers.
Solutions:
(a)(i) a) PQT is a straight line because T is the common point of contact of two
circles and a common tangent drawn through T will be perpendicular toboth PT and TQ. Hence, angle PTQ = 90o + 90o =1800
b) PQ = 7cm
11
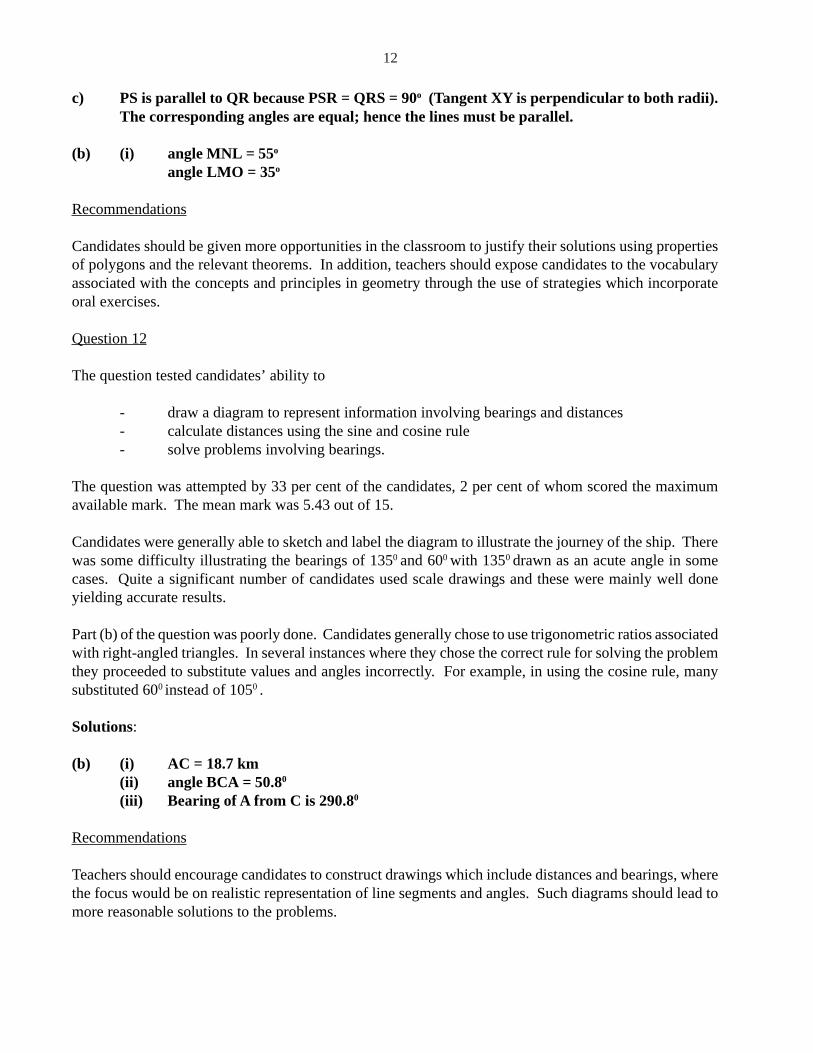
c) PS is parallel to QR because PSR = QRS = 90o (Tangent XY is perpendicular to both radii).The corresponding angles are equal; hence the lines must be parallel.
(b) (i) angle MNL = 55o
angle LMO = 35o
Recommendations
Candidates should be given more opportunities in the classroom to justify their solutions using propertiesof polygons and the relevant theorems. In addition, teachers should expose candidates to the vocabularyassociated with the concepts and principles in geometry through the use of strategies which incorporateoral exercises.
Question 12
The question tested candidates’ ability to
- draw a diagram to represent information involving bearings and distances- calculate distances using the sine and cosine rule- solve problems involving bearings.
The question was attempted by 33 per cent of the candidates, 2 per cent of whom scored the maximumavailable mark. The mean mark was 5.43 out of 15.
Candidates were generally able to sketch and label the diagram to illustrate the journey of the ship. Therewas some difficulty illustrating the bearings of 1350 and 600 with 1350 drawn as an acute angle in somecases. Quite a significant number of candidates used scale drawings and these were mainly well doneyielding accurate results.
Part (b) of the question was poorly done. Candidates generally chose to use trigonometric ratios associatedwith right-angled triangles. In several instances where they chose the correct rule for solving the problemthey proceeded to substitute values and angles incorrectly. For example, in using the cosine rule, manysubstituted 600 instead of 1050 .
Solutions:
(b) (i) AC = 18.7 km(ii) angle BCA = 50.80
(iii) Bearing of A from C is 290.80
Recommendations
Teachers should encourage candidates to construct drawings which include distances and bearings, wherethe focus would be on realistic representation of line segments and angles. Such diagrams should lead tomore reasonable solutions to the problems.
12
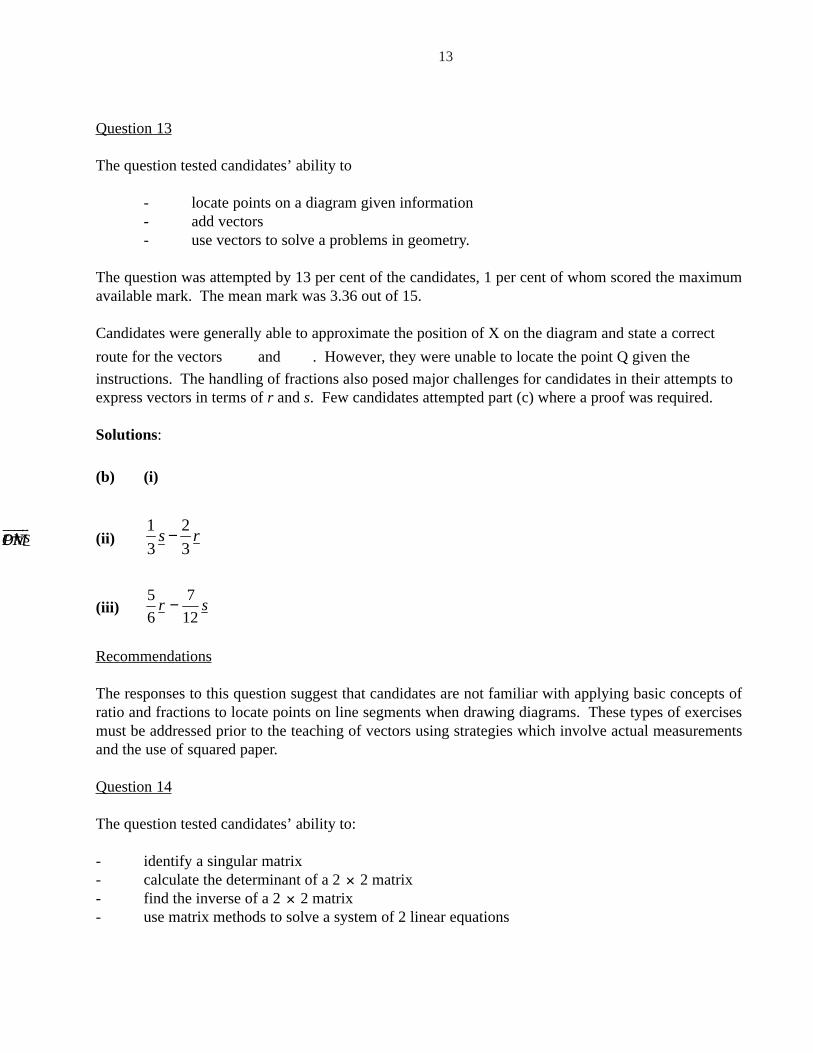
Question 13
The question tested candidates’ ability to
- locate points on a diagram given information- add vectors- use vectors to solve a problems in geometry.
The question was attempted by 13 per cent of the candidates, 1 per cent of whom scored the maximumavailable mark. The mean mark was 3.36 out of 15.
Candidates were generally able to approximate the position of X on the diagram and state a correct
route for the vectors
OMuuuur
and
PNuuur
. However, they were unable to locate the point Q given the
instructions. The handling of fractions also posed major challenges for candidates in their attempts toexpress vectors in terms of r and s. Few candidates attempted part (c) where a proof was required.
Solutions:
(b) (i)
r s+ (ii)1 2
3 3s r−
(iii) sr12
7
6
5 −
Recommendations
The responses to this question suggest that candidates are not familiar with applying basic concepts ofratio and fractions to locate points on line segments when drawing diagrams. These types of exercisesmust be addressed prior to the teaching of vectors using strategies which involve actual measurementsand the use of squared paper.
Question 14
The question tested candidates’ ability to:
- identify a singular matrix- calculate the determinant of a 2 × 2 matrix- find the inverse of a 2 × 2 matrix- use matrix methods to solve a system of 2 linear equations
13
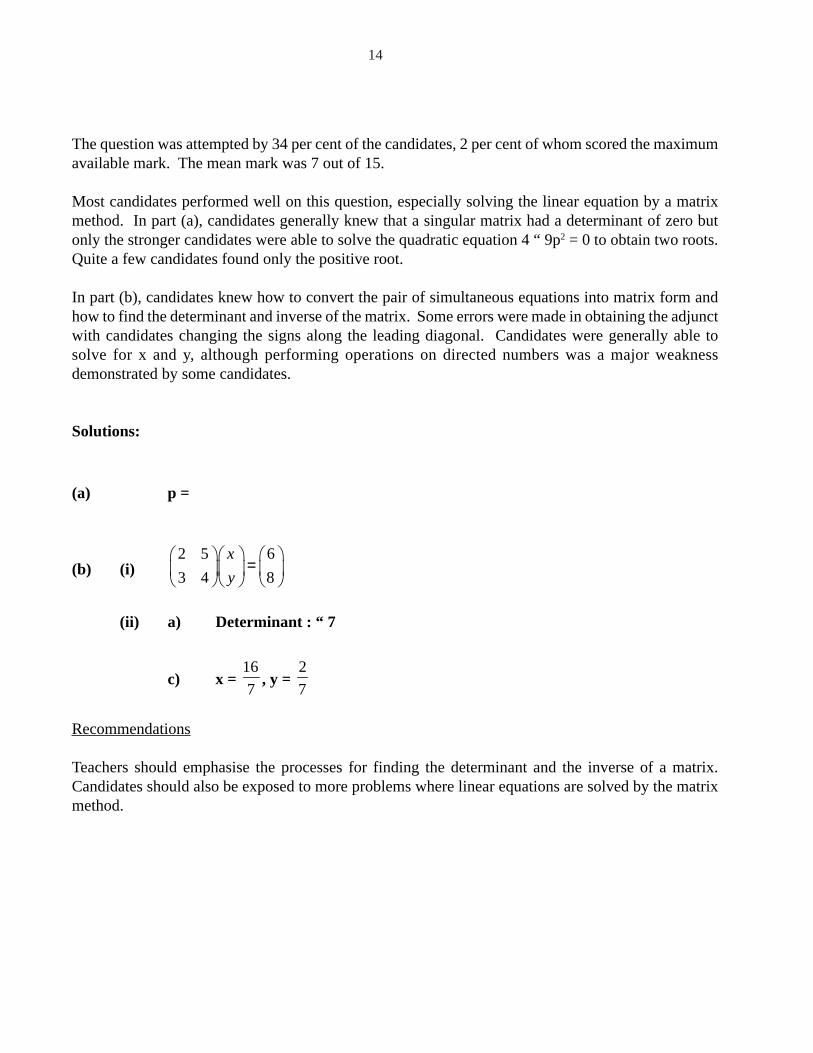
The question was attempted by 34 per cent of the candidates, 2 per cent of whom scored the maximumavailable mark. The mean mark was 7 out of 15.
Most candidates performed well on this question, especially solving the linear equation by a matrixmethod. In part (a), candidates generally knew that a singular matrix had a determinant of zero butonly the stronger candidates were able to solve the quadratic equation 4 “ 9p2 = 0 to obtain two roots.Quite a few candidates found only the positive root.
In part (b), candidates knew how to convert the pair of simultaneous equations into matrix form andhow to find the determinant and inverse of the matrix. Some errors were made in obtaining the adjunctwith candidates changing the signs along the leading diagonal. Candidates were generally able tosolve for x and y, although performing operations on directed numbers was a major weaknessdemonstrated by some candidates.
Solutions:
(a) p =
(b) (i)2 5 6
3 4 8
x
y
=
(ii) a) Determinant : “ 7
c) x =16
7, y =
2
7
Recommendations
Teachers should emphasise the processes for finding the determinant and the inverse of a matrix.Candidates should also be exposed to more problems where linear equations are solved by the matrixmethod.
14
C A R I B B E A N E X A M I N A T I O N S C O U N C I L
REPORT ON CANDIDATES’ WORK IN THE SECONDARY EDUCATION CERTIFICATE EXAMINATIONS
MAY/JUNE 2007
MATHEMATICS
Copyright © 2007 Caribbean Examinations Council® St. Michael, Barbados
All rights reserved.
- 2 -
MATHEMATICS
GENERAL AND BASIC PROFICIENCY EXAMINATIONS
MAY/JUNE 2007
GENERAL COMMENTS
The General Proficiency Mathematics examination is offered in January and May/June each year, while the Basic Proficiency examination is offered in May/June only.
In May/June 2007 approximately 86 835 candidates registered for the General Proficiency examination. Candidate entry for the Basic Proficiency examination was approximately 5 513.
At the General Proficiency level, approximately 34 per cent of the candidates achieved Grades I - III. This represents a 2 per cent decrease over 2006. Thirty-two per cent of the candidates at the Basic Proficiency level achieved Grades I - III compared with 44 per cent in 2006.
DETAILED COMMENTS
General Proficiency
In general, candidates’ work revealed a lack of knowledge of basic mathematical concepts, especially the areas of Measurement, Algebra and Transformation Geometry. The optional section of Paper 02 seemed to have posed the greatest challenge to candidates, particularly the areas of Relations, Functions and Graphs; and Geometry and Trigonometry.
One candidate scored the maximum mark on the overall examination compared with six candidates in 2006. Twenty-three per cent of the candidates scored at least half the available marks compared with 26 per cent in 2006.
Paper 01 - Multiple Choice
Paper 01 consisted of 60 multiple-choice items. This year, 120 candidates earned the maximum available mark compared with 84 in 2006. Approximately 60 per cent of the candidates scored at least half the total marks for this paper.
Paper 02 – Essay
Paper 02 consisted of two sections. Section I comprised eight compulsory questions totalling 90 marks. Section II comprised six optional questions: two each in Relations, Functions and Graphs; Trigonometry and Geometry; Vectors and Matrices. Candidates were required to choose any two questions. Each question in this section was worth 15 marks.
This year, one candidate earned the maximum available mark on Paper 02 compared with 17 in 2006. Approximately 15 per cent of the candidates earned at least half the maximum mark on this paper.
- 3 -
Compulsory Section
Question 1
This question tested the candidates’ ability to:
– perform basic operations with decimals
– express a common fraction in its lowest terms
– calculate the fraction and the percentage of a given quantity
– express one quantity as a fraction of another
– solve problems involving ratios.
The question was attempted by 98 per cent of the candidates, 13 per cent of whom scored the maximum available mark. The mean mark was 6.9 out of 11.
Responses were generally good with the majority of candidates displaying competence in using the calculator to perform computations and in calculating the fraction or percentage of a quantity.
Those candidates who performed the computation without the use of calculators made errors such as evaluating 3.72 as 7.4 or (6.24 ÷ 1.3) as 0.48. A few who used calculators ignored the brackets and performed the operations from left to right.
In part (b) where candidates had to find the missing part of a ratio, many did not understand that 30 parts had to be equated to 1200 and interpreted it as sharing 1200 into 31 parts, hence they divided 1200 by 31 instead of 30.
A large number of candidates correctly calculated the number of students who own personal computers but omitted to subtract from 1200 to calculate the number of students who do not own computers.
A major problem faced by candidates in calculating the fraction of students in the school who own play-stations, was recognizing that the whole consists of 1200 students. Many candidates were able to reduce the fraction to its lowest terms but quite a large number omitted this part of the question.
Solutions:
(a) 8.89
(b) (i) 40 (ii) 720 (iii) 3
25
Recommendations
Teachers need to emphasize the difference between:
• Calculating the missing part of a ratio and dividing a quantity in a given ratio
• A part-part comparison (ratio) and a part-whole comparison (fraction).
Question 2
This question tested the candidates’ ability to:
– perform operations involving directed numbers
– use symbols to represent binary operations
– divide algebraic fractions
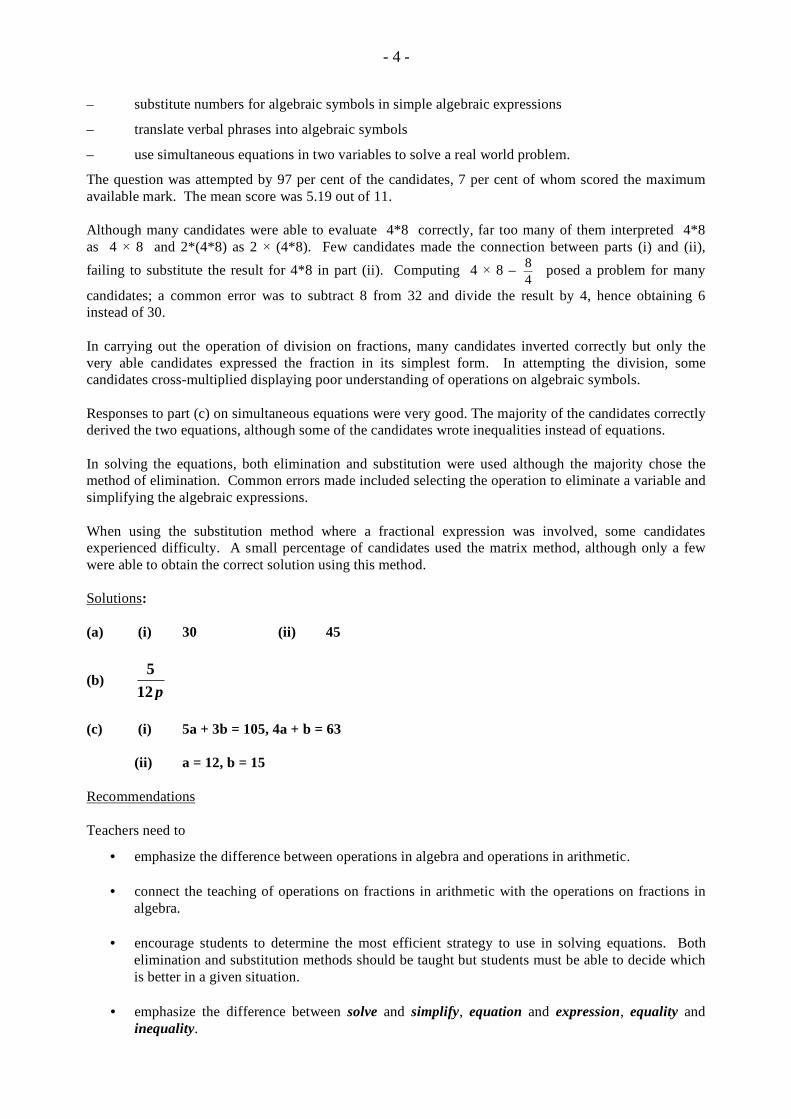
- 4 -
– substitute numbers for algebraic symbols in simple algebraic expressions
– translate verbal phrases into algebraic symbols
– use simultaneous equations in two variables to solve a real world problem.
The question was attempted by 97 per cent of the candidates, 7 per cent of whom scored the maximum available mark. The mean score was 5.19 out of 11.
Although many candidates were able to evaluate 4*8 correctly, far too many of them interpreted 4*8 as 4 × 8 and 2*(4*8) as 2 × (4*8). Few candidates made the connection between parts (i) and (ii), failing to substitute the result for 4*8 in part (ii). Computing 4 × 8 – 8
4 posed a problem for many
candidates; a common error was to subtract 8 from 32 and divide the result by 4, hence obtaining 6 instead of 30.
In carrying out the operation of division on fractions, many candidates inverted correctly but only the very able candidates expressed the fraction in its simplest form. In attempting the division, some candidates cross-multiplied displaying poor understanding of operations on algebraic symbols.
Responses to part (c) on simultaneous equations were very good. The majority of the candidates correctly derived the two equations, although some of the candidates wrote inequalities instead of equations.
In solving the equations, both elimination and substitution were used although the majority chose the method of elimination. Common errors made included selecting the operation to eliminate a variable and simplifying the algebraic expressions.
When using the substitution method where a fractional expression was involved, some candidates experienced difficulty. A small percentage of candidates used the matrix method, although only a few were able to obtain the correct solution using this method.
Solutions:
(a) (i) 30 (ii) 45
(b) 5
12 p
(c) (i) 5a + 3b = 105, 4a + b = 63
(ii) a = 12, b = 15
Recommendations
Teachers need to
• emphasize the difference between operations in algebra and operations in arithmetic.
• connect the teaching of operations on fractions in arithmetic with the operations on fractions inalgebra.
• encourage students to determine the most efficient strategy to use in solving equations. Bothelimination and substitution methods should be taught but students must be able to decide whichis better in a given situation.
• emphasize the difference between solve and simplify, equation and expression, equality andinequality.
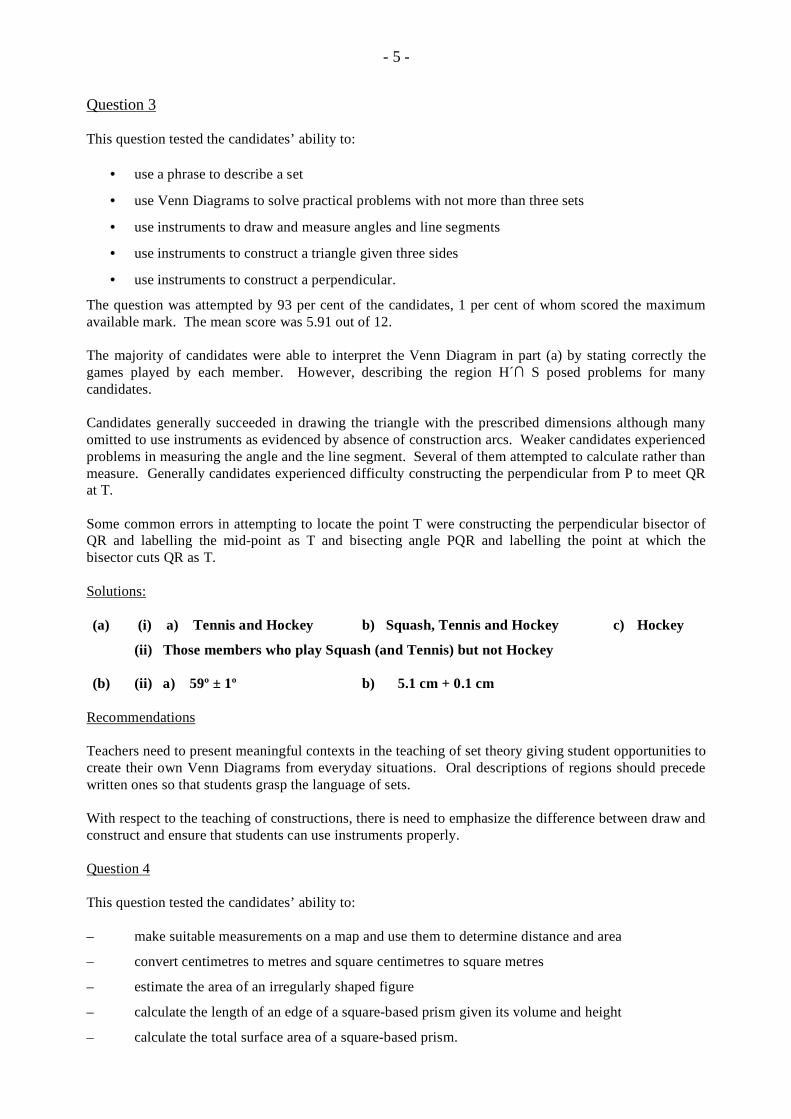
- 5 -
Question 3 This question tested the candidates’ ability to:
• use a phrase to describe a set
• use Venn Diagrams to solve practical problems with not more than three sets
• use instruments to draw and measure angles and line segments
• use instruments to construct a triangle given three sides
• use instruments to construct a perpendicular.
The question was attempted by 93 per cent of the candidates, 1 per cent of whom scored the maximum available mark. The mean score was 5.91 out of 12. The majority of candidates were able to interpret the Venn Diagram in part (a) by stating correctly the games played by each member. However, describing the region H´∩ S posed problems for many candidates. Candidates generally succeeded in drawing the triangle with the prescribed dimensions although many omitted to use instruments as evidenced by absence of construction arcs. Weaker candidates experienced problems in measuring the angle and the line segment. Several of them attempted to calculate rather than measure. Generally candidates experienced difficulty constructing the perpendicular from P to meet QR at T. Some common errors in attempting to locate the point T were constructing the perpendicular bisector of QR and labelling the mid-point as T and bisecting angle PQR and labelling the point at which the bisector cuts QR as T.
Solutions: (a) (i) a) Tennis and Hockey b) Squash, Tennis and Hockey c) Hockey
(ii) Those members who play Squash (and Tennis) but not Hockey
(b) (ii) a) 59º ± 1º b) 5.1 cm + 0.1 cm
Recommendations
Teachers need to present meaningful contexts in the teaching of set theory giving student opportunities to create their own Venn Diagrams from everyday situations. Oral descriptions of regions should precede written ones so that students grasp the language of sets. With respect to the teaching of constructions, there is need to emphasize the difference between draw and construct and ensure that students can use instruments properly. Question 4 This question tested the candidates’ ability to: – make suitable measurements on a map and use them to determine distance and area
– convert centimetres to metres and square centimetres to square metres
– estimate the area of an irregularly shaped figure
– calculate the length of an edge of a square-based prism given its volume and height
– calculate the total surface area of a square-based prism.
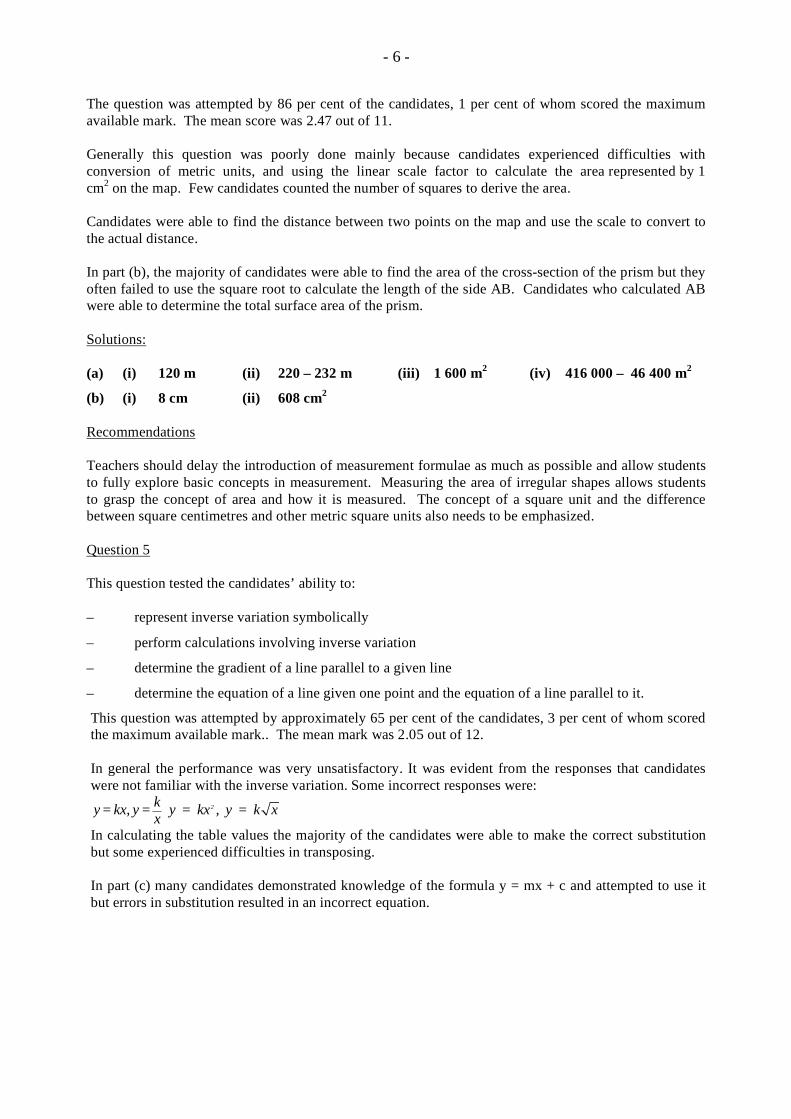
- 6 -
The question was attempted by 86 per cent of the candidates, 1 per cent of whom scored the maximum available mark. The mean score was 2.47 out of 11.
Generally this question was poorly done mainly because candidates experienced difficulties with conversion of metric units, and using the linear scale factor to calculate the area represented by 1 cm2 on the map. Few candidates counted the number of squares to derive the area.
Candidates were able to find the distance between two points on the map and use the scale to convert to the actual distance.
In part (b), the majority of candidates were able to find the area of the cross-section of the prism but they often failed to use the square root to calculate the length of the side AB. Candidates who calculated AB were able to determine the total surface area of the prism.
Solutions:
(a) (i) 120 m (ii) 220 – 232 m (iii) 1 600 m2 (iv) 416 000 – 46 400 m2
(b) (i) 8 cm (ii) 608 cm2
Recommendations
Teachers should delay the introduction of measurement formulae as much as possible and allow students to fully explore basic concepts in measurement. Measuring the area of irregular shapes allows students to grasp the concept of area and how it is measured. The concept of a square unit and the difference between square centimetres and other metric square units also needs to be emphasized.
Question 5
This question tested the candidates’ ability to:
– represent inverse variation symbolically
– perform calculations involving inverse variation
– determine the gradient of a line parallel to a given line
– determine the equation of a line given one point and the equation of a line parallel to it.
This question was attempted by approximately 65 per cent of the candidates, 3 per cent of whom scored the maximum available mark.. The mean mark was 2.05 out of 12.
In general the performance was very unsatisfactory. It was evident from the responses that candidates were not familiar with the inverse variation. Some incorrect responses were:
y= kx, y =k
x y = kx2 , y = k x
In calculating the table values the majority of the candidates were able to make the correct substitution but some experienced difficulties in transposing.
In part (c) many candidates demonstrated knowledge of the formula y = mx + c and attempted to use it but errors in substitution resulted in an incorrect equation.
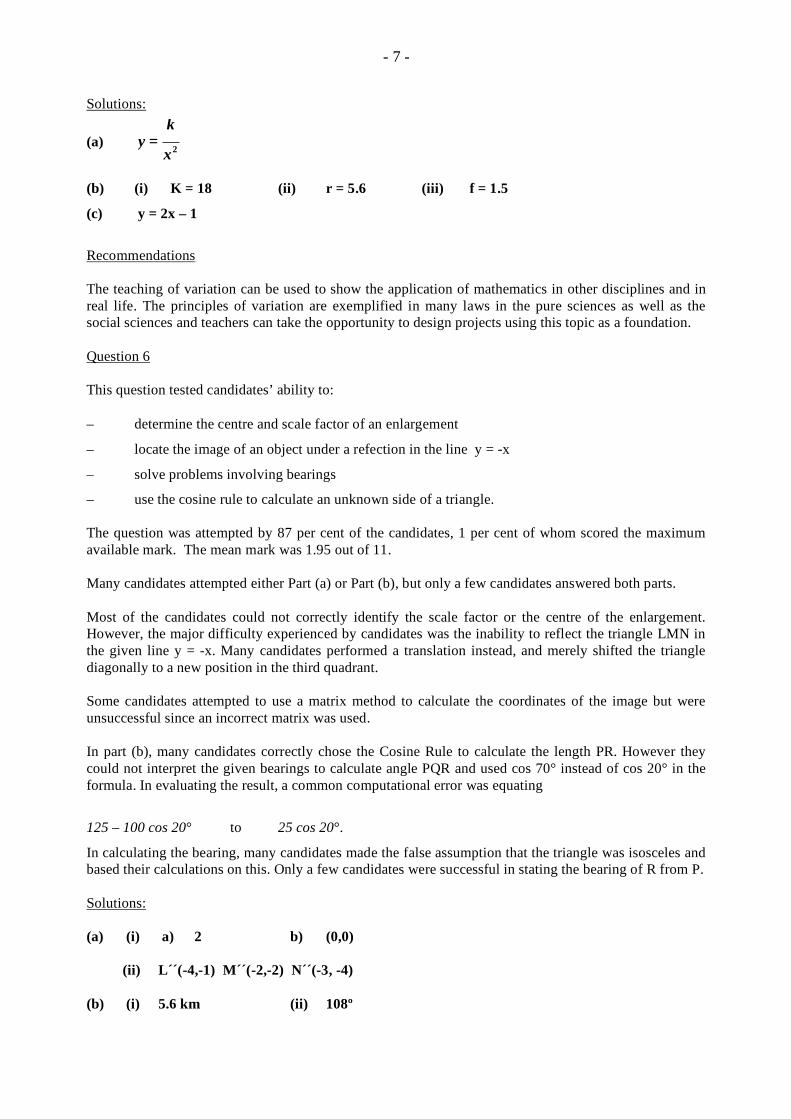
- 7 -
Solutions:
(a) y =
k
x2
(b) (i) K = 18 (ii) r = 5.6 (iii) f = 1.5
(c) y = 2x – 1
Recommendations
The teaching of variation can be used to show the application of mathematics in other disciplines and in real life. The principles of variation are exemplified in many laws in the pure sciences as well as the social sciences and teachers can take the opportunity to design projects using this topic as a foundation.
Question 6
This question tested candidates’ ability to:
– determine the centre and scale factor of an enlargement
– locate the image of an object under a refection in the line y = -x
– solve problems involving bearings
– use the cosine rule to calculate an unknown side of a triangle.
The question was attempted by 87 per cent of the candidates, 1 per cent of whom scored the maximum available mark. The mean mark was 1.95 out of 11.
Many candidates attempted either Part (a) or Part (b), but only a few candidates answered both parts.
Most of the candidates could not correctly identify the scale factor or the centre of the enlargement. However, the major difficulty experienced by candidates was the inability to reflect the triangle LMN in the given line y = -x. Many candidates performed a translation instead, and merely shifted the triangle diagonally to a new position in the third quadrant.
Some candidates attempted to use a matrix method to calculate the coordinates of the image but were unsuccessful since an incorrect matrix was used.
In part (b), many candidates correctly chose the Cosine Rule to calculate the length PR. However they could not interpret the given bearings to calculate angle PQR and used cos 70° instead of cos 20° in the formula. In evaluating the result, a common computational error was equating
125 – 100 cos 20° to 25 cos 20°.
In calculating the bearing, many candidates made the false assumption that the triangle was isosceles and based their calculations on this. Only a few candidates were successful in stating the bearing of R from P.
Solutions:
(a) (i) a) 2 b) (0,0)
(ii) L´´(-4,-1) M´´(-2,-2) N´´(-3, -4)
(b) (i) 5.6 km (ii) 108º
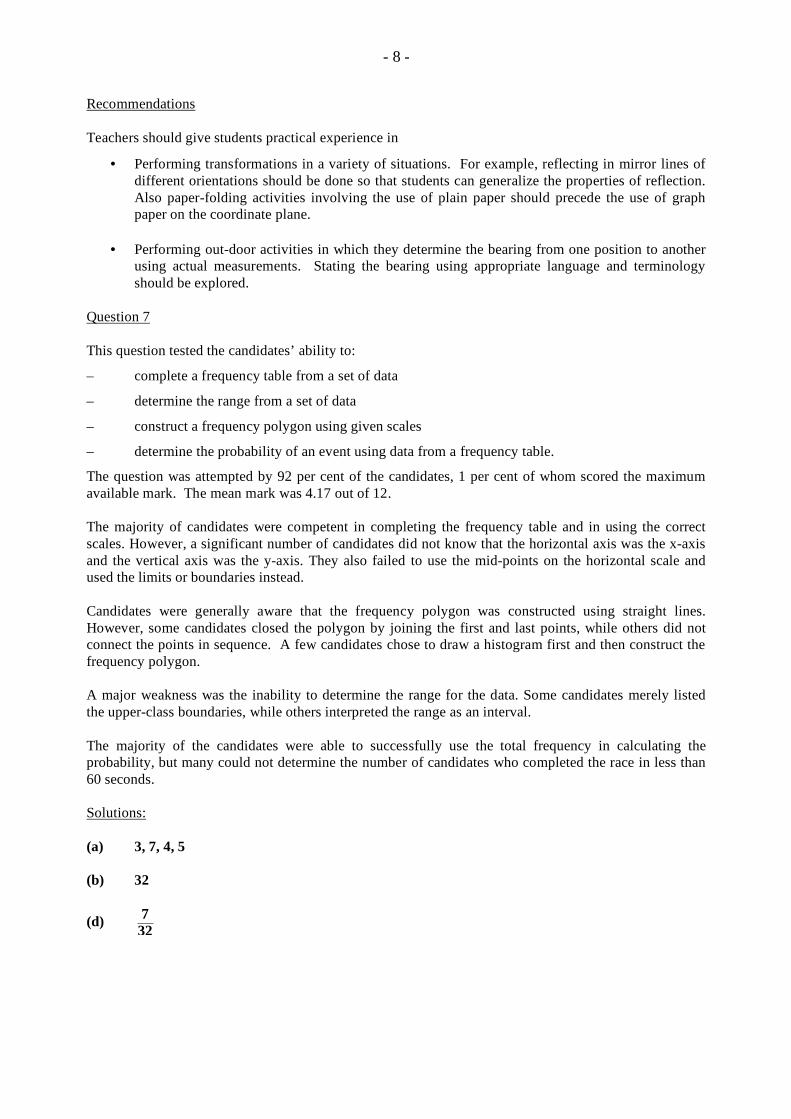
- 8 -
Recommendations
Teachers should give students practical experience in
• Performing transformations in a variety of situations. For example, reflecting in mirror lines ofdifferent orientations should be done so that students can generalize the properties of reflection.Also paper-folding activities involving the use of plain paper should precede the use of graphpaper on the coordinate plane.
• Performing out-door activities in which they determine the bearing from one position to anotherusing actual measurements. Stating the bearing using appropriate language and terminologyshould be explored.
Question 7
This question tested the candidates’ ability to:
– complete a frequency table from a set of data
– determine the range from a set of data
– construct a frequency polygon using given scales
– determine the probability of an event using data from a frequency table.
The question was attempted by 92 per cent of the candidates, 1 per cent of whom scored the maximum available mark. The mean mark was 4.17 out of 12.
The majority of candidates were competent in completing the frequency table and in using the correct scales. However, a significant number of candidates did not know that the horizontal axis was the x-axis and the vertical axis was the y-axis. They also failed to use the mid-points on the horizontal scale and used the limits or boundaries instead.
Candidates were generally aware that the frequency polygon was constructed using straight lines. However, some candidates closed the polygon by joining the first and last points, while others did not connect the points in sequence. A few candidates chose to draw a histogram first and then construct the frequency polygon.
A major weakness was the inability to determine the range for the data. Some candidates merely listed the upper-class boundaries, while others interpreted the range as an interval.
The majority of the candidates were able to successfully use the total frequency in calculating the probability, but many could not determine the number of candidates who completed the race in less than 60 seconds.
Solutions:
(a) 3, 7, 4, 5
(b) 32
(d) 7
32
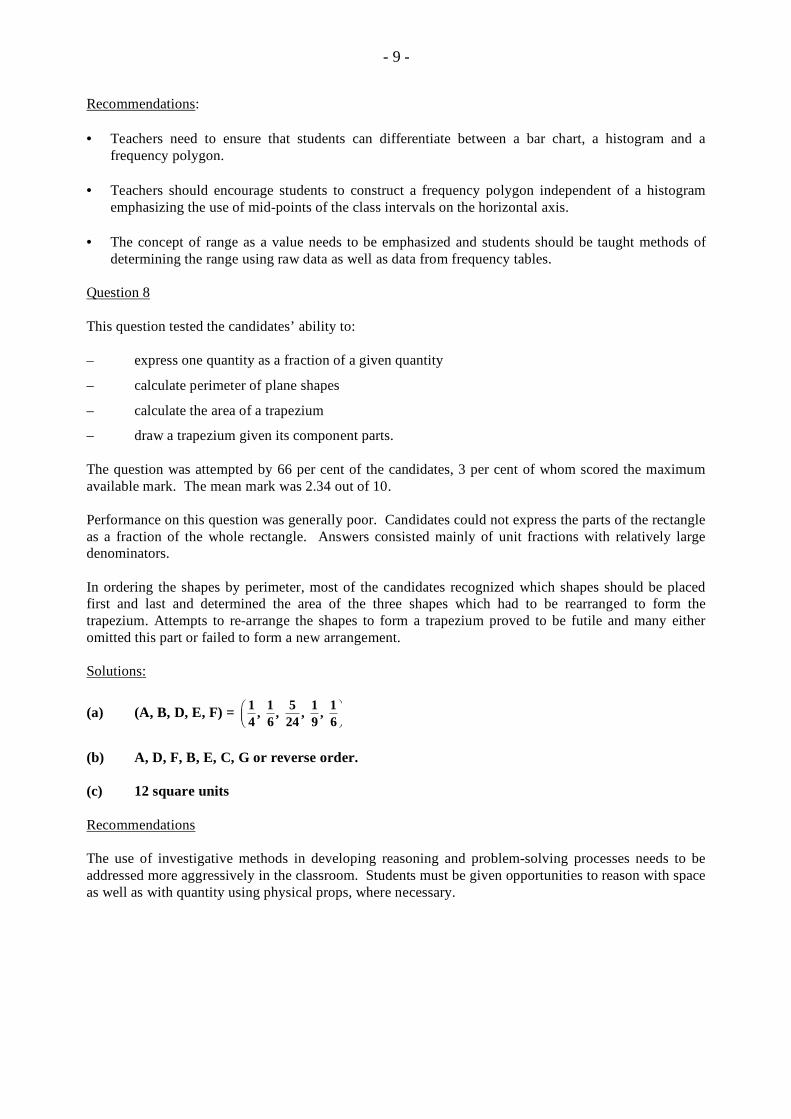
- 9 -
Recommendations:
• Teachers need to ensure that students can differentiate between a bar chart, a histogram and afrequency polygon.
• Teachers should encourage students to construct a frequency polygon independent of a histogramemphasizing the use of mid-points of the class intervals on the horizontal axis.
• The concept of range as a value needs to be emphasized and students should be taught methods ofdetermining the range using raw data as well as data from frequency tables.
Question 8
This question tested the candidates’ ability to:
– express one quantity as a fraction of a given quantity
– calculate perimeter of plane shapes
– calculate the area of a trapezium
– draw a trapezium given its component parts.
The question was attempted by 66 per cent of the candidates, 3 per cent of whom scored the maximum available mark. The mean mark was 2.34 out of 10.
Performance on this question was generally poor. Candidates could not express the parts of the rectangle as a fraction of the whole rectangle. Answers consisted mainly of unit fractions with relatively large denominators.
In ordering the shapes by perimeter, most of the candidates recognized which shapes should be placed first and last and determined the area of the three shapes which had to be rearranged to form the trapezium. Attempts to re-arrange the shapes to form a trapezium proved to be futile and many either omitted this part or failed to form a new arrangement.
Solutions:
(a) (A, B, D, E, F) = 1
4,
1
6,
5
24,
1
9,
1
6
!"#
$%&
(b) A, D, F, B, E, C, G or reverse order.
(c) 12 square units
Recommendations
The use of investigative methods in developing reasoning and problem-solving processes needs to be addressed more aggressively in the classroom. Students must be given opportunities to reason with space as well as with quantity using physical props, where necessary.
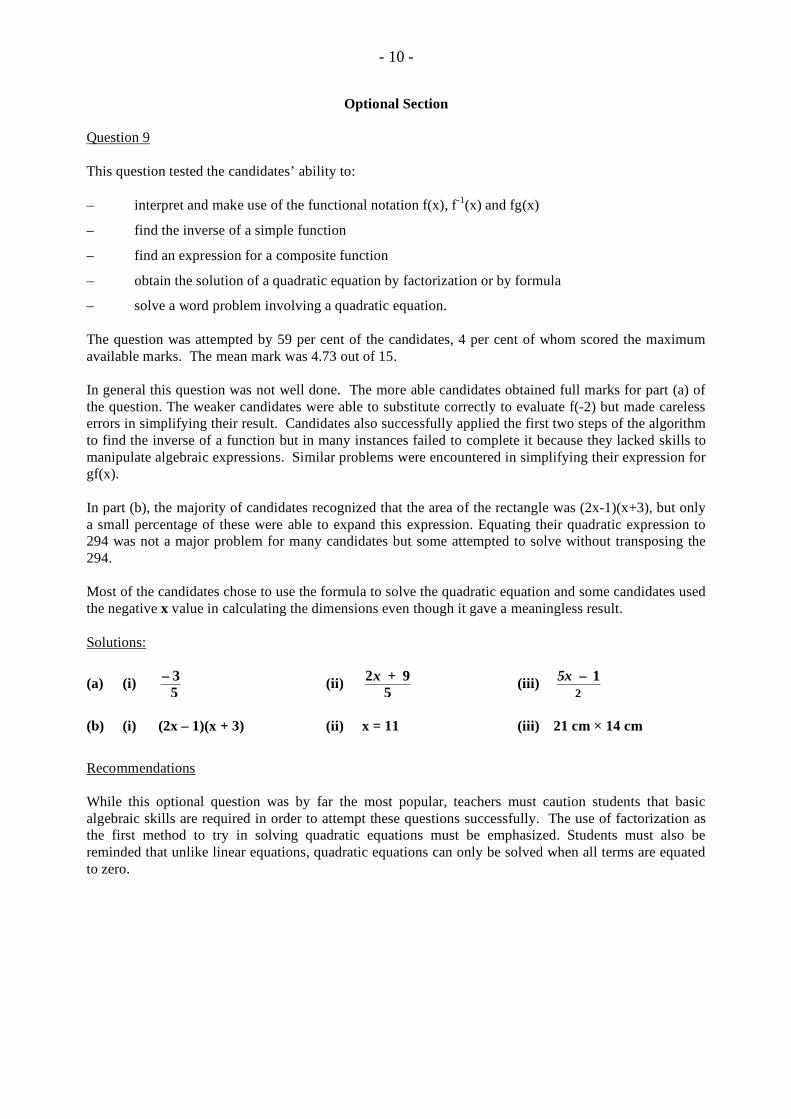
- 10 -
Optional Section
Question 9
This question tested the candidates’ ability to:
– interpret and make use of the functional notation f(x), f-1(x) and fg(x)
– find the inverse of a simple function
– find an expression for a composite function
– obtain the solution of a quadratic equation by factorization or by formula
– solve a word problem involving a quadratic equation.
The question was attempted by 59 per cent of the candidates, 4 per cent of whom scored the maximum available marks. The mean mark was 4.73 out of 15.
In general this question was not well done. The more able candidates obtained full marks for part (a) of the question. The weaker candidates were able to substitute correctly to evaluate f(-2) but made careless errors in simplifying their result. Candidates also successfully applied the first two steps of the algorithm to find the inverse of a function but in many instances failed to complete it because they lacked skills to manipulate algebraic expressions. Similar problems were encountered in simplifying their expression for gf(x).
In part (b), the majority of candidates recognized that the area of the rectangle was (2x-1)(x+3), but only a small percentage of these were able to expand this expression. Equating their quadratic expression to 294 was not a major problem for many candidates but some attempted to solve without transposing the 294.
Most of the candidates chose to use the formula to solve the quadratic equation and some candidates used the negative x value in calculating the dimensions even though it gave a meaningless result.
Solutions:
(a) (i) – 3
5(ii) 2x + 9
5(iii) 5x – 1
2
(b) (i) (2x – 1)(x + 3) (ii) x = 11 (iii) 21 cm × 14 cm
Recommendations
While this optional question was by far the most popular, teachers must caution students that basic algebraic skills are required in order to attempt these questions successfully. The use of factorization as the first method to try in solving quadratic equations must be emphasized. Students must also be reminded that unlike linear equations, quadratic equations can only be solved when all terms are equated to zero.
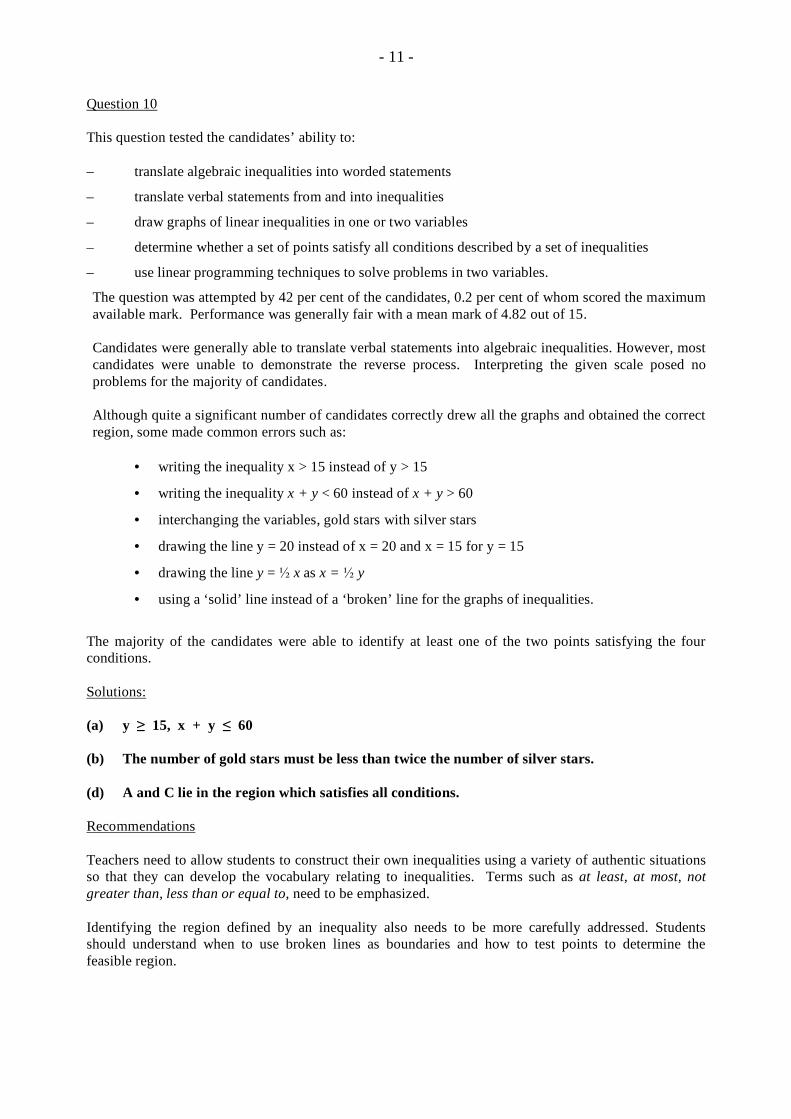
- 11 -
Question 10
This question tested the candidates’ ability to:
– translate algebraic inequalities into worded statements
– translate verbal statements from and into inequalities
– draw graphs of linear inequalities in one or two variables
– determine whether a set of points satisfy all conditions described by a set of inequalities
– use linear programming techniques to solve problems in two variables.
The question was attempted by 42 per cent of the candidates, 0.2 per cent of whom scored the maximum available mark. Performance was generally fair with a mean mark of 4.82 out of 15.
Candidates were generally able to translate verbal statements into algebraic inequalities. However, most candidates were unable to demonstrate the reverse process. Interpreting the given scale posed no problems for the majority of candidates.
Although quite a significant number of candidates correctly drew all the graphs and obtained the correct region, some made common errors such as:
• writing the inequality x > 15 instead of y > 15
• writing the inequality x + y < 60 instead of x + y > 60
• interchanging the variables, gold stars with silver stars
• drawing the line y = 20 instead of x = 20 and x = 15 for y = 15
• drawing the line y = ½ x as x = ½ y
• using a ‘solid’ line instead of a ‘broken’ line for the graphs of inequalities.
The majority of the candidates were able to identify at least one of the two points satisfying the four conditions.
Solutions:
(a) y ≥ 15, x + y ≤ 60
(b) The number of gold stars must be less than twice the number of silver stars.
(d) A and C lie in the region which satisfies all conditions.
Recommendations
Teachers need to allow students to construct their own inequalities using a variety of authentic situations so that they can develop the vocabulary relating to inequalities. Terms such as at least, at most, not greater than, less than or equal to, need to be emphasized.
Identifying the region defined by an inequality also needs to be more carefully addressed. Students should understand when to use broken lines as boundaries and how to test points to determine the feasible region.
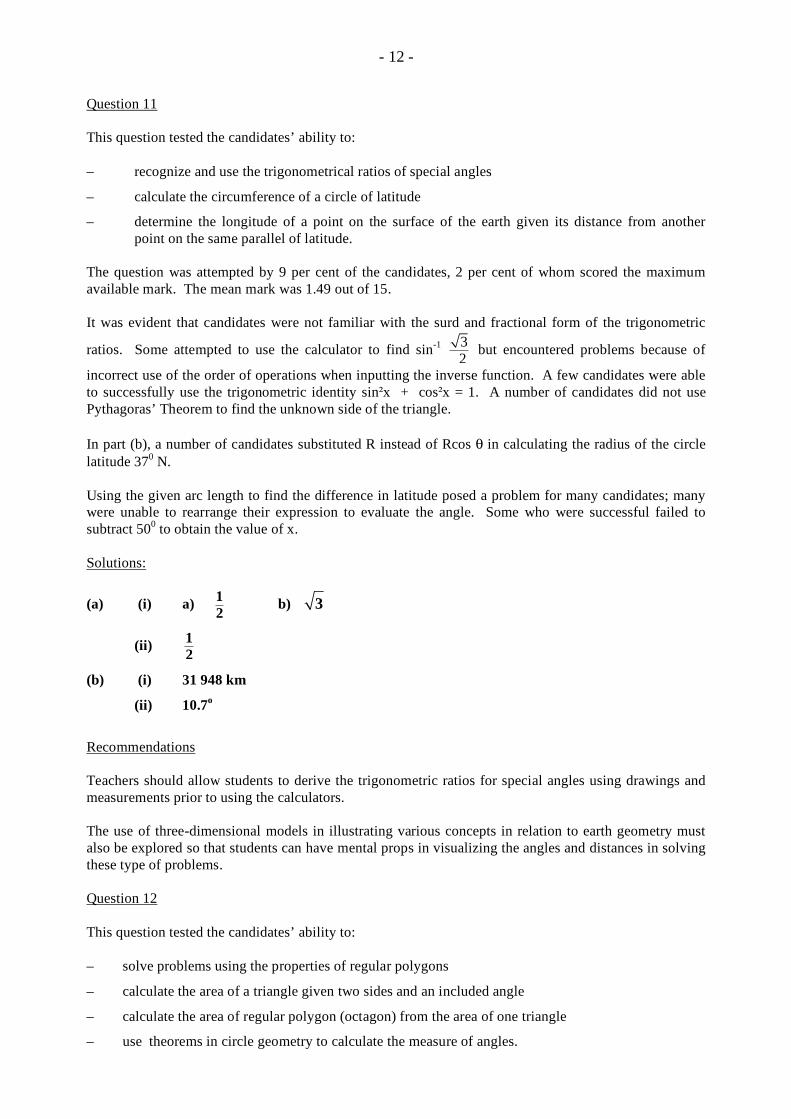
- 12 -
Question 11
This question tested the candidates’ ability to:
– recognize and use the trigonometrical ratios of special angles
– calculate the circumference of a circle of latitude
– determine the longitude of a point on the surface of the earth given its distance from anotherpoint on the same parallel of latitude.
The question was attempted by 9 per cent of the candidates, 2 per cent of whom scored the maximum available mark. The mean mark was 1.49 out of 15.
It was evident that candidates were not familiar with the surd and fractional form of the trigonometric
ratios. Some attempted to use the calculator to find sin-1 3
2 but encountered problems because of
incorrect use of the order of operations when inputting the inverse function. A few candidates were able to successfully use the trigonometric identity sin²x + cos²x = 1. A number of candidates did not use Pythagoras’ Theorem to find the unknown side of the triangle.
In part (b), a number of candidates substituted R instead of Rcos θ in calculating the radius of the circle latitude 370 N.
Using the given arc length to find the difference in latitude posed a problem for many candidates; many were unable to rearrange their expression to evaluate the angle. Some who were successful failed to subtract 500 to obtain the value of x.
Solutions:
(a) (i) a) 1
2b) 3
(ii) 1
2
(b) (i) 31 948 km
(ii) 10.7o
Recommendations
Teachers should allow students to derive the trigonometric ratios for special angles using drawings and measurements prior to using the calculators.
The use of three-dimensional models in illustrating various concepts in relation to earth geometry must also be explored so that students can have mental props in visualizing the angles and distances in solving these type of problems.
Question 12
This question tested the candidates’ ability to:
– solve problems using the properties of regular polygons
– calculate the area of a triangle given two sides and an included angle
– calculate the area of regular polygon (octagon) from the area of one triangle
– use theorems in circle geometry to calculate the measure of angles.
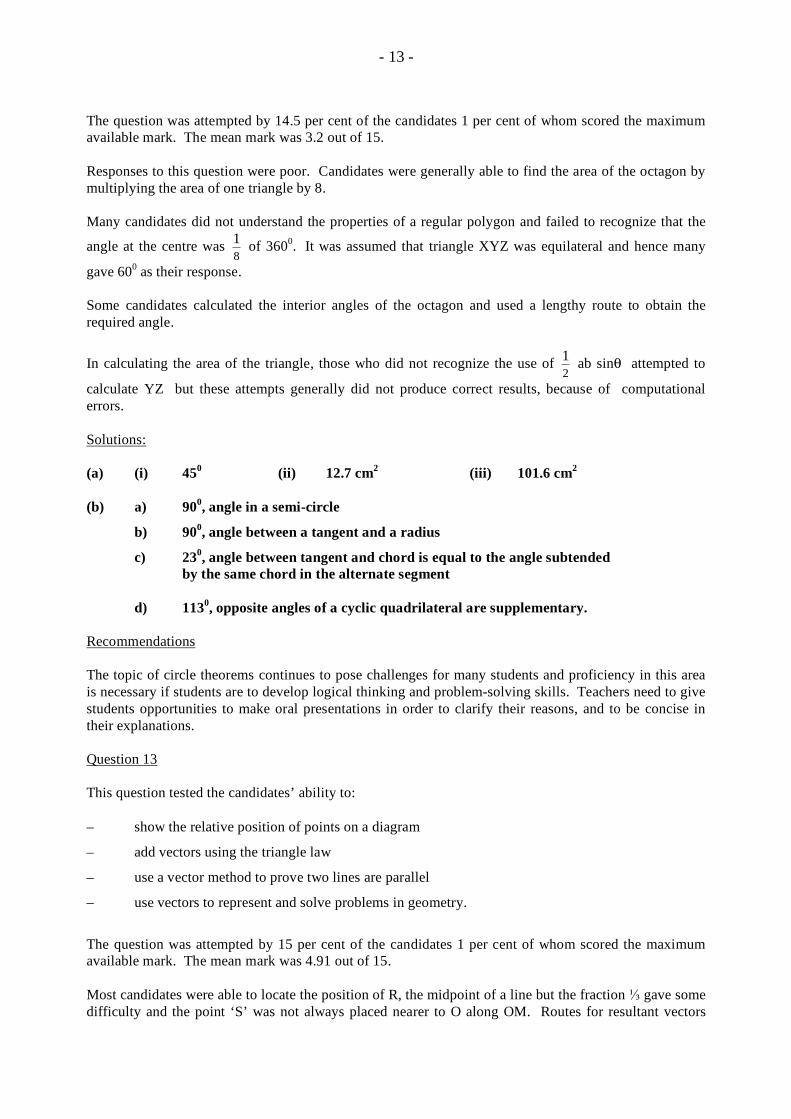
- 13 -
The question was attempted by 14.5 per cent of the candidates 1 per cent of whom scored the maximum available mark. The mean mark was 3.2 out of 15. Responses to this question were poor. Candidates were generally able to find the area of the octagon by multiplying the area of one triangle by 8. Many candidates did not understand the properties of a regular polygon and failed to recognize that the
angle at the centre was 1
8 of 3600. It was assumed that triangle XYZ was equilateral and hence many
gave 600 as their response. Some candidates calculated the interior angles of the octagon and used a lengthy route to obtain the required angle.
In calculating the area of the triangle, those who did not recognize the use of 1
2 ab sinθ attempted to
calculate YZ but these attempts generally did not produce correct results, because of computational errors. Solutions: (a) (i) 450 (ii) 12.7 cm2 (iii) 101.6 cm2 (b) a) 900, angle in a semi-circle
b) 900, angle between a tangent and a radius
c) 230, angle between tangent and chord is equal to the angle subtended by the same chord in the alternate segment d) 1130, opposite angles of a cyclic quadrilateral are supplementary. Recommendations The topic of circle theorems continues to pose challenges for many students and proficiency in this area is necessary if students are to develop logical thinking and problem-solving skills. Teachers need to give students opportunities to make oral presentations in order to clarify their reasons, and to be concise in their explanations. Question 13 This question tested the candidates’ ability to: – show the relative position of points on a diagram
– add vectors using the triangle law
– use a vector method to prove two lines are parallel
– use vectors to represent and solve problems in geometry.
The question was attempted by 15 per cent of the candidates 1 per cent of whom scored the maximum available mark. The mean mark was 4.91 out of 15. Most candidates were able to locate the position of R, the midpoint of a line but the fraction ⅓ gave some difficulty and the point ‘S’ was not always placed nearer to O along OM. Routes for resultant vectors
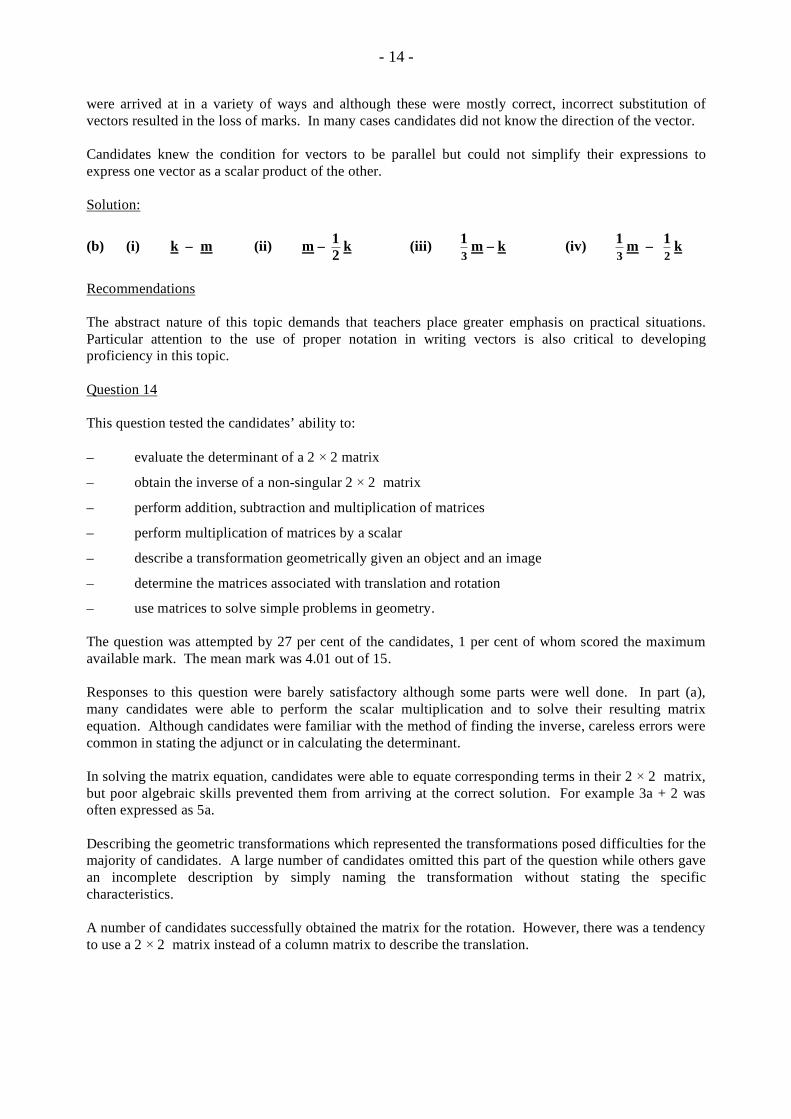
- 14 -
were arrived at in a variety of ways and although these were mostly correct, incorrect substitution of vectors resulted in the loss of marks. In many cases candidates did not know the direction of the vector.
Candidates knew the condition for vectors to be parallel but could not simplify their expressions to express one vector as a scalar product of the other.
Solution:
(b) (i) k – m (ii) m – 1
2k (iii) 1
3m – k (iv) 1
3m – 1
2k
Recommendations
The abstract nature of this topic demands that teachers place greater emphasis on practical situations. Particular attention to the use of proper notation in writing vectors is also critical to developing proficiency in this topic.
Question 14
This question tested the candidates’ ability to:
– evaluate the determinant of a 2 × 2 matrix
– obtain the inverse of a non-singular 2 × 2 matrix
– perform addition, subtraction and multiplication of matrices
– perform multiplication of matrices by a scalar
– describe a transformation geometrically given an object and an image
– determine the matrices associated with translation and rotation
– use matrices to solve simple problems in geometry.
The question was attempted by 27 per cent of the candidates, 1 per cent of whom scored the maximum available mark. The mean mark was 4.01 out of 15.
Responses to this question were barely satisfactory although some parts were well done. In part (a), many candidates were able to perform the scalar multiplication and to solve their resulting matrix equation. Although candidates were familiar with the method of finding the inverse, careless errors were common in stating the adjunct or in calculating the determinant.
In solving the matrix equation, candidates were able to equate corresponding terms in their 2 × 2 matrix, but poor algebraic skills prevented them from arriving at the correct solution. For example 3a + 2 was often expressed as 5a.
Describing the geometric transformations which represented the transformations posed difficulties for the majority of candidates. A large number of candidates omitted this part of the question while others gave an incomplete description by simply naming the transformation without stating the specific characteristics.
A number of candidates successfully obtained the matrix for the rotation. However, there was a tendency to use a 2 × 2 matrix instead of a column matrix to describe the translation.
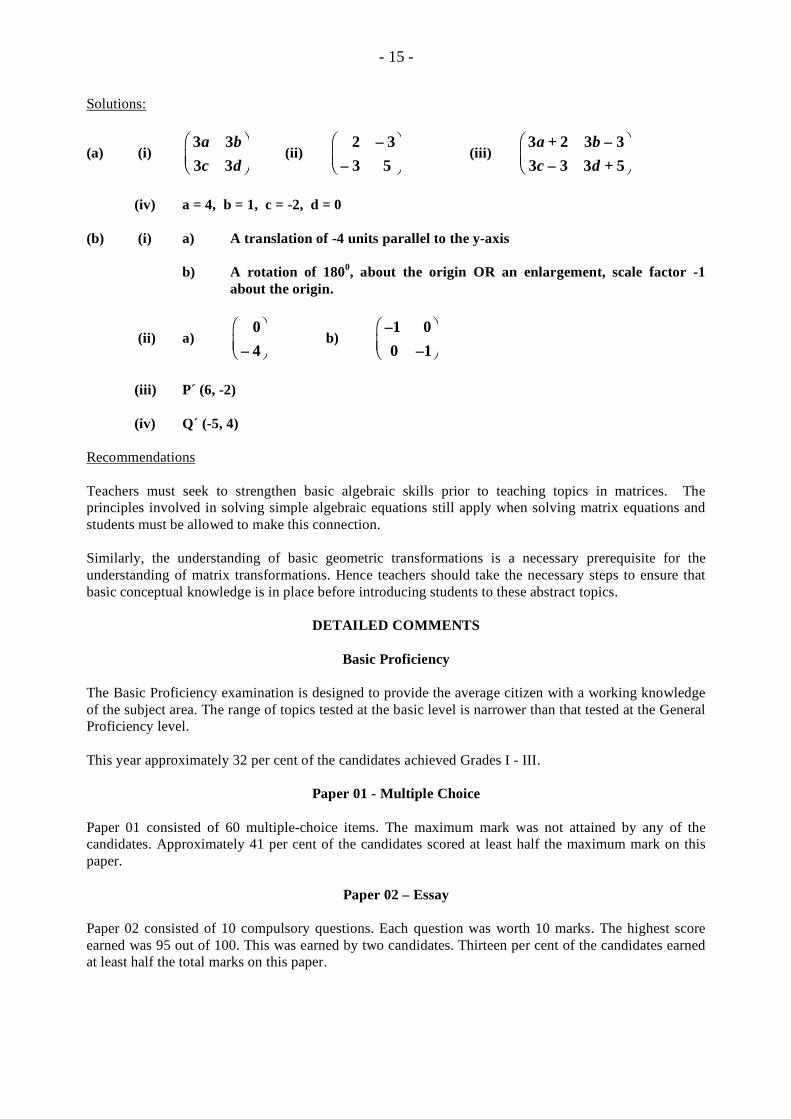
- 15 -
Solutions:
(a) (i) 3a 3b
3c 3d
!
"#$
%& (ii)
2 – 3
– 3 5
!
"#$
%& (iii)
3a + 2 3b – 3
3c – 3 3d + 5
!
"#$
%&
(iv) a = 4, b = 1, c = -2, d = 0 (b) (i) a) A translation of -4 units parallel to the y-axis b) A rotation of 1800, about the origin OR an enlargement, scale factor -1 about the origin.
(ii) a) 0
– 4
!
"#$
%& b)
–1 0
0 –1
!
"#$
%&
(iii) P´ (6, -2) (iv) Q´ (-5, 4) Recommendations Teachers must seek to strengthen basic algebraic skills prior to teaching topics in matrices. The principles involved in solving simple algebraic equations still apply when solving matrix equations and students must be allowed to make this connection. Similarly, the understanding of basic geometric transformations is a necessary prerequisite for the understanding of matrix transformations. Hence teachers should take the necessary steps to ensure that basic conceptual knowledge is in place before introducing students to these abstract topics.
DETAILED COMMENTS
Basic Proficiency
The Basic Proficiency examination is designed to provide the average citizen with a working knowledge of the subject area. The range of topics tested at the basic level is narrower than that tested at the General Proficiency level. This year approximately 32 per cent of the candidates achieved Grades I - III.
Paper 01 - Multiple Choice
Paper 01 consisted of 60 multiple-choice items. The maximum mark was not attained by any of the candidates. Approximately 41 per cent of the candidates scored at least half the maximum mark on this paper.
Paper 02 – Essay
Paper 02 consisted of 10 compulsory questions. Each question was worth 10 marks. The highest score earned was 95 out of 100. This was earned by two candidates. Thirteen per cent of the candidates earned at least half the total marks on this paper.
- 16 -
Question 1
This question tested candidates’ ability to:
– perform any of the basic operations with rational numbers
– approximate a value to given number of significant figures
– solve problems involving fractions and decimals.
The question was attempted by 98 per cent of the candidates, 0.5 per cent of whom scored the maximum available mark. The mean mark was 3.12 out of 10.
The candidates were able to use calculators to evaluate 1.05² but they generally lacked knowledge of significant figures. Examples of incorrect responses were 690.000 or 69. Some candidates wrote their answer in standard form.
In part (b), candidates were able to recognize that the total number of shares was 7 and that 3 shares were equivalent to $45. However, some candidates assumed that one share was the $45 while others equated $45 to 7 shares.
In part (c), most candidates knew that they had to add the fractions but the weaker candidates associated the ‘and’ with multiplication and proceed to multiply ¼ by ⅜ instead of ¼ + ⅜. Candidates were generally aware that they had to find the fraction that played basketball by subtracting before they found the required percentage.
Solutions:
(a) (i) 687.96 (ii) 690
(b) $105
(c) (i) 5
8(ii) 37.5%
Recommendations
• The concept of significant figures should be reinforced and more practice exercises given.
• More non-routine problems based on ratio must be given to students, and more wordproblems involving fractions.
Question 2
This question tested candidates’ ability to:
– perform operations involving directed numbers
– use symbols to represent binary operations and perform simple computations
– use the laws of indices to manipulate expressions with integral indices
– apply the distributive law to insert or remove brackets in algebraic expressions
– solve a simple linear inequality in one unknown.The question was attempted by 95 per cent of the candidates, 1 per cent of whom scored the maximum available mark. The mean mark was 2.3 out of 10.
Generally, candidates performed unsatisfactorily. They experienced difficulty in all parts of the question.
- 17 -
Candidates were generally unable to apply the laws of indices. For example, they incorrectly equated 2p² × 3p³ with 6p6 or 5p6.
In other cases, 2p² × 3p³ was interpreted as 2² × 3³ × p = 4 × 27 × p = 108p.
In part (iii), candidates multiplied the entire expression by 3 instead of the terms in the bracket. Thus 3(2x +1) – 4x was equated to 6x + 3 – 12x, instead of 6x + 3 – 4x. They also experienced difficulty in collecting the like terms and simplifying.
In part (b) 4 × (-5²) was interpreted to mean (4× – 5)².
Solutions:
(a) (i) 6p5 (ii) p² (iii) 2x + 3
(b) 100
(c) (i) x < 2 (ii) x = 1
Recommendations
• Emphasis should be placed on the laws of indices and operations with directed numbers.
Question 3
This question tested candidates’ ability to:
– solve simple problems involving payments in installments as in the case of hire purchase
– solve problems involving insurances
– solve problems involving compound interest.
The question was attempted by 95 per cent of the candidates, 5 per cent of whom scored the maximum available mark. The mean mark was 3.31 out of 10.
Candidates showed a fairly good understanding of the topic hire purchase. However, many did not complete the question by finding the difference between the cash price and the hire purchase price.
Candidates showed very limited knowledge of insurance calculations. Most added the fixed land charge to the price of the house and then tried to find 0.5% of the total. Some found 5% instead of 0.5%.
Compound interest was very often calculated as simple interest.
Solutions :
(a) $35
(b) $1 350
(c) $6 615
Recommendations
• Students should be taught to distinguish between simple and compound interest.
• More emphasis should be placed on all areas of consumer arithmetic.
- 18 -
Question 4
This question tested candidates’ ability to:
– calculate the area enclosed by a trapezium
– use measurements on a map and a scale to calculate actual distance and vice versa
– solve problems involving measurements .
The question was attempted by 93 percent of the candidates, 7 per cent of whom scored the maximum available mark. The mean mark was 3.83 out of 10. . In part (a) most candidates were able to calculate the actual distance in km. However many could not do the calculation to find the distance on the map.
Solutions:
(a) (i) 11.2 km (ii) 7.5 cm
(b) (i) 6 cm (ii) 88 cm²
Recommendations
• Students need to do more examples in measurement involving irregular shapes.
• More emphasis on the use of scale drawings and converting from maps to actualmeasures and vice versa.
Question 5
This question tested candidates’ ability to:
– solve problems involving cost price, percentages and discount
– solve problems involving salaries and wages.
The question was attempted by 95 per cent of the candidates, 13 per cent of whom scored the maximum available mark. The mean mark was 5.06 out of 10.
The majority of the candidates were able to calculate the total cost of books and magazines. They also understood the concept of doubling to obtain the overtime hourly rate. Although many of the candidates were able to calculate the discount, they were unable to follow through to determine the actual discount price. Many of the candidates were unable to calculate the overtime wage of $80 for the week.
Solutions:
(a) (i) $8 (ii) $16 (iii) $440
(b) (i) a) $150
b) $45
(iii) $179.40
Recommendations
• Students should be given more practice in solving word problems in consumer arithmetic.
- 19 -
Question 6
This question tested candidates’ ability to:
– translate verbal phrases into algebraic symbols and vice versa
– solve simultaneous linear equations in two unknowns algebraically
– use a linear equation to solve word problems.
The question was attempted by 89 per cent of the candidates, 3 per cent of whom scored the maximum available mark. The mean mark was 1.97 out of 10.
Candidates generally had knowledge of methods used in solving simultaneous equations. However, some candidates failed to subtract correctly after equating the coefficients. A number of candidates obtained the result below.
x + 2y = 7 6x + 2y = 12 ______________
– 5x = 5 or
5x = – 5
After the candidates found the value for one variable, they incorrectly substituted it for the other variable, for example, after obtaining x = 1, some mistakenly used this value to substitute for y instead of x in the equation.
In part (b), candidates interpreted the statement “more than” as the inequality symbol and wrote p > 36 instead of p + 36. In simplifying algebraic expressions, some common errors were: Equating p + 36 with 36p or with 36p². Forming an equation from the given information also posed problems for candidates.
Solutions:
(a) x = 1, y = 3
(b) (i) a) p + 36 b) 2p + 36
(ii) p = 9
Recommendations
• The simplification of algebraic expressions needs to be practised by students, as well as thesolution of simultaneous equations.
Question 7
This question tested candidates’ ability to:
– use instruments to draw and measure angles and line segments
– use instruments to construct triangles
– use Pythagoras’ Theorem to solve simple problems
– use trigonometric ratios in the solution of right-angled triangles.
The question was attempted by 79 per cent of the candidates, 1 per cent of whom scored the maximum available mark. The mean mark was 2.19 out of 10.
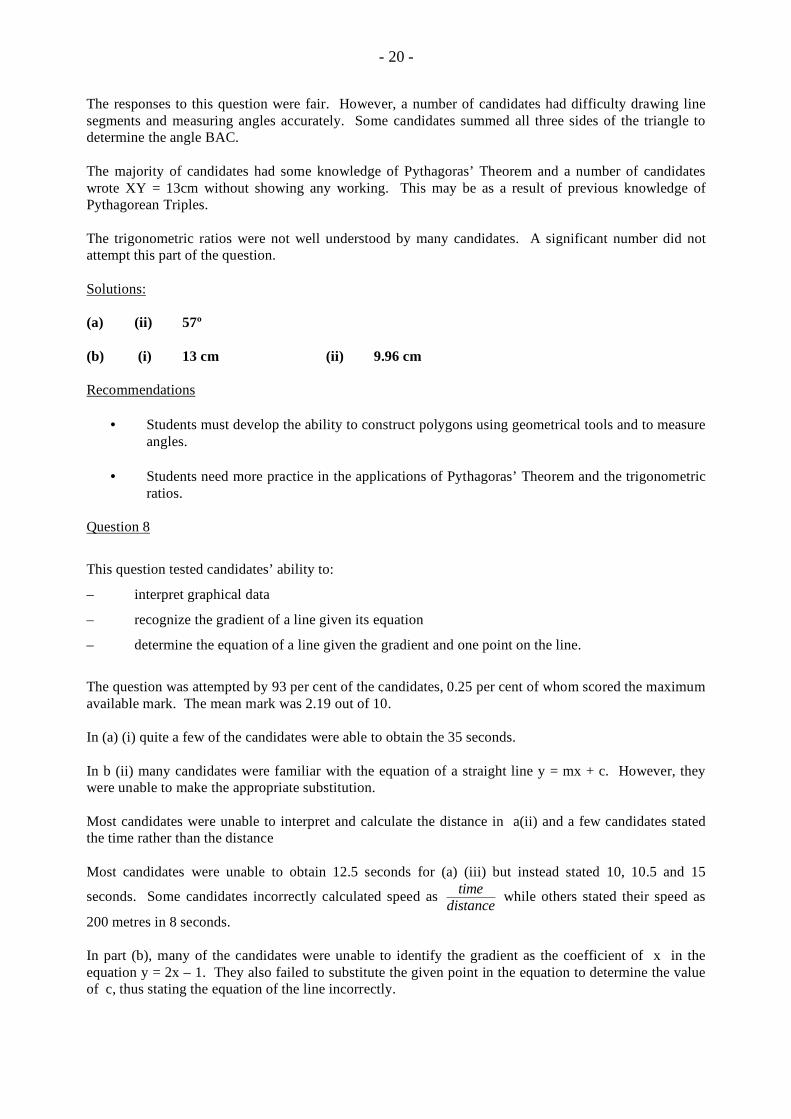
- 20 -
The responses to this question were fair. However, a number of candidates had difficulty drawing line segments and measuring angles accurately. Some candidates summed all three sides of the triangle to determine the angle BAC.
The majority of candidates had some knowledge of Pythagoras’ Theorem and a number of candidates wrote XY = 13cm without showing any working. This may be as a result of previous knowledge of Pythagorean Triples.
The trigonometric ratios were not well understood by many candidates. A significant number did not attempt this part of the question.
Solutions:
(a) (ii) 57º
(b) (i) 13 cm (ii) 9.96 cm
Recommendations
• Students must develop the ability to construct polygons using geometrical tools and to measureangles.
• Students need more practice in the applications of Pythagoras’ Theorem and the trigonometricratios.
Question 8
This question tested candidates’ ability to:
– interpret graphical data
– recognize the gradient of a line given its equation
– determine the equation of a line given the gradient and one point on the line.
The question was attempted by 93 per cent of the candidates, 0.25 per cent of whom scored the maximum available mark. The mean mark was 2.19 out of 10.
In (a) (i) quite a few of the candidates were able to obtain the 35 seconds.
In b (ii) many candidates were familiar with the equation of a straight line y = mx + c. However, they were unable to make the appropriate substitution.
Most candidates were unable to interpret and calculate the distance in a(ii) and a few candidates stated the time rather than the distance
Most candidates were unable to obtain 12.5 seconds for (a) (iii) but instead stated 10, 10.5 and 15
seconds. Some candidates incorrectly calculated speed as time
distance while others stated their speed as
200 metres in 8 seconds.
In part (b), many of the candidates were unable to identify the gradient as the coefficient of x in the equation y = 2x – 1. They also failed to substitute the given point in the equation to determine the value of c, thus stating the equation of the line incorrectly.
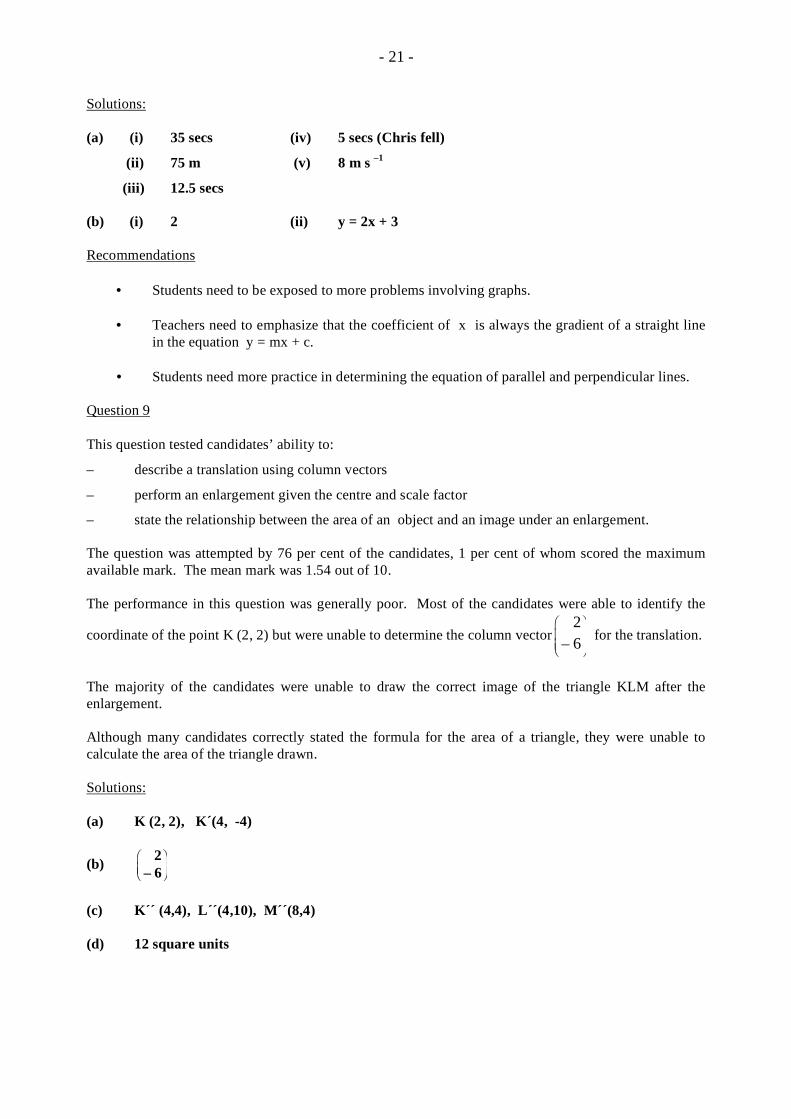
- 21 -
Solutions: (a) (i) 35 secs (iv) 5 secs (Chris fell)
(ii) 75 m (v) 8 m s –1
(iii) 12.5 secs
(b) (i) 2 (ii) y = 2x + 3 Recommendations
• Students need to be exposed to more problems involving graphs. • Teachers need to emphasize that the coefficient of x is always the gradient of a straight line
in the equation y = mx + c. • Students need more practice in determining the equation of parallel and perpendicular lines.
Question 9 This question tested candidates’ ability to:
– describe a translation using column vectors
– perform an enlargement given the centre and scale factor
– state the relationship between the area of an object and an image under an enlargement. The question was attempted by 76 per cent of the candidates, 1 per cent of whom scored the maximum available mark. The mean mark was 1.54 out of 10. The performance in this question was generally poor. Most of the candidates were able to identify the
coordinate of the point K (2, 2) but were unable to determine the column vector 2
– 6
!
"##
$
%&&
for the translation.
The majority of the candidates were unable to draw the correct image of the triangle KLM after the enlargement. Although many candidates correctly stated the formula for the area of a triangle, they were unable to calculate the area of the triangle drawn. Solutions: (a) K (2, 2), K´(4, -4)
(b) 2
– 6
!"#
$%&
(c) K´´ (4,4), L´´(4,10), M´´(8,4) (d) 12 square units
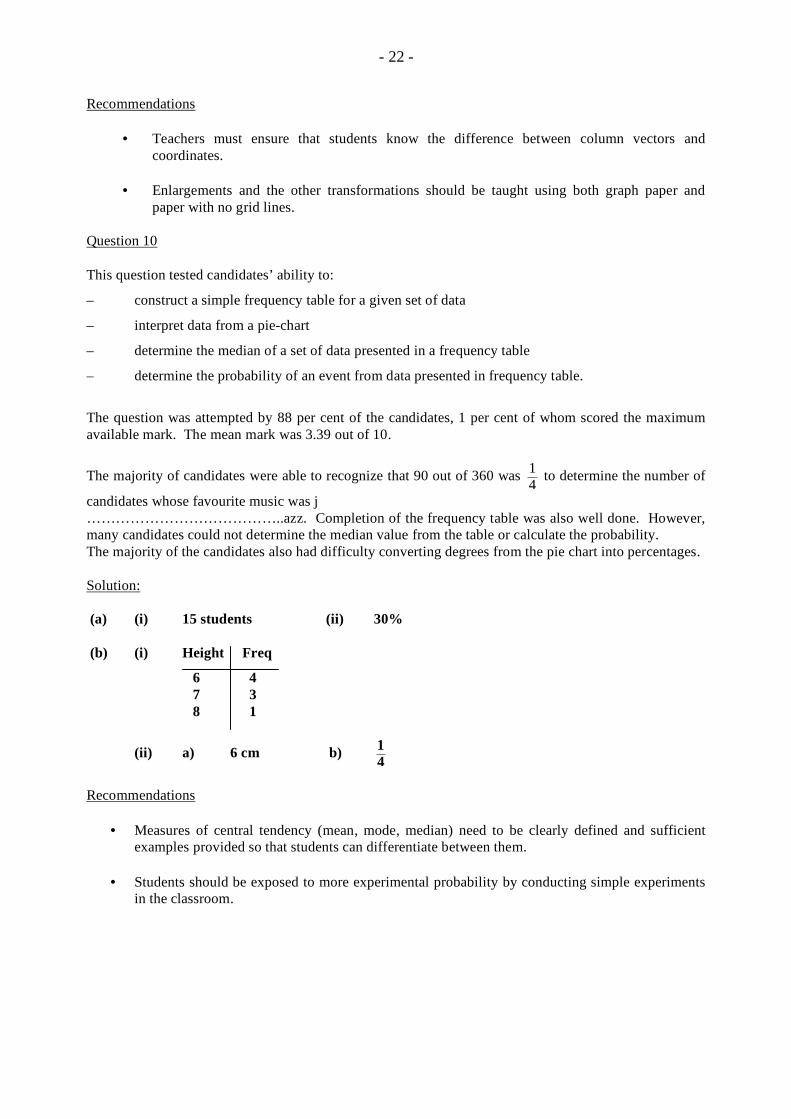
- 22 -
Recommendations
• Teachers must ensure that students know the difference between column vectors andcoordinates.
• Enlargements and the other transformations should be taught using both graph paper andpaper with no grid lines.
Question 10
This question tested candidates’ ability to:
– construct a simple frequency table for a given set of data
– interpret data from a pie-chart
– determine the median of a set of data presented in a frequency table
– determine the probability of an event from data presented in frequency table.
The question was attempted by 88 per cent of the candidates, 1 per cent of whom scored the maximum available mark. The mean mark was 3.39 out of 10.
The majority of candidates were able to recognize that 90 out of 360 was 1
4 to determine the number of
candidates whose favourite music was j …………………………………..azz. Completion of the frequency table was also well done. However, many candidates could not determine the median value from the table or calculate the probability. The majority of the candidates also had difficulty converting degrees from the pie chart into percentages.
Solution:
(a) (i) 15 students (ii) 30%
(b) (i) Height Freq
6 4 7 3 8 1
(ii) a) 6 cm b) 1
4
Recommendations
• Measures of central tendency (mean, mode, median) need to be clearly defined and sufficientexamples provided so that students can differentiate between them.
• Students should be exposed to more experimental probability by conducting simple experimentsin the classroom.

CARIBBEAN EXAMINATIONS COUNCIL
REPORT ON CANDIDATES’ WORK IN THECARIBBEAN SECONDARY EDUCATION CERTIFICATE
JANUARY 2008
MATHEMATICS
Copyright © 2008 Caribbean Examinations Council ®St Michael Barbados
All rights reserved
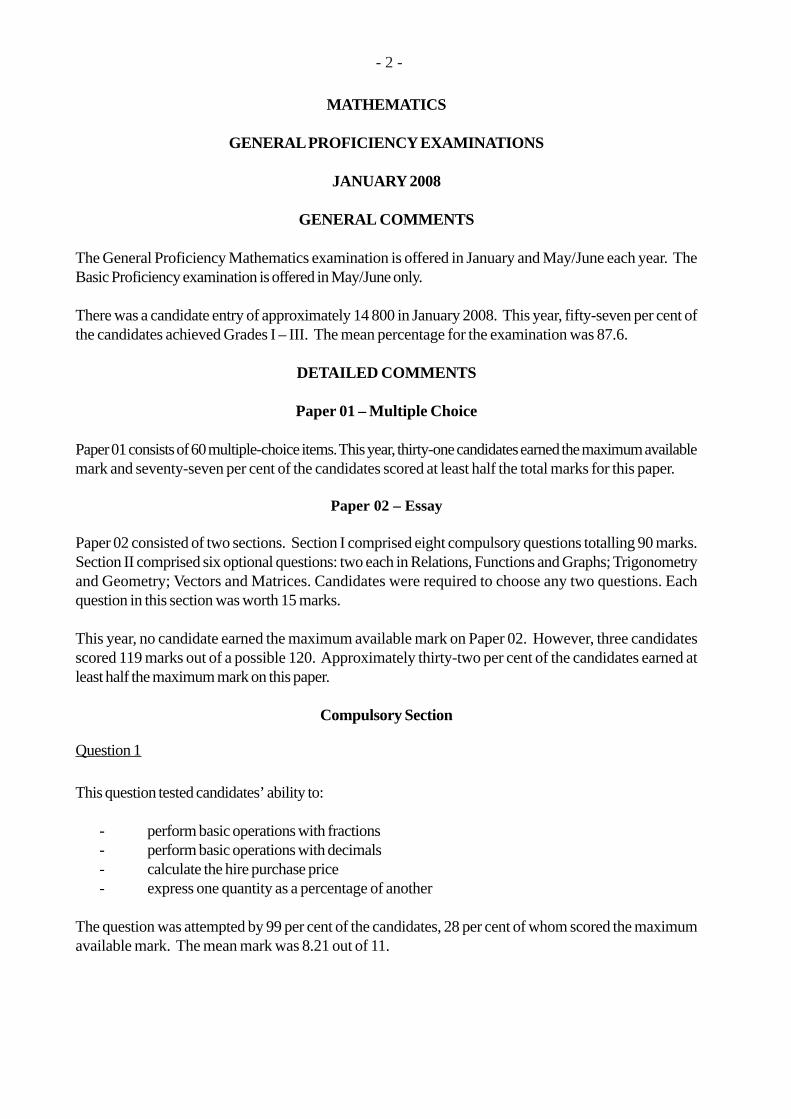
- 2 -
MATHEMATICS
GENERAL PROFICIENCY EXAMINATIONS
JANUARY 2008
GENERAL COMMENTS
The General Proficiency Mathematics examination is offered in January and May/June each year. TheBasic Proficiency examination is offered in May/June only.
There was a candidate entry of approximately 14 800 in January 2008. This year, fifty-seven per cent ofthe candidates achieved Grades I – III. The mean percentage for the examination was 87.6.
DETAILED COMMENTS
Paper 01 – Multiple Choice
Paper 01 consists of 60 multiple-choice items. This year, thirty-one candidates earned the maximum availablemark and seventy-seven per cent of the candidates scored at least half the total marks for this paper.
Paper 02 – Essay
Paper 02 consisted of two sections. Section I comprised eight compulsory questions totalling 90 marks.Section II comprised six optional questions: two each in Relations, Functions and Graphs; Trigonometryand Geometry; Vectors and Matrices. Candidates were required to choose any two questions. Eachquestion in this section was worth 15 marks.
This year, no candidate earned the maximum available mark on Paper 02. However, three candidatesscored 119 marks out of a possible 120. Approximately thirty-two per cent of the candidates earned atleast half the maximum mark on this paper.
Compulsory Section
Question 1
This question tested candidates’ ability to:
- perform basic operations with fractions- perform basic operations with decimals- calculate the hire purchase price- express one quantity as a percentage of another
The question was attempted by 99 per cent of the candidates, 28 per cent of whom scored the maximumavailable mark. The mean mark was 8.21 out of 11.
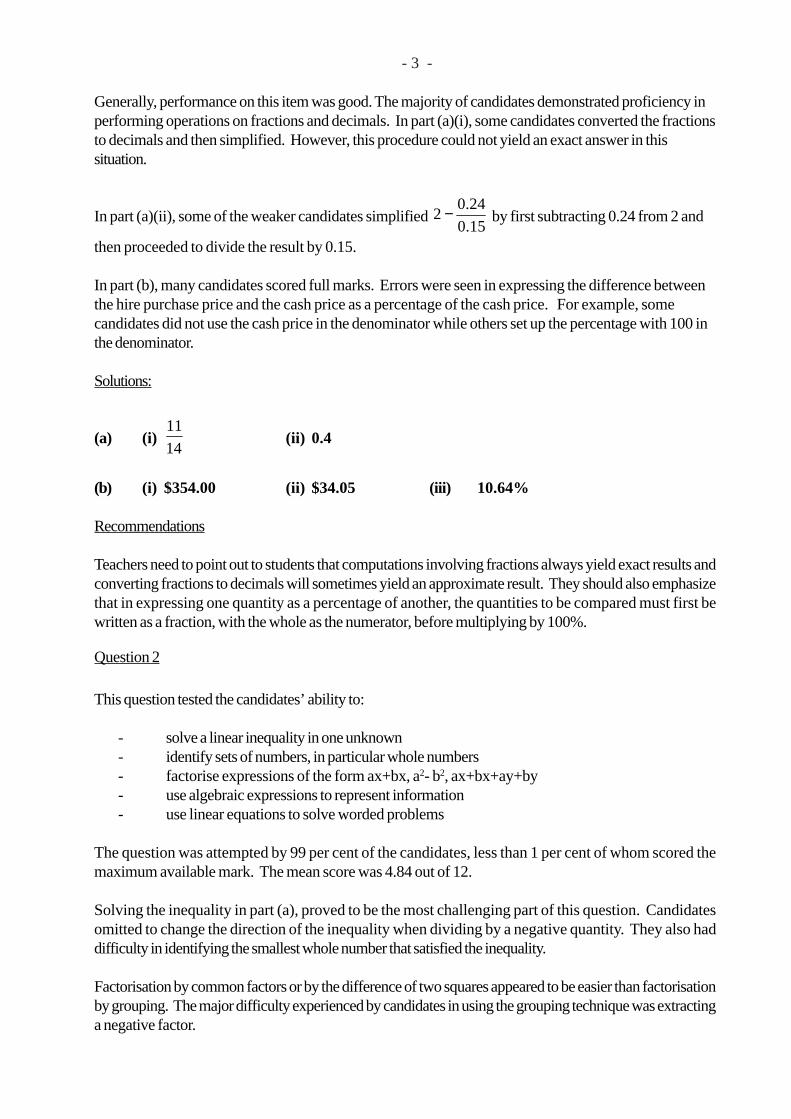
- 3 -
Generally, performance on this item was good. The majority of candidates demonstrated proficiency inperforming operations on fractions and decimals. In part (a)(i), some candidates converted the fractionsto decimals and then simplified. However, this procedure could not yield an exact answer in thissituation.
In part (a)(ii), some of the weaker candidates simplified 15.0
24.02 − by first subtracting 0.24 from 2 and
then proceeded to divide the result by 0.15.
In part (b), many candidates scored full marks. Errors were seen in expressing the difference betweenthe hire purchase price and the cash price as a percentage of the cash price. For example, somecandidates did not use the cash price in the denominator while others set up the percentage with 100 inthe denominator.
Solutions:
(a) (i) 14
11(ii) 0.4
(b) (i) $354.00 (ii) $34.05 (iii) 10.64%
Recommendations
Teachers need to point out to students that computations involving fractions always yield exact results andconverting fractions to decimals will sometimes yield an approximate result. They should also emphasizethat in expressing one quantity as a percentage of another, the quantities to be compared must first bewritten as a fraction, with the whole as the numerator, before multiplying by 100%.
Question 2
This question tested the candidates’ ability to:
- solve a linear inequality in one unknown- identify sets of numbers, in particular whole numbers- factorise expressions of the form ax+bx, a2- b2, ax+bx+ay+by- use algebraic expressions to represent information- use linear equations to solve worded problems
The question was attempted by 99 per cent of the candidates, less than 1 per cent of whom scored themaximum available mark. The mean score was 4.84 out of 12.
Solving the inequality in part (a), proved to be the most challenging part of this question. Candidatesomitted to change the direction of the inequality when dividing by a negative quantity. They also haddifficulty in identifying the smallest whole number that satisfied the inequality.
Factorisation by common factors or by the difference of two squares appeared to be easier than factorisationby grouping. The major difficulty experienced by candidates in using the grouping technique was extractinga negative factor.
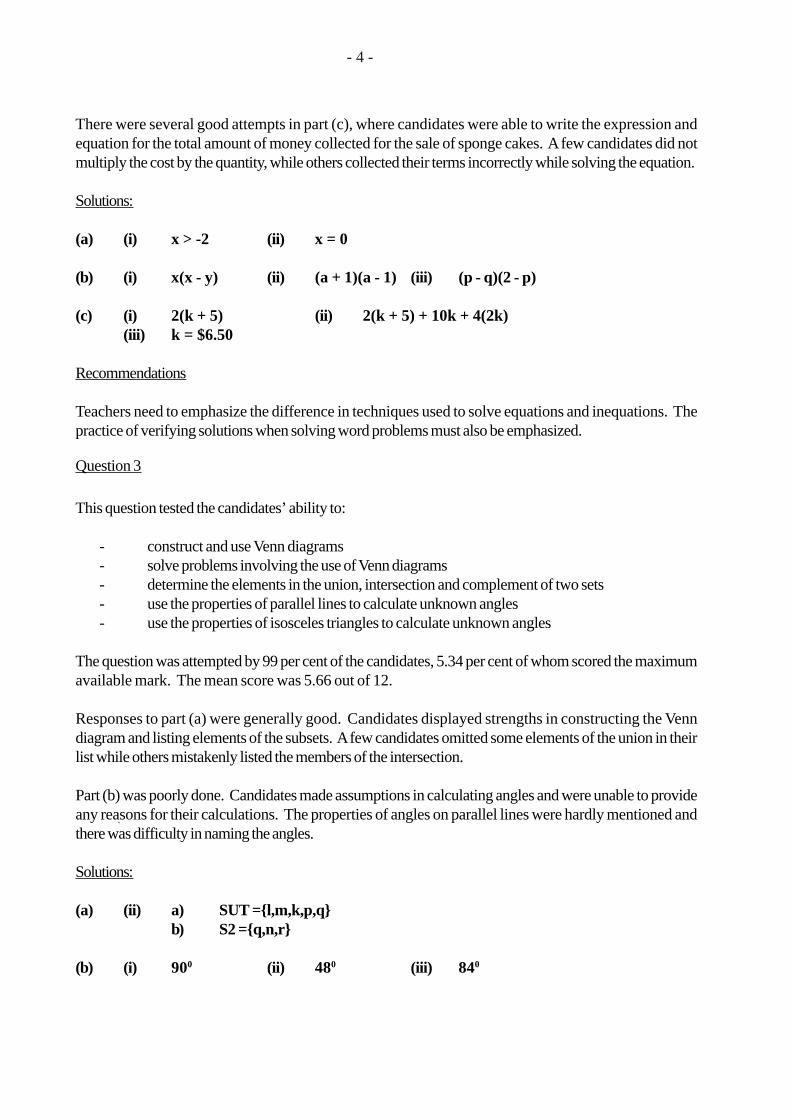
- 4 -
There were several good attempts in part (c), where candidates were able to write the expression andequation for the total amount of money collected for the sale of sponge cakes. A few candidates did notmultiply the cost by the quantity, while others collected their terms incorrectly while solving the equation.
Solutions:
(a) (i) x > -2 (ii) x = 0
(b) (i) x(x - y) (ii) (a + 1)(a - 1) (iii) (p - q)(2 - p)
(c) (i) 2(k + 5) (ii) 2(k + 5) + 10k + 4(2k)(iii) k = $6.50
Recommendations
Teachers need to emphasize the difference in techniques used to solve equations and inequations. Thepractice of verifying solutions when solving word problems must also be emphasized.
Question 3
This question tested the candidates’ ability to:
- construct and use Venn diagrams- solve problems involving the use of Venn diagrams- determine the elements in the union, intersection and complement of two sets- use the properties of parallel lines to calculate unknown angles- use the properties of isosceles triangles to calculate unknown angles
The question was attempted by 99 per cent of the candidates, 5.34 per cent of whom scored the maximumavailable mark. The mean score was 5.66 out of 12.
Responses to part (a) were generally good. Candidates displayed strengths in constructing the Venndiagram and listing elements of the subsets. A few candidates omitted some elements of the union in theirlist while others mistakenly listed the members of the intersection.
Part (b) was poorly done. Candidates made assumptions in calculating angles and were unable to provideany reasons for their calculations. The properties of angles on parallel lines were hardly mentioned andthere was difficulty in naming the angles.
Solutions:
(a) (ii) a) SUT ={l,m,k,p,q}b) S2 ={q,n,r}
(b) (i) 900 (ii) 480 (iii) 840
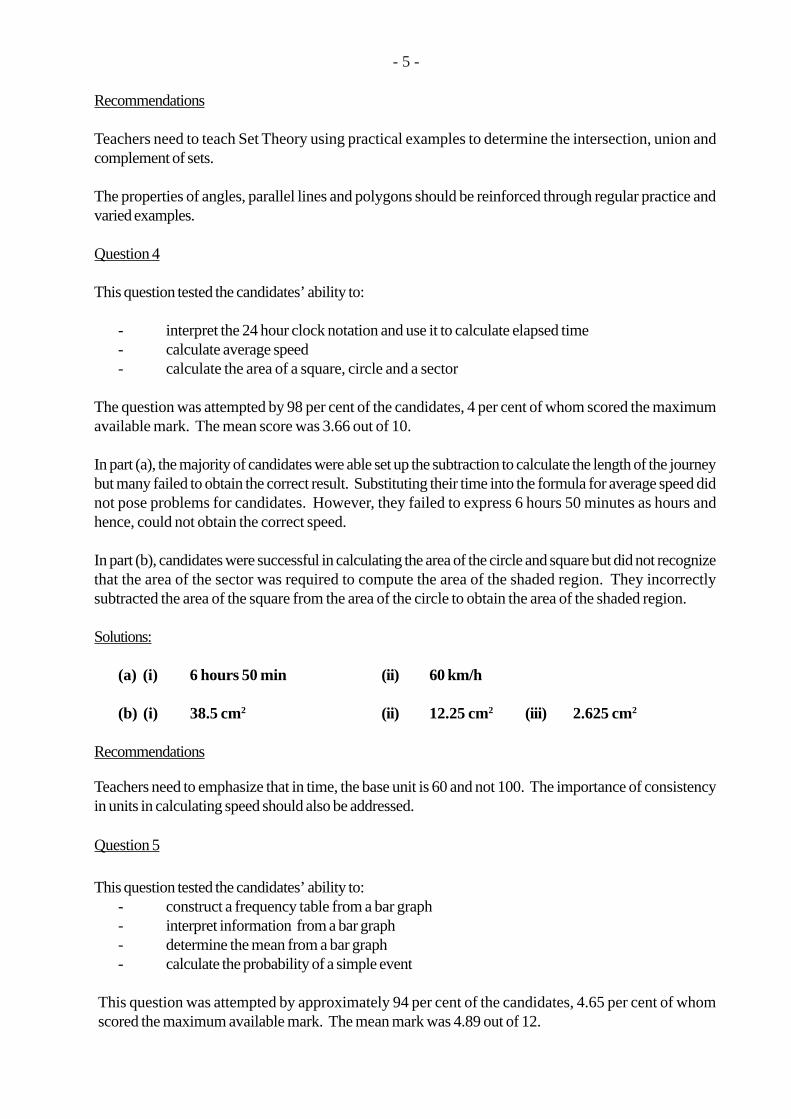
- 5 -
Recommendations
Teachers need to teach Set Theory using practical examples to determine the intersection, union andcomplement of sets.
The properties of angles, parallel lines and polygons should be reinforced through regular practice andvaried examples.
Question 4
This question tested the candidates’ ability to:
- interpret the 24 hour clock notation and use it to calculate elapsed time- calculate average speed- calculate the area of a square, circle and a sector
The question was attempted by 98 per cent of the candidates, 4 per cent of whom scored the maximumavailable mark. The mean score was 3.66 out of 10.
In part (a), the majority of candidates were able set up the subtraction to calculate the length of the journeybut many failed to obtain the correct result. Substituting their time into the formula for average speed didnot pose problems for candidates. However, they failed to express 6 hours 50 minutes as hours andhence, could not obtain the correct speed.
In part (b), candidates were successful in calculating the area of the circle and square but did not recognizethat the area of the sector was required to compute the area of the shaded region. They incorrectlysubtracted the area of the square from the area of the circle to obtain the area of the shaded region.
Solutions:
(a) (i) 6 hours 50 min (ii) 60 km/h
(b) (i) 38.5 cm2 (ii) 12.25 cm2 (iii) 2.625 cm2
Recommendations
Teachers need to emphasize that in time, the base unit is 60 and not 100. The importance of consistencyin units in calculating speed should also be addressed.
Question 5
This question tested the candidates’ ability to:- construct a frequency table from a bar graph- interpret information from a bar graph- determine the mean from a bar graph- calculate the probability of a simple event
This question was attempted by approximately 94 per cent of the candidates, 4.65 per cent of whomscored the maximum available mark. The mean mark was 4.89 out of 12.
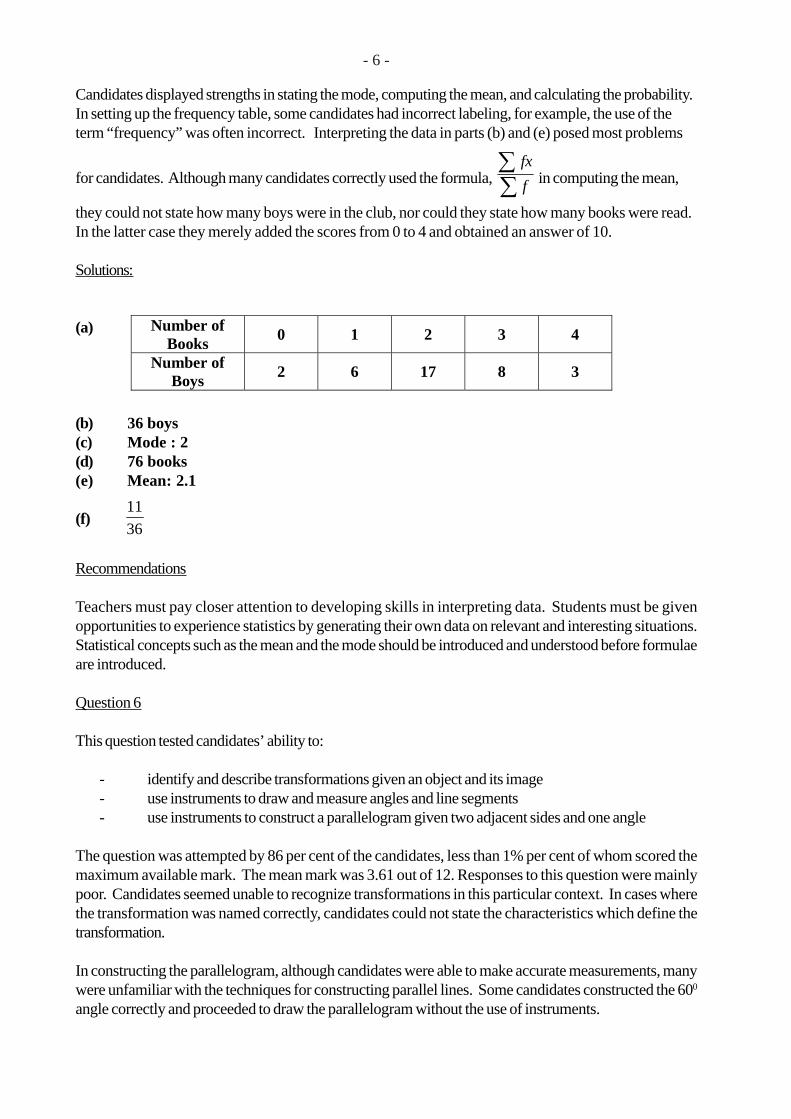
- 6 -
Candidates displayed strengths in stating the mode, computing the mean, and calculating the probability.In setting up the frequency table, some candidates had incorrect labeling, for example, the use of theterm “frequency” was often incorrect. Interpreting the data in parts (b) and (e) posed most problems
for candidates. Although many candidates correctly used the formula, ∑∑
f
fx in computing the mean,
they could not state how many boys were in the club, nor could they state how many books were read.In the latter case they merely added the scores from 0 to 4 and obtained an answer of 10.
Solutions:
(a)
(b) 36 boys(c) Mode : 2(d) 76 books(e) Mean: 2.1
(f)36
11
Recommendations
Teachers must pay closer attention to developing skills in interpreting data. Students must be givenopportunities to experience statistics by generating their own data on relevant and interesting situations.Statistical concepts such as the mean and the mode should be introduced and understood before formulaeare introduced.
Question 6
This question tested candidates’ ability to:
- identify and describe transformations given an object and its image- use instruments to draw and measure angles and line segments- use instruments to construct a parallelogram given two adjacent sides and one angle
The question was attempted by 86 per cent of the candidates, less than 1% per cent of whom scored themaximum available mark. The mean mark was 3.61 out of 12. Responses to this question were mainlypoor. Candidates seemed unable to recognize transformations in this particular context. In cases wherethe transformation was named correctly, candidates could not state the characteristics which define thetransformation.
In constructing the parallelogram, although candidates were able to make accurate measurements, manywere unfamiliar with the techniques for constructing parallel lines. Some candidates constructed the 600
angle correctly and proceeded to draw the parallelogram without the use of instruments.
Number of Books
0 1 2 3 4
Number of Boys
2 6 17 8 3
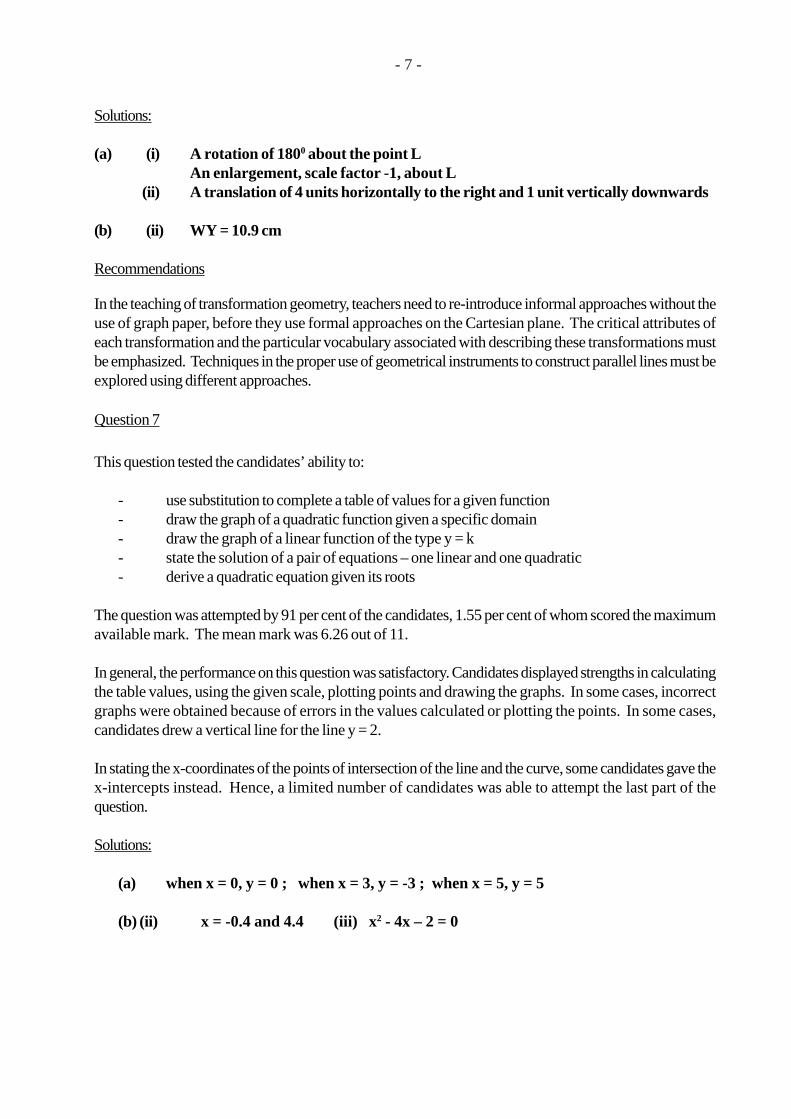
- 7 -
Solutions:
(a) (i) A rotation of 1800 about the point LAn enlargement, scale factor -1, about L
(ii) A translation of 4 units horizontally to the right and 1 unit vertically downwards
(b) (ii) WY = 10.9 cm
Recommendations
In the teaching of transformation geometry, teachers need to re-introduce informal approaches without theuse of graph paper, before they use formal approaches on the Cartesian plane. The critical attributes ofeach transformation and the particular vocabulary associated with describing these transformations mustbe emphasized. Techniques in the proper use of geometrical instruments to construct parallel lines must beexplored using different approaches.
Question 7
This question tested the candidates’ ability to:
- use substitution to complete a table of values for a given function- draw the graph of a quadratic function given a specific domain- draw the graph of a linear function of the type y = k- state the solution of a pair of equations – one linear and one quadratic- derive a quadratic equation given its roots
The question was attempted by 91 per cent of the candidates, 1.55 per cent of whom scored the maximumavailable mark. The mean mark was 6.26 out of 11.
In general, the performance on this question was satisfactory. Candidates displayed strengths in calculatingthe table values, using the given scale, plotting points and drawing the graphs. In some cases, incorrectgraphs were obtained because of errors in the values calculated or plotting the points. In some cases,candidates drew a vertical line for the line y = 2.
In stating the x-coordinates of the points of intersection of the line and the curve, some candidates gave thex-intercepts instead. Hence, a limited number of candidates was able to attempt the last part of thequestion.
Solutions:
(a) when x = 0, y = 0 ; when x = 3, y = -3 ; when x = 5, y = 5
(b) (ii) x = -0.4 and 4.4 (iii) x2 - 4x – 2 = 0
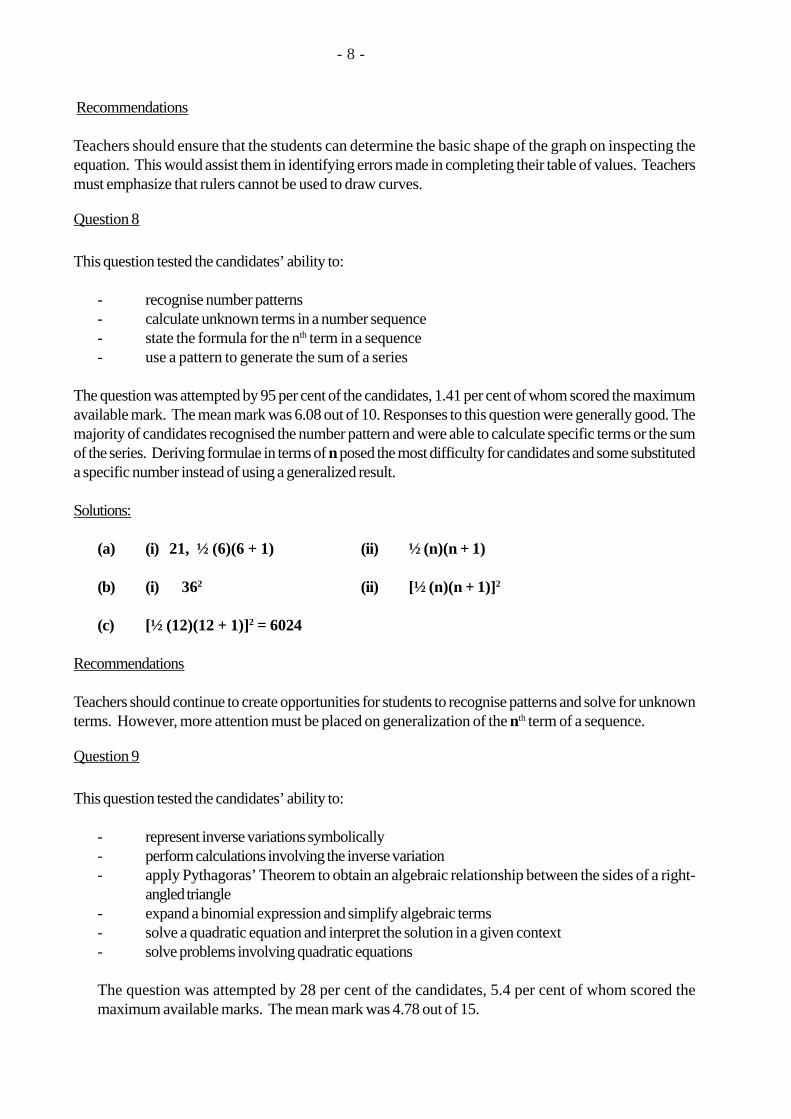
Recommendations
Teachers should ensure that the students can determine the basic shape of the graph on inspecting theequation. This would assist them in identifying errors made in completing their table of values. Teachersmust emphasize that rulers cannot be used to draw curves.
Question 8
This question tested the candidates’ ability to:
- recognise number patterns- calculate unknown terms in a number sequence- state the formula for the nth term in a sequence- use a pattern to generate the sum of a series
The question was attempted by 95 per cent of the candidates, 1.41 per cent of whom scored the maximumavailable mark. The mean mark was 6.08 out of 10. Responses to this question were generally good. Themajority of candidates recognised the number pattern and were able to calculate specific terms or the sumof the series. Deriving formulae in terms of n posed the most difficulty for candidates and some substituteda specific number instead of using a generalized result.
Solutions:
(a) (i) 21, ½ (6)(6 + 1) (ii) ½ (n)(n + 1)
(b) (i) 362 (ii) [½ (n)(n + 1)]2
(c) [½ (12)(12 + 1)]2 = 6024
Recommendations
Teachers should continue to create opportunities for students to recognise patterns and solve for unknownterms. However, more attention must be placed on generalization of the nth term of a sequence.
Question 9
This question tested the candidates’ ability to:
- represent inverse variations symbolically- perform calculations involving the inverse variation- apply Pythagoras’ Theorem to obtain an algebraic relationship between the sides of a right-
angled triangle- expand a binomial expression and simplify algebraic terms- solve a quadratic equation and interpret the solution in a given context- solve problems involving quadratic equations
The question was attempted by 28 per cent of the candidates, 5.4 per cent of whom scored themaximum available marks. The mean mark was 4.78 out of 15.
- 8 -
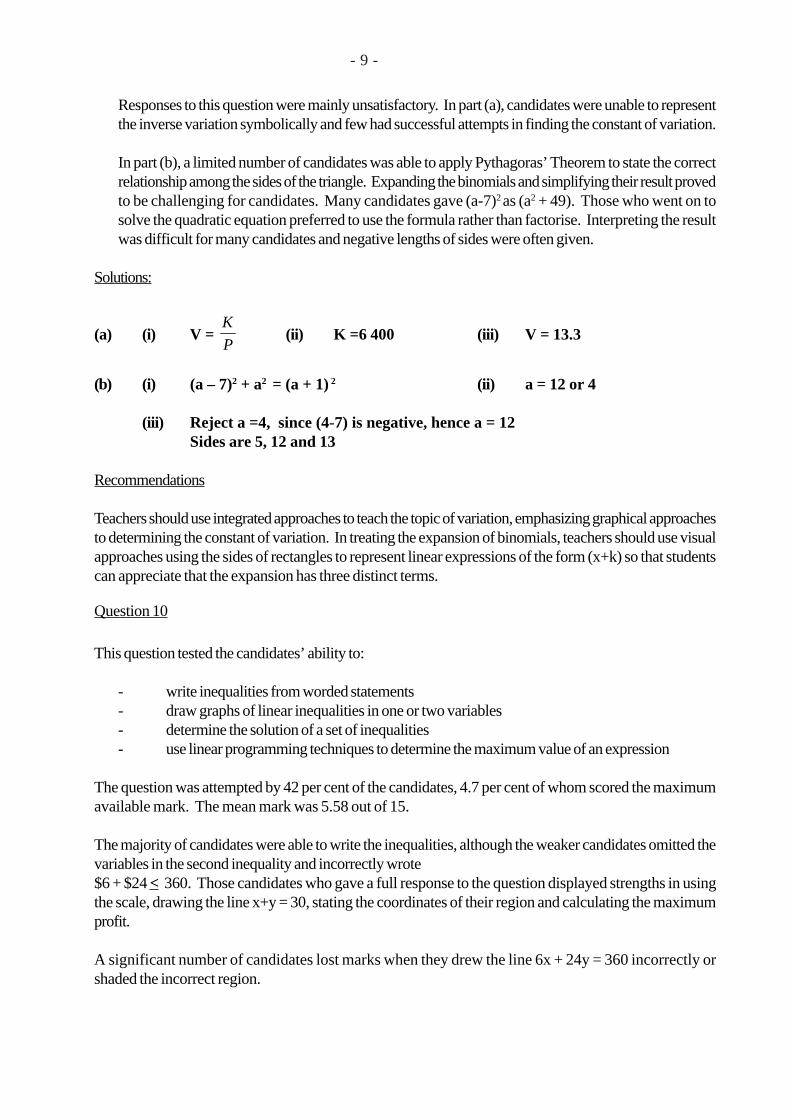
- 9 -
Responses to this question were mainly unsatisfactory. In part (a), candidates were unable to representthe inverse variation symbolically and few had successful attempts in finding the constant of variation.
In part (b), a limited number of candidates was able to apply Pythagoras’ Theorem to state the correctrelationship among the sides of the triangle. Expanding the binomials and simplifying their result provedto be challenging for candidates. Many candidates gave (a-7)2 as (a2 + 49). Those who went on tosolve the quadratic equation preferred to use the formula rather than factorise. Interpreting the resultwas difficult for many candidates and negative lengths of sides were often given.
Solutions:
(a) (i) V = P
K(ii) K =6 400 (iii) V = 13.3
(b) (i) (a – 7)2 + a2 = (a + 1) 2 (ii) a = 12 or 4
(iii) Reject a =4, since (4-7) is negative, hence a = 12Sides are 5, 12 and 13
Recommendations
Teachers should use integrated approaches to teach the topic of variation, emphasizing graphical approachesto determining the constant of variation. In treating the expansion of binomials, teachers should use visualapproaches using the sides of rectangles to represent linear expressions of the form (x+k) so that studentscan appreciate that the expansion has three distinct terms.
Question 10
This question tested the candidates’ ability to:
- write inequalities from worded statements- draw graphs of linear inequalities in one or two variables- determine the solution of a set of inequalities- use linear programming techniques to determine the maximum value of an expression
The question was attempted by 42 per cent of the candidates, 4.7 per cent of whom scored the maximumavailable mark. The mean mark was 5.58 out of 15.
The majority of candidates were able to write the inequalities, although the weaker candidates omitted thevariables in the second inequality and incorrectly wrote$6 + $24 < 360. Those candidates who gave a full response to the question displayed strengths in usingthe scale, drawing the line x+y = 30, stating the coordinates of their region and calculating the maximumprofit.
A significant number of candidates lost marks when they drew the line 6x + 24y = 360 incorrectly orshaded the incorrect region.
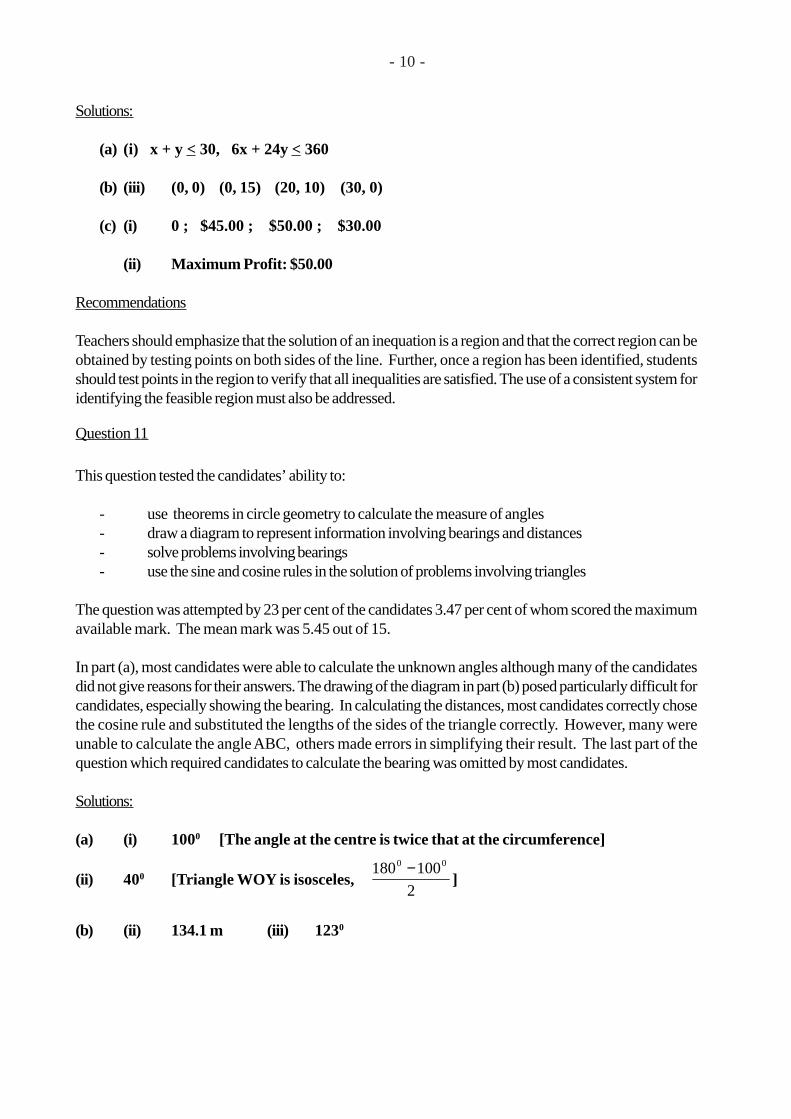
- 10 -
Solutions:
(a) (i) x + y < 30, 6x + 24y < 360
(b) (iii) (0, 0) (0, 15) (20, 10) (30, 0)
(c) (i) 0 ; $45.00 ; $50.00 ; $30.00
(ii) Maximum Profit: $50.00
Recommendations
Teachers should emphasize that the solution of an inequation is a region and that the correct region can beobtained by testing points on both sides of the line. Further, once a region has been identified, studentsshould test points in the region to verify that all inequalities are satisfied. The use of a consistent system foridentifying the feasible region must also be addressed.
Question 11
This question tested the candidates’ ability to:
- use theorems in circle geometry to calculate the measure of angles- draw a diagram to represent information involving bearings and distances- solve problems involving bearings- use the sine and cosine rules in the solution of problems involving triangles
The question was attempted by 23 per cent of the candidates 3.47 per cent of whom scored the maximumavailable mark. The mean mark was 5.45 out of 15.
In part (a), most candidates were able to calculate the unknown angles although many of the candidatesdid not give reasons for their answers. The drawing of the diagram in part (b) posed particularly difficult forcandidates, especially showing the bearing. In calculating the distances, most candidates correctly chosethe cosine rule and substituted the lengths of the sides of the triangle correctly. However, many wereunable to calculate the angle ABC, others made errors in simplifying their result. The last part of thequestion which required candidates to calculate the bearing was omitted by most candidates.
Solutions:
(a) (i) 1000 [The angle at the centre is twice that at the circumference]
(ii) 400 [Triangle WOY is isosceles, 2
100180 00 −]
(b) (ii) 134.1 m (iii) 1230
- 11 -
Recommendations
Teachers should allow students to represent situations involving bearings using models, before drawingthem on paper. Approaches to teaching bearings need to be practical and done in an outdoor setting.Basic geometrical skills in calculating angles should be reviewed prior to teaching this topic.
Question 12
This question tested the candidates’ ability to:
- recognize and use the trigonometrical ratios to solve right-angled triangles- solve problems involving angles of elevation and depression- represent lines of latitude and longitude, and points given their positions on a sketch of the
Earth- calculate the distance between two points on the Earth measured along a circle of longitude- calculate the circumference of a circle of latitude
The question was attempted by 8 per cent of the candidates, 1.64 per cent of whom scored the maximumavailable mark. The mean mark was 4.03 out of 15.
In part (a), candidates had difficulty in identifying the angles of elevation and depression. However, oncethese angles were inserted they were able to correctly select the trigonometric ratio needed to solve theproblem. In part (b), most candidates were able to draw the lines of latitude and longitude, although theline of longitude did not always pass through the North and South Poles. Locating the points P and Q waswell done. In calculating the distance PQ along the circle of latitude, some candidates did not use theradius of a great circle and many could not calculate the angular difference.
Solutions:
(a) (i) 28.6 m (ii) 12.9 m
(b) (iii) a) 8 890 km b) 25 714 km
Recommendations
In teaching the application of trigonometry to solving problems in the real world, teachers should constructapparatus to measure angles of elevation and use models to represent the Earth. Students should beencouraged to use these materials to construct diagrams and solve problems. In addition, scale drawingsshould be done to reinforce these concepts.
Question 13
This question tested the candidates’ ability to:
- locate points on a diagram given the relevant information- add vectors- use vectors to represent and solve problems in geometry
- 12 -
The question was attempted by 24 per cent of the candidates 1.38 per cent of whom scored the maximumavailable mark, The mean mark was 4.83 out of 15.
In part (a), candidates were able to locate the points on their diagram and write vectors for AC and PQ.Many candidates demonstrated weaknesses in simplifying their vectors and could not derive the proof.
In determining the position vectors for RT and SR in part (b), many candidates did not reverse theirvectors in writing the route, for example RT was written as OR + OT instead of RO + OT.
Candidates were unable to choose an appropriate strategy to determine the position vector of F. Hence,this part was either omitted or poorly done.
Solutions:
(a) (ii) a) 2x + 3y b) x +2
3 y
(b) (i) a)
− 6
2b)
−2
4
(ii) b) F(4, 1)
Recommendations
The resolution of vectors should be taught using concrete examples such as airplane routes. Teachersshould challenge students to find alternate routes to the same journey. Students should also be givensufficient opportunities to communicate their routes using vector notation, emphasizing that vectors canonly be added end to end.
Question 14
This question tested the candidates’ ability to:
- multiply matrices- identify a singular matrix- calculate the determinant of a 2 × 2 matrix- find the inverse of a non-singular 2 × 2 matrix- use matrix methods to solve a system of linear equations
The question was attempted by 50 per cent of the candidates, 4.35 per cent of whom scored the maximumavailable mark. The mean mark was 5.42 out of 15.
In part (a), the multiplication of a 1 × 2 matrix by a 2 × 2 matrix proved to be very challenging forcandidates. The majority of candidates obtained a column matrix instead of a row matrix.
- 13 -
In showing that R is non-singular, many candidates merely found the determinant and did not make astatement to the effect that since the determinant was not zero, the matrix was non-singular. In multiplyingR by R-1 , many candidates worked with the fraction inside the matrix thus setting themselves up forcomputational errors in multiplying the elements. Some candidates were unfamiliar with I as the identitymatrix.
There were better attempts at part (b) where candidates had to use matrices to solve a pair of simultaneousequations. However, many candidates did not use their calculations of the inverse from the earlier questionand treated the last part of the question as an independent question, losing valuable time redoing thecalculations.
Solutions:
(a) x = 4, y = 3
(b) (i) Determinant of R is 7.Since the determinant of R is not equal to zero, R is non-singular.
(iv) x = 1, y = 2
Recommendations
Teachers should emphasize that there is a condition for the multiplication of matrices. Students shouldbe given opportunities to create their own matrices and determine if it is possible to multiply any two ofthese matrices. In solving simultaneous equations, students should appreciate that it is more efficient to
perform the multiplication bydet
1 in the final stage of the solution.
C A R I B B E A N E X A M I N A T I O N S C O U N C I L
REPORT ON CANDIDATES’ WORK IN THE
SECONDARY EDUCATION CERTIFICATE EXAMINATIONS
JUNE 2008
MATHEMATICS (T & T)
Copyright © 2008 Caribbean Examinations Council ®
St. Michael, Barbados
All rights reserved.
2
MATHEMATICS
GENERAL PROFICIENCY – TRINIDAD AND TOBAGO
MAY/JUNE 2008
The General Proficiency Mathematics examination is offered in January and May/June each year,
while the Basic Proficiency examination is offered in May/June only.
In May/June 2008 approximately 20 000 candidates registered for the General Proficiency
examination. At the General Proficiency level, approximately 47 per cent of the candidates
achieved Grades I – III.
DETAILED COMMENTS
General Proficiency
No candidate scored the maximum mark on the overall examination. Forty per cent of the
candidates scored at least half the available marks.
Paper 01 – Multiple Choice
Paper 01 consisted of 60 multiple-choice items. Approximately 57 per cent of the candidates
scored at least half the total marks for this paper.
Paper 02 – Essay
Paper 02 consisted of two sections. Section I comprised eight compulsory questions totaling 90
marks. Section II comprised six optional questions: two each in Relations, Functions and Graphs;
Trigonometry and Geometry; Vectors and Matrices. Candidates were required to choose any two
questions. Each question in this section was worth 15 marks.
This year, fourteen candidates earned the maximum available mark on Paper 02. Approximately
33 per cent of the candidates earned at least half the maximum mark on this paper.
Question 1
This question tested candidates’ ability to:
• Perform basic operations on mixed numbers
• Solve problems associated with income tax
• Calculate a percentage of a derived quantity
• Write as a percentage the ratio of two quantities
3
The question was attempted by 100 per cent of the candidates, 15 per cent of whom scored the
maximum available mark. The mean score was 7.42 out of 12.
Responses were satisfactory. Candidates demonstrated competence in:
• Choosing an appropriate strategy for subtracting common fractions
• Converting a mixed number into an improper fraction
• Inverting and multiplying when dividing improper fractions
• Calculating annual salary given monthly salary
• Calculating 22 per cent of a quantity
• Expressing one quantity as a percentage of another
Some candidates employed incorrect algorithms for performing operations on mixed numbers.
e.g.
15
8 was equated to
40
8
21
511
3 was simplified to
135
15 815
Many of the candidates disregarded the fact that the family had 3 children and so computed the
total taxable allowance on the assumption that there was only one child. Some candidates did not
recognize the difference between taxable allowance and income tax payable. They therefore,
calculated 22 % of the taxable allowances.
Recommendations
It would be useful to expose students to more real-life situations based on income tax.
Solutions:
(a) 8/15
(b) (i) $90000.00 (ii) $22500.00 (iii) $14850.00
(iv) 16.5 %
Question 2
This question tested candidates’ ability to:
• Square a binomial
• Change the subject of the formula
• Factorize expressions using common factors and the difference of two squares
• Solve a pair of linear simultaneous equations
4
The question was attempted by 97 per cent of the candidates, 8 per cent of whom scored the
maximum available mark. The mean score was 4.2 out of 12.
A high proportion of candidates scored zero. The areas of good performance were:
• Factorizing the expression 3mn – 6n2
• Choosing strategy for solving simultaneous equations
Students in general experienced difficulty in:
• Squaring the binomial
• Changing the subject of the formula
• Factorizing the difference of two squares
• Applying strategy for solving simultaneous equations
Recommendations
Topics which are covered in the junior school need to be reviewed systematically.
Solutions:
(a) 9a2 – 6a + 1
(b)
p 53q
q
(c) (i) 3n ( m – 2n ) (ii) ( 5p – q )( 5p + q )
(d) x = 5 ; y = -2
Question 3
This question tested candidates’ ability to:
• Describe a set
• Identify the cardinal number of a set
• Determine the complement of a given set
• Determine the elements in the intersection of a set
• Use a ruler and protractor to draw angles and measure line segments
The question was attempted by 98 per cent of the candidates, 2 per cent of whom scored the
maximum available mark. The mean score was 6.01 out of 12.
5
Students were able to:
• List the members of the intersection
• Measure lines and angles with some degree of accuracy
Students in general:
• Failed to demonstrate an understanding of the complement of a set
• Were unable to find the cardinal number for a set
• Were unable to recognize relations among numbers, hence, the terms ‘multiples’ and ‘factors’
were used interchangeably
• Experienced difficulty in describing the range of a set
• Appeared to have measured from ‘1’ rather than ‘0’ on their rulers
• Attempted to construct the quadrilateral rather than draw it
Recommendations
Teachers should pay attention to instructional terms such as draw, sketch, construct, describe,
define.
Solutions:
(a) (i) a) { 12, 24 } b) { 4, 8, 16, 20 }
(ii) 9
(iii) a) even numbers less than or equal to 30
b) multiples of 6 less than or equal to 30
Question 4
This question tested candidates’ ability to:
• Calculate the area of a right-angled triangle
• Calculate the length of a prism given its volume and cross-section
• Use Pythagoras theorem to find the length of a line segment
• Identify the number of faces, edges and vertices in a given prism
• Use, correctly, the S.I. units of measure for area and length
6
The question was attempted by 92 per cent of the candidates, 14 per cent of whom scored the
maximum available mark. The mean score was 4.64 out of 10.
Candidates were generally able to calculate the area of the triangle. However, many candidates
either omitted the units of measure for area (cm2) or wrote the incorrect S.I. units of measure
(cm). Many of them chose an appropriate strategy for finding the length of AC (use of Pythagoras
or trigonometric ratio). However, they encountered difficulty following through with the
computation.
Candidates found difficulty in calculating the length of the prism given its volume and area.
Many misinterpreted the length of the prism to be the height of its cross-section. Several
candidates interchanged the number of edges and vertices.
Recommendations
Teachers may wish to make greater use of concrete objects in teaching the properties of solids.
Solutions:
(a) 8 cm2
(b) 9 cm
(c) 5.7 cm
(d) 5 faces, 9 edges, 6 vertices
Question 5
This question tested candidates’ ability to:
• State the relation between an object and its image as a combination of transformations
• Locate the image of a set of points when the transformations (reflection and enlargement) are
performed
• Determine the ratio of the area of the object and its image under an enlargement
The question was attempted by 89 per cent of the candidates, 3 per cent of whom scored the
maximum available mark. The mean score was 5.38 out of 12.
The responses to this question were generally satisfactory. Candidates knew how to reflect the
original triangle in a line. Most of them were able to plot the points of the triangle representing
the enlargement.
The majority of the candidates were able to identify the transformation as an enlargement.
However, they were unable to describe the transformation fully, particularly the negative aspect
of the scale factor and the centre of enlargement (the origin). Students were unfamiliar with the
use of the square of the scale factor to find the ratio of the areas of the triangle and its enlarged
image.
7
Solutions:
(c) (ii) Enlargement; centre (0, 0); scale factor -2
(d) 4
Question 6
This question tested candidates’ ability to:
• Represent given statistical data graphically, using specified graph and scale
• Use a graph to make estimates and to draw inferences from it
The question was attempted by 88 per cent of the candidates, 11 per cent of whom scored the
maximum available mark. The mean score was 5.9 out of 11.
Most candidates were able to identify the five-year periods where there were increases in the
population. Generally they were able to show on the graph how to estimate the population of the
country in 1989. Most candidates were able also to draw correctly, the scales on both axes.
However, a large number of them
• Interchanged the axes
• Used the values from the table as intervals on the population axis
• Drew bar charts or histograms
• Joined the points without using a straight edge
Most candidates were unable to explain in a concise manner (using terms such as gradient, slope)
two facts about the population.
Recommendations
Teachers may wish to expose their students to the full range of graphs as specified by the
syllabus. Interpretation of information represented graphically needs to be reinforced.
Solutions:
(b) 1.75 to 1.85 million
(c) (i) 1990 – 1995 (ii) 1995 - 2000
Question 7
This question tested candidates’ ability to:
• Calculate the coordinates of the end point of a line segment given the midpoint and the other
end point
• Determine the image on to which a particular function maps a member of the domain
8
• Find the inverse of a linear function
• Find the domain value for which the composite function is equal to a real number
The question was attempted by 77 per cent of the candidates, 8.62 percent of whom scored the
maximum available mark. The mean score was 4.24 out of 11.
Candidates were generally able to employ a suitable strategy to find the values of j and k, some
used
1 j
24 and
8 k2
5 while others plotted the coordinates and extended the line segment.
Candidates were able to substitute correctly for f(0) and g(2) but multiplication by zero proved
problematic, for example, 5 × 0 was commonly written as 5 and
4
21 was equated to 2.
Responses to finding the inverse function were generally satisfactory. However, after candidates
interchanged the domain and range, transposition of terms proved difficult for them.
Candidates experienced difficulty with the composite function. They simply multiplied the
functions. In some cases they substituted 1 for x rather than equating the composite function to 1.
Many candidates could not proceed beyond
5( 4
x 1)2 to solve for x.
Solutions:
(a) j = 7 ; k = 2
(b) (i) -2 (ii) 4/3 (iii)
f1(x) x 2
5 (iv)
17
5
Question 8
This question tested candidates’ ability to:
• Continue a sequence of diagrams given three terms in the sequence
• Follow number patterns in order to make generalizations
The question was attempted by 87 per cent of the candidates, 10 per cent of whom scored the
maximum available mark. The mean score was 4.67 out of 10.
Most candidates were able to
• Sketch the fourth pattern in the sequence although in some cases they did not
distinguish between grey and white triangles
• Deduce the pattern for the total number of triangular shapes and the number of grey
triangular shapes. However, they had difficulty in generalizing the number of white
triangular shapes
9
Recommendations
Teachers might choose to expose students to a wide range of problem solving experiences
involving number patters and generalizations. Investigative methods should prove to be helpful.
Solutions:
(b) (i) 36, 21, 15 (ii) 400, 190
(c) n2 ,
n(n 1)2
Question 9
This question tested candidates’ ability to:
• Solve a pair of simultaneous equations – one linear and one quadratic
• Establish an identity
• Determine the minimum value of a function
• Sketch the graph of a quadratic function to show roots of the function and the values of x at
which the function is a minimum
The question was attempted by 25 per cent of the candidates, 12 per cent of whom scored the
maximum available mark. The mean score was 5.32 out of 15.
Most candidates were able to:
• Eliminate one of the variables and to solve for x and y
• Solve the quadratic equation and to sketch the curve showing the minimum value and
the intercept on the x-axis
Candidates generally had difficulty:
• Completing the square
• Identifying the x coordinate of the minimum point
Recommendations
Teachers might consider teaching the completion of the square as a means to an end which may
include curve sketching, solving quadratic equations, maximizing and minimizing equations.
Solutions:
(a) x = 1, y = -14; x = 4, y = -8
(b) (i)
(x 32)2141
4(ii) – 14 4
1
(iii) 5.3; -2.3
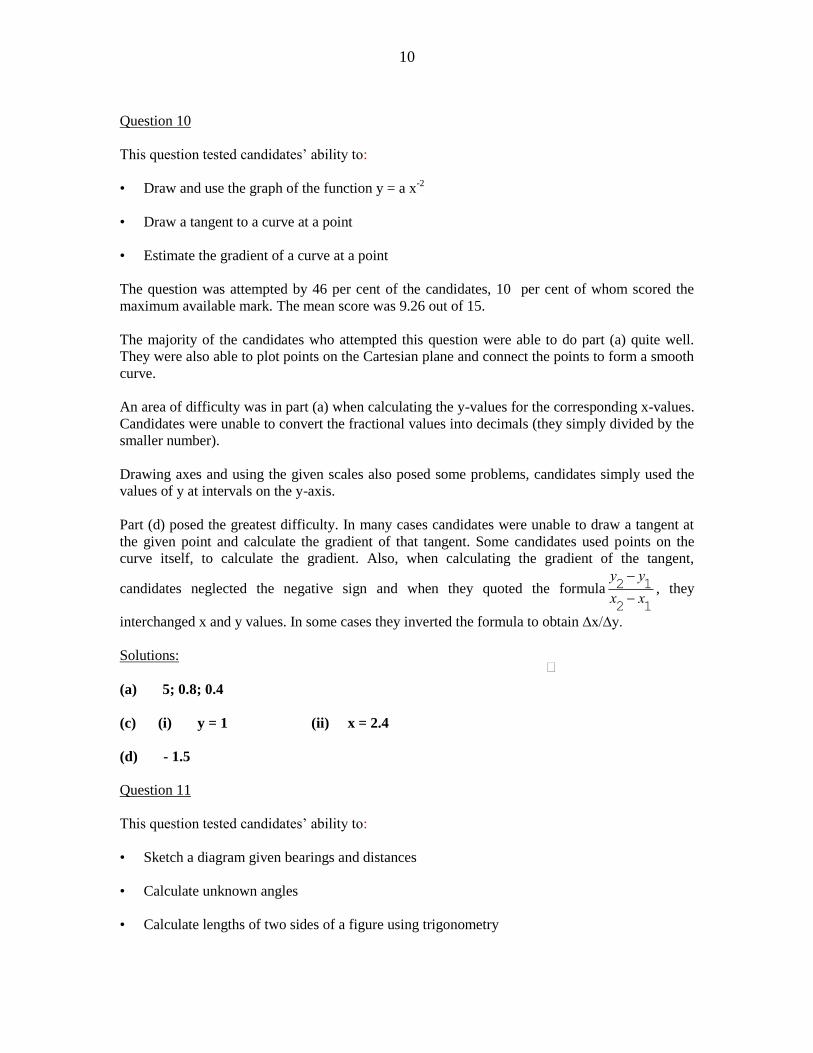
10
Question 10
This question tested candidates’ ability to:
• Draw and use the graph of the function y = a x-2
• Draw a tangent to a curve at a point
• Estimate the gradient of a curve at a point
The question was attempted by 46 per cent of the candidates, 10 per cent of whom scored the
maximum available mark. The mean score was 9.26 out of 15.
The majority of the candidates who attempted this question were able to do part (a) quite well.
They were also able to plot points on the Cartesian plane and connect the points to form a smooth
curve.
An area of difficulty was in part (a) when calculating the y-values for the corresponding x-values.
Candidates were unable to convert the fractional values into decimals (they simply divided by the
smaller number).
Drawing axes and using the given scales also posed some problems, candidates simply used the
values of y at intervals on the y-axis.
Part (d) posed the greatest difficulty. In many cases candidates were unable to draw a tangent at
the given point and calculate the gradient of that tangent. Some candidates used points on the
curve itself, to calculate the gradient. Also, when calculating the gradient of the tangent,
candidates neglected the negative sign and when they quoted the formula
y2 y1
x2 x1
, they
interchanged x and y values. In some cases they inverted the formula to obtain ∆x/∆y.
Solutions:
(a) 5; 0.8; 0.4
(c) (i) y = 1 (ii) x = 2.4
(d) - 1.5
Question 11
This question tested candidates’ ability to:
• Sketch a diagram given bearings and distances
• Calculate unknown angles
• Calculate lengths of two sides of a figure using trigonometry
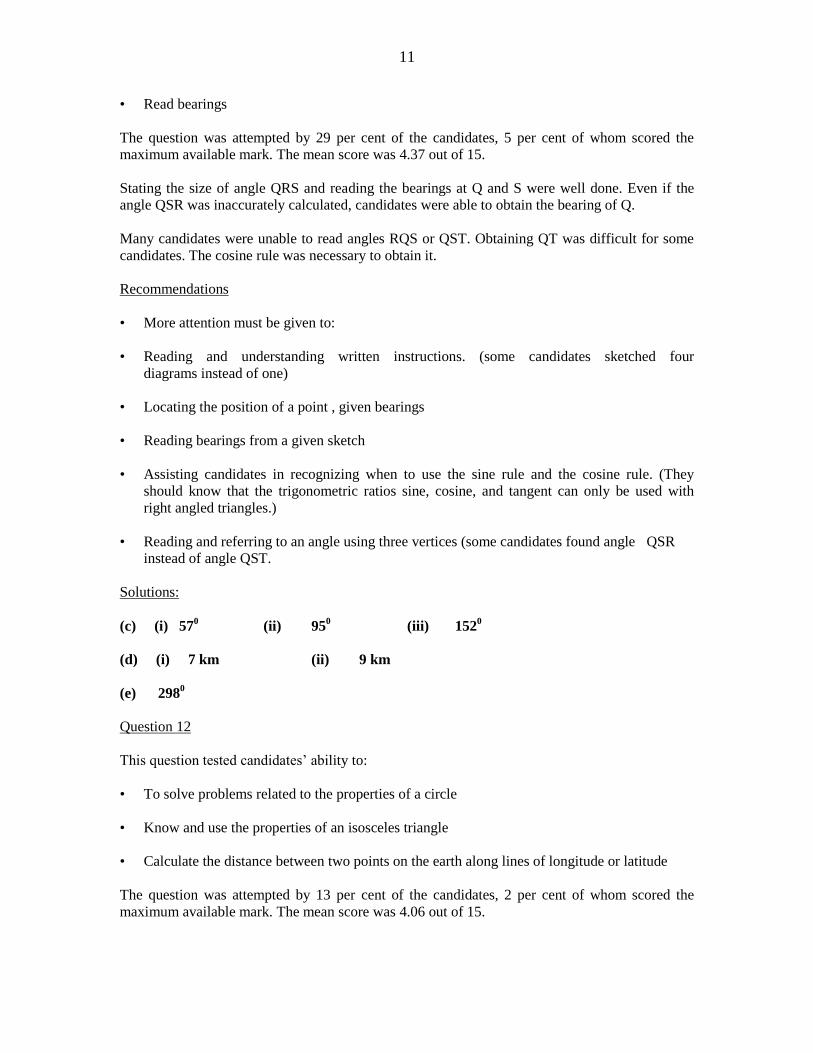
11
• Read bearings
The question was attempted by 29 per cent of the candidates, 5 per cent of whom scored the
maximum available mark. The mean score was 4.37 out of 15.
Stating the size of angle QRS and reading the bearings at Q and S were well done. Even if the
angle QSR was inaccurately calculated, candidates were able to obtain the bearing of Q.
Many candidates were unable to read angles RQS or QST. Obtaining QT was difficult for some
candidates. The cosine rule was necessary to obtain it.
Recommendations
• More attention must be given to:
• Reading and understanding written instructions. (some candidates sketched four
diagrams instead of one)
• Locating the position of a point , given bearings
• Reading bearings from a given sketch
• Assisting candidates in recognizing when to use the sine rule and the cosine rule. (They
should know that the trigonometric ratios sine, cosine, and tangent can only be used with
right angled triangles.)
• Reading and referring to an angle using three vertices (some candidates found angle QSR
instead of angle QST.
Solutions:
(c) (i) 570 (ii) 95
0(iii) 152
0
(d) (i) 7 km (ii) 9 km
(e) 2980
Question 12
This question tested candidates’ ability to:
• To solve problems related to the properties of a circle
• Know and use the properties of an isosceles triangle
• Calculate the distance between two points on the earth along lines of longitude or latitude
The question was attempted by 13 per cent of the candidates, 2 per cent of whom scored the
maximum available mark. The mean score was 4.06 out of 15.
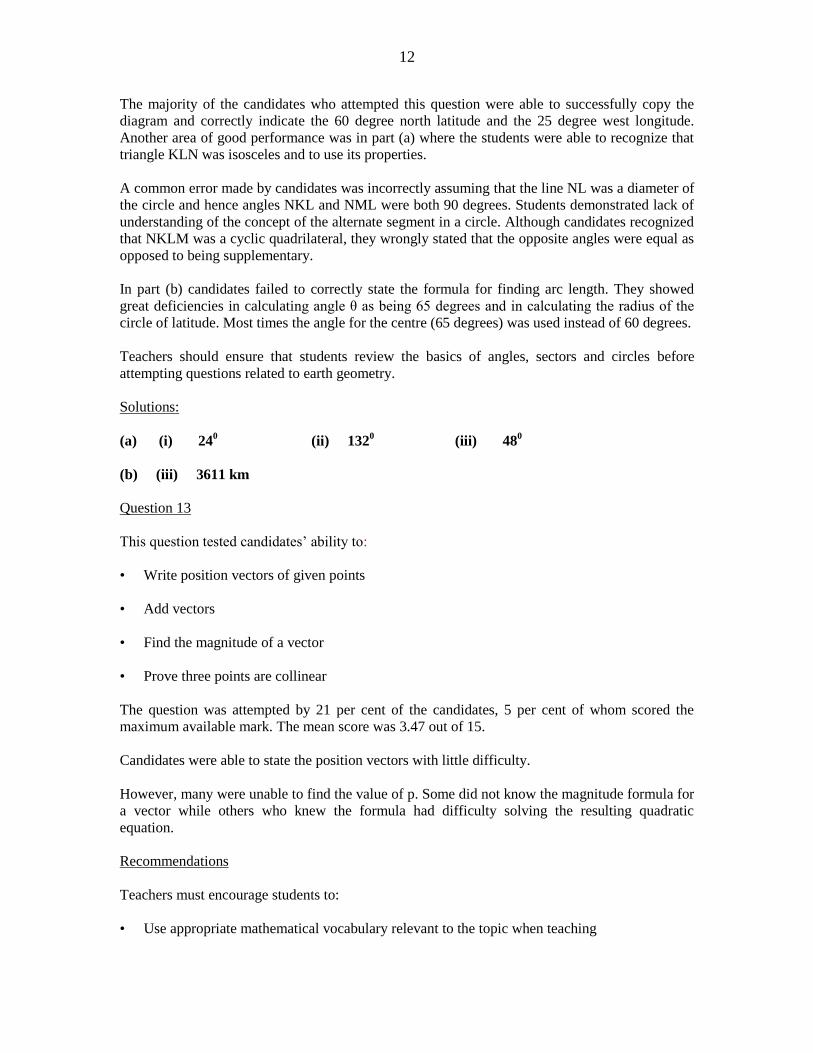
12
The majority of the candidates who attempted this question were able to successfully copy the
diagram and correctly indicate the 60 degree north latitude and the 25 degree west longitude.
Another area of good performance was in part (a) where the students were able to recognize that
triangle KLN was isosceles and to use its properties.
A common error made by candidates was incorrectly assuming that the line NL was a diameter of
the circle and hence angles NKL and NML were both 90 degrees. Students demonstrated lack of
understanding of the concept of the alternate segment in a circle. Although candidates recognized
that NKLM was a cyclic quadrilateral, they wrongly stated that the opposite angles were equal as
opposed to being supplementary.
In part (b) candidates failed to correctly state the formula for finding arc length. They showed
great deficiencies in calculating angle θ as being 65 degrees and in calculating the radius of the
circle of latitude. Most times the angle for the centre (65 degrees) was used instead of 60 degrees.
Teachers should ensure that students review the basics of angles, sectors and circles before
attempting questions related to earth geometry.
Solutions:
(a) (i) 240
(ii) 1320 (iii) 48
0
(b) (iii) 3611 km
Question 13
This question tested candidates’ ability to:
• Write position vectors of given points
• Add vectors
• Find the magnitude of a vector
• Prove three points are collinear
The question was attempted by 21 per cent of the candidates, 5 per cent of whom scored the
maximum available mark. The mean score was 3.47 out of 15.
Candidates were able to state the position vectors with little difficulty.
However, many were unable to find the value of p. Some did not know the magnitude formula for
a vector while others who knew the formula had difficulty solving the resulting quadratic
equation.
Recommendations
Teachers must encourage students to:
• Use appropriate mathematical vocabulary relevant to the topic when teaching
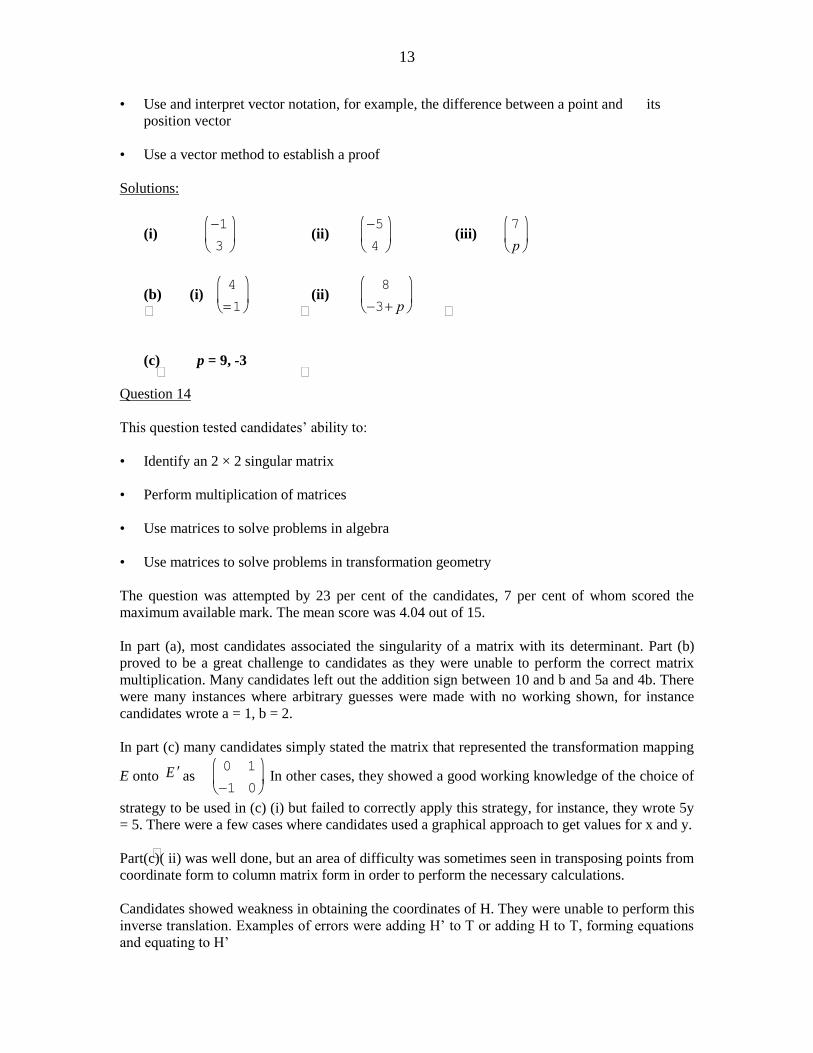
13
• Use and interpret vector notation, for example, the difference between a point and its
position vector
• Use a vector method to establish a proof
Solutions:
(i)
1
3
(ii)
5
4
(iii)
7
p
(b) (i)
4
1
(ii)
8
3 p
(c) p = 9, -3
Question 14
This question tested candidates’ ability to:
• Identify an 2 × 2 singular matrix
• Perform multiplication of matrices
• Use matrices to solve problems in algebra
• Use matrices to solve problems in transformation geometry
The question was attempted by 23 per cent of the candidates, 7 per cent of whom scored the
maximum available mark. The mean score was 4.04 out of 15.
In part (a), most candidates associated the singularity of a matrix with its determinant. Part (b)
proved to be a great challenge to candidates as they were unable to perform the correct matrix
multiplication. Many candidates left out the addition sign between 10 and b and 5a and 4b. There
were many instances where arbitrary guesses were made with no working shown, for instance
candidates wrote a = 1, b = 2.
In part (c) many candidates simply stated the matrix that represented the transformation mapping
E onto E as
0 1
1 0
. In other cases, they showed a good working knowledge of the choice of
strategy to be used in (c) (i) but failed to correctly apply this strategy, for instance, they wrote 5y
= 5. There were a few cases where candidates used a graphical approach to get values for x and y.
Part(c)( ii) was well done, but an area of difficulty was sometimes seen in transposing points from
coordinate form to column matrix form in order to perform the necessary calculations.
Candidates showed weakness in obtaining the coordinates of H. They were unable to perform this
inverse translation. Examples of errors were adding H’ to T or adding H to T, forming equations
and equating to H’
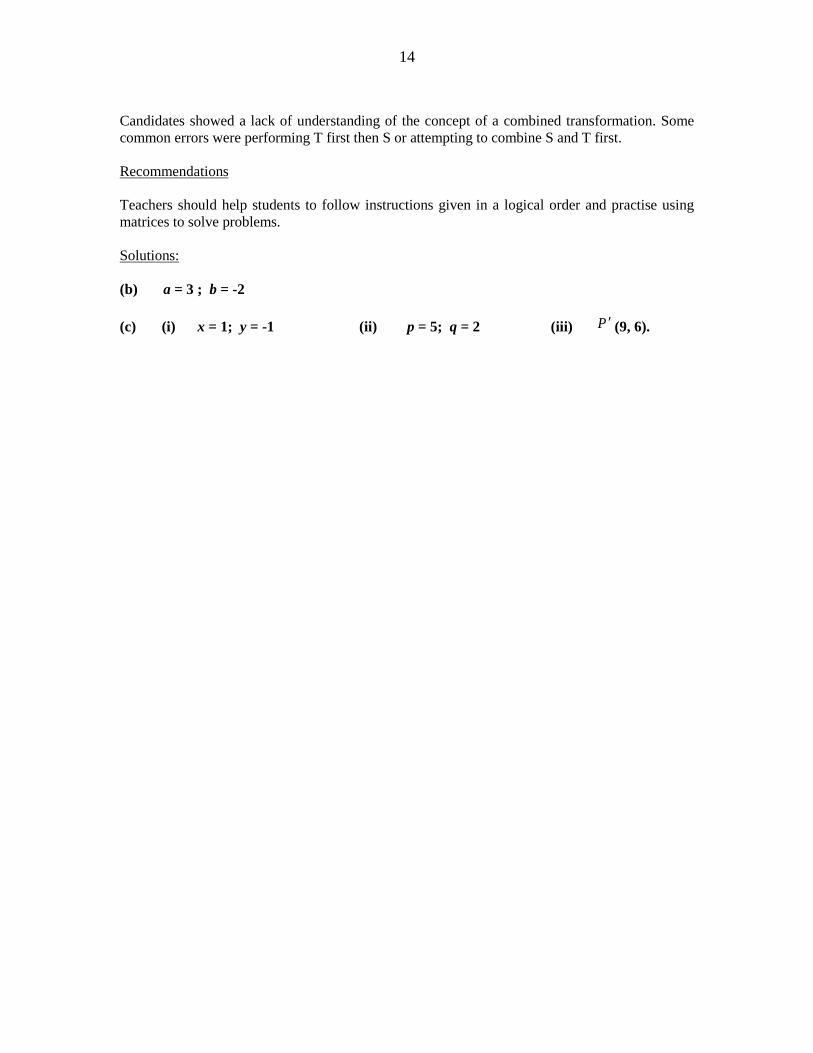
14
Candidates showed a lack of understanding of the concept of a combined transformation. Some
common errors were performing T first then S or attempting to combine S and T first.
Recommendations
Teachers should help students to follow instructions given in a logical order and practise using
matrices to solve problems.
Solutions:
(b) a = 3 ; b = -2
(c) (i) x = 1; y = -1 (ii) p = 5; q = 2 (iii) P (9, 6).
C A R I B B E A N E X A M I N A T I O N S C O U N C I L
REPORT ON CANDIDATES’ WORK IN THE
SECONDARY EDUCATION CERTIFICATE EXAMINATIONS
MAY/JUNE 2008
MATHEMATICS - (ROR SCRIPTS)
Copyright © 2008 Caribbean Examinations Council ®
St Michael, Barbados
All rights reserved.
- 2 -
MATHEMATICS
GENERAL AND BASIC PROFICIENCY EXAMINATIONS
MAY/JUNE 2008
GENERAL COMMENTS
The General Proficiency Mathematics examination is offered in January and May/June each year, while the
Basic Proficiency examination is offered in May/June only.
In May/June 2008 approximately 57 000 candidates registered for the General Proficiency examination.
Candidate entry for the Basic Proficiency examination was approximately 4 000. At the General Proficiency
level, approximately 37 per cent of the candidates achieved Grades I – III. At the Basic Proficiency level,
approximately 32 per cent of the candidates achieved Grades I – III.
DETAILED COMMENTS
General Proficiency
One candidate scored the maximum mark on the overall examination. Twenty-eight per cent of the
candidates scored at least half the available marks.
Paper 01 – Multiple Choice
Paper 01 consisted of 60 multiple choice items. This year, 53 candidates earned the maximum available
mark. Approximately 54 per cent o the candidates scored at least half the total marks for this paper.
Paper 02 – Essay Choice
Paper 02 consisted of two sections. Section I comprised eight compulsory questions totaling 90 marks.
Section II comprised six optional questions: two each in Relation, Functions and Graphs; Trigonometry and
Geometry; Vectors and Matrices. Candidates were required to choose any two questions. Each question in
this section was worth 15 marks.
This year, four candidates earned the maximum available mark on Paper 02. Approximately 18 per cent of
the candidates earned at least half the maximum mark on this paper.
Compulsory Section
Question 1
This question was designed to test candidates’ ability to:
perform basic operations with decimals
perform basic operations with fractions
convert from one currency to another given the exchange rate
The question was attempted by 100 percent of the candidates, 33 per cent of whom scored the maximum
available mark. The mean mark was 7.48 out of 10.
- 3 -
Responses were generally good with the majority of candidates obtaining correct solutions to all parts of the
question.
In part (a), errors were made mainly by candidates who performed the computations without the use of
calculators. They often failed to place the decimal point in the correct position when multiplying or when
computing the square root. Candidates were more proficient in dividing fractions than in subtracting
fractions.
In converting currencies using the given rate of exchange, some candidates used $72.00 instead of $72.50
and hence could not obtain the exact answer. They also ignored the cents and gave answers correct to the
nearest dollar.
In part (b) (ii), a significant number of candidates correctly obtained the amount left (in $JA) on the credit
card by subtracting what was spent from $30 000. However, they did not proceed to convert this amount to
Canadian dollars.
Solutions
(a) (i) 1.873 (ii) 2 4
15
(b) (i) JA $18 125.00 (ii) CAN $163.79
Recommendations
In order to avoid errors with respect to the position of the decimal point, students must be reminded to check
for the reasonableness of their answers when performing operations on decimals. Unless a question
specifies a particular degree of accuracy, students must leave their answers correct to the nearest cent when
performing calculations with money.
Question 2
The question tested the candidates’ ability to:
perform operations involving directed numbers
substitute numbers for algebraic symbols in simple algebraic expressions
translate verbal phrases into algebraic symbols
solve simple equations in one variable
factorise simple algebraic expressions using common factors
factorise a quadratic expression
The question was attempted by 99.6 per cent of the candidates, 2 per cent of whom scored the maximum
available mark. The mean score was 5.3 out of 12.
Most candidates substituted the values correctly in the expressions but a significant number failed to
simplify the answer. Weaknesses in operating with directed numbers were evident. For example 2(–1 + 3)
was equated to 2(– 4) or 2(–2). Candidates also made errors in simplifying 4(–1)2. This was often written
as: (– 4 x – 4 x –1 x –1) or (– 42) or 4(–1).
- 4 -
Too many candidates had poor responses to part (b) of this question. In part (i), four times the sum of x and
5 was stated as 4x + 5, again ignoring the brackets. Far too many candidates wrote an inequality in response
to part (ii) instead of an expression. A popular response was 16 > ab.
In solving the equation in part (c), many candidates had problems in using the distributive law while others
made errors in transposing terms. Hence, 2(3x + 1) was often seen as 6x + 1 and 15 – 4x = 6x + 2 was
simplified to – 4x + 6x = 2 + 15.
In using the method of common factors to factorise the expression, only a few candidates were able to get
the correct HCF. Errors were frequently made in dividing algebraic terms. Weaker candidates had no idea
what factorise meant and attempted to add the terms to give 18a6b
4.
Factorizing the quadratic expression also presented problems for candidates. Errors in signs were common.
A significant number of candidates assumed it was an equation and attempted to use the quadratic formula
or the method of completing the squares to solve for m.
Solutions
(a) (i) 4 (ii) –2
(b) (i) 4 (x + 5) (ii) 16 + ab
(c) (i) 13
10
(d) (i) 6a2b (b
2 + 2a
2) (ii) (2m – 1) (m + 5)
Recommendations
Teachers need to ensure that students are familiar with the necessary vocabulary associated with algebra.
Terms such as expression, equation, factorize, simplify and solve must be explored fully. In the teaching of
translation of worded statements to symbols, students need to reverse the process and translate symbols to
words as well. When solving equations, students should verify their solutions. Careless mistakes in
substitution can be avoided if students use brackets in making substitutions and then simplify each term
separately before collecting them.
Question 3
The question tested the candidates’ ability to:
calculate the frequency of an item given the total frequency and a frequency distribution
calculate the angles in sectors of a Pie Chart
construct a Pie Chart
The question was attempted by 97 per cent of the candidates, 27 per cent of whom scored the maximum
available mark. The mean score was 5.51 out of 12.
Almost all of the candidates who attempted this question were able to calculate the value of the unknown
frequency, t.
Calculating the angles for the Pie Chart in (b) (i) posed the most difficult for candidates. Many failed to
recognize that each frequency had to be expressed as a fraction of the total before multiplying by 360°. A
- 5 -
large number calculated percentages for each category and then multiplied these percentages by 360° in an
attempt to convert them to angles.
In constructing the Pie Chart, far too many candidates did not use protractors to measure angles. Those who
attempted to measure frequently made errors by reading the complement of the angle on the protractor, for
example 80° was read as 100°. Incorrect angle calculations often resulted in Pie Charts in which angles did
not add up to 360°. Hence it was quite common to see six instead of five sectors. There were also several
instances where sectors were not labelled.
Solutions
(a) 105
(b) Lawyer: 80º; Teacher: 63º; Doctor 35º; Artist: 72º; Salesperson: 110º
Recommendations
Teachers must emphasize that a Pie Chart is a statistical graph in which the sectors of the circle represent
fractions of the sample surveyed. Hence the calculation of fractional parts must precede calculation of
angles. Students who used faulty algorithms to compute angles were unable to make this connection and
could not detect their errors. The use of instruments in drawing accurate diagrams must also be emphasized.
In particular, care must be taken in selecting the correct scale (inner or outer) when using a protractor.
Question 4
The question tested the candidates’ ability to:
list members of a set from a given description
construct Venn Diagrams to show relationships between two sets within a Universal set
list members of the union of two sets and the members of the complement of a set
identify prime, odd and even numbers
use instruments to construct angles and measure line segments
use instruments to construct a parallelogram
This question was attempted by approximately 98 per cent of the candidates 8 per cent of whom scored the
maximum available mark. The mean mark was 6.80 out of 12.
Candidates had fairly good responses to part (a) in which concepts in sets was tested. They displayed
strengths in identifying even numbers and prime numbers. Setting up the Venn Diagram also appeared to be
an easy task for candidates although many did not recognize that the intersection was empty. Identifying
members of the region (MN)´ posed the most challenging for candidates who either omitted this part or
gave members of the union instead.
In constructing the parallelogram, candidates generally were successful in constructing the 60° angle and
measuring the lengths of sides AB and AC. Only a few candidates were able to use instruments to
accurately construct the parallelogram. Errors in labelling the parallelogram were common and many
located D incorrectly to produce a quadrilateral ACBD instead of ABCD.
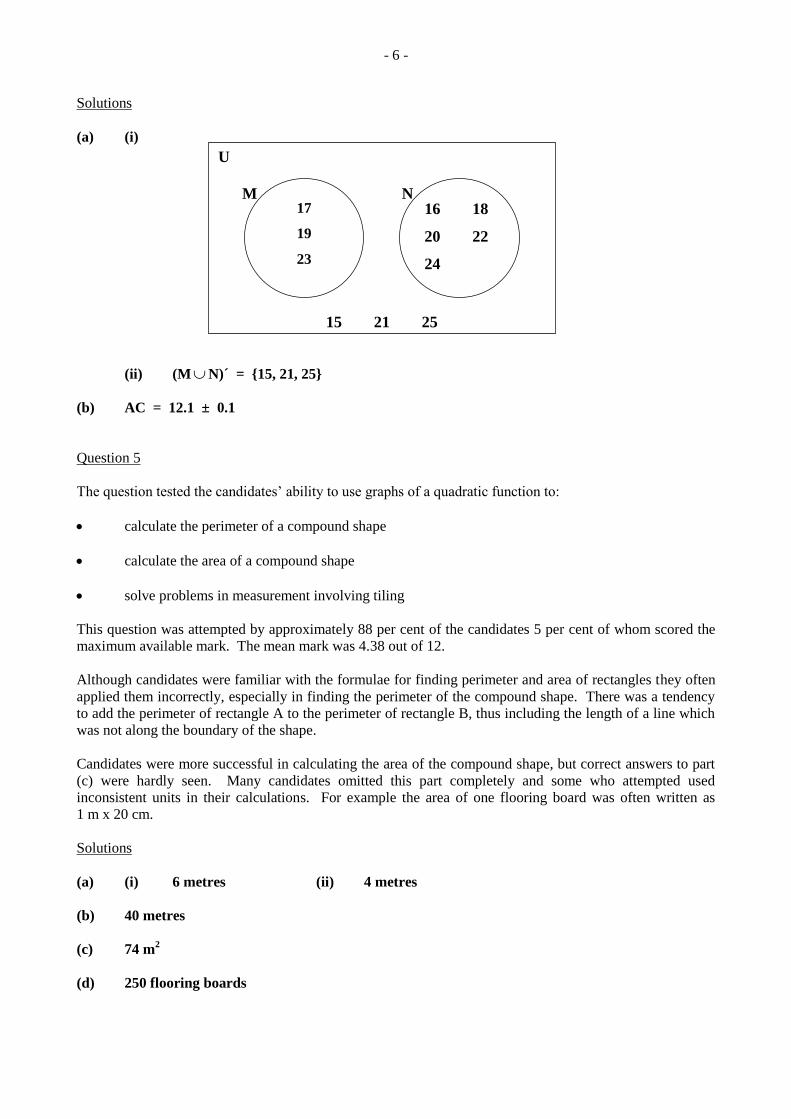
- 6 -
Solutions
(a) (i)
(ii) (MN)´ = {15, 21, 25}
(b) AC = 12.1 ± 0.1
Question 5
The question tested the candidates’ ability to use graphs of a quadratic function to:
calculate the perimeter of a compound shape
calculate the area of a compound shape
solve problems in measurement involving tiling
This question was attempted by approximately 88 per cent of the candidates 5 per cent of whom scored the
maximum available mark. The mean mark was 4.38 out of 12.
Although candidates were familiar with the formulae for finding perimeter and area of rectangles they often
applied them incorrectly, especially in finding the perimeter of the compound shape. There was a tendency
to add the perimeter of rectangle A to the perimeter of rectangle B, thus including the length of a line which
was not along the boundary of the shape.
Candidates were more successful in calculating the area of the compound shape, but correct answers to part
(c) were hardly seen. Many candidates omitted this part completely and some who attempted used
inconsistent units in their calculations. For example the area of one flooring board was often written as
1 m x 20 cm.
Solutions
(a) (i) 6 metres (ii) 4 metres
(b) 40 metres
(c) 74 m2
(d) 250 flooring boards
U
M N
15 21 25
16 18
20 22
24
17
19
23
- 7 -
Recommendations
Teachers need to emphasize the concept of perimeter using examples of irregular figures prior to using
formulae to calculate the perimeter of a shape.
Practical work in measurement should be done using authentic situations such as tiling and carpeting.
Question 6
The question tested candidates’ ability to:
identify angles of elevation on a diagram
use trigonometric ratios to solve a right a right-angled triangle
describe a translation given the object and image
draw the line y = x
locate the image of an object under a refection in the line y = x
This question was attempted by approximately 91 per cent of the candidates 1 per cent of whom scored the
maximum available mark. The mean mark was 2.3 out of 12.
Inserting the angles of elevation in part (a) of this question was done correctly by less than half of the
candidates. Common errors were interchanging the angles or inserting them between the vertical and the
line of vision. Although many candidates recognized that they had to use the tangent ratio to calculate the
unknown sides, they sometimes set up the ratio incorrectly or transposed incorrectly in solving for HK. A
significant number did not attempt to find JK. Weaker candidates assumed triangle JKG was right-angled
and used trigonometric ratios to find JK.
Part (b) was less popular than part (a) and few candidates had a completely correct response to this part of
the question. Drawing the line y = x posed great difficulty for candidates. Others could not successfully
perform the reflection and only the very strong candidates described the translation correctly. There was a
tendency to use informal language to describe the translation, and column matrices were rarely seen.
Solutions
(a) (ii) a) 19.2 metres b) 4.4 metres
(b) (i) A translation
2
–7
(ii) Coordinates of the image of P: (4, 4) (4, 6) (2, 4) and (2, 7)
Recommendations
Trigonometry should be approached through out-door activities whereby students can actually measure the
heights of buildings using three-dimensional models to represent situations. Teachers should emphasize that
angles of elevation and depression are measured in relation to a horizontal line.
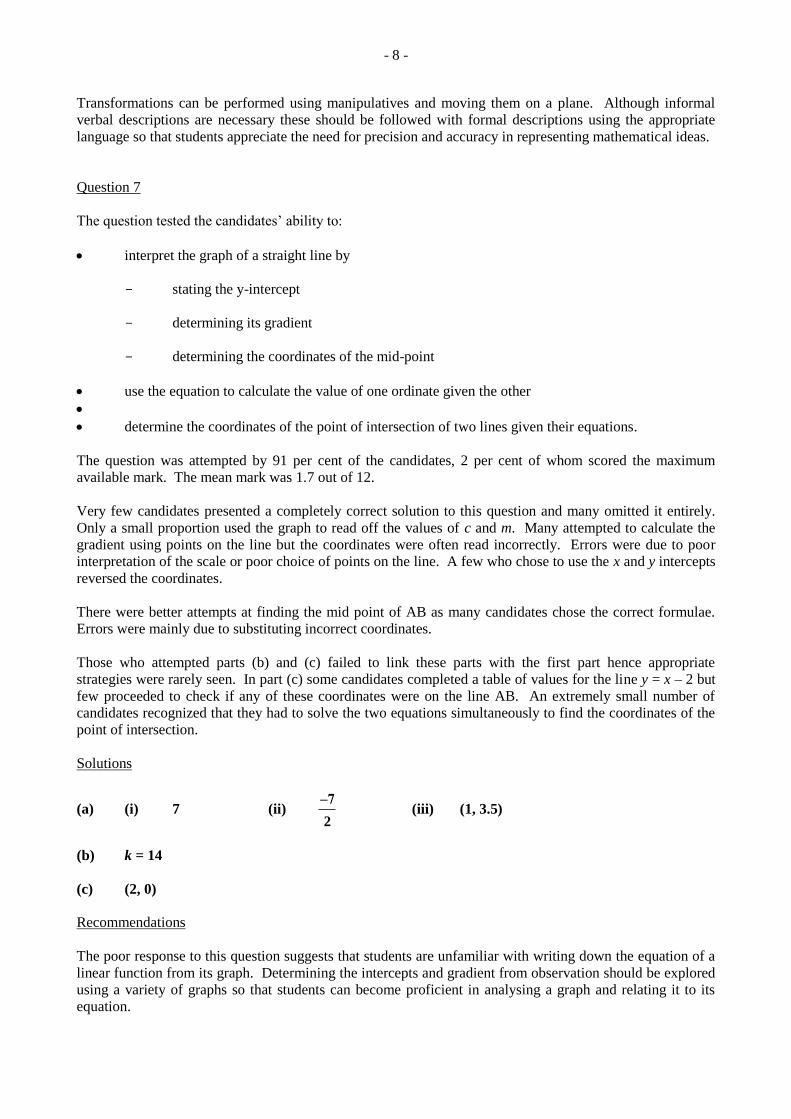
- 8 -
Transformations can be performed using manipulatives and moving them on a plane. Although informal
verbal descriptions are necessary these should be followed with formal descriptions using the appropriate
language so that students appreciate the need for precision and accuracy in representing mathematical ideas.
Question 7
The question tested the candidates’ ability to:
interpret the graph of a straight line by
- stating the y-intercept
- determining its gradient
- determining the coordinates of the mid-point
use the equation to calculate the value of one ordinate given the other
determine the coordinates of the point of intersection of two lines given their equations.
The question was attempted by 91 per cent of the candidates, 2 per cent of whom scored the maximum
available mark. The mean mark was 1.7 out of 12.
Very few candidates presented a completely correct solution to this question and many omitted it entirely.
Only a small proportion used the graph to read off the values of c and m. Many attempted to calculate the
gradient using points on the line but the coordinates were often read incorrectly. Errors were due to poor
interpretation of the scale or poor choice of points on the line. A few who chose to use the x and y intercepts
reversed the coordinates.
There were better attempts at finding the mid point of AB as many candidates chose the correct formulae.
Errors were mainly due to substituting incorrect coordinates.
Those who attempted parts (b) and (c) failed to link these parts with the first part hence appropriate
strategies were rarely seen. In part (c) some candidates completed a table of values for the line y = x – 2 but
few proceeded to check if any of these coordinates were on the line AB. An extremely small number of
candidates recognized that they had to solve the two equations simultaneously to find the coordinates of the
point of intersection.
Solutions
(a) (i) 7 (ii) –7
2(iii) (1, 3.5)
(b) k = 14
(c) (2, 0)
Recommendations
The poor response to this question suggests that students are unfamiliar with writing down the equation of a
linear function from its graph. Determining the intercepts and gradient from observation should be explored
using a variety of graphs so that students can become proficient in analysing a graph and relating it to its
equation.
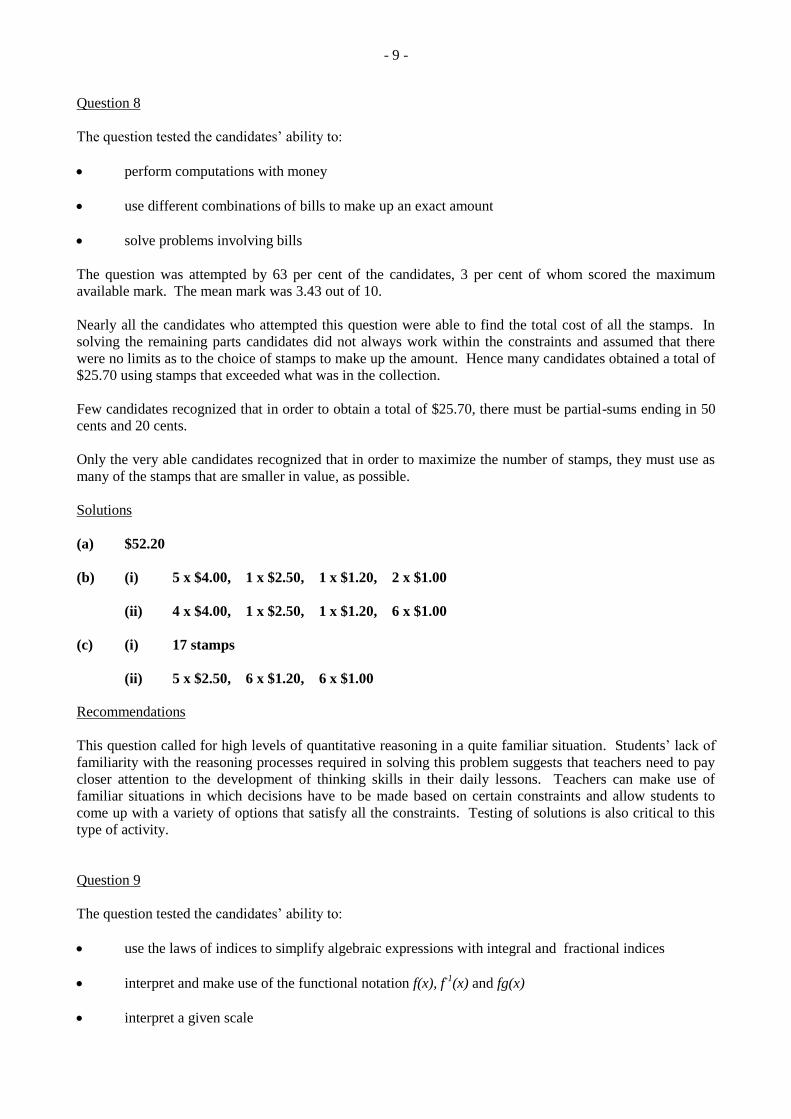
- 9 -
Question 8
The question tested the candidates’ ability to:
perform computations with money
use different combinations of bills to make up an exact amount
solve problems involving bills
The question was attempted by 63 per cent of the candidates, 3 per cent of whom scored the maximum
available mark. The mean mark was 3.43 out of 10.
Nearly all the candidates who attempted this question were able to find the total cost of all the stamps. In
solving the remaining parts candidates did not always work within the constraints and assumed that there
were no limits as to the choice of stamps to make up the amount. Hence many candidates obtained a total of
$25.70 using stamps that exceeded what was in the collection.
Few candidates recognized that in order to obtain a total of $25.70, there must be partial-sums ending in 50
cents and 20 cents.
Only the very able candidates recognized that in order to maximize the number of stamps, they must use as
many of the stamps that are smaller in value, as possible.
Solutions
(a) $52.20
(b) (i) 5 x $4.00, 1 x $2.50, 1 x $1.20, 2 x $1.00
(ii) 4 x $4.00, 1 x $2.50, 1 x $1.20, 6 x $1.00
(c) (i) 17 stamps
(ii) 5 x $2.50, 6 x $1.20, 6 x $1.00
Recommendations
This question called for high levels of quantitative reasoning in a quite familiar situation. Students’ lack of
familiarity with the reasoning processes required in solving this problem suggests that teachers need to pay
closer attention to the development of thinking skills in their daily lessons. Teachers can make use of
familiar situations in which decisions have to be made based on certain constraints and allow students to
come up with a variety of options that satisfy all the constraints. Testing of solutions is also critical to this
type of activity.
Question 9
The question tested the candidates’ ability to:
use the laws of indices to simplify algebraic expressions with integral and fractional indices
interpret and make use of the functional notation f(x), f-1
(x) and fg(x)
interpret a given scale
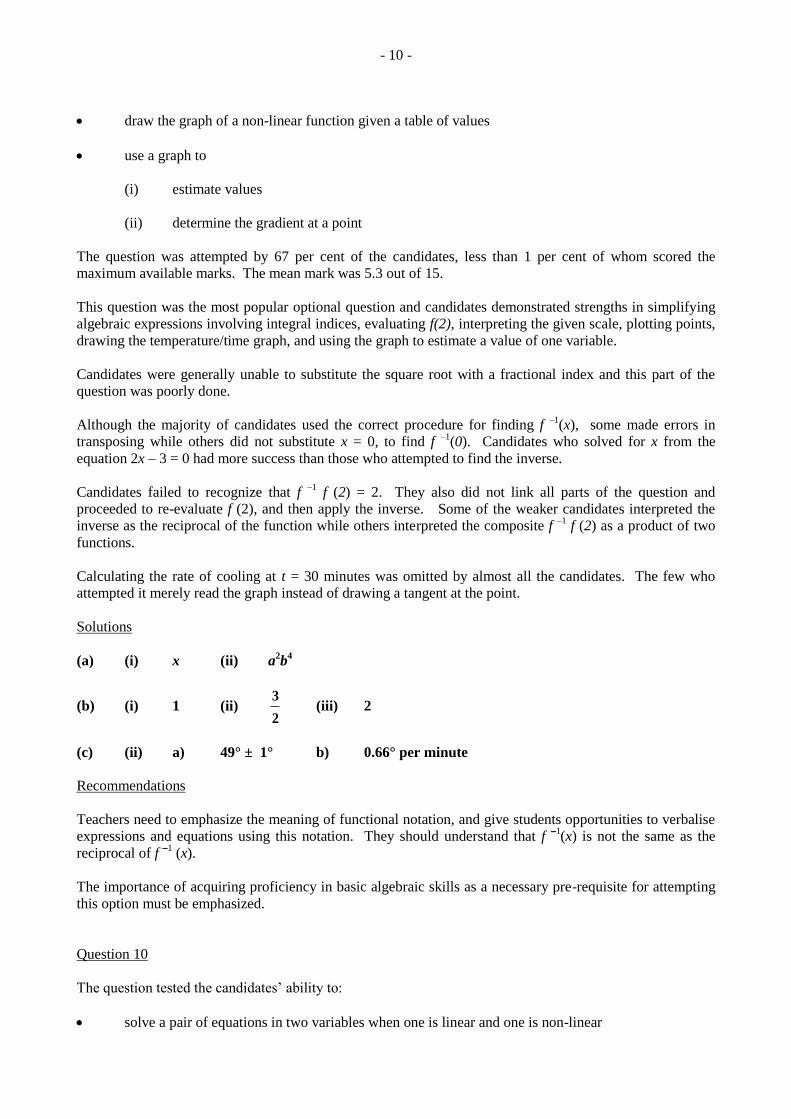
- 10 -
draw the graph of a non-linear function given a table of values
use a graph to
(i) estimate values
(ii) determine the gradient at a point
The question was attempted by 67 per cent of the candidates, less than 1 per cent of whom scored the
maximum available marks. The mean mark was 5.3 out of 15.
This question was the most popular optional question and candidates demonstrated strengths in simplifying
algebraic expressions involving integral indices, evaluating f(2), interpreting the given scale, plotting points,
drawing the temperature/time graph, and using the graph to estimate a value of one variable.
Candidates were generally unable to substitute the square root with a fractional index and this part of the
question was poorly done.
Although the majority of candidates used the correct procedure for finding f –1
(x), some made errors in
transposing while others did not substitute x = 0, to find f –1
(0). Candidates who solved for x from the
equation 2x – 3 = 0 had more success than those who attempted to find the inverse.
Candidates failed to recognize that f –1
f (2) = 2. They also did not link all parts of the question and
proceeded to re-evaluate f (2), and then apply the inverse. Some of the weaker candidates interpreted the
inverse as the reciprocal of the function while others interpreted the composite f –1
f (2) as a product of two
functions.
Calculating the rate of cooling at t = 30 minutes was omitted by almost all the candidates. The few who
attempted it merely read the graph instead of drawing a tangent at the point.
Solutions
(a) (i) x (ii) a2b
4
(b) (i) 1 (ii) 3
2(iii) 2
(c) (ii) a) 49° ± 1° b) 0.66° per minute
Recommendations
Teachers need to emphasize the meaning of functional notation, and give students opportunities to verbalise
expressions and equations using this notation. They should understand that f –1
(x) is not the same as the
reciprocal of f –1
(x).
The importance of acquiring proficiency in basic algebraic skills as a necessary pre-requisite for attempting
this option must be emphasized.
Question 10
The question tested the candidates’ ability to:
solve a pair of equations in two variables when one is linear and one is non-linear
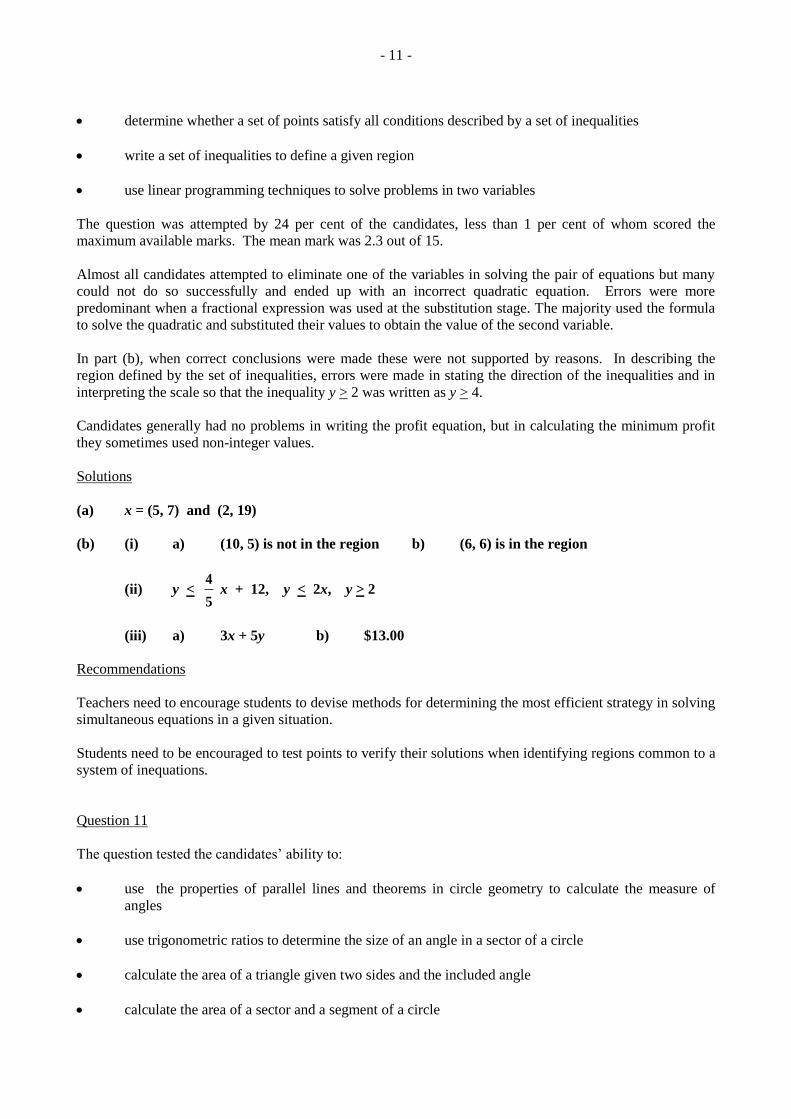
- 11 -
determine whether a set of points satisfy all conditions described by a set of inequalities
write a set of inequalities to define a given region
use linear programming techniques to solve problems in two variables
The question was attempted by 24 per cent of the candidates, less than 1 per cent of whom scored the
maximum available marks. The mean mark was 2.3 out of 15.
Almost all candidates attempted to eliminate one of the variables in solving the pair of equations but many
could not do so successfully and ended up with an incorrect quadratic equation. Errors were more
predominant when a fractional expression was used at the substitution stage. The majority used the formula
to solve the quadratic and substituted their values to obtain the value of the second variable.
In part (b), when correct conclusions were made these were not supported by reasons. In describing the
region defined by the set of inequalities, errors were made in stating the direction of the inequalities and in
interpreting the scale so that the inequality y > 2 was written as y > 4.
Candidates generally had no problems in writing the profit equation, but in calculating the minimum profit
they sometimes used non-integer values.
Solutions
(a) x = (5, 7) and (2, 19)
(b) (i) a) (10, 5) is not in the region b) (6, 6) is in the region
(ii) y < 4
5 x + 12, y < 2x, y > 2
(iii) a) 3x + 5y b) $13.00
Recommendations
Teachers need to encourage students to devise methods for determining the most efficient strategy in solving
simultaneous equations in a given situation.
Students need to be encouraged to test points to verify their solutions when identifying regions common to a
system of inequations.
Question 11
The question tested the candidates’ ability to:
use the properties of parallel lines and theorems in circle geometry to calculate the measure of
angles
use trigonometric ratios to determine the size of an angle in a sector of a circle
calculate the area of a triangle given two sides and the included angle
calculate the area of a sector and a segment of a circle
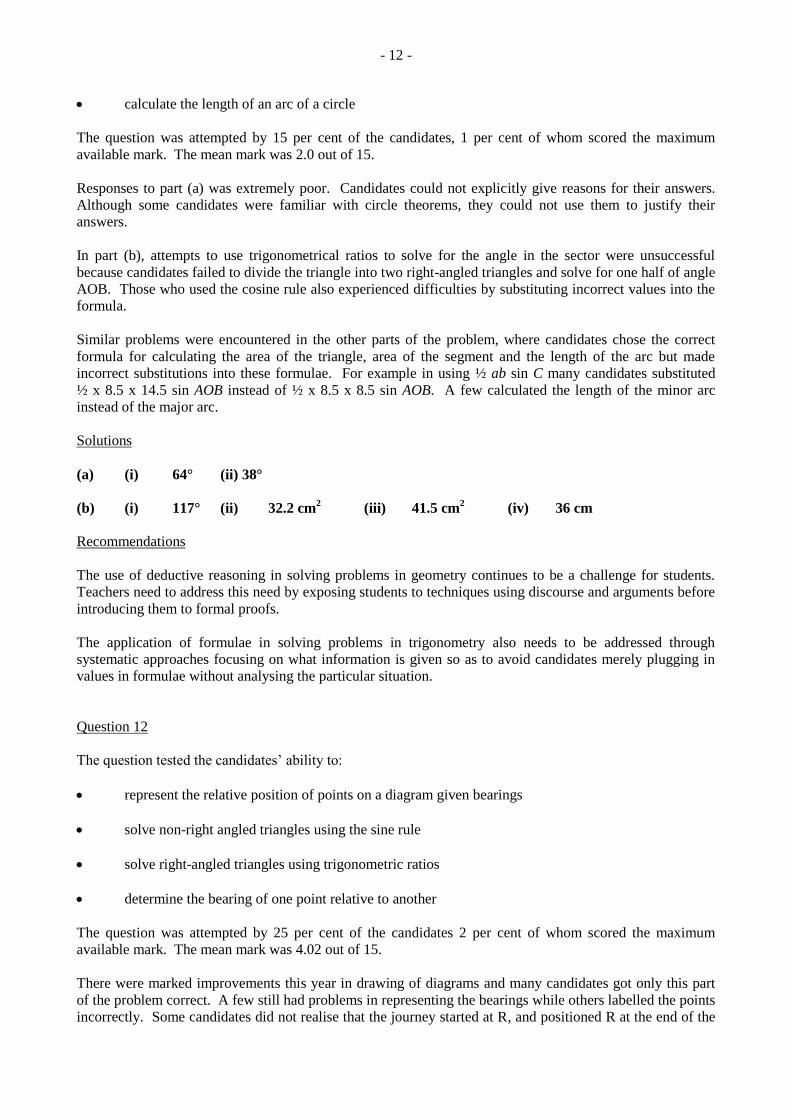
- 12 -
calculate the length of an arc of a circle
The question was attempted by 15 per cent of the candidates, 1 per cent of whom scored the maximum
available mark. The mean mark was 2.0 out of 15.
Responses to part (a) was extremely poor. Candidates could not explicitly give reasons for their answers.
Although some candidates were familiar with circle theorems, they could not use them to justify their
answers.
In part (b), attempts to use trigonometrical ratios to solve for the angle in the sector were unsuccessful
because candidates failed to divide the triangle into two right-angled triangles and solve for one half of angle
AOB. Those who used the cosine rule also experienced difficulties by substituting incorrect values into the
formula.
Similar problems were encountered in the other parts of the problem, where candidates chose the correct
formula for calculating the area of the triangle, area of the segment and the length of the arc but made
incorrect substitutions into these formulae. For example in using ½ ab sin C many candidates substituted
½ x 8.5 x 14.5 sin AOB instead of ½ x 8.5 x 8.5 sin AOB. A few calculated the length of the minor arc
instead of the major arc.
Solutions
(a) (i) 64° (ii) 38°
(b) (i) 117° (ii) 32.2 cm2
(iii) 41.5 cm2
(iv) 36 cm
Recommendations
The use of deductive reasoning in solving problems in geometry continues to be a challenge for students.
Teachers need to address this need by exposing students to techniques using discourse and arguments before
introducing them to formal proofs.
The application of formulae in solving problems in trigonometry also needs to be addressed through
systematic approaches focusing on what information is given so as to avoid candidates merely plugging in
values in formulae without analysing the particular situation.
Question 12
The question tested the candidates’ ability to:
represent the relative position of points on a diagram given bearings
solve non-right angled triangles using the sine rule
solve right-angled triangles using trigonometric ratios
determine the bearing of one point relative to another
The question was attempted by 25 per cent of the candidates 2 per cent of whom scored the maximum
available mark. The mean mark was 4.02 out of 15.
There were marked improvements this year in drawing of diagrams and many candidates got only this part
of the problem correct. A few still had problems in representing the bearings while others labelled the points
incorrectly. Some candidates did not realise that the journey started at R, and positioned R at the end of the
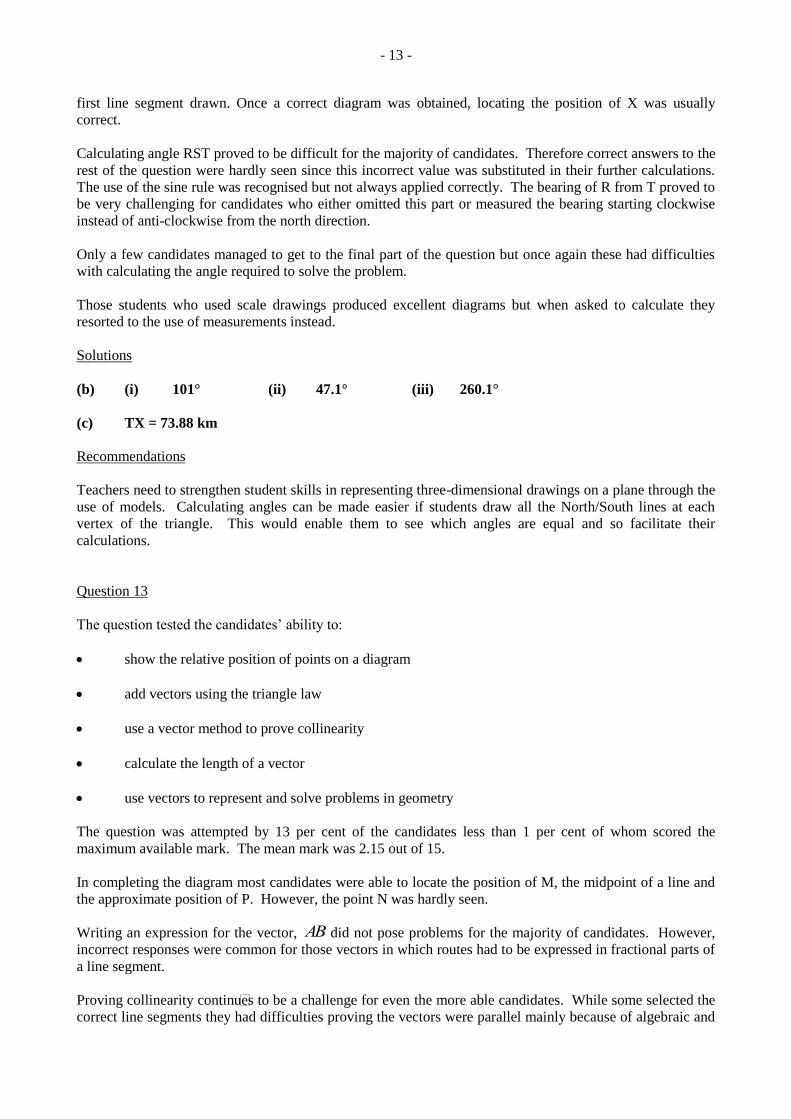
- 13 -
first line segment drawn. Once a correct diagram was obtained, locating the position of X was usually
correct.
Calculating angle RST proved to be difficult for the majority of candidates. Therefore correct answers to the
rest of the question were hardly seen since this incorrect value was substituted in their further calculations.
The use of the sine rule was recognised but not always applied correctly. The bearing of R from T proved to
be very challenging for candidates who either omitted this part or measured the bearing starting clockwise
instead of anti-clockwise from the north direction.
Only a few candidates managed to get to the final part of the question but once again these had difficulties
with calculating the angle required to solve the problem.
Those students who used scale drawings produced excellent diagrams but when asked to calculate they
resorted to the use of measurements instead.
Solutions
(b) (i) 101° (ii) 47.1° (iii) 260.1°
(c) TX = 73.88 km
Recommendations
Teachers need to strengthen student skills in representing three-dimensional drawings on a plane through the
use of models. Calculating angles can be made easier if students draw all the North/South lines at each
vertex of the triangle. This would enable them to see which angles are equal and so facilitate their
calculations.
Question 13
The question tested the candidates’ ability to:
show the relative position of points on a diagram
add vectors using the triangle law
use a vector method to prove collinearity
calculate the length of a vector
use vectors to represent and solve problems in geometry
The question was attempted by 13 per cent of the candidates less than 1 per cent of whom scored the
maximum available mark. The mean mark was 2.15 out of 15.
In completing the diagram most candidates were able to locate the position of M, the midpoint of a line and
the approximate position of P. However, the point N was hardly seen.
Writing an expression for the vector,
AB did not pose problems for the majority of candidates. However,
incorrect responses were common for those vectors in which routes had to be expressed in fractional parts of
a line segment.
Proving collinearity continues to be a challenge for even the more able candidates. While some selected the
correct line segments they had difficulties proving the vectors were parallel mainly because of algebraic and
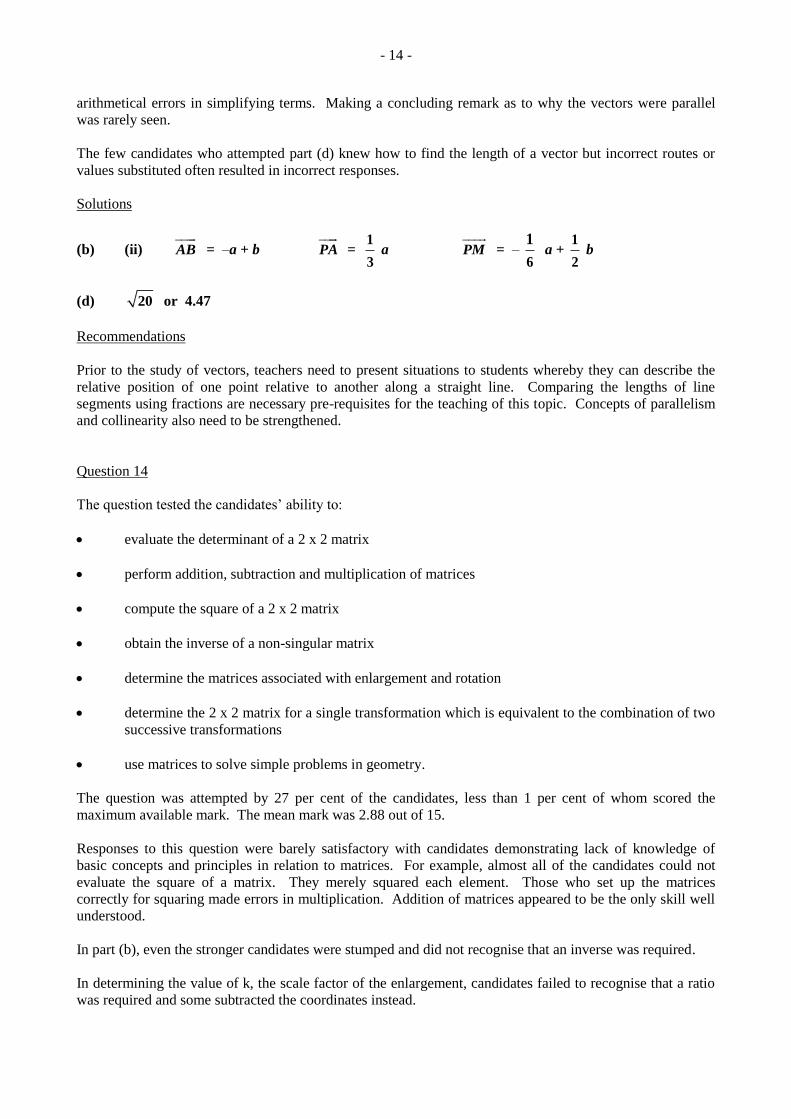
- 14 -
arithmetical errors in simplifying terms. Making a concluding remark as to why the vectors were parallel
was rarely seen.
The few candidates who attempted part (d) knew how to find the length of a vector but incorrect routes or
values substituted often resulted in incorrect responses.
Solutions
(b) (ii) AB = –a + b
PA =
1
3 a
PM = –
6
1 a +
1
2 b
(d) 20 or 4.47
Recommendations
Prior to the study of vectors, teachers need to present situations to students whereby they can describe the
relative position of one point relative to another along a straight line. Comparing the lengths of line
segments using fractions are necessary pre-requisites for the teaching of this topic. Concepts of parallelism
and collinearity also need to be strengthened.
Question 14
The question tested the candidates’ ability to:
evaluate the determinant of a 2 x 2 matrix
perform addition, subtraction and multiplication of matrices
compute the square of a 2 x 2 matrix
obtain the inverse of a non-singular matrix
determine the matrices associated with enlargement and rotation
determine the 2 x 2 matrix for a single transformation which is equivalent to the combination of two
successive transformations
use matrices to solve simple problems in geometry.
The question was attempted by 27 per cent of the candidates, less than 1 per cent of whom scored the
maximum available mark. The mean mark was 2.88 out of 15.
Responses to this question were barely satisfactory with candidates demonstrating lack of knowledge of
basic concepts and principles in relation to matrices. For example, almost all of the candidates could not
evaluate the square of a matrix. They merely squared each element. Those who set up the matrices
correctly for squaring made errors in multiplication. Addition of matrices appeared to be the only skill well
understood.
In part (b), even the stronger candidates were stumped and did not recognise that an inverse was required.
In determining the value of k, the scale factor of the enlargement, candidates failed to recognise that a ratio
was required and some subtracted the coordinates instead.
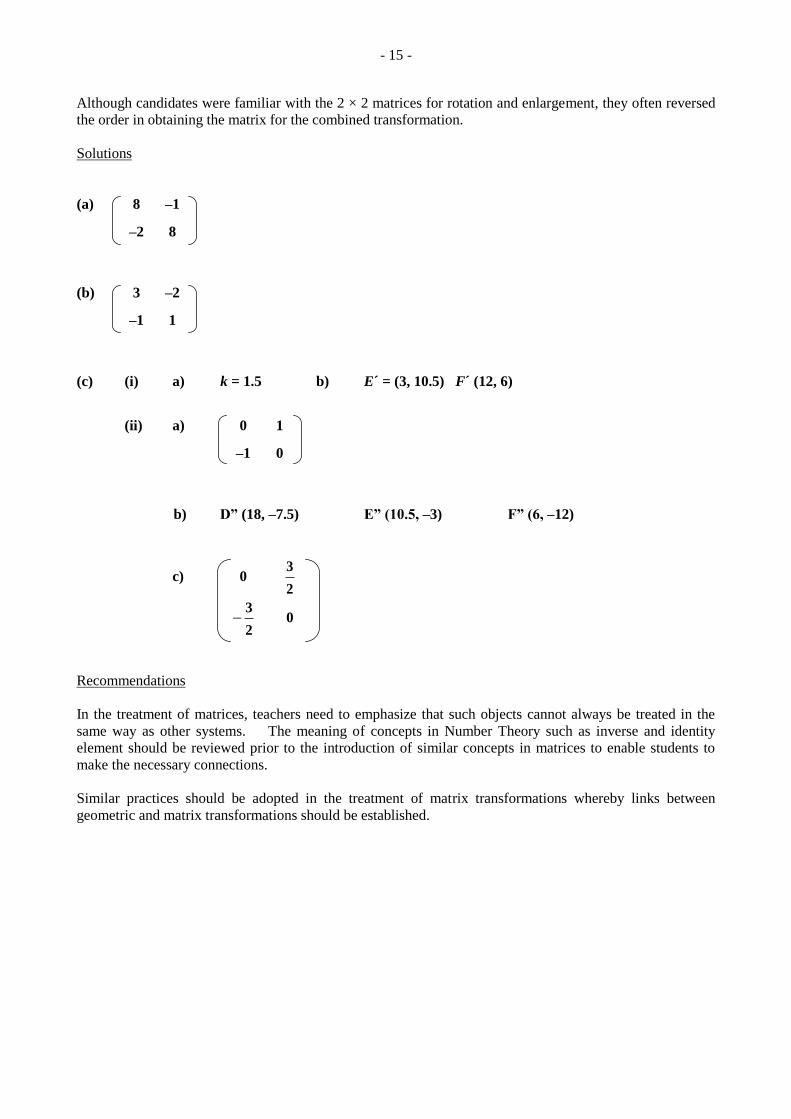
- 15 -
Although candidates were familiar with the 2 × 2 matrices for rotation and enlargement, they often reversed
the order in obtaining the matrix for the combined transformation.
Solutions
(a) 8 –1
–2 8
(b) 3 –2
–1 1
(c) (i) a) k = 1.5 b) E´ = (3, 10.5) F´ (12, 6)
(ii) a) 0 1
–1 0
b) D” (18, –7.5) E” (10.5, –3) F” (6, –12)
c) 0 3
2
3
20
Recommendations
In the treatment of matrices, teachers need to emphasize that such objects cannot always be treated in the
same way as other systems. The meaning of concepts in Number Theory such as inverse and identity
element should be reviewed prior to the introduction of similar concepts in matrices to enable students to
make the necessary connections.
Similar practices should be adopted in the treatment of matrix transformations whereby links between
geometric and matrix transformations should be established.
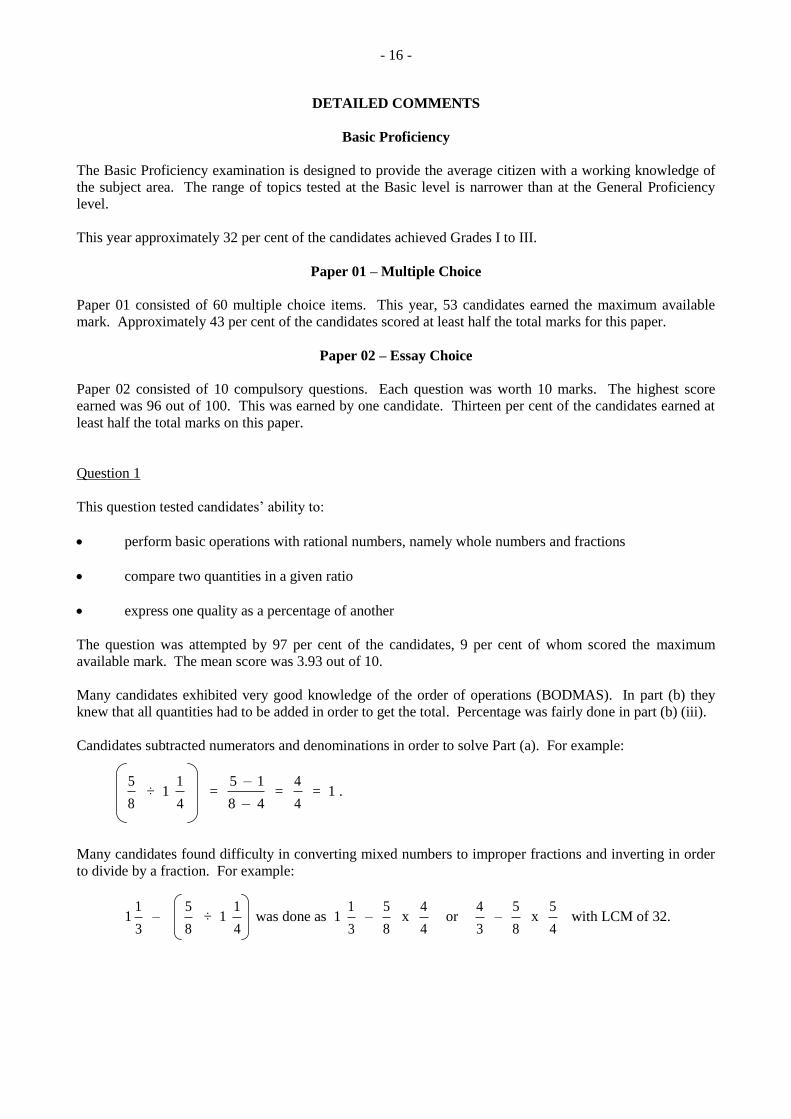
- 16 -
DETAILED COMMENTS
Basic Proficiency
The Basic Proficiency examination is designed to provide the average citizen with a working knowledge of
the subject area. The range of topics tested at the Basic level is narrower than at the General Proficiency
level.
This year approximately 32 per cent of the candidates achieved Grades I to III.
Paper 01 – Multiple Choice
Paper 01 consisted of 60 multiple choice items. This year, 53 candidates earned the maximum available
mark. Approximately 43 per cent of the candidates scored at least half the total marks for this paper.
Paper 02 – Essay Choice
Paper 02 consisted of 10 compulsory questions. Each question was worth 10 marks. The highest score
earned was 96 out of 100. This was earned by one candidate. Thirteen per cent of the candidates earned at
least half the total marks on this paper.
Question 1
This question tested candidates’ ability to:
perform basic operations with rational numbers, namely whole numbers and fractions
compare two quantities in a given ratio
express one quality as a percentage of another
The question was attempted by 97 per cent of the candidates, 9 per cent of whom scored the maximum
available mark. The mean score was 3.93 out of 10.
Many candidates exhibited very good knowledge of the order of operations (BODMAS). In part (b) they
knew that all quantities had to be added in order to get the total. Percentage was fairly done in part (b) (iii).
Candidates subtracted numerators and denominations in order to solve Part (a). For example:
5
8 ÷ 1
1
4 =
5 1
8 4
–
– =
4
4 = 1 .
Many candidates found difficulty in converting mixed numbers to improper fractions and inverting in order
to divide by a fraction. For example:
11
3 –
5
8 ÷ 1
1
4 was done as 1
1
3 –
5
8 x
4
4 or
4
3 –
5
8 x
5
4 with LCM of 32.
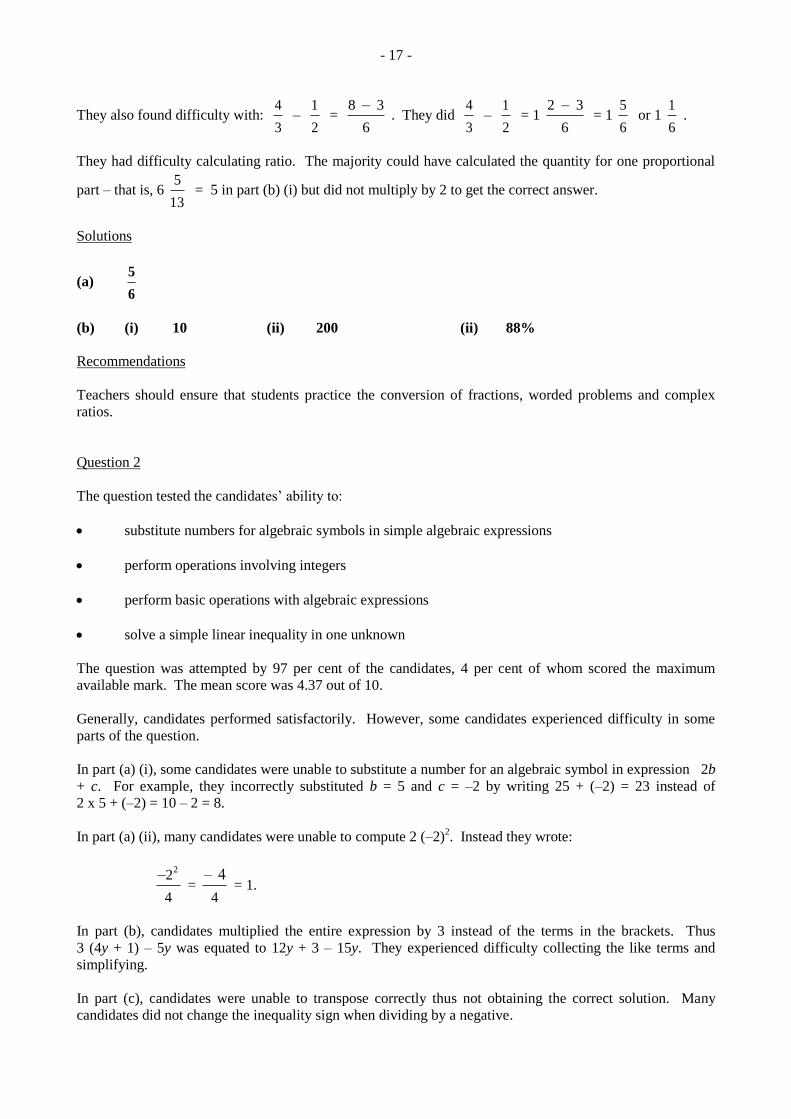
- 17 -
They also found difficulty with: 4
3 –
1
2 =
8 3
6
– . They did
4
3 –
1
2 = 1
2 3
6
– = 1
5
6 or 1
1
6 .
They had difficulty calculating ratio. The majority could have calculated the quantity for one proportional
part – that is, 6 5
13 = 5 in part (b) (i) but did not multiply by 2 to get the correct answer.
Solutions
(a) 5
6
(b) (i) 10 (ii) 200 (ii) 88%
Recommendations
Teachers should ensure that students practice the conversion of fractions, worded problems and complex
ratios.
Question 2
The question tested the candidates’ ability to:
substitute numbers for algebraic symbols in simple algebraic expressions
perform operations involving integers
perform basic operations with algebraic expressions
solve a simple linear inequality in one unknown
The question was attempted by 97 per cent of the candidates, 4 per cent of whom scored the maximum
available mark. The mean score was 4.37 out of 10.
Generally, candidates performed satisfactorily. However, some candidates experienced difficulty in some
parts of the question.
In part (a) (i), some candidates were unable to substitute a number for an algebraic symbol in expression 2b
+ c. For example, they incorrectly substituted b = 5 and c = –2 by writing 25 + (–2) = 23 instead of
2 x 5 + (–2) = 10 – 2 = 8.
In part (a) (ii), many candidates were unable to compute 2 (–2)2. Instead they wrote:
22
4
– =
4
– 4 = 1.
In part (b), candidates multiplied the entire expression by 3 instead of the terms in the brackets. Thus
3 (4y + 1) – 5y was equated to 12y + 3 – 15y. They experienced difficulty collecting the like terms and
simplifying.
In part (c), candidates were unable to transpose correctly thus not obtaining the correct solution. Many
candidates did not change the inequality sign when dividing by a negative.
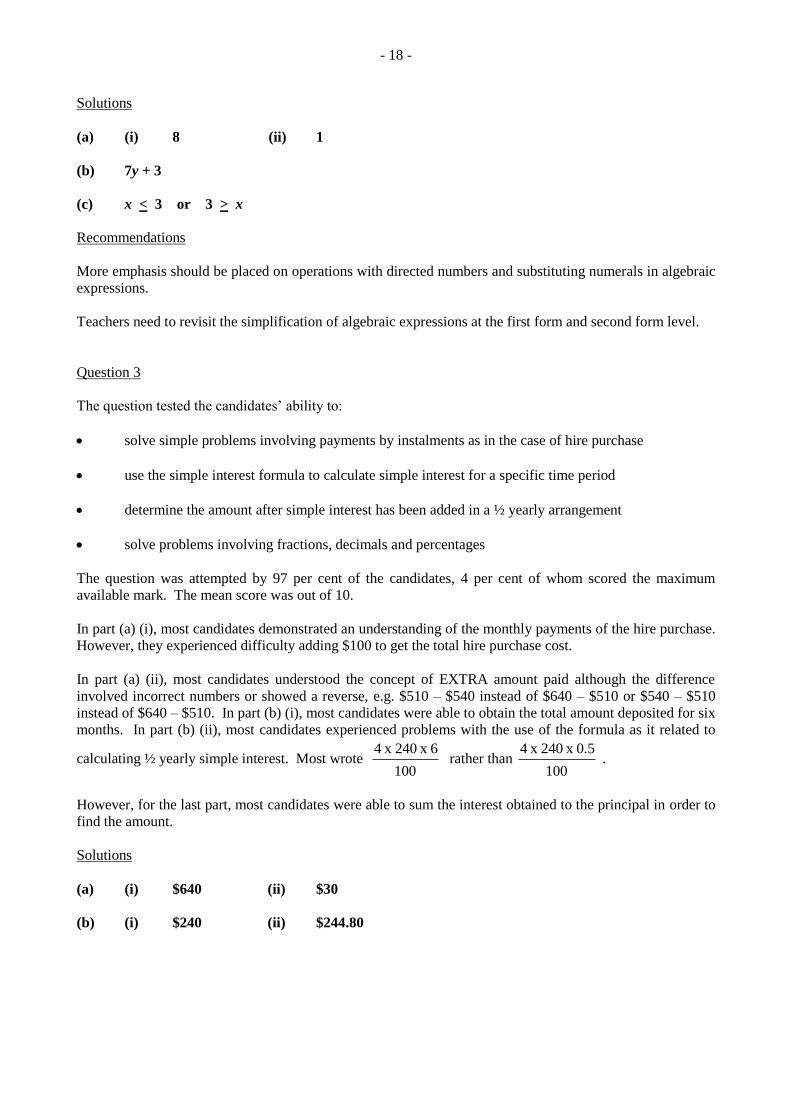
- 18 -
Solutions
(a) (i) 8 (ii) 1
(b) 7y + 3
(c) x < 3 or 3 > x
Recommendations
More emphasis should be placed on operations with directed numbers and substituting numerals in algebraic
expressions.
Teachers need to revisit the simplification of algebraic expressions at the first form and second form level.
Question 3
The question tested the candidates’ ability to:
solve simple problems involving payments by instalments as in the case of hire purchase
use the simple interest formula to calculate simple interest for a specific time period
determine the amount after simple interest has been added in a ½ yearly arrangement
solve problems involving fractions, decimals and percentages
The question was attempted by 97 per cent of the candidates, 4 per cent of whom scored the maximum
available mark. The mean score was out of 10.
In part (a) (i), most candidates demonstrated an understanding of the monthly payments of the hire purchase.
However, they experienced difficulty adding $100 to get the total hire purchase cost.
In part (a) (ii), most candidates understood the concept of EXTRA amount paid although the difference
involved incorrect numbers or showed a reverse, e.g. $510 – $540 instead of $640 – $510 or $540 – $510
instead of $640 – $510. In part (b) (i), most candidates were able to obtain the total amount deposited for six
months. In part (b) (ii), most candidates experienced problems with the use of the formula as it related to
calculating ½ yearly simple interest. Most wrote 4 x 240 x 6
100 rather than
4 x 240 x 0.5
100 .
However, for the last part, most candidates were able to sum the interest obtained to the principal in order to
find the amount.
Solutions
(a) (i) $640 (ii) $30
(b) (i) $240 (ii) $244.80
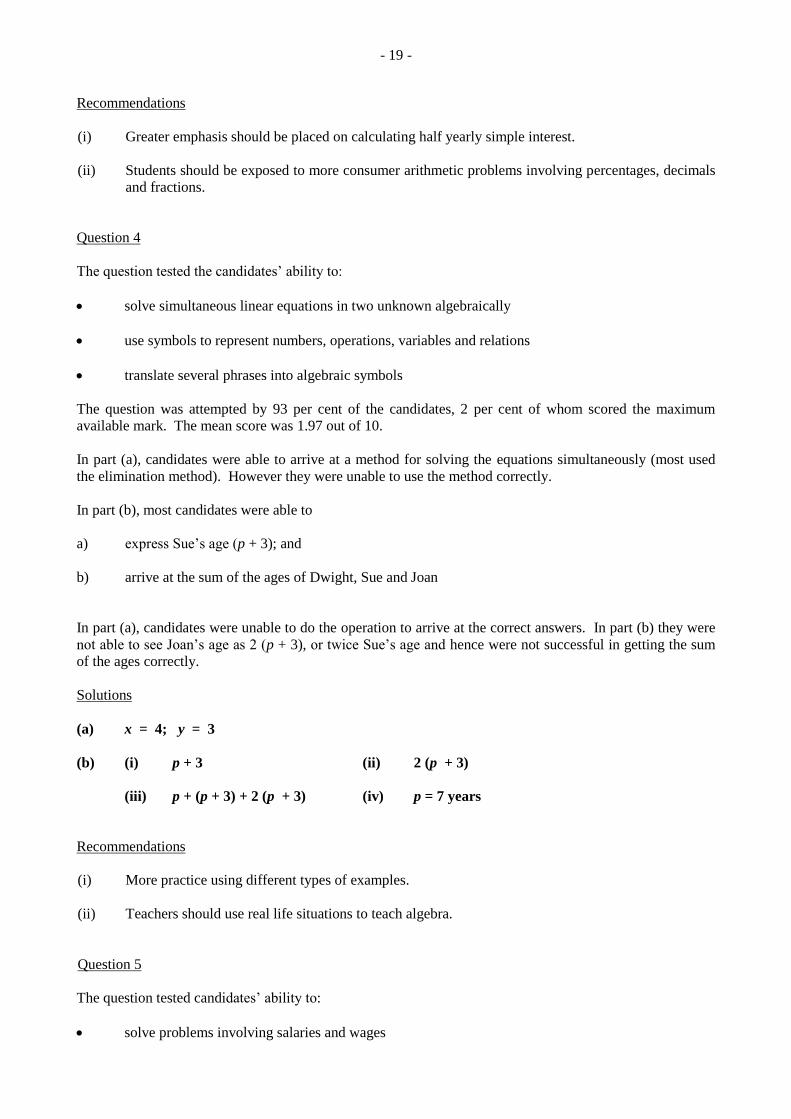
- 19 -
Recommendations
(i) Greater emphasis should be placed on calculating half yearly simple interest.
(ii) Students should be exposed to more consumer arithmetic problems involving percentages, decimals
and fractions.
Question 4
The question tested the candidates’ ability to:
solve simultaneous linear equations in two unknown algebraically
use symbols to represent numbers, operations, variables and relations
translate several phrases into algebraic symbols
The question was attempted by 93 per cent of the candidates, 2 per cent of whom scored the maximum
available mark. The mean score was 1.97 out of 10.
In part (a), candidates were able to arrive at a method for solving the equations simultaneously (most used
the elimination method). However they were unable to use the method correctly.
In part (b), most candidates were able to
a) express Sue’s age (p + 3); and
b) arrive at the sum of the ages of Dwight, Sue and Joan
In part (a), candidates were unable to do the operation to arrive at the correct answers. In part (b) they were
not able to see Joan’s age as 2 (p + 3), or twice Sue’s age and hence were not successful in getting the sum
of the ages correctly.
Solutions
(a) x = 4; y = 3
(b) (i) p + 3 (ii) 2 (p + 3)
(iii) p + (p + 3) + 2 (p + 3) (iv) p = 7 years
Recommendations
(i) More practice using different types of examples.
(ii) Teachers should use real life situations to teach algebra.
Question 5
The question tested candidates’ ability to:
solve problems involving salaries and wages
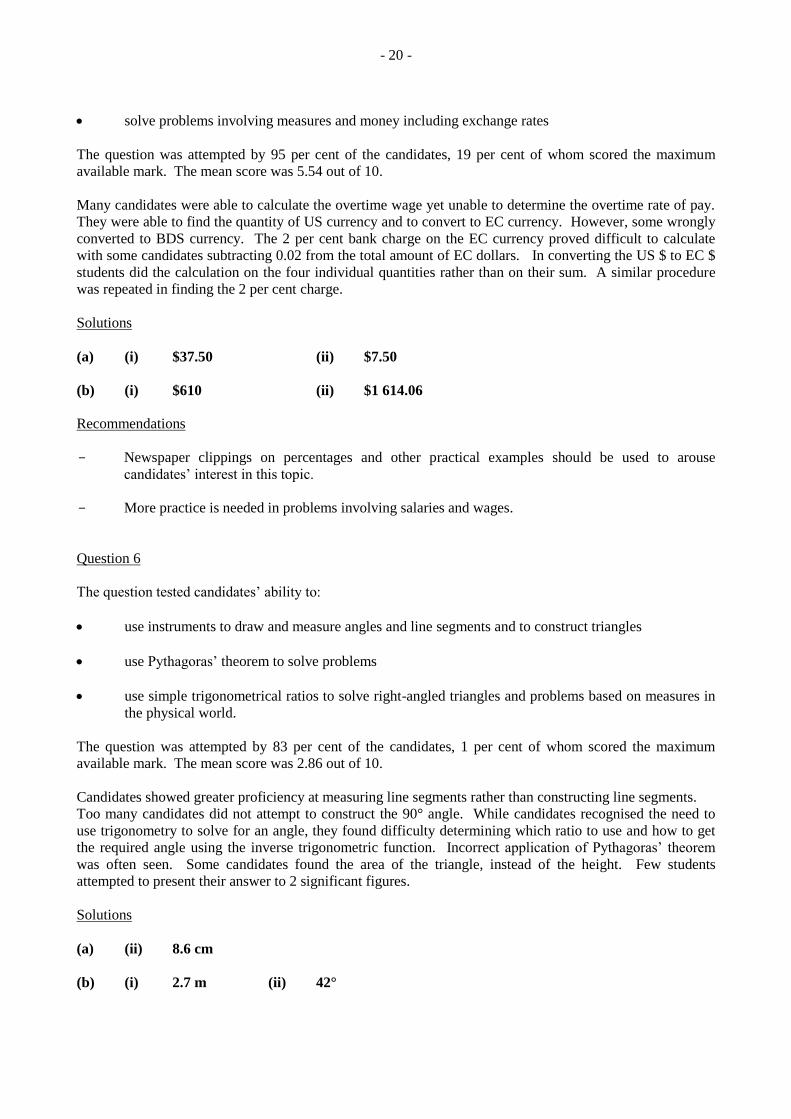
- 20 -
solve problems involving measures and money including exchange rates
The question was attempted by 95 per cent of the candidates, 19 per cent of whom scored the maximum
available mark. The mean score was 5.54 out of 10.
Many candidates were able to calculate the overtime wage yet unable to determine the overtime rate of pay.
They were able to find the quantity of US currency and to convert to EC currency. However, some wrongly
converted to BDS currency. The 2 per cent bank charge on the EC currency proved difficult to calculate
with some candidates subtracting 0.02 from the total amount of EC dollars. In converting the US $ to EC $
students did the calculation on the four individual quantities rather than on their sum. A similar procedure
was repeated in finding the 2 per cent charge.
Solutions
(a) (i) $37.50 (ii) $7.50
(b) (i) $610 (ii) $1 614.06
Recommendations
- Newspaper clippings on percentages and other practical examples should be used to arouse
candidates’ interest in this topic.
- More practice is needed in problems involving salaries and wages.
Question 6
The question tested candidates’ ability to:
use instruments to draw and measure angles and line segments and to construct triangles
use Pythagoras’ theorem to solve problems
use simple trigonometrical ratios to solve right-angled triangles and problems based on measures in
the physical world.
The question was attempted by 83 per cent of the candidates, 1 per cent of whom scored the maximum
available mark. The mean score was 2.86 out of 10.
Candidates showed greater proficiency at measuring line segments rather than constructing line segments.
Too many candidates did not attempt to construct the 90° angle. While candidates recognised the need to
use trigonometry to solve for an angle, they found difficulty determining which ratio to use and how to get
the required angle using the inverse trigonometric function. Incorrect application of Pythagoras’ theorem
was often seen. Some candidates found the area of the triangle, instead of the height. Few students
attempted to present their answer to 2 significant figures.
Solutions
(a) (ii) 8.6 cm
(b) (i) 2.7 m (ii) 42°
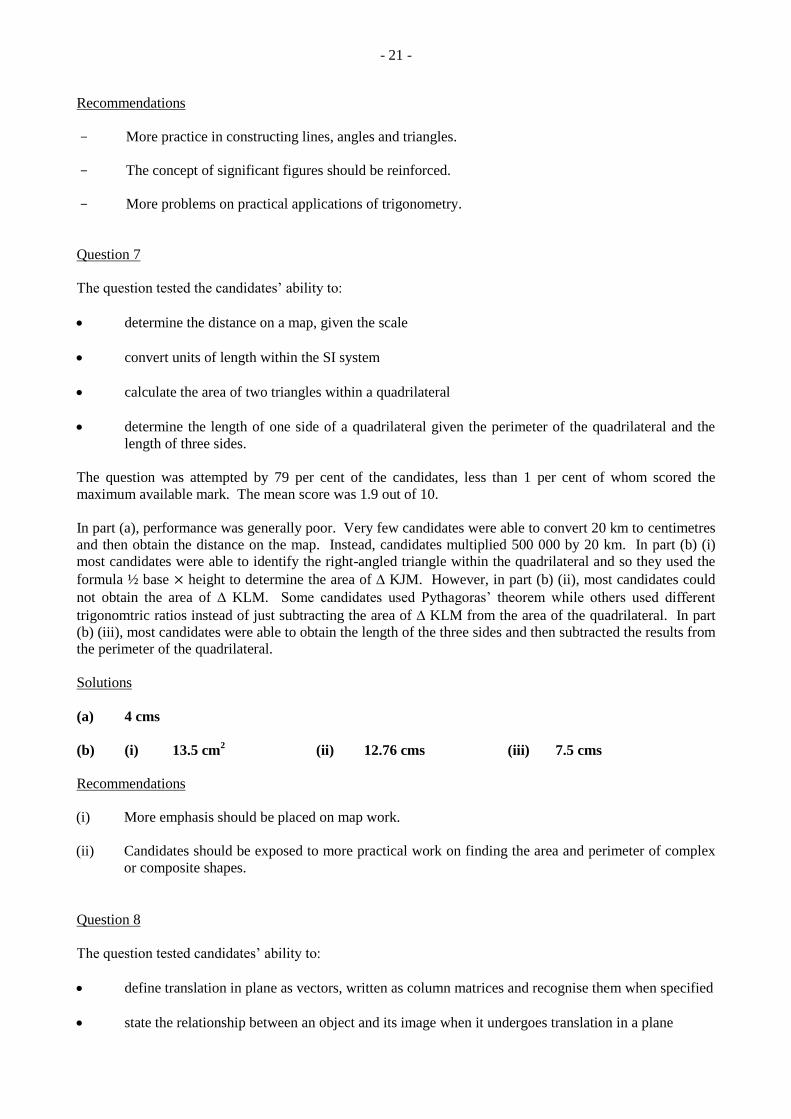
- 21 -
Recommendations
- More practice in constructing lines, angles and triangles.
- The concept of significant figures should be reinforced.
- More problems on practical applications of trigonometry.
Question 7
The question tested the candidates’ ability to:
determine the distance on a map, given the scale
convert units of length within the SI system
calculate the area of two triangles within a quadrilateral
determine the length of one side of a quadrilateral given the perimeter of the quadrilateral and the
length of three sides.
The question was attempted by 79 per cent of the candidates, less than 1 per cent of whom scored the
maximum available mark. The mean score was 1.9 out of 10.
In part (a), performance was generally poor. Very few candidates were able to convert 20 km to centimetres
and then obtain the distance on the map. Instead, candidates multiplied 500 000 by 20 km. In part (b) (i)
most candidates were able to identify the right-angled triangle within the quadrilateral and so they used the
formula ½ base × height to determine the area of KJM. However, in part (b) (ii), most candidates could
not obtain the area of KLM. Some candidates used Pythagoras’ theorem while others used different
trigonomtric ratios instead of just subtracting the area of KLM from the area of the quadrilateral. In part
(b) (iii), most candidates were able to obtain the length of the three sides and then subtracted the results from
the perimeter of the quadrilateral.
Solutions
(a) 4 cms
(b) (i) 13.5 cm2 (ii) 12.76 cms (iii) 7.5 cms
Recommendations
(i) More emphasis should be placed on map work.
(ii) Candidates should be exposed to more practical work on finding the area and perimeter of complex
or composite shapes.
Question 8
The question tested candidates’ ability to:
define translation in plane as vectors, written as column matrices and recognise them when specified
state the relationship between an object and its image when it undergoes translation in a plane
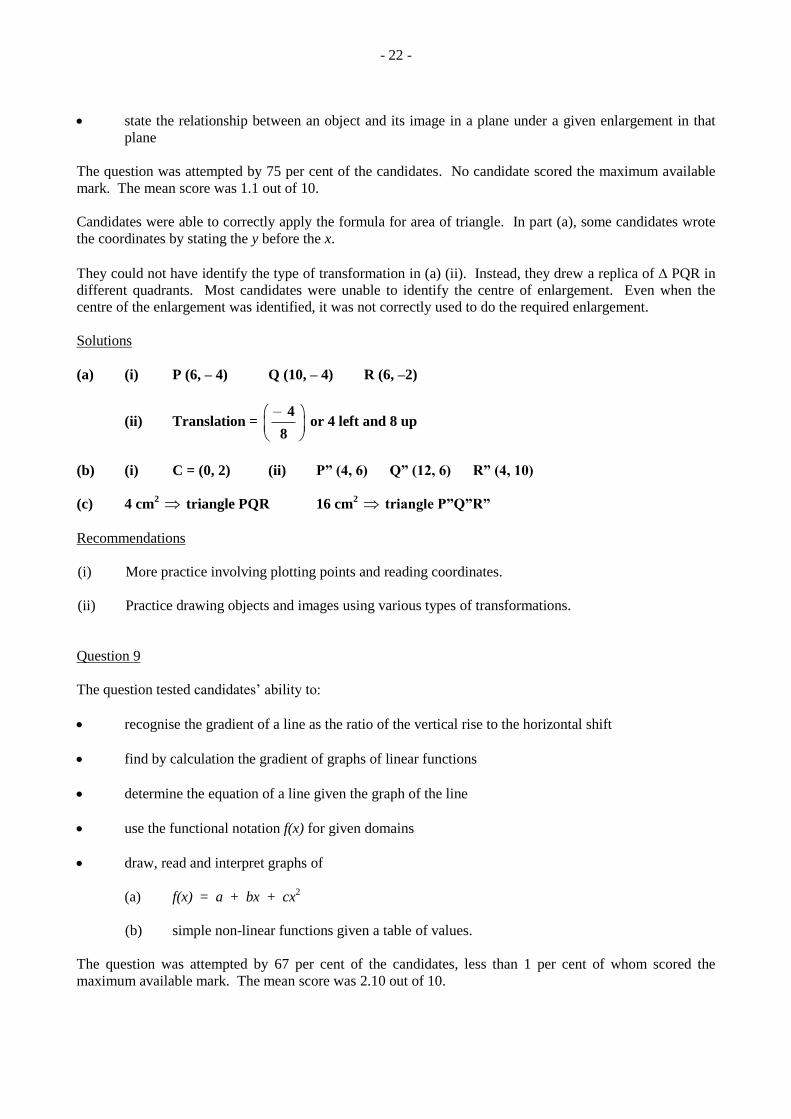
- 22 -
state the relationship between an object and its image in a plane under a given enlargement in that
plane
The question was attempted by 75 per cent of the candidates. No candidate scored the maximum available
mark. The mean score was 1.1 out of 10.
Candidates were able to correctly apply the formula for area of triangle. In part (a), some candidates wrote
the coordinates by stating the y before the x.
They could not have identify the type of transformation in (a) (ii). Instead, they drew a replica of PQR in
different quadrants. Most candidates were unable to identify the centre of enlargement. Even when the
centre of the enlargement was identified, it was not correctly used to do the required enlargement.
Solutions
(a) (i) P (6, – 4) Q (10, – 4) R (6, –2)
(ii) Translation = –
4
8 or 4 left and 8 up
(b) (i) C = (0, 2) (ii) P” (4, 6) Q” (12, 6) R” (4, 10)
(c) 4 cm2 triangle PQR 16 cm
2 triangle P”Q”R”
Recommendations
(i) More practice involving plotting points and reading coordinates.
(ii) Practice drawing objects and images using various types of transformations.
Question 9
The question tested candidates’ ability to:
recognise the gradient of a line as the ratio of the vertical rise to the horizontal shift
find by calculation the gradient of graphs of linear functions
determine the equation of a line given the graph of the line
use the functional notation f(x) for given domains
draw, read and interpret graphs of
(a) f(x) = a + bx + cx2
(b) simple non-linear functions given a table of values.
The question was attempted by 67 per cent of the candidates, less than 1 per cent of whom scored the
maximum available mark. The mean score was 2.10 out of 10.
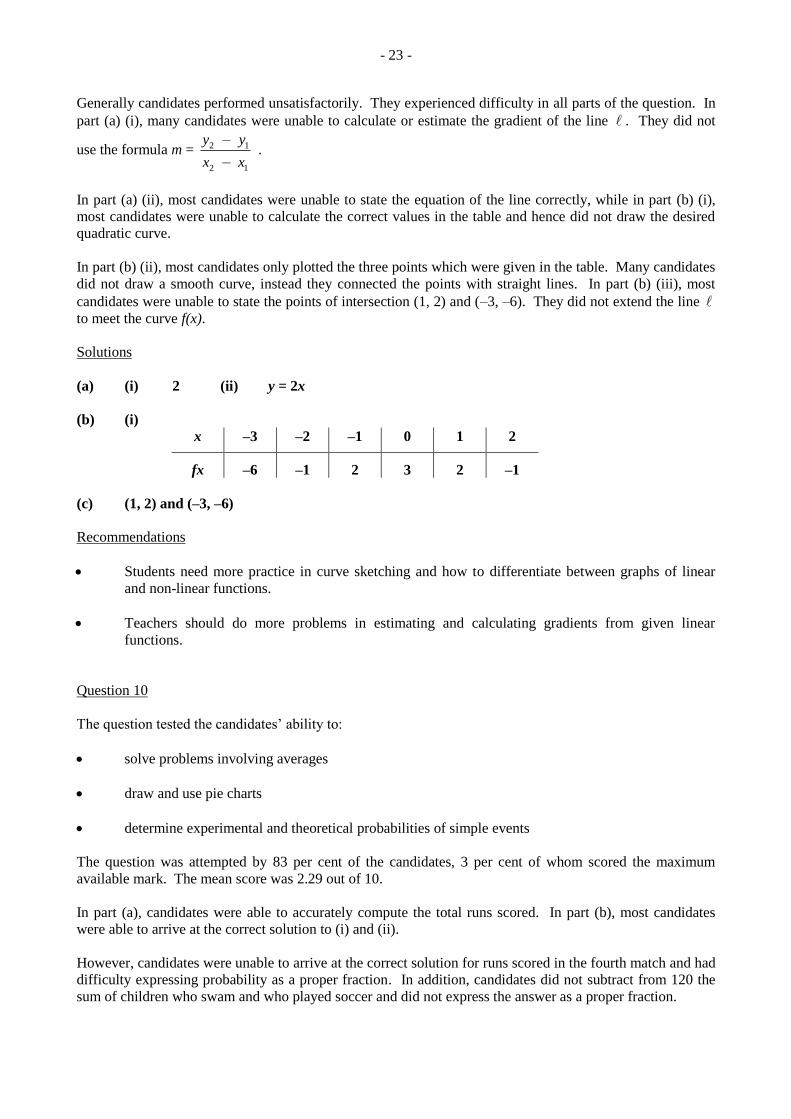
- 23 -
Generally candidates performed unsatisfactorily. They experienced difficulty in all parts of the question. In
part (a) (i), many candidates were unable to calculate or estimate the gradient of the line . They did not
use the formula m = 2 1
2 1
–
–
y y
x x .
In part (a) (ii), most candidates were unable to state the equation of the line correctly, while in part (b) (i),
most candidates were unable to calculate the correct values in the table and hence did not draw the desired
quadratic curve.
In part (b) (ii), most candidates only plotted the three points which were given in the table. Many candidates
did not draw a smooth curve, instead they connected the points with straight lines. In part (b) (iii), most
candidates were unable to state the points of intersection (1, 2) and (–3, –6). They did not extend the line
to meet the curve f(x).
Solutions
(a) (i) 2 (ii) y = 2x
(b) (i)
x –3 –2 –1 0 1 2
fx –6 –1 2 3 2 –1
(c) (1, 2) and (–3, –6)
Recommendations
Students need more practice in curve sketching and how to differentiate between graphs of linear
and non-linear functions.
Teachers should do more problems in estimating and calculating gradients from given linear
functions.
Question 10
The question tested the candidates’ ability to:
solve problems involving averages
draw and use pie charts
determine experimental and theoretical probabilities of simple events
The question was attempted by 83 per cent of the candidates, 3 per cent of whom scored the maximum
available mark. The mean score was 2.29 out of 10.
In part (a), candidates were able to accurately compute the total runs scored. In part (b), most candidates
were able to arrive at the correct solution to (i) and (ii).
However, candidates were unable to arrive at the correct solution for runs scored in the fourth match and had
difficulty expressing probability as a proper fraction. In addition, candidates did not subtract from 120 the
sum of children who swam and who played soccer and did not express the answer as a proper fraction.
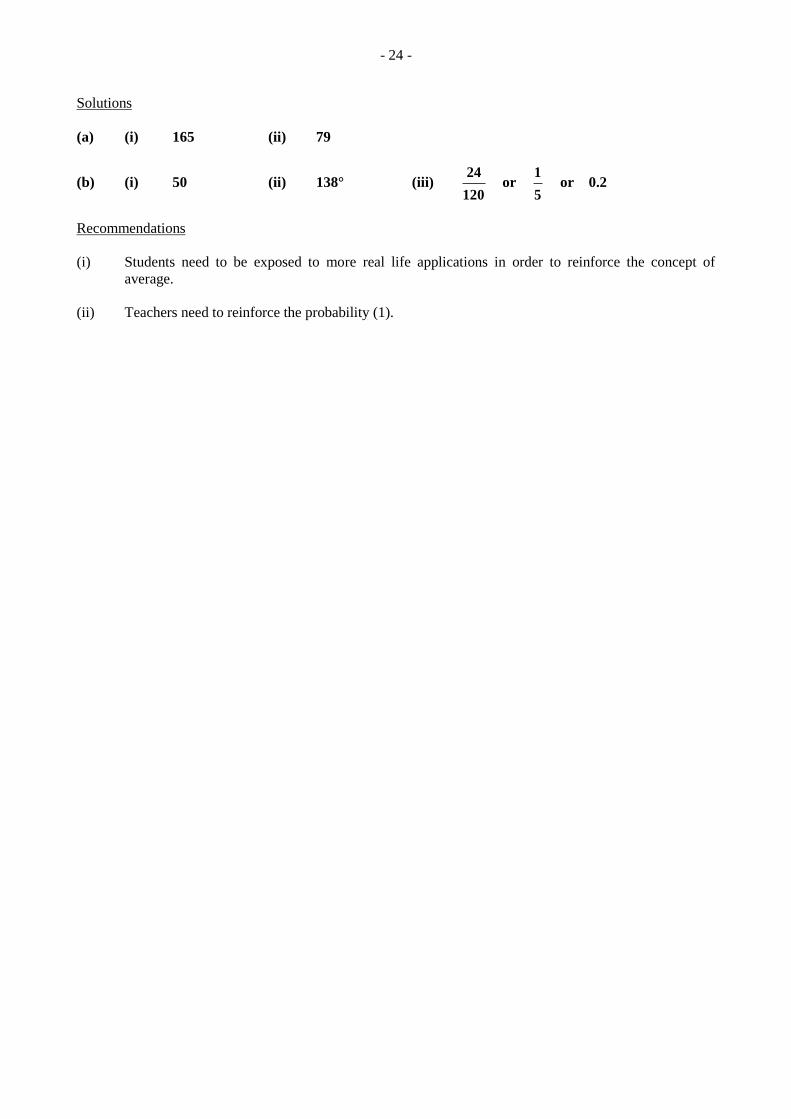
- 24 -
Solutions
(a) (i) 165 (ii) 79
(b) (i) 50 (ii) 138° (iii) 24
120 or
1
5 or 0.2
Recommendations
(i) Students need to be exposed to more real life applications in order to reinforce the concept of
average.
(ii) Teachers need to reinforce the probability (1).
CARIBBEAN EXAMINATIONS COUNCIL
REPORT ON CANDIDATES’ WORK IN THE
CARIBBEAN SECONDARY EDUCATION CERTIFICATE
JANUARY 2009
MATHEMATICS
Copyright © 2008 Caribbean Examinations Council ®
St Michael Barbados
All rights reserved
2
MATHEMATICS
GENERAL PROFICIENCY EXAMINATIONS
JANUARY 2009
GENERAL COMMENTS
The General Proficiency Mathematics examination is offered in January and May/June each year. The Basic Proficiency examination is offered in May/June only. There was a candidate entry of approximately 15 300 in January 2009. Forty-nine per cent of the candidates achieved Grades I-III. The mean score for the examination was 84.54 out of 180 marks.
DETAILED COMMENTS
Paper 01- Multiple Choice
Paper 01 consists of 60 multiple choice items. This year, twenty-eight candidates each earned the maximum available mark of 60. Sixty-eight per cent of the candidates scored 30 marks or more.
Paper 02 - Essay
Paper 02 consisted of two sections. Section I comprised eight compulsory questions totalling 90 marks. Section II comprised six optional questions: two each from Relation, Functions and Graphs; Trigonometry and Geometry and Vectors and Matrices. Candidates were required to answer any two questions from this section. Each question in this section was worth 15 marks. This year, four candidates each earned the maximum available mark of 120 on Paper 02. There were five candidates who each scored 119 marks. Approximately twenty-eight per cent of the candidates earned at least half of the maximum mark on this paper.
Compulsory Section
Question 1
This question tested candidates’ ability to:
- perform basic operations with fractions - solve problems related to currency conversion - calculate compound interest over two periods
The question was attempted by 99.7 per cent of the candidates, 7 per cent of whom earned the maximum available mark. The mean mark was 6.66 out of 11.
3
Candidates demonstrated good proficiency in inverting and multiplying when dividing one improper fraction by another and calculating the exchange rate from BDS$ to EC$.
Candidates showed weak performance in finding the lowest common multiple, using it correctly to subtract fractions and using the algorithm for subtracting fractions. Some incorrect procedures were:
3
2
6
5
3
7=− and
12
)52()74( +−+
Candidates also experienced difficulty calculating the compound interest for 2 years.
Solutions:
(a)2
5
(b) (i) EC $1.35 (ii) BDS $320.00
(c) $27 933.60
Recommendations
The use of the calculator is a necessary skill in learning mathematics. Teachers are encouraged to teach students how to use the calculator, as well as the requisite skills necessary for determining the accuracy of the calculation such as estimation and rounding.
Question 2
This question tested candidates’ ability to:
- write the difference between two algebraic fractions as a single fraction - evaluate the result of a binary operation on two integers - factorize an expression of the form ax + bx + ay + by - use algebraic symbols to represent information - use linear equations to solve a worded problem
The question was attempted by 99 per cent of the candidates, 9 per cent of whom earned the maximum available mark. The mean mark was 6.07 out of 12.
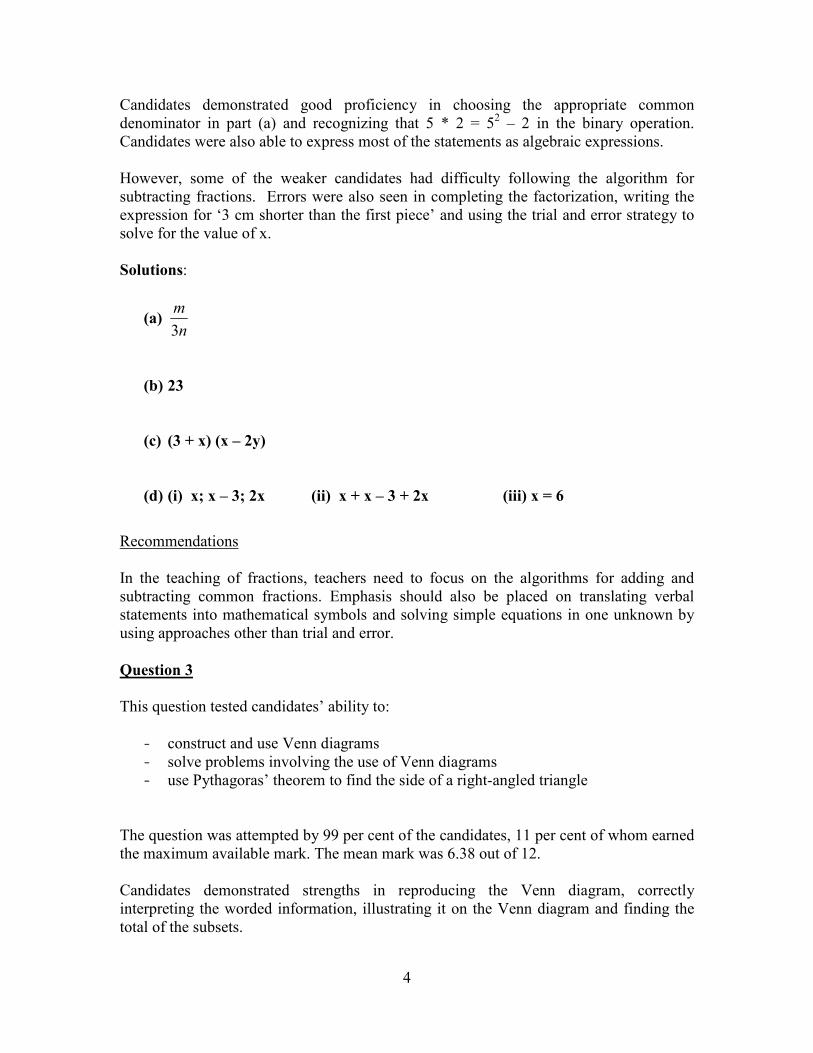
4
Candidates demonstrated good proficiency in choosing the appropriate common denominator in part (a) and recognizing that 5 * 2 = 52 – 2 in the binary operation. Candidates were also able to express most of the statements as algebraic expressions.
However, some of the weaker candidates had difficulty following the algorithm for subtracting fractions. Errors were also seen in completing the factorization, writing the expression for ‘3 cm shorter than the first piece’ and using the trial and error strategy to solve for the value of x.
Solutions:
(a)n
m
3
(b) 23
(c) (3 + x) (x – 2y)
(d) (i) x; x – 3; 2x (ii) x + x – 3 + 2x (iii) x = 6
Recommendations
In the teaching of fractions, teachers need to focus on the algorithms for adding and subtracting common fractions. Emphasis should also be placed on translating verbal statements into mathematical symbols and solving simple equations in one unknown by using approaches other than trial and error.
Question 3
This question tested candidates’ ability to:
- construct and use Venn diagrams - solve problems involving the use of Venn diagrams - use Pythagoras’ theorem to find the side of a right-angled triangle
The question was attempted by 99 per cent of the candidates, 11 per cent of whom earned the maximum available mark. The mean mark was 6.38 out of 12.
Candidates demonstrated strengths in reproducing the Venn diagram, correctly interpreting the worded information, illustrating it on the Venn diagram and finding the total of the subsets.
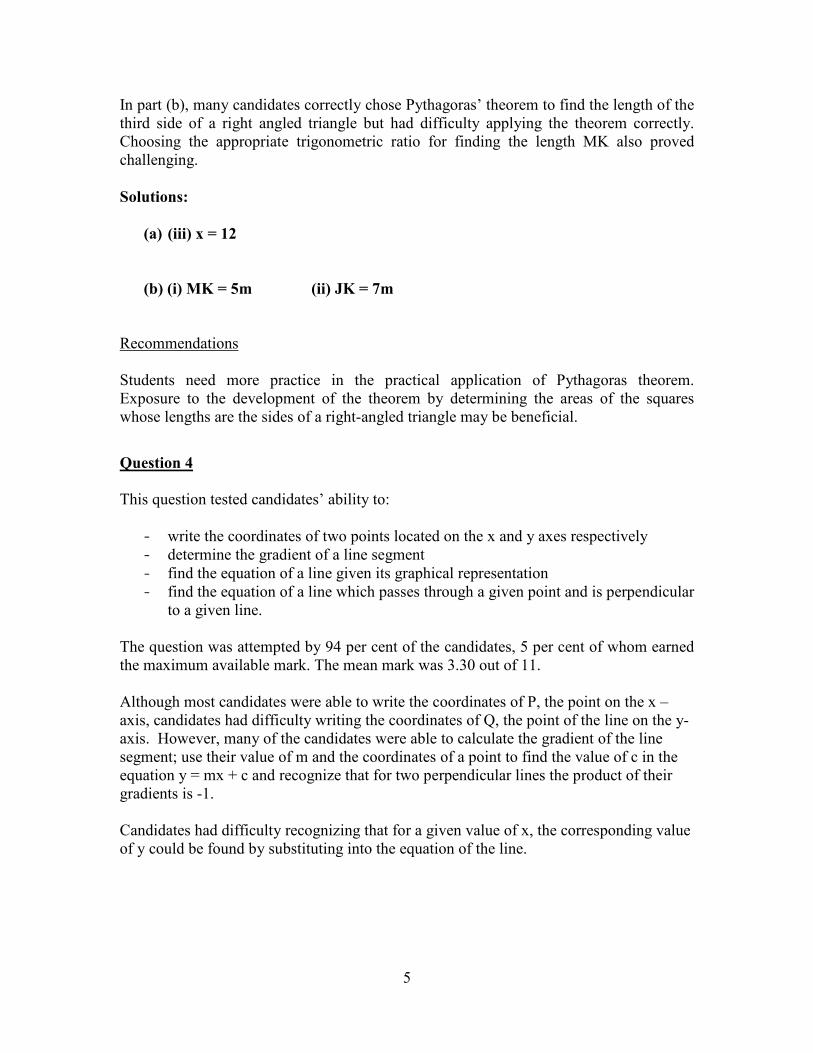
5
In part (b), many candidates correctly chose Pythagoras’ theorem to find the length of the third side of a right angled triangle but had difficulty applying the theorem correctly. Choosing the appropriate trigonometric ratio for finding the length MK also proved challenging.
Solutions:
(a) (iii) x = 12
(b) (i) MK = 5m (ii) JK = 7m
Recommendations Students need more practice in the practical application of Pythagoras theorem. Exposure to the development of the theorem by determining the areas of the squares whose lengths are the sides of a right-angled triangle may be beneficial.
Question 4
This question tested candidates’ ability to:
- write the coordinates of two points located on the x and y axes respectively - determine the gradient of a line segment - find the equation of a line given its graphical representation - find the equation of a line which passes through a given point and is perpendicular
to a given line.
The question was attempted by 94 per cent of the candidates, 5 per cent of whom earned the maximum available mark. The mean mark was 3.30 out of 11. Although most candidates were able to write the coordinates of P, the point on the x – axis, candidates had difficulty writing the coordinates of Q, the point of the line on the y-axis. However, many of the candidates were able to calculate the gradient of the line segment; use their value of m and the coordinates of a point to find the value of c in the equation y = mx + c and recognize that for two perpendicular lines the product of their gradients is -1. Candidates had difficulty recognizing that for a given value of x, the corresponding value of y could be found by substituting into the equation of the line.
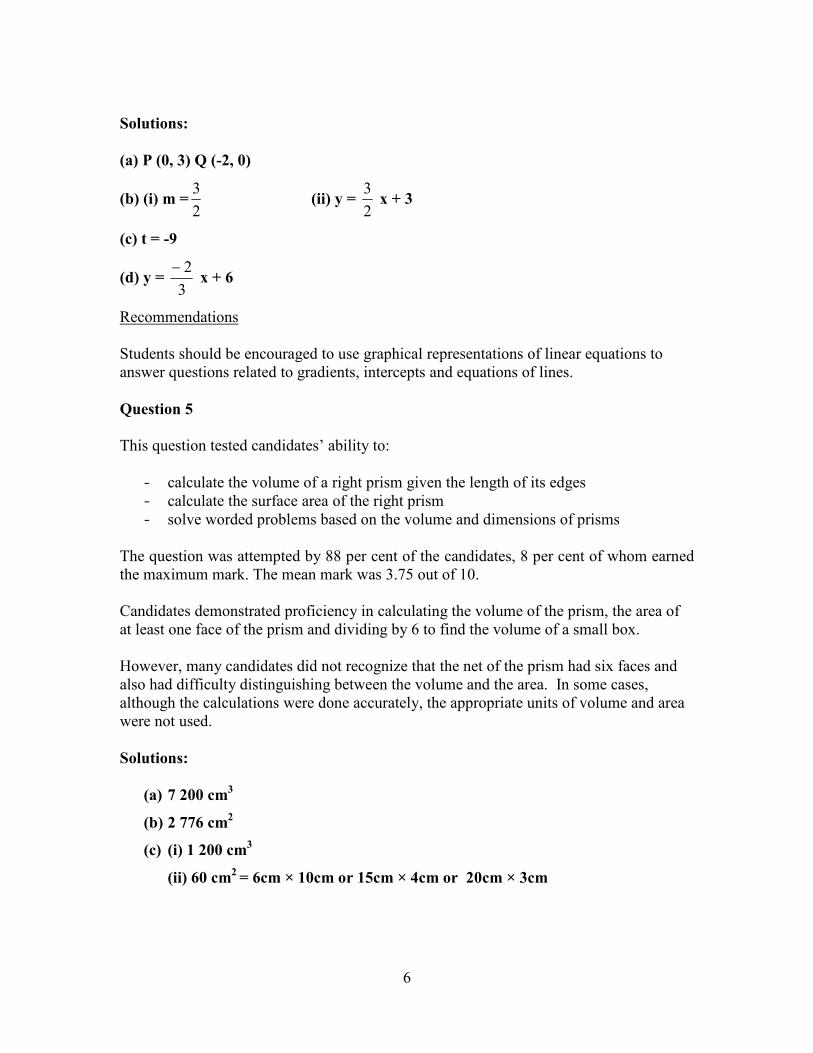
6
Solutions:
(a) P (0, 3) Q (-2, 0)
(b) (i) m =2
3(ii) y =
2
3 x + 3
(c) t = -9
(d) y = 3
2− x + 6
Recommendations
Students should be encouraged to use graphical representations of linear equations to answer questions related to gradients, intercepts and equations of lines.
Question 5
This question tested candidates’ ability to:
- calculate the volume of a right prism given the length of its edges - calculate the surface area of the right prism - solve worded problems based on the volume and dimensions of prisms
The question was attempted by 88 per cent of the candidates, 8 per cent of whom earned the maximum mark. The mean mark was 3.75 out of 10.
Candidates demonstrated proficiency in calculating the volume of the prism, the area of at least one face of the prism and dividing by 6 to find the volume of a small box.
However, many candidates did not recognize that the net of the prism had six faces and also had difficulty distinguishing between the volume and the area. In some cases, although the calculations were done accurately, the appropriate units of volume and area were not used.
Solutions:
(a) 7 200 cm3
(b) 2 776 cm2
(c) (i) 1 200 cm3
(ii) 60 cm2 = 6cm × 10cm or 15cm × 4cm or 20cm × 3cm
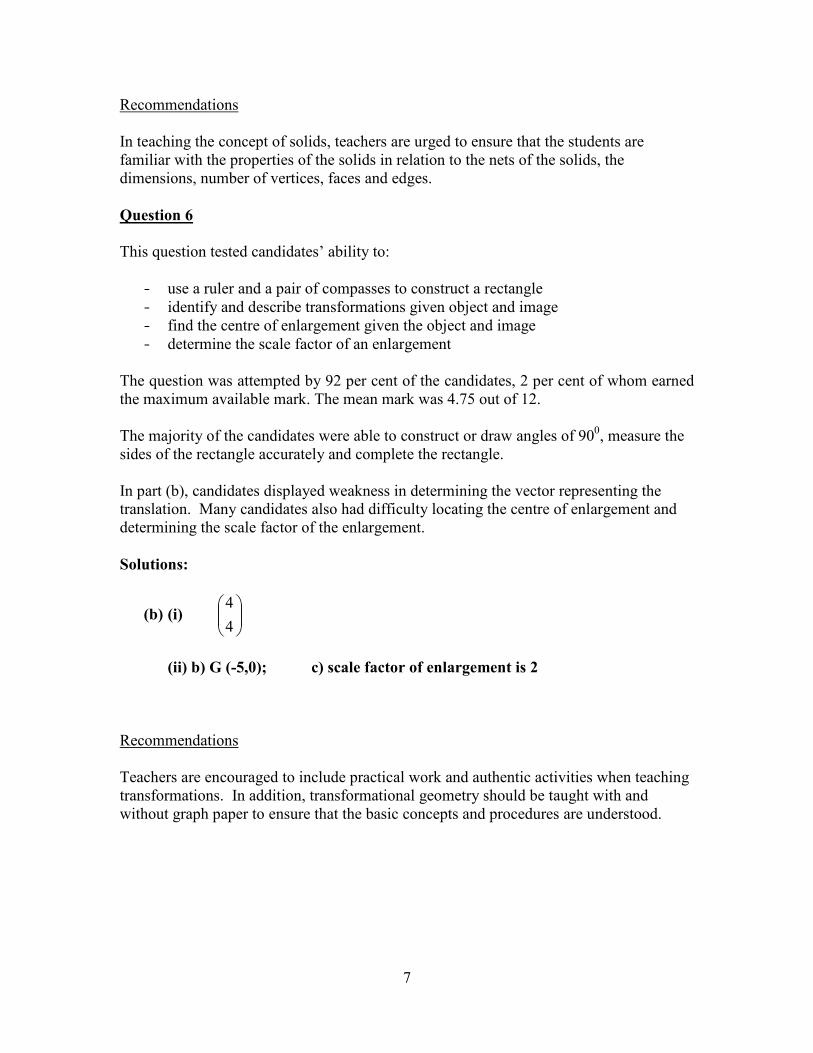
7
Recommendations
In teaching the concept of solids, teachers are urged to ensure that the students are familiar with the properties of the solids in relation to the nets of the solids, the dimensions, number of vertices, faces and edges.
Question 6
This question tested candidates’ ability to:
- use a ruler and a pair of compasses to construct a rectangle - identify and describe transformations given object and image - find the centre of enlargement given the object and image - determine the scale factor of an enlargement
The question was attempted by 92 per cent of the candidates, 2 per cent of whom earned the maximum available mark. The mean mark was 4.75 out of 12.
The majority of the candidates were able to construct or draw angles of 900, measure the sides of the rectangle accurately and complete the rectangle.
In part (b), candidates displayed weakness in determining the vector representing the translation. Many candidates also had difficulty locating the centre of enlargement and determining the scale factor of the enlargement.
Solutions:
(b) (i)
4
4
(ii) b) G (-5,0); c) scale factor of enlargement is 2
Recommendations
Teachers are encouraged to include practical work and authentic activities when teaching transformations. In addition, transformational geometry should be taught with and without graph paper to ensure that the basic concepts and procedures are understood.
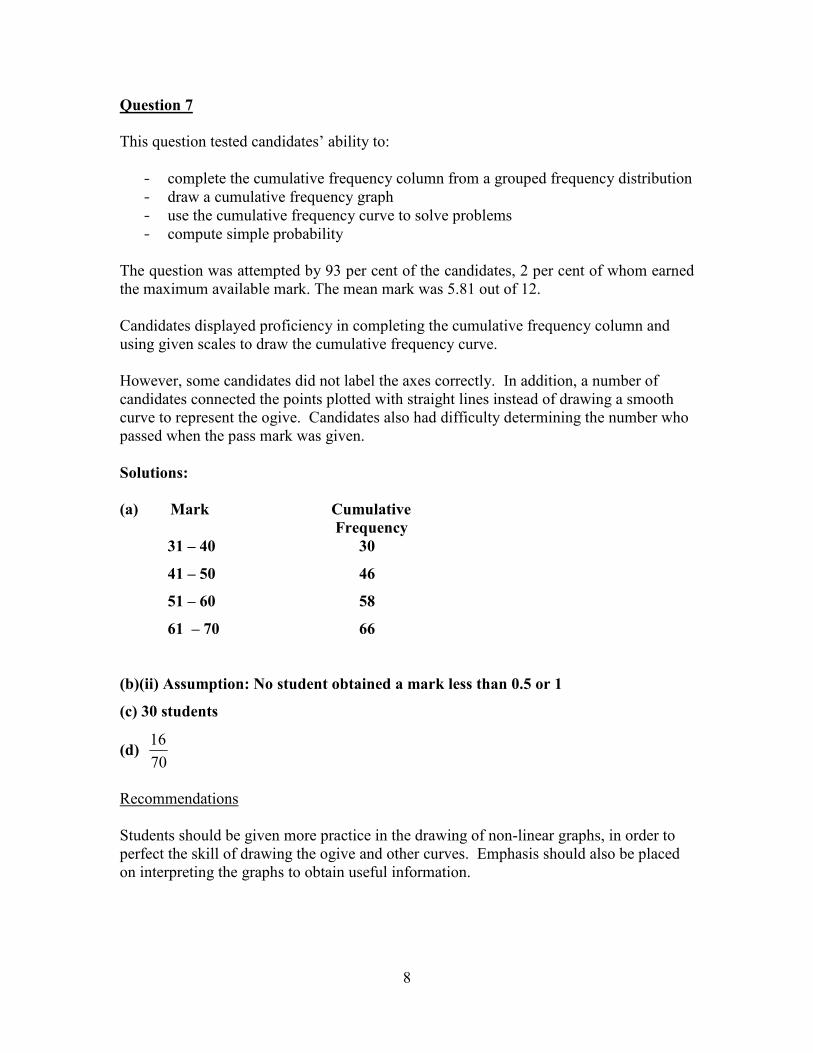
8
Question 7
This question tested candidates’ ability to:
- complete the cumulative frequency column from a grouped frequency distribution - draw a cumulative frequency graph - use the cumulative frequency curve to solve problems - compute simple probability
The question was attempted by 93 per cent of the candidates, 2 per cent of whom earned the maximum available mark. The mean mark was 5.81 out of 12. Candidates displayed proficiency in completing the cumulative frequency column and using given scales to draw the cumulative frequency curve.
However, some candidates did not label the axes correctly. In addition, a number of candidates connected the points plotted with straight lines instead of drawing a smooth curve to represent the ogive. Candidates also had difficulty determining the number who passed when the pass mark was given.
Solutions:
(a) Mark Cumulative
Frequency
31 – 40 30
41 – 50 46
51 – 60 58
61 – 70 66
(b)(ii) Assumption: No student obtained a mark less than 0.5 or 1
(c) 30 students
(d) 70
16
Recommendations Students should be given more practice in the drawing of non-linear graphs, in order to perfect the skill of drawing the ogive and other curves. Emphasis should also be placed on interpreting the graphs to obtain useful information.
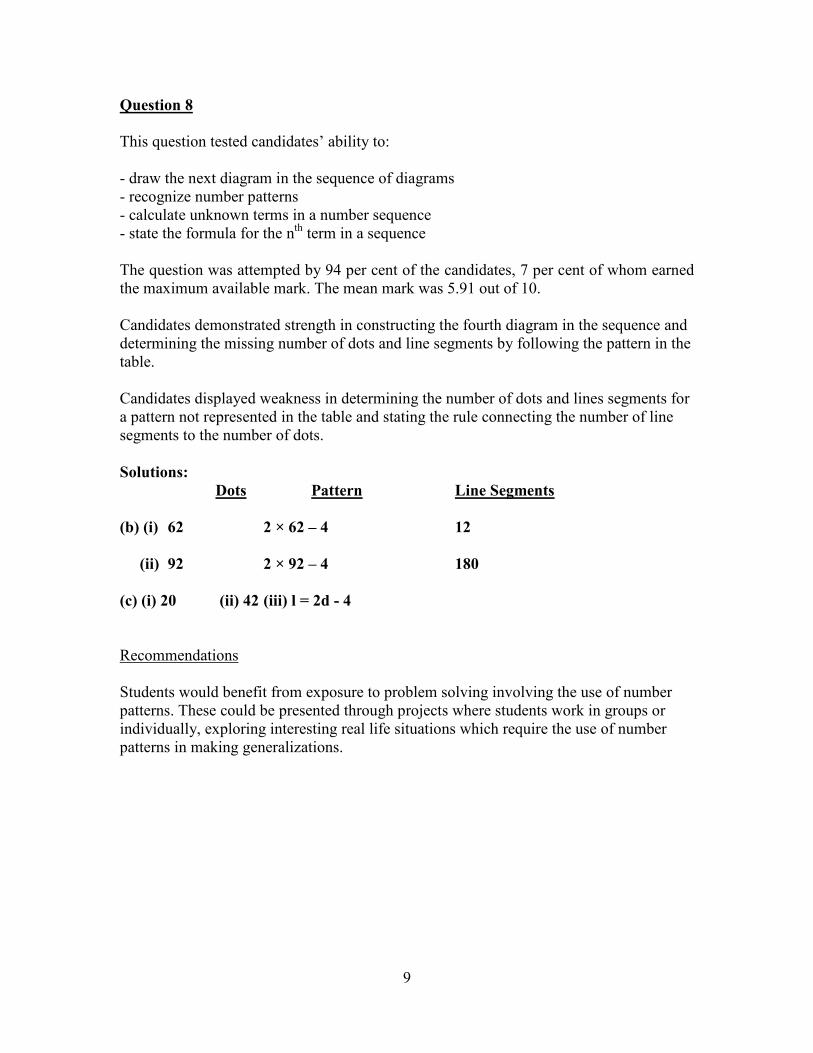
9
Question 8
This question tested candidates’ ability to:
- draw the next diagram in the sequence of diagrams - recognize number patterns - calculate unknown terms in a number sequence - state the formula for the nth term in a sequence
The question was attempted by 94 per cent of the candidates, 7 per cent of whom earned the maximum available mark. The mean mark was 5.91 out of 10.
Candidates demonstrated strength in constructing the fourth diagram in the sequence and determining the missing number of dots and line segments by following the pattern in the table.
Candidates displayed weakness in determining the number of dots and lines segments for a pattern not represented in the table and stating the rule connecting the number of line segments to the number of dots.
Solutions:
Dots Pattern Line Segments
(b) (i) 62 2 × 62 – 4 12
(ii) 92 2 × 92 – 4 180
(c) (i) 20 (ii) 42 (iii) l = 2d - 4
Recommendations
Students would benefit from exposure to problem solving involving the use of number patterns. These could be presented through projects where students work in groups or individually, exploring interesting real life situations which require the use of number patterns in making generalizations.
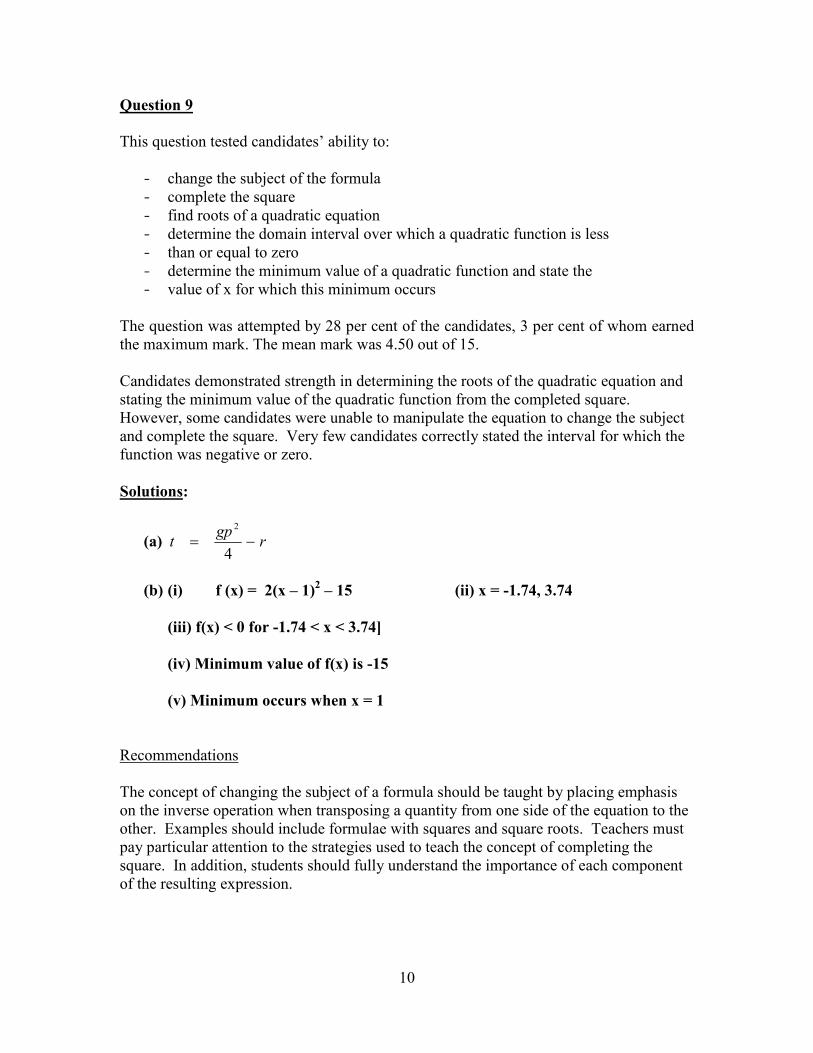
10
Question 9
This question tested candidates’ ability to:
- change the subject of the formula - complete the square - find roots of a quadratic equation - determine the domain interval over which a quadratic function is less - than or equal to zero - determine the minimum value of a quadratic function and state the - value of x for which this minimum occurs
The question was attempted by 28 per cent of the candidates, 3 per cent of whom earned the maximum mark. The mean mark was 4.50 out of 15.
Candidates demonstrated strength in determining the roots of the quadratic equation and stating the minimum value of the quadratic function from the completed square. However, some candidates were unable to manipulate the equation to change the subject and complete the square. Very few candidates correctly stated the interval for which the function was negative or zero.
Solutions:
(a) rgp
t −=4
2
(b) (i) f (x) = 2(x – 1)2 – 15 (ii) x = -1.74, 3.74
(iii) f(x) < 0 for -1.74 < x < 3.74]
(iv) Minimum value of f(x) is -15
(v) Minimum occurs when x = 1
Recommendations
The concept of changing the subject of a formula should be taught by placing emphasis on the inverse operation when transposing a quantity from one side of the equation to the other. Examples should include formulae with squares and square roots. Teachers must pay particular attention to the strategies used to teach the concept of completing the square. In addition, students should fully understand the importance of each component of the resulting expression.
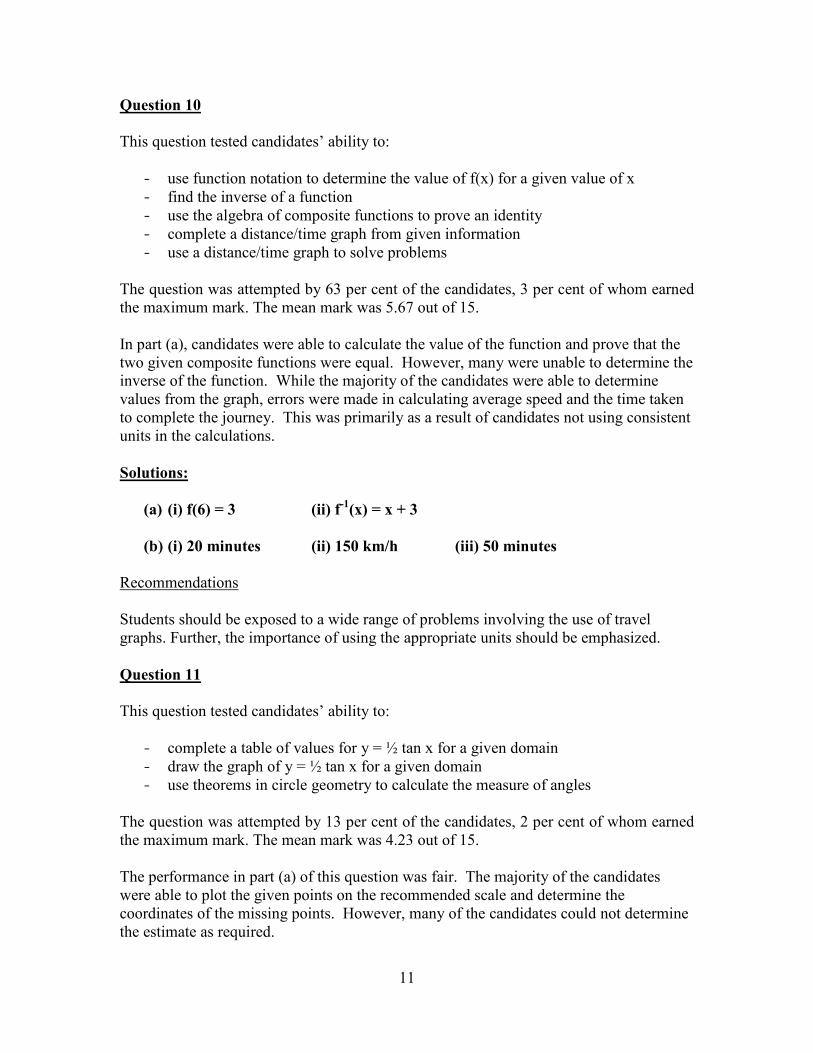
11
Question 10
This question tested candidates’ ability to:
- use function notation to determine the value of f(x) for a given value of x - find the inverse of a function - use the algebra of composite functions to prove an identity - complete a distance/time graph from given information - use a distance/time graph to solve problems
The question was attempted by 63 per cent of the candidates, 3 per cent of whom earned the maximum mark. The mean mark was 5.67 out of 15. In part (a), candidates were able to calculate the value of the function and prove that the two given composite functions were equal. However, many were unable to determine the inverse of the function. While the majority of the candidates were able to determine values from the graph, errors were made in calculating average speed and the time taken to complete the journey. This was primarily as a result of candidates not using consistent units in the calculations.
Solutions:
(a) (i) f(6) = 3 (ii) f-1
(x) = x + 3
(b) (i) 20 minutes (ii) 150 km/h (iii) 50 minutes
Recommendations Students should be exposed to a wide range of problems involving the use of travel graphs. Further, the importance of using the appropriate units should be emphasized.
Question 11
This question tested candidates’ ability to:
- complete a table of values for y = ½ tan x for a given domain - draw the graph of y = ½ tan x for a given domain - use theorems in circle geometry to calculate the measure of angles
The question was attempted by 13 per cent of the candidates, 2 per cent of whom earned the maximum mark. The mean mark was 4.23 out of 15. The performance in part (a) of this question was fair. The majority of the candidates were able to plot the given points on the recommended scale and determine the coordinates of the missing points. However, many of the candidates could not determine the estimate as required.
12
Generally, the candidates were unable to determine the measure of the unknown angles. In some cases, incorrect assumptions were made about the properties of the polygons in the circle and hence the answers and accompanying reasons were incorrect.
Solutions:
(a) (i) x y
200
0.18
400
0.42
(iii) For y = 0.7, x = 550
(b) (i) 900
(ii)1320
(iii) 660
(iv) 1140
Recommendations
Teachers should provide opportunities for more work on constructing and interpreting scales on graphs. Greater attention should be given to the interpretation of graphs than to the mechanics of drawing them. Theorems related to the geometry of the circle should be verified by the accurate construction of diagrams.
Question 12
This question tested candidates’ ability to:
- find the length of the side of a triangle using the cosine formula - find the measure of the size of an angle in a triangle using the sine formula - find the area of a triangle given two sides and the included angle - show lines of latitude and longitude on the circle representing the earth
- calculate the distance between two places on the earth measured along a circle of longitude
- determine the radius of a circle of latitude
The question was attempted by 21 per cent of the candidates, 2 per cent of whom earned the maximum mark. The mean mark was 2.89 out of 15.
The performance on the question was generally weak. In part (a), the majority of candidates correctly applied the sine rule to determine the measure of angle UVW. However, very few candidates correctly calculated the length UW or the area of triangle TUW. In part (b), candidates were able to correctly label the circles of latitude and longitude on the diagram but experienced difficulty calculating the required radius and distance.
13
Solutions:
(a) (i) 9.17 m (ii) 32.40
(iii) 34.6 m2
(b) (ii)a) 5560 km b) 5990 km
Recommendations
Students should be exposed to a range of exercises involving the trigonometric ratios, where they will be required to select the appropriate ratio: sine, cosine or tangent. Practical and authentic activities should be incorporated, where possible, as well as accurate scale drawings to reinforce concepts.
Question 13
This question tested candidates’ ability to:
- write coordinates of points as position vectors - write the displacement of one point from another as a column vector - state the condition for two vectors to be parallel - determine the magnitude of a vector - determine the values of two variables given two equal vectors - use a vector method to establish that a given quadrilateral is a parallelogram
The question was attempted by 20 per cent of the candidates, 2 per cent of whom earned the maximum available mark. The mean mark was 3.78 out of 15.
Candidates demonstrated strengths in writing the co-ordinates of the given points as position vectors and adding vectors with numerical values. However, the majority of the candidates experienced challenges routing vectors, proving that the vectors QR and OP are parallel, finding the magnitude of a column vector and proving that the given shape was a parallelogram.
Solutions:
(a) (i)
2
3(ii)
−
3
1
(b) (i)
6
9(iii) 74
(c) (i)
−
+
3
1
b
a(ii) a = 2; b = 5
14
Recommendations The concept of vectors should be taught using concrete examples. Students should be challenged to express a given route using a variety of paths and vectors.
Question 14
This question tested candidates’ ability to:
- multiply 2 × 2 matrices - multiply a matrix by a scalar - calculate the determinant of a 2 × 2 matrix - find the inverse of a non-singular 2 × 2 matrix - use matrices to transform geometrical shapes - use the matrix method to solve a system of linear equations
The question was attempted by 32 per cent of the candidates, 1 per cent of whom earned the maximum available mark. The mean mark was 5.13 out of 15. In this question, candidates demonstrated competence in multiplying a matrix by a scalar, writing a pair of simultaneous equations in matrix form and inverting a given 2 × 2 matrix. The areas of weak performance included multiplying two matrices and stating the effect of a matrix transformation on an object.
Solutions:
(a)
3312
3915
(b) (i) V produces an enlargement, scale factor 2, centre of
enlargement (0,0)
(ii)
−
20
02
(iii) A' (-2,4) B' (-2,2) C' (-4,2)
(c) (i)
59
611
y
x =
7
6
(ii)
y
x =
−
−
119
65
7
6
15
Recommendations
Teachers should emphasize the conditions for multiplication of matrices, noting that not all matrices can be multiplied. The use of matrices in transformations needs to be reinforced.
CARIBBEAN EXAMINATIONS COUNCIL
REPORT ON CANDIDATES’ WORK IN THE
SECONDARY EDUCATION CERTIFICATE EXAMINATION
JANUARY 2010
MATHEMATICS
GENERAL PROFICIENCY EXAMINATION
Copyright© 2010 Caribbean Examinations Council ®
St. Michael, Barbados
All rights reserved
2
GENERAL COMMENTS
The General Proficiency Mathematics examination is offered in January and May/June each year. In January
2010, approximately 16,900 candidates registered for the examination. Approximately 45 per cent of the
candidates achieved Grades I–III. The mean score for this examination was 79.5 out of 180 marks.
DETAILED COMMENTS
Paper 01 – Multiple Choice
Paper 01 consisted of 60 multiple-choice items. This year, 21 candidates each earned the maximum
available score of 60 and approximately 68 per cent of the candidates scored 30 marks or more.
Paper 02 – Essay
Paper 02 comprised two sections. Section I consisted of eight compulsory questions totaling 90 marks.
Section II consisted of six optional questions: two each from Relations, Functions and Graphs; Trigonometry
and Geometry; and Vectors and Matrices. Candidates were required to answer any two questions from this
section. Each question in this section was worth 15 marks.
This year, three candidates each earned the maximum available mark of 120 on Paper 02 and approximately
21 per cent of the candidates earned at least 60 marks on this paper.
Compulsory Section
Question 1
This question tested candidates’ ability to:
- add, multiply and divide decimals
- calculate annual salary, commission and total income
- calculate a percentage of a sum of money
- solve problems involving ratio and proportion
The question was attempted by 99 per cent of the candidates, 16 per cent of whom earned the maximum
available mark. The mean mark was 6.8 out of 11.
The majority of candidates scored full marks on the computation with decimals in Part (a). The errors
observed included:
(a)
(b)
(c) .
Candidates who performed well on Part (a) also did well on Part (b). Those who encountered difficulties did
not know the terms: ‘fixed salary for the year’, ‘commission’ or ‘total income for the year’. Some common
responses were:
i. Fixed salary for the year
ii. Fixed salary for the year iii. Fixed salary for the year
iv. Commission for the year
v. Commission for the year
3
Part (c) of the question proved to be the most inaccessible. Many candidates established that 1 cup of mix
would make 4 pancakes, but could not proceed to determine how many cups of mix would make 12
pancakes. A wide variety of strategies were attempted, several of which were appropriate, but generally,
candidates did not correctly follow through on the path selected.
Solutions:
(a) 79.14
(b) (i) $37680 (ii) $14400 (iii) $52080
(c) (i) 3 cups pancake mix (ii) 30 pancakes.
Recommendations
Reinforce understanding of the concepts of fixed salary, commission, yearly salary and total salary.
Candidates need to understand the proper use of ratio and proportion. Attention should also be given to the
skill of squaring a quantity.
Question 2
This question tested candidates’ ability to:
- substitute numbers for algebraic symbols in simple algebraic expressions
- perform the four basic operations on directed numbers
- use the distributive property to simplify algebraic expressions
- use the laws of indices to simplify algebraic expressions with integral indices
- solve simple in-equations in one variable and interpret the result
The question was attempted by 99 per cent of the candidates, 2 per cent of whom earned the maximum
available mark. The mean mark was 6.0 out of 12.
Most candidates substituted the values correctly in Part (a) but a substantial number lacked the numeracy
skills to complete the simplification correctly. Common errors included:
(i)
(ii)
(Improper use of the calculator)
In (b) (i), most candidates were able to apply the distributive law to remove at least one pair of brackets.
However, grouping like terms proved difficult for some who proceeded to rearrange terms without paying
attention to their signs. A common occurrence was
In (b) (ii), candidates generally knew how to evaluate
to obtain 2. However, many of the candidates
multiplied the indices instead of adding them, and divided instead of subtracting. As a result,
became and in some cases,
was evaluated as
In Part (c), candidates frequently transposed incorrectly and even when they transposed correctly, they
encountered difficulties with the use of directed numbers. A common occurrence was: . A
major problem arose at the point of solving In most cases, candidates divided by and did not
change the sign of the inequality. The weaker candidates proceeded to solve the in-equation by solving two
equations:
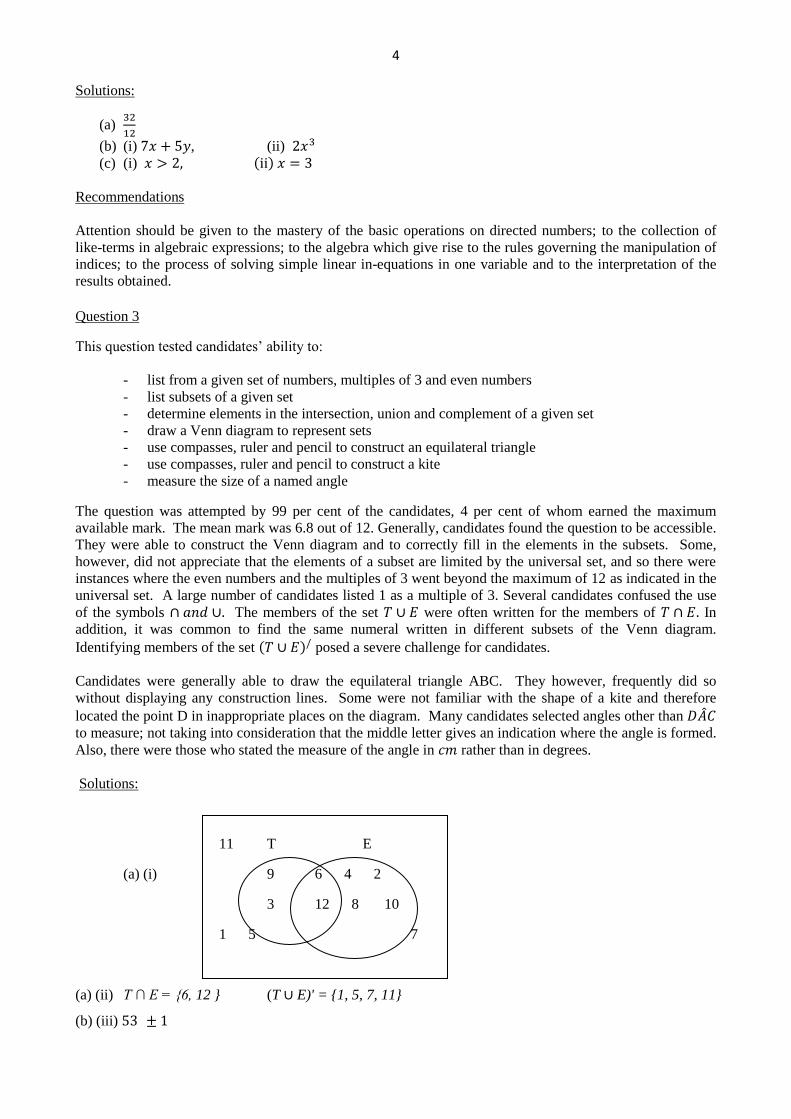
4
Solutions:
(a)
(b) (i) , (ii)
(c) (i)
Recommendations
Attention should be given to the mastery of the basic operations on directed numbers; to the collection of
like-terms in algebraic expressions; to the algebra which give rise to the rules governing the manipulation of
indices; to the process of solving simple linear in-equations in one variable and to the interpretation of the
results obtained.
Question 3
This question tested candidates’ ability to:
- list from a given set of numbers, multiples of 3 and even numbers
- list subsets of a given set
- determine elements in the intersection, union and complement of a given set
- draw a Venn diagram to represent sets
- use compasses, ruler and pencil to construct an equilateral triangle
- use compasses, ruler and pencil to construct a kite
- measure the size of a named angle
The question was attempted by 99 per cent of the candidates, 4 per cent of whom earned the maximum
available mark. The mean mark was 6.8 out of 12. Generally, candidates found the question to be accessible.
They were able to construct the Venn diagram and to correctly fill in the elements in the subsets. Some,
however, did not appreciate that the elements of a subset are limited by the universal set, and so there were
instances where the even numbers and the multiples of 3 went beyond the maximum of 12 as indicated in the
universal set. A large number of candidates listed 1 as a multiple of 3. Several candidates confused the use
of the symbols The members of the set were often written for the members of In
addition, it was common to find the same numeral written in different subsets of the Venn diagram.
Identifying members of the set posed a severe challenge for candidates.
Candidates were generally able to draw the equilateral triangle ABC. They however, frequently did so
without displaying any construction lines. Some were not familiar with the shape of a kite and therefore
located the point D in inappropriate places on the diagram. Many candidates selected angles other than to measure; not taking into consideration that the middle letter gives an indication where the angle is formed.
Also, there were those who stated the measure of the angle in rather than in degrees.
Solutions:
11 T E
(a) (i) 9 6 4 2
3 12 8 10
1 5 7
(a) (ii) T ∩ E = {6, 12 } (T E)' = {1, 5, 7, 11}
(b) (iii)
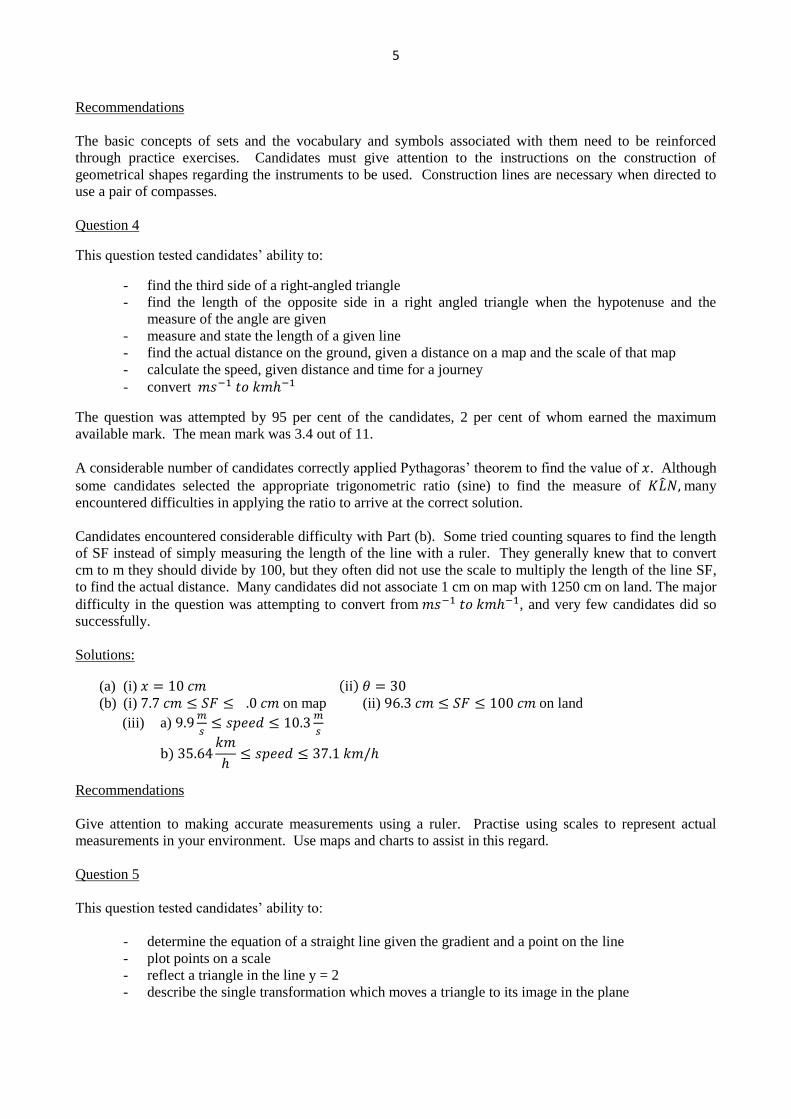
5
Recommendations
The basic concepts of sets and the vocabulary and symbols associated with them need to be reinforced
through practice exercises. Candidates must give attention to the instructions on the construction of
geometrical shapes regarding the instruments to be used. Construction lines are necessary when directed to
use a pair of compasses.
Question 4
This question tested candidates’ ability to:
- find the third side of a right-angled triangle
- find the length of the opposite side in a right angled triangle when the hypotenuse and the
measure of the angle are given
- measure and state the length of a given line
- find the actual distance on the ground, given a distance on a map and the scale of that map
- calculate the speed, given distance and time for a journey
- convert
The question was attempted by 95 per cent of the candidates, 2 per cent of whom earned the maximum
available mark. The mean mark was 3.4 out of 11.
A considerable number of candidates correctly applied Pythagoras’ theorem to find the value of . Although
some candidates selected the appropriate trigonometric ratio (sine) to find the measure of many
encountered difficulties in applying the ratio to arrive at the correct solution.
Candidates encountered considerable difficulty with Part (b). Some tried counting squares to find the length
of SF instead of simply measuring the length of the line with a ruler. They generally knew that to convert
cm to m they should divide by 100, but they often did not use the scale to multiply the length of the line SF,
to find the actual distance. Many candidates did not associate 1 cm on map with 1250 cm on land. The major
difficulty in the question was attempting to convert from , and very few candidates did so
successfully.
Solutions:
(a) (i) (b) (i) on map (ii) on land
(iii) a)
Recommendations
Give attention to making accurate measurements using a ruler. Practise using scales to represent actual
measurements in your environment. Use maps and charts to assist in this regard.
Question 5
This question tested candidates’ ability to:
- determine the equation of a straight line given the gradient and a point on the line
- plot points on a scale
- reflect a triangle in the line y = 2
- describe the single transformation which moves a triangle to its image in the plane
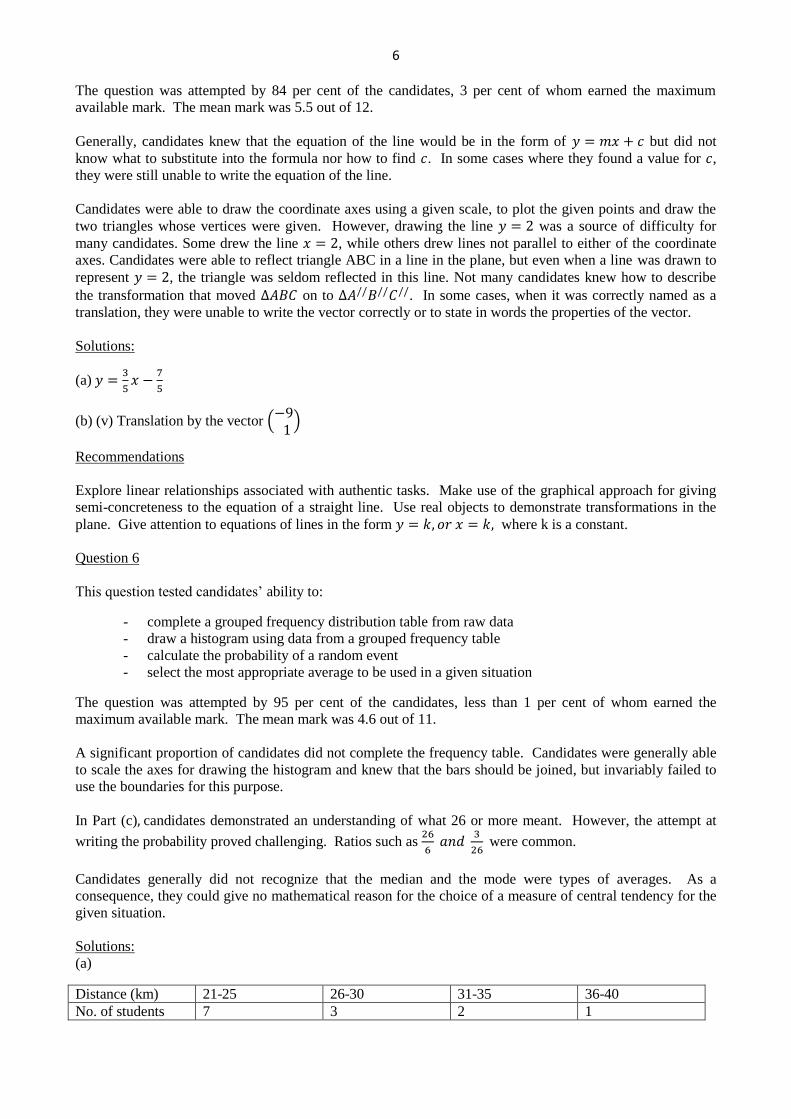
6
The question was attempted by 84 per cent of the candidates, 3 per cent of whom earned the maximum
available mark. The mean mark was 5.5 out of 12.
Generally, candidates knew that the equation of the line would be in the form of but did not
know what to substitute into the formula nor how to find . In some cases where they found a value for ,
they were still unable to write the equation of the line.
Candidates were able to draw the coordinate axes using a given scale, to plot the given points and draw the
two triangles whose vertices were given. However, drawing the line was a source of difficulty for
many candidates. Some drew the line , while others drew lines not parallel to either of the coordinate
axes. Candidates were able to reflect triangle ABC in a line in the plane, but even when a line was drawn to
represent , the triangle was seldom reflected in this line. Not many candidates knew how to describe
the transformation that moved on to . In some cases, when it was correctly named as a
translation, they were unable to write the vector correctly or to state in words the properties of the vector.
Solutions:
(a)
(b) (v) Translation by the vector
Recommendations
Explore linear relationships associated with authentic tasks. Make use of the graphical approach for giving
semi-concreteness to the equation of a straight line. Use real objects to demonstrate transformations in the
plane. Give attention to equations of lines in the form where k is a constant.
Question 6
This question tested candidates’ ability to:
- complete a grouped frequency distribution table from raw data
- draw a histogram using data from a grouped frequency table
- calculate the probability of a random event
- select the most appropriate average to be used in a given situation
The question was attempted by 95 per cent of the candidates, less than 1 per cent of whom earned the
maximum available mark. The mean mark was 4.6 out of 11.
A significant proportion of candidates did not complete the frequency table. Candidates were generally able
to scale the axes for drawing the histogram and knew that the bars should be joined, but invariably failed to
use the boundaries for this purpose.
In Part (c) candidates demonstrated an understanding of what 26 or more meant. However, the attempt at
writing the probability proved challenging. Ratios such as
were common.
Candidates generally did not recognize that the median and the mode were types of averages. As a
consequence, they could give no mathematical reason for the choice of a measure of central tendency for the
given situation.
Solutions:
(a)
Distance (km) 21-25 26-30 31-35 36-40
No. of students 7 3 2 1
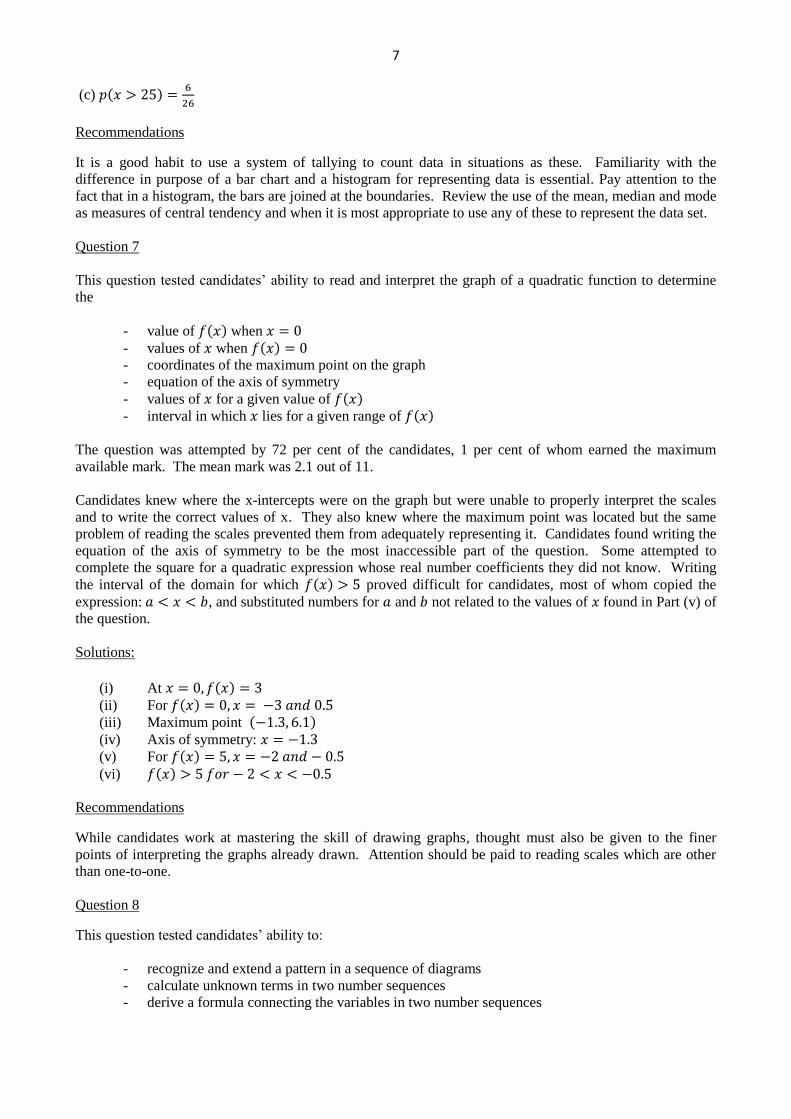
7
(c)
Recommendations
It is a good habit to use a system of tallying to count data in situations as these. Familiarity with the
difference in purpose of a bar chart and a histogram for representing data is essential. Pay attention to the
fact that in a histogram, the bars are joined at the boundaries. Review the use of the mean, median and mode
as measures of central tendency and when it is most appropriate to use any of these to represent the data set.
Question 7
This question tested candidates’ ability to read and interpret the graph of a quadratic function to determine
the
- value of when - values of when - coordinates of the maximum point on the graph
- equation of the axis of symmetry
- values of for a given value of - interval in which lies for a given range of
The question was attempted by 72 per cent of the candidates, 1 per cent of whom earned the maximum
available mark. The mean mark was 2.1 out of 11.
Candidates knew where the x-intercepts were on the graph but were unable to properly interpret the scales
and to write the correct values of x. They also knew where the maximum point was located but the same
problem of reading the scales prevented them from adequately representing it. Candidates found writing the
equation of the axis of symmetry to be the most inaccessible part of the question. Some attempted to
complete the square for a quadratic expression whose real number coefficients they did not know. Writing
the interval of the domain for which proved difficult for candidates, most of whom copied the
expression: , and substituted numbers for and not related to the values of found in Part (v) of
the question.
Solutions:
(i) At (ii) For
(iii) Maximum point (iv) Axis of symmetry:
(v) For
(vi)
Recommendations
While candidates work at mastering the skill of drawing graphs, thought must also be given to the finer
points of interpreting the graphs already drawn. Attention should be paid to reading scales which are other
than one-to-one.
Question 8
This question tested candidates’ ability to:
- recognize and extend a pattern in a sequence of diagrams
- calculate unknown terms in two number sequences
- derive a formula connecting the variables in two number sequences
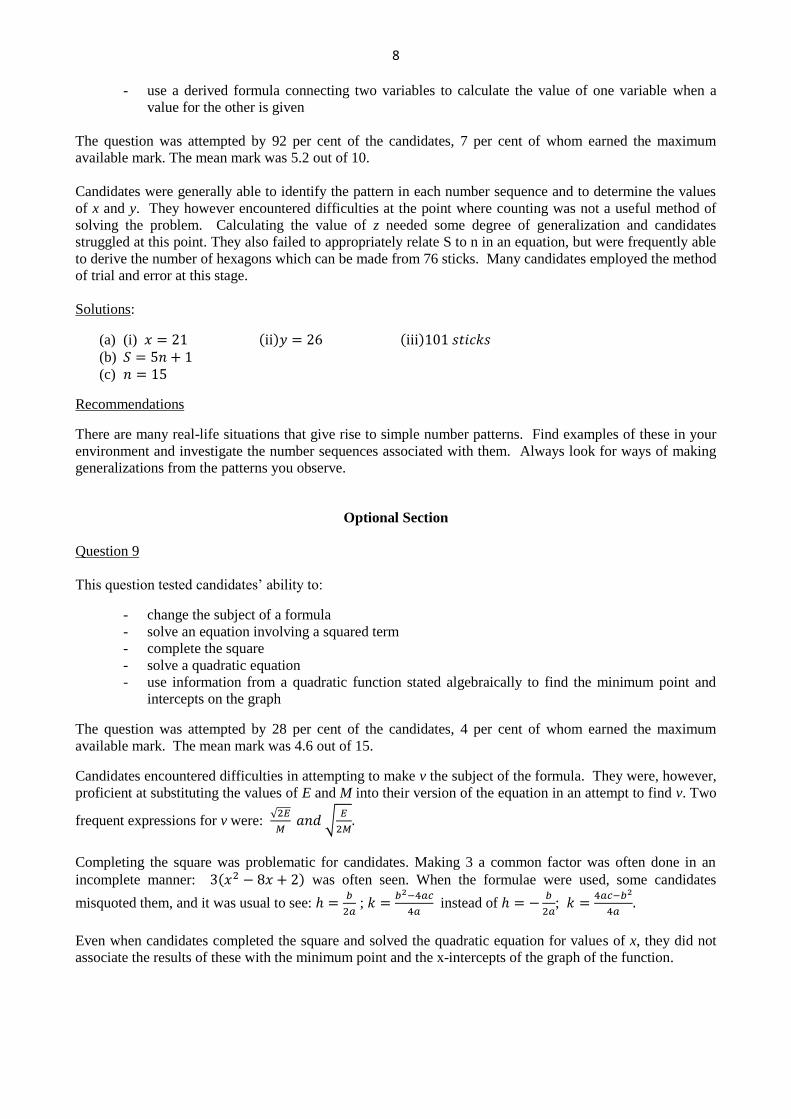
8
- use a derived formula connecting two variables to calculate the value of one variable when a
value for the other is given
The question was attempted by 92 per cent of the candidates, 7 per cent of whom earned the maximum
available mark. The mean mark was 5.2 out of 10.
Candidates were generally able to identify the pattern in each number sequence and to determine the values
of x and y. They however encountered difficulties at the point where counting was not a useful method of
solving the problem. Calculating the value of z needed some degree of generalization and candidates
struggled at this point. They also failed to appropriately relate S to n in an equation, but were frequently able
to derive the number of hexagons which can be made from 76 sticks. Many candidates employed the method
of trial and error at this stage.
Solutions:
(a) (i) (b)
(c)
Recommendations
There are many real-life situations that give rise to simple number patterns. Find examples of these in your
environment and investigate the number sequences associated with them. Always look for ways of making
generalizations from the patterns you observe.
Optional Section
Question 9
This question tested candidates’ ability to:
- change the subject of a formula
- solve an equation involving a squared term
- complete the square
- solve a quadratic equation
- use information from a quadratic function stated algebraically to find the minimum point and
intercepts on the graph
The question was attempted by 28 per cent of the candidates, 4 per cent of whom earned the maximum
available mark. The mean mark was 4.6 out of 15.
Candidates encountered difficulties in attempting to make v the subject of the formula. They were, however,
proficient at substituting the values of E and M into their version of the equation in an attempt to find v. Two
frequent expressions for v were:
Completing the square was problematic for candidates. Making 3 a common factor was often done in an
incomplete manner: was often seen. When the formulae were used, some candidates
misquoted them, and it was usual to see:
;
instead of
;
Even when candidates completed the square and solved the quadratic equation for values of x, they did not
associate the results of these with the minimum point and the x-intercepts of the graph of the function.
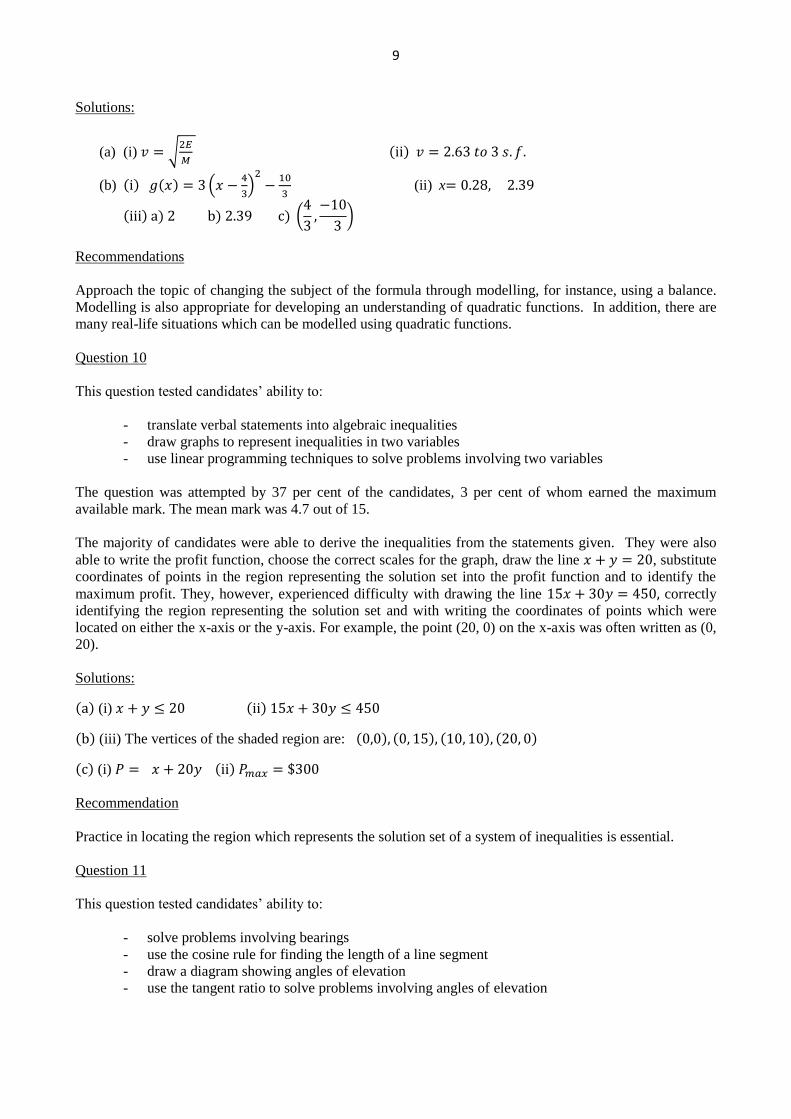
9
Solutions:
(a) (i)
(b)
(ii) x
Recommendations
Approach the topic of changing the subject of the formula through modelling, for instance, using a balance.
Modelling is also appropriate for developing an understanding of quadratic functions. In addition, there are
many real-life situations which can be modelled using quadratic functions.
Question 10
This question tested candidates’ ability to:
- translate verbal statements into algebraic inequalities
- draw graphs to represent inequalities in two variables
- use linear programming techniques to solve problems involving two variables
The question was attempted by 37 per cent of the candidates, 3 per cent of whom earned the maximum
available mark. The mean mark was 4.7 out of 15.
The majority of candidates were able to derive the inequalities from the statements given. They were also
able to write the profit function, choose the correct scales for the graph, draw the line , substitute
coordinates of points in the region representing the solution set into the profit function and to identify the
maximum profit. They, however, experienced difficulty with drawing the line correctly
identifying the region representing the solution set and with writing the coordinates of points which were
located on either the x-axis or the y-axis. For example, the point (20, 0) on the x-axis was often written as (0,
20).
Solutions:
(i)
(iii) The vertices of the shaded region are:
(i)
Recommendation
Practice in locating the region which represents the solution set of a system of inequalities is essential.
Question 11
This question tested candidates’ ability to:
- solve problems involving bearings
- use the cosine rule for finding the length of a line segment
- draw a diagram showing angles of elevation
- use the tangent ratio to solve problems involving angles of elevation
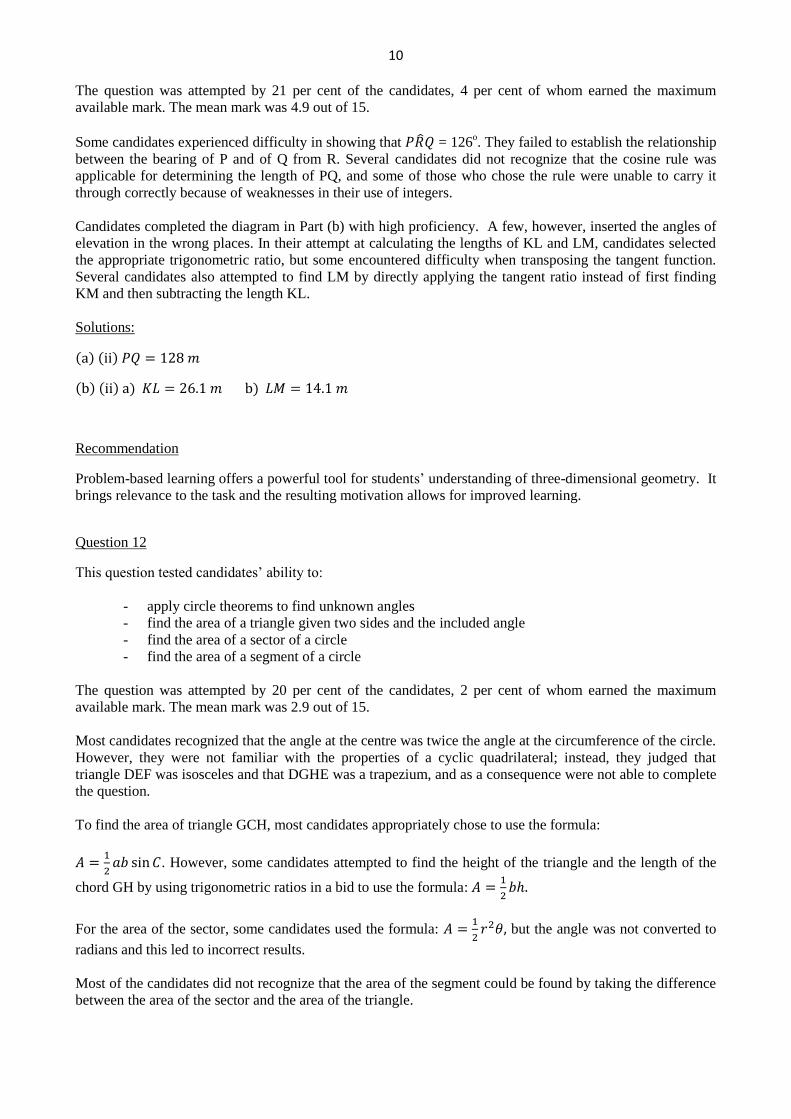
10
The question was attempted by 21 per cent of the candidates, 4 per cent of whom earned the maximum
available mark. The mean mark was 4.9 out of 15.
Some candidates experienced difficulty in showing that = 126o. They failed to establish the relationship
between the bearing of P and of Q from R. Several candidates did not recognize that the cosine rule was
applicable for determining the length of PQ, and some of those who chose the rule were unable to carry it
through correctly because of weaknesses in their use of integers.
Candidates completed the diagram in Part (b) with high proficiency. A few, however, inserted the angles of
elevation in the wrong places. In their attempt at calculating the lengths of KL and LM, candidates selected
the appropriate trigonometric ratio, but some encountered difficulty when transposing the tangent function.
Several candidates also attempted to find LM by directly applying the tangent ratio instead of first finding
KM and then subtracting the length KL.
Solutions:
Recommendation
Problem-based learning offers a powerful tool for students’ understanding of three-dimensional geometry. It
brings relevance to the task and the resulting motivation allows for improved learning.
Question 12
This question tested candidates’ ability to:
- apply circle theorems to find unknown angles
- find the area of a triangle given two sides and the included angle
- find the area of a sector of a circle
- find the area of a segment of a circle
The question was attempted by 20 per cent of the candidates, 2 per cent of whom earned the maximum
available mark. The mean mark was 2.9 out of 15.
Most candidates recognized that the angle at the centre was twice the angle at the circumference of the circle.
However, they were not familiar with the properties of a cyclic quadrilateral; instead, they judged that
triangle DEF was isosceles and that DGHE was a trapezium, and as a consequence were not able to complete
the question.
To find the area of triangle GCH, most candidates appropriately chose to use the formula:
. However, some candidates attempted to find the height of the triangle and the length of the
chord GH by using trigonometric ratios in a bid to use the formula:
For the area of the sector, some candidates used the formula:
but the angle was not converted to
radians and this led to incorrect results.
Most of the candidates did not recognize that the area of the segment could be found by taking the difference
between the area of the sector and the area of the triangle.
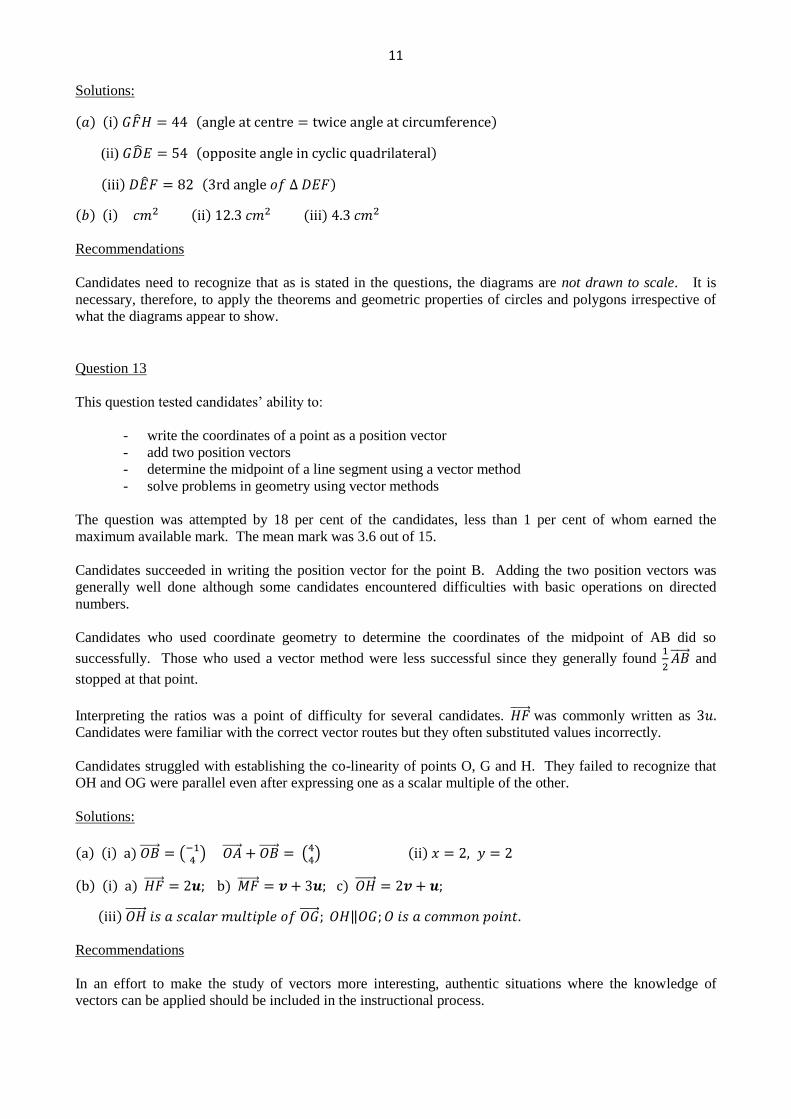
11
Solutions:
(ii)
Recommendations
Candidates need to recognize that as is stated in the questions, the diagrams are not drawn to scale. It is
necessary, therefore, to apply the theorems and geometric properties of circles and polygons irrespective of
what the diagrams appear to show.
Question 13
This question tested candidates’ ability to:
- write the coordinates of a point as a position vector
- add two position vectors
- determine the midpoint of a line segment using a vector method
- solve problems in geometry using vector methods
The question was attempted by 18 per cent of the candidates, less than 1 per cent of whom earned the
maximum available mark. The mean mark was 3.6 out of 15.
Candidates succeeded in writing the position vector for the point B. Adding the two position vectors was
generally well done although some candidates encountered difficulties with basic operations on directed
numbers.
Candidates who used coordinate geometry to determine the coordinates of the midpoint of AB did so
successfully. Those who used a vector method were less successful since they generally found
and
stopped at that point.
Interpreting the ratios was a point of difficulty for several candidates. was commonly written as Candidates were familiar with the correct vector routes but they often substituted values incorrectly.
Candidates struggled with establishing the co-linearity of points O, G and H. They failed to recognize that
OH and OG were parallel even after expressing one as a scalar multiple of the other.
Solutions:
Recommendations
In an effort to make the study of vectors more interesting, authentic situations where the knowledge of
vectors can be applied should be included in the instructional process.
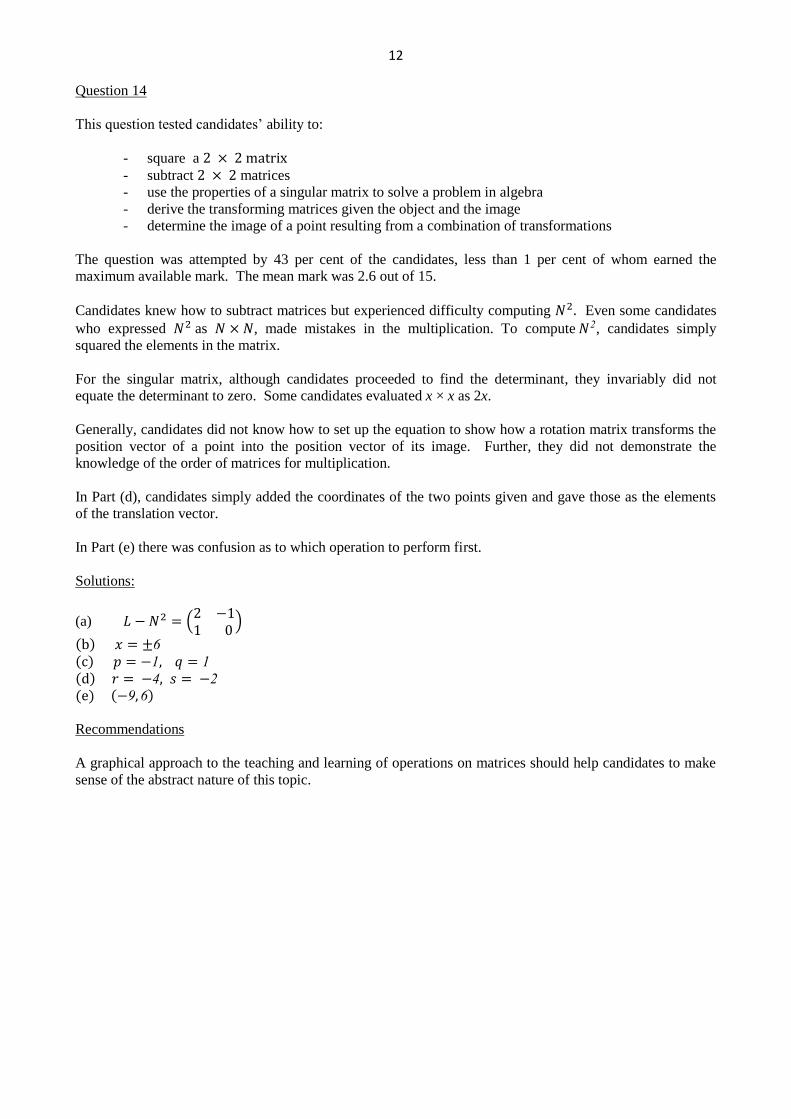
12
Question 14
This question tested candidates’ ability to:
- square a - subtract matrices
- use the properties of a singular matrix to solve a problem in algebra
- derive the transforming matrices given the object and the image
- determine the image of a point resulting from a combination of transformations
The question was attempted by 43 per cent of the candidates, less than 1 per cent of whom earned the
maximum available mark. The mean mark was 2.6 out of 15.
Candidates knew how to subtract matrices but experienced difficulty computing Even some candidates
who expressed as , made mistakes in the multiplication. To compute , candidates simply
squared the elements in the matrix.
For the singular matrix, although candidates proceeded to find the determinant, they invariably did not
equate the determinant to zero. Some candidates evaluated x × x as 2x.
Generally, candidates did not know how to set up the equation to show how a rotation matrix transforms the
position vector of a point into the position vector of its image. Further, they did not demonstrate the
knowledge of the order of matrices for multiplication.
In Part (d), candidates simply added the coordinates of the two points given and gave those as the elements
of the translation vector.
In Part (e) there was confusion as to which operation to perform first.
Solutions:
(a)
6
6
Recommendations
A graphical approach to the teaching and learning of operations on matrices should help candidates to make
sense of the abstract nature of this topic.
C A R I B B E A N E X A M I N A T I O N S C O U N C I L
REPORT ON CANDIDATES’ WORK IN THE
SECONDARY EDUCATION CERTIFICATE EXAMINATION
MAY/JUNE 2010
MATHEMATICS
GENERAL PROFICIENCY
Copyright © 2010 Caribbean Examinations Council
St Michael, Barbados
All rights reserved.
-2-
GENERAL COMMENTS
The General Proficiency Mathematics examination is offered in January and May/June each year. This
was the first examination of the revised Mathematics syllabus effective for the May/June 2010
examinations.
There was a candidate entry of approximately 88,400 in May/June 2010. Forty-one per cent of the
candidates achieved Grades I to III. The mean score for the examination was 76.59 out of 180 marks.
DETAILED COMMENTS
Paper 01 – Multiple Choice
Paper 01 consisted of 60 multiple choice items. This year, 54 candidates each earned the maximum
available mark of 60. Fifty-seven per cent of the candidates scored 30 marks or more.
Paper 02 – Structured Questions
Paper 02 consisted of two sections. Section I comprised eight compulsory questions totalling 90 marks.
Section II comprised three optional questions: one each from (i) Algebra and Relations, Functions and
Graphs; (ii) Measurement, Geometry and Trigonometry and (iii) Vectors and Matrices. Candidates were
required to answer any two questions from this section. Each question in this section was worth 15 marks.
This year, 20 candidates each earned the maximum available mark of 120 on Paper 02. Approximately
24 per cent of the candidates earned at least half of the maximum mark on this paper.
Compulsory Section
Question 1
This question tested candidates’ ability to
- subtract, multiply and divide fractions
- multiply, subtract and divide decimal numbers
- express a number correct to a given number of significant figures
- find the unit price, given the cost price and the number of items purchased
- determine the profit and profit percent, given the selling price and cost price
The question was attempted by 99 per cent of the candidates, 9.4 per cent of whom earned the maximum
available mark. The mean mark was 7.0 out of 11.
Responses to this question were generally good. The majority of candidates were able to accurately
perform the computations required with the use of a calculator.
-3-
In performing subtraction on fractions, some candidates failed to use a common denominator and
incorrectly simplified 3
2 −
2
5 as
1
3 or
1
−3.
In performing the division, some candidates mistakenly interpreted 11
10÷
33
10as
33
10÷
11
10 and thus inverted
the quotient instead of the divisor.
Squaring 2.5 also posed difficulties for some candidates, for example, 2.52 was interpreted as,
2.5 × 2 or 22 + 5
2.
In computing 2.52
− 2.89
17 some candidates did not recognize that
2.89
17 was a separate term and incorrectly
subtracted 2.89 from 2.52, then divided by 17.
Expressing 6.08 correct to two significant figures also posed some difficulties for candidates. Common
incorrect answers were 6.0, 60.8 and 61. In addition, a few candidates confused significant figures with
scientific notation.
In Part (b), a few candidates were unable to differentiate between profit and profit percent. Surprisingly,
a significant number of candidates could not express the profit as a percentage of the cost price. Some
candidates did not multiply by 100 while others expressed the profit as a percentage of the selling price.
Solutions:
(a) (i) 𝟏
𝟑(ii) 6.1
(b) (i) $12.80 (ii) $2 998.50 (iii) $1 078.50 (iv) 56%
Recommendations
Teachers should allow students to estimate the result of a computation prior to performing computations
using calculators. In this way, they can determine if their answers are reasonable and make adjustments to
their procedures.
Basic concepts in computation of fractions, percentages and decimals should be reviewed using
conceptual rather than procedural approaches. Students should also be encouraged to investigate the use
of calculators in performing multi-step computations. They should be allowed to check their results using
different orders and verify the correct order based on the context of the problem.
In teaching approximations, a clear distinction must be made between significant figures, decimal places
and standard form. The use of each type in real life situations must also be emphasized.
-4-
Question 2
This question tested candidates’ ability to
- substitute numbers for algebraic symbols in simple algebraic expressions
- perform the four basic operations on directed numbers
- convert verbal phrases to algebraic expressions
- solve a pair of simultaneous linear equations, algebraically
- apply the distributive law to factorize or expand algebraic expressions
- factorize quadratic expressions
The question was attempted by 99.6 per cent of the candidates, 2 per cent of whom earned the maximum
available mark. The mean mark was 4.6 out of 12.
Candidates performed reasonably well on substituting the numbers in the algebraic expressions. However,
a small percentage had difficulty using directed numbers. Common errors were observed in simplifying
22- (-3)
2, which was often written as 2
2- -3
2 and equated to 4 + 9 =13.
In Part (b), a large number of candidates were unable to successfully use symbols to express a phrase as
an algebraic expression. Further, they did not know when to use brackets and incorrectly wrote 7x + y
instead of 7(x+y) in Part (b) (i).
Responses to Part (b)(ii) were generally below the required standard. Candidates either omitted this part
or made unsuccessful attempts. Common incorrect responses included xy and x < y.
Many candidates displayed competence in solving simultaneous equations. Both the elimination and
substitution methods were used, with the majority choosing the method of elimination. However, too
many errors were made in simplifying algebraic terms, irrespective of the method used. Where the
substitution method was used, many candidates were unable to express one variable in terms of the other.
Quite a number of candidates arrived at the correct answers seemingly by trial and error and did not show
working. A few candidates chose a matrix method but this approach was also fraught with errors and
correct solutions were seldom obtained.
In factorizing the given expressions, the method of common factors and the difference of two squares was
generally known by candidates. However, quite a number of them incorrectly interpreted 4𝑦2 − 𝑧2 as
4(𝑦2 – 𝑧2) ; (4𝑦)2 − 𝑧2 or (2𝑦 − 𝑧)2.
Grouping terms to factorize also posed challenges for many candidates who did not strategize to obtain a
second pair of common factors. For example, they often wrote:
2𝑎𝑥 − 2𝑎𝑦 − 𝑏𝑥 + 𝑏𝑦 = 2𝑎 𝑥 − 𝑦 − 𝑏 𝑥 + 𝑦 and could go no further.
Some candidates correctly factorized the first step as 2𝑎 𝑥 − 𝑦 − 𝑏(𝑥 − 𝑦) but failed to complete the
factorization.
In (d)(iii), candidates also had difficulty factorizing the quadratic expression 3𝑥2 + 10𝑥 − 8 and many
ended up with incorrect factors such as 3𝑥 − 2 𝑥 − 4 ; 3𝑥 + 2 𝑥 − 4 or 3𝑥 + 4 𝑥 − 2 . This
suggests that they had no idea how to check their results to obtain the original expression.
-5-
Solutions:
(a) (i) -2 (ii) -5
(b) (i) 𝟕(𝒙 + 𝒚) (ii) 𝒚(𝒚 + 𝟏)
(c) 𝒙 = 𝟑, 𝒚 = 𝟏
(d) (i) 𝟐𝒚 − 𝒛 (𝟐𝒚 + 𝒛) (ii) 𝒙 − 𝒚 (𝟐𝒂 − 𝒃) (iii) 𝒙 + 𝟒 (𝟑𝒙 − 𝟐)
Recommendations
Teachers need to emphasize the importance of brackets when making substitutions. When indices are
used in substitutions, they should note that the index must apply to what is inside the bracket only.
In solving simultaneous linear equations, teachers should also encourage students to determine the most
efficient strategy to use. Both elimination and substitution methods should be taught and students must
develop strategies to decide on which method is better in a given situation.
Teachers should also pay close attention to mathematical vocabulary so that students are familiar with
basic terminology such as solve, simplify and factorize.
Question 3
This question tested candidates’ ability to
- use a Venn diagram to solve practical problems involving two sets
- determine elements in the intersection, union and complement of a set
- solve a simple equation
- calculate the area of a compound shape
- use Pythagoras’ theorem to find one side of a right-angled triangle
- solve geometric problems using properties of congruent triangles
The question was attempted by 99.2 per cent of the candidates, 3 per cent of whom earned the maximum
available mark. The mean mark was 4.4 out of 12.
Performance was generally unsatisfactory with candidates having extremely poor responses to Part (b) in
particular. In Part (a), the majority of candidates were able to identify the elements in the intersection, but
only a small percentage of candidates could determine the elements in A B and B A correctly.
Although some candidates correctly placed 3x in the intersection, they subtracted x in their expressions to
obtain (28 – x) and (30 – x) for A ∩ B' and A' ∩ B respectively. As a result, they obtained x = −9 but
were unable to conclude that one cannot have a negative number of tourists. Far too many candidates
produced an equation when asked for an expression.
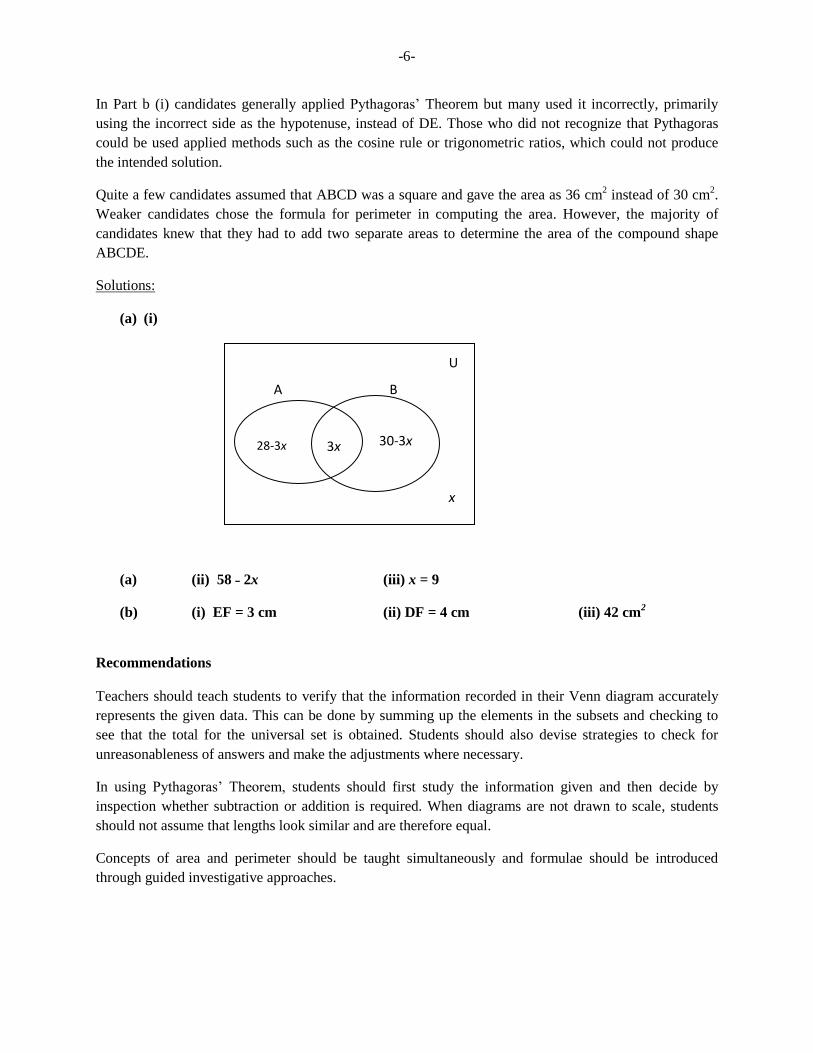
-6-
In Part b (i) candidates generally applied Pythagoras’ Theorem but many used it incorrectly, primarily
using the incorrect side as the hypotenuse, instead of DE. Those who did not recognize that Pythagoras
could be used applied methods such as the cosine rule or trigonometric ratios, which could not produce
the intended solution.
Quite a few candidates assumed that ABCD was a square and gave the area as 36 cm2 instead of 30 cm
2.
Weaker candidates chose the formula for perimeter in computing the area. However, the majority of
candidates knew that they had to add two separate areas to determine the area of the compound shape
ABCDE.
Solutions:
(a) (i)
(a) (ii) 58 ˗ 2x (iii) x = 9
(b) (i) EF = 3 cm (ii) DF = 4 cm (iii) 42 cm2
Recommendations
Teachers should teach students to verify that the information recorded in their Venn diagram accurately
represents the given data. This can be done by summing up the elements in the subsets and checking to
see that the total for the universal set is obtained. Students should also devise strategies to check for
unreasonableness of answers and make the adjustments where necessary.
In using Pythagoras’ Theorem, students should first study the information given and then decide by
inspection whether subtraction or addition is required. When diagrams are not drawn to scale, students
should not assume that lengths look similar and are therefore equal.
Concepts of area and perimeter should be taught simultaneously and formulae should be introduced
through guided investigative approaches.
A B
U
3x 28-3x 30-3x
x
-7-
Question 4
This question tested candidates’ ability to
- solve problems involving direct variation
- construct a triangle given two angles and one side
- draw and measure line segments accurately
- construct angles of 60o and 90
o
- measure the size of a given angle using a protractor
The question was attempted by 94.8 per cent of the candidates, 8 per cent of whom earned the maximum
available mark. The mean mark was 4.4 out of 11.
Generally, performance was unsatisfactory in both parts of this question. In Part (a), although candidates
were able to substitute correctly to determine the value of k, a significant number of them had difficulty
transposing correctly after substituting and obtained incorrect values.
Candidates generally drew and measured the line segments accurately. However, the weaker candidates
measured starting at one rather than zero. The construction of angles posed a problem for many
candidates. They had more success in constructing 60o than 90
o. It was also evident that some candidates
used a pair of compasses in drawing the figure but erased their arcs afterwards thinking that this was the
correct procedure. A small number of candidates also had problems labelling their diagram.
Solutions:
(a) (i) k = 0.5 (ii) y = 450
(b) (ii) (a) EF = 12 ± 0.1 cm (b) EFG = 30o±1
Recommendations
Candidates need to be reminded that they must use the required instruments when attempting questions on
the construction of figures. They must also show all construction lines and refrain from answering these
questions on graph paper.
Question 5
This question tested candidates’ ability to
- interpret and use functional notations such as f(x) and gf(x)
- derive the inverse of a simple function
- determine the scale used on the axis of a graph
- use a graph to determine the value of one variable, given the equation
- state the range of a function from its graph
The question was attempted by 83.7 per cent of the candidates, 3 per cent of whom earned the maximum
available mark. The mean mark was 4.0 out of 12.
-8-
Generally, performance on this question was unsatisfactory. A significant number of candidates did not
attempt this question or scored zero.
In Part (a), candidates were able to substitute the value of x into the function f(x) and many obtained the
correct answer for f(4). However, they were not as successful in evaluating gf (4). Many candidates could
not interpret this notation and proceeded to evaluate g(4) instead of using the result obtained for f(4).
Those candidates who went the route of first finding gf(x) experienced difficulties in squaring (2x - 5) and
invariably ended up with an incorrect expression.
In determining f--1
(x), many candidates knew that they had to interchange the variables, but far too many
were unable to correctly carry out the other steps. A major difficulty arose when they had to transpose a
term with a negative coefficient.
In Part (b), candidates generally knew that the scale for the x-axis was in the ratio 1:2 but few were able to
write down the scale using the correct format. They were also able to use the graph to determine the
value of y when x = −1.5 and to state at least one of the values of x for which y = 0. However, far too
many candidates failed to follow instructions and used calculations instead of the graph in determining
the unknown values.
Although candidates were able to state the range of values of y, many were unable to write the answer in
the form a ≤ y ≤ b, as requested.
Solutions:
(a) (i) (a) 3 (b) 12 (ii) 𝒇−𝟏 𝒙 = 𝒙+𝟓
𝟐
(b) (i) 2 cm represents 1 unit (ii) 𝒚 = −𝟑.𝟖 ± 𝟎.𝟏
(iii) x = -3, 1 (iv) −𝟒 ≤ 𝒚 ≤ 𝟓
Recommendations
Teachers need to emphasize the role of language in teaching functional notation. In particular, students
need to understand the meaning of f(x) and gf(x). With respect to the latter, they must allow students to
make connections between notation in geometry (when representing combined transformations) and
notation in algebra (for composite functions).
Students also need to understand the language used in interpreting graphs. Terms such as range and
phrases such as the value of x for which y = k are not fully understood.
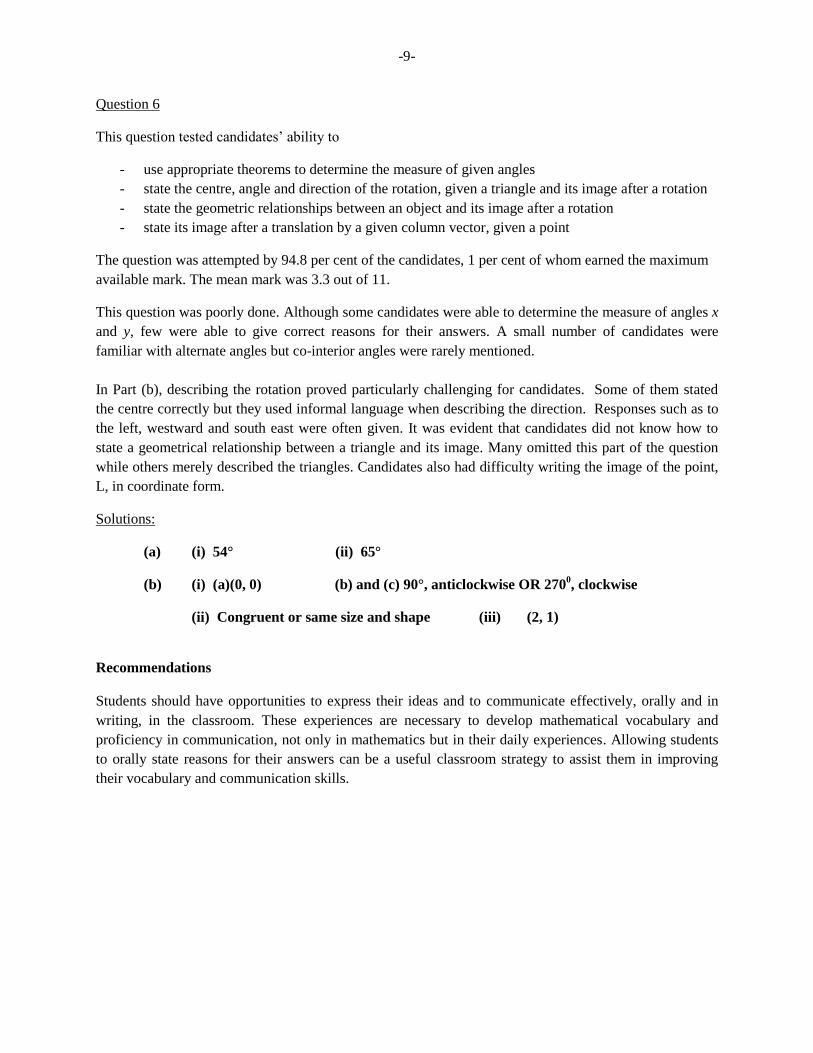
-9-
Question 6
This question tested candidates’ ability to
- use appropriate theorems to determine the measure of given angles
- state the centre, angle and direction of the rotation, given a triangle and its image after a rotation
- state the geometric relationships between an object and its image after a rotation
- state its image after a translation by a given column vector, given a point
The question was attempted by 94.8 per cent of the candidates, 1 per cent of whom earned the maximum
available mark. The mean mark was 3.3 out of 11.
This question was poorly done. Although some candidates were able to determine the measure of angles x
and y, few were able to give correct reasons for their answers. A small number of candidates were
familiar with alternate angles but co-interior angles were rarely mentioned.
In Part (b), describing the rotation proved particularly challenging for candidates. Some of them stated
the centre correctly but they used informal language when describing the direction. Responses such as to
the left, westward and south east were often given. It was evident that candidates did not know how to
state a geometrical relationship between a triangle and its image. Many omitted this part of the question
while others merely described the triangles. Candidates also had difficulty writing the image of the point,
L, in coordinate form.
Solutions:
(a) (i) 54° (ii) 65°
(b) (i) (a)(0, 0) (b) and (c) 90°, anticlockwise OR 2700, clockwise
(ii) Congruent or same size and shape (iii) (2, 1)
Recommendations
Students should have opportunities to express their ideas and to communicate effectively, orally and in
writing, in the classroom. These experiences are necessary to develop mathematical vocabulary and
proficiency in communication, not only in mathematics but in their daily experiences. Allowing students
to orally state reasons for their answers can be a useful classroom strategy to assist them in improving
their vocabulary and communication skills.
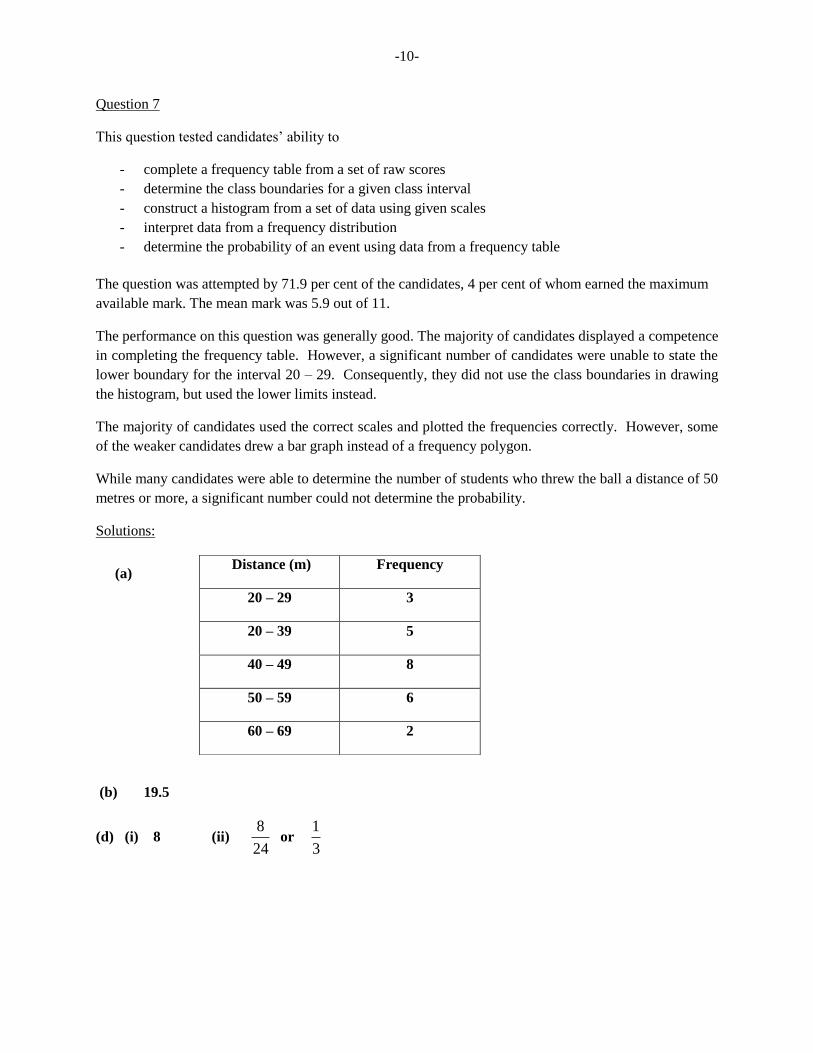
-10-
Question 7
This question tested candidates’ ability to
- complete a frequency table from a set of raw scores
- determine the class boundaries for a given class interval
- construct a histogram from a set of data using given scales
- interpret data from a frequency distribution
- determine the probability of an event using data from a frequency table
The question was attempted by 71.9 per cent of the candidates, 4 per cent of whom earned the maximum
available mark. The mean mark was 5.9 out of 11.
The performance on this question was generally good. The majority of candidates displayed a competence
in completing the frequency table. However, a significant number of candidates were unable to state the
lower boundary for the interval 20 – 29. Consequently, they did not use the class boundaries in drawing
the histogram, but used the lower limits instead.
The majority of candidates used the correct scales and plotted the frequencies correctly. However, some
of the weaker candidates drew a bar graph instead of a frequency polygon.
While many candidates were able to determine the number of students who threw the ball a distance of 50
metres or more, a significant number could not determine the probability.
Solutions:
(b) 19.5
(d) (i) 8 (ii) 8
24 or
1
3
Distance (m) Frequency
20 – 29 3
20 – 39 5
40 – 49 8
50 – 59 6
60 – 69 2
(a)
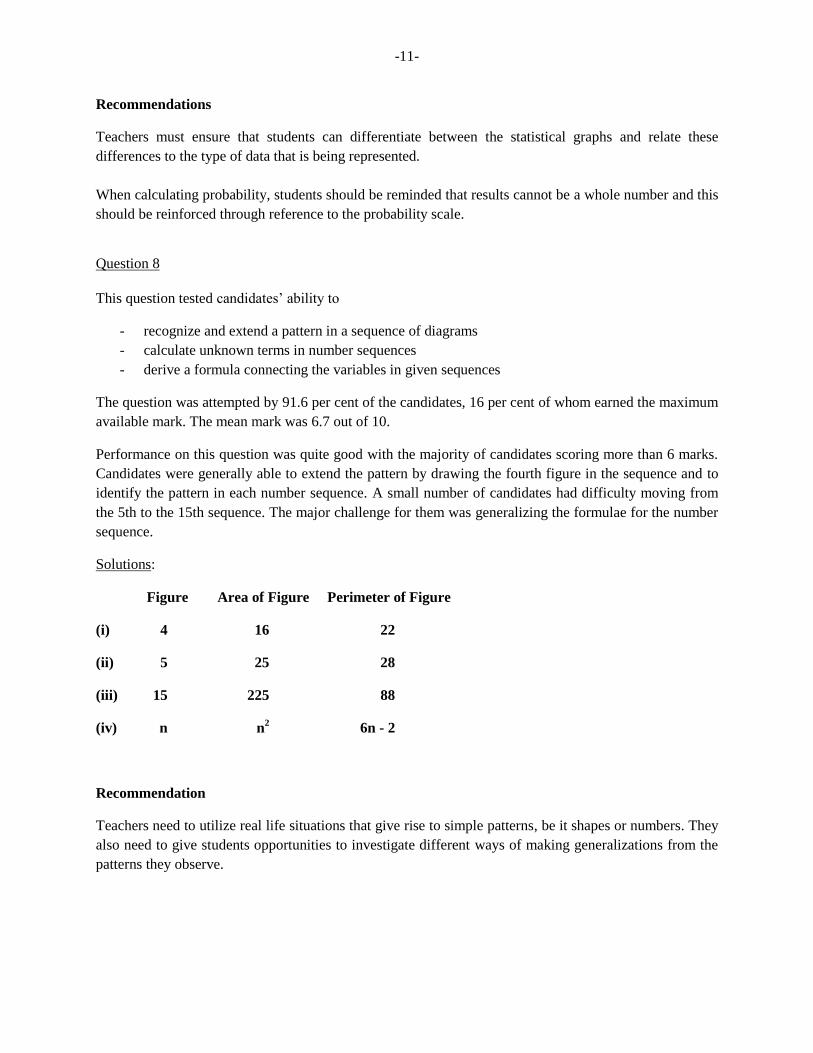
-11-
Recommendations
Teachers must ensure that students can differentiate between the statistical graphs and relate these
differences to the type of data that is being represented.
When calculating probability, students should be reminded that results cannot be a whole number and this
should be reinforced through reference to the probability scale.
Question 8
This question tested candidates’ ability to
- recognize and extend a pattern in a sequence of diagrams
- calculate unknown terms in number sequences
- derive a formula connecting the variables in given sequences
The question was attempted by 91.6 per cent of the candidates, 16 per cent of whom earned the maximum
available mark. The mean mark was 6.7 out of 10.
Performance on this question was quite good with the majority of candidates scoring more than 6 marks.
Candidates were generally able to extend the pattern by drawing the fourth figure in the sequence and to
identify the pattern in each number sequence. A small number of candidates had difficulty moving from
the 5th to the 15th sequence. The major challenge for them was generalizing the formulae for the number
sequence.
Solutions:
Figure Area of Figure Perimeter of Figure
(i) 4 16 22
(ii) 5 25 28
(iii) 15 225 88
(iv) n n2 6n - 2
Recommendation
Teachers need to utilize real life situations that give rise to simple patterns, be it shapes or numbers. They
also need to give students opportunities to investigate different ways of making generalizations from the
patterns they observe.
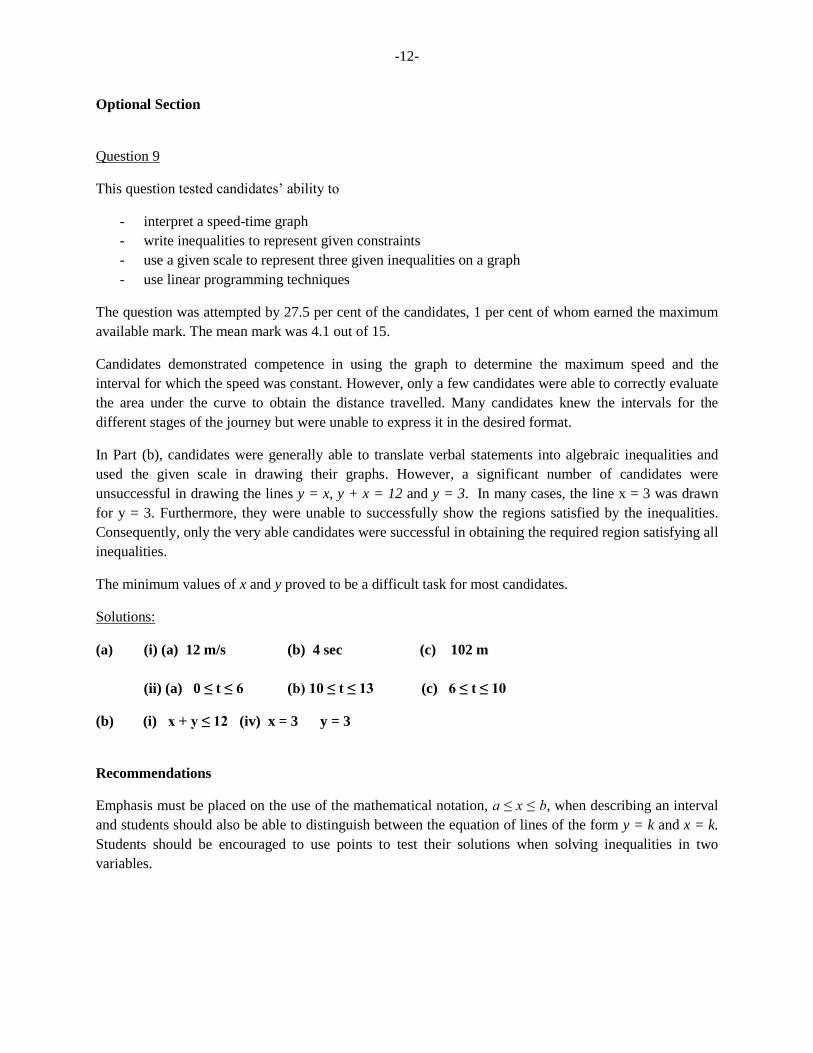
-12-
Optional Section
Question 9
This question tested candidates’ ability to
- interpret a speed-time graph
- write inequalities to represent given constraints
- use a given scale to represent three given inequalities on a graph
- use linear programming techniques
The question was attempted by 27.5 per cent of the candidates, 1 per cent of whom earned the maximum
available mark. The mean mark was 4.1 out of 15.
Candidates demonstrated competence in using the graph to determine the maximum speed and the
interval for which the speed was constant. However, only a few candidates were able to correctly evaluate
the area under the curve to obtain the distance travelled. Many candidates knew the intervals for the
different stages of the journey but were unable to express it in the desired format.
In Part (b), candidates were generally able to translate verbal statements into algebraic inequalities and
used the given scale in drawing their graphs. However, a significant number of candidates were
unsuccessful in drawing the lines y = x, y + x = 12 and y = 3. In many cases, the line x = 3 was drawn
for y = 3. Furthermore, they were unable to successfully show the regions satisfied by the inequalities.
Consequently, only the very able candidates were successful in obtaining the required region satisfying all
inequalities.
The minimum values of x and y proved to be a difficult task for most candidates.
Solutions:
(a) (i) (a) 12 m/s (b) 4 sec (c) 102 m
(ii) (a) 0 ≤ t ≤ 6 (b) 10 ≤ t ≤ 13 (c) 6 ≤ t ≤ 10
(b) (i) x + y ≤ 12 (iv) x = 3 y = 3
Recommendations
Emphasis must be placed on the use of the mathematical notation, a ≤ x ≤ b, when describing an interval
and students should also be able to distinguish between the equation of lines of the form y = k and x = k.
Students should be encouraged to use points to test their solutions when solving inequalities in two
variables.
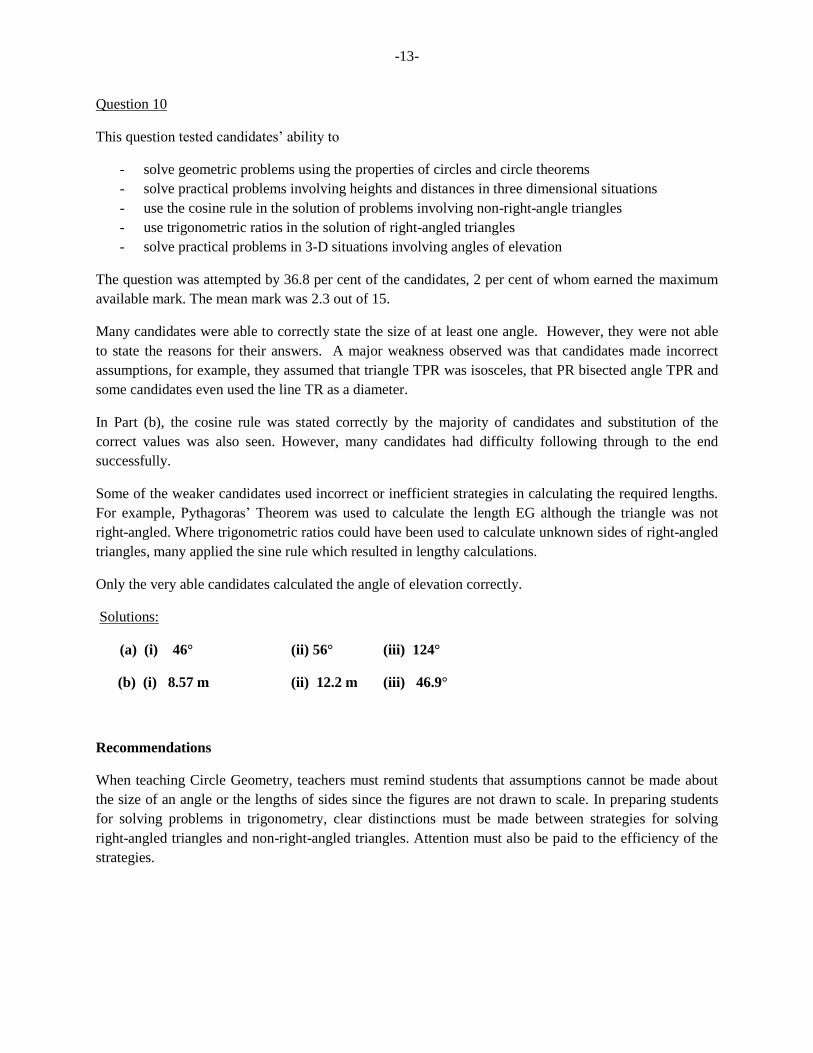
-13-
Question 10
This question tested candidates’ ability to
- solve geometric problems using the properties of circles and circle theorems
- solve practical problems involving heights and distances in three dimensional situations
- use the cosine rule in the solution of problems involving non-right-angle triangles
- use trigonometric ratios in the solution of right-angled triangles
- solve practical problems in 3-D situations involving angles of elevation
The question was attempted by 36.8 per cent of the candidates, 2 per cent of whom earned the maximum
available mark. The mean mark was 2.3 out of 15.
Many candidates were able to correctly state the size of at least one angle. However, they were not able
to state the reasons for their answers. A major weakness observed was that candidates made incorrect
assumptions, for example, they assumed that triangle TPR was isosceles, that PR bisected angle TPR and
some candidates even used the line TR as a diameter.
In Part (b), the cosine rule was stated correctly by the majority of candidates and substitution of the
correct values was also seen. However, many candidates had difficulty following through to the end
successfully.
Some of the weaker candidates used incorrect or inefficient strategies in calculating the required lengths.
For example, Pythagoras’ Theorem was used to calculate the length EG although the triangle was not
right-angled. Where trigonometric ratios could have been used to calculate unknown sides of right-angled
triangles, many applied the sine rule which resulted in lengthy calculations.
Only the very able candidates calculated the angle of elevation correctly.
Solutions:
(a) (i) 46° (ii) 56° (iii) 124°
(b) (i) 8.57 m (ii) 12.2 m (iii) 46.9°
Recommendations
When teaching Circle Geometry, teachers must remind students that assumptions cannot be made about
the size of an angle or the lengths of sides since the figures are not drawn to scale. In preparing students
for solving problems in trigonometry, clear distinctions must be made between strategies for solving
right-angled triangles and non-right-angled triangles. Attention must also be paid to the efficiency of the
strategies.
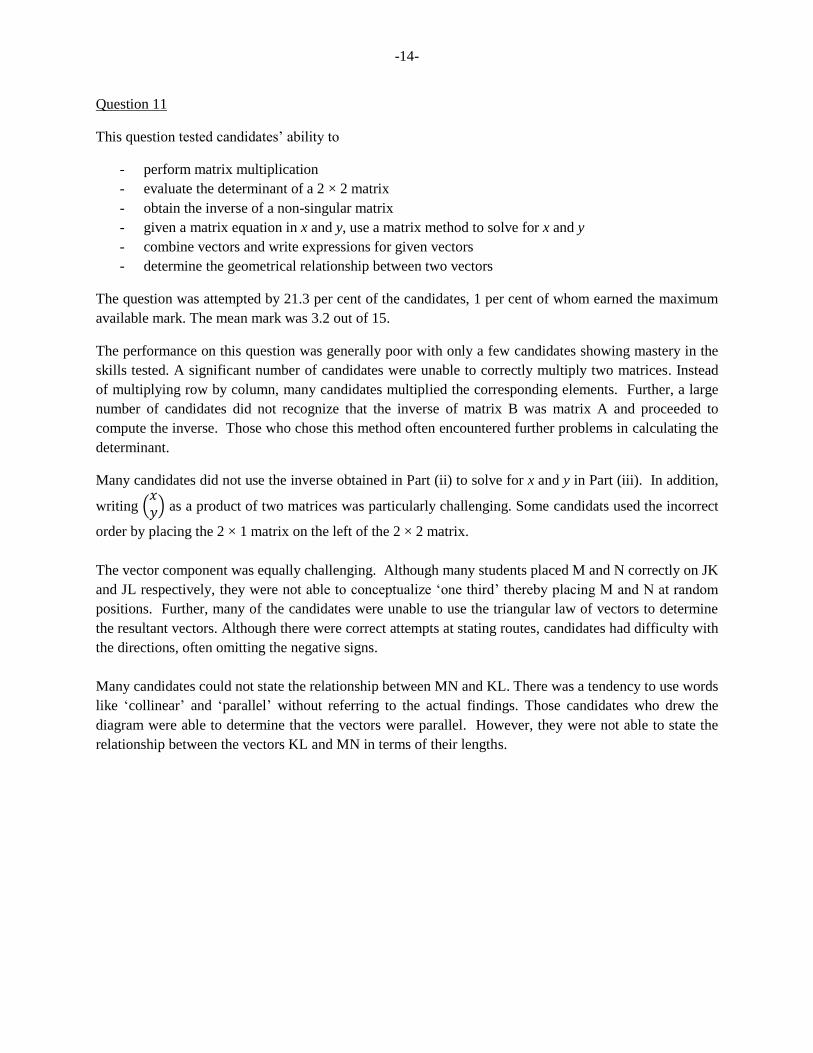
-14-
Question 11
This question tested candidates’ ability to
- perform matrix multiplication
- evaluate the determinant of a 2 × 2 matrix
- obtain the inverse of a non-singular matrix
- given a matrix equation in x and y, use a matrix method to solve for x and y
- combine vectors and write expressions for given vectors
- determine the geometrical relationship between two vectors
The question was attempted by 21.3 per cent of the candidates, 1 per cent of whom earned the maximum
available mark. The mean mark was 3.2 out of 15.
The performance on this question was generally poor with only a few candidates showing mastery in the
skills tested. A significant number of candidates were unable to correctly multiply two matrices. Instead
of multiplying row by column, many candidates multiplied the corresponding elements. Further, a large
number of candidates did not recognize that the inverse of matrix B was matrix A and proceeded to
compute the inverse. Those who chose this method often encountered further problems in calculating the
determinant.
Many candidates did not use the inverse obtained in Part (ii) to solve for x and y in Part (iii). In addition,
writing 𝑥𝑦 as a product of two matrices was particularly challenging. Some candidats used the incorrect
order by placing the 2 × 1 matrix on the left of the 2 × 2 matrix.
The vector component was equally challenging. Although many students placed M and N correctly on JK
and JL respectively, they were not able to conceptualize ‘one third’ thereby placing M and N at random
positions. Further, many of the candidates were unable to use the triangular law of vectors to determine
the resultant vectors. Although there were correct attempts at stating routes, candidates had difficulty with
the directions, often omitting the negative signs.
Many candidates could not state the relationship between MN and KL. There was a tendency to use words
like ‘collinear’ and ‘parallel’ without referring to the actual findings. Those candidates who drew the
diagram were able to determine that the vectors were parallel. However, they were not able to state the
relationship between the vectors KL and MN in terms of their lengths.
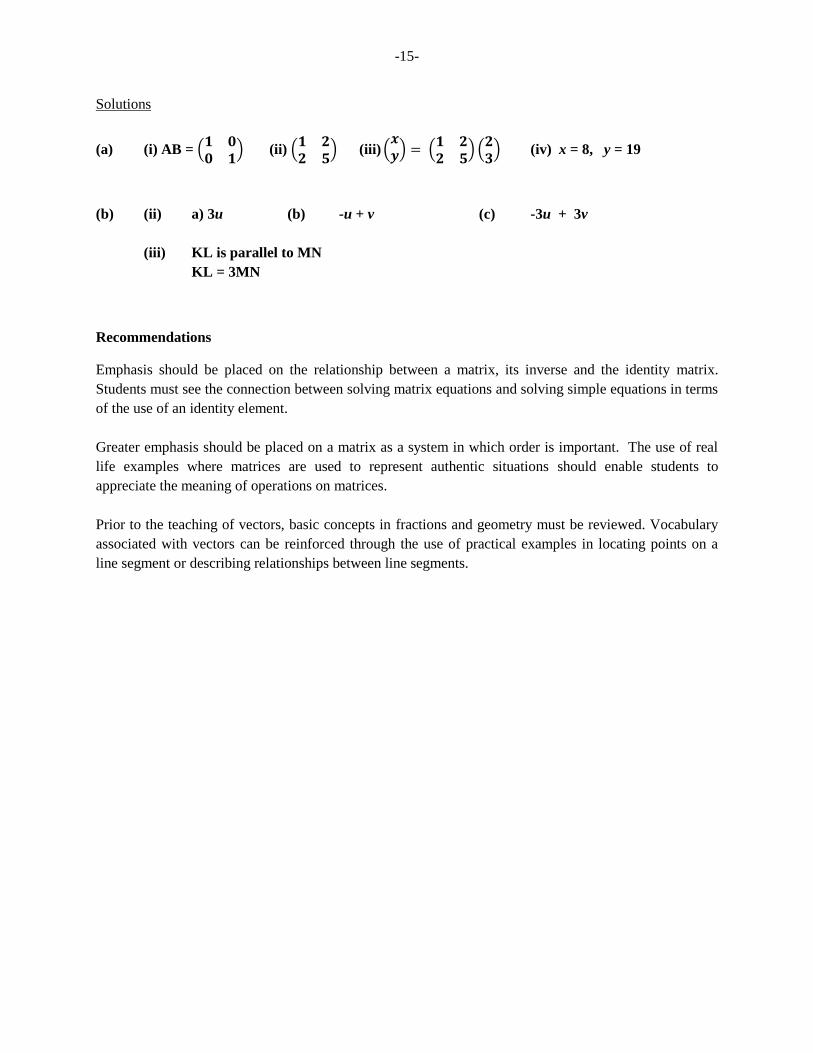
-15-
Solutions
(a) (i) AB = 𝟏 𝟎𝟎 𝟏
(ii) 𝟏 𝟐𝟐 𝟓
(iii) 𝒙𝒚 =
𝟏 𝟐𝟐 𝟓
𝟐𝟑 (iv) x = 8, y = 19
(b) (ii) a) 3u (b) -u + v (c) -3u + 3v
(iii) KL is parallel to MN
KL = 3MN
Recommendations
Emphasis should be placed on the relationship between a matrix, its inverse and the identity matrix.
Students must see the connection between solving matrix equations and solving simple equations in terms
of the use of an identity element.
Greater emphasis should be placed on a matrix as a system in which order is important. The use of real
life examples where matrices are used to represent authentic situations should enable students to
appreciate the meaning of operations on matrices.
Prior to the teaching of vectors, basic concepts in fractions and geometry must be reviewed. Vocabulary
associated with vectors can be reinforced through the use of practical examples in locating points on a
line segment or describing relationships between line segments.
CARIBBEAN EXAMINATIONS COUNCIL
REPORT ON CANDIDATES’ WORK IN THE
SECONDARY EDUCATION CERTIFICATE EXAMINATION
JANUARY 2011
MATHEMATICS
GENERAL PROFICIENCY EXAMINATION
Copyright © 2011 Caribbean Examinations Council
St Michael, Barbados
All rights reserved.
2
GENERAL COMMENTS
The General Proficiency Mathematics examination is offered in January and May/June
each year. This was the first January examination for the revised Mathematics syllabus
effective from May/June 2010.
There was a candidate entry of approximately 13,760 in January 2011. Thirty-seven per
cent of the candidates earned Grades I–III. The mean score for the examination was 74.97
out of 180 marks.
DETAILED COMMENTS
Paper 01 – Multiple Choice
Paper 01 consisted of 60 multiple-choice items. This year, 24 candidates each earned the
maximum available score of 60. Sixty-two per cent of the candidates scored 30 marks or
more.
Paper 02 – Structured Questions
Paper 02 consisted of two sections. Section I comprised eight compulsory questions
totalling 90 marks. Section II comprised three optional questions one each from (i)
Algebra, Relation, Functions and Graphs; (ii) Measurement, Trigonometry and Geometry
and (iii) Vectors and Matrices. Candidates were required to answer any two questions
from this section. Each question in this section was worth 15 marks.
This year, no candidate earned the maximum available mark of 120 on Paper 02. There
were five candidates who each scored 119 marks. Approximately 16 per cent of the
candidates earned at least half of the maximum marks on this paper.
Compulsory Section
Question 1
This question tested candidates’ ability to
- square, add and multiply decimal numbers
- subtract and divide fractions involving mixed numbers
- solve problems involving wages and overtime
The question was attempted by 99 per cent of the candidates, 15.5 per cent of whom
earned the maximum available mark. The mean mark was 6.98 out of 11.
3
In general, candidates provided satisfactory responses to this question. However, there
were a number of incorrect strategies employed in an attempt to solve the problem. These
included for Part
(i) (Incorrect application of
the distributive property)
(ii)
(Multiplying by 2 instead of squaring)
(iii) (Squaring 0.8 and then adding 5)
(iv) (Squaring 5 and 0.8 separately and
adding the result)
In Part most candidates were able to calculate the basic weekly wage for one
employee, but very few candidates were able to calculate the overtime wages and the
number of hours worked overtime.
Solutions:
(a) (i) 86.65 (ii)
(b) (i) $380 (ii) $85.50 (iii) $684 (iv) 48 hours
Recommendations
Teachers should ensure that students master the use of the scientific calculator in
performing basic arithmetic operations on rational numbers. Attention should also be
given to the order in which operations are performed.
Problems related to wages and overtime should be approached from a conceptual rather
than an algorithmic viewpoint. In addition, a distinction should be made between rates
and wages.
Question 2
This question tested candidates’ ability to
- simplify algebraic fractions
- factorize algebraic expressions involving HCF
- change the subject of the formula
- solve worded problems involving simple linear equations
The question was attempted by 99 per cent of the candidates, 6.51 per cent of whom
earned the maximum available mark. The mean mark was 4.40 out of 12.
4
The performance of candidates on this question was generally unsatisfactory. In Part (a),
candidates were generally able to simplify the algebraic fractions, although there was a
high incidence of
For Part (b), the majority of candidates were able to obtain a common factor even when
they could not follow through to obtain the second factor. In some cases, candidates
attempted to group and wrote .
For Part (c), a large proportion of candidates attempted to transpose r before clearing the
fraction, so
became
In general, candidates were unable to
transpose t and to find p from
The primary difficulty experienced in Part (d) was writing an expression for the total
number of donuts sold. It was common to see for the number sold in 5 large
boxes instead of A considerable number of candidates used trial and error to
arrive at the number of donuts in each type of box.
Solutions:
(a) (i)
(b)
(c)
(d) (i)
(ii) a)
Recommendations
When factorizing, students should practise dividing each of the expressions separately by
the common factor.
Teachers should provide students with adequate examples of finding the inverse
operations, as well as the operation associated with each quantity or variable to be
transposed.
Question 3
This question tested candidates’ ability to
- apply the laws of indices to simplify expressions
- calculate the volume of a right rectangular prism
- convert from litres to cubic centimetres
- solve problems involving volume
5
The question was attempted by 99.3 per cent of the candidates, 2.2 per cent of whom
earned the maximum available mark. The mean mark was 3.61 out of 11.
Candidates performed satisfactorily when applying the laws of indices for multiplication,
although there were a few candidates who did not multiply the coefficients.
The formula for calculating the volume of the rectangular prism was widely known and
correctly applied. However, some candidates omitted the units of volume from their
calculations. In general, candidates did not consider the number of cartons to be a discrete
quantity. In addition, a significant number of candidates could not distinguish between
diameter and radius in their attempt to calculate the volume of the cylinder, and as a
consequence, the diameter was substituted in place of the radius.
Solutions:
(a)
(b) (i) (ii) (iii)
Recommendations
Students should be reminded of the importance of writing the units of any measurement
derived from calculations. Further, the difference between discrete and continuous
variables should be emphasized.
Question 4
This question tested candidates’ ability to
- identify numbers which are prime and numbers which are odd
- draw Venn diagrams to show the relationship between sets of numbers
- construct an angle of 60 degrees using ruler and compasses only
- use a protractor to measure an angle
- construct a triangle and a parallelogram
The question was attempted by 98.3 per cent of the candidates, 0.94 per cent of whom
earned the maximum available mark. The mean mark was 5.10 out of 12.
Candidates were proficient at listing the odd numbers between 4 and 12. They, however,
were generally unaware that 1 is not a prime number and that 2 is a prime number. Some
candidates did not understand that the universal set included the sets of prime numbers
and the set of odd numbers under consideration, and proceeded to draw a third set to
represent the universal set.
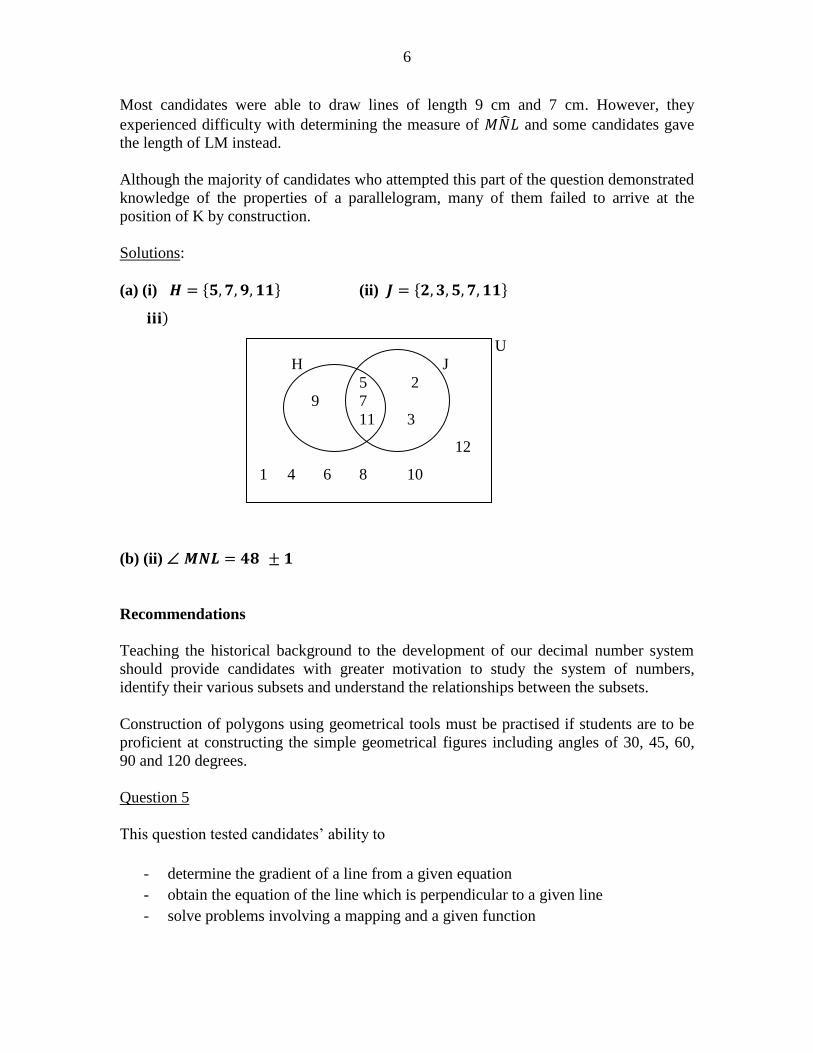
6
Most candidates were able to draw lines of length 9 cm and 7 cm. However, they
experienced difficulty with determining the measure of and some candidates gave
the length of LM instead.
Although the majority of candidates who attempted this part of the question demonstrated
knowledge of the properties of a parallelogram, many of them failed to arrive at the
position of K by construction.
Solutions:
(a) (i) (ii)
U
H J
5 2
9 7
11 3
12
1 4 6 8 10
(b) (ii)
Recommendations
Teaching the historical background to the development of our decimal number system
should provide candidates with greater motivation to study the system of numbers,
identify their various subsets and understand the relationships between the subsets.
Construction of polygons using geometrical tools must be practised if students are to be
proficient at constructing the simple geometrical figures including angles of 30, 45, 60,
90 and 120 degrees.
Question 5
This question tested candidates’ ability to
- determine the gradient of a line from a given equation
- obtain the equation of the line which is perpendicular to a given line
- solve problems involving a mapping and a given function
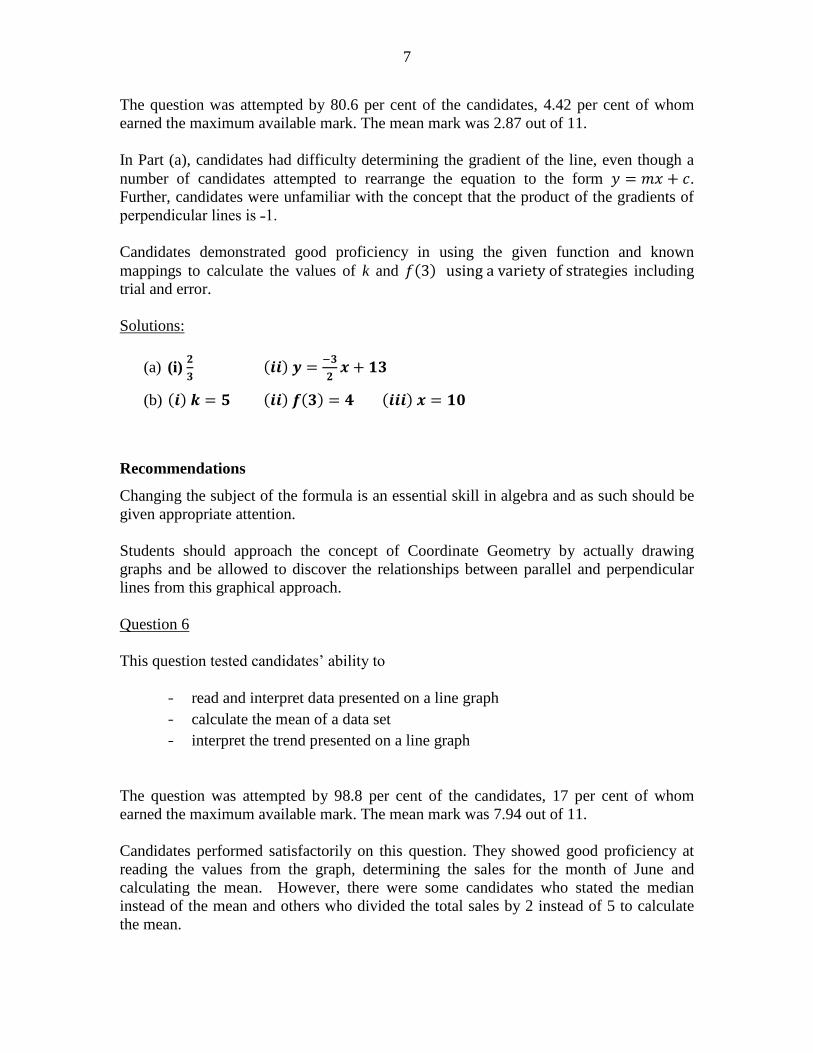
7
The question was attempted by 80.6 per cent of the candidates, 4.42 per cent of whom
earned the maximum available mark. The mean mark was 2.87 out of 11.
In Part (a), candidates had difficulty determining the gradient of the line, even though a
number of candidates attempted to rearrange the equation to the form .
Further, candidates were unfamiliar with the concept that the product of the gradients of
perpendicular lines is ˗1.
Candidates demonstrated good proficiency in using the given function and known
mappings to calculate the values of k and rategies including
trial and error.
Solutions:
(a) (i)
(b)
Recommendations
Changing the subject of the formula is an essential skill in algebra and as such should be
given appropriate attention.
Students should approach the concept of Coordinate Geometry by actually drawing
graphs and be allowed to discover the relationships between parallel and perpendicular
lines from this graphical approach.
Question 6
This question tested candidates’ ability to
- read and interpret data presented on a line graph
- calculate the mean of a data set
- interpret the trend presented on a line graph
The question was attempted by 98.8 per cent of the candidates, 17 per cent of whom
earned the maximum available mark. The mean mark was 7.94 out of 11.
Candidates performed satisfactorily on this question. They showed good proficiency at
reading the values from the graph, determining the sales for the month of June and
calculating the mean. However, there were some candidates who stated the median
instead of the mean and others who divided the total sales by 2 instead of 5 to calculate
the mean.
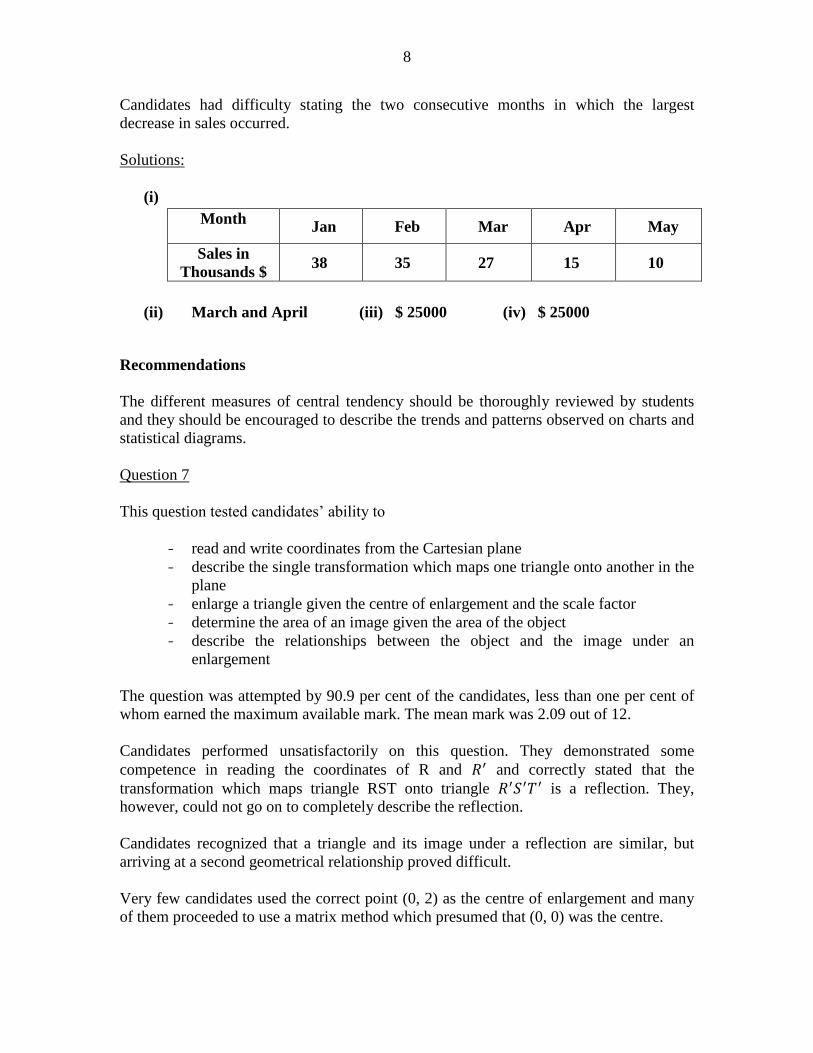
8
Candidates had difficulty stating the two consecutive months in which the largest
decrease in sales occurred.
Solutions:
(i)
Month Jan Feb Mar Apr May
Sales in
Thousands $ 38 35 27 15 10
(ii) March and April (iii) $ 25000 (iv) $ 25000
Recommendations
The different measures of central tendency should be thoroughly reviewed by students
and they should be encouraged to describe the trends and patterns observed on charts and
statistical diagrams.
Question 7
This question tested candidates’ ability to
- read and write coordinates from the Cartesian plane
- describe the single transformation which maps one triangle onto another in the
plane
- enlarge a triangle given the centre of enlargement and the scale factor
- determine the area of an image given the area of the object
- describe the relationships between the object and the image under an
enlargement
The question was attempted by 90.9 per cent of the candidates, less than one per cent of
whom earned the maximum available mark. The mean mark was 2.09 out of 12.
Candidates performed unsatisfactorily on this question. They demonstrated some
competence in reading the coordinates of R and and correctly stated that the
transformation which maps triangle RST onto triangle is a reflection. They,
however, could not go on to completely describe the reflection.
Candidates recognized that a triangle and its image under a reflection are similar, but
arriving at a second geometrical relationship proved difficult.
Very few candidates used the correct point (0, 2) as the centre of enlargement and many
of them proceeded to use a matrix method which presumed that (0, 0) was the centre.
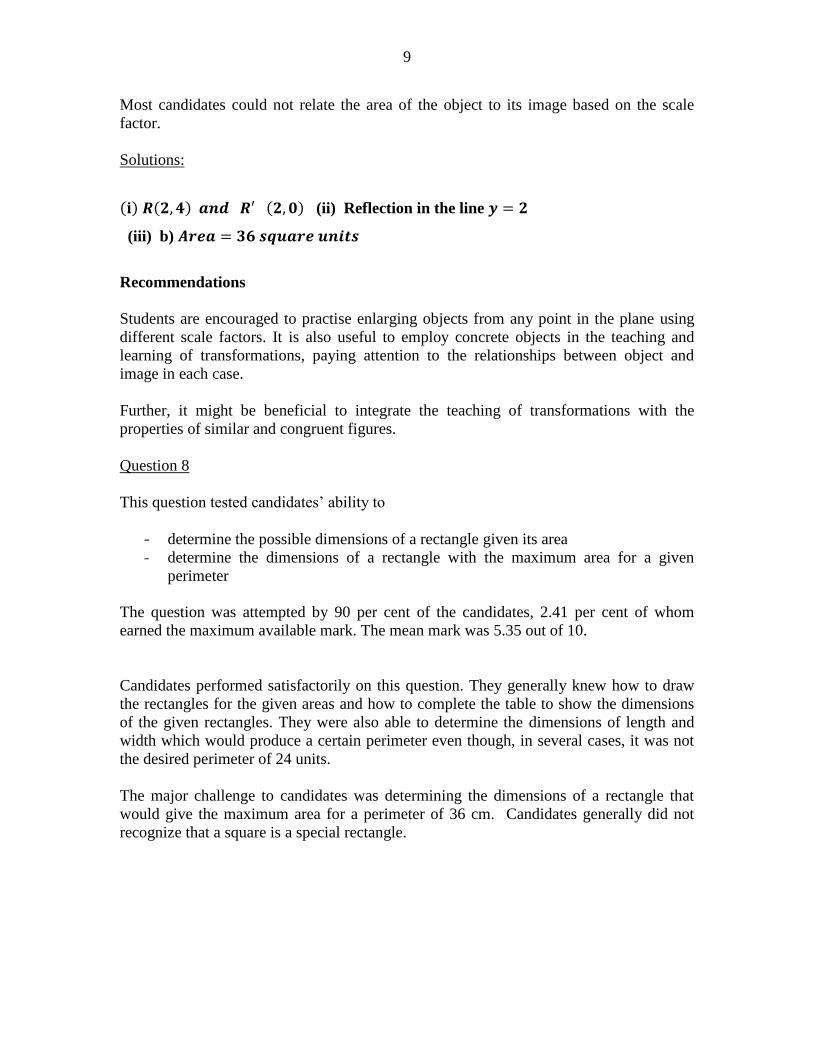
9
Most candidates could not relate the area of the object to its image based on the scale
factor.
Solutions:
(ii) Reflection in the line
(iii) b)
Recommendations
Students are encouraged to practise enlarging objects from any point in the plane using
different scale factors. It is also useful to employ concrete objects in the teaching and
learning of transformations, paying attention to the relationships between object and
image in each case.
Further, it might be beneficial to integrate the teaching of transformations with the
properties of similar and congruent figures.
Question 8
This question tested candidates’ ability to
- determine the possible dimensions of a rectangle given its area
- determine the dimensions of a rectangle with the maximum area for a given
perimeter
The question was attempted by 90 per cent of the candidates, 2.41 per cent of whom
earned the maximum available mark. The mean mark was 5.35 out of 10.
Candidates performed satisfactorily on this question. They generally knew how to draw
the rectangles for the given areas and how to complete the table to show the dimensions
of the given rectangles. They were also able to determine the dimensions of length and
width which would produce a certain perimeter even though, in several cases, it was not
the desired perimeter of 24 units.
The major challenge to candidates was determining the dimensions of a rectangle that
would give the maximum area for a perimeter of 36 cm. Candidates generally did not
recognize that a square is a special rectangle.
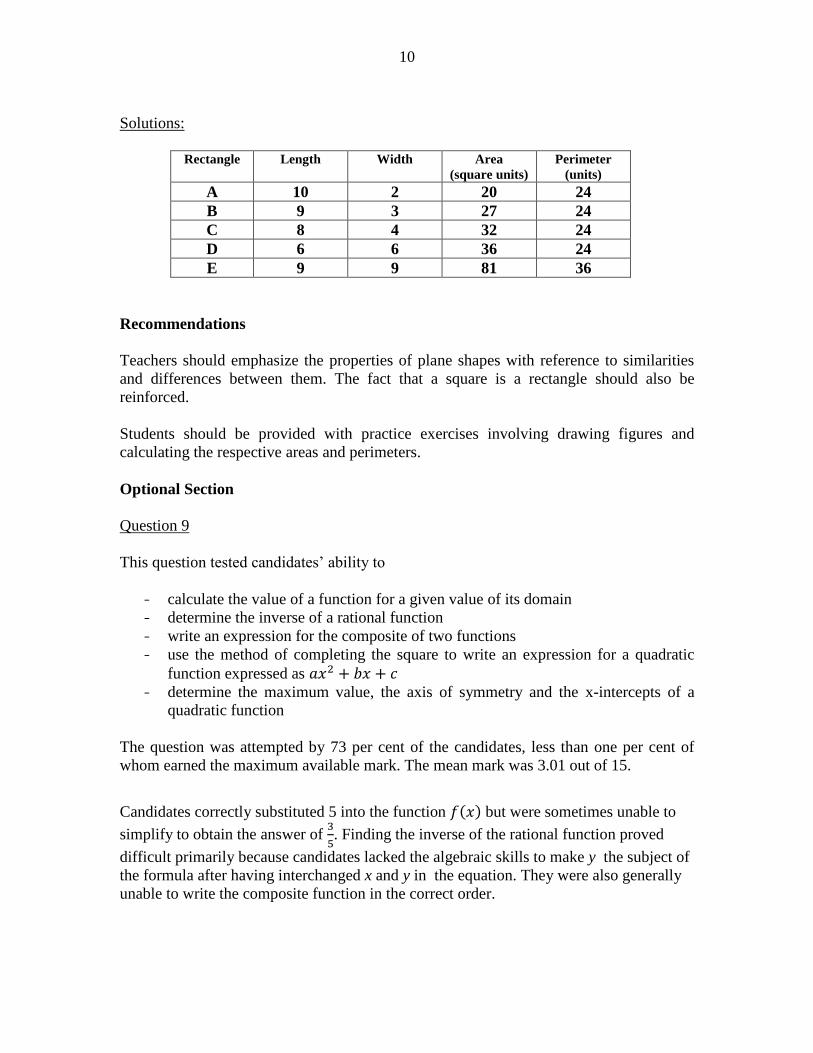
10
Solutions:
Rectangle Length Width Area
(square units)
Perimeter
(units)
A 10 2 20 24
B 9 3 27 24
C 8 4 32 24
D 6 6 36 24
E 9 9 81 36
Recommendations
Teachers should emphasize the properties of plane shapes with reference to similarities
and differences between them. The fact that a square is a rectangle should also be
reinforced.
Students should be provided with practice exercises involving drawing figures and
calculating the respective areas and perimeters.
Optional Section
Question 9
This question tested candidates’ ability to
- calculate the value of a function for a given value of its domain
- determine the inverse of a rational function
- write an expression for the composite of two functions
- use the method of completing the square to write an expression for a quadratic
function expressed as - determine the maximum value, the axis of symmetry and the x-intercepts of a
quadratic function
The question was attempted by 73 per cent of the candidates, less than one per cent of
whom earned the maximum available mark. The mean mark was 3.01 out of 15.
Candidates correctly substituted 5 into the function but were sometimes unable to
simplify to obtain the answer of
. Finding the inverse of the rational function proved
difficult primarily because candidates lacked the algebraic skills to make y the subject of
the formula after having interchanged x and y in the equation. They were also generally
unable to write the composite function in the correct order.
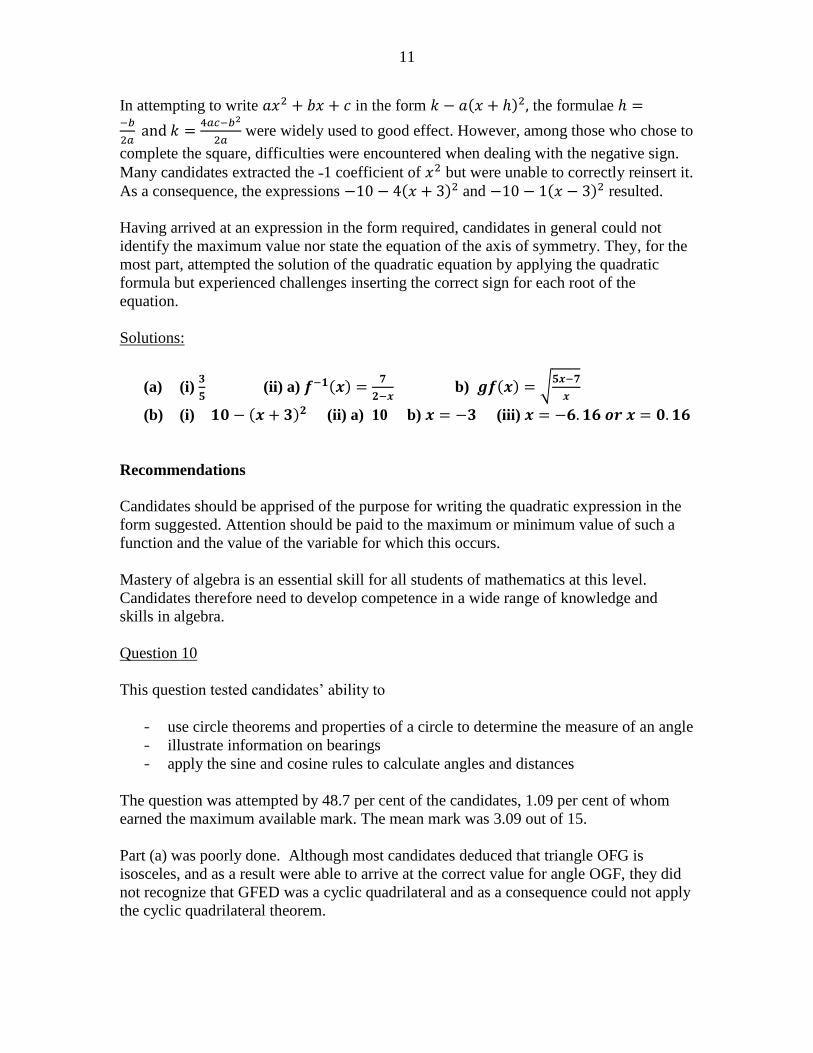
11
In attempting to write in the form the formulae
were widely used to good effect. However, among those who chose to
complete the square, difficulties were encountered when dealing with the negative sign.
Many candidates extracted the ˗1 coefficient of but were unable to correctly reinsert it.
As a consequence, the expressions and resulted.
Having arrived at an expression in the form required, candidates in general could not
identify the maximum value nor state the equation of the axis of symmetry. They, for the
most part, attempted the solution of the quadratic equation by applying the quadratic
formula but experienced challenges inserting the correct sign for each root of the
equation.
Solutions:
(a) (i)
(ii) a)
b)
(b) (i) (ii) a) 10 b) (iii)
Recommendations
Candidates should be apprised of the purpose for writing the quadratic expression in the
form suggested. Attention should be paid to the maximum or minimum value of such a
function and the value of the variable for which this occurs.
Mastery of algebra is an essential skill for all students of mathematics at this level.
Candidates therefore need to develop competence in a wide range of knowledge and
skills in algebra.
Question 10
This question tested candidates’ ability to
- use circle theorems and properties of a circle to determine the measure of an angle
- illustrate information on bearings
- apply the sine and cosine rules to calculate angles and distances
The question was attempted by 48.7 per cent of the candidates, 1.09 per cent of whom
earned the maximum available mark. The mean mark was 3.09 out of 15.
Part (a) was poorly done. Although most candidates deduced that triangle OFG is
isosceles, and as a result were able to arrive at the correct value for angle OGF, they did
not recognize that GFED was a cyclic quadrilateral and as a consequence could not apply
the cyclic quadrilateral theorem.
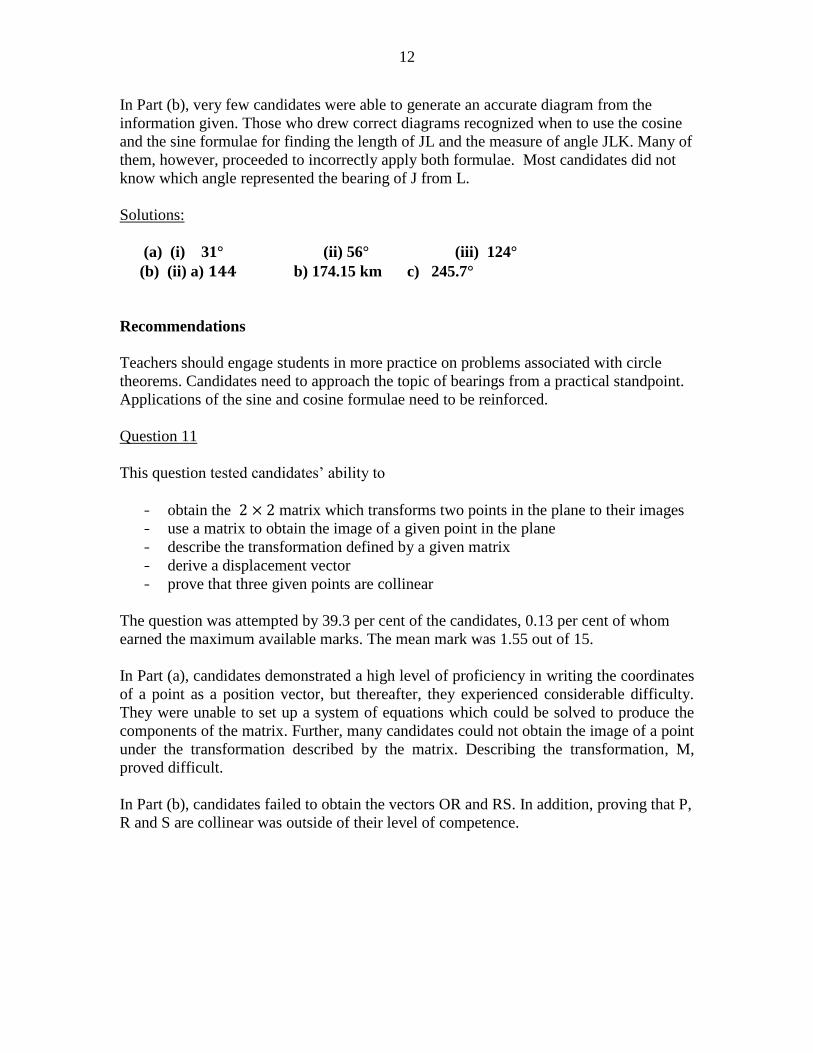
12
In Part (b), very few candidates were able to generate an accurate diagram from the
information given. Those who drew correct diagrams recognized when to use the cosine
and the sine formulae for finding the length of JL and the measure of angle JLK. Many of
them, however, proceeded to incorrectly apply both formulae. Most candidates did not
know which angle represented the bearing of J from L.
Solutions:
(a) (i) 31° (ii) 56° (iii) 124°
(b) (ii) a) b) 174.15 km c) 245.7°
Recommendations
Teachers should engage students in more practice on problems associated with circle
theorems. Candidates need to approach the topic of bearings from a practical standpoint.
Applications of the sine and cosine formulae need to be reinforced.
Question 11
This question tested candidates’ ability to
- obtain the matrix which transforms two points in the plane to their images
- use a matrix to obtain the image of a given point in the plane
- describe the transformation defined by a given matrix
- derive a displacement vector
- prove that three given points are collinear
The question was attempted by 39.3 per cent of the candidates, 0.13 per cent of whom
earned the maximum available marks. The mean mark was 1.55 out of 15.
In Part (a), candidates demonstrated a high level of proficiency in writing the coordinates
of a point as a position vector, but thereafter, they experienced considerable difficulty.
They were unable to set up a system of equations which could be solved to produce the
components of the matrix. Further, many candidates could not obtain the image of a point
under the transformation described by the matrix. Describing the transformation, M,
proved difficult.
In Part (b), candidates failed to obtain the vectors OR and RS. In addition, proving that P,
R and S are collinear was outside of their level of competence.
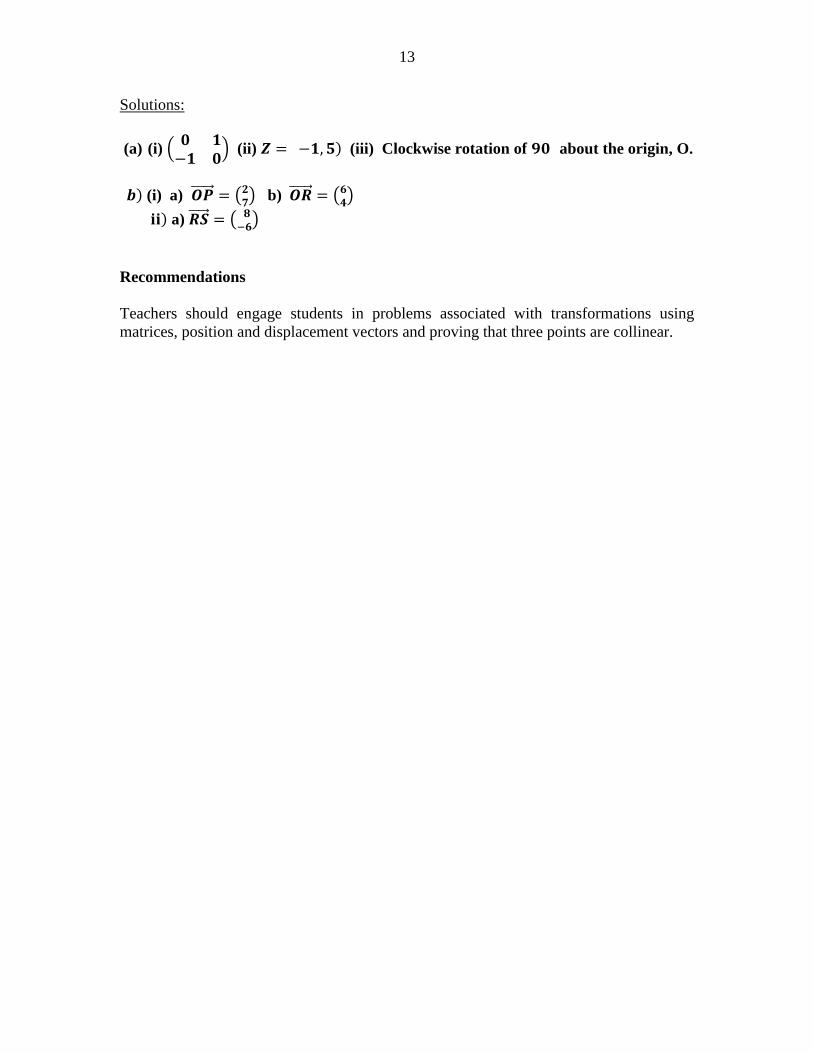
13
Solutions:
(a) (i)
(ii) (iii) Clockwise rotation of about the origin, O.
(i) a) b)
a)
Recommendations
Teachers should engage students in problems associated with transformations using
matrices, position and displacement vectors and proving that three points are collinear.
C A R I B B E A N E X A M I N A T I O N S C O U N C I L
REPORT ON CANDIDATES’ WORK IN THE
SECONDARY EDUCATION CERTIFICATE EXAMINATION
MAY/JUNE 2011
MATHEMATICS
GENERAL PROFICIENCY EXAMINATION
Copyright © 2011 Caribbean Examinations Council
St Michael, Barbados
All rights reserved.
-2-
GENERAL COMMENTS
The General Proficiency Mathematics examination is offered in January and May/June each year. There was a
candidate entry of approximately 90,000 in May/June 2011. Thirty-five per cent of the candidates earned Grades
I–III. The mean score for the examination was 71.43 out of 180 marks.
DETAILED COMMENTS
Paper 01 – Multiple-Choice
Paper 01 consisted of 60 multiple choice items. This year, 180 candidates earned the maximum available score of
60. The mean mark for this paper was 32.32 out of 60 marks.
Paper 02 – Structured Questions
Paper 02 comprised two sections. Section I consisted of eight compulsory questions totalling 90 marks. Section II
consisted of three optional questions: one each from Algebra, Relations, Functions and Graphs; Measurement,
Trigonometry and Geometry; and Vectors and Matrices. Candidates were required to answer any two questions
from this section. Each question in this section was worth 15 marks.
Thirty-seven candidates earned the maximum available score of 120 marks on Paper 02. Approximately 19 per
cent of the candidates earned at least half of the maximum mark on this paper.
Compulsory Section
Question 1
This question tested candidates’ ability to
- add, subtract, multiply and divide fractions involving mixed numbers and decimals
- express a value to a given number of significant figures
- express one quantity as a fraction of another
- solve problems involving invoices and shopping bills
The question was attempted by 99 per cent of the candidates, 18.8 per cent of whom earned the maximum
available mark. The mean mark was 7.45 out of 11.
The responses to this question were generally good. Most candidates demonstrated a high level of proficiency in
computing the common denominator and one correct numerator when adding fractions although some of them
could not convert a mixed number to an improper fraction. The candidates demonstrated competence with the
the application of the order of operations although many could not divide one fraction by another. For example,
27 9÷
8 2 was often written as
8 9×
27 2 or
9 8×
2 27. Several candidates interpreted 0.0256 as 0.0256
2.
About ten per cent of the candidates made no attempt at calculating the per cent VAT which is an indication that
they could not interpret the relevant information given in the table. For those who attempted this part of the
question, the major error was dividing the amount paid as VAT by the total amount of the bill rather than by the
sub-total before VAT.
-3-
Solutions
(a) (i) 3
4 (ii) 0.83
(b) $15.60; $13.20; 6; 12%
Recommendations
Teachers should provide more opportunities for students to practise solving problems with operations involving
fractions. They should encourage and teach the use of the calculator in simplifying expressions related to
computations with fractions, squares and square roots.
Question 2
This question tested candidates’ ability to
- simplify simple algebraic fractions
- perform binary operations
- factorize algebraic expressions
- solve problems involving direct variation
The question was attempted by 98 per cent of the candidates, 6.6 per cent of whom earned the maximum available
mark. The mean mark was 4.63 out of 12.
Performance on this question was generally unsatisfactory. Although a large percentage of candidates were able to
apply the LCM to the algebraic fraction, they were unable to follow through with expanding, collecting and
simplifying the terms. Substituting the numbers into the binary operation and factorizing the expression xy3 + x
2y
were well done; but many candidates were unable to successfully complete the task of factorizing by grouping the
expression 2mh – 2nh – 3mk + 3nk.
Solutions
(a) (i) 7x - 5
12
(b) 25
(c) (i) xy(y2 + x) (ii) (2h – 3k)(m – n)
(d) a = 30; b = 8
Recommendations
Teachers should ensure that the algebra of directed numbers is adequately mastered by students. The basic
principles of algebra including understanding algebraic terms, expanding brackets, factorizing and collecting
terms should be reinforced and tested regularly.
-4-
Question 3
This question tested candidates’ ability to
- determine elements in the intersection, union and complement of sets
- solve problems involving the use of Venn diagrams
- draw and measure angles and line segments accurately using appropriate geometrical instruments
- construct lines, angles and polygons using appropriate geometrical instruments
The question was attempted by 97 per cent of the candidates, 9.4 per cent of whom earned the maximum available
mark. The mean mark was 5.21 out of 11.
The performance of candidates on this question was generally satisfactory. Candidates easily identified the
number of students who studied neither Art nor Music, and the number who studied Music only. Nevertheless,
many of them encountered difficulty identifying the universal set as representing all the elements in the Venn
diagram. Hence, the 4 students who studied neither Art nor Music were excluded from the sum of the elements.
In some cases, candidates formulated the equation to be solved for x but were unable to solve the equation.
In Part (b), candidates were able to draw and measure the required straight lines, but demonstrated little
proficiency in using the protractor to measure the required angles. Moreover, they seemed not to recognize that
125˚ is an obtuse angle.
Solutions
(a) (i) 4 (ii) 9 (iii) 14
(b) (ii) GH = 8.5 ± 0.2 cm.
Recommendations
Teachers should provide students with more practice in writing and solving algebraic equations in one unknown;
they should encourage the use of authentic situations that would involve displaying information in a Venn
diagram. The correct use of all geometrical instruments must be taught and reinforced.
Question 4
This question tested candidates’ ability to
- solve a simple linear inequation
- determine the length and perimeter of a square
- determine the radius and area of a circle
The question was attempted by 92 per cent of the candidates, 2.1 per cent of whom earned the maximum available
mark. The mean mark was 2.54 out of 10.
Generally, the performance of candidates on this question was unsatisfactory. In Part (a), few candidates were
able to get the sign of the inequality correct when dividing by the negative coefficient of x. This posed some
difficulty in answering Part (a) (ii) especially if x < -2 was offered as a solution for Part (a) (i).
A few candidates were able to determine the perimeter of the square from the length calculated for the side of a
square. Similarly, the area of the circle was easily computed from the radius.
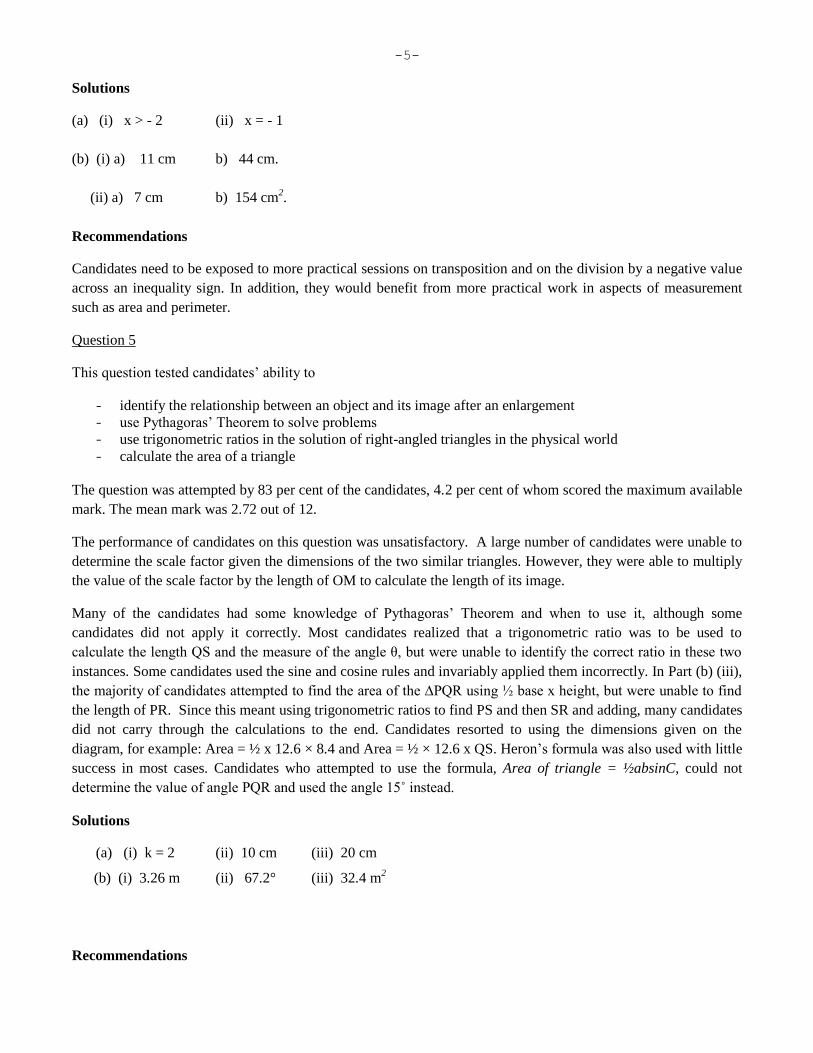
-5-
Solutions
(a) (i) x > - 2 (ii) x = - 1
(b) (i) a) 11 cm b) 44 cm.
(ii) a) 7 cm b) 154 cm2.
Recommendations
Candidates need to be exposed to more practical sessions on transposition and on the division by a negative value
across an inequality sign. In addition, they would benefit from more practical work in aspects of measurement
such as area and perimeter.
Question 5
This question tested candidates’ ability to
- identify the relationship between an object and its image after an enlargement
- use Pythagoras’ Theorem to solve problems
- use trigonometric ratios in the solution of right-angled triangles in the physical world
- calculate the area of a triangle
The question was attempted by 83 per cent of the candidates, 4.2 per cent of whom scored the maximum available
mark. The mean mark was 2.72 out of 12.
The performance of candidates on this question was unsatisfactory. A large number of candidates were unable to
determine the scale factor given the dimensions of the two similar triangles. However, they were able to multiply
the value of the scale factor by the length of OM to calculate the length of its image.
Many of the candidates had some knowledge of Pythagoras’ Theorem and when to use it, although some
candidates did not apply it correctly. Most candidates realized that a trigonometric ratio was to be used to
calculate the length QS and the measure of the angle θ, but were unable to identify the correct ratio in these two
instances. Some candidates used the sine and cosine rules and invariably applied them incorrectly. In Part (b) (iii),
the majority of candidates attempted to find the area of the ∆PQR using ½ base x height, but were unable to find
the length of PR. Since this meant using trigonometric ratios to find PS and then SR and adding, many candidates
did not carry through the calculations to the end. Candidates resorted to using the dimensions given on the
diagram, for example: Area = ½ x 12.6 × 8.4 and Area = ½ × 12.6 x QS. Heron’s formula was also used with little
success in most cases. Candidates who attempted to use the formula, Area of triangle = ½absinC, could not
determine the value of angle PQR and used the angle 15˚ instead.
Solutions
(a) (i) k = 2 (ii) 10 cm (iii) 20 cm
(b) (i) 3.26 m (ii) 67.2° (iii) 32.4 m2
Recommendations
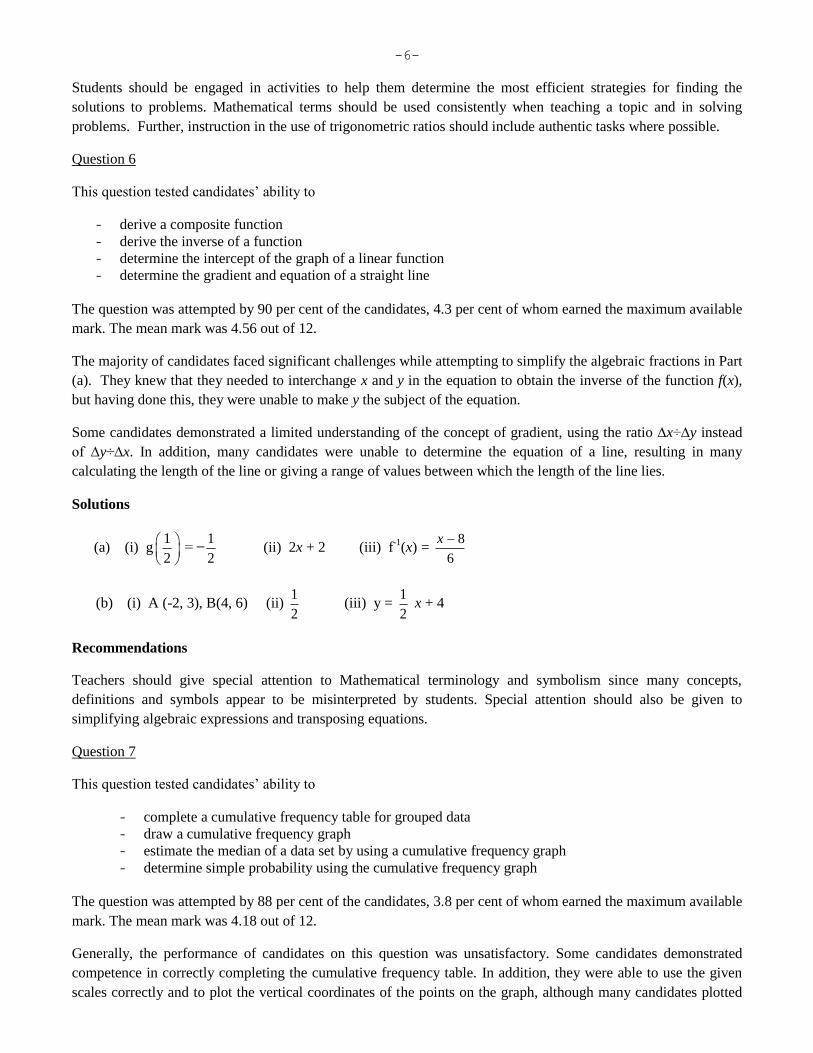
-6-
Students should be engaged in activities to help them determine the most efficient strategies for finding the
solutions to problems. Mathematical terms should be used consistently when teaching a topic and in solving
problems. Further, instruction in the use of trigonometric ratios should include authentic tasks where possible.
Question 6
This question tested candidates’ ability to
- derive a composite function
- derive the inverse of a function
- determine the intercept of the graph of a linear function
- determine the gradient and equation of a straight line
The question was attempted by 90 per cent of the candidates, 4.3 per cent of whom earned the maximum available
mark. The mean mark was 4.56 out of 12.
The majority of candidates faced significant challenges while attempting to simplify the algebraic fractions in Part
(a). They knew that they needed to interchange x and y in the equation to obtain the inverse of the function f(x),
but having done this, they were unable to make y the subject of the equation.
Some candidates demonstrated a limited understanding of the concept of gradient, using the ratio ∆x÷∆y instead
of ∆y÷∆x. In addition, many candidates were unable to determine the equation of a line, resulting in many
calculating the length of the line or giving a range of values between which the length of the line lies.
Solutions
(a) (i) g1
2
1
2(ii) 2x + 2 (iii) f
-1(x) =
8
6
x
(b) (i) A (-2, 3), B(4, 6) (ii) 1
2 (iii) y =
1
2 x + 4
Recommendations
Teachers should give special attention to Mathematical terminology and symbolism since many concepts,
definitions and symbols appear to be misinterpreted by students. Special attention should also be given to
simplifying algebraic expressions and transposing equations.
Question 7
This question tested candidates’ ability to
- complete a cumulative frequency table for grouped data
- draw a cumulative frequency graph
- estimate the median of a data set by using a cumulative frequency graph
- determine simple probability using the cumulative frequency graph
The question was attempted by 88 per cent of the candidates, 3.8 per cent of whom earned the maximum available
mark. The mean mark was 4.18 out of 12.
Generally, the performance of candidates on this question was unsatisfactory. Some candidates demonstrated
competence in correctly completing the cumulative frequency table. In addition, they were able to use the given
scales correctly and to plot the vertical coordinates of the points on the graph, although many candidates plotted
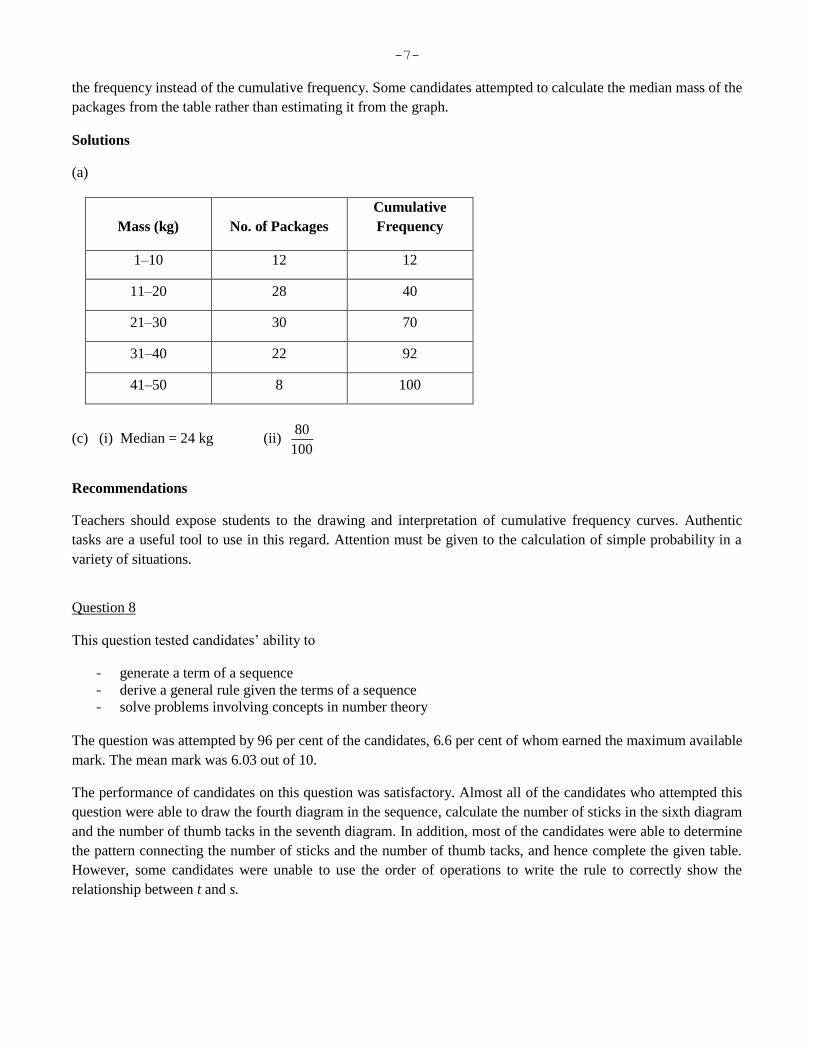
-7-
the frequency instead of the cumulative frequency. Some candidates attempted to calculate the median mass of the
packages from the table rather than estimating it from the graph.
Solutions
(a)
Mass (kg) No. of Packages
Cumulative
Frequency
1–10 12 12
11–20 28 40
21–30 30 70
31–40 22 92
41–50 8 100
(c) (i) Median = 24 kg (ii) 80
100
Recommendations
Teachers should expose students to the drawing and interpretation of cumulative frequency curves. Authentic
tasks are a useful tool to use in this regard. Attention must be given to the calculation of simple probability in a
variety of situations.
Question 8
This question tested candidates’ ability to
- generate a term of a sequence
- derive a general rule given the terms of a sequence
- solve problems involving concepts in number theory
The question was attempted by 96 per cent of the candidates, 6.6 per cent of whom earned the maximum available
mark. The mean mark was 6.03 out of 10.
The performance of candidates on this question was satisfactory. Almost all of the candidates who attempted this
question were able to draw the fourth diagram in the sequence, calculate the number of sticks in the sixth diagram
and the number of thumb tacks in the seventh diagram. In addition, most of the candidates were able to determine
the pattern connecting the number of sticks and the number of thumb tacks, and hence complete the given table.
However, some candidates were unable to use the order of operations to write the rule to correctly show the
relationship between t and s.
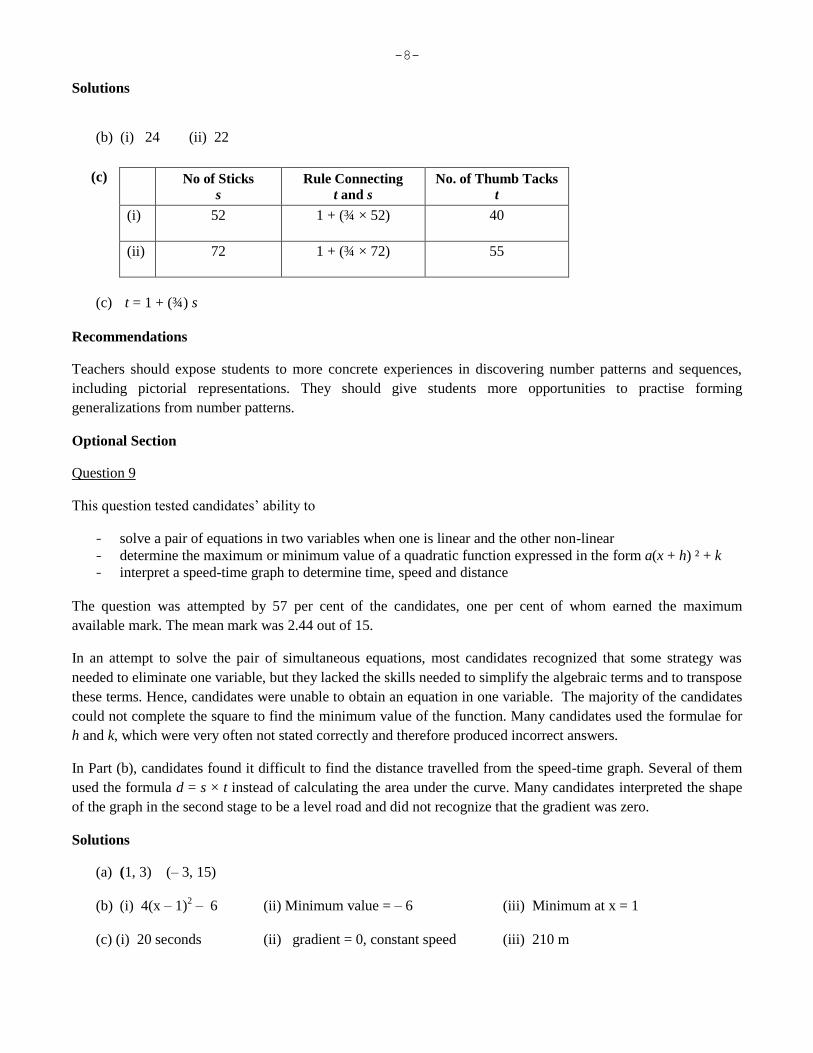
-8-
Solutions
(b) (i) 24 (ii) 22
(c) No of Sticks
s
Rule Connecting
t and s
No. of Thumb Tacks
t
(i) 52 1 + (¾ × 52) 40
(ii) 72 1 + (¾ × 72) 55
(c) t = 1 + (¾) s
Recommendations
Teachers should expose students to more concrete experiences in discovering number patterns and sequences,
including pictorial representations. They should give students more opportunities to practise forming
generalizations from number patterns.
Optional Section
Question 9
This question tested candidates’ ability to
- solve a pair of equations in two variables when one is linear and the other non-linear
- determine the maximum or minimum value of a quadratic function expressed in the form a(x + h) ² + k
- interpret a speed-time graph to determine time, speed and distance
The question was attempted by 57 per cent of the candidates, one per cent of whom earned the maximum
available mark. The mean mark was 2.44 out of 15.
In an attempt to solve the pair of simultaneous equations, most candidates recognized that some strategy was
needed to eliminate one variable, but they lacked the skills needed to simplify the algebraic terms and to transpose
these terms. Hence, candidates were unable to obtain an equation in one variable. The majority of the candidates
could not complete the square to find the minimum value of the function. Many candidates used the formulae for
h and k, which were very often not stated correctly and therefore produced incorrect answers.
In Part (b), candidates found it difficult to find the distance travelled from the speed-time graph. Several of them
used the formula d = s × t instead of calculating the area under the curve. Many candidates interpreted the shape
of the graph in the second stage to be a level road and did not recognize that the gradient was zero.
Solutions
(a) (1, 3) (– 3, 15)
(b) (i) 4(x – 1)2 – 6 (ii) Minimum value = – 6 (iii) Minimum at x = 1
(c) (i) 20 seconds (ii) gradient = 0, constant speed (iii) 210 m
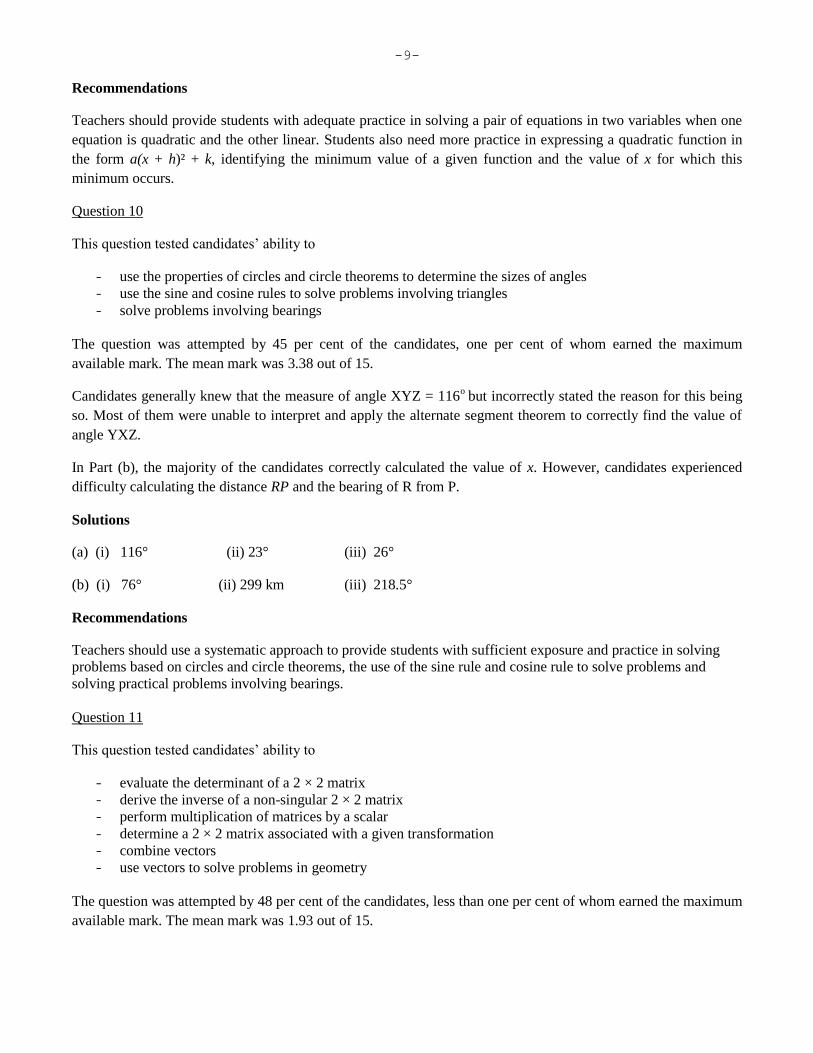
-9-
Recommendations
Teachers should provide students with adequate practice in solving a pair of equations in two variables when one
equation is quadratic and the other linear. Students also need more practice in expressing a quadratic function in
the form a(x + h)² + k, identifying the minimum value of a given function and the value of x for which this
minimum occurs.
Question 10
This question tested candidates’ ability to
- use the properties of circles and circle theorems to determine the sizes of angles
- use the sine and cosine rules to solve problems involving triangles
- solve problems involving bearings
The question was attempted by 45 per cent of the candidates, one per cent of whom earned the maximum
available mark. The mean mark was 3.38 out of 15.
Candidates generally knew that the measure of angle XYZ = 116o
but incorrectly stated the reason for this being
so. Most of them were unable to interpret and apply the alternate segment theorem to correctly find the value of
angle YXZ.
In Part (b), the majority of the candidates correctly calculated the value of x. However, candidates experienced
difficulty calculating the distance RP and the bearing of R from P.
Solutions
(a) (i) 116° (ii) 23° (iii) 26°
(b) (i) 76° (ii) 299 km (iii) 218.5°
Recommendations
Teachers should use a systematic approach to provide students with sufficient exposure and practice in solving
problems based on circles and circle theorems, the use of the sine rule and cosine rule to solve problems and
solving practical problems involving bearings.
Question 11
This question tested candidates’ ability to
- evaluate the determinant of a 2 × 2 matrix
- derive the inverse of a non-singular 2 × 2 matrix
- perform multiplication of matrices by a scalar
- determine a 2 × 2 matrix associated with a given transformation
- combine vectors
- use vectors to solve problems in geometry
The question was attempted by 48 per cent of the candidates, less than one per cent of whom earned the maximum
available mark. The mean mark was 1.93 out of 15.
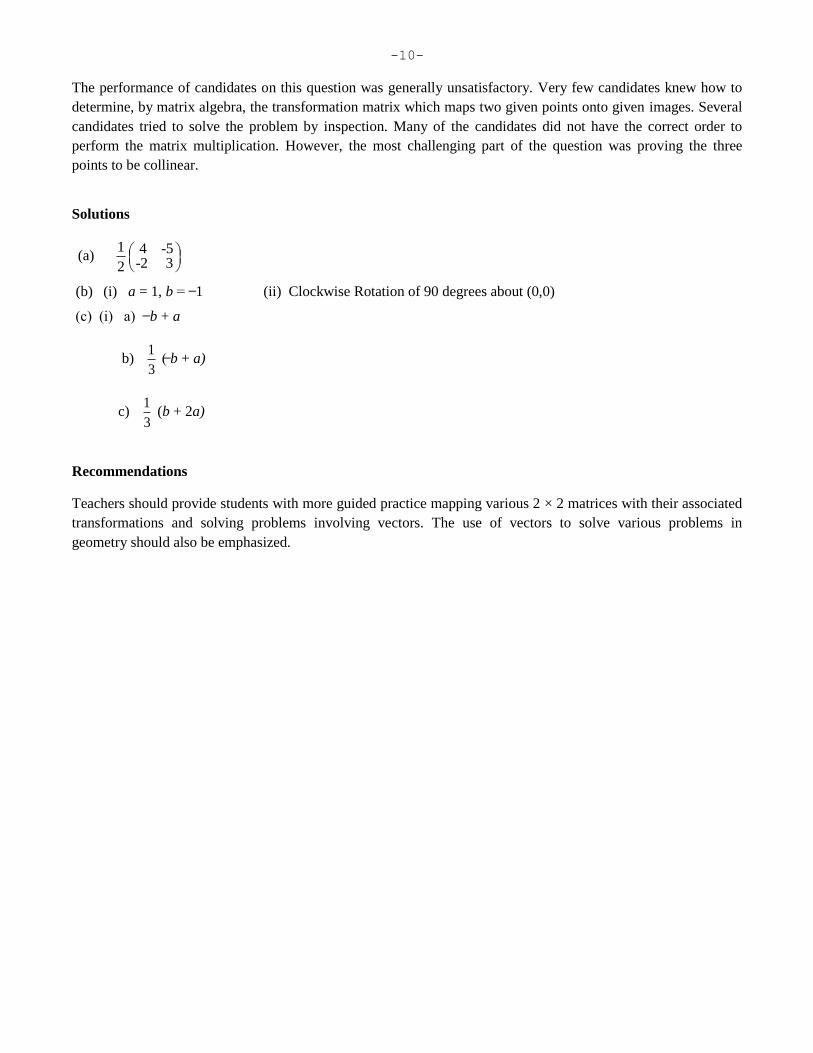
-10-
The performance of candidates on this question was generally unsatisfactory. Very few candidates knew how to
determine, by matrix algebra, the transformation matrix which maps two given points onto given images. Several
candidates tried to solve the problem by inspection. Many of the candidates did not have the correct order to
perform the matrix multiplication. However, the most challenging part of the question was proving the three
points to be collinear.
Solutions
(a) 1 4 -5
-2 32
(b) (i) a = 1, b 1 (ii) Clockwise Rotation of 90 degrees about (0,0)
c i a b + a
b) 1
3 b + a)
c) 1
3 (b + 2a)
Recommendations
Teachers should provide students with more guided practice mapping various 2 × 2 matrices with their associated
transformations and solving problems involving vectors. The use of vectors to solve various problems in
geometry should also be emphasized.
CARIBBEA� EXAMI�ATIO�S COU�CIL
REPORT O� CA�DIDATES’ WORK I� THE
SECO�DARY EDUCATIO� CERTIFICATE EXAMI�ATIO�
JA�UARY 2012
MATHEMATICS
GE�ERAL PROFICIE�CY EXAMI�ATIO�
Copyright © 2012 Caribbean Examinations Council
St Michael, Barbados
All rights reserved.
2
GE�ERAL COMME�TS
The General Proficiency Mathematics examination is offered in January and May/June each
year. There was a candidate entry of approximately 14 200 in January 2012. Forty per cent of the
candidates earned Grades I–III. The mean score for the examination was 77.14 out of 180 marks.
DETAILED COMME�TS
Paper 01 – Multiple Choice
Paper 01 consisted of 60 multiple-choice items. This year, 24 candidates each earned the
maximum available score of 60. Sixty-one per cent of the candidates scored 30 marks or more.
Paper 02 – Structured Questions
Paper 02 consisted of two sections. Section I comprised eight compulsory questions totalling 90
marks. Section II comprised three optional questions: one each from (i) Algebra, Relation,
Functions and Graphs; (ii) Measurement, Trigonometry and Geometry; and (iii) Vectors and
Matrices. Candidates were required to answer any two questions from this section. Each question
in this section was worth 15 marks.
This year, three candidates earned the maximum available mark of 120 on Paper 02.
Approximately 21 per cent of the candidates earned at least half the maximum marks on this
paper.
Compulsory Section
Question 1
This question tested candidates’ ability to
- square and divide fractions involving mixed numbers
- determine the square root of and add decimal numbers
- write a decimal number in standard form
- solve problems involving wages and overtime.
The question was attempted by 99 per cent of the candidates, 9.6 per cent of whom earned the
maximum available mark. The mean mark was 7.89 out of 12.
3
In general, candidates provided satisfactory responses to this question. However, some incorrect
responses provided useful insights into some misconceptions held by candidates.
These included for Part (a):
(i) �1 ���
�= 2
� (Each digit is multiplied by 2 instead of squaring the numerator and
denominator in the equivalent improper fraction)
(ii) �1 ���
�= 1 �
(Each digit in the mixed number is squared)
In Part (b),while most candidates were able to calculate the basic weekly wage, a large
proportion of candidates experienced difficulty in determining the overtime wage for one hour.
Incorrect attempts included either the multiplication of the basic hourly wage by 2.5 or by 0.5
instead of by 1.5.
Solutions
(a) (i) �� (ii) 0.446, 4.46× 10�
(b) (i) $900 (ii) $33.75 (iii) $405 (iv) 16 hours
Recommendations
Teachers should provide students with opportunities to use the calculator to perform basic
arithmetic operations on rational numbers. Attention should also be given to finding the square
and square root of improper fractions and decimals.
Question 2
This question tested candidates’ ability to
- solve a pair of simultaneous linear equations
- factorize quadratic functions involving the difference of squares and grouping
- solve worded problems involving simple linear equations.
The question was attempted by 99 per cent of the candidates, 2.5 per cent of whom earned the
maximum available mark. The mean mark was 3.54 out of 12. The performance of candidates
on this question was generally unsatisfactory.
4
In Part (a), which required candidates to solve simultaneous equations in two unknowns, a large
proportion of candidates showed some proficiency on this objective but some were unable to
correctly complete the process. Many of them made errors in attempting to eliminate one of the
variables as they experienced some difficulty with directed numbers.
For Part (b), which involved the factorization of quadratic expressions, few candidates
demonstrated an awareness of the difference of squares and, as a consequence, the factors were
not obtained for �� − 16.Factorizing 2�� − 3� + 8� − 12 was more competently done.
Nevertheless, even when candidates were able to identify the common factors, they encountered
difficulty with the signs.
In Part (c), few candidates were able to show that the total amount spent on the 28 tickets was
$�15� + 420�. Further, they did not combine the separate expressions
�28 − �� × 15and 30� to obtain the stated result.
Solutions
(a) � = 3, � = 2(b) (i) �� − 4��� + 4� (ii) �2� − 3��� + 4�(c) (i) a) �28 − �� b) 30� c) 15�28 − �� (ii) 15� + 420 (iii) 16
Recommendations
Teachers should engage students in translating worded phrases into algebraic expressions and
equations. The difference between squares is a useful tool in factorization and needs special
attention by teachers and students.
Question 3
This question tested candidates’ ability to
- identify and list odd and prime numbers
- draw a Venn diagram to illustrate the relationship between two sets
- construct a triangle which included an angle of 45°
- construct a perpendicular to a line from a point outside that line
- determine the measure of an angle.
The question was attempted by 99 per cent of the candidates, 1.4 per cent of whom earned the
maximum available mark. The mean mark was 5.58 out of 12.
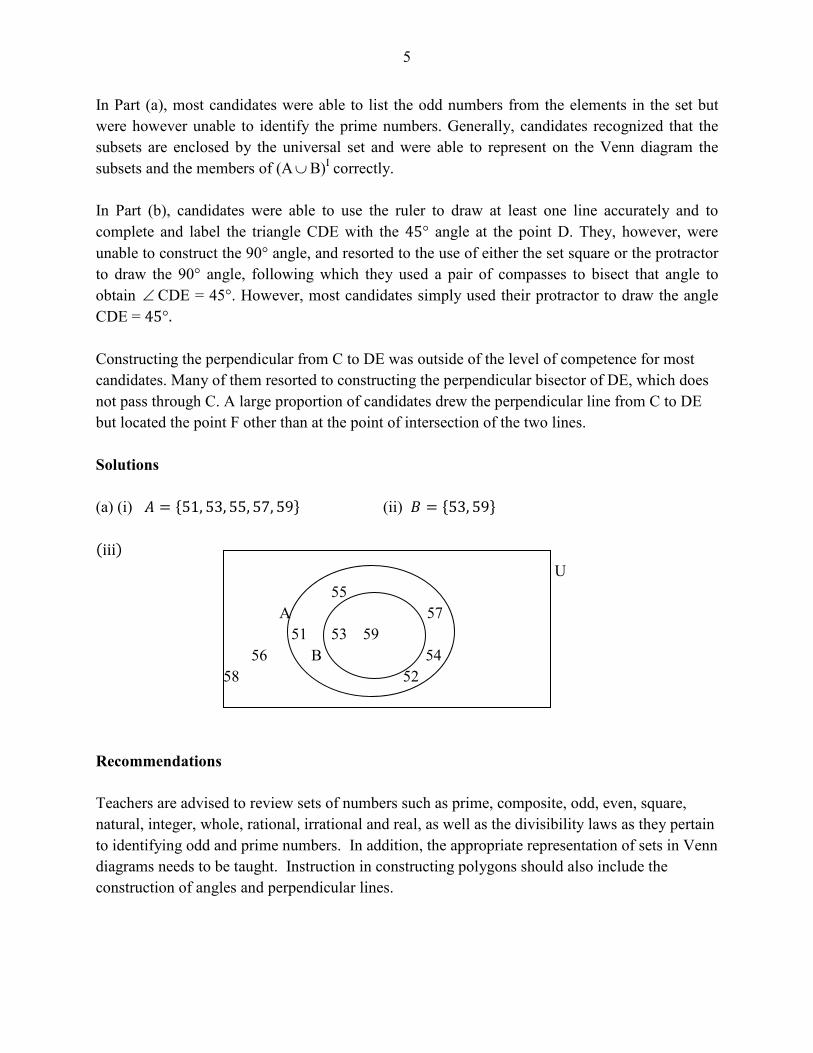
5
In Part (a), most candidates were able to list the odd numbers from the elements in the set but
were however unable to identify the prime numbers. Generally, candidates recognized that the
subsets are enclosed by the universal set and were able to represent on the Venn diagram the
subsets and the members of (A∪B)I correctly.
In Part (b), candidates were able to use the ruler to draw at least one line accurately and to
complete and label the triangle CDE with the 45° angle at the point D. They, however, were
unable to construct the 90° angle, and resorted to the use of either the set square or the protractor
to draw the 90° angle, following which they used a pair of compasses to bisect that angle to
obtain ∠CDE = 45°. However, most candidates simply used their protractor to draw the angle
CDE = 45°.
Constructing the perpendicular from C to DE was outside of the level of competence for most
candidates. Many of them resorted to constructing the perpendicular bisector of DE, which does
not pass through C. A large proportion of candidates drew the perpendicular line from C to DE
but located the point F other than at the point of intersection of the two lines.
Solutions
(a) (i) = !51, 53, 55, 57, 59$ (ii) % = !53, 59$
�iii� U
55
A 57
51 53 59
56 B 54
58 52
Recommendations
Teachers are advised to review sets of numbers such as prime, composite, odd, even, square,
natural, integer, whole, rational, irrational and real, as well as the divisibility laws as they pertain
to identifying odd and prime numbers. In addition, the appropriate representation of sets in Venn
diagrams needs to be taught. Instruction in constructing polygons should also include the
construction of angles and perpendicular lines.
6
Question 4
This question tested candidates’ ability to
- determine the time interval between two times written in the 24-hour clock notation
- calculate distance in '( given time in minutes and speed in '(/ℎ
- convert from litres to cubic centimetres
- calculate the height of a cuboid given the length and width of its base
- derive and solve a simple linear equation in one unknown using concepts of area and
volume of a cuboid.
The question was attempted by 98 per cent of the candidates, 5.0 per cent of whom earned the
maximum available mark. The mean mark was 3.91 out of 11.
Candidates were proficient at evaluating the time in minutes between 7:35 and 7:45 on the
24−hour clock. They however experienced difficulty in determining the time elapsed between
6:40 and 7:35, with the most common result being 95 minutes instead of 55 minutes.
The formula, +,-./012 = -322+ × .,(2, was well known but attention was not paid to the
different units used in the question. The inconsistency with the use of units was again evident in
Part (b). Here, candidates knew that ℎ = 45, but did not know how to convert litres to cubic
centimetres. A frequent incorrect conversion was 4.86 = 4801(�. The greatest challenge
candidates encountered was in expressing area in terms of a variable h, and in establishing the
equation connecting the volume of the cuboid to 286.
Solutions
(a) (i) 10 minutes (ii) 55 minutes (iii) 49.5 km
(b) 16 cm
�1� (i) 4ℎ1(� (ii) 52ℎ1(� (iii) 5.5 cm
Recommendations
Teachers should give special attention to conversion of units. Emphasis should be placed on the
value of a quantity based on its unit; for example: 4.86 > 3001(�. A common-sense approach
to the calculation of time elapsed should be encouraged so that when Mathematics is applied, the
result of the calculation fits the estimation.
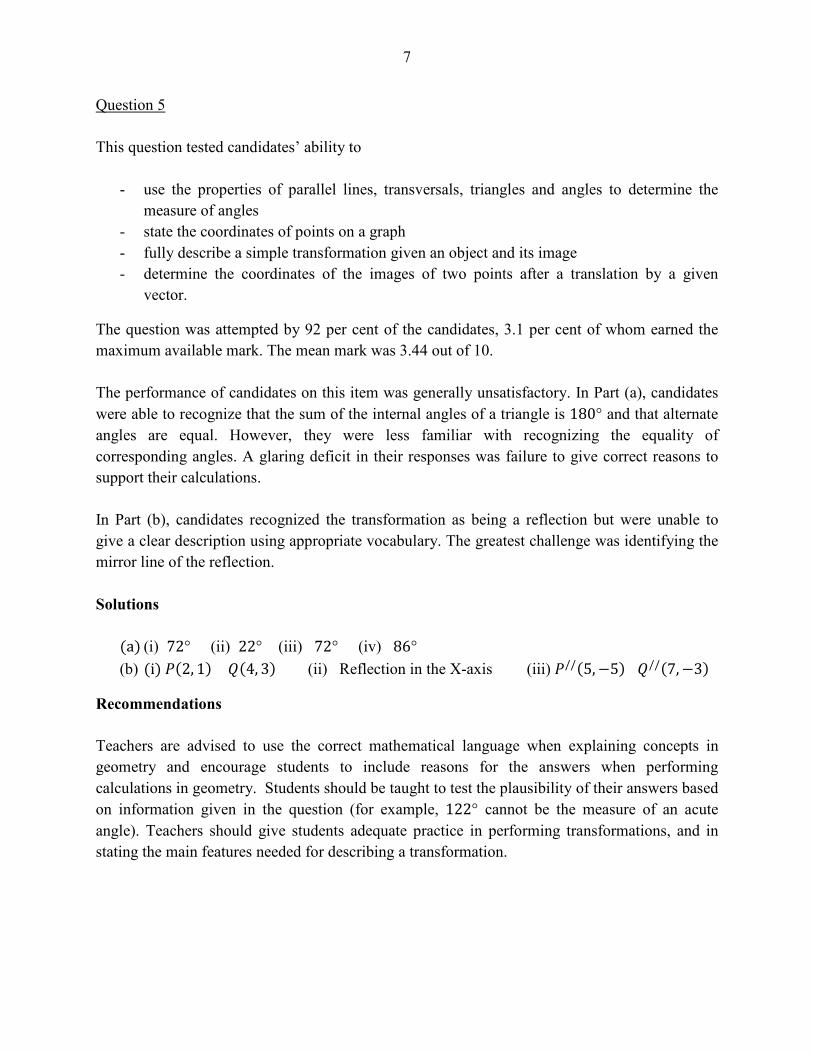
7
Question 5
This question tested candidates’ ability to
- use the properties of parallel lines, transversals, triangles and angles to determine the
measure of angles
- state the coordinates of points on a graph
- fully describe a simple transformation given an object and its image
- determine the coordinates of the images of two points after a translation by a given
vector.
The question was attempted by 92 per cent of the candidates, 3.1 per cent of whom earned the
maximum available mark. The mean mark was 3.44 out of 10.
The performance of candidates on this item was generally unsatisfactory. In Part (a), candidates
were able to recognize that the sum of the internal angles of a triangle is 180° and that alternate
angles are equal. However, they were less familiar with recognizing the equality of
corresponding angles. A glaring deficit in their responses was failure to give correct reasons to
support their calculations.
In Part (b), candidates recognized the transformation as being a reflection but were unable to
give a clear description using appropriate vocabulary. The greatest challenge was identifying the
mirror line of the reflection.
Solutions
�a� (i) 72° (ii) 22° (iii) 72° (iv) 86°
(b) �i�9�2, 1� :�4, 3� (ii) Reflection in the X-axis (iii) 9//�5, −5� ://�7, −3�
Recommendations
Teachers are advised to use the correct mathematical language when explaining concepts in
geometry and encourage students to include reasons for the answers when performing
calculations in geometry. Students should be taught to test the plausibility of their answers based
on information given in the question (for example, 122° cannot be the measure of an acute
angle). Teachers should give students adequate practice in performing transformations, and in
stating the main features needed for describing a transformation.
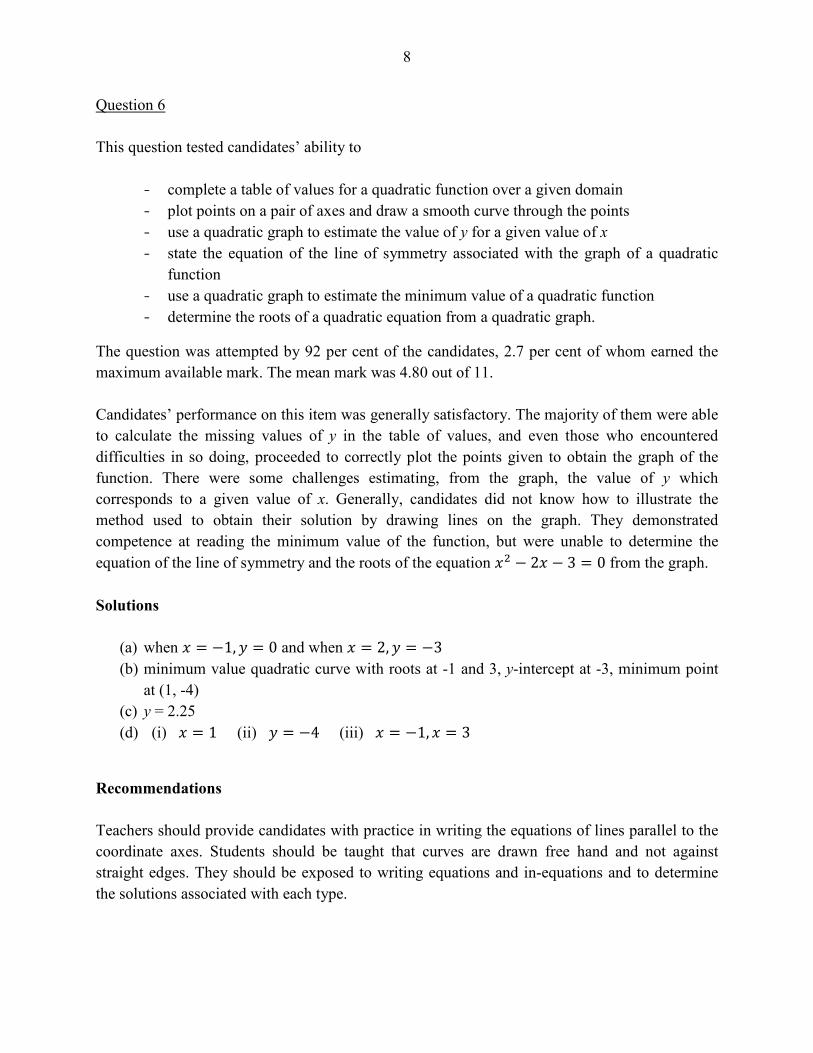
8
Question 6
This question tested candidates’ ability to
- complete a table of values for a quadratic function over a given domain
- plot points on a pair of axes and draw a smooth curve through the points
- use a quadratic graph to estimate the value of y for a given value of x
- state the equation of the line of symmetry associated with the graph of a quadratic
function
- use a quadratic graph to estimate the minimum value of a quadratic function
- determine the roots of a quadratic equation from a quadratic graph.
The question was attempted by 92 per cent of the candidates, 2.7 per cent of whom earned the
maximum available mark. The mean mark was 4.80 out of 11.
Candidates’ performance on this item was generally satisfactory. The majority of them were able
to calculate the missing values of y in the table of values, and even those who encountered
difficulties in so doing, proceeded to correctly plot the points given to obtain the graph of the
function. There were some challenges estimating, from the graph, the value of y which
corresponds to a given value of x. Generally, candidates did not know how to illustrate the
method used to obtain their solution by drawing lines on the graph. They demonstrated
competence at reading the minimum value of the function, but were unable to determine the
equation of the line of symmetry and the roots of the equation �� − 2� − 3 = 0 from the graph.
Solutions
(a) when � = −1, � = 0 and when � = 2, � = −3(b) minimum value quadratic curve with roots at -1 and 3, y-intercept at -3, minimum point
at (1, -4)
(c) y = 2.25
(d) (i) � = 1 (ii) � = −4 (iii) � = −1, � = 3
Recommendations
Teachers should provide candidates with practice in writing the equations of lines parallel to the
coordinate axes. Students should be taught that curves are drawn free hand and not against
straight edges. They should be exposed to writing equations and in-equations and to determine
the solutions associated with each type.
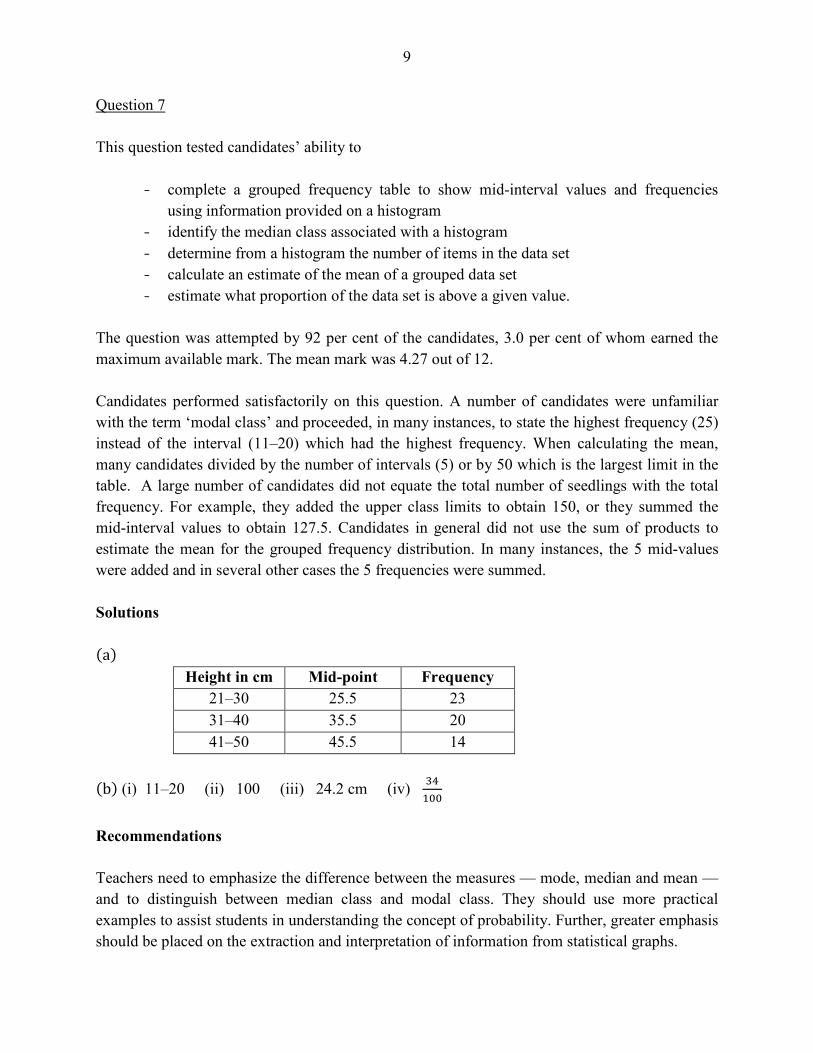
9
Question 7
This question tested candidates’ ability to
- complete a grouped frequency table to show mid-interval values and frequencies
using information provided on a histogram
- identify the median class associated with a histogram
- determine from a histogram the number of items in the data set
- calculate an estimate of the mean of a grouped data set
- estimate what proportion of the data set is above a given value.
The question was attempted by 92 per cent of the candidates, 3.0 per cent of whom earned the
maximum available mark. The mean mark was 4.27 out of 12.
Candidates performed satisfactorily on this question. A number of candidates were unfamiliar
with the term ‘modal class’ and proceeded, in many instances, to state the highest frequency (25)
instead of the interval (11–20) which had the highest frequency. When calculating the mean,
many candidates divided by the number of intervals (5) or by 50 which is the largest limit in the
table. A large number of candidates did not equate the total number of seedlings with the total
frequency. For example, they added the upper class limits to obtain 150, or they summed the
mid-interval values to obtain 127.5. Candidates in general did not use the sum of products to
estimate the mean for the grouped frequency distribution. In many instances, the 5 mid-values
were added and in several other cases the 5 frequencies were summed.
Solutions
�a�Height in cm Mid-point Frequency
21–30 25.5 23
31–40 35.5 20
41–50 45.5 14
�b� (i) 11–20 (ii) 100 (iii) 24.2 cm (iv)�� <<
Recommendations
Teachers need to emphasize the difference between the measures — mode, median and mean —
and to distinguish between median class and modal class. They should use more practical
examples to assist students in understanding the concept of probability. Further, greater emphasis
should be placed on the extraction and interpretation of information from statistical graphs.
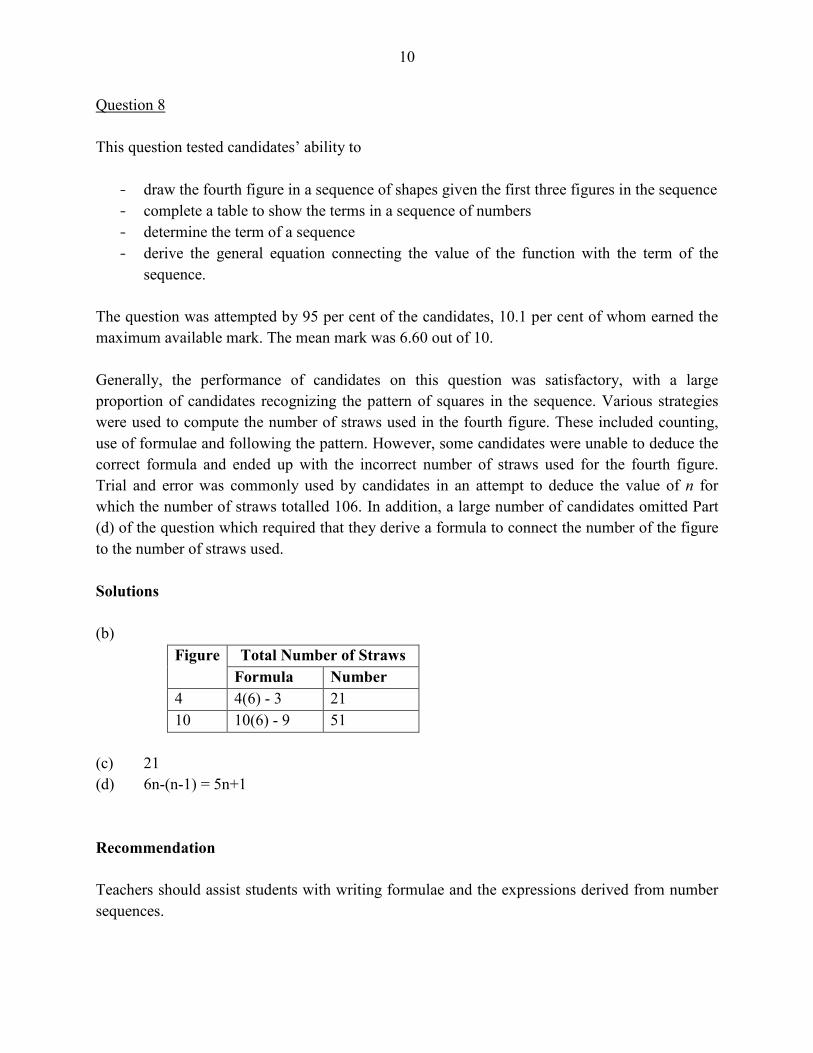
10
Question 8
This question tested candidates’ ability to
- draw the fourth figure in a sequence of shapes given the first three figures in the sequence
- complete a table to show the terms in a sequence of numbers
- determine the term of a sequence
- derive the general equation connecting the value of the function with the term of the
sequence.
The question was attempted by 95 per cent of the candidates, 10.1 per cent of whom earned the
maximum available mark. The mean mark was 6.60 out of 10.
Generally, the performance of candidates on this question was satisfactory, with a large
proportion of candidates recognizing the pattern of squares in the sequence. Various strategies
were used to compute the number of straws used in the fourth figure. These included counting,
use of formulae and following the pattern. However, some candidates were unable to deduce the
correct formula and ended up with the incorrect number of straws used for the fourth figure.
Trial and error was commonly used by candidates in an attempt to deduce the value of n for
which the number of straws totalled 106. In addition, a large number of candidates omitted Part
(d) of the question which required that they derive a formula to connect the number of the figure
to the number of straws used.
Solutions
(b)
Figure Total �umber of Straws
Formula �umber
4 4(6) - 3 21
10 10(6) - 9 51
(c) 21
(d) 6n-(n-1) = 5n+1
Recommendation
Teachers should assist students with writing formulae and the expressions derived from number
sequences.
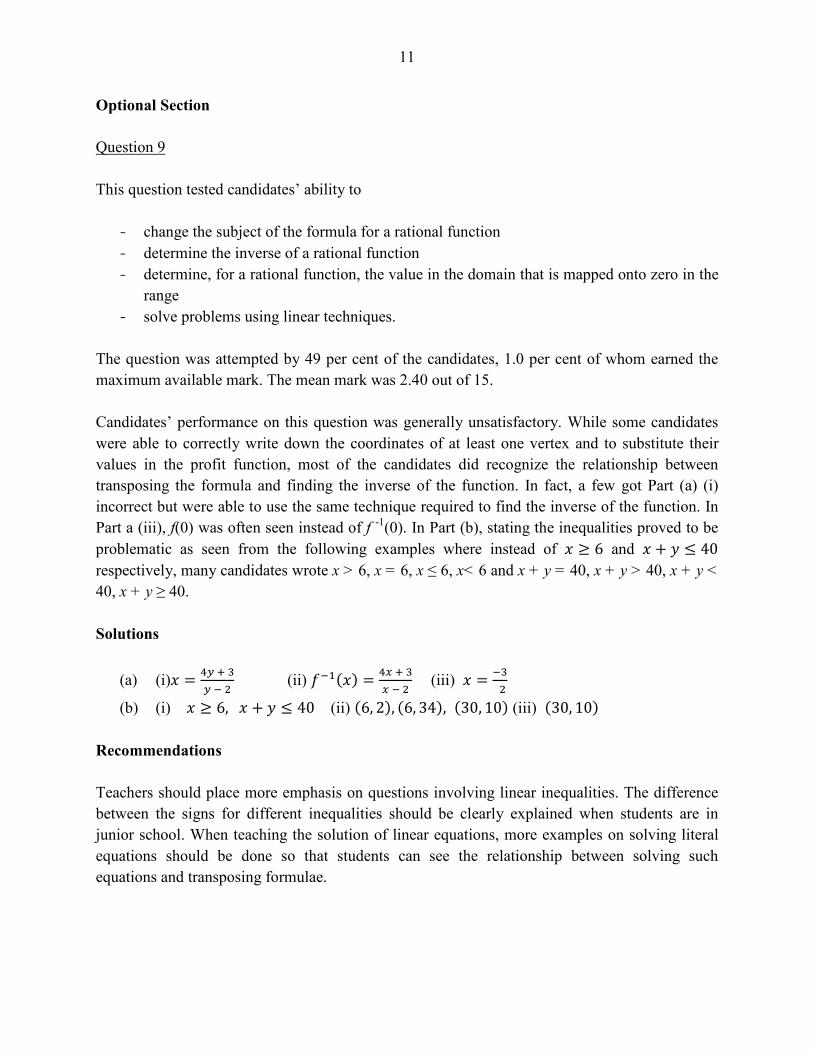
11
Optional Section
Question 9
This question tested candidates’ ability to
- change the subject of the formula for a rational function
- determine the inverse of a rational function
- determine, for a rational function, the value in the domain that is mapped onto zero in the
range
- solve problems using linear techniques.
The question was attempted by 49 per cent of the candidates, 1.0 per cent of whom earned the
maximum available mark. The mean mark was 2.40 out of 15.
Candidates’ performance on this question was generally unsatisfactory. While some candidates
were able to correctly write down the coordinates of at least one vertex and to substitute their
values in the profit function, most of the candidates did recognize the relationship between
transposing the formula and finding the inverse of the function. In fact, a few got Part (a) (i)
incorrect but were able to use the same technique required to find the inverse of the function. In
Part a (iii), f(0) was often seen instead of f -1(0). In Part (b), stating the inequalities proved to be
problematic as seen from the following examples where instead of � ≥ 6 and � + � ≤ 40
respectively, many candidates wrote x > 6, x = 6, x ≤ 6, x< 6 and x + y = 40, x + y > 40, x + y <
40, x + y ≥ 40.
Solutions
(a) (i)� = �?@�?�� (ii) A� ��� = �B@�
B�� (iii) � = ���
(b) (i) � ≥ 6,� + � ≤ 40 (ii) �6, 2�, �6, 34�, �30, 10� (iii) �30, 10�
Recommendations
Teachers should place more emphasis on questions involving linear inequalities. The difference
between the signs for different inequalities should be clearly explained when students are in
junior school. When teaching the solution of linear equations, more examples on solving literal
equations should be done so that students can see the relationship between solving such
equations and transposing formulae.
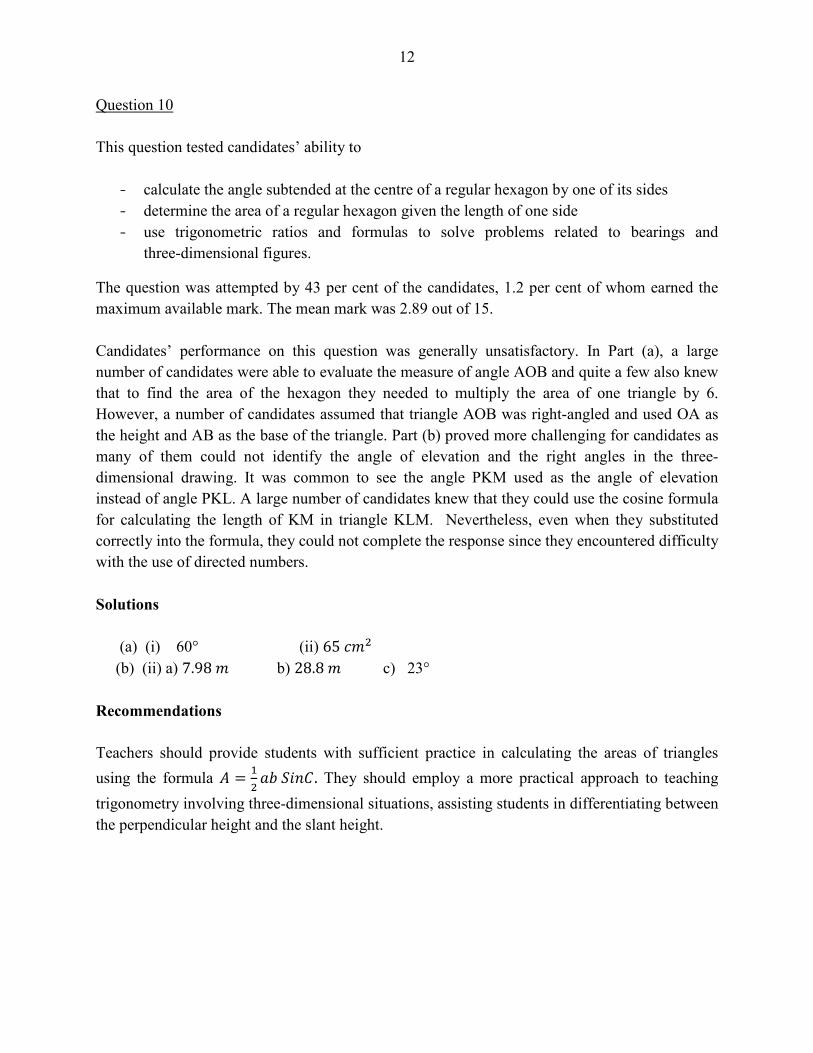
12
Question 10
This question tested candidates’ ability to
- calculate the angle subtended at the centre of a regular hexagon by one of its sides
- determine the area of a regular hexagon given the length of one side
- use trigonometric ratios and formulas to solve problems related to bearings and
three-dimensional figures.
The question was attempted by 43 per cent of the candidates, 1.2 per cent of whom earned the
maximum available mark. The mean mark was 2.89 out of 15.
Candidates’ performance on this question was generally unsatisfactory. In Part (a), a large
number of candidates were able to evaluate the measure of angle AOB and quite a few also knew
that to find the area of the hexagon they needed to multiply the area of one triangle by 6.
However, a number of candidates assumed that triangle AOB was right-angled and used OA as
the height and AB as the base of the triangle. Part (b) proved more challenging for candidates as
many of them could not identify the angle of elevation and the right angles in the three-
dimensional drawing. It was common to see the angle PKM used as the angle of elevation
instead of angle PKL. A large number of candidates knew that they could use the cosine formula
for calculating the length of KM in triangle KLM. Nevertheless, even when they substituted
correctly into the formula, they could not complete the response since they encountered difficulty
with the use of directed numbers.
Solutions
(a) (i) 60° (ii) 651(�
(b) (ii) a) 7.98( b) 28.8( c) 23°
Recommendations
Teachers should provide students with sufficient practice in calculating the areas of triangles
using the formula = � /CD,0E. They should employ a more practical approach to teaching
trigonometry involving three-dimensional situations, assisting students in differentiating between
the perpendicular height and the slant height.
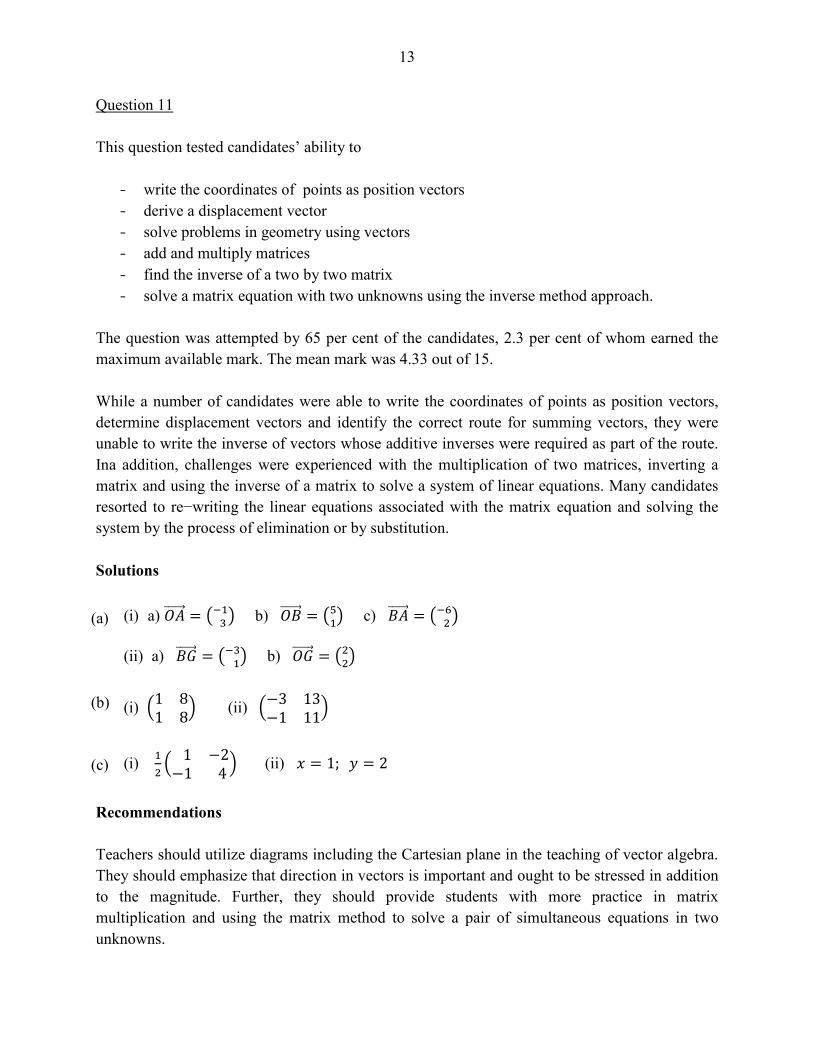
13
Question 11
This question tested candidates’ ability to
- write the coordinates of points as position vectors
- derive a displacement vector
- solve problems in geometry using vectors
- add and multiply matrices
- find the inverse of a two by two matrix
- solve a matrix equation with two unknowns using the inverse method approach.
The question was attempted by 65 per cent of the candidates, 2.3 per cent of whom earned the
maximum available mark. The mean mark was 4.33 out of 15.
While a number of candidates were able to write the coordinates of points as position vectors,
determine displacement vectors and identify the correct route for summing vectors, they were
unable to write the inverse of vectors whose additive inverses were required as part of the route.
Ina addition, challenges were experienced with the multiplication of two matrices, inverting a
matrix and using the inverse of a matrix to solve a system of linear equations. Many candidates
resorted to re−writing the linear equations associated with the matrix equation and solving the
system by the process of elimination or by substitution.
Solutions
(i) a) F GGGGGH = I� �J b) F%GGGGGH = IK J c) % GGGGGH = I��J
(ii) a) %LGGGGGH = I�� J b) FLGGGGGH = I��J
(i) �1 81 8� (ii) �−3 13
−1 11�
(i) � �1 −2−1 4 � (ii) � = 1; � = 2
Recommendations
Teachers should utilize diagrams including the Cartesian plane in the teaching of vector algebra.
They should emphasize that direction in vectors is important and ought to be stressed in addition
to the magnitude. Further, they should provide students with more practice in matrix
multiplication and using the matrix method to solve a pair of simultaneous equations in two
unknowns.
(a)
(b)
(c)
C A R I B B E A N E X A M I N A T I O N S C O U N C I L
REPORT ON CANDIDATES’ WORK IN THE
CARIBBEAN SECONDARY EDUCATION CERTIFICATE EXAMINATION®
MAY/JUNE 2012
MATHEMATICS
GENERAL PROFICIENCY EXAMINATION
Copyright © 2012 Caribbean Examinations Council
St Michael, Barbados
All rights reserved.
- 2 -
GENERAL COMMENTS
The General Proficiency Mathematics examination is offered in January and May/June each year. There
was a candidate entry of approximately 95,000 in May/June 2012. Thirty-three per cent of the candidates
earned Grades I–III. The mean score for the examination was 66.40 out of 180 marks.
DETAILED COMMENTS
Paper 01 — Multiple Choice
Paper 01 consisted of 60 multiple choice items. This year, 298 candidates each earned the maximum
available score of 60 marks in the paper. The mean mark for this paper was 32.70 out of 60 marks.
Paper 02 — Structured Questions
Paper 02 comprised two sections. Section I consisted of eight compulsory questions for a total of 90
marks. Section II consisted of three optional questions: one each from Algebra, Relation, Functions and
Graphs; Measurement, Trigonometry and Geometry; and Vectors and Matrices. Candidates were required
to answer any two out of three questions from this section. Each question in this section was worth 15
marks.
This year, 13 candidates earned the maximum available score of 120 marks on the paper. Furthermore,
based on the data collected, candidates were able to secure full marks in every question on the paper.
The mean mark for this paper was 33.64 out of 120 marks.
Compulsory Section
Question 1
This question tested candidates’ ability to
— subtract and divide fractions involving mixed numbers
— express a fraction in its lowest terms
— determine percentage profit or loss given cost price and selling price
— determine cost price given selling price and percentage profit
— perform currency conversions using given rates
— solve problems involving currency conversions.
- 3 -
The question was attempted by 99.4 per cent of the candidates, 3.1 per cent of whom earned the
maximum available mark. The mean mark was 4.60 out of 12.
In general, candidates provided fair responses but there were far too many instances of poor responses in
all the areas tested. In Part (a), the majority of candidates knew that they had to calculate the Lowest
Common Multiple (LCM) of the denominators but a significant number of candidates made careless
errors obtaining the equivalent fractions. The following errors were noted:
— In converting the mixed number 4
25
to an improper fraction, some candidates wrote 24
5 instead
of 14
5
— After simplifying the numerator and the denominator, far too many candidates divided their terms
in the reverse order, using the numerator as the divisor instead of the denominator.
In addition, candidates did not state the fraction in lowest terms and some candidates incorrectly wrote
19 2 = 1
21 21
For Part (b), the majority of candidates were able to determine the percentage loss as a percentage of the
cost price but few were able to reverse this process and determine the cost price given the selling price
and percentage profit. Some common errors in Part (i) were:
— Stating the loss instead of the percentage loss, a common error being $55 – $44 = 11% instead of
$11
— Computing the percentage loss using the selling price rather than the cost price.
In Part (ii), candidates merely subtracted the 25% from $100 and obtained $75 as the cost price. This was
an extremely popular incorrect response, demonstrating that candidates did not know how to proceed to
solve problems on percentages when the whole was not given.
For Part (c), candidates experienced great difficulty in setting up the required proportions, others made
careless errors in simplifying decimal products and obtained unreasonable answers to the various parts.
Solutions
(a) 19
21(b) (i) 20% (ii) $80
(c) (i) TT$2.50 (ii) EC$216 (iii) US$96
Recommendations
When solving fraction problems involving mixed operations, teachers should encourage students to
present their work in logical steps, simplifying each step as they proceed towards the solution. The use of
the calculator in performing decimal computations should be emphasized. Students must also be taught
estimation skills so that they can determine the reasonableness of their answers.
- 4 -
Question 2
This question tested candidates’ ability to
— factorize algebraic expressions involving common factors, the difference of two squares and
grouping
— solve a linear equation involving fractions
— solve a pair of simultaneous linear equations.
The question was attempted by 97.9 per cent of the candidates, 3.7 per cent of whom earned the
maximum available mark. The mean mark was 3.79 out of 12.
Generally, performance on this question was weak, with candidates only demonstrating proficiency in a
few of the basic concepts in algebra that were tested. Candidate’s inability to perform simple operations
with directed numbers was a general weakness throughout.
In Part (a), the inability to recognize the Highest Common Factor (HCF) in an algebraic expression was
also a clear weakness. Even though candidates were able to find a common factor they were unable to
determine the HCF. Candidates were unable to recognize the difference of two squares and some actually
commented that the expression could not be factorized. Candidates also had difficulty in factoring the
second group and ignored the negative signs, that is, obtaining ( ) instead of ( ).
For Part (c), a variety of methods was used to solve the simultaneous equations including the use of
Cramer’s Rule. However, candidates experienced difficulty in identifying the correct operation (addition
or subtraction) to eliminate one of the variables.
Solutions
(a) (i) 2x2y (x + 3y) (ii) (3 2) (3 2)x x (iii) (4 ( 2 )x y x y
(b) x = 9 (c) x = 4, y = 1
Recommendations
Students must be taught to recognize the various types of algebraic expressions so that they can select the
correct strategy for factorization. When using common factors they must also be able to recognize when
an expression has been completely factorized. A consistent method of clearing fractions in an equation
must be taught and these methods must be connected to arithmetical operations with fractions. Errors can
also be avoided if students are taught to verify their solutions when solving simultaneous equations.
- 5 -
Question 3
This question tested candidates’ ability to
— use a Venn diagram to solve practical problems involving two sets
— determine the number of elements in subsets involving two intersecting sets
— solve problems involving Venn diagrams using algebraic methods
— represent points on a plane given bearings
— solve problems involving bearings using Pythagoras’ theorem and trigonometric ratios
The question was attempted by 97.6 per cent of the candidates, 4.3 per cent of whom earned the
maximum available mark. The mean mark was 4.63 out of 12.
Performance was generally unsatisfactory; however, a significant number of candidates scored higher in
Part (b) than in Part (a).
In Part (a), only a small percentage of candidates was able to obtain (30 – 9x) for the number of students
who play only tennis. Many candidates incorrectly obtained y = 30 – x as the answer.
Candidates also had difficulty relating parts of a set to the whole set. In many instances, the expression
given did not match the information offered by the candidates in their Venn diagram. In such cases,
incorrect equations resulted in unrealistic solutions such as fractions and the candidates were unable to
deduce that their answers were incorrect.
In Part (b), the majority of candidates produced correctly labelled diagrams showing the positions of Q
and R. Although candidates generally recognized the use of Pythagoras’ theorem to solve the triangle,
they had problems applying it to the problem.
Candidates were also unable to apply the correct trigonometrical ratio for finding an angle. Many
candidates made serious omissions in presenting their work, such as 15 20
= and 20 15
tan . Some
candidates applied the sine and cosine rules but very few arrived at a correct answer using these methods.
A significant number of candidates attempted to find the angle QRP instead of QPR, indicating that basic
skills in naming angles are missing.
Solution
(a) (i) (ii) a) b)
(b) (i) (ii) 25 km (iii) 530
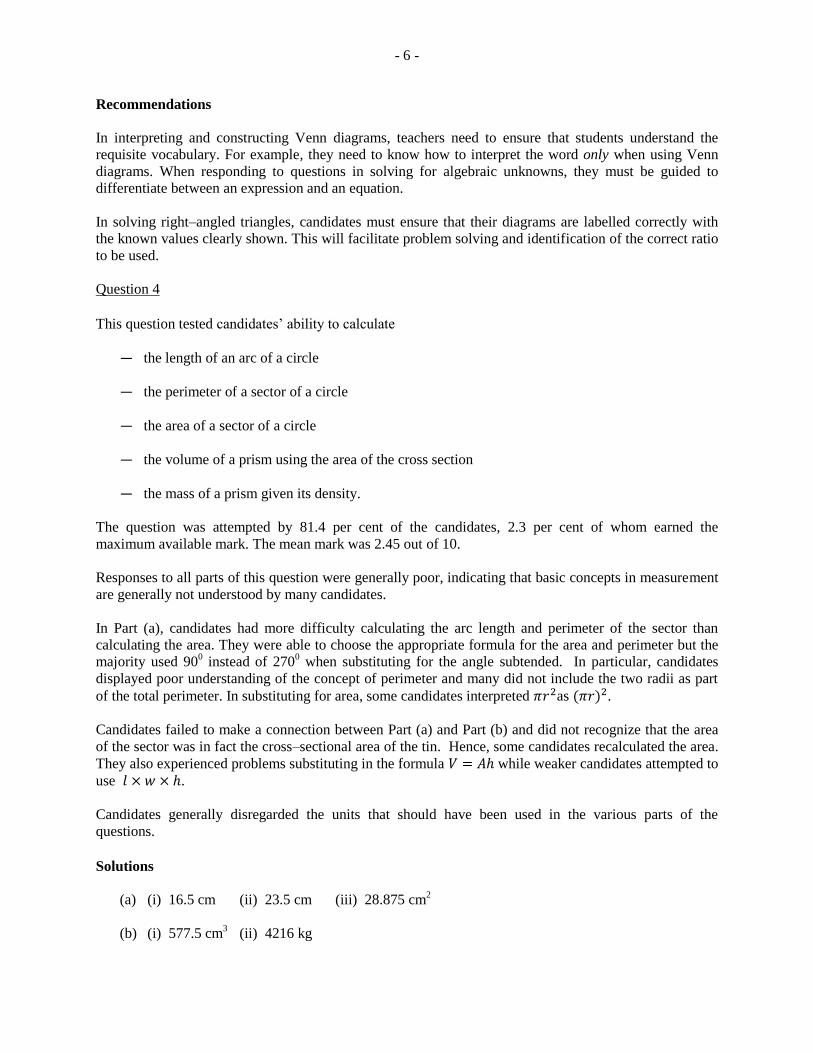
- 6 -
Recommendations
In interpreting and constructing Venn diagrams, teachers need to ensure that students understand the
requisite vocabulary. For example, they need to know how to interpret the word only when using Venn
diagrams. When responding to questions in solving for algebraic unknowns, they must be guided to
differentiate between an expression and an equation.
In solving right–angled triangles, candidates must ensure that their diagrams are labelled correctly with
the known values clearly shown. This will facilitate problem solving and identification of the correct ratio
to be used.
Question 4
This question tested candidates’ ability to calculate
— the length of an arc of a circle
— the perimeter of a sector of a circle
— the area of a sector of a circle
— the volume of a prism using the area of the cross section
— the mass of a prism given its density.
The question was attempted by 81.4 per cent of the candidates, 2.3 per cent of whom earned the
maximum available mark. The mean mark was 2.45 out of 10.
Responses to all parts of this question were generally poor, indicating that basic concepts in measurement
are generally not understood by many candidates.
In Part (a), candidates had more difficulty calculating the arc length and perimeter of the sector than
calculating the area. They were able to choose the appropriate formula for the area and perimeter but the
majority used 900 instead of 270
0 when substituting for the angle subtended. In particular, candidates
displayed poor understanding of the concept of perimeter and many did not include the two radii as part
of the total perimeter. In substituting for area, some candidates interpreted as ( ) .
Candidates failed to make a connection between Part (a) and Part (b) and did not recognize that the area
of the sector was in fact the cross–sectional area of the tin. Hence, some candidates recalculated the area.
They also experienced problems substituting in the formula while weaker candidates attempted to
use .
Candidates generally disregarded the units that should have been used in the various parts of the
questions.
Solutions
(a) (i) 16.5 cm (ii) 23.5 cm (iii) 28.875 cm2
(b) (i) 577.5 cm3 (ii) 4216 kg
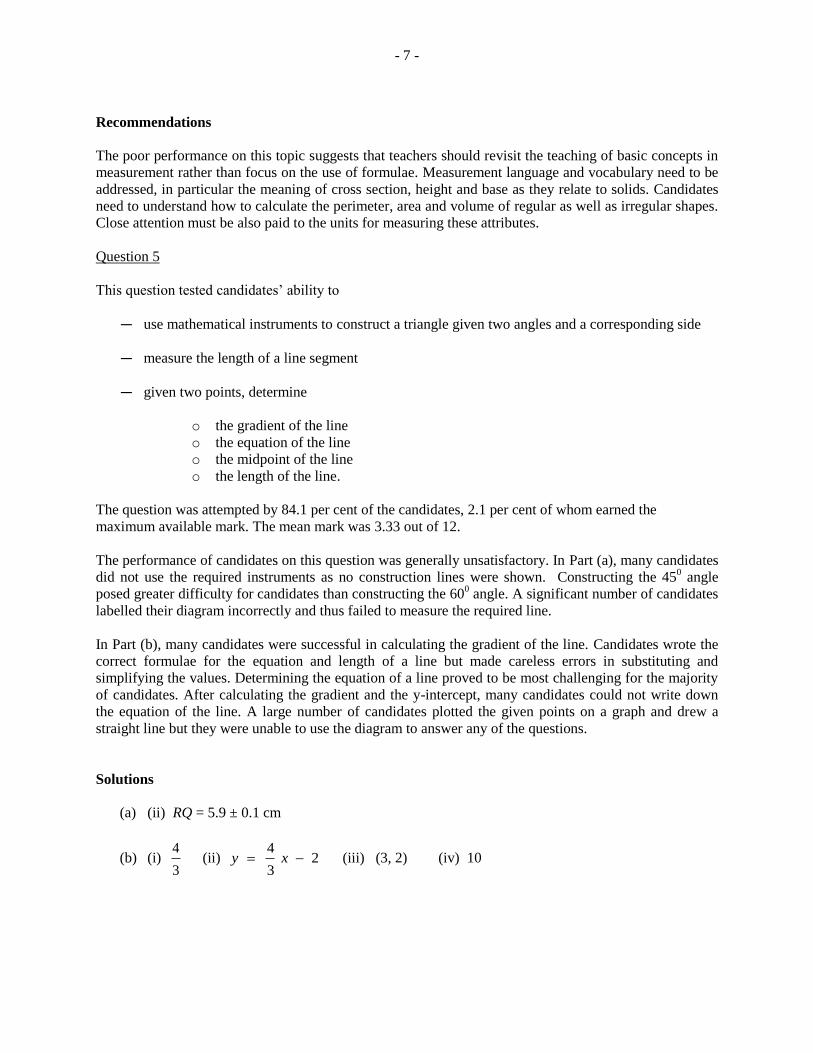
- 7 -
Recommendations
The poor performance on this topic suggests that teachers should revisit the teaching of basic concepts in
measurement rather than focus on the use of formulae. Measurement language and vocabulary need to be
addressed, in particular the meaning of cross section, height and base as they relate to solids. Candidates
need to understand how to calculate the perimeter, area and volume of regular as well as irregular shapes.
Close attention must be also paid to the units for measuring these attributes.
Question 5
This question tested candidates’ ability to
— use mathematical instruments to construct a triangle given two angles and a corresponding side
— measure the length of a line segment
— given two points, determine
o the gradient of the line
o the equation of the line
o the midpoint of the line
o the length of the line.
The question was attempted by 84.1 per cent of the candidates, 2.1 per cent of whom earned the
maximum available mark. The mean mark was 3.33 out of 12.
The performance of candidates on this question was generally unsatisfactory. In Part (a), many candidates
did not use the required instruments as no construction lines were shown. Constructing the 450 angle
posed greater difficulty for candidates than constructing the 600 angle. A significant number of candidates
labelled their diagram incorrectly and thus failed to measure the required line.
In Part (b), many candidates were successful in calculating the gradient of the line. Candidates wrote the
correct formulae for the equation and length of a line but made careless errors in substituting and
simplifying the values. Determining the equation of a line proved to be most challenging for the majority
of candidates. After calculating the gradient and the y-intercept, many candidates could not write down
the equation of the line. A large number of candidates plotted the given points on a graph and drew a
straight line but they were unable to use the diagram to answer any of the questions.
Solutions
(a) (ii) RQ = 5.9 ± 0.1 cm
(b) (i) 4
3 (ii)
4 2
3y x (iii) (3, 2) (iv) 10
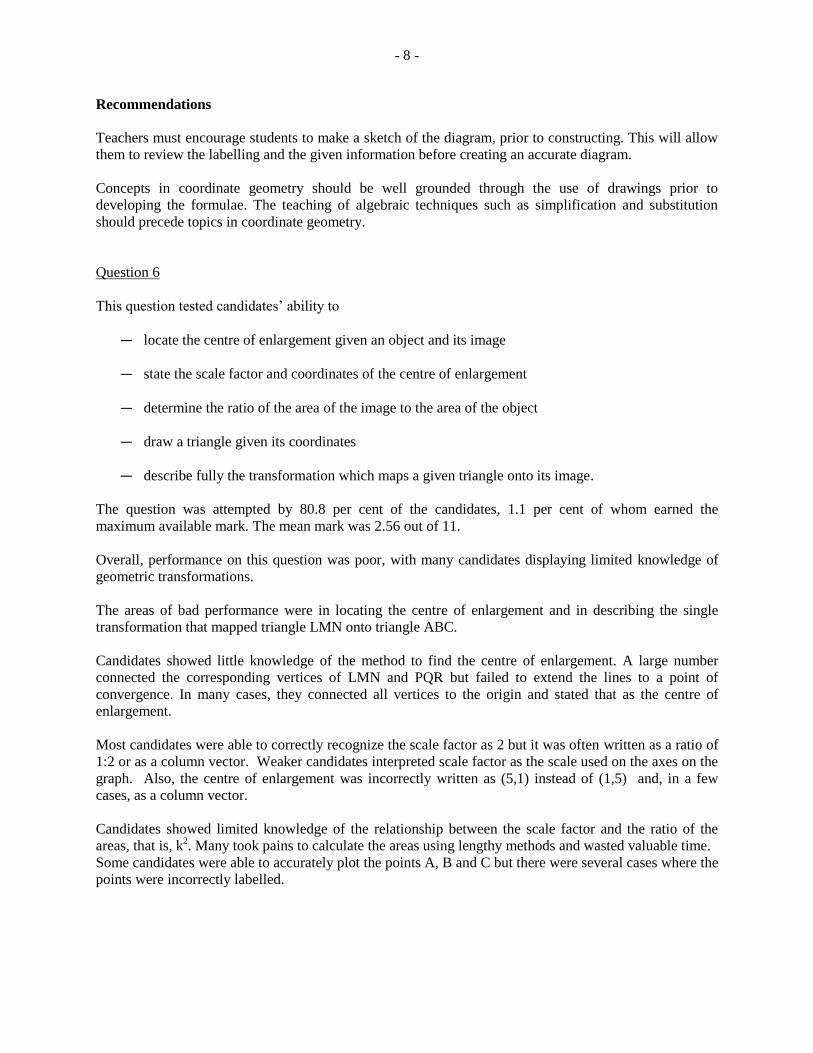
- 8 -
Recommendations
Teachers must encourage students to make a sketch of the diagram, prior to constructing. This will allow
them to review the labelling and the given information before creating an accurate diagram.
Concepts in coordinate geometry should be well grounded through the use of drawings prior to
developing the formulae. The teaching of algebraic techniques such as simplification and substitution
should precede topics in coordinate geometry.
Question 6
This question tested candidates’ ability to
— locate the centre of enlargement given an object and its image
— state the scale factor and coordinates of the centre of enlargement
— determine the ratio of the area of the image to the area of the object
— draw a triangle given its coordinates
— describe fully the transformation which maps a given triangle onto its image.
The question was attempted by 80.8 per cent of the candidates, 1.1 per cent of whom earned the
maximum available mark. The mean mark was 2.56 out of 11.
Overall, performance on this question was poor, with many candidates displaying limited knowledge of
geometric transformations.
The areas of bad performance were in locating the centre of enlargement and in describing the single
transformation that mapped triangle LMN onto triangle ABC.
Candidates showed little knowledge of the method to find the centre of enlargement. A large number
connected the corresponding vertices of LMN and PQR but failed to extend the lines to a point of
convergence. In many cases, they connected all vertices to the origin and stated that as the centre of
enlargement.
Most candidates were able to correctly recognize the scale factor as 2 but it was often written as a ratio of
1:2 or as a column vector. Weaker candidates interpreted scale factor as the scale used on the axes on the
graph. Also, the centre of enlargement was incorrectly written as (5,1) instead of (1,5) and, in a few
cases, as a column vector.
Candidates showed limited knowledge of the relationship between the scale factor and the ratio of the
areas, that is, k2. Many took pains to calculate the areas using lengthy methods and wasted valuable time.
Some candidates were able to accurately plot the points A, B and C but there were several cases where the
points were incorrectly labelled.
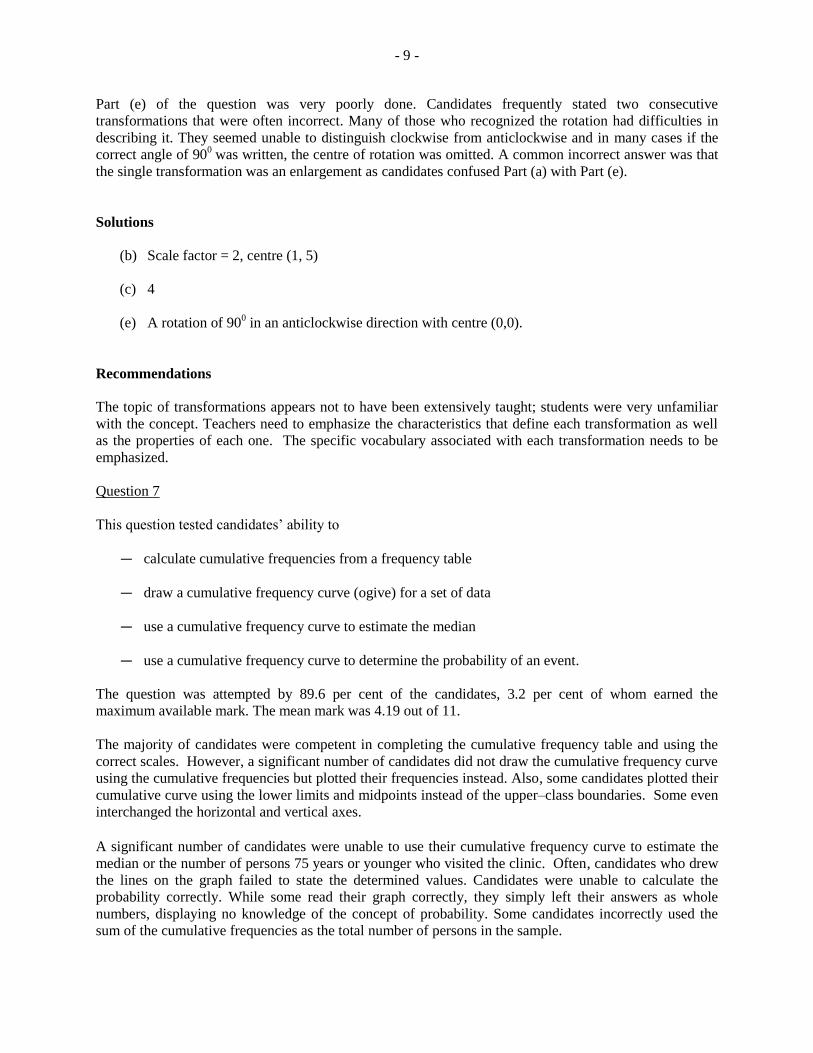
- 9 -
Part (e) of the question was very poorly done. Candidates frequently stated two consecutive
transformations that were often incorrect. Many of those who recognized the rotation had difficulties in
describing it. They seemed unable to distinguish clockwise from anticlockwise and in many cases if the
correct angle of 900 was written, the centre of rotation was omitted. A common incorrect answer was that
the single transformation was an enlargement as candidates confused Part (a) with Part (e).
Solutions
(b) Scale factor = 2, centre (1, 5)
(c) 4
(e) A rotation of 900 in an anticlockwise direction with centre (0,0).
Recommendations
The topic of transformations appears not to have been extensively taught; students were very unfamiliar
with the concept. Teachers need to emphasize the characteristics that define each transformation as well
as the properties of each one. The specific vocabulary associated with each transformation needs to be
emphasized.
Question 7
This question tested candidates’ ability to
— calculate cumulative frequencies from a frequency table
— draw a cumulative frequency curve (ogive) for a set of data
— use a cumulative frequency curve to estimate the median
— use a cumulative frequency curve to determine the probability of an event.
The question was attempted by 89.6 per cent of the candidates, 3.2 per cent of whom earned the
maximum available mark. The mean mark was 4.19 out of 11.
The majority of candidates were competent in completing the cumulative frequency table and using the
correct scales. However, a significant number of candidates did not draw the cumulative frequency curve
using the cumulative frequencies but plotted their frequencies instead. Also, some candidates plotted their
cumulative curve using the lower limits and midpoints instead of the upper–class boundaries. Some even
interchanged the horizontal and vertical axes.
A significant number of candidates were unable to use their cumulative frequency curve to estimate the
median or the number of persons 75 years or younger who visited the clinic. Often, candidates who drew
the lines on the graph failed to state the determined values. Candidates were unable to calculate the
probability correctly. While some read their graph correctly, they simply left their answers as whole
numbers, displaying no knowledge of the concept of probability. Some candidates incorrectly used the
sum of the cumulative frequencies as the total number of persons in the sample.
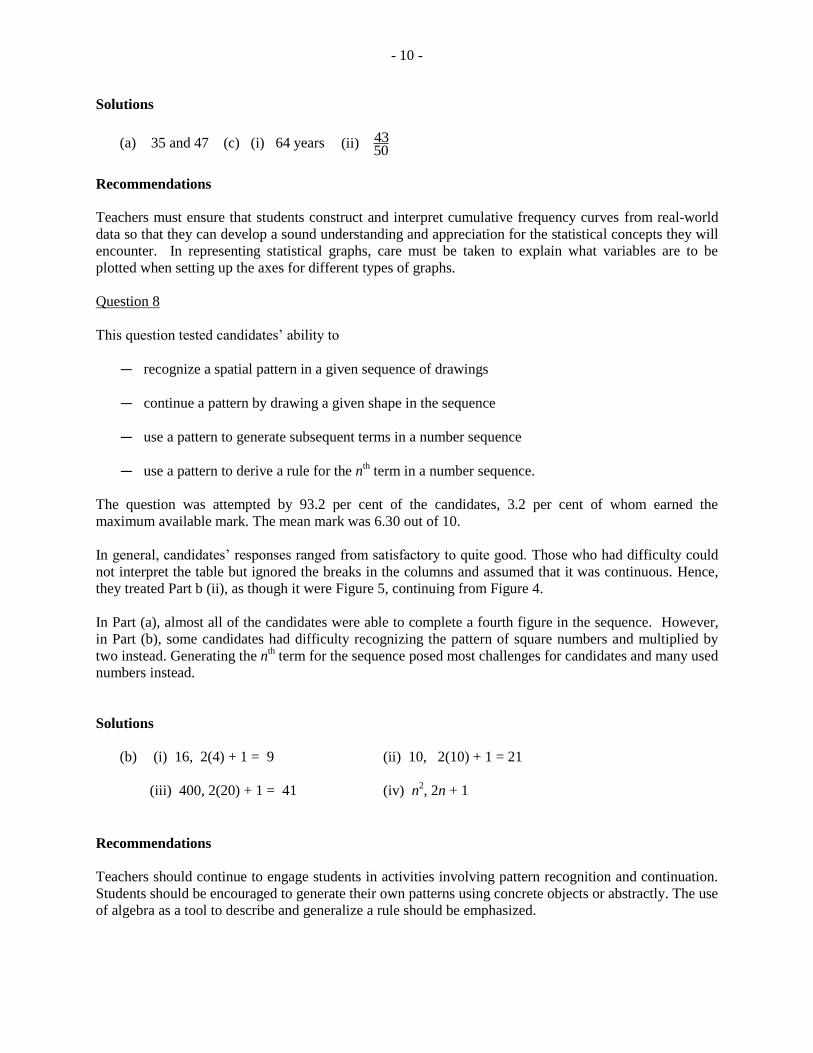
- 10 -
Solutions
(a) 35 and 47 (c) (i) 64 years 43(ii) 50
Recommendations
Teachers must ensure that students construct and interpret cumulative frequency curves from real-world
data so that they can develop a sound understanding and appreciation for the statistical concepts they will
encounter. In representing statistical graphs, care must be taken to explain what variables are to be
plotted when setting up the axes for different types of graphs.
Question 8
This question tested candidates’ ability to
— recognize a spatial pattern in a given sequence of drawings
— continue a pattern by drawing a given shape in the sequence
— use a pattern to generate subsequent terms in a number sequence
— use a pattern to derive a rule for the nth term in a number sequence.
The question was attempted by 93.2 per cent of the candidates, 3.2 per cent of whom earned the
maximum available mark. The mean mark was 6.30 out of 10.
In general, candidates’ responses ranged from satisfactory to quite good. Those who had difficulty could
not interpret the table but ignored the breaks in the columns and assumed that it was continuous. Hence,
they treated Part b (ii), as though it were Figure 5, continuing from Figure 4.
In Part (a), almost all of the candidates were able to complete a fourth figure in the sequence. However,
in Part (b), some candidates had difficulty recognizing the pattern of square numbers and multiplied by
two instead. Generating the nth term for the sequence posed most challenges for candidates and many used
numbers instead.
Solutions
(b) (i) 16, 2(4) + 1 = 9 (ii) 10, 2(10) + 1 = 21
(iii) 400, 2(20) + 1 = 41 (iv) n2, 2n + 1
Recommendations
Teachers should continue to engage students in activities involving pattern recognition and continuation.
Students should be encouraged to generate their own patterns using concrete objects or abstractly. The use
of algebra as a tool to describe and generalize a rule should be emphasized.
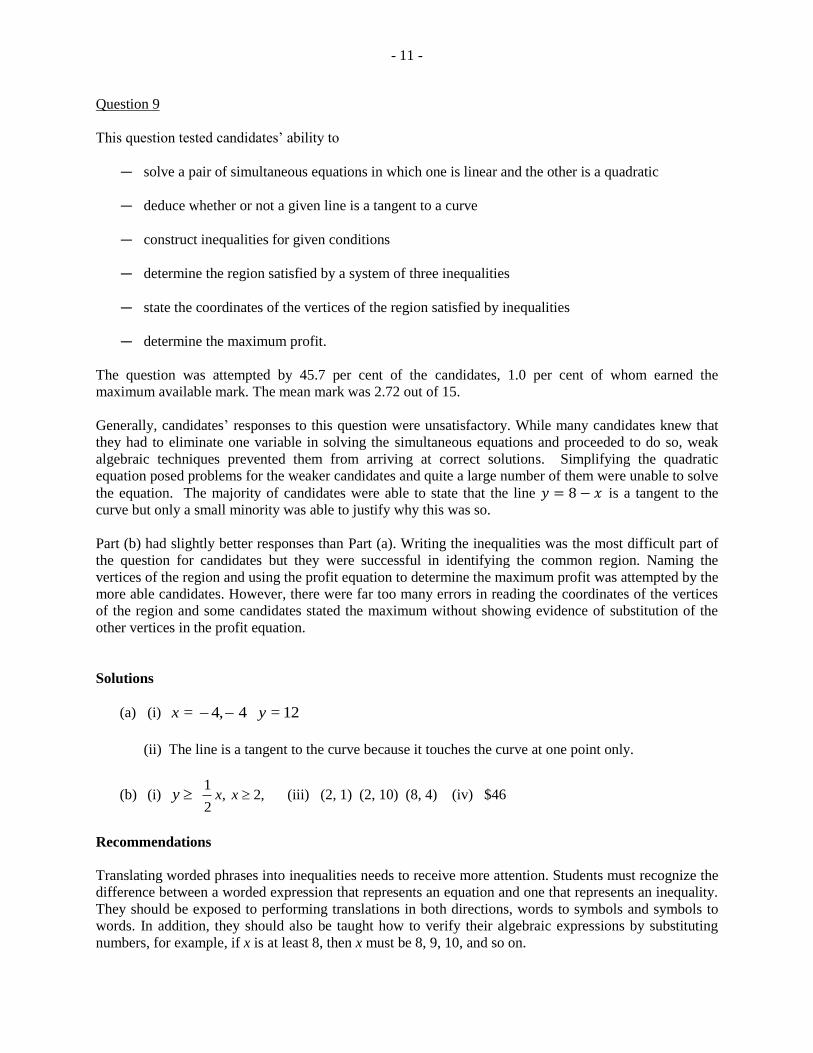
- 11 -
Question 9
This question tested candidates’ ability to
— solve a pair of simultaneous equations in which one is linear and the other is a quadratic
— deduce whether or not a given line is a tangent to a curve
— construct inequalities for given conditions
— determine the region satisfied by a system of three inequalities
— state the coordinates of the vertices of the region satisfied by inequalities
— determine the maximum profit.
The question was attempted by 45.7 per cent of the candidates, 1.0 per cent of whom earned the
maximum available mark. The mean mark was 2.72 out of 15.
Generally, candidates’ responses to this question were unsatisfactory. While many candidates knew that
they had to eliminate one variable in solving the simultaneous equations and proceeded to do so, weak
algebraic techniques prevented them from arriving at correct solutions. Simplifying the quadratic
equation posed problems for the weaker candidates and quite a large number of them were unable to solve
the equation. The majority of candidates were able to state that the line is a tangent to the
curve but only a small minority was able to justify why this was so.
Part (b) had slightly better responses than Part (a). Writing the inequalities was the most difficult part of
the question for candidates but they were successful in identifying the common region. Naming the
vertices of the region and using the profit equation to determine the maximum profit was attempted by the
more able candidates. However, there were far too many errors in reading the coordinates of the vertices
of the region and some candidates stated the maximum without showing evidence of substitution of the
other vertices in the profit equation.
Solutions
(a) (i) = 4, 4 = 12x y
(ii) The line is a tangent to the curve because it touches the curve at one point only.
(b) (i) 1
, 2,2
x xy (iii) (2, 1) (2, 10) (8, 4) (iv) $46
Recommendations
Translating worded phrases into inequalities needs to receive more attention. Students must recognize the
difference between a worded expression that represents an equation and one that represents an inequality.
They should be exposed to performing translations in both directions, words to symbols and symbols to
words. In addition, they should also be taught how to verify their algebraic expressions by substituting
numbers, for example, if x is at least 8, then x must be 8, 9, 10, and so on.
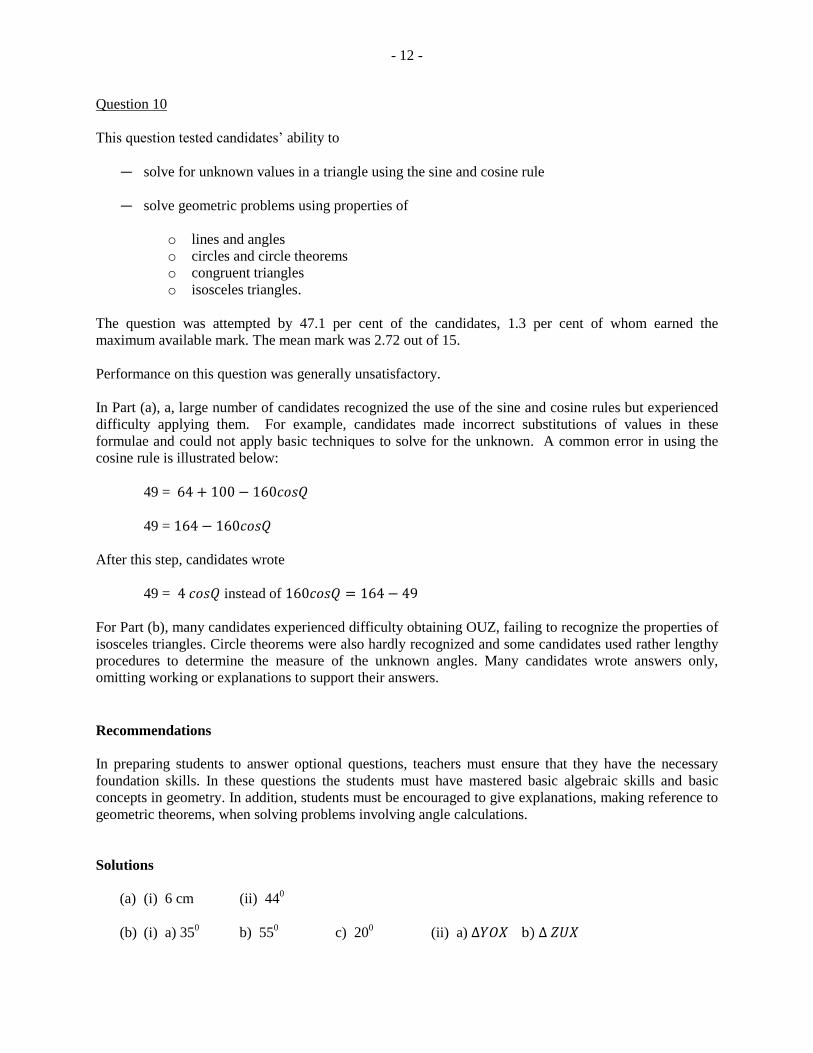
- 12 -
Question 10
This question tested candidates’ ability to
— solve for unknown values in a triangle using the sine and cosine rule
— solve geometric problems using properties of
o lines and angles
o circles and circle theorems
o congruent triangles
o isosceles triangles.
The question was attempted by 47.1 per cent of the candidates, 1.3 per cent of whom earned the
maximum available mark. The mean mark was 2.72 out of 15.
Performance on this question was generally unsatisfactory.
In Part (a), a, large number of candidates recognized the use of the sine and cosine rules but experienced
difficulty applying them. For example, candidates made incorrect substitutions of values in these
formulae and could not apply basic techniques to solve for the unknown. A common error in using the
cosine rule is illustrated below:
49 =
49 =
After this step, candidates wrote
49 = instead of
For Part (b), many candidates experienced difficulty obtaining OUZ, failing to recognize the properties of
isosceles triangles. Circle theorems were also hardly recognized and some candidates used rather lengthy
procedures to determine the measure of the unknown angles. Many candidates wrote answers only,
omitting working or explanations to support their answers.
Recommendations
In preparing students to answer optional questions, teachers must ensure that they have the necessary
foundation skills. In these questions the students must have mastered basic algebraic skills and basic
concepts in geometry. In addition, students must be encouraged to give explanations, making reference to
geometric theorems, when solving problems involving angle calculations.
Solutions
(a) (i) 6 cm (ii) 440
(b) (i) a) 350 b) 55
0c) 20
0(ii) a) )
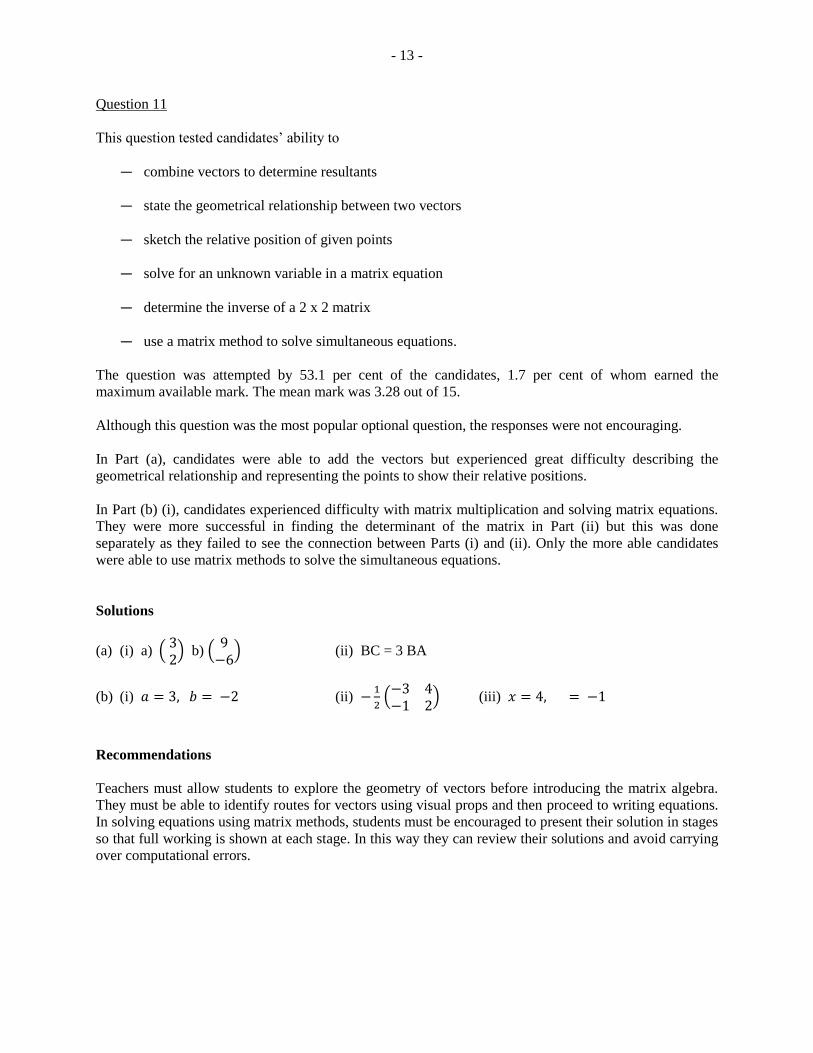
- 13 -
Question 11
This question tested candidates’ ability to
— combine vectors to determine resultants
— state the geometrical relationship between two vectors
— sketch the relative position of given points
— solve for an unknown variable in a matrix equation
— determine the inverse of a 2 x 2 matrix
— use a matrix method to solve simultaneous equations.
The question was attempted by 53.1 per cent of the candidates, 1.7 per cent of whom earned the
maximum available mark. The mean mark was 3.28 out of 15.
Although this question was the most popular optional question, the responses were not encouraging.
In Part (a), candidates were able to add the vectors but experienced great difficulty describing the
geometrical relationship and representing the points to show their relative positions.
In Part (b) (i), candidates experienced difficulty with matrix multiplication and solving matrix equations.
They were more successful in finding the determinant of the matrix in Part (ii) but this was done
separately as they failed to see the connection between Parts (i) and (ii). Only the more able candidates
were able to use matrix methods to solve the simultaneous equations.
Solutions
(a) (i) a) ( ) b) (
) (ii) BC = 3 BA
(b) (i) (ii)
(
) (iii)
Recommendations
Teachers must allow students to explore the geometry of vectors before introducing the matrix algebra.
They must be able to identify routes for vectors using visual props and then proceed to writing equations.
In solving equations using matrix methods, students must be encouraged to present their solution in stages
so that full working is shown at each stage. In this way they can review their solutions and avoid carrying
over computational errors.

CARIBBEAN EXAMINATIONS COUNCIL
REPORT ON CANDIDATES’ WORK IN THE
CARIBBEAN SECONDARY EDUCATION CERTIFICATE® EXAMINATION
JANUARY 2013
MATHEMATICS
GENERAL PROFICIENCY EXAMINATION
Copyright © 2013 Caribbean Examinations Council
St Michael, Barbados
All rights reserved.
2
GENERAL COMMENTS
The General Proficiency Mathematics examination is offered in January and May/June each
year. There was a candidate entry of approximately 12 900 in January 2013; 40 per cent of the
candidates earned Grades I–III. The mean score for the examination was 78 out of 180 marks.
DETAILED COMMENTS
Paper 01– Multiple Choice
Paper 01 consisted of 60 multiple-choice items. This year, 29 candidates each earned the
maximum available score of 60. Sixty-eight per cent of the candidates scored 30 marks or more.
Paper 02 – Structured Questions
Paper 02 consisted of two sections. Section I comprised eight compulsory questions totalling 90
marks. Section II comprised three optional questions: one each from (i) Algebra, Relations,
Functions and Graphs; (ii) Measurement, Trigonometry and Geometry; and (iii) Vectors and
Matrices. Candidates were required to answer any two questions from this section. Each question
in this section was worth 15 marks.
This year, one candidate earned the maximum available mark of 120 on Paper 02.
Approximately 20 per cent of the candidates earned at least 60 marks on this paper.
Compulsory Section
Question 1
This question tested candidates’ ability to
perform the four basic operations with decimals
use the order of operations to do calculations with decimals
convert from one currency to another
find the cost price given the percentage sales tax.
The question was attempted by 99 per cent of the candidates, 4.3 per cent of whom earned the
maximum available mark. The mean mark was 7.52 out of 11.
The majority of candidates produced satisfactory responses to this question. In general, they
demonstrated competence in the use of the calculator to perform computations in the correct
order. However, there were some misconceptions by some candidates as are reflected in the
following methods and procedures.
In Part (a), instead of squaring, some candidates multiplied by 2 and was evaluated as
3
In Part (b), the hotel accommodation for 3 nights was misunderstood and the return airfare was
also multiplied by 3. Few of the candidates associated the charge, which included a
15% sales tax, with 115% of the cost price. Most of them proceeded to calculate 15% of
and then to subtract the result from this amount to determine the cost price.
Solutions
(a) 9.257
(b) (i) US $647 (ii) US $596.30
(iii) Angie’s since $596.30 (iv) $1400
Recommendations
Teachers are advised to teach proportion using the unitary method. They should also use
authentic tasks in the teaching of consumer arithmetic. Attention should be given to squaring and
to writing the result of a computation exactly.
Question 2
This question tested candidates’ ability to
use the distributive property of multiplication over addition
solve a linear equation in one unknown
factorize quadratic functions involving difference of squares
solve worded problems involving a pair of simultaneous equations.
The question was attempted by 99 per cent of the candidates, 10.6 per cent of whom earned the
maximum available mark. The mean mark was 5.48 out of 12.
The performance of candidates on this question was satisfactory. In Part (a), while most
candidates were able to correctly apply the distributive property, they were generally unable to
simplify the equation and to correctly proceed to calculating the value of p.
In Part (b), candidates encountered difficulties in factorizing the quadratic expressions. Some
popular but incorrect methods seen included
( )( ); ( ) ( )( )
In Part (c), candidates correctly translated words into symbols and wrote the pair of equations in
x and y. The majority of candidates identified an appropriate strategy for solving the pair of
equations such as elimination, substitution, matrices and trial and error. The most popular choice
was elimination; but with this, several candidates added the equations and hence could not
eliminate either variable.
4
Solutions
(a)
(b) (i) ( )( ) (ii) ( )( )
(c) (i)
(ii) a) ; b) 3 g
Recommendations
Teachers should emphasize the appropriate use of the distributive, associative and commutative
properties and should emphasize the difference between an expression and an equation. Students
should practise the factorization of quadratic expressions and solving simultaneous linear
equations. The difference between squares is a useful tool in factorization and needs continued
attention by teachers and students.
Question 3
This question tested candidates’ ability to
represent information in a Venn diagram
formulate and solve a linear equation in one unknown using information from a Venn
diagram
solve simple geometrical problems using the properties of parallel lines and angles in
isosceles triangles
use the properties of two triangles, to explain why they are similar but not congruent.
The question was attempted by 99 per cent of the candidates, 1.5 per cent of them earned the
maximum available mark. The mean mark was 5.42 out of 12.
The performance of candidates on this question was moderate. In Part (a), most candidates were
able to enter in the intersection of the sets , 2x in M S and x in S M, but were
less proficient in identifying the number of elements in (M S). Many of them were unable to
form an equation from information represented on the Venn diagram, and in several instances
when they arrived at the equation, they lacked the algebraic skills to solve it.
In Part (b), candidates were able to correctly determine the measure of the angle formed at A.
However, calculating angle AED proved more challenging, as well as providing a reason why
the two triangles in question were similar but not congruent. A common incorrect response was
that they were similar because they were two isosceles triangles.
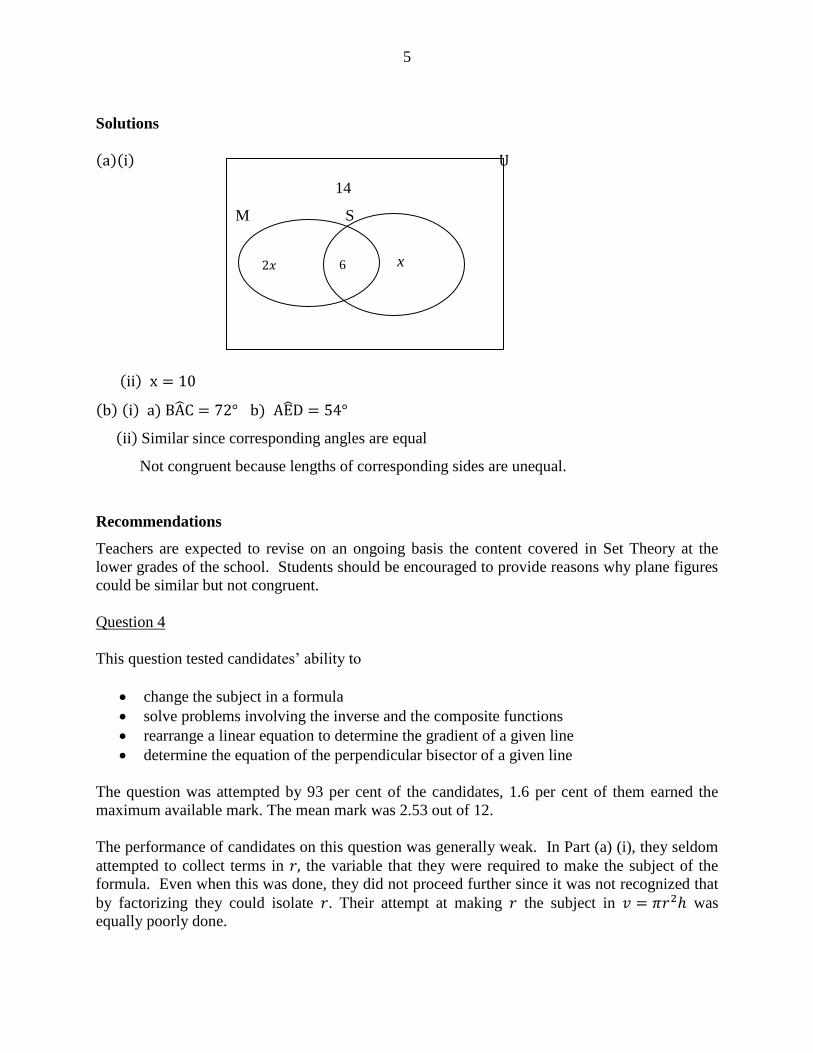
5
Solutions
( )( )
14
M S
( )
( ) ( ) ) )
( ) Similar since corresponding angles are equal
Not congruent because lengths of corresponding sides are unequal.
Recommendations
Teachers are expected to revise on an ongoing basis the content covered in Set Theory at the
lower grades of the school. Students should be encouraged to provide reasons why plane figures
could be similar but not congruent.
Question 4
This question tested candidates’ ability to
change the subject in a formula
solve problems involving the inverse and the composite functions
rearrange a linear equation to determine the gradient of a given line
determine the equation of the perpendicular bisector of a given line
The question was attempted by 93 per cent of the candidates, 1.6 per cent of them earned the
maximum available mark. The mean mark was 2.53 out of 12.
The performance of candidates on this question was generally weak. In Part (a) (i), they seldom
attempted to collect terms in the variable that they were required to make the subject of the
formula. Even when this was done, they did not proceed further since it was not recognized that
by factorizing they could isolate . Their attempt at making the subject in was
equally poorly done.
6 𝑥 x
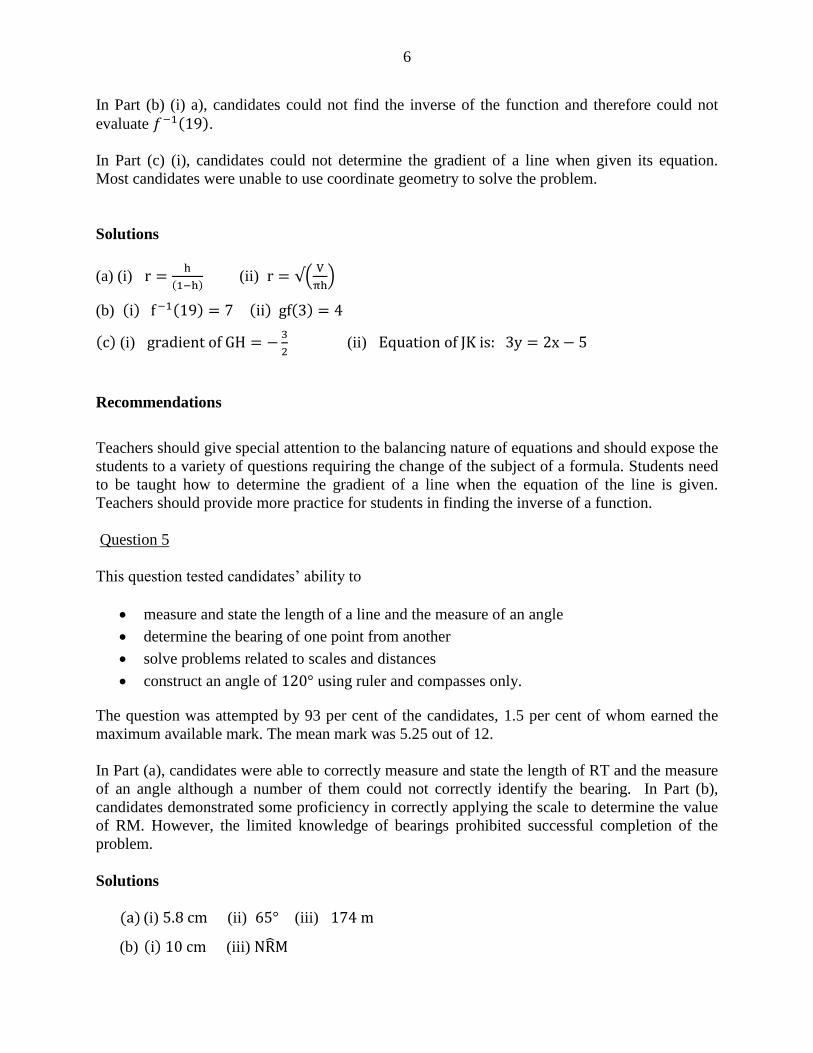
6
In Part (b) (i) a), candidates could not find the inverse of the function and therefore could not
evaluate ( ).
In Part (c) (i), candidates could not determine the gradient of a line when given its equation.
Most candidates were unable to use coordinate geometry to solve the problem.
Solutions
(a) (i)
( )(ii) (
)
(b) ( ) ( ) ( ) ( )
( ) (i)
(ii)
Recommendations
Teachers should give special attention to the balancing nature of equations and should expose the
students to a variety of questions requiring the change of the subject of a formula. Students need
to be taught how to determine the gradient of a line when the equation of the line is given.
Teachers should provide more practice for students in finding the inverse of a function.
Question 5
This question tested candidates’ ability to
measure and state the length of a line and the measure of an angle
determine the bearing of one point from another
solve problems related to scales and distances
construct an angle of using ruler and compasses only.
The question was attempted by 93 per cent of the candidates, 1.5 per cent of whom earned the
maximum available mark. The mean mark was 5.25 out of 12.
In Part (a), candidates were able to correctly measure and state the length of RT and the measure
of an angle although a number of them could not correctly identify the bearing. In Part (b),
candidates demonstrated some proficiency in correctly applying the scale to determine the value
of RM. However, the limited knowledge of bearings prohibited successful completion of the
problem.
Solutions
(a) (i) (ii) (iii)
(b) ( ) (iii)
7
Recommendations
Teachers need to use mathematical language when teaching concepts in geometry. Efforts
should also be made to teach related concepts at the same time instead of in isolation. Questions
should be set using authentic situations to assist in the transfer of learning to everyday
experiences.
.
Question 6
This question tested candidates’ ability to
determine the radius when the diameter is given
determine the circumference of the cross section of a cylinder
use information from the net of a cylinder to determine its curved surface area
determine the depth of water in a cylinder when given the volume of water, in litres.
The question was attempted by 91 per cent of the candidates, 2.5 per cent of whom earned the
maximum available mark. The mean mark was 3.35 out of 11.
In Part (a), candidates easily obtained the radius of the circle and the circumference of the cross
section of the cylinder. In Part (b), when the net of the same cylinder was given, many
candidates did not see the relationship between the two. As a consequence, they invariably
arrived at the incorrect answer for the curved surface area of the cylinder.
In Part (c), many candidates did not convert litres to cubic centimeters as was required. They also
had difficulty formulating an equation for the volume of water in the cylinder; and in situations
where they formed the equation, many of them could not correctly make h the subject of the
formula.
Solutions
(a) ( ) ( )
(b)
(c)
Recommendations
Teachers should ensure that students are familiar with the nets of solids. Attention should also be
given to the consistency of units within equations.
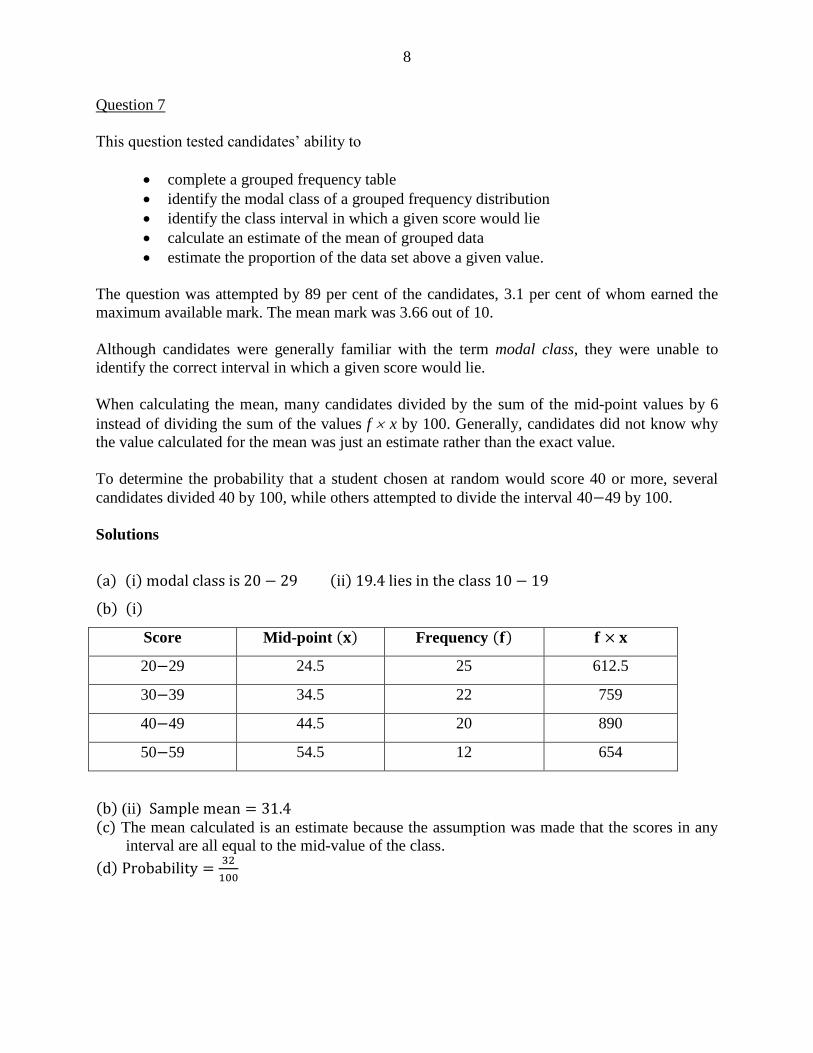
8
Question 7
This question tested candidates’ ability to
complete a grouped frequency table
identify the modal class of a grouped frequency distribution
identify the class interval in which a given score would lie
calculate an estimate of the mean of grouped data
estimate the proportion of the data set above a given value.
The question was attempted by 89 per cent of the candidates, 3.1 per cent of whom earned the
maximum available mark. The mean mark was 3.66 out of 10.
Although candidates were generally familiar with the term modal class, they were unable to
identify the correct interval in which a given score would lie.
When calculating the mean, many candidates divided by the sum of the mid-point values by 6
instead of dividing the sum of the values f x by 100. Generally, candidates did not know why
the value calculated for the mean was just an estimate rather than the exact value.
To determine the probability that a student chosen at random would score 40 or more, several
candidates divided 40 by 100, while others attempted to divide the interval 40 49 by 100.
Solutions
( ) ( ) ( )
( ) ( )
Score Mid-point ( ) Frequency ( )
20 29 24.5 25 612.5
30 39 34.5 22 759
40 49 44.5 20 890
50 59 54.5 12 654
( ) (ii)
( ) The mean calculated is an estimate because the assumption was made that the scores in any
interval are all equal to the mid-value of the class.
( )
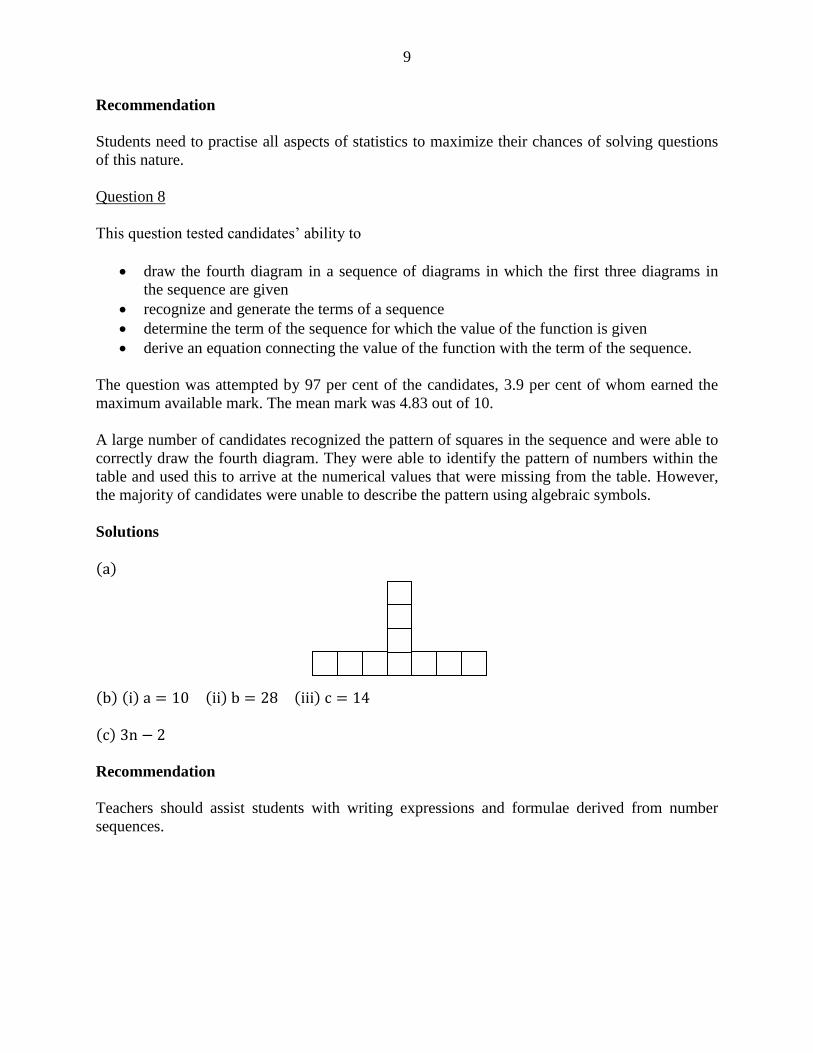
9
Recommendation
Students need to practise all aspects of statistics to maximize their chances of solving questions
of this nature.
Question 8
This question tested candidates’ ability to
draw the fourth diagram in a sequence of diagrams in which the first three diagrams in
the sequence are given
recognize and generate the terms of a sequence
determine the term of the sequence for which the value of the function is given
derive an equation connecting the value of the function with the term of the sequence.
The question was attempted by 97 per cent of the candidates, 3.9 per cent of whom earned the
maximum available mark. The mean mark was 4.83 out of 10.
A large number of candidates recognized the pattern of squares in the sequence and were able to
correctly draw the fourth diagram. They were able to identify the pattern of numbers within the
table and used this to arrive at the numerical values that were missing from the table. However,
the majority of candidates were unable to describe the pattern using algebraic symbols.
Solutions
( )
( ) ( ) ( ) ( )
( )
Recommendation
Teachers should assist students with writing expressions and formulae derived from number
sequences.
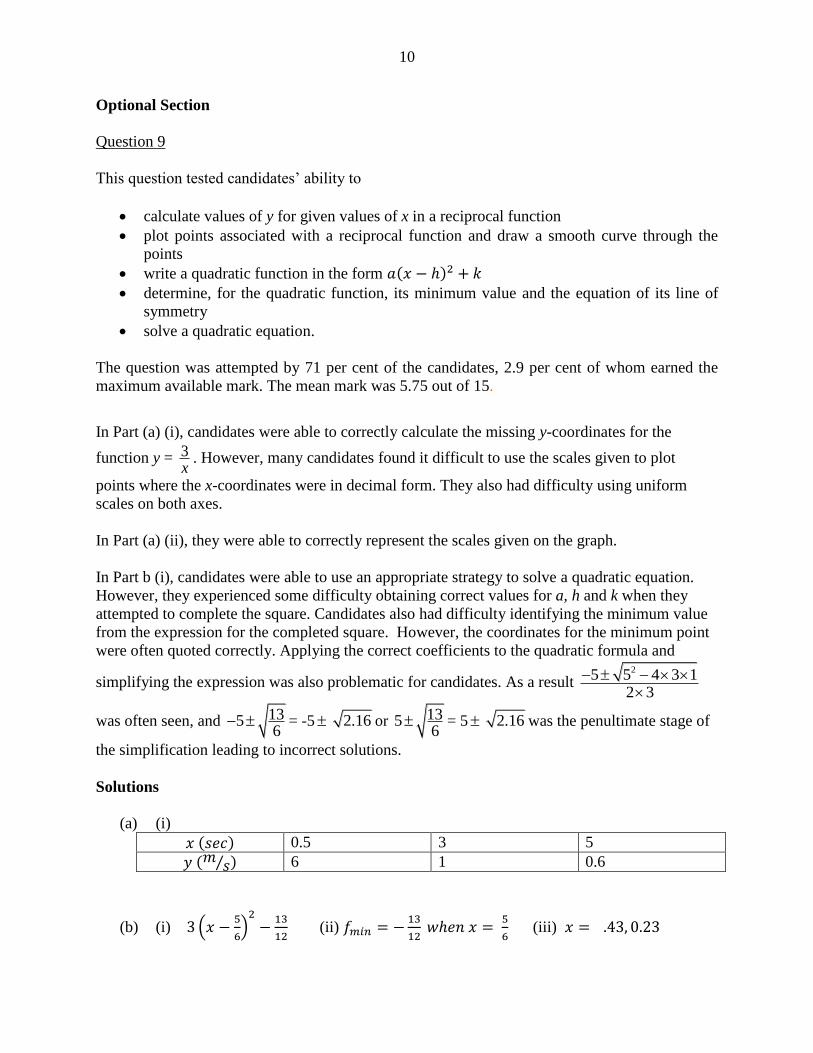
10
Optional Section
Question 9
This question tested candidates’ ability to
calculate values of y for given values of x in a reciprocal function
plot points associated with a reciprocal function and draw a smooth curve through the
points
write a quadratic function in the form ( )
determine, for the quadratic function, its minimum value and the equation of its line of
symmetry
solve a quadratic equation.
The question was attempted by 71 per cent of the candidates, 2.9 per cent of whom earned the
maximum available mark. The mean mark was 5.75 out of 15.
In Part (a) (i), candidates were able to correctly calculate the missing y-coordinates for the
function y = 3x
. However, many candidates found it difficult to use the scales given to plot
points where the x-coordinates were in decimal form. They also had difficulty using uniform
scales on both axes.
In Part (a) (ii), they were able to correctly represent the scales given on the graph.
In Part b (i), candidates were able to use an appropriate strategy to solve a quadratic equation.
However, they experienced some difficulty obtaining correct values for a, h and k when they
attempted to complete the square. Candidates also had difficulty identifying the minimum value
from the expression for the completed square. However, the coordinates for the minimum point
were often quoted correctly. Applying the correct coefficients to the quadratic formula and
simplifying the expression was also problematic for candidates. As a result 25 5 4 3 1
2 3
was often seen, and 1356
= -5 2.16 or 1356
= 5 2.16 was the penultimate stage of
the simplification leading to incorrect solutions.
Solutions
(a) (i)
( ) 0.5 3 5
( ⁄ ) 6 1 0.6
(b) (i) (
)
(ii)
(iii)
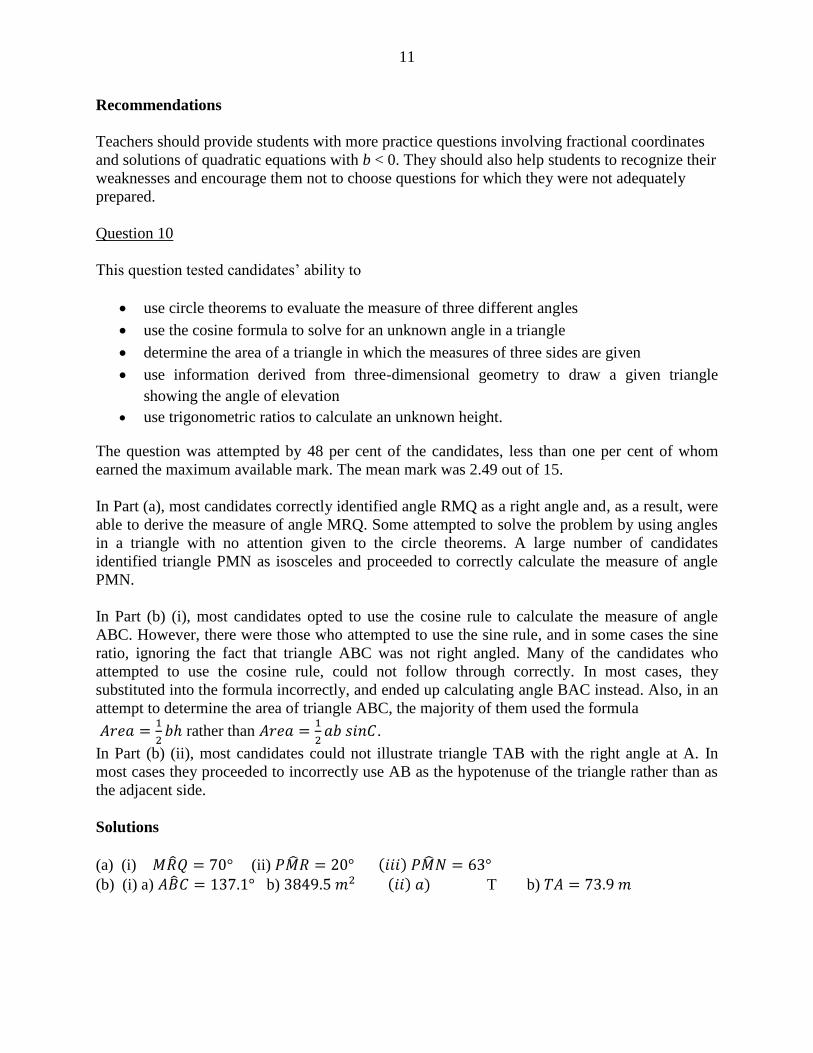
11
Recommendations
Teachers should provide students with more practice questions involving fractional coordinates
and solutions of quadratic equations with b < 0. They should also help students to recognize their
weaknesses and encourage them not to choose questions for which they were not adequately
prepared.
Question 10
This question tested candidates’ ability to
use circle theorems to evaluate the measure of three different angles
use the cosine formula to solve for an unknown angle in a triangle
determine the area of a triangle in which the measures of three sides are given
use information derived from three-dimensional geometry to draw a given triangle
showing the angle of elevation
use trigonometric ratios to calculate an unknown height.
The question was attempted by 48 per cent of the candidates, less than one per cent of whom
earned the maximum available mark. The mean mark was 2.49 out of 15.
In Part (a), most candidates correctly identified angle RMQ as a right angle and, as a result, were
able to derive the measure of angle MRQ. Some attempted to solve the problem by using angles
in a triangle with no attention given to the circle theorems. A large number of candidates
identified triangle PMN as isosceles and proceeded to correctly calculate the measure of angle
PMN.
In Part (b) (i), most candidates opted to use the cosine rule to calculate the measure of angle
ABC. However, there were those who attempted to use the sine rule, and in some cases the sine
ratio, ignoring the fact that triangle ABC was not right angled. Many of the candidates who
attempted to use the cosine rule, could not follow through correctly. In most cases, they
substituted into the formula incorrectly, and ended up calculating angle BAC instead. Also, in an
attempt to determine the area of triangle ABC, the majority of them used the formula
rather than
.
In Part (b) (ii), most candidates could not illustrate triangle TAB with the right angle at A. In
most cases they proceeded to incorrectly use AB as the hypotenuse of the triangle rather than as
the adjacent side.
Solutions
(a) (i) ° (ii) ( ) (b) (i) a) b) ( ) ) T b)
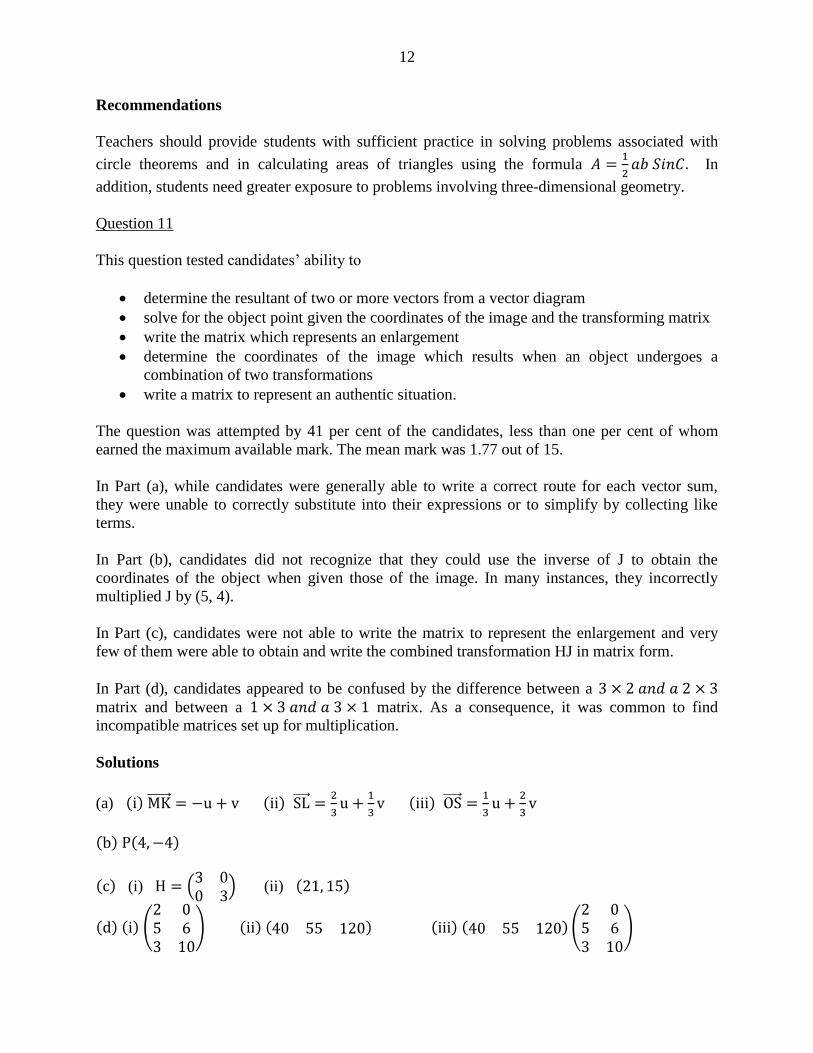
12
Recommendations
Teachers should provide students with sufficient practice in solving problems associated with
circle theorems and in calculating areas of triangles using the formula
In
addition, students need greater exposure to problems involving three-dimensional geometry.
Question 11
This question tested candidates’ ability to
determine the resultant of two or more vectors from a vector diagram
solve for the object point given the coordinates of the image and the transforming matrix
write the matrix which represents an enlargement
determine the coordinates of the image which results when an object undergoes a
combination of two transformations
write a matrix to represent an authentic situation.
The question was attempted by 41 per cent of the candidates, less than one per cent of whom
earned the maximum available mark. The mean mark was 1.77 out of 15.
In Part (a), while candidates were generally able to write a correct route for each vector sum,
they were unable to correctly substitute into their expressions or to simplify by collecting like
terms.
In Part (b), candidates did not recognize that they could use the inverse of J to obtain the
coordinates of the object when given those of the image. In many instances, they incorrectly
multiplied J by (5, 4).
In Part (c), candidates were not able to write the matrix to represent the enlargement and very
few of them were able to obtain and write the combined transformation HJ in matrix form.
In Part (d), candidates appeared to be confused by the difference between a
matrix and between a matrix. As a consequence, it was common to find
incompatible matrices set up for multiplication.
Solutions
(a) ( ) ( )
( )
( ) ( )
( ) (i) (
) (ii) ( )
( ) ( ) (
) ( ) ( ) ( ) ( ) (
)

13
Recommendations
Teachers should provide students with adequate practice in the multiplication of matrices with
emphasis on the compatibility of matrices for multiplication. Attention should also be given to
the use of the inverse matrix in determining the object coordinates when given the coordinates of
the image under a given transformation.
C A R I B B E A N E X A M I N A T I O N S C O U N C I L
REPORT ON CANDIDATES’ WORK IN THE
CARIBBEAN SECONDARY EDUCATION CERTIFICATE®
EXAMINATION
MAY/JUNE 2013
MATHEMATICS
GENERAL PROFICIENCY EXAMINATION
Copyright© 2013 Caribbean Examinations Council
St Michael, Barbados
All rights reserved.
- 2 -
GENERAL COMMENTS
The General Proficiency Mathematics examination is offered in January and May/June each year. There
was a candidate entry of approximately 92 400 in May/June 2013 and 30 per cent of the candidates earned
Grades I‒III. The mean score for the examination was 65 out of 180 marks.
DETAILED COMMENTS
Paper 01 — Multiple Choice
Paper 01 consisted of 60 multiple–choice items. It was designed to provide adequate coverage of the
content with items taken from all sections of the syllabus. Approximately 74 per cent of the
candidates earned acceptable grades on this paper; the mean score was 33 out of 60 marks. This
year, 142 candidates earned the maximum available score of 60.
Paper 02 — Structured Questions
Paper 02 consisted of two sections. Section I comprised eight compulsory questions for a total of 90 marks.
Section II comprised three optional questions: one each from Algebra, Relations, Functions and Graphs;
Measurement, Trigonometry and Geometry; and Vectors and Matrices. Candidates were required to answer
any two out of three questions from this section. Each question in this section was worth 15 marks. The
mean score for this paper was 31 out of 120 marks.
Compulsory Section
Question 1
This question tested candidates’ ability to
add, subtract, multiply and divide fractions involving mixed numbers and decimals
use the calculator to evaluate the square and the square root of rational numbers
solve problems involving compound interest.
The question was attempted by 99 per cent of the candidates, 3.7 per cent of whom earned the maximum
available mark. The mean mark was 5.28 out of 11.
In Part (a), candidates generally provided unsatisfactory responses. While they were able to follow through
on the algorithm for subtracting the fractions, many of them were confused as to which of the improper
fractions should be inverted when performing division. They demonstrated competence in using the
calculator to compute the square and square root of rational numbers. However, two common errors were
(0.32) 2 = 0.32 + 0.32 and (0.32)
2 = 2 × 0.32.
In Part (b), many candidates did not attempt to calculate either the cost of the same quantity of juice or the
volume of juice for the same cost; and in several instances when the correct approach was taken, they
experienced difficulty comparing small values such as 0.012 cents and 0.0114 cents.
In Part (c), candidates were able to identify the interest at the end of one year as 8 per cent of the principal.
However, those who used the compound interest formula, experienced difficulty in separating the interest
from the aggregate.
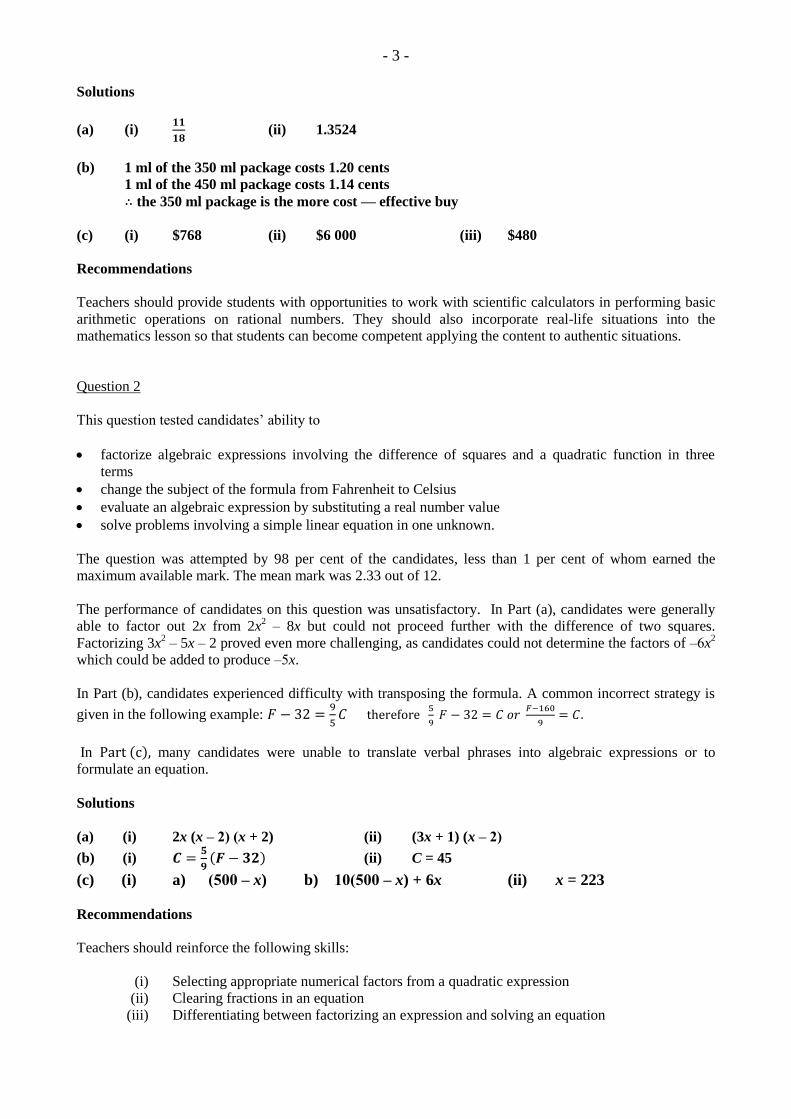
- 3 -
Solutions
(a) (i)
(ii) 1.3524
(b) 1 ml of the 350 ml package costs 1.20 cents
1 ml of the 450 ml package costs 1.14 cents
the 350 ml package is the more cost — effective buy
(c) (i) $768 (ii) $6 000 (iii) $480
Recommendations
Teachers should provide students with opportunities to work with scientific calculators in performing basic
arithmetic operations on rational numbers. They should also incorporate real-life situations into the
mathematics lesson so that students can become competent applying the content to authentic situations.
Question 2
This question tested candidates’ ability to
factorize algebraic expressions involving the difference of squares and a quadratic function in three
terms
change the subject of the formula from Fahrenheit to Celsius
evaluate an algebraic expression by substituting a real number value
solve problems involving a simple linear equation in one unknown.
The question was attempted by 98 per cent of the candidates, less than 1 per cent of whom earned the
maximum available mark. The mean mark was 2.33 out of 12.
The performance of candidates on this question was unsatisfactory. In Part (a), candidates were generally
able to factor out 2x from 2x2 – 8x but could not proceed further with the difference of two squares.
Factorizing 3x2 – 5x – 2 proved even more challenging, as candidates could not determine the factors of ‒6x
2
which could be added to produce ‒5x.
In Part (b), candidates experienced difficulty with transposing the formula. A common incorrect strategy is
given in the following example:
In ( ) many candidates were unable to translate verbal phrases into algebraic expressions or to
formulate an equation.
Solutions
(a) (i) 2x (x ‒ 2) (x + 2) (ii) (3x + 1) (x ‒ 2)
(b) (i)
( ) (ii) C = 45
(c) (i) a) (500 ‒ x) b) 10(500 ‒ x) + 6x (ii) x = 223
Recommendations
Teachers should reinforce the following skills:
(i) Selecting appropriate numerical factors from a quadratic expression
(ii) Clearing fractions in an equation
(iii) Differentiating between factorizing an expression and solving an equation
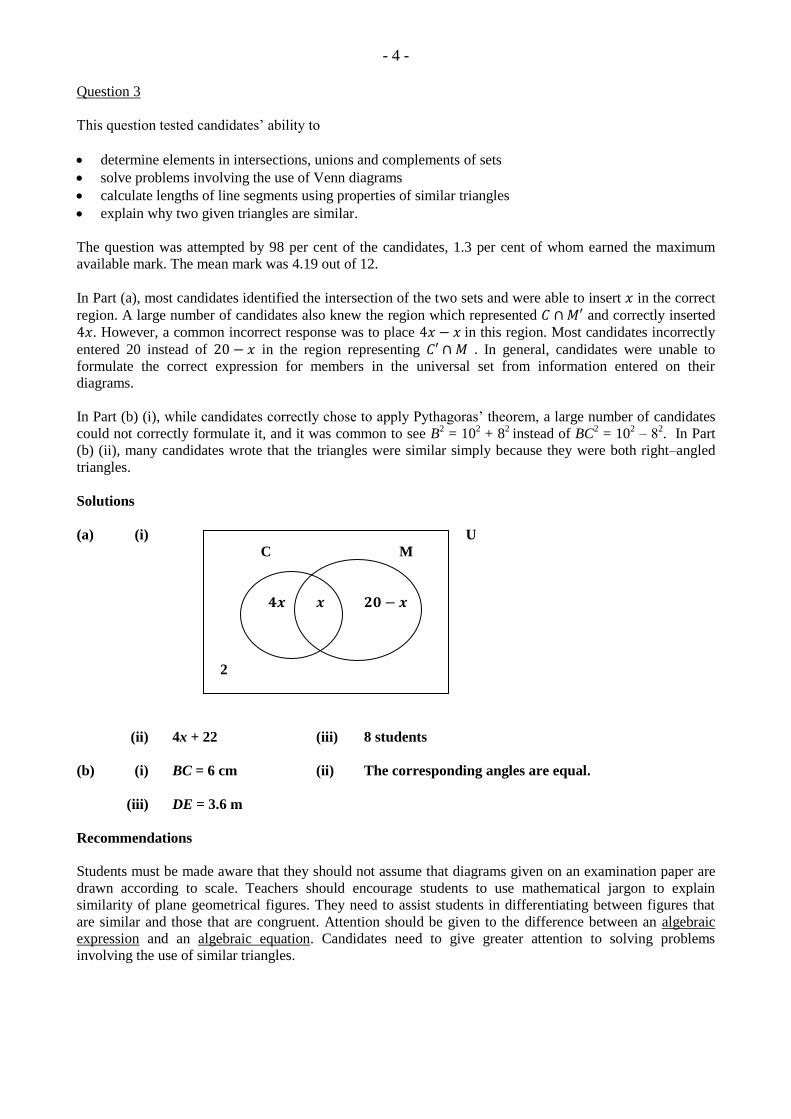
- 4 -
Question 3
This question tested candidates’ ability to
determine elements in intersections, unions and complements of sets
solve problems involving the use of Venn diagrams
calculate lengths of line segments using properties of similar triangles
explain why two given triangles are similar.
The question was attempted by 98 per cent of the candidates, 1.3 per cent of whom earned the maximum
available mark. The mean mark was 4.19 out of 12.
In Part (a), most candidates identified the intersection of the two sets and were able to insert in the correct
region. A large number of candidates also knew the region which represented and correctly inserted
. However, a common incorrect response was to place in this region. Most candidates incorrectly
entered 20 instead of in the region representing In general, candidates were unable to
formulate the correct expression for members in the universal set from information entered on their
diagrams.
In Part (b) (i), while candidates correctly chose to apply Pythagoras’ theorem, a large number of candidates
could not correctly formulate it, and it was common to see B2 = 10
2 + 8
2 instead of BC
2 = 10
2 ‒ 8
2. In Part
(b) (ii), many candidates wrote that the triangles were similar simply because they were both right–angled
triangles.
Solutions
(a) (i) U
C M
2
(ii) 4x + 22 (iii) 8 students
(b) (i) BC = 6 cm (ii) The corresponding angles are equal.
(iii) DE = 3.6 m
Recommendations
Students must be made aware that they should not assume that diagrams given on an examination paper are
drawn according to scale. Teachers should encourage students to use mathematical jargon to explain
similarity of plane geometrical figures. They need to assist students in differentiating between figures that
are similar and those that are congruent. Attention should be given to the difference between an algebraic
expression and an algebraic equation. Candidates need to give greater attention to solving problems
involving the use of similar triangles.
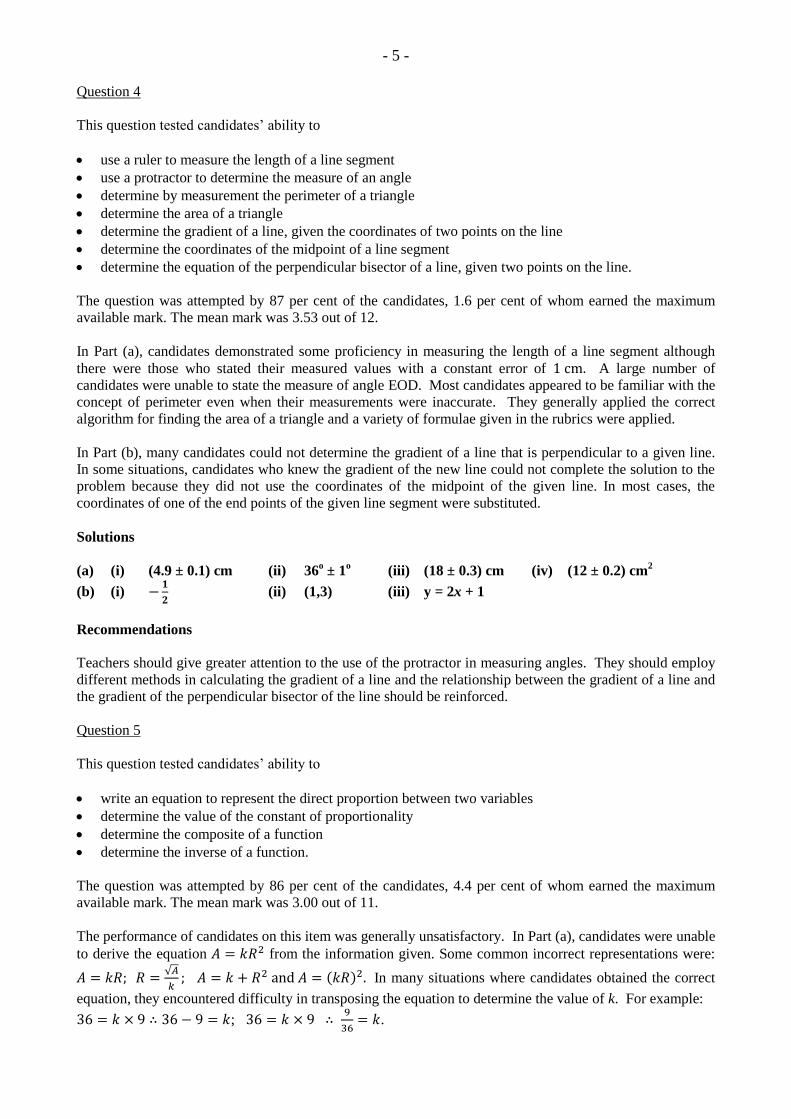
- 5 -
Question 4
This question tested candidates’ ability to
use a ruler to measure the length of a line segment
use a protractor to determine the measure of an angle
determine by measurement the perimeter of a triangle
determine the area of a triangle
determine the gradient of a line, given the coordinates of two points on the line
determine the coordinates of the midpoint of a line segment
determine the equation of the perpendicular bisector of a line, given two points on the line.
The question was attempted by 87 per cent of the candidates, 1.6 per cent of whom earned the maximum
available mark. The mean mark was 3.53 out of 12.
In Part (a), candidates demonstrated some proficiency in measuring the length of a line segment although
there were those who stated their measured values with a constant error of A large number of
candidates were unable to state the measure of angle EOD. Most candidates appeared to be familiar with the
concept of perimeter even when their measurements were inaccurate. They generally applied the correct
algorithm for finding the area of a triangle and a variety of formulae given in the rubrics were applied.
In Part (b), many candidates could not determine the gradient of a line that is perpendicular to a given line.
In some situations, candidates who knew the gradient of the new line could not complete the solution to the
problem because they did not use the coordinates of the midpoint of the given line. In most cases, the
coordinates of one of the end points of the given line segment were substituted.
Solutions
(a) (i) (4.9 ± 0.1) cm (ii) 36o ± 1
o (iii) (18 ± 0.3) cm (iv) (12 ± 0.2) cm
2
(b) (i)
(ii) (1,3) (iii) y = 2x + 1
Recommendations
Teachers should give greater attention to the use of the protractor in measuring angles. They should employ
different methods in calculating the gradient of a line and the relationship between the gradient of a line and
the gradient of the perpendicular bisector of the line should be reinforced.
Question 5
This question tested candidates’ ability to
write an equation to represent the direct proportion between two variables
determine the value of the constant of proportionality
determine the composite of a function
determine the inverse of a function.
The question was attempted by 86 per cent of the candidates, 4.4 per cent of whom earned the maximum
available mark. The mean mark was 3.00 out of 11.
The performance of candidates on this item was generally unsatisfactory. In Part (a), candidates were unable
to derive the equation from the information given. Some common incorrect representations were:
√
( ) In many situations where candidates obtained the correct
equation, they encountered difficulty in transposing the equation to determine the value of k. For example:
;
.
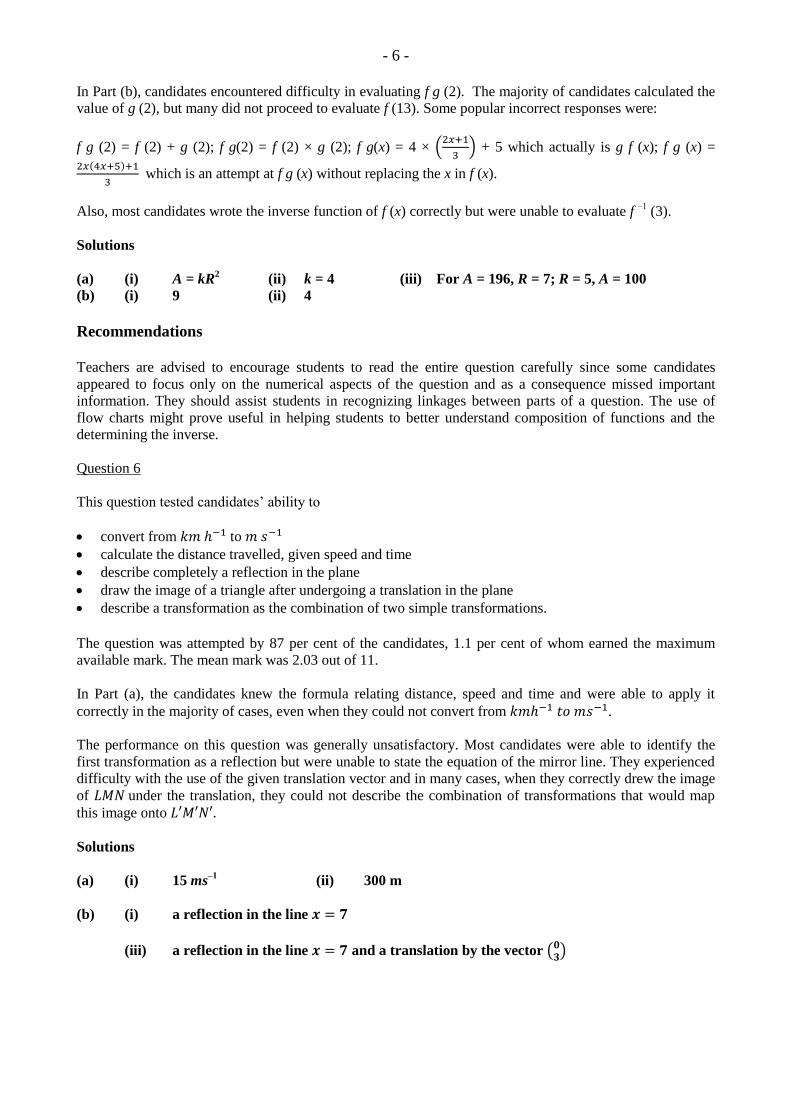
- 6 -
In Part (b), candidates encountered difficulty in evaluating f g (2). The majority of candidates calculated the
value of g (2), but many did not proceed to evaluate f (13). Some popular incorrect responses were:
f g (2) = f (2) + g (2); f g(2) = f (2) × g (2); f g(x) = 4 × (
) + 5 which actually is g f (x); f g (x) =
( )
which is an attempt at f g (x) without replacing the x in f (x).
Also, most candidates wrote the inverse function of f (x) correctly but were unable to evaluate f ‒1
(3).
Solutions
(a) (i) A = kR2 (ii) k = 4 (iii) For A = 196, R = 7; R = 5, A = 100
(b) (i) 9 (ii) 4
Recommendations
Teachers are advised to encourage students to read the entire question carefully since some candidates
appeared to focus only on the numerical aspects of the question and as a consequence missed important
information. They should assist students in recognizing linkages between parts of a question. The use of
flow charts might prove useful in helping students to better understand composition of functions and the
determining the inverse.
Question 6
This question tested candidates’ ability to
convert from to
calculate the distance travelled, given speed and time
describe completely a reflection in the plane
draw the image of a triangle after undergoing a translation in the plane
describe a transformation as the combination of two simple transformations.
The question was attempted by 87 per cent of the candidates, 1.1 per cent of whom earned the maximum
available mark. The mean mark was 2.03 out of 11.
In Part (a), the candidates knew the formula relating distance, speed and time and were able to apply it
correctly in the majority of cases, even when they could not convert from .
The performance on this question was generally unsatisfactory. Most candidates were able to identify the
first transformation as a reflection but were unable to state the equation of the mirror line. They experienced
difficulty with the use of the given translation vector and in many cases, when they correctly drew the image
of under the translation, they could not describe the combination of transformations that would map
this image onto .
Solutions
(a) (i) 15 ms‒1
(ii) 300 m
(b) (i) a reflection in the line
(iii) a reflection in the line and a translation by the vector ( )
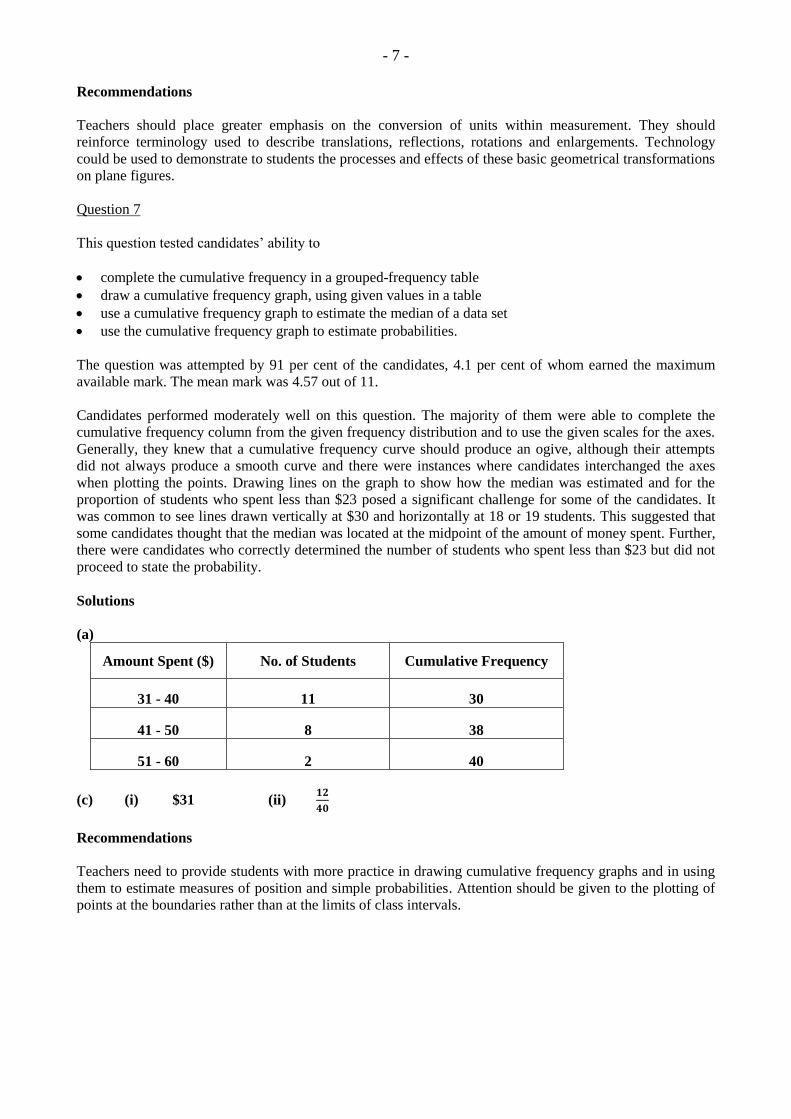
- 7 -
Recommendations
Teachers should place greater emphasis on the conversion of units within measurement. They should
reinforce terminology used to describe translations, reflections, rotations and enlargements. Technology
could be used to demonstrate to students the processes and effects of these basic geometrical transformations
on plane figures.
Question 7
This question tested candidates’ ability to
complete the cumulative frequency in a grouped-frequency table
draw a cumulative frequency graph, using given values in a table
use a cumulative frequency graph to estimate the median of a data set
use the cumulative frequency graph to estimate probabilities.
The question was attempted by 91 per cent of the candidates, 4.1 per cent of whom earned the maximum
available mark. The mean mark was 4.57 out of 11.
Candidates performed moderately well on this question. The majority of them were able to complete the
cumulative frequency column from the given frequency distribution and to use the given scales for the axes.
Generally, they knew that a cumulative frequency curve should produce an ogive, although their attempts
did not always produce a smooth curve and there were instances where candidates interchanged the axes
when plotting the points. Drawing lines on the graph to show how the median was estimated and for the
proportion of students who spent less than $23 posed a significant challenge for some of the candidates. It
was common to see lines drawn vertically at $30 and horizontally at 18 or 19 students. This suggested that
some candidates thought that the median was located at the midpoint of the amount of money spent. Further,
there were candidates who correctly determined the number of students who spent less than $23 but did not
proceed to state the probability.
Solutions
(a)
Amount Spent ($) No. of Students Cumulative Frequency
31 - 40 11 30
41 - 50 8 38
51 - 60 2 40
(c) (i) $31 (ii)
Recommendations
Teachers need to provide students with more practice in drawing cumulative frequency graphs and in using
them to estimate measures of position and simple probabilities. Attention should be given to the plotting of
points at the boundaries rather than at the limits of class intervals.
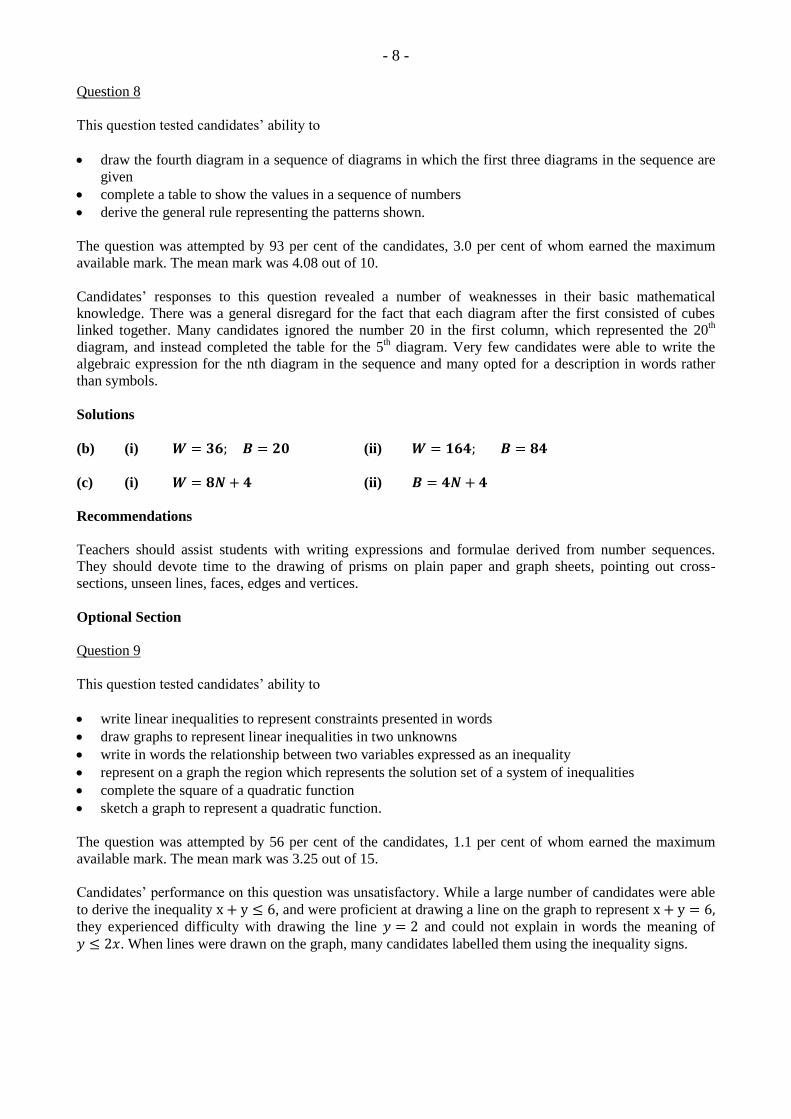
- 8 -
Question 8
This question tested candidates’ ability to
draw the fourth diagram in a sequence of diagrams in which the first three diagrams in the sequence are
given
complete a table to show the values in a sequence of numbers
derive the general rule representing the patterns shown.
The question was attempted by 93 per cent of the candidates, 3.0 per cent of whom earned the maximum
available mark. The mean mark was 4.08 out of 10.
Candidates’ responses to this question revealed a number of weaknesses in their basic mathematical
knowledge. There was a general disregard for the fact that each diagram after the first consisted of cubes
linked together. Many candidates ignored the number 20 in the first column, which represented the 20th
diagram, and instead completed the table for the 5th diagram. Very few candidates were able to write the
algebraic expression for the nth diagram in the sequence and many opted for a description in words rather
than symbols.
Solutions
(b) (i) (ii)
(c) (i) (ii)
Recommendations
Teachers should assist students with writing expressions and formulae derived from number sequences.
They should devote time to the drawing of prisms on plain paper and graph sheets, pointing out cross-
sections, unseen lines, faces, edges and vertices.
Optional Section
Question 9
This question tested candidates’ ability to
write linear inequalities to represent constraints presented in words
draw graphs to represent linear inequalities in two unknowns
write in words the relationship between two variables expressed as an inequality
represent on a graph the region which represents the solution set of a system of inequalities
complete the square of a quadratic function
sketch a graph to represent a quadratic function.
The question was attempted by 56 per cent of the candidates, 1.1 per cent of whom earned the maximum
available mark. The mean mark was 3.25 out of 15.
Candidates’ performance on this question was unsatisfactory. While a large number of candidates were able
to derive the inequality , and were proficient at drawing a line on the graph to represent they experienced difficulty with drawing the line and could not explain in words the meaning of
. When lines were drawn on the graph, many candidates labelled them using the inequality signs.
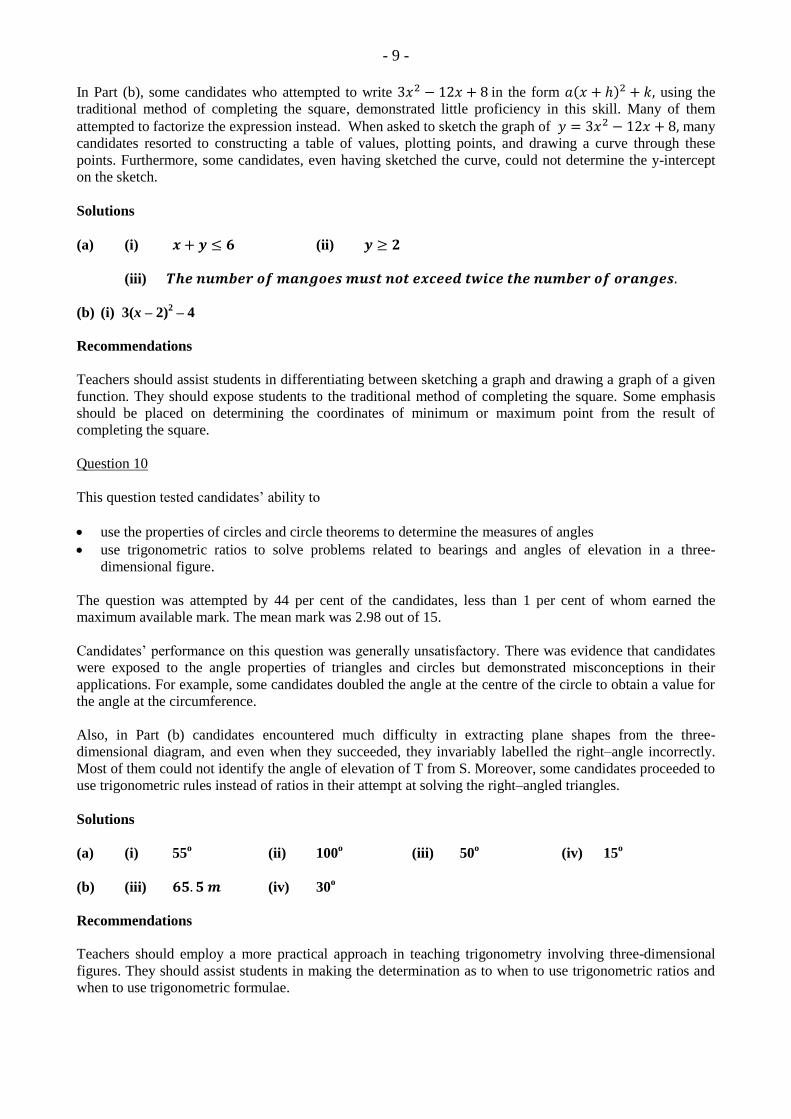
- 9 -
In Part (b), some candidates who attempted to write in the form ( ) using the
traditional method of completing the square, demonstrated little proficiency in this skill. Many of them
attempted to factorize the expression instead. When asked to sketch the graph of many
candidates resorted to constructing a table of values, plotting points, and drawing a curve through these
points. Furthermore, some candidates, even having sketched the curve, could not determine the y-intercept
on the sketch.
Solutions
(a) (i) (ii)
(iii)
(b) (i) 3(x – 2)2 – 4
Recommendations
Teachers should assist students in differentiating between sketching a graph and drawing a graph of a given
function. They should expose students to the traditional method of completing the square. Some emphasis
should be placed on determining the coordinates of minimum or maximum point from the result of
completing the square.
Question 10
This question tested candidates’ ability to
use the properties of circles and circle theorems to determine the measures of angles
use trigonometric ratios to solve problems related to bearings and angles of elevation in a three-
dimensional figure.
The question was attempted by 44 per cent of the candidates, less than 1 per cent of whom earned the
maximum available mark. The mean mark was 2.98 out of 15.
Candidates’ performance on this question was generally unsatisfactory. There was evidence that candidates
were exposed to the angle properties of triangles and circles but demonstrated misconceptions in their
applications. For example, some candidates doubled the angle at the centre of the circle to obtain a value for
the angle at the circumference.
Also, in Part (b) candidates encountered much difficulty in extracting plane shapes from the three-
dimensional diagram, and even when they succeeded, they invariably labelled the right–angle incorrectly.
Most of them could not identify the angle of elevation of T from S. Moreover, some candidates proceeded to
use trigonometric rules instead of ratios in their attempt at solving the right–angled triangles.
Solutions
(a) (i) 55o (ii) 100
o (iii) 50
o (iv) 15
o
(b) (iii) (iv) 30o
Recommendations
Teachers should employ a more practical approach in teaching trigonometry involving three-dimensional
figures. They should assist students in making the determination as to when to use trigonometric ratios and
when to use trigonometric formulae.
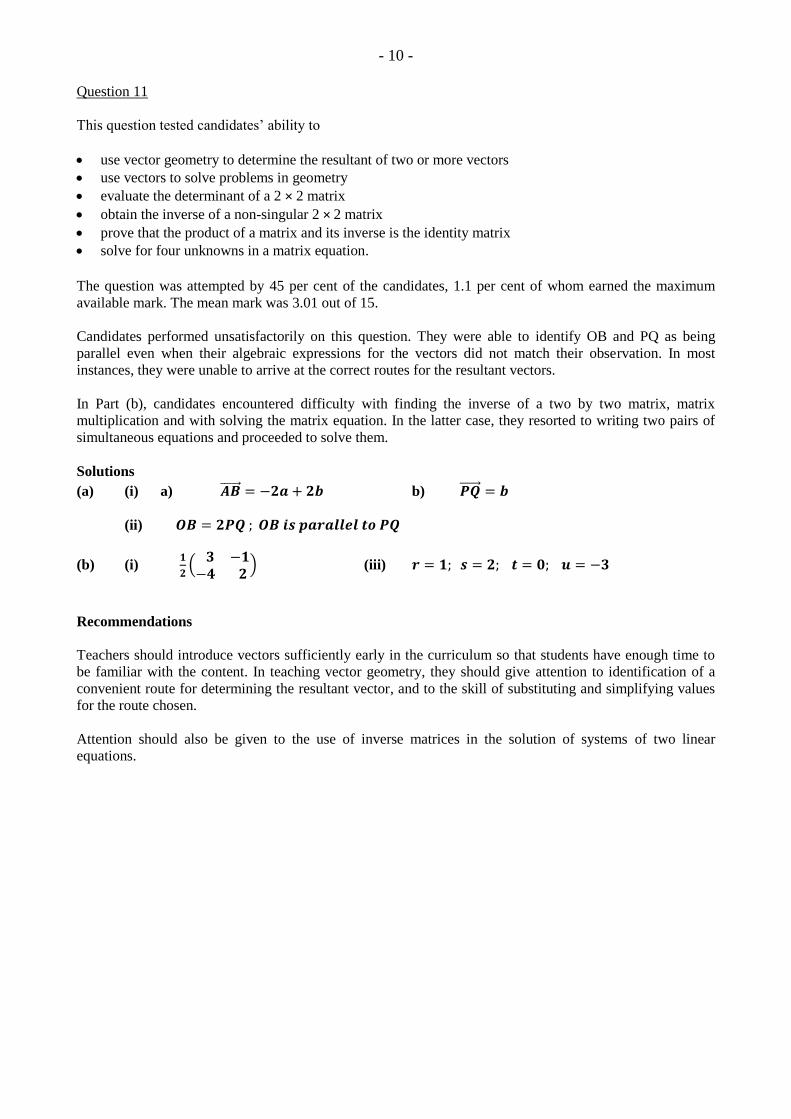
- 10 -
Question 11
This question tested candidates’ ability to
use vector geometry to determine the resultant of two or more vectors
use vectors to solve problems in geometry
evaluate the determinant of a 2 × 2 matrix
obtain the inverse of a non-singular 2 × 2 matrix
prove that the product of a matrix and its inverse is the identity matrix
solve for four unknowns in a matrix equation.
The question was attempted by 45 per cent of the candidates, 1.1 per cent of whom earned the maximum
available mark. The mean mark was 3.01 out of 15.
Candidates performed unsatisfactorily on this question. They were able to identify OB and PQ as being
parallel even when their algebraic expressions for the vectors did not match their observation. In most
instances, they were unable to arrive at the correct routes for the resultant vectors.
In Part (b), candidates encountered difficulty with finding the inverse of a two by two matrix, matrix
multiplication and with solving the matrix equation. In the latter case, they resorted to writing two pairs of
simultaneous equations and proceeded to solve them.
Solutions
(a) (i) a) b)
(ii)
(b) (i)
(
) (iii)
Recommendations
Teachers should introduce vectors sufficiently early in the curriculum so that students have enough time to
be familiar with the content. In teaching vector geometry, they should give attention to identification of a
convenient route for determining the resultant vector, and to the skill of substituting and simplifying values
for the route chosen.
Attention should also be given to the use of inverse matrices in the solution of systems of two linear
equations.
CARIBBEAN EXAMINATIONS COUNCIL
REPORT ON CANDIDATES’ WORK IN THE
CARIBBEAN SECONDARY EDUCATION CERTIFICATE® EXAMINATION
JANUARY 2014
MATHEMATICS
GENERAL PROFICIENCY EXAMINATION
Copyright © 2014 Caribbean Examinations Council
St Michael, Barbados
All rights reserved.
2
GENERAL COMMENTS
The General Proficiency Mathematics examination is offered in January and May/June
each year. There was a candidate entry of approximately 11, 600 in January 2014 and 45
per cent of the candidates earned Grades I–III. The mean score for the examination was
74 out of 180 marks.
DETAILED COMMENTS
Paper 01 Multiple Choice
Paper 01 consisted of 60 multiple-choice items. It was designed to provide adequate
coverage of the content with items taken from all sections of the syllabus.
Approximately 76 per cent of candidates earned acceptable grades on this paper; the
mean score was 34 out of 60 marks. This year 16 candidates each earned the maximum
available score of 60. Sixty per cent of the candidates scored 30 marks or more.
Paper 02 – Structured Questions
Paper 02 consisted of two sections. Section I comprised eight compulsory questions for a
total of 90 marks. Section II comprised three optional questions: one each from Algebra,
Relations, Functions and Graphs; Measurement, Trigonometry and Geometry; and
Vectors and Matrices. Candidates were required to answer any two out of the three
questions from Section II. Each question was worth 15 marks. The mean score for this
paper was 41 out of 120 marks. This year, no candidate earned the maximum available
mark of 120. Approximately 17 per cent of candidates earned at least 60 marks.
Section I: Compulsory Questions
Question 1
This question tested candidates’ ability to
perform the four basic operations on common fractions
compute the square and positive square root of decimals
divide decimals
round off to a given number of decimal places
solve problems involving cost price, taxes, profit and percentage profit.
3
The question was attempted by 99 per cent of candidates, 8.2 per cent of whom earned
the maximum available mark. The mean mark was 7.03 out of 11.
The performance of candidates was satisfactory. In Part (a), some candidates knew the
algorithms for subtracting, dividing and adding fractions although several erred by not
following the order of operations. In Part (b), some candidates multiplied by 2 instead of
squaring 1.31. Further, a number of candidates rounded off too early in their
computations. In Part (c), some candidates made the error of adding money to the
number of bracelets, while some obtained a percentage profit that was not logical in the
context of the problem. Also, many candidates used an incorrect value for the cost price
when calculating the percentage profit.
Solutions
(a)
(b) 2.40
(c) (i) (ii) a) $3 200.25 b) 39%
Recommendations
Teachers should provide students with opportunities to use the calculator to perform basic
arithmetic operations on rational numbers. Attention should also be given to squaring and
finding the square root, converting improper fractions to decimals, and estimating the
answer and the order in which operations should be performed.
Question 2
This question tested candidates’ ability to
solve a linear in-equation in one unknown and to graphically represent its solution set
factorize quadratic functions by grouping and by difference of squares
find the product of two binomial expressions
solve a pair of simultaneous equations.
The question was attempted by 98 per cent of candidates, 4.8 per cent of whom earned
the maximum available mark. The mean mark was 4.84 out of 12.
Candidate performance was unsatisfactory. In Part (a), candidates experienced difficulty
working with the inequality sign. It was a common feature to see the sign incorrectly
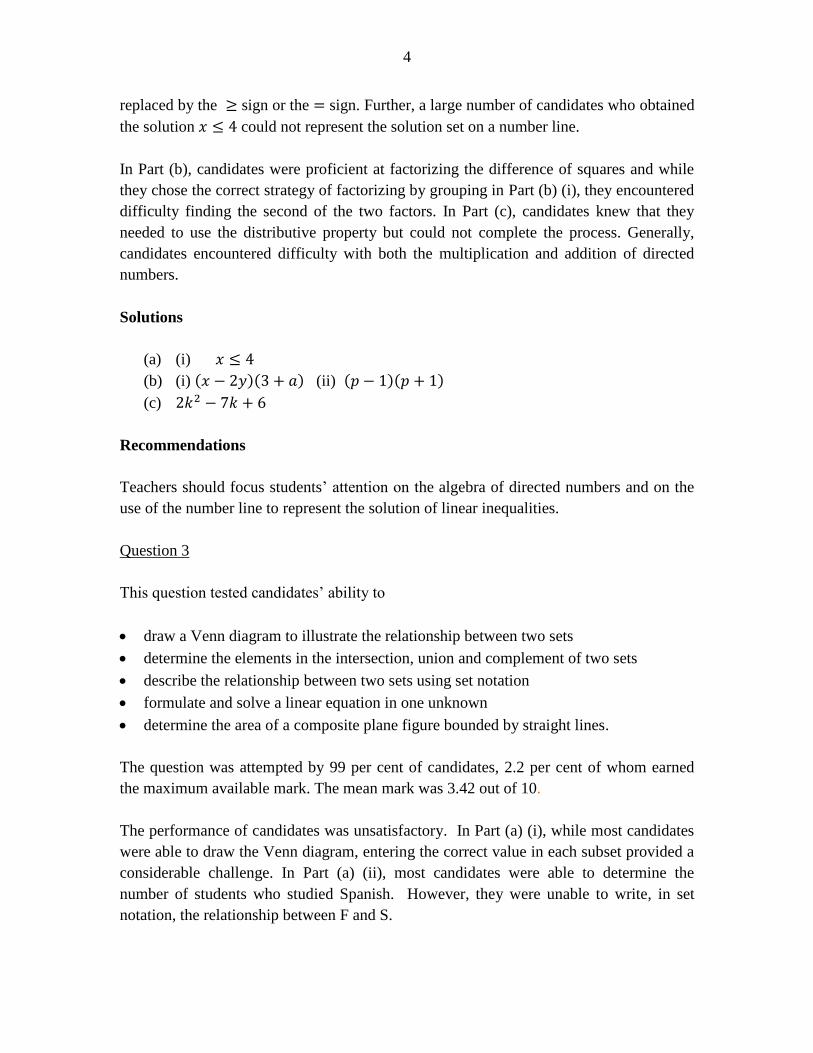
4
replaced by the sign or the sign. Further, a large number of candidates who obtained
the solution could not represent the solution set on a number line.
In Part (b), candidates were proficient at factorizing the difference of squares and while
they chose the correct strategy of factorizing by grouping in Part (b) (i), they encountered
difficulty finding the second of the two factors. In Part (c), candidates knew that they
needed to use the distributive property but could not complete the process. Generally,
candidates encountered difficulty with both the multiplication and addition of directed
numbers.
Solutions
(a) (i)
(b) (i) ( )( ) (ii) ( )( )
(c)
Recommendations
Teachers should focus students’ attention on the algebra of directed numbers and on the
use of the number line to represent the solution of linear inequalities.
Question 3
This question tested candidates’ ability to
draw a Venn diagram to illustrate the relationship between two sets
determine the elements in the intersection, union and complement of two sets
describe the relationship between two sets using set notation
formulate and solve a linear equation in one unknown
determine the area of a composite plane figure bounded by straight lines.
The question was attempted by 99 per cent of candidates, 2.2 per cent of whom earned
the maximum available mark. The mean mark was 3.42 out of 10.
The performance of candidates was unsatisfactory. In Part (a) (i), while most candidates
were able to draw the Venn diagram, entering the correct value in each subset provided a
considerable challenge. In Part (a) (ii), most candidates were able to determine the
number of students who studied Spanish. However, they were unable to write, in set
notation, the relationship between F and S.
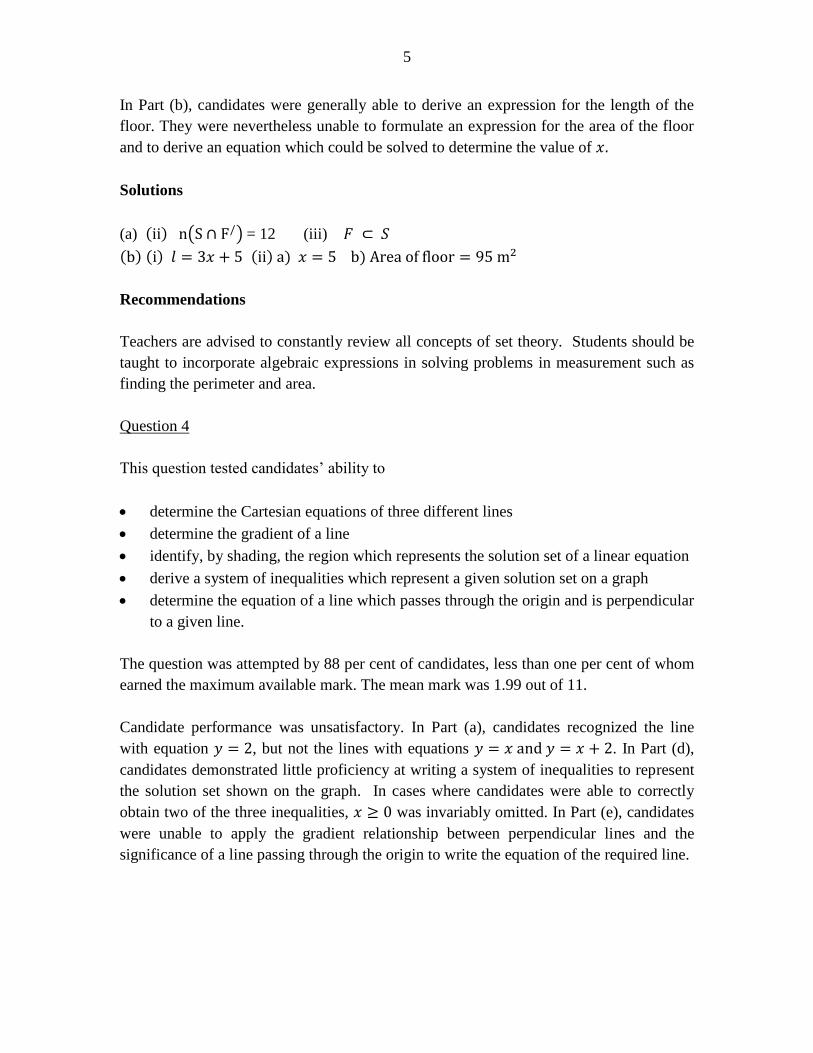
5
In Part (b), candidates were generally able to derive an expression for the length of the
floor. They were nevertheless unable to formulate an expression for the area of the floor
and to derive an equation which could be solved to determine the value of
Solutions
(a) ( ) ( ) = 12 (iii)
( ) ( ) ( ) ) )
Recommendations
Teachers are advised to constantly review all concepts of set theory. Students should be
taught to incorporate algebraic expressions in solving problems in measurement such as
finding the perimeter and area.
Question 4
This question tested candidates’ ability to
determine the Cartesian equations of three different lines
determine the gradient of a line
identify, by shading, the region which represents the solution set of a linear equation
derive a system of inequalities which represent a given solution set on a graph
determine the equation of a line which passes through the origin and is perpendicular
to a given line.
The question was attempted by 88 per cent of candidates, less than one per cent of whom
earned the maximum available mark. The mean mark was 1.99 out of 11.
Candidate performance was unsatisfactory. In Part (a), candidates recognized the line
with equation , but not the lines with equations . In Part (d),
candidates demonstrated little proficiency at writing a system of inequalities to represent
the solution set shown on the graph. In cases where candidates were able to correctly
obtain two of the three inequalities, was invariably omitted. In Part (e), candidates
were unable to apply the gradient relationship between perpendicular lines and the
significance of a line passing through the origin to write the equation of the required line.
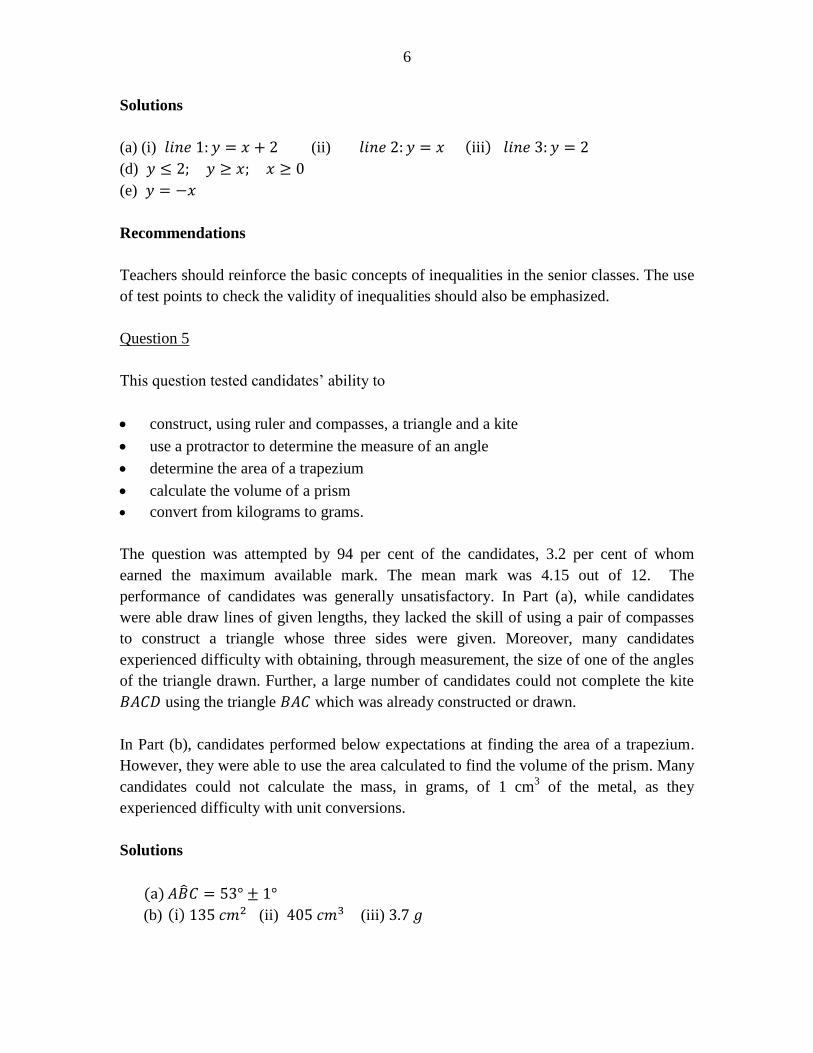
6
Solutions
(a) (i) (ii) ( )
(d)
(e)
Recommendations
Teachers should reinforce the basic concepts of inequalities in the senior classes. The use
of test points to check the validity of inequalities should also be emphasized.
Question 5
This question tested candidates’ ability to
construct, using ruler and compasses, a triangle and a kite
use a protractor to determine the measure of an angle
determine the area of a trapezium
calculate the volume of a prism
convert from kilograms to grams.
The question was attempted by 94 per cent of the candidates, 3.2 per cent of whom
earned the maximum available mark. The mean mark was 4.15 out of 12. The
performance of candidates was generally unsatisfactory. In Part (a), while candidates
were able draw lines of given lengths, they lacked the skill of using a pair of compasses
to construct a triangle whose three sides were given. Moreover, many candidates
experienced difficulty with obtaining, through measurement, the size of one of the angles
of the triangle drawn. Further, a large number of candidates could not complete the kite
using the triangle which was already constructed or drawn.
In Part (b), candidates performed below expectations at finding the area of a trapezium.
However, they were able to use the area calculated to find the volume of the prism. Many
candidates could not calculate the mass, in grams, of 1 cm3 of the metal, as they
experienced difficulty with unit conversions.
Solutions
(a)
(b) ( ) (ii) (iii)
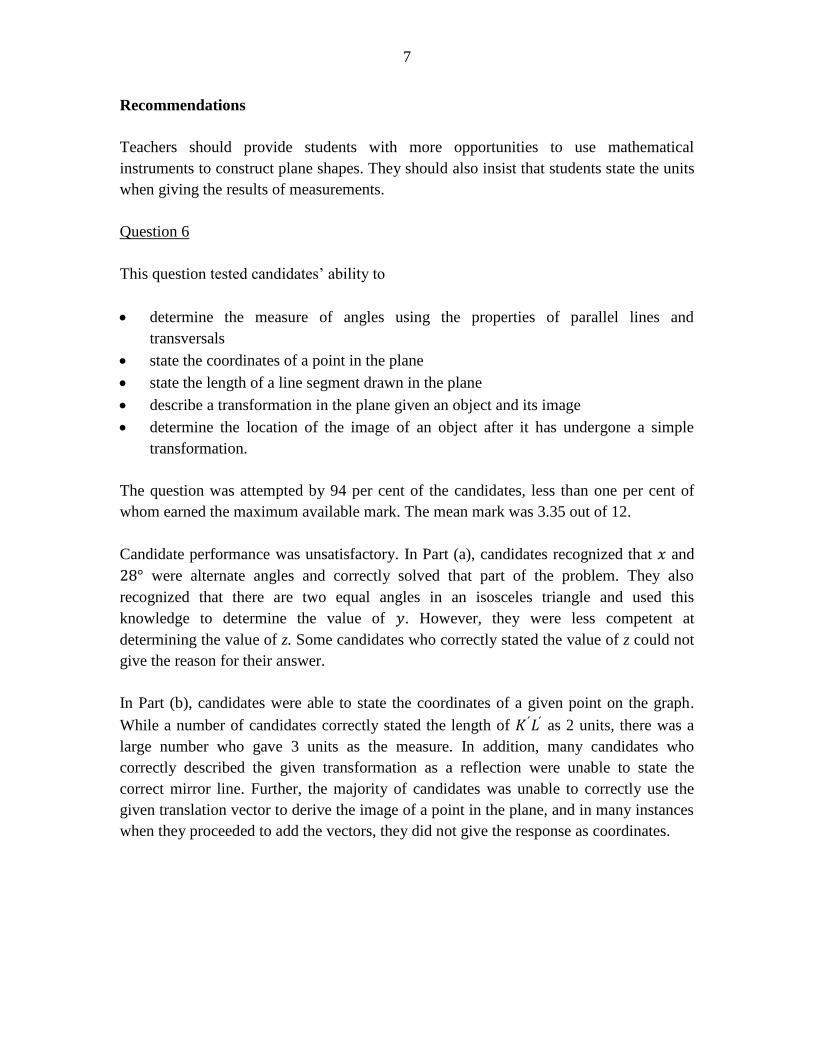
7
Recommendations
Teachers should provide students with more opportunities to use mathematical
instruments to construct plane shapes. They should also insist that students state the units
when giving the results of measurements.
Question 6
This question tested candidates’ ability to
determine the measure of angles using the properties of parallel lines and
transversals
state the coordinates of a point in the plane
state the length of a line segment drawn in the plane
describe a transformation in the plane given an object and its image
determine the location of the image of an object after it has undergone a simple
transformation.
The question was attempted by 94 per cent of the candidates, less than one per cent of
whom earned the maximum available mark. The mean mark was 3.35 out of 12.
Candidate performance was unsatisfactory. In Part (a), candidates recognized that and
were alternate angles and correctly solved that part of the problem. They also
recognized that there are two equal angles in an isosceles triangle and used this
knowledge to determine the value of . However, they were less competent at
determining the value of z. Some candidates who correctly stated the value of z could not
give the reason for their answer.
In Part (b), candidates were able to state the coordinates of a given point on the graph.
While a number of candidates correctly stated the length of as 2 units, there was a
large number who gave 3 units as the measure. In addition, many candidates who
correctly described the given transformation as a reflection were unable to state the
correct mirror line. Further, the majority of candidates was unable to correctly use the
given translation vector to derive the image of a point in the plane, and in many instances
when they proceeded to add the vectors, they did not give the response as coordinates.
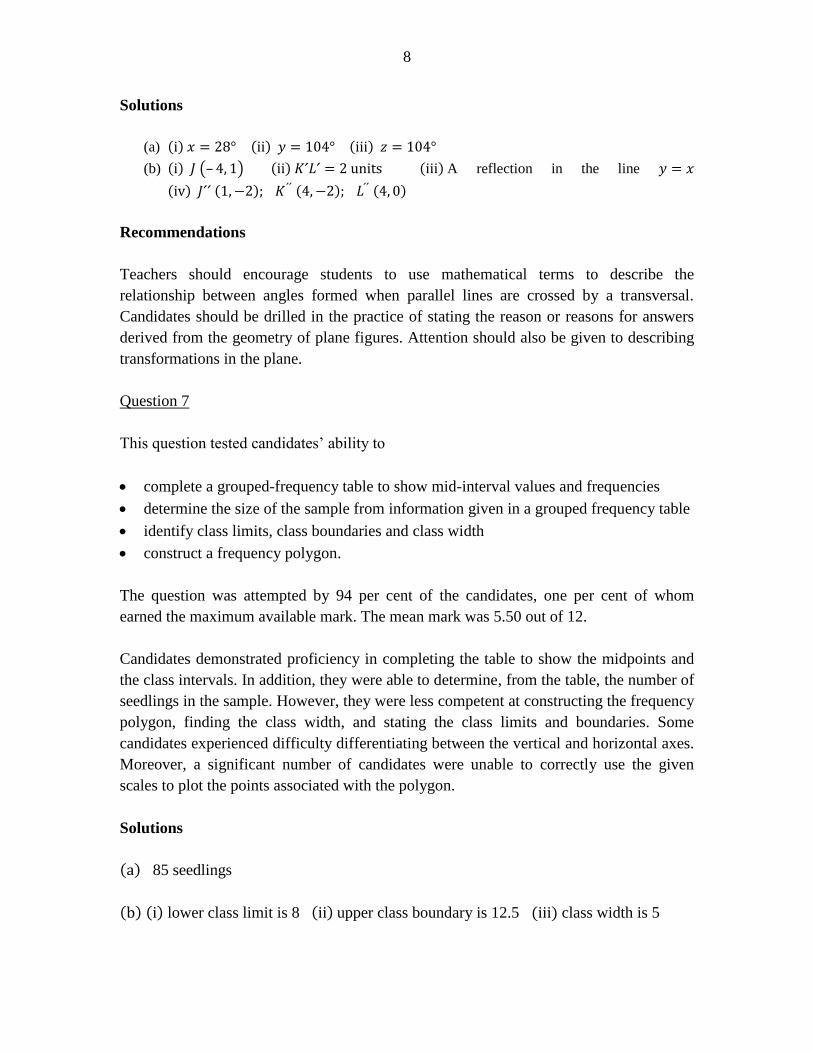
8
Solutions
(a) ( ) ( ) ( )
(b) ( ) (– ) ( ) ( ) A reflection in the line
( ) ( ) ( ) ( )
Recommendations
Teachers should encourage students to use mathematical terms to describe the
relationship between angles formed when parallel lines are crossed by a transversal.
Candidates should be drilled in the practice of stating the reason or reasons for answers
derived from the geometry of plane figures. Attention should also be given to describing
transformations in the plane.
Question 7
This question tested candidates’ ability to
complete a grouped-frequency table to show mid-interval values and frequencies
determine the size of the sample from information given in a grouped frequency table
identify class limits, class boundaries and class width
construct a frequency polygon.
The question was attempted by 94 per cent of the candidates, one per cent of whom
earned the maximum available mark. The mean mark was 5.50 out of 12.
Candidates demonstrated proficiency in completing the table to show the midpoints and
the class intervals. In addition, they were able to determine, from the table, the number of
seedlings in the sample. However, they were less competent at constructing the frequency
polygon, finding the class width, and stating the class limits and boundaries. Some
candidates experienced difficulty differentiating between the vertical and horizontal axes.
Moreover, a significant number of candidates were unable to correctly use the given
scales to plot the points associated with the polygon.
Solutions
( ) 85 seedlings
( ) ( ) lower class limit is 8 ( ) upper class boundary is 12.5 ( ) class width is 5
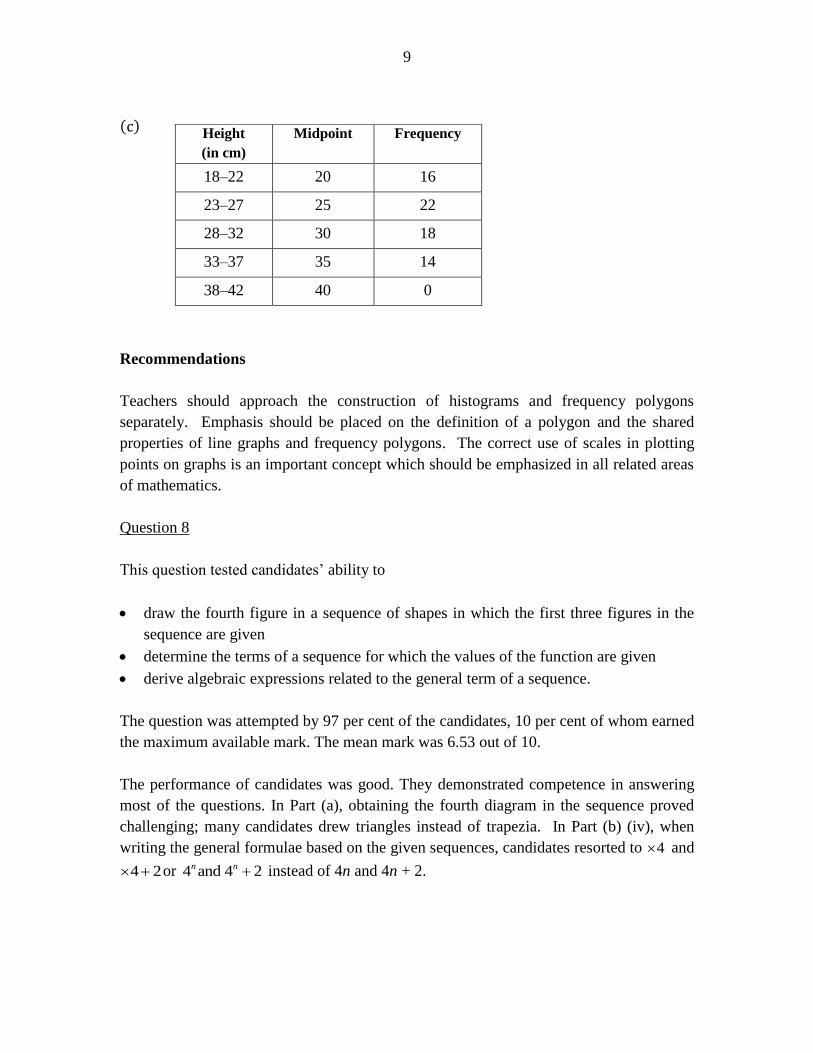
9
( )
Recommendations
Teachers should approach the construction of histograms and frequency polygons
separately. Emphasis should be placed on the definition of a polygon and the shared
properties of line graphs and frequency polygons. The correct use of scales in plotting
points on graphs is an important concept which should be emphasized in all related areas
of mathematics.
Question 8
This question tested candidates’ ability to
draw the fourth figure in a sequence of shapes in which the first three figures in the
sequence are given
determine the terms of a sequence for which the values of the function are given
derive algebraic expressions related to the general term of a sequence.
The question was attempted by 97 per cent of the candidates, 10 per cent of whom earned
the maximum available mark. The mean mark was 6.53 out of 10.
The performance of candidates was good. They demonstrated competence in answering
most of the questions. In Part (a), obtaining the fourth diagram in the sequence proved
challenging; many candidates drew triangles instead of trapezia. In Part (b) (iv), when
writing the general formulae based on the given sequences, candidates resorted to 4 and
4 2 or 4 and 4 2n n instead of 4n and 4n + 2.
Height
(in cm)
Midpoint Frequency
18–22 20 16
23–27 25 22
28–32 30 18
33–37 35 14
38–42 40 0
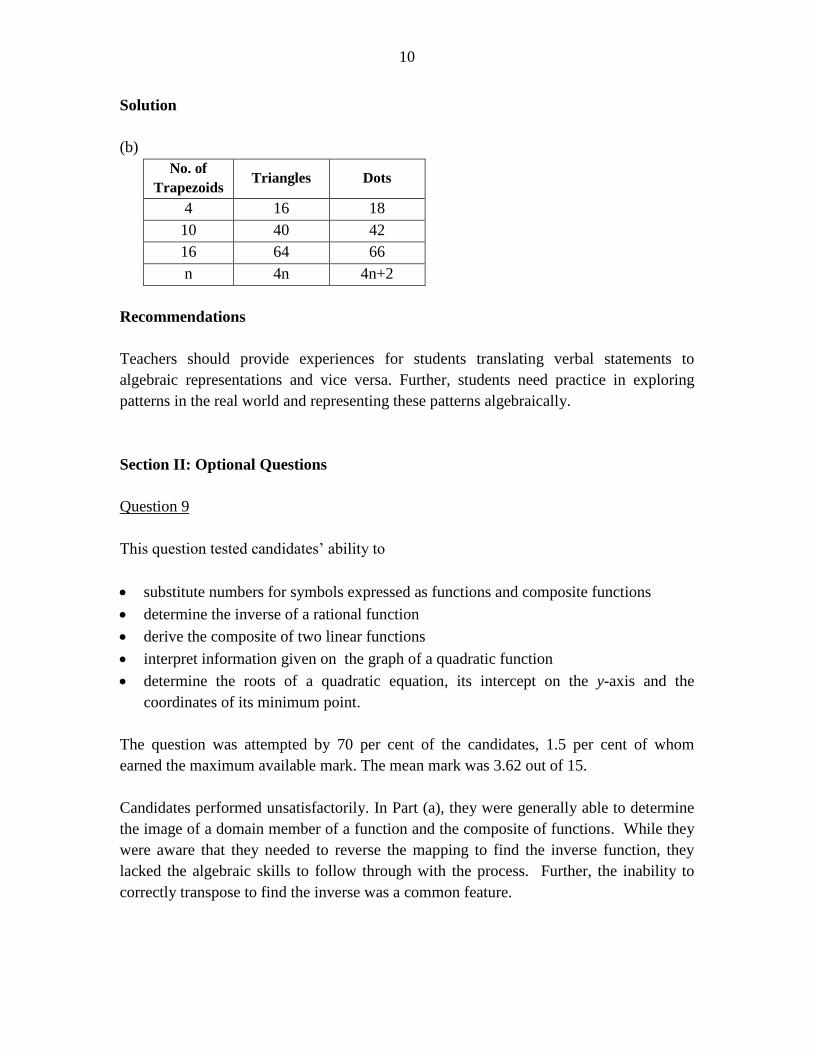
10
Solution
(b)
No. of
Trapezoids Triangles Dots
4 16 18
10 40 42
16 64 66
n 4n 4n+2
Recommendations
Teachers should provide experiences for students translating verbal statements to
algebraic representations and vice versa. Further, students need practice in exploring
patterns in the real world and representing these patterns algebraically.
Section II: Optional Questions
Question 9
This question tested candidates’ ability to
substitute numbers for symbols expressed as functions and composite functions
determine the inverse of a rational function
derive the composite of two linear functions
interpret information given on the graph of a quadratic function
determine the roots of a quadratic equation, its intercept on the y-axis and the
coordinates of its minimum point.
The question was attempted by 70 per cent of the candidates, 1.5 per cent of whom
earned the maximum available mark. The mean mark was 3.62 out of 15.
Candidates performed unsatisfactorily. In Part (a), they were generally able to determine
the image of a domain member of a function and the composite of functions. While they
were aware that they needed to reverse the mapping to find the inverse function, they
lacked the algebraic skills to follow through with the process. Further, the inability to
correctly transpose to find the inverse was a common feature.
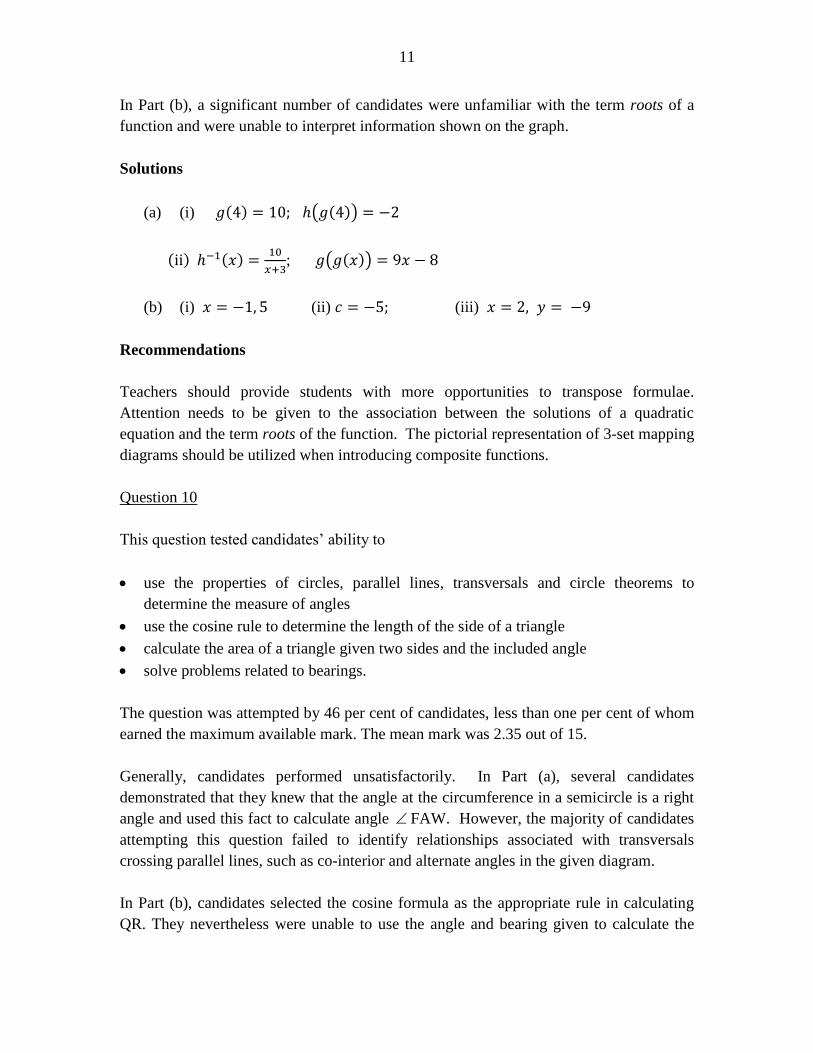
11
In Part (b), a significant number of candidates were unfamiliar with the term roots of a
function and were unable to interpret information shown on the graph.
Solutions
(a) (i) ( ) ( ( ))
( ) ( )
; ( ( ))
(b) (i) (ii) (iii)
Recommendations
Teachers should provide students with more opportunities to transpose formulae.
Attention needs to be given to the association between the solutions of a quadratic
equation and the term roots of the function. The pictorial representation of 3-set mapping
diagrams should be utilized when introducing composite functions.
Question 10
This question tested candidates’ ability to
use the properties of circles, parallel lines, transversals and circle theorems to
determine the measure of angles
use the cosine rule to determine the length of the side of a triangle
calculate the area of a triangle given two sides and the included angle
solve problems related to bearings.
The question was attempted by 46 per cent of candidates, less than one per cent of whom
earned the maximum available mark. The mean mark was 2.35 out of 15.
Generally, candidates performed unsatisfactorily. In Part (a), several candidates
demonstrated that they knew that the angle at the circumference in a semicircle is a right
angle and used this fact to calculate angle FAW. However, the majority of candidates
attempting this question failed to identify relationships associated with transversals
crossing parallel lines, such as co-interior and alternate angles in the given diagram.
In Part (b), candidates selected the cosine formula as the appropriate rule in calculating
QR. They nevertheless were unable to use the angle and bearing given to calculate the
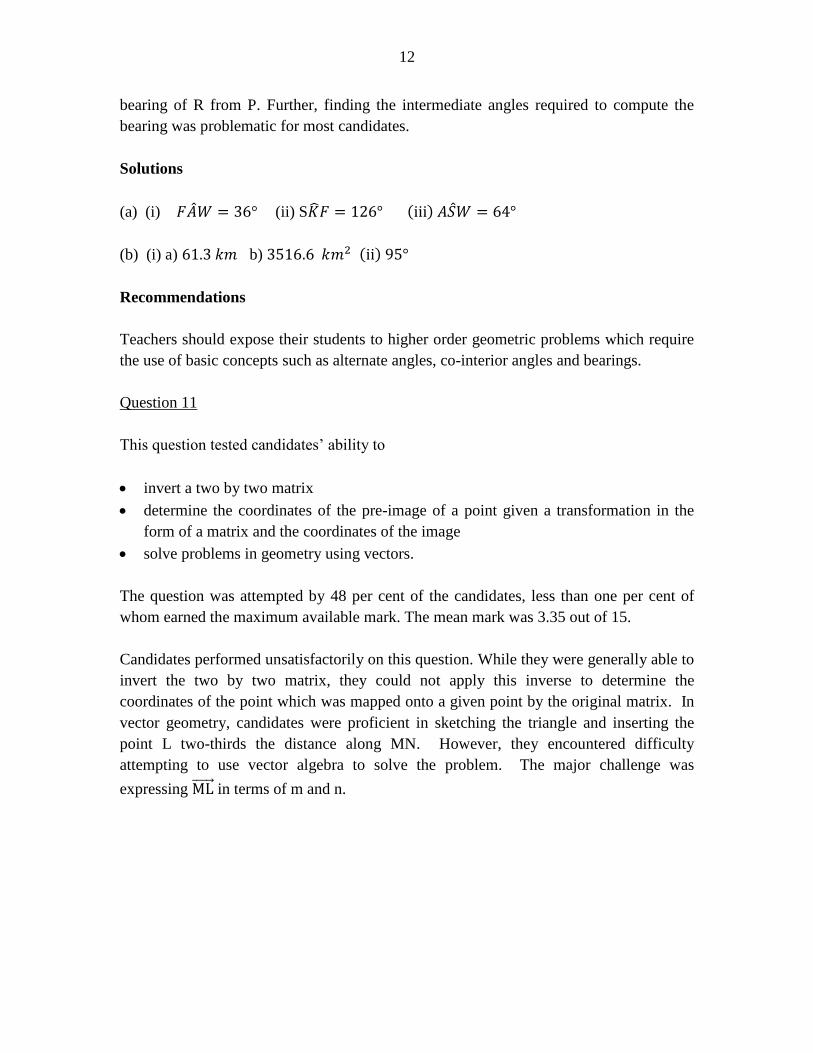
12
bearing of R from P. Further, finding the intermediate angles required to compute the
bearing was problematic for most candidates.
Solutions
(a) (i) ° (ii) S ( )
(b) (i) a) b) ( )
Recommendations
Teachers should expose their students to higher order geometric problems which require
the use of basic concepts such as alternate angles, co-interior angles and bearings.
Question 11
This question tested candidates’ ability to
invert a two by two matrix
determine the coordinates of the pre-image of a point given a transformation in the
form of a matrix and the coordinates of the image
solve problems in geometry using vectors.
The question was attempted by 48 per cent of the candidates, less than one per cent of
whom earned the maximum available mark. The mean mark was 3.35 out of 15.
Candidates performed unsatisfactorily on this question. While they were generally able to
invert the two by two matrix, they could not apply this inverse to determine the
coordinates of the point which was mapped onto a given point by the original matrix. In
vector geometry, candidates were proficient in sketching the triangle and inserting the
point L two-thirds the distance along MN. However, they encountered difficulty
attempting to use vector algebra to solve the problem. The major challenge was
expressing in terms of m and n.
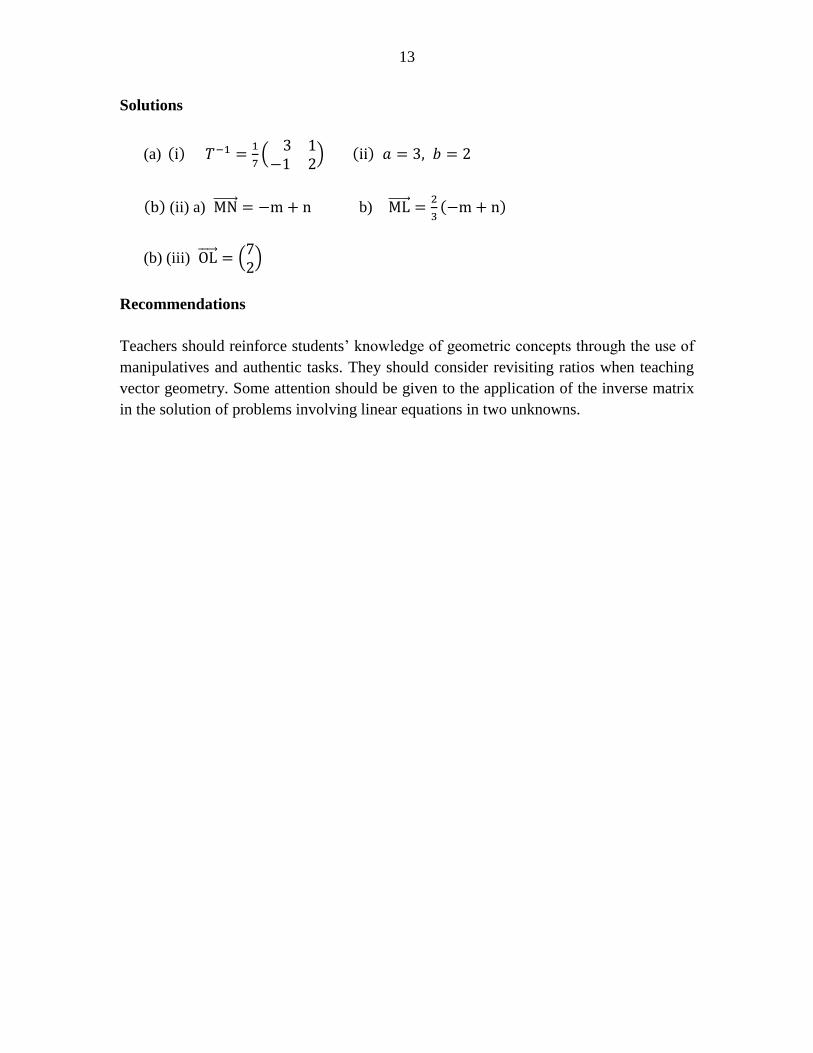
13
Solutions
(a) ( )
(
) ( )
( ) (ii) a) b)
( )
(b) (iii) (
)
Recommendations
Teachers should reinforce students’ knowledge of geometric concepts through the use of
manipulatives and authentic tasks. They should consider revisiting ratios when teaching
vector geometry. Some attention should be given to the application of the inverse matrix
in the solution of problems involving linear equations in two unknowns.
C A R I B B E A N E X A M I N A T I O N S C O U N C I L
REPORT ON CANDIDATES’ WORK IN THE
CARIBBEAN SECONDARY EDUCATION CERTIFICATE® EXAMINATION
MAY/JUNE 2014
MATHEMATICS
GENERAL PROFICIENCY EXAMINATION
Copyright© 2014 Caribbean Examinations Council
St Michael, Barbados
All rights reserved.
- 2 -
GENERAL COMMENTS
The General Proficiency Mathematics examination is offered in January and May/June each year. There
was a candidate entry of approximately 90,100 in May/June 2014 and 50 per cent of the candidates earned
Grades I‒III. The mean score for the examination was 75 out of 180 marks.
DETAILED COMMENTS
Paper 01 — Multiple Choice
Paper 01 consisted of 60 multiple–choice items. It was designed to provide adequate coverage of the
content with items taken from all sections of the syllabus. Approximately 70 per cent of the candidates
earned acceptable grades on this paper; the mean score was 33 out of 60 marks. This year, 271 candidates
earned the maximum available score of 60.
Paper 02 — Structured Questions
Paper 02 consisted of two sections. Section I comprised eight compulsory questions for a total of 90 marks.
Section II comprised three optional questions: one each from Algebra, Relations, Functions and Graphs;
Measurement, Trigonometry and Geometry; and Vectors and Matrices. Candidates were required to answer
any two of the three questions from this section. Each question in this section was worth 15 marks. The
mean score for this paper was 42 out of 120 marks.
Compulsory Section
Question 1
This question tested candidates’ ability to
use the calculator to divide decimals
evaluate the square and the square root of rational numbers
write a rational number correct to three significant figures
solve problems involving hire purchase.
The question was attempted by 99 per cent of the candidates, 12.9 per cent of whom earned the maximum
available mark. The mean mark was 7.21 out of 12.
In Part (a), candidates generally provided satisfactory responses. Those who used the calculator were able to
perform the computations but did not approximate the result of the third computation to three significant
figures.
In Part (b), a large number of candidates experienced difficulty in deriving the number of buckets of gravel
that should be mixed with 4 buckets of cement. Two popular incorrect responses to this part of the question
were: 4
11× 6 and
6
11× 4. Many candidates attempted to use the proportion 1:4:6 and any of the numbers
given in the question to compute the required values.
In Part (c), most candidates were able to calculate the hire purchase price by adding the down payment to the
total paid by instalments. However, some candidates incorrectly interpreted hire purchase to mean simple
interest, and hence produced the following result: HP = P × R × T
100=
350 × 120 × 10
100. Another common error in
the solution to this part of the question was: Amt saved = Cost price – Hire purchase price.
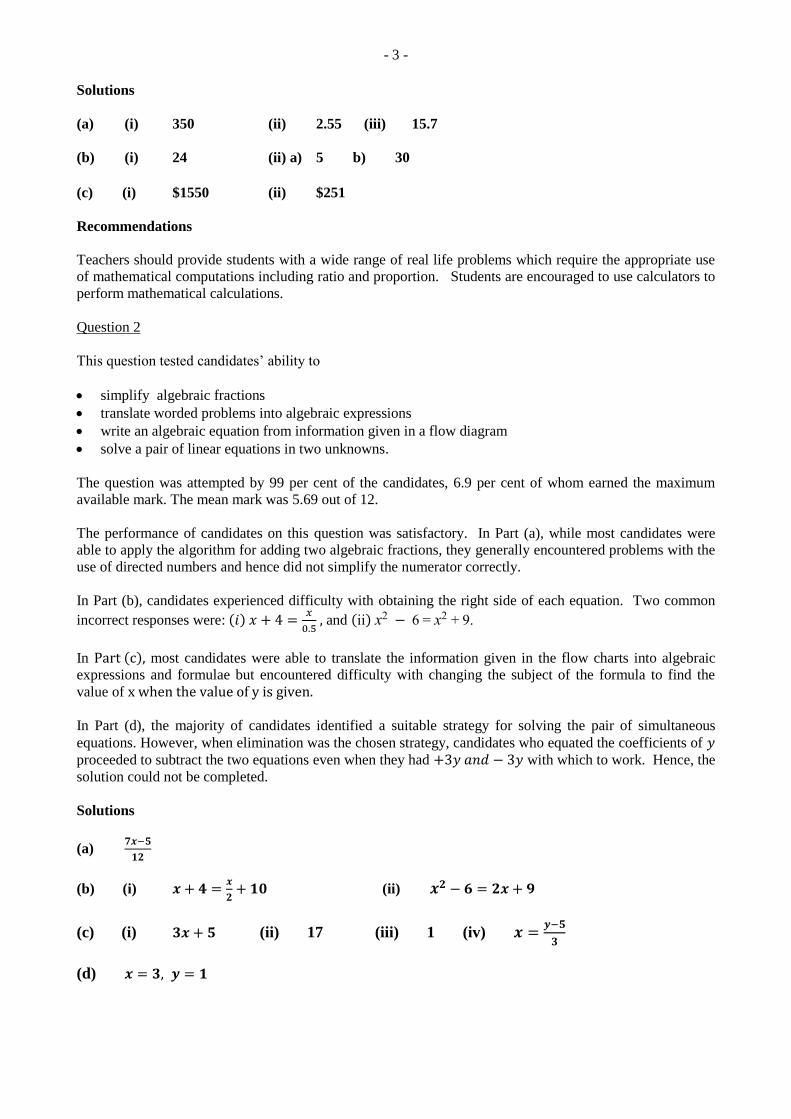
- 3 -
Solutions
(a) (i) 350 (ii) 2.55 (iii) 15.7
(b) (i) 24 (ii) a) 5 b) 30
(c) (i) $1550 (ii) $251
Recommendations
Teachers should provide students with a wide range of real life problems which require the appropriate use
of mathematical computations including ratio and proportion. Students are encouraged to use calculators to
perform mathematical calculations.
Question 2
This question tested candidates’ ability to
simplify algebraic fractions
translate worded problems into algebraic expressions
write an algebraic equation from information given in a flow diagram
solve a pair of linear equations in two unknowns.
The question was attempted by 99 per cent of the candidates, 6.9 per cent of whom earned the maximum
available mark. The mean mark was 5.69 out of 12.
The performance of candidates on this question was satisfactory. In Part (a), while most candidates were
able to apply the algorithm for adding two algebraic fractions, they generally encountered problems with the
use of directed numbers and hence did not simplify the numerator correctly.
In Part (b), candidates experienced difficulty with obtaining the right side of each equation. Two common
incorrect responses were: (𝑖) 𝑥 + 4 =𝑥
0.5 , and (ii) x2 − 6 = x2 + 9.
In Part (c), most candidates were able to translate the information given in the flow charts into algebraic
expressions and formulae but encountered difficulty with changing the subject of the formula to find the
value of x when the value of y is given.
In Part (d), the majority of candidates identified a suitable strategy for solving the pair of simultaneous
equations. However, when elimination was the chosen strategy, candidates who equated the coefficients of 𝑦
proceeded to subtract the two equations even when they had +3𝑦 𝑎𝑛𝑑 − 3𝑦 with which to work. Hence, the
solution could not be completed.
Solutions
(a) 𝟕𝒙−𝟓
𝟏𝟐
(b) (i) 𝒙 + 𝟒 =𝒙
𝟐+ 𝟏𝟎 (ii) 𝒙𝟐 − 𝟔 = 𝟐𝒙 + 𝟗
(c) (i) 𝟑𝒙 + 𝟓 (ii) 17 (iii) 1 (iv) 𝒙 =𝒚−𝟓
𝟑
(d) 𝒙 = 𝟑, 𝒚 = 𝟏
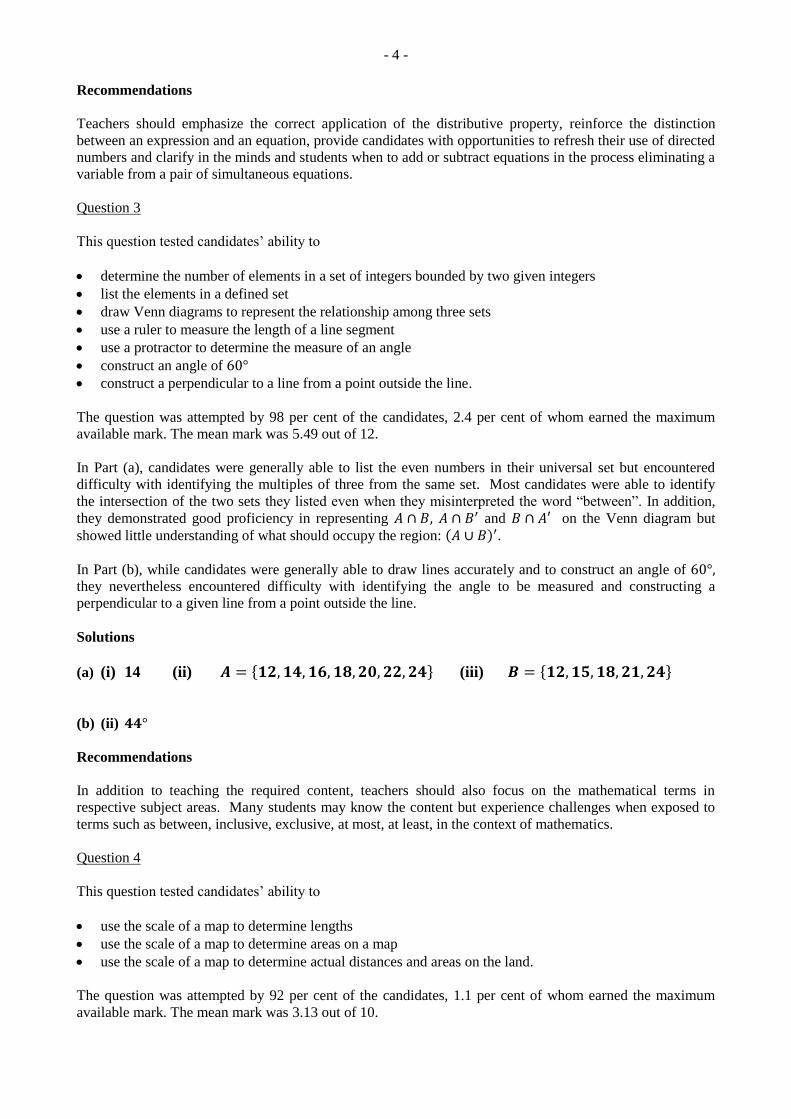
- 4 -
Recommendations
Teachers should emphasize the correct application of the distributive property, reinforce the distinction
between an expression and an equation, provide candidates with opportunities to refresh their use of directed
numbers and clarify in the minds and students when to add or subtract equations in the process eliminating a
variable from a pair of simultaneous equations.
Question 3
This question tested candidates’ ability to
determine the number of elements in a set of integers bounded by two given integers
list the elements in a defined set
draw Venn diagrams to represent the relationship among three sets
use a ruler to measure the length of a line segment
use a protractor to determine the measure of an angle
construct an angle of 60° construct a perpendicular to a line from a point outside the line.
The question was attempted by 98 per cent of the candidates, 2.4 per cent of whom earned the maximum
available mark. The mean mark was 5.49 out of 12.
In Part (a), candidates were generally able to list the even numbers in their universal set but encountered
difficulty with identifying the multiples of three from the same set. Most candidates were able to identify
the intersection of the two sets they listed even when they misinterpreted the word “between”. In addition,
they demonstrated good proficiency in representing 𝐴 ∩ 𝐵, 𝐴 ∩ 𝐵′ and 𝐵 ∩ 𝐴′ on the Venn diagram but
showed little understanding of what should occupy the region: (𝐴 ∪ 𝐵)′.
In Part (b), while candidates were generally able to draw lines accurately and to construct an angle of 60°, they nevertheless encountered difficulty with identifying the angle to be measured and constructing a
perpendicular to a given line from a point outside the line.
Solutions
(a) (i) 14 (ii) 𝑨 = {𝟏𝟐, 𝟏𝟒, 𝟏𝟔, 𝟏𝟖, 𝟐𝟎, 𝟐𝟐, 𝟐𝟒} (iii) 𝑩 = {𝟏𝟐, 𝟏𝟓, 𝟏𝟖, 𝟐𝟏, 𝟐𝟒}
(b) (ii) 𝟒𝟒°
Recommendations
In addition to teaching the required content, teachers should also focus on the mathematical terms in
respective subject areas. Many students may know the content but experience challenges when exposed to
terms such as between, inclusive, exclusive, at most, at least, in the context of mathematics.
Question 4
This question tested candidates’ ability to
use the scale of a map to determine lengths
use the scale of a map to determine areas on a map
use the scale of a map to determine actual distances and areas on the land.
The question was attempted by 92 per cent of the candidates, 1.1 per cent of whom earned the maximum
available mark. The mean mark was 3.13 out of 10.
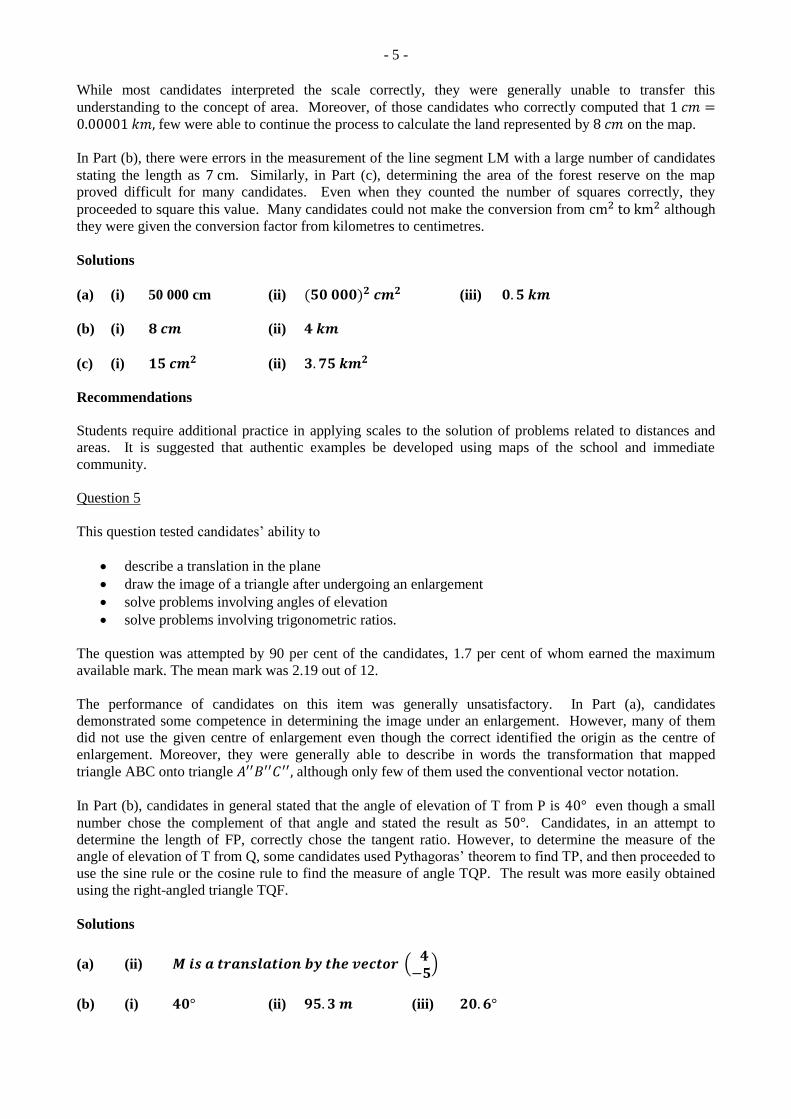
- 5 -
While most candidates interpreted the scale correctly, they were generally unable to transfer this
understanding to the concept of area. Moreover, of those candidates who correctly computed that 1 𝑐𝑚 =0.00001 𝑘𝑚, few were able to continue the process to calculate the land represented by 8 𝑐𝑚 on the map.
In Part (b), there were errors in the measurement of the line segment LM with a large number of candidates
stating the length as 7 cm. Similarly, in Part (c), determining the area of the forest reserve on the map
proved difficult for many candidates. Even when they counted the number of squares correctly, they
proceeded to square this value. Many candidates could not make the conversion from cm2 to km2 although
they were given the conversion factor from kilometres to centimetres.
Solutions
(a) (i) 50 000 cm (ii) (𝟓𝟎 𝟎𝟎𝟎)𝟐 𝒄𝒎𝟐 (iii) 𝟎. 𝟓 𝒌𝒎
(b) (i) 𝟖 𝒄𝒎 (ii) 𝟒 𝒌𝒎
(c) (i) 𝟏𝟓 𝒄𝒎𝟐 (ii) 𝟑. 𝟕𝟓 𝒌𝒎𝟐
Recommendations
Students require additional practice in applying scales to the solution of problems related to distances and
areas. It is suggested that authentic examples be developed using maps of the school and immediate
community.
Question 5
This question tested candidates’ ability to
describe a translation in the plane
draw the image of a triangle after undergoing an enlargement
solve problems involving angles of elevation
solve problems involving trigonometric ratios.
The question was attempted by 90 per cent of the candidates, 1.7 per cent of whom earned the maximum
available mark. The mean mark was 2.19 out of 12.
The performance of candidates on this item was generally unsatisfactory. In Part (a), candidates
demonstrated some competence in determining the image under an enlargement. However, many of them
did not use the given centre of enlargement even though the correct identified the origin as the centre of
enlargement. Moreover, they were generally able to describe in words the transformation that mapped
triangle ABC onto triangle 𝐴′′𝐵′′𝐶′′, although only few of them used the conventional vector notation.
In Part (b), candidates in general stated that the angle of elevation of T from P is 40° even though a small
number chose the complement of that angle and stated the result as 50°. Candidates, in an attempt to
determine the length of FP, correctly chose the tangent ratio. However, to determine the measure of the
angle of elevation of T from Q, some candidates used Pythagoras’ theorem to find TP, and then proceeded to
use the sine rule or the cosine rule to find the measure of angle TQP. The result was more easily obtained
using the right-angled triangle TQF.
Solutions
(a) (ii) 𝑴 𝒊𝒔 𝒂 𝒕𝒓𝒂𝒏𝒔𝒍𝒂𝒕𝒊𝒐𝒏 𝒃𝒚 𝒕𝒉𝒆 𝒗𝒆𝒄𝒕𝒐𝒓 ( 𝟒−𝟓
)
(b) (i) 𝟒𝟎° (ii) 𝟗𝟓. 𝟑 𝒎 (iii) 𝟐𝟎. 𝟔°
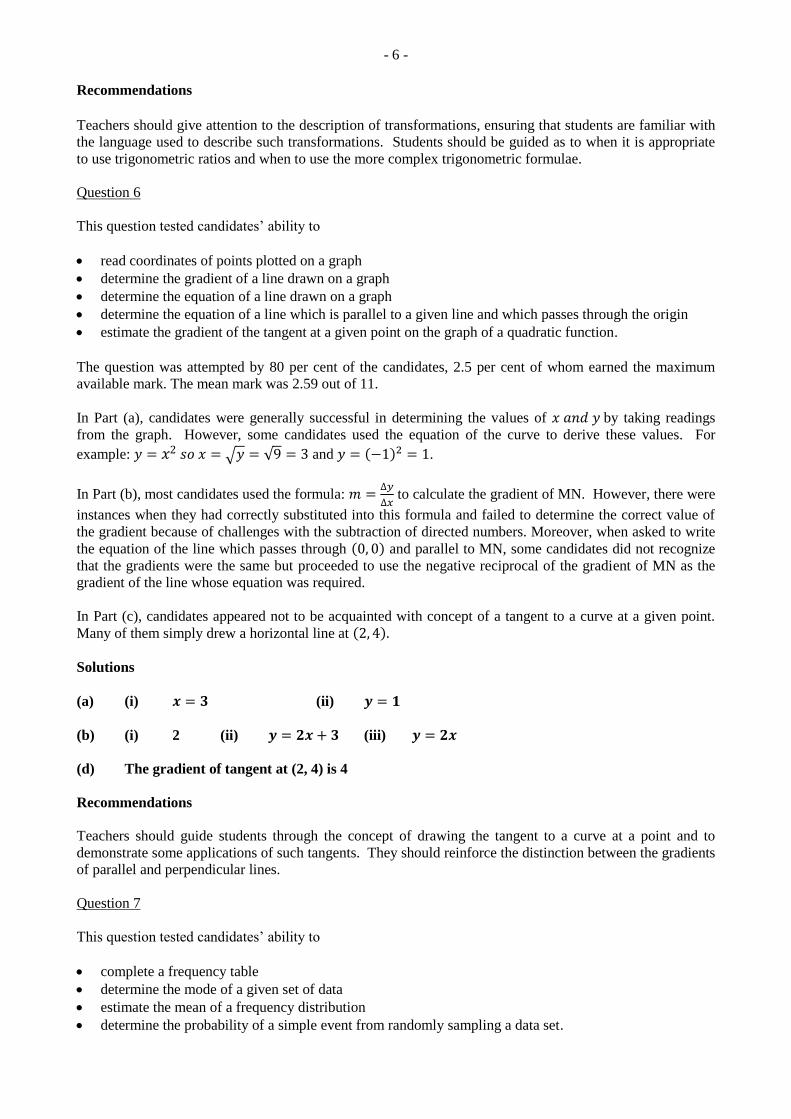
- 6 -
Recommendations
Teachers should give attention to the description of transformations, ensuring that students are familiar with
the language used to describe such transformations. Students should be guided as to when it is appropriate
to use trigonometric ratios and when to use the more complex trigonometric formulae.
Question 6
This question tested candidates’ ability to
read coordinates of points plotted on a graph
determine the gradient of a line drawn on a graph
determine the equation of a line drawn on a graph
determine the equation of a line which is parallel to a given line and which passes through the origin
estimate the gradient of the tangent at a given point on the graph of a quadratic function.
The question was attempted by 80 per cent of the candidates, 2.5 per cent of whom earned the maximum
available mark. The mean mark was 2.59 out of 11.
In Part (a), candidates were generally successful in determining the values of 𝑥 𝑎𝑛𝑑 𝑦 by taking readings
from the graph. However, some candidates used the equation of the curve to derive these values. For
example: 𝑦 = 𝑥2 𝑠𝑜 𝑥 = √𝑦 = √9 = 3 and 𝑦 = (−1)2 = 1.
In Part (b), most candidates used the formula: 𝑚 =∆𝑦
∆𝑥 to calculate the gradient of MN. However, there were
instances when they had correctly substituted into this formula and failed to determine the correct value of
the gradient because of challenges with the subtraction of directed numbers. Moreover, when asked to write
the equation of the line which passes through (0, 0) and parallel to MN, some candidates did not recognize
that the gradients were the same but proceeded to use the negative reciprocal of the gradient of MN as the
gradient of the line whose equation was required.
In Part (c), candidates appeared not to be acquainted with concept of a tangent to a curve at a given point.
Many of them simply drew a horizontal line at (2, 4).
Solutions
(a) (i) 𝒙 = 𝟑 (ii) 𝒚 = 𝟏
(b) (i) 2 (ii) 𝒚 = 𝟐𝒙 + 𝟑 (iii) 𝒚 = 𝟐𝒙
(d) The gradient of tangent at (2, 4) is 4
Recommendations
Teachers should guide students through the concept of drawing the tangent to a curve at a point and to
demonstrate some applications of such tangents. They should reinforce the distinction between the gradients
of parallel and perpendicular lines.
Question 7
This question tested candidates’ ability to
complete a frequency table
determine the mode of a given set of data
estimate the mean of a frequency distribution
determine the probability of a simple event from randomly sampling a data set.
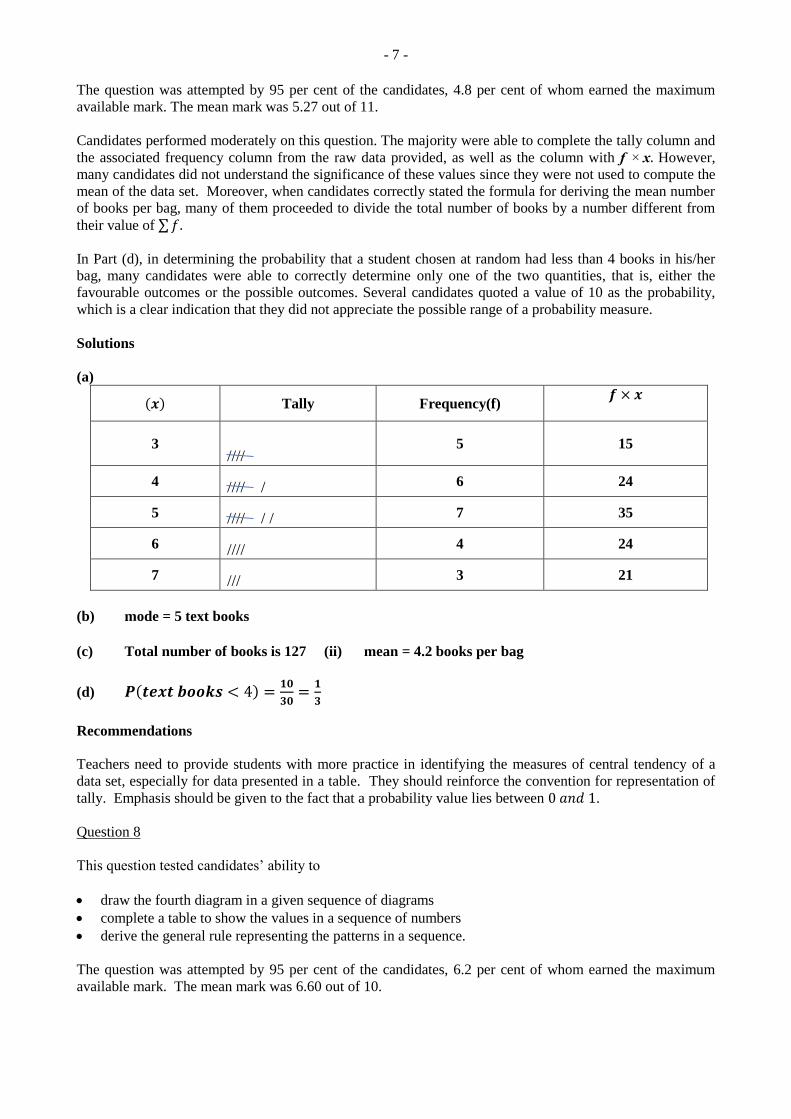
- 7 -
The question was attempted by 95 per cent of the candidates, 4.8 per cent of whom earned the maximum
available mark. The mean mark was 5.27 out of 11.
Candidates performed moderately on this question. The majority were able to complete the tally column and
the associated frequency column from the raw data provided, as well as the column with f × x. However,
many candidates did not understand the significance of these values since they were not used to compute the
mean of the data set. Moreover, when candidates correctly stated the formula for deriving the mean number
of books per bag, many of them proceeded to divide the total number of books by a number different from
their value of ∑𝑓.
In Part (d), in determining the probability that a student chosen at random had less than 4 books in his/her
bag, many candidates were able to correctly determine only one of the two quantities, that is, either the
favourable outcomes or the possible outcomes. Several candidates quoted a value of 10 as the probability,
which is a clear indication that they did not appreciate the possible range of a probability measure.
Solutions
(a)
(𝒙) Tally Frequency(f) 𝒇 × 𝒙
3 ////
5 15
4 //// / 6 24
5 //// / / 7 35
6 //// 4 24
7 /// 3 21
(b) mode = 5 text books
(c) Total number of books is 127 (ii) mean = 4.2 books per bag
(d) 𝑷(𝒕𝒆𝒙𝒕 𝒃𝒐𝒐𝒌𝒔 < 4) =𝟏𝟎
𝟑𝟎=
𝟏
𝟑
Recommendations
Teachers need to provide students with more practice in identifying the measures of central tendency of a
data set, especially for data presented in a table. They should reinforce the convention for representation of
tally. Emphasis should be given to the fact that a probability value lies between 0 𝑎𝑛𝑑 1.
Question 8
This question tested candidates’ ability to
draw the fourth diagram in a given sequence of diagrams
complete a table to show the values in a sequence of numbers
derive the general rule representing the patterns in a sequence.
The question was attempted by 95 per cent of the candidates, 6.2 per cent of whom earned the maximum
available mark. The mean mark was 6.60 out of 10.
- 8 -
Candidates’ responses to this question were generally good. They were able to draw the fourth figure in the
sequence of figures even though they did not always insert the correct number of dots on each side of the
pentagon.
In Part (b) (i), most candidates were able to follow the pattern in the formula column and to determine the
correct number of dots on each figure by counting even when they did not write the correct formula.
Writing an algebraic expression for the number of dots associated with each term in the sequence proved
challenging for most candidates.
Solutions
(b) (i) 𝒇𝒐𝒓𝒎𝒖𝒍𝒂: 𝟓 × 𝟔 − 𝟓; 𝒏 = 𝟐𝟓 (ii) 𝒇𝒐𝒓𝒎𝒖𝒍𝒂: 𝟓 × 𝟕 − 𝟓; 𝒏 = 𝟑𝟎
(c) 𝒏 = 𝟓(𝒇 + 𝟏) − 𝟓 = 𝟓𝒇
(d) 𝒇 = 𝟐𝟗
Recommendations
Teachers need to extend the teaching of patterns and sequences to include deriving the general algebraic
formulae for these sequences.
Optional Section
Question 9
This question tested candidates’ ability to
determine the value of 𝑥 for which a rational function is undefined
evaluate the composite of a function
determine the inverse of a rational function use a table of values to draw the graph of a non-linear relation
interpret a graph to determine unknown information.
The question was attempted by 73 per cent of the candidates, less than 1 per cent of whom earned the
maximum available mark. The mean mark was 4.74 out of 15.
Candidates’ performance on this question was generally unsatisfactory.
In Part (a), the majority of candidates were unable to determine the value of 𝑥 for which a rational function
is undefined. Further, although many of the candidates were able to correctly substitute 𝑓(5) into 𝑔(𝑥), they
lacked the algebraic skills to simplify the response. Many candidates, in an attempt to derive the inverse of
𝑓(𝑥), reached as far as interchanging 𝑥 𝑎𝑛𝑑 𝑦 in the original equation. However, they did not demonstrate
the algebraic skills to correctly proceed to make 𝑦 the subject of the formula in their reversed mapping.
In Part (b), the majority of candidates demonstrated a high level of proficiency in using the correct scales
and plotting the given points. Nevertheless, a large number of these candidates connected the points with
straight lines instead of drawing a parabola as required. Also, a large number of candidates were unable to
determine the average speed of the ball during the first two seconds of its motion, and among those who
provided an answer, the correct unit of speed was not used. Moreover, the majority of candidates could not
determine the speed of the ball at t = 3 since they did not associate this speed with the gradient of the
tangent at the greatest height reached by the ball.
- 9 -
Solutions
(a) (i) 𝒙 = −𝟏 (ii) 𝒈𝒇(𝟓) =𝟒𝟑
𝟑 (iii) 𝒇−𝟏(𝒙) =
𝒙−𝟕
𝟐−𝒙
(b) (ii) a) 𝟒𝟎 𝒎𝒔−𝟏 b) 𝟎 𝒎𝒔−𝟏
Recommendations
Teachers should strengthen basic algebraic and computational skills of students prior to teaching the
functions. Students must be able to differentiate between the composite and the inverse function. The
concept of tangent at a point on a curve needs to be reinforced.
Question 10
This question tested candidates’ ability to
use the properties of circles and circle theorems to determine the measures of angles
use cosine and sine rules to solve problems related to bearings.
The question was attempted by 43 per cent of the candidates, 2.2 per cent of whom earned the maximum
available mark. The mean mark was 2.70 out of 15.
Candidates’ performance on this question was generally unsatisfactory.
In Part (a), which required the use of the angle properties of triangles and circles, many candidates based
their reasoning on the properties of triangles only instead of referring to circle theorems.
In Part (b), candidates lacked proper understanding of bearings. A common response to the calculation of the
bearing of P from Q was 180° − (66° + 54°) instead of (66° + 54°). In addition, candidates made the
assumption that they were working with a right angled triangle and proceeded to employ trigonometric ratios
in an attempt to calculate the length of PR and the measure of angle QPR. A simple application of the cosine
formula followed by an application of the sine formula was required to complete these calculations.
Solutions
(a) (i) 140o (ii) 22o (iii) 110o
(b) (i) 𝟏𝟐𝟎° (ii) 𝑷𝑹 = 𝟖𝟑. 𝟔𝟒 𝒌𝒎 (iii) 𝟕𝟓°
Recommendations
Teachers should use the appropriate jargon in the teaching of circle theorems. They should assist students in
making the determination as to when to use trigonometric ratios and when to use trigonometric formulae.
Question 11
This question tested candidates’ ability to
solve for one unknown in a singular matrix
use the matrix method to solve an equation with two unknowns
recognize the position vector of a point in the plane
write the coordinates of points in the plane as position vectors
use vector geometry to determine the resultant of two or more vectors
use the properties of equal vectors to solve problems in geometry.
- 10 -
The question was attempted by 37 per cent of the candidates, less than 1 per cent of whom earned the
maximum available mark. The mean mark was 3.90 out of 15.
Candidates performed unsatisfactorily on this question. Most candidates seemed unaware of the condition
under which the matrix would not have an inverse, that is, when |𝑀| = 0. A few candidates were able to
express the simultaneous equations in the required form and some continued to attempt to find a solution
although this was not required.
In Part (c), candidates generally wrote the position vectors as required. However, challenges were
experienced in determining the coordinates of the point R and identifying the type of quadrilateral.
Solutions
(a) 𝒑 =−𝟕
𝟐
(b) ( 𝟒 −𝟐𝟐 𝟑
) (𝒙𝒚) = (
𝟎𝟒)
(c) (i) 𝑶𝑷 is the position vector of the point 𝑷
(ii) a) 𝑶𝑷 = (𝟐𝟒); b) 𝑶𝑸 = (
𝟖𝟐); c) 𝑷𝑸 = (
𝟔−𝟐
)
(iii) 𝑹 (𝟔,−𝟐)
(iv) 𝑷𝑸𝑹𝑶 is a parallelogram. It is a quadrilateral with a pair of opposite sides equal and
parallel.
Recommendations
Teachers should encourage students to utilize diagrams to add clarity to their responses when solving
problems on Vector Geometry. They should reinforce the concept that a resultant vector can be derived
from the sum or difference of two or more position vectors. They should provide students with opportunity
to develop the art of identifying the type of quadrilateral formed from a system of vectors in which there are
equal or parallel combinations. They should provide students with more practice in writing the matrix
equation corresponding to a pair of simultaneous linear equations.
CARIBBEAN EXAMINATIONS COUNCIL
REPORT ON CANDIDATES’ WORK IN THE
CARIBBEAN SECONDARY EDUCATION CERTIFICATE® EXAMINATION
JANUARY 2015
MATHEMATICS
GENERAL PROFICIENCY EXAMINATION
Copyright © 2015 Caribbean Examinations Council
St Michael, Barbados
All rights reserved.
2
GENERAL COMMENTS
The General Proficiency Mathematics examination is offered in January and May/June
each year. There was a candidate entry of approximately 9970 in January 2015.
Approximately 65 per cent of the candidates earned Grades I–III. The mean score for the
examination was 88 out of 180 marks.
DETAILED COMMENTS
Paper 01–Multiple-Choice
Paper 01 consisted of 60 multiple choice items. It was designed to provide adequate
coverage of the content with items taken from all sections of the syllabus. This year, no
candidate earned the maximum available score of 60. Fifty-nine per cent of the candidates
scored 30 marks or more.
Paper 02–Structured Questions
Paper 02 consisted of two sections. Section I comprised eight compulsory questions
totalling 90 marks. Section II comprised three optional questions: one each from Algebra,
Relation, Functions and Graphs; Measurement, Trigonometry and Geometry; and Vectors
and Matrices. Candidates were required to answer any two questions from this section.
Each question in this section was worth 15 marks. The mean score for this paper was 54
out of 120 marks. This year, six candidates earned the maximum available mark of 120.
Section I: Compulsory Questions
Question 1
This question tested candidates’ ability to
perform computations on decimals
solve worded problems involving fractions
convert from one currency to another given an exchange rate.
The question was attempted by 99 per cent of the candidates, 9.8 per cent of whom earned
the maximum available mark. The mean mark was 7.16 out of 11.
Candidates’ performance on this question was satisfactory. In Part (a), candidates were
generally proficient at computing the square of the decimal and at subtracting from this
value their result of the division. However, there were cases where candidates multiplied
by 2 instead of squaring, and instances where the division by a decimal was done
incorrectly.
3
In Part (b) (i), most candidates attempted multiplication by 1
3 even when they failed to
recognize that the fraction in the product was the result of (1 −3
8). In Part (b) (ii), while
some candidates recognized that to determine the fraction saved required that they subtract
from 1, they generally experienced difficulty with determining what to subtract from 1. In
Part (c), most candidates multiplied by $1.96 to convert from US$ to BD$, and divided by
$700 to determine the exchange rate used.
Solutions
(a) 83.84
(b) (i) 5
24 (ii)
5
12
(c) (i) BD$1372 (ii) US$1 = BD$ 1.98
Recommendations
Teachers should provide practice involving computation of fractions in authentic
situations. They should continue to provide candidates with opportunities to work with the
calculator in performing basic arithmetic operations on rational numbers. Attention should
also be given to the difference between the square and the square root, converting from
improper fractions and to decimals, estimation and the order of operations.
Question 2
This question tested candidates’ ability to
apply the rules of indices for multiplication of terms
add two fractional algebraic terms with numerical denominators
factorize expressions
solve a linear inequality in one variable
determine the value of an expression by substituting given values.
The question was attempted by 94 per cent of the candidates, 5.4 per cent of whom earned
the maximum available mark. The mean mark was 5.59 out of 12.
The performance of candidates on this question was satisfactory. Most candidates
demonstrated an understanding of adding fractions as evidenced by finding a correct
common denominator and getting at least one numerator correct. However, a number of
candidates simply added the numerator and the denominator with 4𝑎
7 being the most popular
incorrect response. In Part (c) (i), candidates experienced difficulty arriving at the correct
factors. They generally did not make the connection that they needed – 4x and – x to replace
the term – 5x. Many who chose to use 4 and 1 as the appropriate factors of 4 for this
situation proceeded to use incorrect signs in at least one of the two brackets resulting in the
factors (x ± 4)(x ± 1) with alternating signs in each bracket. In Part (d) (ii), several
candidates included 0 in their list of positive integer values for x. Many were unable to
4
correctly solve the inequality and some were unable to correctly list values in Part (d) (ii)
based on their answer to Part (d) (i).
Solutions
(a) 𝑝4𝑞7
(b) 17
10𝑎
(c) (i) (𝑥 − 1)(𝑥 − 4) (ii) (𝑚 − 2𝑛)(𝑚 + 2𝑛)
(d) (i) 𝑥 ≤ 5 (ii) 𝑥 = {1,2,3,4,5} (e) 1.57
Recommendations
Teachers should encourage the use of teaching aids such as algebra tiles to factorize
expressions. Manipulation of fractional expressions should be thoroughly reviewed since
many candidates indicated incorrect application of the procedure for addition of fractions.
Question 3
This question tested candidates’ ability to
complete a Venn diagram to illustrate the relationship between two sets
determine the elements in the intersection, union and complement of two sets
write an expression in 𝑥 to represent the total number of elements in the Universal
set
formulate and solve a linear equation in one unknown
use geometric tools to construct a parallelogram.
The question was attempted by 97 per cent of the candidates, 8.0 per cent of whom earned
the maximum available mark. The mean mark was 6.74 out of 12.
The performance of candidates on this question was satisfactory. In Part (a), a large
percentage of candidates demonstrated knowledge of Venn diagrams accurately
completing the diagram from the information provided. However, some candidates
experienced difficulty in dealing with the ‘x’ to obtain, in terms of x, the number in the
subsets of C only and D only. The majority of the candidates was able to use ‘their’
diagram to form both an expression x and an equation in x for the number of families in the
survey. It was however evident that there were those who did not know the difference
between an expression and an equation. In addition, many candidates proceeded to solve
the equation for x even though they were not required to do so.
In Part (b), the majority of candidates was able to draw the lines AB and AD of length 8
cm and 6 cm, respectively. A moderate percentage of candidates constructed the 60° angle
but was unable to construct the 120° angle at B. However, many clearly used a protractor
and then tried to place the arcs. At least one construction mark was lost as a result. Many
candidates simply reproduced the shape through the use of protractors and set squares for
5
which they lost the construction marks. There were a few instances where the completed
shape did not resemble a parallelogram even though the shape was provided on the question
paper.
Solutions
(a) (ii) 35 − 𝑥 (iii) 35 − 𝑥 = 30
Recommendations
Candidates need to be able to distinguish between an expression and an equation.
Attention needs to be given to dealing with ‘both’ common elements of subsets in the set.
Students need greater exposure to construction using compasses instead of the protractor
to produce angles such as 120°, 150°.
Question 4
This question tested candidates’ ability to
substitute given values into a linear equation to determine the missing values in a
table
plot coordinates on a Cartesian plane draw a straight line graph to show the relationship between sets of ordered pairs use a graph to determine given values.
The question was attempted by 96 per cent of the candidates, 23.4 per cent of whom earned
the maximum available mark. The mean mark was 8.71 out of 12.
Candidates’ performance on this question was good. They were able to complete the
missing values in the table, determine the total charge for a given number of hours worked
and the fixed charge. Nevertheless, several candidates interchanged the axes when drawing
the graph of total charge against time spent on the job. Furthermore, a large number of
candidates disregarded the suggested scale and a few used the values from the table to label
the vertical axis and plot these with the corresponding number of hours. Most candidates
failed to use the graph to deduce the total charge for 4.5 hours and the time worked to earn
$300.
Solutions
(a) 𝑤ℎ𝑒𝑛 𝑥 = 2, 𝑦 = 155; 𝑤ℎ𝑒𝑛 𝑥 = 4, 𝑦 = 235
(c) (i) $255 (ii) 5.6 hrs (iii) Fixed charge is $75
6
Recommendations
Teachers should ensure that students are familiar with using different scales on graph
paper as well as plotting coordinates for various situations and reading coordinates from
graphs.
Question 5
This question tested candidates’ ability to
write the coordinates of a point
draw the image of a triangle after a reflection in the y-axis describe, using vector notation, the transformation which maps one triangle onto
another in the plane describe the series of transformations which map one triangle to another in the plane
explain why two given triangles are congruent.
The question was attempted by 96 per cent of the candidates, 4.3 per cent of whom earned
the maximum available mark. The mean mark was 6.48 out of 12.
The performance of candidates on this item was generally satisfactory. They demonstrated
high proficiency at writing the coordinates of N and drawing the reflection of triangle LMN
in the y-axis. However, candidates experienced difficulty providing a description using
vector notation of the transformation which mapped ∆ 𝐿𝑀𝑁 onto ∆ 𝑃𝑄𝑅, describing the
combination of transformations which mapped ∆ 𝑃𝑄𝑅 onto ∆ 𝐺𝐹𝐻, and stating the
properties of congruency.
Solutions
(i) 𝑁(4, 5) (iii) ( 0−6
)
(iv) translation parallel to the y-axis followed by a reflection in the y-axis; (v) any two cases for congruency of triangles such as same shape, same measure
for angles, same length for corresponding sides
Recommendations
Teachers should teach students different ways of describing transformations and
combinations of transformations. In addition, they should guide students in deriving the
properties of congruency and similarity through discovery methods.
Question 6
This question tested candidates’ ability to
measure and state the length of a line
determine the scale used on a drawing
7
determine the area of a composite figure by taking measurements
determine the length of the diameter of a semicircle
calculate the area of a composite figure.
The question was attempted by 87 per cent of the candidates, 2 per cent of whom earned
the maximum available mark. The mean mark was 4.07 out of 11.
The performance of candidates on this question was unsatisfactory. In Part (a), most
candidates correctly measured and stated the length of PQ. However, they generally
recognized that the figure was a compound one comprising of two separate areas and the
formulae for finding the area of a rectangle and a triangle were appropriately applied.
Nevertheless, they experienced difficulty determining the scale of the drawing and the units
were very often ignored, resulting in the popular incorrect answer 1:3. Calculating the
actual area of the face of the building required use of the actual length of PQ, but converting
PQ to an actual value by multiplying by the scale was often overlooked. In Part (b),
candidates knew that the lengths of the straight sides had to be included in the perimeter of
the swimming pool. However, some candidates viewed the pool as two separate figures
— a circle and a rectangle — so the diameter was included in the final sum.
Solutions
(a) (i) PQ = 3.4 cm (ii) 1: 300 (iii) area of LMPK = 256.5 m2
(b) (i) 3.5 m (ii) 27 m
Recommendations
Teachers should encourage students to pay closer attention to units of measurement. They
should provide opportunities for students to solve problems associated with scale diagrams
and distinguishing between the area and perimeter.
Question 7
This question tested candidates’ ability to
complete the frequency column in grouped frequency table, given the histogram
determine the cumulative frequency
construct a cumulative frequency curve
determine the median mass, using the graph drawn.
The question was attempted by 94 per cent of the candidates, 11.2 per cent of whom earned
the maximum available mark. The mean mark was 5.55 out of 10.
Candidates performed satisfactorily on this question. In Part (a), they demonstrated a high
level of proficiency in transferring information from the histogram to the grouped
frequency table and in completing the cumulative frequency column. In Part (b), candidates
competently used the given scales on the axes provided and to draw the ogive once they
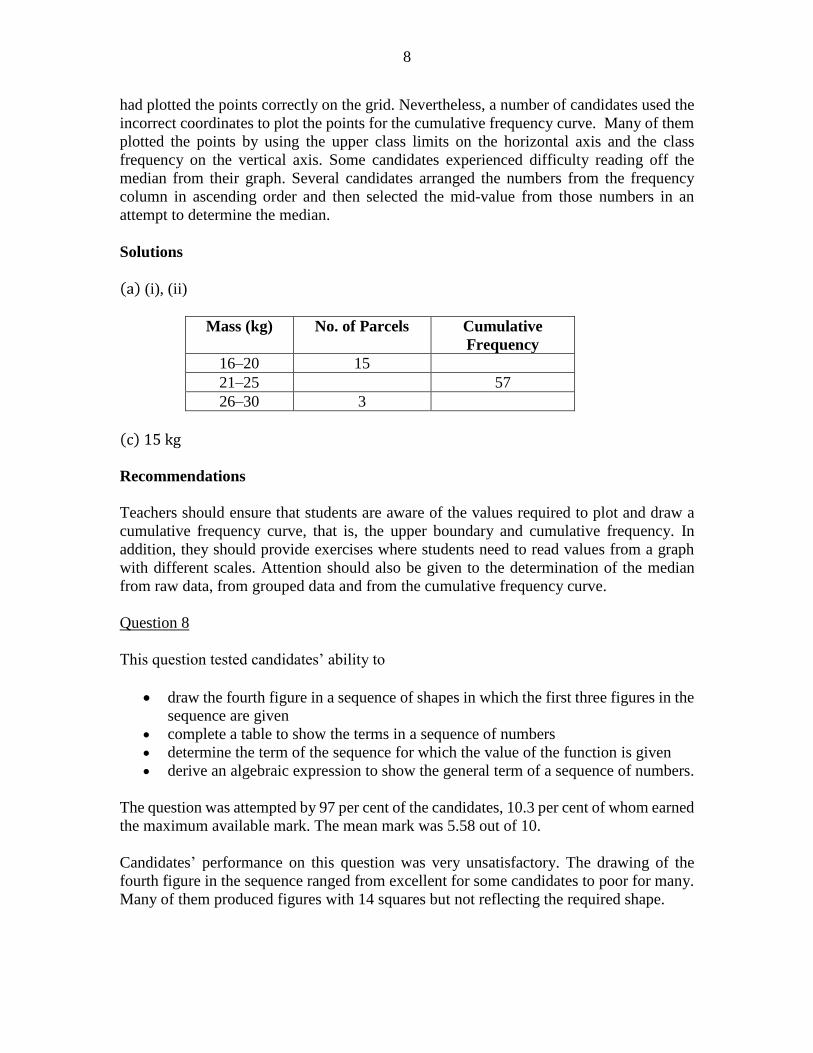
8
had plotted the points correctly on the grid. Nevertheless, a number of candidates used the
incorrect coordinates to plot the points for the cumulative frequency curve. Many of them
plotted the points by using the upper class limits on the horizontal axis and the class
frequency on the vertical axis. Some candidates experienced difficulty reading off the
median from their graph. Several candidates arranged the numbers from the frequency
column in ascending order and then selected the mid-value from those numbers in an
attempt to determine the median.
Solutions
(a) (i), (ii)
Mass (kg) No. of Parcels Cumulative
Frequency
16–20 15
21–25 57
26–30 3
(c) 15 kg
Recommendations
Teachers should ensure that students are aware of the values required to plot and draw a
cumulative frequency curve, that is, the upper boundary and cumulative frequency. In
addition, they should provide exercises where students need to read values from a graph
with different scales. Attention should also be given to the determination of the median
from raw data, from grouped data and from the cumulative frequency curve.
Question 8
This question tested candidates’ ability to
draw the fourth figure in a sequence of shapes in which the first three figures in the
sequence are given
complete a table to show the terms in a sequence of numbers determine the term of the sequence for which the value of the function is given derive an algebraic expression to show the general term of a sequence of numbers.
The question was attempted by 97 per cent of the candidates, 10.3 per cent of whom earned
the maximum available mark. The mean mark was 5.58 out of 10.
Candidates’ performance on this question was very unsatisfactory. The drawing of the
fourth figure in the sequence ranged from excellent for some candidates to poor for many.
Many of them produced figures with 14 squares but not reflecting the required shape.
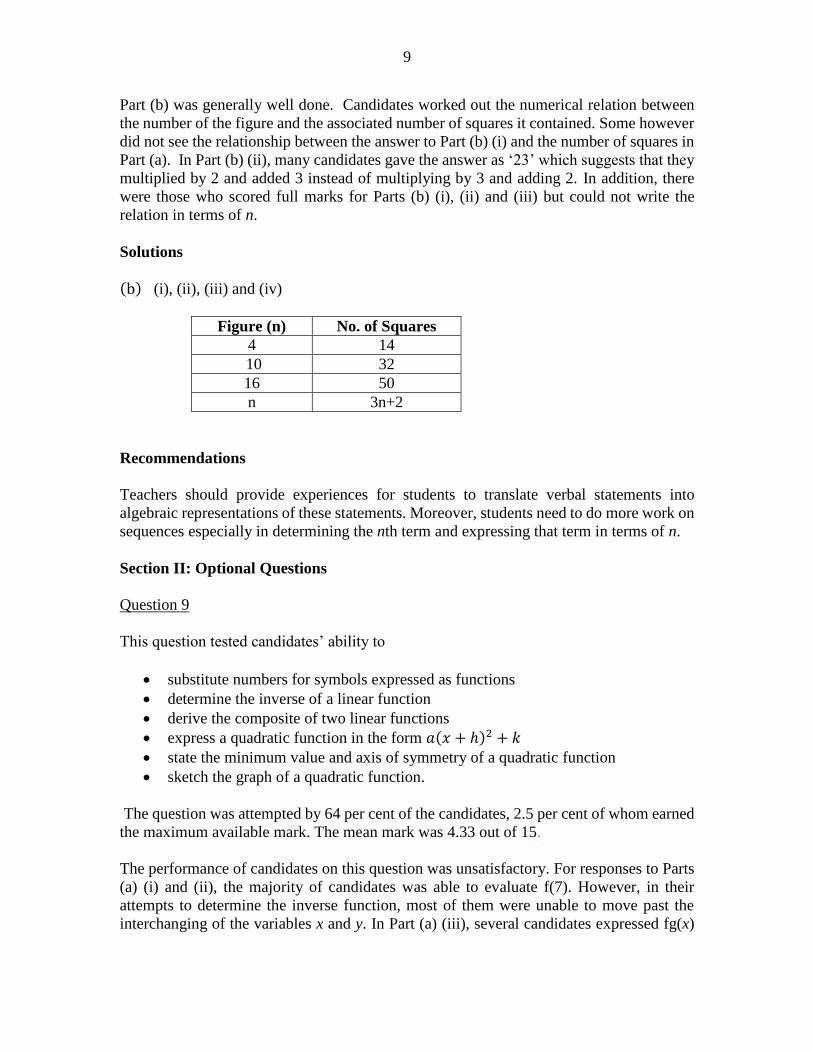
9
Part (b) was generally well done. Candidates worked out the numerical relation between
the number of the figure and the associated number of squares it contained. Some however
did not see the relationship between the answer to Part (b) (i) and the number of squares in
Part (a). In Part (b) (ii), many candidates gave the answer as ‘23’ which suggests that they
multiplied by 2 and added 3 instead of multiplying by 3 and adding 2. In addition, there
were those who scored full marks for Parts (b) (i), (ii) and (iii) but could not write the
relation in terms of n.
Solutions
(b) (i), (ii), (iii) and (iv)
Figure (n) No. of Squares
4 14
10 32
16 50
n 3n+2
Recommendations
Teachers should provide experiences for students to translate verbal statements into
algebraic representations of these statements. Moreover, students need to do more work on
sequences especially in determining the nth term and expressing that term in terms of n.
Section II: Optional Questions
Question 9
This question tested candidates’ ability to
substitute numbers for symbols expressed as functions
determine the inverse of a linear function
derive the composite of two linear functions
express a quadratic function in the form 𝑎(𝑥 + ℎ)2 + 𝑘
state the minimum value and axis of symmetry of a quadratic function
sketch the graph of a quadratic function.
The question was attempted by 64 per cent of the candidates, 2.5 per cent of whom earned
the maximum available mark. The mean mark was 4.33 out of 15.
The performance of candidates on this question was unsatisfactory. For responses to Parts
(a) (i) and (ii), the majority of candidates was able to evaluate f(7). However, in their
attempts to determine the inverse function, most of them were unable to move past the
interchanging of the variables x and y. In Part (a) (iii), several candidates expressed fg(x)
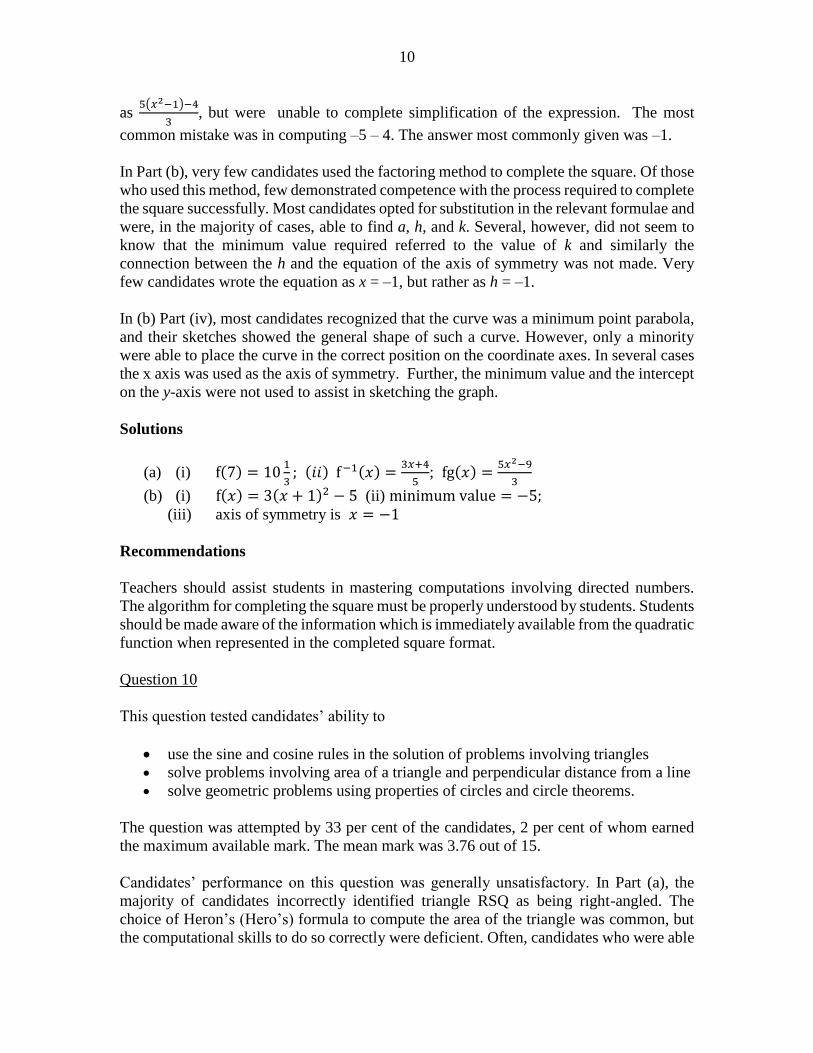
10
as 5(𝑥2−1)−4
3, but were unable to complete simplification of the expression. The most
common mistake was in computing –5 – 4. The answer most commonly given was –1.
In Part (b), very few candidates used the factoring method to complete the square. Of those
who used this method, few demonstrated competence with the process required to complete
the square successfully. Most candidates opted for substitution in the relevant formulae and
were, in the majority of cases, able to find a, h, and k. Several, however, did not seem to
know that the minimum value required referred to the value of k and similarly the
connection between the h and the equation of the axis of symmetry was not made. Very
few candidates wrote the equation as x = –1, but rather as h = –1.
In (b) Part (iv), most candidates recognized that the curve was a minimum point parabola,
and their sketches showed the general shape of such a curve. However, only a minority
were able to place the curve in the correct position on the coordinate axes. In several cases
the x axis was used as the axis of symmetry. Further, the minimum value and the intercept
on the y-axis were not used to assist in sketching the graph.
Solutions
(a) (i) f(7) = 101
3; (𝑖𝑖) f−1(𝑥) =
3𝑥+4
5; fg(𝑥) =
5𝑥2−9
3
(b) (i) f(𝑥) = 3(𝑥 + 1)2 − 5 (ii) minimum value = −5; (iii) axis of symmetry is 𝑥 = −1
Recommendations
Teachers should assist students in mastering computations involving directed numbers.
The algorithm for completing the square must be properly understood by students. Students
should be made aware of the information which is immediately available from the quadratic
function when represented in the completed square format.
Question 10
This question tested candidates’ ability to
use the sine and cosine rules in the solution of problems involving triangles
solve problems involving area of a triangle and perpendicular distance from a line
solve geometric problems using properties of circles and circle theorems.
The question was attempted by 33 per cent of the candidates, 2 per cent of whom earned
the maximum available mark. The mean mark was 3.76 out of 15.
Candidates’ performance on this question was generally unsatisfactory. In Part (a), the
majority of candidates incorrectly identified triangle RSQ as being right-angled. The
choice of Heron’s (Hero’s) formula to compute the area of the triangle was common, but
the computational skills to do so correctly were deficient. Often, candidates who were able
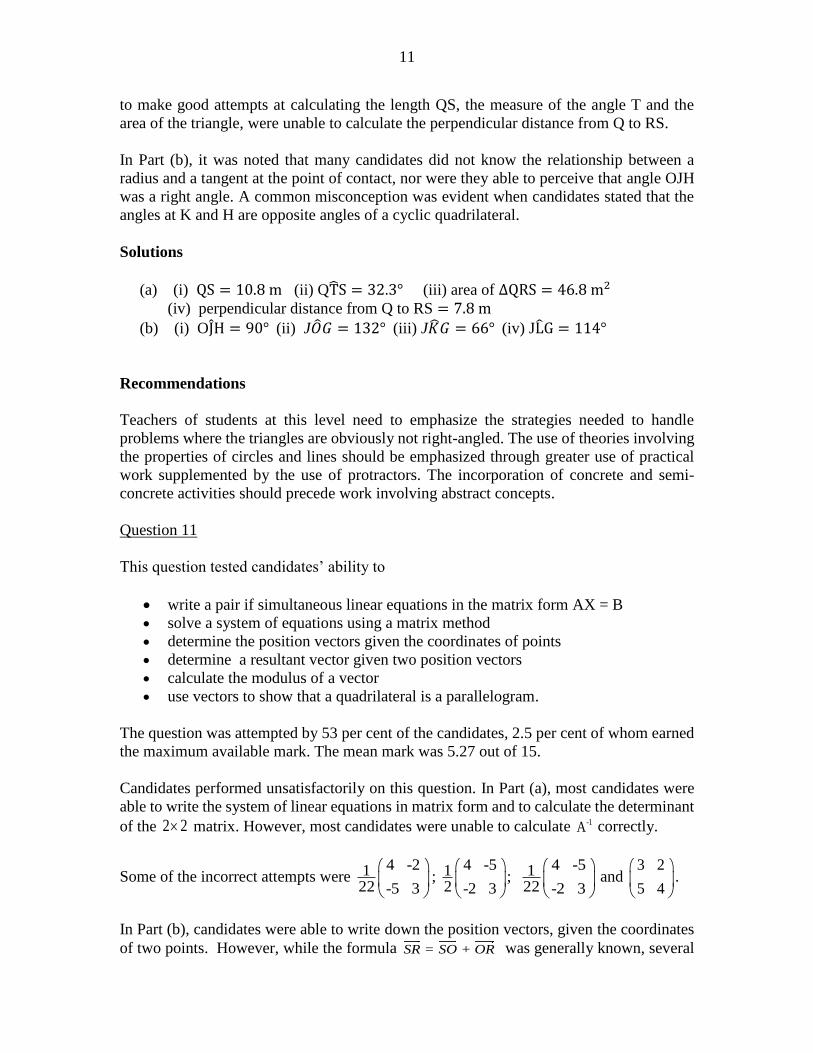
11
to make good attempts at calculating the length QS, the measure of the angle T and the
area of the triangle, were unable to calculate the perpendicular distance from Q to RS.
In Part (b), it was noted that many candidates did not know the relationship between a
radius and a tangent at the point of contact, nor were they able to perceive that angle OJH
was a right angle. A common misconception was evident when candidates stated that the
angles at K and H are opposite angles of a cyclic quadrilateral.
Solutions
(a) (i) QS = 10.8 m (ii) QTS = 32.3° (iii) area of ∆QRS = 46.8 m2
(iv) perpendicular distance from Q to RS = 7.8 m
(b) (i) OJH = 90° (ii) J��𝐺 = 132° (iii) J��𝐺 = 66° (iv) JLG = 114°
Recommendations
Teachers of students at this level need to emphasize the strategies needed to handle
problems where the triangles are obviously not right-angled. The use of theories involving
the properties of circles and lines should be emphasized through greater use of practical
work supplemented by the use of protractors. The incorporation of concrete and semi-
concrete activities should precede work involving abstract concepts.
Question 11
This question tested candidates’ ability to
write a pair if simultaneous linear equations in the matrix form AX = B
solve a system of equations using a matrix method determine the position vectors given the coordinates of points determine a resultant vector given two position vectors calculate the modulus of a vector use vectors to show that a quadrilateral is a parallelogram.
The question was attempted by 53 per cent of the candidates, 2.5 per cent of whom earned
the maximum available mark. The mean mark was 5.27 out of 15.
Candidates performed unsatisfactorily on this question. In Part (a), most candidates were
able to write the system of linear equations in matrix form and to calculate the determinant
of the 2 2 matrix. However, most candidates were unable to calculate -1A correctly.
Some of the incorrect attempts were 4 -21
22 -5 3
; 4 -51
2 -2 3
; 4 -51
22 -2 3
and 3 2
5 4
.
In Part (b), candidates were able to write down the position vectors, given the coordinates
of two points. However, while the formula = + SR SO OR was generally known, several
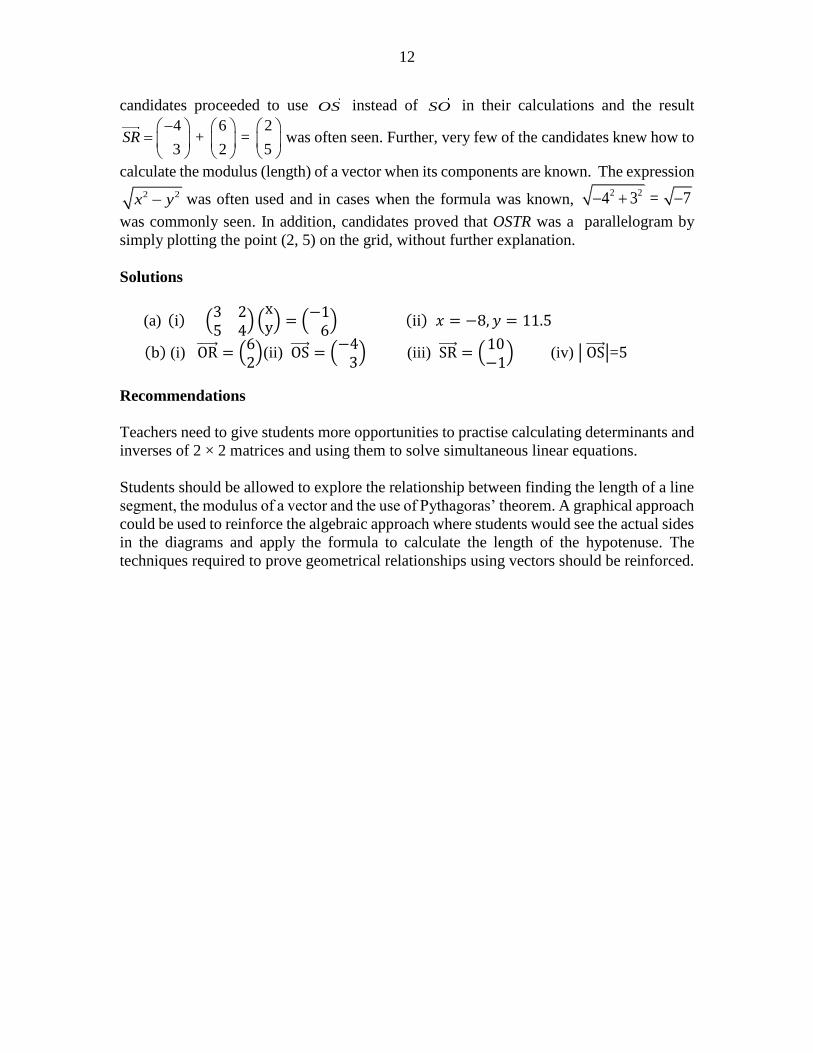
12
candidates proceeded to use OS instead of SO in their calculations and the result
4 6 2 + =
3 2 5SR
was often seen. Further, very few of the candidates knew how to
calculate the modulus (length) of a vector when its components are known. The expression
2 2x y was often used and in cases when the formula was known, 2 24 3 = 7
was commonly seen. In addition, candidates proved that OSTR was a parallelogram by
simply plotting the point (2, 5) on the grid, without further explanation.
Solutions
(a) (i) (3 25 4
) (xy) = (
−1 6
) (ii) 𝑥 = −8, 𝑦 = 11.5
(b) (i) OR = (62) (ii) OS = (
−4 3
) (iii) SR = (10−1
) (iv) | OS |=5
Recommendations
Teachers need to give students more opportunities to practise calculating determinants and
inverses of 2 × 2 matrices and using them to solve simultaneous linear equations.
Students should be allowed to explore the relationship between finding the length of a line
segment, the modulus of a vector and the use of Pythagoras’ theorem. A graphical approach
could be used to reinforce the algebraic approach where students would see the actual sides
in the diagrams and apply the formula to calculate the length of the hypotenuse. The
techniques required to prove geometrical relationships using vectors should be reinforced.
C A R I B B E A N E X A M I N A T I O N S C O U N C I L
REPORT ON CANDIDATES’ WORK IN THE
CARIBBEAN SECONDARY EDUCATION CERTIFICATE® EXAMINATION
MAY/JUNE 2015
MATHEMATICS
GENERAL PROFICIENCY EXAMINATION
Copyright© 2015 Caribbean Examinations Council
St Michael, Barbados
All rights reserved.
- 2 -
GENERAL COMMENTS
The General Proficiency Mathematics examination is offered in January and May/June each year. There was
a candidate entry of approximately 85 000 in May/June 2015 and 57 per cent of the candidates earned Grades
I‒III. The mean score for the examination was 82 out of 180 marks.
DETAILED COMMENTS
Paper 01 — Multiple Choice
Paper 01 consisted of 60 multiple-choice items. It was designed to provide adequate coverage of the content
with items taken from all sections of the syllabus. Approximately 74 per cent of the candidates earned
acceptable grades on this paper; the mean score was 35 out of 60 marks. This year, 386 candidates earned the
maximum available score of 60.
Paper 02 — Structured Questions
Paper 02 consisted of two sections. Section I comprised eight compulsory questions for a total of 90 marks.
Section II comprised three optional questions: one each from Algebra, Relations, Functions and Graphs;
Measurement, Trigonometry and Geometry; and Vectors and Matrices. Candidates were required to answer
any two of the three questions from this section. Each question in this section was worth 15 marks. The mean
score for this paper was 47 out of 120 marks.
Compulsory Section
Question 1
This question tested candidates’ ability to
add and subtract mixed numbers
add, divide and square rational numbers expressed as decimals
evaluate the square root of a rational number
evaluate the tangent of an angle expressed in degrees
solve problems involving shopping bills and sales tax.
The question was attempted by 99.5 per cent of the candidates, 16.3 per cent of whom earned the maximum
available mark. The mean mark was 8.06 out of 12.
The responses of candidates to this question were satisfactory. They demonstrated competence on
computations with decimals using a calculator but were less proficient at using the calculator to perform
calculations on common fractions and mixed numbers. In many instances, candidates proceeded to round off
answers to two or three decimal places even though they were asked to determine the exact values. With
reference to the shopping bill, they were able to calculate the unit price of 1 kg of sugar. They also knew that
to find the total cost of 4 kg of rice, they should multiply the unit cost by 4. However, they generally
experienced difficulty in obtaining the price for a kilogram of rice and produced errors which resulted from
not recognizing that 80 cents = $0.80 and instead wrote $80. Hence they obtained the solution $81.60 instead
of $2.40.
Solutions
(a) (i) 𝟏𝟑𝟕
𝟑𝟎 (ii) 3.3444 (iii) 7.855 (iv) 1.7
(b) (i) X = $3.60 (ii) Y = $2.40; Z = $9.60 (iii) $25.96
- 3 -
Recommendations
Teachers should provide students with practice in the proper use of the calculator when performing basic
mathematical computations including squares and square roots of numbers and trigonometric operations. They
should guide students as to what is expected when exact solutions are required.
Question 2
This question tested candidates’ ability to
substitute directed numbers for variables and evaluate the result
write algebraic expressions for verbal statements
simplify algebraic fractions
translate verbal statements into a pair of linear equations which could be solved simultaneously
factorize algebraic expressions.
The question was attempted by 99 per cent of the candidates, less than 1 per cent of whom earned the maximum
available mark. The mean mark was 4.95 out of 12.
Candidates’ performance on this item was less than satisfactory. In Part (a) (i), the majority of candidates
correctly substituted numbers for the variables, but there were those who could not evaluate 4 − 2 − 1.
In Part (a) (ii), candidates substituted numbers for variables correctly, although a large number of them
proceeded to incorrectly evaluate 2(4)2 as being equal to 82.
In Part (b) (i), several candidates reversed the order of the expression. Instead of writing 500 − 𝑝, they wrote
𝑝 − 500. The majority of candidates either did not respond to Part (b) (ii) or responded incorrectly. It was
common to see 500 − 𝑞 = 𝑟 instead of 500 − 𝑞𝑟 as the solution.
In Part (c), candidates recognized that they needed to find the lowest common multiple in order to write the
sum as a single fraction. However, once the denominator was found, the numerator proved to be difficult —
there were errors in simplification, incorrect use of the distributive law and failure to collect like terms. Hence,
10k + 3(2 - k) generated answers such as 9k + 6 or 7k + 2.
In Part (d) (i), although candidates were able to write the pair of equations, they could not state what 𝑥 and y
represented. The most popular responses were 𝑥 represents mangoes and 𝑦 represents pears.
In Part (d) (ii), a large number of candidates correctly factorized 𝑎3 − 12𝑎, while only the best prepared were
able to correctly factorize 2𝑥2 − 5𝑥 + 3.
Solutions
(a) (i) 1 (ii) 32
(b) (i) 𝟓𝟎𝟎 − 𝒑 (ii) 𝟓𝟎𝟎 − 𝒒𝒓
(c) 𝟕𝒌+𝟔
𝟏𝟓
(d) (𝒊) 𝟒𝒙 + 𝟐𝒚 = 𝟐𝟒, 𝟐𝒙 + 𝟑𝒚 = 𝟏𝟔 (ii) 𝒙 represents the cost of one mango; y represents the
cost of one pear
(e) (i) 𝒂(𝒂𝟐 − 𝟏𝟐); (ii) (𝟐𝒙 − 𝟑)(𝒙 − 𝟏)
- 4 -
Recommendations
Teachers should ensure that students are proficient at carrying out the four basic rules of arithmetic on directed
numbers. They should also be encourage to use brackets to maintain the order of operations. Algebraic
expressions should be introduced using actual values, such as 100 ml, instead of p, before using the abstract
quantity p.
Question 3
This question tested candidates’ ability to
determine the number of elements in the complement of two intersecting sets
list the elements in a defined set
use information given in a Venn diagram to determine the number of elements in the universal set
obtain an equation in 𝑥 for the number of elements in the universal set
determine the number of elements in a given set
use a ruler, a pencil and a pair of compasses to construct a right-angled triangle
use a protractor to determine the measure of an angle
determine and locate a fourth point in the plane that would extend the right angled triangle to a rectangle.
The question was attempted by 99 per cent of the candidates, 1.7 per cent of whom earned the maximum
available mark. The mean mark was 5.04 out of 12.
The performance of candidates on this question was unsatisfactory. In Part (a), a large majority of candidates
correctly stated the number of students who played neither the guitar nor the violin. However, an equally large
percentage had difficulty identifying the number who played the guitar. Many concluded that 2𝑥 instead of
2𝑥 + 𝑥, played the guitar. Moreover, it was also recognized that some candidates had difficulty substituting a
value for an unknown, in that, having arrived at 𝑥 = 8, too many failed to correctly proceed to
2𝑥 + 𝑥 = 2(8) + 8 = 24. Also, writing an expression followed by an equation in 𝑥 for the total number of
students in the class was problematic for many. Candidates were unclear as to the difference between writing
an expression and writing an equation.
In Part (b), some candidates failed to demonstrate competency in using the ruler and compasses to complete
the construction of the right-angled triangle. Some drew the line AB as 8 cm rather than 9 cm. A moderate
percentage did not construct the right angle using a pair of compasses while there were others who drew the
90 degree angle at the incorrect point.
In Part (b) (ii), some candidates gave the size of angle BAC as a linear while there was evidence that many
candidates did not know what a parallelogram looked like and failed to accurately complete the parallelogram.
Solutions
(a) (i) 12 (ii) 𝟑𝒙 + 𝟏𝟔 (iii) 𝟑𝒙 + 𝟏𝟔 = 𝟒𝟎 (iv) 𝟐𝟒
(b) (ii) 𝟑𝟒°
Recommendations
Teachers should engage students in using hands-on resources such as tiles to help distinguish between a
whole set, a subset and their relationship to each other.
Students need to learn how to make realistic judgments, for example, the whole is always larger than a part.
Teachers should review the basics in algebra as a prerequisite for problem-solving involving Venn diagrams.
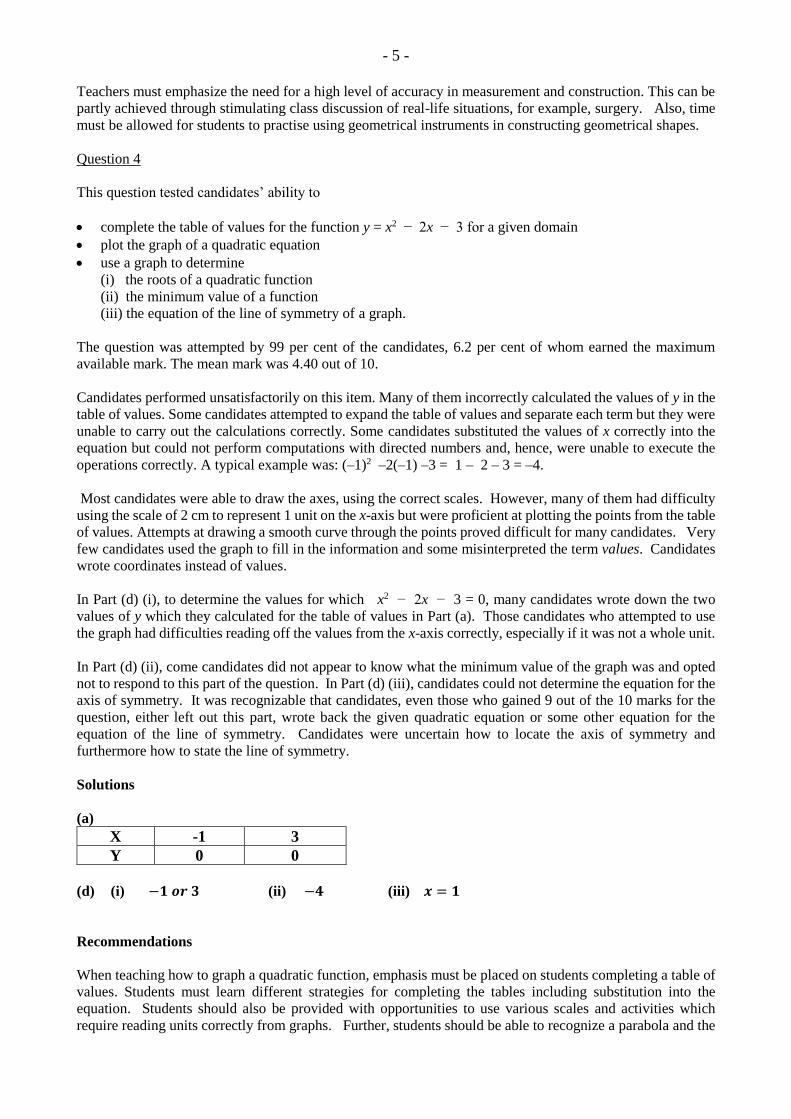
- 5 -
Teachers must emphasize the need for a high level of accuracy in measurement and construction. This can be
partly achieved through stimulating class discussion of real-life situations, for example, surgery. Also, time
must be allowed for students to practise using geometrical instruments in constructing geometrical shapes.
Question 4
This question tested candidates’ ability to
complete the table of values for the function y = x2 − 2x − 3 for a given domain
plot the graph of a quadratic equation
use a graph to determine
(i) the roots of a quadratic function
(ii) the minimum value of a function
(iii) the equation of the line of symmetry of a graph.
The question was attempted by 99 per cent of the candidates, 6.2 per cent of whom earned the maximum
available mark. The mean mark was 4.40 out of 10.
Candidates performed unsatisfactorily on this item. Many of them incorrectly calculated the values of y in the
table of values. Some candidates attempted to expand the table of values and separate each term but they were
unable to carry out the calculations correctly. Some candidates substituted the values of x correctly into the
equation but could not perform computations with directed numbers and, hence, were unable to execute the
operations correctly. A typical example was: (–1)2 –2(–1) –3 = 1 – 2 – 3 = –4.
Most candidates were able to draw the axes, using the correct scales. However, many of them had difficulty
using the scale of 2 cm to represent 1 unit on the x-axis but were proficient at plotting the points from the table
of values. Attempts at drawing a smooth curve through the points proved difficult for many candidates. Very
few candidates used the graph to fill in the information and some misinterpreted the term values. Candidates
wrote coordinates instead of values.
In Part (d) (i), to determine the values for which x2 − 2x − 3 = 0, many candidates wrote down the two
values of y which they calculated for the table of values in Part (a). Those candidates who attempted to use
the graph had difficulties reading off the values from the x-axis correctly, especially if it was not a whole unit.
In Part (d) (ii), come candidates did not appear to know what the minimum value of the graph was and opted
not to respond to this part of the question. In Part (d) (iii), candidates could not determine the equation for the
axis of symmetry. It was recognizable that candidates, even those who gained 9 out of the 10 marks for the
question, either left out this part, wrote back the given quadratic equation or some other equation for the
equation of the line of symmetry. Candidates were uncertain how to locate the axis of symmetry and
furthermore how to state the line of symmetry.
Solutions
(a)
X -1 3
Y 0 0
(d) (i) −𝟏 𝒐𝒓 𝟑 (ii) −𝟒 (iii) 𝒙 = 𝟏
Recommendations
When teaching how to graph a quadratic function, emphasis must be placed on students completing a table of
values. Students must learn different strategies for completing the tables including substitution into the
equation. Students should also be provided with opportunities to use various scales and activities which
require reading units correctly from graphs. Further, students should be able to recognize a parabola and the
- 6 -
characteristics of a quadratic graph. Identifying examples and non-examples of quadratic graphs could
reinforce this.
Teachers need to spend more time developing students’ skills in graphical interpretation rather than merely
drawing graphs as well as the concept of axis of symmetry and the methods in which it may be derived.
Question 5
This question tested candidates’ ability to
calculate the distance travelled at constant speed for a given interval of time
calculate time taken in seconds to travel a given distance
write given scales in the form 1: 𝑥
use the scale of a map to determine actual distances and areas on the land
use the scale of a map to determine lengths
use the scale of a map to determine areas on a map.
The question was attempted by 99 per cent of the candidates, less than 1 per cent of whom earned the maximum
available mark. The mean mark was 2.58 out of 12.
The performance of candidates on this question was generally unsatisfactory. In Part (a) (i) most candidates
could write the product 54 × 2 ¼, but could not complete the computation to arrive at 121.5. Many of the
candidates converted the ¼ of an hour to 15 minutes and then proceeded to multiply 54 × 2.15. Others
converted the hours to 135 minutes and then multiplied. For many, the multiplication of 54 by the improper
fraction 9
4 proved a challenge.
Part (a) (ii) proved to be very challenging and few candidates obtained the correct answer or carried out the
steps which would lead to the correct answer. A few candidates multiplied 54 by 5
18 to obtain the speed 15
and then divided 315 by 15 to obtain the time 21 seconds. Few candidates divided 315 by 54 which also would
have given the correct solution.
In Part (b) (i) and (ii), determining the ratio in the given format proved difficult. Many candidates could not
arrive at a scale of 1:1000 in Part (i) and in Part (ii), candidates left their answer as 2:600 instead of 1: 300.
In Part (c), the responses showed that candidates were not familiar with this type of question and most
candidates omitted this part. For those who attempted it, in Part (i), counting of the squares for QR gave varied
answers, for example, 6.1, 7, 5.5 and even 4. Many used the scale 1:2000 and gave their answer as 12 000.
In Part (ii), candidates were not able to give a good estimate of the area and many answers fell outside the
range of 17 to 19. Since it was area, some candidates gave answer as 18² and likewise for their estimate. Some
used the trapezium rule to determine the area: ½(6 + 3) × 4 =18.
In Part (iii), to determine the actual length QR in kilometers, some candidates multiplied the measured length
of QR by 2000 giving 12 000 as their answer not realizing that the unit was centimetres. Others tried but could
not convert their answer in centimetres to kilometers by dividing by 100 000.
In Part (iv), most candidates did not know that area is calculated as the square of the ratio. Candidates just
multiplied ‘their’ 18 by 2000 rather than 2000². Some did use 2000² in ingenious ways but did not divide by
100² to convert to square metres. Some used the trapezium rule and converted the lengths using the
scale 1:2000 and produced solutions as follows:
½(12000 + 6000) × 8000 = 72 000 000 000 cm². Having arrived at this answer, candidates should have divided
by 10 000 to convert to square metres. However, many did not do the final conversion.
- 7 -
Solutions
(a) (i) 𝟏𝟐𝟏. 𝟓 𝐤𝐦 (ii) 21 seconds
(b) (i) 𝟏: 𝟏𝟎𝟎𝟎 (ii) 𝟏: 𝟑𝟎𝟎
(c) (i) 6 cm (ii) 18 𝐜𝐦𝟐 (iii) 0.12 km (iv) 7200 𝐦𝟐
Recommendations
Teachers should give attention to authentic tasks when teaching scales and scale drawings. Operations with
scale factors when determining lengths, areas and volumes must also be reinfroced.
Question 6
This question tested candidates’ ability to
determine the volume of a cylinder given the diameter of its base and its height
determine the length of the radius of a circle given the measure of its area
determine the height of a cylinder given its volume and the area of its base
estimate the gradient of the tangent at a given point on the graph of a quadratic function.
The question was attempted by 99 per cent of the candidates, less than 1 per cent of whom earned the maximum
available mark. The mean mark was 2.26 out of 11.
The performance of candidates on this question was unsatisfactory. Most candidates knew the formula for the
volume of a cylinder and how to substitute and 𝑟 into the formula. Some candidates wrote the units of
volume incorrectly. For example, a few candidates wrote 𝑉 = 251.2 𝑐𝑚 3 , others wrote 𝑉 = 251.2 𝑙𝑖𝑡𝑟𝑒𝑠,
while a minority of candidates wrote 𝑉 = 251.2 3.
In Part (a) (ii), candidates were required to arrive at 𝑟 = 14.3
314 = 10𝑚. Some students, who used
= 7
22 instead of = 3.14 , got 𝑟 = 9.99 𝑚. Some candidates started with the answer 𝑟 = 10 𝑚 and
then showed that 3.14 × 10 2 = 314. In some cases, candidates correctly stated 𝑟 = 14.3
314 = 100
but did not proceed to 𝑟 = 10 𝑚.
In Part (a) (iii), some candidates did not use the information that 𝑉𝑜𝑙𝑢𝑚𝑒 𝑜𝑓 𝑡𝑎𝑛𝑘 𝐴 = 8 ×𝑉𝑜𝑙𝑢𝑚𝑒 𝑜𝑓 𝑇𝑎𝑛𝑘 𝐵, and hence could not proceed to determine the value of ℎ.
In Part (b) (i), some candidates confused the concepts of scale factor and scale, and there were instances when
the candidates incorrectly wrote the scale factor as 1: 2.
In Part (b) (ii), most candidates recognized that the transformation was an enlargement. Nevertheless, there
were those who incorrectly opined that the transformation was a reflection. In some instances, candidates
wrongly argued that rotation accounts for the negative scale factor.
In Part (b) (iii), some candidates incorrectly stated that QP = 213 = 26 instead of
QP = 2 13 = 4 × 13 = 52 = 7.21 (correct to two decimal places).
In Part (b) (v), some common approaches that candidates used to determine the area of triangle RQP were
as follows:
- 8 -
Area of triangle RQP = 2
1 × 4 × 6 = 12 square units.
Area of triangle RQP = (𝑠𝑐𝑎𝑙𝑒 𝑓𝑎𝑐𝑡𝑜𝑟) 2 × Area of triangle PQR = 4 × 3 = 12 square units.
Solutions
(a) (i) 𝟐𝟓𝟏. 𝟐 𝒎𝟑 (ii) 𝟏𝟎 𝐦 (iii) 6.4 m
(b) (i) 2 (ii) 𝐭𝐡𝐞 𝐜𝐞𝐧𝐭𝐫𝐞 𝐨𝐟 𝐞𝐧𝐥𝐚𝐫𝐠𝐞𝐦𝐞𝐧𝐭 𝐥𝐢𝐞𝐬 𝐛𝐞𝐭𝐰𝐞𝐞𝐧 𝐨𝐛𝐣𝐞𝐜𝐭 𝐚𝐧𝐝 𝐢𝐦𝐚𝐠𝐞
(iii) 2√𝟏𝟑 (iv) 3 square units (v) 12 square units
Recommendations
Candidates are encouraged to examine the properties of each transformation given in the syllabus. They
should explore different techniques for finding the area of triangles and other polygons. Changing the subject
of a formula is also an important skill that is useful in various mathematical concepts.
Question 7
This question tested candidates’ ability to
complete a table of values with information extracted from a given line graph
interpret trends shown in a given line graph
calculate the mean of a set of values
complete a given line graph to show calculated values.
The question was attempted by 99 per cent of the candidates, 1.3 per cent of whom earned the maximum
available mark. The mean mark was 5.28 out of 11.
Candidates performed moderately on this question. Almost all of the candidates scored full marks for Part (a)
which required reading information from the graph and completing the related table of values.
In Parts (b) (i) and (ii), many candidates demonstrated a lack of understanding of the term consecutive months.
Many candidates misunderstood the questions to be asking for the two months between which the highest and
lowest increase in sales occurred. In Part (b) (iii), very few candidates were able to identify the feature on the
graph that indicated the difference between the greatest and lowest increase in sales, with less than about 10
per cent of candidates identifying the gradient as the feature that indicates the variation in increase in sales.
In Part (c), most candidates demonstrated the correct strategy for calculating the mean sales. A large number
of candidates’ responses reflected the process of adding the sales for the five months (July to November) then
dividing by five to calculate the average sales for that period.
In Part (d) (i), in calculating the December sales, most candidates added the total sales of the months from
July to November then subtracted from $130 (the total sales for the six month period). In Part (d) (ii) candidates
were generally able to plot their December sales correctly on the graph.
Solutions
(a) August $20 000 October $25 000 November $15 000
(b) (i) August and September (ii) July and August (iii) Gradient of line
(c) $21 800
- 9 -
(d) (𝒊) $21 000
Recommendations
Teachers are encouraged to provide students with opportunities to read and interpret information such as titles,
keys, scales and footnotes as used on graphs and diagrams. Teachers will find it useful to guide students to
develop the practice of interpreting and analysing information given in questions as a first step in responding
to questions.
Teachers are encouraged to engage students in activities which allow them to use the concept gradient in
situations outside the study of coordinate geometry.
Question 8
This question tested candidates’ ability to
draw the fourth diagram in a given sequence of diagrams
complete a numerical pattern to determine the total number of unit triangles
use an arithmetic algorithm to determine the number of unit sides
derive the general rule representing the patterns in a sequence.
The question was attempted by 99 per cent of the candidates, 15.9 per cent of whom earned the maximum
available mark. The mean mark was 5.42 out of 10.
Candidates’ responses to this question were satisfactory. However, in Part (a), a large number of candidates
could not extend the figure correctly to obtain figure 4 in the sequence. In Parts (b) (i) – (iii), candidates
were generally able to determine the correct values for the number of triangles and unit sides, even in instances
where they could not get the general rule correct.
Solutions
(b) (i) 𝟏𝟔 𝐮𝐧𝐢𝐭 𝐭𝐫𝐢𝐚𝐧𝐠𝐥𝐞𝐬; 𝟑𝟎 𝐮𝐧𝐢𝐭 𝐬𝐢𝐝𝐞𝐬 (ii) 𝐟𝐢𝐠𝐮𝐫𝐞 𝟏𝟐; 𝟐𝟑𝟒 𝐮𝐧𝐢𝐭 𝐬𝐢𝐝𝐞𝐬
(𝒊𝒊𝒊) 625 unit triangles; 975 unit sides (iv) 𝐧𝟐 𝐮𝐧𝐢𝐭 𝐭𝐫𝐢𝐚𝐧𝐠𝐥𝐞𝐬; 𝟑𝐧(𝐧+𝟏)
𝟐 𝐮𝐧𝐢𝐭 𝐬𝐢𝐝𝐞𝐬
Recommendations
Students are encouraged to use pattern recognition and generalization of patterns in games and puzzles to
determine the general rules for patterns and sequences.
Optional Section
Question 9
This question tested candidates’ ability to
draw and interpret graphs of linear functions
plot a graph given a data set
interpret data from a given graph
evaluate the composite of a function
determine the inverse of a linear function
apply the distributive law to expand algebraic expressions
simplify and factorize a quadratic expression.

- 10 -
The question was attempted by 92 per cent of the candidates, 1.7 per cent of whom earned the maximum
available mark. The mean mark was 5.22 out of 15.
Candidates’ performance on this question was generally unsatisfactory. Many candidates successfully derived
the correct percentages for Part (a) (i). Several of them opted to calculate the percentages by first expressing
the mark as a fraction of 120. Nevertheless, there were those who misinterpreted the data and instead of
plotting a linear relationship of Percentage vs Mark, the following were plotted: bar graphs; frequency
polygons, line graphs; cumulative frequency curves and in a few instances, two points with no line passing
through the points.
In Part (a) (ii), most candidates recognized that the graph was linear and passed through the origin. Many of
them successfully derived the correct percentage for Part (a) (iii) either by way of interpolation or by
performing the computation 95
100 × 100 . In addition, many candidates successfully derived the correct score
for Part (a) (iv) as 102 either by interpolation or by forming an equation. For candidates who produced an
answer within the band of 102±2 marks, the full marks were awarded once the lines of interpolation were
shown.
Some candidates plotted straight line graphs where the y intercept was not 0 even though a correct scale was
used and some attempted to draw the straight line freehand instead of using a ruler. Some candidates who
correctly plotted the graph, failed to show the pair of lines of interpolation to show the answers for Parts (a)
(iii) and (a) (iv). Despite this, some candidates correctly derived the answers by either visual inspection of the
graph or by forming an equation and solving it.
Candidates who opted to ‘break’ the x-axis by starting off with a number other than 10 did not put the
appropriate symbol on the x-axis (even though the scale was appropriate). Some candidates did not chose
appropriate scales, thereby making it difficult to interpret the graph.
In Part (b) (i), many candidates successfully determined g(5). Some, however, appeared not to understand the
notation and how to carry out the correct substitution and experienced difficulty in arriving at the correct
answer. In Part (b) (ii), some candidates were able to find the inverse. However, a large number of candidates
knew they had to interchange the x and the y but did not know how to transpose. In Part (b) (iii), many
candidates experienced difficulty carrying out the correct expansion of (3x+2)2.
They also had difficulty with algebraic simplification: particularly with the expression (3𝑥+2)2+1
3. As a result
many of these candidates erroneously produced the result9𝑥2 + 4
3. Some candidates who correctly produced
the expression 3x2 + 4x + 1 from (3𝑥 + 2)2 + 1
3 were unable to derive the correct quadratic factorization.
Solutions
(a) (i) 𝟓𝟎%; 𝟏𝟎𝟎% (ii) 𝐥𝐢𝐧𝐞 𝐭𝐡𝐫𝐨𝐮𝐠𝐡 (𝟔𝟎, 𝟓𝟎) 𝐚𝐧𝐝 (𝟏𝟐𝟎, 𝟏𝟎𝟎)
(iii) 𝟕𝟗% (iv) 102 marks
(b) (i) 8 (ii) 𝒙−𝟐
𝟑 (iii) (𝟑𝒙 + 𝟏)(𝒙 + 𝟏)
Recommendations
Teachers need to reinforce the correct reading of scales and maintaining consistency in scales. They should
instruct students on the use of the electronic, non-programmable calculator in areas where order of operations
is key so that fractions and squares can be solved with relative ease. Students should be taught to assess the
validity of an answer.
Further, teachers need to put heavy emphasis on factorization of quadratic expressions where the coefficient
of x2 is not 1 and the expansion of two bracketed expressions, similar to (3x+2)2.
- 11 -
The ideas of a function, inverse of a function and compositions of functions must be introduced to students in
the form of arrow diagrams. Authentic representations of mappings and functions should be discussed.
Examples are the names and numbers in a telephone directory, the assignment of students to classes in a school
and the relationships in families.
Question 10
This question tested candidates’ ability to
use trigonometric ratios to solve problems involving angles of elevation
use the cosine and sine rules to solve problems related to bearings.
The question was attempted by 65 per cent of the candidates, 2.4 per cent of whom earned the maximum
available mark. The mean mark was 3.15 out of 15.
Candidates’ performance on this question was generally unsatisfactory.
In Part (a) (i), the line representing a distance of 60 m and a right angle on the diagram were widely known.
However, only a minority of candidates was able to label the angles of 35o and 42o to show the angles of
elevation. As a consequence, several candidates who calculated BT and BP to be 42 m and 54 m respectively
did so from an incorrect diagram and their ratios of tan 35 and tan 42 were incorrect. The angles of 35o and
42o were often inserted on the diagram as angles BTR and BPR respectively. In a few cases, 35 and 42 were
placed along the lines TR and PR. In Part (a) (ii), some candidates correctly used the tangent ratio to solve
the problem. However, there were those who incorrectly used the sine ratio.
In Parts (b) (i) and (ii), candidates who were unable to calculate angle KLM, did not recognize the relation,
alternate angles, between KLM and the bearing. Many indicated on the diagram that the bearing was in fact
the angle KLM. In Part (b) (iii), most candidates were able to use the cosine rule correctly and to substitute
the correct values of the sides and angle KLM and follow through with their calculations to give a correct
answer to the nearest kilometre. There were too many, however, who, on reaching the stage
KM = 20 800 – 19200 cos40, evaluated it to be KM = 1 600 cos40.
In Part (b) (iv), those candidates who used the sine rule were able, generally, to find angle LKM. The weakness
here for those who did not, was in making sin K the subject. This also applied to candidates who attempted to
use the cosine rule. In Part (b) (v), the majority of candidates was unable to calculate the bearing of M from
K. Calculations, such as adding the bearing of 40 degrees to LKM and then subtracting from 180 degrees
seemed to indicate that they did not know where the bearing was located.
Solutions
(a) (ii) 12 m
(b) (ii) 𝟒𝟎° (iii) 𝑲𝑴 = 𝟕𝟖 𝐤𝐦 (iv) 𝟖𝟏° (v) 121°
Recommendations
Students need to be exposed to a greater variety of problems involving trigonometrical drawings in the areas
stated in the syllabus. Some of these drawings can be produced through practical work on the part of the
students. In this question, for example, showing the bearing on a diagram or calculating the measure of a
bearing should be reinforced. Students also need to be taught how to select the most appropriate ratio to be
used in a given situation in order to reduce the number of calculations required.
- 12 -
Question 11
This question tested candidates’ ability to
solve for one unknown in a singular matrix
use the matrix method to solve an equation with two unknowns
recognize the position vector of a point in the plane
write the coordinates of points in the plane as position vectors
use vector geometry to determine the resultant of two or more vectors
use the properties of equal vectors to solve problems in geometry.
The question was attempted by 42 per cent of the candidates, 1 per cent of whom earned the maximum
available mark. The mean mark was 5.60 out of 15.
Generally, candidates submitted better answers to Part (a) which tested their ability to manipulate 2 × 2
matrices, than Part (b) which tested their working knowledge of vectors.
In Part (a), while many candidates could correctly multiply two 2 × 2 matrices, too many used incorrect
strategies, such as multiplying or adding corresponding elements. Many demonstrated that they knew how to
compute the adjoint of the matrix M. However, many candidates seemed unfamiliar with the notation |M| for
the determinant of the matrix.
In Part (b), the notation |OR| was not familiar to many candidates, and the computation (-3)2 = - 9 was also
common when the correct method was adopted. Even candidates who could obtain correct solutions to RS
and ST were unable to articulate properly that the two were parallel; and they found it even more difficult to
conclude that because S was a common point, RST was a straight line. It was good to see that many of the
better candidates were able to get the expected result, and for many others this last point was their only failing
in the whole question.
Solutions
(a) (i) 𝑨𝑩 = ( 𝟏 𝟑𝟐 𝟕
) (ii) BA = ( 𝟓 𝟕𝟐 𝟑
) (iii) 𝑨−𝟏 = ( 𝟑 −𝟏−𝟐 𝟏
) (i) 𝒙 = 𝟑
(b) (i) | 𝑶𝑹 | = 𝟓 (ii) 𝑹𝑺 = ( 𝟒−𝟑
); 𝑺𝑻 = ( 𝟒−𝟑
);
(iii) RS ST; S is a common point; so R, S and T are collinear
Recommendations
Teachers should encourage students to utilize diagrams to add clarity to their responses when solving problems
on Vector Geometry. They should reinforce the concept that a resultant vector can be derived from the sum
or difference of two or more position vectors. They should provide students with the opportunity to develop
the art of identifying the type of quadrilateral formed from a system of vectors in which there are equal or
parallel combinations. They should also provide students with more practice in writing the matrix equation
corresponding to a pair of simultaneous linear equations.


