Embed Size (px)
Citation preview

University of Mississippi University of Mississippi
eGrove eGrove
Guides, Handbooks and Manuals American Institute of Certified Public Accountants (AICPA) Historical Collection
1-1-1960
Cost reduction and cost control in the small business; Cost reduction and cost control in the small business;
Management services by CPAs, 4 Management services by CPAs, 4
American Institute of Certified Public Accountants
Follow this and additional works at: https://egrove.olemiss.edu/aicpa_guides
Part of the Accounting Commons, and the Taxation Commons
Recommended Citation Recommended Citation American Institute of Certified Public Accountants, "Cost reduction and cost control in the small business; Management services by CPAs, 4" (1960). Guides, Handbooks and Manuals. 178. https://egrove.olemiss.edu/aicpa_guides/178
This Article is brought to you for free and open access by the American Institute of Certified Public Accountants (AICPA) Historical Collection at eGrove. It has been accepted for inclusion in Guides, Handbooks and Manuals by an authorized administrator of eGrove. For more information, please contact [email protected].

MANAGEMENT
SERVICES BY
C P A s
4
Cost Reduction and Cost Control
in the Small Business
AMERICAN INSTITUTE OF CERTIFIED PUBLIC ACCOUNTANTS 1960

Copyright 1960 by theAmerican Institute of Certified Public Accountants
270 Madison Avenue, New York 16, New York
This is the fourth in a series of five bulletins on Management Services by CPAs available on a subscription basis at $10. Additional copies may be ordered at $3.50 each.

MANAGEMENT SER V IC ES BY
C P A s
Cost Reduction and Cost Control
in the Small Business

To the reader
§ The profit margins of all businesses—large and small—have been declining.
§ They were lower in 1958, according to many economists, than at any time since 1945. Under the twin pressures of high taxes and high costs, they may well decline again this year.
§ The ultimate survival of small business will depend in part upon its readiness to adopt the techniques of modern management.
§ It can effectively use the tool of budgeting to increase profits. This was the subject of the second bulletin in this current series on management services by CPAs.
§ It should engage in sound financial planning—and obtain the funds needed for growth—the subject of the third bulletin.
§ And it should constantly strive to reduce and control its costs. This bulletin provides a review of some of the techniques of cost reduction and control which can be applied most effectively in a small business.
§ No one is better equipped than a CPA to advise the management of small business in improving its operations. In doing so, he will not only expand his own opportunities for service, but will contribute to the financial health of small business.

Cost Reduction and Cost Control in the Small Business
Foreword
Countless pages of accounting and management literature are devoted to cost reduction and control.
Which cost controls can be of the greatest benefit to small business?
This is not an easy question to answer. Some of the techniques of reducing or controlling costs would be valuable to any business. It is not the purpose of this bulletin, therefore, to imply priority by virtue of its coverage.
The second bulletin in this series on management services by CPAs, "Budgeting for Profit in Small Business,” covered one of the more important cost control tools. In the opinion of many, it is the most valuable over-all cost control tool available to any business. Many of the other cost control techniques, however, do not have universal application. Some small businesses, for example, could profit from the installation of a complete standard cost system. Most of them would not. Nor could the majority justify the cost or administer many of the other elaborate control techniques employed by big business.
This bulletin will be confined to two of the elements of cost control: the development of formal cost reduction programs; and the use of cost analysis. Both have considerable value for a high percentage of small businesses. Both also involve techniques which
5

are already familiar to most CPAs or in which they may become competent quickly.
The orientation section of this bulletin (pp. 7 to 21) is concerned with the basic principles underlying a formal cost reduction program, the benefits to be derived from it, and the approaches to be used in establishing it in a small business.
The values and other end results of using cost analysis in the management of the small business is the purpose of the illustrative material (pp. 22 to 68). These illustrations of how CPAs have advised managements of small clients—on the basis of simple cost finding techniques—provide coverage of (1) distribution cost analysis and the use of such data in management decision involving small-order policy, and (2) direct variable product cost analysis which, through use of the contribution concept, served to advise management on marketing policy, product profitability and costs.
The final section of the bulletin (pp. 68 to 71) provides reference or study material in the areas of cost reduction, cost accounting, distribution cost accounting or cost analysis techniques.
6

A C O S T R E D U C T IO N P R O G R A M IN T H E S M A L L B U S IN E S S
Most large companies have established cost reduction and cost control programs on a formal basis. In the typical large company, the planning and administration of a cost reduction program is often assigned as a full-time responsibility to a top executive. Big business has learned from experience that successful cost reduction and control efforts must be applied continuously if full benefits are to be obtained. Experience also proves that programmed cost reduction in any business, large or small, must have one basic element if it is to succeed. That element is leadership. It must be spearheaded by an aggressive and imaginative leader.
The role o f the CPA
In big business the leader, more often than not, is a financial man. In the largest business the leader will function as a specialist in this sphere alone; in larger businesses unable to justify specialists, the controller is generally the leader. But who is to command the attack on costs in a small business without a controller? The CPA must do it. He is the best man to do it because of his intimate knowledge of his client’s operations and because of his ability to
7

install the necessary standards, reports and controls. His independent status provides other tremendous advantages by which he can assist a small business in reducing and controlling its costs.
1. He is a second pair of eyes which can often spot potential cost saving areas or operations that management itself has taken for granted for years.
2. The CPA can exert an independent pressure on management for action which people within the organization would hesitate to apply. He can discuss a trouble area critically and will build client relations in doing so. Employees will often refrain from suggesting changes that may step on the toes of co-workers. And who is to blame them? They generally have nothing to gain, but much to lose in their relationships.
3. The independent CPA can often function as a “lightning rod” during the brief storms which occasionally follow the inauguration of new procedures or policies. Smaller businesses are generally intimate units, and explanations of the need for such changes can often be made easier when they can be attributed to recommendations made by the independent CPA. Management, for example, may often act on the CPA’s proposal to share secretarial services in order to eliminate, say, two of the private but only “prestigebuilding” secretaries of the four middle-management executives of a small business.
4. Because of his wide experience in servicing many businesses, he can bring the experience of one business to another.
The CPA, however, cannot do the job alone. No more so than the program leader in the biggest business can “expert” the job. Cost reduction is a team job. It is also a state of mind. The CPA can only work with the small business management as the leader. The creation of a favorable company atmosphere and the development of cost-consciousness down the line—these are tasks which management itself must perform; but the CPA may have to show them how arid guide them into cost reduction. Moving too fast will often prove disastrous. A doctor will often spend a long time in readying his patient for an operation. The CPA must set the pace for management.
8

The obstacles in establishing
a cost reduction program
Why do most small businesses pay little attention to formal cost reduction programs?
There are many reasons—here are some:1. It takes time to establish a program and even longer to achieve
results. The control and reduction of costs, the development of a conducive company climate, the gradual inculcation of cost- consciousness throughout the organization cannot be done overnight. Interest has often been lost in smaller companies before their programs have had an opportunity to generate some tangible benefits. This undoubtedly occurs in small business programs because there is no leader who continually keeps the atmosphere and program alive.
2. Current operations are satisfactory—complacency sets in. As in big business, cost reduction is seldom taken seriously in smaller businesses until sales or profit margins slip. Yet costs cannot be trimmed any faster in periods of declining business than at any other time. The lag in adjusting costs to lowered sales or margins is not nearly so serious in the business that has continually been practicing cost reduction formally.
3. Continual cost reduction strains the small business organization. It adds another burden to management that already has too much to do and exerts a pressure on the employees. It involves more work for everyone and cost investigation or operational change sometimes results in disruption. Some managements apparently do not want to face up to these facts.
4. Tradition is often the largest obstacle to cost reduction in the small business. Management generally accepts the fact that employees do not like changes; but, managements are sometimes not as aggressive and dynamic as they believe they are. They are human, too, and the maintenance of the status quo provides a feeling of security. After all, we’ve been doing it this way for years —why gamble on a new way? The managers of a small business
9

who have developed the bad habit of operating by habit will generally overlook many ways to save money. There is always a better way of doing things. Tradition should often be cherished; but it cannot be allowed to set the pace of business progress.
5. It costs too much to cut costs. The engagement of a consultant, the addition of control reports, or addition of staff or supervision —all logically appear, on the surface, to be additional expenses, not reductions. Small business must be shown that it often takes money to save money. It is the smart manager, for example, who realizes that additional supervisory personnel may be required when things get tough or that additional advertising money is best spent when sales are falling. The successful management also recognizes that capital additions will often contribute to a reduction of costs.
6. Potential disruption of relations is another reason smaller business does not adopt cost-saving techniques. The strain on employee relations has already been mentioned; but union and customer relations are often regarded even more as “touch-me-not” areas. However, the experiences of others suggest that changes in factory methods and procedures will not always violate the “mechanical improvement” or “automation” clause in a union contract—nor are customers likely to be as distressed as it is feared merely because the billing procedure is revised.
7. Cost-saving opportunities are rarely visible in the small business. A big business has expert cost accountants and industrial engineers on its staff who, in spite of the operation’s complexity, can detect high cost areas and do something about them. A small business operation is rarely as complex as big business. A small business management must be convinced that expensive cost reports and industrial engineering departments are not necessary in the small business in order to locate and correct out-of-line costs. Introduction or expansion of a simple accounting system, the establishment of even informal standards of performance, and the development of a few basic reports drawn from the system is often all that is required to provide the tools for a small business to locate high cost operations, to reduce them, and then to keep them in line.
10

The CPA can help small business managements to recognize these cost reduction barriers. None are insurmountable—particularly if management is aware of their existence. Many of them are the result of inertia; but management itself is responsible for some of them. It too often lacks the time or the financial information with which to launch an attack on costs. Small business management can benefit greatly if the CPA will seize the initiative in organizing a cost reduction and control program.
The major principles o f a successful
cost reduction program
Certain basic principles to be followed in a successful cost reduction and control program have already been touched upon— but due to the importance of avoiding pitfalls in going about cost reduction the wrong way, the four major principles of programmed cost reduction are listed.
1. Cost reduction cannot be a one-shot proposition. The crash- program, initiated on the spur of the moment by management, is rarely effective in the long run. And more often than not, the crash-program will fall flat as soon as management has taken the heat off. If it results in “cost reduction” due to across-the-board cuts, the reductions are likely to be short-lived. The fat will creep back in and “cost reduction” will have come to mean “fired” to employees.
Optimum results can be achieved only if the cost reduction and control are continuously practiced. It must become a state of mind —a habit—with people, and cost-consciousness must be a part of the daily operations of a small business. Cost reduction and control must be everywhere within the business and individual cost-saving efforts must be integrated with the over-all system of cost control.
2. Cost reduction and control is a team job. “Hogwash,” say the autocratic, iron-fisted small business leaders—and perhaps some CPAs agree with them. There is too much evidence to the contrary, however, to accept any other point of view. Management is most
11

often defined as the art of getting things done through other people. The area of cost reduction and control is no exception. Cost reductions can only succeed through the co-ordinated efforts of all of a company’s employees. While one individual must provide the leadership in activating the program and keeping it alive, it will be the ideas, activities and participation of the employees that will prove to be of most benefit in cost reduction. In a small business particularly, possible reductions in one area must be weighed against the possibility of increased cost in other areas. The combined thinking of several people will furnish the best answer.
All of the employees—from the office boy to the president—must be put on the cost reduction team. The most important employee to enlist, however, is the foreman or supervisor. These are the people who, through their own enthusiasm, can help instill the proper cost-conscious climate throughout the business. In a small business a few foremen and the office manager, for example, will represent the first line of responsibility for the great majority of operating costs. They work directly with the people who make the product, waste the invoices, break the tools—and who can also come up with the ideas for reducing the costs they generate. First line supervisors must be sold on cost reduction and control first as they, in turn, if they are good supervisors, will then sell other employees on the importance of continual cost reduction. This level of employee is also in the best position— the president or program leader having been considered—to follow up ideas and changes to ensure that the cost reduction job is actually performed.
Selling cost consciousness is not always easy. The keys to success are (1) the enthusiasm for cost reduction in the supervisory ranks and (2) the ability of the supervisor and management to motivate the other employees with their own enthusiasm and to enlist their co-operation through financial and nonfinancial rewards.
This bulletin cannot delve deeply into techniques of employee motivation, but it is so important that the employees be brought into the cost reduction and control program that a few of the basics might well be mentioned. The CPA need not be an expert on employee relations to determine if the personnel practices of his small business client are fostering sound employee attitudes—which, in
12

turn, are conducive to cost reduction and control. A CPA is generally aware of the employee attitudes of his clients. If this aspect of the company’s environment appears to be discouraging employee participation in cost reduction, the CPA may be the logical man to alert management to the situation and perhaps to advise action that will correct the climate and motivate the personnel to orient themselves to the needs of management. The ranks must be made up of employees who want what the boss wants. A strictly “nine-to-five” attitude on the part of the majority of a small company’s employees is a dangerous condition. If a few employees are locker-room lawyers—chronically unhappy and unco-operative— there is no real problem. They can be fired—or put out of harm’s way, if complete elimination is precluded. However, when the majority of the employees of a small business do not identify themselves with the objectives of management, the company will have lost its most valuable allies in the battle to reduce and control costs. The causes of such a condition should not be difficult to uncover. Look at the financial incentive first. Seek the answers to a few basic questions:
a. Are the company s salaries and wage rates competitive with those paid by similar businesses in the community? How long has it been since comparisons of rates were made to formal or informal surveys of wages and fringe benefits offered by similar businesses in the area? Experience dictates that an underpaid worker will often cost the company even more than the going rate as a result of his disgruntled attitude and lack of initiative. If low salaries and wage rates have created an excessive turnover rate, the cost of continual rehiring and retraining, in itself, may cost more than a few cents per hour across-the-board which would correct the situation.
b. Are jobs alike in skill and importance paid in the same range? Has management ever evaluated jobs, objectively—even informally —so that higher wages are paid for more difficult jobs? Or has time resulted in salary favoritism or too many red circle rates, based solely on seniority? If jobs have been evaluated, do the employees understand it? And do they know when they will be evaluated again, if their jobs change?
13

c. Are there financial incentives that extend beyond base pay? Any group of employees, each of which is capable of a different quantity of output, is likely to maintain a common level of production, in the absence of individual incentive. The level will generally be close to the production rate of the low producers. A wage incentive system will provide the better employee with the opportunity he wants: to relate his superior abilities to a superior pay check.
d. Are there financial incentives that specifically promote cost reduction? Has a suggestion program or other formal means of rewarding active participation in cost reduction been established? Most large businesses have set up formal mechanics to satisfy this need—and it is safe to say that an overwhelming majority have profited by doing so.
While it is well established that people are motivated quite effectively by money, this is never all that is required. There are many nonfinancial factors that seriously influence employee attitudes, and which are necessary to satisfy the emotional needs of employees. Any lengthy discussion of these nonfinancial factors would contribute nothing further to the point being made here: that the small business must develop a positive attitude on the part of its employees. As an adviser on cost reduction to a small business management, the CPA can help by stressing the basic definition of management—the art of getting things done through other people. Cost reduction efforts will never be fully effective without the support of people.
3. Another important principle in cost reduction is the recognition that cost saving possibilities are available throughout the small business. In smaller businesses where failures stem preponderantly from deficiencies in management, this is particularly significant. Cost control and efforts at cost reduction should encompass the entire business. The experience of big business has proved that cost savings can be effected almost everywhere. The economies may not be achieved immediately, but sooner or later the costs generated in any area can be reduced—but only if that area is covered in the program.
4. Costs can be effectively reduced and controlled only if a small
14

business has adequate cost information. A profit and loss statement, with the usual schedules of expenses, is rarely enough—although in some small businesses even these can provide a start. It is here that the CPA can probably make his largest single contribution to management. Through his knowledge of his small business client’s operations and his understanding of its management, their attitudes, strengths, weaknesses, and needs, he can best assist in providing this necessary element of cost control. Each client’s needs, as well as the accounting and reporting methods to be utilized in the circumstances, may be different. The CPA must evaluate this in each case in order that the management receive adequate information about its costs. The reports of cost activity, moreover, must be oriented to the needs of the man directly responsible for the costs. This often calls for a change of thinking on the part of a small business management—or a CPA—who thinks only of directors and stockholders when preparing reports.
Only by observing these four interlocking principles can a cost reduction and control program be effectively introduced and utilized in a small business.
15

W H A T IS T H E A P P R O A C H T O P R O G R A M M E D C O S T R E D U C T IO N A N D C O N T R O L ?H O W D O E S A S M A L L B U S IN E S S G ET S T A R T E D ?
Suppose that a CPA has helped a small business management to become convinced of the advantages of a formal and continuous effort to reduce and control costs. The CPA, in turn, is satisfied that management will back the program; that company climate does not appear to be a roadblock to getting started and that the general accounting records are adequately maintained. In other words, the necessary elements on which to build a sound program are present.
Where does the small business go from there? How should the problem be approached? Where can efforts at reduction and control be most effectively concentrated? Most small businesses would be doing a better job of controlling costs if they knew the answers to these questions. Unfortunately, there is no pat answer, as the individual circumstances of each small business are different; but the experience of others does provide some worth-while rules which can be applied to almost any set of conditions.
One businessman has made this observation, facetiously or acidly: “Business has been told how to approach the subject stealthily and from the flanks, how to approach it boldly and head on, how to approach it with money, how to approach it without money, how to approach it with a complex system, or no system at
16

all. How to cut costs with the left hand, how to cut them with the right hand and even how to cut them with no hands at all.” With so many different means to accomplish the same end available to him, this man could not understand why determined small business people (like himself, perhaps) found it so difficult to cut and control costs.
Cost control specialists are continually discovering “new” and “different” approaches. They have passed through the mere “organized,” “tested,” “practical,” or “dynamic” approaches and currently will not settle for anything less than “systems engineering,” “integrated standardization,” or some equally sophisticated method for getting and keeping costs down.
“Systems engineering,” or what have you, is not necessary in the small business. On the contrary, there is a definite need for simplicity and, to be practical, the cost control process cannot be too costly. For the small business even if it is unable to “engineer” new systems or cannot afford large investments, progress can still be made. Based on successful experience, this is how cost reduction ought to be approached and where it may be best concentrated in the small business.
1. Plan the entire program carefully before starting to work the plan. A timetable of anticipated goals should be developed in order to avoid discouragement over what may appear to be slow progress. It should also be recognized at the outset that the time needed to effect an adequate control system depends largely on how much control already exists in the business. If a small business can build on good records, and perhaps on some basic budgeting as simple performance standards, results should appear quickly. If there is little or no control at the start it is going to take a lot more time. This fact should be accepted in the beginning; then program the goals and only insist, in starting out, that some progress be shown constantly.
2. Preplan which elements of cost are to bear concentration first. A small business cannot work effectively on all of its cost elements and cost areas at the same time. An element or area should be selected where savings can most likely be effected. The results will then stimulate the program. There is generally little to
17

be accomplished by “turning out lights.” Time and material are ordinarily the two elements of cost which should bear the brunt of the attack. As a rule, concentration on these elements will produce the best results.
3. Break the business into activity areas—and then develop a plan of priority. Select an activity area in which to start—just on e- keeping in mind that an initial success will make it easier to achieve results in the next area. How is the first activity area to be selected? Experience provides a few hints:
(a ) Look for a bottleneck area—one where everything is always wrong, or where people are constantly chasing around the organization expediting everything in sight.
(b ) If the small business is fortunately free of such an area, look for one in which things have been done the same way for the longest time. This is often ripe for immediate cost saving, as its methods and procedures which have been taken for granted for years are often screaming for change.
(c ) Make sure the first area to be attacked is generating enough costs to justify its selection. In other words, it is an obvious error to announce the new cost program with a great fanfare and then proceed to “work simplify” the office boy’s job because he’s “always chasing around” and mail deliveries have been made via the same route for years. Show the employees that you’re dead serious. They will, in turn, take the program seriously, and it will help to foster their participation.
4. Having established a list of priorities and having selected the first area to be studied, what is to be done next? These are the steps:
(a) Let the employees know what’s going on and get them into the act. Don’t try to “expert” the job.
(b) Get the facts—analyze the area. Find out what is going on, and why things are done as they are. Determine to what extent the area is presently being controlled.
(c) On the basis of the facts, decide what procedures can best be utilized for reducing and controlling the costs in the area. What control methods will contribute to increased productivity or control of material usage? In the small business, as in the large, no magic formula is available for determining a control procedure which
18

can be used in all cases or in all areas. The procedure for adequate control of costs in the area will rarely be found to lie altogether in a revision of the accounting system or reports. Control of labor cost, for example, might not only require the introduction of time standards; it might also require better procedure for control of employee selection or training. Control of the manpower must also provide for a continual review of what is being done, how it is being done, and who is doing it. To summarize, only by obtaining and analyzing all the facts can the appropriate control procedures be established.
(d) Set up the tools for analysis and control. The basic technique of cost control in any business involves a comparison of actual operations with standards through cost reports. This basic definition of cost control may in itself be a reason small businesses do nothing about controlling costs. The definition is probably interpreted, erroneously, to mean that an expensive cost accounting system must be installed, only after establishing standards through time studies conducted by high-priced engineering experts. If a small company can afford these luxuries of cost control, it will probably do a better job. But, they are by no means necessary in the average small company. I t needs only standards and reports.
The reporting aspect of the control procedure should pose few problems to the CPA. It is the establishment of "standards” or other “measures of performance” that appear to raise questions. It is often thought to be a task reserved solely for engineers. This may be true at General Motors; but the formulation of standards is complex only to the extent that the business is complex—and small businesses are rarely complex.
Standards can be effectively established in any division of the business—production, sales, the office—on the basis of observation, historical records or simply informed judgment. Standards set in this manner will be a valuable beginning. Like budgets, they will become better. They may at first serve only as an over-all means of measurement with which to evaluate the variances in an entire month’s operations in a single activity area. However, as the standards are refined in that area and expanded to include other areas, the reports can start to disclose the effects of efficiency or changes
19

in prices or volume. They may ultimately form the basis of a complete standard cost accounting system. The important thing is that a small business must have basic standards of measurement. Every business, of course, has standards; but they are not always standards for measurement. In fact, in many businesses, managed by default, the work standards are set by the employees themselves. Because of this the setting of formal standards in some companies may call for changes in the work habits of employees. They would be less than human if they did not resent the idea of being controlled. Consequently, any changes made in the first activity area should be simple—and make sure no one in the area is hurt by the changes or by the introduction of standards. More changes and tighter standards can be adopted later. Handled right, the employees will help to make them.
(e) Set up the reports for analysis and control. The other tool of the cost control checkup is the report by which the activity area can now be watched and improved. Experience of others in this phase of cost control points up the need to recognize that it is not the stockholders nor even the officers of a business that primarily control the activity areas. The foreman or supervisor is the first line of responsibility, and the reporting process must be geared to his needs. Keep the reports simple in design and content. If possible, the foreman’s own ideas on presentation should be accepted. The internal cost report is probably the most valuable instrument of control. They must be informative and understandable to the people who bear the responsibility for the costs being reported.
In planning new or revising old reports for each activity area, it is also important to consider the accounting procedures and records from which the reports are to be prepared. Does the system of obtaining the basic operational data require revision? Will the preparation of reports be simple, or will their preparation and the recording of the data in the general records require two distinct analyses of the operating data? Should the reports tie in to the general records? A tie-in is generally held to be desirable, but a CPA will have to evaluate the necessity in each case. In short, the whole record-keeping function must be reviewed.
These are the steps which, taken together, represent a successful
20

approach to cost reduction and control in the small business.If the CPA doesn’t guide small business clients through the
steps outlined and get them started on a formal program for reducing and controlling their costs, there is reason to wonder who else ever will.
21

A N IL L U S T R A T IO N O F H O W A C P A ’S A N A L Y S IS O F D IS T R IB U T IO N C O S T S A S S IS T E D M A N A G E M E N T D E C IS IO N IN E S T A B L IS H IN G S M A L L A N D M IN IM U M O R D E R P O L IC IE S O F A S M A L L B U S IN E S S
History o f the company
In 1947 Otto Mason, then working as a supervisor in the meat department of a supermarket, purchased an old truck and a failing meat provision route from the widow of a friend. Ten years later he had added a fourth truck to his "fleet” and ranked as one of the city’s larger independent meat distributors. Otto’s customary workday called for arrival at the market about 5 a.m . to purchase the items required for each day’s deliveries and supervise the loading of his trucks. He often made the deliveries himself when any of his route men did not report for work. If he wasn’t driving, he would spend most of his day soliciting prospective accounts. He would return to his small office late in the afternoon, check the day’s “weights” and compile orders received from his regular customers for delivery the following day. This usually kept him busy until 10 p .m . His consistent 14 or 15-hour days, however, were not for naught. They paid off handsomely.
As an "independent,” Otto supplied a complete line of meat products required to service butcher shops and restaurants. He was happy to fill an order for any grade of meat, but he catered
22

primarily to customers desiring prime beef and meat products. The key to his success lay in his ability to select the best meat available in each grade in the open market for his customers, and in gross profit margins. The entire sales mix produced an average gross margin of about 7 per cent, and Otto had learned long ago that the best way to get the extra “point” consistently was to handle the higher quality grades where market price fluctuation was not as extreme as it was with the lower grade products.
Otto had first engaged a CPA about a year after he had been in business. The CPA prepared monthly financial statements, and spent a couple of hours with Otto each month discussing “business in general.” Otto seemingly saved up his ideas and his less urgent problems for these monthly conferences with his CPA. After a brief review of the financial statements, they would discuss each one of them. It was more than a business relationship. They had become good friends.
The CPA had submitted separate bills for a good deal of special work that he had done for Otto in the past. Otto, like most shrewd businessmen, was receptive to new ideas, and was always willing to make an investment—if the cost stood more than an even chance of helping to produce additional profits. Otto was even incensed when he didn’t receive a bill from the CPA for suggesting a simple idea that involved the use of a tape recording telephone answering system and arranging for its installation. Otto had thought it absolutely ingenious that any of his 500 customers could dial a number and have a tape record their routine orders. The installation of this automatic telephone equipment had already eliminated hundreds of hours of time which Otto and his part-time assistants would have spent taking orders over the phone.
The problem o f specialty orders
The early 1959 monthly sessions found one problem area continually coming up. Somewhere along the line, Otto had gradually started to service delicatessens, small restaurants and luncheonettes. He was now servicing over 250 of these smaller customers
23

on what he called a “specialty order” basis only. Otto had regularly supplied specialty items (such as cold cuts and private brand packaged meats) in addition to his principal beef and pork lines, to his major customers.
He had found that delicatessens and other smaller retailers were simple to sell. The national meat packers and most of the “independents” in the area were not interested in servicing delicatessens and luncheonettes; but Otto had felt that these stops were worth while as long as they were on his customary routes. This type of business had originally been confined to small stops near one of his larger customers, but now the stops had become more scattered.
Another factor had led to the acquisition of a number of these accounts: a commission arrangement which Otto had with his drivers. This, too, had been thrashed out with the CPA a few years ago. In addition to a basic salary, the drivers received a one-half of 1 per cent commission on beef, pork and other heavy items and 1 per cent on specialties. Otto installed this system as a “service incentive.” When the plan was being installed, the CPA admits that he had not been altogether convinced of its merits; but he had been wrong. It had been extremely successful in stimulating the drivers to retain and expand existing accounts and to seek new ones. Many of the smaller accounts had been acquired through brief sales calls which the drivers had made when time permitted.
Did it pay to make these small order stops? As Otto talked about it, he became increasingly certain that he was losing money by servicing them. Many of his competitors had apparently come to this conclusion long ago.
He agreed with the CPA, however, that there were other considerations. The service of these small customers had often led to referral to larger accounts. Moreover, most of the stops were serviced on “off” days. The majority of the heavy beef and pork deliveries were made on Wednesday and Thursday, in order to stock the larger customers for their week-end trade. Deliveries were moderate on other days. It was on these days that most of the small order stops were made. Otto thought, however, that if he were to cut out all small orders, he might be able to eliminate one driver and a truck—although this might create a tight schedul
24

ing problem. The CPA had pointed out that this might restrict Otto’s ability to service new accounts and that eventually the fourth driver and truck might be necessary in any event—if the business continued to grow. As the conference continued, it became obvious that more facts were needed for a sound decision on whether to eliminate some or all of the specialty stops, or at least to establish a minimum order.
Three basic problems
As soon as he was able to delve into the situation, the CPA quickly found three problems facing him.
1. He would probably not be able to separate the costs and other data on the specialty stops from the regular business with any degree of precision. He did establish, however, that most of the required data would be available and accurate. By introducing a few logical assumptions, he would be able to fill in the areas where exact data were lacking.
2. Discussions with Otto and one of the experienced drivers revealed contradictory estimates of delivery times, distances between stops, etc. This could be settled. The CPA arranged to have a staff assistant accompany one of the city route drivers the following Monday and a suburban route driver on Tuesday. He would collect his own data through observation of a normal delivery day on which a representative number of small order stops would be made.
3. While all the information on costs and sales could be extracted, it would require too much time of Otto’s bookkeeper. The CPA solved this problem by arranging to have one of his office girls and Otto’s daughter, who attended college in the morning but had afternoons free, do the necessary detail in the CPA’s office. Most of the analysis work would be quite simple.
It was two weeks before the CPA received enough data from his assistants to work up the distribution costs. He had been reasonably confident that cost analysis for a three-month period would prove adequate and accurate. Only in the event certain estimates
25

could not reasonably be made did he feel further analysis would have to be made.
He first prepared a schedule of gross profit margins on specialty products from the analysis of vendors’ and customers’ invoices.
SCHEDULE IGross Profit Margins
Specialty Product Lines
Product Group
Gross Profit Rate for
Three Months Ended 3 /31 /59
% of All Specialty Sales, Based on Three Months
Ended 3 /31 /59
Specialty beefs and h am s.............. . 12.12% 19.54%Cold cuts—g en era l........................ 11.04% 20.32%Barrel products—(pigs feet, e tc .) . . 14.23% 14.71%Private brand packaged goods
(bacon, hot dogs, e t c . ) ............ 9.62% 45.43%100.00%
He pondered whether he should use an average gross profit rate for purposes of his study, but decided that while it was possible to weigh the average by the sales volume of each item for a three- month period, it would have to be adjusted for seasonal sales variations. It made more sense, in any case, to use the lowest rate of gross profit in order to keep the calculations of order profitability and minimum order or break-even sale on a conservative basis.
The CPA then prepared a schedule of the variable costs—the costs which varied in direct proportion to the sales value of the order. By applying these marginal costs to gross profit margins, he arrived at an adjusted gross profit rate. He computed a rate for other than specialty items for information purposes only. I t was not pertinent to the distribution cost study of the specialty stops.
The spoilage and shrinkage allowance was estimated in conversation with Otto. No records had ever been maintained on this loss.
The delivery cost data from which he prepared his next calculations and schedule again contained a few estimates he worked out
26

with Otto. Miles driven, per truck speedometers, for example, were adjusted for miles driven to and from the market each day. The tire expense had to be estimated because the three-month expense recorded in the books for tires did not prove to be representative. Data on stops made were disclosed by a count of delivery tickets and the rest of the information in the schedule had been obtained directly from analysis of records. The delivery cost data represented the elements of expense that varied in proportion to the length of time required to make delivery and collect the proceeds.
The CPA then reviewed his staff man’s observations. There was a reasonably significant difference in miles traveled between stops on the different routes (as he suspected), but the difference in sales value per stop on each of the routes bothered him. He questioned the accuracy of the figures. Further conversation with Otto, however, established the reasonableness of the fact that suburban stops were generally larger in value than city stops. Suppliers of packaged meat specialties serviced smaller customers in the city, but most did not venture into the subtubs to drop off typical orders of say twenty pounds of bacon. Otto’s small customers in the subtubs, therefore, generally purchased more specialty items from him than their city counterparts. With the assurance that the data
SCHEDULE HCalculation of Adjusted Gross Profit
Available to Cover Variable Delivery Costs
OtherProducts
SpecialtyProducts
Gross profit r a t e ..............................................Less selling expenses which vary in proportion
to the dollar value of the order:
9.62% 6.37%
Driver’s commission................................ 1.00% .50%Cash d iscount.......................................... .50% —Spoilage and shrinkage allow ance........ 1.00% 1.50%
2.50% 2.00%Adjusted gross p ro f it...................................... 7.12% 4.37%
27

were representative, the CPA scheduled the facts disclosed from observation of the drivers.
SCHEDULE III Delivery Cost Data
Based on Three Months Ended March 3 1 , 1959
Miles d riven .............................................................. 21,750Stops made—T o ta l.................................................... 6,400
—Specialty stops o n ly .......................... 2,650
Value of deliveries—T o ta l........................................ $334,000.00—Specialty stops on ly ................ 47,200.00
Truck costs:Variable costs:
Gas and o i l .................................................... $ 903.00T ire s ............................................................ 165.00R epairs........................................................ 273.00
Total variable costs...................... $ 1,341.00Fixed costs (licenses, insurance, depreciation) 745.00
Total truck co sts .......................... $ 2,086.00
Driver costs:Salaries.................................................................. $ 3,735.00Miscellaneous .................................................... 198.00
Total driver c o s ts ........................ $ 3,933.00Total delivery costs...................... $ 6,019.00
Analysis
Miles driven between stops—(all s to p s ) ................ 3.4 milesValue of deliveries per stop—(all s to p s ) ................ $52.19Value of deliveries per mile—(all stops) ................ $15.35Value of deliveries per stop—(specialty stops only) $17.81Variable truck costs per m ile .................................... .062
28

SCHEDULE IVObservation of Delivery Procedure
City Route Suburban Route
Estimated allocation of driver’s time:Driving between s to p s ..................Delivering and collecting............Assisting display and delay tim e.,
20%55%25%
100%
35%35%30%
100%
Miles d riven ....................................... 58 82Stops—(all s to p s ) ............................. 24 16Stops—(specialty o n ly ) .................. 9 7Dollar value of deliveries—total. . . . . $1,087 $1,042Dollar value of deliveries—
specialty o n ly .............................. . .$ 124 $ 136
AnalysisMiles driven between stops—
(all stops) ...................................... 2.4 5.1Miles driven between stops—
(specialty only)—per observation. 2.7 4.8Sales per delivery—(all stops).......... $45.29 $65.13Sales per delivery—(specialty only) $13.77 $19.43
The junior accountant had timed each delivery and found that a typical specialty stop required 12½ minutes. This initially seemed too long to the CPA, but the junior stuck to his guns. He explained that the delays in waiting for payment while customers were waited on, showcase rearrangement, which was part of the service, plus time just passing the time of day with the proprietor took this long. As a matter of fact, the junior suspected that the drivers, conscious of his presence, had worked a little faster than they might ordinarily, even though they had been told to assume he wasn’t there. The CPA was convinced. He used an average time of 15 minutes per stop to stay on the conservative side.
29

The CPA included a schedule of computed base wage rates only so subsequent schedules would be appropriately supported. Commissions, of course, were paid in addition after the drivers themselves computed what was due them at the end of each week. Otto rarely checked their computations and didn’t want the CPA to do so either. I t was his expression of good faith to his employees. Not the best of internal control, but the CPA is as sure as Otto that this practice has made a good deal more money than it has lost. Otto feels, too, that it puts the drivers in closer contact with the dollar activity for each customer.
SCHEDULE V Schedule of Wage Rates
Based on Standard 40-Hour WeekCity Routes—#1 ........................................................................ $1.85
—# 2 ........................................................................ 1.82Suburban Routes—# 1 ................................................................ 1.75
—# 2 .............................................................. 1.72Average—all ro u te s .................................................................. 1.78Average—city ro u te s .................................................................. 1.83Average—suburban ro u te s ........................................................ 1.73
The CPA’s next calculation was a summation of all of the distribution cost data contained in his first five schedules. This was the heart of his report to Otto. Once again he was obliged to proceed on the basis of an assumption, as disclosed in Note A; but he could not see that this would materially affect the validity of his conclusions. He wanted, throughout the study, to keep it conservative.
Even before the CPA computed the minimum specialty order required to break even, he could see that specialty stops were contributing to profits. He prepared his schedule after making a few simple calculations.
He wondered if he should chart this. He was sure he could show the same data on a simple break-even chart, but remembering the time he confused Otto with what he had thought was a magnificent graphic portrayal of comparative gross profits by months
30

SCHEDULE VI Variable Delivery Costs
Per Specialty StopAll
RoutesCity
RoutesSuburban
RoutesMarginal delivery costs which
vary in proportion to distance between stops:
Estimated driving timebetween s tops........................ 10 min. 10 min. 10 min.
Wages per hour—Schedule V . . . Truck costs per mile—
$1.78 $1.83 $1.73
Schedule I I I ............................Miles between specialty stops—
6.2¢ 6.2¢ 6.2¢
Schedules III and IV—Note A 3.7 2.7 4.8Total variable driving time
cost, per s to p ..........................Total variable truck cost
29.7¢ 30.5¢ 28.8¢
per s to p .................................. 22.9¢ 16.7¢ 29.8¢T o ta l............................................Less 50% allowance for “on
52.6¢ 47.2¢ 58.6¢
route” stops—Note A .............. 26.3¢ 23.6¢ 29.3¢26.3¢ 23.6¢ 29.3¢
Marginal delivery costs which varyin proportion to length of time for driver to deliver order andcollect payment:
Wages, per hour—Schedule V .. $1.78 $1.83 $1.73Estimated delivery t im e .......... 15 min. 15 min. 15 min.Total cost per s to p ......................
Total variable delivery cost44.50 45.70 - 43.20
per s to p .......................................... 70.8¢ 69.3¢ 72.5¢
Note A appears on page 32.
31
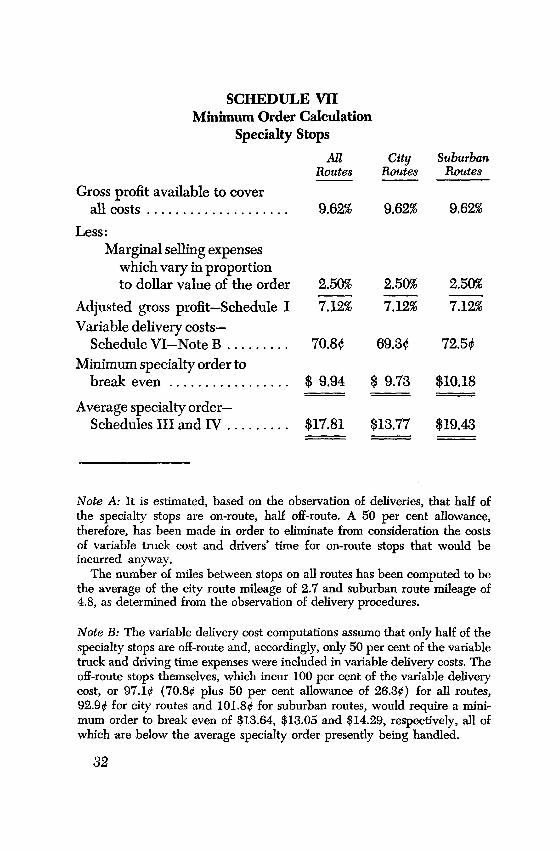
SCHEDULE VII Minimum Order Calculation
Specialty StopsAll City Suburban
Routes Routes Routes
Gross profit available to cover all co sts ......................................
Less:Marginal selling expenses
which vary in proportion to dollar value of the order
Adjusted gross profit—Schedule I Variable delivery costs—
Schedule VI—Note B ................Minimum specialty order to
break e v e n ................................
Average specialty order— Schedules III and I V ................
9.62% 9.62% 9.62%
2.50% 2.50% 2.50%7.12% 7.12% 7.12%
70.8¢ 69.3¢ 72.5¢
$ 9.94 $ 9.73 $10.18
$17.81 $13.77 $19.43
Note A: It is estimated, based on the observation of deliveries, that half of the specialty stops are on-route, half off-route. A 50 per cent allowance, therefore, has been made in order to eliminate from consideration the costs of variable truck cost and drivers’ time for on-route stops that would be incurred anyway.
The number of miles between stops on all routes has been computed to be the average of the city route mileage of 2.7 and suburban route mileage of 4.8, as determined from the observation of delivery procedures.
Note B: The variable delivery cost computations assume that only half of the specialty stops are off-route and, accordingly, only 50 per cent of the variable truck and driving time expenses were included in variable delivery costs. The off-route stops themselves, which incur 100 per cent of the variable delivery cost, or 97.1¢ (70.80 plus 50 per cent allowance of 26.3¢) for all routes, 92.9¢ for city routes and 101.8¢ for suburban routes, would require a minimum order to break even of $13.64, $13.05 and $14.29, respectively, all of which are below the average specialty order presently being handled.
32

for a four-year period, he decided the schedule was enough.The report settled the entire issue. The CPA recommended that
a hard-and-fast minimum order rule should not be established, but that new or existing specialty accounts which often purchased less than the computed minimum break-even order should be continually re-examined. A distribution cost analysis, he cautioned, should be made periodically in the future, as the picture would always be subject to change as costs and distribution patterns changed. Although the CPA recommended that no minimum order be established and that service of additional small accounts was desirable, he was careful to point out that the principal sales concentration should continue to be directed toward large orders and the regular line of business. Sales at the minimum order level, he explained, are only desirable in that they produce marginal profits and contribute to fixed expenses.
The lack of organized competition had probably been due to the fact that Otto’s competitors had long ago come to the conclusion that the cost to distribute to these small customers prohibited even a reasonable contribution to overhead, let alone the making of a small profit. The cost analysis had disclosed that Otto was actually in an enviable marketing position. The analysis had perhaps pointed up a few things his competitors did not know.
33

A N IL L U S T R A T IO N O F H O W A C P A A D V IS E D A S M A L L B U S IN E S S M A N A G E M E N T O N IT S C O S T S , P R IC IN G , A N D S A L E S P O L IC IE S T H R O U G H A N A L Y S IS O F P R IC E S A N D A D IR E C T P R O D U C T
C O S T S T U D Y
For the benefit of the reader with limited time, this lengthy illustration has been divided into three sections. The first section provides general background on the company; it can be reviewed quickly. Section II represents the first part of the CPA’s report and covers his recommendations for changing or strengthening pricing and marketing policies. The final section represents the second half of the CPA’s report and deals with his direct costing study and his application of such data under the contribution concept to an analysis of product profitability. Either of these sections can be read independently of the other.
SECTION I
History o f the company
The Wahoo Building Supply Company had been adjudicated bankrupt in July 1958, had continued its operations as a debtor in possession and had come out of the bankruptcy proceedings in November 1958.
At the time of this bankruptcy, Wahoo had been in business for approximately nine years. It was formed in the late 1940’s by three former salesmen of a national building supply firm. The three men
34

had serviced the local market for several years and were familiar with the jobbers, distributors and contractors operating in the area. Pooling their resources, they had bought the machinery, equipment, brand name and other related assets of a division of a large manufacturer of building supplies which wanted to divest itself of the manufacture and sale of overhead garage doors. The new owners were able to retain many of the employees of the division so that the manufacturing aspects of the business with which they were unfamiliar had been left in capable hands.
During the heavy home construction years of the late 1940’s in Wahoo’s market area, additional sales volume was quickly built and the sales-oriented management was able to show profits. Profits, however, were never substantial. The operation turned into a breakeven during the early 1950’s and then slipped to losses in 1955, 1956 and 1957. Even during the loss years, the sales volume continued to increase. Although the owners knew that the company had been operating at small losses, they were still astounded to find themselves suddenly confronted with bankruptcy.
They were able to continue their operation through the bankruptcy proceedings and settlement primarily because of a large loan from a private investor. The sympathetic investor was a successful contractor to whom some favor had been granted in the past when shortages in building supplies had occurred. He was also fond of the three members of management and sufficiently impressed by their sincerity that he agreed to advance them $75,000 to effect a partial settlement. With this loan and arrangements with a factor for the financing of their receivables, they were able to maintain enough working capital to overcome their weak credit position.
Retention o f the CPA and companyoperations after the bankruptcy
Wahoo had never retained a CPA. The entire accounting staff had consisted of a bookkeeper and a clerical assistant, who from time to time (usually twice a year) prepared basic financial state
35

ments. The managers’ first meeting with the CPA had occurred during the bankruptcy proceedings. They had been impressed with his manner and his speed in preparing financial statements. He was engaged when, as a condition of his loan, the friendly investor demanded monthly financial reports which had been reviewed by a CPA.
The management explained to the CPA that present budget restrictions would require that he spend a minimum of time on the engagement. He was authorized only to assist a young and recently hired accountant in preparing income statements and balance sheets and in reviewing the books for “significant errors.” The owners hoped that, as a result of this inexpensive arrangement, the friendly investor would remain friendly.
Dividing his hourly standard rates into the fixed fee allotted would have permitted the CPA to allot about four hours to the job each month. During the early months of 1959, he averaged twice that number. The extra time was spent in coaching the young accountant and in exploring several matters which—although outside the scope of his engagement—he felt obliged to check over. It had been impossible for him to probe much beyond the surface of the records even though the management apparently regarded him as a financial wizard capable of deciphering a set of statements, books and monthly entries at a single glance. They had insisted, in view of the investor’s demands, that he perform the work personally. He had received constant calls from the young accountant and had held two rather lengthy conferences with the investor. At this point he wondered whether the arrangements were beneficial to either his client or himself.
The investor became apprehensive after reviewing the second set of statements with the CPA—and his concern increased on receiving the statements for the third month. All of the statements had shown small operating losses. The CPA had been authorized by management to discuss the statements with the investor; but he had been embarrassed when he found that he could not answer some of the investor’s questions. The investor understood, however, that the CPA could not be expected to have an intimate knowledge of the operations in view of the terms of his engage
36

ment. While both the CPA and the investor were unable to put their finger on all the specific reasons why the business was not operating profitably, they were agreed the cause lay somewhere in the price-cost relationships—which, of course, the financial statements could not disclose.
The managers had looked at the monthly statements and were honestly surprised that the company was continuing to operate at a loss, particularly during a good selling season. They were confident that the problem could be solved by increased sales. Before they really reviewed the financial statements completely, they would get their hats and go out to raise sales volume which, as terrific salesmen, they always seemed to be able to do.
Company organization and products
Each of the three owners served as a "regional” sales manager, and each had three salesmen working for him in each of nine "districts.” The principal products sold were a line of overhead garage doors, all of which were manufactured under the direction of the factory manager. They also sold accessories such as door- track and items related to the installation of the doors, which for the most part were also manufactured by Wahoo. In addition, the company sold and manufactured a small line of aluminum and wood awnings which had been gaining favor. Some revenue was received from garage door installation and service work, but it was the policy of the company to avoid this type of work, if possible. Most of this work was performed for home owners who found installation on a do-it-yourself basis (which was the way the doors were advertised and sold to this type of customer) a bit risky after reading the installation instructions.
Wahoo still carried and occasionally sold a bit of aluminum ivy. This product was the brainstorm of one of the owners who was sure the aluminum scrap could be more profitably salvaged by punching ivy leaves from it, “greening” them through an electrolytic process, and attaching them to wires or mesh frames. The idea, apparently, was to sell the ivy to young buyers of new homes
37

who had promised their brides ivy-covered cottages. Unfortunately, young brides had proved to be considerably more practical than the idea.
The company’s markets
Sales dollars were derived roughly as follows:Garage doors and accessories.................... 75%Awnings and “ivy” ...................................... 15%Installation and service.............................. 10%
The distribution channels were mainly through outlets which served the builders of single or multiple housing construction. The rapid growth of new family formations in their market area had expanded demand and had also created a growth market for Wahoo’s products. At the same time, remodeling of older garages —particularly in the enlarging to accommodate bigger and longer autos—provided a sizable market for Wahoo. The company had six major sales channels:
1. Wholesale lumber and hardware dealers who sold to contractors. These dealers represent the largest segment of Wahoo’s market.
2. Tract building contractors who contracted for work in single and multiple dwelling construction.
3. Tract builders of housing developments who purchased directly from a garage door manufacturer.
4. Garage distributors who sold a “package” garage to a builder.
5. Small local contractors who repaired, replaced, or built garages.
6. The home owners, sold primarily through local newspaper advertising on a do-it-yourself basis. Installation assistance was offered, but held to be unnecessary in the advertising. Very few direct sales were made to this market.
38

The issue o f sales policy
The competition in the garage door industry was relatively fierce despite a steady and growing demand.
Product design had proved to be one important feature in meeting competition. Design had to appeal to both a contractor and the ultimate user from both a functional and appearance viewpoint.
Price, however, had become the most predominant feature of the highly competitive industry. To compete in the market, Wahoo carried three basic models (budget, de luxe and custom), as did most of their competitors. The higher priced models, in less demand, were relatively stable in price. The budget model was more vulnerable to price cutting throughout the industry—largely as a result of severe price pressure from tract builders of development houses. Almost all buyers of garage doors were initially drawn to the lowest priced model. They quite often purchased the higher priced doors, however, after a quality comparison. Wahoo sold a well designed product and backed up their quality product with a guarantee. The company pushed the budget model saleswise, as it was the simplest to sell and understandably would always be accountable for the largest volume of sales.
Pricing attitudes of Wahoo’s competitors varied. Most of them were also small businesses, presumably in business to make a profit; but they tried to accomplish this end in various ways. One, who obviously believed in high prices on lower volume, apparently did quite well. A few relied heavily upon engineering talent and patent protection and sold only luxury priced doors. The majority believed, as Wahoo did, in high volume at lower prices and accordingly made every effort to meet the lowest competitive price. Several smaller companies in the industry had gone out of business during the last few years.
Wahoo had a simple salesman’s incentive plan wherein commissions were based solely on sales volume. The company, at one time, had experimented with commissions based on “territorial profit,” which was sales, less certain direct sales expenses. However, this became too cumbersome, and did not tie in with the incentive system for the owners which had always been based solely on sales
39

volume. The owners had agreed that this was the best way to reward themselves, over base salaries, for their respective efforts.
Use o f available cost datain profit p lanning and pricing
The owners had worked their ‘profit planning” on an “average” month budget of expenses. Based on an average percentage of gross margin earned, they believed that all sales over a precomputed break-even volume should produce profits. They had paid little attention to price-cost relationships in their sales practices. This had often been criticized by the factory manager. By using production cost reports, prepared only at the insistence of the factory manager, the price-cost relationship of the various garage door models had been informally reviewed, but had not seemed to prove very much. The cost reports included direct labor, material cost and standard factory overhead—presently 160 per cent of direct labor. This information was prepared from payroll time records and material requisitions, but was not tied in with the general accounting records. On certain large orders or bids, this information had occasionally been reviewed. The offering price per unit under consideration, less the “total” manufacturing costs, and an allowance for “other overhead,” was inspected, and the effect of volume on the resultant “mathematical loss” would be considered. This, according to management, never appeared to prove anything because of the effect of the increased sales on the “over-all profit planning under their budget system.”
How the CPA sold the need fo rprice and cost study
It took only one more loss, in April 1959, to point up the fact that there were basic deficiencies in the Wahoo operation. The investor, with little opposition from an equally concerned manage
40

ment, arranged for a meeting of the owners, the CPA and himself to explore the situation.
The CPA was gratified to find that the owners welcomed outside “interference.” There was no doubt in their minds that they were making mistakes. While attempting to probe further into price-cost relationships in the conference, the CPA sensed that each of the owners felt the other partners were the ones making the mistakes. Each of them seemed to feel that selling policies in other regions could be improved; but each was equally convinced that the policy in his own region was correct and necessary in view of the particular competitive forces.
The CPA was asked how the entire problem could best be reviewed. He suggested that if a simple pricing study were made, through some basic sales analysis, and if adequate cost data were obtained and analyzed using the “direct costing” concept, he believed that a wealth of knowledge would become available to aid in evaluating the company’s price and sales policies. He briefly explained the direct costing concept, pointing out that the recordkeeping practices of the past would create several analysis problems; but he indicated that enough information was present for study. Changes in the accounting system could be introduced to improve the use of this technique in the future, if it were later deemed desirable.
It made sense to everyone present that if costs could be allocated to individual operations and products, and then compared to sales prices of the same products, it would be quite simple to locate the trouble areas in prices or costs. The CPA made it quite clear that the necessary analyses could not be done overnight. However, he felt that if a man from his staff were assigned to spearhead the analysis work and if the accounting staff of Wahoo could make some time available, the work could be completed in about eight weeks. The estimate of what the total fee might run did not raise a single eyebrow. The apprehensive investor insisted on a formal report from the CPA which would contain all of his independent findings and recommendations. It had been an easy sale for the CPA on a job he was confident he could perform well in view of two past experiences in studies of this nature.
41

The CPA program and p lan
The CPA started the engagement within a week. The first analysis was to be made of sales in order to determine in what regions and on what models prices had softened from “basic” price lists. From this analysis he also expected to be able to report on sales trend, and perhaps highlight deficiencies or recommend changes in sales policy. Next, the cost analysis work would be done. He would then develop the product cost-price relationships and report on them. The analysis efforts were to be directed primarily to sales and costs of the garage door line.
The work required to analyze sales was relatively simple. It involved, for the most part, the preparation and coding of sales invoices which would be turned over to an independent agency for tabulation. Some additional information, primarily on freight and cash discounts allowed, would have to be obtained from the records. Assistants, in close co-operation with the tabulating service agency, could handle this part of the job. The cost information would be somewhat more difficult to obtain, and allocation of costs to products could prove tricky. He would handle this himself.
The results o f the CPA’s sales analysis
The basic price schedule for the three models of doors, F.O.B. plant, had been developed by the owners from two viewpoints. First, they wanted to price the doors competitively; second, they wanted to provide what they felt was the best sales leverage to effectively interchange models in selling to either volume or small unit buyers. The basic price schedule follows:
Units Budget De Luxel - 10 .................. $65.00 $85.001 0 -5 0 .................. $55.00 $72.50Over 5 0 .................. $45.00 $65.00
Custom $100.00 $ 95.00 $ 85.00
Within a few weeks, the CPA was able to prepare the following schedules of net sales prices, derived from the sales analysis.
42

Average Selling Prices—Per Unit Budget Model
AllLocal Central Western Territories
March 1958 ................ $49.30 $50.90 $47.35April 1958 .................. 48.70 51.20 47.30May 1958 .................... 49.45 51.10 44.75Total units for 3 months 49.10 51.05 46.30% Below average “basic
price” ...................... 12.4% 10.1% 14.6% 11.7%January 1959 .............. $47.30 $51.05 $46.25February 1959 ............ 48.85 51.15 47.65March 1959 ................ 47.60 50.00 46.85April 1959 .................. 46.95 49.20 47.25May 1959 .................... 47.10 50.25 46.90Total units for 5 months 47.30 50.10 47.80% Below average "basic
price” ...................... 15.1% 11.7% 14.7% 13.8%$ Decrease in average
unit price .............. $ 1.80 $ .95 $ .10 $1.25
Before presenting the sales price information on the other models, a brief explanation of the approach the CPA took in arriving at average selling prices must be given.
The sales data had not only been analyzed as to billed sales prices, but had been classified by quantity ordered and freight charged. By combining these data with additional information as to freight allowances and cash discounts allowed after due dates, the CPA was able to arrive at the average net selling price. It was his fear that freight allowances and cash discounts were being used as sales tools; which, of course, would contribute to the softening of prices. He was careful to retain analyses of the freight and discount allowances, made during both periods, as well as data relative to shipments on which freight had not been charged in the first place. His primary concern was in arriving at a comparative "per cent below average basic price” during each of the periods. To accomplish this, the sales analysis information as to order quantity had permitted computation of what the over-all
43

weighted basic price should have been, for each region, compared to what it actually had been.
Although the CPA did not formally schedule the information, it was also simple to analyze how each quantity group had fared pricewise in the respective periods. He would like to have obtained more than the basic necessary information on sales by type of customer, but he felt that the information on the number of orders in each region from the various trade classes could adequately supplement his presentation and assist in evaluating the contentions of any of the regional managers that the nature of his sales territory was “different.”
The average selling prices of the other models are presented in the following schedules.
Average Selling Prices—Per Unit De Luxe Model
Local
March 1958 ................ $71.85April 1958 .................. 72.25May 1958 .................... 70.90Total units for 3 months 71.40 % Below average “basic
price” ...................... 7.3%January 1959 .............. $68.20February 1959 ............ 66.80March 1959 ................ 66.90April 1959 .................. 63.45May 1959 .................... 64.75Total units for 5 months 65.30 % Below average “basic
price” ...................... 14.1%$ Decrease in average
unit price .............. $ 6.10
Central$70.9570.5072.0571.10
Western
$71.3569.2069.8570.15
AllTerritories
7.2% 7.9% 7.5%$66.45 $68.8567.00 68.2568.20 67.9066.95 67.5065.35 68.1066.80 68.05
12.3% 10.2% 12.4%
$ 4.30 $ 2.10 $4.30
While the CPA readily admits that the sales and price analysis did not contain all of the detailed information that could have been extracted by the tabulating equipment, it was adequate to
44

uncover a wealth of information. The data would not only be useful in further price-cost analysis; it provided the basis for an interim report on sales and pricing practices that the CPA felt required immediate attention.
Average Selling Prices—Per Unit Custom Model
AllLocal Central Western Territories
March 1958 ................ $94.50 $95.05 $95.50April 1958 .................. 93.80 95.20 96.05May 1958 .................... 94.20 94.85 95.95Total units for 3 months 94.10 94.95 95.70% Below average “basic
price” ...................... 3.0% 2.2% 2.1% 2.6%January 1959 .............. $93.60 $93.95 $95.20February 1959 ............ 93.65 94.10 95.20March 1959 ................ 93.70 94.55 95.10April 1959 .................. 92.90 93.95 95.15May 1959 .................... 92.95 93.45 95.75Total units for 5 months 93.20 94.00 95.25% Below average “basic
price” ...................... 4.1% 3.0% 2.2% 3.4%$ Decrease in average
unit price .............. $ .90 $ .95 $ .45 $ .75
SECTION II
THE REPORT ON SALES AND PRICING PRACTICES
The CPA’s report on sales and pricing practices ran to eighteen pages. He could have reduced its length, but he felt that the extra words had helped to make the report more comprehensible and meaningful to the sales-oriented owners. It is impractical to reproduce his eighteen-page report; but it is interesting to observe that the CPA’s conclusions and recommendations are based on his own
45

training and experience in marketing to the facts disclosed by his analysis of sales. For that reason, the more significant comments of his report have been condensed and are presented here.
A SUMMARY OF THE REPORT
Analysis o f price softening o f products
His first stress was in reporting that prices had softened considerably in a period of one year, on all models and in all territories. Based on the small losses incurred during the first five months of 1959, he informed management that a continuing softening of prices (which was undoubtedly the trend) would result in larger losses and, inevitably, in the company’s failure.
He disclosed that the budget model—the model subject to the fiercest competition—was not the only trouble area. The mild softening of the custom model had been primarily due to nonenforcement of the freight and cash discount policies and for the most part the realized basic sales prices between years had not varied at all. The CPA called particular attention to the softening of price on the de luxe model. While the percentage decrease from basic price had dropped to 12.4 per cent from 7.5 per cent a year earlier, this was an over-all percentage decrease of 4.9 per cent whereas the average selling prices per unit on the budget model had softened only 2.1 per cent on an over-all basis during the same year. He contended that the softening on this model might well be due to the attempt to sell the de luxe models at substantially lower than list prices, in order to combat the competition on the budget model. In other words, he asked management to question their sales practices to determine if it had not become a sales tool to offer the higher quality product at a “bargain” price in order to effect a more profitable sale than could be obtained by underselling competition on the budget model. Through a short supplementary presentation of quantities sold by models, he was able to substantiate his viewpoint. There had been a steady upward increase in
46

unit sales of the de luxe model and a slight but steady decreasing volume on unit sales of the budget model. He also pointed out that management should be particularly concerned about the softening on the de luxe model in that the dollar reduction in unit contributions to sales was $4.30 below that of the preceding year. In contrast, a softening on the budget model had amounted to a dollar reduction of only $1.25 per unit—and a portion of this had been due to relaxed freight and cash discount policies.
Analysis o f price softening by sales regions
The CPA pointed out that it must be kept in mind that the freight problem was most significant as it affected the western region; secondarily as it affected the central region; and of lesser significance in the local region. In other words, there appeared to be more opportunity for price softening through freight allowance in those areas that would ordinarily result in more freight charges.
In spite of this, the price softening was the most dangerous in the local area. On all three models, the local area had experienced the worst percentage of price decline. The central region was not too far behind, but, in terms of percentages, had experienced considerable price softening only in the de luxe model. In the western region where the effect of freight allowances would seemingly contribute significantly to price softening, experience over the year had been considerably better on all models. The 1959 prices for the budget and custom models were only one-tenth of 1 per cent below average prices of the 1958 period. While the de luxe model price had distinctly softened, it had dropped only 2.3 per cent. The CPA scheduled more information relative to the dollar amounts by which the unearned cash discounts and freight allowances had contributed to the price softening by regions.
In order to implement management evaluation, he also provided certain unit sales information by territory. An increase in total unit sales was evident in the local region. At least, the CPA concluded, the softening of prices in this area had contributed to additional sales. It was expected that the central region would have accounted
47

for the second largest percentage increase in unit sales but actually this had not been true. The western region had made more progress in this regard. He believed management would logically conclude that the western regional sales group had done the best job during the past year. The analysis had proved that sales by lines of distribution (type of customer) were relatively similar for all of the regions, and the CPA was therefore unable to point to any market characteristics in the western region that, at least on the surface, would have made their job simpler than in either of the other two territories.
Recommendations fo r strengthening prices
The second part of the CPA’s report was devoted to his recommendations for strengthening the price policy.
In leading off this section of his report, he suggested that the “strengthening of prices” must be defined as asking as much as can be asked in the face of all the pressures for price reduction which affect the sale of garage doors. He also made clear that his recommendations were made in light of the fact that the price-setting policies of Wahoo would always be a delicate process requiring a feel for many intangibles in a dynamic market. He pointed out that no formula could be provided to measure precisely all of the influence which would affect the willingness of a customer to accept a certain price at a certain time. Essentially, Wahoo would have to meet competition.
The CPA recommended that the primary objective of the Wahoo management should be to develop a revised sales policy which would correct deficiencies disclosed from his sales analysis, in an administrative framework that would preserve control over the sales effort without injecting an undue amount of rigidity into the organization. On the other hand, there was an equally clear need for limiting the decisions to be made on the salesman’s level.
With these practical considerations in mind, the CPA advanced eleven recommendations that he felt would contribute to the
48

strengthening of prices. These have been extracted, in part, from the report and follow:
1. Freight terms. In spite of the fact that several competitors are absorbing freight costs, freight terms should continue to be F.O.B. plant. The analysis work has disclosed that the terms are admittedly price-bargaining tools, but if these terms are changed to the terms of the competitors, further revenue loss will result. Strong attempts to collect freight on larger orders should be instituted by the sales force, and small orders should only be accepted with the previous understanding that the customer will pay the transportation cost. The cost per unit of delivering the garage doors into the western region can amount to as much as 9 per cent of the basic selling price. Forgiveness of freight, therefore, is a serious matter. In the development of new accounts or reactivation of old accounts, freight terms should be negotiated in Wahoo’s favor. If a consistent effort is made with all accounts, freight recovery will undoubtedly increase.
2. Cash discounts. The use of cash discounts as pricing aids has further contributed to the deterioration of price policy. Moreover, the accounting staff is wasting valuable time when it is unable to determine which customers have been granted “special” discount terms beyond the normal payment period. Perhaps a more serious consideration to Wahoo in the present use of cash discounts as price reducers is that analysis proves distinctly that cash flow is being significantly affected. This is particularly significant in view of the heavy obligations assumed under the bankruptcy settlement of Wahoo during the next two years—and the fact that delayed payment results in larger interest cost on receivables being financed. In other words, the “special” cash discount arrangements have negatively affected not only price softening but the critical financing problems of the company. Experience dictates that a customer who has been granted special cash discounts will continue to expect them, and the sales force should immediately discard the practice of using cash discounts as a factor in price setting and embark on a period of customer re-education.
3. Quantity prices. The sales analysis has disclosed that quantity
49

prices are not being maintained even near those listed in the price schedule. The sales department must attempt to overcome buyer resistance by pointing out that the jobbers themselves only use quantity discounts after scheduled volume levels have been reached. Another sales argument in this regard is to emphasize continually the fact that the handling of small orders is more expensive.
4. Use of published price lists. Wahoo does not, as a matter of industry custom, issue formal price lists or schedules to its customers. Published price sheets will generally add a degree of stability to price structure by establishing an upper level for prices. They will contribute, at least, to what might be called price respectability and will help to establish in the mind of a customer how much of a discount he is actually requesting. The published price lists should, of course, emphasize the freight, and cash discount terms of Wahoo.
5. Price changes. The sales analysis, plus subsequent discussion with the sales manager and salesmen in the local territory, leads to the following recommendation:
Although it is not nearly the largest company serving the local market, Wahoo is attempting to initiate basic price changes. An organization the size of Wahoo should not attempt to set the price pattern for the industry. While this has undoubtedly contributed to a higher sales volume in the local region, sales personnel have confirmed that it has produced the following unhappy results:
(a ) The price cuts have been difficult to reverse. Wahoo—and its competitors who have met the lowered prices—may now have to wait until a marked cost or demand cycle offers an excuse to return to previous price levels.
(b) The advantages of such price cuts have generally been short-lived. The sales benefit has been quickly lost because competitors have cut their prices either directly or indirectly to meet those of Wahoo.
(c) The over-all market demand for garage doors has apparently not been affected by price cuts, either those instituted by Wahoo or by any of its competitors. In other words, the demand for garage doors has proved to be relatively inelastic in any given set of general market conditions. The price reductions, in view
50

of the fact that competitors will meet them, do not appear to stimulate an increased volume over a sustained period. Nor is it likely that the price reductions have contributed to an over-all industry demand for this product.
(d) The constantly changing prices negate the value of published price lists which, as mentioned earlier, should be published in an attempt to strengthen prices.
Thus, while an aggressive sales policy is undoubtedly an attribute of any management, it is recommended that Wahoo follow rather than attempt to lead in the setting of prices. This policy should be pursued not only in respect to price reduction but also, of course, in respect to the general raising of prices.
6. Lines of distribution and customer concentration. The management of Wahoo should give consideration to the present concentration of sales effort. There is evidence in the sales analysis that prices quoted to tract builders, even on small orders, must of necessity be considerably lower than those to the other lines of distribution. I t appears that additional effort might better be directed to wholesale lumber and hardware dealers, garage distributors and service agents. Because there is less appearance of price softening on these sales, they would seem to be a logical area of concentration.
Individual door sales to home owners is one area where price softening has not occurred, either through straight discount or allowance of freight or cash discount. This market has not been actively sought by the management of Wahoo; yet there appears to be some justification for suggesting that this market should bear a heavier degree of concentration in the future. While there is an obvious problem in actively competing with its own customers, certain methods could be explored by which Wahoo might effectively increase direct sales without significantly affecting the sales or arousing the resentment of hardware or lumber dealers and service agents.
7. Sales promotion and advertising. A primary purpose of these functions should be to contribute to the strengthening of prices. The policies of Wahoo do not appear to accomplish or even attempt to accomplish this end. Sales promotion, which generally takes the
51

form of co-operative advertising with customers, has been used often as a price kick-back rather than as a bona fide attempt to place the name of Wahoo in front of the public. This, of course, also contributes to price softening. This factor has not been considered in the analysis of average selling prices because it is frankly impossible to determine from the records if advertising benefits were obtained from the allowances or not. This has, in turn, contributed to confusion in the accounting department as to reimbursement for "co-operative advertising” when bills have been submitted without adequate proof. The following comments on the advertising policy of Wahoo are in no way the result of sales analysis but are independently offered as they appear somewhat related.
(a) Most of the advertising has been addressed to home owners. This appears to be contradictory to the fact that direct selling to this market has not been done.
(b) Local advertising to the home owner encourages self- installation. Sales managers and salesmen have indicated that there has never been a problem in obtaining what are considered adequate service charges for installation. Management ought to consider whether this form of advertising may contribute to a loss of sales that could otherwise produce profits if service were offered.
Advertising and sales promotion policies do not come under the jurisdiction of one individual, nor are they budgeted closely. It is suggested that if the function were delegated to one responsible person, co-ordination of the over-all program and increased benefits might result.
8. Price-range policies—and the interchangeability of models. The offering of three basic models in various price ranges is presumably designed to accomplish two basic purposes: (1) to enable sale to all sections of the market, and (2) to afford a certain prestige to the lower-priced models through sale of the high-priced custom model.
Model interchangeability should be used by Wahoo as a "price strengthener.” The sales analysis has indicated that the inter
52

changeability of models, in fact, is contributing to price softening rather than strengthening.
Analysis of average selling prices indicates that dollarwise the most significant softening during the last year has occurred on the de luxe model, particularly in the local and central territories. Customers are being induced to “trade-up” to the de luxe model from the budget model at a price dangerously close to that of the budget model. This seemingly has occurred as a result of the strong competition in the sale of cheaper models throughout the industry which has led salesmen to try to convince customers to trade-up to the de luxe model at a dangerously low price differential. If the marketing advantages of carrying three models are to be recognized, Wahoo’s sales policy must somehow revert to a position where model interchangeability contributes to a price strengthening of lower-priced models rather than to price erosion of the higher-priced models.
9. Sales forecasting. While each sales manager is informally establishing dollar sales quotas for his territory, there is no formal company-wide procedure that accurately forecasts over-all sales volume. The constantly fluctuating market conditions underscore the need for a formal sales forecast. If properly prepared in terms of both units and dollars, it would enable the management to develop the sales and areas of sales concentration, and it would implement decisions with respect to engineering, finance, production, research and development. It would also serve as a forerunner to an over-all company budget system which ought to be developed as soon as possible. The recommended procedures for installation of sales forecasting and over-all budgeting are, of course, beyond the scope of this report.
10. Sales commission policy. The incentive plan presently in effect for salesmen and regional managers does not contribute to price strengthening. On the contrary, it contributes to the destruction of a firm price structure.
It is recommended that the “straight sales over-ride” commission policy be abandoned and that a substitute plan be conceived which will contribute to profit objectives rather than to sales volume alone. Any revised sales incentive plan should be pat-
53

temed so that sales commissions will not be paid to salesmen or regional managers until such time as the company’s profit objectives are obtained. Alternative plans are beyond the scope of this report; but assistance in their formation would be gladly furnished, if and when it is decided to revise the present program.
The present form of “over-ride” commissions for regional managers is also contributing to the eroding of price structure. In addition, it can be challenged on the ground that it is incompatible with sound sales administration practices when the compensation of a regional manager is dependent only on his own direct sales effort and results. In other words, it might logically be expected that the administrative responsibilities of both sales and other company policies are unconsciously subordinated by the owner- regional managers in favor of the motivation provided them — dollar commissions on dollar sales.
II . Establishment of price floors. It is imperative that the management of Wahoo take immediate steps to set tentative price floors for each of the models. As indicated in the analysis of “average selling prices,” the trend toward further price erosion must be halted at once. While price-cost relationships must be analyzed before the establishment of permanent price floors, it is recommended that tentative floors be established. The following schedule would apply to hardware and lumber distributors. Floors should be established for all other lines of distribution.
Local Region
M anager..........Budget
.................................. $48.50De Luxe
$66.50Custom
$93.50Salesmen.......... .................................. 49.50 67.50 94.50
M anager..........Central Region
.................................. $51.00 $68.50 $93.50Salesmen.......... .................................. 52.00 69.00 94.50
M anager..........Western Region
.................................. $48.50 $69.00 $96.00Salesm en.......... .................................. 49.50 69.50 96.50All prices are exclusive of freight charges.
These tentative price floors should be reviewed immediately
54
when cost analysis has been completed. The purpose of the floors for the moment should merely be to halt the continual trend to lower prices.
A word of caution is in order. All sales personnel must recognize that the floor prices are not prices that are now charged. It must be impressed on all sales personnel that these prices must be exceeded where possible, and that they must be plus freight and plus cash discount.
The regional managers will have to take a firm stand with respect to both pricing practices of salesmen and requests to authorize prices lower than salesmen themselves can offer. Management’s ultimate goal in this regard should be to establish prices and allow salesmen no discretion whatsoever in the setting of prices.
SummaryThe CPA emphasized that this report was of an interim nature and that no action could be taken on some of his recommendations until the analysis of price-cost relationships and product profitability became available.
He recommended further that the members of management of Wahoo meet and collectively analyze his report.
It was well received. As the CPA had anticipated, each of the owners had attempted to justify his results with claims that his territories were "different.” However, with the investor serving as moderator and the CPA offering additional facts and interpretations of the analyzed data, the meeting was extremely constructive. The manager of the local region expressed the opinion that the CPA’s report had really opened his eyes to the many factors within the sales policy that were distinctly in need of attention. He chided his partners and, in doing so, chided himself on the inability of a sales-oriented management to see the deficiencies an accountant had pointed out. They had disagreed with the CPA (and among themselves) with respect to some of his recommendations; but the quarrels involved "methods of correction” rather than principles. They all agreed that his report disclosed marketing defects which urgently required their attention.
55

The conversation ultimately turned to the CPA’s next step. The danger areas within the pricing policy were now apparent. The owner-managers were now anxious to apply costs against selling prices in order, as one of them put it, “to see which product we should push.” Apparently, thought the CPA, a salesman never changes.
SECTION III
The CPA’s Report on His Direct Costing Analysis of Product Profitability and the Application
of the Contribution Accounting Technique to Wahoo’s Operations
A SUMMARY OF THE REPORT
Scope o f study and methods used in analysis
The CPA explained that his cost analysis and allocations would be made from the accounting records for the five-month period ending May 31, 1959. He also made it clear in the report that the basic accounting records had not been maintained in a fashion that would guarantee absolute accuracy and that in the area of cost and expense allocation, particularly, he had required the factory manager and the owners to make a good many estimates of expenses allocable to certain products, which the records did not disclose.
The CPA, incidentally, admits that he made a few false starts in his cost and expense allocation. He had, for example, taken a “production area cost center” viewpoint to start but determined finally that the approach should be along the lines of allocating costs directly to the product lines themselves.
56

He had found that the prime costs—the raw material and direct labor—were reasonably simple to segregate by product and that the heart of his problem had been in the segregation of variable costs and fixed costs and the assignment of the variable costs to products. Attempts at segregation created a number of questions. The CPA ultimately resolved all of them through discussions with the factory manager or other personnel, and was able to place each cost and expense into one of the following categories: primarily variable, primarily fixed, or both variable and fixed. He had been forced to assume that the costs placed in either of the first two categories were either all variable or all fixed, and he then proceeded to segregate each of the costs and expenses in the last category into its fixed and variable portions.
In addition to estimating the amount of each expense that was allocable to each product line, a good deal of estimating also had to be done by the CPA and the factory manager in determining the extent to which hardware and accessories pertained to each of the products. In other words, while much of the hardware and accessory equipment was wholly interchangeable on the various models of garage doors, there were many exceptions. The company accounting system did not permit the segregation of sound cost data on hardware and accessories, but reliable estimates appeared adequate for present purposes.
Although the primary objective of the cost and expense allocation was in connection with garage door sales, the CPA allocated all expenses to all products and services of Wahoo, in order to account for the distribution of all variable costs and expenses. The variable items were allocated into five “product” categories: the budget, de luxe and custom garage doors, and two further categories, (1) door accessories and miscellaneous products and (2) installation and service.
After the determination of the variable manufacturing, selling, and general and administrative expenses, the CPA enlisted the aid of management and operating people in carefully evaluating how these expenses fluctuated with changes in sales and production. It had been agreed that both the variable selling and general and administrative expenses showed a distinct and consistent
57

pattern which would enable them to be measured in direct relation to sales volume. The variable manufacturing expenses, the factory manager was convinced, would vary in reasonably close proportion to direct labor cost
Results o f cost study
The CPA's report included a simple statement for the five- month period which was intended primarily to show the contribution (net sales minus total variable costs) that was made to cover fixed expenses.
This statement was placed first in his report as the basis for a brief explanation of the contribution accounting concept and of his handling of fixed expenses. The CPA had noted some lack of comprehension on the part of the management when he had briefly explained the relationship of variable and fixed expenses under the contribution concept. He knew that management must have a clear understanding of what the report called fixed expenses. The term was defined in his report as the cost of “staying in business” which would continue unless plant activity, sales, and other operations were completely discontinued. The report also explained why any attempt to allocate fixed expenses to products would have to be completely arbitrary. It had appeared to the CPA that the fixed expenses were somewhat out of line, particularly in the manufacturing area. His report attempted to drive home the point that any reduction in fixed expenses would result in a 100 per cent profit before taxes, for every dollar of reduction. The first statement he prepared is shown opposite.
This statement showed the effect on profitability for the total sales mix. The next statement broke down the sales by product groups. The purpose of this statement was to show the cost-price relationship of each of the products and the contribution each had made to the “staying in business” expenses.
The statement objectively disclosed two basic facts:1. Sale of accessories and miscellaneous items, and installation
and service revenue, were contributing to fixed expense, percent
58

agewise, at far higher rates than the sales of the principal line. It was fortunate that these occasional sales and services had occurred. If they had not done so, the staying-in-business costs, which would not have changed, would have exceeded the dollar contribution from garage doors alone by almost $78,000.
Statement of Contribution to Fixed Expenses and Resulting Net Loss—All Products
For Five-Month Period Ended May 31 , 1959
Net sales.......................................................... $847,554 100.00%Less variable c o s ts ........................................ 595,033 70.21Contribution to fixed expense . . . . .............. $252,521 29.79%Less fixed expenses:
General and administrative.. $51,963 6.13%Advertising............................ 42,823 5.06Manufacturing—Note A . . . . 99,112 11.69Selling.................................... 73,003 8.61
T o ta l........................ .............. $266,901 31.49%Net operating lo ss .......................... .............. $(14,380) (1.70)%Note A—Includes engineering and designing.
Statement of Contribution to Fixed Expenses of Individual Product Groups
For Five-Month Period Ended May 31 , 1959
Accessories InstallationGarage Doors and Misc. and Service Total
Net sales............Less variable
. $710,141 $82,695 $54,718 $847,554
c o s ts ............ 521,029 49,017 24,987 595,033Contribution to
fixed expense % of net sales
. $189,112 $33,678 $29,731 $252,521
contributed . 26.63% 40.73% 54.33% 29.79%
59

2. The policy of discouraging installation and service, which the CPA had questioned from a sales viewpoint, now appeared to make even less sense. It was an extremely profitable operation, contrary to the owners’ views.
The CPA’s next statement was intended to show a price-cost relationship on the individual garage doors. From sales analysis, he already had the sales dollars by product. By reassigning the variable costs attaching to production and sale of garage doors only, to the three types of doors carried, he was able to prepare the following statement.
Statement of Contribution to Fixed Expense of Garage Doors
For Five-Month Period Ended May 31 , 1959
BudgetModel
Net sales.................... $371,996Less variable costs . . 263,363Contribution to fixed
expense ................ $108,633% of net sales
con tribu ted .......... 29.20%
De Luxe Custom Model Model Total
$225,708 $112,437 $710,041 186,848 70,818 521,029
$ 38,860 $ 41,619 $189,112
17.22% 37.02% 26.63%
Recognizing a similarity in the production and sale of the three models, the CPA felt that by one further step it could be determined whether cost or selling price was the factor primarily responsible for the high percentage of contribution of the custom model and the low contribution afforded by the de luxe model. This information he added as a footnote to the statement.
% of sales to total sales . . . . % of variable costs to
total costs........................
BudgetModel
De Luxe Model
CustomModel Total
52.4% 31.8% 15.8% 100.0%
50.5% 35.9% 13.6% 100.0%
60

In his comments, he reasoned that the significant price softening and low selling prices of the de luxe model, rather than a higher proportionate variable cost, was the reason for its poor contribution.
He later questioned the logic of his position—and had some difficulty explaining it during a later conference. However, regardless of the validity of his assumptions, he had undoubtedly located a serious trouble spot in the price-cost relationship of the de luxe model.
It would have been reasonable to assume from the sales analysis data alone that a pattern of contribution on the different models would emerge, as it actually did. He recommended in his report that any tentative decisions reached on the basis of his report on sales and pricing practices relative to either lines of customer concentration, the interchangeability of models or the establishment of price floors should now be re-examined in the light of these supplemental cost data.
Use o f the break-even pointas a profit p lanning tool
The CPA had been exposed thoroughly during the course of his study to the management’s method of attempting to predetermine profitability through the use of the “average month budget.”
This was, in reality, nothing more than the total of an “average month’s expenses” divided by an “average mark-up.” In principle, it resulted in a break-even sales volume required to cover all costs and expense. The required sales volume had been reached in each of the last five months, and the management had a difficult time reconciling their break-even computations to the losses Wahoo had continued to show.
In view of their interest in examining their operation from a break-even point of view, the CPA felt this was one area where he could assist the owner-managers in acquiring an understanding of the proper over-all concept of break-even. If they could substitute proper variable and fixed costs in their computations in place of
61

the lumped “averages” they had been using, he was sure the sales- minded management could use this as a simple but effective profitplanning and control technique.
He prefaced this section of his report with a colorful chart reproduced on page 63. The loss area was red, the profit area black. It was professionally drawn and an attention-getter.
The CPA’s commentary on the use of the break-even concept as a management guide was as follows:
The management of Wahoo in their application of the breakeven concept to Wahoo’s operations is assuming that the breakeven point remains constant. The break-even point is being computed by dividing the total of all expenses, both fixed and variable, by an “average” gross profit percentage. Actually, the break-even point is constantly changing. If this concept is to be used as an operational guide, the following must be kept in mind:
Break-even is the point at which any given sales volume equals the variable costs directly related to this volume of sales—plus the fixed expenses which remain constant at all sales volumes. Reviewing the operations of Wahoo for the five months ended May 31, 1959 as shown in the foregoing schedules, it has been determined that fixed expenses were $266,901 and that the percentage of contribution, for the entire sales mix, was 29.79 per cent. By dividing the fixed expenses by the percentage of contribution, a break-even sales volume of $895,900 is computed. The following is proof of this calculation:
Break-even sales com puted.................. $895,9Variable expenses @ 70.21% of sales. . . 629,0Contribution to fixed expenses............ $266,9Fixed expenses...................................... 266,9P ro fit...................................................... —0—
Actually, Wahoo sustained a sales volume which was lower than the break-even point by 5.39 per cent. In a profitable operation, this difference between actual sales and break-even sales is called the margin of safety. In the Wahoo operation it represents the
62

W A H O O BUILDING SUPPLY CO M PANY
BREAKEVEN CHART
WITH OPERATING RESULTS INDICATED FOR FIVE MONTHS ENDED MAY 31, 1959COSTS
ANDEXPENSES
(IN THOUSANDS OF DOLLARS)
SALES ( IN THOUSANDS OF DOLLARS)
*GENERAL AND ADMINISTRATIVE___ $52.0ADVERTISING ........................................ 42.8MANUFACTURING AND
ENGINEERING.................................... 99.1SELLING................................................... 73.0
$266.9
tVARIABLE COSTS AND EXPENSES. . 70.21% CONTRIBUTION TO
FIXED EXPENSE............................... 29.79%MARGIN OF SAFETY (LOSS)........... 5.39%
63

margin of loss. The margin of loss has been computed as follows: 895.9 - 847.6 (actual sales) = 48.3 ÷ 895.9 = 5.39%To relate the contribution concept to the loss Wahoo incurred,
the margin of loss in net sales, less proportionate variable costs, equals the net loss for the period. Stated in figures:
$48.3 - 33.9 (48.3 X 70.21%) = $14.4 net lossIn other words, an additional sales volume of $48,000 during
the period would have resulted in a break-even. This does not mean unit sales are necessarily inadequate. If “average sales prices” had yielded 6 per cent more, Wahoo would have shown a profit. The sales analysis indicated that prices on the budget, de luxe and custom models have softened by 2.1 per cent, 4.9 per cent and .8 per cent, respectively, in the last year. It is evident, therefore, that if cost reductions cannot be effected or if sales volume cannot be increased by 6 per cent at present prices, then Wahoo must realize average selling prices even higher than those of a year ago to assure profits. While cost and price data should be studied regularly, management may reasonably forecast break-even points in the immediate future on the basis of fixed and variable costs disclosed by the cost analysis for the five-month period under review.
Use o f the contribution conceptin pricing decisions
The CPA’s report also explained further how the contribution concept could be used to assist management decision when pricing changes were being considered, or when changes in the sales mix occurred. He also indicated that not only could each of the various products in the line be regularly tested to determine how much each was contributing to the over-all results, but that sales territories could also be evaluated similarly. He also stressed the effect on profits that decisions to add to or reduce fixed expenses would have. The results could be evaluated well in advance by keeping the contribution theory in mind. Finally, he emphasized that the concept could be effectively utilized to assist in the formulation of formal operating and cash budgets.
64

It has not been considered worthwhile to cover these points in detail.
The report covered at some length how the contribution method could be used to assist in determining price proposals on large bids, particularly those from tract builders, and how it might be used to appraise the adequacy (or inadequacy) of the price floors that Wahoo Building Supply Company had temporarily instituted shortly after his first report.
His report showed the following as the simple method for determining either of the foregoing:
From the sales price (net of freight and cash discount), deduct the variable cost of the products to be sold. Variable costs should include:
1. Direct materials2. Direct labor3. Variable manufacturing, general and administration and sell
ing costs and expensesHe stated that direct material and labor costs were available and
seemingly accurate for the entire garage door line. The costs should, of course, be adjusted for any changes in the future.
The CPA’s analysis of variable costs of the individual products for the five-month period produced the following variable burden rates as a percentage of direct labor:
Garage doors:Budget m o d e l.................................. 145%D e luxe m odel.................................. 130%Custom m odel.................................. 135%
Accessories and miscellaneous................ 110%Installation and service.......................... 80%
The report made it clear that the variable expense overhead rate on accessories and miscellaneous items had only been computed on a composite basis and that adequate information was not available to determine adequately separate overhead rates for each item. Use of the composite rate, in other words, could be dangerous if a specific item actually incurred a good deal more variable over
65

head than the average of all the items. Fortunately, the factory manager had not been able to put his finger on any accessory or miscellaneous items that “absorbed” significantly more, or less, variable overhead than others.
The last step, therefore, in arriving at a contribution amount was to compute the variable expense cost by use of the foregoing percentages, add the material and labor, and subtract the total from the selling price. The contribution to fixed expense, if then divided by the selling price being considered, would produce a percentage of contribution which could be evaluated for adequacy.
For example, assume it is believed that a tract builder will accept an offer to sell him 400 de luxe model garage doors for a price which—after deduction for applicable freight and cash discounts if they are to be allowed—would net Wahoo $60 for each door. This price would be considerably lower than the price floor recently instituted for this model, but the size of the order has obviously made it attractive to consider.
The variable costs of the de luxe model, including basic accessories, are estimated from the cost analysis to be:
Direct m aterial.................. $25.96Direct la b o r ...................... 12.75Direct variable expense . . . 16.58 (12.75 X 130%)Total variable c o s t............ $55.29
The contribution percentage to be realized from this sale can be computed as:
Net sales (400 doors @ $60.00).......... $24,000Variable cost (400 doors @ $55.29) . . 22,116Contribution to fixed expense
and p ro f it ........................................ $ 1,884Contribution percentage.................... 7.54%
Should an offer be made at this price level? It must depend on circumstances at the time which only management can evaluate.
If management bears in mind that a contribution percentage of
66

29.79 per cent derived from the entire sales mix in the five months ended May 31 was not adequate to make a profit, there is a distinct question whether an order yielding a 7.54 per cent contribution rate should be accepted, except in unusual circumstances. It is also evident that a contribution of 7.54 per cent is lower by 9.68 per cent than the average contribution rate derived from de luxe model doors in the five months analyzed. This model which yielded a contribution rate of 17.22 per cent was, at this rate, the lowest contributor of the garage door line.
The above example was cited because it actually occurred as a sale during the month of March. A production backlog existed at the time. The decision to make this sale resulted in a contribution of $1,884 to overhead which, during a period of idle capacity, would conceivably be justified. However, if $6,300 of other sales, on which the average contribution of 29.79 per cent could have been realized, had been lost that month by virtue of producing for this order, the bid should not have been made at the price of $60.
The CPA recommended that the price floors be re-evaluated immediately through use of this concept and that all future pricing decisions on large special orders be made only after application of this method in each circumstance.
Other matters included in report
The remainder of the report was devoted to a few recommendations relative to (1) the accounting changes that should be made in order that the system could produce product-line income statements as well as the conventional “all products” statements, (2) a review of the variable and fixed expenses which would have to be made from time to time, (3) the pricing of inventories, which as the CPA emphasized, were not now to be priced with inclusion of the variable direct cost rates he had computed and shown in the report. He explained that these rates included distribution, S & A and other expenses not normally included in inventory burden but on the other hand did not include elements of fixed overhead which would have to be included in inventory valuation for financial
67

statement and tax purposes and (4) cost reduction areas which the CPA felt should be explored by the management of Wahoo.
The CPA was rather surprised to find that his report was understood far better than he had expected. The owners felt that the CPA had, as one of them put it, “exploded the whole business wide open.” The factory manager derived considerable pleasure from reminding his bosses of his prior attempts to relate costs to prices. He wanted more information from the workpapers on which he and the CPA had spread the variable manufacturing costs. Victorious at last, he announced that his “next project” would be to see what he could do about reducing his costs, now that he really knew what they were.
Summary o f illustration
Perhaps the principal beneficiary of the report will prove to be the friendly lender. It may even be worth $75,000. Wahoo finally broke even in August and September, after continued small losses in June and July. It met its first installment of notes due under the bankruptcy settlement in July. It is too early to determine if Wahoo will show profits adequate to meet the remaining bankruptcy obligations and eventually repay the $75,000 loan. It can only be reported at this time that continual small monthly losses have been stopped.
Wahoo has, since the CPA’s report, worked up formal sales forecasts, has adopted a simple over-all budget system and has made several revisions in its accounting system to effect further cost controls. Time, and continued attention to the problem areas, could produce good profits, according to the optimistic CPA.
Reference list fo r fu r th er study
The primary purpose of this bulletin has been to provide the reader with a few ideas from the wide area of costs and cost controls that may profitably be utilized by smaller business clients.
68

The bulletin has been confined to programmed cost reduction, cost accounting and distribution costs. The reference list is likewise confined to these areas. The CPA who wishes to study these subjects further or seeks specific reference to matters within these areas should find the following books and articles helpful. If additional material is required, members of the American Institute are invited to utilize the resources of its library and the assistance of its librarians.
Cost reduction and control techniques
1. Cost Reduction at Work. Management Report No. 28, published by the American Management Association, 1515 Broadway, New York 36, New York. 1959.
An 84-page report of successful company practices in effecting cost reduction and control. Among the specific approaches to programmed cost reduction considered in the booklet are standardization, value analysis, work simplification and systems engineering. Control of manufacturing costs is emphasized.2. Control of Non-Manufacturing Costs. Management Report No. 26, pub
lished by the American Management Association, 1515 Broadway, New York 36, New York. 1957. 128 pages.
A report of proven methods and techniques of reducing and controlling expenses. In addition to three company studies involving control of office costs, the report contains an excellent chapter on the values and uses of distribution cost analysis.
The report is oriented to big business; but the principles and ideas advanced in it are, for the most part, applicable to small businesses.3. Management Aids for Small Manufacturers. Annual No. 5, published by
the Small Business Administration. 1959. Chapter 5, “Effective Control for Better Management,” and Chapter 6, “Analyzing Your Cost of Marketing.” Copies are available from the Superintendent of Documents, U. S. Government Printing Office, Washington, D. C., 45¢ per copy.
Chapter 5 gives down-to-earth ideas for devising a simple and effective cost control system in a small business.
Chapter 6 provides the “basics” for determining and measuring the effectiveness of the small business marketing dollar.
69

This volume contains nine additional chapters, representing other reprints of Management Aids issued by the SBA. The entire booklet is worth reviewing—and perhaps sending to small business clients.4. “Practical Cost Reduction Is Programmed Cost Reduction” by Rolfe Wyer.
N.A.A. Bulletin, November 1954.
This excellent article not only summarizes the "do’s” and "don’ts” of successful cost reduction, but contains a detailed outline of the items and areas to be programmed in a cost reduction plan for a small or medium-sized company. It provides examples of special cost reduction reports.
Cost accounting for cost control1. Standard Costs by Clinton W. Bennett. Prentice-Hall, Inc., Englewood
Cliffs, New Jersey. 1957. 450 pages of text, 50 pages of problems and questions.
This excellent book comprehensively covers all aspects of standard cost accounting. Its biggest value to the CPA lies in the fact that the subject is approached from a management point of view. While it adequately covers all the basic areas of standard cost accounting, it emphasizes the management values of standard costs and the relation of the cost system to the organization as a whole. It is recommended primarily to the CPA who is already conversant with basic cost accounting for either review or reference.2. Theory and Technique of Cost Accounting by Lawrence L. Vance. Henry
Holt and Company, Inc., 383 Madison Avenue, New York, New York.1958. 530 pages.
An excellent basic text which provides up-to-date coverage of all phases of cost accounting—including standard, process, job order, joint and by-product cost methods. It devotes a full chapter to direct costing techniques. While some coverage is provided to management uses of cost accounting, the book is recommended primarily for the CPA or staff member who wishes to review the entire field of basic cost accounting. The questions and problems which follow each chapter may assist in self study or in study groups.3. Cost Accountant’s Handbook, edited by Theodore Lang. The Ronald Press
Company, 15 East 26th Street, New York, New York. 1944. 1430 pages.
70

This is the most complete reference book on all matters within cost accounting—and a valuable addition to the library of any CPA who deals with cost accounting systems or methods.
Distribution cost control1. Distribution Costs by J. B. Heckert and R. B. Miner. The Ronald Press
Company, 15 East 26th Street, New York, New York. 1953. 380 pages.
A basic text written to aid accountants and marketing executives in analyzing, supervising and controlling selling costs. An excellent text for either a thorough study of the entire subject or as a reference book for use in solving specific problems.2. Practical Distribution Cost Analysis by D. R. Longman and M. Schiff.
Richard D. Irwin, Inc., Homewood, Illinois. 1955. 450 pages.
Another excellent volume for CPAs which provides coverage of the entire subject of distribution costs. It stresses the analysis of distribution costs and does not provide as much coverage of the “marketing function” as Heckert’s and Miner’s book.
71