Embed Size (px)
Citation preview
COST-BENEFIT ANALYSIS GUIDE FOR NIH IT PROJECTS
Prepared by
Robert [email protected]
OFFICE OF THE DEPUTY CHIEF INFORMATION OFFICER
CENTER FOR INFORMATION TECHNOLOGY
NATIONAL INSTITUTES OF HEALTH
DEPARTMENT OF HEALTH AND HUMAN SERVICES
May 1999
05/05/99 CBA GUIDE FOR NIH IT PROJECTS Revision 1
Revision Summary
The principal revisions are additional information related to the requirements for a Cost-Benefit Analysis and its relationship to the investment review process. Section 1.5, Requirements for a CBA, was added to explain the regulatory origin of the CBA requirement (it comes from OMB Circular A-130, which was written to implement the Paperwork reduction Act of 1980. Section 5, Competing With Other Projects, addresses Payback Period and Return On Investment as terms that are often used to compare projects in the Investment Review Process.
A paragraph was added to Section 3.2, When is the CBA Performed, to describe how several different versions of the CBA may be required during the planning stage, before the project is included in the budget, and as part of a post-implementation review. A footnote was added in Section 4.9, Discount Costs and Benefits, to explain that thecurrent interest rate to be used in discounting is found in Appendix Cof OMB Circular A-94 under the title, Real Discount Rates.
05/05/99 CBA GUIDE FOR NIH IT PROJECTS Revision 1
Table of Contents
1 INTRODUCTION....................................................11.1 PURPOSE OF THIS GUIDE......................................11.2 STRUCTURE OF THIS GUIDE....................................11.3 OMB GUIDANCE...............................................11.4 ACKNOWLEDGMENTS............................................21.5 REQUIREMENTS FOR A CBA.....................................2
2 GENERAL CONCEPTS OF COST-BENEFIT ANALYSIS.......................32.1 PURPOSE....................................................32.2 TIME PERIOD................................................32.3 ALTERNATIVES...............................................42.4 TWO TYPES OF ANALYSIS......................................42.5 IDENTIFYING AND MEASURING BENEFITS AND COSTS...............42.6 DECISION CRITERIA..........................................5
3 OVERVIEW OF THE CBA PROCESS.....................................53.1 WHEN IS A CBA REQUIRED?....................................53.2 WHEN IS THE CBA PERFORMED?.................................53.3 WHO SHOULD DO THE CBA?.....................................63.4 HOW IS THE CBA PERFORMED?..................................7
3.4.1 ...........................Determine/Define Objectives......................................................7
3.4.2 ..............................Document Current Process......................................................7
3.4.3 ..........................Estimate Future Requirements......................................................7
3.4.4 .....................................Collect Cost Data......................................................7
3.4.5 ....................Choose at Least Three Alternatives......................................................7
3.4.6 ..............................Document CBA Assumptions......................................................8
3.4.7 ........................................Estimate Costs......................................................8
3.4.8 .....................................Estimate Benefits......................................................8
3.4.9 ...........................Discount Costs and Benefits
i
05/05/99 CBA GUIDE FOR NIH IT PROJECTS Revision 1
......................................................93.4.10 ................................Evaluate Alternatives
......................................................93.4.11 .........................Perform Sensitivity Analysis
......................................................9
4 THE COST-BENEFIT ANALYSIS PROCESS..............................104.1 STEP 1 - DETERMINE/DEFINE PROJECT OBJECTIVES..............104.2 STEP 2 - DOCUMENT CURRENT PROCESS.........................10
4.2.1 .....................................Customer Services.....................................................11
4.2.2 ...................................System Capabilities.....................................................11
4.2.3 ...................................System Architecture.....................................................11
4.2.4 ..........................................System Costs.....................................................12
4.3 STEP 3 - ESTIMATE FUTURE REQUIREMENTS.....................134.3.1 .............................Determine Life Cycle Time
.....................................................134.3.2 ...........................Estimate Life-Cycle Demands
.....................................................144.3.3 ..................................Other Considerations
.....................................................154.4 STEP 4 - COLLECT COST DATA................................15
4.4.1 ..........................Historical Organization Data.....................................................15
4.4.2 ..................................Current System Costs.....................................................16
4.4.3 .......................................Market Research.....................................................16
4.4.4 ..........................................Publications.....................................................16
4.4.5 Analyst Judgment....................................174.4.6 Special Studies.....................................17
4.5 STEP 5 - CHOOSE AT LEAST THREE ALTERNATIVES...............174.6 STEP 6 - DOCUMENT CBA ASSUMPTIONS.........................184.7 STEP 7 - ESTIMATE COSTS...................................18
4.7.1 ..............................Activities and Resources.....................................................19
ii
05/05/99 CBA GUIDE FOR NIH IT PROJECTS Revision 1
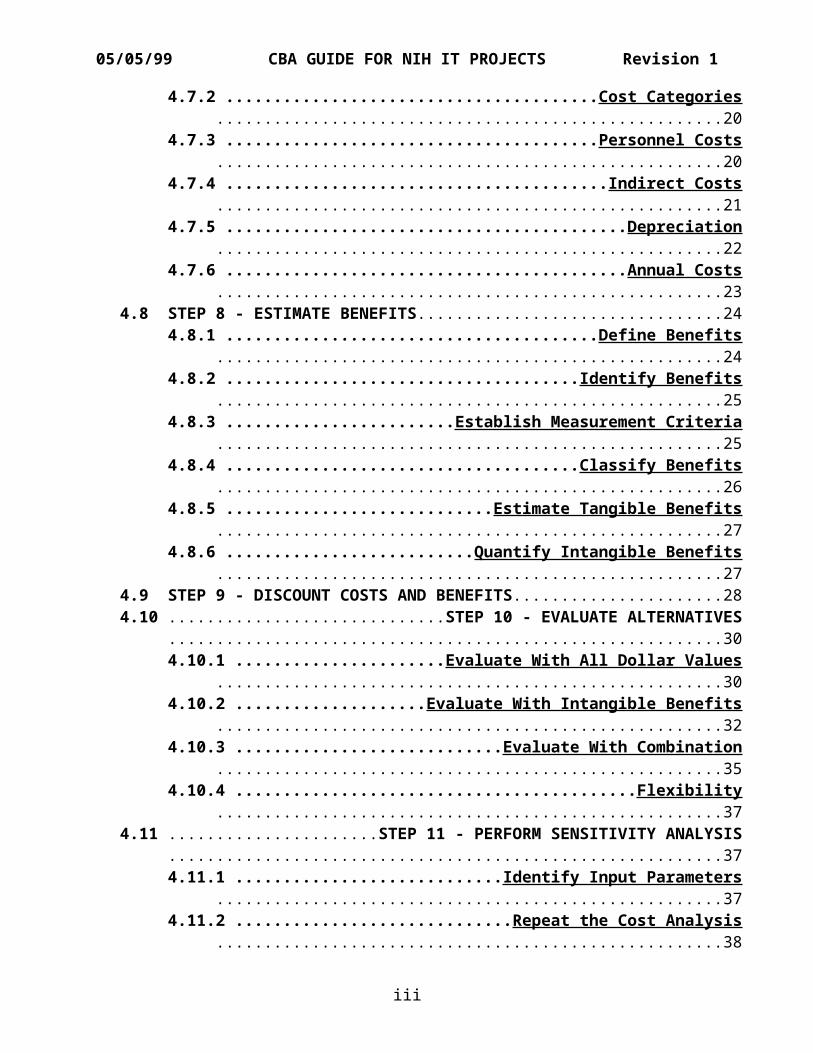
4.7.2 .......................................Cost Categories.....................................................20
4.7.3 .......................................Personnel Costs.....................................................20
4.7.4 ........................................Indirect Costs.....................................................21
4.7.5 ..........................................Depreciation.....................................................22
4.7.6 ..........................................Annual Costs.....................................................23
4.8 STEP 8 - ESTIMATE BENEFITS................................244.8.1 .......................................Define Benefits
.....................................................244.8.2 .....................................Identify Benefits
.....................................................254.8.3 ........................Establish Measurement Criteria
.....................................................254.8.4 .....................................Classify Benefits
.....................................................264.8.5 ............................Estimate Tangible Benefits
.....................................................274.8.6 ..........................Quantify Intangible Benefits
.....................................................274.9 STEP 9 - DISCOUNT COSTS AND BENEFITS......................284.10 .............................STEP 10 - EVALUATE ALTERNATIVES
..........................................................304.10.1 ......................Evaluate With All Dollar Values
.....................................................304.10.2 ....................Evaluate With Intangible Benefits
.....................................................324.10.3 ............................Evaluate With Combination
.....................................................354.10.4 ..........................................Flexibility
.....................................................374.11 ......................STEP 11 - PERFORM SENSITIVITY ANALYSIS
..........................................................374.11.1 ............................Identify Input Parameters
.....................................................374.11.2 .............................Repeat the Cost Analysis
.....................................................38
iii
05/05/99 CBA GUIDE FOR NIH IT PROJECTS Revision 1
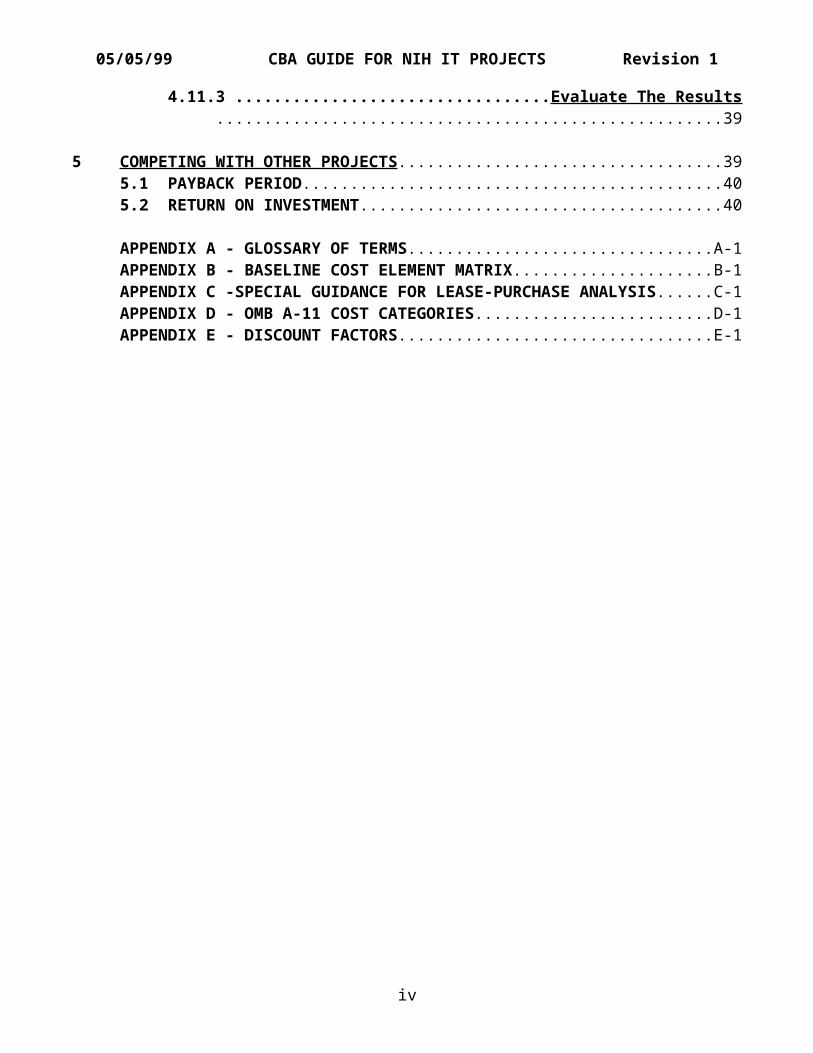
4.11.3 .................................Evaluate The Results.....................................................39
5 COMPETING WITH OTHER PROJECTS..................................395.1 PAYBACK PERIOD............................................405.2 RETURN ON INVESTMENT......................................40
APPENDIX A - GLOSSARY OF TERMS................................A-1APPENDIX B - BASELINE COST ELEMENT MATRIX.....................B-1APPENDIX C -SPECIAL GUIDANCE FOR LEASE-PURCHASE ANALYSIS......C-1APPENDIX D - OMB A-11 COST CATEGORIES.........................D-1APPENDIX E - DISCOUNT FACTORS.................................E-1
iv

05/05/99 CBA GUIDE FOR NIH IT PROJECTS Revision 1
v
05/05/99 CBA GUIDE FOR NIH IT PROJECTS Revision 1
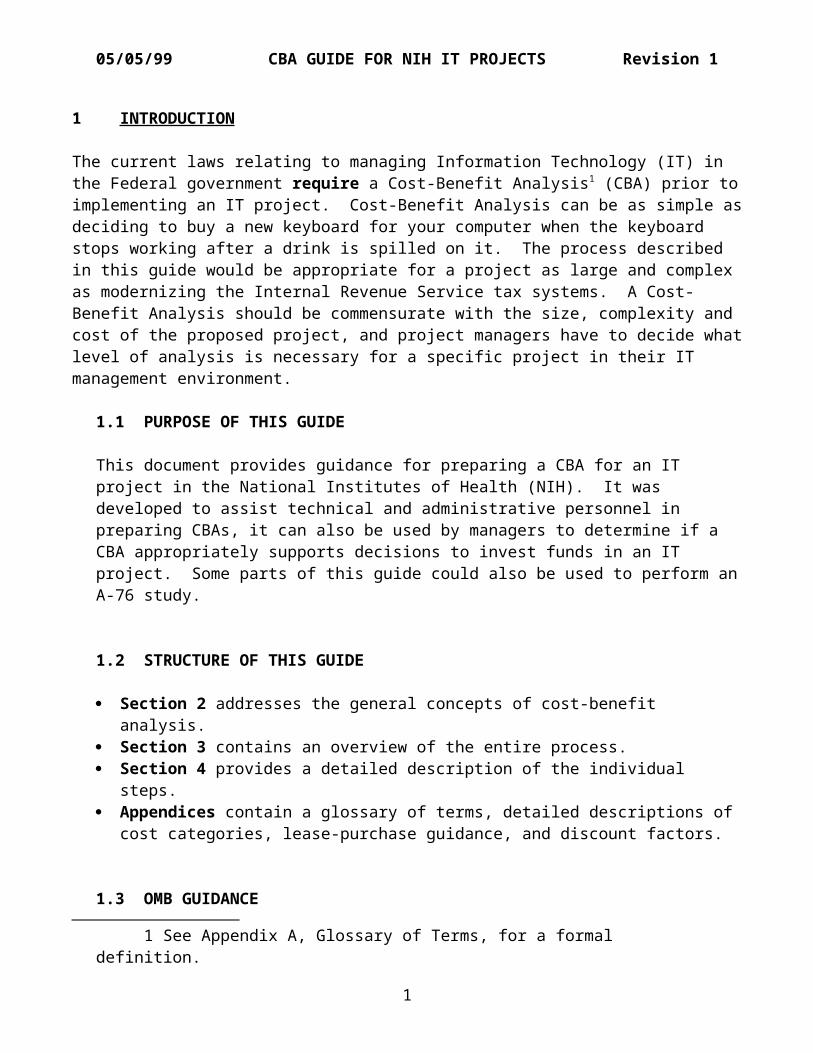
1 INTRODUCTION
The current laws relating to managing Information Technology (IT) in the Federal government require a Cost-Benefit Analysis1 (CBA) prior toimplementing an IT project. Cost-Benefit Analysis can be as simple asdeciding to buy a new keyboard for your computer when the keyboard stops working after a drink is spilled on it. The process described in this guide would be appropriate for a project as large and complex as modernizing the Internal Revenue Service tax systems. A Cost-Benefit Analysis should be commensurate with the size, complexity and cost of the proposed project, and project managers have to decide whatlevel of analysis is necessary for a specific project in their IT management environment.
1.1 PURPOSE OF THIS GUIDE
This document provides guidance for preparing a CBA for an IT project in the National Institutes of Health (NIH). It was developed to assist technical and administrative personnel in preparing CBAs, it can also be used by managers to determine if a CBA appropriately supports decisions to invest funds in an IT project. Some parts of this guide could also be used to perform anA-76 study.
1.2 STRUCTURE OF THIS GUIDE
Section 2 addresses the general concepts of cost-benefit analysis.
Section 3 contains an overview of the entire process. Section 4 provides a detailed description of the individual
steps. Appendices contain a glossary of terms, detailed descriptions of
cost categories, lease-purchase guidance, and discount factors.
1.3 OMB GUIDANCE
1 See Appendix A, Glossary of Terms, for a formal definition.
1
05/05/99 CBA GUIDE FOR NIH IT PROJECTS Revision 1
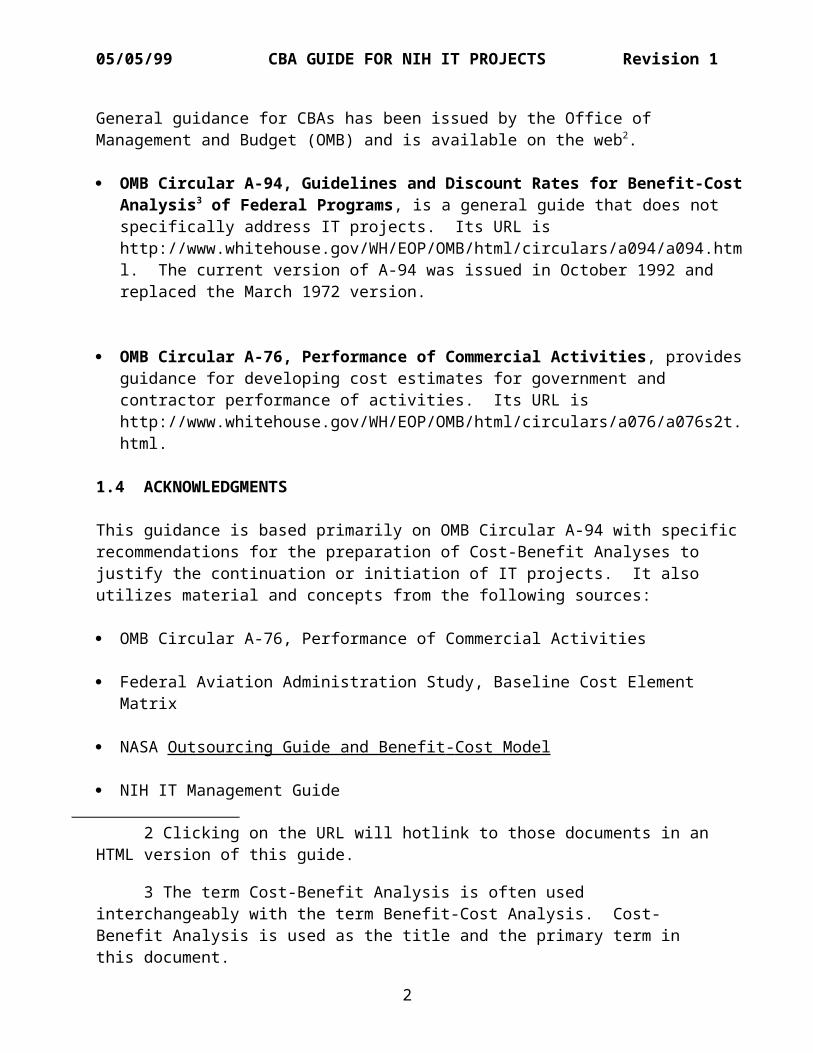
General guidance for CBAs has been issued by the Office of Management and Budget (OMB) and is available on the web2.
OMB Circular A-94, Guidelines and Discount Rates for Benefit-CostAnalysis3 of Federal Programs, is a general guide that does not specifically address IT projects. Its URL is http://www.whitehouse.gov/WH/EOP/OMB/html/circulars/a094/a094.html. The current version of A-94 was issued in October 1992 and replaced the March 1972 version.
OMB Circular A-76, Performance of Commercial Activities, providesguidance for developing cost estimates for government and contractor performance of activities. Its URL is http://www.whitehouse.gov/WH/EOP/OMB/html/circulars/a076/a076s2t.html.
1.4 ACKNOWLEDGMENTS
This guidance is based primarily on OMB Circular A-94 with specificrecommendations for the preparation of Cost-Benefit Analyses to justify the continuation or initiation of IT projects. It also utilizes material and concepts from the following sources:
OMB Circular A-76, Performance of Commercial Activities
Federal Aviation Administration Study, Baseline Cost Element Matrix
NASA Outsourcing Guide and Benefit - Cost Model
NIH IT Management Guide
2 Clicking on the URL will hotlink to those documents in an HTML version of this guide.
3 The term Cost-Benefit Analysis is often used interchangeably with the term Benefit-Cost Analysis. Cost-Benefit Analysis is used as the title and the primary term in this document.
2
05/05/99 CBA GUIDE FOR NIH IT PROJECTS Revision 1
(http://irm.cit.nih.gov/itmra/itmgmtgd.html)
OMB Circular A-11, Preparation and Submission of Budget Estimates(old version)
1.5 REQUIREMENTS FOR A CBA
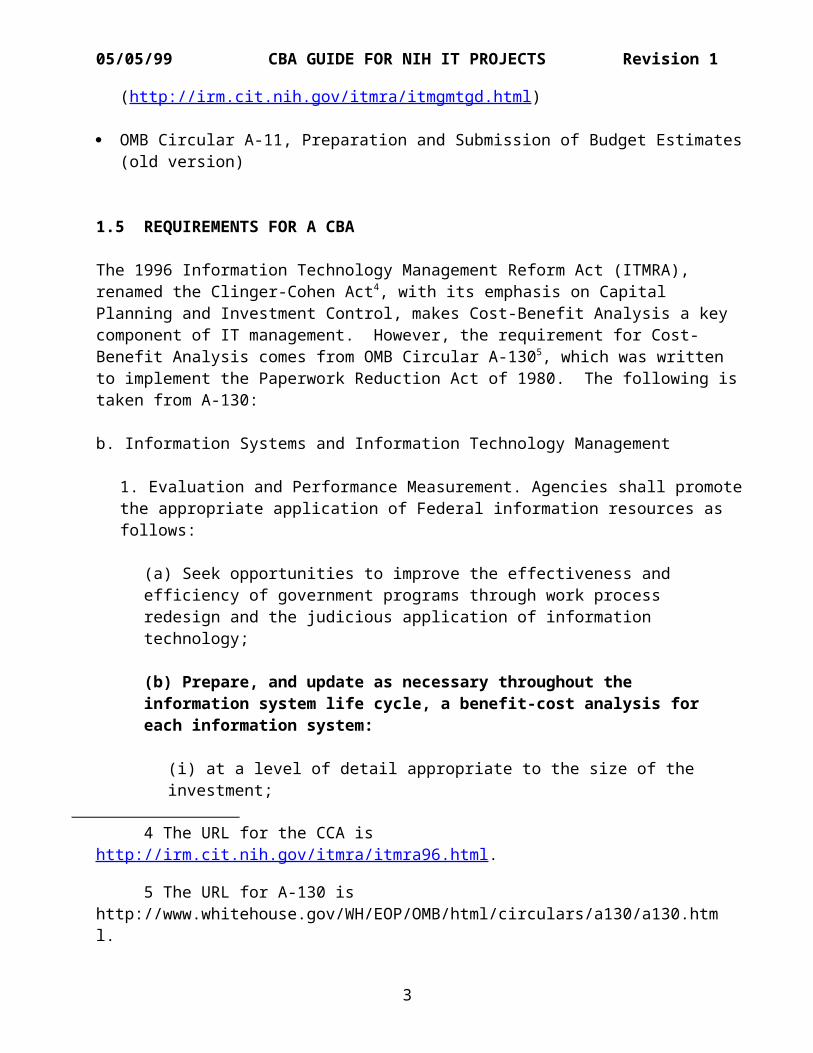
The 1996 Information Technology Management Reform Act (ITMRA), renamed the Clinger-Cohen Act4, with its emphasis on Capital Planning and Investment Control, makes Cost-Benefit Analysis a key component of IT management. However, the requirement for Cost-Benefit Analysis comes from OMB Circular A-1305, which was written to implement the Paperwork Reduction Act of 1980. The following istaken from A-130:
b. Information Systems and Information Technology Management
1. Evaluation and Performance Measurement. Agencies shall promotethe appropriate application of Federal information resources as follows:
(a) Seek opportunities to improve the effectiveness and efficiency of government programs through work process redesign and the judicious application of information technology;
(b) Prepare, and update as necessary throughout the information system life cycle, a benefit-cost analysis for each information system:
(i) at a level of detail appropriate to the size of the investment;
4 The URL for the CCA is http://irm.cit.nih.gov/itmra/itmra96.html.
5 The URL for A-130 is http://www.whitehouse.gov/WH/EOP/OMB/html/circulars/a130/a130.html.
3
05/05/99 CBA GUIDE FOR NIH IT PROJECTS Revision 1
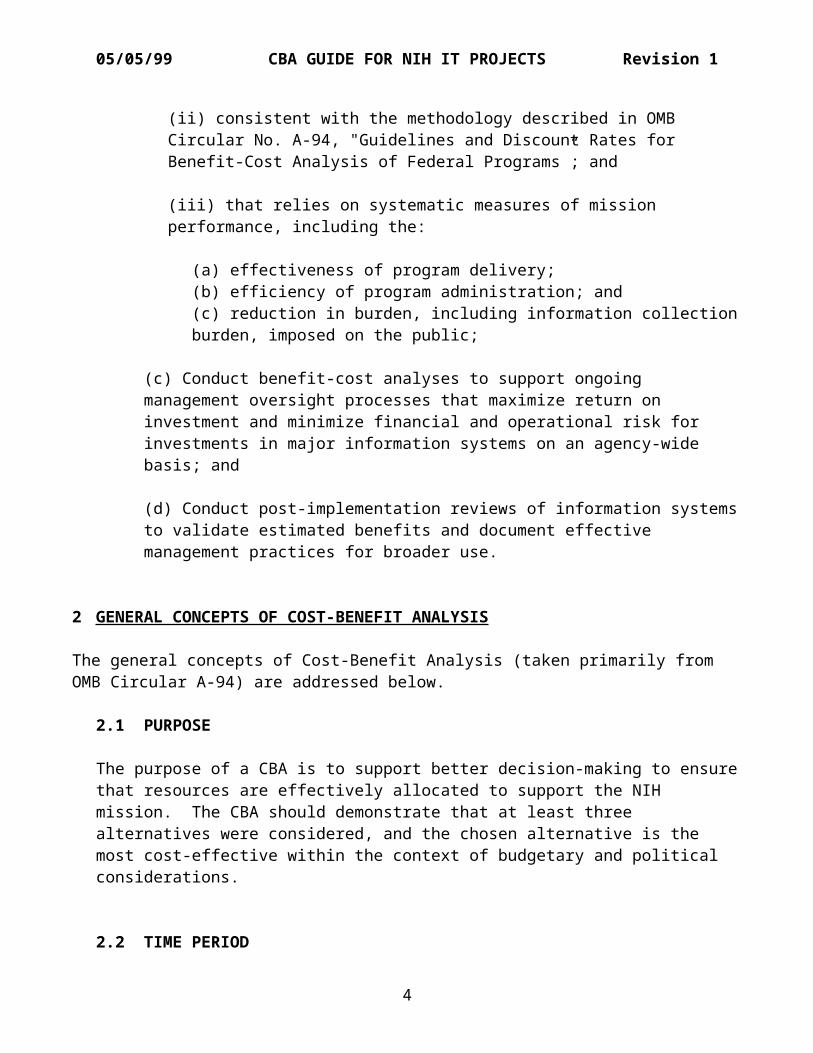
(ii) consistent with the methodology described in OMB Circular No. A-94, "Guidelines and Discount Rates for Benefit-Cost Analysis of Federal Programs”; and
(iii) that relies on systematic measures of mission performance, including the:
(a) effectiveness of program delivery; (b) efficiency of program administration; and (c) reduction in burden, including information collectionburden, imposed on the public;
(c) Conduct benefit-cost analyses to support ongoing management oversight processes that maximize return on investment and minimize financial and operational risk for investments in major information systems on an agency-wide basis; and
(d) Conduct post-implementation reviews of information systemsto validate estimated benefits and document effective management practices for broader use.
2 GENERAL CONCEPTS OF COST-BENEFIT ANALYSIS
The general concepts of Cost-Benefit Analysis (taken primarily from OMB Circular A-94) are addressed below.
2.1 PURPOSE
The purpose of a CBA is to support better decision-making to ensurethat resources are effectively allocated to support the NIH mission. The CBA should demonstrate that at least three alternatives were considered, and the chosen alternative is the most cost-effective within the context of budgetary and political considerations.
2.2 TIME PERIOD
4
05/05/99 CBA GUIDE FOR NIH IT PROJECTS Revision 1
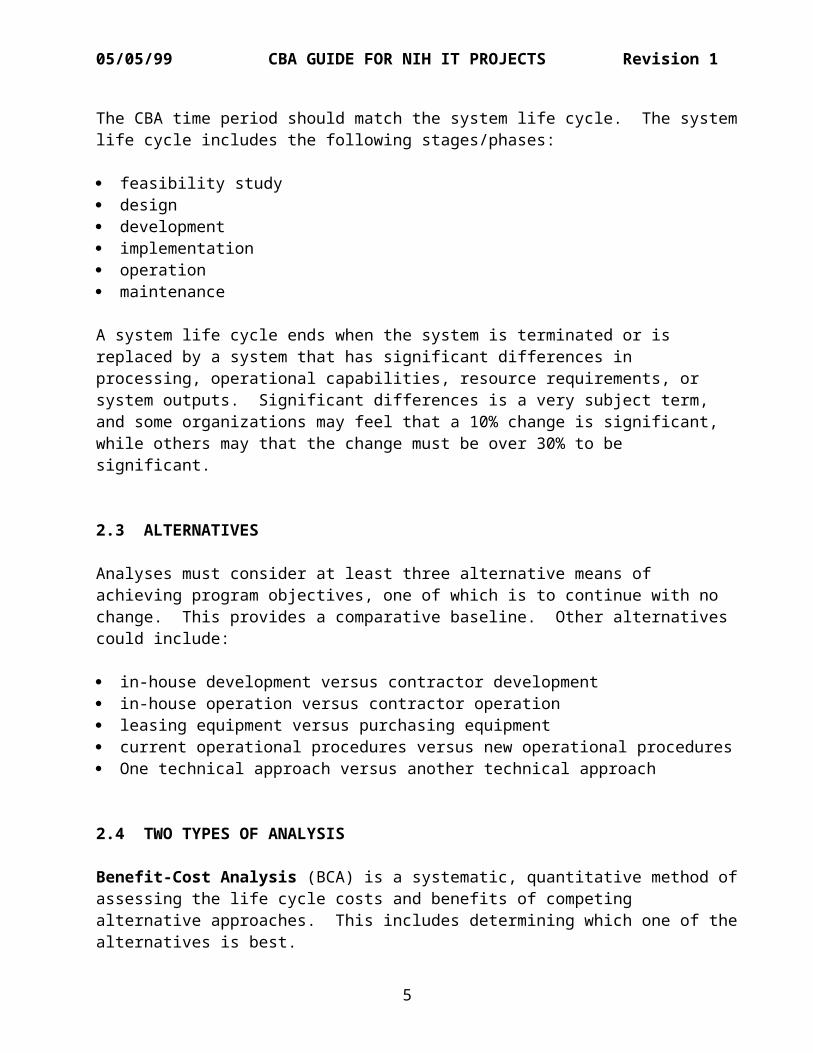
The CBA time period should match the system life cycle. The systemlife cycle includes the following stages/phases:
feasibility study design development implementation operation maintenance
A system life cycle ends when the system is terminated or is replaced by a system that has significant differences in processing, operational capabilities, resource requirements, or system outputs. Significant differences is a very subject term, and some organizations may feel that a 10% change is significant, while others may that the change must be over 30% to be significant.
2.3 ALTERNATIVES
Analyses must consider at least three alternative means of achieving program objectives, one of which is to continue with no change. This provides a comparative baseline. Other alternatives could include:
in-house development versus contractor development in-house operation versus contractor operation leasing equipment versus purchasing equipment current operational procedures versus new operational procedures One technical approach versus another technical approach
2.4 TWO TYPES OF ANALYSIS
Benefit-Cost Analysis (BCA) is a systematic, quantitative method ofassessing the life cycle costs and benefits of competing alternative approaches. This includes determining which one of thealternatives is best.
5
05/05/99 CBA GUIDE FOR NIH IT PROJECTS Revision 1
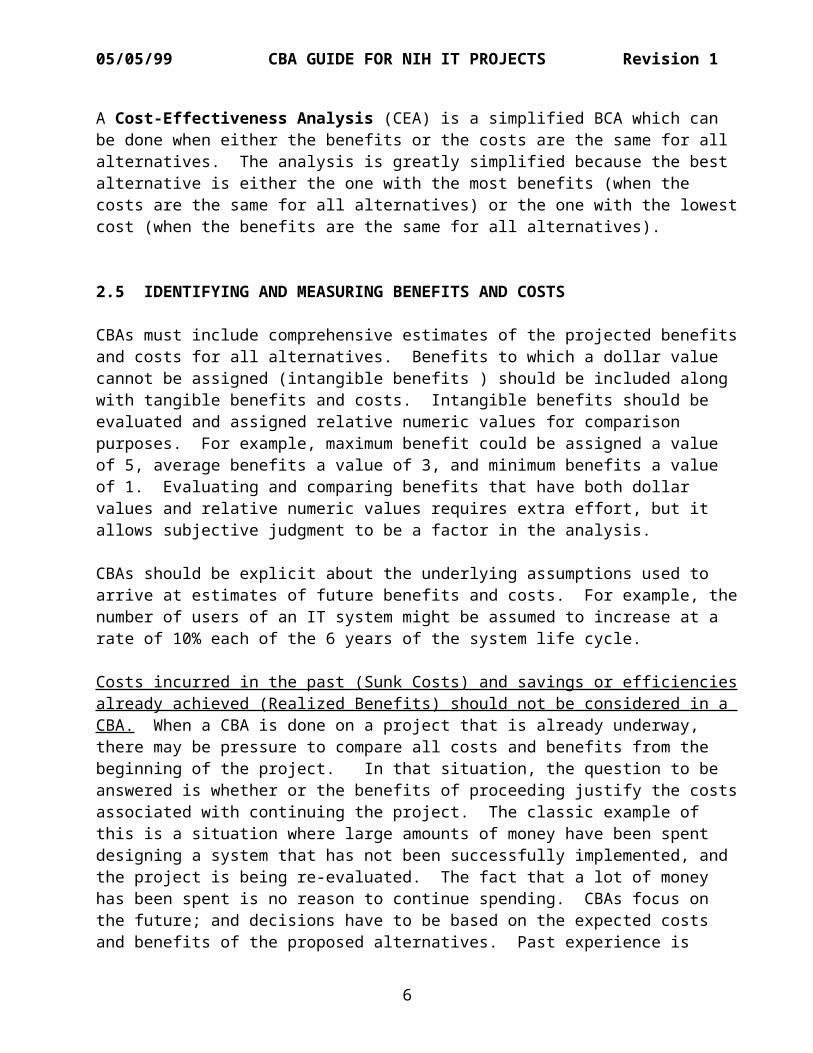
A Cost-Effectiveness Analysis (CEA) is a simplified BCA which can be done when either the benefits or the costs are the same for all alternatives. The analysis is greatly simplified because the best alternative is either the one with the most benefits (when the costs are the same for all alternatives) or the one with the lowestcost (when the benefits are the same for all alternatives).
2.5 IDENTIFYING AND MEASURING BENEFITS AND COSTS
CBAs must include comprehensive estimates of the projected benefitsand costs for all alternatives. Benefits to which a dollar value cannot be assigned (intangible benefits ) should be included along with tangible benefits and costs. Intangible benefits should be evaluated and assigned relative numeric values for comparison purposes. For example, maximum benefit could be assigned a value of 5, average benefits a value of 3, and minimum benefits a value of 1. Evaluating and comparing benefits that have both dollar values and relative numeric values requires extra effort, but it allows subjective judgment to be a factor in the analysis.
CBAs should be explicit about the underlying assumptions used to arrive at estimates of future benefits and costs. For example, thenumber of users of an IT system might be assumed to increase at a rate of 10% each of the 6 years of the system life cycle.
Costs incurred in the past (Sunk Costs) and savings or efficienciesalready achieved (Realized Benefits) should not be considered in a CBA. When a CBA is done on a project that is already underway, there may be pressure to compare all costs and benefits from the beginning of the project. In that situation, the question to be answered is whether or the benefits of proceeding justify the costsassociated with continuing the project. The classic example of this is a situation where large amounts of money have been spent designing a system that has not been successfully implemented, and the project is being re-evaluated. The fact that a lot of money has been spent is no reason to continue spending. CBAs focus on the future; and decisions have to be based on the expected costs and benefits of the proposed alternatives. Past experience is
6
05/05/99 CBA GUIDE FOR NIH IT PROJECTS Revision 1
relevant only in helping estimate the value of future benefits and costs.
2.6 DECISION CRITERIA
Projects should be initiated or continued only if the projected benefits exceed the projected costs. The only exception is if benefits are mandated by law.
Benefit-Cost Analysis - The standard criterion for justifying an ITproject is that the benefits exceed the costs over the life cycle of the project. The competing alternative with the greatest net benefit (benefits minus costs) should be selected. When all benefits and costs cannot be assigned monetary values, relative values for costs and benefits can be used, and the alternative withthe greatest net benefit (benefit values minus cost values) should still be selected.
Cost-Effectiveness Analysis - When comparing alternatives with identical costs and different benefits, the alternative with the largest benefits should be selected. When comparing alternatives with identical benefits and different costs, the alternative with the lowest costs should be selected.
3 OVERVIEW OF THE CBA PROCESS
3.1 WHEN IS A CBA REQUIRED?
A CBA is always required before a decision is made to initiate or continue an IT project; the only issue is the level of detail required for the analysis. The process described here is appropriate for a very large, complex, and costly IT project. Scaled down versions of the CBA would be appropriate for smaller, less costly projects; and your organization should provide guidelines to determine the amount of scaling that would be appropriate for IT projects based on their size, cost, and complexity.
7
05/05/99 CBA GUIDE FOR NIH IT PROJECTS Revision 1
3.2 WHEN IS THE CBA PERFORMED?
A cost-benefit analysis should occur prior to initiating or modifying an IT system. Most of the activities described below arepart of the IT management process at NIH6, and may be completed before the CBA is initiated, concurrently with the CBA, or as part of the CBA. The CBA is a key input for the investment review that should take place before a new project proceeds to the acquisition or development phase. DEFINE THE PROBLEM - Clearly define and document the problem. If
possible, it should be described from a management perspective.
REVIEW THE CURRENT WORK PROCESS DOCUMENTATION - If no documentation exists, it must be developed. If it is not clear and up-to-date, it should be updated to clearly describe the current work process. The information processing requirements must be part of the documentation for the current work process orthe current IT system.
EVALUATE THE WORK PROCESS - There are two questions to address in the work process evaluation: Should We Be Doing This? and Can the Process Be Improved?
DEFINE THE NEW PROCESSING REQUIREMENTS - Define the information processing requirements for the proposed work process at a general level. The security requirements should be addressed in terms of data integrity, reliable processing, privacy and confidentiality.
DETERMINE IT PERFORMANCE MEASURES - Identify indicators for measuring and assessing performance of the process and the IT system in relation to the NIH mission. Also determine the means of collecting and storing the performance data.
The Cost-Benefit Analysis for may have to be updated several times during the life cycle of a system. The first cut at a CBA may be quite brief, and can be used to get concept approval to proceed
6 More information about the IT management process at NIH can be found in the NIH IT Management Guide.
8
05/05/99 CBA GUIDE FOR NIH IT PROJECTS Revision 1
with a detailed CBA. After the detailed CBA has been completed, the development and implementation plans may call for a prototype system or a pilot phase to test the costs and benefits on a limitedscale before the full system is implemented for all users. If thatoccurs, a third version of the CBA would reflect revised costs and benefits, and would be used to decide whether or not to proceed with full implementation of the system. The post-implementation review of a system may also require an updated CBA to determine if the expected benefits are being achieved, and to decide if the operation of the system should continue as implemented, or if the system should be modified to achieve benefits to justify continued operation.
3.3 WHO SHOULD DO THE CBA?
One person should be responsible for ensuring that a CBA is done. However, that person will need to assemble a team with expertise inIT systems development and operation, budget, finance, statistics, procurement, IT architecture and the work process being analyzed. A team brings different perspectives to the analysis and the process of estimating costs and benefits, and should ensure more realistic estimates than those of just one person. Additionally, one person rarely has expertise in all of the areas required for a CBA and the knowledge of the work process that is being automated.
3.4 HOW IS THE CBA PERFORMED?
This section briefly describes the steps required to perform a CBA for a large IT project.
3.5 Determine/Define Objectives
The CBA should include the project objectives and other pertinentbackground information so that it stands on its own and can be understood by a reviewer who is not intimately familiar with the organization and its work process. The objectives should be
9
05/05/99 CBA GUIDE FOR NIH IT PROJECTS Revision 1
designed to improve the work process so NIH can better perform its mission. If this information is available from previous steps of the IT management process, it should either be incorporated directly into the CBA or fully referenced in the CBA.
3.5.1 Document Current Process
The baseline for any CBA is the current process. Because understanding the current process provides the basis for decisions regarding new alternatives, a CBA must thoroughly document the current process to ensure that everyone involved in the CBA preparation and review understands that process. The primary areas to be documented are Customer Services, System Capabilities, Technical Architecture, and System Costs.
3.5.2 Estimate Future Requirements
Future customer requirements determine the system capabilities and architecture, and ultimately affect system costs and benefits. Thus, it is very important to accurately estimate the future requirements. The two key items to consider are the system life cycle and the peak life cycle demands. A number of useful forecasting methods are discussed in Section 4.
3.5.3 Collect Cost Data
Cost data must be collected for estimating the cost and benefits of each project alternative. Six sources of data are historical organization experience, current system costs, market research, publications, analyst judgment, and special studies. This step is the preparation for the actually estimating costs and benefitsin later steps.
3.5.4 Choose at Least Three Alternatives
10
05/05/99 CBA GUIDE FOR NIH IT PROJECTS Revision 1
A CBA must present at least three alternatives. One alternative that should be always be included in the CBA is to continue with no change. During the Work Process Evaluation, a number of alternatives may be considered. Other alternatives are whether to do development, operations, and maintenance with in-house personnel or contractors. Each technical approach that is a viable alternative from a work process perspective should be included as an alternative. However, the number of technical approaches may be limited if only one or two are compatible with the NIH IT architecture. Some alternatives can be addressed and rejected because they are not feasible for reasons other than costs and benefits.
3.5.5 Document CBA Assumptions
Because a CBA often relies on many assumptions, it is important to document all of them, and, if possible, justify them on the basis of prior experiences or actual data. For example, you may assume that the PC hardware and software for a system will need to be upgraded every three years. This could be justified on thebasis of the rapid increases in capacity and speed and decreases in cost for PCs over the past 15 years.
This can also be an opportunity to explain why some alternatives were not included in the analysis. Some alternatives are eliminated in the early stages of a CBA because of a conclusion that it is not feasible. If that conclusion is based on an assumption, the assumption must be clearly explained and justified.
3.5.6 Estimate Costs
Many factors must be considered during the process of estimating the costs associated with competing alternatives in a CBA. All costs for the full system life cycle for each competing alternative must be included. The following factors must be addressed: Activities and Resources, Cost Categories, Personnel Costs, Direct and Indirect Costs (Overhead), Depreciation, and
11
05/05/99 CBA GUIDE FOR NIH IT PROJECTS Revision 1
Annual Costs.
3.5.7 Estimate Benefits
Benefits are the services, capabilities, and qualities of each alternative system, and can be viewed as the return from an investment. To estimate benefits, first identify the benefits for both the customers and the organization that provides the service(s) to the customers. Benefits to customers are improvements to the current IT services and/or the addition of new services. Some possible benefits for the servicing organization are productivity gains, staffing reductions, or improved organizational effectiveness.
After the benefits are identified, establish performance measuresfor each benefit. The final step is to estimate the value of thebenefits. If a benefit cannot reasonably be assigned a monetary value, it should be valued using a more subjective, qualitative rating system (which assigns relative numerical values for the competing alternatives). All benefits for the full system life cycle for each competing alternative must be included.
3.5.8 Discount Costs and Benefits
After the costs and benefits for each year of the system life cycle have been estimated, convert them to a common unit of measurement to properly compare competing alternatives. That is accomplished by discounting future dollar values, which transforms future benefits and costs to their “present value.” The present value (also referred to as the discounted value) of afuture amount is calculated with the following formula:
P = F (1/(1+I)n), where P = Present Value, F = Future Value, I = Interest Rate, and n = number of years. Section 4 provides an example that shows how the costs and benefits are discounted.
3.5.9 Evaluate Alternatives
12
05/05/99 CBA GUIDE FOR NIH IT PROJECTS Revision 1
` When the costs and benefits for each competing alternative have been discounted, compare and rank the discounted net value (discounted benefit minus discounted cost) of the competing alternatives. When the alternative with the lowest discounted cost provides the highest discounted benefits, it is clearly the best alternative. Most cases may not be that simple, and other techniques must be used to determine the best alternative. Section 4 describes and provides an example for several differenttechniques.
When some benefits have dollar values assigned, but others do not, the non-cost values can be used as tie-breakers if the cost figures do not show a clear winner among the competing alternatives, and if the non-costed benefits are not key factors.If the non-costed benefits are key factors, the costed benefits can be converted to scaled numeric values consistent with the other non-costed benefits. The evaluation can then be done by comparing the discounted costs and the relative values of the benefits for each alternative. When the alternative with the lowest discounted cost provides the highest relative benefits, itis clearly the best alternative (the same basic rule used when you have discounted benefits). If that is not the case, the evaluation is more complex. Those techniques are addressed in Section 4.
If no benefits have dollar values, numerical values can be assigned (using some relative scale) to each benefit for each competing alternative. The evaluation and ranking are then completed in the manner described in the previous paragraph.
3.5.10 Perform Sensitivity Analysis
Sensitivity analysis tests the sensitivity and reliability of theresults obtained from the cost-benefit analysis. Since the CBA is normally the key document in the investment review process, reviewers want assurance that the analysis is reliable. Sensitivity analysis identifies those input parameters that have the greatest influence on the outcome, repeats the analysis with
13
05/05/99 CBA GUIDE FOR NIH IT PROJECTS Revision 1
different input parameter values, and evaluates the results to determine which, if any, input parameters are sensitive. If a relatively small change in the value of an input parameter changes the alternative selected, then the analysis is consideredto be sensitive to that parameter. If the value of a parameter has to be doubled before there is a change in the selected alternative, the analysis is not considered to be sensitive to that parameter. The estimates for sensitive input parameters should be re-examined to ensure that they are as accurate as possible.
4 THE COST-BENEFIT ANALYSIS PROCESS
The Cost-Benefit Analysis process can be broken down into eleven different steps. Many of the steps and examples were taken from the National Aeronautics and Space Administration (NASA) Outsourcing Guideand Benefit - Cost Model 7. The NASA model and the OMB Circular A-94 guidance served as the primary guides for this document. The examplesprovided here come from a variety of sources, and do not relate to onespecific project. A sample CBA that has been developed, and should beavailable at the same Web site as this guide.
4.1 STEP 1 - DETERMINE/DEFINE PROJECT OBJECTIVES
The CBA should include the project objectives and other pertinent background information so that it stands on its own and can be understood by a reviewer who is not intimately familiar with the organization and its work process. The objectives should be designed to improve the work process so NIH can better perform its mission. This information should be available from previous steps of the NIH IT management process, and should either be incorporateddirectly into the CBA or fully referenced in the CBA. The key items to be addressed are:
Problem Definition - The problem perceived by management must be clearly defined.
Background - Pertinent issues such as staffing, system history,
7NIH was unable to obtain an electronic copy of the NASA document.
14
05/05/99 CBA GUIDE FOR NIH IT PROJECTS Revision 1
customer satisfaction should be addressed. Project Objectives - The objectives should be stated in terms of
supporting the NIH mission.
Although it is important for the reader to understand the project objectives, the crucial issue is that the project manager and management understand what it is that they are trying to accomplish.
In some environments, a CBA may be initiated when management has only generally defined the problem. When that occurs, the time andeffort required to complete the CBA will be increased significantly.
4.2 STEP 2 - DOCUMENT CURRENT PROCESS
Everyone involved in the preparation and review of the CBA needs tounderstand the current process because it is the baseline for nearly all decisions regarding new alternatives. Therefore, the current process must be thoroughly documented. The areas to be addressed are Customer Services, System Capabilities, Technical Architecture, and System Costs. The current documentation should be revised if it does not address these areas, or does not reflect the current environment. If no documentation is available, it willhave to be created.
4.2.1 Customer Services
Because every process or IT system provides services to customers, each customer’s relationship with the processing organization should be clearly documented. This requires documenting the role and placement of the customer in their parent organization and specifically identifying the services provided. For example, one customer may be from the accounting area, and the processing organization may perform data entry, maintain an on-line database, execute data analysis programs on aregular basis, and generate reports. Customer services should be specific and quantified as much as possible. For example, in a typical month, you may input 2
15
05/05/99 CBA GUIDE FOR NIH IT PROJECTS Revision 1
megabytes (MB) of data, spend 10 hours on database maintenance, use 30 minutes of Computer Processing Unit (CPU) time executing programs, and generate 50 pages of reports. Include other activities such as tape mounting, answering user queries, and cyclical fluctuations in services (i.e., year-end reports).
The system outputs and services for internal customers should be defined with the same precision used for external customers.
While this information provides the basis for identifying benefits, most IT system and operational procedures do not explain how the services provided to customers helps them performtheir function faster and/or better. That question is addressed in step 8, Estimating Benefits.
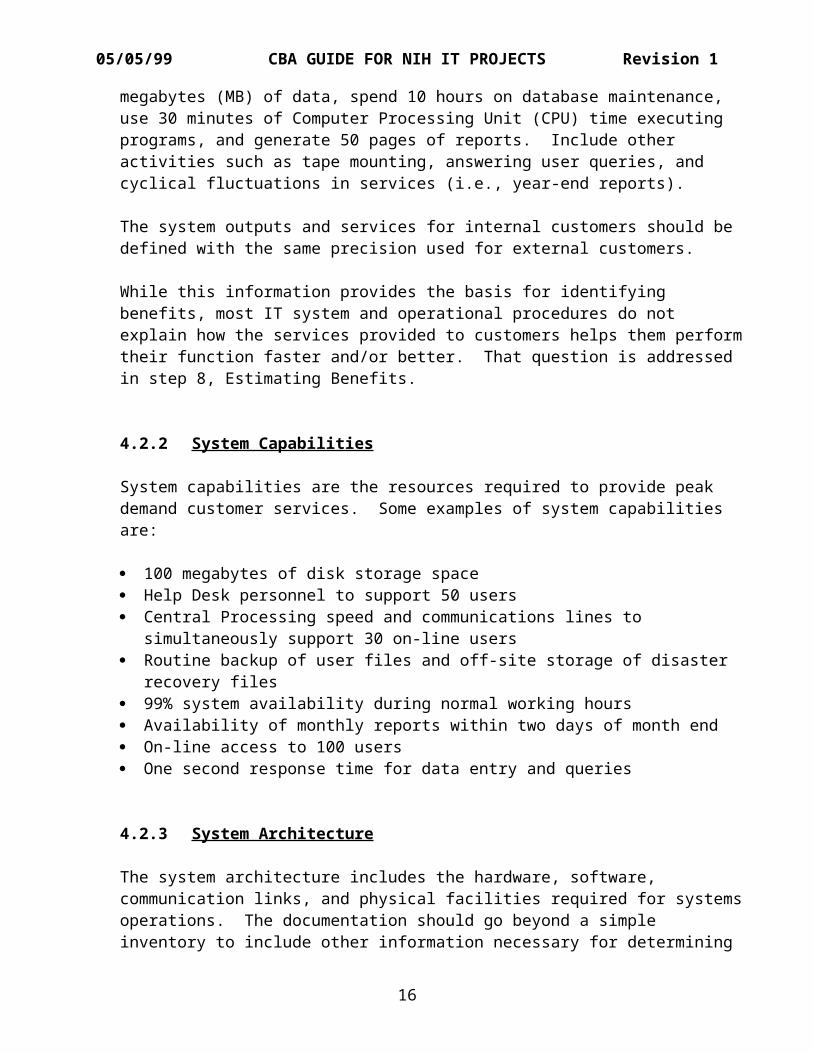
4.2.2 System Capabilities
System capabilities are the resources required to provide peak demand customer services. Some examples of system capabilities are:
100 megabytes of disk storage space Help Desk personnel to support 50 users Central Processing speed and communications lines to
simultaneously support 30 on-line users Routine backup of user files and off-site storage of disaster
recovery files 99% system availability during normal working hours Availability of monthly reports within two days of month end On-line access to 100 users One second response time for data entry and queries
4.2.3 System Architecture
The system architecture includes the hardware, software, communication links, and physical facilities required for systemsoperations. The documentation should go beyond a simple inventory to include other information necessary for determining
16
05/05/99 CBA GUIDE FOR NIH IT PROJECTS Revision 1
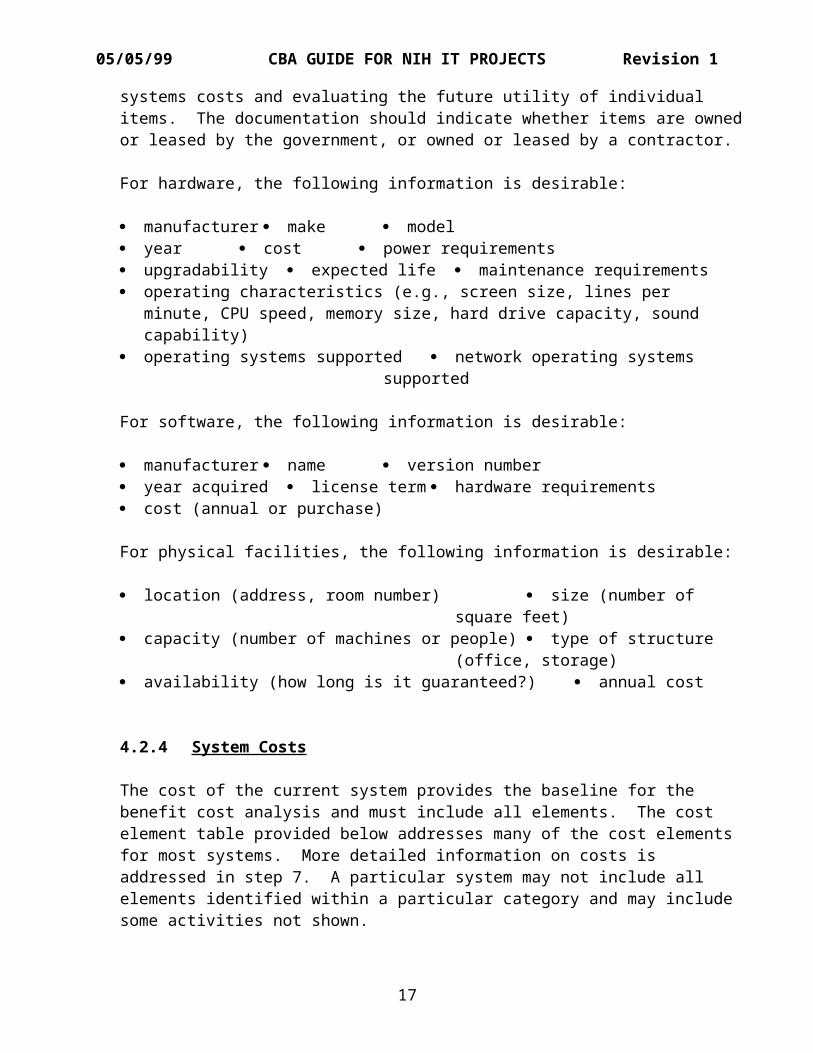
systems costs and evaluating the future utility of individual items. The documentation should indicate whether items are ownedor leased by the government, or owned or leased by a contractor.
For hardware, the following information is desirable:
manufacturer make model year cost power requirements upgradability expected life maintenance requirements operating characteristics (e.g., screen size, lines per
minute, CPU speed, memory size, hard drive capacity, sound capability)
operating systems supported network operating systems supported
For software, the following information is desirable:
manufacturer name version number year acquired license term hardware requirements cost (annual or purchase)
For physical facilities, the following information is desirable:
location (address, room number) size (number of square feet)
capacity (number of machines or people) type of structure (office, storage)
availability (how long is it guaranteed?) annual cost
4.2.4 System Costs
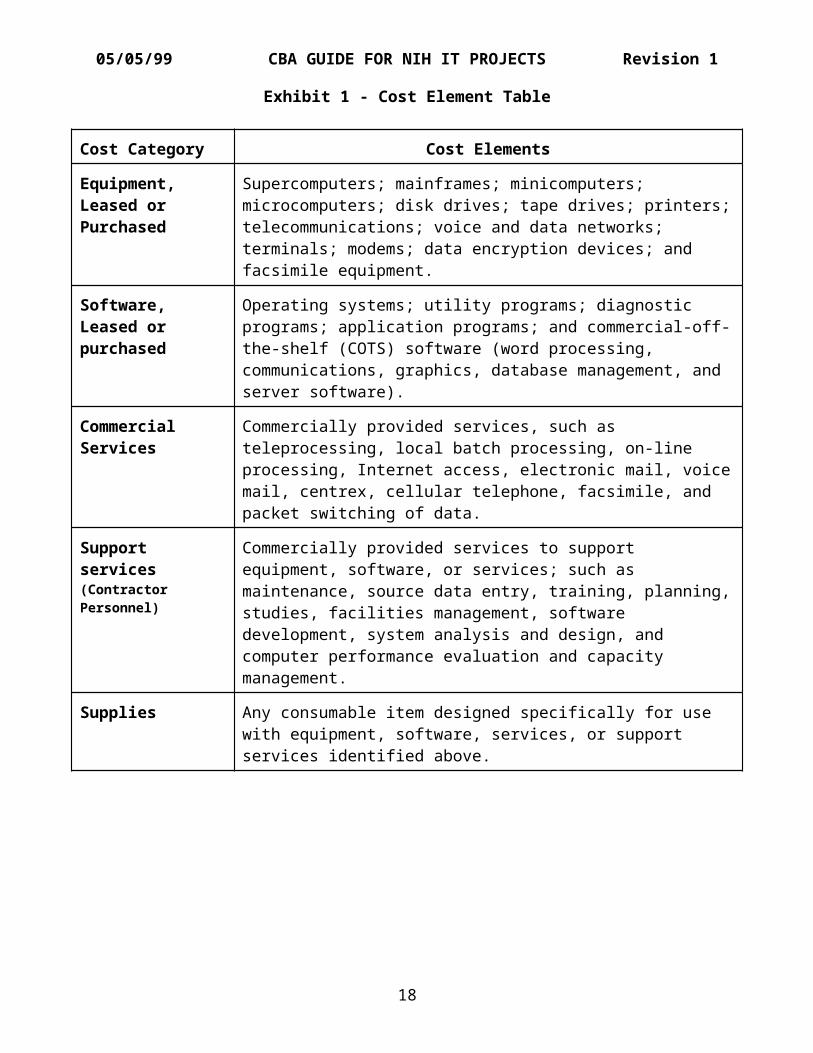
The cost of the current system provides the baseline for the benefit cost analysis and must include all elements. The cost element table provided below addresses many of the cost elements for most systems. More detailed information on costs is addressed in step 7. A particular system may not include all elements identified within a particular category and may include some activities not shown.
17
05/05/99 CBA GUIDE FOR NIH IT PROJECTS Revision 1
Exhibit 1 - Cost Element Table
Cost Category Cost Elements
Equipment,Leased or Purchased
Supercomputers; mainframes; minicomputers; microcomputers; disk drives; tape drives; printers;telecommunications; voice and data networks; terminals; modems; data encryption devices; and facsimile equipment.
Software,Leased or purchased
Operating systems; utility programs; diagnostic programs; application programs; and commercial-off-the-shelf (COTS) software (word processing, communications, graphics, database management, and server software).
Commercial Services
Commercially provided services, such as teleprocessing, local batch processing, on-line processing, Internet access, electronic mail, voicemail, centrex, cellular telephone, facsimile, and packet switching of data.
Support services(Contractor Personnel)
Commercially provided services to support equipment, software, or services; such as maintenance, source data entry, training, planning,studies, facilities management, software development, system analysis and design, and computer performance evaluation and capacity management.
Supplies Any consumable item designed specifically for use with equipment, software, services, or support services identified above.
18
05/05/99 CBA GUIDE FOR NIH IT PROJECTS Revision 1
Cost Category Cost Elements
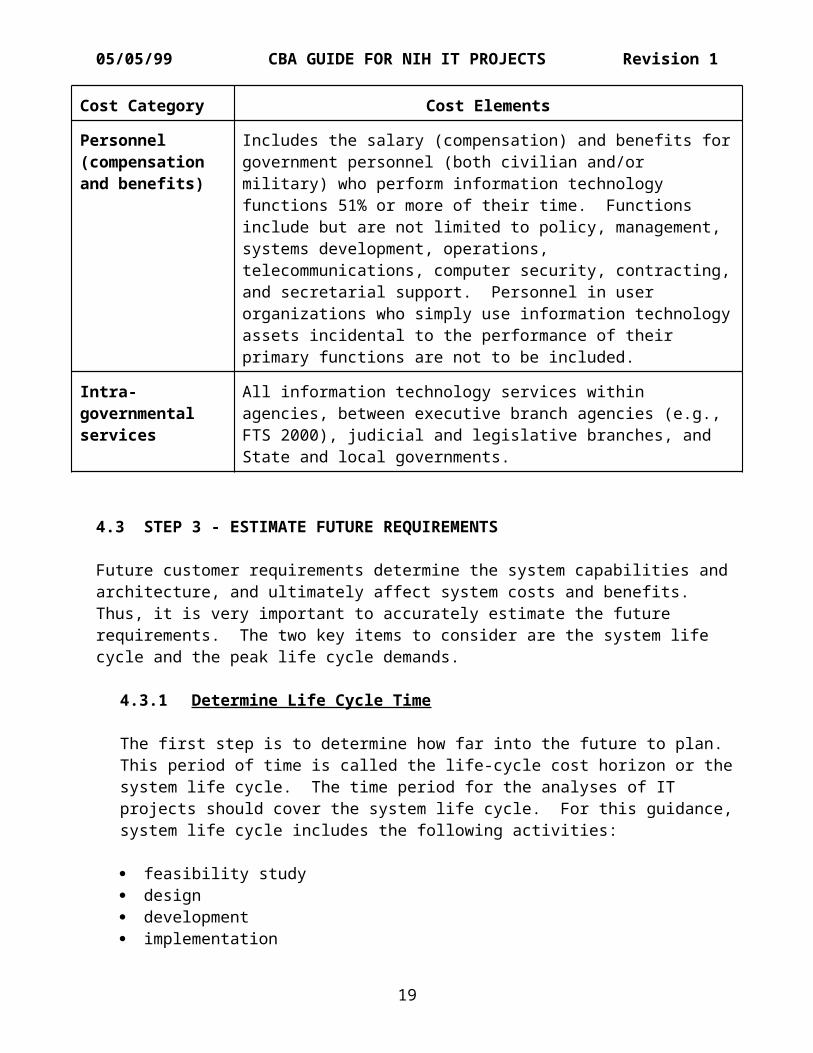
Personnel (compensation and benefits)
Includes the salary (compensation) and benefits forgovernment personnel (both civilian and/or military) who perform information technology functions 51% or more of their time. Functions include but are not limited to policy, management, systems development, operations, telecommunications, computer security, contracting,and secretarial support. Personnel in user organizations who simply use information technologyassets incidental to the performance of their primary functions are not to be included.
Intra-governmental services
All information technology services within agencies, between executive branch agencies (e.g., FTS 2000), judicial and legislative branches, and State and local governments.
4.3 STEP 3 - ESTIMATE FUTURE REQUIREMENTS
Future customer requirements determine the system capabilities and architecture, and ultimately affect system costs and benefits. Thus, it is very important to accurately estimate the future requirements. The two key items to consider are the system life cycle and the peak life cycle demands.
4.3.1 Determine Life Cycle Time
The first step is to determine how far into the future to plan. This period of time is called the life-cycle cost horizon or the system life cycle. The time period for the analyses of IT projects should cover the system life cycle. For this guidance, system life cycle includes the following activities:
feasibility study design development implementation
19
05/05/99 CBA GUIDE FOR NIH IT PROJECTS Revision 1
operation maintenance
A system life cycle ends when the system is terminated or is replaced by a system with significant changes in processing, operational capabilities, resource requirements, or system outputs. Some of the factors to consider are the speed of hardware and software changes, the probability of major changes in system requirements, and the estimated costs of maintaining the system. Large, complex systems should have a life cycle of at least five years, and the maximum length of time for a CBA should normally be no more than 10 or 12 years.
4.3.2 Estimate Life-Cycle Demands
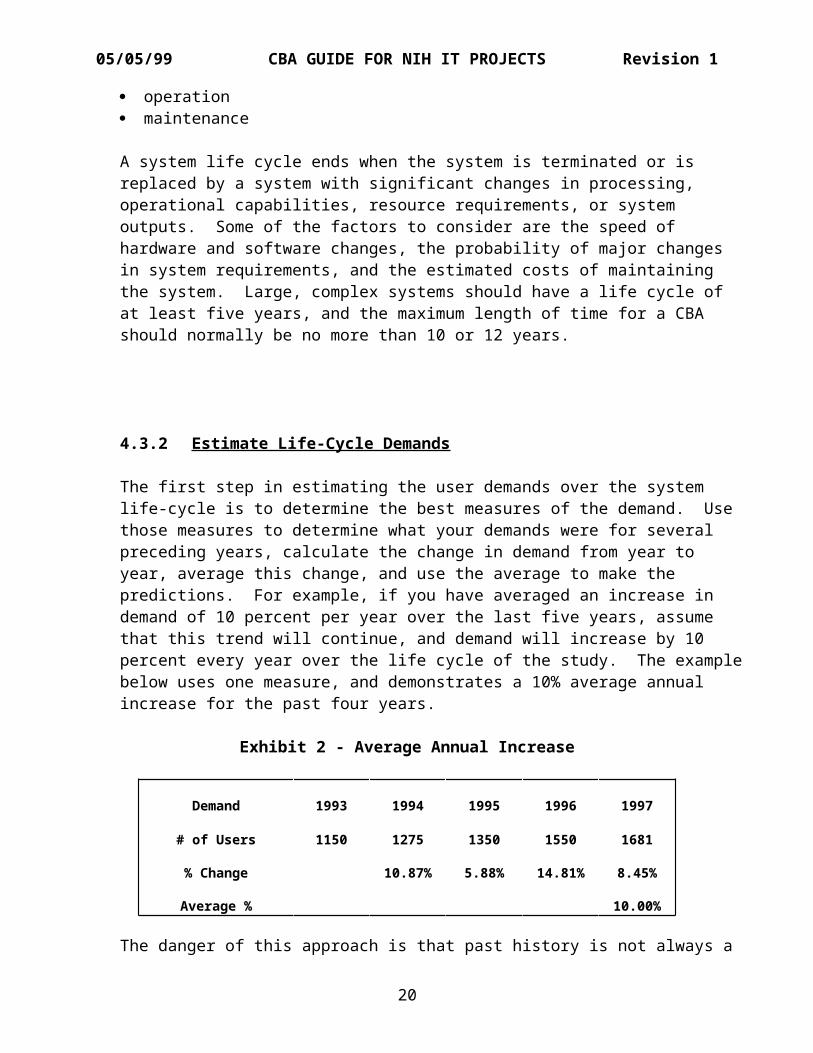
The first step in estimating the user demands over the system life-cycle is to determine the best measures of the demand. Use those measures to determine what your demands were for several preceding years, calculate the change in demand from year to year, average this change, and use the average to make the predictions. For example, if you have averaged an increase in demand of 10 percent per year over the last five years, assume that this trend will continue, and demand will increase by 10 percent every year over the life cycle of the study. The examplebelow uses one measure, and demonstrates a 10% average annual increase for the past four years.
Exhibit 2 - Average Annual Increase
Demand 1993 1994 1995 1996 1997
# of Users 1150 1275 1350 1550 1681
% Change 10.87% 5.88% 14.81% 8.45%
Average % 10.00%
The danger of this approach is that past history is not always a
20
05/05/99 CBA GUIDE FOR NIH IT PROJECTS Revision 1
good indicator of the future. The mainframe computer centers that assumed mainframe usage would continue to increase in the 80's at the same rate as the 70's were not prepared for the PC explosion. Use this method when external factors have been evaluated to confirm that the past should be a good indicator of the future. Consult staff members who have been involved with the current system operation for a significant period of time.
A second method to determine life-cycle demands is to survey yourcustomers. The advantage to the survey method is that it can identify major changes in customer requirements. Another possible outcome to a survey is that you will find that your customers have problems for which there is an IT solution. These“value added” solutions should be noted and quantified for inclusion under benefits. Surveying your customers properly requires time and expertise. Surveys must be prepared carefully and evaluated even more carefully to ensure that the results are interpreted properly. Consider hiring a professional survey organization unless in-house personnel with survey experience areavailable to perform the task or assist the CBA team.
In a complex situation that does not lend itself to the simple methods described above, sophisticated tools, such as time-seriesand regression analysis, can be used to forecast the future. Information on time series analysis can be found in books such asApplied Forecasting Methods by Nick Thomopoulos. A thorough treatmentof regression analysis is provided by Norman Draper and Harry Smith in Applied Regression Analysis. Such tools should only be used by trained, experienced individuals.
4.3.3 Other Considerations
If possible, make more than one forecast using different estimating methods. This will serve as a "sanity check" for the original forecast and add validity to the overall estimate.
Include averages and peak demands in your estimates. If the system is not designed to meet peak demands, there must be a good reason (usually cost) not to do so.
21
05/05/99 CBA GUIDE FOR NIH IT PROJECTS Revision 1
Use professional experience to temper the results of any forecast. Don't ignore this experience with regard to future demands and technology trends. Experience will enable you to identify and explore local IT issues and trends.
Get feedback from other IT professionals on your estimates. Other analysts can point out potential shortcomings in the estimate or provide confirmation of methods and results.
Try for an estimate range in addition to the point estimate. The point estimate is the basis for developing your alternative systems, but the high and low values are extremelyimportant for the sensitivity analysis.
Document everything. Good documentation backs up your estimates, thus minimizing uncertainty during reviews. The documentation will also facilitate the (inevitable) updates tothe estimate.
4.4 STEP 4 - COLLECT COST DATA
Cost data must be collected for estimating the cost and benefits ofeach project alternative. Six sources of data are historical organization experience, current system costs, market research, publications, analyst judgment, and special studies. This is one of the most difficult steps in a CBA, but also on of the most important; the quality of your analysis is only as good as the quality of the cost data.
4.4.1 Historical Organization Data
Historical contract data for an organization can be used to estimate the future purchase price of hardware, software, and services. If contracts were used to provide system support in the past, they can give you the costs for leasing and purchasing hardware and hourly rates for contractor personnel. Contracts for system support services for other systems in your organizations or other ICs can provide comparable cost data for the development and operation of a new system. The numbers will
22
05/05/99 CBA GUIDE FOR NIH IT PROJECTS Revision 1
probably need to be adjusted to account for differing quantities and qualities for the proposed system. If necessary, adjust the cost to reflect current year price levels. Document all adjustments for future reference.
4.4.2 Current System Costs
The cost of your current computer system can be used to price similar alternatives. A study performed by the Department of Housing and Urban Development prior to their decision to outsource IT functions, for example, assumed percentage increasesand decreases from their current system when estimating differentalternatives. Appendix B, Baseline Cost Element Matrix, used fora Federal Aviation Administration study, is another example of using current system costs. Cost elements were addressed in Section 4.2.4 and will be addressed in more detail in Section 4.7
4.4.3 Market Research
Contact several sources to provide cost estimates for computer hardware, software, networks, user support, outsourcing, etc. Prepare clear, detailed performance requirements to be the basis for the estimates. Quotes from multiple sources (if possible) will provide an average figure that should be realistic price. Check the technical content and scope of the quotes: low estimates may be omitting some necessary (and costly) services. Also remember that a vendor quote is not usually prepared with the same level of effort as a bid on a contract.
Vendors are usually happy to provide cost information because it gives them an opportunity to market their services. Be sure to let them know you are only looking for generic cost data for planning and analysis purposes, and that no procurement is planned at the present time. Organizations such as the Gartner Group and IDC Government can also provide assistance in developing cost data.
The government-wide agency contracts (GWACS) are also good
23
05/05/99 CBA GUIDE FOR NIH IT PROJECTS Revision 1
sources of current cost data for personnel, hardware, and software. The CIT Web site for IT Acquisitions (URL = http://www.cit.nih.gov/acqs.html) provides access to a variety ofprocurement vehicles.
4.4.4 Publications
Trade journals and industry publications are also good sources ofcost data. Trade journals usually conduct annual surveys that provide general cost data for IT personnel. Included in this category are government sources such as the General Services Administration (GSA) pricing schedule. The Supplement to the Office of Management (OMB) Circular A-76, "Performance of Commercial Activities," provides inflation rates and tax rates; URL = http://www.whitehouse.gov/OMB/circulars/a076/a076.html
4.4.5 Analyst Judgment
In some cases, data may not be available to provide an adequate cost estimate. In that situation, the best alternative is to usethe judgment and experience of CBA team members to estimate costs. To provide a check against the team’s estimates, discuss them with other IT professionals, both in government and industry. These discussions can highlight the strengths and weaknesses of the estimating logic and provide alternative estimates for comparison. Detailed documentation very important,because it will facilitate your discussions with others and renders a history for later verification and validation.
Analyst judgment is also a legitimate tool for evaluating costs obtained through other means. The team’s experience and knowledge must ensure that data gathered from other sources is applicable to the cost being estimated, and that the data is applied correctly.
4.4.6 Special Studies
Special studies are sometimes done to collect cost data for large
24
05/05/99 CBA GUIDE FOR NIH IT PROJECTS Revision 1
IT projects. For example, the Federal Aviation Administration (FAA), which outsourced its data centers, used three different in-house studies to provide costs for software conversion, internal operations, and potential benefits. These data sources became the foundation of the FAA benefit-cost analysis. While the number and scope of the studies may seem excessive, the FAA was trying to gather as much information as possible before deciding how to spend hundreds of millions on automated data processing. Such studies are not feasible for a quick analysis, but should be considered before committing to outsourcing or other large, mission-critical projects.
4.5 STEP 5 - CHOOSE AT LEAST THREE ALTERNATIVES
A CBA must normally present at least three alternatives. One alternative that should always be included in the CBA is to continue with no change. During the Work Process Evaluation, a number of alternatives may be considered. Other alternatives are whether to do development, operations, and maintenance with in-house personnel or contractors. Each technical approach that is a viable alternative from a work process perspective should be included as an alternative. However, the number of technical approaches may be limited if only one or two are compatible with the NIH IT architecture. Some alternatives can be addressed and rejected because they are not feasible for reasons other than costsand benefits.
Management has probably decided that the no change alternative is unacceptable, or you wouldn’t be looking at other alternatives; however, the costs and benefits of that alternative may not have been documented. Including that alternative should prove that it is not the best alternative. If there are other factors that make the no change alternative unacceptable, that can be documented, andit would not be necessary to compare its costs and benefits againstthe feasible alternatives.
During the early stages of an IT project, there are many alternatives to be considered. This is particularly true during the Work Process Evaluation. If the work process is operating in a
25
05/05/99 CBA GUIDE FOR NIH IT PROJECTS Revision 1
manner that makes maximum use of IT to maximize its efficiency and effectiveness, the process may not need to be changed. If the process can be changed to take advantage of IT, there may be two ormore alternatives that appear to be feasible. If so, they may be alternatives that should be included in the CBA.
The development, operation and maintenance can be done either with in-house personnel or contractors, providing several potential, competing alternatives. The decision to use in-house resources or contractor resources is often a case where in-house resources are not available, so only one alternative may be feasible for the CBA.If that is the case, it should be documented.
When considering the potential use of contractors, it should be noted that, technically, a decision to contract out a specific function must be made following the guidelines in OMB Circular No. A-76, Performance of Commercial Activities. Using a contractor to develop, maintain or operate an IT system does not normally requirean A-76 study, but the circular does contain guidance on determining in-house costs that would be pertinent to a CBA alternative.
Any IT project that involves acquiring equipment should consider the alternatives of leasing and purchasing. With the rapid changesin technology, the useful life of desktop PCs has been reduced to less than 5 years. OMB Circular A-94, Section 13, specifically addresses lease-purchase analysis, and is included here as AppendixC.
4.6 STEP 6 - DOCUMENT CBA ASSUMPTIONS
Because a CBA often relies on many assumptions, it is important to document all of them, and, if possible, justify them on the basis of prior experiences or actual data. For example, you may assume that the PC hardware and software for a system will need to be upgraded every three years. This could be justified on the basis of the rapid increases in capacity and speed and decreases in cost for PCs over the past 15 years.
26
05/05/99 CBA GUIDE FOR NIH IT PROJECTS Revision 1
This can also be an opportunity to explain why some alternatives were not included in the analysis. Some alternatives are eliminated in the early stages of a CBA because of a conclusion that it is not feasible. If that conclusion is based on an assumption, the assumption must be clearly explained and justified.
4.7 STEP 7 - ESTIMATE COSTS
Many factors must be considered during the process of estimating the costs associated with competing alternatives in a CBA. All costs for the full system life cycle for each competing alternativemust be included. The following factors must be addressed: Activities and Resources, Cost Categories, Personnel Costs, Indirect Costs, Depreciation, and Annual Costs.
4.7.1 Activities and Resources
Identify and estimate the costs associated with the initiation, design, development, operation, and maintenance of an IT system. One approach is to identify the activities performed and estimatethe cost of the resources associated with each activity. The activities identified below (or comparable activities that are part of the system life cycle) should be addressed. The tasks associated with the activities listed below are addressed in the NIH IT Management Guide.
Problem Definition Work Process Evaluation Processing Requirements Definition Security Planning IT Performance Measure Development Cost Benefit Analysis IT Investment Review IT Resources Acquisition System Implementation
- Design- Development- Operation- Maintenance
27
05/05/99 CBA GUIDE FOR NIH IT PROJECTS Revision 1
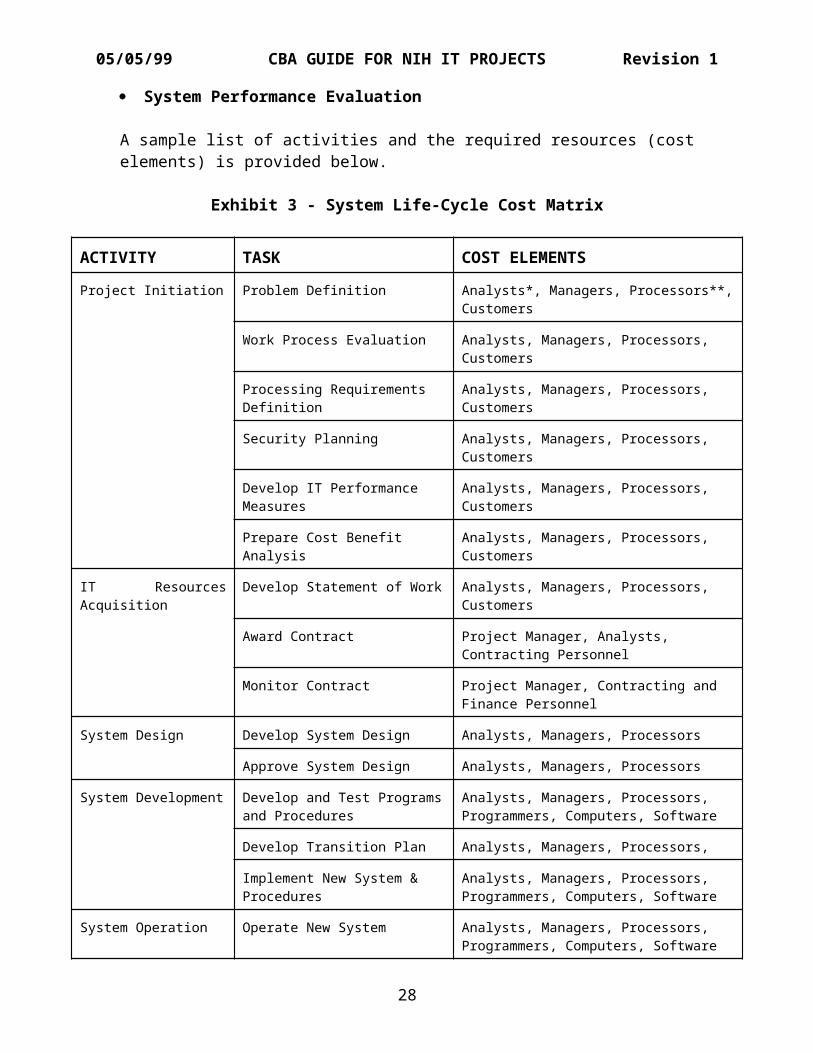
System Performance Evaluation
A sample list of activities and the required resources (cost elements) is provided below.
Exhibit 3 - System Life-Cycle Cost Matrix
ACTIVITY TASK COST ELEMENTS Project Initiation Problem Definition Analysts*, Managers, Processors**,
Customers
Work Process Evaluation Analysts, Managers, Processors, Customers
Processing Requirements Definition
Analysts, Managers, Processors, Customers
Security Planning Analysts, Managers, Processors, Customers
Develop IT Performance Measures
Analysts, Managers, Processors, Customers
Prepare Cost Benefit Analysis
Analysts, Managers, Processors, Customers
IT ResourcesAcquisition
Develop Statement of Work Analysts, Managers, Processors, Customers
Award Contract Project Manager, Analysts, Contracting Personnel
Monitor Contract Project Manager, Contracting and Finance Personnel
System Design Develop System Design Analysts, Managers, Processors
Approve System Design Analysts, Managers, Processors
System Development Develop and Test Programsand Procedures
Analysts, Managers, Processors, Programmers, Computers, Software
Develop Transition Plan Analysts, Managers, Processors,
Implement New System & Procedures
Analysts, Managers, Processors, Programmers, Computers, Software
System Operation Operate New System Analysts, Managers, Processors, Programmers, Computers, Software
28
05/05/99 CBA GUIDE FOR NIH IT PROJECTS Revision 1
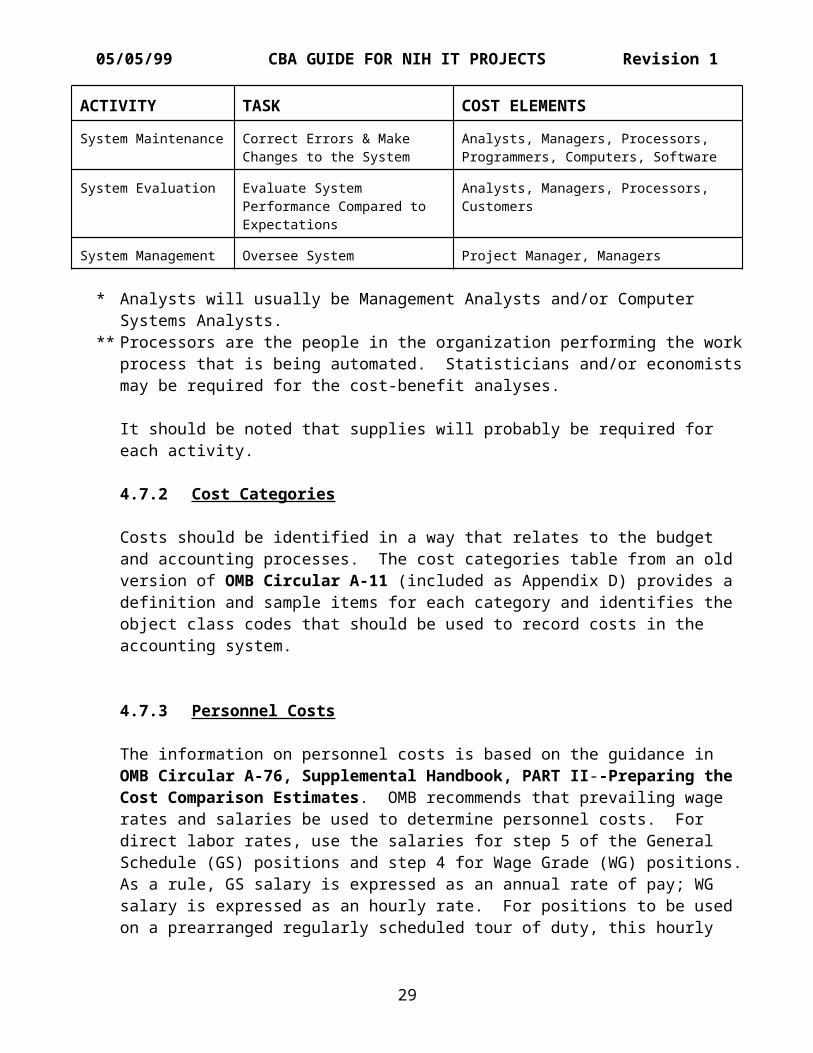
ACTIVITY TASK COST ELEMENTS System Maintenance Correct Errors & Make
Changes to the SystemAnalysts, Managers, Processors, Programmers, Computers, Software
System Evaluation Evaluate System Performance Compared to Expectations
Analysts, Managers, Processors, Customers
System Management Oversee System Project Manager, Managers
* Analysts will usually be Management Analysts and/or Computer Systems Analysts.
** Processors are the people in the organization performing the workprocess that is being automated. Statisticians and/or economistsmay be required for the cost-benefit analyses.
It should be noted that supplies will probably be required for each activity.
4.7.2 Cost Categories
Costs should be identified in a way that relates to the budget and accounting processes. The cost categories table from an old version of OMB Circular A-11 (included as Appendix D) provides a definition and sample items for each category and identifies the object class codes that should be used to record costs in the accounting system.
4.7.3 Personnel Costs
The information on personnel costs is based on the guidance in OMB Circular A-76, Supplemental Handbook, PART II--Preparing the Cost Comparison Estimates. OMB recommends that prevailing wage rates and salaries be used to determine personnel costs. For direct labor rates, use the salaries for step 5 of the General Schedule (GS) positions and step 4 for Wage Grade (WG) positions.As a rule, GS salary is expressed as an annual rate of pay; WG salary is expressed as an hourly rate. For positions to be used on a prearranged regularly scheduled tour of duty, this hourly
29
05/05/99 CBA GUIDE FOR NIH IT PROJECTS Revision 1
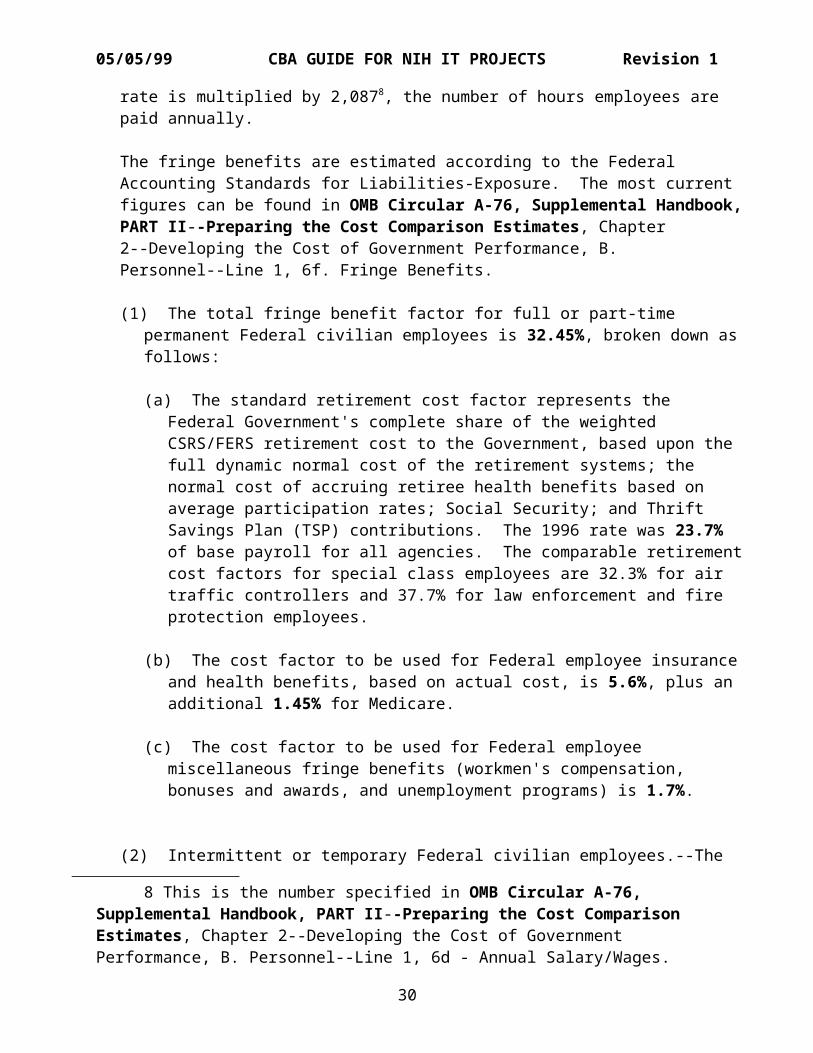
rate is multiplied by 2,0878, the number of hours employees are paid annually.
The fringe benefits are estimated according to the Federal Accounting Standards for Liabilities-Exposure. The most current figures can be found in OMB Circular A-76, Supplemental Handbook,PART II--Preparing the Cost Comparison Estimates, Chapter 2--Developing the Cost of Government Performance, B. Personnel--Line 1, 6f. Fringe Benefits.
(1) The total fringe benefit factor for full or part-time permanent Federal civilian employees is 32.45%, broken down asfollows:
(a) The standard retirement cost factor represents the Federal Government's complete share of the weighted CSRS/FERS retirement cost to the Government, based upon the full dynamic normal cost of the retirement systems; the normal cost of accruing retiree health benefits based on average participation rates; Social Security; and Thrift Savings Plan (TSP) contributions. The 1996 rate was 23.7% of base payroll for all agencies. The comparable retirementcost factors for special class employees are 32.3% for air traffic controllers and 37.7% for law enforcement and fire protection employees.
(b) The cost factor to be used for Federal employee insuranceand health benefits, based on actual cost, is 5.6%, plus an additional 1.45% for Medicare.
(c) The cost factor to be used for Federal employee miscellaneous fringe benefits (workmen's compensation, bonuses and awards, and unemployment programs) is 1.7%.
(2) Intermittent or temporary Federal civilian employees.--The
8 This is the number specified in OMB Circular A-76, Supplemental Handbook, PART II--Preparing the Cost Comparison Estimates, Chapter 2--Developing the Cost of Government Performance, B. Personnel--Line 1, 6d - Annual Salary/Wages.
30
05/05/99 CBA GUIDE FOR NIH IT PROJECTS Revision 1
Federal Insurance Contribution Act (FICA) employer cost factorof 7.65 (or the current rate established by law) will be applied to civilian employees not covered by either of the twocivilian civil service retirement systems (normally intermittent and temporary employees). Apply the FICA rate only to wages and salaries subject to the tax; there is an annual salary limitation for FICA tax.
Example: The 1998 annual salary for a GS-13 employee, step 5, working in the Washington - Baltimore area is $63,431. The annual fringe benefits cost is computed by multiplying the annualsalary($63,431) by .3245, which equals $20,583.36.
4.7.4 Indirect Costs
Direct costs, such as direct labor and direct material, are costsincurred in a process that is “hands on,” that directly produces the output. Indirect costs (often referred to as overhead costs)are incurred in a support role (all costs that are not direct). Typical overhead items are indirect labor, indirect material, andfixed costs such as rent, depreciation, advertising, taxes, utilities, and insurance. Overhead is often expressed as a percentage of direct labor. For example, if an organization has $50,000 of direct labor costs and the overhead costs are $10,000,the overhead rate would be 20% ((10,000/50,000) x 100).
Overhead in the Federal government normally includes two major categories of cost:
Operations Overhead is defined as those costs that are not 100percent attributable to the activity under study, but that aregenerally associated with the recurring management or support of the activity.
General and Administrative Overhead includes salaries, equipment, space and other activities related to headquarters management, accounting, personnel, legal support, data processing management and similar common services performed outside the activity, but in support of it
31
05/05/99 CBA GUIDE FOR NIH IT PROJECTS Revision 1
OMB Circular A-76 specifies 12% as the overhead rate (see 3/96 Supplemental Handbook, Chapter II (Preparing the Cost Comparison Estimates), Section E (Overhead - Line 4)).
To determine the “fully burdened” cost of a government employee, add the overhead costs to the cost of the salary and fringe benefits. In the case of the GS-13, discussed above under Personnel Costs, the annual salary of $63,431 plus fringe benefits of $20,583.36 equals $84,014.36. Overhead is computed by multiplying $84,014.36 by .12, giving $10,081.72. Adding the overhead gives a “fully burdened” cost of $94,096.08. The general formula for the total/fully burdened annual cost would beDirect Annual Salary x 1.48344 (the 1.48344 is equal to 1.3245 x 1.12). The hourly costs can be computed by dividing the annual costs by 2,087.
4.7.5 Depreciation
Depreciation is defined as lowering the estimated value (referredto as book value) of a capital asset (usually only those items valued at $5,000 or more). Depreciation is also defined as the method used to spread the cost of tangible capital assets over anasset's useful life (the number of years it functions as designed). It is computed by comparing the original cost (or value) with the estimated value when it can no longer perform thefunction(s) for which it was designed, its residual or salvage value9. There are a number of ways to compute depreciation, but OMB prefers that straight-line depreciation be used for capital assets.
Exhibit 4, Tangible Asset Depreciation, illustrates straight-line
9 OMB Circular A-76, Appendix 3, USEFUL LIFE AND DISPOSAL VALUES, provides useful life and disposal values for computer resources, but most of the values are 13 to 15 years, which is not realistic. You will have to make those determinations.
32
05/05/99 CBA GUIDE FOR NIH IT PROJECTS Revision 1
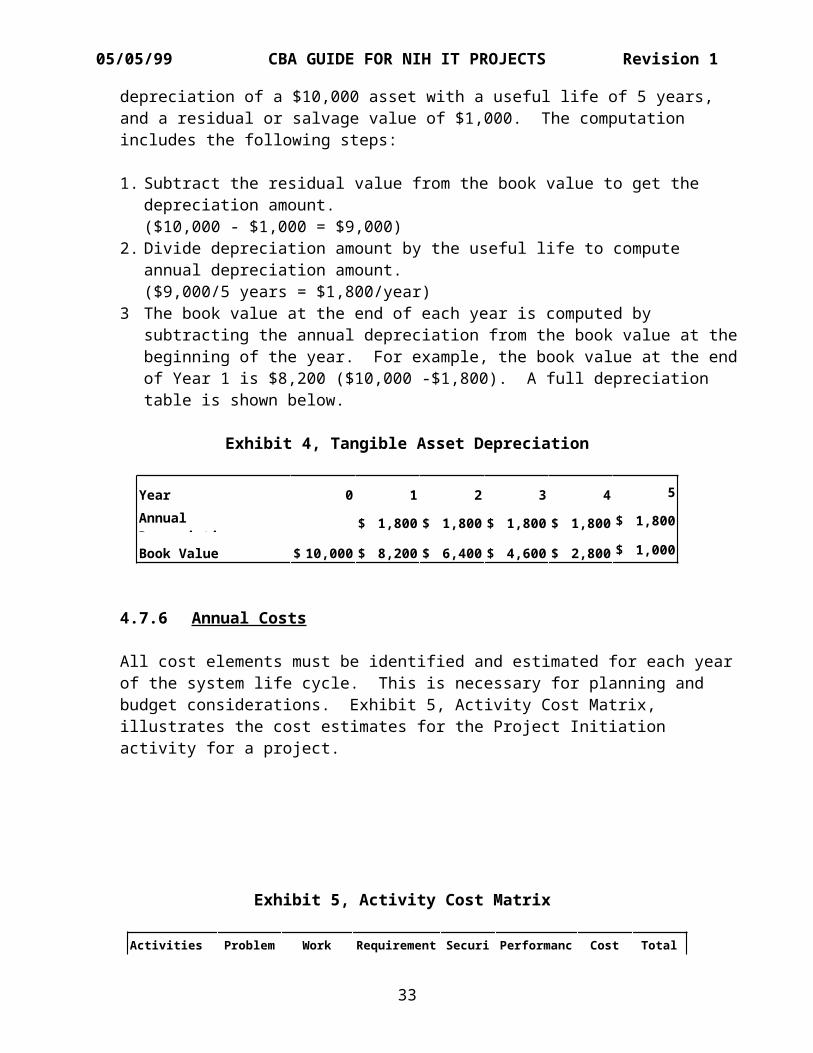
depreciation of a $10,000 asset with a useful life of 5 years, and a residual or salvage value of $1,000. The computation includes the following steps:
1. Subtract the residual value from the book value to get the depreciation amount.($10,000 - $1,000 = $9,000)
2. Divide depreciation amount by the useful life to compute annual depreciation amount.($9,000/5 years = $1,800/year)
3 The book value at the end of each year is computed by subtracting the annual depreciation from the book value at thebeginning of the year. For example, the book value at the endof Year 1 is $8,200 ($10,000 -$1,800). A full depreciation table is shown below.
Exhibit 4, Tangible Asset Depreciation
Year 0 1 2 3 4 5Annual Depreciation
$ 1,800 $ 1,800 $ 1,800 $ 1,800 $ 1,800
Book Value $ 10,000 $ 8,200 $ 6,400 $ 4,600 $ 2,800 $ 1,000
4.7.6 Annual Costs
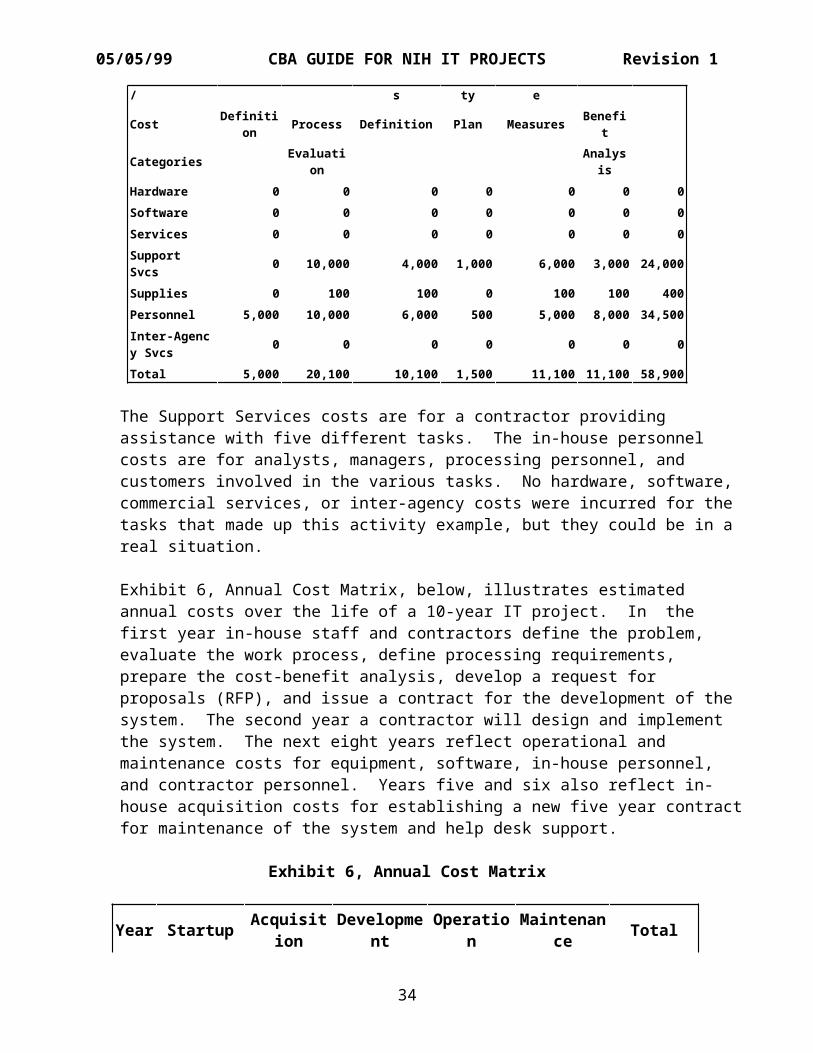
All cost elements must be identified and estimated for each year of the system life cycle. This is necessary for planning and budget considerations. Exhibit 5, Activity Cost Matrix, illustrates the cost estimates for the Project Initiation activity for a project.
Exhibit 5, Activity Cost Matrix
Activities Problem Work Requirement Securi Performanc Cost Total
33
05/05/99 CBA GUIDE FOR NIH IT PROJECTS Revision 1
/ s ty e
Cost Definition Process Definition Plan Measures Benefi
t
Categories Evaluation
Analysis
Hardware 0 0 0 0 0 0 0Software 0 0 0 0 0 0 0Services 0 0 0 0 0 0 0Support Svcs 0 10,000 4,000 1,000 6,000 3,000 24,000
Supplies 0 100 100 0 100 100 400Personnel 5,000 10,000 6,000 500 5,000 8,000 34,500Inter-Agency Svcs 0 0 0 0 0 0 0
Total 5,000 20,100 10,100 1,500 11,100 11,100 58,900
The Support Services costs are for a contractor providing assistance with five different tasks. The in-house personnel costs are for analysts, managers, processing personnel, and customers involved in the various tasks. No hardware, software, commercial services, or inter-agency costs were incurred for the tasks that made up this activity example, but they could be in a real situation.
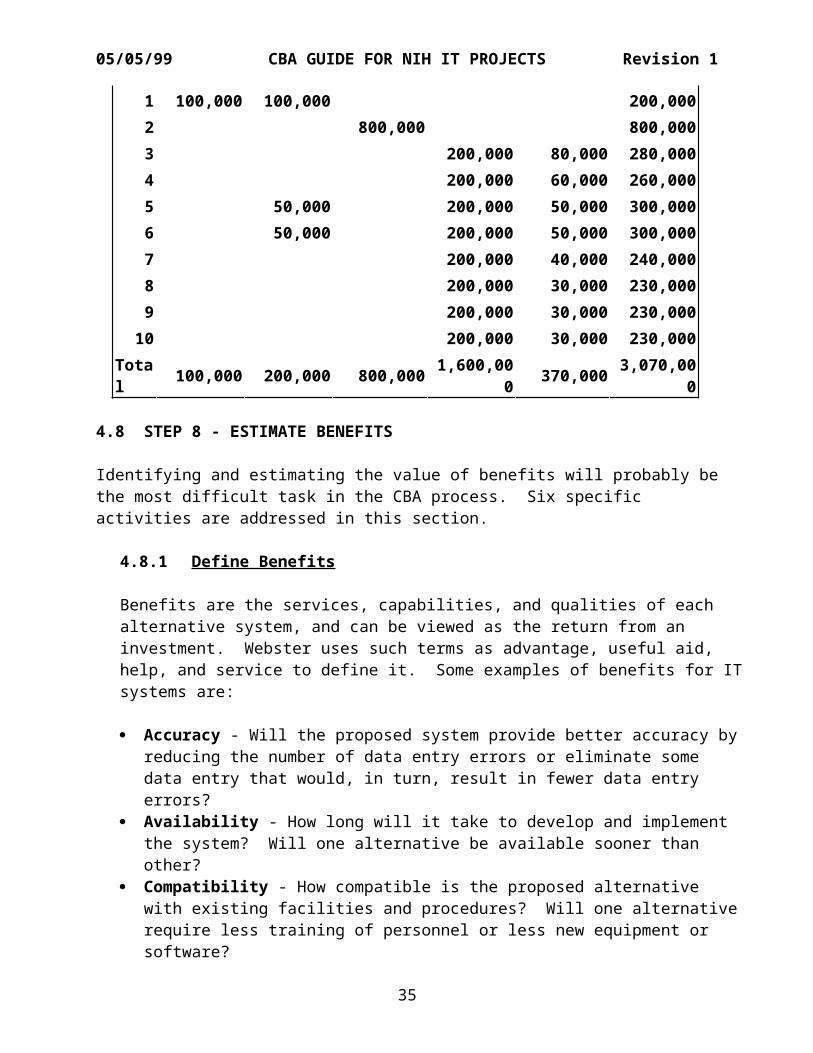
Exhibit 6, Annual Cost Matrix, below, illustrates estimated annual costs over the life of a 10-year IT project. In the first year in-house staff and contractors define the problem, evaluate the work process, define processing requirements, prepare the cost-benefit analysis, develop a request for proposals (RFP), and issue a contract for the development of the system. The second year a contractor will design and implement the system. The next eight years reflect operational and maintenance costs for equipment, software, in-house personnel, and contractor personnel. Years five and six also reflect in-house acquisition costs for establishing a new five year contractfor maintenance of the system and help desk support.
Exhibit 6, Annual Cost Matrix
Year Startup Acquisition
Development
Operation
Maintenance Total
34
05/05/99 CBA GUIDE FOR NIH IT PROJECTS Revision 1
1 100,000 100,000 200,0002 800,000 800,0003 200,000 80,000 280,0004 200,000 60,000 260,0005 50,000 200,000 50,000 300,0006 50,000 200,000 50,000 300,0007 200,000 40,000 240,0008 200,000 30,000 230,0009 200,000 30,000 230,00010 200,000 30,000 230,000
Total 100,000 200,000 800,000 1,600,00
0 370,000 3,070,000
4.8 STEP 8 - ESTIMATE BENEFITS
Identifying and estimating the value of benefits will probably be the most difficult task in the CBA process. Six specific activities are addressed in this section.
4.8.1 Define Benefits
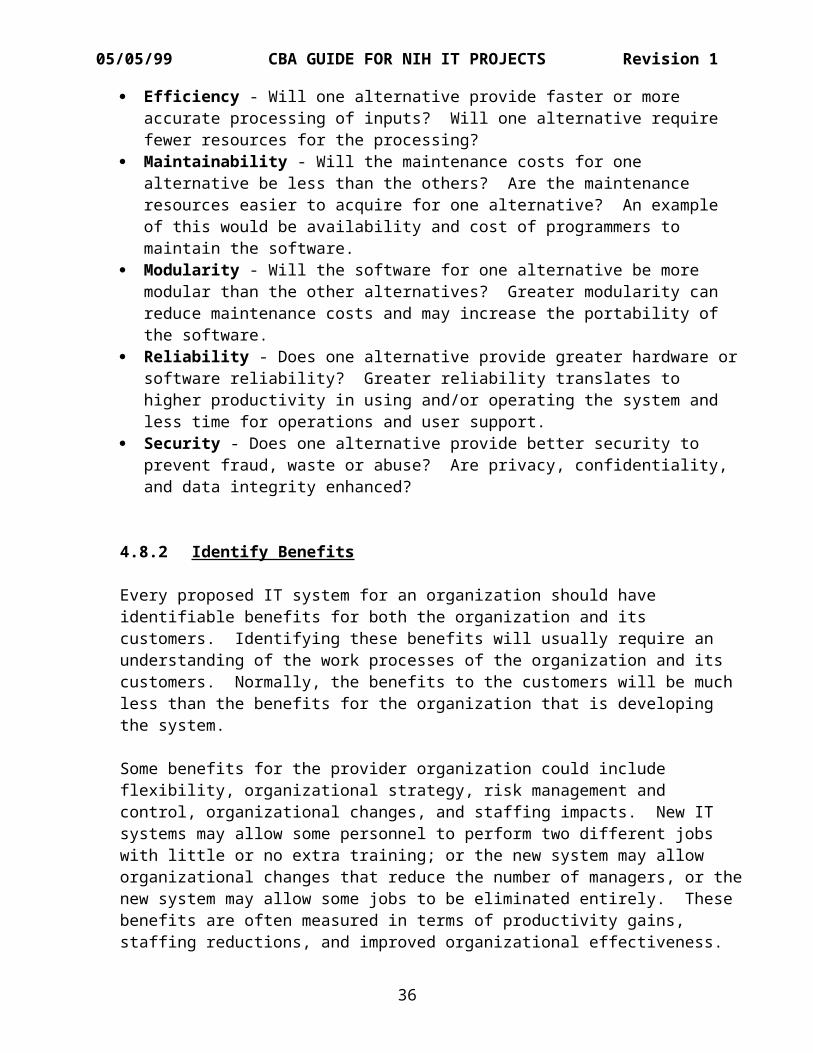
Benefits are the services, capabilities, and qualities of each alternative system, and can be viewed as the return from an investment. Webster uses such terms as advantage, useful aid, help, and service to define it. Some examples of benefits for ITsystems are:
Accuracy - Will the proposed system provide better accuracy byreducing the number of data entry errors or eliminate some data entry that would, in turn, result in fewer data entry errors?
Availability - How long will it take to develop and implement the system? Will one alternative be available sooner than other?
Compatibility - How compatible is the proposed alternative with existing facilities and procedures? Will one alternativerequire less training of personnel or less new equipment or software?
35
05/05/99 CBA GUIDE FOR NIH IT PROJECTS Revision 1
Efficiency - Will one alternative provide faster or more accurate processing of inputs? Will one alternative require fewer resources for the processing?
Maintainability - Will the maintenance costs for one alternative be less than the others? Are the maintenance resources easier to acquire for one alternative? An example of this would be availability and cost of programmers to maintain the software.
Modularity - Will the software for one alternative be more modular than the other alternatives? Greater modularity can reduce maintenance costs and may increase the portability of the software.
Reliability - Does one alternative provide greater hardware orsoftware reliability? Greater reliability translates to higher productivity in using and/or operating the system and less time for operations and user support.
Security - Does one alternative provide better security to prevent fraud, waste or abuse? Are privacy, confidentiality, and data integrity enhanced?
4.8.2 Identify Benefits
Every proposed IT system for an organization should have identifiable benefits for both the organization and its customers. Identifying these benefits will usually require an understanding of the work processes of the organization and its customers. Normally, the benefits to the customers will be much less than the benefits for the organization that is developing the system.
Some benefits for the provider organization could include flexibility, organizational strategy, risk management and control, organizational changes, and staffing impacts. New IT systems may allow some personnel to perform two different jobs with little or no extra training; or the new system may allow organizational changes that reduce the number of managers, or thenew system may allow some jobs to be eliminated entirely. These benefits are often measured in terms of productivity gains, staffing reductions, and improved organizational effectiveness.
36
05/05/99 CBA GUIDE FOR NIH IT PROJECTS Revision 1
Possible benefits to customers include improvements to the current IT services and the addition of new services. These benefits can be measured in terms of productivity gains and cost savings, but the customers must be the ones to identify and determine how to measure and evaluate the benefits. Customer surveys are often needed to identify these benefits. At a minimum, the customers should be interviewed to identify the potential impacts of new or modified systems.
Many of the benefits discussed here are very general, and, in actual practice, they will need to be defined more precisely. For example, the benefits of greater accuracy may be defined as in terms of reduced personnel costs for data entry, error detection, and correction of errors.
4.8.3 Establish Measurement Criteria
Establishing measurement criteria for benefits is crucial becauseof the Government Performance and Results Act (GPRA) and the Information Technology Management Reform Act (ITMRA). These Actsboth emphasize having tangible measures of success (benefits) that are related to the overall mission and goals of the organization.
Establishing performance measures is a difficult task, especiallyfor an activity that is in the planning stage. Fortunately, mostIT systems have similar systems that can be used as guides for measuring benefits. The CIT Web site has a Performance Measures site, http://irm.cit.nih.gov/itmra/perfmeasure.html, that provides a wide range of documents and links to other sites with information related to performance measures. Some general concepts relating to performance measures are addressed below.
Some of the generic performance measures used to account for the value and impact of information technology are:
Improvements in process/product/service Cycle time reduction
37
05/05/99 CBA GUIDE FOR NIH IT PROJECTS Revision 1
Customer Satisfaction Cost-effectiveness
The National Academy of Public Administration (NAPA) performed a study for the Department of Defense (DOD) and identified the following generic information management performance measures:
Percent change in life cycle costs Percent change in work process cycle time Percent change in acquisition time to deliver a product or
service Percent change in functional products/services quality
(e.g., fewer errors in transactions) Percent change in satisfied customers Percent change in major automated information systems
projects that are on schedule, within budget, and achieve expected results
Percent change in systems that comply with architectures andstandards
Percentage of systems project management staff which meet acquisition and information management education and training requirements
Some of the “Lessons Learned” by NAPA are:
Involve key stakeholders Focus first on most costly or troubled programs Develop measures in the context of goal setting (plans) &
management controls (budgets) Choose measures that are outcome-oriented, quantifiable, and
can demonstrate value Select a “vital few” (concentrate on 3 or 4 good measures) Do not overpromise Educate and train stakeholders in performance measurements
4.8.4 Classify Benefits
Benefits that are “capable of being appraised at an actual or approximate value” are called tangible benefits. Benefits that cannot be assigned a dollar value are called intangible benefits.
38
05/05/99 CBA GUIDE FOR NIH IT PROJECTS Revision 1
A good example of a tangible benefit is lower hardware costs; it is the difference between two dollar values for hardware. By subtracting the cost of hardware for the proposed system ($100,000) from the cost of the current system hardware ($150,000) we compute a savings (benefit) of $50,000. An exampleof an intangible benefit is flexibility. A proposed system may allow a manager to have two or three different people perform thesame job without significant training expense. This could keep asystem operational if one or more employees were out of the office for a period of time, but it would be impossible to assigna realistic dollar value to that capability. The value would depend on the impact of a portion of a system being inoperable for a period of time, the length of that time, and the frequency of that situation occurring.
4.8.5 Estimate Tangible Benefits
The process of estimating the dollar value of a benefit is similar to the cost estimation process discussed in the previous section. The dollar value of benefits can be estimated by determining the fair market of the benefits. These dollar valuesare then assigned to the year in which the benefits will occur. If a benefit cannot be associated with a particular year, and that benefit is expected to be realized over the life-cycle of the study, you may allocate the dollar value of the benefit equally to each year of the study. The benefit value may also beassigned to specific years with different values for each year.
Market Research quotes can also be useful in determining benefit value. An important economic principle used in estimating publicbenefits is the market value concept. Market value is the price that a private sector organization would pay to purchase a product or service. When valuing new services that an upgraded IT system could provide, it may be useful to determine how much acompany would charge to provide such a service. When increased productivity or reductions in personnel are the projected benefits, the value of the personnel time can be computed just assystems costs for personnel are computed.
4.8.6 Quantify Intangible Benefits
39
05/05/99 CBA GUIDE FOR NIH IT PROJECTS Revision 1
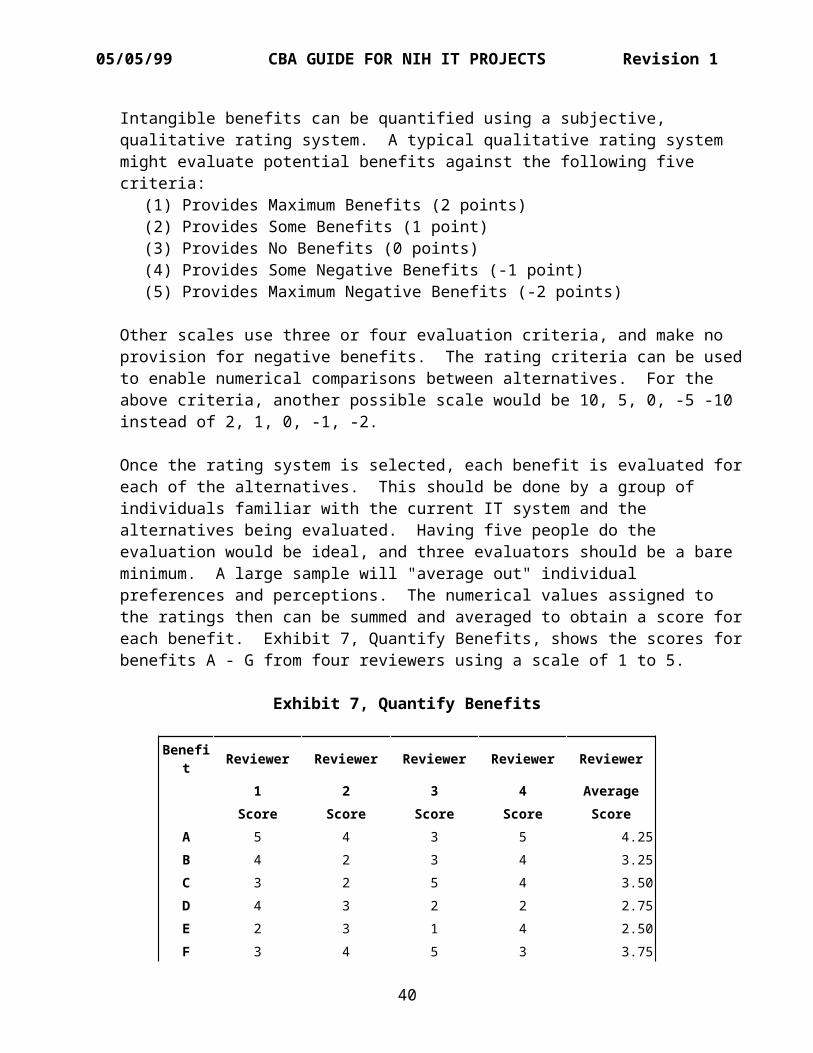
Intangible benefits can be quantified using a subjective, qualitative rating system. A typical qualitative rating system might evaluate potential benefits against the following five criteria:
(1) Provides Maximum Benefits (2 points) (2) Provides Some Benefits (1 point)(3) Provides No Benefits (0 points)(4) Provides Some Negative Benefits (-1 point) (5) Provides Maximum Negative Benefits (-2 points)
Other scales use three or four evaluation criteria, and make no provision for negative benefits. The rating criteria can be usedto enable numerical comparisons between alternatives. For the above criteria, another possible scale would be 10, 5, 0, -5 -10 instead of 2, 1, 0, -1, -2.
Once the rating system is selected, each benefit is evaluated foreach of the alternatives. This should be done by a group of individuals familiar with the current IT system and the alternatives being evaluated. Having five people do the evaluation would be ideal, and three evaluators should be a bare minimum. A large sample will "average out" individual preferences and perceptions. The numerical values assigned to the ratings then can be summed and averaged to obtain a score foreach benefit. Exhibit 7, Quantify Benefits, shows the scores forbenefits A - G from four reviewers using a scale of 1 to 5.
Exhibit 7, Quantify Benefits
Benefit Reviewer Reviewer Reviewer Reviewer Reviewer
1 2 3 4 AverageScore Score Score Score Score
A 5 4 3 5 4.25B 4 2 3 4 3.25C 3 2 5 4 3.50D 4 3 2 2 2.75E 2 3 1 4 2.50F 3 4 5 3 3.75
40
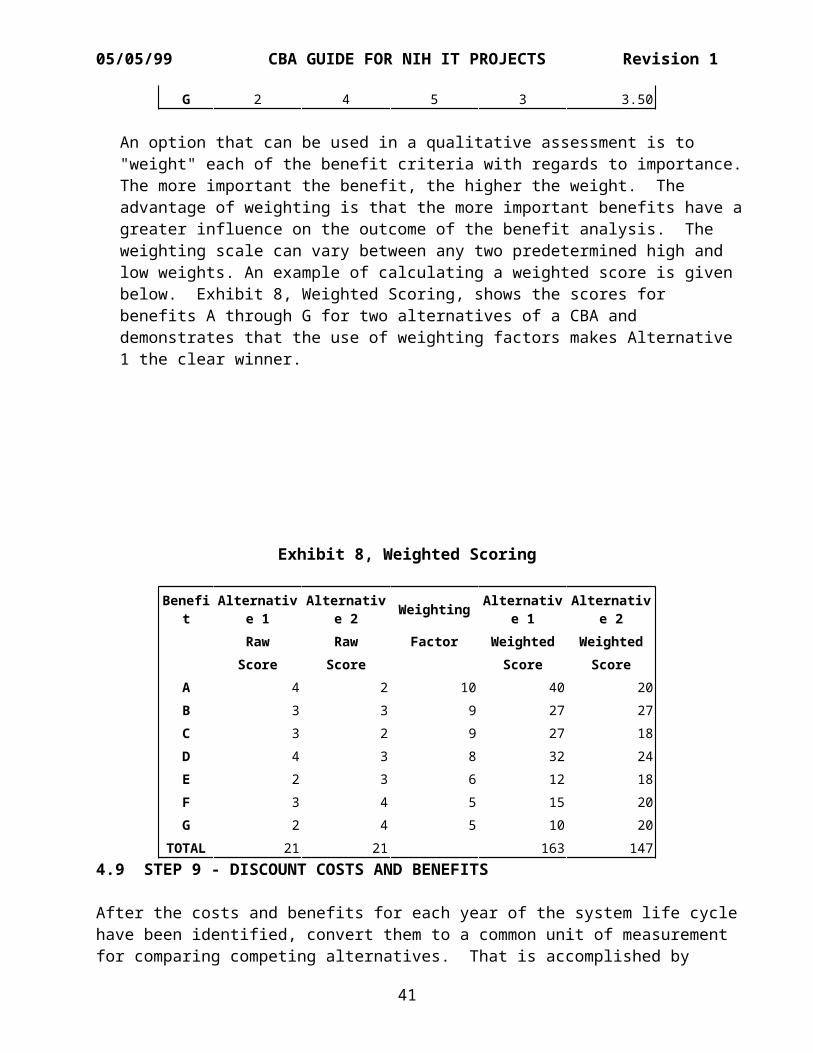
05/05/99 CBA GUIDE FOR NIH IT PROJECTS Revision 1
G 2 4 5 3 3.50
An option that can be used in a qualitative assessment is to "weight" each of the benefit criteria with regards to importance.The more important the benefit, the higher the weight. The advantage of weighting is that the more important benefits have agreater influence on the outcome of the benefit analysis. The weighting scale can vary between any two predetermined high and low weights. An example of calculating a weighted score is given below. Exhibit 8, Weighted Scoring, shows the scores for benefits A through G for two alternatives of a CBA and demonstrates that the use of weighting factors makes Alternative 1 the clear winner.
Exhibit 8, Weighted Scoring
Benefit
Alternative 1
Alternative 2 Weighting Alternativ
e 1Alternativ
e 2Raw Raw Factor Weighted WeightedScore Score Score Score
A 4 2 10 40 20B 3 3 9 27 27C 3 2 9 27 18D 4 3 8 32 24E 2 3 6 12 18F 3 4 5 15 20G 2 4 5 10 20
TOTAL 21 21 163 1474.9 STEP 9 - DISCOUNT COSTS AND BENEFITS
After the costs and benefits for each year of the system life cyclehave been identified, convert them to a common unit of measurement for comparing competing alternatives. That is accomplished by
41
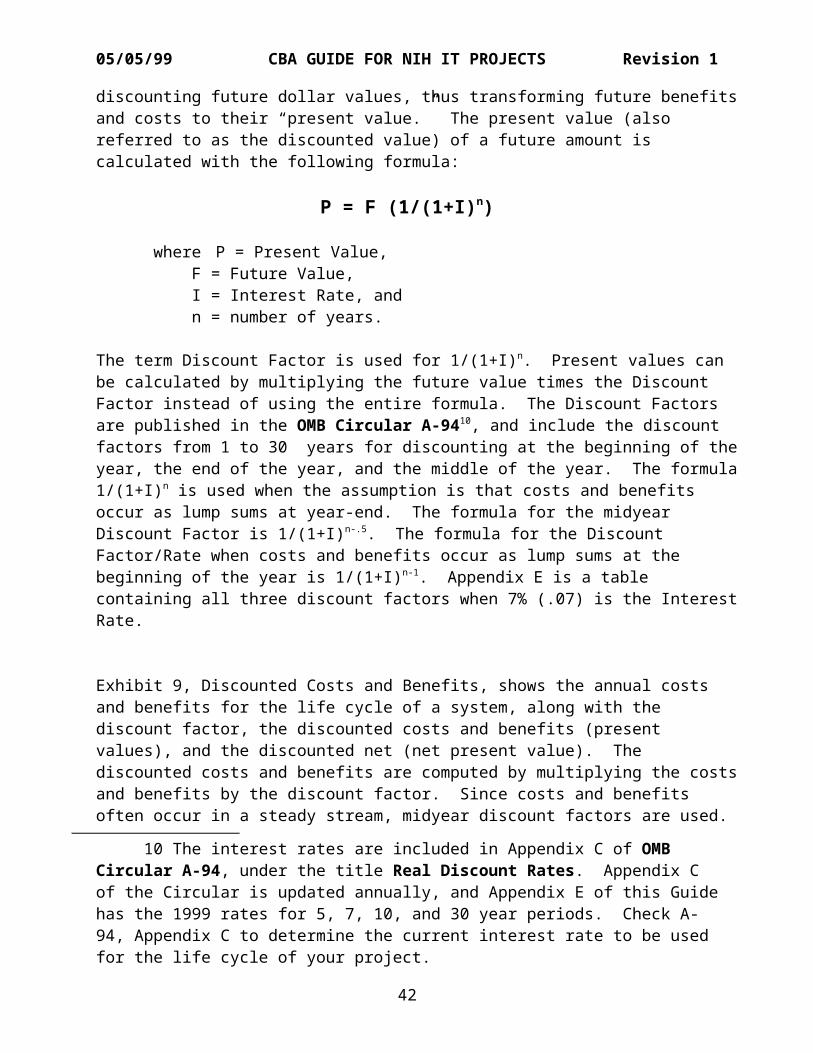
05/05/99 CBA GUIDE FOR NIH IT PROJECTS Revision 1
discounting future dollar values, thus transforming future benefitsand costs to their “present value.” The present value (also referred to as the discounted value) of a future amount is calculated with the following formula:
P = F (1/(1+I)n)
where P = Present Value, F = Future Value, I = Interest Rate, and n = number of years.
The term Discount Factor is used for 1/(1+I)n. Present values can be calculated by multiplying the future value times the Discount Factor instead of using the entire formula. The Discount Factors are published in the OMB Circular A-9410, and include the discount factors from 1 to 30 years for discounting at the beginning of theyear, the end of the year, and the middle of the year. The formula1/(1+I)n is used when the assumption is that costs and benefits occur as lump sums at year-end. The formula for the midyear Discount Factor is 1/(1+I)n-.5. The formula for the Discount Factor/Rate when costs and benefits occur as lump sums at the beginning of the year is 1/(1+I)n-1. Appendix E is a table containing all three discount factors when 7% (.07) is the InterestRate.
Exhibit 9, Discounted Costs and Benefits, shows the annual costs and benefits for the life cycle of a system, along with the discount factor, the discounted costs and benefits (present values), and the discounted net (net present value). The discounted costs and benefits are computed by multiplying the costsand benefits by the discount factor. Since costs and benefits often occur in a steady stream, midyear discount factors are used.
10 The interest rates are included in Appendix C of OMB Circular A-94, under the title Real Discount Rates. Appendix C of the Circular is updated annually, and Appendix E of this Guidehas the 1999 rates for 5, 7, 10, and 30 year periods. Check A-94, Appendix C to determine the current interest rate to be used for the life cycle of your project.
42
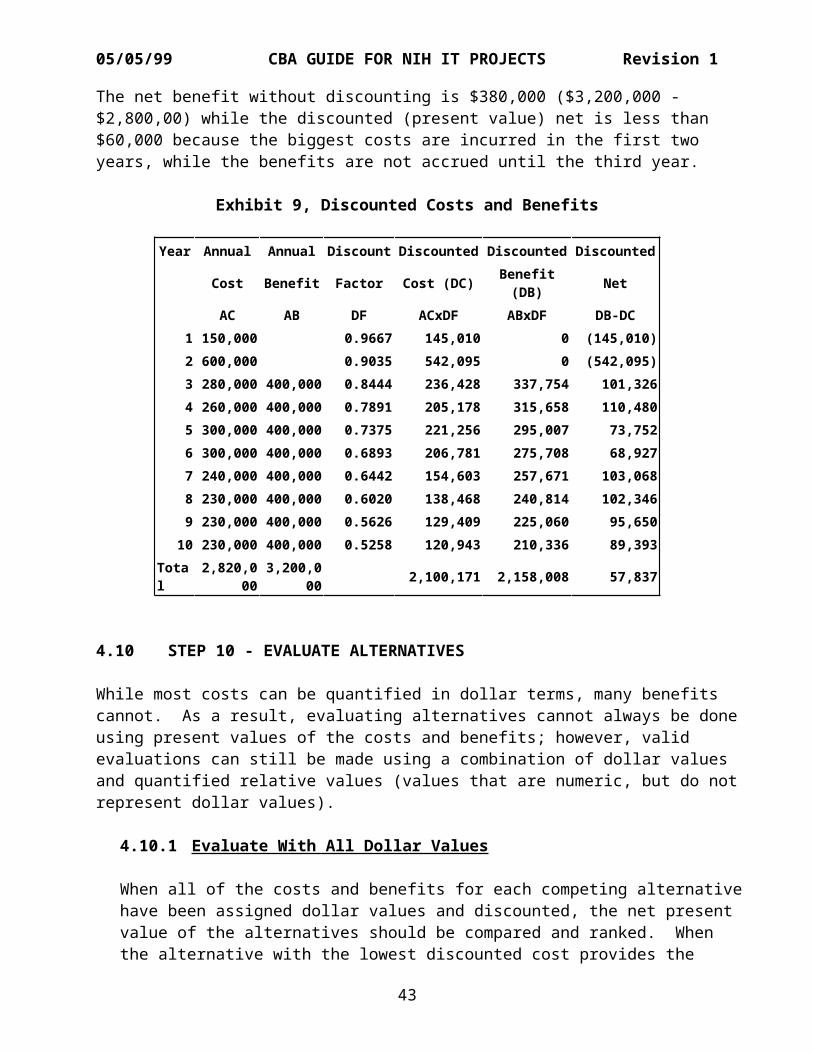
05/05/99 CBA GUIDE FOR NIH IT PROJECTS Revision 1
The net benefit without discounting is $380,000 ($3,200,000 - $2,800,00) while the discounted (present value) net is less than $60,000 because the biggest costs are incurred in the first two years, while the benefits are not accrued until the third year.
Exhibit 9, Discounted Costs and Benefits
Year Annual Annual Discount Discounted Discounted Discounted
Cost Benefit Factor Cost (DC) Benefit(DB) Net
AC AB DF ACxDF ABxDF DB-DC1 150,000 0.9667 145,010 0 (145,010)2 600,000 0.9035 542,095 0 (542,095)3 280,000 400,000 0.8444 236,428 337,754 101,3264 260,000 400,000 0.7891 205,178 315,658 110,4805 300,000 400,000 0.7375 221,256 295,007 73,7526 300,000 400,000 0.6893 206,781 275,708 68,9277 240,000 400,000 0.6442 154,603 257,671 103,0688 230,000 400,000 0.6020 138,468 240,814 102,3469 230,000 400,000 0.5626 129,409 225,060 95,65010 230,000 400,000 0.5258 120,943 210,336 89,393
Total
2,820,000
3,200,000 2,100,171 2,158,008 57,837
4.10 STEP 10 - EVALUATE ALTERNATIVES
While most costs can be quantified in dollar terms, many benefits cannot. As a result, evaluating alternatives cannot always be doneusing present values of the costs and benefits; however, valid evaluations can still be made using a combination of dollar values and quantified relative values (values that are numeric, but do notrepresent dollar values).
4.10.1 Evaluate With All Dollar Values
When all of the costs and benefits for each competing alternativehave been assigned dollar values and discounted, the net present value of the alternatives should be compared and ranked. When the alternative with the lowest discounted cost provides the
43
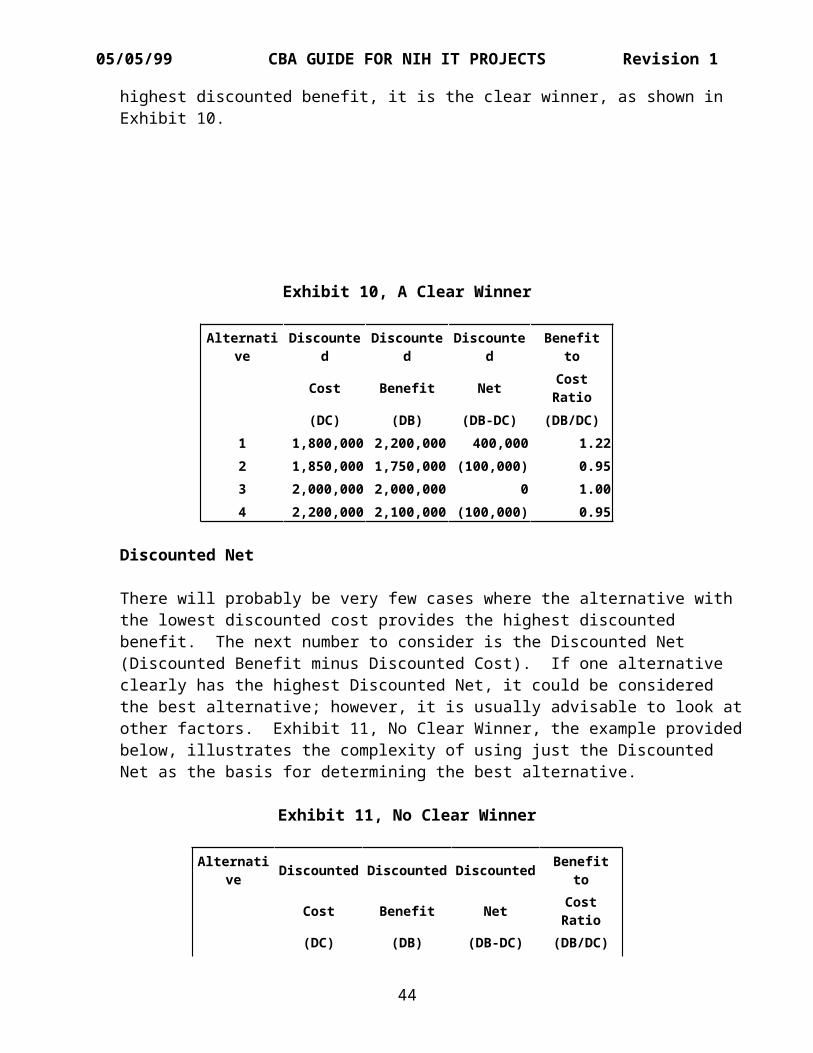
05/05/99 CBA GUIDE FOR NIH IT PROJECTS Revision 1
highest discounted benefit, it is the clear winner, as shown in Exhibit 10.
Exhibit 10, A Clear Winner
Alternative
Discounted
Discounted
Discounted
Benefitto
Cost Benefit Net CostRatio
(DC) (DB) (DB-DC) (DB/DC)1 1,800,000 2,200,000 400,000 1.222 1,850,000 1,750,000 (100,000) 0.953 2,000,000 2,000,000 0 1.004 2,200,000 2,100,000 (100,000) 0.95
Discounted Net
There will probably be very few cases where the alternative with the lowest discounted cost provides the highest discounted benefit. The next number to consider is the Discounted Net (Discounted Benefit minus Discounted Cost). If one alternative clearly has the highest Discounted Net, it could be considered the best alternative; however, it is usually advisable to look atother factors. Exhibit 11, No Clear Winner, the example providedbelow, illustrates the complexity of using just the Discounted Net as the basis for determining the best alternative.
Exhibit 11, No Clear Winner
Alternative Discounted Discounted Discounted Benefit
to
Cost Benefit Net CostRatio
(DC) (DB) (DB-DC) (DB/DC)
44
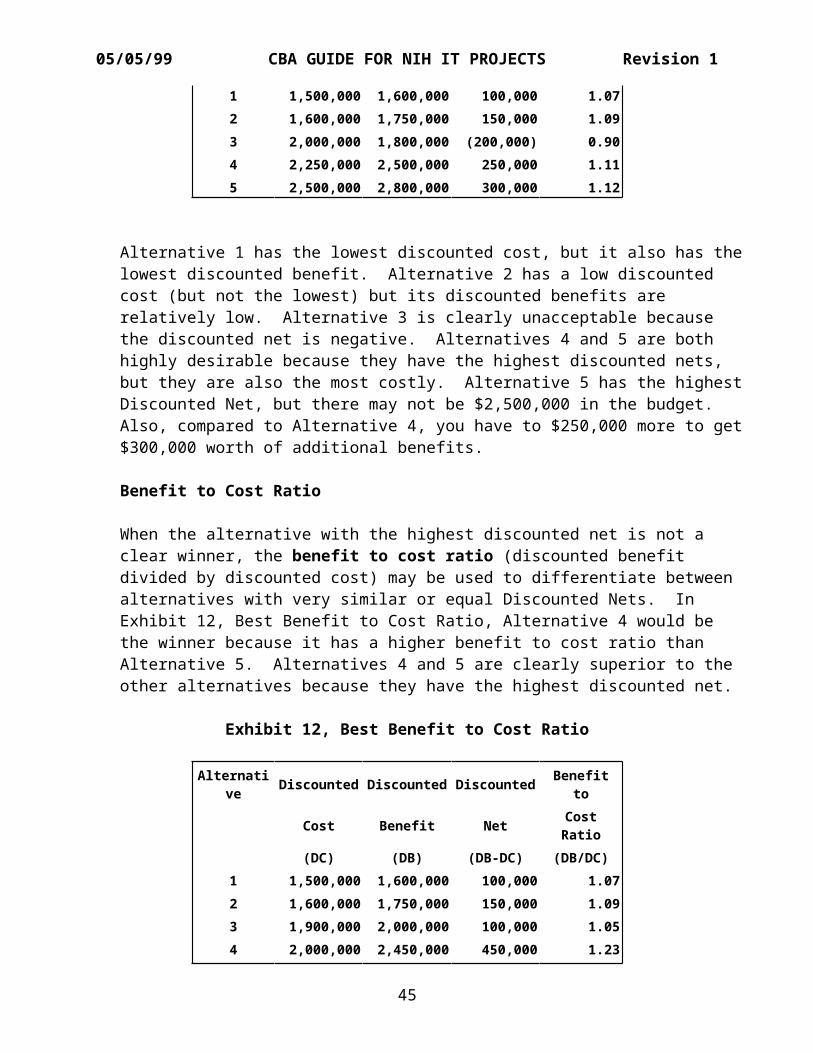
05/05/99 CBA GUIDE FOR NIH IT PROJECTS Revision 1
1 1,500,000 1,600,000 100,000 1.072 1,600,000 1,750,000 150,000 1.093 2,000,000 1,800,000 (200,000) 0.904 2,250,000 2,500,000 250,000 1.115 2,500,000 2,800,000 300,000 1.12
Alternative 1 has the lowest discounted cost, but it also has thelowest discounted benefit. Alternative 2 has a low discounted cost (but not the lowest) but its discounted benefits are relatively low. Alternative 3 is clearly unacceptable because the discounted net is negative. Alternatives 4 and 5 are both highly desirable because they have the highest discounted nets, but they are also the most costly. Alternative 5 has the highestDiscounted Net, but there may not be $2,500,000 in the budget. Also, compared to Alternative 4, you have to $250,000 more to get$300,000 worth of additional benefits.
Benefit to Cost Ratio
When the alternative with the highest discounted net is not a clear winner, the benefit to cost ratio (discounted benefit divided by discounted cost) may be used to differentiate between alternatives with very similar or equal Discounted Nets. In Exhibit 12, Best Benefit to Cost Ratio, Alternative 4 would be the winner because it has a higher benefit to cost ratio than Alternative 5. Alternatives 4 and 5 are clearly superior to the other alternatives because they have the highest discounted net.
Exhibit 12, Best Benefit to Cost Ratio
Alternative Discounted Discounted Discounted Benefit
to
Cost Benefit Net CostRatio
(DC) (DB) (DB-DC) (DB/DC)1 1,500,000 1,600,000 100,000 1.072 1,600,000 1,750,000 150,000 1.093 1,900,000 2,000,000 100,000 1.054 2,000,000 2,450,000 450,000 1.23
45
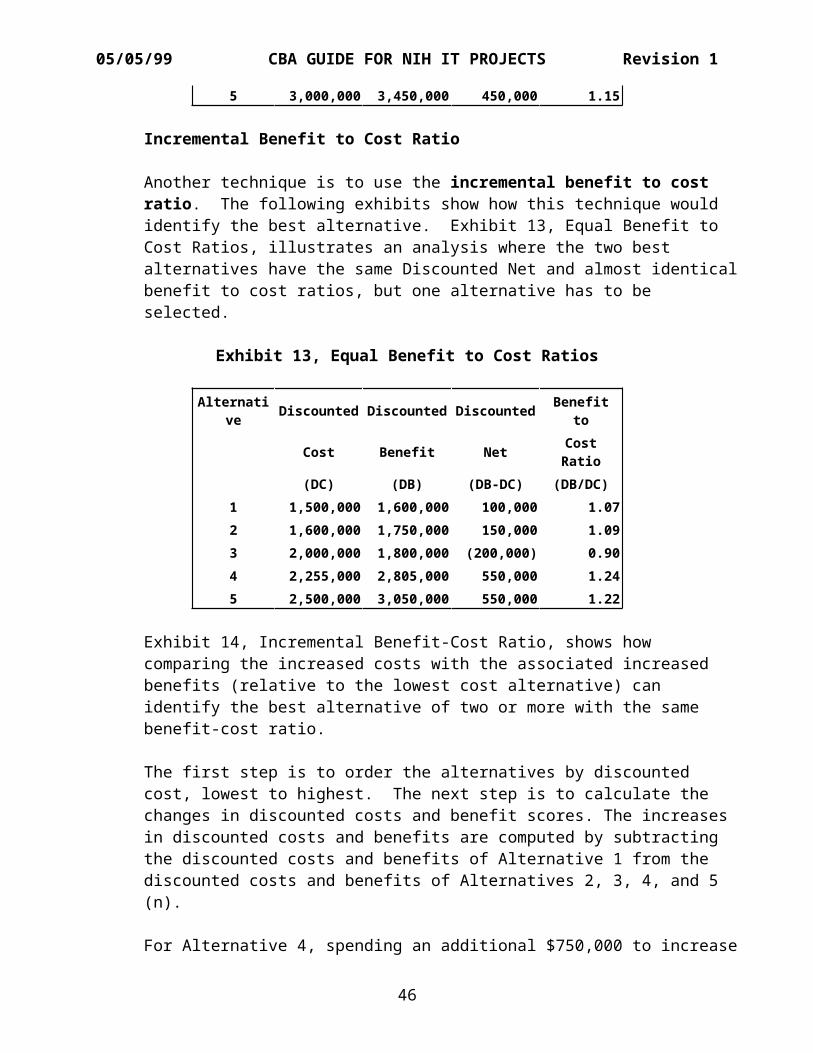
05/05/99 CBA GUIDE FOR NIH IT PROJECTS Revision 1
5 3,000,000 3,450,000 450,000 1.15
Incremental Benefit to Cost Ratio
Another technique is to use the incremental benefit to cost ratio. The following exhibits show how this technique would identify the best alternative. Exhibit 13, Equal Benefit to Cost Ratios, illustrates an analysis where the two best alternatives have the same Discounted Net and almost identicalbenefit to cost ratios, but one alternative has to be selected.
Exhibit 13, Equal Benefit to Cost Ratios
Alternative Discounted Discounted Discounted Benefit
to
Cost Benefit Net CostRatio
(DC) (DB) (DB-DC) (DB/DC)1 1,500,000 1,600,000 100,000 1.072 1,600,000 1,750,000 150,000 1.093 2,000,000 1,800,000 (200,000) 0.904 2,255,000 2,805,000 550,000 1.245 2,500,000 3,050,000 550,000 1.22
Exhibit 14, Incremental Benefit-Cost Ratio, shows how comparing the increased costs with the associated increased benefits (relative to the lowest cost alternative) can identify the best alternative of two or more with the same benefit-cost ratio.
The first step is to order the alternatives by discounted cost, lowest to highest. The next step is to calculate the changes in discounted costs and benefit scores. The increases in discounted costs and benefits are computed by subtracting the discounted costs and benefits of Alternative 1 from the discounted costs and benefits of Alternatives 2, 3, 4, and 5 (n).
For Alternative 4, spending an additional $750,000 to increase
46
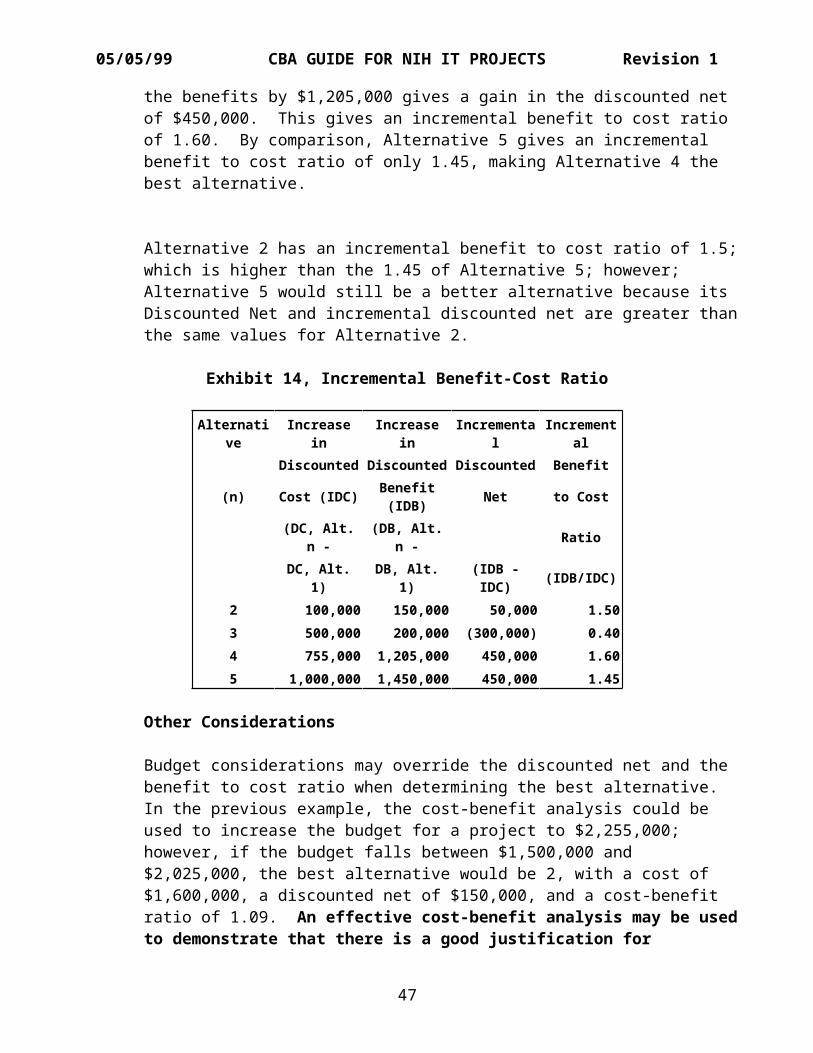
05/05/99 CBA GUIDE FOR NIH IT PROJECTS Revision 1
the benefits by $1,205,000 gives a gain in the discounted net of $450,000. This gives an incremental benefit to cost ratio of 1.60. By comparison, Alternative 5 gives an incremental benefit to cost ratio of only 1.45, making Alternative 4 the best alternative.
Alternative 2 has an incremental benefit to cost ratio of 1.5;which is higher than the 1.45 of Alternative 5; however; Alternative 5 would still be a better alternative because its Discounted Net and incremental discounted net are greater thanthe same values for Alternative 2.
Exhibit 14, Incremental Benefit-Cost Ratio
Alternative
Increasein
Increasein
Incremental
Incremental
Discounted Discounted Discounted Benefit
(n) Cost (IDC) Benefit(IDB) Net to Cost
(DC, Alt.n -
(DB, Alt.n - Ratio
DC, Alt.1)
DB, Alt.1)
(IDB -IDC) (IDB/IDC)
2 100,000 150,000 50,000 1.503 500,000 200,000 (300,000) 0.404 755,000 1,205,000 450,000 1.605 1,000,000 1,450,000 450,000 1.45
Other Considerations
Budget considerations may override the discounted net and the benefit to cost ratio when determining the best alternative. In the previous example, the cost-benefit analysis could be used to increase the budget for a project to $2,255,000; however, if the budget falls between $1,500,000 and $2,025,000, the best alternative would be 2, with a cost of $1,600,000, a discounted net of $150,000, and a cost-benefit ratio of 1.09. An effective cost-benefit analysis may be usedto demonstrate that there is a good justification for
47
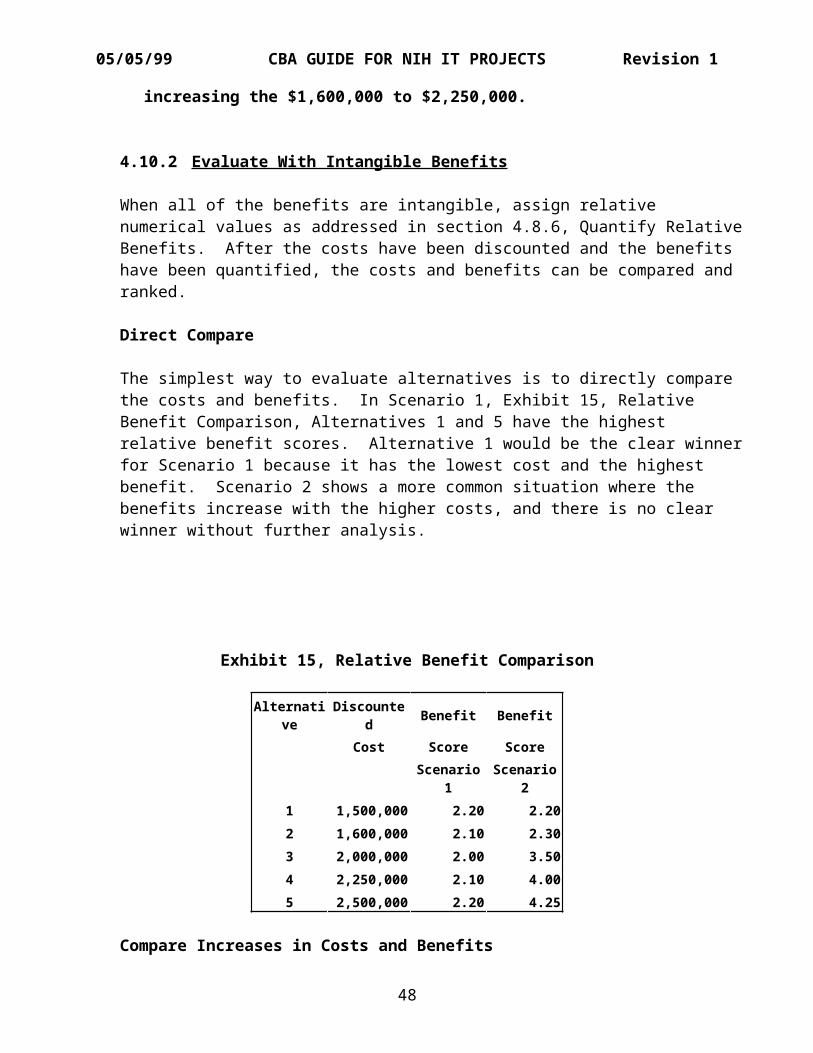
05/05/99 CBA GUIDE FOR NIH IT PROJECTS Revision 1
increasing the $1,600,000 to $2,250,000.
4.10.2 Evaluate With Intangible Benefits
When all of the benefits are intangible, assign relative numerical values as addressed in section 4.8.6, Quantify RelativeBenefits. After the costs have been discounted and the benefits have been quantified, the costs and benefits can be compared and ranked.
Direct Compare
The simplest way to evaluate alternatives is to directly compare the costs and benefits. In Scenario 1, Exhibit 15, Relative Benefit Comparison, Alternatives 1 and 5 have the highest relative benefit scores. Alternative 1 would be the clear winnerfor Scenario 1 because it has the lowest cost and the highest benefit. Scenario 2 shows a more common situation where the benefits increase with the higher costs, and there is no clear winner without further analysis.
Exhibit 15, Relative Benefit Comparison
Alternative
Discounted Benefit Benefit
Cost Score ScoreScenario
1Scenario
21 1,500,000 2.20 2.202 1,600,000 2.10 2.303 2,000,000 2.00 3.504 2,250,000 2.10 4.005 2,500,000 2.20 4.25
Compare Increases in Costs and Benefits
48
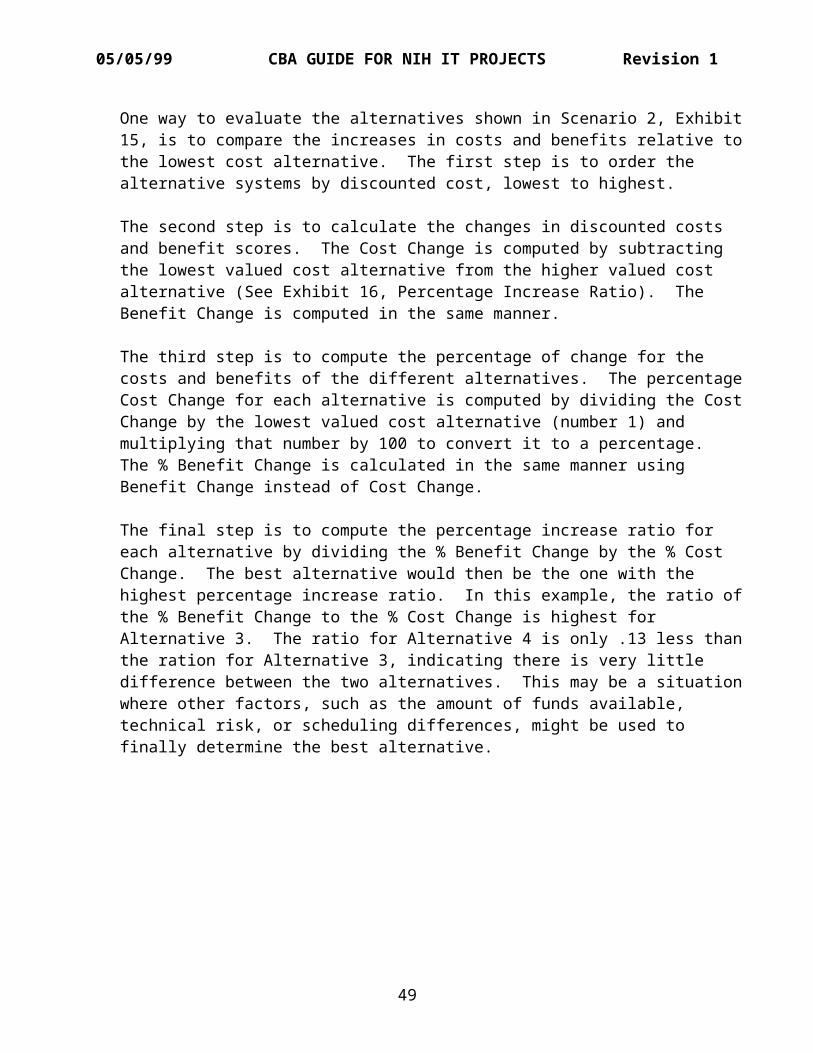
05/05/99 CBA GUIDE FOR NIH IT PROJECTS Revision 1
One way to evaluate the alternatives shown in Scenario 2, Exhibit15, is to compare the increases in costs and benefits relative tothe lowest cost alternative. The first step is to order the alternative systems by discounted cost, lowest to highest.
The second step is to calculate the changes in discounted costs and benefit scores. The Cost Change is computed by subtracting the lowest valued cost alternative from the higher valued cost alternative (See Exhibit 16, Percentage Increase Ratio). The Benefit Change is computed in the same manner.
The third step is to compute the percentage of change for the costs and benefits of the different alternatives. The percentageCost Change for each alternative is computed by dividing the CostChange by the lowest valued cost alternative (number 1) and multiplying that number by 100 to convert it to a percentage. The % Benefit Change is calculated in the same manner using Benefit Change instead of Cost Change.
The final step is to compute the percentage increase ratio for each alternative by dividing the % Benefit Change by the % Cost Change. The best alternative would then be the one with the highest percentage increase ratio. In this example, the ratio ofthe % Benefit Change to the % Cost Change is highest for Alternative 3. The ratio for Alternative 4 is only .13 less thanthe ration for Alternative 3, indicating there is very little difference between the two alternatives. This may be a situationwhere other factors, such as the amount of funds available, technical risk, or scheduling differences, might be used to finally determine the best alternative.
49
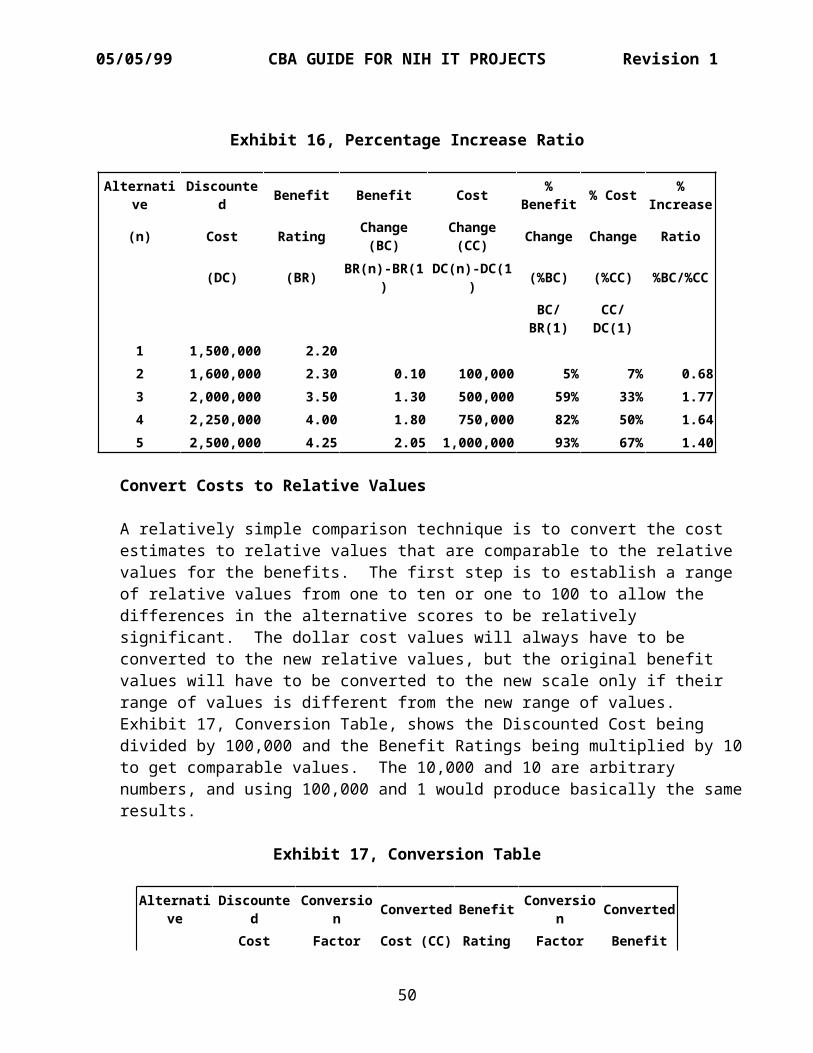
05/05/99 CBA GUIDE FOR NIH IT PROJECTS Revision 1
Exhibit 16, Percentage Increase Ratio
Alternative
Discounted Benefit Benefit Cost %
Benefit % Cost %Increase
(n) Cost Rating Change(BC)
Change(CC) Change Change Ratio
(DC) (BR) BR(n)-BR(1)
DC(n)-DC(1) (%BC) (%CC) %BC/%CC
BC/BR(1)
CC/DC(1)
1 1,500,000 2.202 1,600,000 2.30 0.10 100,000 5% 7% 0.683 2,000,000 3.50 1.30 500,000 59% 33% 1.774 2,250,000 4.00 1.80 750,000 82% 50% 1.645 2,500,000 4.25 2.05 1,000,000 93% 67% 1.40
Convert Costs to Relative Values
A relatively simple comparison technique is to convert the cost estimates to relative values that are comparable to the relative values for the benefits. The first step is to establish a range of relative values from one to ten or one to 100 to allow the differences in the alternative scores to be relatively significant. The dollar cost values will always have to be converted to the new relative values, but the original benefit values will have to be converted to the new scale only if their range of values is different from the new range of values. Exhibit 17, Conversion Table, shows the Discounted Cost being divided by 100,000 and the Benefit Ratings being multiplied by 10to get comparable values. The 10,000 and 10 are arbitrary numbers, and using 100,000 and 1 would produce basically the sameresults.
Exhibit 17, Conversion Table
Alternative
Discounted
Conversion Converted Benefit Conversion Converted
Cost Factor Cost (CC) Rating Factor Benefit
50
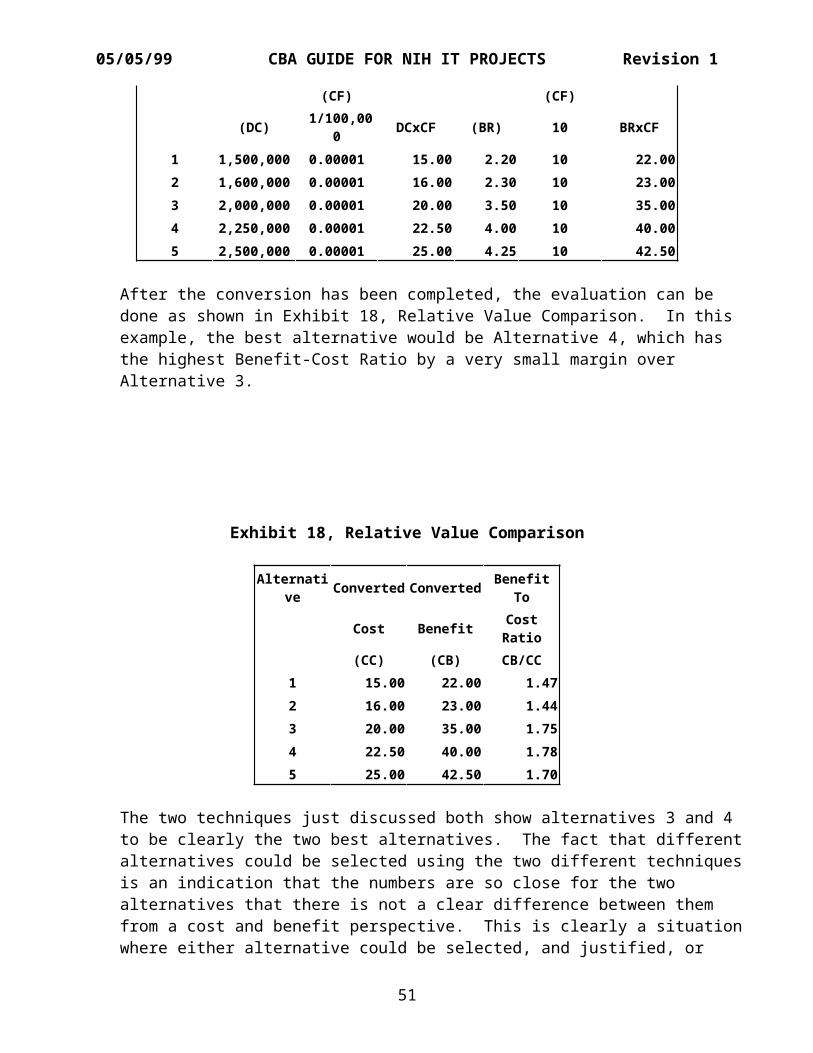
05/05/99 CBA GUIDE FOR NIH IT PROJECTS Revision 1
(CF) (CF)
(DC) 1/100,000 DCxCF (BR) 10 BRxCF
1 1,500,000 0.00001 15.00 2.20 10 22.002 1,600,000 0.00001 16.00 2.30 10 23.003 2,000,000 0.00001 20.00 3.50 10 35.004 2,250,000 0.00001 22.50 4.00 10 40.005 2,500,000 0.00001 25.00 4.25 10 42.50
After the conversion has been completed, the evaluation can be done as shown in Exhibit 18, Relative Value Comparison. In this example, the best alternative would be Alternative 4, which has the highest Benefit-Cost Ratio by a very small margin over Alternative 3.
Exhibit 18, Relative Value Comparison
Alternative Converted Converted Benefit
To
Cost Benefit CostRatio
(CC) (CB) CB/CC1 15.00 22.00 1.472 16.00 23.00 1.443 20.00 35.00 1.754 22.50 40.00 1.785 25.00 42.50 1.70
The two techniques just discussed both show alternatives 3 and 4 to be clearly the two best alternatives. The fact that differentalternatives could be selected using the two different techniquesis an indication that the numbers are so close for the two alternatives that there is not a clear difference between them from a cost and benefit perspective. This is clearly a situationwhere either alternative could be selected, and justified, or
51
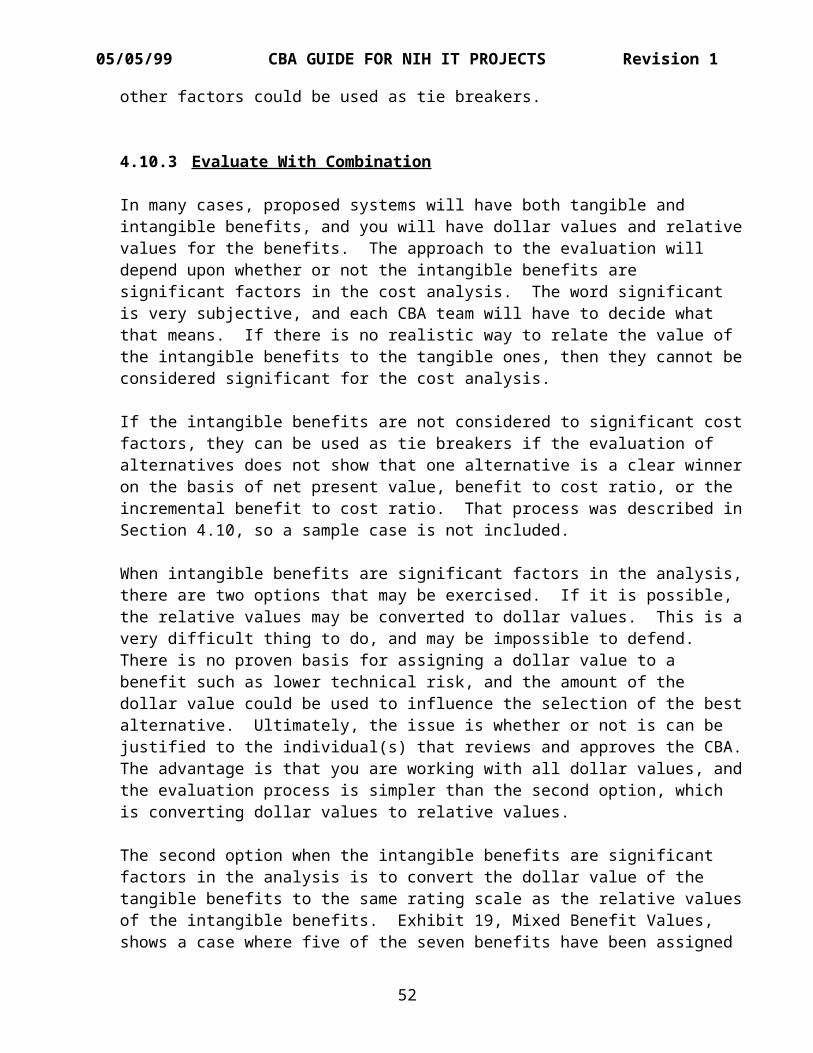
05/05/99 CBA GUIDE FOR NIH IT PROJECTS Revision 1
other factors could be used as tie breakers.
4.10.3 Evaluate With Combination
In many cases, proposed systems will have both tangible and intangible benefits, and you will have dollar values and relativevalues for the benefits. The approach to the evaluation will depend upon whether or not the intangible benefits are significant factors in the cost analysis. The word significant is very subjective, and each CBA team will have to decide what that means. If there is no realistic way to relate the value of the intangible benefits to the tangible ones, then they cannot beconsidered significant for the cost analysis.
If the intangible benefits are not considered to significant costfactors, they can be used as tie breakers if the evaluation of alternatives does not show that one alternative is a clear winneron the basis of net present value, benefit to cost ratio, or the incremental benefit to cost ratio. That process was described inSection 4.10, so a sample case is not included.
When intangible benefits are significant factors in the analysis,there are two options that may be exercised. If it is possible, the relative values may be converted to dollar values. This is avery difficult thing to do, and may be impossible to defend. There is no proven basis for assigning a dollar value to a benefit such as lower technical risk, and the amount of the dollar value could be used to influence the selection of the bestalternative. Ultimately, the issue is whether or not is can be justified to the individual(s) that reviews and approves the CBA.The advantage is that you are working with all dollar values, andthe evaluation process is simpler than the second option, which is converting dollar values to relative values.
The second option when the intangible benefits are significant factors in the analysis is to convert the dollar value of the tangible benefits to the same rating scale as the relative valuesof the intangible benefits. Exhibit 19, Mixed Benefit Values, shows a case where five of the seven benefits have been assigned
52
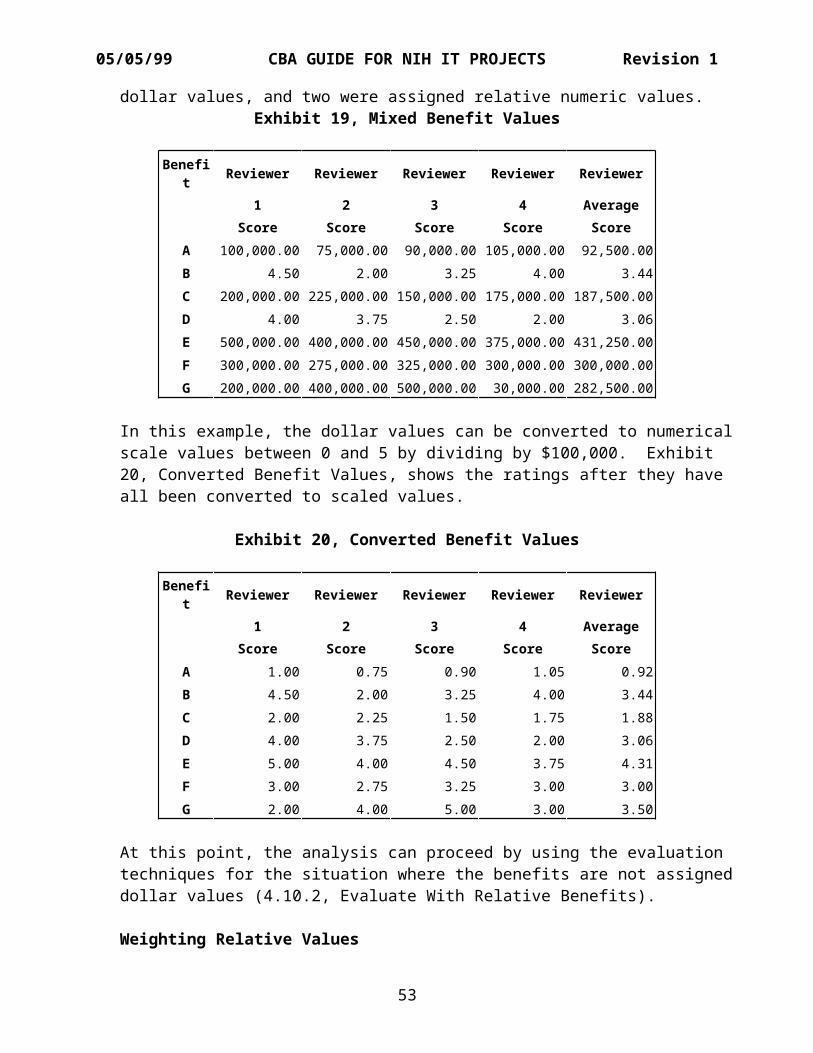
05/05/99 CBA GUIDE FOR NIH IT PROJECTS Revision 1
dollar values, and two were assigned relative numeric values.Exhibit 19, Mixed Benefit Values
Benefit Reviewer Reviewer Reviewer Reviewer Reviewer
1 2 3 4 AverageScore Score Score Score Score
A 100,000.00 75,000.00 90,000.00 105,000.00 92,500.00B 4.50 2.00 3.25 4.00 3.44C 200,000.00 225,000.00 150,000.00 175,000.00 187,500.00D 4.00 3.75 2.50 2.00 3.06E 500,000.00 400,000.00 450,000.00 375,000.00 431,250.00F 300,000.00 275,000.00 325,000.00 300,000.00 300,000.00G 200,000.00 400,000.00 500,000.00 30,000.00 282,500.00
In this example, the dollar values can be converted to numerical scale values between 0 and 5 by dividing by $100,000. Exhibit 20, Converted Benefit Values, shows the ratings after they have all been converted to scaled values.
Exhibit 20, Converted Benefit Values
Benefit Reviewer Reviewer Reviewer Reviewer Reviewer
1 2 3 4 AverageScore Score Score Score Score
A 1.00 0.75 0.90 1.05 0.92B 4.50 2.00 3.25 4.00 3.44C 2.00 2.25 1.50 1.75 1.88D 4.00 3.75 2.50 2.00 3.06E 5.00 4.00 4.50 3.75 4.31F 3.00 2.75 3.25 3.00 3.00G 2.00 4.00 5.00 3.00 3.50
At this point, the analysis can proceed by using the evaluation techniques for the situation where the benefits are not assigned dollar values (4.10.2, Evaluate With Relative Benefits).
Weighting Relative Values
53
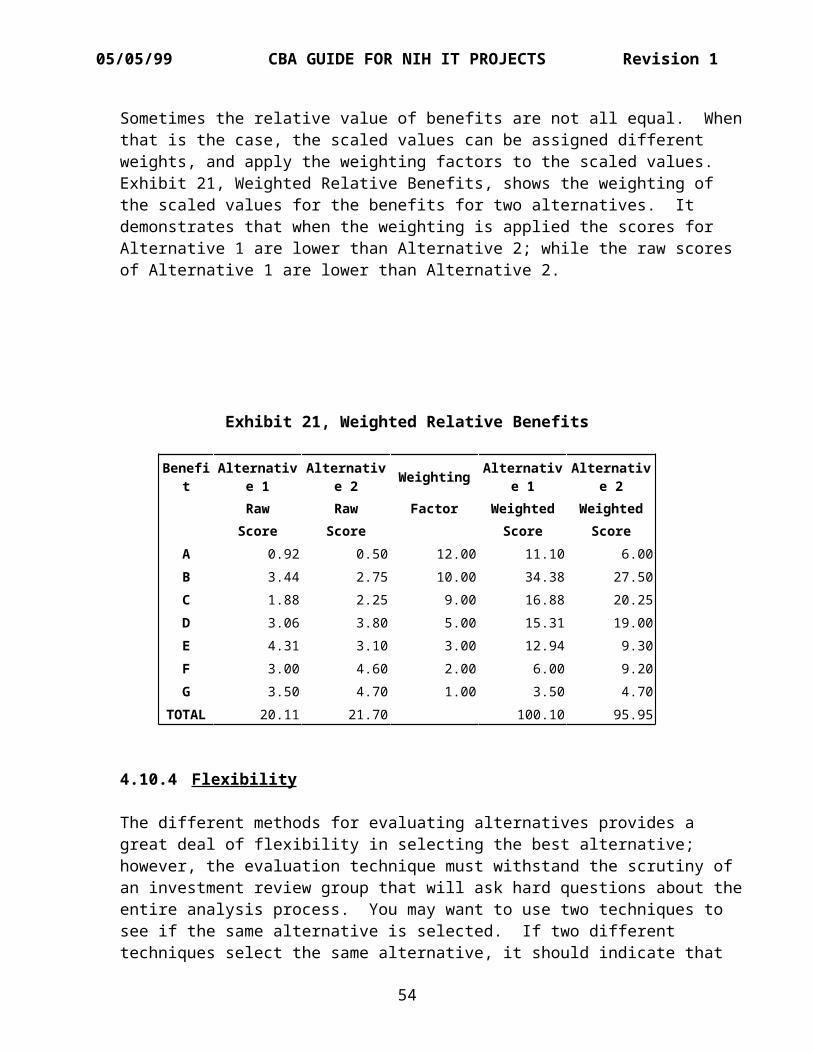
05/05/99 CBA GUIDE FOR NIH IT PROJECTS Revision 1
Sometimes the relative value of benefits are not all equal. Whenthat is the case, the scaled values can be assigned different weights, and apply the weighting factors to the scaled values. Exhibit 21, Weighted Relative Benefits, shows the weighting of the scaled values for the benefits for two alternatives. It demonstrates that when the weighting is applied the scores for Alternative 1 are lower than Alternative 2; while the raw scores of Alternative 1 are lower than Alternative 2.
Exhibit 21, Weighted Relative Benefits
Benefit
Alternative 1
Alternative 2 Weighting Alternativ
e 1Alternativ
e 2Raw Raw Factor Weighted WeightedScore Score Score Score
A 0.92 0.50 12.00 11.10 6.00B 3.44 2.75 10.00 34.38 27.50C 1.88 2.25 9.00 16.88 20.25D 3.06 3.80 5.00 15.31 19.00E 4.31 3.10 3.00 12.94 9.30F 3.00 4.60 2.00 6.00 9.20G 3.50 4.70 1.00 3.50 4.70
TOTAL 20.11 21.70 100.10 95.95
4.10.4 Flexibility
The different methods for evaluating alternatives provides a great deal of flexibility in selecting the best alternative; however, the evaluation technique must withstand the scrutiny of an investment review group that will ask hard questions about theentire analysis process. You may want to use two techniques to see if the same alternative is selected. If two different techniques select the same alternative, it should indicate that
54
05/05/99 CBA GUIDE FOR NIH IT PROJECTS Revision 1
the analyses are valid and accurate. Another way to validate a cost-benefit analysis is through a sensitivity analysis, which isaddressed in detail in the next section.
4.11 STEP 11 - PERFORM SENSITIVITY ANALYSIS
Sensitivity analysis tests the sensitivity of input parameters and the reliability of the results obtained from the benefit-cost analysis. Since the cost-benefit analysis is the key document in the investment review process, reviewers will want assurance that the analysis is valid. They are likely to ask questions about the accuracy of different parameters and cost estimates and their impact on the final recommendation. The sensitivity analysis should assure reviewers that the analysis provides a sound basis for making decisions regarding the proposed project. The sensitivity analysis process requires three steps: identification of input parameters with the greatest influence on the outcome, repetition of the cost analysis, and evaluation of the results.
4.11.1 Identify Input Parameters
The ground rules and assumptions documented earlier in the benefit-cost analysis are now used to identify the model inputs to be tested for sensitivity. Input parameters that are good candidates for testing are those that are both significant (large) cost factors and have a wide range of maximum and minimumestimated values. Some common parameters to be considered include the following:
System Requirement Definition Costs System Development Costs System Operation Costs Transition Costs, Especially Software Conversion System Life Cycle Peak System Demands Dollar Values and Relative Values for Benefits
4.11.2 Repeat the Cost Analysis
55
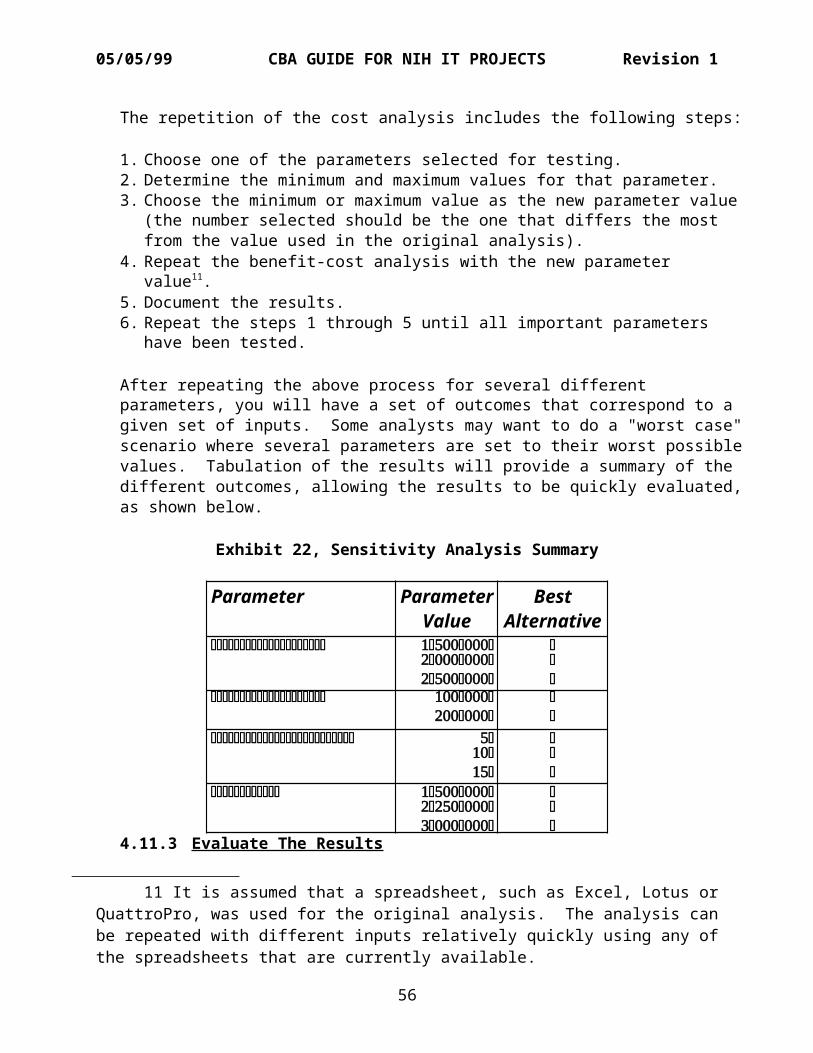
05/05/99 CBA GUIDE FOR NIH IT PROJECTS Revision 1
The repetition of the cost analysis includes the following steps:
1. Choose one of the parameters selected for testing.2. Determine the minimum and maximum values for that parameter.3. Choose the minimum or maximum value as the new parameter value
(the number selected should be the one that differs the most from the value used in the original analysis).
4. Repeat the benefit-cost analysis with the new parameter value11.
5. Document the results.6. Repeat the steps 1 through 5 until all important parameters
have been tested.
After repeating the above process for several different parameters, you will have a set of outcomes that correspond to a given set of inputs. Some analysts may want to do a "worst case"scenario where several parameters are set to their worst possiblevalues. Tabulation of the results will provide a summary of the different outcomes, allowing the results to be quickly evaluated,as shown below.
Exhibit 22, Sensitivity Analysis Summary
Parameter Parameter Best Value Alternative
4.11.3 Evaluate The Results
11 It is assumed that a spreadsheet, such as Excel, Lotus orQuattroPro, was used for the original analysis. The analysis canbe repeated with different inputs relatively quickly using any ofthe spreadsheets that are currently available.
56
05/05/99 CBA GUIDE FOR NIH IT PROJECTS Revision 1
Evaluation is done by comparing the original set of inputs and the resulting outcome to the outcomes obtained by varying the input parameters. In the example above, the original values are the first value listed for each parameter. Sensitivity is measured by how much change in a parameter is required to change the alternative selected in the original analysis. Sensitivity is another very subjective word, so the following guidelines are provided:
A parameter is not considered to be sensitive if it requires adecrease of 50% or an increase of 100% to cause a change in the selected alternative.
A parameter is considered to be sensitive if a change between 10% and 50% causes a change in the selected alternative.
A parameter is considered to be very sensitive if a change of 10% or less causes a change in the selected alternative.
In the example shown above, the analysis would appear to be somewhat sensitive to the development costs, but not sensitive tothe transition costs and benefits. The selection of three different alternatives based on three different system life cycles demonstrates that system life cycle is an important parameter, and illustrates that the guidelines above cannot be used as absolute criteria.
Sensitive parameters warrant further study. Assumptions, data sources, and analyses should be revisited to ensure that the bestpossible value is used for that parameter. If the analysis is found to be sensitive to several parameters, return to the beginning of the analysis and review all ground rules and assumptions. The final cost-benefit analysis report should include a sensitivity analysis that demonstrates that sensitive parameters have been carefully investigated and the best possiblevalues have been used in the final analysis.
5 COMPETING WITH OTHER PROJECTS
Most proposed IT systems will be competing for budget dollars against
57
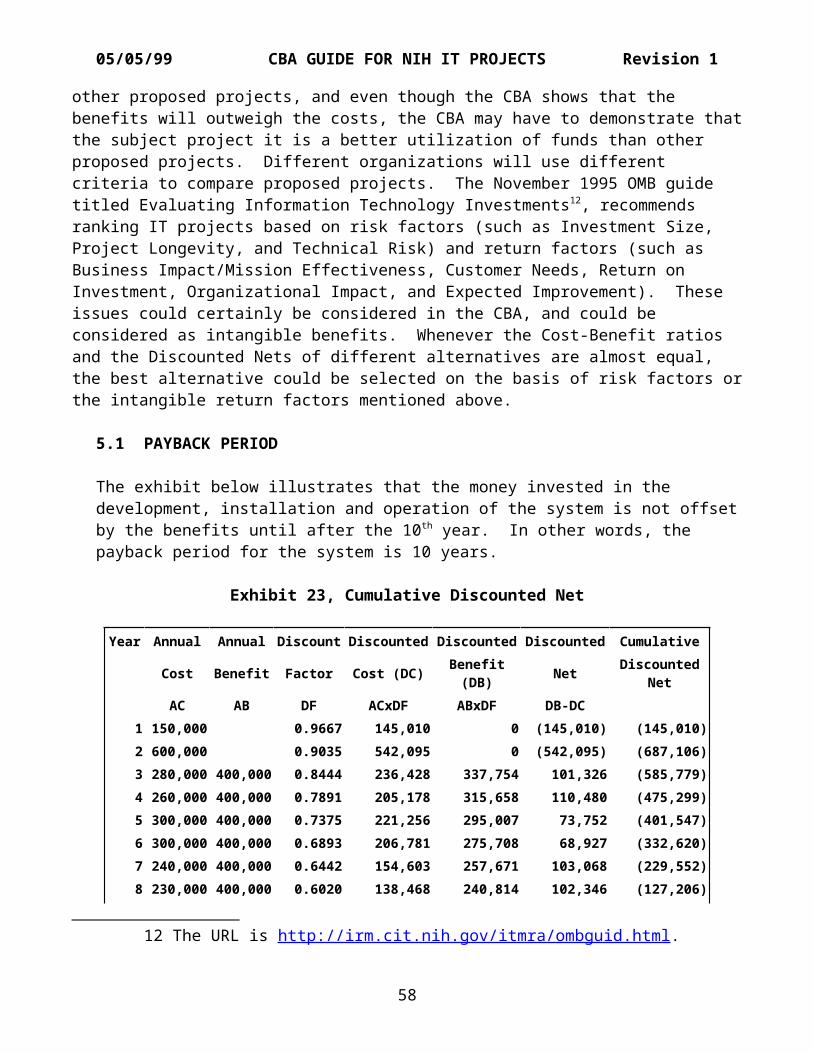
05/05/99 CBA GUIDE FOR NIH IT PROJECTS Revision 1
other proposed projects, and even though the CBA shows that the benefits will outweigh the costs, the CBA may have to demonstrate thatthe subject project it is a better utilization of funds than other proposed projects. Different organizations will use different criteria to compare proposed projects. The November 1995 OMB guide titled Evaluating Information Technology Investments12, recommends ranking IT projects based on risk factors (such as Investment Size, Project Longevity, and Technical Risk) and return factors (such as Business Impact/Mission Effectiveness, Customer Needs, Return on Investment, Organizational Impact, and Expected Improvement). These issues could certainly be considered in the CBA, and could be considered as intangible benefits. Whenever the Cost-Benefit ratios and the Discounted Nets of different alternatives are almost equal, the best alternative could be selected on the basis of risk factors orthe intangible return factors mentioned above.
5.1 PAYBACK PERIOD
The exhibit below illustrates that the money invested in the development, installation and operation of the system is not offsetby the benefits until after the 10th year. In other words, the payback period for the system is 10 years.
Exhibit 23, Cumulative Discounted Net
Year Annual Annual Discount Discounted Discounted Discounted Cumulative
Cost Benefit Factor Cost (DC) Benefit(DB) Net Discounted
NetAC AB DF ACxDF ABxDF DB-DC
1 150,000 0.9667 145,010 0 (145,010) (145,010)2 600,000 0.9035 542,095 0 (542,095) (687,106)3 280,000 400,000 0.8444 236,428 337,754 101,326 (585,779)4 260,000 400,000 0.7891 205,178 315,658 110,480 (475,299)5 300,000 400,000 0.7375 221,256 295,007 73,752 (401,547)6 300,000 400,000 0.6893 206,781 275,708 68,927 (332,620)7 240,000 400,000 0.6442 154,603 257,671 103,068 (229,552)8 230,000 400,000 0.6020 138,468 240,814 102,346 (127,206)
12 The URL is http://irm.cit.nih.gov/itmra/ombguid.html.
58
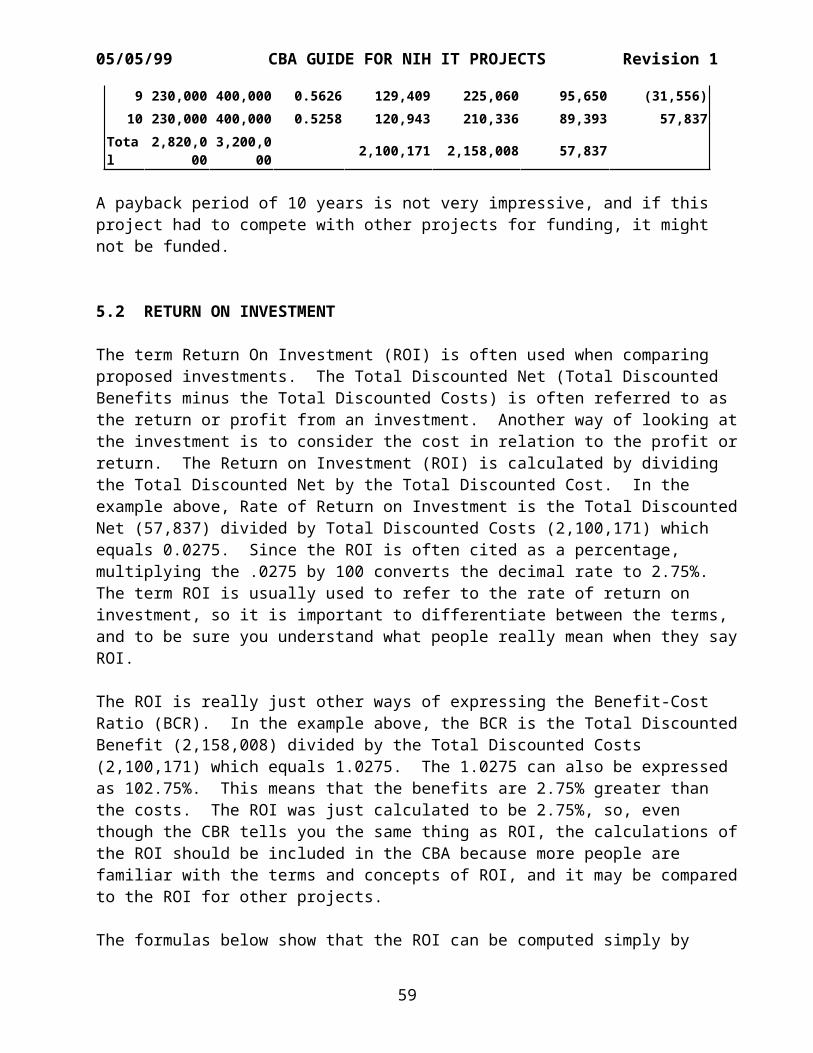
05/05/99 CBA GUIDE FOR NIH IT PROJECTS Revision 1
9 230,000 400,000 0.5626 129,409 225,060 95,650 (31,556)10 230,000 400,000 0.5258 120,943 210,336 89,393 57,837
Total
2,820,000
3,200,000 2,100,171 2,158,008 57,837
A payback period of 10 years is not very impressive, and if this project had to compete with other projects for funding, it might not be funded.
5.2 RETURN ON INVESTMENT
The term Return On Investment (ROI) is often used when comparing proposed investments. The Total Discounted Net (Total Discounted Benefits minus the Total Discounted Costs) is often referred to as the return or profit from an investment. Another way of looking atthe investment is to consider the cost in relation to the profit orreturn. The Return on Investment (ROI) is calculated by dividing the Total Discounted Net by the Total Discounted Cost. In the example above, Rate of Return on Investment is the Total DiscountedNet (57,837) divided by Total Discounted Costs (2,100,171) which equals 0.0275. Since the ROI is often cited as a percentage, multiplying the .0275 by 100 converts the decimal rate to 2.75%. The term ROI is usually used to refer to the rate of return on investment, so it is important to differentiate between the terms, and to be sure you understand what people really mean when they sayROI.
The ROI is really just other ways of expressing the Benefit-Cost Ratio (BCR). In the example above, the BCR is the Total DiscountedBenefit (2,158,008) divided by the Total Discounted Costs (2,100,171) which equals 1.0275. The 1.0275 can also be expressed as 102.75%. This means that the benefits are 2.75% greater than the costs. The ROI was just calculated to be 2.75%, so, even though the CBR tells you the same thing as ROI, the calculations ofthe ROI should be included in the CBA because more people are familiar with the terms and concepts of ROI, and it may be comparedto the ROI for other projects.
The formulas below show that the ROI can be computed simply by
59
05/05/99 CBA GUIDE FOR NIH IT PROJECTS Revision 1
subtracting 1 from the CBR.
CBR = TDB/TDC, Where TDB = Total Discounted Benefits and TDC = Total Discounted Costs
ROI = (TDB - TDC)/TDC, or show the items in the parentheses individually, and it becomes
= TDB/TDC - TDC/TDC, then, since any term divided by itself equals 1, it becomes
= TDB/TDC - 1, then replace TDB/TDC with its equivalent, CBR,and it becomes
= CBR - 1
60
05/05/99 CBA GUIDE FOR NIH IT PROJECTS Revision 1
APPENDIX A - GLOSSARY OF TERMS
Note: most of the definitions are from OMB Circular A-94.
Benefit-Cost Analysis (BCA) -- A systematic quantitative method of assessing the desirability of Government projects or policies when it is important to take a long view of future effects and a broad view ofpossible side-effects.
Benefit-Cost Ratio (BCR) -- The Total Discounted Benefits of a projectdivided by the Total Discounted Costs of the project. If the value ofthe BCR is less than one, the project should not be continued.
Capital Asset -- Tangible property, including durable goods, equipment, buildings, installations, and land.
Cost-Benefit Analysis (CBA) -- An evaluation of the costs and benefitsof alternative approaches to a proposed activity to determine the bestalternative. (Definition created for this document)
Cost-Effectiveness Analysis (CEA) -- A systematic quantitative method for comparing the costs of alternative means of achieving the same stream of benefits or a given objective.
Discount Rate -- The interest rate used in calculating the present value of expected yearly benefits and costs.
Discount Factor -- The factor that translates expected benefits or costs in any given future year into present value terms. The discountfactor is equal to 1/(1 + i)t where i is the interest rate and t is the number of years from the date of initiation for the program or policy until the given future year.
Inflation -- The proportionate rate of change in the general price level, as opposed to the proportionate increase in a specific price. Inflation is usually measured by a broad-based price index, such as the implicit deflator for Gross Domestic Product or the Consumer PriceIndex.
A-1
05/05/99 CBA GUIDE FOR NIH IT PROJECTS Revision 1
Information Technology -- Any equipment or interconnected system or subsystems of equipment that is used in the automatic acquisition, storage, manipulation, management, movement, control, display, switching, interchange, transmission, or reception, of data or information.
Life Cycle Cost -- The overall estimated cost for a particular programalternative over the time period corresponding to the life of the program including direct and indirect initial costs plus any periodic or continuing costs of operation and maintenance.
Net Present Value -- The difference between the discounted present value of benefits and the discounted present value of costs. This is also referred to as the discounted net.
Payback Period – The number of years it takes for the cumulative dollar value of the benefits to exceed the cumulative costs of a project.Real or Constant Dollar Values -- Economic units measured in terms of constant purchasing power. A real value is not affected by general price inflation. Real values can be estimated by deflating nominal values with a general price index, such as the implicit deflator for Gross Domestic Product or the Consumer Price Index.
Return -- The difference between the value of the benefits and the costs of a project. In a Cost-Benefit Analysis it is computed by subtracting the Total Discounted Costs from the Total Discounted Benefits, and is called the Total Discounted Net.
Return on Investment (ROI) -- Calculated by dividing the Total Discounted Net by the Total Discounted Costs. To express it as a percentage, it must be multiplied by 100. It can also be expressed as(Total Discounted Benefits minus Total Discounted Costs) divided by Total Discounted Costs. Note: Rate of Return on Investment (RROI) would be a more accurate name than ROI, but most people that are familiar with the term recognize that it is a percentage rate rather than an amount. The terms are often used interchangeably.
Sunk Cost -- A cost incurred in the past that will not be affected by
A-2

05/05/99 CBA GUIDE FOR NIH IT PROJECTS Revision 1
any present or future decision. Sunk costs should be ignored in determining whether a new investment is worthwhile.
A-3
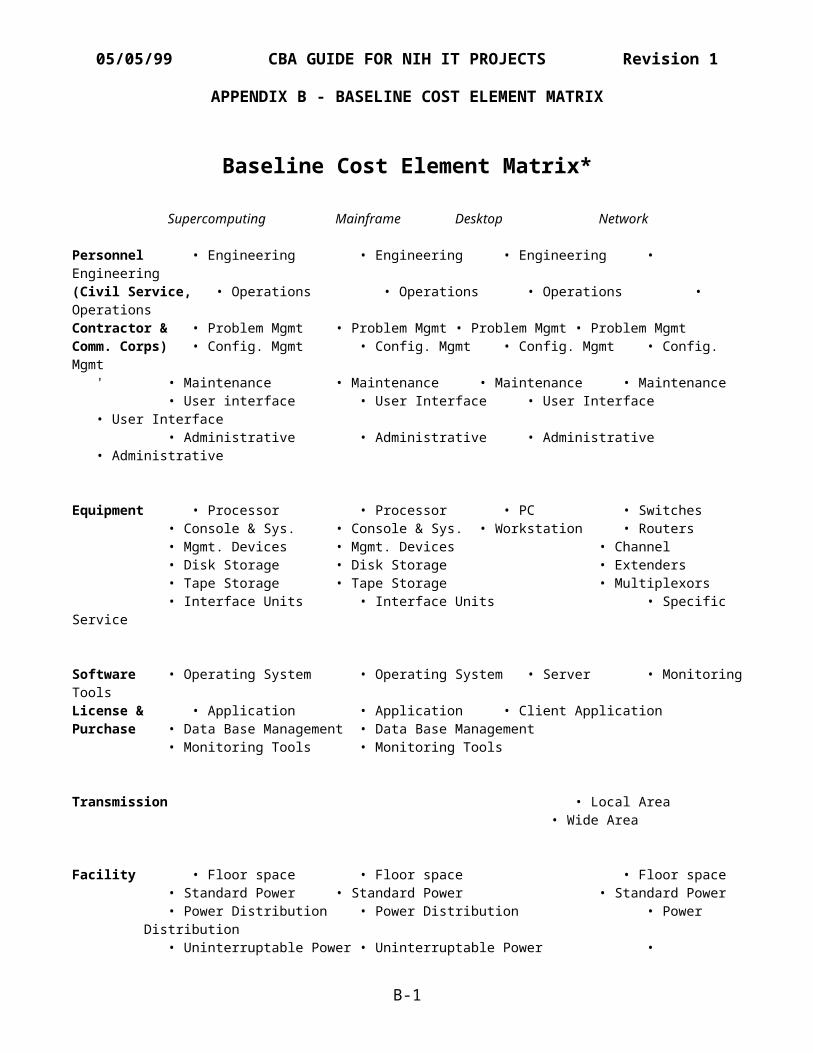
05/05/99 CBA GUIDE FOR NIH IT PROJECTS Revision 1
APPENDIX B - BASELINE COST ELEMENT MATRIX
Baseline Cost Element Matrix*
Supercomputing Mainframe Desktop Network
Personnel • Engineering • Engineering • Engineering • Engineering(Civil Service, • Operations • Operations • Operations • OperationsContractor & • Problem Mgmt • Problem Mgmt • Problem Mgmt • Problem MgmtComm. Corps) • Config. Mgmt • Config. Mgmt • Config. Mgmt • Config. Mgmt
' • Maintenance • Maintenance • Maintenance • Maintenance• User interface • User Interface • User Interface
• User Interface• Administrative • Administrative • Administrative
• Administrative
Equipment • Processor • Processor • PC • Switches• Console & Sys. • Console & Sys. • Workstation • Routers• Mgmt. Devices • Mgmt. Devices • Channel• Disk Storage • Disk Storage • Extenders• Tape Storage • Tape Storage • Multiplexors• Interface Units • Interface Units • Specific
Service
Software • Operating System • Operating System • Server • MonitoringToolsLicense & • Application • Application • Client ApplicationPurchase • Data Base Management • Data Base Management
• Monitoring Tools • Monitoring Tools
Transmission • Local Area• Wide Area
Facility • Floor space • Floor space • Floor space• Standard Power • Standard Power • Standard Power• Power Distribution • Power Distribution • Power
Distribution• Uninterruptable Power • Uninterruptable Power •
B-1

05/05/99 CBA GUIDE FOR NIH IT PROJECTS Revision 1
Uninterruptable Power• Heating & AC • Heating & AC • Heating & AC• Liquid Cooling • Liquid Cooling• Custodial, Supplies • Custodial, Supplies
• Custodial, Supplies
* Based on Benefit-Cost Study Performed for the Federal Aviation Administration
B-2
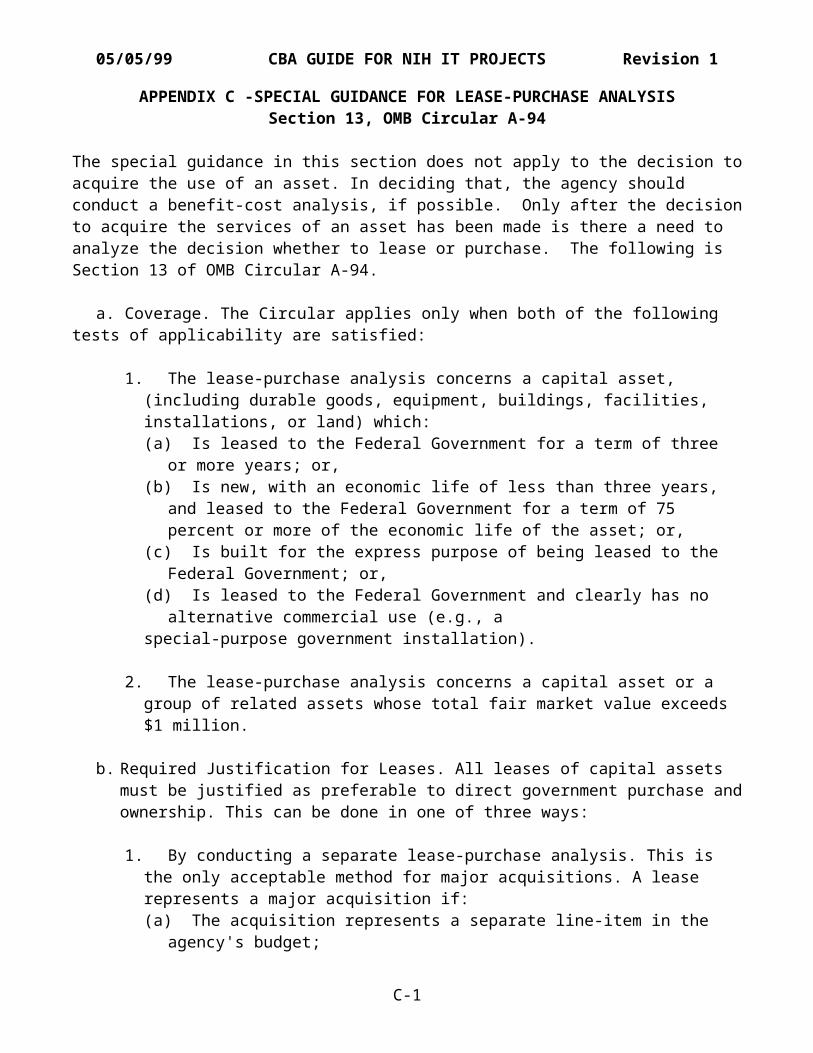
05/05/99 CBA GUIDE FOR NIH IT PROJECTS Revision 1
APPENDIX C -SPECIAL GUIDANCE FOR LEASE-PURCHASE ANALYSISSection 13, OMB Circular A-94
The special guidance in this section does not apply to the decision toacquire the use of an asset. In deciding that, the agency should conduct a benefit-cost analysis, if possible. Only after the decisionto acquire the services of an asset has been made is there a need to analyze the decision whether to lease or purchase. The following is Section 13 of OMB Circular A-94.
a. Coverage. The Circular applies only when both of the following tests of applicability are satisfied:
1. The lease-purchase analysis concerns a capital asset, (including durable goods, equipment, buildings, facilities, installations, or land) which: (a) Is leased to the Federal Government for a term of three
or more years; or, (b) Is new, with an economic life of less than three years,
and leased to the Federal Government for a term of 75 percent or more of the economic life of the asset; or,
(c) Is built for the express purpose of being leased to the Federal Government; or,
(d) Is leased to the Federal Government and clearly has no alternative commercial use (e.g., a
special-purpose government installation).
2. The lease-purchase analysis concerns a capital asset or a group of related assets whose total fair market value exceeds $1 million.
b. Required Justification for Leases. All leases of capital assets must be justified as preferable to direct government purchase andownership. This can be done in one of three ways:
1. By conducting a separate lease-purchase analysis. This is the only acceptable method for major acquisitions. A lease represents a major acquisition if: (a) The acquisition represents a separate line-item in the
agency's budget;
C-1
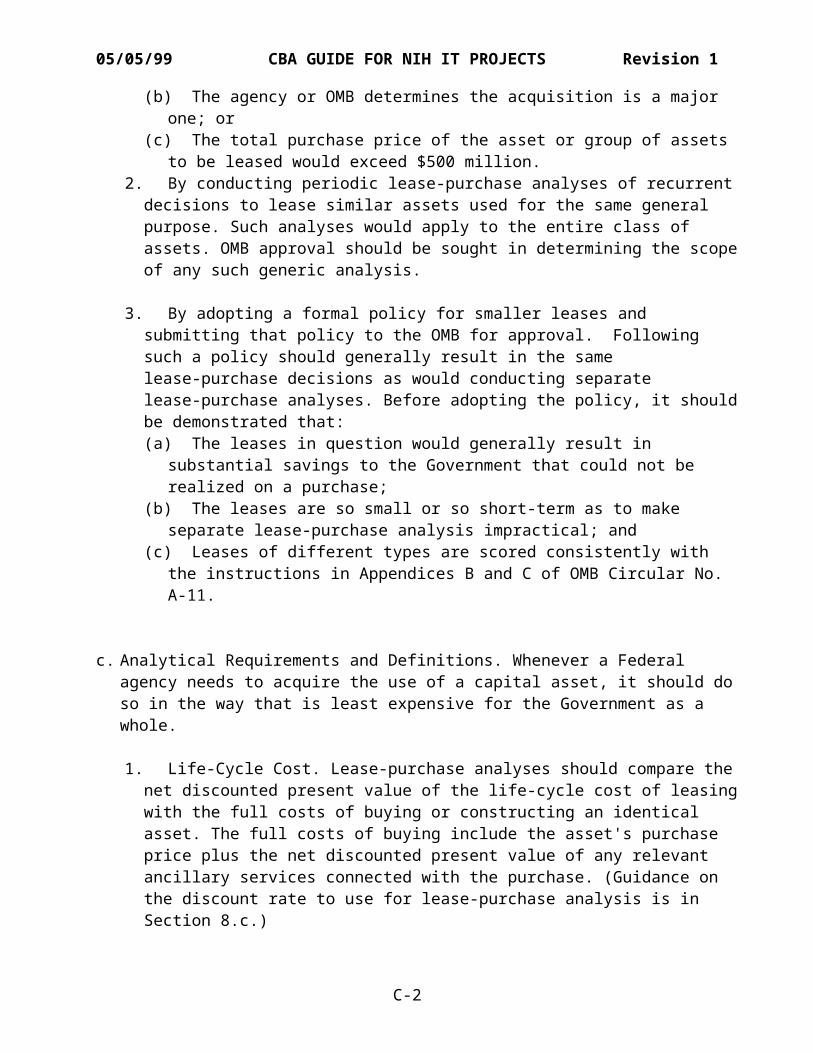
05/05/99 CBA GUIDE FOR NIH IT PROJECTS Revision 1
(b) The agency or OMB determines the acquisition is a major one; or
(c) The total purchase price of the asset or group of assets to be leased would exceed $500 million.
2. By conducting periodic lease-purchase analyses of recurrent decisions to lease similar assets used for the same general purpose. Such analyses would apply to the entire class of assets. OMB approval should be sought in determining the scopeof any such generic analysis.
3. By adopting a formal policy for smaller leases and submitting that policy to the OMB for approval. Following such a policy should generally result in the same lease-purchase decisions as would conducting separate lease-purchase analyses. Before adopting the policy, it shouldbe demonstrated that: (a) The leases in question would generally result in
substantial savings to the Government that could not be realized on a purchase;
(b) The leases are so small or so short-term as to make separate lease-purchase analysis impractical; and
(c) Leases of different types are scored consistently with the instructions in Appendices B and C of OMB Circular No. A-11.
c. Analytical Requirements and Definitions. Whenever a Federal agency needs to acquire the use of a capital asset, it should do so in the way that is least expensive for the Government as a whole.
1. Life-Cycle Cost. Lease-purchase analyses should compare the net discounted present value of the life-cycle cost of leasingwith the full costs of buying or constructing an identical asset. The full costs of buying include the asset's purchase price plus the net discounted present value of any relevant ancillary services connected with the purchase. (Guidance on the discount rate to use for lease-purchase analysis is in Section 8.c.)
C-2
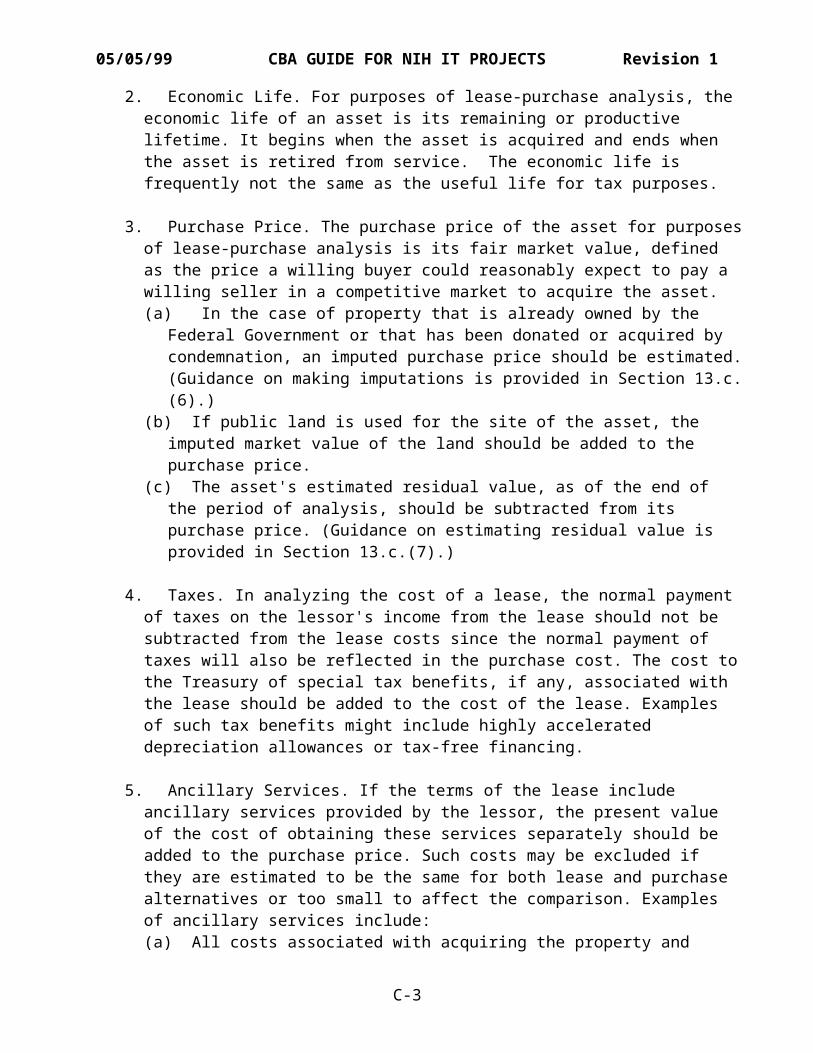
05/05/99 CBA GUIDE FOR NIH IT PROJECTS Revision 1
2. Economic Life. For purposes of lease-purchase analysis, the economic life of an asset is its remaining or productive lifetime. It begins when the asset is acquired and ends when the asset is retired from service. The economic life is frequently not the same as the useful life for tax purposes.
3. Purchase Price. The purchase price of the asset for purposesof lease-purchase analysis is its fair market value, defined as the price a willing buyer could reasonably expect to pay a willing seller in a competitive market to acquire the asset. (a) In the case of property that is already owned by the
Federal Government or that has been donated or acquired by condemnation, an imputed purchase price should be estimated.(Guidance on making imputations is provided in Section 13.c.(6).)
(b) If public land is used for the site of the asset, the imputed market value of the land should be added to the purchase price.
(c) The asset's estimated residual value, as of the end of the period of analysis, should be subtracted from its purchase price. (Guidance on estimating residual value is provided in Section 13.c.(7).)
4. Taxes. In analyzing the cost of a lease, the normal payment of taxes on the lessor's income from the lease should not be subtracted from the lease costs since the normal payment of taxes will also be reflected in the purchase cost. The cost tothe Treasury of special tax benefits, if any, associated with the lease should be added to the cost of the lease. Examples of such tax benefits might include highly accelerated depreciation allowances or tax-free financing.
5. Ancillary Services. If the terms of the lease include ancillary services provided by the lessor, the present value of the cost of obtaining these services separately should be added to the purchase price. Such costs may be excluded if they are estimated to be the same for both lease and purchase alternatives or too small to affect the comparison. Examples of ancillary services include: (a) All costs associated with acquiring the property and
C-3
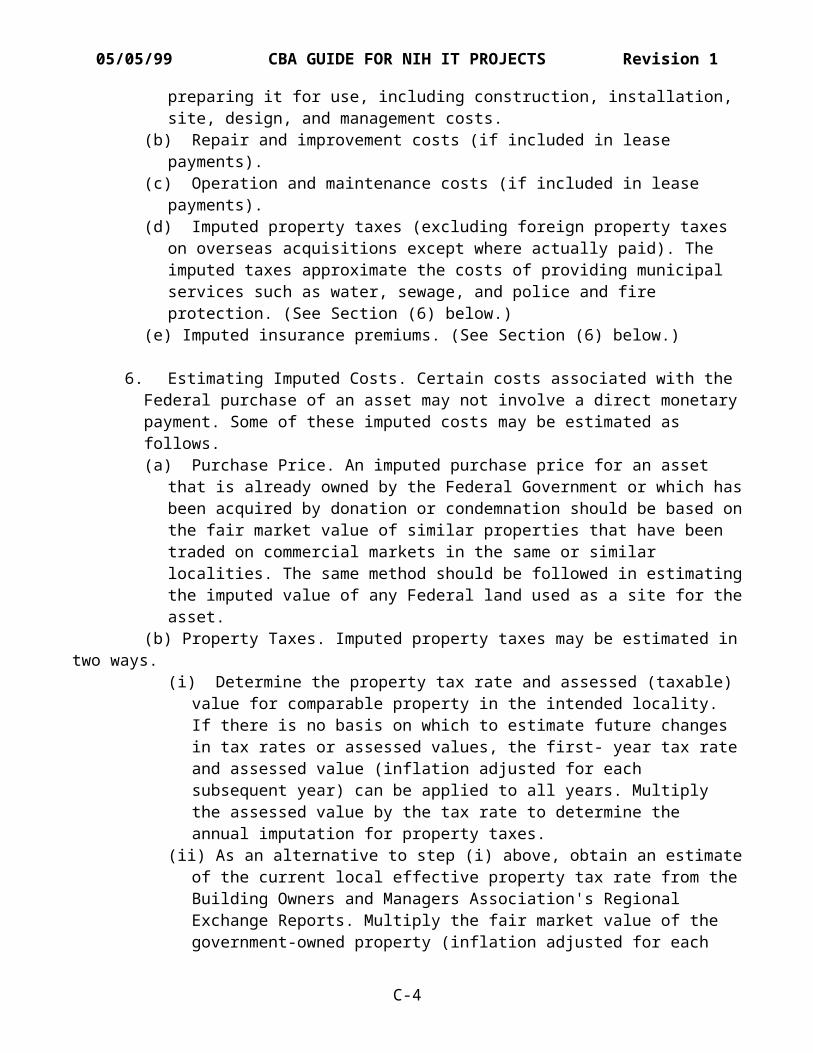
05/05/99 CBA GUIDE FOR NIH IT PROJECTS Revision 1
preparing it for use, including construction, installation, site, design, and management costs.
(b) Repair and improvement costs (if included in lease payments).
(c) Operation and maintenance costs (if included in lease payments).
(d) Imputed property taxes (excluding foreign property taxes on overseas acquisitions except where actually paid). The imputed taxes approximate the costs of providing municipal services such as water, sewage, and police and fire protection. (See Section (6) below.)
(e) Imputed insurance premiums. (See Section (6) below.)
6. Estimating Imputed Costs. Certain costs associated with the Federal purchase of an asset may not involve a direct monetarypayment. Some of these imputed costs may be estimated as follows. (a) Purchase Price. An imputed purchase price for an asset
that is already owned by the Federal Government or which hasbeen acquired by donation or condemnation should be based onthe fair market value of similar properties that have been traded on commercial markets in the same or similar localities. The same method should be followed in estimatingthe imputed value of any Federal land used as a site for theasset.
(b) Property Taxes. Imputed property taxes may be estimated intwo ways.
(i) Determine the property tax rate and assessed (taxable) value for comparable property in the intended locality. If there is no basis on which to estimate future changes in tax rates or assessed values, the first- year tax rateand assessed value (inflation adjusted for each subsequent year) can be applied to all years. Multiply the assessed value by the tax rate to determine the annual imputation for property taxes.
(ii) As an alternative to step (i) above, obtain an estimateof the current local effective property tax rate from theBuilding Owners and Managers Association's Regional Exchange Reports. Multiply the fair market value of the government-owned property (inflation adjusted for each
C-4
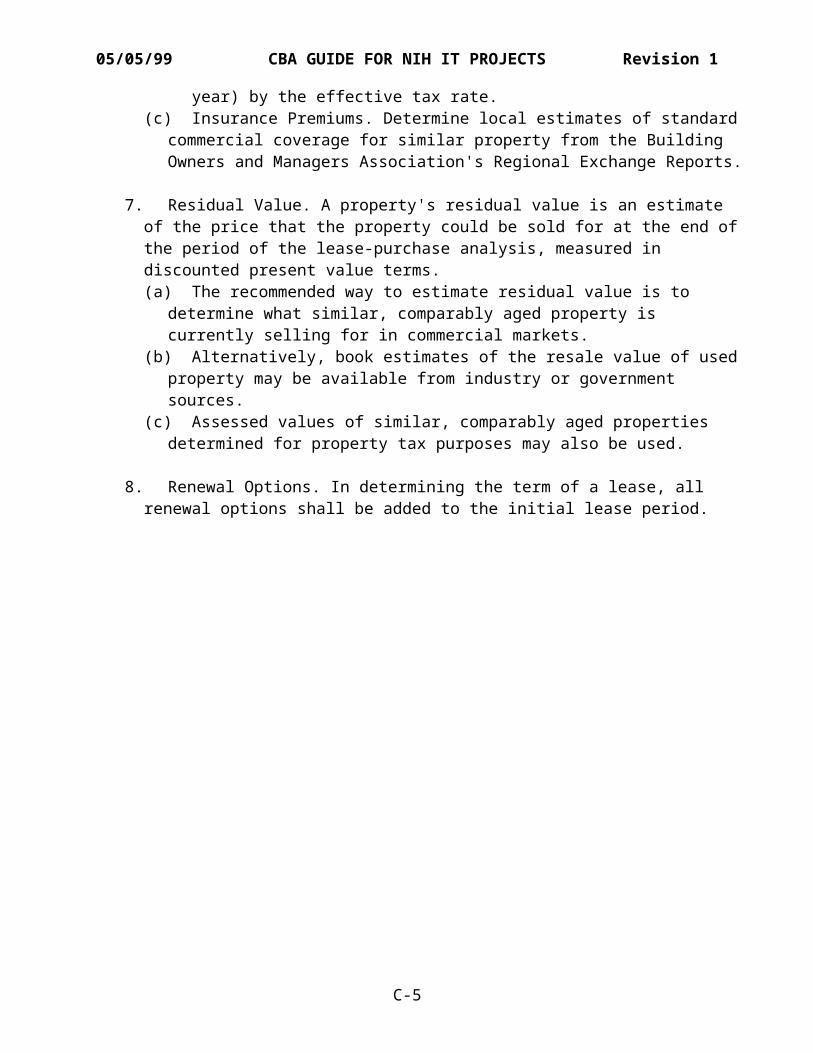
05/05/99 CBA GUIDE FOR NIH IT PROJECTS Revision 1
year) by the effective tax rate. (c) Insurance Premiums. Determine local estimates of standard
commercial coverage for similar property from the Building Owners and Managers Association's Regional Exchange Reports.
7. Residual Value. A property's residual value is an estimate of the price that the property could be sold for at the end ofthe period of the lease-purchase analysis, measured in discounted present value terms. (a) The recommended way to estimate residual value is to
determine what similar, comparably aged property is currently selling for in commercial markets.
(b) Alternatively, book estimates of the resale value of usedproperty may be available from industry or government sources.
(c) Assessed values of similar, comparably aged properties determined for property tax purposes may also be used.
8. Renewal Options. In determining the term of a lease, all renewal options shall be added to the initial lease period.
C-5
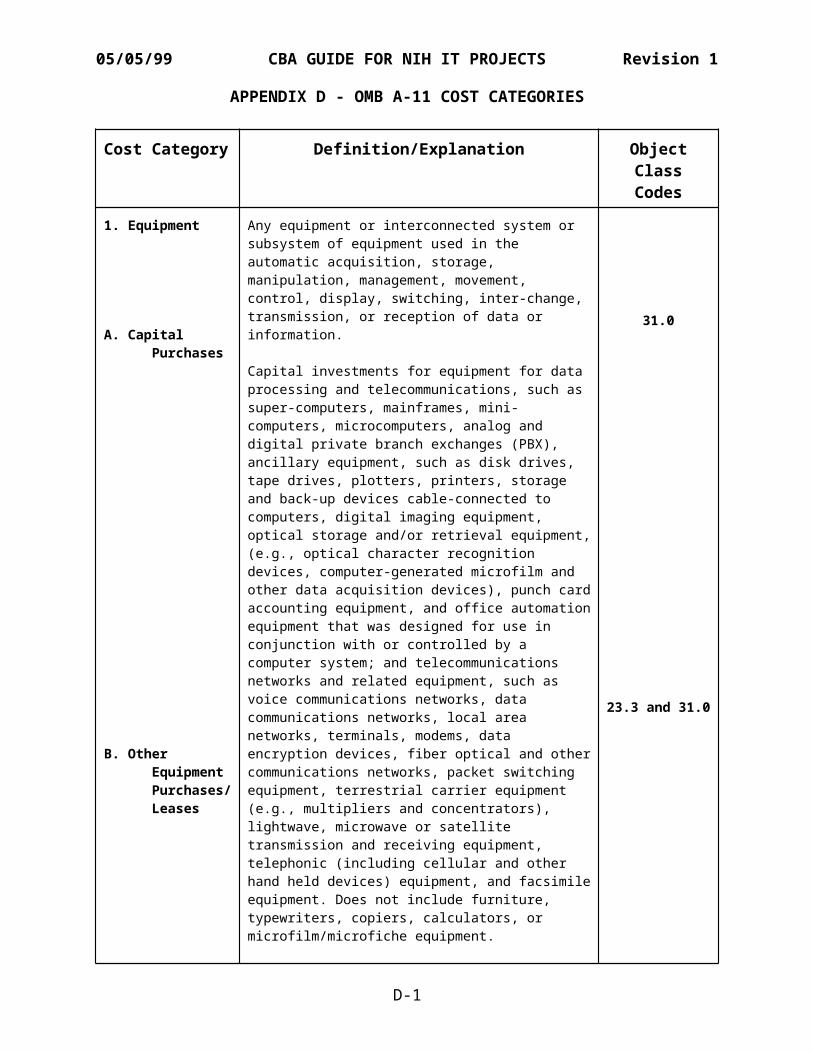
05/05/99 CBA GUIDE FOR NIH IT PROJECTS Revision 1
APPENDIX D - OMB A-11 COST CATEGORIES
Cost Category Definition/Explanation ObjectClassCodes
1. Equipment
A. Capital Purchases
B. Other Equipment Purchases/Leases
Any equipment or interconnected system or subsystem of equipment used in the automatic acquisition, storage, manipulation, management, movement, control, display, switching, inter-change, transmission, or reception of data or information.
Capital investments for equipment for data processing and telecommunications, such as super-computers, mainframes, mini-computers, microcomputers, analog and digital private branch exchanges (PBX), ancillary equipment, such as disk drives, tape drives, plotters, printers, storage and back-up devices cable-connected to computers, digital imaging equipment, optical storage and/or retrieval equipment,(e.g., optical character recognition devices, computer-generated microfilm and other data acquisition devices), punch cardaccounting equipment, and office automationequipment that was designed for use in conjunction with or controlled by a computer system; and telecommunications networks and related equipment, such as voice communications networks, data communications networks, local area networks, terminals, modems, data encryption devices, fiber optical and othercommunications networks, packet switching equipment, terrestrial carrier equipment (e.g., multipliers and concentrators), lightwave, microwave or satellite transmission and receiving equipment, telephonic (including cellular and other hand held devices) equipment, and facsimileequipment. Does not include furniture, typewriters, copiers, calculators, or microfilm/microfiche equipment.
31.0
23.3 and 31.0
D-1
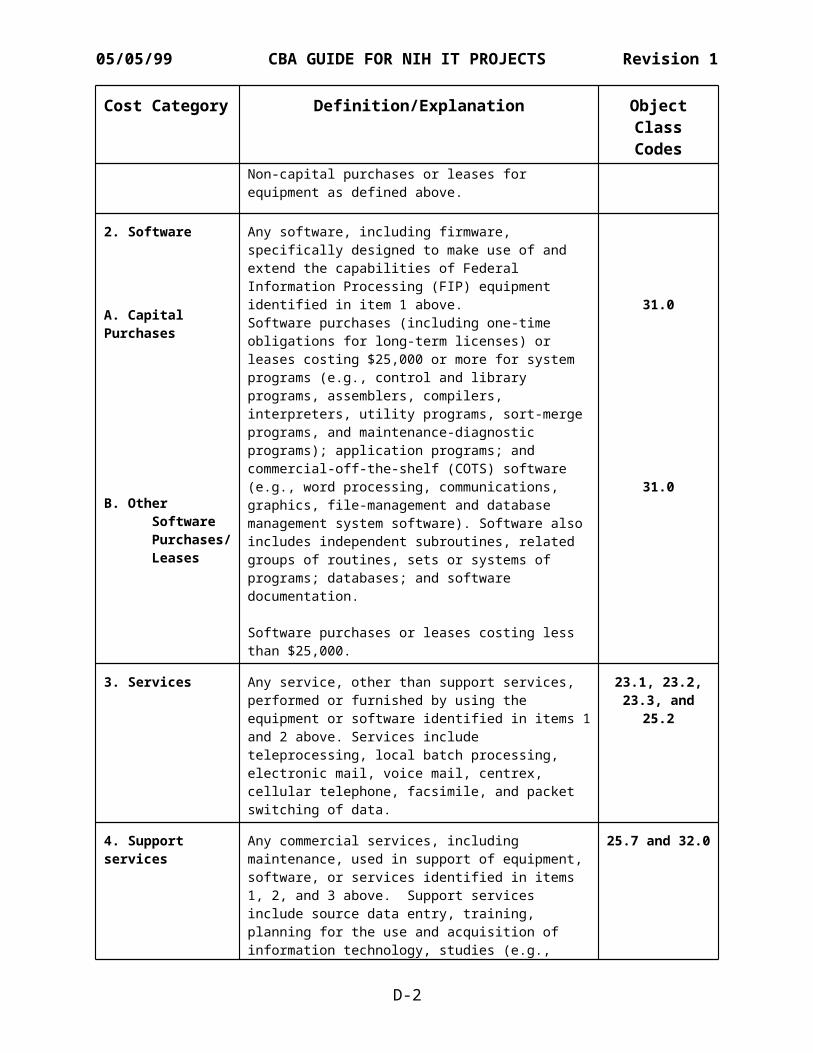
05/05/99 CBA GUIDE FOR NIH IT PROJECTS Revision 1
Cost Category Definition/Explanation ObjectClassCodes
Non-capital purchases or leases for equipment as defined above.
2. Software
A. Capital Purchases
B. Other Software Purchases/Leases
Any software, including firmware, specifically designed to make use of and extend the capabilities of Federal Information Processing (FIP) equipment identified in item 1 above.Software purchases (including one-time obligations for long-term licenses) or leases costing $25,000 or more for system programs (e.g., control and library programs, assemblers, compilers, interpreters, utility programs, sort-merge programs, and maintenance-diagnostic programs); application programs; and commercial-off-the-shelf (COTS) software (e.g., word processing, communications, graphics, file-management and database management system software). Software also includes independent subroutines, related groups of routines, sets or systems of programs; databases; and software documentation.
Software purchases or leases costing less than $25,000.
31.0
31.0
3. Services Any service, other than support services, performed or furnished by using the equipment or software identified in items 1and 2 above. Services include teleprocessing, local batch processing, electronic mail, voice mail, centrex, cellular telephone, facsimile, and packet switching of data.
23.1, 23.2,23.3, and
25.2
4. Support services
Any commercial services, including maintenance, used in support of equipment, software, or services identified in items 1, 2, and 3 above. Support services include source data entry, training, planning for the use and acquisition of information technology, studies (e.g.,
25.7 and 32.0
D-2
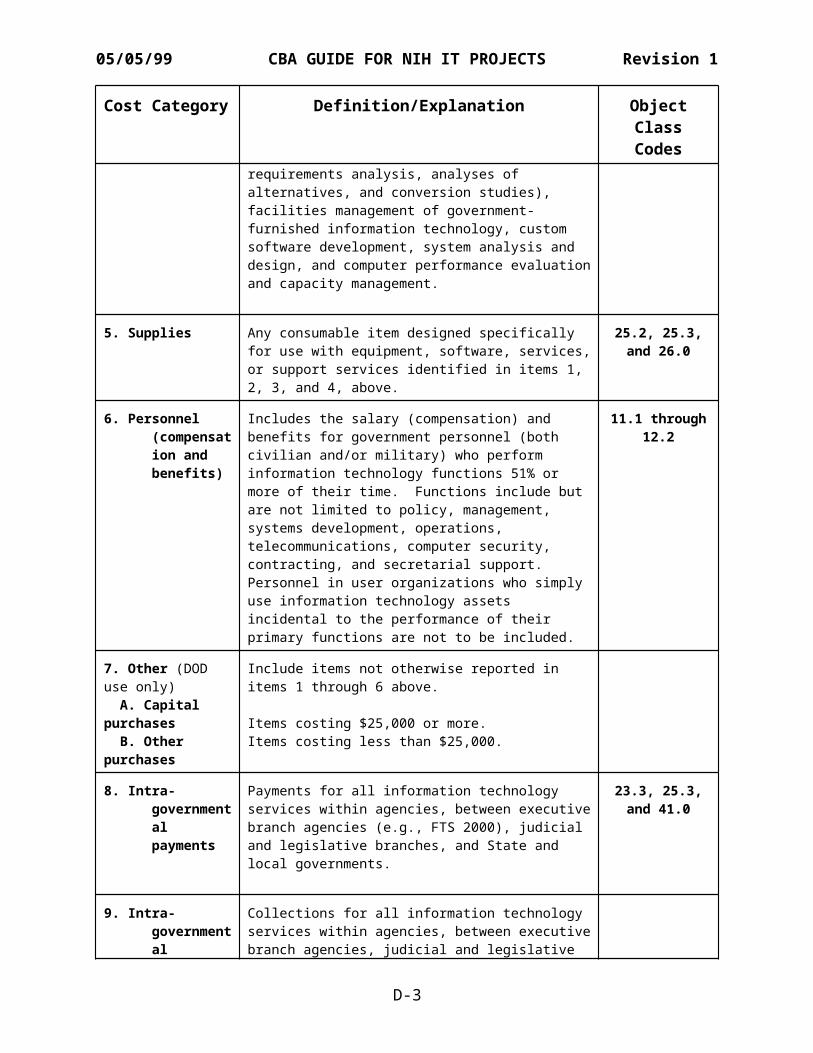
05/05/99 CBA GUIDE FOR NIH IT PROJECTS Revision 1
Cost Category Definition/Explanation ObjectClassCodes
requirements analysis, analyses of alternatives, and conversion studies), facilities management of government-furnished information technology, custom software development, system analysis and design, and computer performance evaluationand capacity management.
5. Supplies Any consumable item designed specifically for use with equipment, software, services,or support services identified in items 1, 2, 3, and 4, above.
25.2, 25.3,and 26.0
6. Personnel (compensation and benefits)
Includes the salary (compensation) and benefits for government personnel (both civilian and/or military) who perform information technology functions 51% or more of their time. Functions include but are not limited to policy, management, systems development, operations, telecommunications, computer security, contracting, and secretarial support. Personnel in user organizations who simply use information technology assets incidental to the performance of their primary functions are not to be included.
11.1 through12.2
7. Other (DOD use only) A. Capital purchases B. Other purchases
Include items not otherwise reported in items 1 through 6 above.
Items costing $25,000 or more.Items costing less than $25,000.
8. Intra-governmental payments
Payments for all information technology services within agencies, between executivebranch agencies (e.g., FTS 2000), judicial and legislative branches, and State and local governments.
23.3, 25.3,and 41.0
9. Intra-governmental
Collections for all information technology services within agencies, between executivebranch agencies, judicial and legislative
D-3

05/05/99 CBA GUIDE FOR NIH IT PROJECTS Revision 1
Cost Category Definition/Explanation ObjectClassCodes
collections
branches, and State and local governments.
D-4
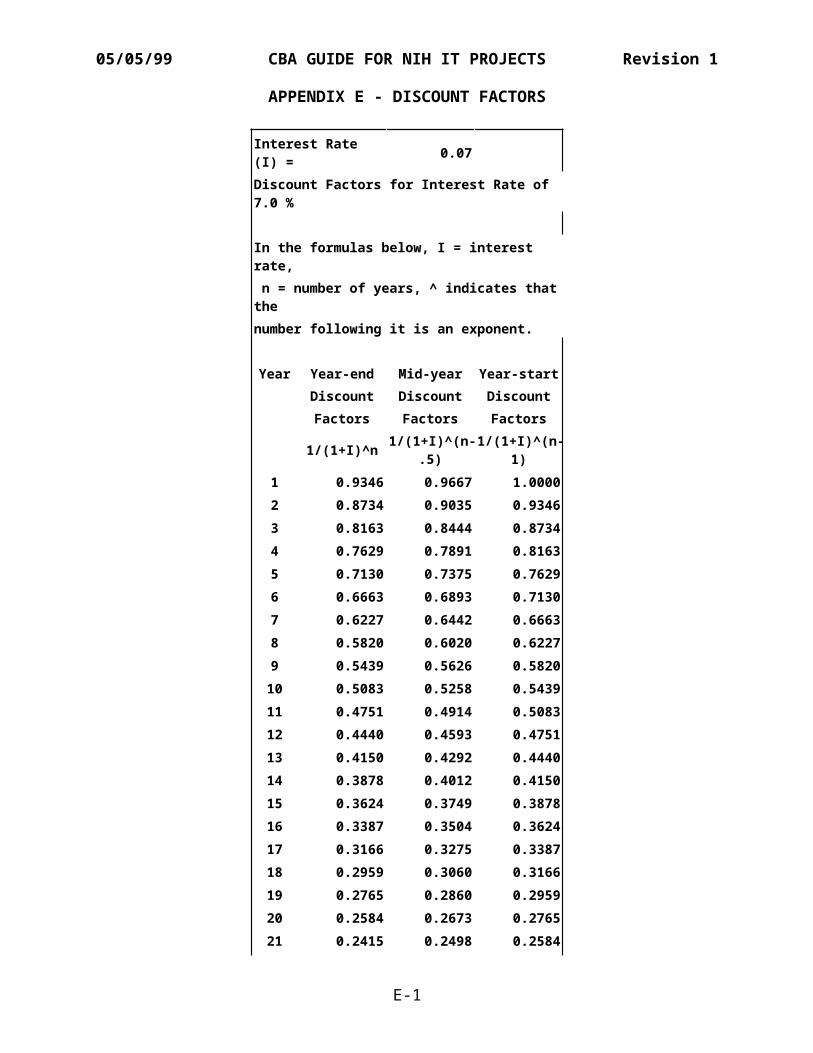
05/05/99 CBA GUIDE FOR NIH IT PROJECTS Revision 1
APPENDIX E - DISCOUNT FACTORS
Interest Rate (I) = 0.07
Discount Factors for Interest Rate of 7.0 %
In the formulas below, I = interest rate, n = number of years, ^ indicates thatthenumber following it is an exponent.
Year Year-end Mid-year Year-startDiscount Discount DiscountFactors Factors Factors
1/(1+I)^n 1/(1+I)^(n-.5)
1/(1+I)^(n-1)
1 0.9346 0.9667 1.00002 0.8734 0.9035 0.93463 0.8163 0.8444 0.87344 0.7629 0.7891 0.81635 0.7130 0.7375 0.76296 0.6663 0.6893 0.71307 0.6227 0.6442 0.66638 0.5820 0.6020 0.62279 0.5439 0.5626 0.582010 0.5083 0.5258 0.543911 0.4751 0.4914 0.508312 0.4440 0.4593 0.475113 0.4150 0.4292 0.444014 0.3878 0.4012 0.415015 0.3624 0.3749 0.387816 0.3387 0.3504 0.362417 0.3166 0.3275 0.338718 0.2959 0.3060 0.316619 0.2765 0.2860 0.295920 0.2584 0.2673 0.276521 0.2415 0.2498 0.2584
E-1
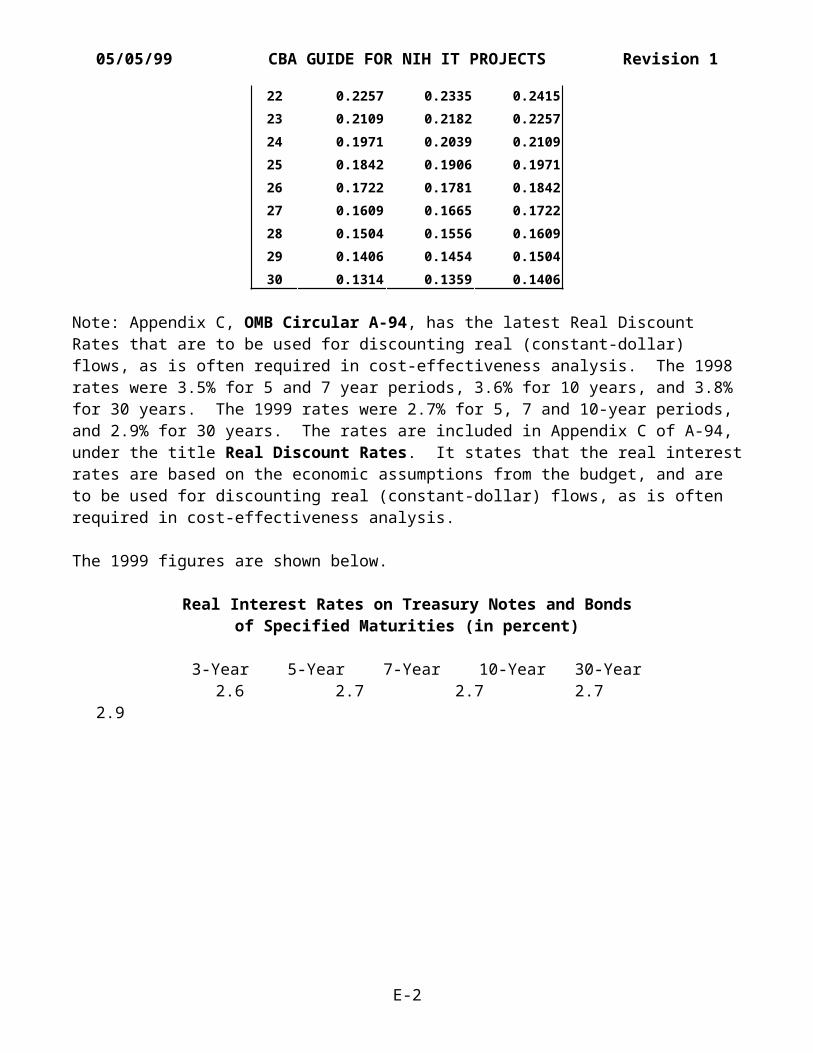
05/05/99 CBA GUIDE FOR NIH IT PROJECTS Revision 1
22 0.2257 0.2335 0.241523 0.2109 0.2182 0.225724 0.1971 0.2039 0.210925 0.1842 0.1906 0.197126 0.1722 0.1781 0.184227 0.1609 0.1665 0.172228 0.1504 0.1556 0.160929 0.1406 0.1454 0.150430 0.1314 0.1359 0.1406
Note: Appendix C, OMB Circular A-94, has the latest Real Discount Rates that are to be used for discounting real (constant-dollar) flows, as is often required in cost-effectiveness analysis. The 1998 rates were 3.5% for 5 and 7 year periods, 3.6% for 10 years, and 3.8% for 30 years. The 1999 rates were 2.7% for 5, 7 and 10-year periods, and 2.9% for 30 years. The rates are included in Appendix C of A-94, under the title Real Discount Rates. It states that the real interestrates are based on the economic assumptions from the budget, and are to be used for discounting real (constant-dollar) flows, as is often required in cost-effectiveness analysis.
The 1999 figures are shown below.
Real Interest Rates on Treasury Notes and Bondsof Specified Maturities (in percent)
3-Year 5-Year 7-Year 10-Year 30-Year2.6 2.7 2.7 2.7
2.9
E-2


