Embed Size (px)
Citation preview

Institute for Advanced Development Studies
Development Research Working Paper Series
No. 9/2007
Corruption, privatisation and the distribution of income in Latin America
by:
Antonio Rodriguez Carlyn Ramlogan
November 2007 The views expressed in the Development Research Working Paper Series are those of the authors and do not necessarily reflect those of the Institute for Advanced Development Studies. Copyrights belong to the authors. Papers may be downloaded for personal use only.
1
Corruption, privatisation and the distribution of income in Latin America
Antonio Rodriguez Andres
Universidad Catolica del Northe, Chile
Carlyn Ramlogan
University of Otago, New Zealand
Abstract
This paper presents some new evidence on income inequality in Latin America over the
period 1980-1999, examining in particular the relationship between corruption, privatisation
and inequality. Using a panel data methodology, we find that a reduction in corruption is
associated with a rise in inequality. This suggests that while privatisation removes industries
from government influence and government corruption, it worsens income inequality as new
owners strive for efficiency and profits. The paper highlights the fact that structural reform
policies aimed primarily at achieving positive and increasing growth rates do not adequately
address the income distribution problem.
Key words: income inequality, corruption, privatisation, panel data, Latin America,
instrumental variables.
JEL classifications: O15, O54
Antonio Rodriguez Andres Departamento de Economía, Universidad Católica del Norte, Av. Angamos 0610, Antofagasta, Chile Telephone: +56 55 355747 Email: [email protected] Carlyn Ramlogan Department of Economics, University of Otago, PO Box 56, Dunedin, New Zealand Tel: +64 3 479 5278 Email: [email protected]

2
Corruption, privatisation and the distribution of income in Latin America
1. Introduction
In broad terms, corruption is the abuse of public office for personal gain. Surveys of public
opinion in Latin America highlight corruption as one of the major problems facing the region,
along with unemployment, crime and inequality (Lagos, 2003). According to the 2005
Corruption Perception Index (CPI), levels of corruption are highest in Paraguay and
Venezuela and lowest in Chile1. Though corruption is perceived to be a problem throughout
the region, the International Country Risk Guide (ICRG)2 reports that during the period 1980-
2000 several countries, namely Bolivia, Ecuador, Guatemala and El Salvador, showed
evidence of falling levels of corruption.
The origins of corruption and income inequality in Latin America go back to the early post
colonial period and the development of key institutions (Engerman & Sokoloff, 2002;
Acemoglu et al, 2002). At this time, a privileged few controlled the profitable activities and,
to protect their interests, institutions were structured in such a way that most of the population
were denied access to land, education and political power. The pattern of non-representative
institutions survived the move to independence across the region as the Creole elite gained
control of key institutions and shaped them to their advantage. This elite group was able to
wield significant influence on the formation and implementation of government policies. For
example, the failure to expand public education helped to protect the vested interests of the
elite group.3 This neglect continued into the 20th century with education being of low quality4
and patterns of social exclusion and discrimination remaining (Kelley & Klein, 1981).
3
The opening up of the international economy exacerbated rather than reduced income
differentials because the gains accrued to landholders (the elite). These gains were
exaggerated by the fact that Latin America is rich in natural resources, the abundant
productive factor in the region. Natural resources (rather than labour5) were more intensively
used in the production of exportable goods. Consequently, returns to land grew relative to
those of labour. Since the majority of the population were excluded from owning property, the
income distribution problem worsened as the wealth of landowners increased. The natural
outcome was that inequality increased over the early period of globalisation (Williamson,
1999)6. Furthermore, an abundance of natural resources increases opportunities for windfall
gains thus raising the likelihood of corrupt practices (Ades & Di Tella, 1999, Leite &
Weidman, 1999).
Bourguignon and Morrisson (2002) suggest that the distribution of income did not change
from the time of independence to the mid 20th century, while Morley (2000) argues that since
World War 2 the situation has worsened. Londono and Szekeley (2000) argue that inequality
levels in the 1990s were similar to those in the 1930s. De Ferranti et al (2004) note that, as in
the 19th century, authoritarianism may be the primary reason for the persistence of inequality
in the 20th century. Although democratisation has taken place, the process is unconsolidated
and the authors conclude that correcting institutional failures along with direct polices are
essential to reduce inequality. Perry et al (2006) confirm the findings of De Ferranti et al and,
after examining the evidence, conclude that Latin America entered the 20th century with high
levels of inequality which persisted for the rest of the century. Finally, in a study of
Argentina, Calvo et al (2002) indicate that inequality levels changed little during the 20th
century.
4
While the above sheds light on the roots of inequality in Latin America, it also illustrates the
close links between corrupt practices, institutions and inequality. It seems reasonable to
conclude that if the basic principles of the early colonial period had been carried out in a more
impartial manner, with less preferential treatment towards a few, then it is likely that the
outcome with respect to inequality would have been different. The discussion also highlights
the fact that corruption is entrenched in the political and economic operations of the region.
The empirical literature on corruption and income inequality finds that higher levels of
corruption increase income inequality. In a few studies, some Latin American countries have
been included as part of a larger sample of both developing and developed countries (e.g. Li
et al, 2000; Gupta et al, 2002; Gyimah-Brempong & Muñoz de Camacho, 2006). However, no
study has yet examined income differences and corruption specifically across Latin American
countries.
According to economic theory, corruption is expected to worsen income inequality (Mauro,
1997; Jain, 2001; Gupta et al, 2002). Corruption, in the form of tax evasions and exemptions,
reduces tax revenues and funds for social programmes, including education and health.
Furthermore, since the beneficiaries of tax evasion and exemptions are more likely to be the
relatively wealthy, the tax burden falls almost exclusively on the poor, making the effective
tax system regressive. The impact on social programmes can be more direct as funds may be
siphoned out of poverty alleviation programmes in order to extend benefits to relatively
wealthy population groups. Even when social programmes are not reduced, corruption may
change the composition of social spending in a manner that benefits the rich at the expense of
the poor; for example, expenditure on tertiary rather primary education. In a corrupt system,
the allocation of public procurement contracts may lead to inferior public infrastructure,
which also has implications for inequality and welfare.

5
In this study, we present new evidence on the relationship between income inequality and
corruption for Latin America. In contrast to other empirical work and a priori expectations,
we find that lower levels of corruption are associated with higher levels of inequality. This
finding is partly explained by the privatisation process in the region (see Section 3). The
structure of the paper is as follows. In Section 2 the model specification and data are
described. The empirical results are presented and discussed in Section 3. Section 4 is the
conclusion.
2. Model Specification and Data
Econometric estimation is conducted using four-year panel data over the period 1980-1999
for 19 Latin American countries,7 with each observation of the dependent variable being the
relevant four year average value. Panel data allows for many more degrees of freedom than
cross-section and time series data. Moreover, it controls for omitted variable bias and reduces
the problem of multicollinearity, thus improving the accuracy of parameter estimates. This
approach also has the advantage of capturing possible idiosyncratic differences in income
inequality by means of individual effects. A priori, a fixed effects model is preferred to a
random effects model since we expect the explanatory variables to be correlated with the
unobserved individual effects. All the countries of the region for which data is available are
included in the study. There are some missing observations in the data and, consequently, the
sample is unbalanced.
The empirical specification to be estimated is:
= + +it it i itI X Aβ ε = =( i 1,....n;t 1,......T ) (1)
where I is a measure of income inequality for country i at time t. Xit contains all regressors
which vary across time and countries. It includes a corruption variable (corupt). The

6
parameter Ai contains a constant and individual specific variables that are invariant over time
(for example, geographic location and history) and εit is the classical error term.
The dependent variable is a standard measure of income inequality, the Gini coefficient. The
data on inequality is drawn from the United Nations World Income Inequality Database
(WIID) (UNU-WIDER, 2005).8 We use the new quality label provided in Version 2a of the
WIID, which combines and improves the quality ratings in Deininger & Squire (1996) with
older versions of the WIID. Data classified as the lowest quality is excluded. Furthermore,
only data which covers both the entire population and the whole area of the country is
employed. Gini coefficients are based on income rather than on consumption because of data
limitations.9 For each country, we have formed the longest possible series of observations.
The measure of corruption is the International Country Risk Guide (ICRG) corruption index
published by Political Risk Services (PRS). This measure has been used by a number of
scholars in the empirical literature (e.g. Fisman & Gatti, 2002) and it takes values from zero
(most corrupt) to six (least corrupt). The measure has the advantage of having the broadest
coverage for Latin American countries for the period of study.
The natural logarithm of real output per capita (lgdp) and real output per capita squared
(lgdp2) are included to test the classical Kuznets hypothesis (Kuznets, 1955; Lewis, 1954).
According to this hypothesis, inequality rises with income at low levels but falls above a
given level (inverted U hypothesis). In line with other studies (e.g. Bourguignon & Morrison,
1998; Li et al, 1998; De Janvry & Sadoulet, 2000; Morley, 2000; Reuveny & Li, 2003; Breen
& García-Peñalosa, 2005), the model also includes the following variables: primary (primary)
and secondary (secondary) gross school enrolment rates, the share of agriculture in total

7
output (aggdp), the ratio of broad money to output (m2gdp) and a variable to represent the
distribution of land resources (land). Both land and education represent investment in human
assests and hence should contribute to lowering inequality. Because of its labour intensive
nature, an expansion of the agriculture sector is expected to increase employment levels and
contribute to reducing inequality. Finally, m2gdp is included as an indicator of financial
development – a more developed financial sector is expected to lower inequality by
alleviating the credit constraints and increasing the accessibility of investment opportunities
to low income households. Data for all these variables is taken from the Penn World Table,
Version 6.1 (Heston, Summers, and Aten, 2002), World Bank’s World Development
Indicators (2003), and Frankema (2005).
An important potential issue in estimating equation (1) is the endogeneity of the control
variables. Incorporating time invariant fixed effects into the model deals with this to some
extent, but the inclusion of time varying factors means omitted variable bias is still a potential
problem. Furthermore, if there is correlation between at least one explanatory variable and the
error term, OLS estimates will suffer from simultaneity bias.10 In order to deal with both
potential problems, an instrumental variable (IV) methodology is adopted. It should be noted,
however, that because of data limitations we only instrument for the corruption variable.
8
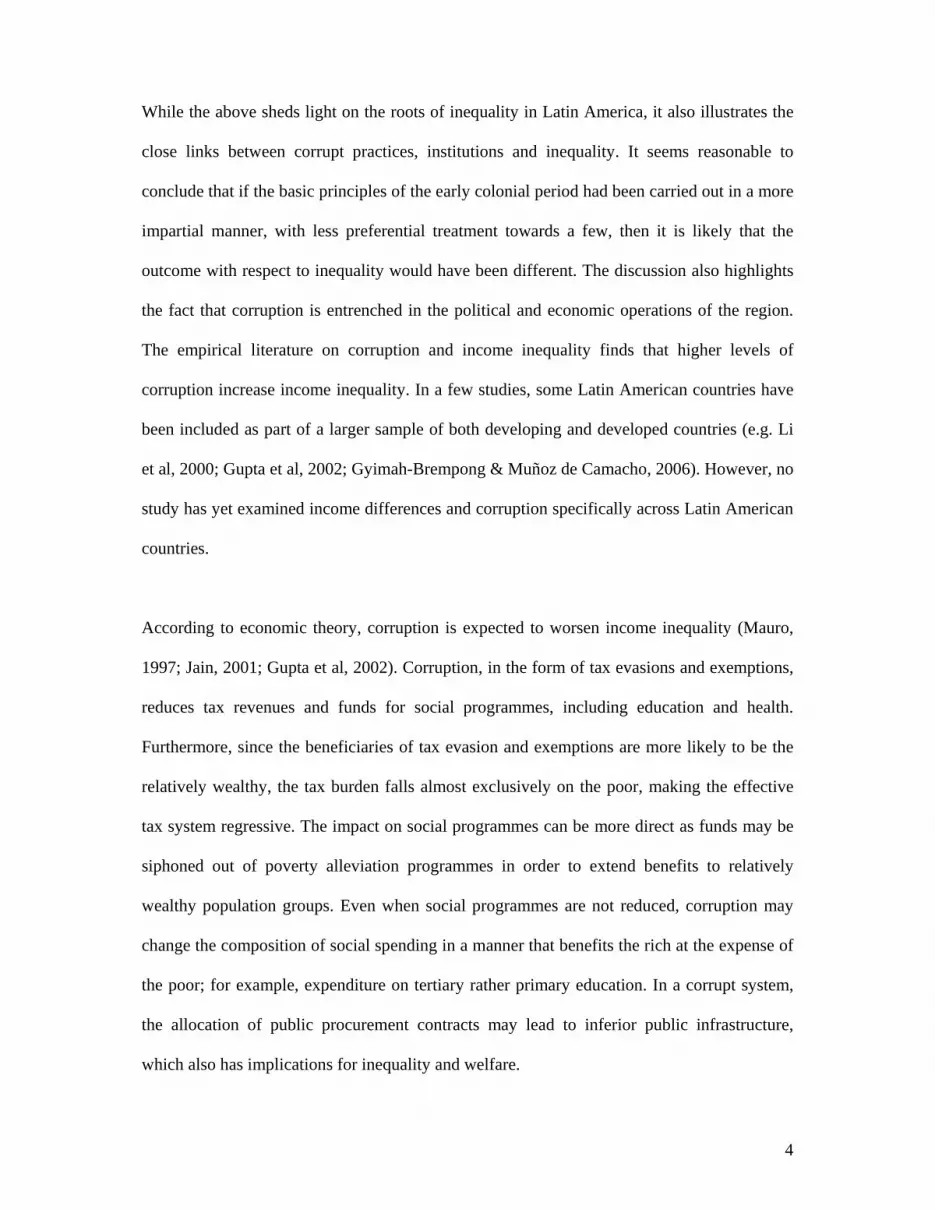
Table 1: Inequality in Latin America (Average Gini coefficients)
Country 1980-83 1984-87 1988-91 1992-95 1996-99 Argentina 40.98 41.55 45.60 45.83 47.90 Bolivia 51.50 53.50 51.41 60.10 Brazil 57.23 58.75 61.83 59.03 60.30 Chile 54.53 55.11 55.65 53.00 56.50 Columbia 55.75 55.05 58.29 57.40 Costa Rica 46.90 48.13 48.15 48.68 Dominican Republic 45.20 51.50 51.60 48.90 Ecuador 44.40 56.07 56.97 Guatemala 56.00 55.30 54.90 Honduras 54.80 55.33 55.05 53.90 Jamaica 54.45 59.40 56.75 Mexico 50.60 53.10 54.55 54.90 Nicaragua 53.90 54.30 Panama 47.60 57.75 56.80 57.20 Peru 50.90 54.70 50.12 Paraguay 45.10 39.80 55.85 55.40 El Salvador 47.10 50.15 53.60 Uruguay 42.10 40.13 41.14 43.17 43.79 Venezuela 45.40 46.23 44.29 44.01 47.91 Latin America (19) 48.40 49.48 51.20 52.83 53.66 Source: UNU-WIDER (2005)
Table 1 shows the four-year average values for the Gini coefficient. According to this
measure, inequality increased steadily over the period for the region as a whole. There is also
evidence of variation across individual countries and variation across the countries over
different time periods. For example, the Gini index increased markedly for Panama from over
47 in the earliest period to 57 by 1996-99, while there were more modest increases for Costa
Rica and Uruguay. No country experienced any large reduction in inequality over the period
as a whole. For those countries for which start and end period data are available, Paraguay
and Panama experienced the largest relative declines. In Figure 1 the graphical relationship
between the Gini index and corruption is illustrated. Based on this rudimentary indicator we
can conclude that a fall in the corruption index (rising corruption) is associated with a higher
level of inequality, ceteris paribus.

9
Figure 1: Corruption and inequality
0
1
2
3
4
5
6
0 10 20 30 40 50 60 70
Gini Index
Cor
rupt
ion
3. Empirical results and analysis
Table 2 shows the empirical results using OLS. A Hausman test rejects the random effects
model in favour of the fixed effects model. Along with the fixed effects, the explanatory
variables capture 85% of the variation in income inequality across countries. The result for
corruption in Model 1 is particularly interesting as it indicates that a fall in corruption (a rise
in the corruption index) is associated with a rise in the Gini coefficient.
Table 2. Panel data regression models using OLS
Dependent variable: Gini index
Independent variables Model (1) Model (2) lgdp -46.7849 -53.6396 [0.4253] [0.4780] lgdp2 22.2923 25.6610 [0.4053] [0.4591] primary -0.1044** -0.1017** [2.3227] [2.2612] secondary 0.0788** 0.0683* [2.3072] [1.8567]
10
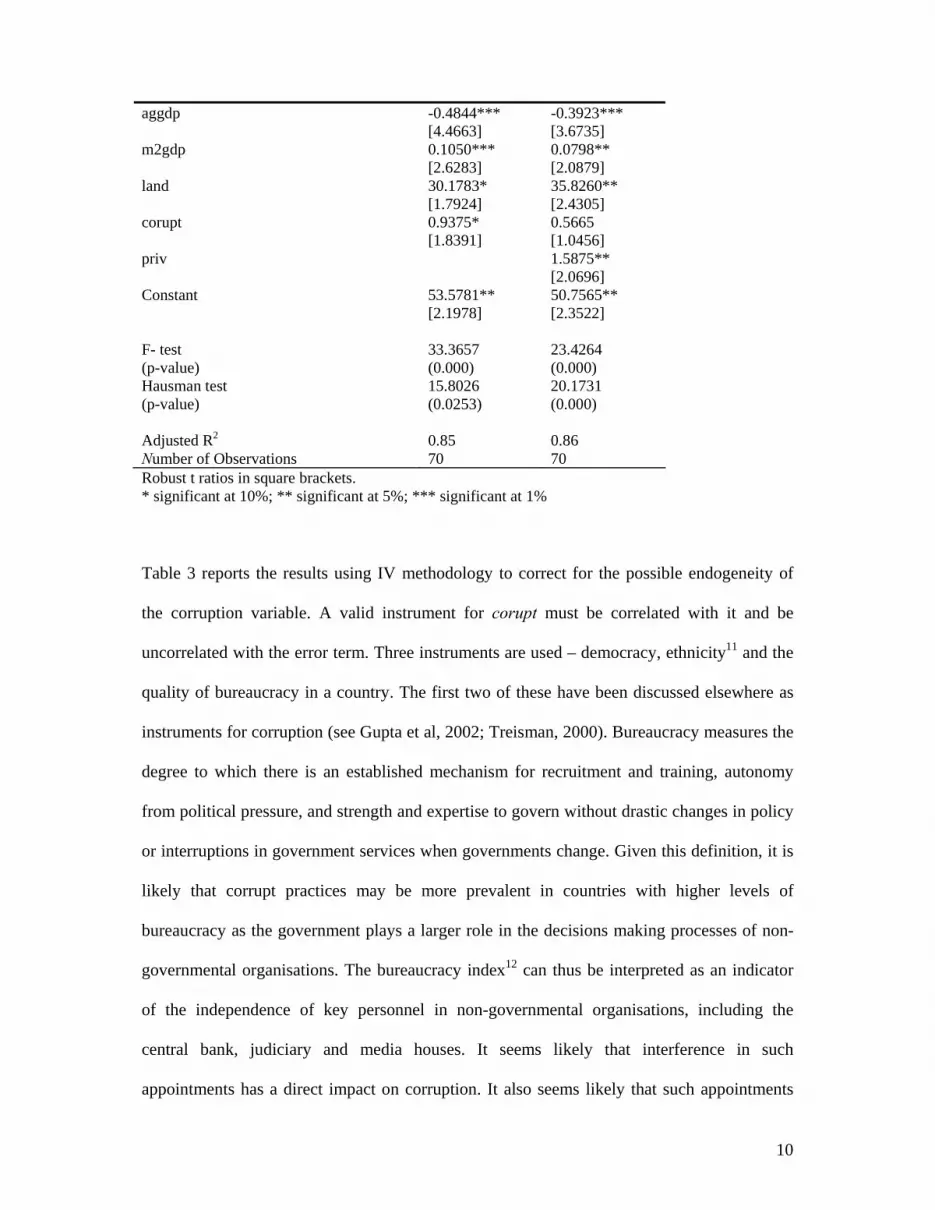
aggdp -0.4844*** -0.3923*** [4.4663] [3.6735] m2gdp 0.1050*** 0.0798** [2.6283] [2.0879] land 30.1783* 35.8260** [1.7924] [2.4305] corupt 0.9375* 0.5665 [1.8391] [1.0456] priv 1.5875** [2.0696] Constant 53.5781** 50.7565** [2.1978] [2.3522] F- test 33.3657 23.4264 (p-value) (0.000) (0.000) Hausman test 15.8026 20.1731 (p-value) (0.0253) (0.000) Adjusted R2 0.85 0.86 Number of Observations 70 70 Robust t ratios in square brackets. * significant at 10%; ** significant at 5%; *** significant at 1%
Table 3 reports the results using IV methodology to correct for the possible endogeneity of
the corruption variable. A valid instrument for corupt must be correlated with it and be
uncorrelated with the error term. Three instruments are used – democracy, ethnicity11 and the
quality of bureaucracy in a country. The first two of these have been discussed elsewhere as
instruments for corruption (see Gupta et al, 2002; Treisman, 2000). Bureaucracy measures the
degree to which there is an established mechanism for recruitment and training, autonomy
from political pressure, and strength and expertise to govern without drastic changes in policy
or interruptions in government services when governments change. Given this definition, it is
likely that corrupt practices may be more prevalent in countries with higher levels of
bureaucracy as the government plays a larger role in the decisions making processes of non-
governmental organisations. The bureaucracy index12 can thus be interpreted as an indicator
of the independence of key personnel in non-governmental organisations, including the
central bank, judiciary and media houses. It seems likely that interference in such
appointments has a direct impact on corruption. It also seems likely that such appointments

11
have little direct impact on inequality except via income, which is already included in the
model. The relationship between corruption and bureaucracy is shown in Figure 2.
Figure 2: Corruption and bureaucracy
0
1
2
3
4
5
6
0 1 2 3 4 5 6
Bureaucracy
Cor
rupt
ion
A potential issue in using bureaucracy as an instrument is that it may be correlated with the
error term. The main source for such correlation comes via the region’s historical legacies
and, in particular, its socio-political culture. However, since these factors will already have
been captured to a large extent by the fixed effects, we can be confident that bureaucracy is an
appropriate instrument for corruption.
Table 3 reports statistical information on the validity of the instruments. The F-1st reports the
F test statistic from the first stage regression and captures the relevance of the instruments.
The high F-test statistic indicates that the instruments are not weak in the sense discussed in
the econometric literature on instrumental variables methods (Bound et al, 1995; Staiger &
Stock, 1997). Thus, the standard methods for statistical inference using the estimated
12
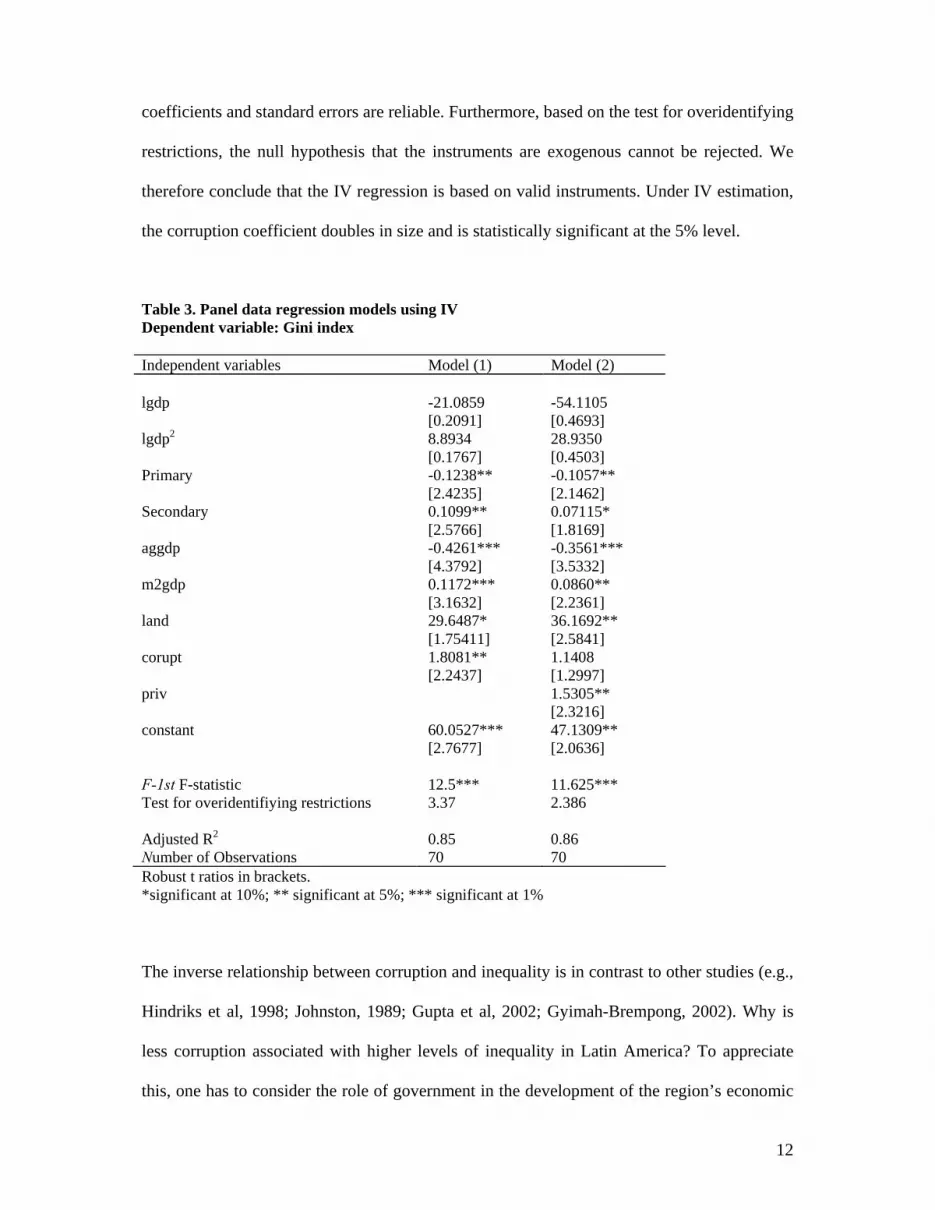
coefficients and standard errors are reliable. Furthermore, based on the test for overidentifying
restrictions, the null hypothesis that the instruments are exogenous cannot be rejected. We
therefore conclude that the IV regression is based on valid instruments. Under IV estimation,
the corruption coefficient doubles in size and is statistically significant at the 5% level.
Table 3. Panel data regression models using IV Dependent variable: Gini index
Independent variables Model (1) Model (2) lgdp -21.0859 -54.1105 [0.2091] [0.4693] lgdp2 8.8934 28.9350 [0.1767] [0.4503] Primary -0.1238** -0.1057** [2.4235] [2.1462] Secondary 0.1099** 0.07115* [2.5766] [1.8169] aggdp -0.4261*** -0.3561*** [4.3792] [3.5332] m2gdp 0.1172*** 0.0860** [3.1632] [2.2361] land 29.6487* 36.1692** [1.75411] [2.5841] corupt 1.8081** 1.1408 [2.2437] [1.2997] priv 1.5305** [2.3216] constant 60.0527*** 47.1309** [2.7677] [2.0636] F-1st F-statistic 12.5*** 11.625*** Test for overidentifiying restrictions 3.37 2.386 Adjusted R2 0.85 0.86 Number of Observations 70 70 Robust t ratios in brackets. *significant at 10%; ** significant at 5%; *** significant at 1%
The inverse relationship between corruption and inequality is in contrast to other studies (e.g.,
Hindriks et al, 1998; Johnston, 1989; Gupta et al, 2002; Gyimah-Brempong, 2002). Why is
less corruption associated with higher levels of inequality in Latin America? To appreciate
this, one has to consider the role of government in the development of the region’s economic

13
policies. The experiences of the 1930s and World War 2 pushed Latin American countries
towards a policy of self reliance based on import substitution. Import substitution
industrialisation (ISI) was an economy-wide-strategy where governments were expected to
play an active and visible role.
The main instruments of ISI were quotas, import licences, tariffs, an overvalued exchange
rate, foreign currency rationing, subsidies for inputs and transportation, tax breaks, and
preferential interest rates. These instruments helped to create an environment suitable for
corrupt activities. For example, restrictions on imports make import licenses very valuable
since importers are willing to bribe officials in order to obtain them.13 The availability of
credit at preferential rates and foreign exchange allocation schemes also create incentives for
rent seeking. Managers of state owned banks allocate credit and foreign exchange based on
personal preferences and businessmen are willing to bribe managers in order to obtain the
necessary credit and foreign exchange (Cardoso & Helwege, 1995). The provision of tax
breaks and other benefits by the government have a similar impact. In sum, ISI promotes the
growth of the government sector relative to the private sector and creates an environment
which is conducive to corruption.
By the 1970s it was clear that the ISI policy had failed - inward looking policies were not
sustainable and a reliance on the state had not produced the expected results. In the 1980s
there was a recommendation that the region alter its development strategy towards one based
on market forces with only a limited role for the state in economic affairs. This new approach
to economic development resulted in the removal of preferential treatment by the state which
had existed under ISI. The natural implication is that the potential for earning rents and, by
extension, the need to bribe government officials becomes a non-issue. Moreover, the

14
liberalisation of the exchange rate and the privatisation of the financial sectors also reduced
the potential to earn rents. In short, the implementation of an economic policy based on
liberalisation and a reduced role for the state creates less room for rent-seeking activities and,
to this extent, reduces activities that are associated with a high degree of government
intervention in the production process. This view is shared by Rose-Ackerman (1999) who
notes that the most obvious way to reduce rent-earning activities is to eliminate corrupt
programmes.
Privatisation involves restructuring industries in an attempt to improve efficiency and
profitability (though in some instances industries were restructured before privatisation). This
includes laying-off workers. Unless these workers are absorbed by other industries or given
some form of severance payment which lasts until alternative employment is obtained, there
will be an increase in income inequality. Hence, to the extent that corruption coexists with
state-owned enterprises and a high degree of protection, privatisation, and the opening up of
markets, brings an end to such practices. However, the need for efficiency in newly privatised
industries means a loss of jobs.
While privatisation removes industries from direct government influence and hence
government corruption, it worsens income inequality through several channels. First of all,
the increase in unemployment which follows privatisation hurts the lower class directly.14
Furthermore, as privatisation often results in increased prices for previously public goods, the
lower classes are the most affected as they are the principal beneficiaries of these goods.
Beyond its effect on prices, consumer welfare may be adversely affected through decreased
access, poorer distribution and a lower quality of goods and services. Privatisation may also
result in the elimination of subsides to public services which are sometimes genuinely
15
redistributive (Chong & López-de-Silanes, 2003; Bayliss, 2002; Birdsall & Nellis, 2003).
Also, to the extent that privatisation results in continued or increased corruption it can
exacerbate inequality (Rose-Ackerman, 1999).
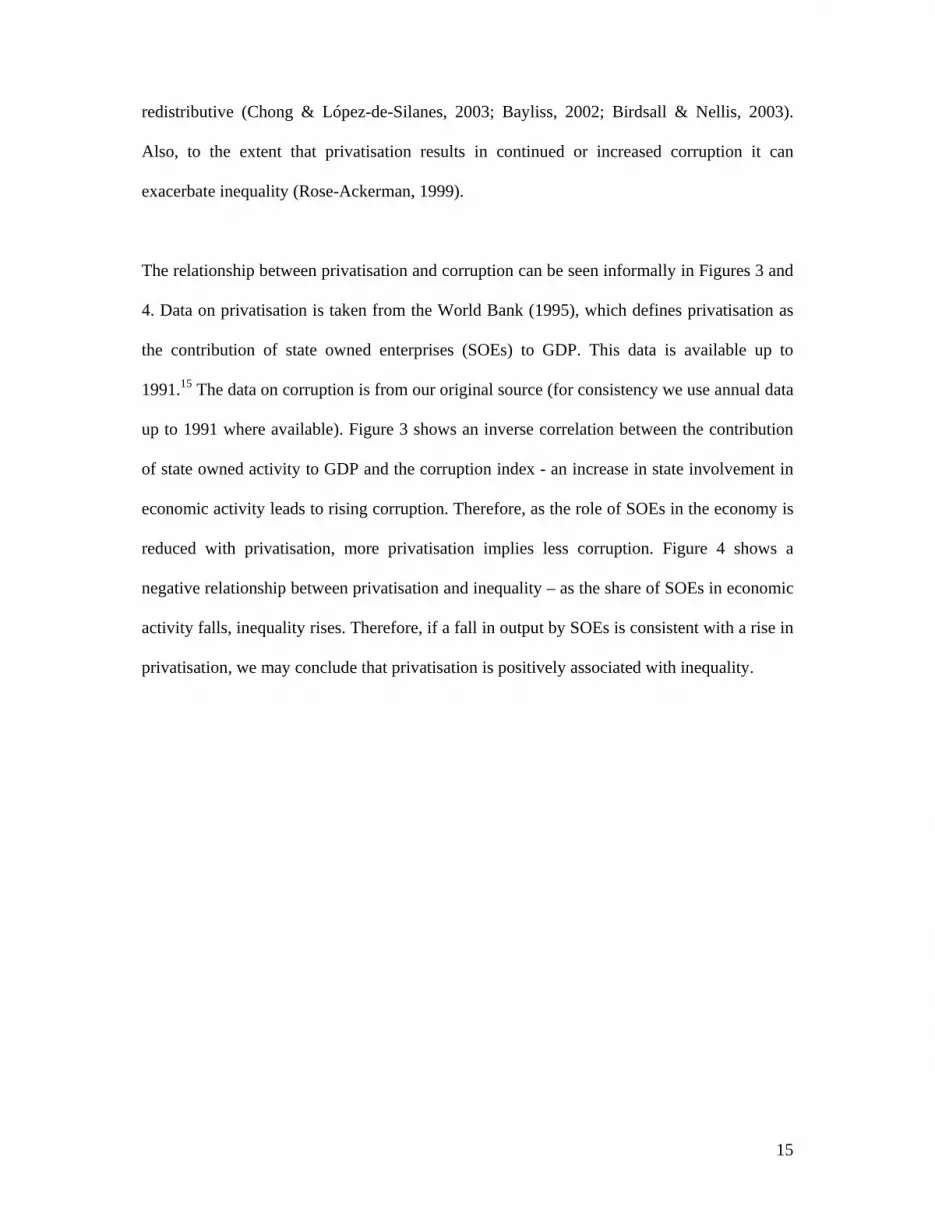
The relationship between privatisation and corruption can be seen informally in Figures 3 and
4. Data on privatisation is taken from the World Bank (1995), which defines privatisation as
the contribution of state owned enterprises (SOEs) to GDP. This data is available up to
1991.15 The data on corruption is from our original source (for consistency we use annual data
up to 1991 where available). Figure 3 shows an inverse correlation between the contribution
of state owned activity to GDP and the corruption index - an increase in state involvement in
economic activity leads to rising corruption. Therefore, as the role of SOEs in the economy is
reduced with privatisation, more privatisation implies less corruption. Figure 4 shows a
negative relationship between privatisation and inequality – as the share of SOEs in economic
activity falls, inequality rises. Therefore, if a fall in output by SOEs is consistent with a rise in
privatisation, we may conclude that privatisation is positively associated with inequality.
16
Figure 3: Corruption and Privatisation
0
1
2
3
4
5
6
0 5 10 15 20 25 30 35
SOEs contribution to GDP
Cor
rupt
ion
Figure 4: SOEs economic activity as a % of GDP and inequality
0.0
10.0
20.0
30.0
40.0
50.0
60.0
70.0
0 5 10 15 20 25 30 35
% of GDP
Gin
i Ind
ex
If the above discussion is valid, the inclusion of a privatisation variable in the empirical model
should lessen the impact of the corruption variable. The privatisation variable (priv) takes the
form of a dummy variable, which assumes a value of 1 starting in the year of significant
privatisation activity and continuing thereafter, and zero otherwise.16 When the privatisation

17
variable is included (Tables 2 and 3, Model (2)) the coefficient on corruption becomes
statistically insignificant in both estimations. Although corupt is still positive, the coefficient
falls in size by approximately 40%. In other words, once privatisation is controlled for the
importance of corruption in explaining inequality is reduced. The privatisation variable is
positively signed and is statistically significant. This result indicates that privatisation has had
a regressive impact on income distribution and is consistent with the assertions of Berry
(1998) and Bulmer-Thomas (1996). This does not mean that corruption is good for inequality
or that privatisation is necessarily a problem. The policy of ISI exacerbated inequality so that
by the late 1970s the region had the most unequal income distribution in the world. Given
this, it would require a huge effort over a lengthy period to overcome inequality. Eliminating
corruption is only one part of a much bigger process.
The privatisation process in many Latin American countries did not gain momentum until the
1990s. The move from a regulated to a non-regulated environment is a learning experience
and adjustment costs are inevitable. In fact, little is known about the privatisation process both
at the academic and managerial levels. The implication is that authorities must improvise and
learn on the job. Generally, privatisation failures can be traced to substantial state
participation in less than transparent processes, poor contract design, inadequate re-regulation,
insufficient de-regulation, deficient corporate governance institutions, and a lack of
competition (Chong & López-de-Silanes, 2003). It is especially important to define a clear
regulatory framework before firms are put up for sale. Unfortunately, in many countries it is
difficult to do this because of the limited experience with the implementation of modern
regulatory legislation and the absence of skilled personnel to carry out such an undertaking. In
this situation, the input of international institutions is important and essential. The World
Bank, for example, has taken an active stance on this issue by providing financial and

18
technical support to countries engaged in the design of new regulations. In addition to skilled
personnel and legislation, regulatory institutions need to maintain a certain degree of
independence and not operate as mere agents of government.
Even when authorities are convinced of the benefits of a well-designed regulatory framework,
new legislation is likely to become operational slowly. Chong & López-de-Silanes (2003, p.
41) note that “…..perfection in developing the regulatory framework may require a lot of time
and this should not be used as an excuse for postponing the privatisation of money losing
entities.” A natural implication of this is the need for sound institutions and good governance.
It takes time to build institutions that are credible and able to fulfil their role. The problem is
exacerbated in regions like Latin America which has a history of coerced labour and one in
which institutions played an important role in protecting the interests of the elite. Moreover, it
must be noted that privatisation and the reduction of corrupt practices cannot be seen as an
isolated venture but rather as part of an overall programme of reform.
If privatisation is properly undertaken as part of a wider programme of reform, it can produce
efficiency gains, higher growth and an expansion in jobs. In addition, given that reform
encourages competition, private firms will work towards enhancing efficiency, the gains of
which can be passed on to consumers in the form of lower prices17 and increased access. It
has been argued that privatisation also results in infrastructure developments (McKenzie &
Mookherjee, 2005) and has a dynamism of its own, which in turn serves to create a demand
for better institutions so as to achieve increased transparency, better regulation and more
protection for minority holders (Boubakri et al, 2005). There are also fiscal gains as
privatisation impacts on the government budget by reducing subsidies to previously state-
owned enterprises, obtaining revenue from their sales18 and higher taxes. Chong & López-de-

19
Silanes (2003) argue that the gains from a well managed privatisation programme could be
substantial not only for the privatised firm but for the society in general, while Kikeri &
Nellis (2004) argues that privatisation should neither be abandoned nor reversed.
Turning to other results, the inclusion of the privatisation dummy in both the OLS and IV
regressions does not alter the sign or significance of the other variables. The results for the
income variables do not support the Kuznets hypothesis for Latin America – the coefficients
are statistically insignificant and have incorrect signs. This finding is in line with the findings
of others, including Ravallion (1995); Deininger & Squire (1988), Odekokun & Round
(2004), and Angeles (2006). Indeed, Fields & Jakubson (1994) show that the estimated curve
can go from an inverted U shaped to U shaped when allowing for fixed effects.
The coefficient on primary school enrolment rates reflects the widely accepted view that a rise
in education serves to reduce income inequality (see for instance, Tinbergen, 1975; Sylwester,
2002; Chu, 2000). However, the positive coefficient on secondary school enrolment rates
suggests that a higher level of education increases skill differentials and worsens inequality.
The latter finding is a reflection of the fact that education above the primary school level
remains largely a privilege for the more wealthy. A natural solution is the introduction of an
education strategy which achieves a significant leap in both participation rates and quality
across the school system and in particular at the secondary school level.
The result for the agriculture variable is not surprising as one would expect that growth in the
labour intensive sector would contribute to higher levels of employment among lower income
households and falling inequality (Franko, 2003). The variable m2gdp is an indicator of
financial development; however, it can also be interpreted as a proxy for financial reform or

20
an indicator of macroeconomic policy19. The coefficient is statistically significant and
suggests that a change in the m2gdp ratio by one unit stimulates a change in the Gini
coefficient by at least 7%. The positive coefficient means that a more developed financial
sector is associated with higher inequality. Similar results were found by Morley (2000), who
noted that while the positive sign does not concur with the theory, it does support the
assertion that inequality in the region widened after the implementation of reforms (Berry,
1998; Bulmer-Thomas, 1996). In line with the findings of Odekokun & Round (2004) and
Angeles (2006), our results suggest that the abundance of land resources exacerbates the
income inequality problem in the region. Similar conclusions were made by De Ferranti et al.
(2004), who state that the unequal distribution of land still matters as a source of inequality in
Latin America and suggest that there is scope for land reform. If, however, land reform is to
be successful at alleviating poverty and reducing inequality it must be part of a package which
embraces complementary agricultural policies.
Since the Gini coefficient is bounded between 0 and 100, OLS may be problematic since it
assumes that the dependent variable is unbounded. In order to overcome this problem, the
dependent variable is transformed using the formula log [gini/(100-gini)] to become
unbounded. This also serves as a robustness test for the model. Tables 4 and 5 reveal no
marked difference in the results compared to Tables 2 and 3. Perhaps this can be explained by
the fact that Gini values for no country are very close to 0 or 100.

21
Table 4. Panel data regression models using OLS
Dependent variable: Gini index (unbounded)
Independent variables Model (1) Model (2) lgdp -1.7183 -2.0736 [0.3864] [0.4590] lgdp2 0.8149 0.9904 [0.3665] [0.4383] primary -0.0042** -0.0041** [2.2954] [2.2449] secondary 0.0032** 0.0023 [2.3079] [1.5548] aggdp -0.0196*** -0.0158*** [4.4739] [3.6750] m2gdp 0.0042*** 0.0032** [2.6316] [2.0895] land 1.2106*** 1.4450** [1. 7787] [2.4297] corupt 0.0381* 0.0231 [1.88474] [1.0456] priv 0.0648** [2.3657] constant 0.1422 0.0233 [0.9842] [0.2291] F- test 32.9122 23.2008 (p-value) (0.000) (0.000) Hausman test 15.7787 20.1701 (p-value) (0.0457) (0.000) Adjusted R2 0.95 0.95 Number of Observations 70 70 Robust t ratios in square brackets. * significant at 10%; ** significant at 5%; *** significant at 1%

22
Table 5. Panel data regression models using IV Dependent variable: Gini index (unbounded)
Independent variables Model (1) Model (2) lgdp 0.7639 -2.0318 [0.1867] [0.4434] lgdp2 0.3153 0.9709 [0.1544] [0.4241] primary -0.0050** -0.0043** [2.4048] [2.1317] secondary 0.0044** 0.0029* [2.5797] [1.7022] aggdp -0.0171*** -0.0144*** [4.3647] [3.5270] m2gdp 0.0047*** 0.0035** [3.1492] [2.2310] land 1.1922 1.4581** [1.7441] [2.57641] corupt 1.0728** 0.0456 [2.2304] 0.0626 priv 1.5305** [23354] constant 0.4091 -0.1164 [0.46676] [0.1259] F-1st F-statistic 12.5*** 11.625*** Test for overidentifiying restrictions 3.248 2.158 Adjusted R2 0.92 0.86 Number of Observations 70 70 Robust t ratios in brackets. *significant at 10%; ** significant at 5%; *** significant at 1%
4. Conclusion
This paper has examined income inequality in Latin America and, more specifically, the
relationship between inequality, corruption and privatisation. In contrast to other empirical
work, these results for Latin America show that falling levels of corruption are associated
with higher levels of inequality. However, a lower level of corruption per se does not worsen
inequality but rather it is a development strategy focused around privatisation that serves as
the conduit for the impact of corruption. With privatisation industries are removed from direct
state control and associated corrupt practices. However, as private investors focus on
efficiency and profitability, firms are restructured and inequality worsens.

23
The paper has argued that inequality is the outcome of the institutional structure and history
of the countries in the region, and has persisted over time because little or nothing has been
done to increase or enhance the assets of those affected. Progress in reducing inequality is
only possible if policies are aimed directly at reducing inequality, in addition to the structural
reform programmes which are aimed at increasing economic growth. In other words, growth
must be accompanied by policies that promote human capital investment so that the
productivity of the poorest groups can be increased. Investment in education is the key to
increasing the assets of the poor and the key to achieving lower levels of inequality. The
income distribution problem cannot be dismissed as a temporary and inevitable cost as
economies strive towards positive and increasing economic growth. Rather, governments
must design and implement privatisation (and reform) programmes that can achieve gains
both in terms of distribution and efficiency (growth). The initial regressive impact of the
reforms highlights the fact that relying primarily on markets to reduce inequality is
insufficient and must be complemented with state intervention, particularly in terms of
strengthening property rights in the rural sector. In other words, Latin America requires “good
governance” from the state sector.

24
Referencesrom History Growth, Distribution and
Acemoglu, D., Johnson, S., & Robinson, J.A. (2002). “Reversal of fortune: geography and
institutions in the making of modern world income distribution.” Quarterly Journal of
Economics 117, 4, 1231-1294.
Ades, A. & Di Tella, R. (1999). “Rents, competition and corruption,” American Economic
Review 89, 4, 982-94
Angeles, L. (2006). “Income inequality and colonialism.” Forthcoming European Economic
Review.
Bayliss, K. (2002). “Privatization and poverty: the distributional impact of utility
privatization.” Annals of Public and Cooperative Economics 73, 4, 603-625.
Berry, A. (1998). Poverty, economic reform and income distribution in Latin America.
London:Lynne Rienner Publishers Inc.
Birdsall, N., & Nellis, J. (2003). “Winners and losers: assessing the distributional impact of
privatization.” World Development 31, 1617-1633.
Boubakri, N., Cosset, J.C., & Smaoui, H. (2005). “Does privatisation lead to institutional
change?” Unpublished manuscript.
Bound, J.D., Jaeger, D.A., & Baker, R. (1995). “Problems with instrumental variables
estimation when the correlation between the instruments and the endogenous explanatory
variable is weak.” Journal of American Statistical Association 90, 443-450.
Bourguignon, F., & Morrison, C. (1998). “Inequality and development: the role of dualism.”
Journal of Development Economics 57, 2, 233-257.
Bourguignon, F., & Morrison, C. (2002). “Inequality among world citizens: 1820-1992.”
American Economic Review 92, 4, 727-744.
Bowen, H., Leamer, E., & Sveikauskas, L. (1987). “Multicountry, multifactor tests of factor
abundance theory.” American Economic Review 77, 5 791-809.

25
Breen, R., & García-Peñalosa, C. (2005). “Income inequality and macroeconomic volatility:
an empirical investigation.” Review of Development Economics 9, 3, 380-398.
Bulmer-Thomas,V. (1996). “Introduction”, in V. Bulmer-Thomas (ed.) The new Economic
Model in Latin America and its Impact on Income Distribution and Poverty, pp. 7–26. New
York: St Martin’s Press.
Cabelková, I. (2001). “Perceptions of corruption in Ukraine: are they correct?” Cerge-EI
Working Papers 176, Economic Institute, Prague.
Calvo, E., Torre, J.C., & Szwarcberg, M. (2002). “The new welfare alliance.” Buenos Aires:
Universidad di Tella, Department of Political Science.
Cardoso, E., & Helwege, A. (1995). Latin America’s economy: diversity, trends and conflicts.
Cambridge, Massachusetts: MIT.
Chong, A., & López de Silanes, F. (2003). “The truth about privatization in Latin America:
myths and reality.” IADB Working Paper, No.R-486.
Chu, H.J. (2000). “The impacts of educational expansion and schooling on income
distribution.” Quarterly Journal of Business and Economics 39, 39-49.
De Ferranti, D., Perry, G., Ferreira, F., & Walton, M. (2004). Inequality in Latin America-
Breaking with History? Washington DC: World Bank.
De Janvry, A., & Sadoulet, E. (2000). “Growth, poverty and inequality in Latin America: a
causal analysis.” Review of Income and Wealth 46, 3, 267-87.
Deininger, K., & Squire, L. (1996). “A new dataset measuring income inequality.” World
Bank Economic Review 10, 3, 565-591.
Deininger, K., & Squire, L. (1998). “New ways of looking at old issues: inequality and
growth.” Journal of Development Economics 57, 2, 259-287.
Engerman, S.L., & Sokoloff, K.L. (2002). “Factor endowments, inequality and paths of
development among new world economies.” NBER Working Paper 9259.

26
Estache, A., Gómez-Lobo, A., & Leipziger, D. (2001). “Utilities privatisation and the poor:
lesson and evidence from Latin America.” World Development 29, 7, 1179-1198.
Fields, G.S., Jakubson, G. H. (1994). “New evidence on the Kutznets curve.” Mimeo.
Department of Economics, Cornell University.
Fisman, R., & Gatti, R. (2002). “Decentralization and corruption: evidence across countries.”
Journal of Public Economics 83, 3, 325-345.
Frankema, E. (2005). “The colonial origins of inequality: a global investigation of land
distribution.” Presented at a symposium on poverty, inequality in Latin America, Ibero-
American Institute for Economic Research.
Franko, P. (2003). The puzzle of Latin American development. Oxford, Rowman and Little
field Publishers, Inc.
Gupta, S., Davoodi, H., & Alonso-Terme, R. (2002). “Does corruption affect income
inequality and poverty?” Economics of Governance 3, 1, 23-45.
Gyimah-Brempong, K. (2002). “Corruption, economic growth and income inequality in
Africa.” Economics of Governance 3, 3,183-209.
Gyimah-Brempong, K., & Muñoz de Camacho, S. (2006).“Corruption, growth, and income
distribution: are there regional differences?” Economics of Governance 7, 3, 245-269.
Heston, A., Summers, R., & Aten, B. (2002). Penn World Table 6.1. Center for International
Comparisons at the University of Pennsylvania, October.
Hindriks, J., Keen, M., & Muthoo, A. (1998). “Corruption, extortion and evasion.” Journal of
Public Economics 74, 3, 395-430.
Jain, A.K. (2001). “Corruption: a review.” Journal of Economic Surveys 15, 1, 71-121.
Johnston, M. (1989). “Corruption, inequality and change” in: Corruption, development and
inequality: soft touch or hard graft, ed: Peter M. Ward. London: Routledge.
27
Jong-Sung, Y., & Khagram, S. (2005). “A comparative study of inequality and corruption.”
American Sociological Review 70, 1, 136-157.
Kelly, J & Klein, H. (1981). Revolution and the rebirth of inequality: a theory applied to the
national revolution in Bolivia. Berkeley: University of California Press.
Kikeri, S., & Nellis, J. (2004). “An assessment of privatization.” World Bank Research
Observer 19, 1, 87-118.
Kuznets, S. (1955). “Economic growth and income inequality.” American Economic Review
45, 1, 1-28.
Lagos, M. (2003). “Public opinion of corruption in Latin America” in Global Corruption
Report, Transparency International 2003, 282-284.
La Porta, R., & López de Silanes, F. (1997). “The benefits of privatisation: evidence from
Mexico.” NBER Working Paper 6215.
Leamer, E. (1984). Sources of international comparative advantage. Cambridge, MA: MIT
Press.
Leite, C. & Weidman, J. (1999). Does Mother Nature corrupt? Natural resources, corruption
and economic growth. International Monetary Fund Working Paper No. 99/85.
Lewis, W.A (1954). “Economic development with unlimited supplies of labour.” Manchester
School 22, 139-191.
Li, H., Squire, L., & Zou, H.F. (1998). “Explaining international and intertemporal variations
in income inequality.” Economic Journal 108, 1, 26-43.
Li, H., Xu, L.C., & Zou, H.F. (2000). “Corruption, income distribution, and growth.”
Economics and Politics 12, 2, 155-181.
Londono, J.L. & Szekely, M. (2000). “Persistent poverty and excess inequality: Latin
America 1970-95” Journal of Appled Economics 3, 1, 93-134

28
Mauro, P. (1997). “The effects of corruption on growth, investment, and government
expenditure” in A cross-country analysis in Corruption and the Global Economy, ed: K. A.
Elliot. Washington: Institute for International Economics.
Mckenzie, D., & Mookherjee, D. (2005). “Paradox and Perception: evidence from four Latin
American Countries” in Reality Check: the distributional impact of privatisation in
developing countries. Eds: J. Nellis & N. Birdsall. Washington DC: Centre for Global
development.
Morley, S. (2000). “The effects of growth and economic reform on income distribution in
Latin America.” CEPAL Review 71, August, 23-40.
Ocampo, J.A. (1998). “Income distribution, poverty and social expenditure in Latin
America.” CEPAL Review 65, August, 7-14.
Odekokun, M.O., & Round, J.I. (2004). “Determinants of income inequality and its effects on
economic growth: evidence from African countries.” African Development Review 16, 2,
287-327
Perry, G., Arias O., Lopez, J., Maloney S., & Serven, L. (2006). Poverty reduction and
growth: virtuous and vicious circles. Washington DC: World Bank
Ravallion, M. (1995). “Growth and poverty: evidence for developing countries in the 1980s.”
Economics Letters 48, 3-4, 411-417.
Reuveny, R., & Li, Q. (2003). “Economic openness, democracy and income inequality an
empirical analysis.” Comparative Political Studies 36, 5, 575-601.
Rivas, A. (2005). “Does trade increase inequality? A cross region comparisons.” Presented at
a symposium on poverty, inequality in Latin America. Ibero-American Institute for
Economic Research.
Rodrik, D. (1997). “Has globalization gone too far?” Washington D.C, Institute for
International Economics.
29
Rose-Ackerman, S. (1999). Corruption and Government- Causes, Consequence and Reform.
Cambridge: Cambridge University Press.
Staiger, D., Stock, J.H. (1997). “Instrumental variables regressions with weak instruments.”
Econometrica 65, 557-586.
Sylwester, K. (2002). “Can education expenditures reduce income inequality?” Economics of
Education Review 21, 1, 43-52.
Szekeley, M. (2003). “The 1990s in Latin America: another decade of persistent inequality
with somewhat lower poverty.” Journal of Applied Economics 6, 2, 317-339.
Tinbergen, J. (1975). Income Distribution. North-Holland, Amsterdam.
Treisman, D. (2000). “The causes of corruption: a cross national study”. Journal of Public
Economics 76, 3, 399-457.
United Nations. (2005). World Income Inequality Database, Version 2.a, WIDER, Helsinki,
Finland; http://www.wider.unu.edu/wiid/wiid.htm.
Williamson, J.G. (1999). “Real wage inequality and globalization in Latin America before
1940.” Revista de Historia Económica XVII (special issue), 101-142.
World Bank. (1995). Bureaucrats in Business. Washington, D.C.: Oxford University Press.
World Bank (2003). World Development Indicators CD-ROM. The World Bank,
Washington, D.C.

30
Notes
1 Available at http://www.transparency.org/policy_research/surveys_indices/cpi/2005.
2 Corruption might be influenced by the perception of corruption. In some cases, corruption
perceptions might reinforce or diminish corruption (see, Cabelková, 2001).
3 They were generous for universities and other higher learning institutions which were
geared towards providing education to the children of the elite.
4 Several other reasons are cited in De Ferranti et al. (2004, Chapter 4) for the neglect of
education in the 20th century.
5 Leamer (1984) and Bowen et al (1987) show that the abundant factor in most countries of
the region is not labour but some natural resource; furthermore, labour skills in the region are
ranked at an intermediate level on a world scale.
6 Lewis (1954) provided a similar basis for rising inequality in his labour surplus model.
7 Countries included in the sample are: Argentina, Bolivia, Brazil, Chile, Colombia, Costa
Rica, Dominican Republic, Ecuador, Guatemala, Honduras, Jamaica, Mexico, Nicaragua,
Panama, Paraguay, Peru, El Salvador, Uruguay, and Venezuela.
8 Available on http://www.wider.unu.edu/wiid/wiid.htm.
9 Inequality data are far from perfect. Differences in data sources, definitions and time periods
might cause measurement errors in a pooled sample. Nevertheless, it is the only database
available for analysing Latin American countries.
10 Jong-sung & Khagram (2005) provide a discussion of the channels through which
inequality affects corruption.
11 Source: http://www.prsgroup.com/ICRG_Methodology.aspx.
12 Source: http://www.prsgroup.com/ICRG_Methodology.aspx.
31
13 In general, the protection of domestic industries from international competition creates the
potential for lucrative rents, which entrepreneurs are willing to pay for in the form of bribes
(Mauro, 1997).
14 This is so for several reasons: lower income workers are more likely to be laid off than the
higher income ones; dismissed low income workers have more difficulty finding
employment; if they do obtain alternative employment it may be less remunerative; and if
both unskilled and skilled labour have been laid off, there is a greater chance that alternative
employment will be obtained by skilled individuals.
15 Because of the short time span for this variable it is not used in the econometric estimation.
16 While there are number of ways of representing privatisation, no consistent definition was
available over the entire period under consideration.
17 It has been suggested that poor householders do not mind a reasonable price increase if it is
associated with an improvement in the quality of the service. There are examples where, prior
to privatisation, poor householders have an illegal connection to water but the quality is
compromised; with privatisation there is a rise in cost though water quality is not
compromised. In some instances households even end up paying less with privatisation
(Estache et al, 2001) because of increased competition.
18 Based on their own calculations, La Porta & López -de-Silanes (1997) conclude that the
additional revenues received by the government in Mexico as a result of privatisation was
probably large enough to offset society’s cost of job losses.
19 Openness is another explanatory variable often included in models of inequality (Rodrik,
1997; Ocampo, 1998; Reuveny & Li, 2003; Rivas 2000), however, when included in the
model the coefficient is statistically insignificant. Similar results were obtained by Szekeley,
(2003) and Odekokum & Round (2004).
![(Co-author) "Transparency International: Government Defence Anti-Corruption Index" [Corruption research]](https://img.dokumen.tips/doc/110x75/631f2055d10f1687490fa722/co-author-transparency-international-government-defence-anti-corruption-index.jpg)


