Embed Size (px)
Citation preview

ARTICLE
Received 28 Aug 2013 | Accepted 14 Mar 2014 | Published 10 Apr 2014
Correlated optical and isotopic nanoscopySinem K. Saka1,2, Angela Vogts3, Katharina Krohnert1, Francois Hillion4, Silvio O. Rizzoli1
& Johannes T. Wessels5
The isotopic composition of different materials can be imaged by secondary ion mass
spectrometry. In biology, this method is mainly used to study cellular metabolism and
turnover, by pulsing the cells with marker molecules such as amino acids labelled with stable
isotopes (15N, 13C). The incorporation of the markers is then imaged with a lateral resolution
that can surpass 100 nm. However, secondary ion mass spectrometry cannot identify specific
subcellular structures like organelles, and needs to be correlated with a second technique,
such as fluorescence imaging. Here, we present a method based on stimulated emission
depletion microscopy that provides correlated optical and isotopic nanoscopy (COIN) images.
We use this approach to study the protein turnover in different organelles from cultured
hippocampal neurons. Correlated optical and isotopic nanoscopy can be applied to
a variety of biological samples, and should therefore enable the investigation of the isotopic
composition of many organelles and subcellular structures.
DOI: 10.1038/ncomms4664 OPEN
1 Department of Neuro- and Sensory Physiology, University of Gottingen Medical Centre, and Centre for Nanoscale Microscopy and Molecular Physiology ofthe Brain (CNMPB), Grisebachstr. 5, 37077 Gottingen, Germany. 2 International Max Planck Research School, 37077 Gottingen, Germany. 3 Leibniz-Institutefor Baltic Sea Research, Seestr. 15, 18119 Rostock, Germany. 4 Cameca, 29 Quai des Gresillons, 92622 Gennevilliers, France. 5 University of Gottingen MedicalCenter, Robert-Koch-Street 34, 37075 Gottingen, Germany. Correspondence and requests for materials should be addressed to S.O.R.(email: [email protected]) or to J.T.W. (email: [email protected]).
NATURE COMMUNICATIONS | 5:3664 | DOI: 10.1038/ncomms4664 | www.nature.com/naturecommunications 1
& 2014 Macmillan Publishers Limited. All rights reserved.
The turnover of subcellular organelles is one of the leastunderstood aspects of modern cell biology, despite itswidely recognized importance. In an ideal experiment, the
cells are pulsed with specific marker molecules, which are thenmeasured in situ, within various organelles. This type ofexperiment has not been easy to attempt. For example,radioactivity-based imaging of marker molecules1,2 can only beperformed at low-spatial resolution, which precludes theidentification of specific organelles. Alternatively, the turnoverof single proteins has been investigated by imaging their green-fluorescent-protein-coupled chimeras3,4, which, however, doesnot reveal the overall metabolism of the organelles containing theproteins of interest.
A different perspective has been introduced by recentimprovements in the field of secondary ion mass spectrometry(SIMS)5, such as multi-isotope imaging mass spectrometry6. InSIMS, the samples are imaged using a primary ion beam, such asCsþ , as a probe. This beam is scanned on the surface of thesample, causing the sputter of secondary particles, atoms oratomic clusters6. A proportion of the secondary particles isionized and can then be identified by mass spectrometry7. SIMShas been applied to many types of materials, in different fields ofthe natural sciences, from geology to soil science and biology. Toapply this technology to the study of cellular turnover, the cellsare fed with marker molecules that contain stable isotopes such as15N and 13C, which are metabolically incorporated over time.These markers are then imaged with a lateral resolution thatdepends mainly on the size of the primary ion beam, as thesecondary ions are released only from the area exposed to thebeam. The resolution has been demonstrated to reach almost30 nm with modern SIMS instruments such as the CamecaNanoSIMS 50L6,8,9, although the high resolution has generallynot always been explicitly indicated in previous publications10–12.The z-axis (depth) resolution of SIMS imaging is even higher (asexplained below, in the Results).
SIMS/multi-isotope imaging mass spectrometry can be used toinvestigate different cellular structures, as already demonstratedby its application to a number of biological systems, from cellcultures to organisms such as Drosophila and mice6,10–14.Nevertheless, the technique is limited by the fact that specificorganelles are not identified with precision. Some structures, suchas nuclei, may be identified by their morphology, but this is notthe case for most small organelles. To evade this limitation, onewould need to combine SIMS with a method that identifiesspecific organelles. This has not been performed successfullyso far.
We have addressed this problem here by combining SIMS withfluorescence imaging. We provide a simple protocol that allowssamples to be investigated in both SIMS and confocal imaging.Moreover, we have also solved the disparity between the spatialresolution of SIMS and that of conventional microscopy(B200 nm lateral resolution and B500–600 nm axial resolution)by using super-resolution microscopy (nanoscopy)15. Theresulting approach, termed correlated optical and isotopicnanoscopy (COIN), allowed us to analyse the turnover for avariety of organelles, and should be easily applied to differentbiological systems.
ResultsSIMS and STED provide images with comparable resolution.The main difficulty we initially encountered in correlating theSIMS and the microscopy data was to obtain a sufficientlyaccurate spatial identification of cellular structures. Using con-ventional microscopy, whose resolution is poorer than that ofSIMS, implied that accurately measured isotope positions could
not always be placed within their appropriate organelle back-ground. This problem is almost negligible for organelles largerthan the diffraction limit, for which we were able to use confocalmicroscopy. However, small organelles and protein groups can bedifficult to discriminate, thus requiring super-resolution micro-scopy, a group of techniques that provide fluorescenceimages within or beyond the resolution range of SIMS16,17
(Supplementary Fig. 1a,b).To test the feasibility of correlating SIMS with super-resolution
microscopy, we turned to stimulated emission depletion (STED).In STED microscopy, the excitation beam is overlaid with asecond, toroid-shaped beam that quenches the fluorophores bystimulated emission18,19. Fluorescence is allowed only at thecentre of the excitation beam, resulting in a substantially smallereffective focal spot (Supplementary Fig. 1c). The resolution of thetechnique is no longer limited by diffraction15,18, and reachesdown to at least 50–90 nm (Supplementary Fig. 1d) withcommercial STED devices20 and substantially lower values withexperimental setups21.
Protocol for obtaining samples for both SIMS and STED. Tocorrelate STED and SIMS images, the biological specimen shouldbe prepared in a form that can be imaged in both setups. Thespecimen must be stable enough not to suffer any changesbetween the acquisition of the two images, and it must not bedamaged by either of the techniques. As the high-vacuum con-ditions required for SIMS prohibit the use of live cellular speci-mens, we decided to fix and embed them in a resin medium thatis suitable for multiple microscopy applications. Although SIMSexperiments have previously relied on Epon, a resin originallydeveloped for electron microscopy6, it cannot be used incorrelative imaging due to its high autofluorescence. Wetherefore replaced Epon with LR White, a polyhydroxy-aromatic acrylic resin with low autofluorescence.
For 15N incorporation, we treated cultured hippocampalneurons19 with 15N-labelled leucine for three days. The leucinewas incorporated into all the newly produced neuronal proteins,and thus served as a marker for the turnover of neuronalstructures. On the fourth day, we fixed the cells andimmunostained them for several organelle markers, includingthe endoplasmic reticulum (ER), the Golgi apparatus,mitochondria and synaptic vesicles. The cells were thenembedded in LR White resin according to a protocol weoptimized for the best fluorescence and morphologypreservation (presented in detail in the Methods). Sections of200 nm were cut using an ultramicrotome and were deposited onsilicon wafers10, using procedures that have been standardized forelectron microscopy22. The use of ultrathin sections, as opposedto whole cells grown on the wafers, has the advantage ofincreasing the resolution of fluorescence imaging along thevertical axis (otherwise the z-axis resolution of the typical STEDmicroscope is comparable to that of confocal instruments, about500–600 nm).
For correlated imaging, we first investigated the samples usingSTED microscopy. As the silicon wafers do not allow thetransmission of light, we placed the wafers upside-down on theobjective stage, with the sections facing the lens, bathed inimmersion oil (Supplementary Fig. 1c). This procedure did notharm the samples and allowed efficient excitation (using a 635 nmpulsed laser, Leica Microsystems) and fluorescence depletion(using a Mai Tai laser tuned to 750 nm; Supplementary Fig. 1c).As the exact location of the area imaged by STED needs to beknown when the sample is transferred to the SIMS instrument,one needs to create several location markers on the specimen. Weachieved this by scanning the regions surrounding the imaged
ARTICLE NATURE COMMUNICATIONS | DOI: 10.1038/ncomms4664
2 NATURE COMMUNICATIONS | 5:3664 | DOI: 10.1038/ncomms4664 | www.nature.com/naturecommunications
& 2014 Macmillan Publishers Limited. All rights reserved.
area with the multiphoton beam of the Mai Tai laser at maximumenergy. This induced rapid (30–60 s) deformation of the LRWhite resin, selectively in the regions scanned (seeSupplementary Fig. 2). Markings of different shapes and sizescan be created around the different areas imaged with STED,allowing easy recognition in the SIMS instrument.
The samples were then mounted into a SIMS instrument(NanoSIMS 50L, Cameca). A Csþ beam raster was scanned overthe sample surface, applying a sufficient dose of primary ions toreach the steady-state of secondary ion formation. These ionswere then mass separated and detected by using a doublefocalization mass spectrometer (see the Methods for details).Before dealing with biological investigations, we verified themaximum resolution achievable with the SIMS instrument, underour imaging conditions. We imaged gold particles placed in a thinlayer of gelatin, as they provide an excellent signal-to-noise23.This approach allowed us to verify that a full-width-at-half-maximum of B50 nm can be regularly achieved for theseparticles (Fig. 1a,b; see also Lechene et al.6). A differentdefinition for the image resolution has often been used inSIMS: the distance across which the signal drops from 84 to 16%of the maximum6,24. This indicates an even higher resolution forour gold particle images, B33 nm, or close to the maximumreported with the type of instrument we used6,10–12.
Measurements of SIMS resolution in COIN samples. Goldparticles have been employed in the study of cellular endocytosis(see for example, Wedlock et al.23, but are not typical biologicalmarkers. We therefore proceeded to check the SIMS resolution inneuronal sections (Fig. 1c,d), prepared as indicated above.Nitrogen was detected in the form of CN� ions (we detected12C14N� and 12C15N� separately). Figure 1c and Supple-mentary Fig. 1a show example images for 12C14N� and12C15N� (labelled, for simplicity, as 14N and 15N throughoutthe text and figures). The lower signal-to-noise ratios inherent tobiological samples reduced the performance of the SIMS imaging,but nevertheless resulted in a resolution of B100 nm or less forboth the 14N and 15N images (Fig. 1c,d).
Having established that the lateral resolution of our SIMSimages can reach below the resolution of confocal microscopy, wenext investigated the z-axis (depth) resolution of the measure-ments. It has been claimed in the past that the mean penetrationdepth of the primary ions should be the standard for the axialresolution25. However, secondary ions have been shown to bereleased from shallower depths than the penetration depth of theprimary ions26. This led to the following definition of the depthresolution of SIMS: ‘the minimum amount of material that needsto be sputtered to obtain an atomic mass image’, which can be assmall as B1 nm6. In practice, the amount of sputtered materialdepends on the sample and on the imaging conditions. To studythis in our samples, we collected SIMS images repeatedly in asmall area of a neuronal cell body, until the secondary particlegeneration consumed the sample (Fig. 2a). The 200 nm-thicksample was eroded within B35 SIMS images, indicating that, onaverage, 5.7-nm-thick sections of the sample were eroded for eachimage. According to the definition indicated above, the depthresolution of our images would be approximately 5.7 nm.
An alternative definition of z-axis (depth) resolution has alsobeen made in the past: ‘the depth interval over which thesecondary ion intensity drops from 84 to 16% of the maximum24’.According to this definition, a depth resolution of B14.3 nm wascalculated in the past for the NanoSIMS 50 instrument24 (thesame type that we used here). In our samples, the drop insecondary ion (14N) intensity takes place typically over 2–4 SIMSimages (Fig. 2b), indicating a depth resolution of B11.4–23 nm,far higher than the axial resolution of fluorescence imaging.
COIN imaging of neuronal axons. To test the usefulness ofcombining SIMS with fluorescence imaging, we produced severalCOIN images. We analysed the enrichment of 15N at differentlocations in the neurons, such as axonal areas (Fig. 3) or the cellbody (Fig. 4) by calculating the ratio between 15N and 14N atdifferent regions of the cell. As in images obtained in the past incomparable experiments10–12 the ratio, and therefore the relativeincorporation of 15N, is variable in different regions of the cell(close to B3–8% of all nitrogen atoms, on average, which
0 50 100
150
200
197 A
u co
unts
0
20
40
60
80
14N 15N7
5
3
0
44
33
22
11
0
Bassoon (STED)
FWHM 51.7 ± 3.5 nm
Line scan (nm)
010
020
030
040
0
15N
cou
nts
0
2
4
6
8
010
020
030
040
0
14N
cou
nts
0
20
40
60
80
100
16–84% Apparent resolution108.5 nm ± 8.5 nm
16–84% apparent resolution
83.9 ± 8.5 nm
Line scan (nm)Line scan (nm)
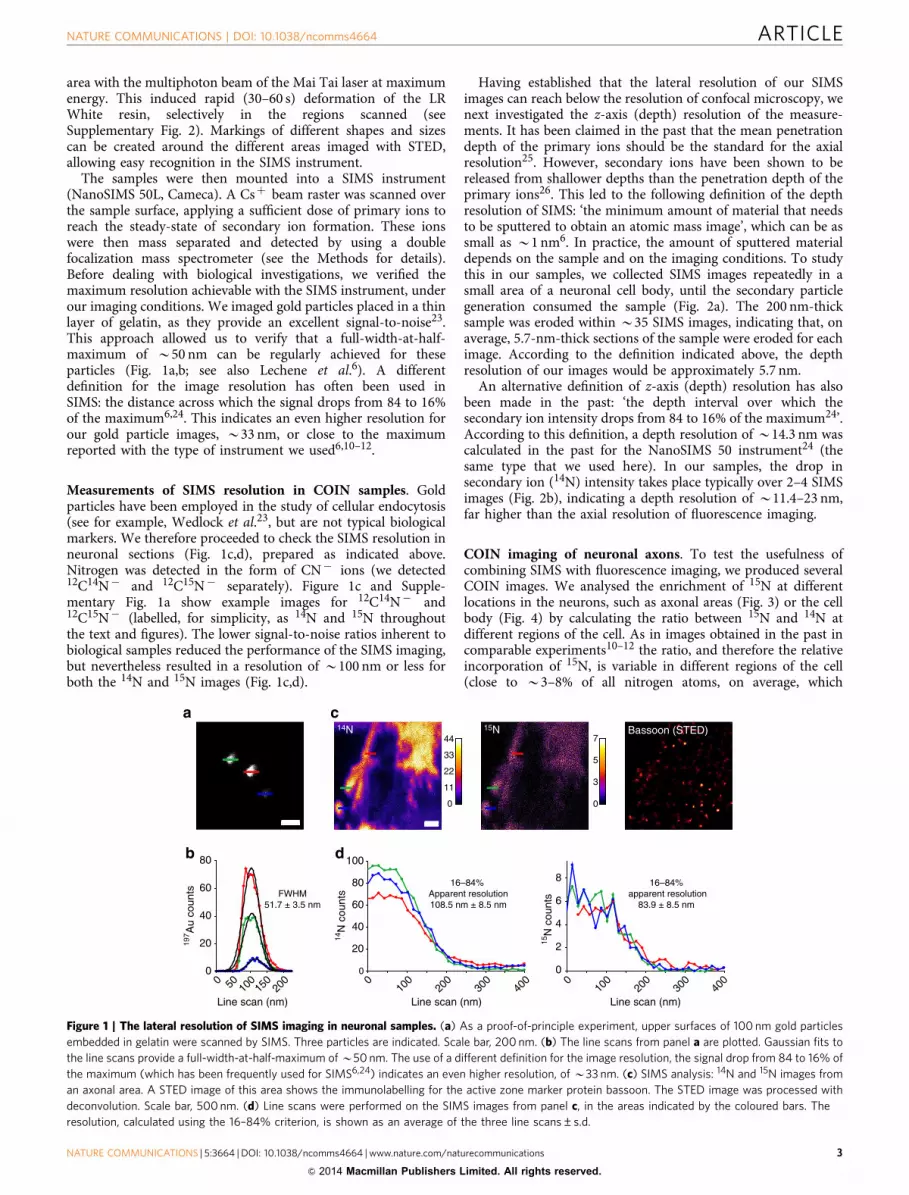
Figure 1 | The lateral resolution of SIMS imaging in neuronal samples. (a) As a proof-of-principle experiment, upper surfaces of 100 nm gold particles
embedded in gelatin were scanned by SIMS. Three particles are indicated. Scale bar, 200 nm. (b) The line scans from panel a are plotted. Gaussian fits to
the line scans provide a full-width-at-half-maximum of B50 nm. The use of a different definition for the image resolution, the signal drop from 84 to 16% of
the maximum (which has been frequently used for SIMS6,24) indicates an even higher resolution, of B33 nm. (c) SIMS analysis: 14N and 15N images from
an axonal area. A STED image of this area shows the immunolabelling for the active zone marker protein bassoon. The STED image was processed with
deconvolution. Scale bar, 500 nm. (d) Line scans were performed on the SIMS images from panel c, in the areas indicated by the coloured bars. The
resolution, calculated using the 16–84% criterion, is shown as an average of the three line scans±s.d.
NATURE COMMUNICATIONS | DOI: 10.1038/ncomms4664 ARTICLE
NATURE COMMUNICATIONS | 5:3664 | DOI: 10.1038/ncomms4664 | www.nature.com/naturecommunications 3
& 2014 Macmillan Publishers Limited. All rights reserved.

suggests a high enrichment in comparison to the terrestrial ratioof 0.367%6).
First, we targeted several organelles of the synapse (Fig. 3a).The synapse contains neurotransmitter-filled synaptic vesicles,which release their contents by fusing to the plasma membrane atspecific sites termed active zones. We identified synaptic vesiclesby immunostaining for synaptophysin 1, one of their mostimportant components; similarly, active zones were detected bystaining for one of their major proteins, bassoon27. We alsoidentified mitochondria, which deliver the energy necessary forsynaptic transmission, by staining for the mitochondrial transport
protein TOMM20. Figure 3a shows a section through a neuronalbranch (axon) in which a synapse, characterized by thecolocalization of all three types of organelles (vesicles, activezone, mitochondria), is indicated by the white arrowheads. Therest of the cytosol was populated by numerous transport vesiclescontaining synaptophysin 1 or bassoon, and by several othermitochondria. The turnover of this synapse appears to have beenstronger than that of the neighbouring axon, as the synapsecontained higher levels of 15N-leucine (Fig. 3b,c). The resolutionof the SIMS images is indicated by line scans shown inSupplementary Fig. 3a. Supplementary Fig. 3b,c also presents
0 5 10 15 20 25 300
20
40
60
80
100
Depth (images)0 5 10 15 20 25 30
0
20
40
60
80
100
0 5 10 15 20 25 300
20
40
60
80
100
180
0
45
90
135
14N
cou
nts
14N
Figure 2 | The depth resolution of SIMS imaging in neuronal samples. (a) SIMS images were collected repeatedly in one neuronal area. The sample is
slowly eroded, which allows the production of images from progressively deeper layers. A Z-stack of the sample is obtained. For simplicity, only the 14N
images are shown. The 200-nm-thick sample was eroded over 35 images, which indicates that, on average, a sample layer of 5.7 nm is eroded for each
image. Scale bar, 500 nm. (b) We analysed the signal changes in three areas, indicated by the coloured circles in the first image in panel a (for clarity, the
circles are omitted in the following images). Circular regions of interest were used, with a diameter of 152 nm (20 pixels). The signal intensity for each of
the three regions of interest (ROI) is shown (averaged for all pixels in each circular regions of interest). Signal changes occur over 2–4 SIMS images.
Therefore, according to the 16–84% criterion, the depth resolution is (at most) 11.4–23 nm (as individual images correspond to a depth of 5.7 nm, as
indicated above).
ARTICLE NATURE COMMUNICATIONS | DOI: 10.1038/ncomms4664
4 NATURE COMMUNICATIONS | 5:3664 | DOI: 10.1038/ncomms4664 | www.nature.com/naturecommunications
& 2014 Macmillan Publishers Limited. All rights reserved.
0.00
0.02
0.04
0.06
0.08
0.10
1 2 3 4
56789
TOMM20 Synaptophysin 1 Bassoon Bassoon (STED)Overlay
0.00
0.02
0.04
0.06
15N
/14N
rat
io
Bassoon (confocal)
Bassoon (STED)
12
Synapse Axon0.00
0.02
0.04
0.06
15N
/14N
rat
io
1 2 3 4 5 6Clusters
7 8 9
15N
/14N
rat
io
1 2
Clusters
0.08
0.10
1230 31 62 92 110 3 6 8 0.06 0.170.110
0.00 0.05 0.10 0.15 0.20 0.25
% O
f all
pixe
ls
0
10
20
30
40 1469
Low 15N/14N ratio clusters
23578
High 15N/14N ratio clusters Averages%
Of a
ll pi
xels
(16)
(75)
(22)
(16)(22) (12)
(14)
(38)
(84)
12
0
10
20
30 HighLow
15N/14N ratio
0.000
10
20
30
40
0.05 0.10 0.15 0.20 0.25 0.00 0.05 0.10 0.15 0.20 0.25
0
10
20
30
0.00 0.05 0.10 0.15 0.20 0.2515N/14N ratio
% O
f all
pixe
ls
15N/14N ratio15N/14N ratio
14N 15N 15N/14N
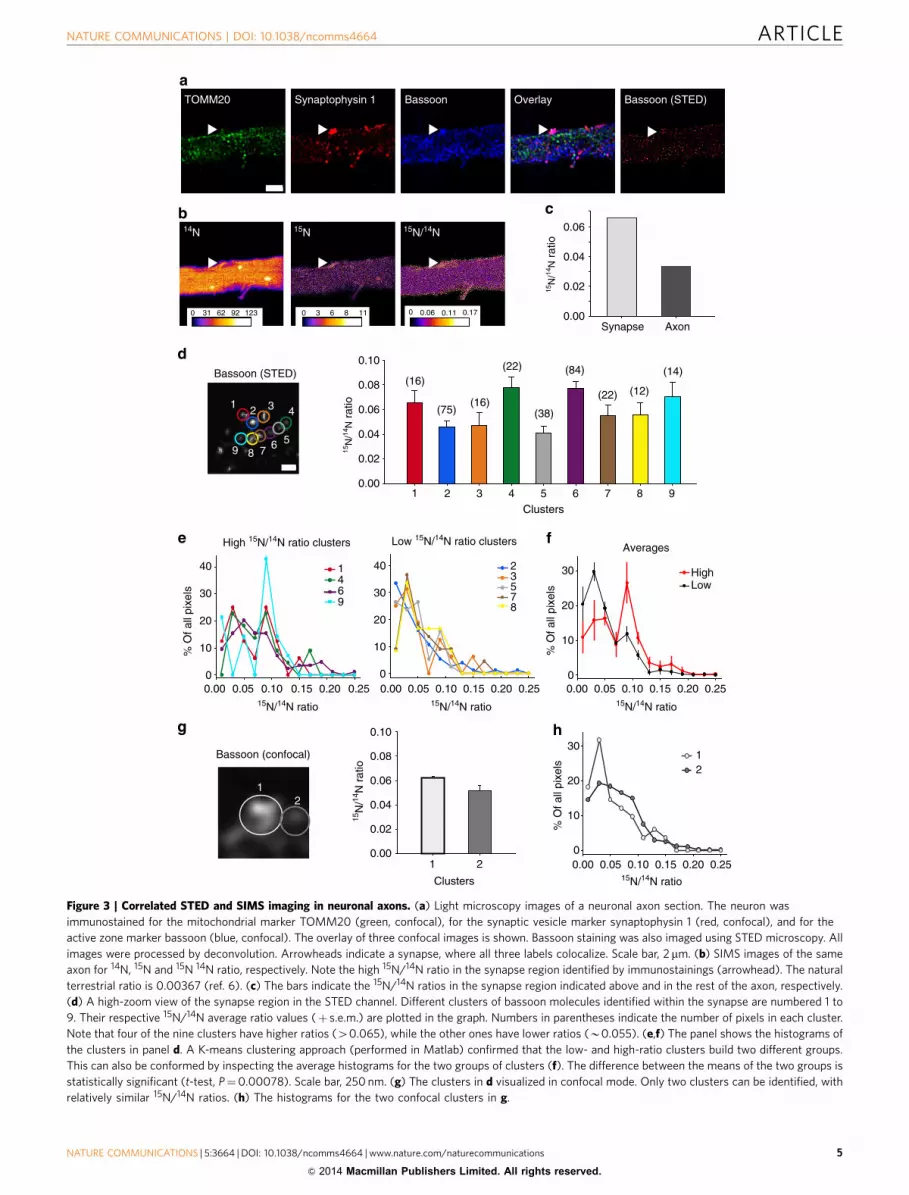
Figure 3 | Correlated STED and SIMS imaging in neuronal axons. (a) Light microscopy images of a neuronal axon section. The neuron was
immunostained for the mitochondrial marker TOMM20 (green, confocal), for the synaptic vesicle marker synaptophysin 1 (red, confocal), and for the
active zone marker bassoon (blue, confocal). The overlay of three confocal images is shown. Bassoon staining was also imaged using STED microscopy. All
images were processed by deconvolution. Arrowheads indicate a synapse, where all three labels colocalize. Scale bar, 2 mm. (b) SIMS images of the same
axon for 14N, 15N and 15N 14N ratio, respectively. Note the high 15N/14N ratio in the synapse region identified by immunostainings (arrowhead). The natural
terrestrial ratio is 0.00367 (ref. 6). (c) The bars indicate the 15N/14N ratios in the synapse region indicated above and in the rest of the axon, respectively.
(d) A high-zoom view of the synapse region in the STED channel. Different clusters of bassoon molecules identified within the synapse are numbered 1 to
9. Their respective 15N/14N average ratio values (þ s.e.m.) are plotted in the graph. Numbers in parentheses indicate the number of pixels in each cluster.
Note that four of the nine clusters have higher ratios (40.065), while the other ones have lower ratios (B0.055). (e,f) The panel shows the histograms of
the clusters in panel d. A K-means clustering approach (performed in Matlab) confirmed that the low- and high-ratio clusters build two different groups.
This can also be conformed by inspecting the average histograms for the two groups of clusters (f). The difference between the means of the two groups is
statistically significant (t-test, P¼0.00078). Scale bar, 250 nm. (g) The clusters in d visualized in confocal mode. Only two clusters can be identified, with
relatively similar 15N/14N ratios. (h) The histograms for the two confocal clusters in g.
NATURE COMMUNICATIONS | DOI: 10.1038/ncomms4664 ARTICLE
NATURE COMMUNICATIONS | 5:3664 | DOI: 10.1038/ncomms4664 | www.nature.com/naturecommunications 5
& 2014 Macmillan Publishers Limited. All rights reserved.
the line scans performed in the correlated fluorescence and SIMSimages, showing the overlap of different organelles (identified byfluorescence microscopy) with the metabolic labels (14N, 15N).Interestingly, the edges of the axon appear somewhat blurryin the SIMS image. An electron microscopy investigation(Supplementary Fig. 4) suggests that this is likely due to thepresence of protein-rich material on the outside of the cell,probably in the form of extracellular matrix components.
We used confocal imaging for both TOMM20 and synapto-physin 1, and STED imaging for bassoon. Confocal imagingallowed the identification of organelles in the general synapticarea, and even allowed separating the mitochondria from thesynaptic vesicle cluster27. This is possible as both mitochondriaand the vesicle cluster are larger than the diffraction limit.However, the advantage of STED imaging is evident when groupsof bassoon molecules, which are much smaller than thediffraction limit, are investigated (Fig. 3d–f). The synaptic areacontained several groups of bassoon molecules, four of whichpresented much higher incorporation of 15N-leucine than theothers. This level of detail is invisible with conventional
microscopy (Fig. 3g,h). The presence of two groups of bassoonclusters, with low and high turnover rates (Fig. 3e,f),demonstrates that newly synthesized protein clusters coexistwith older structures within single synapses. This confirms thatthe material in synaptic boutons is replaced gradually over time,as often hypothesized in the past28. A thorough future study ofthe replacement of different synaptic organelles (synaptic vesicles,endosomes, mitochondria, active zone components) will providesubstantial new information on the metabolic rates of individualsynapses.
COIN imaging of turnover in the cell body of neurons. We alsoinvestigated organelles in the neuronal cell body, a typicalexample of which is shown in Fig. 4a,b. We immunostained forthe trans-Golgi marker TGN38 and for synaptophysin 1, amarker of synaptic vesicle precursors, as well as for the ER markercalnexin. Confocal imaging was applied for TGN38 and synap-tophysin 1, while the denser calnexin labelling was imaged bySTED. The nucleus, easily identified by its morphology, had the
TGN38 Synaptophysin 1 Calnexin Calnexin (STED)
14N 15N 15N/14N
Overlay
Nucleus TGN38 Synapto-physin 1
0.06
0.07
0.08
0.09**
15N
/14 N
rat
io
Calnexin(STED)
***
**
49 196147980 5 2116110
Golgi vs ER(confocal)
Golgi vs ER(STED)
0.06 0.190.130
Golgi vs ER (confocal) Golgi vs ER (STED)3D representation
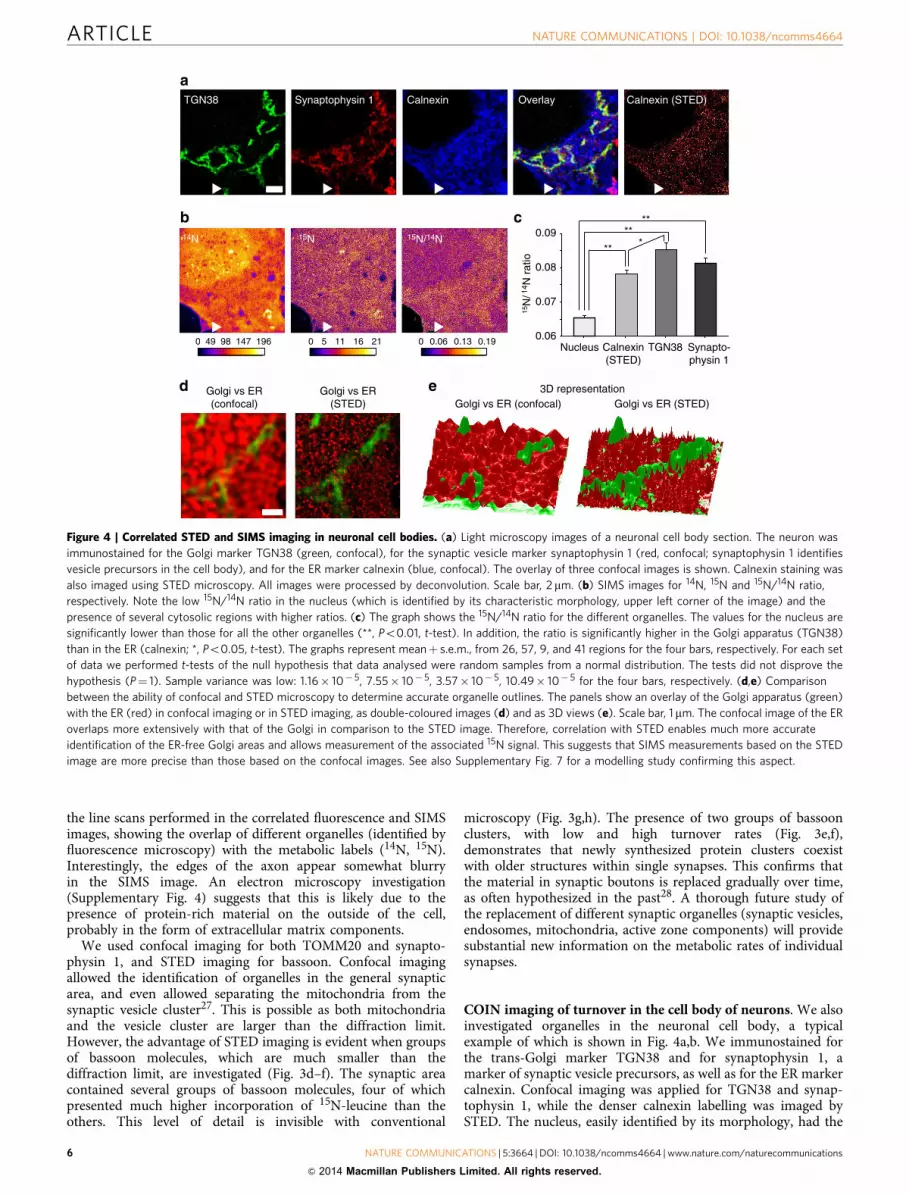
Figure 4 | Correlated STED and SIMS imaging in neuronal cell bodies. (a) Light microscopy images of a neuronal cell body section. The neuron was
immunostained for the Golgi marker TGN38 (green, confocal), for the synaptic vesicle marker synaptophysin 1 (red, confocal; synaptophysin 1 identifies
vesicle precursors in the cell body), and for the ER marker calnexin (blue, confocal). The overlay of three confocal images is shown. Calnexin staining was
also imaged using STED microscopy. All images were processed by deconvolution. Scale bar, 2 mm. (b) SIMS images for 14N, 15N and 15N/14N ratio,
respectively. Note the low 15N/14N ratio in the nucleus (which is identified by its characteristic morphology, upper left corner of the image) and the
presence of several cytosolic regions with higher ratios. (c) The graph shows the 15N/14N ratio for the different organelles. The values for the nucleus are
significantly lower than those for all the other organelles (**, Po0.01, t-test). In addition, the ratio is significantly higher in the Golgi apparatus (TGN38)
than in the ER (calnexin; *, Po0.05, t-test). The graphs represent meanþ s.e.m., from 26, 57, 9, and 41 regions for the four bars, respectively. For each set
of data we performed t-tests of the null hypothesis that data analysed were random samples from a normal distribution. The tests did not disprove the
hypothesis (P¼ 1). Sample variance was low: 1.16� 10� 5, 7.55� 10� 5, 3.57� 10� 5, 10.49� 10� 5 for the four bars, respectively. (d,e) Comparison
between the ability of confocal and STED microscopy to determine accurate organelle outlines. The panels show an overlay of the Golgi apparatus (green)
with the ER (red) in confocal imaging or in STED imaging, as double-coloured images (d) and as 3D views (e). Scale bar, 1mm. The confocal image of the ER
overlaps more extensively with that of the Golgi in comparison to the STED image. Therefore, correlation with STED enables much more accurate
identification of the ER-free Golgi areas and allows measurement of the associated 15N signal. This suggests that SIMS measurements based on the STED
image are more precise than those based on the confocal images. See also Supplementary Fig. 7 for a modelling study confirming this aspect.
ARTICLE NATURE COMMUNICATIONS | DOI: 10.1038/ncomms4664
6 NATURE COMMUNICATIONS | 5:3664 | DOI: 10.1038/ncomms4664 | www.nature.com/naturecommunications
& 2014 Macmillan Publishers Limited. All rights reserved.
lowest incorporation of 15N-leucine of all identifiable organelles(Fig. 4c). In contrast, the trans-Golgi network (TGN38 bar)contained high levels of newly produced proteins, as did thesynaptic vesicle precursors (synaptophysin 1 bar); note thatsynaptic vesicle precursors overlapped partially with both theGolgi and the ER. Interestingly, the ER (calnexin bar) contained amuch lower proportion of new proteins than the trans-Golgi,suggesting that newly produced proteins leave the ER rapidly, butlinger substantially longer in the Golgi apparatus (see alsoSupplementary Fig. 5, for an analysis of the resolution of theSIMS images, and for a line scan-based evaluation of the imagecorrelation).
Although these measurements seem appropriate for largeorganelles such as the nucleus and the Golgi apparatus, confocalimaging is no longer sufficient for the diffuse, high-densitycalnexin staining. It is extremely difficult to determine whichparts of the Golgi apparatus are free from overlap with the ERstaining based on the confocal images (Fig. 4d,e). This is easilyachieved by STED imaging (Fig. 4d,e), suggesting that correlationwith super-resolution microscopy is necessary for studying smallor densely packed organelles.
DiscussionOverall, these experiments indicate that COIN is a feasibleapproach. Each of the two combined technologies provides apiece of information that is unavailable for the other: SIMS yieldsthe isotopic composition of the material investigated, and even itsturnover (as indicated by the 15N/14N ratio), while STEDmicroscopy reveals the identities and the spatial distribution oforganelles or organelle components. An important note ofcaution is, however, linked to the sample preparation, asinaccurate fixation, immunostaining and/or embedding mightinduce misleading results. An overview of the parameters weoptimized in order to obtain efficient stainings withoutcompromising structure preservation is presented inSupplementary Discussion. The use of COIN in conjunctionwith high-pressure freezing and freeze-substitution, which wouldensure even higher cellular preservation, is conceivable in thefuture.
One difficulty that may be apparent for fluorescence micro-scopy specialists is that our SIMS images are far noisier than thefluorescence images. This could be addressed, to some extent, byaccumulating a series of SIMS images (Supplementary Fig. 6).However, the noise of SIMS images, as presented here, is due tothe inherent noisy nature of metabolic (bulk) 15N incorporation,and not due to difficulties with SIMS imaging (as demonstratedby modelling SIMS versus fluorescence imaging, SupplementaryFig. 7a–f). Depending on how labelling is achieved, SIMS candeliver images with much lower levels of noise (see gold particleimages in Fig. 1).
Despite the higher noise associated with metabolic labelling,averaging the SIMS signal over different areas does providereliable results (Supplementary Fig. 7g). In the past, theinvestigators defined such areas only by following the morphol-ogy of the preparation. COIN imaging now enables us to defineareas of interest based on the correlated fluorescence images. Ourmodelling approach demonstrates that defining such an areabased on STED imaging provides a far higher precision for theSIMS measurements than the use of confocal imaging(Supplementary Fig. 7g).
We suggest that COIN has a large field of potentialapplications, as it enables the investigation of the metabolismand organization of any cellular organelle. This is not restricted tothe analysis of nitrogen or carbon isotope ratios. Many othercellular isotopes can be analysed (such as Si, S, As, P), which may
be of interest especially in plant or bacterial biology29. Finally, afurther potential use of this procedure is the generation of triple-correlation images, as the samples prepared for COIN can alsobe investigated with scanning electron microscopy30, thusallowing a combination of super-resolution fluorescencemicroscopy, electron microscopy and SIMS on the same sample.
MethodsSample preparation. Primary cultures of hippocampal neurons (prepared fromnew-born rats, plated onto astrocytic monolayers19 and used after 10 days in vitro)were incubated in Neurobasal-A medium (GIBCO) with 2% B27 Supplement(GIBCO), 1% GlutaMAX Supplement (GIBCO) and 60 units ml� 1 Penicillin–Streptomycin (Lonza) in the presence of 2.2 mM 15N-leucine for 3 days. The cellswere fixed for with 4% paraformaldehyde in phosphate-buffered saline (PBS) for15 min on ice followed by 30 min at room temperature, and quenched for 25 minwith 100 mM NH4Cl. Then permeabilization and blocking was performed with0.1% Triton-X100 in PBS containing 1.5% bovine serum albumin for 15 min atroom temperature. The cells were incubated for 1 h at room temperature with thefollowing primary antibodies: for Figs 1 and 3, mouse monoclonal anti-TOMM20(Sigma, WH0009804M1), guinea pig synaptophysin 1 (Synaptic Systems, 101004)and rabbit polyclonal anti-bassoon (Synaptic Systems, 141002); for Fig. 4, mousemonoclonal anti-TGN38 (BD Biosciences, 610898), guinea pig synaptophysin 1(Synaptic Systems, 101004) and rabbit polyclonal anti-calnexin (Abcam, 22595).Primary antibodies were detected using goat anti-mouse Cy2 (Dianova, 115-225-146), donkey anti-guinea pig Cy3 (Dianova, 706-165-148) and Atto647N-labelledgoat anti-rabbit (Rockland, 611-156-122S). After washing, a post-fixation step wasperformed with 4% paraformaldehyde and 0.2% glutaraldehyde in PBS for 30 minat room temperature, followed by quenching with 100 mM NH4Cl in PBS for15 min. The optimization of the immunostaining protocol is discussed in detail inSupplementary Discussion. Gold particles used for Fig. 1 and Supplementary Fig. 4were purchased from Sigma Aldrich.
Embedding. First partial serial dehydration was performed with ethanol: 30%ethanol for 5 min, three times 50% ethanol for 5 min each, and incubation with 1:1mixture of 50% ethanol and LR White (London Resin Company Ltd) for 30 min.This was followed by the incubation of coverslips with LR White in ethanol-freeconditions for 1 h. The cells were then embedded at 4 �C with LR White andaccelerator mixture (London Resin Company Ltd), and incubated for 15 min. Later,they were incubated for 90 min at 60 �C, and cooled down to room temperature.200-nm-sections were cut from the resulting blocks using an EM UC6ultramicrotome from Leica Microsystems.
Fluorescence imaging. Fluorescence images were acquired using a Leica TCS SP5STED confocal microscope (Leica Microsystems) equipped with a 100� 1.4N.A.HCX PL APO CS oil objective (Leica) and the Leica Application Suite AdvancedFluorescence software. In STED mode, the excitation of Atto647N was performedusing a pulsed diode laser (Leica Microsystems) at 635 nm, and depletion wasachieved by means of a Spectra-Physics Mai Tai tunable laser (pulsed at 80 MHz;Titanium Sapphire, Newport Spectra-Physics) at 750 nm, with an output power of1.6 W. For multichannel confocal images, the following excitation lines were used:an argon laser at a wavelength of 488 nm and Helium-Neon lasers at 594 nm and633 nm, for the Cy2, Cy3, and Atto647 channels, respectively. Appropriate emis-sion intervals were selected using an AOTF filter (Leica) and line-by-line sequentialscanning at 1,000 Hz was applied with 32 times line averaging for confocal and 96times line averaging for STED. Images of 2,048� 2,048 pixels were taken at � 3zoom at a final pixel size of 25.2 nm. Signal detection was performed using pho-tomultiplier tubes in confocal mode and an avalanche photodiode in STED mode.
SIMS imaging. SIMS imaging was performed by using a Cameca NanoSIMS 50Linstrument from Cameca (France). A 133Csþ primary ion beam at 16 keV energywas used to sputter and partly ionize atoms belonging to the sample. These ionswere then mass separated and detected by using a double focalization mass spec-trometer equipped with seven miniature electron multipliers (Hamamatsu). Themass resolving power was adjusted to suppress interferences at all masses (allowingthe optimal separation of 12C15N� from interfering ions like 13C14N� ). Primaryion beam current was 0.5 to 1 pA, scanning parameters were 512� 512 pixels forareas of 3.2 to 12.9 mm with a dwell time of 500ms per pixel. All figures representdata from single plane without accumulation.
Image processing. For Figs 1, 3 and 4, the fluorescence images were rotated andaligned to the SIMS images. A background subtraction was performed for the 15N/14N ratio images, for display purposes. All line scans and spot size measurementswere performed using custom-written routines in MATLAB (The Mathworks Inc).Only horizontal line scans were used; several lines were averaged, to increase thesignal-to-noise ratio (three lines for Fig. 1a and Supplementary Fig. 1; 5 lines forSupplementary Figs 3b and 5b; three lines for all other 14N images, and seven linesfor all other 15N images, unless otherwise noted in the figure legends). Fluorescence
NATURE COMMUNICATIONS | DOI: 10.1038/ncomms4664 ARTICLE
NATURE COMMUNICATIONS | 5:3664 | DOI: 10.1038/ncomms4664 | www.nature.com/naturecommunications 7
& 2014 Macmillan Publishers Limited. All rights reserved.
images were deconvolved (applying classical maximum likelihood estimationalgorithm) with the aid of Huygens Essential software (Scientific Volume Imaging),using the inbuilt routines designed specifically for confocal and STED images. Foridentifying individual protein clusters in Fig. 3, we first selected a region of interestcentred on the synapse (indicated by an arrowhead in Fig. 3a). The region was thenfiltered using a median filter (2� 2 pixels), to remove noise. The resulting imagewas then thresholded using an empirically derived threshold, equivalent to themean intensity of the regions of interest plus two to ten arbitrary units (dependingon the image). The thresholding was applied at the pixel level (not at subpixellevels), and resulted in separated regions of interest corresponding to the individualprotein clusters. These were subsequently analysed as indicated in the main textand in Fig. 3.
References1. Johansson, M. E. V. & Hansson, G. C. Analysis of assembly of secreted mucins.
Methods. Mol. Biol. 842, 109–121 (2012).2. Dittrich, A., Siewert, E. & Schaper, F. Determination of protein turnover rates
in the Jak/STAT pathway using a radioactive pulse-chase approach. Methods.Mol. Biol. 967, 69–80 (2013).
3. Zhang, J., Campbell, R. E., Ting, A. Y. & Tsien, R. Y. Creating new fluorescentprobes for cell biology. Nat. Rev. Mol. Cell. Biol. 3, 907–918 (2002).
4. Zhang, L. et al. Method for real-time monitoring of protein degradation at thesingle cell level. Biotechniques 42, 446–450 (2007).
5. Hindie, E., Coulomb, B., Beaupain, R. & Galle, P. Mapping the cellulardistribution of labelled molecules by SIMS microscopy. Biol. Cell. 74, 81–88(1992).
6. Lechene, C. et al. High-resolution quantitative imaging of mammalian andbacterial cells using stable isotope mass spectrometry. J. Biol. 5, 1–30 (2006).
7. Steinhauser, M. L. & Lechene, C. P. Quantitative imaging of subcellularmetabolism with stable isotopes and multi-isotope imaging mass spectrometry.Semin. Cell. Dev. Biol. 24, 661–667 (2013).
8. Slodzian, G., Daigne, B., Girard, F., Boust, F. & Hillion, F. A high-resolutionscanning ion microscope with parallel detection of secondary ions. in Proc 8thInt Conf Secondary Ion Mass Spectrometry 1991, SIMS VIII 169–178 (1992).
9. Slodzian, G., Daigne, B., Girard, F., Boust, F. & Hillion, F. Scanning secondaryion analytical microscopy with parallel detection. Biol. Cell. 74, 43–50 (1992).
10. Zhang, D.-S. et al. Multi-isotope imaging mass spectrometry reveals slowprotein turnover in hair-cell stereocilia. Nature 481, 520–524 (2012).
11. Steinhauser, M. L. et al. Multi-isotope imaging mass spectrometry quantifiesstem cell division and metabolism. Nature 481, 516–519 (2012).
12. Senyo, S. E. et al. Mammalian heart renewal by pre-existing cardiomyocytes.Nature 493, 433–436 (2013).
13. Frisz, J. F. et al. Direct chemical evidence for sphingolipid domains in theplasma membranes of fibroblasts. Proc. Natl Acad. Sci. USA 110, E613–E622(2013).
14. Frisz, J. F. et al. Sphingolipid domains in the plasma membranes of fibroblastsare not enriched with cholesterol. J. Biol. Chem. 288, 16855–16861 (2013).
15. Hell, S. W. Far-field optical nanoscopy. Science 316, 1153–1158 (2007).16. Toomre, D. & Bewersdorf, J. A new wave of cellular imaging. Annu. Rev. Cell.
Dev. Biol. 26, 285–314 (2010).17. Huang, B., Babcock, H. & Zhuang, X. Breaking the diffraction barrier: super-
resolution imaging of cells. Cell 143, 1047–1058 (2010).18. Hell, S. W. & Wichmann, J. Breaking the diffraction resolution limit by
stimulated emission: stimulated-emission-depletion fluorescence microscopy.Opt. Lett. 19, 780–782 (1994).
19. Willig, K. I., Rizzoli, S. O., Westphal, V., Jahn, R. & Hell, S. W. STEDmicroscopy reveals that synaptotagmin remains clustered after synaptic vesicleexocytosis. Nature 440, 935–939 (2006).
20. Hoopmann, P. et al. Endosomal sorting of readily releasable synaptic vesicles.Proc. Natl Acad. Sci. USA 107, 19055–19060 (2010).
21. Meyer, L. et al. Dual-color STED microscopy at 30-nm focal-plane resolution.Small. 4, 1095–1100 (2008).
22. Denker, A., Krohnert, K. & Rizzoli, S. O. Revisiting synaptic vesicle poollocalization in the Drosophila neuromuscular junction. J. Physiol. 587,2919–2926 (2009).
23. Wedlock, L. E. et al. Visualising gold inside tumour cells following treatmentwith an antitumour gold(I) complex. Metallomics 3, 917–925 (2011).
24. Ghosal, S. et al. Imaging and 3D elemental characterization of intact bacterialspores by high-resolution secondary ion mass spectrometry. Anal. Chem. 80,5986–5992 (2008).
25. Ishitani, T. & Shimizu, R. Computer simulation of atomic mixing during ionbombardment - Springer. Appl. Phys. 6, 241–248 (1975).
26. Muramoto, S., Brison, J. & Castner, D. G. Exploring the surface sensitivity ofTOF-secondary ion mass spectrometry by measuring the implantation andsampling depths of Bi(n) and C60 ions in organic films. Anal. Chem. 84,365–372 (2012).
27. Sudhof, T. C. The synaptic vesicle cycle. Annu. Rev. Neurosci. 27, 509–547(2004).
28. Rizzoli, S. O. Synaptic vesicle recycling: steps and principles. EMBO J.doi:10.1002/embj.201386357 (2014).
29. Moore, K. L., Lombi, E., Zhao, F.-J. & Grovenor, C. R. M. Elemental imaging atthe nanoscale: NanoSIMS and complementary techniques for elementlocalisation in plants. Anal. Bioanal. Chem. 402, 3263–3273 (2012).
30. Watanabe, S. et al. Protein localization in electron micrographs usingfluorescence nanoscopy. Nat. Methods 8, 80–84 (2011).
AcknowledgementsWe thank Dr U. Ehrke (Cameca, Unterschleissheim, Germany) for valuable commentson the data and on the manuscript. We thank C. Schafer for technical assistance. Wethank B. Rizzoli for proofreading the manuscript. The SIMS instrument was fundedby the German Federal Ministry of Education and Research (BMBF), grant identifier03F0626A. S.K.S. was supported by a Boehringer Ingelheim Fonds PhD Fellowship. Thework was supported by grants to S.O.R. from the German Research Foundation (DFG,grant identifiers RI 1967/2-1, RI 1967/3-1 and the Collaborative Research Center 889‘Cellular Mechanisms of Sensory Processing’, SFB 899).
Author contributionsS.K.S., S.O.R. and J.T.W. conceived the project and designed the experiments. S.K.S. andK.K. prepared the samples and performed the fluorescence and electron microscopy.A.V., F.H. and S.K.S. performed the NanoSIMS imaging. S.K.S and S.O.R analysed thedata. S.K.S., S.O.R. and J.T.W. wrote the manuscript.
Additional informationSupplementary Information accompanies this paper at http://www.nature.com/naturecommunications
Competing financial interests: Francois Hillion is an employee of Cameca, a companymanufacturing SIMS instruments. All the other authors declare no competing financialinterests.
Reprints and permission information is available online at http://npg.nature.com/reprintsandpermissions/
How to cite this article: Saka, S. K. et al. Correlated optical and isotopic nanoscopy.Nat. Commun. 5:3664 doi: 10.1038/ncomms4664 (2014).
This work is licensed under a Creative Commons Attribution-NonCommercial-ShareAlike 3.0 Unported License. The images or
other third party material in this article are included in the article’s Creative Commonslicense, unless indicated otherwise in the credit line; if the material is not included underthe Creative Commons license, users will need to obtain permission from the licenseholder to reproduce the material. To view a copy of this license, visit http://creativecommons.org/licenses/by-nc-sa/3.0/
ARTICLE NATURE COMMUNICATIONS | DOI: 10.1038/ncomms4664
8 NATURE COMMUNICATIONS | 5:3664 | DOI: 10.1038/ncomms4664 | www.nature.com/naturecommunications
& 2014 Macmillan Publishers Limited. All rights reserved.


