Embed Size (px)
Citation preview
Citation: Alakkas, A.A.; Vivek; Paul,
M.; Nabi, M.K.; Khan, M.A.
Corporate Social Responsibility and
Firm-Based Brand Equity: The
Moderating Effect of Marketing
Communication and Brand Identity.
Sustainability 2022, 14, 6033. https://
doi.org/10.3390/su14106033
Academic Editor: Flavio Boccia
Received: 31 March 2022
Accepted: 26 April 2022
Published: 16 May 2022
Publisher’s Note: MDPI stays neutral
with regard to jurisdictional claims in
published maps and institutional affil-
iations.
Copyright: © 2022 by the authors.
Licensee MDPI, Basel, Switzerland.
This article is an open access article
distributed under the terms and
conditions of the Creative Commons
Attribution (CC BY) license (https://
creativecommons.org/licenses/by/
4.0/).
sustainability
Article
Corporate Social Responsibility and Firm-Based Brand Equity:The Moderating Effect of Marketing Communication andBrand IdentityAbdullah A. Alakkas 1, Vivek 2,*, Mohinder Paul 3, Mohammed Kamalun Nabi 2 and Mohammed Arshad Khan 1,*
1 Department of Accountancy, College of Administrative and Financial Sciences, Saudi Electronic University,Riyadh 11673, Saudi Arabia; [email protected]
2 Department of Commerce and Business Studies, Jamia Millia Islamia, New Delhi 110025, India;[email protected]
3 Department of Commerce, Ramanujan College, University of Delhi, New Delhi 110019, India;[email protected]
* Correspondence: [email protected] (V.); [email protected] (M.A.K.)
Abstract: Abstract: PurposeTo examine how the CSR activities facilitate a company’s brand-buildingprocess and useful in building its Brand Equity i.e., Firm-Based Brand Equity (FBBE). Methodol-ogy: For the present study, responses have been elicited from a sample of 69 company executives.Multi-stage sampling (method of random sampling) is used in the present study to select the sam-ple executives. The collected sample dataset is analyzed through SPSS (version 25) and AMOS(version 24) software. Cronbach’s Alpha technique is used to measure how closely related a set ofitems are as a group. This is considered to be a measure of scale reliability. The Exploratory FactorAnalysis (EFA) statistical method is used to uncover the underlying structure of a relatively largeset of variables. Structural Equation Modeling (SEM) is conducted in the study in order to test thestatistical hypotheses formulated for the study and to examine the effect of CSR on Brand Equity withthe moderating effect of Marketing Communication and Brand Identity. Findings: The outcomes ofthe study revealed that Corporate Social Responsibility (CSR), Marketing Communication, BrandIdentity and Brand Equity are positively associated. Thus, it can be surmised that CSR affects BrandEquity with the mediating effect of Marketing Communication and Brand Identity. Originality:The present study is based on original research that facilitates new insight instead of summarizingwhat is already known in a new form. Though many studies on CSR have been conducted in thepast, but studies on the relationship between Corporate Social Responsibility and Firm-Based BrandEquity with the moderating effect of Marketing Communication and Brand Identity are few and farbetween. Implications: The outcome of the study will cast new light on the impact of CorporateSocial Responsibility on Corporate Brand Image and also facilitate future research endeavors on CSR.The results of the study will help corporate houses in building a strong brand image. As a matter offact, the CSR activities implemented by the companies offer a better brand recognition, resulting ingreater brand awareness among customers and society at large. Such awareness is related to CSRinitiatives of the companies brings brand trust and loyalty. Consequently, the trust and loyalty sodeveloped enhances the Brand Image and strengthens the Brand Equity.
Keywords: corporate social responsibility; firm-based brand equity; brand image; marketingcommunication; brand identity
1. Introduction
Corporate Social Responsibility (CSR) is a concept that has gained steam aroundthe world. Moreover, globalization has opened the door to a variety of challenges forgovernments all over the world. This has resulted in a growing visibility and corporatecitizenship, as well as the opening of the door for an abstraction known as Corporate Social
Sustainability 2022, 14, 6033. https://doi.org/10.3390/su14106033 https://www.mdpi.com/journal/sustainability
Sustainability 2022, 14, 6033 2 of 21
Responsibility, which requires companies to play a part in the advancement of society. CSRhas become unavoidable in today’s environment, and it plays a critical part in the efficacyof corporate branding.
Corporate branding has been a critical concern for many businesses in recent years.Each organization’s most valuable asset is its brand, which is evaluated in terms of BrandEquity. Companies can better their Brand Equity by marketing their products in moreunique and easily recognizable ways, charging higher prices and maintaining high qualitystandards. Branding is more than just assigning a product a name; it also allows businessesto differentiate themselves from their competition. A brand is a firm’s mirror, since itportrays every action that the company engages in. Companies’ efforts engage consumersin developing a picture of a brand, which leads to Brand Building [1].
Branding aids in the formation of a good image of the organization, allowing foreffective customer relationship management, which is a critical predictor of brand equity [2].Customers in today’s world are concerned about more than just the cost and quality ofthe products; they are also concerned about their environment and the society in whichthey live, and want to be a part of the program that benefits the globe (Battistoni et al. [3]).As a result, modern firms have realized that CSR builds brand equity and that it is nowas vital as the manufacturing of their goods. In light of this, the purpose of this study isto investigate the role of corporate social responsibility in the development of firm-basedbrand equity (FBBE) [4]. Furthermore, the current research makes recommendations tobusinesses on how to include CSR into their overall company plan [5].
2. Review of Literature and Gap Identification
In modern times, CSR has become one of the most talked about subjects in business andpolitics. To ensure the sustainability and growth of business, CSR has become indispensablein today’s capitalist economy. Against such a backdrop, this section reviews the availableliterature on CSR. It also attempts to derive some hypotheses from the review of literatureto be tested in order to fulfil the objectives of this study.
Shafi and Madhavaiah [6] opined that integrated Marketing Communication plays avital role in building Brand Equity. According to them, if companies will adopt appropriateintegrated Marketing Communication components and use them judiciously in the rightplace, this will increase Brand Equity. Building and accessing an energetic and influentialBrand is one of the important priorities of the companies, as it offers them many privilegesand status.
Brunello [7] examined the essence of ‘Marketing Communication’ between customersand businesses. In today’s worldwide culture, the usage of an ‘Integrated MarketingCommunication Strategy’ (IMC) is critical in persuading people to purchase a specificorganization’s products or services. To be sure, IMC serves a useful purpose in that itcontributes to the establishment of an organization’s ‘Brand Equity.’ The researcher hasexamined the notion of ‘Brand Equity’ and has arrived at a conclusion that there is adeep-rooted relationship between IMC and ‘Brand Equity’.
Alexander et al. [8] discovered the effect of CSR on building future brands in anorganization. Some communities of beneficiaries have been segmented into focus groupsfor discussions on the ramifications of CSR. The discussions led to three main ramificationsfor CSR, namely stakeholder’s expectations, collaborations, research and development,which eventually led to the discovery of a good effect.
Dapi and Phiri [9], in their study, described corporate social responsibility (CSR) asan organizational tool whose successful implementation can be used to gain brand loyalty.The benefits of CSR to society have been well documented to a great extent. However,there is very little information on the benefits of it to the actual corporations that practice it.The findings of the study concluded that most consumers did not correctly understand theconcept of CSR and believed that companies should be socially responsible. However, themajor takeaway of the study was regarding the awareness of a company’s CSR initiativesas it could lead to better ‘Brand Image’ and ‘Brand Loyalty’. This study recommends
Sustainability 2022, 14, 6033 3 of 21
that companies should take a more proactive rather than reactive approach to social andenvironmental problems.
Esmaeilpour and Barjoei [10] examined that corporate social responsibility is animportant issue for most organizations and their managers. One of the most valuableassets of any company is its brand. The brand equity is an asset which in its light thecompany can obtain many benefits and maintains the value of the company. The authorsconducted this study to analyze the influence of corporate social responsibility and BrandImage on ‘Brand Equity’. The results revealed that corporate social responsibility has asignificant positive impact on ‘Brand Image’ and ‘Brand Equity’. Furthermore, ‘BrandImage’ positively influences ‘Brand Equity’. Corporate social responsibility efforts are morestrategically related to product differentiation and brand differentiation. This relationshipis significant, especially in the case of competitive markets and differentiated products.
Jyothsna et al. [11] highlighted the significance of building a brand in their research.The researchers underscored ‘brand’ as an organization’s most valuable asset. The findingsof the research signified that “high levels of ‘Brand Equity’ lead to higher purchasing prefer-ences and intentions”. Moreover, in their study, the ‘Brand Equity’ measures such as ‘BrandAwareness’, ‘Perceived Quality’, ‘Price’ and ‘Brand Association’, accompanied with ‘BrandIdentity’ measures such as culture, self-image and personality, are taken into consideration.When customers perceive a high brand value, they are ready to pay higher prices anddefend such a brand on the grounds of excellent product quality (Zhang et al. [12]). Theself-image constitutes the attributions that customers make. The personality traits, on theother hand, are related to the characteristics of an individual. For building robust customerloyalty, it is essential to formulate a high quality perceived by the customer. This is becausethe ‘Brand Loyalty’ and ‘Perceived Quality’ are intertwined (Mohammed Arshad Khan).The researchers asserted that “strong brands have a substantial ‘Brand Equity’, to whichcustomers associate the brand to be strong”.
Singh and Verma [13] in their study, observed that corporate social responsibilityindeed affects brand performance. Their findings indicate that a company’s CSR activitieshave a positive effect on the value of its brand. The study’s findings will encouragebusinesses to shift their management techniques away from the old profit-driven strategyand toward a more socially responsible approach to long-term corporate performance.
Caracuel and Guerrero-Villegas [14] revealed that advanced social activities and man-agement techniques can help businesses improve their brands. These companies frequentlyestablish their operations in developing countries to take advantage of environmentaland social standards while also lowering their operational expenses. Corporations, on theother hand, can use corporate social responsibility (CSR) efforts to directly influence thedevelopment of those nations. The findings show that companies operating in underde-veloped regions can improve their corporate reputation by implementing CSR efforts thatfulfil the expectations of certain stakeholders regarding the firm’s actions in these locations(Ali et al. [15]). Furthermore, the authors contend that Multinational Enterprises (MNEs)with operations in many regions enhance the impact of corporate social performance onbrand equity.
Wisdom et al. [16], in their study, found that CSR is inevitably an important issue forbusiness agents across the globe because attention is paid repeatedly to all components of abusiness. Furthermore, in expanding economies, the number of companies that take part inCSR intentionally (for example, support relationships, natural relationships, ecological andsocial relations or reports on corporate social obligations) is underway expansion. Theysuggested that investment in CSR will benefit the shareholders and promote an effectiveoverall performance in phases of funding in the company, leading to a better performanceof the company. They came to the conclusion that CSR practices should be linked toorganizational processes of value generation, or they should be developed only as a tool toimprove overall performance.
Salehzadeh et al. [17] said that corporate social responsibility has a strong impacton brand image since participation in CSR activities generates a positive reputation and
Sustainability 2022, 14, 6033 4 of 21
improves brand image. The findings of the study conclude that the development of a brandrequires a long-term effort, but its destruction can take place quickly due to a CSR scandal.Therefore, for improving the ‘Brand Image’, as well as for enhancing ‘Brand Equity’, it isessential for companies to include CSR activities in their business practices.
Yaw Simpson and Aprim [18] analyzed the various CSR practices to attract potentialworkers in developing economies. The outcomes of the research exhibit a deficient degreeof awareness of CSR. Respondents recognized that elements of an organization’s CSRpractice, be they financial, social or environmental, had a vital role in their final preferencefor a particular business enterprise (employer). Besides, the disclosure of CSR practices byan organization is relevant in their choice of an employer. The findings suggest the needfor organizations to take cognizance of the growing interest of prospective employees inworking for organizations that engage in CSR activities and disclosures.
Abdul Azid and Tahir [19] suggested that CSR, one of the crucial factors for anorganization, is here to stay in the commercial game. Numerous CSR activities can helpa business in achieving its organizational objectives as well as assist in the furtherance ofthe business enterprise. The popularity of a business enterprise is based on its relationshipwith employees, consumers, suppliers and the community in which it functions. These areseveral stakeholders that take part in CSR activities. CSR may now not be fashionable, butit is nevertheless an essential aspect for better performance and requires devoted leaders.
Mahmood and Bashir [20] concluded that brand reputation is a significant predictorof brand equity and its predictive power is boosted in the presence of CSR activities. Itwas also ascertained that CSR initiatives related to ethics, the economy and philanthropyexpedite the process of conversion from brand reputation to brand equity. The findings ofthe study indicated that the most effective dimensions are philanthropic, ethical, economicand legal, respectively. All dimensions of CSR except the legal aspect positively moderatedthe relationship to form brand equity. It could be construed that customers of McDonald’sand KFC are not abreast of their legal activities related to CSR. Therefore, it is essentialto channelize fast-food’s marketing programs to publicize legal aspects through in-storebulletins and websites. On the other hand, marketers should devise plans and formulatestrategies by considering all significant dimensions of CSR.
Wang et al. [1] concluded that Brand Credibility, Brand Equity and Brand Reputationserve as powerful mediators. Brand Credibility mediates the relationship between CSRperceptions and Purchase Intention fully. When CSR initiatives and messages are commu-nicated properly, customers believe the promises of the company and consider purchasingits products. Brand Credibility also mediates the relationship between CSR perceptionsand BR partially. When customers observe CSR activities, they are far more likely to believethat the company is reliable and trustworthy, which improves the reputation of its brand.As far as Brand Equity is concerned, it was found that it acts as a powerful mediator thatinfluences the path from CSR perceptions to PI directly, as well as the path from CSRperceptions to BR partially. CSR can contribute to the formation of an ethical, sustainableand reliable image, therefore improving perceived brand loyalty. Moreover, communicatingCSR activities well can raise customer awareness. When a company succeeds in building asustainable BE, it can maintain a positive reputation and encourage customers to purchaseits products.
On the basis of the aforesaid discussed extensive literature review, we can say that afew research studies have been undertaken so far to examine the perception of executivestowards their respective companies CSR initiatives. A close look at the review of theliterature indicates a clear research gap. Thus, the present work is an endeavor by theresearchers to determine the impact of CSR activities implemented by companies on theirBrand Equity. It is obvious that there are many studies available on CSR and its impact onbrand equity in the context of various regions, but there are hardly any studies that havebeen undertaken to analyze the interface between CSR and Firm-based Brand Equity withthe moderating effect of Marketing Communication and Brand Identity particularly in thecontext of Delhi-NCR, India.
Sustainability 2022, 14, 6033 5 of 21
3. Conceptual Model of the Study
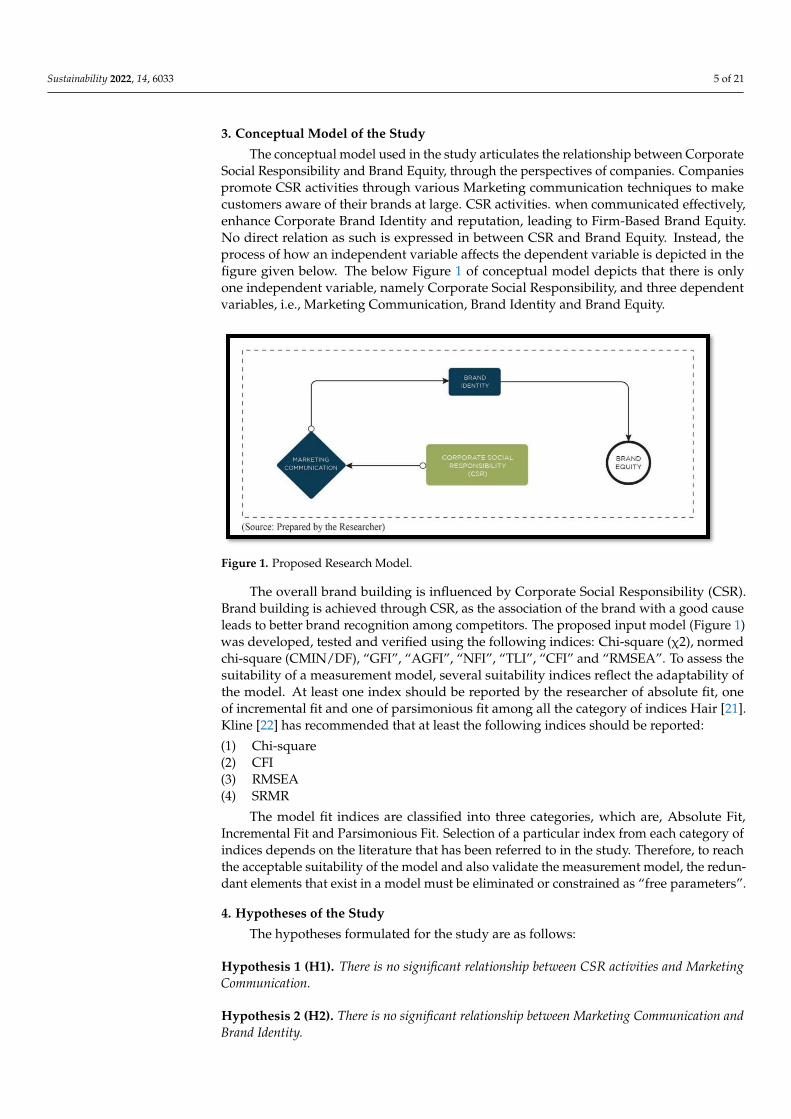
The conceptual model used in the study articulates the relationship between CorporateSocial Responsibility and Brand Equity, through the perspectives of companies. Companiespromote CSR activities through various Marketing communication techniques to makecustomers aware of their brands at large. CSR activities. when communicated effectively,enhance Corporate Brand Identity and reputation, leading to Firm-Based Brand Equity.No direct relation as such is expressed in between CSR and Brand Equity. Instead, theprocess of how an independent variable affects the dependent variable is depicted in thefigure given below. The below Figure 1 of conceptual model depicts that there is onlyone independent variable, namely Corporate Social Responsibility, and three dependentvariables, i.e., Marketing Communication, Brand Identity and Brand Equity.
Figure 1. Proposed Research Model.
The overall brand building is influenced by Corporate Social Responsibility (CSR).Brand building is achieved through CSR, as the association of the brand with a good causeleads to better brand recognition among competitors. The proposed input model (Figure 1)was developed, tested and verified using the following indices: Chi-square (χ2), normedchi-square (CMIN/DF), “GFI”, “AGFI”, “NFI”, “TLI”, “CFI” and “RMSEA”. To assess thesuitability of a measurement model, several suitability indices reflect the adaptability ofthe model. At least one index should be reported by the researcher of absolute fit, oneof incremental fit and one of parsimonious fit among all the category of indices Hair [21].Kline [22] has recommended that at least the following indices should be reported:
(1) Chi-square(2) CFI(3) RMSEA(4) SRMR
The model fit indices are classified into three categories, which are, Absolute Fit,Incremental Fit and Parsimonious Fit. Selection of a particular index from each category ofindices depends on the literature that has been referred to in the study. Therefore, to reachthe acceptable suitability of the model and also validate the measurement model, the redun-dant elements that exist in a model must be eliminated or constrained as “free parameters”.
4. Hypotheses of the Study
The hypotheses formulated for the study are as follows:
Hypothesis 1 (H1). There is no significant relationship between CSR activities and MarketingCommunication.
Hypothesis 2 (H2). There is no significant relationship between Marketing Communication andBrand Identity.
Sustainability 2022, 14, 6033 6 of 21
Hypothesis 3 (H3). There is no significant relationship between Brand Identity and Brand Equity.
5. Methodology of the Study
This research study is descriptive-cum-cross sectional in nature. A cross-sectionalresearch design connotes a distinctive category of descriptive research design, which issystematic and exact to enfold the properties established in a research question. Such asystem is usually formed from the construction and examination of hypotheses derivedout of a theory Hair [23]. For the purpose of determining the sample size of executives,a multi-stage sampling technique was used by the researchers in the study. A list ofIndian companies was obtained firstly from the data of CSRBOX (https://csrbox.org/list-companies-india, accessed on 12 November 2021) and it had 1094 companies in aggregate.In the second stage, CSR-practicing companies operating in various sectors located in theDelhi-NCR region were selected randomly. In the third stage, only those companies wereselected that regularly conducted CSR activities for the last five years.
According to Cochran [24] “the required sample size should not exceed 5% of thefinite population”. Therefore, for a population of 1094 companies, the required samplesize is 55, i.e., 1094 × 5%. However, 109 executives of the selected companies were chosenrandomly as a sample, out of which 74 were willing to participate in the survey. Therefore,the required sample size for the present study was 74, which is more than 5% of the finitepopulation of 1094. formula for revising the finite population was used to determine thefinal sample size as given below:
n = n(1+n/N)
n = 74(1+74/1094) = 69
where,N = Finite Population Size = 1094n = Required Return Sample Size for finite population = 74n = Final Required Return Sample Size for finite population is 69 because sample size
of 74 exceeds 5% of the population (i.e., 1094 × 5% = 55).It is also essential to choose an accurate method of data collection for answering the
research questions. A survey method is used in the study for the purpose of collection ofprimary data. The survey took place in India’s National Capital Region from January toJune 2021.
5.1. Development of the Survey Instrument
For this study, the data was collected from the sample executives via a self-administeredweb-based questionnaire. Accordingly, a web-based questionnaire was prepared and ad-ministered with the help of Google Forms among the executives of companies that werelocated in NCR. This online survey comprises two sections: Section-A encompasses thedistribution of sample companies with respect to their individual profiles, i.e., type oforganization, nature of industry to which the company belongs to, implementation of CSRpractices and the legal compliance of corporate social responsibility as per the guidelines ofthe Companies Act, 2013. Section-B of the Questionnaire assesses Executives’ perceptionsand attitudes toward how CSR initiatives are implemented in a company’s brand-buildingprocess and how this is useful in building their Brand Equity, i.e., Firm-Based Brand Equity(FBBE). This “survey” was based on a “Five-Point Likert Scale” ranging from StronglyDisagree (1) to Strongly Agree (5). For the validity and reliability testing of the survey in-strument, the modified questionnaire was evaluated by the experts, and a pilot survey wasconducted among 28 company executives, according to the results of which appropriatechanges were made prior to circulating it finally in the target population. On account ofreliability, to specify how the items are precisely correlated “Cronbach’s alpha” techniquehas been used in the present study with the help of SPSS (version 25) software.
Sustainability 2022, 14, 6033 7 of 21
5.2. Methods for Data Analysis
The collected sample dataset has been brought into SPSS (v-25) software throughMicrosoft excel in order to analyze the collected data by the researchers. Exploratory factoranalysis (EFA) is a set of statistical processes for determining the number and types ofconstructs needed to account for the pattern of correlations between a set of variables(Frey [25]). Accordingly, the researcher performed an Exploratory Factor Analysis (EFA) on9 items of Marketing Communication method, 8 items of Brand Identity and 10 items ofBrand Equity to group the variables.
The statistical technique that is used in marketing to examine the causal association be-tween two or more variables and is exclusively used for testing the theorized/hypotheticalmodels developed by the researcher himself or by the other researchers is called as Struc-tural Equation Modeling (SEM) Bagozzi [26]. An SEM model is used by the researchersthrough AMOS (version 24) software to analyze the relationship between CSR, MarketingCommunication, Brand Identity and Brand Equity from the perspective of companies.
6. Results and Findings
In order to collect primary data from the sample company executives, the questionnairewas distributed online via Google Docs through various social media platforms. Theweb-based questionnaire was specially planned with the variables under study. Closed-ended questions were included in the survey. A summated five-point rating scale, i.e.,“Strongly Disagree (1)” to “Strongly Agree (5)”, was used to collect information fromresponders. The researchers received 69 responses that qualified for data analysis. By usingSPSS (version-25) and AMOS (version-24) software, the collected sample dataset from theexecutives of companies engaged in CSR activities were analyzed quantitatively.
6.1. Profile of the Sample Companies
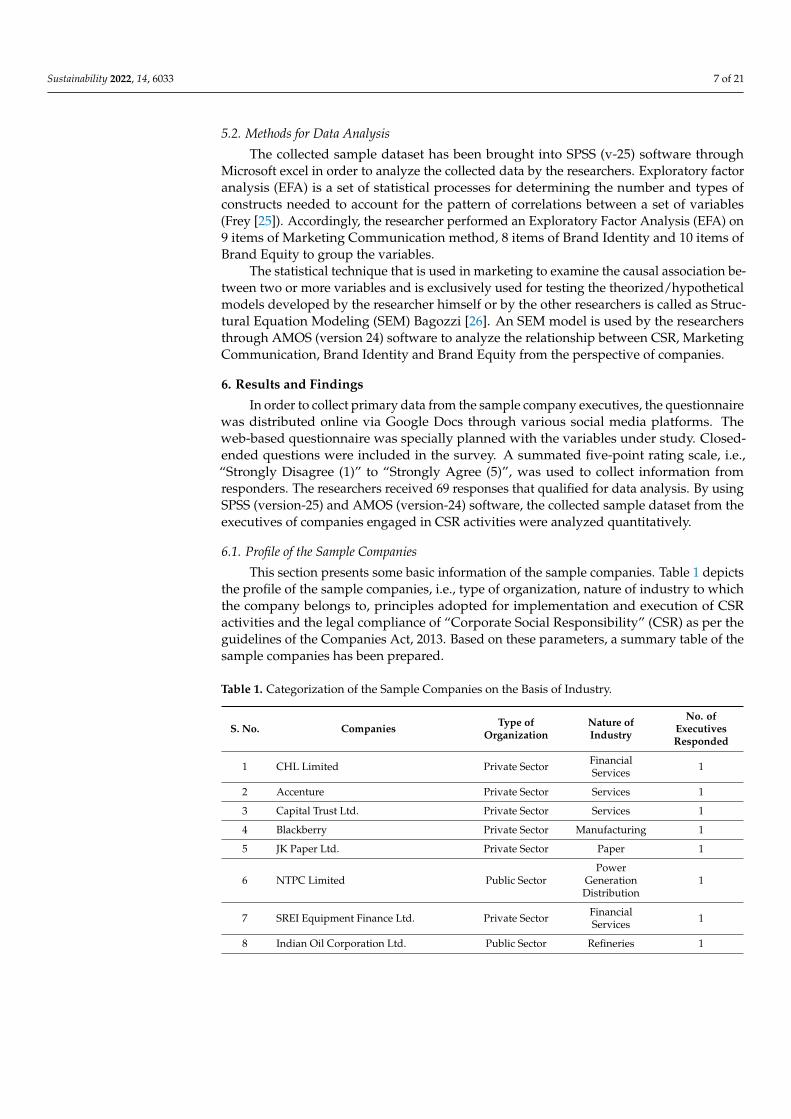
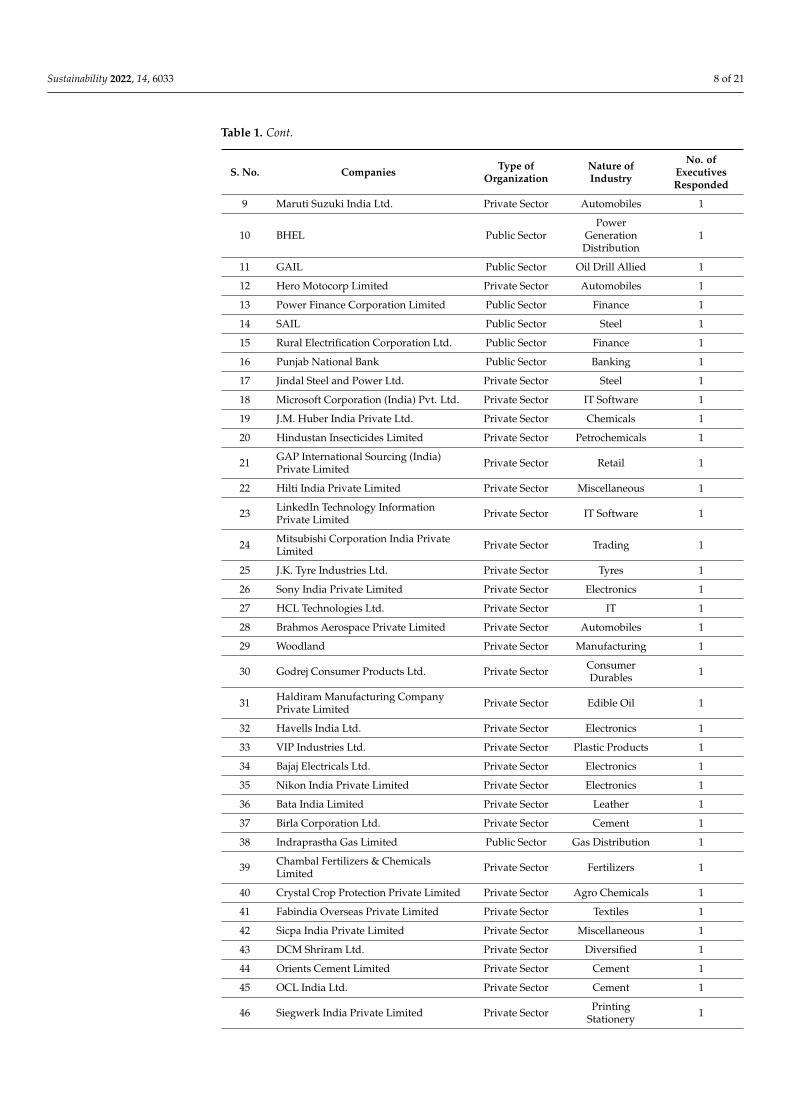
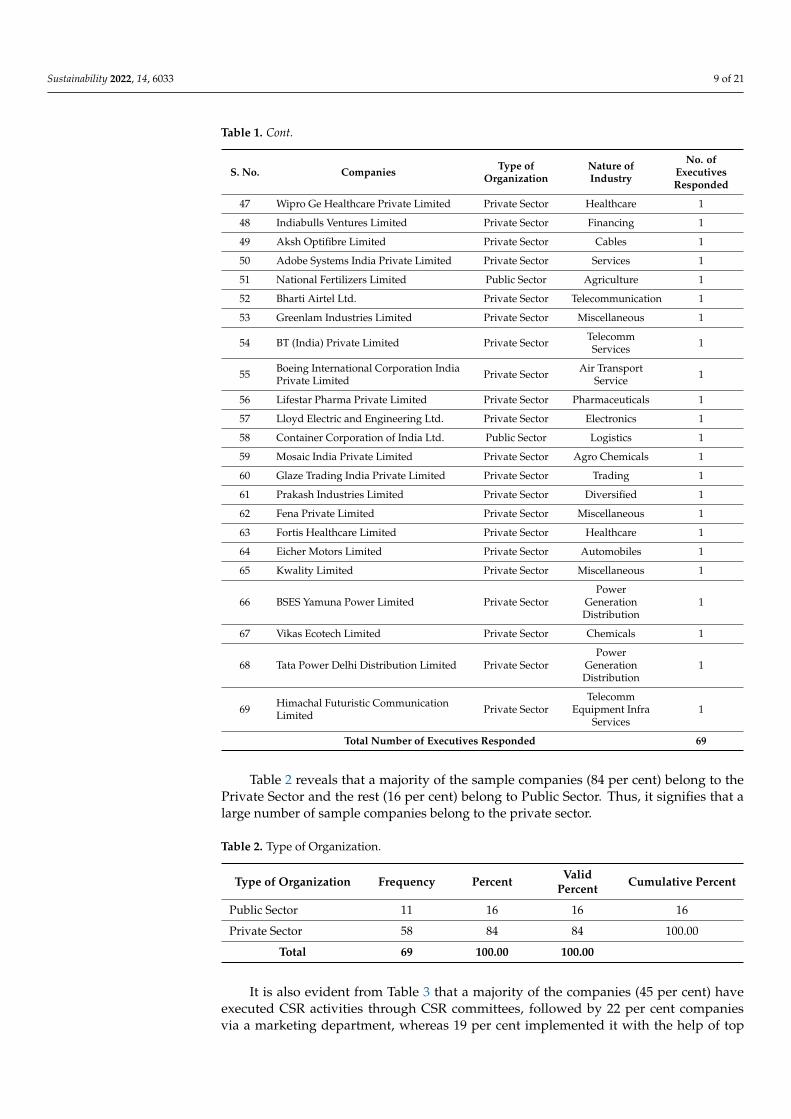
This section presents some basic information of the sample companies. Table 1 depictsthe profile of the sample companies, i.e., type of organization, nature of industry to whichthe company belongs to, principles adopted for implementation and execution of CSRactivities and the legal compliance of “Corporate Social Responsibility” (CSR) as per theguidelines of the Companies Act, 2013. Based on these parameters, a summary table of thesample companies has been prepared.
Table 1. Categorization of the Sample Companies on the Basis of Industry.
S. No. Companies Type ofOrganization
Nature ofIndustry
No. ofExecutivesResponded
1 CHL Limited Private Sector FinancialServices 1
2 Accenture Private Sector Services 1
3 Capital Trust Ltd. Private Sector Services 1
4 Blackberry Private Sector Manufacturing 1
5 JK Paper Ltd. Private Sector Paper 1
6 NTPC Limited Public SectorPower
GenerationDistribution
1
7 SREI Equipment Finance Ltd. Private Sector FinancialServices 1
8 Indian Oil Corporation Ltd. Public Sector Refineries 1
Sustainability 2022, 14, 6033 8 of 21
Table 1. Cont.
S. No. Companies Type ofOrganization
Nature ofIndustry
No. ofExecutivesResponded
9 Maruti Suzuki India Ltd. Private Sector Automobiles 1
10 BHEL Public SectorPower
GenerationDistribution
1
11 GAIL Public Sector Oil Drill Allied 1
12 Hero Motocorp Limited Private Sector Automobiles 1
13 Power Finance Corporation Limited Public Sector Finance 1
14 SAIL Public Sector Steel 1
15 Rural Electrification Corporation Ltd. Public Sector Finance 1
16 Punjab National Bank Public Sector Banking 1
17 Jindal Steel and Power Ltd. Private Sector Steel 1
18 Microsoft Corporation (India) Pvt. Ltd. Private Sector IT Software 1
19 J.M. Huber India Private Ltd. Private Sector Chemicals 1
20 Hindustan Insecticides Limited Private Sector Petrochemicals 1
21 GAP International Sourcing (India)Private Limited Private Sector Retail 1
22 Hilti India Private Limited Private Sector Miscellaneous 1
23 LinkedIn Technology InformationPrivate Limited Private Sector IT Software 1
24 Mitsubishi Corporation India PrivateLimited Private Sector Trading 1
25 J.K. Tyre Industries Ltd. Private Sector Tyres 1
26 Sony India Private Limited Private Sector Electronics 1
27 HCL Technologies Ltd. Private Sector IT 1
28 Brahmos Aerospace Private Limited Private Sector Automobiles 1
29 Woodland Private Sector Manufacturing 1
30 Godrej Consumer Products Ltd. Private Sector ConsumerDurables 1
31 Haldiram Manufacturing CompanyPrivate Limited Private Sector Edible Oil 1
32 Havells India Ltd. Private Sector Electronics 1
33 VIP Industries Ltd. Private Sector Plastic Products 1
34 Bajaj Electricals Ltd. Private Sector Electronics 1
35 Nikon India Private Limited Private Sector Electronics 1
36 Bata India Limited Private Sector Leather 1
37 Birla Corporation Ltd. Private Sector Cement 1
38 Indraprastha Gas Limited Public Sector Gas Distribution 1
39 Chambal Fertilizers & ChemicalsLimited Private Sector Fertilizers 1
40 Crystal Crop Protection Private Limited Private Sector Agro Chemicals 1
41 Fabindia Overseas Private Limited Private Sector Textiles 1
42 Sicpa India Private Limited Private Sector Miscellaneous 1
43 DCM Shriram Ltd. Private Sector Diversified 1
44 Orients Cement Limited Private Sector Cement 1
45 OCL India Ltd. Private Sector Cement 1
46 Siegwerk India Private Limited Private Sector PrintingStationery 1
Sustainability 2022, 14, 6033 9 of 21
Table 1. Cont.
S. No. Companies Type ofOrganization
Nature ofIndustry
No. ofExecutivesResponded
47 Wipro Ge Healthcare Private Limited Private Sector Healthcare 1
48 Indiabulls Ventures Limited Private Sector Financing 1
49 Aksh Optifibre Limited Private Sector Cables 1
50 Adobe Systems India Private Limited Private Sector Services 1
51 National Fertilizers Limited Public Sector Agriculture 1
52 Bharti Airtel Ltd. Private Sector Telecommunication 1
53 Greenlam Industries Limited Private Sector Miscellaneous 1
54 BT (India) Private Limited Private Sector TelecommServices 1
55 Boeing International Corporation IndiaPrivate Limited Private Sector Air Transport
Service 1
56 Lifestar Pharma Private Limited Private Sector Pharmaceuticals 1
57 Lloyd Electric and Engineering Ltd. Private Sector Electronics 1
58 Container Corporation of India Ltd. Public Sector Logistics 1
59 Mosaic India Private Limited Private Sector Agro Chemicals 1
60 Glaze Trading India Private Limited Private Sector Trading 1
61 Prakash Industries Limited Private Sector Diversified 1
62 Fena Private Limited Private Sector Miscellaneous 1
63 Fortis Healthcare Limited Private Sector Healthcare 1
64 Eicher Motors Limited Private Sector Automobiles 1
65 Kwality Limited Private Sector Miscellaneous 1
66 BSES Yamuna Power Limited Private SectorPower
GenerationDistribution
1
67 Vikas Ecotech Limited Private Sector Chemicals 1
68 Tata Power Delhi Distribution Limited Private SectorPower
GenerationDistribution
1
69 Himachal Futuristic CommunicationLimited Private Sector
TelecommEquipment Infra
Services1
Total Number of Executives Responded 69
Table 2 reveals that a majority of the sample companies (84 per cent) belong to thePrivate Sector and the rest (16 per cent) belong to Public Sector. Thus, it signifies that alarge number of sample companies belong to the private sector.
Table 2. Type of Organization.
Type of Organization Frequency Percent ValidPercent Cumulative Percent
Public Sector 11 16 16 16
Private Sector 58 84 84 100.00
Total 69 100.00 100.00
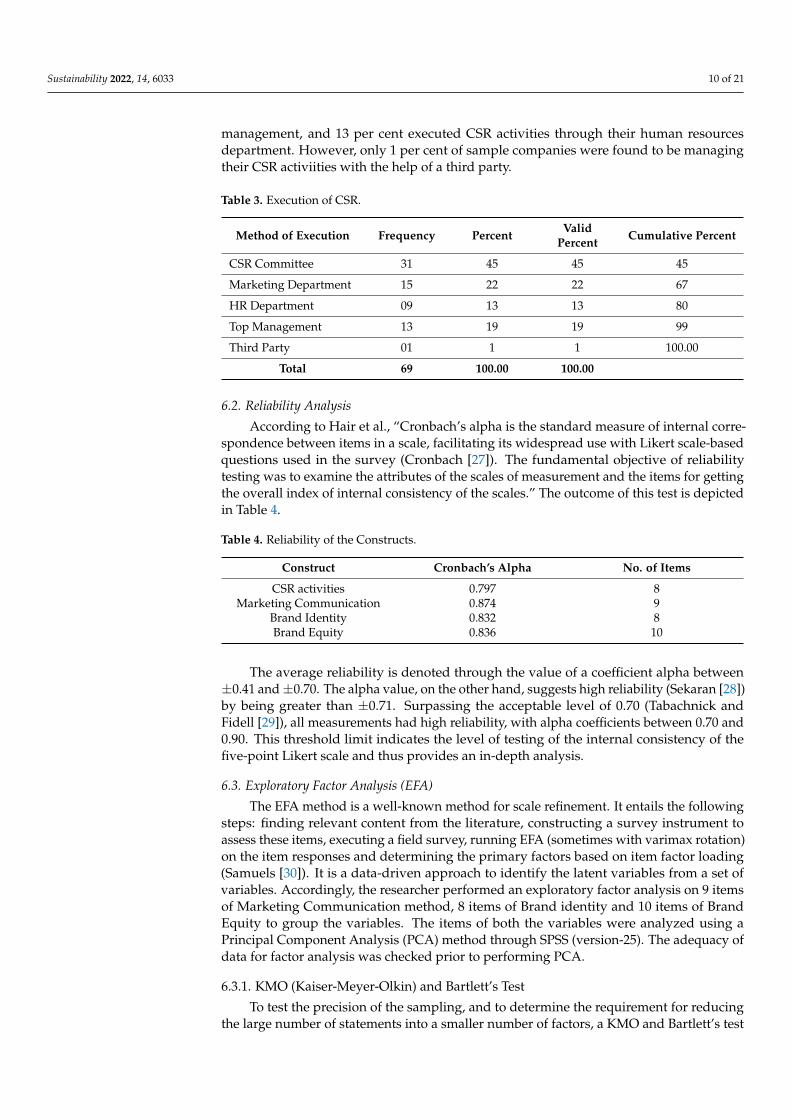
It is also evident from Table 3 that a majority of the companies (45 per cent) haveexecuted CSR activities through CSR committees, followed by 22 per cent companiesvia a marketing department, whereas 19 per cent implemented it with the help of top
Sustainability 2022, 14, 6033 10 of 21
management, and 13 per cent executed CSR activities through their human resourcesdepartment. However, only 1 per cent of sample companies were found to be managingtheir CSR activiities with the help of a third party.
Table 3. Execution of CSR.
Method of Execution Frequency Percent ValidPercent Cumulative Percent
CSR Committee 31 45 45 45
Marketing Department 15 22 22 67
HR Department 09 13 13 80
Top Management 13 19 19 99
Third Party 01 1 1 100.00
Total 69 100.00 100.00
6.2. Reliability Analysis
According to Hair et al., “Cronbach’s alpha is the standard measure of internal corre-spondence between items in a scale, facilitating its widespread use with Likert scale-basedquestions used in the survey (Cronbach [27]). The fundamental objective of reliabilitytesting was to examine the attributes of the scales of measurement and the items for gettingthe overall index of internal consistency of the scales.” The outcome of this test is depictedin Table 4.
Table 4. Reliability of the Constructs.
Construct Cronbach’s Alpha No. of Items
CSR activities 0.797 8Marketing Communication 0.874 9
Brand Identity 0.832 8Brand Equity 0.836 10
The average reliability is denoted through the value of a coefficient alpha between±0.41 and±0.70. The alpha value, on the other hand, suggests high reliability (Sekaran [28])by being greater than ±0.71. Surpassing the acceptable level of 0.70 (Tabachnick andFidell [29]), all measurements had high reliability, with alpha coefficients between 0.70 and0.90. This threshold limit indicates the level of testing of the internal consistency of thefive-point Likert scale and thus provides an in-depth analysis.
6.3. Exploratory Factor Analysis (EFA)
The EFA method is a well-known method for scale refinement. It entails the followingsteps: finding relevant content from the literature, constructing a survey instrument toassess these items, executing a field survey, running EFA (sometimes with varimax rotation)on the item responses and determining the primary factors based on item factor loading(Samuels [30]). It is a data-driven approach to identify the latent variables from a set ofvariables. Accordingly, the researcher performed an exploratory factor analysis on 9 itemsof Marketing Communication method, 8 items of Brand identity and 10 items of BrandEquity to group the variables. The items of both the variables were analyzed using aPrincipal Component Analysis (PCA) method through SPSS (version-25). The adequacy ofdata for factor analysis was checked prior to performing PCA.
6.3.1. KMO (Kaiser-Meyer-Olkin) and Bartlett’s Test
To test the precision of the sampling, and to determine the requirement for reducingthe large number of statements into a smaller number of factors, a KMO and Bartlett’s test
Sustainability 2022, 14, 6033 11 of 21
was used. EFA was performed after obtaining the positive results of the KMO and Bartletttest. The test results are presented in Table 3.
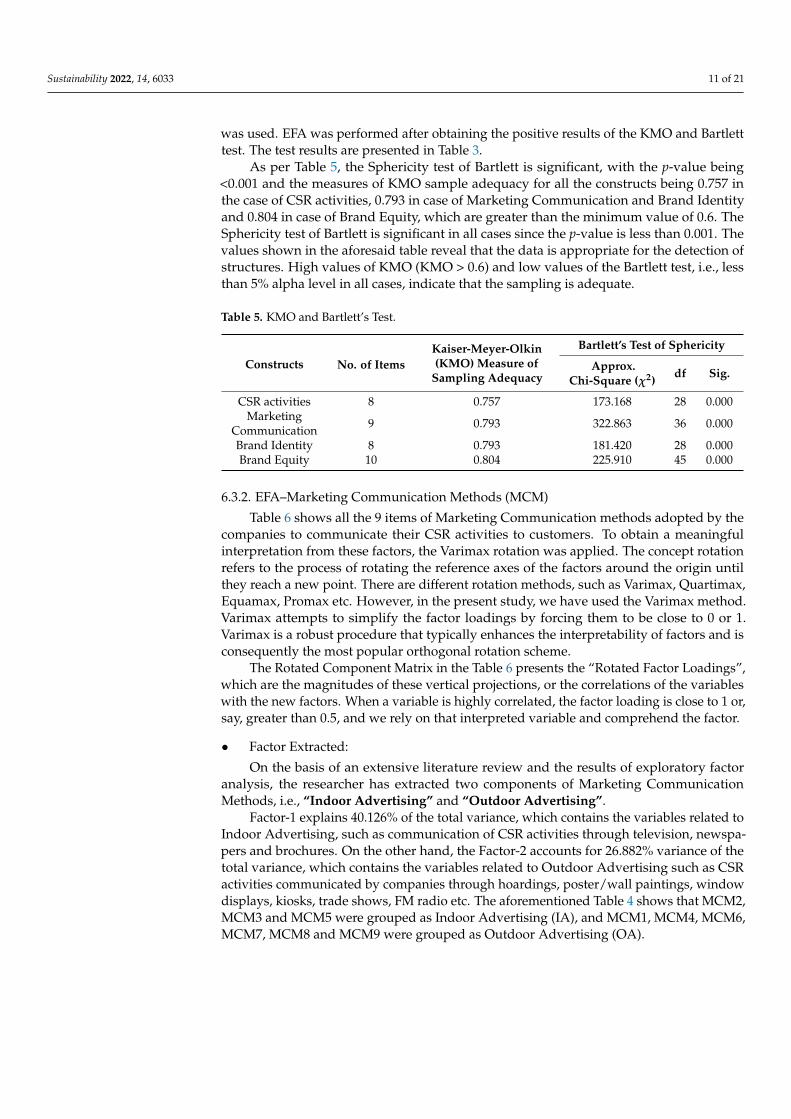
As per Table 5, the Sphericity test of Bartlett is significant, with the p-value being<0.001 and the measures of KMO sample adequacy for all the constructs being 0.757 inthe case of CSR activities, 0.793 in case of Marketing Communication and Brand Identityand 0.804 in case of Brand Equity, which are greater than the minimum value of 0.6. TheSphericity test of Bartlett is significant in all cases since the p-value is less than 0.001. Thevalues shown in the aforesaid table reveal that the data is appropriate for the detection ofstructures. High values of KMO (KMO > 0.6) and low values of the Bartlett test, i.e., lessthan 5% alpha level in all cases, indicate that the sampling is adequate.
Table 5. KMO and Bartlett’s Test.
Constructs No. of ItemsKaiser-Meyer-Olkin(KMO) Measure of
Sampling Adequacy
Bartlett’s Test of Sphericity
Approx.Chi-Square (χ2) df Sig.
CSR activities 8 0.757 173.168 28 0.000Marketing
Communication 9 0.793 322.863 36 0.000
Brand Identity 8 0.793 181.420 28 0.000Brand Equity 10 0.804 225.910 45 0.000
6.3.2. EFA–Marketing Communication Methods (MCM)
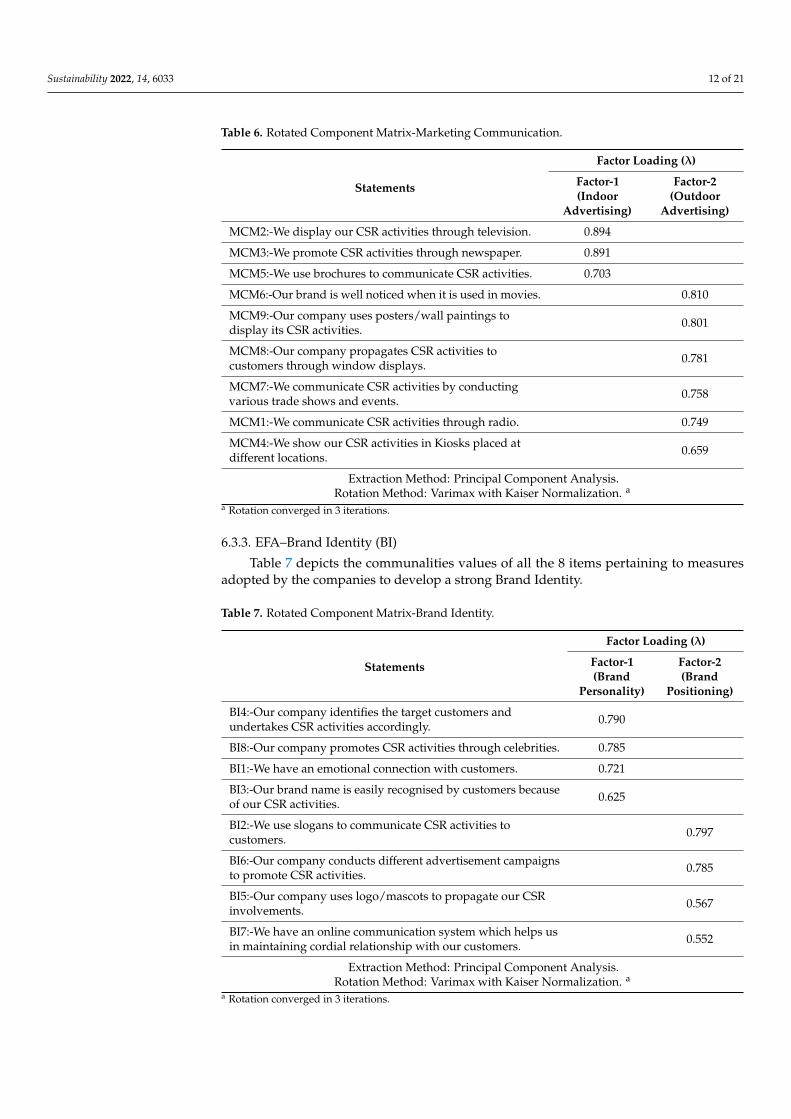
Table 6 shows all the 9 items of Marketing Communication methods adopted by thecompanies to communicate their CSR activities to customers. To obtain a meaningfulinterpretation from these factors, the Varimax rotation was applied. The concept rotationrefers to the process of rotating the reference axes of the factors around the origin untilthey reach a new point. There are different rotation methods, such as Varimax, Quartimax,Equamax, Promax etc. However, in the present study, we have used the Varimax method.Varimax attempts to simplify the factor loadings by forcing them to be close to 0 or 1.Varimax is a robust procedure that typically enhances the interpretability of factors and isconsequently the most popular orthogonal rotation scheme.
The Rotated Component Matrix in the Table 6 presents the “Rotated Factor Loadings”,which are the magnitudes of these vertical projections, or the correlations of the variableswith the new factors. When a variable is highly correlated, the factor loading is close to 1 or,say, greater than 0.5, and we rely on that interpreted variable and comprehend the factor.
• Factor Extracted:
On the basis of an extensive literature review and the results of exploratory factoranalysis, the researcher has extracted two components of Marketing CommunicationMethods, i.e., “Indoor Advertising” and “Outdoor Advertising”.
Factor-1 explains 40.126% of the total variance, which contains the variables related toIndoor Advertising, such as communication of CSR activities through television, newspa-pers and brochures. On the other hand, the Factor-2 accounts for 26.882% variance of thetotal variance, which contains the variables related to Outdoor Advertising such as CSRactivities communicated by companies through hoardings, poster/wall paintings, windowdisplays, kiosks, trade shows, FM radio etc. The aforementioned Table 4 shows that MCM2,MCM3 and MCM5 were grouped as Indoor Advertising (IA), and MCM1, MCM4, MCM6,MCM7, MCM8 and MCM9 were grouped as Outdoor Advertising (OA).
Sustainability 2022, 14, 6033 12 of 21
Table 6. Rotated Component Matrix-Marketing Communication.
Statements
Factor Loading (λ)
Factor-1(Indoor
Advertising)
Factor-2(Outdoor
Advertising)
MCM2:-We display our CSR activities through television. 0.894
MCM3:-We promote CSR activities through newspaper. 0.891
MCM5:-We use brochures to communicate CSR activities. 0.703
MCM6:-Our brand is well noticed when it is used in movies. 0.810
MCM9:-Our company uses posters/wall paintings todisplay its CSR activities. 0.801
MCM8:-Our company propagates CSR activities tocustomers through window displays. 0.781
MCM7:-We communicate CSR activities by conductingvarious trade shows and events. 0.758
MCM1:-We communicate CSR activities through radio. 0.749
MCM4:-We show our CSR activities in Kiosks placed atdifferent locations. 0.659
Extraction Method: Principal Component Analysis.Rotation Method: Varimax with Kaiser Normalization. a
a Rotation converged in 3 iterations.
6.3.3. EFA–Brand Identity (BI)
Table 7 depicts the communalities values of all the 8 items pertaining to measuresadopted by the companies to develop a strong Brand Identity.
Table 7. Rotated Component Matrix-Brand Identity.
Statements
Factor Loading (λ)
Factor-1(Brand
Personality)
Factor-2(Brand
Positioning)
BI4:-Our company identifies the target customers andundertakes CSR activities accordingly. 0.790
BI8:-Our company promotes CSR activities through celebrities. 0.785
BI1:-We have an emotional connection with customers. 0.721
BI3:-Our brand name is easily recognised by customers becauseof our CSR activities. 0.625
BI2:-We use slogans to communicate CSR activities tocustomers. 0.797
BI6:-Our company conducts different advertisement campaignsto promote CSR activities. 0.785
BI5:-Our company uses logo/mascots to propagate our CSRinvolvements. 0.567
BI7:-We have an online communication system which helps usin maintaining cordial relationship with our customers. 0.552
Extraction Method: Principal Component Analysis.Rotation Method: Varimax with Kaiser Normalization. a
a Rotation converged in 3 iterations.
Sustainability 2022, 14, 6033 13 of 21
• Factor Extracted:
On the basis of an extensive literature review and the results of factor analysis, theresearchers have extracted two components of Brand Identity, i.e., “Brand Personality”and “Brand Positioning”.
Factor-1 accounted for 34.020% of the total variance, which comprises the variablesrelated to Brand Personality such as “Company identifies the target customers and thenundertakes CSR activities accordingly”, “Company promotes CSR activities through celebri-ties”, “Company has an emotional connection with customers” and “Company’s brandname is easily recognized by the customers because of their CSR activities”. On the otherhand, Factor-2 accounted for 25.926% of the total variance, which consist of variables relatedto Brand Positioning such as “Company uses slogans to communicate its CSR activities tocustomers”, “Company conducts different advertisement campaigns to promote CSR activ-ities”, “Company uses logo/mascots to propagate its CSR initiatives” and “Company hasan online communication system which helps company in maintaining cordial relationshipwith the customers”. Table 5 depicts the grouping of Brand Identity. BI1, BI3, BI4 and BI8were grouped as Brand Personality (BP), and BI2, BI5, BI6 and BI7 were grouped as BrandPositioning (BPo).
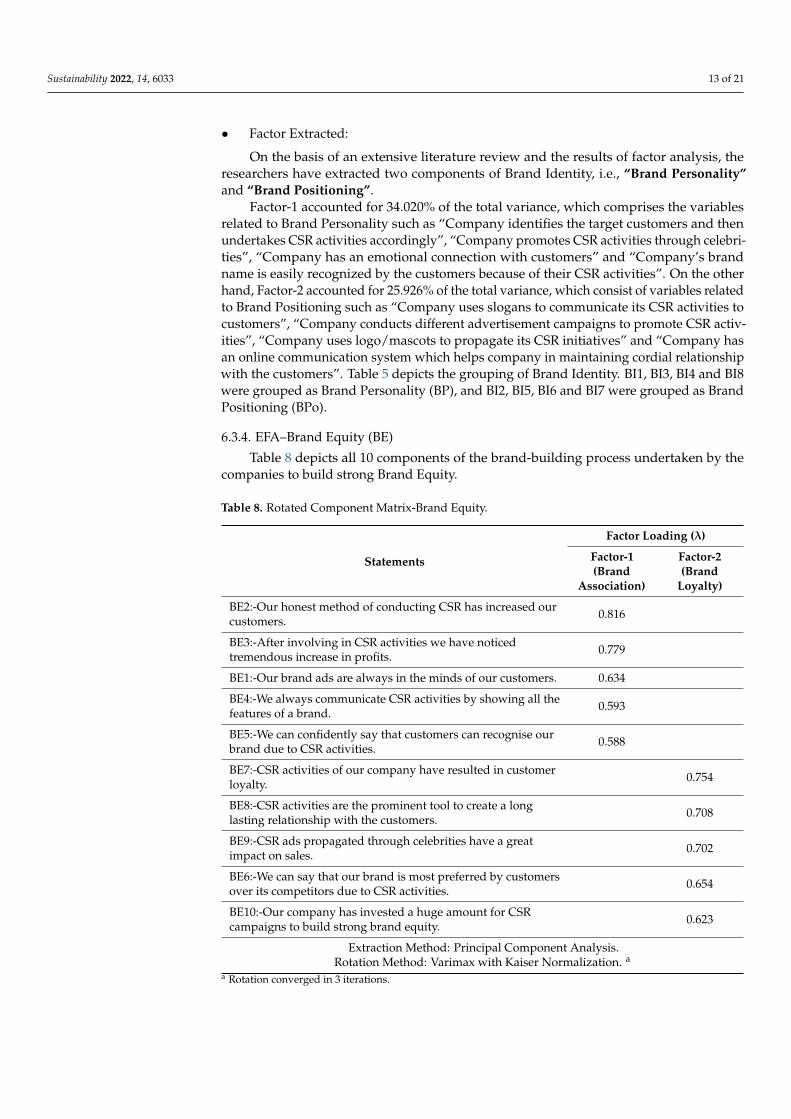
6.3.4. EFA–Brand Equity (BE)
Table 8 depicts all 10 components of the brand-building process undertaken by thecompanies to build strong Brand Equity.
Table 8. Rotated Component Matrix-Brand Equity.
Statements
Factor Loading (λ)
Factor-1(Brand
Association)
Factor-2(Brand
Loyalty)
BE2:-Our honest method of conducting CSR has increased ourcustomers. 0.816
BE3:-After involving in CSR activities we have noticedtremendous increase in profits. 0.779
BE1:-Our brand ads are always in the minds of our customers. 0.634
BE4:-We always communicate CSR activities by showing all thefeatures of a brand. 0.593
BE5:-We can confidently say that customers can recognise ourbrand due to CSR activities. 0.588
BE7:-CSR activities of our company have resulted in customerloyalty. 0.754
BE8:-CSR activities are the prominent tool to create a longlasting relationship with the customers. 0.708
BE9:-CSR ads propagated through celebrities have a greatimpact on sales. 0.702
BE6:-We can say that our brand is most preferred by customersover its competitors due to CSR activities. 0.654
BE10:-Our company has invested a huge amount for CSRcampaigns to build strong brand equity. 0.623
Extraction Method: Principal Component Analysis.Rotation Method: Varimax with Kaiser Normalization. a
a Rotation converged in 3 iterations.
Sustainability 2022, 14, 6033 14 of 21
• Factor Extracted:
Through an extensive review of the literature and the results of factor analysis, re-searchers have extracted two factors of Brand Identity, i.e., “Brand Association” and “BrandLoyalty”. Factor-1 accounted for 27.533% of the total variance, which comprises the vari-ables related to Brand Association such as honest implementation of CSR activities, CSRactivities leading to an increase in profits, CSR based ads being in the mind of customersand companies propagating their CSR initiatives to gain brand recognition.
On the other hand, Factor-2 accounted for 26.860% of the total variance, which consistsof the variables related to Brand Positioning such as CSR activities leading to long lastingrelationship with the customers/customer loyalty, propagation of CSR activities throughcelebrities having a significant impact on sales, customers preferring brands because ofCSR activities and huge investment by the companies on CSR campaigns to build strongBrand Equity. Table 8 explains the factor loadings of Brand Equity. BE6, BE7, BE8, BE9and BE10 were grouped as Brand Association (BA), and BE1, BE2, BE3, BE4 and BE5 weregrouped as Brand Loyalty (BL).
6.4. Pooled-CFA Measurement Model-Validity and Reliability
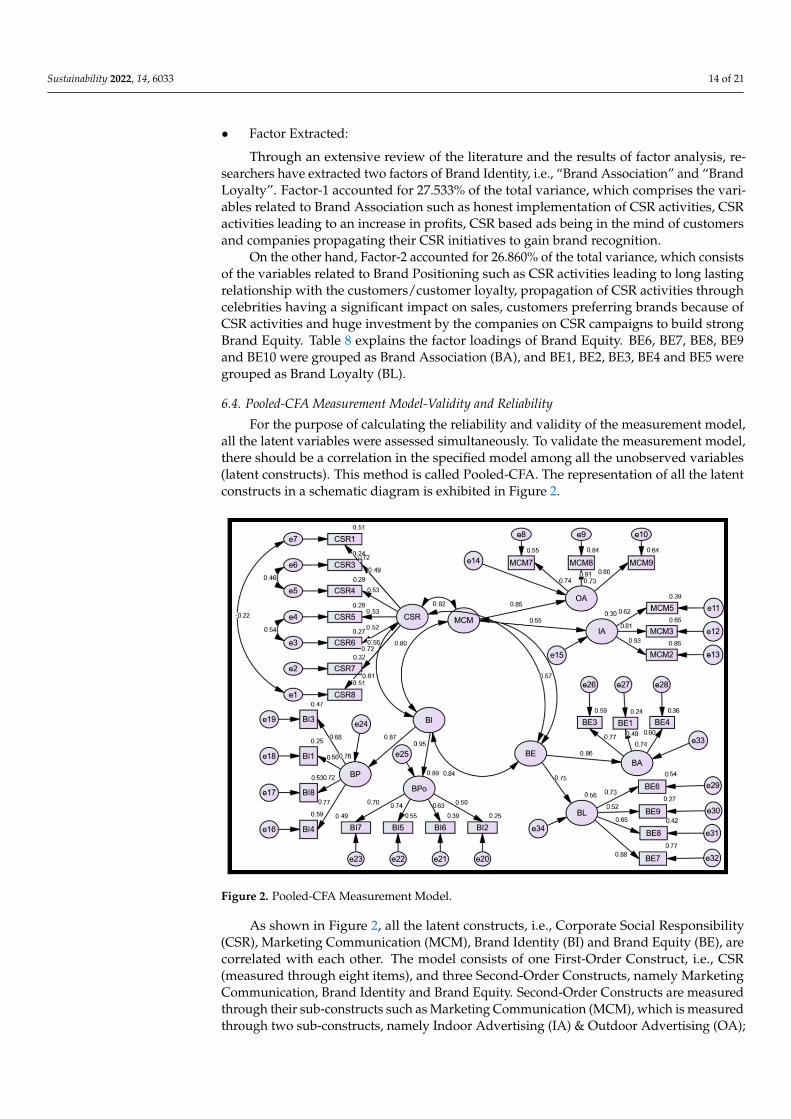
For the purpose of calculating the reliability and validity of the measurement model,all the latent variables were assessed simultaneously. To validate the measurement model,there should be a correlation in the specified model among all the unobserved variables(latent constructs). This method is called Pooled-CFA. The representation of all the latentconstructs in a schematic diagram is exhibited in Figure 2.
Figure 2. Pooled-CFA Measurement Model.
As shown in Figure 2, all the latent constructs, i.e., Corporate Social Responsibility(CSR), Marketing Communication (MCM), Brand Identity (BI) and Brand Equity (BE), arecorrelated with each other. The model consists of one First-Order Construct, i.e., CSR(measured through eight items), and three Second-Order Constructs, namely MarketingCommunication, Brand Identity and Brand Equity. Second-Order Constructs are measuredthrough their sub-constructs such as Marketing Communication (MCM), which is measuredthrough two sub-constructs, namely Indoor Advertising (IA) & Outdoor Advertising (OA);
Sustainability 2022, 14, 6033 15 of 21
Brand Identity (BI), which is measured by Brand Personality (BP) & Brand Positioning(BPo) and Brand Equity (BE) is measured by Brand Association (BA) & Brand Loyalty(BL). Each of the aforesaid sub-constructs is measured through various manifest variablespresented in boxes. To address the issue of item redundancy and improve the outcomes ofmodel fit indices, various items were deleted due to the low values of their standardizedregression weights. As a matter of fact, six redundant items were constrained as a “freeparameter” in the model. Table 9 depicts the analysis summary of the aforementionedpooled measurement model produced by AMOS 24.
Table 9. Validity and Reliability Results.
Construct CR AVE MSV MaxR (H) BE CSR BI MCM
BE 0.804 0.582 0.423 0.849 0.763CSR 0.788 0.559 0.391 0.825 0.325 0.748BI 0.761 0.517 0.494 0.774 0.638 0.625 0.719
MCM 0.856 0.666 0.494 0.870 0.650 0.449 0.703 0.816Source: Validity and Reliability Results from Stats Tools Package.
As per the validity and reliability analysis (Table 9), the Composite Reliability (CR) ofeach latent variable in the Pooled-CFA model is more than the acceptable limit, i.e., 0.70,and the AVE value of each latent construct affirms that the aforementioned Pooled-CFAhas strong convergent validity since it exceeds the recommended limit, i.e., 0.5. As faras the discriminant validity is concerned, the diagonal values shown in the bold fontare the square root of AVE of the construct, while the correlation between the respectivelatent constructs is depicted by the other values (R2C6 → R5C9). These diagonal valuesare an indication that discriminant validity is achieved for all the latent constructs, sincethese values are greater than the values that exist in their respective row and column(R2C6 → R5C9).
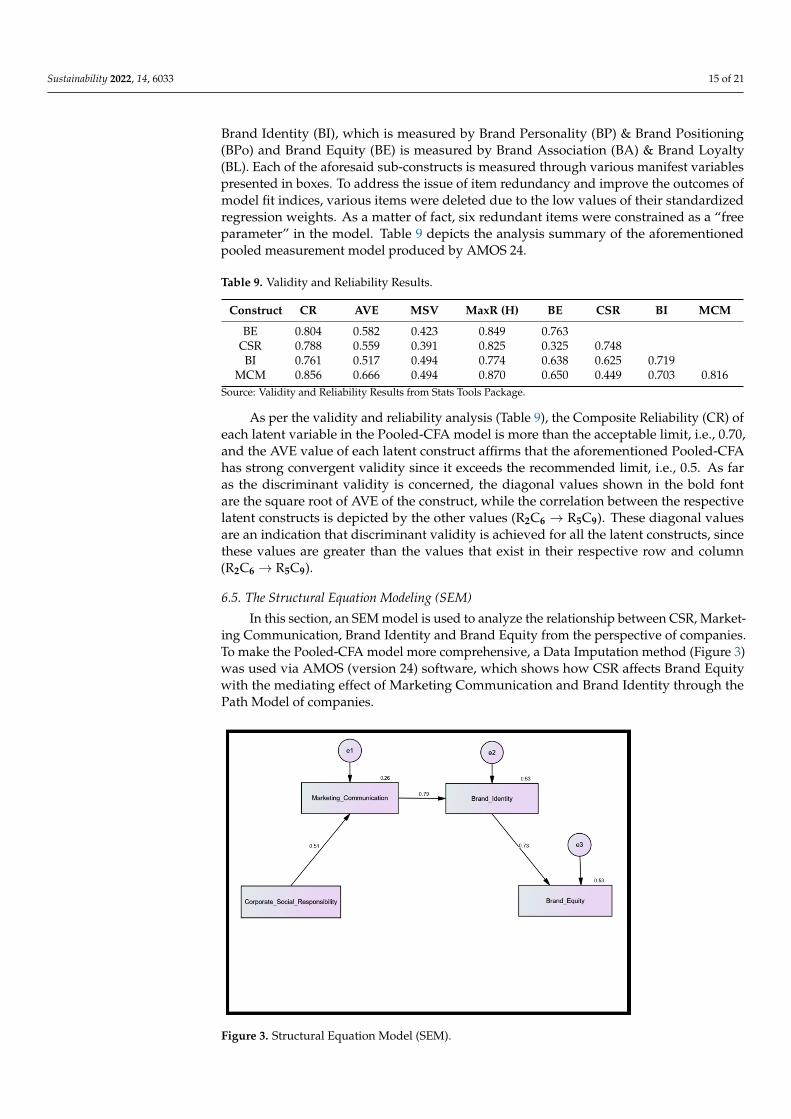
6.5. The Structural Equation Modeling (SEM)
In this section, an SEM model is used to analyze the relationship between CSR, Market-ing Communication, Brand Identity and Brand Equity from the perspective of companies.To make the Pooled-CFA model more comprehensive, a Data Imputation method (Figure 3)was used via AMOS (version 24) software, which shows how CSR affects Brand Equitywith the mediating effect of Marketing Communication and Brand Identity through thePath Model of companies.
Figure 3. Structural Equation Model (SEM).
Sustainability 2022, 14, 6033 16 of 21
Figure 3 reveals that an increase in the units of each variable increases Brand Equity.The figure further explains that CSR, Marketing Communication, Brand Identity and BrandEquity are positively associated. Thus, we can conclude that CSR affects Brand Equitywith the mediating effect of Marketing Communication and Brand Identity. The analysissummary of the aforesaid model provided by AMOS 24 is exhibited in Tables 10 and 11.
Table 10. SEM-Model Fit Summary.
Name of Category Required Fit Indices Threshold Limits Values Attained
AbsoluteFit Indices
χ2 p-value > 0.05 0.181
RMSEA<0.05 good fit;
0.05–0.10 mediocre fit;and if >0.10 bad fit
0.052
SRMR <0.09 0.056
GFI >0.90 0.923
Incremental FitIndices
AGFI >0.80 0.810
CFI
>0.95 great; >0.90traditional; and if>0.80 sometimes
permissible
0.975
TLI >0.90 0.965
NFI >0.90 0.934
ParsimoniousFit Index CMIN/DF
<3 good; and if <5sometimespermissible
1.182
Table 11. Path Analysis–Final Model.
PathStandardized
RegressionCoefficients
VarianceExplained
CriticalRatio p-Value
CSR→MarketingCommunication 0.515 0.529 4.951 <0.001
Marketing Communication→Brand Identity 0.795 0.631 10.791 <0.001
Brand Identity→ Brand Equity 0.727 0.265 8.742 <0.001
Table 10 shows that the value of discrepancy χ2 is 0.181, which is greater than 5% ofp-value, and the “CMIN/DF” value is 1.182 (less than 3), which affirms that the data issuitable for the model fit. The model has also generated other indices of goodness, i.e.,“GFI” = 0.923, “AGFI” = 0.810, “CFI” = 0.975 and “NFI” = 0.934, all of which exceed theiracceptable range, indicating that this model is well-fitted, and two indices of badness, i.e.,“RMSEA” = 0.052 (less than 0.10) and “SRMR” = 0.056 (less than 0.09), prove that the modelis a good fit because the lesser values of “RMSEA” and “SRMR” indicate a better fit. A “TLI”value of 0.965 reveals that the model has very strong convergent validity since it exceedsthe recommended limit of 0.9. Thus, it can be concluded that Pooled-CFA measurementmodel for combining all the variables simultaneously is a well-fitted model.
Table 11 reveals that each of the aforementioned paths exhibited in the table are signif-icant since their p-values are less than 5% alpha level. It further explains that convergentvalidity of the above Structural Equation Model of sample companies is achieved becausethe standardized regression weight of each path is greater than 0.4. As a result of this, eachmanifest variable is strongly correlated with its assumed theoretical construct (Abbott [31]).From the above analysis, it is observed that CSR activities affect Marketing Communication,
Sustainability 2022, 14, 6033 17 of 21
Marketing Communication affects Brand Identity and Brand Identity affects Brand Equity,which can be symbolically written as:
• CSR activities = 0.515 Marketing Communication• Marketing Communication = 0.795 Brand Identity• Brand Identity = 0.727 Brand Equity
The aforementioned equations explain that CSR activities significantly lead to Mar-keting Communication with a standardized regression coefficient of 0.515, and this pos-itive value of standardized regression weight implies that Marketing Communication issignificantly affected by the CSR. The standardized regression weight of Marketing Com-munication towards Brand Identity is 0.795, which signifies the change in Brand Identityon account of a change in the Marketing Communication, and this estimated positive valueof regression coefficient implies that Marketing Communication is significantly influencingthe Brand Identity, and the beta value is also significant at 5% alpha level. The standardizedregression weight of Brand Identity towards Brand Equity is 0.727, which indicates thatBrand Identity is significantly related to Brand Equity. This positive value of standardizedregression weight signifies the positive change and further explains that CSR is indirectlyinfluencing Brand Equity, and the value of standardized beta is significant at a 5% leveltoo. Thus, it can be concluded that CSR affects Brand Equity with the mediating effect ofMarketing Communication and Brand Identity.
Table 12 exhibits the direct effects of each exogenous variable on the endogenousvariable. Corporate Social Responsibility is directly related to Marketing Communicationwith the standardized beta value of 0.515, but there is no direct effect of CSR on BrandIdentity and Brand Equity. It further explains that Brand Identity is directly affected bythe Marketing Communication with the regression coefficient of 0.795. The standardizedregression weight of Brand Identity towards Brand Equity is 0.727, which depicts the directassociation between Brand Identity and Brand Equity, and the Brand Identity is the onlyfactor which directly affects the Brand Equity.
Table 12. Standardized Direct Effects (Group number 1-Default model).
Variables Corporate SocialResponsibility
MarketingCommunication
BrandIdentity
MarketingCommunication 0.515 — —
Brand Identity — 0.795 —Brand Equity — — 0.727
Table 13 exhibits the indirect effects of each exogenous variable on the endogenousvariable. The equations given below determine the indirect effect between the variables:
(1) Corporate Social Responsibility and Brand Identity:=β value of Marketing Comm. × β value of Brand Identity=0.515 × 0.795=0.409
Table 13. Standardized Indirect Effects (Group number 1-Default model).
Variables Corporate SocialResponsibility
MarketingCommunication
BrandIdentity
Marketing Communication 0.000 0.000 0.000Brand Identity 0.409 0.000 0.000Brand Equity 0.298 0.578 0.000
(2) Marketing Communication and Brand Equity:=β value of Brand Identity × β value of Brand Equity
Sustainability 2022, 14, 6033 18 of 21
=0.795 × 0.727=0.578
(3) Corporate Social Responsibility and Brand Equity:=β value of Marketing Communication × β value of BrandIdentity × β value of Brand Equity=0.515 × 0.795 × 0.727=0.298
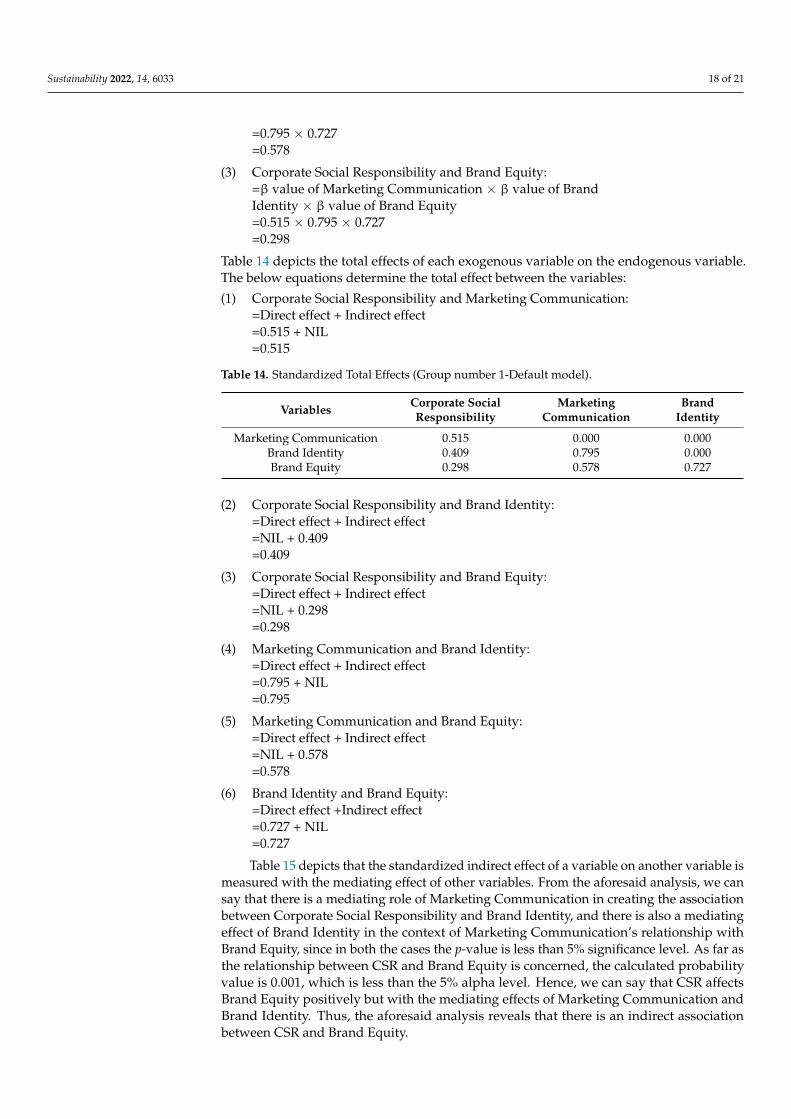
Table 14 depicts the total effects of each exogenous variable on the endogenous variable.The below equations determine the total effect between the variables:
(1) Corporate Social Responsibility and Marketing Communication:=Direct effect + Indirect effect=0.515 + NIL=0.515
Table 14. Standardized Total Effects (Group number 1-Default model).
Variables Corporate SocialResponsibility
MarketingCommunication
BrandIdentity
Marketing Communication 0.515 0.000 0.000Brand Identity 0.409 0.795 0.000Brand Equity 0.298 0.578 0.727
(2) Corporate Social Responsibility and Brand Identity:=Direct effect + Indirect effect=NIL + 0.409=0.409
(3) Corporate Social Responsibility and Brand Equity:=Direct effect + Indirect effect=NIL + 0.298=0.298
(4) Marketing Communication and Brand Identity:=Direct effect + Indirect effect=0.795 + NIL=0.795
(5) Marketing Communication and Brand Equity:=Direct effect + Indirect effect=NIL + 0.578=0.578
(6) Brand Identity and Brand Equity:=Direct effect +Indirect effect=0.727 + NIL=0.727
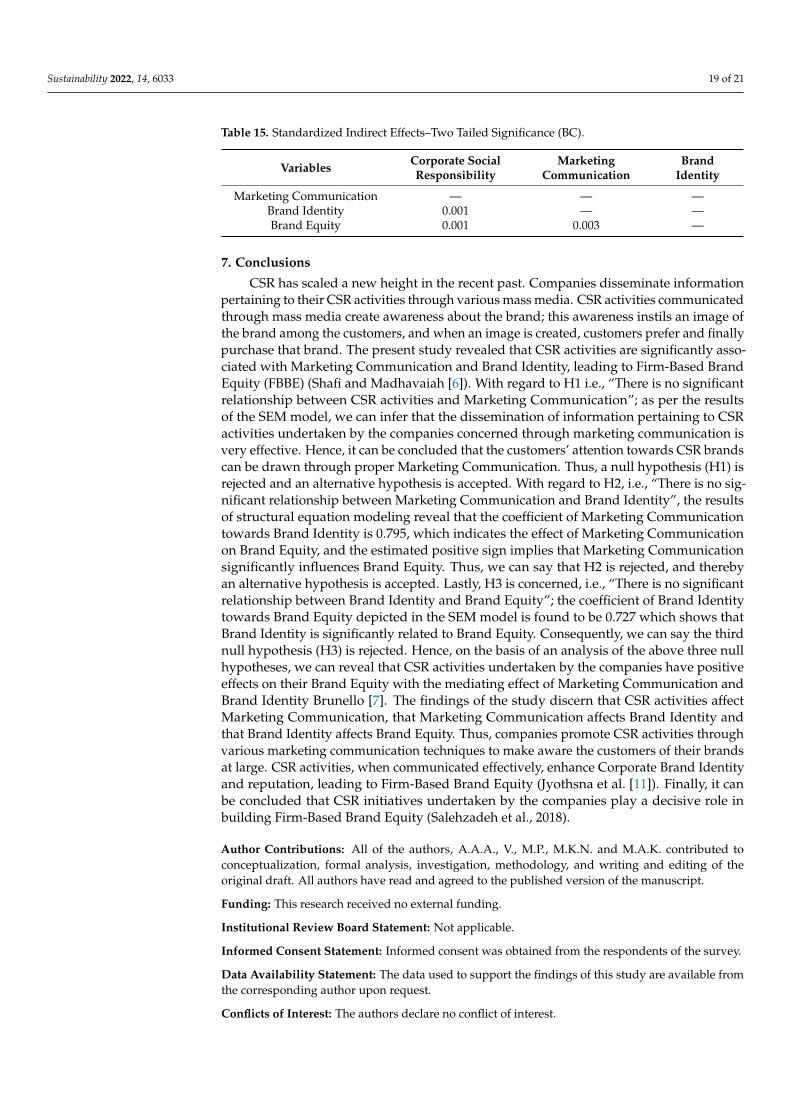
Table 15 depicts that the standardized indirect effect of a variable on another variable ismeasured with the mediating effect of other variables. From the aforesaid analysis, we cansay that there is a mediating role of Marketing Communication in creating the associationbetween Corporate Social Responsibility and Brand Identity, and there is also a mediatingeffect of Brand Identity in the context of Marketing Communication’s relationship withBrand Equity, since in both the cases the p-value is less than 5% significance level. As far asthe relationship between CSR and Brand Equity is concerned, the calculated probabilityvalue is 0.001, which is less than the 5% alpha level. Hence, we can say that CSR affectsBrand Equity positively but with the mediating effects of Marketing Communication andBrand Identity. Thus, the aforesaid analysis reveals that there is an indirect associationbetween CSR and Brand Equity.
Sustainability 2022, 14, 6033 19 of 21
Table 15. Standardized Indirect Effects–Two Tailed Significance (BC).
Variables Corporate SocialResponsibility
MarketingCommunication
BrandIdentity
Marketing Communication — — —Brand Identity 0.001 — —Brand Equity 0.001 0.003 —
7. Conclusions
CSR has scaled a new height in the recent past. Companies disseminate informationpertaining to their CSR activities through various mass media. CSR activities communicatedthrough mass media create awareness about the brand; this awareness instils an image ofthe brand among the customers, and when an image is created, customers prefer and finallypurchase that brand. The present study revealed that CSR activities are significantly asso-ciated with Marketing Communication and Brand Identity, leading to Firm-Based BrandEquity (FBBE) (Shafi and Madhavaiah [6]). With regard to H1 i.e., “There is no significantrelationship between CSR activities and Marketing Communication”; as per the resultsof the SEM model, we can infer that the dissemination of information pertaining to CSRactivities undertaken by the companies concerned through marketing communication isvery effective. Hence, it can be concluded that the customers’ attention towards CSR brandscan be drawn through proper Marketing Communication. Thus, a null hypothesis (H1) isrejected and an alternative hypothesis is accepted. With regard to H2, i.e., “There is no sig-nificant relationship between Marketing Communication and Brand Identity”, the resultsof structural equation modeling reveal that the coefficient of Marketing Communicationtowards Brand Identity is 0.795, which indicates the effect of Marketing Communicationon Brand Equity, and the estimated positive sign implies that Marketing Communicationsignificantly influences Brand Equity. Thus, we can say that H2 is rejected, and therebyan alternative hypothesis is accepted. Lastly, H3 is concerned, i.e., “There is no significantrelationship between Brand Identity and Brand Equity”; the coefficient of Brand Identitytowards Brand Equity depicted in the SEM model is found to be 0.727 which shows thatBrand Identity is significantly related to Brand Equity. Consequently, we can say the thirdnull hypothesis (H3) is rejected. Hence, on the basis of an analysis of the above three nullhypotheses, we can reveal that CSR activities undertaken by the companies have positiveeffects on their Brand Equity with the mediating effect of Marketing Communication andBrand Identity Brunello [7]. The findings of the study discern that CSR activities affectMarketing Communication, that Marketing Communication affects Brand Identity andthat Brand Identity affects Brand Equity. Thus, companies promote CSR activities throughvarious marketing communication techniques to make aware the customers of their brandsat large. CSR activities, when communicated effectively, enhance Corporate Brand Identityand reputation, leading to Firm-Based Brand Equity (Jyothsna et al. [11]). Finally, it canbe concluded that CSR initiatives undertaken by the companies play a decisive role inbuilding Firm-Based Brand Equity (Salehzadeh et al., 2018).
Author Contributions: All of the authors, A.A.A., V., M.P., M.K.N. and M.A.K. contributed toconceptualization, formal analysis, investigation, methodology, and writing and editing of theoriginal draft. All authors have read and agreed to the published version of the manuscript.
Funding: This research received no external funding.
Institutional Review Board Statement: Not applicable.
Informed Consent Statement: Informed consent was obtained from the respondents of the survey.
Data Availability Statement: The data used to support the findings of this study are available fromthe corresponding author upon request.
Conflicts of Interest: The authors declare no conflict of interest.
Sustainability 2022, 14, 6033 20 of 21
References1. Wang, S.; Liao, Y.K.; Wu, W.Y.; Lê, H.B.K. Hypothesis the role of corporate social responsibility perceptions in brand equity, brand
credibility, brand reputation, and purchase intentions. Sustainability 2021, 13, 1975. [CrossRef]2. Hayes, A. Brand Equity Definition. Investopedia. 2021. Available online: https://www.investopedia.com/terms/b/brandequity.
asp (accessed on 15 February 2022).3. Battistoni, E.; Fronzetti Colladon, A.; Mercorelli, G. Prominent determinants of consumer-based brand equity. Int. J. Eng. Bus.
Manag. 2013, 5, 5–25. [CrossRef]4. Gazzola, P.; Amelio, S.; Pezzetti, R. CSR as a Driver of Corporate Reputation: Family Firms in the Italian Luxury Industry. Int. J.
Bus. Adm. 2020, 11, 21. [CrossRef]5. Camilleri, M.A. Corporate sustainability and responsibility: Creating value for business, society and the environment. Asian J.
Sustain. Soc. Responsib. 2017, 2, 59–74. [CrossRef]6. Irfan Shafi, S.; Madhavaiah, C. The Relationship Between Brand Equity, Apparel Product Attributes and Purchase Intention: A
Study of Selected Apparel Brands in India. Int. J. Adv. Res. 2013, 1, 23–41.7. Brunello, A. The Relationship Between Integrated Marketing Communication and Brand Equity. Int. J. Commun. Res. 2013,
3, 9–14.8. Alexander, A.; Francis, A.; Kyire, L.A.; Mohammed, H. The Effect of Corporate Social Responsibility on Brand Building. Int. J.
Mark. Stud. 2014, 6, 126–134. [CrossRef]9. Dapi, B.; Phiri, M.A. The impact of corporate social responsibility on brand loyalty. J. Gov. Regul. 2015, 4, 8–16. [CrossRef]10. Esmaeilpour, M.; Barjoei, S. The effect of corporate image on customer satisfaction through Brand equity Explaining the impact
of service quality on identity and brand personality View project The Effect of Environment-Friendly Attitude on ConsumerPerception of Usability of Product Packaging View Project The effect of corporate image on customer satisfaction through Brandequity. Adv. Manag. Appl. Econ. 2016, 6, 1792–7552.
11. Jyothsna, M. Role of Brand Equity and Brand Identity on Preferences of Smartphones among Students. Pac. Bus. Rev. Int. 2016,8, 44–53.
12. Zhang, B.; Comite, U.; Yucel, A.G.; Liu, X.; Khan, M.A.; Husain, S.; Sial, M.S.; Popp, J.; Oláh, J. Unleashing the Importance ofTQM and Knowledge Management for Organizational Sustainability in the Age of Circular Economy. Sustainability 2021, 13, 1514.[CrossRef]
13. Singh, A.; Verma, P. How CSR Affects Brand Equity of Indian Firms? Glob. Bus. Rev. 2017, 18 (Suppl. S3), S52–S69. [CrossRef]14. Aguilera-Caracuel, J.; Guerrero-Villegas, J.; García-Sánchez, E. Reputation of multinational companies: Corporate social responsi-
bility and internationalization. Eur. J. Manag. Bus. Econ. 2017, 26, 329–346. [CrossRef]15. Ali, M.A.; Pervez, A.; Bansal, R.; Khan, M.A. Analyzing Performance of Banks in India: A Robust Regression Analysis Approach.
Discret. Dyn. Nat. Soc. 2022, 2022, 8103510. [CrossRef]16. Wisdom, O.; Lawrence, I.; Akindele, O.; Muideen, I. Corporate Social Responsibility and Investment Decisions in Listed
Manufacturing Firms in Nigeria. J. Econ. Manag. Trade 2018, 21, 1–12. [CrossRef]17. Salehzadeh, R.; Khazaei Pool, J.; Jafari Najafabadi, A.H. Exploring the relationship between corporate social responsibility, brand
image and brand equity in Iranian banking industry. J. Islamic Account. Bus. Res. 2018, 9, 106–118. [CrossRef]18. Simpson, S.N.Y.; Aprim, E.K. Do corporate social responsibility practices of firms attract prospective employees? Perception of
university students from a developing country. Int. J. Corp. Soc. Responsib. 2018, 3, 1–11. [CrossRef]19. Azid, N.N.A.; Tahir, P.R. Corporate Social Responsibility Environment in Malaysia: Lessons Learned from the Effectiveness of the
CSR Programme by Axiata Group. Int. J. Entrep. Manag. Pract. 2019, 2, 72–82.20. Mahmood, A.; Bashir, J. How does corporate social responsibility transform brand reputation into brand equity? Economic and
noneconomic perspectives of CSR. Int. J. Eng. Bus. Manag. 2020, 12, 1847979020927547. [CrossRef]21. Sarstedt, M.; Ringle, C.M.; Hair, J.F. Partial Least Squares Structural Equation Modeling. Handb. Mark. Res. 2017, 26, 1–40.
[CrossRef]22. Kline, R.B. Principles and Practice of Structural Equation Modeling, 2nd ed.; American Psychological Association: Washington, DC,
USA, 2005. Available online: https://psycnet.apa.org/record/2005-03476-000 (accessed on 24 July 2021).23. Hair, J.F.; Celsi, M.; Money, A.; Samouel, P.; Page, M. The Essentials of Business Research Methods, 3rd ed.; Routledge: New York, NY,
USA, 2015; pp. 1–494. [CrossRef]24. Cochran, W.G. Sampling Techniques, 3rd ed.John Wiley: Hoboken, NJ, USA, 1977.25. Frey, B.B. The SAGE Encyclopedia of Educational Research, Measurement, and Evaluation; SAGE Publications, Inc.: Thousand Oaks,
CA, USA, 2018. [CrossRef]26. Netemeyer, R.; Bentler, P.; Bagozzi, R.; Cudeck, R.; Cote, J.; Lehmann, D. Structural Equations Modeling. J. Consum. Psychol. 2001,
10, 83–100.27. Cronbach, L.J. Coefficient alpha and the internal structure of tests. Psychometrika 1951, 16, 297–334. [CrossRef]28. Sekaran, U.; Bougie, R. Research Methods for Business: A Skill-Building Approach. 2006. Available online: https://www.wiley.
com/enus/Research+Methods+For+Business%3A+A+Skill+Building+Approach%2C+7th+Edition-p-9781119266846 (accessedon 20 January 2022).
29. Tabachnick, B.G.; Fidell, L.S. Using Multivariate Statistics; Pearson: Boston, MA, USA, 2007; Volume 5, pp. 481–498. [CrossRef]

Sustainability 2022, 14, 6033 21 of 21
30. Samuels, P. Advice on Exploratory Factor Analysis; Centre for Academic Success: Birmingham, UK, 2017. [CrossRef]31. Abbott, A.A. A Confirmatory Factor Analysis of the Professional Opinion Scale: A Values Assessment Instrument. Res. Soc. Work.
Pract. 2003, 13, 641–666. [CrossRef]