Embed Size (px)
Citation preview

Corporate Life Cycle and Cost of Equity Capital*
Mostafa Monzur Hasana,b
Mahmud Hossainc,1
Adrian (Wai-Kong) Cheunga
Ahsan Habibd
*This paper is derived from Mostafa Monzur Hasan’s PhD dissertation at the School of Economics and Finance, Curtin University, Perth, Australia. We thank the Editor and David Emanuel (discussant at JACE mid-year symposium 2014) for their useful comments. We have also benefited considerably from the thoughtful comments of an anonymous referee. We are also grateful for the comments and insights of Chandrasekhar Krishnamurti and conference participants at the Financial Markets and Corporate Governance Conference, 2014. Finally, we gratefully acknowledge the support of the Curtin Business School, Curtin University. a
Curtin University, Australia; bUniversity of Dhaka, Bangladesh; cKing Fahd University of
Petroleum and Minerals, Kingdom of Saudi Arabia; dMassey University, New Zealand.
1Corresponding author. Tel: +61 466 248 141
Email address: [email protected]

1
Corporate Life Cycle and Cost of Equity Capital
Abstract
This paper investigates the effect of the corporate life cycle on the cost of equity capital.
Using a sample of Australian firms between 1990 and 2012, we find that the cost of equity
capital varies over the life cycle of the firm. In particular, using Dickinson’s (2011) life cycle
measure, we find that the cost of equity is higher in the introduction and decline stages and
lower in the growth and mature stages, resembling a U-shaped pattern. When DeAngelo,
DeAngelo, and Stulz’s (2006) life cycle measure—earned/contributed capital mix (RE/TA)—
is used, we find that the cost of equity decreases as retained earnings as a proportion of total
asset increases after controlling for other firm characteristics and unobserved heterogeneity.
These findings are shown to be robust using a series of sensitivity tests.
JEL classifications: D21, G12, G30, L22
Keywords: Cost of equity; Firm life cycle; Earned equity; Contributed capital

2
Corporate Life Cycle and Cost of Equity Capital
I. Introduction
In this paper we investigate whether, and how, firm life cycle1 affects the cost of equity
capital. The firm life cycle theory suggests that firms, like living organisms, pass through a
series of predictable patterns of development and that the resources, capabilities, strategies,
structures, and functioning of the firm vary significantly with the corresponding stages of
development (Miller and Friesen, 1980, 1984; Quinn and Cameron, 1983). Life cycle theory
provides management with some parameters, guidelines, and diagnostic tools to assess the
transition of the firm from one stage to the next. Hence, understanding the essence of the life
cycle can help firms to utilize valuable resources in the most optimal way to outperform their
peers (Adizes, 1999) and to achieve and retain the prime life stage. Recent research in
financial economics and accounting (DeAngelo et al., 2006, 2010; Dickinson, 2011) also
recognizes that life cycle stages have important implications for understanding the financial
performance of firms.
The concept of cost of equity capital is of paramount importance in accounting and
finance research. It is frequently used in the estimation of equity risk premiums, firm
valuation and capital budgeting, and investment management practices (Câmara et al., 2009;
Hou et al., 2012). The cost of equity depends on a firm’s economic fundamentals, industry
dynamics and overall national economic conditions (Banz, 1981; Fama and French, 1989;
Gebhardt et al., 2001). Previous research indicates that firm-specific determinants of the cost
of equity include size, leverage, financial strength, level of disclosure, and overall riskiness of
the firm. As the resource base and corresponding competitive advantages of the firm vary
across the life cycle, the investors’ demand for a risk premium could potentially vary
accordingly. Together, these two streams of research suggest that the firm life cycle has
1 We use the terms ‘firm life cycle’, ‘corporate life cycle’, and ‘organizational life cycle’ interchangeably
throughout this paper.

3
important implications for attracting investors, which eventually increases the liquidity of
shares and lowers the cost of equity capital. However, there has been little research on the
interrelationship. Hence, we make a significant contribution to the literature by investigating
the association between corporate life cycle and cost of equity to reveal whether, and how,
the cost of equity capital of the firm varies with the corresponding change in the stage of the
firm’s life cycle.
This study is primarily motivated by the ‘dynamic resource-based view’ of the firm,
which articulates that the general patterns and paths in the evolution of organizational
capabilities change over time. This resource-based view analyzes firms from the resource
side rather than from the product side, and posits that the existence and application of the
bundle of valuable, interchangeable, immobile, and imitable resources generate the basis of
the competitive advantage of a firm and of the heterogeneity in organizational capabilities
(Penrose, 1959; Rumelt, 1984; Wernerfelt, 1984). Dynamic resource-based theory
incorporates the founding, development, and maturity of capabilities and thereby suggests
that the competitive advantages and disadvantages in terms of resources and capabilities
evolve over time in important ways (Helfat and Peteraf, 2003). Thus, the evolution of the
firm’s competitiveness, in terms of its resource base and capabilities, is the foundation of the
firm’s life cycle.
The essence of firm life cycle theory suggests that investment and financing decisions
and operating performance of the firm are greatly influenced by the change in the firm’s
organizational capabilities (life cycle stages). Management accounting literature (Richardson
and Gordon, 1980; Rappaport, 1981) provides evidence that performance measures differ
across life cycle stages. In a recent study, DeAngelo et al. (2010) demonstrate that corporate
life cycle has a significant influence on the probability that a firm will engage in secondary
equity offerings. Other studies (Fama and French, 2001; DeAngelo et al., 2006; Bulan et al.,
4
2007; Coulton and Ruddock, 2011) acknowledge the role of the firm life cycle in determining
the dividend payout policy of the firm. Berger and Udell (1998), in a related study, document
that different capital structures are optimal at different points in the cycle. Evidence in
accounting literature also suggests that investors’ valuation of firm is a function of the life
cycle stage of the firm (Anthony and Ramesh, 1992). Based on the above studies, we also
posit that the life cycle has significant influences on the firm’s ability to attract investors,
which eventually affects the ex-ante cost of equity capital of the firm.
Using a sample of Australian listed companies, we find that compared to the shake-
out stage, the cost of equity is significantly higher in the introduction and decline stages,
while it is lower in the growth and mature stages of the firm life cycle. Moreover, our results
show that the cost of equity decreases as the retained earnings as a proportion of total assets
(RE/TA) increase. These results conform with the findings of Bender and Ward (1993)
showing that financing strategy and structures of firms evolve over the firm’s life cycle. Our
results are robust to alternative measures of the cost of equity, firm life cycle, and potential
endogeneity concerns.
Our study contributes to the literature in several ways. First, we extend life cycle
literature by directly examining the role of firm life cycle in influencing the cost of equity.
While prior research investigates the role of the firm life cycle in dividend and capital
structure decisions, little attention has been paid to the role of the firm life cycle in
determining the cost of equity capital. Although Easley and O’Hara’s (2004, p. 1574) model
predicts that the “…life cycle of a firm may also influence its cost of capital. In particular, it
seems reasonable that a firm with a long operating history will be better known by investors
…the greater the prior precision, the lower the cost of capital”, they did not examine the
validity of this prediction empirically. In this paper we attempt to fill this gap in the literature
and in doing so augment our understanding of the role of the corporate life cycle in major

5
financial policies. Second, the cost of equity represents the return that the investors require on
their investment in the firm and thus it is a key factor in long-term investment decisions.
Examining the link between the firm life cycle and the cost of equity, therefore, should help
managers to understand the effect of the life cycle on the financing costs of firms, and hence
this study has important implications for strategic planning. Indeed, the cost of equity capital
could be the channel through which capital markets encourage firms to reach and maintain
maturity, the prime stage, in their life cycle. Third, given the importance of the firm life cycle
and the cost of equity capital in the literature, and the longstanding interest in trying to
understand their determinants, an empirical study of the association between corporate life
cycle and cost of equity is timely.
The remainder of the paper is organized as follows, in section two, we review prior
related studies and develop testable hypotheses. Section three focuses on the research design,
data sources, and sample selection. Section four documents results of the study, while section
five concludes the paper.
II. Literature Review and Hypotheses Development
2.1 Corporate Life Cycle: Theory
The corporate life cycle theory suggests that firms, like the organic body, tend to progress in
a linear fashion through predictable stages of development sequentially from birth to decline
and that their strategies, structures, and activities correspond to their stages of development
(Miller and Friesen, 1980, 1984; Quinn and Cameron, 1983; Gray and Ariss 1985). Strategy
and management researchers have adopted the firm life cycle model from the biological
sciences (Van De Ven and Poole, 1995) and have incorporated it into business research since
the 1960s. Penrose (1959) provides a general theory of growth for firms and argues that it

6
depends on the firm’s resources and productive opportunities. Chandler (1962) argues that
organizational structure follows the growth strategy of the firm to avail itself of external
opportunities. Subsequent studies in organizational science reveal the grounds behind the
existence of the firm life cycle. For example, the resource-based theory of Wernerfelt (1984)
suggests that resources are the ultimate source for establishment and maintenance of
competitive advantage. He argues that a firm possesses resources, a subset of which allows it
to achieve competitive advantage over other firms, and a subset of those helps it to attain
superior long-term performance. In a more recent study, Helfat and Peteraf (2003) argue that
the resource-based view must incorporate the emergence, development, and progression of
organizational resources and capabilities over time and hence they introduce a more
comprehensive and vibrant view, ‘the dynamic resource-based theory’. This view suggests
that the resource base that forms the foundation of competitive advantage and disadvantage
comes about over a period of time and also may shift over time. They explain that portfolios
of resources and capacities and the characteristics of firms change over time, and this
variation results in different stages in the firm life cycle.
The firm life cycle has important implications in management and business strategy.
Each stage in the firm life cycle enforces unique characteristics and demands which entail
organizational structures, personnel, leadership styles, and decision-making processes
appropriate to meet the requirements (Kazanjian, 1988). Koberg et al. (1996) document that
the effect of organizational and environmental attributes on innovation is moderated by the
firm’s life cycle stage. However, much of the work in the field of management,
entrepreneurship, and strategy is conceptual rather than empirical.
There are some recent empirical studies that investigate the effect of the firm life
cycle on corporate financial decisions. Bender and Ward (1993) report that the financial
structure of firms changes over the life cycle. Berger and Udell (1998) argue that small and

7
young firms generally resort to private equity and debt markets, while larger and more mature
firms mainly rely on public markets. Richardson (2006) suggests that a firm is more likely to
undertake relatively larger, growth-oriented investments in the initial stage while, in the
mature stage, its investments are more likely to be geared towards maintenance of assets-in
place. Fama and French (2001), Grullon et al. (2002), DeAngelo et al. (2006), and Coulton
and Ruddock (2011) document that mature and profitable firms are more likely to pay
dividends, while young firms with higher growth options are less likely to do so. These
archival studies suggest that the firm life cycle has important implications for corporate
financing decisions, especially in the area of the cost of equity capital.
2.2 Cost of Equity: Theory
Cost of equity is the return that shareholders require on their investment in the firm and is
extensively used in the valuation of investment projects and estimation of equity risk
premiums (Câmara et al., 2009).
Firm-specific factors such as firm size, age, riskiness, liquidity of stock, leverage, and
disclosure quality determine the cost of equity. Moreover, other factors such as the industry
and the economy also influence the cost of equity. Transparency and availability of
information about management and potential earnings of large firms reduce uncertainty
levels. Hence, investors in larger firms require less return on their investment, which
effectively reduces the cost of equity (Banz, 1981; Berk, 1995; Witmer and Zorn, 2007). Firm
age or maturity affects equity price and thereby the cost of equity (Pástor et al., 2008).
Transaction cost (e.g., commission, fees, and other charges) is higher for less liquid stock and
hence investors require more return for these securities. Shareholders are the residual
claimants and hence an increase in the financial leverage also increases the risk to the
shareholders. This effectively increases the cost of equity (Witmer and Zorn, 2007). Firms in

8
different industries have different costs of equity depending on the nature of their business
(Gebhardt et al., 2001). Moreover, the cost of equity is higher under weak economic
conditions, while it is lower under strong economic conditions (Fama and French, 1989).
2.3 Association between Corporate Life Cycle and Cost of Equity Capital
Firms in different life cycle stages differ in their ability to raise funds from the market
(Berger and Udell, 1998). Firms at the earlier stage of the life cycle are relatively small,
unknown, and are less closely followed by analysts and investors. Hence, these firms suffer
from substantial information asymmetry. This information asymmetry may cause equity
mispricing (Myers and Majluf, 1984), which is positively related to riskiness and the cost of
capital (Armstrong et al., 2011). On the other hand, mature firms have a longer existence in
the market and they are more closely followed by analysts and investors. Hence, these firms
suffer from less information asymmetry and are less risky. Easley and O’Hara (2004) also
note that firms with a long operating history are better known by investors, improving the
precision of information about the firm and lowering the cost of capital. Investors generally
prefer securities with low estimation risk, low transaction costs, and/or less information
asymmetry (Botosan, 2006). A greater demand for securities with these characteristics
enhances the liquidity of the stocks (Diamond and Verrecchia, 1991), which influences the
cost of equity (O’Hara, 2003). Prior studies (Gebhardt et al., 2001) overwhelmingly show
that firm maturity is associated with a decline in systematic risk.
In addition, resource-based theory assumes that firms differ in terms of their bundle of
resources (e.g., financial, physical, human capital, technological, reputation, and
organizational resources) and capabilities (Dierickx and Cool, 1989; Barney, 1991), and that
these firm-specific resources and capabilities are crucial in explaining the firm’s growth and
performance (Penrose, 1959). According to this view, the resource base and capabilities of

9
mature firms are large, diverse and rich, while those of young and declining firms are small,
concentrated, and limited. This resource base and its accompanying superior competitive
advantages and capacities help mature firms to benefit from cheaper and easier sources of
finance. More specifically, as the life cycle affects the perceived riskiness of the firm, mature
stage firms should be in a better position to raise adequate capital at a lower cost. We
therefore hypothesize that:
H1: Compared to the shake-out stage of the firm life cycle2, the cost of equity is lower in the
mature stage of the firm life cycle.
Although firms in the growth stage of the life cycle have an insufficient resource base,
these firms are promising and have strong potential. Organizational theory suggests that
growth firms maintain greater information asymmetry, benefiting from product development
and market movement (Smith and Watts, 1992; Aboody and Lev, 2000; Barth et al., 2001).
However, prior studies also suggest that characteristics of growth firms attract greater analyst
coverage, attaining potential benefits from private information acquisition (Barth et al., 2001;
Lehavy et al., 2011). Greater analyst coverage in turn reduces mispricing and information
asymmetry (Brennan and Subrahmanyam, 1995; Barth et al., 2001). Furthermore, growth
firms are more likely to receive coverage in the business press (Bentley et al., 2012). Bushee
et al. (2010) show that firms with greater press coverage are associated with lower levels of
information asymmetry. Moreover, growth firms have greater incentives to reduce
information asymmetry via voluntary disclosure to possibly attract ‘strategic investors3’ who
2 As Dickinson (2011) remarks, the literature clearly spells out the role of different stages of the firm life cycle
except for the shake-out stage. As a result, the expected sign of this stage is unclear. Thus, in developing our
hypothesis, we use the shake-out stage as a basis of comparison with other stages of the firm life cycle. 3 Strategic investors invest in young companies that have the potential to bring something of value to investors
or to create synergy with the existing business of the investor. An independent venture capitalist only cares
10
intend to invest in growth firms to benefit from the future success of the firm. In summary,
greater analyst following, press coverage, and voluntary disclosures reduce the information
asymmetry of growth firms, which eventually reduces the cost of capital. Hence, we
hypothesize that:
H2: Compared to the shake-out stage of the firm life cycle, the cost of equity is lower in the
growth stage of the firm life cycle.
Firms in the introduction stages have limited resources and resource combinations,
while those in the decline stage have downgraded resources. Dickinson (2011) provides
empirical evidence that both introduction and decline stages are associated with negative
earnings per share, return on net operating assets, and profit margin. As investments in these
firms are relatively less attractive, analysts are reluctant to cover these firms. Hence,
introduction and decline firms cannot raise capital unless investors are properly compensated
(Nickel and Rodriguez, 2002), which effectively increases the cost of equity. Therefore, we
hypothesize that:
H3: Compared to the shake-out stage of the firm life cycle, the cost of equity is higher in the
introduction and decline stages of the firm life cycle.
III. Research Method
3.1 Sample and Data
Our sample is drawn from the population of companies listed on the Australian Securities
Exchange (ASX) and covered by the I/B/E/S International database for the period 1990–
about financial gain, while the strategic investor also cares about the new venture’s strategic effect (Hellmann,
2002).

11
2012. This yields an initial sample of 8020 firm-year observations. Data for the control
variables, except beta, are extracted from the Aspect Financial Analysis databases. Data for
beta and fiscal year end stock price are collected from DataStream and DatAnalysis
Morningstar, respectively. Moreover, the risk-free rate (10-year Treasury note rates) is
collected from the Reserve Bank of Australia website.4 To avoid the undesirable influence of
outliers we winsorize continuous variables at the 1st and 99
th percentiles. We exclude the
financial sector as the accounting practice, risk, and complexity characteristics of financial
institutions are substantially different from those of other firms. We also exclude
observations with missing values in the computation of cost of equity and control variables
and lose 545, 189, and 196 firm years for price/earnings to growth ratio (PEG), modified
PEG ratio (MPEG), and Ohlson and Juettner-Nauroth (2005) (OJ) models, respectively. This
produces a final sample of 3888, 3563, and 3482 firm-year observations for the PEG (Easton,
2004) model, MPEG (Easton, 2004) model, and OJ model (Ohlson and Juettner-Nauroth,
2005), respectively. Table 1 presents the sample distribution by cost of equity models (Panel
A), yearly distribution of observations (Panel B), and sample distribution by industry sector
(Panel C).
Insert Table 1 about here
Table 1 shows that sample size increases over the sample period, with the largest
samples of 292 and 289 in the years 2008 and 2011, respectively. In addition, the sample is
unevenly distributed across industries with the largest samples being in industrial (24.72%)
and consumer discretionary (21.04%) sectors.
3.2 Empirical Model
4 http://www.rba.gov.au/statistics/tables/index.html

12
We test the relationship between the cost of equity and the firm life cycle using four measures
of cost of equity and three measures of firm life cycle proxies. To control for individual firm
heterogeneity, we use the following fixed effect model:
𝑅𝑖,𝑡 = 𝛼0 + ∑ 𝛽𝑖𝐶𝐿𝐶_𝐷𝑈𝑀𝑖,𝑡4𝑖=1 + 𝛽5𝑆𝐼𝑍𝐸𝑖,𝑡 + 𝛽6𝐵𝑀𝑖,𝑡 + 𝛽7𝐵𝐸𝑇𝐴𝑖,𝑡 + 𝛽8𝐿𝑂𝑆𝑆𝑖,𝑡−1 +
𝛽9𝐿𝐸𝑉𝑖,𝑡 + 𝛽10𝑍𝑆𝐶𝑂𝑅𝐸𝑖,𝑡 + ∑𝑡𝛼𝑡𝑌𝐸𝐴𝑅𝑡 + 𝑎𝑖 + 𝜀𝑖,𝑡 (1)
Our main variable of interest is CLC_DUM. Based on the dynamic resource-based view and
the life cycle theory, we predict 𝛽1 and 𝛽4 to be positive for H3 and 𝛽2 and 𝛽3 to be negative
for H1 and H2. Variables are as defined in Appendix A.
3.2 Measurement of Variables
3.2.1 Estimation of Corporate Life Cycle
Assessing the life cycle stage at the firm level is difficult because an individual firm is
composed of many overlapping, but distinct, product life cycle stages. Moreover, firms can
compete in multiple industries and their product offerings can be fairly diverse (Dickinson,
2011). To overcome this estimation problem, we follow the methodologies of Dickinson
(2011) and DeAngelo et al. (2006) to develop proxies for the firms’ stage in the life cycle.5
Dickinson (2011) deploys data from the firm’s cash flow statement. She argues that cash flow
captures differences in a firm’s profitability, growth, and risk and, hence, that one may use
the cash flow from operating (CFO), investing (CFI), and financing (CFF) to group firms in
life cycle stages such as ‘introduction’, ‘growth’, ‘mature’, ‘shake-out’, and ‘decline’. The
methodology is, introduction, if CFO<0, CFI<0, and CFF˃0; growth, if CFO˃0, CFI<0, and
5 Anthony and Ramesh (1992) provide one of the first empirical procedures for classifying firms in different life
cycle stages. However, we do not use their method for several reasons, (1) this classification scheme requires at
least six years of data availability for each firm, which reduces our sample size significantly, (2) the life cycle
proxy in this procedure is ‘ad hoc’ and relies on portfolio sorts to classify the firm in different life cycle stages,
and (3) Dickinson (2011) shows that life cycle classification based on Anthony and Ramesh’s (1992) procedure
leads to an erronous classification of firm life cycle stages.

13
CFF˃0; mature, if CFO˃0, CFI<0, and CFF<0; decline, if CFO<0, CFI˃0, and CFF≤ or ≥0;
and the remaining firm years are classified under the shake-out stage. Identification of life
cycle stages based on Dickinson (2011) combines the implications from diverse research
areas such as production behavior, learning/experience, investment, market share, and
entry/exit patterns. As a result, this process can capture the performance and allocation of
resources of the firm.
Following DeAngelo et al. (2006), we use retained earnings as a proportion of total
assets (RE/TA) as a proxy for corporate life cycle. This proxy measures the extent to which a
firm is self-financing or reliant on external capital. A high RE/TA implies that the firm is
more mature or older with declining investment, while firms with a low RE/TA tend to be
young and growing (DeAngelo et al., 2006).
3.2.2 Estimation of Cost of Equity
Cost of equity can be measured using both the implied approach and the realized approach.
Estimation of implied cost of equity involves calculating the internal rate of return that
equates the stock prices to the present value of forecasted cash flows (Hou et al., 2012). On
the other hand, the realized approach uses ex-post stock returns to estimate the cost of equity.
However, estimates based on ex-post realized stock returns suffer from measurement errors
such as imprecise estimates of factor risk premium and risk loading (Fama and French,
1997)6. Hence, researchers are increasingly relying on the implied cost of equity capital
7. In
line with previous studies, we use implied approaches to estimate the cost of equity. In
particular, we use Easton (2004) and Ohlson and Juettner-Nauroth (2005) models, as
6 Pástor et al. (2008) document that estimation of the cost of equity that uses forward estimates of earnings
outperforms measures based on realized returns. 7 Most Australian studies on the cost of equity adopt the realized approach to estimate the cost of equity. For
example, Gray et al. (2009) use industry-adjusted earnings-to-price ratios and Monkhouse (1993) uses the
capital asset pricing model (CAPM) to estimate the cost of equity. However, Azizkhani et al. (2010) use the
PEG approach. Moreover, some cross-country studies (Khurana and Raman, 2004; Hail and Leuz, 2006; Gray et
al., 2009) use the implied approach to estimate the cost of equity with a limited sample size.

14
modified by Gode and Mohanram (2003). We choose these measures because Botosan and
Plumlee (2005) document that Easton’s (2004) PEG ratio model and the target price (or
dividend discount) method, introduced by Botosan and Plumlee (2002), are preferable
measures of the cost of equity as both dominate the other alternatives in the sense that they
are consistently and predictably related to various risk measures8. In addition, we use the
Ohlson and Juettner-Nauroth (2005) (OJ) model modified by Gode and Mohanram (2003)
because this model is theoretically rigorous yet parsimonious, and provides a simple closed
form solution for the implied cost of capital. Consistent with prior studies (Hail and Leuz,
2006; Chen et al., 2009; Hou et al., 2012), we also use a simple average of three models due
to the lack of consensus on precision of the estimation of implied cost of equity capital.
3.3 Control Variables
We control for a number of risk factors and firm characteristics likely to determine the cost of
equity capital. Firm size reduces the cost of equity capital because large firms have a lower
probability of default (Berger and Udell, 1995), are followed more by analysts, and are more
liquid (Witmer and Zorn, 2007). We use the natural log of total assets to measure firm size
(SIZE). We control for the effect of systematic risk (BETA)9, as this is positively associated
with the cost of equity capital (Sharpe, 1964; Lintner, 1965; Mossin, 1966; Harris and
Marston, 1992). Growth opportunity is characterized by uncertainty and risk and, therefore, is
expected to be positively associated with the cost of equity capital (Chan et al., 1991; Fama
and French, 1992; Khurana and Raman, 2004; Boone et al., 2008). We use book-to-market
ratio (BM) as growth proxy. We also control for loss as the continuous negative earnings
stream of a firm could influence investors to consider that the firm will abandon its resources
8 The necessary forecasted data for the target price (or dividend discount) method are not available for
Australian companies. Using forecasted eps4 and eps5 for Australian companies to calculate the cost of equity
would significantly reduce our sample size. 9 Datastream calculates beta over a five-year period by regressing the share price against the respective
Datastream total market index, using log changes of the closing price on the first day of each month.
15
(Collins et al., 1999). We include an indicator variable coded 1 for firm-year observations
with negative earnings in the previous year, and 0 otherwise. We include leverage (LEV) as a
proxy for riskiness of the firm. The higher the level of leverage, the greater the perceived risk
associated with the firm and, consequently, the higher the cost of equity capital (Modigliani
and Miller, 1958; Fama and French, 1992; Petersen and Rajan, 1994; Gebhardt et al., 2001).
We measure financial leverage as (short-term debt + long-term debt)/shareholders’ equity.
Finally, we include Altman’s (1968) Z score (ZSCORE) to control for the bankruptcy risk.10
Altman’s Z score is an unsystematic risk factor and Dichev (1998) suggests that it is separate
from the size and book-to-market factors. However, we acknowledge the inherent limitation
of Altman’s model in using historical information to predict current bankruptcy.
IV. Empirical Results and Discussion
4.1 Descriptive Statistics
Table 2 reports the descriptive statistics for the key variables included in the regression
models. Panel A shows that the mean (median) cost of equity (simple average of the three
cost of equity estimates) for the sample is 17.8% (14.0%) with a standard deviation of 12.9%.
Owing to limited study of Australian listed firms using the same models for calculating the
cost of equity capital, a reliable comparison of this estimate is difficult. The closest possible
comparison is with Khurana and Raman (2004) and Azizkhani et al. (2010). Using a sample
of Australian firms, Khurana and Raman (2004) find that the mean cost of equity, estimated
by the PEG (Easton, 2004) model, is 10.3% and 10.7% and that the median cost of equity is
9.1% and 9.7% for the firms audited by Big and non-Big Auditors, respectively. Furthermore,
using a sample of 2,170 Australian firms during the period 1995–2005, Azizkhani et al.
(2010) find that the mean cost of equity, estimated by the same model, is 10.8% and 14.3%
10
Altman’s Z score = 1.2(Working Capital/Total Assets) + 1.4(Retained Earnings/Total Assets) + 3.3(Earnings
Before Interest & Tax/Total Assets) + 0.6(Market Value of Equity/Total Liabilities) + 0.999(Sales/Total
Assets). A higher score indicates better financial health and hence lower probability of financial distress.

16
for the firms audited by Big and non-Big Auditors, respectively.11
The reported mean
(median) cost of equity for this paper estimated by the PEG (Easton, 2004) model with a
sample of 3888 firm years from 1990–2012 is 15.6% (11.8%).12
Botosan (1997) uses a US
sample to estimate the cost of equity based on Ohlson (1995) and shows that the cost of
equity is 20.1%. Therefore, an average cost of equity of 17.8% for this study is consistent
with prior studies. Table 2 shows that there is a large dispersion among the sample firms in
terms of control variables, and this dispersion indicates a considerable diversity in the
sample.
Insert Table 2 about here
Panel A also shows that the mean (median) RE/TA is 0.038 (0.089). The mean values
of SIZE (19.903), ZSCORE (3.893), and LOSSt-1 (0.105) suggest the presence of large and
financially sound firms in the sample. Moreover, the mean (0.805) and median (0.566) BM
suggest that the sample firms have valuable growth opportunities. The mean BETA (0.954) is
slightly lower than that of Azizkhani et al. (2010) (1.02) and higher than that of Chen et al.
(2004) (0.75).
Panel B of Table 2 exhibits the life cycle-wise (Dickinson, 2011) cost of equity under
different models. All the models show that the cost of equity is lowest at the mature stage,
while it is comparatively higher at the introduction and decline stages. The lowest cost of
equity at mature stage firms indicates that they are, on average, the least risky compared to
11
Moreover, the cost of equity estimates of Truong and Partington (2007) for Australian firms are in the range
of 10% to 17%. 12
Our results differ from those of Azizkhani et al. (2010) for several reasons. (a) Our sample size and sample
period differ from that of their study. More specifically, our sample covers the period of the global financial
crisis, which is associated with increased risk and cost of equity. (b) We winsorize the cost of equity estimates at
the 1% level (both sides), while they exclude the extreme values. (c) Azizkhani et al. (2010) use the square root
of the numerator only, while we use the square root of both numerator and denominator, which is consistent
with Easton’s (2004) original model.

17
firms at other stages. Panel C of Table 2 shows that the cost of equity under all models shows
a U-shaped pattern across the life cycle stages.
Panel D of Table 2 reports life cycle-wise descriptive statistics for the sample firms.
Firms in the mature stage are characterized by stability, while firms in the decline stage are in
a transition phase (Dickinson, 2011). Consistent with Dickinson (2011), we find that highest
(lowest) observations belong to the mature (decline) stage with 47.07% (1.52%) of
observations. The overall results of Panel D of Table 2 show that mature firms, consistent
with their lower riskiness, have the lowest BETA, lowest rate of LOSSt-1, and highest
ZSCORE. Moreover, the descriptive statistics show that firms in the introduction and decline
stages are relatively more risky, with BETA of 1.154 and 1.425 as opposed to 0.978 and
0.895 in the growth and mature stages. Hence, as shown in Panel B, investors demand a
relatively higher risk premium, with an average cost of equity of 29.1% and 36.8%, for firms
in these stages compared to 17.4% and 15.4% in the growth and mature stages. Further
analysis reveals that SIZE and RE/TA progressively increase as firms move from the
introduction to mature stage and that these estimates then decline as firms move from the
mature to the decline stage. The opposite pattern is observed for the average cost of equity,
BETA, and LOSSt-1. The estimates in Panel D of Table 2 are also consistent with Dickinson
(2011), signifying the reliability of our estimates.
4.2 Correlation Analysis
Table 3 reports the Pearson correlations among the cost of equity, life cycle proxies, and
control variables. As expected, the cost of equity is positively correlated (at p<0.01) with
introduction, shake-out, and decline stages and negatively correlated (at p<0.01) with the
mature stage of the life cycle. Moreover, consistent with expectations, the cost of equity
estimates is also negatively correlated (p<0.01) with RE/TA. Finally, the correlations among
18
cost of equity estimate and BM, BETA, and LOSSt-1 are positive and significant (p<0.01),
while the correlation of cost of equity with SIZE and ZSCORE is negative and significant
(p<0.01). Overall, the correlations among estimates of cost of equity, life cycle proxies, and
the control variables are all in the expected direction.
Insert Table 3 about here
4.3 Univariate t-Test
Table 4 reports the mean difference test of cost of equity capital for different stages of the
firm life cycle. It shows that all cost of equity estimates significantly decrease (p<0.01) from
the introduction to growth stage, from the growth to mature stage, from the introduction to
mature stage, and from the introduction to the shake-out stage of the firm life cycle.
However, the mean cost of equity increases significantly from the mature to the shake-out
stage (p<0.01), from the shake-out to the decline stage (p<0.01), from the introduction to the
decline stage (p<0.05 mostly), from the growth to the shake-out stage (p<0.01), and finally
from the growth to the decline stage (p<0.01).
Insert Table 4 about here
4.4 Association between Cost of Equity and Firm Life Cycle
4.4.1 Firm Fixed Effect Estimation
Table 5 reports the fixed effect estimates of the relationship between the cost of equity and
the firm life cycle. As firm fixed effects and year dummies are specified in the regressions,
their estimates are constant at firm level and year level, respectively. All other control
variables (such as SIZE, BM, BETA, LOSSt-1, LEV, and ZSCORE) are measured at firm-
year level. The regression coefficients on control variables remain constant in the sample.
19
Table 5, Panel A, shows the regression results for different measures of the cost of equity and
Dickinson’s (2011) life cycle proxies. The life cycles of firms are categorized into five stages,
introduction, growth, mature, shake-out, and decline. Five dummy variables are thus created
for each of the five stages. However, to avoid the problem of dummy variable trap
multicollinearity in the regression model, one of the stages is dropped. As the shake-out stage
of the life cycle is ambiguous in theory (Dickinson, 2011), we drop this stage in the
regression model. The regression results suggest that, compared to the shake-out stage, the
introduction (except in model 1) and decline stages of the firm life cycle are significantly
positively associated with the cost of equity, while the growth and mature stages of the life
cycle are negatively associated with all estimates of the cost of equity (p<.01). The results
also reveal that investors demand less risk premium for large and financially sound firms (the
coefficients on SIZE and ZSCORE are both negative and significant at p<.01). On the other
hand, demand for risk premium is higher for growth and risky firms, with positive and
statistically significant coefficients for BM, BETA, LOSSt–1, and LEV.
Insert Table 5 Panel A about here
Table 5, Panel B, shows the results for different measures of the cost of equity and
RE/TA, a life cycle proxy proposed by DeAngelo et al. (2006). The coefficients on RE/TA
are negative and significant (p<.01) across all cost of equity measures, suggesting that
investors’ demand for the cost of equity decreases as RE/TA increases13
. Moreover, the
coefficients on most of the control variables, for example, SIZE, BM, LEV, and ZSCORE
have the predicted signs and significance, suggesting that the model specification is
reasonable.
13
We also test the association between retained earnings as a proportion of total equity (RE/TE - another life
cycle proxy of DeAngelo et al. (2006)) and cost of equity. Our results are robust with the use of RE/TE. For
brevity, results are not tabulated, they may be requested from the authors.

20
Insert Table 5 Panel B about here
Overall, our evidence is consistent with the resource-based theory and life cycle
explanation for the cost of equity of the firm. Controlling for known determinants of the cost
of equity (SIZE, BM, BETA, LOSSt–1, LEV, and ZSCORE) and individual firm
heterogeneity, we find that the cost of equity is negative and significant in the growth and
mature stages, while it is positive and significant in the introduction and decline stages when
compared to the shake-out stage. The reported results support the notion that, in the early
stages of the life cycle, firms have a limited resource base. These firms do not have a long-
term relationship with the financial market and consequently do not enjoy the opportunity to
raise capital at the same cost as firms in the growth and mature stages. Growth firms have
good potential, disclose more information to reduce information asymmetry, and hence can
attract growth and strategic investors, thereby enabling capital to be raised at a lower cost.
Moreover, mature firms have positive goodwill and good credit history. Thus, these firms
have access to less expensive capital. The cost of equity is higher in the decline stage because
potential investors do not want to invest money into a declining firm unless they are properly
compensated for the risk. The important bottom line of the analysis is that all the life cycle
proxies and cost of equity estimates uniformly and strongly support the view that firms’ cost
of equity varies significantly with the stages in the firms’ life cycle.
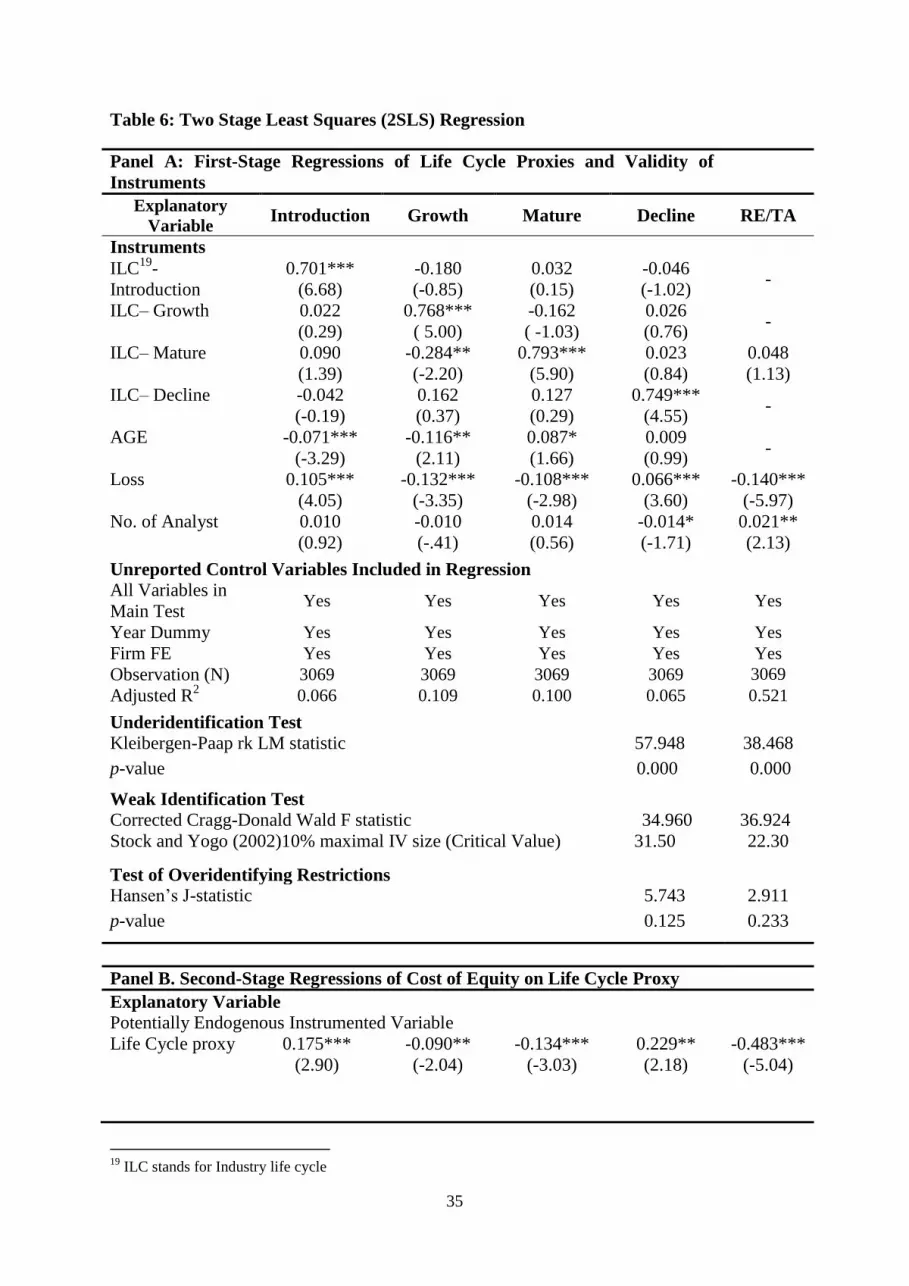
4.5 Two Stage Least Squares (2SLS) Regression
The fixed effect estimation suggests a significantly negative association between the growth
and mature stages and the cost of equity, while there is a positive association between the
introduction and decline stages and cost of equity. However, the sign, magnitude, or
statistical significance of these estimates may be biased due to endogeneity. That is, if the life
21
cycle proxy and the error term in Equation (1) are correlated. To address this concern, we
adopt a two-stage instrumental variable approach to re-examine the fixed effect panel
regression findings reported in Table 5. However, this approach is appropriate only if the
instrumental variables are correlated with the endogenous regressor but uncorrelated with the
error term of the second-stage regression. In this context, good instruments are exogenous
variables that are economically related to the life cycle proxy but are uncorrelated with the
error term of the second stage regression relating the cost of equity to the life cycle. Hence,
we use the average cost of equity (simple average of all non-missing observations), industry
life cycle stages and firm-level variables (e.g., AGE, LOSS - dummy variable that takes a
value of 1 if the firm has a net loss in the current year, and is 0 otherwise, and number of
analysts following a firm) as instruments for firm life cycle proxies.
We use the average cost of equity because it is expected to exhibit lower measurement
error than any of the individual measures (Chen et al., 2009; Hou et al., 2012). Use of
industry life cycle stages as instruments can be justified on the premise that industry level life
cycle has a profound effect on the firm level life cycle stages14
. Lumpkin and Dess (2001)
suggest that the industry life cycle affects a firm’s strategy on proactiveness or competitive
aggressiveness. Therefore, it is expected that industry-level growth, performance, and
financial solvency of the firm have a direct effect on the overall performance of the firm,
eventually shaping the life cycle stages. Firm-level operating performance is one of the key
indicators of the firm’s stage in the life cycle (Dickinson, 2011). Firms in the introduction
and decline stages generally have negative operating performance, while firms in the growth
and mature stages have strong operating performance. Hence, we use a dummy variable for
loss of the firm, which reflects stages of the firm life cycle. We use firm age and number of
analysts following a firm on the basis that these variables provide good indications for the
14
We use firm level life cycle stages data to calculate industry level life cycle stage.
22
firm stage in life cycle. Prior studies (Lang and Lundholm, 1996) document that analysts
prefer to follow large companies with high visibility and lower performance volatility. Pástor
and Pietro (2003) suggest that firm age is a “natural proxy” for investors’ uncertainty about
profitability of the firm.
Table 6, Panel A, reports that coefficients on the instrumental variables are significant
at the conventional level, suggesting that industry life cycle and included firm level variables
have a significant effect on firm life cycle stages. Firm age is positively associated with the
mature stage, but negatively associated with the introduction and growth stages. Furthermore,
results show that introduction and decline firms are positively related with loss, while growth
and mature firms are negatively related with loss. The coefficient on RE/TA and the number
of analysts following a firm show that analysts follow large and mature firms. Results in
Table 6, Panel B, suggest that the relationship between life cycle proxies and the cost of
equity remain robust after accounting for the endogenous relationship between the life cycle
proxies and the implied cost of equity capital. The estimated coefficients (and p values) of
introduction (0.175 and p<.01), growth (-0.090 and p<.05), mature (-0.134 and p<.01),
decline (0.229 and p<.05), and RE/TA (-0.483 and p<.01) in the fixed effect two stage least
squares (2SLS) regression suggest that endogeneity cannot explain away the expected
relationship between the life cycle and the cost of equity capital15
.
Insert Table 6 about here
In support of the instruments, we also conduct underidentification, weak
identification, Hansen’s overidentifying restrictions and Hausman’s endogeneity tests. In
Table 6, underidentification test results (LM statistic) reveal that the excluded instruments are
15
We perform Hausman’s (1978) specification test to examine whether the fixed effect and random effect
instrumental variable approaches are suitable. Test results suggest that the data support the fixed effect model in
estimating the relationship.

23
“relevant”. The weak instrument test results show that the excluded instruments are
correlated with the endogenous regressors because the (corrected) Cragg-Donald Wald F
statistic (34.96) is greater than Stock and Yogo’s (2002) critical value (i.e., 31.5) at 10%. It is
worth noting that Stock and Yogo (2002) provide critical values only for a range of possible
circumstances up to three endogenous regressors. However, there are four endogenous
regressors (proxies for four life cycle stages) in Dickinson (2011) life cycle measures and
thus, Stock and Yogo (2002) cannot provide critical value in this circumstance. To address
this problem, we follow the approach proposed by Angrist and Pischke (2008) and recently
modified by Sanderson and Windmeijer (2013) and estimate a corrected version of the first
stage F statistic that is suitable for our setting of more than three endogenous variables. Our
corrected Cragg-Donald Wald F statistic shows that a weak instrument is not a concern with
our estimates. Results from Hansen’s overidentifying restrictions test do not reject the null
hypothesis (p>.10), suggesting that instruments are uncorrelated with the error term and are
correctly excluded from the second stage regression, which reflects the validity of the
instruments used for the 2SLS regression. Finally, Hausman’s (1978) test significantly rejects
(p<.001) the exogeneity of the firm life cycle proxies, justifying the use of the 2SLS
regression estimates.
4.6 Additional Analysis and Robustness Check
4.6.1 Alternative Measure of Cost of Equity
To mitigate the concerns that our results are driven by the choice of cost of equity estimates,
we adopt an alternative approach to measure the cost of equity. For this purpose, we use the
Easton and Monahan (2005) model to calculate the ex-ante cost of equity:
𝑃𝑖𝑡 =𝑒𝑝𝑠𝑖 𝑡+1 + 𝑟 × 𝑑𝑝𝑠𝑖𝑡 + 𝑒𝑝𝑠𝑖 𝑡+2
(1 + 𝑟)2 − 1 (3)
24
Table 7 reports the results of the sensitivity analysis with RPE as the dependent
variable and two alternative measures of firm life cycle proxies, Dickinson’s (2011) measure
and RE/TA, as the key independent variables along with control variables. As reported in the
table, our inferences on the role of the firm life cycle on the cost of equity remain unaltered
when the new empirical proxy for the cost of equity is used as the dependent variable. For
example, in Table 7, Model 1, Dickinson’s (2011) life cycle proxies show that the cost of
equity is positively associated with the decline stages and negatively associated with the
growth and mature stages. Model 2 shows that the cost of equity is negatively associated
(significant at p<.05) with RE/TA.
Insert Table 7 about here
4.6.2 Alternative Measure of Firm Life Cycle
To mitigate the concerns over whether the main results are sensitive to life cycle proxy, we
use firm age as an alternative measure16
. Firm age is a simple and natural choice as life cycle
stages are naturally linked to firm age. We define AGE as the difference between the current
year and the year of incorporation of the firm17
. Untabulated results reveal that the
association between all the estimates of the cost of equity and AGE are negative and
statistically significant (p<.01). Moreover, considering that firm age can be a proxy for
various time-varying arguments, we also use a dummy variable to distinguish between firms
in old and young groups. We use AGE equals 1 if the firm age is greater than the median in
any given year, and 0 otherwise. The untabulated results remain qualitatively the same. In
summary, these findings corroborate the results reported earlier in our main analysis.
16
Pástor and Pietro (2003) also use firm age as a “natural proxy” for investors’ uncertainty about the
profitability of the firm. 17
We have collected data on the firm’s year of incorporation from company history and listing details of
DatAnalysis Morningstar.
25
4.6.3 Estimates Excluding Regulated Industries
We repeat estimations in the main analysis by excluding utilities, telecommunications, and
energy industries from the sample as the investment behavior of firms in these industries is
more likely to be affected by regulations and by the nature of their activities (Aivazian et al.,
2005). In untabulated results, estimates of this restricted sample are very similar to the
estimates with the main analysis. None of the coefficients changes its sign or significance.
V. Concluding Remarks
In this study we test whether the dynamic resource-based view and life cycle theory can
explain the variation in the cost of equity across different phases of a firm’s life cycle. We
posit that firms in different life cycle stages have different levels of resource base,
competitive advantages, information asymmetry, and riskiness and, hence, the cost of equity
of the firm should vary systematically across the firm’s life cycle. Using a sample of
Australian listed firms from 1990–2012, we find that the cost of equity of the firm
significantly differs across the life cycle stages. In particular, we find that the cost of equity is
higher in the introduction and decline stages of the firm, while it is lower in the growth and
mature stage. Moreover, cost of equity decreases as the retained earnings as a proportion of
total asset (RE/TA) increase. These results are unaffected by different estimations of the cost
of equity and the firm life cycle
Overall, our empirical evidence contributes to the growing body of literature that
focuses on the financial implications of the firm life cycle. Particularly, this study contributes
to the literature by showing evidence of the role that firm life cycle plays in determining cost
of equity capital.
Our findings strongly support the resource-based view of competitive advantage and
firm life cycle theory. According to the resource-based view, the financial capital, physical

26
resources, human resources, intangible know-how, and skills and capabilities of large and
mature firms are rich, diverse, and strong, while those of small and young firms are small,
concentrated and limited. These resource bases and expertise help mature firms to achieve a
competitive advantage, to reduce the risk and information asymmetry problem, and to gain
easy access to finance, which contribute to a reduction in the cost of equity capital. The
findings are also consistent with the life cycle theory of the firm in that different stages of the
life cycle exhibit different levels of disclosure, analysts and investors following, liquidity of
stock, credibility, and reputation in the market. Hence, as a consequence of the transition
from one stage to another, the cost of equity changes accordingly. Finally, from a
practitioner’s perspective, our results have direct implications for the financial management
and strategic direction of the firm. An implication of our study is that firms should reach and
maintain maturity, the prime stage of the firm life cycle, to benefit from the lower cost of
equity.
27
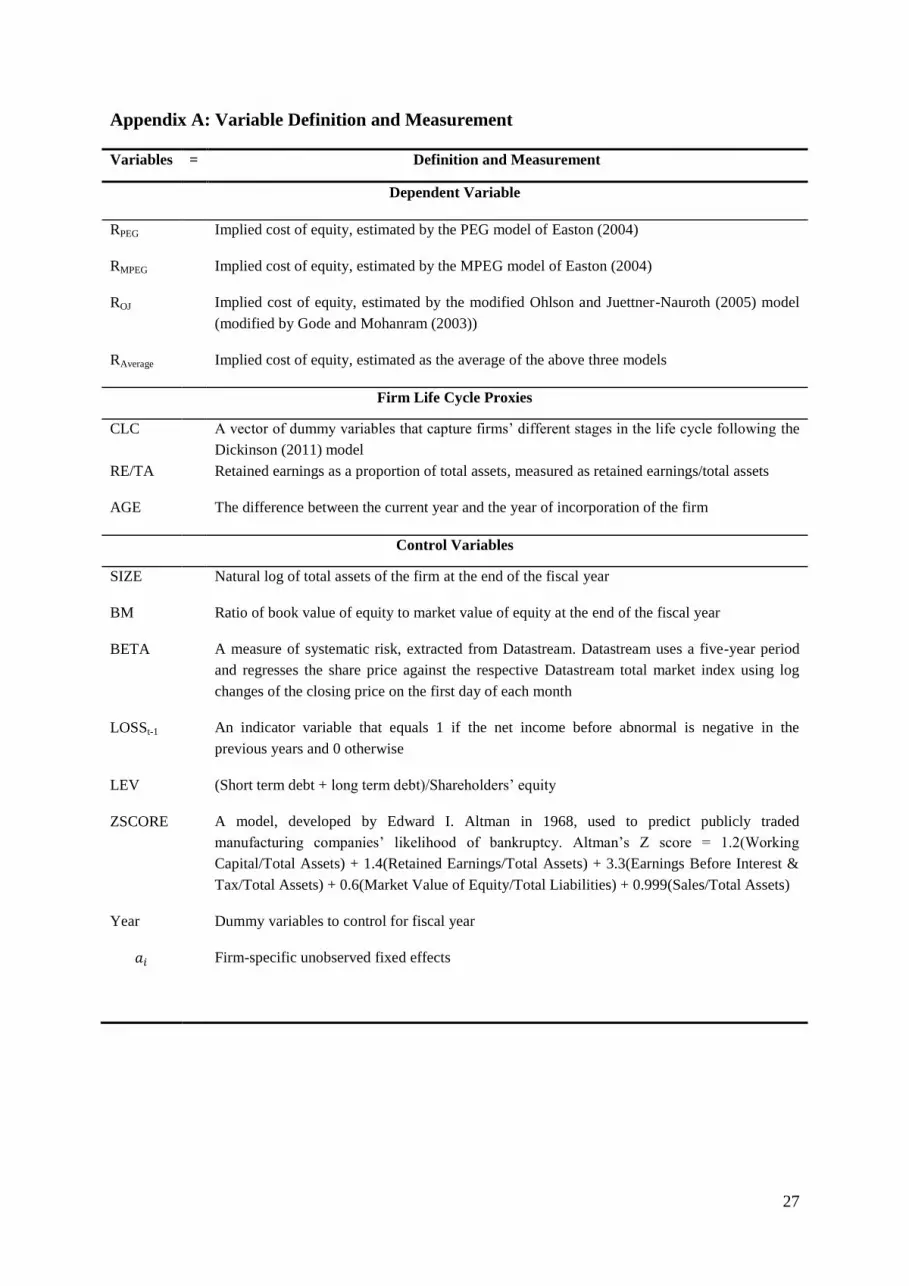
Appendix A: Variable Definition and Measurement
Variables = Definition and Measurement
Dependent Variable
RPEG Implied cost of equity, estimated by the PEG model of Easton (2004)
RMPEG Implied cost of equity, estimated by the MPEG model of Easton (2004)
ROJ Implied cost of equity, estimated by the modified Ohlson and Juettner-Nauroth (2005) model
(modified by Gode and Mohanram (2003))
RAverage Implied cost of equity, estimated as the average of the above three models
Firm Life Cycle Proxies
CLC
A vector of dummy variables that capture firms’ different stages in the life cycle following the
Dickinson (2011) model
RE/TA Retained earnings as a proportion of total assets, measured as retained earnings/total assets
AGE The difference between the current year and the year of incorporation of the firm
Control Variables
SIZE Natural log of total assets of the firm at the end of the fiscal year
BM Ratio of book value of equity to market value of equity at the end of the fiscal year
BETA A measure of systematic risk, extracted from Datastream. Datastream uses a five-year period
and regresses the share price against the respective Datastream total market index using log
changes of the closing price on the first day of each month
LOSSt-1 An indicator variable that equals 1 if the net income before abnormal is negative in the
previous years and 0 otherwise
LEV (Short term debt + long term debt)/Shareholders’ equity
ZSCORE A model, developed by Edward I. Altman in 1968, used to predict publicly traded
manufacturing companies’ likelihood of bankruptcy. Altman’s Z score = 1.2(Working
Capital/Total Assets) + 1.4(Retained Earnings/Total Assets) + 3.3(Earnings Before Interest &
Tax/Total Assets) + 0.6(Market Value of Equity/Total Liabilities) + 0.999(Sales/Total Assets)
Year Dummy variables to control for fiscal year
𝑎𝑖 Firm-specific unobserved fixed effects

28
Table 1: Sample Selection and Distribution of the Sample
Panel A: Sample Selection by Models
Description Pooled
Easton
PEG
(2004)
Easton
MPEG
(2004)
Ohlson and
Juettner-
Nauroth
(2005)
I/B/E/S forecasted EPS (fiscal year
1990-2012)
8020 8020 8020 8020
Less firm years dropped due to:
Model’s specific requirement18
2250 2250 2250 2342
Absence of forecasted DPS1 N/A N/A 707 703
Financial sector and delisted firms 1337 1337 1311 1297
Missing values on control valuables 545 545 189 196
Final Sample 3888 3888 3563 3482
Panel B: Distribution by Year (Pooled)
Year 1990 1991 1992 1993 1994 1995 1996 1997
N 35 46 46 43 46 87 120 118
Year 1998 1999 2000 2001 2002 2003 2004 2005
N 127 145 162 230 223 188 191 231
Year 2006 2007 2008 2009 2010 2011 2012 Total
N 252 275 292 216 262 289 264 3888
Panel C: Distribution by Sectors and Cost of Equity Models
Name of the Sector Pooled
Easton
PEG
(2004)
Easton
MPEG
(2004)
Ohlson and
Juettner-
Nauroth (2005)
Consumer Discretionary 818 818 770 765
Consumer Staples 362 362 322 320
Energy 283 283 246 231
Health Care 266 266 250 243
Industrials 961 961 918 912
Information Technology 273 273 263 258
Materials 776 776 656 621
Telecommunication Services 79 79 69 65
Utilities 70 70 69 67
Total 3888 3888 3563 3482
18
For estimating the cost of equity, we exclude cases where eps2>eps1>0 are not met.

29
Table 2: Descriptive Statistics This table presents descriptive statistics for the major variables
used in the study. All the variables are defined in Appendix A.
Panel A: Pooled Descriptive Statistics
Variables N Mean Standard
Deviation 25% Median 75%
RAverage 3888 0.178 0.129 0.105 0.140 0.202
RE/TA 3888 0.038 0.338 0.009 0.089 0.184
SIZE 3888 19.903 1.680 18.706 19.775 21.082
BM 3888 0.805 0.905 0.311 0.566 0.942
BETA 3888 0.954 0.779 0.474 0.857 1.305
LOSSt-1 3888 0.105 0.307 0.000 0.000 0.000
LEV 3888 0.544 0.588 0.150 0.420 0.720
ZSCORE 3888 3.893 4.071 1.899 2.835 4.401
Panel B: Life Cycle-wise Cost of Equity Using Different Models
Model Statistics Pooled Introducti
on
Growth Mature Shake-
out
Decline
RPEG (Easton
2004)
Mean 0.156 0.267 0.154 0.132 0.178 0.339
Median 0.118 0.204 0.119 0.108 0.133 0.268
Std. Dev. 0.123 0.198 0.110 0.091 0.136 0.222
RMPEG (Easton
2004)
Mean 0. 185 0.310 0.179 0.162 0.204 0.369
Median 0. 147 0.229 0.144 0.137 0.161 0.277
Std. Dev. 0.133 0.230 0.120 0.095 0.142 0.256
R(Ohlson
and Juettner-
Nauroth
2005)
Mean 0.187 0.295 0.185 0.167 0.204 0.359
Median 0.154 0.227 0.154 0.144 0.164 0.259
Std. Dev. 0.119 0.200 0.113 0.089 0.124 0.229
RAverage Mean 0.178 0.291 0.174 0.154 0.199 0.368
Median 0.140 0.217 0.140 0.129 0.154 0.293
Std. Dev. 0.129 0.211 0.117 0.095 0.143 0.236
Panel C: Life Cycle-wise Mean Cost of Equity Using Different Models
0
0.05
0.1
0.15
0.2
0.25
0.3
0.35
0.4
Introduction Growth Maturity Shake-out Decline
PEG (Easton 2004)
MPEG (Easton 2004)
Ohlson and Juettner-Nauroth (2005)Average

30
Panel D: Life Cycle-wise Descriptive Statistics
Variables Statistics Introduction Growth Mature Shake-
out Decline
RE/TA Mean -0.280 0.049 0.103 -0.003 -0.482
Median -0.072 0.077 0.120 0.081 -0.300
Standard Deviation 0.551 0.236 0.292 0.360 0.728
SIZE Mean 18.884 20.033 19.979 19.936 18.999
Median 18.831 19.926 19.875 19.832 19.070
Standard Deviation 1.478 1.573 1.712 1.722 1.828
BM Mean 0.775 0.780 0.782 1.003 0.979
Median 0.571 0.560 0.538 0.725 0.704
Standard Deviation 0.931 0.850 0.905 0.990 1.239
BETA Mean 1.154 0.978 0.895 0.932 1.425
Median 1.063 0.888 0.808 0.825 1.255
Standard Deviation 1.012 0.767 0.710 0.861 1.004
LOSSt -1 Mean 0.500 0.097 0.046 0.156 0.407
Median 0.000 0.000 0.000 0.000 0.000
Standard Deviation 0.493 0.297 0.209 0.363 0.495
LEV Mean 0.700 0.636 0.480 0.472 0.559
Median 0.470 0.520 0.350 0.340 0.230
Standard Deviation 0.797 0.582 0.531 0.575 0.866
ZSCORE Mean 3.477 3.323 4.393 3.835 3.773
Median 1.959 2.579 3.231 2.657 1.611
Standard Deviation 5.665 3.295 4.019 4.489 7.275
N 271 1356 1830 372 59

31
Table 3: Correlation Matrix
R_Average Introduction Growth Mature Shake-
out Decline RETA SIZE BM BETA LOSS LEV ZSCORE
R_Average 1.00
Introduction 0.239*** 1.000
Growth -0.021 -0.200*** 1.000
Mature -0.178*** -0.258*** -0.690*** 1.000
Shake-out 0.053*** -0.089*** -0.238*** -0.307*** 1.000
Decline 0.182*** -0.034** -0.091*** -0.117*** -0.040** 1.000
RETA -0.416*** -0.258*** 0.022 0.181*** -0.040** -0.191*** 1.000
SIZE -0.319*** -0.166*** 0.057*** 0.043*** 0.006 -0.067*** 0.239*** 1.000
BM 0.271*** -0.009 -0.020 -0.024 0.071*** 0.024 -0.019 0.021 1.000
BETA 0.196*** 0.07*** 0.023 -0.071*** -0.009 0.075*** -0.169*** -0.040** -0.008 1.000
LOSS 0.327*** 0.272*** -0.019 -0.182*** 0.054*** 0.122*** -0.430*** -0.207*** 0.006 0.157*** 1.000
LEV 0.006 0.065*** 0.114*** -0.119*** -0.04** 0.003 -0.100*** 0.254*** -0.019 -0.097*** -0.020 1.000
ZSCORE -0.145*** -0.028* -0.102*** 0.116*** -0.005 -0.004 0.191*** -0.255*** -0.213*** 0.015 -0.011 -0.331*** 1.000 This table presents the correlations among cost of equity, life cycle proxies, and control variables. The values in the matrix are Pearson correlation coefficients and ***, **, and * denote
significance at 1%, 5%, and 10% levels respectively (two-tailed tests). All the variables are as defined in Appendix A.

32
Table 4: Mean Difference Test of Cost of Equity (assuming unequal variance)
Mean Difference Test of Cost of Equity Using Dickinson’s (2011) life cycle proxies
Estimates Cost of Equity
(Stage 1)
Cost of Equity
(Stage 2)
t statistics for
differences p-values
Introduction Growth
RPEG 0.267 0.154 -9.153 0.000
RMPEG 0.309 0.178 -8.783 0.000
ROJ 0.295 0.185 -7.855 0.000
RAverage 0.291 0.174 -8.822 0.000
Growth Mature
RPEG 0.154 0.132 -5.969 0.000
RMPEG 0.178 0.162 -4.137 0.000
ROJ 0.185 0.167 -4.694 0.000
RAverage 0.174 0.154 -5.309 0.000
Mature Shake-out
RPEG 0.132 0.178 6.253 0.000
RMPEG 0.162 0.204 5.033 0.000
ROJ 0.167 0.204 4.847 0.000
RAverage 0.154 0.199 5.884 0.000
Shake-out Decline
RPEG 0.178 0.338 5.404 0.000
RMPEG 0.204 0.369 4.567 0.000
ROJ 0.204 0.359 4.698 0.000
RAverage 0.199 0.368 5.347 0.000
Introduction Mature
RPEG 0.267 0.132 -11.078 0.000
RMPEG 0.309 0.162 -10.057 0.000
ROJ 0.295 0.167 -9.284 0.000
RAverage 0.291 0.154 -10.540 0.000
Introduction Shake-out
RPEG 0.267 0.178 -6.387 0.000
RMPEG 0.309 0.204 -6.326 0.000
ROJ 0.295 0.204 -5.919 0.000
RAverage 0.291 0.199 -6.194 0.000
Introduction Decline
RPEG 0.267 0.338 2.286 0.025
RMPEG 0.309 0.369 1.559 0.123
ROJ 0.295 0.359 1.833 0.071
RAverage 0.291 0.368 2.312 0.023
Growth Shake-out
RPEG 0.154 0.178 3.165 0.001
RMPEG 0.178 0.204 2.911 0.004
ROJ 0.185 0.204 2.341 0.019
RAverage 0.174 0.199 3.085 0.002
Growth Decline
RPEG 0.154 0.338 6.371 0.000
RMPEG 0.178 0.369 5.394 0.000
ROJ 0.185 0.359 5.363 0.000
RAverage 0.174 0.368 6.279 0.000

33
Table 5: Association between Cost of Equity and Firm Life Cycle
Panel A: Association between Cost of Equity and Life Cycle Proxies using Dickinson’s
(2011) Model
𝑅𝑖,𝑡 = 𝛼0 + ∑ 𝛽𝑖𝐶𝐿𝐶_𝐷𝑈𝑀𝑖,𝑡4𝑖=1 + 𝛽5𝑆𝐼𝑍𝐸𝑖,𝑡 + 𝛽6𝐵𝑀𝑖,𝑡 + 𝛽7𝐵𝐸𝑇𝐴𝑖,𝑡 + 𝛽8𝐿𝑂𝑆𝑆𝑖,𝑡−1 +
𝛽9𝐿𝐸𝑉𝑖,𝑡 + 𝛽10𝑍𝑆𝐶𝑂𝑅𝐸𝑖,𝑡 + ∑𝑡𝛼𝑡𝑌𝐸𝐴𝑅𝑡 + 𝑎𝑖 + 𝜀𝑖,𝑡
Variables Pred.
Sign
Model 1 Model 2 Model 3 Model 4
Easton 2004
RPEG
Easton 2004
RMPEG
OJ 2005
ROJ RAverage
Intercept ? 0.503*** 0.458*** 0.438*** 0.475***
(6.72) (5.75) (5.86) (6.11)
Introduction + 0.017 0.032*** 0.024** 0.019*
(1.57) (2.65) (2.32) (1.68)
Growth - -0.015*** -0.014*** -0.012*** -0.017***
(-2.84) (-2.89) (-2.68) (-3.08)
Mature - -0.015*** -0.014*** -0.014*** -0.016***
(-3.13) (-2.89) (-3.00) (-3.28)
Decline + 0.076*** 0.061** 0.055** 0.069***
(2.96) (2.12) (1.99) (2.62)
SIZE - -0.017*** -0.016*** -0.014*** -0.015***
(-4.76) (-3.78) (-3.57) (-4.13)
BM + 0.033*** 0.042*** 0.040*** 0.038***
(7.46) (7.89) (8.14) (7.63)
BETA + 0.006* 0.012*** 0.011*** 0.007*
(1.75) (3.06) (3.04) (1.93)
LOSSt-1 + 0.031*** 0.014* 0.012 0.025***
(3.44) (1.66) (1.46) (2.77)
LEV + 0.016*** 0.019*** 0.016*** 0.020***
(3.36) (3.16) (3.47) (3.70)
ZSCORE - -0.004*** -0.004*** -0.004*** -0.005***
(-6.25) (-5.76) (-5.40) (-6.40)
Year Dummy Yes Yes Yes Yes
Firm Fixed Effect Yes Yes Yes Yes
Adj. R-squared 0.761 0.783 0.770 0.757
Observations (N) 3,888 3,564 3,483 3,888
Number of Firms 704 679 656 704
Robust t-statistics in brackets
*** p<0.01, ** p<0.05, * p<0.10
Variable definitions are provided in the Appendix.

34
Table 5: Association between Cost of Equity and Firm Life Cycle
Panel B: Association between Cost of Equity and RE/TA (Life Cycle Proxy of DeAngelo
(2006))
𝑅𝑖,𝑡 = 𝛼0 + 𝛽1𝑅𝐸/𝑇𝐴𝑖,𝑡 + 𝛽2𝑆𝐼𝑍𝐸𝑖,𝑡 + 𝛽3𝐵𝑀𝑖,𝑡 + 𝛽4𝐵𝐸𝑇𝐴𝑖,𝑡 + 𝛽5𝐿𝑂𝑆𝑆𝑖,𝑡−1 +
𝛽6𝐿𝐸𝑉𝑖,𝑡 + 𝛽7𝑍𝑆𝐶𝑂𝑅𝐸𝑖,𝑡 + ∑𝑡𝛼𝑡𝑌𝐸𝐴𝑅𝑡 + 𝑎𝑖 + 𝜀𝑖,𝑡
Variables Pred.
Sign
Model 1 Model 2 Model 3 Model 4
Easton 2004
RPEG
Easton 2004
RMPEG
OJ 2005
ROJ RAverage
Intercept ? 0.415*** 0.364*** 0.377*** 0.392***
(5.47) (4.95) (5.50) (5.09)
RE/TA - -0.058*** -0.051*** -0.034** -0.056***
(-4.14) (-3.10) (-2.41) (-3.81)
SIZE - -0.012*** -0.011*** -0.011*** -0.011***
(-3.31) (-2.88) (-3.09) (-2.94)
BM + 0.032*** 0.041*** 0.040*** 0.037***
(6.86) (7.52) (7.88) (7.19)
BETA + 0.004 0.010*** 0.010*** 0.005
(1.23) (2.61) (2.68) (1.43)
LOSSt-1 + 0.027*** 0.011 0.011 0.020**
(3.14) (1.29) (1.35) (2.34)
LEV + 0.013*** 0.017*** 0.015*** 0.017***
(2.84) (2.87) (3.29) (3.24)
ZSCORE - -0.003*** -0.004*** -0.003*** -0.004***
(-4.85) (-4.75) (-4.68) (-5.23)
Year Dummy Yes Yes Yes Yes
Firm Fixed Effect Yes Yes Yes Yes
Adj. R-squared 0.759 0.781 0.767 0.755
Observations (N) 3,888 3,563 3,482 3,888
Number of Firms 704 679 656 704
Robust t-statistics in brackets
*** p<0.01, ** p<0.05, * p<0.10
Variable definitions are provided in the Appendix.
35
Table 6: Two Stage Least Squares (2SLS) Regression
Panel A: First-Stage Regressions of Life Cycle Proxies and Validity of
Instruments
Explanatory
Variable Introduction Growth Mature Decline RE/TA
Instruments
ILC19
-
Introduction
0.701***
(6.68)
-0.180
(-0.85)
0.032
(0.15)
-0.046
(-1.02) -
ILC– Growth 0.022
(0.29)
0.768***
( 5.00)
-0.162
( -1.03)
0.026
(0.76) -
ILC– Mature 0.090
(1.39)
-0.284**
(-2.20)
0.793***
(5.90)
0.023
(0.84)
0.048
(1.13)
ILC– Decline -0.042
(-0.19)
0.162
(0.37)
0.127
(0.29)
0.749***
(4.55) -
AGE -0.071***
(-3.29)
-0.116**
(2.11)
0.087*
(1.66)
0.009
(0.99) -
Loss 0.105***
(4.05)
-0.132***
(-3.35)
-0.108***
(-2.98)
0.066***
(3.60)
-0.140***
(-5.97)
No. of Analyst 0.010
(0.92)
-0.010
(-.41)
0.014
(0.56)
-0.014*
(-1.71)
0.021**
(2.13)
Unreported Control Variables Included in Regression
All Variables in
Main Test Yes Yes Yes Yes Yes
Year Dummy Yes Yes Yes Yes Yes
Firm FE Yes Yes Yes Yes Yes
Observation (N) 3069 3069 3069 3069 3069
Adjusted R2
0.066 0.109 0.100 0.065 0.521
Underidentification Test
Kleibergen-Paap rk LM statistic 57.948 38.468
p-value 0.000 0.000
Weak Identification Test
Corrected Cragg-Donald Wald F statistic
34.960 36.924
Stock and Yogo (2002)10% maximal IV size (Critical Value) 31.50
22.30
Test of Overidentifying Restrictions
Hansen’s J-statistic 5.743 2.911
p-value 0.125 0.233
Panel B. Second-Stage Regressions of Cost of Equity on Life Cycle Proxy
Explanatory Variable
Potentially Endogenous Instrumented Variable
Life Cycle proxy 0.175*** -0.090** -0.134*** 0.229** -0.483***
(2.90) (-2.04) (-3.03) (2.18) (-5.04)
19
ILC stands for Industry life cycle

36
Unreported Control Variables Included in Regression All Variables in
Main Test Yes Yes Yes Yes Yes
Year Dummy Yes Yes Yes Yes Yes
Firm FE Yes Yes Yes Yes Yes
Hausman Test for the Effect of Life Cycle (Coefficient 2SLS = Coefficient OLS)
Cluster-robust F-statistic 45.545 40.731
p-value 0.000 0.000

37
Table 7: Sensitivity Analysis
Alternative Estimation of Cost of Equity
𝑅𝑖,𝑡 = 𝛼0 + ∑ 𝛽𝑖𝐶𝐿𝐶_𝐷𝑈𝑀𝑖,𝑡
4
𝑖=1
+ 𝛽5𝑆𝐼𝑍𝐸𝑖,𝑡 + 𝛽6𝐵𝑀𝑖,𝑡 + 𝛽7𝐵𝐸𝑇𝐴𝑖,𝑡 + 𝛽8𝐿𝑂𝑆𝑆𝑖,𝑡−1
+ 𝛽9𝐿𝐸𝑉𝑖,𝑡 + 𝛽10𝑍𝑆𝐶𝑂𝑅𝐸𝑖,𝑡 + ∑𝑡𝛼𝑡𝑌𝐸𝐴𝑅𝑡 + 𝑎𝑖 + 𝜀𝑖,𝑡
𝑅𝑖,𝑡 = 𝛼0 + 𝛽1𝑅𝐸/𝑇𝐴𝑖,𝑡 + 𝛽2𝑆𝐼𝑍𝐸𝑖,𝑡 + 𝛽3𝐵𝑀𝑖,𝑡 + 𝛽4𝐵𝐸𝑇𝐴𝑖,𝑡 + 𝛽5𝐿𝑂𝑆𝑆𝑖,𝑡−1
+ 𝛽6𝐿𝐸𝑉𝑖,𝑡 + 𝛽7𝑍𝑆𝐶𝑂𝑅𝐸𝑖,𝑡 + ∑𝑡𝛼𝑡𝑌𝐸𝐴𝑅𝑡 + 𝑎𝑖 + 𝜀𝑖,𝑡
Variables Pred. Sign Model 1 Model 2
RPE RPE
Intercept ? 0.223 0.010
(0.87) (0.05)
Introduction + 0.017
(0.54)
Growth - -0.026**
(-2.18)
Mature - -0.024**
(-2.23)
Decline + 0.219***
(3.01)
RE/TA - -0.114**
(-1.97)
SIZE - -0.008 0.003
(-0.55) (0.28)
BM + 0.100*** 0.100***
(5.79) (5.42)
BETA + 0.016 0.011
(1.32) (0.89)
LOSSt – 1 + -0.019 -0.030*
(-0.97) (-1.51)
LEV + 0.053** 0.045**
(2.41) (2.05)
ZSCORE - -0.000* -0.000
(-1.68) (-.77)
Year Dummy Yes Yes
Firm Fixed Effect Yes Yes
Adj. R-squared 0.849 0.848
Observations (N) 4,498 4,498
Number of Firms 798 798 Robust t-statistics in brackets
*** p<0.01, ** p<0.05, * p<0.10
Variable definitions are provided in the Appendix.
38
References
Aboody, D., Lev, B., 2000. Information asymmetry, R&D, and insider gains. J. Finance 55 (6), 2747-
2766.
Adizes, I., 1979. Managing corporate lifecycles: how to get and stay at the top. New Jersey: The
Adizes Institute Publishing.
Aivazian, V. A., Ge, Y., Qiu, J., 2005. The impact of leverage on firm investment: Canadian
evidence. J. Corp. Financ. 11 (1), 277-291.
Altman, E. I., 1968. Financial ratios, discriminant analysis and the prediction of corporate bankruptcy.
J. Finance 23 (4), 589-609.
Angrist, J. D., Pischke J. S., 2008. Mostly harmless econometrics: an empiricist’s companion.
Princeton university press, Princeton.
Anthony, J. H., Ramesh, K., 1992. Association between accounting performance measures and stock
prices. J. Account. Econ. 15 (2/3), 203-227.
Armstrong, C. S., Core, J. E., Taylor, D. J., Verrecchia, R. E., 2011. When does information
asymmetry affect the cost of capital? J. Account. Res. 49 (1), 1-40.
Azizkhani, M., Monroe, G. S., Shailer, G., 2010. The value of Big 4 audits in Australia. Account.
Finance 50 (4), 743-766.
Banz, R. W., 1981. The relationship between return and market value of common stocks. J. Financ.
Econ. 9 (1), 3-18.
Barney, J., 1991. Firm resources and sustained competitive advantage. J. Manage. 17 (1), 99-120.
Barth, M. E., Kasznik, R., McNichols, M. F., 2001. Analyst Coverage and Intangible Assets. J.
Account. Res. 39 (1), 1-34.
Bender, R., Ward, K., 1993. Corporate Financial Strategy. Oxford: Butterworth-Heinemann.
Bentley, K., Omer, T., Twedt, B., 2012. Does business strategy impact a firm’s information
environment? Working paper, The University of New South Wales. Available
at:http://papers.ssrn.com/sol3/papers.cfm?abstract_id=2162240
Berger, A. N., Udell G. F., 1995. Relationship lending and lines of credit in small firm finance. J. Bus.
68 (3), 351-381.
Berger, A. N., Udell G. F., 1998. The economics of small business finance: the roles of private equity
and debt markets in the financial growth cycle. J. Bank. Finance 22 (6-8), 613-673.
Berk, J. B., 1995. A critique of size-related anomalies. Rev. Financ. Stud. 8 (2), 275-286.
Boone, J. P., Khurana, I. K., Raman, K. K., 2008. Audit firm tenure and the equity risk premium. J.
Account. Audit. Finance 23 (1), 115-140.
Botosan, C. A., 1997. Disclosure level and the cost of equity capital. Account. Rev. 72 (3), 323-349.
Botosan, C. A., 2006. Disclosure and the cost of capital: what do we know? Account. Bus. Res. 36
(sup1), 31-40.
Botosan, C. A., Plumlee, M. A., 2002. A re‐examination of disclosure level and the expected cost of
equity capital. J. Account. Res. 40 (1), 21-40.
Botosan, C. A., Plumlee, M. A., 2005. Assessing alternative proxies for the expected risk premium.
Account. Rev. 80 (1), 21-53.
Brennan, M. J., Subrahmanyam A., 1995. Investment analysis and price formation in securities
markets. J. Financ. Econ. 38 (3), 361-381.
Bulan, L., Subramanian, N., Tanlu, L., 2007. On the timing of dividend initiations. Financ. Manage.
36 (4), 31-65.
Bushee, B. J., Core, J. E., Guay, W., Hamm, S. J., 2010. The role of the business press as an
information intermediary. J. Account. Res. 48 (1), 1-19.
Câmara, A., San-Lin, C., Yaw-Huei, W., 2009. Option implied cost of equity and its properties. J.
Futures Markets 29 (7), 599-629.
Chan, L. K. C., Hamao,Y., Lakonishok, J., 1991. Fundamentals and Stock Returns in Japan. J.
Finance 46 (5), 1739-1764.
Chandler, A. D., 1962. Strategy and structure: chapters in the history of the American enterprise.
Massachusetts Institute of Technology Press, Cambridge, MA.
Chen, F., Jorgensen, B. N., Yoo, Y. K., 2004. Implied cost of equity capital in earnings-based
valuation: international evidence. Account. Bus. Res. 34 (4), 323-344.
39
Chen, K. C., Chen, W. Z., Wei, K. C. J., 2009. Legal protection of investors, corporate governance,
and the cost of equity capital. J. Corp. Financ. 15 (3), 273-289.
Collins, D. W., Pincus, M., Xie, H., 1999. Equity valuation and negative earnings: the role of book
value of equity. Account. Rev. 74 (1), 29-61.
Coulton, J. J., Ruddock, C., 2011. Corporate payout policy in Australia and a test of the life-cycle
theory. Account. Finance 51 (2), 381-407.
DeAngelo, H., DeAngelo, L. Stulz, R. M., 2006. Dividend policy and the earned/contributed capital
mix: a test of the life-cycle theory. J. Financ. Econ. 81 (2), 227-254.
DeAngelo, H., DeAngelo, L. Stulz, R. M., 2010. Seasoned equity offerings, market timing, and the
corporate lifecycle. J. Financ. Econ. 95 (3), 275-295.
Diamond, D. W., Verrecchia, R. E., 1991. Disclosure, liquidity, and the cost of capital. J. Finance 46
(4):1325-1359.
Dichev, I. D., 1998. Is the risk of bankruptcy a systematic risk? J. Finance 53 (3), 1131-1147.
Dickinson, V., 2011. Cash flow patterns as a proxy for firm life cycle. Account. Rev. 86 (6), 1964-
1994.
Dierickx, I., Cool, K., 1989. Asset stock accumulation and sustainability of competitive advantage.
Manage. Sci. 35 (12), 1504-1511.
Easley, D., O’Hara, M., 2004. Information and the cost of capital. J. Finance 59 (4), 1553-1583.
Easton, P. D., 2004. PE ratios, PEG ratios, and estimating the implied expected rate of return on
equity capital. Account. Rev. 79 (1), 73-95.
Easton, P. D., Monahan, S. J., 2005. An evaluation of accounting-based measures of expected returns.
Account. Rev. 80 (2), 501-538.
Fama, E. F., French, K. R., 1989. Business conditions and expected returns on stocks and bonds. J.
Financ. Econ. 25 (1), 23-49.
Fama, E. F., French, K. R., 1992. The cross-section of expected stock returns. J. Finance 47 (2), 427-
465.
Fama, E. F., French, K. R., 1997. Industry costs of equity. J. Financ. Econ. 43 (2), 153-193.
Fama, E. F., French, K. R., 2001. Disappearing dividends: changing firm characteristics or lower
propensity to pay? J. Financ. Econ. 60 (1), 3-43.
Gebhardt, W. R., Lee, C. M. C., Swaminathan B., 2001. Toward an implied cost of capital. J.
Account. Res. 39 (1), 135-176.
Gode, D., Mohanram, P., 2003. Inferring the cost of capital using the Ohlson–Juettner model. Rev.
Acc. Stud. 8 (4), 399-431.
Gray, B., Ariss S. S., 1985. Politics and strategic change across organizational life cycles. Acad.
Manage. Rev. 10 (4), 707-723.
Gray, P., Koh, P. S., Tong, Y. H., 2009. Accruals quality, information risk and cost of capital:
evidence from Australia. J. Bus. Finance Account. 36 (1-2), 51-72.
Grullon, G., Michaely, R. Swaminathan, B., 2002. Are dividend changes a sign of firm maturity? J.
Bus. 75 (3), 387-424.
Hail, L., Leuz, C., 2006. International differences in the cost of equity capital: do legal institutions and
securities regulation matter? J. Account. Res. 44 (3), 485-531.
Harris, R. S., Marston, F. C., 1992. Estimating shareholder risk premia using analysts’ growth
forecasts. Financ. Manage. 21(2), 63-70.
Hausman, J. A., 1978. Specification tests in econometrics. Econometrica 46(6), 1251-1271.
Helfat, C. E., Peteraf, M. A., 2003. The dynamic resource-based view: capability lifecycles. Strategic
Manage. J. 24 (10), 997-1010.
Hellmann, T., 2002. A theory of strategic venture investing. J. Financ. Econ. 64 (2), 285-314.
Hou, K., Van Dijk, M. A., Zhang, Y., 2012. The implied cost of capital: a new approach. J. Account.
Econ. 53 (3), 504-526.
Kazanjian, R. K., 1988. Relation of dominant problems to stages growth in technology-based new
ventures. Acad. Manag. J. 31 (2), 257-279.
Khurana, I. K., Raman, K., 2004. Litigation risk and the financial reporting credibility of Big 4 versus
non-Big 4 audits: evidence from Anglo-American countries. Account. Rev. 79 (2), 473-495.
Koberg, C. S., Uhlenbruck, N., Sarason, Y., 1996. Facilitators of organizational innovation: the role of
life-cycle stage. J. Bus. Venturing 11 (2), 133-149.

40
Lang, M. H., Lundholm, R. J., 1996. Corporate disclosure policy and analyst behavior. Account. Rev.
71(4), 467-492.
Lehavy, R., Li, F. Merkley, K., 2011. The effect of annual report readability on analyst following and
the properties of their earnings forecasts. Account. Rev. 86 (3), 1087-1115.
Lintner, J., 1965. The valuation of risk assets and the selection of risky investments in stock portfolios
and capital budgets. Rev. Econ. Stat. 47 (1), 13-37.
Lumpkin, G. T., Dess, G. G., 2001. Linking two dimensions of entrepreneurial orientation to firm
performance: the moderating role of environment and industry life cycle. J. Bus. Venturing 16
(5), 429-451.
Miller, D., Friesen, P. H., 1980. Momentum and revolution in organizational adaptation. Acad.
Manag. J. 23 (4), 591-614.
Miller, D., Friesen, P. H., 1984. A longitudinal study of the corporate life cycle. Manage. Sci. 30 (10),
1161-1183.
Modigliani, F., Miller, M. H., 1958. The cost of capital, corporation finance and the theory of
investment. Am. Econ. Rev. 48 (3), 261-297.
Monkhouse, P. H., 1993. The cost of equity under the Australian dividend imputation tax system.
Account. Finance 33 (2), 1-18.
Mossin, J., 1966. Equilibrium in a capital asset market. Econometrica 34 (4), 768-783.
Myers, S. C., Majluf, N. S., 1984. Corporate financing and investment decisions when firms have
information that investors do not have. J. Financ. Econ. 13 (2), 187-221.
Nickel, M. N., Rodriguez, M. C., 2002. A review of research on the negative accounting relationship
between risk and return: Bowman’s paradox. Omega-Int. J. Manage. S. 30 (1), 1-18.
O’Hara, M., 2003. Presidential address: liquidity and price discovery. J. Finance 58 (4), 1335-1354.
Ohlson, J. A., 1995. Earnings, book values, and dividends in equity valuation. Contemp. Account.
Res. 11 (2), 661-687.
Ohlson, J. A., Juettner-Nauroth, B. E., 2005. Expected EPS and EPS growth as determinants of value.
Rev. Acc. Stud. 10 (2), 349-365.
Pástor, Ľ., Pietro, V., 2003. Stock valuation and learning about profitability. J. Finance 58 (5), 1749-
1790.
Pástor, Ľ., Sinha, M., Swaminathan, B., 2008. Estimating the intertemporal risk–return tradeoff using
the implied cost of capital. J. Finance. 63 (6), 2859-2897.
Penrose, E. T., 1959. The theory of the growth of the firm: Wiley, New York.
Petersen, M. A., Rajan, R. G.,1994. The effect of credit market competition on lending relationships:
National Bureau of Economic Research.
Quinn, R. E., Cameron, K., 1983. Organizational life cycles and shifting criteria of effectiveness:
some preliminary evidence. Manage. Sci. 29 (1), 33-51.
Rappaport, A., 1981. Selecting strategies that create shareholder value. Harvard Bus. Rev. 59 (3),
139-149.
Richardson, P. R., Gordon, J. R., 1980. Measuring total manufacturing performance. Sloan Manage.
Rev. 21 (2), 47-58.
Richardson, S., 2006. Over-investment of free cash flow. Rev. Acc. Stud. 11 (2/3), 159-189.
Rumelt, R. P., 1984. Towards a strategic theory of the firm. In Competitive Strategic Management,
edited by B. Lamb: Englewood Cliffs, NJ: Prentice-Hall, 556-570.
Sanderson, E., Windmeijer, F., 2013. A weak instrument F-test in linear IV models with multiple
endogenous variables (No. CWP58/13). CEMMAP working paper, Centre for Microdata
Methods and Practice.
Sharpe, W. F., 1964. Capital asset prices: a theory of market equilibrium under conditions of risk. J.
Finance 19 (3), 425-442.
Smith, C. W., Watts, R. L., 1992. The investment opportunity set and corporate financing, dividend,
and compensation policies. J. Financ. Econ. 32 (3), 263-292.
Smith, K. G., Mitchell, T. R., Summer, C. E., 1985. Top level management priorities in different
stages of the organizational life cycle. Acad. Manage. Rev. Acad. Manag. J. 28 (4), 799-820.
Stock, J. H., Yogo, M., 2002. Testing for weak instruments in linear IV regression: National Bureau
of Economic Research, Cambridge, MA, USA.

41
Truong, G., Partington, G., 2007. Alternative estimates of the cost of equity capital for Australian
firms. Working Paper, available at http://dx.doi.org/10.2139/ssrn.1009125
Van De Ven, A. H., Poole, M. S., 1995. Explaining development and change in organizations. Acad.
Manage. Rev. 20 (3), 510-540.
Wernerfelt, B., 1984. A resource-based view of the firm. Strategic Manage. J. 5 (2), 171-180.
Witmer, J., and Zorn, L., 2007. Estimating the cost of equity for Canadian and U.S. firms. Bank of
Canada Review, 27-35.