Embed Size (px)
Citation preview
citable using Digital Object Identifier – DOI)
Early View publication on wileyonlinelibrary.com(issue and page numbers not yet assigned;
Laser Photonics Rev., 1–19 (2012) / DOI 10.1002/lpor.201100036
LASER & PHOTONICSREVIEWS
Abstract Over the past 10 years, with the advent of new crystalsdesigns and a new generation of pump lasers, continuous-wave(cw) optical parametric oscillators (OPOs) have developed intomature monochromatic light sources. Nowadays, cw OPOs canfulfill a wide variety of criteria for sensitive molecular gas sens-ing. It can access the mid-infrared wavelength region, wheremany molecules have their fundamental rotational-vibrationaltransitions, with high power. This high power combined withwide wavelength tuning and narrow linewidth creates excellentconditions for sensitive, high-resolution spectroscopy. OPOscombined with robust methods, such as photoacoustic spec-troscopy and cavity-enhanced spectroscopy, are well suitedfor field measurements and remote-sensing applications. Thewide tunability of cw OPOs allows detection of larger moleculeswith broad absorption band structures, and its fast scanning
capabilities allow rapid detection of trace gases, the latter is ademand for life-science applications. After a short introductionabout the physical principle of cw OPOs, with its most recentphysical developments, this review focuses on sensitive molec-ular gas sensing with a variety of spectroscopic applications inatmospheric and life sciences.
Continuous-wave optical parametric oscillator based infraredspectroscopy for sensitive molecular gas sensingDenis D. Arslanov1, Marius Spunei2, Julien Mandon1, Simona M. Cristescu1,Stefan T. Persijn2, and Frans J. M. Harren1,*
1. Introduction
In 1965, five years after the demonstration of the first laser,Joseph Giordmaine and Bob Miller developed the opticalparametric oscillator (OPO) at Bell Labs [1]. While lasersfound almost directly widespread use in the field of gassensing (see, e.g., [2,3]), this only happened for OPOs thirtyyears later [4]. Its initial slow development was caused bythe fact that OPOs were far from being a workhorse. Lackof proper nonlinear crystals with a sufficiently high dam-age threshold, the unavailability of good pump lasers, andthe need for skilled operators restricted their usefulnessin applications. The advent of new crystals like periodi-cally poled lithium niobate (PPLN) and a new generation of(fiber) pump lasers have changed this situation. Nowadays,OPOs are commercially available from many suppliers cov-ering the visible, near- and mid-infrared and (recently) partof the ultraviolet wavelength region, using the pulsed andcontinuous-wave (cw) regimes [5].
Here, we will mainly focus on mid-infrared cw singlyresonant OPOs (SROs), nowadays considered as the mostuseful configuration for sensitive molecular detection. Forchemical sensing there are many possible detection schemesthat use laser spectroscopy, each with their own advantagesor disadvantages. OPO-based gas spectroscopy relies onthe use of cw and pulsed OPOs. OPOs have proven tobe excellent sources for spectroscopy within Doppler-freespectroscopy that relies on the reliable tuning characteris-
tics and narrow linewidth of OPOs [6–8]; Photoacousticspectroscopy that utilizes the power of OPOs in the in-frared [9–11]; Cavity ring-down spectroscopy that benefitsfrom the narrow linewidth attainable by cw OPOs [12, 13],and frequency/wavelength modulation spectroscopy thatprofits from the ease of modulation for certain types ofOPOs [14, 15]. In this work, a number of these schemesare demonstrated and evaluated, and applications in atmo-spheric, medical and life sciences are presented.
For trace-gas sensing, OPOs have to be developed in themid-infrared wavelength region between 2.5 and 25 µm, asmany molecules possess their unique vibrational transitionsin this ‘fingerprint’ wavelength region (see Table 1 for the2.5–5 µm region). This wavelength region is widely dom-inated by Fourier transform infrared spectrometry (FTIR)to uniquely identify molecular gases. The development ofmid-infrared laser sources associated with the strong fun-damental rovibrational molecular transitions present in thisregion has offered remarkable opportunities for highly sen-sitive detection of these molecules. Thus, by combiningselectivity (unique identification) with sensitivity (by us-ing sensitive spectroscopic methods) state-of-the-art tracedetection of molecular gases is achievable.
Many molecular gases are involved in chemical pro-cesses in industry or atmosphere, but also in biological pro-cesses, in agriculture, biology or medicine, and nowadayswithin security and public safety. There is an increasingdemand for novel monitoring techniques to detect all kinds
1 Life Science Trace Gas Facility, Molecular and Laser Physics, Institute for Molecules and Materials, Radboud University, P. O. Box 9010, 6500 GLNijmegen, Netherlands 2 VSL, Dutch Metrology Institute, Thijsseweg 11, 2629 JA Delft, Netherlands* Corresponding author: e-mail: [email protected]
© 2012 by WILEY-VCH Verlag GmbH & Co. KGaA, Weinheim
2
LASER & PHOTONICSREVIEWS
D. D. Arslanov et al.: cw OPO spectroscopy for chemical gas sensing
Table 1 Some molecular (end) groups and their characteris-tic absorbing wavelength regions in the 2.5–5 µm range (2000–4000 cm�1).
of molecular gas species. OPOs are provided with a rela-tively broad continuous tuning range when they are based onquasiphase-matched materials; since they combine this withhigh power levels (� 1 W cw) and narrow linewidth, theyrepresent an excellent source for sensitive spectroscopicgas analysis.
2. Physical basics of opticalparametric oscillators
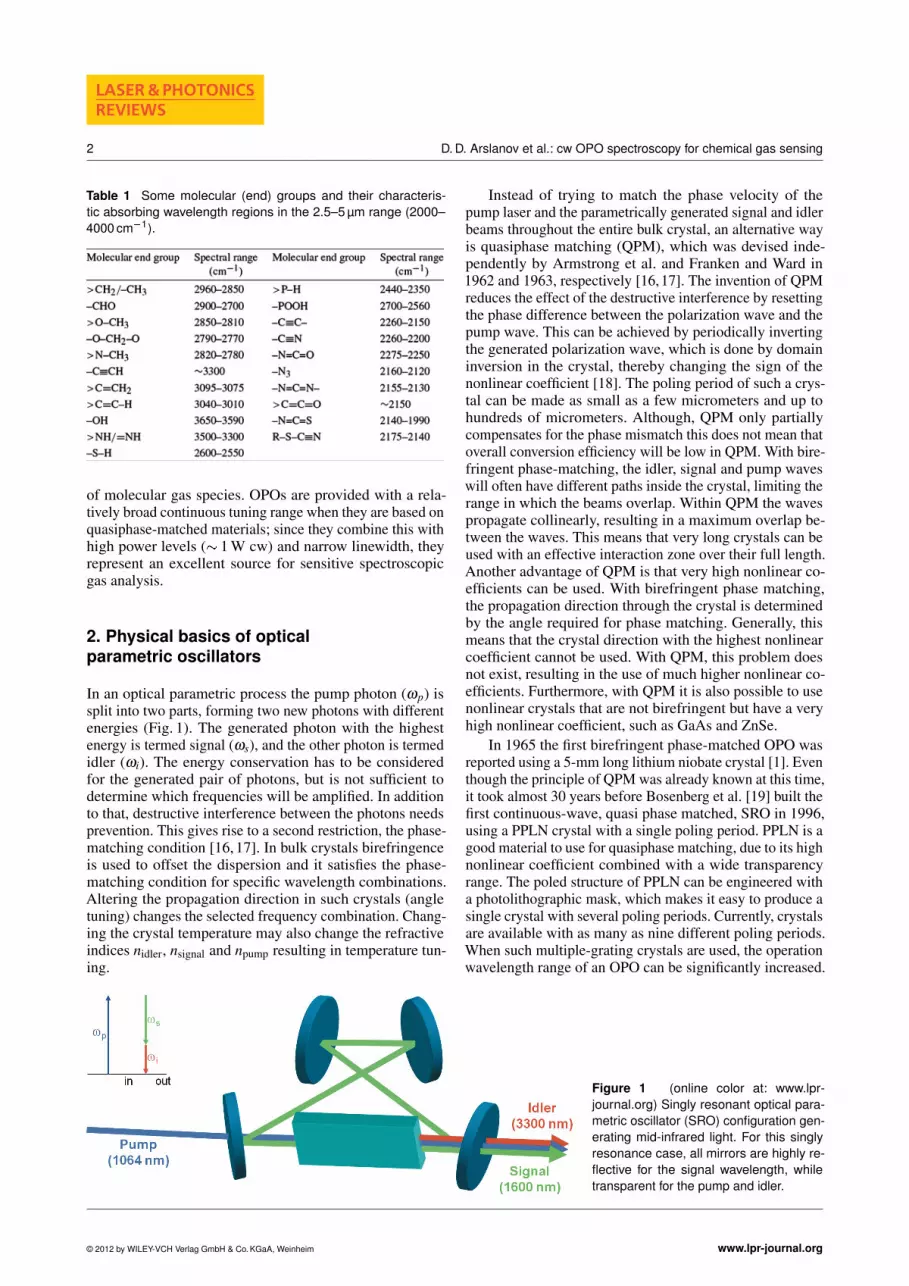
In an optical parametric process the pump photon (ωp) issplit into two parts, forming two new photons with differentenergies (Fig. 1). The generated photon with the highestenergy is termed signal (ωs), and the other photon is termedidler (ωi). The energy conservation has to be consideredfor the generated pair of photons, but is not sufficient todetermine which frequencies will be amplified. In additionto that, destructive interference between the photons needsprevention. This gives rise to a second restriction, the phase-matching condition [16, 17]. In bulk crystals birefringenceis used to offset the dispersion and it satisfies the phase-matching condition for specific wavelength combinations.Altering the propagation direction in such crystals (angletuning) changes the selected frequency combination. Chang-ing the crystal temperature may also change the refractiveindices nidler, nsignal and npump resulting in temperature tun-ing.
Instead of trying to match the phase velocity of thepump laser and the parametrically generated signal and idlerbeams throughout the entire bulk crystal, an alternative wayis quasiphase matching (QPM), which was devised inde-pendently by Armstrong et al. and Franken and Ward in1962 and 1963, respectively [16,17]. The invention of QPMreduces the effect of the destructive interference by resettingthe phase difference between the polarization wave and thepump wave. This can be achieved by periodically invertingthe generated polarization wave, which is done by domaininversion in the crystal, thereby changing the sign of thenonlinear coefficient [18]. The poling period of such a crys-tal can be made as small as a few micrometers and up tohundreds of micrometers. Although, QPM only partiallycompensates for the phase mismatch this does not mean thatoverall conversion efficiency will be low in QPM. With bire-fringent phase-matching, the idler, signal and pump waveswill often have different paths inside the crystal, limiting therange in which the beams overlap. Within QPM the wavespropagate collinearly, resulting in a maximum overlap be-tween the waves. This means that very long crystals can beused with an effective interaction zone over their full length.Another advantage of QPM is that very high nonlinear co-efficients can be used. With birefringent phase matching,the propagation direction through the crystal is determinedby the angle required for phase matching. Generally, thismeans that the crystal direction with the highest nonlinearcoefficient cannot be used. With QPM, this problem doesnot exist, resulting in the use of much higher nonlinear co-efficients. Furthermore, with QPM it is also possible to usenonlinear crystals that are not birefringent but have a veryhigh nonlinear coefficient, such as GaAs and ZnSe.
In 1965 the first birefringent phase-matched OPO wasreported using a 5-mm long lithium niobate crystal [1]. Eventhough the principle of QPM was already known at this time,it took almost 30 years before Bosenberg et al. [19] built thefirst continuous-wave, quasi phase matched, SRO in 1996,using a PPLN crystal with a single poling period. PPLN is agood material to use for quasiphase matching, due to its highnonlinear coefficient combined with a wide transparencyrange. The poled structure of PPLN can be engineered witha photolithographic mask, which makes it easy to produce asingle crystal with several poling periods. Currently, crystalsare available with as many as nine different poling periods.When such multiple-grating crystals are used, the operationwavelength range of an OPO can be significantly increased.
Figure 1 (online color at: www.lpr-journal.org) Singly resonant optical para-metric oscillator (SRO) configuration gen-erating mid-infrared light. For this singlyresonance case, all mirrors are highly re-flective for the signal wavelength, whiletransparent for the pump and idler.
© 2012 by WILEY-VCH Verlag GmbH & Co. KGaA, Weinheim www.lpr-journal.org
Laser Photonics Rev. (2012)
REVIEWARTICLE
3
Even though PPLN has many advantages, it also exhibitsseveral undesirable properties such as a weak photorefrac-tive damage resistance. Due to high intensities photoexcitedelectrons generate a charge distribution, known as a space-charge field that can cause damage of the crystal. In addi-tion, the refractive index of the crystal changes in regionswhere the space-charge field is the strongest. Both can beprevented by using doped materials; nearly stoichiomet-ric crystals doped with over 1.8 mol. % MgO showed nomeasurable photorefractive damage to intensities as muchas 8 MW/cm2 at 532 nm [20]. Dopants like Mg, In or Znincrease the photoconductivity of the crystal and renderadvantages such as three orders of magnitude higher thresh-old damage and reduced lensing, resulting in better powerand temperature stability, and room-temperature operationof the crystal. This last property extends the temperaturetuning range within a single period considerably as com-pared to undoped PPLN [13]. Some of the limitations ofPPLN can be overcome by the use of other kinds of ferro-electric materials, such as LiTaO3, and RbTiOAsO4, whileorientation-patterned GaAs has recently gained a lot of in-terest [21].
With the advent of high-power tunable pump lasers forOPOs and the availability of better optical coatings thewavelength coverage of OPOs has extended considerably inthe recent years. These aspects, together with lowering theoscillation threshold and continuous, mode-hop-free tuning,will be discussed in more detail.
3. Singly resonant OPOs
3.1. Efficient tuning of cw OPO
Due to energy conservation, a widely tunable pump fre-quency will generate widely tunable signal and idler fre-quencies. With pump tuning, very wide idler tuning rangescan be obtained, because the well-developed tuning methodsin pump sources can be transferred within an OPO to theidler frequency. Using this principle as one of the first, Kleinand coworkers [22] developed a single-frequency SRO, di-rectly pumped by a tunable InGaAs diode laser. Tuning thepump output around 925 nm resulted in coarse tuning of theidler wavelengths from 2.03–2.29 µm; they achieved 56 GHzcontinuous pump tuning for the idler wave. Van Herpen etal. [23] combined wide pump tuning with a high powerSRO. Here, tuning of the idler frequency was achieved by
longitudinal mode-hop tuning of the pump source (free spec-tral range 100 MHz). In this way an idler frequency scanof 100–150 GHz could be obtained. Recent advances showthat fiber lasers are very promising for wide pump tuning.Lindsay and coworkers [24] obtained 110 GHz continuoustuning using a fiber-amplified DBR laser. In addition, usinga fiber-based source Henderson and Stafford [25] achieved60 GHz of continuous mode-hop-free tuning by applying avoltage to a piezoelectric transducer attached to the fiber.
3.2. Widening wavelength coverage
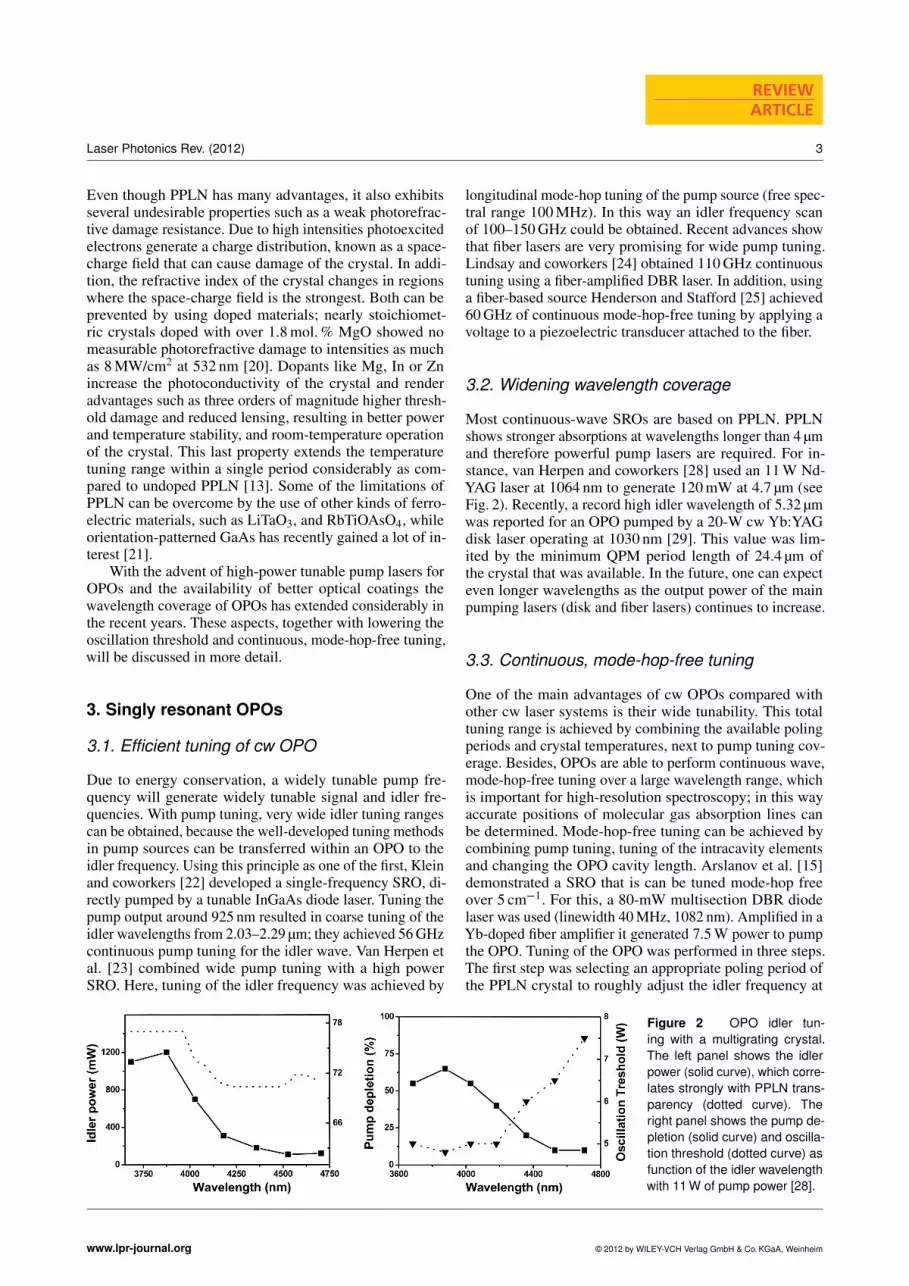
Most continuous-wave SROs are based on PPLN. PPLNshows stronger absorptions at wavelengths longer than 4 µmand therefore powerful pump lasers are required. For in-stance, van Herpen and coworkers [28] used an 11 W Nd-YAG laser at 1064 nm to generate 120 mW at 4.7 µm (seeFig. 2). Recently, a record high idler wavelength of 5.32 µmwas reported for an OPO pumped by a 20-W cw Yb:YAGdisk laser operating at 1030 nm [29]. This value was lim-ited by the minimum QPM period length of 24.4 µm ofthe crystal that was available. In the future, one can expecteven longer wavelengths as the output power of the mainpumping lasers (disk and fiber lasers) continues to increase.
3.3. Continuous, mode-hop-free tuning
One of the main advantages of cw OPOs compared withother cw laser systems is their wide tunability. This totaltuning range is achieved by combining the available polingperiods and crystal temperatures, next to pump tuning cov-erage. Besides, OPOs are able to perform continuous wave,mode-hop-free tuning over a large wavelength range, whichis important for high-resolution spectroscopy; in this wayaccurate positions of molecular gas absorption lines canbe determined. Mode-hop-free tuning can be achieved bycombining pump tuning, tuning of the intracavity elementsand changing the OPO cavity length. Arslanov et al. [15]demonstrated a SRO that is can be tuned mode-hop freeover 5 cm�1. For this, a 80-mW multisection DBR diodelaser was used (linewidth 40 MHz, 1082 nm). Amplified in aYb-doped fiber amplifier it generated 7.5 W power to pumpthe OPO. Tuning of the OPO was performed in three steps.The first step was selecting an appropriate poling period ofthe PPLN crystal to roughly adjust the idler frequency at
Figure 2 OPO idler tun-ing with a multigrating crystal.The left panel shows the idlerpower (solid curve), which corre-lates strongly with PPLN trans-parency (dotted curve). Theright panel shows the pump de-pletion (solid curve) and oscilla-tion threshold (dotted curve) asfunction of the idler wavelengthwith 11 W of pump power [28].
www.lpr-journal.org © 2012 by WILEY-VCH Verlag GmbH & Co. KGaA, Weinheim

4
LASER & PHOTONICSREVIEWS
D. D. Arslanov et al.: cw OPO spectroscopy for chemical gas sensing
Figure 3 (online color at:www.lpr-journal.org) Leftpanel: Continuous-wavemode-hop-free tunable op-tical parametric oscillator.Right panel: Wide mode-hop-free idler tuning over180 GHz by tuning of theseed laser.
a wavelength between 3 and 4 µm. Then, by changing thecrystal temperature the output wavelength can be changedwithin a 200 cm�1 range; thirdly a fast, 5 cm�1 range, mode-hop-free tuning can be achieved with the diode DBR pumplaser. The latter is achieved by synchronously sweeping thecurrent through resistive heaters of the DBR and the phasesections of the multisection diode laser. Mode-hop-free tun-ing or the absence of multimode operation of the idler isconfirmed by the absence of discontinuities or broadenedabsorption lines, respectively, in the measured gas absorp-tion spectra. The OPO itself is housed in a solid aluminummonoblock designed to ensure good long-term frequencystability (Fig. 3, left panel). Here a mode-hop-free tuningfor the idler is shown over 6 cm�1 (Fig. 3, right panel).
Recently, the group of Zondy and coworkers [30] evendemonstrated a 500-GHz mode-hop-free tuning around3 µm. In their SRO the cavity length is shielded againstacoustical perturbations causing mode hops by servoing itslength to a stable confocal Fabry–Perot resonator using theFM/AM modulation spectroscopy.
3.4. Decreasing oscillation threshold
To miniaturize OPOs and make them suitable for “field”applications, decreasing oscillation threshold is a primaryconcern. For many years the typical threshold pump powerfor oscillation of a continuous-wave SRO operating around3 µm was 1.5–3.5 W. Henderson and Stafford [25] couldlower this value to 780 mW using a long PPLN crystalof 80 mm. The Buse group showed that the threshold canbe further reduced by using so-called ‘hybrid pumping’ inwhich, next to a coherent pump laser an incoherent laseris used to pump a piece of doped glass inside the cavity.In this way a threshold < 100 mW (of coherent light) wasobtained [26]. Recently, they showed that only a thresholdas low as 6 mW is needed thanks to a completely new designbased on whispering-gallery modes [27].
3.5. Broadband near- and mid-infrared OPOs
Recently, there is a growing interest in broadband, fem-tosecond OPOs for chemical sensing. Spectrometers based
on broadband sources and with near/mid-infrared camerasallow massive parallel detection of gas species. In recentyears there has been a rapid progress in the mid-infraredwavelength region, due to maturing laser technology in thenear-infrared. An example is the high-power OPO-basedfrequency comb developed by the group of Jun Ye at theUniversity of Colorado, with its continuous tunability from2.8 to 4.8 µm [31]. Their OPO was synchronously pumpedby a 10-W femtosecond Yb-fiber laser centered at 1.07 µm.Its operation in the mid-infrared wavelength region with asimultaneous bandwidth up to 300 cm�1 and an idler powerof 1.5 W generates an enormous potential for sensitive gasanalysis. This potential was realized in 2010 when this OPOwas used as a broadband source and coupled with a Fouriertransform spectrometer [32]. Detection limits at the (sub)part per billion levels (ppbv, 1 : 109) were obtained for gaseslike methane, ethane, isoprene, formaldehyde and nitrousoxide using a 36-m multipass cell.
4. Molecular gas sensing via spectroscopy
Nowadays, gas-phase spectroscopy is very common in awide variety of fields. Next to chemistry and physics it isinvolved in the research of living organisms ranging frombiology to medical sciences. There are various ways of utiliz-ing gas sensors, and each application requires a different setof demands. Some applications require very high sensitivityfor one specific gas compound, while others benefit morefrom a sensor that can monitor a wide range of gases. Ahigh time resolution is often desirable, as well as selectivity,robustness, and little or no need for sample preparation. Tosome extent, these characteristics can be combined withina single device, but often compromises have to be made.Established methods of gas detection such as chemilumines-cence and gas chromatography meet some of these require-ments, but not all. For example, gas chromatography has alimited sensitivity and also sample preparation is needed.Often, the gas sample needs to be preconcentrated on a solidsorbent, which prohibits online measurement.
Laser-based absorption spectroscopy performs well interms of sensitivity and selectivity, besides the fact that itallows online measurements. Its high sensitivity and selec-
© 2012 by WILEY-VCH Verlag GmbH & Co. KGaA, Weinheim www.lpr-journal.org

Laser Photonics Rev. (2012)
REVIEWARTICLE
5
tivity are due to several factors. First, the narrow linewidthof lasers gives a high spectral power density as comparedto broadband light sources. Especially for continuous-wave(cw) lasers this linewidth is typically much narrower thanthe molecular absorption lines. This causes the total laserintensity to be attenuated by the gas sample, instead of onlya small fraction, as in the case of broadband sources. In addi-tion, scanning over absorption lines improves the selectivityand helps to distinguish the target molecule from interferingcompounds and background signals. The selectivity is fur-ther enhanced by the unique spectral absorption features ofthe molecules in the mid-infrared wavelength region. These‘fingerprint’ absorption spectra correspond to rovibrationaltransitions features unique for each molecule; it probes theinternal structure of the molecule, whereas other methods,such as mass spectrometry, only assess a global property ofthe investigated compound. Thus, in the infrared fingerprintwavelength region (2.5–25 µm) molecules have their char-acteristic, strong, absorption lines. Combined with highlysensitive spectroscopic methods, gases can be detected atsub-ppbv levels. Here, a number of these spectroscopicmethods will be compared. Also, applications will be shownfor a variety of gases.
4.1. Photoacoustic spectroscopy
The photoacoustic (PA) effect was discovered by A. G. Bellin 1880 [33]. Early photoacoustic instruments had limitedsensitivities due to the use of blackbody radiators as thesource. This situation changed when lasers became available.As early as 1971, an excellent detection limit of 10 ppbvwas obtained for methane using an infrared He–Ne laser,operating at 3.39 µm [34]. Current state-of-the-art photoa-coustic spectrometers use high-power lasers in combinationwith sensitive microphones or piezoelectric transducers andreach sub-ppbv detection sensitivity. Their robustness andreal-time capabilities were recently shown in airborne mea-surements over industrial sources [35].
Photoacoustic spectroscopy is based on the detection ofacoustic waves, formed after the absorption of modulatedradiation (Fig. 4) [36]. When a gas absorbs light, the temper-ature of the gas increases; the gas expands adiabatically andgenerates a pressure increase. By turning the light off, the
Figure 4 Continuous-wave OPO-based photoacoustic spectrom-eter with a classical microphone. The generated sound in thecell is amplified by an acoustical resonator in its first longitudinalmode [37].
temperature and pressure drop. Thus, the modulated lightgenerates a pressure wave at the same frequency as the mod-ulation frequency (i.e. sound). This sound can be amplifiedin an acoustic resonator and is detected by a microphone;the latter is connected to the resonator at a point where thepressure standing pressure wave has its maximum ampli-tude.
For small absorptions the strength of the photoacousticsignal is given by:
S = P �R � pa �α ; (1)
with P the laser power, R the cell response, pa the partialpressure of the absorbing gas and α the absorption coef-ficient. This equation shows the photoacoustic signal islinearly dependent on the concentration of absorbing mol-ecules and the laser power. Therefore, high-power sourceslike OPOs yield the highest sensitivities. Since photoacous-tic spectroscopy is an indirect detection technique, cali-brated gas samples are needed to obtain absolute concen-trations. Photoacoustic spectroscopy with OPOs has beenapplied to liquids, solids and gases. Here, we restrict our-selves to the application of trace-gas measurements.
Before the invention of high-power cw OPOs with PPLNcrystals, pulsed OPOs were first used in the mid-infraredwavelength region for molecular spectroscopy. Already, in1991, Haub et al. [38] used an injection seeded OPO with aBBO crystal (idler pulse energy 12 mJ) and recorded the pho-toacoustic absorption spectrum of acetylene gas in the near-infrared at 10382.3 cm�1. Using a commercial nanosecondpulsed OPO and difference frequency generation Bohrenand Sigrist [39] covered the mid-infrared wavelength re-gion between 2.5–4.5 µm. They were able to record dif-ferent gases (methanol, ethanol, isopentane, benzene andtoluene) and a mixture of 6 gases (methane, methanol,ethanol, isopentane, benzene and toluene) at atmosphericpressure in the region between 2850 and 3090 cm�1 at ppmvlevels. Operating a pulsed OPO, Costopoulos et al. [40] de-veloped a photoacoustic setup for measurements of N2Oaround 3492 cm�1 and achieved a detection limit of 60 ppbv.Later, they used this OPO, with the grazing-incidence grat-ing for improving spectral resolution, to obtain a sensitivityof 1.2 ppbv for methane at 2948 cm�1 [41]. Recently, Berrouet al. [11] used tunable, narrow line width (<100 MHz),pulsed (8 ns) OPO radiation over the 3.8–4.3 µm spectralrange at a multikilohertz repetition rate and 100 W peakpower (Fig. 5) for the photoacoustic detection of different
Figure 5 (online color at: www.lpr-journal.org) Scheme of theentangled cavity doubly resonant OPO (ECOPO) with double-pass pump beam [11].
www.lpr-journal.org © 2012 by WILEY-VCH Verlag GmbH & Co. KGaA, Weinheim

6
LASER & PHOTONICSREVIEWS
D. D. Arslanov et al.: cw OPO spectroscopy for chemical gas sensing
greenhouse gases (CO2, N2O, SO2 and CH4). For N2O, thesensitivity was estimated to be of 200 ppmv with a 300-msintegration time. This result shows that pulsed OPOs can bemade miniaturized and that reasonable detection limits canbe achieved. Due to the pulsed operation, resulting in highpeak power, nonlinear absorption and a lower duty cycle,detection limits never reached extreme levels. On the otherhand, broad scanning capabilities and smaller footprints arein advantage for pulsed OPOs.
4.2. Photoacoustic spectroscopy with cw OPOs
The first continuous-wave OPO photoacoustic set-up wasdemonstrated by Kuhnemann et al. [42] in 1998. Using a cwOPO with an output power of 100 mW operating in the 2.3–4 µm range a detection limit of 0.5 ppbv was obtained forethane (C2H6) with a scan time of 10 s. Later, van Herpenet al. [9] used the combination of a SRO with photoacousticspectroscopy for trace-gas detection of ethane. To measureat a specific absorption line, e.g. of ethane at 2996.9 cm�1,the OPO was tuned to the center of the absorption peakby adjusting the PPLN crystal to the proper period and ro-tating the solid intracavity etalon. This was followed by a24-GHz of continuous tuning of the pump laser source overthe entire absorption peak. Using a Lorentzian fit with a lin-early decreasing background a detection limit of 0.01 ppbv(SNR = 1) was found, which results in a detection sensi-tivity of 3 × 10�10 cm�1 (scan time 40 s, Fig. 6.
In addition, the same authors were able to detect CO2emissions from small insects under atmospheric condi-tions [43]. For this, the OPO was made tunable in the3.9–4.8 µm infrared wavelength region, covering the strongrotational-vibrational absorption band of CO2 at 4.23 µm.With this system it was possible to detect CO2 with a sensi-tivity of 7 ppbv using 20 mW OPO power. They demon-strated in real-time CO2 in exhaled breath of a singleant (Lasius niger) and individual fruit flies (Drosophilamelanogaster, Fig. 7) [43].
Figure 6 Photoacoustic signal of the ethane absorption lineat 2996.9 cm�1 for a mixture of 0.4 ppbv ethane in nitrogen. ALorentzian fit (dashed line) with a linearly decreasing background(dotted line) has been plotted through the experimental data (solidline). Evidently, there are the microphone noise (5 mV/Hz1/2) andthe high background signal (0.3 mV/W). Due to the wavelength-dependent background signal it is hard to use solely the peakvalue of the absorption at this ethane concentration, but theLorentzian fit is able to find the background signal very well [9].
Another application of OPO photoacoustics was themonitoring of isotope methane (12CH4 and 13CH4) emis-sions by plants. The study was provoked by an earlier studypublished in Nature [44] containing the finding that terres-trial plants can produce a large amount of methane in aerobicconditions. In collaboration with other research groups theresearch group of Harren re-examined this finding using anindependent test performed on OPO spectroscopy [45]. Forthis study 13C labeled plants were grown under controlledconditions in a hermetically sealed plant growth chamber(3.5 m3) specifically designed for atmospheric isotope la-beling. When investigating possible methane emission itis preferable to use 13C labeled plants, since the naturalbackground concentration of 13C-methane is 20 ppbv com-pared to 1.7 ppmv of 12C-methane. Methane shows a verypronounced absorption spectrum around 3000 cm�1 that is
Figure 7 Left panel: Real-time CO2 emission of a small ant (Lasius niger, weight 3.7 mg). Analysis of the ants’ respiration shows aperiodic release of CO2, on average every 90 s. Right panel: CO2 release of a fruit fly (Drosophila melanogaster, weight 1.4 mg). Thecomparison of the CO2 trace from the fruit fly with the background (without fly) shows that the CO2 release does not drop to zero. Theaccuracy of the CO2 detection shows that the CO2 peaks vary in amplitude and frequency [43].
© 2012 by WILEY-VCH Verlag GmbH & Co. KGaA, Weinheim www.lpr-journal.org
Laser Photonics Rev. (2012)
REVIEWARTICLE
7
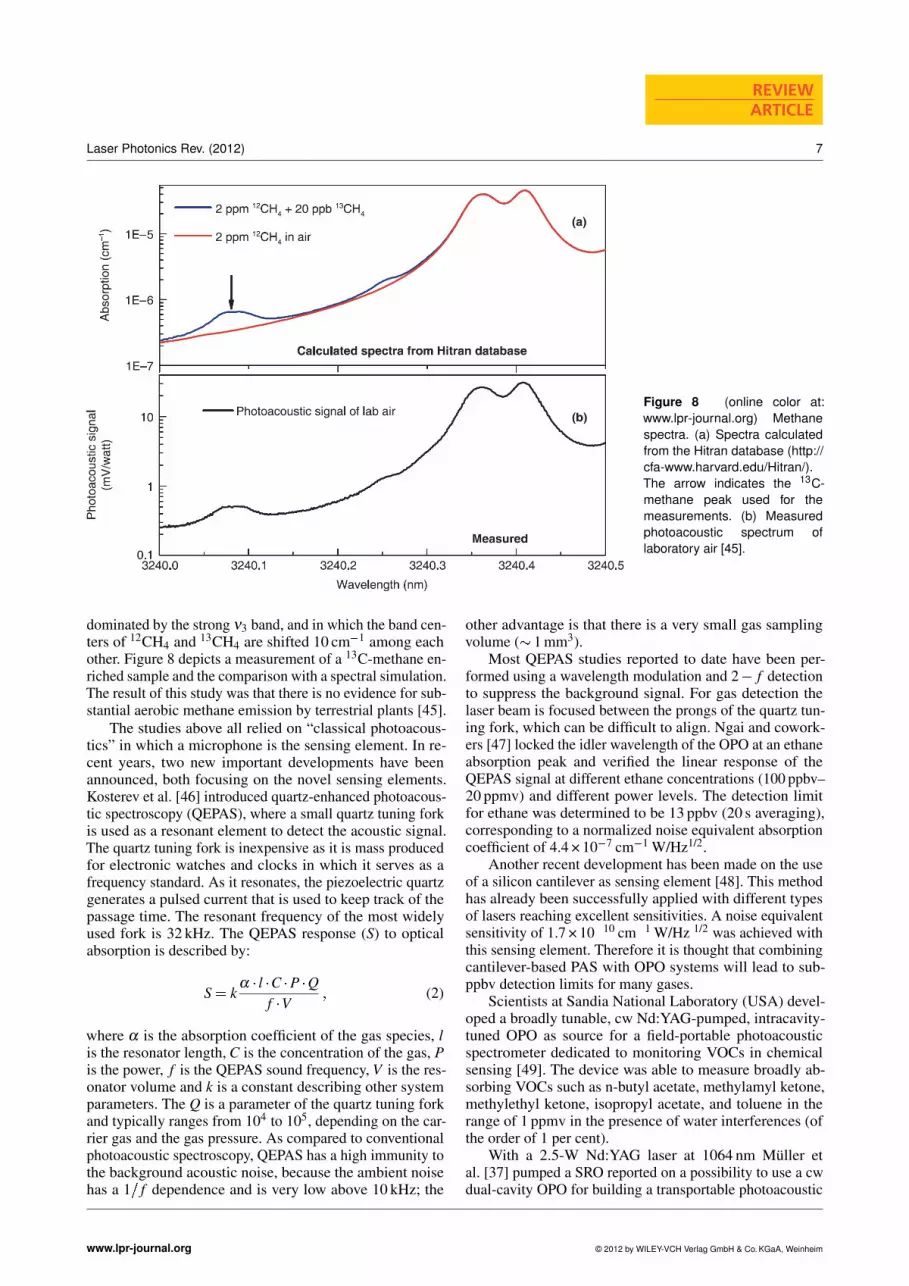
Figure 8 (online color at:www.lpr-journal.org) Methanespectra. (a) Spectra calculatedfrom the Hitran database (http://cfa-www.harvard.edu/Hitran/).The arrow indicates the 13C-methane peak used for themeasurements. (b) Measuredphotoacoustic spectrum oflaboratory air [45].
dominated by the strong ν3 band, and in which the band cen-ters of 12CH4 and 13CH4 are shifted 10 cm�1 among eachother. Figure 8 depicts a measurement of a 13C-methane en-riched sample and the comparison with a spectral simulation.The result of this study was that there is no evidence for sub-stantial aerobic methane emission by terrestrial plants [45].
The studies above all relied on “classical photoacous-tics” in which a microphone is the sensing element. In re-cent years, two new important developments have beenannounced, both focusing on the novel sensing elements.Kosterev et al. [46] introduced quartz-enhanced photoacous-tic spectroscopy (QEPAS), where a small quartz tuning forkis used as a resonant element to detect the acoustic signal.The quartz tuning fork is inexpensive as it is mass producedfor electronic watches and clocks in which it serves as afrequency standard. As it resonates, the piezoelectric quartzgenerates a pulsed current that is used to keep track of thepassage time. The resonant frequency of the most widelyused fork is 32 kHz. The QEPAS response (S) to opticalabsorption is described by:
S = kα � l �C �P �Q
f �V; (2)
where α is the absorption coefficient of the gas species, lis the resonator length, C is the concentration of the gas, Pis the power, f is the QEPAS sound frequency, V is the res-onator volume and k is a constant describing other systemparameters. The Q is a parameter of the quartz tuning forkand typically ranges from 104 to 105, depending on the car-rier gas and the gas pressure. As compared to conventionalphotoacoustic spectroscopy, QEPAS has a high immunity tothe background acoustic noise, because the ambient noisehas a 1= f dependence and is very low above 10 kHz; the
other advantage is that there is a very small gas samplingvolume (� 1 mm3).
Most QEPAS studies reported to date have been per-formed using a wavelength modulation and 2� f detectionto suppress the background signal. For gas detection thelaser beam is focused between the prongs of the quartz tun-ing fork, which can be difficult to align. Ngai and cowork-ers [47] locked the idler wavelength of the OPO at an ethaneabsorption peak and verified the linear response of theQEPAS signal at different ethane concentrations (100 ppbv–20 ppmv) and different power levels. The detection limitfor ethane was determined to be 13 ppbv (20 s averaging),corresponding to a normalized noise equivalent absorptioncoefficient of 4.4 × 10�7 cm�1 W/Hz1/2.
Another recent development has been made on the useof a silicon cantilever as sensing element [48]. This methodhas already been successfully applied with different typesof lasers reaching excellent sensitivities. A noise equivalentsensitivity of 1.7 × 10�10 cm�1 W/Hz 1/2 was achieved withthis sensing element. Therefore it is thought that combiningcantilever-based PAS with OPO systems will lead to sub-ppbv detection limits for many gases.
Scientists at Sandia National Laboratory (USA) devel-oped a broadly tunable, cw Nd:YAG-pumped, intracavity-tuned OPO as source for a field-portable photoacousticspectrometer dedicated to monitoring VOCs in chemicalsensing [49]. The device was able to measure broadly ab-sorbing VOCs such as n-butyl acetate, methylamyl ketone,methylethyl ketone, isopropyl acetate, and toluene in therange of 1 ppmv in the presence of water interferences (ofthe order of 1 per cent).
With a 2.5-W Nd:YAG laser at 1064 nm Muller etal. [37] pumped a SRO reported on a possibility to use a cwdual-cavity OPO for building a transportable photoacoustic
www.lpr-journal.org © 2012 by WILEY-VCH Verlag GmbH & Co. KGaA, Weinheim

8
LASER & PHOTONICSREVIEWS
D. D. Arslanov et al.: cw OPO spectroscopy for chemical gas sensing
spectrometer in the wavelength region of 3.1–3.9 µm. Themode-hop tuning in steps of 450 MHz is performed by tun-ing the intracavity etalon over 52 GHz, which is sufficient toresolve the pressure-broadened spectral lines at atmosphericpressure. The available idler power for photoacoustics ofabout 70 mW allowed the authors to reach a minimum de-tectable absorption coefficient of 3.2 × 10�9 cm�1 in a 10-sintegration time, corresponding to the detection limit of0.11 ppbv and 0.25 ppbv for ethane and ethylene, respec-tively.
4.3. Cavity ring-down spectroscopy
The development of cavity ring-down spectroscopy (CRDS)started in 1988 with a paper published by O’Keefe and Dea-con [50] in which they adapted a technique to characterizehigh-reflective mirrors, and used this to measure the smallabsorption by gases in the visible region. A short laser pulseis coupled into the cavity and is reflected back and forth.Each time the light is reflected a small amount (1�R) leaksout, leading to an exponential decay of the pulse energy inthe cavity. This small amount is measured with a fast detec-tor and recorded using a fast data acquisition card. The highsensitivity in CRDS results from the long path lengths oftypically several kilometers that can be obtained. CRDS isbased on the measurement of the exponential decay of lightwithin the cavity rather than the absolute absorbance [51].The temporal behavior of the intensity I(t) on the detectoris given by:
I(t) = I0 � e�t=τ with τ(ν) =d
c [(1�R)+α(ν)d]: (3)
With I0 the initial intensity falling on the detector andτ , the decay constant, is called the ring-down time, and isdefined as the 1/e decrease of the exponential signal. Thering-down time can be written as a function containing thereflectivity of the mirrors (R), the distance between the mir-rors (d), and α(ν) the absorption coefficient. The ring-downtime for an empty cavity, τ0 for which α(ν) = 0, depends
mainly on mirror losses and various optical phenomena likescattering and refraction. In the visible and near-infraredring-down times up to a few hundred microseconds can bereached while in the mid-infrared, decay times are moremodest (<13 µs) as the reflectivity is typically less than99.99%. The absorption coefficient can be calculated fromboth ring-down times of an empty cavity and filled with anabsorber, and is given by:
α(ν) =1
c�
1τ(ν) �
1τ0(ν)
� : (4)
Absolute densities can be determined by comparing thering-down time in a nonabsorbing medium, such as nitro-gen, with the ring-down time in the absorbing medium underinvestigation. The sensitivity is set by the accuracy at whichthese ring-down times can be determined. There are severalfactors that influence the accuracy: spatial characteristicsof the laser beam, mode matching with the cavity, data-acquisition card resolution and detector noise. The use offast data-acquisition cards and software is important to readthe high amount of data and fit the decays. A major advan-tage of CRDS is that intensity fluctuations of the laser donot add to the noise in the final spectrum, as the ring-downtime is independent of the initial light intensity I0.
For pulsed lasers the bandwidth is sufficiently wide sothat light will always couple into the cavity. For narrow-band, continuous-wave lasers the laser frequency or cavitylength must be tuned to mode-match the laser frequency tothe cavity mode of the absorption cell and, thus, couple lightinto the cavity. Modulating the cavity length is normallydone by using a piezoactuator attached to one of the mirrors.Typically, at least one free spectral range is covered in thescan so that a resonance in each period is guaranteed. Whenthe light intensity inside the cavity exceeds a certain thresh-old, an acousto-optical modulator (AOM) turns off the OPObeam, followed by a measurement of the ring-down decay(Fig. 9). In a typical setup operating around a wavelengthof 3 µm the background ring-down time τ0 has a maximumvalue of � 13 µs, for a cavity length d= 50 cm and a mirror
Figure 9 (online color at: www.lpr-journal.org) SRO pumped by a cw-Nd:YAG laser used for cw cavity ring-down spectroscopy. The CRD cell isscanned by a piezo actuator over its freespectral range. If the OPO frequencyis matching one of the cavity modes ofthe cell the transmitted light rises abovethreshold, after which the AOM turns offthe OPO beam and the ring-down eventis recorded.
© 2012 by WILEY-VCH Verlag GmbH & Co. KGaA, Weinheim www.lpr-journal.org

Laser Photonics Rev. (2012)
REVIEWARTICLE
9
reflectivity R = 99.98%, which gives an absorption path ofapproximately 4 km.
4.4. OPO-based cavity ring-down spectroscopy
There are numerous research groups actively involved in thedevelopment and application of CRDS. The current state-of-the art is well described in a recent book by Berden andEngeln [52]. Here, we only refer to OPO-based instrumentsand applications for molecular gas sensing.
Van Zee et al. [53] were the first to apply a pulsed OPOfor CRDS. Using an injection-seeded pulsed OPO witha bandwidth of about 115 MHz and a short 10.5 cm ring-down cavity, they recorded the absorption spectra of thePQ(9) transition of the A-band of molecular oxygen (� 13100 cm�1) by simultaneously scanning the OPO and thecavity length. An excellent noise-equivalent absorption co-efficient of 5 × 10�10 cm�1 Hz�1/2 was demonstrated, witha standard deviation for repeated measurements of the linestrength better than 0.3%. Using a commercial pulsed OPOMorville et al. [54] recorded the collision-induced absorp-tion band of oxygen at low temperatures in an 84-cm longcavity. This OPO was pumped by a frequency-tripled YAGlaser with a pulse energy of several hundred microjoules,tunable from 400 to 700 nm and a large spectral width ofthe laser from 5–10 nm.
In 2002 Popp et al. [55] reported the first cw-CRDStrace-gas detector employing a pump-resonant SRO. Theyreached for ethane a 300 pptv (part per trillion volume,1: 1012) detection limit with an integration time of 16 s.Later, von Basum et al. [56] improved the performance ofthis system. The OPO was changed from a common-cavitydesign to one with two independent cavities for the pumpand signal, which led to much wider frequency tunability.With the pump cavity locked to the laser by use of a Pound–Drever–Hall scheme, the idler beam is rapidly modulatedin frequency. As a result, the ring-down cell is periodicallyexcited, which led in their experiments to a high data rate of1.4 kHz. An impressive 0.5 pptv ethane detection limit wasobtained for 3 min integration time at 2997 cm�1. They alsodemonstrated the detection of several gases by measuringethane, methane and water in human breath within a 1 cm�1
spectral range, which shows the high potential of an OPO-based CRDS for a transportable, ultrasensitive trace gasanalyzer for environmental and medical studies.
Using a continuous-wave SRO, Ngai et al. [13] mea-sured traces of CH4 and C2H6 with CRDS. They used acw-OPO pumped by a single frequency master oscillator-power amplifier MOPA at 1064 nm, which could betuned continuously over 48 GHz. A detection limit of0.16 ppbv was obtained for CH4 using the absorption peakat 3221 nm (3105 cm�1) in 200 s with a spectral resolutionof 0.001 cm�1 and 0.07 ppbv for C2H6 over the absorptionpeak at 3337 nm (2997 cm�1) in 60 s and a spectral resolu-tion of 0.01 cm�1.
The wide tunability of OPOs makes them especiallysuitable to measure the broad absorption patterns of larger
molecules such as ethanol, propane or acetone. Under at-mospheric conditions, the spectra of these molecules donot exist out of well-isolated lines but of broad absorptionbands spanning typically 100 cm�1. Using a cw-OPO tun-able from 2693 nm to 3505 nm, Persijn et al. [57] developeda CRDS-based OPO spectrometer for sensitive and quanti-tative measurements. This setup has been used for trace-gasdetection and also for purity analysis of gases. As a pumpsource for the OPO a DFB single-frequency fiber laser isused centered at 1063.9 nm with an output power of 7 Wand a laser linewidth better than 70 kHz. The laser can betuned thermally over 45 GHz, or via applying a tensile strainto the fiber over 53 GHz using a multilayered piezo. Thecombined tuning range is 90 GHz (Fig. 10).
Figure 10 Pump laser light is coupled into the OPO via a collima-tor (COL), Faraday isolator (FI) and AR-coated focusing lens (L1).The output of the OPO is collimated using an uncoated CaF2 lens(L2). Signal and residual pump are separated from the idler usinga dichroic beam splitter (DBS). Part of the idler beam is directedto a wavelength meter using a ZnSe window placed near theBrewster angle. The idler is guided through an acousto-optic mod-ulator (AOM), and via mode-matching optics (L3) coupled into thering-down cavity. Length of the cell is modulated at 35 Hz using aring piezo-electric transducer (PZT). Light emerging from the cellis focused with a lens (L4) on a fast photodetector (PD) [57].
The system was used in VSL, the Dutch MetrologyInstitute for purity analysis of gases. For this, gas mixtureswere prepared gravimetrically in cylinders, or via dynamicgeneration using diffusion tubes. The results were comparedwith data from the Hitran [58], NIST [59] and PNNL [60]databases. An example of benzene is given in Fig. 11 for theQ-branch region at 3100 cm�1, and as can be seen a goodagreement is observed with the PNNL and NIST databases.
A problem arises when gas sensing is extended to larger,more complex molecules, which represent the majority ofVOCs. At room temperature, these molecules exhibit broadand complex absorption patterns. Because of their lack ofsymmetry, these molecules tend to have a high degree ofvibrational and rotational freedom, resulting in complexspectra consisting of a multitude of overlapping lines. Thiscomplicates the spectral identification considerably and italso effectively decreases the state density, i.e. detectionsensitivity. One way to tackle this problem is using a super-sonic planar jet expansion. Supersonic slit jet expansions,both cw and pulsed, are well known in the field of molecularspectroscopy. A planar expansion combines a Doppler-freeenvironment with a relatively large absorption path length
www.lpr-journal.org © 2012 by WILEY-VCH Verlag GmbH & Co. KGaA, Weinheim

10
LASER & PHOTONICSREVIEWS
D. D. Arslanov et al.: cw OPO spectroscopy for chemical gas sensing
Figure 11 (online color at: www.lpr-journal.org) Measurement of1.00 µmol/mol benzene (solid blue line) and after subtraction ofwater vapor interference (dashed red line). Spectra from PNNL(black dots) and NIST (black squares including expanded uncer-tainty) databases are shown for comparison.
and low final rotational temperatures. The adiabatic cool-ing compresses the population distribution of a complexspecies into the lowest quantum states. Broad, complex,and overlapping absorption patterns thus become distinc-tive with linewidths that are principally determined by theresidual Doppler broadening. Relatively short scans overtenths of wave numbers are sufficient to unambiguouslyidentify and quantify multiple compounds with high sen-sitivity (ppbv-range) and short time scales. Using this ap-proach, Ngai et al. [61] recorded the CH stretching region ofmethanol in a continuous jet at 10 mbar (Fig. 12). With a to-tal optical path length of 180 m in the planar jet, a detectionlimit for methanol in an air expansion was determined at70 ppbv, corresponding to a minimum detectable absorptionof 2.2 × 10�8 cm�1 (over 90 s).
The same setup was used [62] to measure in planarplasma the rotationally cold spectrum of formyl cation,HCO+, in the CH-stretching region. The transitions ob-served here were first recorded in 1983 in discharge cellsusing phase-sensitive detection and have been used eversince for testing new discharge techniques [63]. Using thisdetection method (CRDS in jet), it is possible to obtain ab-solute densities of the different species once the absorbanceis available. The authors showed that direct absorption meth-ods (cw-CRDS) could be used as an alternative method andwould be suited to quantify reaction dynamical aspects inthe expansion. Using this setup they obtain an average den-sity of roughly 2 × 10¹⁰ HCO+/cm3. This setup allows theonline probing of densities of different reaction products,by intersecting the plasma at different distances from thenozzle orifice.
4.5. Cavity-enhanced absorption spectroscopy
An alternative for cavity ring-down spectroscopy was de-veloped independently in 1998 in two different groups by
Figure 12 Continuous-wave CRD spectra of the CH stretch fun-damental region of methanol: (A) 125 ppmv methanol in 10 mbarlaboratory air without jet, (B) an expansion of 60 ppmv methanol ina 525 l /h laboratory air flow, and (C) an expansion of 1250 ppmvmethanol in 25 l /h air mixed with 500 l /h argon. For each datapoint 16 ring-down events were averaged over a data acquisitiontime of 1 s [61].
O’Keefe [64] and Engeln et al. [65]: integrated cavity outputspectroscopy (ICOS) also named cavity-enhanced absorp-tion spectroscopy (CEAS). Rather than via a decay time asin CRDS, this approach enables absorption spectra to beobtained by means of the integration of the transmitted lightintensity. Light is enabled passing through the high-finesseoptical cavity, either by oscillating the cavity length [66] orby antimode matching the laser with the cavity such thatthe laser couples to a large number of transverse cavitymodes [67]. Very high effective optical path lengths can beobtained and the technique provides detection sensitivitiescomparable to CRDS.
The amplitude of the E-field transmitted through anoptical cavity can be expressed as [68]:
Et =E0eiωtt1t2e�αL=2
1� r1r2e�αLeiδ ; (5)
where E0 and Et are the incident and transmitted electricalfields, t1, t2, r1, and r2 the transmission and reflection coef-ficients for each mirror, ω the frequency of the light, α theabsorption coefficient (in cm�1), L the cavity length and δ
the phase shift that the wave acquires in a round trip. Foridentical mirrors the transmitted intensity through the cavity
© 2012 by WILEY-VCH Verlag GmbH & Co. KGaA, Weinheim www.lpr-journal.org

Laser Photonics Rev. (2012)
REVIEWARTICLE
11
Figure 13 The intensity change ∆I=I0 of thetransmitted light beam through an optical cavity(with length L = 30 cm and mirror reflectivity R) isshown as a function of the absorption strength α
for various mirror reflectivities. α = σ �N with σ theabsorption cross section at a specific wavelength(in cm2) and N the density of the molecular gas (in1/cm3). Data are results of Eq. (7).
will be:
ItI0
=
����E2
t
E20
����
=T 2e�αL
1+R2e�2αL�2Re�αL cosδ
=T 2e�αL
(1�Re�αL)2 �1
1+F sin2(δ=2); (6)
in which R = r2 and T = t2 and R+T = 1. The second partof the last equation is the well-known Airy function used inmultiple-beam interference with the coefficient of finesse:F = 4R=(1�R)2. In the case of optimal transmission δ =2πm, with m an integer, we get:
It
I0=
(1�R)2e�αL
(1�Re�αL)2 : (7)
For various reflectivities and absorption strengths this equa-tion is shown in Fig. 13.
Figure 13 shows that even small changes in absorptionresult in rather large changes in the total transmitted sig-nal. It also shows that for relative strong gas absorptions(e.g. 10�4 cm�1) 99% mirrors can be sufficient (and costeffective) as compared to mirrors with a high reflectivity.Depending on the noise-reduction schemes a ∆I=I0 of 10�3–10�4 is achievable; more advanced modulation schemes(such as wavelength modulation) are able to observe 10�5.
As compared to CRDS, ICOS does not require activefrequency-locking schemes, which results in simple align-ment routines and more robust gas-detection cells for tracegases sensing. Although developed for pulsed lased sys-tems, ICOS is ideally suited for continuous-wave lasers es-pecially when off-axis ICOS configurations were developed.In off-axis integrated cavity output spectroscopy (OA-ICOS)multiple reflections are within the optical cavity before thelight beam returns to its entry position [67]. Off-axis pathsthrough optical cavities are well understood [69, 70]. This
condition is dictated by the curvature and spacing betweenmirrors forming the cavity. For a spherical two-mirror cavity,the stability condition is defined by:
0 < (1�d=R1)(1�d=R2)< 1 ; (8)
where d is the mirror spacing and R1 and R2 are the mirrorcurvatures. The multiple reflections appear on the mirrorsurfaces as a series of spots in an elliptical pattern for spher-ical mirrors, or in a Lissajous spot pattern for astigmaticmirrors, which can further lengthen the re-entrant condition.The per-pass rotation θ is determined by the geometry ofthe cavity:
cos(θ) = 1�d=R (9)
assuming the same reflectivity R for both mirrors. For a cer-tain conditions the number of passes can approach infinity.OA-ICOS is effectively lowering the FSR of the cavity byeffectively increasing the cavity length, which results in adense mode structure [67, 71]. In a successful off-axis align-ment, many cavity modes exist underneath every moleculartransition and the laser linewidth should be broad with re-gard to the FSR of the cavity, but narrow with regard to themolecular line. Even narrow-band lasers link to many cavitymodes simultaneously, which gives alignment robustness atthe cost of transmitted power (see Fig. 14).
One big advantage of OA-ICOS is, as compared withCRDS, that neither the time evolution of every individ-ual ring-down event has to be monitored nor that modematching is needed between the laser frequency and theFSR. The potential drawback of the OA-ICOS approachis the significantly lower transmission power through thecavity compared with resonant-coupling methods. There-fore, high-power sources such as OPOs are rendered tobe most suitable, usually, having an output cw power atWatt level [24, 72–74].
Despite the advantages that OPOs have over other mid-IR coherent sources, such as high power, narrow linewidthand broad tunability, not until 2010 was ICOS combinedwith an OPO [75]. The high output power of an OPO (>1 W)
www.lpr-journal.org © 2012 by WILEY-VCH Verlag GmbH & Co. KGaA, Weinheim

12
LASER & PHOTONICSREVIEWS
D. D. Arslanov et al.: cw OPO spectroscopy for chemical gas sensing
Figure 14 (online color at: www.lpr-journal.org) Mode spectrashown here contrast the on-axis mode structure with the off-axismode structure, showing how the free spectral range effectivelycollapses. The lower panels illustrate the resultant signals fromeach alignment. In a successful off-axis alignment, many cavitymodes should exist underneath every molecular transition, andthe laser line width should be broad with regard to the free spec-tral range of the cavity but narrow with regard to the molecularline [71].
gives superiority in use of OA-ICOS. The authors demon-strated that 50 pptv ethane (C2H6) in nitrogen, at 2997 cm�1,can be recorded in just 0.25 s. In addition, they showed real-time breath sampling of methane and water with the timeresolution of 0.1 s (Fig. 15).
4.6. Wavelength modulation spectroscopy
One of the most straightforward and simple methods to dolaser spectroscopy is direct absorption spectroscopy. Onecan enhance the sensitivity by enlarging the path length upto hundreds of meters in a multiple-pass cell, using mirrorsto fold the optical path. There are two basic conventionaldesigns of multiple pass cells, developed by White [76]and Herriott and Schutte [70]. By incorporating wavelengthmodulation spectroscopy in such setups an order of magni-tude better sensitivity can be achieved [77, 78].
In practice, modulation spectroscopy can be divided intotwo approaches. The first is WMS, in which the modulationfrequency is much lower than the absorption linewidth ofthe molecular transition; detection is performed at the mod-ulation frequency (1 f ), or the higher harmonics (2 f , 3 f ,etc.). This typically corresponds to modulation frequenciesfrom a few kHz to a few MHz. On the other hand, there isfrequency modulation spectroscopy (FMS) that applies formodulation frequencies comparable to or higher than thespectral feature of interest (100 MHz to GHz) [79, 80].
Due to the ease of diode laser frequency modulation,WMS has been widely applied in diode laser spectroscopy.Only in 2006 was WMS described for the first time in com-bination with an OPO [14]. One of the reasons could bethat modulating the wavelength of the OPO is not as easy
Figure 15 (online color at: www.lpr-journal.org) Panel (a): Spectrasimulated for 1 cm path length and a pressure of 250 mbar of1.7 ppmv of methane (solid curve) and 2% of water (dashed curve)based on the HITRAN 2008 database. (b) Dynamics of water(upper graph, right scale) and methane (lower graph, left scale)concentration measured in exhaled human breath, in real time.White sections correspond to exhalation, gray to inhalation [75].
as in diode laser spectroscopy, for which injection currentmodulation is used.
When the laser is modulated around its center frequencyωL at a frequency ωm with modulation amplitude δω , theinstantaneous frequency is ω = ωL + δω cos(ωmt). Theintensity of the radiation transmitted through the absorptioncell can then be expressed as a Fourier series expansion:
I(ωL; t) =∞
∑n=0
An(ωL)cos(nωmt) ; (10)
where An(ωL)(n > 0) are the individual harmonic compo-nents, which can be measured with a lock-in amplifier. Inthe limit of low absorbance (σNL� 1) An(ωL) becomes:
An(ωL) =2IoNL
π
πZ
0
�σ(ωL +δω cosθ)cosnθdθ : (11)
Thus, each harmonic component is directly proportional tothe species concentration N. A special case occurs whenthe modulation amplitude δω is much smaller than theabsorption linewidth. In this case, a Taylor series expansion
© 2012 by WILEY-VCH Verlag GmbH & Co. KGaA, Weinheim www.lpr-journal.org

Laser Photonics Rev. (2012)
REVIEWARTICLE
13
Figure 16 Wavelength modulation spectroscopy of an absorption peak. When the modulated laser frequency at ωL probes theabsorption feature, part of the wavelength modulation is converted into an amplitude modulation, which is subsequently detected with afast photodetector. Phase-sensitive detection with a lock-in amplifier of the first and second harmonics result in a WMS signal that isproportional to the first and second derivatives, respectively.
Figure 17 Optical configurations for OPO-basedWMS and FMS experiments. DBR: multisection dis-tributed Bragg reflector diode laser, ISO1: 60 dB iso-lator, ISO2: 30 dB isolator, Q and H: quarter- and half-wave plates, M1�4: OPO cavity mirrors, E: intracavityetalon, tune: tuning input to DBR laser, ILD: DBRlaser injection current supply, DHF : fast mid-IR detec-tor output, DLF : slow mid-IR detector output [14].
of σ(ω) gives:
An(ωL) =2Io21�nNL
n!δω
n dnσ
dωn
����ω=ωL
: (12)
Each harmonic component is directly proportional to thederivative of σ(ω). The last is roughly proportional to theabsorption signal, which is proportional to the species con-centration (Fig. 16).
Due to the high modulation frequency for wavelengthmodulation and frequency modulation the noise at thesefrequencies is extremely low. This gives the advantage toachieve a factor 10 higher ∆I=I ratios per cm path length(10�5) than other direct absorption methods (10�4).
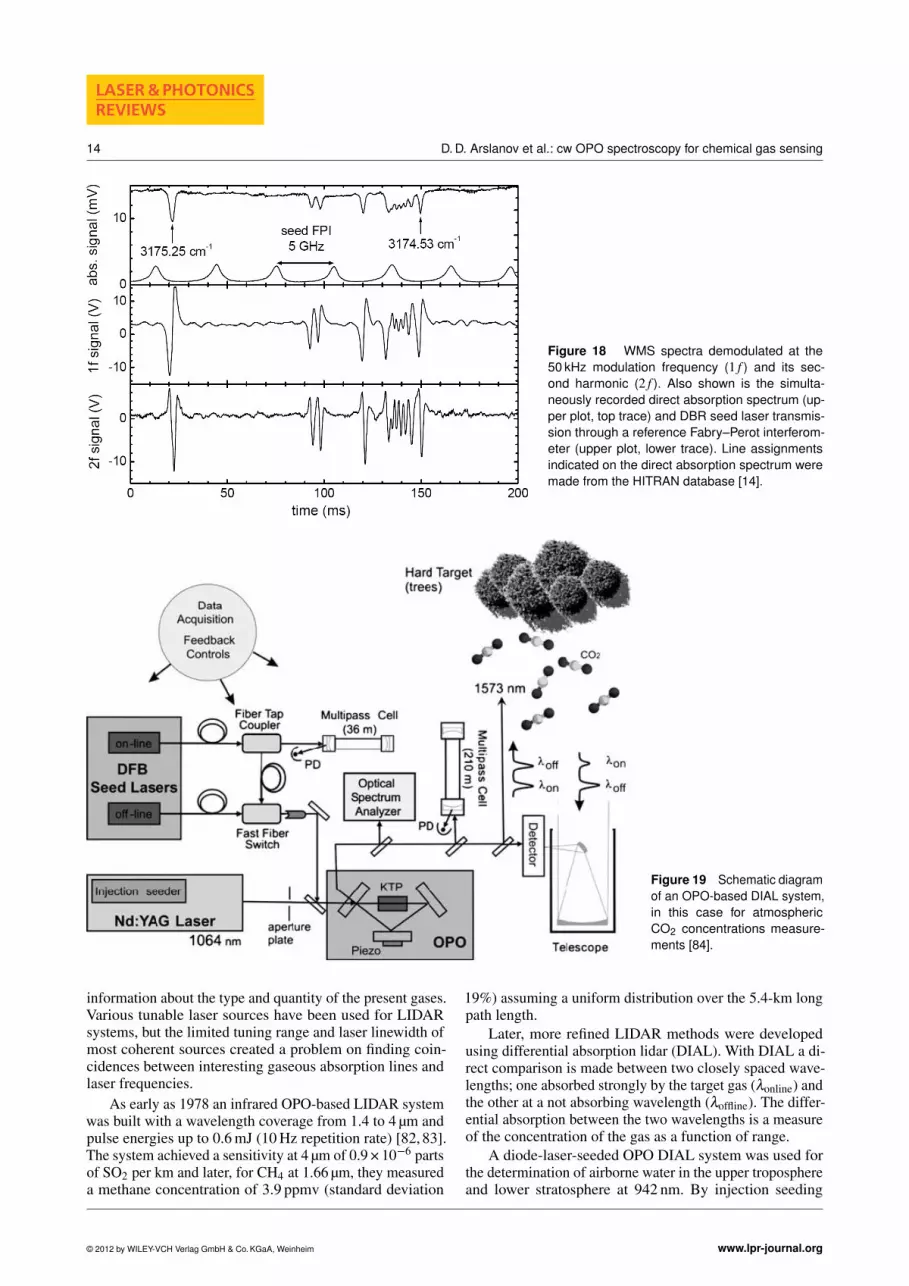
Ng et al. [81] were the first to combine WMS with anOPO for wavelength-modulated photoacoustic spectroscopy.In addition, Lindsay et al. [14] demonstrated the full poten-tial of OPO-based WMS and FMS, their optical configura-tion is shown in Fig. 17. The idler output of the OPO (wave-length 3.1 µm) was passed through a 90-cm long absorptioncell containing a dilute mixture of methane in nitrogen. ForWMS, a 50-kHz modulation was applied to the DBR laser;a typical result is shown in Fig. 18, demonstrating spectra atboth the modulation frequency (1 f ) and its second harmonic(2 f ). The authors clearly demonstrated that a SRO pumped
by a fiber-amplified diode laser can be used to implementWMS and FMS detection.
Having a similar fiber amplified SRO setup, Arslanovand coworkers [15] demonstrated trace-gas OPO-basedWMS for trace-gas detection reaching a sensitivity of0.8 ppbv in ethane (2996.9 cm�1, recorded in 1.3 s), cor-responding to a noise equivalent absorption sensitivity of1.2 × 10�9 cm�1/Hz1/2 [69]. The authors also showed abroad continuous tunability, covering 35 cm�1, while record-ing absorption features of ethane, methane and water. Thelatter demonstrates the multicomponent capabilities, neces-sary for life-science applications.
4.7. Remote sensing
Optical remote sensing came quickly under developmentafter the invention of the laser. LIDAR (light detection andranging) is able to remotely measure the concentration andthe spatial distribution of gas clouds. Pulsed laser light trav-els through the atmosphere, scatters on atmospheric parti-cles, molecules or objects, and backscattered light travelsto an optical receiver (Fig. 19). The spatial distribution isdetermined on the arrival time of the pulses. The intensityof the reflected pulse as a function of the wavelength gives
www.lpr-journal.org © 2012 by WILEY-VCH Verlag GmbH & Co. KGaA, Weinheim
14
LASER & PHOTONICSREVIEWS
D. D. Arslanov et al.: cw OPO spectroscopy for chemical gas sensing
Figure 18 WMS spectra demodulated at the50 kHz modulation frequency (1 f ) and its sec-ond harmonic (2 f ). Also shown is the simulta-neously recorded direct absorption spectrum (up-per plot, top trace) and DBR seed laser transmis-sion through a reference Fabry–Perot interferom-eter (upper plot, lower trace). Line assignmentsindicated on the direct absorption spectrum weremade from the HITRAN database [14].
Figure 19 Schematic diagramof an OPO-based DIAL system,in this case for atmosphericCO2 concentrations measure-ments [84].
information about the type and quantity of the present gases.Various tunable laser sources have been used for LIDARsystems, but the limited tuning range and laser linewidth ofmost coherent sources created a problem on finding coin-cidences between interesting gaseous absorption lines andlaser frequencies.
As early as 1978 an infrared OPO-based LIDAR systemwas built with a wavelength coverage from 1.4 to 4 µm andpulse energies up to 0.6 mJ (10 Hz repetition rate) [82, 83].The system achieved a sensitivity at 4 µm of 0.9 × 10�6 partsof SO2 per km and later, for CH4 at 1.66 µm, they measureda methane concentration of 3.9 ppmv (standard deviation
19%) assuming a uniform distribution over the 5.4-km longpath length.
Later, more refined LIDAR methods were developedusing differential absorption lidar (DIAL). With DIAL a di-rect comparison is made between two closely spaced wave-lengths; one absorbed strongly by the target gas (λonline) andthe other at a not absorbing wavelength (λoffline). The differ-ential absorption between the two wavelengths is a measureof the concentration of the gas as a function of range.
A diode-laser-seeded OPO DIAL system was used forthe determination of airborne water in the upper troposphereand lower stratosphere at 942 nm. By injection seeding
© 2012 by WILEY-VCH Verlag GmbH & Co. KGaA, Weinheim www.lpr-journal.org

Laser Photonics Rev. (2012)
REVIEWARTICLE
15
with a 4.5-mW external cavity diode laser system, the spec-tral width of the pulsed OPO was line-narrowed down to190 MHz, generating 40 mJ/pulse [85]. The line-narrowedOPO fulfils the spectral and energy requirements for air-borne water vapor measurements. In 2002 a modified sys-tem was used in an intercomparison study for atmosphericwater vapor measurements (925–940 nm) between three air-borne DIAL systems to draw conclusions for future fieldcampaigns. Data were collected during flight on verticalwater vapor profiles in the atmosphere with a 10-s temporalaverage (Fig. 20) [86].
Figure 20 (online color at: www.lpr-journal.org) Water-vapor pro-files (mixing ratio against height) of the atmosphere measuredwith the DLR-DIAL (Deutsche Luft und Raumfahrt) platform duringthe formation flight on 7–8 June 2002. Data are with a temporalresolution of 10 s and an effective vertical resolution of 195 m [87].
OPO-based DIAL systems were also developed foratmospheric methane measurement [88]. With a pulsedinjection-seeded OPO, capable of tuning over a range of90 nm (1490–1580 nm), atmospheric methane was measuredat a concentration of 1.78 ppmv, which correspond closelyto the established value of methane in atmosphere. TheOPO had an output energy of 5 mJ/pulse and a linewidthof 140 MHz. Methane was also measured at 3.3 µm withan OPO-based LIDAR system for urban atmosphere pol-lution studies [89]. The overall tunability of the system(1.41–4.24 µm) and short acquisition time of 1 s makes thedescribed LIDAR system capable of infrared remote sensingof multiple molecules in the atmosphere.
For atmospheric carbon dioxide measurements a DIAL-OPO system was used at 1.57 µm for horizontal mappingusing a topographic target [84]. For the first time, mea-surements were performed on the diurnal variations ofCO2 at 1.57 µm, using a direct detection receiving system.Sakaizawa et al. [90] extended the described approach tomeasure vertical CO2 profiles at 1.6 µm. The described LI-DAR could be used to observe CO2 with 2% statistical errorin the troposphere from a few hundred meters to 5.2 km.
A femtosecond infrared LIDAR system based on a super-broadband OPO at 3 µm (pulse duration 100 fs, pulse energy50 µJ, 1 kHz repetition rate) and its capability for remote
sensing have been studied for multicomponent aerosols andatmospheric gases pollution [90]. The transmission spec-trum of tributylamine ((C4H9)3N) was recorded as an exam-ple of hydrocarbon atmospheric pollutant.
A versatile mobile laser LIDAR system for multipleremote-sensing tasks, ranging from air-pollutant mappingto aquatic and terrestrial monitoring, has been developedand described by Weibring et al. [91]. The OPO-basedsource was capable of generating a very wide wavelengthrange from 220 nm to 4 µm. The authors demonstrated at-mospheric monitoring on several example ranging fromatomic mercury emission from a chlorine-alkali plant to sul-fur dioxide emission from the Italian volcano Mount Etna.The described LIDAR transmitter extended the measure-ments capabilities far beyond the standard DIAL methodsand enabled simultaneous measurement of multiple speciesor resolving interference effects between compounds ofinterest and background gases such as CO2 and water.
A portable gas imager employing a fiber-pumped OPOwas demonstrated in 2002 [92]. The handheld device shouldmeet the demand for gas imaging in the natural-gas indus-tries. The target species is methane, the primary componentof natural gas. This industry, but also the petroleum refin-ing industry, needs remote surveillance for (indoor) gasleaks, the latter for a blend of organic hydrocarbons. Forthese gasses the strongest infrared absorptions are thoseattributable to the CH-stretch vibrations with maxima near3.3 µm wavelength. The nature of the absorption spectraof these molecules varies with the size of the molecule.Methane exhibits a typical ‘small-molecule’ spectrum withresolved rotational lines having a pressure-broadened linewidth of � 0.1 cm�1. While refinery hydrocarbons such asbutane exhibit a ‘large-molecule’ spectrum in which individ-ual rotational lines cannot be resolved and the rovibrationalband has a broad (20–40 cm�1) smooth structure (Fig. 21).
The portable imager consisted of a miniature, single-frequency diode-pumped Nd:YAG seed laser whose out-put is directed into the core of a double-clad Yb-dopedfiber amplifier resulting in 4.2 W single-frequency outputpower directed to a SRO generating 250–300 mW of idlerpower. At full OPO power, the portable system is capableof imaging at ranges up to 9 m. The OPO was coupled toa raster-scanned camera and laser-illuminated gas imageswere created using laser radiation backscattered from solidobjects in the field-of-view of the camera.
5. Conclusions
OPOs can fulfill a wide variety of criteria for sensitivemolecular gas sensing in a range of applications. One ofthe main advantages of the OPO is that it can access the in-frared wavelength region where many molecules have theirfundamental rovibrational transitions. Other laser sourceseither do not exist at this wavelength region, or have a verylow power. As shown in this review, combinations of theOPO with all kind of conventional laser-based spectroscopicmethods, such as WMS, FMS, CRDS, CEAS (ICOS), PA,QEPAS or LIDAR are possible. Due to its high output power
www.lpr-journal.org © 2012 by WILEY-VCH Verlag GmbH & Co. KGaA, Weinheim

16
LASER & PHOTONICSREVIEWS
D. D. Arslanov et al.: cw OPO spectroscopy for chemical gas sensing
Figure 21 A long-wavelengthscan with cavity ring-down spec-troscopy of a gas mixture consist-ing nitrous oxide (50 ppmv), butane(324 ppbv), benzene (1.69 ppmv),ethane (540 ppbv), and water vapor(40% RH at 23 �C). The scan wasassembled from 27 individual scansegments. The lower panel showsthe calculated total spectrum andthe contribution from the individualchemical constituents. The upperpanel shows the calculated spectrumoverlaid with the measured spec-trum [92].
and narrow linewidth the OPO can be an excellent sourcefor sensitive high-resolution spectroscopy. In addition, ow-ing to quasiphase matching in nonlinear crystals cw OPOsoffer much wider wavelength tuning ranges as comparedwith other laser sources.
For a particular problem, one has to consider whichspectroscopic method should be combined with the OPO.High-sensitivity experiments require a high-power laser andsensitive methods; robust methods such as PA and ICOSare more suitable for “field” measurements; detection oflarge volatile molecules requires a widely tunable or broad-band sources; remote sensing applications uses pulsed OPO-based LIDAR systems; high temporal resolution is on de-mand in life sciences where rapid detection of trace gases isrequired. All these approaches are accessible using OPOs.The incorporation of highly engineered products from thetelecom industry will advance the goals for sensing at lowercosts. For the future, the extension of the spectral infraredcoverage up to 20 µm is of interest, through the use of pat-terned semiconductor materials, such as GaAs.
Acknowledgements. This research was financially supported bythe Dutch Technology Foundation (STW); the Dutch Ministry ofEconomic Affairs, Agriculture & Innovation; the European Com-mission under the programmes: FP6-NESTA-0025042 ‘the OpticalNose’; FP6-Infrastructures-026183 ‘Life Science Trace Gas Fa-cility’ and FP7-ERA-NET+, under the iMERA+ project, contractnumber 217257.
Received: 20 October 2011, Revised: 19 December 2011,Accepted: 23 January 2012
Published online: 20 March 2012
Key words: Optical parametric oscillators, infrared spectroscopy,chemical sensing, trace-gas detection, applications.
Denis D. Arslanov received his M. Sc.degree in Physics from LomonosovMoscow State University of Russia in2007. From 2007 to 2008 he worked asa guest scientist in the Department ofPhysics in Duisburg-Essen University ofGermany. He is currently working towardsthe Ph. D. degree at the Radboud Univer-sity of Nijmegen in the Netherlands. His
current research interests include optical parametric oscilla-tor based laser absorption spectroscopy, rapid and sensitivetrace-gas detection, and real-time breath analysis.
Marius Spunei received his M. Sc. de-gree in Physics from the West UniversityTimisoara, Romania in 2004. From 2008till 2010 he worked as a junior researcherat Radboud University of Nijmegen in theNetherlands and afterwards worked forVSL, the Dutch Metrology Institute, inDelft, the Netherlands. His research inter-ests include cw-OPO-based laser absorp-tion spectroscopy, sensitive trace-gas de-
tection and breath analysis.
Julien Mandon is a postdoctoral fellowat the Radboud University, Nijmegen (theNetherlands). He completed his PhD inPhysics in 2009 at the University ParisSud, Orsay (France), where he used fre-quency combs for infrared spectroscopyand proposed, for the first time, their usein combination with Fourier spectroscopy.Financed by an EU Marie Curie Fellow-
ship his recent research involves the use of quantum cascade
© 2012 by WILEY-VCH Verlag GmbH & Co. KGaA, Weinheim www.lpr-journal.org

Laser Photonics Rev. (2012)
REVIEWARTICLE
17
lasers with innovative infrared spectroscopic schemes for thedetection of trace gas emitted by various biological samples.
Simona M. Cristescu is a Senior Scien-tist at the Department of Molecular andLaser Physics at Radboud University. Shereceived the Ph. D. degree (magna cumlaude) in laser spectroscopy from Poly-technic University of Bucharest, Rumania,in 1999. Between 2006 and 2011 she wasmanager and research coordinator of theEU Life Science Trace Gas Facility. Cur-rently, she conducts research focused on
the development of mid-infrared laser spectroscopic instru-ments and their applications in biology, plant physiology, en-vironmental monitoring and medicine. She has authored andcoauthored over 40 publications and has given more than 60presentations in international conferences and seminars.
Stefan Persijn is a researcher at VSL,the Dutch Metrology Institute where hehas constructed spectrometers based onoptical parametric oscillators and quan-tum cascade lasers for application in thefield of gas analysis (in particular purityanalysis). Earlier in his career he workedat the Radboud University of Nijmegenwhere he constructed sensitive gas de-tectors based on laser spectroscopy and
applied these instruments in the Life Sciences.
Frans J. M. Harren is Associate Profes-sor at Radboud University, Nijmegen (theNetherlands). His research focuses onthe reliable state-of-the-art sensing ofminute quantities of trace gases in com-plicated gas mixtures, online, noninva-sive, with high selectivity and detectionspeed. For this photoacoustic, frequencymodulation, and cavity-enhanced spec-troscopy are combined with quantum cas-
cade lasers, optical parametric oscillators and frequency comblasers. These methods are applied within biology, agrotechnol-ogy and medical sciences.
References
[1] J. A. Giordmaine and R. C. Miller, Phys. Rev. Lett. 14, 973–976 (1965).
[2] E. L. Kerr and J. G. Atwood, Appl. Opt. 7, 915–921 (1968).[3] J. A. Hodgeson, W. A. McClenny, and P. L. Hanst, Science
182, 248–258 (1973).[4] J. J. Scherer, D. Voelkel, D. J. Rakestraw, J. B. Paul, C. P. Col-
lier, R. J. Saykally, and A. O’Keefe, Chem. Phys. Lett. 245,273–280 (1995).
[5] M. H. Dunn and M. Ebrahimzadeh, Science 286, 1513–1517(1999).
[6] F. Huisken, M. Kaloudis, and A. Kulcke, J. Chem. Phys. 104,17–25 (1996).
[7] E. V. Kovalchuk, D. Dekorsy, A. I. Lvovsky, C. Braxmaier,J. Mlynek, A. Peters, and S. Schiller, Opt. Lett. 26, 1430–1432 (2001).
[8] M. Vainio, M. Siltanen, J. Peltola, and L. Halonen, Appl. Opt.50, A1–A10 (2010).
[9] M. M. J. W. van Herpen, S. C. Li, S. E. Bisson, andF. J. M. Harren, Appl. Phys. Lett. 81, 1157–1159 (2002).
[10] G. W. Baxter, H. D. Barth, and B. J. Orr, Appl. Phys. B 66,653–657 (1998).
[11] A. Berrou, M. Raybaut, A. Godard, and M. Lefebvre, Appl.Phys. B 98, 217–230 (2010).
[12] G. von Basum, D. Halmer, P. Hering, M. Murtz, S. Schiller,F. Muller, A. Popp, and A. Kuhnemann, Appl. Phys. B 29,797–799 (2004).
[13] A. K. Y. Ngai, S. T. Persijn, G. von Basum, and F. J. M. Har-ren, Appl. Phys. B 85, 173–180 (2006).
[14] I. D. Lindsay, P. Gross, C. J. Lee, B. Adhimoolam, and K.-J. Boller, Opt. Express 14, 12341–12346 (2006).
[15] D. D. Arslanov, M. Spunei, A. K. Y. Ngai, S. M. Cristescu,I. D. Lindsay, S. T. Persijn, K. J. Boller, and F. J. M. Harren,Appl. Phys. B 103, 223–228 (2011).
[16] J. A. Armstrong, N. Bloembergen, J. Ducuing, and P. S. Per-shan, Phys. Rev. 127, 1918–1939 (1962).
[17] P. A. Franken and J. F. Ward, Rev. Mod. Phys. 35, 23–39(1963).
[18] L. E. Myers, R. C. Eckardt, M. M. Fejer, R. L. Byer,W. R. Bosenberg, and J. W. Pierce, J. Opt. Soc. Am. B 12,2102–2116 (1995).
[19] W. R. Bosenberg, A. Drobshoff, J. I. Alexander, L. E. Myers,and R. L. Byer, Opt. Lett. 21, 713–715 (1996).
[20] Y. Furukawa, K. Kitamura, S. Takekawa, K. Niwa, andH. Hatano, Opt. Lett. 23, 1892–1894 (1998).
[21] K. L. Vodopyanov, O. Levi, P. S. Kuo, T. J. Pinguet, J. S. Har-ris, M. M. Fejer, B. Gerard, L. Becouarn, and E. Lallier, Opt.Lett. 29, 1912 –1914 (2004).
[22] M. E. Klein, D. H. Lee, J. P. Meyn, K. J. Boller, and R. Wal-lenstein, Opt. Lett. 24, 1142–1144 (1999).
[23] M. M. J. W. van Herpen, S. E. Bisson, A. K. Y. Ngai, andF. J. M. Harren, Appl. Phys. B 78, 281–286 (2004).
[24] I. D. Lindsay, B. Adhimoolam, P. Gross, M. E. Klein, andK. J. Boller, Opt. Express 13, 1234–1239 (2005).
[25] A. Henderson and R. Stafford, Opt. Express 14, 767–772(2006).
[26] I. Breunig, J. Kiessling, B. Knabe, R. Sowade, and K. Buse,Opt. Express 16, 5662–5666 (2008).
[27] T. Beckmann, H. Linnenbank, H. Steigerwald, B. Sturman,D. Haertle, K. Buse, and I. Breunig, Phys. Rev. Lett. 106,143903 (2011).
[28] M. van Herpen, S. E. Bisson, and F. J. M. Harren, Opt. Lett.28, 2497–2499 (2003).
[29] J. Kiessling, R. Sowade, I. Breunig, K. Buse, and V. Dierolf,Opt. Express 17, 87–91 (2009).
[30] E. Andrieux, T. Zanon, M. Cadoret, A. Rihan, and J.-J. Zondy,Opt. Lett. 36, 1212–1214 (2011).
[31] F. Adler, K. C. Cossel, M. J. Thorpe, I. Hartl, M. E. Fermann,and J. Ye, Opt. Lett. 34, 1330–1332 (2009).
[32] F. Adler, P. Masłowski, A. Foltynowicz, K. C. Cossel,T. C. Briles, I. Hartl, and J. Ye, Opt. Express 18, 21861–21872 (2010).
[33] A. G. Bell, Am. J. Sci. 20, 305–324 (1880).[34] L. B. Kreuzer, J. Appl. Phys. 42, 2934–2943 (1971).
www.lpr-journal.org © 2012 by WILEY-VCH Verlag GmbH & Co. KGaA, Weinheim

18
LASER & PHOTONICSREVIEWS
D. D. Arslanov et al.: cw OPO spectroscopy for chemical gas sensing
[35] J. A. de Gouw, S. te Lintel Hekkert, J. Mellqvist, C. Warneke,E. L. Atlas, F. C. Fehsenfeld, A. Fried, G. J. Frost, F. J. M. Har-ren, J. S. Holloway, B. Lefer, R. Lueb, J. F. Meagher,D. D. Parrish, M. Patel, L. Pope, D. Richter, C. Rivera,T. B. Ryerson, J. Samuelsson, J. Walega, R. A. Washenfelder,P. Weibring, and X. Zhu, Envir. Sci. Technol. 43, 2437–2442(2009).
[36] F. J. M. Harren, S. T. Persijn, and S. M. Cristescu, Photoa-coustic Spectroscopy, in: Handbook of Metrology, edited byM. Glaser and M. Kochsiek (Wiley-VCH, Weinheim, 2009),pp. 581–622.
[37] F. Muller, A. Popp, F. Kuhnemann, and S. Schiller, Opt.Express 11, 2820–2825 (2003).
[38] J. G. Haub, M. J. Johnson, and B. J. Orr, Appl. Phys. Lett. 58,1718–1720 (1991).
[39] A. Bohren and M. W. Sigrist, Infrared Phys. Techn. 38, 423–435 (1997).
[40] D. Costopoulos, A. Miklos, and P. Hess, Appl. Phys. B 75,385–389 (2002).
[41] A. Miklos, C. H. Lim, W. W. Hsiang, G. C. Liang, A. H. Kung,A. Schmohl, and P. Hess, Appl. Opt. 41, 2986–2993 (2002).
[42] F. Kuhnemann, K. Schneider, A. Hecker, A. A. E. Martis,W. Urban, S. Schiller, and J. Mlynek, Appl. Phys. B 66, 741–745 (1998).
[43] M. M. J. W. van Herpen, A. K. Y. Ngai, S. E. Bisson,J. H. P. Hackstein, E. J. Woltering, and F. J. M. Harren, Appl.Phys. B 82, 665–669 (2006).
[44] F. Keppler, J. T. G. Hamilton, M. Brass, and T. Rockmann,Nature 439, 187–191 (2006).
[45] T. A. Dueck, R. de Visser, H. Poorter, S. Persijn,A. Gorissen, W. de Visser, A. Schapendonk, J. Verha-gen, J. Snel, F. J. M. Harren, A. K. Y. Ngai, F. Verstappen,H. Bouwmeester, L. A. C. J. Voesenek, and A. van der Werf,New Phytol. 175, 29–35 (2007).
[46] A. A. Kosterev, A. Yu. Bakhirkin, R. F. Curl, and F. K. Tittel,Opt. Lett. 27, 1902–1904 (2002).
[47] A. K. Y. Ngai, S. T. Persijn, I. D. Lindsay, A. A. Kosterev,P. Groß, C. J. Lee, S. M. Cristescu, F. K. Tittel, K.-J. Boller,and F. J. M. Harren, Appl. Phys. B 89, 123–128 (2007).
[48] V. Koskinen, J. Fonsen, K. Roth, and J. Kauppinen, Appl.Phys. B 86, 451–454 (2007).
[49] S. E. Bisson, K. M. Armstrong, T. J. Kulp, and M. Hartings,Appl. Opt. 40, 6049–6055 (2001).
[50] A. O’Keefe and D. A. G. Deacon, Rev. Sci. Instrum. 59, 2544–2551 (1988).
[51] G. Berden, R. Peeters, and G. Meijer, Int. Rev. Phys. Chem.19, 565–607 (2000).
[52] G. Berden and R. Engeln, (Eds.), Cavity Ring-Down Spec-troscopy: Techniques and Applications (Wiley & Sons, NewYork, 2009).
[53] R. D. van Zee, J. T. Hodges, and J. P. Looney, Appl. Opt. 38,3951–3960 (1999).
[54] J. Morville, D. Romanini, A. Campargue, and R. Bacis,Chem. Phys. Lett. 363, 498–504 (2002).
[55] A. Popp, F. Muller, F. Kuhnemann, S. Schiller, G. von Basum,H. Dahnke, P. Hering, and M. Murtz, Appl. Phys. B 75, 751–754 (2002).
[56] G. von Basum, D. Halmer, P. Hering, M. Murtz, S. Schiller,F. Muller, A. Popp, and F. Kuhnemann, Opt. Lett. 29, 797–799 (2004).
[57] S. Persijn, F. Harren, and A. van der Veen, Appl. Phys. B 100,383–390 (2010).
[58] L. S. Rothman, I. E. Gordon, A. Barbe, D. C. Benner,P. F. Bernath, M. Birk, V. Boudon, L. R. Brown, A. Cam-pargue, J. P. Champion, K. Chance, L. H. Coudert, V. Dana,V. M. Devi, S. Fally, J. M. Flaud, R. R. Gamache, A. Gold-man, D. Jacquemart, I. Kleiner, N. Lacome, W. J. Lafferty,J. Y. Mandin, S. T. Massie, S. Mikhailenko, C. E. Miller,N. Moazzen-Ahmadi, O. V. Naumenko, A. Nikitin, J. Or-phal, A. Predoi-Cross, V. Perevalov, A. Perrin, C. P. Rins-land, M. Rotger, M. Simeckova, M. A. H. Smith, K. Sung,S. Tashkun, J. Tennyson, R. A. Toth, A. C. Vandaele, andJ. Vander Auwera, J. Quant. Spectrosc. Radiat. Transfer 110,533–572 (2009).
[59] P. M. Chu, F. R. Guenther, G. C. Rhoderick, and W. J. Lafferty,J. Res. Natl. Inst. Stan. 104, 59–81 (1999).
[60] S. W. Sharpe, T. J. Johnson, R. L. Sams, P. M. Chu,G. C. Rhoderick, and P. A. Johnson, Appl. Spectrosc. 58,1452–1461 (2004).
[61] A. K. Y. Ngai, S. T. Persijn, and F. J. M. Harren, Appl. Phys.Lett. 90, 081109 (2007).
[62] H. Verbraak, A. K. Y. Ngai, S. T. Persijn, F. J. M. Harren, andH. Linnartz, Chem. Phys. Lett. 442,145–149 (2007).
[63] C. S. Gudeman, M. H. Begemann, J. Pfaff, and R. J. Saykally,Phys. Rev. Lett. 50, 727–731(1983).
[64] A. O’Keefe, Chem. Phys. Lett. 293, 331–336 (1998).[65] R. Engeln, G. Berden, R. Peeters, and G. Meijer, Rev. Sci.
Instrum. 6, 93763–3769 (1998).[66] A. O’Keefe, J. J. Scherer, and J. B. Paul, Chem. Phys. Lett.
307, 343–349 (1999).[67] J. B. Paul, L. Lapson, and J. G. Anderson, Appl. Opt. 40,
4904–4910 (2001).[68] C. C. Davis (Ed.), Lasers and Electro-Optics (Cambridge
University Press, Cambridge, United Kingdom, 2002), p. 88.[69] D. Herriott, H. Kogelnik, and R. Kompfner, Appl. Opt. 3,
523–526 (1964).[70] D. R. Herriott and H. J. Schulte, Appl. Opt. 4, 883–889
(1965).[71] G. S. Engel, W. S. Drisdell, F. N. Keutsch, E. J. Moyer, and
J. G. Anderson, Appl. Opt. 45, 9221–9229 (2006).[72] A. F. Nieuwenhuis, C. J. Lee, B. Sumpf, P. J. M. van der Slot,
G. Erbert, and K. J. Boller, Opt. Express 18, 11123–11131(2010).
[73] A. Henderson, Photonics Spectra 43, 72–75 (2009).[74] G. K. Samanta and M. Ebrahim-Zadeh, Opt. Lett. 35, 1986–
1988 (2010).[75] D. D. Arslanov, S. M. Cristescu, and F. J. M. Harren, Opt.
Lett. 35, 3300–3302 (2010).[76] J. U. White, J. Opt. Soc. Am. 66, 411–416 (1976).[77] P. Werle and F. Slemr, Appl. Opt. 30, 430–434 (1991).[78] P. Werle, Spectrochim. Acta A 54, 197–236 (1998).[79] D. S. Bomse, A. C. Stanton, and J. A. Silver, Appl. Opt. 31,
718–731 (1992).[80] F. S. Pavone and M. Inguscio, Appl. Phys. B 56, 118–122
(1993).[81] J. Ng, A. H. Kung, A. Miklos, and P. Hess, Opt. Lett. 29,
1206–1208 (2004).[82] R. A. Baumgartner and R. L. Byer, Appl. Opt. 17, 3555–3561
(1978).[83] M. Endemann and R. L. Byer, Opt. Lett. 5, 452–454 (1980).[84] A. Amediek, A. Fix, M. Wirth, and G. Ehret, Appl. Phys. B
92, 295–302 (2008).[85] G. Ehret and A. Fix, V. Weiß, G. Poberaj, and T. Baumert,
Appl. Phys. B 67, 427–431 (1998).
© 2012 by WILEY-VCH Verlag GmbH & Co. KGaA, Weinheim www.lpr-journal.org

Laser Photonics Rev. (2012)
REVIEWARTICLE
19
[86] A. Behrendt, V. Wulfmeyer, P. Di Girolamo, C. Kiemle,H. S. Bauer, T. Schaberl, D. Summa, D. N. Whiteman,B. B. Demoz, E. V. Browell, S. Ismail, R. Ferrare, S. Kooi,G. Ehret, and J. H. Wang, J. Atmos. Ocean. Tech. 24, 3–21(2007).
[87] A. Behrendt, V. Wulfmeyer, C. Kiemle, G. Ehret, C. Fla-mant, T. Schaberl, H. S. Bauer, S. Kooi, S. Ismael, R. Ferrare,E. V. Browell, and D. N. Whitemann, J. Atmos. Ocean. Tech.24, 22–39 (2007).
[88] M. J. T. Milton, T. D. Gardiner, F. Molero, and J. Galech, Opt.Commun. 142, 153–160 (1997).
[89] V. S. Airapetyan, J. Appl. Spectrosc. 76, 268–272 (2009).[90] D. Sakaizawa, C. Nagasawa, T. Nagai, M. Abo, Y. Shibata,
M. Nakazato, and T. Sakai, Appl. Opt. 48, 748–757 (2009).[91] P. Weibring, H. Edner, and S. Svanberg, Appl. Opt. 42, 3583–
3594 (2003).[92] T. J. Kulp, S. E. Bisson, R. P. Bambha, T. A. Reichardt,
U. B. Goers, K. W. Aniolek, D. A. V. Kliner, B. A. Richman,K. M. Armstrong, R. Sommers, R. Schmitt, P. E. Powers,O. Levi, T. Pinguet, M. Fejer, J. P. Koplow, L. Goldberg, andT. G. Mcrae, Appl. Phys. B 75, 317–325 (2002).
www.lpr-journal.org © 2012 by WILEY-VCH Verlag GmbH & Co. KGaA, Weinheim


