Embed Size (px)
Citation preview

Multimodal photoacoustic remote sensing (PARS) microscopy combined with swept-source optical coherence tomography (SS-OCT) for in-vivo, non-contact, functional
and structural ophthalmic imaging applications.
by
Zohreh Hosseinaee
A thesis presented to the University of Waterloo
in fulfillment of the thesis requirement for the degree of
Doctor of Philosophy in
System Design Engineering
Waterloo, Ontario, Canada, 2021
©Zohreh Hosseinaee 2021

ii
Examining Committee Membership
The following served on the Examining Committee for this thesis. The decision of the Examining
Committee is by majority vote.
External Examiner Michael C. Kolios
Professor, Department of Physics
Ryerson University
Supervisor(s) Parsin Haji Reza
Assistant Professor, System Design Engineering
Department
University of Waterloo
Internal Member Paul Fieguth
Professor, System Design Engineering Department
University of Waterloo
Internal Member Alexander Wong
Professor, System Design Engineering Department
University of Waterloo
Internal-external Member Chris Hudson
Professor, School of Optometry & Vision Science
University of Waterloo

iii
AUTHOR'S DECLARATION
This thesis consists of material all of which I authored or co-authored: see Statement of Contributions included in the thesis. This is a true copy of the thesis, including any required final revisions, as accepted by my examiners. I understand that my thesis may be made electronically available to the public.

iv
Statement of Contributions
Chapter 2:
Zohreh Hosseinaee, Alexander James Tummon Simmons, Parsin Haji Reza. "Dual-modal
photoacoustic imaging and optical coherence tomography." Frontiers in Physics 8 (2021): 635.
Author contributions
Zohreh Hosseinaee read and collected the reference papers, organized the content of the review paper,
sub-categorized the techniques, compiled the article, prepared the figures, and wrote the main
manuscript.
Alexander James Tummon Simmons edited parts of the article.
Parsin Haji Reza was the principal investigator, set the article scope, and proofread the article.
All authors contributed to the final version for publication.
Chapter 3:
Zohreh Hosseinaee, Martin Le, Kevan Bell, and Parsin Haji Reza "Towards non-contact photoacoustic
imaging." Photoacoustics (2020): 100207.
Author contributions
Zohreh Hosseinaee read and collected the reference papers, organized the content of the review paper,
sub-categorized the non-contact photoacoustic imaging techniques, compiled the article, prepared the
figures and wrote the main manuscript.
Martin Le edited parts of the article and helped in reviewing some of the references.
Kevan Bell edited parts of the article.
Parsin Haji Reza was the principal investigator, set the article scope, and proofread the article.
All authors contributed to the final version for publication.

v
Chapter 4:
Zohreh Hosseinaee, Layla Khalili, James A. Tummon Simmons, Kevan Bell, and Parsin Haji Reza,
“Label-free, non-contact, in vivo ophthalmic imaging using photoacoustic remote sensing microscopy,”
Opt. Lett. 45, 6254-6257 (2020)
Author contributions
Zohreh Hosseinaee co-designed with supervisor the optical system for PARS suitable for imaging the
eye, prepared and ordered the optical and digital components of the system, constructed the PARS
system, conducted the experiments, processed the images, contributed to interpreting the data, prepared
the figures, and wrote the main manuscript.
James A. Tummon Simmons helped in constructing the PARS system.
Kevan Bell helped with hardware and software of the PARS system.
Layla Khalili assisted with animal imaging experiments.
Parsin Haji Reza conceived the study, contributed to the interpretation of all results, and acted as the
primary investigators.
All authors contributed to the final version for publication.
Chapter 5:
Zohreh Hosseinaee, Benjamin Ecclestone, Nicholas Pellegrino, Layla Khalili, Lyazzat
Mukhangaliyeva, Paul Fieguth, and Parsin Haji Reza, "Functional photoacoustic remote sensing
microscopy using a stabilized temperature-regulated stimulated Raman scattering light source," Opt.
Express 29, 29745-29754 (2021)
Author contributions
Zohreh Hosseinaee co-designed with supervisor the optical system for PARS, collected background
information on the topic, conducted the experiments, collected the data, processed the PARS data,
prepared the figures, and wrote the main manuscript.
Benjamin Ecclestone helped with processing the data and conducting the experiments.
Nicholas Pellegrino developed and implemented the signal unmixing method.

vi
Layla Khalili and Lyazzat Mukhangaliyeva developed the chicken embryo model.
Paul Fieguth contributed to the interpretation of the results and provide guidance.
Parsin Haji Reza proposed the idea, conceived the study, contributed to the interpretation of all results,
and acted as the primary investigators.
All the authors reviewed the manuscript.
Chapter 6:
Zohreh Hosseinaee, Nima Abbasi F., Nicholas Pellegrino, Layla Khalili, Lyazzat Mukhangaliyeva,
Parsin Haji Reza, " Functional and structural ophthalmic imaging using noncontact multimodal
photoacoustic remote sensing microscopy and optical coherence tomography " Sci Rep 11, 11466
(2021).
Author contributions
Zohreh Hosseinaee co-designed with supervisor the optical system for PARS-OCT suitable for
imaging the eye, investigated and lead the digital control requirements for the system, prepared and
ordered the optical and digital components of the PARS-OCT system, constructed the PARS-OCT
system, investigated and lead image processing for the SS-OCT system, conducted the experiments,
processed the images, contributed to the interpretation the data, prepared the figures, and wrote the
main manuscript.
Nima Abbasi constructed the software of the OCT system.
Nicholas Pellegrino developed and implemented the signal unmixing method.
Layla Khalili and Lyazzat Mukhangaliyeva assist with animal handling and conducting imaging
experiments.
Parsin Haji Reza proposed the idea, conceived the study, contributed to the interpretation of all results,
and acted as the primary investigators.
All the authors reviewed the manuscript.

vii
Chapter 7:
Zohreh Hosseinaee, Nicholas Pellegrino, Nima Abbasi, Tara Amiri, James A. Tummon Simmons,
Paul Fieguth, Parsin Haji Reza " In vivo functional and structural retina imaging using multimodal
photoacoustic remote sensing microscopy and optical coherence tomography " (submitted to Scientific
Reports)
Author contributions
Zohreh Hosseinaee studied and designed the modifications required for retina imaging, co-designed
with supervisor the SO2 accuracy experiments, conducted the experiments, processed the images,
contributed to the interpretation the data, prepared the figures, and wrote the main manuscript.
Nicholas Pellegrino developed and implemented the signal unmixing method.
Nima Abbasi constructed the software of the OCT system.
Tara Amiri assisted with conducting SO2 validation experiments.
Alexander James Tummon Simmons helped with designing the rat eye model phantom.
Paul Fieguth contributed to the interpretation of the results and provide guidance.
Parsin Haji Reza proposed the idea, conceived the study, contributed to the interpretation of all results,
and acted as the primary investigators.
All the authors reviewed the manuscript.
Peer review journals, conference, and patent contributions:
1. Benjamin Ecclestone, Zohreh Hosseinaee, Nima Abbasi, Kevan Bell, Deepak Dinakaran,
John R. Mackey, and Parsin Haji Rez “Three-dimensional virtual histology in unprocessed
resected tissues with photoacoustic remote sensing (PARS) microscopy and optical coherence
tomography (OCT)”. Sci Rep 11, 13723 (2021).
2. Zohreh Hosseinaee, Nima Abbasi, Layla Khalili, Lyazzat Mukhangaliyeva, Anne Mei,
Nicholas Pallegrino, Parsin Haji Reza, “Non-contact, in-vivo, functional, and structural
ophthalmic imaging using dual-modal photoacoustic remote sensing microscopy and optical

viii
coherence tomography”, The Association for Research in Vision and Ophthalmology (ARVO)
conference, 2021.
3. Zohreh Hosseinaee, Nima Abbasi, Alex Tummon Simmons, Layla Khalil, Kevan L Bell,
Parsin Haji Reza, “Dual-modality photoacoustic remote sensing (PARS) microscopy and
swept-source optical coherence tomography (SS-OCT) for in-vivo imaging”, SPIE Photonics
West, 2021
4. Parsin Haji Reza, Kevan Bell, Zohreh Hosseinaee, Benjamin Ecclestone, Saad Abbasi,
“PARS imaging methods”, US Patent. Patent number: US 11,122,978 B1
5. Parsin Haji Reza, Kevan Bell, Zohreh Hosseinaee, Benjamin Ecclestone, Saad Abbasi, “Dual-
modality Photoaocustic remote sensing and optical coherence tomography (PARS-OCT), and
thermally enhance photoacoustic remote sensing microscopy (TE-PARS)”, Provisional Patent.
Application number: 63/040,866

ix
Abstract
Ophthalmic imaging has long played an important role in the understanding, diagnosis, and
treatment of a wide variety of ocular disorders. Currently available clinical ophthalmic imaging
instruments are primarily optical-based, including slit-lamp microscopy, fundus photography,
confocal microscopy, scanning laser ophthalmoscopy, and optical coherence tomography
(OCT). The development of these imaging instruments has greatly extended our ability to
evaluate the ocular environment. Studies have shown that at least 40% of blinding disorders in
the United States are either preventable or treatable with timely diagnosis and intervention.
OCT is a state-of-the-art imaging technique extensively used in preclinical and clinical
applications for imaging both anterior and posterior parts of the eye. OCT has become a
standard of care for the assessment and treatment of most ocular conditions. The technology
enables non-contact, high-speed, cross-sectional imaging over a large field of view with
submicron resolutions.
In eye imaging applications, functional extensions of OCT such as spectroscopic OCT and
Doppler OCT have been applied to provide a better understanding of tissue activity.
Spectroscopic OCT is usually achieved through OCT systems in the visible spectral range, and
it enables the amount of light absorption inside the ocular environment to be measured. This
indirect optical absorption measurement is used to estimate the amount of ocular oxygen
saturation (SO2) which is a well-known biomarker in prevalent eye diseases including diabetic
retinopathy, glaucoma, and retinal vein occlusions. Despite all the advancements in functional
spectroscopic OCT methods, they still rely primarily on measuring the backscattered photons
to quantify the absorption of chromophores inside the tissue. Therefore, they are sensitive to

x
local geometrical parameters, such as retinal thickness, vessel diameters, and retinal
pigmentation, and may result in biased estimations.
Of the various optical imaging modalities, photoacoustic imaging (PAI) offers unique imaging
contrast of optical absorption because PAI can image any target that absorbs light energy. This
unique imaging ability makes PAI a favorable candidate for various functional and molecular
imaging applications as well as for measuring chromophore concentration.
Over the past decade, photoacoustic ophthalmoscopy has been applied for visualizing
hemoglobin and melanin content in ocular tissue, quantifying ocular SO2, and measuring the
metabolic rate of oxygen consumption (MRO2). Despite all these advantages offered by PAI
devices, a major limitation arises from their need to be in contact with the ocular tissues. This
physical contact may increase the risk of infection and cause patient discomfort. Furthermore,
this contact-based imaging approach applies pressure to the eye and introduces barriers to
oxygen diffusion. Thus, it has a crucial influence on the physiological and pathophysiological
balance of ocular vasculature function, and it is not capable of studying dynamic processes
under normal conditions. To overcome these limitations and to benefit from the numerous
advantages offered by photoacoustic ophthalmoscopy, non-contact detection of photoacoustic
signals has been a long-lasting goal in the field of ocular imaging.
In 2017 Haji Reza et al. developed photoacoustic remote sensing (PARS) for non-contact, non-
interferometric detection of photoacoustic signals. PARS is the non-contact, all-optical version
of optical-resolution photoacoustic microscopy (OR-PAM), where the acoustically coupled
ultrasound transducer is replaced with a co-focused probe beam. This all-optical detection
scheme allows the system to measure the photoacoustic pressure waves at the subsurface origin

xi
where the pressure is at a maximum. In a very short time, PARS technology has proven its
potential for various biomedical applications, including label-free histological imaging, SO2
mapping, and angiogenesis imaging. PARS is an ideal companion for OCT in ophthalmic
applications, where the depth-resolved, detailed scattering information of OCT is well
complemented by rich absorption information of PARS. This combined multimodal imaging
technology has the potential to provide chromophore selective absorption contrast in concert
with depth-resolved scattering contrast in the ocular environment.
The main goals of this PhD project are to:
• Develop a photoacoustic remote sensing microscopy system for in-vivo, non-contact
ophthalmic imaging. This is the first time a non-contact photoacoustic imaging has
been used for in-vivo imaging of the eye.
• Develop a robust and temporally stable multiwavelength light source for functional
photoacoustic imaging applications.
• Develop a multimodal PARS-OCT imaging system that can image in-vivo and
record, simultaneously, functional, and structural information in the anterior segment
of a rodent eye. This is the first time a multiwavelength non-contact photoacoustic
system is used for in-vivo measurement of oxygen saturation in the ocular
environment.
• Develop and modify the multimodal PARS-OCT imaging system for non-contact,
in-vivo, functional, and structural imaging of the posterior part of the rodent eye.

xii
Acknowledgements
These years will be the cherished treasure of my life and I would like to acknowledge the
people who were of great importance to me during that time. This study would not have been
possible without your generous support.
First, I would like to thank Dr. Parsin Haji Reza, my supervisor as well as mentor, for
nourishing me with knowledge and training me to be a scientist. He is always both positive
and constructively critical to the ideas I came up with. Those challenges and encouragements
helped me to grow into an independent researcher. Dr. Haji Reza provided a wonderful
atmosphere in the lab that encouraged both independent studies and teamwork. He has been a
wonderful supervisor, a great mentor, and an awesome friend during these years. I am very
fortunate to have been one of the researchers in his lab and gained a lot of support scientifically
and mentally from him and all my colleagues. I also want to thank Dr. Haji Reza for financially
supporting my research and providing funding for journal publications and international
conferences. Dr. Haji Reza helped me to get my motivation and confidence back when I’ve
been through the rough days of Covid-19 quarantine. He helped me to make those days
productive by encouraging me to write two review papers and patents directly related to my
PhD dissertation.
Second, I like to appreciate the advice I received from Dr. Luigina Sorbara, who unfortunately
passed away and is no longer with us. I will always remember her with her kind smile and
beautiful heart. I want to thank Dr. Chris Hudson for stepping in during our time of need and
kindly accepting to be on the committee board to review my thesis. I am also fortunate enough
to have Dr. Paul Fieguth and Dr. Alexander Wong as my committee members throughout my
PhD study. Their valuable advice and constructive feedback were precious experience for me.
I want to take this chance to thank Jean Flanagan from the University of Waterloo Central
Animal Facility for her help and continuous support for all animal experiments. Last but
certainly not the least, I would like to thank Professor Kostadinka Bizheva for her continuous
support, mentorship, and precious help during these years.
xiii
I want to thank my friends and colleagues at PhotoMedicine Labs. I want to thank Dr. Kevan
Bell for his mentorship and patience in answering all my questions. Also, I am thankful to
Nima Abbasi for helping me with experiments and his continued encouragement and creating
joyful atmosphere during the experiments! Last, but certainly not least, I want to thank Layla
Khalili, Lyazzat Mukhangaliyeva, Benjamin Ecclestone, Nicholas Pellegrino, and James
Alexander Tummon Simmons for their selfless support, encouragements, and precious help.
I would like to acknowledge all our funding partners. This research was gratefully funded by
Natural Sciences and Engineering Research Council of Canada, Canada Foundation for
Innovation, Mitacs Accelerate, University of Waterloo, Centre for Bioengineering and
Biotechnology, illumiSonics Inc and New frontiers in research fund exploration.
Finally, I want to thank my parents, my beloved brother and sisters, and my friends, Mehdi
and Shaghayegh, for gracious support of my choice to become a scientist and throughout my
PhD training. I am very grateful for the support you offered during the difficult times of my
PhD training and for celebrating my every single success regardless of how small it may have
been. I could not even begin my PhD study in the first place without your understanding and
non-hesitant support.

xiv
Dedication
To my mom and Dad, for their endless love and support.

xv
Table of Contents Examining Committee Membership ....................................................................................................... ii AUTHOR'S DECLARATION .............................................................................................................. iii
Statement of Contributions .................................................................................................................... iv
Abstract ................................................................................................................................................. ix
Acknowledgements .............................................................................................................................. xii
Dedication .......................................................................................................................................... xiv List of Figures ................................................................................................................................... xviii
List of Abbreviations ............................................................................................................................ xx
List of Tables ...................................................................................................................................... xxii
Chapter 1 Introduction ............................................................................................................................ 1 1.1 A Brief History of ophthalmic imaging ........................................................................................ 2 1.2 Chapter overview.......................................................................................................................... 5
Chapter 2 Dual-modal photoacoustic imaging and optical coherence tomography ............................... 7
Notes and Acknowledgement ............................................................................................................. 7 2.1 Introduction .................................................................................................................................. 8
2.2 Photoacoustic imaging: Principles and applications .................................................................... 9 2.3 Optical coherence tomography: Principles and applications ...................................................... 13 2.4 Dual-modal photoacoustic imaging and optical coherence tomography .................................... 20
2.4.1 Photoacoustic tomography combined with optical coherence tomography. ....................... 24 2.4.2 Photoacoustic endoscopy combined with optical coherence tomography. .......................... 26
2.4.3. Photoacoustic microscopy combined with optical coherence tomography. ..................... 28 2.4.4. Photoacoustic microscopy combined with optical coherence tomography for
ophthalmic applications. ............................................................................................................... 36
Chapter 3 Non-contact photoacoustic imaging .................................................................................... 43 Notes and Acknowledgement ........................................................................................................... 43
3.1. Introduction .......................................................................................................................... 44
3.2. Physical mechanism of photoacoustic imaging .................................................................... 45
3.3. Photoacoustic modalities ...................................................................................................... 47
3.4. Imaging Contrast .................................................................................................................. 49 3.5. Photoacoustic signal detection ............................................................................................. 51
3.6. Non-contact photoacoustic signal detection ......................................................................... 54

xvi
3.6.1. Air-Coupled detection .................................................................................................. 54
3.6.2. Optical detection of Photoacoustic signals .................................................................. 56
3.6.3. Photoacoustic remote sensing (PARS)......................................................................... 68 Chapter 4 Photoacoustic remote sensing microscopy for ophthalmic imaging ................................... 75
Notes and Acknowledgement .......................................................................................................... 75
4.1. Introduction .......................................................................................................................... 76
4.2. Method ................................................................................................................................. 78
4.3. Results .................................................................................................................................. 79
4.4. Discussion and Conclusion .................................................................................................. 85 Chapter 5 Functional photoacoustic remote sensing microscopy using stabilized temperature-
regulated stimulated Raman scattering light source ............................................................................. 87
Notes and Acknowledgement .......................................................................................................... 87
5.1. Introduction .......................................................................................................................... 88 Chapter 6 Functional and structural ophthalmic imaging using noncontact multimodal photoacoustic
remote sensing microscopy and optical coherence tomography. ....................................................... 102
Notes and Acknowledgement ........................................................................................................ 102
6.1. Introduction ........................................................................................................................ 103 6.2. Methods: ............................................................................................................................ 107
6.2.1. Stimulated Raman Scattering ..................................................................................... 107
6.2.2. System Architecture ................................................................................................... 108
6.3. Image Reconstruction ........................................................................................................ 112 6.4. Animal Preparation ............................................................................................................ 112
6.5. Ocular Light Safety ............................................................................................................ 113 6.6. Results and Discussion....................................................................................................... 114
6.7. Conclusions ........................................................................................................................ 123
Chapter 7 In vivo functional and structural retina imaging using multimodal photoacoustic remote
sensing microscopy and optical coherence tomography .................................................................... 124
Notes and Acknowledgement ........................................................................................................ 124
7.1. Introduction ........................................................................................................................ 125
7.2. Method ............................................................................................................................... 128
7.3. Results ................................................................................................................................ 131
7.4. Conclusion ......................................................................................................................... 141

xvii
Chapter 8 Ocular light safety .............................................................................................................. 142
8.1. DAMAGE MECHANISMS AND EXPOSURE LIMITS ................................................. 142
8.2. Assumptions leading to exposure limits ............................................................................. 143 8.3. Concise presentation of the ANSI standard ........................................................................ 145
8.4. ANSI standard for ophthalmic applications ....................................................................... 147
8.5. Exposure by repetitive pulses ............................................................................................. 149
8.6. ANSI standard for scanning beam ...................................................................................... 151
8.7. Additional safety issues in the multimodal imaging system .............................................. 154
Chapter 9 Conclusion and future work ............................................................................................... 155 9.1. Future research ................................................................................................................... 157
Bibliography ....................................................................................................................................... 159

List of Figures Figure 1-1 Side view of the eye ............................................................................................................. 2
Figure 2-1. Signal generation and detection in different implementations of PAI. ............................. 11 Figure 2-2. Schematic of different OCT modalities.. ........................................................................... 15
Figure 2-3. A-Scan, B-Scan in OCT. ................................................................................................... 19
Figure 2-4. Dual modal PAT-OCT scanner. ....................................................................................... 25
Figure 2-5. PAI-OCTendoscopic probe.. ............................................................................................. 28
Figure 2-6. Schematic of the combined PAM-OCT.. .......................................................................... 30 Figure 2-7. PAM and OCT results of the microvascular. .................................................................... 31
Figure 2-8. Schematic of the reflection mode PAM-OCT system ....................................................... 34
Figure 2-9. Schematic of the experimental system of a free-space OC-PAM.. ................................... 36
Figure 2-10. Illustration of integrated PAM and SD-OCT. ................................................................. 38 Figure 2-11.Integrated PAM and OCT systems for multimodal retinal imaging. ............................... 39 Figure 3-1. General principle of photoacoustic imaging. .................................................................... 47
Figure 3-2. Absorption spectra of common endogenous chromophores in biological tissues. ............ 51
Figure 3-3 Photoacoustic imaging with air-coupled ultrasound transducers. ..................................... 56 Figure 3-4. Schematic setup for speckl-based non-contact photoacoustic detection. .......................... 59
Figure 3-5. Schematic of all-fiber-based dual modality PA-OCT with miniature common probe.. .... 61 Figure 3-6. Schematic of the PRC-based PAM system. ...................................................................... 62 Figure 3-7. In vivo photoacoustic image of microvasculature of a mouse ear. ................................... 65
Figure 3-8. In vivo photoacoustic images of blood vessels in the mouse ear . .................................... 67 Figure 3-9. simplified schematic of PARS microscopy.. ..................................................................... 69 Figure 3-10. PARS imaging applications. ........................................................................................... 71 Figure 3-11. One to one comparison of PARS histological imaging and H&E staining.. ................... 72
Figure 4-1. Schematic of the PARS microscopy system. .................................................................... 79
Figure 4-2 Carbon fiber images acquired using PARS microscopy. . ................................................ 80 Figure 4-3 In-vivo imaging of mouse ear using PARS microscopy ..................................................... 81
Figure 4-4 In-vivo imaging of ocular vasculature within different FOVs. ........................................... 84
Figure 5-1. Schematic of the experimental setup.. ............................................................................... 91
Figure 5-2. Schematic of the PARS imaging system, .......................................................................... 93
Figure 5-3. Spectrum of SRS peaks acquired at different temperature levels. .................................... 94 Figure 5-4 Temporal stability of SRS peaks at different temperature levels. ...................................... 97
Figure 5-5. Functional oxygen saturation measurement of microvasculature in capillary beds. ....... 100
Figure 6-1. Simplified schematic and timing chart of the multimodal PARS-OCT system. . ........... 111

xix
Figure 6-2. Imaging performance of the multimodal PARS-OCT system. ........................................ 115
Figure 6-3. In-vivo imaging of mouse ear using multimodal PARS-OCT system.. ........................... 117
Figure 6-4. In-vivo imaging of ocular tissue using SS-OCT. ............................................................. 118 Figure 6-5. In-vivo imaging of ocular tissue using PARS. ................................................................. 121
Figure 6-6. simultaneous imaging of the ocular tissue using multimodal PARS-OCT system.. ........ 122
Figure 7-1 Simplified schematic of the multimodal PARS-OCT system.. ......................................... 129
Figure 7-2. Imaging phantom eye models for human and rat. ........................................................... 132
Figure 7-3. Experimental setup of the in vitro phantom experiment using bovine blood. ................. 135
Figure 7-4. Volumetric and cross-sectional OCT images. ................................................................. 136 Figure 7-5. Fundus PARS image acquired from large vessels around ONH ..................................... 138
Figure 8-1 Maximum permissible beam power (in watts) for CW photochemical damage ............... 153
Figure 8-2 Maximum permissible beam power (in watts) for CW beam thermal damage ................ 153

xx
List of Abbreviations AMD Age-Related Macular Degeneration
ANSI American National Standards Institute
AR-PAM Acoustic-Resolution Photoacoustic Microscopy
CAM Chicken Embryo Chorioallantois Membrane
CL Collimating
DC Dispersion Compensator
DR Diabetic Retinopathy
ELM External Limiting Membrane
FA Fluorescein Angiography
FD-OCT Fourier domain OCT
FL Focusing Lens
FOV Field of View
FWHM Full Width Half Maximum
GCL Ganglion Cell Layer
ICG Indocyanine Green
IFT Inverse Fourier Transform
INL Inner Nuclear Layer
IOP Intraocular Pressure
IOS Intrinsic Optical Signal
IPL Inner Plexiform Layer
IS Inner Segment
M Mirror
MIP Maximum Intensity Projections
MRO2 Metabolic Rate of Oxygen Consumption
MPE Maximum permissible exposure
NA Numerical Aperture
NIR Near-Infrared
OCT Optical Coherence Tomography
OCTA Optical Coherence Tomography Angiography
ONH Optic Nerve Head

xxi
ONL Outer Nuclear Layers
OR-PAM Optical-Resolution Photoacoustic Microscopy
OPD Optical Path Difference
OS Outer Segment
PAI Photoacoustic Imaging
PAE Photoacoustic Endoscopy
PARS Photoacoustic remote sensing
PAT Photoacoustic Tomography
PBS Plarized beam splitter
PC Polarization Controllers
PD Photodiode
PM Polarization Maintaining
PSF Point Spread Function
RGC Retinal Ganglion Cell
RMS Root Mean Square
RPE Retina Pigmental Epithelium
SD-OCT Spectral-Domain OCT
SLD Superluminescent Diode
SLO Scanning Laser Ophthalmascopy
SM Single Mode
SNR Signal to Noise Ratio
SO2 Oxygen Saturation
SRS Stimulated Raman Scattering
SS-OCT Swept Source Optical Coherence Tomography
TD-OCT Time-Domain OCT
VCSEL Vertical Cavity Surface Emitting Laser

xxii
List of Tables Table 2-1 Comparison of photoacoustic imaging and optical coherence tomography ........................ 21 Table 5-1 SRS characteristics at 300 K temperature ........................................................................... 98
Table 5-2 SRS characteristics at 273 K temperature ........................................................................... 98
Table 5-3 SRS characteristics at 195 K temperature ........................................................................... 98
Table 6-1 Measured power of SRS peaks generated in 3.5m fiber and at 100kHz PRR. .................. 108
Table 8-1 Maximum permissible radiant exposure MPHc (in J/cm2) at the cornea (Overfilling pupil)
reproduced with permission from [351] © The Optical Society. ....................................................... 146
Table 8-2 Parameters to be used in Tables 8-1 and 8-3 reproduced with permission from [351] © The
Optical Society. .................................................................................................................................. 146
Table 8-3 Maximum permissible radiant power MP𝝓𝝓 (in watts) entering the natural or diluted pupil
reproduced with permission from [351] © The Optical Society. ....................................................... 147
Table 8-4 Effective 𝑪𝑪𝑪𝑪′ used in evaluating the 𝑴𝑴𝑴𝑴𝝓𝝓 for exposures in rectangular areas ................ 148
Table 8-5 repetitive pulses (Evenly spaced pulsed of equal energy/pulse) ........................................ 150

1
Chapter 1 Introduction
Humans might have seen the world for centuries, but the world has only been able to
see inside the living human eye for the last 170 years. Until the invention of the
ophthalmoscope in 1851, the structure of the living human eye was an inaccessible mystery.
Since that time, there have been many exciting breakthroughs in the field of ophthalmic
imaging, including but not limited to fluorescein angiography (FA), scanning laser
ophthalmoscopy (SLO), optical coherence tomography (OCT) and photoacoustic
ophthalmoscopy. The development of these imaging instruments has greatly extended our
ability to evaluate ophthalmic diseases. Studies have shown that at least 40% of blinding
diseases in the United States are either preventable or treatable with timely diagnosis and
intervention[1].
The human eye is a complex organ of numerous components (Figure 1-1). The eye can be
broadly classified into two main parts: anterior and posterior segments. The anterior segment
of the eye is composed of the cornea, conjunctiva, sclera, aqueous humor, lens, and iris. The
posterior segment contains the inner side of the choroid, vitreous humor, retina, and optic
nerve. The ability to image both anterior and posterior segments of the eye play a crucial role
in early detection, monitoring, and treatment of common blinding eye diseases such as
glaucoma, diabetic retinopathy, and macular degeneration.

2
Figure 1-1 Side view of the eye (reproduced from allaboutvision’s website [https://www.allaboutvision.com/resources/anatomy.htm])
1.1 A Brief History of ophthalmic imaging
The invention of the ophthalmoscope by Helmholtz in 1851 inaugurated the modern era in
ophthalmology[2]. The design consisted of a partially reflecting mirror that directed light from
a source onto the retina. The back-reflected light was then magnified to form an image.
Helmholtz’s ophthalmoscope equipped scientists with a tool for examining the retina. In 1886,
Jackman and Webster recorded the first in-vivo human retinal photograph, showing the optic
disc and larger blood vessels[3]. In 1920, such en-face retinal photography known as fundus
photography was commercialized by Zeiss (Zeiss-Nordenson)[4]. Initially, due to its slow film

3
speed and long exposure time, it had limited clinical use. However, in the 1950s, the invention
of the electronic flash made the technology a more common tool in clinics. Shortly after, in
1961, the first successful fluorescein angiography was administered in human eye. Through
intravenous injection of fluorescein dyes, FA became the main diagnostic tool for study of
retinal circulation[5]. In both fundus photography and fluorescein angiography, the choroid is
not usually visible due to the strong scattering and absorption of the retinal pigment epithelium
above it. By the early 1990s, indocyanine green angiography gained clinical acceptance for the
study of choroidal circulation. The dye has infrared emittance and excitation spectra which
facilitates penetration into the choroid. In the early 1980s, Webb's invention of the scanning
laser ophthalmoscope thrust the field of fundus imaging into a new era[6]. Instead of capturing
the image as a whole, the SLO samples the retina point by point in a raster-like scanning mode.
The SLO's high light efficiency allows the laser beam to penetrate better into the lens and
corneal opacities, resulting in improved spatial resolution and image contrast.
One of the greatest modern developments in ophthalmic imaging is the ability to evaluate
posterior microanatomy in three dimensions. To this end, in 1987, the aforementioned SLO
was combined with confocal optics[7]. In addition to obtaining higher contrast by reducing
scattered light from other ocular structures, the confocal SLO was capable of depth-sectioning
and enabled en-face fundus imaging with micron-scale resolution. Meanwhile, ultrasound
techniques were widely used clinically for quantitative measurements of intraocular distances.
Ultrasound determines distances within the eye from the echo delay of sound waves.
Unfortunately, the ultrasound measuring device (transducer) requires direct contact with the
cornea or immersion of the eye in a liquid to facilitate transmission of sound waves. Standard

4
ultrasound offers axial resolution ~150 µm; higher-frequency ultrasound can offer higher
resolution approaching 20 µm, however, its application is only limited to imaging the anterior
segment[8]. Furthermore, other methods such as computed tomography and magnetic
resonance imaging are limited to the resolutions of hundreds of microns[9]. None of these
techniques have sufficient depth resolution to provide useful three-dimensional images of
retinal structure. In 1991 optical coherence tomography was introduced into the field of optical
imaging. In comparison to the other imaging modalities, OCT provides high resolution (<10
µm) cross-sectional images of the eye in a non-invasive and non-contact manner. It became
the standard of care in clinics for various ophthalmic imaging applications and provides
detailed structural and three-dimensional images of both anterior and posterior parts of the
eye[10].
Despite all the advances in OCT and other ophthalmic imaging modalities, there remains a gap
in the amount of functional and physiological information that they can provide for the accurate
diagnosis of common eye diseases. The structural information offered by these modalities is
usually limited in clinical diagnostic value, and they often require additional techniques to
examine physiologic changes related to the structural abnormalities. Recently, photoacoustic
ophthalmoscopy techniques have been developed for pre-clinical trials and imaging both
anterior and posterior segments in animal eye models. Photoacoustic imaging modalities
provide the unique imaging contrast of optical absorption. In the ocular environment,
hemoglobin and melanin are the two main optical absorbers. Photoacoustic imaging techniques
can potentially quantify the amount of oxygenated, de-oxygenated hemoglobin, oxygen
saturation (SO2), and concentration of melanin in the ocular tissue. These functional

5
measurements can be achieved based on the differences in optical absorption of these
chromophores[11]. Studies have demonstrated that variations in retinal blood oxygen
saturation and melanin concentration play an important role in several prevalent blinding eye
diseases[12], [13]. Over the last decade, photoacoustic ophthalmoscopy of both the anterior
and posterior segments have been reported[14]. However, a major limitation that prevents the
technology from moving to clinics is its contact-based imaging approach [11]. This contact-
based detection mechanism can increase the risk of infection, abrasion and may cause patient
discomfort. Furthermore, it applies pressure to the eye and has a crucial influence on the
physiological and pathophysiological balance of ocular vasculature function.
In this thesis we develop a non-contact photoacoustic imaging system based on photoacoustic
remote sensing (PARS) for imaging the ocular tissue. The technology enables non-contact
photoacoustic imaging of the ocular environment for the first time, and it also provides
functional information of the eye. It is further combined with OCT, the state-of-the-art
ophthalmic imaging technique, to provide complementary information of optical absorption
and optical scattering in both anterior and posterior segments of animal eye models.
1.2 Chapter overview
This thesis is organized based on several journal manuscripts (published or currently in
review):
Chapter 2 reviews the importance of dual-modal imaging and discusses the combination of
photoacoustic imaging and optical coherence tomography for ophthalmic applications. The
impact the dual-modal imaging in the field of ophthalmology is discussed in this chapter.

6
Chapter 3 explains the importance of non-contact photoacoustic imaging and how it is
important in ophthalmic imaging applications. It provides an overview of the different methods
applied to achieve non-contact photoacoustic imaging alongside with the advantages and
disadvantage of each method. The chapter also introduces photoacoustic remote sensing
microscopy and discusses some of its potential applications.
Chapter 4 focuses on the non-contact imaging of the murine eye using photoacoustic remote
sensing microscopy.
Chapter 5 discusses the development of a temporally stable multiwavelength light source and
its application in functional photoacoustic imaging.
Chapter 6 discusses a multimodal photoacoustic remote sensing microscopy combined with
swept source optical coherence tomography for functional and structural imaging in the
anterior segment of the eye.
Chapter 7 discusses the modifications of the multimodal system in Chapter 6 and examines
its applications for in vivo functional and structural imaging of rat retina.
Chapter 8 discusses the ocular light safety for the multimodal PARS-OCT system.
Chapter 9 Summarizes the results from this PhD thesis and discusses potential future studies.

7
Chapter 2 Dual-modal photoacoustic imaging and optical coherence
tomography
Notes and Acknowledgement
This chapter reviews the importance of dual-modal photoacoustic imaging combined with
optical coherence tomography for biomedical applications and ophthalmic imaging. The
content of this chapter is based on the following journal manuscript:
Zohreh Hosseinaee, Alexander James Tummon Simmons, Parsin Haji Reza. "Dual-modal
photoacoustic imaging and optical coherence tomography." Frontiers in Physics 8 (2021): 635.
Author contributions
Zohreh Hosseinaee read and collected the reference papers, organized the content of the review
paper, sub-categorized the techniques, compiled the article, prepared the figures and wrote the main
manuscript.
Alexander James Tummon Simmons edited parts of the article.
Parsin Haji Reza was the principal investigator, set the article scope, and proofread the article.
All authors contributed to the final version for publication.

8
2.1 Introduction
The field of medical imaging has continued to grow quickly since the turn of the century, with
many new modalities introduced to perform critical steps in a variety of different disease care
pathways. Novel imaging technologies continue to be developed to access valuable functional
and morphological information. Each imaging modality has its own specific strength and
intrinsic limitations, such as spatial resolution, penetration depth, contrast mechanism, and
sensitivity, leading to precise and reliable images correlated with a true anatomy. To
compensate for the weak aspects of different modalities, multimodal imaging concepts have
been considered in recent years[15]–[17]. Multimodal imaging can play an important role in
the clinical care of various diseases by improving the clinician’s ability to monitor, surveil,
stage, diagnose, plan and guide therapy, screen therapy efficacy, and evaluates recurrence
[16]. Multimodal imaging systems have been widely used in medical research and clinical
practice, such as for cardiovascular diseases [18], [19], neuropsychiatric diseases [20],
Alzheimer’s [21] and tumor resection surgeries [22].
Photoacoustic imaging (PAI) is one recent example of a successful novel optical imaging
modality. PAI uses the absorption characteristics of specific endogenous or exogenous
biomarkers to generate targeted image contrast with a wide scalable range of spatial resolution
and penetration depths [23], [24]. The rich absorption information that PAI provides would be
well complemented by an imaging modality that offers detailed scattering information. Optical
coherence tomography (OCT) is a well-established imaging technology which provides
excellent depth-resolved morphological information. OCT is currently used in a broad range
of clinical applications and is a standard of care in the field of ophthalmology for the diagnosis

9
of various critical eye diseases [25]–[27]. OCT is considered as an ideal companion for PAI
because it provides complementary imaging contrast, which has strongly motivated the
development of multi-modal PAI and OCT systems. While OCT can image microanatomy of
biological tissues, PAI devices could provide detailed molecular and metabolic information of
the sample [28]–[30]. This multimodal system could provide access to valuable information
about biological tissues and has the potential to impact a broad range of clinical and pre-clinical
imaging applications, including but not limited to oncology, neurology, dermatology, and
ophthalmology. Here, we first introduce the basic mechanisms of PAI and OCT and discuss
their current applications. Then we compare PAI and OCT, contrasting the strengths and
limitations of each modality while highlighting the potential applications of a multimodal
system. Finally, we review the development of existing dual modal systems, emphasizing their
strengths along with the challenges that need to overcome before such modalities move to the
clinic.
2.2 Photoacoustic imaging: Principles and applications
Photoacoustic imaging is among the most rapidly growing technologies in biomedical imaging
[24], [31]. The modality is based on the photoacoustic effect, which was discovered by Bell in
1880[32]. In general, once the tissue is irradiated by short laser pulses, endogenous or
exogenous chromophores inside the tissue absorb the photon’s energy. This absorbed energy
then induces a transient local temperature rise, which in turn generates pressure waves through
thermoelastic expansion. These pressure waves, which propagate in tissue as ultrasound
signals, can be captured by acoustic detectors to form images of the chromophore’s distribution
inside the sample[33]. Depending on the spatial scales of optical absorbers, the frequency

10
content of generated ultrasound signals might extend to several tens or even hundreds of
megahertz[34]. The bandwidth of this signal and corresponding spatial resolution is not limited
by the PA generation process. Instead, the tissue frequency-dependent acoustic attenuation
limits the maximum frequency content of PA wave, and therefore defines the achievable spatial
resolution. As a result, the spatial resolution in PAI scales with depth. In addition, ultrasound
detector’s properties such as bandwidth, center frequency, element size, and detection aperture
can limit the spatial resolutions of PAI devices [35].
Based on the way images are formed, PAI can be split into two main categories: photoacoustic
tomography (PAT), which uses reconstruction-based image formation, and photoacoustic
microscopy (PAM) which uses focused-based image formation [36]. In photoacoustic
tomography, usually a wide-field unfocused excitation beam is used together with an array of
ultrasonic detectors which measure the generated ultrasound waves in multiple positions
simultaneously [37]–[39]. It can provide large field of view (FOV) images, and has been used
in applications such as whole-body imaging of small animals[40] and breast cancer studies[41].
In contrast to PAT, PAM is based on raster-scanning of optical and acoustic foci and forms
images directly from recorded depth-resolved signals [42]. Generally, PAM is the preferred
configuration for use in applications which require high-resolution over deep penetration
depth, for example in single cell imaging [43]. PAM can be further divided into acoustic-
resolution PAM (AR-PAM), where the acoustic focusing is tighter than optical focusing[44],
and optical-resolution PAM (OR-PAM), where the optical focusing dominates the
resolution[45]. Figure 2-1 demonstrates the imaging setup for different possible configurations
of photoacoustic imaging systems. Photoacoustic endoscopy (PAE) can be considered as a sub-

11
category of both PAM and PAT (depending on the implementation), which is applied for
imaging internal tissue/organs and usually provides micron-scale spatial resolution and
millimeter-scale imaging depth [46].
Figure 2-1. Signal generation and detection in different implementations of PAI and penetration limits in scattering tissue. (A) Reflection-mode OR-PAM system with an optical–acoustic combiner that transmits light but reflects sound. (B) AR-PAM system where the laser light is poorly focused. (C) PAT system with ultrasonic transducer array (UTA). The laser beam is expanded and homogenized by a diffuser to provide widefield illumination.
Photoacoustic imaging devices offer two distinct advantages which primarily stem from the
combination of optical excitation and acoustic detection. First, they provide the unique imaging
contrast of optical absorption. As a result, PAI enables high sensitivity detection of endogenous
chromophores which are weakly fluorescent and difficult or impractical to be labeled with
exogenous fluorophores, including but not limited to hemoglobin, melanin, collagen,
cytochrome and lipid[47]. This complements established imaging technologies including

12
fluorescence imaging, which is currently one of the leading technologies for in-vivo optical
molecular imaging [48]. Second, PAI enables a wide scalable range of spatial resolution and
penetration depths across macroscopic (i.e. 100-400 µm resolution at the depth of several
centimeters)[24], mesoscopic (i.e. tens of micrometer resolution at the depth of 1-10 mm)[49]
and microscopic (i.e. micrometer resolution at the depth of sub-millimeter)[50]. Additionally,
the modality has practical functional and molecular imaging capabilities making it a powerful
tool for biomedical investigations [35]. One of these well-known capabilities is photoacoustic
spectroscopy which is based on the ability to selectively image specific chromophores by
tuning the excitation wavelength [51]. Here, by acquiring images at multiple wavelengths and
undertaking spectroscopic analysis, the concentration of specific chromophores can be
quantified. For example, in the visible and NIR wavelength, the absorption spectrum of blood
is highly dependent on its oxygen saturation (SO2), and consequently the significant spectral
difference between oxyhemoglobin (HbO2) and deoxyhemoglobin (Hb). Using this spectral
difference, it is possible to quantify the concentration of HbO2 and Hb and estimate SO2 which
is an important physiological parameter related to several pathophysiological processes and
inflammatory conditions. Other functional extensions of PAI such as Doppler flowmetry [52],
[53] and photoacoustic thermometry [54], [55] have enabled measurement of blood flow
velocity and acquiring maps of temperature distributions in tissue, respectively.
These unique and important imaging advantages offered by PAI make it the preferred modality
for a broad range of functional and molecular imaging applications. It has been used in
numerous pre-clinical and clinical applications including but not limited to blood oxygen
saturation imaging[56], [57], brain vasculature and functional imaging [58], [59], gene

13
expression[60], vulnerable atherosclerotic plaques diagnosis[61], skin melanomas[62],
histology-like tissue imaging [63], [64], longitudinal tumor angiogenesis studies [65], imaging
and detection of protein interactions[66], ophthalmic imaging [67], and tissue engineering
scaffolds[68].
2.3 Optical coherence tomography: Principles and applications
Optical coherence tomography is an optical imaging technique with high resolution structural
content. Unlike photoacoustic imaging, OCT obtains its imaging contrast from optical
scattering of internal tissue microstructures, and can be considered as an optical analogy to
ultrasound pulse echo imaging [69]. The modality is based on the principles of low-coherence
interferometry, where a low-coherence light beam is directed on to the targeted tissue. The
backscattered light is combined with a reference beam, which was split off from the original
light beam. The resulting interference patterns are used to reconstruct cross-sectional images,
which represent the reflectivity profile of the tissue along the beam path[70], [71].
The first generation of OCT known as time domain OCT (TD-OCT) was developed in
1990s[69]. The technology required acquisition of a depth scan for every location and
subsequently suffered from slow imaging speed and poor image quality that limited adoption
of the technology. The introduction of Fourier domain OCT (FD-OCT) overcame these
limitations by providing a more efficient implementation of low-coherence interferometry
principles[72]. Unlike TD-OCT, FD-OCT uses spectral information to generate a depth profile
without the need for mechanical scanning of the optical path length[73]. It offers >100x
improvement of the image acquisition rate and >20 dB signal-to-noise ratio (SNR) compared
to TD-OCT systems.

14
Depending on whether spectral information in FD-OCT is separated at the system’s input
(tunable laser), or system’s detection end (spectrometer), FD-OCT systems can be classified
into two major groups: Spectral-domain OCT (SD-OCT) in which a broad bandwidth light
source is used as the interferometer input and a spectrometer with a linear array camera at the
interferometer output, or swept-source OCT (SS-OCT), which uses a tunable laser as the
interferometer input and a single photodiode at the interferometer output[74]. Figure 2-2
depicts schematic of different OCT modalities.
OCT technology has enabled non-contact, high speed, cross-sectional imaging over a large
field of view with submicron resolution in biological tissues. It is currently the preferred
technology in ophthalmology for corneal imaging, as well as retinal structural and vascular
imaging[75]–[77]. Various functional extensions of OCT have been developed including:
Doppler OCT [78], OCT angiography (OCTA) [79], polarization sensitive OCT (PS-OCT)
[80], OCT elastography [81], and spectroscopic OCT [82]. Besides ophthalmic applications,
OCT has been applied in other clinical applications such as brain imaging [83], [84], tissue
engineering[85], cardiology and cardiovascular imaging [86], skin imaging[87],
neuroimaging[88], gynecology[89], oncology [90] and dental imaging[91].
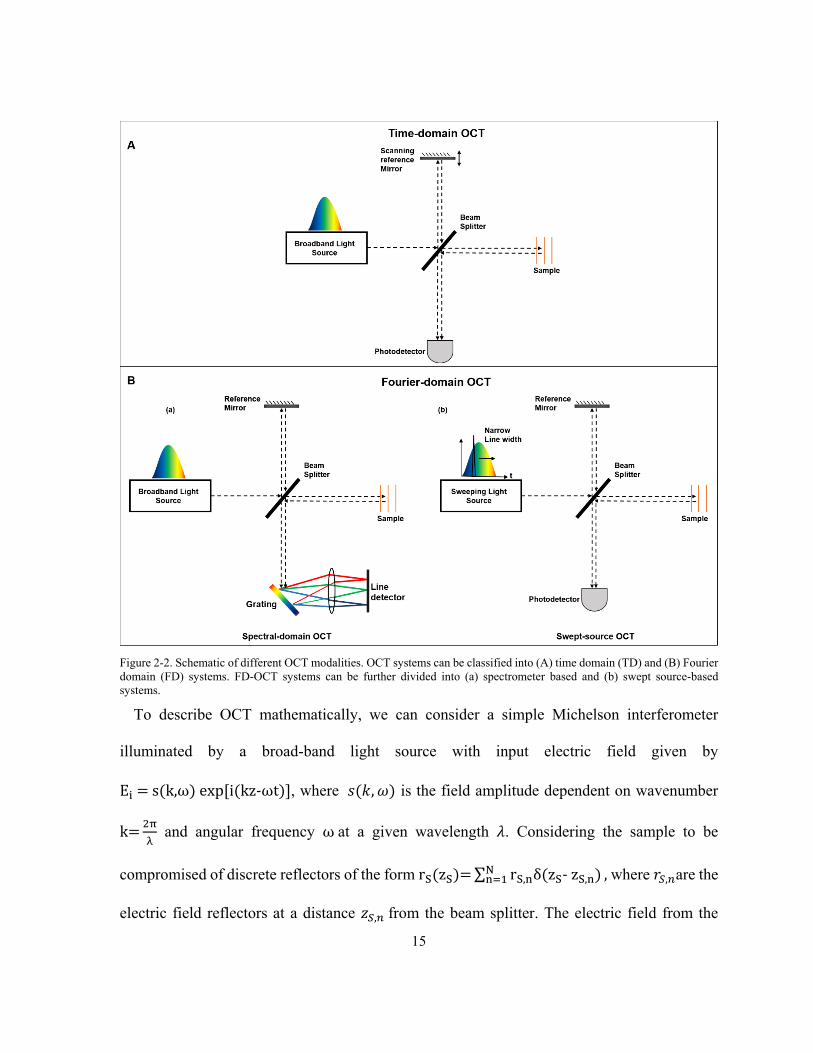
15
Figure 2-2. Schematic of different OCT modalities. OCT systems can be classified into (A) time domain (TD) and (B) Fourier domain (FD) systems. FD-OCT systems can be further divided into (a) spectrometer based and (b) swept source-based systems.
To describe OCT mathematically, we can consider a simple Michelson interferometer
illuminated by a broad-band light source with input electric field given by
Ei = s(k,ω) exp[i(kz-ωt)], where 𝑠𝑠(𝑘𝑘, 𝜔𝜔) is the field amplitude dependent on wavenumber
k= 2πλ
and angular frequency ω at a given wavelength 𝜆𝜆. Considering the sample to be
compromised of discrete reflectors of the form rS(zS)= ∑ rS,nδ(zS- zS,n)Nn=1 , where 𝑟𝑟𝑆𝑆,𝑛𝑛are the
electric field reflectors at a distance 𝑧𝑧𝑆𝑆,𝑛𝑛 from the beam splitter. The electric field from the

16
sample arm at the 50:50 beam splitter is given by ES=( Ei√2� ) ∑ rS,nexp(i2kzS,n)N
n=1 . The
electric field from a mirror reflector with reflectivity rR is 𝐸𝐸𝑅𝑅 = (𝐸𝐸𝑖𝑖√2� ) 𝑟𝑟𝑅𝑅𝑒𝑒𝑒𝑒𝑒𝑒(𝑖𝑖2𝑘𝑘𝑧𝑧𝑅𝑅) where
𝑧𝑧𝑅𝑅 is the distance of the reference mirror from the beam splitter. The factor of 1√2� is due to
the splitting of power into half due to 50:50 beam splitter. The interference signal recorded by
the square law detector is given by:
ID(k,ω) = ρ2
⟨|ER+ES|2⟩ Equation 2-1
Where 𝜌𝜌 is the detector responsivity and ⟨. ⟩ is the average over detector response time. The
factor of 1 2� is due to the double pass of fields through beam splitter. Equation 2-1 can be
extended as:
𝐼𝐼𝐷𝐷(𝑘𝑘) = 𝜌𝜌4
𝑆𝑆(𝑘𝑘) �𝑅𝑅𝑅𝑅 + � 𝑅𝑅𝑆𝑆,𝑛𝑛
𝑁𝑁
𝑛𝑛=1
�
+ ρ4
�S(k) ∑ �RS,nRS,mNn≠m=1 �ei2k(zS,n-zS,m ) + e-i2k(zS,n-zS,m )�� Equation 2-2
+ ρ4
�S(k) � �RRRS,n
N
n=1
�ei2k(zR-zS,n ) + e-i2k(zR-zS,n )��
Where S(k) = ⟨|s(k,ω)|2⟩, RS,n= |rS,n|2 and RR = |rR|2. The averaging of the signal over the
detector response time causes the terms dependent on the temporal angular frequency ω=2πν
to be eliminated in Equation 2-2. This is due to the fact that in practice, the optical frequency
ν oscillates much faster than the detector response time. Equation 2-2 can be further simplified
to:

17
𝐼𝐼𝐷𝐷(𝑘𝑘) = 𝜌𝜌4
𝑆𝑆(𝑘𝑘) �𝑅𝑅𝑅𝑅 + � 𝑅𝑅𝑆𝑆,𝑛𝑛
𝑁𝑁
𝑛𝑛=1
� "𝐷𝐷𝐷𝐷 𝑡𝑡𝑒𝑒𝑟𝑟𝑡𝑡"
+ ρ4
�S(k) ∑ �RS,nRS,mNn≠m=1 cos [2k(zS,n-zS,m )]� "Autocorrelation term" Equation 2-3
+ ρ2
�S(k) � �RRRS,n
N
n=1
cos �2k(zR-zS,n )�� . "Cross-correlation term"
The first term in Equation 2-3 is the DC off-set or the constant component, independent of any
optical pathlength, whose amplitude is proportional to the sum of the power reflectivity of the
reference mirror and the power reflectivity’s of the sample. The second term is the auto-
correlation term, which is due to the interference between the sample reflectors. The amplitude
of this term is usually low compared to the DC term in OCT as it depends linearly on the power
reflectivity of the sample reflections, which is much lower than reference power reflectivity.
The third term is the signal of interest in OCT referred to as the cross-correlation component,
and it depends on the optical pathlength difference between the reference arm and the sample
reflectors. Amplitudes of these components are proportional to the square root of the sample
power reflectivity’s scaled by the square root reference power reflectivity. Although the
amplitudes are lower than the DC component, the square root dependence implies logarithmic
gain over direct measurement of sample reflectivity’s. All the three terms are scaled by the
wavenumber spectrum of the light source. Based on Equation 2-3, the measurement of the
sample reflections at different depth can be done in both the time domain and Fourier domain.
Since Fourier domain OCT is the focus of the present work, a brief description of its principle
is discussed here.

18
As mentioned earlier, there are primarily two ways to get OCT measurement in Fourier domain
OCT, SD-OCT, and SS-OCT. In both cases the reference path length is fixed. Once the
spectrum of the interference signal, given in Equation 2-3, can be detected spatially or
temporally, a simple 1-D Fourier transform FTK→Z {ID(k)} gives the reflectivity profile with
depth:
𝐼𝐼𝐷𝐷(𝑘𝑘) = 𝜌𝜌8
𝛾𝛾(𝑧𝑧) �𝑅𝑅𝑅𝑅 + � 𝑅𝑅𝑆𝑆,𝑛𝑛
𝑁𝑁
𝑛𝑛=1
�
+ ρ4
�γ(z)⊗ ∑ �RS,nRS,mNn≠m=1 δ [z ± 2(zS,n-zS,m )]� Equation 2-4
+ ρ8
�γ(z) ⊗ � �RRRS,n
N
n=1
δ�z ± 2(zR-zS,n )�� .
The sample reflectivity profiles �RS,n, scaled by the reference reflectivity �RR , appear at
distance z= +2 (ZR- ZS,n) relative to the reference mirror position and convolved with the
complex coherence function 𝜸𝜸(𝒛𝒛). Thus, the axial width of the sample reflectivity profile
depends on the coherence length of the light source, which in turn is inversely dependent on
the light source bandwidth. Note that the factor of 2 for the path length difference in Equation
2-4 is due to the double pass in Michelson interferometer. The complex conjugate term also
appears as distance z= -2 (ZR- ZS,n), and can be separated from the actual terms of interest by
placing the sample completely on one side relative to the reference mirror position. The DC
component appears at zero delay, which is the location of the reference mirror. The auto-
correlation term appears close to the zero delay, as the pathlength difference between sample
reflectors are small in comparison to the pathlength difference between the reference and the
sample reflectors[30].
19
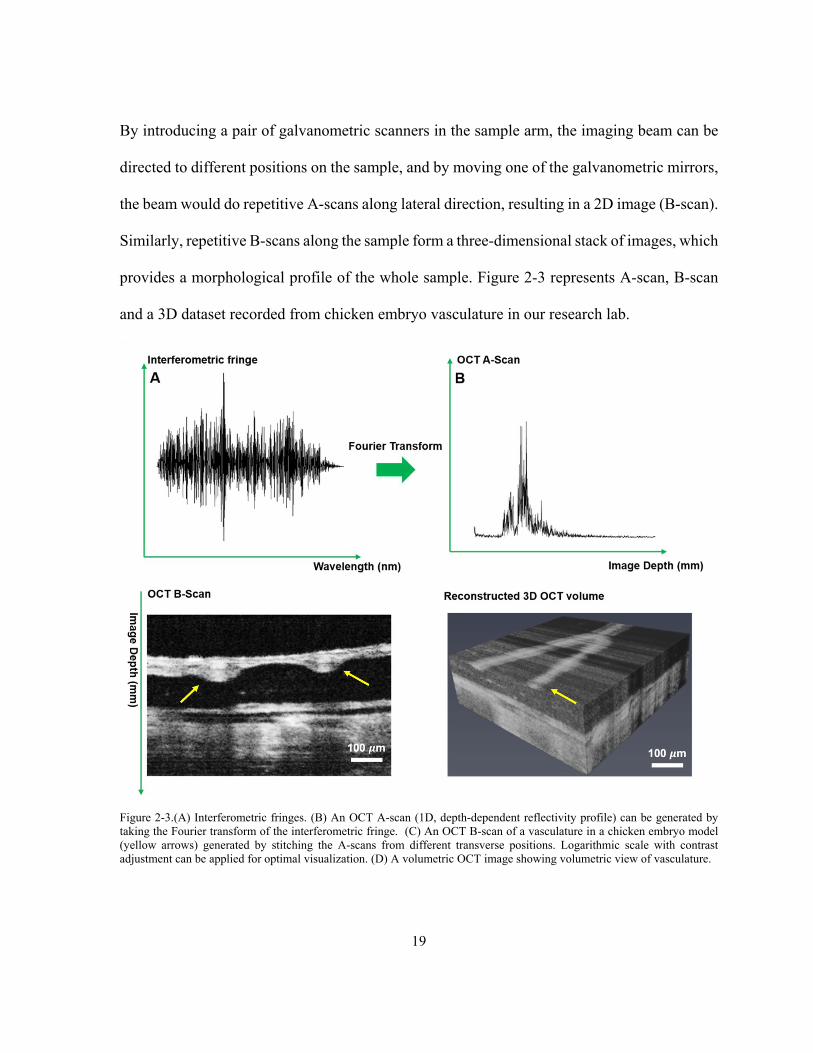
By introducing a pair of galvanometric scanners in the sample arm, the imaging beam can be
directed to different positions on the sample, and by moving one of the galvanometric mirrors,
the beam would do repetitive A-scans along lateral direction, resulting in a 2D image (B-scan).
Similarly, repetitive B-scans along the sample form a three-dimensional stack of images, which
provides a morphological profile of the whole sample. Figure 2-3 represents A-scan, B-scan
and a 3D dataset recorded from chicken embryo vasculature in our research lab.
Figure 2-3.(A) Interferometric fringes. (B) An OCT A-scan (1D, depth-dependent reflectivity profile) can be generated by taking the Fourier transform of the interferometric fringe. (C) An OCT B-scan of a vasculature in a chicken embryo model (yellow arrows) generated by stitching the A-scans from different transverse positions. Logarithmic scale with contrast adjustment can be applied for optimal visualization. (D) A volumetric OCT image showing volumetric view of vasculature.

20
Due to the highly scattering nature of biological tissues and the contrast mechanism of OCT,
the penetration depth of OCT devices is limited to be within a few millimeters [26]. In addition,
OCT relies on variation in scattering information to derive useful imaging contrast about the
sample, making it unable to effectively image interconnected soft tissues with similar
scattering properties. To provide additional contrast information, efforts have been made to
integrate OCT with other optical imaging modalities such as multiphoton microscopy [92], and
confocal microscopy [93]. While these technologies provide new contrast information, they
both rely on fluorescence as their contrast mechanism. In addition, they cannot enhance the
depth information that OCT devices currently obtain.
2.4 Dual-modal photoacoustic imaging and optical coherence tomography
The performance characteristics of PAI and OCT imaging systems make them a suitable
companion for a multimodal imaging system. A brief comparison of important features of both
PAI and OCT modalities are given in Table 2-1. The spatial resolution of both modalities is
highly dependent on their implementation and can range from sub-micron resolution for OCT
[94], [95] and OR-PAM to a few hundreds of microns in PAT systems [24]. While the available
imaging depth of OCT is restricted by the optical transport mean free path to ~ 2 mm, AR-
PAM and PAT systems can achieve imaging depth of a few millimeters [49] to a few
centimeters [41], respectively. In terms of speed, both modalities offer a wide range of imaging
speed with sub-milliseconds to a hundred of seconds range [96], [97], that should be chosen
based on intended applications.

21
Table 2-1 Comparison of photoacoustic imaging and optical coherence tomography Imaging parameter Photoacoustic imaging Optical coherence tomography
Axial resolution Determined by the detected photoacoustic bandwidth, usually
several tens of microns
Determined by the central wavelength and coherence length of the light source, generally within a few
microns Lateral resolution Depending on the implementation
can range from ~ 0.3 to 400 µm Determined by the central wavelength of the light source and imaging" optics, usually within tens of
microns Imaging depth Depending on the implementation
range from ~ 1.5 mm to ~ 7cm Restricted by the optical transport mean free path ~ 2
mm Imaging speed Defined by the laser pulse repetition
rate, mechanical scanning speed or the multiplexed data acquisition
time
Usually defined by the sweep rate of laser or speed of spectrometers’ camera
Contrast mechanism
Absorption Scattering
The complementary information of PAI and OCT makes them the favoured modality for a
wide range of imaging applications. For example, in blood flow imaging, OCT angiography
and Doppler OCT could obtain high resolution images based on the backscattering properties
of moving red blood cells, while PAI would remain sensitive to all blood cells, regardless of
their flowing state. Therefore, the integrated system provides a powerful tool for blood flow
imaging in vascular diseases such as stroke, haemorrhage, vascular occlusions or certain
pathologies with flow stasis such as tumours [98], [99].
For spectroscopic analysis and blood oxygen saturation measurements, despite recent advances
in the spectroscopic OCT [100]–[102] the technology is not background free and suffers from
sensitivity to speckle and polarization changes. In addition, the scattering losses alter the
spectral signal components and makes it difficult to quantify blood oxygen. On the other hand,
spectroscopic PAI methods are well-established for quantifying blood oxygen saturation. This
information would be well complemented with Doppler OCT flow measurements and help to
quantify metabolic rate of oxygen consumption. This will open a broad range of applications
for pathophysiological conditions such as angiogenesis, tissue inflammatory and healing

22
responses. For example, in ophthalmology measuring metabolic rate of oxygen is a sensitive
biomarker for early-stage diagnosis and an indicator for progression of several retinal diseases
including glaucoma, diabetic retinopathy, and age-related macular degeneration [103]–[106].
Alternatively, in oncology and metastasis detection, the spectroscopic and metabolic
information available through dual-modal PAI-OCT system could reveal changes in
endogenous chromophore concentrations and be employed for differentiating normal and
pathological tissues [107]. It may facilitate longitudinal assessment of tumour growth and
evaluate treatment success of novel therapeutic agents [107], [108]. In brain imaging
applications, this metabolic information can be used to extract brain oxygenation and
metabolism of oxygen and glucose [109], resting-state connectivity [110] and to study how
brain responds to various physiological and pathological conditions [111]. Furthermore, the
fine vascular structure and subcellular features available through high spatial resolution of
OCT and OR-PAM could facilitate diagnosis of brain disorders such as stroke, epilepsy, and
edema [95], [112], [113].
The combination of PAI and OCT is a powerful tool in dermatology by providing detailed
morphology and complete description map of skin perfusion. It enables studying the texture of
skin and determines the margin of morphological changes caused by skin disorders [114]. The
technique may overcome the limitations of histology-based margin assessment methodologies
and facilitate tumor resections in surgical rooms [115], [116]. Subsequently, it can be used to
improve the rate of complete excision and to reduce the average number of stages during Mohs
micrographic surgery [117], [118]. The dual-modal imaging platform can be applied for
studying a wide range of skin conditions such as melanoma tumours, vascular lesions, soft

23
tissue damages such as wounds and burns, inflammatory conditions and other superficial tissue
abnormalities characterized by morphology and function of supplying vasculature [119].
The dual-modal PAI-OCT system could have a significant impact for endoscopic applications
as well. Currently, most of endoscopic imaging devices rely on wide-field white-light optical
methods, which are limited by what the human eye can see and therefore suffer from lack of
sensitivity to subsurface and physiological changes. The combination of deep tissue
penetration, high resolution along with functional and molecular information make PAI-OCT
the favourable endoscope to observe inside the body and visualize physiological processes and
microscopic features of tissues [120], [121]. The targeted molecular imaging may allow for the
detection of small and invisible lesions in epithelial surfaces that line the internal organs such
as gastrointestinal, pulmonary, and ductal. This information can be used to facilitate detecting
cancer at early stages [122]. Another important application for endoscopic PAI-OCT would be
intravascular atherosclerotic imaging, where PAI subsystem could penetrate deep and provide
molecular information about the plaque composition and OCT maintains high resolution,
depth-resolved scattering contrast for lipid rich plaques [123].
It is clear there are a diverse set of biomedical applications for a functional multimodal PAI-
OCT system. The potential impact of such a broadly applicable technology has motivated the
further investigation of possible multimodal system configurations. Here, depending on the
photoacoustic imaging system, the multimodal PAI-OCT imaging systems are divided into
three main categories of PAT-OCT, PAE-OCT, and PAM-OCT. The developed configurations
for each category are reviewed and their advantages and technical challenges are discussed.

24
2.4.1 Photoacoustic tomography combined with optical coherence tomography.
Due to the high penetration depth benefits, dual-modal PAT-OCT systems are mainly used for
applications where depth information is required. For example, in dermatology, while OCT
techniques visualize superficial small capillary loops with vessel diameters from 10 to 200 μm
to a depth of 1 mm; PAT enables visualization of vasculatures with diameters from 100 μm
down to a depth of several centimetres. Therefore, the combination of these modalities could
provide a complete perfusion map of the skin [124]. In addition, acquiring PAT and OCT
images from overlapping or identical regions has the advantage that highly absorbing
structures, which appear as shadow in OCT images (e.g., blood vessels), can be observed in
PAT images.
In 2011, Zhang et al.[99] developed a PAT-OCT system and demonstrated in-vivo volumetric
images of vasculature and surrounding tissue in mouse and human skin. The schematic of their
system is presented in Figure 2-4A. The system employed an integrated all-optical detection
scheme for both modalities in reflection-mode maintaining a field of view of ~ 13 mm × 13
mm. The photoacoustic waves were detected using a Fabry-Perot sensor place on the surface
of the skin. The planar-view PAT system based on Fabry-Perot interferometer is of particular
interest in most dual-modal PAT-OCT applications because of the simplicity of sample
positioning and optical detection mechanism [125], [126]. The study reported tissue
information of vascular structure to a depth of ~ 5 mm. Similar systems were further developed
and in-vivo clinical experiments were performed on healthy and pathological skin, [127]–[130]
(Figure 2-4B). Initial clinical studies demonstrate that the dual modal PAT-OCT systems hold
a great potential for applications in dermatology. Recently Liu et al. [119] published a

25
comprehensive overview of the dual modality PAT-OCT system in the field of dermatology
and the challenges and prospects of these two imaging modalities for dermatology were
discussed thoroughly.
Figure 2-4. (A) Dual modal PAT-OCT scanner. Reprinted with permission from [99]. (B) (a-c) overlaid PAT-OCTA images with PAT in the green channel and OCTA in the red channel. (d) Blood vessel network given in volumetric display by fused OCTA and PAT data. (e) PAT image (f) PAT image in deeper region (g) A snapshot of the 3D volume with OCT in gray, OCTA and PAT in red color map. Scale bar = 1 mm. Reprinted with permission from [127].

26
2.4.2 Photoacoustic endoscopy combined with optical coherence tomography.
Toward realizing dual-modality PAE-OCT, in 2011 Yang et al. [131] made the initial step by
integrating ultrasound tomography with photoacoustic and OCT imaging in a single
intraoperative probe. The performance of the system was demonstrated on ex-vivo porcine and
human ovaries. The OCT subsystem used a swept-source laser centered at ~1300 nm with 110
nm spectral bandwidth and a 20 kHz scan rate and the PAE subsystem had a tunable Ti:
Sapphire laser with spectral range of 700 – 950 nm and a 15 Hz repetition rate. The ultrasound
transducer operated as both PAI detection and ultrasound transmission and detection. Figure
2-5A depicts the combined three-modality endoscopic probe. The overall diameter of the
endoscope was 5mm and included a ball-lensed OCT sample arm probe, and a multimode fiber
to deliver light for photoacoustic imaging. Later, in 2013, Xi et al. [132] reported an endoscopic
delivery probe with a diameter of 2.3 mm. The system had a low-frequency unfocused 10 MHz
transducer for photoacoustic signal detection and a time-domain OCT system at 1 kHz. The
performance of their system could be improved in several ways such as increasing the central
frequency of photoacoustic transducer, employing a higher resolution DAQ card, and replacing
the time-domain OCT device with a frequency-domain OCT device to enhance the sensitivity.
Inspired by one of the initial efforts in the field (Yang et al. [131] study), Dai et al. [133]
developed a multimodal miniature probe through which OR-PAM, OCT and pulsed-echo
ultrasound images were acquired coaxially and were displayed simultaneously. Figure 2-5B
depicts the schematic of the integrated miniature probe. The 2 mm diameter probe had a 40
MHz unfocused ultrasound transducer for both OR-PAM detection and ultrasound
transmission and receiving, and in-vivo images of rat ear were recorded (Figure 2-5C). The

27
results show cross-sectional images acquired by OR-PAM, OCT, ultrasound, and combined
images, corresponding to the three dashed lines in the respective maximum-amplitude-
projection image. Despite offering high imaging resolution, the system suffered from lack of
rotational scanning and its imaging speed was limited by the slow repetition rate (20 Hz) of
the pulsed laser. Mathews et al. [134] developed a dual-modal intravascular imaging probe
using a commercial OCT catheter and a fiber optic ultrasound sensor based on Fabry-Perot
cavity. Their experimental setup and the enlarged view of the distal end of the probe is
presented in Figure 2-5D. They demonstrated circumferential PAE-OCT imaging and
multispectral PAI on a synthetic phantom. One limitation of their probe configuration was that
the stationary fiber optic ultrasound receiver resulted in shielding of the photoacoustic waves
by the OCT catheter for certain excitation angles. As a result, the detected photoacoustic signal
amplitude varied relatively with respect to the receiving angle in the rotation plane. In general,
future direction for multimodal PAE-OCT studies can be focused on improving scanning
speed, miniaturizing the probe size, and enhancing detection mechanism.

28
Figure 2-5. (A) Integrated OCT-US-PAI three-modality endoscopic probe. Reprinted with permission from [131]. (B) Schematic and photograph of miniature integrated probe. Reprinted with permission from [133] (C) In-vivo images of a rat ear. Maximum amplitude projection images (top row) and cross-sectional images (2nd, 3rd, and bottom rows) corresponding to the dotted lines in first row images (a) OR-PAM, (b) OCT, (c) US, and (d) fused images. Reprinted with permission from [133](D) Schematic of the dual-modality PA-OCT system. An enlarged image of the distal end of the probe. Reprinted with permission from [134].
2.4.3. Photoacoustic microscopy combined with optical coherence tomography.
One of the earliest works on the feasibility of multimodal PAM-OCT was demonstrated by Li
et al. in 2009 [135]. Their proposed system operated in transmission mode and was only
capable of imaging thin samples (Figure 2-6). The reported penetration depth was ~ 1.5 mm

29
and 1.8 mm for the PAM and OCT subsystem, respectively. Due to the mechanically
translating objective, the system had slow acquisition time which severely limited its in-vivo
applications. Despite this limitation, the system was later used to look at the neovascularization
of mouse ear [136](Figure 2-6B). Later Jiao et al. [137]developed a reflection-mode PAM-
OCT system, and imaged microvasculature of the mouse ear. The temporal resolution of their
dual modal system was limited by the pulse repetition rate of the PAM excitation source (~ 1
kHz). Liu et al. [138] developed a dual modal system where a tunable dye laser was used as
excitation source (Figure 2-6C). It leveraged the spectroscopic measurement capabilities of the
PAM subsystem to evaluate total hemoglobin concentration as well as the metabolic rate of
oxygen consumption in the mouse ear. Dual modal PAM-OCT systems were further applied
on various samples such as animal model of epilepsy progress [139], bovine cartilage
osteoarthritis tissue[140], imaging/needle guiding for injection and drug delivery in mouse
thigh [141].

30
Figure 2-6. (A) Schematic of the combined PAM-OCT. SLD: superluminescent diode. Solid lines represent single-mode optical fibers. Reprinted with permission from [135]. (B) PAM and OCT images showing the vasculature and tissue structure for an inverse scaffold with a pore size of 200 μm. (A–C) PAM images showing the development of blood vessels at 2-, 4-, and 6-weeks post implantation, respectively. (D–F) The corresponding OCT images showing the tissue structure. Reprinted with permission from [136]. (C) Schematics of the combined PAM and OCT. PD: photodiode; HM: hot mirror; GM: 2D galvanometer; OBJ: objective lens; AMP: amplifier; UT: ultrasonic transducer; WT: water tank; SLED: superluminescent emitting diode; Ref: OCT reference arm. Reprinted with permission from [138].
Qin et al. [142] was among the first to develop portable dual-modal PAM-OCT system. Their
system was used for monitoring the recovery of an ulcer wound in human lip. They carried out
quantitative analysis by measuring total hemoglobin concentration as well as the size of the
ulcer. In-vivo images recorded from healing process of human lip ulcer are shown in Figure
2-7A. The system offered lateral resolutions of ~ 8 µm for both modalities, and axial
resolutions of 116.5 µm for PAM and 6.1 µm for OCT. However, since the system suffered
from bulky size, in 2018 the same author demonstrated a handheld version of the system
implemented with a MEMS-based optical scanner that offered more flexibility for oral tissue
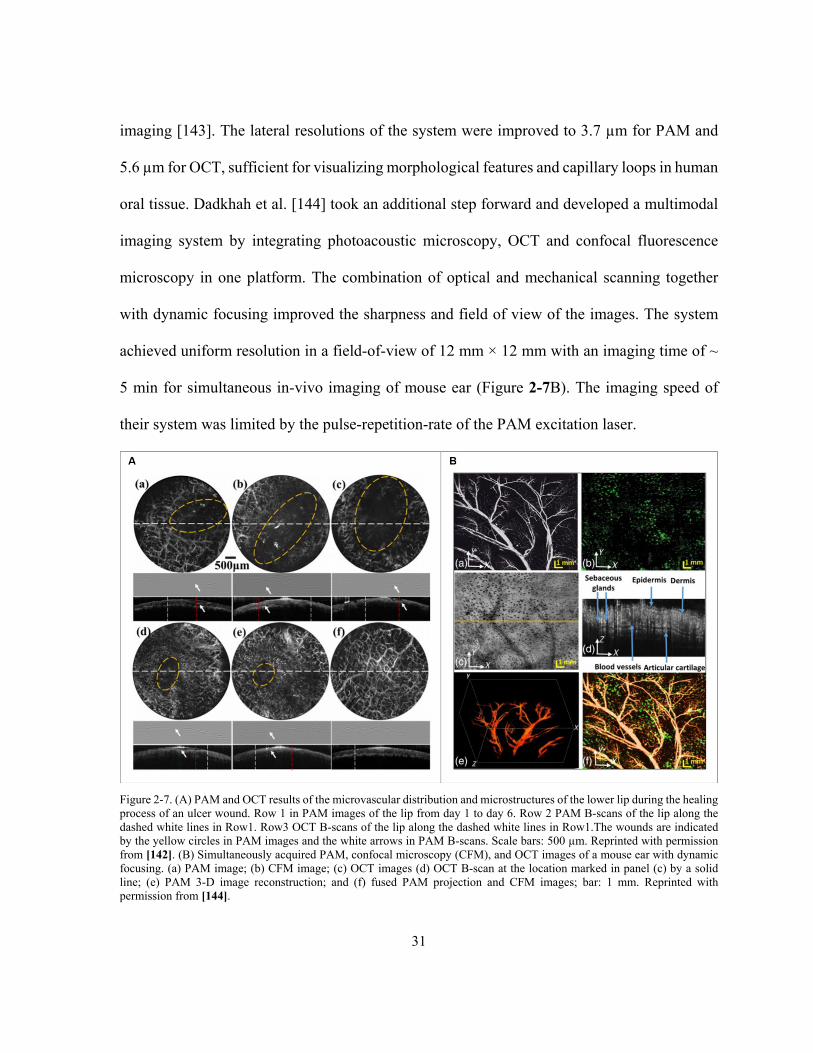
31
imaging [143]. The lateral resolutions of the system were improved to 3.7 µm for PAM and
5.6 µm for OCT, sufficient for visualizing morphological features and capillary loops in human
oral tissue. Dadkhah et al. [144] took an additional step forward and developed a multimodal
imaging system by integrating photoacoustic microscopy, OCT and confocal fluorescence
microscopy in one platform. The combination of optical and mechanical scanning together
with dynamic focusing improved the sharpness and field of view of the images. The system
achieved uniform resolution in a field-of-view of 12 mm × 12 mm with an imaging time of ~
5 min for simultaneous in-vivo imaging of mouse ear (Figure 2-7B). The imaging speed of
their system was limited by the pulse-repetition-rate of the PAM excitation laser.
Figure 2-7. (A) PAM and OCT results of the microvascular distribution and microstructures of the lower lip during the healing process of an ulcer wound. Row 1 in PAM images of the lip from day 1 to day 6. Row 2 PAM B-scans of the lip along the dashed white lines in Row1. Row3 OCT B-scans of the lip along the dashed white lines in Row1.The wounds are indicated by the yellow circles in PAM images and the white arrows in PAM B-scans. Scale bars: 500 µm. Reprinted with permission from [142]. (B) Simultaneously acquired PAM, confocal microscopy (CFM), and OCT images of a mouse ear with dynamic focusing. (a) PAM image; (b) CFM image; (c) OCT images (d) OCT B-scan at the location marked in panel (c) by a solid line; (e) PAM 3-D image reconstruction; and (f) fused PAM projection and CFM images; bar: 1 mm. Reprinted with permission from [144].

32
In early 2020, Liu et al. [145] developed a dual-modal system in the NIR range for real-time,
in-vivo visualization of the tumor microenvironment changes during chemotherapy. The PAM
subsystem utilized an optical parametric oscillation laser which had a wavelength range of
680-1064 nm. The OCT subsystem was based on a commercial system with a center
wavelength of ~ 1300 nm, providing 12 μm axial resolution. This study worked to characterize
tumor angiogenesis by monitoring changes in the vascular network’s density, quantitative total
hemoglobin concentration, and oxygen saturation of cancerous tissue. They suggested the dual-
modal imaging-guided dose control system as a more efficient technology compared to the
presently utilized tumor treatment options.
The majority of PAM-OCT configurations discussed earlier utilized ultrasound transducers for
detecting acoustic waves. Despite offering high sensitivity, these transducers pose challenges
when integrating PAM and OCT subsystems [146]. In transmission mode, the sample needs to
be placed in a water tank or be in contact with ultrasound gel as coupling medium [147]–[149],
which limits the application of the technique to thin specimens. In reflection mode, because
the opaque transducer obstructs the optical beam path, it needs to be positioned obliquely with
respect to the optical axis which causes sensitivity loss [150], [151]. In 2019, Hindl et al. [152]
developed a reflection-mode OCT-PAM system using an all-optical akinetic Fabry-Perot
etalon sensor. The miniature sensor included a rigid, fiber based Fabry-Perot etalon with a
transparent central opening, and enabled linear signal detection over a broad bandwidth[153].
A schematic of the system is presented in Figure 2-8A. The OCT subsystem used a broadband
laser centered at 840 nm, with a 5 µm axial resolution and the PAM subsystem used a 532 nm
pulsed laser operating at a pulse repetition rate of 50 kHz. This system acquired OCT and PAM

33
images sequentially. In-vivo images of zebrafish larva’s tissue and vascular morphologies were
presented (Figure 2-8B). The system had limited imaging speed due to the use of stepper
motors for scanning and the need for signal averaging to provide increased SNR. In addition,
the OCT light source combined three superluminescent diodes which were not polarization
aligned and resulted in various imaging artifacts and a degraded axial resolution. They recently
reported a dual-modal system using a Ti: Sapphire broadband light source and fast laser
scanning. The axial resolution was 2.4 µm enabling visualization of retinal layers in zebrafish
model. Functional extensions of PAM-OCT system including Doppler OCT and spectroscopic
PAM were applied to monitor arterial pulsation and to measure absolute blood flow and
oxygen saturation. The in-vivo oxygenation measurement was acquired using a dye laser [154]
with a 10 kHz repetition rate at 578 nm, 570 nm, and 562 nm wavelengths. Representative
images recorded using the system are presented in Figure 2-8C&D.

34
Figure 2-8. (A) Schematic of the reflection mode PAM-OCT system [152]. (B) Images of a zebrafish larva. (a) OCT image (b) PAM image (c) Color blended PAM-OCT image using (a) and (b). (d)–(f ) Images of OCT integrating 60 μm depth range. Reprinted with permission from [152]. (C) Oxygenation map of a zebrafish larval tail. The image is acquired after spectral unmixing using the absorption coefficients of human (a) and zebrafish blood (b), respectively [154]. (D) OCT-PAM image of a zebrafish larva. (a) OCT average intensity projection, (b) PAM maximum amplitude projection, (c) multimodal OCT-PAM. Reprinted with permission from [154].
In the system configurations discussed earlier, both PAM and OCT subsystems used their own
specific light source. Normally, PAM excitation is based on a narrow band pulsed laser, while
OCT requires broadband, continuous light (e.g., superluminescent diode) or virtually
continuous light (e.g., Ti: Sapphire laser). The other important difference in their light source
is that OCT systems usually use near infrared (NIR) light for deeper penetration, but PAM
mainly uses visible light to target the absorption peak of hemoglobin and melanin [155].
However, this apparent difference in wavelength, does not impede applying visible light for
OCT or NIR light for PAM. Recent experiments have demonstrated applications of visible

35
OCT for high resolution imaging and measuring metabolic rate of oxygen for clinical studies
[156], [157], while NIR light has been used for imaging lipid and collagen tissues in PAM
[157], [158]. Several studies explored the feasibility of using a single light source for PAM
excitation and OCT imaging, which would reduce the complexity and costs of the system, in
addition, it will generate synchronized and co-registered PAM and OCT images. Zhang et al.
[28] demonstrated the first single pulsed light source for PAM-OCT in 2012 and termed the
technique optical coherence photoacoustic microscopy (OC-PAM). Experimental setup of the
proposed system is demonstrated in Figure 2-9A. The system was in transmission mode with
a custom-designed broadband dye laser centered at 580 nm with 20 nm bandwidth, and a 5
kHz pulse repetition rate. The system was tested on in-vivo mouse ear and promising results
were demonstrated; however, the low repetition rate of the light source limited the imaging
speed, and the noisy spectrum of the laser degraded the quality of OCT images. Due to their
broad spectral bandwidth, supercontinuum (SC) sources were employed in OC-PAM systems
as well [159]. In 2016, Shu et al. [151] reported a dual-modality OC-PAM system using a
homebuilt fiber-based SC source (Figure 2-9B). The beam coming from the light source was
split into a shorter wavelength band (500 – 800 nm) for PAM and a longer wavelength band
(800 – 900 nm) for OCT. The system was tested for in-vivo imaging of mouse ear, and
multispectral PAM was performed on ex-vivo porcine retinal sample (Figure 2-9C).

36
Figure 2-9. (A) Schematic of the experimental system of a free-space OC-PAM. BS: beam splitter; SMF: single mode fiber; PD: photodiode; UT: ultrasonic transducer; L: Lens, M: mirror. Reprinted with permission from [28]. (B) Schematic of PAM-OCT system setup. SC, supercontinuum; DM: dichroic mirrors; GM, galvanometer; UT, ultrasound transducer; AMP, amplifier; ADC, digitizer; SM, spectrometer; DC, dispersion compensating slab; M, mirrors; BD, beam dump. Reprinted with permission from [151]. (C) Results of in-vivo mouse ear imaging. (a) En-face PAM image (b) PAM B-scan taken from location indicated by the green line in (a). (c) Typical PA A-line and its signal envelope obtained by a Hilbert transform. (d) En face OCT image. G, gland; BV, blood vessel. (e) OCT B-scan taken from location indicated by yellow line in (d). ED, epidermis; CT, cartilage; D, dermis. Scale bar, 150 μm. Reprinted with permission from [151].
2.4.4. Photoacoustic microscopy combined with optical coherence tomography for ophthalmic applications.
Due to the prevalence of OCT imaging for clinical ophthalmology, dual modal PAM-OCT is
a natural extension for imaging the eye. In ophthalmic application, access to the absorption
information could provide information about the functional and molecular properties of the
tissue, such as evaluating the retinal pigment epithelium in diseases like age-related macular
degeneration or measuring metabolic rate of oxygen in retinal and choroidal circulations in
diabetic retinopathy. In 2010, Jiao et al. [160] reported one of the first multimodal PAM-OCT
ophthalmoscope which used an unfocused transducer directly placed on the sclera. The OCT

37
subsystem was based on a SD-OCT design consisting of a superluminescent diode centred at
870 nm. Experimental results were demonstrated for in-vivo imaging of retinal vessels and
retinal pigment epithelium layer in rat eyes, with a laser pulse energy well within the ANSI
safety limits. Song et al. [161] further extended this system to include additional modalities
like scanning laser ophthalmoscopy and fluorescein angiography and imaged rat retina. They
also measured the metabolic rate of oxygen in rat retina [106]. Figure 2-10 illustrates the
developed functional imaging system and the combined PAM and OCT scanning pattern on
the retina. In 2015, Liu et al. [162] developed an OC-PAM system by using a single pulsed
broadband light source with central wavelength of 800 nm. Since the absorption coefficient of
haemoglobin is relatively weak at this wavelength, the PAM signals were mainly providing
melanin-specific information of the retina. The imaging speed of the system was limited by
the 10 kHz pulse repetition rate of the light source, which is not as high as conventional
ophthalmic OCT systems. To avoid possible motion artifacts and image blurring/disruption
high imaging speed is required. Robinson et al. [163] reported that the eye has a fixation time
of ~ 500 ms. Increasing the repetition rate can improve the imaging speed, however it will also
increase the average power of the light source which is constrained by existing laser safety
limits. This may cause issues in practical applications where there are pulses overlapping in
the retina. This highlights the trade-off between pulse repetition rate and pulse energy.
Developing a highly sensitive PA detection method is the key for reducing the pulse energy
and thus making it safe for clinical eye imaging.

38
Figure 2-10. Illustration of integrated PAM and SD-OCT to measure retinal metabolic rate of oxygen. (a) Schematic of the experimental setup. (b) Circular scanning pattern on the retina. (c) Molar extinction coefficient spectrum of oxy- and deoxy-hemoglobin. (d) A maximum-amplitude-projection PAM fundus image showing major retinal vessels. Bar: 200 mm. (e) An OCT fundus image of the same rat showed in the panel d. Bar: 200 mm. Reprinted with permission from [106].
Mice and rat eye models have been extensively used in pre-clinical ophthalmic imaging
experiments. The eyeballs of these animals are smaller (axial length of mouse eyeballs ~3 mm,
rats ~6 mm) compared to humans (~25 mm). Therefore, using animals with larger eyeballs,
like rabbits and monkeys are more relevant to human. Tian et al. [164] was among the first
groups to demonstrate the application of PAM-OCT system for chorioretinal imaging of rabbit
in 2017. They were able to visualize depth-resolved retinal and choroidal vessels using laser
exposure well below the ANSI safety limit. A multi-modal imaging system combining PAM,
OCT and florescence microscopy was demonstrated by Zhang et al. [165], [166], and it was
applied to evaluate angiogenesis in both albino and pigmented live rabbit eyes. The authors
claimed that in pigmented rabbits, melanin from the retinal pigment epithelium overlies the
choroid and thus possibly block the diffuse choroidal hyperfluorescence and improve the
image quality of all the three modalities. Nguyen et al. [108] employed gold nanoparticles as

39
a contrast agent for both OCT and PAM imaging. They imaged in-vivo rabbit retina, and the
exogenous contrast agent improved the efficiency for visualizing capillaries, retinal and
choroidal vessel. The speed of the system was defined by 1 kHz pulse repetition rate of the
excitation laser. The system was later used to evaluate optical properties of retinal vein
occlusion and retinal neovascularization in living rabbits [167]. Spectroscopic PAM was
performed at wavelengths ranging from 510 to 600 nm to further evaluate dynamic changes in
the retinal morphology [168]. The schematic of the developed system and recorded images
using multimodal system are presented in Figure 2-11A and B, respectively.
Figure 2-11. (A) Schematic diagram of the integrated PAM and OCT systems for multimodal retinal imaging. Reprinted with permission from [167]. (B) images of retinal blood vessels in rabbits: (a) color fundus photography of retina. (b) Fluorescein angiography image showing retinal, choroidal and capillaries. (c) Corresponding maximum amplitude projection PAM images of retina. (d,e) volumetric PAM and OCT image, respectively. (a1–a4) Cross-sectional OCT images acquired along the scanning lines from Figure (a). Reprinted with permission from [167].
In general, PAM devices have relatively low axial resolution compared to OCT systems, and
there is a large resolution gap between two modalities. Unlike, OCT whose axial resolution is
defined by the spectral bandwidth of the light source, in PAM axial resolution depends on
detector’s bandwidth and ultrasound attenuation [47]. The typical axial resolution of OCT

40
systems is less than 10 µm, which corresponds to ~ 100 MHz ultrasound signal frequency.
These high frequency signal can rarely survive in some cases where the distance from the
source to the detector is long such as retina imaging. Therefore, for ophthalmic PAM-OCT, it
is importance to enhance PA detection mechanism to reduce the gap in axial resolution.
2.5. Discussion
The combination of PAI and OCT has drawn a large amount of research interest throughout
the past decade. This multi-modal technology has the potential to provide chromophore
selective image contrast in concert with depth-resolved scattering contrast. Despite offering
several advantages there are still a couple of key challenges to overcome.
One of the major limitations of current systems is the significant imaging speed mismatch
between OCT and PAI subsystems. Imaging speed is a critical parameter when it comes to
real-time functional studies. Additionally, faster imaging speeds will help systems mitigate
image artifacts due to involuntary motion. Thanks to technological developments, current OCT
systems are able to reach video rate over a large scanning area [169]–[171]. The same is not
true for PAI systems, and as a result the imaging speed of the dual-modal system is defined by
the pulse repetition rate of the PA excitation light source or mechanical scanning speed of the
PAI probe head. Widespread implementation of PAI-OCT systems will depend on the
development and integration of suitable light sources with high repetition rate, stable short
pulse illumination, and high output energy at multiple wavelengths. This development would
enable PAI-OCT systems to capture real-time large field-of-view images.
The other major constraint in most PAI systems is that most ultrasound detectors are opaque.
Therefore, the physical size of the sensor obstructs the optical path required for OCT

41
acquisition. To overcome this limitation, in some studies the active size of the transducer was
reduced, or the transducer was positioned obliquely [153]. However, since the sensitivity of
the photoacoustic imaging scales with the active element size of the detector, these methods
effect the sensitivity of the photoacoustic images and will degrade image quality [172]. Several
studies have investigated optimizing light delivery to improve PA image contrast and signal-
to-noise ratio [173]–[175]. Monte Carlo simulations suggest that the optimal PA illumination
depends on the optical properties of the sample[176]. Improvements in light delivery have also
be investigated through using optically transparent spacer between transducer and sample to
directly deliver light to the surface underneath the transducer [177]–[179]. In addition, custom
transducers and new materials have been explored to develop different illumination geometries
and improve the quality of the PA image [59], [180], [181]. However, these methods require
significant modification of the system and cannot be readily integrated into standard clinical
scanners[181].
Another important constraint of ultrasound transducers used in most PAI system rise from their
need for physical contact with the sample through a coupling medium. This contact-based
detection minimizes the acoustic reflection losses at poorly matched interfaces such as tissue
and air. However, it is not suitable for several clinical and pre-clinical applications such as
wound assessment, brain imaging or ophthalmic imaging [182]. Various approaches have been
suggested to overcome this limitation among which optical detection approaches hold the
promise to provide high sensitivity over a wide frequency range [183]–[186]. Optical detection
methods also offer the opportunity of developing miniaturized and optically transparent
ultrasound detectors [146]. Pure optical PAI-OCT system is more attractive nowadays and

42
offers a better choice for the multimodal imaging. Different studies have been conducted on
the performance of pure optical photoacoustic imaging integrated with optical coherence
tomography [187], [188]. In [141], authors proposed a resolution-matched reflection mode
PAM-OCT system for in-vivo imaging applications. The PAM subsystem is based on a
polarization-dependent reflection ultrasonic detection (PRUD), which still requires water as
coupling medium and complicated optical alignment. The akinetic sensor employed in [152],
is another example of pure optical PA detection sensor, which also suffers from the need for
acoustic gel as coupling medium. All-optical PA detection methods have been investigated for
non-contact, dual modal PAI-OCT system as well. In the next chapter, we will discuss different
methods developed for achieving non-contact PA signal detection with an emphasis on the all-
optical methods. Each method is discussed along with its advantages and disadvantages.

43
Chapter 3 Non-contact photoacoustic imaging
Notes and Acknowledgement
This chapter reviews the importance of non-contact photoacoustic imaging. It overviews the current
non-contact photoacoustic detection techniques with an emphasis on all-optical detection methods and
their associated physical mechanisms. The content of this chapter is based on the following journal
manuscript:
Zohreh Hosseinaee, Martin Le, Kevan Bell, and Parsin Haji Reza "Towards non-contact
photoacoustic imaging." Photoacoustics (2020): 100207.
Author contributions
Zohreh Hosseinaee read and collected the reference papers, organized the content of the review
paper, sub-categorized the non-contact photoacoustic imaging techniques, compiled the article,
prepared the figures, and wrote the main manuscript.
Martin Le edited parts of the article and helped in reviewing some of the references.
Kevan Bell edited parts of the article.
Parsin Haji Reza was the principal investigator, set the article scope, and proofread the article.
All authors contributed to the final version for publication.

44
3.1. Introduction
Photoacoustic imaging (PAI) is an impactful modality in biomedical optics that has
attracted interest from various research communities in the last decade, especially biomedical
imaging. The photoacoustic effect was discovered by Bell in 1880[32]. He discovered that
sound waves might be generated in solid material when exposed to a pulsed light source.
Development of the laser in the 1960s had a significant impact on the field by providing
directional, high peak power, and spectrally pure beam that many photoacoustic applications
require. Subsequently, the phenomena found popularity in spectroscopy, and in 1964 Amar et
al. reported the application of PA spectroscopy for in-vivo rabbit eye[189] and ex-vivo human
eye specimens[190]. Theodore Bowen was among the first to propose the phenomena for soft
tissue imaging in 1981[37]. These early studies progressed, culminating in work published in
1993 which demonstrated one of the first in-vivo photoacoustic study performed on human
finger[191]. Thereafter, the field has seen significant advancements in terms of
instrumentation, image reconstruction algorithms, functional imaging, and molecular imaging
capabilities.
PAI offers high sensitivity for obtaining optical absorption contrast over a wide range of spatial
scales from organelles, cells, tissue, organs, and small animals. Additionally, it is
complementary to other imaging modalities in terms of contrast, sample penetration, spatial
and temporal resolutions. These unique opportunities were utilized in the last two decades in
several pre-clinical and clinical applications including but not limited to blood oxygen
saturation imaging[42], [56], [57], brain vasculature and functional imaging[43], [59], [192],
gene expression[60], vulnerable atherosclerotic plaques diagnosis[61], skin melanomas[62],

45
histology-like tissue imaging[63], [64], longitudinal tumor angiogenesis studies[65], imaging
and detection of protein interactions[66], multi-modal ocular imaging[67], [182], [193], [194],
and tissue engineering scaffolds[31], [68] . In addition, PAI methods have been utilized in
different non-medical applications such as non-destructive testing[195], [196] detecting metal
surface defects[197], spectroscopy[198], [199], and uncovering hidden features in
paintings[200].
Despite offering high sensitivity, novel imaging contrast, and high resolution, photoacoustic
microscopy is not generally an all-optical imaging method unlike the other microscopy
techniques. One of the significant limitations of photoacoustic microscopes arises from their
need to be in physical contact with the sample through a coupling media. This physical contact,
coupling, or immersion of the sample is undesirable or impractical for many clinical and pre-
clinical applications. This also limits the flexibility of photoacoustic techniques to be integrated
with other all-optical imaging microscopes for providing complementary imaging contrast. To
overcome these limitations, several non-contact photoacoustic signal detection approaches
have been proposed. This chapter presents a brief overview of current non-contact
photoacoustic detection techniques with an emphasis on all-optical detection methods and their
associated physical mechanisms.
3.2. Physical mechanism of photoacoustic imaging
In general, when biological tissues are irradiated by photons of light, depending on the light
wavelength, the photons penetrate to some depths. Inside the tissue, these photons get scattered
and absorbed, where the absorption occurs by light-absorbing molecules known as
chromophores. The absorbed optical energy induces a local transient temperature rise, which

46
generates pressure via thermo-elastic expansion. In thermal confinement the photoacoustic
equation for an arbitrary absorbing target with an arbitrary excitation source is defined as[33]:
�𝜵𝜵𝟐𝟐 − 𝟏𝟏𝒗𝒗𝒔𝒔𝟐𝟐
𝝏𝝏𝟐𝟐
𝝏𝝏𝝏𝝏𝟐𝟐� 𝒑𝒑(𝒓𝒓�⃗ , 𝝏𝝏) = − 𝜷𝜷
𝑪𝑪𝒑𝒑
𝝏𝝏𝝏𝝏𝝏𝝏𝝏𝝏
Equation 3-1
Where 𝑝𝑝(𝑟𝑟, 𝑡𝑡) denotes the acoustic pressure rise at location 𝑟𝑟 at time 𝑡𝑡, 𝑣𝑣𝑠𝑠 is the speed of sound,
β is the thermal coefficient of volume expansion, 𝐶𝐶𝑝𝑝 denotes the specific heat capacity at
constant pressure, and 𝐻𝐻 represents the heating function defined as the thermal energy
deposited per unit volume and per unit time [201]. Based on this equation, photoacoustic
pressure propagation is driven by the first-time derivative of the heating function 𝐻𝐻. Therefore,
time-invariant heating does not generate photoacoustic pressure waves. When both thermal
and stress confinements are met, thermal expansion causes a pressure rise (𝑝𝑝0) that can be
estimated by [202]:
𝒑𝒑𝟎𝟎 = 𝜞𝜞. µ𝒂𝒂.𝑭𝑭 Equation 3-2
Where 𝑝𝑝0 is the initial pressure rise, 𝜇𝜇𝑎𝑎 is the absorption coefficient ( 1𝑐𝑐𝑐𝑐
), 𝛤𝛤 = 𝛽𝛽𝑣𝑣𝑠𝑠2/𝐶𝐶𝑝𝑝 is the
Grüneisen coefficient[203], [204] representing thermal and mechanical properties of the tissue,
and 𝐹𝐹 is the fluence of the irradiated energy ( 𝐽𝐽𝑐𝑐𝑐𝑐2). According to the American National
Standard Institute (ANSI) safety standard, in the visible spectral region, the maximum
permissible fluence on the skin surface is 20 𝑚𝑚𝑚𝑚/𝑐𝑐𝑚𝑚2. The generated pressure propagates in
the form of acoustic waves and can be detected on the surface of the tissue by an ultrasonic
transducer or transducer array. These signals form an image that maps the optical energy
absorption inside the tissue[47] (Figure 3-1).

47
Figure 3-1. General principle of photoacoustic imaging. Targeted chromophores absorb optical energy resulting in a local temperature rise, inducing local pressure rise, which propagates outwards towards an ultrasonic transducer. The recorded signal is reconstructed to map the original optical energy deposition inside the tissue.
3.3. Photoacoustic modalities
PAI can be split into two main categories depending on how the images are formed:
photoacoustic tomography (PAT), which uses reconstruction-based image formation and
photoacoustic microscopy (PAM), which uses focused-based image formation.
In PAT, an unfocused optical beam excites the region of interest, and an array of ultrasonic
transducers measures the generated ultrasound waves in multiple positions[24], [36], [40],
[205]. Common detection geometries used in PAT are planar, cylindrical, and spherical. In
planar detection mode, a two-dimensional planar, linear, or phased array is used, while
cylindrical detection mode uses ring transducer arrays or split ring arrays[206], [207].
Spherical detection has been used for imaging with an arc-shaped transducer array[208], [209]
and a hemispherical array[109], [210]. The axial resolution of a PAT system is defined by the
bandwidth of the detector, while the lateral resolution is dependent on the detection
geometries[211]. PAT imaging depth theoretically is limited to a few centimeters in soft tissue,

48
where the optical fluence is significantly attenuated due to both absorption and scattering[96].
Previous works have demonstrated 720 μm lateral resolution at a depth of ~7 cm in biological
tissue[24]. PAT can be used for various applications ranging from microscopic to macroscopic
imaging, and it can provide large field of view (FOV) images. As a result, it has been used in
applications such as whole-body imaging of small animals[212] and clinical breast cancer
studies[41].
Unlike PAT, PAM employs raster-scanning of optical and acoustic foci and forms images
directly from recorded depth-resolved signals[23]. PAM is generally used for applications that
require high-resolution rather than deep penetration depth like single-cell imaging[50]. PAM
can be further classified into acoustic-resolution PAM (AR-PAM), where the acoustic focusing
is tighter than optical focusing[213], and optical-resolution PAM (OR-PAM), where the optical
focusing is tighter[44], [214].
Acoustic resolution photoacoustic microscopy (AR-PAM). For AR-PAM, an unfocused
beam of light illuminates the tissue, and the induced photoacoustic signals are detected using
a focused ultrasound transducer. Since the acoustic focus is limited by the acoustic diffraction
limit rather than the optical diffraction limit, the achieved resolution by AR-PAM is on the
order of tens of microns[45]. The lateral resolution of AR-PAM is given by[215]:
𝜟𝜟𝜟𝜟𝑨𝑨𝑨𝑨−𝑷𝑷𝑨𝑨𝑷𝑷 = 𝟎𝟎.𝟕𝟕𝟏𝟏𝝀𝝀𝒂𝒂/𝑵𝑵𝑨𝑨𝒂𝒂 Equation 3-3
Where 𝜆𝜆𝑎𝑎 is the acoustic wavelength, and 𝑁𝑁𝑁𝑁𝑎𝑎 is the numerical aperture (NA) of the focused
ultrasonic transducer. The axial resolution of PAT and AR-PAM is determined by the
bandwidth (𝛥𝛥𝛥𝛥) of the ultrasonic transducer, which can be described as[216]:
𝜟𝜟𝜟𝜟 = 𝟎𝟎.𝟖𝟖𝟖𝟖𝟖𝟖/𝜟𝜟𝜟𝜟 Equation 3-4

49
where c is the speed of sound. AR-PAM has been used for the deep-penetration imaging of
microvasculature[217] and functional brain imaging with improved penetration depth[218].
For example, an imaging depth of ~ 11 mm has been demonstrated in biological tissue, which
is ~10 times higher than the attainable depth of OR-PAM[219]. Another example comes from
Moothanchery et al. [49], who reported an AR-PAM system with a lateral resolution of 45 µm
with an imaging depth of ~7.6 mm for deep vasculature imaging.
Optical resolution photoacoustic microscopy (OR-PAM). The resolution of OR-PAM is
limited by the optical diffraction limit of the focused laser beam[220]. Therefore it generates
images with higher resolution than AR-PAM; however its penetration depth is restricted by
the optical transport mean free path, which is ~ 1.5 mm for visible wavelengths in biological
tissues[221], [222]. The lateral resolution of OR-PAM can be defined as[44]:
𝜟𝜟𝜟𝜟𝑶𝑶𝑨𝑨−𝑷𝑷𝑨𝑨𝑷𝑷 = 𝟎𝟎.𝟓𝟓𝟏𝟏𝝀𝝀𝒐𝒐/𝑵𝑵𝑨𝑨𝒐𝒐 Equation 3-5
where 𝜆𝜆𝑜𝑜 is the optical wavelength and 𝑁𝑁𝑁𝑁𝑜𝑜 is the NA of the objective lens. In an OR-PAM
configuration, the axial and lateral resolutions are defined by the NA of the objective lens. The
high lateral resolution makes OR-PAM suitable for a wide range of applications. Zhang et al.[50]
reported the first subwavelength OR-PAM by employing a 1.23 NA objective lens, obtaining
a lateral resolution of 0.22 µm. Here, single-cell imaging was demonstrated on individual
melanoma cells and erythrocytes.
3.4. Imaging Contrast
Photoacoustic imaging modalities offer a unique imaging contrast by taking advantage of
direct optical absorption. In other words, any imaging target that absorbs light energy, can be

50
visualized by PAI modalities. In biological tissues, both endogenous and exogenous contrast
agents can be exploited as imaging targets. Endogenous contrast agents are ideal targets as they
are naturally available in tissue. Therefore, they are non-toxic and do not interfere with the
original tissue microenvironment. The most commonly imaged endogenous contrast agents for
PAI include DNA/RNA, hemoglobin, melanin, lipids, collagen, and water (Figure 3-2).
Among these, DNA/RNA is commonly used for cell nuclei imaging using an ultraviolet
excitation source[223], hemoglobin is widely used for vascular imaging in the visible and near-
infrared (NIR) spectral ranges[220], and melanin is used for melanoma tumor imaging in the
NIR region[224]. Additionally, in the NIR region, lipids and water are used for atherosclerotic
plaque[225] and injury imaging[226], respectively. Since these endogenous contrast agents
have different absorption spectra, PAI can differentiate them with spectral measurements when
the local optical fluence is known[227]. Exogenous contrast agents also offer the ability to be
specifically engineered for maximum detection sensitivity and can be conjugated with target
molecules to selectively bind to specific cell surface receptors[228], [229]. Their performance
has been demonstrated for several applications such as cancer imaging[230], [231], functional
brain imaging[232], [233], and monitoring therapeutic procedures[234], [235].

51
Figure 3-2. (A) Absorption spectra of common endogenous chromophores in biological tissues. Reprinted with permission from[47] (B) photoacoustic images acquired from mouse small intestine cells and DNA contrast at 266 nm. Reprinted with permission from[236], fibroblast cytoplasm’s with cytochrome contrast at 422 nm, reprinted with permission from [237], PA image of mouse blood smear with hemoglobin contrast at 532 nm, reprinted with permission from[238], tyrosinase tumor expressing with melanin contrast at 680 nm, reprinted with permission from [60], photoacoustic image of mouse paw with skin removed and collagen contrast at 780 nm, reprinted with permission from [158], intramuscular fat photoacoustic image with lipid contrast at 1197 nm, reprinted with permission from [157].
3.5. Photoacoustic signal detection
Photoacoustic signals can be generated by an intensity-modulated continuous-wave (CW)
excitation[239] or pulsed excitation[217]. Pulse excitation is more commonly used, since the
signal-to-noise ratio (SNR) of photoacoustic signal is higher than that in CW excitation, if the
same number of photons are delivered, or ANSI safety limits are considered[240].
Photoacoustic signals are broadband and thus demand the use of wideband ultrasonic
transducers. The center frequency and bandwidth of the detector are two significant
parameters, and, based on the intended application, the appropriate center frequency and
bandwidth must be selected. Popular types of ultrasonic transducers for photoacoustic signal

52
detection include piezoelectric transducers, Fabry-Perot interferometers (FPI), capacitive
micromachined ultrasound transducers (CMUTs), and micro ring resonators (MRRs)[36].
Despite offering several advantages, ultrasonic transducers need to be physically in contact
with the sample through a coupling medium. Contact-based detection minimizes acoustic
reflection losses at poorly matched interfaces such as between tissue and air. This poorly
matched interface would result in pressure wave reflections back into the sample and away
from the acoustic transducer. Appropriate acoustic matching is required to produce a
conventional PAI device with high sensitivity. Physical contact, coupling, or immersion is not
suitable for some applications. For example, ophthalmic imaging applications cannot fully
benefit from PAI for structural and functional microvasculature visualization. Currently, in
ophthalmic applications, the ultrasonic transducer is placed on the surface of the tissue or
conjunctiva[165], increasing the risk of abrasion, infection, and patient discomfort.
Additionally, involuntary eye movements may affect the coupling efficiency and degrade
image quality[241], [242]. In small animal imaging, immersion in water significantly
complicates the procedure and commonly results in sacrificing the animal[241], [243].
Although the skin is potentially the most accessible organ for optical and acoustic imaging,
and PAI can be used for clinical dermatological applications, the requirement of physical
contact, as opposed to purely optical methods, poses some limitations. In wound assessment
and burn diagnostics, a coupling medium and physical contact with the sample increases the
risk of pain and infection.
Endoscopic applications would also benefit from a non-contact detection mechanism[244]–
[246]. At the moment, most photoacoustic endoscopic systems use miniaturized piezoelectric

53
transducers, which complicate the design of the endoscopic tip due to their size and opaque
nature. The sensitivity and FOV of these transducers will be sacrificed by shrinking their size
which adversely affect the achieved image quality. In addition, these transducers require direct
contact and an impedance matching medium, resulting in an obstructed view, restricting their
imaging capabilities to rotational scanning and side-views. Therefore, the advantages of
forward-view imaging for guiding minimally invasive surgical procedures and special imaging
applications are not available[247].
Additionally, in brain imaging, when applied to surgical applications, the transducer array must
be inserted in a sterile saline solution, which acts as the coupling medium. To keep the solution
stable and maintain maximum efficiency, it requires a horizontal working plane which is not
convenient to achieve when the patient is on a surgical bed[245].
Moreover, most ultrasound detectors are opaque, which restricts the illumination direction of
the excitation laser beam so that the inline configuration of detector and laser is challenging.
Furthermore, combining PAI systems with other optical imaging modalities may require a
complicated design. Therefore, a non-contact detection approach that avoids these issues opens
up new possibilities for clinical applications and multi-modal imaging techniques[35], [160],
[188].
Several techniques have been developed to realize non-contact detection of photoacoustic
signals. Air-coupled transducers and all-optical detection methods such as interferometric- and
non-interferometric-based approaches have been proposed as alternatives to contact-based
ultrasonic transducers. Here, an overview of these techniques and their underlying physical
mechanisms and reconstruction algorithms are presented.

54
3.6. Non-contact photoacoustic signal detection
3.6.1. Air-Coupled detection
Coupling transducers through air/gas has been explored to eliminate the need to use coupling
media in conventional ultrasound transducers. The approach has been used for a wide range of
ultrasound imaging applications, including non-destructive testing[248]–[251], material
characterization[252]–[254], secure wireless transmission of data[255], sensing and analysis
of cultural heritage[256], water control in agriculture[257], [258], quality control in food
industry[259] and computer gesture-base control[260], [261]. A major drawback of the air-
coupled ultrasound transducers comes from the impedance mismatch between air and solids,
which cause high attenuation of ultrasound signal in the air[262]. Therefore, applications
mentioned earlier were possible through improving the design of air-coupled
transducers[263]–[266], increasing the excitation energy, low noise amplification, and digital
signal processing techniques[267]–[270]. In addition, to further reduce losses and maintain a
reasonable SNR, the working frequency is usually below 1 MHz, which is relatively low
compared to the tens of MHz frequency range of common ultrasound transducers used in
medical photoacoustic imaging applications.
In 2010, Kolkman et al.[271] demonstrated the feasibility of air-coupled transducers to detect
photoacoustic signals in artificial blood vessels made of a silicon rubber tube filled with human
blood. Here, the excitation fluence satisfied the ANSI maximum permissible exposure (MPE)
limits and the energy density at the interface was of about 20 𝑚𝑚𝑚𝑚/𝑐𝑐𝑚𝑚2. Two unfocused
transducers with central frequencies at 200 kHz and 1 MHz were placed at 7.5 mm above the
phantom interface and recorded photoacoustic time traces (Figure 3-3A). The achieved axial

55
resolution of their system was measured as 13 mm for 200 kHz transducer and 4 mm for the 1
MHz one. In 2015, Dean-Ben et al.[272] developed a transmission mode PAI system using a
custom-designed air-coupled piezoelectric transducer with a central frequency of 800 kHz and
bandwidth of 400 kHz. Their experiment followed the excitation light fluence determined by
the ANSI safety limits, however, the narrow detection bandwidth of the transducer
significantly compromised the system’s resolution performance. Images of vessel-mimicking
tubes were acquired; and significant averaging was found necessary to properly resolve these
structures (Figure 3-3B). Sathiyamoorthy et al.[273] developed an inverted photoacoustic
microscope using a low-power CW laser and a kHz-range microphone. Information about the
incident power on the imaging sample was not reported for this study. The detector was
attached to a custom-designed chamber, and images from red blood cells located inside the
chamber were recorded with a lateral resolution of 1.37 μm (Figure 3-3C). The need for
mechanical scanning and a large ensemble of averaging inhibits potential in-vivo applications
of the air-coupled transducers due to their long acquisition time.

56
Figure 3-3 (A) Photoacoustic time traces from an artificial blood vessel, recorded with air-coupled ultrasound transducers with center frequency of 200 kHz and 1 MHz (the recorded signals are averaged 512 times), reprinted with permission from [271] (B) Photoacoustic images obtained by raster scanning of the air-coupled transducer (a) Photograph of the imaged ink channels. (b)–(e) Photoacoustic images of the phantom after the recorded signals have been averaged 1, 10, 100, and 1000 times respectively, Reprinted from [272], with the permission of AIP Publishing. (C) Schematic diagram of the PA sensor and PA images of red blood cells smeared on a glass substrate, M is the microphone, SC is the sample chamber, S is substrate, reprinted with permission from [273].
3.6.2. Optical detection of Photoacoustic signals
Early studies on optical detection of ultrasound signal began in 1960s[274]. In the last decade,
due to the advancement of material science and fabrication technologies, significant progress
has been made in developing high-performance optical detectors for ultrasound signals[275].
Optical ultrasound detection methods provide higher sensitivity, and wider frequency
bandwidth over conventional piezoelectric devices, and also offer the opportunity of
developing miniaturized and optically transparent ultrasound detectors[146]. Contact-based
optical photoacoustic detectors like polymer microring resonators and FPIs have been widely
used in applications such as bladder tissue vasculature imaging[276], in-vivo imaging of the
vasculature in human skin[58], [114], [127], [277], endoscopic imaging of

57
microvasculature[278], [279] and multi-modal imaging[99], [280]. Furthermore, all-optical
PAM system based on pressure distribution measurements and probe beam deflection
techniques were developed, despite offering high sensitivity and micron scale resolution in
these method the sample needs to be submerged in water cell limiting the in-vivo
applications[281]–[284].
3.6.2.1. Speckle pattern analysis
Speckle is a feature of coherent wave propagation formed when interference occurs between
superimposed waves[285]. This effect has been leveraged in several techniques, including
laser speckle imaging[286], ultrasonography[287], synthetic aperture radar[288], and optical
coherence tomography[289]. When photoacoustic waves arrive at the sample surface, they
cause mechanical deformations. When a continuous-wave laser illuminates this region, these
surface deformations modulate the speckle patterns of the backscattered beam. By
characterizing these patterns, information about the surface deformations, and thus the acoustic
pressure, can be extracted[290]–[294].
In 1999, Leveque et al. [295] developed a speckle detection scheme where a CCD camera
operated as a detector array. This technique could demonstrate one-dimensional images of
biological tissue. The system was further modified for acquiring two-dimensional and three-
dimensional images[296]–[300] (Figure 3-4A). Horstmann et al. [301] reported a full‐field
speckle interferometry method where the backscattered light was combined with a reference
and imaged onto a high-speed camera. This experimental setup is demonstrated in Figure 3-4B.
Through consecutive measurements, they were able to extract signals from porcine skin
phantoms with a 90 µm lateral resolution over a 4 mm penetration depth range. Lengenfelder

58
et al.[290] performed experiments in both reflection and transmission modes for ex-vivo fat
tissue imaging. To increase the SNR of the system, the optical exposure was 5-times higher
than the ANSI MPE limits for biological tissues. They went on to further apply speckle pattern
analysis for endoscopic applications and demonstrated 2.76 μm lateral resolution on phantoms
and ex-vivo porcine fat tissue using a high frame rate camera (823,500 fps) [247]. Recently, Li
et al.[302] evaluated the feasibility of delineating the strength of PA signals using a two-beam
optical design and a CMOS camera operating at 60 Hz with a 10 𝜇𝜇𝑠𝑠 exposure. A black tape
phantom was imaged and by correlating the speckle patterns as a function of time, the strength
of PA perturbations was quantified (Figure 3-4C). In the report, the probe beam was not
focused on the sample interface resulting in a reflected speckle pattern that was highly sensitive
to surface motion on the sample. As well, the bandwidth of the camera proved insufficient for
capturing salient MHz-regime signals limiting its potential efficacy. However, this would need
to be balanced against the resulting decrease in SNR brought on by lower integration times.
Since any form of motion and mechanical noise can distort the speckle patterns of the probe
beam, this method is very sensitive to phase noise and ambient motions and in-vivo
applications would be extremely limited.

59
Figure 3-4. (A) Two-dimensional image of chicken breast tissue in which two gizzard objects were buried, reprinted with permission from [299]. (B) Interferometric detection of object surface displacement after photoacoustic excitation. © Institute of Physics and Engineering in Medicine. Reproduced by permission of IOP Publishing[301]. All rights reserved. (C) Schematic setup for specklegram-based non-contact photoacoustic detection. BS, beamsplitter; CMOS, CMOS camera; L, lens; PD, photodiode; SF, spectral filter. Speckle pattern generated by the probe beam observed for various moments (i)–(ix) in (a). Among them, (i) is the initial speckle pattern, (ii) and (iii) are recorded when the shutter is off, and no excitation beam is illuminated on the sample, and (iv)–(ix) are a sequence of patterns associated with the excitation of PA effect. (a) Measured speckle correlation changes as a function of excitation pulse energy (right axis) and the ultrasound piezoelectric transducer-based PA amplitude as a function of excitation pulse energy (left axis). (b) Linearity between the two detection methods, reprinted with permission from [302].
3.6.2.2. Interferometric PA detection methods
Interferometric approaches have become a popular method for remote detection of
photoacoustic signals. They overcome some of the issues brought forward with speckle-based
detection by leveraging dedicated interferometers for extraction of phase-contrast from light
returning from the sample. Both homodyne and heterodyne architectures have been
investigated for ultrasound signal detection[303], [304]. In homodyne mode, interference
occurs between beams of the same frequency, and the phase difference of the beams results in

60
an intensity modulation of the detected light[305]. On the other hand, in heterodyne mode, the
interference occurs between beams with different frequencies, generating an interference with
one constant component and one oscillating component where the amplitude of the oscillating
component is proportional to the product of the interfering beams[306]–[309]. In general,
heterodyne interferometers are relatively less sensitive to ambient noise compared with
homodyne variants[310]. Each of these methods depends on the tissue surface as well as the
stability of the entire detection system, which will be discussed in the following sections.
3.6.2.2.1. Heterodyne detection
In 1968, Massey et al.[311] demonstrated the application of an optical heterodyne system for
sensing the vibration amplitude distribution on a reflective resonant diaphragm placed in the
liquid acoustic medium. The method was further applied for all-optical detection of PA signals
in spectroscopy[312], [313] and imaging applications[314], [315]. In 2014, Park et al.[316]
explored an all-fiber heterodyne interferometer for photoacoustic imaging. They reported 1.7
µm lateral resolution from a miniaturized probe looking at polyethylene terephthalate fibers
positioned inside the gelatin-based phantom. However, the excitation fluence used in this study
was above ANSI MPE limits. The year after, Eom et al.[314] reported a different fiber-optic
heterodyne interferometer looking at a chicken chorioallantois membrane (CAM). Blood
vessel structures as deep as 2.5 mm were identified with lateral and axial resolutions of 100
μm and 30 μm, respectively (Figure 3-5A). They further developed the system into a dual-
modality imaging technique by integrating the photoacoustic detection with a swept-source
optical coherence tomography (OCT) for endoscopic imaging (Figure 3-5B)[187]. Acoustic
waves were detected at the outer surface of the water layer under which the sample was

61
submerged. The method was also applied for non-contact delineation of stereotactic boundaries
of artificial tumor in pig brain tissue and was successful in providing accurate thickness
information of the sample[317].
Figure 3-5. (A) 3-D photoacoustic images of the CAM. Top left: XY plane maximum intensity projection (MIP) image. Top right: YZ plane MIP image. Lower left: XZ plane MIP image. Lower right: 3-D image, reprinted with permission from [314] (B) Schematic of all-fiber-based dual modality PA-OCT with miniature common probe. AOM: acousto-optic modulator; PC polarization controller, BPD: balanced photodetector, Col: collimator; ND: neutral density filter; WDM: Wavelength division multiplexer; MMF: multimode fiber, reprinted with permission from [187]. Heterodyne interferometers have difficulty detecting highly scattered probe beams on rough
surfaces, and therefore require a thin layer of water or oil above the sample[314], [317]. This
provides an appropriate smooth and reflective surface for the interferometer; however, the
method can no longer be considered fully non-contact (called quasi non-contact) as the system
requires the addition of fluid to the surface of the sample. Much like standard acoustic coupling
performed in conventional PAI techniques, this greatly limits potential biomedical
applications.
A solution that was explored involved the application of a two-wave-mixing interferometer
(TWMI)[318], [319]. In these devices the beams interfere inside a photorefractive nonlinear

62
crystal, where the beams are amplified and low frequency noises are suppressed so the effect
of ambient noises like air disturbance is negligible [320], [321]. While the technique is mainly
used for non-destructive testing applications[322], biomedical applications like skin imaging
have also been explored[323]–[325]. George et al.[326] developed a non-contact
photoacoustic microscope utilizing a photorefractive crystal-based interferometer for imaging
of red blood cells and ex-vivo porcine retinal samples. The schematic diagram of the system
and representative images recorded with the system are presented in Figure 3-6A-C a CW laser
with a wavelength of 532 nm operates as the light source for the interferometer, and the sample
was irradiated using a diode laser operating at 638 nm. The reference and sample beam were
combined inside the 𝐵𝐵𝐵𝐵12𝑆𝑆𝐵𝐵𝑆𝑆20 crystal operating at its drift regime, leading to the formation
of a dynamic hologram detected by the photodetector. The resolution of the microscope was
estimated to be ~ 5.3 μm. Despite offering a completely non-contact detection scheme for
imaging rough tissue surfaces, the excitation exposure was 3 times higher than the safe limit
for skin imaging which may impede its application to in-vivo studies.
Figure 3-6. (A) Schematic of the PRC-based PAM system. FC: fiber optic collimator, M: Mirror, DM: dichroic mirror, QW: quarter-waveplate, OBJ: objective, BS: beamsplitter, HW: half-waveplate PRC: photorefractive crystal, BD: beam dump, PD: photodetector, F: laser line filter. (B) (left) PAM image of ex-vivo retinal samples, (right) Photograph of the sample. (C) (left)

63
photoacoustic image of blood smear showing RBC; (right) corresponding bright field image. Reprinted with permission from [326].
3.6.2.2.2. Homodyne detection
Depending on the coherence length of the light source used, homodyne interferometers
employed for PA detection, can be divided into low-coherence and long-coherence. When a
single beam of light is split and interfered with itself, coherent edition will only occur for path
lengths which are less than the characteristic coherence length of the source. For low-
coherence light sources this is generally on the order of microns, whereas it can reach
kilometers for a long-coherence source. Techniques which use low-coherence interferometers
generally leverage this low coherence as a means of path length discrimination since the
absolute length of a sample path can be determined against a reference path of known length
down to single-micron scales.
Low-coherence devices. For these devices interference only occurs for path lengths on the
scale of the coherence length. This effect can be leveraged to omit scattered signals arising
from depths which are far away from the reference path length. The coherence length of typical
light sources used in a low-coherence interferometer is on the order of micrometers, and when
compared to nanometer scale photoacoustic induced surface displacement, the coherence
length of the source is larger by three orders of magnitude. For such small displacements, the
sensitivity of the interferometer depends on the initial phase of the system. Since an
interference signal varies in a sinusoidal form, the highest sensitivity occurs when the initial
phase is at the quadrature-point (kπ ± π∕2) of the interferometer. However, it is difficult to
maintain the quadrature-point consistently during the whole measurement period, as the system
is sensitive to environmental perturbations such as vibration, and room temperature variation.

64
To overcome this problem, feedback methods are introduced, in which the optical phase of an
interferometric signal is adjusted using a motorized stage[327] or by changing the laser
wavelength[328]. These feedback methods may slow down the imaging speed or invoke other
external perturbations due to the mechanical movement of the stage. Wang et al. [184]
developed a synchronization detection method, in which only measurements made at
quadrature points were analyzed. The system was used for in-vivo imaging of blood vessels
within the mouse ear. The PA signals were detected in quasi non-contact approach from the
oil layer on top of the sample; and the system’s axial and lateral resolutions were measured as
60 μm and 30 μm, respectively. The imaging speed was highly limited by the 10 Hz pulse
repetition rate of the excitation source, slow scanning mirror in the detection interferometer,
and the synchronization system. Chen et al.[329] reported a PAM system using an all-fiber
low-coherence interferometer. The imaging speed of the system was improved by a
piezoelectric actuator driving the reference mirror of the interferometer. The imaging time of
collecting one dataset was ~17 minutes which was much faster than the 10 hour imaging time
reported by Wang et al. [184]. In-vivo images of mouse ear microvasculature with 11 μm
lateral and ~ 20 μm axial resolution was demonstrated in quasi non-contact mode (Figure
3-7A). A similar system was developed by Liu et al. [330] for PAT. The interferometer had a
central wavelength at ~1300 nm and a spectral bandwidth of 46 nm; an axial and lateral
resolution of 45 µm and ∼15 µm was achieved, respectively for in-vivo imaging of mouse ear
vasculature. Recently, Park et al.[183] employed the intrinsic phase difference of a multiport
(3 × 3) interferometer to reconstruct the photoacoustic signal without suffering from the initial
phase drift (Figure 3-7B). The performance of the system was evaluated by imaging human

65
hairs embedded in polydimethylsiloxane resin block, and isometric resolution of ~ 85 µm over
1.5 mm imaging depth was reported. Generally, in an ideal 3 × 3 coupler, the return ports have
an intrinsic phase difference of 120° to each other. Therefore, the quadrature component of the
signal measured at one particular return port can be calculated using the measured signal at
any other return port of the same coupler[331]. Moreover, the long-term variation of intrinsic
phase difference in a 3 × 3 fiber-optic coupler is rather stable; and in it has slight effect on the
displacement measurement [332]. The proposed system eliminated the need for any feedback
components. However, the imaging speed was again highly limited by the low repetition rate
of the excitation laser which prevented in-vivo experiments. In general, for a low-coherence
interferometer the sensitivity decreases when the optical path difference (OPD) between two
arms increases, and it turns to zero when the OPD is greater than the coherence length of the
light source[98]. This might not be an issue for imaging thin samples like mouse ear and ex-
vivo studies. However, while imaging thick samples or in-vivo experiments where motion is
unavoidable, it would become a severe issue.
Figure 3-7. (A) In vivo photoacoustic image of microvasculature of a mouse ear. (a) Photoacoustic maximum intensity projection of the microvasculature of a mouse ear. The total time for obtaining the photoacoustic image is 16.7 min. Inset: photograph of the imaging area. (b)–(d) B-scan image of microvasculature corresponding to the three white dotted line in (a) Reprinted from [329], with the permission of AIP Publishing (B) Schematic of the experimental setup. The probe beam and

66
the excitation beam are combined and scanned together. APD, avalanche photodetector; ND, neutral density filter; Col, collimator; BS, beam splitter; DM, dichroic mirror; L, lens; OL, objective lens; P, fiber-optic coupler port; PC, polarization controller; PD, photodetector, Reprinted with permission from [183].
Long-coherence devices. To overcome the sensitivity dependence of low-coherence
interferometers and to maintain constant sensitivity over a large dynamic range of OPDs, long-
coherence interferometers can be used. Lu et al.[333] utilized a homodyne interferometer with
~ 17 mm coherence length along with a synchronization method to lock the system at its
maximum sensitivity. The imaging was performed in quasi non-contact mode using a water
layer on top the mouse ear, demonstrating in-vivo images of blood vessels. Images with and
without a water layer on top of the sample are shown in Figure 3-8A. It is clear that the water
layer on the sample surface plays a crucial role in the method. Ma et al.[98] utilized a similar
technology and developed a dual-modality imaging system combining spectral-domain OCT
with PAM. The system was utilized for in-vivo blood flow assessment in the mouse ear. In the
PAI subsystem, surface vibrations of the water layer on top of the sample were detected by a
homodyne interferometer operating at 1310 nm with a 0.1 nm bandwidth. The vasculature in
the mouse ear were imaged with normal and impeded blood circulations. The experimental
results indicated that the integrated system could differentiate blood flow states and improved
visualization of conditions such as hemorrhage (Figure 3-8B). Wang et al.[185] recently
employed a multiport (3 × 3) fiber coupler homodyne interferometer centered at 1310 nm with
a coherence length of more than several hundred millimeters ( Figure 3-8C). The multiport
interferometer eliminated the influence of initial phase and the phase perturbation from the
environment. The intensity changes of the probe beam were used to reconstruct the
photoacoustic images. The method offered several advantages including, freedom from the
influence of the rough tissue surface and having a confocal configuration to focus both probe

67
light and excitation light at a common point below the sample surface. The system
demonstrated in-vivo imaging of the blood vessels of a mouse ear with an excitation fluence
well within the ANSI MPE limits (Figure 3-8D). In general, long coherence devices may suffer
from unwanted interferences due to reflection from the optical components and sample
structures.
Figure 3-8. (A) In vivo photoacoustic images of blood vessels in the mouse ear (left) with and (right) without water layer on top, Reprinted with permission from [333]. (B) differentiation of blood flow states with the dual-modal system. (left) En-face microvasculature image of OCT angiography, (right) photoacoustic image of mouse pinna, (top) images with blood flow, (down) images with blood flow blocked, Reprinted with permission from [98]. (C) Schematic of the multiport photoacoustic imaging system. Reprinted with permission from [185] (D) Photoacoustic MAP image acquired in-vivo from mouse ear. Reprinted with permission from [185].
The interferometric detection of photoacoustic signals has several significant technical
limitations. First, the rough tissue surface dramatically affects the quality of the image when
directly measuring the vibration of the tissue surface. This motivates the use of a water/oil
layer on the surface of the sample. Secondly, in most of these methods except the one proposed

68
by Wang et al.[185], the probe beam is focused on the surface of the sample or water layer,
while the excitation beam was focused below the surface. This requires elaborate adjustment
of the probe beam, making it difficult to perform in-vivo imaging due to the uneven surface of
the tissue and motion of the sample. Finally, to maintain the interferometric system at its
highest sensitivity, complicated phase stabilization techniques are required, which sacrifice the
imaging speed, and limited success could be achieved in well-controlled lab settings[334].
3.6.3. Photoacoustic remote sensing (PARS)
Photoacoustic remote sensing (PARS) was first introduced by Haji Reza et al. in 2017 for non-
contact non-interferometric detection of photoacoustic signals [335]. Similar to conventional
PAI, PARS employs a nanosecond pulsed laser to excite ultrasonic pressures in biological
tissues. Unlike other PAI modalities, in PARS the ultrasound transducer is replaced with a
second detection laser, which is co-focused with the excitation laser on the sample. The back-
reflected beams from the sample are directed towards a photodiode. A long-pass filter is
typically placed before the photodiode to block any excitation light and to ensure the detector
only measures the detection laser's intensity. If only the detection laser is incident on the
sample, the reflected light would have a constant intensity (effectively a DC signal). As an
excitation pulse is applied, a small and rapid oscillation is found to be imposed on the back-
reflected light. Therefore, the photodiode voltage output is typically high pass filtered to only
extract these rapidly oscillating signals and reject the scattering signals. A simplified system
diagram of a PARS system is provided in Figure 3-9.

69
Figure 3-9. simplified schematic of PARS microscopy. F: Filter, PD: Photodiode, LP: Long pass filter, PBS: Polarized beamsplitter, QWP: Quarter waveplate, M: Mirror, DM: Dichroic mirror, C: Collimator, L: Lens, MO: microscope objective, PC: Polarization controller, GM: Galvanometer mirror.
In PARS, the thermoelastic pressure and temperature rise induced by both the excitation and
detection beams contribute to the optical absorption and the final signal. By propagating
through the sample, they modulate the refractive index of the medium due to the elasto-optic
effect[336]. The change in refractive index leads to a change in reflectivity of the sample,
which can be observed as fluctuations in the back-reflection intensity of the detection laser.
For the case of normally incident light, the reflectivity R, can be calculated using Fresnel
equations as R = | 𝑛𝑛1−𝑛𝑛2𝑛𝑛1+𝑛𝑛2
|2 where n1 and n2 are refractive indices of two media within the tissue.
Assuming the excitation laser is incident on an object whose index of refraction is n1, we can
express a slight perturbation in its refractive index as n1 + ẟn1. The reflectivity can now be

70
described as R’=| 𝑛𝑛1+ẟ𝑛𝑛1−𝑛𝑛2𝑛𝑛1+ẟ𝑛𝑛1+𝑛𝑛2
|2. As PARS only measures the resulting transient oscillations, we
can express the change in reflectivity as 𝛥𝛥𝛥𝛥 = 𝛥𝛥 – 𝛥𝛥’. This can be shown to be 𝛥𝛥𝛥𝛥 =∝
ẟ(𝑛𝑛1 − 𝑛𝑛2)[335]. The key insight is the fact that the PARS effect is amplified if there is an
existing refractive step between the media. Without this pre-existing refractive index contrast,
the reflectivity change is subtle. Though this may seem to be of little use in practice, scattering
and optical absorption contrast exists prevalently throughout biological tissue. Subsequent
works extended this model to include temporal and spatial dimensions[337], [338].
Over the short period of time, PARS has demonstrated its potential for high-resolution in-vivo
imaging of microvasculature structures [335], deep sensing capabilities [339], label-free
histology imaging [340]–[342] and functional imaging [339]. Images acquired in-vivo from
single red blood cells, oxygen saturation mapping, and deep-vasculatures are presented in
Figure 3-10. Oxygen saturation measurement was achieved by utilizing spectra generated
using stimulated Raman scattering (SRS) in a single mode fiber. Additionally, a fully fiber-
tetherable design of the system for real-time functional imaging was reported, and
characterized by estimating blood oxygen saturation in blood-flow phantoms and with in-vivo
mouse ear microvasculature[343].

71
Figure 3-10. (A) In vivo PARS microscopy structural images. (a) Image of en face microvasculature in mouse ear using the high-resolution mode (Scale bar: 500 μm) (b) In-vivo image of red blood cells in the mouse ear using the high-resolution mode (Scale bar: 5 μm) (c) Image of mouse ear vasculature using the deep-penetrating mode (Scale bar: 500 μm) (d) Image of en face microvasculature in the tip of a mouse ear using the high-resolution mode (Scale bar: 500 μm) (e) Images of back flank of mouse at various depths using the deep penetrating mode (Scale bar: 100 μm) (B) Image of carbon fiber networks using the deep penetrating imaging mode. (c) Image of carbon fiber networks using the high-resolution imaging mode, as well as an inset image of 100-nm gold nanoparticles. (d) Images of carbon fiber networks at various depths in tissue-mimicking solution. (C) Functional images SO2 measurement of en face microvasculature in the ear of an 8-week-old nude mouse. Reprinted with permission from [339].
Recently, Ecclestone et al. [340], [344], [345] utilized the UV absorption peak of DNA to
visualize cell nuclei and bulk tissue structure. Representative images of one-to-one comparison

72
of PARS histological imaging and H&E staining in human breast tissue are presented in Figure
3-11.
Figure 3-11. One to one comparison of PARS histological imaging and H&E staining. (a) Large field of view (9 mm × 13.25 mm) PARS (780 megapixel) image of nuclear morphology in a thin section of formalin fixed paraffin embedded excised breast tumor tissues. (b–d) (i) Subsections of the large field of view PARS image (a) highlighting regions of interest within the large field scan. (ii) Images of the exact same set of tissues following H&E staining, providing a direct one-to-one comparison between PARS imaging of tissues and the gold standard for histopathology H&E imaging. (a) Scale Bar: 2 mm. (b) Scale Bar: 200 µm. (c) Scale Bar: 50 µm. (d) Scale Bar: 75 µm. Reprinted with permission from [344]. In general, the all-optical detection scheme applied in PARS presents several benefits over
previously discussed approaches:

73
i. PARS usually employs an optical confocal geometry between the excitation and the
detection lasers. This confocal geometry is significantly simpler than the conventional
OR-PAM devices and does not require additional components between the microscope
objective and the target[334]. This all-optical confocal geometry enables high-
resolution imaging in a reflection-mode architecture.
ii. The all-optical confocal geometry also eliminates the need for acoustic coupling and
provides non-contact detection of photoacoustic pressures. This non-contact detection
scheme minimizes the risk of infection in clinical settings and does not require the
apparatus to be submerged in water.
iii. The PARS confocal detection mechanism measures the initial pressures and
temperature rise local to the targeted absorber. These initial pressure waves dissipate
in a few hundred nanoseconds and allow for significantly faster imaging speeds
compared to conventional PAI system, potentially in the range of tens of megahertz
[81]. However, conventional PAI devices typically require waiting for a minimum
interval of time for the ultrasonic pressure waves to propagate through the tissue. The
minimum time interval is dependent on the speed of sound in the tissue and the image
depth. Assuming that the average speed of sound in the tissue is 1540 mm/s [82], it will
take the acoustic waves about 0.65 μs to propagate over an imaging depth of 1 mm.
Therefore, the maximum imaging rate is 1.5 MHz. If an excitation pulse is applied
before this minimum time interval, acoustic waves within the sample can potentially
interfere with each other and degrade the image quality.

74
iv. Like other PAI devices, PARS takes advantage of intrinsic optical absorption to
visualize contrast and does not require the use of exogenous chromophores. This label-
free imaging modality can be deployed in clinical settings and may not require special
control measures and precautions.
v. The all-optical imaging mechanism enables PARS to be combined with other imaging
modalities to capture additional contrasts and yield additional diagnostic information
to the clinicians. The all-optical imaging design also enables to be miniaturized to an
endoscope and visualize absorption contrast deep within the body.
Employing PARS, the next chapter investigates the application of PARS for non-contact
ophthalmic imaging applications. This is the first time a non-contact photoacoustic imaging
has been used for in-vivo imaging of the eye.

75
Chapter 4 Photoacoustic remote sensing microscopy for ophthalmic imaging
Notes and Acknowledgement
This chapter summarizes results from a study that showed the first label-free, non-contact, in-vivo
imaging of the ocular vasculature using a photoacoustic imaging technique. Both anterior and posterior
segments of mouse eye were imaged in this study. The content of this chapter is based on the following
journal manuscript:
Zohreh Hosseinaee, Layla Khalili, James A. Tummon Simmons, Kevan Bell, and Parsin Haji Reza,
"Label-free, non-contact, in vivo ophthalmic imaging using photoacoustic remote sensing microscopy,"
Opt. Lett. 45, 6254-6257 (2020)
Author contributions
Zohreh Hosseinaee co-designed with supervisor the optical system for PARS suitable for imaging the
eye, prepared and ordered the optical and digital components of the system, constructed the PARS
system, conducted the experiments, processed the images, contributed to interpreting the data, prepared
the figures, and wrote the main manuscript.
James A. Tummon Simmons helped in constructing the PARS system.
Kevan Bell helped with hardware and software of the PARS system.
Layla Khalili assisted with animal imaging experiments.
Parsin Haji Reza conceived the study, contributed to the interpretation of all results, and acted as the
primary investigators.
All authors contributed to the final version for publication.

76
4.1. Introduction
Ophthalmic imaging has long played an important role in the understanding, diagnostic and
treatment of a wide variety of ocular disorders. Currently available clinical ophthalmic imaging
instruments are primarily optical-based, including slit-lamp microscopy, fundus photography,
confocal microscopy, scanning laser ophthalmoscopy and optical coherence tomography
(OCT). Despite offering valuable structural and morphological information from ocular tissue,
these modalities have limitations providing detailed functional and molecular characteristics
of the eye[11]. Access to this information would help with early diagnosis and consequently
facilitate the treatment of major eye diseases including age related macular degeneration,
glaucoma and diabetic retinopathy[103].
Photoacoustic microscopy (PAM) is among the most rapidly growing optical imaging
modalities. The technology is well-known for its practical functional and molecular imaging
capabilities. Its unique imaging contrast of optical absorption makes PAM the preferred
modality for a wide range of biomedical applications[47]. In ophthalmic imaging, PAM has
been used for visualizing hemoglobin and melanin content[216], measuring blood oxygen
saturation[349], and quantifying metabolic rate of oxygen in the ocular tissue[106]. Even
though PAM offers high sensitivity, unique imaging contrast, and high resolution, it is not
generally an all-optical imaging method unlike the other ophthalmic microscopy techniques.
One of the significant limitations of photoacoustic microscopes in ophthalmic applications
arises from their need to be in physical contact with the sample through a coupling media. This
physical contact, coupling, or immersion of the sample is undesirable in ophthalmic
applications. It may increase the risk of abrasion, infection, and patient discomfort.

77
Additionally, involuntary eye movements may affect the coupling efficiency and degrade
image quality. In small animal imaging, immersion in water significantly complicates the
procedure and commonly results in sacrificing the animal[241].
To overcome the limitations of contact-based PAM devices, in 2017 Haji Reza et. al
developed photoacoustic remote sensing (PARS) microscopy for non-contact, non-
interferometric detection of photoacoustic signals[335]. The technology has proved its
potential over a short period of time in various biomedical applications such as label-free
histology imaging[341], [342], SO2 mapping and angiogenesis imaging[339]. Here, we have
successfully extended the application of PARS microscopy for non-contact photoacoustic
imaging of ocular tissue. This has been a long-lasting desire in the field of photoacoustic
ophthalmoscopy[350]. In this study, we present the first real-time, in-vivo, non-contact
photoacoustic imaging of the eye. To make this possible, we made significant modifications to
make PARS microscopy suitable for ophthalmic imaging. These modifications include
employing, eye-friendly 830 nm detection wavelength, suitable scanning pattern and
interpolation algorithm, focusing optics and live feedback during in-vivo imaging. The 830 nm
probe beam improves photoacoustic signal detection in the ocular environment by having
lower absorption in water. Additionally, it reduces the amount of chromatic aberration in the
system by having close spectral bandwidth to the 532 nm excitation beam. The PARS
microscope reported in this study, for the first time has employed a telecentric pair, which
provides a uniform image intensity and improves the effective imaging field of view (FOV) of
the optical scanning. We have also showed the first live feedback imaging in the eye which is
beneficial for accurate alignment and to select the right imaging location. The system is used

78
for imaging different regions of the ocular tissue including, iris, scleral and retinal vasculature.
To best of our knowledge this is the first study showing non-contact photoacoustic imaging
conducted on ocular tissue.
4.2. Method
Figure 4-1 illustrates the experimental setup used in this study. The excitation source is 532-
nm 1 ns pulse-width, ytterbium-doped fiber laser (IPG Photonics) capable of pulse repetition
rates from 20 kHz to 600 kHz. The detection arm uses an 830-nm Superluminescent Diodes
with 20 nm full width at half maximum linewidth (SLD830S-A20, Thorlabs). The output end
of the fiber is coupled to a collimator. A polarized beam splitter is used to transmit the majority
of the forward light onto a quarter wave-plate, which transforms the linearly polarized light to
circularly polarized light. The detection and excitation light are then combined using a dichroic
mirror. The co-aligned beams are then directed toward a large beam galvanometer scanning
mirror system (GVS012/M, Thorlabs, Inc.) driven by a two-channel function generator. The
beams are then directed to a set of 1:1 telecentric pair that provides uniform image intensity
and improves the effective FOV. A 0.26 NA refractive objective co-focused the beams onto
the sample. The back-reflected light from the sample is collected via the same objective lens
and guided towards the detection path. The quarter wave-plate transforms the reflected
circularly polarized light back to linearly polarized light. This enables the polarized beam
splitter to direct the back-reflected light towards the photodiode. A long-pass filter
(FELH0800, Thorlabs Inc.) is used to block any residual 532 nm light. The 830 nm signal is
then focused onto the photodiode with an aspherical lens. The photodiode is connected to a
high-speed digitizer (CSE1442, Gage Applied, Lockport, IL, USA). A point acquisition is

79
acquired for each pixel and recorded by the digitizer. Each point acquisition is converted to an
intensity value by computing its maximum amplitude and plotted at its respective location in
the image.
Figure 4-1. Schematic of the PARS microscopy system.
4.3. Results
The performance of the system was first tested on 7 µm carbon fiber networks at ~1 mm depth
in water and representative images are shown in Figure 4-2 A-C. The images were acquired
using ~ 900 pJ excitation pulse energy and ~ 2 mW interrogation power on the sample. The
black strips in Figure 4-2B&C is resulted from the shadow of the carbon fibers located on top
of the depth of focus (white arrows). The signal-to-noise ratio (SNR), defined as the average
of the maximum amplitude projection pixels in a region of interest (dashed yellow rectangles
in Figure 4-2A) over the standard deviation of the noise (dashed white rectangles in Figure
4-2A), was quantified as 56 ± 3 dB. The SNR measurement was performed in four different
regions of the image to quantify the deviation.

80
Figure 4-2 (A-C) Images of carbon fiber networks at ~1 mm depth in water acquired using PARS microscopy. The dashed
yellow rectangles in (A) depict the regions for measuring the maximum amplitude and the dashed white rectangles show the region for measuring the standard deviation of the noise. Scale bar: 30 µm.
To demonstrate the in-vivo capabilities of the system the ear of a nude mouse (NU/NU,
Charles River, MA, USA) was imaged. All of the experimental procedures were carried out in
conformity with the laboratory animal protocol and was approved by the Research Ethics
Committee at the University of Waterloo. A custom-made animal holder was used to restrain
the animal. The base of the animal holder was lined with a thermal pad in order to keep the
mouse body temperature between 36° and 38°C. Artificial tears were used frequently (~ every
5 minutes) to keep the cornea hydrated. Vital signs, such as respiration rates, heart rates and
body temperature were monitored during the experiment. All of the 2D images shown in this
manuscript were formed using a maximum amplitude projection (MAP) of each A-scan as a
pixel in a C-scan en-face image. All images shown in this manuscript were produced by direct
plotting from interpolated raw data using a Delaunay triangulation interpolation
algorithm[351]. All images and signal processing steps were performed in the MATLAB

81
environment. Frangi vesselness filter was applied on the vasculature images[352]. Scale bars
in the FOV were calibrated using a 1951 USAF resolution test target. Figure 4-3 demonstrates
in-vivo PARS images of en-face microvasculature in the ear. Images were acquired with 20
kHz pulse repetition rate (PRR) of the excitation laser. The FOV covered in Figure 4-3A is 1
mm × 1 mm, and it took ~7 seconds to acquire the image. Figure 4-3 B. was recorded from
the same area with a smaller FOV of 500 µm × 500 µm, red blood cells within the capillaries
can be clearly seen in this image (~ 7 seconds). The lateral resolution of the system for in-vivo
experiment was measured ~ 2.6 µm. The lateral resolution of in-vivo ear and eye imaging was
measured using edge spread function of the vessels as explained in [353]. The measured pulse
energy at the sample surface was measured as ~ 50 nJ and the detection power was ~ 4 mW.
The SNR of the large vessels was measured as approximately 41 ± 4 dB.
Figure 4-3 In-vivo imaging of mouse ear using PARS microscopy (A) Scale bar: 100 µm. (B) Scale bar: 15 µm.

82
For the eye imaging experiments, the repetition rate of the excitation laser was increased
to 100 kHz to reduce the effect of motion artifacts. Both iris and retinal vasculature were
imaged in-vivo in the mouse eye. The lateral resolution of the system for in-vivo eye imaging
experiments was measured as ~ 2.6 µm. In the current design of PARS microscopy, the axial
resolution is defined by optical sectioning. This has been measured to be equal to the depth of
focus of imaging optics, which in this case is equal to ~ 40 µm. Since the ocular media are
clear, optical scattering is not a major concern for imaging retinal vasculature in the mouse
small eyeball. Therefore, imaging the retinal vasculature was possible with current setup and
the imaging depth of the system was measured to be ~ 3 mm corresponding for the size of the
mouse eyeball. The SNR of large vessels was measured as approximately 37 ± 3 dB. Figure
4-4 depicts representative images acquired from iris and retinal vasculature within different
FOVs. Figure 4-4 A. represents an image acquired from the vasculature in the peripheral iris,
covering an area of ~ 3 mm × 3 mm, and it took ~ 4 seconds to record the image. The enlarged
capillary networks represented in the blue region is shown in Figure 4-4 B. Figure 4-4 C. is
recorded from the vasculature of the inner iris, and Figure 4-4 E. shows the enlarged vessels
of the area in the green rectangular region. Since the employed objective lens of the system
has long enough working distance (~ 30 mm) compared to the diameter of mouse eyeball (~3
mm), imaging the retinal vasculature was also possible using the current setup. Figure 4-4 D
& F show representative images acquired from retinal vasculature. Both detection and
excitation beams were sent through the central part of the anterior segment to back of the eye.
The reflected signals coming from the retinal vasculature were detected to form the images.
Additionally, live imaging of vasculature near the limbal and episcleral region was acquired

83
during manual depth scanning over ~ 150µm imaging depth. Snapshots acquired from the
video are presented in Figure 4-4G. To maintain higher real-time speed, a more basic scatter
point interpolation was used, which resulted in lower resolution compared to single captures.
Currently, depending on the resolution and FOV, live imaging operates between 1-4 frames
per second. The live imaging was used constantly during the imaging session to enable accurate
alignment and focusing to select the right location. Unlike other pre-clinical imaging
techniques[354], [355], in these experiments to mimic real world situation for clinical
applications, the head of animal was not fixed and no tropical anesthesia or pupil dilation was
applied to the eyeball. Therefore, motion artifacts are still presented in the images, for example,
in Figure 4-4 A., these motion artifacts resulted in out of focus and losing PARS signal from
part of the iris.

84
Figure 4-4 In-vivo imaging of ocular vasculature within different FOVs. (A) image acquired from the vasculature in the
peripheral iris, covering an area of ~ 3 mm × 3 mm. (B) The enlarged capillary networks in the blue region. (C) Vasculature of the inner iris. (E) Enlarged vessels of the green rectangular area. (D & F) Images acquired from retinal vasculature. (G)
Snapshots acquired from the live video acquired during imaging.

85
Light safety is an important factor to consider in ophthalmic imaging. In the eye imaging
experiments, reasonably good images were formed with the minimum excitation pulse energy
of ~ 50 nJ and ~ 4 mW detection beam power. The ocular maximum permissible exposure
(MPE) depends on the optical wavelength, pulse duration, and exposure aperture. For a single
laser pulse at 532 nm, the MPE should not exceed 5×10⁻⁷ J/cm2; which corresponds to
maximum pulse energy to be 200 nJ, assuming the size of a typical dilated human pupil to be
7 mm in diameter[356] . The 50 nJ laser pulse energy used in the experiment is well within the
ANSI safety limits and the 160 nJ safety limit reported in [164]. The ~ 4 mW detection power
is also within the ANSI safety limits for imaging human eye [357], [358]. In addition, for
exposure duration longer than 1 seconds, eye movements redistribute the light over larger
retinal areas, and decreases the retinal irradiance and thus the risk for injury [357]. In this study,
depending on FOV, number of collected data points for each image, resolution, and duration
of recorded PARS signal, the image acquisition time (different than live feedback speed) varies
between 1 - 4 seconds. This helps to reduce the risk of ocular damage. Even though the
employed values are within the ANSI safety limits of the previously reported methods, in the
future an intensive study will be performed to analyze and improve the safety of the proposed
system for clinical trials.
4.4. Discussion and Conclusion
There are several aspects that can be further refined for future studies. Unlike other OR-
PAM systems that use mechanical scanning [359], [360] the reported system employs optical
scanning using galvanometer mirrors. Even though, optical scanning enables the high imaging
speed required for live feedback and real-world applications, the FOV of the current setup is

86
limited to 3 mm × 3 mm. The achieved FOV is not enough for capturing the full retina
vasculature network in the rodent eye. To improve the FOV, we plan to employ customized
scan lens. Moreover, we plan to apply multi-wavelength PARS to assess the blood oxygen
saturation in both anterior and posterior segments of the eye in rodent models. Since PARS is
an all-optical imaging system, it can naturally be combined with all other all-optical imaging
systems such as OCT. We can potentially integrate optical coherence tomography to image
with both scattering and absorption contrast and acquire volumetric images of the eye structure
and vasculature.
To achieve functional PARS imaging combined with OCT, one of the important requirements
is to provide a multiwavelength light source with enough pulse energy at each wavelength and
high pulse repetition rates. Currently available multiwavelength light sources for functional
photoacoustic studies are usually based on optical parametric oscillator (OPO) or dye lasers.
Unfortunately, they are both expensive, bulky, and more importantly they have low pulse
repetition rates (PRR) that severely compromise image acquisition speed for in-vivo imaging
applications. In the next chapter, we propose a method for achieving temporally stable
multiwavelength light source with enough pulse energy and high PRR for in-vivo, functional
photoacoustic imaging applications and demonstrate the performance of the light source for
functional PARS imaging.

87
Chapter 5 Functional photoacoustic remote sensing microscopy using
stabilized temperature-regulated stimulated Raman scattering light source
Notes and Acknowledgement
This chapter summarizes results from investigation on the effect of temperature on the temporal stability
and spectrum of stimulated Raman scattering (SRS) occurring inside single-mode silica fibers. The study is
performed at temperature levels of 195 K, 273 K, and 300 K. The results suggest that a decrease in
temperature causes an improvement of temporal stability of the output, considerable rise in the intensity of
the SRS peaks, and significant increase of SRS cross section. The application of the method is shown for in
vivo functional imaging of capillary networks in chicken embryo chorioallantois membrane using
photoacoustic remote sensing microscopy. The content of this chapter is based on the following journal
manuscript:
Zohreh Hosseinaee, Benjamin Ecclestone, Nicholas Pellegrino, Layla Khalili, Lyazzat Mukhangaliyeva,
Paul Fieguth, and Parsin Haji Reza, "Functional photoacoustic remote sensing microscopy using a stabilized
temperature-regulated stimulated Raman scattering light source," Opt. Express 29, 29745-29754 (2021)
Author contributions
Zohreh Hosseinaee co-designed with supervisor the optical system for PARS, collected background
information on the topic, conducted the experiments, collected the data, processed the PARS data, prepared
the figures, and wrote the main manuscript.
Benjamin Ecclestone helped with processing the data and conducting the experiments.
Nicholas Pellegrino developed and implemented the signal unmixing method.
Layla Khalili and Lyazzat Mukhangaliyeva developed the chicken embryo model.
Paul Fieguth contributed to the interpretation of the results and provide guidance.
Parsin Haji Reza proposed the idea, conceived the study, contributed to the interpretation of all results, and
acted as the primary investigators.
All the authors reviewed the manuscript.

88
5.1. Introduction
Photoacoustic microscopy (PAM) is among the most rapidly growing optical imaging
techniques. This modality is well-known for its practical functional and molecular imaging
capabilities [202]. PAM has the unique imaging contrast of optical absorption and is the
preferred modality for a wide range of biomedical applications [47], [186]. This technology
has been applied to many clinical and pre-clinical applications including but not limited to
functional brain imaging, measurement of the oxygen consumption rate of a tumor, imaging
of lipid-rich samples [361], and detection of circulating melanoma cells[220], [362].
Functional photoacoustic measurements (e.g., blood oxygenation) require a tunable
wavelength excitation laser that can target multiple chromophores inside the tissue [51].
Optical parametric oscillators (OPOs) and dye lasers are commonly used for functional
photoacoustic studies [217], [363]. In addition to being expensive and bulky, these tunable
laser systems typically have low pulse repetition rates (PRR) that severely compromise image
acquisition speed for in vivo imaging applications (10 Hz – 10 kHz) [364]. For example, in
ophthalmic applications, where functional imaging could help with early diagnosis of major
blinding diseases, imaging speed is a critical parameter [11]. Conventionally, OPO lasers have
been used for photoacoustic ophthalmoscopy, however, their low PRR would result in long
acquisition time which is not compatible with clinical applications [165]. In contrast, the high
speed offered by tunable SRS sources, may improve imaging time by several orders of
magnitude, mitigating image artifacts due to involuntary eye motion [365].
Stimulated Raman scattering provides a simple, cost-effective technique that has been
widely used to create multispectral pulsed sources with high PRR [366], [367]. SRS is a

89
nonlinear optical effect that generates one or more Stokes wavelengths downshifted from the
frequency of the pump laser [368]. This phenomenon occurs when the light intensity inside a
non-linear medium reaches a certain threshold level [369]. In multispectral photoacoustic
imaging applications, silica fibers are typically used as the SRS medium. Here, if the peak
power of the pump light is strong enough, cascading Raman shifts will occur (spaced at 13.2
THz), generating higher-order Stokes waves [362]. In 2011, Koeplinger et al. demonstrated
the first application of the method for photoacoustic imaging [370]. The concept has been
extended by other groups for generation of multispectral light sources with different pulse
energies and pulse repetition rates [56], [371]. Free-space multiwavelength SRS light sources
have been also developed for functional photoacoustic imaging. They are reported to have
better monochromaticity compared to the fiber-based versions, however the cavity is more
sensitive to environmental changes and misalignment compared to fiber-based SRS
sources[372], [373]. Despite all the advantages provided by SRS sources, they suffer from
pulse-to-pulse output energy fluctuations and power drift that will directly affect imaging
quality [374], [375].
In this manuscript, we propose a new technique to improve the temporal stability of the
SRS-based multispectral pulsed source. We achieve this by lowering the temperature of the
SRS medium. There are two main reasons that temperature is an important factor in Raman-
based optical components. First, Raman scattering involves nonlinear phonon-photon
interactions. The characteristics of phonons, which are quantized lattice vibrations, are highly
temperature-dependent [376], [377]. Second, Raman based devices may suffer from high
operating temperatures, since they require high average intensity optical beams to produce

90
their nonlinear effects [378]. Therefore, temperature plays an important role in designing
and/or operating Raman-based devices. The experiment is performed by keeping the optical
fiber inside a temperature-controlled unit. The temperature of the unit is adjustable between
195 K and 300 K. It is shown that by controlling and decreasing the temperature, the temporal
fluctuations of the generated output peaks are reduced. The proposed method is used to
generate stable multiwavelength light at a high pulse repetition rate. The light source is used
as the excitation laser for a photoacoustic remote sensing (PARS) microscope and applied to
in vivo functional imaging of capillary networks in chicken embryo chorioallantois membrane
(CAM). The proposed method offers a promising technology for creating reliable, cost-
effective multiwavelength light sources with a sufficiently high pulse energy and PRR for a
variety of photoacoustic imaging applications.
5.2. Methods
5.2.1. Temperature-controlled stimulated Raman scattering
The experimental setup used in this study is shown in Figure 5-1. A 532-nm 1.5 ns pulse-
width, ytterbium-doped fiber laser (IPG Photonics) capable of PRRs from 20 to 600 kHz is
used as the pump laser. To stabilize the laser output prior to the experiment, the source was
continuously operated for 30 minutes at an output power of ~370 mW with 50 kHz PRR. The
output of the laser was coupled to the fiber by a 10x microscope objective lens. The coupling
efficiency for all the experiments was measured to be 63 ± 2%. The optical fiber (PM-460-
HP, Thorlabs, Inc) used in this study is single-mode (SM) with 3 μm core diameter, and 6 m
in length. Polarization maintaining (PM) fibers are selected for this study since they make SRS
generation more efficient compared to non-PM SM fibers [379], [380]. The fiber is kept in a

91
custom-designed isolated passive temperature-controlled unit during the experiment. The
temperature of the unit is adjusted at 300 K, 273 K, and 195 K, by adding water, mixture of
water and ice, and dry ice. Once the temperature was stable at the required value, the
experiments were conducted. The temperature of the unit stays stable over the several seconds
data acquisition time since the thermal mass of the fiber is negligible relative to the cooling
media. To prevent the effect of reduced temperature on the fiber coupling efficiency, the fiber
coupler is kept outside of the temperature unit. SRS efficiency may also be affected by airflow
which can cause random errors and long-term drift in the pulse energy[375]. To avoid this, the
fiber was covered and placed at the bottom of the chamber and by sealing the unit, its airflow
was isolated. The fiber output is coupled to a collimator, and spectral filters were used to select
the SRS peak values. A measuring system made up of a beamsplitter, spectrometer,
photodiode, power meter, data acquisition card and computer were used to collect and analyze
the required information.
Figure 5-1. Schematic of the experimental setup. MO: microscope objective, C: collimator, BS: Beamsplitter, PD: Photodiode,
PM: Power meter.
2.2. Multiwavelength photoacoustic remote sensing microscopy
The multiwavelength light source is applied in a functional photoacoustic imaging study.
The imaging system used in this study is based on photoacoustic remote sensing microscopy,

92
previously described in[365], [381]. Figure 5-2A, shows the schematic of the PARS system.
Briefly, the multispectral light source operates as the excitation laser for the setup.
Concurrently, the detection light is provided by an 830-nm Superluminescent Diode
(SLD830S-A20, Thorlabs). A polarized beam splitter is used to transmit most of the forward
detection light onto a quarter wave-plate, which transforms the linearly polarized light into
circularly polarized light. The detection and excitation beams are then combined using a
dichroic mirror. The co-aligned beams are directed toward the sample using a large-beam
galvanometer scanning mirror (GVS012/M, Thorlabs, Inc.), and are co-focused into the sample
using an objective lens. The back-reflected light from the sample is collected via the same
objective lens and guided towards a balanced photodiode. The photodiode outputs are
connected to a high-speed digitizer (CSE1442, Gage Applied, Lockport, IL, USA) that
performs analog to digital signal conversion. A point acquisition is made for each image pixel
and is recorded by the digitizer. Each point acquisition is converted to an intensity value by
computing its maximum amplitude and is plotted at its respective location in the image. All
images and signal processing steps were performed in the MATLAB environment. Figure
5-2B shows the spectra of the individual SRS peaks acquired after spectral filters (FL532-1,
FL543.5-10, FB560-10, FB570-10, FB590-10, Thorlabs, Inc.) and demonstrated the available
wavelengths for the functional imaging. The spectral peaks at 573 nm and 588 nm wavelengths
are broader compared to the other SRS peaks. This can be explained by the broadness of the
Raman gain spectrum and also the existence of other non-linear effects such as four-wave-
mixing [382]. When it comes to functional measurements, this type of spectral broadening
should be considered in the unmixing model to maintain accuracy.

93
Figure 5-2. (A)Schematic of the PARS imaging system, P: polarizer, PBS: polarized beamsplitter, L: lens, PD: photodiode,
GM: Galvanometer mirrors, QWP: quarter waveplate, MO: microscope objective, DM: dichroic mirror, C: collimator, TCU:
temperature control unit. (B) Spectrum of the filter out wavelength acquired after spectral filters.
5.3. Results
5.3.1. Temperature-controlled stimulated Raman scattering
We first characterized the temporal stability of the laser itself. The root-mean-square (RMS)
temporal fluctuation of the light source at an output power of ~ 370 mW was measured as ±
0.7%, which is in correspondence with the values reported by the manufacturer. The output of
the laser was then coupled into the fiber and the spectrum of the generated SRS peaks were
measured using the spectrometer. Figure 5-3 shows the spectrum of SRS peaks acquired at
different temperature levels. In this case, the coupling efficiency was ~ 62%, resulting in ~ 220
mW power coupled into the fiber. As the temperature increases, the bandwidth of the spectrum
expands which is in agreement with previous reports [383]–[385]. This could be explained by
decreasing of chromatic dispersion of the fiber with increasing temperature [386]. Raising the

94
temperature results in decreasing the phonon lifetime which leads to a broadening of the optical
phonon spectrum [378]. Later it is shown that this temperature-dependent spectrum narrowing
is accompanied with an increase in the output power intensity for the wavelengths at the higher
end of the spectrum.
Figure 5-3. Spectrum of SRS peaks acquired at different temperature levels.
After evaluating the effect of temperature on the generated spectrums, we analyzed the
temporal stability of the SRS peaks at different operating temperatures. We analyze the RMS
stability using a photodiode to measure the SRS intensity generated by each laser pulse. To
have high temporal resolution in the acquisitions, a 350 MHz-bandwidth silicon photodetector
is used to collect the output pulses after the spectral filters. The timescale of the measurements
is based on the potential photoacoustic imaging applications, thus the pulse-to-pulse
fluctuations over several seconds are considered in this study. At selected temperature levels

95
and for each measurement 1000 datapoints are collected over ~ 6 seconds. Figure 5-4A-C
shows an example of the light intensity measured using the photodetector, for the 558 nm
Raman peak, which directly relates to the number of photons detected, at 300 K, 273K and 195
K, respectively. Here, if the 558 nm SRS peak is not generated (failed SRS event), it will cause
a zero voltage on the detector output. The black arrows in Figure 5-4A-C refers to these failed
SRS datapoints. In the graphs it can be observed that by reducing the temperature the number
of datapoints contributing to SRS events increased, from ~ 690/1000 to ~ 999/1000, at 300K
and 195 K, respectively. This represents a ~30% increase in the probability of the SRS event,
corresponding to a significant improvement in the temporal stability of the source. This can be
explained by the substantial growth of SRS cross section (i.e. the probability that the process
will happen) and increase of SRS conversion coefficient as the temperature reduces [387].
In addition to the rate of failed SRS events, we also observe the variation in generated SRS
peak intensity. We use the RMS deviation of the peak intensities in the acquired data as a
stability metric. The dashed box in each figure highlights these corresponding SRS peaks.
Here, the 300K temperature exhibits a large amount of peak variation in comparison to the
195K and 273K cases. Observing the inset figures, the standard deviation of the SRS pulses
can be directly visualized. The differences in the variation at each temperature level, clearly
shows the improvement in temporal stability with reduced temperature. In this case, both the
peak variation, and the failed SRS events contribute greatly to the very large RMS deviation
in the SRS peak at 300K. Conversely, the 273K and 195K each exhibit substantially improved
pulse-to-pulse stability and substantially reduced SRS failures. Thus, corresponding to a
significant improvement in the RMS stability.

96
We have also extended these measurements across each of the 545 nm 558nm, 573nm and
588nm SRS peaks. The relative power of individually filtered SRS peaks at different
temperature levels is shown in Figure 5-4D. The bar chart presented here reveals the relative
SRS intensity, while the error bars show the RMS fluctuations of the peaks. The results suggest
that by lowering the temperature, the standard deviation of the pulse energy is reduced as well.
As the temperature reduces, the generated SRS peak intensities become more uniform and their
temporal power fluctuations decrease as well. Lowering the temperature improves the
consistency of SRS events and might result in higher accuracy for applications such as
photoacoustic microscopy.
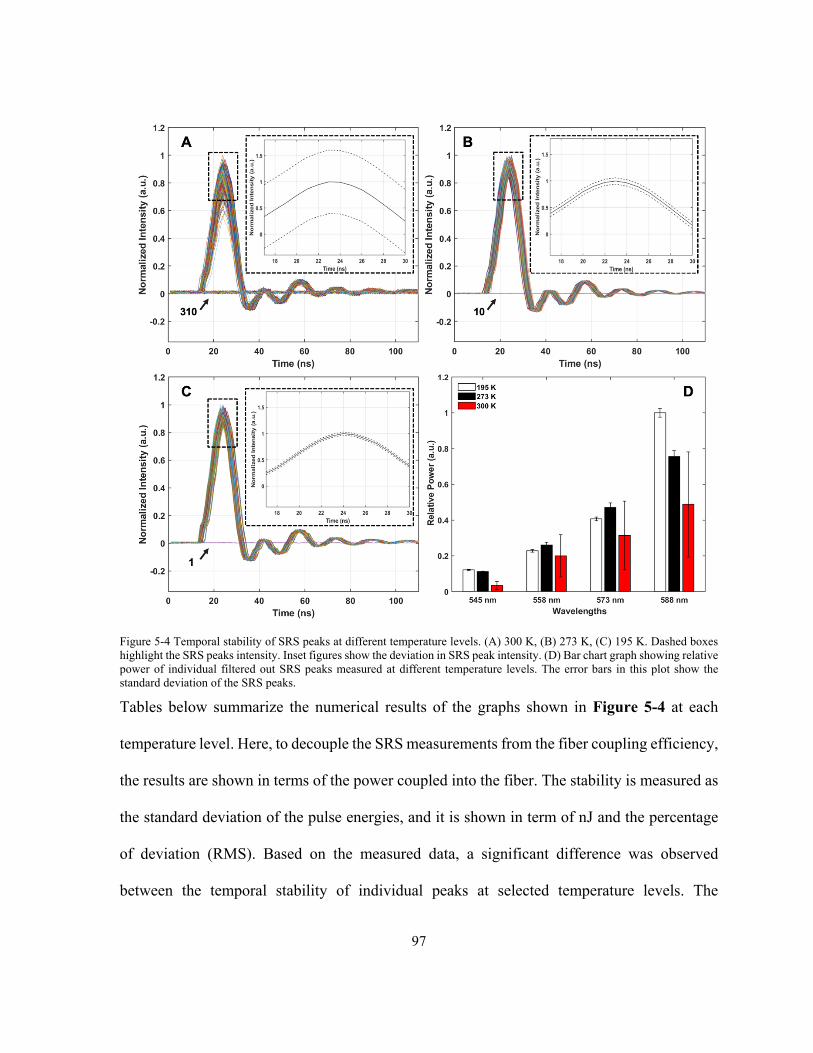
97
Figure 5-4 Temporal stability of SRS peaks at different temperature levels. (A) 300 K, (B) 273 K, (C) 195 K. Dashed boxes highlight the SRS peaks intensity. Inset figures show the deviation in SRS peak intensity. (D) Bar chart graph showing relative power of individual filtered out SRS peaks measured at different temperature levels. The error bars in this plot show the standard deviation of the SRS peaks.
Tables below summarize the numerical results of the graphs shown in Figure 5-4 at each
temperature level. Here, to decouple the SRS measurements from the fiber coupling efficiency,
the results are shown in terms of the power coupled into the fiber. The stability is measured as
the standard deviation of the pulse energies, and it is shown in term of nJ and the percentage
of deviation (RMS). Based on the measured data, a significant difference was observed
between the temporal stability of individual peaks at selected temperature levels. The

98
conversion efficiency, i.e., how much of the coupled light gets converted into each wavelength,
is also improved by reducing the temperature of the SRS medium. This is in agreement with
previous reports[378]. The total efficiency which is measured using cumulative energy
converted from the 532 nm pump wavelength into other wavelength is also improved by
lowering the temperature. We observed that higher pump powers lead to higher efficiency in
all cases, which is to be expected. Additionally, the tables show that decreasing temperature
causes a considerable rise in the intensity of the wavelengths at the higher end of the spectrum.
This might be related to the rise in the Kerr constant by lowering the temperature which can
affect the SRS intensity[388]. It is worthwhile to mention that the general effect of temperature
was consistent for other stock configurations and input powers.
Table 5-1 SRS characteristics at 300 K temperature
300 K Wavelength (nm) 545 558 573 588
Output Power (mW) 0.92 5.46 8.58 13.34 Output Pulse Energy (nJ) 18.34 109.29 171.65 266.81
Stability (±nJ) 5.92 31.28 51.21 78.04 Stability (%RMS) 32.3 28.6 29.8 29.3
Conversion Efficiency (%) 0.52 3.07 4.82 7.50 Total Efficiency (%) 16
Table 5-2 SRS characteristics at 273 K temperature
273 K Wavelength (nm) 545 558 573 588
Output Power (mW) 3.06 7.13 12.88 20.68 Output Pulse Energy (nJ) 61.10 142.65 257.54 413.60
Stability (±nJ) 2.35 8.39 13.43 17.62 Stability (%RMS) 3.8 5.9 5.2 4.3
Conversion Efficiency (%) 1.65 3.85 6.96 11.17 Total Efficiency (%) 24
Table 5-3 SRS characteristics at 195 K temperature
195 K

99
Wavelength (nm) 545 558 573 588 Output Power (mW) 3.32 6.23 11.11 27.34
Output Pulse Energy (nJ) 66.31 124.68 222.28 546.72 Stability (±nJ) 2.01 3.75 5.90 13.04
Stability (%RMS) 3.0 3.0 2.7 2.4 Conversion Efficiency (%) 1.79 3.37 6.00 14.77
Total Efficiency (%) 26
5.3.2. Multiwavelength photoacoustic remote sensing microscopy
The PARS system with the stabilized SRS-based multispectral system was applied to in-
vivo oxygen saturation measurement of a CAM model. Figure 5-5A shows a corresponding
white light photograph of the CAM model. The temperature of the unit is set to 273 K to
achieve temporally stable emissions with large enough pulse energies at 532 nm, 545 nm, and
558 nm spectral wavelengths. The output pulse energy measured on the sample was equal to
150 nJ, 100 nJ and 120 nJ at 558 nm, 545 nm, and 532 nm, respectively. Due to the motion of
the CAM model, slight spatial shifts are observed between images. These shifts are corrected
for using non-rigid image registration so that the spectral unmixing algorithm can subsequently
be applied[389]. Briefly, the unmixing algorithm solves the inverse problem of estimating the
relative concentrations of oxy- and deoxyhemoglobin, [HbO2] and [Hb] respectively, on a per-
pixel basis. The PARS response is linear with respect to hemoglobin concentration, and a
regularized least-squares solution is used to estimate the relative concentrations. In addition to
the effects of absorption at the excitation wavelengths, the reflectivity of the detection
wavelength for both oxy- and deoxyhemoglobin must be considered due to its scaling effect
on the detected PARS amplitude. To account for this, estimates of the relative concentrations
are normalized by the associated reflectivity. Reflectivity is approximated as inverse
absorption at the detection wavelength of 830 nm. In future works, the scattering information

100
provided through the probe beam of PARS can be used the same way as other scattering-based
imaging modalities such as fundus photography or OCT to measure the amount of absorption
inside the tissue. Figure 5-5 B-D shows capillary beds in the CAM model imaged with 532
nm, 545 nm, and 558 nm, respectively. Each image was acquired over 10 seconds and the
temporal sequence between images is ~ 5-8 seconds. The oxygen saturation of the CAM model
is presented in Figure 5-5E. Blood oxygenation saturation level is indicated using pseudocolor,
ranging from blue to red in an ascending order.
Figure 5-5. Functional oxygen saturation measurement of microvasculature in capillary beds. (A) Corresponding white light photograph of the CAM model. (B) PARS images acquired at 532 nm wavelength, (C) 545 nm, and (D) 558 nm. (E) Oxygen saturation map acquired using spectral unmixing.
5.4. Conclusion

101
To summarize, we have investigated the effects of temperature on the spectral shape and
temporal stability of SRS peaks generated in single-mode silica fibers. In a temperature-
controlled condition, with constant laser output, we observed that by lowering the temperature
of the fiber the temporal stability of the SRS peaks increases by as much as 60%. This
temporally stable multispectral light source could improve the repeatability and may lead to
more accurate functional measurements. Therefore, it is expected that in a longitudinal SO2
study, the temperature controlled multiwavelength light source will result in more accurate
measurements. To test the full implications of the improved SRS will require a system capable
of satisfying the simultaneity therefore reducing the systematic error in measuring functional
information. Several groups have reported methods to achieve ultrashort switching time (a few
hundred nanoseconds) among wavelengths [343], [375]. In future studies, similar methods can
be used to evaluate the effect of light source stability on the accuracy of the measured values.
This results in achieving a stable multispectral light source and improves the accuracy for
functional photoacoustic imaging applications. It is also shown that as the temperature
increases, the spectral bandwidth of the output beam broadens. Additionally, decreasing the
temperature causes a considerable rise in the intensity of SRS peaks and significant growth of
SRS cross section. The proposed method can be used to generate a cost-effective
multiwavelength light source with high enough pulse energy and PRR for several imaging
applications.
In the next chapters we show the application of the proposed stabilized multiwavelength
light source for functional imaging of the ocular environment and combine it with OCT for
acquiring complementary imaging contrast of depth-resolved optical scattering.

102
Chapter 6 Functional and structural ophthalmic imaging using noncontact
multimodal photoacoustic remote sensing microscopy and optical coherence tomography.
Notes and Acknowledgement
This chapter summarizes results from a study that for the first time present a non-contact, multiwavelength
photoacoustic remote sensing (PARS) microscopy combined with swept-source optical coherence
tomography (SS-OCT) for in-vivo functional and structural imaging of the eye. The system provides
complementary imaging contrasts of optical absorption and optical scattering, and is used for simultaneous,
non-contact, in-vivo imaging of murine eye. The content of this chapter is based on the following journal
manuscript:
Zohreh Hosseinaee, Nima Abbasi F., Nicholas Pellegrino, Layla Khalili, Lyazzat Mukhangaliyeva, Parsin
Haji Reza, " Functional and structural ophthalmic imaging using noncontact multimodal photoacoustic
remote sensing microscopy and optical coherence tomography " Sci Rep 11, 11466 (2021).
Author contributions
Zohreh Hosseinaee co-designed with supervisor the optical system for PARS-OCT suitable for imaging
the eye, investigated and lead the digital control requirements for the system, prepared and ordered the
optical and digital components of the PARS-OCT system, constructed the PARS-OCT system, investigated
and lead image processing for the SS-OCT system, conducted the experiments, processed the images,
contributed to the interpretation the data, prepared the figures, and wrote the main manuscript.
Nima Abbasi constructed the software of the OCT system.
Nicholas Pellegrino developed and implemented the signal unmixing method.
Layla Khalili and Lyazzat Mukhangaliyeva assist with animal handling and conducting imaging
experiments.
Parsin Haji Reza proposed the idea, conceived the study, contributed to the interpretation of all results, and
acted as the primary investigators.
All the authors reviewed the manuscript.

103
6.1. Introduction
The ability to precisely detect and measure chromophore concentration in ocular tissue
is crucial for improving investigations and diagnoses of major eye diseases. Several studies
have demonstrated the vital role of ocular oxygen saturation (SO2) and melanin concentration
in various prevalent eye diseases[11]. For example, retinal oxygen saturation has been shown
to be abnormal in diabetic retinopathy (DR)[390], [391], glaucoma diseases[392], [393], and
retinal vein occlusions[394], [395]. In addition, melanin loss in the retinal pigment epithelium
(RPE) layer is shown to be a major factor affecting the progression of age-related macular
degeneration (AMD)[396], [397]. Therefore, accurate measurement of chromophore
concentrations in the ocular environment could potentially enable improved measurement of
biomarkers for early diagnosis of eye diseases[398]. In the past decades, extensive efforts have
been made to accurately measure SO2 and melanin concentration in the ocular environment.
The gold standard for measuring retinal SO2 in ophthalmic research uses intra-retinal
electrodes to directly measure the oxygen tension[399], however, the invasive nature of the
method limits its clinical applications, thus it can only be used in human subjects during
surgical procedures[400]. Additionally, it is nearly impossible to map the amount of
oxygenation over a large area using this method. Imaging-based methods are required to
visualize the spatial distribution of oxygen in ocular blood vessels. Phosphorescence lifetime
imaging has been used to map oxygenation in the mouse eye. Unfortunately, the need to
introduce fluorescent probes into systematic circulation makes the method inappropriate for
human practice[401]. Magnetic resonance imaging (MRI) can also detect retinal oxygen
distribution non-invasively in humans, however, it has low resolution and offers only

104
qualitative measurement [402]. Recently, researchers are focused on optical imaging-based
methods to extract blood oxygen saturation. Optical measurement of SO2 is possible because
the two forms of hemoglobin, oxy- and deoxyhemoglobin (HbO2 and Hb), have distinct optical
absorption properties. The differences in the absorption spectra of oxy- and deoxyhemoglobin
can be utilized to quantify the relative amounts of HbO2 and Hb in the blood[403]. Several
optical imaging methods, including multiwavelength fundus imaging, scanning laser
ophthalmoscopy and visible light optical coherence tomography (OCT), have all been
investigated to measure ocular oxygen saturation[400]. These methods, however, rely on
measuring the backscattered photons from blood vessels to quantify the absorption of specific
chromophores inside the tissue[404], [405]. Therefore, they are sensitive to local geometrical
parameters, such as retinal thickness, vessel diameters, and retinal pigmentation and may result
in biased estimations[14].
Among various optical imaging modalities, photoacoustic microscopy (PAM) offers unique
imaging contrast of optical absorption. In other words, any imaging target that absorbs light
energy, can be imaged using PAM. Biological tissues have endogenous chromophores that can
be exploited as imaging targets. For example, the absorption peak of DNA/RNA is in the
ultraviolet spectral region, and hemoglobin and melanin mainly absorb light in the visible and
near-infrared (NIR) spectral ranges[186]. This unique imaging ability makes PAM a favorable
candidate for various functional and molecular imaging applications and measuring
chromophore concentration[47]. Over the past decades, photoacoustic ophthalmoscopy has
been applied for visualizing hemoglobin and melanin content in ocular tissue[348], quantifying
ocular SO2[406], and measuring the metabolic rate of oxygen consumption (MRO2)[106].

105
Despite all these advantages offered by PAM devices, a major limitation arises from their need
to be in contact with the ocular tissue[186]. This physical contact may increase the risk of
infection and may cause patient discomfort. Furthermore, this contact-based imaging approach
applies pressure to the eye and introduces barriers to oxygen diffusion. Thus, it has a crucial
influence on the physiological and pathophysiological balance of ocular vasculature function,
and it is not capable of studying dynamic processes under close conditions to normality[407].
In 2017 Haji Reza et al. developed photoacoustic remote sensing (PARS) microscopy for non-
contact, non-interferometric detection of photoacoustic signals[335]. PARS microscopy can
be considered as the non-contact, all-optical version of optical resolution PAM (OR-PAM),
where the acoustically coupled ultrasound transducer is replaced with a co-focused probe
beam. This all-optical detection scheme allows the system to measure the photoacoustic
pressure waves at the subsurface origin where the pressure is maximum. Besides optical
absorption imaging contrast, PARS also offers optical scattering contrast through its probe
beam and can be considered as a dual-contrast imaging modality. Using only the probe beam,
the PARS microscope can act as a confocal microscope to visualize scattering information of
the tissue. In functional studies such as SO2 measurement an additional advantage of PARS
microscopy over other optical imaging modalities comes from its sensitivity to both optical
absorption and optical scattering imaging contrasts. In other words, the scattering information
provided through the probe beam of PARS microscopy can be used the same way as other
scattering-based imaging modalities such as fundus photography or OCT to measure the
amount of absorption inside the tissue. In addition, the wavelength of PARS excitation beam
can be tuned to target a specific chromophore inside the tissue. The technology has proved its

106
potential over a short period of time in various biomedical applications, such as label-free
histological imaging[340], [345], SO2 mapping and angiogenesis imaging[339]. Very recently,
our group demonstrated the first, non-contact, in-vivo photoacoustic imaging of ocular tissue
using PARS microscopy[381].
In ophthalmic imaging applications, optical coherence tomography is a state-of-the-art
imaging technique extensively used in preclinical and clinical applications for imaging both
anterior and posterior parts of the eye[71]. Unlike photoacoustic imaging, OCT obtains its
imaging contrast from optical scattering of internal tissue microstructures. Due to its
interferometric nature, OCT provides depth-resolved scattering information and can be
considered as an ideal companion for PARS microscopy for ophthalmic imaging applications.
This combined multimodal imaging technology has the potential to provide chromophore
selective absorption contrast in concert with depth-resolved scattering contrast in the ocular
environment[408]. Recently, Martell et al.[409] reported a dual-modal PARS microscopy
combined with spectral-domain OCT (SD-OCT) and applied it for in-vivo imaging of ear
tissue.
To allow for in-vivo, non-contact, functional and structural ophthalmic imaging, here we have
combined a multiwavelength PARS microscope with a swept source OCT system (SS-OCT).
SS-OCT has been used in this study, as it provides extended imaging range, reduced sensitivity
roll-off and improved light detection efficiency compared to SD-OCT counterparts. To the best
of our knowledge, this is the first time that a swept-source OCT system is combined with an
OR-PAM system in general (both contact-based OR-PAM and non-contact OR-PAM – i.e.,
PARS). In addition, for the first time we present dual-contrast PARS microscopy, where

107
multiwavelength excitation is used for targeting absorption contrast and the probe beam is used
for targeting scattering imaging contrast. Additionally, here by capitalizing on the distinct
differences in absorption spectra of oxy- and deoxyhemoglobin, oxygen saturation is estimated
in the ocular tissue. To our knowledge, this is the first time a non-contact photoacoustic system
is used for in-vivo SO2 measurement in the ocular environment. This reported work has the
potential to advance the diagnosis and treatment of major eye diseases.
6.2. Methods:
6.2.1. Stimulated Raman Scattering
Previous multiwavelength OR-PAM studies commonly used dye lasers or optical parametric
oscillators to obtain multiple wavelengths required for oxygen saturation measurements[362],
[410]. However, these sources suffer from low pulse repetition rates (PRR) of 10 Hz – 10 kHz
and thus are not suitable for in-vivo ocular imaging applications. In this study to achieve
multiwavelength PARS microscopy and provide a reasonable speed for eye imaging, the SRS
effect is employed. SRS offers an effective approach for implementing high-speed and
multiwavelength light sources [56]. Distinct SRS peaks are generated from inelastic nonlinear
interactions between incoming photons and the molecules of the fiber itself [367]. Here, the
output of the excitation laser was coupled into a 3.5-m polarization-maintaining single-mode
fiber (PM-460 HP) using a fiber launch system. The coupling efficiency was ~65%, and four
distinct optical wavelengths were observed at the output of the fiber. To evaluate the
performance of the multiwavelength light source, a comprehensive study was conducted on
the peak power values, damage threshold, and the temporal stability of the procedure [411].
Input power levels are limited by the fiber damage threshold. In our experiments, the input

108
power was varied between 1 mW- 800 mW. The fiber damage was first observed at 100-kHz
pulse-repetition-rate and 800 mW average input power. SRS efficiency could be affected by
temperature and airflow changes, and random errors and drift in pulse energy[375]. To improve
the stability of the SRS peaks, the fiber was kept in a temperature-controlled unit (273 K) to
isolate the airflow and the temperature. Additionally, at the output port of the fiber, which is
connected to the collimator, the back-reflected light from the filter may also cause damage at
the end of the fiber; this can be solved by introducing a small angle to the filter[56]. A fiber
optic spectrometer measured the SRS peaks and confirmed the filtered wavelengths. Table
6-1shows maximum powers available for each wavelength at 100 kHz pulse-repetition-rate.
These values are acquired by adjusting the input power of the fiber to find the maximum output
power at each SRS wavelength.
Table 6-1 Measured power of SRS peaks generated in 3.5m fiber and at 100kHz PRR.
3.5-m fiber (100 kHz)
Generated Wavelength (nm) 532 545 558 573
Output Energy (nJ) 250 230 230 180
6.2.2. System Architecture
Figure 6-1A demonstrates the experimental setup of the multimodal PARS-OCT system.
Details of the PARS subsystem was explained in the previous study published by our group
for non-contact ophthalmic imaging[381]. Briefly, a 532-nm 1.5 ns pulse-width, ytterbium-
doped fiber laser (IPG Photonics) is coupled to a single mode optical fiber to generate SRS
peaks. The collimated excitation beam passes through bandpass filters to select the desired
wavelength and is directed toward the sample. The detection arm uses an 830-nm
Superluminescent Diode with 20 nm full width at half maximum linewidth (SLD830S-A20,

109
Thorlabs). A polarized beam splitter is used to transmit the majority of the forward light onto
a quarter wave-plate, which transforms the linearly polarized light into circularly polarized
light. The detection and excitation beams are then combined using a dichroic mirror. The co-
aligned beams are directed toward a large-beam galvanometer scanning mirror system
(GVS012/M, Thorlabs, Inc.). The beams are then directed to a telecentric pair set that provides
uniform image intensity and improves the effective field-of-view. The excitation and detection
beams are co-focused into the sample using a refractive objective lens (depending on the
application the numerical aperture (NA) of the objective lens is switched between 0.26 and
0.4). The back-reflected light from the sample is collected via the same objective lens and
guided towards the detection path. The quarter wave-plate transforms the reflected circularly
polarized light back to linearly polarized light, which enables the polarized beam splitter to
direct the back-reflected light towards the photodiode. A long-pass filter is used to block any
residual 532 nm light. The 830 nm beam is then focused with an aspherical lens onto a balanced
photodiode. The photodiode outputs are connected to a high-speed digitizer (CSE1442, Gage
Applied, Lockport, IL, USA) that performs analog to digital signal conversion.
In the SS-OCT subsystem, a vertical cavity surface emitting laser (VCSEL) (Thorlabs, Inc.) is
used as the light source. The laser is centered at ~1060 nm with 100 nm spectral bandwidth
and frequency swept at 60 kHz which enables higher sensitivity compared to higher speed SS-
OCT counterparts. A‐line trigger, i. e. sweep trigger, was supplied by the light source and a
K‐linear sampling clock was provided by the Mach‐Zehnder interferometer‐based clock
module integrated within the laser[412]. The output of the laser was connected to a custom
fiber optic interferometer consisting of a circulator and a 50:50 fiber coupler that splits the

110
light into the reference and sample arms. The reference arm consists of BK7 dispersion
compensating prisms in the optical path and a translating mirror to set the zero delay. In the
sample arm the collimated light is combined with the PARS excitation and probe beams and
together are directed to the sample. The returning light from the sample and reference arms
were interfered at the coupler and detected by the built-in dual balanced photodetector. The
OCT signal was digitized by a high-speed A/D card (ATS9351, Alazar Technologies Inc.,
Pointe-Claire, QC, Canada). The raw OCT data was transmitted to a host computer through a
PCI‐Express interface. The OCT system control was implemented in MATLAB platform to
automatically control all the operations including system calibration, galvo‐scanning, system
synchronization, real‐time imaging preview and data acquisition. The multimodal PARS-OCT
system has two independent imaging modes. It can either performs as two standalone
subsystems, or as a multimodal imaging unit to acquire simultaneous images. Figure 6-1B
demonstrates the timing chart of the multimodal imaging system. Briefly, in the simultaneous
imaging mode, at each A-line, and for each rising edge of sweep trigger signal, the OCT
digitizer collects data during the sampling clock of the K-clock, and it stops collecting data
during the dummy clock (frequency ~ 250 MHz). The sweep-trigger signal also generates an
auxiliary signal, and the falling edge of this auxiliary signal is used as the external trigger for
PARS excitation and data acquisition. As a result, during the time that OCT system is
collecting data, the PARS excitation is off and it turns on during the backward sweep of the
swept source laser, where the OCT digitizer has stopped collecting signal. This will ensure that
the photoacoustic pressure waves induced by PARS excitation, will not affect the quality of
the OCT signal.

111
Figure 6-1. Simplified schematic and timing chart of the multimodal PARS-OCT system. Simplified system schematic. DM: Dichroic mirror, QWP: Quarter wave plate, PBS: Polarized beamsplitter, LP: Long pass filter, GM: Galvanometer mirrors, MO: microscope objective, L: Lens, C: Collimator, PD: Photodiode. DC: Dispersion compensation, P: Polarization controller (A). Multimodal imaging mode timing chart (B).

112
6.3. Image Reconstruction
All the PARS images shown in this manuscript were formed using a maximum amplitude
projection (MAP) of each A-scan for each pixel of the en-face image. The images were
produced by direct plotting from interpolated raw data using a Delaunay triangulation
interpolation algorithm [351]. All images and signal processing steps were performed in the
MATLAB environment. Scale bars in the field-of-view were calibrated using a 1951 USAF
resolution test target.
For each OCT data set, 500 A‐lines were acquired for each B‐scan and on each cross‐sectional
position the slow scan axis traversed through 500 lateral positions. For each A‐line trigger,
2448 sampling points were acquired to cover the resultant spectral interferogram, providing a
depth ranging distance of ∼12 mm. As a pre‐processing step to extract complex data, the OCT
reference spectrum was subtracted from the interference signal to remove DC bias, then
Fourier transform was performed to extract the depth‐resolved OCT signal. The top half of the
Fourier transformed data was considered as valid complex data for further processing. Images
were generated from the raw OCT data and numerically dispersion compensated up to the 5th
order with a custom MATLAB algorithm[413]. No additional image post-processing was used
for the OCT images presented in this thesis. The volumetric and en-face images were generated
from the 3D data sets with ImageJ[414].
6.4. Animal Preparation
All of the experimental procedures were carried out in conformity with the laboratory animal
protocol approved by the Research Ethics Committee at the University of Waterloo and
adhered to the ARVO statement for use of animals in ophthalmic and vision research. All

113
sections of this report adhere to the ARRIVE Guidelines for reporting animal research. Nude
mice and albino mice (NU/NU, Charles River, MA, USA) were imaged to demonstrate the in-
vivo capabilities of the system. A custom-made animal holder was used to restrain the animal.
The base of the animal holder was lined with a thermal pad in order to keep the animal body
temperature between 36° and 38°C. Artificial tears were used frequently (~ every 5 minutes)
to keep the cornea hydrated. Vital signs, such as respiration rates, heart rates and body
temperature were monitored during the experiment.
6.5. Ocular Light Safety
Light safety is an important factor to consider in ocular imaging applications. In this study, the
OCT light power on the cornea was measured to be ~1.5 mW centered at 1060 nm which is
well within the ANSI safety limits for imaging human eye[415]. For the PARS system the
detection power was ~ 2-3 mW which is in the range allowed by ANSI limits for imaging
human eye. The PARS excitation pulse energy was in the range of 50-100 nJ. The ANSI
standard was used to calculate the maximum permissible exposure (MPE) for ocular imaging
[357], [415]. Based on the ANSI standard, the MPE for a single laser pulse can be measured
as MPESP=5.0 CE×10−7=1.33×10⁻⁴ J/cm2, where CE is a correction factor calculated as 267
according to the NA of the system. The repetitive pulse limit was then calculated as MPERP =
(ntotal)-0.25× MPESP= (5×10⁵)-0.25 ×1.33×10-4 J/cm2=5.12×10−6 J/cm2, where ntotal is the total
number of pulses during imaging (500,000 pixels in the image). The maximum permissible
single laser pulse energy in a typical human pupil of 7 mm[182] was then calculated as MPERP
× pupil area=1.93 μJ, which is 19 times higher than the pulse energy used in this experiment.

114
6.6. Results and Discussion
The imaging performance of the multimodal PARS-OCT system was evaluated by measuring
its spatial resolution and signal-to-noise ratio (SNR). These results are presented in Figure 6-2.
As mentioned earlier, PARS microscopy can be considered as a dual contrast imaging
modality, providing both absorption and scattering imaging contrasts. The resolutions of both
contrast mechanisms of PARS microscopy system were characterized by imaging 0.97 µm
diameter microbead solution as explained in [353]. The lateral resolution provided by PARS
absorption contrast with a 0.4 NA objective lens was measured to be ~ 1.5 ± 0.1 µm, as shown
in Figure 6-2A. The black line shows the raw data, and the red line represents the first order
Gaussian curve fit using the MATLAB curve fitting toolbox. As mentioned earlier, in this
chapter for the first time we showed the capability of PARS microscopy in providing scattering
contrast. Basically, before applying an excitation beam, the probe beam has a constant intensity
(effectively a DC signal). This constant light is due to the backscattering from the sample. This
light can be collected to construct an image that represents the scattering contrast in PARS
microscopy. The lateral resolution of PARS scattering contrast was characterized using
microbead solution to be ~ 3.1 ± 0.1 µm (Figure 6-2B). The difference between the absorption
and scattering contrast lateral resolution, is induced by the different spectral ranges and slight
variations in the beam size.
The OCT axial resolution was measured experimentally by using a mirror as the test sample.
The result is shown in Figure 6-2C. The red line point spread function (PSF) was measured
after the coarse hardware dispersion compensation unit in the reference arm. The black line
PSF in Figure 6-2C was measured after numerical dispersion compensation up to the 5th order

115
using a custom MATLAB based algorithm. The full width half maximum of the axial PSF was
10.1 µm in free space, which corresponds to 7.3 µm in biological tissue, assuming an average
refractive index of n = 1.38 and ignoring wavelength dependent local variation of the refractive
index[416]. The SNR roll-off of the SS-OCT system was characterized by imaging a mirror in
the sample arm at different positions. A neutral density filter with an optical density (OD) of
2.0 was used to reduce the signal intensity. The SNR in dB was calculated as the ratio of the
A-scan peak height to the standard deviation of the noise floor. The maximum SNR of 100 dB
was measured at ~ 100 µm away from the zero-delay line with incident power of ~ 1.5 mW.
The SNR roll-off in free space was measured to be ~ 1dB over a scanning range of 1.3 mm
Figure 6-2D).
Figure 6-2. Imaging performance of the multimodal PARS-OCT system. PSF of PARS absorption contrast mechanism characterized by imaging 0.97 µm diameter microbead solution (A). PSF of PARS scattering contrast (B). Axial PSF of SS-OCT measured in free space (C). Sensitivity roll-off of SS-OCT (D)

116
To evaluate the in-vivo capabilities of our multimodal imaging system, we chose to first image
mouse ear, a long-established animal model of cutaneous microcirculation that closely
resembles that of human skin[417]. Since the multimodal system is configured similarly to a
conventional optical microscope, it can be readily applied for studying other popular animal
models such as zebra fish [154]. Figure 6-3A shows white light photograph of the mouse ear.
The dotted rectangles indicate the corresponding PARS and OCT imaging regions. Figure 6-3B
demonstrates a volumetric rendering of nude mouse ear covering ~ 2.5 mm × 2.5 mm area
obtained in-vivo by SS-OCT system through a 0.26 NA microscope objective. The SS-OCT
system provided a microanatomy of the avascular structures in the ear tissue (Figure 6-3C).
From the OCT cross-sectional images we were able to estimate that the imaged region had a
thickness between 200 to 300 µm, which agreed well with previous reports[135]. The
orthogonal view of the skin (Figure 6-3D) clearly shows the structures of the ear due to the
system’s high resolution. The ear tissue consists of two skin layers separated by a layer of non-
scattering cartilage, whereas, the epidermis, the outmost layer of the skin, tends to be more
scattering. The junction between epidermis and dermis is clearly visible followed by the dermis
where hair follicles, follicle shafts, follicle bulbs, and small blood and lymph vessels are
located. The low-scattering regions embedded in the skin layers are most likely sebaceous
glands. However, blood vessels are not evident on the OCT images. In contrast, the PARS
absorption mechanism is good at locating vasculature with great details in the ear (Figure 6-3E-
G). For the mouse ear images the SNR, defined as the average of the maximum amplitude
projection pixels in a region of interest over the standard deviation of the noise, was quantified
as 36 ± 3 dB. The in-vivo resolution of the mouse ear images was measured as approximately
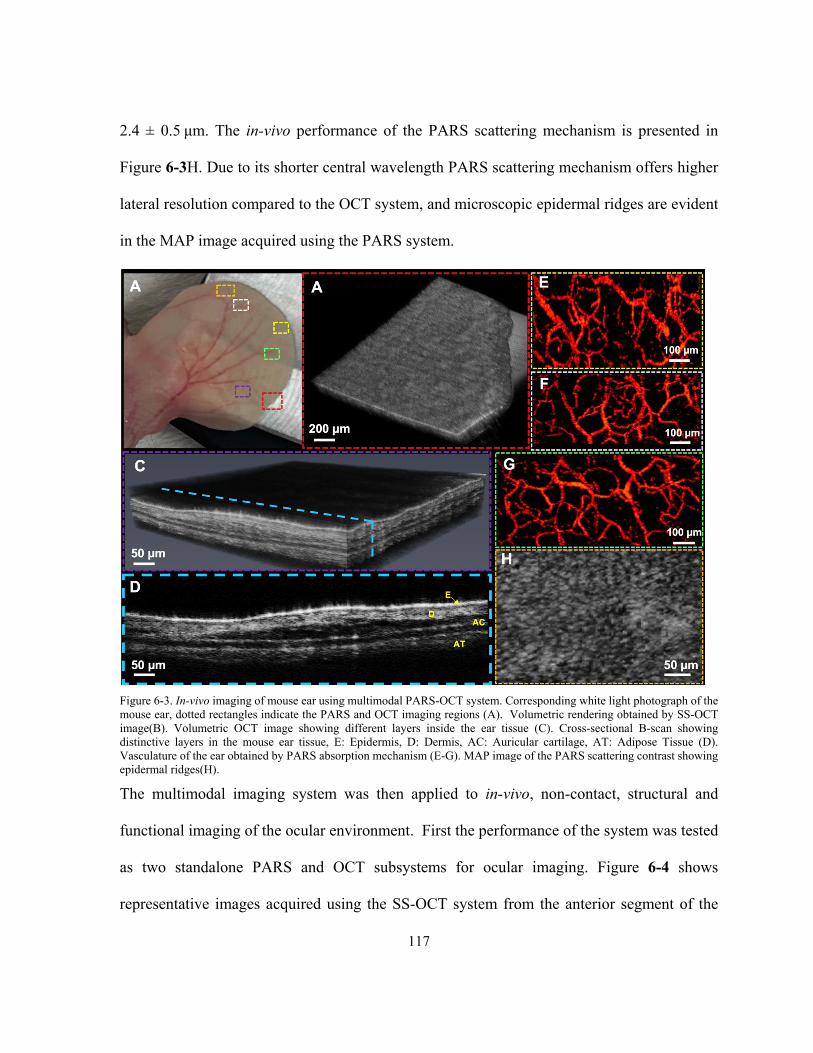
117
2.4 ± 0.5 μm. The in-vivo performance of the PARS scattering mechanism is presented in
Figure 6-3H. Due to its shorter central wavelength PARS scattering mechanism offers higher
lateral resolution compared to the OCT system, and microscopic epidermal ridges are evident
in the MAP image acquired using the PARS system.
Figure 6-3. In-vivo imaging of mouse ear using multimodal PARS-OCT system. Corresponding white light photograph of the mouse ear, dotted rectangles indicate the PARS and OCT imaging regions (A). Volumetric rendering obtained by SS-OCT image(B). Volumetric OCT image showing different layers inside the ear tissue (C). Cross-sectional B-scan showing distinctive layers in the mouse ear tissue, E: Epidermis, D: Dermis, AC: Auricular cartilage, AT: Adipose Tissue (D). Vasculature of the ear obtained by PARS absorption mechanism (E-G). MAP image of the PARS scattering contrast showing epidermal ridges(H).
The multimodal imaging system was then applied to in-vivo, non-contact, structural and
functional imaging of the ocular environment. First the performance of the system was tested
as two standalone PARS and OCT subsystems for ocular imaging. Figure 6-4 shows
representative images acquired using the SS-OCT system from the anterior segment of the

118
mouse eye. Figure 6-4 A demonstrates volumetric rendering of the entire eye, covering ~ 3.5
mm × 3.5 mm area obtained from albino mouse using a 0.26 NA microscope objective. Cross-
sectional B-scans are shown in Figure 6-4 B&C, the resolution of the SS-OCT system allows
for visualizing the anterior segment structures. To bring the lower part of the anterior segment
into focus and increase its signal strength, the B-scan in Figure 6-4C is flipped over the zero-
delay line thus, iris, crystalline lens, iridocorneal angle and sclera are clearly visible. In Figure
6-4B, cornea epithelium layer, Bowman’s membrane and stroma can be distinguished.
Figure 6-4. In-vivo imaging of ocular tissue using SS-OCT. Volumetric rendering acquired from the mouse eye (A). Cross-sectional OCT B-scan showing cornea and crystalline lens (B). Cross-sectional B-scan demonstrating cornea, sclera, crystalline lens, iris and iridocorneal angle (C).
The high-definition structural information provided by SS-OCT can be well complemented by
high resolution vasculature images obtained from non-contact PARS microscopy. The
potential of PARS microscopy for label-free, non-contact, in-vivo imaging of the iris and
retinal vasculature was previously reported by our group[381]. Figure 6-5A shows vasculature
of the eye imaged with PARS microscope. The image was acquired using a 0.26 NA objective
and the field of view was measured as ~ 2.5 mm × 2.5 mm. The boxes in this figure are not
highlighting the exact structure and are only used to show the approximate region imaged in

119
Figure 6-5B,D&E. Figure 6-5B-F shown smaller field-of-views and are acquired using 20X
microscope objective. The SNR of in-vivo eye images was measured ~ 35 ± 2 dB, and the in-
vivo resolution of the mouse eye images was measured as 4.3 ± 0.6 μm. The mismatch between
the in-vivo imaging resolution and the one measured using microbead solution can be explained
by the presence of chromatic aberration and involuntary motion of the eye.
In this study, we also applied PARS microscopy for non-contact, in-vivo imaging of melanin
which is another dominant light absorber in the ocular environment. In conventional
photoacoustic imaging techniques, for in-vivo experiments, photoacoustic signals must
propagate through various layers of the eye including the vitreous and lens which can
significantly attenuate high frequency photoacoustic signals[418]. However, in PARS
microscopy these pressure signals can be detected at the subsurface origin where the pressure
is maximum, making PARS microscopy a great candidate for in-vivo ophthalmic imaging
applications. Since the employed objective lens of the system has long enough working
distance (~ 30 mm) compared to the diameter of mouse eyeball (~3 mm), therefore imaging
the posterior segment of the eye was also possible using the current setup. The axial resolution
of the PARS system (~ 100 𝜇𝜇m), enables separating the signals of retinal blood vasculature
from the RPE melanin given the retina thickness of ~ 200 𝜇𝜇m[419]. The imaging depth of the
system was measured to be ~ 3 mm corresponding for the size of the mouse eyeball. Figure
6-5C demonstrates representative image acquired in-vivo from melanin content in RPE and
choroid layers through PARS microscopy. In Figure 6-5C, the honeycomb shaped RPE cells
can be appreciated, however involuntary eye motion has distorted part of the image.
Additionally, according to the Takekoshi et al. study[420], the RPE cells are more irregular in

120
albino mice compared to pigmented ones which can partially explain the irregularity present
in the images.
Capitalizing on the distinct difference in the absorption spectra of oxyhemoglobin HbO2 and
deoxyhemoglobin Hb, we used two excitation wavelengths (532 nm and 558 nm) to estimate
the concentration of HbO2 and Hb. These two wavelengths have been successfully applied for
measuring SO2 in previous reports[421]. The 532-nm wavelength is close to an isosbestic
point, and the 558-nm wavelength is more absorptive for Hb than HbO2[422]. Figure 6-5 D&E
show PARS images acquired from vasculature around the iris with 532 nm and 558 nm
wavelengths, respectively. The different absorption coefficients at the two wavelengths make
it possible to implement the linear SO2 model. Briefly, an inverse problem is solved to estimate
the relative concentrations of oxy- and deoxyhemoglobine on a per-pixel basis. The
photoacoustic response is approximately linear with respect to hemoglobin concentration, and
as such a regularized least squares algorithm can be used to solve for the relative
concentrations. Once the relative concentrations of oxy- and deoxyhemoglobin, [HbO2] and
[Hb] respectively, have been obtained, oxygen saturation (SO2) is estimated as [HbO2] [HbO2] + [Hb]
.
Blood oxygenation levels shown in Figure 6-5F are pseudocolored from red to blue in an
ascending order. The peripheral parts of the vessels have mainly lower oxygen saturation
compared to the central regions which can be explained by oxygen uptake in the capillaries
and delivery to the ocular cells[423]. The values measured in this study are an approximate
estimation of blood oxygenation, and to further analyze the accuracy of PARS SO2
measurement comprehensive phantom-based study using in-vitro blood will be conducted. In

121
addition, the method will be compared with other conventional techniques such as visible light
OCT and multiwavelength fundus photography.
Figure 6-5. In-vivo imaging of ocular tissue using PARS. Vasculature of the iris imaged from ~ 2.5 mm × 2.5 mm area (A) Vasculature around the iris imaged with PARS (B) In-vivo images of melanin content in RPE and choroid layers (C) Images acquired using multiwavelength PARS system at 532 nm (D) 558 nm (E) and the corresponding SO2 map (F).
Finally, the multimodal system is used for simultaneous imaging of the ocular tissue. Figure
6-6 shows representative images acquired using 0.4 NA microscope objective with the
multimodal system. Figure 6-5A depicts OCT volume rendering of a ~ 0.7 mm ×0.7 mm area.
In Figure 6-5B, cross-sectional B-Scan is presented, with iris tissue in focus. The focus of the
system is adjusted to be on the iris and yellow arrows show cross-section of the iris vasculature.
Figure 6-5C represents en-face OCT image generated from a single depth layer. The
corresponding PARS image acquired simultaneously is presented in Figure 6-5C, yellow spline
in both images represent a large vessel which appeared in both images. The overlayed image

122
is presented in Figure 6-5E. Involuntary eye and head motions have distorted parts of the image
in both PARS and OCT. Since the lateral resolution of the PARS subsystem is ~ 2X higher
than the OCT system, smaller vasculature can be seen in the PARS image which are not clear
in the OCT image. Additionally, in the current PARS setup, the detected signal is from all
depths withing the detection beam depth-of-focus [335], therefore, some of the vessels in the
PARS image which are not visible in the OCT en-face image, could be located in upper/lower
layers.
Figure 6-6. In-vivo, non-contact, simultaneous imaging of the ocular tissue using multimodal PARS-OCT system. Volume OCT rendering of the eye (A). OCT B-scan representing cross-section of the iris vasculature (yellow arrows) (B). en-face OCT image (C). vasculature of the iris imaged with the PARS subsystem over the dashed area (D). Overlayed PARS and OCT images (E).
There are several aspects that can be further studied in future works. We are planning to
conduct a comprehensive study to evaluate the performance and sensitivity of the proposed
multiwavelength PARS microscopy for accurate measurement of oxygen saturation and to
compare it with other conventional techniques. Other animal models including rats and rabbits
would be also employed to evaluate the performance of the system for imaging both anterior

123
and posterior parts of the eye. In addition, to improve the field-of-view of the system required
for imaging larger eyeballs we plan to employ customized scan lens. Furthermore, we are
planning to quantify ocular blood flow using Doppler-OCT and PARS microscopy. These
capabilities will provide us with local SO2 and blood flow that will lead to oxygen metabolic
rate which is a potential biomarker for major eye diseases[424].
6.7. Conclusions
In summary, for the first time, we presented in-vivo, non-contact, simultaneous, functional and
structural ophthalmic imaging using multiwavelength PARS microscopy combined with SS-
OCT. The presented multimodal system provides complementary imaging contrasts of optical
absorption and optical scattering. The capability of PARS microscopy for providing both
absorption and scattering imaging contrasts was presented for the first time. The non-contact
imaging ability offered by both systems makes them a favorable companion for clinical
ophthalmic imaging applications. The reported system is a major step toward non-invasive,
simultaneous, and accurate measurement of functional details in the ophthalmic tissue and can
assist ophthalmologists with the diagnostics and treatment of major eye diseases.

124
Chapter 7 In vivo functional and structural retina imaging using multimodal photoacoustic remote sensing microscopy and optical coherence
tomography
Notes and Acknowledgement
This chapter summarizes results from a study on the application multimodal PARS-OCT for in vivo, non-
contact, functional and structural retinal imaging. To make system compatible for retina imaging, the
microscope objective lens was removed. The optical power of the eye was used to focus the beams on the
back of the eye. Additionally, the 50:50 telecentric pair was replaced with a 50:30 telescope to reduce the
beam size. To our knowledge this is the first time a non-contact photoacoustic imaging technique is
employed for in vivo oxygen saturation measurement in the retina. The content of this chapter is submitted
to Scientific Reports journal:
Zohreh Hosseinaee, Nicholas Pellegrino, Nima Abbasi, Tara Amiri, James A. Tummon Simmons, Paul
Fieguth, Parsin Haji Reza " In vivo functional and structural retina imaging using multimodal photoacoustic
remote sensing microscopy and optical coherence tomography " (submitted to Scientific Reports)
Author contributions
Zohreh Hosseinaee studied and designed the modifications required for retina imaging, co-designed with
supervisor the SO2 accuracy experiments, conducted the experiments, processed the images, contributed to
the interpretation the data, prepared the figures, and wrote the main manuscript.
Nicholas Pellegrino developed and implemented the signal unmixing method.
Nima Abbasi constructed the software of the OCT system.
Tara Amiri assisted with conducting SO2 validation experiments.
Alexander James Tummon Simmons helped with designing the rat eye model phantom.
Paul Fieguth contributed to the interpretation of the results and provide guidance.
Parsin Haji Reza proposed the idea, conceived the study, contributed to the interpretation of all results, and
acted as the primary investigators.

125
7.1. Introduction
Functional imaging techniques enable measuring alterations in biological function including
metabolism, blood flow, regional chemical composition, and biochemical processes. These
methods promise to dramatically improve the ability to study in-situ biochemistry and disease
pathology[425]. In ophthalmology, functional changes most often precede structural changes
in major eye diseases. Detecting these alterations aids in understanding pathogenesis, early
diagnosis, and timely management of ophthalmic disorders. Retinal oxygen saturation (SO2)
and metabolic rate of oxygen consumption (MRO2) are among the most important biomarkers
characterizing the pathophysiological status of the posterior eye. Additionally, abnormal
retinal SO2 levels are believed to be involved in major eye diseases such as diabetic retinopathy
(DR) and age-related macular degeneration (AMD) [426]–[428]. Therefore, the precise
measurement of retinal oxygen saturation can be critical in investigating these blinding
diseases. Additionally, since the retinal arterioles are derived from the central nervous system.
Presuming the retinal arterial oxygen content is identical to the systemic circulation, retinal
oximetry may provide relevant information on oxygen delivery to the central nervous system.
Therefore, determination of oxygen saturation in the retinal vessels could enhance the
monitoring and treatment of critically ill patients in the intensive care units[429]. Oxygen-
sensitive electrodes and magnetic resonance imaging have been used to measure retinal SO2,
however these methods are usually restricted to terminal experiments and/or limited by low
spatial resolution[427], [430]. Phosphorescence lifetime imaging has been also applied to map
ocular oxygenation in animal models. Unfortunately, the need to inject fluorescent probes into
systematic circulation makes the method inappropriate for human practice[401].

126
Recently, researchers are focused on optical imaging-based methods to evaluate retinal
oxygenation. Optical imaging methods are capable of non-invasive SO2 measurement and they
can visualize the spatial distribution of oxygenation with high resolution in ocular
environment[365]. Optical measurement of SO2 is possible because the two forms of
hemoglobin, oxy- and deoxyhemoglobin (HbO2 and Hb), have distinct optical absorption
properties. Owing to the differences in the absorption spectra of oxy- and deoxyhemoglobin,
multi-wavelength imaging methods can assess the SO2 in retinal vessels[431]. Currently
available optical imaging modalities, such as fundus photography[432], scanning laser
ophthalmoscope (SLO) [433], and optical coherence tomography (OCT) [30], [73], [79] are
scattering based techniques and rely on the back-scattered light from the tissue to form an
image. Despite the great progress in these optical imaging techniques, however, they use
indirect methods to measure optical absorption. Therefore, the accuracy of these methods is
affected by factors such as variation in vessel size[434], pigmentation[435], multiple light
paths[419], and vessel wall thickness[431]. For example, in larger vessels the amount of
detected backscattered light is much greater than in small vessels[419], hence the calculation
of the optical density and SO2 values can be affected in clinical trials[436],[437]. Additionally,
it is shown that SO2 variations, induce changes in vessel diameter[431], which may further
alter the amount of backscattered light from the vessel and consequently the SO2
measurements.
Photoacoustic microscopy (PAM), has the unique capability to map the direct optical
absorption properties with high resolution in biological tissues[438]. The modality has the
potential to overcome the limitations of current ocular imaging methods in functional

127
studies[439]. It has been shown in simulation studies that by increasing the vessel diameter
and melanin concentration, the relative error of SO2 measurement in the scattering-based
method increases. However, the SO2 measurement was insensitive to these parameters in PAM
[436]. As these results suggest, PAM can be potentially a more accurate tool in quantifying
retinal SO2. However, the disadvantage of PAM in ophthalmic imaging arises from its need to
be in contact with the ocular tissue[440]. This physical contact may increase the risk of
infection and may cause patient discomfort. Additionally, it applies pressure to the eye and
introduces barriers to oxygen diffusion and alter physiological and pathophysiological balance
of ocular vasculature function[365]. Additionally, the use of ultrasonic signal detection scheme
poses challenges in combining the technology with other imaging modalities[440].
Recently our group at PhotoMedicine Labs for the first time demonstrated non-contact
photoacoustic imaging of the ocular tissue in murine eye using photoacoustic remote sensing
(PARS) microscopy[381]. Later we combined the technology with OCT and applied it for in-
vivo non-contact imaging of the anterior segment in the mouse eye[365]. We showed the
potential of the system for estimation oxygen saturation in the iris vasculature and visualizing
melanin content in the RPE. Building on the proven strength of PARS imaging, we further
developed the technology to address the aforementioned need in retinal oximetry. In this paper
we report our latest progress on in-vivo retinal imaging and present the capability of the
reported non-contact multimodal imaging system for visualizing structural and functional
information of the rodent retina. To our knowledge, this is the first time a non-contact
photoacoustic imaging technique is applied for measuring oxygen saturation in the living

128
retina. This reported work has the potential to advance the diagnosis and treatment of major
retinal disorders.
7.2. Method
7.2.1. System architecture
Figure 7-1 demonstrates the experimental setup of the multimodal PARS-OCT system.
Briefly, the output beam of a 532-nm, ytterbium-doped laser (IPG Photonics) with 1.5 ns pulse-
width is coupled to a single mode optical fiber. At the output end of the fiber multiwavelength
spectral peaks are generated through stimulated Raman scattering (SRS). SRS efficiency could
be affected by temperature and airflow changes, and random errors and drift in pulse
energy[375]. To improve the stability of the SRS peaks, the fiber was kept in a temperature-
controlled unit to isolate the airflow and the temperature[441]. The laser output was collimated
into 2.1 mm diameter, then merged with the PARS probe beam centered at 830 (SLD830S-
A20, Thorlabs) and the light of SS-OCT (center wavelength: 1060 nm; 100 nm spectral
bandwidth, 60 kHz swept rate, Thorlabs). A two-dimensional galvanometer scanned the
combined light beams (GVS012/M, Thorlabs) and relayed them to the eye through a telescopic
lens (50:30 ratio) system. The pivot point of the telecentric pair is properly positioned to relay
the galvanometer mirrors onto the entrance pupil of the eye, thereby minimizing vignetting. In
PARS, pressure waves induced by light absorption were detected by the probe beam. The back-
reflected light from the retina is directed towards the detection path. The quarter wave-plate
transforms the reflected circularly polarized light back to linearly polarized light, which
enables the polarized beam splitter to direct the back-reflected light towards the photodiode.
The photodiode outputs are connected to a high-speed digitizer (CSE1442, Gage Applied,

129
Lockport, IL, USA) that performs analog to digital signal conversion. In SS-OCT,
backscattered light from the retina first interfered with the reference arm beam, then detected
by the built-in dual balanced photodetector. The OCT signal was digitized by a high-speed
A/D card (ATS9351, Alazar Technologies Inc., Pointe-Claire, QC, Canada). The raw OCT
data was transmitted to a host computer through a PCI‐Express interface. OCT system control
was implemented in MATLAB platform to automatically control all the operations including
system calibration, galvo‐scanning, system synchronization, real‐time imaging preview and
data acquisition. The lateral resolutions of both PARS and SS-OCT were around ~ 6 𝜇𝜇m in
the retina with a slight difference caused by the different spectral ranges. The axial resolutions
of PARS and OCT were ~40 𝜇𝜇m and ~7.3 𝜇𝜇m, respectively.
Figure 7-1 Simplified schematic of the multimodal PARS-OCT system. DM: Dichroic mirror, QWP: Quarter wave plate, PBS: Polarized beamsplitter, LP: Long pass filter, GM: Galvanometer mirrors, L: Lens, C: Collimator, PD: Photodiode. DC: Dispersion compensation, P: Polarization controller.

130
7.2.2. Image reconstruction
All the PARS images shown in this manuscript were formed using a maximum amplitude
projection (MAP) of each A-scan for each pixel of the en-face image. The images were
produced by direct plotting from interpolated raw data using a Delaunay triangulation
interpolation algorithm[351]. All images and signal processing steps were performed in the
MATLAB environment.
For each OCT data set, 500 A‐lines were acquired for each B‐scan. For each A‐line trigger,
2448 sampling points were acquired to cover the resultant spectral interferogram, providing a
depth ranging distance of ∼ 12 mm. To extract the OCT complex data, reference spectrum was
subtracted from the interference signal to remove DC bias, then Fourier transform was
performed to extract the depth‐resolved OCT signal. Images were generated from the raw OCT
data and numerically dispersion compensated up to the 5th order with a custom MATLAB
algorithm[413]. No additional image post-processing was used for the OCT images presented
in this paper. The volumetric and en-face images were generated from the 3D data sets with
ImageJ[414].
7.2.3. Animal preparation
All the experimental procedures were carried out in conformity with the laboratory animal
protocol approved by the Research Ethics Committee at the University of Waterloo and
adhered to the ARVO statement for use of animals in ophthalmic and vision research. All
sections of this report adhere to the ARRIVE Guidelines for reporting animal research. Albino
rats (NU/NU, Charles River, MA, USA) were imaged to demonstrate the in vivo capabilities
of the system. A custom-made animal holder was used to restrain the animal. The base of the

131
animal holder was lined with a thermal pad to keep the animal body temperature between 36°
and 38°C. One drop 0.5% proparacaine hydrochloride (topical anaesthetic; Alcaine, Alcon,
Mississauga, ON, Canada) was applied to the eye, followed by one drop of 0.5% tropicamide
(pupillary dilator; Alcon). Artificial tears were used frequently (~ every 2 minutes) to keep the
cornea hydrated. Vital signs, such as respiration rates, heart rates and body temperature were
monitored during the experiment.
7.3. Results
7.3.1. Phantom imaging
Initial calibration of the PARS sub-system was achieved through imaging phantom eye models.
First, we used a realistic human eye model to test the feasibility of PARS on the retina. The
phantom is shown in Figure 7-2a, and it was modified from a commercial product (OEM-7,
Ocular Instruments, Bellevue, WA). The model consists of the cornea, crystalline lens, aqueous
humor, vitreous humor, and artificial retina. Strings of 7 𝜇𝜇𝜇𝜇 carbon fibers (CF) were placed at
the bottom of the model where the artificial retina is located (Figure 7-2b), and they were
imaged using the PARS system. Figure 7-2c shows representative PARS image acquired from
CF at the back of the human eye model and Figure 7-2d shows corresponding image acquired
using PARS scattering mechanism described in our previous report[365]. The PARS excitation
and PARS detection are co-aligned, so that the same fibers are in focus in both absorption and
scattering contrast images (white arrow).
Then a custom rat eye model was developed to help with the alignment of PARS excitation
and detection beam for in-vivo trials. The eye model consisted of a single achromatic lens (63-
817; Edmund Optics, Inc) with numerical aperture and curvature close to that of in the rat eye,

132
and a custom 3D printed plastic chamber. Strings of 7 𝜇𝜇𝜇𝜇 carbon fibers were located at a fix
distance from the lens (Figure 7-2e) corresponding to the focus of the lens and was
approximately equal to the path length of a rat eye [442]. Representative images acquired using
absorption and scattering contrast of PARS system are shown in Figure 7-2f-g. Similar to the
human eye model, the excitation and detection beams were co-aligned so that the same CF are
in focus in both images (white arrows).
Figure 7-2. Imaging phantom eye models for human and rat. (A) Human eye model consisting of the cornea, crystalline lens, aqueous humor, vitreous humor, and artificial retina. (B) Strings of 7 μm carbon fibers are placed at the bottom of the eye model. (C) CF image acquired with PARS system. (D) CF image acquired using PARS scattering mechanism. (E) Custom rat eye model consisting of a single achromatic lens and a 3D printed plastic chamber and strings of carbon fibers. (F-G) PARS absorption and scattering contrast images, respectively. PARS excitation and detection beams are co-aligned so that the same CF are in focus in both images (white arrows).
7.3.2. SO2 accuracy
The accuracy of the multiwavelength PARS sub-system in measuring oxygen saturation, was
investigated by performing in-vitro phantom experiments using freshly collected bovine blood
(Peel Sausage, Drayton, ON) with Sodium Citrated anticoagulant solution. Figure 7-3a shows
the experimental setup. The setup included a blood reservoir, tubing, oxygen tank, oxygen

133
meter access points and a syringe pump (NE-4000, New Era Pump Systems, Inc.). Different
levels of oxygen were delivered to the blood reservoir. Blood samples were drawn before and
after image acquisition for CO-oximetry measurements. A clinical grade CO-oximeter
(Avoximeter 4000, Instrumentation Laboratory LTD, Richmond Hill, Canada) served as a
reference device for measuring blood oxygen saturation.
Images of glass capillary with flowing blood (20.00 ml/min), are acquired at 532 nm and 558
nm excitation wavelength (Figure 7-3b-c, shown from the top view in the X-Y plane). The
depth of focus of the imaging system (~ 100 𝜇𝜇𝜇𝜇) was smaller compared to the size of the glass
capillary (~ 200 𝜇𝜇𝜇𝜇). Therefore, to collect adequate data points, the focus is adjusted to the
middle of the capillary which results in the black region in the center of the image (shadow
effect from the higher depths blood absorption). The oval shape of the capillary can be resulted
from the field curvature caused by the large field of view used to acquire signal from the full
capillary. To estimate the SO2, representative signal values were extracted from the two
images. It is assumed that the SO2 is homogeneous within the capillary and the mean values
are extracted. Compared to the per-pixel basis estimation, the mean value method offers higher
accuracy by reducing the impact of random errors. Here, rather than averaging the signal
intensity over the entire image, only a sub-region where the target is adequately in-focus is
used. The PARS signal intensity within the selected region is averaged to arrive at a
representative value associated with each excitation wavelength. The relative concentrations
of oxy- and deoxyhemoglobin and the corresponding SO2 value is then calculated. The PARS
measurements showed 40% and 60% oxygenation over 4 separate measurements, which were
found to be within 6% accuracy (measured as standard deviation of the acquired data) with the

134
oximeter results. The value is in the range reported by other photoacoustic imaging studies
[443], [444], and approaches the ISO-defined acceptable performance criterion for oximeters
(< 4%) [445]. To further improve the accuracy several factors can be considered in future
works. For example, nonlinear methods employing more than two optical wavelengths can be
implemented to compensate for the absorption saturation effect [446]. Furthermore, to reduce
the effect of laser pulse energy fluctuations, a more stable tunable source can be employed and
ultrashort switching time (a few hundred nanoseconds) among wavelengths can be applied.
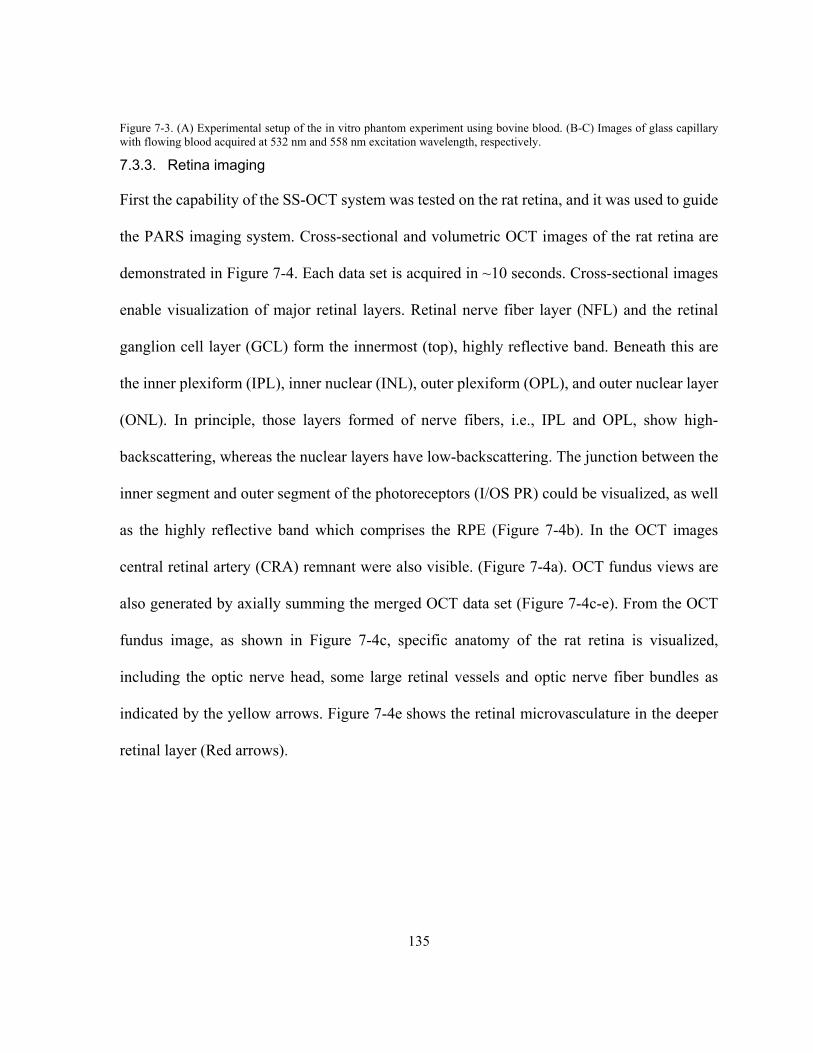
135
Figure 7-3. (A) Experimental setup of the in vitro phantom experiment using bovine blood. (B-C) Images of glass capillary with flowing blood acquired at 532 nm and 558 nm excitation wavelength, respectively.
7.3.3. Retina imaging
First the capability of the SS-OCT system was tested on the rat retina, and it was used to guide
the PARS imaging system. Cross-sectional and volumetric OCT images of the rat retina are
demonstrated in Figure 7-4. Each data set is acquired in ~10 seconds. Cross-sectional images
enable visualization of major retinal layers. Retinal nerve fiber layer (NFL) and the retinal
ganglion cell layer (GCL) form the innermost (top), highly reflective band. Beneath this are
the inner plexiform (IPL), inner nuclear (INL), outer plexiform (OPL), and outer nuclear layer
(ONL). In principle, those layers formed of nerve fibers, i.e., IPL and OPL, show high-
backscattering, whereas the nuclear layers have low-backscattering. The junction between the
inner segment and outer segment of the photoreceptors (I/OS PR) could be visualized, as well
as the highly reflective band which comprises the RPE (Figure 7-4b). In the OCT images
central retinal artery (CRA) remnant were also visible. (Figure 7-4a). OCT fundus views are
also generated by axially summing the merged OCT data set (Figure 7-4c-e). From the OCT
fundus image, as shown in Figure 7-4c, specific anatomy of the rat retina is visualized,
including the optic nerve head, some large retinal vessels and optic nerve fiber bundles as
indicated by the yellow arrows. Figure 7-4e shows the retinal microvasculature in the deeper
retinal layer (Red arrows).

136
Figure 7-4. Volumetric and cross-sectional OCT images. (A-B) cross-sectional images acquired in vivo from rat retina showing distinct layers of the retina. NFL: nerve fiber layer, IPL: inner plexiform layer, INL: inner nuclear layer, OPL: outer plexiform layer, ONL: Outer nuclear layer, IS/OS junction of inner segment and outer segment layer. RPE retinal pigment epithelium layer, CH: choroid, CRA: central retinal artery, ONH: optic nerve head. (C-E). OCT fundus images visualizing optic nerve head, large retinal vessels, optic nerve fiber bundle (yellow arrows), deeper retinal layer microvasculature (red arrows).
These high-definition structural information of the SS-OCT subsystem can be well
complemented by absorption based functional information obtained from PARS microscopy.
The axial resolution of the PARS system (~ 40 𝜇𝜇m), enables separating the signals of retinal
blood vasculature from the RPE melanin given the retina thickness of ~ 200 𝜇𝜇m[419]. As a
result, PARS signals generated from major vessels can be considered to be mainly from
hemoglobin. Figure 7-5a demonstrates fundus PARS image acquired from large vessels around
ONH from a 2.6 mm × 2.6 mm area. Smaller vessels are also visible in the image; however,
they are slightly distorted by motion artifacts. Figure 7-5b shows a zoomed-in section of one
of the vessels acquired from a similar area where the smaller vasculature is more visible. In
the previous report of PARS-OCT system[365], the PARS scattering contrast provided through
the PARS detection beam was introduced. In retinal imaging applications, this capability
allows the PARS microscope to be used the same way as fundus photography to image the

137
interior surface of the eye. Figure 7-5c, show a representative image acquired from the ONH
using scattering contrast of the PARS system. Since 830 nm beam used in the proposed
architecture, has different absorption coefficient for oxygenated and de-oxygenated
hemoglobin (higher absorption for oxygenated hemoglobin); arteries appear dark (red arrows),
and veins are light (blue arrows) in the image. Therefore, the scattering contrast of PARS
microscope, can be used similar to retinal oximeters to measure oxygen saturation in the
eye[447].
Relying on the proven strength of the PARS sub-system in providing functional information,
the amplitude of multiwavelength PARS signals were employed to estimate SO2 in every
vessel (Figure 7-5d). The calculation is done based on the molecular extinction coefficients of
HbO2 and Hb at 532 nm and 558 nm optical wavelengths. The rodent’s venous SO2 measured
with PARS was around 70% which agrees with previous reports [448]. Despite the good match
between measured SO2 by PARS and the preset SO2 for blood experiments, the in-vivo rodent
experiments conditions are different from those in in vitro experiments. For example, there are
eye movements during imaging, notable chromatic aberration from the eyeball, etc. Whether
such differences will affect the SO2 quantification or not require future validation [449], [450].
Additionally, it is reported that visual stimulus might increase the retinal vessel diameter and
blood flow, as well as affect the retinal SO2 due to retinal neurovascular coupling[451]. These
factors may affect the accuracy of the SO2 measurements, and they need further investigation
in the future. To our knowledge, this is the first report of optical absorption based retinal SO2
demonstrated in the fundus view. It is important to note that PARS can provide two
independent absorption contrast effect. First, is the absorption contrast provided by the

138
excitation laser. In this case, an isosbestic detection laser wavelength can be used to only
visualize the excitation effect. Finally, PARS detection laser can also act as the secondary
absorption contrast (Figure 7-5c.). The combination of these two effects, which is unique to
PARS microscopy, can lead to more accurate measurements compared to current methods.
This will be investigated further in the future.
Figure 7-5. (A) Fundus PARS image acquired from large vessels around ONH from a 2.6 mm × 2.6 mm area. (B) zoomed-in section of one of the vessels acquired from a similar area with smaller vasculature. (C) Fundus image acquired using scattering contrast of PARS system. (D) Oxygen saturation map in the retina obtained using multiwavelength PARS imaging.

139
7.3.4. Ocular light Safety
Using ANSI standards, the ocular light safety for the developed multimodal PARS-OCT
system can be calculated[357], [415]. First, the safety of PARS excitation laser is tested using
the three ANSI rules: single pulse limit, average power limit, and multiple pulse limit. The
pulse duration for the IPG laser used in this study is 𝑡𝑡1 = 1.5 𝑛𝑛𝑛𝑛. In the imaging setup,
assuming that the collimated laser beam after being focused by the eye has a maximum
diameter of 20 𝜇𝜇𝜇𝜇 on the retina, the angular subtense of the source:
𝜶𝜶 = 𝟐𝟐𝟐𝟐 𝝁𝝁𝝁𝝁𝟏𝟏𝟏𝟏 𝝁𝝁𝝁𝝁
= 𝟏𝟏.𝟐𝟐 𝝁𝝁𝒎𝒎𝒎𝒎𝒎𝒎 < 𝜶𝜶𝝁𝝁𝒎𝒎𝒎𝒎 = 𝟏𝟏.𝟓𝟓 𝝁𝝁𝒎𝒎𝒎𝒎𝒎𝒎
Where 17 mm is the focal length of human eye. Therefore, the light source can be considered
as a point source.
Rule 1 Since the pulse duration of the laser is 1.5 𝑛𝑛𝑛𝑛 only the thermal effect needs to be
considered and the maximum permissible exposure (MPE) will be:
𝑀𝑀𝑀𝑀𝑀𝑀𝑆𝑆𝑆𝑆 = 5 × 10⁻⁷ 𝐽𝐽/𝑐𝑐𝜇𝜇2
Rule 2 Since the exposure time (~ 10 𝑛𝑛) is longer than the 0.7 𝑛𝑛 and the wavelength is between
400 and 600 nm, dual limits due to both thermal and photochemical effects apply here. For the
photochemical effect:
𝑀𝑀𝑀𝑀𝑀𝑀𝑝𝑝ℎ = 4.36 × 10⁻² 𝐽𝐽/𝑐𝑐𝜇𝜇2
For the thermal effect:
𝑀𝑀𝑀𝑀𝑀𝑀𝑡𝑡ℎ = 1.01 × 10⁻²𝐽𝐽/𝑐𝑐𝜇𝜇2
Rule 3 tests whether an exposure by a long pulse of duration 𝑛𝑛𝑡𝑡1is safe. Within a laser spot of
20 𝜇𝜇𝜇𝜇, there are at most two overlapping laser pulses (n = 2).

140
𝑀𝑀𝑀𝑀𝑀𝑀𝑟𝑟𝑝𝑝 = 𝑛𝑛−0.25 × 𝑀𝑀𝑀𝑀𝑀𝑀𝑠𝑠𝑝𝑝 = 0.84 × 5 × 10−7 = 4.2 × 10⁻⁷𝐽𝐽/𝑐𝑐𝜇𝜇2
Rule 3 is the most conservative of the three. Considering a pupil diameter of 𝐷𝐷 = 0.7 𝑐𝑐𝜇𝜇 MPE
for a single pulse would be equal to 𝑀𝑀𝑀𝑀𝑀𝑀𝑟𝑟𝑆𝑆 × �𝐷𝐷2�2
× 𝜋𝜋 ≈ 160 𝑛𝑛𝐽𝐽. The acquired value is in
correspondence to the values reported by other groups[14], [452]. In this manuscript the energy
of a single pulse is < 150 𝑛𝑛𝐽𝐽 which is below the allowed pulse exposure limit.
For 𝜆𝜆=380 – 1400 nm, a spectrally flat limit was recently introduced that recommends MP
corneal irradiances of 25t−0.75 W/cm2 for 𝑡𝑡 < 10 𝑛𝑛, (𝑡𝑡 = 10, 𝑀𝑀𝑀𝑀 = 4.4 W/cm2), and 4.0
W/cm2 for 𝑡𝑡 > 10𝑛𝑛[453]. Based on the proposed limit the OCT light power on the cornea (
~1.5 𝜇𝜇𝑚𝑚) and the PARS detection power (~ 2 − 3 𝜇𝜇𝑚𝑚) are well within the ANSI limits.
There are several aspects of the proposed system that can be further refined for future studies.
The current PARS-OCT system was developed using visible excitation wavelength for
targeting oxygenated and de-oxygenated hemoglobin in the blood. However, the laser safety
threshold for ocular imaging is stricter in the visible than in the NIR spectral range.
Additionally, the retina is sensitive to the visible light which poses challenges to eye fixation
during imaging. Therefore, in future studies, the NIR spectral range can be examined as the
excitation wavelength to overcome these issues. Additionally, the oxygen saturation
measurement accuracy can be improved by using a more stable tunable light source and using
nonlinear methods. In future, the scanning pattern of the SS-OCT system can be modified to
enable Doppler OCT and OCT angiography and provide blood flow measurement and
vasculature map, respectively. This information can be further combined with the non-contact
oxygen saturation measurements of PARS to measure metabolic rate of oxygen consumption
in the ocular environment in both small and large vessels. The system can be further applied

141
for evaluating the effects of visually evoked stimulus and how they could change this
functional information. It can also be used in longitudinal studies on larger animal models like
rabbit and monkeys with size of eyeballs closer to that of humans. Different eye disease models
(such as Glaucoma, and DR) can be developed in these animals and the efficacy of the system
be evaluated in diagnosis and monitoring of them.
7.4. Conclusion
In conclusion, for the first time, a non-contact photoacoustic imaging technique was applied
for in-vivo measuring of retinal SO2. It was also the first time multimodal in-vivo imaging of
retina was demonstrated using multiwavelength PARS-OCT. The detailed structural
information of OCT is well complemented with absorption-based functional information of
PARS imaging. The proposed method can be a measure step toward non-invasive measurement
of metabolic rate of oxygen consumption in retina, and it can further improve the diagnosis
and treatment of important eye diseases.

142
Chapter 8 Ocular light safety
The invention and development of ophthalmic imaging instruments have increased our
understanding of eye diseases and greatly improved the quality of treatments. Light safety is a
major factor to consider when employing these devices. Studies to address safety concerns
have been widely published over the past 40 years [357], [415]. The American National
Standard Institute’s (ANSI) Standard is among several safety standards that provide guidelines
for the safe use of lasers in ophthalmic applications. Maximum permissible exposures (MPE)
for different conditions in the ANSI Standard are derived on the foundation of animal (monkey,
rabbit) testing to determine damage thresholds [453]. The MPE for a light source striking the
retina in ANSI Standard is defined as the “level of laser radiation to which an unprotected
person may be exposed without adverse biological changes in the eye”[412].
This chapter will discuss ocular safety of the developed multimodal PARS-OCT system and
discuss important parameters that need to be considered for making the technology safe for
clinical trials.
8.1. DAMAGE MECHANISMS AND EXPOSURE LIMITS
Retinal damage from light exposure occurs mainly from three main mechanisms:
a. Thermal damage is due to protein denaturation induced by temperature increases
secondary to light absorption by melanin in the RPE. This form of damage can occur
when the retina is exposed to laser light with a wavelength between 400 – 1400 nm for
a duration longer than 20 μs [454]. For exposure durations longer than 20 𝜇𝜇s, heat can
dissipate out of the exposed area and the energy needed to produce retinal damage

143
increases with less than a linear dependence on exposure duration[455], [456]. For
exposure durations shorter than ~20 𝜇𝜇s, heat diffusion can be neglected, and the energy
needed to produce retinal damage is independent of time.
b. Photochemical damage occurs at short visible wavelengths (400 – 600 nm), and it
happens for exposure duration longer than ~ 1 second. It is associated with photo-
oxidative damage to photoreceptors and lipofuscin pigments in the RPE. The energy
needed to cause photochemical damage is independent of exposure duration[457].
c. Thermoacoustic damage occurs for pulses shorter than ~1 𝑛𝑛𝑛𝑛 and is associated with
various nonlinear mechanisms (laser-induced breakdown, self-focusing, etc.)[458].
Here less amount of energy is needed to cause retinal damage. Since the pulse duration
and imaging time of our multimodal system is greater than 1 𝑛𝑛𝑛𝑛 we do not consider it
as a damage mechanism for our system.
Retinal irradiances or retinal radiant energies causing threshold retinal damage are converted
into exposure limits that are generally expressed as maximum permissible (MP) radiant
exposure (𝐽𝐽/𝑐𝑐𝜇𝜇2) for laser beams overfilling the pupil of the eye, which is the most common
situation for accidental laser exposure.
8.2. Assumptions leading to exposure limits
The Standard’s conversions of damage thresholds to exposure limits were based on several
important assumptions as below:
8.2.1. Safety Factor and applicability
The exposure limits are set to be at least 10 times lower than the damage “threshold”
expressed as a 50% probability of a minimum visible lesion. The Standard is derived for

144
healthy, alert individuals in occupational settings. Alert subjects exposed to bright light will
either close their eyes or look away. This aversion reflex is not included in the Standard but
can be accounted for by selecting the exposure duration of 0.25 𝑛𝑛 for wavelengths in the 400–
700 nm range[357].
8.2.2. Diameter of the Pupil
The Standard was developed under the assumption that the incident radiation overfills
the natural pupil (iris) of the eye and that the pupil would constrict under bright lights in the
visible spectrum. The duration of this pupil reflex is 0.2 − 1.0 𝑛𝑛. Therefore, the pupil was
assumed to be 7 mm in diameter (maximum natural dilation) for exposures shorter than
0.2– 1.0 𝑛𝑛. For longer exposures in the visible range, the pupil was assumed to constrict in
response to bright light to a diameter of 3 mm. This protective effect of pupil constriction is
included in the Standard[354].
8.2.3. Minimal Retinal Dimension
An underlying assumption in the Standard is that, for exposure by a collimated beam
and durations less than ~1 s, the minimal retinal image is effectively ~25 𝜇𝜇m in diameter (visual
angle of 1.5 mrad). Although the point-spread function of the eye measured at half power is
4–6 𝜇𝜇m wide[459], the sharp central peak is surrounded by a larger area containing substantial
energy from small-angle forward scattering[459]. The resulting “thermal image” is ~25 𝜇𝜇m,
and the smallest observed thermal lesions were also of that order[460]. For exposure duration
longer than ~1 s, eye movements redistribute the light over larger retinal areas, decreasing the
retinal irradiance and thus the risk for injury compared with the instantaneous profile 25 𝜇𝜇m
in diameter[461]. For exposures of 100 𝑛𝑛, the Standard uses a diameter of ~190 𝜇𝜇m (visual

145
angle of 11 mrad) [462]. For even longer exposure durations, when task-determined eye and
head movements dominate, the dimension of exposed retina is assumed to be ~1.7 mm in
diameter (visual angle of 100 mrad or 5°).
8.2.4. Ocular Media
The retina is partially protected by absorption of light in the ocular media (cornea,
crystalline lens, and vitreous). The crystalline lens absorbs light in 𝜆𝜆 < 400 nm, but the cornea
and vitreous absorb for 𝜆𝜆 < 300 nm, allowing harmful radiation (UV) to reach the retina if the
lens is removed. Absorption by the ocular media of young adult subjects was incorporated into
the Standard as well[463].
8.3. Concise presentation of the ANSI standard
The ANSI Standard gives the MP radiant exposure at the cornea (𝑀𝑀𝑀𝑀𝑀𝑀𝐶𝐶 𝑖𝑖𝑛𝑛 𝐽𝐽/𝑐𝑐𝜇𝜇2) (Table 8-1)
for both small and extended sources. The MP levels for thermal and photochemical damage
are dual limits for 𝜆𝜆 ≤ 600 𝑛𝑛𝜇𝜇 and 𝑡𝑡 ≥ 0.7 𝑛𝑛, and the smaller MP level is used. To use Table
8-1, first we must identify the cell that corresponds to our application. Then find the relevant
parameters from Table 8-2 and calculate 𝑀𝑀𝑀𝑀𝑀𝑀𝐶𝐶. The 𝑀𝑀𝑀𝑀𝑀𝑀𝐶𝐶 is the MP radiant exposure at the
cornea for light overfilling the pupil.

146
Table 8-1 Maximum permissible radiant exposure MPHc (in J/cm2) at the cornea (Overfilling pupil) reproduced with permission from [357] © The Optical Society.
Table 8-2 Parameters to be used in Tables 8-1 and 8-3 reproduced with permission from [357] © The Optical Society.

147
8.4. ANSI standard for ophthalmic applications
Optical devices that image the retina or perform diagnostic tests often bring light into the eye
through a small area of the natural pupil (Maxwellian illumination). The exposure limits for
ophthalmic applications in intrapupillary are expressed in radiant power 𝜙𝜙 (watts). Division
by the exposure duration, 𝑡𝑡, converts energy to power. Table 8-3 together with the parameters
defined in Table 8-2 gives the intrapupillary radiant power for light entering the pupil of the
eye. The 𝑀𝑀𝑀𝑀𝜙𝜙’s in Table 8-3 were obtained by converting the 𝑀𝑀𝑀𝑀𝐻𝐻𝑐𝑐’s of Table 8-1 using the
area of 0.7 cm pupil and the pupil factor[357].
Table 8-3 Maximum permissible radiant power MP𝝓𝝓 (in watts) entering the natural or diluted pupil reproduced with permission from [357] © The Optical Society.
Table 8-3 can be used for most ophthalmic applications. If the wavelength (𝜆𝜆) and visual angle
(𝛼𝛼) of the retinal exposure duration (𝑡𝑡) are known, then Table 8-3 shows which equations of

148
the thermal and photochemical limits are relevant. After eventual testing of the dual limits, one
obtains the MP radiant power (in watts), for light entering the pupil of the eye.
The standards assume that the exposed retinal area is circular, if this is not the case, then an
equivalent visual angle 𝛼𝛼𝑒𝑒𝑒𝑒, is defined. The 𝑀𝑀𝑀𝑀𝜙𝜙[𝛼𝛼 = 𝛼𝛼𝑒𝑒𝑒𝑒] is the limiting power for an area
corresponding to 𝛼𝛼𝑒𝑒𝑒𝑒. Where the 𝐶𝐶𝐸𝐸′ is defined as an effective scaling factor for use in
computation of the 𝑀𝑀𝑀𝑀𝜙𝜙 for noncircular sources:
𝑪𝑪𝑬𝑬′ = 𝑪𝑪𝑬𝑬[𝜶𝜶 = 𝜶𝜶𝒆𝒆𝒆𝒆] × 𝑨𝑨𝑨𝑨𝒆𝒆𝑨𝑨 𝒐𝒐𝒐𝒐 𝒏𝒏𝒐𝒐𝒏𝒏𝒏𝒏𝒏𝒏𝑨𝑨𝒏𝒏𝒏𝒏𝒏𝒏𝑨𝑨𝑨𝑨 𝒐𝒐𝒏𝒏𝒆𝒆𝒏𝒏𝒇𝒇𝑨𝑨𝑨𝑨𝒆𝒆𝑨𝑨 𝒐𝒐𝒐𝒐 𝒏𝒏𝒏𝒏𝑨𝑨𝒏𝒏𝒏𝒏𝒆𝒆 𝒔𝒔𝒏𝒏𝒔𝒔𝒔𝒔𝒆𝒆𝒏𝒏𝒇𝒇𝒆𝒆𝒇𝒇 𝒔𝒔𝒃𝒃 𝜶𝜶𝒆𝒆𝒆𝒆
Equation 8-1
Table 8-4 represents 𝐶𝐶𝐸𝐸′ for rectangles of various dimensions as well as for squares and slits.
Table 8-4 Effective 𝑪𝑪𝑬𝑬′ used in evaluating the 𝑴𝑴𝑴𝑴𝝓𝝓 for exposures in rectangular areas

149
8.5. Exposure by repetitive pulses
The material above describes safety limits for single-pulse exposures. The Standard also
addresses the exposure by complex trains of pulses. Here we describe the case of evenly spaced
pulses, each with the same energy. Such a pulse train is described by its pulse repetition
frequency 𝐹𝐹, its total duration 𝑇𝑇, the number 𝑛𝑛 of pulses 𝑛𝑛 = 𝐹𝐹𝑇𝑇, the duration t1 and peak
radiant power 𝜙𝜙1 of a single pulse, the energy per pulse Q1 (Q1=𝜙𝜙1t1), and the duty factor 𝛿𝛿 =
𝐹𝐹𝑡𝑡1. The ANSI Standard applies three “rules” that define three separate MP exposures (Table
8-5) and the rule that offers the highest protection is used. These MP levels are expressed in
the same units so they can be easily compared with one another.
The first rule tests whether the radiant exposure of a single pulse (duration: t1) exceeds the
MPHc[t1] at pulse duration t1. In the more general form, it tests the safety of the brightest pulse
in a train of uneven pulses, but this limit can also be applied for equally spaced equienergy
pulses.
The second rule protects against average-power heat buildup in thermal injury and cumulative
injury from the photochemical damage mechanism. It tests the safety of a continuous-wave
(CW) equivalent exposure of duration 𝑇𝑇 with a constant-power radiant power. The MP𝜙𝜙av is
then MP𝜙𝜙[T], and the corresponding radiant exposure per pulse is (1/𝑛𝑛) MPHc[T]. Both
thermal and photochemical limits must be tested separately.
The third rule protects against subthreshold pulse cumulative thermal injury and applies only
to the thermal limits. It essentially tests whether the exposure by a long pulse of duration 𝑛𝑛𝑡𝑡1
is safe. The Standard formulation of rule 3 is as follows: “The exposure of any single pulse

150
within the group of pulses shall not exceed the single-pulse MPE (for t1 > tmin) multiplied by
n−0.25.
Table 8-5 repetitive pulses (Evenly spaced pulsed of equal energy/pulse)
Using these ANSI rules, the ocular light safety for the developed multimodal PARS-OCT
system can be calculated. First, we start with the PARS excitation laser centered at 532 𝑛𝑛𝑛𝑛.
The pulse duration for the IPG laser used in this study is 𝑡𝑡1 = 1.5 𝑛𝑛𝑛𝑛. In our imaging setup,
assuming that the collimated laser beam after being focused by the eye has a diameter of 20
μm on the retina, the angular subtense of the source:
𝜶𝜶 = 𝟐𝟐𝟐𝟐 𝝁𝝁𝝁𝝁𝟏𝟏𝟏𝟏 𝝁𝝁𝝁𝝁
= 𝟏𝟏.𝟐𝟐 𝝁𝝁𝑨𝑨𝑨𝑨𝒇𝒇 < 𝜶𝜶𝝁𝝁𝒏𝒏𝒏𝒏 = 𝟏𝟏.𝟓𝟓 𝝁𝝁𝑨𝑨𝑨𝑨𝒇𝒇
Where 17 mm is the focal length of human eye. Therefore, the light source can be considered
as a point source.
Rule 1 The MPE for single pulse exposure can be obtained based on Table 8-1. Since the pulse
duration of the laser is 1.5 𝑛𝑛𝑛𝑛 we only need to consider the thermal effect and the MP will be
equal to:
𝑀𝑀𝑀𝑀𝑀𝑀𝑆𝑆𝑆𝑆 = 5 × 10⁻⁷𝐶𝐶𝑇𝑇𝐶𝐶𝐸𝐸𝐶𝐶𝐽𝐽 = 5 × 10⁻⁷ 𝐽𝐽/𝑐𝑐𝑛𝑛2

151
Rule 2 For each PARS image, 600,000 pulses with PRR of 60 kHz are recorded. Since the
exposure time (~ 10 𝑛𝑛) is longer than the 0.7 𝑛𝑛 and the wavelength is between 400 and 600
nm, dual limits due to both thermal and photochemical effects apply here. For the
photochemical effect:
𝑀𝑀𝑀𝑀𝑀𝑀𝑝𝑝ℎ = 1 × 10⁻⁴ × 𝐶𝐶𝐵𝐵 × 𝑡𝑡 = 10−4 × 43.65 × 10 = 4.36 × 10⁻² 𝐽𝐽/𝑐𝑐𝑛𝑛2
Where 𝐶𝐶𝐵𝐵 = 100.020(𝜆𝜆−450) = 43.65.
For the thermal effect:
𝑀𝑀𝑀𝑀𝑀𝑀𝑡𝑡ℎ = 1.8 × 10⁻³ × 𝐶𝐶𝑇𝑇 × 𝐶𝐶𝐸𝐸 × 𝑡𝑡0.75 = 1.8 × 10−3 × 1 × 5.62 = 1.01 × 10⁻²𝐽𝐽/𝑐𝑐𝑛𝑛2
Rule 3 tests whether an exposure by a long pulse of duration 𝑛𝑛𝑡𝑡1is safe. Within a laser spot of
20 𝜇𝜇𝑛𝑛, there are at most two overlapping laser pulses (n = 2).
𝑀𝑀𝑀𝑀𝑀𝑀𝑟𝑟𝑝𝑝 = 𝑛𝑛−0.25 × 𝑀𝑀𝑀𝑀𝑀𝑀𝑠𝑠𝑝𝑝 = 0.84 × 5 × 10−7 = 4.2 × 10⁻⁷𝐽𝐽/𝑐𝑐𝑛𝑛2
Rule 3 is the most conservative of the three. Considering a pupil diameter of 𝐷𝐷 = 0.7 𝑐𝑐𝑛𝑛 MPE
for a single pulse would be equal to 𝑀𝑀𝑀𝑀𝑀𝑀𝑟𝑟𝑆𝑆 × �𝐷𝐷2�2
× 𝜋𝜋 ≈ 160 𝑛𝑛𝐽𝐽. The acquired value is in
correspondence to the values reported by other groups[14], [452]. In our imaging applications
the energy of a single pulse is < 150 𝑛𝑛𝐽𝐽 which is below the allowed pulse exposure limit.
8.6. ANSI standard for scanning beam
To acquire one PARS image, the beam needs to be scanned over the field of view. Here, we
show the safety calculation for the scanning beam. We can consider the 𝑀𝑀𝑀𝑀𝜙𝜙𝐵𝐵 beam power,
the average power deposited over the region, for 𝐹𝐹 frames/s, each frame having 𝑅𝑅 horizontal
lines (𝑅𝑅 = 512). The retinal field is square (visual angle of 𝛼𝛼𝐹𝐹), and we have a total exposure
duration of 𝑇𝑇 = 10 𝑛𝑛. Here we consider the 𝑀𝑀𝑀𝑀𝜙𝜙𝐵𝐵 for fields ranging from a visual angle (𝛼𝛼𝐹𝐹)

152
from 1°to 50° (𝛼𝛼𝐹𝐹 = 17.5 𝑡𝑡𝑡𝑡 875 𝑛𝑛𝑚𝑚𝑚𝑚𝑚𝑚), and 532 𝑛𝑛𝑛𝑛 wavelengths. These values are selected
based on the conventional values used in our system. The visual scanning angle used in our
study is between 15°to 30°(262 𝑡𝑡𝑡𝑡 525 𝑛𝑛𝑚𝑚𝑚𝑚𝑚𝑚), and the frame rates is usually between 2-5 Hz.
For the thermal limit, the equivalent continuous wavelength (CW) beam uniformly distributed
over the entire field 𝑀𝑀𝑀𝑀𝜙𝜙𝐵𝐵 (in watts), for 𝛼𝛼𝐹𝐹 < 100 𝑛𝑛𝑚𝑚𝑚𝑚𝑚𝑚, 𝑇𝑇 = 10 𝑛𝑛, and the 𝐶𝐶𝐸𝐸′
corresponding to a square filed, is given by:
𝑀𝑀𝑀𝑀𝜙𝜙𝐵𝐵,𝐶𝐶𝐶𝐶,𝑡𝑡ℎ = �6.93 × 10⁻⁴𝐶𝐶𝑇𝑇 �4𝛼𝛼𝐹𝐹𝜋𝜋𝛼𝛼𝑚𝑚𝑚𝑚𝑚𝑚
�𝑀𝑀10−1𝑡𝑡−0.25�
For example, in strict case of 1° (𝛼𝛼𝐹𝐹 = 17.5 × 1 = 17.5 𝑛𝑛𝑚𝑚𝑚𝑚𝑚𝑚) the value will become
~ 1.064 𝑛𝑛𝑚𝑚.
and for 𝛼𝛼𝐹𝐹 ≥ 100 𝑛𝑛𝑚𝑚𝑚𝑚𝑚𝑚:
𝑀𝑀𝑀𝑀𝜙𝜙𝐵𝐵,𝐶𝐶𝐶𝐶,𝑡𝑡ℎ = �6.93 × 10⁻⁴𝐶𝐶𝑇𝑇 �4𝛼𝛼𝐹𝐹2
𝜋𝜋𝛼𝛼𝑚𝑚𝑚𝑚𝑚𝑚𝛼𝛼𝑚𝑚𝑚𝑚𝑚𝑚�𝑀𝑀10−1𝑡𝑡−0.25�
Similarly, in a 50° (𝛼𝛼𝐹𝐹 = 17.5 × 50 = 875 𝑛𝑛𝑚𝑚𝑚𝑚𝑚𝑚) it will be ~ 46 𝑛𝑛𝑚𝑚.
The photochemical limit (in watts) for the CW beam is given by:
𝑀𝑀𝑀𝑀𝜙𝜙𝐵𝐵,𝐶𝐶𝐶𝐶,𝑝𝑝ℎ = �5.56 × 10⁻⁶𝐶𝐶𝐵𝐵4𝜋𝜋𝛼𝛼𝐹𝐹2𝑡𝑡−1�
Similarly, for the 𝛼𝛼𝐹𝐹 = 1°, the limit will become 2.36 𝑛𝑛𝑚𝑚, and for 𝛼𝛼𝐹𝐹 = 50° ~6 𝑚𝑚𝑚𝑚𝑡𝑡𝑡𝑡𝑛𝑛.
Figure 8-1 and Figure 8-2 represent MP (in watts) for both photochemical and thermal damages
in a CW beam simulation, respectively. The plots show the values for 3 different PARS
excitation wavelengths as a function of the visual angle.

153
Figure 8-1 Maximum permissible beam power (in watts) for CW photochemical damage and 3 different PARS excitation wavelengths as a function of the visual angle.
Figure 8-2 Maximum permissible beam power (in watts) for CW beam thermal damage and 3 different PARS excitation wavelengths as a function of the visual angle.
In general, the safety value of system is highly dependent on the visual field angle, wavelength,
and duration of the imaging and will require careful consideration of the exposure limits. In

154
our simulations we have calculated the safety values for visible and NIR wavelengths. The
laser safety threshold for ocular imaging is stricter in the visible spectrum than in the NIR
spectral range. By moving to NIR region (𝜆𝜆 > 700 𝑛𝑛𝑛𝑛) , the absorption coefficients of blood
will drop an order of magnitude[464], however, it would be possible to use higher amount of
energy. In [465], 795 nm wavelength is applied for in vivo photoacoustic imaging of blood in
human skin. Additionally, for ophthalmic imaging, since retina is sensitive to the visible light
eye motion will cause challenges in eye fixations which will be mitigated by using NIR
wavelengths [466].
8.7. Additional safety issues in the multimodal imaging system
The instrumentation for corneal and crystalline lens examination, often use high radiant
exposures or irradiances in the anterior segment of the eye. Since the Standard was developed
for light overfilling the pupil, it includes protection for light damage in the anterior segment in
the visible spectrum, and the Standard extends to the UV and the IR, where damage is likely
to occur. For 𝜆𝜆=380–1400 nm, a spectrally flat limit was recently introduced that recommends
MP corneal irradiances of 25t−0.75 W/cm2 for 𝑡𝑡 < 10 𝑛𝑛, and 4.0 W/cm2 for 𝑡𝑡 > 10𝑛𝑛[453].
Based on the proposed limit the OCT light power on the cornea ( ~1.5 𝑛𝑛𝑚𝑚) and the PARS
detection power (~ 2 − 3 𝑛𝑛𝑚𝑚) are well within the ANSI limits.

155
Chapter 9 Conclusion and future work
In this thesis dissertation several improvements over previous functional and structural
ophthalmic imaging systems are reported. First, here, for the first time we applied a non-contact
photoacoustic microscopy technique for imaging ocular tissue. Using PARS microscopy, we
showed in vivo images acquired from both anterior and posterior segments of the murine eye.
To make this possible, we made significant modifications to conventional PARS microscope.
These modifications included employing, eye-friendly 830 nm detection wavelength, focusing
optics and live feedback during in vivo imaging. The 830 nm probe beam improved PARS
signal detection in the ocular environment by having lower absorption in water. Additionally,
it reduced the amount of chromatic aberration in the system by having close spectral bandwidth
to the 532 nm excitation beam. The PARS microscope used in this thesis, for the first time
employed a telecentric pair, which provided a uniform image intensity and improved the
effective imaging FOV. We have also showed the first live feedback in PARS imaging which
is beneficial for accurate alignment and to select the right imaging location.
Second, we developed a method to generate stable multiwavelength light source with high
pulse repetition rate. To this aim, stimulated Raman scattering happening inside a single mode
fiber was employed and by controlling and decreasing the temperature, the temporal
fluctuations of the generated output peaks were reduced. The light source was used as the
excitation laser for a PARS microscope and applied to in vivo functional imaging of capillary
networks in chicken embryo model. The method offered a promising technology for creating

156
reliable, cost-effective multiwavelength light sources with a sufficiently high pulse energy and
PRR for a variety of photoacoustic imaging applications.
Third, using the temperature-regulated multiwavelength light source for the first time we
showed in vivo functional imaging of the ocular tissue with a non-contact photoacoustic
imaging modality. The multiwavelength PARS system is further combined with a swept-
source OCT system and for the first time showed simultaneous, non-contact, in vivo imaging
of murine eye. In addition, for the first time we presented dual-contrast PARS microscopy,
where multiwavelength excitation was used for targeting absorption contrast and the PARS
probe beam was used for targeting scattering imaging contrast. The reported system was a
major step toward non-invasive, simultaneous, and accurate measurement of functional details
in the ophthalmic tissue.
Finally, the multimodal PARS-OCT system were further modified and applied for non-contact
imaging of the retina in living animal. Here, for the first time, non-contact oxygen saturation
measurement was shown in in vivo using an absorption-based imaging technique in retinal
tissue. The accuracy of PARS microscopy for oxygen saturation measurement was investigated
using bovine blood. Furthermore, the system is evaluated in terms of ocular light safety offered
by ANSI standards. The proposed technique offered a promising method for non-invasive
measurement of metabolic rate of oxygen and improve diagnosis of major blinding eye
diseases.

157
9.1. Future research
The technology developed and discussed in this PhD thesis leave plenty of room for future
technological development, as well as pose questions that can before the center point of future
animal and human studies.
First, the current PARS-OCT system was developed using visible excitation wavelength for
targeting oxygenated and de-oxygenated hemoglobin in the blood. However, the laser safety
threshold for ocular imaging is stricter in the visible spectrum than in the NIR spectral range.
Additionally, the retina is sensitive to the visible light which poses challenges to eye fixation
during imaging. Therefore, in future studies, the NIR spectral range can be examined as the
excitation wavelength to overcome these issues.
Second, the imaging speed of the multimodal PARS-OCT system can be increased as well.
The higher imaging speed may affect the SNR of the recorded images; however, it can reduce
the challenges arising from involuntary eye motions.
Third, to improve the field of view of the system, scan lens can be employed in the imaging
head of the system. By reducing the field of curvature, the scan lens optimizes the FOV and
produce a flat imaging plane as the laser beam is scanned across the sample.
Forth, a fiber-based version of the system can be developed, which may offer easier alignment,
and to make the system compact. Additionally, it can help with improving the SNR of the
acquired images by acting as a pinhole in the detection end of the PARS system and eliminating
specular reflections.
Fifth, the scanning pattern of the SS-OCT system can be modified to enable Doppler OCT and
OCT angiography and provide blood flow measurement and vasculature map, respectively.

158
This information can be further combined with the non-contact oxygen saturation
measurements of PARS to measure metabolic rate of oxygen consumption in the ocular
environment in both small and large vessels. It can be further applied for evaluating the effects
of visually evoked stimulus and how they could change this functional information.
Sixth, the application of light emitting diodes (LED) as an alternative excitation source for
multiwavelength PARS imaging can be investigated in future studies.
Last, but not the least, the proposed multimodal ophthalmic imaging system can be employed
for pre-clinical applications. The system can be used in longitudinal studies on larger animal
models like rabbit and monkeys with size of eyeballs closer to that of humans. Different eye
disease models (such as Glaucoma, and DR) can be developed in these animals and the efficacy
of the system be evaluated in diagnosis and monitoring of them.

159
Bibliography
[1] S. Rowe, C. H. MacLean, and P. G. Shekelle, “Preventing visual loss from chronic eye disease in primary care: scientific review,” JAMA, vol. 291, no. 12, pp. 1487–1495, Mar. 2004, doi: 10.1001/jama.291.12.1487.
[2] M. Ivanišević, “First look into the eye,” Eur J Ophthalmol, vol. 29, no. 6, pp. 685–688, Nov. 2019, doi: 10.1177/1120672118804388.
[3] Curtin Robert, “Ophthalmic photography: retinal photography, angiography, and electronic imaging, second edition,” Ophthalmic Surgery, Lasers and Imaging Retina, vol. 34, no. 1, pp. 79–80, Jan. 2003, doi: 10.3928/1542-8877-20030101-20.
[4] T. C. V. Cader, “History of Ophthalmic Photography,” p. 3. [5] S. Wolf, F. Jung, H. Kiesewetter, N. Körber, and M. Reim, “Video fluorescein angiography:
method and clinical application,” Graefes Arch Clin Exp Ophthalmol, vol. 227, no. 2, pp. 145–151, 1989, doi: 10.1007/BF02169788.
[6] R. H. Webb and G. W. Hughes, “Scanning laser ophthalmoscope,” IEEE Trans Biomed Eng, vol. 28, no. 7, pp. 488–492, Jul. 1981, doi: 10.1109/TBME.1981.324734.
[7] R. H. Webb, G. W. Hughes, and F. C. Delori, “Confocal scanning laser ophthalmoscope,” Appl. Opt., AO, vol. 26, no. 8, pp. 1492–1499, Apr. 1987, doi: 10.1364/AO.26.001492.
[8] C. J. Pavlin, K. Harasiewicz, M. D. Sherar, and F. S. Foster, “Clinical Use of Ultrasound Biomicroscopy,” Ophthalmology, vol. 98, no. 3, pp. 287–295, Mar. 1991, doi: 10.1016/S0161-6420(91)32298-X.
[9] Masters, Barry R., ed. Noninvasive diagnostic techniques in ophthalmology. New York: Springer-Verlag, 1990.
[10] M. L. Gabriele et al., “Optical Coherence Tomography: History, Current Status, and Laboratory Work,” Invest Ophthalmol Vis Sci, vol. 52, no. 5, pp. 2425–2436, Apr. 2011, doi: 10.1167/iovs.10-6312.
[11] W. Liu and H. F. Zhang, “Photoacoustic imaging of the eye: A mini review,” Photoacoustics, vol. 4, no. 3, pp. 112–123, Sep. 2016, doi: 10.1016/j.pacs.2016.05.001.
[12] N. D. Wangsa-Wirawan and R. A. Linsenmeier, “Retinal Oxygen: Fundamental and Clinical Aspects,” Arch Ophthalmol, vol. 121, no. 4, pp. 547–557, Apr. 2003, doi: 10.1001/archopht.121.4.547.
[13] J. R. Sparrow, D. Hicks, and C. P. Hamel, “The Retinal Pigment Epithelium in Health and Disease,” Curr Mol Med, vol. 10, no. 9, pp. 802–823, Dec. 2010, doi: 10.2174/156652410793937813.
[14] W. Liu and H. F. Zhang, “Photoacoustic imaging of the eye: A mini review,” Photoacoustics, vol. 4, no. 3, pp. 112–123, Sep. 2016, doi: 10.1016/j.pacs.2016.05.001.
[15] C. M. C. Tempany et al., “Multimodal imaging for improved diagnosis and treatment of cancers,” Cancer, vol. 121, no. 6, pp. 817–827, 2015, doi: 10.1002/cncr.29012.
[16] M. Wu and J. Shu, “Multimodal Molecular Imaging: Current Status and Future Directions,” Contrast Media Mol Imaging, vol. 2018, Jun. 2018, doi: 10.1155/2018/1382183.
[17] J. F. Rodríguez-Palomares, M. A. García Fernández, and J. Barba Cosials, “Integrating Multimodal Imaging in Clinical Practice: The Importance of a Multidisciplinary Approach,” Rev Esp Cardiol, vol. 69, no. 5, pp. 477–479, May 2016, doi: 10.1016/j.rec.2016.01.019.
[18] H. Pan, J. Myerson, X. Yang, G. Lanza, and S. A. Wickline, “Atherosclerosis endothelial activation quantification in vivo with fluorine magnetic resonance imaging and spectroscopy,” Journal of Cardiovascular Magnetic Resonance, vol. 16, no. 1, p. O91, Jan. 2014, doi: 10.1186/1532-429X-16-S1-O91.

160
[19] M. A. Bruckman et al., “Dual-modal magnetic resonance and fluorescence imaging of atherosclerotic plaques in vivo using VCAM-1 targeted tobacco mosaic virus,” Nano Lett., vol. 14, no. 3, pp. 1551–1558, Mar. 2014, doi: 10.1021/nl404816m.
[20] R. O’Halloran, B. H. Kopell, E. Sprooten, W. K. Goodman, and S. Frangou, “Multimodal Neuroimaging-Informed Clinical Applications in Neuropsychiatric Disorders,” Frontiers in Psychiatry, vol. 7, p. 63, 2016, doi: 10.3389/fpsyt.2016.00063.
[21] S. Teipel et al., “Multimodal imaging in Alzheimer’s disease: validity and usefulness for early detection,” Lancet Neurol, vol. 14, no. 10, pp. 1037–1053, Oct. 2015, doi: 10.1016/S1474-4422(15)00093-9.
[22] M. F. Kircher et al., “A brain tumor molecular imaging strategy using a new triple-modality MRI-photoacoustic-Raman nanoparticle,” Nat. Med., vol. 18, no. 5, pp. 829–834, Apr. 2012, doi: 10.1038/nm.2721.
[23] J. Yao and L. V. Wang, “Photoacoustic microscopy: Photoacoustic microscopy,” Laser & Photonics Reviews, vol. 7, no. 5, pp. 758–778, Sep. 2013, doi: 10.1002/lpor.201200060.
[24] L. V. Wang and S. Hu, “Photoacoustic tomography: in vivo imaging from organelles to organs,” science, vol. 335, no. 6075, pp. 1458–1462, 2012.
[25] A. H. Kashani et al., “Optical coherence tomography angiography: A comprehensive review of current methods and clinical applications,” Progress in Retinal and Eye Research, vol. 60, pp. 66–100, Sep. 2017, doi: 10.1016/j.preteyeres.2017.07.002.
[26] A. M. Zysk, F. T. Nguyen, A. L. Oldenburg, D. L. Marks, and S. A. Boppart, “Optical coherence tomography: a review of clinical development from bench to bedside,” Journal of biomedical optics, vol. 12, no. 5, p. 051403, 2007.
[27] A. C. S. Tan et al., “An overview of the clinical applications of optical coherence tomography angiography,” Eye, vol. 32, no. 2, Art. no. 2, Feb. 2018, doi: 10.1038/eye.2017.181.
[28] X. Zhang, H. F. Zhang, and S. Jiao, “Optical coherence photoacoustic microscopy: accomplishing optical coherence tomography and photoacoustic microscopy with a single light source,” J. Biomed. Opt., vol. 17, no. 3, p. 030502, 2012, doi: 10.1117/1.JBO.17.3.030502.
[29] Brunker, Joanna, Junjie Yao, Jan Laufer, and Sarah E. Bohndiek. "Photoacoustic imaging using genetically encoded reporters: a review." Journal of biomedical optics 22, no. 7 (2017): 070901.
[30] W. Drexler and J. G. Fujimoto, Optical coherence tomography: technology and applications. Springer Science & Business Media, 2008.
[31] X. Cai, B. S. Paratala, S. Hu, B. Sitharaman, and L. V. Wang, “Multiscale Photoacoustic Microscopy of Single-Walled Carbon Nanotube-Incorporated Tissue Engineering Scaffolds,” Tissue Engineering Part C: Methods, vol. 18, no. 4, pp. 310–317, Apr. 2012, doi: 10.1089/ten.tec.2011.0519.
[32] A. G. Bell, “On the production and reproduction of sound by light,” in Proc. Am. Assoc. Adv. Sci., 1881, vol. 29, pp. 115–136.
[33] L. V. Wang and H.-I. Wu, Biomedical Optics: Principles and Imaging. Hoboken, NJ, USA: John Wiley & Sons, Inc., 2009. doi: 10.1002/9780470177013.
[34] L. V. Wang, Photoacoustic Imaging and Spectroscopy. CRC Press, 2017. [35] P. Beard, “Biomedical photoacoustic imaging,” Interface Focus, vol. 1, no. 4, pp. 602–631,
Aug. 2011, doi: 10.1098/rsfs.2011.0028. [36] J. Chan, Z. Zheng, K. Bell, M. Le, P. H. Reza, and J. T. Yeow, “Photoacoustic Imaging with
Capacitive Micromachined Ultrasound Transducers: Principles and Developments,” Sensors, vol. 19, no. 16, p. 3617, 2019.
[37] T. Bowen, “Radiation-Induced Thermoacoustic Soft Tissue Imaging,” in 1981 Ultrasonics Symposium, 1981, pp. 817–822. doi: 10.1109/ULTSYM.1981.197737.

161
[38] R. G. M. Kolkman, E. Hondebrink, W. Steenbergen, and F. F. M. de Mul, “In vivo photoacoustic imaging of blood vessels using an extreme-narrow aperture sensor,” IEEE J. Select. Topics Quantum Electron., vol. 9, no. 2, pp. 343–346, Mar. 2003, doi: 10.1109/JSTQE.2003.813302.
[39] P. Haji Reza, J. Sorge, M. Brett, and R. Zemp, “In vivo optical resolution photoacoustic microscopy using glancing angle-deposited nanostructured Fabry–Perot etalons,” Optics letters, vol. 40, no. 7, pp. 1350–1353, 2015.
[40] J. Xia et al., “Whole-body ring-shaped confocal photoacoustic computed tomography of small animals in vivo,” Journal of biomedical optics, vol. 17, no. 5, p. 050506, 2012.
[41] L. Lin et al., “Single-breath-hold photoacoustic computed tomography of the breast,” Nat Commun, vol. 9, no. 1, p. 2352, Dec. 2018, doi: 10.1038/s41467-018-04576-z.
[42] C. L. Bayer, G. P. Luke, and S. Y. Emelianov, “Photoacoustic Imaging for Medical Diagnostics,” Acou. Today, vol. 8, no. 4, p. 15, 2012, doi: 10.1121/1.4788648.
[43] E. W. Stein, K. I. Maslov, and L. V. Wang, “Noninvasive, in vivo imaging of blood-oxygenation dynamics within the mouse brain using photoacoustic microscopy,” Journal of biomedical optics, vol. 14, no. 2, p. 020502, 2009.
[44] J. Yao and L. V. Wang, “Photoacoustic microscopy,” Laser & photonics reviews, vol. 7, no. 5, pp. 758–778, 2013.
[45] S. Hu and L. V. Wang, “Photoacoustic imaging and characterization of the microvasculature,” J. Biomed. Opt., vol. 15, no. 1, p. 011101, 2010, doi: 10.1117/1.3281673.
[46] H. Guo, Y. Li, W. Qi, and L. Xi, “Photoacoustic endoscopy: a progress review,” Journal of Biophotonics, vol. n/a, no. n/a, p. e202000217, doi: 10.1002/jbio.202000217.
[47] J. Yao and L. V. Wang, “Sensitivity of photoacoustic microscopy,” Photoacoustics, vol. 2, no. 2, pp. 87–101, 2014.
[48] S. Hu, “Emerging Concepts in Functional and Molecular Photoacoustic Imaging,” Curr Opin Chem Biol, vol. 33, pp. 25–31, Aug. 2016, doi: 10.1016/j.cbpa.2016.04.003.
[49] M. Moothanchery and M. Pramanik, “Performance Characterization of a Switchable Acoustic Resolution and Optical Resolution Photoacoustic Microscopy System,” Sensors, vol. 17, no. 2, p. 357, Feb. 2017, doi: 10.3390/s17020357.
[50] C. Zhang, K. Maslov, and L. V. Wang, “Subwavelength-resolution label-free photoacoustic microscopy of optical absorption in vivo,” Opt. Lett., vol. 35, no. 19, p. 3195, Oct. 2010, doi: 10.1364/OL.35.003195.
[51] M. Li, Y. Tang, and J. Yao, “Photoacoustic tomography of blood oxygenation: A mini review,” Photoacoustics, vol. 10, pp. 65–73, May 2018, doi: 10.1016/j.pacs.2018.05.001.
[52] J. Yao, K. I. Maslov, Y. Shi, L. A. Taber, and L. V. Wang, “In vivo photoacoustic imaging of transverse blood flow by using Doppler broadening of bandwidth,” Opt Lett, vol. 35, no. 9, pp. 1419–1421, May 2010, doi: 10.1364/OL.35.001419.
[53] J. Yao and L. V. Wang, “Transverse flow imaging based on photoacoustic Doppler bandwidth broadening,” JBO, vol. 15, no. 2, p. 021304, Mar. 2010, doi: 10.1117/1.3339953.
[54] J. Yao, H. Ke, S. Tai, Y. Zhou, and L. V. Wang, “Absolute Photoacoustic Thermometry in Deep Tissue,” Opt Lett, vol. 38, no. 24, pp. 5228–5231, Dec. 2013.
[55] L. Gao et al., “Single-cell photoacoustic thermometry,” JBO, vol. 18, no. 2, p. 026003, Feb. 2013, doi: 10.1117/1.JBO.18.2.026003.
[56] P. Haji Reza, A. Forbrich, and R. Zemp, “In-Vivo functional optical-resolution photoacoustic microscopy with stimulated Raman scattering fiber-laser source,” Biomed. Opt. Express, vol. 5, no. 2, p. 539, Feb. 2014, doi: 10.1364/BOE.5.000539.
[57] J. Yao et al., “High-speed label-free functional photoacoustic microscopy of mouse brain in action,” Nat Methods, vol. 12, no. 5, pp. 407–410, May 2015, doi: 10.1038/nmeth.3336.

162
[58] Z. Chen et al., “Non-invasive multimodal optical coherence and photoacoustic tomography for human skin imaging,” Scientific Reports, vol. 7, no. 1, Art. no. 1, Dec. 2017, doi: 10.1038/s41598-017-18331-9.
[59] J. Laufer, E. Zhang, G. Raivich, and P. Beard, “Three-dimensional noninvasive imaging of the vasculature in the mouse brain using a high resolution photoacoustic scanner,” Applied optics, vol. 48, no. 10, pp. D299–D306, 2009.
[60] R. J. Paproski, A. Heinmiller, K. Wachowicz, and R. J. Zemp, “Multi-wavelength photoacoustic imaging of inducible tyrosinase reporter gene expression in xenograft tumors,” Scientific reports, vol. 4, p. 5329, 2014.
[61] S. Sethuraman, J. H. Amirian, S. H. Litovsky, R. W. Smalling, and S. Y. Emelianov, “Ex vivo Characterization of Atherosclerosis using Intravascular Photoacoustic Imaging,” Opt. Express, vol. 15, no. 25, p. 16657, 2007, doi: 10.1364/OE.15.016657.
[62] J.-T. Oh, M.-L. Li, H. F. Zhang, K. Maslov, and L. V. Wang, “Three-dimensional imaging of skin melanoma in vivo by dual-wavelength photoacoustic microscopy,” Journal of biomedical optics, vol. 11, no. 3, p. 034032, 2006.
[63] S. M. Maswadi et al., “All-optical optoacoustic microscopy based on probe beam deflection technique,” Photoacoustics, vol. 4, no. 3, pp. 91–101, 2016.
[64] T. T. Wong et al., “Fast label-free multilayered histology-like imaging of human breast cancer by photoacoustic microscopy,” Science advances, vol. 3, no. 5, p. e1602168, 2017.
[65] R. Lin, J. Chen, H. Wang, M. Yan, W. Zheng, and L. Song, “Longitudinal label-free optical-resolution photoacoustic microscopy of tumor angiogenesis in vivo,” Quant Imaging Med Surg, vol. 5, no. 1, pp. 23–29, Feb. 2015, doi: 10.3978/j.issn.2223-4292.2014.11.08.
[66] L. Li et al., “Small near-infrared photochromic protein for photoacoustic multi-contrast imaging and detection of protein interactions in vivo,” Nature Communications, vol. 9, no. 1, Art. no. 1, Jul. 2018, doi: 10.1038/s41467-018-05231-3.
[67] V. Nguyen and Y. Paulus, “Photoacoustic Ophthalmoscopy: Principle, Application, and Future Directions,” J. Imaging, vol. 4, no. 12, p. 149, Dec. 2018, doi: 10.3390/jimaging4120149.
[68] S. Y. Nam, L. M. Ricles, L. J. Suggs, and S. Y. Emelianov, “In vivo Ultrasound and Photoacoustic Monitoring of Mesenchymal Stem Cells Labeled with Gold Nanotracers,” PLoS ONE, vol. 7, no. 5, p. e37267, May 2012, doi: 10.1371/journal.pone.0037267.
[69] D. Huang et al., “Optical coherence tomography,” Science, vol. 254, no. 5035, pp. 1178–1181, Nov. 1991, doi: 10.1126/science.1957169.
[70] C. A. de Amorim Garcia Filho, Z. Yehoshua, G. Gregori, C. A. Puliafito, and P. J. Rosenfeld, “Chapter 3 - Optical Coherence Tomography,” in Retina (Fifth Edition), S. J. Ryan, S. R. Sadda, D. R. Hinton, A. P. Schachat, S. R. Sadda, C. P. Wilkinson, P. Wiedemann, and A. P. Schachat, Eds. London: W.B. Saunders, 2013, pp. 82–110. doi: 10.1016/B978-1-4557-0737-9.00003-5.
[71] J. F. de Boer, R. Leitgeb, and M. Wojtkowski, “Twenty-five years of optical coherence tomography: the paradigm shift in sensitivity and speed provided by Fourier domain OCT [Invited],” Biomed. Opt. Express, vol. 8, no. 7, p. 3248, Jul. 2017, doi: 10.1364/BOE.8.003248.
[72] A. F. Fercher, R. Leitgeb, C. K. Hitzenberger, H. Sattmann, and M. Wojtkowski, “Complex spectral interferometry OCT,” in Medical Applications of Lasers in Dermatology, Cardiology, Ophthalmology, and Dentistry II, Feb. 1999, vol. 3564, pp. 173–178. doi: 10.1117/12.339152.
[73] S. Aumann, S. Donner, J. Fischer, and F. Müller, “Optical Coherence Tomography (OCT): Principle and Technical Realization,” in High Resolution Imaging in Microscopy and Ophthalmology: New Frontiers in Biomedical Optics, J. F. Bille, Ed. Cham: Springer International Publishing, 2019, pp. 59–85. doi: 10.1007/978-3-030-16638-0_3.

163
[74] Z. Yaqoob, J. Wu, and C. Yang, “Spectral domain optical coherence tomography: a better OCT imaging strategy,” BioTechniques, vol. 39, no. 6 Suppl, pp. S6-13, Dec. 2005, doi: 10.2144/000112090.
[75] P. Hahn, J. Migacz, R. O’Connell, R. S. Maldonado, J. A. Izatt, and C. A. Toth, “The use of optical coherence tomography in intraoperative ophthalmic imaging,” Ophthalmic Surgery, Lasers and Imaging Retina, vol. 42, no. 4, pp. S85–S94, 2011.
[76] M. Pircher and R. J. Zawadzki, “Review of adaptive optics OCT (AO-OCT): principles and applications for retinal imaging,” Biomedical optics express, vol. 8, no. 5, pp. 2536–2562, 2017.
[77] J. L. B. Ramos, Y. Li, and D. Huang, “Clinical and research applications of anterior segment optical coherence tomography–a review,” Clinical & experimental ophthalmology, vol. 37, no. 1, pp. 81–89, 2009.
[78] R. A. Leitgeb, R. M. Werkmeister, C. Blatter, and L. Schmetterer, “Doppler optical coherence tomography,” Progress in retinal and eye research, vol. 41, pp. 26–43, 2014.
[79] C.-L. Chen and R. K. Wang, “Optical coherence tomography based angiography [Invited],” Biomed. Opt. Express, BOE, vol. 8, no. 2, pp. 1056–1082, Feb. 2017, doi: 10.1364/BOE.8.001056.
[80] J. F. De Boer, C. K. Hitzenberger, and Y. Yasuno, “Polarization sensitive optical coherence tomography–a review,” Biomedical optics express, vol. 8, no. 3, pp. 1838–1873, 2017.
[81] X. Liang, V. Crecea, and S. A. Boppart, “Dynamic optical coherence elastography: a review,” Journal of innovative optical health sciences, vol. 3, no. 04, pp. 221–233, 2010.
[82] X. Shu, L. J. Beckmann, and H. F. Zhang, “Visible-light optical coherence tomography: a review,” Journal of biomedical optics, vol. 22, no. 12, p. 121707, 2017.
[83] P. J. Marchand, A. Bouwens, D. Szlag, T. Lasser, and J. Extermann, “Brain imaging with extended-focus optical coherence tomography at different scales and spectral ranges (Conference Presentation),” in Optical Coherence Tomography and Coherence Domain Optical Methods in Biomedicine XXIII, 2019, vol. 10867, p. 108671U.
[84] C. Magnain et al., “Human Brain Imaging by Optical Coherence Tomography,” Handbook of Neurophotonics, p. 399, 2020.
[85] Y. Ling, C. Li, C. Purslow, Y. Yang, and Z. Huang, “Evaluation of human corneal ulcer healing process using optical coherence tomography: an in vitro study,” in Optical Elastography and Tissue Biomechanics VI, 2019, vol. 10880, p. 108801H.
[86] C. P. Hendon, T. H. Lye, X. Yao, Y. Gan, and C. C. Marboe, “Optical coherence tomography imaging of cardiac substrates,” Quantitative imaging in medicine and surgery, vol. 9, no. 5, p. 882, 2019.
[87] A. Rajabi-Estarabadi et al., “Optical coherence tomography imaging of melanoma skin cancer,” Lasers in medical science, vol. 34, no. 2, pp. 411–420, 2019.
[88] A. Pinhas et al., “Optical Coherence Tomography Angiography in Neurology and Neuro-Ophthalmology,” in OCT and Imaging in Central Nervous System Diseases, Springer, 2020, pp. 523–544.
[89] J. Malone et al., “Endoscopic optical coherence tomography (OCT) and autofluorescence imaging (AFI) of ex vivo fallopian tubes,” in Multimodal Biomedical Imaging XV, 2020, vol. 11232, p. 1123202.
[90] J. E. Freund et al., “Optical coherence tomography in urologic oncology: a comprehensive review,” SN Comprehensive Clinical Medicine, vol. 1, no. 2, pp. 67–84, 2019.
[91] D. Fried, “Optical Coherence Tomography for Imaging Dental Caries,” in Detection and Assessment of Dental Caries, Springer, 2019, pp. 199–208.

164
[92] E. Beaurepaire, L. Moreaux, F. Amblard, and J. Mertz, “Combined scanning optical coherence and two-photon-excited fluorescence microscopy,” Opt. Lett., OL, vol. 24, no. 14, pp. 969–971, Jul. 1999, doi: 10.1364/OL.24.000969.
[93] J. P. Dunkers, M. T. Cicerone, and N. R. Washburn, “Collinear optical coherence and confocal fluorescence microscopies for tissue engineering,” Opt. Express, OE, vol. 11, no. 23, pp. 3074–3079, Nov. 2003, doi: 10.1364/OE.11.003074.
[94] D. J. Harper et al., “White Light Optical Coherence Tomography for Sub-Micron Resolution and Spectroscopic Imaging in the Mouse Retina,” Invest. Ophthalmol. Vis. Sci., vol. 59, no. 9, pp. 5826–5826, Jul. 2018.
[95] P. J. Marchand, D. Szlag, A. Bouwens, and T. Lasser, “In vivo high-resolution cortical imaging with extended-focus optical coherence microscopy in the visible-NIR wavelength range,” J Biomed Opt, vol. 23, no. 3, pp. 1–7, 2018, doi: 10.1117/1.JBO.23.3.036012.
[96] L. V. Wang and J. Yao, “A practical guide to photoacoustic tomography in the life sciences,” Nat Methods, vol. 13, no. 8, pp. 627–638, Aug. 2016, doi: 10.1038/nmeth.3925.
[97] B. Marsh-Armstrong, J. Migacz, R. Jonnal, and J. S. Werner, “Automated quantification of choriocapillaris anatomical features in ultrahigh-speed optical coherence tomography angiograms,” Biomed. Opt. Express, BOE, vol. 10, no. 10, pp. 5337–5350, Oct. 2019, doi: 10.1364/BOE.10.005337.
[98] Z. Ma et al., “Assessment of microvasculature flow state with a high speed all-optic dual-modal system of optical coherence tomography and photoacoustic imaging,” Biomedical optics express, vol. 9, no. 12, pp. 6103–6115, 2018.
[99] E. Z. Zhang et al., “Multimodal photoacoustic and optical coherence tomography scanner using an all optical detection scheme for 3D morphological skin imaging,” Biomed. Opt. Express, vol. 2, no. 8, p. 2202, Aug. 2011, doi: 10.1364/BOE.2.002202.
[100] B. J. Vakoc et al., “Three-dimensional microscopy of the tumor microenvironment in vivo using optical frequency domain imaging,” Nat. Med., vol. 15, no. 10, pp. 1219–1223, Oct. 2009, doi: 10.1038/nm.1971.
[101] H. S. Nam and H. Yoo, “Spectroscopic optical coherence tomography: A review of concepts and biomedical applications,” Applied Spectroscopy Reviews, vol. 53, no. 2–4, pp. 91–111, Apr. 2018, doi: 10.1080/05704928.2017.1324876.
[102] U. Morgner et al., “Spectroscopic optical coherence tomography,” Opt. Lett., OL, vol. 25, no. 2, pp. 111–113, Jan. 2000, doi: 10.1364/OL.25.000111.
[103] N. D. Wangsa-Wirawan and R. A. Linsenmeier, “Retinal Oxygen: Fundamental and Clinical Aspects,” Arch Ophthalmol, vol. 121, no. 4, pp. 547–557, Apr. 2003, doi: 10.1001/archopht.121.4.547.
[104] H.-P. Hammes, “Pericytes and the Pathogenesis of Diabetic Retinopathy,” Horm Metab Res, vol. 37, no. S 1, pp. 39–43, Apr. 2005, doi: 10.1055/s-2005-861361.
[105] M. Mozaffarieh, M. C. Grieshaber, and J. Flammer, “Oxygen and blood flow: players in the pathogenesis of glaucoma,” Mol Vis, vol. 14, pp. 224–233, Jan. 2008.
[106] W. Song et al., “A combined method to quantify the retinal metabolic rate of oxygen using photoacoustic ophthalmoscopy and optical coherence tomography,” Sci Rep, vol. 4, no. 1, p. 6525, May 2015, doi: 10.1038/srep06525.
[107] K. E. Wilson, S. V. Bachawal, L. Tian, and J. K. Willmann, “Multiparametric Spectroscopic Photoacoustic Imaging of Breast Cancer Development in a Transgenic Mouse Model,” Theranostics, vol. 4, no. 11, pp. 1062–1071, Aug. 2014, doi: 10.7150/thno.9922.
[108] V. P. Nguyen et al., “Contrast Agent Enhanced Multimodal Photoacoustic Microscopy and Optical Coherence Tomography for Imaging of Rabbit Choroidal and Retinal Vessels in vivo,” Sci Rep, vol. 9, no. 1, p. 5945, Dec. 2019, doi: 10.1038/s41598-019-42324-5.

165
[109] J. Yao et al., “Noninvasive photoacoustic computed tomography of mouse brain metabolism in vivo,” NeuroImage, vol. 64, pp. 257–266, Jan. 2013, doi: 10.1016/j.neuroimage.2012.08.054.
[110] M. Nasiriavanaki, J. Xia, H. Wan, A. Q. Bauer, J. P. Culver, and L. V. Wang, “High-resolution photoacoustic tomography of resting-state functional connectivity in the mouse brain,” Proc Natl Acad Sci U S A, vol. 111, no. 1, pp. 21–26, Jan. 2014, doi: 10.1073/pnas.1311868111.
[111] J. Jo and X. Yang, “Functional photoacoustic imaging to observe regional brain activation induced by cocaine hydrochloride,” J Biomed Opt, vol. 16, no. 9, Sep. 2011, doi: 10.1117/1.3626576.
[112] P. J. Marchand et al., “Visible spectrum extended-focus optical coherence microscopy for label-free sub-cellular tomography,” Biomed. Opt. Express, vol. 8, no. 7, p. 3343, Jul. 2017, doi: 10.1364/BOE.8.003343.
[113] S. Hu, K. Maslov, V. Tsytsarev, and L. V. Wang, “Functional transcranial brain imaging by optical-resolution photoacoustic microscopy,” J Biomed Opt, vol. 14, no. 4, p. 040503, 2009, doi: 10.1117/1.3194136.
[114] B. Zabihian et al., “In vivo dual-modality photoacoustic and optical coherence tomography imaging of human dermatological pathologies,” Biomed. Opt. Express, BOE, vol. 6, no. 9, pp. 3163–3178, Sep. 2015, doi: 10.1364/BOE.6.003163.
[115] D. Lee, C. Lee, S. Kim, Q. Zhou, J. Kim, and C. Kim, “In Vivo Near Infrared Virtual Intraoperative Surgical Photoacoustic Optical Coherence Tomography,” Sci Rep, vol. 6, no. 1, p. 35176, Dec. 2016, doi: 10.1038/srep35176.
[116] K. J. Cash, C. Li, J. Xia, L. V. Wang, and H. A. Clark, “Optical Drug Monitoring: Photoacoustic Imaging of Nanosensors to Monitor Therapeutic Lithium in Vivo,” ACS Nano, vol. 9, no. 2, pp. 1692–1698, Feb. 2015, doi: 10.1021/nn5064858.
[117] R. Pomerantz, D. Zell, G. McKenzie, and D. M. Siegel, “Optical Coherence Tomography Used as a Modality to Delineate Basal Cell Carcinoma prior to Mohs Micrographic Surgery,” CDE, vol. 3, no. 3, pp. 212–218, 2011, doi: 10.1159/000333000.
[118] U. Dahlstrand et al., “Photoacoustic imaging for three-dimensional visualization and delineation of basal cell carcinoma in patients,” Photoacoustics, vol. 18, p. 100187, Jun. 2020, doi: 10.1016/j.pacs.2020.100187.
[119] M. Liu and W. Drexler, “Optical coherence tomography angiography and photoacoustic imaging in dermatology,” Photochem. Photobiol. Sci., vol. 18, no. 5, pp. 945–962, May 2019, doi: 10.1039/C8PP00471D.
[120] T.-J. Yoon and Y.-S. Cho, “Recent advances in photoacoustic endoscopy,” World J Gastrointest Endosc, vol. 5, no. 11, pp. 534–539, Nov. 2013, doi: 10.4253/wjge.v5.i11.534.
[121] M. J. Gora, M. J. Suter, G. J. Tearney, and X. Li, “Endoscopic optical coherence tomography: technologies and clinical applications [Invited],” Biomed. Opt. Express, BOE, vol. 8, no. 5, pp. 2405–2444, May 2017, doi: 10.1364/BOE.8.002405.
[122] S. Zackrisson, S. M. W. Y. van de Ven, and S. S. Gambhir, “Light In and Sound Out: Emerging Translational Strategies for Photoacoustic Imaging,” Cancer Res, vol. 74, no. 4, pp. 979–1004, Feb. 2014, doi: 10.1158/0008-5472.CAN-13-2387.
[123] M. Wu, A. FW van der Steen, E. Regar, and G. van Soest, “Emerging Technology Update Intravascular Photoacoustic Imaging of Vulnerable Atherosclerotic Plaque,” Interv Cardiol, vol. 11, no. 2, pp. 120–123, Oct. 2016, doi: 10.15420/icr.2016:13:3.
[124] R. A. Leitgeb and B. Baumann, “Multimodal Optical Medical Imaging Concepts Based on Optical Coherence Tomography,” Front. Phys., vol. 6, p. 114, Oct. 2018, doi: 10.3389/fphy.2018.00114.

166
[125] M. Liu et al., “Dual modality optical coherence and whole-body photoacoustic tomography imaging of chick embryos in multiple development stages,” Biomed. Opt. Express, BOE, vol. 5, no. 9, pp. 3150–3159, Sep. 2014, doi: 10.1364/BOE.5.003150.
[126] J. Xia and L. V. Wang, “Small-animal whole-body photoacoustic tomography: a review,” IEEE Trans Biomed Eng, vol. 61, no. 5, pp. 1380–1389, May 2014, doi: 10.1109/TBME.2013.2283507.
[127] M. Liu et al., “Combined multi-modal photoacoustic tomography, optical coherence tomography (OCT) and OCT angiography system with an articulated probe for in vivo human skin structure and vasculature imaging,” Biomed. Opt. Express, BOE, vol. 7, no. 9, pp. 3390–3402, Sep. 2016, doi: 10.1364/BOE.7.003390.
[128] B. Zabihian et al., “Comprehensive vascular imaging using optical coherence tomography-based angiography and photoacoustic tomography,” J. Biomed. Opt, vol. 21, no. 9, p. 096011, Sep. 2016, doi: 10.1117/1.JBO.21.9.096011.
[129] W. Zhou, Z. Chen, S. Yang, and D. Xing, “Optical biopsy approach to basal cell carcinoma and melanoma based on all-optically integrated photoacoustic and optical coherence tomography,” Opt. Lett., vol. 42, no. 11, p. 2145, Jun. 2017, doi: 10.1364/OL.42.002145.
[130] K. Kratkiewicz et al., “Photoacoustic/Ultrasound/Optical Coherence Tomography Evaluation of Melanoma Lesion and Healthy Skin in a Swine Model,” Sensors, vol. 19, no. 12, p. 2815, Jun. 2019, doi: 10.3390/s19122815.
[131] Y. Yang et al., “Integrated optical coherence tomography, ultrasound and photoacoustic imaging for ovarian tissue characterization,” Biomedical optics express, vol. 2, no. 9, pp. 2551–2561, 2011.
[132] L. Xi, C. Duan, H. Xie, and H. Jiang, “Miniature probe combining optical-resolution photoacoustic microscopy and optical coherence tomography for in vivomicrocirculation study,” Applied optics, vol. 52, no. 9, pp. 1928–1931, 2013.
[133] X. Dai, L. Xi, C. Duan, H. Yang, H. Xie, and H. Jiang, “Miniature probe integrating optical-resolution photoacoustic microscopy, optical coherence tomography, and ultrasound imaging: proof-of-concept,” Opt. Lett., vol. 40, no. 12, p. 2921, Jun. 2015, doi: 10.1364/OL.40.002921.
[134] S. J. Mathews et al., “All-optical dual photoacoustic and optical coherence tomography intravascular probe,” Photoacoustics, vol. 11, pp. 65–70, Jul. 2018, doi: 10.1016/j.pacs.2018.07.002.
[135] L. Li, K. Maslov, G. Ku, and L. V. Wang, “Three-dimensional combined photoacoustic and optical coherence microscopy for in vivo microcirculation studies,” Optics express, vol. 17, no. 19, pp. 16450–16455, 2009.
[136] X. Cai et al., “Investigation of neovascularization in three-dimensional porous scaffolds in vivo by a combination of multiscale photoacoustic microscopy and optical coherence tomography,” Tissue Engineering Part C: Methods, vol. 19, no. 3, pp. 196–204, 2013.
[137] S. Jiao, Z. Xie, H. F. Zhang, and C. A. Puliafito, “Simultaneous multimodal imaging with integrated photoacoustic microscopy and optical coherence tomography,” Optics letters, vol. 34, no. 19, pp. 2961–2963, 2009.
[138] T. Liu, Q. Wei, J. Wang, S. Jiao, and H. F. Zhang, “Combined photoacoustic microscopy and optical coherence tomography can measure metabolic rate of oxygen,” Biomed Opt Express, vol. 2, no. 5, pp. 1359–1365, Apr. 2011, doi: 10.1364/BOE.2.001359.
[139] V. Tsytsarev, B. Rao, K. I. Maslov, L. Li, and L. V. Wang, “Photoacoustic and optical coherence tomography of epilepsy with high temporal and spatial resolution and dual optical contrasts,” Journal of Neuroscience Methods, vol. 216, no. 2, pp. 142–145, Jun. 2013, doi: 10.1016/j.jneumeth.2013.04.001.

167
[140] M. Liu, “A study of spectral domain optical coherence tomography and photoacoustic microscopy for biometric and biomedical applications,” Thesis, University of Delaware, 2011. Accessed: May 20, 2020. [Online]. Available: http://udspace.udel.edu/handle/19716/10135
[141] X. Zhu et al., “Resolution-matched reflection mode photoacoustic microscopy and optical coherence tomography dual modality system,” Photoacoustics, vol. 19, p. 100188, Sep. 2020, doi: 10.1016/j.pacs.2020.100188.
[142] W. Qin, W. Qi, T. Jin, H. Guo, and L. Xi, “In vivo oral imaging with integrated portable photoacoustic microscopy and optical coherence tomography,” Appl. Phys. Lett., vol. 111, no. 26, p. 263704, Dec. 2017, doi: 10.1063/1.5006234.
[143] W. Qin, Q. Chen, and L. Xi, “A handheld microscope integrating photoacoustic microscopy and optical coherence tomography,” Biomed. Opt. Express, vol. 9, no. 5, p. 2205, May 2018, doi: 10.1364/BOE.9.002205.
[144] A. Dadkhah and S. Jiao, “Optical coherence tomography-guided dynamic focusing for combined optical and mechanical scanning multimodal photoacoustic microscopy,” J. Biomed. Opt., vol. 24, no. 12, p. 1, Aug. 2019, doi: 10.1117/1.JBO.24.12.121906.
[145] Y. Liu et al., “NIR-II Dual-Modal Optical Coherence Tomography and Photoacoustic Imaging-Guided Dose-Control Cancer Chemotherapy,” ACS Appl. Polym. Mater., vol. 2, no. 5, pp. 1964–1973, May 2020, doi: 10.1021/acsapm.0c00155.
[146] B. Dong, C. Sun, and H. F. Zhang, “Optical detection of ultrasound in photoacoustic imaging,” IEEE Transactions on Biomedical Engineering, vol. 64, no. 1, pp. 4–15, 2016.
[147] C. Lee et al., “Combined photoacoustic and optical coherence tomography using a single near-infrared supercontinuum laser source,” Applied optics, vol. 52, no. 9, pp. 1824–1828, 2013.
[148] B. Hermann et al., “Hybrid ultrahigh resolution optical coherence / photoacoustic microscopy,” in Photons Plus Ultrasound: Imaging and Sensing 2015, Mar. 2015, vol. 9323, p. 93232N. doi: 10.1117/12.2079232.
[149] L. Li et al., “Fast subcellular optical coherence photoacoustic microscopy for pigment cell imaging,” Opt. Lett., OL, vol. 40, no. 19, pp. 4448–4451, Oct. 2015, doi: 10.1364/OL.40.004448.
[150] S. Shang, Z. Chen, Y. Zhao, S. Yang, and D. Xing, “Simultaneous imaging of atherosclerotic plaque composition and structure with dual-mode photoacoustic and optical coherence tomography,” Opt. Express, OE, vol. 25, no. 2, pp. 530–539, Jan. 2017, doi: 10.1364/OE.25.000530.
[151] X. Shu, M. Bondu, B. Dong, A. Podoleanu, L. Leick, and H. F. Zhang, “Single all-fiber-based nanosecond-pulsed supercontinuum source for multispectral photoacoustic microscopy and optical coherence tomography,” Opt. Lett., vol. 41, no. 12, p. 2743, Jun. 2016, doi: 10.1364/OL.41.002743.
[152] R. Haindl et al., “Dual modality reflection mode optical coherence and photoacoustic microscopy using an akinetic sensor,” Opt. Lett., OL, vol. 42, no. 21, pp. 4319–4322, Nov. 2017, doi: 10.1364/OL.42.004319.
[153] S. Preisser et al., “All-optical highly sensitive akinetic sensor for ultrasound detection and photoacoustic imaging,” Biomedical optics express, vol. 7, no. 10, pp. 4171–4186, 2016.
[154] R. Haindl et al., “Functional optical coherence tomography and photoacoustic microscopy imaging for zebrafish larvae,” Biomed. Opt. Express, BOE, vol. 11, no. 4, pp. 2137–2151, Apr. 2020, doi: 10.1364/BOE.390410.
[155] L. V. Wang, “Multiscale photoacoustic microscopy and computed tomography,” Nature Photon, vol. 3, no. 9, pp. 503–509, Sep. 2009, doi: 10.1038/nphoton.2009.157.

168
[156] S. Pi et al., “Rodent retinal circulation organization and oxygen metabolism revealed by visible-light optical coherence tomography,” Biomed. Opt. Express, vol. 9, no. 11, p. 5851, Nov. 2018, doi: 10.1364/BOE.9.005851.
[157] J. Hui, R. Li, E. H. Phillips, C. J. Goergen, M. Sturek, and J.-X. Cheng, “Bond-selective photoacoustic imaging by converting molecular vibration into acoustic waves,” Photoacoustics, vol. 4, no. 1, pp. 11–21, Mar. 2016, doi: 10.1016/j.pacs.2016.01.002.
[158] H. D. Lee, J. G. Shin, H. Hyun, B.-A. Yu, and T. J. Eom, “Label-free photoacoustic microscopy for in-vivo tendon imaging using a fiber-based pulse laser,” Sci Rep, vol. 8, no. 1, p. 4805, Dec. 2018, doi: 10.1038/s41598-018-23113-y.
[159] M. Bondu, M. J. Marques, P. M. Moselund, G. Lall, A. Bradu, and A. Podoleanu, “Multispectral photoacoustic microscopy and optical coherence tomography using a single supercontinuum source,” Photoacoustics, vol. 9, pp. 21–30, 2018.
[160] S. Jiao et al., “Photoacoustic ophthalmoscopy for in vivo retinal imaging,” Opt. Express, vol. 18, no. 4, p. 3967, Feb. 2010, doi: 10.1364/OE.18.003967.
[161] W. Song et al., “Integrating photoacoustic ophthalmoscopy with scanning laser ophthalmoscopy, optical coherence tomography, and fluorescein angiography for a multimodal retinal imaging platform,” Journal of biomedical optics, vol. 17, no. 6, p. 061206, 2012.
[162] X. Liu et al., “Optical coherence photoacoustic microscopy for in vivo multimodal retinal imaging,” Opt. Lett., vol. 40, no. 7, p. 1370, Apr. 2015, doi: 10.1364/OL.40.001370.
[163] D. A. Robinson, “The mechanics of human saccadic eye movement,” The Journal of Physiology, vol. 174, no. 2, pp. 245–264, 1964, doi: 10.1113/jphysiol.1964.sp007485.
[164] C. Tian, W. Zhang, A. Mordovanakis, X. Wang, and Y. M. Paulus, “Noninvasive chorioretinal imaging in living rabbits using integrated photoacoustic microscopy and optical coherence tomography,” Opt. Express, vol. 25, no. 14, p. 15947, Jul. 2017, doi: 10.1364/OE.25.015947.
[165] W. Zhang et al., “High-resolution, in vivo multimodal photoacoustic microscopy, optical coherence tomography, and fluorescence microscopy imaging of rabbit retinal neovascularization,” Light Sci Appl, vol. 7, no. 1, p. 103, Dec. 2018, doi: 10.1038/s41377-018-0093-y.
[166] W. Zhang et al., “Simultaneous photoacoustic microscopy, spectral-domain optical coherence tomography, and fluorescein microscopy multi-modality retinal imaging,” Photoacoustics, vol. 20, p. 100194, Dec. 2020, doi: 10.1016/j.pacs.2020.100194.
[167] V. P. Nguyen, Y. Li, W. Zhang, X. Wang, and Y. M. Paulus, “Multi-wavelength, en-face photoacoustic microscopy and optical coherence tomography imaging for early and selective detection of laser induced retinal vein occlusion,” Biomed. Opt. Express, vol. 9, no. 12, p. 5915, Dec. 2018, doi: 10.1364/BOE.9.005915.
[168] V. P. Nguyen, Y. Li, W. Zhang, X. Wang, and Y. M. Paulus, “High-resolution multimodal photoacoustic microscopy and optical coherence tomography image-guided laser induced branch retinal vein occlusion in living rabbits,” Sci Rep, vol. 9, no. 1, p. 10560, Dec. 2019, doi: 10.1038/s41598-019-47062-2.
[169] L. Han, L. K. Chen, Z. Hosseinaee, and K. Bizheva, “In-vivo, non-contact, cellular resolution imaging of the human cornea with line-field SD-OCT at 2.5 kHz frame rate (Conference Presentation),” in Optical Coherence Tomography and Coherence Domain Optical Methods in Biomedicine XXIV, Mar. 2020, vol. 11228, p. 112280J. doi: 10.1117/12.2547884.
[170] K. Kawana, Y. Yasuno, T. Yatagai, and T. Oshika, “High-speed, swept-source optical coherence tomography: a 3-dimensional view of anterior chamber angle recession,” Acta Ophthalmologica Scandinavica, vol. 85, no. 6, pp. 684–685, 2007.

169
[171] E. Auksorius et al., “In vivo imaging of the human cornea with high-speed and high-resolution Fourier-domain full-field optical coherence tomography,” Biomed. Opt. Express, BOE, vol. 11, no. 5, pp. 2849–2865, May 2020, doi: 10.1364/BOE.393801.
[172] W. Drexler, M. Liu, A. Kumar, T. Kamali, A. Unterhuber, and R. A. Leitgeb, “Optical coherence tomography today: speed, contrast, and multimodality,” Journal of biomedical optics, vol. 19, no. 7, p. 071412, 2014.
[173] G. Held, S. Preisser, H. G. Akarçay, S. Peeters, M. Frenz, and M. Jaeger, “Effect of irradiation distance on image contrast in epi-optoacoustic imaging of human volunteers,” Biomed. Opt. Express, BOE, vol. 5, no. 11, pp. 3765–3780, Nov. 2014, doi: 10.1364/BOE.5.003765.
[174] C. Haisch, K. Eilert-Zell, M. M. Vogel, P. Menzenbach, and R. Niessner, “Combined optoacoustic/ultrasound system for tomographic absorption measurements: possibilities and limitations,” Anal Bioanal Chem, vol. 397, no. 4, pp. 1503–1510, Jun. 2010, doi: 10.1007/s00216-010-3685-9.
[175] G. S. Sangha, N. J. Hale, and C. J. Goergen, “Adjustable photoacoustic tomography probe improves light delivery and image quality,” Photoacoustics, vol. 12, pp. 6–13, Dec. 2018, doi: 10.1016/j.pacs.2018.08.002.
[176] Sowers, Timothy, Heechul Yoon, and Stanislav Emelianov. "Investigation of light delivery geometries for photoacoustic applications using Monte Carlo simulations with multiple wavelengths, tissue types, and species characteristics." Journal of biomedical optics 25, no. 1 (2020): 016005.
[177] K. Daoudi et al., “Handheld probe integrating laser diode and ultrasound transducer array for ultrasound/photoacoustic dual modality imaging,” Opt. Express, OE, vol. 22, no. 21, pp. 26365–26374, Oct. 2014, doi: 10.1364/OE.22.026365.
[178] L. Zhao, M. Yang, Y. Jiang, and C. Li, “Optical fluence compensation for handheld photoacoustic probe: An in vivo human study case,” J. Innov. Opt. Health Sci., vol. 10, no. 04, p. 1740002, Jun. 2017, doi: 10.1142/S1793545817400028.
[179] Y. Zhou, J. Liang, and L. V. Wang, “Cuffing-based photoacoustic flowmetry in humans in the optical diffusive regime,” Journal of Biophotonics, vol. 9, no. 3, pp. 208–212, 2016, doi: https://doi.org/10.1002/jbio.201500181.
[180] X. Zhang, X. Wu, O. J. Adelegan, F. Y. Yamaner, and Ö. Oralkan, “Backward-Mode Photoacoustic Imaging Using Illumination Through a CMUT With Improved Transparency,” IEEE Transactions on Ultrasonics, Ferroelectrics, and Frequency Control, vol. 65, no. 1, pp. 85–94, Jan. 2018, doi: 10.1109/TUFFC.2017.2774283.
[181] J. H. Uliana et al., “Multiangle Long-Axis Lateral Illumination Photoacoustic Imaging Using Linear Array Transducer,” Sensors, vol. 20, no. 14, Art. no. 14, Jan. 2020, doi: 10.3390/s20144052.
[182] S. Jeon et al., “In Vivo Photoacoustic Imaging of Anterior Ocular Vasculature: A Random Sample Consensus Approach,” Sci Rep, vol. 7, no. 1, p. 4318, Dec. 2017, doi: 10.1038/s41598-017-04334-z.
[183] S. Park, S. Rim, Y. Kim, and B. H. Lee, “Noncontact photoacoustic imaging based on optical quadrature detection with a multiport interferometer,” Optics letters, vol. 44, no. 10, pp. 2590–2593, 2019.
[184] Y. Wang, C. Li, and R. K. Wang, “Noncontact photoacoustic imaging achieved by using a low-coherence interferometer as the acoustic detector,” Optics letters, vol. 36, no. 20, pp. 3975–3977, 2011.
[185] Y. Wang, Y. Hu, B. Peng, H. Zhou, Y. Zhao, and Z. Ma, “Complete-noncontact photoacoustic microscopy by detection of initial pressures using a 3× 3 coupler-based fiber-optic interferometer,” Biomedical Optics Express, vol. 11, no. 1, pp. 505–516, 2020.

170
[186] Z. Hosseinaee, M. Le, K. Bell, and P. H. reza, “Towards non-contact photoacoustic imaging [Review],” Photoacoustics, p. 100207, Sep. 2020, doi: 10.1016/j.pacs.2020.100207.
[187] J. Eom, J. G. Shin, S. Park, S. Rim, and B. H. Lee, “An all-fiber-optic combined system of noncontact photoacoustic tomography and optical coherence tomography,” Sensors, vol. 16, no. 5, p. 734, 2016.
[188] T. Berer, E. Leiss-Holzinger, A. Hochreiner, J. Bauer-Marschallinger, and A. Buchsbaum, “Multimodal noncontact photoacoustic and optical coherence tomography imaging using wavelength-division multiplexing,” Journal of biomedical optics, vol. 20, no. 4, p. 046013, 2015.
[189] L. Amar, “Detection d’omes elastiques (ultrasonores) sur l’os occipital, induites par impulsions laser dans l’oeil d’un lapin,” CR Acad. Sc. Paris, vol. 259, pp. 3653–3655, 1964.
[190] L. Amar, M. Bruma, M. Velghe, and P. Desvignes, “On the detection of laser induced ultrasonic waves in the human eye and the elaboration of a theory on the fundamental mechanism of vision,” Zeitschrift für angewandte Mathematik und Physik ZAMP, vol. 16, no. 1, pp. 182–183, 1965.
[191] Q. X. Chen, A. Davies, R. J. Dewhurst, and P. A. Payne, “Photo-acoustic probe for intra-arterial imaging and therapy,” Electronics Letters, vol. 29, no. 18, pp. 1632–1633, Sep. 1993, doi: 10.1049/el:19931087.
[192] V. Tsytsarev, K. I. Maslov, J. Yao, A. R. Parameswar, A. V. Demchenko, and L. V. Wang, “In vivo imaging of epileptic activity using 2-NBDG, a fluorescent deoxyglucose analog,” Journal of neuroscience methods, vol. 203, no. 1, pp. 136–140, 2012.
[193] M. R. Kelly-Goss et al., “Dynamic, heterogeneous endothelial Tie2 expression and capillary blood flow during microvascular remodeling,” Sci Rep, vol. 7, no. 1, p. 9049, Dec. 2017, doi: 10.1038/s41598-017-08982-z.
[194] C. Tian, W. Zhang, V. P. Nguyen, X. Wang, Z. Huang, and Y. M. Paulus, “Integrated photoacoustic microscopy, optical coherence tomography, and fluorescence microscopy for multimodal chorioretinal imaging,” in Photons Plus Ultrasound: Imaging and Sensing 2018, San Francisco, United States, Feb. 2018, p. 204. doi: 10.1117/12.2290594.
[195] L. Yan, C. Gao, B. Zhao, X. Ma, N. Zhuang, and H. Duan, “Non-destructive Imaging of Standard Cracks of Railway by Photoacoustic Piezoelectric Technology,” Int J Thermophys, vol. 33, no. 10, pp. 2001–2005, Nov. 2012, doi: 10.1007/s10765-012-1253-6.
[196] M. Sun, X. Lin, Z. Wu, Y. Liu, Y. Shen, and N. Feng, “Non-destructive photoacoustic detecting method for high-speed rail surface defects,” in 2014 IEEE International Instrumentation and Measurement Technology Conference (I2MTC) Proceedings, May 2014, pp. 896–900. doi: 10.1109/I2MTC.2014.6860871.
[197] S. Jeon, J. Kim, J. P. Yun, and C. Kim, “Non-destructive photoacoustic imaging of metal surface defects,” J. Opt., vol. 18, no. 11, p. 114001, Nov. 2016, doi: 10.1088/2040-8978/18/11/114001.
[198] H. Wu et al., “Beat frequency quartz-enhanced photoacoustic spectroscopy for fast and calibration-free continuous trace-gas monitoring,” Nature Communications, vol. 8, no. 1, Art. no. 1, May 2017, doi: 10.1038/ncomms15331.
[199] P. Patimisco, G. Scamarcio, F. K. Tittel, and V. Spagnolo, “Quartz-Enhanced Photoacoustic Spectroscopy: A Review,” Sensors, vol. 14, no. 4, Art. no. 4, Apr. 2014, doi: 10.3390/s140406165.
[200] G. J. Tserevelakis et al., “Photoacoustic imaging reveals hidden underdrawings in paintings,” Sci Rep, vol. 7, no. 1, p. 747, Dec. 2017, doi: 10.1038/s41598-017-00873-7.
[201] L. V. Wang and H. Wu, Biomedical optics: principles and imaging. John Wiley & Sons, 2012.

171
[202] M. Xu and L. V. Wang, “Photoacoustic imaging in biomedicine,” Review of Scientific Instruments, vol. 77, no. 4, p. 041101, Apr. 2006, doi: 10.1063/1.2195024.
[203] D.-K. Yao, C. Zhang, K. I. Maslov, and L. V. Wang, “Photoacoustic measurement of the Grüneisen parameter of tissue,” Journal of biomedical optics, vol. 19, no. 1, p. 017007, 2014.
[204] E. Petrova, S. Ermilov, R. Su, V. Nadvoretskiy, A. Conjusteau, and A. Oraevsky, “Using optoacoustic imaging for measuring the temperature dependence of Grüneisen parameter in optically absorbing solutions,” Opt. Express, vol. 21, no. 21, p. 25077, Oct. 2013, doi: 10.1364/OE.21.025077.
[205] L. V. Wang, “Tutorial on photoacoustic microscopy and computed tomography,” IEEE Journal of Selected Topics in Quantum Electronics, vol. 14, no. 1, pp. 171–179, 2008.
[206] Y. Liu, L. Nie, and X. Chen, “Photoacoustic Molecular Imaging: From Multiscale Biomedical Applications Towards Early-Stage Theranostics,” Trends in Biotechnology, vol. 34, no. 5, pp. 420–433, May 2016, doi: 10.1016/j.tibtech.2016.02.001.
[207] J. Xia, C. Huang, K. Maslov, M. A. Anastasio, and L. V. Wang, “Enhancement of photoacoustic tomography by ultrasonic computed tomography based on optical excitation of elements of a full-ring transducer array,” Opt. Lett., OL, vol. 38, no. 16, pp. 3140–3143, Aug. 2013, doi: 10.1364/OL.38.003140.
[208] H.-P. Brecht, R. Su, M. Fronheiser, S. A. Ermilov, A. Conjusteau, and A. A. Oraevsky, “Whole-body three-dimensional optoacoustic tomography system for small animals,” J. Biomed. Opt., vol. 14, no. 6, p. 064007, 2009, doi: 10.1117/1.3259361.
[209] J. K. Gamelin et al., “Curved array photoacoustic tomographic system for small animal imaging,” JBO, vol. 13, no. 2, p. 024007, Mar. 2008, doi: 10.1117/1.2907157.
[210] M. Toi et al., “Visualization of tumor-related blood vessels in human breast by photoacoustic imaging system with a hemispherical detector array,” Scientific Reports, vol. 7, no. 1, Art. no. 1, Feb. 2017, doi: 10.1038/srep41970.
[211] J. Xia, J. Yao, and L. V. Wang, “Photoacoustic tomography: principles and advances,” Electromagnetic waves (Cambridge, Mass.), vol. 147, p. 1, 2014.
[212] J. Xia et al., “Whole-body ring-shaped confocal photoacoustic computed tomography of small animals in vivo,” J. Biomed. Opt., vol. 17, no. 5, p. 050506, 2012, doi: 10.1117/1.JBO.17.5.050506.
[213] K. Maslov, G. Stoica, and L. V. Wang, “In vivo dark-field reflection-mode photoacoustic microscopy,” Opt. Lett., vol. 30, no. 6, p. 625, Mar. 2005, doi: 10.1364/OL.30.000625.
[214] K. Maslov, H. F. Zhang, S. Hu, and L. V. Wang, “Optical-resolution photoacoustic microscopy for in vivo imaging of single capillaries,” Opt. Lett., vol. 33, no. 9, p. 929, May 2008, doi: 10.1364/OL.33.000929.
[215] H. Azhari, Basics of biomedical ultrasound for engineers. John Wiley & Sons, 2010. [216] C. Zhang, K. I. Maslov, J. Yao, and L. V. Wang, “In vivo photoacoustic microscopy with 7.6-
µm axial resolution using a commercial 125-MHz ultrasonic transducer,” JBO, vol. 17, no. 11, p. 116016, Nov. 2012, doi: 10.1117/1.JBO.17.11.116016.
[217] H. F. Zhang, K. Maslov, G. Stoica, and L. V. Wang, “Functional photoacoustic microscopy for high-resolution and noninvasive in vivo imaging,” Nat Biotechnol, vol. 24, no. 7, pp. 848–851, Jul. 2006, doi: 10.1038/nbt1220.
[218] L.-D. Liao et al., “Imaging brain hemodynamic changes during rat forepaw electrical stimulation using functional photoacoustic microscopy,” NeuroImage, vol. 52, no. 2, pp. 562–570, Aug. 2010, doi: 10.1016/j.neuroimage.2010.03.065.
[219] V. Periyasamy, N. Das, A. Sharma, and M. Pramanik, “1064 nm acoustic resolution photoacoustic microscopy,” J. Biophotonics, vol. 12, no. 5, May 2019, doi: 10.1002/jbio.201800357.

172
[220] S. Hu and L. V. Wang, “Optical-Resolution Photoacoustic Microscopy: Auscultation of Biological Systems at the Cellular Level,” Biophysical Journal, vol. 105, no. 4, pp. 841–847, Aug. 2013, doi: 10.1016/j.bpj.2013.07.017.
[221] S.-L. Chen, L. J. Guo, and X. Wang, “All-optical photoacoustic microscopy,” Photoacoustics, vol. 3, no. 4, pp. 143–150, 2015.
[222] M. Moothanchery, R. Bi, J. Y. Kim, S. Jeon, C. Kim, and M. Olivo, “Optical resolution photoacoustic microscopy based on multimode fibers,” Biomed Opt Express, vol. 9, no. 3, pp. 1190–1197, Feb. 2018, doi: 10.1364/BOE.9.001190.
[223] D.-K. Yao, K. Maslov, K. K. Shung, Q. Zhou, and L. V. Wang, “In vivo label-free photoacoustic microscopy of cell nuclei by excitation of DNA and RNA,” Optics letters, vol. 35, no. 24, pp. 4139–4141, 2010.
[224] Y. Zhou, G. Li, L. Zhu, C. Li, L. A. Cornelius, and L. V. Wang, “Handheld photoacoustic probe to detect both melanoma depth and volume at high speed in vivo,” J. Biophoton, vol. 8, no. 11–12, pp. 961–967, Nov. 2015, doi: 10.1002/jbio.201400143.
[225] P. Wang et al., “High-speed Intravascular Photoacoustic Imaging of Lipid-laden Atherosclerotic Plaque Enabled by a 2-kHz Barium Nitrite Raman Laser,” Sci Rep, vol. 4, no. 1, p. 6889, May 2015, doi: 10.1038/srep06889.
[226] Z. Xu, Q. Zhu, and L. V. Wang, “In vivo photoacoustic tomography of mouse cerebral edema induced by cold injury,” J. Biomed. Opt., vol. 16, no. 6, p. 066020, 2011, doi: 10.1117/1.3584847.
[227] Y. Zhou, J. Yao, and L. V. Wang, “Tutorial on photoacoustic tomography,” J. Biomed. Opt, vol. 21, no. 6, p. 061007, Apr. 2016, doi: 10.1117/1.JBO.21.6.061007.
[228] G. P. Luke, D. Yeager, and S. Y. Emelianov, “Biomedical applications of photoacoustic imaging with exogenous contrast agents,” Annals of biomedical engineering, vol. 40, no. 2, pp. 422–437, 2012.
[229] E. M. Strohm, M. J. Moore, and M. C. Kolios, “Single Cell Photoacoustic Microscopy: A Review,” IEEE J. Select. Topics Quantum Electron., vol. 22, no. 3, pp. 137–151, May 2016, doi: 10.1109/JSTQE.2015.2497323.
[230] K. Homan, S. Mallidi, E. Cooley, and S. Emelianov, “Combined photoacoustic and ultrasound imaging of metal nanoparticles in vivo,” Nanoimaging, vol. 3, 2010.
[231] S. Kim, Y.-S. Chen, G. P. Luke, M. Mehrmohammadi, J. R. Cook, and S. Y. Emelianov, “Ultrasound and photoacoustic image-guided photothermal therapy using silica-coated gold nanorods: in-vivo study,” in 2010 IEEE International Ultrasonics Symposium, 2010, pp. 233–236.
[232] X. Yang, S. E. Skrabalak, Z.-Y. Li, Y. Xia, and L. V. Wang, “Photoacoustic tomography of a rat cerebral cortex in vivo with Au nanocages as an optical contrast agent,” Nano letters, vol. 7, no. 12, pp. 3798–3802, 2007.
[233] S. Yang et al., “Noninvasive monitoring of traumatic brain injury and post-traumatic rehabilitation with laser-induced photoacoustic imaging,” Applied Physics Letters, vol. 90, no. 24, p. 243902, 2007.
[234] J. L.-S. Su, B. Wang, and S. Y. Emelianov, “Photoacoustic imaging of coronary artery stents,” Optics Express, vol. 17, no. 22, pp. 19894–19901, 2009.
[235] T. Sowers and S. Emelianov, “Exogenous imaging contrast and therapeutic agents for intravascular photoacoustic imaging and image-guided therapy,” Phys. Med. Biol., vol. 63, no. 22, p. 22TR01, Nov. 2018, doi: 10.1088/1361-6560/aae62b.
[236] D.-K. Yao, K. Maslov, K. K. Shung, Q. Zhou, and L. V. Wang, “In vivo label-free photoacoustic microscopy of cell nuclei by excitation of DNA and RNA,” Opt. Lett., vol. 35, no. 24, p. 4139, Dec. 2010, doi: 10.1364/OL.35.004139.

173
[237] C. Zhang, Y. S. Zhang, D.-K. Yao, Y. Xia, and L. V. Wang, “Label-free photoacoustic microscopy of cytochromes,” Journal of biomedical optics, vol. 18, no. 2, p. 020504, 2013.
[238] B. Dong et al., “Isometric multimodal photoacoustic microscopy based on optically transparent micro-ring ultrasonic detection,” Optica, vol. 2, no. 2, pp. 169–176, 2015.
[239] K. Maslov and L. V. Wang, “Photoacoustic imaging of biological tissue with intensity-modulated continuous-wave laser,” J. Biomed. Opt., vol. 13, no. 2, p. 024006, 2008, doi: 10.1117/1.2904965.
[240] A. Petschke and P. J. La Rivière, “Comparison of intensity-modulated continuous-wave lasers with a chirped modulation frequency to pulsed lasers for photoacoustic imaging applications,” Biomed. Opt. Express, vol. 1, no. 4, p. 1188, Nov. 2010, doi: 10.1364/BOE.1.001188.
[241] H. F. Zhang, C. A. Puliafito, and S. Jiao, “Photoacoustic Ophthalmoscopy for In Vivo Retinal Imaging: Current Status and Prospects,” Ophthalmic Surg Lasers Imaging, vol. 42, no. 4, pp. S106–S115, Jul. 2011, doi: 10.3928/15428877-20110627-10.
[242] A. de La Zerda et al., “Photoacoustic ocular imaging,” Optics letters, vol. 35, no. 3, pp. 270–272, 2010.
[243] X. Wang, Y. Pang, G. Ku, X. Xie, G. Stoica, and L. V. Wang, “Noninvasive laser-induced photoacoustic tomography for structural and functional in vivo imaging of the brain,” Nature biotechnology, vol. 21, no. 7, pp. 803–806, 2003.
[244] H. F. Zhang, K. Maslov, G. Stoica, and L. V. Wang, “Imaging acute thermal burns by photoacoustic microscopy,” Journal of biomedical optics, vol. 11, no. 5, p. 054033, 2006.
[245] V. Ntziachristos, J. S. Yoo, and G. M. van Dam, “Current concepts and future perspectives on surgical optical imaging in cancer,” J. Biomed. Opt., vol. 15, no. 6, p. 066024, 2010, doi: 10.1117/1.3523364.
[246] G. Rousseau, A. Blouin, and J.-P. Monchalin, “Non-contact photoacoustic tomography and ultrasonography for tissue imaging,” Biomedical optics express, vol. 3, no. 1, pp. 16–25, 2012.
[247] B. Lengenfelder et al., “Contact‐free endoscopic photoacoustic sensing using speckle analysis,” Journal of biophotonics, vol. 12, no. 12, p. e201900130, 2019.
[248] M. Luukkala, P. Heikkila, and J. Surakka, “Plate wave resonance — a contactless test method,” Ultrasonics, vol. 9, no. 4, pp. 201–208, Oct. 1971, doi: 10.1016/0041-624X(71)90387-8.
[249] W. A. Grandia and C. M. Fortunko, “NDE applications of air-coupled ultrasonic transducers,” in 1995 IEEE Ultrasonics Symposium. Proceedings. An International Symposium, 1995, vol. 1, pp. 697–709.
[250] D. K. Hsu, “Nondestructive testing using air-borne ultrasound,” Ultrasonics, vol. 44, pp. e1019–e1024, 2006.
[251] A. J. Rogovsky, “Development and application of ultrasonic dry-contact and air-contact C-scan systems for nondestructive evaluation of aerospace composites,” Materials evaluation, vol. 49, no. 12, pp. 1491–1497, 1991.
[252] T. E. Gómez Álvarez-Arenas, F. R. Montero de Espinosa, M. Moner-Girona, E. Rodrı́guez, A. Roig, and E. Molins, “Viscoelasticity of silica aerogels at ultrasonic frequencies,” Appl. Phys. Lett., vol. 81, no. 7, pp. 1198–1200, Aug. 2002, doi: 10.1063/1.1499225.
[253] D. A. Hutchins, W. M. D. Wright, and D. W. Schindel, “Ultrasonic measurements in polymeric materials using air‐coupled capacitance transducers,” The Journal of the Acoustical Society of America, vol. 96, no. 3, pp. 1634–1642, Sep. 1994, doi: 10.1121/1.410243.
[254] B. Hosten, D. A. Hutchins, and D. W. Schindel, “Measurement of elastic constants in composite materials using air‐coupled ultrasonic bulk waves,” The Journal of the Acoustical Society of America, vol. 99, no. 4, pp. 2116–2123, Apr. 1996, doi: 10.1121/1.415398.

174
[255] C. Li, D. A. Hutchins, and R. J. Green, “Short-range ultrasonic communications in air using quadrature modulation,” IEEE transactions on ultrasonics, ferroelectrics, and frequency control, vol. 56, no. 10, pp. 2060–2072, 2009.
[256] F.-J. García-Diego, J. M. Bravo, J. Pérez-Miralles, H. Estrada, and A. Fernández-Navajas, “Development of a Low-Cost Airborne Ultrasound Sensor for the Detection of Brick Joints behind a Wall Painting,” Sensors, vol. 12, no. 2, Art. no. 2, Feb. 2012, doi: 10.3390/s120201299.
[257] D. Sancho-Knapik, T. Gómez Álvarez-Arenas, J. J. Peguero-Pina, and E. Gil-Pelegrín, “Air-coupled broadband ultrasonic spectroscopy as a new non-invasive and non-contact method for the determination of leaf water status,” J Exp Bot, vol. 61, no. 5, pp. 1385–1391, Mar. 2010, doi: 10.1093/jxb/erq001.
[258] D. Sancho-Knapik, H. Calas, J. J. Peguero-Pina, A. Ramos Fernandez, E. Gil-Pelegrin, and T. E. Gomez Alvarez-Arenas, “Air-coupled ultrasonic resonant spectroscopy for the study of the relationship between plant leaves’ elasticity and their water content,” IEEE Transactions on Ultrasonics, Ferroelectrics, and Frequency Control, vol. 59, no. 2, pp. 319–325, Feb. 2012, doi: 10.1109/TUFFC.2012.2194.
[259] E. Corona, J. V. Garcia-Perez, T. E. Gomez Alvarez-Arenas, N. Watson, M. J. W. Povey, and J. Benedito, “Advances in the ultrasound characterization of dry-cured meat products,” Journal of Food Engineering, vol. 119, no. 3, pp. 464–470, Dec. 2013, doi: 10.1016/j.jfoodeng.2013.06.023.
[260] T.-I. Chiu, H.-C. Deng, S.-Y. Chang, and S.-B. Luo, “Implementation of ultrasonic touchless interactive panel using the polymer-based CMUT array,” in 2009 IEEE SENSORS, Oct. 2009, pp. 625–630. doi: 10.1109/ICSENS.2009.5398325.
[261] G. R. McMillan, “The technology and applications of gesture-based control,” NASA, no. 19990007890, 1998.
[262] T. E. Gómez Álvarez-Arenas, J. Camacho, and C. Fritsch, “Passive focusing techniques for piezoelectric air-coupled ultrasonic transducers,” Ultrasonics, vol. 67, pp. 85–93, Apr. 2016, doi: 10.1016/j.ultras.2016.01.001.
[263] B. T. Khuri-Yakub, J. H. Kim, C.-H. Chou, P. Parent, and G. S. Kino, “A new design for air transducers,” in IEEE 1988 Ultrasonics Symposium Proceedings., 1988, pp. 503–506.
[264] T. Yano, M. Tone, and A. Fukumoto, “Range finding and surface characterization using high-frequency air transducers,” IEEE transactions on ultrasonics, ferroelectrics, and frequency control, vol. 34, no. 2, pp. 232–236, 1987.
[265] W. Manthey, N. Kroemer, and V. Magori, “Ultrasonic transducers and transducer arrays for applications in air,” Measurement Science and Technology, vol. 3, no. 3, p. 249, 1992.
[266] D. W. Schindel, D. A. Hutchins, L. Zou, and M. Sayer, “The design and characterization of micromachined air-coupled capacitance transducers,” IEEE Transactions on ultrasonics, ferroelectrics, and frequency control, vol. 42, no. 1, pp. 42–50, 1995.
[267] L. Svilainis, A. Chaziachmetovas, and V. Dumbrava, “Efficient high voltage pulser for piezoelectric air coupled transducer,” Ultrasonics, vol. 53, no. 1, pp. 225–231, 2013.
[268] D. Hutchins, P. Burrascano, L. Davis, S. Laureti, and M. Ricci, “Coded waveforms for optimised air-coupled ultrasonic nondestructive evaluation,” Ultrasonics, vol. 54, no. 7, pp. 1745–1759, 2014.
[269] T. H. Gan, D. A. Hutchins, and R. J. Green, “Swept Frequency Multiplication (SFM) Techniques for Improved Air‐Coupled Ultrasonic NDE,” in AIP Conference Proceedings, 2003, vol. 657, no. 1, pp. 620–627.
[270] A. Turo et al., “Ultra-low noise front-end electronics for air-coupled ultrasonic non-destructive evaluation,” NDT & e International, vol. 36, no. 2, pp. 93–100, 2003.

175
[271] R. G. Kolkman et al., “Feasibility of noncontact piezoelectric detection of photoacoustic signals in tissue-mimicking phantoms,” Journal of biomedical optics, vol. 15, no. 5, p. 055011, 2010.
[272] X. L. Deán-Ben, G. A. Pang, F. Montero de Espinosa, and D. Razansky, “Non-contact optoacoustic imaging with focused air-coupled transducers,” Applied Physics Letters, vol. 107, no. 5, p. 051105, 2015.
[273] K. Sathiyamoorthy, E. M. Strohm, and M. C. Kolios, “Low-power noncontact photoacoustic microscope for bioimaging applications,” Journal of biomedical optics, vol. 22, no. 4, p. 046001, 2017.
[274] J.-P. Monchalin, “Optical Detection of Ultrasound,” IEEE Transactions on Ultrasonics, Ferroelectrics, and Frequency Control, vol. 33, no. 5, pp. 485–499, Sep. 1986, doi: 10.1109/T-UFFC.1986.26860.
[275] S.-L. Chen, “Review of Laser-Generated Ultrasound Transmitters and Their Applications to All-Optical Ultrasound Transducers and Imaging,” Applied Sciences, vol. 7, no. 1, Art. no. 1, Jan. 2017, doi: 10.3390/app7010025.
[276] Z. Xie, S.-L. Chen, T. Ling, L. J. Guo, P. L. Carson, and X. Wang, “Pure optical photoacoustic microscopy,” Optics express, vol. 19, no. 10, pp. 9027–9034, 2011.
[277] E. Z. Zhang, J. G. Laufer, R. B. Pedley, and P. C. Beard, “In vivohigh-resolution 3D photoacoustic imaging of superficial vascular anatomy,” Phys. Med. Biol., vol. 54, no. 4, pp. 1035–1046, Jan. 2009, doi: 10.1088/0031-9155/54/4/014.
[278] S.-L. Chen, Z. Xie, T. Ling, L. J. Guo, X. Wei, and X. Wang, “Miniaturized all-optical photoacoustic microscopy based on microelectromechanical systems mirror scanning,” Opt. Lett., OL, vol. 37, no. 20, pp. 4263–4265, Oct. 2012, doi: 10.1364/OL.37.004263.
[279] R. Ansari, E. Z. Zhang, A. E. Desjardins, and P. C. Beard, “All-optical forward-viewing photoacoustic probe for high-resolution 3D endoscopy,” Light Sci Appl, vol. 7, no. 1, p. 75, Dec. 2018, doi: 10.1038/s41377-018-0070-5.
[280] S.-L. Chen, Z. Xie, L. J. Guo, and X. Wang, “A fiber-optic system for dual-modality photoacoustic microscopy and confocal fluorescence microscopy using miniature components,” Photoacoustics, vol. 1, no. 2, pp. 30–35, May 2013, doi: 10.1016/j.pacs.2013.07.001.
[281] R. A. Barnes, S. Maswadi, R. Glickman, and M. Shadaram, “Probe beam deflection technique as acoustic emission directionality sensor with photoacoustic emission source,” Appl. Opt., vol. 53, no. 3, p. 511, Jan. 2014, doi: 10.1364/AO.53.000511.
[282] R. Nuster, G. Zangerl, M. Haltmeier, and G. Paltauf, “Full field detection in photoacoustic tomography,” Opt. Express, OE, vol. 18, no. 6, pp. 6288–6299, Mar. 2010, doi: 10.1364/OE.18.006288.
[283] R. Nuster, P. Slezak, and G. Paltauf, “High resolution three-dimensional photoacoustic tomography with CCD-camera based ultrasound detection,” Biomedical optics express, vol. 5, no. 8, pp. 2635–2647, 2014.
[284] K. P. Köstli, M. Frenz, H. P. Weber, G. Paltauf, and H. Schmidt-Kloiber, “Optoacoustic tomography: time-gated measurement of pressure distributions and image reconstruction,” Appl. Opt., AO, vol. 40, no. 22, pp. 3800–3809, Aug. 2001, doi: 10.1364/AO.40.003800.
[285] E. Bossy and S. Gigan, “Photoacoustics with coherent light,” Photoacoustics, vol. 4, no. 1, pp. 22–35, Mar. 2016, doi: 10.1016/j.pacs.2016.01.003.
[286] D. A. Boas and A. K. Dunn, “Laser speckle contrast imaging in biomedical optics,” J. Biomed. Opt., vol. 15, no. 1, p. 011109, 2010, doi: 10.1117/1.3285504.
[287] C. B. Burckhardt, “Speckle in ultrasound B-mode scans,” IEEE Transactions on Sonics and ultrasonics, vol. 25, no. 1, pp. 1–6, 1978.
[288] J.-S. Lee, “Speckle analysis and smoothing of synthetic aperture radar images,” Computer graphics and image processing, vol. 17, no. 1, pp. 24–32, 1981.

176
[289] J. M. Schmitt, S. H. Xiang, and K. M. Yung, “Speckle in optical coherence tomography,” Journal of biomedical optics, vol. 4, no. 1, pp. 95–106, 1999.
[290] B. Lengenfelder et al., “Remote photoacoustic sensing using speckle-analysis,” Scientific reports, vol. 9, no. 1, pp. 1–11, 2019.
[291] M. Benyamin, H. Genish, R. Califa, A. Schwartz, Z. Zalevsky, and N. Ozana, “Non-contact photoacoustic imaging using laser speckle contrast analysis,” Optics letters, vol. 44, no. 12, pp. 3110–3113, 2019.
[292] C. Buj, J. Horstmann, M. Münter, and R. Brinkmann, “Speckle-based off-axis holographic detection for non-contact photoacoustic tomography,” Current Directions in Biomedical Engineering, vol. 1, no. 1, pp. 356–360, 2015.
[293] Z. Guo, L. Li, and L. V. Wang, “On the speckle‐free nature of photoacoustic tomography,” Medical physics, vol. 36, no. 9Part1, pp. 4084–4088, 2009.
[294] Z. Zalevsky et al., “Simultaneous remote extraction of multiple speech sources and heart beats from secondary speckles pattern,” Optics express, vol. 17, no. 24, pp. 21566–21580, 2009.
[295] S. Lévêque, A. C. Boccara, M. Lebec, and H. Saint-Jalmes, “Ultrasonic tagging of photon paths in scattering media:?parallel speckle modulation processing,” Opt. Lett., vol. 24, no. 3, p. 181, Feb. 1999, doi: 10.1364/OL.24.000181.
[296] S. Lévêque-Fort, “Three-dimensional acousto-optic imaging in biological tissues with parallel signal processing,” Applied Optics, vol. 40, no. 7, pp. 1029–1036, 2001.
[297] G. Yao and L. V. Wang, “Theoretical and experimental studies of ultrasound-modulated optical tomography in biological tissue,” Appl. Opt., vol. 39, no. 4, p. 659, Feb. 2000, doi: 10.1364/AO.39.000659.
[298] G. Yao, S. Jiao, and L. V. Wang, “Frequency-swept ultrasound-modulated optical tomography in biological tissue by use of parallel detection,” Opt. Lett., vol. 25, no. 10, p. 734, May 2000, doi: 10.1364/OL.25.000734.
[299] J. Li and L. V. Wang, “Methods for parallel-detection-based ultrasound-modulated optical tomography,” Applied optics, vol. 41, no. 10, pp. 2079–2084, 2002.
[300] C. Buj, M. Münter, B. Schmarbeck, J. Horstmann, G. Hüttmann, and R. Brinkmann, “Noncontact holographic detection for photoacoustic tomography,” JBO, vol. 22, no. 10, p. 106007, Oct. 2017, doi: 10.1117/1.JBO.22.10.106007.
[301] J. Horstmann, H. Spahr, C. Buj, M. Münter, and R. Brinkmann, “Full-field speckle interferometry for non-contact photoacoustic tomography,” Physics in Medicine & Biology, vol. 60, no. 10, p. 4045, 2015.
[302] H. Li, F. Cao, and P. Lai, “Interferometry-free noncontact photoacoustic detection method based on speckle correlation change,” Optics letters, vol. 44, no. 22, pp. 5481–5484, 2019.
[303] U. Sangawa, T. Iwamoto, Y. Kaneko, and M. Hashimoto, “Palm sized airborne ultrasonic sensor with nanofoam acoustic lens and homodyne interferometer,” in 2010 IEEE International Ultrasonics Symposium, Oct. 2010, pp. 1442–1445. doi: 10.1109/ULTSYM.2010.5935546.
[304] “Measurement of in-plane and out-of-plane ultrasonic displacements by optical heterodyne interferometry | SpringerLink.” https://link.springer.com/article/10.1007/BF00565636 (accessed May 13, 2020).
[305] W. Li, X. Yu, Z. Meng, Y. Jin, and J. Zhang, “Experimental study of balanced optical homodyne and heterodyne detection by controlling sideband modulation,” Sci. China Phys. Mech. Astron., vol. 58, no. 10, p. 104201, Oct. 2015, doi: 10.1007/s11433-015-5718-z.
[306] M. J. Collett, R. Loudon, and C. W. Gardiner, “Quantum Theory of Optical Homodyne and Heterodyne Detection,” Journal of Modern Optics, vol. 34, no. 6–7, pp. 881–902, Jun. 1987, doi: 10.1080/09500348714550811.

177
[307] S. Jacob, C. Johansson, M. Ulfendahl, and A. Fridberger, “A digital heterodyne laser interferometer for studying cochlear mechanics,” Journal of neuroscience methods, vol. 179, no. 2, pp. 271–277, 2009.
[308] E. Zhang et al., “Laser heterodyne interferometric signal processing method based on rising edge locking with high frequency clock signal,” Optics express, vol. 21, no. 4, pp. 4638–4652, 2013.
[309] G. De Vine et al., “Picometer level displacement metrology with digitally enhanced heterodyne interferometry,” Optics express, vol. 17, no. 2, pp. 828–837, 2009.
[310] A. J. A. Bruinsma and J. A. Vogel, “Ultrasonic noncontact inspection system with optical fiber methods,” Appl. Opt., AO, vol. 27, no. 22, pp. 4690–4695, Nov. 1988, doi: 10.1364/AO.27.004690.
[311] G. A. Massey, “An optical heterodyne ultrasonic image converter,” Proceedings of the IEEE, vol. 56, no. 12, pp. 2157–2161, 1968.
[312] K. Krzempek et al., “Multi-pass cell-assisted photoacoustic/photothermal spectroscopy of gases using quantum cascade laser excitation and heterodyne interferometric signal detection,” Appl. Phys. B, vol. 124, no. 5, p. 74, May 2018, doi: 10.1007/s00340-018-6941-x.
[313] K. Krzempek, G. Dudzik, K. Abramski, G. Wysocki, P. Jaworski, and M. Nikodem, “Heterodyne interferometric signal retrieval in photoacoustic spectroscopy,” Opt. Express, OE, vol. 26, no. 2, pp. 1125–1132, Jan. 2018, doi: 10.1364/OE.26.001125.
[314] J. Eom, S. J. Park, and B. H. Lee, “Noncontact photoacoustic tomography of in vivo chicken chorioallantoic membrane based on all-fiber heterodyne interferometry,” Journal of biomedical optics, vol. 20, no. 10, p. 106007, 2015.
[315] S. A. Carp, A. Guerra III, S. Q. Duque Jr, and V. Venugopalan, “Optoacoustic imaging using interferometric measurement of surface displacement,” Applied Physics Letters, vol. 85, no. 23, pp. 5772–5774, 2004.
[316] S. J. Park, J. Eom, Y. H. Kim, C. S. Lee, and B. H. Lee, “Noncontact photoacoustic imaging based on all-fiber heterodyne interferometer,” Optics letters, vol. 39, no. 16, pp. 4903–4906, 2014.
[317] C. Tian et al., “Non-contact photoacoustic imaging using a commercial heterodyne interferometer,” IEEE sensors journal, vol. 16, no. 23, pp. 8381–8388, 2016.
[318] T. Berer, A. Hochreiner, S. Zamiri, and P. Burgholzer, “Remote photoacoustic imaging on solid material using a two-wave mixing interferometer,” Optics letters, vol. 35, no. 24, pp. 4151–4153, 2010.
[319] S. Zamiri, B. Reitinger, T. Berer, S. Bauer, and P. Burgholzer, “Determination of nanometer vibration amplitudes by using a homodyne photorefractive crystal interferometer,” Procedia Engineering, vol. 5, pp. 299–302, 2010.
[320] T. Honda, T. Yamashita, and H. Matsumoto, “Optical measurement of ultrasonic nanometer motion of rough surface by two-wave mixing in Bi12SiO20,” Japanese journal of applied physics, vol. 34, no. 7R, p. 3737, 1995.
[321] S. Luo, Y. Wang, Y. Luo, and C. Fan, “Study of two-wave-mixing interferometric method in ultrasonic detection using BSO crystal,” in 2012 IEEE International Conference on Mechatronics and Automation, 2012, pp. 1938–1942.
[322] C. B. Scruby and L. E. Drain, Laser ultrasonics techniques and applications. CRC press, 1990. [323] P. V. Chitnis, H. Lloyd, and R. H. Silverman, “An adaptive interferometric sensor for all-optical
photoacoustic microscopy,” in 2014 IEEE International Ultrasonics Symposium, Sep. 2014, pp. 353–356. doi: 10.1109/ULTSYM.2014.0087.

178
[324] A. Hochreiner, J. Bauer-Marschallinger, P. Burgholzer, B. Jakoby, and T. Berer, “Non-contact photoacoustic imaging using a fiber based interferometer with optical amplification,” Biomedical optics express, vol. 4, no. 11, pp. 2322–2331, 2013.
[325] A. Hochreiner, T. Berer, H. Grün, M. Leitner, and P. Burgholzer, “Photoacoustic imaging using an adaptive interferometer with a photorefractive crystal,” Journal of biophotonics, vol. 5, no. 7, pp. 508–517, 2012.
[326] D. George, H. Lloyd, R. H. Silverman, and P. V. Chitnis, “A frequency‐domain non‐contact photoacoustic microscope based on an adaptive interferometer,” Journal of biophotonics, vol. 11, no. 6, p. e201700278, 2018.
[327] B. Yu and A. Wang, “Grating-assisted demodulation of interferometric optical sensors,” Applied optics, vol. 42, no. 34, pp. 6824–6829, 2003.
[328] J. J. Alcoz, C. E. Lee, and H. F. Taylor, “Embedded fiber-optic Fabry-Perot ultrasound sensor,” IEEE Trans. Ultrason., Ferroelect., Freq. Contr., vol. 37, no. 4, pp. 302–306, Jul. 1990, doi: 10.1109/58.56491.
[329] Z. Chen, S. Yang, Y. Wang, and D. Xing, “Noncontact broadband all-optical photoacoustic microscopy based on a low-coherence interferometer,” Applied Physics Letters, vol. 106, no. 4, p. 043701, 2015.
[330] J. Liu, Z. Tang, Y. Wu, and Y. Wang, “Rapid and noncontact photoacoustic tomography imaging system using an interferometer with high-speed phase modulation technique,” Review of Scientific Instruments, vol. 86, no. 4, p. 044904, 2015.
[331] M. A. Choma, C. Yang, and J. A. Izatt, “Instantaneous quadrature low-coherence interferometry with 3×3 fiber-optic couplers,” Opt. Lett., vol. 28, no. 22, p. 2162, Nov. 2003, doi: 10.1364/OL.28.002162.
[332] S. Park, J. Lee, Y. Kim, and B. H. Lee, “Nanometer-Scale Vibration Measurement Using an Optical Quadrature Interferometer Based on 3 × 3 Fiber-Optic Coupler,” Sensors, vol. 20, no. 9, Art. no. 9, Jan. 2020, doi: 10.3390/s20092665.
[333] J. Lu, Y. Gao, Z. Ma, H. Zhou, R. K. Wang, and Y. Wang, “In vivo photoacoustic imaging of blood vessels using a homodyne interferometer with zero-crossing triggering,” Journal of biomedical optics, vol. 22, no. 3, p. 036002, 2017.
[334] J. Yao, “When pressure meets light: detecting the photoacoustic effect at the origin,” Light: Science & Applications, vol. 6, no. 6, pp. e17062–e17062, 2017.
[335] P. Hajireza, W. Shi, K. Bell, R. J. Paproski, and R. J. Zemp, “Non-interferometric photoacoustic remote sensing microscopy,” Light: Science & Applications, vol. 6, no. 6, pp. e16278–e16278, 2017.
[336] S. H. Jack, D. B. Hann, and C. A. Greated, “Influence of the acousto-optic effect on laser Doppler anemometry signals,” Review of Scientific Instruments, vol. 69, no. 12, pp. 4074–4081, Dec. 1998, doi: 10.1063/1.1149253.
[337] K. L. Bell, P. Hajireza, W. Shi, and R. J. Zemp, “Temporal evolution of low-coherence reflectrometry signals in photoacoustic remote sensing microscopy,” Appl. Opt., AO, vol. 56, no. 18, pp. 5172–5181, Jun. 2017, doi: 10.1364/AO.56.005172.
[338] K. Bell, P. Hajireza, and R. Zemp, “Scattering cross-sectional modulation in photoacoustic remote sensing microscopy,” Opt. Lett., OL, vol. 43, no. 1, pp. 146–149, Jan. 2018, doi: 10.1364/OL.43.000146.
[339] P. H. Reza, K. Bell, W. Shi, J. Shapiro, and R. J. Zemp, “Deep non-contact photoacoustic initial pressure imaging,” Optica, vol. 5, no. 7, pp. 814–820, 2018.
[340] B. R. Ecclestone et al., “Towards virtual biopsies of gastrointestinal tissues using photoacoustic remote sensing microscopy,” Quantitative Imaging in Medicine and Surgery, vol. 11, no. 3, pp. 1070077–1071077, Mar. 2021, doi: 10.21037/qims-20-722.

179
[341] S. Abbasi et al., “All-optical Reflection-mode Microscopic Histology of Unstained Human Tissues,” Scientific reports, vol. 9, no. 1, pp. 1–11, 2019.
[342] S. Abbasi et al., “Chromophore selective multi-wavelength photoacoustic remote sensing of unstained human tissues,” Biomed. Opt. Express, BOE, vol. 10, no. 11, pp. 5461–5469, Nov. 2019, doi: 10.1364/BOE.10.005461.
[343] K. L. Bell, P. H. Reza, and R. J. Zemp, “Real-time functional photoacoustic remote sensing microscopy,” Optics letters, vol. 44, no. 14, pp. 3466–3469, 2019.
[344] B. R. Ecclestone et al., “Three-dimensional virtual histology in unprocessed resected tissues with photoacoustic remote sensing (PARS) microscopy and optical coherence tomography (OCT),” Sci Rep, vol. 11, no. 1, p. 13723, Jul. 2021, doi: 10.1038/s41598-021-93222-8.
[345] B. R. Ecclestone et al., “Improving maximal safe brain tumor resection with photoacoustic remote sensing microscopy,” Scientific Reports, vol. 10, no. 1, Art. no. 1, Oct. 2020, doi: 10.1038/s41598-020-74160-3.
[346] S. Abbasi, K. Bell, and P. Haji Reza, “Rapid High-Resolution Mosaic Acquisition for Photoacoustic Remote Sensing,” Sensors, vol. 20, no. 4, p. 1027, 2020.
[347] S. Abbasi et al., “Chromophore selective multi-wavelength photoacoustic remote sensing of unstained human tissues,” Biomedical Optics Express, vol. 10, no. 11, pp. 5461–5469, 2019.
[348] X. Shu, H. Li, B. Dong, C. Sun, and H. F. Zhang, “Quantifying melanin concentration in retinal pigment epithelium using broadband photoacoustic microscopy,” Biomed. Opt. Express, BOE, vol. 8, no. 6, pp. 2851–2865, Jun. 2017, doi: 10.1364/BOE.8.002851.
[349] S. N. Hennen et al., “Photoacoustic tomography imaging and estimation of oxygen saturation of hemoglobin in ocular tissue of rabbits,” Experimental Eye Research, vol. 138, pp. 153–158, Sep. 2015, doi: 10.1016/j.exer.2015.05.022.
[350] S. Jeon et al., “In Vivo Photoacoustic Imaging of Anterior Ocular Vasculature: A Random Sample Consensus Approach,” Scientific Reports, vol. 7, no. 1, Art. no. 1, Jun. 2017, doi: 10.1038/s41598-017-04334-z.
[351] L. Chen and J. Xu, “OPTIMAL DELAUNAY TRIANGULATIONS,” Journal of Computational Mathematics, vol. 22, no. 2, pp. 299–308, 2004.
[352] Frangi, Alejandro F., Wiro J. Niessen, Koen L. Vincken, and Max A. Viergever. "Multiscale vessel enhancement filtering." In International conference on medical image computing and computer-assisted intervention, pp. 130-137. Springer, Berlin, Heidelberg, 1998.
[353] Abbasi, Saad, Kevan Bell, Benjamin Ecclestone, and Parsin Haji Reza. "Live feedback and 3D photoacoustic remote sensing." Quantitative Imaging in Medicine and Surgery 11, no. 3 (2021): 1033.
[354] J. Min, Y. Lv, L. Mao, Y. Gong, Q. Gu, and F. Wei, “A rodent model of anterior ischemic optic neuropathy (AION) based on laser photoactivation of verteporfin,” BMC Ophthalmol, vol. 18, no. 1, p. 304, Nov. 2018, doi: 10.1186/s12886-018-0937-5.
[355] M. Augustin, S. Fialová, C. Fischak, L. Schmetterer, C. K. Hitzenberger, and B. Baumann, “Ocular fundus pulsations within the posterior rat eye: Chorioscleral motion and response to elevated intraocular pressure,” Scientific Reports, vol. 7, no. 1, Art. no. 1, Aug. 2017, doi: 10.1038/s41598-017-09310-1.
[356] S. Hu, B. Rao, K. Maslov, and L. V. Wang, “Label-free photoacoustic ophthalmic angiography,” p. 3.
[357] F. C. Delori, R. H. Webb, and D. H. Sliney, “Maximum permissible exposures for ocular safety (ANSI 2000), with emphasis on ophthalmic devices,” J. Opt. Soc. Am. A, JOSAA, vol. 24, no. 5, pp. 1250–1265, May 2007, doi: 10.1364/JOSAA.24.001250.
[358] N. Suehira et al., “Three-beam spectral-domain optical coherence tomography for retinal imaging,” JBO, vol. 17, no. 10, p. 106001, Oct. 2012, doi: 10.1117/1.JBO.17.10.106001.

180
[359] R. H. Silverman et al., “High-Resolution Photoacoustic Imaging of Ocular Tissues,” Ultrasound in Medicine & Biology, vol. 36, no. 5, pp. 733–742, May 2010, doi: 10.1016/j.ultrasmedbio.2010.02.006.
[360] W. Liu et al., “In vivo corneal neovascularization imaging by optical-resolution photoacoustic microscopy,” Photoacoustics, vol. 2, no. 2, pp. 81–86, Jun. 2014, doi: 10.1016/j.pacs.2014.04.003.
[361] T. Buma, N. C. Conley, and S. W. Choi, “Multispectral photoacoustic microscopy of lipids using a pulsed supercontinuum laser,” Biomed. Opt. Express, BOE, vol. 9, no. 1, pp. 276–288, Jan. 2018, doi: 10.1364/BOE.9.000276.
[362] S. M. Park et al., “Quickly Alternating Green and Red Laser Source for Real-time Multispectral Photoacoustic Microscopy,” Photoacoustics, vol. 20, p. 100204, Dec. 2020, doi: 10.1016/j.pacs.2020.100204.
[363] K. H. Song, E. W. Stein, J. A. Margenthaler, and L. V. Wang, “Noninvasive photoacoustic identification of sentinel lymph nodes containing methylene blue in vivo in a rat model,” J Biomed Opt, vol. 13, no. 5, p. 054033, Oct. 2008, doi: 10.1117/1.2976427.
[364] G. Paltauf, R. Nuster, and M. Frenz, “Progress in biomedical photoacoustic imaging instrumentation toward clinical application,” Journal of Applied Physics, vol. 128, no. 18, p. 180907, Nov. 2020, doi: 10.1063/5.0028190.
[365] Z. Hosseinaee, Nima Abbasi, N. Pellegrino, L. Khalili, L. Mukhangaliyeva, and P. Haji Reza, “Functional and structural ophthalmic imaging using noncontact multimodal photoacoustic remote sensing microscopy and optical coherence tomography,” Sci Rep, vol. 11, no. 1, Art. no. 1, Jun. 2021, doi: 10.1038/s41598-021-90776-5.
[366] Y. Liang, L. Jin, B.-O. Guan, and L. Wang, “2 MHz multi-wavelength pulsed laser for functional photoacoustic microscopy,” Opt Lett, vol. 42, no. 7, pp. 1452–1455, Apr. 2017, doi: 10.1364/OL.42.001452.
[367] P. Hajireza, A. Forbrich, and R. J. Zemp, “Multifocus optical-resolution photoacoustic microscopy using stimulated Raman scattering and chromatic aberration,” Opt. Lett., OL, vol. 38, no. 15, pp. 2711–2713, Aug. 2013, doi: 10.1364/OL.38.002711.
[368] T. Cheng, W. Gao, X. Xue, T. Suzuki, and Y. Ohishi, “Experimental investigation of multiple Raman peak properties in a hundred-meter tellurite fiber,” Opt. Mater. Express, OME, vol. 6, no. 11, pp. 3438–3445, Nov. 2016, doi: 10.1364/OME.6.003438.
[369] L. Sirleto and M. A. Ferrara, “Fiber Amplifiers and Fiber Lasers Based on Stimulated Raman Scattering: A Review,” Micromachines (Basel), vol. 11, no. 3, Feb. 2020, doi: 10.3390/mi11030247.
[370] D. Koeplinger, M. Liu, and T. Buma, “Photoacoustic microscopy with a pulsed multi-color source based on stimulated Raman scattering,” in 2011 IEEE International Ultrasonics Symposium, Oct. 2011, pp. 296–299. doi: 10.1109/ULTSYM.2011.0071.
[371] Y. Zhou, S. Liang, M. Li, C. Liu, P. Lai, and L. Wang, “Optical-resolution photoacoustic microscopy with ultrafast dual-wavelength excitation,” Journal of Biophotonics, vol. 13, no. 6, p. e201960229, 2020, doi: https://doi.org/10.1002/jbio.201960229.
[372] Y. He, J. Shi, K. I. Maslov, R. Cao, and L. V. Wang, “Wave of single-impulse-stimulated fast initial dip in single vessels of mouse brains imaged by high-speed functional photoacoustic microscopy,” JBO, vol. 25, no. 6, p. 066501, Jun. 2020, doi: 10.1117/1.JBO.25.6.066501.
[373] H. Linnenbank et al., “Robust and rapidly tunable light source for SRS/CARS microscopy with low-intensity noise,” AP, vol. 1, no. 5, p. 055001, Sep. 2019, doi: 10.1117/1.AP.1.5.055001.
[374] T. Buma, J. L. Farland, and M. R. Ferrari, “Near-infrared multispectral photoacoustic microscopy using a graded-index fiber amplifier,” Photoacoustics, vol. 4, no. 3, pp. 83–90, Aug. 2016, doi: 10.1016/j.pacs.2016.08.002.

181
[375] C. Liu, J. Chen, Y. Zhang, J. Zhu, and L. Wang, “Five-wavelength optical-resolution photoacoustic microscopy of blood and lymphatic vessels,” AP, vol. 3, no. 1, p. 016002, Jan. 2021, doi: 10.1117/1.AP.3.1.016002.
[376] T. R. Hart, R. L. Aggarwal, and B. Lax, “Temperature Dependence of Raman Scattering in Silicon,” Phys. Rev. B, vol. 1, no. 2, pp. 638–642, Jan. 1970, doi: 10.1103/PhysRevB.1.638.
[377] M. Balkanski, R. F. Wallis, and E. Haro, “Anharmonic effects in light scattering due to optical phonons in silicon,” Phys. Rev. B, vol. 28, no. 4, pp. 1928–1934, Aug. 1983, doi: 10.1103/PhysRevB.28.1928.
[378] W.-C. Kim and D.-W. Park, “Analysis of Temperature Effects on Raman Silicon Photonic Devices,” J. Opt. Soc. Korea, JOSK, vol. 12, no. 4, pp. 288–297, Dec. 2008.
[379] S.-W. Cho et al., “Optimal Generation of Ten Individual Green-to-Red Raman Source for Wavelength-Dependent Real-Time OR-PAM Images,” IEEE Journal of Selected Topics in Quantum Electronics, vol. 25, no. 1, pp. 1–9, Jan. 2019, doi: 10.1109/JSTQE.2018.2869646.
[380] R. Stolen, “Polarization effects in fiber Raman and Brillouin lasers,” IEEE Journal of Quantum Electronics, vol. 15, no. 10, pp. 1157–1160, Oct. 1979, doi: 10.1109/JQE.1979.1069913.
[381] Z. Hosseinaee, L. Khalili, J. A. T. Simmons, K. Bell, K. Bell, and P. H. Reza, “Label-free, non-contact, in vivo ophthalmic imaging using photoacoustic remote sensing microscopy,” Opt. Lett., OL, vol. 45, no. 22, pp. 6254–6257, Nov. 2020, doi: 10.1364/OL.410171.
[382] Nonlinear Fiber Optics. Elsevier, 2019. doi: 10.1016/C2018-0-01168-8. [383] Arun, S., Vishal Choudhury, V. Balaswamy, and V. R. Supradeepa. "Stability analysis of high
power, octave spanning, continuous-wave supercontinuum sources based on cascaded Raman scattering in standard telecom fibers." OSA Continuum 1, no. 4 (2018): 1267-1276.
[384] J. Suda and P. G. Zverev, “Temperature Dependence of Raman Frequency Shift in SrWO4 Crystal Studied by Lattice Dynamical Calculations,” Crystals, vol. 9, no. 4, Art. no. 4, Apr. 2019, doi: 10.3390/cryst9040197.
[385] M. Zhi-Wei et al., “Influence of Temperature on Stimulated Raman Scattering in Single-Mode Silica Fibre,” Chinese Physics Letters, vol. 25, no. 11, pp. 3999–4002, 2008, doi: 10.1088/0256-307X/25/11/044.
[386] S. Martin-Lopez, M. Gonzalez-Herraez, P. Corredera, M. L. Hernanz, A. Carrasco, and J. A. Mendez, “Temperature effects on supercontinuum generation using a continuous-wave Raman fiber laser,” Optics Communications, vol. 267, no. 1, pp. 193–196, Nov. 2006, doi: 10.1016/j.optcom.2006.05.057.
[387] A. I. Sokolovskaya, A. D. Kudryavtseva, G. L. Brekhovskikh, and M. M. Suschinskiǐ, “Effect of Temperature on Stimulated Raman Scattering of Light in Substances with Various Kerr Constants,” Soviet Journal of Experimental and Theoretical Physics, vol. 30, p. 633, 1969.
[388] A. D. Kudryavtseva and A. I. Sokolovskaya, “Investigation of the self-focusing of light scattered in the stimulated Raman effect at different excitation levels,” Sov. J. Quantum Electron., vol. 4, no. 4, p. 531, Apr. 1974, doi: 10.1070/QE1974v004n04ABEH006804.
[389] Y. WAN, H. HU, Y. XU, Q. CHEN, Y. WANG, and D. GAO, “A Robust and Accurate Non-rigid Medical Image Registration Algorithm Based on Multi-level Deformable Model,” Iran J Public Health, vol. 46, no. 12, pp. 1679–1689, Dec. 2017.
[390] M. Hammer et al., “Diabetic patients with retinopathy show increased retinal venous oxygen saturation,” Graefes Arch Clin Exp Ophthalmol, vol. 247, no. 8, pp. 1025–1030, Aug. 2009, doi: 10.1007/s00417-009-1078-6.
[391] B. Khoobehi, K. Firn, H. Thompson, M. Reinoso, and J. Beach, “Retinal Arterial and Venous Oxygen Saturation Is Altered in Diabetic Patients,” Invest. Ophthalmol. Vis. Sci., vol. 54, no. 10, pp. 7103–7106, Oct. 2013, doi: 10.1167/iovs.13-12723.

182
[392] E. Vandewalle et al., “Oximetry in glaucoma: correlation of metabolic change with structural and functional damage,” Acta Ophthalmologica, vol. 92, no. 2, pp. 105–110, 2014, doi: https://doi.org/10.1111/aos.12011.
[393] O. B. Olafsdottir, S. H. Hardarson, M. S. Gottfredsdottir, A. Harris, and E. Stefánsson, “Retinal Oximetry in Primary Open-Angle Glaucoma,” Invest. Ophthalmol. Vis. Sci., vol. 52, no. 9, pp. 6409–6413, Aug. 2011, doi: 10.1167/iovs.10-6985.
[394] S. H. Hardarson and E. Stefánsson, “Oxygen Saturation in Central Retinal Vein Occlusion,” American Journal of Ophthalmology, vol. 150, no. 6, pp. 871–875, Dec. 2010, doi: 10.1016/j.ajo.2010.06.020.
[395] T. Eliasdottir, D. Bragason, S. Hardarson, and E. Stefánsson, “Retinal Oxygen Saturation is Affected in Central Retinal Vein Occlusion,” Invest. Ophthalmol. Vis. Sci., vol. 54, no. 15, pp. 46–46, Jun. 2013.
[396] L. G. HYMAN, A. M. LILIENFELD, F. L. FERRIS III, and S. L. FINE, “SENILE MACULAR DEGENERATION: A CASE-CONTROL STUDY,” American Journal of Epidemiology, vol. 118, no. 2, pp. 213–227, Aug. 1983, doi: 10.1093/oxfordjournals.aje.a113629.
[397] J. Landrum, R. Bone, and M. Kilburn, “The macular pigment: A possible role in protection from age-related macular degeneration,” vol. 38, pp. 537–538, 1997.
[398] J. Yi et al., “Visible light optical coherence tomography measures retinal oxygen metabolic response to systemic oxygenation,” Light: Science & Applications, vol. 4, no. 9, Art. no. 9, Sep. 2015, doi: 10.1038/lsa.2015.107.
[399] J. C. M. Lau and R. A. Linsenmeier, “Increased intraretinal PO2 in short-term diabetic rats,” Diabetes, vol. 63, no. 12, pp. 4338–4342, Dec. 2014, doi: 10.2337/db14-0101.
[400] S. Chen, X. Shu, P. L. Nesper, W. Liu, A. A. Fawzi, and H. F. Zhang, “Retinal oximetry in humans using visible-light optical coherence tomography [Invited],” Biomed Opt Express, vol. 8, no. 3, pp. 1415–1429, Feb. 2017, doi: 10.1364/BOE.8.001415.
[401] O. S. Finikova et al., “Oxygen microscopy by two-photon-excited phosphorescence,” Chemphyschem, vol. 9, no. 12, pp. 1673–1679, Aug. 2008, doi: 10.1002/cphc.200800296.
[402] Y. Ito and B. A. Berkowitz, “MR studies of retinal oxygenation,” Vision Res, vol. 41, no. 10–11, pp. 1307–1311, 2001, doi: 10.1016/s0042-6989(00)00258-3.
[403] R. N. Pittman, Measurement of Oxygen. Morgan & Claypool Life Sciences, 2011. Accessed: Feb. 18, 2021. [Online]. Available: http://www.ncbi.nlm.nih.gov/books/NBK54107/
[404] D. Schweitzer, E. Thamm, M. Hammer, and J. Kraft, “A new method for the measurement of oxygen saturation at the human ocular fundus,” International Ophthalmology, vol. 23, no. 4–6, pp. 347–353, 2001, doi: 10.1023/A:1014458815482.
[405] “Human macular pigment assessed by imaging fundus reflectometry,” Vision Research, vol. 29, no. 6, pp. 663–674, Jan. 1989, doi: 10.1016/0042-6989(89)90028-X.
[406] S. Chen, J. Yi, and H. F. Zhang, “Measuring oxygen saturation in retinal and choroidal circulations in rats using visible light optical coherence tomography angiography,” Biomed Opt Express, vol. 6, no. 8, pp. 2840–2853, Jul. 2015, doi: 10.1364/BOE.6.002840.
[407] D. Link et al., “Novel non-contact retina camera for the rat and its application to dynamic retinal vessel analysis,” Biomed Opt Express, vol. 2, no. 11, pp. 3094–3108, Oct. 2011, doi: 10.1364/BOE.2.003094.
[408] Z. Hosseinaee, J. A. Tummon Simmons, and P. H. Reza, “Dual-Modal Photoacoustic Imaging and Optical Coherence Tomography [Review],” Front. Phys., vol. 8, 2021, doi: 10.3389/fphy.2020.616618.
[409] Martell, Matthew T., Nathaniel JM Haven, and Roger J. Zemp. "Multimodal imaging with spectral-domain optical coherence tomography and photoacoustic remote sensing microscopy." Optics Letters 45, no. 17 (2020): 4859-4862.

183
[410] X. Wang, G. Ku, M. A. Wegiel, D. J. Bornhop, G. Stoica, and L. V. Wang, “Noninvasive photoacoustic angiography of animal brains in vivo with near-infrared light and an optical contrast agent,” Opt. Lett., OL, vol. 29, no. 7, pp. 730–732, Apr. 2004, doi: 10.1364/OL.29.000730.
[411] S. O. Abu-Sardanah, C. Subramaniam, S. Abbasi, and P. H. Reza, “A comprehensive characterization of a stimulated Raman scattering fiber-laser source for multi-wavelength dependent photoacoustic microscopy techniques (Conference Presentation),” in Photons Plus Ultrasound: Imaging and Sensing 2020, Mar. 2020, vol. 11240, p. 1124024. doi: 10.1117/12.2545195.
[412] O. O. Ahsen et al., “Swept source optical coherence microscopy using a 1310 nm VCSEL light source,” Opt. Express, OE, vol. 21, no. 15, pp. 18021–18033, Jul. 2013, doi: 10.1364/OE.21.018021.
[413] B. Cense et al., “Ultrahigh-resolution high-speed retinal imaging using spectral-domain optical coherence tomography,” Opt. Express, OE, vol. 12, no. 11, pp. 2435–2447, May 2004, doi: 10.1364/OPEX.12.002435.
[414] C. A. Schneider, W. S. Rasband, and K. W. Eliceiri, “NIH Image to ImageJ: 25 years of image analysis,” Nature Methods, vol. 9, no. 7, Art. no. 7, Jul. 2012, doi: 10.1038/nmeth.2089.
[415] “ANSI Z136.1-2014: Safe Use of Lasers - ANSI Blog,” The ANSI Blog, Jul. 24, 2015. https://blog.ansi.org/2015/07/ansi-z1361-2014-safe-use-of-lasers/ (accessed Sep. 13, 2020).
[416] S. Hariri, A. A. Moayed, A. Dracopoulos, C. Hyun, S. Boyd, and K. Bizheva, “Limiting factors to the OCT axial resolution for in-vivo imaging of human and rodent retina in the 1060nm wavelength range,” Opt. Express, vol. 17, no. 26, p. 24304, Dec. 2009, doi: 10.1364/OE.17.024304.
[417] E. Eriksson, J. V. Boykin, and R. N. Pittman, “Method for in vivo microscopy of the cutaneous microcirculation of the hairless mouse ear,” Microvasc Res, vol. 19, no. 3, pp. 374–379, May 1980, doi: 10.1016/0026-2862(80)90056-4.
[418] S. G. Ye, K. A. Harasiewicz, C. J. Pavlin, and F. S. Foster, “Ultrasound characterization of normal ocular tissue in the frequency range from 50 MHz to 100 MHz,” IEEE Transactions on Ultrasonics, Ferroelectrics, and Frequency Control, vol. 42, no. 1, pp. 8–14, Jan. 1995, doi: 10.1109/58.368319.
[419] M. Hammer, S. Leistritz, L. Leistritz, and D. Schweitzer, “Light paths in retinal vessel oxymetry,” IEEE Trans Biomed Eng, vol. 48, no. 5, pp. 592–598, May 2001, doi: 10.1109/10.918598.
[420] I.-T. L, R. A, S. A, W. S, B. R, and M. C, “Retinal pigment epithelial integrity is compromised in the developing albino mouse retina.,” J Comp Neurol, vol. 524, no. 18, pp. 3696–3716, May 2016, doi: 10.1002/cne.24025.
[421] R. Cao et al., “Photoacoustic microscopy reveals the hemodynamic basis of sphingosine 1-phosphate-induced neuroprotection against ischemic stroke,” Theranostics, vol. 8, no. 22, pp. 6111–6120, Nov. 2018, doi: 10.7150/thno.29435.
[422] C. Liu, Y. Liang, and L. Wang, “Optical-resolution photoacoustic microscopy of oxygen saturation with nonlinear compensation,” Biomed Opt Express, vol. 10, no. 6, pp. 3061–3069, May 2019, doi: 10.1364/BOE.10.003061.
[423] I. M. Hogeboom van Buggenum, G. L. van der Heijde, G. J. Tangelder, and J. W. Reichert-Thoen, “Ocular oxygen measurement.,” Br J Ophthalmol, vol. 80, no. 6, pp. 567–573, Jun. 1996.
[424] L. V. Wang, “Prospects of photoacoustic tomography,” Med Phys, vol. 35, no. 12, pp. 5758–5767, Dec. 2008, doi: 10.1118/1.3013698.

184
[425] H. Chen, M. M. Rogalski, and J. N. Anker, “Advances in functional X-ray imaging techniques and contrast agents,” Phys Chem Chem Phys, vol. 14, no. 39, pp. 13469–13486, Oct. 2012, doi: 10.1039/c2cp41858d.
[426] D. A. Antonetti, R. Klein, and T. W. Gardner, “Diabetic retinopathy,” N Engl J Med, vol. 366, no. 13, pp. 1227–1239, Mar. 2012, doi: 10.1056/NEJMra1005073.
[427] N. D. Wangsa-Wirawan and R. A. Linsenmeier, “Retinal oxygen: fundamental and clinical aspects,” Arch Ophthalmol, vol. 121, no. 4, pp. 547–557, Apr. 2003, doi: 10.1001/archopht.121.4.547.
[428] T. A. Ciulla et al., “Color Doppler imaging discloses reduced ocular blood flow velocities in nonexudative age-related macular degeneration,” Am J Ophthalmol, vol. 128, no. 1, pp. 75–80, Jul. 1999, doi: 10.1016/s0002-9394(99)00061-6.
[429] T. S. Eliasdottir, “Retinal oximetry and systemic arterial oxygen levels,” Acta Ophthalmol, vol. 96 Suppl A113, pp. 1–44, Nov. 2018, doi: 10.1111/aos.13932.
[430] B. A. Berkowitz and C. A. Wilson, “Quantitative mapping of ocular oxygenation using magnetic resonance imaging,” Magn Reson Med, vol. 33, no. 4, pp. 579–581, Apr. 1995, doi: 10.1002/mrm.1910330419.
[431] A. Harris, R. B. Dinn, L. Kagemann, and E. Rechtman, “A review of methods for human retinal oximetry,” Ophthalmic Surg Lasers Imaging, vol. 34, no. 2, pp. 152–164, Apr. 2003.
[432] Z. Huang et al., “Retinal choroidal vessel imaging based on multi-wavelength fundus imaging with the guidance of optical coherence tomography,” Biomed. Opt. Express, BOE, vol. 11, no. 9, pp. 5212–5224, Sep. 2020, doi: 10.1364/BOE.397750.
[433] P. F. Sharp, A. Manivannan, H. Xu, and J. V. Forrester, “The scanning laser ophthalmoscope—a review of its role in bioscience and medicine,” Phys. Med. Biol., vol. 49, no. 7, pp. 1085–1096, Mar. 2004, doi: 10.1088/0031-9155/49/7/001.
[434] D. G. Buerk, R. D. Shonat, C. E. Riva, and S. D. Cranstoun, “O2 gradients and countercurrent exchange in the cat vitreous humor near retinal arterioles and venules,” Microvasc Res, vol. 45, no. 2, pp. 134–148, Mar. 1993, doi: 10.1006/mvre.1993.1013.
[435] M. Hammer, W. Vilser, T. Riemer, and D. Schweitzer, “Retinal vessel oximetry-calibration, compensation for vessel diameter and fundus pigmentation, and reproducibility,” J Biomed Opt, vol. 13, no. 5, p. 054015, Oct. 2008, doi: 10.1117/1.2976032.
[436] W. Liu, S. Jiao, and H. F. Zhang, “Accuracy of retinal oximetry: a Monte Carlo investigation,” J Biomed Opt, vol. 18, no. 6, p. 066003, Jun. 2013, doi: 10.1117/1.JBO.18.6.066003.
[437] S. Jiao et al., “Photoacoustic ophthalmoscopy for in vivo retinal imaging,” Opt Express, vol. 18, no. 4, pp. 3967–3972, Feb. 2010, doi: 10.1364/OE.18.003967.
[438] J. Yao and L. V. Wang, “Sensitivity of photoacoustic microscopy,” Photoacoustics, vol. 2, no. 2, pp. 87–101, Jun. 2014, doi: 10.1016/j.pacs.2014.04.002.
[439] W. Zhang et al., “Simultaneous photoacoustic microscopy, spectral-domain optical coherence tomography, and fluorescein microscopy multi-modality retinal imaging,” Photoacoustics, vol. 20, p. 100194, Dec. 2020, doi: 10.1016/j.pacs.2020.100194.
[440] W. Song et al., “A combined method to quantify the retinal metabolic rate of oxygen using photoacoustic ophthalmoscopy and optical coherence tomography,” Scientific Reports, vol. 4, no. 1, Art. no. 1, Oct. 2014, doi: 10.1038/srep06525.
[441] Z. Hosseinaee et al., “Functional photoacoustic remote sensingmicroscopy using a stabilized temperature-regulated stimulated Raman scattering light source,” Optics Express, Aug. 2021, doi: 10.1364/OE.434004.
[442] D. C. Lozano and M. D. Twa, “Development of a Rat Schematic Eye From In Vivo Biometry and the Correction of Lateral Magnification in SD-OCT Imaging,” Invest. Ophthalmol. Vis. Sci., vol. 54, no. 9, pp. 6446–6455, Sep. 2013, doi: 10.1167/iovs.13-12575.

185
[443] M. Gehrung, S. E. Bohndiek, and J. Brunker, “Development of a blood oxygenation phantom for photoacoustic tomography combined with online pO2 detection and flow spectrometry,” JBO, vol. 24, no. 12, p. 121908, Oct. 2019, doi: 10.1117/1.JBO.24.12.121908.
[444] R. Bulsink, M. Kuniyil Ajith Singh, M. Xavierselvan, S. Mallidi, W. Steenbergen, and K. J. Francis, “Oxygen Saturation Imaging Using LED-Based Photoacoustic System,” Sensors (Basel), vol. 21, no. 1, p. 283, Jan. 2021, doi: 10.3390/s21010283.
[445] 14:00-17:00, “ISO 80601-2-61:2017,” ISO. https://www.iso.org/cms/render/live/en/sites/isoorg/contents/data/standard/06/79/67963.html (accessed Sep. 08, 2021).
[446] C. Liu, Y. Liang, and L. Wang, “Optical-resolution photoacoustic microscopy of oxygen saturation with nonlinear compensation,” Biomed. Opt. Express, vol. 10, no. 6, p. 3061, Jun. 2019, doi: 10.1364/BOE.10.003061.
[447] J. Beach, “Pathway to Retinal Oximetry,” Transl Vis Sci Technol, vol. 3, no. 5, p. 2, Sep. 2014, doi: 10.1167/tvst.3.5.2.
[448] Gray, L. H., and J. M. Steadman. "Determination of the oxyhaemoglobin dissociation curves for mouse and rat blood." The Journal of physiology 175, no. 2 (1964): 161-171.
[449] W. M. Harmening, P. Tiruveedhula, A. Roorda, and L. C. Sincich, “Measurement and correction of transverse chromatic offsets for multi-wavelength retinal microscopy in the living eye,” Biomed Opt Express, vol. 3, no. 9, pp. 2066–2077, Aug. 2012, doi: 10.1364/BOE.3.002066.
[450] S. Remtulla and P. E. Hallett, “A schematic eye for the mouse, and comparisons with the rat,” Vision Res, vol. 25, no. 1, pp. 21–31, 1985, doi: 10.1016/0042-6989(85)90076-8.
[451] H. Radhakrishnan and V. J. Srinivasan, “Multiparametric optical coherence tomography imaging of the inner retinal hemodynamic response to visual stimulation,” J Biomed Opt, vol. 18, no. 8, p. 86010, Aug. 2013, doi: 10.1117/1.JBO.18.8.086010.
[452] C. Tian, W. Zhang, A. Mordovanakis, X. Wang, and Y. M. Paulus, “Noninvasive chorioretinal imaging in living rabbits using integrated photoacoustic microscopy and optical coherence tomography,” Opt. Express, OE, vol. 25, no. 14, pp. 15947–15955, Jul. 2017, doi: 10.1364/OE.25.015947.
[453] D. Sliney et al., “Adjustment of guidelines for exposure of the eye to optical radiation from ocular instruments: statement from a task group of the International Commission on Non-Ionizing Radiation Protection (ICNIRP),” Appl. Opt., AO, vol. 44, no. 11, pp. 2162–2176, Apr. 2005, doi: 10.1364/AO.44.002162.
[454] P. N. Youssef, N. Sheibani, and D. M. Albert, “Retinal light toxicity,” Eye, vol. 25, no. 1, pp. 1–14, Jan. 2011, doi: 10.1038/eye.2010.149.
[455] Lund, David J., and Peter R. Edsall. "Action spectrum for retinal thermal injury." In Ophthalmic Technologies IX, vol. 3591, pp. 324-334. International Society for Optics and Photonics, 1999.
[456] D. H. Sliney, “Retinal injury from laser radiation,” Molecular Crystals and Liquid Crystals Science and Technology Section B: Nonlinear Optics, vol. 21, no. 1–4, pp. 1–17, Jun. 1999.
[457] J. J. Hunter, J. I. W. Morgan, W. H. Merigan, D. H. Sliney, J. R. Sparrow, and D. R. Williams, “The susceptibility of the retina to photochemical damage from visible light,” Progress in Retinal and Eye Research, vol. 31, no. 1, pp. 28–42, Jan. 2012, doi: 10.1016/j.preteyeres.2011.11.001.
[458] Rockwell, Benjamin A., Daniel X. Hammer, Richard A. Hopkins, Dale J. Payne, Cynthia A. Toth, William P. Roach, Jeffrey J. Druessel et al. "Ultrashort laser pulse bioeffects and safety." Journal of Laser Applications 11, no. 1 (1999): 42-44.
[459] R. W. Gubisch, “Optical Performance of the Human Eye,” J. Opt. Soc. Am., JOSA, vol. 57, no. 3, pp. 407–415, Mar. 1967, doi: 10.1364/JOSA.57.000407.

186
[460] E. S. Beatrice, D. I. Randolph, H. Zwick, B. E. Stuck, and D. J. Lund, “Laser hazards: biomedical threshold level investigations,” Mil Med, vol. 142, no. 11, pp. 889–891, Nov. 1977.
[461] A. A. Skavenski, D. A. Robinson, R. M. Steinman, and G. T. Timberlake, “Miniature eye movements of fixation in rhesus monkey,” Vision Research, vol. 15, no. 11, pp. 1269-IN7, Nov. 1975, doi: 10.1016/0042-6989(75)90173-X.
[462] J. W. Ness et al., “Retinal image motion during deliberate fixation: implications to laser safety for long duration viewing,” Health Phys, vol. 78, no. 2, pp. 131–142, Feb. 2000, doi: 10.1097/00004032-200002000-00002.
[463] W. J. Geeraets and E. R. Berry, “Ocular spectral characteristics as related to hazards from lasers and other light sources,” Am J Ophthalmol, vol. 66, no. 1, pp. 15–20, Jul. 1968, doi: 10.1016/0002-9394(68)91780-7.
[464] Bosschaart, Nienke, Gerda J. Edelman, Maurice CG Aalders, Ton G. van Leeuwen, and Dirk J. Faber. "A literature review and novel theoretical approach on the optical properties of whole blood." Lasers in medical science 29, no. 2 (2014): 453-479.
[465] Matsumoto, Y., Y. Asao, A. Yoshikawa, H. Sekiguchi, M. Takada, M. Furu, S. Saito et al. "Label-free photoacoustic imaging of human palmar vessels: a structural morphological analysis." Scientific reports 8, no. 1 (2018): 1-8.
[466] X. Shu et al., “Designing visible-light optical coherence tomography towards clinics,” Quant Imaging Med Surg, vol. 9, no. 5, pp. 769–781, May 2019, doi: 10.21037/qims.2019.05.01.


