Embed Size (px)
Citation preview
1
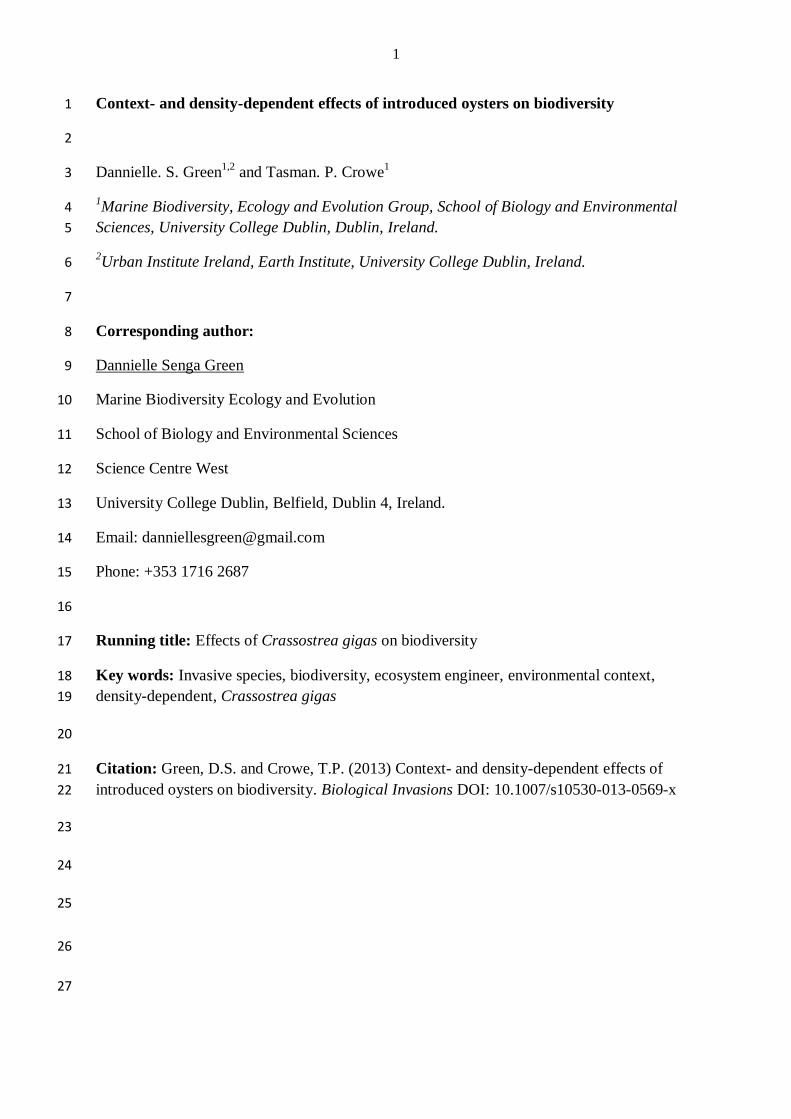
Context- and density-dependent effects of introduced oysters on biodiversity 1
2
Dannielle. S. Green1,2
and Tasman. P. Crowe1 3
1Marine Biodiversity, Ecology and Evolution Group, School of Biology and Environmental 4
Sciences, University College Dublin, Dublin, Ireland. 5
2Urban Institute Ireland, Earth Institute, University College Dublin, Ireland. 6
7
Corresponding author: 8
Dannielle Senga Green 9
Marine Biodiversity Ecology and Evolution 10
School of Biology and Environmental Sciences 11
Science Centre West 12
University College Dublin, Belfield, Dublin 4, Ireland. 13
Email: [email protected] 14
Phone: +353 1716 2687 15
16
Running title: Effects of Crassostrea gigas on biodiversity 17
Key words: Invasive species, biodiversity, ecosystem engineer, environmental context, 18
density-dependent, Crassostrea gigas 19
20
Citation: Green, D.S. and Crowe, T.P. (2013) Context- and density-dependent effects of 21
introduced oysters on biodiversity. Biological Invasions DOI: 10.1007/s10530-013-0569-x 22
23
24
25
26
27
2
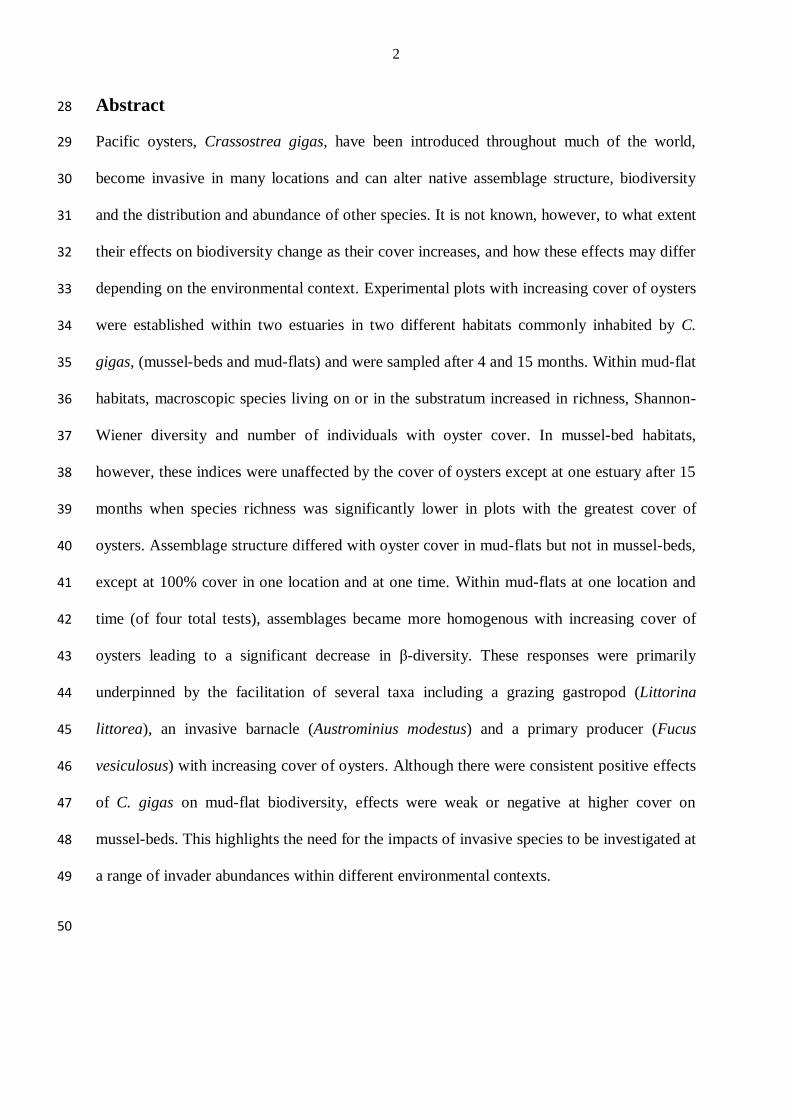
Abstract 28
Pacific oysters, Crassostrea gigas, have been introduced throughout much of the world, 29
become invasive in many locations and can alter native assemblage structure, biodiversity 30
and the distribution and abundance of other species. It is not known, however, to what extent 31
their effects on biodiversity change as their cover increases, and how these effects may differ 32
depending on the environmental context. Experimental plots with increasing cover of oysters 33
were established within two estuaries in two different habitats commonly inhabited by C. 34
gigas, (mussel-beds and mud-flats) and were sampled after 4 and 15 months. Within mud-flat 35
habitats, macroscopic species living on or in the substratum increased in richness, Shannon-36
Wiener diversity and number of individuals with oyster cover. In mussel-bed habitats, 37
however, these indices were unaffected by the cover of oysters except at one estuary after 15 38
months when species richness was significantly lower in plots with the greatest cover of 39
oysters. Assemblage structure differed with oyster cover in mud-flats but not in mussel-beds, 40
except at 100% cover in one location and at one time. Within mud-flats at one location and 41
time (of four total tests), assemblages became more homogenous with increasing cover of 42
oysters leading to a significant decrease in β-diversity. These responses were primarily 43
underpinned by the facilitation of several taxa including a grazing gastropod (Littorina 44
littorea), an invasive barnacle (Austrominius modestus) and a primary producer (Fucus 45
vesiculosus) with increasing cover of oysters. Although there were consistent positive effects 46
of C. gigas on mud-flat biodiversity, effects were weak or negative at higher cover on 47
mussel-beds. This highlights the need for the impacts of invasive species to be investigated at 48
a range of invader abundances within different environmental contexts. 49
50
3
1 Introduction 51
Predicting the impacts of invasive species can be complicated by the fact that their effects 52
are often context-dependent, varying in nature and magnitude depending on the properties of 53
the receiving environment (Hewitt et al 2001; Agrawal et al 2007; Padilla 2010; Queirόs et al. 54
2011) and the abundance of the invader (Thomsen et al. 2011). There is increasing 55
recognition of the need to explore the effects of invasive species in different types of habitats 56
in order to understand mechanistic interactions between invaders and abiotic conditions 57
(Sousa et al. 2009; Thomsen et al. 2011). Also, as the abundance of an invasive species 58
increases, the effect it has on the physical, chemical and biological properties of the 59
environment may also change in nature or magnitude (Sousa et al. 2009) and although there 60
has been extensive research into the impacts of invasive species, few studies have compared 61
their impacts at different abundances (Thomsen et al. 2011). This is a significant shortcoming 62
in invasion biology because it precludes the ability to make generalisations about abundance-63
dependent impacts or to predict how impacts may change as the invasion proceeds 64
(Yokomizo et al. 2009; Thomsen et al. 2011). 65
Among the most influential invasive species are those which alter existing habitats and/or 66
create new habitats that persist in the environment for a long time. Such species have been 67
referred to as “ecosystem engineers” (Jones et al. 1994) or “foundation species” (Dayton 68
1975). Invasive ecosystem engineers can have far reaching impacts on the structure of 69
assemblages over space and time (Jones et al. 1994) through multiple direct and indirect 70
mechanisms (Crooks 2002). Many bivalves are ecosystem engineers, physically altering the 71
environment and affecting the availability of resources to other organisms either through their 72
physical structure (shell) or their biological activities (filter-feeding and biodeposition). Due 73
to their potential to alter the structure and functioning of receiving ecosystems, invasive 74
4
bivalves have been identified as a priority for conservation and management initiatives 75
(Sousa et al. 2009) as they can have severe cascading economic impacts (Aldridge et al. 76
2004). 77
C. gigas is a commercially important species (accounting for 98% of global commercial 78
oyster production) and, as a consequence of deliberate introduction, has become invasive 79
throughout much of the world (Ruesink et al. 2005). C. gigas is able to modify habitats in a 80
way that enhances its own further spread (Diederich 2005) and as such, it can form very 81
dense populations (over 500 individuals per m2; Wrange et al. 2010). C. gigas is an 82
ecosystem engineer which modifies the physical properties of the receiving environment and 83
provides a complex three dimensional habitat (Markert et al. 2010). 84
Invasive populations of C. gigas have been found to alter the abundance and distribution of 85
native species in several parts of the world including the United Kingdom, Canada, Australia, 86
New Zealand and Western Europe (Troost 2010). Effects have been documented in a variety 87
of different habitats, including mussel-beds ( Kochmann et al. 2008;), marshes (Escapa et al. 88
2004), seagrass beds (Wagner et al. 2012) and rocky platforms (Krassoi et al. 2008;) and 89
possible effects may occur in polychaete reefs (Dubois et al. 2006) and mud-flats (Trimble et 90
al. 2009). In some cases, C. gigas was associated with an increase in the abundance and 91
diversity of organisms (Dubois et al. 2006; Markert et al. 2010; Lejart and Hily 2011). In 92
other cases, diversity was unchanged, but the structure of assemblages associated with C. 93
gigas differed from those associated with indigenous habitats (Kochmann et al. 2008; 94
Markert et al. 2010). 95
Padilla (2010) predicted how the impacts of C. gigas may vary depending on the receiving 96
habitat. For example, in mussel-beds if the native bivalve provides many of the same 97
engineering functions as C. gigas, such as the facilitation of other species through the 98
5
provision of habitat or refugia, then the impacts of C. gigas on the local diversity are more 99
likely quantitative rather than qualitative. Alternatively, in mud-flats the presence of C. gigas 100
creates hard habitat for sessile algae and invertebrates that are typically not found in soft 101
sediments, while also increasing available habitat and refugia for mobile organisms, thereby 102
the changes to local diversity are likely to be qualitative and quantitative. 103
Therefore, the effects of C. gigas on biodiversity may differ as their abundance, cover or 104
density increases, and their effects may differ depending on the receiving habitat, but these 105
factors have not yet been explicitly examined together. The aims of this study were therefore 106
to determine 1) How C. gigas affects biodiversity, assemblage structure and the abundance of 107
individual taxa, 2) How these impacts vary with increasing cover of C. gigas and 3) whether 108
these impacts vary in different habitats. 109
110
2 Materials and methods 111
2.1 Study sites 112
This study was done at two locations in Ireland, Lough Foyle (Quigley’s Point, County 113
Donegal: 55° 7' 14.87", -7° 11' 53.59) and Lough Swilly (Ballylin Point, County Donegal, 114
Ireland: 55° 2' 36.12", -7° 33' 36.09"). At each location experimental plots were set up on two 115
different types of habitat, both in lower intertidal areas: mussel-beds and mud-flats. Mussel-116
bed habitats consisted of dense populations of blue mussels, Mytilus edulis. Mud-flat habitats 117
were patches of mud, ranging from 4 to 20 m2 in area, interspersed between the mussel-beds 118
which were not dominated by any other biogenic habitat building organism or by hard 119
substratum. Sediment within mussel-beds was a mixture of fine sand, silt with large shell 120
6
fragments throughout. Sediment within mud-flats was a mixture of very fine sand, silt and 121
clay. 122
2.2 Experimental set-up 123
The experiment was set-up during late April 2009 and had 2 factors: Habitat (fixed and 124
orthogonal with 2 levels, mussel-bed or mud-flat) and cover (fixed and orthogonal with 4 125
levels, 0, 5, 50 or 100 % cover of oysters). These four levels of cover were arranged into 50 x 126
50 cm plots in mussel-bed and muddy sediment habitat and equated to the following 127
densities: 0, 16 +/- 0.5, 120 +/- 8 and 240 +/- 12 individuals per m2 which equated to 0, 26.06 128
+/- 2.13, 390.88 +/- 31.95 and 781.77 +/- 63.90 g per m2 ash free dry weight. All oysters used 129
in this experiment were found in situ and were not moved between locations. Oysters were 130
rinsed with seawater and cleaned of any epibionts prior to use and then simply inserted 131
upright into the mud and mussel-bed habitats to mimic the positions in which they are found 132
in natural populations. Oysters were inserted to simulate an overgrowth, rather than a 133
complete replacement of mussels. Because sampling was destructive, 8 replicate plots of each 134
treatment were set up and 4 replicates were sampled at each of 2 times. Plots were spaced at 135
least 5 m apart and were spread across a section of shore that was approximately 25 m in 136
length and 100 m in width. 137
138
2.3 Sampling methods 139
The experiment was sampled after 4 and 15 months, during late July, 2009 and late June, 140
2010 respectively. To measure epifauna and flora, a 25 x 25 cm quadrat was randomly placed 141
onto each plot and a 2 minute search was conducted in which large mobile macrofauna, 142
including gastropods and crabs, were counted and percentage covers of algae were estimated 143
visually. After this, a core with 10 cm diameter was taken down to 10 cm depth in the centre 144
7
of the plot. The top section, which included epifauna and the first 1-2 cm of sediment, was 145
removed and placed into a container and preserved in 5% formalin. Any epifauna or flora on 146
the surface of the bivalves was later identified and counted and the organisms in the sediment 147
were sieved through a 125µm mesh, sorted and identified. Sessile epifauna including 148
bryozoans, barnacles and polychaetes were counted as individuals not as colonies. The 149
remainder of the core (from 2 to 10 cm depth) was sieved through a 500 µm mesh to retain 150
macrofauna, which were then stained with rose bengal and placed into a container topped up 151
with 5% formalin to preserve fauna for later sorting and identification in the laboratory. 152
Organisms in quadrats and cores were scaled up to numbers per m2. 153
154
2.4 Statistical analyses 155
Univariate analyses were done using 2-factor analysis of variance (ANOVA) using the design 156
described above. Total number of individuals (N), species richness (SR) and Shannon-Wiener 157
diversity (H’) were analysed. Differences in the abundance of taxa thought to be susceptible 158
to the impacts of oysters based on previous studies, or found as dominant space occupiers on 159
the shore were also analysed. These included common periwinkles, Littorina littorea, green 160
shore crabs, Carcinus maenas, invasive barnacles, Austrominius modestus (accidently 161
introduced to Ireland in the 1940's and now widespread (Allen et al. 2006)), and 162
Phyllodocidae polychaetes. Separate analyses were done for each variable at each sampling 163
time and within each location. 164
Variation in assemblage structure among treatments at each sampling time and within each 165
location was compared using two-factor PERMANOVA (Anderson 2001) based on the 166
design described above and using Bray-Curtis dissimilarities (Bray and Curtis 1957) of 167
square root transformed data with 9999 permutations under the reduced model. Assemblage 168
8
data were ordinated on a 2-dimensional non-metric multidimensional scaling (nMDS) 169
diagram, with the stress values representing the level of distortion of the actual rank order of 170
dissimilarity among samples (Clarke 1993). Where significant differences in assemblage 171
structure were found, SIMPER (Clarke 1993) analyses were computed on square root 172
transformed data and were used to identify the contribution of different taxa to dissimilarities 173
between treatments. Tests for homogeneity of multivariate dispersions (PERMDISP: 174
Anderson, 2004) were done to identify heterogenous variability among experimental groups 175
and also represented a measure of β diversity (Anderson et al, 2006). 176
Analyses of Variance were computed using the software Win-GMAV (Underwood and 177
Chapman, 1998). Prior to univariate ANOVAs, homogeneity of variance was tested using 178
Cochran’s C-test and when significant, data were square root or log transformed to make 179
variances homogenous. Transformations were consistently applied to separate analyses of the 180
same variable (done for each sampling time and location) to ensure that outcomes were 181
comparable among analyses. When significant differences were detected by ANOVA (P < 182
0.05), post-hoc Student-Newman Keuls (SNK) tests were used to identify patterns of 183
difference. All multivariate analyses were completed using the PRIMER package (PRIMER-184
e, 2009). 185
186
3 Results 187
A total of 61 taxa were found throughout the duration of the experiment (detailed in 188
Appendix 1). Not all taxa were present at both locations in both years, but in aggregate they 189
comprised 4 algal species, 9 gastropod species, 6 bivalve species, 4 amphipod species, 190
harpacticoid copepods, Janiridae isopods, cumaceans, oligochaetes, leeches, bryozoans, 191
thaliaceans, holothurians, chitons, sponges and 16 different families of polychaetes. At Lough 192
9
Foyle after 15 months several plots were missing or damaged so only 3 replicate plots for 193
each treatment could be used in the analyses. 194
195
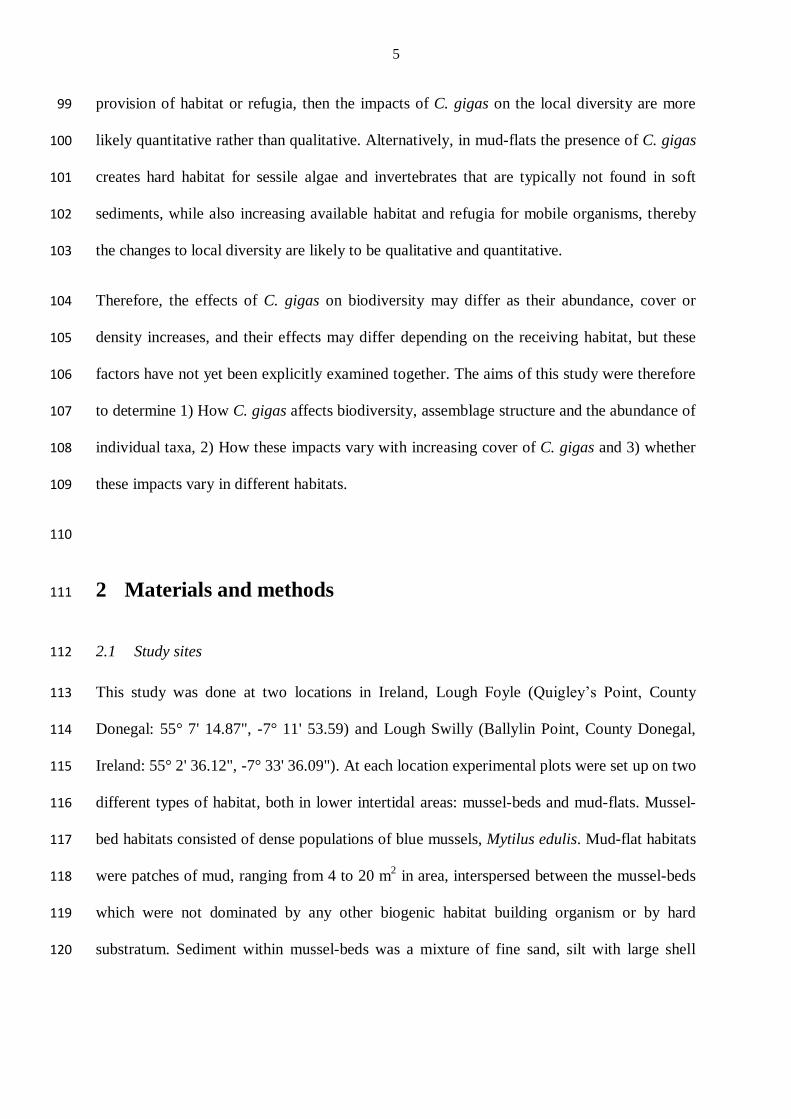
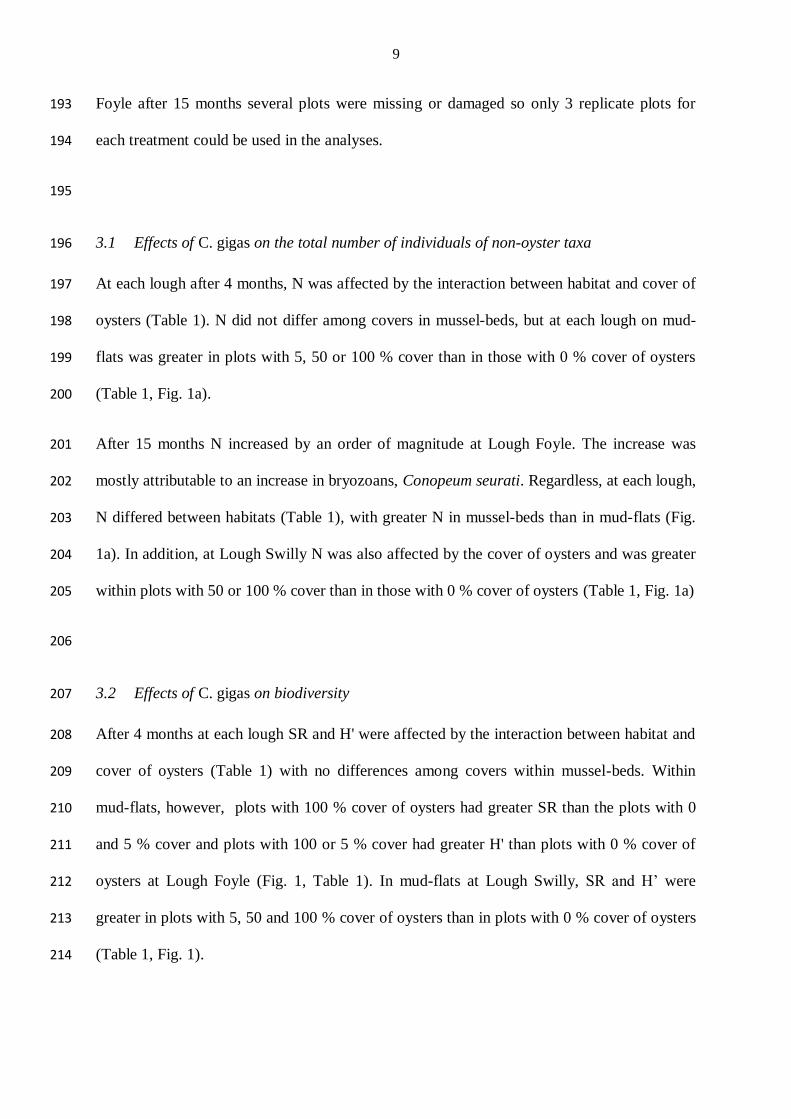
3.1 Effects of C. gigas on the total number of individuals of non-oyster taxa 196
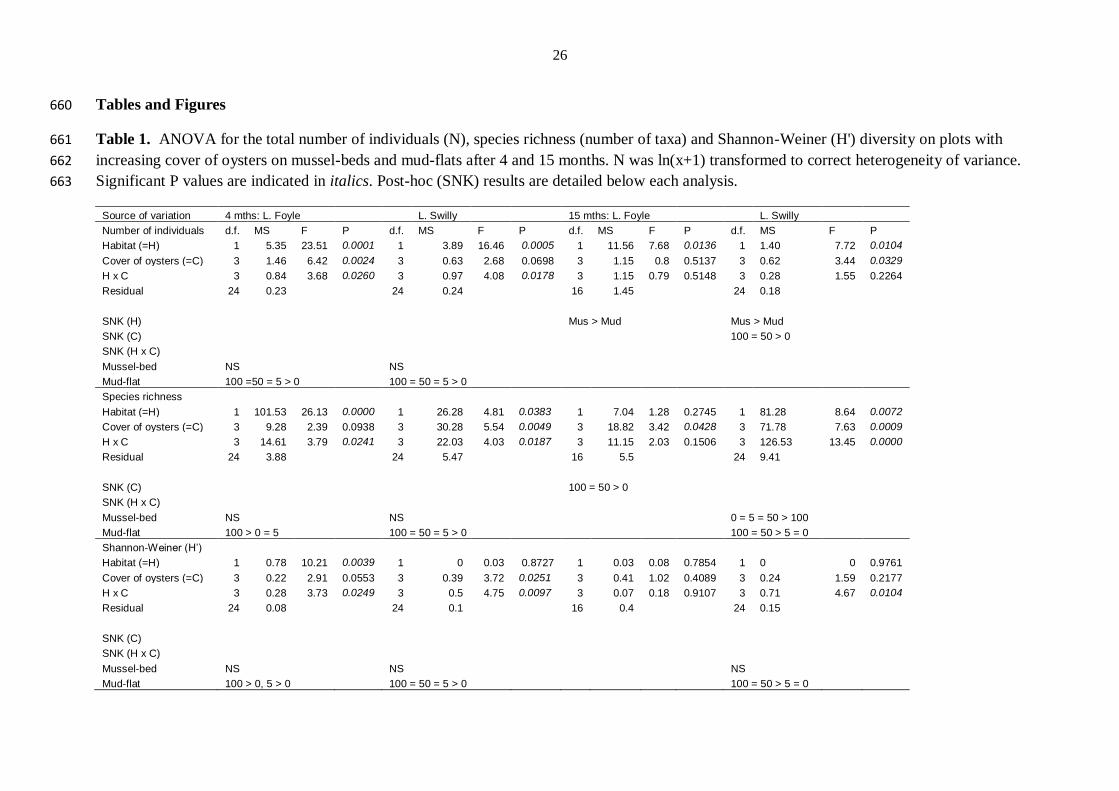
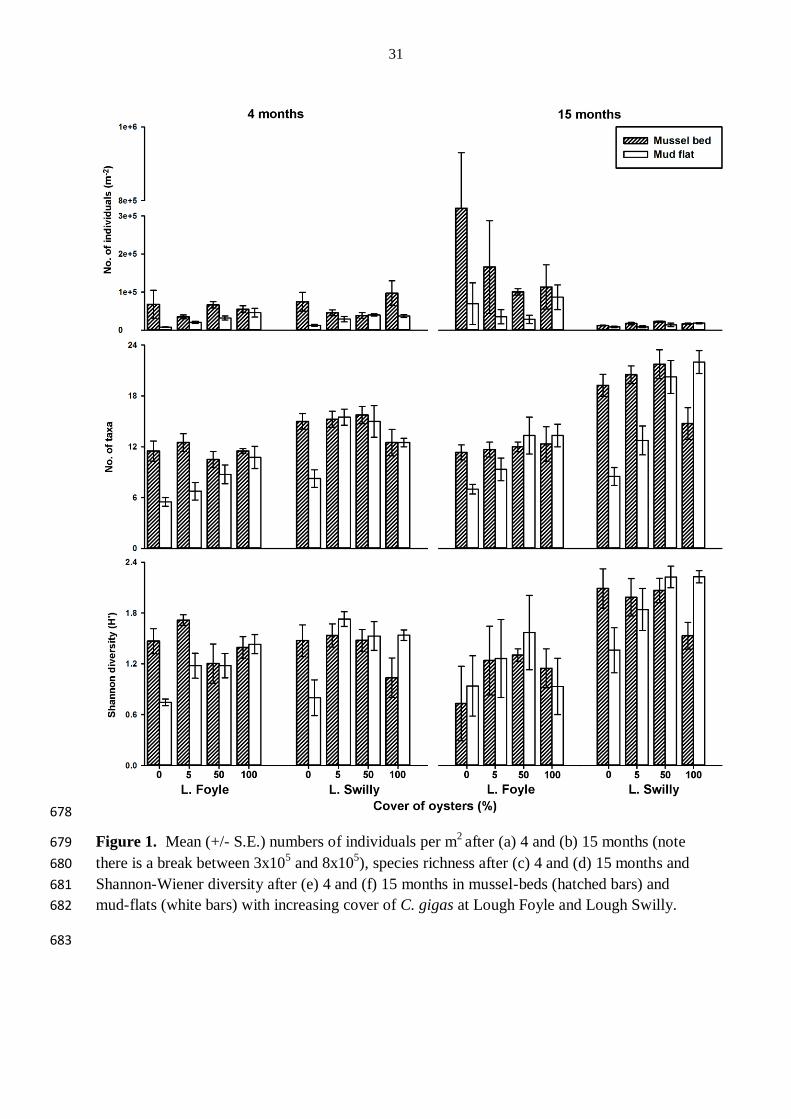
At each lough after 4 months, N was affected by the interaction between habitat and cover of 197
oysters (Table 1). N did not differ among covers in mussel-beds, but at each lough on mud-198
flats was greater in plots with 5, 50 or 100 % cover than in those with 0 % cover of oysters 199
(Table 1, Fig. 1a). 200
After 15 months N increased by an order of magnitude at Lough Foyle. The increase was 201
mostly attributable to an increase in bryozoans, Conopeum seurati. Regardless, at each lough, 202
N differed between habitats (Table 1), with greater N in mussel-beds than in mud-flats (Fig. 203
1a). In addition, at Lough Swilly N was also affected by the cover of oysters and was greater 204
within plots with 50 or 100 % cover than in those with 0 % cover of oysters (Table 1, Fig. 1a) 205
206
3.2 Effects of C. gigas on biodiversity 207
After 4 months at each lough SR and H' were affected by the interaction between habitat and 208
cover of oysters (Table 1) with no differences among covers within mussel-beds. Within 209
mud-flats, however, plots with 100 % cover of oysters had greater SR than the plots with 0 210
and 5 % cover and plots with 100 or 5 % cover had greater H' than plots with 0 % cover of 211
oysters at Lough Foyle (Fig. 1, Table 1). In mud-flats at Lough Swilly, SR and H’ were 212
greater in plots with 5, 50 and 100 % cover of oysters than in plots with 0 % cover of oysters 213
(Table 1, Fig. 1). 214
10
After 15 months, at Lough Foyle, SR was affected by the cover of oysters and was greater in 215
plots with 50 or 100 % cover than in those with 0 % cover of oysters (Table 1, Fig. 1). At 216
Lough Swilly, SR and H' were affected by the interaction between habitat and cover and 217
within mussel-beds, SR in plots with 0, 5 or 50 % cover of oysters was greater than in those 218
with 100 % cover of oysters and in mud-flats, plots with 50 and 100 % cover of oysters had 219
greater SR and H’ than plots with 0 and 5 % cover of oysters (Table 1, Fig. 1). 220
221
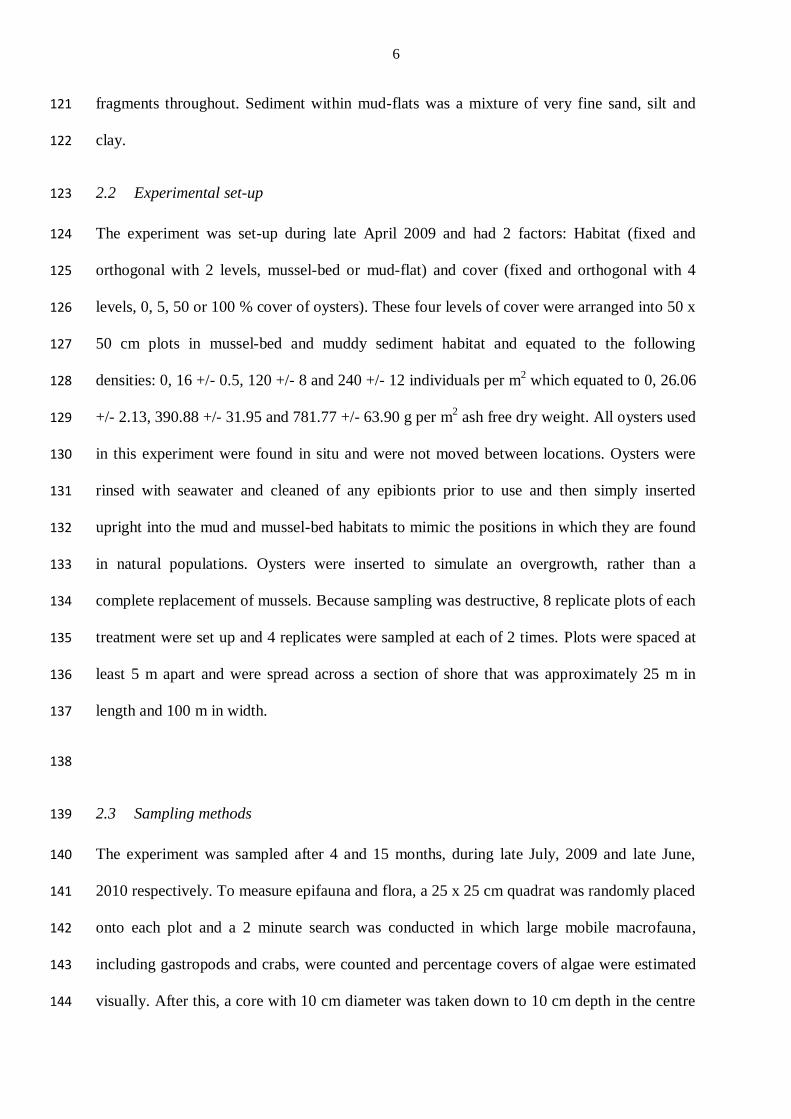
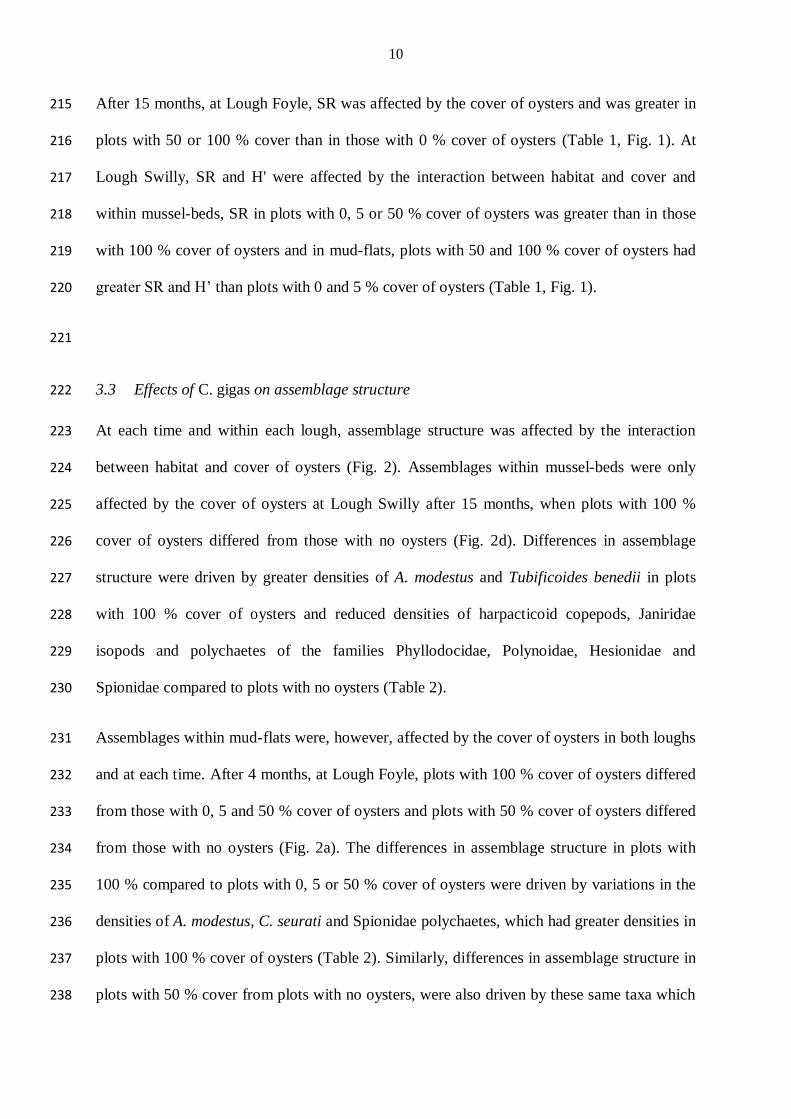
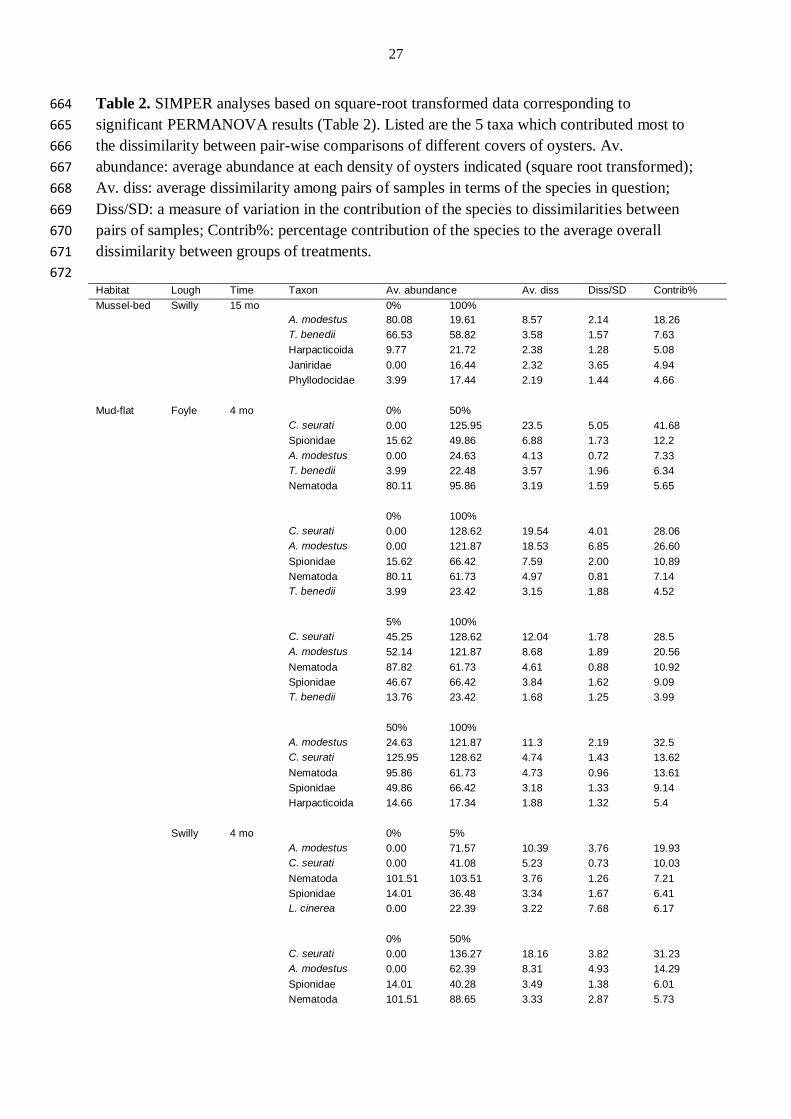
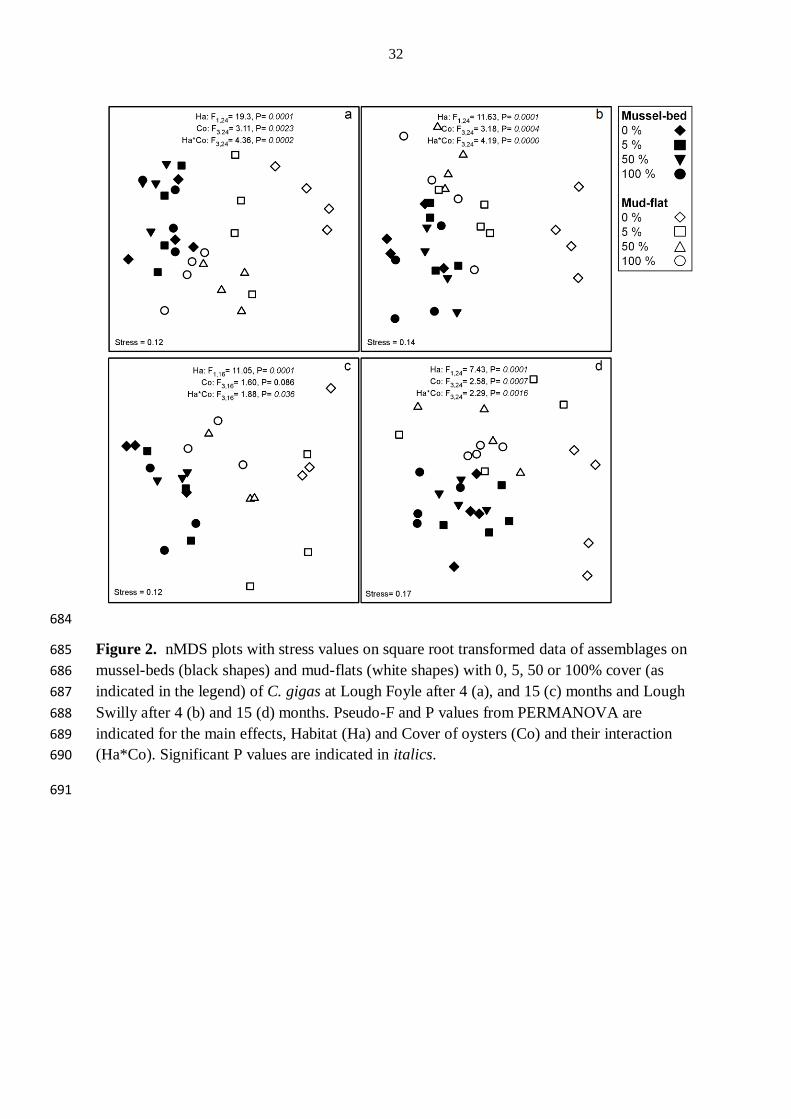
3.3 Effects of C. gigas on assemblage structure 222
At each time and within each lough, assemblage structure was affected by the interaction 223
between habitat and cover of oysters (Fig. 2). Assemblages within mussel-beds were only 224
affected by the cover of oysters at Lough Swilly after 15 months, when plots with 100 % 225
cover of oysters differed from those with no oysters (Fig. 2d). Differences in assemblage 226
structure were driven by greater densities of A. modestus and Tubificoides benedii in plots 227
with 100 % cover of oysters and reduced densities of harpacticoid copepods, Janiridae 228
isopods and polychaetes of the families Phyllodocidae, Polynoidae, Hesionidae and 229
Spionidae compared to plots with no oysters (Table 2). 230
Assemblages within mud-flats were, however, affected by the cover of oysters in both loughs 231
and at each time. After 4 months, at Lough Foyle, plots with 100 % cover of oysters differed 232
from those with 0, 5 and 50 % cover of oysters and plots with 50 % cover of oysters differed 233
from those with no oysters (Fig. 2a). The differences in assemblage structure in plots with 234
100 % compared to plots with 0, 5 or 50 % cover of oysters were driven by variations in the 235
densities of A. modestus, C. seurati and Spionidae polychaetes, which had greater densities in 236
plots with 100 % cover of oysters (Table 2). Similarly, differences in assemblage structure in 237
plots with 50 % cover from plots with no oysters, were also driven by these same taxa which 238
11
occurred in greater densities in plots with 50 % cover of oysters than in plots with no oysters. 239
At Lough Swilly after 4 months, assemblage structure in plots with 0 % cover of oysters 240
differed from those with 5, 50 and 100 % cover in mud-flats (Fig. 2b). Differences in 241
assemblage structure were mostly driven by greater densities of A. modestus, C. seurati, 242
harpacticoid copepods, juvenile Mytilus edulis and Spionidae polychaetes in plots with 5, 50 243
or 100 % than in plots with 0 % cover of oysters (Table 2). 244
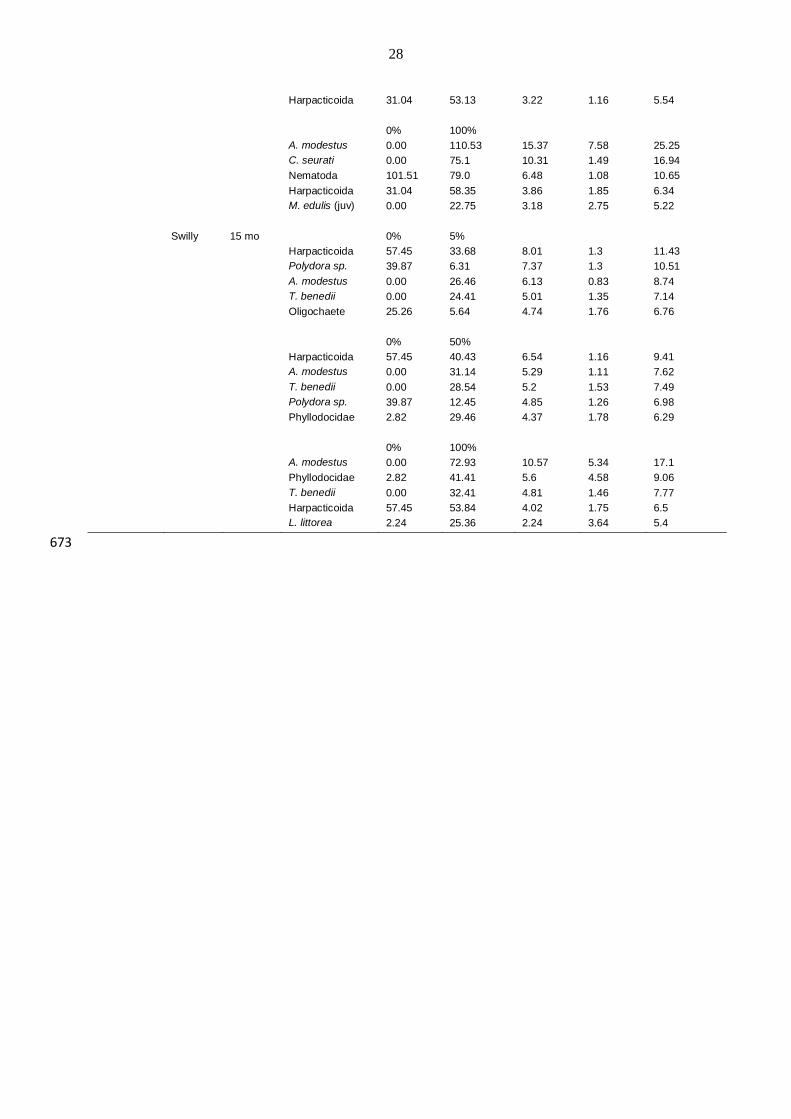
After 15 months at Lough Foyle although there was a significant interaction between habitat 245
and cover of oysters, the post-hoc procedure did not detect any patterns of difference 246
(although due to the loss of replication, only 10 unique permutations were possible for 247
comparing levels of cover within habitats so statistical power was very limited). At Lough 248
Swilly after 15 months assemblage structure in plots in mud-flat habitats with 0 % cover of 249
oysters differed from those with 5, 50 or 100 % cover (Fig. 2d). Differences were largely 250
driven by greater densities of T. benedii, A. modestus, Polydora sp., Phyllodocidae 251
polychaetes and a greater cover of F. vesiculosus but a lower density of harpacticoid 252
copepods in plots with either 5, 50 or 100 % cover than plots with no oysters (Table 2). 253
254
3.3.1 Effects on β-diversity 255
β-diversity (multivariate dispersion indices) significantly varied among covers of oysters in 256
mud-flat habitats at Lough Swilly after 15 months, where plots with 100 % cover of oysters 257
were less dispersed than those with 0, 5 or 50 % cover (PERMDISP: F7,24 = 6.83, P = 0.006). 258
Homogeneity of multivariate dispersions did not differ significantly at any other occasion 259
(time, lough or habitat) throughout the experiment. 260
261
12
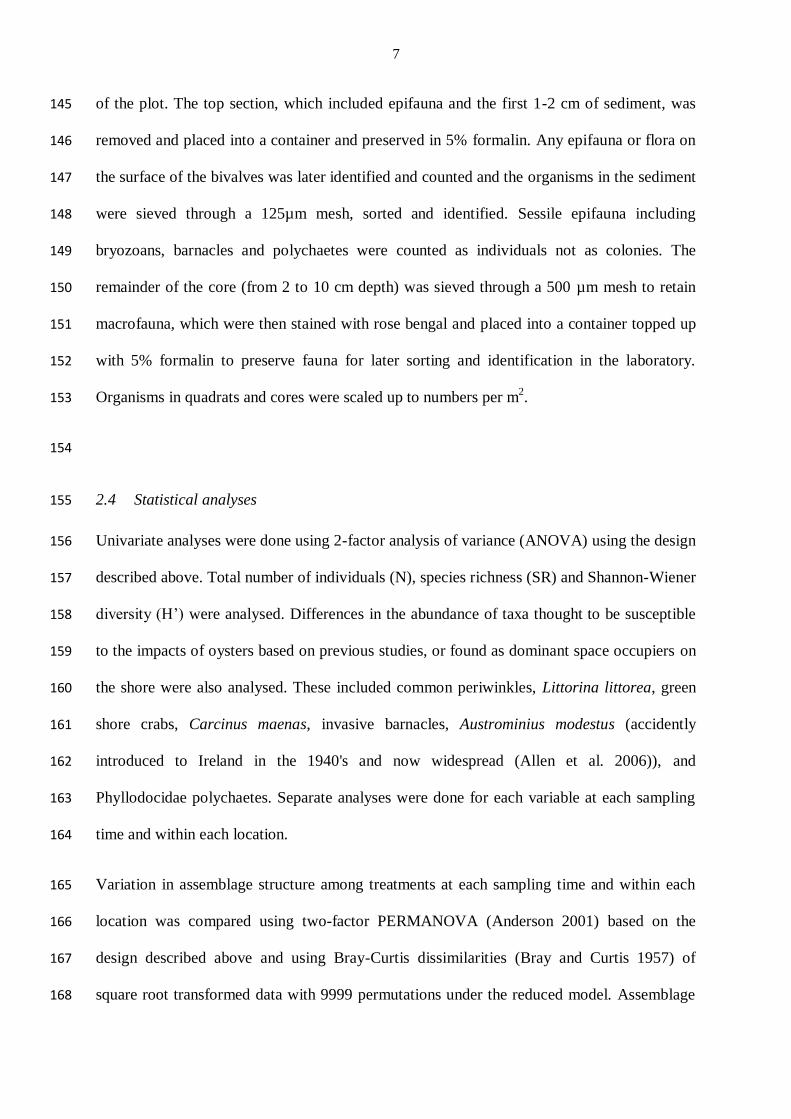
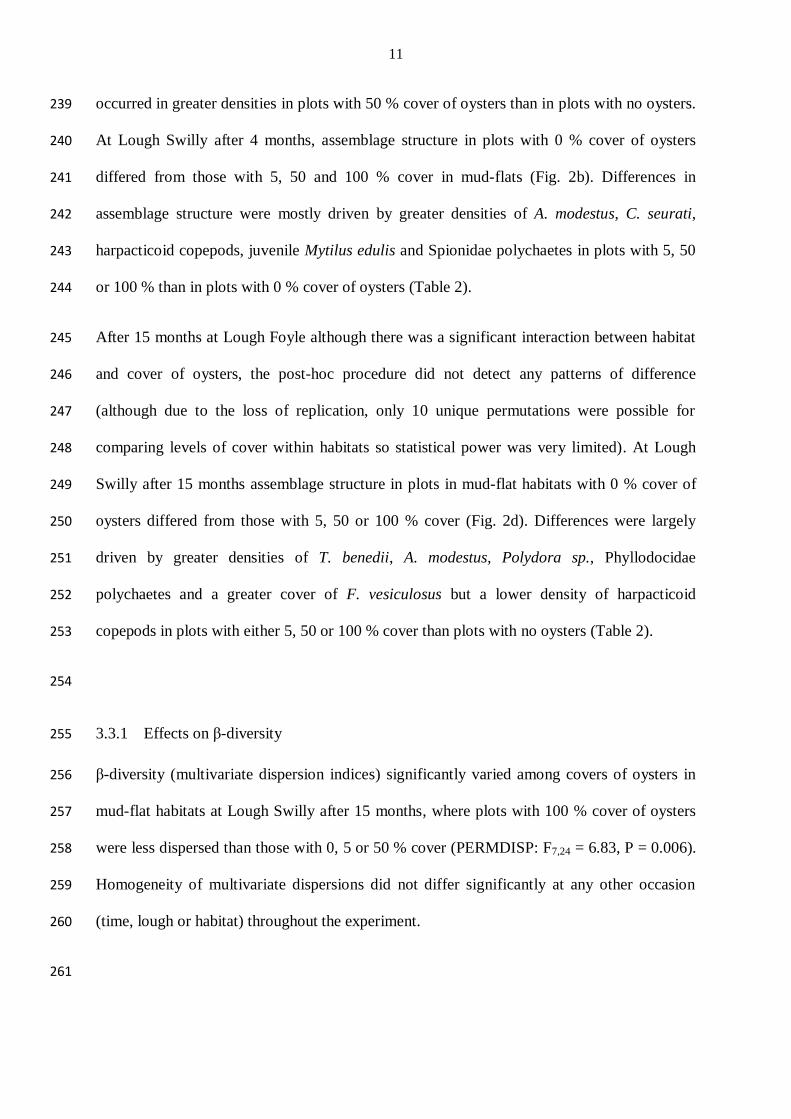
3.4 Effects of C. gigas on density or cover of individual taxa 262
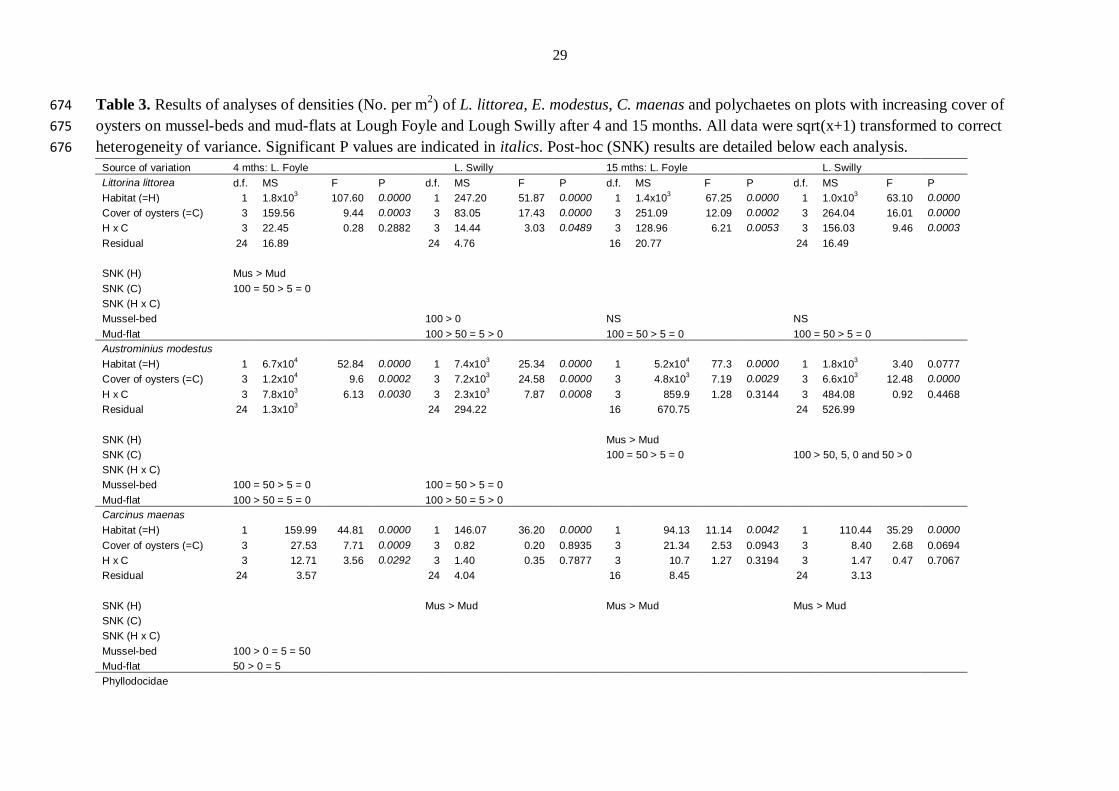
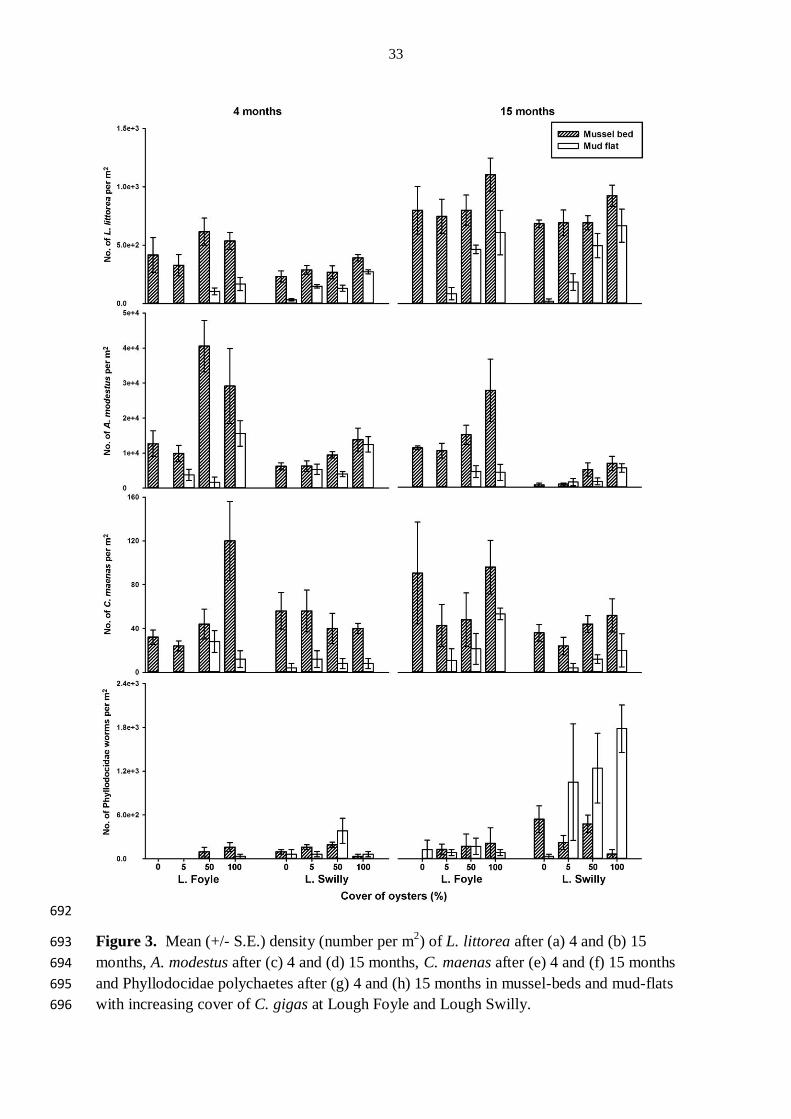
After 4 months, the density of L. littorea was greater in mussel-beds than in mud-flats and at 263
Lough Swilly was also greater in plots with 100 % cover than in those with 0, 5 or 50 % 264
cover of oysters (Table 3, Fig. 3). After 15 months at Lough Foyle, the density of L. littorea 265
was greater in mussel-beds than in mud-flats and greater in plots with 100 % than with 0 or 5 266
% cover of oysters. At Lough Swilly, the density of L. littorea was greater in plots with 50 or 267
100 % cover of oysters than in those with 0 or 5 % cover in mudflats, but was not affected by 268
C. gigas in mussel-beds (Table 3, Fig. 3). 269
After 4 months, at each lough, the density of A. modestus was affected by the interaction 270
between habitat and cover but in both habitats barnacle numbers generally increased with 271
oyster cover (Table 3, Fig. 3). After 15 months at Lough Foyle the density of A. modestus 272
was greater in mussel-beds than in mud-flats and greater in plots with 50 or 100 % than in 273
those with 0 or 5 % cover of oysters (Table 3, Fig. 3). At Lough Swilly, the density of A. 274
modestus was greater in plots with 50 or 100 % than those with 0 or 5 % cover of oysters 275
(Table 3, Fig. 3). 276
After 4 months, at Lough Foyle the density of C. maenas was affected by the interaction 277
between habitat and cover with a greater density in plots with 100 % than in those with 0, 5, 278
or 50 % cover of oysters in mussel-beds, and a greater density in plots with 50 % cover of 279
oysters than in those with 0 or 5 % cover of oysters in mud-flats (Table 3, Fig. 3). At Lough 280
Swilly at each sampling time and at Lough Foyle after 15 months, the density of C. maenas 281
was greater in mussel-beds than in mud-flats (Table 3, Fig. 3). 282
After 4 months, at Lough Foyle, the density of Phyllodocidae polychaetes was greater in 283
mussel-beds than in mud-flats and, in both habitats was greater in plots with 100 % cover of 284
oysters than in plots with 0 or 5 % cover of oysters (Table 3, Fig. 3). After 4 months at Lough 285
13
Swilly the density of Phyllodocidae polychaetes was greater in plots with 50 % cover of 286
oysters than in plots with 0, 5 or 100 % cover of oysters (Table 3, Fig. 3). After 15 months at 287
Lough Swilly, the density of Phyllodocidae polychaetes was affected by the interaction 288
between habitat and cover and was greater in plots with 0 or 50 % cover of oysters than in 289
plots with 100 % cover of oysters in mussel-beds and greater in plots with 5, 50 or 100 % 290
cover than in those with 0 % cover of oysters in mud-flats (Table 3, Fig. 3). 291
292
4 Discussion 293
Crassostrea gigas affected biodiversity, assemblage structure and the abundance of several 294
organisms, and the nature of these effects depended both on the habitat and on the cover of C. 295
gigas. 296
Overall effects on biota were more consistent in mud-flat than in mussel-bed habitats. This is 297
not surprising since the addition of C. gigas to mud-flats provides hard substratum where it 298
was formerly rare, thus completely changing the habitat from soft unstructured mud-flat to 299
one with hard biogenic reef (Lejart and Hily 2011) with more habitat available for the 300
recruitment of sessile organisms and refugia from desiccation and heat stress for mobile 301
organisms (Padilla 2010). This is in contrast to mussel-beds, where C. gigas are overgrowing 302
an existing hard biogenic habitat formed by M. edulis, which provides similar engineering 303
functions; both species are suspension-feeders that change the characteristics of the sediment 304
and provide shelter for other organisms thereby enabling a different assemblage to develop 305
than would otherwise be present (Padilla 2010). Regardless, the formation of oyster reefs in 306
either habitat results in an increase of habitat complexity and heterogeneity (McCoy and Bell 307
1991), and although not always consistent, there were also strong effects of C. gigas in 308
mussel-beds. In mud-flats the total number of individuals, species richness and Shannon-309
14
Wiener diversity generally increased with increasing cover of C. gigas. The importance of 310
availability of refuges and structural complexity of habitat on intertidal assemblage structure 311
has long been recognised (Barshaw and Lavalli 1988; Gee and Warwick 1994) and the 312
increase in the total number of individuals with increasing cover of oysters may be a result of 313
reduced mortality or increased recruitment (Crooks and Khim 1999; Grabowski 2004). 314
Effects on assemblage structure in mud-flats were also consistent across locations and time, 315
with plots with the greatest cover differing from those with less or no cover of C. gigas. 316
These changes were mostly underpinned by increases of organisms which require a hard 317
surface for colonisation, such as barnacles, bryozoans and fucoid algae, with the oysters’ 318
shell allowing these organisms to exist in a habitat where they previously could not. 319
Assemblage structure in mussel-beds did not differ at Lough Foyle, (perhaps due to reduced 320
statistical power due to the loss of replicates) but at Lough Swilly after 15 months, plots with 321
the greatest cover differed from those with no cover of C. gigas. Since C. gigas is bigger, has 322
overlapping ridges and layers on its shell and is more complex in structure than M. edulis 323
(Lejart and Hily 2011), in both habitats differences in assemblage structure could be due to an 324
increase in surface area for settlement or habitat complexity. 325
Because C. gigas enhances habitat heterogeneity with its shell and forms complex reefs, it is 326
expected to increase biodiversity (McCoy and Bell 1991). Previous studies have confirmed 327
this hypothesis, finding C. gigas to increase biodiversity and the abundance of taxa compared 328
to adjacent habitats (Dubois et al. 2006; Troost 2010; Lejart and Hily 2011; Ferraro and Cole 329
2011). Several studies have found increases in the number of individuals and species richness 330
associated with C. gigas on mud-flats, similar to results of the current study (Hosack 2003; 331
Lejart and Hily 2011). Previous studies of mussel-beds similar to those in the present study, 332
found that C. gigas reefs had greater biodiversity than adjacent mussel-beds (Markert et al. 333
2010) or a greater number of organisms (Kochmann et al. 2008). The current study is, 334
15
however, the first to find a decrease in macro- invertebrate and algal diversity associated with 335
C. gigas, where species richness decreased at the greatest cover of C. gigas on mussel-beds at 336
Lough Swilly after 15 months. Although not statistically significant, this trend was visible for 337
both diversity metrics (species richness and Shannon-Wiener) in both years at Lough Swilly. 338
Also at Lough Swilly after 15 months, β-diversity (assessed using multivariate dispersion 339
indices) was reduced with the greatest cover of C. gigas in mud-flat habitats. Tests for 340
homogeneity of multivariate dispersions have been identified as a way of measuring β-341
diversity (Anderson et al. 2006). The exact meaning of this measure, however, is largely 342
dependent on the dissimilarity index and any transformations used and therefore should be 343
carefully interpreted (Anderson et al. 2011). β-diversity, as measured here, based on Bray-344
Curtis, square-root transformed data, captures variation in assemblage structure with 345
emphasis on both species composition and relative abundance (Anderson et al. 2011). 346
Therefore, the reduction in β-diversity with increasing cover of C. gigas means that 347
assemblages were more homogeneous in terms of their composition (the types of taxa 348
present) and the relative abundance of these taxa. The potential for homogenisation (Olden 349
and Rooney 2006), in terms of decreased β-diversity (Olden et al. 2008; McKinney and 350
Lockwood 1999) is an important, but often overlooked, consequence of invasive species 351
(Wright 2011).The issue of homogenisation may become magnified if invasive species also 352
cause homogenisation of the habitat (Rahel 2002). 353
Experimental manipulations, such as those in the current study, are a more powerful method 354
than purely mensurative studies of investigating the impacts of invasive species because they 355
allow inferences concerning the cause and effect of ecological processes to be assigned 356
(Underwood 1997). However, in the current study it was necessary for the experimental plots 357
to be relatively small, only 25cm2 (to allow for replication and manipulation), and scaling up 358
from the scale of centimetres to that of an estuary (kilometres) can be very uncertain and has 359
16
long been recognised as a challenging and pervasive issue in ecology (Levin 1992). C. gigas 360
is, however, an ecosystem engineer which can dominate large areas (for example, a 361
continuous reef covering 26.5 ha was reported in The Netherlands (Fey et al. 2010)) thereby 362
causing extensive habitat homogenisation. 363
It is not uncommon for invasive species to have “positive” effects, such as increasing the 364
diversity and abundance of native organisms (Simberloff and Von Holle 1999; Altieri et al. 365
2010). In fact, some previous studies have found positive effects to increase with invader 366
abundance (Thomsen 2010), but it is possible that there is a threshold after a critical invader 367
abundance is reached whereupon the positive effects on an invasive species become negative, 368
or the negative effects increase substantially (White and Shurin, 2011). Despite this, very few 369
studies have explicitly tested the effects of invasive species at a range of abundances 370
(Thomsen et al. 2011), but this is paramount if we are to avoid the detrimental consequences 371
of under-estimating their effects at greater abundances (Yokomizo et al. 2009). For example 372
in the current study, at lower cover, C. gigas might be interpreted as having positive effects 373
by increasing biodiversity. At greater cover, however, there was evidence of a threshold 374
being reached, and in mussel-beds, the effects on biodiversity became negative. 375
Whilst the effects of any invasive species on biodiversity can be difficult to predict, some 376
single species, such as L. littorea and A. modestus, exhibited very consistent responses, 377
increasing with increasing cover of C. gigas within both habitats, locations and at both times. 378
Similar results have been found by others for both of these species (Kochmann et al. 2008; 379
Markert et al. 2010) and are probably due to an increase in habitat complexity provided by 380
oyster shells providing more refuges from desiccation or predation, or in the case of the 381
periwinkles, an increase in available microalgae for grazing. Although C. maenas initially 382
increased at Lough Foyle with increasing cover of oysters, it was mostly affected by the type 383
of habitat, with more crabs found in mussel-beds than on mud-flats, probably due to greater 384
17
source of food from the mussels themselves (Mascaro and Seed, 2001). This was in contrast 385
to past studies which have found C. maenas to increase in association with C. gigas 386
(Kochmann et al. 2008; Markert et al. 2010). The density of Phyllodocidae polychaetes at 387
Lough Swilly increased with increasing cover of C. gigas on mud-flats, but decreased with 388
the greatest cover of C. gigas in mussel-beds. In addition, Polynoidae, Hesionidae and 389
Spionidae polychaetes were also less abundant in plots with the greatest cover of oysters 390
compared to control plots with no oysters. 391
Declines in polychaetes and biodiversity at the greatest cover of oysters in mussel-beds may 392
have been caused by an increase in the concentration of nutrients in the pore-water, such as 393
ammonium, resulting either directly from oyster excretion (Dame et al. 1984, 1985) or 394
indirectly due to the breakdown of organic matter in oyster “biodeposits” which may be 395
composed of faeces or pseudofaeces. In a concurrent study, abiotic measurements were also 396
taken from the experimental plots at Lough Swilly after 15 months, and the concentration of 397
porewater ammonium was indeed greater beneath a greater cover of C. gigas (Green et al. 398
2013). Oysters produce large quantities of biodeposits (Hayakawa et al. 2001) which 399
organically enrich sediments and supply food for other organisms (Castel et al. 1989). But the 400
decomposition of biodeposits increases the uptake of oxygen in the sediment (Christensen et 401
al. 2003) and if the rate of biodeposition is great, this can lead to sediment anoxia, thus 402
making the habitat unsuitable, and decreasing the diversity and abundance of infaunal 403
organisms (Callier et al. 2009). At Lough Swilly, community respiration (CO2 flux) from 404
mussel-beds and mud-flats was greatest from plots with 100 % cover of C. gigas (Green et al. 405
2013), most likely indicating an increase in microbially mediated decomposition rates (Green 406
et al. 2012). 407
Alternatively, some of the differences in assemblage structure or biodiversity could also be 408
due to structural effects, such as competition for space or alterations to hydrodynamics, 409

18
caused by the oysters’ shells (Moulin et al. 2007). Of course, in order to understand the 410
mechanisms underpinning these changes, it would be necessary to separate the effects of the 411
physical structure and the biological activities of C. gigas. This was not explored in the 412
current study, but Wagner et al (2012) found that the shells of C. gigas can decrease eelgrass 413
shoot density and size and Green and Crowe (2013) found that the structure of C. gigas was 414
at least as important as their biological activity in determining patterns of difference in the 415
abundance and diversity of organisms in boulder-fields. 416
It is also possible that indirect effects of organisms that were facilitated by increasing cover 417
of C. gigas may have excluded the establishment of others, thereby decreasing biodiversity. 418
For example, some species which consistently increased in density with increasing cover of 419
C. gigas, at one or both loughs, are known to be able to reduce the establishment of other 420
invertebrates and algae, for example, A. modestus through competition for space and food 421
(Little et al. 1992), L. littorea via bull-dozing effects from grazing (Buschbaum 2000) and F. 422
vesiculosus via mechanical abrasion caused by the wave-induced movement of fronds (Grant 423
1977; Kiirikki 1996). The ecological importance of facilitation of native organisms by 424
invaders, and the cascading indirect effects on biodiversity, have recently been highlighted 425
(White et al. 2006; Rodriguez 2006; Pope et al. 2008) and warrant further investigation. 426
Estuarine habitats such as those examined here are inherently patchy (Morrisey et al. 1992) 427
characterised by a high level of spatial and temporal variability not only in the abundance and 428
distribution of invertebrates (Underwood and Chapman 1996) but also geochemical 429
properties of sediments (Tolhurst and Chapman 2007). The current study found that some 430
impacts of C. gigas on individual taxa were consistent across habitats, but the majority were 431
context dependent varying in direction and magnitude with regards to the type of habitat 432
being invaded and on the cover of C. gigas. Generally in mud-flats the number of individuals 433
and their diversity increased at 5 and 50% cover of C. gigas and then plateaued, with no 434
19
additional increase at 100% cover. In mussel-beds species richness was reduced at 100% 435
cover at Lough Swilly after 15 months. If the objective of management is to maintain or 436
enhance biodiversity, then results from this study suggest that action should be taken at an 437
early stage to restrict the spread of C. gigas before dense reefs (exceeding 50% cover) are 438
formed. At present in Ireland, wild populations of intertidal C. gigas are being harvested by 439
hand (F. O’Beirn, pers. comm.). This may be a cost effective solution to help control their 440
population size. 441
Typically studies on the impacts of invasive species have compared the presence or absence 442
of invaders (Thomsen et al. 2011). In order to improve predictions of their impacts, it is 443
advantageous to relate invader effects directly to their abundance, which may vary through 444
time, as populations expand or decline, or differ spatially through patchy distribution. 445
Although impacts may form continuous gradients with abundance (Parker et al. 1999), it is 446
more common for the relationship between effect and invader abundance to be non-linear 447
(Yokomizo et al. 2009). If responses are non-linear, then small abundances of an invader may 448
have different or disproportionate effects on native ecosystems than larger abundances. For 449
instance, if small populations of an invader have positive or neutral impacts on native species, 450
then a threshold value may exist, above which effects become negative (Groffman et al., 451
2006). The current study suggests that this may be the case for C. gigas and confirms the 452
recommendations of others (Sousa et al. 2009; Padilla 2010; Thomsen et al. 2011) that more 453
experimental studies spanning a range of habitats and a range of invader abundances are 454
needed in order to assess the context-dependency of invasive species and to aid in the 455
development of cost-effective mitigation strategies. 456
457
458
20
Acknowledgements 459
This research was funded by the project SIMBIOSYS (2007-B-CD-1-S1) as part of the 460
Science, Technology, Research and Innovation for the Environment (STRIVE) Programme, 461
financed by the Irish Government under the National Development Plan 2007–2013, 462
administered on behalf of the Department of the Environment, Heritage and Local 463
Government by the Irish Environmental Protection Agency (EPA). We would also like to 464
thank Bas Boots, the editor Jennifer Ruesink and two anonymous reviewers for helpful 465
comments that helped to improve this manuscript. 466
467
References 468
Agrawal AA, Ackerly DD, Adler F, Arnold E, Cáceres C, Doak DF, Post E, Hudson PJ, 469
Maron J, Mooney KA, Power M, Schemske D, Stachowicz J, Strauss S, Turner MG, Werner 470
E (2007) Filling key gaps in population and community ecology. Frontiers in Ecology and the 471
Environment 5: 145–152 472
Aldridge DC, Elliott P, Moggridge GD (2004) The recent and rapid spread of the zebra 473
mussel (Dreissena polymorpha) in Great Britain. Biological Conservation 119:253-261 474
Allen BM, Power AM, O’Riordan RM, Myers AA, McGrath D (2006) Increases in the 475
abundance of the invasive barnacle Austrominius modestus Darwin in Ireland. Biology and 476
Environment: Proceedings of the Royal Irish Academy 106: 155-161 477
Altieri AH, van Wesenbeeck BK, Bertness MD, Silliman BR (2010) Facilitation cascade 478
drives positive relationship between native biodiversity and invasion success. Ecology 479
91:1269-1275 480
Anderson MJ (2001) A new method for non-parametric multivariate analysis of variance. 481
Austral Ecology 26:32-46 482
Anderson MJ (2006) Distance-based tests for homogeneity of multivariate dispersions. 483
Biometrics 62:245-253 484
Anderson MJ, Crist TO, Chase JM, Vellend M, Inouye BD, Freestone AL, Sanders NJ, 485
Cornell HV, Comita LS, Davies KF, Harrison SP, Kraft NJB, Stegen JC, Swenson NG 486
(2011) Navigating the multiple meanings of beta diversity: a roadmap for the practicing 487
ecologist. Ecology Letters 14:19-28 488
21
Anderson MJ, Ellingsen KE, McArdle BH (2006) Multivariate dispersion as a measure of 489
beta diversity. Ecology Letters 9:683-693 490
Barshaw DE, Lavalli KL (1988) Predation upon postlarval lobsters Homarus americanus by 491
Cunners Tautogolabrus adspersus and mud crabs Neopanope sayi on 3 different substrates – 492
eelgrass, mud and rocks. Marine Ecology-Progress Series 48:119-123 493
Bray JR, Curtis JT (1957) An ordination of the upland forest communities of Southern 494
Wisconsin. Ecological Monographs 27:326-349 495
Buschbaum C (2000) Direct and indirect effects of Littorina littorea (L.) on barnacles 496
growing on mussel-beds in the Wadden Sea. Hydrobiologia 440:119-128 497
Buttger H, Asmus H, Asmus R, Buschbaum C, Dittmann S, Nehls G (2008) Community 498
dynamics of intertidal soft-bottom mussel-beds over two decades. Helgoland Marine 499
Research 62:23-36 500
Callier MD, Richard M, McKindsey CW, Archambault P, Desrosiers G (2009) Responses of 501
benthic macrofauna and biogeochemical fluxes to various levels of mussel biodeposition: An 502
in situ "benthocosm" experiment. Marine Pollution Bulletin 58:1544-1553 503
Castel J, Labourg PJ, Escaravage V, Auby I, Garcia ME (1989) Influence of seagrass beds 504
and oyster parks on the abundance and biomass patterns of meiobenthos and macrobenthos in 505
tidal flats. Estuarine Coastal and Shelf Science 28:71-85 506
Christensen PB, Glud RN, Dalsgaard T, Gillespie P (2003) Impacts of longline mussel 507
farming on oxygen and nitrogen dynamics and biological communities of coastal sediments. 508
Aquaculture 218:567-588 509
Clarke KR (1993) Non-parametric multivariate analyses of changes in community structure. 510
Australian Journal of Ecology 18:117-143 511
Crooks JA (2002) Characterizing ecosystem-level consequences of biological invasions: the 512
role of ecosystem engineers. Oikos 97:153-166 513
Crooks JA, Khim HS (1999)Architectural vs. biological effects of a habitat-altering, exotic 514
mussel, Musculista senhousia. Journal of Experimental Marine Biology and Ecology 240:53-515
75 516
Dame RF, Wolaver TG, Libes SM (1985) The summer uptake and release of nitrogen by an 517
intertidal oyster reef. Netherlands Journal of Sea Research 19:265-268 518
Dame RF, Zingmark RG, Haskin E (1984) Oyster reefs as processors of estuarine materials. 519
Journal of Experimental Marine Biology and Ecology 83:239-247 520
Dayton PK (1975) Experimental evaluation of ecological dominance in a rocky intertidal 521
algal community. Ecological Monographs 45:137-159 522
22
Diederich S (2005) Differential recruitment of introduced Pacific oysters and native mussels 523
at the North Sea coast: coexistence possible? Journal of Sea Research 53:269-281 524
Dubois S, Commito JA, Olivier F, Retiere C (2006) Effects of epibionts on Sabellaria 525
alveolata (L.) biogenic reefs and their associated fauna in the Bay of Mont Saint-Michel. 526
Estuarine Coastal and Shelf Science 68:635-646 527
Escapa M, Isacch JP, Daleo P, Alberti J, Iribarne O, Borges M, Dos Santos EP, Gagliardini 528
DA, Lasta M (2004) The distribution and ecological effects of the introduced Pacific oyster 529
Crassostrea gigas (Thunberg, 1793) in northern Patagonia. Journal of Shellfish Research 530
23:765-772 531
Fey F, Dankers N, Steenbergen J, Goudswaard K (2010). Development and distribution of 532
the non-indigenous Pacific oyster (Crassostrea gigas) in the Dutch Wadden Sea. Aquaculture 533
International 18:45-59 534
Ferraro SP, Cole FA (2011) Ecological periodic tables for benthic macrofaunal usage of 535
estuarine habitats in the US Pacific Northwest. Estuarine Coastal and Shelf Science 94:36-47 536
Gee JM, Warwick RM (1994) Metazoan community structure in relation to the fractal 537
dimensions of marine macroalgae. Marine Ecology-Progress Series 103:141-150 538
Grabowski JH (2004) Habitat complexity disrupts predator-prey interactions but not the 539
tropic cascade on oyster reefs. Ecology 85:995-1004 540
Grant WS (1977) High intertidal community organization on a rocky headland in Maine, 541
USA. Marine Biology 44:15-25 542
Green DS, Boots B, Crowe TP (2012) Effects of non-indigenous oysters on microbial 543
diversity and ecosystem functioning. PLoS ONE 7(10): e48410. 544
doi:10.1371/journal.pone.0048410 545
Green DS, Rocha C, Crowe TP (2013) Effects of non-indigenous oysters on ecosystem 546
processes vary with abundance and context. Ecosystems: DOI: 10.1007/s10021-013-9659-y 547
Green DS, Crowe TP (2013) Physical and biological effects of introduced oysters on 548
biodiversity in an intertidal boulder field. Marine Ecology Progress Series 482:119-132 549
Gutierrez JL, Jones CG, Strayer DL, Iribarne OO (2003) Mollusks as ecosystem engineers: 550
the role of shell production in aquatic habitats. Oikos 101:79-90 551
Hayakawa Y, Kobayashi M, Izawa M (2001) Sedimentation flux from mariculture of oyster 552
(Crassostrea gigas) in Ofunato estuary, Japan. Ices Journal of Marine Science 58:435-444 553
Hosack G (2003) Effects of Zostera marina and Crassostrea gigas culture on the intertidal 554
communities of Willapa. Bay, Washington. Msc Thesis, University of Washington 555
Jones CG, Lawton JH, Shachak M (1994) Organisms as ecosystem engineers. Oikos 69:373-556
386 557
23
Kater BJ, Baars JMDD (2003) Reconstructie van oppervlakten van litorale Japanse 558
oesterbanken in de Oosterschelde in het verleden en een schatting van het huidig oppervlak. 559
(RIVO rapport C017/03) Nederlands Instituut voor Visserij Onderzoek (RIVO), Wageningen, 560
The Netherlands 561
Kiirikki M (1996) Experimental evidence that Fucus vesiculosus (Phaeophyta) controls 562
filamentous algae by means of the whiplash effect. European Journal of Phycology 31:61-66 563
Kochmann J, Buschbaum C, Volkenborn N, Reise K (2008) Shift from native mussels to 564
alien oysters: Differential effects of ecosystem engineers. Journal of Experimental Marine 565
Biology and Ecology 364:1-10 566
Krassoi FR, Brown KR, Bishop MJ, Kelaher BP, Summerhayes S (2008) Condition-specific 567
competition allows coexistence of competitively superior exotic oysters with native oysters. 568
Journal of Animal Ecology 77:5-15 569
Lang AC, Buschbaum C (2010) Facilitative effects of introduced Pacific oysters on native 570
macroalgae are limited by a secondary invader, the seaweed Sargassum muticum. Journal of 571
Sea Research 63 119-128 572
Lejart M, Hily C (2011) Differential response of benthic macrofauna to the formation of 573
novel oyster reefs (Crassostrea gigas, Thunberg) on soft and rocky substrate in the intertidal 574
of the Bay of Brest, France. Journal of Sea Research 65:84-93 575
Levin SA (1992) The problem of pattern and scale in ecology. Ecology 73: 1943-1967 576
Little C, Morritt D, and Stirling P (1992) Changes in the shore fauna and flora of Lough 577
Hyne. The Irish Naturalists’ Journal 24: 87-95 578
Markert A, Wehrmann A, Kroncke I (2010) Recently established Crassostrea-reefs versus 579
native Mytilus-beds: differences in ecosystem engineering affects the macrofaunal 580
communities (Wadden Sea of Lower Saxony, southern German Bight). Biol. Invasions 12:15-581
32 582
Mascaro M, Seed R (2001) Choice of prey size and species in Carcinus maenas (L.) feeding 583
on four bivalves of contrasting shell morphology. Hydrobiologia 449: 159-170 584
McCoy ED, Bell SS (1991)Habitat structure: the evolution and diversification of a complex 585
topic. In: Bell SS, McCoy ED, Mushinsky HR (eds). Habitat Structure: The Physical 586
Arrangement of Objects in Space, Chapman and Hall, New York, pp. 3–27 587
McKinney ML, Lockwood JL (1999) Biotic homogenization: a few winners replacing many 588
losers in the next mass extinction. Trends in Ecology & Evolution 14:450-453 589
Morrisey DJ, Howitt L, Underwood AJ, Stark JS (1992) Spatial Variation in Soft-Sediment 590
Benthos. Marine Ecology Progress Series 81:197-204 591
24
Moulin FY, Guizien K, Thouzeau G, Chapalain G, Mulleners K, Bourg C (2007) Impact of 592
an invasive species, Crepidula fornicata, on the hydrodynamics and transport properties of 593
the benthic boundary layer. Aquatic Living Resources 20:15-31 594
Muschenheim DK (1987) The dynamics of near-bed seston flux and suspension-feeding 595
benthos. Journal of Marine Research 45:473-496 596
Olden JD, Kennard MJ, Pusey BJ (2008) Species invasions and the changing biogeography 597
of Australian freshwater fishes. Global Ecology and Biogeography 17:25-37 598
Olden JD, Rooney TP (2006) On defining and quantifying biotic homogenization. Global 599
Ecology and Biogeography 15:113-120 600
Padilla DK (2010) Context-dependent Impacts of a Non-native Ecosystem Engineer, the 601
Pacific Oyster Crassostrea gigas. Integrative and Comparative Biology 50:213-225 602
Peterson CH, Grabowski JH, Powers SP (2003) Estimated enhancement of fish production 603
resulting from restoring oyster reef habitat: quantitative valuation. Marine Ecology Progress 604
Series 264:249-264 605
Pope KL, Garwood JM, Welsh HH, Lawler SP (2008) Evidence of indirect impacts of 606
introduced trout on native amphibians via facilitation of a shared predator. Biological 607
Conservation 141:1321-1331 608
Queiros AD, Hiddink JG, Johnson G, Cabral HN, Kaiser MJ (2011) Context dependence of 609
marine ecosystem engineer invasion impacts on benthic ecosystem functioning. Biological 610
Invasions 13:1059-1075 611
Rahel FJ (2002) Homogenization of freshwater faunas. Annual Review of Ecology and 612
Systematics 33:291-315 613
Reise K, Olenin S, Thieltges DW (2006) Are aliens threatening European aquatic coastal 614
ecosystems? Helgoland Marine Research 60:77-83 615
Rodriguez LF (2006) Can invasive species facilitate native species? Evidence of how, when, 616
and why these impacts occur. Biological Invasions 8:927-939 617
Ruesink JL (2007) Biotic resistance and facilitation of a non-native oyster on rocky shores. 618
Marine Ecology Progress Series 331:1-9 619
Ruesink JL, Lenihan HS, Trimble AC, Heiman KW, Micheli F, Byers JE, Kay MC (2005) 620
Introduction of non-native oysters: Ecosystem effects and restoration implications. Annual 621
Review of Ecology Evolution and Systematics 36:643-689 622
Simberloff D, Von Holle B (1999) Positive interactions of nonindigenous species: Invasional 623
meltdown? Biological Invasions 1:21-32 624
Sousa R, Gutierrez JL, Aldridge DC (2009) Non-indigenous invasive bivalves as ecosystem 625
engineers. Biological Invasions 11:2367-2385 626
25
Thomsen MS (2010) Experimental evidence for positive effects of invasive seaweed on 627
native invertebrates via habitat-formation in a seagrass bed. Aquatic Invasions 5:341-346 628
Thomsen MS, Wernberg T, Olden JD, Griffin JN, Silliman BR (2011) A framework to study 629
the context-dependent impacts of marine invasions. Journal of Experimental Marine Biology 630
and Ecology 400:322-327 631
Tolhurst TJ, Chapman MG (2007) Patterns in biogeochemical properties of sediments and 632
benthic animals among different habitats in mangrove forests. Austral Ecology 32:775-788 633
Trimble AC, Ruesink JL, Dumbauld BR (2009) Factors preventing the recovery of a 634
historically overexploited shellfish species, Ostrea lurida Carpenter 1864. Journal of 635
Shellfish Research 28:97-106 636
Troost K (2010) Causes and effects of a highly successful marine invasion: Case-study of the 637
introduced Pacific oyster Crassostrea gigas in continental NW European estuaries. Journal of 638
Sea Research 64:145-165 639
Underwood AJ, Chapman MG (1996) Scales of spatial patterns of distribution of intertidal 640
invertebrates. Oecologia 107:212-224 641
Underwood AJ, Chapman MG (1998) Spatial analyses of intertidal assemblages on sheltered 642
rocky shores. Australian Journal of Ecology 23:138-157 643
Wagner EL, Ruesink JL, Dumbauld BR, Hacker SD, Wisehart LM (2012) Density-dependent 644
effects of an introduced oyster, Crassostrea gigas, on native intertidal eelgrass, Zostera 645
marina. Mar Ecol Prog Ser 468:149-160 646
White EM, Wilson JC, Clarke AR (2006) Biotic indirect effects: a neglected concept in 647
invasion biology. Diversity and Distributions 12: 443-455 648
White LF, Shurin JB (2011) Density dependent effects of an exotic marine macroalga on 649
native community diversity. Journal of Experimental Marine Biology and Ecology 405: 111-650
119 651
Wrange AL, Valero J, Harkestad LS, Strand O, Lindegarth S, Christensen HT, Dolmer P, 652
Kristensen PS, Mortensen S (2010) Massive settlements of the Pacific oyster, Crassostrea 653
gigas, in Scandinavia. Biological Invasions 12:1145-1152 654
Wright S (2011) Invasive Species and the Loss of Beta Diversity. Ethics and the Environment 655
16:75-97 656
Yokomizo H, Possingham HP, Thomas MB, Buckley YM (2009) Managing the impact of 657
invasive species: the value of knowing the density-impact curve. Ecological Applications 658
19:376-386 659
26
Tables and Figures 660
Table 1. ANOVA for the total number of individuals (N), species richness (number of taxa) and Shannon-Weiner (H') diversity on plots with 661
increasing cover of oysters on mussel-beds and mud-flats after 4 and 15 months. N was ln(x+1) transformed to correct heterogeneity of variance. 662
Significant P values are indicated in italics. Post-hoc (SNK) results are detailed below each analysis. 663
Source of variation 4 mths: L. Foyle L. Swilly 15 mths: L. Foyle L. Swilly
Number of individuals d.f. MS F P d.f. MS F P d.f. MS F P d.f. MS F P
Habitat (=H) 1 5.35 23.51 0.0001 1 3.89 16.46 0.0005 1 11.56 7.68 0.0136 1 1.40 7.72 0.0104
Cover of oysters (=C) 3 1.46 6.42 0.0024 3 0.63 2.68 0.0698 3 1.15 0.8 0.5137 3 0.62 3.44 0.0329
H x C 3 0.84 3.68 0.0260 3 0.97 4.08 0.0178 3 1.15 0.79 0.5148 3 0.28 1.55 0.2264
Residual 24 0.23
24 0.24
16 1.45
24 0.18
SNK (H)
Mus > Mud
Mus > Mud SNK (C)
100 = 50 > 0
SNK (H x C)
Mussel-bed NS
NS
Mud-flat 100 =50 = 5 > 0
100 = 50 = 5 > 0
Species richness
Habitat (=H) 1 101.53 26.13 0.0000 1 26.28 4.81 0.0383 1 7.04 1.28 0.2745 1 81.28 8.64 0.0072
Cover of oysters (=C) 3 9.28 2.39 0.0938 3 30.28 5.54 0.0049 3 18.82 3.42 0.0428 3 71.78 7.63 0.0009
H x C 3 14.61 3.79 0.0241 3 22.03 4.03 0.0187 3 11.15 2.03 0.1506 3 126.53 13.45 0.0000
Residual 24 3.88
24 5.47
16 5.5
24 9.41
SNK (C)
100 = 50 > 0 SNK (H x C)
Mussel-bed NS
NS
0 = 5 = 50 > 100 Mud-flat 100 > 0 = 5
100 = 50 = 5 > 0
100 = 50 > 5 = 0
Shannon-Weiner (H’)
Habitat (=H) 1 0.78 10.21 0.0039 1 0 0.03 0.8727 1 0.03 0.08 0.7854 1 0 0 0.9761
Cover of oysters (=C) 3 0.22 2.91 0.0553 3 0.39 3.72 0.0251 3 0.41 1.02 0.4089 3 0.24 1.59 0.2177
H x C 3 0.28 3.73 0.0249 3 0.5 4.75 0.0097 3 0.07 0.18 0.9107 3 0.71 4.67 0.0104
Residual 24 0.08
24 0.1
16 0.4
24 0.15
SNK (C)
SNK (H x C)
Mussel-bed NS
NS
NS Mud-flat 100 > 0, 5 > 0 100 = 50 = 5 > 0 100 = 50 > 5 = 0
27
Table 2. SIMPER analyses based on square-root transformed data corresponding to 664
significant PERMANOVA results (Table 2). Listed are the 5 taxa which contributed most to 665
the dissimilarity between pair-wise comparisons of different covers of oysters. Av. 666
abundance: average abundance at each density of oysters indicated (square root transformed); 667
Av. diss: average dissimilarity among pairs of samples in terms of the species in question; 668
Diss/SD: a measure of variation in the contribution of the species to dissimilarities between 669
pairs of samples; Contrib%: percentage contribution of the species to the average overall 670
dissimilarity between groups of treatments. 671
672 Habitat Lough Time Taxon Av. abundance Av. diss Diss/SD Contrib%
Mussel-bed Swilly 15 mo 0% 100%
A. modestus 80.08 19.61 8.57 2.14 18.26
T. benedii 66.53 58.82 3.58 1.57 7.63
Harpacticoida 9.77 21.72 2.38 1.28 5.08
Janiridae 0.00 16.44 2.32 3.65 4.94
Phyllodocidae 3.99 17.44 2.19 1.44 4.66
Mud-flat Foyle 4 mo 0% 50%
C. seurati 0.00 125.95 23.5 5.05 41.68
Spionidae 15.62 49.86 6.88 1.73 12.2
A. modestus 0.00 24.63 4.13 0.72 7.33
T. benedii 3.99 22.48 3.57 1.96 6.34
Nematoda 80.11 95.86 3.19 1.59 5.65
0% 100%
C. seurati 0.00 128.62 19.54 4.01 28.06
A. modestus 0.00 121.87 18.53 6.85 26.60
Spionidae 15.62 66.42 7.59 2.00 10.89
Nematoda 80.11 61.73 4.97 0.81 7.14
T. benedii 3.99 23.42 3.15 1.88 4.52
5% 100%
C. seurati 45.25 128.62 12.04 1.78 28.5
A. modestus 52.14 121.87 8.68 1.89 20.56
Nematoda 87.82 61.73 4.61 0.88 10.92
Spionidae 46.67 66.42 3.84 1.62 9.09
T. benedii 13.76 23.42 1.68 1.25 3.99
50% 100%
A. modestus 24.63 121.87 11.3 2.19 32.5
C. seurati 125.95 128.62 4.74 1.43 13.62
Nematoda 95.86 61.73 4.73 0.96 13.61
Spionidae 49.86 66.42 3.18 1.33 9.14
Harpacticoida 14.66 17.34 1.88 1.32 5.4
Swilly 4 mo 0% 5%
A. modestus 0.00 71.57 10.39 3.76 19.93
C. seurati 0.00 41.08 5.23 0.73 10.03
Nematoda 101.51 103.51 3.76 1.26 7.21
Spionidae 14.01 36.48 3.34 1.67 6.41
L. cinerea 0.00 22.39 3.22 7.68 6.17
0% 50%
C. seurati 0.00 136.27 18.16 3.82 31.23
A. modestus 0.00 62.39 8.31 4.93 14.29
Spionidae 14.01 40.28 3.49 1.38 6.01
Nematoda 101.51 88.65 3.33 2.87 5.73
28
Harpacticoida 31.04 53.13 3.22 1.16 5.54
0% 100%
A. modestus 0.00 110.53 15.37 7.58 25.25
C. seurati 0.00 75.1 10.31 1.49 16.94
Nematoda 101.51 79.0 6.48 1.08 10.65
Harpacticoida 31.04 58.35 3.86 1.85 6.34
M. edulis (juv) 0.00 22.75 3.18 2.75 5.22
Swilly 15 mo 0% 5%
Harpacticoida 57.45 33.68 8.01 1.3 11.43
Polydora sp. 39.87 6.31 7.37 1.3 10.51
A. modestus 0.00 26.46 6.13 0.83 8.74
T. benedii 0.00 24.41 5.01 1.35 7.14
Oligochaete 25.26 5.64 4.74 1.76 6.76
0% 50%
Harpacticoida 57.45 40.43 6.54 1.16 9.41
A. modestus 0.00 31.14 5.29 1.11 7.62
T. benedii 0.00 28.54 5.2 1.53 7.49
Polydora sp. 39.87 12.45 4.85 1.26 6.98
Phyllodocidae 2.82 29.46 4.37 1.78 6.29
0% 100%
A. modestus 0.00 72.93 10.57 5.34 17.1
Phyllodocidae 2.82 41.41 5.6 4.58 9.06
T. benedii 0.00 32.41 4.81 1.46 7.77
Harpacticoida 57.45 53.84 4.02 1.75 6.5
L. littorea 2.24 25.36 2.24 3.64 5.4
673
29
Table 3. Results of analyses of densities (No. per m2) of L. littorea, E. modestus, C. maenas and polychaetes on plots with increasing cover of 674
oysters on mussel-beds and mud-flats at Lough Foyle and Lough Swilly after 4 and 15 months. All data were sqrt(x+1) transformed to correct 675
heterogeneity of variance. Significant P values are indicated in italics. Post-hoc (SNK) results are detailed below each analysis. 676
Source of variation 4 mths: L. Foyle L. Swilly 15 mths: L. Foyle L. Swilly
Littorina littorea d.f. MS F P d.f. MS F P d.f. MS F P d.f. MS F P
Habitat (=H) 1 1.8x10³ 107.60 0.0000 1 247.20 51.87 0.0000 1 1.4x10
3 67.25 0.0000 1 1.0x10
3 63.10 0.0000
Cover of oysters (=C) 3 159.56 9.44 0.0003 3 83.05 17.43 0.0000 3 251.09 12.09 0.0002 3 264.04 16.01 0.0000
H x C 3 22.45 0.28 0.2882 3 14.44 3.03 0.0489 3 128.96 6.21 0.0053 3 156.03 9.46 0.0003
Residual 24 16.89
24 4.76
16 20.77
24 16.49
SNK (H) Mus > Mud
SNK (C) 100 = 50 > 5 = 0 SNK (H x C)
Mussel-bed
100 > 0
NS
NS
Mud-flat
100 > 50 = 5 > 0
100 = 50 > 5 = 0
100 = 50 > 5 = 0 Austrominius modestus
Habitat (=H) 1 6.7x10⁴ 52.84 0.0000 1 7.4x10
3 25.34 0.0000 1 5.2x10
4 77.3 0.0000 1 1.8x10
3 3.40 0.0777
Cover of oysters (=C) 3 1.2x10⁴ 9.6 0.0002 3 7.2x10
3 24.58 0.0000 3 4.8x10
3 7.19 0.0029 3 6.6x10
3 12.48 0.0000
H x C 3 7.8x10³ 6.13 0.0030 3 2.3x10
3 7.87 0.0008 3 859.9 1.28 0.3144 3 484.08 0.92 0.4468
Residual 24 1.3x10³
24 294.22
16 670.75
24 526.99
SNK (H)
Mus > Mud SNK (C)
100 = 50 > 5 = 0
100 > 50, 5, 0 and 50 > 0
SNK (H x C) Mussel-bed 100 = 50 > 5 = 0
100 = 50 > 5 = 0
Mud-flat 100 > 50 = 5 = 0
100 > 50 = 5 > 0 Carcinus maenas
Habitat (=H) 1 159.99 44.81 0.0000 1 146.07 36.20 0.0000 1 94.13 11.14 0.0042 1 110.44 35.29 0.0000
Cover of oysters (=C) 3 27.53 7.71 0.0009 3 0.82 0.20 0.8935 3 21.34 2.53 0.0943 3 8.40 2.68 0.0694
H x C 3 12.71 3.56 0.0292 3 1.40 0.35 0.7877 3 10.7 1.27 0.3194 3 1.47 0.47 0.7067
Residual 24 3.57
24 4.04
16 8.45
24 3.13
SNK (H)
Mus > Mud
Mus > Mud
Mus > Mud SNK (C)
SNK (H x C)
Mussel-bed 100 > 0 = 5 = 50 Mud-flat 50 > 0 = 5 Phyllodocidae
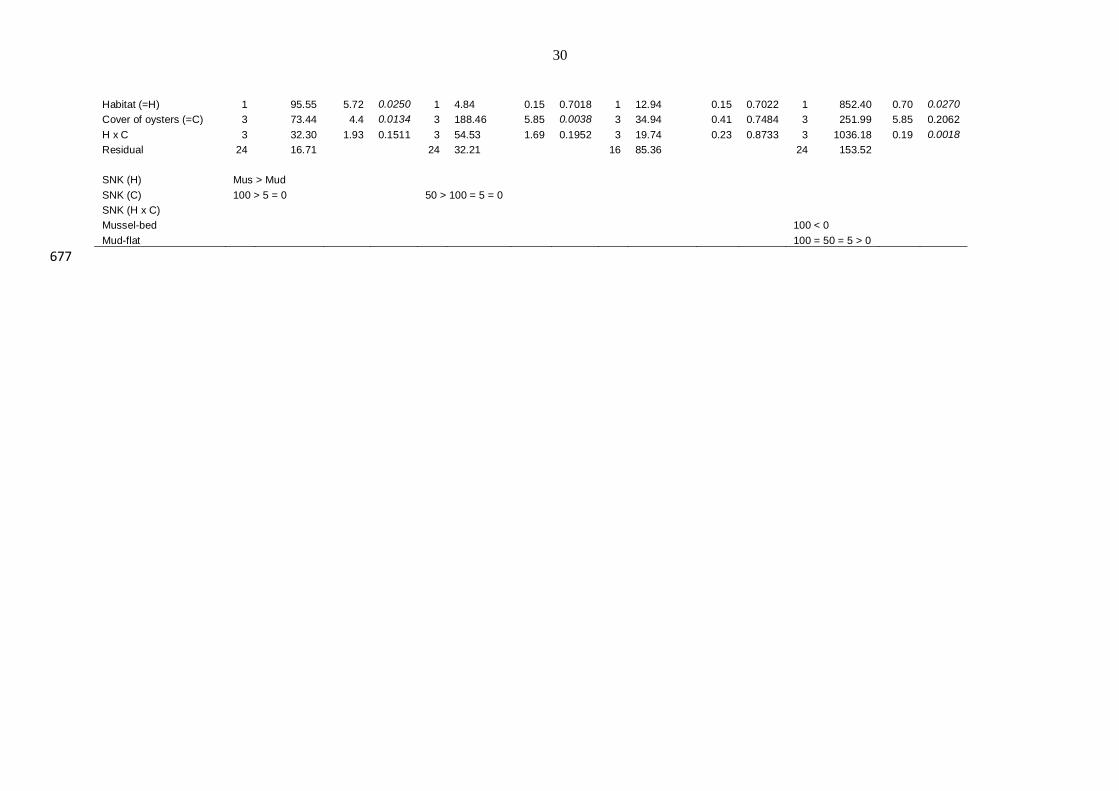
30
Habitat (=H) 1 95.55 5.72 0.0250 1 4.84 0.15 0.7018 1 12.94 0.15 0.7022 1 852.40 0.70 0.0270
Cover of oysters (=C) 3 73.44 4.4 0.0134 3 188.46 5.85 0.0038 3 34.94 0.41 0.7484 3 251.99 5.85 0.2062
H x C 3 32.30 1.93 0.1511 3 54.53 1.69 0.1952 3 19.74 0.23 0.8733 3 1036.18 0.19 0.0018
Residual 24 16.71
24 32.21
16 85.36
24 153.52
SNK (H) Mus > Mud
SNK (C) 100 > 5 = 0
50 > 100 = 5 = 0 SNK (H x C)
Mussel-bed
100 < 0
Mud-flat 100 = 50 = 5 > 0
677
31
678
Figure 1. Mean (+/- S.E.) numbers of individuals per m2
after (a) 4 and (b) 15 months (note 679
there is a break between 3x10⁵ and 8x10
5), species richness after (c) 4 and (d) 15 months and 680
Shannon-Wiener diversity after (e) 4 and (f) 15 months in mussel-beds (hatched bars) and 681
mud-flats (white bars) with increasing cover of C. gigas at Lough Foyle and Lough Swilly. 682
683
32
684
Figure 2. nMDS plots with stress values on square root transformed data of assemblages on 685
mussel-beds (black shapes) and mud-flats (white shapes) with 0, 5, 50 or 100% cover (as 686
indicated in the legend) of C. gigas at Lough Foyle after 4 (a), and 15 (c) months and Lough 687
Swilly after 4 (b) and 15 (d) months. Pseudo-F and P values from PERMANOVA are 688
indicated for the main effects, Habitat (Ha) and Cover of oysters (Co) and their interaction 689
(Ha*Co). Significant P values are indicated in italics. 690
691
33
692
Figure 3. Mean (+/- S.E.) density (number per m2) of L. littorea after (a) 4 and (b) 15 693
months, A. modestus after (c) 4 and (d) 15 months, C. maenas after (e) 4 and (f) 15 months 694
and Phyllodocidae polychaetes after (g) 4 and (h) 15 months in mussel-beds and mud-flats 695
with increasing cover of C. gigas at Lough Foyle and Lough Swilly. 696
34
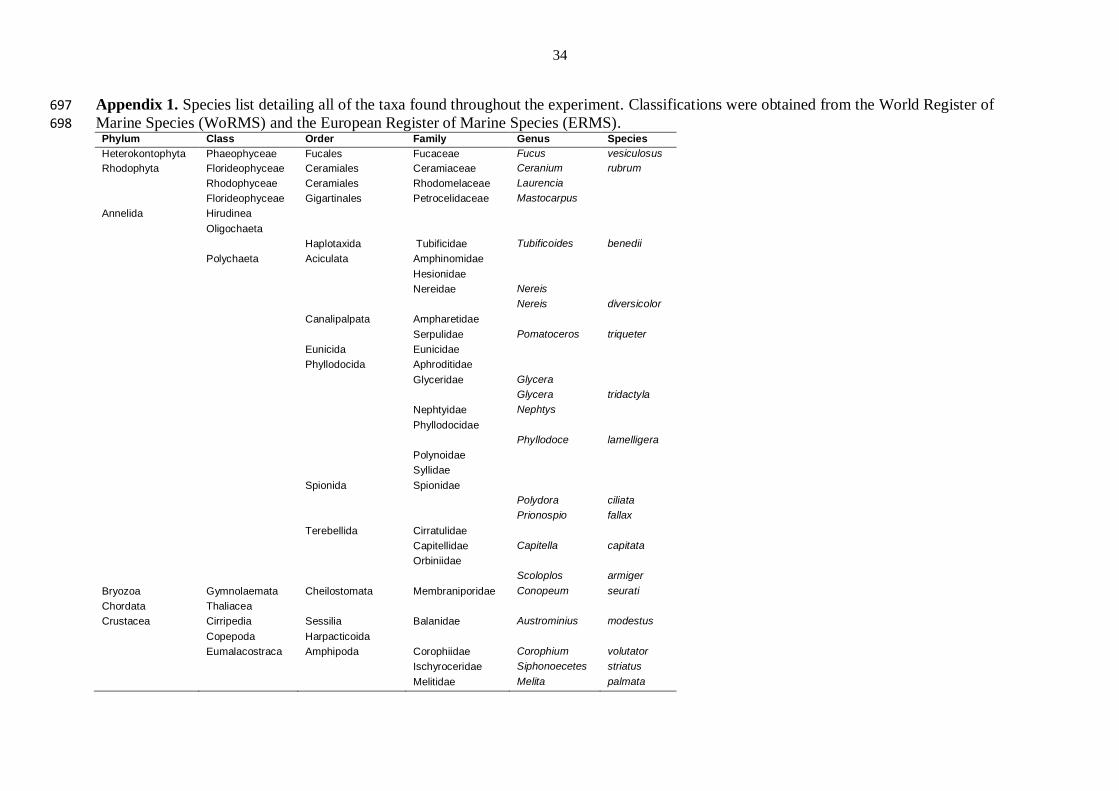
Appendix 1. Species list detailing all of the taxa found throughout the experiment. Classifications were obtained from the World Register of 697 Marine Species (WoRMS) and the European Register of Marine Species (ERMS). 698
Phylum Class Order Family Genus Species
Heterokontophyta Phaeophyceae Fucales Fucaceae Fucus vesiculosus
Rhodophyta Florideophyceae Ceramiales Ceramiaceae Ceranium rubrum
Rhodophyceae Ceramiales Rhodomelaceae Laurencia
Florideophyceae Gigartinales Petrocelidaceae Mastocarpus
Annelida Hirudinea
Oligochaeta
Haplotaxida Tubificidae Tubificoides benedii
Polychaeta Aciculata Amphinomidae
Hesionidae
Nereidae Nereis
Nereis diversicolor
Canalipalpata Ampharetidae
Serpulidae Pomatoceros triqueter
Eunicida Eunicidae
Phyllodocida Aphroditidae
Glyceridae Glycera
Glycera tridactyla
Nephtyidae Nephtys
Phyllodocidae
Phyllodoce lamelligera
Polynoidae
Syllidae
Spionida Spionidae
Polydora ciliata
Prionospio fallax
Terebellida Cirratulidae
Capitellidae Capitella capitata
Orbiniidae
Scoloplos armiger
Bryozoa Gymnolaemata Cheilostomata Membraniporidae Conopeum seurati
Chordata Thaliacea
Crustacea Cirripedia Sessilia Balanidae Austrominius modestus
Copepoda Harpacticoida
Eumalacostraca Amphipoda Corophiidae Corophium volutator
Ischyroceridae Siphonoecetes striatus
Melitidae Melita palmata
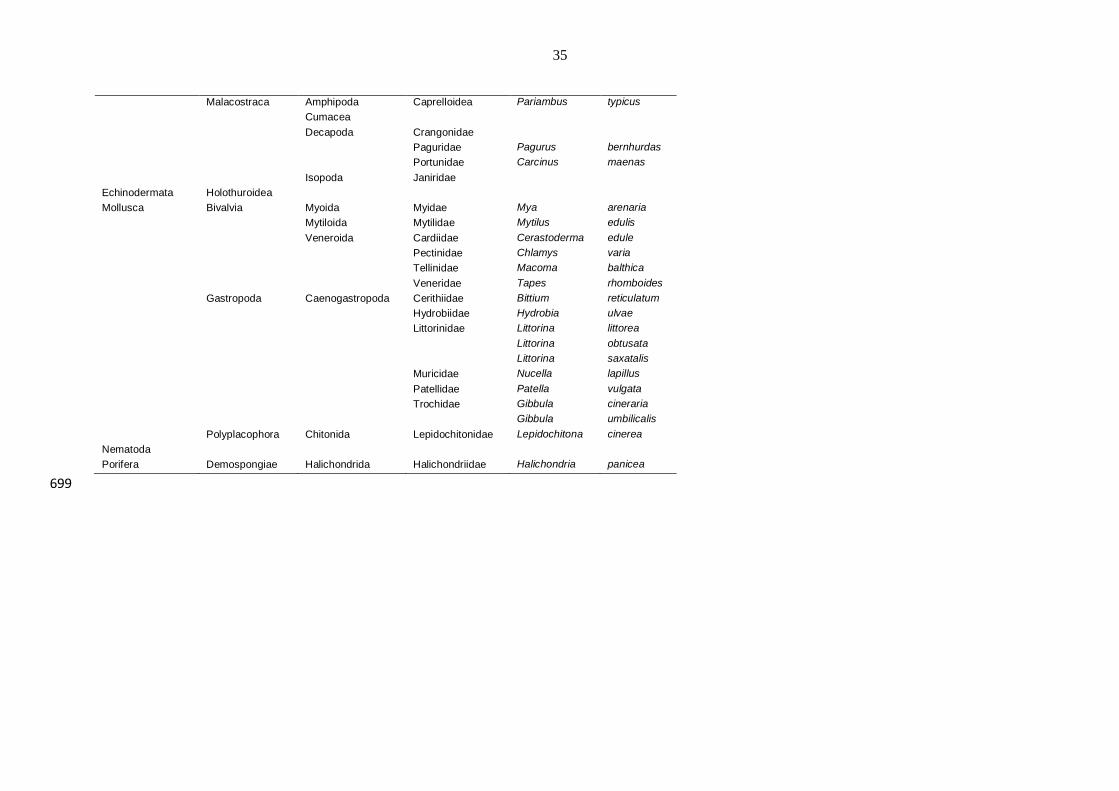
35
Malacostraca Amphipoda Caprelloidea Pariambus typicus
Cumacea
Decapoda Crangonidae
Paguridae Pagurus bernhurdas
Portunidae Carcinus maenas
Isopoda Janiridae
Echinodermata Holothuroidea
Mollusca Bivalvia Myoida Myidae Mya arenaria
Mytiloida Mytilidae Mytilus edulis
Veneroida Cardiidae Cerastoderma edule
Pectinidae Chlamys varia
Tellinidae Macoma balthica
Veneridae Tapes rhomboides
Gastropoda Caenogastropoda Cerithiidae Bittium reticulatum
Hydrobiidae Hydrobia ulvae
Littorinidae Littorina littorea
Littorina obtusata
Littorina saxatalis
Muricidae Nucella lapillus
Patellidae Patella vulgata
Trochidae Gibbula cineraria
Gibbula umbilicalis
Polyplacophora Chitonida Lepidochitonidae Lepidochitona cinerea
Nematoda
Porifera Demospongiae Halichondrida Halichondriidae Halichondria panicea
699


