Embed Size (px)
Citation preview

Republic of Iraq
Ministry of Higher Education and Scientific Research
Al-NahrainUniversity
College of Science
Department of Chemistry
Construction of new MIP-Ion Selective
Electrodes for Warfarin Sodium
A Thesis
Submitted to the College of Science, Al-NahrainUniversity as a
Partial Fulfillment of the Requirements for the Degree of Master
of Science in Chemistry
By
Maysam Ayad Hussain B.Sc. in Chemistry (2008) / College of Science/ Al-NahrainUniversity
Supervised by
Assistant professor
Dr. Yehya Kamal AL-bayati
June 2016 Ramadan 1437

الَعظيم العلي َصَدَق الله
"يرفع الل الذيَن آمنوا مهنكم والذيَن أوتوا
العلَم درجت"
(۱۱سورة المجادلة اآلية )
بهس مه الله الرَّح َمنه الرَّحهيمه

االهداء
إلى الذي لم يأل جهدا في تربيتي منذ الصغر...
... انتظار بدون العطاء الى الذي علمني ...افتخار بكل أسمه أحمل من إلى
الغالي ابي
...اجلي من شبابها نذرت التي إلى
...راحتي اجل من وسهرت صبرت التي الى
...جراحي بلسم وحنانها نجاحي سر دعائها كان من إلى
الغالية امي
…االمل نفسي في غرس من الى
…الكبير القلب الى
العزيز زوجي
الى من اشد بهم ازري في الحياة...
...جراحيالى من هم بلسم
اخواتي
فرح ودعاء
.. كل من فرح بي وشجعني على هذه الدراسة لى إ
قارباألو ءصدقااال
... بفضلهم عرفانا جهدي ثمرة اهدي جميعا إليهم
ميسم

First of all, thanks to Allah, the Almighty, who has
granted me the strength and patience to finish this work.
I wish to express my deepest gratitude and appreciation to
my supervisor Asst. prof Dr. Yehya K. Al- bayati for his
fruitful supervision, guidance, valuable suggestions, great
help and encouragement during the research course. I am
sincerely thankful to Asst. professor Dr. Nasreen R . Jber
the Head of Chemistry Department at AL-Nahrain
University for all the facilities that she offered during my
research, and I would like to thank Dr. Khaleda H. Al-
saidi, great and special thanks are due to senior researcher
Dr.Nabil S. Nassory for his valuable help and assistance
during my work. I would like to thank every one who helped
me to finish this thesis. All my dearest friends
especially,Sumayah,Marwah,Noor.Finally, my special
thanks and sense of gratitude are due to my family.
Maysam Ayad Hussain
2016
Summary
I
This piece of research includes three main chapters .
Chapter one includes an introduction on ion selective electrodes
(ISEs) and their work, properties, classification of ion selective
membranes, cell design of ion-selective electrode and characterization of
ion-selective electrodes such as selectivity coefficient with different
method (separation solution method) and (matched potential method)
with range of linear response, detection limit, response of time.
Molecularly imprinted polymers (MIP) Technique and Approaches for
preparing Molecularly Imprinted Polymers (Covalent Imprinting Method,
Non-Covalent Imprinting Method). MIP component and Factors
influencing polymerization (Template molecule, Functional monomer,
Cross linker, Initiator and Solvent). Factors that control the synthesis of
selective MIP preparation methods of MIPs Bulk polymerization and
polymerization precipitation, and analytical Methods for drug estimation
using the ( ISEs) and (MIPs), direct method, standard addition method,
multiple standard addition method and titration method. The research
work covers in detail a comprehensive of a full survey of the chemical
literatures related with project title. Warfarin sodium is an anticoagulant
drug, which competitively depresses the synthesis of vitamin K-
dependent coagulation factors. Presence of coumarin ring makes
Warfarin a good complexing ligand. Coumarin complexes are of
significant interest because of their biological and complexing ability .
Chapter two comprises a complete description for the chemicals used,
their preparations, in addition to instruments and equipments, cell design
of ion selective electrode , molecularly imprinted polymers and casting
the membrane.
Summary
II
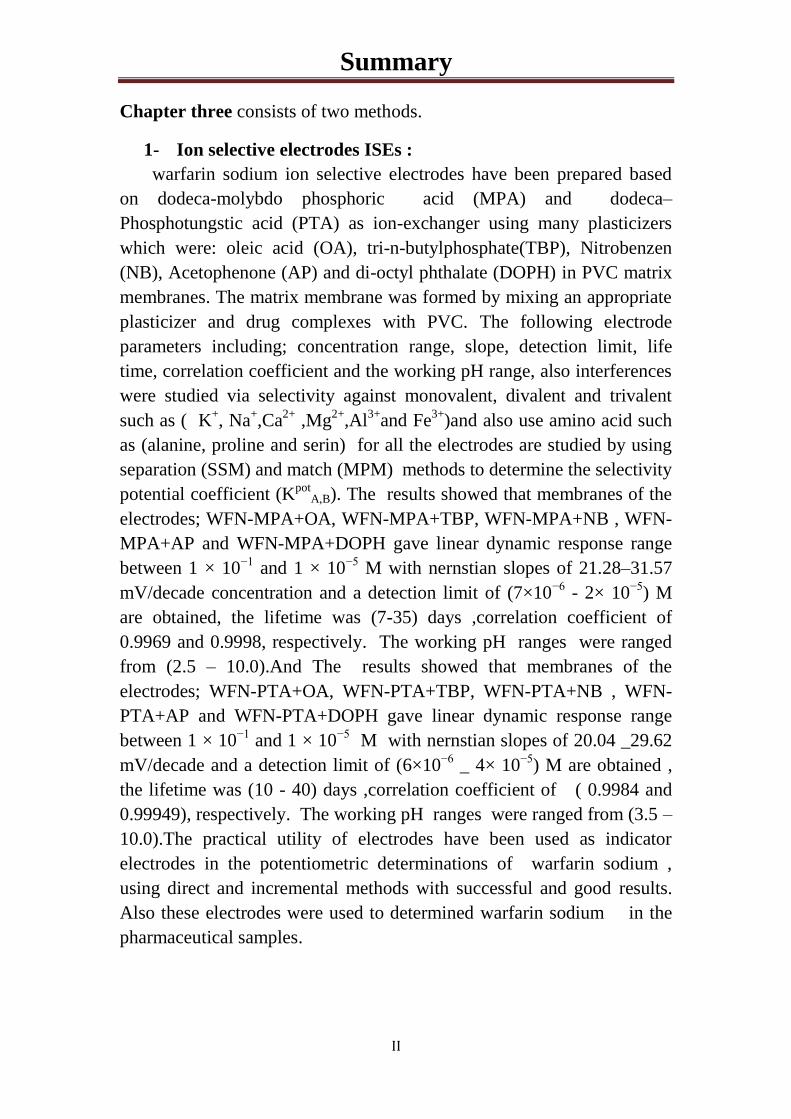
Chapter three consists of two methods.
1- Ion selective electrodes ISEs :
warfarin sodium ion selective electrodes have been prepared based
on dodeca-molybdo phosphoric acid (MPA) and dodeca–
Phosphotungstic acid (PTA) as ion-exchanger using many plasticizers
which were: oleic acid (OA), tri-n-butylphosphate(TBP), Nitrobenzen
(NB), Acetophenone (AP) and di-octyl phthalate (DOPH) in PVC matrix
membranes. The matrix membrane was formed by mixing an appropriate
plasticizer and drug complexes with PVC. The following electrode
parameters including; concentration range, slope, detection limit, life
time, correlation coefficient and the working pH range, also interferences
were studied via selectivity against monovalent, divalent and trivalent
such as ( K+, Na
+,Ca
2+ ,Mg
2+,Al
3+and Fe
3+)and also use amino acid such
as (alanine, proline and serin) for all the electrodes are studied by using
separation (SSM) and match (MPM) methods to determine the selectivity
potential coefficient (Kpot
A,B). The results showed that membranes of the
electrodes; WFN-MPA+OA, WFN-MPA+TBP, WFN-MPA+NB , WFN-
MPA+AP and WFN-MPA+DOPH gave linear dynamic response range
between 1 × 10⁻¹
and 1 × 10⁻⁵
M with nernstian slopes of 21.28–31.57
mV/decade concentration and a detection limit of (7×10⁻⁶
- 2× 10⁻⁵
) M
are obtained, the lifetime was (7-35) days ,correlation coefficient of
0.9969 and 0.9998, respectively. The working pH ranges were ranged
from (2.5 – 10.0).And The results showed that membranes of the
electrodes; WFN-PTA+OA, WFN-PTA+TBP, WFN-PTA+NB , WFN-
PTA+AP and WFN-PTA+DOPH gave linear dynamic response range
between 1 × 10⁻¹
and 1 × 10⁻⁵
M with nernstian slopes of 20.04 _29.62
mV/decade and a detection limit of (6×10⁻⁶
_ 4× 10⁻⁵
) M are obtained ,
the lifetime was (10 - 40) days ,correlation coefficient of ( 0.9984 and
0.99949), respectively. The working pH ranges were ranged from (3.5 –
10.0).The practical utility of electrodes have been used as indicator
electrodes in the potentiometric determinations of warfarin sodium ,
using direct and incremental methods with successful and good results.
Also these electrodes were used to determined warfarin sodium in the
pharmaceutical samples.
Summary
III
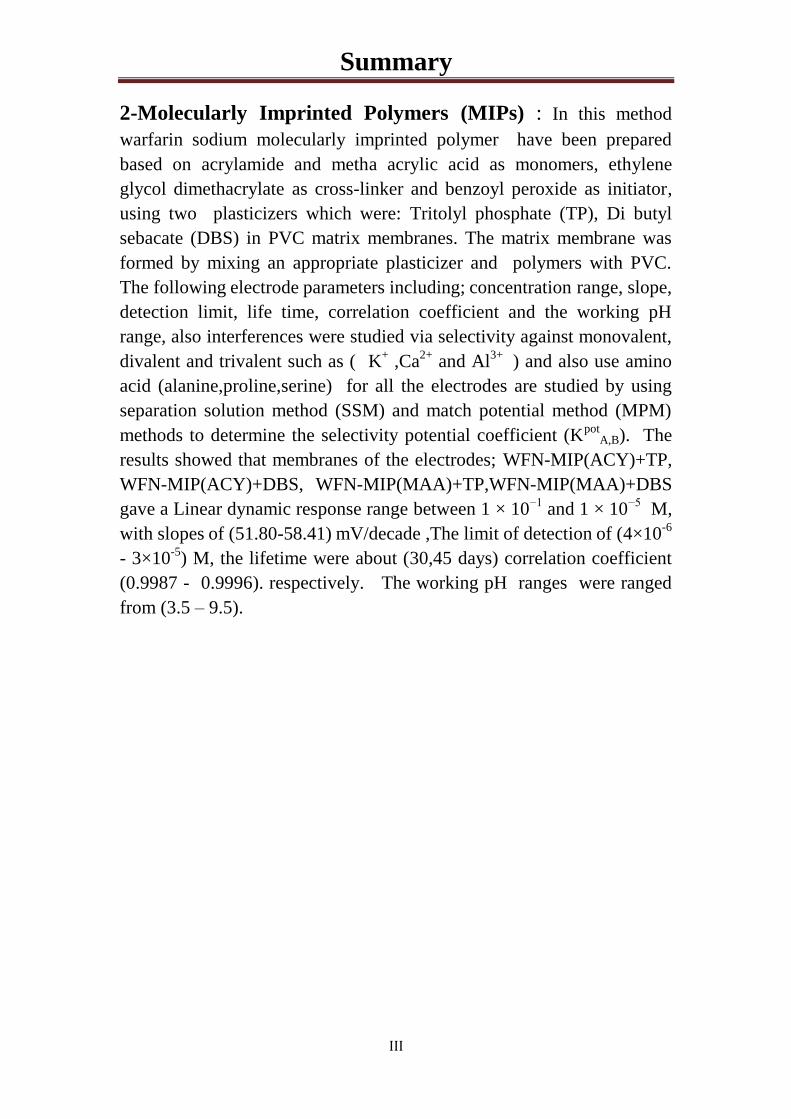
2-Molecularly Imprinted Polymers (MIPs) : In this method
warfarin sodium molecularly imprinted polymer have been prepared
based on acrylamide and metha acrylic acid as monomers, ethylene
glycol dimethacrylate as cross-linker and benzoyl peroxide as initiator,
using two plasticizers which were: Tritolyl phosphate (TP), Di butyl
sebacate (DBS) in PVC matrix membranes. The matrix membrane was
formed by mixing an appropriate plasticizer and polymers with PVC.
The following electrode parameters including; concentration range, slope,
detection limit, life time, correlation coefficient and the working pH
range, also interferences were studied via selectivity against monovalent,
divalent and trivalent such as ( K+ ,Ca
2+ and Al
3+
) and also use amino
acid (alanine,proline,serine) for all the electrodes are studied by using
separation solution method (SSM) and match potential method (MPM)
methods to determine the selectivity potential coefficient (Kpot
A,B). The
results showed that membranes of the electrodes; WFN-MIP(ACY)+TP,
WFN-MIP(ACY)+DBS, WFN-MIP(MAA)+TP,WFN-MIP(MAA)+DBS
gave a Linear dynamic response range between 1 × 10⁻¹
and 1 × 10⁻⁵
M,
with slopes of (51.80-58.41) mV/decade ,The limit of detection of (4×10⁻⁶
- 3×10⁻⁵
) M, the lifetime were about (30,45 days) correlation coefficient
(0.9987 - 0.9996). respectively. The working pH ranges were ranged
from (3.5 – 9.5).
Content
IV
Contents Page
No.
Summary I
List of subjects V
List of tables X
List of figures XV
List of abbreviations XIX
Chapter One: Introduction
1 1.1 Ion Selective electrode 1
Basic Theory of ISE Measurements 1.2 2
1.3 Ion selective electrode cell measurements 3
1.4 Classification of ion-selective electrodes 4
1.5. Reference electrodes 5
1.6. Characterization of ion-selective electrode
5
1.6.1 Calibration curve 5
1.6.2 Slope 6
1.6.3 Detection limit 6
1.6.4 Range of linear response 7
1.6.5 Response time 7
1.6.6 stability and lifetime 7
1.6.7 Selectivity 7
1.6.7.1 Mixed solution methods 8
1.6.7.1 (a) Fixed Interference method (FIM) 8
1.6.7.1 (b) Fixed Primary ion method (FPM) 9
1.6.7.1 (c) Two solutions Method (TSM) 9
1.6.7.1 (d) Matched potential method (MPM) 9
1.6.7.2 Separate solution methods
10
1.6.7.2 (a) When (aA= aB) 10
1.6.7.2 (b) When (EA= EB ) 11
Content
V
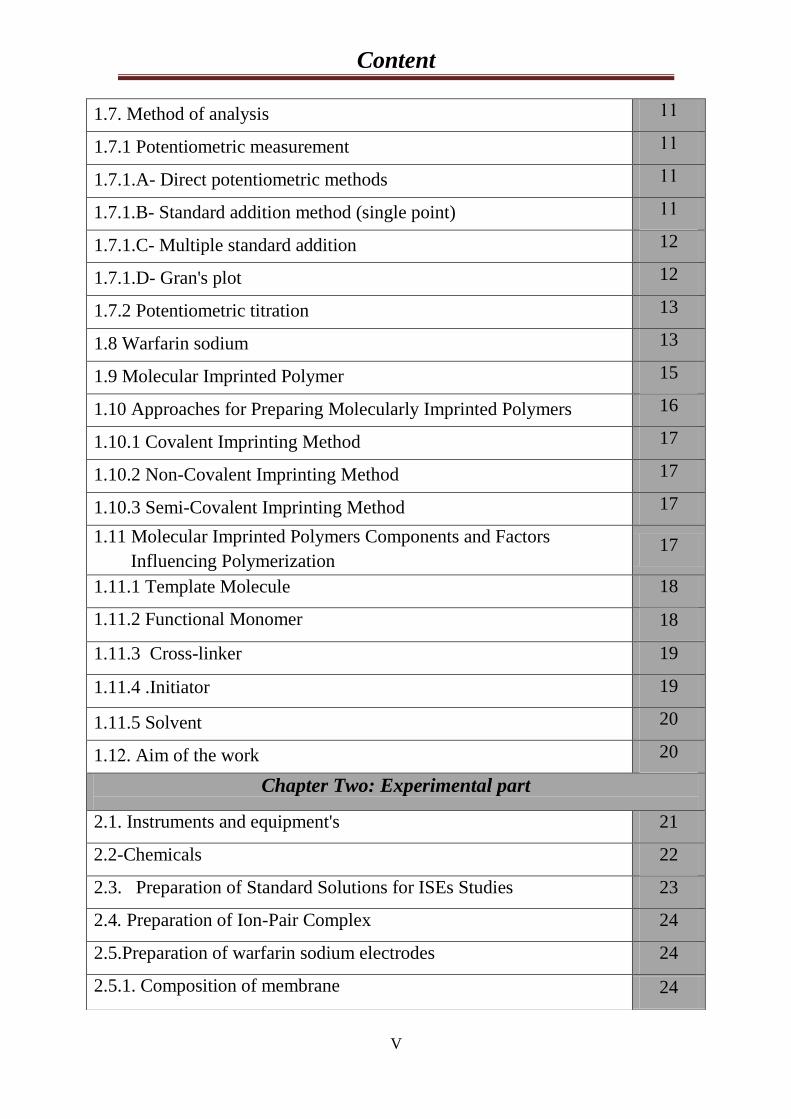
1.7. Method of analysis 11
1.7.1 Potentiometric measurement 11
1.7.1.A- Direct potentiometric methods 11
1.7.1.B- Standard addition method (single point) 11
1.7.1.C- Multiple standard addition 12
1.7.1.D- Gran's plot
12
1.7.2 Potentiometric titration
13
1.8 Warfarin sodium 13
1.9 Molecular Imprinted Polymer 15
1.10 Approaches for Preparing Molecularly Imprinted Polymers 16
1.10.1 Covalent Imprinting Method 17
1.10.2 Non-Covalent Imprinting Method 17
1.10.3 Semi-Covalent Imprinting Method 17
1.11 Molecular Imprinted Polymers Components and Factors
Influencing Polymerization 17
1.11.1 Template Molecule
18
1.11.2 Functional Monomer
18
1.11.3 Cross-linker
19
1.11.4 .Initiator
19
1.11.5 Solvent 20
1.12. Aim of the work 20
Chapter Two: Experimental part
2.1. Instruments and equipment's 21
2.2-Chemicals 22
2.3. Preparation of Standard Solutions for ISEs Studies 23
2.4. Preparation of Ion-Pair Complex 24
2.5.Preparation of warfarin sodium electrodes 24
2.5.1. Composition of membrane
24
Content
VI
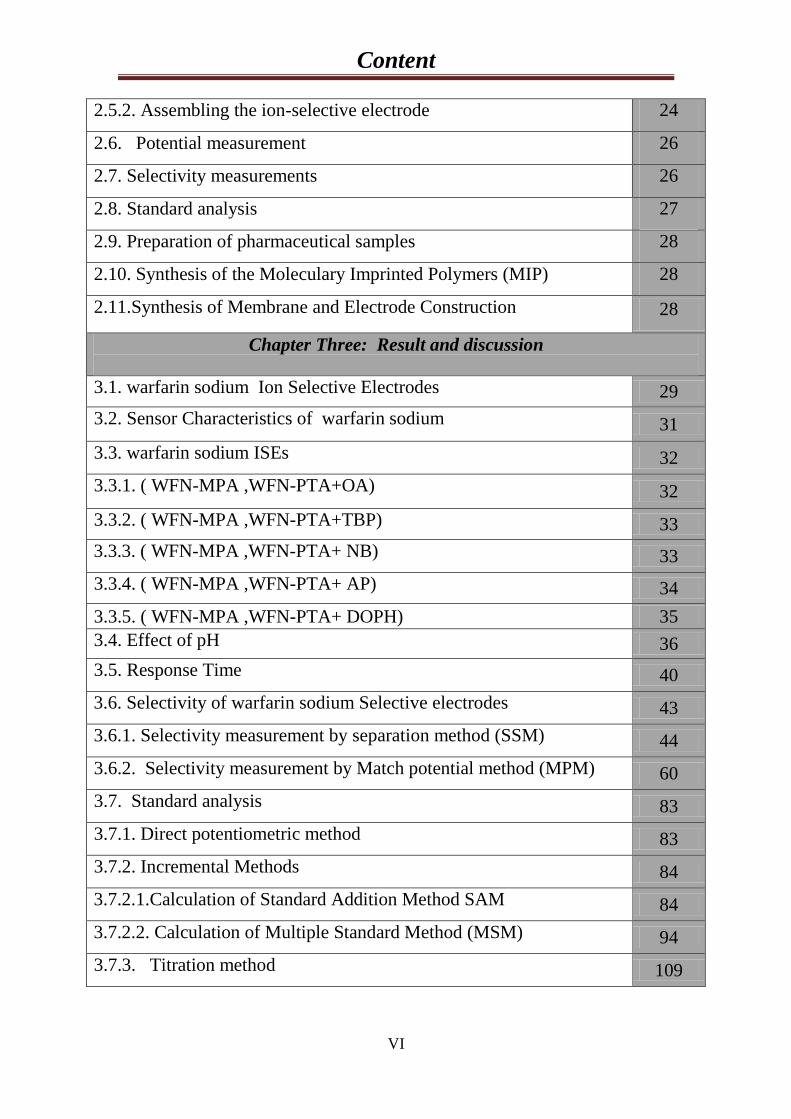
2.5.2. Assembling the ion-selective electrode 24
2.6. Potential measurement 26
2.7. Selectivity measurements 26
2.8. Standard analysis 27
2.9. Preparation of pharmaceutical samples 28
2.10. Synthesis of the Moleculary Imprinted Polymers (MIP) 28
2.11.Synthesis of Membrane and Electrode Construction
28
Chapter Three: Result and discussion
3.1. warfarin sodium Ion Selective Electrodes
29
3.2. Sensor Characteristics of warfarin sodium
31
3.3. warfarin sodium ISEs
32
3.3.1. ( WFN-MPA ,WFN-PTA+OA)
32
3.3.2. ( WFN-MPA ,WFN-PTA+TBP)
33
3.3.3. ( WFN-MPA ,WFN-PTA+ NB) 33
3.3.4. ( WFN-MPA ,WFN-PTA+ AP)
34
3.3.5. ( WFN-MPA ,WFN-PTA+ DOPH) 35
3.4. Effect of pH
36
3.5. Response Time
40
3.6. Selectivity of warfarin sodium Selective electrodes 43
3.6.1. Selectivity measurement by separation method (SSM) 44
3.6.2. Selectivity measurement by Match potential method (MPM) 60
3.7. Standard analysis 83
3.7.1. Direct potentiometric method 83
3.7.2. Incremental Methods 84
3.7.2.1.Calculation of Standard Addition Method SAM 84
3.7.2.2. Calculation of Multiple Standard Method (MSM) 94
3.7.3. Titration method 109
Content
VII
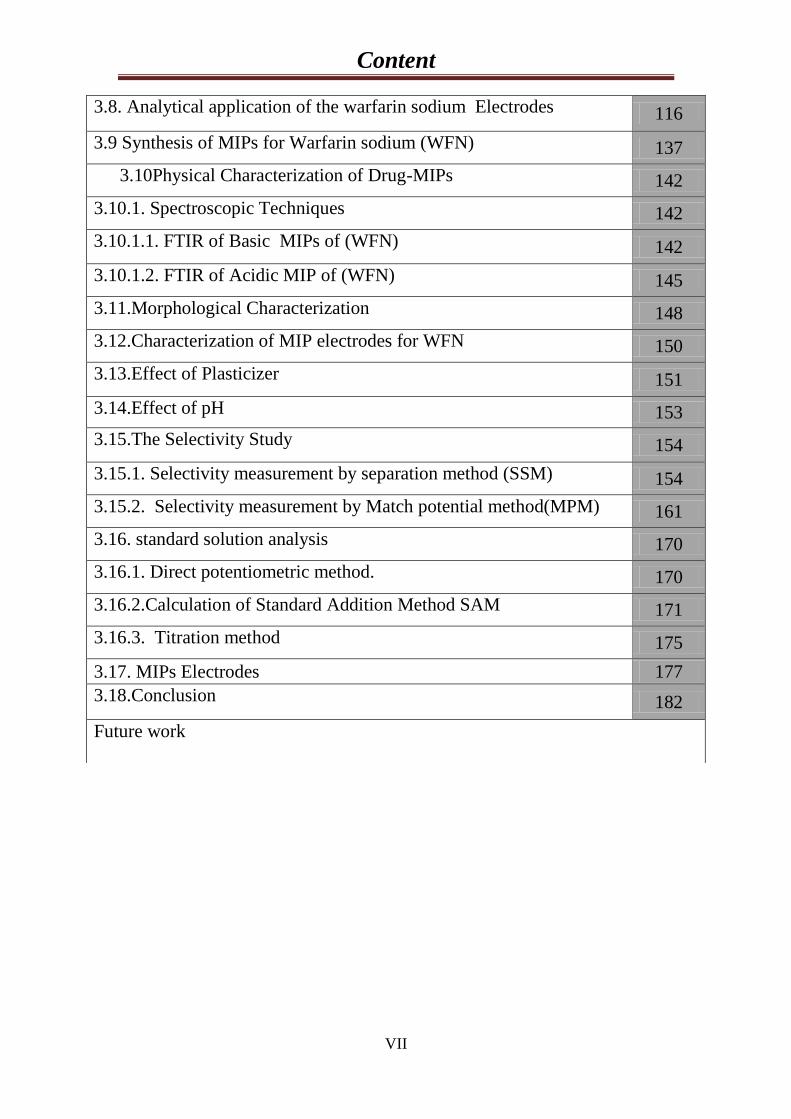
3.8. Analytical application of the warfarin sodium Electrodes
116
3.9 Synthesis of MIPs for Warfarin sodium (WFN) 137
3.10Physical Characterization of Drug-MIPs 142
3.10.1. Spectroscopic Techniques 142
3.10.1.1. FTIR of Basic MIPs of (WFN)
142
3.10.1.2. FTIR of Acidic MIP of (WFN) 145
3.11.Morphological Characterization
148
3.12.Characterization of MIP electrodes for WFN
150
3.13.Effect of Plasticizer
151
3.14.Effect of pH
153
3.15.The Selectivity Study
154
3.15.1. Selectivity measurement by separation method (SSM) 154
3.15.2. Selectivity measurement by Match potential method(MPM) 161
3.16. standard solution analysis 170
3.16.1. Direct potentiometric method. 170
3.16.2.Calculation of Standard Addition Method SAM 171
3.16.3. Titration method 175
3.17. MIPs Electrodes 177
3.18.Conclusion
182
Future work
Content
VIII
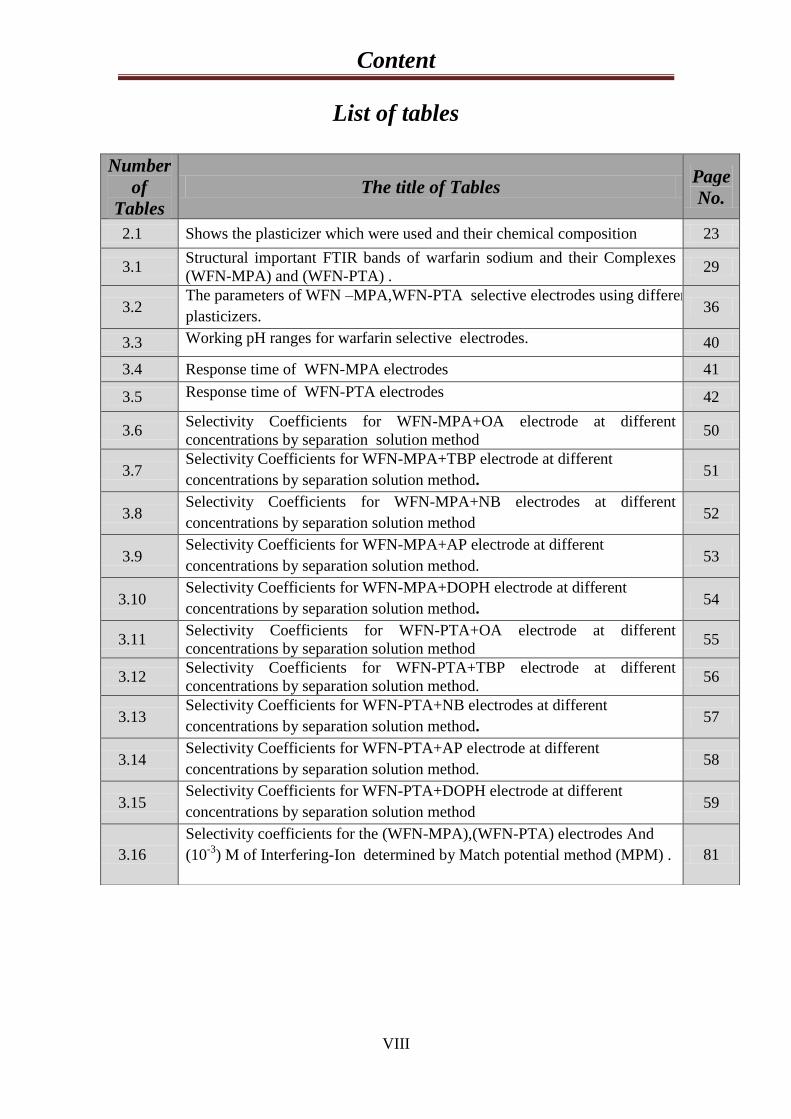
List of tables
Number
of
Tables
The title of Tables Page
No.
2.1 Shows the plasticizer which were used and their chemical composition 23
3.1 Structural important FTIR bands of warfarin sodium and their Complexes
(WFN-MPA) and (WFN-PTA) . 29
3.2 The parameters of WFN –MPA,WFN-PTA selective electrodes using different
plasticizers. 36
3.3 Working pH ranges for warfarin selective electrodes.
40
3.4 Response time of WFN-MPA electrodes 41
3.5 Response time of WFN-PTA electrodes
42
3.6 Selectivity Coefficients for WFN-MPA+OA electrode at different
concentrations by separation solution method 50
3.7 Selectivity Coefficients for WFN-MPA+TBP electrode at different
concentrations by separation solution method. 51
3.8 Selectivity Coefficients for WFN-MPA+NB electrodes at different
concentrations by separation solution method 52
3.9 Selectivity Coefficients for WFN-MPA+AP electrode at different
concentrations by separation solution method. 53
3.10 Selectivity Coefficients for WFN-MPA+DOPH electrode at different
concentrations by separation solution method. 54
3.11 Selectivity Coefficients for WFN-PTA+OA electrode at different
concentrations by separation solution method 55
3.12 Selectivity Coefficients for WFN-PTA+TBP electrode at different
concentrations by separation solution method. 56
3.13 Selectivity Coefficients for WFN-PTA+NB electrodes at different
concentrations by separation solution method. 57
3.14 Selectivity Coefficients for WFN-PTA+AP electrode at different
concentrations by separation solution method. 58
3.15 Selectivity Coefficients for WFN-PTA+DOPH electrode at different
concentrations by separation solution method 59
3.16
Selectivity coefficients for the (WFN-MPA),(WFN-PTA) electrodes And
(10-3
) M of Interfering-Ion determined by Match potential method (MPM) .
81
Content
IX
7113 Selectivity coefficients for the (WFN-MPA),(WFN-PTA) electrodes And
(10-4
) M of Interfering-Ion determined by Match potential method (MPM) . 82
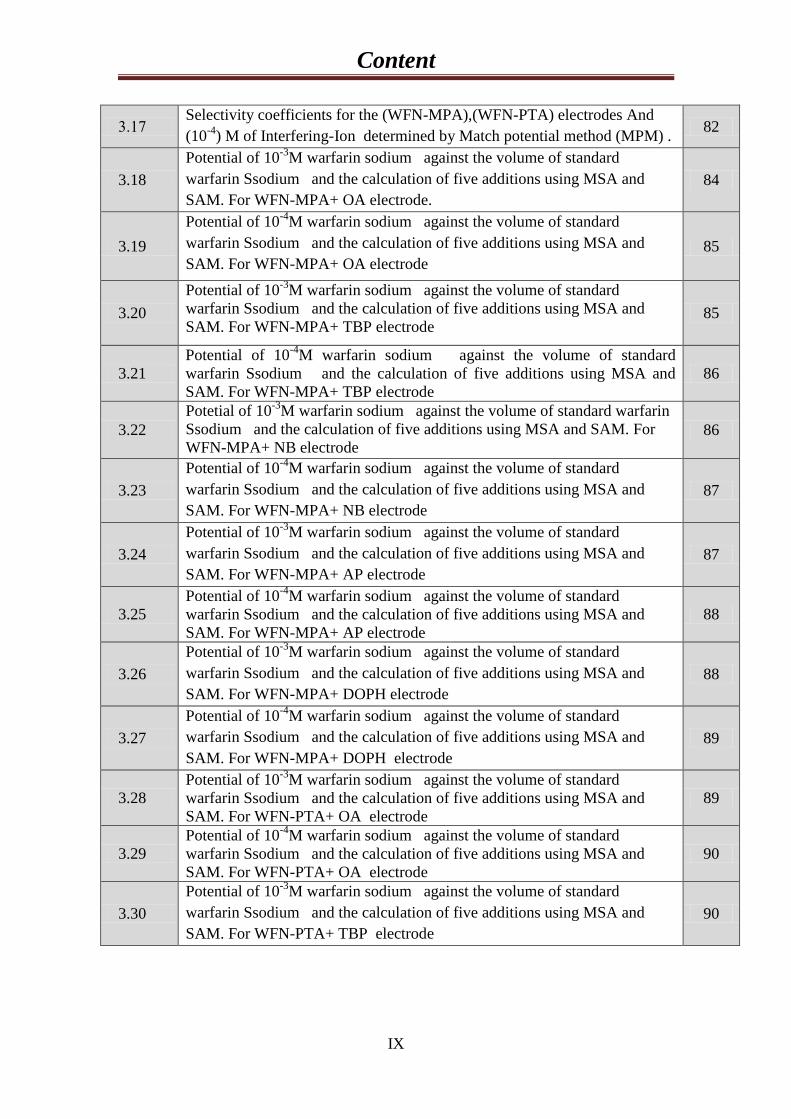
3.18
Potential of 10-3
M warfarin sodium against the volume of standard
warfarin Ssodium and the calculation of five additions using MSA and
SAM. For WFN-MPA+ OA electrode.
84
3.19
Potential of 10-4
M warfarin sodium against the volume of standard
warfarin Ssodium and the calculation of five additions using MSA and
SAM. For WFN-MPA+ OA electrode
85
3.20
Potential of 10-3
M warfarin sodium against the volume of standard
warfarin Ssodium and the calculation of five additions using MSA and
SAM. For WFN-MPA+ TBP electrode
85
3.21
Potential of 10-4
M warfarin sodium against the volume of standard
warfarin Ssodium and the calculation of five additions using MSA and
SAM. For WFN-MPA+ TBP electrode
86
3.22
Potetial of 10-3
M warfarin sodium against the volume of standard warfarin
Ssodium and the calculation of five additions using MSA and SAM. For
WFN-MPA+ NB electrode
86
3.23
Potential of 10-4
M warfarin sodium against the volume of standard
warfarin Ssodium and the calculation of five additions using MSA and
SAM. For WFN-MPA+ NB electrode
87
3.24
Potential of 10-3
M warfarin sodium against the volume of standard
warfarin Ssodium and the calculation of five additions using MSA and
SAM. For WFN-MPA+ AP electrode
87
3.25
Potential of 10-4
M warfarin sodium against the volume of standard
warfarin Ssodium and the calculation of five additions using MSA and
SAM. For WFN-MPA+ AP electrode
88
3.26
Potential of 10-3
M warfarin sodium against the volume of standard
warfarin Ssodium and the calculation of five additions using MSA and
SAM. For WFN-MPA+ DOPH electrode
88
3.27
Potential of 10-4
M warfarin sodium against the volume of standard
warfarin Ssodium and the calculation of five additions using MSA and
SAM. For WFN-MPA+ DOPH electrode
89
3.28
Potential of 10-3
M warfarin sodium against the volume of standard
warfarin Ssodium and the calculation of five additions using MSA and
SAM. For WFN-PTA+ OA electrode
89
3.29
Potential of 10-4
M warfarin sodium against the volume of standard
warfarin Ssodium and the calculation of five additions using MSA and
SAM. For WFN-PTA+ OA electrode
90
3.30
Potential of 10-3
M warfarin sodium against the volume of standard
warfarin Ssodium and the calculation of five additions using MSA and
SAM. For WFN-PTA+ TBP electrode
90
Content
X
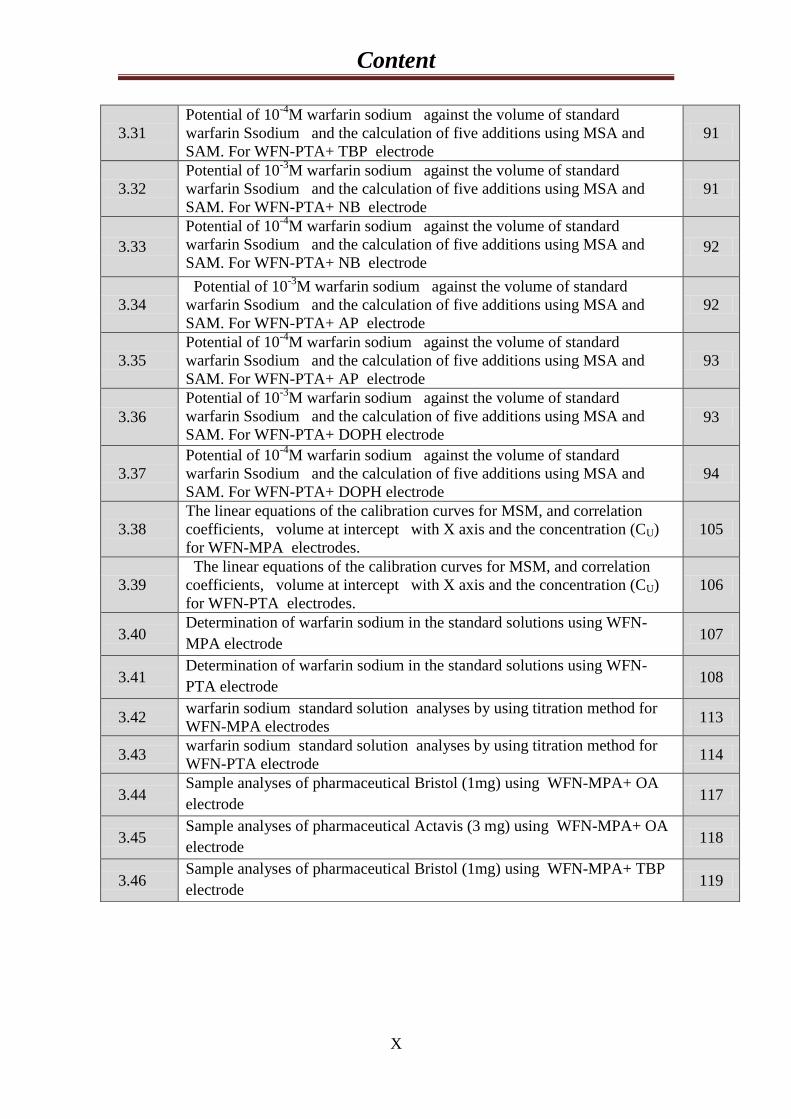
3.31
Potential of 10-4
M warfarin sodium against the volume of standard
warfarin Ssodium and the calculation of five additions using MSA and
SAM. For WFN-PTA+ TBP electrode
91
3.32
Potential of 10-3
M warfarin sodium against the volume of standard
warfarin Ssodium and the calculation of five additions using MSA and
SAM. For WFN-PTA+ NB electrode
91
3.33
Potential of 10-4
M warfarin sodium against the volume of standard
warfarin Ssodium and the calculation of five additions using MSA and
SAM. For WFN-PTA+ NB electrode
92
3.34
Potential of 10-3
M warfarin sodium against the volume of standard
warfarin Ssodium and the calculation of five additions using MSA and
SAM. For WFN-PTA+ AP electrode
92
3.35
Potential of 10-4
M warfarin sodium against the volume of standard
warfarin Ssodium and the calculation of five additions using MSA and
SAM. For WFN-PTA+ AP electrode
93
3.36
Potential of 10-3
M warfarin sodium against the volume of standard
warfarin Ssodium and the calculation of five additions using MSA and
SAM. For WFN-PTA+ DOPH electrode
93
3.37
Potential of 10-4
M warfarin sodium against the volume of standard
warfarin Ssodium and the calculation of five additions using MSA and
SAM. For WFN-PTA+ DOPH electrode
94
3.38
The linear equations of the calibration curves for MSM, and correlation
coefficients, volume at intercept with X axis and the concentration (CU)
for WFN-MPA electrodes.
105
3.39
The linear equations of the calibration curves for MSM, and correlation
coefficients, volume at intercept with X axis and the concentration (CU)
for WFN-PTA electrodes.
106
3.40 Determination of warfarin sodium in the standard solutions using WFN-
MPA electrode 107
3.41 Determination of warfarin sodium in the standard solutions using WFN-
PTA electrode 108
3.42 warfarin sodium standard solution analyses by using titration method for
WFN-MPA electrodes 113
3.43 warfarin sodium standard solution analyses by using titration method for
WFN-PTA electrode 114
3.44 Sample analyses of pharmaceutical Bristol (1mg) using WFN-MPA+ OA
electrode 117
3.45 Sample analyses of pharmaceutical Actavis (3 mg) using WFN-MPA+ OA
electrode 118
3.46 Sample analyses of pharmaceutical Bristol (1mg) using WFN-MPA+ TBP
electrode 119
Content
XI
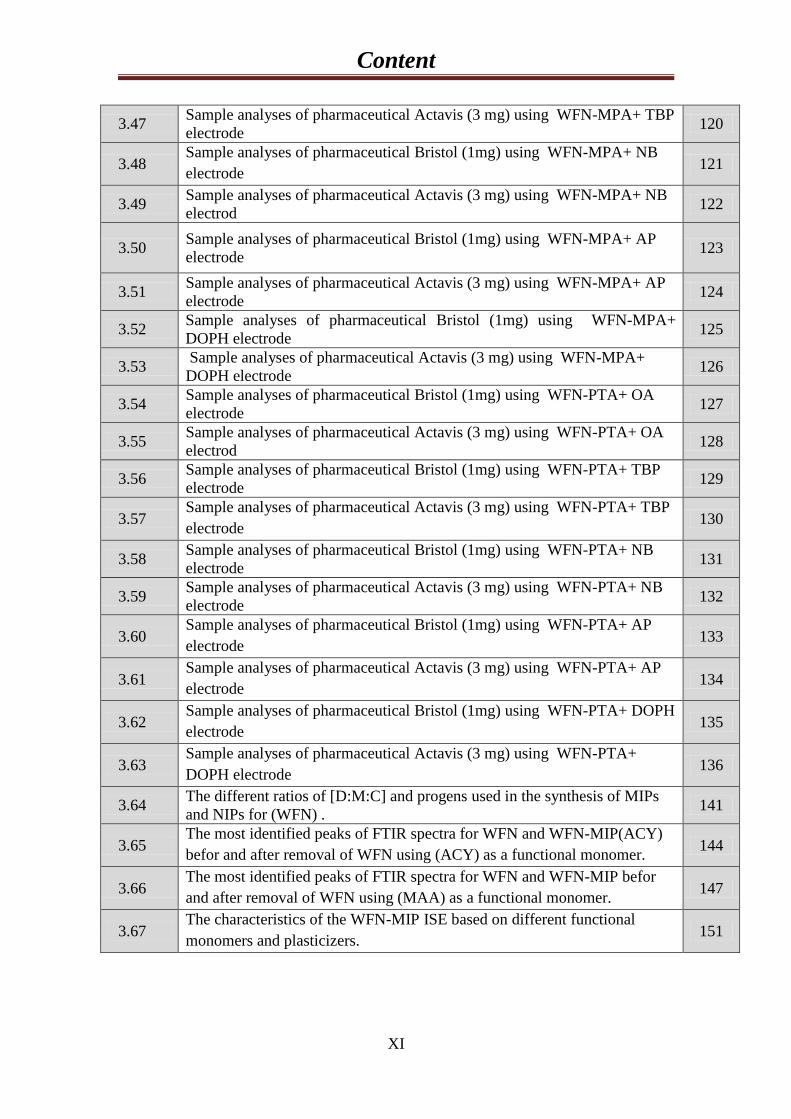
3.47 Sample analyses of pharmaceutical Actavis (3 mg) using WFN-MPA+ TBP
electrode 120
3.48 Sample analyses of pharmaceutical Bristol (1mg) using WFN-MPA+ NB
electrode 121
3.49 Sample analyses of pharmaceutical Actavis (3 mg) using WFN-MPA+ NB
electrod
122
3.50 Sample analyses of pharmaceutical Bristol (1mg) using WFN-MPA+ AP
electrode 123
3.51 Sample analyses of pharmaceutical Actavis (3 mg) using WFN-MPA+ AP
electrode 124
3.52 Sample analyses of pharmaceutical Bristol (1mg) using WFN-MPA+
DOPH electrode
125
3.53 Sample analyses of pharmaceutical Actavis (3 mg) using WFN-MPA+
DOPH electrode 126
3.54 Sample analyses of pharmaceutical Bristol (1mg) using WFN-PTA+ OA
electrode 127
3.55 Sample analyses of pharmaceutical Actavis (3 mg) using WFN-PTA+ OA
electrod 128
3.56 Sample analyses of pharmaceutical Bristol (1mg) using WFN-PTA+ TBP
electrode 129
3.57 Sample analyses of pharmaceutical Actavis (3 mg) using WFN-PTA+ TBP
electrode 130
3.58 Sample analyses of pharmaceutical Bristol (1mg) using WFN-PTA+ NB
electrode 131
3.59 Sample analyses of pharmaceutical Actavis (3 mg) using WFN-PTA+ NB
electrode 132
3.60 Sample analyses of pharmaceutical Bristol (1mg) using WFN-PTA+ AP
electrode 133
3.61 Sample analyses of pharmaceutical Actavis (3 mg) using WFN-PTA+ AP
electrode 134
3.62 Sample analyses of pharmaceutical Bristol (1mg) using WFN-PTA+ DOPH
electrode 135
3.63 Sample analyses of pharmaceutical Actavis (3 mg) using WFN-PTA+
DOPH electrode 136
3.64 The different ratios of [D:M:C] and progens used in the synthesis of MIPs
and NIPs for (WFN) . 141
3.65 The most identified peaks of FTIR spectra for WFN and WFN-MIP(ACY)
befor and after removal of WFN using (ACY) as a functional monomer. 144
3.66 The most identified peaks of FTIR spectra for WFN and WFN-MIP befor
and after removal of WFN using (MAA) as a functional monomer. 147
3.67 The characteristics of the WFN-MIP ISE based on different functional
monomers and plasticizers. 151
Content
XII
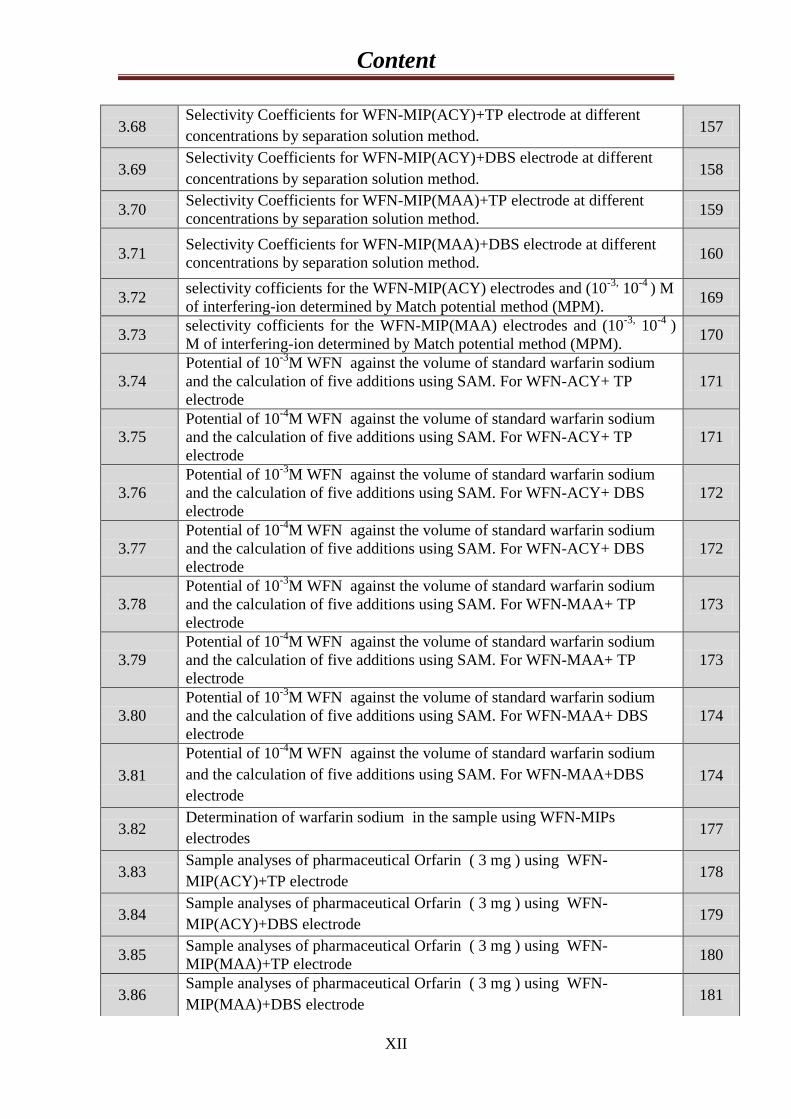
3.68 Selectivity Coefficients for WFN-MIP(ACY)+TP electrode at different
concentrations by separation solution method. 157
3.69 Selectivity Coefficients for WFN-MIP(ACY)+DBS electrode at different
concentrations by separation solution method. 158
3.70 Selectivity Coefficients for WFN-MIP(MAA)+TP electrode at different
concentrations by separation solution method.
159
3.71 Selectivity Coefficients for WFN-MIP(MAA)+DBS electrode at different
concentrations by separation solution method. 160
3.72 selectivity cofficients for the WFN-MIP(ACY) electrodes and (10
-3, 10
-4 ) M
of interfering-ion determined by Match potential method (MPM). 169
3.73 selectivity cofficients for the WFN-MIP(MAA) electrodes and (10
-3, 10
-4 )
M of interfering-ion determined by Match potential method (MPM).
170
3.74
Potential of 10-3
M WFN against the volume of standard warfarin sodium
and the calculation of five additions using SAM. For WFN-ACY+ TP
electrode
171
3.75
Potential of 10-4
M WFN against the volume of standard warfarin sodium
and the calculation of five additions using SAM. For WFN-ACY+ TP
electrode
171
3.76
Potential of 10-3
M WFN against the volume of standard warfarin sodium
and the calculation of five additions using SAM. For WFN-ACY+ DBS
electrode
172
3.77
Potential of 10-4
M WFN against the volume of standard warfarin sodium
and the calculation of five additions using SAM. For WFN-ACY+ DBS
electrode
172
3.78
Potential of 10-3
M WFN against the volume of standard warfarin sodium
and the calculation of five additions using SAM. For WFN-MAA+ TP
electrode
173
3.79
Potential of 10-4
M WFN against the volume of standard warfarin sodium
and the calculation of five additions using SAM. For WFN-MAA+ TP
electrode
173
3.80
Potential of 10-3
M WFN against the volume of standard warfarin sodium
and the calculation of five additions using SAM. For WFN-MAA+ DBS
electrode
174
3.81
Potential of 10-4
M WFN against the volume of standard warfarin sodium
and the calculation of five additions using SAM. For WFN-MAA+DBS
electrode 174
3.82 Determination of warfarin sodium in the sample using WFN-MIPs
electrodes 177
3.83 Sample analyses of pharmaceutical Orfarin ( 3 mg ) using WFN-
MIP(ACY)+TP electrode 178
3.84 Sample analyses of pharmaceutical Orfarin ( 3 mg ) using WFN-
MIP(ACY)+DBS electrode 179
3.85 Sample analyses of pharmaceutical Orfarin ( 3 mg ) using WFN-
MIP(MAA)+TP electrode 180
3.86 Sample analyses of pharmaceutical Orfarin ( 3 mg ) using WFN-
MIP(MAA)+DBS electrode 181
Content
XIII
List of figures
Figure
No. The Figure name
Page
No.
1-1 A classical ion selective electrode in electrochemical cell 3
1-2 Classification of ion-selective electrodes . 4
1-3 Typical ISE calibration graph
6
1-4 Determination of selectivity coefficients by the matched potential
method 10
1-5 structure of warfarin sodium
13
1-6 Representation of the principle of molecular imprinting.
16
2-1 Assembling the Ion-Selective Electrode
25
3-1 FTIR spectrum of standard warfarin sodium. 30
3-2 FTIR spectrum of warfarin – MPA complex.
30
3-3 FTIR spectrum of warfarin – PTA complex.
31
3-4 calibration curve of WFN-MPA , WFN-PTA selective electrod using
(OA)as plasticizer. 32
3-5 calibration curve of WFN–MPA , WFN-PTA selective electrode using
(TBP) as plasticizer. 33
3-6 calibration curve of WFN-MPA,WFN-PTA selective electrode using
(NB) as plasticizer 34
3-7 calibration curve of WFN – MPA ,WFN-PTA selective electrode using
(AP) as plasticizer. 34
3-8 calibration curve of WFN – MPA ,WFN-PTA selective electrode using
(DOPH) as plasticizer. 35
3-9 Effect of pH on the potential of the warfarin sodium electrodes at
concentrations (■10-2
, ▲ 10-3
and ■ 10-4
) M. 37
3-10 The scheme of degradation products for warfarin sodium in basic media
39
3-11 The scheme of degradation products for warfarin sodium in acidic
media 39
3-12 Selectivity of (WFN-MPA+OA) ,(WFN-PTA+OA)and the interfering
cations and amino acid by separation solution method. 44
3-13 Selectivity of (WFN-MPA+TBP) ,(WFN-PTA+TBP)and the interfering
cations and amino acid by separation solution method. 45
3-14 Selectivity of (WFN-MPA+NB) ,(WFN-PTA+NB)and the interfering
cations and amino acid by separation solution method. 46
3-15 Selectivity of (WFN-MPA+AP) ,(WFN-PTA+AP)and the interfering
cations and amino acid by separation solution method. 48
3-16 Selectivity of (WFN-MPA+DOPH) ,(WFN-PTA+DOPH)and the
interfering cations and amino acid by separation solution method. 49
Content
XIV
3-17 Selectivity of electrode (WFN-MPA) for (10
-3 and 10
-4) M based on OA ,
for cation and amino acid interfering by match potential method,
Solutions of interfering , ♦ WFN solutions.
62
3-18 Selectivity of electrode (WFN-MPA) for (10
-3 and 10
-4) M based on TBP ,
for cation and amino acid interfering by match potential method,
Solutions of interfering , ♦ WFN solutions.
64
3-19 Selectivity of electrode (WFN-MPA) for (10
-3 and 10
-4) M based on NB ,
for cation and amino acid interfering by match potential method,
Solutions of interfering , ♦ WFN solutions.
66
3-20 Selectivity of electrode (WFN-MPA) for (10
-3 and 10
-4) M based on AP ,
for cation and amino acid interfering by match potential method,
Solutions of interfering , ♦ WFN solutions.
68
3-21 Selectivity of electrode (WFN-MPA) for (10
-3 and 10
-4) M based on
DOPH, for cation and amino acid interfering by match potential
method, Solutions of interfering , ♦ WFN solutions.
70
3-22
Selectivity of electrode (WFN-PTA) for (10-3
and 10-4
) M based on OA,
for cation and amino acid interfering by match potential method,
Solutions of interfering , ♦ WFN solutions.
72
3-23
Selectivity of electrode (WFN-PTA) for (10-3
and 10-4
) M based on TBP,
for cation and amino acid interfering by match potential method,
Solutions of interfering , ♦ WFN solutions.
74
3-24
Selectivity of electrode (WFN-PTA) for (10-3
and 10-4
) M based on NB,
for cation and amino acid interfering by match potential method,
Solutions of interfering , ♦ WFN solutions.
76
3-25 Selectivity of electrode (WFN-PTA) for (10
-3 and 10
-4) M based on AP,
for cation and amino acid interfering by match potential method,
Solutions of interfering , ♦ WFN solutions.
78
3-26
Selectivity of electrode (WFN-PTA) for (10-3
and 10-4
) M based on
DOPH, for cation and amino acid interfering by match potential
method, Solutions of interfering , ♦ WFN solutions.
80
3-27 Antilog (E/S) versus the volume of the added standard for the
determination of warfarin solution (10-3
M) by MSM using WFN-
MPA+OA electrode
95
3-28
Antilog (E/S) versus the volume of the added standard for the
determination of warfarin solution (10-4
M) by MSM using WFN-
MPA+OA electrode
95
3-29 Antilog (E/S) versus the volume of the added standard for the
determination of warfarin solution (10-3
M) by MSM using WFN-
MPA+TBP electrode
96
3-30 Antilog (E/S) versus the volume of the added standard for the
determination of warfarin solution (10-4
M) by MSM using WFN-
MPA+TBP electrode
96
3-31
Antilog (E/S) versus the volume of the added standard for the
determination of warfarin solution (10-3
M) by MSM using WFN-
MPA+NB electrode
97

Content
XV
3-32 Antilog (E/S) versus the volume of the added standard for the
determination of warfarin solution (10-4
M) by MSM using WFN-
MPA+NB electrode
97
3-33 Antilog (E/S) versus the volume of the added standard for the
determination of warfarin solution (10-3
M) by MSM using WFN-
MPA+AP electrode
98
3-34 Antilog (E/S) versus the volume of the added standard for the
determination of warfarin solution (10-4
M) by MSM using WFN-
MPA+AP electrode
98
3-35 Antilog (E/S) versus the volume of the added standard for the
determination of warfarin solution (10-3
M) by MSM using WFN-
MPA+DOPH electrode
99
3-36 Antilog (E/S) versus the volume of the added standard for the
determination of warfarin solution (10-4
M) by MSM using WFN-
MPA+DOPH electrode
99
3-37 Antilog (E/S) versus the volume of the added standard for the
determination of warfarin solution (10-3
M) by MSM using WFN-
PTA+OA electrode 100
3-38 Antilog (E/S) versus the volume of the added standard for the
determination of warfarin solution (10-4
M) by MSM using WFN-
PTA+OA electrode 100
3-39 Antilog (E/S) versus the volume of the added standard for the
determination of warfarin solution (10-3
M) by MSM using WFN-
PTA+TBP electrode 101
3-40 Antilog (E/S) versus the volume of the added standard for the
determination of warfarin solution (10-4
M) by MSM using WFN-
PTA+TBP electrode 101
3-41 Antilog (E/S) versus the volume of the added standard for the
determination of warfarin solution (10-3
M) by MSM using WFN-
PTA+NB electrode 102
3-42 Antilog (E/S) versus the volume of the added standard for the
determination of warfarin solution (10-4
M) by MSM using WFN-
PTA+NB electrode
102
3-43 Antilog (E/S) versus the volume of the added standard for the
determination of warfarin solution (10-3
M) by MSM using WFN-
PTA+AP electrode 103
3-44 Antilog (E/S) versus the volume of the added standard for the
determination of warfarin solution (10-4
M) by MSM using WFN-
PTA+AP electrode
103
3-45 Antilog (E/S) versus the volume of the added standard for the
determination of warfarin solution (10-3
M) by MSM using WFN-
PTA+DOPH electrode 104
3-46 Antilog (E/S) versus the volume of the added standard for the
determination of warfarin solution (10-4
M) by MSM using WFN-
PTA+DOPH electrode
104
3-47 Titration curve for (10
-3, 10
-4) M of warfarin sodium solution by using
MPA as a titrant . 110

Content
XVI
3-48 Titration curve for (10
-3, 10
-4) M of warfarin sodium solution by using
PTA as a titrant . 112
3-49 WFN-MIP synthesis, using Methacrylic acid (MAA) as an acidic
functional monomer. 138
3-50 WFN-MIP synthesis, using Methacrylic acid (MAA) as an acidic
functional monomer. 139
3-51 WFN-MIP synthesis, using Acrylamide (ACY) as an Basic functional
monomer. 140
3-52 FTIR spectrum of standard warfarin sodium.
142
3-53 FTIR of WFN-MIP(ACY) before the removal of (WFN).
143
3-54 FTIR of WFN-MIP(ACY) after the removal of (WFN).
143
3-55 FTIR of WFN-MIP(MAA) before the removal of (WFN).
146
3-56 FTIR of WFN-MIP(MAA) after the removal of (WFN)
146
3-57 The steps of Molecularly Imprinted Polymer preparation.
149
3-58 Scanning electron micrographs of [WFN-MIP(ACY)]obtained by bulk
polymerization 149
3-59 Scanning electron micrographs of [WFN-MIP(MAA)]obtained by bulk
polymerization 150
3-60 show Calibration curve for WFN-MIP(ACY),(MAA) by using TP as
plasticizer. 152
3-61 show Calibration curve for WFN-MIP(ACY),(MAA) by using DBS as
plasticizer. 152
3-62 structure of TP plasticizer.
153
3-63 Effect of pH on the potential of the warfarin sodium MIPs electrodes at
concentrations (■10-2
, ▲ 10-3
and ■ 10-4
) M. 154
3-64 Selectivity of (WFN – MIP(ACY) and the interfering cations , amino
acid by separation solution method, by using TP,DBS as a plasticizer 155
3-65 Selectivity of (WFN – MIP(MAA) and the interfering cations , amino
acid by separation solution method, by using TP,DBS as a plasticizer.
156
3-66 Selectivity of electrode for (10
-3 and 10
-4) M based on TP, for cations
interfering by match potential method, Solutions of cations interfering
, ♦ WFN solutions.
162
3-67 Selectivity of electrode for (10
-3 and 10
-4) M based on TP, for amino acid
interfering by match potential method, Solutions of amino acid
interfering ♦ WFN solutions.
163
3-68 Selectivity of electrode for (10
-3 and 10
-4) M based on DBS, for ions
interfering by match potential method, Solutions of cations interfering
♦ WFN solutions.
164
3-69 Selectivity of electrode for (10
-3 and 10
-4) M based on DBS, for amino
acid interfering by match potential method, Solutions of amino acid
interfering ♦ WFN solutions.
165
3-70 Selectivity of electrode for (10
-3 and 10
-4) M based on TP, for ions
interfering by match potential method, Solutions of cations interfering
♦ WFN solutions.
166
Content
XVII
3-71 Selectivity of electrode for (10
-3 and 10
-4) M based on TP, for amino acid
interfering by match potential method, Solutions of amino acid
interfering ♦ WFN solution
167
3-72 Selectivity of electrode for (10
-3 and 10
-4) M based on DBS, for ions
interfering by match potential method, Solutions of cation interfering
♦ WFN solutions
168
3-73 Selectivity of electrode for (10
-3 and 10
-4) M based on DBS, for amino
acid interfering by match potential method, Solutions of amino acid
interfering ♦ WFN solutions.
169
3-74 Titration curve for solution containing 10
-3, 10
-4 M WFN with10
-3, 10
-4 M
PMA solution of electrode (WFN-MIP(ACY) by use TP,DBS as a
plasticizer.
175
3-75 Titration curve for solution containing 10
-3, 10
-4 M WFN with10
-3, 10
-4 M
PMA solution of electrode (WFN-MIP(MAA) by use TP,DBS as a
plasticizer.
176
List of abbreviation ISE Ion-selective electrode
WFN Warfarin sodium
MPA Dodeca- molybdo Phosphoric acid
PTA Dodeca–Phosphotungstic
WFN-MPA Warfarin sodium-molybdo phosphoric complex.
WFN-PTA Warfarin sodium- Phosphotungstic complex.
OA Oleic acid
TBP Tri-butylphosphate
NB Nitro benzene
AP Acetophenone
DOPH Di-octylphthalate
TP Tritolyl phosphate
DBS Di butyl sebacate
ACY Acrylamide
MAA Meth acrylic acid
EGDMA Ethylene glycol dimethacrylate
BPO Benzoyl peroxide
PVC Polyvinyl chloride
THF Tetra hydrofuran
MIP Moleculary Imprinted Polymers
NIP Non Imprinted Polymers
cST stock unit of viscosity gm/sec.cm.density
e.m.f Electromotive force
Content
XVIII
RSD Relative standard deviation
RE Relative error
Rec. Recovery
FTIR Fourier transform infrared spectroscopy
SEM Scaning Electron Microscopy
HPLC High performance liquid chromatography
LC liquid chromatography
SCE Saturated calomel electrode
SHE Standard hydrogen electrode
FIM Fixed interference method
FPM Fixed primary ion method
MPM Match potential method
TSM Two solution method
SAM Standard addition method
MSA Multi Standard addition method
Std. Standard
Chapter One Introduction
1
1.1. Ion Selective electrode
An ion-selective electrode (ISE) also known as specific ion
electrode, , is a sensor that converts the activity of a specific ion dissolved
in a solution in to an electrical potential which can be measured by a
voltmeter or pH meter .Ion selective electrodes are generally based on
highly selective ionophores embedded in hydrophobic membranes. They
are usually contacted with aqueous electrolytes conductive wire and an
internal or external reference. Analyte recognition process takes place
followed by the conversion of chemical information into an electrical or
optical signal. The ionophore is primarily responsible for the ion
selectivity of the sensor by selectively and reversibly binding the analyte
of interest. With optimized membrane formulations, the measured zero-
current membrane potential can be directly related to the free ion activity
of the analyte in the sample .(1)
ISE measure the concentration of ions in equilibrium at the membrane
surface. In dilute solutions, this is directly related to the total number of
ions in the solution but at higher concentrations, inter ionic interactions
between all ions in the solution (both positive and negative) tend to reduce
the mobility and thus there are relatively fewer of the measured ions in the
vicinity of the membrane than in the bulk solution. Thus, the measured
voltage is less than it would be if it reflected the total number of measured
ions in the solution. This causes erroneously low estimates of the ion
concentration in samples with a high concentration or a complex matrix.
The activity coefficient is always less than one and becomes smaller as
the ionic strength increases; thus the difference between the measured
activity and the actual concentration differs at higher concentrations. This
effect causes problems with ion selective electrode measurement. It has
been observed that when plotting a calibration graph using concentration
units, the line is seen to deviate from linearity as the concentration
increases (it remains straight, up to the highest concentrations if activity
units are used).( 2 )
Chapter One Introduction
2
Basic Theory of ISE Measurements 1.2
Ion-selective electrodes ( ISE) are electrochemical transducers that
respond selectively ,directly, and continuously to the activity of the free
ion of interest in solution. Theoretical and practical aspects of ISE
technology and methodology are reviewed regularly by Koryta every 2-3
years.(3)
The electromotive force ( Ecell) of an electrochemical cell
consisting of an ISE for the ion i and a reference electrode is described by
the Nernest equation :
ECell = Econstsnt - 2.303 RT/nF log ai ….1-1
Where ECell = the total potential (mV) developed between the sensing
and reference electrodes.
Econstsnt = a constant for a given cell.
R = The ideal gas constant (8.314 joule mole-1
K-1
).
T = Temperature in Kelvin 298K (250C).
n = Ionic charge.
F = Faraday constant (96500 coulombs)
ai = Activity of the ion .
Besides the membrane electrodes selective to the common inorganic
anion and cation , which are commercially available , a great number of
ISES have been constructed by several research groups which are
selective to organic ions of pharmaceutical interest.(4)
Ion-selective
electrodes have some inherent advantages , such as ,sufficient selectivity
and sensitivity ,wide analytical range of analyte concentrations
,insensitivity to optical interferences ,low cost ,fast response ,and
flexibility in constructing flow-through sensors for analyzers.(5,6)
Chapter One Introduction
3
1.3 Ion selective electrode cell measurements :
The cell consists of both an indicator and reference electrode. Since
the potential of the reference electrode is constant, the potential
developed at the indicator electrode that contains information about the
amount (activity) of analyte in a sample. An electrochemical sensor based
on a thin selective membrane or film as recognition element is an
electrochemical half-cell equivalent to other half-cells of the zeroth (inert
metal in a redox electrolyte).
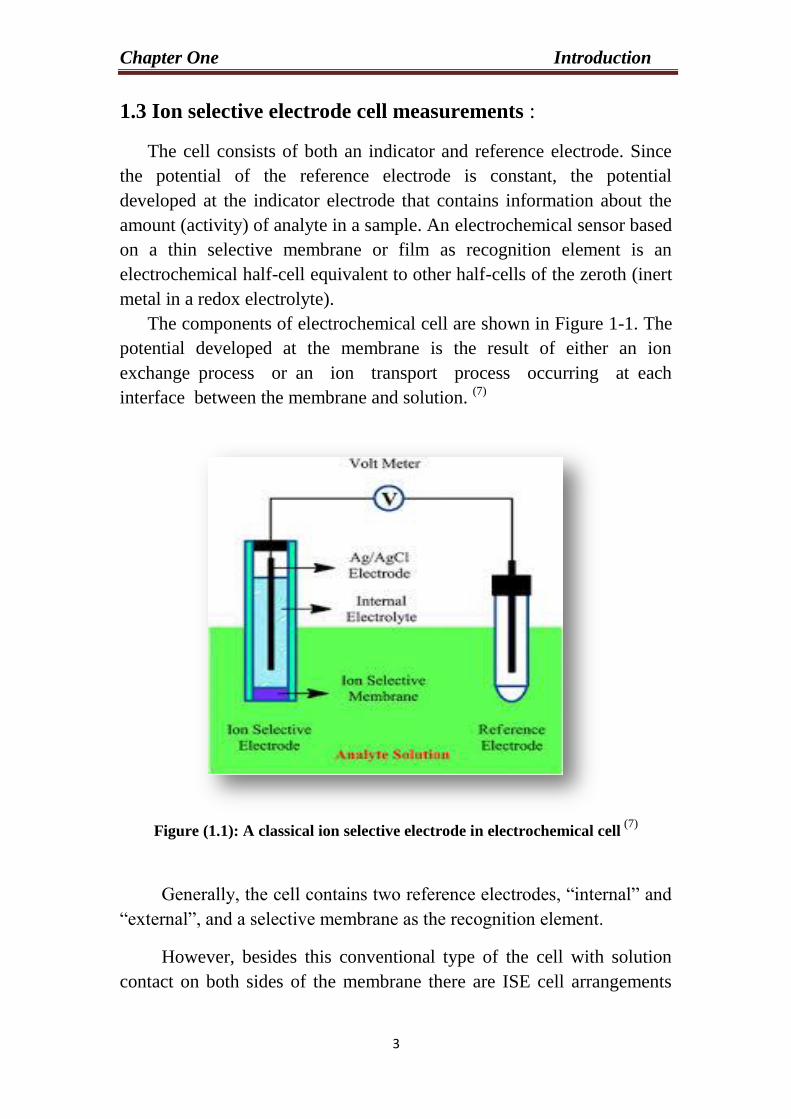
The components of electrochemical cell are shown in Figure 1-1. The
potential developed at the membrane is the result of either an ion
exchange process or an ion transport process occurring at each
interface between the membrane and solution. (7)
Figure (1.1): A classical ion selective electrode in electrochemical cell (7)
Generally, the cell contains two reference electrodes, “internal” and
“external”, and a selective membrane as the recognition element.
However, besides this conventional type of the cell with solution
contact on both sides of the membrane there are ISE cell arrangements
Chapter One Introduction
4
Ion selective electrodes
Primary ISES
Crystalline
electrodes
single crystal
poly crystallin
e
Non-crystalline electrodes
Glass electrode
s
Electrodes with mobile
charged sites
Molecularly imprinted
sensor
Multiple membrane (
multilayer) ISES
Gas sensing
electrodes
Enzyme electrodes
with wire contact to one side of the membrane. Conventional notation of
the cell is (7)
:-
External ref.│testsolution│membrane│internalsolution│internal ref.
The exchange that occurs between the internal and external solution
across the membrane depends on ionic exchange and the active ionophore
which used in the membrane (8)
.
Etotal = E0 + Ejunction – Emembren …1-2
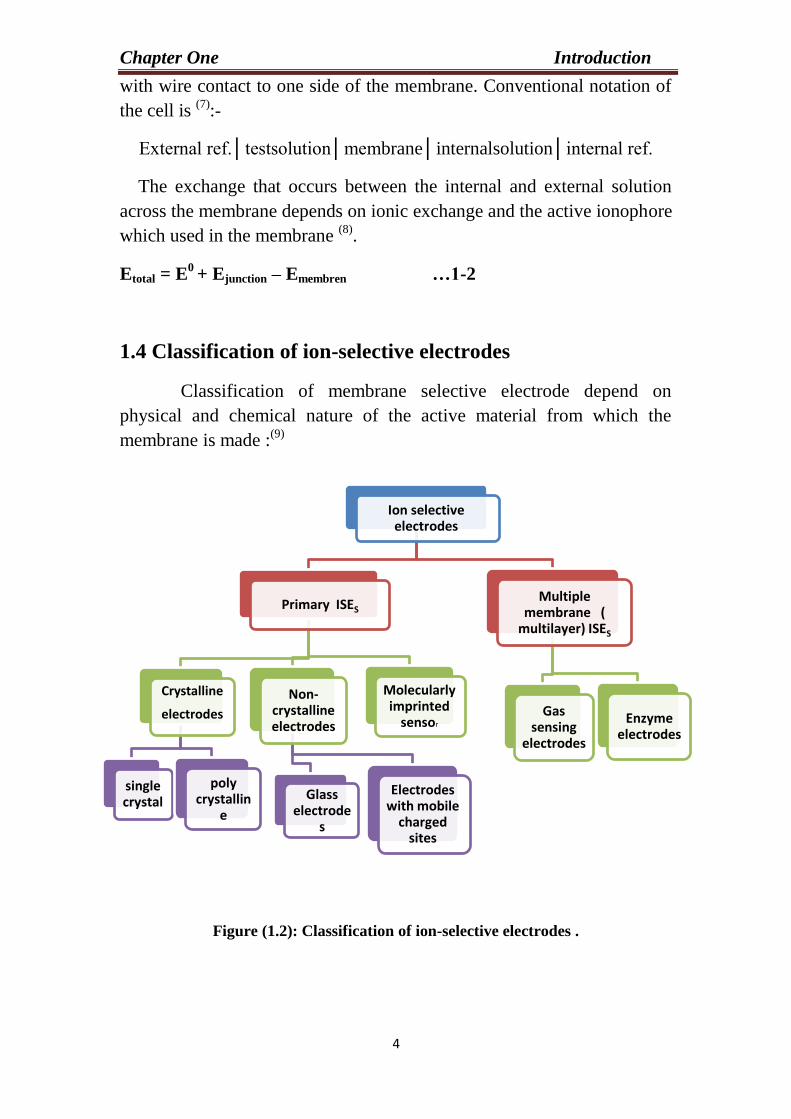
1.4 Classification of ion-selective electrodes
Classification of membrane selective electrode depend on
physical and chemical nature of the active material from which the
membrane is made :(9)
Figure (1.2): Classification of ion-selective electrodes .
Chapter One Introduction
5
1.5.Reference electrodes:-
Reference electrodes are applicable in instances where the electrical
potential is to be imposed or measured in a solution. Also, it has a stable
and well defined electrochemical potential against which the applied or
measured potentials in an electrochemical cell are referred. In order to
measure the change in potential difference across the ion selective
membrane as the ionic concentration changes, it is necessary to include in
the circuit a stable reference voltage which acts as a half-cell from which
to measure the relative deviations.(10)
1.6. Characterization of ion-selective electrode:
The properties of an ion-selective electrode are characterized by
parameters like:
1.6.1 Calibration curve:-
The operation of ion selective electrodes is based on the fact that there
is a linear relationship between the electrical potential developed between
an ISE and a reference electrode immersed in the same solution, and the
logarithm of the activity of the ions in the solution(11)
. This relationship is
described by the Nernst equation as …. 1-1:
E= constant ± (2.303 RT/ nF) log a ...1-1
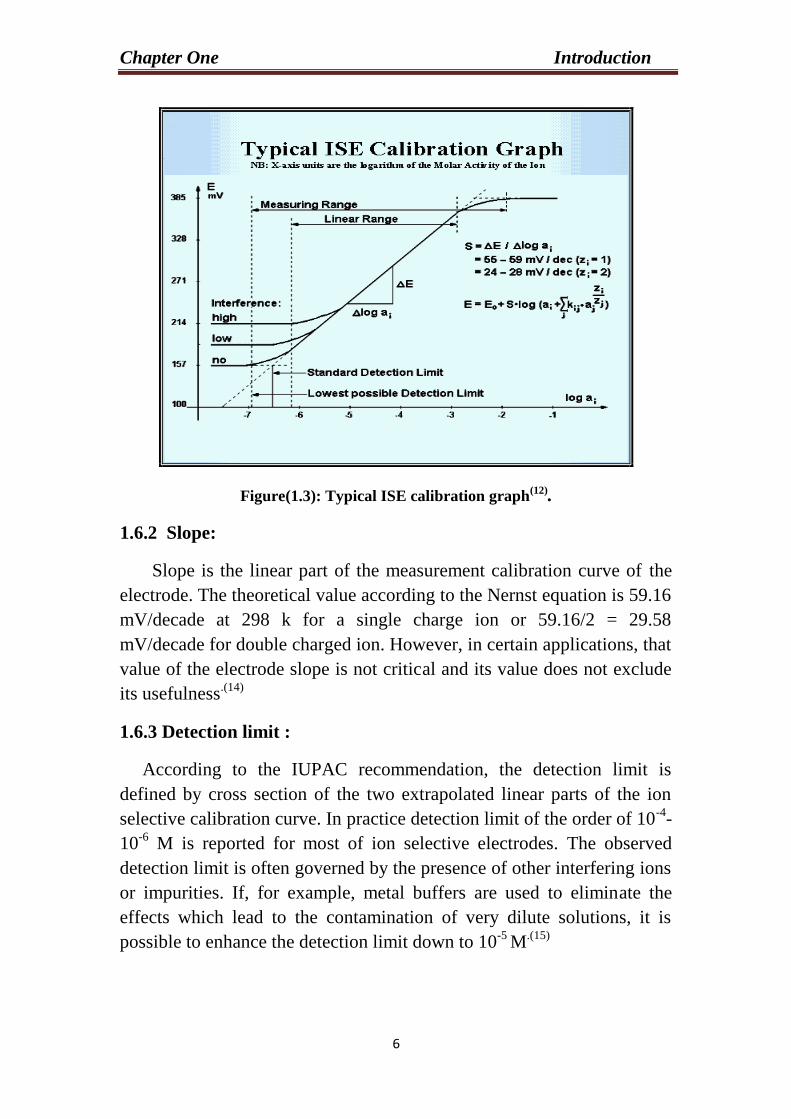
Figure 1-3 shows, a typical plot of the electrochemical cell (i.e. the
potential difference measured between the ISE and the external RE of a
given ion-selective electrode cell assembly) versus the logarithm of the
single ionic activity (concentration) of a given species.(12)
It is recommended that the electrochemical cell is ascribed to the
ordinate (vertical axis) with the more positive potentials at the top of the
graph and that paA (-log activity of the measured species A) or pcA (-log
concentration of the measured species A) is ascribed to the (horizontal
axis) with increasing activity or concentration to the right[1].The linear
rang is a part of the calibration curve through which a linear regression
would demonstrate that the datapoints do not deviate from linearity by
more than 2 mV(13)
.
Chapter One Introduction
6
Figure(1.3): Typical ISE calibration graph(12).
1.6.2 Slope:
Slope is the linear part of the measurement calibration curve of the
electrode. The theoretical value according to the Nernst equation is 59.16
mV/decade at 298 k for a single charge ion or 59.16/2 = 29.58
mV/decade for double charged ion. However, in certain applications, that
value of the electrode slope is not critical and its value does not exclude
its usefulness.(14)
1.6.3 Detection limit :
According to the IUPAC recommendation, the detection limit is
defined by cross section of the two extrapolated linear parts of the ion
selective calibration curve. In practice detection limit of the order of 10-4
-
10-6
M is reported for most of ion selective electrodes. The observed
detection limit is often governed by the presence of other interfering ions
or impurities. If, for example, metal buffers are used to eliminate the
effects which lead to the contamination of very dilute solutions, it is
possible to enhance the detection limit down to 10-5
M.(15)
Chapter One Introduction
7
1.6.4 Range of linear response :
The linear range of the electrode is defined as that part of the
calibration curve through which a linear regression would demonstrate
that the data points do not deviate from linearity by more than 2 mV. For
many electrodes,this range can extend from 1 M down to 10-6
or even 10-7
M (16)
1.6.5 Response time:
In earlier IUPAC recommendations, it was defined as the time
between the instant at which the ion selective electrode and a reference
electrode are dipped in the sample solution and the first instant at which
the potential of the cell becomes equal to its steady-state value within
±1mV for the final equilibrium potential. Generally electrodes with liquid
ion-exchanger membrane have longer response time than solid
membraneelectrode. This may be due to the slow rate of reaction between
the determined ion and the ion-exchanger which lead to slower transport
of the ions across the membrane-solution interface. However, the main
factors that influenced on the response time include; the type of
membraneand the presence of interferences which all slow the response
time of these electrodes(17)
.
1.6.6 Stability and lifetime:
The stability and lifetime are features associated with the response
behavior of ISEs. A number of problems affect the stability and lifetime
of PVC based electrodes. They include the solution concentration, the
interfering ions, which poison the electrode surface, the limited solubility
of the active material, and its solvent, which affect the content of the
membrane to leak away. All these lead to a positive or negative drift in
the response and slope values, indicating that the electrode is approaching
the end of its life (18)
.
1.6.7 Selectivity :
Ion selective electrodes are not entirely ion specific. This means that
they may be sensitive to other ions to some extent in a system. In some
situations where there are low ratio of interfering ion to the primary ion
(ion of interest), interferences can be ignored. There are extreme cases
Chapter One Introduction
8
where the electrode may be far more sensitive to the interfering ion
than to the primary ion and can only be used if the interfering ions are
only present in trace quantities or completely absent. The interfering ion
can be removed by chemical complexation or precipitation. The ability of
an ion selective electrode to distinguish between different ions in same
solution is expressed as the Selectivity Coefficient. The potentiometric
selectivity coefficients are expressed according to the Nicolsky-Eisenman
equation as:
E = E0 + R T / ZAF ln [aA+ ΣKA,B (aB)
Za/Zb] ......1.3
Where E is the measured potential; E0 is a constant that includes the
standard potential of the electrode, the reference electrode potential, and
the junction potential; (zA, zB, aA and aB are the charge numbers and
activities of the primary ion, A, and the interfering ion, B respectively);
and KA,Bis the potentiometric selectivity coefficient for the primary ion A
against the interfering ion B. This selectivity coefficient can be
determined using either separate solutions or match solutions method,
containing both the analyte A, and the interfering B ions(19,20)
.
Potentiometric selectivity coefficients can be measured with different
methods :
1.6.7.1 Mixed solution methods :
They are common and rapid methods for selectivity coefficient
measuments(21)
. ΚAB can be evaluated by:
(a) Fixed Interference method (FIM) :
This is a situation where we have a constant activity of the
interfering ion, aB and varying activity of the primary ion, aA . The EMF
values obtained are plotted against the logarithm of the activity of the
primary ion. The intersection of the extrapolated linear portions of this
plot indicates the value of aA that is to be used to calculate Kpot
AB from
the following equation:
Kpot
AB = aA / aBZA/ZB
………1-4
Where, ZA and ZB have the same signs, positive or negative (22)
.
Chapter One Introduction
9
(b) Fixed primary ion method (FPM):
This is the opposite of the fixed interference method. There is constant
activity of the ion of interest, aA and varying activity of the interfering
ion, aB. The intersection of the extrapolated linear portions of this plot
indicates the value of aB that is to be used to calculate Kpot
AB from
equation (1-4) (22).
(c) Two solutions Method (TSM):
This method involves measuring potentials of a pure solution of the
primary ion, EA, and a mixed solution containing the primary and
interfering ions EA+B. The Kpot
A,B is calculated by inserting the value of
the potential difference, ΔE=EA+B -EA, into the following equation (22)
:
Kpot
A,B = aA(eΔEzA F / (R T)
– 1) / (aB) Za/Zb
... 1-5
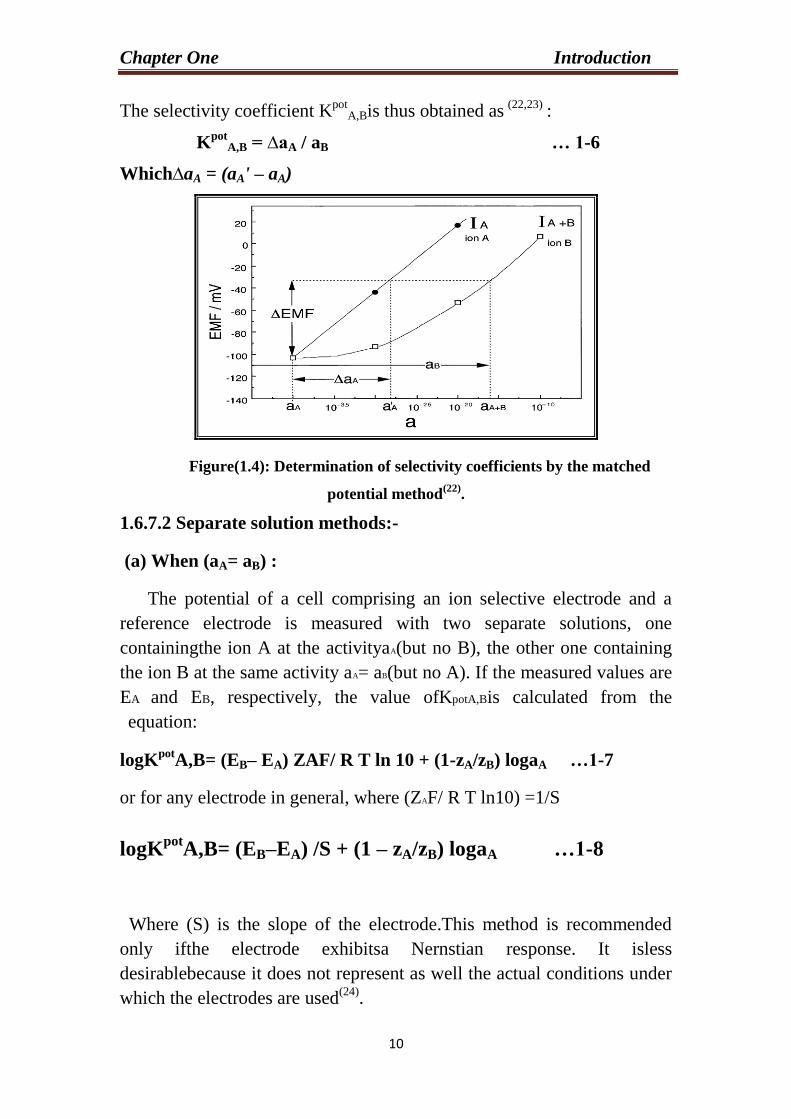
(d) Matched potential method (MPM):
A theory is presented that describes the matched potential method
(MPM) for the determination of the potentiometric selectivity coefficients
Kpot
A,B of ion-selective electrodes when the charge of the primary ion not
equal to charge of interfering ions and used in case no possible do
achieve Nernstain responses for a given interfering ion. This method is
based on electrical diffuse layers on both the membrane and the aqueous side
of the interface, a solution ofthe primary ion A with a fixed activity is used
as the referencesolution. The activity aA is calculated from the ionic
strength ofthe solution. While the primary ion is added step by step,
thepotential change is measured and plotted against aA (curve IA) in
Figure( 1-4), another curve, IA+B, is obtained from the potentialchange by
stepwise adding the interfering ion B to the referencesolution with the
same composition as on curve IA.When thechange in potential (ΔE) on
curve IA at a′A matches that oncurve IA+Bat aA+B, the ratio between the
activities of the primary ion A relative to the interferingion B denotes the
selectivity coefficient Kpot
A,B .
Chapter One Introduction
11
The selectivity coefficient Kpot
A,Bis thus obtained as (22,23)
:
Kpot
A,B = ∆aA / aB … 1-6
Which∆aA = (aA' – aA)
Figure(1.4): Determination of selectivity coefficients by the matched
potential method(22)
.
1.6.7.2 Separate solution methods:-
(a) When (aA= aB) :
The potential of a cell comprising an ion selective electrode and a
reference electrode is measured with two separate solutions, one
containingthe ion A at the activityaA(but no B), the other one containing
the ion B at the same activity aA= aB(but no A). If the measured values are
EA and EB, respectively, the value ofKpotA,Bis calculated from the
equation:
logKpot
A,B= (EB– EA) ZAF/ R T ln 10 + (1-zA/zB) logaA …1-7
or for any electrode in general, where (ZAF/ R T ln10) =1/S
logKpot
A,B= (EB–EA) /S + (1 – zA/zB) logaA …1-8
Where (S) is the slope of the electrode.This method is recommended
only ifthe electrode exhibitsa Nernstian response. It isless
desirablebecause it does not represent as well the actual conditions under
which the electrodes are used(24)
.
Chapter One Introduction
11
(b) When (EA= EB ):-
The potential of an ISE for the primary and interfering ions are
obtained independently. Then, the activities that correspond to the same
electrodepotential value are used to determine the KpotA,Bvalue and it
equal (22)
:
KpotA,B= aA/ (aB) Za/Zb …1-9
1.7. Method of analysis:
1.7.1 Potentiometric measurement:
The method used depends upon many parameters such as the analyse
and the required accuracy and precision for such analyses. These methods
are grouped into direct reading, standard addition and potentiometric
titrations.
A- Direct potentiometric methods :
This is the simplest and most widely used method of obtaining
quantitative result using ion-selective electrodes. A calibration graph is
constructed by measuring the equilibrium cell potential for several
solutions of known concentrations. Then the potential of the sample is
measured at the same conditions, and the concentration is read directly
from the graph. This method is extremely rapid, enabling measurements
to be complete in two or three minutes. This method is suitable for the
analyses of all samples in which the analyte of interest is present in the
free un complexed states (25)
.
B- Standard addition method (single point):
This method is generally more accurate than direct method for
concentration, but it is more time-consuming because of the calibration
involved . The electrode potential of a known volume of unknown
solution is measured and small volume of a known solution is added to
the first volume and the electrode potential re-measured, from which the
potential difference ∆E is found. By solving the following equation the
unknown concentration can be obtained(25)
:
Cu=Cs/10∆E/s(1+Vu/Vs)-(Vu/Vs)
….………1.10
Chapter One Introduction
12
Where Cu: the concentration of unknown solution
Cs: the concentration of standard solution
Vu: the volume of unknown solution
Vs: the volume of standard solution
S: the slope of electrode.
C- Multiple standard addition:
In this method several addition of standard solution to the same Sample
to be measured in order to increase the accuracy and decreases the error.
It is an extension of standard addition.The response of (ISEs ) to certain
analyte A in solution free from interfering ions can be represented by
Nernstain equation:
E=E0 +S log (C+X Vs/Vu) .……..1.11
Where: S: slope
Vs: volume of standard addition.
Vu: volume of unknown.
C: concentration of unknown.
X: concentration of standard addition .
Vu is usually set to be hundred times more than Vs. Rearranging of
equation and taking the antilog gives:
Antilog (E/S) = constant (C+X Vs/Vu)
Where antilog (E/S) is constant thus the antilog (E/S) is proportional to
Vs(26)
. A plot of antilog (E/S) against Vs, a straight line is obtained, the
intercept of which with the volume axis denote the end point of the
unknown concentration in an addition method.
D- Gran's plot :
Is a way of linearizing the data obtained in potentiometric titration and
thus easily and precisely locating the equivalence points of titrations.The
plots are used in work with ISEs, for this original purpose and also for
linearizing data from multiple standard addition procedures. The
technique may be applied to both complexometric and precipitation
titrations(27)
.
Chapter One Introduction
13
1.7.2 Potentiometric titration :
This method can increase the precision of ISE measurements and
alsothe number of ionic species that can be determined. ISEs are
commonly used as indicators for the titrant or sample species to follow
the progress of a precipitation or complexation titration. A small change
in reactant addition corresponds to a large change in electrode potential at
the stoichiometric end point. The sample is titrated with a suitable titrant
and the increase or decrease in titrant activity is followed with an ion-
selective electrode response, to locate the equivalence point.
A direct plot of potential as a function of titrant volume, the midpoint in
the steeply rising portion of the curve is estimated visually and taken as
end point. A second approach to end point detection is to calculate the
change in potential per unit volume of titrant ΔE/ΔV plotted versus the
average volume of titrant, the maximum is the end point (12,28)
.
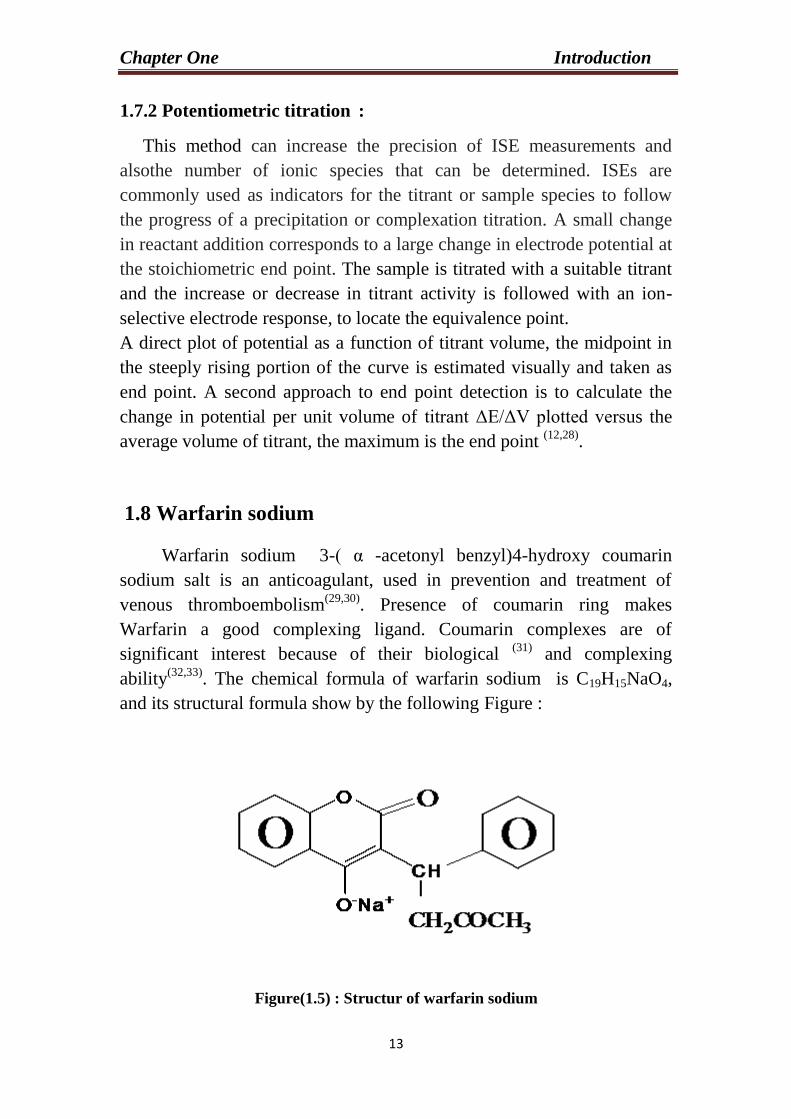
1.8 Warfarin sodium
Warfarin sodium 3-( α -acetonyl benzyl)4-hydroxy coumarin
sodium salt is an anticoagulant, used in prevention and treatment of
venous thromboembolism(29,30)
. Presence of coumarin ring makes
Warfarin a good complexing ligand. Coumarin complexes are of
significant interest because of their biological (31)
and complexing
ability(32,33)
. The chemical formula of warfarin sodium is C19H15NaO4,
and its structural formula show by the following Figure :
Figure(1.5) : Structur of warfarin sodium
Chapter One Introduction
14
Crystalline warfarin sodium occurs as a white, odorless, crystalline
powder, is discolored by light and is very soluble in water; freely soluble
in alcohol; very slightly soluble in chloroform and in ether (34).
The sodium
salt of warfarin has become the most widely used in order to improve the
physicochemical properties of warfarin such as solubility, dissolution
rate, hygroscopicity, chemical stability, crystal form and mechanical
properties (35)
.
Warfarin is an anticoagulant drug, which competitively depresses the
synthesis of vitamin K-dependent coagulation factors (36)
.
Warfarin inhibits the action of vitamin K epoxide reductase, whose gene
(VKORC1) was discovered in 2004 by two independent teams(37,38)
.
Another key factor influencing warfarin bioavailability is its transport in
blood, where some 99% is found bound to the Sudlow binding sites of
human serum albumin (HSAa).(39)
Currently, the anticoagulant effect of warfarin is indirectly measured
through the correlation of the clotting time (prothrombin time) and the
amount of the drug present in blood(40)
.
The compound was first synthesized by Schroeder and Link (41)
with
two solid forms available-amorphous and crystalline clathrate. The
amorphous form isstable in ambient conditions. The crystalline clathrate
form is warfarin sodium-isopropyl alcohol complex, which is prepared
either from warfarin or amorphous warfarin sodium to eliminate
impurities in warfarin sodium (42)
.
In an attempt to decrease the toxicity of warfarin induction,several
clinical dosing algorithms have been proposed (43,44)
, but none has been
well accepted. A major barrier to their use is that they were developed for
middle-aged inpatients who could tolerate doses of 5–10 mg warfarin
dailyand who had daily monitoring of the INR. Today,the typical person
taking warfarin is elderly.Because warfarin dose requirements decrease
with age ,use of existing algorithms tends to overdose the elderly (45,46)
.
The most analytical methods havebeen reported for determine warfarin
such as high performance liquid chromatography (HPLC)with
fluorescence detection (47,48)
, LC and HPLC with UV detection(49,50)
,
HPLC-MS/MS (51,52)
, multi-mode UPLC (ultra performanceliquid
Chapter One Introduction
15
chromatography)-MS/MS method (53,54)
LC-MS/MS (55)
,chiral capillary
electrophoresis with spectrophotometric detection (56)
, chiral stationary-
phase liquid chromatography-fluorescencesystem coupled with on-line
circular dichroism detector (57)
andtime-correlated single-photon counting (58).
However, there maybe several disadvantages for these methods. For
example some ofthem are time consuming and tedious, while others use
large bio-logical fluid volumes and need expensive instruments and
toxicsolvents, plus time consuming procedures. And there are several
methods havebeen reported for quantification of warfarin in biological
samplesare: HPLC with detector of UV–vis (59,60)
,HPLC with detector of
fluorescence (61,62)
, gas chromatography with detector of mass(63)
,
differential pulse and/or square-wave stripping voltamme-ters (64,65)
,
fluorescence spectrophotometry(66,67)
, and capillaryzone electrophoresis
with detector of PDA (68,69)
.In all of these methods, the biological sample
preparation.
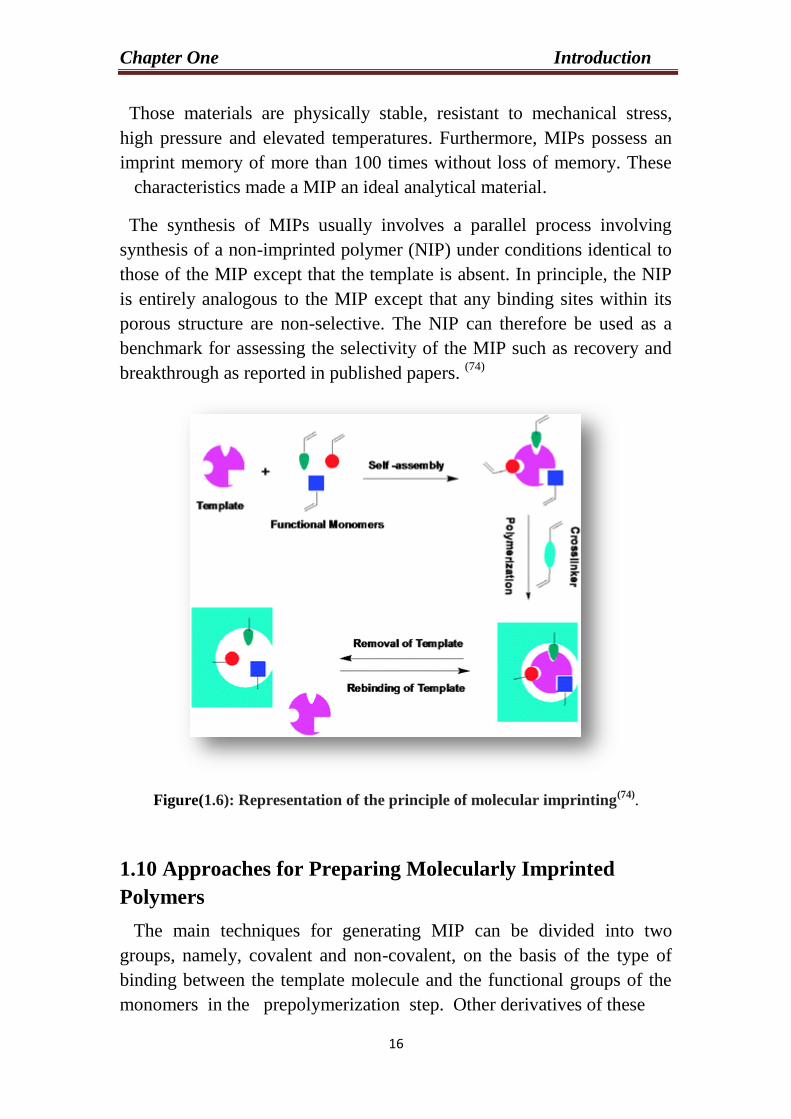
1.9 Molecular Imprinted Polymer:
Molecular imprinting is a process in which functional and cross-
linking monomers are copolymerized in the presence of the target analyte
(the imprint molecule), which acts as a molecular template. The
functional monomers initially form a complex with the imprint molecule.
After polymerization, their functional groups are held in position by the
highly cross-linked polymeric structure (70,71)
as illustrated in Figure (1.6).
Additionally, the steric arrangement of these interactions around a given
substrate, molecular template, is a crucial aspect necessary for the
creation of binding pockets providing complementary size, shape, and
functionality for preferentially facilitating selective recognition along
with a high affinity toward the target. Thus, the recognition process in
MIPs may be described in analogy with mechanisms established for
enzyme– substrate-complexes such as, for example, the lock-and-key. (72)
Molecular imprinting can also be defined as a method for creating
specific cavities in synthetic polymer matrices with memory for the
template molecules(73)
.
Chapter One Introduction
16
Those materials are physically stable, resistant to mechanical stress,
high pressure and elevated temperatures. Furthermore, MIPs possess an
imprint memory of more than 100 times without loss of memory. These
characteristics made a MIP an ideal analytical material.
The synthesis of MIPs usually involves a parallel process involving
synthesis of a non-imprinted polymer (NIP) under conditions identical to
those of the MIP except that the template is absent. In principle, the NIP
is entirely analogous to the MIP except that any binding sites within its
porous structure are non-selective. The NIP can therefore be used as a
benchmark for assessing the selectivity of the MIP such as recovery and
breakthrough as reported in published papers. (74)
Figure(1.6): Representation of the principle of molecular imprinting(74)
.
1.10 Approaches for Preparing Molecularly Imprinted
Polymers
The main techniques for generating MIP can be divided into two
groups, namely, covalent and non-covalent, on the basis of the type of
binding between the template molecule and the functional groups of the
monomers in the prepolymerization step. Other derivatives of these
Chapter One Introduction
17
approaches, especially semi-covalent or metal-mediated imprinting, have
been applied to organic MIP preparation.
1.10.1 Covalent Imprinting Method: This technique, also known as the
preorganised approach, consists of the reaction of the template molecule
with polymerisable monomers by reversible binding.
Polymerisation takes place in the presence of a large excess of cross-
linker to yield an insoluble rigid network. The covalent bonds have to be
cleaved for template extraction, leading to defined binding sites of
complementary steric and functional topography to the template
molecule. Reversible cleavage and formation of the covalent bonds are
the basis of molecular recognition. (75,76,77)
1.10.2 Non-Covalent Imprinting Method: This method, also known as
the self-assembly approach , is inspired by nature where non-covalent
interactions play a key role in molecular recognition processes, and is
accepted as the most successful and commonly applied method for MIP
synthesis .
The prepolymerization complex between the template molecule and the
functional monomer is stabilised by weak interactions including
electrostatic (charge-charge) interactions, dipole interactions, London
dispersion or hydrogen bonding, which will also govern the rebinding
process. (75,76,77)
1.10.3 Semi-Covalent Imprinting Method: In this procedure, the
template is covalently bound to a polymerisable group for polymer
synthesis, but template rebinding takes place via non-covalent
interactions. After polymerisation with an excess of crosslinker, the
resulting network was hydrolysed to release the template molecule. In
general, this approach combines the advantages and limitations of the
covalent and non-covalent imprinting(87,79,80).
1.11 Molecular Imprinted Polymers Components and
Factors Influencing Polymerization:
As described previously, the basic components required for the
synthesis of an MIP consist of the template molecule, one or more
functional monomers, a cross-linker, a polymerisation initiator and a
solvent.
Chapter One Introduction
18
1.11.1 Template Molecule: Various substances can act as the template
molecules in the molecular imprinting technique. For example,
carbohydrates, amino acids and their derivatives, organic amines,
vitamins, proteins, and other molecules have been successfully used as
template molecules in the preparation of MIPs. Typically, these
molecules contain highly polar groups (such as carboxyl and amino). It is
easy to prepare high-performance MIPs because strong polar groups and
the functional monomer could form more stable molecular complexes.
The molecular imprinted polymers with high selectivity and affinity can
be produced from the imprinted molecules that can form hydrogen bonds
with the functional monomer, due to the outstanding advantages of
hydrogen bonds in terms of its directionality, saturation and strength.
Macromolecules, supramolecular cells, and even metal ions are also used
as the template molecule. (75)
1.11.2 Functional Monomer: The functional monomer provides the
functional groups which are responsible for the binding interactions with
the target molecule in the imprinted cavities. Thereby, as described
previously, stronger interactions between the template and the functional
monomer during imprinting, result in MIP with higher binding capacity
and selectivity. In some cases, monomer reactivity can be affected by
complex formation with the template molecule . Functional monomer can
provide specific functional groups in polymerization or copolymerization.
In various polymerization reaction the most widely used one is free
radical polymerization. During the polymerization process, the molar
ratio of imprinted molecule and functional monomer has a great effect on
the generation of the specific cavities.
Generally, with the ratio of functional monomer to the template molecule
increasing, one can make the self-assembly of template molecule to
functional monomer easy and fully complete on the one hand it will do
harm to the polymerization for the high ratio of proportion of functional
monomer, since the excess of functional monomer leads to an increase in
non-selective binding sites generated by non-assembled functional
monomer residues in the polymer. On other hand, excess functional
monomer may cause self-aggregation, which result in reducing selective
binding sites. The mole ratio of template molecule to functional monomer
are generally controlled as 1:4. In additional functional groups of the
Chapter One Introduction
19
imprinted molecules and the properties of solvent should also be
considered during the preparation.(75,81)
1.11.3 Cross-linker : Cross-linkers bridge the linear molecules so as to
bond with each other among molecules to establish a network, and they
also promote or regulate the polymer chain formation. The cross-linker in
the synthesis of molecular imprinted polymers acts in three aspects:
(a) They control the morphology of MIPs.
(b) They fix imprinted recognition sites.
(c) They affect the mechanical stability of the MIP array. (75)
The amount of cross-linker directly affects the number and the cross-
linking degree of active functional monomers in the unit mass of
imprinted polymer, whereas the number of active functional monomer
and cross-linking degree directly influences the selectivity of MIPs and
the binding capacity.
In conclusion, the ratio of functional monomer to cross-linker has a great
impact on the properties of molecularly imprinted polymers. When the
amount of cross-linker is less, the cavity configuration of MIPs cannot
maintain itself in a stable state due to insufficient cross-linking. However,
an excess of cross-linker decrease the number of functional monomer in
unit mass and then reduced the number of recognized sites.(75,82).
1.11.4 .Initiator: Most MIPs are synthesized using free radical
polymerization (FRP), either thermally or photochemically induced. The
process consists of three basic steps: initiation, propagation and
termination.
In the first step, radical generation is usually accomplished by the
decomposition of an initiator; increasing the concentration of the initiator
results in higher polymerization rates, but lower polymer molecular
weights. The most important initiators used in FRP are azo compounds,
peroxo compounds, redox systems and photo-initiators. The generation of
free radical from azo initators can be accomplished either by UV-
irradiation, at the maximum absorption wavelength of the compound, or
by heating at its decomposition temperature.(77,83)
Chapter One Introduction
21
1.11.5 Solvent : Play important role in the imprinting process .
Poreforming solvents, referred to as porogens, are applied during
imprinting with The ultimate goal of obtaining macroporous polymeric
network to facilitated mass transfer and allow easy access of the analyte
to the binding sites.
The solvent serve to bring all the components of the polymerization
(monomer, template, initiator and cross-linker)into one phase and has
significant effect on the texture (pore size distribution and shape)and
physical form of synthesized material and promote the bonding of the
guest molecules.(77,82)
1.12. Aim of the work:
This project was to construct and characterize several types of ion-
selective electrode for the potentiometric determination of warfarin
sodium in pure and pharmaceuticals :
A) The first type included fabrication of membranes for warfarin sodium
(WFN) was constructed by warfarin sodium with Dodeca-molybdo
phosphoric acid (MPA), Dodeca-phosphotungstic acid (PTA),and many
plasticizer : oleic acid (OA), tri-n-butyl phosphate(TBP), Nitrobenzene
(NB), Acetophenone (AP) and di-octyl phthalate (DOPH) in PVC matrix
membrane . The constructed electrodes characteristic parameters that
include slope ,liner range , detection limit, lifetime, selectivity, and
working pH range will be investigated. Also, the statistical treatments
were applied for the analytical results.
B) The second type included fabrication of membranes by using
molecularly imprinted polymer , The study involves the preparation of
MIPs and NIPs for the warfarin sodium (WFN) as templates using two
kinds of functionl monomers, Methacrylic acid (MAA) as acidic
monomer and Acrylamide (ACY) as basic monomer,and study the
characteristic parameters that include slope, linear range, detection limit,
lifetime , selectivity, and working pH range for these electrode.
Chapter two Experimental part
12
2- Experimental part
2.1. Instruments and equipment's: 1-A digital pH/ion meter (inoLab 740 with terminal 740 – WTW,Germany).
2- Double-beam UV-Visible spectrophotometer model (UV-1650 PC)
SHIMADZO (Japan), interfaced with computer via a SHIMADZU UV
probe data system program (Version 1.10), using 1.00 cm quartz cells, (W.
Germany)
3- Infrared spectrophotometer SHIMADZU, FTIR-8000 (Japan).
4- Expandable ion analyzer, HANA(Italic), model pH meter 211.
5- Reference electrode single junction, ORION, model 90-01 Saturated
calomel electrode (SCE) .
pH combination glass electrode (SenTix® 82 WTW, Germany). 6-
7- Silver-silver chloride wire.
8- PVC tubing (6 mm i.d.).
9- Hotplate Magnetic stirrer (LMS-1003, DaihanLabtech).
10-Sartorius Handy 4 digits Analytical Balance (GMBH, H110, Germany).
11- Micropipettes (200-1000μl) and 25μl (Swiss made).
12-Nitrogen gas system.
13-Scaning Electron Microscopy ( Inspect S50 ) Nether land (Tokyo, japan).
14- Laboratery oven .
15- vacum desicator ( Barnant company ) .

Chapter two Experimental part
11
2.2-Chemicals:-
1- Warfarin sodium standard (C19H15NaO4 M.W 330.31 g mol-1
) was a gift
from the State Company of Drug Industries and Medical Appliances
(SamaraIRAQ-SDI).
2- Commerical drugs: warfarin 1mg ( Bristal ) (UK),warfarin 3mg (Actavi )
(UK), Orfarin (3mg ) Finland .
3- Dodeca-molybdo phosphoric acid (MPA) (H3PO4.12MoO3.24H2O; M.W.
2257.6), (Analar, 99.6%).
4- Dodeca–Phosphotungstic acid (PTA) (H3PO4.12WO3.XH2O; M.W.
2880.21), (Analar, 99.3%).
5- Methacrylic acid ( 2-methyl propeonic acid ),(C4H6O2. M.wt 86.09 g
mol -1
),( sigma-aldrich 99% ).
6- Benzoyl peroxide ( C14H10O4. M. wt. 242.23 ),(78% Sigma-Aldrich ).
7- Ethylene glycol dimethacrylate (C10H14O4 . M.wt. 198.22 g mol-1
), (98%
Sigma-Aldrich ).
8. Acrylamide (C₃H₅NO M. wt. 71.08 g·mol−1
) , (99% BDH ).
9- Chloroform ( CHCl3 M. wt. 119.38 g. mol-1
), (99.7% Analar).
10- Tetrahydrofuran (C4H8O; 72.11 g mol-1
), (Fluka AG, 99.5%).
11-Polyvinyl chloride (PVC) of relatively high molecular weight (Fluka
AG, 98%).
12- The plasticizers were obtained from Fluka AG, (Switzerland), their
composition and viscosities are tabulating in Table (2.1).
13- Other chemicals: hydrochloric acid (HCl; 36.45 g mol-1
sp.gr. 1.184;
37% HCl; 12M), ammonium hydroxide (NH4OH; 35.05 g mol-1
sp.gr.
0.90; 28% NH3; 14.82M ), sodium chloride ( NaCl; 58.44 g mol-1
) ,
potassium chloride (KCl; 74.55 g mol-1
) , aluminum (III) nitrate
(Al(NO3)3.9H2O; 375.13 g mol-1
), iron(III) nitrate [Fe(NO3)3.9H2O;
(404.02 g mol-1
)], magnesium chloride (MgCl2 ; 95.21 g mol-1
),
calcium chloride (CaCl2; 110.98 g mol-1
) ,Alanine (C3H7NO2 ; 89.09 g
mol-1
),serine (C3H7NO2 ;105.09 g mol-1
) ,proline (C5H9NO2 ;115.13 g
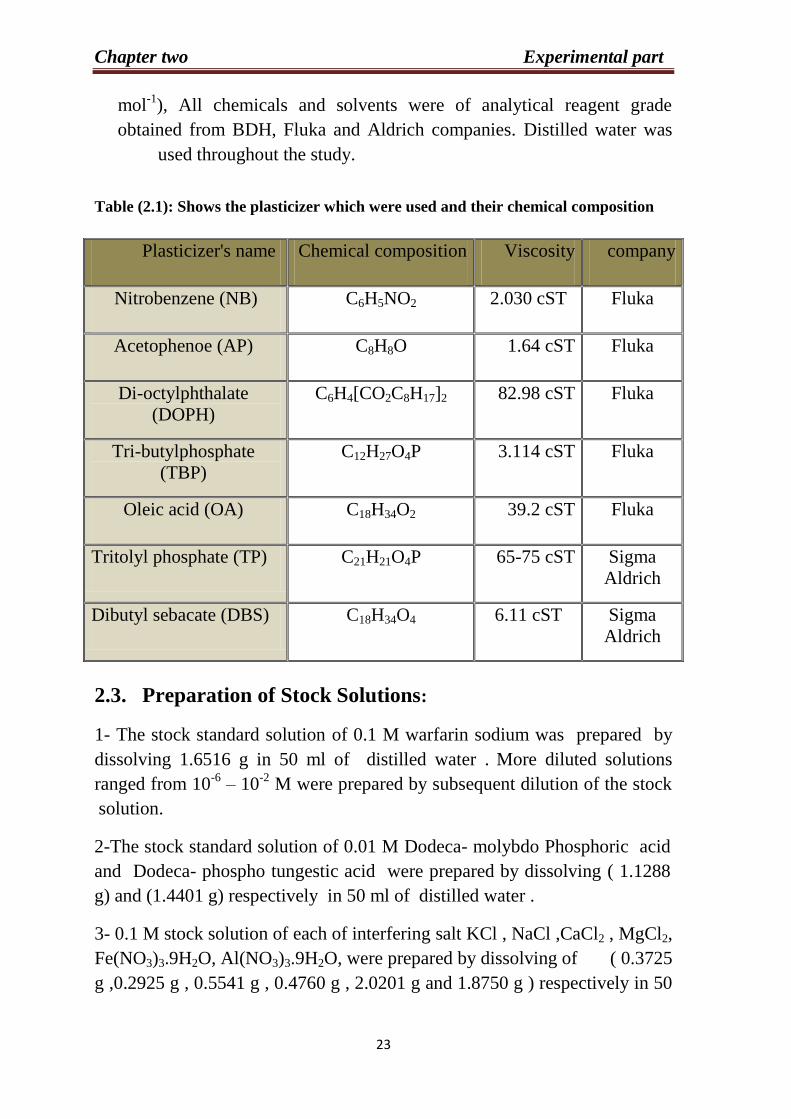
Chapter two Experimental part
12
mol-1
), All chemicals and solvents were of analytical reagent grade
obtained from BDH, Fluka and Aldrich companies. Distilled water was
used throughout the study.
Table (2.1): Shows the plasticizer which were used and their chemical composition
2.3. Preparation of Stock Solutions:
1- The stock standard solution of 0.1 M warfarin sodium was prepared by
dissolving 1.6516 g in 50 ml of distilled water . More diluted solutions
ranged from 10-6
– 10-2
M were prepared by subsequent dilution of the stock
solution.
2-The stock standard solution of 0.01 M Dodeca- molybdo Phosphoric acid
and Dodeca- phospho tungestic acid were prepared by dissolving ( 1.1288
g) and (1.4401 g) respectively in 50 ml of distilled water .
3- 0.1 M stock solution of each of interfering salt KCl , NaCl ,CaCl2 , MgCl2,
Fe(NO3)3.9H2O, Al(NO3)3.9H2O, were prepared by dissolving of ( 0.3725
g ,0.2925 g , 0.5541 g , 0.4760 g , 2.0201 g and 1.8750 g ) respectively in 50
Plasticizer's name Chemical composition Viscosity company
Nitrobenzene (NB) C6H5NO2 2.030 cST Fluka
Acetophenoe (AP) C8H8O 1.64 cST Fluka
Di-octylphthalate
(DOPH)
C6H4[CO2C8H17]2 82.98 cST Fluka
Tri-butylphosphate
(TBP)
C12H27O4P 3.114 cST Fluka
Oleic acid (OA) C18H34O2 39.2 cST Fluka
Tritolyl phosphate (TP) C21H21O4P 65-75 cST Sigma
Aldrich
Dibutyl sebacate (DBS) C18H34O4 6.11 cST Sigma
Aldrich
Chapter two Experimental part
12
ml of distilled water . More diluted solutions ranged from (10-6
– 10-2
) M
were prepared by subsequent dilution of the stock solution.
4- 0.1 M stock solution of each of interfering amino acid alanin, proline,
serine were prepared by dissolving of ( 0.4455 g ,0.5757 g and 0.5255 g )
respectively in 50 ml of distilled water. . More diluted solution ranged from
(10-6
– 10-2
) M were prepared by subsequent dilution of the stock solution .
2.4. Preparation of Ion-Pair Complex:
The preparation of ion-pair (WFN-MPA) and (WFN-PTA) was prepared
by mixing 50 mL of 0.01 M solution of warfarin sodium (WFN) with 50 mL
of 0.01 M solution of molybdo phosphoric acid (MPA) with
phosphotungstic acid (PTA) with stirring. The resulting are white
precipitates formed after 24 hr, filtered, washed with water, dried at room
temperature for two days using the vacuum desiccator.
The composition of the two ion-pair compounds (WFN-MPA) and (WFN-
PTA) were confirmed using infrared spectroscopy (FTIR).
2.5. Preparation of warfarin sodium electrodes:-
2.5.1. Composition of membrane:-
Ten warfarin sodium ion-selective electrodes were prepared depending on
the use of ion-pair compounds warfarin sodium- molybdo Phosphoric acid
and warfarin sodium-phosphotungstic acid (PTA)as the electro-active
substances with five plasticizers (OA, TBP, NB, DOPH, AP ).
The method that followed for immobilization of the ion-pair compounds
into the PVC matrix membrane as described by Craggs et al (84). 0.040 g of
electro-active precipitates was mixed with 0.360 g of plasticizer and 0.170 g
of PVC powder; all were dissolved in 5-6 mL of THF with stirring until a
clear viscous solution was obtained.
2.5.2. Assembling the ion-selective electrode:
Each of the above solution was poured into a glass casting assembly which
It consists of two pieces; a glass cylinder (30mm height and 35mm
diameter),mounted on a glass plate The two pieces were pasted together via
a (PVC-THF) viscous mixture (to make sure for no loss in the membrane
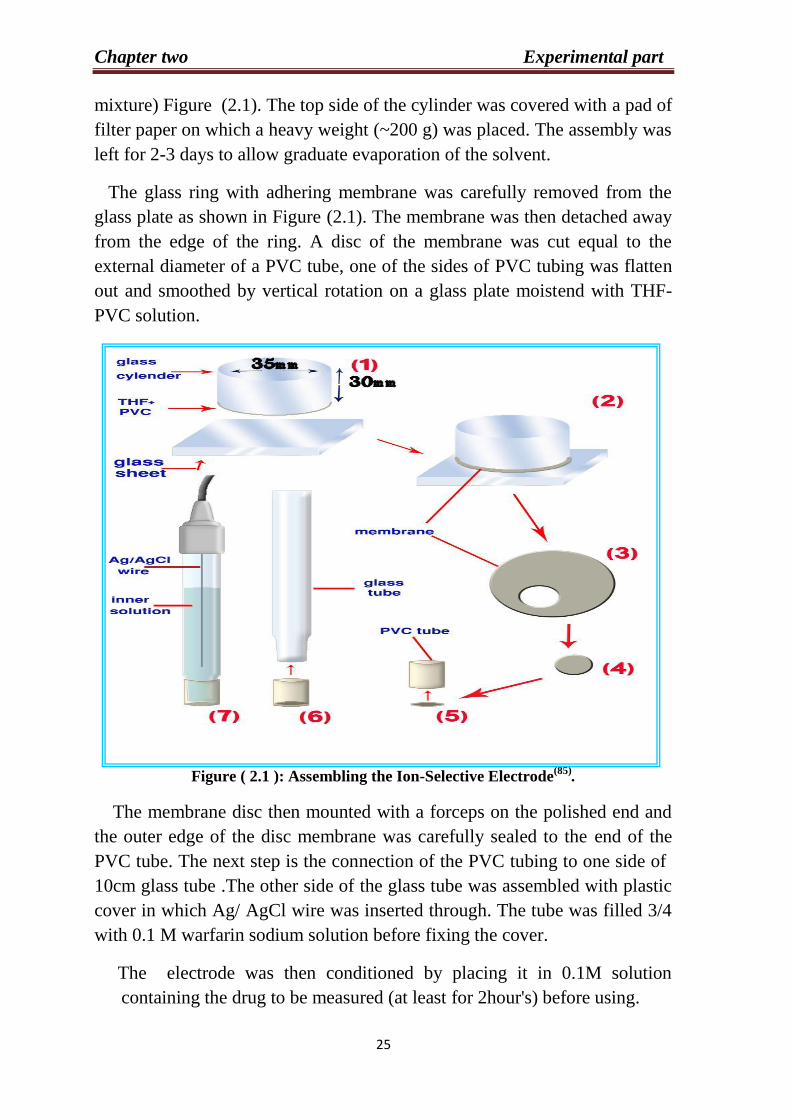
Chapter two Experimental part
12
mixture) Figure (2.1). The top side of the cylinder was covered with a pad of
filter paper on which a heavy weight (~200 g) was placed. The assembly was
left for 2-3 days to allow graduate evaporation of the solvent.
The glass ring with adhering membrane was carefully removed from the
glass plate as shown in Figure (2.1). The membrane was then detached away
from the edge of the ring. A disc of the membrane was cut equal to the
external diameter of a PVC tube, one of the sides of PVC tubing was flatten
out and smoothed by vertical rotation on a glass plate moistend with THF-
PVC solution.
Figure ( 2.1 ): Assembling the Ion-Selective Electrode(85)
.
The membrane disc then mounted with a forceps on the polished end and
the outer edge of the disc membrane was carefully sealed to the end of the
PVC tube. The next step is the connection of the PVC tubing to one side of
10cm glass tube .The other side of the glass tube was assembled with plastic
cover in which Ag/ AgCl wire was inserted through. The tube was filled 3/4
with 0.1 M warfarin sodium solution before fixing the cover.
The electrode was then conditioned by placing it in 0.1M solution
containing the drug to be measured (at least for 2hour's) before using.
Chapter two Experimental part
12
2.6. Potential measurement
Warfarin sodium selective electrode and saturated calomel electrode
(SCE) were used as indicator electrode and reference electrode, respectively.
The e.m.f. measurements were carried out at room temperature using the
following cell:
SCE. | test solution | ISEs
A calibration curve was constructed for each ISEs using several standard
solutions ranged from (10-6
– 10-1
)M warfarin sodium . The test solutions
were constantly stirred during measurements with magnetic stirrer.
Calibration curves were prepared by plotting the potential versus the
concentration on Orion 7 cycle semi-logarithmic graph paper (manual
calculation E versus log c.). From the calibration curve, all the characteristic
parameters of the ISEs were obtained including slope, correlation coefficient,
concentration range and detection limit.
The effect of pH on the response of membrane was examined by measuring
the potential of the standard solutions of concentrations (10-4
, 10-3
, 10-2
) M at
different pH ranged from 1-12 obtained by addition of small volumes of
hydrochloric acid and/or ammonium hydroxide solutions. The life time of
each membrane was calculated, by monitoring the decrease in response with
the time.
2.7 Selectivity measurements:
The selectivity of the studied electrodes were measured by two
methods:
1-The separated solution method (SSM) : In this method, standard solutions
(10-6
– 10-1
) M warfarin sodium were prepared and their potentials were
measured. At the same time the potential for interfering species (K+, Na
+,
Ca2+
, Mg2+
, Al3+
, Fe3+
, alanin, proline and serine ) which were selected due to
their biological importance at concentrations range from (10-6
– 10-1
) M,
were measured. From equation (1-8 ), the selectivity coefficient can be
calculated.
2- Match potential method (MPM), this method involes the using one
standard solution of warfarin sodium with concentration of 10-3
M in 50 mL
Chapter two Experimental part
12
then aliquot 10 mL of standard solution and added 0.1 mL of 0.1 M from
standard solution of warfarin sodium which has concentration 100 times
than that of sample, and measured the potential of standard solution 10-3
M
before and after each addition of standard solution.The same concentration
10-3
M aliquot 10 mL added 0.1 mL of 0.1M of interfering species
(K+,Ca
2+,AL
3+, alanin, proline and serine). Measured potential before and
after each addition of interfering species but the potential for standard
solution 10-3
M are same for two aliquots because the same of concentration.
The potential response to interfering ions was then measured according to
equation (1-6).
2.8. Standard analysis:
Two synthetic samples of warfarin sodium in the concentration of 10-3
,
10-4
M were prepared. The concentration of these samples were calculated
using direct, standard addition (SAM) and titration method .
In the direct method the e.m.f. of sample is measured directly using warfarin
sodium indicator electrode .The concentration was then calculated using
calibration curves.
In the standard addition method;to 10 mL sample solution with concentration
of (10-3
-10-4
M) successive amounts, is introduced five additions of 0.1 mL
of 0.1M increments of warfarin sodium solution were added . The e.m.f. is
measured before and after each addition. The concentration of the sample is
calculated using equation (1-10) for a single point increment. This method
depends on the fact that the plot of electrode potential (mV) against
concentration (M) is a logarithmic curve. Thus any particular ratio of the
amount of increase in mV in response to a particular increase in
concentration (i.e. the slope of the curve) will only fit in one unique part of
the curve and thus the concentration before and after addition can be
determined.
A precipitation titration was then performed for the potentiometric
determination of warfarin sodium samples. In this method, a 10 mL sample
solutions containing warfarin sodium with concentration of 10-3
,10-4
M were
titrated against 10-3
and 10-4
M of each of dodeca molybdo Phosphoric acid
and Dodeca Phosphotungstic acid solution. Potential was measured after
each addition using the prepared ISEs.
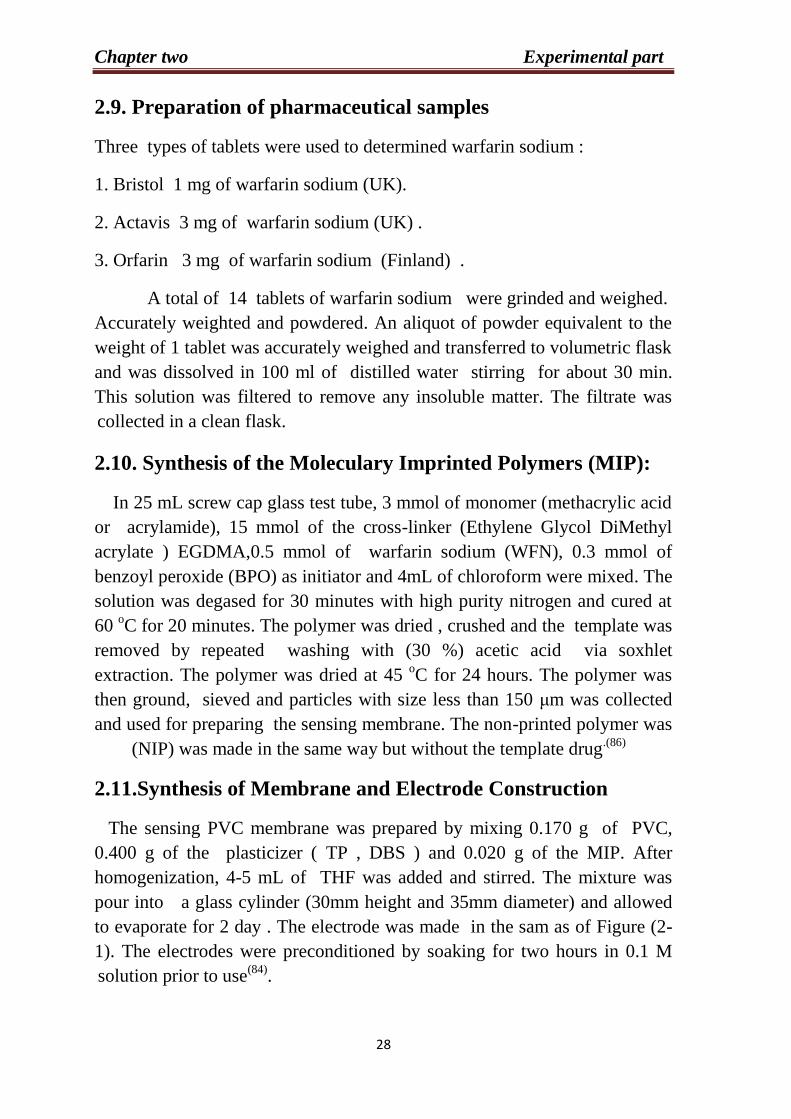
Chapter two Experimental part
12
2.9. Preparation of pharmaceutical samples
Three types of tablets were used to determined warfarin sodium :
1. Bristol 1 mg of warfarin sodium (UK).
2. Actavis 3 mg of warfarin sodium (UK) .
3. Orfarin 3 mg of warfarin sodium (Finland) .
A total of 14 tablets of warfarin sodium were grinded and weighed.
Accurately weighted and powdered. An aliquot of powder equivalent to the
weight of 1 tablet was accurately weighed and transferred to volumetric flask
and was dissolved in 100 ml of distilled water stirring for about 30 min.
This solution was filtered to remove any insoluble matter. The filtrate was
collected in a clean flask.
2.10. Synthesis of the Moleculary Imprinted Polymers (MIP):
In 25 mL screw cap glass test tube, 3 mmol of monomer (methacrylic acid
or acrylamide), 15 mmol of the cross-linker (Ethylene Glycol DiMethyl
acrylate ) EGDMA,0.5 mmol of warfarin sodium (WFN), 0.3 mmol of
benzoyl peroxide (BPO) as initiator and 4mL of chloroform were mixed. The
solution was degased for 30 minutes with high purity nitrogen and cured at
60 oC for 20 minutes. The polymer was dried , crushed and the template was
removed by repeated washing with (30 %) acetic acid via soxhlet
extraction. The polymer was dried at 45 oC for 24 hours. The polymer was
then ground, sieved and particles with size less than 150 μm was collected
and used for preparing the sensing membrane. The non-printed polymer was
(NIP) was made in the same way but without the template drug.(86)
2.11.Synthesis of Membrane and Electrode Construction
The sensing PVC membrane was prepared by mixing 0.170 g of PVC,
0.400 g of the plasticizer ( TP , DBS ) and 0.020 g of the MIP. After
homogenization, 4-5 mL of THF was added and stirred. The mixture was
pour into a glass cylinder (30mm height and 35mm diameter) and allowed
to evaporate for 2 day . The electrode was made in the sam as of Figure (2-
1). The electrodes were preconditioned by soaking for two hours in 0.1 M
solution prior to use(84)
.

Chapter Three Result and discussion
92
3.1. Warfarin sodium Ion Selective Electrodes:
In this study ten new ionphores as potentiometric sensors for
warfarin sodium were prepared using dodeca-molybdo phosphoric acid
and dodeca phosphotungestic acid, as an ion-paring agents. Association
complexes for sparingly soluble white complexes of warfarin sodium
with
dodeca-molybdo phosphoric acid(WFN-MPA) and dodeca
phosphotungestic acid (WFN-PTA) as counter an ions, were
instantaneously formed upon the addition of dodeca-molybdo
phosphoric acid or dodeca phosphotungestic acid to warfarin sodium
solution . The dry powder of the ion pair (WFN-MPA) and (WFN-PTA)
were used to construct ten warfarin sodium electrodes. The electro-active
compounds (WFN-MPA) and (WFM-PTA) were confirmed using FTIR.
Figure (3.1),( 3.2)and(3.3) show the spectra of warfarin sodium and the
two (WFN-MPA),(WFN-PTA) complexes, respectively. The coordination
sites of the warfarin sodium involved in the bonding with molybdo
Phosphoric acid (MPA) and phosphotungestic acid had been determined
by careful comparison of the FIR spectra of the complexes with that of
the parent drug. The full spectrum of the drug is highly complicated
only diagnostic those bands of coordination with metal ions have been
considered for discussion. These bands were tabulated in Table (3.1).
Table ( 3.1): Structural important FTIR bands of warfarin sodium and their
Complexes (WFN-MPA) and (WFN-PTA) .
Assignment WFN WFN-MPA WFN-PTA
OH str. 3278 3556 3280
C-H aromatic 3082,3059 3001 3022
C-H aliphatic 2850 2881 9292
C=O str. 1681 1720 1111
C=C str. 1604 1608 1111
CH bending aliphatic 1492,1450 1454 1549
C-O str. Asymm 1276 1265 1911
C-O str. Symm 1165 1161 1111
Out-of plane-mono-sub 759 759 142
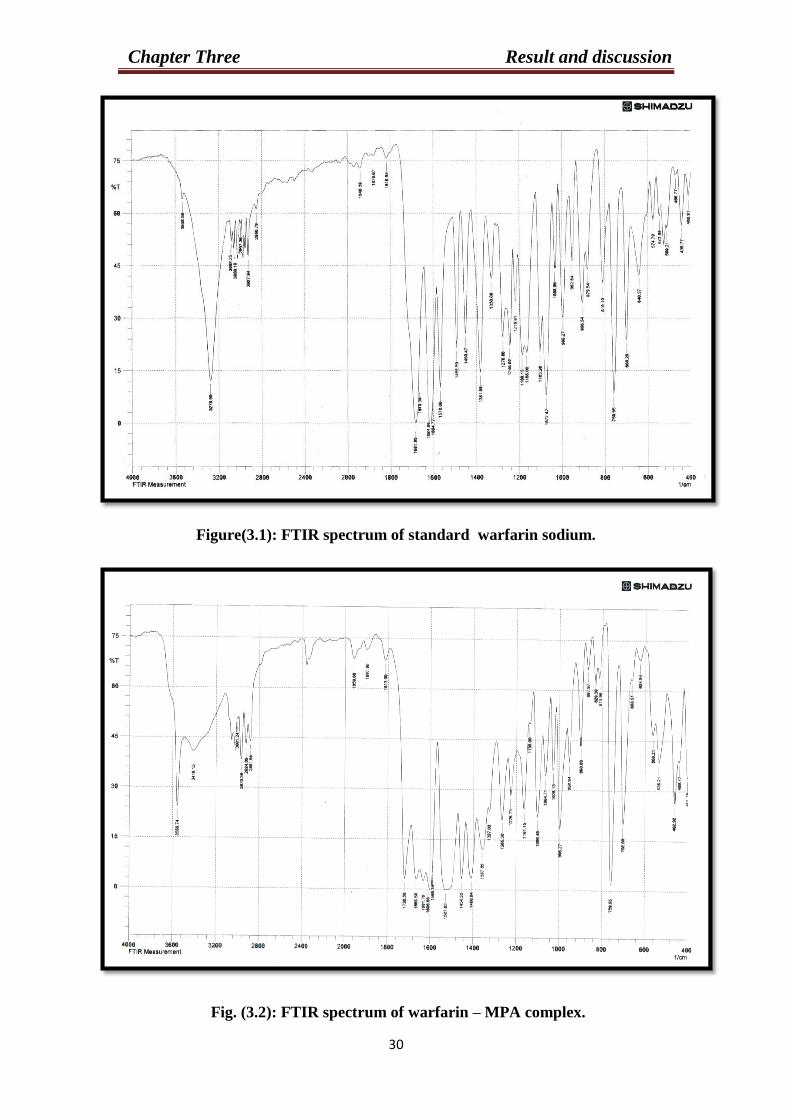
Chapter Three Result and discussion
03
Figure(3.1): FTIR spectrum of standard warfarin sodium.
Fig. (3.2): FTIR spectrum of warfarin – MPA complex.
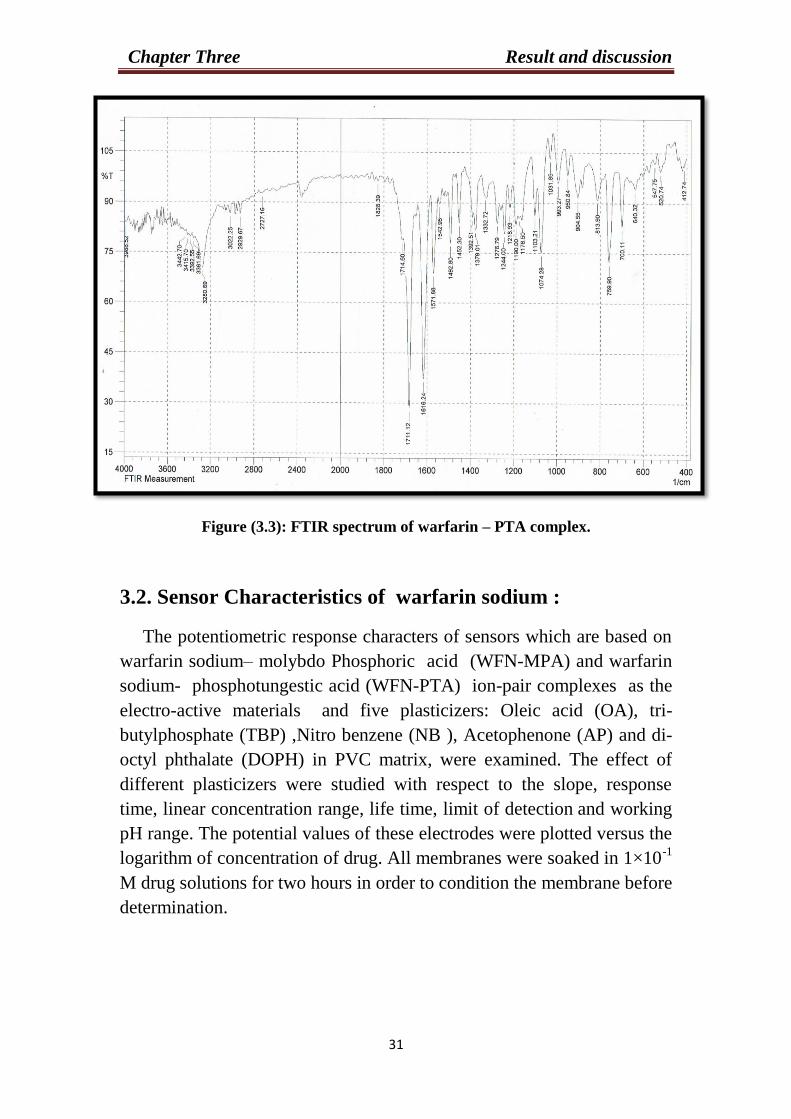
Chapter Three Result and discussion
03
Figure (3.3): FTIR spectrum of warfarin – PTA complex.
3.2. Sensor Characteristics of warfarin sodium :
The potentiometric response characters of sensors which are based on
warfarin sodium– molybdo Phosphoric acid (WFN-MPA) and warfarin
sodium- phosphotungestic acid (WFN-PTA) ion-pair complexes as the
electro-active materials
and five plasticizers: Oleic acid (OA), tri-
butylphosphate (TBP) ,Nitro benzene (NB ), Acetophenone (AP) and di-
octyl phthalate (DOPH) in PVC matrix, were examined. The effect of
different plasticizers were studied with respect to the slope, response
time, linear concentration range, life time, limit of detection and working
pH range. The potential values of these electrodes were plotted versus the
logarithm of concentration of drug. All membranes were soaked in 1×10⁻¹
M drug solutions for two hours in order to condition the membrane before
determination.
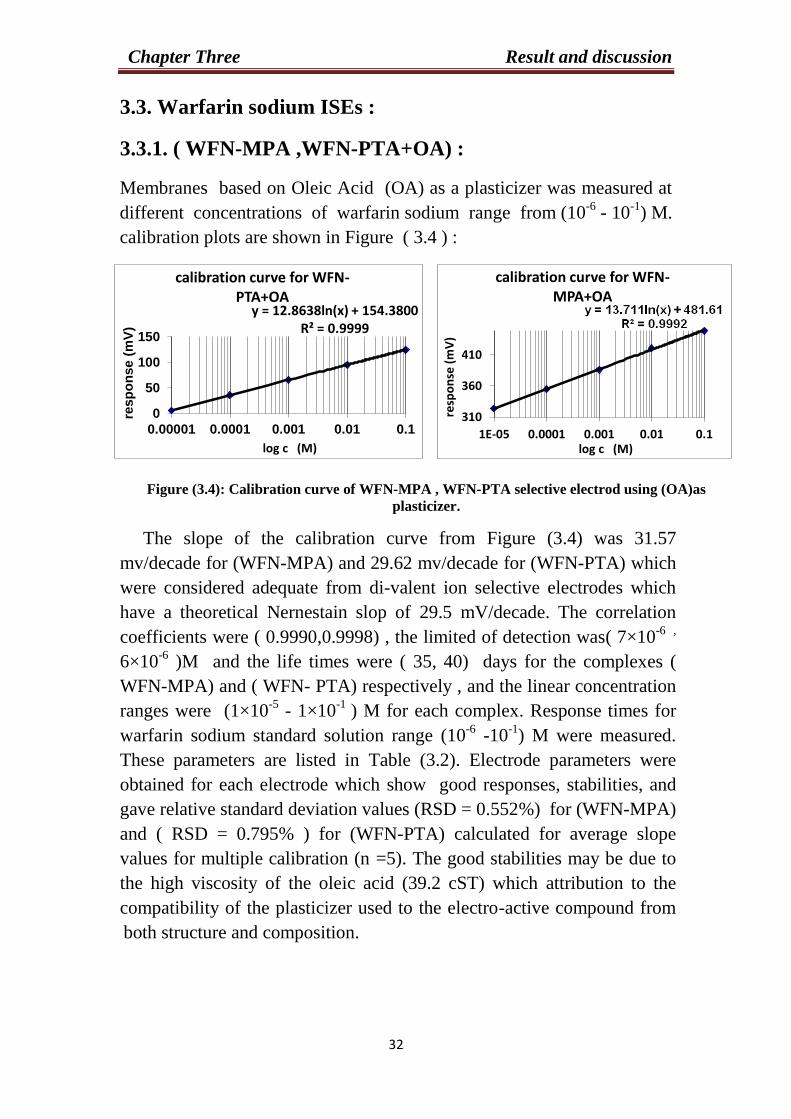
Chapter Three Result and discussion
09
3.3. Warfarin sodium ISEs :
3.3.1. ( WFN-MPA ,WFN-PTA+OA) :
Membranes based on Oleic Acid (OA) as a plasticizer was measured at
different concentrations of warfarin sodium range from (10-6
- 10-1
) M.
calibration plots are shown in Figure ( 3.4 ) :
Figure (3.4): Calibration curve of WFN-MPA , WFN-PTA selective electrod using (OA)as
plasticizer.
The slope of the calibration curve from Figure (3.4) was 31.57
mv/decade for (WFN-MPA) and 29.62 mv/decade for (WFN-PTA) which
were considered adequate from di-valent ion selective electrodes which
have a theoretical Nernestain slop of 29.5 mV/decade. The correlation
coefficients were ( 0.9990,0.9998) , the limited of detection was( 7×10⁻⁶ ,
6×10⁻⁶
)M and the life times were ( 35, 40) days for the complexes (
WFN-MPA) and ( WFN- PTA) respectively , and the linear concentration
ranges were (1×10⁻⁵
- 1×10⁻¹
) M for each complex. Response times for
warfarin sodium standard solution range (10-6
-10-1
) M were measured.
These parameters are listed in Table (3.2). Electrode parameters were
obtained for each electrode which show good responses, stabilities, and
gave relative standard deviation values (RSD = 0.552%) for (WFN-MPA)
and ( RSD = 0.795% ) for (WFN-PTA) calculated for average slope
values for multiple calibration (n =5). The good stabilities may be due to
the high viscosity of the oleic acid (39.2 cST) which attribution to the
compatibility of the plasticizer used to the electro-active compound from
both structure and composition.
310
360
410
1E-05 0.0001 0.001 0.01 0.1re
spo
nse
(m
V)
log c (M)
calibration curve for WFN-MPA+OA
y = 12.8638ln(x) + 154.3800 R² = 0.9999
0
50
100
150
0.00001 0.0001 0.001 0.01 0.1
resp
on
se (
mV
)
log c (M)
calibration curve for WFN- PTA+OA
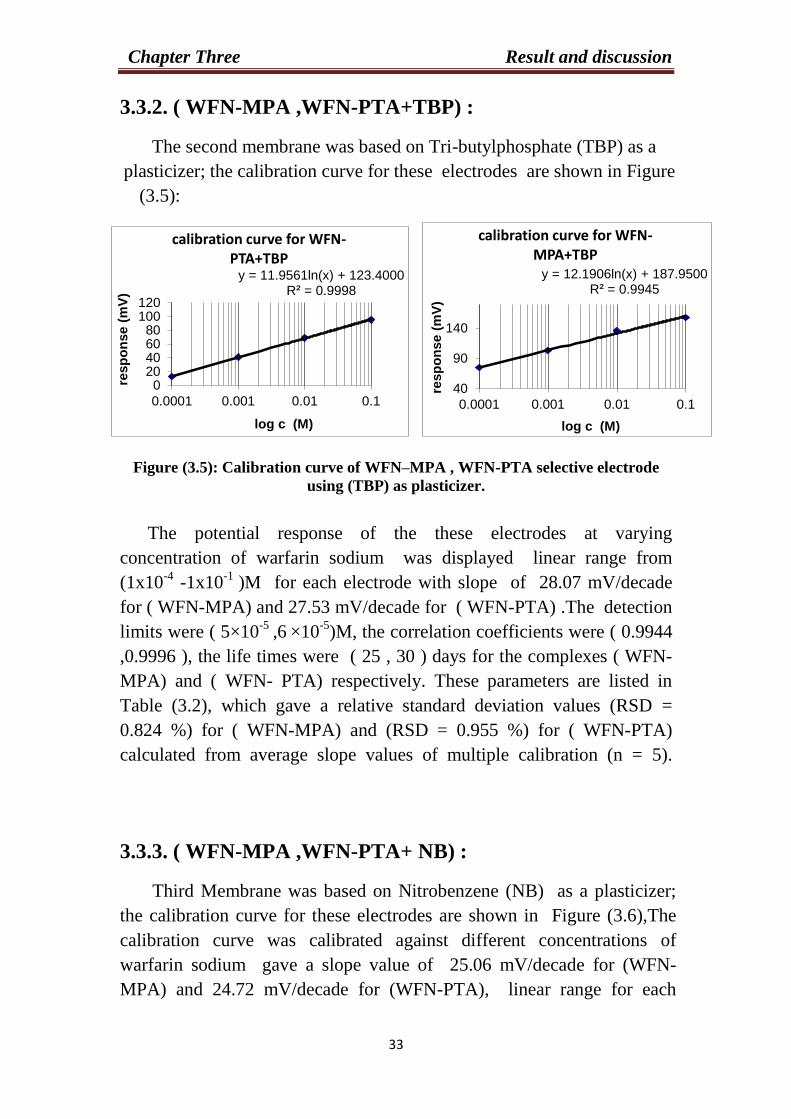
Chapter Three Result and discussion
00
3.3.2. ( WFN-MPA ,WFN-PTA+TBP) :
The second membrane was based on Tri-butylphosphate (TBP) as a
plasticizer; the calibration curve for these electrodes are shown in Figure
(3.5):
Figure (3.5): Calibration curve of WFN–MPA , WFN-PTA selective electrode
using (TBP) as plasticizer.
The potential response of the these electrodes at varying
concentration of warfarin sodium was displayed linear range from
(1x10⁻⁴
-1x10⁻¹
)M for each electrode with slope of 28.07 mV/decade
for ( WFN-MPA) and 27.53 mV/decade for ( WFN-PTA) .The detection
limits were ( 5×10⁻⁵
,6 ×10
-5)M, the correlation coefficients were ( 0.9944
,0.9996 ), the life times were ( 25 , 30 ) days for the complexes ( WFN-
MPA) and ( WFN- PTA) respectively. These parameters are listed in
Table (3.2), which gave a relative standard deviation values (RSD =
0.824 %) for ( WFN-MPA) and (RSD = 0.955 %) for ( WFN-PTA)
calculated from average slope values of multiple calibration (n = 5).
3.3.3. ( WFN-MPA ,WFN-PTA+ NB) :
Third Membrane was based on Nitrobenzene (NB) as a plasticizer;
the calibration curve for these electrodes are shown in Figure (3.6),The
calibration curve was calibrated against different concentrations of
warfarin sodium gave a slope value of 25.06 mV/decade for (WFN-
MPA) and 24.72 mV/decade for (WFN-PTA), linear range for each
y = 12.1906ln(x) + 187.9500 R² = 0.9945
40
90
140
0.0001 0.001 0.01 0.1
resp
on
se (
mV
) log c (M)
calibration curve for WFN-MPA+TBP
y = 11.9561ln(x) + 123.4000 R² = 0.9998
020406080
100120
0.0001 0.001 0.01 0.1
resp
on
se (
mV
)
log c (M)
calibration curve for WFN-PTA+TBP
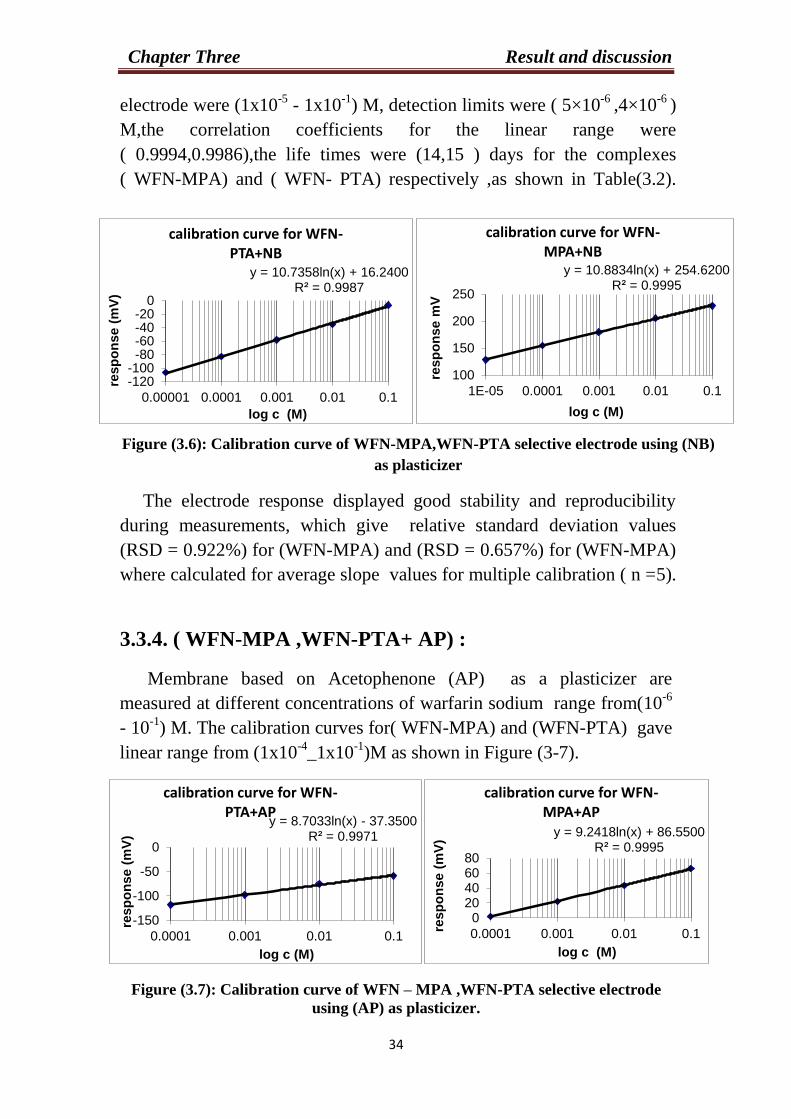
Chapter Three Result and discussion
03
electrode were (1x10⁻⁵
- 1x10⁻¹
) M, detection limits were ( 5×10⁻⁶
,4×10-6
)
M,the correlation coefficients for the linear range were
( 0.9994,0.9986),the life times were (14,15 ) days for the complexes
( WFN-MPA) and ( WFN- PTA) respectively ,as shown in Table(3.2).
Figure (3.6): Calibration curve of WFN-MPA,WFN-PTA selective electrode using (NB)
as plasticizer
The electrode response displayed good stability and reproducibility
during measurements, which give relative standard deviation values
(RSD = 0.922%) for (WFN-MPA) and (RSD = 0.657%) for (WFN-MPA)
where calculated for average slope values for multiple calibration ( n =5).
3.3.4. ( WFN-MPA ,WFN-PTA+ AP) :
Membrane based on Acetophenone (AP) as a plasticizer are
measured at different concentrations of warfarin sodium range from(10-6
- 10-1
) M. The calibration curves for( WFN-MPA) and (WFN-PTA) gave
linear range from (1x10⁻⁴
_1x10-1
)M as shown in Figure (3-7).
Figure (3.7): Calibration curve of WFN – MPA ,WFN-PTA selective electrode
using (AP) as plasticizer.
y = 10.8834ln(x) + 254.6200 R² = 0.9995
100
150
200
250
1E-05 0.0001 0.001 0.01 0.1
resp
on
se m
V
log c (M)
calibration curve for WFN- MPA+NB
y = 10.7358ln(x) + 16.2400 R² = 0.9987
-120-100
-80-60-40-20
0
0.00001 0.0001 0.001 0.01 0.1
resp
on
se (
mV
)
log c (M)
calibration curve for WFN- PTA+NB
y = 9.2418ln(x) + 86.5500 R² = 0.9995
020406080
0.0001 0.001 0.01 0.1resp
on
se (
mV
)
log c (M)
calibration curve for WFN-MPA+AP
y = 8.7033ln(x) - 37.3500 R² = 0.9971
-150
-100
-50
0
0.0001 0.001 0.01 0.1
resp
on
se (
mV
)
log c (M)
calibration curve for WFN- PTA+AP
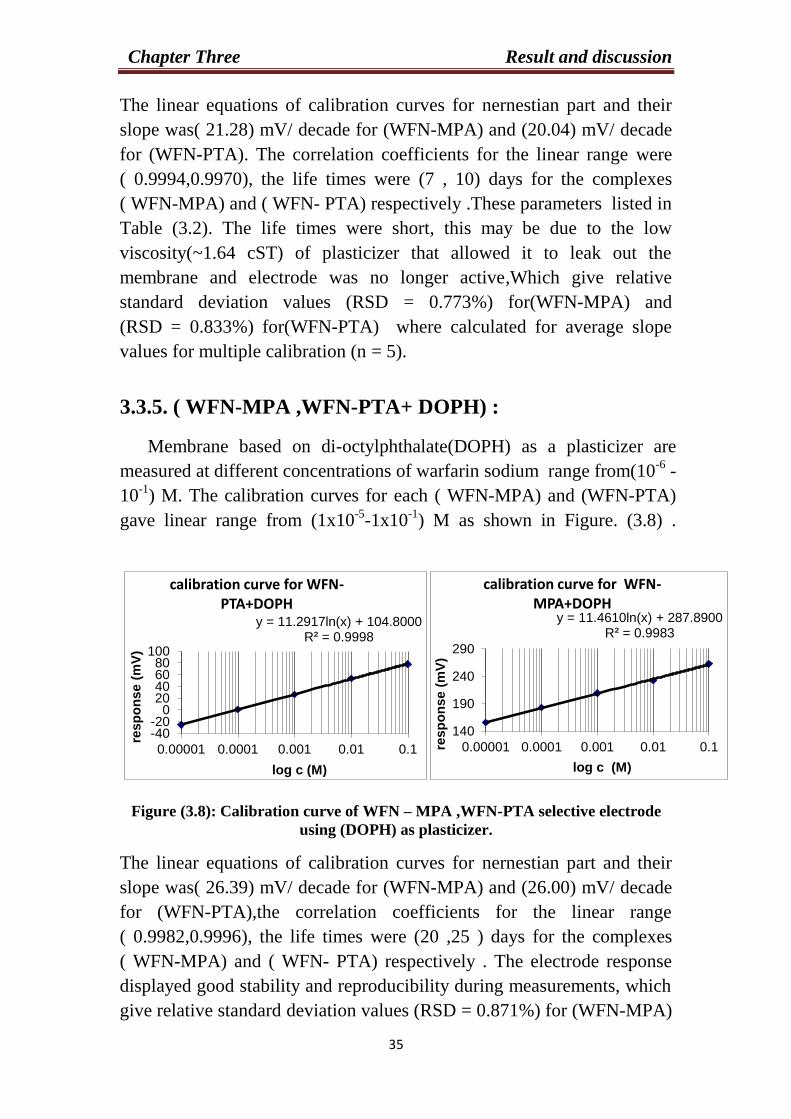
Chapter Three Result and discussion
03
The linear equations of calibration curves for nernestian part and their
slope was( 21.28) mV/ decade for (WFN-MPA) and (20.04) mV/ decade
for (WFN-PTA). The correlation coefficients for the linear range were
( 0.9994,0.9970), the life times were (7 , 10) days for the complexes
( WFN-MPA) and ( WFN- PTA) respectively .These parameters listed in
Table (3.2). The life times were short, this may be due to the low
viscosity(~1.64 cST) of plasticizer that allowed it to leak out the
membrane and electrode was no longer active,Which give relative
standard deviation values (RSD = 0.773%) for(WFN-MPA) and
(RSD = 0.833%) for(WFN-PTA) where calculated for average slope
values for multiple calibration (n = 5).
3.3.5. ( WFN-MPA ,WFN-PTA+ DOPH) :
Membrane based on di-octylphthalate(DOPH) as a plasticizer are
measured at different concentrations of warfarin sodium range from(10-6
-
10-1
) M. The calibration curves for each ( WFN-MPA) and (WFN-PTA)
gave linear range from (1x10⁻⁵
-1x10⁻¹
) M as shown in Figure. (3.8) .
Figure (3.8): Calibration curve of WFN – MPA ,WFN-PTA selective electrode
using (DOPH) as plasticizer.
The linear equations of calibration curves for nernestian part and their
slope was( 26.39) mV/ decade for (WFN-MPA) and (26.00) mV/ decade
for (WFN-PTA),the correlation coefficients for the linear range
( 0.9982,0.9996), the life times were (20 ,25 ) days for the complexes
( WFN-MPA) and ( WFN- PTA) respectively . The electrode response
displayed good stability and reproducibility during measurements, which
give relative standard deviation values (RSD = 0.871%) for (WFN-MPA)
y = 11.4610ln(x) + 287.8900 R² = 0.9983
140
190
240
290
0.00001 0.0001 0.001 0.01 0.1resp
on
se (
mV
)
log c (M)
calibration curve for WFN-MPA+DOPH
y = 11.2917ln(x) + 104.8000 R² = 0.9998
-40-20
020406080
100
0.00001 0.0001 0.001 0.01 0.1
resp
on
se (
mV
)
log c (M)
calibration curve for WFN-PTA+DOPH
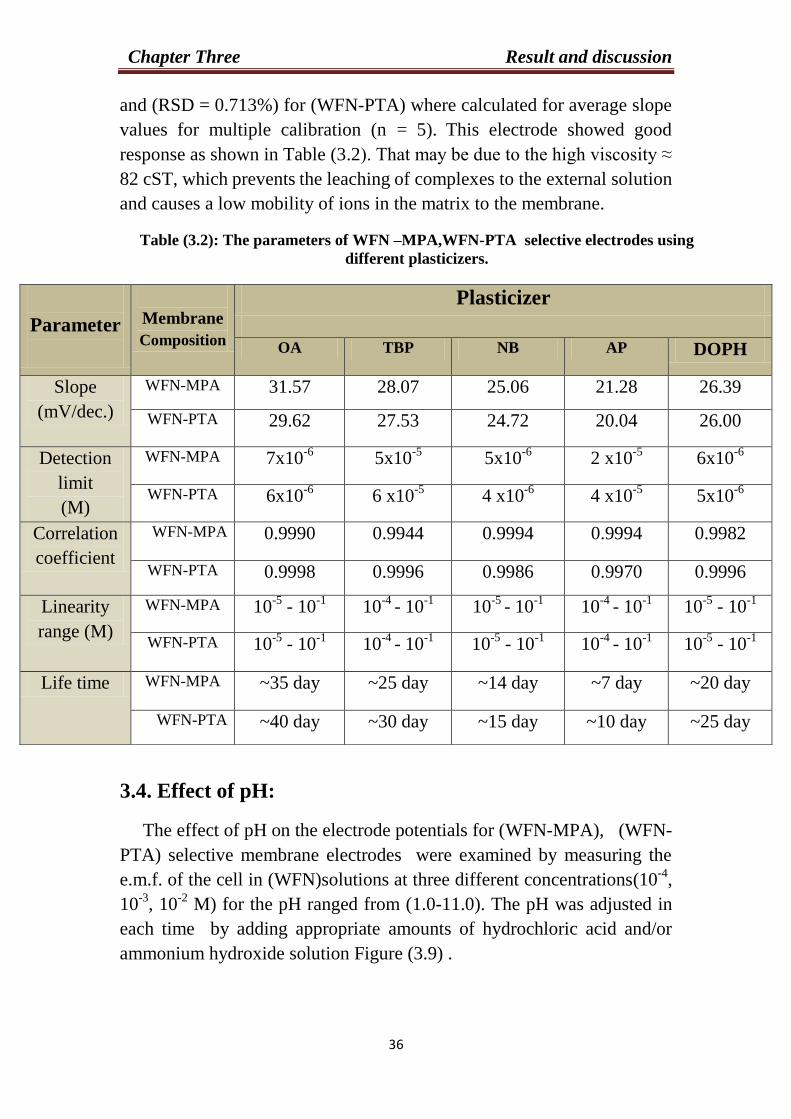
Chapter Three Result and discussion
03
and (RSD = 0.713%) for (WFN-PTA) where calculated for average slope
values for multiple calibration (n = 5). This electrode showed good
response as shown in Table (3.2). That may be due to the high viscosity ≈
82 cST, which prevents the leaching of complexes to the external solution
and causes a low mobility of ions in the matrix to the membrane.
Table (3.2): The parameters of WFN –MPA,WFN-PTA selective electrodes using
different plasticizers.
3.4. Effect of pH:
The effect of pH on the electrode potentials for (WFN-MPA), (WFN-
PTA) selective membrane electrodes were examined by measuring the
e.m.f. of the cell in (WFN)solutions at three different concentrations(10-4
,
10-3
, 10-2
M) for the pH ranged from (1.0-11.0). The pH was adjusted in
each time by adding appropriate amounts of hydrochloric acid and/or
ammonium hydroxide solution Figure (3.9) .
Parameter
Membrane
Composition
Plasticizer
OA TBP NB AP DOPH
Slope
(mV/dec.)
WFN-MPA 31.57 28.07 25.06 21.28 26.39
WFN-PTA 29.62 27.53 24.72 20.04 26.00
Detection
limit
(M)
WFN-MPA 7x10⁻⁶ 5x10
-5 5x10
-6 2 x10
-5 6x10⁻⁶
WFN-PTA 6x10⁻⁶ 6 x10
-5 4 x10
-6 4 x10
-5 5x10
-6
Correlation
coefficient
WFN-MPA 0.9990 0.9944 0.9994 0.9994 0.9982
WFN-PTA 0.9998 0.9996 0.9986 0.9970 0.9996
Linearity
range (M)
WFN-MPA 10-5
- 10-1 10
-4 - 10
-1 10-5
- 10-1 10
-4 - 10
-1 10
-5 - 10
-1
WFN-PTA 10-5
- 10-1
10-4
- 10-1
10-5
- 10-1
10-4
- 10-1
10-5
- 10-1
Life time WFN-MPA ~35 day ~25 day ~14 day ~7 day ~20 day
WFN-PTA ~40 day ~30 day ~15 day ~10 day ~25 day
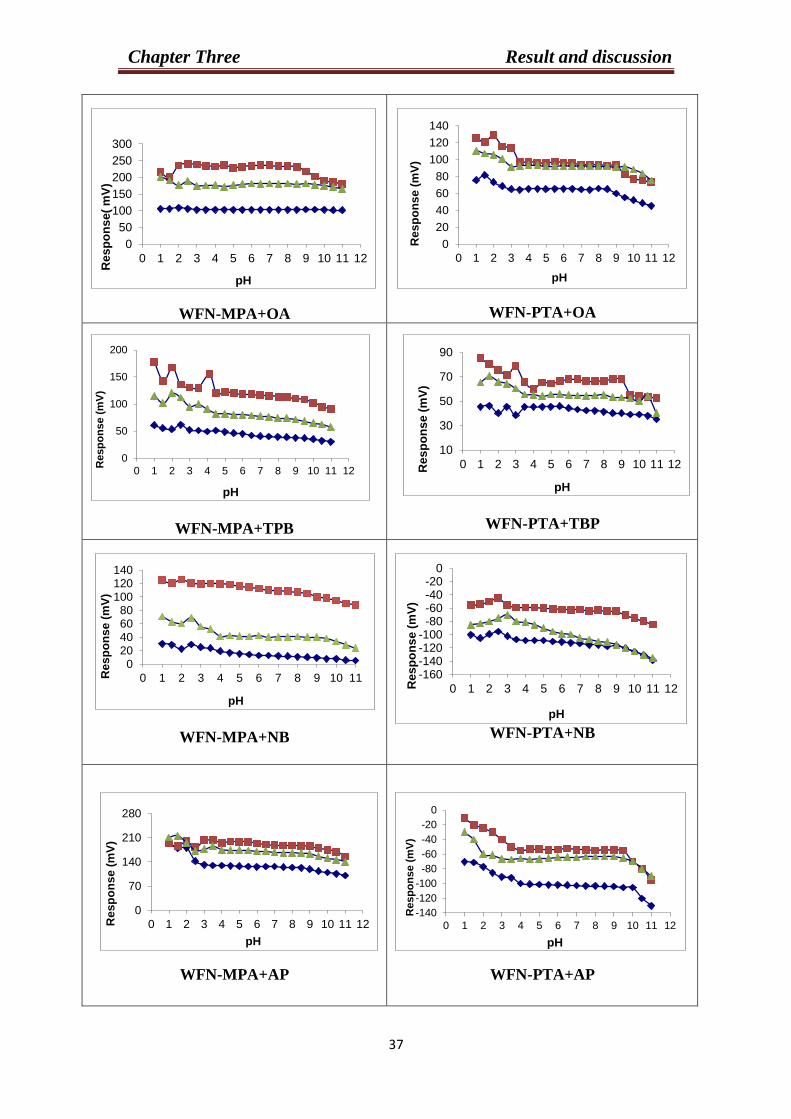
Chapter Three Result and discussion
03
WFN-PTA+OA
WFN-MPA+OA
WFN-PTA+TBP
WFN-MPA+TPB
WFN-PTA+NB
WFN-MPA+NB
WFN-PTA+AP
WFN-MPA+AP
0
20
40
60
80
100
120
140
0 1 2 3 4 5 6 7 8 9 10 11 12
Re
sp
on
se (
mV
)
pH
0
50
100
150
200
250
300
0 1 2 3 4 5 6 7 8 9 10 11 12
Re
sp
on
se
( m
V)
pH
10
30
50
70
90
0 1 2 3 4 5 6 7 8 9 10 11 12Res
po
ns
e (
mV
)
pH
0
50
100
150
200
0 1 2 3 4 5 6 7 8 9 10 11 12
Resp
on
se (
mV
)
pH
-160-140-120-100
-80-60-40-20
0
0 1 2 3 4 5 6 7 8 9 10 11 12Res
po
ns
e (
mV
)
pH
020406080
100120140
0 1 2 3 4 5 6 7 8 9 10 11Re
sp
on
se (
mV
)
pH
-140
-120
-100
-80
-60
-40
-20
0
0 1 2 3 4 5 6 7 8 9 10 11 12
Resp
on
se (
mV
)
pH
0
70
140
210
280
0 1 2 3 4 5 6 7 8 9 10 11 12Re
sp
on
se (
mV
)
pH
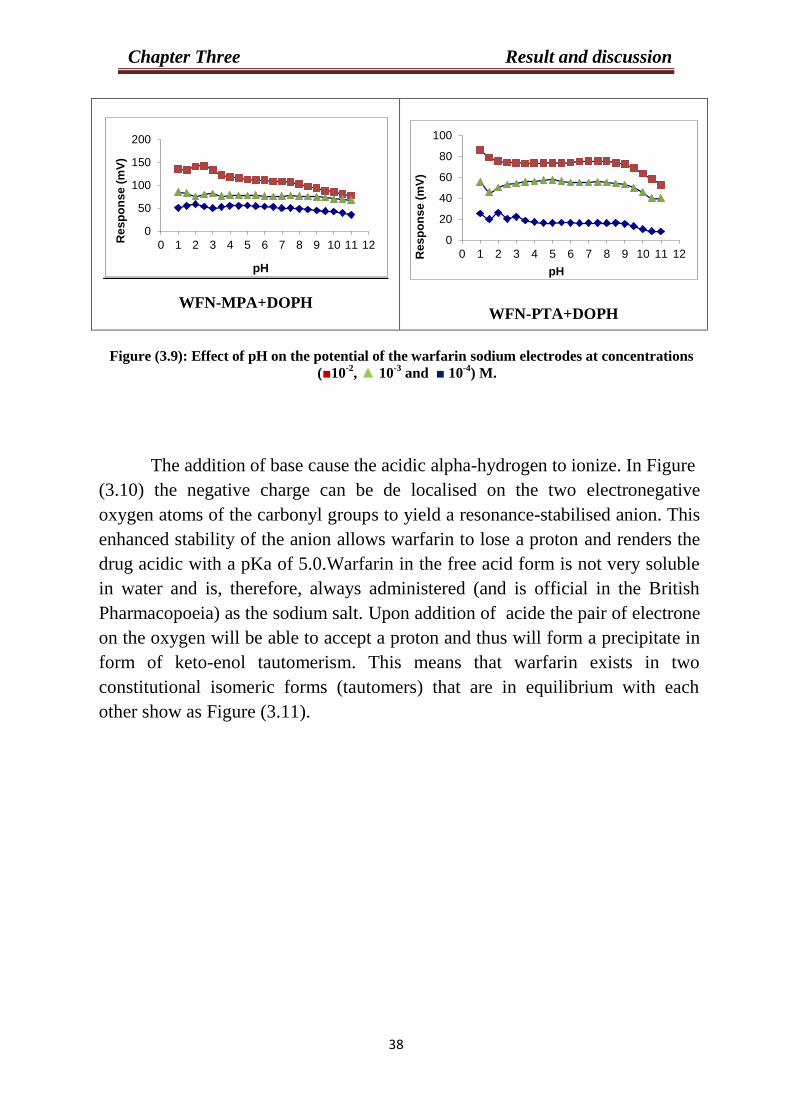
Chapter Three Result and discussion
03
WFN-PTA+DOPH
WFN-MPA+DOPH
Figure (3.9): Effect of pH on the potential of the warfarin sodium electrodes at concentrations
(■10-2
, ▲ 10-3
and ■ 10-4
) M.
The addition of base cause the acidic alpha-hydrogen to ionize. In Figure
(3.10) the negative charge can be de localised on the two electronegative
oxygen atoms of the carbonyl groups to yield a resonance-stabilised anion. This
enhanced stability of the anion allows warfarin to lose a proton and renders the
drug acidic with a pKa of 5.0.Warfarin in the free acid form is not very soluble
in water and is, therefore, always administered (and is official in the British
Pharmacopoeia) as the sodium salt. Upon addition of acide the pair of electrone
on the oxygen will be able to accept a proton and thus will form a precipitate in
form of keto-enol tautomerism. This means that warfarin exists in two
constitutional isomeric forms (tautomers) that are in equilibrium with each
other show as Figure (3.11).
0
20
40
60
80
100
0 1 2 3 4 5 6 7 8 9 10 11 12Re
sp
on
se (
mV
)
pH
0
50
100
150
200
0 1 2 3 4 5 6 7 8 9 10 11 12Re
sp
on
se (
mV
)
pH
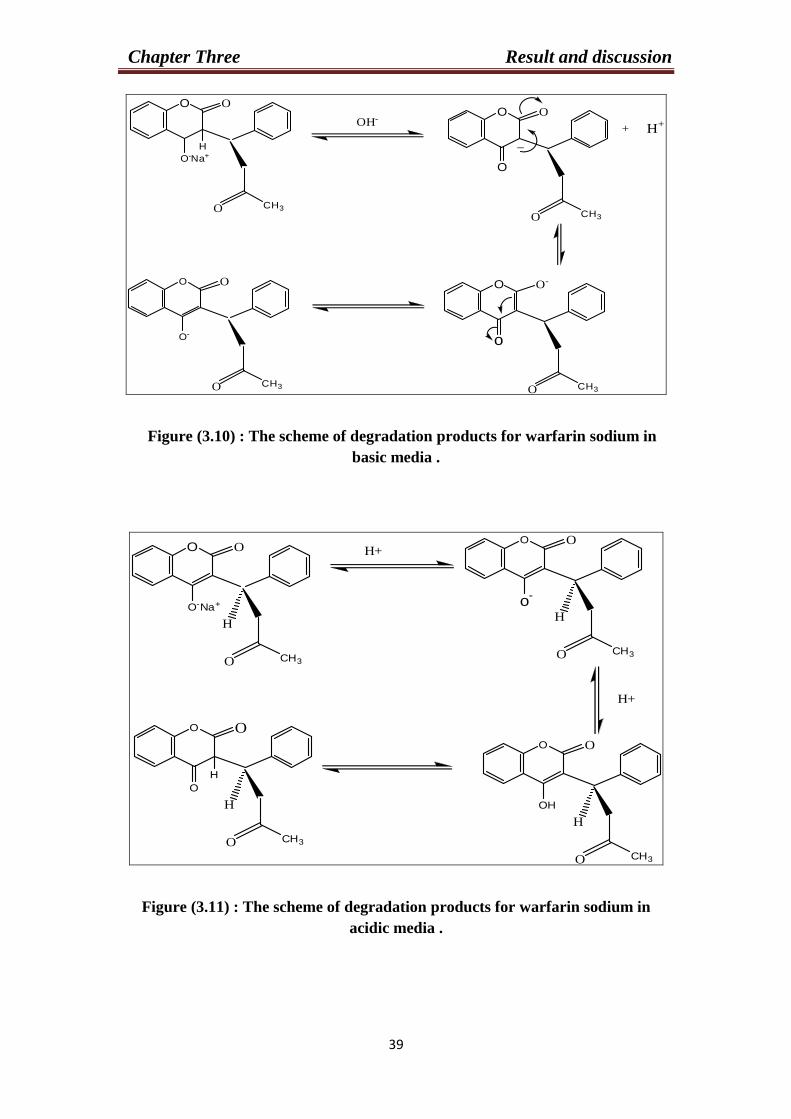
Chapter Three Result and discussion
02
OH-O O
O
CH3O
O O
O-Na+
CH3O
H _
+ H+
O O
O-
CH3O
O O-
o
CH3O
Figure (3.10) : The scheme of degradation products for warfarin sodium in
basic media .
O O
O-Na+
H
CH3O
H+O O
o-
H
CH3O
H+
O O
OH
H
CH3O
O O
O
H
CH3O
H
Figure (3.11) : The scheme of degradation products for warfarin sodium in
acidic media .
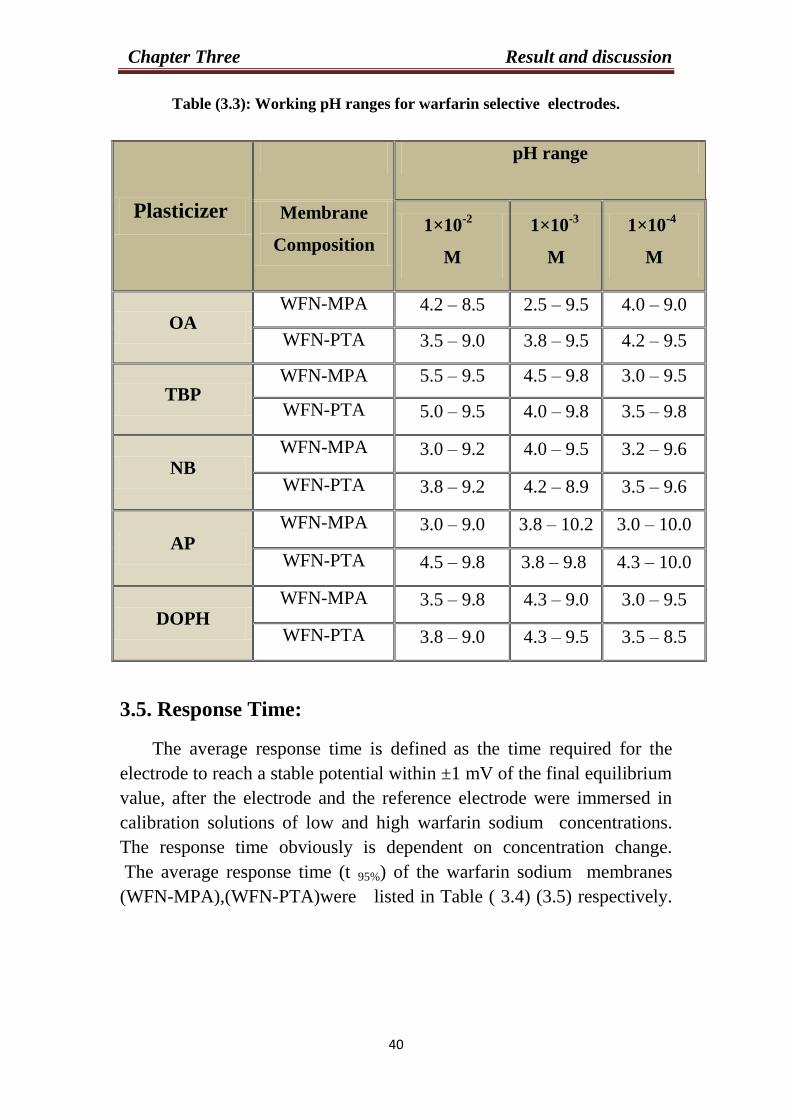
Chapter Three Result and discussion
33
Table (3.3): Working pH ranges for warfarin selective electrodes.
3.5. Response Time:
The average response time is defined as the time required for the
electrode to reach a stable potential within ±1 mV of the final equilibrium
value, after the electrode and the reference electrode were immersed in
calibration solutions of low and high warfarin sodium concentrations.
The response time obviously is dependent on concentration change.
The average response time (t 95%) of the warfarin sodium membranes
(WFN-MPA),(WFN-PTA)were listed in Table ( 3.4) (3.5) respectively.
Plasticizer
pH range
Membrane
Composition 1×10
-2
M
1×10⁻³
M
1×10⁻⁴
M
OA WFN-MPA 4.2 – 8.5 2.5 – 9.5 4.0 – 9.0
WFN-PTA 3.5 – 9.0 3.8 – 9.5 4.2 – 9.5
TBP WFN-MPA 5.5 – 9.5 4.5 – 9.8 3.0 – 9.5
WFN-PTA 5.0 – 9.5 4.0 – 9.8 3.5 – 9.8
NB
WFN-MPA 3.0 – 9.2 4.0 – 9.5 3.2 – 9.6
WFN-PTA 3.8 – 9.2 4.2 – 8.9 3.5 – 9.6
AP
WFN-MPA 3.0 – 9.0 3.8 – 10.2 3.0 – 10.0
WFN-PTA 4.5 – 9.8 3.8 – 9.8 4.3 – 10.0
DOPH WFN-MPA 3.5 – 9.8 4.3 – 9.0 3.0 – 9.5
WFN-PTA 3.8 – 9.0 4.3 – 9.5 3.5 – 8.5
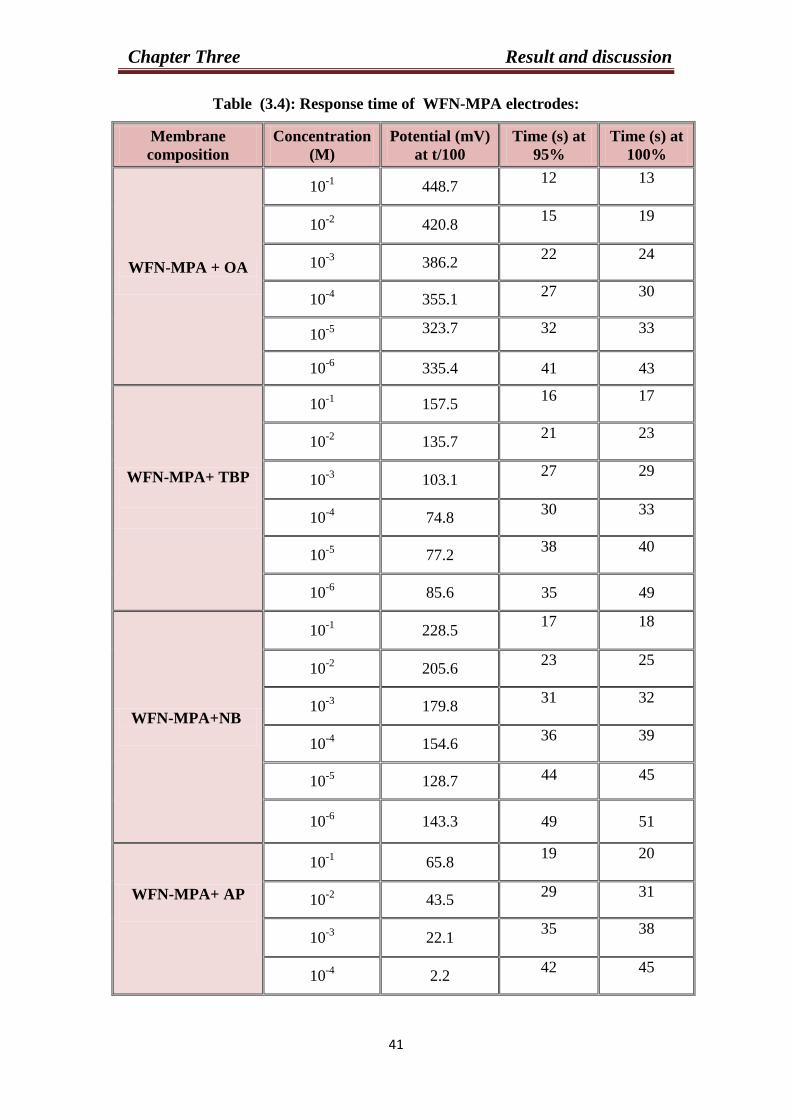
Chapter Three Result and discussion
33
Table (3.4): Response time of WFN-MPA electrodes:
Membrane
composition
Concentration
(M)
Potential (mV)
at t/100
Time (s) at
95%
Time (s) at
100%
WFN-MPA + OA
10-1
448.7 12 13
10-2
420.8 15 19
10-3
386.2 22 24
10-4
355.1 27 30
10-5
323.7 32 33
10-6
335.4 41 43
WFN-MPA+ TBP
10-1
157.5 16 17
10-2
135.7 21 23
10-3
103.1 27 29
10-4
74.8 30 33
10-5
77.2 38 40
10-6
85.6 35 49
WFN-MPA+NB
10-1
228.5 17 18
10-2
205.6 23 25
10-3
179.8 31 32
10-4
154.6 36 39
10-5
128.7 44 45
10-6
143.3 49 51
WFN-MPA+ AP
10-1
65.8 19 20
10-2
43.5 29 31
10-3
22.1 35 38
10-4
2.2 42 45
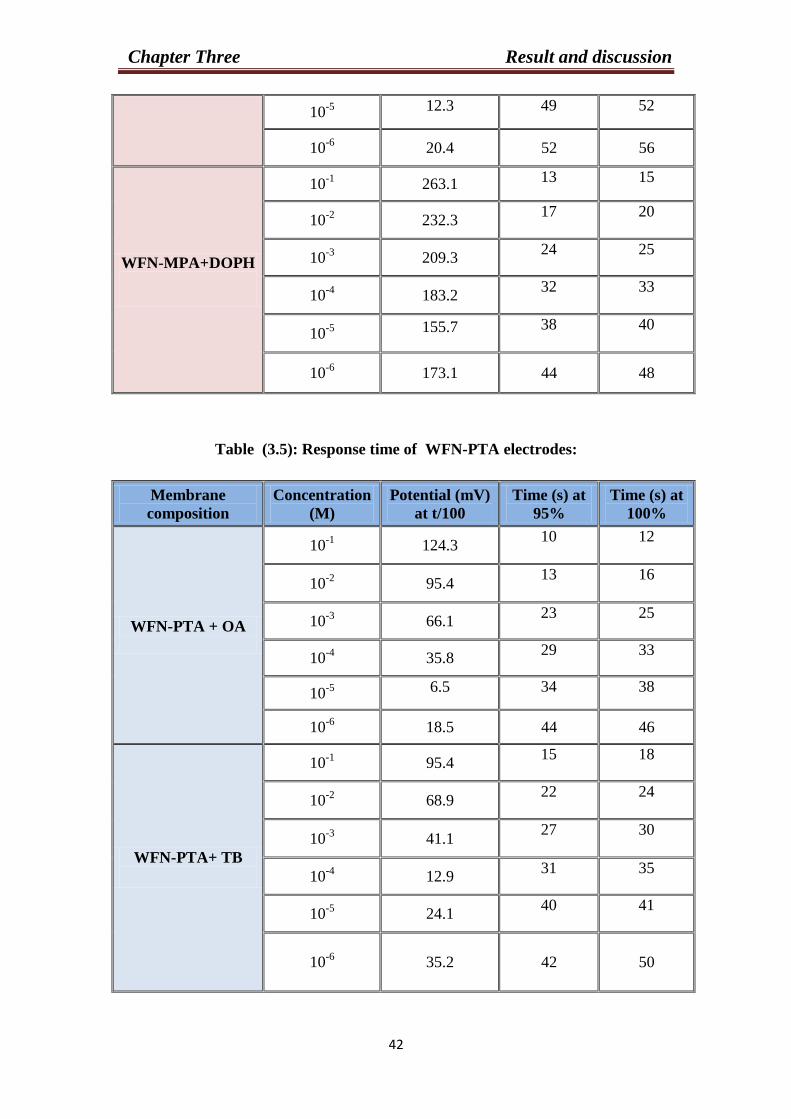
Chapter Three Result and discussion
39
10-5
12.3 49 52
10-6
20.4 52 56
WFN-MPA+DOPH
10-1
263.1 13 15
10-2
232.3 17 20
10-3
209.3 24 25
10-4
183.2 32 33
10-5
155.7 38 40
10-6
173.1 44 48
Table (3.5): Response time of WFN-PTA electrodes:
Membrane
composition
Concentration
(M)
Potential (mV)
at t/100
Time (s) at
95%
Time (s) at
100%
WFN-PTA + OA
10-1
124.3 10 12
10-2
95.4 13 16
10-3
66.1 23 25
10-4
35.8 29 33
10-5
6.5 34 38
10-6
18.5 44 46
WFN-PTA+ TB
10-1
95.4 15 18
10-2
68.9 22 24
10-3
41.1 27 30
10-4
12.9 31 35
10-5
24.1 40 41
10-6
35.2 42 50
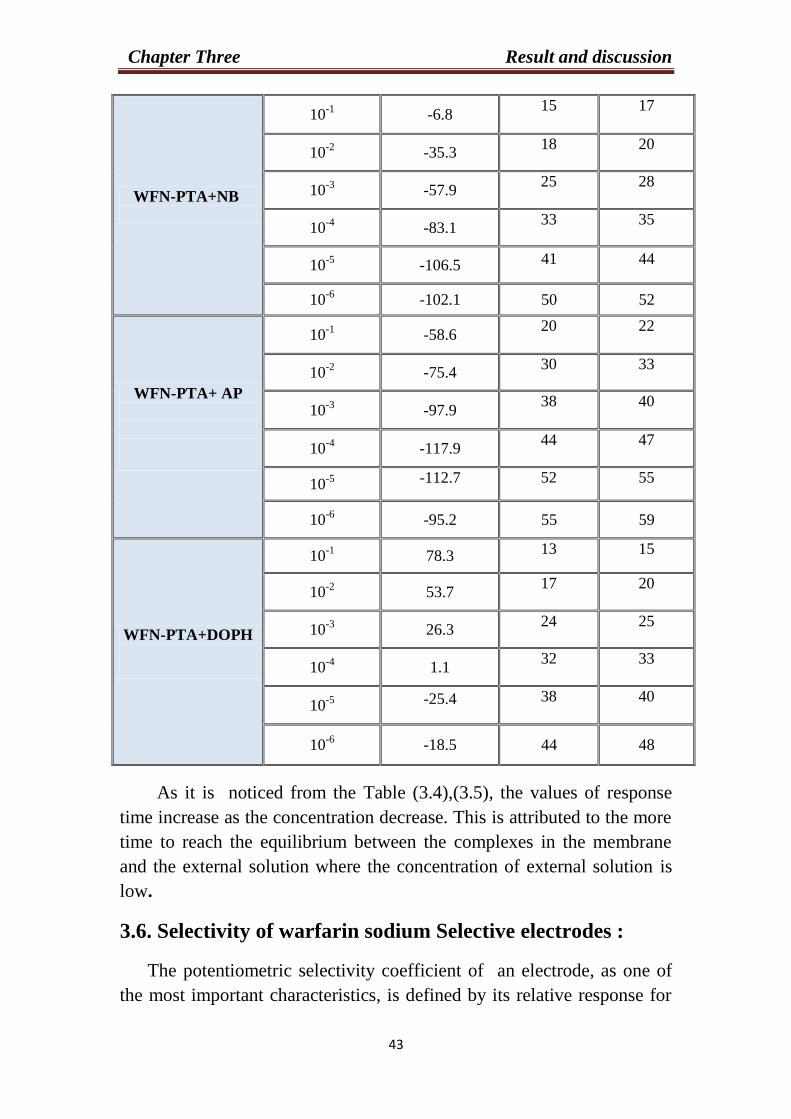
Chapter Three Result and discussion
30
WFN-PTA+NB
10-1
-6.8 15 17
10-2
-35.3 18 20
10-3
-57.9 25 28
10-4
-83.1 33 35
10-5
-106.5 41 44
10-6
-102.1 50 52
WFN-PTA+ AP
10-1
-58.6 20 22
10-2
-75.4 30 33
10-3
-97.9 38 40
10-4
-117.9 44 47
10-5
-112.7 52 55
10-6
-95.2 55 59
WFN-PTA+DOPH
10-1
78.3 13 15
10-2
53.7 17 20
10-3
26.3 24 25
10-4
1.1 32 33
10-5
-25.4 38 40
10-6
-18.5 44 48
As it is noticed from the Table (3.4),(3.5), the values of response
time increase as the concentration decrease. This is attributed to the more
time to reach the equilibrium between the complexes in the membrane
and the external solution where the concentration of external solution is
low.
3.6. Selectivity of warfarin sodium Selective electrodes :
The potentiometric selectivity coefficient of an electrode, as one of
the most important characteristics, is defined by its relative response for
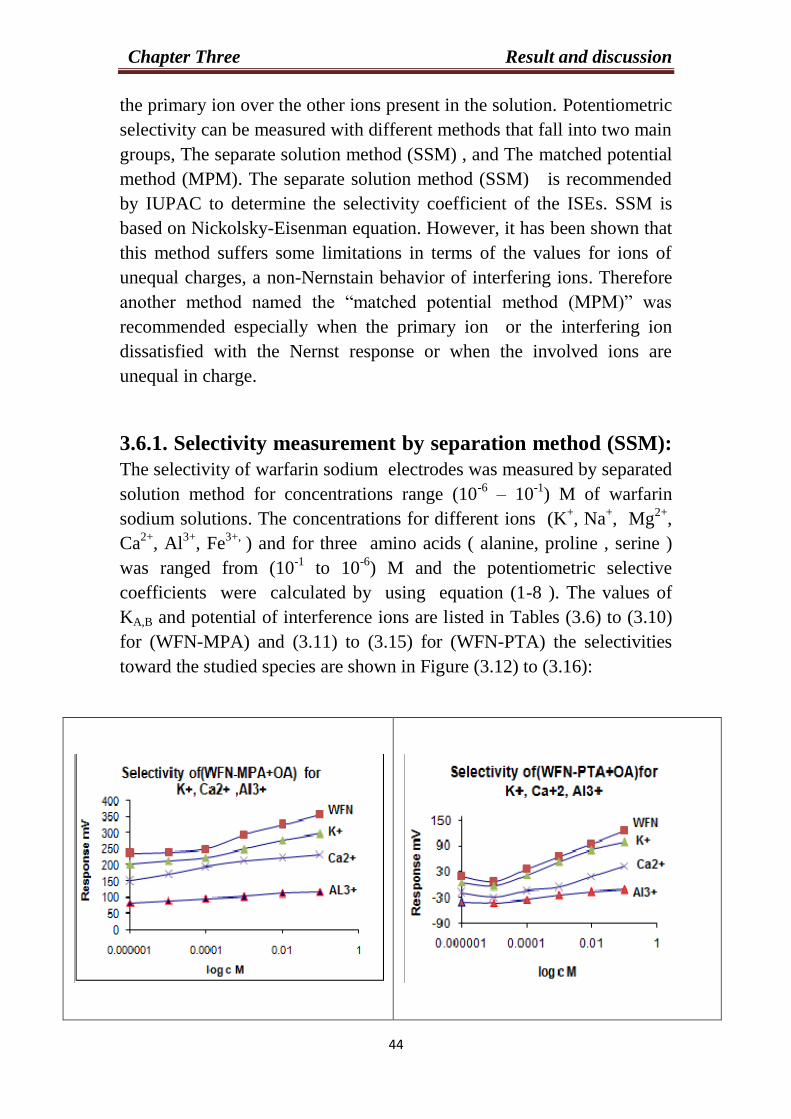
Chapter Three Result and discussion
33
the primary ion over the other ions present in the solution. Potentiometric
selectivity can be measured with different methods that fall into two main
groups, The separate solution method (SSM) , and The matched potential
method (MPM). The separate solution method (SSM) is recommended
by IUPAC to determine the selectivity coefficient of the ISEs. SSM is
based on Nickolsky-Eisenman equation. However, it has been shown that
this method suffers some limitations in terms of the values for ions of
unequal charges, a non-Nernstain behavior of interfering ions. Therefore
another method named the “matched potential method (MPM)” was
recommended especially when the primary ion or the interfering ion
dissatisfied with the Nernst response or when the involved ions are
unequal in charge.
3.6.1. Selectivity measurement by separation method (SSM):
The selectivity of warfarin sodium electrodes was measured by separated
solution method for concentrations range (10-6
– 10-1
) M of warfarin
sodium solutions. The concentrations for different ions (K+, Na
+, Mg
2+,
Ca2+
, Al3+
, Fe3+,
) and for three amino acids ( alanine, proline , serine )
was ranged from (10-1
to 10-6
) M and the potentiometric selective
coefficients were calculated by using equation (1-8 ). The values of
KA,B and potential of interference ions are listed in Tables (3.6) to (3.10)
for (WFN-MPA) and (3.11) to (3.15) for (WFN-PTA) the selectivities
toward the studied species are shown in Figure (3.12) to (3.16):
-20
10
40
70
100
1E-06 0.0001 0.01 1
Resp
on
se m
V
log c M
Selectivity of(WFN-PTA+TBP)for K1+
-30
-5
20
45
70
95
120
1E-06 0.0001 0.01 1
Response m
V
log c M
Selectivity of(WFN-PTA+TBP)for Na1+
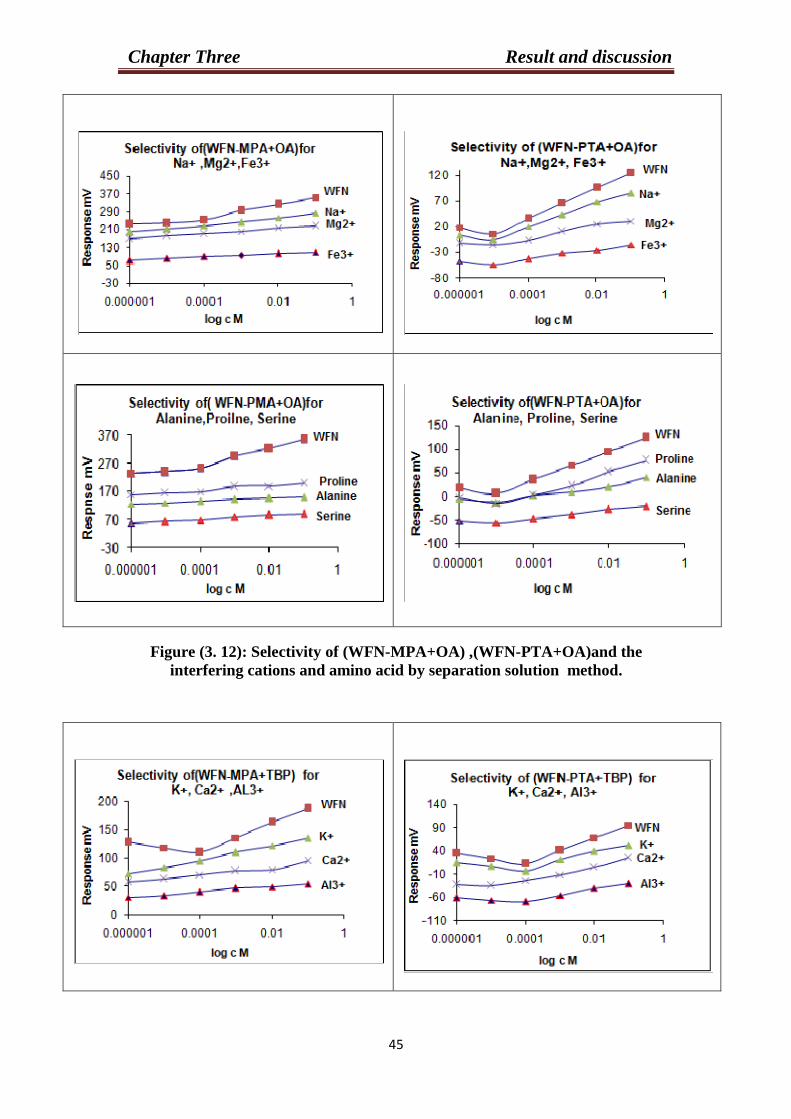
Chapter Three Result and discussion
33
Figure (3. 12): Selectivity of (WFN-MPA+OA) ,(WFN-PTA+OA)and the
interfering cations and amino acid by separation solution method.
-80
-20
40
100
160
1E-06 0.0001 0.01 1
Response m
V
log c M
Selectivity of(WFN-PTA+TBP)for Ca2+
-40
-10
20
50
80
110
1E-06 0.0001 0.01 1
Respnse m
V
log c M
Selectivity of(WFN-PTA+TBP)for Mg2+
-80
-20
40
100
160
1E-06 0.0001 0.01 1
Response m
V
log c M
Selectivity of(WFN-PTA+TBP)for Ca2+
-80-60-40-20
020406080
100120
1E-06 0.0001 0.01 1
Re
sp
on
se m
V
log c M
Selectivity of (WFN-PTA+TBP) for Al3+
-20
10
40
70
100
1E-06 0.0001 0.01 1
Resp
on
se m
V
log c M
Selectivity of(WFN-PTA+TBP)for K1+
-30
-5
20
45
70
95
120
1E-06 0.0001 0.01 1
Response m
V
log c M
Selectivity of(WFN-PTA+TBP)for Na1+
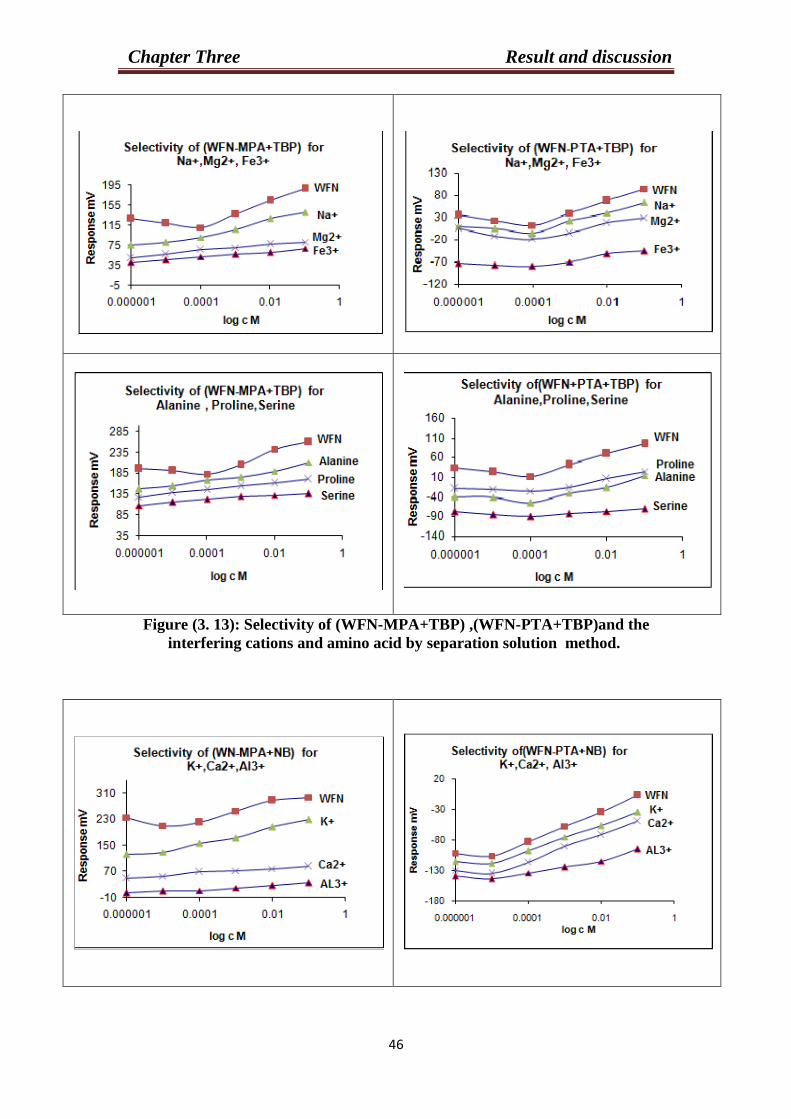
Chapter Three Result and discussion
33
Figure (3. 13): Selectivity of (WFN-MPA+TBP) ,(WFN-PTA+TBP)and the
interfering cations and amino acid by separation solution method.
-80
-20
40
100
160
1E-06 0.0001 0.01 1
Response m
V
log c M
Selectivity of(WFN-PTA+TBP)for Ca2+
-40
-10
20
50
80
110
1E-06 0.0001 0.01 1
Respnse m
V
log c M
Selectivity of(WFN-PTA+TBP)for Mg2+
-80
-20
40
100
160
1E-06 0.0001 0.01 1
Response m
V
log c M
Selectivity of(WFN-PTA+TBP)for Ca2+
-80-60-40-20
020406080
100120
1E-06 0.0001 0.01 1
Re
sp
on
se m
V
log c M
Selectivity of (WFN-PTA+TBP) for Al3+
-20
10
40
70
100
1E-06 0.0001 0.01 1
Resp
on
se m
V
log c M
Selectivity of(WFN-PTA+TBP)for K1+
-30
-5
20
45
70
95
120
1E-06 0.0001 0.01 1
Response m
V
log c M
Selectivity of(WFN-PTA+TBP)for Na1+
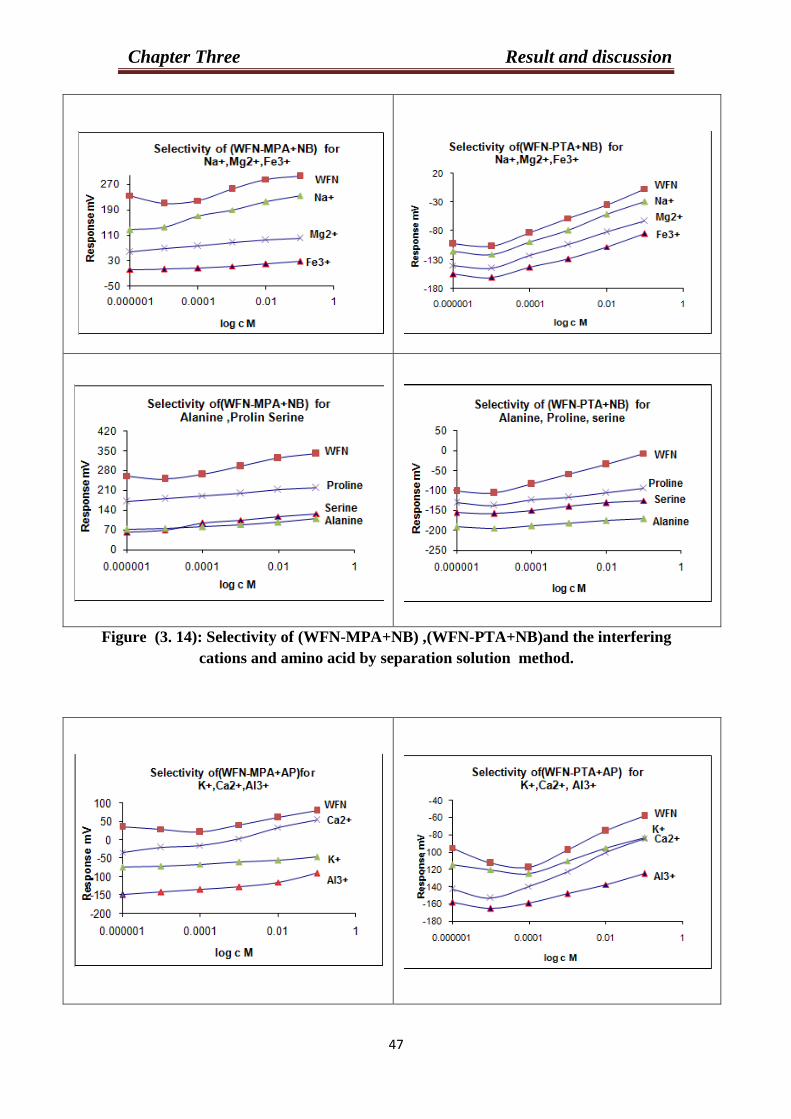
Chapter Three Result and discussion
33
Figure (3. 14): Selectivity of (WFN-MPA+NB) ,(WFN-PTA+NB)and the interfering
cations and amino acid by separation solution method.
-80
-20
40
100
160
1E-06 0.0001 0.01 1
Response m
V
log c M
Selectivity of(WFN-PTA+TBP)for Ca2+
-40
-10
20
50
80
110
1E-06 0.0001 0.01 1
Respnse m
V
log c M
Selectivity of(WFN-PTA+TBP)for Mg2+
-80
-20
40
100
160
1E-06 0.0001 0.01 1
Response m
V
log c M
Selectivity of(WFN-PTA+TBP)for Ca2+
-80-60-40-20
020406080
100120
1E-06 0.0001 0.01 1
Re
sp
on
se m
V
log c M
Selectivity of (WFN-PTA+TBP) for Al3+
-20
10
40
70
100
1E-06 0.0001 0.01 1
Resp
on
se m
V
log c M
Selectivity of(WFN-PTA+TBP)for K1+
-30
-5
20
45
70
95
120
1E-06 0.0001 0.01 1
Response m
V
log c M
Selectivity of(WFN-PTA+TBP)for Na1+
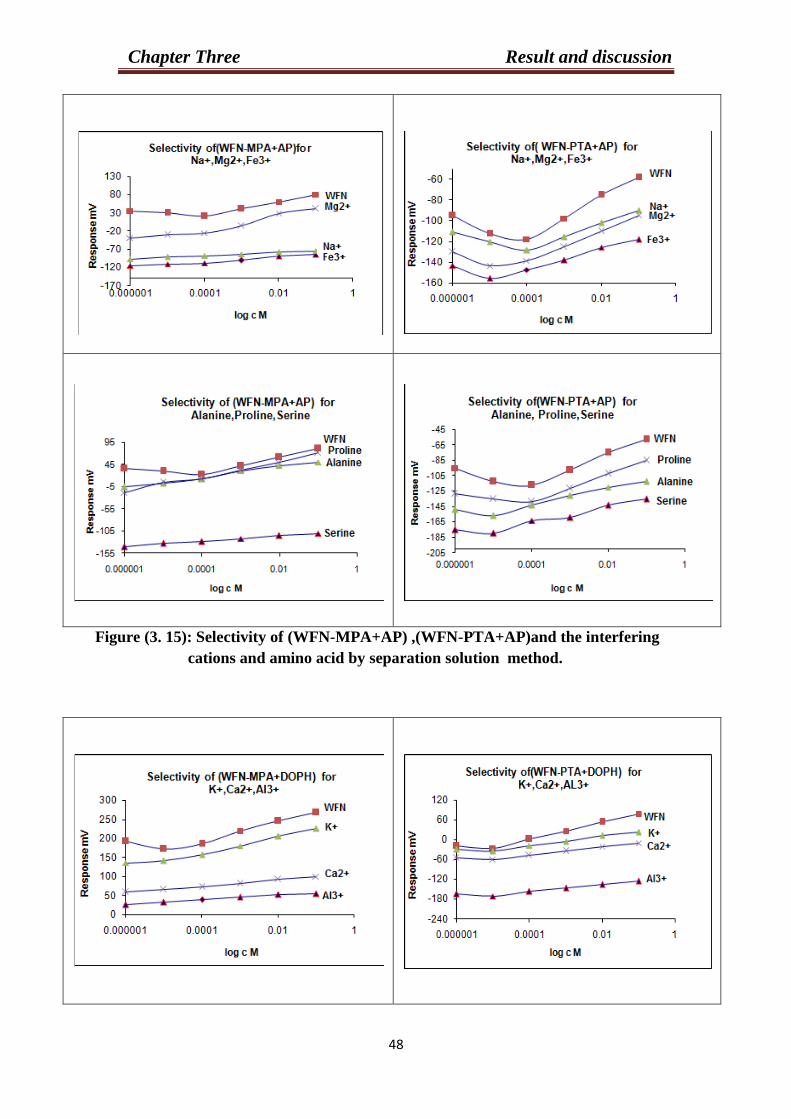
Chapter Three Result and discussion
33
Figure (3. 15): Selectivity of (WFN-MPA+AP) ,(WFN-PTA+AP)and the interfering
cations and amino acid by separation solution method.
-80
-20
40
100
160
1E-06 0.0001 0.01 1
Response m
V
log c M
Selectivity of(WFN-PTA+TBP)for Ca2+
-40
-10
20
50
80
110
1E-06 0.0001 0.01 1
Respnse m
V
log c M
Selectivity of(WFN-PTA+TBP)for Mg2+
-80
-20
40
100
160
1E-06 0.0001 0.01 1
Response m
V
log c M
Selectivity of(WFN-PTA+TBP)for Ca2+
-80-60-40-20
020406080
100120
1E-06 0.0001 0.01 1
Re
sp
on
se m
V
log c M
Selectivity of (WFN-PTA+TBP) for Al3+
-20
10
40
70
100
1E-06 0.0001 0.01 1
Resp
on
se m
V
log c M
Selectivity of(WFN-PTA+TBP)for K1+
-30
-5
20
45
70
95
120
1E-06 0.0001 0.01 1
Response m
V
log c M
Selectivity of(WFN-PTA+TBP)for Na1+
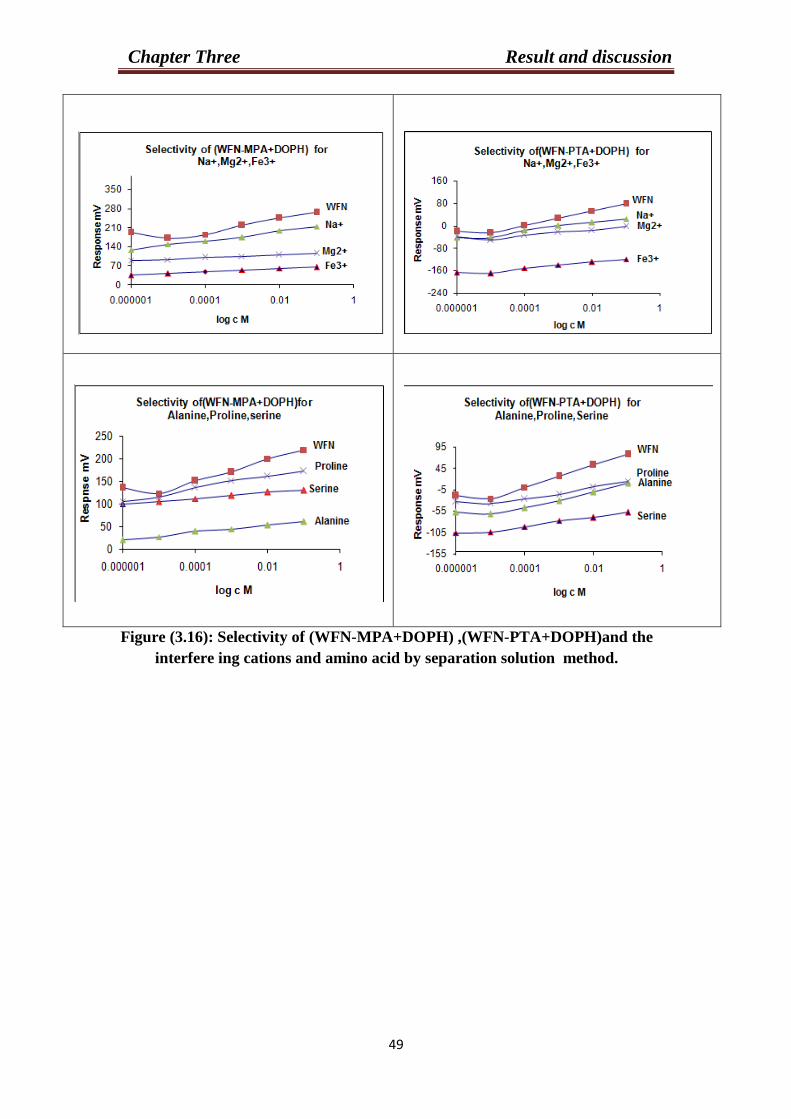
Chapter Three Result and discussion
32
Figure (3.16): Selectivity of (WFN-MPA+DOPH) ,(WFN-PTA+DOPH)and the
interfere ing cations and amino acid by separation solution method.
-80
-20
40
100
160
1E-06 0.0001 0.01 1
Response m
V
log c M
Selectivity of(WFN-PTA+TBP)for Ca2+
-40
-10
20
50
80
110
1E-06 0.0001 0.01 1
Respnse m
V
log c M
Selectivity of(WFN-PTA+TBP)for Mg2+
-80
-20
40
100
160
1E-06 0.0001 0.01 1
Response m
V
log c M
Selectivity of(WFN-PTA+TBP)for Ca2+
-80-60-40-20
020406080
100120
1E-06 0.0001 0.01 1
Re
sp
on
se m
V
log c M
Selectivity of (WFN-PTA+TBP) for Al3+
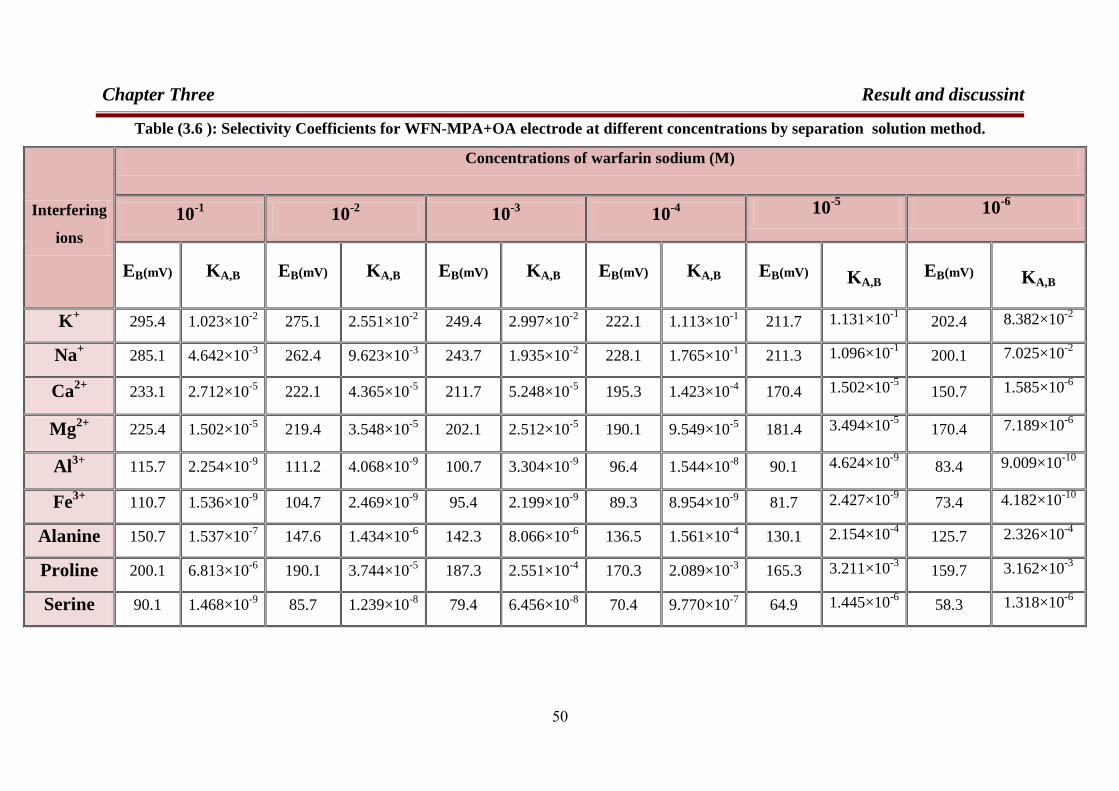
Chapter Three Result and discussint
05
Table (3.6 ): Selectivity Coefficients for WFN-MPA+OA electrode at different concentrations by separation solution method.
Interfering
ions
Concentrations of warfarin sodium (M)
10-1
10-2
10-3
10-4
10-5
10-6
EB(mV) KA,B EB(mV) KA,B EB(mV) KA,B EB(mV) KA,B EB(mV)
KA,B EB(mV)
KA,B
K+ 295.4 1.023×10
-2 275.1 2.551×10
-2 249.4 2.997×10
-2 222.1 1.113×10
-1 211.7 1.131×10
-1 202.4 8.382×10
-2
Na+ 285.1 4.642×10
-3 262.4 9.623×10
-3 243.7 1.935×10
-2 228.1 1.765×10
-1 211.3 1.096×10
-1 200.1 7.025×10
-2
Ca2+
233.1 2.712×10⁻⁵
222.1 4.365×10⁻⁵
211.7 5.248×10⁻⁵
195.3 1.423×10⁻⁴
170.4 1.502×10⁻⁵
150.7 1.585×10⁻⁶
Mg2+
225.4 1.502×10⁻⁵
219.4 3.548×10⁻⁵
202.1 2.512×10⁻⁵
190.1 9.549×10⁻⁵
181.4 3.494×10⁻⁵
170.4 7.189×10⁻⁶
Al3+
115.7 2.254×10⁻⁹
111.2 4.068×10⁻⁹
100.7 3.304×10⁻⁹
96.4 1.544×10⁻⁸
90.1 4.624×10⁻⁹
83.4 9.009×10⁻¹⁰
Fe3+
110.7 1.536×10⁻⁹
104.7 2.469×10⁻⁹
95.4 2.199×10⁻⁹
89.3 8.954×10⁻⁹
81.7 2.427×10⁻⁹
73.4 4.182×10⁻¹⁰
Alanine 150.7 1.537×10⁻⁷
147.6 1.434×10⁻⁶
142.3 8.066×10⁻⁶
136.5 1.561×10⁻⁴
130.1 2.154×10⁻⁴
125.7 2.326×10⁻⁴
Proline 200.1 6.813×10⁻⁶
190.1 3.744×10⁻⁵
187.3 2.551×10⁻⁴
170.3 2.089×10⁻³
165.3 3.211×10⁻³
159.7 3.162×10⁻³
Serine 90.1 1.468×10⁻⁹
85.7 1.239×10⁻⁸
79.4 6.456×10⁻⁸
70.4 9.770×10⁻⁷
64.9 1.445×10⁻⁶
58.3 1.318×10⁻⁶

Chapter Three Result and discussint
05
Table (3.7): Selectivity Coefficients for WFN-MPA+TBP electrode at different concentrations by separation solution method.
Interfering
ions
Concentrations of warfarin sodium (M)
10-1
10-2
10-3
10-4
10-5
10-6
EB(mV) KA,B EB(mV) KA,B EB(mV) KA,B EB(mV) KA,B EB(mV)
KA,B EB(mV)
KA,B
K+ 135.7 9.824×10
-3 122.3 2.557×10
-2 110.7 1.018×10
-1 95.3 2.649×10
-1 83.7 4.587×10
-2 72.8 7.335×10
-3
Na+ 140.3 1.476×10
-2 127.4 4.016×10
-2 105.8 6.595×10
-2 90.7 1.763×10
-1 80.3 3.394×10
-2 75.4 9.233×10
-3
Ca2+
95.4 8.756×10⁻⁵
80.3 6.199×10⁻⁵
77.3 1.642×10⁻⁴
71.4 3.190×10⁻⁴
63.4 2.403×10⁻⁵
58.5 2.067×10⁻⁶
Mg2+
81.3 2.152×10⁻⁵
77.4 4.794×10⁻⁵
70.8 9.234×10⁻⁵
66.1 1.995×10⁻⁴
57.3 1.400×10⁻⁵
50.2 9.912×10⁻⁷
Al3+
55.1 1.679×10⁻⁶
50.4 2.034×10⁻⁶
47.4 3.668×10⁻⁶
40.1 4.285×10⁻⁶
33.1 2.401×10⁻⁷
30.7 1.754×10⁻⁸
Fe3+
68.7 5.602×10⁻⁶
60.1 4.802×10⁻⁶
57.3 8.814×10⁻⁶
52.4 1.274×10⁻⁵
45.7 7.328×10⁻⁷
40.3 4.106×10⁻⁸
Alanine 210.5 1.398×10⁻²
190.3 1.109×10⁻²
175.3 7.596×10⁻²
167.7 2.640×10⁻¹
154.3 4.383×10⁻²
148.2 1.718×10⁻²
Proline 170.1 4.346×10⁻⁴
161.3 9.177×10⁻⁴
153.7 1.187×10⁻²
145.8 4.022×10⁻²
138.9 1.167×10⁻²
127.7 2.950×10⁻³
Serine 135.8 2.281×10⁻⁵
132.7 7.862×10⁻⁵
128.7 1.386×10⁻³
121.8 5.116×10⁻³
115.9 1.618×10⁻³
107.2 5.073×10⁻⁴
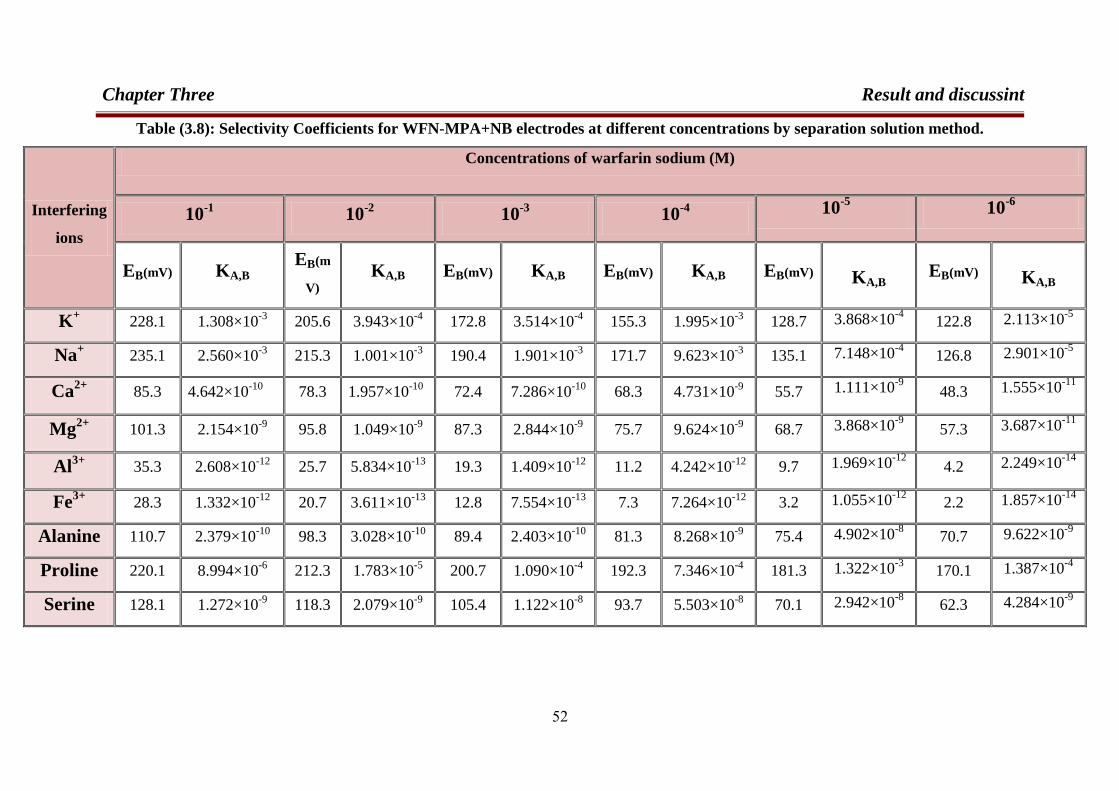
Chapter Three Result and discussint
05
Table (3.8): Selectivity Coefficients for WFN-MPA+NB electrodes at different concentrations by separation solution method.
Interfering
ions
Concentrations of warfarin sodium (M)
10-1
10-2
10-3
10-4
10-5
10-6
EB(mV) KA,B EB(m
V) KA,B EB(mV) KA,B EB(mV) KA,B EB(mV)
KA,B EB(mV)
KA,B
K+ 228.1 1.308×10
-3 205.6 3.943×10
-4 172.8 3.514×10
-4 155.3 1.995×10
-3 128.7 3.868×10
-4 122.8 2.113×10
-5
Na+ 235.1 2.560×10
-3 215.3 1.001×10
-3 190.4 1.901×10
-3 171.7 9.623×10
-3 135.1 7.148×10
-4 126.8 2.901×10
-5
Ca2+
85.3 4.642×10⁻¹⁰
78.3 1.957×10⁻¹⁰
72.4 7.286×10⁻¹⁰
68.3 4.731×10⁻⁹
55.7 1.111×10⁻⁹
48.3 1.555×10⁻¹¹
Mg2+
101.3 2.154×10⁻⁹
95.8 1.049×10⁻⁹
87.3 2.844×10⁻⁹
75.7 9.624×10⁻⁹
68.7 3.868×10⁻⁹
57.3 3.687×10⁻¹¹
Al3+
35.3 2.608×10⁻¹²
25.7 5.834×10⁻¹³
19.3 1.409×10⁻¹²
11.2 4.242×10⁻¹²
9.7 1.969×10⁻¹²
4.2 2.249×10⁻¹⁴
Fe3+
28.3 1.332×10⁻¹²
20.7 3.611×10⁻¹³
12.8 7.554×10⁻¹³
7.3 7.264×10⁻¹²
3.2 1.055×10⁻¹²
2.2 1.857×10⁻¹⁴
Alanine 110.7 2.379×10⁻¹⁰
98.3 3.028×10⁻¹⁰
89.4 2.403×10⁻¹⁰
81.3 8.268×10⁻⁹
75.4 4.902×10⁻⁸
70.7 9.622×10⁻⁹
Proline 220.1 8.994×10⁻⁶
212.3 1.783×10⁻⁵
200.7 1.090×10⁻⁴
192.3 7.346×10⁻⁴
181.3 1.322×10⁻³
170.1 1.387×10⁻⁴
Serine 128.1 1.272×10⁻⁹
118.3 2.079×10⁻⁹
105.4 1.122×10⁻⁸
93.7 5.503×10⁻⁸
70.1 2.942×10⁻⁸
62.3 4.284×10⁻⁹
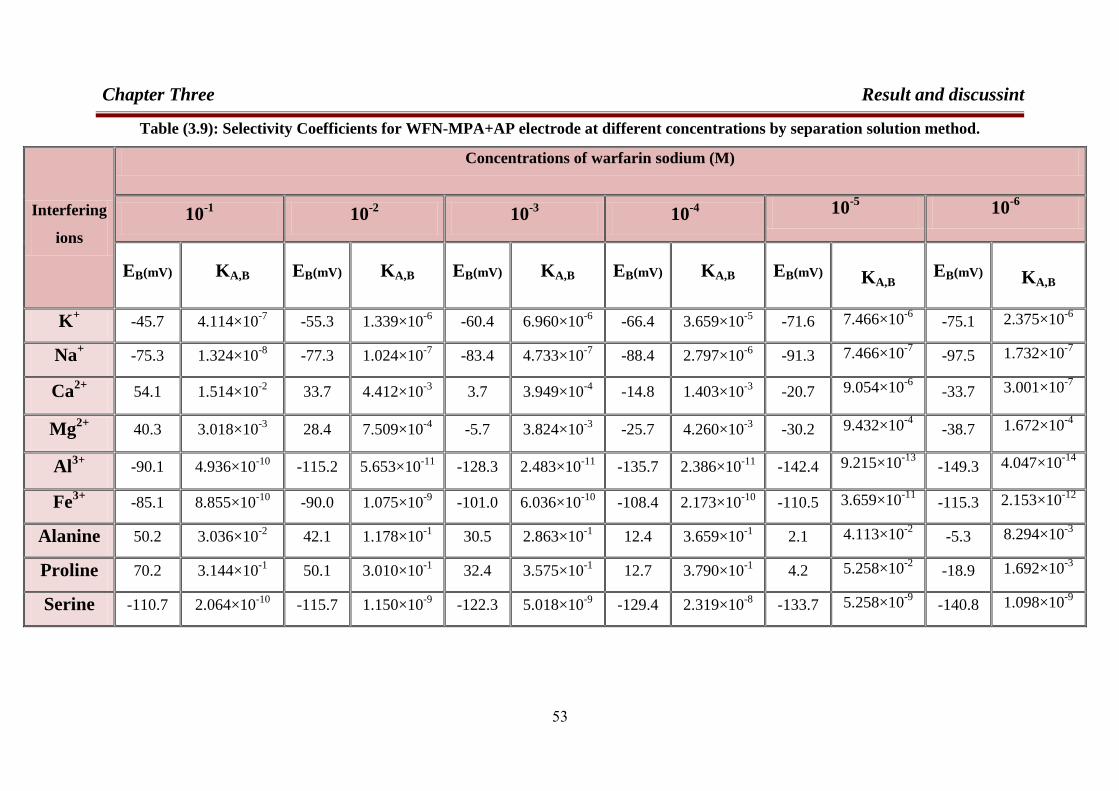
Chapter Three Result and discussint
05
Table (3.9): Selectivity Coefficients for WFN-MPA+AP electrode at different concentrations by separation solution method.
Interfering
ions
Concentrations of warfarin sodium (M)
10-1
10-2
10-3
10-4
10-5
10-6
EB(mV) KA,B EB(mV) KA,B EB(mV) KA,B EB(mV) KA,B EB(mV)
KA,B EB(mV)
KA,B
K+ -45.7 4.114×10
-7 -55.3 1.339×10
-6 -60.4 6.960×10
-6 -66.4 3.659×10
-5 -71.6 7.466×10
-6 -75.1 2.375×10
-6
Na+ -75.3 1.324×10
-8 -77.3 1.024×10
-7 -83.4 4.733×10
-7 -88.4 2.797×10
-6 -91.3 7.466×10
-7 -97.5 1.732×10
-7
Ca2+
54.1 1.514×10⁻²
33.7 4.412×10⁻³
3.7 3.949×10⁻⁴
-14.8 1.403×10⁻³
-20.7 9.054×10⁻⁶
-33.7 3.001×10⁻⁷
Mg2+
40.3 3.018×10⁻³
28.4 7.509×10⁻⁴
-5.7 3.824×10⁻³
-25.7 4.260×10⁻³
-30.2 9.432×10⁻⁴
-38.7 1.672×10⁻⁴
Al3+
-90.1 4.936×10⁻¹⁰
-115.2 5.653×10⁻¹¹
-128.3 2.483×10⁻¹¹
-135.7 2.386×10⁻¹¹
-142.4 9.215×10⁻¹³
-149.3 4.047×10⁻¹⁴
Fe3+
-85.1 8.855×10⁻¹⁰
-90.0 1.075×10⁻⁹
-101.0 6.036×10⁻¹⁰
-108.4 2.173×10⁻¹⁰
-110.5 3.659×10⁻¹¹
-115.3 2.153×10⁻¹²
Alanine 50.2 3.036×10⁻²
42.1 1.178×10⁻¹
30.5 2.863×10⁻¹
12.4 3.659×10⁻¹
2.1 4.113×10⁻²
-5.3 8.294×10⁻³
Proline 70.2 3.144×10⁻¹
50.1 3.010×10⁻¹
32.4 3.575×10⁻¹
12.7 3.790×10⁻¹
4.2 5.258×10⁻²
-18.9 1.692×10⁻³
Serine -110.7 2.064×10⁻¹⁰
-115.7 1.150×10⁻⁹
-122.3 5.018×10⁻⁹
-129.4 2.319×10⁻⁸
-133.7 5.258×10⁻⁹
-140.8 1.098×10⁻⁹

Chapter Three Result and discussint
05
Table (3.10): Selectivity Coefficients for WFN-MPA+DOPH electrode at different concentrations by separation solution method.
Interfering
ions
Concentrations of warfarin sodium (M)
10-1
10-2
10-3
10-4
10-5
10-6
EB(mV) KA,B EB(mV) KA,B EB(mV) KA,B EB(mV) KA,B EB(mV)
KA,B EB(mV)
KA,B
K+ 225.3 1.995×10
-2 205.3 2.208×10
-2 180.1 2.489×10
-2 157.3 7.586×10
-2 141.2 5.598×10
-2 135.7 5.346×10
-3
Na+ 215.2 7.870×10
-3 200.1 1.368×10
-2 175.4 1.614×10
-2 162.3 1.202×10
-1 150.4 1.306×10
-1 129.2 2.938×10
-3
Ca2+
100.4 6.368×10⁻⁸
92.2 6.607×10⁻⁸
81.7 9.120×10⁻⁸
72.3 3.019×10⁻⁷
65.7 1.690×10⁻⁷
59.4 4.742×10⁻⁹
Mg2+
115.3 2.512×10⁻⁷
110.8 3.664×10⁻⁷
105.7 8.318×10⁻⁷
100.7 4.130×10⁻⁶
94.2 2.333×10⁻⁶
90.7 8.472×10⁻⁸
Al3+
55.3 6.808×10⁻¹⁰
51.7 1.399×10⁻¹⁰
46.2 1.094×10⁻⁹
39.7 3.221×10⁻⁹
32.4 1.151×10⁻⁹
25.7 2.118×10⁻¹¹
Fe3+
65.3 1.710×10⁻⁹
61.8 1.862×10⁻⁹
55.4 2.553×10⁻⁹
49.3 7.798×10⁻⁹
41.3 2.612×10⁻⁹
35.7 5.321×10⁻¹¹
Alanine 60.2 2.349×10⁻⁷
52.7 7.217×10⁻⁷
43.9 5.412×10⁻⁶
38.7 2.154×10⁻⁵
26.7 9.905×10⁻⁵
20.1 1.525×10⁻⁵
Proline 172.3 1.101×10⁻²
160.3 2.196×10⁻²
152.3 1.778×10⁻¹
135.1 2.239×10⁻¹
115.4 4.917×10⁻¹
105.7 5.623×10⁻²
Serine 130.1 1.920×10⁻⁴
125.7 7.943×10⁻⁴
118.6 7.012×10⁻³
111.4 2.304×10⁻²
104.7 1.761×10⁻¹
100.1 3.286×10⁻²
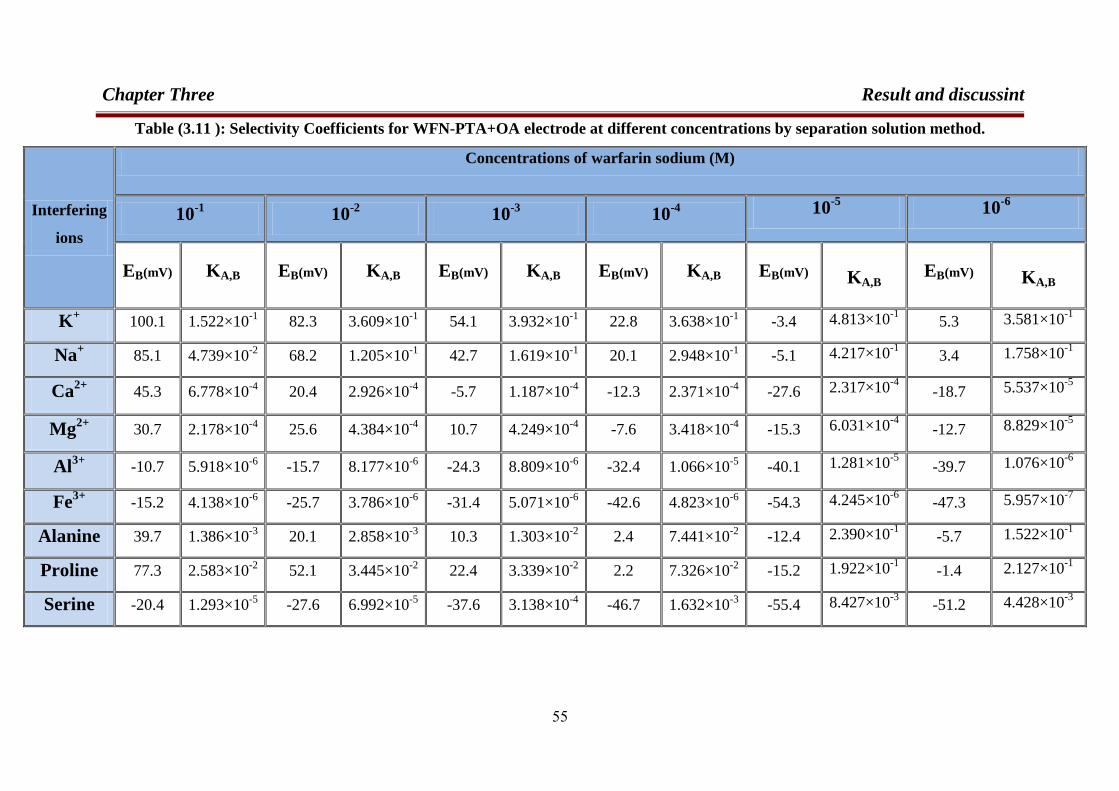
Chapter Three Result and discussint
55
Table (3.11 ): Selectivity Coefficients for WFN-PTA+OA electrode at different concentrations by separation solution method.
Interfering
ions
Concentrations of warfarin sodium (M)
10-1
10-2
10-3
10-4
10-5
10-6
EB(mV) KA,B EB(mV) KA,B EB(mV) KA,B EB(mV) KA,B EB(mV)
KA,B EB(mV)
KA,B
K+ 100.1 1.522×10
-1 82.3 3.609×10
-1 54.1 3.932×10
-1 22.8 3.638×10
-1 -3.4 4.813×10
-1 5.3 3.581×10
-1
Na+ 85.1 4.739×10
-2 68.2 1.205×10
-1 42.7 1.619×10
-1 20.1 2.948×10
-1 -5.1 4.217×10
-1 3.4 1.758×10
-1
Ca2+
45.3 6.778×10⁻⁴
20.4 2.926×10⁻⁴
-5.7 1.187×10⁻⁴
-12.3 2.371×10⁻⁴
-27.6 2.317×10⁻⁴
-18.7 5.537×10⁻⁵
Mg2+
30.7 2.178×10⁻⁴
25.6 4.384×10⁻⁴
10.7 4.249×10⁻⁴
-7.6 3.418×10⁻⁴
-15.3 6.031×10⁻⁴
-12.7 8.829×10⁻⁵
Al3+
-10.7 5.918×10⁻⁶
-15.7 8.177×10⁻⁶
-24.3 8.809×10⁻⁶
-32.4 1.066×10⁻⁵
-40.1 1.281×10⁻⁵
-39.7 1.076×10⁻⁶
Fe3+
-15.2 4.138×10⁻⁶
-25.7 3.786×10⁻⁶
-31.4 5.071×10⁻⁶
-42.6 4.823×10⁻⁶
-54.3 4.245×10⁻⁶
-47.3 5.957×10⁻⁷
Alanine 39.7 1.386×10⁻³
20.1 2.858×10⁻³
10.3 1.303×10⁻²
2.4 7.441×10⁻²
-12.4 2.390×10⁻¹
-5.7 1.522×10⁻¹
Proline 77.3 2.583×10⁻²
52.1 3.445×10⁻²
22.4 3.339×10⁻²
2.2 7.326×10⁻²
-15.2 1.922×10⁻¹
-1.4 2.127×10⁻¹
Serine -20.4 1.293×10⁻⁵
-27.6 6.992×10⁻⁵
-37.6 3.138×10⁻⁴
-46.7 1.632×10⁻³
-55.4 8.427×10⁻³
-51.2 4.428×10⁻³
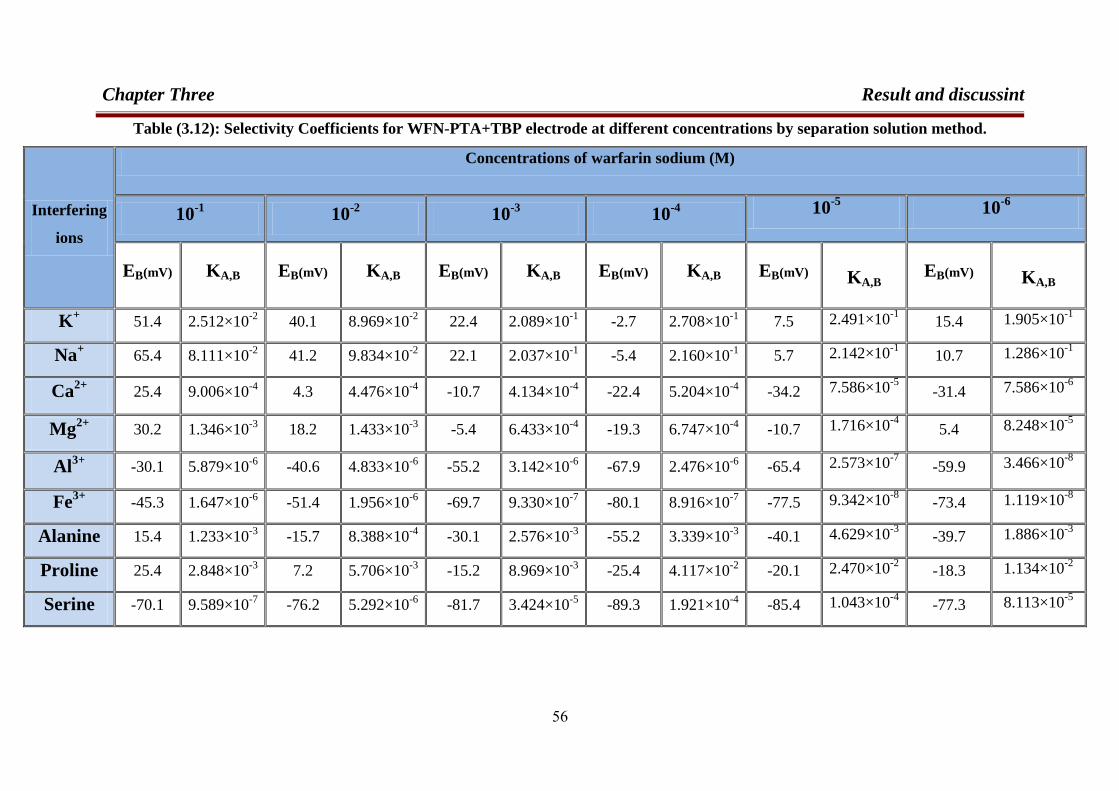
Chapter Three Result and discussint
55
Table (3.12): Selectivity Coefficients for WFN-PTA+TBP electrode at different concentrations by separation solution method.
Interfering
ions
Concentrations of warfarin sodium (M)
10-1
10-2
10-3
10-4
10-5
10-6
EB(mV) KA,B EB(mV) KA,B EB(mV) KA,B EB(mV) KA,B EB(mV)
KA,B EB(mV)
KA,B
K+ 51.4 2.512×10
-2 40.1 8.969×10
-2 22.4 2.089×10
-1 -2.7 2.708×10
-1 7.5 2.491×10
-1 15.4 1.905×10
-1
Na+ 65.4 8.111×10
-2 41.2 9.834×10
-2 22.1 2.037×10
-1 -5.4 2.160×10
-1 5.7 2.142×10
-1 10.7 1.286×10
-1
Ca2+
25.4 9.006×10⁻⁴
4.3 4.476×10⁻⁴
-10.7 4.134×10⁻⁴
-22.4 5.204×10⁻⁴
-34.2 7.586×10⁻⁵
-31.4 7.586×10⁻⁶
Mg2+
30.2 1.346×10⁻³
18.2 1.433×10⁻³
-5.4 6.433×10⁻⁴
-19.3 6.747×10⁻⁴
-10.7 1.716×10⁻⁴
5.4 8.248×10⁻⁵
Al3+
-30.1 5.879×10⁻⁶
-40.6 4.833×10⁻⁶
-55.2 3.142×10⁻⁶
-67.9 2.476×10⁻⁶
-65.4 2.573×10⁻⁷
-59.9 3.466×10⁻⁸
Fe3+
-45.3 1.647×10⁻⁶
-51.4 1.956×10⁻⁶
-69.7 9.330×10⁻⁷
-80.1 8.916×10⁻⁷
-77.5 9.342×10⁻⁸
-73.4 1.119×10⁻⁸
Alanine 15.4 1.233×10⁻³
-15.7 8.388×10⁻⁴
-30.1 2.576×10⁻³
-55.2 3.339×10⁻³
-40.1 4.629×10⁻³
-39.7 1.886×10⁻³
Proline 25.4 2.848×10⁻³
7.2 5.706×10⁻³
-15.2 8.969×10⁻³
-25.4 4.117×10⁻²
-20.1 2.470×10⁻²
-18.3 1.134×10⁻²
Serine -70.1 9.589×10⁻⁷
-76.2 5.292×10⁻⁶
-81.7 3.424×10⁻⁵
-89.3 1.921×10⁻⁴
-85.4 1.043×10⁻⁴
-77.3 8.113×10⁻⁵
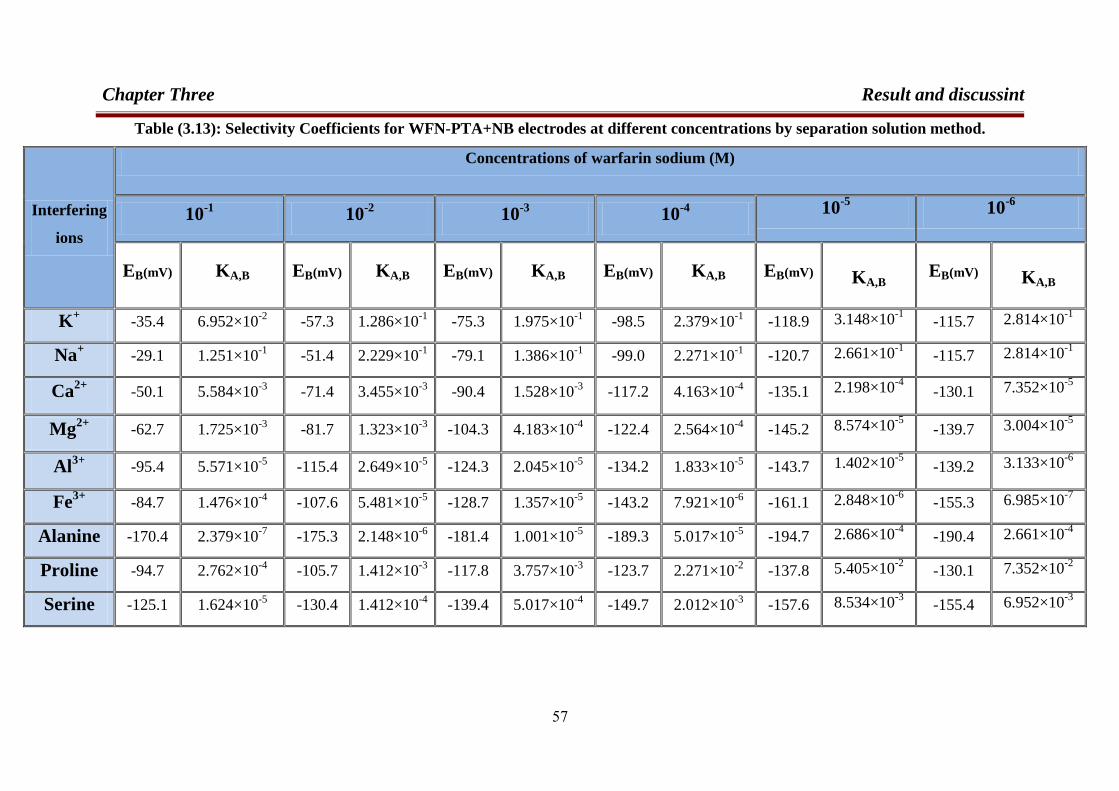
Chapter Three Result and discussint
55
Table (3.13): Selectivity Coefficients for WFN-PTA+NB electrodes at different concentrations by separation solution method.
Interfering
ions
Concentrations of warfarin sodium (M)
10-1
10-2
10-3
10-4
10-5
10-6
EB(mV) KA,B EB(mV) KA,B EB(mV) KA,B EB(mV) KA,B EB(mV)
KA,B EB(mV)
KA,B
K+ -35.4 6.952×10
-2 -57.3 1.286×10
-1 -75.3 1.975×10
-1 -98.5 2.379×10
-1 -118.9 3.148×10
-1 -115.7 2.814×10
-1
Na+ -29.1 1.251×10
-1 -51.4 2.229×10
-1 -79.1 1.386×10
-1 -99.0 2.271×10
-1 -120.7 2.661×10
-1 -115.7 2.814×10
-1
Ca2+
-50.1 5.584×10⁻³
-71.4 3.455×10⁻³
-90.4 1.528×10⁻³
-117.2 4.163×10⁻⁴
-135.1 2.198×10⁻⁴
-130.1 7.352×10⁻⁵
Mg2+
-62.7 1.725×10⁻³
-81.7 1.323×10⁻³
-104.3 4.183×10⁻⁴
-122.4 2.564×10⁻⁴
-145.2 8.574×10⁻⁵
-139.7 3.004×10⁻⁵
Al3+
-95.4 5.571×10⁻⁵
-115.4 2.649×10⁻⁵
-124.3 2.045×10⁻⁵
-134.2 1.833×10⁻⁵
-143.7 1.402×10⁻⁵
-139.2 3.133×10⁻⁶
Fe3+
-84.7 1.476×10⁻⁴
-107.6 5.481×10⁻⁵
-128.7 1.357×10⁻⁵
-143.2 7.921×10⁻⁶
-161.1 2.848×10⁻⁶
-155.3 6.985×10⁻⁷
Alanine -170.4 2.379×10⁻⁷
-175.3 2.148×10⁻⁶
-181.4 1.001×10⁻⁵
-189.3 5.017×10⁻⁵
-194.7 2.686×10⁻⁴
-190.4 2.661×10⁻⁴
Proline -94.7 2.762×10⁻⁴
-105.7 1.412×10⁻³
-117.8 3.757×10⁻³
-123.7 2.271×10⁻²
-137.8 5.405×10⁻²
-130.1 7.352×10⁻²
Serine -125.1 1.624×10⁻⁵
-130.4 1.412×10⁻⁴
-139.4 5.017×10⁻⁴
-149.7 2.012×10⁻³
-157.6 8.534×10⁻³
-155.4 6.952×10⁻³
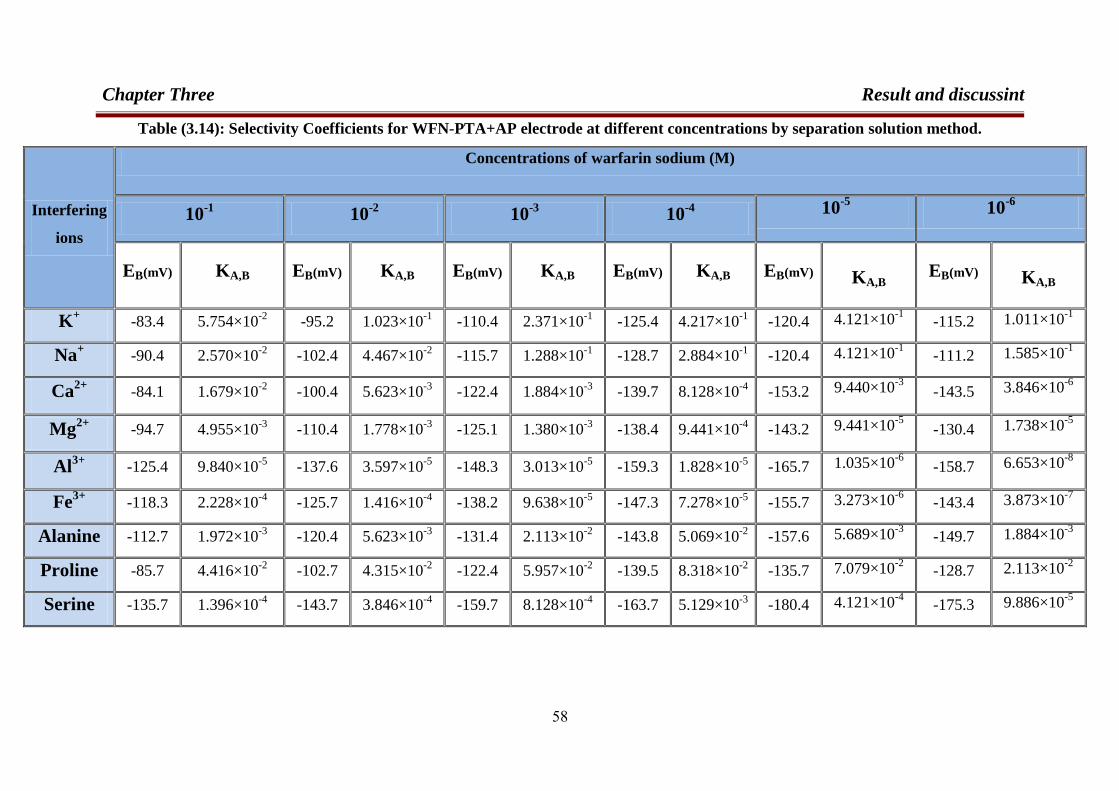
Chapter Three Result and discussint
55
Table (3.14): Selectivity Coefficients for WFN-PTA+AP electrode at different concentrations by separation solution method.
Interfering
ions
Concentrations of warfarin sodium (M)
10-1
10-2
10-3
10-4
10-5
10-6
EB(mV) KA,B EB(mV) KA,B EB(mV) KA,B EB(mV) KA,B EB(mV)
KA,B EB(mV)
KA,B
K+ -83.4 5.754×10
-2 -95.2 1.023×10
-1 -110.4 2.371×10
-1 -125.4 4.217×10
-1 -120.4 4.121×10
-1 -115.2 1.011×10
-1
Na+ -90.4 2.570×10
-2 -102.4 4.467×10
-2 -115.7 1.288×10
-1 -128.7 2.884×10
-1 -120.4 4.121×10
-1 -111.2 1.585×10
-1
Ca2+
-84.1 1.679×10⁻²
-100.4 5.623×10⁻³
-122.4 1.884×10⁻³
-139.7 8.128×10⁻⁴
-153.2 9.440×10⁻³
-143.5 3.846×10⁻⁶
Mg2+
-94.7 4.955×10⁻³
-110.4 1.778×10⁻³
-125.1 1.380×10⁻³
-138.4 9.441×10⁻⁴
-143.2 9.441×10⁻⁵
-130.4 1.738×10⁻⁵
Al3+
-125.4 9.840×10⁻⁵
-137.6 3.597×10⁻⁵
-148.3 3.013×10⁻⁵
-159.3 1.828×10⁻⁵
-165.7 1.035×10⁻⁶
-158.7 6.653×10⁻⁸
Fe3+
-118.3 2.228×10⁻⁴
-125.7 1.416×10⁻⁴
-138.2 9.638×10⁻⁵
-147.3 7.278×10⁻⁵
-155.7 3.273×10⁻⁶
-143.4 3.873×10⁻⁷
Alanine -112.7 1.972×10⁻³
-120.4 5.623×10⁻³
-131.4 2.113×10⁻²
-143.8 5.069×10⁻²
-157.6 5.689×10⁻³
-149.7 1.884×10⁻³
Proline -85.7 4.416×10⁻²
-102.7 4.315×10⁻²
-122.4 5.957×10⁻²
-139.5 8.318×10⁻²
-135.7 7.079×10⁻²
-128.7 2.113×10⁻²
Serine -135.7 1.396×10⁻⁴
-143.7 3.846×10⁻⁴
-159.7 8.128×10⁻⁴
-163.7 5.129×10⁻³
-180.4 4.121×10⁻⁴
-175.3 9.886×10⁻⁵

Chapter Three Result and discussint
55
Table (3.15): Selectivity Coefficients for WFN-PTA+DOPH electrode at different concentrations by separation solution method.
Interfering
ions
Concentrations of warfarin sodium (M)
10-1
10-2
10-3
10-4
10-5
10-6
EB(mV) KA,B EB(mV) KA,B EB(mV) KA,B EB(mV) KA,B EB(mV)
KA,B EB(mV)
KA,B
K+ 22.4 7.079×10
-3 11.4 2.361×10
-2 -5.7 5.878×10
-2 -18.3 1.794×10
-1 -35.7 4.016×10
-1 -30.1 3.579×10
-1
Na+ 25.1 8.992 ×10
-3 12.4 2.579×10
-2 1.4 1.102×10
-1 -15.4 2.319×10
-1 -42.4 2.219×10
-1 -41.5 1.304×10
-1
Ca2+
-10.4 1.226×10⁻⁴
-20.4 1.413×10⁻⁴
-34.6 1.438×10⁻⁴
-48.6 1.226×10⁻²
-59.7 4.795×10⁻²
-55.3 3.843×10⁻²
Mg2+
-1.5 2.696×10⁻⁴
-15.7 2.142×10⁻⁴
-21.5 4.587×10⁻⁴
-34.2 4.388×10⁻⁴
-49.7 3.676×10⁻⁴
-40.1 1.476×10⁻⁴
Al3+
-125.3 3.179×10⁻⁹
-135.7 2.406×10⁻⁹
-146.7 2.214×10⁻⁹
-157.9 1.647×10⁻⁹
-171.4 1.121×10⁻⁹
-165.3 2.248×10⁻¹⁰
Fe3+
-118.3 5.908×10⁻⁹
-129.4 4.204×10⁻⁹
-138.6 4.536×10⁻⁹
-150.4 3.199×10⁻⁹
-169.4 1.338×10⁻⁹
-165.7 2.170×10⁻¹⁰
Alanine 10.3 2.424×10⁻³
-10.4 3.425×10⁻³
-30.5 6.537×10⁻³
-47.6 1.339×10⁻²
-61.4 4.125×10⁻²
-57.3 3.219×10⁻²
Proline 15.7 3.911×10⁻³
3.4 1.162×10⁻²
-15.7 2.424×10⁻²
-26.8 8.451×10⁻²
-37.4 3.455×10⁻¹
-32.4 2.920×10⁻¹
Serine -56.7 6.422×10⁻⁶
-69.5 1.826×10⁻⁵
-76.8 1.083×10⁻⁴
-91.4 2.769×10⁻⁴
-103.2 1.018×10⁻³
-105.7 4.427×10⁻⁴
Chapter Three Result and discussion
33
In general, when the value of selectivity coefficient, which represent
the potential difference between the interfering ion and the analyte, is less
than one, the electrode is respond to analyte more than interfering ion,
while when it is higher than one,the electrode starts its response to the
interfering ion mor than analyte .The results in Tables (3.6) to (3.15)
showed that the selectivity coefficients for monovalent interfering ions is
in the order mono> di> trivalent.This may be attributed to the difference
in ionic size, mobility and permeability. When the concentration of
monovalent ion decreases, the difference in potential measurement
decrease. Therefore, the selectivity coefficient increases and the
interference of monovalent ion is also increased. An inorganic cations
does not interfere because of difference in ionic size, mobility and
permeability.
3.6.2. Selectivity measurement by Match potential method
(MPM):
In this method the selectivity coefficient is given by using equation
(1- 6) is defined by the ratio of the activity of the primary ion relative to
an interfering ion when they generate identical potentials in the same
reference solution. In this method both monovalent ions are treated in the
same manner, and the valence of the ions does not influence the
selectivity coefficient. The results of selectivity coefficient are shown in
Figures. (3.17) to ( 3.21) for (WFN-MPA), (3.22) to (3.26) for (WFN-
PTA) and in the Table (3.16) and (3.17) were calculated from the
concentration of the interfering ion which endued the same amount of
the potential change as that induced by the increase of the concentration
of primary ion.
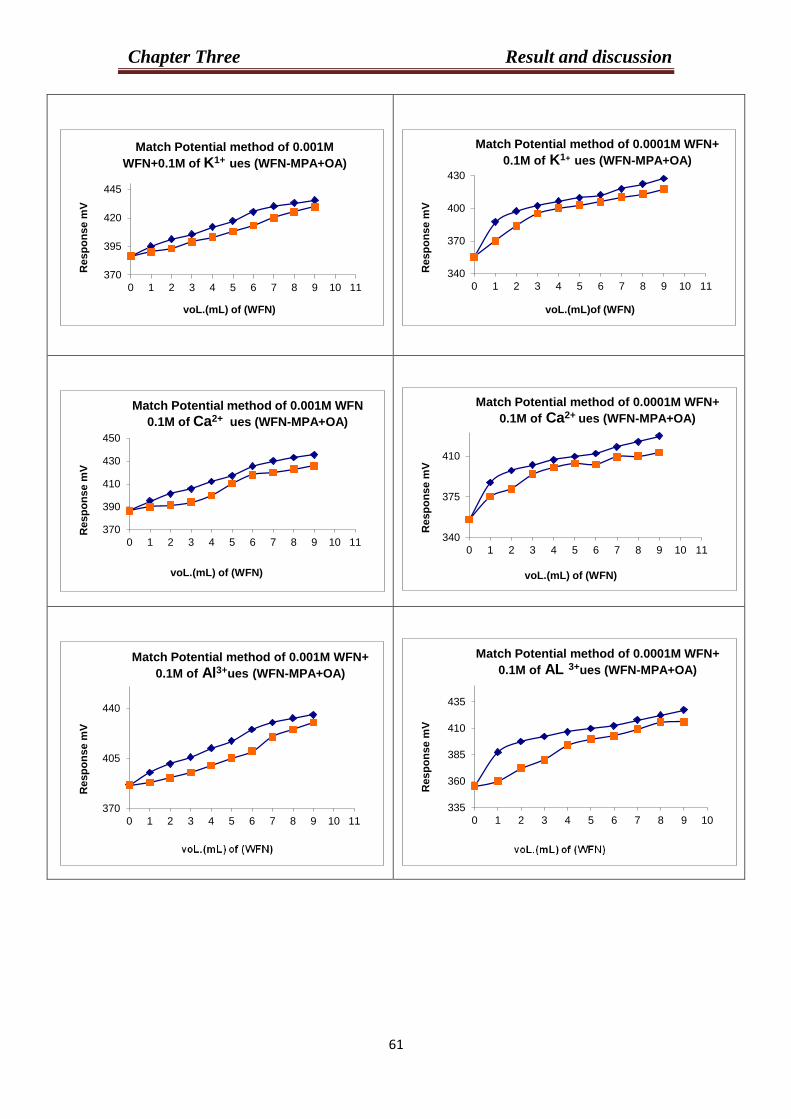
Chapter Three Result and discussion
33
370
395
420
445
0 1 2 3 4 5 6 7 8 9 10 11
Resp
on
se m
V
voL.(mL) of (WFN)
Match Potential method of 0.001M
WFN+0.1M of K1+ ues (WFN-MPA+OA)
340
370
400
430
0 1 2 3 4 5 6 7 8 9 10 11
Resp
on
se m
V
voL.(mL)of (WFN)
Match Potential method of 0.0001M WFN+
0.1M of K1+ ues (WFN-MPA+OA)
370
390
410
430
450
0 1 2 3 4 5 6 7 8 9 10 11
Resp
on
se m
V
voL.(mL) of (WFN)
Match Potential method of 0.001M WFN
0.1M of Ca2+ ues (WFN-MPA+OA)
340
375
410
0 1 2 3 4 5 6 7 8 9 10 11
Resp
on
se m
V
voL.(mL) of (WFN)
Match Potential method of 0.0001M WFN+
0.1M of Ca2+ ues (WFN-MPA+OA)
370
405
440
0 1 2 3 4 5 6 7 8 9 10 11
Resp
on
se m
V
Match Potential method of 0.001M WFN+
0.1M of Al3+ues (WFN-MPA+OA)
335
360
385
410
435
0 1 2 3 4 5 6 7 8 9 10
Resp
on
se m
V
Match Potential method of 0.0001M WFN+
0.1M of AL 3+ues (WFN-MPA+OA)
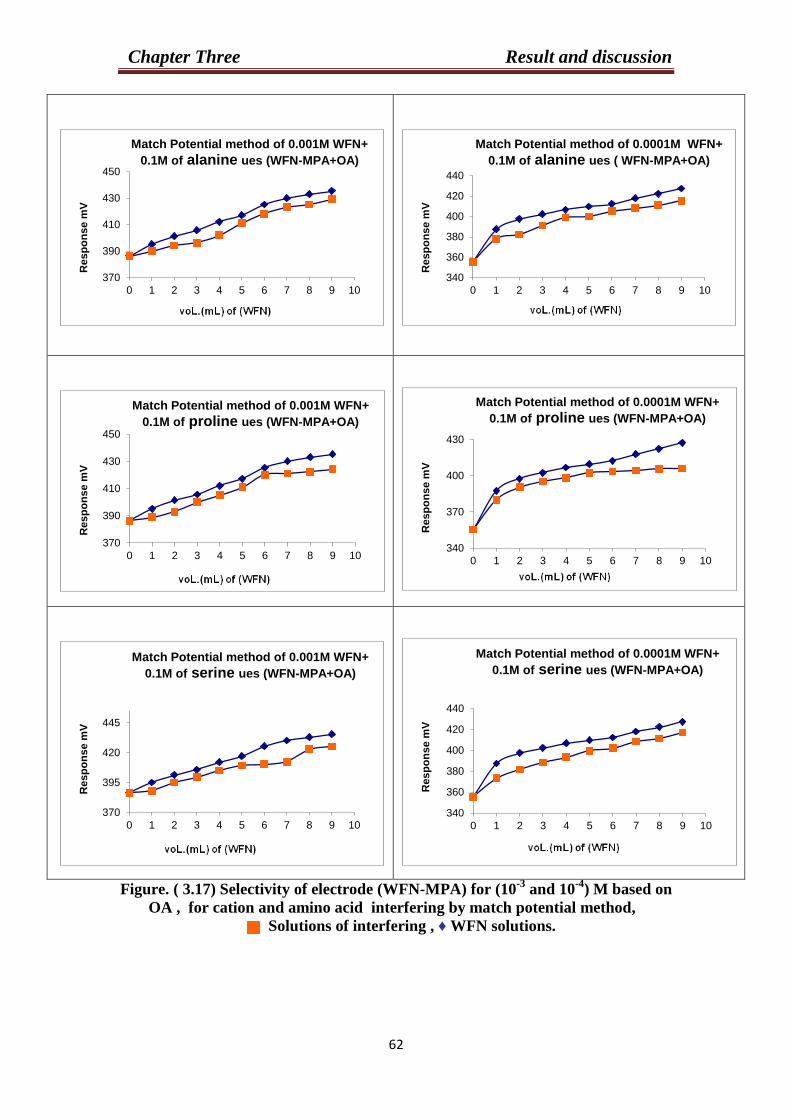
Chapter Three Result and discussion
39
Figure. ( 3.17) Selectivity of electrode (WFN-MPA) for (10-3
and 10-4
) M based on
OA , for cation and amino acid interfering by match potential method,
Solutions of interfering , ♦ WFN solutions.
370
390
410
430
450
0 1 2 3 4 5 6 7 8 9 10
Resp
on
se m
V
Match Potential method of 0.001M WFN+
0.1M of alanine ues (WFN-MPA+OA)
340
360
380
400
420
440
0 1 2 3 4 5 6 7 8 9 10
Resp
on
se m
V
Match Potential method of 0.0001M WFN+
0.1M of alanine ues ( WFN-MPA+OA)
370
390
410
430
450
0 1 2 3 4 5 6 7 8 9 10
Resp
on
se m
V
Match Potential method of 0.001M WFN+
0.1M of proline ues (WFN-MPA+OA)
340
370
400
430
0 1 2 3 4 5 6 7 8 9 10
Resp
on
se m
V
Match Potential method of 0.0001M WFN+
0.1M of proline ues (WFN-MPA+OA)
370
395
420
445
0 1 2 3 4 5 6 7 8 9 10
Resp
on
se m
V
Match Potential method of 0.001M WFN+
0.1M of serine ues (WFN-MPA+OA)
340
360
380
400
420
440
0 1 2 3 4 5 6 7 8 9 10
Resp
on
se m
V
Match Potential method of 0.0001M WFN+
0.1M of serine ues (WFN-MPA+OA)
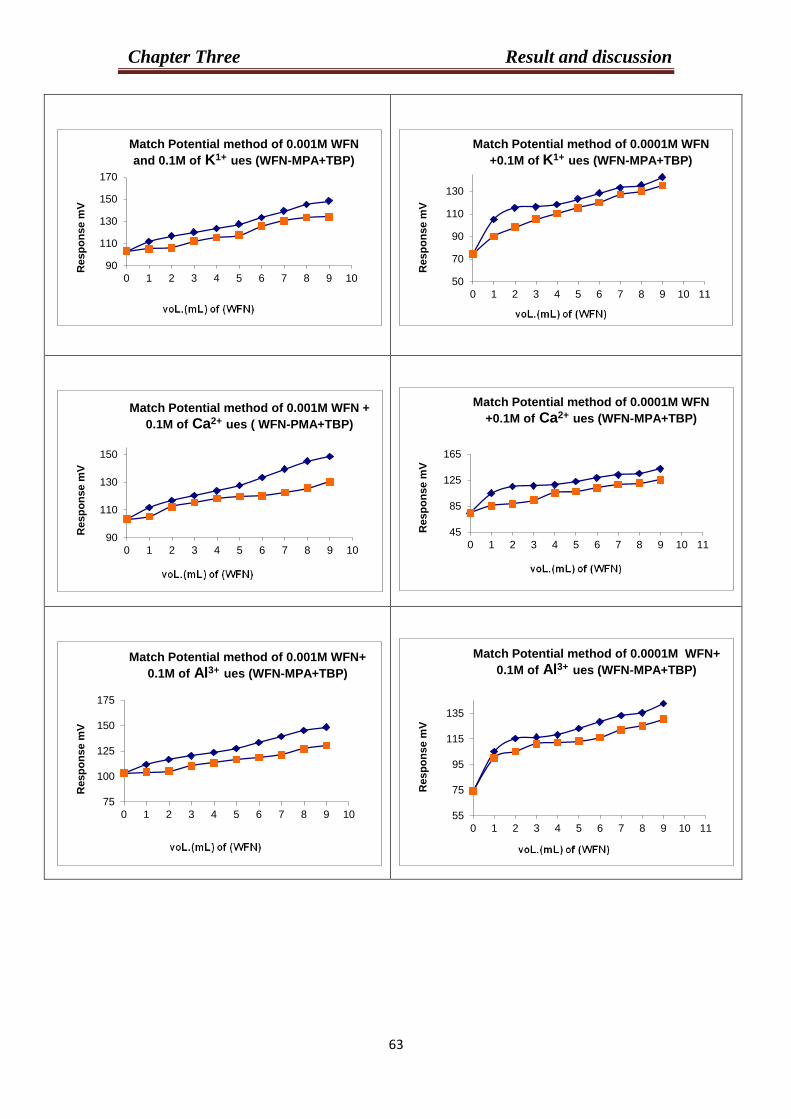
Chapter Three Result and discussion
30
90
110
130
150
170
0 1 2 3 4 5 6 7 8 9 10
Resp
on
se m
V
Match Potential method of 0.001M WFN
and 0.1M of K1+ ues (WFN-MPA+TBP)
50
70
90
110
130
0 1 2 3 4 5 6 7 8 9 10 11
Resp
on
se m
V
Match Potential method of 0.0001M WFN
+0.1M of K1+ ues (WFN-MPA+TBP)
90
110
130
150
0 1 2 3 4 5 6 7 8 9 10
Resp
on
se m
V
Match Potential method of 0.001M WFN +
0.1M of Ca2+ ues ( WFN-PMA+TBP)
45
85
125
165
0 1 2 3 4 5 6 7 8 9 10 11
Resp
on
se m
V
Match Potential method of 0.0001M WFN
+0.1M of Ca2+ ues (WFN-MPA+TBP)
75
100
125
150
175
0 1 2 3 4 5 6 7 8 9 10
Resp
on
se m
V
Match Potential method of 0.001M WFN+
0.1M of Al3+ ues (WFN-MPA+TBP)
55
75
95
115
135
0 1 2 3 4 5 6 7 8 9 10 11
Resp
on
se m
V
Match Potential method of 0.0001M WFN+
0.1M of Al3+ ues (WFN-MPA+TBP)
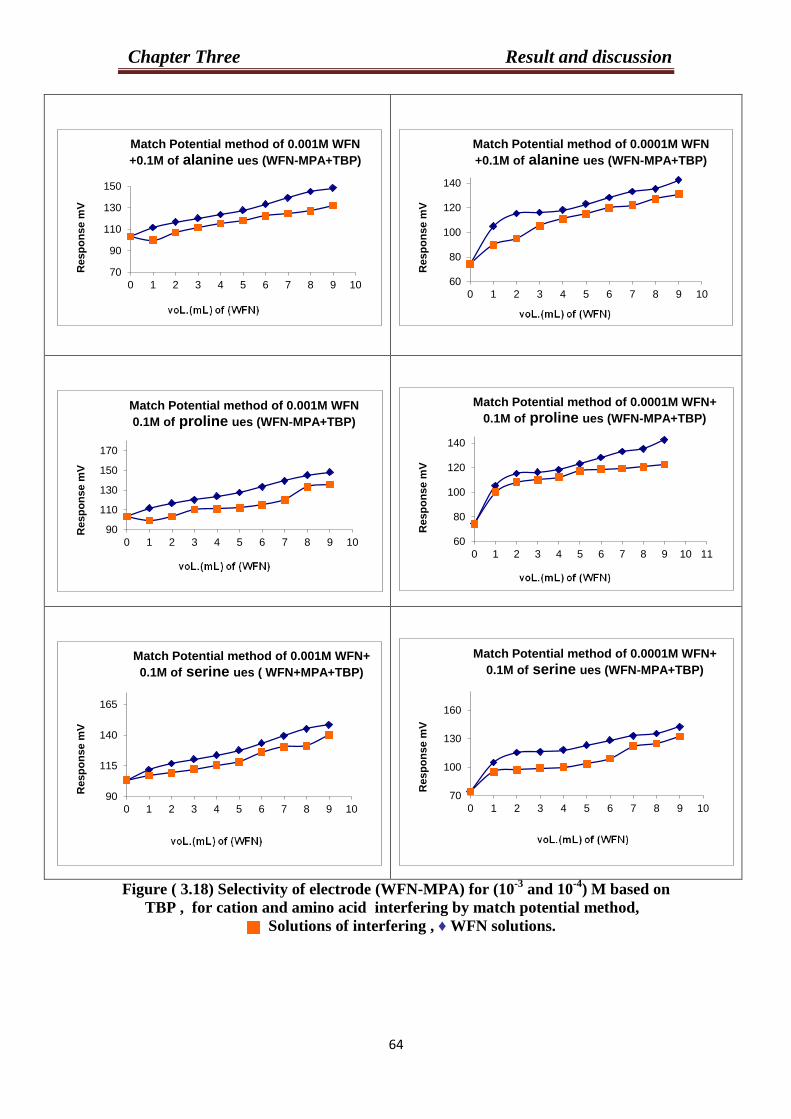
Chapter Three Result and discussion
33
Figure ( 3.18) Selectivity of electrode (WFN-MPA) for (10-3
and 10-4
) M based on
TBP , for cation and amino acid interfering by match potential method,
Solutions of interfering , ♦ WFN solutions.
70
90
110
130
150
0 1 2 3 4 5 6 7 8 9 10
Resp
on
se m
V
Match Potential method of 0.001M WFN
+0.1M of alanine ues (WFN-MPA+TBP)
60
80
100
120
140
0 1 2 3 4 5 6 7 8 9 10
Resp
on
se m
V
Match Potential method of 0.0001M WFN
+0.1M of alanine ues (WFN-MPA+TBP)
90
110
130
150
170
0 1 2 3 4 5 6 7 8 9 10
Resp
on
se m
V
Match Potential method of 0.001M WFN
0.1M of proline ues (WFN-MPA+TBP)
60
80
100
120
140
0 1 2 3 4 5 6 7 8 9 10 11
Resp
on
se m
V
Match Potential method of 0.0001M WFN+
0.1M of proline ues (WFN-MPA+TBP)
90
115
140
165
0 1 2 3 4 5 6 7 8 9 10
Resp
on
se m
V
Match Potential method of 0.001M WFN+
0.1M of serine ues ( WFN+MPA+TBP)
70
100
130
160
0 1 2 3 4 5 6 7 8 9 10
Resp
on
se m
V
Match Potential method of 0.0001M WFN+
0.1M of serine ues (WFN-MPA+TBP)
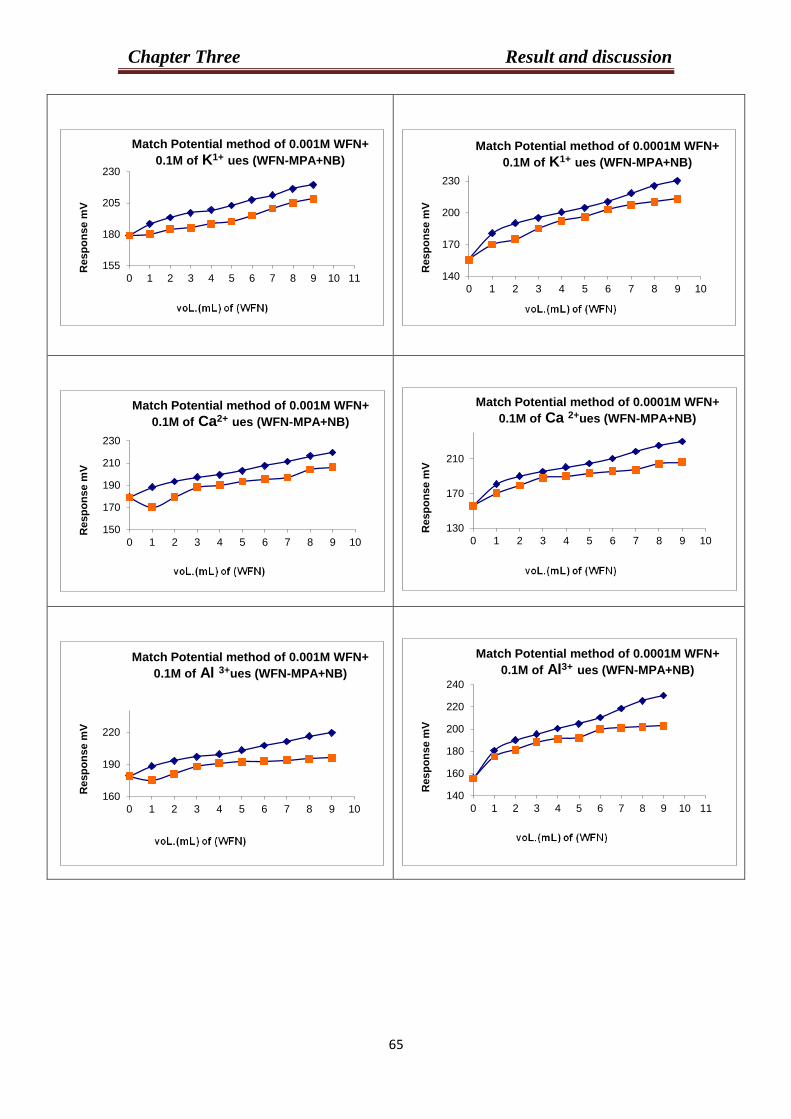
Chapter Three Result and discussion
33
155
180
205
230
0 1 2 3 4 5 6 7 8 9 10 11
Resp
on
se m
V
Match Potential method of 0.001M WFN+
0.1M of K1+ ues (WFN-MPA+NB)
140
170
200
230
0 1 2 3 4 5 6 7 8 9 10
Resp
on
se m
V
Match Potential method of 0.0001M WFN+
0.1M of K1+ ues (WFN-MPA+NB)
150
170
190
210
230
0 1 2 3 4 5 6 7 8 9 10
Resp
on
se m
V
Match Potential method of 0.001M WFN+
0.1M of Ca2+ ues (WFN-MPA+NB)
130
170
210
0 1 2 3 4 5 6 7 8 9 10
Resp
on
se m
V
Match Potential method of 0.0001M WFN+
0.1M of Ca 2+ues (WFN-MPA+NB)
160
190
220
0 1 2 3 4 5 6 7 8 9 10
Resp
on
se m
V
Match Potential method of 0.001M WFN+
0.1M of Al 3+ues (WFN-MPA+NB)
140
160
180
200
220
240
0 1 2 3 4 5 6 7 8 9 10 11
Resp
on
se m
V
Match Potential method of 0.0001M WFN+
0.1M of Al3+ ues (WFN-MPA+NB)
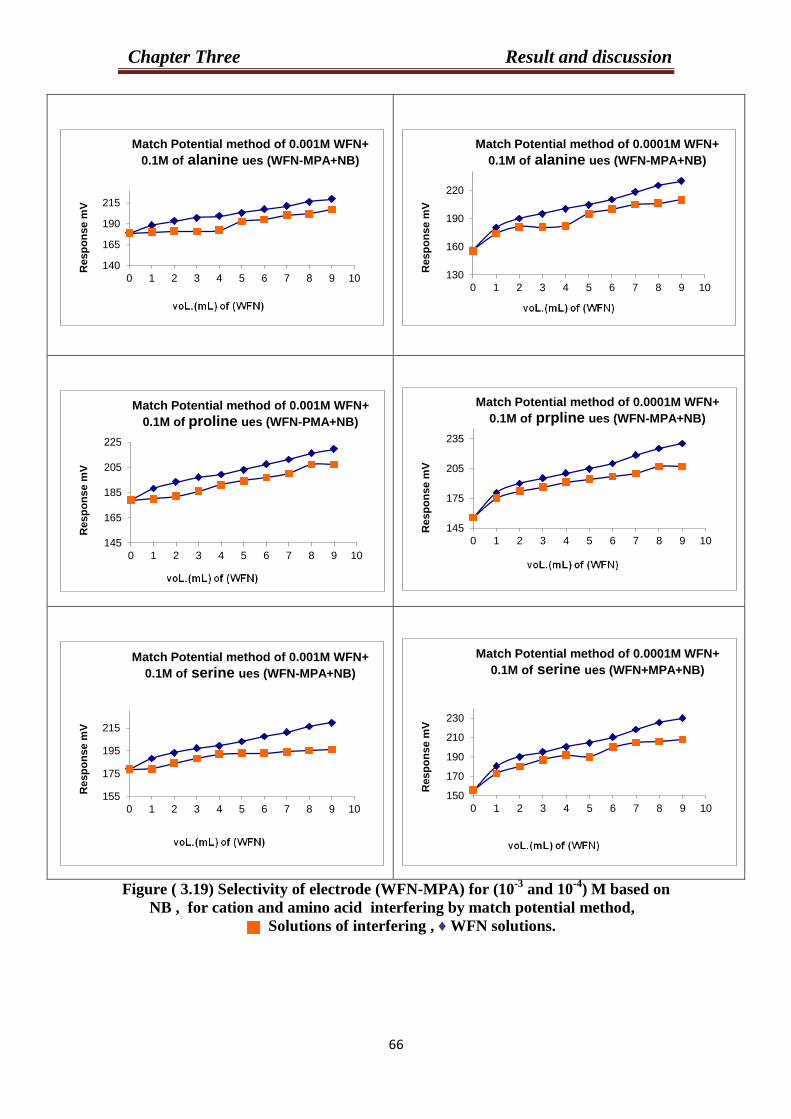
Chapter Three Result and discussion
33
Figure ( 3.19) Selectivity of electrode (WFN-MPA) for (10-3
and 10-4
) M based on
NB , for cation and amino acid interfering by match potential method,
Solutions of interfering , ♦ WFN solutions.
140
165
190
215
0 1 2 3 4 5 6 7 8 9 10
Resp
on
se m
V
Match Potential method of 0.001M WFN+
0.1M of alanine ues (WFN-MPA+NB)
130
160
190
220
0 1 2 3 4 5 6 7 8 9 10
Resp
on
se m
V
Match Potential method of 0.0001M WFN+
0.1M of alanine ues (WFN-MPA+NB)
145
165
185
205
225
0 1 2 3 4 5 6 7 8 9 10
Resp
on
se m
V
Match Potential method of 0.001M WFN+
0.1M of proline ues (WFN-PMA+NB)
145
175
205
235
0 1 2 3 4 5 6 7 8 9 10
Resp
on
se m
V
Match Potential method of 0.0001M WFN+
0.1M of prpline ues (WFN-MPA+NB)
155
175
195
215
0 1 2 3 4 5 6 7 8 9 10
Resp
on
se m
V
Match Potential method of 0.001M WFN+
0.1M of serine ues (WFN-MPA+NB)
150
170
190
210
230
0 1 2 3 4 5 6 7 8 9 10
Resp
on
se m
V
Match Potential method of 0.0001M WFN+
0.1M of serine ues (WFN+MPA+NB)
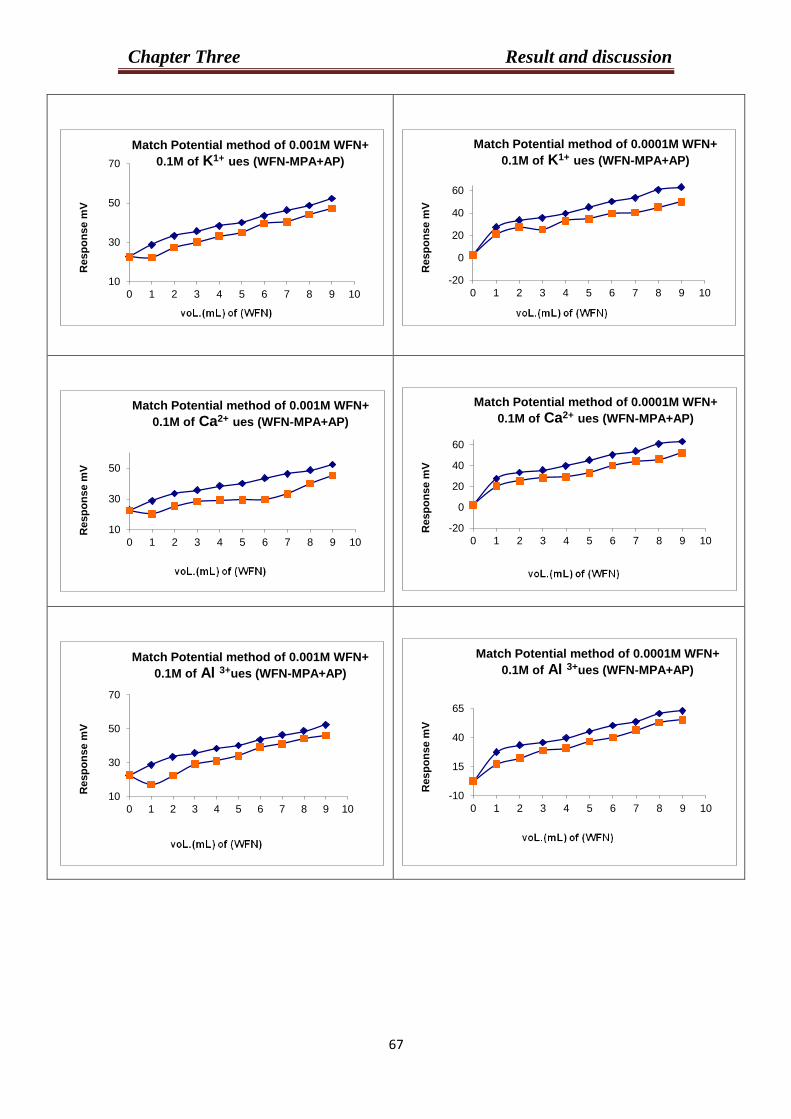
Chapter Three Result and discussion
33
10
30
50
70
0 1 2 3 4 5 6 7 8 9 10
Resp
on
se m
V
Match Potential method of 0.001M WFN+
0.1M of K1+ ues (WFN-MPA+AP)
-20
0
20
40
60
0 1 2 3 4 5 6 7 8 9 10
Resp
on
se m
V
Match Potential method of 0.0001M WFN+
0.1M of K1+ ues (WFN-MPA+AP)
10
30
50
0 1 2 3 4 5 6 7 8 9 10
Resp
on
se m
V
Match Potential method of 0.001M WFN+
0.1M of Ca2+ ues (WFN-MPA+AP)
-20
0
20
40
60
0 1 2 3 4 5 6 7 8 9 10
Resp
on
se m
V
Match Potential method of 0.0001M WFN+
0.1M of Ca2+ ues (WFN-MPA+AP)
10
30
50
70
0 1 2 3 4 5 6 7 8 9 10
Resp
on
se m
V
Match Potential method of 0.001M WFN+
0.1M of Al 3+ues (WFN-MPA+AP)
-10
15
40
65
0 1 2 3 4 5 6 7 8 9 10
Resp
on
se m
V
Match Potential method of 0.0001M WFN+
0.1M of Al 3+ues (WFN-MPA+AP)
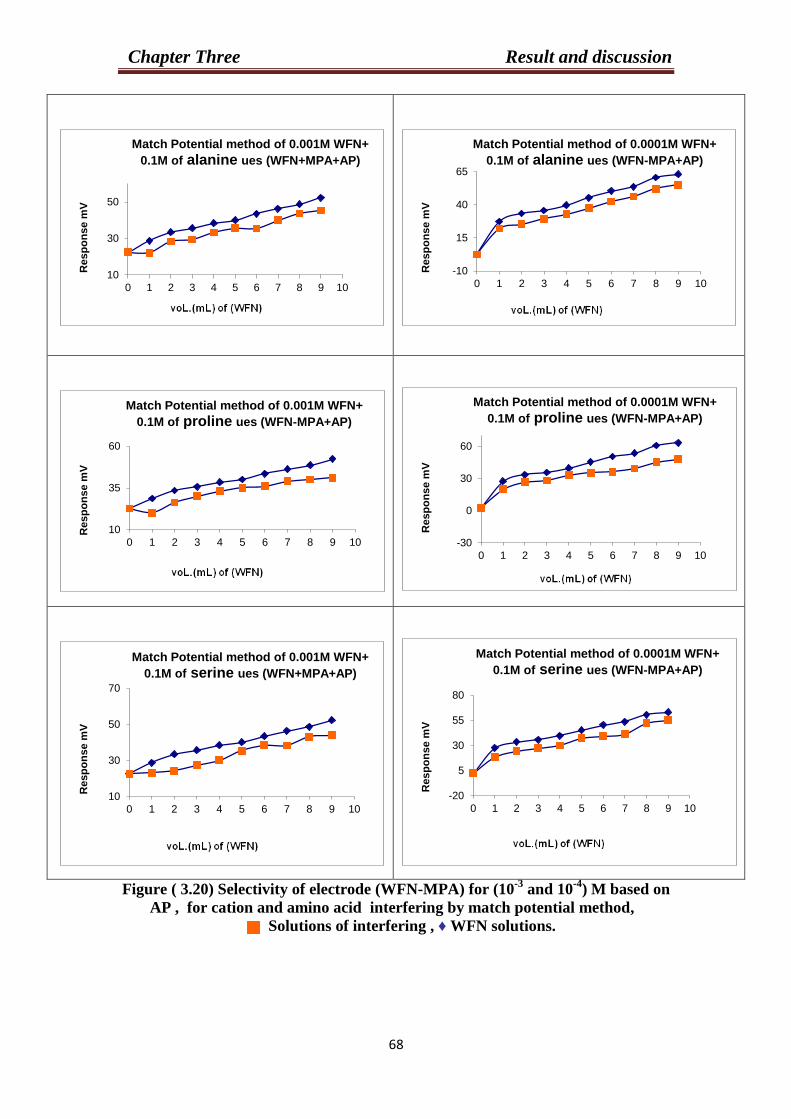
Chapter Three Result and discussion
33
Figure ( 3.20) Selectivity of electrode (WFN-MPA) for (10-3
and 10-4
) M based on
AP , for cation and amino acid interfering by match potential method,
Solutions of interfering , ♦ WFN solutions.
10
30
50
0 1 2 3 4 5 6 7 8 9 10
Resp
on
se m
V
Match Potential method of 0.001M WFN+
0.1M of alanine ues (WFN+MPA+AP)
-10
15
40
65
0 1 2 3 4 5 6 7 8 9 10
Resp
on
se m
V
Match Potential method of 0.0001M WFN+
0.1M of alanine ues (WFN-MPA+AP)
10
35
60
0 1 2 3 4 5 6 7 8 9 10
Resp
on
se m
V
Match Potential method of 0.001M WFN+
0.1M of proline ues (WFN-MPA+AP)
-30
0
30
60
0 1 2 3 4 5 6 7 8 9 10
Resp
on
se m
V
Match Potential method of 0.0001M WFN+
0.1M of proline ues (WFN-MPA+AP)
10
30
50
70
0 1 2 3 4 5 6 7 8 9 10
Resp
on
se m
V
Match Potential method of 0.001M WFN+
0.1M of serine ues (WFN+MPA+AP)
-20
5
30
55
80
0 1 2 3 4 5 6 7 8 9 10
Resp
on
se m
V
Match Potential method of 0.0001M WFN+
0.1M of serine ues (WFN-MPA+AP)
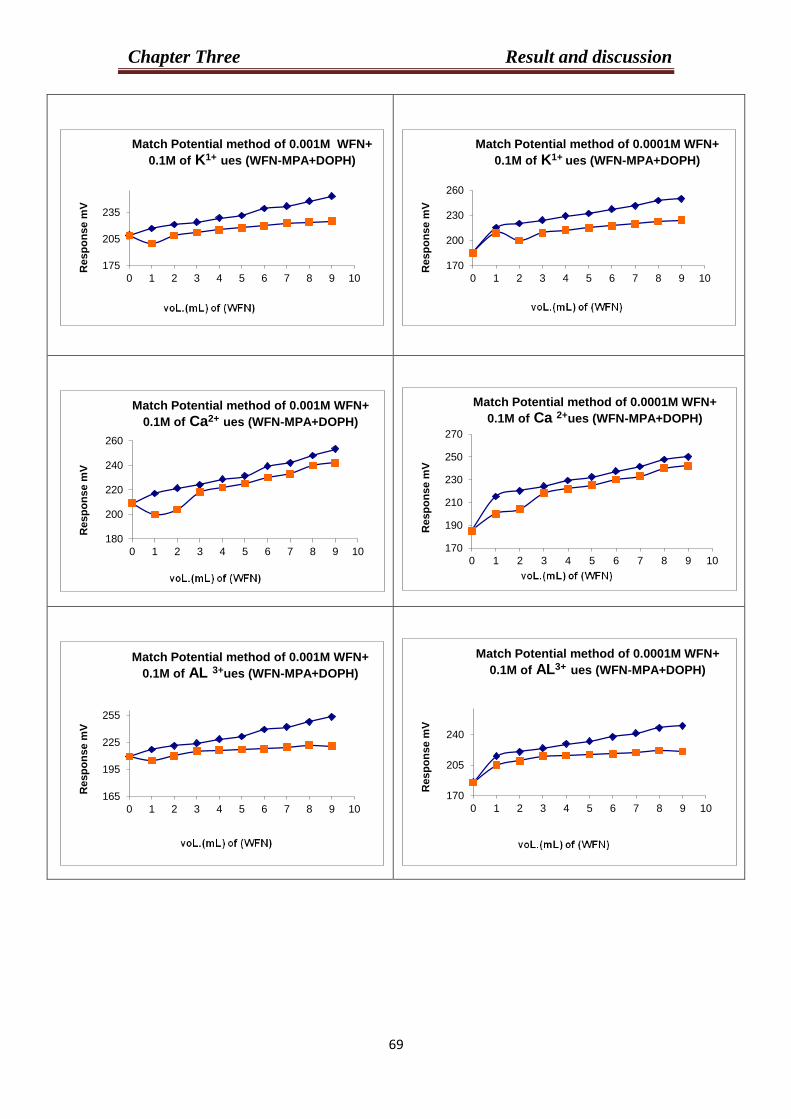
Chapter Three Result and discussion
32
175
205
235
0 1 2 3 4 5 6 7 8 9 10
Resp
on
se m
V
Match Potential method of 0.001M WFN+
0.1M of K1+ ues (WFN-MPA+DOPH)
170
200
230
260
0 1 2 3 4 5 6 7 8 9 10
Resp
on
se m
V
Match Potential method of 0.0001M WFN+
0.1M of K1+ ues (WFN-MPA+DOPH)
180
200
220
240
260
0 1 2 3 4 5 6 7 8 9 10
Resp
on
se m
V
Match Potential method of 0.001M WFN+
0.1M of Ca2+ ues (WFN-MPA+DOPH)
170
190
210
230
250
270
0 1 2 3 4 5 6 7 8 9 10
Resp
on
se m
V
Match Potential method of 0.0001M WFN+
0.1M of Ca 2+ues (WFN-MPA+DOPH)
165
195
225
255
0 1 2 3 4 5 6 7 8 9 10
Resp
on
se m
V
Match Potential method of 0.001M WFN+
0.1M of AL 3+ues (WFN-MPA+DOPH)
170
205
240
0 1 2 3 4 5 6 7 8 9 10
Resp
on
se m
V
Match Potential method of 0.0001M WFN+
0.1M of AL3+ ues (WFN-MPA+DOPH)
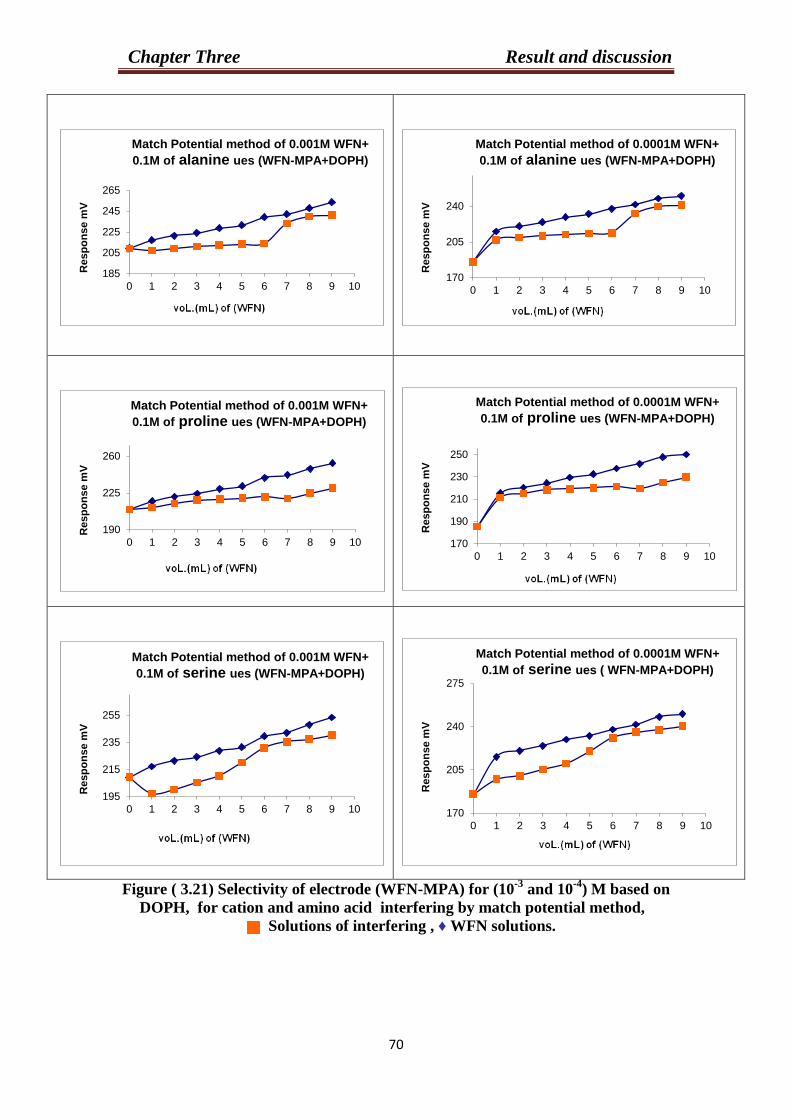
Chapter Three Result and discussion
33
Figure ( 3.21) Selectivity of electrode (WFN-MPA) for (10-3
and 10-4
) M based on
DOPH, for cation and amino acid interfering by match potential method,
Solutions of interfering , ♦ WFN solutions.
185
205
225
245
265
0 1 2 3 4 5 6 7 8 9 10
Resp
on
se m
V
Match Potential method of 0.001M WFN+
0.1M of alanine ues (WFN-MPA+DOPH)
170
205
240
0 1 2 3 4 5 6 7 8 9 10
Resp
on
se m
V
Match Potential method of 0.0001M WFN+
0.1M of alanine ues (WFN-MPA+DOPH)
190
225
260
0 1 2 3 4 5 6 7 8 9 10
Resp
on
se m
V
Match Potential method of 0.001M WFN+
0.1M of proline ues (WFN-MPA+DOPH)
170
190
210
230
250
0 1 2 3 4 5 6 7 8 9 10
Resp
on
se m
V
Match Potential method of 0.0001M WFN+
0.1M of proline ues (WFN-MPA+DOPH)
195
215
235
255
0 1 2 3 4 5 6 7 8 9 10
Resp
on
se m
V
Match Potential method of 0.001M WFN+
0.1M of serine ues (WFN-MPA+DOPH)
170
205
240
275
0 1 2 3 4 5 6 7 8 9 10
Resp
on
se m
V
Match Potential method of 0.0001M WFN+
0.1M of serine ues ( WFN-MPA+DOPH)
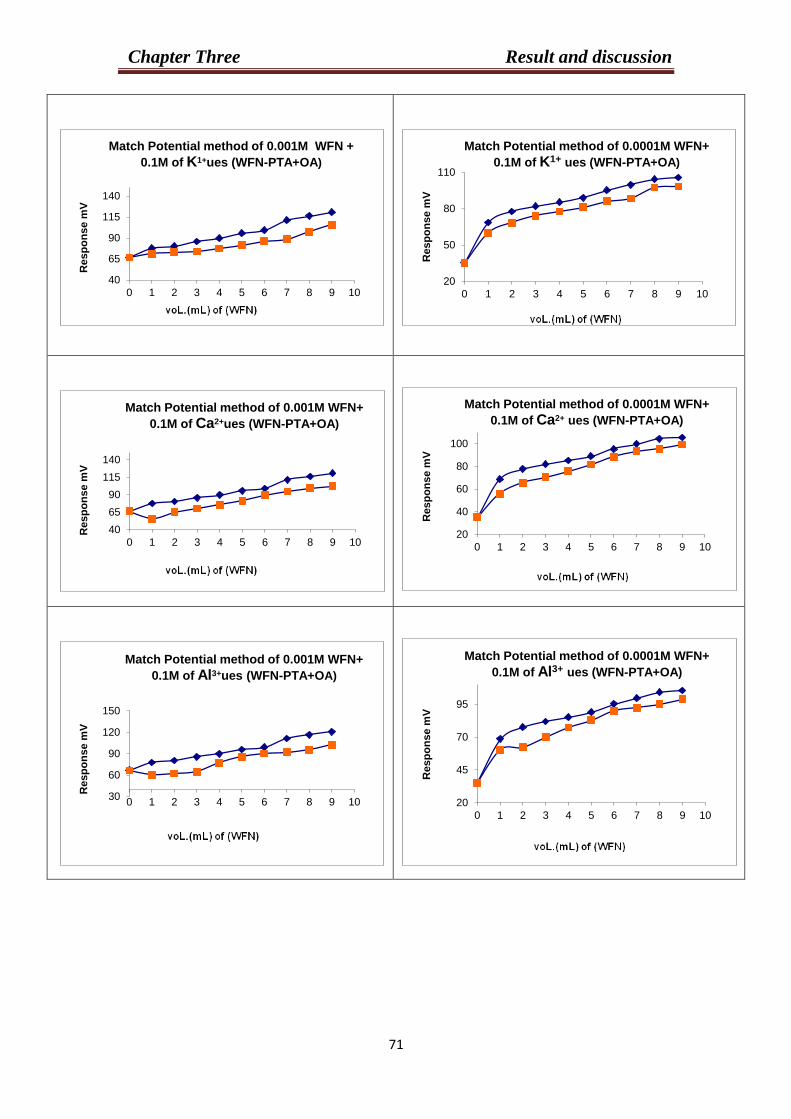
Chapter Three Result and discussion
33
40
65
90
115
140
0 1 2 3 4 5 6 7 8 9 10
Resp
on
se m
V
Match Potential method of 0.001M WFN +
0.1M of K1+ues (WFN-PTA+OA)
20
50
80
110
0 1 2 3 4 5 6 7 8 9 10
Resp
on
se m
V
Match Potential method of 0.0001M WFN+
0.1M of K1+ ues (WFN-PTA+OA)
40
65
90
115
140
0 1 2 3 4 5 6 7 8 9 10
Resp
on
se m
V
Match Potential method of 0.001M WFN+
0.1M of Ca2+ues (WFN-PTA+OA)
20
40
60
80
100
0 1 2 3 4 5 6 7 8 9 10
Resp
on
se m
V
Match Potential method of 0.0001M WFN+
0.1M of Ca2+ ues (WFN-PTA+OA)
30
60
90
120
150
0 1 2 3 4 5 6 7 8 9 10
Resp
on
se m
V
Match Potential method of 0.001M WFN+
0.1M of Al3+ues (WFN-PTA+OA)
20
45
70
95
0 1 2 3 4 5 6 7 8 9 10
Res
po
ns
e m
V
Match Potential method of 0.0001M WFN+
0.1M of Al3+ ues (WFN-PTA+OA)
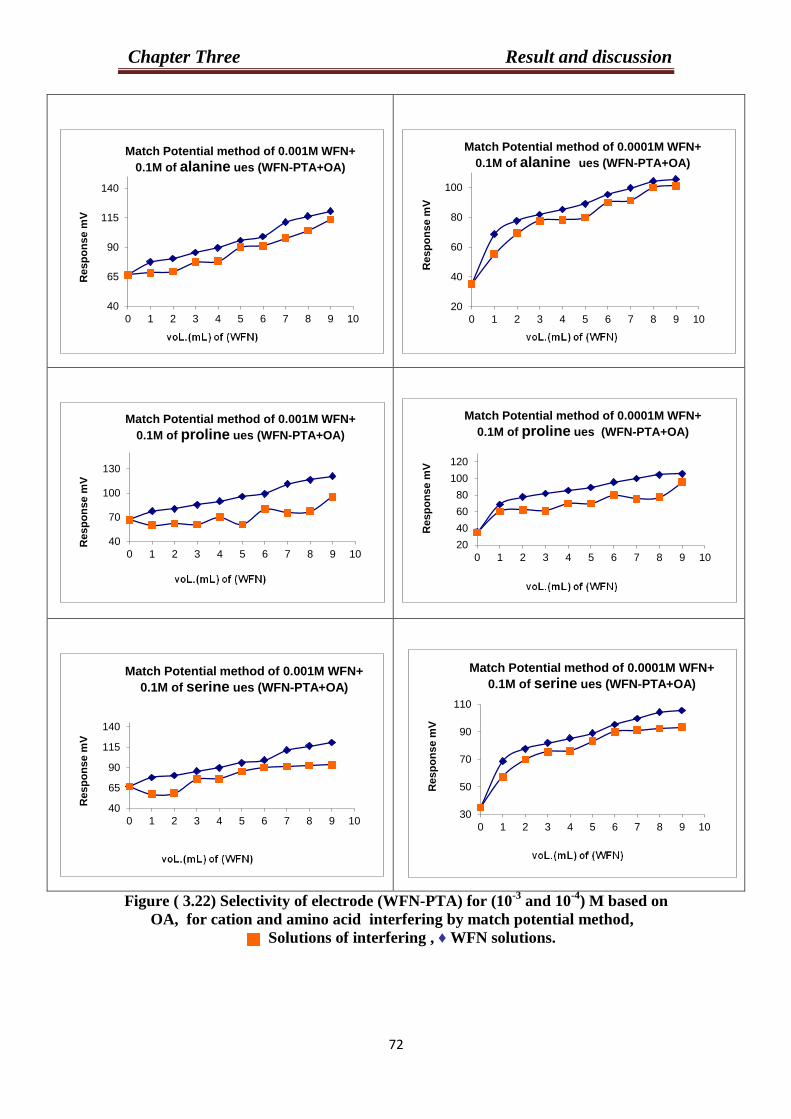
Chapter Three Result and discussion
39
Figure ( 3.22) Selectivity of electrode (WFN-PTA) for (10-3
and 10-4
) M based on
OA, for cation and amino acid interfering by match potential method,
Solutions of interfering , ♦ WFN solutions.
40
65
90
115
140
0 1 2 3 4 5 6 7 8 9 10
Resp
on
se m
V
Match Potential method of 0.001M WFN+
0.1M of alanine ues (WFN-PTA+OA)
20
40
60
80
100
0 1 2 3 4 5 6 7 8 9 10
Resp
on
se m
V
Match Potential method of 0.0001M WFN+
0.1M of alanine ues (WFN-PTA+OA)
40
70
100
130
0 1 2 3 4 5 6 7 8 9 10
Resp
on
se m
V
Match Potential method of 0.001M WFN+
0.1M of proline ues (WFN-PTA+OA)
20
40
60
80
100
120
0 1 2 3 4 5 6 7 8 9 10
Resp
on
se m
V
Match Potential method of 0.0001M WFN+
0.1M of proline ues (WFN-PTA+OA)
40
65
90
115
140
0 1 2 3 4 5 6 7 8 9 10
Resp
on
se m
V
Match Potential method of 0.001M WFN+
0.1M of serine ues (WFN-PTA+OA)
30
50
70
90
110
0 1 2 3 4 5 6 7 8 9 10
Resp
on
se m
V
Match Potential method of 0.0001M WFN+
0.1M of serine ues (WFN-PTA+OA)
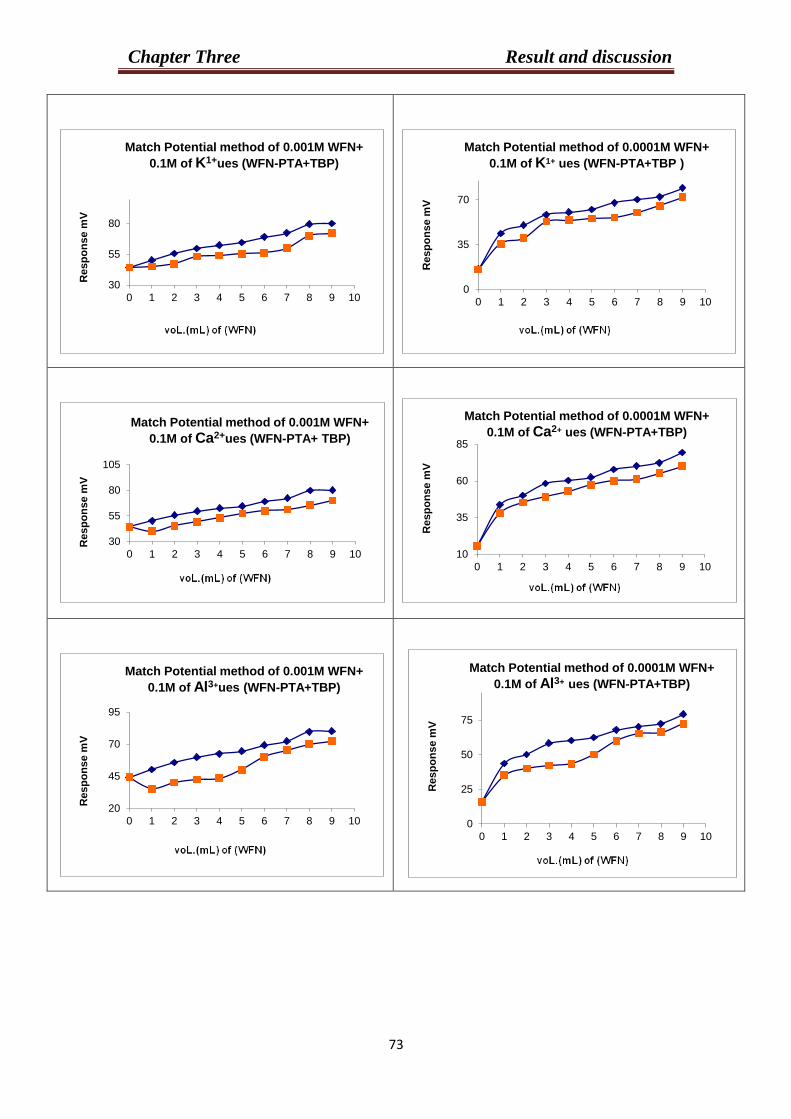
Chapter Three Result and discussion
30
30
55
80
0 1 2 3 4 5 6 7 8 9 10
Resp
on
se m
V
Match Potential method of 0.001M WFN+
0.1M of K1+ues (WFN-PTA+TBP)
0
35
70
0 1 2 3 4 5 6 7 8 9 10
Resp
on
se m
V
Match Potential method of 0.0001M WFN+
0.1M of K1+ ues (WFN-PTA+TBP )
30
55
80
105
0 1 2 3 4 5 6 7 8 9 10
Resp
on
se m
V
Match Potential method of 0.001M WFN+
0.1M of Ca2+ues (WFN-PTA+ TBP)
10
35
60
85
0 1 2 3 4 5 6 7 8 9 10
Resp
on
se m
V
Match Potential method of 0.0001M WFN+
0.1M of Ca2+ ues (WFN-PTA+TBP)
20
45
70
95
0 1 2 3 4 5 6 7 8 9 10
Resp
on
se m
V
Match Potential method of 0.001M WFN+
0.1M of Al3+ues (WFN-PTA+TBP)
0
25
50
75
0 1 2 3 4 5 6 7 8 9 10
Resp
on
se m
V
Match Potential method of 0.0001M WFN+
0.1M of Al3+ ues (WFN-PTA+TBP)
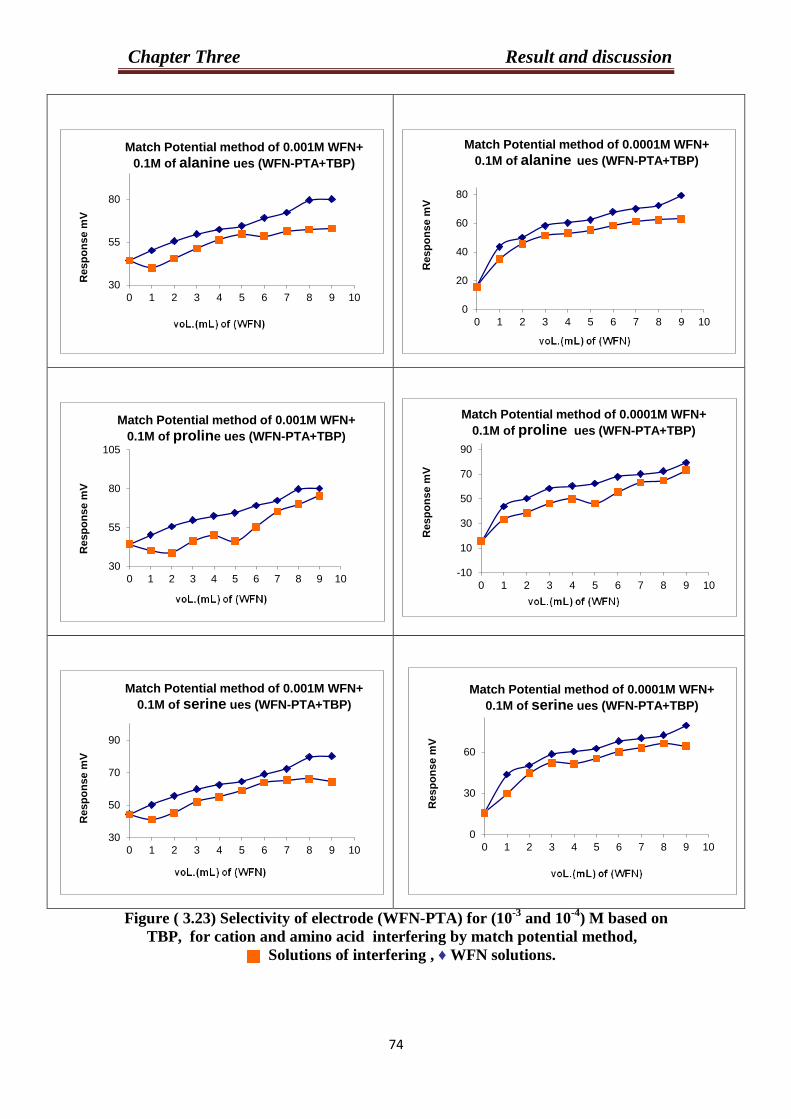
Chapter Three Result and discussion
33
Figure ( 3.23) Selectivity of electrode (WFN-PTA) for (10-3
and 10-4
) M based on
TBP, for cation and amino acid interfering by match potential method,
Solutions of interfering , ♦ WFN solutions.
30
55
80
0 1 2 3 4 5 6 7 8 9 10
Resp
on
se m
V
Match Potential method of 0.001M WFN+
0.1M of alanine ues (WFN-PTA+TBP)
0
20
40
60
80
0 1 2 3 4 5 6 7 8 9 10
Resp
on
se m
V
Match Potential method of 0.0001M WFN+
0.1M of alanine ues (WFN-PTA+TBP)
30
55
80
105
0 1 2 3 4 5 6 7 8 9 10
Resp
on
se m
V
Match Potential method of 0.001M WFN+
0.1M of proline ues (WFN-PTA+TBP)
-10
10
30
50
70
90
0 1 2 3 4 5 6 7 8 9 10
Res
po
ns
e m
V
Match Potential method of 0.0001M WFN+
0.1M of proline ues (WFN-PTA+TBP)
30
50
70
90
0 1 2 3 4 5 6 7 8 9 10
Resp
on
se m
V
Match Potential method of 0.001M WFN+
0.1M of serine ues (WFN-PTA+TBP)
0
30
60
0 1 2 3 4 5 6 7 8 9 10
Resp
on
se m
V
Match Potential method of 0.0001M WFN+
0.1M of serine ues (WFN-PTA+TBP)
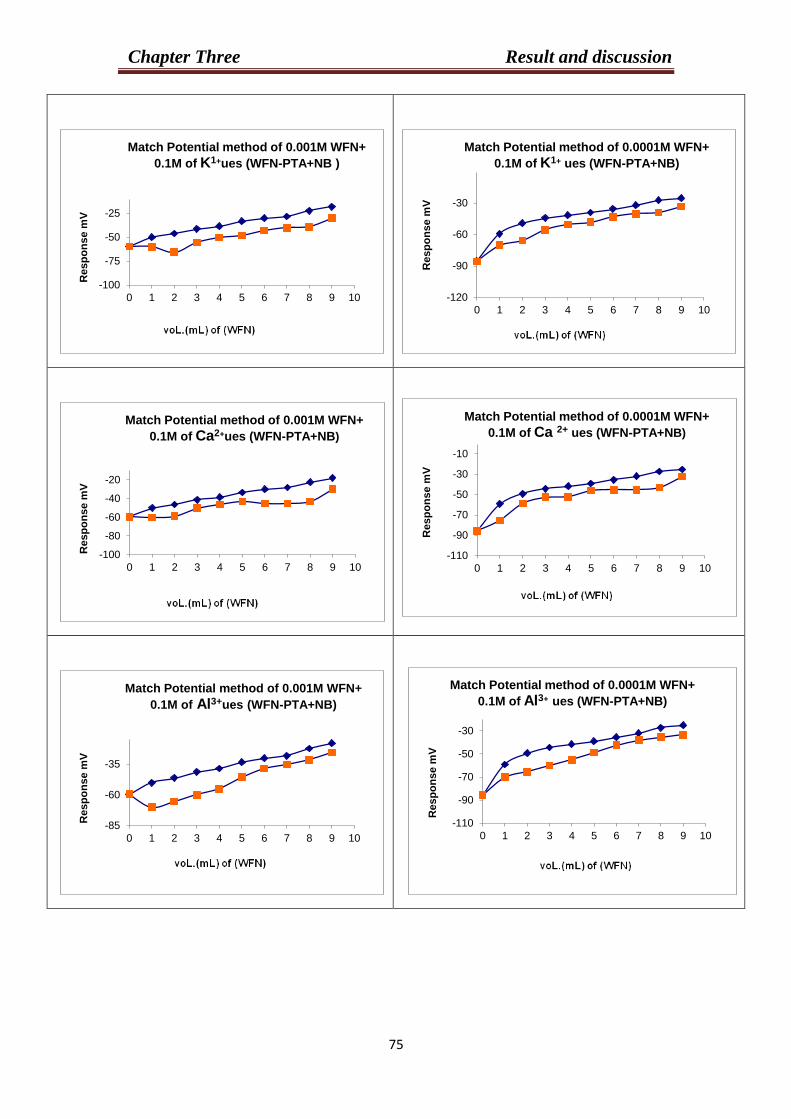
Chapter Three Result and discussion
33
-100
-75
-50
-25
0 1 2 3 4 5 6 7 8 9 10
Resp
on
se m
V
Match Potential method of 0.001M WFN+
0.1M of K1+ues (WFN-PTA+NB )
-120
-90
-60
-30
0 1 2 3 4 5 6 7 8 9 10
Resp
on
se m
V
Match Potential method of 0.0001M WFN+
0.1M of K1+ ues (WFN-PTA+NB)
-100
-80
-60
-40
-20
0 1 2 3 4 5 6 7 8 9 10
Resp
on
se m
V
Match Potential method of 0.001M WFN+
0.1M of Ca2+ues (WFN-PTA+NB)
-110
-90
-70
-50
-30
-10
0 1 2 3 4 5 6 7 8 9 10
Res
po
ns
e m
V
Match Potential method of 0.0001M WFN+
0.1M of Ca 2+ ues (WFN-PTA+NB)
-85
-60
-35
0 1 2 3 4 5 6 7 8 9 10
Resp
on
se m
V
Match Potential method of 0.001M WFN+
0.1M of Al3+ues (WFN-PTA+NB)
-110
-90
-70
-50
-30
0 1 2 3 4 5 6 7 8 9 10
Resp
on
se m
V
Match Potential method of 0.0001M WFN+
0.1M of Al3+ ues (WFN-PTA+NB)
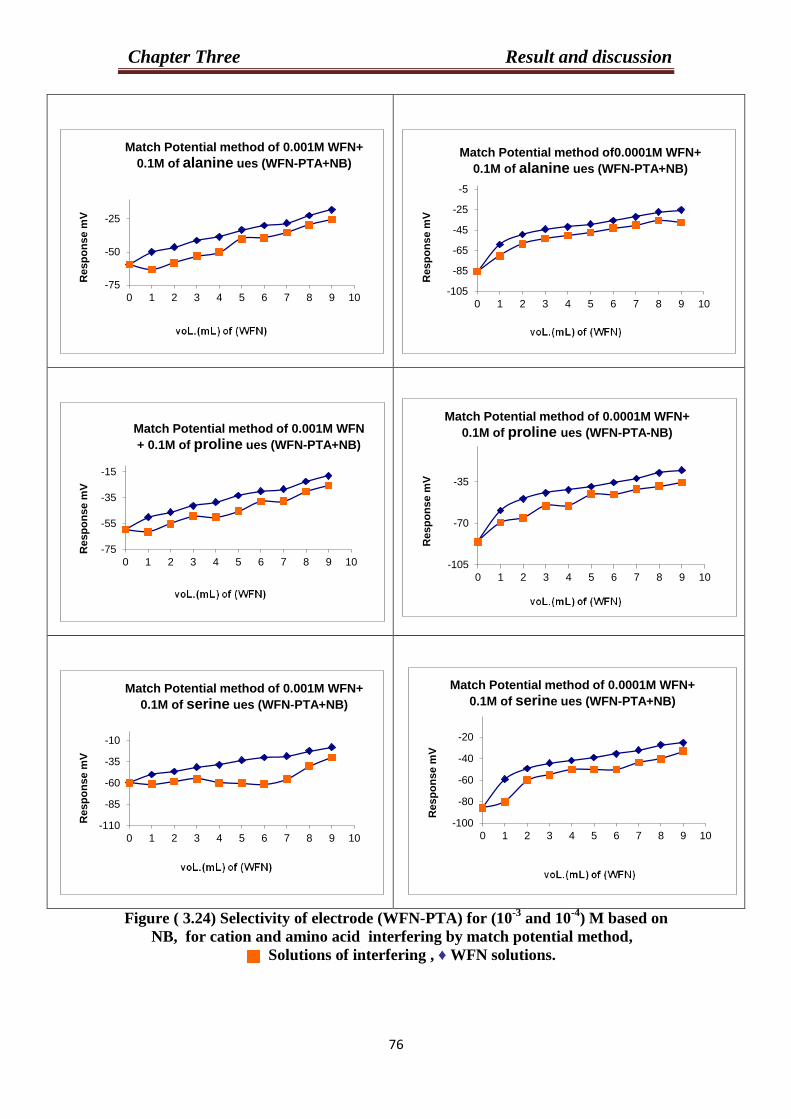
Chapter Three Result and discussion
33
Figure ( 3.24) Selectivity of electrode (WFN-PTA) for (10-3
and 10-4
) M based on
NB, for cation and amino acid interfering by match potential method,
Solutions of interfering , ♦ WFN solutions.
-75
-50
-25
0 1 2 3 4 5 6 7 8 9 10
Resp
on
se m
V
Match Potential method of 0.001M WFN+
0.1M of alanine ues (WFN-PTA+NB)
-105
-85
-65
-45
-25
-5
0 1 2 3 4 5 6 7 8 9 10
Resp
on
se m
V
Match Potential method of0.0001M WFN+
0.1M of alanine ues (WFN-PTA+NB)
-75
-55
-35
-15
0 1 2 3 4 5 6 7 8 9 10
Resp
on
se m
V
Match Potential method of 0.001M WFN
+ 0.1M of proline ues (WFN-PTA+NB)
-105
-70
-35
0 1 2 3 4 5 6 7 8 9 10
Resp
on
se m
V
Match Potential method of 0.0001M WFN+
0.1M of proline ues (WFN-PTA-NB)
-110
-85
-60
-35
-10
0 1 2 3 4 5 6 7 8 9 10
Resp
on
se m
V
Match Potential method of 0.001M WFN+
0.1M of serine ues (WFN-PTA+NB)
-100
-80
-60
-40
-20
0 1 2 3 4 5 6 7 8 9 10
Resp
on
se m
V
Match Potential method of 0.0001M WFN+
0.1M of serine ues (WFN-PTA+NB)
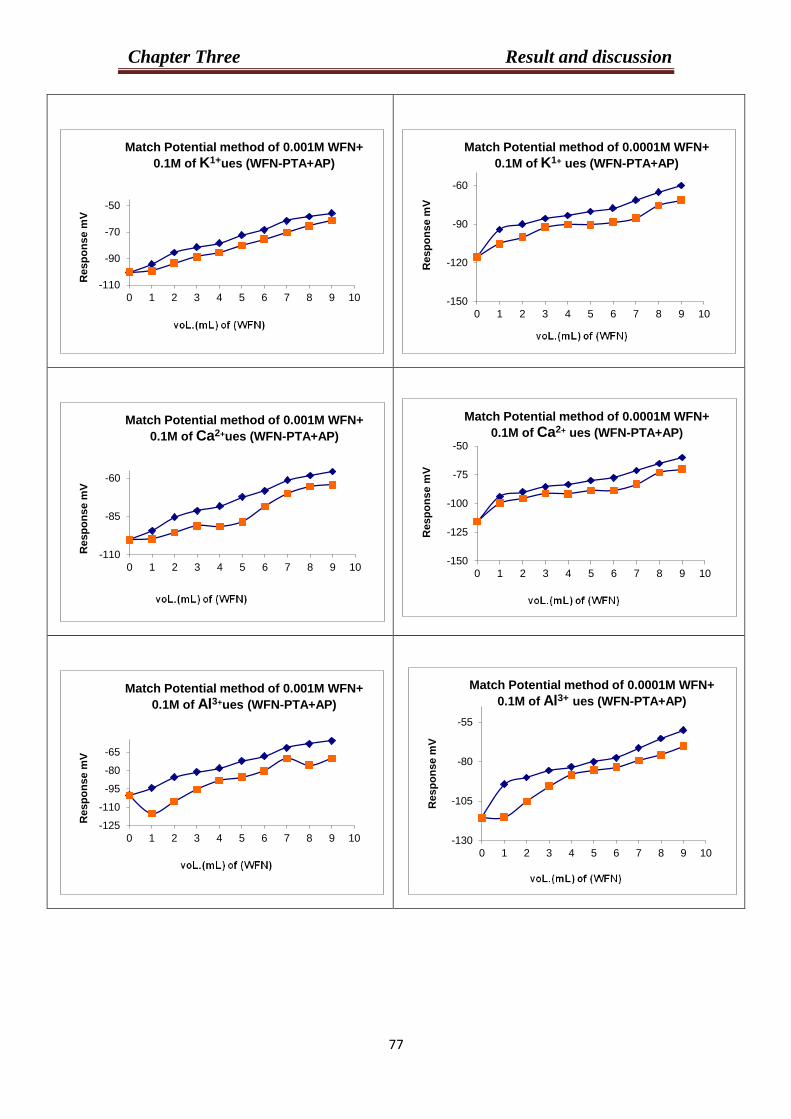
Chapter Three Result and discussion
33
-110
-90
-70
-50
0 1 2 3 4 5 6 7 8 9 10
Resp
on
se m
V
Match Potential method of 0.001M WFN+
0.1M of K1+ues (WFN-PTA+AP)
-150
-120
-90
-60
0 1 2 3 4 5 6 7 8 9 10
Resp
on
se m
V
Match Potential method of 0.0001M WFN+
0.1M of K1+ ues (WFN-PTA+AP)
-110
-85
-60
0 1 2 3 4 5 6 7 8 9 10
Resp
on
se m
V
Match Potential method of 0.001M WFN+
0.1M of Ca2+ues (WFN-PTA+AP)
-150
-125
-100
-75
-50
0 1 2 3 4 5 6 7 8 9 10
Res
po
ns
e m
V
Match Potential method of 0.0001M WFN+
0.1M of Ca2+ ues (WFN-PTA+AP)
-125
-110
-95
-80
-65
0 1 2 3 4 5 6 7 8 9 10
Resp
on
se m
V
Match Potential method of 0.001M WFN+
0.1M of Al3+ues (WFN-PTA+AP)
-130
-105
-80
-55
0 1 2 3 4 5 6 7 8 9 10
Resp
on
se m
V
Match Potential method of 0.0001M WFN+
0.1M of Al3+ ues (WFN-PTA+AP)
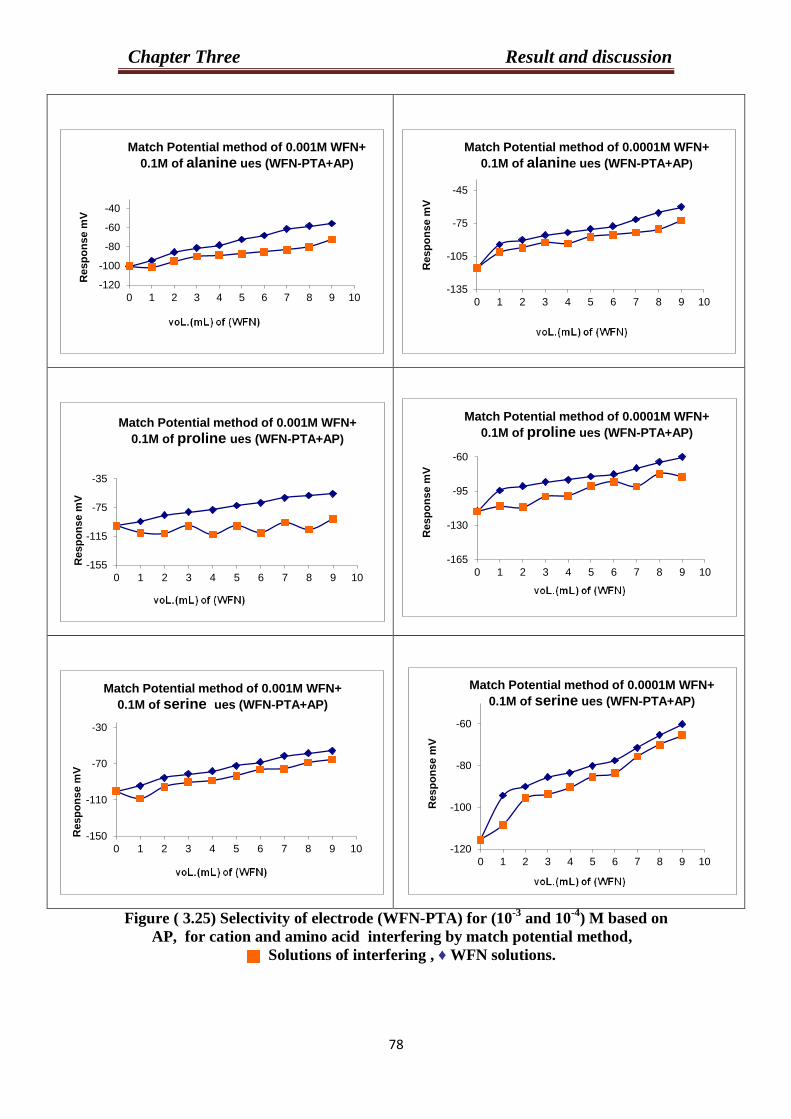
Chapter Three Result and discussion
33
Figure ( 3.25) Selectivity of electrode (WFN-PTA) for (10-3
and 10-4
) M based on
AP, for cation and amino acid interfering by match potential method,
Solutions of interfering , ♦ WFN solutions.
-120
-100
-80
-60
-40
0 1 2 3 4 5 6 7 8 9 10
Resp
on
se m
V
Match Potential method of 0.001M WFN+
0.1M of alanine ues (WFN-PTA+AP)
-135
-105
-75
-45
0 1 2 3 4 5 6 7 8 9 10
Resp
on
se m
V
Match Potential method of 0.0001M WFN+
0.1M of alanine ues (WFN-PTA+AP)
-155
-115
-75
-35
0 1 2 3 4 5 6 7 8 9 10
Resp
on
se m
V
Match Potential method of 0.001M WFN+
0.1M of proline ues (WFN-PTA+AP)
-165
-130
-95
-60
0 1 2 3 4 5 6 7 8 9 10
Res
po
ns
e m
V
Match Potential method of 0.0001M WFN+
0.1M of proline ues (WFN-PTA+AP)
-150
-110
-70
-30
0 1 2 3 4 5 6 7 8 9 10
Resp
on
se m
V
Match Potential method of 0.001M WFN+
0.1M of serine ues (WFN-PTA+AP)
-120
-100
-80
-60
0 1 2 3 4 5 6 7 8 9 10
Resp
on
se m
V
Match Potential method of 0.0001M WFN+
0.1M of serine ues (WFN-PTA+AP)

Chapter Three Result and discussion
32
10
30
50
70
0 1 2 3 4 5 6 7 8 9 10
Resp
on
se m
V
Match Potential method of 0.001M WFN+
0.1M of K1+ues (WFN-PTA+DOPH)
-10
15
40
65
0 1 2 3 4 5 6 7 8 9 10
Resp
on
se m
V
Match Potential method of 0.0001M WF+
0.1M of K1+ ues (WFN-PTA+DOPH)
20
35
50
65
0 1 2 3 4 5 6 7 8 9 10
Resp
on
se m
V
Match Potential method of 0.001M WFN+
0.1M of Ca2+ues (WFN-PTA+DOPH)
-15
15
45
0 1 2 3 4 5 6 7 8 9 10
Resp
on
se m
V
Match Potential method of 0.0001M WFN+
0.1M of Ca2+ ues (WFN-PTA+DOPH)
0
25
50
75
0 1 2 3 4 5 6 7 8 9 10
Resp
on
se m
V
Match Potential method of 0.001M WFN+
0.1M of Al3+ues (WFN-PTA+DOPH)
-10
15
40
65
0 1 2 3 4 5 6 7 8 9 10
Resp
on
se m
V
Match Potential method of 0.0001M WFN+
0.1M of Al3+ ues (WFN-PTA+DOPH)
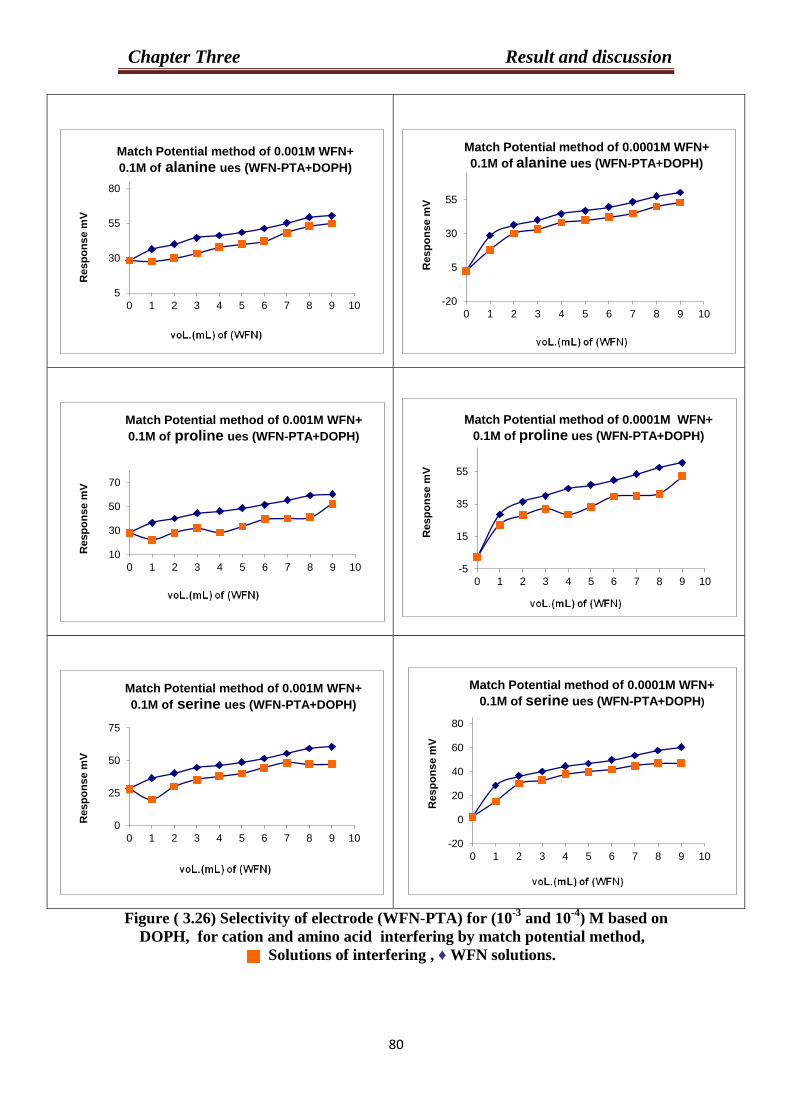
Chapter Three Result and discussion
33
Figure ( 3.26) Selectivity of electrode (WFN-PTA) for (10-3
and 10-4
) M based on
DOPH, for cation and amino acid interfering by match potential method,
Solutions of interfering , ♦ WFN solutions.
5
30
55
80
0 1 2 3 4 5 6 7 8 9 10
Resp
on
se m
V
Match Potential method of 0.001M WFN+
0.1M of alanine ues (WFN-PTA+DOPH)
-20
5
30
55
0 1 2 3 4 5 6 7 8 9 10
Resp
on
se m
V
Match Potential method of 0.0001M WFN+
0.1M of alanine ues (WFN-PTA+DOPH)
10
30
50
70
0 1 2 3 4 5 6 7 8 9 10
Resp
on
se m
V
Match Potential method of 0.001M WFN+
0.1M of proline ues (WFN-PTA+DOPH)
-5
15
35
55
0 1 2 3 4 5 6 7 8 9 10
Res
po
ns
e m
V
Match Potential method of 0.0001M WFN+
0.1M of proline ues (WFN-PTA+DOPH)
0
25
50
75
0 1 2 3 4 5 6 7 8 9 10
Resp
on
se m
V
Match Potential method of 0.001M WFN+
0.1M of serine ues (WFN-PTA+DOPH)
-20
0
20
40
60
80
0 1 2 3 4 5 6 7 8 9 10
Resp
on
se m
V
Match Potential method of 0.0001M WFN+
0.1M of serine ues (WFN-PTA+DOPH)
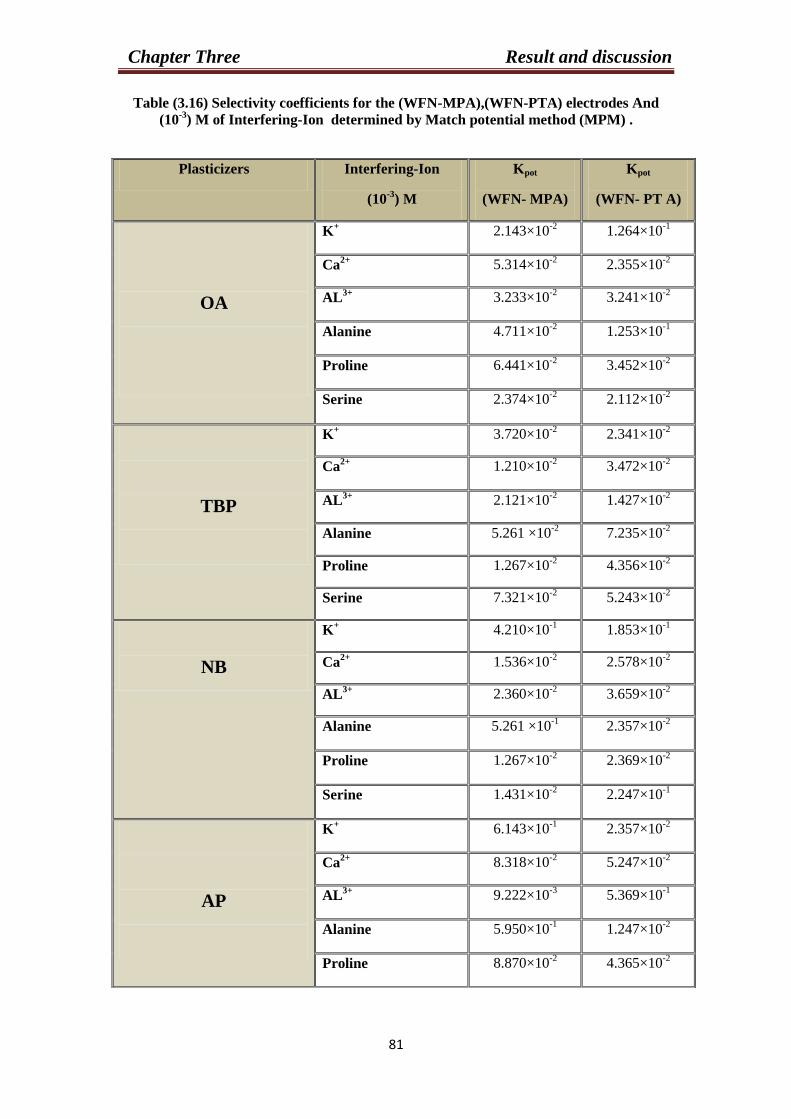
Chapter Three Result and discussion
33
Table (3.16) Selectivity coefficients for the (WFN-MPA),(WFN-PTA) electrodes And
(10-3
) M of Interfering-Ion determined by Match potential method (MPM) .
Plasticizers Interfering-Ion
(10-3
) M
Kpot
(WFN- MPA)
Kpot
(WFN- PT A)
OA
K+ 2.143×10
-2 1.264×10
-1
Ca2+
5.314×10⁻²
2.355×10⁻²
AL3+
3.233×10⁻²
3.241×10⁻²
Alanine 4.711×10⁻²
1.253×10⁻¹
Proline 6.441×10⁻²
3.452×10⁻²
Serine 2.374×10⁻²
2.112×10⁻²
TBP
K+
3.720×10⁻²
2.341×10⁻²
Ca2+
1.210×10⁻²
3.472×10⁻²
AL3+
2.121×10⁻²
1.427×10⁻²
Alanine 5.261 ×10⁻²
7.235×10⁻²
Proline 1.267×10⁻²
4.356×10⁻²
Serine 7.321×10⁻²
5.243×10⁻²
NB
K+
4.210×10⁻¹
1.853×10⁻¹
Ca2+
1.536×10⁻²
2.578×10⁻²
AL3+
2.360×10⁻²
3.659×10⁻²
Alanine 5.261 ×10⁻¹
2.357×10⁻²
Proline 1.267×10⁻²
2.369×10⁻²
Serine 1.431×10⁻²
2.247×10⁻¹
AP
K+ 6.143×10
-1 2.357×10
-2
Ca2+
8.318×10⁻²
5.247×10⁻²
AL3+
9.222×10⁻³
5.369×10⁻¹
Alanine 5.950×10⁻¹
1.247×10⁻²
Proline 8.870×10⁻²
4.365×10⁻²
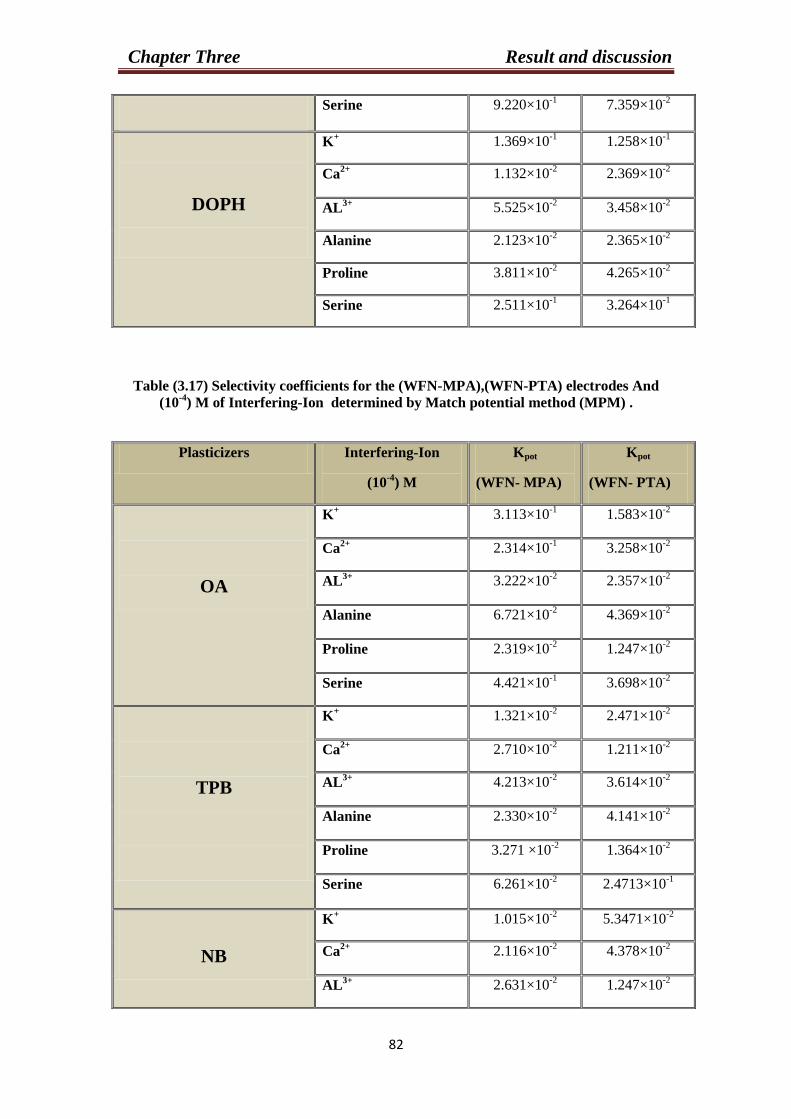
Chapter Three Result and discussion
39
Table (3.17) Selectivity coefficients for the (WFN-MPA),(WFN-PTA) electrodes And
(10-4
) M of Interfering-Ion determined by Match potential method (MPM) .
Serine 9.220×10⁻¹
7.359×10⁻²
DOPH
K+
1.369×10⁻¹
1.258×10⁻¹
Ca2+
1.132×10⁻²
2.369×10⁻²
AL3+ 5.525×10
-2 3.458×10
-2
Alanine 2.123×10⁻²
2.365×10⁻²
Proline 3.811×10⁻²
4.265×10⁻²
Serine 2.511×10⁻¹
3.264×10⁻¹
Plasticizers Interfering-Ion
(10-4
) M
Kpot
(WFN- MPA)
Kpot
(WFN- PTA)
OA
K+ 3.113×10
-1 1.583×10⁻²
Ca2+
2.314×10⁻¹
3.258×10⁻²
AL3+
3.222×10⁻²
2.357×10⁻²
Alanine 6.721×10⁻²
4.369×10⁻²
Proline 2.319×10⁻² 1.247×10
-2
Serine 4.421×10⁻¹
3.698×10⁻²
TPB
K+ 1.321×10
-2 2.471×10
-2
Ca2+
2.710×10⁻²
1.211×10⁻²
AL3+
4.213×10⁻²
3.614×10⁻²
Alanine 2.330×10⁻²
4.141×10⁻²
Proline 3.271 ×10⁻²
1.364×10⁻²
Serine 6.261×10⁻²
2.4713×10⁻¹
NB
K+
1.015×10⁻²
5.3471×10⁻²
Ca2+
2.116×10⁻²
4.378×10⁻²
AL3+
2.631×10⁻²
1.247×10⁻²
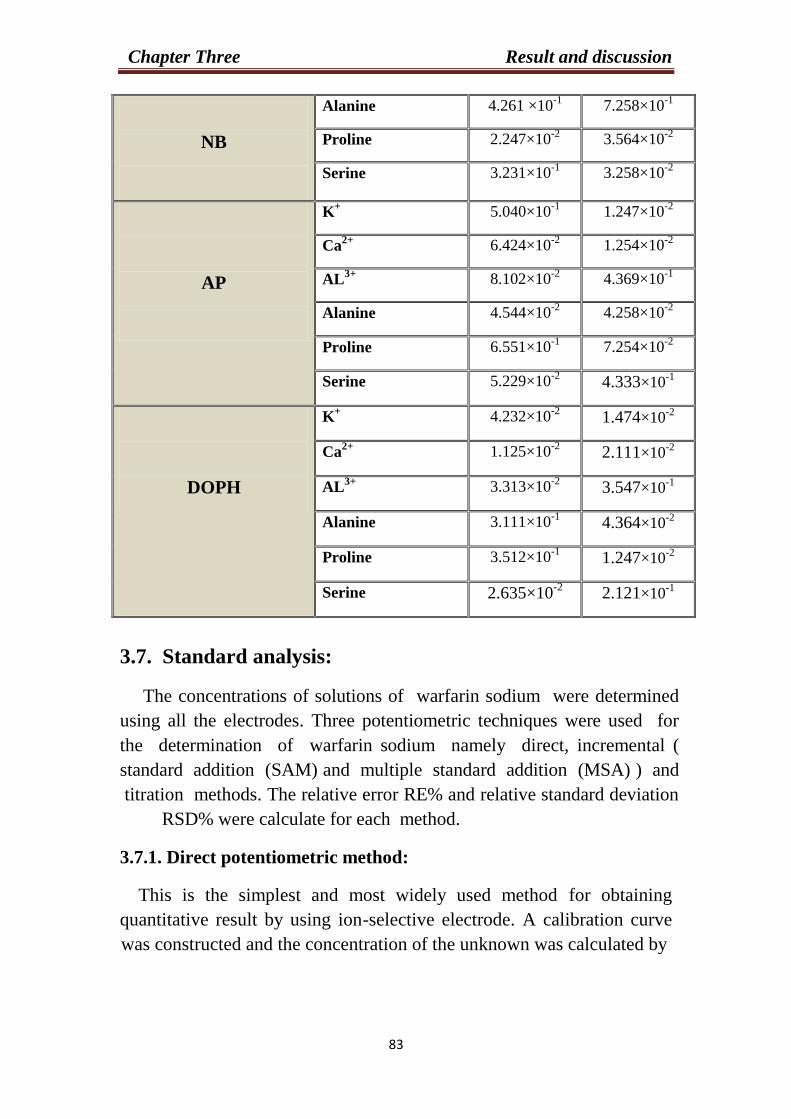
Chapter Three Result and discussion
30
3.7. Standard analysis:
The concentrations of solutions of warfarin sodium were determined
using all the electrodes. Three potentiometric techniques were used for
the determination of warfarin sodium namely direct, incremental (
standard addition (SAM) and multiple standard addition (MSA) ) and
titration methods. The relative error RE% and relative standard deviation
RSD% were calculate for each method.
3.7.1. Direct potentiometric method:
This is the simplest and most widely used method for obtaining
quantitative result by using ion-selective electrode. A calibration curve
was constructed and the concentration of the unknown was calculated by
NB
Alanine 4.261 ×10⁻¹
7.258×10⁻¹
Proline 2.247×10⁻²
3.564×10⁻²
Serine 3.231×10⁻¹
3.258×10⁻²
AP
K+
5.040×10⁻¹
1.247×10⁻²
Ca2+
6.424×10⁻²
1.254×10⁻²
AL3+
8.102×10⁻²
4.369×10⁻¹
Alanine 4.544×10⁻²
4.258×10⁻²
Proline 6.551×10⁻¹
7.254×10⁻²
Serine 5.229×10⁻²
4.333×10⁻¹
DOPH
K+
4.232×10⁻²
1.474×10⁻²
Ca2+
1.125×10⁻²
2.111×10⁻²
AL3+
3.313×10⁻²
3.547×10⁻¹
Alanine 3.111×10⁻¹
4.364×10⁻²
Proline 3.512×10⁻¹
1.247×10⁻²
Serine 2.635×10⁻² 2.121×10
-1
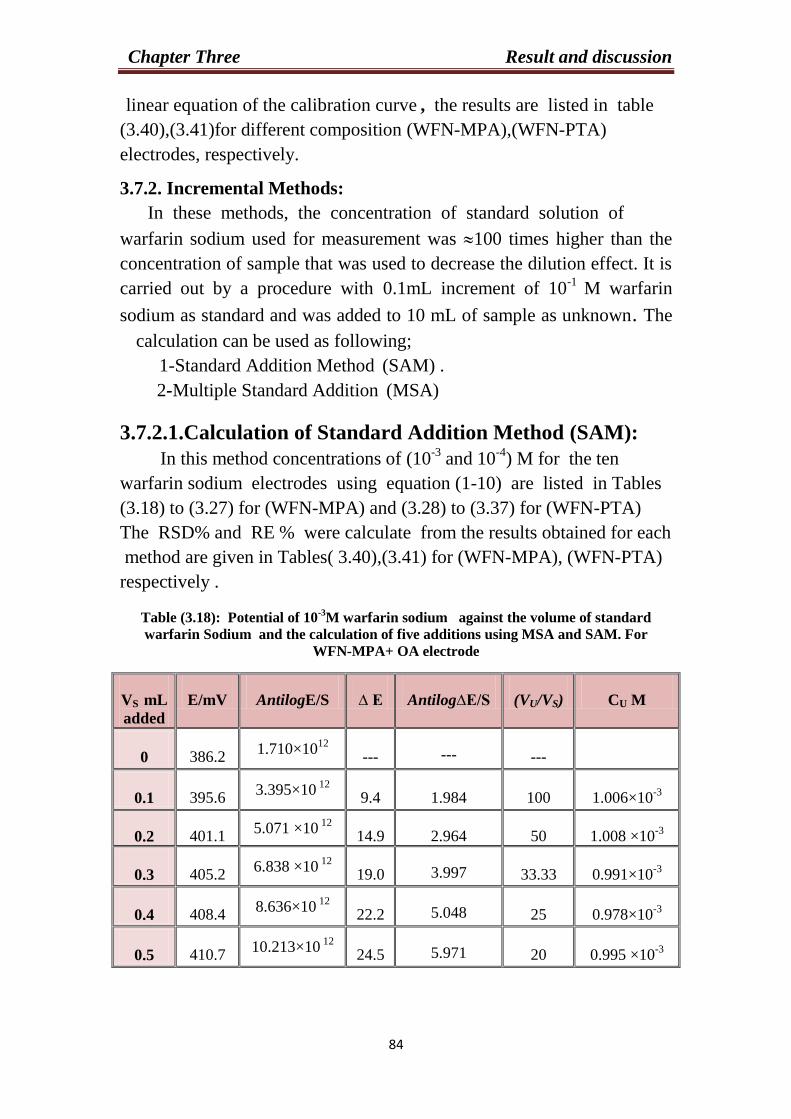
Chapter Three Result and discussion
33
linear equation of the calibration curve , the results are listed in table
(3.40),(3.41)for different composition (WFN-MPA),(WFN-PTA)
electrodes, respectively.
3.7.2. Incremental Methods:
In these methods, the concentration of standard solution of
warfarin sodium used for measurement was 100 times higher than the
concentration of sample that was used to decrease the dilution effect. It is
carried out by a procedure with 0.1mL increment of 10-1
M warfarin
sodium as standard and was added to 10 mL of sample as unknown. The
calculation can be used as following;
1-Standard Addition Method (SAM) .
2-Multiple Standard Addition (MSA)
3.7.2.1.Calculation of Standard Addition Method (SAM):
In this method concentrations of (10-3
and 10-4
) M for the ten
warfarin sodium electrodes using equation (1-10) are listed in Tables
(3.18) to (3.27) for (WFN-MPA) and (3.28) to (3.37) for (WFN-PTA)
The RSD% and RE % were calculate from the results obtained for each
method are given in Tables( 3.40),(3.41) for (WFN-MPA), (WFN-PTA)
respectively .
Table (3.18): Potential of 10-3
M warfarin sodium against the volume of standard
warfarin Sodium and the calculation of five additions using MSA and SAM. For
WFN-MPA+ OA electrode
VS mL
added
E/mV AntilogE/S ∆ E Antilog∆E/S (VU/VS) CU M
0 386.2 1.710×10
12
--- --- ---
0.1 395.6 3.395×10
12
9.4 1.984 100 1.006×10⁻³
0.2 401.1 5.071 ×10
12
14.9 2.964 50 1.008 ×10⁻³
0.3 405.2 6.838 ×10
12
19.0 3.997 33.33 0.991×10⁻³
0.4 408.4 8.636×10
12
22.2 5.048 25 0.978×10⁻³
0.5 410.7 10.213×10
12
24.5 5.971 20 0.995 ×10⁻³
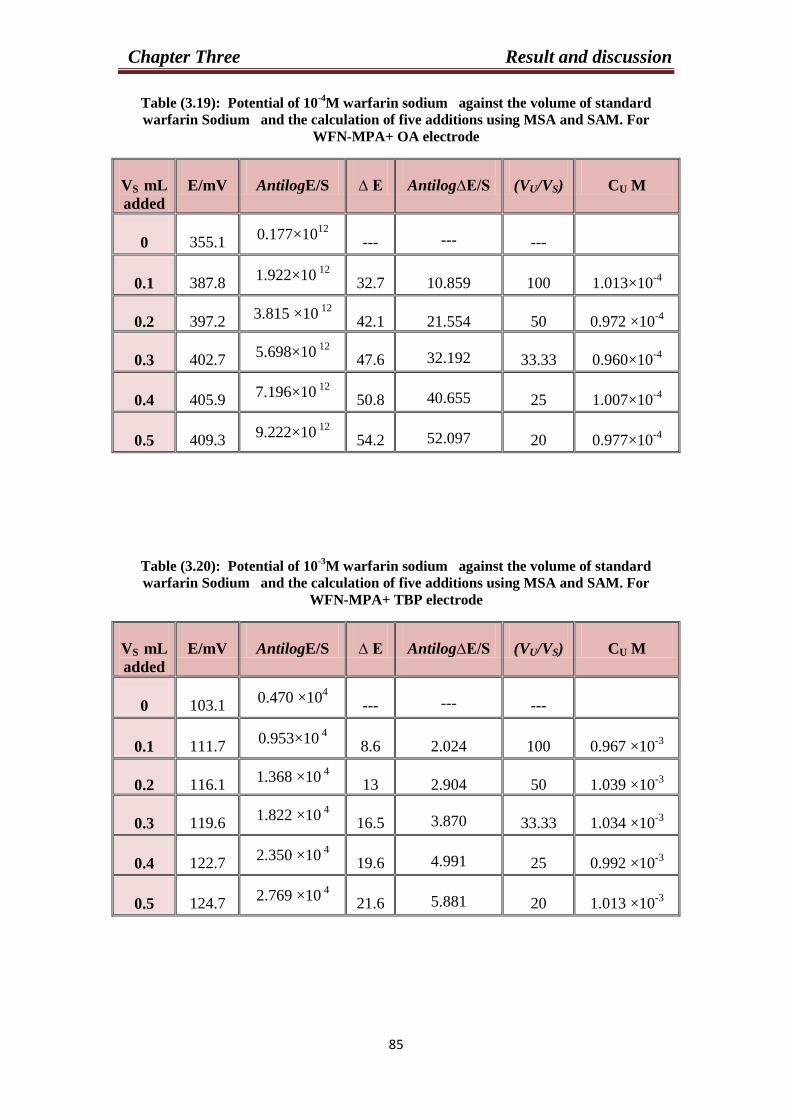
Chapter Three Result and discussion
33
Table (3.19): Potential of 10-4
M warfarin sodium against the volume of standard
warfarin Sodium and the calculation of five additions using MSA and SAM. For
WFN-MPA+ OA electrode
VS mL
added
E/mV AntilogE/S ∆ E Antilog∆E/S (VU/VS) CU M
0 355.1 0.177×10
12
--- --- ---
0.1 387.8 1.922×10
12
32.7 10.859 100 1.013×10⁻⁴
0.2 397.2 3.815 ×10
12
42.1 21.554 50 0.972 ×10⁻⁴
0.3 402.7 5.698×10
12
47.6 32.192 33.33 0.960×10⁻⁴
0.4 405.9 7.196×10
12
50.8 40.655 25 1.007×10⁻⁴
0.5 409.3 9.222×10
12
54.2 52.097 20 0.977×10⁻⁴
Table (3.20): Potential of 10-3
M warfarin sodium against the volume of standard
warfarin Sodium and the calculation of five additions using MSA and SAM. For
WFN-MPA+ TBP electrode
VS mL
added
E/mV AntilogE/S ∆ E Antilog∆E/S (VU/VS) CU M
0 103.1 0.470 ×10
4
--- --- ---
0.1 111.7 0.953×10
4 8.6 2.024 100 0.967 ×10
-3
0.2 116.1 1.368 ×10
4
13 2.904 50 1.039 ×10⁻³
0.3 119.6 1.822 ×10
4 16.5 3.870 33.33 1.034 ×10
-3
0.4 122.7 2.350 ×10
4
19.6 4.991 25 0.992 ×10⁻³
0.5 124.7 2.769 ×10
4
21.6 5.881 20 1.013 ×10⁻³

Chapter Three Result and discussion
33
Table (3.21): Potential of 10-4
M warfarin sodium against the volume of standard
warfarin Sodium and the calculation of five additions using MSA and SAM. For
WFN-MPA+ TBP electrode
VS mL
added
E/mV AntilogE/S ∆ E Antilog∆E/S (VU/VS) CU M
0 74.8 0.046 ×10
4
--- --- ---
0.1 105.2 0.559 ×10
4
30.4 12.007 100 0.907 ×10⁻⁴
0.2 112.0 0.977 ×10
4
37.2 21.147 50 0.990 ×10⁻⁴
0.3 116.9 1.460 ×10
4
42.1 31.609 33.33 0.979×10⁻⁴
0.4 120.6 1.978 ×10
4
45.8 42.818 25 0.956 ×10⁻⁴
0.5 123.2 2.449 ×10
4
48.4 52.998 20 0.960 ×10⁻⁴
Table (3.22): Potential of 10-3
M warfarin sodium against the volume of standard
warfarin Sodium and the calculation of five additions using MSA and SAM. For
WFN-MPA+ NB electrode
VS mL
added
E/mV AntilogE/S ∆ E Antilog∆E/S (VU/VS) CU M
0 179.8 1.495×10
7
--- --- ---
0.1 186.6 2.793 ×10
7 6.8 1.867 100 1.110 ×10
-3
0.2 191.7 4.463 ×10
7
11.9 2.984 50 0.998 ×10⁻³
0.3 195.0 6.044 ×10
7
15.2 4.041 33.33 0.977 ×10⁻³
0.4 197.4 7.535 ×10
7
17.6 5.038 25 0.980 ×10⁻³
0.5 199.1 8.809 ×10
7
19.3 5.890 20 1.012 ×10⁻³

Chapter Three Result and discussion
33
Table (3.23): Potential of 10-4
M warfarin sodium against the volume of standard
warfarin Sodium and the calculation of five additions using MSA and SAM. For
WFN-MPA+ NB electrode
VS mL
added
E/mV AntilogE/S ∆ E Antilog∆E/S (VU/VS) CU M
0 155.5 0.160 ×10
7
--- --- ---
0.1 180.3 1.565 ×10
7
24.8 9.763 100 1.130 ×10⁻⁴
0.2 187.8 3.118 ×10
7
32.3 19.449 50 1.082 ×10⁻⁴
0.3 192.7 4.892 ×10
7
37.2 30.509 33.33 1.015 ×10⁻⁴
0.4 195.1 6.099 ×10
7
39.6 38.037 25 1.078 ×10⁻⁴
0.5 197.5 7.604 ×10
7 42.0 47.421 20 1.075 ×10
-4
Table (3.24): Potential of 10-3
M warfarin sodium against the volume of standard
warfarin Sodium and the calculation of five additions using MSA and SAM. For
WFN-MPA+ AP electrode
VS mL
added
E/mV AntilogE/S ∆ E Antilog∆E/S (VU/VS) CU M
0 22.1 1.092 ×10
1
--- --- ---
0.1 28.4 2.160 ×10
1 6.3 1.977 100 1.013 ×10
-3
0.2 32.3 3.295 ×10
1
10.2 3.015 50 0. 982 ×10-3
0.3 34.8 4.318 ×10
1
12.7 3.951 33.33 1.006 ×10⁻³
0.4 36.7 5.304 ×10
1
14.6 4.853 25 1.027 ×10⁻³
0.5 38.6 6.514 ×10
1
16.5 5.961 20 0.997 ×10⁻³
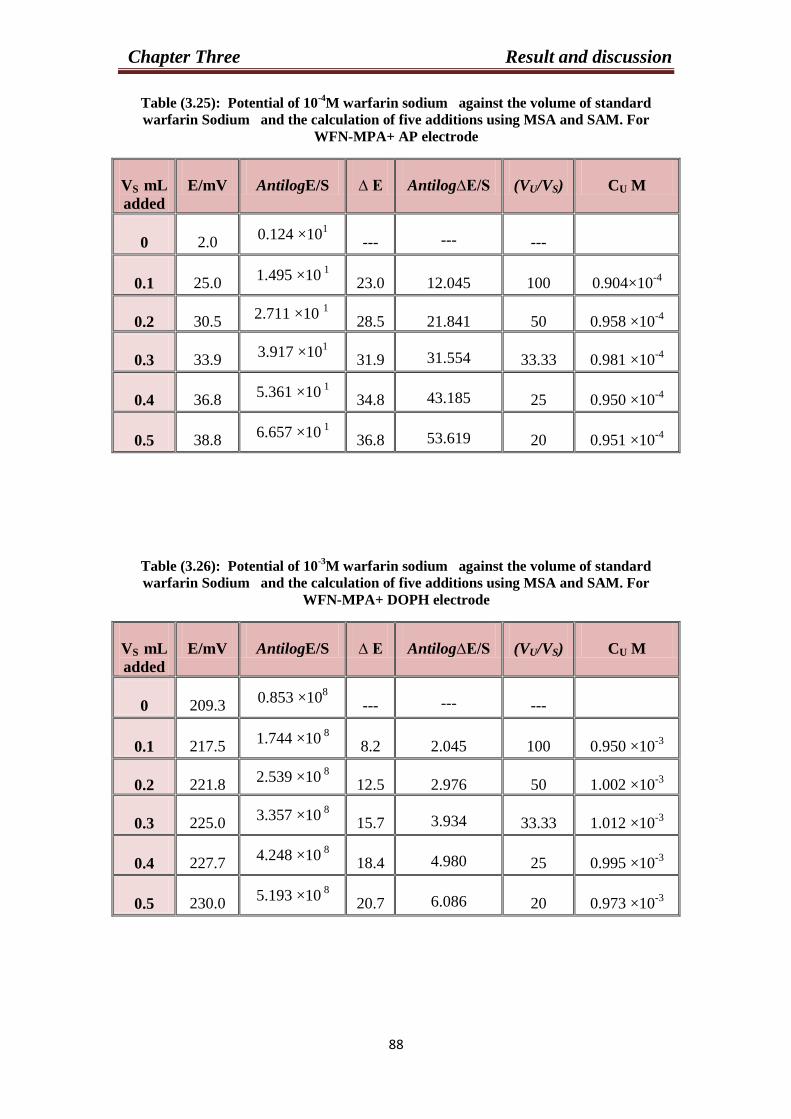
Chapter Three Result and discussion
33
Table (3.25): Potential of 10-4
M warfarin sodium against the volume of standard
warfarin Sodium and the calculation of five additions using MSA and SAM. For
WFN-MPA+ AP electrode
VS mL
added
E/mV AntilogE/S ∆ E Antilog∆E/S (VU/VS) CU M
0 2.0 0.124 ×10
1
--- --- ---
0.1 25.0 1.495 ×10
1
23.0 12.045 100 0.904×10⁻⁴
0.2 30.5 2.711 ×10
1
28.5 21.841 50 0.958 ×10⁻⁴
0.3 33.9 3.917 ×10
1
31.9 31.554 33.33 0.981 ×10⁻⁴
0.4 36.8 5.361 ×10
1
34.8 43.185 25 0.950 ×10⁻⁴
0.5 38.8 6.657 ×10
1
36.8 53.619 20 0.951 ×10⁻⁴
Table (3.26): Potential of 10-3
M warfarin sodium against the volume of standard
warfarin Sodium and the calculation of five additions using MSA and SAM. For
WFN-MPA+ DOPH electrode
VS mL
added
E/mV AntilogE/S ∆ E Antilog∆E/S (VU/VS) CU M
0 209.3 0.853 ×10
8
--- --- ---
0.1 217.5 1.744 ×10
8 8.2 2.045 100 0.950 ×10
-3
0.2 221.8 2.539 ×10
8
12.5 2.976 50 1.002 ×10⁻³
0.3 225.0 3.357 ×10
8
15.7 3.934 33.33 1.012 ×10⁻³
0.4 227.7 4.248 ×10
8
18.4 4.980 25 0.995 ×10⁻³
0.5 230.0 5.193 ×10
8
20.7 6.086 20 0.973 ×10⁻³

Chapter Three Result and discussion
32
Table (3.27): Potential of 10-4
M warfarin sodium against the volume of standard
warfarin Sodium and the calculation of five additions using MSA and SAM. For
WFN-MPA+ DOPH electrode
VS mL
added
E/mV AntilogE/S ∆ E Antilog∆E/S (VU/VS) CU M
0 183.2 0.087 ×10
8
--- --- ---
0.1 211.1 0.998 ×10
8
27.9 11.408 100 0.959 ×10⁻⁴
0.2 218.0 1.822 ×10
8
34.8 20.829 50 1.007 ×10⁻⁴
0.3 222.4 2.675 ×10
8
39.2 30.578 33.33 1.013 ×10⁻⁴
0.4 225.9 3.631 ×10
8
42.7 41.498 25 0.986 ×10⁻⁴
0.5 228.3 4.477 ×10
8
45.1 51.165 20 0.995×10⁻⁴
Table (3.28): Potential of 10-3
M warfarin sodium against the volume of standard
warfarin Sodium and the calculation of five additions using MSA and SAM. For
WFN-PTA+ OA electrode
VS mL
added
E/mV AntilogE/S ∆ E Antilog∆E/S (VU/VS) CU M
0 66.1 1.704×10
2
-- -- -- --
0.1 75.3 3.484×10
2
9.2 2.044 100 0.948×10 -3
0.2 80.0 5.022×10
2
13.9 2.946 50 1.017×10 -3
0.3 83.5 6.592×10
2
17.4 3.867 33.33 1.035×10 -3
0.4 86.6 8.388×10
2
20.5 4.921 25. 1.009×10 -3
0.5 89.4 10.428×10
2
23.3 6.118 20 0.967×10 -3
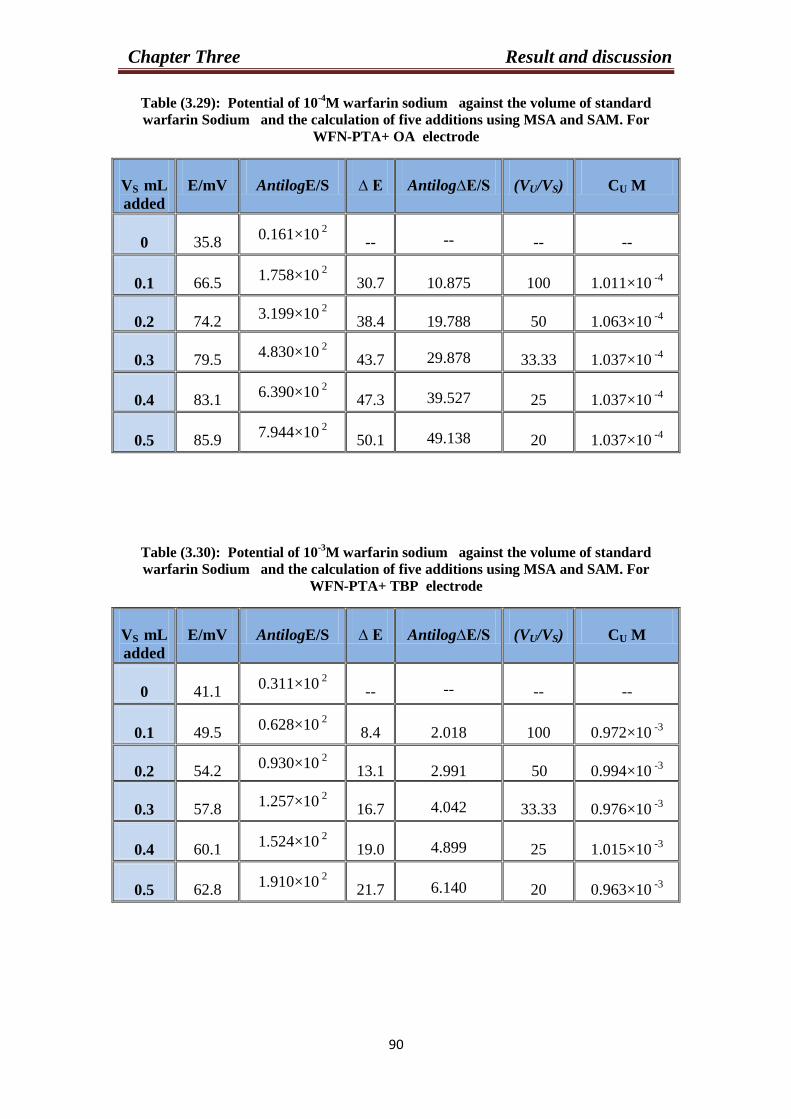
Chapter Three Result and discussion
23
Table (3.29): Potential of 10-4
M warfarin sodium against the volume of standard
warfarin Sodium and the calculation of five additions using MSA and SAM. For
WFN-PTA+ OA electrode
VS mL
added
E/mV AntilogE/S ∆ E Antilog∆E/S (VU/VS) CU M
0 35.8 0.161×10
2
-- -- -- --
0.1 66.5 1.758×10
2
30.7 10.875 100 1.011×10 -4
0.2 74.2 3.199×10
2
38.4 19.788 50 1.063×10 -4
0.3 79.5 4.830×10
2
43.7 29.878 33.33 1.037×10 -4
0.4 83.1 6.390×10
2
47.3 39.527 25 1.037×10 -4
0.5 85.9 7.944×10
2
50.1 49.138 20 1.037×10 -4
Table (3.30): Potential of 10-3
M warfarin sodium against the volume of standard
warfarin Sodium and the calculation of five additions using MSA and SAM. For
WFN-PTA+ TBP electrode
VS mL
added
E/mV AntilogE/S ∆ E Antilog∆E/S (VU/VS) CU M
0 41.1 0.311×10
2
-- -- -- --
0.1 49.5 0.628×10
2
8.4 2.018 100 0.972×10 -3
0.2 54.2 0.930×10
2
13.1 2.991 50 0.994×10 -3
0.3 57.8 1.257×10
2
16.7 4.042 33.33 0.976×10 -3
0.4 60.1 1.524×10
2
19.0 4.899 25 1.015×10 -3
0.5 62.8 1.910×10
2
21.7 6.140 20 0.963×10 -3
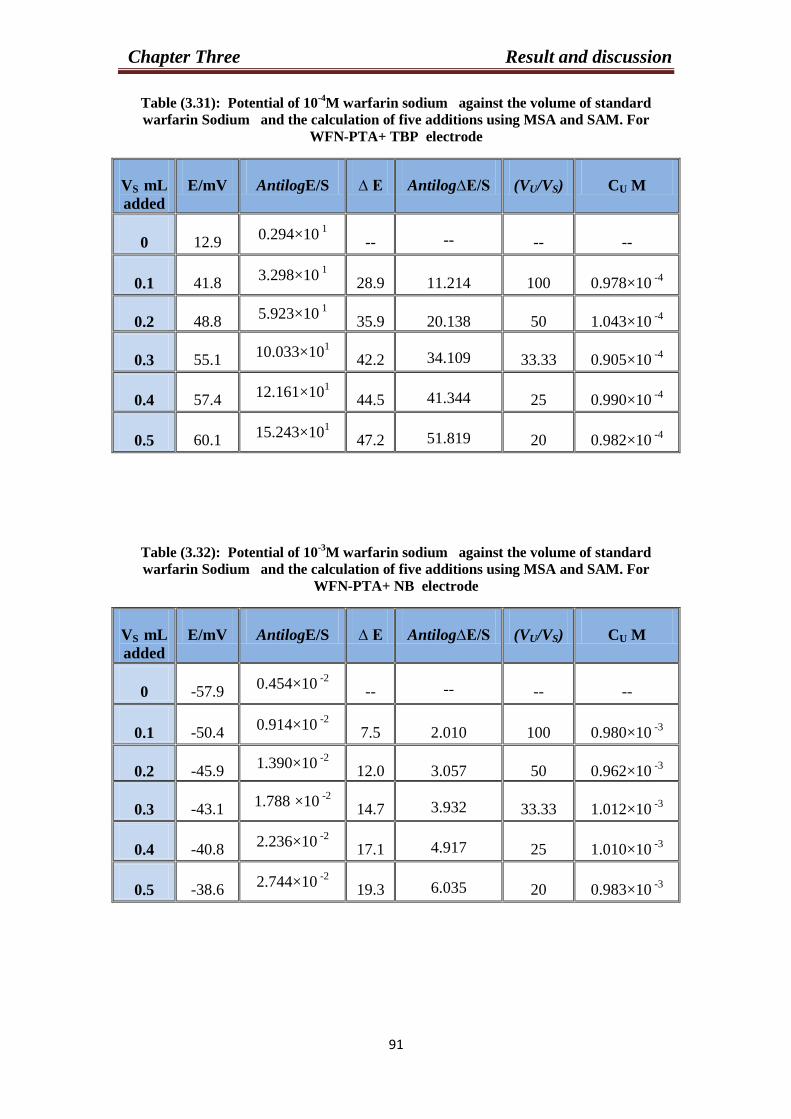
Chapter Three Result and discussion
23
Table (3.31): Potential of 10-4
M warfarin sodium against the volume of standard
warfarin Sodium and the calculation of five additions using MSA and SAM. For
WFN-PTA+ TBP electrode
VS mL
added
E/mV AntilogE/S ∆ E Antilog∆E/S (VU/VS) CU M
0 12.9 0.294×10
1 -- -- -- --
0.1 41.8 3.298×10
1
28.9 11.214 100 0.978×10 -4
0.2 48.8 5.923×10
1
35.9 20.138 50 1.043×10 -4
0.3 55.1 10.033×10
1
42.2 34.109 33.33 0.905×10 -4
0.4 57.4 12.161×10
1
44.5 41.344 25 0.990×10 -4
0.5 60.1 15.243×10
1
47.2 51.819 20 0.982×10 -4
Table (3.32): Potential of 10-3
M warfarin sodium against the volume of standard
warfarin Sodium and the calculation of five additions using MSA and SAM. For
WFN-PTA+ NB electrode
VS mL
added
E/mV AntilogE/S ∆ E Antilog∆E/S (VU/VS) CU M
0 -57.9 0.454×10
-2
-- -- -- --
0.1 -50.4 0.914×10
-2
7.5 2.010 100 0.980×10 -3
0.2 -45.9 1.390×10
-2
12.0 3.057 50 0.962×10 -3
0.3 -43.1 ×10
-2 1.788 14.7 3.932 33.33 1.012×10
-3
0.4 -40.8 2.236×10
-2
17.1 4.917 25 1.010×10 -3
0.5 -38.6 2.744×10
-2
19.3 6.035 20 0.983×10 -3
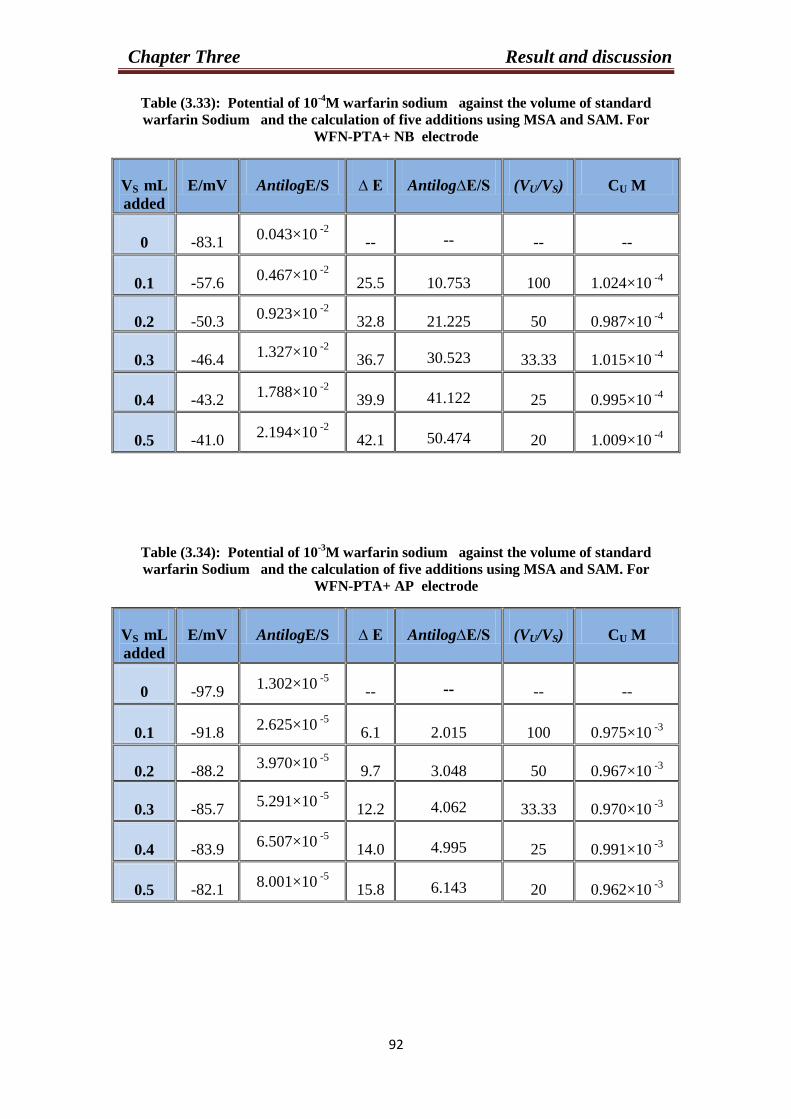
Chapter Three Result and discussion
29
Table (3.33): Potential of 10-4
M warfarin sodium against the volume of standard
warfarin Sodium and the calculation of five additions using MSA and SAM. For
WFN-PTA+ NB electrode
VS mL
added
E/mV AntilogE/S ∆ E Antilog∆E/S (VU/VS) CU M
0 -83.1 0.043×10
-2
-- -- -- --
0.1 -57.6 0.467×10
-2
25.5 10.753 100 1.024×10 -4
0.2 -50.3 0.923×10
-2
32.8 21.225 50 0.987×10 -4
0.3 -46.4 1.327×10
-2
36.7 30.523 33.33 1.015×10 -4
0.4 -43.2 1.788×10
-2
39.9 41.122 25 0.995×10 -4
0.5 -41.0 2.194×10
-2
42.1 50.474 20 1.009×10 -4
Table (3.34): Potential of 10-3
M warfarin sodium against the volume of standard
warfarin Sodium and the calculation of five additions using MSA and SAM. For
WFN-PTA+ AP electrode
VS mL
added
E/mV AntilogE/S ∆ E Antilog∆E/S (VU/VS) CU M
0 -97.9 1.302×10
-5
-- -- -- --
0.1 -91.8 2.625×10
-5
6.1 2.015 100 0.975×10 -3
0.2 -88.2 3.970×10
-5
9.7 3.048 50 0.967×10 -3
0.3 -85.7 5.291×10
-5
12.2 4.062 33.33 0.970×10 -3
0.4 -83.9 6.507×10
-5
14.0 4.995 25 0.991×10 -3
0.5 -82.1 8.001×10
-5
15.8 6.143 20 0.962×10 -3
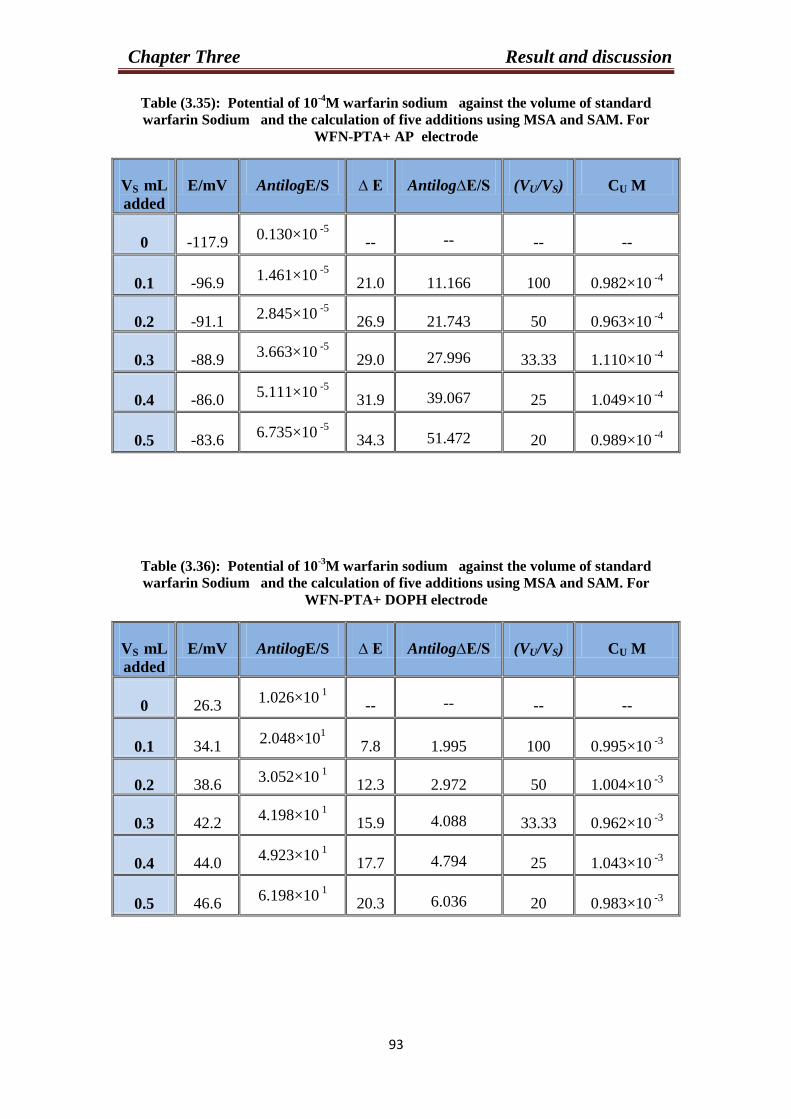
Chapter Three Result and discussion
20
Table (3.35): Potential of 10-4
M warfarin sodium against the volume of standard
warfarin Sodium and the calculation of five additions using MSA and SAM. For
WFN-PTA+ AP electrode
VS mL
added
E/mV AntilogE/S ∆ E Antilog∆E/S (VU/VS) CU M
0 -117.9 0.130×10
-5
-- -- -- --
0.1 -96.9 1.461×10
-5
21.0 11.166 100 0.982×10 -4
0.2 -91.1 2.845×10
-5
26.9 21.743 50 0.963×10 -4
0.3 -88.9 3.663×10
-5
29.0 27.996 33.33 1.110×10 -4
0.4 -86.0 5.111×10
-5
31.9 39.067 25 1.049×10 -4
0.5 -83.6 6.735×10
-5
34.3 51.472 20 0.989×10 -4
Table (3.36): Potential of 10-3
M warfarin sodium against the volume of standard
warfarin Sodium and the calculation of five additions using MSA and SAM. For
WFN-PTA+ DOPH electrode
VS mL
added
E/mV AntilogE/S ∆ E Antilog∆E/S (VU/VS) CU M
0 26.3 1.026×10
1
-- -- -- --
0.1 34.1 2.048×10
1
7.8 1.995 100 0.995×10 -3
0.2 38.6 3.052×10
1
12.3 2.972 50 1.004×10 -3
0.3 42.2 4.198×10
1
15.9 4.088 33.33 0.962×10 -3
0.4 44.0 4.923×10
1
17.7 4.794 25 1.043×10 -3
0.5 46.6 6.198×10
1
20.3 6.036 20 0.983×10 -3
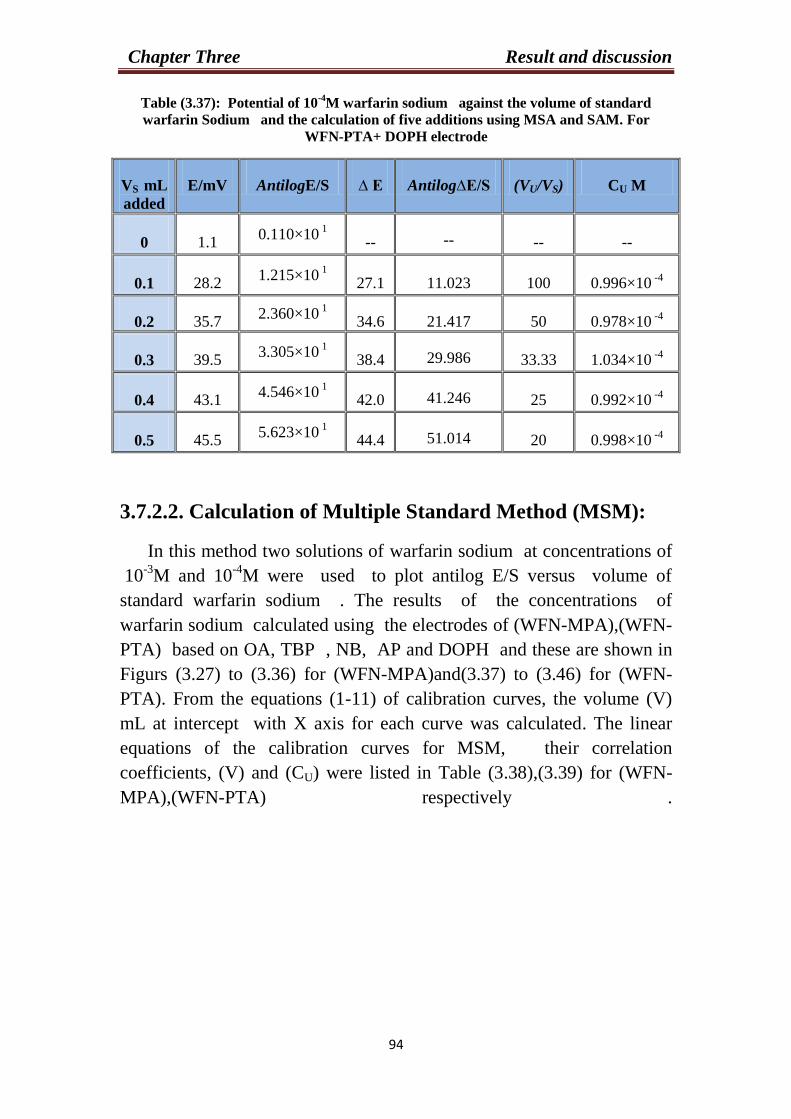
Chapter Three Result and discussion
23
Table (3.37): Potential of 10-4
M warfarin sodium against the volume of standard
warfarin Sodium and the calculation of five additions using MSA and SAM. For
WFN-PTA+ DOPH electrode
VS mL
added
E/mV AntilogE/S ∆ E Antilog∆E/S (VU/VS) CU M
0 1.1 0.110×10
1
-- -- -- --
0.1 28.2 1.215×10
1
27.1 11.023 100 0.996×10 -4
0.2 35.7 2.360×10
1
34.6 21.417 50 0.978×10 -4
0.3 39.5 3.305×10
1
38.4 29.986 33.33 1.034×10 -4
0.4 43.1 4.546×10
1
42.0 41.246 25 0.992×10 -4
0.5 45.5 5.623×10
1
44.4 51.014 20 0.998×10 -4
3.7.2.2. Calculation of Multiple Standard Method (MSM):
In this method two solutions of warfarin sodium at concentrations of
10-3
M and 10-4
M were used to plot antilog E/S versus volume of
standard warfarin sodium . The results of the concentrations of
warfarin sodium calculated using the electrodes of (WFN-MPA),(WFN-
PTA) based on OA, TBP , NB, AP and DOPH and these are shown in
Figurs (3.27) to (3.36) for (WFN-MPA)and(3.37) to (3.46) for (WFN-
PTA). From the equations (1-11) of calibration curves, the volume (V)
mL at intercept with X axis for each curve was calculated. The linear
equations of the calibration curves for MSM, their correlation
coefficients, (V) and (CU) were listed in Table (3.38),(3.39) for (WFN-
MPA),(WFN-PTA) respectively .
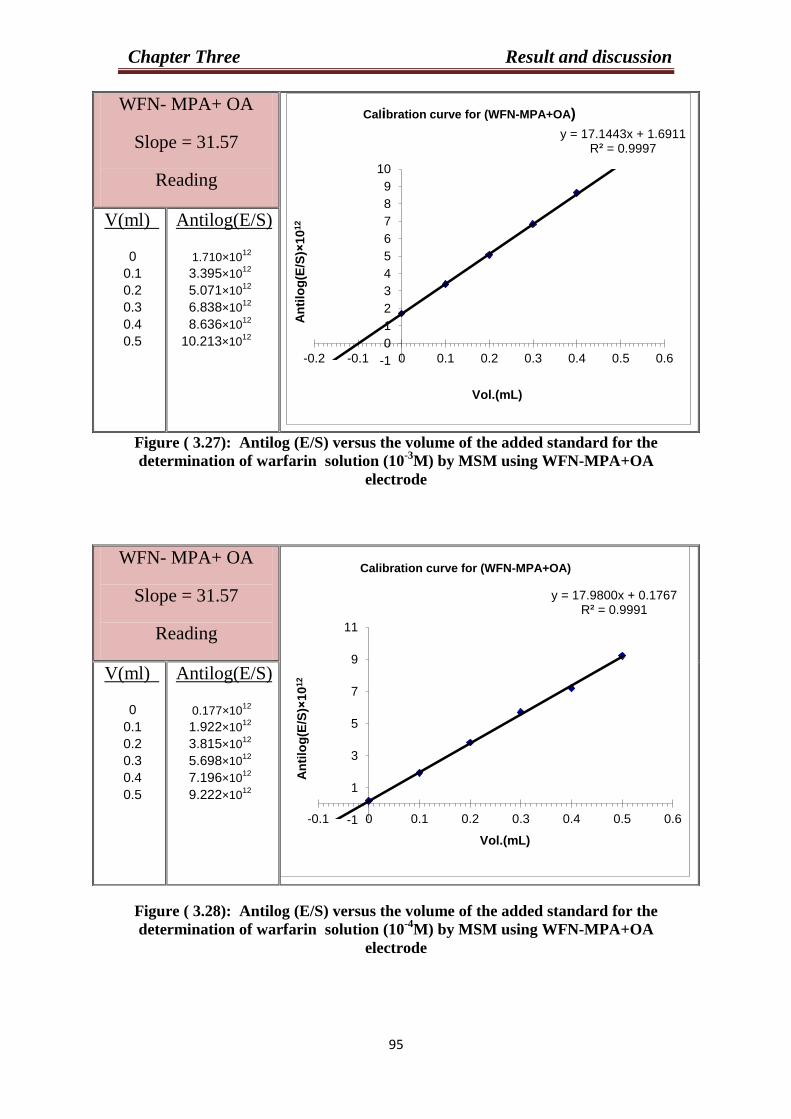
Chapter Three Result and discussion
23
Figure ( 3.27): Antilog (E/S) versus the volume of the added standard for the
determination of warfarin solution (10-3
M) by MSM using WFN-MPA+OA
electrode
Figure ( 3.28): Antilog (E/S) versus the volume of the added standard for the
determination of warfarin solution (10-4
M) by MSM using WFN-MPA+OA
electrode
WFN- MPA+ OA
Slope = 31.57
Reading
V(ml)
0
0.1
0.2
0.3
0.4
0.5
Antilog(E/S)
1.710×10¹²
3.395×10¹²
5.071×10¹²
6.838×10¹²
8.636×10¹²
10.213×10¹²
WFN- MPA+ OA
Slope = 31.57
Reading
V(ml)
0
0.1
0.2
0.3
0.4
0.5
Antilog(E/S)
0.177×10¹²
1.922×10¹²
3.815×10¹²
5.698×10¹²
7.196×10¹²
9.222×10¹²
y = 17.1443x + 1.6911 R² = 0.9997
-1
0
1
2
3
4
5
6
7
8
9
10
-0.2 -0.1 0 0.1 0.2 0.3 0.4 0.5 0.6
An
tilo
g(E
/S)×
10
12
Vol.(mL)
Calibration curve for (WFN-MPA+OA)
y = 17.9800x + 0.1767 R² = 0.9991
-1
1
3
5
7
9
11
-0.1 0 0.1 0.2 0.3 0.4 0.5 0.6
An
tilo
g(E
/S)×
10
12
Vol.(mL)
Calibration curve for (WFN-MPA+OA)
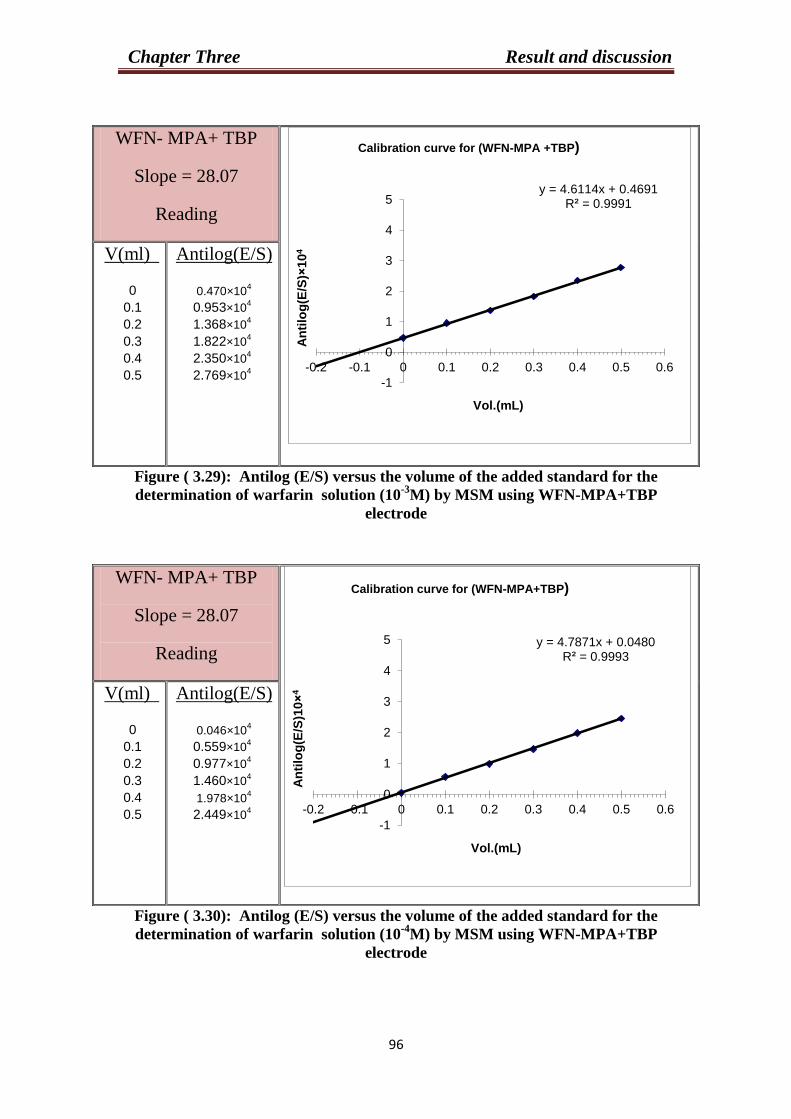
Chapter Three Result and discussion
23
Figure ( 3.29): Antilog (E/S) versus the volume of the added standard for the
determination of warfarin solution (10-3
M) by MSM using WFN-MPA+TBP
electrode
Figure ( 3.30): Antilog (E/S) versus the volume of the added standard for the
determination of warfarin solution (10-4
M) by MSM using WFN-MPA+TBP
electrode
WFN- MPA+ TBP
Slope = 28.07
Reading
V(ml)
0
0.1
0.2
0.3
0.4
0.5
Antilog(E/S)
0.470×10⁴
0.953×10⁴
1.368×10⁴
1.822×10⁴
2.350×10⁴
2.769×10⁴
WFN- MPA+ TBP
Slope = 28.07
Reading
V(ml)
0
0.1
0.2
0.3
0.4
0.5
Antilog(E/S)
0.046×10⁴
0.559×10⁴
0.977×10⁴
1.460×10⁴
1.978×10⁴
2.449×10⁴
y = 4.6114x + 0.4691 R² = 0.9991
-1
0
1
2
3
4
5
-0.2 -0.1 0 0.1 0.2 0.3 0.4 0.5 0.6
An
tilo
g(E
/S)×
10
4
Vol.(mL)
Calibration curve for (WFN-MPA +TBP)
y = 4.7871x + 0.0480 R² = 0.9993
-1
0
1
2
3
4
5
-0.2 -0.1 0 0.1 0.2 0.3 0.4 0.5 0.6
An
tilo
g(E
/S)1
0×
4
Vol.(mL)
Calibration curve for (WFN-MPA+TBP)

Chapter Three Result and discussion
23
Figure ( 3.31): Antilog (E/S) versus the volume of the added standard for the
determination of warfarin solution (10-3
M) by MSM using WFN-MPA+NB
electrode
Figure ( 3.32): Antilog (E/S) versus the volume of the added standard for the
determination of warfarin solution (10-4
M) by MSM using WFN-MPA+NB
electrode
WFN- MPA+ NB
Slope = 25.06
Reading
V(ml)
0
0.1
0.2
0.3
0.4
0.5
Antilog(E/S)
1.495×10⁷
2.793×10⁷
4.463×10⁷
6.044×10⁷
7.535×10⁷
8.809×10⁷
WFN- MPA+ NB
Slope = 25.06
Reading
V(ml)
0
0.1
0.2
0.3
0.4
0.5
Antilog(E/S)
0.160×10⁷
1.565×10⁷
3.118×10⁷
4.892×10⁷
6.099×10⁷
7.604×10⁷
y = 14.9649x + 1.4486 R² = 0.9984
-1
0
1
2
3
4
5
6
7
8
9
10
-0.2 -0.1 0 0.1 0.2 0.3 0.4 0.5 0.6
An
tilo
g(E
/S)×
10
7
Vol.(mL)
Calibration curve for (WFN-MPA+NB)
y = 15.0274x + 0.1495 R² = 0.9982
-1
0
1
2
3
4
5
6
7
8
9
-0.1 0 0.1 0.2 0.3 0.4 0.5 0.6
An
tilo
g(E
/S)×
10
7
Vol.(mL)
Calibration curve for (WFN-MPA+NB)
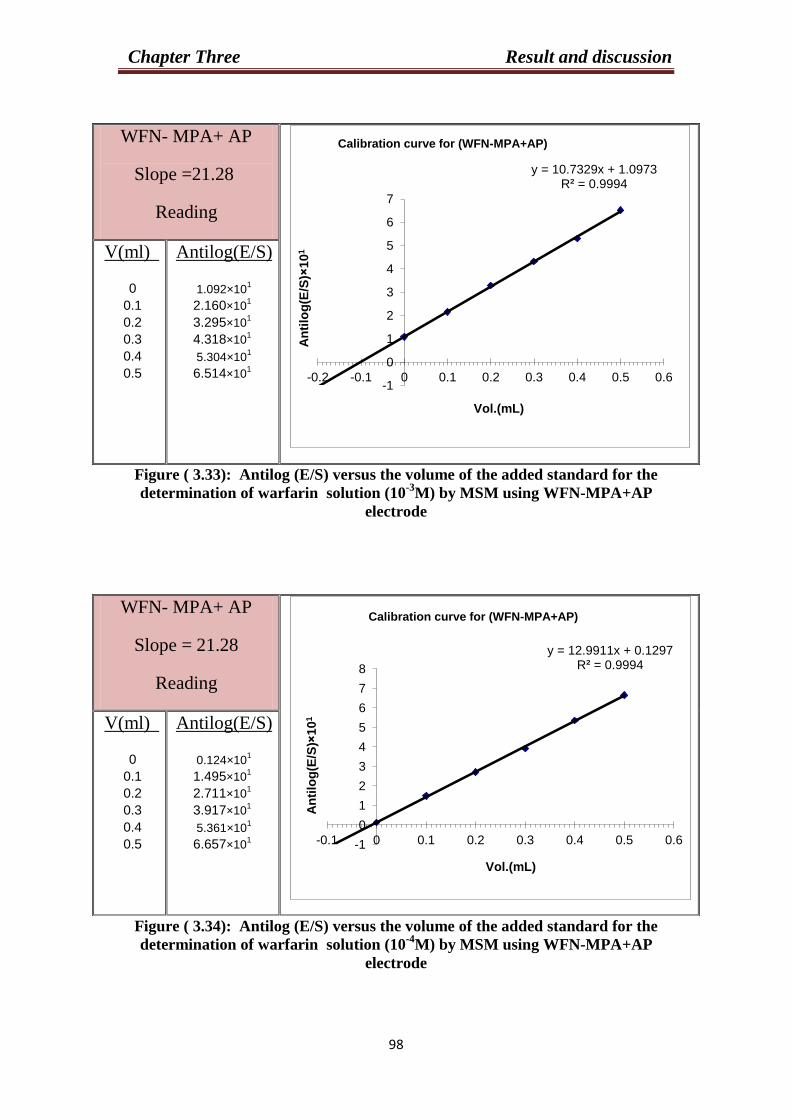
Chapter Three Result and discussion
23
Figure ( 3.33): Antilog (E/S) versus the volume of the added standard for the
determination of warfarin solution (10-3
M) by MSM using WFN-MPA+AP
electrode
Figure ( 3.34): Antilog (E/S) versus the volume of the added standard for the
determination of warfarin solution (10-4
M) by MSM using WFN-MPA+AP
electrode
WFN- MPA+ AP
Slope =21.28
Reading
V(ml)
0
0.1
0.2
0.3
0.4
0.5
Antilog(E/S)
1.092×101
2.160×101
3.295×101
4.318×101
5.304×101
6.514×101
WFN- MPA+ AP
Slope = 21.28
Reading
V(ml)
0
0.1
0.2
0.3
0.4
0.5
Antilog(E/S)
0.124×101
1.495×101
2.711×101
3.917×101
5.361×101
6.657×101
y = 10.7329x + 1.0973 R² = 0.9994
-1
0
1
2
3
4
5
6
7
-0.2 -0.1 0 0.1 0.2 0.3 0.4 0.5 0.6
An
tilo
g(E
/S)×
10
1
Vol.(mL)
Calibration curve for (WFN-MPA+AP)
y = 12.9911x + 0.1297 R² = 0.9994
-1
0
1
2
3
4
5
6
7
8
-0.1 0 0.1 0.2 0.3 0.4 0.5 0.6
An
tilo
g(E
/S)×
10
1
Vol.(mL)
Calibration curve for (WFN-MPA+AP)
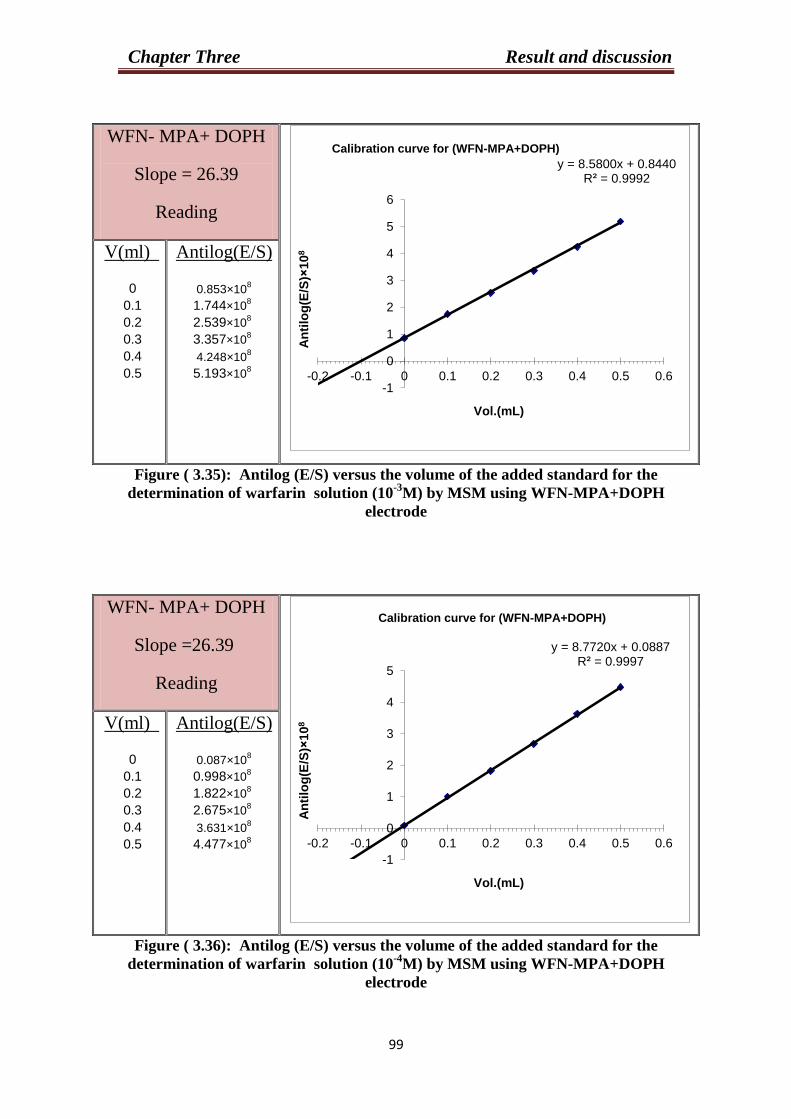
Chapter Three Result and discussion
22
Figure ( 3.35): Antilog (E/S) versus the volume of the added standard for the
determination of warfarin solution (10-3
M) by MSM using WFN-MPA+DOPH
electrode
Figure ( 3.36): Antilog (E/S) versus the volume of the added standard for the
determination of warfarin solution (10-4
M) by MSM using WFN-MPA+DOPH
electrode
WFN- MPA+ DOPH
Slope = 26.39
Reading
V(ml)
0
0.1
0.2
0.3
0.4
0.5
Antilog(E/S)
0.853×10⁸
1.744×10⁸
2.539×10⁸
3.357×10⁸
4.248×10⁸
5.193×10⁸
WFN- MPA+ DOPH
Slope =26.39
Reading
V(ml)
0
0.1
0.2
0.3
0.4
0.5
Antilog(E/S)
0.087×10⁸
0.998×10⁸
1.822×10⁸
2.675×10⁸
3.631×10⁸
4.477×10⁸
y = 8.5800x + 0.8440 R² = 0.9992
-1
0
1
2
3
4
5
6
-0.2 -0.1 0 0.1 0.2 0.3 0.4 0.5 0.6
An
tilo
g(E
/S)×
10
8
Vol.(mL)
Calibration curve for (WFN-MPA+DOPH)
y = 8.7720x + 0.0887 R² = 0.9997
-1
0
1
2
3
4
5
-0.2 -0.1 0 0.1 0.2 0.3 0.4 0.5 0.6
An
tilo
g(E
/S)×
10
8
Vol.(mL)
Calibration curve for (WFN-MPA+DOPH)
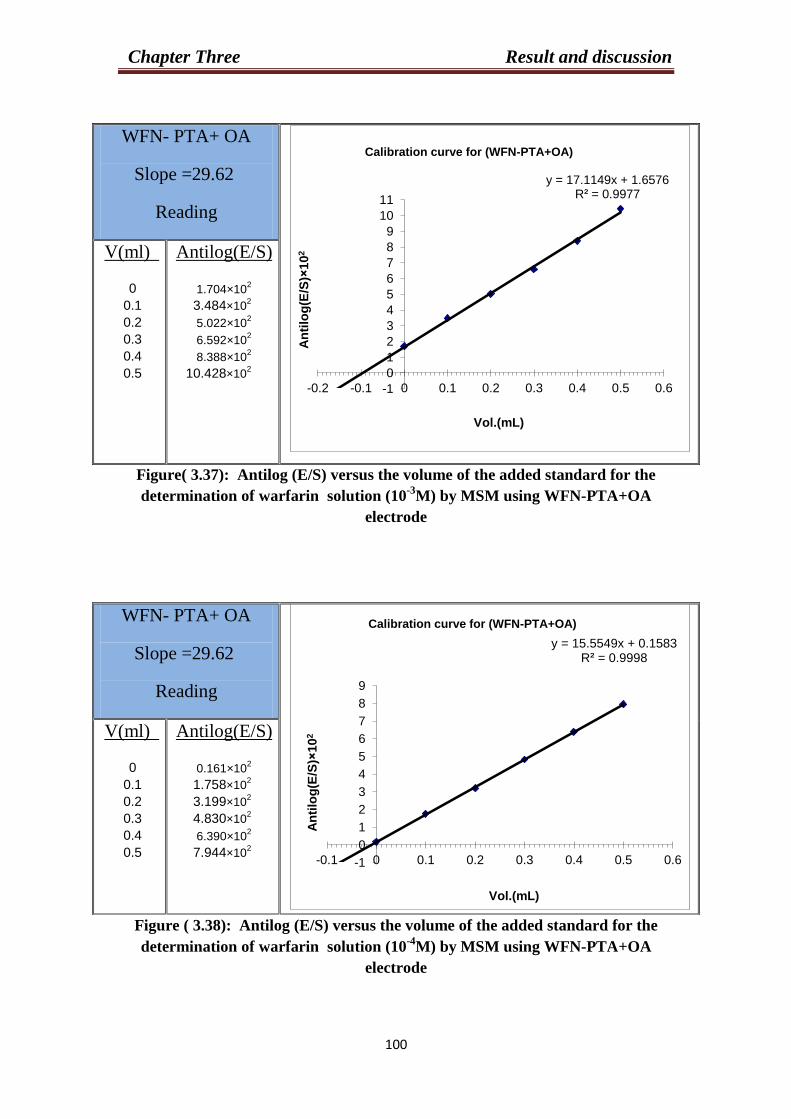
Chapter Three Result and discussion
333
Figure( 3.37): Antilog (E/S) versus the volume of the added standard for the
determination of warfarin solution (10-3
M) by MSM using WFN-PTA+OA
electrode
Figure ( 3.38): Antilog (E/S) versus the volume of the added standard for the
determination of warfarin solution (10-4
M) by MSM using WFN-PTA+OA
electrode
WFN- PTA+ OA
Slope =29.62
Reading
V(ml)
0
0.1
0.2
0.3
0.4
0.5
Antilog(E/S)
1.704×10²
3.484×10²
5.022×10²
6.592×10²
8.388×10²
10.428×10²
WFN- PTA+ OA
Slope =29.62
Reading
V(ml)
0
0.1
0.2
0.3
0.4
0.5
Antilog(E/S)
0.161×10²
1.758×10²
3.199×10²
4.830×10²
6.390×10²
7.944×10²
y = 17.1149x + 1.6576 R² = 0.9977
-1
0
1
2
3
4
5
6
7
8
9
10
11
-0.2 -0.1 0 0.1 0.2 0.3 0.4 0.5 0.6
An
tilo
g(E
/S)×
10
2
Vol.(mL)
Calibration curve for (WFN-PTA+OA)
y = 15.5549x + 0.1583 R² = 0.9998
-1
0
1
2
3
4
5
6
7
8
9
-0.1 0 0.1 0.2 0.3 0.4 0.5 0.6
An
tilo
g(E
/S)×
10
2
Vol.(mL)
Calibration curve for (WFN-PTA+OA)
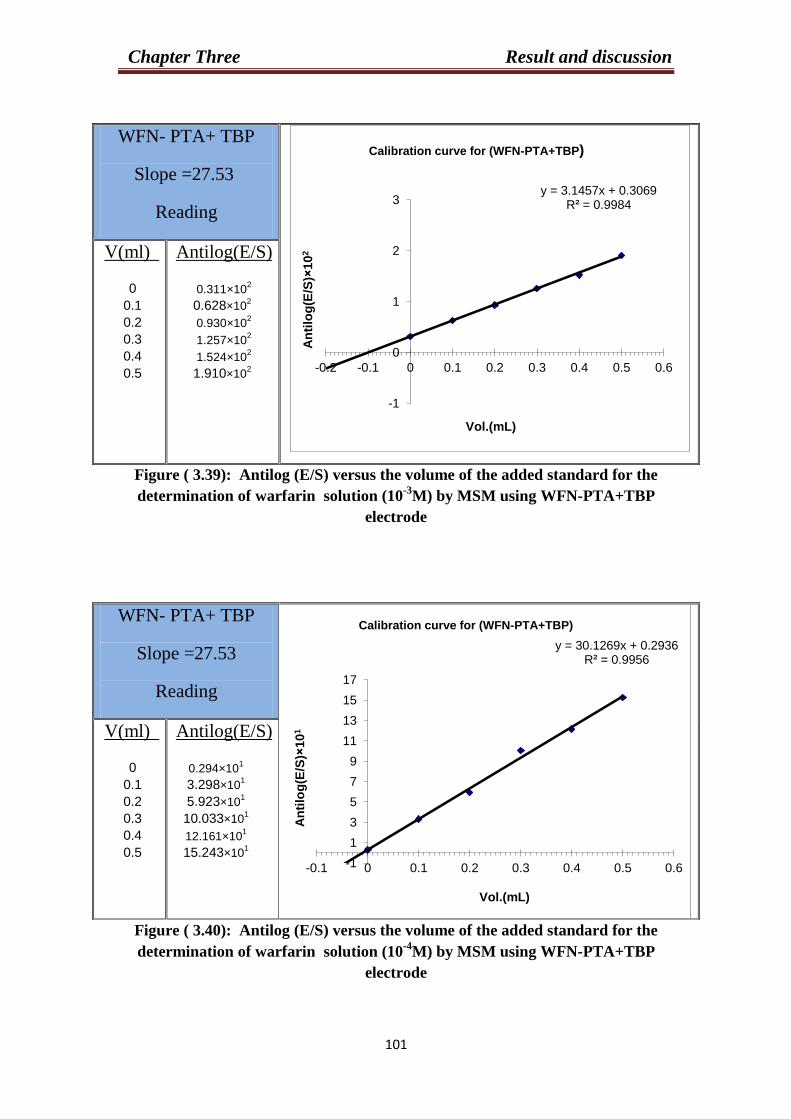
Chapter Three Result and discussion
333
Figure ( 3.39): Antilog (E/S) versus the volume of the added standard for the
determination of warfarin solution (10-3
M) by MSM using WFN-PTA+TBP
electrode
Figure ( 3.40): Antilog (E/S) versus the volume of the added standard for the
determination of warfarin solution (10-4
M) by MSM using WFN-PTA+TBP
electrode
WFN- PTA+ TBP
Slope =27.53
Reading
V(ml)
0
0.1
0.2
0.3
0.4
0.5
Antilog(E/S)
0.311×10²
0.628×10²
0.930×10²
1.257×10²
1.524×10²
1.910×10²
WFN- PTA+ TBP
Slope =27.53
Reading
V(ml)
0
0.1
0.2
0.3
0.4
0.5
Antilog(E/S)
0.294×101
3.298×101
5.923×101
10.033×101
12.161×101
15.243×101
y = 3.1457x + 0.3069 R² = 0.9984
-1
0
1
2
3
-0.2 -0.1 0 0.1 0.2 0.3 0.4 0.5 0.6
An
tilo
g(E
/S)×
10
2
Vol.(mL)
Calibration curve for (WFN-PTA+TBP)
y = 30.1269x + 0.2936 R² = 0.9956
-1
1
3
5
7
9
11
13
15
17
-0.1 0 0.1 0.2 0.3 0.4 0.5 0.6
An
tilo
g(E
/S)×
10
1
Vol.(mL)
Calibration curve for (WFN-PTA+TBP)
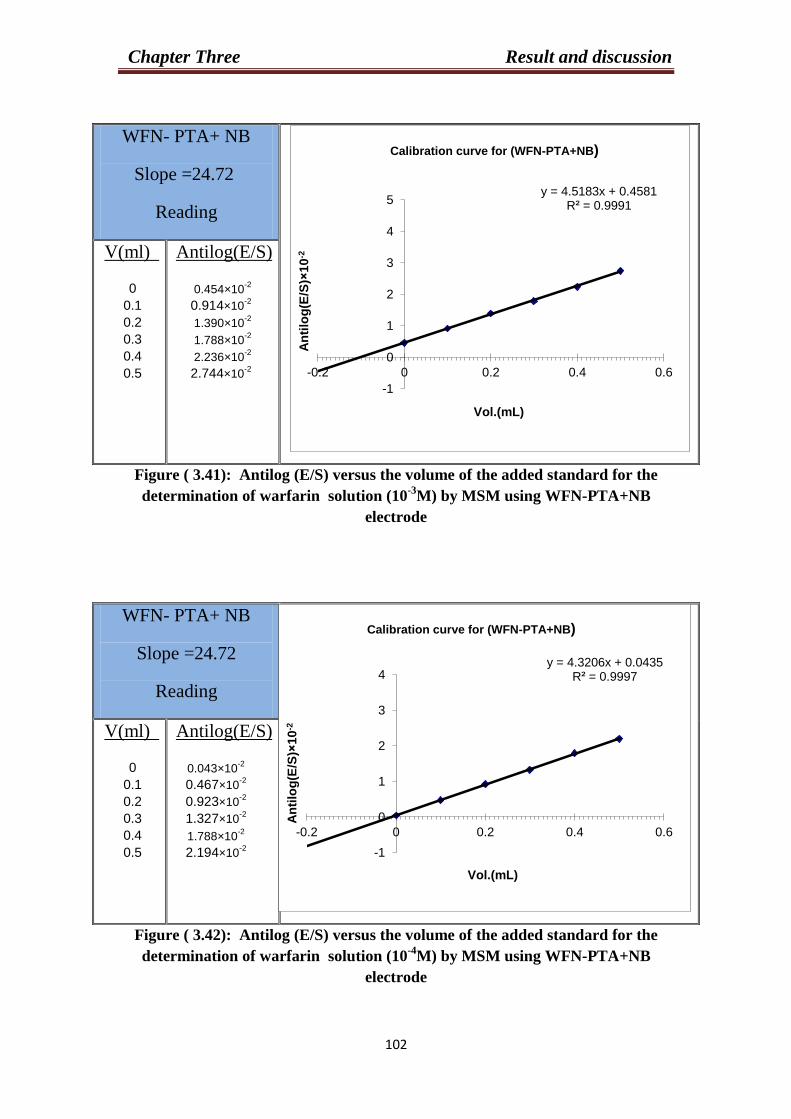
Chapter Three Result and discussion
339
Figure ( 3.41): Antilog (E/S) versus the volume of the added standard for the
determination of warfarin solution (10-3
M) by MSM using WFN-PTA+NB
electrode
Figure ( 3.42): Antilog (E/S) versus the volume of the added standard for the
determination of warfarin solution (10-4
M) by MSM using WFN-PTA+NB
electrode
WFN- PTA+ NB
Slope =24.72
Reading
V(ml)
0
0.1
0.2
0.3
0.4
0.5
Antilog(E/S)
0.454×10⁻²
0.914×10⁻²
1.390×10⁻²
1.788×10⁻²
2.236×10⁻²
2.744×10⁻²
WFN- PTA+ NB
Slope =24.72
Reading
V(ml)
0
0.1
0.2
0.3
0.4
0.5
Antilog(E/S)
0.043×10⁻²
0.467×10⁻²
0.923×10⁻²
1.327×10⁻²
1.788×10⁻²
2.194×10⁻²
y = 4.5183x + 0.4581 R² = 0.9991
-1
0
1
2
3
4
5
-0.2 0 0.2 0.4 0.6
An
tilo
g(E
/S)×
10
-2
Vol.(mL)
Calibration curve for (WFN-PTA+NB)
y = 4.3206x + 0.0435 R² = 0.9997
-1
0
1
2
3
4
-0.2 0 0.2 0.4 0.6
An
tilo
g(E
/S)×
10
-2
Vol.(mL)
Calibration curve for (WFN-PTA+NB)

Chapter Three Result and discussion
330
Figure ( 3.43): Antilog (E/S) versus the volume of the added standard for the
determination of warfarin solution (10-3
M) by MSM using WFN-PTA+AP
electrode
Figure ( 3.44): Antilog (E/S) versus the volume of the added standard for the
determination of warfarin solution (10-4
M) by MSM using WFN-PTA+AP
electrode
WFN- PTA+ AP
Slope =20.04
Reading
V(ml)
0
0.1
0.2
0.3
0.4
0.5
Antilog(E/S)
1.302×10⁻⁵
2.625×10⁻⁵
3.970×10⁻⁵
5.291×10⁻⁵
6.507×10⁻⁵
8.001×10⁻⁵
WFN- PTA+ AP
Slope =20.04
Reading
V(ml)
0
0.1
0.2
0.3
0.4
0.5
Antilog(E/S)
0.130×10⁻⁵
1.461×10⁻⁵
2.845×10⁻⁵
3.663×10⁻⁵
5.111×10⁻⁵
6.735×10⁻⁵
y = 4.3206x + 0.0435 R² = 0.9997
-1
0
1
2
3
4
-0.2 0 0.2 0.4 0.6
An
tilo
g(E
/S)×
10
-5
Vol.(mL)
Calibration curve for (WFN-PTA+NB)
y = 12.7980x + 0.1247 R² = 0.9937
-1
0
1
2
3
4
5
6
7
8
-0.1 0 0.1 0.2 0.3 0.4 0.5 0.6
An
tilo
g(E
/S)×
10
-5
Vol.(mL)
Calibration curve for (WFN-PTA+AP)

Chapter Three Result and discussion
333
Figure ( 3.45): Antilog (E/S) versus the volume of the added standard for the
determination of warfarin solution (10-3
M) by MSM using WFN-PTA+DOPH
electrode
Figure ( 3.46): Antilog (E/S) versus the volume of the added standard for the
determination of warfarin solution (10-4
M) by MSM using WFN-PTA+DOPH
electrode
WFN- PTA+ DOPH
Slope =26.00
Reading
V(ml)
0
0.1
0.2
0.3
0.4
0.5
Antilog(E/S)
1.026×101
2.048×101
3.052×101
4.198×101
4.923×101
6.198×101
WFN- PTA+ DOPH
Slope =26.00
Reading
V(ml)
0
0.1
0.2
0.3
0.4
0.5
Antilog(E/S)
0.110×101
1.215×101
2.360×101
3.305×101
4.546×101
5.623×101
y = 10.1803x + 1.0291 R² = 0.9972
-1
0
1
2
3
4
5
6
7
-0.2 -0.1 0 0.1 0.2 0.3 0.4 0.5 0.6
An
tilo
g(E
/S)×
10
1
Vol.(mL)
Calibration curve for (WFN-PTA+DOPH)
y = 11.0009x + 0.1096 R² = 0.9993
-1
0
1
2
3
4
5
6
-0.1 0 0.1 0.2 0.3 0.4 0.5 0.6
An
tilo
g(E
/S)×
10
1
Vol.(mL)
Calibration curve for (WFN-PTA+DOPH)
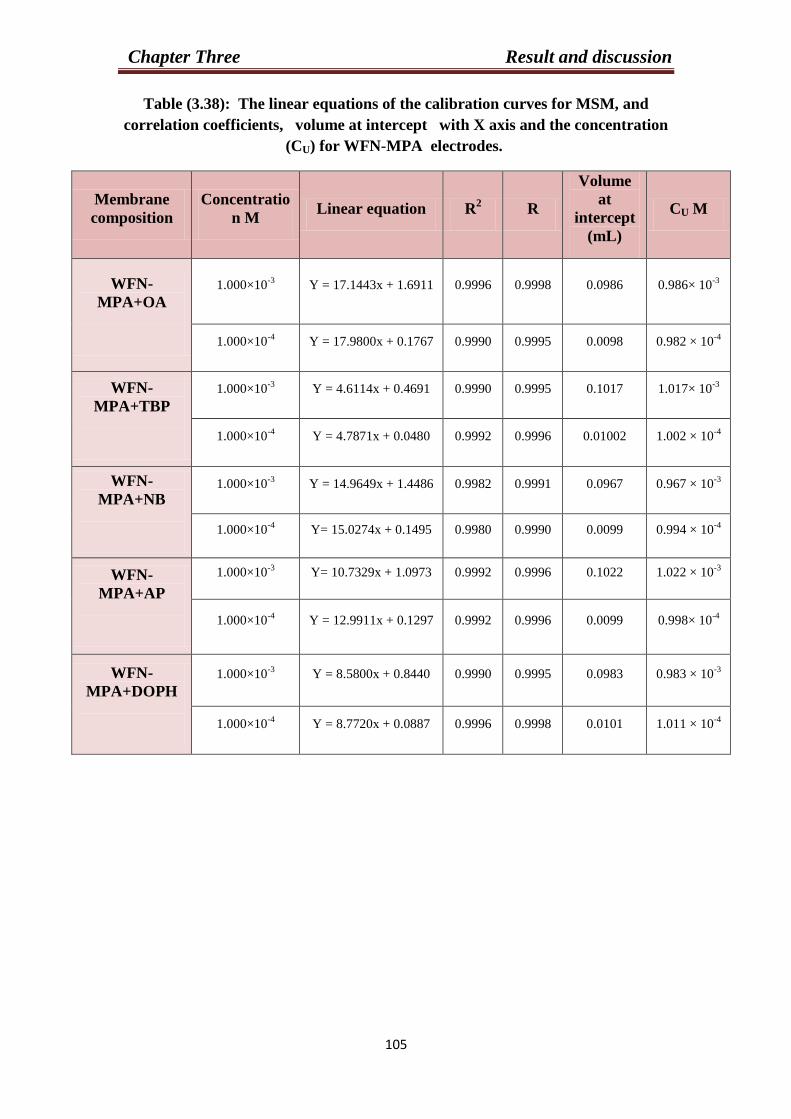
Chapter Three Result and discussion
333
Table (3.38): The linear equations of the calibration curves for MSM, and
correlation coefficients, volume at intercept with X axis and the concentration
(CU) for WFN-MPA electrodes.
Membrane
composition
Concentratio
n M Linear equation R
2 R
Volume
at
intercept
(mL)
CU M
WFN-
MPA+OA
1.000×10⁻³
Y = 17.1443x + 1.6911 0.9996 0.9998 0.0986 0.986× 10⁻³
1.000×10⁻⁴
Y = 17.9800x + 0.1767 0.9990 0.9995 0.0098 0.982 × 10⁻⁴
WFN-
MPA+TBP
1.000×10⁻³
Y = 4.6114x + 0.4691 0.9990 0.9995 0.1017 1.017× 10⁻³
1.000×10⁻⁴
Y = 4.7871x + 0.0480 0.9992 0.9996 0.01002 1.002 × 10⁻⁴
WFN-
MPA+NB
1.000×10⁻³
Y = 14.9649x + 1.4486 0.9982 0.9991 0.0967 0.967 × 10⁻³
1.000×10⁻⁴
Y= 15.0274x + 0.1495 0.9980 0.9990 0.0099 0.994 × 10⁻⁴
WFN-
MPA+AP
1.000×10⁻³
Y= 10.7329x + 1.0973 0.9992 0.9996 0.1022 1.022 × 10⁻³
1.000×10⁻⁴
Y = 12.9911x + 0.1297 0.9992 0.9996 0.0099 0.998× 10⁻⁴
WFN-
MPA+DOPH
1.000×10⁻³
Y = 8.5800x + 0.8440 0.9990 0.9995 0.0983 0.983 × 10⁻³
1.000×10⁻⁴
Y = 8.7720x + 0.0887 0.9996 0.9998 0.0101 1.011 × 10⁻⁴
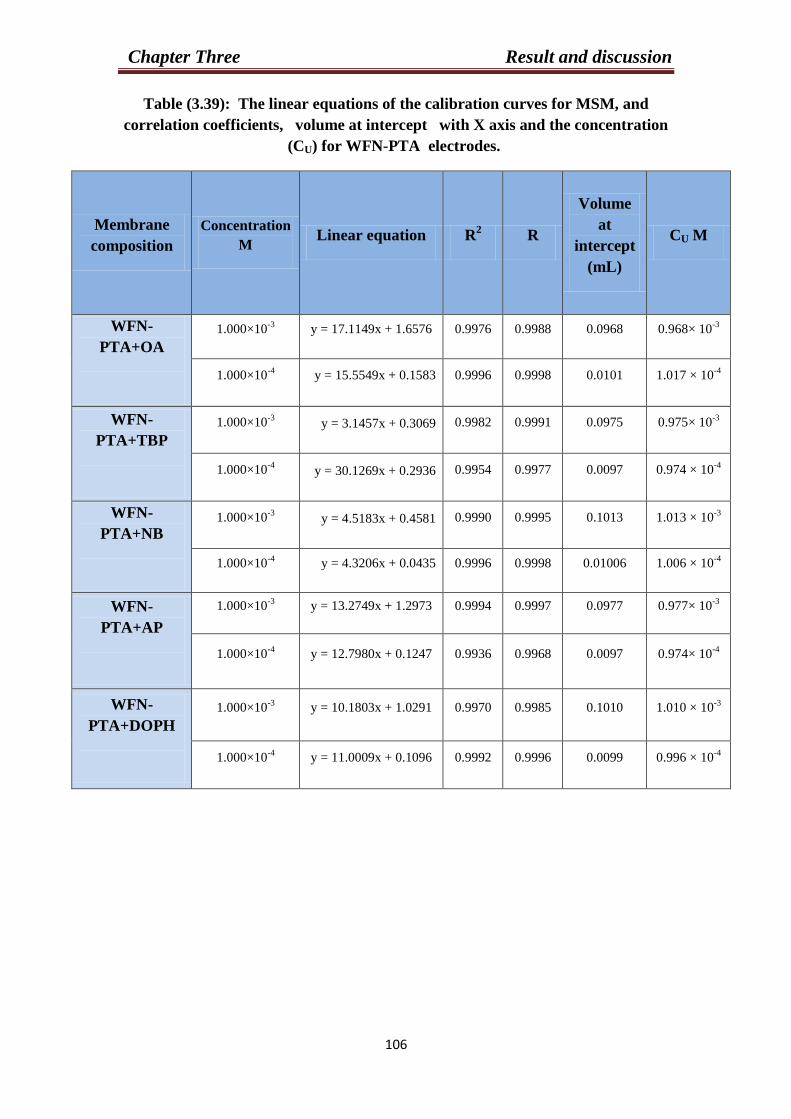
Chapter Three Result and discussion
333
Table (3.39): The linear equations of the calibration curves for MSM, and
correlation coefficients, volume at intercept with X axis and the concentration
(CU) for WFN-PTA electrodes.
Membrane
composition
Concentration
M Linear equation R
2 R
Volume
at
intercept
(mL)
CU M
WFN-
PTA+OA
1.000×10⁻³
y = 17.1149x + 1.6576 0.9976 0.9988 0.0968 0.968× 10⁻³
1.000×10⁻⁴
y = 15.5549x + 0.1583 0.9996 0.9998 0.0101 1.017 × 10⁻⁴
WFN-
PTA+TBP
1.000×10⁻³
y = 3.1457x + 0.3069 0.9982 0.9991 0.0975 0.975× 10⁻³
1.000×10⁻⁴
y = 30.1269x + 0.2936 0.9954 0.9977 0.0097 0.974 × 10⁻⁴
WFN-
PTA+NB
1.000×10⁻³
y = 4.5183x + 0.4581 0.9990 0.9995 0.1013 1.013 × 10⁻³
1.000×10⁻⁴
y = 4.3206x + 0.0435 0.9996 0.9998 0.01006 1.006 × 10⁻⁴
WFN-
PTA+AP
1.000×10⁻³
y = 13.2749x + 1.2973 0.9994 0.9997 0.0977 0.977× 10⁻³
1.000×10⁻⁴
y = 12.7980x + 0.1247 0.9936 0.9968 0.0097 0.974× 10⁻⁴
WFN-
PTA+DOPH
1.000×10⁻³
y = 10.1803x + 1.0291 0.9970 0.9985 0.1010 1.010 × 10⁻³
1.000×10⁻⁴
y = 11.0009x + 0.1096 0.9992 0.9996 0.0099 0.996 × 10⁻⁴
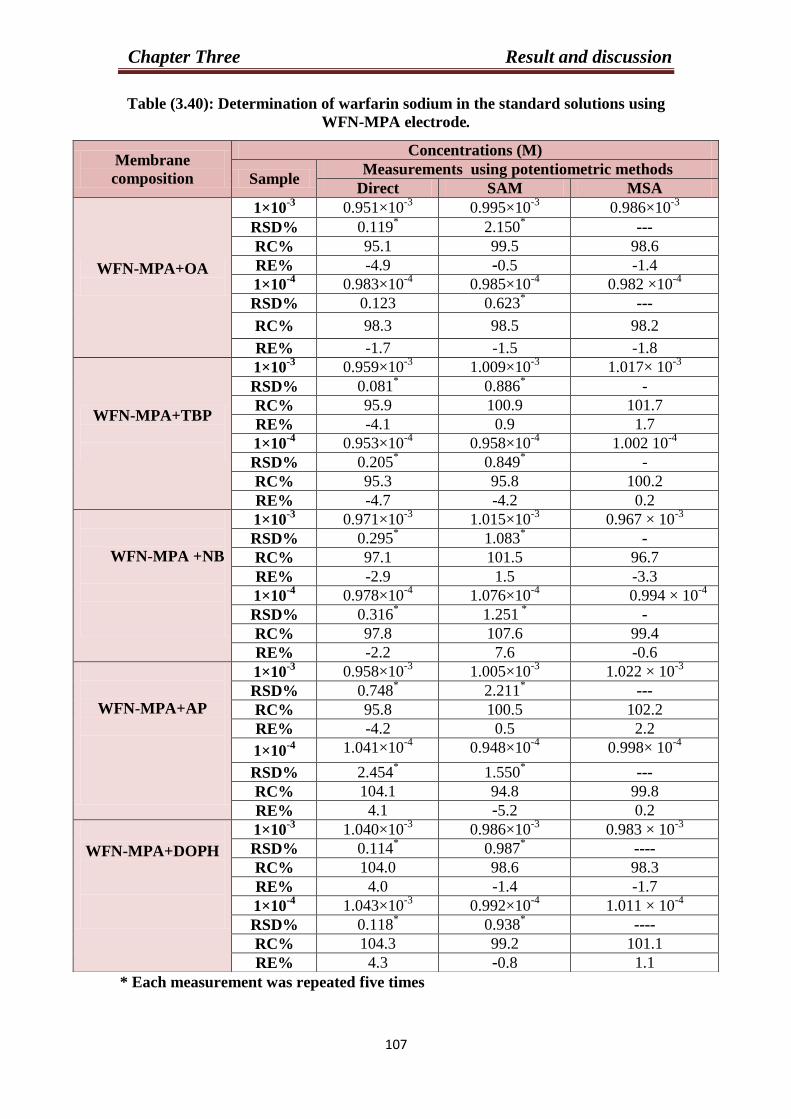
Chapter Three Result and discussion
333
Table (3.40): Determination of warfarin sodium in the standard solutions using
WFN-MPA electrode.
* Each measurement was repeated five times
Membrane
composition
Concentrations (M)
Sample Measurements using potentiometric methods
Direct SAM MSA
WFN-MPA+OA
1×10⁻³ 0.951×10
-3 0.995×10⁻³
0.986×10⁻³
RSD% 0.119*
2.150*
---
RC% 95.1 99.5 98.6
RE% -4.9 0.5- -1.4
1×10⁻⁴ 0.983×10
-4 0.985×10
-4 0.982 ×10
-4
RSD% 0.123 0.623*
---
RC% 98.3 98.5 98.2
RE% -1.7 -1.5 -1.8
WFN-MPA+TBP
1×10⁻³ 0.959×10
-3 1.009×10⁻³ 1.017× 10
-3
RSD% 0.081*
0.886*
-
RC% 95.9 100.9 101.7
RE% -4.1 0.9 1.7
1×10⁻⁴
0.953×10⁻⁴
0.958×10⁻⁴ 1.002 10
-4
RSD% 0.205*
0.849*
-
RC% 95.3 95.8 100.2
RE% -4.7 -4.2 0.2
WFN-MPA +NB
1×10⁻³ 0.971×10
-3 1.015×10
-3 0.967 × 10
-3
RSD% 0.295* 1.083
* -
RC% 97.1 101.5 96.7
RE% -2.9 1.5 -3.3
1×10⁻⁴ 0.978×10
-4 1.076×10⁻⁴
0.994 × 10⁻⁴
RSD% 0.316* 1.251
* -
RC% 97.8 107.6 99.4
RE% -2.2 7.6 -0.6
APMPA+-WFN
1×10⁻³ 0.958×10
-3 1.005×10
-3 1.022 × 10
-3
RSD% 0.748*
2.211*
---
RC% 95.8 100.5 102.2
RE% -4.2 0.5 2.2
1×10⁻⁴ 1.041×10
-4 ×10
-40.948 0.998× 10
-4
RSD% 2.454*
1.550*
---
RC% 104.1 94.8 99.8
RE% 4.1 5.2- 0.2
WFN-MPA+DOPH
1×10⁻³ 1.040×10
-3 0.986×10
-3 0.983 × 10
-3
RSD% 0.114*
0.987*
----
RC% 104.0 98.6 98.3
RE% 4.0 -1.4 -1.7
1×10⁻⁴ 1.043×10
-3 0.992×10
-4 1.011 × 10
-4
RSD% 0.118*
0.938*
----
RC% 104.3 99.2 101.1
RE% 4.3 0.8- 1.1
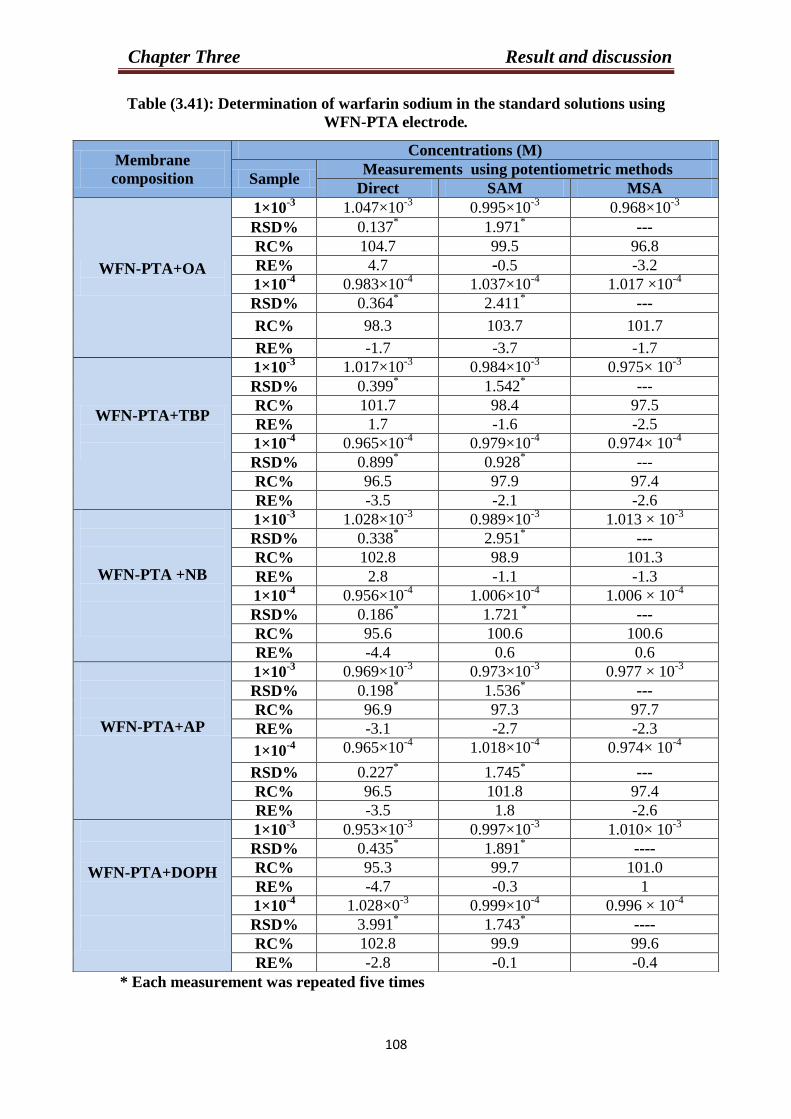
Chapter Three Result and discussion
333
Table (3.41): Determination of warfarin sodium in the standard solutions using
WFN-PTA electrode.
* Each measurement was repeated five times
Membrane
composition
Concentrations (M)
Sample Measurements using potentiometric methods
Direct SAM MSA
WFN-PTA+OA
1×10⁻³ 1.047×10
-3 0.995×10⁻³
0.968×10⁻³
RSD% 0.137*
1.971*
---
RC% 104.7 99.5 96.8
RE% 4.7 0.5- -3.2
1×10⁻⁴ 0.983×10
-4 1.037×10
-4 1.017 ×10
-4
RSD% 0.364*
2.411*
---
RC% 98.3 103.7 101.7
RE% -1.7 -3.7 -1.7
WFN-PTA+TBP
1×10⁻³ 1.017×10
-3 0.984×10⁻³ 0.975× 10
-3
RSD% 0.399*
1.542*
---
RC% 101.7 98.4 97.5
RE% 1.7 -1.6 -2.5
1×10⁻⁴
0.965×10⁻⁴
0.979×10⁻⁴ 0.974× 10
-4
RSD% 0.899*
0.928*
---
RC% 96.5 97.9 97.4
RE% -3.5 -2.1 -2.6
WFN-PTA +NB
1×10⁻³ 1.028×10
-3 0.989×10
-3 1.013 × 10
-3
RSD% 0.338* 2.951
* ---
RC% 102.8 98.9 101.3
RE% 2.8 -1.1 -1.3
1×10⁻⁴ 0.956×10
-4 1.006×10⁻⁴
1.006 × 10⁻⁴
RSD% 0.186* 1.721
* ---
RC% 95.6 100.6 100.6
RE% -4.4 0.6 0.6
WFN-PTA+AP
1×10⁻³ 0.969×10
-3 0.973×10
-3 0.977 × 10
-3
RSD% 0.198*
1.536*
---
RC% 96.9 97.3 97.7
RE% -3.1 -2.7 -2.3
1×10⁻⁴ 0.965×10
-4 ×10
-41.018 0.974× 10
-4
RSD% 0.227*
1.745*
---
RC% 96.5 101.8 97.4
RE% -3.5 1.8 -2.6
WFN-PTA+DOPH
1×10⁻³ 0.953×10
-3 0.997×10
-3 1.010× 10
-3
RSD% 0.435*
1.891*
----
RC% 95.3 99.7 101.0
RE% -4.7 -0.3 1
1×10⁻⁴ 1.028×0
-3 0.999×10
-4 0.996 × 10
-4
RSD% 3.991*
1.743*
----
RC% 102.8 99.9 99.6
RE% -2.8 0.1- -0.4
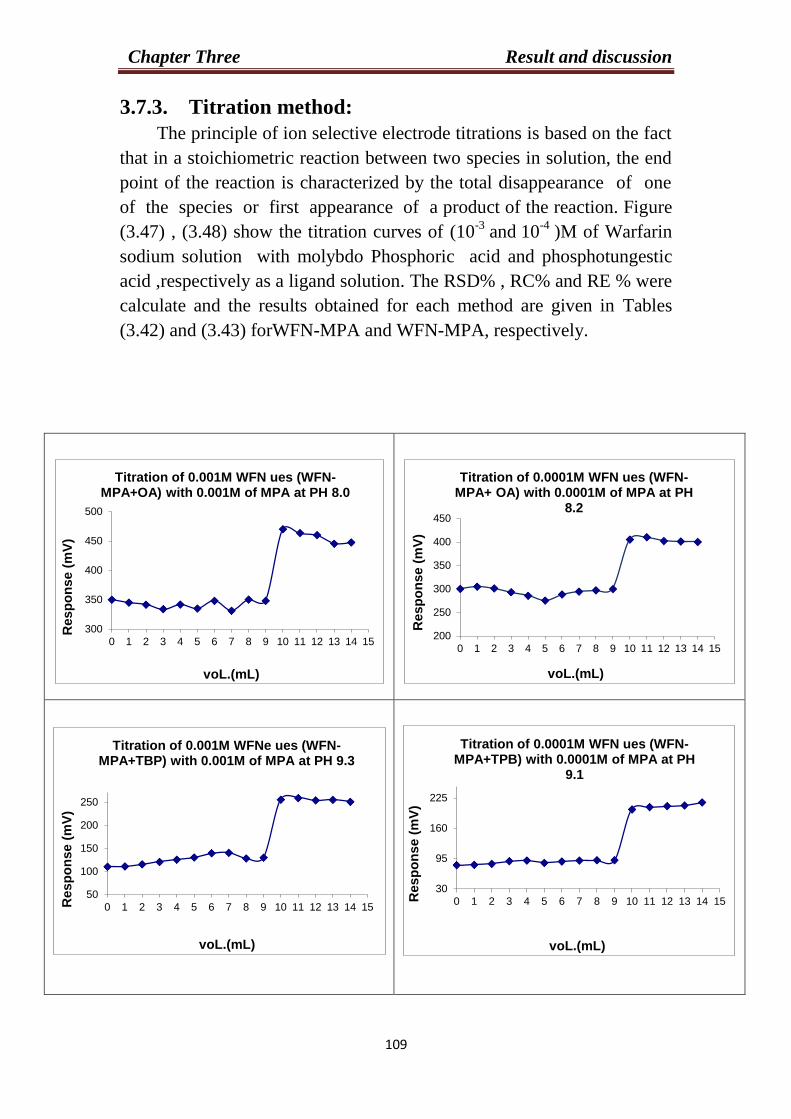
Chapter Three Result and discussion
332
3.7.3. Titration method:
The principle of ion selective electrode titrations is based on the fact
that in a stoichiometric reaction between two species in solution, the end
point of the reaction is characterized by the total disappearance of one
of the species or first appearance of a product of the reaction. Figure
(3.47) , (3.48) show the titration curves of (10-3
and 10
-4 )M of Warfarin
sodium solution with molybdo Phosphoric acid and phosphotungestic
acid ,respectively as a ligand solution. The RSD% , RC% and RE % were
calculate and the results obtained for each method are given in Tables
(3.42) and (3.43) forWFN-MPA and WFN-MPA, respectively.
300
350
400
450
500
0 1 2 3 4 5 6 7 8 9 10 11 12 13 14 15
Resp
on
se (
mV
)
voL.(mL)
Titration of 0.001M WFN ues (WFN-MPA+OA) with 0.001M of MPA at PH 8.0
200
250
300
350
400
450
0 1 2 3 4 5 6 7 8 9 10 11 12 13 14 15
Resp
on
se (
mV
)
voL.(mL)
Titration of 0.0001M WFN ues (WFN-MPA+ OA) with 0.0001M of MPA at PH
8.2
50
100
150
200
250
0 1 2 3 4 5 6 7 8 9 10 11 12 13 14 15Resp
on
se (
mV
)
voL.(mL)
Titration of 0.001M WFNe ues (WFN-MPA+TBP) with 0.001M of MPA at PH 9.3
30
95
160
225
0 1 2 3 4 5 6 7 8 9 10 11 12 13 14 15Resp
on
se (
mV
)
voL.(mL)
Titration of 0.0001M WFN ues (WFN-MPA+TPB) with 0.0001M of MPA at PH
9.1
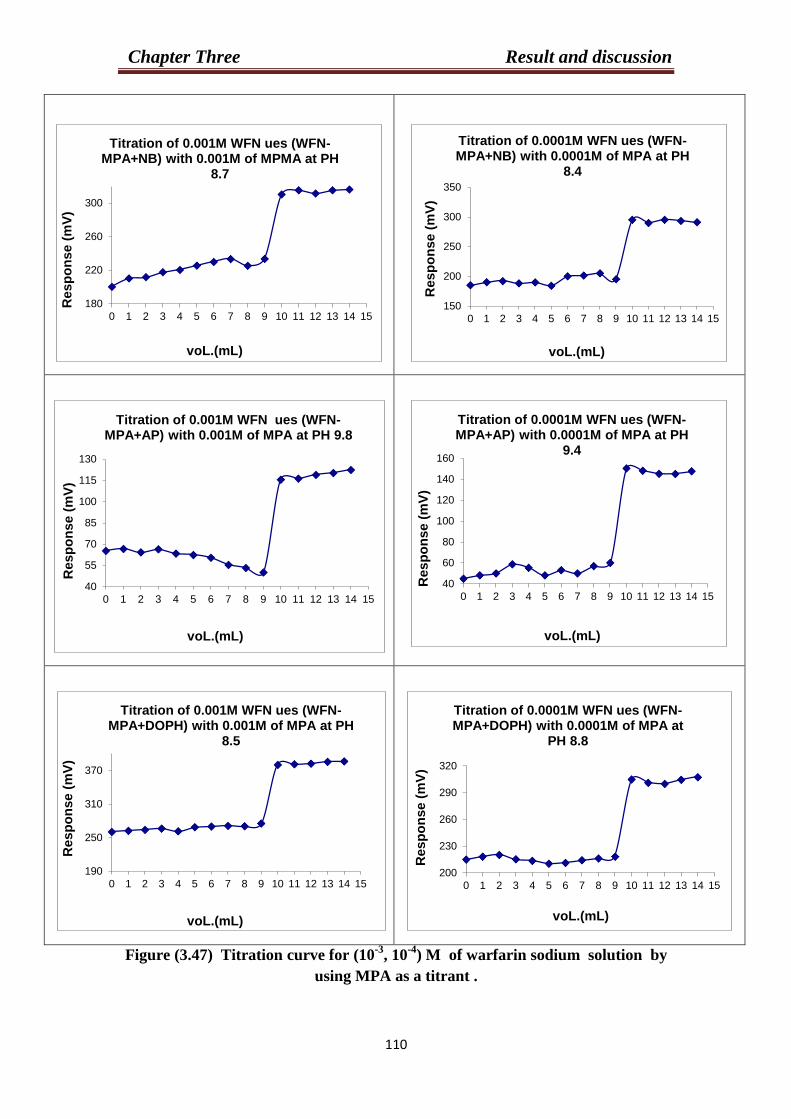
Chapter Three Result and discussion
333
Figure (3.47) Titration curve for (10-3
, 10-4
) M of warfarin sodium solution by
using MPA as a titrant .
180
220
260
300
0 1 2 3 4 5 6 7 8 9 10 11 12 13 14 15
Resp
on
se (
mV
)
voL.(mL)
Titration of 0.001M WFN ues (WFN-MPA+NB) with 0.001M of MPMA at PH
8.7
150
200
250
300
350
0 1 2 3 4 5 6 7 8 9 10 11 12 13 14 15
Resp
on
se (
mV
)
voL.(mL)
Titration of 0.0001M WFN ues (WFN-MPA+NB) with 0.0001M of MPA at PH
8.4
40
55
70
85
100
115
130
0 1 2 3 4 5 6 7 8 9 10 11 12 13 14 15
Resp
on
se (
mV
)
voL.(mL)
Titration of 0.001M WFN ues (WFN-MPA+AP) with 0.001M of MPA at PH 9.8
40
60
80
100
120
140
160
0 1 2 3 4 5 6 7 8 9 10 11 12 13 14 15
Resp
on
se (
mV
)
voL.(mL)
Titration of 0.0001M WFN ues (WFN-MPA+AP) with 0.0001M of MPA at PH
9.4
190
250
310
370
0 1 2 3 4 5 6 7 8 9 10 11 12 13 14 15
Resp
on
se (
mV
)
voL.(mL)
Titration of 0.001M WFN ues (WFN-MPA+DOPH) with 0.001M of MPA at PH
8.5
200
230
260
290
320
0 1 2 3 4 5 6 7 8 9 10 11 12 13 14 15
Resp
on
se (
mV
)
voL.(mL)
Titration of 0.0001M WFN ues (WFN-MPA+DOPH) with 0.0001M of MPA at
PH 8.8
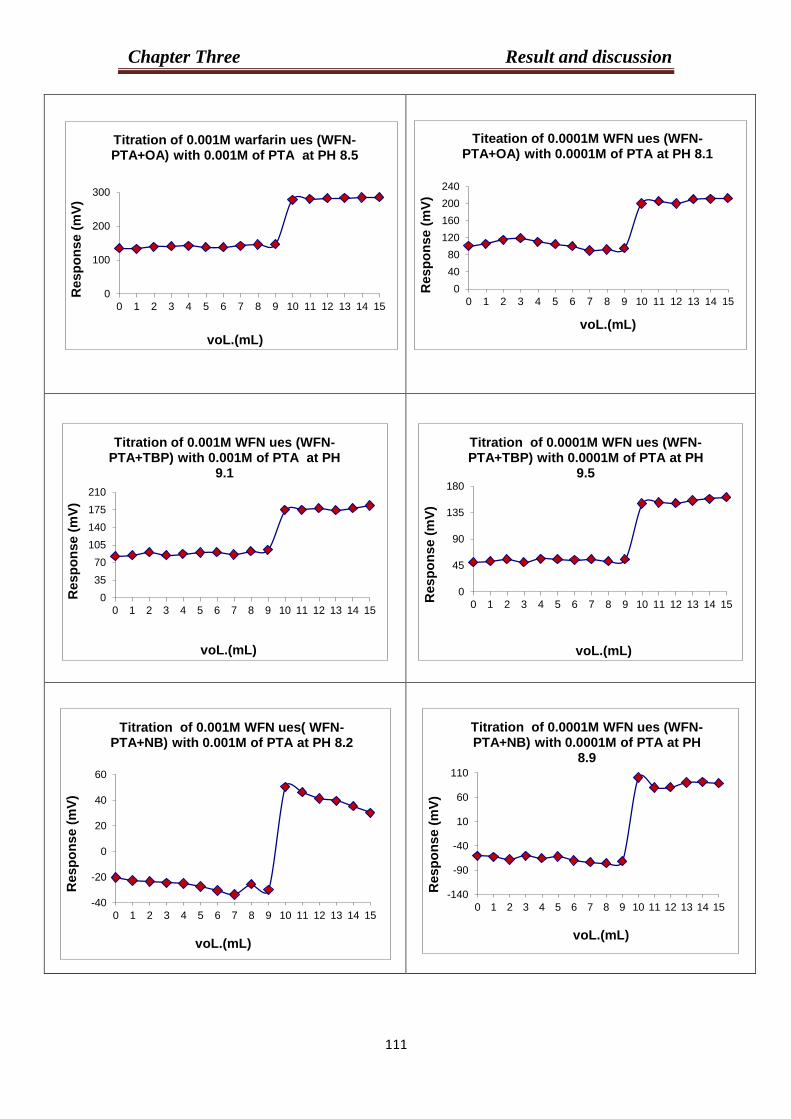
Chapter Three Result and discussion
333
0
100
200
300
0 1 2 3 4 5 6 7 8 9 10 11 12 13 14 15
Resp
on
se (
mV
)
voL.(mL)
Titration of 0.001M warfarin ues (WFN-PTA+OA) with 0.001M of PTA at PH 8.5
0
40
80
120
160
200
240
0 1 2 3 4 5 6 7 8 9 10 11 12 13 14 15
Resp
on
se (
mV
)
voL.(mL)
Titeation of 0.0001M WFN ues (WFN-PTA+OA) with 0.0001M of PTA at PH 8.1
0
35
70
105
140
175
210
0 1 2 3 4 5 6 7 8 9 10 11 12 13 14 15
Resp
on
se (
mV
)
voL.(mL)
Titration of 0.001M WFN ues (WFN-PTA+TBP) with 0.001M of PTA at PH
9.1
0
45
90
135
180
0 1 2 3 4 5 6 7 8 9 10 11 12 13 14 15Resp
on
se (
mV
)
voL.(mL)
Titration of 0.0001M WFN ues (WFN-PTA+TBP) with 0.0001M of PTA at PH
9.5
-40
-20
0
20
40
60
0 1 2 3 4 5 6 7 8 9 10 11 12 13 14 15
Resp
on
se (
mV
)
voL.(mL)
Titration of 0.001M WFN ues( WFN-PTA+NB) with 0.001M of PTA at PH 8.2
-140
-90
-40
10
60
110
0 1 2 3 4 5 6 7 8 9 10 11 12 13 14 15
Resp
on
se (
mV
)
voL.(mL)
Titration of 0.0001M WFN ues (WFN-PTA+NB) with 0.0001M of PTA at PH
8.9

Chapter Three Result and discussion
339
Figure (3.48) Titration curve for (10-3
, 10-4
) M of warfarin sodium solution by
using PTA as a titrant .
-150
-125
-100
-75
-50
-25
0
25
50
0 1 2 3 4 5 6 7 8 9 10 11 12 13 14 15
Resp
on
se (
mV
)
voL.(mL)
Titration of 0.001M WFN ues (WFN-PTA+AP) with 0.001M of PTA at PH 9.1
-195
-150
-105
-60
-15
30
0 1 2 3 4 5 6 7 8 9 10 11 12 13 14 15
Resp
on
se (
mV
)
voL.(mL)
Titration of 0.0001M WFN ues WFN-PTA+AP) with 0.0001M of PTA at PH 9.7
45
100
155
210
265
0 1 2 3 4 5 6 7 8 9 10 11 12 13 14 15
Resp
on
se (
mV
)
voL.(mL)
Titration of 0.001M WFN ues (WFN-PTA+DOPH) with 0.001M of PTA at PH 8.7
15
60
105
150
195
240
0 1 2 3 4 5 6 7 8 9 10 11 12 13 14 15
Resp
on
se (
mV
)
voL.(mL)
Titeation of 0.0001M WFN ues (WFN-PTA+DOPH) with 0.0001M of PTA at PH
8.1
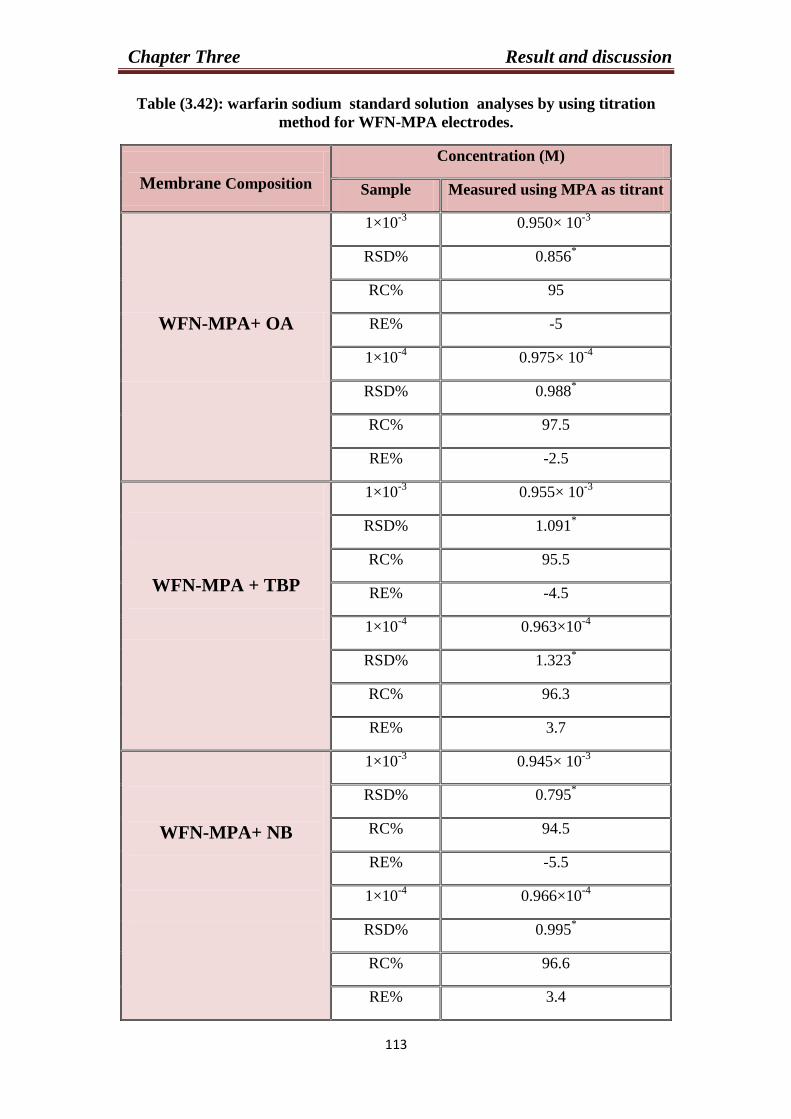
Chapter Three Result and discussion
330
Table (3.42): warfarin sodium standard solution analyses by using titration
method for WFN-MPA electrodes.
Membrane Composition
Concentration (M)
Sample Measured using MPA as titrant
WFN-MPA+ OA
1×10⁻³
0.950× 10⁻³
RSD% 0.856*
RC% 95
RE% -5
1×10⁻⁴
0.975× 10⁻⁴
RSD% 0.988*
RC% 97.5
RE% -2.5
WFN-MPA + TBP
1×10⁻³
0.955× 10⁻³
RSD% 1.091*
RC% 95.5
RE% -4.5
1×10⁻⁴
0.963×10⁻⁴
RSD% 1.323*
RC% 96.3
RE% 3.7
WFN-MPA+ NB
1×10⁻³
0.945× 10⁻³
RSD% 0.795*
RC% 94.5
RE% -5.5
1×10⁻⁴
0.966×10⁻⁴
RSD% 0.995*
RC% 96.6
RE% 3.4
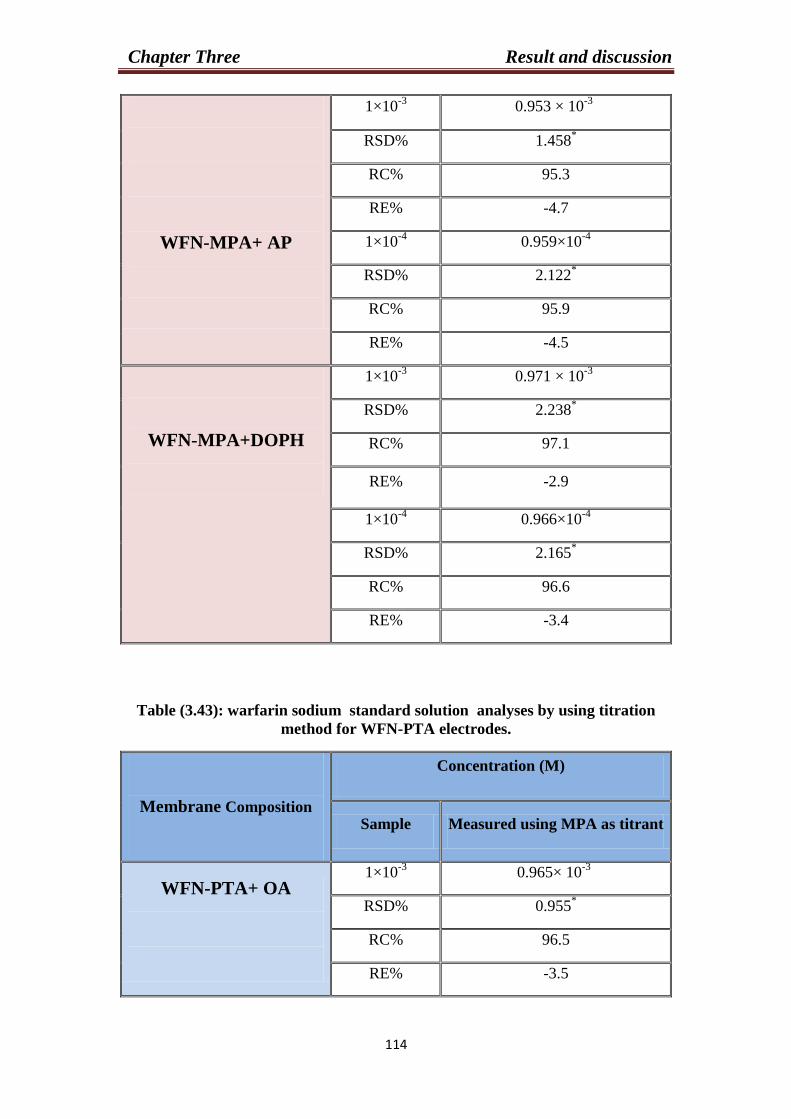
Chapter Three Result and discussion
333
WFN-MPA+ AP
1×10⁻³
0.953 × 10⁻³
RSD% 1.458*
RC% 95.3
RE% -4.7
1×10⁻⁴
0.959×10⁻⁴
RSD% 2.122*
RC% 95.9
RE% -4.5
WFN-MPA+DOPH
1×10⁻³
0.971 × 10⁻³
RSD% 2.238*
RC% 97.1
RE% -2.9
1×10⁻⁴
0.966×10⁻⁴
RSD% 2.165*
RC% 96.6
RE% -3.4
Table (3.43): warfarin sodium standard solution analyses by using titration
method for WFN-PTA electrodes.
Membrane Composition
Concentration (M)
Sample Measured using MPA as titrant
WFN-PTA+ OA
1×10⁻³
0.965× 10⁻³
RSD% 0.955*
RC% 96.5
RE% -3.5
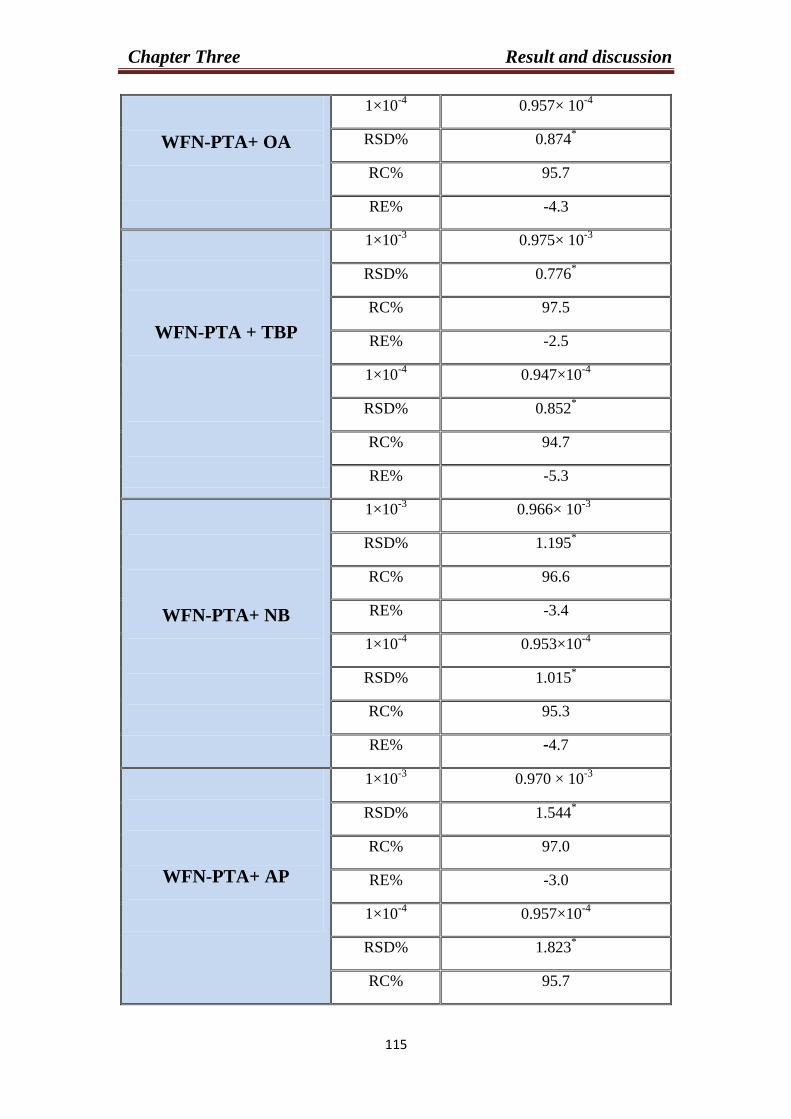
Chapter Three Result and discussion
333
WFN-PTA+ OA
1×10⁻⁴
0.957× 10⁻⁴
RSD% 0.874*
RC% 95.7
RE% -4.3
WFN-PTA + TBP
1×10⁻³
0.975× 10⁻³
RSD% 0.776*
RC% 97.5
RE% -2.5
1×10⁻⁴
0.947×10⁻⁴
RSD% 0.852*
RC% 94.7
RE% -5.3
WFN-PTA+ NB
1×10⁻³
0.966× 10⁻³
RSD% 1.195*
RC% 96.6
RE% -3.4
1×10⁻⁴
0.953×10⁻⁴
RSD% 1.015*
RC% 95.3
RE% 4.7-
WFN-PTA+ AP
1×10⁻³
0.970 × 10⁻³
RSD% 1.544*
RC% 97.0
RE% -3.0
1×10⁻⁴
0.957×10⁻⁴
RSD% 1.823*
RC% 95.7

Chapter Three Result and discussion
333
RE% -4.3
WFN-PTA+DOPH
1×10⁻³
0.960 × 10⁻³
RSD% 1.987*
RC% 96.0
RE% -4.0
1×10⁻⁴
0.951×10⁻⁴
RSD% 2.045*
RC% 95.1
RE% -4.9
* Each measurement was repeated five times
The calculated RSD% using titration method is relatively large in
comparison with the other methods used. This may be attributed to the
precipitation of (WFN-MPA) and (WFN-PTA) complexes on the surface
of the membrane and poisoning the membrane. Also, the titration was
carried out in neutral and acidic medium of warfarin sodium with
molybdo Phosphoric acid and phosphoTungeston acid as a titrant
solution we noticed that there is no response for warfarin electrodes. That
means the electrodes are responsed in basic medium of drug.
3.8. Analytical application of the warfarin sodium electrodes:
The electrodes of (WFN-MPA) and (WFN-PTA) show the
potentiometric responses when used to determination the warfarin
sodium in pharmaceutical preparation by direct potentiometric method,
standard addition method, multi addition method and potentiometric
titration method the result shown from Tables (3.44) to (3.53) for (WFN-
MPA) and (3.54) to (3.62) for (WFN-PTA) .
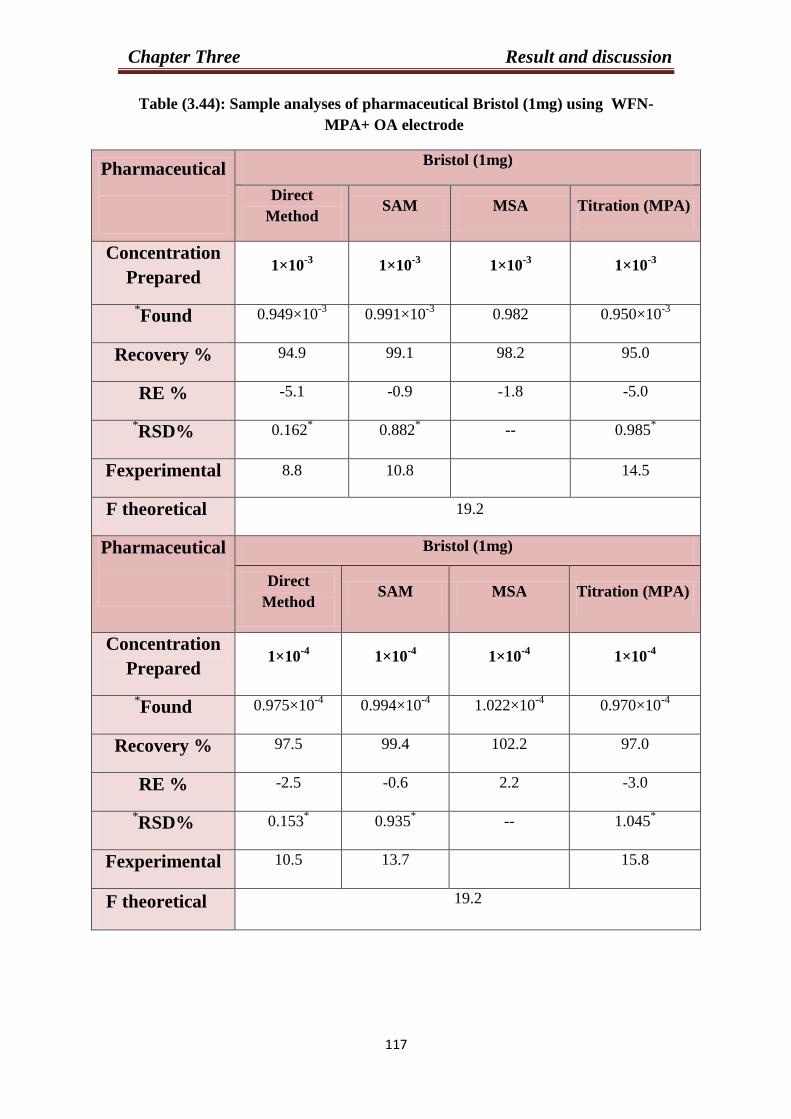
Chapter Three Result and discussion
333
Table (3.44): Sample analyses of pharmaceutical Bristol (1mg) using WFN-
MPA+ OA electrode
Pharmaceutical
Bristol (1mg)
Direct
Method SAM MSA Titration (MPA)
Concentration
Prepared 1×10
-3 1×10
-3 1×10
-3 1×10
-3
*Found 0.949×10
-3 0.991×10
-3 0.982 0.950×10
-3
Recovery % 94.9 99.1 98.2 95.0
RE % -5.1 -0.9 1.8- -5.0
*RSD% 0.162
* 0.882
* -- 0.985
*
Fexperimental 8.8 10.8 14.5
F theoretical 19.2
Pharmaceutical
Bristol (1mg)
Direct
Method SAM MSA Titration (MPA)
Concentration
Prepared 1×10
-4 1×10
-4 1×10
-4 1×10
-4
*Found 0.975×10
-4 0.994×10
-4 1.022×10
-4 0.970×10
-4
Recovery % 97.5 99.4 102.2 97.0
RE % -2.5 -0.6 2.2 -3.0
*RSD% 0.153
* 0.935
* -- 1.045
*
Fexperimental 10.5 13.7 15.8
F theoretical 19.2

Chapter Three Result and discussion
333
Table (3.45): Sample analyses of pharmaceutical Actavis (3 mg) using WFN-
MPA+ OA electrode
Pharmaceutical
Actavis (3 mg)
Direct
Method SAM MSA Titration (MPA)
Concentration
Prepared 1×10
-3 1×10
-3 1×10
-3 1×10
-3
*Found 0.950×10
-3 1.011×10
-3 1.021×10
-3 0.952×10
-3
Recovery % 95.0 101.1 102.1 95.2
RE % -5.0 1.1 2.1 -4.8
*RSD% 0.157
* 1.012
* -- 1.033
*
Fexperimental 11.2 6.8 7.8
F theoretical 19.2
Pharmaceutical
Actavis (3 mg)
Direct
Method SAM MSA Titration (MPA)
Concentration
Prepared 1×10
-4 1×10
-4 1×10
-4 1×10
-4
*Found 0.976×10
-4 1.010×10
-4 0.981×10
-4 0.968×10
-4
Recovery % 97.6 101 98.1 96.8
RE % -2.4 1 1.9 -3.8
*RSD% 0.143
* 0.835
* -- 1.156
*
Fexperimental 17.2 11.4 9.9
F theoretical 19.2

Chapter Three Result and discussion
332
Table (3.46): Sample analyses of pharmaceutical Bristol (1mg) using WFN-
MPA+ TBP electrode
Pharmaceutical
Bristol (1mg)
Direct
Method SAM MSA Titration (MPA)
Concentration
Prepared 1×10
-3 1×10
-3 1×10
-3 1×10
-3
*Found 0.955×10
-3 0.970×10
-3 1.019×10
-3 0.953×10
-3
Recovery % 95.5 97.0 101.9 95.3
RE % -4.5 -3.0 -1.9 -4.7
*RSD% 0.113
* 1.085
* -- 0.995
*
Fexperimental 12.3 8.7 -- 6.6
F theoretical 19.2
Pharmaceutical
Bristol (1mg)
Direct
Method SAM MSA Titration (MPA)
Concentration
Prepared 1×10
-4 1×10
-4 1×10
-4 1×10
-4
*Found 1.050×10
-4 0.963×10
-4 0.994×10
-4 0.960×10
-4
Recovery % 105.0 96.3 99.4 96.0
RE % 5.0 -3.7 -0.6 -4.0
*RSD% 0.245
* 0.988
* -- 1.212
*
Fexperimental 17.3 11.1 -- 12.5
F theoretical 19.2
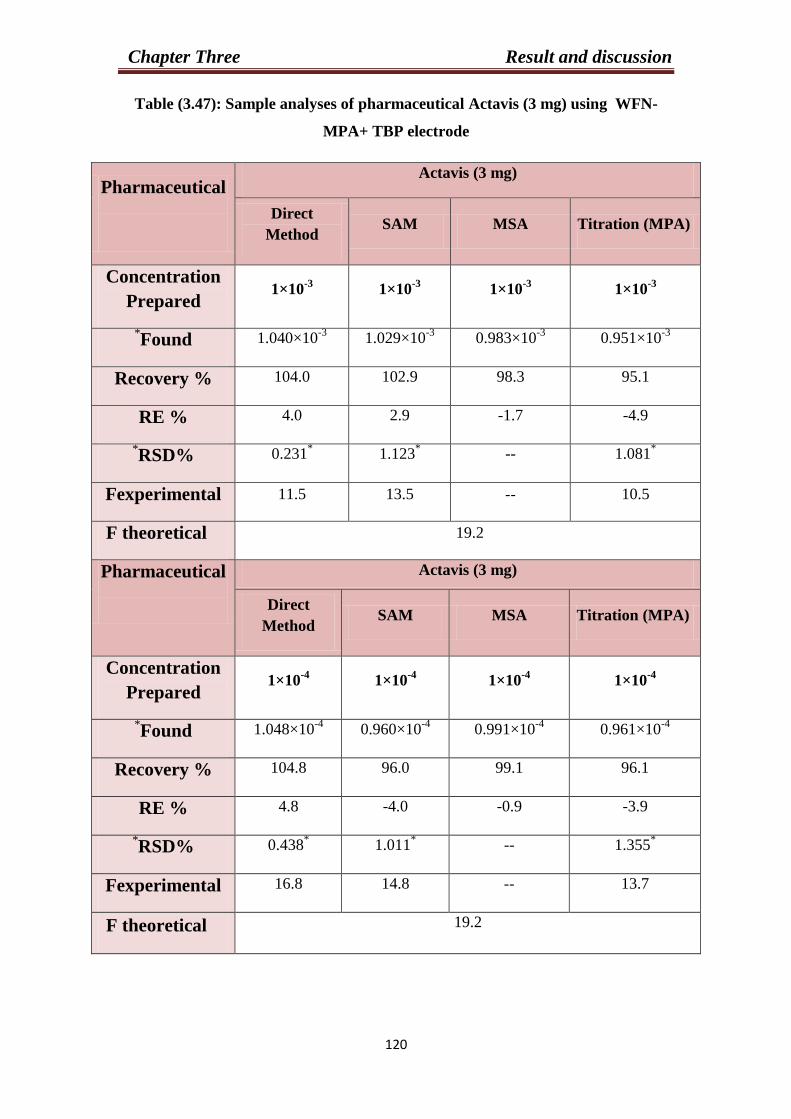
Chapter Three Result and discussion
393
Table (3.47): Sample analyses of pharmaceutical Actavis (3 mg) using WFN-
MPA+ TBP electrode
Pharmaceutical
Actavis (3 mg)
Direct
Method SAM MSA Titration (MPA)
Concentration
Prepared 1×10
-3 1×10
-3 1×10
-3 1×10
-3
*Found 1.040×10
-3 1.029×10
-3 0.983×10
-3 0.951×10
-3
Recovery % 104.0 102.9 98.3 95.1
RE % 4.0 2.9 -1.7 -4.9
*RSD% 0.231
* 1.123
* -- 1.081
*
Fexperimental 11.5 13.5 -- 10.5
F theoretical 19.2
Pharmaceutical
Actavis (3 mg)
Direct
Method SAM MSA Titration (MPA)
Concentration
Prepared 1×10
-4 1×10
-4 1×10
-4 1×10
-4
*Found 1.048×10
-4 0.960×10
-4 0.991×10
-4 0.961×10
-4
Recovery % 104.8 96.0 99.1 96.1
RE % 4.8 -4.0 -0.9 -3.9
*RSD% 0.438
* 1.011
* -- 1.355
*
Fexperimental 16.8 14.8 -- 13.7
F theoretical 19.2

Chapter Three Result and discussion
393
Table (3.48): Sample analyses of pharmaceutical Bristol (1mg) using WFN-
MPA+ NB electrode
Pharmaceutical
Bristol (1mg)
Direct
Method SAM MSA Titration (MPA)
Concentration
Prepared 1×10
-3 1×10
-3 1×10
-3 1×10
-3
*Found 0.970×10
-3 ×10
-3 1.010 0.962×10
-3 0.950×10
-3
Recovery % 97.0 101.0 96.2 95.0
RE % -3.0 1.0 -3.8 -5.0
*RSD% 0.311
* 1.235
* -- 0.838
*
Fexperimental 8.1 10.4 -- 6.6
F theoretical 19.2
Pharmaceutical
Bristol (1mg)
Direct
Method SAM MSA Titration (MPA)
Concentration
Prepared 1×10
-4 1×10
-4 1×10
-4 1×10
-4
*Found 0.973×10
-4 0.986×10
-4 1.010×10
-4 0.961×10
-4
Recovery % 97.3 98.6 101.0 96.1
RE % -2.7 -1.4 1.0 -3.9
*RSD% 0.241
* 1.221
* -- 1.023
*
Fexperimental 11.7 16.3 -- 11.4
F theoretical 19.2

Chapter Three Result and discussion
399
Table (3.49): Sample analyses of pharmaceutical Actavis (3 mg) using WFN-
MPA+ NB electrode
Pharmaceutical
Actavis (3 mg)
Direct
Method SAM MSA Titration (MPA)
Concentration
Prepared 1×10
-3 1×10
-3 1×10
-3 1×10
-3
*Found 0.969×10
-3 0.992×10
-3 0.966×10
-3 0.950×10
-3
Recovery % 96.9 99.2 96.6 95.0
RE % -3.1 -0.8 -3.4 -5
*RSD% 0.315
* 1.102
* -- 0.854
*
Fexperimental 11.3 7.6 -- 8.5
F theoretical 19.2
Pharmaceutical
Actavis (3 mg)
Direct
Method SAM MSA Titration (MPA)
Concentration
Prepared 1×10
-4 1×10
-4 1×10
-4 1×10
-4
*Found 1.025×10
-4 1.015×10
-4 0.992×10
-4 0.960×10
-4
Recovery % 102.5 101.5 99.2 96.0
RE % 2.5 1.5 -0.8 -4.0
*RSD% 0.285
* 1.122
* -- 1.123
*
Fexperimental 13.6 12.1 -- 13.4
F theoretical 19.2
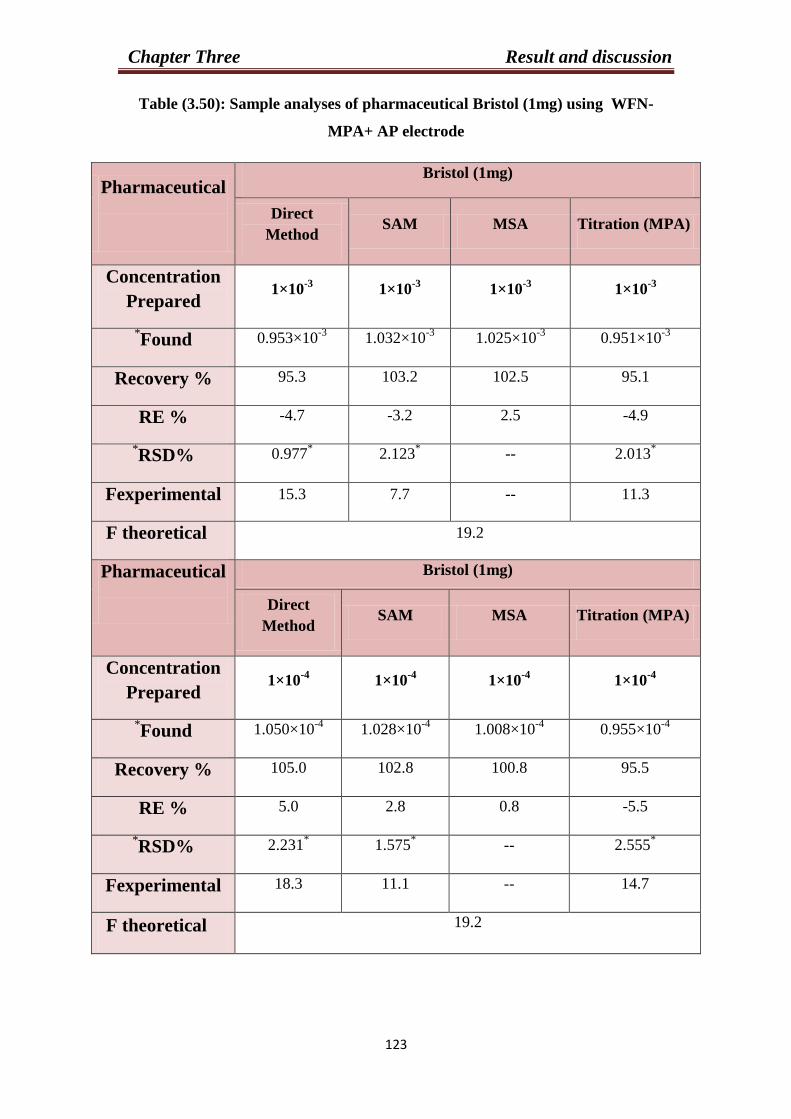
Chapter Three Result and discussion
390
Table (3.50): Sample analyses of pharmaceutical Bristol (1mg) using WFN-
MPA+ AP electrode
Pharmaceutical
Bristol (1mg)
Direct
Method SAM MSA Titration (MPA)
Concentration
Prepared 1×10
-3 1×10
-3 1×10
-3 1×10
-3
*Found 0.953×10
-3 1.032×10
-3 1.025×10
-3 0.951×10
-3
Recovery % 95.3 103.2 102.5 95.1
RE % -4.7 -3.2 2.5 -4.9
*RSD% 0.977
* 2.123
* -- 2.013
*
Fexperimental 15.3 7.7 -- 11.3
F theoretical 19.2
Pharmaceutical
Bristol (1mg)
Direct
Method SAM MSA Titration (MPA)
Concentration
Prepared 1×10
-4 1×10
-4 1×10
-4 1×10
-4
*Found 1.050×10
-4 1.028×10
-4 1.008×10
-4 0.955×10
-4
Recovery % 105.0 102.8 100.8 95.5
RE % 5.0 2.8 0.8 -5.5
*RSD% 2.231
* 1.575
* -- 2.555
*
Fexperimental 18.3 11.1 -- 14.7
F theoretical 19.2

Chapter Three Result and discussion
393
Table (3.51): Sample analyses of pharmaceutical Actavis (3 mg) using WFN-
MPA+ AP electrode
Pharmaceutical
Actavis (3 mg)
Direct
Method SAM MSA Titration (MPA)
Concentration
Prepared 1×10
-3 1×10
-3 1×10
-3 1×10
-3
*Found 1.043×10
-3 0.963×10
-3 0.977×10
-3 0.950×10
-3
Recovery % 104.3 96.3 97.7 95.0
RE % 4.3 -3.7 -2.3 5.0
*RSD% 1.034
* 2.351
* -- 1.853
*
Fexperimental 10.1 12.3 -- 7.1
F theoretical 19.2
Pharmaceutical
Actavis (3 mg)
Direct
Method SAM MSA Titration (MPA)
Concentration
Prepared 1×10
-4 1×10
-4 1×10
-4 1×10
-4
*Found 1.045×10
-4 0.970×10
-4 0.995×10
-4 0.953×10
-4
Recovery % 104.5 97.0 99.5 95.3
RE % 4.5 -3.0 0.5 -4.7
*RSD% 1.133
* 1.225
* -- 2.831
*
Fexperimental 12.5 16.4 -- 9.8
F theoretical 19.2

Chapter Three Result and discussion
393
Table (3.52): Sample analyses of pharmaceutical Bristol (1mg) using WFN-
MPA+ DOPH electrode
Pharmaceutical
Bristol (1mg)
Direct
Method SAM MSA Titration (MPA)
Concentration
Prepared 1×10
-3 1×10
-3 1×10
-3 1×10
-3
*Found 0.954×10
-3 0.990×10
-3 1.020×10
-3 0.970×10
-3
Recovery % 95.4 99.0 102.0 97.0
RE % -4.6 -1.0 2 -3.0
*RSD% 0.133
* 1.034
* -- 2.573
*
Fexperimental 13.8 5.8 -- 14.3
F theoretical 19.2
Pharmaceutical
Bristol (1mg)
Direct
Method SAM MSA Titration (MPA)
Concentration
Prepared 1×10
-4 1×10
-4 1×10
-4 1×10
-4
*Found 0.960×10
-4 1.027×10
-4 0.985×10
-4 0.965×10
-4
Recovery % 96.0 102.7 98.5 96.5
RE % -4.0 2.7 -1.5 -3.5
*RSD% 0.187
* 0.993
* -- -2.217
*
Fexperimental 17.7 8.9 -- 18.1
F theoretical 19.2
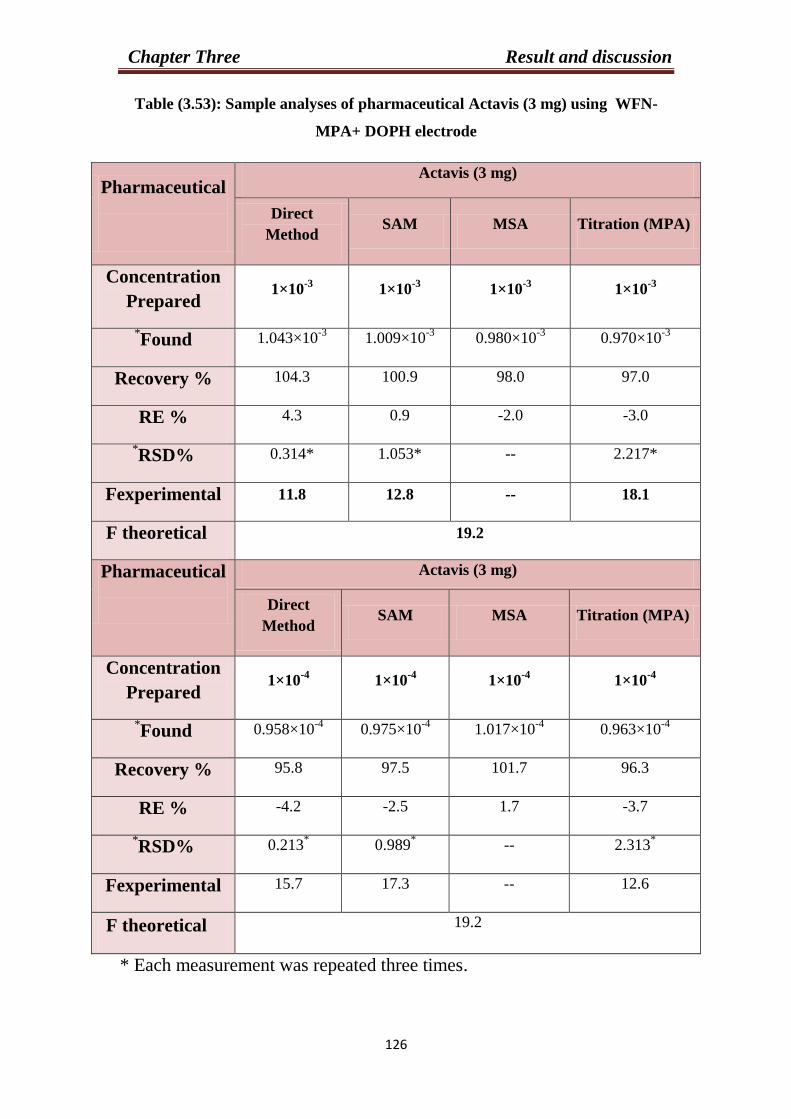
Chapter Three Result and discussion
393
Table (3.53): Sample analyses of pharmaceutical Actavis (3 mg) using WFN-
MPA+ DOPH electrode
Pharmaceutical
Actavis (3 mg)
Direct
Method SAM MSA Titration (MPA)
Concentration
Prepared 1×10
-3 1×10
-3 1×10
-3 1×10
-3
*Found 1.043×10
-3 1.009×10
-3 0.980×10
-3 0.970×10
-3
Recovery % 104.3 100.9 98.0 97.0
RE % 4.3 0.9 -2.0 -3.0
*RSD% 0.314* 1.053* -- 2.217*
Fexperimental 11.8 12.8 -- 18.1
F theoretical 19.2
Pharmaceutical
Actavis (3 mg)
Direct
Method SAM MSA Titration (MPA)
Concentration
Prepared 1×10
-4 1×10
-4 1×10
-4 1×10
-4
*Found 0.958×10
-4 0.975×10
-4 1.017×10
-4 0.963×10
-4
Recovery % 95.8 97.5 101.7 96.3
RE % -4.2 -2.5 1.7 -3.7
*RSD% 0.213
* 0.989
* -- 2.313
*
Fexperimental 15.7 17.3 -- 12.6
F theoretical 19.2
* Each measurement was repeated three times.

Chapter Three Result and discussion
393
Table (3.54): Sample analyses of pharmaceutical Bristol (1mg) using WFN-
PTA+ OA electrode
Pharmaceutical
Bristol (1mg)
Direct
Method SAM MSA Titration (MPA)
Concentration
Prepared 1×10
-3 1×10
-3 1×10
-3 1×10
-3
*Found 1.050×10
-3 0.991×10
-3 1.035×10
-3 0.960×10
-3
Recovery % 105.0 99.1 103.5 96.0
RE % 5.0 -0.9 -3.5 -4.0
*RSD% 0.337
* 2.011
* -- 1.033
*
Fexperimental 9.3 11.3 -- 7.5
F theoretical 19.2
Pharmaceutical
Bristol (1mg)
Direct
Method SAM MSA Titration (MPA)
Concentration
Prepared 1×10
-4 1×10
-4 1×10
-4 1×10
-4
*Found 1.023×10
-4 0.963×10
-4 0.981×10
-4 0.950×10
-4
Recovery % 102.3 96.3 98.1 95.0
RE % 2.3 -3.7 -1.9 -5.0
*RSD% 0.577
* 2.613
* -- 0.938
*
Fexperimental 12.8 13.1 -- 10.3
F theoretical 19.2
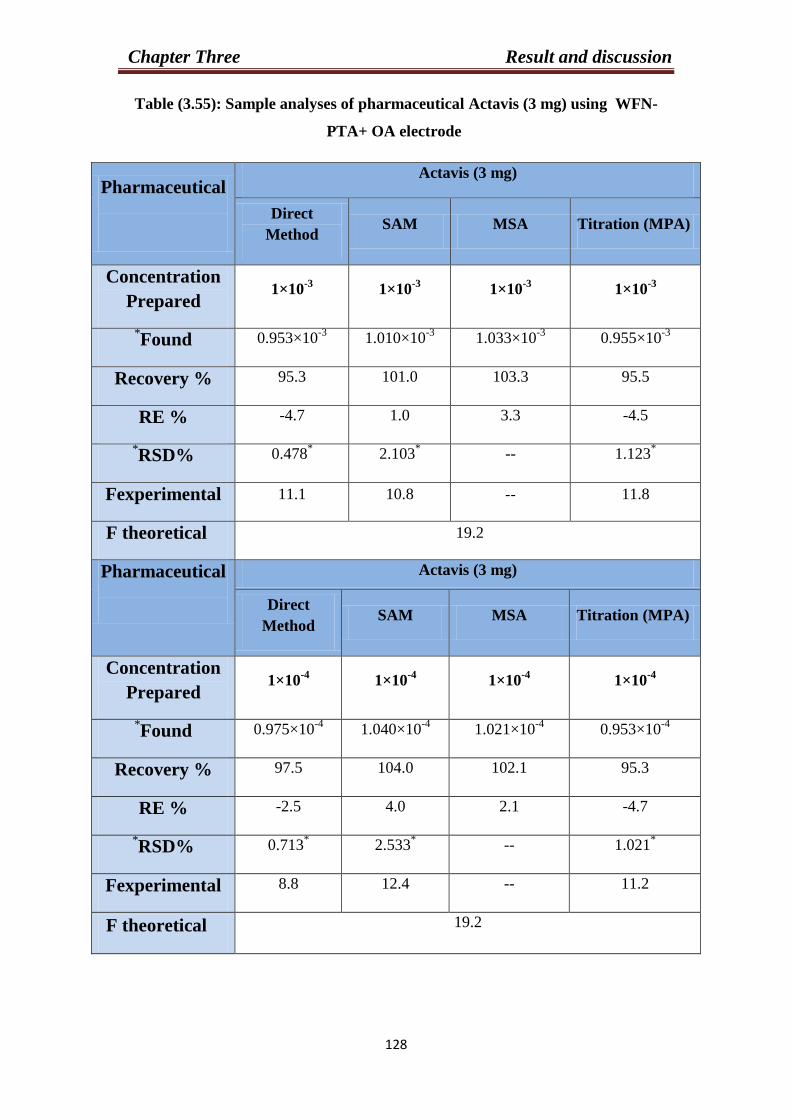
Chapter Three Result and discussion
393
Table (3.55): Sample analyses of pharmaceutical Actavis (3 mg) using WFN-
PTA+ OA electrode
Pharmaceutical
Actavis (3 mg)
Direct
Method SAM MSA Titration (MPA)
Concentration
Prepared 1×10
-3 1×10
-3 1×10
-3 1×10
-3
*Found 0.953×10
-3 1.010×10
-3 1.033×10
-3 0.955×10
-3
Recovery % 95.3 101.0 103.3 95.5
RE % -4.7 1.0 3.3 -4.5
*RSD% 0.478
* 2.103
* -- 1.123
*
Fexperimental 11.1 10.8 -- 11.8
F theoretical 19.2
Pharmaceutical
Actavis (3 mg)
Direct
Method SAM MSA Titration (MPA)
Concentration
Prepared 1×10
-4 1×10
-4 1×10
-4 1×10
-4
*Found 0.975×10
-4 1.040×10
-4 1.021×10
-4 0.953×10
-4
Recovery % 97.5 104.0 102.1 95.3
RE % -2.5 4.0 2.1 -4.7
*RSD% 0.713
* 2.533
* -- 1.021
*
Fexperimental 8.8 12.4 -- 11.2
F theoretical 19.2

Chapter Three Result and discussion
392
Table (3.56): Sample analyses of pharmaceutical Bristol (1mg) using WFN-
PTA+ TBP electrode
Pharmaceutical
Bristol (1mg)
Direct
Method SAM MSA Titration (MPA)
Concentration
Prepared 1×10
-3 1×10
-3 1×10
-3 1×10
-3
*Found 0.980×10
-3 1.020×10
-3 0.970×10
-3 0.970×10
-3
Recovery % 98.0 102.0 97.0 97.0
RE % -2.0 2.0 -3 -3
*RSD% 0.738
* 1.857
* -- 1.034
*
Fexperimental 10.4 13.1 -- 14.3
F theoretical 19.2
Pharmaceutical
Bristol (1mg)
Direct
Method SAM MSA Titration (MPA)
Concentration
Prepared 1×10
-4 1×10
-4 1×10
-4 1×10
-4
*Found 1.040×10
-4 0.973×10
-4 1.030×10
-4 0.950×10
-4
Recovery % 104.0 97.3 103.0 95.0
RE % 4.0 -2.7 3.0 -5.0
*RSD% 0.975
* 1.025
* -- 1.055
*
Fexperimental 11.5 12.5 -- 15.1
F theoretical 19.2

Chapter Three Result and discussion
303
Table (3.57): Sample analyses of pharmaceutical Actavis (3 mg) using WFN-
PTA+ TBP electrode
Pharmaceutical
Actavis (3 mg)
Direct
Method SAM MSA Titration (MPA)
Concentration
Prepared 1×10
-3 1×10
-3 1×10
-3 1×10
-3
*Found 1.021×10
-3 0.979×10
-3 1.028×10
-3 0.965×10
-3
Recovery % 102.1 97.9 102.8 96.5
RE % 2.1 -2.1 2.8 -3.5
*RSD% 0.811
* 1.981
* -- 1.191
*
Fexperimental 9.5 14.5 -- 15.7
F theoretical 19.2
Pharmaceutical
Actavis (3 mg)
Direct
Method SAM MSA Titration (MPA)
Concentration
Prepared 1×10
-4 1×10
-4 1×10
-4 1×10
-4
*Found 1.038×10
-4 1.021×10
-4 0.971×10
-4 0.950×10
-4
Recovery % 103.8 102.1 97.1 95.0
RE % 3.8 2.1 -2.9 -5.0
*RSD% 0.993
* 1.103
* -- 1.103
*
Fexperimental 9.8 11.4 -- 16.3
F theoretical 19.2
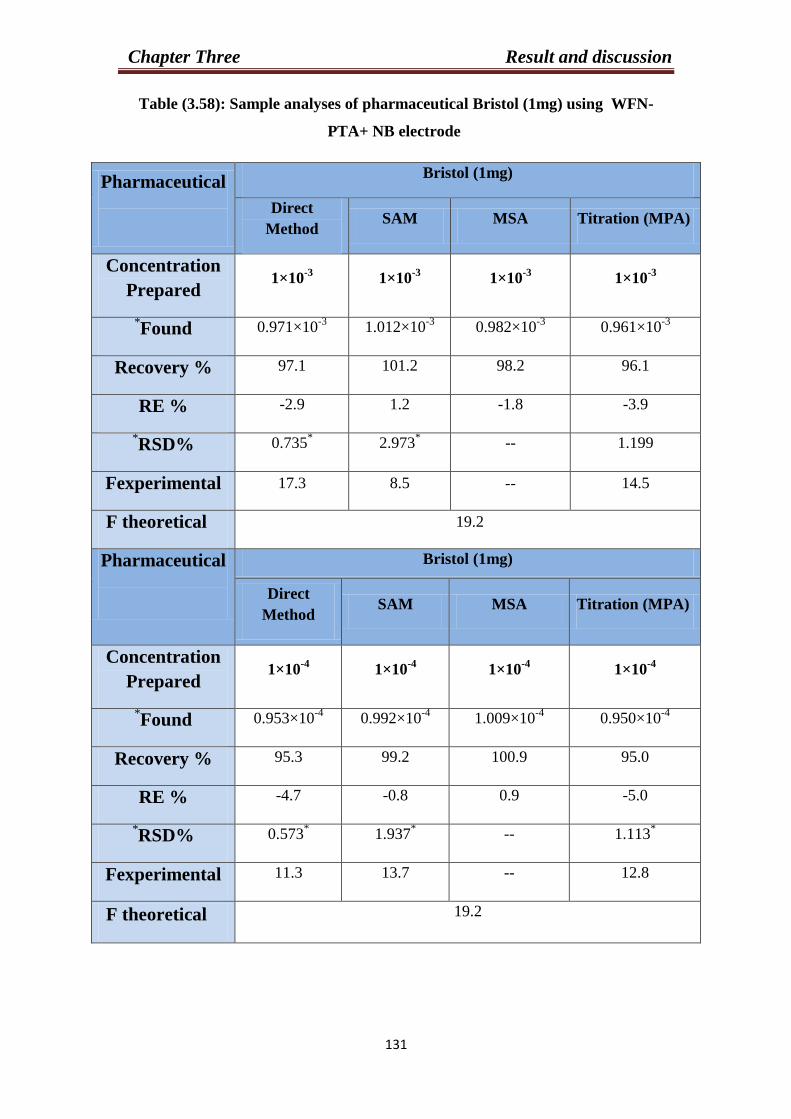
Chapter Three Result and discussion
303
Table (3.58): Sample analyses of pharmaceutical Bristol (1mg) using WFN-
PTA+ NB electrode
Pharmaceutical
Bristol (1mg)
Direct
Method SAM MSA Titration (MPA)
Concentration
Prepared 1×10
-3 1×10
-3 1×10
-3 1×10
-3
*Found 0.971×10
-3 1.012×10
-3 0.982×10
-3 0.961×10
-3
Recovery % 97.1 101.2 98.2 96.1
RE % -2.9 1.2 -1.8 -3.9
*RSD% 0.735
* 2.973
* -- 1.199
Fexperimental 17.3 8.5 -- 14.5
F theoretical 19.2
Pharmaceutical
Bristol (1mg)
Direct
Method SAM MSA Titration (MPA)
Concentration
Prepared 1×10
-4 1×10
-4 1×10
-4 1×10
-4
*Found 0.953×10
-4 0.992×10
-4 1.009×10
-4 0.950×10
-4
Recovery % 95.3 99.2 100.9 95.0
RE % -4.7 -0.8 0.9 -5.0
*RSD% 0.573
* 1.937
* -- 1.113
*
Fexperimental 11.3 13.7 -- 12.8
F theoretical 19.2

Chapter Three Result and discussion
309
Table (3.59): Sample analyses of pharmaceutical Actavis (3 mg) using WFN-
PTA+ NB electrode
Pharmaceutical
Actavis (3 mg)
Direct
Method SAM MSA Titration (MPA)
Concentration
Prepared 1×10
-3 1×10
-3 1×10
-3 1×10
-3
*Found 0.969×10
-3 0.981×10
-3 1.019×10
-3 0.965×10
-3
Recovery % 96.9 98.1 101.9 96.5
RE % -3.1 -1.9 1.9 -3.5
*RSD% 0.851
* 2.879
* -- 1.211
*
Fexperimental 15.9 10.3 -- 16.1
F theoretical 19.2
Pharmaceutical
Actavis (3 mg)
Direct
Method SAM MSA Titration (MPA)
Concentration
Prepared 1×10
-4 1×10
-4 1×10
-4 1×10
-4
*Found 1.049×10
-4 0.995×10
-4 0.992×10
-4 0.953×10
-4
Recovery % 104.9 99.5 99.2 95.3
RE % 4.9 -0.5 -0.8 -4.7
*RSD% 0.612
* 2.911
* -- 1.147
*
Fexperimental 12.7 12.1 -- 11.7
F theoretical 19.2

Chapter Three Result and discussion
300
Table (3.60): Sample analyses of pharmaceutical Bristol (1mg) using WFN-
PTA+ AP electrode
Pharmaceutical
Bristol (1mg)
Direct
Method SAM MSA Titration (MPA)
Concentration
Prepared 1×10
-3 1×10
-3 1×10
-3 1×10
-3
*Found 0.965×10
-3 0.970×10
-3 1.024×10
-3 0.955×10
-3
Recovery % 96.5 97.0 102.4 95.5
RE % -3.5 -3.0 2.4 -4.5
*RSD% 0.237
* 1.671
* -- 2.132
*
Fexperimental 15.2 11.8 -- 16.1
F theoretical 19.2
Pharmaceutical
Bristol (1mg)
Direct
Method SAM MSA Titration (MPA)
Concentration
Prepared 1×10
-4 1×10
-4 1×10
-4 1×10
-4
*Found 1.035×10
-4 1.021×10
-4 0.970×10
-4 0.965×10
-4
Recovery % 103.5 102.1 97.0 96.5
RE % 3.5 2.1 -3.0 -3.5
*RSD% 0.537
* 1.933
* -- 1.873
*
Fexperimental 13.7 8.7 -- 13.3
F theoretical 19.2

Chapter Three Result and discussion
303
Table (3.61): Sample analyses of pharmaceutical Actavis (3 mg) using WFN-
PTA+ AP electrode
Pharmaceutical
Actavis (3 mg)
Direct
Method SAM MSA Titration (MPA)
Concentration
Prepared 1×10
-3 1×10
-3 1×10
-3 1×10
-3
*Found 1.032×10
-3 0.972×10
-3 0.974×10
-3 0.963×10
-3
Recovery % 103.2 97.2 97.4 96.3
RE % 3.2 -2.8 -2.6 -3.7
*RSD% 0.274
* 1.637
* -- 1.985
*
Fexperimental 14.7 11.5 -- 13.1
F theoretical 19.2
Pharmaceutical
Actavis (3 mg)
Direct
Method SAM MSA Titration (MPA)
Concentration
Prepared 1×10
-4 1×10
-4 1×10
-4 1×10
-4
*Found 1.036×10
-4 0.980×10
-4 0.973×10
-4 0.950×10
-4
Recovery % 103.6 98.0 97.3 95.0
RE % 3.6 2.0 -2.7 -5.0
*RSD% 0.578
* 1.917
* -- 2.220
Fexperimental 14.8 10.9 -- 12.5
F theoretical 19.2

Chapter Three Result and discussion
303
Table (3.62): Sample analyses of pharmaceutical Bristol (1mg) using WFN-
PTA+ DOPH electrode
Pharmaceutical
Bristol (1mg)
Direct
Method SAM MSA Titration (MPA)
Concentration
Prepared 1×10
-3 1×10
-3 1×10
-3 1×10
-3
*Found 1.050×10
-3 1.004×10
-3 1.020×10
-3 0.955×10
-3
Recovery % 105.0 100.4 102.0 95.5
RE % 5.0 0.4 2 -4.5
*RSD% 0.616
* 1.976
* -- 2.213
*
Fexperimental 17.3 9.7 -- 11.3
F theoretical 19.2
Pharmaceutical
Bristol (1mg)
Direct
Method SAM MSA Titration (MPA)
Concentration
Prepared 1×10
-4 1×10
-4 1×10
-4 1×10
-4
*Found 0.970×10
-4 0.995×10
-4 1.007×10
-4 0.950×10
-4
Recovery % 97.0 99.5 100.7 95.0
RE % -3 -0.5 0.7 -5.0
*RSD% 3.313
* 1.911* -- 2.514
*
Fexperimental 15.1 10.8 -- 13.3
F theoretical 19.2
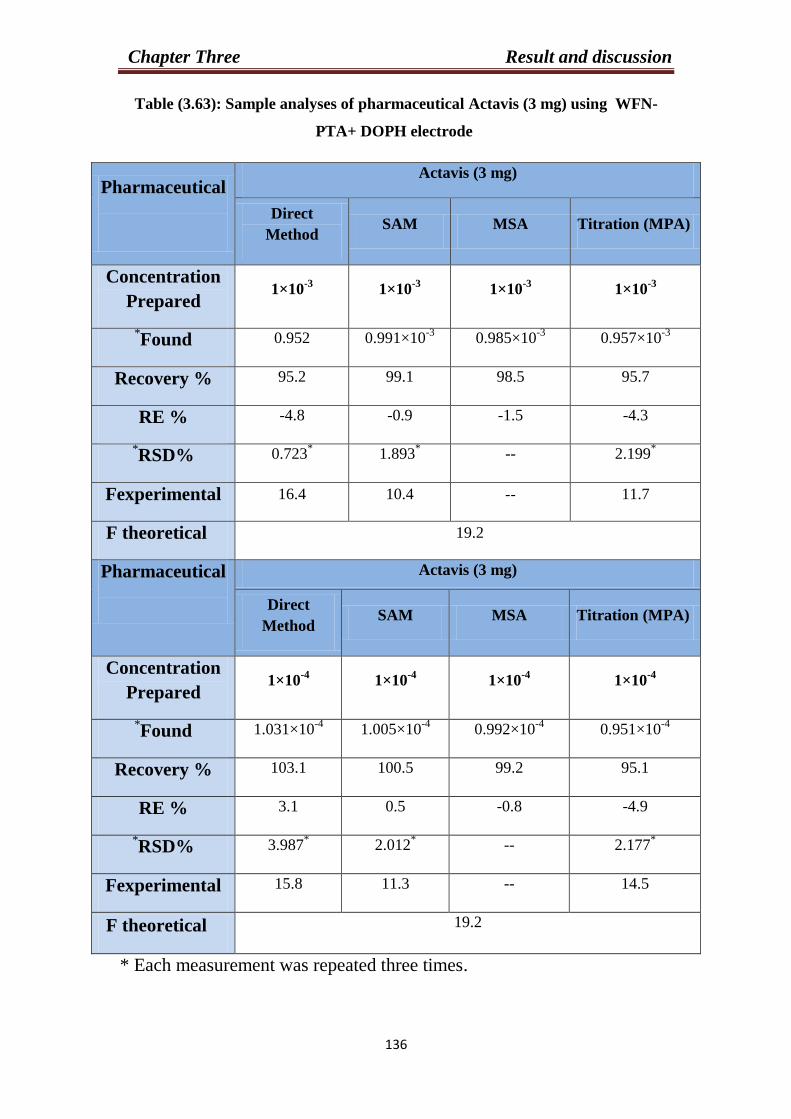
Chapter Three Result and discussion
303
Table (3.63): Sample analyses of pharmaceutical Actavis (3 mg) using WFN-
PTA+ DOPH electrode
Pharmaceutical
Actavis (3 mg)
Direct
Method SAM MSA Titration (MPA)
Concentration
Prepared 1×10
-3 1×10
-3 1×10
-3 1×10
-3
*Found 0.952 0.991×10
-3 0.985×10
-3 0.957×10
-3
Recovery % 95.2 99.1 98.5 95.7
RE % -4.8 -0.9 -1.5 -4.3
*RSD% 0.723
* 1.893
* -- 2.199
*
Fexperimental 16.4 10.4 -- 11.7
F theoretical 19.2
Pharmaceutical
Actavis (3 mg)
Direct
Method SAM MSA Titration (MPA)
Concentration
Prepared 1×10
-4 1×10
-4 1×10
-4 1×10
-4
*Found 1.031×10
-4 1.005×10
-4 0.992×10
-4 0.951×10
-4
Recovery % 103.1 100.5 99.2 95.1
RE % 3.1 0.5 -0.8 -4.9
*RSD% 3.987
* 2.012
* -- 2.177
*
Fexperimental 15.8 11.3 -- 14.5
F theoretical 19.2
* Each measurement was repeated three times.
Chapter Three Result and discussion
303
3.9 Synthesis of MIPs for Warfarin sodium (WFN):
Four MIPs for (WFN) were synthesized by self-assembling (non-
covalent) bulk polymerization method. The careful choice of functional
monomer plays an important role to provide complementary interactions
with the template .Two monomers, methacrylic acid (MAA) and acryl
amide (ACY) were properly and effectively used for the synthesis of
molecularly imprinted polymers (MIPs) and non- imprinted polymer
(NIPs) although the acid-base properties of the two monomers are
different. The carboxyl group on (MAA) and the amide group on
Acrylamid are excellent hydrogen bond donor and acceptor. The kind
and the amount of the cross-linking agent is another important choice as it
controls the chemical environment and morphology of the polymer
matrix and imparts mechanical stability to it. Ethylene glycol
dimethacrylate (EGDMA) was used as a cross-linker that has acrylate
groups that enable it to form more rigid polymer which lead to MIP with
higher capacities and selectivity. In addition the method of
polymerization restricts the type of solvent used. For bulk polymerization
aprotic and a polar organic solvent were exclusively used mainly with
low dielectric constant.The porogen is strongly influence the stability of
the functional monomer-template complexes in the prepolymerization
step. Over several solvents that were tested including dichloromethane,
chloroform, DMSO; chloroform was found to be a suitable porogenic
solvent.The suggested schemes (3.49),(3.50) and (3.51)illustrate the
synthesis of MIPs for (WFN) based on (MAA) and (ACY) as acidic and
basic functional monomer.
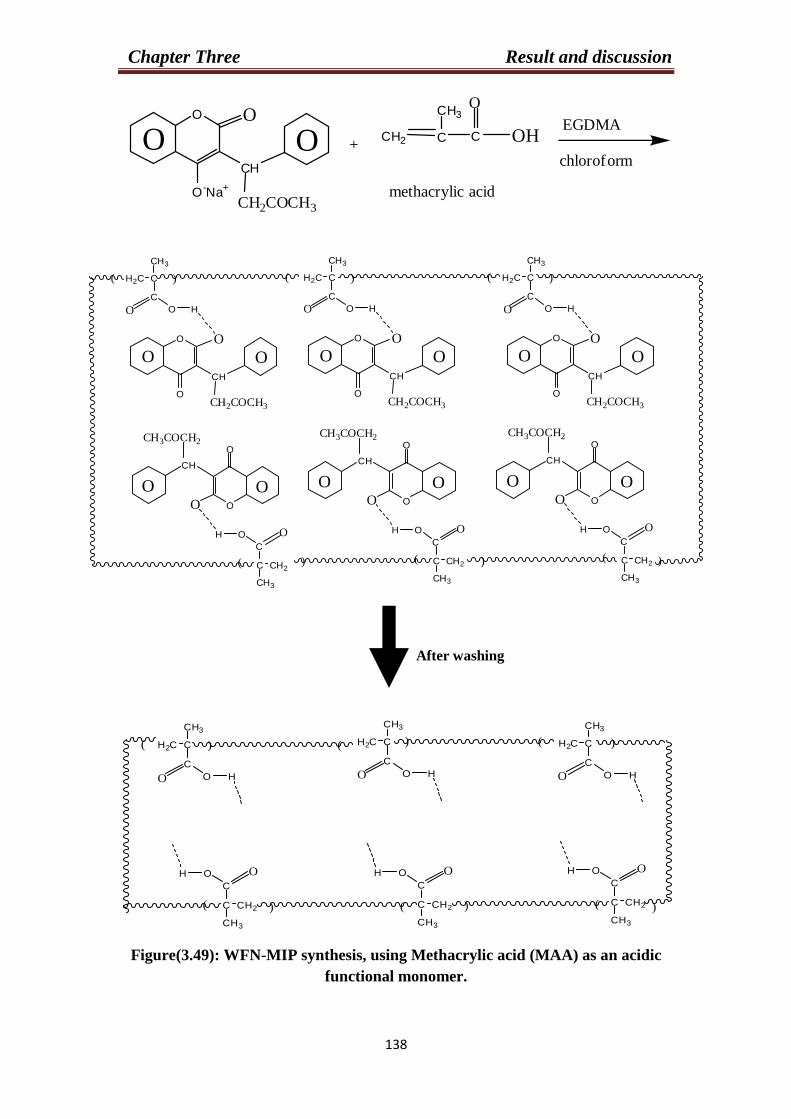
Chapter Three Result and discussion
303
O
O OCH
O
O-Na+
CH2COCH3
+CH2 C C OH
OCH3
EGDMA
chloroform
methacrylic acid
O
C
O
CH2C
H
CH3
()(
O
O OCH
O
OCH2COCH3
O
C
O
CH2C
H
CH3
)
O
O OCH
O
OCH2COCH3
O
C
O
CH2C
H
CH3
)
O
O OCH
O
OCH2COCH3
O
C
O
C CH2
H
CH3
)
O
OOO
O
CH3COCH2
CH
O
C
O
C CH2
H
CH3
)
O
OOO
O
CH3COCH2
CH
O
C
O
C CH2
H
CH3
)
O
OOO
O
CH3COCH2
CH
(
) ) )
After washing
O
C
O
C CH2
H
CH3
O
C
O
C CH2
H
CH3
O
C
O
C CH2
H
CH3
O
C
O
CH2C
H
CH3
O
C
O
CH2C
H
CH3
O
C
O
CH2C
H
CH3
)( )) ((
((( )))
Figure(3.49): WFN-MIP synthesis, using Methacrylic acid (MAA) as an acidic
functional monomer.
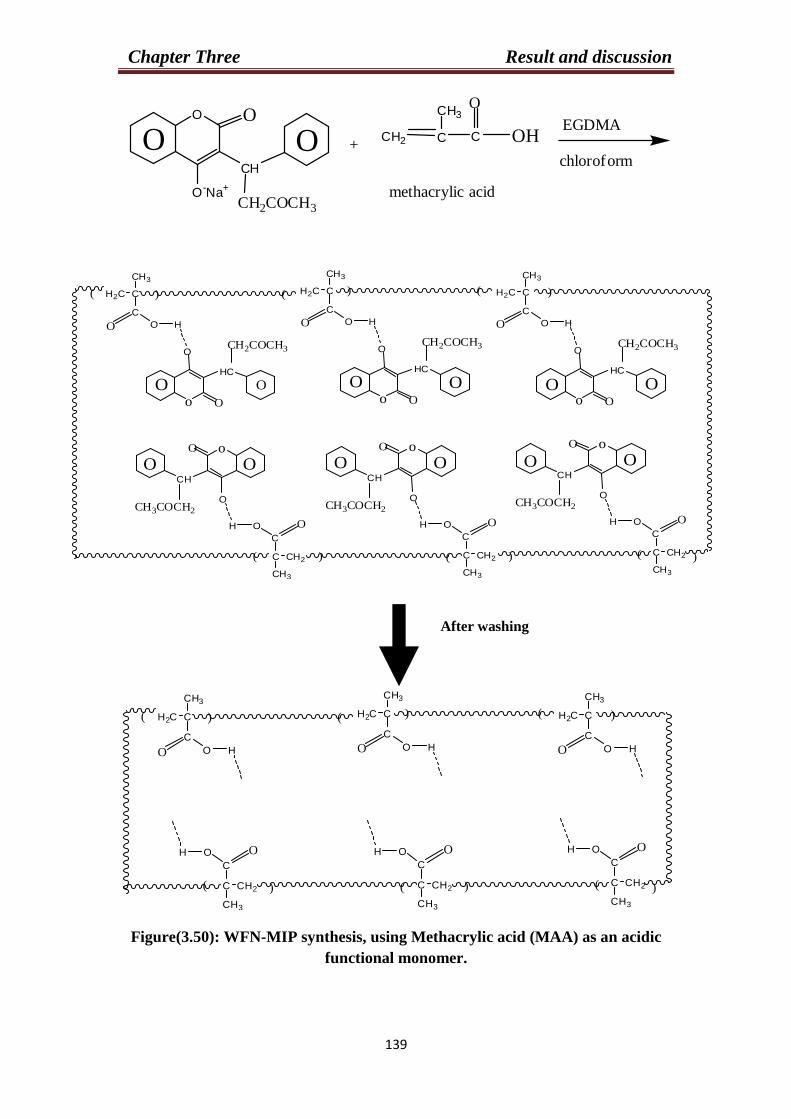
Chapter Three Result and discussion
302
O
O OCH
O
O-Na+
CH2COCH3
+CH2 C C OH
OCH3
EGDMA
chloroform
methacrylic acid
oO
OO
O
C
O
C CH2
H
CH3
O
CH
CH3COCH2
oO
OO
O
C
O
C CH2
H
CH3
O
CH
CH3COCH2
oO
OO
O
C
O
C CH2
H
CH3
O
CH
CH3COCH2
o O
O O
O
C
O
CH2C
H
CH3
O
HC
CH2COCH3
o O
O O
O
C
O
CH2C
H
CH3
O
HC
CH2COCH3
o O
O O
O
C
O
CH2C
H
CH3
O
HC
CH2COCH3
)( )) ((
((( )))
After washing
O
C
O
C CH2
H
CH3
O
C
O
C CH2
H
CH3
O
C
O
C CH2
H
CH3
O
C
O
CH2C
H
CH3
O
C
O
CH2C
H
CH3
O
C
O
CH2C
H
CH3
)( )) ((
((( )))
Figure(3.50): WFN-MIP synthesis, using Methacrylic acid (MAA) as an acidic
functional monomer.
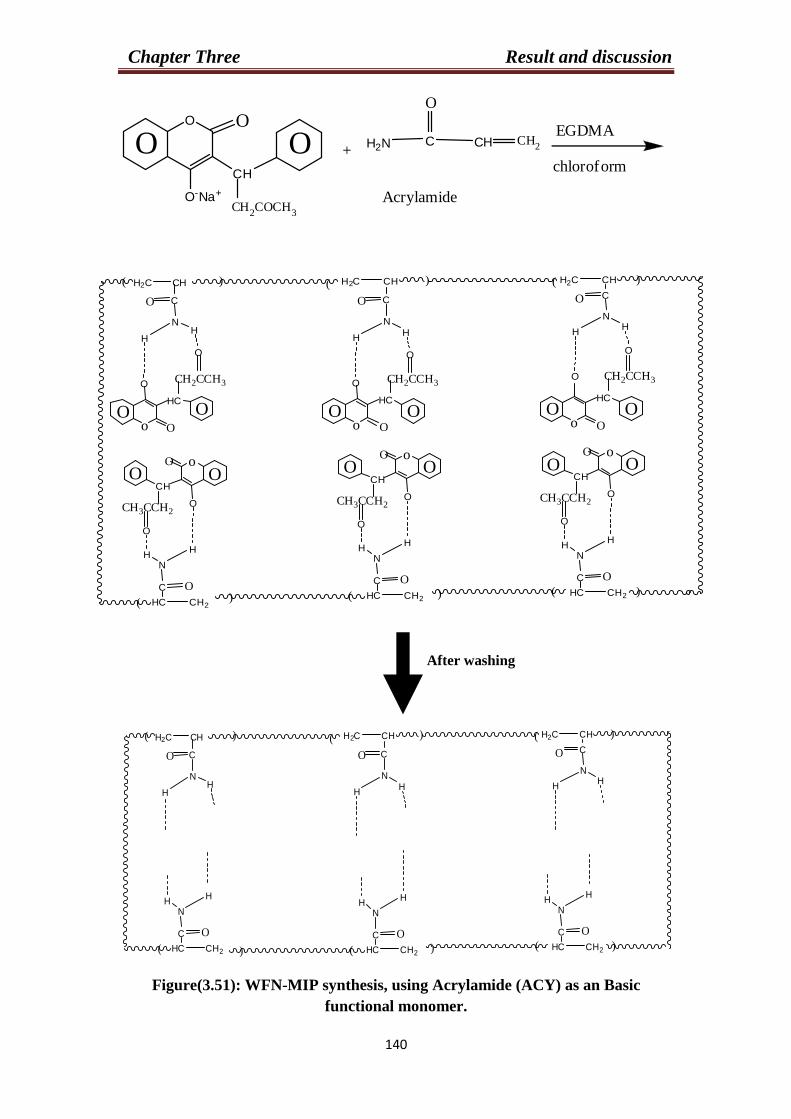
Chapter Three Result and discussion
333
O
O OCH
O
O-Na+
CH2COCH
3
+H2N C CH CH
2
EGDMA
chloroform
Acrylamide
O
o O
O O
O
HC
CH2CCH3
N
CO
H
O
H
o O
O O
O
HC
CH2CCH3
N
CO
H
O
H
o O
O O
O
HC
CH2CCH3
N
CO
H
O
H
oO
OO
O
CH
N
C O
HC CH2
H
O
H
CH3CCH2
oO
OO
O
CH
N
C O
HC CH2
H
O
H
CH3CCH2
oO
OO
O
CH
N
C O
HC CH2
H
O
H
CH3CCH2
)))
)( (
(((
CHH2C )( CHH2C )CHH2C
After washing
N
CO
HH
N
CO
HH
N
CO
HH
N
C O
HC CH2
HH
N
C O
HC CH2
HH
N
C O
HC CH2
HH
)))
)( (
(((
CHH2C )( CHH2C )CHH2C
Figure(3.51): WFN-MIP synthesis, using Acrylamide (ACY) as an Basic
functional monomer.
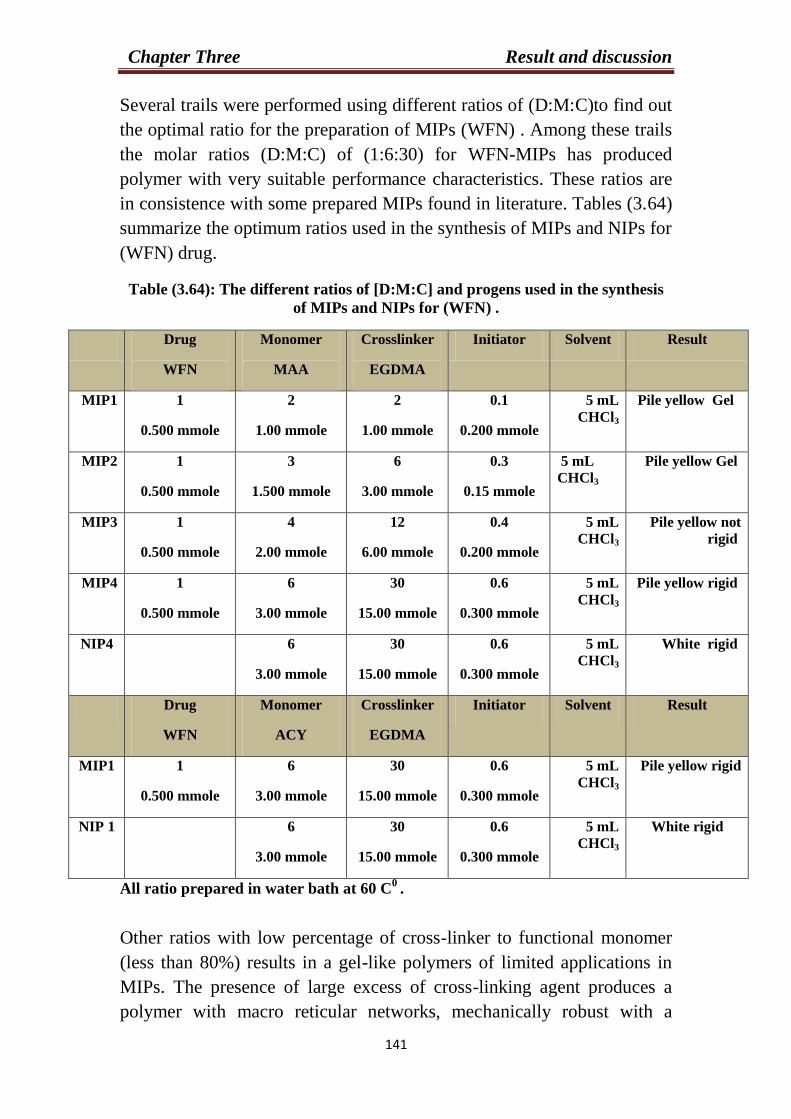
Chapter Three Result and discussion
333
Several trails were performed using different ratios of (D:M:C)to find out
the optimal ratio for the preparation of MIPs (WFN) . Among these trails
the molar ratios (D:M:C) of (1:6:30) for WFN-MIPs has produced
polymer with very suitable performance characteristics. These ratios are
in consistence with some prepared MIPs found in literature. Tables (3.64)
summarize the optimum ratios used in the synthesis of MIPs and NIPs for
(WFN) drug.
Table (3.64): The different ratios of [D:M:C] and progens used in the synthesis
of MIPs and NIPs for (WFN) .
Result Solvent Initiator Crosslinker
EGDMA
Monomer
MAA
Drug
WFN
Pile yellow Gel 5 mL
CHCl3
0.1
0.200 mmole
2
1.00 mmole
2
1.00 mmole
1
0.500 mmole
MIP1
Pile yellow Gel 5 mL
CHCl3
0.3
0.15 mmole
6
3.00 mmole
3
1.500 mmole
1
0.500 mmole
MIP2
Pile yellow not
rigid 5 mL
CHCl3 0.4
0.200 mmole
12
6.00 mmole
4
2.00 mmole
1
0.500 mmole
MIP3
Pile yellow rigid 5 mL
CHCl3 0.6
0.300 mmole
30
15.00 mmole
6
3.00 mmole
1
0.500 mmole
MIP4
White rigid 5 mL
CHCl3 0.6
0.300 mmole
30
15.00 mmole
6
3.00 mmole
NIP4
Result Solvent Initiator Crosslinker
EGDMA
Monomer
ACY
Drug
WFN
Pile yellow rigid 5 mL
CHCl3 0.6
0.300 mmole
30
15.00 mmole
6
3.00 mmole
1
0.500 mmole
MIP1
White rigid 5 mL
CHCl3 0.6
0.300 mmole
30
15.00 mmole
6
3.00 mmole
NIP 1
All ratio prepared in water bath at 60 C0
.
Other ratios with low percentage of cross-linker to functional monomer
(less than 80%) results in a gel-like polymers of limited applications in
MIPs. The presence of large excess of cross-linking agent produces a
polymer with macro reticular networks, mechanically robust with a
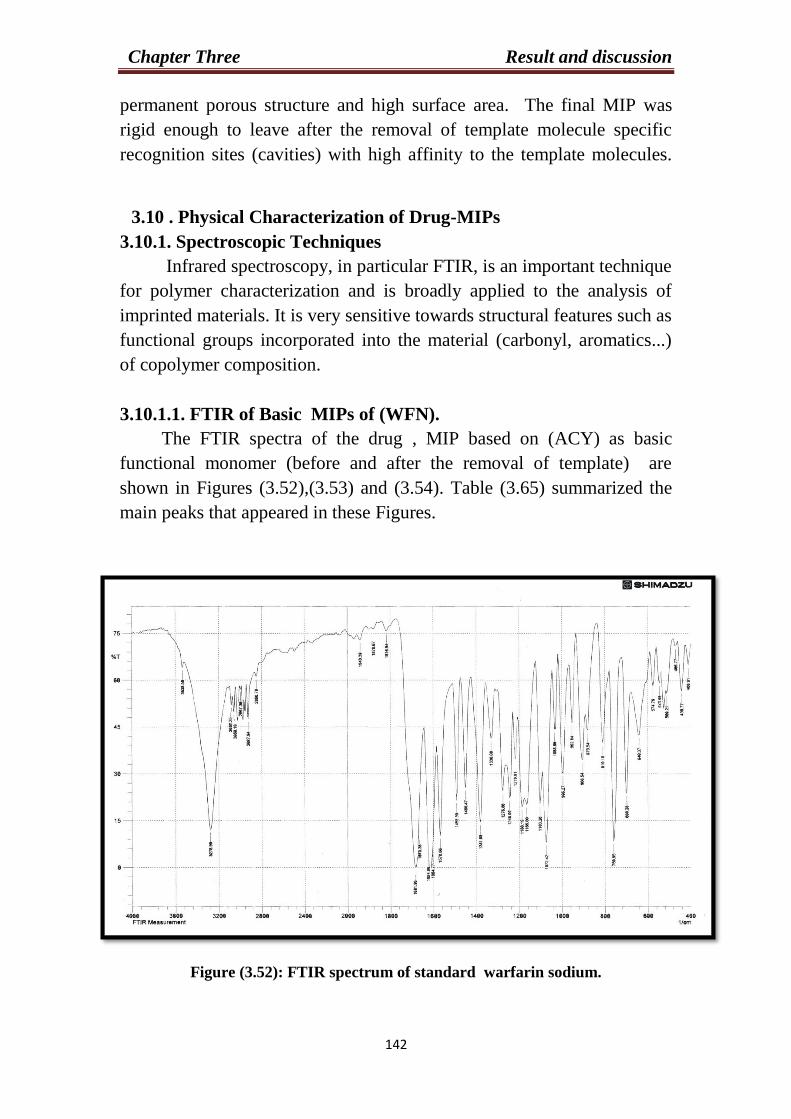
Chapter Three Result and discussion
339
permanent porous structure and high surface area. The final MIP was
rigid enough to leave after the removal of template molecule specific
recognition sites (cavities) with high affinity to the template molecules.
3.10 . Physical Characterization of Drug-MIPs
3.10.1. Spectroscopic Techniques
Infrared spectroscopy, in particular FTIR, is an important technique
for polymer characterization and is broadly applied to the analysis of
imprinted materials. It is very sensitive towards structural features such as
functional groups incorporated into the material (carbonyl, aromatics...)
of copolymer composition.
3.10.1.1. FTIR of Basic MIPs of (WFN).
The FTIR spectra of the drug , MIP based on (ACY) as basic
functional monomer (before and after the removal of template) are
shown in Figures (3.52),(3.53) and (3.54). Table (3.65) summarized the
main peaks that appeared in these Figures.
Figure (3.52): FTIR spectrum of standard warfarin sodium.
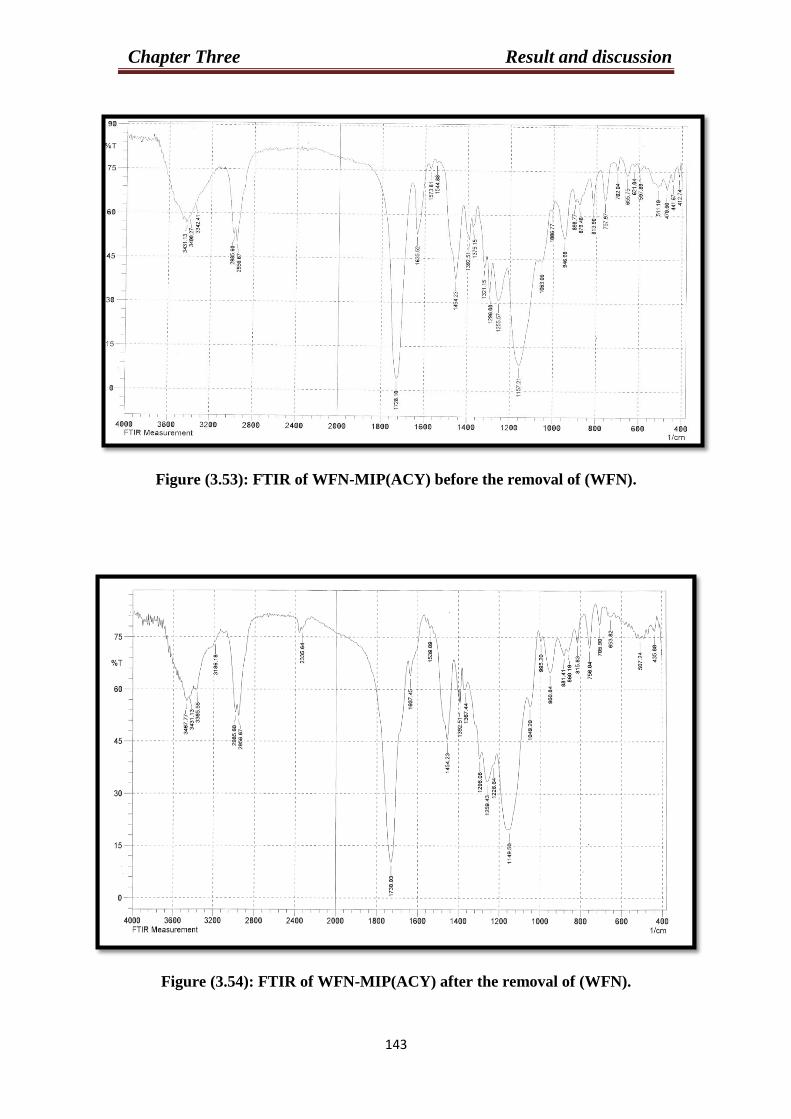
Chapter Three Result and discussion
330
Figure (3.53): FTIR of WFN-MIP(ACY) before the removal of (WFN).
Figure (3.54): FTIR of WFN-MIP(ACY) after the removal of (WFN).
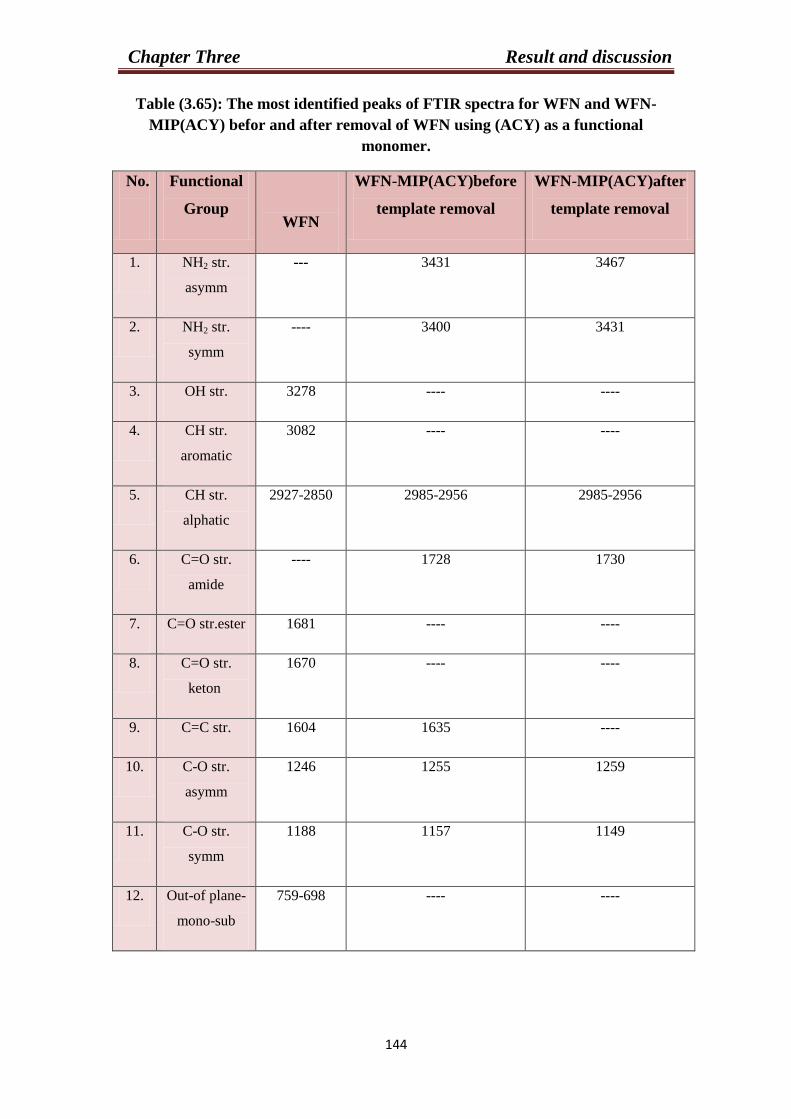
Chapter Three Result and discussion
333
Table (3.65): The most identified peaks of FTIR spectra for WFN and WFN-
MIP(ACY) befor and after removal of WFN using (ACY) as a functional
monomer.
No.
Functional
Group
WFN
WFN-MIP(ACY)before
template removal
WFN-MIP(ACY)after
template removal
1. NH2 str.
asymm
--- 3431 3467
2. NH2 str.
symm
---- 3400 3431
3. OH str. 3278 ---- ----
4. CH str.
aromatic
3082 ---- ----
5. CH str.
alphatic
2927-2850 2985-2956 2985-2956
6. C=O str.
amide
---- 1728 1730
7. C=O str.ester 1681 ---- ----
8. C=O str.
keton
1670 ---- ----
9. C=C str. 1604 1635 ----
10. C-O str.
asymm
1246 1255 1259
11. C-O str.
symm
1188 1157 1149
12. Out-of plane-
mono-sub
759-698 ---- ----
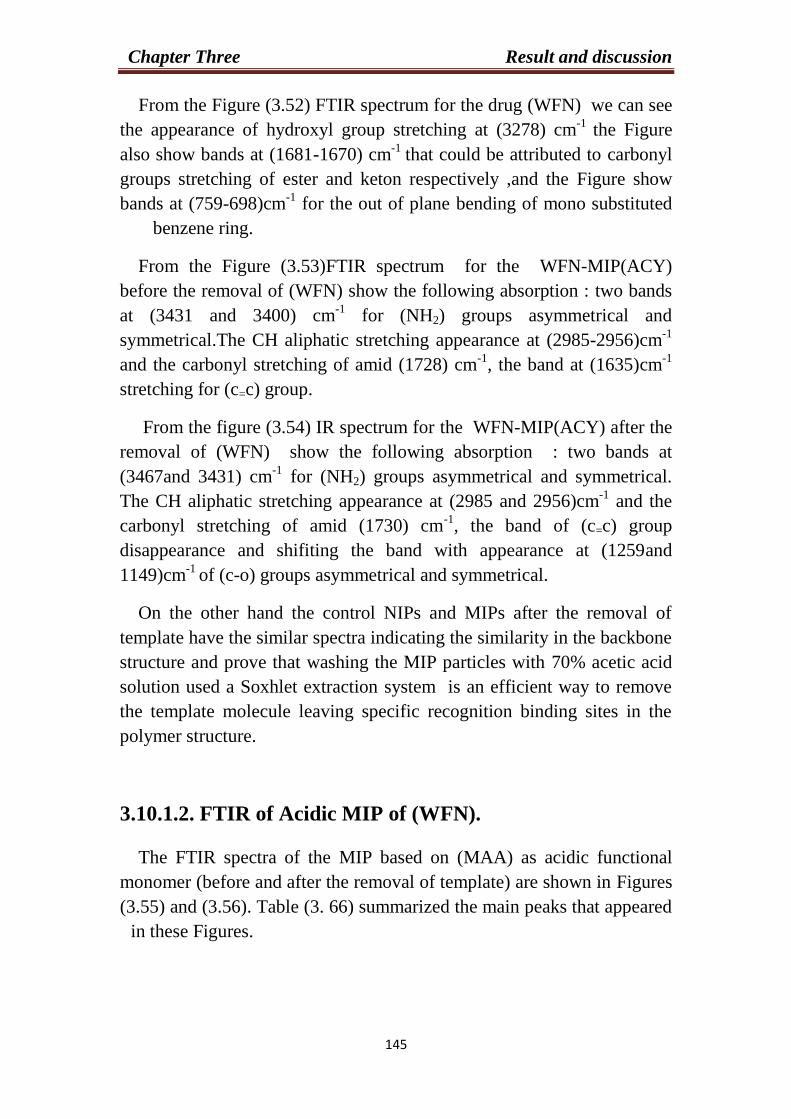
Chapter Three Result and discussion
333
From the Figure (3.52) FTIR spectrum for the drug (WFN) we can see
the appearance of hydroxyl group stretching at (3278) cm-1
the Figure
also show bands at (1681-1670) cm-1
that could be attributed to carbonyl
groups stretching of ester and keton respectively ,and the Figure show
bands at (759-698)cm-1
for the out of plane bending of mono substituted
benzene ring.
From the Figure (3.53)FTIR spectrum for the WFN-MIP(ACY)
before the removal of (WFN) show the following absorption : two bands
at (3431 and 3400) cm-1
for (NH2) groups asymmetrical and
symmetrical.The CH aliphatic stretching appearance at (2985-2956)cm-1
and the carbonyl stretching of amid (1728) cm-1
, the band at (1635)cm-1
stretching for (c=c) group.
From the figure (3.54) IR spectrum for the WFN-MIP(ACY) after the
removal of (WFN) show the following absorption : two bands at
(3467and 3431) cm-1
for (NH2) groups asymmetrical and symmetrical.
The CH aliphatic stretching appearance at (2985 and 2956)cm-1
and the
carbonyl stretching of amid (1730) cm-1
, the band of (c=c) group
disappearance and shifiting the band with appearance at (1259and
1149)cm-1
of (c-o) groups asymmetrical and symmetrical.
On the other hand the control NIPs and MIPs after the removal of
template have the similar spectra indicating the similarity in the backbone
structure and prove that washing the MIP particles with 70% acetic acid
solution used a Soxhlet extraction system is an efficient way to remove
the template molecule leaving specific recognition binding sites in the
polymer structure.
3.10.1.2. FTIR of Acidic MIP of (WFN).
The FTIR spectra of the MIP based on (MAA) as acidic functional
monomer (before and after the removal of template) are shown in Figures
(3.55) and (3.56). Table (3. 66) summarized the main peaks that appeared
in these Figures.
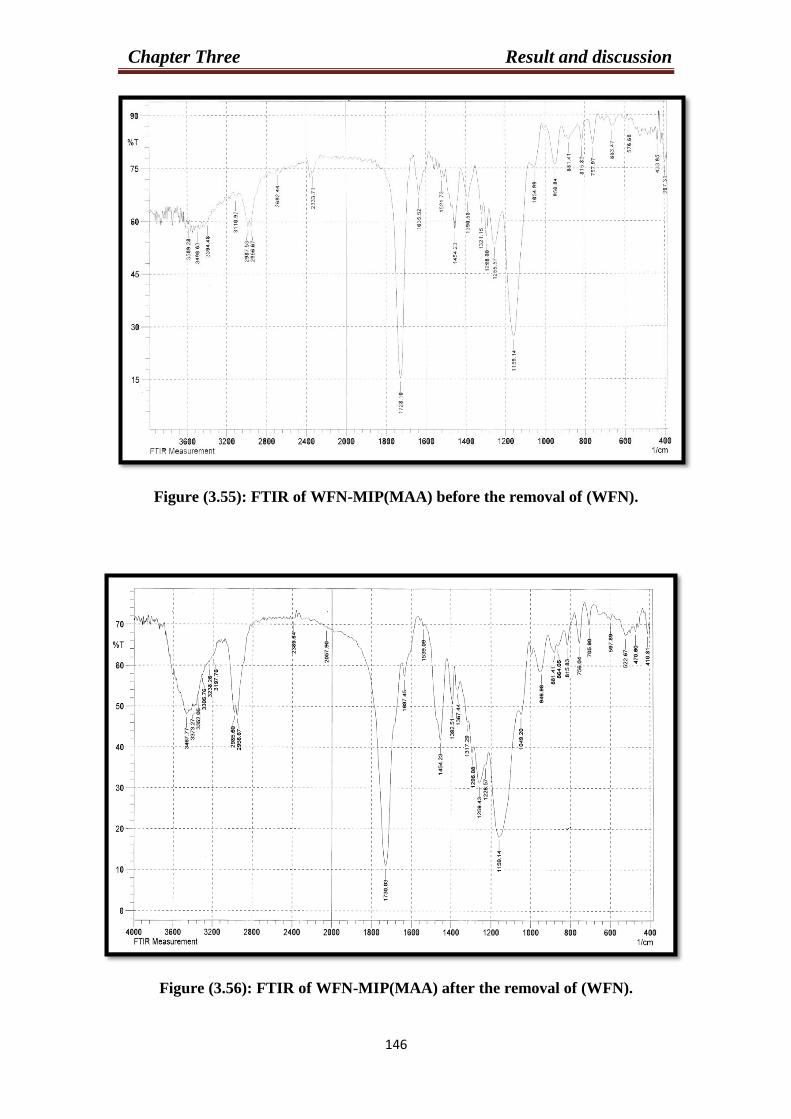
Chapter Three Result and discussion
333
Figure (3.55): FTIR of WFN-MIP(MAA) before the removal of (WFN).
Figure (3.56): FTIR of WFN-MIP(MAA) after the removal of (WFN).
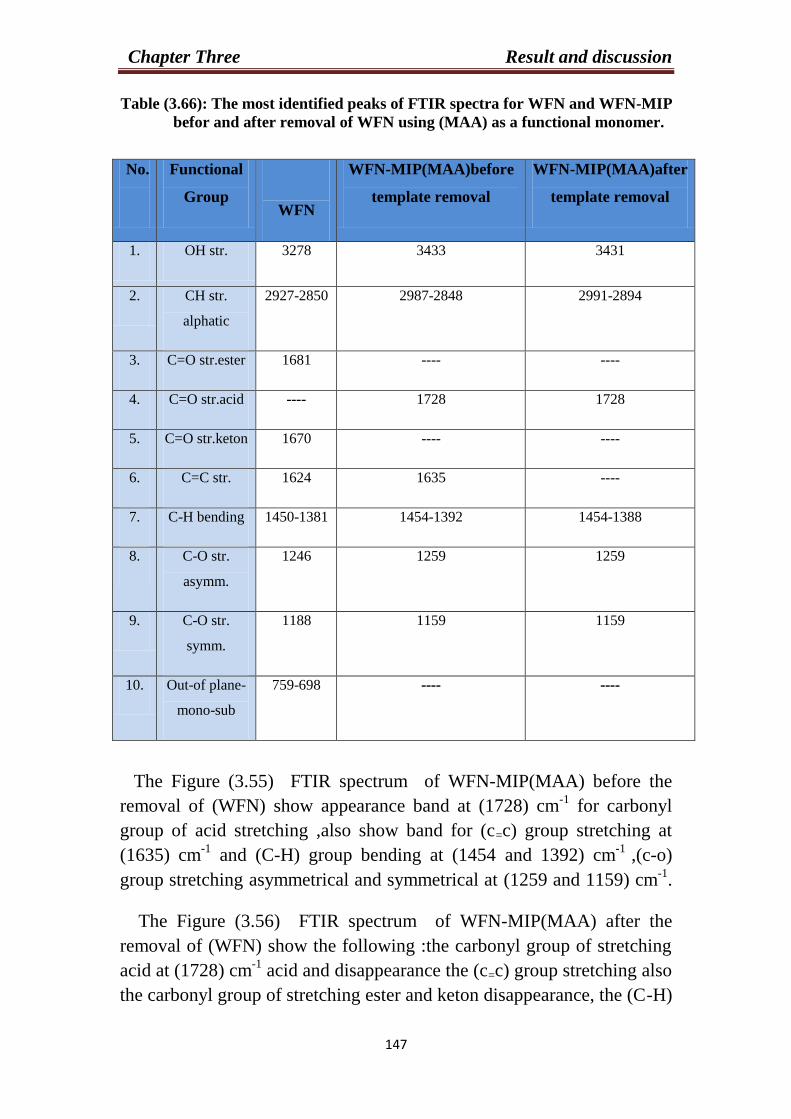
Chapter Three Result and discussion
333
Table (3.66): The most identified peaks of FTIR spectra for WFN and WFN-MIP
befor and after removal of WFN using (MAA) as a functional monomer.
No.
Functional
Group
WFN
WFN-MIP(MAA)before
template removal
WFN-MIP(MAA)after
template removal
1. OH str. 3278 3433 3431
2. CH str.
alphatic
2927-2850 2987-2848 2991-2894
3. C=O str.ester 1681 ---- ----
4. C=O str.acid ---- 1728 1728
5. C=O str.keton 1670 ---- ----
6. C=C str. 1624 1635 ----
7. C-H bending 1450-1381 1454-1392 1454-1388
8. C-O str.
asymm.
1246 1259 1259
9. C-O str.
symm.
1188 1159 1159
10. Out-of plane-
mono-sub
759-698 ---- ----
The Figure (3.55) FTIR spectrum of WFN-MIP(MAA) before the
removal of (WFN) show appearance band at (1728) cm-1
for carbonyl
group of acid stretching ,also show band for (c=c) group stretching at
(1635) cm-1
and (C-H) group bending at (1454 and 1392) cm-1
,(c-o)
group stretching asymmetrical and symmetrical at (1259 and 1159) cm-1
.
The Figure (3.56) FTIR spectrum of WFN-MIP(MAA) after the
removal of (WFN) show the following :the carbonyl group of stretching
acid at (1728) cm-1
acid and disappearance the (c=c) group stretching also
the carbonyl group of stretching ester and keton disappearance, the (C-H)
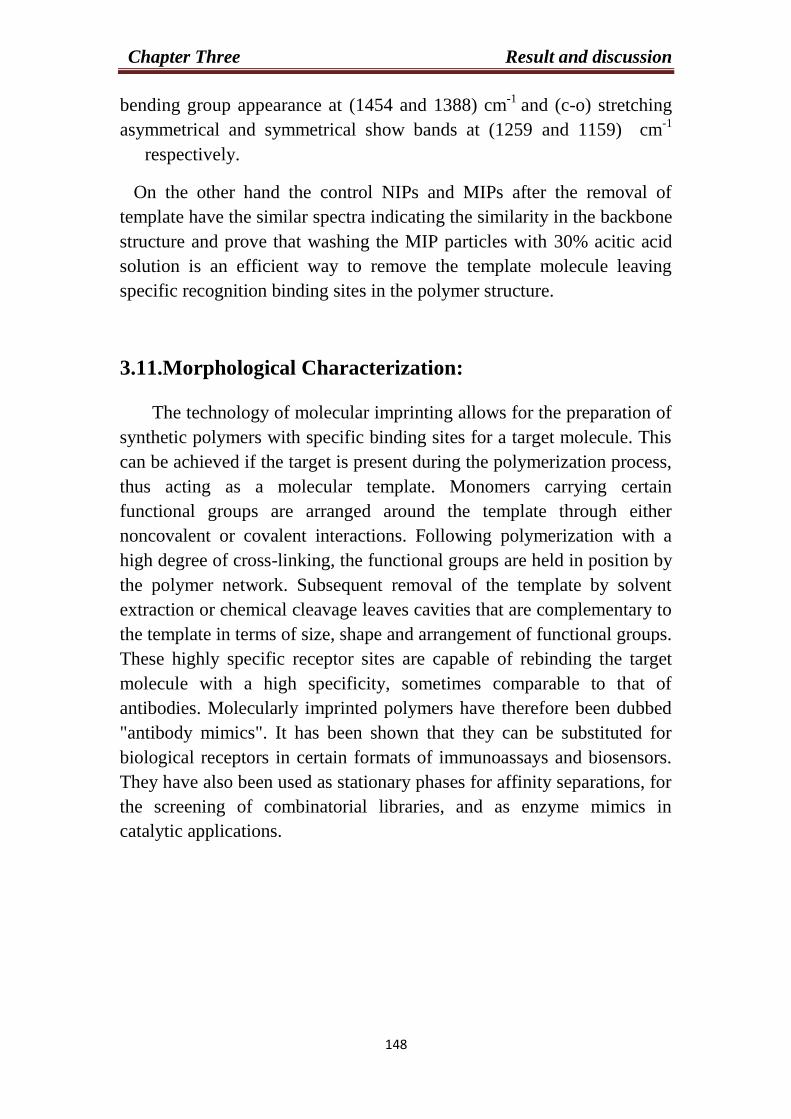
Chapter Three Result and discussion
333
bending group appearance at (1454 and 1388) cm-1
and (c-o) stretching
asymmetrical and symmetrical show bands at (1259 and 1159) cm-1
respectively.
On the other hand the control NIPs and MIPs after the removal of
template have the similar spectra indicating the similarity in the backbone
structure and prove that washing the MIP particles with 30% acitic acid
solution is an efficient way to remove the template molecule leaving
specific recognition binding sites in the polymer structure.
3.11.Morphological Characterization:
The technology of molecular imprinting allows for the preparation of
synthetic polymers with specific binding sites for a target molecule. This
can be achieved if the target is present during the polymerization process,
thus acting as a molecular template. Monomers carrying certain
functional groups are arranged around the template through either
noncovalent or covalent interactions. Following polymerization with a
high degree of cross-linking, the functional groups are held in position by
the polymer network. Subsequent removal of the template by solvent
extraction or chemical cleavage leaves cavities that are complementary to
the template in terms of size, shape and arrangement of functional groups.
These highly specific receptor sites are capable of rebinding the target
molecule with a high specificity, sometimes comparable to that of
antibodies. Molecularly imprinted polymers have therefore been dubbed
"antibody mimics". It has been shown that they can be substituted for
biological receptors in certain formats of immunoassays and biosensors.
They have also been used as stationary phases for affinity separations, for
the screening of combinatorial libraries, and as enzyme mimics in
catalytic applications.
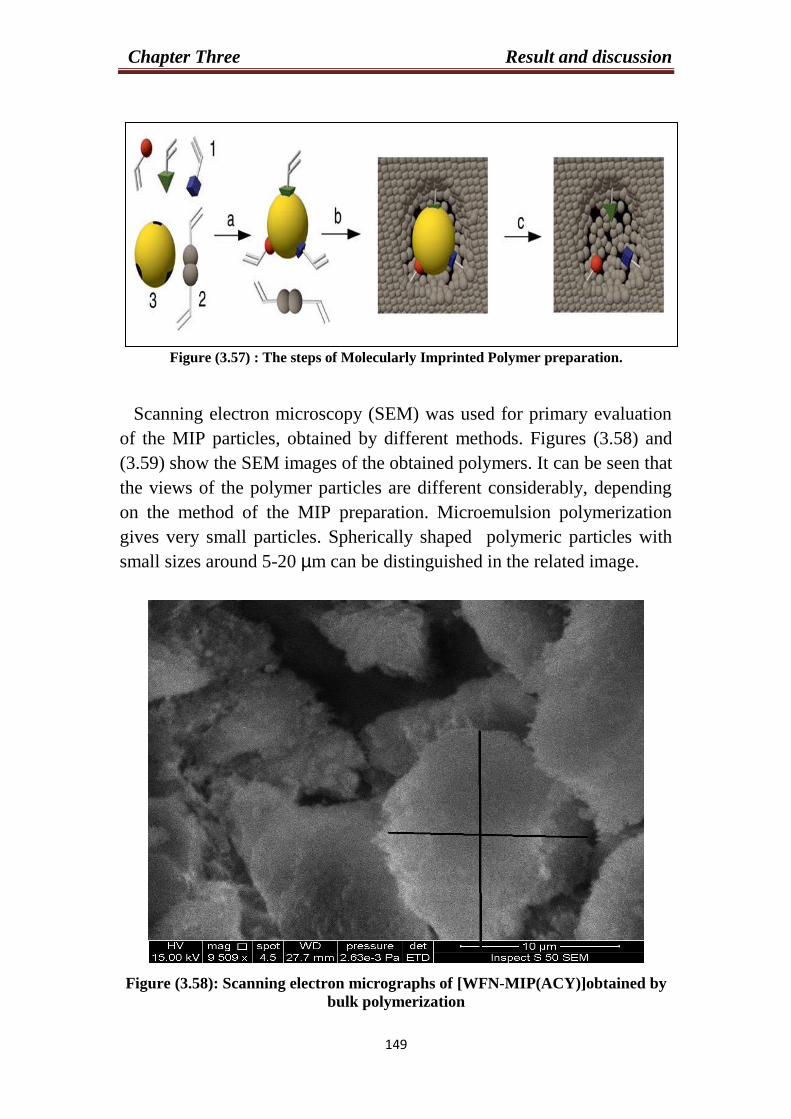
Chapter Three Result and discussion
332
Figure (3.57) : The steps of Molecularly Imprinted Polymer preparation.
Scanning electron microscopy (SEM) was used for primary evaluation
of the MIP particles, obtained by different methods. Figures (3.58) and
(3.59) show the SEM images of the obtained polymers. It can be seen that
the views of the polymer particles are different considerably, depending
on the method of the MIP preparation. Microemulsion polymerization
gives very small particles. Spherically shaped polymeric particles with
small sizes around 5-20 µm can be distinguished in the related image.
Figure (3.58): Scanning electron micrographs of [WFN-MIP(ACY)]obtained by
bulk polymerization
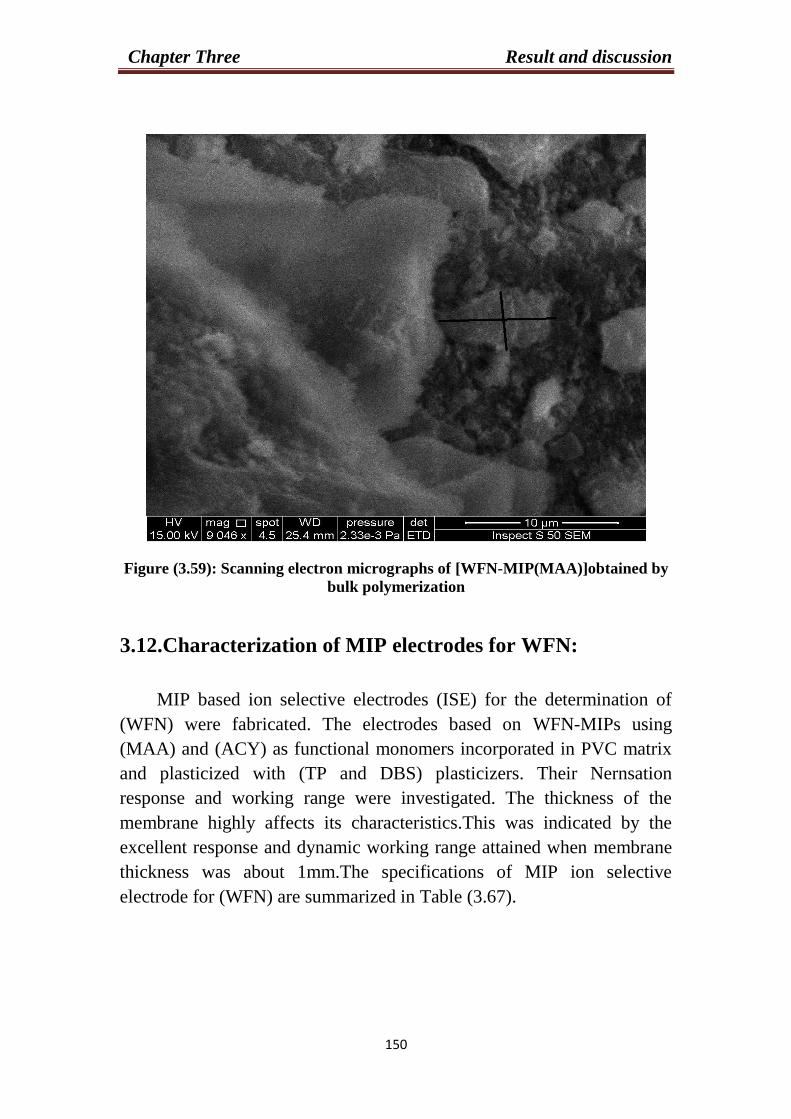
Chapter Three Result and discussion
333
Figure (3.59): Scanning electron micrographs of [WFN-MIP(MAA)]obtained by
bulk polymerization
3.12.Characterization of MIP electrodes for WFN:
MIP based ion selective electrodes (ISE) for the determination of
(WFN) were fabricated. The electrodes based on WFN-MIPs using
(MAA) and (ACY) as functional monomers incorporated in PVC matrix
and plasticized with (TP and DBS) plasticizers. Their Nernsation
response and working range were investigated. The thickness of the
membrane highly affects its characteristics.This was indicated by the
excellent response and dynamic working range attained when membrane
thickness was about 1mm.The specifications of MIP ion selective
electrode for (WFN) are summarized in Table (3.67).
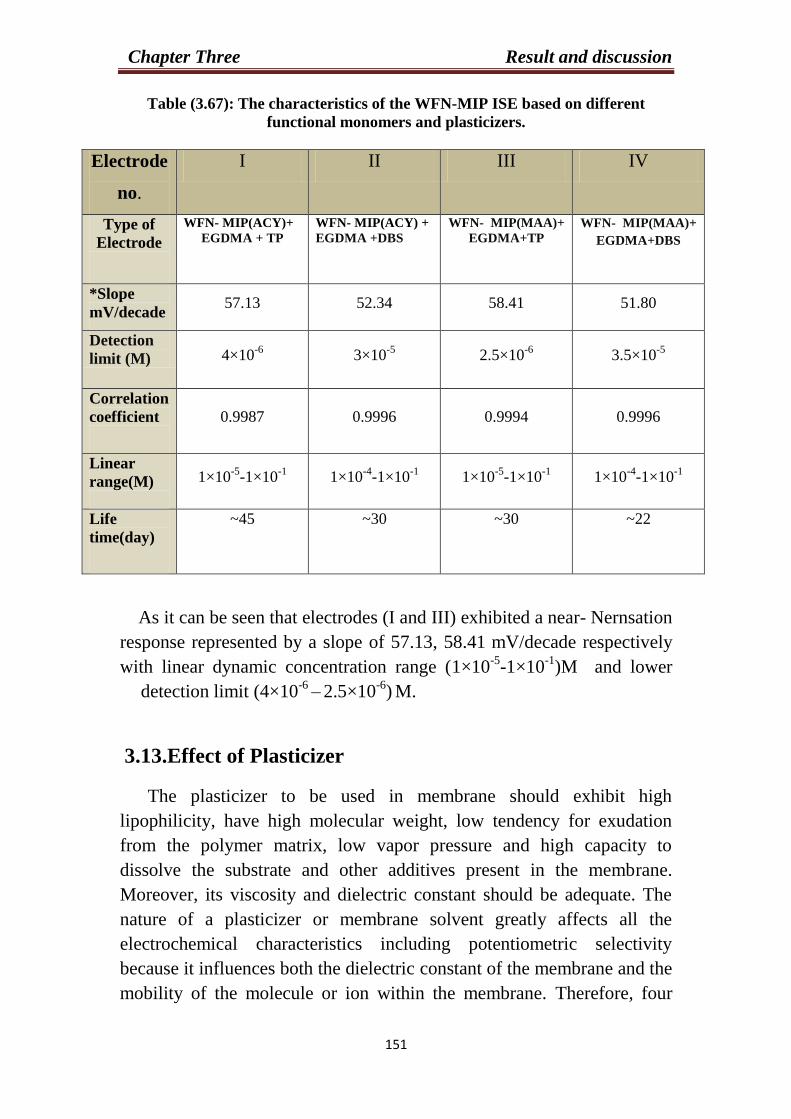
Chapter Three Result and discussion
333
Table (3.67): The characteristics of the WFN-MIP ISE based on different
functional monomers and plasticizers.
Electrode
no.
I II III IV
Type of
Electrode
WFN- MIP(ACY)+ EGDMA + TP
WFN- MIP(ACY) + EGDMA +DBS
WFN- MIP(MAA)+
EGDMA+TP
WFN- MIP(MAA)+
EGDMA+DBS
*Slope
mV/decade 57.13 52.34 58.41 51.80
Detection
limit (M) 4×10⁻⁶ 3×10
-5 2.5×10
-6 3.5×10
-5
Correlation
coefficient
0.9987 0.9996 0.9994 0.9996
Linear
range(M)
1×10⁻⁵
-1×10⁻¹
1×10⁻⁴
-1×10⁻¹
1×10⁻⁵
-1×10⁻¹
1×10⁻⁴
-1×10⁻¹
Life
time(day)
~45 ~30 ~30 ~22
As it can be seen that electrodes (I and III) exhibited a near- Nernsation
response represented by a slope of 57.13, 58.41 mV/decade respectively
with linear dynamic concentration range (1×10⁻⁵
-1×10⁻¹
)M and lower
detection limit (4×10⁻⁶
– 2.5×10
-6)
M.
3.13.Effect of Plasticizer
The plasticizer to be used in membrane should exhibit high
lipophilicity, have high molecular weight, low tendency for exudation
from the polymer matrix, low vapor pressure and high capacity to
dissolve the substrate and other additives present in the membrane.
Moreover, its viscosity and dielectric constant should be adequate. The
nature of a plasticizer or membrane solvent greatly affects all the
electrochemical characteristics including potentiometric selectivity
because it influences both the dielectric constant of the membrane and the
mobility of the molecule or ion within the membrane. Therefore, four
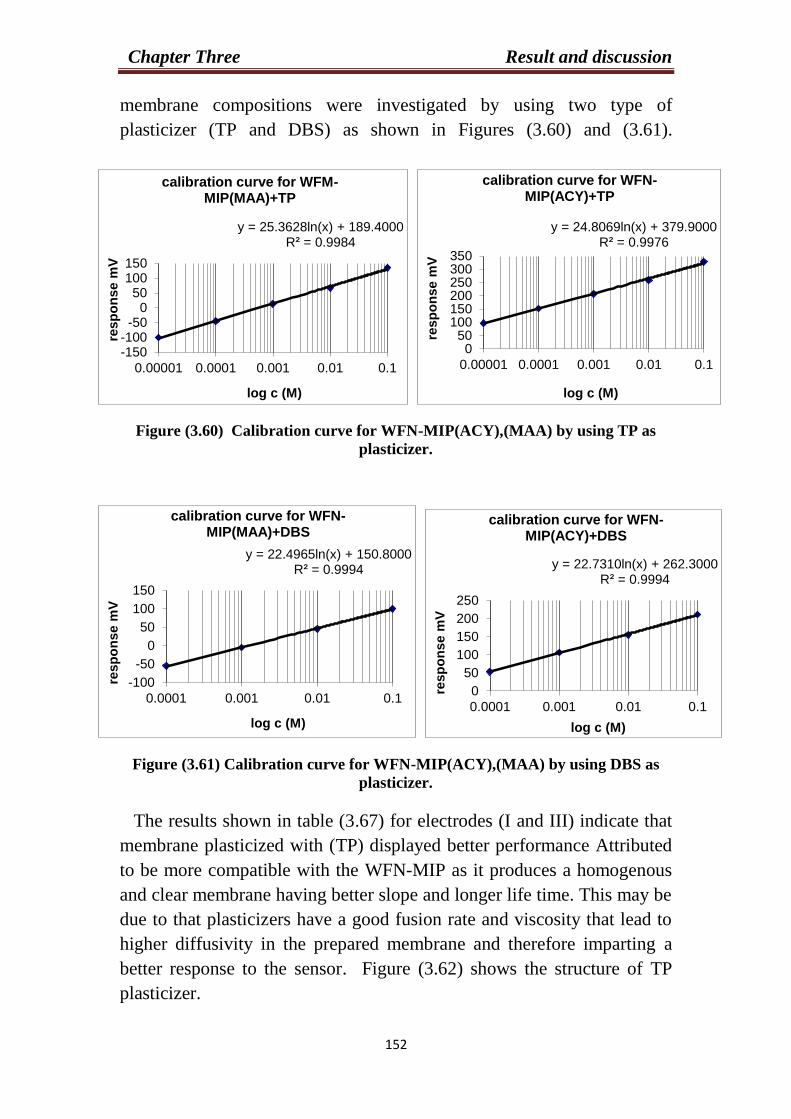
Chapter Three Result and discussion
339
membrane compositions were investigated by using two type of
plasticizer (TP and DBS) as shown in Figures (3.60) and (3.61).
Figure (3.60) Calibration curve for WFN-MIP(ACY),(MAA) by using TP as
plasticizer.
Figure (3.61) Calibration curve for WFN-MIP(ACY),(MAA) by using DBS as
plasticizer.
The results shown in table (3.67) for electrodes (I and III) indicate that
membrane plasticized with (TP) displayed better performance Attributed
to be more compatible with the WFN-MIP as it produces a homogenous
and clear membrane having better slope and longer life time. This may be
due to that plasticizers have a good fusion rate and viscosity that lead to
higher diffusivity in the prepared membrane and therefore imparting a
better response to the sensor. Figure (3.62) shows the structure of TP
plasticizer.
y = 24.8069ln(x) + 379.9000 R² = 0.9976
050
100150200250300350
0.00001 0.0001 0.001 0.01 0.1
resp
on
se m
V
log c (M)
calibration curve for WFN-MIP(ACY)+TP
y = 25.3628ln(x) + 189.4000 R² = 0.9984
-150-100
-500
50100150
0.00001 0.0001 0.001 0.01 0.1
resp
on
se m
V
log c (M)
calibration curve for WFM-MIP(MAA)+TP
y = 22.7310ln(x) + 262.3000 R² = 0.9994
0
50
100
150
200
250
0.0001 0.001 0.01 0.1
resp
on
se m
V
log c (M)
calibration curve for WFN-MIP(ACY)+DBS
y = 22.4965ln(x) + 150.8000 R² = 0.9994
-100
-50
0
50
100
150
0.0001 0.001 0.01 0.1
resp
on
se m
V
log c (M)
calibration curve for WFN-MIP(MAA)+DBS
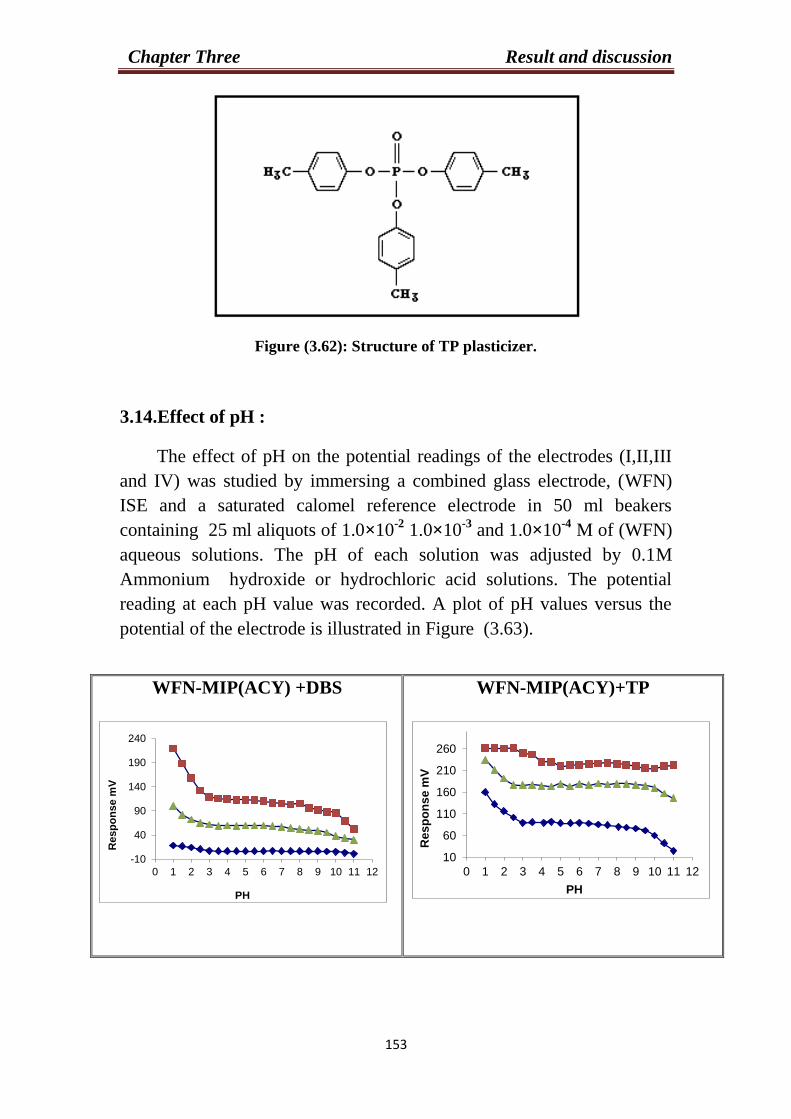
Chapter Three Result and discussion
330
Figure (3.62): Structure of TP plasticizer.
3.14.Effect of pH :
The effect of pH on the potential readings of the electrodes (I,II,III
and IV) was studied by immersing a combined glass electrode, (WFN)
ISE and a saturated calomel reference electrode in 50 ml beakers
containing 25 ml aliquots of 1.0×10⁻²
1.0×10⁻³
and 1.0×10⁻⁴
M of (WFN)
aqueous solutions. The pH of each solution was adjusted by 0.1M
Ammonium hydroxide or hydrochloric acid solutions. The potential
reading at each pH value was recorded. A plot of pH values versus the
potential of the electrode is illustrated in Figure (3.63).
WFN-MIP(ACY) +DBS
WFN-MIP(ACY)+TP
10
60
110
160
210
260
0 1 2 3 4 5 6 7 8 9 10 11 12
Res
po
ns
e m
V
PH
-10
40
90
140
190
240
0 1 2 3 4 5 6 7 8 9 10 11 12
Resp
on
se m
V
PH
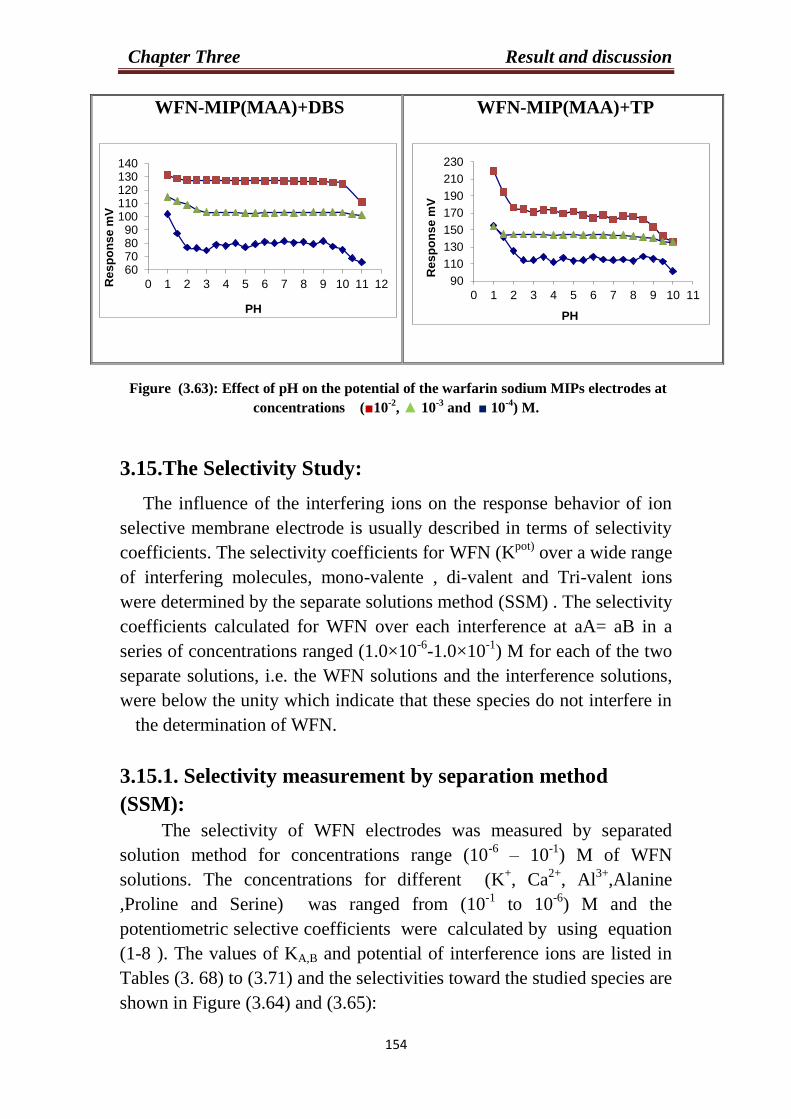
Chapter Three Result and discussion
333
WFN-MIP(MAA)+DBS
WFN-MIP(MAA)+TP
Figure (3.63): Effect of pH on the potential of the warfarin sodium MIPs electrodes at
concentrations (■10-2
, ▲ 10-3
and ■ 10-4
) M.
3.15.The Selectivity Study:
The influence of the interfering ions on the response behavior of ion
selective membrane electrode is usually described in terms of selectivity
coefficients. The selectivity coefficients for WFN (Kpot)
over a wide range
of interfering molecules, mono-valente , di-valent and Tri-valent ions
were determined by the separate solutions method (SSM) . The selectivity
coefficients calculated for WFN over each interference at aA= aB in a
series of concentrations ranged (1.0×10⁻⁶
-1.0×10⁻¹
) M for each of the two
separate solutions, i.e. the WFN solutions and the interference solutions,
were below the unity which indicate that these species do not interfere in
the determination of WFN.
3.15.1. Selectivity measurement by separation method
(SSM):
The selectivity of WFN electrodes was measured by separated
solution method for concentrations range (10-6
– 10-1
) M of WFN
solutions. The concentrations for different (K+, Ca
2+, Al
3+,Alanine
,Proline and Serine) was ranged from (10-1
to 10-6
) M and the
potentiometric selective coefficients were calculated by using equation
(1-8 ). The values of KA,B and potential of interference ions are listed in
Tables (3. 68) to (3.71) and the selectivities toward the studied species are
shown in Figure (3.64) and (3.65):
60708090
100110120130140
0 1 2 3 4 5 6 7 8 9 10 11 12Re
sp
on
se
mV
PH
90
110
130
150
170
190
210
230
0 1 2 3 4 5 6 7 8 9 10 11
Re
sp
on
se
mV
PH

Chapter Three Result and discussion
333
Figure (3.64): Selectivity of (WFN – MIP(ACY) and the interfering cations , amino acid
by separation solution method, by using TP,DBS as a plasticizer.
-140
-120
-100
-80
-60
-40
-20
0
0 1 2 3 4 5 6 7 8 9 10 11 12
Res
po
ns
e m
V
PH
0
70
140
210
280
0 1 2 3 4 5 6 7 8 9 10 11 12
Re
sp
on
se m
V
PH
0102030405060708090
100
0 1 2 3 4 5 6 7 8 9 10 11 12
Re
sp
on
se m
V
PH
0
20
40
60
80
100
120
140
160
0 1 2 3 4 5 6 7 8 9 10 11 12
Re
sp
on
se m
V
PH
-140
-120
-100
-80
-60
-40
-20
0
0 1 2 3 4 5 6 7 8 9 10 11 12
Resp
on
se m
V
PH
0
70
140
210
280
0 1 2 3 4 5 6 7 8 9 10 11 12
Re
sp
on
se m
V
PH
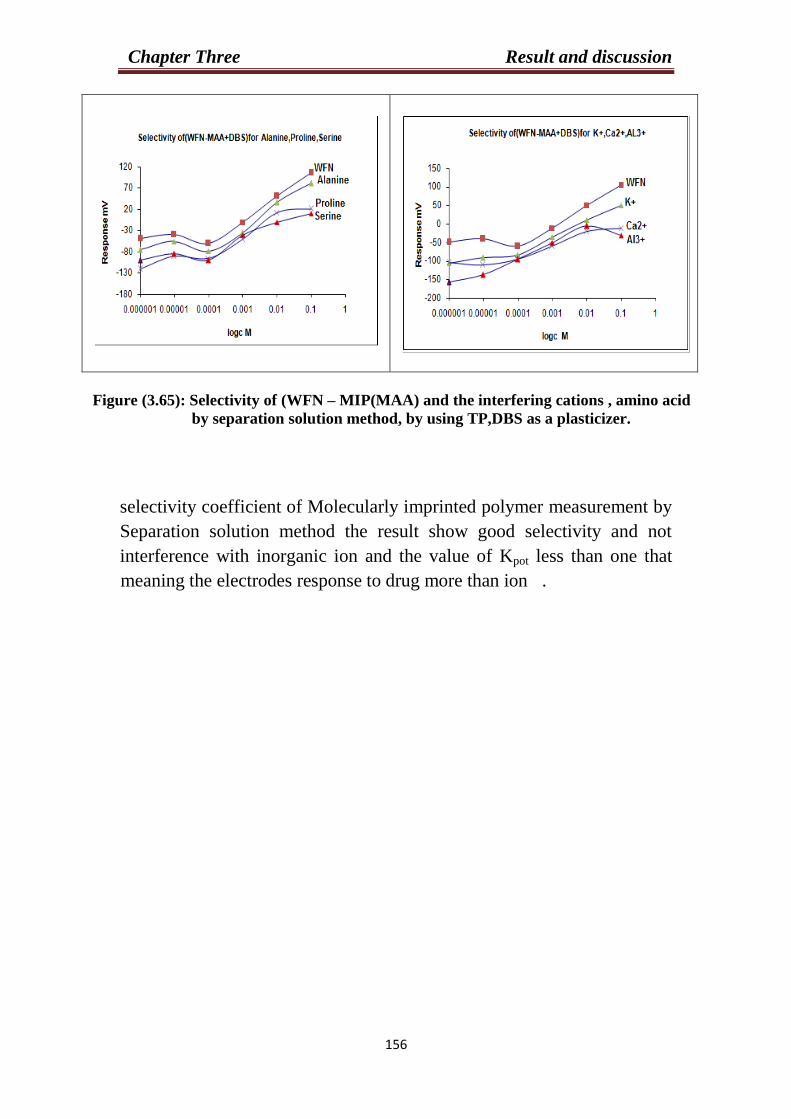
Chapter Three Result and discussion
333
Figure (3.65): Selectivity of (WFN – MIP(MAA) and the interfering cations , amino acid
by separation solution method, by using TP,DBS as a plasticizer.
selectivity coefficient of Molecularly imprinted polymer measurement by
Separation solution method the result show good selectivity and not
interference with inorganic ion and the value of Kpot less than one that
meaning the electrodes response to drug more than ion .
0
10
20
30
40
50
60
70
80
90
100
0 1 2 3 4 5 6 7 8 9 10 11 12
Re
sp
on
se m
V
PH
0
20
40
60
80
100
120
140
160
0 1 2 3 4 5 6 7 8 9 10 11 12
Re
sp
on
se m
V
PH
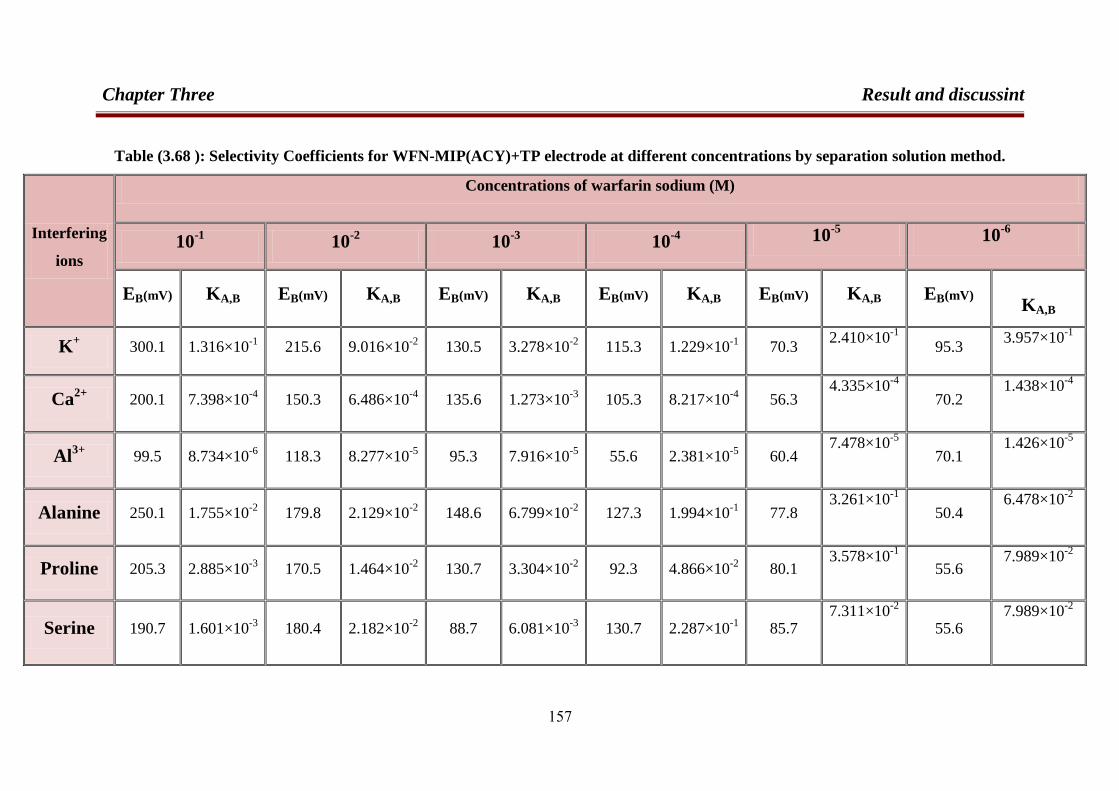
Chapter Three Result and discussint
751
Table (3.68 ): Selectivity Coefficients for WFN-MIP(ACY)+TP electrode at different concentrations by separation solution method.
Interfering
ions
Concentrations of warfarin sodium (M)
10-1
10-2
10-3
10-4
10-5
10-6
EB(mV) KA,B EB(mV) KA,B EB(mV) KA,B EB(mV) KA,B EB(mV)
KA,B EB(mV)
KA,B
K+ 300.1 1.316×10
-1 215.6 9.016×10
-2 130.5 3.278×10
-2 115.3 1.229×10
-1 70.3
2.410×10⁻¹
95.3
3.957×10⁻¹
Ca2+
200.1 7.398×10⁻⁴
150.3 6.486×10⁻⁴
135.6 1.273×10⁻³
105.3 8.217×10⁻⁴
56.3 4.335×10
-4
70.2 1.438×10
-4
Al3+
99.5 8.734×10⁻⁶
118.3 8.277×10⁻⁵
95.3 7.916×10⁻⁵
55.6 2.381×10⁻⁵
60.4 7.478×10
-5
70.1 1.426×10
-5
Alanine 250.1 1.755×10⁻²
179.8 2.129×10⁻²
148.6 6.799×10⁻²
127.3 1.994×10⁻¹
77.8 3.261×10
-1
50.4 6.478×10
-2
Proline 205.3 2.885×10⁻³
170.5 1.464×10⁻²
130.7 3.304×10⁻²
92.3 4.866×10⁻²
80.1 3.578×10
-1
55.6 7.989×10
-2
Serine 190.7 1.601×10⁻³
180.4 2.182×10⁻²
88.7 6.081×10⁻³
130.7 2.287×10⁻¹
85.7 7.311×10
-2
55.6 7.989×10
-2
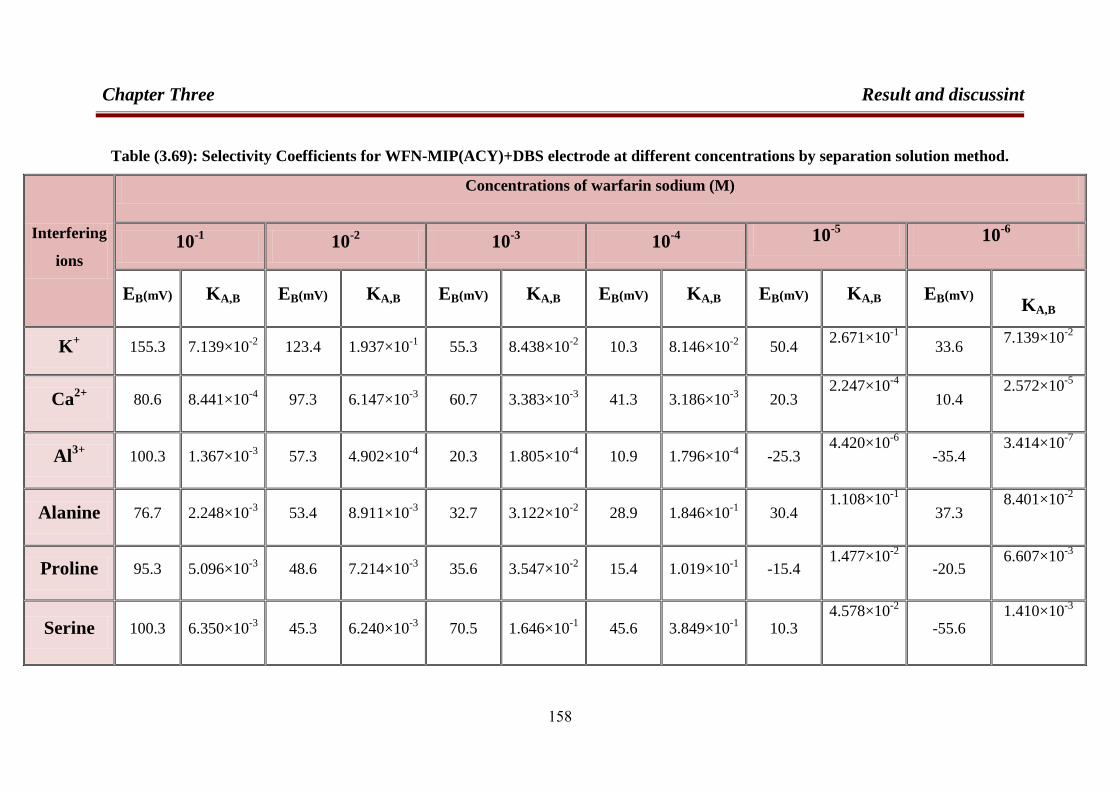
Chapter Three Result and discussint
751
Table (3.69): Selectivity Coefficients for WFN-MIP(ACY)+DBS electrode at different concentrations by separation solution method.
Interfering
ions
Concentrations of warfarin sodium (M)
10-1
10-2
10-3
10-4
10-5
10-6
EB(mV) KA,B EB(mV) KA,B EB(mV) KA,B EB(mV) KA,B EB(mV)
KA,B EB(mV)
KA,B
K+ 155.3 7.139×10
-2 123.4 1.937×10
-1 55.3 8.438×10
-2 10.3 8.146×10
-2 50.4
2.671×10⁻¹
33.6
7.139×10⁻²
Ca2+
80.6 8.441×10⁻⁴
97.3 6.147×10⁻³
60.7 3.383×10⁻³
41.3 3.186×10⁻³
20.3 2.247×10
-4
10.4 2.572×10
-5
Al3+
100.3 1.367×10⁻³
57.3 4.902×10⁻⁴
20.3 1.805×10⁻⁴
10.9 1.796×10⁻⁴
-25.3 4.420×10
-6
-35.4 3.414×10
-7
Alanine 76.7 2.248×10⁻³
53.4 8.911×10⁻³
32.7 3.122×10⁻²
28.9 1.846×10⁻¹
30.4 1.108×10
-1
37.3 8.401×10
-2
Proline 95.3 5.096×10⁻³
48.6 7.214×10⁻³
35.6 3.547×10⁻²
15.4 1.019×10⁻¹
-15.4 1.477×10
-2
-20.5 6.607×10
-3
Serine 100.3 6.350×10⁻³
45.3 6.240×10⁻³
70.5 1.646×10⁻¹
45.6 3.849×10⁻¹
10.3 4.578×10
-2
-55.6 1.410×10
-3
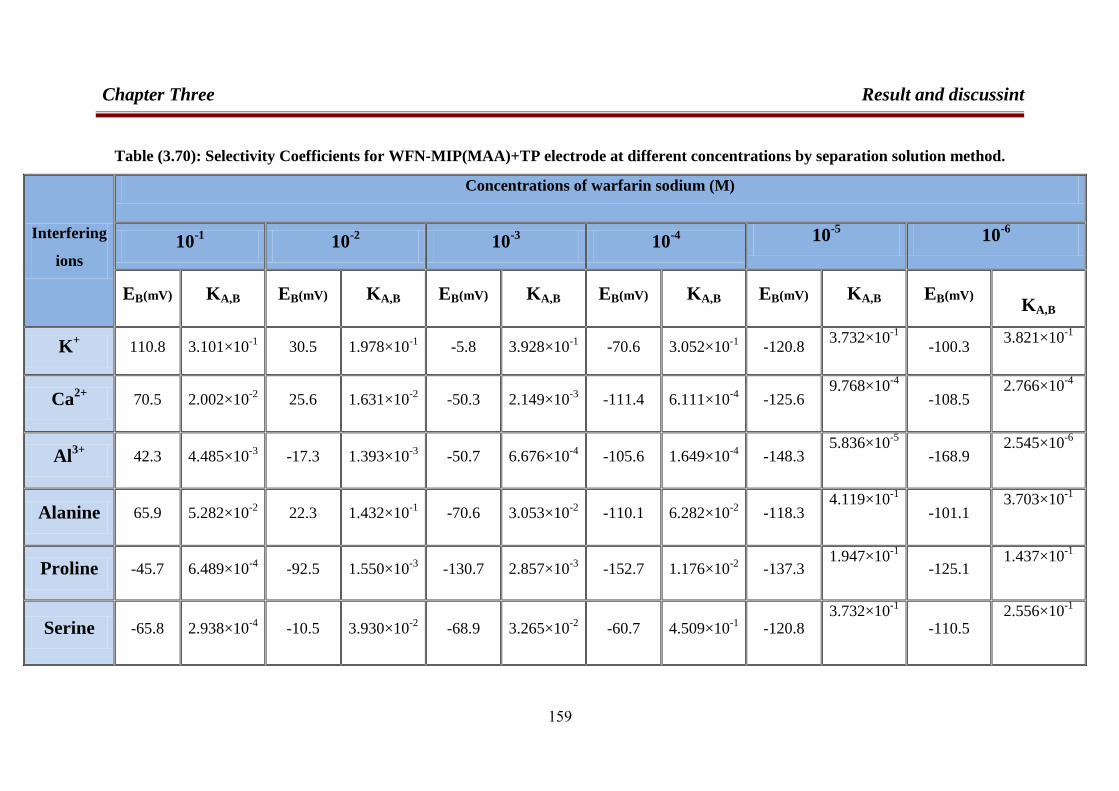
Chapter Three Result and discussint
751
Table (3.70): Selectivity Coefficients for WFN-MIP(MAA)+TP electrode at different concentrations by separation solution method.
Interfering
ions
Concentrations of warfarin sodium (M)
10-1
10-2
10-3
10-4
10-5
10-6
EB(mV) KA,B EB(mV) KA,B EB(mV) KA,B EB(mV) KA,B EB(mV)
KA,B EB(mV)
KA,B
K+ 110.8 3.101×10
-1 30.5 1.978×10
-1 -5.8 3.928×10
-1 -70.6 3.052×10
-1 -120.8
3.732×10⁻¹
-100.3
3.821×10⁻¹
Ca2+
70.5 2.002×10⁻²
25.6 1.631×10⁻²
-50.3 2.149×10⁻³
-111.4 6.111×10⁻⁴
-125.6 9.768×10
-4
-108.5 2.766×10
-4
Al3+
42.3 4.485×10⁻³
-17.3 1.393×10⁻³
-50.7 6.676×10⁻⁴
-105.6 1.649×10⁻⁴
-148.3 5.836×10
-5
-168.9 2.545×10
-6
Alanine 65.9 5.282×10⁻²
22.3 1.432×10⁻¹
-70.6 3.053×10⁻²
-110.1 6.282×10⁻²
-118.3 4.119×10
-1
-101.1 3.703×10
-1
Proline -45.7 6.489×10⁻⁴
-92.5 1.550×10⁻³
-130.7 2.857×10⁻³
-152.7 1.176×10⁻²
-137.3 1.947×10
-1
-125.1 1.437×10
-1
Serine -65.8 2.938×10⁻⁴
-10.5 3.930×10⁻²
-68.9 3.265×10⁻²
-60.7 4.509×10⁻¹
-120.8 3.732×10
-1
-110.5 2.556×10
-1
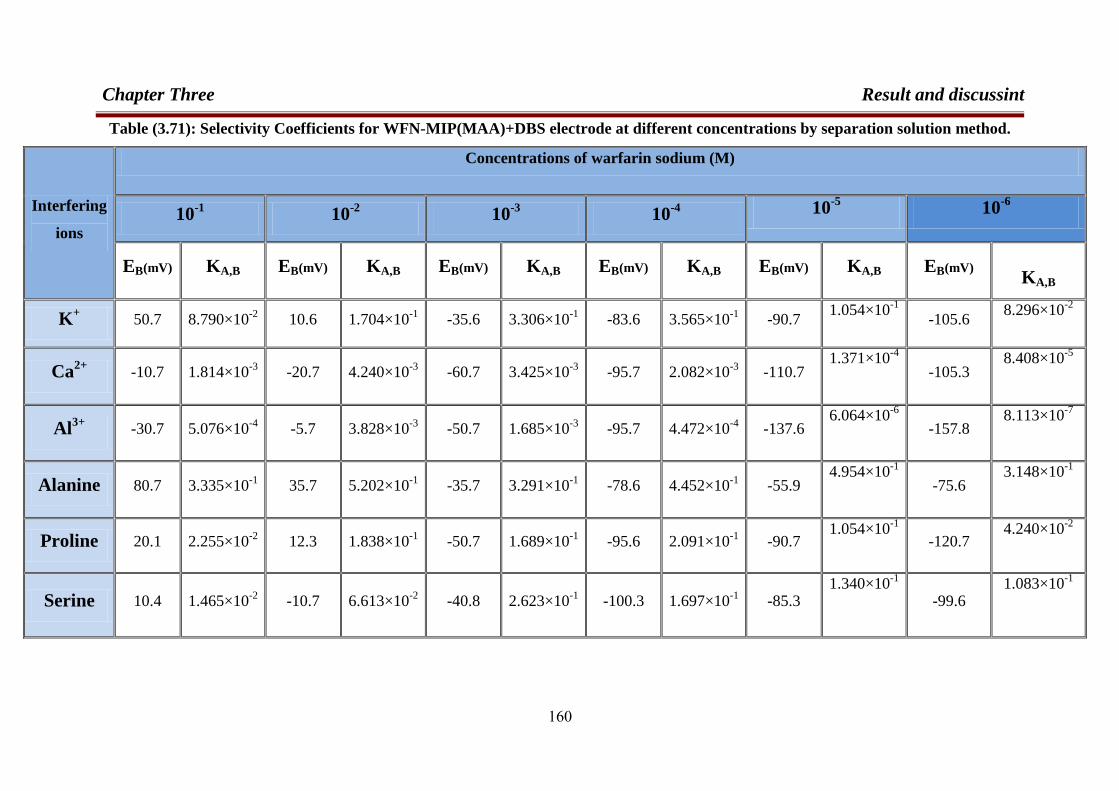
Chapter Three Result and discussint
761
Table (3.71): Selectivity Coefficients for WFN-MIP(MAA)+DBS electrode at different concentrations by separation solution method.
Interfering
ions
Concentrations of warfarin sodium (M)
10-1
10-2
10-3
10-4
10-5
10-6
EB(mV) KA,B EB(mV) KA,B EB(mV) KA,B EB(mV) KA,B EB(mV)
KA,B EB(mV)
KA,B
K+ 50.7 8.790×10
-2 10.6 1.704×10
-1 -35.6 3.306×10
-1 -83.6 3.565×10
-1 -90.7
1.054×10⁻¹
-105.6
8.296×10⁻²
Ca2+
-10.7 1.814×10⁻³
-20.7 4.240×10⁻³
-60.7 3.425×10⁻³
-95.7 2.082×10⁻³
-110.7 1.371×10
-4
-105.3 8.408×10
-5
Al3+
-30.7 5.076×10⁻⁴
-5.7 3.828×10⁻³
-50.7 1.685×10⁻³
-95.7 4.472×10⁻⁴
-137.6 6.064×10
-6
-157.8 8.113×10
-7
Alanine 80.7 3.335×10⁻¹
35.7 5.202×10⁻¹
-35.7 3.291×10⁻¹
-78.6 4.452×10⁻¹
-55.9 4.954×10
-1
-75.6 3.148×10
-1
Proline 20.1 2.255×10⁻²
12.3 1.838×10⁻¹
-50.7 1.689×10⁻¹
-95.6 2.091×10⁻¹
-90.7 1.054×10
-1
-120.7 4.240×10
-2
Serine 10.4 1.465×10⁻²
-10.7 6.613×10⁻²
-40.8 2.623×10⁻¹
-100.3 1.697×10⁻¹
-85.3 1.340×10
-1
-99.6 1.083×10
-1
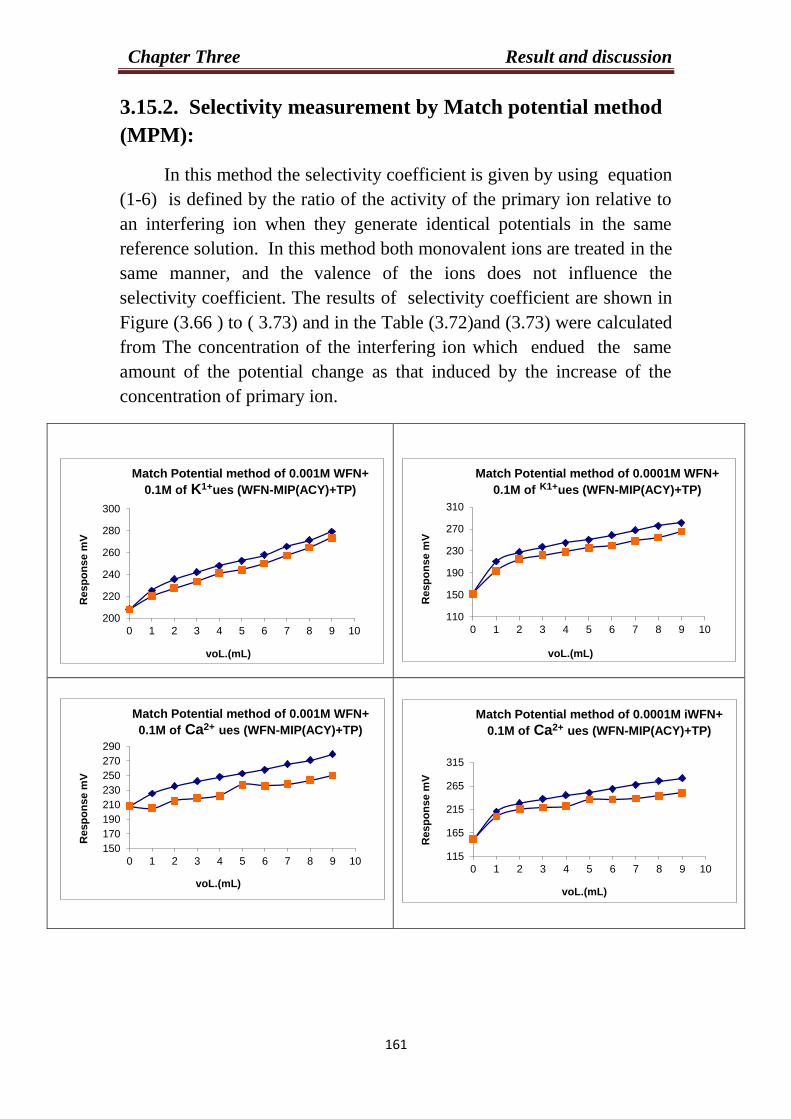
Chapter Three Result and discussion
333
3.15.2. Selectivity measurement by Match potential method
(MPM):
In this method the selectivity coefficient is given by using equation
(1-6) is defined by the ratio of the activity of the primary ion relative to
an interfering ion when they generate identical potentials in the same
reference solution. In this method both monovalent ions are treated in the
same manner, and the valence of the ions does not influence the
selectivity coefficient. The results of selectivity coefficient are shown in
Figure (3.66 ) to ( 3.73) and in the Table (3.72)and (3.73) were calculated
from The concentration of the interfering ion which endued the same
amount of the potential change as that induced by the increase of the
concentration of primary ion.
200
220
240
260
280
300
0 1 2 3 4 5 6 7 8 9 10
Resp
on
se m
V
voL.(mL)
Match Potential method of 0.001M WFN+
0.1M of K1+ues (WFN-MIP(ACY)+TP)
110
150
190
230
270
310
0 1 2 3 4 5 6 7 8 9 10
Resp
on
se m
V
voL.(mL)
Match Potential method of 0.0001M WFN+
0.1M of K1+ues (WFN-MIP(ACY)+TP)
150
170
190
210
230
250
270
290
0 1 2 3 4 5 6 7 8 9 10
Resp
on
se m
V
voL.(mL)
Match Potential method of 0.001M WFN+
0.1M of Ca2+ ues (WFN-MIP(ACY)+TP)
115
165
215
265
315
0 1 2 3 4 5 6 7 8 9 10
Resp
on
se m
V
voL.(mL)
Match Potential method of 0.0001M iWFN+
0.1M of Ca2+ ues (WFN-MIP(ACY)+TP)
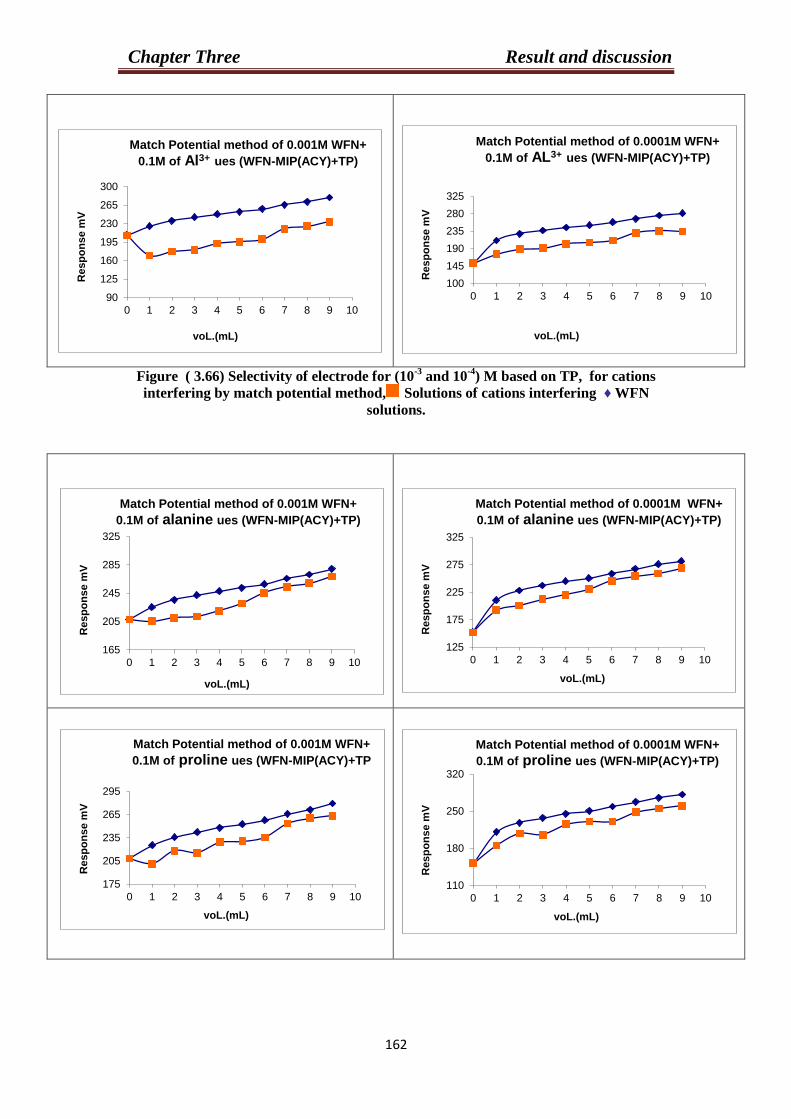
Chapter Three Result and discussion
339
Figure ( 3.66) Selectivity of electrode for (10-3
and 10-4
) M based on TP, for cations
interfering by match potential method, Solutions of cations interfering ♦ WFN
solutions.
90
125
160
195
230
265
300
0 1 2 3 4 5 6 7 8 9 10
Resp
on
se m
V
voL.(mL)
Match Potential method of 0.001M WFN+
0.1M of Al3+ ues (WFN-MIP(ACY)+TP)
100
145
190
235
280
325
0 1 2 3 4 5 6 7 8 9 10
Resp
on
se m
V
voL.(mL)
Match Potential method of 0.0001M WFN+
0.1M of AL3+ ues (WFN-MIP(ACY)+TP)
165
205
245
285
325
0 1 2 3 4 5 6 7 8 9 10
Resp
on
se m
V
voL.(mL)
Match Potential method of 0.001M WFN+
0.1M of alanine ues (WFN-MIP(ACY)+TP)
125
175
225
275
325
0 1 2 3 4 5 6 7 8 9 10
Resp
on
se m
V
voL.(mL)
Match Potential method of 0.0001M WFN+
0.1M of alanine ues (WFN-MIP(ACY)+TP)
175
205
235
265
295
0 1 2 3 4 5 6 7 8 9 10
Resp
on
se m
V
voL.(mL)
Match Potential method of 0.001M WFN+
0.1M of proline ues (WFN-MIP(ACY)+TP
110
180
250
320
0 1 2 3 4 5 6 7 8 9 10
Resp
on
se m
V
voL.(mL)
Match Potential method of 0.0001M WFN+
0.1M of proline ues (WFN-MIP(ACY)+TP)
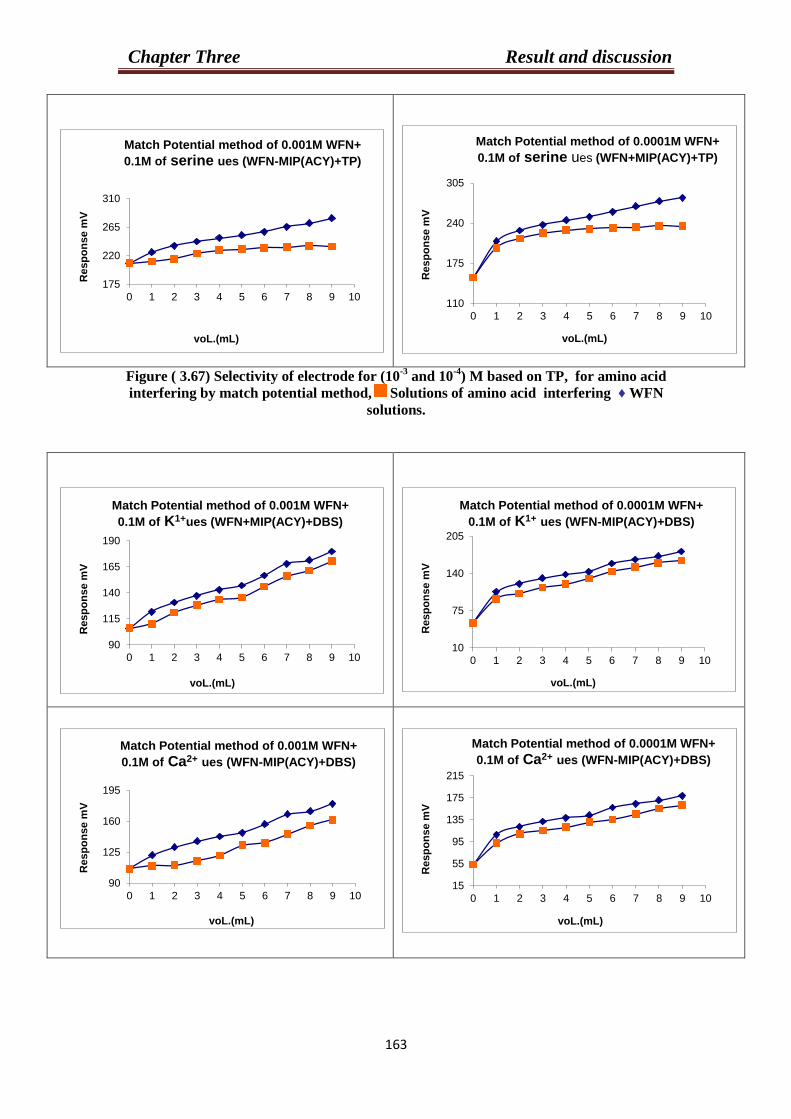
Chapter Three Result and discussion
330
Figure ( 3.67) Selectivity of electrode for (10-3
and 10-4
) M based on TP, for amino acid
interfering by match potential method, Solutions of amino acid interfering ♦ WFN
solutions.
175
220
265
310
0 1 2 3 4 5 6 7 8 9 10
Resp
on
se m
V
voL.(mL)
Match Potential method of 0.001M WFN+
0.1M of serine ues (WFN-MIP(ACY)+TP)
110
175
240
305
0 1 2 3 4 5 6 7 8 9 10
Resp
on
se m
V
voL.(mL)
Match Potential method of 0.0001M WFN+
0.1M of serine ues (WFN+MIP(ACY)+TP)
90
115
140
165
190
0 1 2 3 4 5 6 7 8 9 10
Resp
on
se m
V
voL.(mL)
Match Potential method of 0.001M WFN+
0.1M of K1+ues (WFN+MIP(ACY)+DBS)
10
75
140
205
0 1 2 3 4 5 6 7 8 9 10
Resp
on
se m
V
voL.(mL)
Match Potential method of 0.0001M WFN+
0.1M of K1+ ues (WFN-MIP(ACY)+DBS)
90
125
160
195
0 1 2 3 4 5 6 7 8 9 10
Resp
on
se m
V
voL.(mL)
Match Potential method of 0.001M WFN+
0.1M of Ca2+ ues (WFN-MIP(ACY)+DBS)
15
55
95
135
175
215
0 1 2 3 4 5 6 7 8 9 10
Resp
on
se m
V
voL.(mL)
Match Potential method of 0.0001M WFN+
0.1M of Ca2+ ues (WFN-MIP(ACY)+DBS)
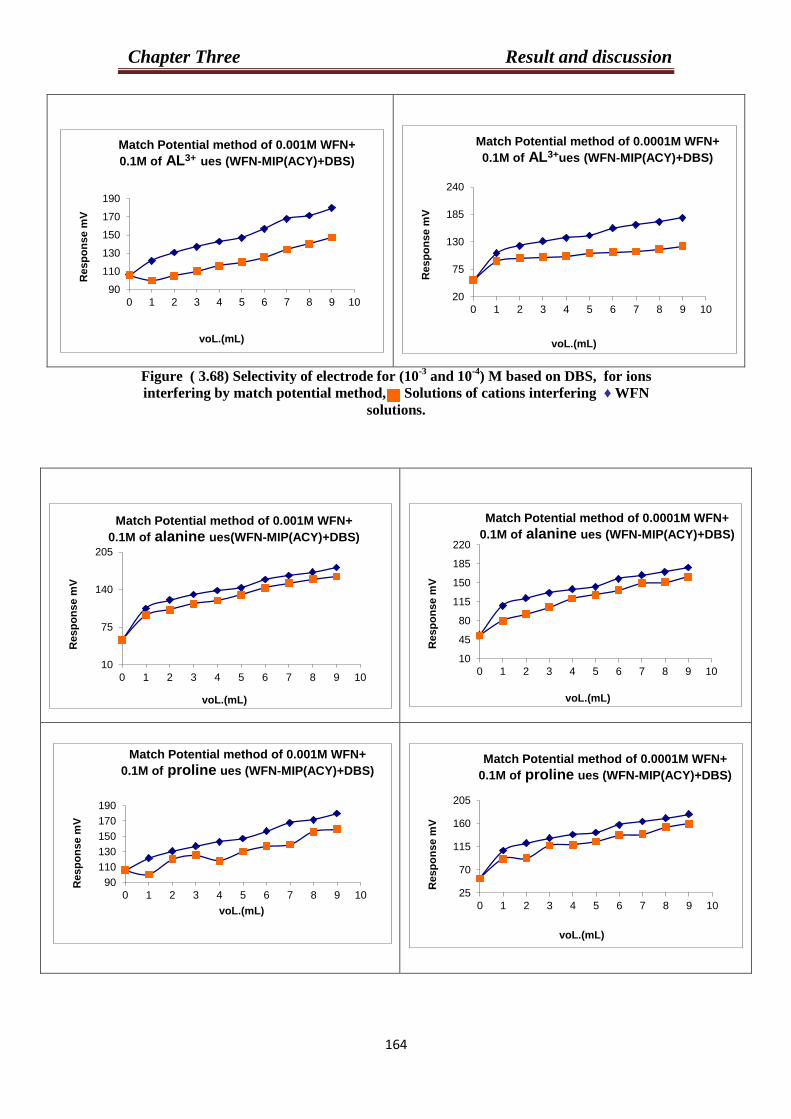
Chapter Three Result and discussion
333
Figure ( 3.68) Selectivity of electrode for (10-3
and 10-4
) M based on DBS, for ions
interfering by match potential method, Solutions of cations interfering ♦ WFN
solutions.
90
110
130
150
170
190
0 1 2 3 4 5 6 7 8 9 10
Resp
on
se m
V
voL.(mL)
Match Potential method of 0.001M WFN+
0.1M of AL3+ ues (WFN-MIP(ACY)+DBS)
20
75
130
185
240
0 1 2 3 4 5 6 7 8 9 10
Resp
on
se m
V
voL.(mL)
Match Potential method of 0.0001M WFN+
0.1M of AL3+ues (WFN-MIP(ACY)+DBS)
10
75
140
205
0 1 2 3 4 5 6 7 8 9 10
Resp
on
se m
V
voL.(mL)
Match Potential method of 0.001M WFN+
0.1M of alanine ues(WFN-MIP(ACY)+DBS)
10
45
80
115
150
185
220
0 1 2 3 4 5 6 7 8 9 10
Resp
on
se m
V
voL.(mL)
Match Potential method of 0.0001M WFN+
0.1M of alanine ues (WFN-MIP(ACY)+DBS)
90
110
130
150
170
190
0 1 2 3 4 5 6 7 8 9 10
Resp
on
se m
V
voL.(mL)
Match Potential method of 0.001M WFN+
0.1M of proline ues (WFN-MIP(ACY)+DBS)
25
70
115
160
205
0 1 2 3 4 5 6 7 8 9 10
Resp
on
se m
V
voL.(mL)
Match Potential method of 0.0001M WFN+
0.1M of proline ues (WFN-MIP(ACY)+DBS)
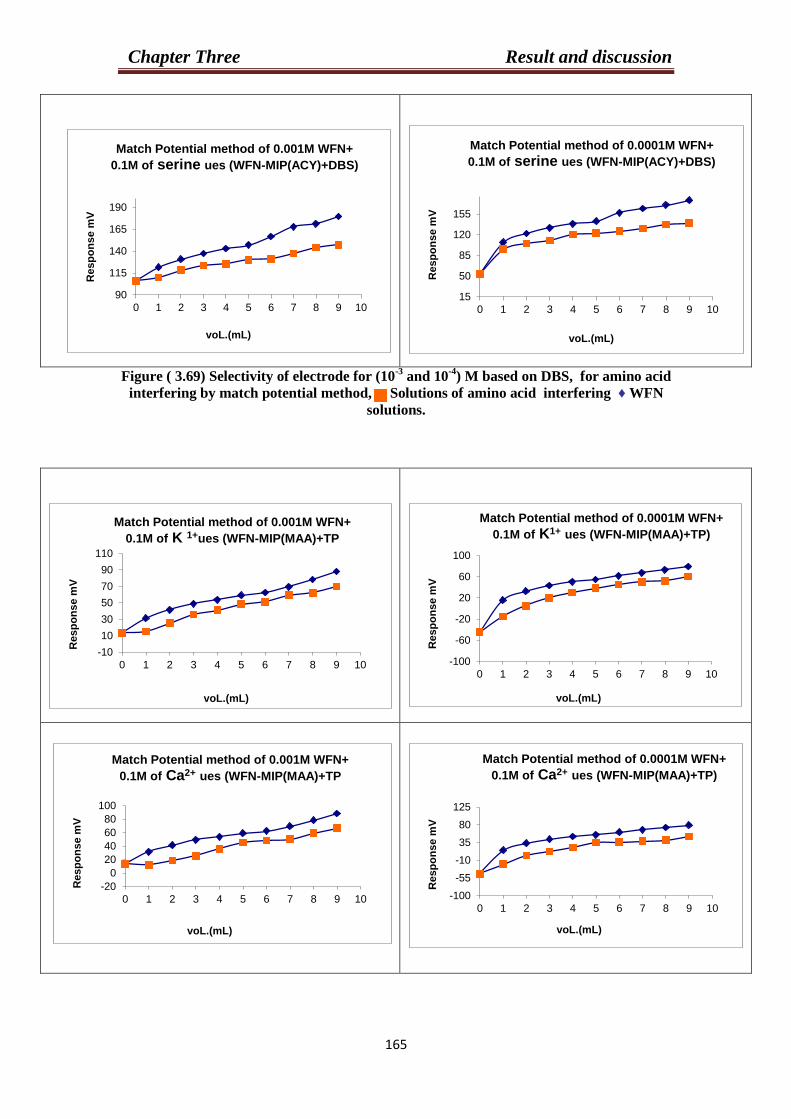
Chapter Three Result and discussion
333
Figure ( 3.69) Selectivity of electrode for (10-3
and 10-4
) M based on DBS, for amino acid
interfering by match potential method, Solutions of amino acid interfering ♦ WFN
solutions.
90
115
140
165
190
0 1 2 3 4 5 6 7 8 9 10
Resp
on
se m
V
voL.(mL)
Match Potential method of 0.001M WFN+
0.1M of serine ues (WFN-MIP(ACY)+DBS)
15
50
85
120
155
0 1 2 3 4 5 6 7 8 9 10
Resp
on
se m
V
voL.(mL)
Match Potential method of 0.0001M WFN+
0.1M of serine ues (WFN-MIP(ACY)+DBS)
-10
10
30
50
70
90
110
0 1 2 3 4 5 6 7 8 9 10
Resp
on
se m
V
voL.(mL)
Match Potential method of 0.001M WFN+
0.1M of K 1+ues (WFN-MIP(MAA)+TP
-100
-60
-20
20
60
100
0 1 2 3 4 5 6 7 8 9 10
Resp
on
se m
V
voL.(mL)
Match Potential method of 0.0001M WFN+
0.1M of K1+ ues (WFN-MIP(MAA)+TP)
-20
0
20
40
60
80
100
0 1 2 3 4 5 6 7 8 9 10
Resp
on
se m
V
voL.(mL)
Match Potential method of 0.001M WFN+
0.1M of Ca2+ ues (WFN-MIP(MAA)+TP
-100
-55
-10
35
80
125
0 1 2 3 4 5 6 7 8 9 10
Resp
on
se m
V
voL.(mL)
Match Potential method of 0.0001M WFN+
0.1M of Ca2+ ues (WFN-MIP(MAA)+TP)
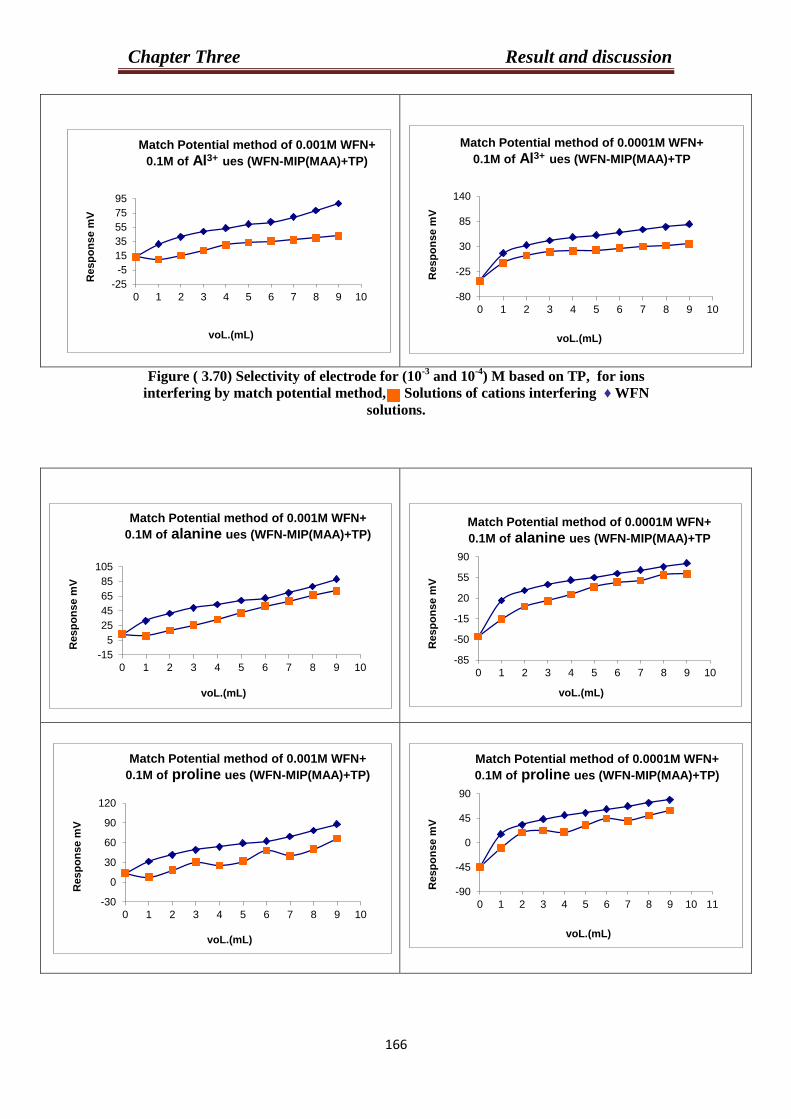
Chapter Three Result and discussion
333
Figure ( 3.70) Selectivity of electrode for (10-3
and 10-4
) M based on TP, for ions
interfering by match potential method, Solutions of cations interfering ♦ WFN
solutions.
-25
-5
15
35
55
75
95
0 1 2 3 4 5 6 7 8 9 10
Resp
on
se m
V
voL.(mL)
Match Potential method of 0.001M WFN+
0.1M of Al3+ ues (WFN-MIP(MAA)+TP)
-80
-25
30
85
140
0 1 2 3 4 5 6 7 8 9 10
Resp
on
se m
V
voL.(mL)
Match Potential method of 0.0001M WFN+
0.1M of Al3+ ues (WFN-MIP(MAA)+TP
-15
5
25
45
65
85
105
0 1 2 3 4 5 6 7 8 9 10
Resp
on
se m
V
voL.(mL)
Match Potential method of 0.001M WFN+
0.1M of alanine ues (WFN-MIP(MAA)+TP)
-85
-50
-15
20
55
90
0 1 2 3 4 5 6 7 8 9 10
Resp
on
se m
V
voL.(mL)
Match Potential method of 0.0001M WFN+
0.1M of alanine ues (WFN-MIP(MAA)+TP
-30
0
30
60
90
120
0 1 2 3 4 5 6 7 8 9 10
Resp
on
se m
V
voL.(mL)
Match Potential method of 0.001M WFN+
0.1M of proline ues (WFN-MIP(MAA)+TP)
-90
-45
0
45
90
0 1 2 3 4 5 6 7 8 9 10 11
Resp
on
se m
V
voL.(mL)
Match Potential method of 0.0001M WFN+
0.1M of proline ues (WFN-MIP(MAA)+TP)
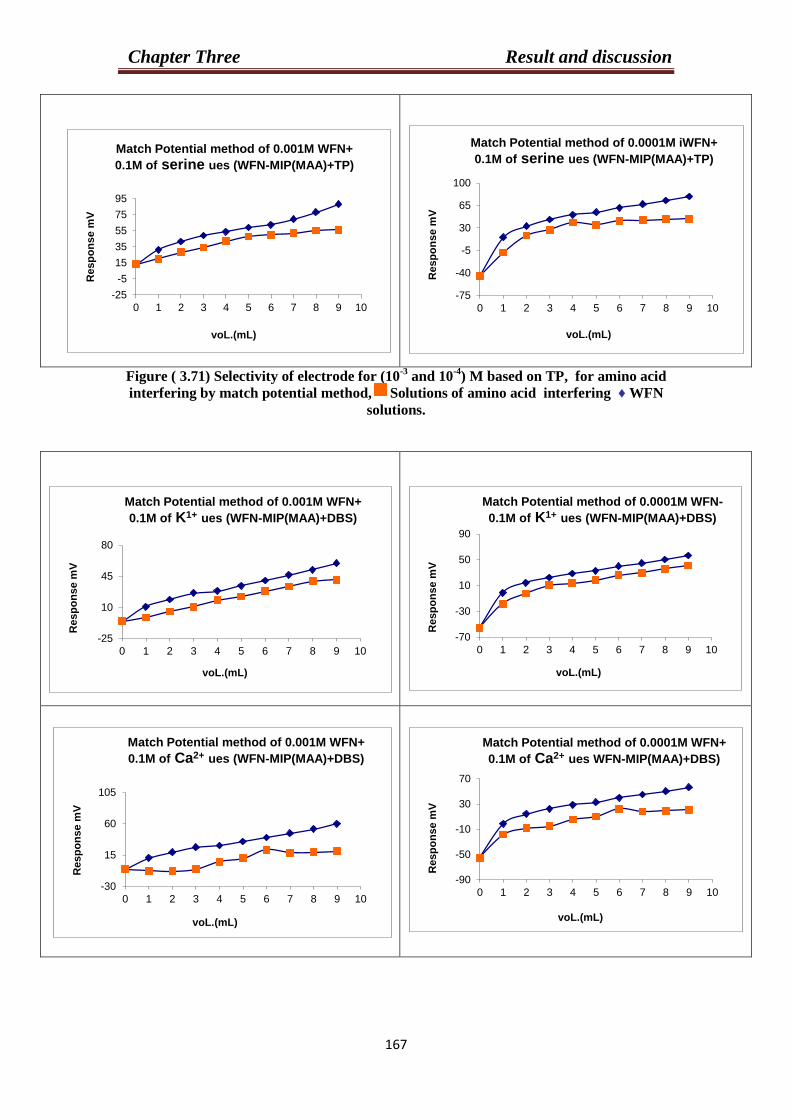
Chapter Three Result and discussion
333
Figure ( 3.71) Selectivity of electrode for (10-3
and 10-4
) M based on TP, for amino acid
interfering by match potential method, Solutions of amino acid interfering ♦ WFN
solutions.
-25
-5
15
35
55
75
95
0 1 2 3 4 5 6 7 8 9 10
Resp
on
se m
V
voL.(mL)
Match Potential method of 0.001M WFN+
0.1M of serine ues (WFN-MIP(MAA)+TP)
-75
-40
-5
30
65
100
0 1 2 3 4 5 6 7 8 9 10
Resp
on
se m
V
voL.(mL)
Match Potential method of 0.0001M iWFN+
0.1M of serine ues (WFN-MIP(MAA)+TP)
-25
10
45
80
0 1 2 3 4 5 6 7 8 9 10
Resp
on
se m
V
voL.(mL)
Match Potential method of 0.001M WFN+
0.1M of K1+ ues (WFN-MIP(MAA)+DBS)
-70
-30
10
50
90
0 1 2 3 4 5 6 7 8 9 10
Resp
on
se m
V
voL.(mL)
Match Potential method of 0.0001M WFN-
0.1M of K1+ ues (WFN-MIP(MAA)+DBS)
-30
15
60
105
0 1 2 3 4 5 6 7 8 9 10
Resp
on
se m
V
voL.(mL)
Match Potential method of 0.001M WFN+
0.1M of Ca2+ ues (WFN-MIP(MAA)+DBS)
-90
-50
-10
30
70
0 1 2 3 4 5 6 7 8 9 10
Resp
on
se m
V
voL.(mL)
Match Potential method of 0.0001M WFN+
0.1M of Ca2+ ues WFN-MIP(MAA)+DBS)
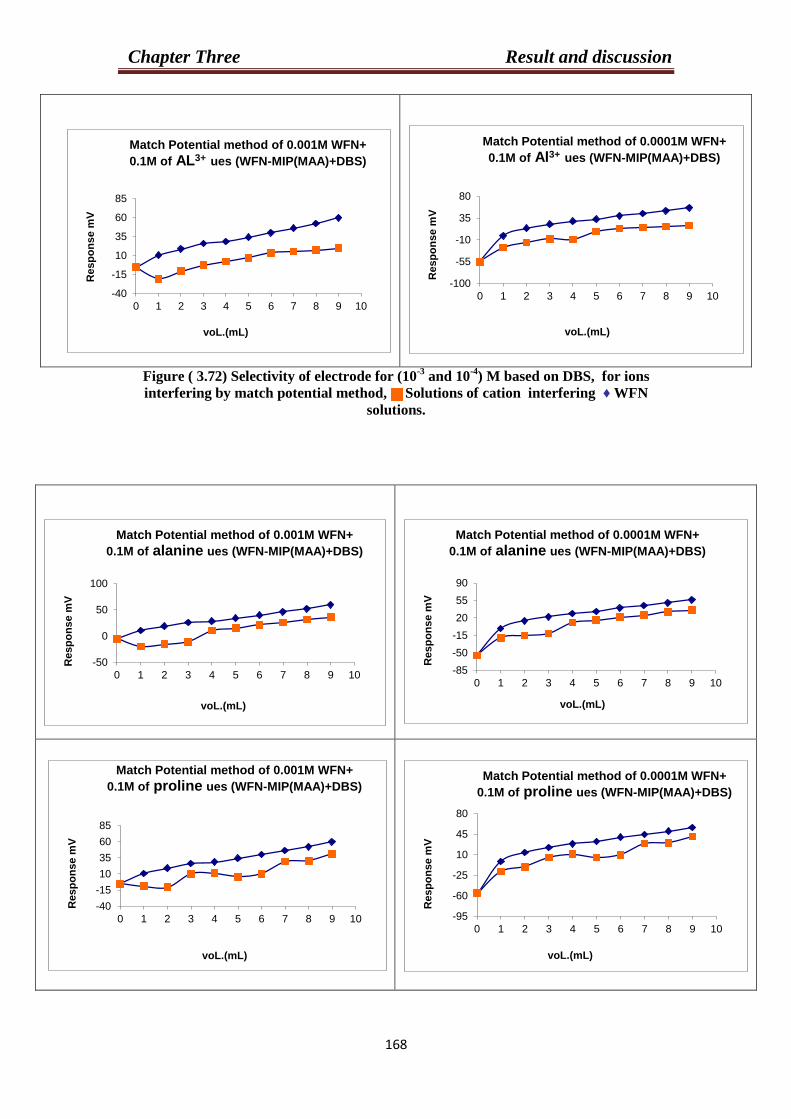
Chapter Three Result and discussion
333
Figure ( 3.72) Selectivity of electrode for (10-3
and 10-4
) M based on DBS, for ions
interfering by match potential method, Solutions of cation interfering ♦ WFN
solutions.
-40
-15
10
35
60
85
0 1 2 3 4 5 6 7 8 9 10
Resp
on
se m
V
voL.(mL)
Match Potential method of 0.001M WFN+
0.1M of AL3+ ues (WFN-MIP(MAA)+DBS)
-100
-55
-10
35
80
0 1 2 3 4 5 6 7 8 9 10
Resp
on
se m
V
voL.(mL)
Match Potential method of 0.0001M WFN+
0.1M of Al3+ ues (WFN-MIP(MAA)+DBS)
-50
0
50
100
0 1 2 3 4 5 6 7 8 9 10
Resp
on
se m
V
voL.(mL)
Match Potential method of 0.001M WFN+
0.1M of alanine ues (WFN-MIP(MAA)+DBS)
-85
-50
-15
20
55
90
0 1 2 3 4 5 6 7 8 9 10
Resp
on
se m
V
voL.(mL)
Match Potential method of 0.0001M WFN+
0.1M of alanine ues (WFN-MIP(MAA)+DBS)
-40
-15
10
35
60
85
0 1 2 3 4 5 6 7 8 9 10
Resp
on
se m
V
voL.(mL)
Match Potential method of 0.001M WFN+
0.1M of proline ues (WFN-MIP(MAA)+DBS)
-95
-60
-25
10
45
80
0 1 2 3 4 5 6 7 8 9 10
Resp
on
se m
V
voL.(mL)
Match Potential method of 0.0001M WFN+
0.1M of proline ues (WFN-MIP(MAA)+DBS)
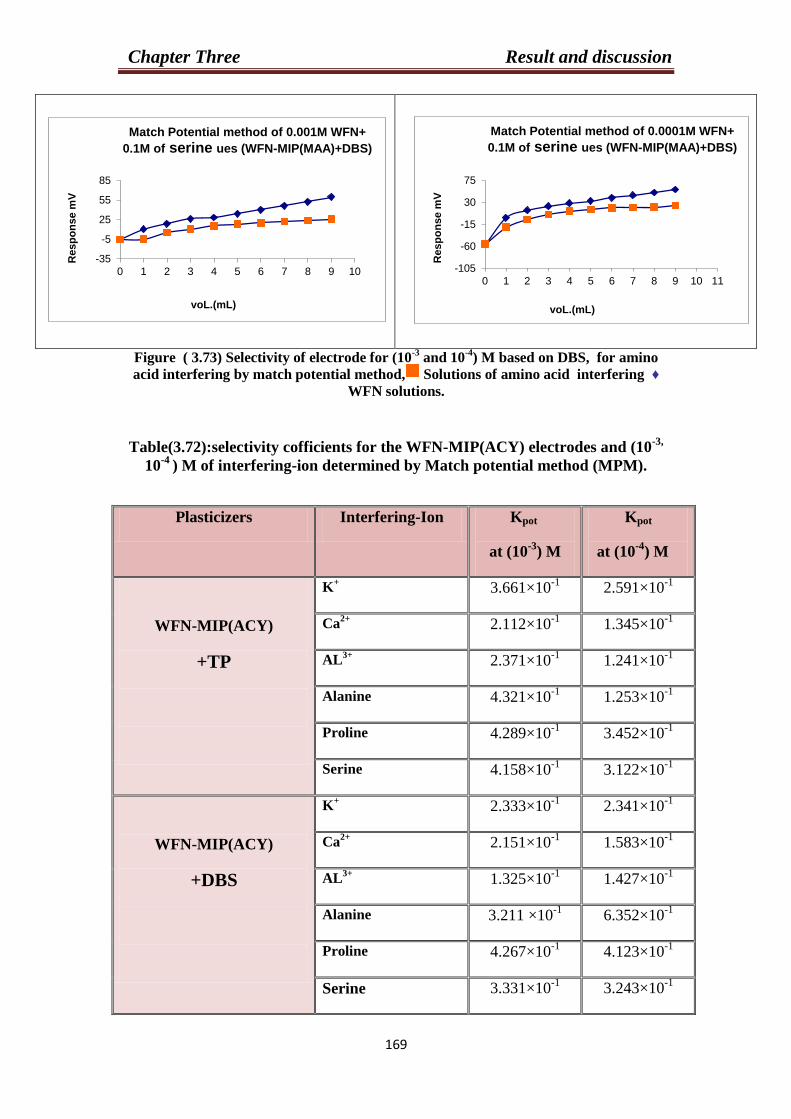
Chapter Three Result and discussion
332
Figure ( 3.73) Selectivity of electrode for (10-3
and 10-4
) M based on DBS, for amino
acid interfering by match potential method, Solutions of amino acid interfering ♦
WFN solutions.
Table(3.72):selectivity cofficients for the WFN-MIP(ACY) electrodes and (10-3,
10-4
) M of interfering-ion determined by Match potential method (MPM).
-35
-5
25
55
85
0 1 2 3 4 5 6 7 8 9 10
Resp
on
se m
V
voL.(mL)
Match Potential method of 0.001M WFN+
0.1M of serine ues (WFN-MIP(MAA)+DBS)
-105
-60
-15
30
75
0 1 2 3 4 5 6 7 8 9 10 11
Res
po
ns
e m
V
voL.(mL)
Match Potential method of 0.0001M WFN+
0.1M of serine ues (WFN-MIP(MAA)+DBS)
Plasticizers Interfering-Ion Kpot
at (10-3
) M
Kpot
at (10-4
) M
WFN-MIP(ACY)
+TP
K+ 3.661×10
-1 2.591×10
-1
Ca2+
2.112×10⁻¹
1.345×10⁻¹
AL3+
2.371×10⁻¹
1.241×10⁻¹
Alanine 4.321×10⁻¹
1.253×10⁻¹
Proline 4.289×10⁻¹
3.452×10⁻¹
Serine 4.158×10⁻¹
3.122×10⁻¹
WFN-MIP(ACY)
+DBS
K+
2.333×10⁻¹
2.341×10⁻¹
Ca2+
2.151×10⁻¹
1.583×10⁻¹
AL3+
1.325×10⁻¹
1.427×10⁻¹
Alanine 3.211 ×10⁻¹
6.352×10⁻¹
Proline 4.267×10⁻¹
4.123×10⁻¹
Serine 3.331×10⁻¹
3.243×10⁻¹
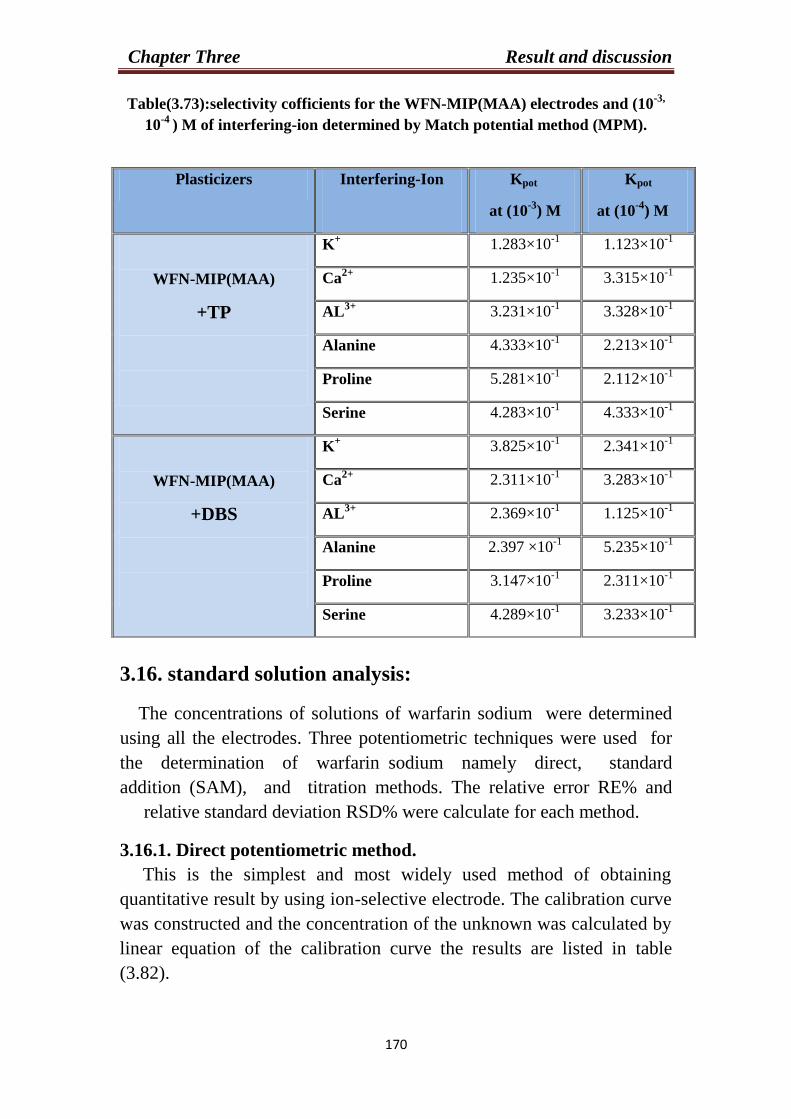
Chapter Three Result and discussion
333
Table(3.73):selectivity cofficients for the WFN-MIP(MAA) electrodes and (10-3,
10-4
) M of interfering-ion determined by Match potential method (MPM).
3.16. standard solution analysis:
The concentrations of solutions of warfarin sodium were determined
using all the electrodes. Three potentiometric techniques were used for
the determination of warfarin sodium namely direct, standard
addition (SAM), and titration methods. The relative error RE% and
relative standard deviation RSD% were calculate for each method.
3.16.1. Direct potentiometric method.
This is the simplest and most widely used method of obtaining
quantitative result by using ion-selective electrode. The calibration curve
was constructed and the concentration of the unknown was calculated by
linear equation of the calibration curve the results are listed in table
(3.82).
Plasticizers Interfering-Ion
Kpot
at (10-3
) M
Kpot
at (10-4
) M
WFN-MIP(MAA)
+TP
K+ 1.283×10
-1 1.123×10
-1
Ca2+
1.235×10⁻¹
3.315×10⁻¹
AL3+
3.231×10⁻¹
3.328×10⁻¹
Alanine 4.333×10⁻¹
2.213×10⁻¹
Proline 5.281×10⁻¹
2.112×10⁻¹
Serine 4.283×10⁻¹
4.333×10⁻¹
WFN-MIP(MAA)
+DBS
K+
3.825×10⁻¹
2.341×10⁻¹
Ca2+
2.311×10⁻¹
3.283×10⁻¹
AL3+ 2.369×10
-1 1.125×10
-1
Alanine 2.397 ×10⁻¹
5.235×10⁻¹
Proline 3.147×10⁻¹
2.311×10⁻¹
Serine 4.289×10⁻¹
3.233×10⁻¹

Chapter Three Result and discussion
333
3.16.2.Calculation of Standard Addition Method SAM:
In this method concentrations of (10-3
and 10-4)
M for the four warfarin
sodium electrodes using equation (1-10) are listed in Tables (3.74) to
(3.81), The RSD% and RE % were calculate from the results obtained
for each method are given in Table(3.82).
Table (3.74): Potential of 10-3
M WFN against the volume of standard warfarin
sodium and the calculation of five additions using SAM. For WFN-ACY+ TP
electrode.
VS mL
added
E/mV AntilogE/S ∆ E Antilog∆E/S (VU/VS) CU M
0 208.1 0.439×10
4
--- --- --- ---
0.1 225.3 0.878×10
4 17.2 2.000 100 0.989×10
-3
0.2 235.6 1.330×10
4
27.5 3.029 50 0.976×10⁻³
0.3 242.2 1.735×10
4
34.1 3.952 33.33 1.006×10⁻³
0.4 248.0 2.192×10
4
39.9 4.993 25 0.991×10⁻³
0.5 252.6 2.639×10
4
44.5 6.010 20 0.988×10⁻³
Table (3.75): Potential of 10
-4M WFN against the volume of standard warfarin
sodium and the calculation of five additions using SAM. For WFN-ACY+ TP
electrode.
VS mL
added
E/mV AntilogE/S ∆ E Antilog∆E/S (VU/VS) CU M
0 151.9 0.455×10
3
--- --- --- ---
0.1 210.8 4.895×10
3
58.9 10.739 100 1.025×10⁻⁴
0.2 228.0 9.792×10
3
76.1 21.480 50 0.975×10⁻⁴
0.3 237.2 14.188×10
3
85.3 31.123 33.33 0.995×10⁻⁴
0.4 244.9 19.351×10
3
93.0 42.448 25 0.964×10⁻⁴
0.5 250.4 24.153×10
3
98.5 52.983 20 0.960×10⁻⁴
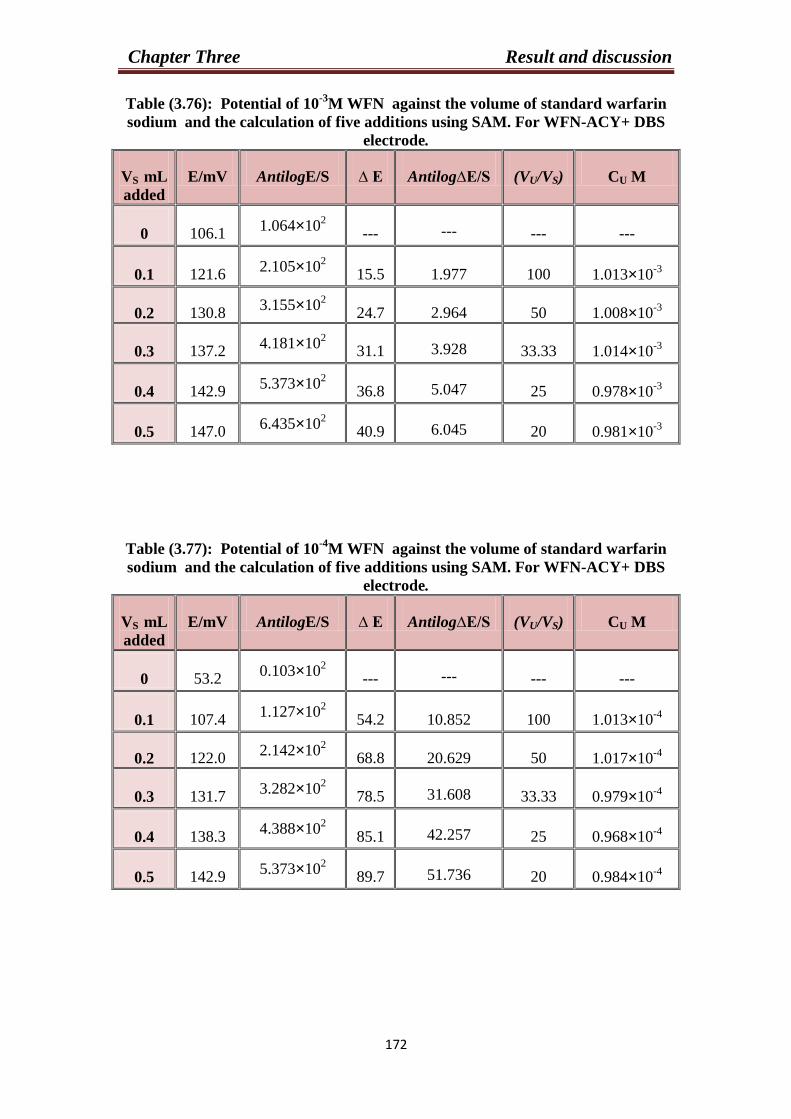
Chapter Three Result and discussion
339
Table (3.76): Potential of 10-3
M WFN against the volume of standard warfarin
sodium and the calculation of five additions using SAM. For WFN-ACY+ DBS
electrode.
VS mL
added
E/mV AntilogE/S ∆ E Antilog∆E/S (VU/VS) CU M
0 106.1 1.064×10
2
--- --- --- ---
0.1 121.6 2.105×10
2
15.5 1.977 100 1.013×10⁻³
0.2 130.8 3.155×10
2
24.7 2.964 50 1.008×10⁻³
0.3 137.2 4.181×10
2
31.1 3.928 33.33 1.014×10⁻³
0.4 142.9 5.373×10
2
36.8 5.047 25 0.978×10⁻³
0.5 147.0 6.435×10
2
40.9 6.045 20 0.981×10⁻³
Table (3.77): Potential of 10-4
M WFN against the volume of standard warfarin
sodium and the calculation of five additions using SAM. For WFN-ACY+ DBS
electrode.
VS mL
added
E/mV AntilogE/S ∆ E Antilog∆E/S (VU/VS) CU M
0 53.2 0.103×10
2
--- --- --- ---
0.1 107.4 1.127×10
2
54.2 10.852 100 1.013×10⁻⁴
0.2 122.0 2.142×10
2
68.8 20.629 50 1.017×10⁻⁴
0.3 131.7 3.282×10
2
78.5 31.608 33.33 0.979×10⁻⁴
0.4 138.3 4.388×10
2
85.1 42.257 25 0.968×10⁻⁴
0.5 142.9 5.373×10
2
89.7 51.736 20 0.984×10⁻⁴
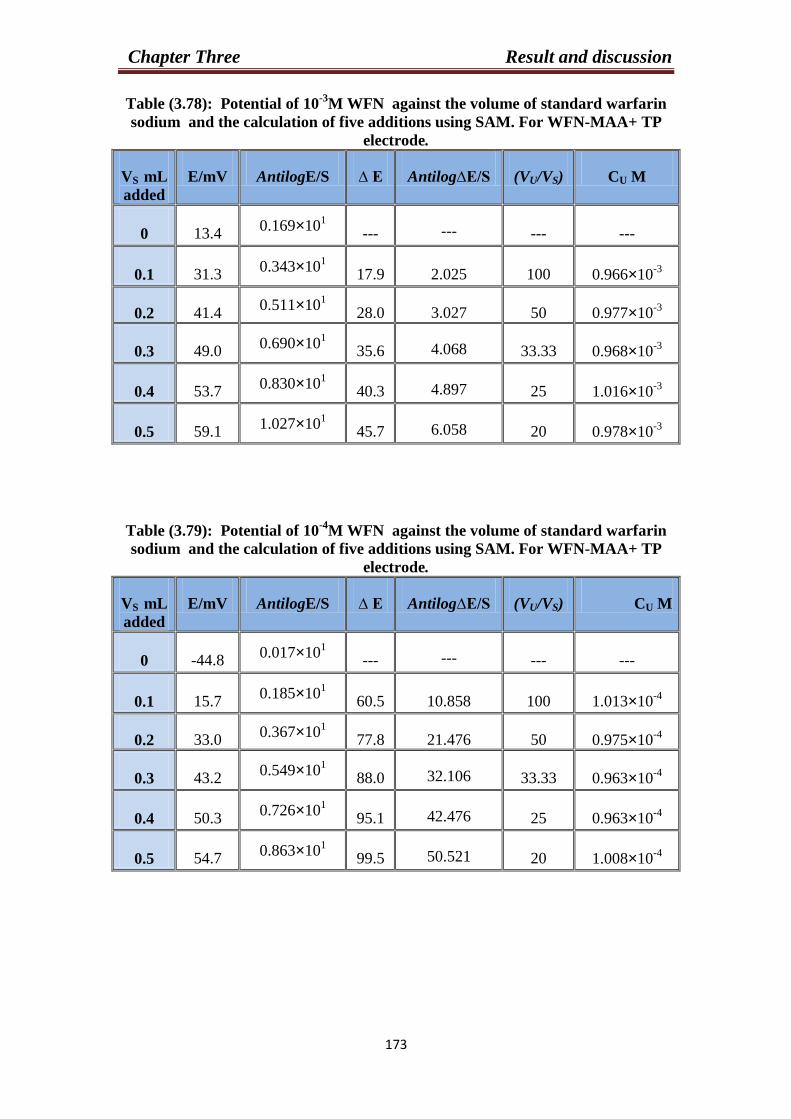
Chapter Three Result and discussion
330
Table (3.78): Potential of 10-3
M WFN against the volume of standard warfarin
sodium and the calculation of five additions using SAM. For WFN-MAA+ TP
electrode.
VS mL
added
E/mV AntilogE/S ∆ E Antilog∆E/S (VU/VS) CU M
0 13.4 0.169×10
1
--- --- --- ---
0.1 31.3 0.343×10
1
17.9 2.025 100 0.966×10⁻³
0.2 41.4 0.511×10
1
28.0 3.027 50 0.977×10⁻³
0.3 49.0 0.690×10
1
35.6 4.068 33.33 0.968×10⁻³
0.4 53.7 0.830×10
1
40.3 4.897 25 1.016×10⁻³
0.5 59.1 1.027×10
1
45.7 6.058 20 0.978×10⁻³
Table (3.79): Potential of 10-4
M WFN against the volume of standard warfarin
sodium and the calculation of five additions using SAM. For WFN-MAA+ TP
electrode.
VS mL
added
E/mV AntilogE/S ∆ E Antilog∆E/S (VU/VS) CU M
0 -44.8 0.017×10
1
--- --- --- ---
0.1 15.7 0.185×10
1
60.5 10.858 100 1.013×10⁻⁴
0.2 33.0 0.367×10
1
77.8 21.476 50 0.975×10⁻⁴
0.3 43.2 0.549×10
1
88.0 32.106 33.33 0.963×10⁻⁴
0.4 50.3 0.726×10
1
95.1 42.476 25 0.963×10⁻⁴
0.5 54.7 0.863×10
1
99.5 50.521 20 1.008×10⁻⁴
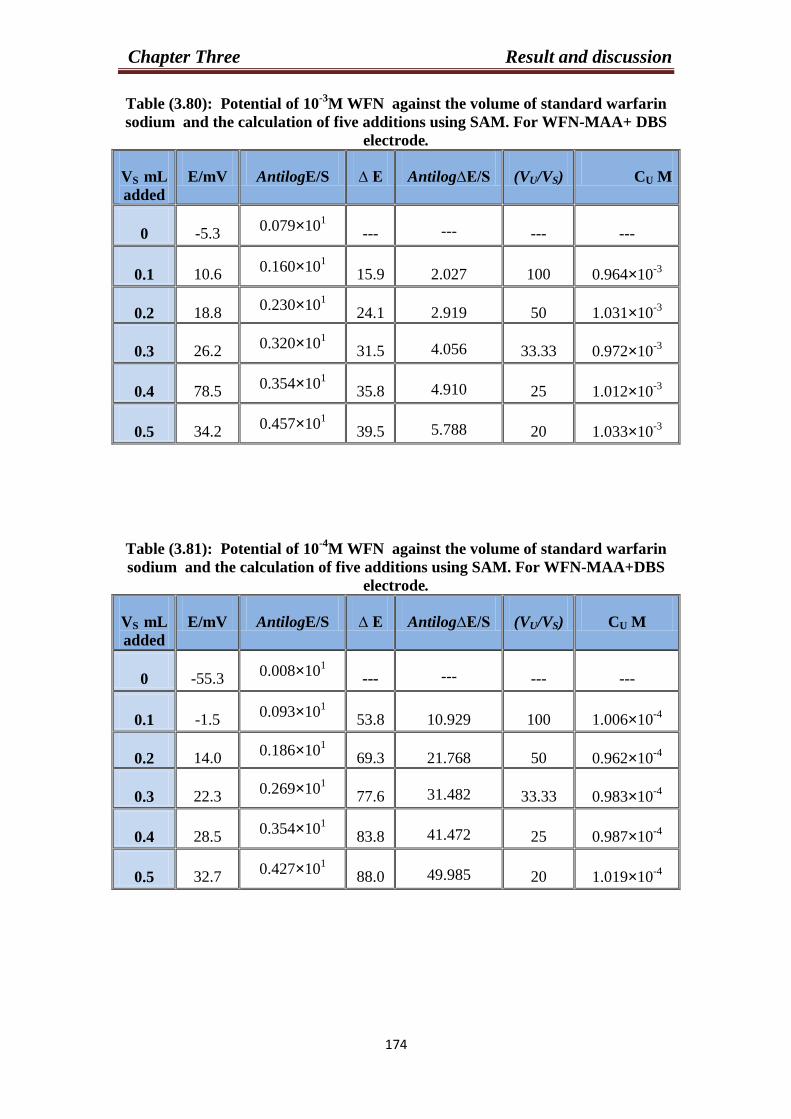
Chapter Three Result and discussion
333
Table (3.80): Potential of 10-3
M WFN against the volume of standard warfarin
sodium and the calculation of five additions using SAM. For WFN-MAA+ DBS
electrode.
VS mL
added
E/mV AntilogE/S ∆ E Antilog∆E/S (VU/VS) CU M
0 -5.3 0.079×10
1
--- --- --- ---
0.1 10.6 0.160×10
1
15.9 2.027 100 0.964×10⁻³
0.2 18.8 0.230×10
1
24.1 2.919 50 1.031×10⁻³
0.3 26.2 0.320×10
1
31.5 4.056 33.33 0.972×10⁻³
0.4 78.5 0.354×10
1
35.8 4.910 25 1.012×10⁻³
0.5 34.2 0.457×10
1
39.5 5.788 20 1.033×10⁻³
Table (3.81): Potential of 10-4
M WFN against the volume of standard warfarin
sodium and the calculation of five additions using SAM. For WFN-MAA+DBS
electrode.
VS mL
added
E/mV AntilogE/S ∆ E Antilog∆E/S (VU/VS) CU M
0 -55.3 0.008×10
1
--- --- --- ---
0.1 -1.5 0.093×10
1
53.8 10.929 100 1.006×10⁻⁴
0.2 14.0 0.186×10
1
69.3 21.768 50 0.962×10⁻⁴
0.3 22.3 0.269×10
1
77.6 31.482 33.33 0.983×10⁻⁴
0.4 28.5 0.354×10
1
83.8 41.472 25 0.987×10⁻⁴
0.5 32.7 0.427×10
1
88.0 49.985 20 1.019×10⁻⁴
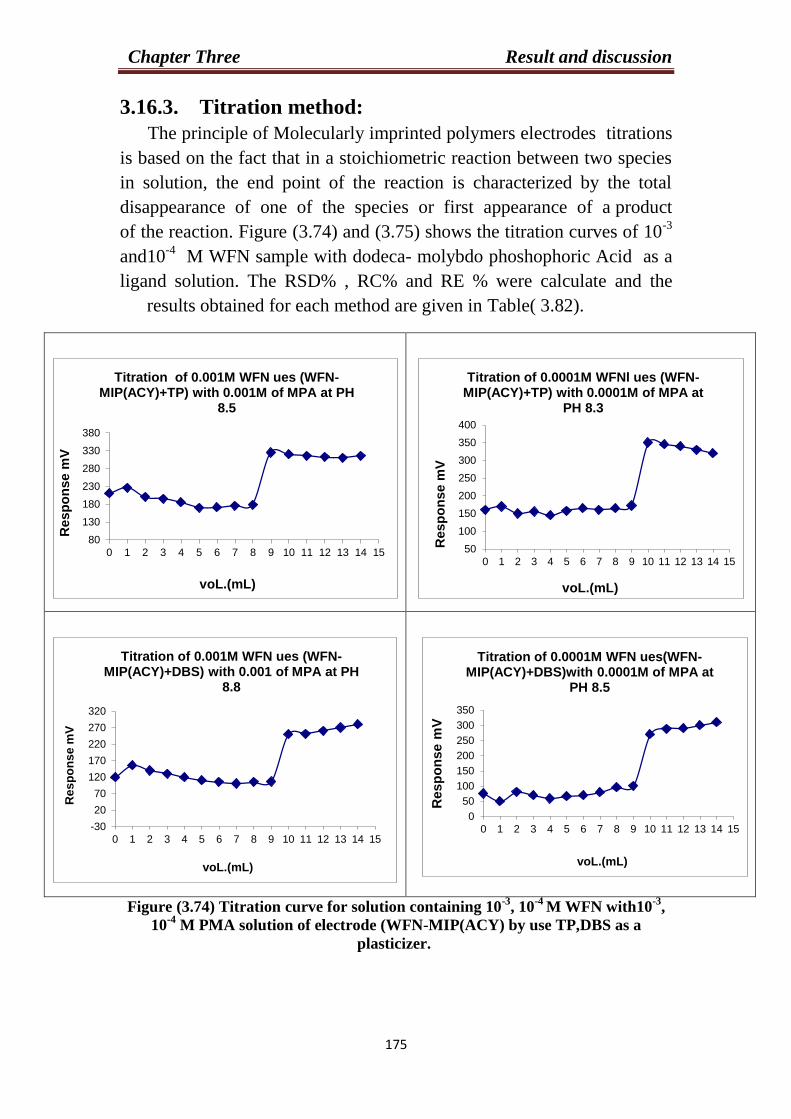
Chapter Three Result and discussion
333
3.16.3. Titration method:
The principle of Molecularly imprinted polymers electrodes titrations
is based on the fact that in a stoichiometric reaction between two species
in solution, the end point of the reaction is characterized by the total
disappearance of one of the species or first appearance of a product
of the reaction. Figure (3.74) and (3.75) shows the titration curves of 10-3
and10-4
M WFN sample with dodeca- molybdo phoshophoric Acid as a
ligand solution. The RSD% , RC% and RE % were calculate and the
results obtained for each method are given in Table( 3.82).
Figure (3.74) Titration curve for solution containing 10-3
, 10-4
M WFN with10-3
,
10-4
M PMA solution of electrode (WFN-MIP(ACY) by use TP,DBS as a
plasticizer.
80
130
180
230
280
330
380
0 1 2 3 4 5 6 7 8 9 10 11 12 13 14 15
Resp
on
se m
V
voL.(mL)
Titration of 0.001M WFN ues (WFN-MIP(ACY)+TP) with 0.001M of MPA at PH
8.5
50
100
150
200
250
300
350
400
0 1 2 3 4 5 6 7 8 9 10 11 12 13 14 15
Resp
on
se m
V
voL.(mL)
Titration of 0.0001M WFNl ues (WFN-MIP(ACY)+TP) with 0.0001M of MPA at
PH 8.3
-30
20
70
120
170
220
270
320
0 1 2 3 4 5 6 7 8 9 10 11 12 13 14 15
Res
po
ns
e m
V
voL.(mL)
Titration of 0.001M WFN ues (WFN-MIP(ACY)+DBS) with 0.001 of MPA at PH
8.8
0
50
100
150
200
250
300
350
0 1 2 3 4 5 6 7 8 9 10 11 12 13 14 15
Resp
on
se m
V
voL.(mL)
Titration of 0.0001M WFN ues(WFN-MIP(ACY)+DBS)with 0.0001M of MPA at
PH 8.5
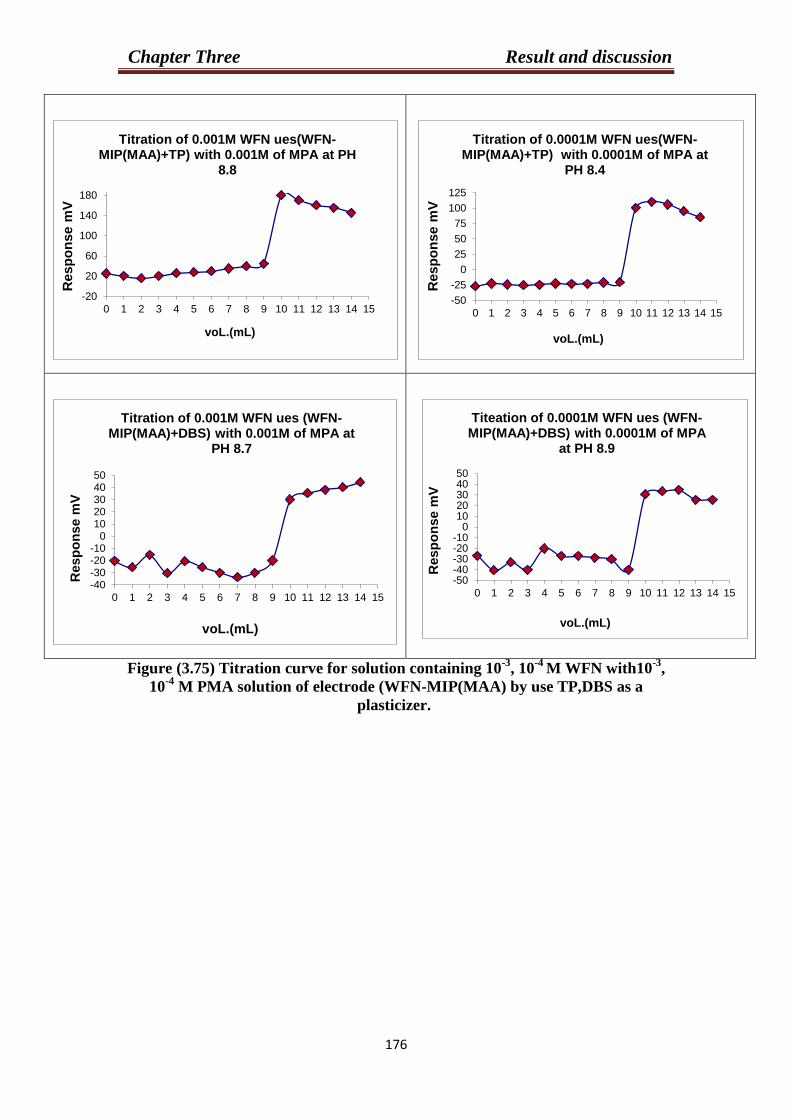
Chapter Three Result and discussion
333
Figure (3.75) Titration curve for solution containing 10-3
, 10-4
M WFN with10-3
,
10-4
M PMA solution of electrode (WFN-MIP(MAA) by use TP,DBS as a
plasticizer.
-20
20
60
100
140
180
0 1 2 3 4 5 6 7 8 9 10 11 12 13 14 15
Resp
on
se m
V
voL.(mL)
Titration of 0.001M WFN ues(WFN-MIP(MAA)+TP) with 0.001M of MPA at PH
8.8
-50
-25
0
25
50
75
100
125
0 1 2 3 4 5 6 7 8 9 10 11 12 13 14 15
Resp
on
se m
V
voL.(mL)
Titration of 0.0001M WFN ues(WFN-MIP(MAA)+TP) with 0.0001M of MPA at
PH 8.4
-40-30-20-10
01020304050
0 1 2 3 4 5 6 7 8 9 10 11 12 13 14 15
Resp
on
se m
V
voL.(mL)
Titration of 0.001M WFN ues (WFN-MIP(MAA)+DBS) with 0.001M of MPA at
PH 8.7
-50-40-30-20-10
01020304050
0 1 2 3 4 5 6 7 8 9 10 11 12 13 14 15
Resp
on
se m
V
voL.(mL)
Titeation of 0.0001M WFN ues (WFN-MIP(MAA)+DBS) with 0.0001M of MPA
at PH 8.9
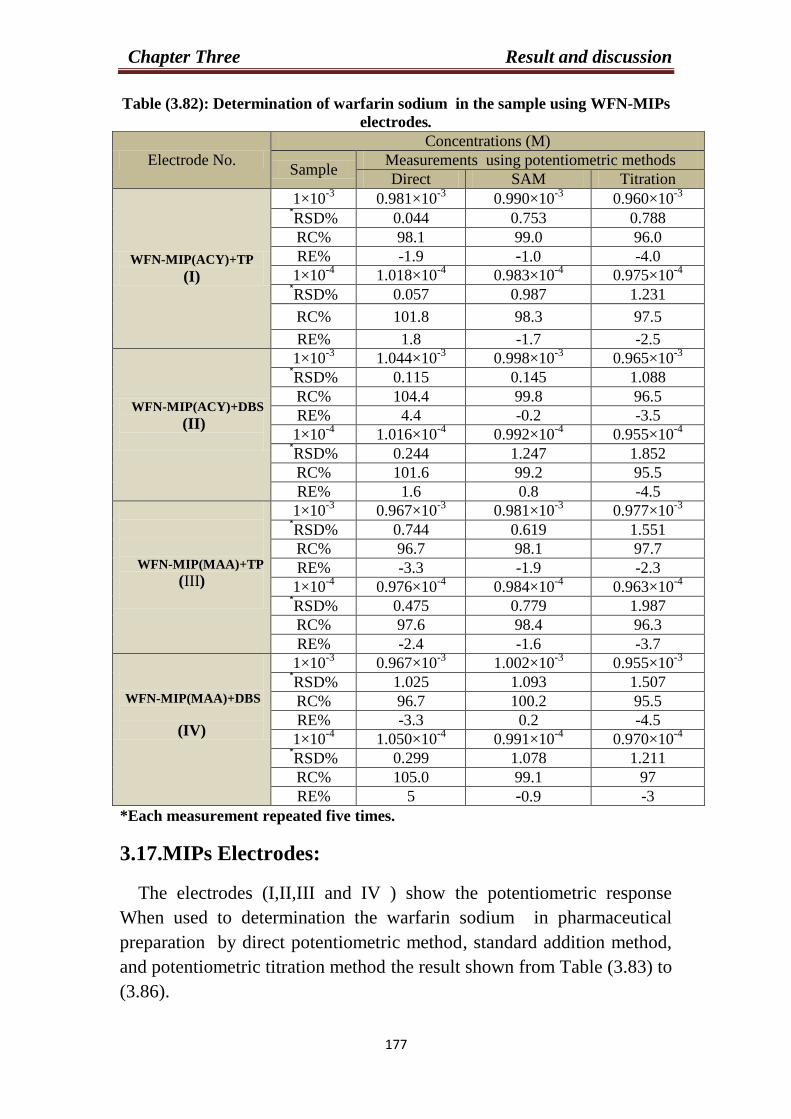
Chapter Three Result and discussion
333
Table (3.82): Determination of warfarin sodium in the sample using WFN-MIPs
electrodes.
*Each measurement repeated five times.
3.17.MIPs Electrodes:
The electrodes (I,II,III and IV ) show the potentiometric response
When used to determination the warfarin sodium in pharmaceutical
preparation by direct potentiometric method, standard addition method,
and potentiometric titration method the result shown from Table (3.83) to
(3.86).
Electrode No.
Concentrations (M)
Sample Measurements using potentiometric methods Direct SAM Titration
WFN-MIP(ACY)+TP
(I)
1×10⁻³
0.981×10⁻³
0.990×10⁻³
0.960×10⁻³
RSD%* 0.044 0.753 0.788
RC% 98.1 99.0 96.0
RE% -1.9 1.0- -4.0
1×10⁻⁴ 1.018×10
-4 0.983×10⁻⁴ 0.975×10
-4
RSD%* 0.057 0.987 1.231
RC% 101.8 98.3 97.5
RE% 1.8 -1.7 -2.5
WFN-MIP(ACY)+DBS
(II)
1×10⁻³
1.044×10⁻³
0.998×10⁻³ 0.965×10
-3
RSD%* 0.115 0.145 1.088
RC% 104.4 99.8 96.5
RE% 4.4 -0.2 -3.5
1×10⁻⁴
1.016×10⁻⁴
0.992×10⁻⁴ 0.955×10
-4
RSD%*
0.244 1.247
1.852
RC% 101.6 99.2 95.5
RE% 1.6 0.8 -4.5
WFN-MIP(MAA)+TP
(III)
1×10⁻³
0.967×10⁻³
0.981×10⁻³
0.977×10⁻³
RSD%* 0.744 0.619 1.551
RC% 96.7 98.1 97.7
RE% -3.3 -1.9 -2.3
1×10⁻⁴ 0.976×10
-4 0.984×10⁻⁴
0.963×10⁻⁴
RSD%* 0.475 0.779 1.987
RC% 97.6 98.4 96.3
RE% -2.4 -1.6 -3.7
WFN-MIP(MAA)+DBS
(IV)
1×10⁻³
0.967×10⁻³
1.002×10⁻³
0.955×10⁻³
RSD%* 1.025 1.093 1.507
RC% 96.7 100.2 95.5
RE% -3.3 0.2 -4.5
1×10⁻⁴ 1.050×10
-4 ×10
-40.991 0.970×10
-4
RSD%* 0.299 1.078 1.211
RC% 105.0 99.1 97
RE% 5 0.9- -3

Chapter Three Result and discussion
333
Table (3.83): Sample analyses of pharmaceutical Orfarin ( 3 mg ) using WFN-
MIP(ACY)+TP electrode
Pharmaceutical
Orfarin ( 3 mg )
Direct SAM Titration
Concentration
Prepared 1×10
-3 1×10
-3 1×10
-3
*Found 0.977×10
-3 1.015×10
-3 0.955×10
-3
Recovery % 97.7 101.5 95.5
RE % -2.3 1.5 -4.5
*RSD% 0.141
* 0.997
* 0.911
*
Fexperimental 11.5 9.8 13.2
F theoretical 19.2
Pharmaceutical
Orfarin ( 3 mg )
Direct SAM Titration
Concentration
Prepared 1×10
-4 1×10
-4 1×10
-4
*Found 0.980×10
-4 1.022×10
-4 0.960×10
-4
Recovery % 98.0 102.2 96.0
RE % -2.0 2.2 -4.0
*RSD% 0.752
* 1.022
* 1.511
*
Fexperimental 9.8 11.1 10.8
F theoretical 19.2
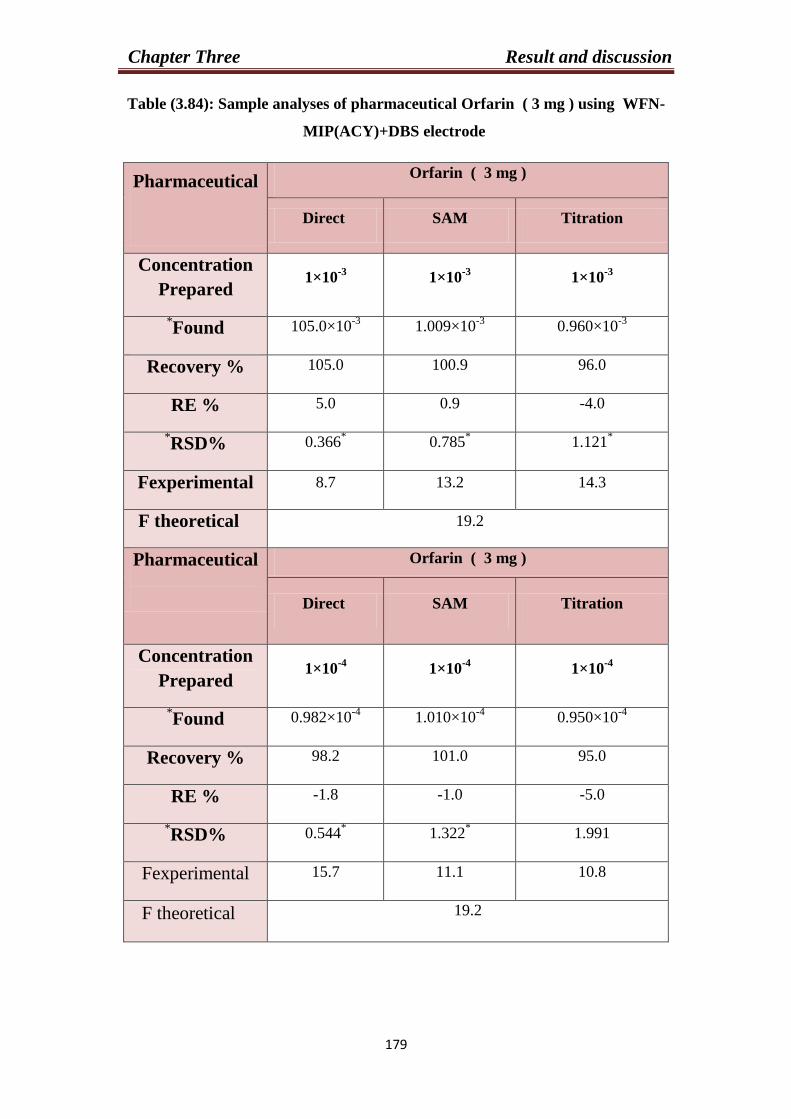
Chapter Three Result and discussion
332
Table (3.84): Sample analyses of pharmaceutical Orfarin ( 3 mg ) using WFN-
MIP(ACY)+DBS electrode
Pharmaceutical
Orfarin ( 3 mg )
Direct SAM Titration
Concentration
Prepared 1×10
-3 1×10
-3 1×10
-3
*Found 105.0×10
-3 1.009×10
-3 0.960×10
-3
Recovery % 105.0 100.9 96.0
RE % 5.0 0.9 -4.0
*RSD% 0.366
* 0.785
* 1.121
*
Fexperimental 8.7 13.2 14.3
F theoretical 19.2
Pharmaceutical
Orfarin ( 3 mg )
Direct SAM Titration
Concentration
Prepared 1×10
-4 1×10
-4 1×10
-4
*Found 0.982×10
-4 1.010×10
-4 0.950×10
-4
Recovery % 98.2 101.0 95.0
RE % -1.8 -1.0 -5.0
*RSD% 0.544
* 1.322
* 1.991
Fexperimental 15.7 11.1 10.8
F theoretical 19.2

Chapter Three Result and discussion
333
Table (3.85): Sample analyses of pharmaceutical Orfarin ( 3 mg ) using WFN-
MIP(MAA)+TP electrode
Pharmaceutical
Orfarin ( 3 mg )
Direct SAM Titration
Concentration
Prepared 1×10
-3 1×10
-3 1×10
-3
*Found 0.960×10
-3 1.023×10
-3 0.970×10
-3
Recovery % 96.0 102.3 97.0
RE % -4.0 2.3 -3.0
*RSD% 1.112
* 1.085
* 1.855
Fexperimental 9.7 11.8 16.3
F theoretical 19.2
Pharmaceutical
Orfarin ( 3 mg )
Direct SAM Titration
Concentration
Prepared 1×10
-4 1×10
-4 1×10
-4
*Found 1.030×10
-4 1.018×10
-4 0.960×10
-4
Recovery % 103.0 101.8 96.0
RE % 3.0 1.8 -4.0
*RSD% 0.711
* 1.088
* 2.012
Fexperimental 13.3 11.1 17.9
F theoretical 19.2
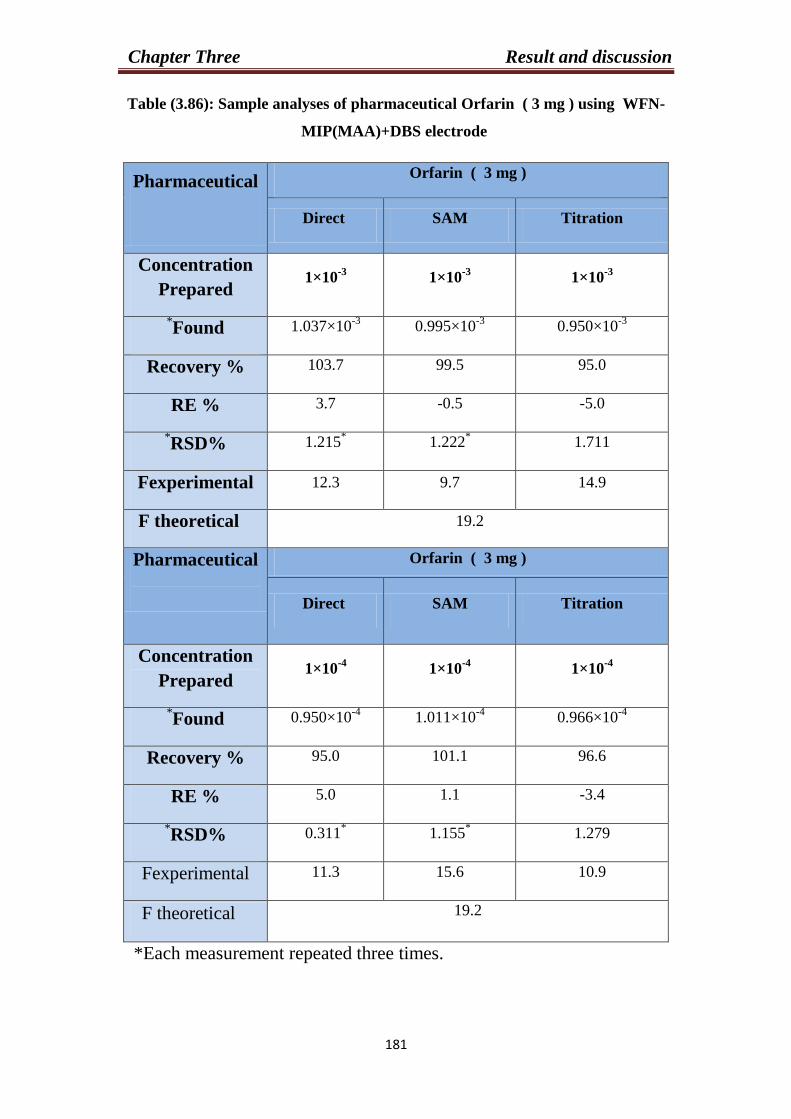
Chapter Three Result and discussion
333
Table (3.86): Sample analyses of pharmaceutical Orfarin ( 3 mg ) using WFN-
MIP(MAA)+DBS electrode
Pharmaceutical
Orfarin ( 3 mg )
Direct SAM Titration
Concentration
Prepared 1×10
-3 1×10
-3 1×10
-3
*Found 1.037×10
-3 0.995×10
-3 0.950×10
-3
Recovery % 103.7 99.5 95.0
RE % 3.7 -0.5 -5.0
*RSD% 1.215
* 1.222
* 1.711
Fexperimental 12.3 9.7 14.9
F theoretical 19.2
Pharmaceutical
Orfarin ( 3 mg )
Direct SAM Titration
Concentration
Prepared 1×10
-4 1×10
-4 1×10
-4
*Found 0.950×10
-4 1.011×10
-4 0.966×10
-4
Recovery % 95.0 101.1 96.6
RE % 5.0 1.1 -3.4
*RSD% 0.311
* 1.155
* 1.279
Fexperimental 11.3 15.6 10.9
F theoretical 19.2
*Each measurement repeated three times.
Chapter Three Result and discussion
339
3.18.Conclusion:
Warfarin sodium which know as an anticoagulant drug determined
in this work by used ISEs method and MIPs method.These methods are
rapid, simple and accurate, the resulting F test obtained by ISEs and MIPs
were quite comparable with HPLC as standard method in British
pharmacopeia. The work included two part, the first part include ISEs
method included fabrication of membranes for warfarin sodium were
constructed by Dodeca-molybdo Phosphoric acid (MPA) and Dodeca–
Phosphotungstic acid (PTA) with drug as ion-exchanger and many
plasticizers : oleic acid (OA), tri-n-butylphosphate(TBP), Nitrobenzen
(NB), Acetophenone (AP) and di-octyl phthalate (DOPH) in PVC matrix
membranes.The best electrode for warfarin sodium by used oleic acid
(OA) for each ion-exchanger . The second part included MIPs which
used fabrication of membranes for warfarin sodium were constructed by
Acrylamide (ACY)and Meth acrylic acid (MAA) as monomers and
Ethylene glycol dimethacrylate(EGDMA) as cross-linker with drug as
ion-exchanger and two plasticizer : Tritolyl phosphate (TP), Di butyl
sebacate (DBS) in PVC matrix membranes the best electrode for warfarin
sodium was (WFN-MIP(ACY),WFN-MIP(MAA) ) by use TP as a
plastisizer.
1. Prepared MIPs can be used as columm packing material for HPLC
method.
2. Different plasticizers could be examined to get better idea on their
influence on the electrode performance.
3. Other amount and percent of components proportions in
membrane, through fixing one of the components and changing the
other.
4. Study the selectivity behavior using other methods and also by
using more interfering ions.
5. Other matrix used such as (Polyurethane and Silicone rubber)
instead PVC in order to compare with PVC matrix.
6. Application of these membranes in analyses of other drug
samples with similar active groups.
7. Use the Molecularly Imprinted polymers (MIPs) for determination
of other drugs used different cross linker.
References
381
1. E. Bakker, and E. Pretsch, Trends Anal. Chem. 20(1),11-19 ( 2001).
2. T . Tafesse, ; Enemchukwu , M. Talanta , 83, 1491-1495( 2011).
3. J . Koryta , Anal. chim. Acta,183,1-46(1986) .
4. V.cosofret , Membrane Electrodes in drug-substances Analysis;
Pergamon : NY , 1982.
5. W. Thomas, J.Pharm.Pharmacol.1973.
6. C. Thomas; A. Voilley,; Pourcelot-Roubeau, Y. J. Pharm.Belg.25, 27-
34(1982).
7. B. Eric and Y. Qin ., "Electrochemical Sensors", Anal. Chem.,
78,3965-39849 (2006).
8. F. Farnoush, R. Mohammad, D. Rassoul and N. Parviz, "Developments
in the Field of Conducting and Non – conducting Polymer Based
Potentiometric Membrane Sensors for Ions Over the Past Decade",
Sensors ,8,2331-24129(2008).
9. R. P. Buck and E. Lindner, "Recommendations for nomenclature of
ion- selective electrodes", Pure &Appl. Chem.,66,2527-2536(1994).
10. S. Safari, M. Ponnambalam , R . Selvaganapathy, M. Jamal Deen,
" Microfabricated True Reference Electrode for Sensing
applications'', Analytica Chimica Acta, , 549,59-66 (2005).
11. G. G. Guilbault, " Recommendations for publishing manuscripts on
ion- selective electrodes ", Pure & Appl. Chem., 53,1907-1912
(1981).
12. C. Rundle, '' A Beginners Guide to Ion - Selective Electrode
Measurements'', Nico2000 Ltd, London, UK, ( 2008) .
13. S. Solomon, "Sensors Handbook", McGraw-Hill, New York, NY,
(1998).
14. G. J. Moody, and J. D. Thomas, Talanta,19,623( 1972).
15. http://www.nico2000.net/index Beginners Guide to ISE
Measurement( 2005).
16. R. P. Buck, and E. Lindner, Pure Appl. Chem.,66,2527( 1994).
17. P.Baily, L.Thomas, "Analysis with ion selective electrodes", Heyden
and Son, London ,65,225(1976) .
References
381
18. A. Evans, Potentiometry and Ion Selective Electrodes, John wiley &
Sons ,(1987).
19. R.Buck, E.Lindner,''Recommendations for nomenclature of ion-
selective electrodes'', Pure Appl. Chem.,66,2527-2536(1994).
20. B. Eric, P. Erno and B. Philippe, ''Selectivity of Potentiometric Ion
Sensors'', Anal. Chem., 72,1127-1133(2000) .
21. U. Yoshio, H. Philippe, U. Kayoko, and A. Shigeru, Pure Appl.
Chem., 72,1851-2082(2000).
22. J. Umezawa, K.Umezawa, H .Sato, ''Selectivity coefficients for
ion- selective electrodes recommended methods for reporting Kpot
values'' Pure Appl. Chem,67, 507-518(1995) .
23. K. Tohda, D. Dragoe, M. Shibata and Y. Umezawa, "Studies on the
Matched Potential Method for Determining the Selectivity
Coefficients of Ion – Selective Electrodes Based on Neutral
Ionophores", Anal. Sci., 17,733-743(2001).
24. M. M. Zurawska and A. Lewenstam, "Selectivity coefficients of ion-
selective magnesium electrodes used for simultaneous determination
of magnesium and calcium ions", Talanta, ,87,295-301(2011).
25. E.Alun,"Potentiometry and ion selective electrode", John Wiley &
Sons, (1998).
26. G. Gran,''Determination of the equivalence point in potentiometric
titrations''. Part II, Analyst, 77,661(1952).
27. G. N. Guncu, F. Cxaglayan, A. Dincxel, A. Bozkurt, S. Sayg, and E.
Karabulut,''Plasma and gingival crevicular fluid phenytoin
concentrations as risk factors for gingival overgrowth'', Journal of
Periodontology,77(22),2005-2010 (2006) .
28. Hann instruments, “Ion selective measurement catalog”,Inc.
Woonsocket, RI USA, (2000).
29. Martindale, "The complete drug reference" Thirty third edition
pharmaceutical press publication division of royal pharmaceutical
society Great Britain,66,998( 2002).
30 K.Tripathi D "Essentials of Medical Pharmacology". Third edition
60,555(1985).
References
381
31. K.Suvarna, C.Shivani , M.Muhammed : Synthesis Docking stud
anticancer activity of coumarin substituted Benzthiazole ,
Journal of computational methods in Molecular design,2(1),51-
60(2012).
32. M.Teotia, D.Rastogi and W.Malik ,Stereochemical features
vis- à-vis spectral data on some Ni(II) complexes with coumarin
derivatives,Inorg. Chim. Acta. 7,339-344(1973).
33. D .Singh and H. Singh , J. Indian ,Chem.,14,781-784(1976).
34. U .Yasar, E. Eliasson, M .Dahl, I .Johansson, Ingelman-Sundberg M,
Sjoqvist F. Validation of methods for CYP2C9 genotyping:
Frequencies of mutant alleles in Swedish population. Biochem
Biophys Res Comm.254,628-631(1999) .
35. A. Serajuddin , Salt formation to improve drug solubility,
Advanced Drug Delivery Review, 59,603-616(2007).
36. D.Gao, Physical Chemical Stability of Warfarin Sodium, AAPS
Pharmsci,3(1),200-218(2001).
37. Li T, Chang CY, Jin DY, Lin PJ, Khvorova A, Stafford DW
Identification of the gene for vitamin K epoxide reductase.Nature
427,541-544(2004).
38. S. Rost, A. Fregin, Ivaskevicius V et al Mutations in VKORC1
cause warfarin resistance and multiple coagulation factor deficiency
type 2. Nature, 427, 537-541(2004).
39. A .Yacobi.; J.Udall, A. Levy, G. Serum-protein binding as a
determinant of warfarin body clearance and anticoagulant effect.
Clin. Pharmacol. Ther.19,552-558(1976).
40. F.Lucas, A.Duncan, R. Jay, R.Coleman, P. Craft, B. Chan,
L.Winfrey, D. Mungall, R. Hirsch, J. A novel whole-blood
capillary technique for measuring the prothrombin time. Am. J.
Clin. Pathol. 88,442-446(1987).
41. Schroeder CH, Link KP, inventors; Wisconsin Alumni Research
Foundation. Warfarin sodium, US patent 3,481( 1963).
42. US Pharmacopoeia. The National Formulary, USP 24/NF19. United
State Pharmacopoeia Convention; Rockville, Md, (2000).

References
381
43. A. Fennerty, J. Dolben, Thomas P et al Flexible induction dose
regimen for warfarin and prediction of maintenance dose. Br Med J
(Clin Res Ed) ,288,1268-1270(1984).
44. A .Oates, Jackson PR, Austin CA, Channer KS A new regimen
for starting warfarin therapy in out -patients. Br J Clin Pharmacol
,46,157-161(1998).
45. Go AS, Hylek EM, Phillips KA et al Prevalence of diagnosed
atrial fibrillation in adults: national implications for rhythm
management and stroke prevention: the anticoagulation and risk fact
in atrial fibrillation (ATRIA) study. JAMA,285,2370-2375( 2001).
46. J .Gurwitz, J .Avorn, Ross- Degnan D, Choodnovskiy I, Ansell J
Aging and the anticoagulant response to warfarin therapy. Ann Intern
Med , 116,901-904(1992).
47. C. Banfield, M . Rowland, Stereospecific fluorescence high-
performance liquidchromatographic analysis of warfarin and its
metabolites in plasma and urine,J. Pharm. Sci.73,1392-1396( 1984).
48. V.K. Boppana, W.H. Schaefer, M.J. Cyronak, High-performance
liquid- chromatographic determination of warfarin enantiomers in
plasma withautomated on-line sample enrichment, J. Biochem.
Biophys . Methods,54,315-326( 2002).
49. T . Niioka, M. Hayakari, K. Sugawara, T. Tateishi, Simultaneous
deter-mination of warfarin enantiomers and its liquid metabolite
in human plasma bycolumn - switching high - performance
chromatography with chiral sepa-ration, Ther. Drug Monit. 29,333
(2007)
50. I. Locatelli, V. Kmetec, A. Mrhar, I. Grabnar, Determination of
warfarin enan-tiomers and hydroxylated metabolites in human blood
plasma by liquidchromatography with achiral and chiral separation,
J. Chromatogr, 818,191-198(2005).
51. G.P. Miller, D.R. Jones, S.Z. Sullivan, A. Mazur, S.N. Owen, N.C.
Mitchell,A. Radominska-Pandya, J.H. Moran, Assessing
cytochrome P450 and UDP-glucuronosyltransferase contributions to
warfarin Metabolism in humans,Chem. Res. Toxicol.22,1239-1245
( 2009).
References
381
52. M.J. Kwon, H.J. Kim, J.W. Kim, K.H. Lee, K .H. Sohn, H.J. Cho,
Y.K. On, J.S. Kim, S.Y.Lee, Determination of plasma warfarin
Concentrations in Korean patients andits potential for clinical
application, Korean J. Lab. Med.29,515-523( 2009).
53. D. R. Jones , G. Boysen, G.P. Miller, Novel multi - mode ultra
performance liquidchromatography-tandem mass spectrometry assay
for profiling enantiomerichydroxywarfarins and warfarin in human
plasma, J. Chromatogr. 879,1056-1062(2011).
54. M.A. Radwan, G.A. Bawazeer, N.M. Aloudah, B.T. AlQuadeib,
H.Y. Aboul-Enein , Determination of free and total warfarin
concentrations in plasma using UPLCMS/MS and its application
to a patient samples, Biomed. Chromatogr.26,6-11( 2012).
55. W. Naidong, P.R. Ring, C. Midtlien, X. Jiang, Development and
validation of asensitive and robust LC-tandem MS method for the
analysis of warfarin enan-tiomers in human plasma, J. Pharm.
Biomed. Anal.25,219-226( 2001).
56. M. Wang, Z. Cai, L. Xu, Coupling of acetonitrile deproteinization
andsalting-out extraction with acetonitrile stacking in chiral capillary
electrophoresisfor the determination of warfarin enantiomers, J.
Chromatogr.1218,4045-4051( 2011).
57. H. Takahashi, T. Kashima, S. Kimura, N. Muramoto, H. Nakahata,
S. Kubo, Y. Shimoyama, M. Kajiwara, H. Echizen, Determination of
Unbound warfarinenantiomers in human plasma and 7-
hydroxywarfarin in human urine by chi-ral stationary-phase liquid
chromatography with ultraviolet or fluorescenceand on-line circular
dichroism detection, J. Chromatogr. 701,71-80(1997).
58. A.M. Rosengren, B.C.G. Karlsson, I. Naslund, P.O. Andersson, I.A.
Nicholls, In situdetection of warfarin using time-correlated single-
photon counting, Biochem.Biophys. Res. Commun. 407,60-62(2011).
59. Y.A. Chua, W.Z. Abdullah, S.H. Gan, Turk. J. Med. Sci. 42,930
(2012).
60. I. Locatelli, V. Kmetec, A. Mrhar, I. Grabnar, J. Chromatogr818,191.
(2005).
61. C. Banfield, M. Rowland, J. Pharm. Sci. 73, 1392(1984).
References
388
62. H. Takahashi, T. Kashima, S. Kimura, N. Muramoto, H. Nakahata,
S. Kubo, Y.Shimoyama, H. Echizen, J. Chromatogr.701,71( 1997).
63. A.Duffield , P .H. Duffield, D.J. Birkett , M. Kennedy, D.N. Wade,
Biomed. MassSpectrom. 6,208(1979).
64. M.R. Nateghi, M.H. Mosslemin, A. Hakimi, S. Kavoosi, Asian J.
Chem. , 22,3516(2010) .
65. M.M. Ghoneim, A. Tawfik, Anal. Chim. Acta, 511,63(2004).
66. T.D. Smirnova, N.V. Nevryueva, S.N. Shtykov, V.I. Kochubei, D.A.
Zhemerichkin,J. Anal. Chem.64,1114(2009).
67. Z. Chang, H.T. Yan, J. Lumin. 132,811(2012).
68. Q. Zhou, W.-P. Yau, E. Chan, Electrophoresis,24,2617(2003).
69. P. Gareil, J.P. Gramond, F. Guyon, J. Chromatogr .615,317(1993).
70. K. Haupt "Topics in Current Chemistry - Molecular Imprinting"
Springer-Verlag Berlin Heidelberg,85,1-6(2012).
71. J.Huangxian , X . Zhangand ,J. Wang, " Nano Biosensing,
Principles, Development and Application " Springer Science
+ Business Media , LLC, 205,268(2011) .
72. V. M. Mirsky and A. K. Yatsimirsky " Artificial Receptors for
Chemical Sensors"WILEY VCHV erlag & Co. KGaA, Germany,
393,414-418(2011).
73. A.Öpik , A.Menaker, J.Reut , and V. Syritski “ Molecularly
Imprinted polymers : a new approach to the preparation of
functional materials”, Proceedings of the Estonian Academy of
Sciences, materials science, 58,3-11(2009).
74. N. Harun “ Application of molecularly imprinted solid phase
Extraction , enzyme - linked immunosorbent assay and liquid
chromatography tandem mass spectrometry to forensic toxicology”.
Section of Forensic Medicine and Science , Division of Cancer
Sciences and Molecular Pathology, Faculty of Medicine,University
of Glasgow, February,708,88-89(2010).
75. Li S., Ge Yi, Piletsky S. A., Lunec J.” Molecular Imprinted Sensors:
overview and Applications” Elsevier B.V.252,36-41( 2012).
76. M.Komiyama, T.Takeuchi, T.Mukawa and H.Asanuma” Molecular
Imprinting From Fundamentals to Applications” Wiley- VCH
Verlag GmbH & Co. KGaA, 2(82),50-52(2003).
References
381
77. C.Alvarez-Lorenzo and A. Concheiro “Handbook of Molecularly
Imprinted Polymers” Smithers Rapra Technology Ltd. UK,211,1-41
(2013).
78. L.Fitzhenry “Development of Molecularly Imprinted polymers for
Corticosteroids” pharmaceutical and molecular biotechnology
research centre , department of chemical and life science ,Waterford
institute of technology, Waterford, Ireland, October ,155,4-20
(2011) .
79. A. Poma "Automatic solid-phase synthesis of molecularly imprinted
nanoparticles (MIP NPs)" Cranfield Health, Cranfield University,
November 17,9(2012).
80. J. E. Lofgreen and G.A.Ozin " Controlling morphology and porosity
to improve performance of molecularly imprinted sol –gel silica"
Chemical Society Reviews,43,911-933( 2014).
81. J.D. Marty and M .Mauzac ''Advances in Polymer Science-
Molecular Imprinting: State of the Art and Perspectives” Adv Polym
Sci 6,1-189(2005).
82. V. Emmanuel Pakade ” Development and Application of
Imprinted Polymers For Selective Adsorption of Metal Ions and
Flavonols in Complex Samples” University of the Witwatersrand,
Johannesburg, 25.10-14(2012).
83. H. Marie”Elaboration of a new sensors based on Molecularly
Imprinted Polymers for the detection of molecules in physicological
fluids” Universite de Technologie de Compiegne, 85,48-50(2014).
84. A. Craggs, G. J. Moody and J . D . R. Thomas, " PVC matrix
membrane ion-selective electrodes: Construction and laboratory
experiments", Chem. Educ.,51,541-544( 1974).
85.Y.Kamal , R.Krabet, thesis ,"Construction of Ion-Selective electrodes
For phenytion analytical (study and application ) 42(2015).
86.Jamal I., Muna A., Nabil S.,"Liquid selective electrodes for
Dextromethorphan Hydrobromide Based on a Molecularly Imprinted
Polymer in PVC Matrix Membrane "9,292-303( 2014).
الخالصة
I
الرسالة تشمل ثالث فصول رئيسية:
تصنيفها خصائصها,, عملهاويتضمن مقدمة عن تقنية االقطاب االنتقائية ,كيفية :الفصل االول
باستخدام طرق قياسها ,تصميم االقطاب االنتقائية ومميزاتها مثل االنتقائية ومعامل االنتقائية و
مدى وكذلك معرفة المنفصلة ( و )طريقة التطابق الجهدي ( )طريقة المحاليلمنها مختلفة
الخطية ,حد التحسس وزمن االستجابة.
) الطريقة التساهمية والطريقة الغير الطبعة الجزيئية البوليمرية وكذلك تم الشرح عن موضوع
والعوامل المؤثرة على البلمرة )جزيئة البلمرة ,المجموعة الفعالة للمونمر, , مكوناتهاالتساهمية (
عملية البلمرة باستخدام التشابك , البادئ و المذيب (.العوامل التي تساعد على السيطرة على مواد
والطرق المستخدمة في تقدير الدواء بطريقة ,طريقتين ) البلمرة الثقيلة والبلمرة الترسيبية (
اب االنتقائية وطريقة الطبعة الجزيئية هي الطريقة المباشرة ,طريقة االضافات القياسية االقط
,طريقة االضافات القياسية المتعددة والطريقة التسحيحية .ويشمل هذا الفصل مسح شامل للبحوث
التي لها عالقة بهذا الموضوع .
ية وتكوين المعقدات فهو يقلل الوارفرين صوديوم هو دواء مضاد للتخثرونظرا لقدرته البايولوج
من عملية التخثر.
تحضيرهم يعطي هذا الفصل وصف كامل للمواد الكيميائية المستخدمة ,كيفية الفصل الثاني :
الطبعة الجزيئية وصب بوليمراتيم الخلية , تحضير,باالضافة الى االجهزة والمعدات ,تصم
شاء.الغ
الخالصة
II
:ويتألف من طريقتين : الفصل الثالث
االقطاب االنتقائية االيونية .-1
تم تحضير االقطاب النتقائية االيونية لدواء الوارفرين صوديوم باالعتماد على
Dodeca-molybdo Phosphoric acid (MPA) , Dodeca–Phosphotungstic
acid (PTA) : وباستخدام عدة ملدنات منها
oleic acid (OA), tri-n-butylphosphate(TBP), Nitrobenzen (NB),
Acetophenone (AP) and di-octyl phthalate (DOPH) باستخدام قالبPVC.
. PVCتم بناء الغشاء عن طريق خلط كميات مناسبة من الملدن مع معقد الدواء باستخدام
دراسة كال من مدى التراكيز ,الميل ,حد التحسس , عمر القطب , تضمنت االقطاب المحضرة
معامل االرتباط والدالة الحامضية , وكذلك التداخالت تم دراستها مع االيونات االحادية والثنائية
Kمثل والثالثية +, Na
+,Ca
2+ ,Mg
2+,Al
3+,Fe
3+( وكذلك استخدمت االحماض االمينية مثل (
(Alanine, Proline , Serin والدراسة تمت باستخدام طريقة المحاليل المنفصلة وطريقة )
WFN-MPA+OA اليجاد معامل التداخل .االقطاب المحضرة من )التطابق الجهدي
WFN-MPA+TBP, WFN-MPA+NB ,WFN-MPA+AP,WFN-
MPA+DOPH10 × 1) ( اعطت مدى خطية بين−1
- 1 × 10⁻⁵
( موالري مع ميل نرنيستي
10×7)( ملي فولت /حقبة وحد تحسس 31.57–21.28)−6
- 2× 10⁻⁵
موالري وكان عمر (
( على التوالي .الدالة 0.9998 - 0.9969( يوم ومعامل االرتباط )(35-7بين قطاباال
. (10.0 – 2.5)ية كانت محصورة بين ضالحام
, WFN-PTA+OA, WFN-PTA+TBP, WFN-PTA+NB اما االقطاب المحضرة من
WFN-PTA+AP , WFN-PTA+DOPH 10×1طت مدى خطية بين )اع−1
–(1×10⁻⁵
10×6)حقبة وحد تحسس/ملي فولت29.62_ 20.04) موالري وميل نرنستيني )−6
_ 4×10⁻⁵
)
(0.99949- 0.9984 ) بين الفعالية ومعامل يوم (40 - 10)كان بين موالري وعمراالقطاب
.(10.0 – 3.5)ية بين ضعلى التوالي .وكانت الدالة الحام
وقد استخدمت االقطاب المذكورة اعاله في تعيين دواء الوارفرين صوديوم في المستحظرات
الصيدالنية.
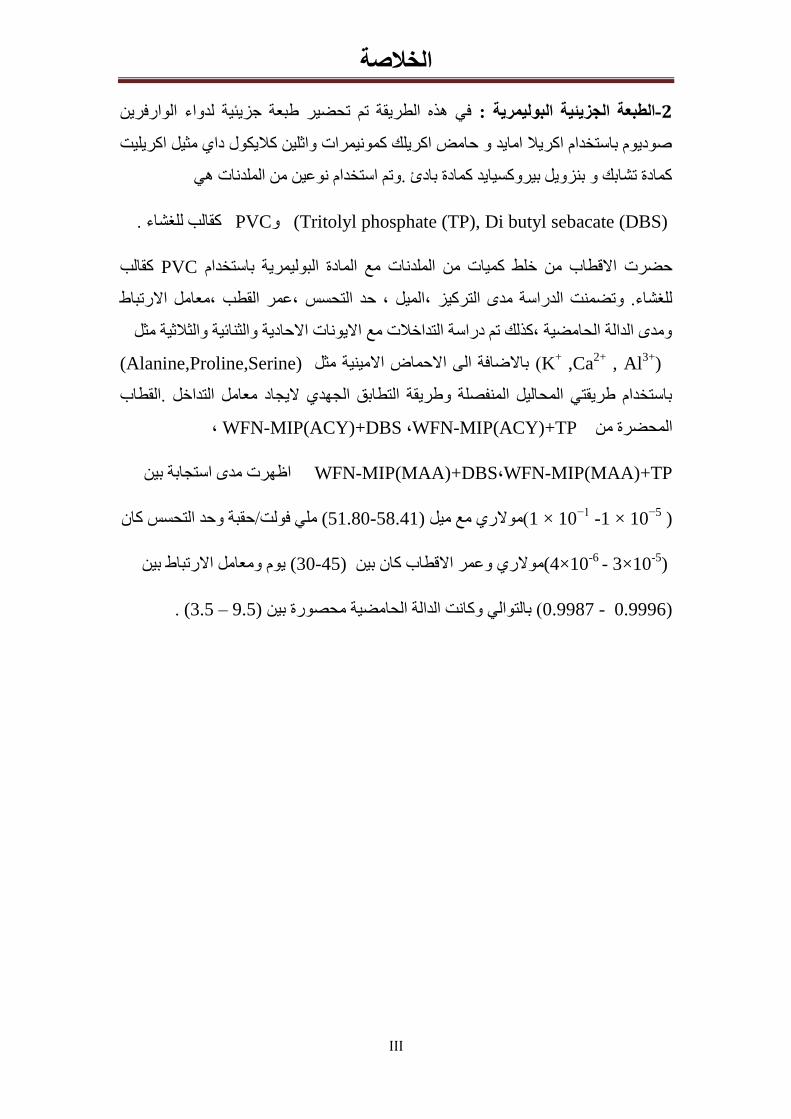
الخالصة
III
لدواء الوارفرين في هذه الطريقة تم تحضير طبعة جزيئية الطبعة الجزيئية البوليمرية : -2
ثيل اكريليت صوديوم باستخدام اكريال امايد و حامض اكريلك كمونيمرات واثلين كاليكول داي م
كمادة تشابك و بنزويل بيروكسيايد كمادة بادئ .وتم استخدام نوعين من الملدنات هي
(Tritolyl phosphate (TP), Di butyl sebacate (DBS) وPVC كقالب للغشاء.
كقالب PVCكميات من الملدنات مع المادة البوليمرية باستخداممن خلط حضرت االقطاب
الميل , حد التحسس ,عمر القطب ,معامل االرتباط للغشاء. وتضمنت الدراسة مدى التركيز ,
ومدى الدالة الحامضية ,كذلك تم دراسة التداخالت مع االيونات االحادية والثنائية والثالثية مثل
K+ ,Ca
2+ , Al
3+)
(Alanine,Proline,Serine)باالضافة الى االحماض االمينية مثل (
اليجاد معامل التداخل .القطاب باستخدام طريقتي المحاليل المنفصلة وطريقة التطابق الجهدي
, WFN-MIP(ACY)+TP , WFN-MIP(ACY)+DBSالمحضرة من
WFN-MIP(MAA)+TP, WFN-MIP(MAA)+DBS ظهرت مدى استجابة بين ا
1 × 10⁻¹
-1 × 10⁻⁵
ملي فولت/حقبة وحد التحسس كان (58.41-51.80)(موالري مع ميل (
(4×10⁻⁶
- 3×10⁻⁵
يوم ومعامل االرتباط بين (45-30)موالري وعمر االقطاب كان بين (
. (9.5 – 3.5)( بالتوالي وكانت الدالة الحامضية محصورة بين (0.9996 - 0.9987
جمهوریة العراق وزارة التعلیم العالي والبحث العلمي
جامعة النهرین/كلیة العلوم قسم الكیمیاء
الطبعة الجزیئیة- بناء اقطاب انتقائیة جدیدة البولیمریة لدواء ورفارین صودیوم
رسالة جامعة النھرین -كلیة العلوم إلىمقدمة
وھي جزء من متطلبات نیل درجة الماجستیر في الكیمیاء
من قبل
میسم أیاد حسین )النھرین(جامعة ۲۰۰۸ كیمیاء علوم بكالوریوس
شرافإتحت
د یحیى كمال البیاتي..مأ
ھ۱٤۳۷ حزیران ۲۰۱٦ م رمضان


