Embed Size (px)
Citation preview
In Silico Pharmacogenetics: Warfarin Metabolism
Yingying Guo1, Paul Weller2, Erin Farrell1, Paul Cheung2, Bill Fitch2, Douglas Clark2, Shao-yong Wu3, Jianmei Wang1, Guochun Liao1, Zhaomei Zhang1, John Allard1, Janet Cheng1,Anh Nguyen1, Sharon Jiang1, Steve Shafer4, Jonathan Usuka1, MohammadMasjedizadeh3, and Gary Peltz11 Departments of Genetics and Genomics,
2 Drug Metabolism and Pharmacokinetics,
3 Chemical Services, Roche Palo Alto, Palo Alto, CA 94304;
4 Stanford University Department of Anesthesiology, Palo Alto, CA 94305
AbstractA recently developed murine haplotype-based computational method was used to identify geneticfactors regulating the metabolism of warfarin, a commonly prescribed anticoagulant with a narrowtherapeutic index and a large variation in individual dosing. The amount of warfarin and 9 identifiedmetabolites in plasma was quantitated after dosing 13 inbred mouse strains. Strain-specificdifferences in drug metabolism through generation of 7-hydroxywarfarin metabolites werecomputationally correlated with genetic variation within a chromosomal region encoding cytochromeP450 2C enzymes. This computational prediction was experimentally confirmed by showing that therate limiting step in biotransformation of warfarin to its 7-hydroxylated metabolite was inhibited bya Cyp2c isoform specific substrate (tolbutamide) and was mediated by expressed recombinantCyp2c29. Genetic variants responsible for inter-individual pharmacokinetic differences for clinicallyimportant drugs can be identified by computational genetic analysis in mice.
AbbreviationsHPLC: high pressure liquid chromatography; LC: liquid chromatography; MS: mass spectrometry;Cyp2c29: cytochrome P450 2c29; PK: pharmacokinetics; IS: internal standard; NMR: nuclearmagnetic resonance; IP: intraperitoneal; QC: quality control; MRM: multiple reaction monitoring;AUC 0-8: area under concentration-time curve within the first 8 h; SNPs: single nucleotidepolymorphisms
INTRODUCTIONIt is widely anticipated that pharmacogenomic information will have a large impact on drugdevelopment, and subsequently on clinical practice. Using pharmacogenomic information canincrease efficacy, reduce side effects, and improve treatment outcome for patients 1. However,a major barrier to increased use of pharmacogenomics in clinical practice is our limitedknowledge about the genetic variables that regulate the mechanism of action or disposition ofmost commonly prescribed medications. It is essential that efficient strategies are developedand utilized to identify genetic factors affecting the metabolism or response to current andfuture therapies.
Correspondence to: Gary Peltz, M.D., Ph.D. Email:[email protected], Roche Palo Alto S3-1, 3431 Hillview Ave, Palo Alto, CA94304.Note: Supplementary information is available on the Nature Biotechnology website.
NIH Public AccessAuthor ManuscriptNat Biotechnol. Author manuscript; available in PMC 2006 July 1.
Published in final edited form as:Nat Biotechnol. 2006 May ; 24(5): 531–536.
NIH
-PA Author Manuscript
NIH
-PA Author Manuscript
NIH
-PA Author Manuscript
Because of this need, we wanted to determine if a recently described murine haplotype-basedcomputational genetic analysis method 2–5 in mice could be utilized to quickly identify factorsaffecting the metabolism of commonly prescribed medications. This method computationallypredicts causal genetic factors by identifying genomic regions where the pattern of geneticvariation correlates with the distribution of trait values among the inbred strains analyzed 2–4. Clearly, pharmacogenomic information can have its largest impact on clinical decisionmaking when applied to commonly prescribed drugs that have a large variation in dose or anarrow therapeutic index in the treated population 6. Therefore, we chose warfarin metabolismin mice as an initial model system for assessing the utility of this computationalpharmacogenetic approach. Warfarin is a commonly prescribed anticoagulant that has a verynarrow therapeutic index, and is a leading cause of iatrogenic complications. It inhibits a γ-carboxylation reaction required for the synthesis of several blood clotting factors 7–9. The dosecan vary by as much as 120-fold among individuals in the treated population 10,11. Warfarinis a racemic mixture of R- and S-enantiomers. The R-warfarin enantiomer has a more complexpattern of metabolism than S-warfarin 12. Warfarin is differentially metabolized by a varietyof cytochrome P450 enzymes into different hydroxylated metabolites 12, which then undergophase II enzyme biotransformation to glucuronidated or sulfated metabolites prior to excretion13. Genetic variation within CYP2C9 and VKOR1 affect the rate of warfarin metabolism oralter the required dose, respectively, in treated patients 14,15.
The complexity of the drug metabolism process could preclude the use of a computationalgenetic method that is dependent upon a single genetic change having a large impact on thephenotypic trait. Simulations have shown that an individual genetic factor must be responsiblefor at least 40% of the phenotypic variation for it to be identified by this computational methodwhen 13–15 inbred strains are analyzed 2,3. In contrast, warfarin metabolism is a very complexprocess. Its biotransformation to over 9 different metabolites in rats and humans is mediatedby many different enzymes 12,16. Each individual genetic difference could be responsible foronly a small portion of the inter-strain differences in warfarin pharmacokinetics. Therefore,we developed an experimental strategy that reduced the complexity of this metabolic process.To do this, the rate of clearance of R-warfarin and each of 9 different metabolites producedafter administration of 14C-labeled R-warfarin to 13 inbred strains was characterized in detail.Computational analysis of this data enabled the identification and experimentalcharacterization of a genetic difference that regulated a rate limiting step in R-warfarinmetabolism. This demonstrates that a complex process involving multiple different pathwaysaffecting the disposition of a drug can be experimentally dissected in a model experimentalorganism, which enables haplotype-based computational genetic analysis to rapidly identifygenetic factors.
RESULTSAnalysis of R-warfarin metabolites in inbred mouse strains
Following the administration of a 10 mg/kg 14C-labeled R-warfarin, the total amount of radio-labeled drug in plasma peaked at 1 hour, and then declined with time in each strain (Figure 1).The peak plasma concentration varied by 3-fold among the inbred strains, indicating that theinbred strains metabolized R-warfarin at different rates. Because of the complexity of thisprocess, genetic factors responsible for inter-strain differences in the overall rate of R-warfarinclearance shown in Figure 1 could not be identified by haplotype-based computational geneticanalysis. To identify a causative genetic factor, the complexity of this metabolic process hadto be reduced, so that individual steps in R-warfarin metabolism could be analyzed. Therefore,the concentration of R-warfarin and 9 identified metabolites in plasma samples obtained fromeach inbred strain was quantitatively determined using HPLC-radioflow analysis. Theseincluded the 4′-, 6-, 7-, 8-, and 10-hydroxylated metabolites of warfarin (4′-, 6-, 7-, 8- and 10-
Guo et al. Page 2
Nat Biotechnol. Author manuscript; available in PMC 2006 July 1.
NIH
-PA Author Manuscript
NIH
-PA Author Manuscript
NIH
-PA Author Manuscript
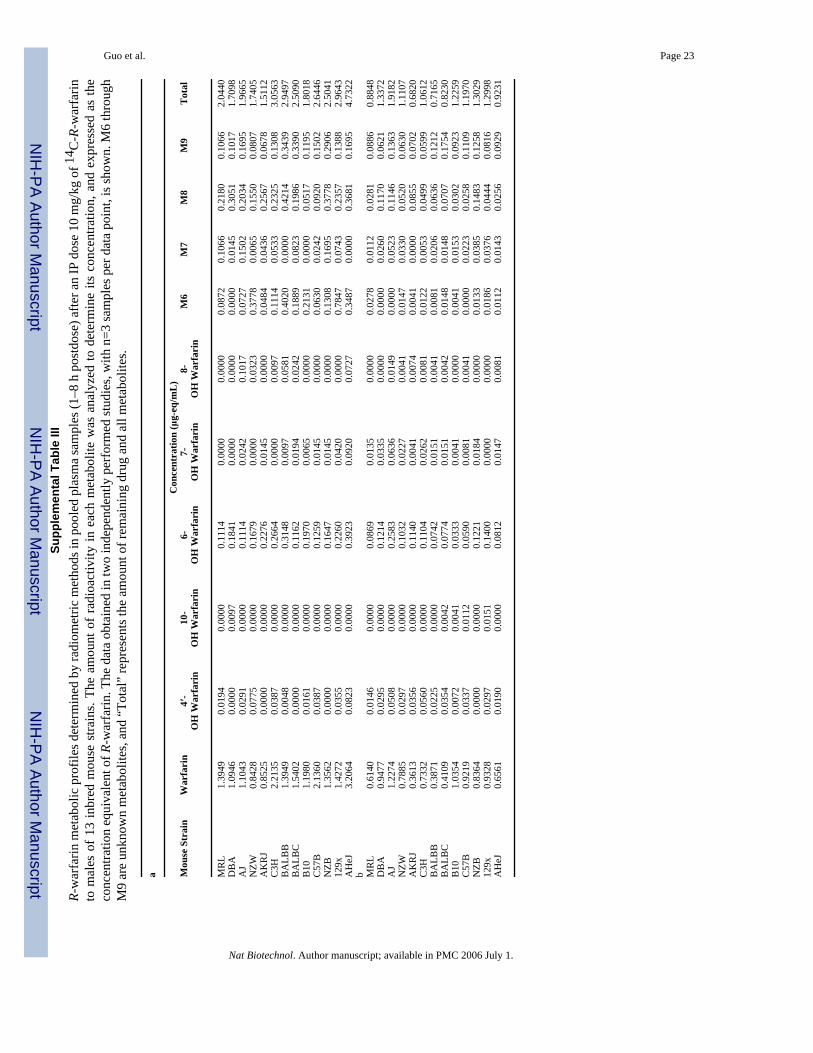
OH), and four with unknown identities that were labeled as M6 through M9 (see representativechromatograms in Figure 2). The inbred strains had very distinct profiles of warfarin and the9 metabolites in their plasma. This strain-specific pattern of metabolite production wasreproducibly observed in 3 independently performed experiments (Supplemental Tables IIIa,IIIb and IV), confirming that R-warfarin was differentially metabolized in a strain-specificmanner.
M8 was a major metabolite that accounted for 3–15% of the total amount of drug-relatedradioactivity present in the plasma of the 13 strains (Supplemental Tables IIIa and IIIb).Enzymatic digestion studies (Supplemental Figure 1) and subsequent structuralcharacterization by mass spectrometry (data not shown) confirmed that M8 is a glucuronidatedmetabolite of 7-hydroxywarfarin. This result is consistent with the fact that glucuronidation isa major pathway for converting hydroxylated warfarin to more water-soluble metabolites 13,16. The amount of 7-hydroxywarfarin (7-OH) and its glucuronidated metabolite (M8) weresummed in all subsequent analyses, because these two metabolites have a substrate-productrelationship that forms a distinct drug elimination pathway. This (%M8 + 7-OH) representsthe combined amount of the two metabolites and is expressed as a percentage of drug-relatedradioactivity in plasma (Figure 3A). Among the 9 metabolites in plasma, the 13 inbred strainshad the greatest statistical difference in the combined amount of these two metabolites(p<0.01); and two closely related inbred strains (C57B/6J and B.10.D2-H2/oSnJ) produced thelowest amount of this material (Supplemental Table IIIa and IIIb). The differential pattern ofM8+7-OH generation across strains was consistently observed throughout the first 8 hoursafter dosing (Supplemental Figure 3). Moreover, the amount of M8 and 7-OH in plasmadecayed at the same rate as warfarin within 8 hr after dosing (Supplemental Figure 2), indicatingthe rate limiting step for elimination of these metabolites is their rate of formation 17. Takentogether, formation of glucuronidated 7-hydroxywarfarin (M8) is a major pathway for R-warfarin disposition among these inbred strains. Since there are strain-specific differences inutilization of this elimination pathway, it was selected for computational genetic analysis.
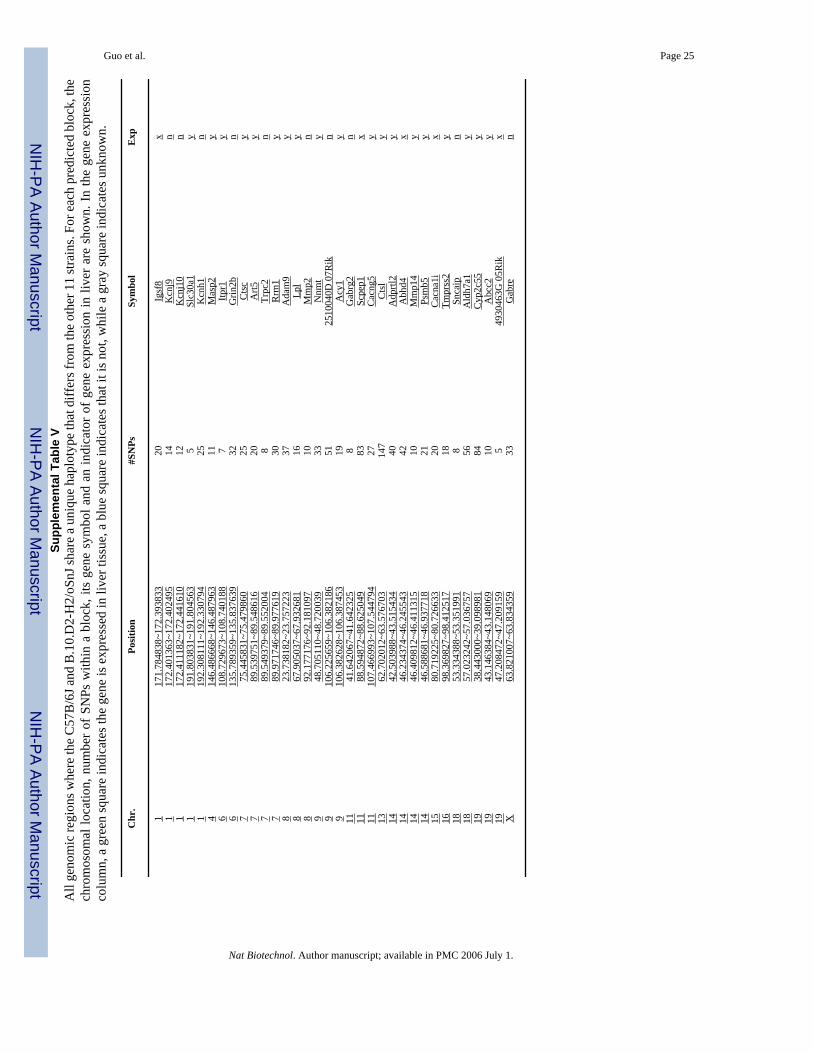
Computational genetic identification of Cyp2c enzymesHaplotype-based computational genetic analysis 2–5 was used to identify genetic factorscontributing to the strain-specific differences in warfarin metabolism. It identified 34 genomicregions where the two closely related strains (C57B/6J and B.10.D2-H2/oSnJ) with the lowestrate of production of 7-hydroxywarfarin metabolites shared a unique haplotype that was distinctfrom the other 11 strains (Supplemental Table V). Since these haplotype blocks had thestrongest correlation with the pharmacokinetic data, genes within any of these regions couldpotentially be responsible for differential warfarin metabolism among the inbred strains.However, the list was quickly narrowed by determining which of these blocks contained genesthat were expressed in liver. Analysis of gene expression data indicated that only 19 of thesehaplotype blocks encoded genes that were expressed in the liver. Furthermore, a 0.52 Mb region(38.44 to 39.10 Mb) on chromosome 19 that encodes several Cyp2c P450 enzymes was ofparticular interest (Figure 3B). It was the only region that encoded a phase I biotransformationenzyme, and polymorphisms in human CYP2C9 affect the rate of warfarin metabolism intreated patients 12. This computationally identified region encodes 3 murine cytochrome P450enzymes: Cyp2c55, Cyp2c29 and Cyp2c39. There were two distinct haplotypes within thisblock, the C57BL/6 and B10.D2 strains shared a haplotype that differed from the other 11strains (Figure 4A). This pattern of genetic variation had a very high degree of correlation withthe pattern of metabolite generation (p=0.0007), since there was no overlap between the twogenetically and phenotypically distinct strain groupings. Among the 93 SNPs located withinthis computationally identified haplotype block, 9 SNPs are in coding regions, but only oneencodes an amino acid change (Val113Ile) in Cyp2c39 (http://mousesnp.roche.com). Of note,there was a distinct haplotype block in an immediately adjacent region on chromosome 19
Guo et al. Page 3
Nat Biotechnol. Author manuscript; available in PMC 2006 July 1.
NIH
-PA Author Manuscript
NIH
-PA Author Manuscript
NIH
-PA Author Manuscript
(39.54 Mb to 39.66 Mb) that encodes two other cytochrome P450 enzymes: Cyp2c37 andCyp2c50. However, the C57BL/6, B10.D2, DBA/2J and C3H strains all share the minorhaplotype in this block, making it unlikely that Cyp2c37 and Cyp2c50 are responsible for theobserved difference in metabolite production. In summary, the computational genetic analysissuggested that genetic variation within Cyp2c55, Cyp2c29 and/or Cyp2c39 may be responsiblefor the strain-specific differences in the rate of 7-hydroxywarfarin metabolite production.
Cyp2c29 mediates warfarin biotransformationExperimental testing was required to assess this computational prediction and to determinewhich cytochrome P450 enzyme(s) played a role in R-warfarin biotransformation. As an initialtest, the role of murine Cyp2c enzymes in R-warfarin metabolism was investigated using anin vitro system. After incubation with R-warfarin, mouse liver microsomes biotransformed R-warfarin into several hydroxylated metabolites in a concentration-dependent manner. Ofimportance, 7-hydroxywarfarin was a major metabolite produced by the microsomal enzymes(Figure 5A). Tolbutamide, a specific inhibitor of Cyp2c enzyme activity 18, inhibited theformation of 7-hydroxywarfarin in a concentration-dependent manner (Figure 5B). These invitro results indicate that biotransformation to 7-hydroxylated metabolites is an importantpathway for R-warfarin metabolism in liver, and confirm the computational prediction that aCyp2c enzyme is a critical part of this elimination pathway.
To determine which Cyp 2C enzyme(s) was responsible for the strain-specific difference inR-warfarin biotranformation, the pattern of gene expression in liver tissue obtained from 13inbred strains was analyzed. Cyp2C55 and Cyp2c39 were eliminated as candidate genesbecause they were not expressed in liver tissue from any inbred strain analyzed (Figure 4B).In contrast, Cyp2c29 was the most abundantly expressed Cyp 2c mRNA in liver tissue.Although there were strain-specific differences in Cyp2c29 mRNA expression, it varied amongstrains sharing the common haplotype, and could not explain the observed difference in 7-hydroxywarfarin metabolite production among the inbred strains (Figure 4B). However,quantitative immunoblot analysis of Cyp2c29 protein in liver tissue obtained from a set ofinbred strains indicated that there was a much better correlation between the amount of thisprotein and the haplotype of the inbred strain. The amount of Cyp2c29 protein in liver obtainedfrom 5 strains (AKR/J, MRL/MpJ, Balb/cJ, Balb/cbyJ, and 129x1/svJ) sharing the commonhaplotype was 2 to 7.4 fold higher than in the two (C57BL/6 and B10.D2) strains with a uniquehaplotype and a low rate of 7-hydroxywarfarin metabolite generation (Figure 6).
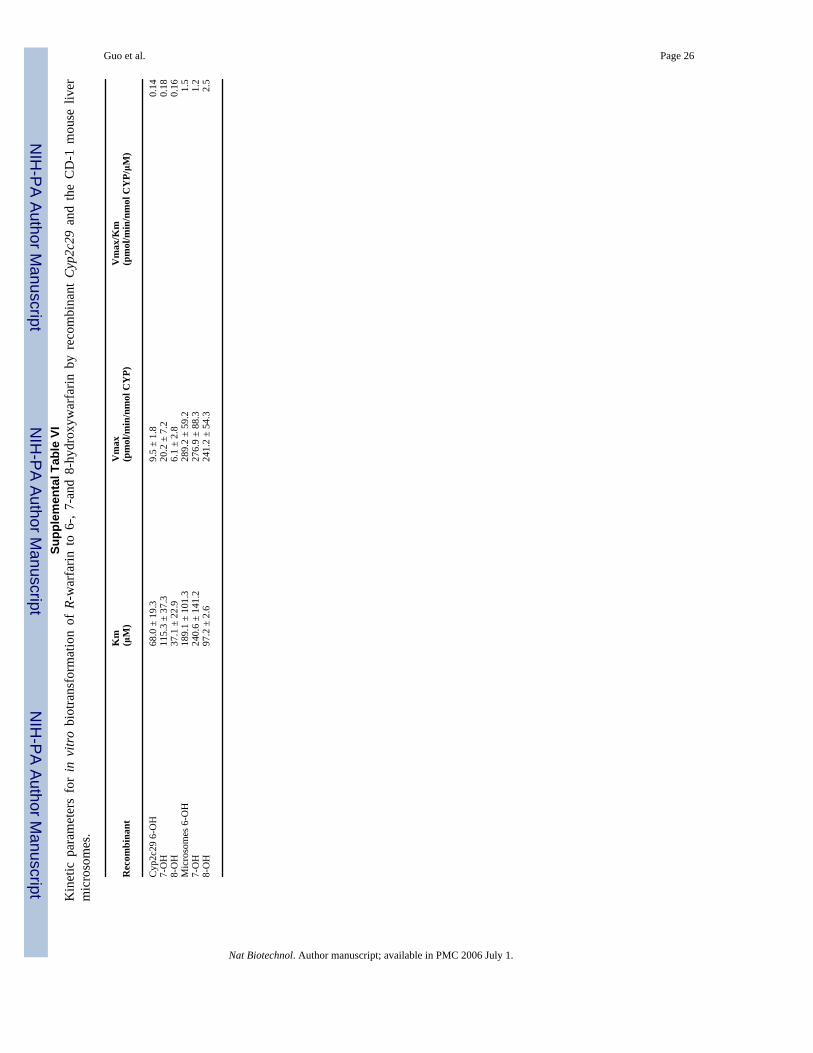
To determine which enzyme mediated R-warfarin biotransformation to its 7-hydoxylatedmetabolite, recombinant Cyp2c enzymes within the computationally predicted block(Cyp2c29 and Cyp2c39) and a Cyp2c enzyme (Cyp2c37) adjacent to this block were prepared.For each of these Cyp2C enzymes, allelic forms from a strain with a high (Balb/cbyJ) and alow (B10.D2) rate of generation of 7-hydroxywarfarin metabolites were expressed. The rateat which these recombinant enzymes converted R-warfarin to hydroxylated metabolites invitro was then measured. Expressed recombinant murine Cyp2c29 converted R-warfarin to 6-,7- or 8-hydroxywarfarin, but could not generate 4- or 10-hydroxywarfarin. However, the rateof formation of 7-hydroxywarfarin was higher than that of the 6- or 8-hydroxywarfarinmetabolites (Supplemental Table VI). In contrast, neither allelic form of Cyp2c39 norCyp2c37 generated measurable amounts of 7-hydroxywarfarin under the same in vitroconditions (Figure 5C). In addition, the measured Km for 7-hydroxywarfarin formation in livermicrosomes was comparable to that of recombinant Cyp2c29, which further supports a rolefor Cyp2c29 in R-warfarin metabolism in liver (Supplemental Table VI) 19. These resultsconfirm the computational prediction and indicate that genetic variation within Cyp2c29 isresponsible for the strain-specific differences in the rate of production of 7-hydroxywarfarin.The amino acid sequence of Cyp2c29 is not altered by polymorphisms among the inbred strains.
Guo et al. Page 4
Nat Biotechnol. Author manuscript; available in PMC 2006 July 1.
NIH
-PA Author Manuscript
NIH
-PA Author Manuscript
NIH
-PA Author Manuscript
However, the 63 SNPs within Cyp2c29 do produce a significant strain-specific difference inCyp2c29 protein expression. Taken together, strain-specific differences in R-warfarinelimination via formation of 7-hydroxywarfarin metabolites result from differences in theamount of Cyp2c29 protein.
DISCUSSIONThis is the first detailed functional and genetic characterization of the metabolism of acommonly prescribed medication using multiple inbred mouse strains. The rate of clearanceof R-warfarin and 9 different metabolites in 13 inbred strains was characterized, and thenanalyzed using a haplotype-based computational genetic analysis method. Cyp2c29 wascomputationally identified as a candidate gene, and experimentally shown to contribute tostrain-specific differences in R-warfarin metabolism. Although other genetic variables alsocontribute to the inter-strain differences in R-warfarin pharmacokinetics, Cyp2c29 wascomputationally identified because it is the rate-limiting enzyme within a major pathway forelimination of this drug. There is limited information available about R-warfarin metabolismin mice, but a role for murine Cyp2c29 in R-warfarin metabolism is consistent with availableinformation. Murine Cyp2c29 is known to metabolize endogenous compounds such asarachidonic acid 20 and scoparone 21, as well as other drugs. We now find that R-warfarin isan additional substrate for this enzyme. Warfarin metabolism in humans is catalyzed by avariety of cytochrome P450 enzymes, and polymorphisms in CYP2C9 alter the rate of warfarinmetabolism in the human population 12,14. Cyp2c29 is a murine homologue of humanCYP2C9, and it may utilize similar mechanisms for biotransformation of warfarin.
Of broader significance, this study demonstrates how genetic changes in a rate-limitingcomponent of a metabolic pathway can be successfully identified using murine haplotype-based computational genetic analysis. This required experimental dissection of a very complex,multi-component drug disposition process into its component parts. Warfarin metabolism is acomplex process in which at least nine different intermediate metabolites were produced.Several different enzymes may be involved in the production of each metabolite, and geneticvariation within each of these enzymes can contribute to the strain-specific differences in R-warfarin metabolism. An individual genetic change must be responsible for at least 40% of thephenotypic variation for it to be identified by this computational method using data obtainedfrom 13 to 15 inbred strains 3. It is therefore not surprising that this computational methodcould not analyze the overall rate of R-warfarin disappearance across the inbred strains. Toreduce the complexity, the rate of production of each individual metabolite was carefullyquantitated. The rate of production of an individual metabolite is regulated by a much morelimited set of genetic variables. Because of the reduced genetic complexity, the haplotype-based computational method could successfully analyze the strain-specific pattern of R-warfarin elimination through a single metabolic pathway. It is likely that a thorough analysisof the rate of formation of intermediate metabolites will also be required to uncover the geneticfactors responsible for differences in the pharmacokinetic response to other drugs.
In addition to identifying a genetic variant regulating a major pathway for R-warfarinelimination, several other findings in this study are of general significance. First, there wassubstantial variation in the pattern of intermediate metabolites of R-warfarin generated by thepanel of inbred strains analyzed. The pattern of metabolism of other commonly used drugsmay also vary among inbred strains, which may enable genetic factors regulating theirdisposition to be identified using this approach. Secondly, it is likely that this experimentalapproach can also be used to uncover the mechanism of drug-induced toxicity. Drug-inducedtoxicity is often caused by intermediate metabolites, rather than by the parent drug itself.Correlation of the strain-specific pattern of drug-induced toxicity with the production of certain
Guo et al. Page 5
Nat Biotechnol. Author manuscript; available in PMC 2006 July 1.
NIH
-PA Author Manuscript
NIH
-PA Author Manuscript
NIH
-PA Author Manuscript
metabolites, as well as with a pattern of genetic variation within a gene can be used to identifya genetic susceptibility factor for a toxic response.
It is also important to emphasize that this murine experimental approach and genetic analysistool may not always generate results that directly translate to human drug metabolism. Forexample, R- and S-warfarin are metabolized by different cytochrome P450 enzymes in differentspecies. CYP1A2 and CYP3A4 are the major contributors to R-warfarin metabolism in humans12, which differs from our findings in mice. Despite these differences, this computationalmouse genetic approach can quickly identify polymorphisms in drug metabolizing enzymesthat contribute to differential drug responses among a panel of inbred mouse strains. The drugmetabolizing enzymes identified in mouse provide important information that indicates whichgenes are likely to play an important role in the human population. We believe that this firstexample illustrates how murine haplotype-based computational genetic analysis can be usedfor pharmacogenetic analysis; and hope that it will be used to analyze many other commonlyused medications.
MATERIALS AND METHODSChemicals, reagents and equipment
R-Warfarin, the 4′-, 6-, 7-, 8-, and 10-hydroxylated metabolites of R-Warfarin, and deuterium-labeled 7-hydroxywarfarin (>98% chemical purity) as the internal standard (IS) for the LC/MS/MS analysis were purchased from Ultrafine Chemicals (Manchester, UK). 14C-R-warfarinused to dose mice and 4-glucuronide 7-hydroxywarfarin used as the standard for quantitationof M8 were synthesized in the Chemical Services (Roche Palo Alto, Palo Alto, CA).Tolbutamide was obtained from Alta Aesar (Ward Hill, MA). Methanol and acetonitrile werepurchased from Burdick & Jackson (Muskegon, MI) and formic acid was from Sigma-Aldrich(St. Louis, USA). All solvents used for HPLC and LC/MS/MS were of chromatographic grade.Liquid scintillation counting of plasma samples was carried out on a Beckman LS-6500 multi-purpose scintillation counter (Beckman Coulter, Fullerton, CA).
Drug dosing and plasma harvesting from inbred strains7–8 week old males of inbred mouse strains were obtained from Jackson Laboratory (BarHarbor, ME) and acclimatized for an additional week in the Laboratory Animal Technology(Roche Palo Alto, Palo Alto, CA). Mice were housed under pathogen-free environment andprovided food and water ad libitum with a 12 h:12 h light: dark cycle. The 13 different inbredmouse strains used were Balb/cJ, DBA/2J, A/J, AKR/J, A/HeJ, 129x1/svJ, Balb/cbyJ, B.10.D2-H2/oSnJ, C57B/6J, NZW/LaCJ, NZB/BinJ, MRL/MpJ, C3H/HeJ. All mice were administereda single 10 mg/kg of 14C-R-warfarin (specific activity: 18.6 μCi/mg) suspended in PBS (pH7.4) via intraperitoneal (IP) route. For each strain, blood samples were collected from 3 miceat the 1, 2, 3, 6 and 8 h, and 5 mice at the 24 h time point following treatment to obtain individualplasma samples. Pooled urine samples from the 5 mice within each strain were collected for24 hours. Animal studies have been replicated once. All animal experiments were implementedunder the protocols approved by our Institutional Animal Care and Use Committee.
HPLC-radiometric analysisAll samples were extracted using an acetonitrile/methanol (4:1 v/v) mixture to precipitateproteins prior to bioanalyses 22. HPLC-radioflow analysis utilized a HP1100 HPLC system(Hewlett Packard Corp., Waldbronn, Germany) with an online Radiomatic Series 500TR(Packard Instruments Co.) equipped with a 0.1-ml flow cell, and a Shimadzu UV detector setat 310 nm. Empower Pro Software Build 1154 (Waters, Milford, MA) was applied to controlthe instrument operation as well as the data acquisition and analysis. R-warfarin and itsmetabolites were separated on a Thermo® BDS Hypersil-C18 (250 x 4.6 mm, 5 μm) with
Guo et al. Page 6
Nat Biotechnol. Author manuscript; available in PMC 2006 July 1.
NIH
-PA Author Manuscript
NIH
-PA Author Manuscript
NIH
-PA Author Manuscript
HPLC guard column (Thermo Electron Corporation, Bellefonte, PA) at a flow rate of 0.5 ml/min. The mobile phases were 5 mM ammonium formate in 0.1 % formic acid (A), and 0.1%formic acid in methanol (B). The gradient of B was as follows: 60% (0–22 min), 65% (23–30min), 90% (45– 46 min), and 60% (47–60 min). The radioflow detector sampled every 6 secwith a 3:1 mixing ratio of scintillation fluid (Beta-Blend, ICN) and HPLC effluent.
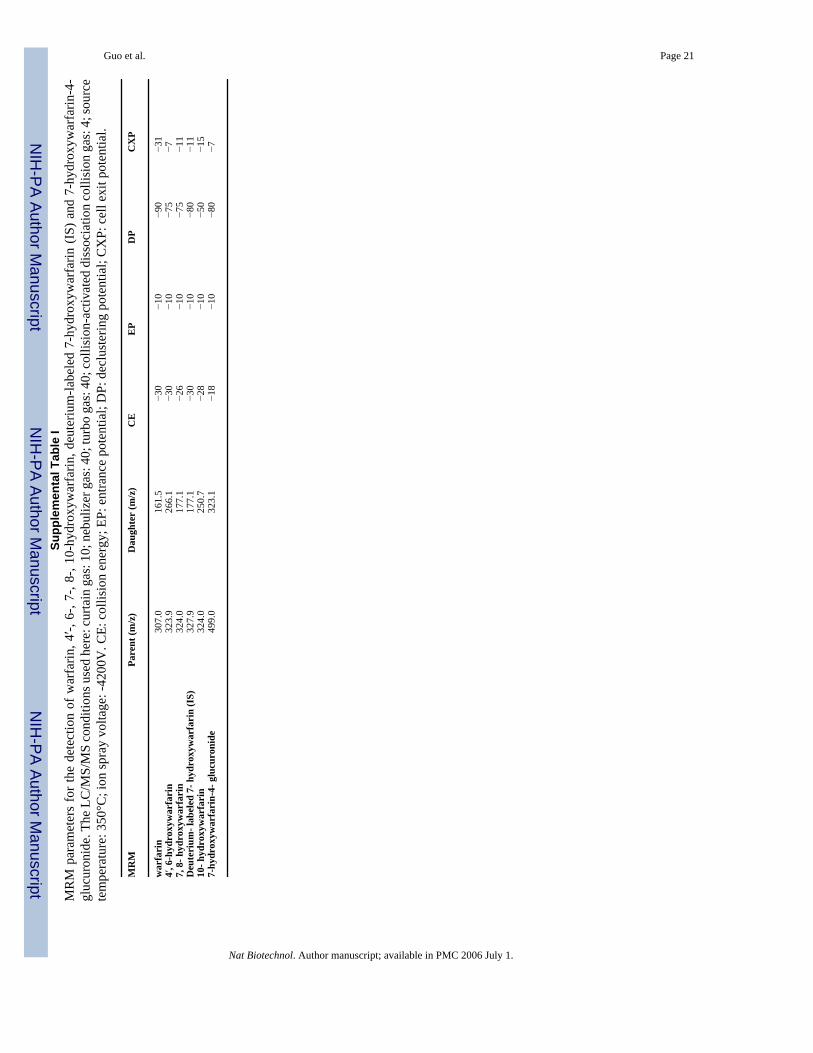
LC/MS/MS analysisThe LC/MS/MS system was equipped with Analyst software (Applied Biosystems) for dataacquisition and calibration, and consisted of a Shimadzu LC system, a vacuum degasser, anautoinjector, and a Sciex API 4000 triple quadrupole mass spectrometer (MS/MS) (AppliedBiosystems, Foster City, CA). Chromatographic separation was achieved on a reversed-phaseLuna C18 (100 × 2.0 mm, 3 μm) (Phenomenex, Torrance, USA) as described previously 23.The MS was operated under negative ionization in the multiple reaction monitoring (MRM)mode for quantitative analysis and synchronized with the HPLC. The parameters of MRM arelisted in the Supplemental Table I. Calibration curves were developed by spiking blank plasmawith appropriate amounts of R-warfarin and its metabolites using eight different concentrationsin the range of 5–3000 ng/ml (R-warfarin) and 5–2000 ng/ml (metabolites), respectively. Thepeak area ratio of R-warfarin or metabolites over that of IS was quantitated, and correlationcoefficients were calculated by least-square regression analysis.
Metabolite identificationWarfarin conjugates were hydrolyzed by incubation of plasma or urine samples with β–glucuronidase (Sigma, St. Louis, USA) according to a modified method 16,24. Then the HPLC-radioflow profiles of samples before and after enzymatic treatments were compared to identifypeak intensity shifts. The identity of conjugates was verified by mass spectrometry with ascanned mass range of 200–800 amu as described before 25 using the chromatographicseparation method described in the previous HPLC-radioflow analysis.
Computational genetic mappingThe computational genetic analysis of the inbred strain data was performed as previouslydescribed 2–5. In brief, allelic data from multiple inbred strains was analyzed and a haplotypeblock map of the mouse genome was constructed 4,5. SNPs were organized into haplotypeblocks; and only a limited number of haplotypes-typically 2, 3 or 4-are present within ahaplotype block. The haplotype-based computational analysis identifies haplotype blocks inwhich the haplotypic strain grouping within the block correlates with the distribution ofphenotypic data among the inbred strains analyzed. To do this, a p-value that assesses thelikelihood that genetic variation within each block could underlie the observed distribution ofphenotypes among the inbred strains is calculated 2,4. The haplotype blocks are then rankedbased upon the calculated p-value. The genomic regions within haplotype blocks that stronglycorrelated with the phenotypic data are then analyzed. When this computational analysis wasperformed, the haplotype map had 5,454 haplotype blocks generated from 193,914 SNPscharacterized across 19 inbred strains covering 2,363 genes. Polymorphisms within 40 Cyp450enzymes and 110 transporter (Abc or Slc) or transferase genes were included in the Roche SNPdatabase. The p-values for the numerical phenotype evaluated in this experiment werecalculated as described using ANOVA (Analysis of Variance) 2–4. Since ANOVA-basedcomputational analysis requires homogeneity of variance, the measured amount of %M8+7-OH for each strain was normalized by logarithmic transformation before the computationalanalysis was performed.
Guo et al. Page 7
Nat Biotechnol. Author manuscript; available in PMC 2006 July 1.
NIH
-PA Author Manuscript
NIH
-PA Author Manuscript
NIH
-PA Author Manuscript
cDNA cloning strategy and baculovirus expressioncDNAs for mouse Cyp2c29, Cyp2c39 and Cyp2c37 from Balb/cbyJ and B.10.D2-H2/oSnJwere generated by RT-PCR using primers described in Supplemental Table II, and cloned intopVL1392 Univ ccdB. Recombinant baculovirus was produced using Rapid SuspensionTransfection methods, and the infection time was 72 h. Lysates of Sf9 cells expressingrecombinant cDNAs were prepared, and protein concentration and total CYP contentmeasurements were performed as described 26,27.
In vitro metabolic assaysIn vitro R-warfarin biotransformation using CD-1 mouse liver microsomes incubated for 30minutes were performed as previously described 28. In vitro CYP inhibition assays used 0.01–1 mM tolbutamide and 0.15 mM R-warfarin. Samples were processed for LC/MS/MS analysisas described above. CYP biotransformation assays were reconstituted by mixing cell lysate ofindividual cDNA-expressed Sf9 cells (20 mg/ml protein) and human NADPH-P450oxidoreductase (BD Gentest, Bedford, MA) at 1:8 molar ratio 29 for 30 min in the presenceof 0.02–0.5 mM R-warfarin before LC/MS/MS analysis.
Gene expression analysis and ImmunoblotingTotal liver RNA was prepared as previously described 4. Cyp450 2c mRNA was analyzed byTaqman as described by the manufacturer (Applied Biosystems, Foster City, CA) using primersspecified in Supplemental Table II. Cyp2c29 protein in liver S9 fractions was fractionated onNuPage 4–12% Bis-tris gels and determined by immunoblotting 30. A polyclonal anti-murineCyp2c29 IgY antibody was raised with a peptide covering amino acids 99–112(SFPMAEKMIKGFGV) by GenWay (San Diego, CA).
Supplemental MaterialAnalysis of R-warfarin metabolites in inbred mouse strains
A single intraperitoneal (IP) injection of a 10 mg/kg dose of 14C-labeled R-Warfarin wasadministered to male mice of 13 inbred strains; and plasma samples were collected 1, 2, 3, 6,8, and 24 hours after dosing. Moreover, the strain-specific pattern of R-warfarin metabolismin plasma was independently confirmed through analysis of a second set of drug-treated malesof 13 inbred mouse strains (Supplemental Table IIIb and IV). In these two independentlyperformed studies, the most abundant metabolites in plasma were 6-hydroxywarfarin, M6, M8and M9. These metabolites accounted for 5–6%, 0–14% and 5–17%, respectively, of the totalamount of drug-related radioactivity present in the plasma of the 13 strains (SupplementalFigure IIIa and IIIb).
Acknowledgements
Y.G. was supported by a grant (1 R01 GM068885-01A1) from the NIGMS awarded to G.P. We would like to thankDavid Shaw, Ezra Tai, Witold Woroniecki, Lisa Lohr, Will Tao, Grace Lam and Larry Bowen for help with thismanuscript.
References1. Evans WE, Relling MV. Pharmacogenomics: translating functional genomics into rational
therapeutics. Science 1999;286:487–91. [PubMed: 10521338]2. Wang, J., Peltz, G. Haplotype-Based Computational Genetic Analysis in Mice. In Computational
Genetics and Genomics: New Tools for Understanding Disease (ed. Peltz, G.) 51–70 (Humana PressInc, Totowa, NJ, 2005).
3. Wang J, Liao G, Usuka J, Peltz G. Computational genetics: from mouse to human? Trends Genet2005;21:526–32. [PubMed: 16009447]
Guo et al. Page 8
Nat Biotechnol. Author manuscript; available in PMC 2006 July 1.
NIH
-PA Author Manuscript
NIH
-PA Author Manuscript
NIH
-PA Author Manuscript
4. Liao G, et al. In silico genetics: identification of a functional element regulating H2-Ealpha geneexpression. Science 2004;306:690–5. [PubMed: 15499019]
5. Wang, J., et al.,. Haplotypic structure of the mouse genome. In Computational Genetics and Genomics:New Tools for Disease Biology (ed. Peltz, G.) 71–83 (Humana Press Inc, Totowa, NJ, 2005).
6. Phillips KA, Veenstra DL, Oren E, Lee JK, Sadee W. Potential role of pharmacogenomics in reducingadverse drug reactions: a systematic review. Jama 2001;286:2270–9. [PubMed: 11710893]
7. Suttie JW. The biochemical basis of warfarin therapy. Adv Exp Med Biol 1987;214:3–16. [PubMed:3310547]
8. Nelsestuen GL, Zytkovicz TH, Howard JB. The mode of action of vitamin K. Identification of gamma-carboxyglutamic acid as a component of prothrombin. J Biol Chem 1974;249:6347–50. [PubMed:4214105]
9. Stenflo J, Fernlund P, Egan W, Roepstorff P. Vitamin K dependent modifications of glutamic acidresidues in prothrombin. Proc Natl Acad Sci U S A 1974;71:2730–3. [PubMed: 4528109]
10. James AH, Britt RP, Raskino CL, Thompson SG. Factors affecting the maintenance dose of warfarin.J Clin Pathol 1992;45:704–6. [PubMed: 1401182]
11. Hallak HO, et al. High clearance of (S)-warfarin in a warfarin-resistant subject. Br J Clin Pharmacol1993;35:327–30. [PubMed: 8471414]
12. Kaminsky LS, Zhang ZY. Human P450 metabolism of warfarin. Pharmacol Ther 1997;73:67–74.[PubMed: 9014207]
13. Rettie AE, Wienkers LC, Gonzalez FJ, Trager WF, Korzekwa KR. Impaired (S)-warfarin metabolismcatalysed by the R144C allelic variant of CYP2C9. Pharmacogenetics 1994;4:39–42. [PubMed:8004131]
14. Daly AK, King BP. Pharmacogenetics of oral anticoagulants. Pharmacogenetics 2003;13:247–52.[PubMed: 12724615]
15. Rieder MJ, et al. Effect of VKORC1 haplotypes on transcriptional regulation and warfarin dose. NEngl J Med 2005;352:2285–93. [PubMed: 15930419]
16. Jansing RL, Chao ES, Kaminsky LS. Phase II metabolism of warfarin in primary culture of adult rathepatocytes. Mol Pharmacol 1992;41:209–15. [PubMed: 1732719]
17. Rowland, M. & Tozer, T.N. Clinical Pharmacokinetics: Concepts and Applications, (LippincottWilliams & Wilkins, 1995).
18. Riley RJ, Hemingway SA, Graham MA, Workman P. Initial characterization of the major mousecytochrome P450 enzymes involved in the reductive metabolism of the hypoxic cytotoxin 3-amino-1,2,4-benzotriazine-1,4-di-N-oxide (tirapazamine, SR 4233, WIN 59075). BiochemPharmacol 1993;45:1065–77. [PubMed: 8461036]
19. Crespi CL, Miller VP. The use of heterologously expressed drug metabolizing enzymes--state of theart and prospects for the future. Pharmacol Ther 1999;84:121–31. [PubMed: 10596902]
20. Luo G, Zeldin DC, Blaisdell JA, Hodgson E, Goldstein JA. Cloning and expression of murine CYP2Csand their ability to metabolize arachidonic acid. Arch Biochem Biophys 1998;357:45–57. [PubMed:9721182]
21. Meyer RP, Hagemeyer CE, Knoth R, Kurz G, Volk B. Oxidative hydrolysis of scoparone bycytochrome p450 CYP2C29 reveals a novel metabolite. Biochem Biophys Res Commun2001;285:32–9. [PubMed: 11437368]
22. Rossi, D.T. Sample Preparation and Handling for LC/MS in Drug Discovery. in Mass Spectrometryin Drug Discovery (ed. Rossi, D.T., Sinz, M.W.) 171–214 (Marcel Dekker, Inc., New York, 2002).
23. Ufer M, Kammerer B, Kirchheiner J, Rane A, Svensson JO. Determination of phenprocoumon,warfarin and their monohydroxylated metabolites in human plasma and urine by liquidchromatography-mass spectrometry after solid-phase extraction. J Chromatogr B Analyt TechnolBiomed Life Sci 2004;809:217–26.
24. Edelbroek PM, van Kempen GM, Hessing TJ, de Wolff FA. Analysis of phenprocoumon and itshydroxylated and conjugated metabolites in human urine by high-performance liquidchromatography after solid-phase extraction. J Chromatogr 1990;530:347–58. [PubMed: 2079509]
25. Fitch WL, et al. Identification of glutathione-derived metabolites from an IP receptor antagonist. DrugMetab Dispos 2004;32:1482–90. [PubMed: 15371298]
Guo et al. Page 9
Nat Biotechnol. Author manuscript; available in PMC 2006 July 1.
NIH
-PA Author Manuscript
NIH
-PA Author Manuscript
NIH
-PA Author Manuscript
26. Patten CJ, et al. Kinetic analysis of the activation of 4-(methylnitrosamino)-1-(3-pyridyl)-1-butanoneby heterologously expressed human P450 enzymes and the effect of P450-specific chemicalinhibitors on this activation in human liver microsomes. Arch Biochem Biophys 1996;333:127–38.[PubMed: 8806763]
27. Omura T, Sato R. The Carbon Monoxide-Binding Pigment of Liver Microsomes. I. Evidence for ItsHemoprotein Nature. J Biol Chem 1964;239:2370–8. [PubMed: 14209971]
28. Zhang ZY, King BM, Wong YN. Quantitative liquid chromatography/mass spectrometry/massspectrometry warfarin assay for in vitro cytochrome P450 studies. Anal Biochem 2001;298:40–9.[PubMed: 11673893]
29. Buters JT, Shou M, Hardwick JP, Korzekwa KR, Gonzalez FJ. cDNA-directed expression of humancytochrome P450 CYP1A1 using baculovirus. Purification, dependency on NADPH-P450oxidoreductase, and reconstitution of catalytic properties without purification. Drug Metab Dispos1995;23:696–701. [PubMed: 7587956]
30. Zhang Z, Fasco MJ, Huang Z, Guengerich FP, Kaminsky LS. Human cytochromes P4501A1 andP4501A2: R-warfarin metabolism as a probe. Drug Metab Dispos 1995;23:1339–46. [PubMed:8689941]
Guo et al. Page 10
Nat Biotechnol. Author manuscript; available in PMC 2006 July 1.
NIH
-PA Author Manuscript
NIH
-PA Author Manuscript
NIH
-PA Author Manuscript
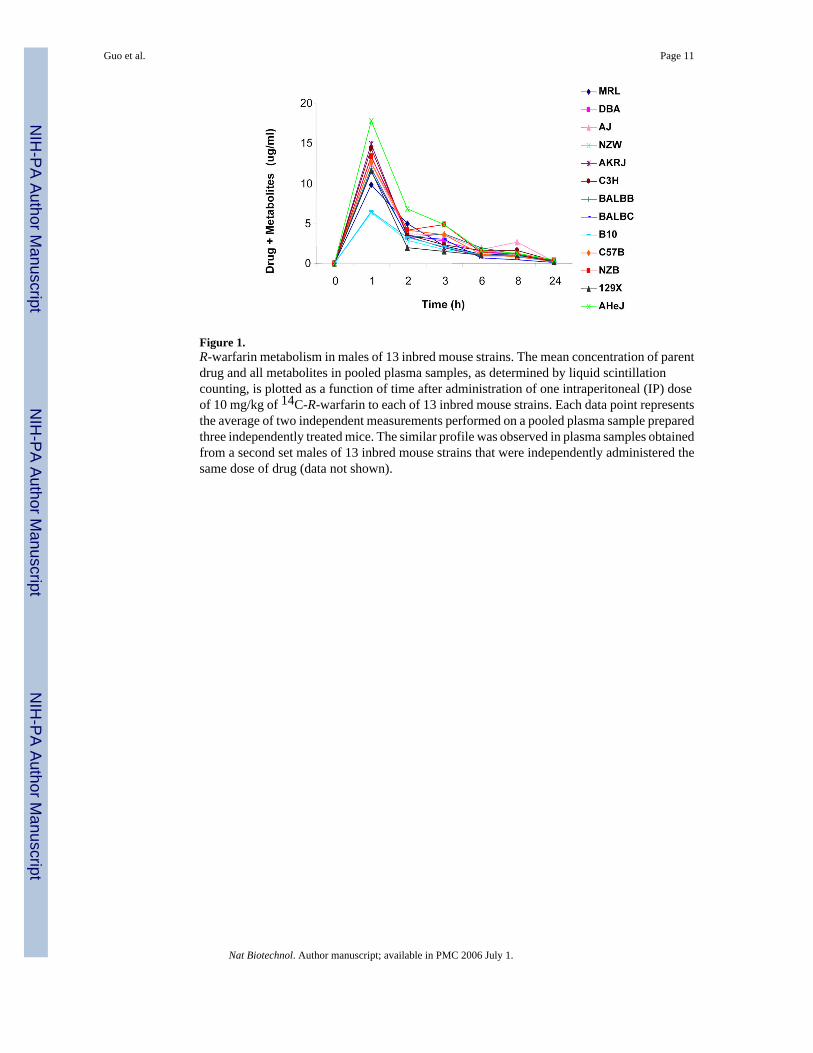
Figure 1.R-warfarin metabolism in males of 13 inbred mouse strains. The mean concentration of parentdrug and all metabolites in pooled plasma samples, as determined by liquid scintillationcounting, is plotted as a function of time after administration of one intraperitoneal (IP) doseof 10 mg/kg of 14C-R-warfarin to each of 13 inbred mouse strains. Each data point representsthe average of two independent measurements performed on a pooled plasma sample preparedthree independently treated mice. The similar profile was observed in plasma samples obtainedfrom a second set males of 13 inbred mouse strains that were independently administered thesame dose of drug (data not shown).
Guo et al. Page 11
Nat Biotechnol. Author manuscript; available in PMC 2006 July 1.
NIH
-PA Author Manuscript
NIH
-PA Author Manuscript
NIH
-PA Author Manuscript
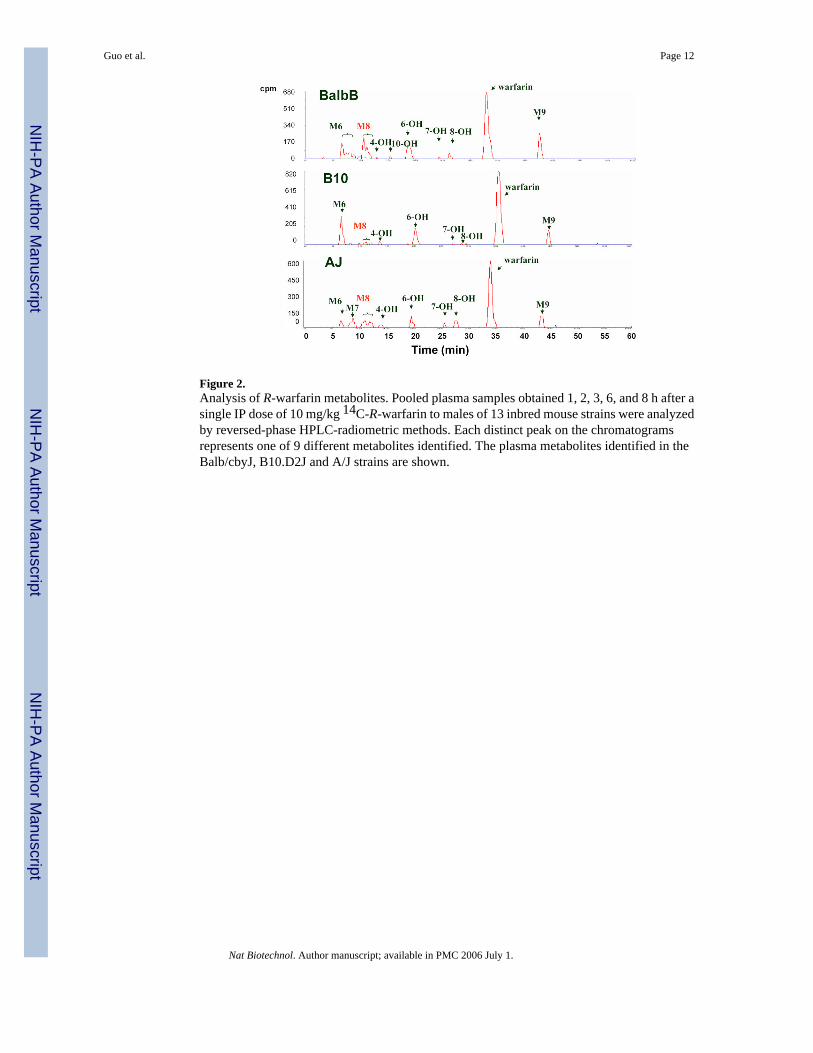
Figure 2.Analysis of R-warfarin metabolites. Pooled plasma samples obtained 1, 2, 3, 6, and 8 h after asingle IP dose of 10 mg/kg 14C-R-warfarin to males of 13 inbred mouse strains were analyzedby reversed-phase HPLC-radiometric methods. Each distinct peak on the chromatogramsrepresents one of 9 different metabolites identified. The plasma metabolites identified in theBalb/cbyJ, B10.D2J and A/J strains are shown.
Guo et al. Page 12
Nat Biotechnol. Author manuscript; available in PMC 2006 July 1.
NIH
-PA Author Manuscript
NIH
-PA Author Manuscript
NIH
-PA Author Manuscript
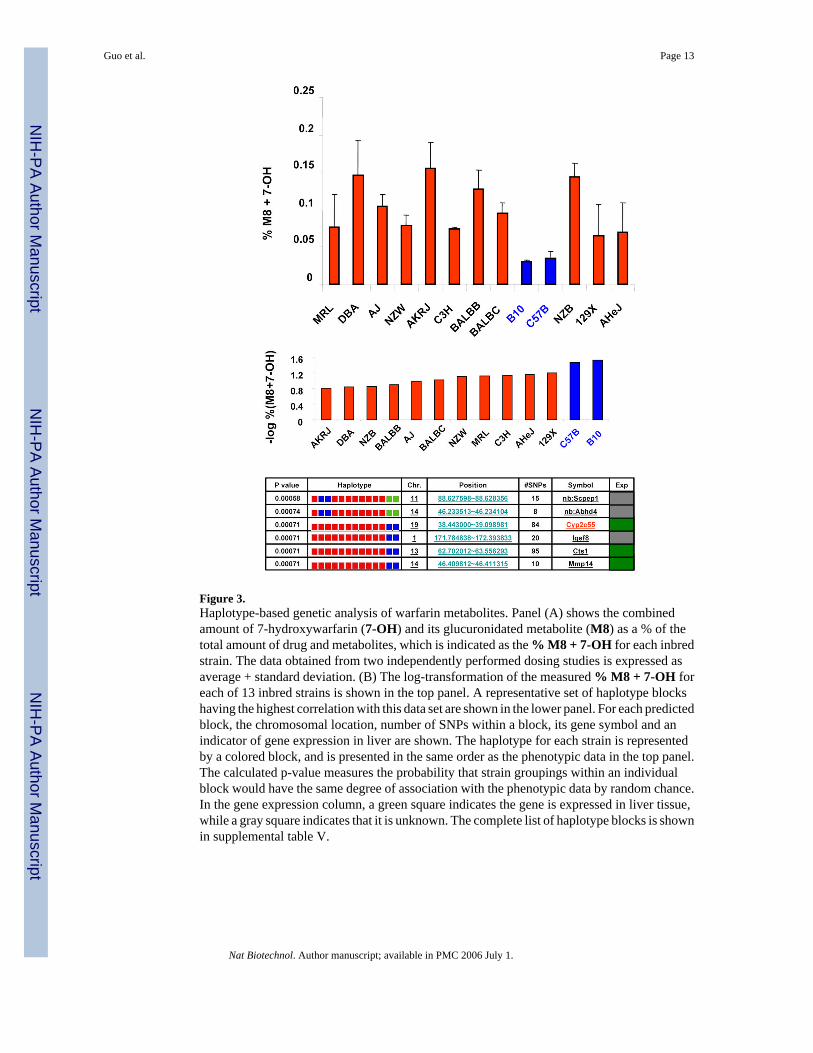
Figure 3.Haplotype-based genetic analysis of warfarin metabolites. Panel (A) shows the combinedamount of 7-hydroxywarfarin (7-OH) and its glucuronidated metabolite (M8) as a % of thetotal amount of drug and metabolites, which is indicated as the % M8 + 7-OH for each inbredstrain. The data obtained from two independently performed dosing studies is expressed asaverage + standard deviation. (B) The log-transformation of the measured % M8 + 7-OH foreach of 13 inbred strains is shown in the top panel. A representative set of haplotype blockshaving the highest correlation with this data set are shown in the lower panel. For each predictedblock, the chromosomal location, number of SNPs within a block, its gene symbol and anindicator of gene expression in liver are shown. The haplotype for each strain is representedby a colored block, and is presented in the same order as the phenotypic data in the top panel.The calculated p-value measures the probability that strain groupings within an individualblock would have the same degree of association with the phenotypic data by random chance.In the gene expression column, a green square indicates the gene is expressed in liver tissue,while a gray square indicates that it is unknown. The complete list of haplotype blocks is shownin supplemental table V.
Guo et al. Page 13
Nat Biotechnol. Author manuscript; available in PMC 2006 July 1.
NIH
-PA Author Manuscript
NIH
-PA Author Manuscript
NIH
-PA Author Manuscript
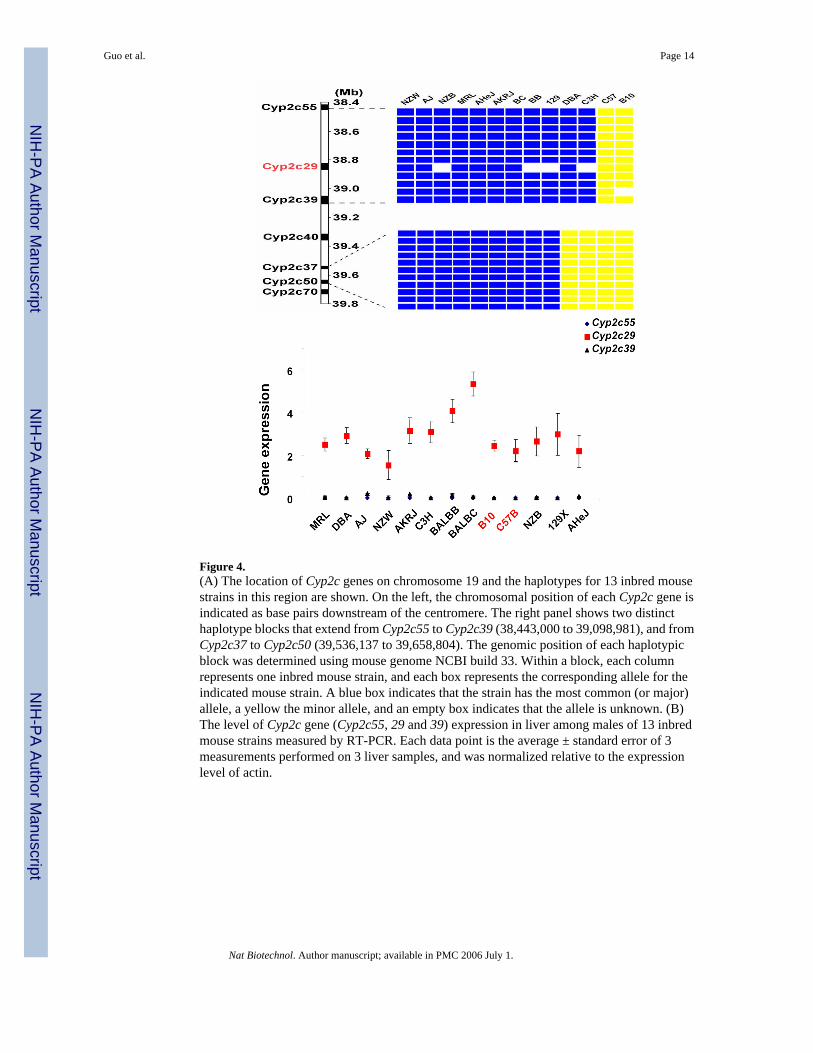
Figure 4.(A) The location of Cyp2c genes on chromosome 19 and the haplotypes for 13 inbred mousestrains in this region are shown. On the left, the chromosomal position of each Cyp2c gene isindicated as base pairs downstream of the centromere. The right panel shows two distincthaplotype blocks that extend from Cyp2c55 to Cyp2c39 (38,443,000 to 39,098,981), and fromCyp2c37 to Cyp2c50 (39,536,137 to 39,658,804). The genomic position of each haplotypicblock was determined using mouse genome NCBI build 33. Within a block, each columnrepresents one inbred mouse strain, and each box represents the corresponding allele for theindicated mouse strain. A blue box indicates that the strain has the most common (or major)allele, a yellow the minor allele, and an empty box indicates that the allele is unknown. (B)The level of Cyp2c gene (Cyp2c55, 29 and 39) expression in liver among males of 13 inbredmouse strains measured by RT-PCR. Each data point is the average ± standard error of 3measurements performed on 3 liver samples, and was normalized relative to the expressionlevel of actin.
Guo et al. Page 14
Nat Biotechnol. Author manuscript; available in PMC 2006 July 1.
NIH
-PA Author Manuscript
NIH
-PA Author Manuscript
NIH
-PA Author Manuscript

Figure 5.
Guo et al. Page 15
Nat Biotechnol. Author manuscript; available in PMC 2006 July 1.
NIH
-PA Author Manuscript
NIH
-PA Author Manuscript
NIH
-PA Author Manuscript
(A) In vitro biotransformation of R-warfarin in mouse liver microsomes. The rate (pmol/min/nmol CYP) of formation of the indicated metabolites was measured after incubation with theindicated concentrations of R-warfarin in CD-1 mouse liver microsomal preparations. Eachdata point represents the average ± standard deviation of 3 individual measurements. (B) Theeffect of a Cyp2c isoform-specific inhibitor (tolbutamide) on the rate of formation of 7-hydroxywarfarin from R-warfarin (150 μM) in mouse liver microsomes was measured. Eachdata point represents the average ± standard error of 3 individual measurements. (C) In vitrobiotransformation of R-warfarin by expressed recombinant murine Cyp2c29, Cyp2c39 andCyp2c37 cDNAs. The rate (pmol/min/nmol CYP) of formation of 7-hydroxywarfarin wasmeasured after incubation with the indicated concentrations of R-warfarin. cDNAs weregenerated from a strain with a high rate (Balb/cbyJ) and a low rate (B.10.D2-H2/oSnJ) ofgeneration of 7- hydroxywarfarin and M8 metabolites. Cyp2c29 biotransformed R-warfarin to7-hydroxywarfarin, while Cyp2c39 and Cyp2c37 lacked this activity. Each data pointrepresents the average ± standard deviation of 4 individual measurements.
Guo et al. Page 16
Nat Biotechnol. Author manuscript; available in PMC 2006 July 1.
NIH
-PA Author Manuscript
NIH
-PA Author Manuscript
NIH
-PA Author Manuscript
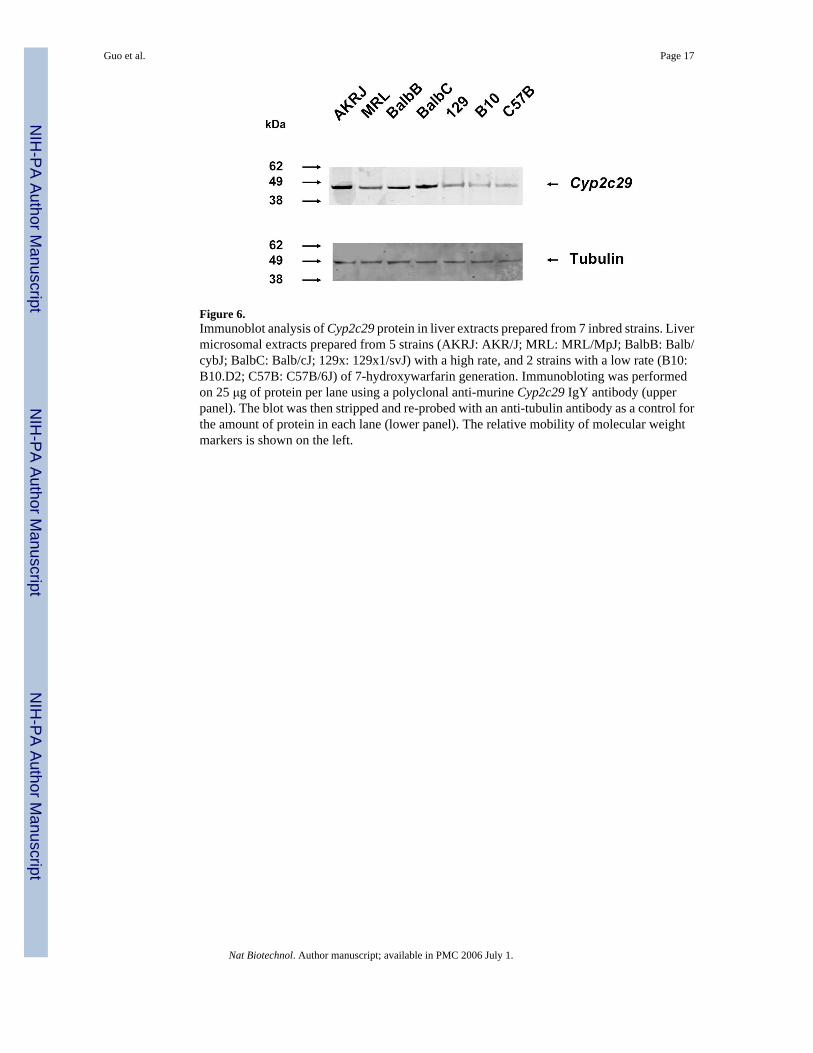
Figure 6.Immunoblot analysis of Cyp2c29 protein in liver extracts prepared from 7 inbred strains. Livermicrosomal extracts prepared from 5 strains (AKRJ: AKR/J; MRL: MRL/MpJ; BalbB: Balb/cybJ; BalbC: Balb/cJ; 129x: 129x1/svJ) with a high rate, and 2 strains with a low rate (B10:B10.D2; C57B: C57B/6J) of 7-hydroxywarfarin generation. Immunobloting was performedon 25 μg of protein per lane using a polyclonal anti-murine Cyp2c29 IgY antibody (upperpanel). The blot was then stripped and re-probed with an anti-tubulin antibody as a control forthe amount of protein in each lane (lower panel). The relative mobility of molecular weightmarkers is shown on the left.
Guo et al. Page 17
Nat Biotechnol. Author manuscript; available in PMC 2006 July 1.
NIH
-PA Author Manuscript
NIH
-PA Author Manuscript
NIH
-PA Author Manuscript
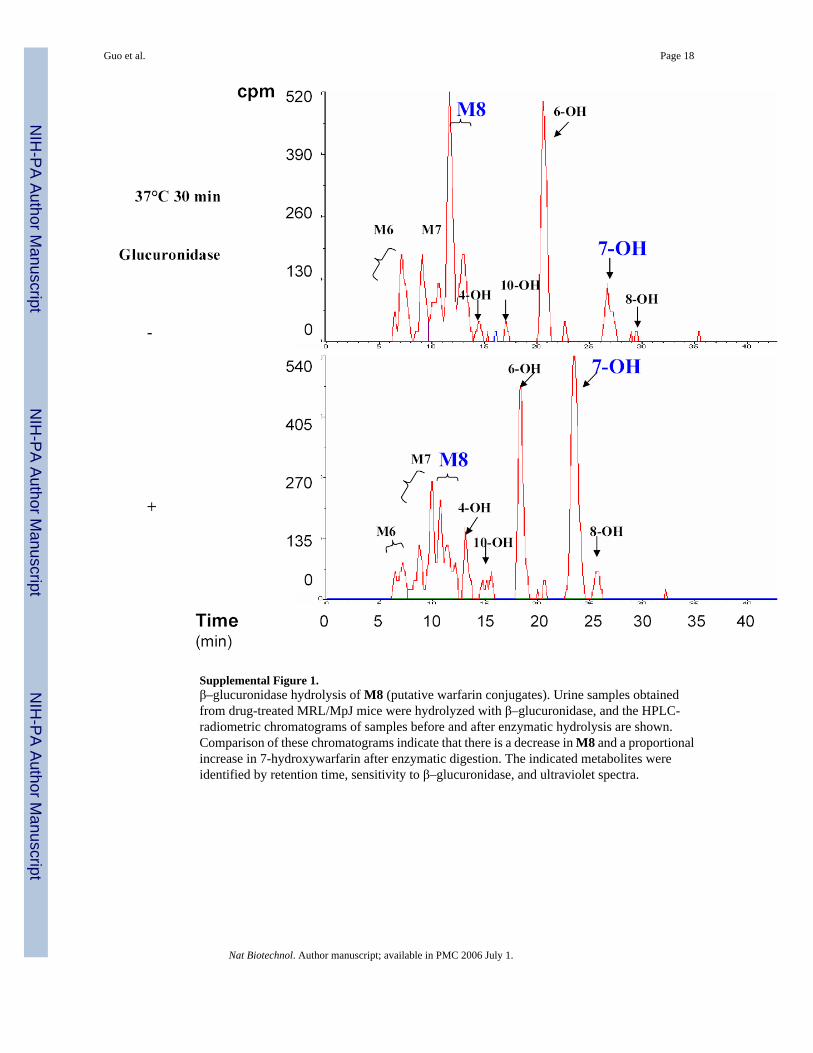
Supplemental Figure 1.β–glucuronidase hydrolysis of M8 (putative warfarin conjugates). Urine samples obtainedfrom drug-treated MRL/MpJ mice were hydrolyzed with β–glucuronidase, and the HPLC-radiometric chromatograms of samples before and after enzymatic hydrolysis are shown.Comparison of these chromatograms indicate that there is a decrease in M8 and a proportionalincrease in 7-hydroxywarfarin after enzymatic digestion. The indicated metabolites wereidentified by retention time, sensitivity to β–glucuronidase, and ultraviolet spectra.
Guo et al. Page 18
Nat Biotechnol. Author manuscript; available in PMC 2006 July 1.
NIH
-PA Author Manuscript
NIH
-PA Author Manuscript
NIH
-PA Author Manuscript
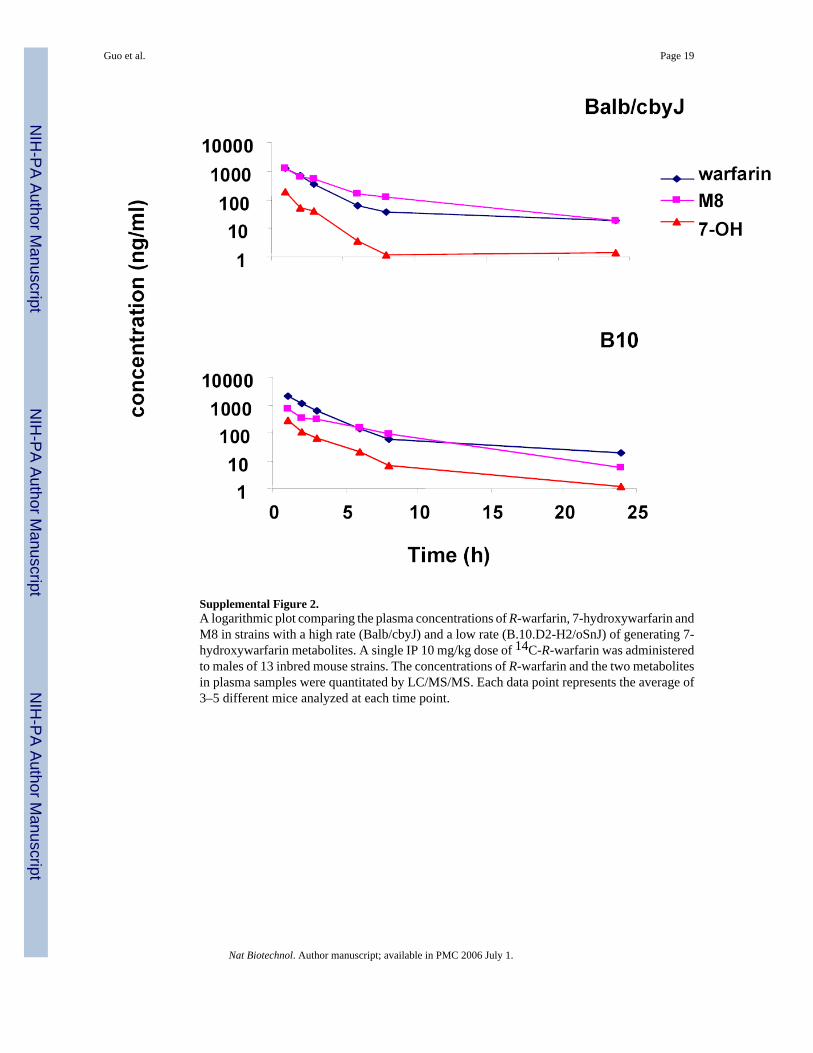
Supplemental Figure 2.A logarithmic plot comparing the plasma concentrations of R-warfarin, 7-hydroxywarfarin andM8 in strains with a high rate (Balb/cbyJ) and a low rate (B.10.D2-H2/oSnJ) of generating 7-hydroxywarfarin metabolites. A single IP 10 mg/kg dose of 14C-R-warfarin was administeredto males of 13 inbred mouse strains. The concentrations of R-warfarin and the two metabolitesin plasma samples were quantitated by LC/MS/MS. Each data point represents the average of3–5 different mice analyzed at each time point.
Guo et al. Page 19
Nat Biotechnol. Author manuscript; available in PMC 2006 July 1.
NIH
-PA Author Manuscript
NIH
-PA Author Manuscript
NIH
-PA Author Manuscript
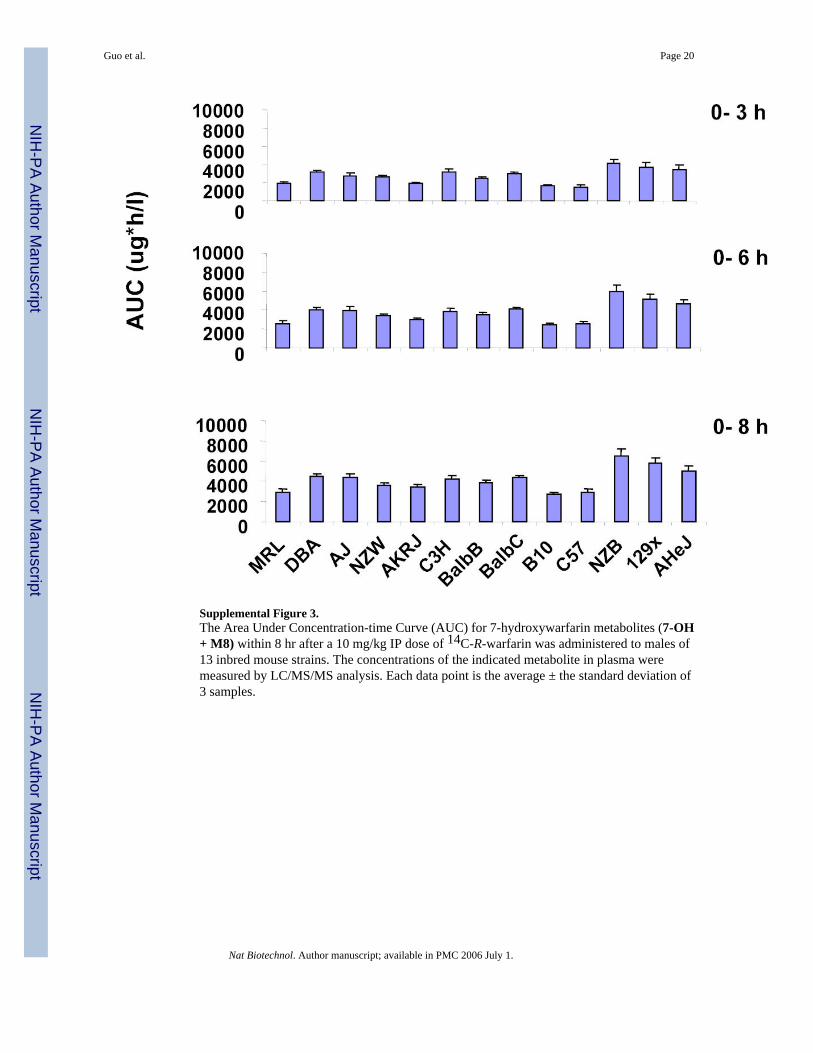
Supplemental Figure 3.The Area Under Concentration-time Curve (AUC) for 7-hydroxywarfarin metabolites (7-OH+ M8) within 8 hr after a 10 mg/kg IP dose of 14C-R-warfarin was administered to males of13 inbred mouse strains. The concentrations of the indicated metabolite in plasma weremeasured by LC/MS/MS analysis. Each data point is the average ± the standard deviation of3 samples.
Guo et al. Page 20
Nat Biotechnol. Author manuscript; available in PMC 2006 July 1.
NIH
-PA Author Manuscript
NIH
-PA Author Manuscript
NIH
-PA Author Manuscript
NIH
-PA Author Manuscript
NIH
-PA Author Manuscript
NIH
-PA Author Manuscript
Guo et al. Page 21Su
pple
men
tal T
able
IM
RM
par
amet
ers
for t
he d
etec
tion
of w
arfa
rin, 4′-,
6-,
7-, 8
-, 10
-hyd
roxy
war
farin
, deu
teriu
m-la
bele
d 7-
hydr
oxyw
arfa
rin (I
S) a
nd 7
-hyd
roxy
war
farin
-4-
gluc
uron
ide.
The
LC
/MS/
MS
cond
ition
s use
d he
re: c
urta
in g
as: 1
0; n
ebul
izer
gas
: 40;
turb
o ga
s: 4
0; c
ollis
ion-
activ
ated
dis
soci
atio
n co
llisi
on g
as: 4
; sou
rce
tem
pera
ture
: 350
°C; i
on sp
ray
volta
ge: -
4200
V. C
E: c
ollis
ion
ener
gy; E
P: e
ntra
nce
pote
ntia
l; D
P: d
eclu
ster
ing
pote
ntia
l; C
XP:
cel
l exi
t pot
entia
l.
MR
MPa
rent
(m/z
)D
augh
ter
(m/z
)C
EE
PD
PC
XP
war
fari
n30
7.0
161.
5−3
0−1
0−9
0−3
14′
, 6-h
ydro
xyw
arfa
rin
323.
926
6.1
−30
−10
−75
−77,
8- h
ydro
xyw
arfa
rin
324.
017
7.1
−26
−10
−75
−11
Deu
teri
um- l
abel
ed 7
- hyd
roxy
war
fari
n (I
S)32
7.9
177.
1−3
0−1
0−8
0−1
110
- hyd
roxy
war
fari
n32
4.0
250.
7−2
8−1
0−5
0−1
57-
hydr
oxyw
arfa
rin-
4- g
lucu
roni
de49
9.0
323.
1−1
8−1
0−8
0−7
Nat Biotechnol. Author manuscript; available in PMC 2006 July 1.

NIH
-PA Author Manuscript
NIH
-PA Author Manuscript
NIH
-PA Author Manuscript
Guo et al. Page 22Su
pple
men
tal T
able
IIPC
R p
rimer
s use
d in
the
cDN
A c
loni
ng a
nd R
T-PC
R e
xper
imen
ts.
Gen
e
cDN
A c
loni
ngC
yp2c
295′
-for
war
d3′
-rev
erse
AC
GTG
CG
GC
CG
CTA
TGG
ATC
TGG
TCG
TGTT
CC
TAG
CG
CTC
AC
TG
ATC
GG
CC
CTG
AA
GG
CC
TCA
TTA
GA
GA
GG
AA
TGA
AG
CA
GA
GC
TGG
TAA
GG
GG
GT
Cyp
2c39
5′-f
orw
ard
3′-r
ever
seA
CG
TGC
GG
CC
GC
TATG
GA
CC
TTG
TCA
CA
TTC
CTA
GTG
CTC
AG
ATC
GG
CC
CTG
AA
GG
CC
TCA
CA
CA
AA
TCA
AA
ATC
AA
GTA
TTA
TTG
Cyp
2c37
5′-f
orw
ard
3′-r
ever
seA
CG
TGC
GG
CC
GC
TATG
GA
TCC
AA
TCC
TGG
TCC
TGG
TGC
TCA
CT
GA
TCG
GC
CC
TGA
AG
GC
CTC
ATC
AG
GA
AG
GA
ATG
AA
GC
AG
AG
CTG
GA
RT-
PCR
Cyp
2c55
5′-f
orw
ard
3′-r
ever
seG
CC
AA
TAC
TTTT
GG
CC
GTG
TAA
TAG
CA
AC
AG
CC
AG
TGTG
TTC
TGC
yp2c
295′
-for
war
d3′
-rev
erse
CC
CTC
CC
TATC
AG
GG
ATA
TGG
CTG
TATG
TGTT
TGC
TGG
GTC
TTG
Cyp
2c39
5′-f
orw
ard
3′-r
ever
seG
GTC
TTTA
TTTA
CC
TCTT
TAC
TTA
TCA
GG
AA
AA
CC
AG
ATG
TGTT
TGC
TAG
GTC
TTT
Nat Biotechnol. Author manuscript; available in PMC 2006 July 1.
NIH
-PA Author Manuscript
NIH
-PA Author Manuscript
NIH
-PA Author Manuscript
Guo et al. Page 23Su
pple
men
tal T
able
III
R-w
arfa
rin m
etab
olic
pro
files
det
erm
ined
by
radi
omet
ric m
etho
ds in
poo
led
plas
ma
sam
ples
(1–8
h p
ostd
ose)
afte
r an
IP d
ose
10 m
g/kg
of 1
4 C-R
-war
farin
to m
ales
of
13 in
bred
mou
se s
train
s. Th
e am
ount
of
radi
oact
ivity
in e
ach
met
abol
ite w
as a
naly
zed
to d
eter
min
e its
con
cent
ratio
n, a
nd e
xpre
ssed
as
the
conc
entra
tion
equi
vale
nt o
f R-w
arfa
rin. T
he d
ata
obta
ined
in tw
o in
depe
nden
tly p
erfo
rmed
stud
ies,
with
n=3
sam
ples
per
dat
a po
int,
is sh
own.
M6
thro
ugh
M9
are
unkn
own
met
abol
ites,
and
“Tot
al”
repr
esen
ts th
e am
ount
of r
emai
ning
dru
g an
d al
l met
abol
ites.
a
Con
cent
ratio
n (μ
g-eq
/mL
)M
ouse
Str
ain
War
fari
n4′
-O
H W
arfa
rin
10-
OH
War
fari
n6-
OH
War
fari
n7-
OH
War
fari
n8-
OH
War
fari
nM
6M
7M
8M
9T
otal
MR
L1.
3949
0.01
940.
0000
0.11
140.
0000
0.00
000.
0872
0.10
660.
2180
0.10
662.
0440
DB
A1.
0946
0.00
000.
0097
0.18
410.
0000
0.00
000.
0000
0.01
450.
3051
0.10
171.
7098
AJ
1.10
430.
0291
0.00
000.
1114
0.02
420.
1017
0.07
270.
1502
0.20
340.
1695
1.96
65N
ZW0.
8428
0.07
750.
0000
0.16
790.
0000
0.03
230.
3778
0.00
650.
1550
0.08
071.
7405
AK
RJ
0.85
250.
0000
0.00
000.
2276
0.01
450.
0000
0.04
840.
0436
0.25
670.
0678
1.51
12C
3H2.
2135
0.03
870.
0000
0.26
640.
0000
0.00
970.
1114
0.05
330.
2325
0.13
083.
0563
BA
LBB
1.39
490.
0048
0.00
000.
3148
0.00
970.
0581
0.40
200.
0000
0.42
140.
3439
2.94
97B
ALB
C1.
5402
0.00
000.
0000
0.11
620.
0194
0.02
420.
1889
0.08
230.
1986
0.33
902.
5090
B10
1.19
800.
0161
0.00
000.
1970
0.00
650.
0000
0.21
310.
0000
0.05
170.
1195
1.80
18C
57B
2.13
600.
0387
0.00
000.
1259
0.01
450.
0000
0.06
300.
0242
0.09
200.
1502
2.64
46N
ZB1.
3562
0.00
000.
0000
0.16
470.
0145
0.00
000.
1308
0.16
950.
3778
0.29
062.
5041
129x
1.42
720.
0355
0.00
000.
2260
0.04
200.
0000
0.78
470.
0743
0.23
570.
1388
2.96
43A
HeJ
3.20
640.
0823
0.00
000.
3923
0.09
200.
0727
0.34
870.
0000
0.36
810.
1695
4.73
22b M
RL
0.61
400.
0146
0.00
000.
0869
0.01
350.
0000
0.02
780.
0112
0.02
810.
0886
0.88
48D
BA
0.94
770.
0295
0.00
000.
1214
0.03
350.
0000
0.00
000.
0260
0.11
700.
0621
1.33
72A
J1.
2274
0.05
080.
0000
0.25
830.
0636
0.01
490.
0000
0.05
230.
1146
0.13
631.
9182
NZW
0.78
850.
0297
0.00
000.
1032
0.02
270.
0041
0.01
470.
0330
0.05
200.
0630
1.11
07A
KR
J0.
3613
0.03
560.
0000
0.11
400.
0041
0.00
740.
0041
0.00
000.
0855
0.07
020.
6820
C3H
0.73
320.
0560
0.00
000.
1104
0.02
620.
0081
0.01
220.
0053
0.04
990.
0599
1.06
12B
ALB
B0.
3871
0.02
250.
0000
0.07
420.
0151
0.00
410.
0081
0.02
060.
0636
0.12
120.
7165
BA
LBC
0.41
090.
0354
0.00
420.
0774
0.01
510.
0042
0.01
480.
0148
0.07
070.
1754
0.82
30B
101.
0354
0.00
720.
0041
0.03
330.
0041
0.00
000.
0041
0.01
530.
0302
0.09
231.
2259
C57
B0.
9219
0.03
370.
0112
0.05
900.
0081
0.00
410.
0000
0.02
230.
0258
0.11
091.
1970
NZB
0.83
640.
0000
0.00
000.
1221
0.01
840.
0000
0.01
330.
0385
0.14
830.
1258
1.30
2912
9x0.
9328
0.02
970.
0151
0.14
000.
0000
0.00
000.
0186
0.03
760.
0444
0.08
161.
2998
AH
eJ0.
6561
0.01
900.
0000
0.08
120.
0147
0.00
810.
0112
0.01
430.
0256
0.09
290.
9231
Nat Biotechnol. Author manuscript; available in PMC 2006 July 1.

NIH
-PA Author Manuscript
NIH
-PA Author Manuscript
NIH
-PA Author Manuscript
Guo et al. Page 24Su
pple
men
tal T
able
IVTh
e ca
lcul
ated
AU
C 0–
8 h f
or R
-war
farin
and
its m
etab
olite
s fol
low
ing
a si
ngle
IP d
ose
of 1
0 m
g/kg
of 1
4 C-R
-war
farin
to m
ales
of 1
3 in
bred
mou
se st
rain
s.In
this
inde
pend
ently
per
form
ed d
rug
dosi
ng e
xper
imen
t, th
e co
ncen
tratio
n of
eac
h dr
ug a
nd m
etab
olite
was
det
erm
ined
by
LC/M
S/M
S m
etho
ds.
War
fari
n10
-OH
War
fari
n4-
OH
War
fari
n6-
OH
War
fari
n7-
OH
War
fari
n8-
OH
War
fari
nM
8A
UC
(0-8
)SD
AU
C(0
-8)
SDA
UC
(0-8
)SD
AU
C(0
-8)
SDA
UC
(0-8
)SD
AU
C(0
-8)
SDA
UC
(0-8
)SD
MR
L48
99.7
333
7.10
74.5
22.
9956
0.33
55.4
020
18.9
713
1.06
747.
5010
3.14
367.
7752
.00
2126
.67
280.
44D
BA
5012
.63
341.
9976
.46
4.96
192.
3615
.43
2647
.53
195.
5813
14.5
510
1.67
232.
5248
.35
3147
.30
189.
42A
J52
69.0
748
2.44
131.
506.
4554
2.95
45.4
729
04.4
425
8.70
1458
.30
148.
5873
8.58
78.6
828
90.7
427
5.77
NZW
4893
.43
401.
9375
.74
4.53
814.
8574
.06
2471
.50
165.
3510
32.2
872
.20
335.
9335
.89
2596
.10
166.
23A
KR
J42
50.7
756
5.81
56.9
57.
0553
9.33
56.9
732
31.3
330
6.39
907.
4772
.44
789.
8087
.27
2538
.27
156.
38C
3H31
79.4
321
7.84
87.3
99.
7538
6.41
30.7
030
10.2
033
7.93
645.
1587
.62
782.
8164
.12
3566
.03
382.
21B
ALB
B28
79.7
318
6.21
56.4
13.
3618
1.17
33.5
214
92.9
311
8.47
326.
3342
.01
219.
1922
.03
3510
.77
239.
05B
ALB
C27
43.5
034
4.04
37.8
24.
3525
5.34
21.5
714
32.7
816
1.63
532.
0257
.09
339.
1936
.16
3846
.07
104.
90B
1049
57.5
018
4.77
205.
0012
.12
807.
0077
.77
1528
.54
66.1
858
1.44
55.4
343
1.98
26.0
621
66.9
097
.62
C57
5632
.27
428.
7711
3.41
10.3
388
1.45
74.8
113
82.7
389
.04
374.
1838
.10
404.
9320
.30
2550
.83
265.
41N
ZB51
08.3
046
2.14
116.
8216
.35
781.
5528
.94
3455
.87
354.
2384
8.99
123.
2860
9.21
85.7
356
62.1
360
1.58
129x
4920
.93
413.
9715
3.71
10.5
611
75.4
311
3.06
3915
.63
407.
4114
59.8
292
.87
517.
8898
.26
4328
.67
479.
82A
HeJ
3608
.10
256.
8551
.56
5.34
447.
2757
.54
2520
.40
188.
3511
93.1
519
3.22
329.
1150
.79
3818
.20
318.
89
Nat Biotechnol. Author manuscript; available in PMC 2006 July 1.
NIH
-PA Author Manuscript
NIH
-PA Author Manuscript
NIH
-PA Author Manuscript
Guo et al. Page 25Su
pple
men
tal T
able
VA
ll ge
nom
ic re
gion
s whe
re th
e C
57B
/6J a
nd B
.10.
D2-
H2/
oSnJ
shar
e a
uniq
ue h
aplo
type
that
diff
ers f
rom
the
othe
r 11
stra
ins.
For e
ach
pred
icte
d bl
ock,
the
chro
mos
omal
loca
tion,
num
ber o
f SN
Ps w
ithin
a b
lock
, its
gen
e sy
mbo
l and
an
indi
cato
r of g
ene
expr
essi
on in
live
r are
sho
wn.
In th
e ge
ne e
xpre
ssio
nco
lum
n, a
gre
en sq
uare
indi
cate
s the
gen
e is
exp
ress
ed in
live
r tis
sue,
a b
lue
squa
re in
dica
tes t
hat i
t is n
ot, w
hile
a g
ray
squa
re in
dica
tes u
nkno
wn.
Chr
.Po
sitio
n#S
NPs
Sym
bol
Exp
117
1.78
4838
~172
.393
833
20Ig
sf8
x1
172.
4013
63~1
72.4
0249
514
Kcn
j9n
117
2.41
1182
~172
.441
610
12K
cnj1
0n
119
1.80
3831
~191
.804
563
5Sl
c30a
1y
119
2.30
8111
~192
.330
794
25K
cnh1
n4
146.
4866
68~1
46.4
8796
311
Mas
p2y
610
8.72
9673
~108
.740
188
7Itp
r1y
613
5.78
9359
~135
.837
639
32G
rin2b
n7
75.4
4583
1~75
.479
860
25C
tsc
y7
89.5
3975
1~89
.548
616
20A
rt5y
789
.549
379~
89.5
5200
48
Trpc
2n
789
.971
746~
89.9
7761
930
Rrm
1y
823
.738
182~
23.7
5722
337
Ada
m9
y8
67.9
0503
7~67
.932
681
16Lp
ly
892
.177
176~
92.1
8109
710
Mm
p2n
948
.705
110~
48.7
2003
933
Nnm
ty
910
6.22
5659
~106
.382
186
5125
1004
0D 0
7Rik
n9
106.
3826
28~1
06.3
8745
319
Acy
1y
1141
.642
067~
41.6
4232
58
Gab
rg2
n11
88.5
9487
2~88
.625
049
83Sc
pep1
x11
107.
4669
93~1
07.5
4479
427
Cac
ng5
y13
62.7
0201
2~63
.576
703
147
Cts
ly
1442
.503
988~
43.5
1543
440
Adp
rtl2
y14
46.2
3437
4~46
.245
543
42A
bhd4
x14
46.4
0981
2~46
.411
315
10M
mp1
4y
1446
.588
681~
46.9
3771
821
Psm
b5y
1580
.719
225~
80.7
2663
320
Cac
na1i
x16
98.3
6982
7~98
.412
517
18Tm
prss
2y
1853
.334
388~
53.3
5199
18
Snca
ipn
1857
.023
242~
57.0
3675
756
Ald
h7a1
y19
38.4
4300
0~39
.098
981
84C
yp2c
55y
1943
.146
384~
43.1
4806
910
Abc
c2y
1947
.208
472~
47.2
0915
95
4930
463G
05R
ikx
X63
.821
007~
63.8
3435
933
Gab
ren
Nat Biotechnol. Author manuscript; available in PMC 2006 July 1.
NIH
-PA Author Manuscript
NIH
-PA Author Manuscript
NIH
-PA Author Manuscript
Guo et al. Page 26Su
pple
men
tal T
able
VI
Kin
etic
par
amet
ers
for
in v
itro
biot
rans
form
atio
n of
R-w
arfa
rin t
o 6-
, 7-
and
8-hy
drox
ywar
farin
by
reco
mbi
nant
Cyp
2c29
and
the
CD
-1 m
ouse
liv
erm
icro
som
es.
Km
Vm
axV
max
/Km
Rec
ombi
nant
(μM
)(p
mol
/min
/nm
ol C
YP)
(pm
ol/m
in/n
mol
CY
P/μM
)
Cyp
2c29
6-O
H68
.0 ±
19.
39.
5 ±
1.8
0.14
7-O
H11
5.3
± 37
.320
.2 ±
7.2
0.18
8-O
H37
.1 ±
22.
96.
1 ±
2.8
0.16
Mic
roso
mes
6-O
H18
9.1
± 10
1.3
289.
2 ±
59.2
1.5
7-O
H24
0.6
± 14
1.2
276.
9 ±
88.3
1.2
8-O
H97
.2 ±
2.6
241.
2 ±
54.3
2.5
Nat Biotechnol. Author manuscript; available in PMC 2006 July 1.


