Embed Size (px)
Citation preview
Constitutive Variation in Hepatic Expression of Porcine Innate Immune Genes Associated with
Novel Promoter Polymorphisms
By
Heindrich Nicolaas Snyman
A Thesis
Presented to
The Faculty of Graduate Studies
of
The University of Guelph
In partial fulfilment of the requirements
for the degree of
Doctor of Veterinary Science
Guelph, Ontario, Canada
© Heindrich Nicolaas Snyman, November, 2013
ABSTRACT
CONSTITUTIVE VARIATION IN HEPATIC EXPRESSION OF PORCINE INNATE
IMMUNE GENES ASSOCIATED WITH NOVEL PROMOTER POLYMORPHISMS
Heindrich N. Snyman Advisor
University of Guelph, 2013 Dr. Brandon Lillie
Infectious diseases are an important factor limiting production, growth performance,
economics and animal welfare in the global swine industry. Numerous pathogenic, environmental and
host genetic factors contribute to infectious disease susceptibility, including defects in the innate
immune system. The secreted, membrane-bound and intracellular proteins of the innate immune
system are critical components in the defense against infectious pathogens, especially in young pigs.
Previous studies have identified a number of single nucleotide polymorphisms (SNPs) in the innate
immune genes of pigs, some of which are more frequent in pigs with economically important
infectious diseases such as enteritis, serositis and pneumonia. Additional novel genetic differences
(SNPs, insertions, deletions or other genetic variations) that alter the expression and/or function of
important resistance-conferring innate immune proteins could, together with previously identified
markers, form the basis for future development of genetic selection strategies aimed at increasing
innate disease resistance in pigs. In this thesis, genome-wide expression analysis and DNA
sequencing were used to screen for polymorphisms that were associated with decreased or increased
expression of selected innate immune genes in the liver of healthy market weight pigs. Using
expression microarrays, innate immune genes were identified that exhibited widely variable hepatic
gene expression. The promoter regions of these variably expressed genes were characterized and
novel promoter SNPs, insertions and deletions were identified in genes coding for proteins such as
secretoglobin, family 1A, member 1; porcine surfactant protein D; retinoic acid-inducible gene 1 and
porcine hepcidin antimicrobial peptide. Some of these SNPs were found to be more prevalent in
animals with either impaired or enhanced hepatic gene expression. Genotyping healthy and diseased
pigs using MassArray MALDI-TOF mass spectrometry revealed that genetic defects were widely

variable in their frequency in different breeds of pigs and some were more or less frequent in pigs
with certain common infectious diseases and/or pathogens. Information from these studies will be
used to develop a comprehensive panel of genetic markers that can be used to breed for pigs with
increased disease resistance. Such a panel could help improve pig production, promote animal health
and welfare, and decrease the need for antimicrobial drugs.

iv
ACKNOWLEDGEMENTS
I would like to extend my most sincere gratitude to my advisor and mentor, Dr. Brandon Lillie, whose
support, guidance and continued encouragement was an integral component to the success of my
research project and graduate training as a veterinary pathologist.
I am also extremely grateful to the pathologists within the Department of Pathobiology for their
mentorship and training throughout my journey towards becoming a successful veterinary pathologist
and to my thesis advisory committee, Dr. Jeff Caswell, Dr.Tony Hayes and Dr. Jim Squires for their
invaluable insights, advice and support throughout my DVSc studies.
I would also like to sincerely thank Dr. Jutta Hammermueller for sharing her knowledge and
experimental expertise and to Dr. Jim Squires (Department of Animal & Poultry Science), Dr. Alex
Martinez (CFIA), Dr. Balu Odedra (CFIA) and the pathologists at the Animal Health Laboratory,
University of Guelph for assistance in obtaining liver samples. I am very appreciative of the
assistance provided by research assistants and summer research students involved in this project;
especially Kelsie Jagt, Sarah Mavin, Eric Nham and David Balogh.
I am also extremely grateful to Dr. Edana Cassol for sharing her expertise and guidance in generating
microarray expression heat maps and Dr. Sharon Cassol for always being available to assist me in
whichever way possible.
I express my gratitude to all funding agencies (Ontario Veterinary College; NSERC; OMAFRA,
Ontario Pork and the Canadian Centre for Swine Improvement) for their financial assistance. Without
their support this research would not have been possible.
To my parents and family: “Ek wil ook baie graag my ouers en familie bedank vir hul
onvoorwaardelike liefde en ondersteuning vir alles wat ek aanpak in my lewe”.
Finally, I am eternally grateful for the endless love and support of my wife, Roberta, and children,
Zander and Myra, whom have made my Canadian journey especially rewarding.

v
DECLARATION OF WORK PERFORMED
With few exceptions (as listed below), all of the work in this thesis was performed by Heindrich
Nicolaas Snyman under the supervision of Dr. Brandon Lillie and an advisory committee composed
of Dr. Jeff Caswell, Dr. Tony Hayes and Dr. Jim Squires.
Dr. Brandon Lillie assisted with the collection of liver samples.
Dr. Jutta Hammermueller (Department of Pathobiology, University of Guelph) assisted with some of
the nucleic acid extractions and real-time PCR assays.
Kelsie Jagt, a summer research student (Department of Molecular and Cellular Biology, University of
Guelph) under my supervision performed some of the real-time PCR, promoter region sequencing and
restriction fragment length polymorphism analyses for surfactant protein D.
David Balogh, an in-course master’s degree student (Department of Biomedical Science, University
of Guelph) under my supervision performed some of the initial primer design and promoter
amplification for peptidoglycan recognition proteins 1 and 2.
vi
TABLE OF CONTENTS
ACKNOWLEDGEMENTS ................................................................................................................... iv
DECLARATION OF WORK PERFORMED ........................................................................................ v
LIST OF TABLES ............................................................................................................................... viii
LIST OF FIGURES ............................................................................................................................... xi
LIST OF ABBREVIATIONS .............................................................................................................. xiii
GENERAL INTRODUCTION, HYPOTHESES AND OBJECTIVES ................................................. 1
GENERAL INTRODUCTION .......................................................................................................... 1
HYPOTHESES ................................................................................................................................... 3
OBJECTIVES ..................................................................................................................................... 3
CHAPTER 1: STRUCTURE, FUNCTION AND GENETICS OF PORCINE INNATE IMMUNE PROTEINS…… ..................................................................................................................................... 4
INTRODUCTION .............................................................................................................................. 4
TOLL-LIKE RECEPTORS ................................................................................................................ 6
COLLECTINS AND FICOLINS (COLLAGENOUS LECTINS) ................................................... 13
C-TYPE LECTIN RECEPTORS AND SCAVENGER RECEPTORS ........................................... 21
GALECTINS .................................................................................................................................... 22
RETINOIC ACID-INDUCIBLE GENE-1-LIKE RECEPTORS ..................................................... 26
NUCLEOTIDE OLIGOMERIZATION DOMAIN-LIKE RECEPTORS ....................................... 30
ANTIMICROBIAL PEPTIDES ....................................................................................................... 34
PEPTIDOGLYCAN RECOGNITION PROTEINS ......................................................................... 38
COMPLEMENT ............................................................................................................................... 42
GENETIC POLYMORPHISM AND THE INNATE IMMUNE GENOME ................................... 46
CHAPTER 2: CONSTITUTIVE VARIATION IN THE HEPATIC INNATE IMMUNE TRANSCRIPTOME OF HEALTHY PIGS .......................................................................................... 53
ABSTRACT ..................................................................................................................................... 53
INTRODUCTION ............................................................................................................................ 54
MATERIALS AND METHODS ..................................................................................................... 56
RESULTS ......................................................................................................................................... 62
DISCUSSION ................................................................................................................................... 82
CHAPTER 3: NOVEL PROMOTER POLYMORPHISMS ASSOCIATED WITH INCREASED CONSTITUTIVE EXPRESSION OF SCGB1A1 AND SFTPD mRNA IN THE LIVER OF HEALTHY PIGS .................................................................................................................................. 89
ABSTRACT ..................................................................................................................................... 89
INTRODUCTION ............................................................................................................................ 91
MATERIALS AND METHODS ..................................................................................................... 93
RESULTS ....................................................................................................................................... 103
DISCUSSION ................................................................................................................................. 117
CHAPTER 4: VARIATION IN CONSTITUTIVE HEPATIC GENE EXPRESSION OF HAMP AND DDX58 WITH IDENTIFICATION OF NOVEL PROMOTER POLYMORPHISMS ............ 123
vii
ABSTRACT ................................................................................................................................... 123
INTRODUCTION .......................................................................................................................... 124
MATERIALS AND METHODS ................................................................................................... 126
RESULTS ....................................................................................................................................... 132
DISCUSSION ................................................................................................................................. 160
GENERAL DISCUSSION ................................................................................................................. 167
SUMMARY AND CONCLUSIONS ................................................................................................. 174
REFERENCES. .................................................................................................................................. 177
APPENDIX I: LIST OF PREVIOUSLY IDENTIFIED INNATE IMMUNE GENE SNPS USED FOR MALDI-TOF MASS SPECTROMETRY SNP GENOTYPING .............................................. 206
APPENDIX II: RANKING OF INNATE IMMUNE GENES BY VARIATION IN CONSTITUTIVE GENE EXPRESSION (TOP 6 % VS. BOTTOM 50 %) ...................................... 207
APPENDIX III: COMPARISON OF RANKING OF ALL INNATE IMMUNE RESPONSE GENE PROBES .................................................................................................................................. 212
APPENDIX IV. TARGET INNATE IMMUNE RESPONSE GENE SEQUENCES WITH ANNOTATED SNPS ......................................................................................................................... 222
viii
LIST OF TABLES
Table 1.1. Ligand and cellular localization of the Toll-like receptors. ................................................. 48
Table 1.2. Sugar specificity and species distribution of various collagenous lectins. .......................... 49
Table 1.3. Ligand and cellular localization of the C-type lectin receptors and scavenger receptors. ... 50
Table 1.4. Ligand and cellular localization of the retinoic acid-inducible gene-I–like receptors. ........ 51
Table 1.5. Ligand and cellular localization of the peptidoglycan recognition proteins. ....................... 52
Table 2.1. List of previously identified innate immune response gene SNPs used for microarray
expression selection. ............................................................................................................................. 60
Table 2.2. Primers used for PCR based sex-genotyping. ...................................................................... 60
Table 2.3. Selected microarray reference genes and calculated gene expression ratio. ........................ 61
Table 2.4. Selected microarray acute phase protein genes and calculated gene expression ratios. ...... 67
Table 2.5. Ranking of innate immune genes by variation in constitutive gene expression. ................. 68
Table 2.6. List of innate immune genes with multiple microarray probes with poor internal probe
correlation. ............................................................................................................................................ 73
Table 2.7. Constitutive variation in innate immune gene expression is not correlated with acute
phase protein expression. ...................................................................................................................... 74
Table 3.1. Primers used for promoter region amplification, sequencing and RFLP assays of
SCGB1A1 and SFTPD. ....................................................................................................................... 100
Table 3.2. Restriction endonucleases used in RFLP assays to genotype pigs for SFTPD promoter
polymorphisms. ................................................................................................................................... 101
Table 3.3. Primers used for semi-quantitative real-time RT-PCR for SCBG1A1 and SFTPD. .......... 102
Table 3.4. Identified SCGB1A1 sequence variations. ......................................................................... 106
Table 3.5. Effect of the SFTPD g.-4509A>G SNP on hepatic gene expression. ................................ 113
Table 3.6. Frequency of variant positive genotypes for the SFTPD g.-4509A>G SNP in pigs
diagnosed with different disease syndromes, bacterial and viral pathogens. ...................................... 114
Table 3.7. Frequency of variant positive genotypes for the SFTPD g.-4509A>G promoter SNP in
purebred pigs. ...................................................................................................................................... 115
ix
Table 3.8. p-values for pair-wise comparisons of SFTPD g.-4509A>G SNP variant genotype
frequencies in purebred pigs. .............................................................................................................. 115
Table 3.9. Frequency of variant positive genotypes for the SFTPD g.-4509A>G promoter SNP in
weighted cross bred pig populations. .................................................................................................. 115
Table 4.1. Primers used for promoter region amplification and sequencing of DDX58, HAMP,
PGLYRP1 and PGLYRP. .................................................................................................................... 130
Table 4.2. Primers used for semi-quantitative real-time RT-PCR assays of DDX58 and HAMP. ...... 131
Table 4.3. Identified HAMP sequence variations. ............................................................................... 139
Table 4.4. Relative allele frequencies of HAMP promoter variants between high and low
expressing groups. ............................................................................................................................... 140
Table 4.5. Identified DDX58 sequence variations. ............................................................................. 141
Table 4.6. Relative allele frequencies of DDX58 promoter variants between high and low
expressing groups. ............................................................................................................................... 142
Table 4.7. Mean hepatic gene expression of HAMP and DDX58 in variant genotypes. ..................... 143
Table 4.8. Effect of variant genotype on HAMP and DDX58 expression. .......................................... 144
Table 4.9. Co-expressing haplotypes identified for HAMP and DDX58 promoter polymorphisms. .. 146
Table 4.10. Frequency of variant positive genotypes for HAMP, DDX58, CD163 and CD169
polymorphisms in diseased groups. .................................................................................................... 147
Table 4.11. Calculated p- and q-values for HAMP, DDX58, CD163 and CD169 polymorphisms in
diseased groups. .................................................................................................................................. 148
Table 4.12. Frequency of variant positive genotypes for HAMP, DDX58, CD163 and CD169
polymorphisms in pigs diagnosed with different bacterial pathogens. ............................................... 149
Table 4.13. Calculated p- and q-values for HAMP, DDX58, CD163 and CD169 polymorphisms in
pigs diagnosed with different bacterial pathogens. ............................................................................. 150
Table 4.14. Frequency of variant positive genotypes for HAMP, DDX58, CD163 and CD169
polymorphisms in pigs diagnosed with different viral pathogens. ..................................................... 151
Table 4.15. Calculated p- and q-values for HAMP, DDX58, CD163 and CD169 polymorphisms in
pigs diagnosed with different viral pathogens. ................................................................................... 152
x
Table 4.16. Frequency of variant positive genotypes for HAMP, DDX58, CD163 and CD169
polymorphisms in purebred pigs. ........................................................................................................ 153
Table 4.17. p-values for pair-wise comparisons of HAMP, DDX58, CD163 and CD169
polymorphism variant genotype frequencies in purebred pigs. .......................................................... 154
Table 4.18. Frequency of variant positive genotypes for HAMP, DDX58, CD163 and CD169
polymorphisms in weighted cross bred pig populations. .................................................................... 156
xi
LIST OF FIGURES
Figure 2.1. Unsupervised agglomerative hierarchical clustering of innate immune gene expression. . 75
Figure 2.2. Microarray expression of representative examples of the four distinct expression
pattern/clusters. ..................................................................................................................................... 77
Figure 2.3. Melting curve analysis of the TSPY and MT-CYB duplex sex-genotyping assay. .............. 78
Figure 2.4. Normalized microarray expression of DDX3Y. ................................................................. 79
Figure 2.5. Hepatic expression of MBL2 in MBL2 g.-1091G>A SNP genotypes measured by
microarray and semi-quantitative real-time RT-PCR. .......................................................................... 80
Figure 2.6. Microarray expression of MBL2. ........................................................................................ 81
Figure 3.1. SCGB1A1 promoter amplification of top and bottom eight expressing pigs. ................... 108
Figure 3.2. Regional Ensembl annotation of Sus scrofa chromosome number 2. .............................. 109
Figure 3.3. Correlation between SCGB1A1 mRNA expression as measured by semi-quantitative
real-time RT-PCR and microarray. ..................................................................................................... 110
Figure 3.4. Restriction length fragment polymorphism analyses developed to genotype pigs for the
three identified SFTPD promoter SNPs. ............................................................................................. 111
Figure 3.5. Microarray expression of SFTPD. .................................................................................... 112
Figure 3.6. Hepatic expression of SFTPD in SFTPD g.-4509A>G SNP genotypes. .......................... 113
Figure 3.7. Frequency of variant positive genotypes for the SFTPD g.-4509A>G SNP in healthy
pure bred and cross bred pigs. ............................................................................................................. 116
Figure 4.1. Hepatic expression of HAMP and DDX58 with respect to polymorphism genotypes. .... 145
Figure 4.2. Correlation of semi-quantitative real-time RT-PCR and microarray mRNA expression
of DDX58. ........................................................................................................................................... 157
Figure 4.3. Correlation of DDX58 mRNA expression levels when measured using two different
microarray probes. .............................................................................................................................. 158
Figure 4.4. Correlation of HAMP mRNA expression levels when measured using two different
microarray probes. .............................................................................................................................. 159
Figure IV.1. Sus scrofa SCGB1A1 amplified promoter sequence. ..................................................... 222
xii
Figure IV.2. Sus scrofa SFTPD amplified promoter sequence. .......................................................... 223
Figure IV.3. Sus scrofa HAMP amplified promoter sequence. ........................................................... 224
Figure IV.4. Sus scrofa DDX58 amplified promoter sequence. .......................................................... 225
Figure IV.5. Sus scrofa PGLYRP1 amplified promoter sequence. ..................................................... 226
Figure IV.6. Sus scrofa PGLYRP2 amplified promoter sequence. ..................................................... 227
xiii
LIST OF ABBREVIATIONS
28S
APP
B2M
bp
C1q
C1r
C1s
C2
C3
C4
cDNA
CRD
CRP
DAMP
DEPC
FBG
FC
FDR
GalNAc
GAPDH
GER
Glc
GlcNAc
HAMP
HP
LacNAc
LPS
LW
MALDI-TOF
28s ribosomal RNA
Actinobacillus pleuropneumoniae
beta-2 microglobulin
base pairs
complement component C1q
C1q-associated serine protease C1r
C1q-associated serine protease C1s
complement component C2
complement component C3
complement component C4
cDNA - complementary DNA
carbohydrate-recognition domain
C-reactive protein
danger-associated molecular pattern
ditheythylenepyrocarbonate
fibrinogen-like domain
fold change
false discovery rate
N-acetylgalactosamine
glyceraldehyde-3-phosphate dehydrogenase
gene expression ratio
glucose
N-acetyl-D-glucosamine
hepcidin antibacterial peptide
haptoglobin
N-acetyllactosamine
lipopolysaccharide
large white
matrix-assisted laser desorption/ionization time of flight
xiv
MASP
MBL
mRNA
NCBI
PAMP
PCR
PCV2
PGLYRP-1
PGLYRP-2
PGLYRPs
FCN
pig-MAP
PRR
PRRSV
RFLP
RIG-1
RT-PCR
SAA
SCGB1A1
SNP
SP-A
SP-D
TLR
Tris
UTR
MBL-associated serine protease
mannan-binding lectin (mannose-binding lectin)
messenger RNA
National Center for Biotechnology Information
pathogen-associated molecular pattern
polymerase-chain reaction
porcine circovirus type 2
peptidoglycan recognition protein-1
peptidoglycan recognition protein-2
mammalian peptidoglycan recognition proteins
ficolin
pig major acute phase protein/ inter-α-trypsin inhibitor
pattern recognition receptor
porcine reproductive and respiratory syndrome virus
restriction fragment length polymorphism
retinoic acid-inducible gene 1
reverse-transcriptase polymerase chain reaction
serum amyloid A
secretoglobin, family 1A, member 1 (uteroglobin)
single nucleotide polymorphism
surfactant protein A
surfactant protein D
Toll-like receptor
tris(hydroxymethyl)aminomethane
untranslated region
1
GENERAL INTRODUCTION, HYPOTHESES AND OBJECTIVES
GENERAL INTRODUCTION
Significant progress has been made in the control of infectious diseases through ongoing
advances in biosecurity, disease management and vaccination. Despite this progress, infectious
diseases are still one of the most important factors limiting production, growth performance,
economics and animal welfare in the global swine industry. Pathogen, environmental, and host
genetic factors contribute to this multifactorial problem. The problem is further confounded by the
fact that common infectious disease syndromes in pigs are often caused by multiple co-infecting
bacterial and viral pathogens. Regardless of the management strategy of different production units, the
identification of pigs that are better able to respond to infectious stimuli can provide insights for
enhancing disease resistance. General health and resistance phenotypes have been shown to be
heritable traits, regardless of the prevailing environmental conditions and the selection of pigs based
on disease resistance phenotypes has been shown to improve production characteristics (Clapperton et
al. 2009, Mellencamp et al. 2008, Wilkie and Mallard 1999). The use of quantitative trait loci (QTL)
allows for the identification and selection of desirable traits (Rothschild 2004, Rothschild et al. 2007).
QTL and disease resistance phenotypes are often polygenic receiving variable contributions from a
large number of genes and many of the underlying variations in these loci have not been extensively
investigated. As a result there is an opportunity to characterize disease resistance phenotypes at a
complex genetic level. Few studies have focussed on genetic defects in the innate immune system of
swine and other domestic animals, or on the potential of these defects to alter disease susceptibility
and/or severity. However a growing body of evidence suggests that genetic polymorphisms in innate
response genes of pigs and other domestic animals can have a detrimental effect on the incidence of
common disease syndromes and susceptibility of these animals to common infectious pathogens
(Jozaki et al. 2009, Juul-Madsen et al. 2011, Keirstead et al. 2011, Lillie et al. 2007, Uenishi et al.
2011, Uenishi et al. 2012, Wang et al. 2011). Identification of novel genetic differences (SNPs,
insertions, deletions or other genetic variations) that alter the expression and/or function of important
resistance-conferring proteins could, together with previously identified markers, form the basis of
2
genetic selection strategies aimed at increasing innate disease resistance in pigs. To date, most studies
of genetic variation have used a targeted single gene approach. These studies have successfully
identified a small number of candidate SNPs that are associated with altered gene expression. As a
result of the focussed nature of these studies, many innate immune genes have not been investigated
and considering the redundancy and complexity of the innate immune system, an opportunity exists to
further expand these studies. Recent advances in sequencing and annotation of the porcine genome,
combined with porcine specific whole genome microarray expression technology, now provides the
opportunity to expand these efforts into a genome-wide approach. In this study, we investigated
whether microarray technology could be used to identify innate immune genes that exhibited
markedly variable gene expression in healthy pigs. The study was based on the premise that, by
detecting target genes that exhibited wide variation in constitutive gene expression and determining
the underlying reasons for this altered gene expression, we would be able to identify genetic
differences that had a major impact on the expression of innate immune response proteins. We also
reasoned that these mutations (SNPs, insertions, deletions) would provide a valuable set of markers
for the development of a comprehensive genetic selection panel that could be used to increase disease
resistance in the commercial swine population. The ability to select for higher innate disease
resistance would result in increased production, promote animal health and welfare and decrease the
need for antimicrobial drugs in commercial pig populations.
3
HYPOTHESES
1. Altered hepatic expression of innate immune proteins can impair disease resistance to some
common infectious diseases
2. In some pigs, this altered expression, may be due to specific genetic variations such as
insertions, deletions and single nucleotide polymorphisms
3. Knowledge of genetic variations associated with impaired disease resistance could be used to
improve the health and production capacities of these animals
OBJECTIVES
1. Identify innate immune genes with widely variable expression in healthy pigs
2. Identify and characterize polymorphisms and other genetic variations in the promoter region
of these genes
3. Determine the impact of identified genetic variants on gene expression
4. Determine the frequency of these genetic variants in pigs with commonly encountered
infectious diseases and pathogens of swine
4
CHAPTER 1: STRUCTURE, FUNCTION AND GENETICS OF PORCINE INNATE
IMMUNE PROTEINS
INTRODUCTION
The innate immune system forms the first line of defense against pathogenic organisms. This ancient
and universal host defense system is intended to clear bacterial, fungal and viral infections before
intervention by the adaptive immune system. Antigen-presenting cells (APCs), such as macrophages
and dendritic cells (DCs), play a central role not only in the initial recognition and processing of
microbial antigens, but also in the subsequent activation of effector T and B cells (adaptive
immunity). Activation of APCs involves the interaction between pattern recognition receptors (PRRs)
in circulation as well as those expressed on cell surfaces, and within the cytoplasm of macrophages,
DCs and other cells of the innate immune system with pathogen-associated molecule patterns
(PAMPS) that are present on different groups of microbes and that are essential for their survival.
These PAMPs include lipopolysaccharide (LPS), peptidoglycan, lipoteichoic acids, mannose and
other sugar moieties, unmethylated CpG DNA, bacterial and protozoal proteins, dsRNA, ssRNA and
glucans. There are two major classes of PRRs: signalling receptors and endocytic receptors. The
binding of microbial products to signalling PRRs such as the Toll-like receptors (TLRs) and
nucleotide-binding and oligomerization domain (NOD)-like receptors (NLRs) stimulates the
transcription and production of inflammatory cytokines, triggering innate immune defenses such as
inflammation. Endocytic PRRs promotes the attachment and subsequent engulfment/destruction of
microbes (Janeway 1989, Medzhitov 2009). In addition to PAMPs, many of these proteins also
interact with various danger associated molecular patterns (DAMPs), such as those generated during
cellular necrosis and oxidative damage of cells as well as extracellular ATP and potassium,
hyaluronan fragments, uric acid and heat shock proteins (HSPs). These interactions between PRRs
and DAMPS can further modify the inflammatory response (Mogensen 2009). The various TLRs,
collagenous lectins, galectins, macrophage scavenger receptors and C-type lectin receptors,
complement proteins, NLRs, retinoic acid-inducible gene I (RIG-1) like receptors (RLRs) as well as
peptidoglycan recognition proteins (PGLYRPs) and antimicrobial peptides (AMPs) all play important

5
roles in pathogen recognition and innate immune defense. The intent of this literature review is to
provide an overview of the structure, function and genetics of these various receptors and
antimicrobial molecules that constitute the porcine innate immune system.
6
TOLL-LIKE RECEPTORS
Toll-like receptors (TLRs) are one of the most widely studied components of the innate
immune system. These receptors play a central role in dorsal-ventral embryonic polarity in
Drosophila spp. and, for this reason, were initially referred to as Drosophila Toll transmembrane
proteins (Hashimoto et al. 1988). Shortly thereafter, it was discovered that the human genome, and the
genome of other mammalian species, contained sequences that were similar to the Drosophila TLR
genes. The finding that these receptors, referred to as hToll receptors (Medzhitov et al. 1997) and as
the human cytoplasmic Toll/IL1R homology (TIR) domain by Gay et al. (Gay and Keith 1991), had
potent antifungal properties (Lemaitre et al. 1996) and were able to recognize and bind microbial
PAMPs (Medzhitov et al. 1997) led to the concept that TLRs were important components of the
immune system. Since these initial studies, TLRs have been extensively studied and reviewed
(Eisenbarth and Flavell 2009, Lin et al. 2012, Takeda and Akira 2007, Takeuchi and Akira 2010,
Uenishi and Shinkai 2009).
TLRs are membrane-bound receptors that are localized on the cell-surface membrane and on
the plasma membrane of endolysosomes. To date, a total of 13 different mammalian TLRs have been
identified including 10 human and 10 porcine TLRs (TLR 1-10) and 12 murine TLRs (TLR 1-9 and
11-13) (Eisenbarth and Flavell 2009, Takeda and Akira 2007, Takeuchi and Akira 2010, Uenishi and
Shinkai 2009). Structurally, TLRs are arranged into three domains, an extracellular domain, a trans-
membrane domain and an intracellular or endolysosomal cytoplasmic Toll/IL1R homology (TIR)
domain. The N-terminal domain consists of 16 to 28 leucine-rich repeats (LRR), arranged in a
horseshoe shaped structure. This extracellular domain is responsible for the binding specificity of
each receptor (Uenishi and Shinkai 2009, Werling et al. 2009). The Toll-interleukin-1-receptor
homology (Toll/IL1R homology/TIR) domain, located on the cytoplasmic side of the cell membrane
(plasma membrane associated TLRs) and within the lysosomal compartment (endolysosomal
associated TLRs), interacts with several adaptor proteins. These adaptor proteins include myeloid
differentiation primary response gene 88 (MyD88), which contains a Death (DD) and TIR domain,
and a TIR-domain containing adaptor protein inducing IFN- (TRIF or TICAM-1) as well as the Toll-
7
interleukin 1 receptor (TIR) domain containing an adaptor protein (TIRAP/Mal), a TRIF related
adaptor molecule (TRAM), and a sterile-alpha and armadillo motif-containing protein (SARM)
(Mogensen 2009, Takeuchi and Akira 2010). These adaptor molecules are essential for effective
cellular signalling via TLRs.
The main cell membrane associated receptors are TLR1, TLR2, TLR4, TLR5, TLR6 and
TLR11. The endolysosomal associated TLRs include TLR3, TLR7, TLR8, TLR9 and TLR10. The
ligands recognized by these various TLRs have been identified and extensively reviewed. These
receptor-ligand interactions are dependent, in large measure, on the cellular localization of the specific
receptor. Ligands and cellular locations are summarized in Table 1.1 (Mogensen 2009, Takeda and
Akira 2007, Takeuchi and Akira 2010, Werling et al. 2009).
The ligands for TLR1 and TLR6 are triacyl- and diacyl-lipoproteins (bacteria and viruses)
respectively. Lipoproteins (bacteria, virus, and parasites) are the primary ligands for TLR2 (Yang et
al. 1998). Endotoxin, or lipopolysaccharide (LPS), a component of the cell wall of Gram-negative
bacteria, is the main TLR4 ligand. Activation of TLR4 occurs only in the presence of myeloid
differentiation protein-2 (MD-2), CD14 and lipopolysaccharide binding protein (LBP) and involves
homodimerization of TLR4 (Park et al. 2009). Other TLR4 ligands include the heat shock proteins
released during necrosis and cell death (Ohashi et al. 2000). Flagellin (flagellated bacteria) and
profilin (protozoa) function as ligands for TLR5 and TLR11, respectively.
TLR3 recognizes and binds the double stranded RNA (dsRNA) found in some viruses. In
contrast, TLR7 (and TLR8 in humans) binds single stranded RNA (ssRNA) found in viruses and
bacteria, as well as purine analog compounds such as imidazoquinolone. CpG DNA and the DNA
sugar backbone of 2′-deoxyribose (viruses, bacteria, protozoa) (Haas et al. 2008) are ligands for TLR9
(virus, bacteria, and protozoa). TLR9 is also activated by malaria after binding to hemozoin, this
results from direct interaction with hemozoin itself as well as malarial DNA bound to the hemozoin
molecule (Coban et al. 2010, Parroche et al. 2007). Recent reports have shown that TLR10 has similar
ligand binding characteristics to that of TLR1 (Guan et al. 2010). The murine receptor, TLR11, which
8
is absent in humans and other mammals, shows close homology to TLR5 (Yarovinsky et al. 2005). It
is uncertain whether this homology has any functional significance.
Specific signal pathways are activated by the interaction of a given ligand with its cognate
receptor. In some cases, binding is not sufficient to induce signaling. Structural changes in the TLR,
such as homodimerization or heterodimerization may also be required for signaling e.g. homo-
dimerization of TLR4 following binding of LPS and interaction with MD-2, homodimerization of
TLR3 after binding to N- and C-terminal ends of dsRNA, TLR1/2, TLR6/2 and TLR10/2
heterodimerization in association with formation of internal pockets (Guan et al. 2010, Ozinsky et al.
2000, Park et al. 2009). Apart from TLR3, MyD88 is involved in all TLR-mediated signalling. The
mechanism involves a sequential signaling cascade that leads to activation and nuclear translocation
of nuclear factor kappa-light-chain-enhancer of activated B cells (NF-κB) as well as the activation of
the three mitogen-activated protein kinase (MAPK) pathways: extracellular signal–regulated kinase
(Erk), Jun N-terminal kinase (Jnk) and p38. NF-κB controls the transcription of inflammatory genes,
and MAPKs regulate both the transcription of inflammatory genes and the stability of these mRNA
transcripts. MyD88-independent/TRIF-dependent signaling (unique to TLRs 3 and 4) leads to the
production of interferon (IFN)-ß (Han 2006, Mogensen 2009, Takeda and Akira 2007).
The porcine genes encoding TLRs 1, 2, 6 and 10 are found on chromosome 8 (SSC8). A
putative quantitative trait locus (QTL), related to the immune properties of TLRs 1, 6 and 10 has also
been identified on this chromosome and is located in a cluster on the p arm (Muneta et al. 2003). In
humans these three TLRs have also been shown to be genetically related likely representing gene
duplication events (Guan et al. 2010). Despite the observed genetic similarities; TLR10 activated
signaling pathways have been shown to differ from those observed for TLR1 and TLR6 (Guan et al.
2010). TLR10 also requires heterodimerization with TLR2 to initiate signal transduction and likewise
to other TLRs also involves MyD88 mediated signalling (Guan et al. 2010, Hasan et al. 2005). In
contrast however to other TLRs, TLR10 signaling does not result in NF-κB-, IL-8-, or IFN-ß-driven
responses and further characterisation of these pathways are necessary to better understand the role
that TLR10 plays as a PRR (Guan et al. 2010, Hasan et al. 2005, Shinkai et al. 2006). In the mouse,
9
TLR10 is disrupted by an endogenous retrovirus and exists as a pseudogene (Guan et al. 2010). The
functional loss of this gene in the mouse has not been associated with any consequence to host
defense and the exact function of this TLR10 remains obscure. Similar QTL sequences are also found
at the distal end of the q arm of SCC8 within the region adjacent to the TLR2 gene (Bergman et al.
2010, Jann et al. 2009, Shinkai et al. 2006). The presence of these QTL’s underscores the importance
of these TLRs in the host immune response.
Non-synonymous SNPs are common in the extracellular LRR domain of all TLRs, especially
in swine (Morozumi and Uenishi 2009, Shinkai et al. 2006, Uenishi et al. 2011). There is considerable
species-specific variation in these SNPs and in the selection pressure exerted on the ligand binding
domain of TLRs (Bergman et al. 2010, Morozumi and Uenishi 2009, Shinkai et al. 2006, Uenishi and
Shinkai 2009). Numerous SNPs have been identified in the cell membrane/ectodomain of various
membrane-bound human and porcine TLRs as well as in the endosomal/lysosomal domain of TLRs in
cattle (Uenishi and Shinkai 2009, Werling et al. 2009). In one study, a total of 136 SNPs (45, 23, 13,
35, and 20) were identified in five different porcine TLR genes (TLR1, TLR2, TLR4, TLR5, and TLR6
respectively), 63 of which result in amino acid substitutions (Shinkai et al. 2006). The majority of
these non-synonymous SNPs were present in the LRR regions of the ectodomain, especially in the
genes that code for TLRs 1, 2 and 6 (Shinkai et al. 2006, Uenishi and Shinkai 2009). The levels of
heterozygosity among non-synonymous SNPs found in the TLR1 and TLR6 genes were greatest in the
regions encoding for the first four LRRs and the 13th LRR proximal to the C-terminal domain. In
contrast, synonymous SNPs with high levels of heterozygosity were located in LRRs 9-12 (Shinkai et
al. 2006, Uenishi and Shinkai 2009). The high degree of variability of these SNPs within the LRR
domains has been proposed to broaden both the range of ligand recognition and thus the ability of
these receptors to recognise a large variety of pathogens. In contrast few SNPs are found in the
domains related to signal transduction and downstream signaling pathways. Such SNPs are believed
to be deleterious and thus, may have been eliminated through evolutionary selective pressure (Uenishi
and Shinkai 2009, Uenishi et al. 2011). Interestingly, non-synonymous and synonymous SNPs in
TLR1, 2 and 6 are far less common in European wild boar populations compared to domestic pigs. As
10
mentioned previously, this difference may be due to increased selection pressure as a consequence of
domestication (Bergman et al. 2010). In the Bergman study; 20, 27 and 26 SNPs were identified in the
TLR1, TLR2 and TLR6 genes of domestic pigs, respectively. Of these SNPs, one major high frequency
haplotype was detected in each of the three genes found in three different European wild boar
populations compared with one high frequency haplotype in the TLR2 gene of the studied domestic
pigs. The relative frequency of non-synonymous SNPs to synonymous SNPs was lower in all three
genes of the wild boar population than in domestic pigs, in this case possibly being a reflection of the
detrimental effects of non-synonymous SNPs on TLR function and ligand specificity.
To date, very few non-synonymous SNPs have been detected in the ectodomain of the porcine
TLR4 gene (Uenishi and Shinkai 2009). In one study, 34 SNPs, 17 in the coding sequence and 17 in
the non-coding sequence including the promoter region were identified. Five of the non-synonymous
SNPs were found to cluster within, or were located in close proximity to, the hyper-variable domain
in exon 3. As in other mammalian species a major exon 3 haplotype can be identified with non-
synonymous SNPs in this region only being present at low frequencies (ranging from 0.6 % and 8.7
%) (Palermo et al. 2009). Different polymorphism in the TLR4 gene has also been shown to have
different frequencies in Japanese wild boar populations when compared to domestic pigs; this is
presumably due to evolutionary selective pressure due to varying residential pathogens or
demographic factors (Shinkai et al. 2012). SNPs are uncommon in the cytoplasmic TIR domain
(dimerization or signaling domains) and sequences in this region are highly conserved across
mammalian species (Bergman et al. 2010, Uenishi et al. 2011, Werling et al. 2009).
The genes encoding endosomal TLRs (TLR3, 7, 8 and 9) of pigs are also highly conserved
with far fewer reported SNPs than in cell surface TLRs, however genetic variations are similarly
distributed and more common within the ectodomain. This relative lack of polymorphisms within the
LRR domains of endosomal TLRs suggests that nucleic acid recognition and binding is well
conserved and a higher degree of variability within the LRR domains may in fact be detrimental to
these PRRs (Morozumi and Uenishi 2009, Uenishi and Shinkai 2009, Uenishi et al. 2011). Porcine
TLR10 has recently been reported to contain more SNPs relative to other TLRs with 13 synonymous
11
and 20 non-synonymous SNPs being detected in a small sample size of 30 pigs (15 wild boar and 15
pure bred Landrace, Hampshire and Large white) (Bergman et al. 2012). Once again, wild boars
contained fewer SNPs and fewer SNP haplotypes than domestic pigs. Bovine TLR4 was found to be
highly polymorphic with seven SNPs being reported (Zhou et al. 2007). Eleven SNPs have been
detected in the TLR4 gene of sheep (Zhou et al. 2007) and five non-synonymous SNPs have been
identified in the extracellular domain of the TLR4 gene in chickens (Leveque et al. 2003). A mutation
in murine TLR4 was originally identified in mice resistant to LPS resulting in substitution of proline
with histadine at position 712 in the amino acid sequence (Poltorak et al. 1998). Subsequently it was
also shown that mutational changes to the structure and expression of TLR4 resulted in variation in
sensitivity to LPS (Du et al. 1999). Two SNPs located within the coding region of the extracellular
domain of the human TLR4 gene, A(896)G [Asp299Gly)] and C(1196)T [Thr399Ile], are associated
with a decreased ability to respond to LPS either as a result of altered binding capacity or altered
ligand induced homo-dimerization (Arbour et al. 2000, Rallabhandi et al. 2006). The presence of
these SNPs has also been linked to an increased risk of acquiring several infectious and non-infectious
diseases (Arbour et al. 2000, Rallabhandi et al. 2006, Schroder and Schumann 2005, Yamakawa et al.
2013). In contrast, the presence of these SNPs can have a protective role in cases where the immune
response to circulating LPS is detrimental (Senthilselvan et al. 2009). SNPs in the human TLR2 gene,
G(2251)A [Arg753Gln] and C(2029)T) [Arg677Trp], have been reported to reduce immune
responsiveness to a number of pathogens and disease syndromes (Ben-Ali et al. 2004, Lorenz et al.
2000, Pabst et al. 2009, Schroder et al. 2003). Some of these changes appear to be due to impaired
ligand binding. Many other human TLR SNPs have been identified but their disease associations have
not been well characterized (Arbour et al. 2000, Arbour et al. 2000, Rallabhandi et al. 2006,
Rallabhandi et al. 2006, Uenishi and Shinkai 2009). Very few disease association studies have been
performed in pigs and the pathological significance of most SNPs is still unknown. SNPs in the TLR2
and TLR6 genes can alter the heterodimerization process and/or function of these receptors. It has
been suggested that these changes may play an important role in Mycoplasma hyopneumoniae
infection (Muneta et al. 2003, Uenishi et al. 2011) and putatively, other diseases. Keirstead et al.
detected an increased frequency of the TLR1 C(2305)T and TLR5 C(1919)A SNPs in diseased pigs

12
with pneumonia, septicemia and enteritis. A 3-fold increase in the frequency of the TLR5 C(1919)A
was detected in pigs with PRRSV and PCV-2 and a 5-fold increase was observed in pigs diagnosed
with Streptococcus suis (Keirstead et al. 2011). The association between increased TLR5 C(1919)A
and infection with PRRSV and PCV-2 was unexpected as bacterial flagellin is the major ligand of
TLR5. This may be due to co-linkage of the TLR5 C(1919)A SNP with other SNPs or to variations in
factors involved in antiviral signaling. Further studies are needed to clarify this apparent discrepancy.
13
COLLECTINS AND FICOLINS (COLLAGENOUS LECTINS)
Collectins (CL) and ficolins (FCN) are multimeric proteins that recognize sugar moieties and
are often grouped together as collagenous lectins, because both share a similar collagen-like domain
as one of their key features. These components of the innate immune system are found in a number of
vertebrate and invertebrate species (Table 1.2). They were first described as plant proteins that had the
capacity to agglutinate erythrocytes. Conglutinin (CG/COLEC8), the first was identified in 1906
(Bordet and Streng 1909, Holmskov and Jensenius 1993, Holmskov et al. 1994). More recently with
renewed interest in innate immunity and PRRs, they have received significant attention. Many
microbial targets on bacteria, viruses, fungi and protozoa that interact with these sugar-binding lectins
have been identified and are described in detail in several reviews (Holmskov et al. 2003, Ip et al.
2009, Keirstead et al. 2008, Kuroki et al. 2007, Lillie et al. 2005, Turner 2003, Veldhuizen et al.
2011). Collagenous lectins function as receptors for pathogen recognition and are involved in
phagocytosis, opsonisation/agglutination and complement activation. Apart from CG, this group
includes proteins such as mannan-binding lectin A (MBL-A), mannan-binding lectin C (MBL-C),
surfactant protein A (SP-A), surfactant protein D (SP-D), collectin liver 1 (CL-L1), collectin placenta
1 (CL-P1), collectin of 43 kDa (CL-43/COLEC9), collectin of 46 kDa (CL-46/COLEC13), collectin
kidney 1 (CL-K1), as well as multiple ficolins, whose nomenclature varies in different species.
Proteins in the collagenous lectin group of receptors are oligomeric assemblies of multiple
trimeric proteins composed of three identical monomer polypeptide units, except for surfactant
protein-A (SP-A), which contains three almost identical units (Holmskov et al. 2003). Each monomer
can be divided into four domains: an N-terminal cysteine rich domain followed by a collagen-like
region of glycine-X-Y (Gly-X-Y) repeats, a neck domain and a C-terminal globular carbohydrate
recognition domain (CRD). The N-terminal cysteine rich domain is important for disulfide bridging
(Cys24
-Cys24
) between adjacent monomers and for trimer stabilization (Holmskov et al. 2003, Jensen
et al. 2005, Ohashi and Erickson 2004). This region is critical for higher order oligomerization with a
minimum of two disulfide bonds being required for efficient oligomer formation (Jensen et al. 2005,
Phatsara et al. 2007). The Gly-X-Y repeat region contributes to the coiled-coil appearance and tertiary
14
structure of the basic trimeric unit (Colley and Baenziger 1987, van Eijk et al. 2000). In addition, the
collagen-like domain contains a six amino acid sequence, GEKGEP, which is similar to sequences
observed in the human and murine C1q with some variation in the third amino acid position (arginine
or glutamate replacing lysine). GEKGEP interacts with C1qRp on leukocytes and plays an essential
role in lectin-mediated phagocytosis (Arora et al. 2001). The GEKGEP sequence is absent in
surfactant protein-D (SP-D) and all mammalian FCNs expect for porcine FCN-α and FCN-β;
suggesting that in pigs, FCNs may play a role in lectin-mediated phagocytosis (Ichijo et al. 1993).
Within the collagen-like domain of CLs, there is a structural interruption, called the Gly-X-Gly
kink/interruption, which provides structural flexibility and allows for higher order sertiform structure
formation (van de Wetering et al. 2004). Although, on electron microscopy, a similar structural bend
is observed in ficolins, it is not due to the presence of a Gly-X-Gly motif kink as in collectins (Ohashi
and Erickson 1997, Ohashi and Erickson 1998). An MBL associated serine protease (MASP)–binding
motif containing hydroxyproline, (Hyp)-Gly-Lys-X-Gly-Pro is located within the collagen-like
domain on the C-terminal side of the Gly-X-Gly kink (Schwaeble et al. 2002, Walport 2001, Zuo et
al. 2010). This sequence is relatively conserved across all mammalian MBLs (Wallis et al. 2004) with
the exception of porcine MBL-C where Met is substituted for Lys, a substitution that has no apparent
effect on MASP binding and subsequent complement activation (Agah et al. 2001). This same
sequence is also present and highly conserved in porcine, rodent and primate ficolins but with certain
amino acid substitutions (specifically Glu for Lys and Val for Hyp in porcine FCN-α and -β
respectively) (Schwaeble et al. 2002, Wallis et al. 2004, Walport 2001). The neck domain is a
relatively short region that functions to line up the collagen-like domains and facilitate formation of
the collagen triple α-helix (Lillie et al. 2005).
The C-terminal end of collectins is characterized by the presence of a large globular
carbohydrate recognition domain (CRD), with binding being calcium dependent (Holmskov and
Jensenius 1993). In contrast, the CRD of ficolins is fibrinogen-related with binding taking place
independent of calcium. All collectins with the exception of collectin placenta 1 (CL-P1) bind
mannose, glucose and other monosaccharides that contain a hydroxyl group in the equatorial plane at
15
carbon atoms 3 and 4 of the pyranose ring (Lee et al. 1991, Ng et al. 1996, Weis et al. 1992). The
sugar binding specificity of CLs is determined by a three amino acid consensus sequence in the CRD
(Ng et al. 1996). Collagenous lectins with the Glu-Pro-Asn sequence bind mannose-type sugars (Weis
et al. 1992), while those with Gln-Pro-Asp bind galactose-containing sugars (Ohtani et al. 2001). The
fibrinogen-related CRD of FCN binds N-acetyl-D-glucosamine (GlcNAc) (Ohashi and Erickson
1997) and other acetylated compounds (Brooks et al. 2003a, Brooks et al. 2003b, Krarup et al. 2004).
Collectin liver 1 (CL-L1) contains a serine substitution (Glu-Pro-Ser), but the impact of this
substitution on sugar binding has not been studied (Ohtani et al. 1999). The various lectin sugar
ligands are summarized within Table 1.2.
Higher order oligomerization of the basic trimeric subunits occurs in all collectins with the
exception of CL-43 and CL-L1 which exist as a basic trimeric unit (Colley and Baenziger 1987,
Holmskov et al. 2003, Ohashi and Erickson 2004, van Eijk et al. 2000). Ficolins, CG, MBLs and SP-
D form tetra-trimers while SP-A and C1q form hexa-trimers (Ohashi and Erickson 2004). Higher
order oligomerization increases the binding avidity of sertiform and cruciform oligomers, from 10-3
M
as a single CRD to 10-10
M in higher oligomers (Lee et al. 1991). Binding specificity is also affected
by saccharide composition and the spatial relationships between CRDs in cell membranes (Hoffmann
et al. 1999). MBLs, SP-A and FCNs form sertiform oligomers (Holmskov et al. 2003, van de
Wetering et al. 2004) while SP-D, CG and CL-46 form cruciform oligomers (Holmskov et al. 2003).
CL-P1 is a membrane-bound trimer originally identified in endometrial tissue (Lillie et al. 2005).
Cruciform lectins (SP-D, CG and CL-46) and SP-A (sertiform lectin) play a role in pathogen
recognition, opsonisation and agglutination while other sertiform lectins (MBLs and FCNs), although
also having opsonisation and agglutination capabilities, primarily interact with MASPs (1, 2, 3) and
the MBL-associated proteins, MAp19 or sMAP (Lawson and Reid 2000, Schaeffer et al. 2004, van de
Wetering et al. 2004). This leads to activation of the complement cascade and the clearance of
targeted PAMPs (Endo et al. 2007, Fujita et al. 2004b, Fujita et al. 2004b, Schwaeble et al. 2002,
Walport 2001). There are three different MASPs proteins, MASP-1, -2 and-3. These molecules are
analogous in structure and function to the C2 and C4 cleaving C1r and C1s serine proteases of the C1
16
complex (Schwaeble et al. 2002, Walport 2001). MASP-2 exhibits a 3- and 23-fold increased ability
to cleave C2 and C4 respectively, relative to human C1s suggesting that MASP-2 is a potent mediator
of complement activation (Rossi et al. 2001). Another recent study has suggested that ficolins may
also be capable of inducing MASP associated complement activation (Girija et al. 2007). Collagenous
lectins also play a role in sensing DAMPs and MBL has been implicated to play a major role in
reperfusion injury (Diepenhorst et al. 2009).
Collagenous lectins such as MBLs and FCNs are present circulating in plasma and are
expressed predominantly in the liver but also at mucosal surfaces. In the pig, FCNs are also expressed
in neutrophils (FCN-β) (Brooks et al. 2003c) and cells of the endometrium (Ichijo et al. 1993) and
immuoreactive FCNs have been shown to be present within the intestinal crypt and lung epithelium
(De Lay 1999). However it is unclear if expression takes place at these sites as well. The genes coding
for these receptors are relatively conserved across the animal kingdom (Holmskov et al. 2003, Lu et
al. 2002, Phatsara et al. 2007, van de Wetering et al. 2004). In pigs SP-A, SP-D and MBL-A are
located within the collectin locus (syntenic genes) on chromosome 14; similar to humans, cattle and
mice (Gjerstorff et al. 2004, Marklund et al. 2000, van Eijk et al. 2000, van Eijk et al. 2002). In
humans, the MBL2 gene (MBL-C) contains four exons: exons 1 and 2 encode the Gly-X-Y triple
collagen helix motif that forms the stalk; exon 3 the coiled-coil neck region and exon 4 the CRD
domain (Garred et al. 2006). The human L-ficolin gene (FCN2) contains sequences for a 25 amino
acid signal peptide and N-terminal region consisting of nine amino acids (exon 1and 2), a collagen-
like domain (exon 3), a neck region (exon 4), the first part of a fibrinogen-like domain (exons 5 to 7)
and the remaining portion of the fibrinogen-like domain (exon 8) (Endo et al. 1996). The human M-
FCN gene (FCN1) is organized in this same manner but contains an extra exon that codes for four
additional Gly-X-Y repeats (Endo et al. 2004, Endo et al. 2006, Endo et al. 2007). All mammals have
two MBL genes, MBL1 and MBL2, which corresponds to MBL-A and MBL-C respectively. Birds
(chickens) and fish have only one MBL gene. Humans and higher order primates have acquired a stop
codon in the gene encoding MBL-A, resulting in the expression of a pseudo gene referred to as
MBL1P (Guo et al. 1998, Lillie et al. 2005, Phatsara et al. 2007). Ascidians and frogs have multiple
17
FCNs. Humans and non-human primates have three FCNs, M-FCN (FCN1), L-FCN (FCN2) and H-
FCN (FCN3) while chickens have only one FCN. Some mammals have two sets of related FCNs
(FCN-α and -β in pigs, FCN-A and -B in rodents; both encoded by FCN1 and FCN2 and FCNA and
FCNB respectively) (Endo et al. 2006, Endo et al. 2007, Fujita et al. 2004a, Fujita et al. 2004b,
Kakinuma et al. 2003, Kenjo et al. 2001, Lillie et al. 2005). In rodents (mice and rats), FCN3 exists as
a pseudo gene (Endo et al. 2004). There are two basic groups of mammalian FCNs: a circulating
plasma group that includes pig FCN-α, mouse FCN-A and human and primate L-FCN and a group
that is present in peripheral blood monocytes, neutrophils and cells of the bone marrow, lung and
spleen. This second subset includes pig FCN-β, mouse FCN-B and human and primate M-FCN (Endo
et al. 2007). The species distribution of the various collagenous lectins is summarized in Table 1.2.
Several different SNPs have been detected in the CL and FCN genes of humans and other
mammalian species (Crouch et al. 1993, Garred et al. 2003, Garred et al. 2006, Juul-Madsen et al.
2011, Lahti et al. 2002, Lillie et al. 2005, Lillie et al. 2006, Lillie et al. 2007, Lipscombe et al. 1992,
Madsen et al. 1994, Madsen et al. 1998, Marklund et al. 2000, Phatsara et al. 2007, Sumiya et al.
1991, Wang et al. 2011, Zhou et al. 2010). These polymorphisms can be divided into SNPs in the
coding region (that affect the structural characteristics of collagenous lectins) in the promoter region
(that may affect gene expression) those present in non-coding or intronic regions, and synonymous
coding region SNPs (that may or may not alter gene expression without resulting in changes to the
structural/functional properties of collagenous lectins).
Nine different SNPs have been identified in the non-coding regions of the porcine MBL2. One
of these SNPs, a C to T substitution at position 328 in the intronic region is associated with the loss of
an HinfI restriction site (Lillie et al. 2007, Marklund et al. 2000, Phatsara et al. 2007). Five SNPs are
found in the promoter region of MBL2 at positions -2148 (T to C), -1081 (G to A), -1636(T to G), -
1614(A to G) and -251 (C to T) (Keirstead et al. 2011, Lillie et al. 2007). All of these SNPs, with the
exception of C(-251)T, are present at increased frequencies in pigs with pneumonia, septicemia,
enteric disease and serositis and in pigs infected with specific etiologic agents such as Streptococcus
suis, porcine reproductive and respiratory syndrome virus (PRRSV) Salmonella enterica subsp.
18
enterica ser. Typhimurium (S. Typhimurium), porcine circovirus type 2 (PCV2), Escherichia coli and
Mycoplasma spp.) (Keirstead et al. 2011, Lillie et al. 2007).
There are three well-known mutations in the promoter region of the human MBL2 gene: H/L
[G(-550)C], X/Y [G(-221)C] and P/Q at (position +4 in the 5'UTR). These SNPs are associated with
decreased serum levels of MBL-C (Garred et al. 2003, Madsen et al. 1998). In humans, three non-
synonymous MBL2 SNPs, located within exon 1, results in amino acid substitutions in codon 52 (Arg
to Cys - D allele), 54 (Gly to Asp - B allele) and 57 (Glu to Gly - C allele) (Garred et al. 2003, Garred
et al. 2006, Lillie et al. 2005, Lipscombe et al. 1992, Madsen et al. 1994, Madsen et al. 1998, Phatsara
et al. 2007, Sumiya et al. 1991). All three SNPs are associated with destabilization of the collagen
triple helix and result in a marked reduction in serum levels of MBL-C (Garred et al. 2003, Garred et
al. 2006). Numerous MBL2 promoter SNPs and infectious diseases studies have been performed in
humans and disease associations have been firmly established (Hamvas et al. 2005, Mullighan et al.
2002, Thiel 2007, Zhang et al. 2005, Zhang and Ali 2008). The human MBL1P1 pseudo gene
contains an intron 1 splicing defect, in addition to two nonsense mutations in exon 3 and 4 and a Gly
to Arg substitution in codon 53. The latter substitution is proposed to disrupt the collagen backbone of
the protein in analogy to the human MBL2 codon 54 Gly to Asp substitution (Seyfarth et al. 2005).
Lillie et al. described three SNPs in the coding regions of the porcine MBL1 gene: G(271)T;
C(273)T and C(687)T SNPs. Two of these SNPS, C(273)T and C(687T) are synonymous mutations.
The remaining SNP, G(271)T, is a non-synonymous mutation located in the collagen-like domain of
the gene. This mutation is similar to both the human MBL2 B/C and the D allele variants in that it
results in the replacement of a glycine to cysteine residue. By analogy to the human gene, this
substitution may also disrupt the collagen structure and its structural stability and alter the blood
levels of the MBL1 gene product (Garred et al. 2006, Garred et al. 2006, Juul-Madsen et al. 2006,
Juul-Madsen et al. 2011, Lillie et al. 2006). Increased frequencies of C(273)T and C(687)T have been
detected in all diseased pig groups (with the exception of those with serositis) (Keirstead et al. 2011)
and in pigs diagnosed with Escherichia coli, Haemophilus parasuis, Actinobacillus
pleuropneumoniae and Streptococcus suis infections. An intronic SNP, MBL1 C(int)T, has also been
19
detected in diseased pigs with enteritis and pneumonia syndromes (Keirstead et al. 2011, Marklund et
al. 2000). How this intronic SNP is related to gene and protein function is, however, still not clear.
The mean serum concentration of MBL-A is a heritable characteristic of Danish Landrace
pigs but not Duroc pigs (Juul-Madsen et al. 2006). Recent studies by Juul-Madsen et al. (2011) have
described 14 different SNPs in the porcine MBL1 gene, eight in exons and six in introns. Four of the
exon SNPs were non-synonymous (A(77)G, C(161)G, T(871)C and G(949)T); the remaining four
were synonymous and located at positions 30, 951, 3233 and 3344. The six intron SNPs were found at
positions 193, 216, 488, 1046, 1102 and 1103. One set of MBL1 SNP haplotypes (A2) was associated
with a decrease in serum concentrations of MBL-A which is likely due to a T substitution at position
949 (Juul-Madsen et al. 2011). This SNP is identical to the G(271)T SNP previously described (Lillie
et al. 2006).
Synonymous SNPs were also found at position G(579)A and G(645)A of the MBL2 gene
(Lillie et al. 2007). Three SNPs; G(855)A, G(2651)A and T(2686)C; have recently been identified in
the MBL1 gene of Chinese native cattle (Wang et al. 2011). G(855)A resides in intron 1, the other two
SNPs, one synonymous and one non-synonymous reside in exon 2. A significant association was
found between the G(2651)A SNP and the somatic cell count in these cows. The combined genotypes
of GGC/AAC had the lowest somatic cell count, AAT/AAT had the highest protein content and
AGC/AGC had the highest 305-day milk yield. These genotypes were considered favorable
combinations for resistance to mastitis and milk production traits (Wang et al. 2011). These findings
demonstrate the potential for SNP-based selection panels for improving innate disease resistance to
common diseases, as well as increased production and enhanced performance parameters. However,
multiple SNPs in the same genotype could affect expression or function in different directions, and
innate immune gene redundancy could mask the impact of particular SNPs. This means that large
panels of many functional SNPs and appropriate disease resistance phenotypes will be needed to
exploit this knowledge.
20
Keirstead et al. discovered three non-synonymous SNPs in the coding region of the CRD of
the SFTPA gene (SP-A). One of these SNPs, T(599)A, was associated with disease conditions such as
pneumonia, septicemia, enteric disease and serositis and with several bacterial infections (S. suis, H.
parasuis, E. coli, S. Typhimurium and Mycoplasma spp.) and the viral agents, PCV2 and PRRSV. No
disease associations were detected with three non-synonymous SNPs located in FCN1 and FCN2
(Keirstead et al. 2011). Several SNPs have been reported in the collagen-like domain of human SP-A
and SP-D with the SP-D SNPs at positions 11 (Met/Thr), 160 (Ala/Thr) and 270 (Ser/Thr) proposed to
result in structural changes to the protein (Crouch et al. 1993, DiAngelo et al. 1999, Heidinger et al.
2005, Lahti et al. 2002, Leth-Larsen et al. 2005) . Numerous disease association studies of these SNPs
have been performed in humans; however few such studies have been performed in pigs (Pastva et al.
2007, Sorensen et al. 2007).
21
C-TYPE LECTIN RECEPTORS AND SCAVENGER RECEPTORS
A number of other collectin-like receptors (CLRs) have been identified including dectin-1, -2
and -3, macrophage C-type lectin (MINCLE), pulmonary macrophage scavenger receptor (MARCO)
and DC-SIGN, a transmembrane receptor expressed on dendritic cells (DCs) and macrophages.
Dectins are immune receptors that contain a tyrosine based activation motif (ITAM) coupled to type II
membrane receptors. They are expressed on cells of myeloid origin (DCs, macrophages/monocytes
and neutrophils). Dectins recognize 1,3 and β1,6 linked glucans present in fungi, plants and bacteria
(Robinson et al. 2009, Zhou et al. 2010). MINCLE, a dectin expressed on macrophages, interacts with
fungi such as some Mallasezia and Candida (Yamasaki et al. 2009) as well as endogenous danger
associated molecular patterns (DAMPs) (e.g. spliceosome-associated protein 130 (SAP130))
(Yamasaki et al. 2008). Microbial binding to pulmonary macrophage scavenger receptor (MARCO)
and dendritic cell-specific intercellular adhesion molecule-3-grabbing non-integrin (DC-SIGN) results
in suppression of the expression of pro-inflammatory cytokines while increasing the expression of
NF- B through interaction with various TLRs (Geijtenbeek and Gringhuis 2009, Mukhopadhyay et
al. 2011) and nucleotide-binding oligomerization domain receptors (NLRs) (Mukhopadhyay et al.
2011). Please see Table 1.3 for a summary of the ligands and cellular localization of the C-type lectin
receptors (CLRs) and scavenger receptors.
To date, a total of nine SNPs have been identified in the -glucan domain of the ovine dectin-
1 gene, CLEC7A; all are present in exons 4 to 6. Four of these SNPs, in exons 4 (n = 2) and 6 (n = 2),
were found to be non-synonymous (Zhou et al. 2010). This gene exhibits a high level of homology
among sheep, cattle and pig populations, however no SNPs have been found in this gene in pigs or
cattle.
No disease or functional associations have been reported in the dectin-1 gene of pigs or other
livestock species (Zhou et al. 2010).
22
GALECTINS
Galectins were previously known as S-type lectins because of the presence of sulfhydryl or
thiol groups and the requirement for reducing conditions to maintain function. This now holds true
only for galectin-1 and -2 (Yang et al. 2008). Fifteen galectins have been identified in mammals and,
based on their structural features; they can be divided into three groups: prototype, tandem and
chimeric type galectins (Liu and Rabinovich 2010, Rapoport et al. 2008, Sato et al. 2009, Vasta 2009,
Yang et al. 2008). Prototype galectins have a molecular weight of approximately 14 kDa and contain
a single CRD. They exist as monomers (galectin-5, -7, -10 and -14), non-covalent dimers the result of
interactions between hydrophobic regions in the carbohydrate binding grooves located at opposite
ends of the CRD (galectin-1, -2, -7, -11, -13 and -14) or as homodimers (galectin-13) that are
stabilized by two disulfide bonds. Tandem type galectins contain two CRDs (homologous but not
identical in amino acid sequence) connected by a linker peptide that consists of 25 to 35 amino acid
residues enriched in proline and glycine tandem repeats (galectin-4, -6, -8, -9 and -12) (Rapoport et al.
2008, Sato et al. 2009, Yang et al. 2008). The chimeric type galectin-3 contains a single CRD with
one regulatory domain within the N-terminus. Furthermore galectin-3 consists of a 100-150 amino
acid sequence which is rich in glycine, tyrosine and proline residues and also contains a number of
repeated collagen-like regions. The active binding site of the CRD is formed by three peptide chains,
S4 to S6. The CRD oligomerizes and forms pentamers upon binding its cognate carbohydrate ligand,
a process that takes place through self-assembly of the N-terminal regulatory domain (Liu and
Rabinovich 2010, Sato et al. 2009, Vasta 2009, Yang et al. 2008). The globular region of the CRD
consists of two antiparallel -sheets composed of up to 130 amino acids containing six (S1-S6) and
five (F1-F5) peptide chains; respectively. Chain S3-S6 forms two long finger like projections that are
steeply bent forming a carbohydrate binding groove with five binding site regions labeled A to E. Site
C and D, the main binding sites, recognize lactosamine fragments. The hydroxyl (OH) group at the C-
4 site is considered crucial for carbohydrate binding. Sites A and B recognize fragment X and site E
recognizes fragment Y in the lactosamine chain structure. The -jelly roll accounts for the topology of
this region (Rapoport et al. 2008, Sato et al. 2009, Yang et al. 2008).
23
Galectins are located intracellular, in the cytoplasm and/or nucleus, and on the cell
membrane. Galectins 1-3 and 6-9 are found in a variety of different epithelial and endothelial cells as
well as various immune cells while galectin-4 and -7 are restricted to the epithelium of the digestive
tract (Wooters et al. 2005) and stratified squamous epithelium, respectively (Sato et al. 2009).
Galectin-1, -3, -9 and -12, are found in all cells of the immune system (Sato et al. 2009). A number of
different cell populations contain galectins-5 and 10-14 (Rapoport et al. 2008). These lectins are
produced through a non-classical synthetic pathway that bypasses the endoplasmic reticulum (ER)
and Golgi apparatus. Following synthesis in cells such as keratinocytes, fibroblasts, endothelial cells
and mucosal epithelial cells, galectins are stored in exosomal vesicles that subsequently fuse with the
cell membrane during times of stress (inflammation or malignant transformation) (Rapoport et al.
2008, Sato et al. 2009). Alternatively, they can be released directly from damaged cells (Elola et al.
2007).
The CRD of galectins binds galactose residues that are linked to an adjacent monosaccharide
in the -configuration ( -galactoside/ Gal 1,4GlcNAc) (Elola et al. 2007, Sato et al. 2009). Binding is
calcium independent with the specificity of binding being determined by a hydroxyl group on residues
C-4 and C-6 (with the C-4 OH being the most critical) and on a GlcNAc residue located at position C-
3 of the sugar moiety (Rapoport et al. 2008, Sato et al. 2009). The target galactose molecules are often
found in O-linked and N-linked “complex type” glycoproteins. Binding avidity is increased through
multivalent interactions with the ligand and is affected by temperature (i.e. membrane fluidity).
Glycan clusters or ordered arrays formed of lectin and multivalent glycoconjugates are often referred
to as the glycan lattice (Sato et al. 2009, Yang et al. 2008). This glycan lattice may prevent
endocytosis of the bound ligand and thereby, prolong the signal transduction. (Sato et al. 2009).
Interactions between galectin PRRs and microbial pathogens have been extensively reviewed
(Sato et al. 2009, Vasta 2009). Intracellular galectins have been shown to play a role in cell cycle
regulation by either inducing or suppressing apoptosis and modulating cellular proliferation and
differentiation. Galectins-1 and -3 bind to Ras proteins and stimulate the Raf - PI3K pathway leading
to mitogenic activity. Bcl-2 contains a binding site for galectin-3 and binding abolishes the anti-
24
apoptotic binding activity of the lectin. Galectins-1 and -7 are positive regulators of apoptosis but the
exact mechanism is unknown although galectin-7 appears to play a role in FAS/caspase-8
mechanisms (Rapoport et al. 2008, Yang et al. 2008). Galectin-1 enhances the expression of
interferon gamma receptor (IFN R) on T-lymphocytes (Rapoport et al. 2008). Intracellular galectins
activate cyclin dependent kinases through an unknown mechanism. Galectins-3 and -12 have been
shown to inhibit cyclin E, A and D1, arresting the cell cycle in the G1-phase. They have also been
implicated in the regulation of gene transcription via specificity protein 1 (Sp1) transcription factor
and cAMP response element-binding (CREB) (Rapoport et al. 2008). Of importance, is their ability to
interact with cellular proteins that regulate galectin transport and expression of galectins on the cell
surface. Surface membrane galectins play a role in cell-cell and cell-matrix adhesion as well as
regulation of the immune system during inflammation and oncologic transformation (Rapoport et al.
2008). Cell-cell and cell-matrix binding takes place via polylactosamine chains of glycoproteins and
is dependent on the concentration of resident galectins, as well as, interactions with cellular
differentiation factors, a process that can have both positive and negative effects on cell adhesion.
Interaction with the carbohydrate chains of integrins, intercellular matrix proteins and membrane
glycolipids induces a cascade of signaling reactions that control cell proliferation and apoptosis
(Rapoport et al. 2008). Galectins can induce apoptosis of T-lymphocytes through interaction with N-
glycans of proteins and subsequent exposure to phosphatidyl-serine as observed with galectin-1 with
CD45, CD43 and CD7; galectin-3 with CD29, CD7 and CD95; and galectin-2 with 1-integrin (Liu
and Rabinovich 2010). Galectins also induce phagocytosis by scavenging immune system cells
(lectin-mediated phagocytosis). Galectin-3 binds to N-glycan LacdiNAc fragments of helminthic cells
and apoptotic bodies of macrophages. Galectin-3 and -9 act as potent chemo attractants for
neutrophils and eosinophils respectively with both galectin-1 and -3 playing a role in neutrophil
adhesion and trafficking (Liu and Rabinovich 2010). Apart from the important role, these proteins
play in sensing PAMPs, galectins like other PRRs have also been proposed to interact with DAMPs
released during tissue injury (Sato et al. 2009).
25
Very little is currently known about the genetics of galectins. The structural features and
genes coding for these lectins seem to be strongly conserved across all species (Vasta 2009). Few
genetic studies have been performed and concrete disease associations are not available (Sato et al.
2009, Vasta 2009). Keirstead et al. discovered four novel polymorphisms within the gene encoding
for porcine galectin 4 and all were located within the CRD. One synonymous mutation, C(96)T, was
found to occur more frequently in all porcine disease groups investigated with the exception of
serositis, and in pigs diagnosed with E. coli, Mycoplasma spp., S. suis and PCV-2. Additional studies
are needed to determine the functional significance of this synonymous SNP and whether it may be
linked to other genetic mutations (Keirstead et al. 2011). Further genetic and disease association
studies will be required to fully understand the complex interactions between this class of lectins and
their detrimental effects on porcine health.
26
RETINOIC ACID-INDUCIBLE GENE-1-LIKE RECEPTORS
The retinoic acid-inducible genes (RIG)-1-like receptors (RLRs) are IFN-inducible
cytoplasmic RNA helicases. This recently discovered group of receptors plays a critical role in the
recognition of cytoplasmic RNA and DNA. The RLRs include retinoic acid-inducible gene 1 (RIG-1,
also known as DDX58), melanoma-differentiation-associated gene 5 (MDA-5 also known as
interferon-induced helicase/IFIH1 or helicard), RNA helicase LGP-2 (LGP-2 also known as DHX58),
DNA-dependent activator of IFN-regulatory factors (DAI also referred to as tumor stroma and
activated macrophage protein/DLM-1 or Z-DNA-binding protein 1/ZBP1), interferon-inducible
protein AIM-2 (absent in melanoma-2) and the more recently described ATP-dependent RNA
helicase DDX60 (DDX60) (Cui et al. 2008, Ha et al. 2008, Kato et al. 2006, Li et al. 2009, Miyashita
et al. 2011, Mogensen 2009, Moresco and Beutler 2010, Saito et al. 2007, Satoh et al. 2010, Schlee et
al. 2009, Takeuchi and Akira 2010, Wilkins and Gale 2010, Yoneyama et al. 2005). Table 1.4
summarizes the various ligands and cellular localization of the known retinoic acid-inducible gene
(RIG)-I–like receptors (RLRs).
These helicases contain an N-terminal caspase recruitment domain (CARD) (Mogensen 2009,
Takeuchi and Akira 2010, Wilkins and Gale 2010), a central DEAD box (DexD/H) helicase/ATPase
and a C-terminal regulatory domain; the CARD domain is absent in LGP-2 (Takeuchi and Akira
2010, Wilkins and Gale 2010, Yoneyama et al. 2005). The N-terminal CARDs of RIG-1 and MDA-5
trigger intracellular signaling pathways via the IFN-β promoter stimulator-1 (IPS-1 also known as
MAVS, VISA or CARDIF). IPS-1, is an adaptor molecule that possesses an N-terminal CARD
(Kawai et al. 2005) and promotes type 1-IFN production via tumour necrosis factor (TNF) receptor-
associated factor 3 (TRAF3) and TNF receptor type 1-associated DEATH domain protein (TRADD)
signaling pathways (Michallet et al. 2008) as well as IκB kinases (IKK-I and Tank binding
kinase1/TBK1) (Akira et al. 2006, Honda et al. 2006). Signaling via IκB kinases results in
phosphorylation of interferon-regulatory factor (IRF) 3 and IRF7 with subsequent transcription of
genes coding for type 1-IFN and IFN-inducible genes (Satoh et al. 2010). ATP is essential for type 1-
IFN production but the exact mechanism is still unknown. RIG-1, which may act as a translocase for
27
dsRNA, is postulated to change conformation and dimerize allowing catalyzation of ATP. The C-
terminal regulatory domain forms an RNA binding loop and is responsible for the binding of dsRNA
(Cui et al. 2008, Satoh et al. 2010, Takahasi et al. 2008, Takahasi et al. 2009, Takeuchi and Akira
2010, Wilkins and Gale 2010). The binding loop in MDA-5 is open and flat, and has low RNA
binding affinity whereas the binding loops of RIG-1 and LGP-2 are round and have a high RNA
binding avidity. RIG-1 ligands include short dsRNA and 5'- triphosphate dsRNA as found in RNA
and DNA viruses and activation of RIG-1 enhances type I-IFN signaling (Schlee et al. 2009, Schmidt
et al. 2009). The ligands for MDA-5, in turn, are longer dsRNA molecules and RNA with complex
folding and a higher order of structure (Pichlmair et al. 2009), such as the molecules found in RNA
viruses (esp. Picornaviridae) (Kato et al. 2006). LGP-2 has a higher binding affinity for dsRNA and
ssRNA than either RIG-1 or MDA-5. Binding occurs via the C-terminal domain which folds and
forms a basic RNA-binding groove that is bounded on one side by a critical RNA-binding loop
(Murali et al. 2008, Takahasi et al. 2009). Expression of LGP-2 is also induced in viral infections and
has been experimentally induced with poly I:C and LPS in pigs (Li et al. 2010). LGP-2 was originally
reported to function as a negative regulator of RIG-1 and MDA-5 by sequestering dsRNA or
inhibiting RIG-1 conformational changes (Rothenfusser et al. 2005, Saito et al. 2007, Yoneyama et al.
2005). Satoh et al. recently reported, however that LGP-2 has positive regulatory properties. These
investigators found that mice with a Lys to Ala (LGP2K30A/K30A
) mutation at position 30, have
impaired ATPase activity which, in turn, leads to impaired IFN-β responses. Similar results were also
observed in knock out (LGP2-/-
) mice and fibroblast cell lines (Satoh et al. 2010). It is proposed that
LGP-2 modifies RNA through its ATPase domain by removing RNA-binding proteins, altering the
conformation of RNA and/or modulating the intracellular localization of viral RNA. Since these
changes are associated with recognition by MDA-5 and RIG-1, LGP-2 is now believed to a positive
regulator of these receptors (Moresco and Beutler 2010, Satoh et al. 2010).
DAI and AIM-2 recognize dsDNA (Mogensen 2009, Schroder and Tschopp 2010, Wang et
al. 2008). DAI has three DNA binding domains, two for the left-handed Z-form of DNA (Z-DNA), Zα
and Zβ, and a third potential domain, the so-called D3 region. During signaling, DAI recruits TBK1
28
serine/threonine kinase and IRF3 resulting in downstream signaling and transcription of type 1-IFN,
similar to what is observed for RIG-1 and MDA-5 (Wang et al. 2008, Yanai et al. 2009). AIM-2 is a
343 amino acid protein with an N-terminal DAPIN/pyrin/PAAD domain (domain in apoptosis and
interferon response) which is represented by amino acids 1-87. AIM-2 also contains a C-terminal
HIN-200 protein domain, represented by amino acids 138 to 337. The HIN domain has two
oligonucleotide-binding folds (Fernandes-Alnemri et al. 2009), binds double stranded DNA (either
viral, bacterial, or even host) and acts as a cytosolic receptor for dsDNA. This leads to the
oligomerization of the inflammasome complex. The N-terminus of AIM2 interacts with the pyrin
domain of another protein, ASC (the apoptosis-associated speck-like protein containing a caspase
activation and recruitment domain). ASC also contains a CARD domain that recruits procaspase-1 to
the complex and leads to the auto activation of caspase-1, an enzyme that processes pro-inflammatory
cytokines (IL-1b and IL-18) (Schroder and Tschopp 2010).
Three non-synonymous coding SNPs, two of which have been linked to proposed structural
differences, have been reported in the porcine IFIH1 gene of oriental pig breeds (Meishan and
Jinhua); these SNPs were not identified in some western breeds (Landrace and Duroc) (Kojima-
Shibata et al. 2009). This same study also detected a total of 17 SNPs in the coding regions of the
DDX58 gene, including six non-synonymous SNPs, four of which are proposed to result in structural
differences. Functional assays on ligand recognition and SNP disease association studies are needed
to further investigate the significance of these identified SNPs. To date no promoter region
polymorphisms in the DDX58 gene have been identified in pigs. A single intronic polymorphism
(g.4919G>C), has been detected in the ninth intron of the porcine DHX58 gene (Li et al. 2010). An
association between the presence of this polymorphism and a variety of hematological parameters of 1
and 17 day old piglets was identified, including red cell distribution width as well as white blood cell
counts, absolute lymphocyte counts, and platelet distribution width respectively. Individuals with the
genotype CC or GC were also found to have significantly lower mean white blood cell counts than
individuals with the genotype GG. This may suggest a decreased ability of these individuals to
respond to infectious and inflammatory stimuli.

29
RIG-1-/-
and MDA5-/-
mice are highly susceptible to infection with various RNA viruses (Kato
et al. 2006). This suggests that the function of both RIG-1 and MDA-5 as essential PRRs is critical to
antiviral sensing. Genetic variations that may result in decreased production and/or function of these
non-redundant PRRs can have significant detrimental effects on host defences.
30
NUCLEOTIDE OLIGOMERIZATION DOMAIN-LIKE RECEPTORS
Nucleotide oligomerization domain (NOD)-like receptors (NLRs), previously known as
CATERPILLERs, NODs or NACHT–LRRs, play a key role as danger signals and intracellular
microbial sensors. NLRs consist of three distinct domains: a C-terminal leucine-rich repeat (LRR)
with structural homology to plant disease resistance proteins and TLRs, a central nucleotide-binding
domain (NACHT/NOD/NBD) and an N-terminal caspase activation and recruitment (CARD) or
pyrin (PYD) domain (Eisenbarth and Flavell 2009, Mogensen 2009, Schroder and Tschopp 2010,
Ting et al. 2008b, Williams et al. 2010). Twenty-two different receptors are currently classified as
NLRs. Based on phylogenetic analysis; NLRs can be divided into three distinct subfamilies that
include six nucleotide-binding oligomerization domain containing (NODs; including NOD1-2,
NOD3/NLRC3, NOD4/NLRC5, NOD5/NLRX1, and CIITA), 14 nucleotide-binding oligomerization
domain, leucine-rich repeat and pyrin domain containing (NLRPs/NALPs; including NLRP1-14) and
two ice protease-activating factor (IPAFs; including IPAF/NLRC4 and NAIP). All the NLRPs contain
a NACHT/NOD/NBD, PYD and LRR domain except for NLRP10 which has no LRR, the
significance of which is unclear (Schroder and Tschopp 2010). A second alternative classification
system has been proposed based on the N-terminal effector domain. Using this classification, NLRs
can be divided into four distinct groups: the NLRA [acidic transactivation domain], NLRB
[baculoviral inhibitory repeat (BIR)-like domain], NLRC [caspase recruitment domain (CARD)] and
NLRP [pyrin domain (PYD)] groups (Ting et al. 2008a). The C-terminal LRR domain serves as a
recognition receptor for PAMPs and DAMPs, especially for pathogens that have evaded cell surface
and endolysosomal mechanisms. (Eisenbarth and Flavell 2009, Schroder and Tschopp 2010, Williams
et al. 2010). ATP-dependent homotypic protein-protein oligomerization between NACHT domains of
NLRs (especially NLRP1,NLRP3/NALP3 and IPAF) results in the formation of high-molecular
weight complexes in the order of hexa- or heptamers (Eisenbarth and Flavell 2009, Martinon et al.
2002, Martinon et al. 2009, Schroder and Tschopp 2010, Williams et al. 2010). This complex then
recruits the CARD domain of adaptor protein ASC (apoptosis-associated speck-like protein) through
homotypic N-terminal CARD or the PYD domains interaction and in turn recruits the CARD domain
31
of multiple pro-caspase-1 proteins resulting in activation and forming the inflammasome. This
autocatalytic action of caspase-1, results in the secretion of pro-IL-1 , pro-IL18 and pro-IL-33 and the
formation of active compounds further stimulating the inflammatory cascade. Apart from the class II
trans-activator (CIITA) that acts as a key regulator of the expression of MHC class II genes (Steimle
et al. 2007, Steimle et al. 2007), all other NLRs are believed to act as intracellular PRRs. NOD1 and
NOD2, the most studied NLRs, recognize the breakdown products of bacterial cell walls (bacterial
peptidoglycans, meso-diaminopimelic acid and muramyl dipeptide, respectively) (Kufer et al. 2006,
Schroder and Tschopp 2010, Tohno et al. 2008a, Tohno et al. 2008b). NOD1 detects Gram-negative
bacteria as well as some Gram-positive bacteria, such as Bacillus and Listeria spp., while NOD2 acts
as a general sensor for both Gram-positive and Gram-negative bacteria (Kufer et al. 2006, Tohno et al.
2008a, Tohno et al. 2008b). The ligands and functions of NOD3 and NOD4 are unknown (Schroder
and Tschopp 2010). It has been proposed that NOD5/NLRX1, which is either located in the
mitochondrion or recruited to the outer mitochondrial membrane, suppresses signaling dependent
antiviral pathways and promotes generation of reactive oxygen species (ROS) (Arnoult et al. 2009,
Moore et al. 2008). The rest of the NLRs are poorly characterized but there is some evidence that
IPAF/NLRC4 is activated by flagellin and NLRP1b is induced by anthrax lethal toxin (Williams et al.
2010). The mechanisms involved in the formation and the function of inflammasomes are still a
subject of debate. NLRP3/NALP3, the best characterized inflammasome, can be induced by several
different compounds but the exact ligands are still largely unknown (Eisenbarth and Flavell 2009,
Martinon et al. 2002, Martinon et al. 2009, Schroder and Tschopp 2010, Williams et al. 2010).
Examples of NLR3P/NALP3 inducers include: Candida albicans and Saccharomyces cerevisiae
(Gross et al. 2009), bacterial pore-forming toxins (Listeria monocytogenes LLO toxin, Aeromonas
aerolysin and α-toxin produced by Staphylococcus aureus) (Schroder and Tschopp 2010), some
viruses (Kanneganti et al. 2006), insoluble crystals such as uric acid (Martinon et al. 2002, Martinon
et al. 2006), silica and asbestos (Cassel et al. 2008, Dostert et al. 2008), hyaluronan (Yamasaki et al.
2009), extracellular ATP (Mariathasan et al. 2006, Pelegrin and Surprenant 2006, Petrilli et al. 2007),
fibrillar amyloid-β peptide in Alzheimer’s disease brain plaques (Halle et al. 2008), released
lysosomal content and reactive oxygen species (Eisenbarth and Flavell 2009). Activation of the
32
inflammasome can also occur through PAMP or cytokine mediated activation of NF- B (Bauernfeind
et al. 2009) or via TNF-α and Il-1 (Franchi et al. 2009). The NLRs have also recently been shown to
induce pyroptosis, pyronecrosis (ASC-dependent but caspase-1-independent) and apoptosis (caspase-
1 and ASC dimerization dependent) (Eisenbarth and Flavell 2009, Ting et al. 2008b) as well as
initiation of the adaptive immune response, especially when activated by aluminum adjuvants, uric
acid and biodegradable polymer nanoparticles (Eisenbarth and Flavell 2009, Williams et al. 2010).
NLRX1 (NOD9) has been shown to inhibit IPS-1 signaling (Moore et al. 2008) and to be a
mitochondrial reactive oxygen species generator (Arnoult et al. 2009).
There are 22 known human NLR genes that have similar murine counterparts but these genes
have not been well characterized in swine (Schroder and Tschopp 2010). Fourteen non-synonymous
and thirty synonymous coding SNPs, distributed along the entire coding sequence, have been
identified in the porcine gene encoding NOD2 (NOD2) (Kojima-Shibata et al. 2009). Ten of the non-
synonymous SNPs have been linked to structural changes in the mature protein. Of these SNPs, the
T(1949)C polymorphism, located in the region encoding the hinge domain of the molecule, markedly
diminished the functional response of porcine NOD2 to muramyl dipeptide (MDP) when cloned into
expression vectors in a HEK293 human cell line. In contrast, the A(2197)C polymorphism, localized
in the region corresponding to the LRR, significantly enhanced the response of porcine NOD2 to this
ligand (Jozaki et al. 2009). The T(1949)C allele was found to be extremely rare among different pig
breeds (Landrace, Large White, Berkshire, Duroc, Hampshire, Meishan and Jinhua breeds) having
been detected in only a single individual of the Meishan breed and suggests that this mutation may
have a deleterious effect on the innate immune response (Jozaki et al. 2009). In contrast, the
A(2197)C allele was common in the commercial oriental (Meishan and Jinhua) and some western
(Duroc) breeds suggesting that this mutation may have a beneficial effect on innate immunity and
thus, prove useful as a genetic marker for disease resistance (Jozaki et al. 2009, Uenishi et al. 2012).
Confirmation of the potential effect of these SNPs will require in vivo disease association studies and
should also be extended to other pig populations from different geographic regions. Such studies,
especially those relating to human NLRs, are rapidly becoming an area of increased interest.
33
Mutations in NLRP1 have been associated with vitiligo in humans (Jin et al. 2007) and SNPs in
NLRP3 have been linked to increased pro-inflammatory signaling, food-induced anaphylaxis and
aspirin induced asthma (Hitomi et al. 2009). There are also reports that NLRP3 mutations that cause
an inherited gain in function can lead to auto-inflammatory disease (AID) and dysregulated
production of IL-1 (Williams et al. 2010). NLRP3 is activated in microglia by the fibrillar amyloid-
present within senile plaques of Alzheimer’s disease (Halle et al. 2008). Mutated CIITA has been
associated with hereditary MHC class II deficiency/bare lymphocyte syndrome (Steimle et al. 2007)
and a frame-shift mutation in the last LRR of NOD2 has been associated with Crohn’s disease and
Blau syndrome (Kufer et al. 2006, Schroder and Tschopp 2010). It is interesting to note that all of the
above-mentioned NLR-associated diseases in humans are primarily non-infectious in nature. This
may in part be due to the role NLRs play in the induction of inflammasome complexes as well as
apoptosis, pyronecrosis and pyroptosis. Little is known about the proteins in this group of PRRs and
their general interactions, ligands and responses remain unclear. As more information becomes
available it is likely that new disease associations may be identified.
34
ANTIMICROBIAL PEPTIDES
Antimicrobial peptides (AMPs) are a diverse and highly heterogeneous group of proteins that
have the ability to rapidly inactivate microbial organisms including Gram-positive and Gram-negative
bacteria as well as fungi and certain viruses (Zaiou and Gallo 2002). These peptides are widely
distributed, and are found in epithelial cells of mucosal surfaces (oral and gastrointestinal membranes)
and skin, as well as within the intracellular granules of leukocytes where they enhance antimicrobial
activity, particularly in granulocytes. All AMPs share two common structural characteristics, an
overall amphipathic topology and a net-positive charge at neutral pH due to a disproportionate
number of basic relative to acidic residues. The amphipathic topology allows AMPs to bind to, and
become inserted in, negatively charged surfaces such as microbial cell walls where they exert their
antimicrobial activity (Ganz et al. 1985, Ganz 2003, Tomasinsig and Zanetti 2005, Zanetti et al.
1995). Mammals have two major groups of AMPs: defensins (α and ) and cathelicidins (protegrins,
prophenins and myeloid antimicrobial peptides). Other mammalian antimicrobial peptides, which are
restricted to a few species only, include histatins (humans), dermcidin (humans), various anionic
peptides (sheep) and θ-defensins (primates) (Brogden et al. 1997, Ganz 2003, Linde et al. 2008). A
fourth, recently identified antimicrobial peptide is liver-expressed antimicrobial peptide LEAP-2 a
cysteine rich antimicrobial peptide (Hocquellet et al. 2010). Hepcidin (HAMP) was originally
identified in humans as an antimicrobial peptide produced in the liver and was subsequently named
liver-expressed antimicrobial peptide-1 (LEAP-1). Hepcidin is however best known for its role as an
iron-regulating protein and although it has recognised antimicrobial activity, its function as an innate
immune protein has not been extensively studied (Barthe et al. 2011, Hocquellet et al. 2012, Krause et
al. 2000, Park et al. 2001, Sang et al. 2006).
Alpha (α)- and beta ( )-defensins are polypeptides consisting of 90-100 amino acids. They
have a -sheet-rich folded core that is triple stranded and stabilized by a six-cysteine residue
framework containing three disulfide bonds. Defensins are differentiated from one another based on
the length of peptide segment between the six cysteine residues and the pattern of disulfide bond
formation (Ganz et al. 1985, Ganz 2003, Lehrer and Ganz 2002b, Selsted et al. 1985). They contain

35
clusters of positive/cationic charged amino acids (commonly arginine and lysine) which are
particularly abundant in defensins stored in granules containing negatively charged
glycosaminoglycans (Ganz 2003). The secondary and tertiary structure of defensins is highly variable
and depends on the exact amino acid sequence. Defensins are formed as a tripartite pre-pro-peptide
sequence with an amino-N-terminal sequence of approximately 19 amino acids, an anionic pro-piece
of approximately 45 amino acids that counterbalances the cationic carboxy-C-terminus, a region that
is approximately 30 amino acids in length and is important for the folding and/or prevention of
intracellular interactions with membranes (Ganz 2003, Lehrer and Ganz 2002b). More recently, θ-
defensins have been described. In contrast to α-and β-defensins, which are widely distributed across
species, θ-defensins are expressed only in the granulocytes of rhesus macaques and a few other
primates, including old world monkeys and orangutans (Linde et al. 2008). The genes encoding θ-
defensins, although present in humans, have acquired mutations that result in premature stop codons
and lack of expression. The θ-defensins are small double-stranded circular molecules (Ganz 2003,
Linde et al. 2008).
Cathelicidins, on the other hand, are a highly heterogeneous group of peptides that vary in
size (from 12 to 80 amino acid residues) and sequence configuration (Gennaro and Zanetti 2000,
Lehrer and Ganz 2002a, Linde et al. 2008, Tomasinsig and Zanetti 2005, Zanetti et al. 1995, Zanetti
2005). They contain a C-terminal cationic antimicrobial domain that is responsible for their
antimicrobial activity and an N-terminal cathelin terminus of approximately 100 residues that is
present on intracellular storage pro-forms of all cathelicidins (Lehrer and Ganz 2002a, Zaiou and
Gallo 2002, Zanetti et al. 1995, Zanetti 2005). The most common type of cathelicidins are linear
peptides that contain amphipathic α-helices (mimicking biological membranes) ranging from 23-40
amino acid residues in length. A second group of smaller cathelicidins, 12-18 amino acid residues in
length, contains -hairpin structures stabilized by one or two disulfide bonds. This region contains a
binding site for an elastase that cleaves primarily at valine, but also at alanine and isoleucine residues
in mammals (Shinnar et al. 2003). A third group of linear peptides (13 amino acid residues in length)
contains a high proportion of tryptophan residues and a fourth group (39-80 amino acid long),
36
contains repetitive proline motifs that form extended polyproline-type structures such as those found
in porcine PR-39, prophenins and bovine Bac (bactenecin) peptides (Tomasinsig and Zanetti 2005).
Defensins and cathelicidins are widely distributed in mammalian epithelial cells, phagocytes
(in primary/azurophil and secondary granules) and Paneth cells (Ganz 2003, Zanetti 2005). The
precise distribution varies considerably between species and individuals. For example, in contrast to
humans, no α-defensins are present in porcine granulocytes. However numerous cathelicidins are
found in the secondary granules of porcine granulocytes [e.g. protegrins 1-5(two-disulfide bridged),
prophenins 1 and 2 (linear and Pro rich), PR-39 (linear and Pro rich) and the porcine myeloid
antimicrobial peptides PMAP 23, 36 and 37 (α-helical AMPs)] (Kokryakov et al. 1993, Sang and
Blecha 2009, Tomasinsig and Zanetti 2005, Zaiou and Gallo 2002). -defensins (pBD-1 to 12) are
expressed at high levels in porcine tongue epithelium and at very low levels in all other porcine
epithelial surfaces (Kokryakov et al. 1993, Shi et al. 1999, Zhang et al. 1998). AMPs have a wide
range of activity against bacteria, fungi and viruses. The antimicrobial functions of AMPs are
activated by cleavage of the pro-sequence. The mechanism involves the folding of AMPs into
amphipathic structures, followed by permeabilization and insertion of the AMP into the target
membrane, a process that disrupts the membrane. AMPs also have chemotactic activity and there is
some evidence that they have direct antimicrobial killing properties (inhibition of bacterial DNA and
protein synthesis by PR-39) (Ganz 2003, Tomasinsig and Zanetti 2005, Zanetti 2005). Cathelicidins
are activated following cleavage of the pro-piece by proteases such as azurophilic elastase (myeloid
derived) and proteinase 3 present in neutrophils. Eventually, these proteases can also lead to the
degradation of cathelicidins. However, the arginine and proline rich cathelicidins are resistant to
protease degradation (Shinnar et al. 2003, Tomasinsig and Zanetti 2005).
The amino acid sequences of defensins and cathelicidins are highly variable across all species
(Ganz 2003, Zanetti 2005). The α- and -defensins of all species most likely evolved from a common
gene precursor (Liu et al. 1997). The cysteine framework of defensins and the cathelin domain of
cathelicidins are highly conserved across all species (Ganz 2003, Zanetti 2005). A study of ten
domestic cattle breeds, representing both Bos taurus and Bos indicus, indicated that the bovine gene

37
family encoding cathelicidins proteins (CATHL) is located on chromosome 22 (BTA22) of the Bos
taurus genome. Sixty SNPs, seven of which were non-synonymous, and five insertion-deletion
mutations were identified in the genes encoding for bovine cathelicidin-2, -5, -6, and -7 (Gillenwaters
et al. 2009). Additional investigation is needed to elucidate the effect that these CATHL gene
polymorphisms may exert on normal host defense and to identify potential disease resistance or
susceptibility conferring polymorphisms. No specific genetic defects or disease associations have
been reported in the antimicrobial peptide genes of swine.
38
PEPTIDOGLYCAN RECOGNITION PROTEINS
The peptidoglycan recognition proteins (PGRPs) are antimicrobial proteins originally
identified as innate immune proteins present in the hemolymph of insects (Yoshida et al. 1996). Four
mammalian homologues have been identified and based on their analogy with insect PGRPs, were
classified according to length as PGRP-S (short isoform), PGRP-L (long isoform), and PGRP-Iα and
PGRP-Iβ (intermediate isoforms) (Dziarski and Gupta 2010, Gottar et al. 2002, Kang et al. 1998, Liu
et al. 2001, Michel et al. 2001, Yoshida et al. 1996). The human proteins were subsequently renamed
and the new classification, PGLYRP-1 (for PGRP-S), PGLYRP-2 (for PGRP-L), PGLYRP-3 (for
PGRP-Iα) and PGLYRP-4 (for PGRP-Iβ), encoded for by the PGLYRP1, PGLYRP2, PGLYRP3 and
PGLYRP4 genes respectively, has become the official designation for all mammalian peptidoglycan
recognition proteins (PGLYRPs) (Dziarski and Gupta 2010). PGLYRPs contain one or more C-
terminal type 2 amidase domains referred to as the PGRP domain, which is approximately 165 amino
acids in length, as well as a signal peptide and an N-terminal domain (Liu et al. 2001, Royet and
Dziarski 2007). This PGRP amidase domain has structural similarities with bacteriophage and
bacterial type 2 amidases and contains three peripheral α-helices and several central β-sheet strands
which form a peptidoglycan-binding groove that is specific for muramyl-tripeptide (Guan et al. 2004,
Guan et al. 2005). A segment that is distinct from bacteriophage and bacterial type 2 amidases and
unique to PGLYRPs is present towards the N-terminus. This segment is often hydrophobic in nature
and perhaps plays a role in ligand binding (Dziarski and Gupta 2010). PGLYRP-1 and PGLYRP-2
each contain a single C-terminal PGRP domain while PGLYRP-3 and PGLYRP-4 contain two non-
identical PGRP domains (Dziarski and Gupta 2010, Royet and Dziarski 2007). The N-terminal
domain varies in length between the different PGLYRPs with that of PGLYRP-2 being approximately
twice the length of the other PGLYRPs. Within the center of the PGRP domains are two closely
spaced disulphide bonds formed between two conserved cysteine residues with a second disulfide
bond formed between two additional conserved cysteine residues. Another conserved pair of cysteine
residues is present within the middle of the PGRP domain forming a third disulphide bond in
PGLYRP-1 while the C-terminal PGRP domain of PGLYRP-3 and PGLYRP-4 also contains an
39
additional pair of cysteine residues forming a third disulfide bond (Royet and Dziarski 2007). These
bonds are essential for structural integrity and activity of the PGRP domain (Dziarski and Gupta 2010,
Guan et al. 2004, Royet and Dziarski 2007, Wang et al. 2003). Similar to the invertebrate amidase
PGRPs and bacteriophage type 2 amidases, PGLYRP-2 contains a conserved Zn2+
-binding site in the
peptidoglycan-binding groove, consisting of two histidine, one tyrosine, and one cysteine (named
C530 in human PGLYRP-2) (Wang et al. 2003). All mammalian PGLYRPs exist as secreted proteins
with PGLYRP-1, PGLYRP-3, and PGLYRP-4 forming disulfide-linked homodimers. When
expressed in the same cell, heterodimerization occurs between PGLYRP-3 and PGLYRP-4 (Dziarski
and Gupta 2010). Homodimerization of PGLYRP-2 is reported to occur independent of disulphide
bond formation (Dziarski and Gupta 2010).
PGLYRPs are expressed in a number of different tissues with some being restricted to very
specific locations. The mature PGLYRP-1 peptide is found in high quantities within tertiary granules
of polymorphonuclear granulocytes and PGLYRP1 is highly expressed in the same cell types in the
bone marrow (Dziarski and Gupta 2010, Kang et al. 1998, Liu et al. 2001, Tydell et al. 2006).
Additional sites of expression include the lactating mammary gland, intestinal M-cells as well as
epithelial cells and fibroblasts (Dziarski and Gupta 2010, Kappeler et al. 2004). The main site of
expression of PGLYRP2 is the liver with the mature protein circulating in the blood (Zhang et al.
2005). However, low levels of expression are also observed in the epithelium of the oral and intestinal
tract as well as fibroblasts and keratinocytes (Dziarski and Gupta 2010). Pigs contain two PGLYRP2
splice variants, a short and long variant. Like the PGLYRP2 gene of most other mammals, the long
isoform is predominantly expressed within the liver. The short form is expressed in a variety of tissues
including the bone marrow, intestine, liver, spleen, kidney, and the skin where it plays a role in
induction of expression of β–defensins (Li et al. 2006, Sang et al. 2005). The skin and mucosal
surfaces are the major sites of expression of PGLYRP3 and PGLYRP4 (Dziarski and Gupta 2010,
Royet and Dziarski 2007, Ueda et al. 2011). These proteins are excreted in various mucosal and
epidermal secretions including sweat, sebum, tears and mucus. The expression of PGLYRP3 and
40
PGLYRP4 can be increased through signaling of TLR2, TLR4, NOD1 and NOD2 (Saha et al. 2009,
Uehara et al. 2005).
As the name suggests, bacterial peptidoglycan (both the lysine and meso-diaminopimelic
acid-type) is the major ligand of PGLYRPs, which bind both Gram-positive and Gram-negative
bacteria (Cho et al. 2005, Dziarski and Gupta 2010, Dziarski et al. 2012, Kumar et al. 2005, Liu et al.
2001, Royet and Dziarski 2007). Binding affinity is determined by the third amino acid in the
peptidoglycan stem peptide and by the presence of N-acetyl-D-glucosamine and N-acetylmuramic
acid in the glycan backbone. At least three amino acids in the stem peptide are needed to attain high-
affinity binding (Cho et al. 2005, Guan et al. 2004). PGLYRPs are also capable of binding to
lipoteichoic acid, lipopolysaccharide and the 1, 3-β-d-glucan of fungi (Dziarski and Gupta 2010, Lee
et al. 2004). Adding a fourth amino acid to the peptide stem however, decreases binding affinity by
approximately 70-fold (Cho et al. 2005). PGLYRPs require divalent cations and N-glycosylation for
bactericidal activity. Although the mechanisms are largely unknown, it has been proposed that
PGLYRPs kill bacteria by inhibiting peptidoglycan synthesis (Dziarski and Gupta 2010). Human
PGLYRP1 is an important mediator in neutrophil-mediated killing of both intracellular and
extracellular bacteria (Cho et al. 2005). The antimicrobial effect of PGLYRPs is synergistic to that of
lysozyme and other granule associated antimicrobial peptides, and both lysozyme and PGLYRPs are
observed to colocalize in neutrophil extracellular traps (NETs), where they exert their bactericidal
effects (Cho et al. 2005). PGLYRP1 knockout mice (PGLYRP1-/-
) have an increased sensitivity to
intraperitoneal bacterial infection with low-pathogenic Gram-positive bacteria and are unable to kill
phagocytized bacteria (Dziarski et al. 2003).
A single non-synonymous SNP, C(419)A, has been reported in the human PGLYRP2 gene
(Dziarski and Gupta 2010, Wang et al. 2003). This SNP is located in the coding region of one of the
conserved cysteine residues and results in an amino acid change to alanine (Cys419Ala) and disrupts
amidase activity (Wang et al. 2003). Two synonymous coding region SNPs [G(102)C, G(480)A ] and
a single 3'UTR SNP [C(625)A], have been identified in the bovine PGLYRP1 gene. No SNPs have
been identified in the 1000 bp of the 5'-upstream promoter region (Pant et al. 2011). The G(480)A

41
synonymous SNP was found to be marginally associated with an increased risk of infection with
Mycobacterium avium subsp. paratuberculosis (Pant et al. 2011). It is important to note that the
G(480)A SNP is synonymous and does not change the amino acid residue at this position but does
change the amino acid codon. As shown for the human MDR1 gene, a shift to a rarer codon can result
in alterations of ribosome traffic and cotranslational folding, changes that may have an impact on
protein function (Kimchi-Sarfaty et al. 2007).
42
COMPLEMENT
The complement system consists of over 30 plasma proteins in addition to a number of cell
surface proteins. This system, which includes classical, alternative and lectin pathways, interacts with
host molecules to exert its effects on both the innate and adaptive immune systems. Although often
depicted as involving simple linear pathways, the various complement cascades form a tight network
of interwoven reactions (Ricklin et al. 2010, Walport 2001) that lead, ultimately, to the activation of
C3 and the formation of a terminal membrane attack complex (MAC). Following an interaction
between C5b, C6 and C7, the MAC complex inserts itself into the microbial membrane where it binds
C8 and C9 and promotes membrane disruption and cell lysis. The various factors were named
according to their historical discovery and do not necessarily follow the order of events in the cascade.
The classic pathway is antibody dependent and involves factors C1 through C9. C1q, a PRR that
recognizes microbial organisms, apoptotic cells and endogenous danger signals can activate the
complement cascade, either through direct pathogen or ligand binding or through interaction with the
Fc portion of antigen bound antibodies (immune complexes). This involves the formation of the C1
complex and the activation of associated C1r and C1s proteases. The C1 complex then cleaves C4 into
C4a and C4b followed by C4b deposition onto the surface of the inciting target, a process that results
in opsonisation. C4b binds to C2 and cleaves it into C2a and C2b generating the C3 convertase
(C4b2b). This, in turn, cleaves C3 resulting in amplification of down-stream effector functions
(Wallport 2001, Ricklin 2010). Both the C4a and C3a fragments act as a potent pro-inflammatory and
chemotactic anaphylatoxins. The lectin pathway (often referred to as the mannan-binding lectin
pathway) is activated by MBLs and FCNs (Endo et al. 2006, Fujita et al. 2004a, Fujita et al. 2004b,
Girija et al. 2007, Rossi et al. 2001, Schwaeble et al. 2002, Walport 2001) in association with the
MBL associated serine proteases (MASPs) and sMAP (a truncated form of MASP-2). MASP-2
cleaves both C4 and C2 forming the same C3 convertase enzyme complex as seen in the classic
pathway. MASP-1 cleaves C2 only, acting as a supplementing system to increase the efficiency of C3
convertase formation (Chen and Wallis 2004, Dobo et al. 2009, Rawal et al. 2008). Interactions
between MBL and MASP/sMAP take place through the MASP binding motif, GEKGEP, a six amino
acid sequence in the collagen-like domain of MBL and in the Clr/Cls/Uegf/bone morphogenetic
43
protein 1 (CUB) and the epidermal growth factor-like (EGF-like) domains of MASP/sMAP (Feinberg
et al. 2003, Teillet et al. 2008, Wallis et al. 2004). A similar mechanism is proposed for FCN
(Gregory et al. 2004, Ichijo et al. 1993, Teillet et al. 2008). sMAP is proposed to play a regulatory role
in lectin-mediated complement activation by competing with MASP-2 binding to MBL and FCN
(Endo et al. 2007).
The alternative pathway is activated by protein, lipid and carbohydrate structures present on
the microbial surface as well as by spontaneous low-grade hydrolysis of a thioester bond in C3
(Harboe and Mollnes 2008, Walport 2001). After cleavage, the exposed highly reactive thioester
group on C3b forms a covalent bond with a nearby target membrane, creating an amplification loop.
C3b can also bind directly to C3 convertase to form C5 convertase. C3b then binds factor B, a C2
homologous protein, and forms the C3bB complex which is subsequently cleaved by factor D,
resulting in formation of an alternative pathway C3 convertase complex (C3bBb). This complex then
cleaves C3 into C3a and C3b, a process that leads to opsonisation of the target membrane. In both the
classical and alternative complement pathways, some C3b binds to C4b to form the C5 convertase
enzyme (Walport 2001). The alternative pathway can also be directly activated by properdin (or factor
P), a gamma globulin released by activated neutrophils. Properdin also enhances the alternative
pathway by stabilizing the C3bBb complex (Kemper et al. 2010, Spitzer et al. 2007). The cleavage of
C5 results in the formation of C5a and C5b. C5a acts as a potent pro-inflammatory and chemotactic
anaphylatoxin while C5b recruits the remaining components (C5b to C9) needed to form the terminal
MAC complex.
C3, a central factor of all complement cascades, has been intensely investigated. Sequencing
and SNP evaluation has revealed that the C3 genes are relatively well conserved across mammalian
species with the porcine gene being the most homologous to human C3 (Wimmers et al. 2003). Two
of the best known polymorphisms in humans, a C(364)G SNP and a second polymorphism defined by
the monoclonal antibody HAV 4-1 have been linked to several infectious and autoimmune diseases
(Botto et al. 1990). The C(364)G non-synonymous SNP is located in exon 3 and results in an arginine
to glycine amino acid substitution with two associated allotypic forms: C3S and C3F. The HAV 4-1
44
polymorphism results in a proline to leucine substitution and is located at position 292 in exon 9 in the
region that encodes for the β-chain of C3. The porcine C3 gene encodes for a 1661 amino acid C3
precursor protein and is comprised of 41 exons and 40 introns. The C3 gene in turn is flanked by a
444 base pair promoter and an 881 base pair 3'-UTR region. The precursor protein consists of a 22
amino acid signaling protein, a 643 amino acid β-chain (including a conserved sequence of the α2-
macroglobulin family N-terminal region) and a 992 amino acid α chain (including a conserved
sequence that is similar to the C-terminus and anaphylatoxin domains of the α2-macroglobulin
family). The α- and β-chains of porcine C3 are connected by a short peptide, RKRR, which is present
within the pre-proprotein at amino acid position 666 to 669 (Wimmers et al. 2003). An internal
thioester bond (GCGEQ), located between amino acids 1007 and 1011, has been shown to play an
important role in the binding of molecules on foreign surfaces (de Bruijn and Fey 1985). Another
thioester at amino acid 1124 serves as the thioester-associated catalytic histidine. A conserved
sequence containing several cysteine disulfide bonds, distributed across the surface of the C3
molecule, connects the various C3 fragments. Similar to the porcine C3 gene, the porcine C5 gene
(C5) is highly homologous (78 %) to that of the human C5 gene and also shows high homology to
other mammalian sequences (73 % mouse and 71 % rat) (Kumar et al. 2004). The complete C5 cDNA
sequence is 5422 nucleotides in length and ends in a polyA tail. The polyadenylation signal
(ATTAAA) is similarly located to the human analog between nucleotides 5400 and 5405. The
predicted protein sequence is 1677 amino acids in length and only one amino acid longer than its
human counterpart. The signal peptide is formed by the first 18 amino acids followed by a 655 amino
acid β-chain (including a conserved sequence of the α2-macroglobulin family N-terminal region from
amino acids 19 to 631) and a 1000 amino acid α chain (including an anaphylatoxin-like domain from
amino acids 698 to 732; a conserved α2-macroglobulin family C-terminal region from amino acids
758 to 1509 and a NTR/C345C module from amino acids 1549 to 1659) (Kumar et al. 2004).
Five SNPs have been identified in the gene encoding the porcine C3 molecule (C3), one each
within the 5'UTR (C(20)T), intron 13 (T(204)C), exon 15 (C(1905)A), exon 30 (G(3882)A) and the
3'UTR (poly dT) (Wimmers et al. 2001, Wimmers et al. 2003). Collectively, these SNPs were shown
45
to be associated with decreased C3 mRNA expression in a single research population (Wimmers et al.
2003). The functional mechanisms and contribution of each individual SNP to alterations in
expression remains to be determined. Studies should also be expanded to include additional
populations to further evaluate the effect of these SNPs on constitutive expression of C3. Furthermore
it is also important to further evaluate the exact consequence that decreased C3 expression has on the
complement cascade as a whole. Four synonymous SNPs have been identified in the porcine C5 gene;
one transversion [A(1044)C] and three transition SNPs [A(1203)G; T(2766)C and A(3018)G] (Kumar
et al. 2004). Significant variations in the classical and alternative complement activities as well as
serum haptoglobin and C3c protein levels were identified between some of the segregating SNP
genotypes for the A(1044)C SNP but not the other SNPs. Classical complement activity in pigs
homozygous AA for the A(1044)C SNP were found to have 7.35 and 9.6 units higher activity (p <
0.05) than the AC and CC genotypes, respectively. In contrast the alternative complement activity of
homozygous AA individuals was 5.35 and 4.25 units lower (p < 0.05) than the AC and CC genotype
respectively. The effect on C3c and haptoglobin serum concentrations was less prominent. In pigs
homozygous CC, the C3c protein levels were 0.014 and 0.009 of a unit higher in concentration than
the AA and AC genotypes, respectively while serum haptoglobin levels were 0.123 and 0.088 of a
unit higher (p < 0.05) than the AA and AC genotypes respectively. In this case it is unclear how this
synonymous SNP alters protein function and further investigation is necessary to elucidate the
significance of this SNP in innate immune defences. Factor H deficiency has also been described in
the Norwegian Yorkshire breed and is associated with the development of lethal
membranoproliferative glomerulonephritis (Jansen et al. 1995). This deficiency is transmitted as a
simple autosomal recessive trait with full penetrance however the underlying genetic defect has not
been identified. Factor H deficiency historically has been limited to the Norwegian Yorkshire
population and has largely been eliminated in this country through an enzyme immunoassay test to
remove putative carriers from the breeding line (Hogasen et al. 1997).
In humans, several different complement factor deficiencies are associated with acute and
severe infections (Wallis et al. 2010). Defective clearance of immune complexes with subsequent
46
glomerulonephritis (Botto et al. 1998, Walport 2001) and an increased risk for the development of
autoimmune diseases such as systemic lupus erythematosus (Lewis and Botto 2006, Lu et al. 2008)
have been reported. In Alzheimer’s disease, C1q binds to normal, non-infectious prion proteins and
activates the complement cascade (Sim et al. 2007), augmenting disease progression (Yasojima et al.
1999). Complement activation has also been implicated in the pathogenesis of reperfusion injury (e.g.
myocardial infarcts and kidney disease) (Mollnes et al. 2002, Wallis et al. 2010). Deficiencies in C3
have been associated with an increased incidence of pyogenic bacterial infections,
membranoproliferative glomerulonephritis and Neisserial infections in humans. C1 deficiency has
been associated with angioedema. C1q, C1r and C1s, C4 and C2 deficiencies have all been associated
with systemic lupus erythematosus while factor H and I deficiencies can lead to hemolytic uremic
syndrome as well as membranoproliferative glomerulonephritis (Walport 2001).
GENETIC POLYMORPHISM AND THE INNATE IMMUNE GENOME
Although there are many differences in the structure, intra- or extracellular location and down-stream
signalling pathways between the various classes of secreted, membrane-bound and intracellular
proteins and receptors of the innate immune system, they ultimately share a common goal, one that is
rooted in the detection and elimination of invading pathogens. Alteration in the normal and essential
functioning of this critical defense component such as those resulting from underlying genetic
variation can have a significant impact on the ability of an individual to resist and clear infectious
pathogens. Despite the critical role that these molecules play, studies aimed at investigating the
relationship between genetic variations in innate immune proteins and resistance to infectious disease
are limited. In humans, a few single nucleotide polymorphisms (SNPs) and other genetic variations in
some innate response receptors have been shown to alter the structure and functional levels of PRRs
and their effect on disease resistance has been extensively studied (Garred et al. 2006, Lahti et al.
2002, Leth-Larsen et al. 2005, Madsen et al. 1994, Pothlichet et al. 2009, Rallabhandi et al. 2006,
Wallis et al. 2010, Wang et al. 2003). In domestic animals the identification of disease conferring
genetic polymorphisms (such as SNPs, insertions, deletions and other genetic variations) are also
47
becoming increasingly important. These genetic variations represent important targets (markers) that
could be used in selective breeding strategies (Ibeagha-Awemu et al. 2008). In pigs, only a small
number of the studies have focussed on such genetic defects within the genes composing the innate
immune system and like in humans some of these genetic polymorphisms have been shown to have a
detrimental effect on porcine host resistance to infectious disease (Bergman et al. 2012, Jozaki et al.
2009, Juul-Madsen et al. 2006, Juul-Madsen et al. 2011, Keirstead et al. 2011, Kojima-Shibata et al.
2009, Lillie et al. 2006, Lillie et al. 2007, Palermo et al. 2009, Phatsara et al. 2007, Shinkai et al.
2012, Uenishi and Shinkai 2009, Uenishi et al. 2011, Uenishi et al. 2012). Additional information on
the function and interactions of the various porcine innate immune proteins should enhance our
understanding of innate disease resistance in pigs. Of specific interest is the identification of
additional genetic variations that may underlie abnormalities within these important factors. The
identification of such genetic variations are likely to serve as important disease resistance markers that
can be included in future genetic strategies aimed at improving innate disease resistance of swine.
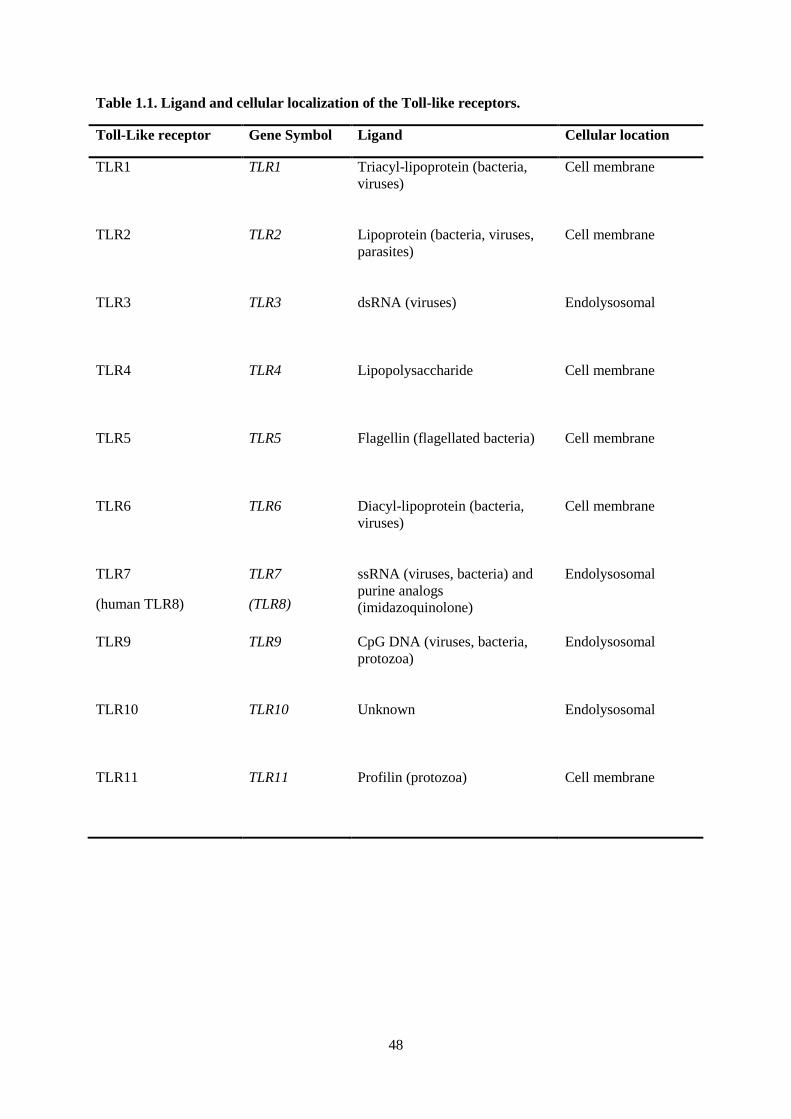
48
Table 1.1. Ligand and cellular localization of the Toll-like receptors.
Toll-Like receptor Gene Symbol Ligand Cellular location
TLR1 TLR1 Triacyl-lipoprotein (bacteria,
viruses)
Cell membrane
TLR2 TLR2 Lipoprotein (bacteria, viruses,
parasites)
Cell membrane
TLR3 TLR3 dsRNA (viruses) Endolysosomal
TLR4 TLR4 Lipopolysaccharide Cell membrane
TLR5 TLR5 Flagellin (flagellated bacteria) Cell membrane
TLR6 TLR6 Diacyl-lipoprotein (bacteria,
viruses)
Cell membrane
TLR7
(human TLR8)
TLR7
(TLR8)
ssRNA (viruses, bacteria) and
purine analogs
(imidazoquinolone)
Endolysosomal
TLR9 TLR9 CpG DNA (viruses, bacteria,
protozoa)
Endolysosomal
TLR10 TLR10 Unknown Endolysosomal
TLR11 TLR11 Profilin (protozoa) Cell membrane
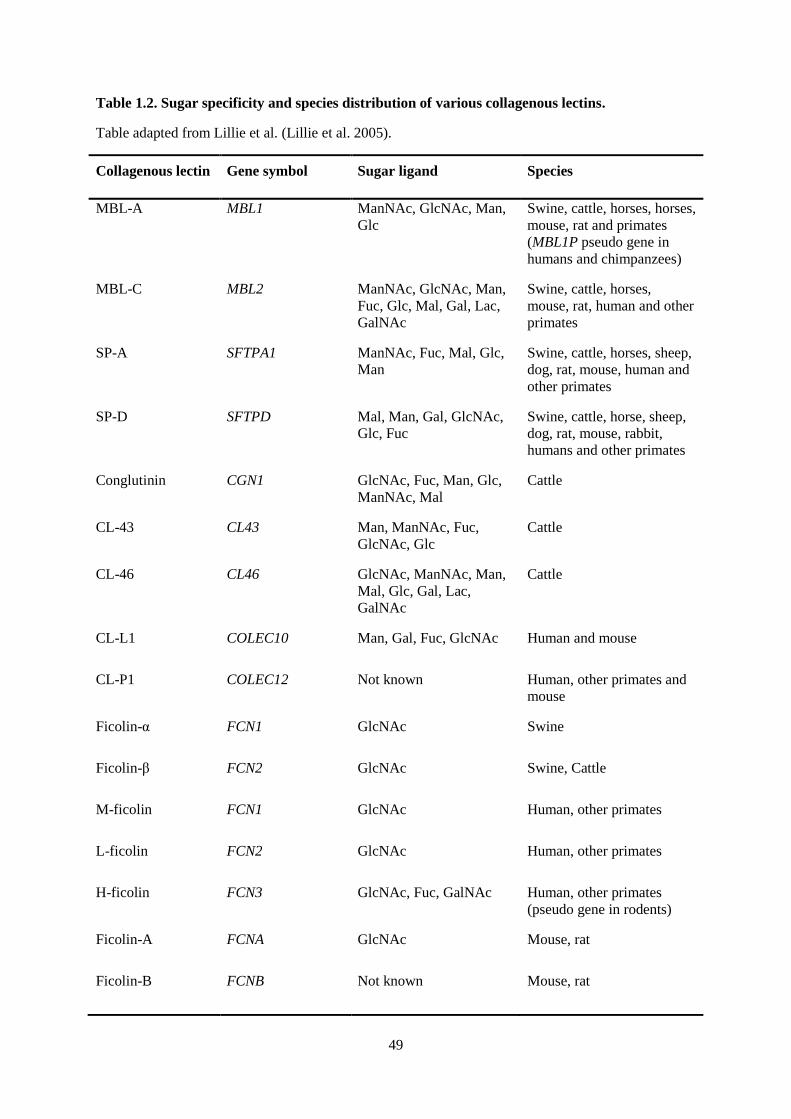
49
Table 1.2. Sugar specificity and species distribution of various collagenous lectins.
Table adapted from Lillie et al. (Lillie et al. 2005).
Collagenous lectin Gene symbol Sugar ligand Species
MBL-A MBL1 ManNAc, GlcNAc, Man,
Glc
Swine, cattle, horses, horses,
mouse, rat and primates
(MBL1P pseudo gene in
humans and chimpanzees)
MBL-C MBL2 ManNAc, GlcNAc, Man,
Fuc, Glc, Mal, Gal, Lac,
GalNAc
Swine, cattle, horses,
mouse, rat, human and other
primates
SP-A SFTPA1 ManNAc, Fuc, Mal, Glc,
Man
Swine, cattle, horses, sheep,
dog, rat, mouse, human and
other primates
SP-D SFTPD Mal, Man, Gal, GlcNAc,
Glc, Fuc
Swine, cattle, horse, sheep,
dog, rat, mouse, rabbit,
humans and other primates
Conglutinin CGN1 GlcNAc, Fuc, Man, Glc,
ManNAc, Mal
Cattle
CL-43 CL43 Man, ManNAc, Fuc,
GlcNAc, Glc
Cattle
CL-46 CL46 GlcNAc, ManNAc, Man,
Mal, Glc, Gal, Lac,
GalNAc
Cattle
CL-L1 COLEC10 Man, Gal, Fuc, GlcNAc Human and mouse
CL-P1 COLEC12 Not known Human, other primates and
mouse
Ficolin-α FCN1 GlcNAc Swine
Ficolin-β FCN2 GlcNAc Swine, Cattle
M-ficolin FCN1 GlcNAc Human, other primates
L-ficolin FCN2 GlcNAc Human, other primates
H-ficolin FCN3 GlcNAc, Fuc, GalNAc Human, other primates
(pseudo gene in rodents)
Ficolin-A FCNA GlcNAc Mouse, rat
Ficolin-B FCNB Not known Mouse, rat
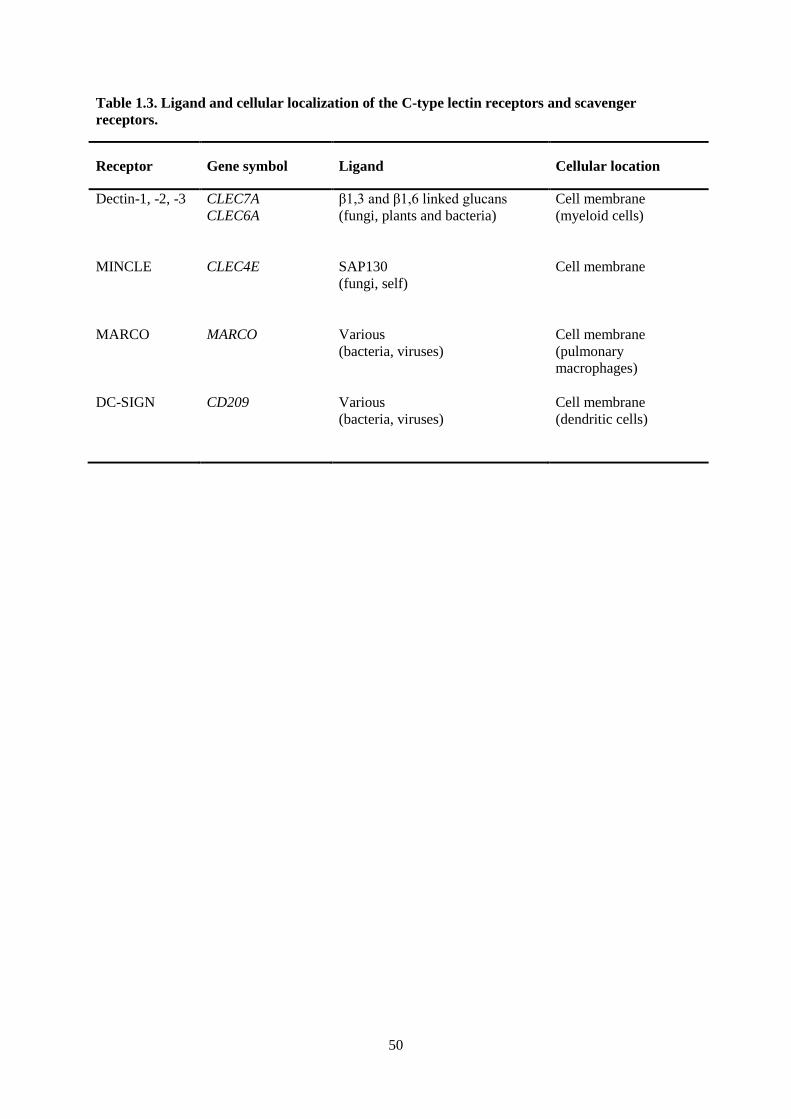
50
Table 1.3. Ligand and cellular localization of the C-type lectin receptors and scavenger
receptors.
Receptor Gene symbol Ligand Cellular location
Dectin-1, -2, -3 CLEC7A
CLEC6A
β1,3 and β1,6 linked glucans
(fungi, plants and bacteria)
Cell membrane
(myeloid cells)
MINCLE CLEC4E SAP130
(fungi, self)
Cell membrane
MARCO MARCO Various
(bacteria, viruses)
Cell membrane
(pulmonary
macrophages)
DC-SIGN CD209 Various
(bacteria, viruses)
Cell membrane
(dendritic cells)
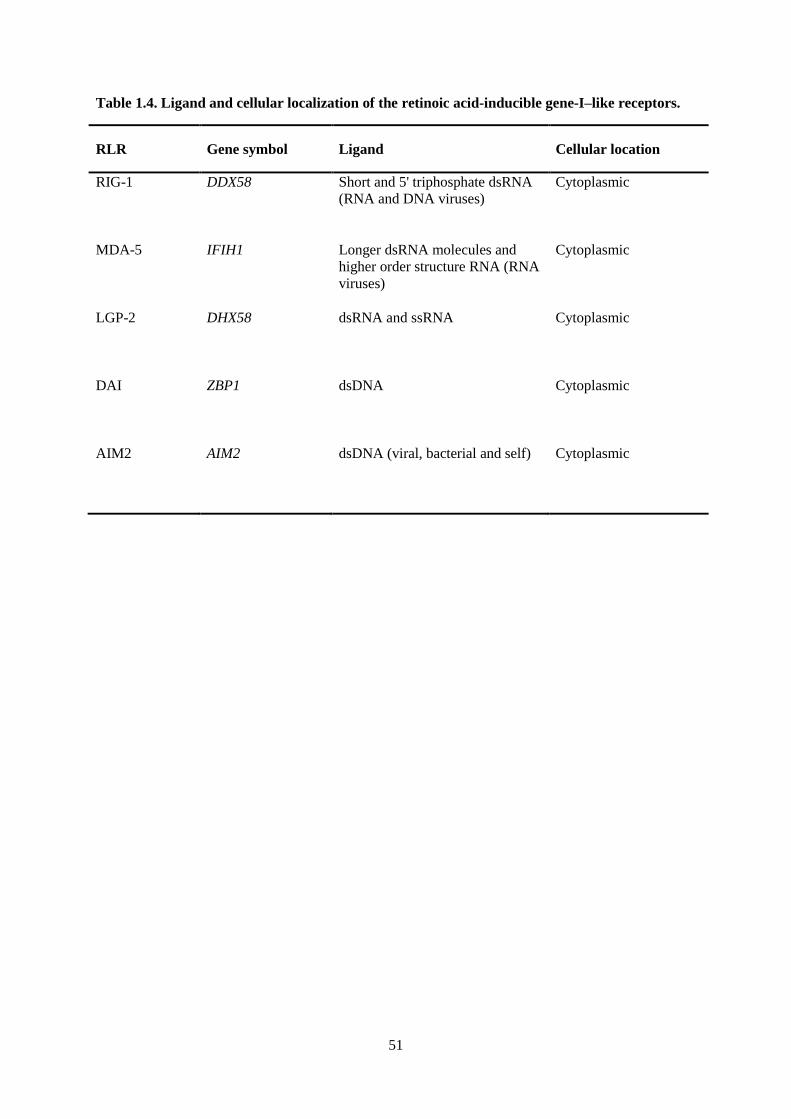
51
Table 1.4. Ligand and cellular localization of the retinoic acid-inducible gene-I–like receptors.
RLR Gene symbol Ligand Cellular location
RIG-1 DDX58 Short and 5' triphosphate dsRNA
(RNA and DNA viruses)
Cytoplasmic
MDA-5 IFIH1 Longer dsRNA molecules and
higher order structure RNA (RNA
viruses)
Cytoplasmic
LGP-2 DHX58 dsRNA and ssRNA Cytoplasmic
DAI ZBP1 dsDNA Cytoplasmic
AIM2 AIM2 dsDNA (viral, bacterial and self) Cytoplasmic
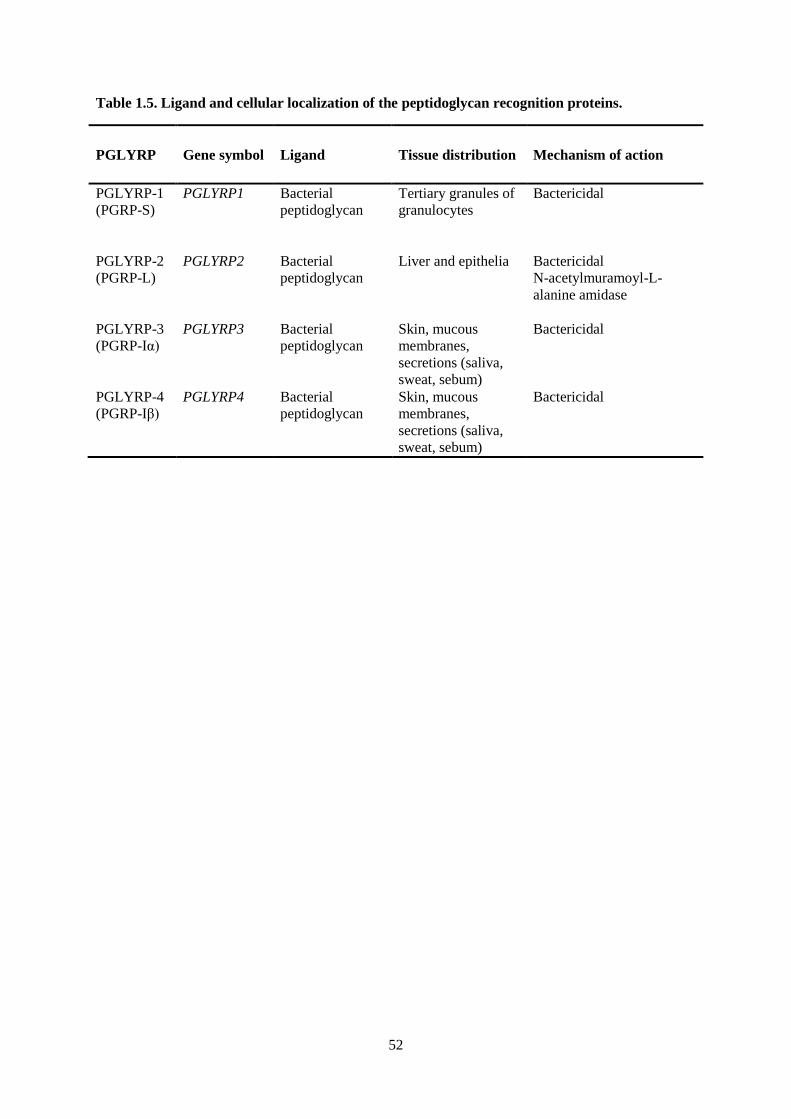
52
Table 1.5. Ligand and cellular localization of the peptidoglycan recognition proteins.
PGLYRP Gene symbol Ligand Tissue distribution Mechanism of action
PGLYRP-1
(PGRP-S)
PGLYRP1 Bacterial
peptidoglycan
Tertiary granules of
granulocytes
Bactericidal
PGLYRP-2
(PGRP-L)
PGLYRP2 Bacterial
peptidoglycan
Liver and epithelia Bactericidal
N-acetylmuramoyl-L-
alanine amidase
PGLYRP-3
(PGRP-Iα)
PGLYRP3 Bacterial
peptidoglycan
Skin, mucous
membranes,
secretions (saliva,
sweat, sebum)
Bactericidal
PGLYRP-4
(PGRP-Iβ)
PGLYRP4 Bacterial
peptidoglycan
Skin, mucous
membranes,
secretions (saliva,
sweat, sebum)
Bactericidal
53
CHAPTER 2: CONSTITUTIVE VARIATION IN THE HEPATIC INNATE IMMUNE
TRANSCRIPTOME OF HEALTHY PIGS
This chapter corresponds to a manuscript of the same title to be submitted with the following
authorship:
Snyman HN, Hammermueller JD, Hayes MA, Lillie BN (2013)
ABSTRACT
The detrimental effects of infectious diseases still pose one of the most significant hurdles
plaguing the global swine industry today. Although this is a multifactorial problem involving a variety
of host, environment and pathogen interactions; early intervention by the host innate immune system
is a critical component in the host defense to infectious diseases. Emerging evidence also suggests
that alterations in the expression of some innate immune genes can have a detrimental effect on the
susceptibility of swine to common infectious diseases. Some of this observed variation can be
explained by specific genetic polymorphisms that alter transcriptional regulation and a number of
single nucleotide polymorphisms (SNPs) in the innate immune genes of swine have been shown to be
associated with decreased (or enhanced) gene expression. Most studies aimed at identifying genetic
variation in pigs have involved a targeted single gene approach. In this study, we used a porcine
specific microarray (Agilent® Porcine Gene Expression Microarray) to quantify constitutive hepatic
expression of a 114 innate immune genes in 96 healthy market weight pigs. Constitutive variation was
determined by comparing the mean gene expression values of the highest and lowest expressing pigs
for each gene. Using this approach, we identified 30 innate immune genes with widely variable gene
expression. Among these were DDX3Y, MBL2, SCGB1A1, PR39, PMAP-23, PMAP-37, NPG4,
SFTPD, PGLYRP1 and HAMP. Some of the high variability in constitutive expression of these
resistance-associated proteins and pattern recognition receptor genes might result from genetic
differences (SNPs, insertions, deletions or other genetic variations), some of which are predicted to
impact resistance of pigs to infectious diseases.
54
INTRODUCTION
Among the major limiting factors resulting in significant strain on the production, growth
performance and economics of the global swine industry today, are the many infectious agents and
disease syndromes that commonly affect commercial swine populations. These are typically
multifactorial problems with complex interactions among pathogen, environmental, and host genetic
factors. Infectious disease syndromes that commonly affect pigs are often caused by multiple co-
infecting bacterial and viral pathogens which further complicate this problem. A critical component of
the complex host defense system is the ancient and evolutionarily conserved innate immune system
which is composed of an elaborate network of secreted, membrane-bound and intracellular proteins
that have the ability, either individually or collectively, to detect and destroy invading pathogens
(Medzhitov 2009, Mogensen 2009). Unlike the adaptive immune system in which genetic diversity
can be acquired by recombination and clonal selection of lymphocytes in an individual, functional
changes in innate immune genes evolves via germ line mutations and selection (Janeway 1989,
Medzhitov 2009).
As in humans, emerging evidence suggests that polymorphisms in the pig genome, including
those that alter the expression of innate immune genes, can have a detrimental effect on the incidence
and susceptibility of these animals to common, economically important infectious diseases (Garred et
al. 2003, Garred and Madsen 2004, Ibeagha-Awemu et al. 2008, Jozaki et al. 2009, Juul-Madsen et al.
2011, Keirstead et al. 2011, Lillie et al. 2006, Lillie et al. 2007, Madsen et al. 1998, Uenishi et al.
2011, Uenishi et al. 2012). The innate immune response to infectious diseases is, in itself, a complex
multifactorial process, involving a large number of interacting factors and pathways, as well as a large
cushion of redundancy. The opportunity exists to characterise the innate immune response and disease
resistance phenotypes at a more complex genetic level.
To date, most studies aimed at identifying variation in gene expression of innate immune
proteins in swine have been limited to a targeted single gene approach. These studies have been
particularly focussed on a limited number of target proteins with the result that many innate immune
genes remain to be investigated. Advances in high throughput sequencing and whole genome
microarray analysis are revolutionizing the medical and biological sciences and there is a growing
55
interest in applying these technologies to the porcine genome (Tuggle et al. 2007). Combining these
technological advances along with the sequencing of the porcine genome and continued improvement
of gene annotation now make it possible to expand these studies to a more complex genomic level.
The majority of porcine microarray studies have focussed on genes that are differentially
expressed following experimental or natural infection with a limited number of pathogens (Bao et al.
2012, Fernandes et al. 2012, Gladue et al. 2010, Hedegaard et al. 2007, Lee et al. 2010, Li et al. 2010,
Ma et al. 2012, Mortensen et al. 2011, Moser et al. 2004, Moser et al. 2008, Sanz-Santos et al. 2011,
Skovgaard et al. 2010, Tomas et al. 2010, Wysocki et al. 2012) and few studies have aimed at
evaluating gene expression at a normal constitutive level (Freeman et al. 2012). The interpretation of
altered gene expression in infection studies can also be complicated by degenerative and
inflammatory changes resulting from tissue destruction. The liver is a major source of circulating
innate immune proteins and also contains large numbers of monocyte/macrophages, Kupffer cells and
NK cells that play a central role in the identification and elimination of pathogens (Exley and Koziel
2004). Since the liver is such a central innate immune organ, and anatomically and physiologically
more consistent in composition than respiratory or gastroenteric tissues, it provides an accessible way
to explore genetic differences in expression of a large number of genes of the innate immune and
many other physiological systems. In this study, we used porcine-specific expression microarray
technology to evaluate the constitutive hepatic expression of innate immune genes in healthy market
weight pigs. Using this approach we identified many genes that exhibited major alterations in
constitutive gene expression. This study expands the knowledge of the hepatic immune transcriptome
and paves the way for additional studies to identify genetic mutations (SNPs, insertions, deletions)
responsible for these alterations in the innate immune system.
56
MATERIALS AND METHODS
Sample Acquisition
Liver samples of healthy market weight pigs were collected at the time of slaughter from a
large southern Ontario pig processing facility. All of the animals were considered to be terminally
crossed commercial pigs of unspecified breeds. A total of 1003 liver samples were collected from pigs
with unique production unit tattoo numbers. A median of 6 samples (range 1 to 21) were collected
from each of 158 different production units. A portion of each liver sample was frozen and stored at -
80 ºC in a 2 mL microcentrifuge tube until required for DNA extraction. Additional portions were
placed in RNAlater for subsequent RNA extraction (two 30 mg samples in each of two 2 mL
microcentrifuge tubes, each of which contained 600 L of RNAlater) (Ambion, Austin TX, USA).
According to the manufacturer’s protocol and published recommendations, these samples were kept
on ice and then placed at 4 ºC for 24 h, followed by 24 h at -20 ºC and storage at -80 ºC (Kasahara et
al. 2006).
DNA and RNA Extraction
Total DNA was extracted from all 1003 liver samples using the QIAGEN DNeasy® tissue kit
(QIAGEN Inc., Mississauga, ON) according to the manufacturer’s protocol. Total RNA was extracted
from the RNAlater stabilized liver samples using the QIAGEN RNeasy minikit® and QIAzol tissue
lysis reagent according to the manufacturer’s protocol. Liver samples were homogenized using a Bio-
Gen PRO200 Homogenizer (Diamed Lab Supplies, Inc., Mississauga, ON). The yield/concentration
of purified DNA and RNA was determined spectrophotometrically using the Nanodrop® (Thermo
Fisher Scientific, Wilmington, DE) and Nanovue® (GE Healthcare, Baie d’Urfe, QC)
spectrophotometer systems at a wavelength of 260 nm. DNA and RNA purity was determined by
measuring the absorbance ratio at 280 and 260 nm. The quality of the RNA was further assessed by
calculating an RNA Integrity Number (RIN) using the Bioanalyzer® system (Agilent Technologies
Canada Inc., Mississauga, ON) at the Advanced Analysis Centre (AAC) Genomics Facility
57
(University of Guelph, Science Complex, Guelph, ON). Only RNA samples with a RIN number of >
7 were selected for microarray expression studies (Madabusi et al. 2006, Schroeder et al. 2006,
Thompson et al. 2007). All purified nucleic acid samples were stored at -80 ºC.
SNP Genotyping
To aid in the selection of a genetically diverse population of pigs for microarray expression
analysis, all pigs were genotyped for 21 previously identified innate immune response gene SNPs
(Keirstead et al. 2011, Lillie et al. 2006) (Appendix I). Aliquots (15 – 45 ng/ μL) of DNA were placed
in a 96-well plates and submitted to the UHN Clinical Genomics Centre at the Mount Sinai Hospital,
Toronto, Ontario for genotyping using Sequenom MassARRAY® matrix-assisted laser
desorption/ionization time-of-flight (MALDI-TOF) mass spectrometry (Sequenom, San Diego, CA,
USA). A subset of 96 pigs was selected for microarray expression analysis based on the genetic
heterogeneity of six of these innate immune gene SNPs, five of which were located in promoter
regions (Table 2.1). The selection of these SNPs was based on their promoter location and previously
identified associations with variation in constitutive gene expression and/or documented disease
associations for some of these SNPs (Keirstead et al. 2011, Lillie et al. 2007). Each pig’s tattoo
number was recorded at the time of collection and this number was used to identify the production
unit origin of each pig in this study. A total of 38 unique SNP combination haplotypes and 68 out of
the total 158 unique production unit tattoo numbers were represented in this subset of pigs subjected
to microarray analysis. A median of 2 (range 1 to 7) pigs were tested for each of the 38 SNP
haplotypes and at least one pig was tested from the 68 different production units (range 1 to 4).
Whole Genome Microarray Analysis
Microarray analysis was performed at the University Health Network (UHN) Microarray
Centre (Toronto, Ontario) using the 4 x 44K Agilent® Porcine Gene Expression Microarray chip
platform (Agilent Technologies Canada Inc., Mississauga, ON) containing 43,603 oligomer probes.
The raw microarray expression data for each probe was median normalized, log2-transformed and
analyzed using arrayQualityMetrics software (UHN, Toronto, ON). Outliers, weak and failed arrays
58
(speckling and blocking issues) were discarded from further analysis (n = 8) as well as two additional
outliers identified at the time of unsupervised hierarchical agglomerative clustering; resulting in a
total of 86 pigs with 38 different SNP genotypes (median of 2; range 1 to 5) from 64 different
production units.
Constitutive variation in gene expression was defined as the gene expression ratio (GER)
(log2) of the mean gene expression of the top 50 % (n = 43) compared to the mean gene expression of
the bottom 6 % (n = 5) of pigs. Variable expression was then ranked based on the calculated GER for
each gene (Table 2.5). For comparative purposes, we also calculated GERs for the top 50 % vs. the
bottom 10 % (n = 9) and bottom 50 % of pigs; the top 20 % (n = 17) vs. the bottom 20 % (n = 17),
top 10 % (n = 9) and bottom 10 % (n = 9) of pigs; and the top 6 % (n = 5) of pigs vs. the bottom 50 %
(n = 43) (Appendix II). Different calculated GER sets were then compared to each other and an
average rank was calculated (Appendix III).When available; probe ontologies, gene symbols and/or
gene descriptions were used to identify microarray probes linked to genes with known or putative
innate immune function. For probes with unknown annotation or gene ontologies, the nucleotide
sequence of the probe was used for identification in conjunction (when available) with the associated
EnsemblID, GenBank-, Primary- or RefSeq accession number, TIGRID or UniGeneID and with
mRNA sequence data from the NCBI GenBank (http://www.ncbi.nlm.nih.gov/gene) and/or the
Ensembl online genome browser database (Flicek et al. 2013).
dCHIP software (http://www.hsph.harvard.edu/cli/complab/dchip/) was used for unsupervised
hierarchical agglomerative clustering of the 114 identified innate immune genes using average linkage
as clustering technique and the Euclidean metric as a distance metric (Eisen et al. 1998). Some genes
contained duplicate or multiple probes. Duplicate and multiple probes that clustered together and
exhibited similar expression patterns on clustering analysis were then combined by calculating an
average normalized expression value for each pig and the clustering analysis was repeated to generate
a final microarray expression heat map (Figure 2.1).
59
Sex-Genotyping
The sex of the pigs used in the microarray expression study (n = 88) was determined using a duplex
PCR assay that amplified a 198 bp fragment of the coding region of the Y-encoded, testis-specific
protein (TSPY) in addition to a 466 bp sequence of the coding region of the mitochondrial cytochrome
b (MT-CYB) (amplified as a positive control) (Irwin et al. 1991). The primers used for the TSPY and
MT-CYB amplifications are listed in Table 2.2. PCR reactions were performed on a Lightcycler® 480
system (Roche Applied Science, Salt Lake City, Utah) according to the manufacturer’s
recommendations (10 µl reaction volume) with primers at a final concentrations of 0.5 µM. PCR
parameters were as follows: pre-incubation at 95 ºC for 5 min, followed by 30 cycles of denaturation
at 95 ºC for 10 s, annealing at 60 ºC for 10 s, and elongation at 72 ºC for 40 s. Melting curve analysis
was used to determine whether the sample contained both the TSPY and MT-CYB genes (male) or
only the MT-CYB gene (female), with results confirmed by visualization of the product by agarose gel
electrophoresis (2 % gel run in 0.5 X TBE buffer and stained with SYBR SAFE) (data not shown).
The fluorescence threshold and amplified product melting temperature were calculated using
Lightcycler® 480 system software (Figure 2.3). DNA sequencing confirmed the amplified products
were TSPY and MT-CYB.
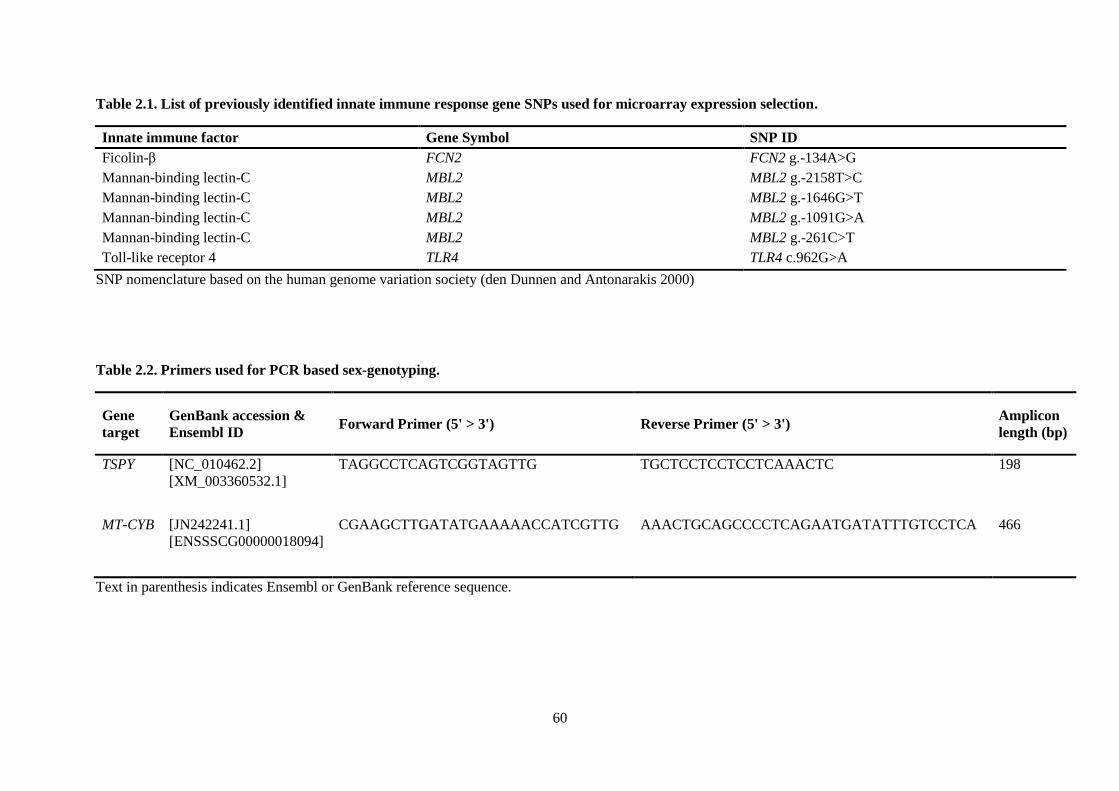
60
Table 2.1. List of previously identified innate immune response gene SNPs used for microarray expression selection.
Innate immune factor Gene Symbol SNP ID
Ficolin-β FCN2 FCN2 g.-134A>G
Mannan-binding lectin-C MBL2 MBL2 g.-2158T>C
Mannan-binding lectin-C MBL2 MBL2 g.-1646G>T
Mannan-binding lectin-C MBL2 MBL2 g.-1091G>A
Mannan-binding lectin-C MBL2 MBL2 g.-261C>T
Toll-like receptor 4 TLR4 TLR4 c.962G>A
SNP nomenclature based on the human genome variation society (den Dunnen and Antonarakis 2000)
Table 2.2. Primers used for PCR based sex-genotyping.
Gene
target
GenBank accession &
Ensembl ID Forward Primer (5' > 3') Reverse Primer (5' > 3')
Amplicon
length (bp)
TSPY [NC_010462.2]
[XM_003360532.1]
TAGGCCTCAGTCGGTAGTTG TGCTCCTCCTCCTCAAACTC 198
MT-CYB [JN242241.1]
[ENSSSCG00000018094]
CGAAGCTTGATATGAAAAACCATCGTTG AAACTGCAGCCCCTCAGAATGATATTTGTCCTCA 466
Text in parenthesis indicates Ensembl or GenBank reference sequence.
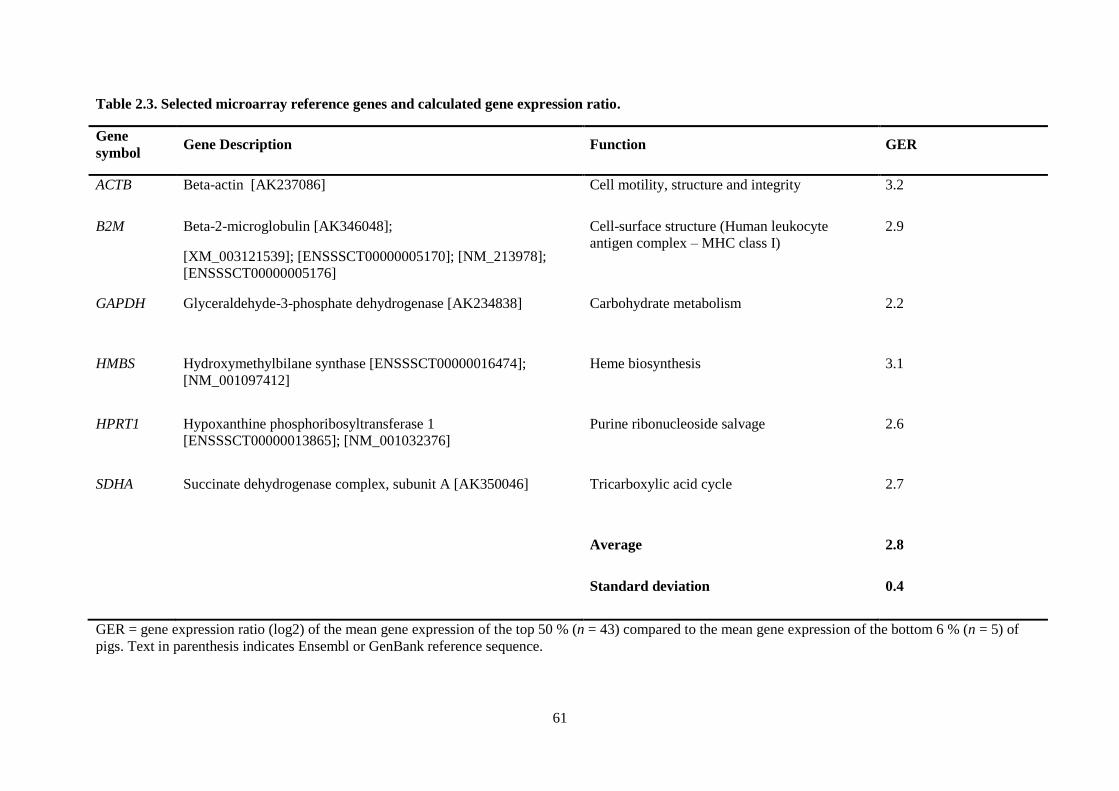
61
Table 2.3. Selected microarray reference genes and calculated gene expression ratio.
Gene
symbol Gene Description Function GER
ACTB Beta-actin [AK237086] Cell motility, structure and integrity 3.2
B2M Beta-2-microglobulin [AK346048];
[XM_003121539]; [ENSSSCT00000005170]; [NM_213978];
[ENSSSCT00000005176]
Cell-surface structure (Human leukocyte
antigen complex – MHC class I)
2.9
GAPDH Glyceraldehyde-3-phosphate dehydrogenase [AK234838] Carbohydrate metabolism
2.2
HMBS Hydroxymethylbilane synthase [ENSSSCT00000016474];
[NM_001097412]
Heme biosynthesis
3.1
HPRT1 Hypoxanthine phosphoribosyltransferase 1
[ENSSSCT00000013865]; [NM_001032376]
Purine ribonucleoside salvage
2.6
SDHA Succinate dehydrogenase complex, subunit A [AK350046] Tricarboxylic acid cycle
2.7
Average 2.8
Standard deviation 0.4
GER = gene expression ratio (log2) of the mean gene expression of the top 50 % (n = 43) compared to the mean gene expression of the bottom 6 % (n = 5) of
pigs. Text in parenthesis indicates Ensembl or GenBank reference sequence.
62
RESULTS
Health Status Evaluation
The health status of all pigs was determined by gross carcass examination at the time of
slaughter. This examination was performed by a Canadian Food Inspection Agency (CFIA) appointed
veterinarian. No samples were collected from animals that did not pass the standard carcass
inspection. The health status of all sampled pigs was further evaluated through microarray expression
data of selected acute phase proteins (haptoglobin, pig MAP/inter-α-trypsin inhibitor, C-reactive
protein, serum amyloid A, ceruloplasmin/ferroxidase and α1-acid glycoprotein/orosomucoid-1)
(Murata et al. 2004). Extensive variation in acute phase mRNA expression was not observed in any of
the pigs studied. The highest and lowest calculated GERs were 5.2 (SAA) and 1.6 (HP) with an
average of 2.9 for all acute phase protein genes (Table 2.4). Acute phase protein mRNA expression
was also evaluated to identify the presence of a subset of pigs with increased mRNA expression as
this would be indicative of an acute phase response; no such subsets were identified in any of the
evaluated acute phase response genes. In addition all of the pigs exhibited a similar pattern of acute
phase protein expression when analyzed by agglomerative hierarchical clustering (Figure 2.1 - Cluster
2). Expression patterns were also similar to those of selected reference genes.
Constitutive Variation in Hepatic Expression of Innate Immune Genes
A total of 114 innate immune genes, identified in the microarray probe set, were ranked
according to their calculated GERs. The ranked GERs of the top (T) 50 % (n = 43) and bottom (B) 6
% of pigs (n = 5) are shown in Table 2.5. Of the 114 genes, three had calculated GERs in excess of
245, namely ATP-dependent DEAD (Asp-Glu-Ala-Asp) box polypeptide 3, Y-linked gene (DDX3Y)
(GER = 2186); mannan-binding lectin C (MBL2) (GER = 741) and secretoglobin, family 1A, member
1 (uteroglobin) (SCGB1A1) (GER = 245). The maximum variation in DDX3Y, MBL2 and SCGB1A1
gene expression between the pig with the highest and lowest microarray expression values was 5900-,
17738- and 1242-fold, respectively. Eighteen genes showed a GER >10; with an additional 29 genes
63
having a GER between 5 - and 10. Another 52 genes had calculated GERs equal to, or less than 5 but
higher than the reference gene with the highest GER (ACTB; GER = 3.2003). The remaining 12 genes
had GER values similar to selected reference genes (Table 2.3 and 2.5). Additionally, GERs were
calculated using different ranking methods (e.g. T 50 % vs. the B 10 % and B 50 % of pigs; the T 20
% vs. the B 20 %; T 10 % and B 10 % of pigs, and the T 6 % vs. the B 50 %), with genes ranked for
each GER, and the average rank calculated (Appendix III). A similar pattern was observed for all
ranking systems, however there were a few exceptions noted when comparing the mean gene
expression of the top 6 % to the bottom 50 % of pigs. Additional genes with a >10-fold change in
expression, using the T 6 %/B 50 % GER, included the complement component C4 precursor
(C4pre), NLR family, pyrin domain containing 5 (NLRP5), NACHT, leucine-rich repeat and PYD
containing 7 Fragment (NLRP7), killer cell lectin-like receptor subfamily A member 1 (LY49), Z-
DNA binding protein 1 (ZBP1), galectin 12 (LGALS12), galectin 3 (LGALS3), pre-pro-beta defensin
104-like (BD104-like) and pre-pro-beta defensin 108-like (BD108-like) (Appendix II). The highest
and lowest calculated GERs for selected reference genes was 3.2 (ACTB) and 2.2 (GAPDH) with an
average of 2.8 for all reference genes (Table 2.3).
Unsupervised agglomerative hierarchical clustering grouped all identified innate immune,
acute phase protein and reference genes into four distinct gene clusters based on their gene expression
patterns (Figure 2.1). The first cluster contained genes where two distinct subpopulations, one with
low and one with high relative mRNA expression could be identified for each gene. Genes within the
second cluster exhibited little variation in relative gene expression. This cluster contained all of the
selected acute phase proteins and reference genes as well as some innate immune genes. The third
cluster was composed of genes where a subpopulation of pigs displayed a marked decrease in relative
mRNA expression. Finally, the fourth cluster consisted of genes where a subpopulation of pigs
showed a marked increase in relative mRNA expression levels. A representative example of each of
the four identified gene expression patterns/clusters is illustrated in Figure 2.2.
A few probes sets with the same gene targets; including LGALS3, galectin 4 (LGALS4),
BD104-like, BD108-like, beta-defensin 123 isoform b (BD123b), complement component 2 (C2),
64
complement component 5a receptor 1 (C5AR1), complement regulator factor H precursor (CFH),
peptidoglycan recognition protein 1 (PGLYRP1), peptidoglycan recognition protein 2 (PGLYRP2) and
ZBP1, did not cluster together and an average expression was not calculated for these gene targets.
Correlation of the mRNA expression of these multiple probes for the same gene target was poorly
correlated. These probe sets had calculated correlation coefficients (R2) ranging from 0.0079 to
0.4395 (Table 2.6).
mRNA expression of selected innate immune genes (MBL2, SCGB1A1, SFTPD, HAMP and
DDX58) was also compared to that of selected acute phase proteins and gene expression was found to
be poorly correlated (Table 2.7).
Sex-Genotyping
In this study we also wanted to identify innate immune genes where the observed variation in
constitutive expression could be explained by differential expression between male and female
individuals. Melting curve analysis of the PCR-amplified fragments generated from the male-specific
TSPY and universal MT-CYB genes was used to differentiate between male pigs that carried both
TSPY (melting point ~ 90.55 ºC) and MT-CYB sequences and female pigs that carried only the MT-
CYB sequence (melting point ~ 81.67 ºC). Forty-nine (55.6 %) of the pigs subjected to sex testing
were identified as males based on the presence of the TSPY gene; the remaining thirty-nine (44.4 %)
of pigs lacked this gene and thus were female. The positive control, MT-CYB, was successfully
amplified from all samples.
There was a significant relationship between sex and the level of mRNA expression as
assessed by microarray analysis of the probe with the highest calculated GER, (microarray probe
annotation - Sus scrofa mRNA, clone:ITT010016G05, expressed in small intestine [AK344932]) and
which corresponded to the Sus scrofa DDX3X gene on the NCBI GenBank database). Male (TSPY-
positive) and female (TSPY-negative) pigs clustered separately with male pigs forming a distinct
cluster of animals that exhibited relatively high levels of mRNA gene expression. Female pigs
65
clustered in a group that exhibited markedly decreased mRNA expression (Figure 2.4). However, the
high level expression of DDX3X in males, observed in this study, and its low level expression in
healthy market weight females was inconsistent with DDX3X being a sexually dimorphic X-linked
gene located in Xp11.3– p11.23 on the X-chromosome (Kim et al. 2001, Park et al. 1998). Alignment
of the microarray probe sequence with the NCBI reference sequence [AK344932] and a number of
other reported DDX3 sequences ([HQ266638.1], [NM_001246203.1], [ENSSSCT00000013398],
[ENSSSCT00000028884]) (Flicek et al. 2013) indicated the microarray gene was in fact the Y-
chromosome ATP-dependent DEAD (Asp-Glu-Ala-Asp) box polypeptide, DDX3Y
(ENSSSCT00000028884) (Flicek et al. 2013). The DDX3Y gene is located in the non-recombining
region of the Y-chromosome (Yq11) and is 91.7 % homologous to the X-linked DDX3X gene with the
microarray probe targeted to this non-homologous region (Lahn and Page 1997, Sekiguchi et al. 2004,
Sekiguchi et al. 2010).
There was no correlation between sex and microarray expression of any of the other identified
innate immune genes (n = 113).
MBL2 Promoter Polymorphisms and their Effect on Hepatic Gene Expression
A subset of eleven pigs with markedly decreased hepatic expression of MBL2 was identified.
This was expected since this study group was selected based on known variations in MBL2 promoter
SNP genotypes. Two polymorphisms in the promoter region of this gene, a MBL2 g.-1091G>A
[previously reported as G(-1081)A] and a MBL2 g.-261C>T SNP [previously reported as C(-251)T],
have been previously identified in our laboratory and linked to altered hepatic expression (Lillie et al.
2007). The presence of the MBL2 g.-1091G>A SNP had a similar effect on microarray gene
expression, as previously reported using semi-quantitative real-time RT-PCR (Lillie et al. 2007)
(Figure 2.5). The Kruskal-Wallis one-way analysis of variance and Dunn’s multiple comparisons post
test was used to identify significant differences in microarray expression between the three MBL2 g.-
1091G>A SNP genotypes (p < 0.0001). Animals that were homozygous (n = 9) for the MBL2 g.-
1091G>A SNP showed a significant decrease in hepatic expression when compared to the wild type
66
allele (n = 47) (p < 0.0001), while expression changes in animals that were heterozygous (n = 32)
were less pronounced (p = 0.1043). Homozygous animals also showed a significant decrease in gene
expression when compared to heterozygous individuals (p = 0.0005). Nine of eleven pigs with the
lowest microarray expression were homozygous for the MBL2 g.-1091G>A promoter polymorphism
(Figure 2.6). The remaining two pigs in this subset were heterozygous for both the MBL2 g.-
1091G>A and MBL2 g.-261C>T promoter SNPs. As previously reported the MBL2 g.-261C>T SNP
had a less profound effect on gene expression. In general, an increase in number of variant SNP
alleles was associated with a decrease in MBL2 gene expression (Figure 2.6).
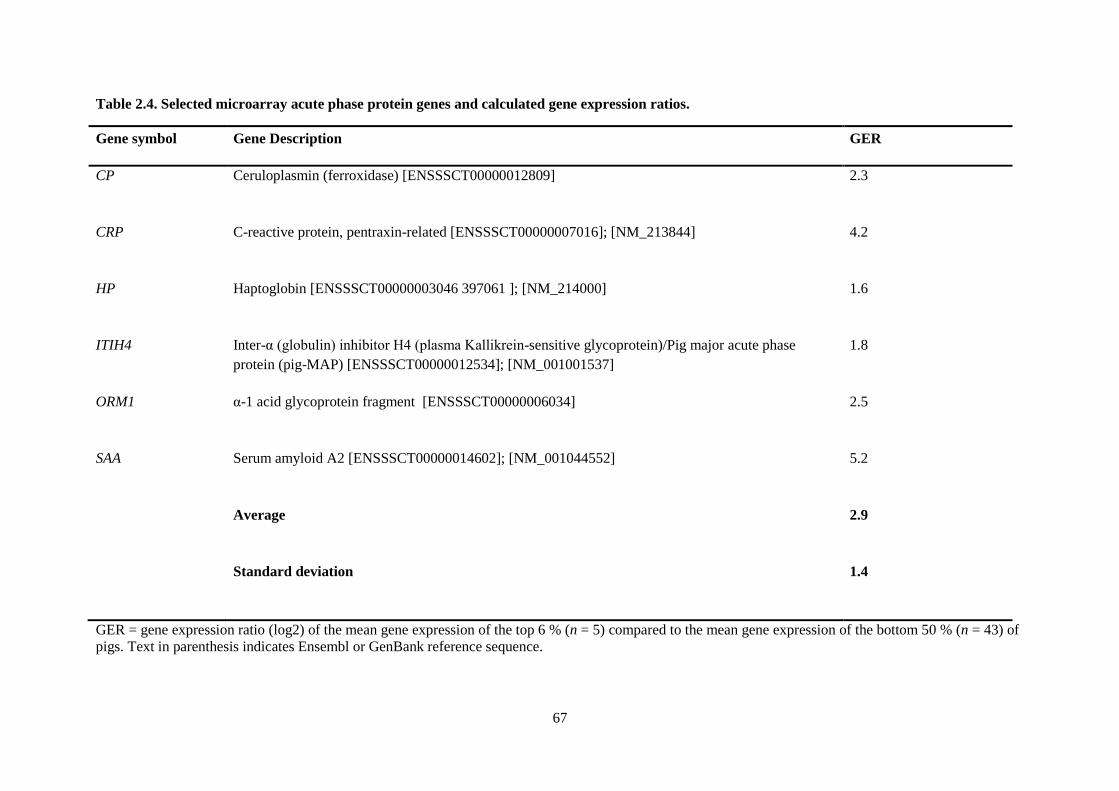
67
Table 2.4. Selected microarray acute phase protein genes and calculated gene expression ratios.
Gene symbol Gene Description GER
CP Ceruloplasmin (ferroxidase) [ENSSSCT00000012809] 2.3
CRP C-reactive protein, pentraxin-related [ENSSSCT00000007016]; [NM_213844] 4.2
HP Haptoglobin [ENSSSCT00000003046 397061 ]; [NM_214000] 1.6
ITIH4 Inter-α (globulin) inhibitor H4 (plasma Kallikrein-sensitive glycoprotein)/Pig major acute phase
protein (pig-MAP) [ENSSSCT00000012534]; [NM_001001537]
1.8
ORM1 α-1 acid glycoprotein fragment [ENSSSCT00000006034] 2.5
SAA Serum amyloid A2 [ENSSSCT00000014602]; [NM_001044552] 5.2
Average 2.9
Standard deviation 1.4
GER = gene expression ratio (log2) of the mean gene expression of the top 6 % (n = 5) compared to the mean gene expression of the bottom 50 % (n = 43) of
pigs. Text in parenthesis indicates Ensembl or GenBank reference sequence.
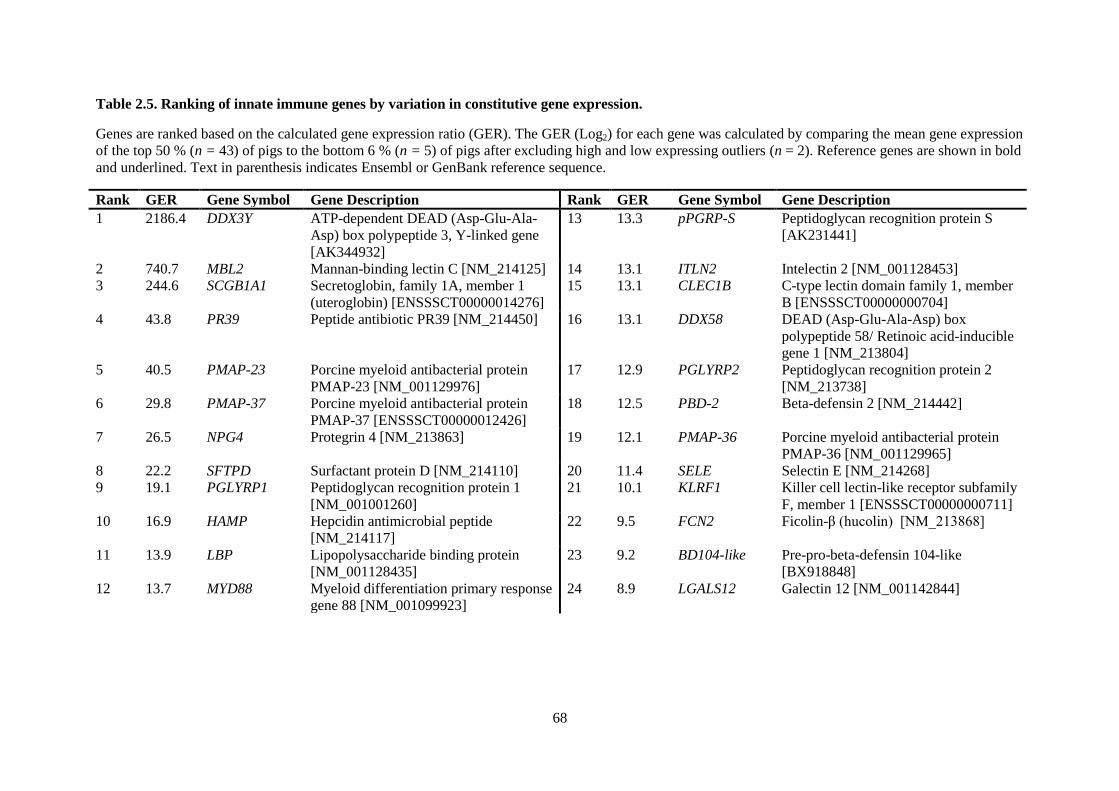
68
Table 2.5. Ranking of innate immune genes by variation in constitutive gene expression.
Genes are ranked based on the calculated gene expression ratio (GER). The GER (Log2) for each gene was calculated by comparing the mean gene expression
of the top 50 % (n = 43) of pigs to the bottom 6 % (n = 5) of pigs after excluding high and low expressing outliers (n = 2). Reference genes are shown in bold
and underlined. Text in parenthesis indicates Ensembl or GenBank reference sequence.
Rank GER Gene Symbol Gene Description Rank GER Gene Symbol Gene Description
1 2186.4 DDX3Y ATP-dependent DEAD (Asp-Glu-Ala-
Asp) box polypeptide 3, Y-linked gene
[AK344932]
13 13.3 pPGRP-S Peptidoglycan recognition protein S
[AK231441]
2 740.7 MBL2 Mannan-binding lectin C [NM_214125] 14 13.1 ITLN2 Intelectin 2 [NM_001128453]
3 244.6 SCGB1A1 Secretoglobin, family 1A, member 1
(uteroglobin) [ENSSSCT00000014276]
15 13.1 CLEC1B C-type lectin domain family 1, member
B [ENSSSCT00000000704]
4 43.8 PR39 Peptide antibiotic PR39 [NM_214450] 16 13.1 DDX58 DEAD (Asp-Glu-Ala-Asp) box
polypeptide 58/ Retinoic acid-inducible
gene 1 [NM_213804]
5 40.5 PMAP-23 Porcine myeloid antibacterial protein
PMAP-23 [NM_001129976]
17 12.9 PGLYRP2 Peptidoglycan recognition protein 2
[NM_213738]
6 29.8 PMAP-37 Porcine myeloid antibacterial protein
PMAP-37 [ENSSSCT00000012426]
18 12.5 PBD-2 Beta-defensin 2 [NM_214442]
7 26.5 NPG4 Protegrin 4 [NM_213863] 19 12.1 PMAP-36 Porcine myeloid antibacterial protein
PMAP-36 [NM_001129965]
8 22.2 SFTPD Surfactant protein D [NM_214110] 20 11.4 SELE Selectin E [NM_214268]
9 19.1 PGLYRP1 Peptidoglycan recognition protein 1
[NM_001001260]
21 10.1 KLRF1 Killer cell lectin-like receptor subfamily
F, member 1 [ENSSSCT00000000711]
10 16.9 HAMP Hepcidin antimicrobial peptide
[NM_214117]
22 9.5 FCN2 Ficolin-β (hucolin) [NM_213868]
11 13.9 LBP Lipopolysaccharide binding protein
[NM_001128435]
23 9.2 BD104-like Pre-pro-beta-defensin 104-like
[BX918848]
12 13.7 MYD88 Myeloid differentiation primary response
gene 88 [NM_001099923]
24 8.9 LGALS12 Galectin 12 [NM_001142844]
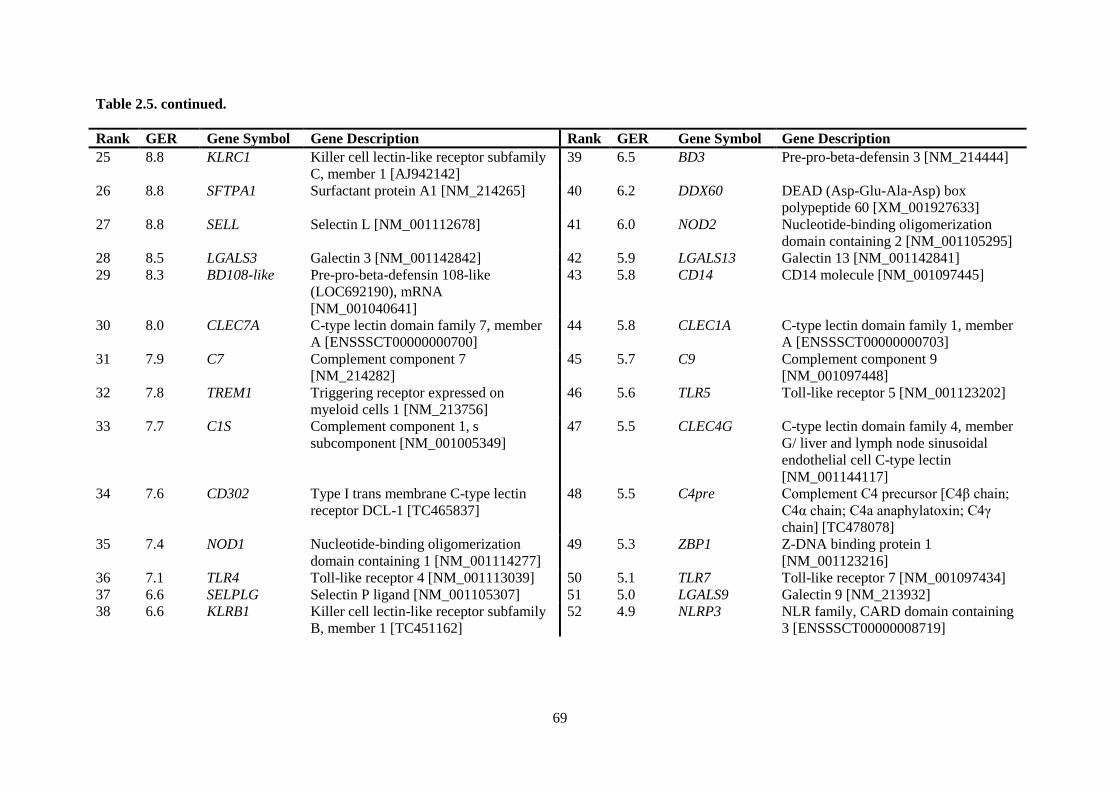
69
Table 2.5. continued.
Rank GER Gene Symbol Gene Description Rank GER Gene Symbol Gene Description
25 8.8 KLRC1 Killer cell lectin-like receptor subfamily
C, member 1 [AJ942142]
39 6.5 BD3 Pre-pro-beta-defensin 3 [NM_214444]
26 8.8 SFTPA1 Surfactant protein A1 [NM_214265] 40 6.2 DDX60 DEAD (Asp-Glu-Ala-Asp) box
polypeptide 60 [XM_001927633]
27 8.8 SELL Selectin L [NM_001112678] 41 6.0 NOD2 Nucleotide-binding oligomerization
domain containing 2 [NM_001105295]
28 8.5 LGALS3 Galectin 3 [NM_001142842] 42 5.9 LGALS13 Galectin 13 [NM_001142841]
29 8.3 BD108-like Pre-pro-beta-defensin 108-like
(LOC692190), mRNA
[NM_001040641]
43 5.8 CD14 CD14 molecule [NM_001097445]
30 8.0 CLEC7A C-type lectin domain family 7, member
A [ENSSSCT00000000700]
44 5.8 CLEC1A C-type lectin domain family 1, member
A [ENSSSCT00000000703]
31 7.9 C7 Complement component 7
[NM_214282]
45 5.7 C9 Complement component 9
[NM_001097448]
32 7.8 TREM1 Triggering receptor expressed on
myeloid cells 1 [NM_213756]
46 5.6 TLR5 Toll-like receptor 5 [NM_001123202]
33 7.7 C1S Complement component 1, s
subcomponent [NM_001005349]
47 5.5 CLEC4G C-type lectin domain family 4, member
G/ liver and lymph node sinusoidal
endothelial cell C-type lectin
[NM_001144117]
34 7.6 CD302 Type I trans membrane C-type lectin
receptor DCL-1 [TC465837]
48 5.5 C4pre Complement C4 precursor [C4β chain;
C4α chain; C4a anaphylatoxin; C4γ
chain] [TC478078]
35 7.4 NOD1 Nucleotide-binding oligomerization
domain containing 1 [NM_001114277]
49 5.3 ZBP1 Z-DNA binding protein 1
[NM_001123216]
36 7.1 TLR4 Toll-like receptor 4 [NM_001113039] 50 5.1 TLR7 Toll-like receptor 7 [NM_001097434]
37 6.6 SELPLG Selectin P ligand [NM_001105307] 51 5.0 LGALS9 Galectin 9 [NM_213932]
38 6.6 KLRB1 Killer cell lectin-like receptor subfamily
B, member 1 [TC451162]
52 4.9 NLRP3 NLR family, CARD domain containing
3 [ENSSSCT00000008719]
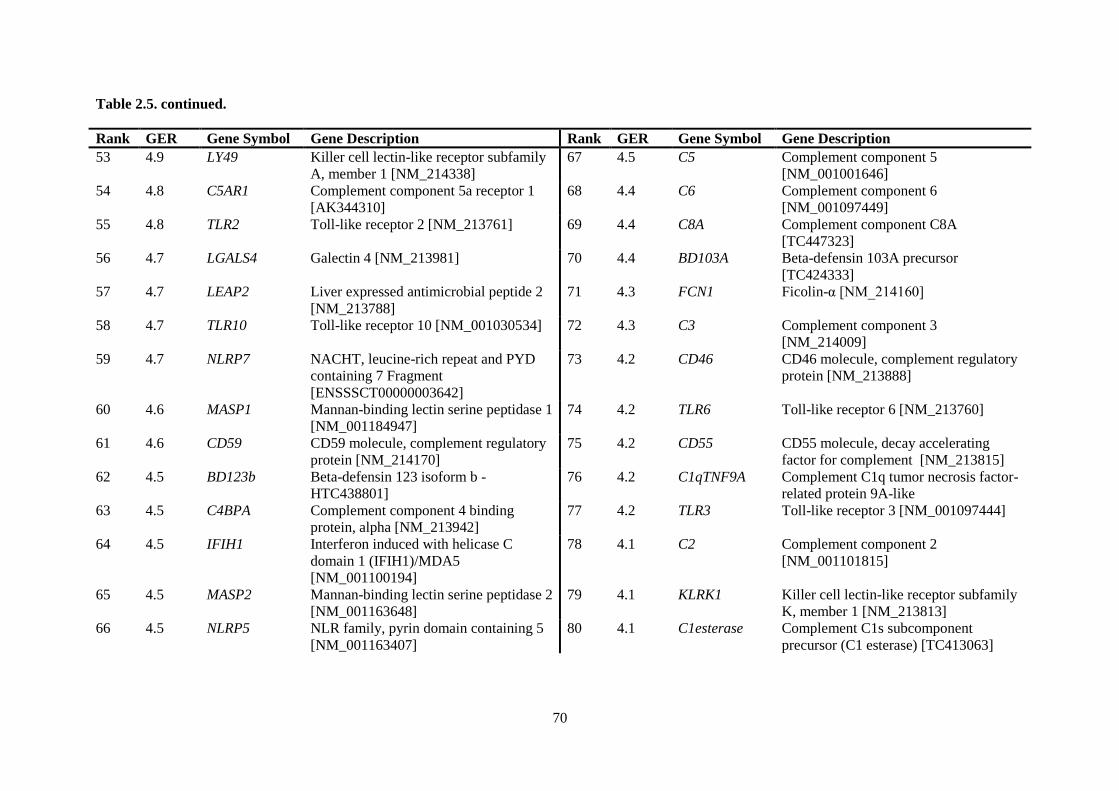
70
Table 2.5. continued.
Rank GER Gene Symbol Gene Description Rank GER Gene Symbol Gene Description
53 4.9 LY49 Killer cell lectin-like receptor subfamily
A, member 1 [NM_214338]
67 4.5 C5 Complement component 5
[NM_001001646]
54 4.8 C5AR1 Complement component 5a receptor 1
[AK344310]
68 4.4 C6 Complement component 6
[NM_001097449]
55 4.8 TLR2 Toll-like receptor 2 [NM_213761] 69 4.4 C8A Complement component C8A
[TC447323]
56 4.7 LGALS4 Galectin 4 [NM_213981] 70 4.4 BD103A Beta-defensin 103A precursor
[TC424333]
57 4.7 LEAP2 Liver expressed antimicrobial peptide 2
[NM_213788]
71 4.3 FCN1 Ficolin-α [NM_214160]
58 4.7 TLR10 Toll-like receptor 10 [NM_001030534] 72 4.3 C3 Complement component 3
[NM_214009]
59 4.7 NLRP7 NACHT, leucine-rich repeat and PYD
containing 7 Fragment
[ENSSSCT00000003642]
73 4.2 CD46 CD46 molecule, complement regulatory
protein [NM_213888]
60 4.6 MASP1 Mannan-binding lectin serine peptidase 1
[NM_001184947]
74 4.2 TLR6 Toll-like receptor 6 [NM_213760]
61 4.6 CD59 CD59 molecule, complement regulatory
protein [NM_214170]
75 4.2 CD55 CD55 molecule, decay accelerating
factor for complement [NM_213815]
62 4.5 BD123b Beta-defensin 123 isoform b -
HTC438801]
76 4.2 C1qTNF9A Complement C1q tumor necrosis factor-
related protein 9A-like
63 4.5 C4BPA Complement component 4 binding
protein, alpha [NM_213942]
77 4.2 TLR3 Toll-like receptor 3 [NM_001097444]
64 4.5 IFIH1 Interferon induced with helicase C
domain 1 (IFIH1)/MDA5
[NM_001100194]
78 4.1 C2 Complement component 2
[NM_001101815]
65 4.5 MASP2 Mannan-binding lectin serine peptidase 2
[NM_001163648]
79 4.1 KLRK1 Killer cell lectin-like receptor subfamily
K, member 1 [NM_213813]
66 4.5 NLRP5 NLR family, pyrin domain containing 5
[NM_001163407]
80 4.1 C1esterase Complement C1s subcomponent
precursor (C1 esterase) [TC413063]
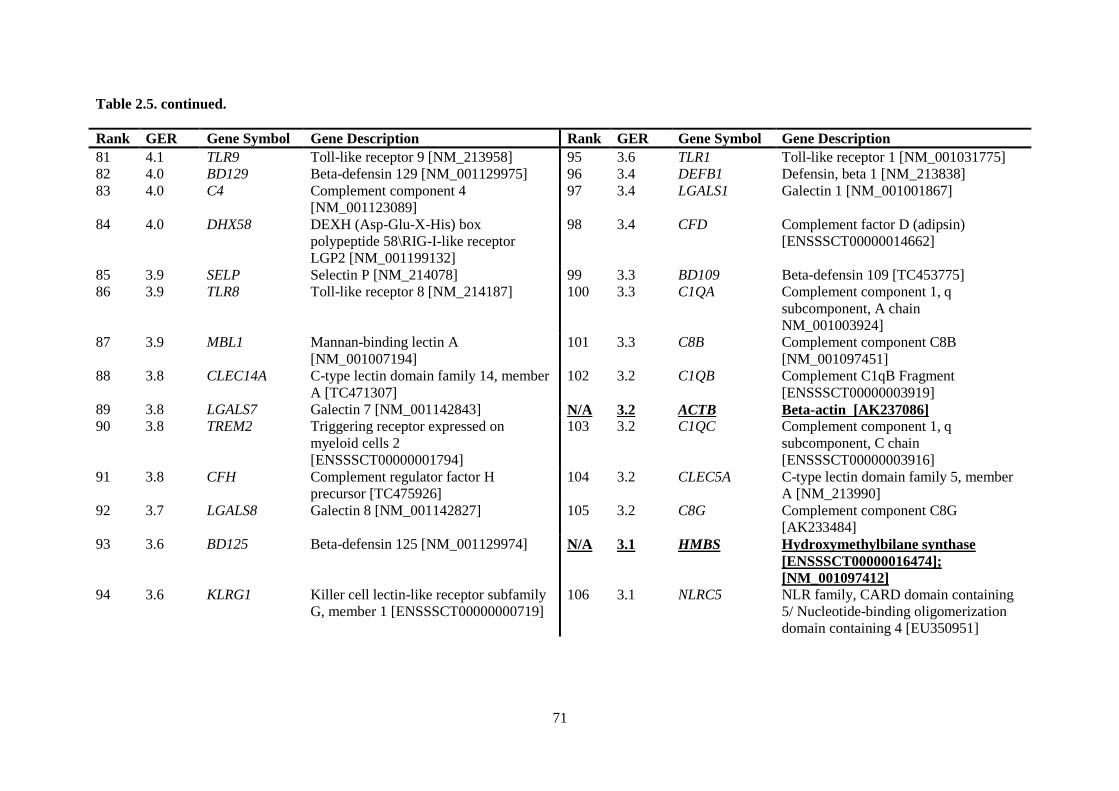
71
Table 2.5. continued.
Rank GER Gene Symbol Gene Description Rank GER Gene Symbol Gene Description
81 4.1 TLR9 Toll-like receptor 9 [NM_213958] 95 3.6 TLR1 Toll-like receptor 1 [NM_001031775]
82 4.0 BD129 Beta-defensin 129 [NM_001129975] 96 3.4 DEFB1 Defensin, beta 1 [NM_213838]
83 4.0 C4 Complement component 4
[NM_001123089]
97 3.4 LGALS1 Galectin 1 [NM_001001867]
84 4.0 DHX58 DEXH (Asp-Glu-X-His) box
polypeptide 58\RIG-I-like receptor
LGP2 [NM_001199132]
98 3.4 CFD Complement factor D (adipsin)
[ENSSSCT00000014662]
85 3.9 SELP Selectin P [NM_214078] 99 3.3 BD109 Beta-defensin 109 [TC453775]
86 3.9 TLR8 Toll-like receptor 8 [NM_214187] 100 3.3 C1QA Complement component 1, q
subcomponent, A chain
NM_001003924]
87 3.9 MBL1 Mannan-binding lectin A
[NM_001007194]
101 3.3 C8B Complement component C8B
[NM_001097451]
88 3.8 CLEC14A C-type lectin domain family 14, member
A [TC471307]
102 3.2 C1QB Complement C1qB Fragment
[ENSSSCT00000003919]
89 3.8 LGALS7 Galectin 7 [NM_001142843] N/A 3.2 ACTB Beta-actin [AK237086]
90 3.8 TREM2 Triggering receptor expressed on
myeloid cells 2
[ENSSSCT00000001794]
103 3.2 C1QC Complement component 1, q
subcomponent, C chain
[ENSSSCT00000003916]
91 3.8 CFH Complement regulator factor H
precursor [TC475926]
104 3.2 CLEC5A C-type lectin domain family 5, member
A [NM_213990]
92 3.7 LGALS8 Galectin 8 [NM_001142827] 105 3.2 C8G Complement component C8G
[AK233484]
93 3.6 BD125 Beta-defensin 125 [NM_001129974] N/A 3.1 HMBS Hydroxymethylbilane synthase
[ENSSSCT00000016474];
[NM_001097412]
94 3.6 KLRG1 Killer cell lectin-like receptor subfamily
G, member 1 [ENSSSCT00000000719]
106 3.1 NLRC5 NLR family, CARD domain containing
5/ Nucleotide-binding oligomerization
domain containing 4 [EU350951]
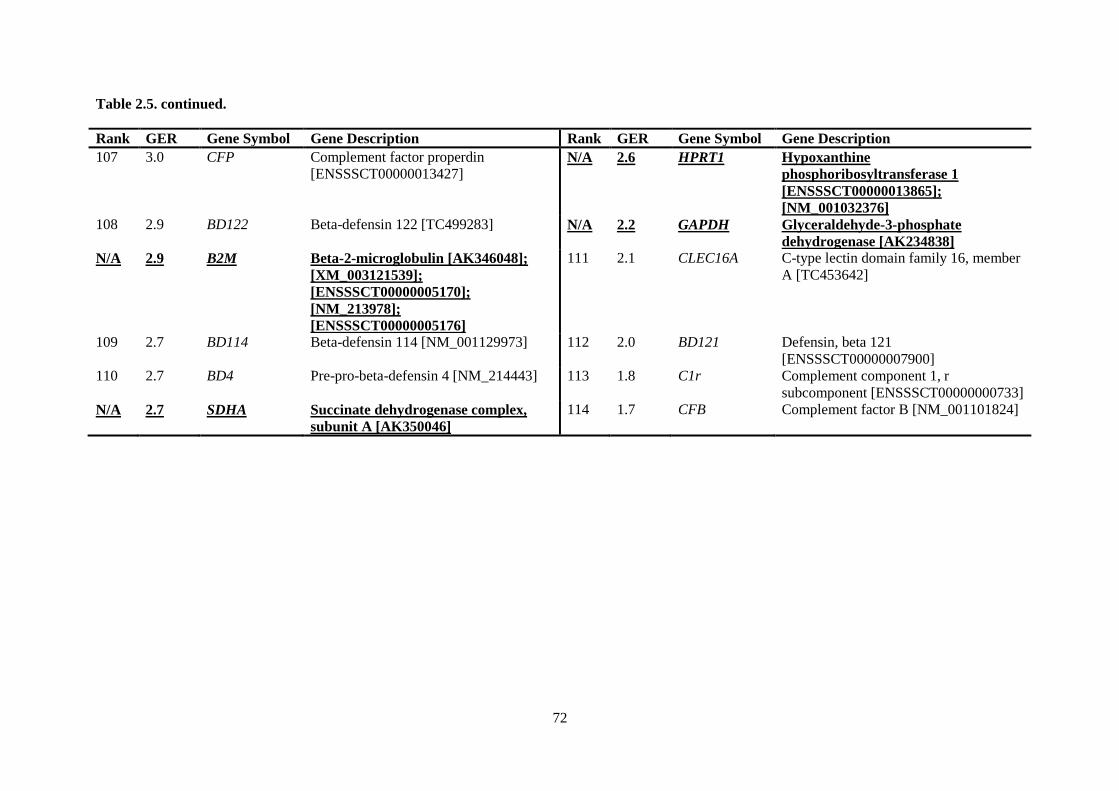
72
Table 2.5. continued.
Rank GER Gene Symbol Gene Description Rank GER Gene Symbol Gene Description
107 3.0 CFP Complement factor properdin
[ENSSSCT00000013427] N/A 2.6 HPRT1 Hypoxanthine
phosphoribosyltransferase 1
[ENSSSCT00000013865];
[NM_001032376]
108 2.9 BD122 Beta-defensin 122 [TC499283] N/A 2.2 GAPDH Glyceraldehyde-3-phosphate
dehydrogenase [AK234838]
N/A 2.9 B2M Beta-2-microglobulin [AK346048];
[XM_003121539];
[ENSSSCT00000005170];
[NM_213978];
[ENSSSCT00000005176]
111 2.1 CLEC16A C-type lectin domain family 16, member
A [TC453642]
109 2.7 BD114 Beta-defensin 114 [NM_001129973] 112 2.0 BD121 Defensin, beta 121
[ENSSSCT00000007900]
110 2.7 BD4 Pre-pro-beta-defensin 4 [NM_214443] 113 1.8 C1r Complement component 1, r
subcomponent [ENSSSCT00000000733]
N/A 2.7 SDHA Succinate dehydrogenase complex,
subunit A [AK350046]
114 1.7 CFB Complement factor B [NM_001101824]
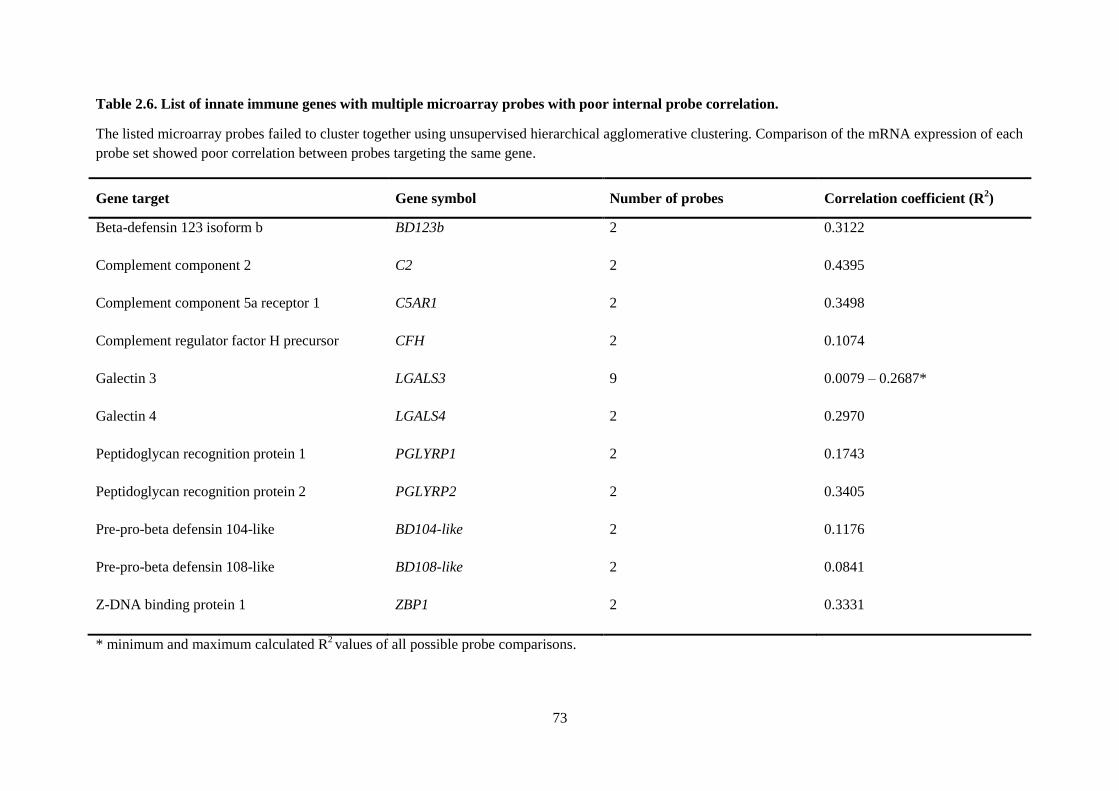
73
Table 2.6. List of innate immune genes with multiple microarray probes with poor internal probe correlation.
The listed microarray probes failed to cluster together using unsupervised hierarchical agglomerative clustering. Comparison of the mRNA expression of each
probe set showed poor correlation between probes targeting the same gene.
Gene target Gene symbol Number of probes Correlation coefficient (R2)
Beta-defensin 123 isoform b BD123b 2 0.3122
Complement component 2 C2 2 0.4395
Complement component 5a receptor 1 C5AR1 2 0.3498
Complement regulator factor H precursor CFH 2 0.1074
Galectin 3 LGALS3 9 0.0079 – 0.2687*
Galectin 4 LGALS4 2 0.2970
Peptidoglycan recognition protein 1 PGLYRP1 2 0.1743
Peptidoglycan recognition protein 2 PGLYRP2 2 0.3405
Pre-pro-beta defensin 104-like BD104-like 2 0.1176
Pre-pro-beta defensin 108-like BD108-like 2 0.0841
Z-DNA binding protein 1 ZBP1 2 0.3331
* minimum and maximum calculated R2 values of all possible probe comparisons.
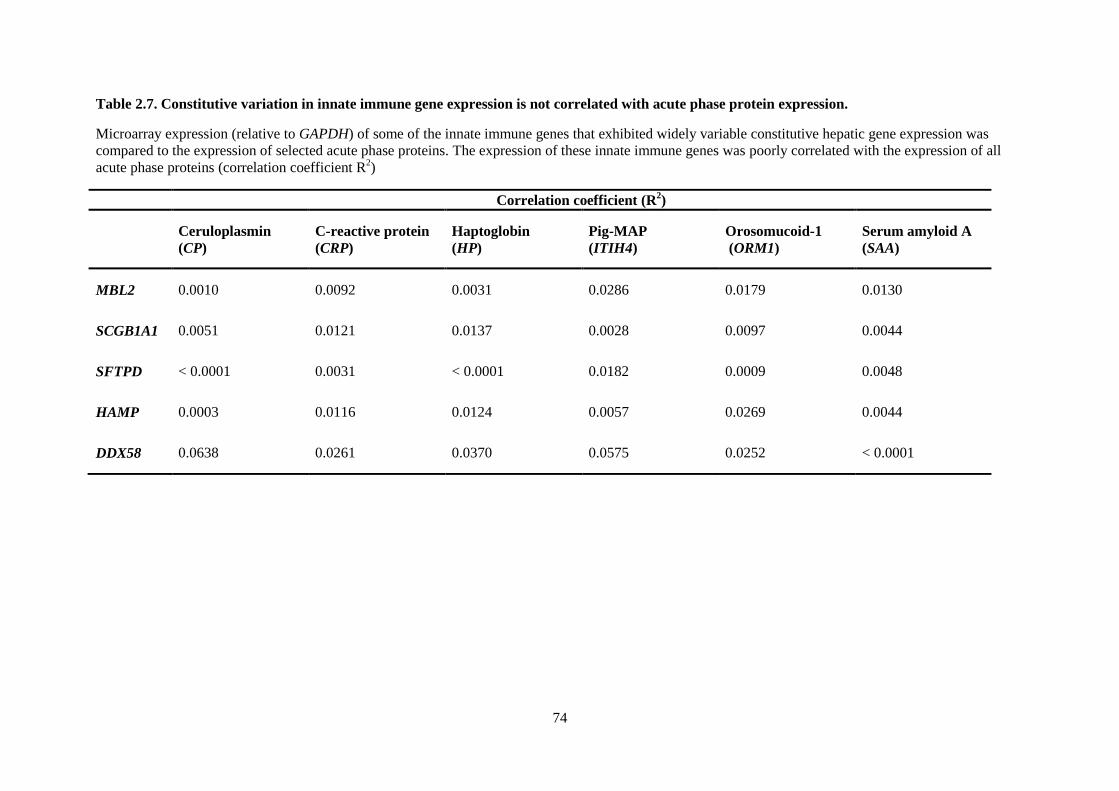
74
Table 2.7. Constitutive variation in innate immune gene expression is not correlated with acute phase protein expression.
Microarray expression (relative to GAPDH) of some of the innate immune genes that exhibited widely variable constitutive hepatic gene expression was
compared to the expression of selected acute phase proteins. The expression of these innate immune genes was poorly correlated with the expression of all
acute phase proteins (correlation coefficient R2)
Correlation coefficient (R2)
Ceruloplasmin
(CP)
C-reactive protein
(CRP)
Haptoglobin
(HP)
Pig-MAP
(ITIH4)
Orosomucoid-1
(ORM1)
Serum amyloid A
(SAA)
MBL2 0.0010 0.0092 0.0031 0.0286 0.0179 0.0130
SCGB1A1 0.0051 0.0121 0.0137 0.0028 0.0097 0.0044
SFTPD < 0.0001 0.0031 < 0.0001 0.0182 0.0009 0.0048
HAMP 0.0003 0.0116 0.0124 0.0057 0.0269 0.0044
DDX58 0.0638 0.0261 0.0370 0.0575 0.0252 < 0.0001
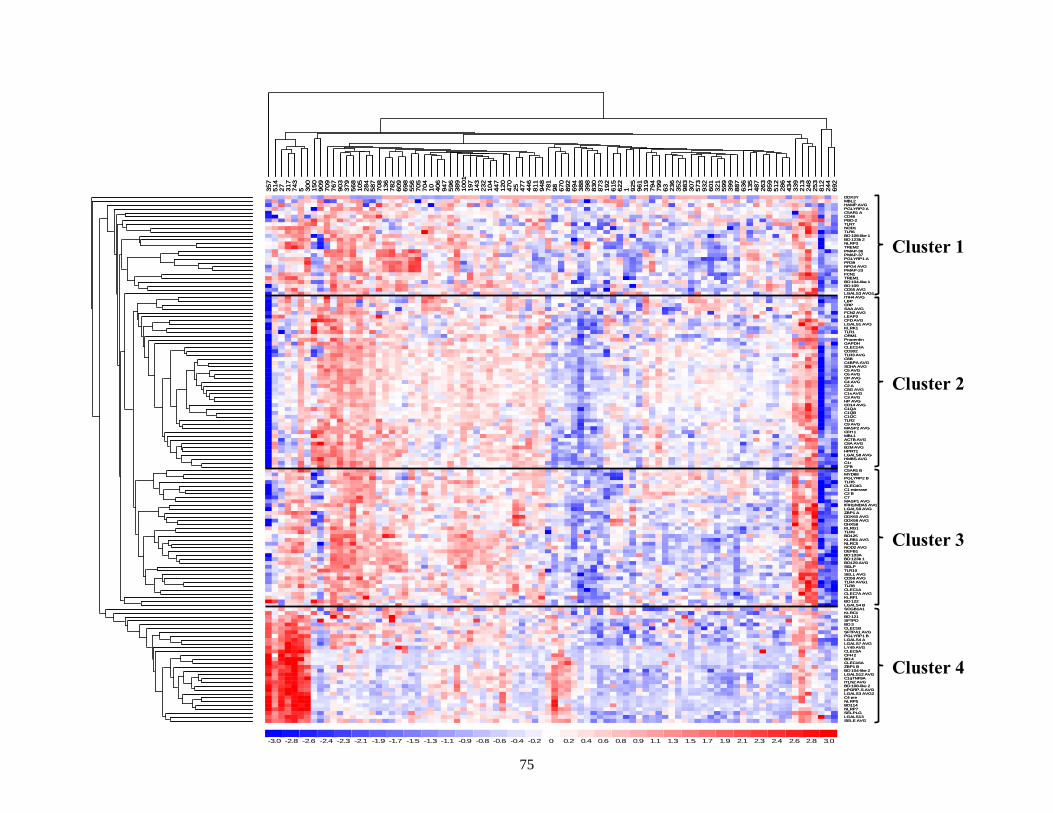
75
357
514
27
317
743
5 300
150
909
709
767
903
379
568
105
284
587
708
136
782
609
698
556
705
704
10
406
947
596
389
1001
197
143
232
104
447
120
470
25
477
446
811
948
781
98
670
892
694
388
398
830
873
192
615
622
1 925
961
319
794
799
63
236
352
983
307
573
932
601
321
599
399
887
636
135
487
263
859
512
286
434
339
213
248
253
812
244
692
DDX3YMBL2HAMP AVGPGLYRP2 AC5AR1 ACD46PBD-2TLR7NOD1TLR6BD 108-like 1BD 123b 2NLRP3TREM2PMAP-36PMAP-37PGLYRP1 APR39NPG4 AVGPMAP-23FCN1TREM1BD 104-like 1BD 109CD55 AVGLGALS3 AVG1ITIH4 AVGLBPCRPSAA AVGFCN2 AVGLEAP2CFD AVGLGALS1 AVGKLRK1TLR1ORM1ProperdinGAPDHCLEC14ACD302TLR3 AVGC8BC4BPA AVGSDHA AVGC5 AVGC6 AVGCP AVGC4 AVGC2 AC8G AVGC1s AVGC3 AVGHP AVGCD14 AVGC1QAC1QBC1QCTLR2C9 AVGMASP2 AVGCFH 1MBL1ACTB AVGC8A AVGB2M AVGHPRT1LGALS8 AVGHMBS AVGC1rCFBC5AR1 BMYD88PGLYRP2 BTLR5CLEC4GC1 esteraseC2 BC7MASP1 AVGIFIH1/MDA5 AVGLGALS9 AVGZBP1 ADDX60 AVGDDX58 AVGDHX58KLRG1TLR9BD125KLRB1 AVGNLRC5NOD2 AVGDEFB1BD 103ABD 123b 1BD129 AVGSELPTLR10SELL AVGCD59 AVGTLR4 AVG1TLR8CLEC1ACLEC7A AVGKLRF1BD 122LGALS4 BSCGB1A1KLRC1BD 121SFTPDBD 3CLEC1BSFTPA1 AVGPGLYRP1 BLGALS4 ALGALS7 AVGLY49 AVGCLEC5ACFH 2BD 4CLEC16AZBP1 BBD 104-like 2LGALS12 AVGC1qTNF9AITLN2 AVGBD 108-like 2pPGRP-S AVGLGALS3 AVG2C4 preNLRP5BD114NLRP7SELPLGLGALS13SELE AVG
-3.0 -2.8 -2.6 -2.4 -2.3 -2.1 -1.9 -1.7 -1.5 -1.3 -1.1 -0.9 -0.8 -0.6 -0.4 -0.2 0 0.2 0.4 0.6 0.8 0.9 1.1 1.3 1.5 1.7 1.9 2.1 2.3 2.4 2.6 2.8 3.0
Cluster 1
Cluster 2
Cluster 3
Cluster 4
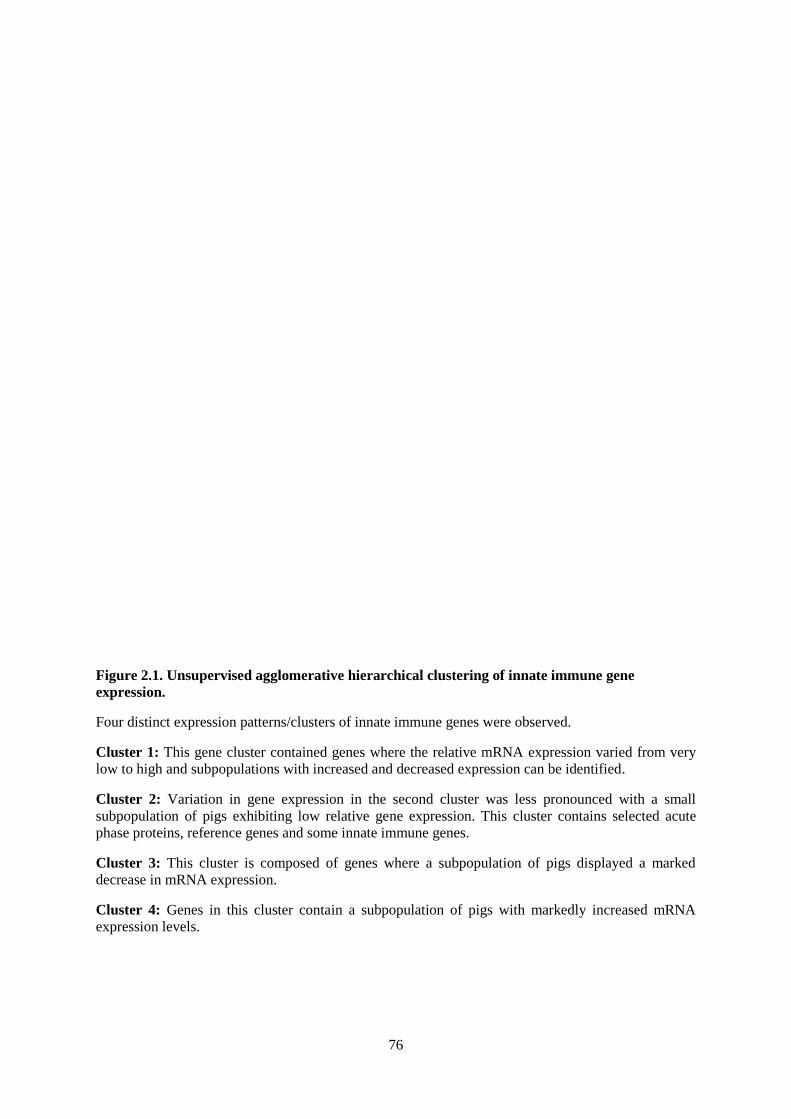
76
Figure 2.1. Unsupervised agglomerative hierarchical clustering of innate immune gene
expression.
Four distinct expression patterns/clusters of innate immune genes were observed.
Cluster 1: This gene cluster contained genes where the relative mRNA expression varied from very
low to high and subpopulations with increased and decreased expression can be identified.
Cluster 2: Variation in gene expression in the second cluster was less pronounced with a small
subpopulation of pigs exhibiting low relative gene expression. This cluster contains selected acute
phase proteins, reference genes and some innate immune genes.
Cluster 3: This cluster is composed of genes where a subpopulation of pigs displayed a marked
decrease in mRNA expression.
Cluster 4: Genes in this cluster contain a subpopulation of pigs with markedly increased mRNA
expression levels.
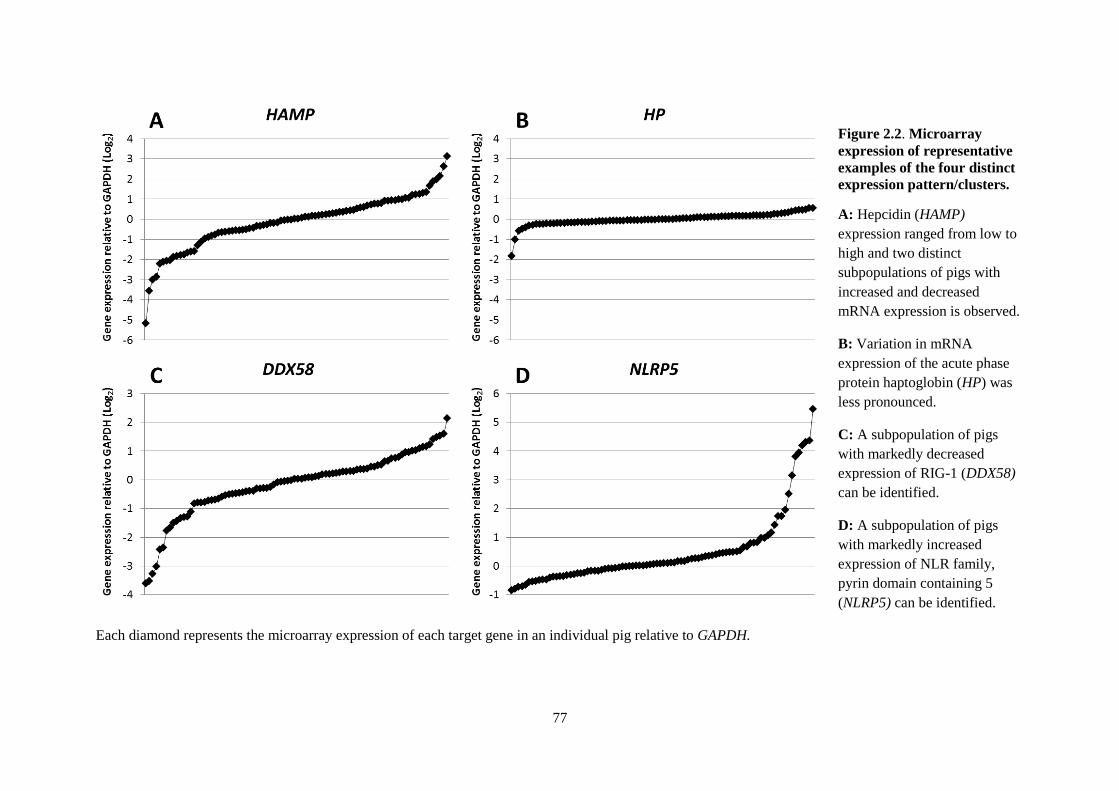
77
Figure 2.2. Microarray
expression of representative
examples of the four distinct
expression pattern/clusters.
A: Hepcidin (HAMP)
expression ranged from low to
high and two distinct
subpopulations of pigs with
increased and decreased
mRNA expression is observed.
B: Variation in mRNA
expression of the acute phase
protein haptoglobin (HP) was
less pronounced.
C: A subpopulation of pigs
with markedly decreased
expression of RIG-1 (DDX58)
can be identified.
D: A subpopulation of pigs
with markedly increased
expression of NLR family,
pyrin domain containing 5
(NLRP5) can be identified.
Each diamond represents the microarray expression of each target gene in an individual pig relative to GAPDH.
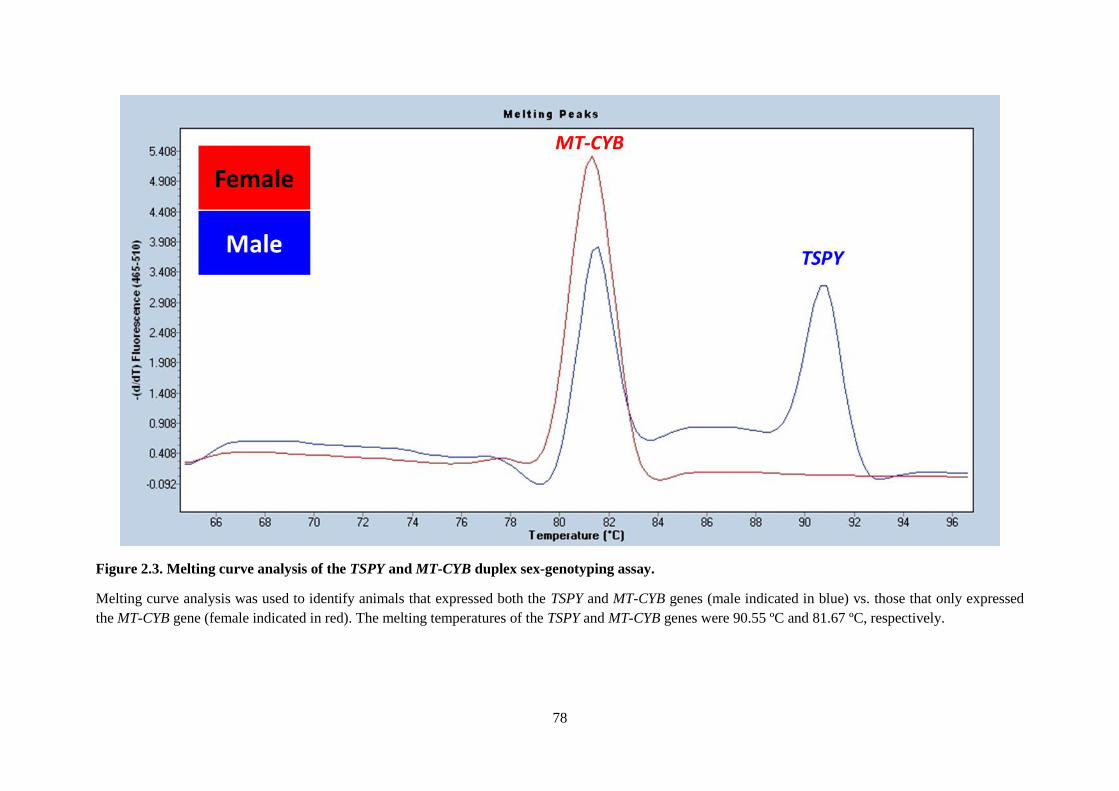
78
Figure 2.3. Melting curve analysis of the TSPY and MT-CYB duplex sex-genotyping assay.
Melting curve analysis was used to identify animals that expressed both the TSPY and MT-CYB genes (male indicated in blue) vs. those that only expressed
the MT-CYB gene (female indicated in red). The melting temperatures of the TSPY and MT-CYB genes were 90.55 ºC and 81.67 ºC, respectively.
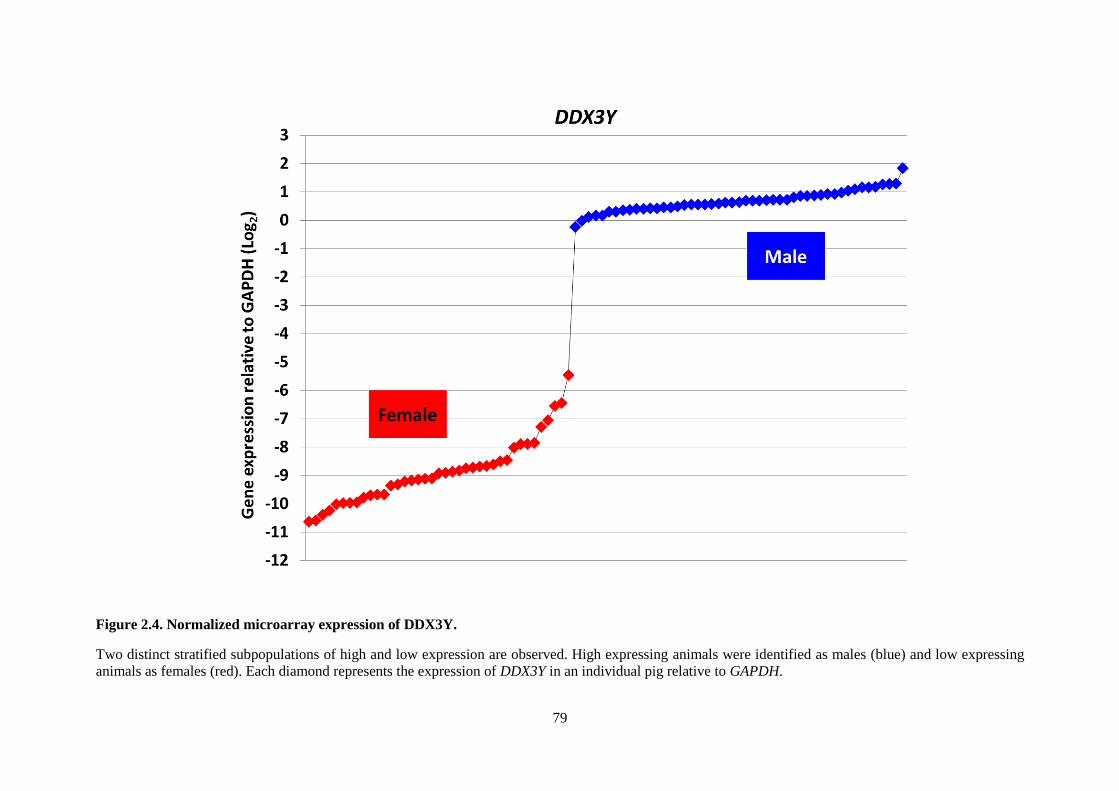
79
Figure 2.4. Normalized microarray expression of DDX3Y.
Two distinct stratified subpopulations of high and low expression are observed. High expressing animals were identified as males (blue) and low expressing
animals as females (red). Each diamond represents the expression of DDX3Y in an individual pig relative to GAPDH.
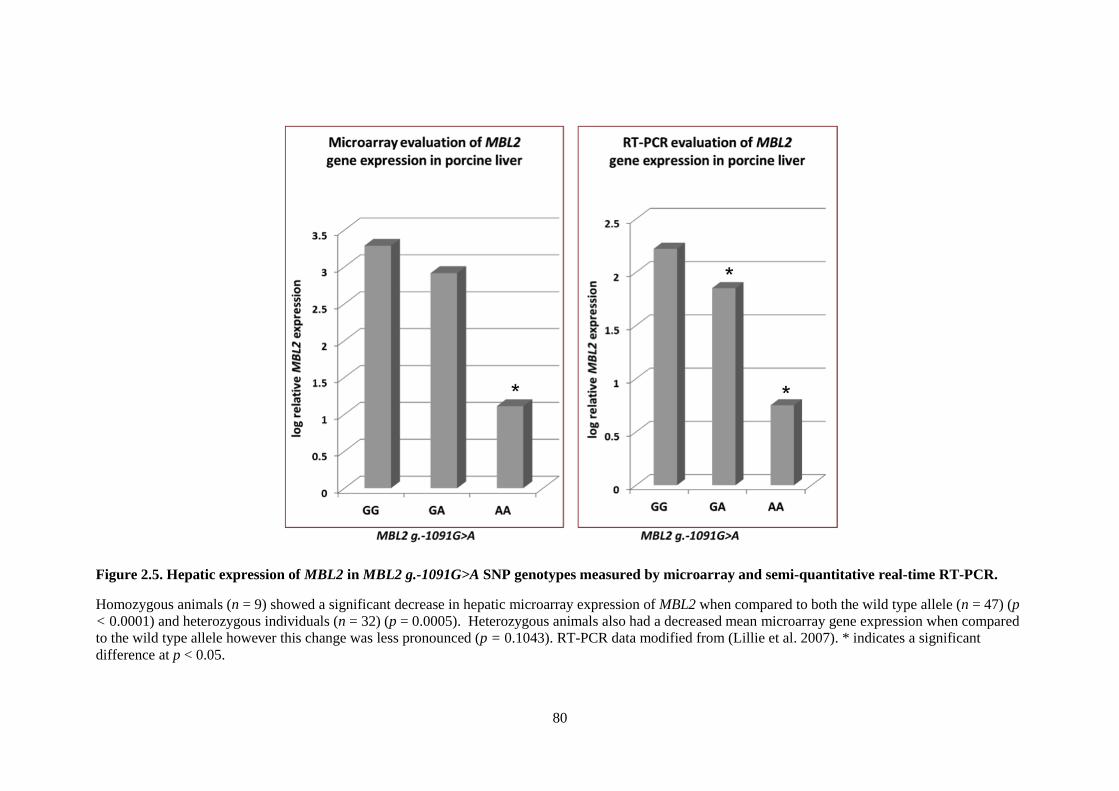
80
Figure 2.5. Hepatic expression of MBL2 in MBL2 g.-1091G>A SNP genotypes measured by microarray and semi-quantitative real-time RT-PCR.
Homozygous animals (n = 9) showed a significant decrease in hepatic microarray expression of MBL2 when compared to both the wild type allele (n = 47) (p
< 0.0001) and heterozygous individuals (n = 32) (p = 0.0005). Heterozygous animals also had a decreased mean microarray gene expression when compared
to the wild type allele however this change was less pronounced (p = 0.1043). RT-PCR data modified from (Lillie et al. 2007). * indicates a significant
difference at p < 0.05.
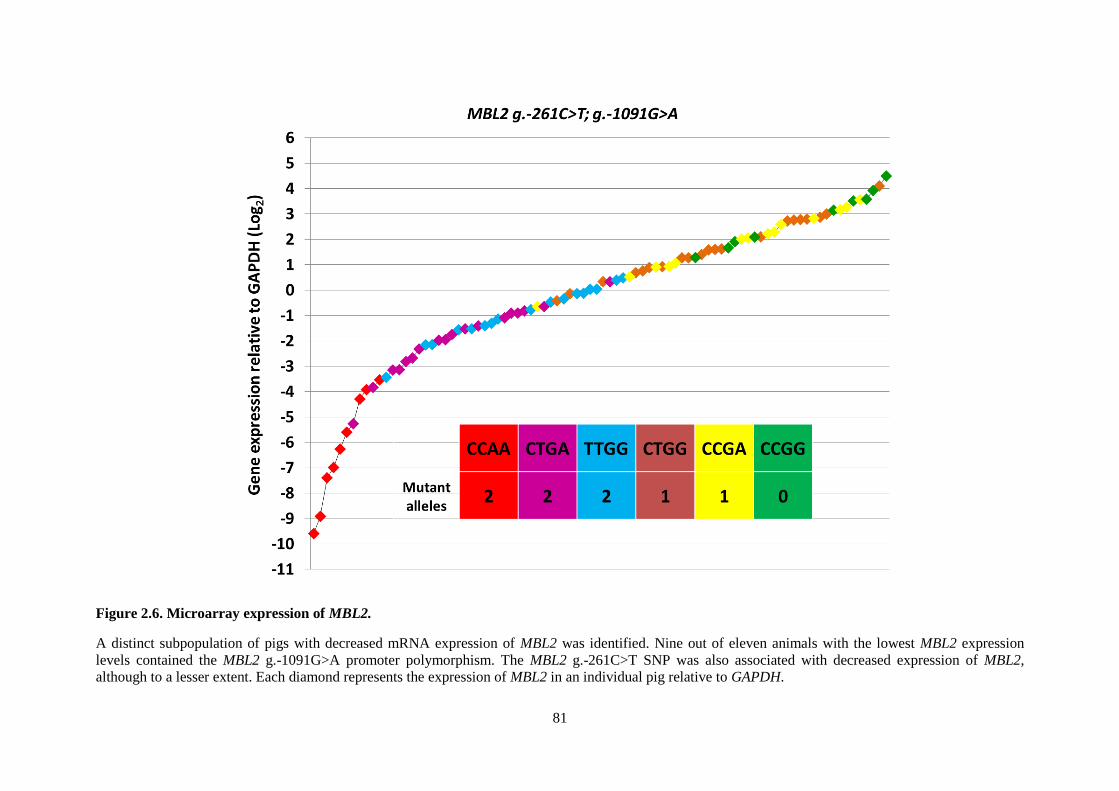
81
Figure 2.6. Microarray expression of MBL2.
A distinct subpopulation of pigs with decreased mRNA expression of MBL2 was identified. Nine out of eleven animals with the lowest MBL2 expression
levels contained the MBL2 g.-1091G>A promoter polymorphism. The MBL2 g.-261C>T SNP was also associated with decreased expression of MBL2,
although to a lesser extent. Each diamond represents the expression of MBL2 in an individual pig relative to GAPDH.
82
DISCUSSION
The use of high through-put sequencing and whole genome microarray analysis have been
particularly informative when applied to gene expression profiling of specific tissues and/or cell types
(Carninci et al. 2005, Su et al. 2002, Su et al. 2004). The expression profiles generated by analyzing
samples from healthy individuals and animal species can be used to establish a reference network,
pattern or atlas of gene expression for a given tissue or cell type (Freeman et al. 2012, Lukk et al.
2010). Comparison of these profiles to those obtained from diseased tissues and cells provides a
powerful approach for identifying the genetic defects that result in increased disease susceptibility and
pathogenesis (Ge et al. 2005, Lukk et al. 2010). Most porcine studies have focussed on genes that are
differentially expressed following experimental or natural infection with a limited number of
pathogens such as porcine reproductive and respiratory syndrome virus (PRRSV), porcine circovirus
type 2 (PCV2) and post-weaning multi-systemic wasting syndrome (PMWS), Actinobacillus
pleuropneumoniae (APP), E. coli F18, classical swine fever (CSF), lipopolysaccharides,
Streptococcus equi subsp. zooepidemicus and other bacterial pneumonias (Bao et al. 2012, Fernandes
et al. 2012, Gladue et al. 2010, Hedegaard et al. 2007, Lee et al. 2010, Li et al. 2010, Li et al. 2013,
Ma et al. 2012, Mortensen et al. 2011, Moser et al. 2004, Moser et al. 2008, Sanz-Santos et al. 2011,
Skovgaard et al. 2010, Tomas et al. 2010, Wysocki et al. 2012, Zuo et al. 2013) while some studies
have also compared expression patterns during different physiological states such as pregnancy,
lactation or following muscle exertion (Jensen et al. 2012, Ostrup et al. 2010, Shu et al. 2012).
Although these studies have advanced our understanding of the porcine transcriptome and the innate
response in pigs, there are still significant gaps in our understanding of constitutive variation in gene
expression in different tissue and cell types. In one recent study, Freeman et al. applied microarray
expression technology to 62 different porcine tissues and cell types (Freeman et al. 2012). Analysis of
large sample sizes is especially important when examining the relationship between genetic variation
and gene expression, as observed in studies of mannan-binding lectin C in humans and pigs (Garred et
al. 2003, Lillie et al. 2007, Madsen et al. 1998). Although the Freeman study serves as an important
resource, it was limited to four animals (one male and three females), making it difficult to extrapolate
83
the results to different pig populations, especially for the evaluation of constitutive variation in gene
expression.
To our knowledge, this is the first study to use whole genome microarray technology to
specifically quantify constitutive variation in the expression of innate immune genes in any tissue or
species. Using this approach, we measured the constitutive expression of a number of innate immune
proteins (n = 114), 21 (18.4 %) of which exhibited a >10-fold decrease (or increase) in hepatic
expression. The gene expression ratio (GER) for these genes, as measured by the mean expression of
the top 50 % compared to the bottom 6 % of pigs, varied from 0 to > 2186. An additional nine genes
(7.9 %) with a GER > 10-fold were identified by comparing mean expression levels in the top 6 % to
the bottom 50 % of pigs, an approach that is more suitable for the detection of a subpopulation with
increased levels of expression. The maximum difference in gene expression between the pig with the
lowest and highest mRNA levels was 17 738 fold in MBL2.
A few of the genes identified in our study have been previously studied in human and/or
porcine tissues, one of which is MBL2. Polymorphisms in the promoter region of human MBL2 have
been previously linked to decreased circulating levels of MBL-C (Garred et al. 2003, Madsen et al.
1998). We found that pigs that were homozygous for MBL2 g.-1091G>A exhibited a significant
decrease in MBL2 gene expression while pigs that were heterozygous for this SNP exhibited a similar,
but less profound decrease. A second SNP, MBL2 g.-261C>T, was also associated with lower levels
of MBL2 expression but the decrease was less profound than that observed for MBL2 g.-1091G>A.
These results are consistent with a previous RT-PCR study showing an association between MBL2 g.-
1091G>A and MBL2 g.-261C>T and reduced hepatic expression of porcine MBL2 (Lillie et al. 2007).
This high degree of concordance between methods and studies support our hypothesis that microarray
technology in combination with sequencing can be used to identify novel polymorphisms (SNPs,
insertions, deletions) associated with altered expression of innate immune genes.
When analyzed using unsupervised agglomerative hierarchical clustering, the 114 genes
identified in this study fell into four distinct clusters (Figure 2.1 and 2.2). The proteins and receptors
within each cluster had similar patterns of gene expression and many, but not all, had similar
functional properties. Cluster 1 was composed of innate response proteins that were highly variable
84
among individual pigs. This expression group contained a number of antibacterial peptides (NPG4,
PR39, PMAP-23, PMAP-36 and PMAP-37) and other neutrophil granule associated molecules
(PGLYRP1 probe A).
Cluster 2 consisted of genes that showed little variation between individual pigs and
occasionally a subpopulation of pigs with decreased relative expression could be identified. In
addition to complement components (C1S, C8G, C2 probe A, C3, C4, C5, C6, C9, C4BPA, C8B,
C1QA, C1QB and C1QC), this cluster contained the acute phase proteins [ITIH4 (pig-MAP); SAA
(serum amyloid A); CRP (c-reactive protein); HP (haptoglobin), CP (ceruloplasmin/ferroxidase) and
ORM1 (α1-acid glycoprotein/orosomucoid-1)] and all of the selected reference genes, (HMBS,
HPRT1, B2M, ACTB, GAPDH and SDHA). The lack of variation in expression of acute phase
proteins, absence of a subset of pigs with elevated acute phase gene expression and the similarity of
gene expression to that of selected reference genes suggests none of the pigs had an acute phase
response at the time of sampling and were thus healthy, a finding that was consistent with the clinical
evaluation of these healthy pigs. The lack of correlation between expression of the selected acute
phase proteins and that of innate immune genes with widely variable constitutive expression is
indicative that these genes are not coordinately expressed (Table 2.7). This finding was of particular
importance in ruling out the possibility that the observed variations in gene expression were due to
infection and inflammation rather than differences in constitutive expression.
Cluster 3 consisted of proteins that often contained markedly reduced expression in a subset
of pigs and included the antiviral signaling RLR helicases DDX58 (RIG-1), IFIH1 (MDA-5), DHX58
(LGP2), ZBP1 probe A (DAI) and DDX60.
In contrast, cluster 4 was composed of genes that often contained markedly increased
expression in a subset of pigs, including the pulmonary C-type lectins SFTPD and SFTPA1 as well as
SCGB1A1, a secretory protein better known as being expressed in Clara cells of the lung.
The mRNA expression of a few target genes with multiple probes, LGALS3, LGALS4,
BD104-like, BD108-like, BD123b, C2, C5AR1, CFH, PGLYRP1, PGLYRP2 and ZBP1, did not cluster
together within any of the four expression groups (Table 2.6). mRNA expression results when
analyzed using multiple targeted probes directed against different regions of the full length mRNA
85
transcript for these genes gave discrepant results. A possible reason for discrepant results may relate
to the potential for differential degradation of the mRNA template. Although every possible effort was
made to ensure that our RNA was intact and of the highest quality (i.e. all of our samples had an RIN
number > 7.0), mRNA is easily degraded by a number of different mechanisms. The majority of
eukaryotic mRNA degradation is initiated by shortening of the 3' polyadenosine tail (deadenylation).
After deadenylation mRNA is then further degraded by either exonucleolytic decapping of the 5'-cap
structure and 5' to 3' degradation (Coller and Parker 2004, Hu et al. 2009, Parker 2012, van Hoof and
Parker 2002). Additionally mRNA degradation can also occur in the 3' to 5' direction, which is
mediated by the cytoplasmic exosome 1 (Coller and Parker 2004, Hu et al. 2009, Parker 2012, van
Hoof and Parker 2002). Preferential degradation of the 3'- (or 5'-) end of the mRNA could, in theory,
give discordant results when using probes directed against these different gene regions. Although
most of these poorly correlated probes were designed to target the 3'-end of the mRNA, some probes
were located toward the 5'-end with an occasional probe spanning an intron and distance between
mRNA probes did not appear to be associated with the observed variation in correlation in this study.
Other more targeted degradation factors such as miRNA may also play a role in determining the
amount of mRNA that is available for quantification (Deneke et al. 2013, Huntzinger and Izaurralde
2011). MicroRNA (miRNA), transcriptional and post-transcriptional regulation, pre-mRNA splicing
and post-splicing RNA processing as well as post-translational modifications and DNA methylation
have all been shown to have a significant effect on mRNA production and final protein product
concentrations (Bartel 2004, Fire et al. 1998, Huntzinger and Izaurralde 2011, Xiao et al. 2012, Yang
and Seto 2008, Ye et al. 2012)
A potential limitation inherent in gene expression studies performed on tissue lysates relates
to the heterogeneity of the sample. Although hepatocytes are the most abundant cell type in the liver
and contributes the most of the cytoplasmic mass and therefore represent a major source of innate
immune response proteins, other cell types such as macrophages, dendritic and Kupffer cells,
fibroblasts, vascular endothelial and biliary epithelial cells, as well as circulating cells within the
vascular compartment of the liver may also contribute to the “global” gene expression patterns
86
observed in our study. The presence of different functional units and zones within hepatic acini and
differences in blood flow to and from different regions and lobes of the liver may also have an effect
on the cellular composition of the liver and the relative contribution of different cell types to the
observed transcriptome patterns. However, variations in these factors among individual pigs should be
minimal and would not be expected to account for the large increases (>245-fold) in mRNA observed
for genes such as MBL2 and SCGB1A1. It is possible, however, that some of the variation observed
for granulocyte associated porcine cathelicidins and peptidoglycan recognition proteins which are
known to be primarily expressed in leukocytes (PR-39, protegrins, porcine myeloid antibacterial
peptides/PMAPs and PGLYRP1) (Dziarski and Gupta 2010, Sang and Blecha 2009) may be due to
differences in blood flow and circulatory constituents. A number of growth promotants, including
antibiotics and repartitioning agents such as Ractopamine, are registered for use in swine, some of
which have short or no withdrawal periods and can be used up to the time of slaughter. In swine,
Ractopamine has been shown to alter gene expression in both white adipose tissue and muscle
(Gunawan et al. 2007, Halsey et al. 2011). Similarly in chickens antibiotics such as Bacitracin has
been shown to alter gene expression of genes in the jejunum of chickens and a similar situation likely
exists in swine (Brennan et al. 2013). The use of such products immediately up to the time of
slaughter can therefore represent a potential limiting factor, especially if such drugs are used
inconsistently between different production units. It is currently unknown if similar alterations in gene
expression would be observed in the liver or whether or not these products would specifically alter the
expression of innate immune genes.
Knowledge of the porcine genome is still in its infancy and, as a result, the probe annotations
used to design commercially available porcine microarrays are continually being improved. As a
result of limited information, inaccurate gene designations may occur as described for DDX3Y. Some
studies have shown that up to 50 % of the oligonucleotide probes in some commercial microarray
platforms can give erroneous results either through cross hybridization with other probes, lack of
target specificity and/or the presence of orphan probes that target genes that do not exist in the target
genome under evaluation (Neerincx et al. 2009). These pitfalls can affect downstream data analysis
87
and lead to erroneous identification of differentially expressed genes. Splice variants can also pose a
potential for error if probes are not designed to differentially quantify all known variants in the target
sequence. This can have a significant effect on inter-platform reproducibility and even on updated
versions of the same platform (Lee et al. 2007).
Splice variants may account for some of the poor probe correlations and divergent clustering
observed in these studies for LGALS3, C2, CFH, PGLYRP2 and ZBP1, all of which code for two or
more transcript variants (Flicek et al. 2013). This may indeed be the case for the PGLYRP2, a protein
that has two different characterized splice variants. The long isoform is expressed predominantly in
the liver, whereas the short isoform is expressed in bone marrow, intestine, spleen, kidney, and the
skin, in addition to liver (Sang et al. 2005). One of the probes recognizes both mRNA isoforms
whereas the second probe recognizes the long [ENSSSCT00000022764] but not the short isoform
[ENSSSCT 00000023031].
A number of software programs have been developed to aid in improving probe annotation
for microarray experiments. These programs, such as IMAD, OligoRAP and sigReannot have been
shown to significantly improve probe annotation and downstream GO term enrichment analyses
(Casel et al. 2009, Neerincx et al. 2009, Neerincx et al. 2009, Prickett and Watson 2009). In addition,
a number of online probe annotation tools have also been developed to support some domestic
animals including GOEAST (http://omicslab. genetics.ac.cn/GOEAST/), Blast2GO
(http://www.blast2go.de/b2ghome), EasyGO (http:// bioinformatics.cau.edu.cn/easygo/) and AgriGo
(http://bioinfo.cau.edu.cn/agriGO/) (Conesa et al. 2005, Du et al. 2010, Zheng and Wang 2008, Zhou
and Su 2007). However, not all programs support all available platforms and in the current study
further annotation of the Agilent porcine microarray platform could not be performed with currently
available software programs. In this study, we identified 114 innate immune genes based on currently
available information. Additional annotations are needed to extend this work to a larger number of
target genes.
88
Since none of the genes in the porcine microarray assay have been annotated for sex, we
investigated whether ATP-dependent DEAD (Asp-Glu-Ala-Asp) box polypeptide, DDX3Y, could be
used a sex-genotyping tool. Selection of this gene was based on the marked variation observed in
mRNA expression and stratification thereof into two distinct groups of high and low expression. This
distinct stratification and strong correlation with our PCR based sex-genotyping assay suggest that
when a microarray platform containing the annotated DDX3Y gene is used, microarray expression of
this gene represents a useful sex-genotyping tool in studies where this information is unknown.
Alternatively DDX3Y can also be used as a gene target to design real-time RT-PCR based sex-
genotyping assays, as described for TSPY and CYB1 in this study. Both the X- and Y-linked homologs
are intracellular RNA sensing PRRs that play an important role in innate antiviral signalling and viral
pathogenesis (Garbelli et al. 2011, Owsianka and Patel 1999, Schroder 2011, Soulat et al. 2008).
Although this gene showed one of the highest calculated GERs, variation in expression in this case
was considered to be due to the sexual dimorphic nature of this Y-chromosome linked gene.
Using genome wide expression microarray technology we were able to identify a number of
innate immune genes that exhibited wide variation in constitutive expression. These innate immune
genes represent important targets for further investigation aimed at identifying the factors that
underlie the observed variation. As was shown with MBL2, sequencing the regulatory regions of these
target innate immune genes should lead to the identification of genetic differences (SNPs, insertions,
deletions or other genetic variations) that are associated with the wide variation observed. Ultimately
the identification of such genetic markers could be used to breed healthy pigs with higher levels of
innate resistance to common infectious diseases. Additionally the opportunity also exists to apply the
same methods in other immunologically important tissues such as the lung or spleen to identify
additional target innate immune genes. The same techniques can also be applied to study constitutive
gene expression of other genes affecting economically important traits such as genes involved in
metabolism, fertility and/or production characteristics.
89
CHAPTER 3: NOVEL PROMOTER POLYMORPHISMS ASSOCIATED WITH
INCREASED CONSTITUTIVE EXPRESSION OF SCGB1A1 AND SFTPD mRNA IN THE
LIVER OF HEALTHY PIGS
This chapter corresponds to a manuscript of the same title to be submitted with the following
authorship:
Snyman HN, Jagt K, Hammermueller JD, Hayes MA, Lillie BN (2013)
ABSTRACT
The innate immune system represents an important component of the host defence against
infectious diseases and alterations in the expression of critical innate immune genes, such as those
resulting from underlying genetic variations, have been associated with increased susceptibility to
developing infectious diseases in pigs. Previous studies identified a number of innate immune genes
with marked variability in constitutive expression. Two of the genes that showed the greatest increase
in mRNA expression were two genes involved in innate immunity in the lung, pulmonary surfactant
protein D (SFTPD), a member of the collectin family of C-type lectins and secretoglobin family 1A
member 1 (SCGB1A1), a secretory protein expressed in Clara cells of the lung. In this study, we
characterized the 5' upstream promoter regions of these genes to determine if genetic differences are
responsible for the variation in constitutive expression. Using pooled sequencing of the lowest and
highest expressing animals, we identified three novel single nucleotide polymorphisms, SFTPD g.-
4509A>G, SFTPD g.-4394G>A and SFTPD g.-4350C>T within the 2682 bp of the 5'-promoter
region of SFTPD. A novel polymorphic sequence with a large number of variations was also
identified in the 1953 bp of the 5' promoter region of SCGB1A1 and may be indicative of duplication
of the SCGB1A1 gene. All three SFTPD SNPs and the polymorphic SCGB1A1 gene were more
frequent in pigs with increased mRNA expression. The SFTPD g.-4509A>G SNP was rare throughout
all healthy and diseased genotyped populations. Although no statistically significant disease or
etiologic agent associations were identified for this SNP, variant genotype frequency was increased
two- to four- fold in pigs infected by a variety of pathogens associated with lung disease. These

90
findings suggest that these SNPs are associated with a gain in function of SP-D. This sets the stage for
future investigations into the significance of these polymorphisms on innate immune defenses and
ultimately may serve as genetic markers to assess and improve innate disease resistance in
commercial swine populations.
91
INTRODUCTION
Abnormalities in gene expression and function resulting from specific genetic polymorphisms
within some innate immune genes of humans and domestic animals have been shown to have a
detrimental effect on host susceptibility to common infectious diseases (Garred et al. 2003, Garred
and Madsen 2004, Garred et al. 2006, Ibeagha-Awemu et al. 2008, Jozaki et al. 2009, Juul-Madsen et
al. 2011, Keirstead et al. 2011, Leth-Larsen et al. 2005, Lillie et al. 2006, Lillie et al. 2007, Madsen et
al. 1998, Uenishi et al. 2011, Uenishi et al. 2012, Wang et al. 2011, Zhao et al. 2012). In pigs, some of
these polymorphisms have been shown to significantly alter gene expression and may involve regions
involved in transcriptional regulation (Juul-Madsen et al. 2006, Juul-Madsen et al. 2011, Lillie et al.
2006, Lillie et al. 2007). The identification of additional polymorphisms (SNPs, insertions, deletions
or other genetic variations) that affect the transcriptional regulation of innate immune genes may lead
to novel selection strategies that can be used to increase resistance to infectious diseases in swine. We
recently conducted a genome-wide study of hepatic gene expression in healthy market weight pigs
using microarray technology to identify innate immune genes with widely variable constitutive gene
expression (Chapter 2). Two genes associated with pulmonary innate immunity showed among the
greatest variation in mRNA expression. One of these was pulmonary surfactant protein D (SP-D;
encoded by SFTPD), a pattern recognition molecule and member of the collectin family of C-type
lectins and the second was secretoglobin family 1A member 1 (SCGB1A1, encoded by SCGB1A1), a
secretory protein expressed in Clara cells of the lung (Haagsman et al. 2008, Mukherjee et al. 2007).
Both SP-D and SCGB1A1 have been shown to play an important role in the immune
modulation of innate immune responses to pulmonary pathogens (Haagsman et al. 2008, Mukherjee et
al. 2007).; The role of SP-D, along with the related SP-A, in pulmonary innate defense has been
extensively reviewed (Creuwels et al. 1997, Haagsman et al. 2008, Hartl and Griese 2006, Kuroki et
al. 2007, McCormack and Whitsett 2002). SP-D is produced primarily in alveolar type II cells and
nonciliated bronchiolar cells of the lung and is constitutively secreted into the alveoli where it
influences surfactant homeostasis, effector cell functions and host defense (Herias et al. 2007, Madsen
et al. 2000). SP-D binds to sugar moieties on the surface of bacterial, viral and fungal pathogens via
92
its carbohydrate recognition domain (CRD) (Chapter 1; Table 1.2), a process that leads to the
agglutination and opsonisation of pathogens followed by phagocytic uptake and clearance (Creuwels
et al. 1997, Hartl and Griese 2006, Kuroki et al. 2007). SFTPD is located within the collectin locus on
Sus scrofa chromosome 14 along with SP-A and mannan-binding lectin-A (MBL-A) (Marklund et al.
2000, van Eijk et al. 2000). SP-D is a trimeric molecule composed of three identical monomeric
polypeptide units (Holmskov et al. 2003) and has a higher order oligomeric cruciform structure
composed of at least four trimeric subunits. Although alveolar type II cells and mucosal surface
epithelium are the major sites of SFTPD expression, expression in a variety of other organs including
other cells in the lungs as well as, liver, kidney and ovary has been reported (Hartl and Griese 2006,
Herias et al. 2007, Madsen et al. 2000, Skovgaard et al. 2010).
SCGB1A1 is found in secretory granules of Clara cells and is one of the most abundant
proteins in airway secretions (Singh and Katyal 2000). SCGB1A1 was originally isolated from early
gravid rabbit uteri and named blastokinin and later uteroglobin (Beier 1968, Krishnan and Daniel
1967). Since then the protein has been isolated from a variety of biological sources and, as a result,
was given various names including Clara cell secretory protein (CCSP), Clara cell 10 kDa protein
(CC10), CC16 and urine protein-1 (UP1) before becoming the founding member of the secretoglobin
superfamily (Mukherjee et al. 2007). SCGB1A1 has many functional properties and, although the
structural features of this protein have been extensively studied, the mechanisms underlying the
protein’s various functions have not been fully elucidated (Callebaut et al. 2000, Pattabiraman et al.
2000, Singh and Katyal 2000). SCGB1A1 has been implicated in a number of anti-inflammatory and
immunomodulatory processes and has been shown to sequester and bind hydrophobic ligands such as
phosphatidylcholine and phosphatidylinositol and also inhibit secretory phospholipase A2 and the
recruitment of leukocytes (de la Cruz and Lee 1996, Singh and Katyal 2000, Wong et al. 2009). Based
on shared structural features with colicin A, an antibacterial protein produced by Escherichia coli, it
has been proposed that SCGB1A1 has similar direct antibacterial functions (de la Cruz and Lee 1996).
Although SCGB1A1 expression has been most extensively studied in lung and endometrial tissue,
93
variable levels of expression have been detected in a variety of other tissues including the liver (Cote
et al. 2012, Peri et al. 1993).
In this study, we characterized the 5'-promoter regions of SFTPD and SCGB1A1 to determine
if there was a genetic basis to the wide variation in constitutive hepatic expression observed. Several
novel SNPs and polymorphisms were identified that were correlated with increased hepatic
expression of these proteins. Restriction fragment length polymorphism (RFLP) assays were
developed to genotype pigs for the identified SFTPD SNPs. Variant genotype frequencies for the
SFTPD g.-4509A>G SNP was also compared in healthy and diseased pig populations.
MATERIALS AND METHODS
Sample Acquisition, Nucleic Acid Extraction and Primer Design
Liver samples of 1003 healthy terminally crossed commercial market weight pigs were
collected from a large southern Ontario pig processing facility as described in Chapter 2.
Nucleic acids were extracted from the livers of a subset of 88 pigs that had been previously
subjected to microarray expression analysis and stored as described in Chapter 2.
Primers for PCR amplification were designed based on genomic sequences available in the
Ensembl online genome browser (Flicek et al. 2013) and NCBI GenBank
(http://www.ncbi.nlm.nih.gov/gene) databases. Primers were designed using a combination of
Primer3 v. 4.0.0 (http://primer3.wi.mit.edu/) (Rozen and Skaletsky 2000); Generunner
(http://www.generunner.net); Primer-Blast (http://www.ncbi.nlm.nih.gov/ tools/primer-blast/);
PrimerQuest (http://www.idtdna.com/Primerquest/Home/Index) and OligoAnalyzer
(http://www.idtdna.com/analyzer/Applications/Oligo Analyzer/).
94
Amplification of the 5'-Promoter Regions of SCGB1A1 and SFTPD
Gene segments, 2362 and 2682 bp in length were amplified from 5'-promoter regions of
SCGB1A1 and SFTPD, respectively, using the forward and reverse primers listed in Table 3.1. PCR
reactions for SCGB1A1 (50 μL) were performed according to the manufacturers recommendations
using the QIAGEN TopTaq DNA Polymerase Kit®, and a final primer concentration of 0.5 µM.
Cycling parameters were as follows: initial denaturation for 3 min at 94 ºC, followed by 35 cycles of
denaturation at 94 ºC for 30 s, annealing at 59 ºC for 30 s and extension at 72 ºC for 2 min and 25 s,
with a final extension of 72 ºC for 10 min. PCR reactions for SFTPD (50 μL) were performed
according to the manufacturers recommendations using the MyTaqTM
DNA polymerase kit (Bioline,
Taunton, MA) and a final primer concentration of 0.4 µM. Cycling parameters for SFTPD were:
initial denaturation for 2 min at 95 ºC, followed by 40 cycles of denaturation at 95 ºC for 20 s,
annealing at 62 ºC for 20 s and extension at 72 ºC for 2 min, with a final extension of 72 ºC for 5 min.
All PCR products in this study were visualized on agarose gels (1 or 2 %) in 0.5 X tris-borate-
EDTA (TBE) buffer stained with SYBR SAFE nucleic acid stain.
Sequencing of PCR products and Identification of Novel SNPs.
PCR products amplified from pigs with the highest (n = 8) and lowest (n = 8) levels of
mRNA expression, as determined by microarray analysis, were purified and pooled into four groups.
The pooled samples, each group consisting of four individual PCR products, were then submitted for
automated sequencing (Lab Services Division, University of Guelph, Guelph, Ontario). Within some
amplification reactions for SCGB1A1, two PCR products were amplified. In these cases, each band on
the agarose gel was purified using the QIAquick® gel extraction kit (QIAGEN, Mississauga, Ontario)
as per manufacturer’s instructions and products were sequenced individually.
Overlapping segments of the pooled PCR products (maximum 600-bp in length) were
sequenced in the forward and reverse directions using the primers listed in Table 3.1. Sequences were
assembled and aligned using Clustal Omega - Multiple Sequence Alignment
(http://www.ebi.ac.uk/Tools/msa/clustalo/), screened for genetic variation and compared to genomic
95
sequences deposited in the Ensembl online genome browser database (Flicek et al. 2013).
Electrophoretograms were also manually examined for the presence of double (heterozygous) peaks.
PCR products in pooled groups that exhibited heterozygosity were then sequenced individually to
determine which sample(s) contained a polymorphic sequence. Polymorphisms were named based on
their nucleotide location relative to the first ATG start codon within the coding sequence and
annotated as described by the human genome variation society (den Dunnen and Antonarakis 2000).
Restriction Fragment Length Polymorphism Assays
Restriction fragment length polymorphism (RFLP) assays were developed using NEBcutter
V2.0 (Vincze et al. 2003) and used to screen additional pigs for the presence of the SFTPD SNPs
identified by sequencing. A smaller 365 bp segment of the promoter region, containing all three
newly-identified SNPs was amplified and subjected to RFLP analysis. The primers used in this PCR
reaction are shown in Table 3.1. PCR reactions (50 μL) were performed according to the
manufacturers recommendations using Platinum® Taq DNA polymerase (Invitrogen, Burlington,
Ontario) and a final primer concentration of 0.5 µM. Cycling parameters were as follows: initial
denaturation for 2 min at 94 ºC, followed by 34 cycles of denaturation at 94 ºC for 30 s, annealing at
54 ºC for 30 s and extension at 72 ºC for 30 s, with a final extension of 72 ºC for 5 min. Restriction
endonuclease enzymes (New England Biolabs, Whitby, ON, Canada) used for these studies and their
expected digestion patterns are summarized in Table 3.2. Restriction digestion with NspI, AciI and
EcoNI to detect SFTPD g.-4509A>G, SFTPD g.-4394G>A and SFTPD g.-4350C>T substitutions,
respectively, were performed on 3 L of PCR product using 5 units of enzyme and the incubation
conditions specified by the manufacturer. In all three reactions the enzyme digests the amplified PCR
product if the major or wild type allele is present. Fragments with evidence of heterozygosity were
individually sequenced to confirm the presence of the identified SNP (Lab Services Division,
University of Guelph, Guelph, Ontario).
96
Semi-Quantitative Real-Time RT-PCR
Variations in the constitutive expression of SFTPD and SCGB1A1 were also assessed using
semi-quantitative real-time RT-PCR. Following treatment with 7X gDNA wipeout buffer to eliminate
DNA contamination, RNA was reverse transcribed into cDNA using the QuantiTect® Reverse
Transcription Kit (QIAGEN, Mississauga, Ontario) as recommended by the manufacturer. Because
the lung is the primary site of expression of SFTPD and SCGB1A1, a standard curve was generated
for each primer set using serial five-fold dilutions of pooled porcine lung cDNA run in quintuplicate.
RT-PCR primers and reaction efficiencies for each standard curve are listed in Tables 3.3. PCR
products were sequenced to confirm amplification of the desired targets (Lab Services Division,
University of Guelph, Guelph, Ontario). Synthesized cDNA was analyzed in triplicate and PCR
reactions were performed on a Lightcycler® 480 system (Roche Applied Science, Salt Lake City,
Utah) according to the manufacturer’s recommendations (10 µl reaction volume) with primers at a
final concentrations of 0.5 µM. The fluorescence threshold value was calculated using Lightcycler®
480 system software. RT-PCR conditions were as follows: pre-incubation at 95 ºC for 5 min, followed
by 45 cycles of denaturation at 95 ºC for 10 s, annealing at appropriate gene melting temperature for
10 s (Table 3.3), and elongation at 72 ºC for 15 s, followed by melting curve analysis (65 to 95 ºC) to
confirm the presence of a single product per PCR reaction. RT-PCR product concentrations of
SCGB1A1 and STFPD relative to the reference gene GAPDH in each sample were determined and
calibrator normalized. Basal expression of SCGB1A1 and SFTPD was normalized based on GAPDH
mRNA expression (pooled liver cDNA at a 1:10x dilution was used to calibrate each 96-well plate).
The mean expression ratios (target gene: GAPDH expression) were determined using RelQuant
software from Roche Diagnostics (Laval, PQ, Canada).
The expression of GAPDH, 28s rRNA and 2M were analyzed as reference genes using the
RefFinder program (http://www. leonxie.com/referencegene.php); combining the BestKeeper (Pfaffl
et al. 2004), Normfinder (Andersen et al. 2004), Genorm (Vandesompele et al. 2002) and comparative
delta-Ct (Silver et al. 2006) methods. Using this program, GAPDH was found to be the most stable
reference gene in this data set and thus, was selected as the reference gene for evaluation of target
gene expression in this study.
97
The Mann-Whitney test was used to identify significant differences in microarray expression
between the two SFTPD g.-4509A>G SNP genotypes.
MALDI-TOF Mass Spectrometry Genotyping of Diseased and Healthy Pig Populations
Three groups of pigs were genotyped for the novel SFTPD SNPs: 1) diseased pigs of
unspecified breed (n = 386) submitted for autopsy evaluation to the Animal Health Laboratory (AHL),
University of Guelph; 2) healthy pure bred boars (n = 475), a reference population representing most
of the major North American breeds used in the commercial swine industry; and 3) healthy terminally
crossed market weight pigs of unspecified breed (n = 500). Pigs in the reference population of pure
bred boars were randomly selected and included Large White/Yorkshire (LW) 21.1 % (n = 100),
Landrace 21.1 % (n = 100), Hampshire 21.1 % (n = 100), Duroc 21.5 % (n = 102) and Pietrain 15.4 %
(n = 73) breeds. The selection of healthy market weight pigs was based on genetic heterogeneity as
determined in MALDI-TOF assays performed on all 21 previously identified innate immune gene
SNPs (Appendix I). To identify the production unit origin of each pig in this study, each pig’s tattoo
number was recorded at the time of collection. Pigs selected for MALDI-TOF genotyping,
represented a total of 140 unique production units and included the 96 pigs that had been previously
subjected to microarray expression analysis. The median number of pigs tested per production unit
was 3 (range 1 to 13).
Aliquots of DNA (10 to 40 ng/ μL; 40 to 200 μL) extracted from each pig were placed in 96-
well plates and submitted to the UHN Clinical Genomics Centre (Mount Sinai Hospital, Toronto,
Ontario). Genotyping was performed using Sequenom MassARRAY® matrix-assisted laser
desorption/ionization time-of-flight (MALDI-TOF) mass spectrometry (Sequenom, San Diego, CA,
USA) and single base extension (Gabriel et al. 2009). MassARRAY® Assay Design software was
used to design all of the multiplex assays. Allele-specific extension products were plated on a
SpectroChip and subjected to spectrometric analysis. Genotypes were identified by means of
SpectroCaller software and a manual review of all allele calls. Unfortunately, SNP genotyping for the
SFTPD g.-4394G>A and SFTPD g.-4350C>T polymorphisms failed and genotyping comparisons
98
could not be made for these variants. The identified SCGB1A1 polymorphisms were not available at
the time of SNP genotyping and genotyping comparisons could not be made for these variants.
For statistical analysis AHL pigs were grouped into broad disease syndrome groups
(infectious, enteric, pneumonia, polyserositis and septicemia) as determined by gross and histological
evaluation as performed by the board certified veterinary anatomic pathologists of the AHL.
Additionally, pigs were further grouped by pathogenic agent as diagnosed by bacterial culture, virus
isolation, PCR, ELISA and/or immunohistochemistry, performed by the AHL diagnostic laboratories.
Pathogenic agent groups included Actinobacillus pleuropneumoniae (APP) (n = 22); K88+
Escherichia coli (n = 31); Haemophilus parasuis (n = 20); Streptococcus suis (n = 84); Salmonella
enterica subsp. enterica ser. Typhimurium (Salmonella Typhimurium) (n = 26); Mycoplasma spp. (n
= 39); porcine circovirus type 2 (PCV2) (n = 84) and porcine reproductive and respiratory syndrome
virus (PRRSV) (n = 69). Variant genotype frequencies were then compared between the healthy
reference pig population (healthy market weight pigs) and the disease syndrome and pathogen groups.
Differences in the percent of animals possessing at least one variant allele between healthy
and diseased pig populations were then assessed by 2 x 2 contingency tables using one-tailed Fisher's
exact probability test analysis. Due to the multiple analyses performed on this data set (260) the false
discovery rate (FDR) was controlled by calculating q-values for each individual calculated p-value
using the FDRtool within the R stats package (Storey 2002, Storey 2003, Strimmer 2008). Analyses
with p-values < 0.05 and q-values < 0.03 were considered statistically significant when controlling the
FDR at 3 % (Storey 2002, Storey 2003, Strimmer 2008).
Variant genotype frequencies were also compared between pure bred pigs. A five-way Chi-
square test (five columns two rows) was used first to identify if any significant differences in variant
allele frequency existed or if the variant allele was considered to be equally distributed throughout all
populations. 2 x 2 contingency tables were then used to identify which specific breeds had a
significantly different variant positive genotype frequency when compared to the other breeds tested

99
in this study using a pairwise Yates Chi-square test or when the expected value for one or more of the
cells was < 5 a one-tailed Fisher's exact probability test was used instead.
Finally variant genotype frequencies within the healthy reference population were also
compared to that of four theoretical crossbred populations (50 % Duroc, 25 % Large White, 25 %
Landrace); (50 % Landrace, 25 % Large White, 25 % Duroc); (50 % Large White; 25 % Landrace, 25
% Duroc) and (33 % Large White, 33 % Landrace, 33 % Duroc) where the variant genotype
frequency was calculated using the proposed percentage that each breed would contribute to the cross
and the measured variant genotype frequency of each purebred population.
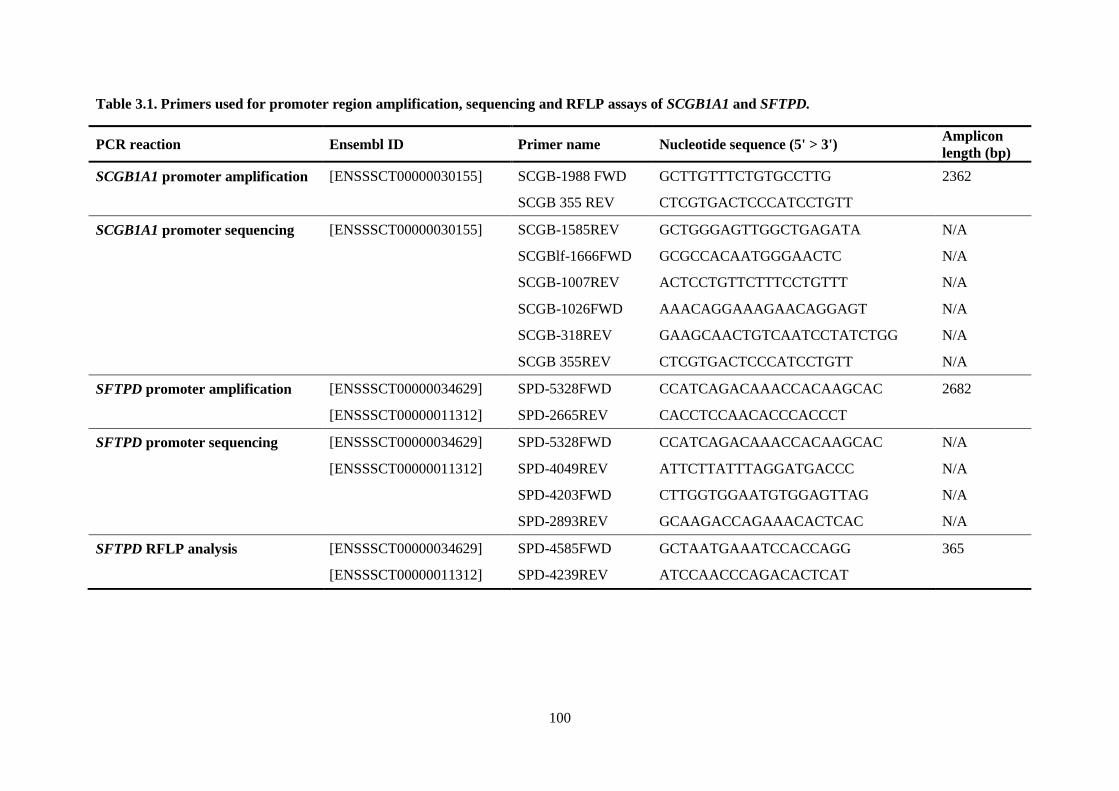
100
Table 3.1. Primers used for promoter region amplification, sequencing and RFLP assays of SCGB1A1 and SFTPD.
PCR reaction Ensembl ID Primer name Nucleotide sequence (5' > 3') Amplicon
length (bp)
SCGB1A1 promoter amplification [ENSSSCT00000030155] SCGB-1988 FWD GCTTGTTTCTGTGCCTTG 2362
SCGB 355 REV CTCGTGACTCCCATCCTGTT
SCGB1A1 promoter sequencing [ENSSSCT00000030155] SCGB-1585REV GCTGGGAGTTGGCTGAGATA N/A
SCGBlf-1666FWD GCGCCACAATGGGAACTC N/A
SCGB-1007REV ACTCCTGTTCTTTCCTGTTT N/A
SCGB-1026FWD AAACAGGAAAGAACAGGAGT N/A
SCGB-318REV GAAGCAACTGTCAATCCTATCTGG N/A
SCGB 355REV CTCGTGACTCCCATCCTGTT N/A
SFTPD promoter amplification [ENSSSCT00000034629] SPD-5328FWD CCATCAGACAAACCACAAGCAC 2682
[ENSSSCT00000011312] SPD-2665REV CACCTCCAACACCCACCCT
SFTPD promoter sequencing [ENSSSCT00000034629] SPD-5328FWD CCATCAGACAAACCACAAGCAC N/A
[ENSSSCT00000011312] SPD-4049REV ATTCTTATTTAGGATGACCC N/A
SPD-4203FWD CTTGGTGGAATGTGGAGTTAG N/A
SPD-2893REV GCAAGACCAGAAACACTCAC N/A
SFTPD RFLP analysis [ENSSSCT00000034629] SPD-4585FWD GCTAATGAAATCCACCAGG 365
[ENSSSCT00000011312] SPD-4239REV ATCCAACCCAGACACTCAT
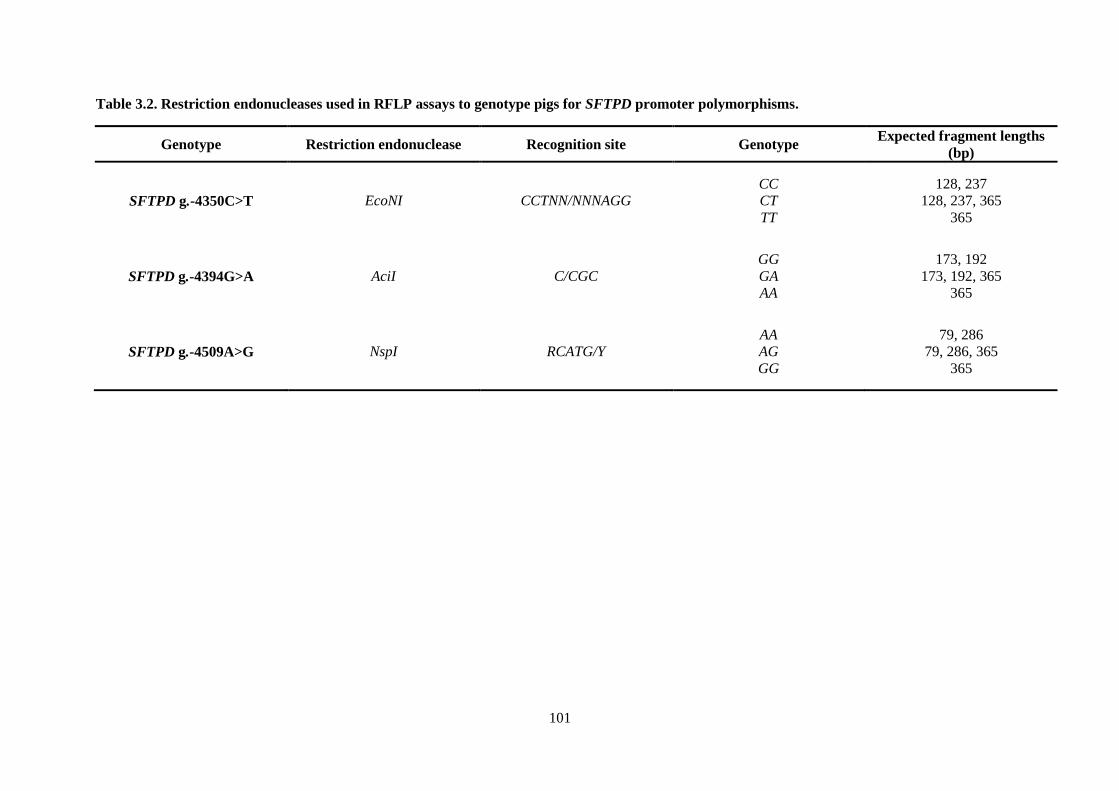
101
Table 3.2. Restriction endonucleases used in RFLP assays to genotype pigs for SFTPD promoter polymorphisms.
Genotype Restriction endonuclease Recognition site Genotype Expected fragment lengths
(bp)
SFTPD g.-4350C>T EcoNI CCTNN/NNNAGG
CC
CT
TT
128, 237
128, 237, 365
365
SFTPD g.-4394G>A AciI C/CGC
GG
GA
AA
173, 192
173, 192, 365
365
SFTPD g.-4509A>G NspI RCATG/Y
AA
AG
GG
79, 286
79, 286, 365
365
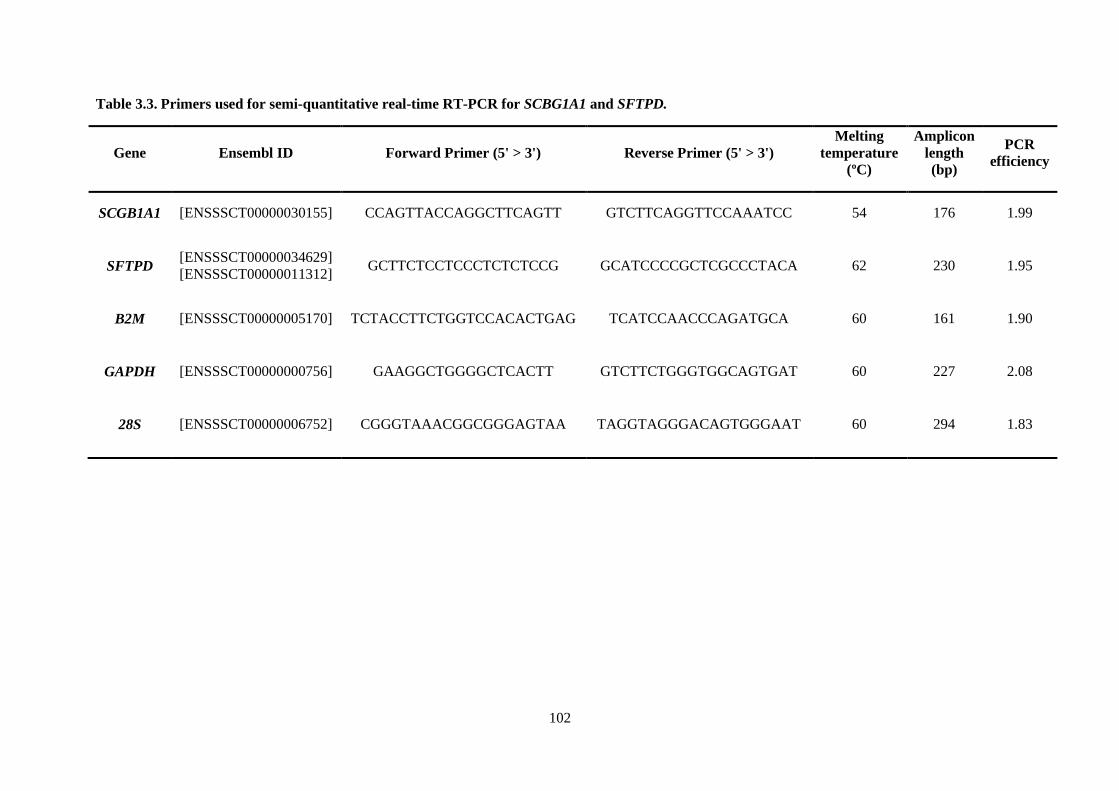
102
Table 3.3. Primers used for semi-quantitative real-time RT-PCR for SCBG1A1 and SFTPD.
Gene Ensembl ID Forward Primer (5' > 3') Reverse Primer (5' > 3')
Melting
temperature
(ºC)
Amplicon
length
(bp)
PCR
efficiency
SCGB1A1 [ENSSSCT00000030155] CCAGTTACCAGGCTTCAGTT GTCTTCAGGTTCCAAATCC 54 176 1.99
SFTPD [ENSSSCT00000034629]
[ENSSSCT00000011312] GCTTCTCCTCCCTCTCTCCG GCATCCCCGCTCGCCCTACA 62 230 1.95
B2M [ENSSSCT00000005170] TCTACCTTCTGGTCCACACTGAG TCATCCAACCCAGATGCA 60 161 1.90
GAPDH [ENSSSCT00000000756] GAAGGCTGGGGCTCACTT GTCTTCTGGGTGGCAGTGAT 60 227 2.08
28S [ENSSSCT00000006752] CGGGTAAACGGCGGGAGTAA TAGGTAGGGACAGTGGGAAT 60 294 1.83
103
RESULTS
Novel SNPs and Polymorphisms in the 5'-Promoter Regions of SCGB1A1 and SFTPD
Three different gel patterns were observed for the amplified 5'-promoter region of SCGB1A1
(Figure 3.1; only data of the eight pigs with the lowest and highest levels of SCGB1A1 expression is
shown). PCR products amplified from the eight pigs with the lowest levels of SCGB1A1 expression,
as determined by microarray analysis, contained a single fragment that was ~2362 bp in length and
was near identical to the sequence reported in the Ensembl online genome browser database
[ENSSSCT00000030155] (Flicek et al. 2013). A novel single transition SNP, g.-748G>A, was
detected in the pooled sample containing the second lowest group of four pigs. Seven of eleven (63.6
%) pigs with the highest level of SCGB1A1 expression contained this same fragment in addition to a
PCR product that was approximately 333-bp longer (2695-bp). The remaining 4 pigs (36.4 %), those
with the first, second, fourth and eleventh highest SCGB1A1 expression levels, contained only the
larger 2695-bp fragment (Figure 3.1). Recently, a second porcine SCGB1A1 sequence was annotated
in the Ensembl website database. This sequence appears to be a separate second gene located 44,396
bp upstream on the reverse strand of the same chromosome, Sus scrofa chromosome 2
[ENSSSCT00000014276] (Figure 3.2) (Flicek et al. 2013). Comparison of the 2363-bp sequence
generated from the 8 pigs with lowest levels of SCGB1A1 expression to the reference sequence of the
second reported SCGB1A1 gene sequence ([ENSSSCT00000014276]) resulted in the identification of
29 SNPs (23 transition and 6 transversion SNPs), two insertions and three deletions within the 1903
bp of the 5'-upstream (promoter) region; two transition SNPs within the UTR of exon 1 and three
SNPs (two transition and one transversion SNP) within the first 234 bp of intron1-2 within this new
reference sequence (Appendix IV - Figure V.1). The sequence of the larger fragment amplified from
pigs with high levels of SCGB1A1 mRNA expression was nearly identical to the newly identified
second gene reported in the Ensembl website database ([ENSSSCT00000014276]) and apart from the
g.-748G>A SNP, contained all the aforementioned identified variations. In addition to the numerous
variations present when compared to the shorter 2,362-bp fragment, the 2,695-bp sequence had an
104
additional transition SNP within exon 1 (g.-9C>T). Please see Table 3.4 and Appendix IV – Figure
IV.1 for a summary of all identified variations.
Three novel transition SNPs were identified within the 2682 bp fragment amplified from the
5'-upstream promoter region of SFTPD: SFTPD g.-4509A>G; SFTPD g.-4394G>A and SFTPD g.-
4350C>T (Appendix IV – Figure IV.2).
The top 15 and bottom 15 expressing pigs were genotyped for the three newly identified
SFTPD SNPs using the designed RFLP assay (Figure 3.4). Six of seven pigs (85.7 %) with the highest
SFTPD expression, as measured by microarray technology, were heterozygous for at least one of the
three newly identified SNPs. All of the remaining pigs subjected to RFLP genotyping (n = 23) were
homozygous wild type at all three alleles (Figure 3.5). None of the pigs were homozygous for any of
the variant alleles. Based on these initial 30 animals, the SFTPD g.-4509A>G and SFTPD g.-
4394G>A SNPs appeared to be linked, with the G at position -4509 always occurring with the A at
position -4394. Based on MALDI-TOF mass spectrometry SNP genotyping, all remaining pigs in this
data group (n = 85) were homozygous wild type for the SFTPD g.-4509A>G SNP. MALDI-TOF
mass spectrometry SNP genotyping was 100 % in agreement with the RFLP assay for this SNP.
Animals that were heterozygous (n = 3) for the SFTPD g.-4509A>G SNP showed a significant
increase in hepatic expression of SFTPD when compared to the wild type allele (AA) (n = 85) (p =
0.0054) (Figure 3.6 and Table 3.5).
The SFTPD g.-4509A>G SNP was not found to be statistically more frequent in any of the
different disease syndrome, bacterial and viral pathogen groups as compared to the healthy reference
pig population after controlling the FDR (3 %) (Table 3.6). The G allele of the SFTPD g.-4509A>G
SNP was however increased two- to four- fold in those pigs that were infected with a variety of
pathogens associated with pulmonary infections and pneumonia including H. parasuis, Mycoplasma
spp., PCV2 and PRRSV (Table 3.6).
The SFTPD g.-4509A>G SNP was represented in all examined North American breeds,
however was quite rare throughout most genotyped populations. The percentage of animals with at
least one variant allele ranged from 1.2 to 5.0 % with the exception of the Hampshire (28.3 %) and
105
Large White (8.0 %) breeds both of which were significantly different from other purebred pig breeds
(Table 3.7, Table 3.8, Table 3.9 and Figure 3.7). Only three (0.2 %) of the pigs genotyped (n = 1361)
pigs genotyped were homozygous for this SNP.
Correlation between SCGB1A1 and SFTPD mRNA Expression Levels
SCGB1A1 mRNA expression varied widely among different pigs. After excluding a single
high expressing outlier, a gene expression ratio was calculated by comparing the mean expression
values of the top 50 % of pigs to the bottom 6 % of pigs which resulted in a GER of 202 when
measured by RT-PCR and a 245 when assessed by microarray technology. The maximum variation
between the pig with the highest and lowest RT-PCR levels was 1430-fold compared to 1242-fold
when measured by microarray expression. There was a strong positive correlation between the
expression levels detected by the microarray and RT-PCR methods (R2 = 0.7237) (Figure 3.3).
Amplification of SFTPD from liver cDNA was not consistent. Crossing points often exceeded 35
cycles and relative quantification of hepatic SFTPD mRNA could not be evaluated.
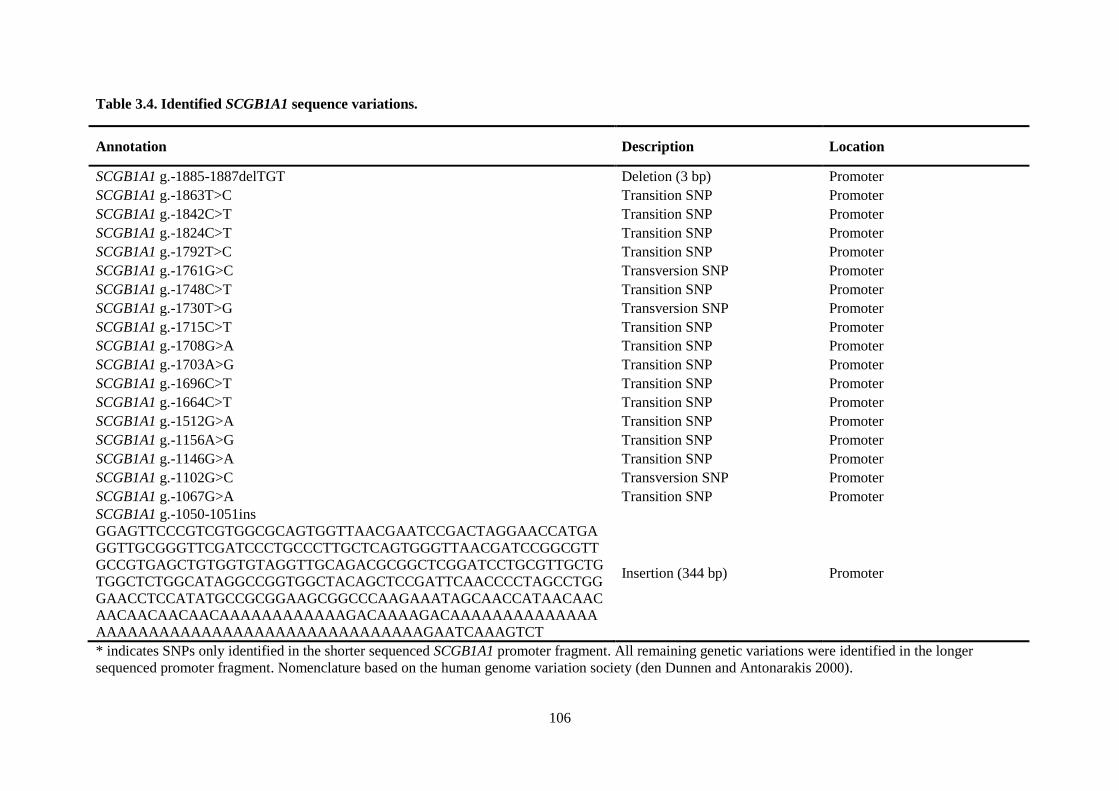
106
Table 3.4. Identified SCGB1A1 sequence variations.
Annotation Description Location
SCGB1A1 g.-1885-1887delTGT Deletion (3 bp) Promoter
SCGB1A1 g.-1863T>C Transition SNP Promoter
SCGB1A1 g.-1842C>T Transition SNP Promoter
SCGB1A1 g.-1824C>T Transition SNP Promoter
SCGB1A1 g.-1792T>C Transition SNP Promoter
SCGB1A1 g.-1761G>C Transversion SNP Promoter
SCGB1A1 g.-1748C>T Transition SNP Promoter
SCGB1A1 g.-1730T>G Transversion SNP Promoter
SCGB1A1 g.-1715C>T Transition SNP Promoter
SCGB1A1 g.-1708G>A Transition SNP Promoter
SCGB1A1 g.-1703A>G Transition SNP Promoter
SCGB1A1 g.-1696C>T Transition SNP Promoter
SCGB1A1 g.-1664C>T Transition SNP Promoter
SCGB1A1 g.-1512G>A Transition SNP Promoter
SCGB1A1 g.-1156A>G Transition SNP Promoter
SCGB1A1 g.-1146G>A Transition SNP Promoter
SCGB1A1 g.-1102G>C Transversion SNP Promoter
SCGB1A1 g.-1067G>A Transition SNP Promoter
SCGB1A1 g.-1050-1051ins
GGAGTTCCCGTCGTGGCGCAGTGGTTAACGAATCCGACTAGGAACCATGA
GGTTGCGGGTTCGATCCCTGCCCTTGCTCAGTGGGTTAACGATCCGGCGTT
GCCGTGAGCTGTGGTGTAGGTTGCAGACGCGGCTCGGATCCTGCGTTGCTG
TGGCTCTGGCATAGGCCGGTGGCTACAGCTCCGATTCAACCCCTAGCCTGG
GAACCTCCATATGCCGCGGAAGCGGCCCAAGAAATAGCAACCATAACAAC
AACAACAACAACAAAAAAAAAAAAGACAAAAGACAAAAAAAAAAAAAA
AAAAAAAAAAAAAAAAAAAAAAAAAAAAAAAGAATCAAAGTCT
Insertion (344 bp) Promoter
* indicates SNPs only identified in the shorter sequenced SCGB1A1 promoter fragment. All remaining genetic variations were identified in the longer
sequenced promoter fragment. Nomenclature based on the human genome variation society (den Dunnen and Antonarakis 2000).
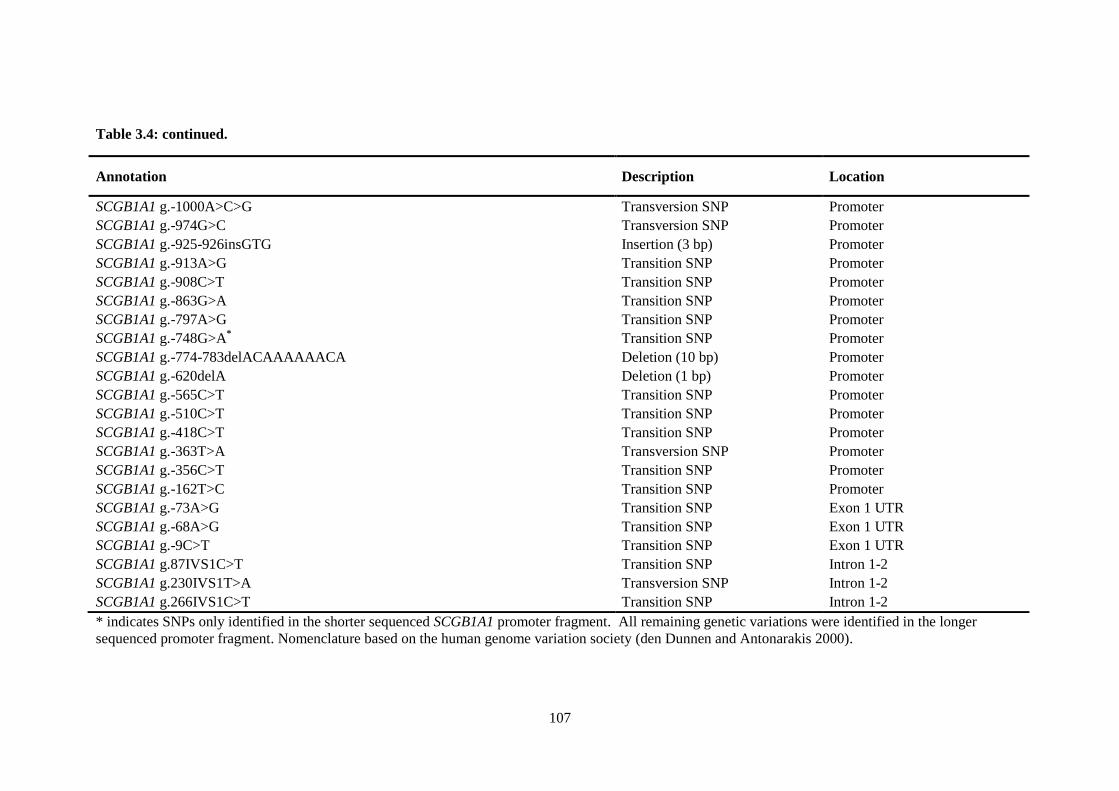
107
Table 3.4: continued.
Annotation Description Location
SCGB1A1 g.-1000A>C>G Transversion SNP Promoter
SCGB1A1 g.-974G>C Transversion SNP Promoter
SCGB1A1 g.-925-926insGTG Insertion (3 bp) Promoter
SCGB1A1 g.-913A>G Transition SNP Promoter
SCGB1A1 g.-908C>T Transition SNP Promoter
SCGB1A1 g.-863G>A Transition SNP Promoter
SCGB1A1 g.-797A>G Transition SNP Promoter
SCGB1A1 g.-748G>A*
Transition SNP Promoter
SCGB1A1 g.-774-783delACAAAAAACA Deletion (10 bp) Promoter
SCGB1A1 g.-620delA Deletion (1 bp) Promoter
SCGB1A1 g.-565C>T Transition SNP Promoter
SCGB1A1 g.-510C>T Transition SNP Promoter
SCGB1A1 g.-418C>T Transition SNP Promoter
SCGB1A1 g.-363T>A Transversion SNP Promoter
SCGB1A1 g.-356C>T Transition SNP Promoter
SCGB1A1 g.-162T>C Transition SNP Promoter
SCGB1A1 g.-73A>G Transition SNP Exon 1 UTR
SCGB1A1 g.-68A>G Transition SNP Exon 1 UTR
SCGB1A1 g.-9C>T
Transition SNP Exon 1 UTR
SCGB1A1 g.87IVS1C>T Transition SNP Intron 1-2
SCGB1A1 g.230IVS1T>A Transversion SNP Intron 1-2
SCGB1A1 g.266IVS1C>T Transition SNP Intron 1-2
* indicates SNPs only identified in the shorter sequenced SCGB1A1 promoter fragment. All remaining genetic variations were identified in the longer
sequenced promoter fragment. Nomenclature based on the human genome variation society (den Dunnen and Antonarakis 2000).
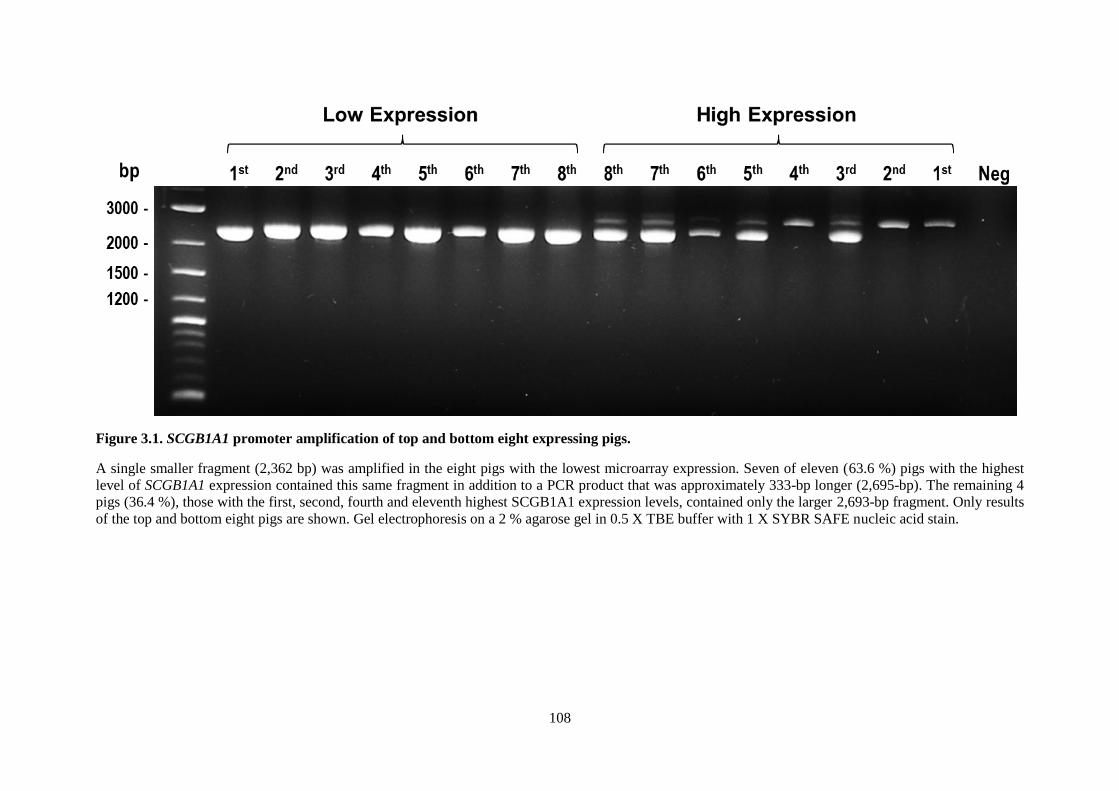
108
Figure 3.1. SCGB1A1 promoter amplification of top and bottom eight expressing pigs.
A single smaller fragment (2,362 bp) was amplified in the eight pigs with the lowest microarray expression. Seven of eleven (63.6 %) pigs with the highest
level of SCGB1A1 expression contained this same fragment in addition to a PCR product that was approximately 333-bp longer (2,695-bp). The remaining 4
pigs (36.4 %), those with the first, second, fourth and eleventh highest SCGB1A1 expression levels, contained only the larger 2,693-bp fragment. Only results
of the top and bottom eight pigs are shown. Gel electrophoresis on a 2 % agarose gel in 0.5 X TBE buffer with 1 X SYBR SAFE nucleic acid stain.
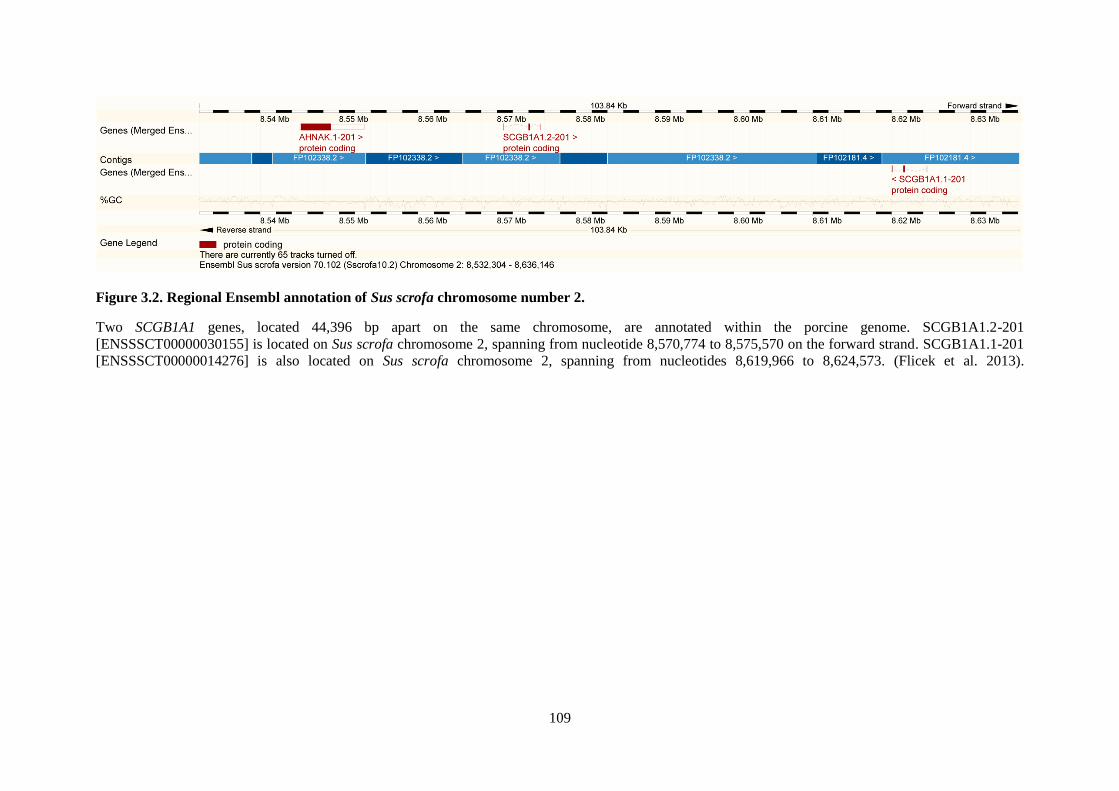
109
Figure 3.2. Regional Ensembl annotation of Sus scrofa chromosome number 2.
Two SCGB1A1 genes, located 44,396 bp apart on the same chromosome, are annotated within the porcine genome. SCGB1A1.2-201
[ENSSSCT00000030155] is located on Sus scrofa chromosome 2, spanning from nucleotide 8,570,774 to 8,575,570 on the forward strand. SCGB1A1.1-201
[ENSSSCT00000014276] is also located on Sus scrofa chromosome 2, spanning from nucleotides 8,619,966 to 8,624,573. (Flicek et al. 2013).
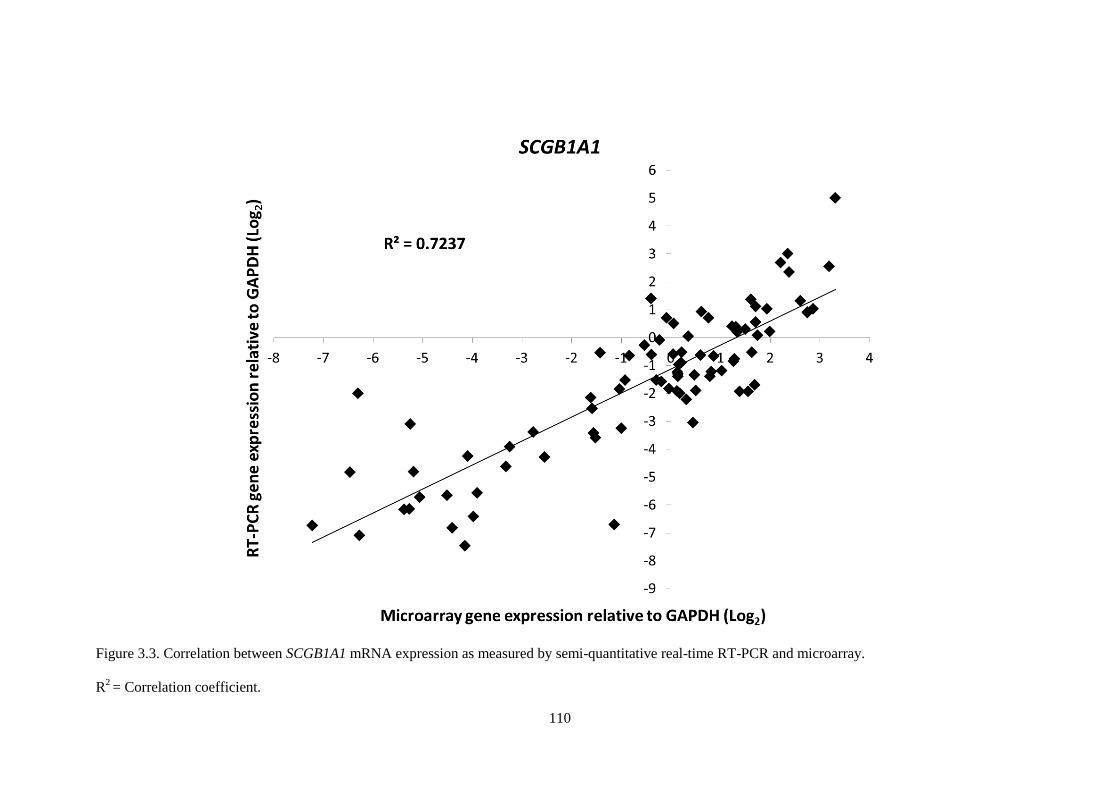
110
Figure 3.3. Correlation between SCGB1A1 mRNA expression as measured by semi-quantitative real-time RT-PCR and microarray.
R2 = Correlation coefficient.
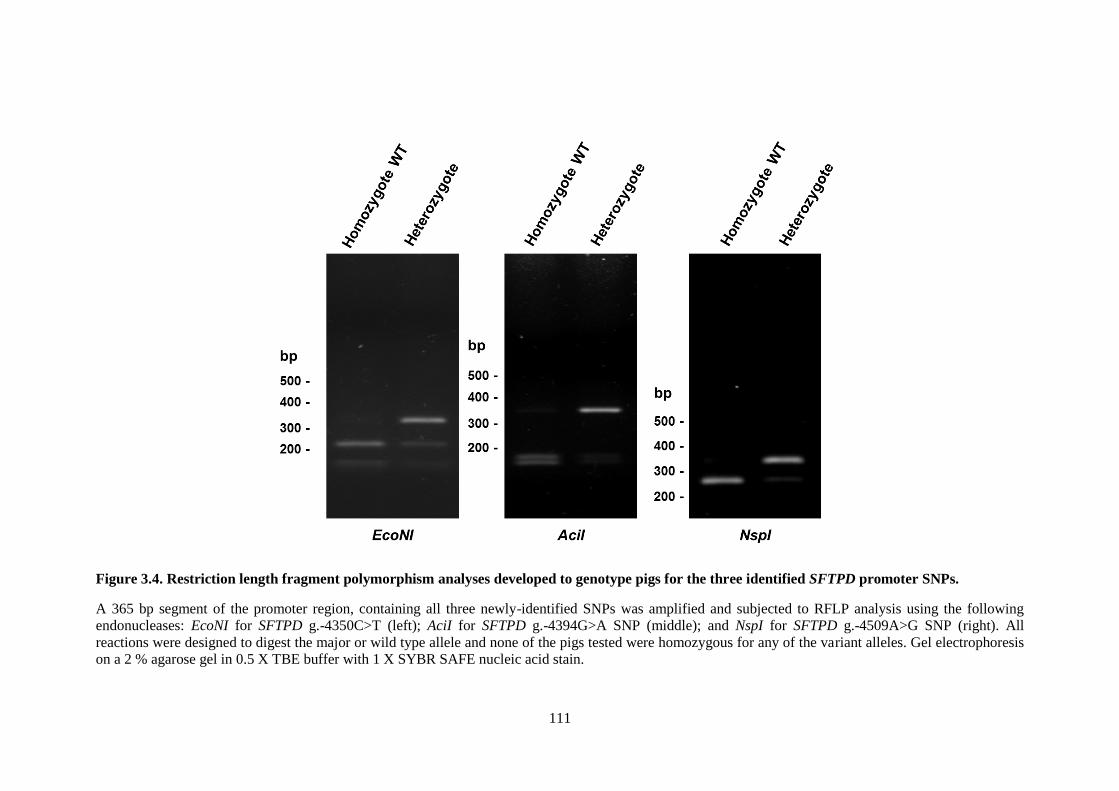
111
Figure 3.4. Restriction length fragment polymorphism analyses developed to genotype pigs for the three identified SFTPD promoter SNPs.
A 365 bp segment of the promoter region, containing all three newly-identified SNPs was amplified and subjected to RFLP analysis using the following
endonucleases: EcoNI for SFTPD g.-4350C>T (left); AciI for SFTPD g.-4394G>A SNP (middle); and NspI for SFTPD g.-4509A>G SNP (right). All
reactions were designed to digest the major or wild type allele and none of the pigs tested were homozygous for any of the variant alleles. Gel electrophoresis
on a 2 % agarose gel in 0.5 X TBE buffer with 1 X SYBR SAFE nucleic acid stain.
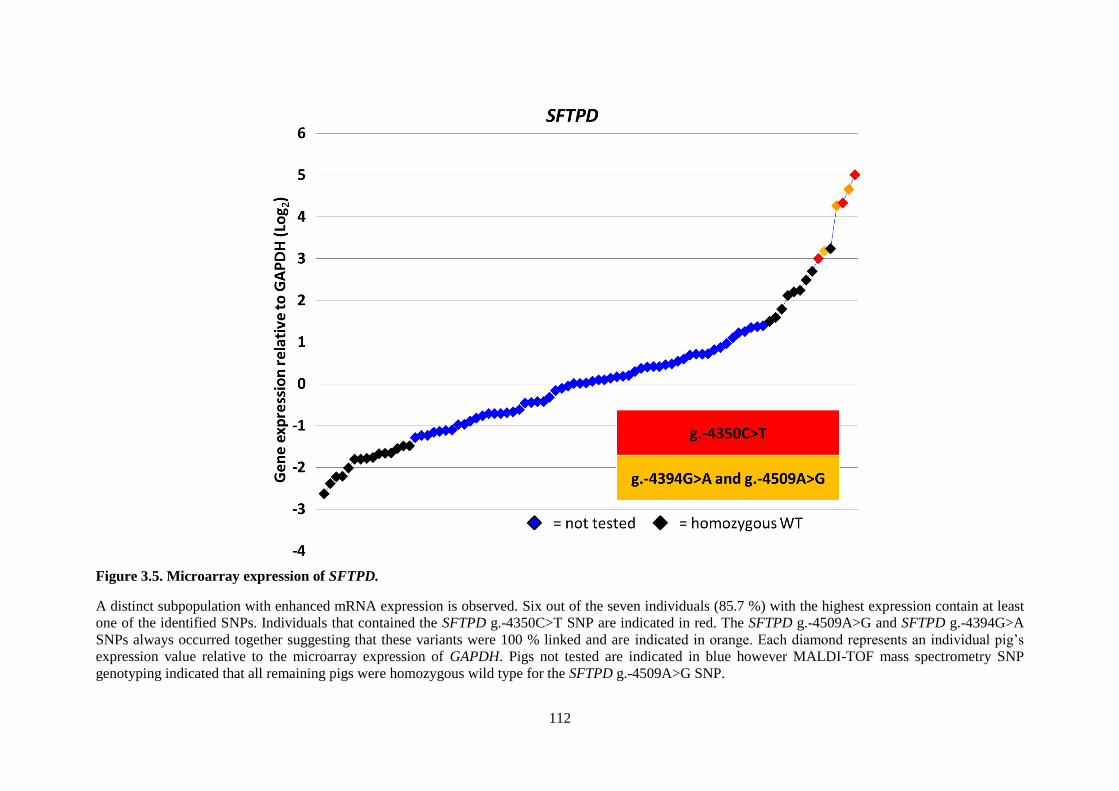
112
Figure 3.5. Microarray expression of SFTPD.
A distinct subpopulation with enhanced mRNA expression is observed. Six out of the seven individuals (85.7 %) with the highest expression contain at least
one of the identified SNPs. Individuals that contained the SFTPD g.-4350C>T SNP are indicated in red. The SFTPD g.-4509A>G and SFTPD g.-4394G>A
SNPs always occurred together suggesting that these variants were 100 % linked and are indicated in orange. Each diamond represents an individual pig’s
expression value relative to the microarray expression of GAPDH. Pigs not tested are indicated in blue however MALDI-TOF mass spectrometry SNP
genotyping indicated that all remaining pigs were homozygous wild type for the SFTPD g.-4509A>G SNP.
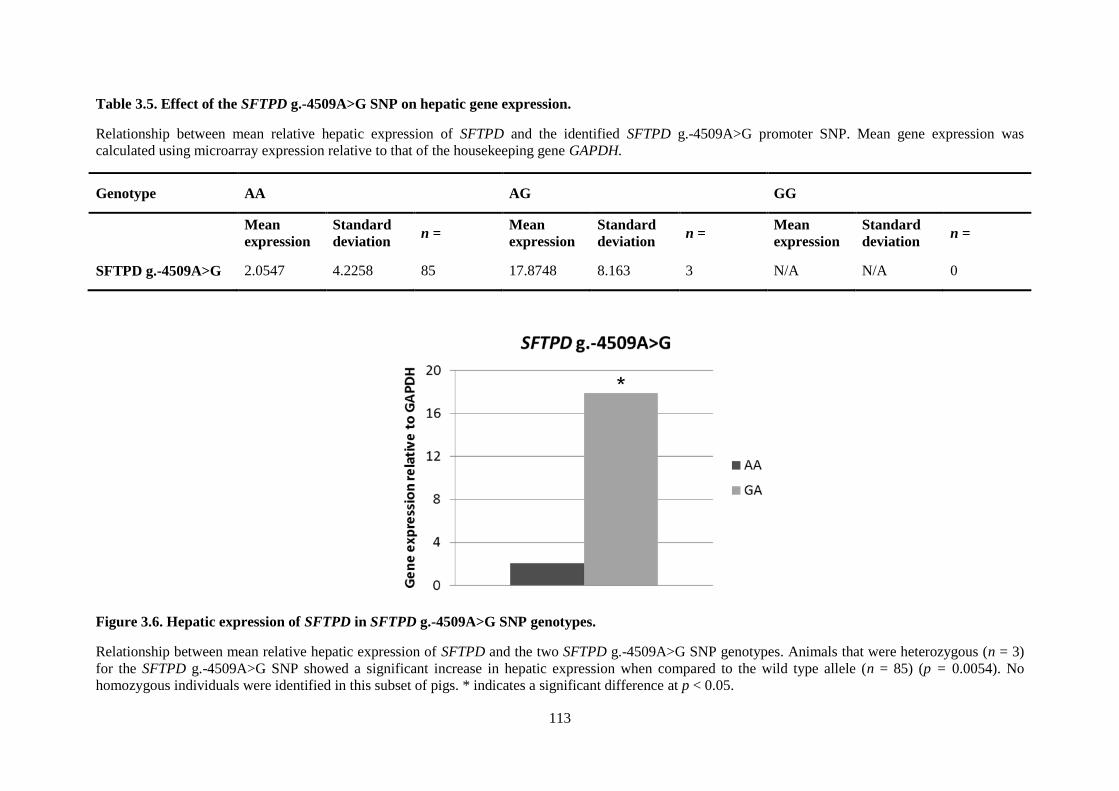
113
Table 3.5. Effect of the SFTPD g.-4509A>G SNP on hepatic gene expression.
Relationship between mean relative hepatic expression of SFTPD and the identified SFTPD g.-4509A>G promoter SNP. Mean gene expression was
calculated using microarray expression relative to that of the housekeeping gene GAPDH.
Genotype AA AG GG
Mean
expression
Standard
deviation n =
Mean
expression
Standard
deviation n =
Mean
expression
Standard
deviation n =
SFTPD g.-4509A>G 2.0547 4.2258 85 17.8748 8.163 3 N/A N/A 0
Figure 3.6. Hepatic expression of SFTPD in SFTPD g.-4509A>G SNP genotypes.
Relationship between mean relative hepatic expression of SFTPD and the two SFTPD g.-4509A>G SNP genotypes. Animals that were heterozygous (n = 3)
for the SFTPD g.-4509A>G SNP showed a significant increase in hepatic expression when compared to the wild type allele (n = 85) (p = 0.0054). No
homozygous individuals were identified in this subset of pigs. * indicates a significant difference at p < 0.05.
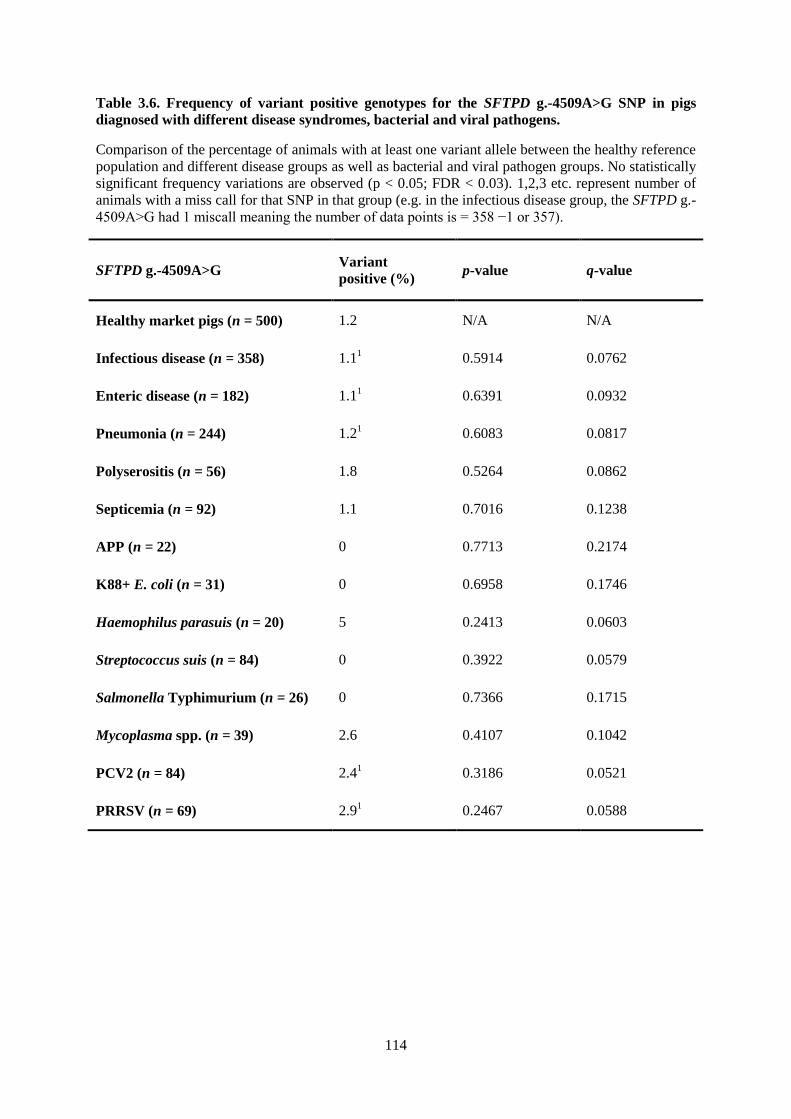
114
Table 3.6. Frequency of variant positive genotypes for the SFTPD g.-4509A>G SNP in pigs
diagnosed with different disease syndromes, bacterial and viral pathogens.
Comparison of the percentage of animals with at least one variant allele between the healthy reference
population and different disease groups as well as bacterial and viral pathogen groups. No statistically
significant frequency variations are observed (p < 0.05; FDR < 0.03). 1,2,3 etc. represent number of
animals with a miss call for that SNP in that group (e.g. in the infectious disease group, the SFTPD g.-
4509A>G had 1 miscall meaning the number of data points is = 358 −1 or 357).
SFTPD g.-4509A>G Variant
positive (%) p-value q-value
Healthy market pigs (n = 500) 1.2 N/A N/A
Infectious disease (n = 358) 1.11
0.5914 0.0762
Enteric disease (n = 182) 1.11
0.6391 0.0932
Pneumonia (n = 244) 1.21
0.6083 0.0817
Polyserositis (n = 56) 1.8 0.5264 0.0862
Septicemia (n = 92) 1.1 0.7016 0.1238
APP (n = 22) 0 0.7713 0.2174
K88+ E. coli (n = 31) 0 0.6958 0.1746
Haemophilus parasuis (n = 20) 5 0.2413 0.0603
Streptococcus suis (n = 84) 0 0.3922 0.0579
Salmonella Typhimurium (n = 26) 0 0.7366 0.1715
Mycoplasma spp. (n = 39) 2.6 0.4107 0.1042
PCV2 (n = 84) 2.41
0.3186 0.0521
PRRSV (n = 69) 2.91
0.2467 0.0588
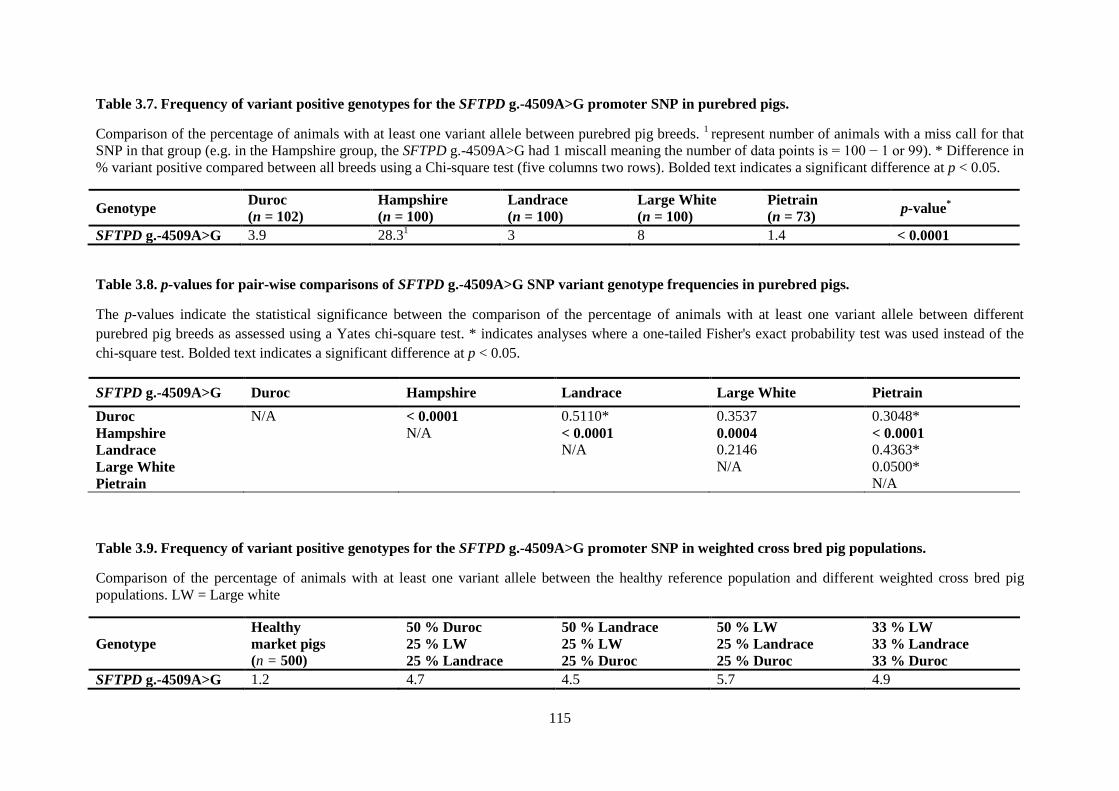
115
Table 3.7. Frequency of variant positive genotypes for the SFTPD g.-4509A>G promoter SNP in purebred pigs.
Comparison of the percentage of animals with at least one variant allele between purebred pig breeds. 1 represent number of animals with a miss call for that
SNP in that group (e.g. in the Hampshire group, the SFTPD g.-4509A>G had 1 miscall meaning the number of data points is = 100 − 1 or 99). * Difference in
% variant positive compared between all breeds using a Chi-square test (five columns two rows). Bolded text indicates a significant difference at p < 0.05.
Genotype Duroc
(n = 102)
Hampshire
(n = 100)
Landrace
(n = 100)
Large White
(n = 100)
Pietrain
(n = 73) p-value
*
SFTPD g.-4509A>G 3.9 28.31
3 8 1.4
< 0.0001
Table 3.8. p-values for pair-wise comparisons of SFTPD g.-4509A>G SNP variant genotype frequencies in purebred pigs.
The p-values indicate the statistical significance between the comparison of the percentage of animals with at least one variant allele between different
purebred pig breeds as assessed using a Yates chi-square test. * indicates analyses where a one-tailed Fisher's exact probability test was used instead of the
chi-square test. Bolded text indicates a significant difference at p < 0.05.
SFTPD g.-4509A>G Duroc Hampshire Landrace Large White Pietrain
Duroc N/A < 0.0001 0.5110* 0.3537 0.3048*
Hampshire N/A < 0.0001 0.0004 < 0.0001
Landrace N/A 0.2146 0.4363*
Large White N/A 0.0500*
Pietrain N/A
Table 3.9. Frequency of variant positive genotypes for the SFTPD g.-4509A>G promoter SNP in weighted cross bred pig populations.
Comparison of the percentage of animals with at least one variant allele between the healthy reference population and different weighted cross bred pig
populations. LW = Large white
Genotype
Healthy
market pigs
(n = 500)
50 % Duroc
25 % LW
25 % Landrace
50 % Landrace
25 % LW
25 % Duroc
50 % LW
25 % Landrace
25 % Duroc
33 % LW
33 % Landrace
33 % Duroc
SFTPD g.-4509A>G 1.2 4.7 4.5 5.7 4.9
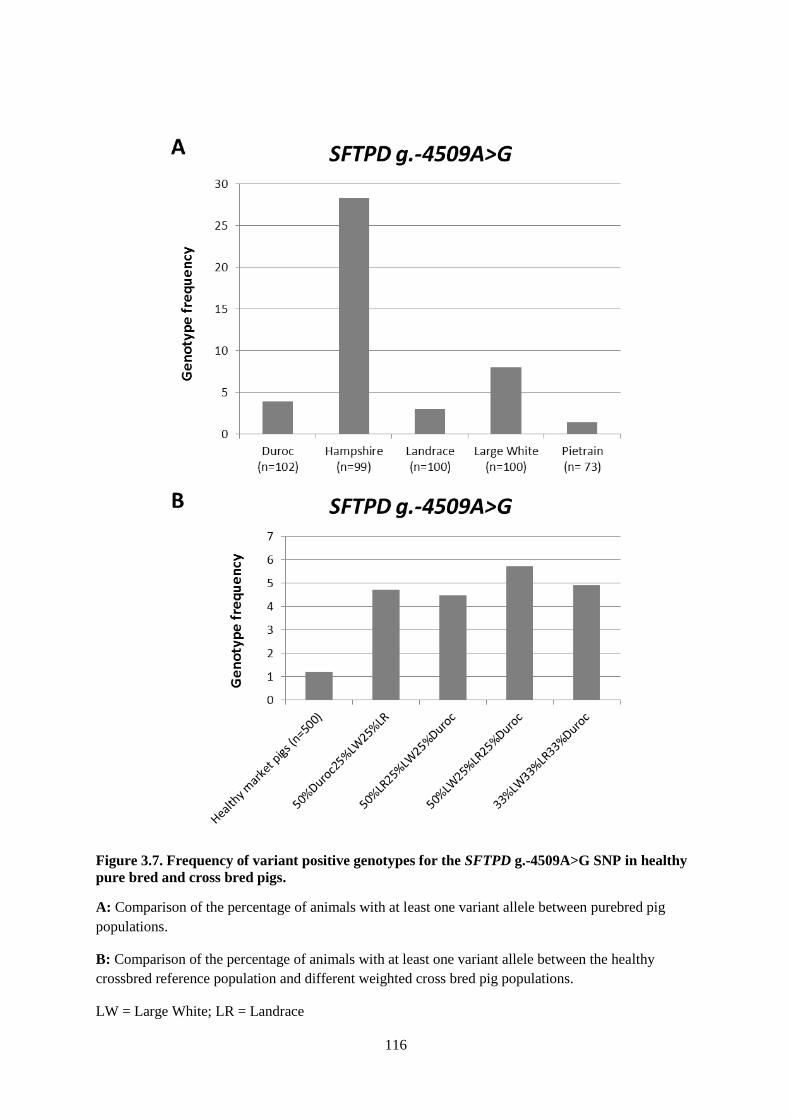
116
Figure 3.7. Frequency of variant positive genotypes for the SFTPD g.-4509A>G SNP in healthy
pure bred and cross bred pigs.
A: Comparison of the percentage of animals with at least one variant allele between purebred pig
populations.
B: Comparison of the percentage of animals with at least one variant allele between the healthy
crossbred reference population and different weighted cross bred pig populations.
LW = Large White; LR = Landrace
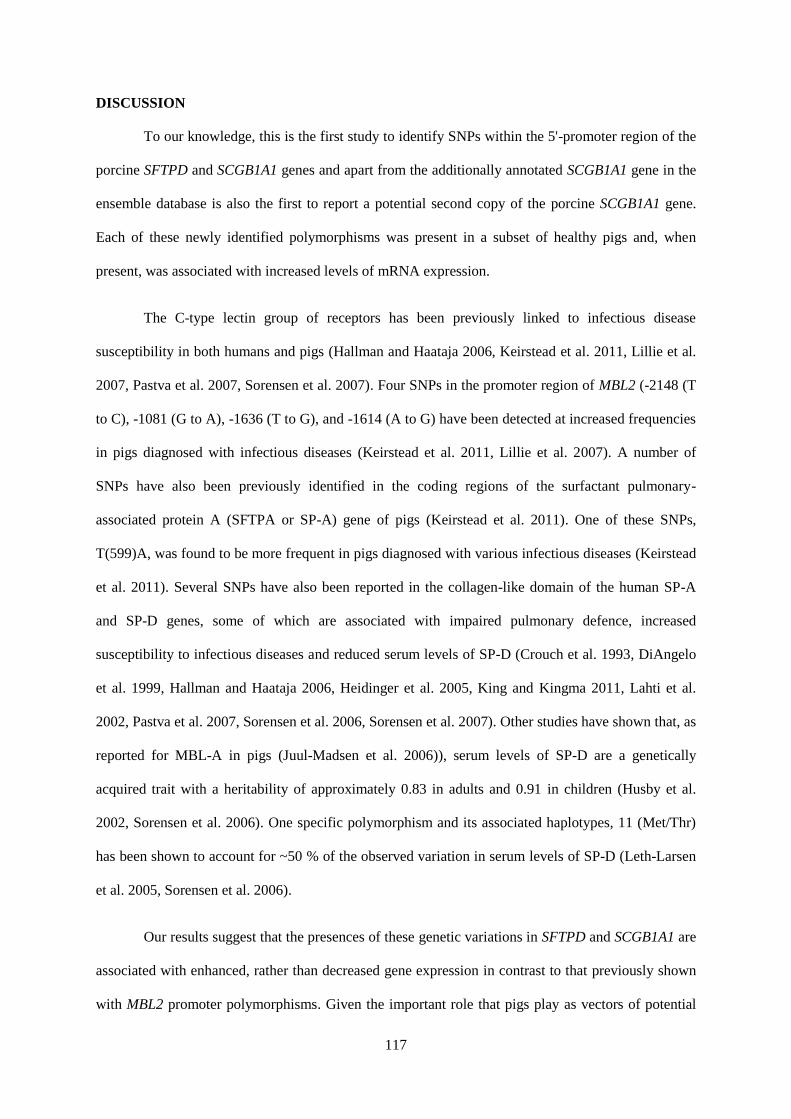
117
DISCUSSION
To our knowledge, this is the first study to identify SNPs within the 5'-promoter region of the
porcine SFTPD and SCGB1A1 genes and apart from the additionally annotated SCGB1A1 gene in the
ensemble database is also the first to report a potential second copy of the porcine SCGB1A1 gene.
Each of these newly identified polymorphisms was present in a subset of healthy pigs and, when
present, was associated with increased levels of mRNA expression.
The C-type lectin group of receptors has been previously linked to infectious disease
susceptibility in both humans and pigs (Hallman and Haataja 2006, Keirstead et al. 2011, Lillie et al.
2007, Pastva et al. 2007, Sorensen et al. 2007). Four SNPs in the promoter region of MBL2 (-2148 (T
to C), -1081 (G to A), -1636 (T to G), and -1614 (A to G) have been detected at increased frequencies
in pigs diagnosed with infectious diseases (Keirstead et al. 2011, Lillie et al. 2007). A number of
SNPs have also been previously identified in the coding regions of the surfactant pulmonary-
associated protein A (SFTPA or SP-A) gene of pigs (Keirstead et al. 2011). One of these SNPs,
T(599)A, was found to be more frequent in pigs diagnosed with various infectious diseases (Keirstead
et al. 2011). Several SNPs have also been reported in the collagen-like domain of the human SP-A
and SP-D genes, some of which are associated with impaired pulmonary defence, increased
susceptibility to infectious diseases and reduced serum levels of SP-D (Crouch et al. 1993, DiAngelo
et al. 1999, Hallman and Haataja 2006, Heidinger et al. 2005, King and Kingma 2011, Lahti et al.
2002, Pastva et al. 2007, Sorensen et al. 2006, Sorensen et al. 2007). Other studies have shown that, as
reported for MBL-A in pigs (Juul-Madsen et al. 2006)), serum levels of SP-D are a genetically
acquired trait with a heritability of approximately 0.83 in adults and 0.91 in children (Husby et al.
2002, Sorensen et al. 2006). One specific polymorphism and its associated haplotypes, 11 (Met/Thr)
has been shown to account for ~50 % of the observed variation in serum levels of SP-D (Leth-Larsen
et al. 2005, Sorensen et al. 2006).
Our results suggest that the presences of these genetic variations in SFTPD and SCGB1A1 are
associated with enhanced, rather than decreased gene expression in contrast to that previously shown
with MBL2 promoter polymorphisms. Given the important role that pigs play as vectors of potential
118
zoonotic and anthropo-zoonotic diseases, it will be particularly important to determine whether
elevated pre-immune levels of SP-D especially in the respiratory tract are protective against diseases
such as influenza-A viruses (IAV) and Mycobacterium tuberculosis. A number of studies have shown
that SP-D plays a critical role in macrophage activation and in the opsonisation and agglutination of
IAV, including swine, avian and human influenza viruses (Hartshorn et al. 1994, Hartshorn et al.
1997, Hartshorn et al. 2000, Hawgood et al. 2004, Hillaire et al. 2011, Hillaire et al. 2012, Hillaire et
al. 2013, LeVine et al. 2001, van Eijk et al. 2012). Unlike other mammalian SP-Ds, porcine SP-D
contains a unique N-linked sialic acid-rich glycan in its CRD that interacts with conserved sialic acid
receptors on the surface of IAV (Hillaire et al. 2011, Hillaire et al. 2013, van Eijk et al. 2012). As a
result, porcine SP-D serves as a decoy receptor that competes with virus binding to the respiratory
epithelium. Porcine SP-D therefore not only represents an important effector in the defense against
infection with economically important diseases such as swine influenza but may also play a crucial
role to ward off infection with pandemic human, avian and porcine influenza viruses. The importance
of this critical function of porcine SP-D is further underscored by the potential of developing a
recombinant form to be used for future therapeutic applications (Hillaire et al. 2011, Hillaire et al.
2013, van Eijk et al. 2012). SP-D also limits macrophage uptake of Mycobacterium tuberculosis
through agglutination-dependent and -independent mechanisms (Ferguson et al. 2002). Genetic
variations that may lead to enhanced expression of SFTPD, such as those identified in this study, may
in theory afford a protective phenotype to these specific diseases in pigs.
In the current study no significant variation in positive genotype frequencies were identified
for the SFTPD g.-4509A>G SNP in pigs of the various disease and pathogen groups. This lack of
statistical significance is in part due to the relative scarcity of this SNP within the assessed healthy
and diseased populations. A protective effect associated with the presence of this SNP was not
observed and in fact the positive variant genotype frequency was increased in pigs, though not
significantly so, of a variety of pathogens groups associated with pulmonary infections and
pneumonia. Studies in SFTPD-/-
mice challenged with intraperitoneal injection of lipopolysaccharide
(LPS) also suggests that SP-D plays a regulatory role in the lung by inhibiting pulmonary
119
inflammation and migration of peripheral monocytes into the lung through GM-CSF–dependent
pathways (King and Kingma 2011). It should therefore also be considered that excessive activation of
macrophages, by increased levels of SP-D can in fact be detrimental if it results in persistent or
excessive inflammation and tissue damage. Additionally gene expression may vary between different
tissues depending on the existence of tissue specific transcription factors and therefore the effect of
promoter polymorphisms on gene expression may be affected by the presence of such tissue specific
transcription factors. Both the NFAT (nuclear factor of activated T cells) family and TTF-1 (thyroid
transcription factor 1) are transcription factors that have been shown to be important in the regulation
of pulmonary expression of SFTPD in mice (Dave et al. 2004) and both have also been shown to have
tissue specific distributions (Civitareale et al. 1989, Guazzi et al. 1990, Rao et al. 1997). Likewise this
tissue specific distribution may also be true for other transcription factors that may be involved in
regulation of SFTPD expression in pigs and it should be established if the promoter polymorphisms
identified in this study would affect tissue specific transcription factor binding of NFAT, TTF-1 and
other transcription factors in the lung of pigs.
The low genotype frequency and relative increased frequency with pulmonary pathogen
infections, although not statistically significant, may in fact suggest that increased levels of SP-D may
be detrimental to innate host defenses. Very few homozygous individuals were identified in this study
and it is not clear if this can be expected based on the low allele frequency or whether or not
homozygosity results in a distinct disadvantage and lethality. Additional surveys of larger samples of
animals with respiratory diseases will be especially helpful to further evaluate this possibility. The
SFTPD g.-4509A>G SNP genotype frequency also varied between different breeds of purebred boars,
although still relatively rare in all but the Large White and especially Hampshire breeds which had a
much higher genotype frequency.
120
Previous studies of the porcine genome suggested that it contained only a single copy of the
SCGB1A1 gene (Gutierrez Sagal and Nieto 1998). This is similar to most species, including humans,
rabbits, rats, mice and primates who also only contain a single copy of the SCGB1A1 gene. In
contrast, horses contain three copies of this gene, presumably due to an intrachromosomal gene
triplication (Cote et al. 2012). These consist of SCGB1A1 and SCGB1A1A, which code for two similar
proteins that have proposed differences in function; and SCGB1A1P, which contains a nonsense
mutation and is not expressed. As reported in our study, it now appears that there may be a second
porcine SCGB1A1 gene that contains a large 334 bp insertion along with multiple other promoter
polymorphisms when compared to the previously reported SCGB1A1 gene sequence. An extra PCR
product of higher molecular weight was amplified in a subset of eleven pigs that expressed the highest
levels of SCGB1A1 mRNA. Although not reported in the literature, a search of the Ensemble website
indicated that an additional SCGB1A1 sequence had recently been annotated in the database as a
separate gene located 44 396 bp upstream on the reverse strand of Sus scrofa chromosome 2
[ENSSSCT00000014276] (Figure 3.2) (Flicek et al. 2013). Further analysis indicated that the long
promoter sequences detected in pigs with higher mRNA expression were near identical to each other
as well as to the newly deposited sequence in the Ensemble database. This sequence contained a large
number of genetic variations that were not present in the short promoter form of the gene. Most of
these variations were present in non-coding regions of the gene. Only three nucleotide variations were
observed in exon 1, with all three located 5' of the ATG start codon. Although our initial data supports
the existence of two unique SCBG1A1 genes, additional studies are required to further verify that
these sequences represent separate genes rather than extensive variation within a single gene.
Additional studies will also be needed to determine the biological and functional significance of the
two different SCBG1A1 sequences and also whether or not any sequence variation exists between the
coding regions of these two genes.
In humans SCGB1A1 is expressed at high levels in a broad range of tissues (lung, uterus,
trachea, prostate, thyroid, mammary gland and pituitary (Peri et al. 1993) with lower levels of
expression being detected in the stomach, ovary, testis, spleen, adrenal, aorta, pancreas, thymus and
121
liver (Peri et al. 1993) with similar tissue variation in horses (Cote et al. 2012). Expression of
SCGB1A1 mRNA has also been detected in high levels in the lung, but not in the liver of pigs using
northern blot analysis (Gutierrez Sagal and Nieto 1998), a technology that is considered less sensitive
than the microarray and RT-PCR assays used in our study. In our study, there was a strong correlation
in hepatic mRNA levels measured by these two independent methods. Expression in both cases
should be viewed as total mRNA expression of both the long and short promoter forms of SCGB1A1
as neither RT-PCR primers nor the microarray probe used in this study were capable of discerning
between these two reported sequences. In this study, the polymorphic longer sequence was identified
only in pigs with the highest measured SCGB1A1 expression suggesting an association between this
polymorphic sequence and enhanced hepatic expression of this gene. Variations in the SCGB1A1 gene
that are associated with specific disease syndromes have also been identified. A G(38)A SNP [also
known as G(-26)A] in humans has been linked to increased airway inflammation, acute respiratory
distress syndrome and the development of asthma (Candelaria et al. 2005, Choi et al. 2000, Frerking
et al. 2005, Ku et al. 2011, Laing et al. 1998, Zhang et al. 1997). Additionally, alterations in the
expression ratio of SCGB1A1A to SCGB1A1 in horses are associated with recurrent airway
obstruction syndrome (RAO) (Cote et al. 2012). Differences in the amount of this secretory protein in
healthy pigs, such as that observed for the polymorphic sequence in this study, can therefore also be
expected to have a significant effect on an animal’s susceptibility and response to allergens and
infectious pathogens. Accordingly, it would be interesting to determine if there are other promoter
polymorphisms in SCGB1A1 not apparent in liver expression studies that affect pulmonary resistance
to respiratory pathogens in pigs or other species.
This study represents an important first step in the identification of innate immune genes that
are differentially up-regulated in the liver of healthy pigs and thus, may serve as markers of enhanced
pre-immune resistance to pulmonary (and other) infectious diseases. Both genes code for innate
immune response proteins that play a key role in host defense against infectious pathogens, especially
in the lung and additional studies will be required to determine if these findings can be extrapolated to
the lung and other tissues. It should also be established whether higher levels of mRNA expression

122
translates into increased levels of functional protein. Such studies would require the measurement of
pulmonary gene expression as well as protein levels in lung and/or serum. Additional investigations
may be aimed at genotyping larger populations in conjunction with controlled prospective infection
trials and carefully designed disease association studies to further evaluated the importance of these
promoter SNPs on innate immune defenses and determine whether they offer a protective advantage
or disadvantage in different pig populations. Genetic variations in these genes may represent a
valuable set of biomarkers that can be used to examine the relationship between innate immunity and
disease resistance and to develop a comprehensive selection panel of markers for breeding pigs with
increased disease resistance.
123
CHAPTER 4: VARIATION IN CONSTITUTIVE HEPATIC GENE EXPRESSION OF HAMP
AND DDX58 WITH IDENTIFICATION OF NOVEL PROMOTER POLYMORPHISMS
This chapter corresponds to a manuscript of the same title to be submitted with the following
authorship:
Snyman HN, Hammermueller JD, Hayes MA, Lillie BN (2013)
ABSTRACT
Single nucleotide polymorphisms (SNPs) within the porcine innate immune genome have
been associated with alterations in gene expression and an increased risk to developing infectious
diseases. In a recent study, a number of additional porcine innate immune genes with widely variable
constitutive gene expression were identified. To evaluate if promoter polymorphisms are responsible
for the observed variation, we attempted to characterize the 5' upstream promoter regions of four of
these genes that exhibited some of the highest variation; including porcine hepcidin antimicrobial
peptide (HAMP), retinoic acid-inducible gene 1 (DDX58), peptidoglycan recognition protein-1
(PGLYRP1) and peptidoglycan recognition protein-2 (PGLYRP2). Pooled sequencing of these genes
in the lowest and highest expressing animals resulted in the identification of fourteen and nineteen
novel polymorphisms within the 5'-upstream promoter of the HAMP and DDX58 genes respectively,
while no polymorphisms were identified in the genes encoding PGLYRP1 and PGLYRP2. Some
polymorphisms identified in the HAMP and DDX58 genes were more frequent in pigs with either
increased or decreased mRNA expression. A significant increase or decrease in variant genotype
frequency in pigs diagnosed with a variety of common disease syndromes and pathogens was
identified for several of these HAMP and DDX58 promoter polymorphisms as well as some CD163
and CD169 coding SNPs. These polymorphisms could serve as genetic markers aimed at enhancing
innate resistance to common infectious diseases encountered by swine.
124
INTRODUCTION
The innate immune system is a critical component of the host immune response and
represents the first line of defense to invading pathogens (Janeway 1989, Medzhitov 2009, Mogensen
2009). This system is composed of an elaborate network of interacting pattern recognition receptors
(PRRs) and secreted proteins that can rapidly identify, neutralize and/or eliminate bacterial, fungal
and viral pathogens.
A large group of secreted innate immune response proteins are the antimicrobial peptides
(AMPs), also known as host defense peptides (HDPs). AMPs are a highly heterogeneous group of
proteins that have the ability to rapidly inactivate microbial organisms including Gram-positive and
Gram-negative bacteria, fungi and certain viruses (Auvynet and Rosenstein 2009, Sang and Blecha
2009, Zaiou and Gallo 2002). Cathelicidins and defensins are the major mammalian AMPs. However,
a number of cysteine stabilized peptides with antibacterial activity have also been identified, including
the liver expressed antimicrobial peptides (Hepcidin/LEAP-1 and LEAP-2), peptidoglycan
recognition proteins (PGLYRPs) and NK-lysin (Dziarski and Gupta 2010, Sang and Blecha 2009).
LEAP-1, better known as hepcidin antimicrobial peptide plays an important role in iron metabolism
(Krause et al. 2000, Sang et al. 2006). However, as its the name suggests, HAMP also has important
antimicrobial activities (Barthe et al. 2011, Hocquellet et al. 2012, Krause et al. 2000, Park et al. 2001,
Sang et al. 2006). Four PGLYRPs have been identified in mammals with these proteins sharing some
homology to the previously identified insect PGRPs. Mammalian PGLYRPs contain one or more C-
terminal type 2 amidase domains with a peptidoglycan-binding groove cleft that is specific for
muramyl-tripeptide (Guan et al. 2004, Liu et al. 2001, Royet and Dziarski 2007). All mammalian
PGLYPRs exist as secreted proteins with PGLYRP1, PGLYRP3, and PGLYRP4 forming disulfide-
linked homodimers. Homodimerization of PGLYRP2 also occurs but is independent of disulphide
bond formation (Dziarski and Gupta 2010). PGLYRP3 and PGLYRP4 can also form disulfide-linked
heterodimers (Dziarski and Gupta 2010).
125
In addition to AMPs, PRRs also play a central role in the innate immune defenses against
microbial pathogens. An important group of intracytoplasmic PRRs are the retinoic acid-inducible
genes (RIG)-I–like receptors (RLR’s). RLRs play a critical role in antiviral sensing and signaling
pathways (Kato et al. 2006, Saito et al. 2007, Schlee et al. 2009, Takeuchi and Akira 2010, Wilkins
and Gale 2010, Yoneyama et al. 2005). They are IFN-inducible RNA helicases that recognize foreign
cytoplasmic RNA and DNA. This innate defense mechanism is particularly important in the case of
viral pathogens that have breached the cytoplasmic compartment of an infected host cell and are
actively replicating and producing mRNA for protein synthesis. A number of molecules have been
added to this class of PRRs but the RIG-1 and melanoma-differentiation-associated gene 5 (MDA-5;
also known as interferon-induced helicase/IFIH1 or helicard, encoded by the IFIH1 gene) proteins are
the prototypical members of this group. These proteins recognize a broad range of RNA viruses (Kato
et al. 2006, Wilkins and Gale 2010, Yoneyama et al. 2005). After binding to their cognate ligands, the
N-terminal caspase recruitment domain (CARD) of RIG-1 and MDA-5 trigger intracellular signaling
pathways via the IFN-β promoter stimulator-1 (IPS-1 also known as MAVS, VISA or CARDIF). This
promotes type 1-IFN production via tumour necrosis factor (TNF) receptor-associated factor 3
(TRAF3) and TNF receptor type 1-associated DEATH domain protein (TRADD) (Michallet et al.
2008) as well as IκB kinase (IKK-I and Tank binding kinase1/TBK1) signalling pathways (Akira et
al. 2006, Honda et al. 2006). Activation of RIG-1 by the short dsRNA and 5'-triphosphate dsRNA
found in RNA and DNA viruses enhances type I-IFN signaling (Schlee et al. 2009, Schmidt et al.
2009).
Alterations in the expression of innate immune proteins as a result of underlying genetic
variations, in both humans and pigs, has been shown to significantly alter the susceptibility of
individuals to infectious disease (Garred et al. 2003, Juul-Madsen et al. 2006, Juul-Madsen et al.
2011, Keirstead et al. 2011, Leth-Larsen et al. 2005, Lillie et al. 2007). Using microarray expression
technology in healthy market weight pigs, we previously reported widely variable constitutive hepatic
gene expression in a number of porcine innate immune genes (chapter 2), including hepcidin
antimicrobial peptide (HAMP; encoded by the HAMP gene), retinoic acid-inducible gene 1 (RIG-1;
126
encoded by the DDX58 gene), peptidoglycan recognition protein-1 (PGLYRP1; encoded by the
PGLYRP1 gene) and peptidoglycan recognition protein-2 (PGLYRP2; encoded by the PGLYRP2
gene). Because of the key role these proteins play in host defense; HAMP, DDX58, PGLYRP1 and
PGLYRP2 were selected for characterization of their 5'-upstream promoter sequences to identify
genetic variations that may underlie the observed variation in expression. Variant genotype
frequencies for the identified HAMP and DDX58 SNPs and previously reported CD169 and CD163
coding SNPs were then compared in healthy and diseased pig populations to identify significant
disease associations.
MATERIALS AND METHODS
Sample Acquisition, Nucleic Acid Extraction and Primer Design
Liver samples of 1003 healthy terminally crossed commercial market weight pigs were
collected from a large southern Ontario pig processing facility as previously described (Chapter 2). As
described in Chapter 2, Nucleic acids were extracted and stored and primers were designed as
described in Chapter 3.
Amplification of the 5'-Promoter Regions of HAMP, DDX58, PGLYRP1 and PGLYRP2
Using the forward and reverse primers listed in Table 4.1, gene segments of the 5'-promoter
regions of HAMP (2587 bp), DDX58 (2643 bp), PGLYRP1 (1520 bp) and PGLYRP2 (1498 bp) were
amplified. All amplifications were performed according to the manufacturer’s recommendations (50
μL reactions; final primer concentration of 0.5 µM) using the QIAGEN TopTaq DNA Polymerase
Kit®. QIAGEN TopTaq Q-solution was added to the PCR reaction for HAMP. Cycling parameters
for all reactions were as follows: initial denaturation for 3 min at 94 ºC, followed by 35 cycles of
denaturation at 94 ºC for 30 s, annealing at 62 ºC (DDX58), 56 ºC (HAMP), 55 ºC (PGLYRP1) or 58
ºC (PGLYRP2) for 30 s and extension at either 72 ºC for 2 min and 55 s (DDX58); 2 min and 30 s
(HAMP) or 1 min and 30 s (PGLYRP1 and PGLYRP2), with a final extension at 72 ºC for 10 min. In
127
this study all PCR products were visualized with agarose gel electrophoresis (1 or 2 %; 0.5 X tris-
borate-EDTA (TBE) buffer; SYBR SAFE nucleic acid stain). The PCR products of DDX58,
PGLYRP1 and PGLYRP2 were extracted from the agarose gel and purified using a QIAquick® gel
extraction kit according to manufacturer’s recommendations prior to submission for sequence
analysis.
Sequencing of PCR products and Identification of Novel SNPs.
Pigs with the highest (n = 8) and lowest (n = 8) levels of mRNA expression, as determined by
microarray analysis, were selected for pooled sequencing as described in Chapter 3. Sequencing
primers used are listed in Table 4.1. Assembled sequences were aligned using Clustal Omega -
Multiple Sequence Alignment (http://www.ebi.ac.uk/Tools/msa/clustalo/) and screened for genetic
variation as previously described (Chapter 3). Nomenclature of the identified polymorphisms was
based on their nucleotide location relative to the first ATG start codon within the coding sequence as
described by the human genome variation society (den Dunnen and Antonarakis 2000). The variant
allele was designated as the allele that varied from the reported nucleotide sequence used as reference
sequence and was not always the less common allele. In all tables, the variant allele is listed last.
Semi-Quantitative Real-Time RT-PCR
Variations in the constitutive expression of HAMP and DDX58 were also assessed using
semi-quantitative real-time RT-PCR. Reverse transcription of cDNA was performed according to the
manufacturer’s recommendations using the QuantiTect® Reverse Transcription Kit (QIAGEN,
Mississauga, Ontario) and semi-quantitative real-time RT-PCR was performed as described in
Chapter 3. RT-PCR primers and reaction efficiencies for each standard curve are listed in Table 4.2. A
reproducible standard curve could not be generated for the amplification of HAMP so semi-
quantitative real-time RT-PCR was not performed on this gene. Amplification of the desired targets
was confirmed by DNA sequencing (Lab Services Division, University of Guelph, Guelph, Ontario).
RT-PCR conditions for all reactions were as follows: pre-incubation at 95 ºC for 5 min, followed by
128
45 cycles of denaturation at 95 ºC for 10 s, annealing at appropriate gene melting temperature for 10 s
(Table 4.2), and elongation at 72 ºC for 15 s, followed by melting curve analysis (65 to 95 ºC) to
confirm the presence of a single product per PCR reaction.
As described previously (Chapter 3), the RefFinder program (http://www.
leonxie.com/referencegene.php) was used to evaluate GAPDH, 28s rRNA and 2M expression to
identify the most stable reference genes in this data set. This program uses the BestKeeper (Pfaffl et
al. 2004), Normfinder (Andersen et al. 2004), Genorm (Vandesompele et al. 2002) and comparative
delta-Ct (Silver et al. 2006) methods and identified GAPDH as the most stable reference gene for
evaluation of target gene expression in this study.
The Mann-Whitney test or Kruskal-Wallis one way analysis of variance along with Dunn’s
multiple comparisons post test was used to identify differences in microarray expression between the
different genotypes of each identified genetic variant (Table 4.8). For genetic variants where only two
genotypes were available for comparison, the Mann-Whitney test was used. For genetic variants for
which three genotype groups were available, the Kruskal-Wallis one way analysis of variance and
Dunn’s multiple comparisons post test were used.
MALDI-TOF Mass Spectrometry of Diseased and Healthy Pig Populations
Comparative SNP genotyping of identified HAMP and DDX58 promoter SNPs as well as
previously reported CD163 and CD169 SNPs was performed on three distinct populations as
previously described (Chapter 3) and consisted of diseased autopsy pigs (n = 386); healthy market
weight pigs (n = 500); healthy purebred boars (n = 475)). Briefly, Sequenom MassARRAY® matrix-
assisted laser desorption/ionization time-of-flight (MALDI-TOF) mass spectrometry (Sequenom, San
Diego, CA, USA) and single base extension (Gabriel et al. 2009) was performed at the UHN Clinical
Genomics Centre (Mount Sinai Hospital, Toronto, Ontario). MALDI-TOF SNP genotyping for some
polymorphisms could not be performed and genotyping comparisons could not be made for the
following variants: CD169 g.4175C>T; HAMP g.-1620G>A; HAMP g.-1123G>A; HAMP g.-
1012T>C; DDX58 g.-542C>T; DDX58 g.777-778delCA and DDX58 g.-783G>A.
129
As described in Chapter 3, diseased pigs were grouped into broad disease syndrome groups
(infectious, enteric, pneumonia, polyserositis and septicemia) and by etiologic agent (Actinobacillus
pleuropneumoniae (APP) (n = 22); K88+ Escherichia coli (n = 31); Haemophilus parasuis (n = 20);
Streptococcus suis (n = 84); Salmonella enterica subsp. enterica ser. Typhimurium (Salmonella
Typhimurium) (n = 26); Mycoplasma spp. (n = 39); porcine circovirus type 2 (PCV2) (n = 84) and
porcine reproductive and respiratory syndrome virus (PRRSV) (n = 69)) and were assessed using a
one-tailed Fisher's exact probability test and 2 x 2 contingency tables and the false discovery rate was
controlled at 3 % as previously described (Chapter 3). This translated to a FDR of 1.08 false
discoveries within the 36 significant associations identified (Storey 2002, Storey 2003, Strimmer
2008).
Variant genotype frequencies within the healthy reference pig population were also compared
to that of pure bred pigs and four theoretical crossbred populations (50 % Duroc, 25 % Large White,
25 % Landrace); (50 % Landrace, 25 % Large White, 25 % Duroc); (50 % Large White; 25 %
Landrace, 25 % Duroc) and (33 % Large White, 33 % Landrace, 33 % Duroc) as described in Chapter
3. Briefly, for pure breed comparisons a five-way chi-square test (five columns two rows) was used to
identify significant differences in variant allele frequencies. If significant differences were identified a
pairwise Yates Chi-square test, using 2 x 2 contingency tables, was used to identify which specific
breeds had significantly different variant positive genotype frequencies when compared to the other
breeds tested in this study. When the expected value for one or more of the cells was < 5 a one-tailed
Fisher's exact probability test was used instead.
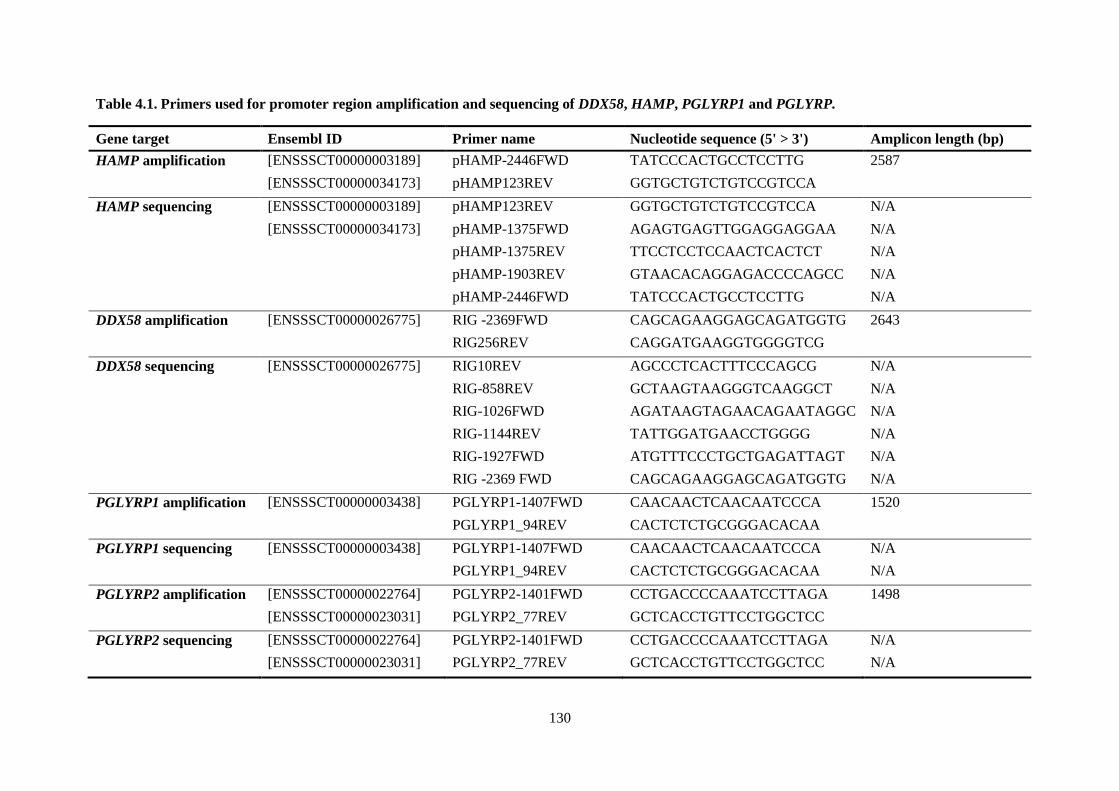
130
Table 4.1. Primers used for promoter region amplification and sequencing of DDX58, HAMP, PGLYRP1 and PGLYRP.
Gene target Ensembl ID Primer name Nucleotide sequence (5' > 3') Amplicon length (bp)
HAMP amplification [ENSSSCT00000003189] pHAMP-2446FWD TATCCCACTGCCTCCTTG 2587
[ENSSSCT00000034173] pHAMP123REV GGTGCTGTCTGTCCGTCCA
HAMP sequencing [ENSSSCT00000003189] pHAMP123REV GGTGCTGTCTGTCCGTCCA N/A
[ENSSSCT00000034173] pHAMP-1375FWD AGAGTGAGTTGGAGGAGGAA N/A
pHAMP-1375REV TTCCTCCTCCAACTCACTCT N/A
pHAMP-1903REV GTAACACAGGAGACCCCAGCC N/A
pHAMP-2446FWD TATCCCACTGCCTCCTTG N/A
DDX58 amplification [ENSSSCT00000026775] RIG -2369FWD CAGCAGAAGGAGCAGATGGTG 2643
RIG256REV CAGGATGAAGGTGGGGTCG
DDX58 sequencing [ENSSSCT00000026775] RIG10REV AGCCCTCACTTTCCCAGCG N/A
RIG-858REV GCTAAGTAAGGGTCAAGGCT N/A
RIG-1026FWD AGATAAGTAGAACAGAATAGGC N/A
RIG-1144REV TATTGGATGAACCTGGGG N/A
RIG-1927FWD ATGTTTCCCTGCTGAGATTAGT N/A
RIG -2369 FWD CAGCAGAAGGAGCAGATGGTG N/A
PGLYRP1 amplification [ENSSSCT00000003438] PGLYRP1-1407FWD CAACAACTCAACAATCCCA 1520
PGLYRP1_94REV CACTCTCTGCGGGACACAA
PGLYRP1 sequencing [ENSSSCT00000003438] PGLYRP1-1407FWD CAACAACTCAACAATCCCA N/A
PGLYRP1_94REV CACTCTCTGCGGGACACAA N/A
PGLYRP2 amplification [ENSSSCT00000022764] PGLYRP2-1401FWD CCTGACCCCAAATCCTTAGA 1498
[ENSSSCT00000023031] PGLYRP2_77REV GCTCACCTGTTCCTGGCTCC
PGLYRP2 sequencing [ENSSSCT00000022764] PGLYRP2-1401FWD CCTGACCCCAAATCCTTAGA N/A
[ENSSSCT00000023031] PGLYRP2_77REV GCTCACCTGTTCCTGGCTCC N/A
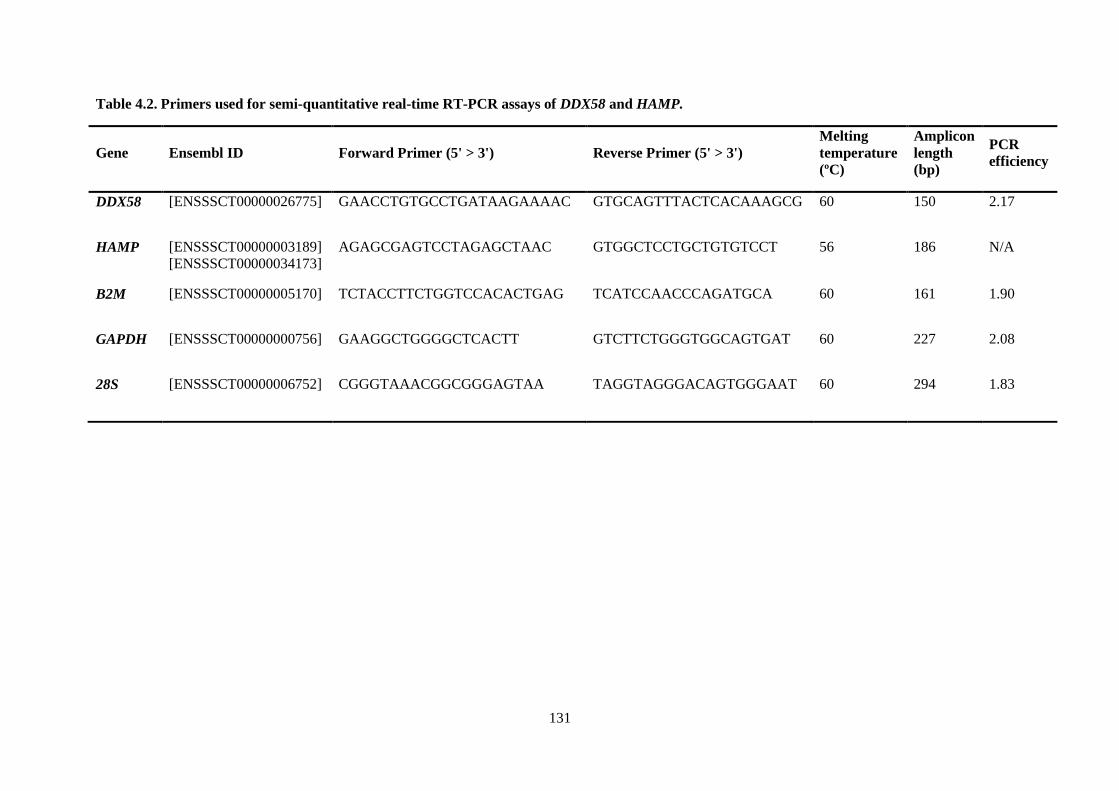
131
Table 4.2. Primers used for semi-quantitative real-time RT-PCR assays of DDX58 and HAMP.
Gene Ensembl ID Forward Primer (5' > 3') Reverse Primer (5' > 3')
Melting
temperature
(ºC)
Amplicon
length
(bp)
PCR
efficiency
DDX58 [ENSSSCT00000026775] GAACCTGTGCCTGATAAGAAAAC GTGCAGTTTACTCACAAAGCG 60 150 2.17
HAMP [ENSSSCT00000003189]
[ENSSSCT00000034173]
AGAGCGAGTCCTAGAGCTAAC GTGGCTCCTGCTGTGTCCT 56 186 N/A
B2M [ENSSSCT00000005170] TCTACCTTCTGGTCCACACTGAG TCATCCAACCCAGATGCA 60 161 1.90
GAPDH [ENSSSCT00000000756] GAAGGCTGGGGCTCACTT GTCTTCTGGGTGGCAGTGAT 60 227 2.08
28S [ENSSSCT00000006752] CGGGTAAACGGCGGGAGTAA TAGGTAGGGACAGTGGGAAT 60 294 1.83
132
RESULTS
Novel SNPs and Polymorphisms in the 5'-Promoter Regions of HAMP and DDX58
Fourteen novel polymorphisms were identified in the 2441 bp of the 5'-upstream promoter
region of the HAMP gene. These genetic variations included four transversion SNPs, nine transition
SNPs and a single deletion. Appendix IV - Figure IV.3 and Table 4.3 summarizes all identified
variations. Some of the SNPs were found to be more frequent in pigs with low levels of HAMP
expression (HAMP g.-902C>G and HAMP g.-1620G>A); while others were more common in pigs
with high levels of expression (HAMP g.-947T>C; HAMP g.-1405C>G and HAMP g.-1421G>C)
(Figure 4.1). A summary of the relative frequency of these SNPs in pigs with low and high levels of
HAMP expression and of the percentage of pigs with at least one copy of the variant allele at each
SNP location is shown in Table 4.4. Within this subset of high and low expressing pigs (n = 18) four
different SNP haplotypes were also identified (Table 4.9): one in which HAMP g.-165G>A; HAMP
g.-1019G>A; HAMP g.-1123G>A; HAMP g.-2142T>C and HAMP g.-1582-
1600delCCCTGCCTCAACCAGCAGC (HAMP haplotype 1) always occurred together; haplotypes
in which either HAMP g.-902C>G and HAMP g.-1620G>A (HAMP haplotype 3) or HAMP g.-
887G>A; HAMP g.-1012T>C and HAMP g.-1540G>C (HAMP haplotype 2) were co-expressed and a
haplotype in which HAMP g.-947T>C; HAMP g.-1405C>G and HAMP g.-1421G>C (HAMP
haplotype 4) that was present only in pigs with high levels of HAMP expression. In this subset, the
polymorphisms in each haplotype were considered to be 100 % linked.
Nineteen novel polymorphisms were identified in the 2364 bp of the 5'-upstream promoter
region of the DDX58 gene. These genetic polymorphisms included four transversion SNPs, ten
transition SNPs, three deletions and two insertions. Appendix IV - Figure IV.4 and Table 4.5
summarize all identified variations. Four of these SNPs, DDX58 g.-293T>G; DDX58 g.-542C>T;
DDX58 g.-1325T>C and DDX58 g.-2089A>G as well as a single deletion g.-1063-1065delATA, were
more frequent in pigs with low levels of DDX58 expression (Figure 4.1). A summary of the
percentage of pigs with at least one copy of the variant allele at each SNP locus, as well as the total
133
variant allele frequency can be found in Table 4.6. Although some of these variants often occurred
together only two SNP haplotypes could be identified in this subpopulation (n = 15) (Table 4.9).
DDX58 haplotype 2 (DDX58 g.-1325T>C, DDX58 g.-2089A>G and DDX58 g.-1063-1065delATA)
was more frequent in pigs with low levels of expression.
Sequencing of pooled samples of the eight highest and lowest expressing pigs (n = 16) did not
identify any SNPs, insertions or deletions within the 1520 and 1498 bp of the 5'-upstream promoter
region and first coding exons of PGLYRP1 and PGLYRP2 respectively (Appendix IV - Figure IV.5
and Figure IV.6).
DDX58 and HAMP mRNA Expression Levels
The variability in DDX58 mRNA expression was less extensive when measured by RT-PCR
compared to microarray analysis. The gene expression ratio, calculated by comparing the mean
expression of the top 50 % of pigs to the mean gene expression of the bottom 6 % of pigs was a 6.5
when measured by RT-PCR and 13 when measured by microarray technology. The maximum
variation between pigs with the highest and lowest RT-PCR expression was 70-fold compared to 130-
fold when assessed by the microarray method. Although measurements of gene expression using RT-
PCR and microarray techniques are usually well correlated, RT-PCR is considered to be the more
sensitive method of the two. RT-PCR is therefore often able to identify smaller changes in gene
expression and often results in larger observed variation in gene expression. This was not the case for
DDX58 expression and correlation between microarray and RT-PCR analysis for individual samples
was poor (R2 = 0.0979) (Figure 4.2). The reason for the poor correlation between microarray and RT-
PCR assays is not known but may be due to differences in the location and design of primers and
probes. Both DDX58 microarray probes were located 401 bp apart at the beginning of the 3'UTR of
exon 20 while RT-PCR primers were located upstream in exons 17 and 18. Discrepancies between
assays may also occur if some primers and probes do not recognize all splice variants and haplotypes
of these genes. In addition, results may also be confounded by interactions between different
134
polymorphisms in other regions of the genes and by the presence of complex haplotypes that occur in
some, but not all, pigs. Additional studies are needed to resolve the discrepancies between these
different technologies. Despite the poor correlation between these two methods a high degree of
correlation was observed between the two different microarray probes. The correlation coefficient
(R2) for assays performed using these two probes was 0.8402 (Figure 4.3) and variations in mRNA
expression were evaluated based on microarray expression alone.
HAMP mRNA expression was quantified using two different (non-identical) microarray
probes located 30-bp apart at the 3'-end of the 3rd exon of the two splice variants of this gene.
Microarray quantification using these probes was considered to encompass both known porcine
transcript variants. The results obtained using these two probes were strongly correlated (R = 0.9760)
(Figure 4.4). HAMP RT-PCR primer design was focussed on the 5'-UTR and first two exons of the
HAMP gene, a common shared region of both transcripts to accommodate for this variation. Despite
multiple attempts and primer sets, generation of a consistent standard curve could not be attained. As
a result, variations in mRNA expression were evaluated based on microarray expression alone.
Animals that were heterozygous (n = 15) and homozygous (n = 2) for the HAMP g.-947T>C,
HAMP g.-1405C>G and HAMP g.-1421G>C SNPs (HAMP haplotype 4) showed an increase in
hepatic expression when compared to the wild type allele (n = 71) with the increase in heterozygous
individuals being statistically significant (p = 0.0152) (Figure 4.1B). The lack of statistical
significance in homozygous individuals is likely due to low sample size. Animals that were
heterozygous (n = 9) for the HAMP g.-902C>G SNP showed a decrease in hepatic expression when
compared to the wild type allele (n = 79) and trended towards statistical significance (p = 0.0803)
(Figure 4.1A). No homozygous individuals were available for comparison. Animals that were
heterozygous (n = 32) for the DDX58 g.-1325T>C, DDX58 g.-1063delATA and DDX58 g.-2089A>G
polymorphisms (DDX58 haplotype 2) showed a significant decrease in hepatic expression when
compared to the wild type allele (n = 56) (p = 0.0104) (Figure 4.1D). No homozygous individuals
were identified in this subset of pigs. Animals that were heterozygous (n = 39) and homozygous (n =
4) for the DDX58 g.-293T>G SNP showed a decrease in hepatic expression when compared to the
135
wild type allele (n = 45) however, the differences were not statistically significant (p = 0.8831 and p =
0.8826) (Figure 4.1C).
MALDI-TOF Mass Spectrometry of Diseased and Healthy Pig Populations
The SNPs identified were genotyped using MALDI-TOF mass spectrometry in diseased pigs,
healthy cross bred and pure bred pigs as described previously. The same DDX58 haplotypes
(haplotype 1 and 2) as previously identified also occurred within this larger population of genotyped
pigs and were 100 % linked across all genotyped pig populations (Table 4.9). Similar results were
also obtained for the HAMP gene however some SNPs, previously allocated to specific haplotypes
(HAMP g.-1123G>A, HAMP g.-1012T>C SNPs and HAMP g.-1620G>A), could not be assessed in
the larger group of genotyped populations. Due to the absence of the HAMP g.-1123G>A and HAMP
g.-1012T>C SNPs from our genotyping data, these haplotypes were renamed as haplotype 1A and 2A
respectively and HAMP g.-902C>G (HAMP haplotype 3) was assessed individually. The HAMP g.-
947T>C; HAMP g.-1405C>G and HAMP g.-1421G>C SNPs (HAMP haplotype 4) often occurred
together and exhibited near identical disease associations however were not 100 % linked in all
genotyped populations and formed three closely related haplotypes (HAMP haplotype 4A, 4B, and
4C). Similarly the DDX58 g.-194-195insGAGGG (DDX58 haplotype 1A) and DDX58 g.-817G>A
(DDX58 haplotype 1B) variants also often occurred together with the genetic variants composing
DDX58 haplotype 1, again with near identical disease associations, however were also not 100 %
linked. Two more SNPs, DDX58 g.-86A>C and DDX58 g.-1309A>C (DDX58 haplotype 3) were also
not 100 % linked however again had near identical disease associations. A summary of all identified
haplotypes and their associated linkage can be found in Table 4.9.
Table 4.10 to 4.14 summarize all the genotyping comparisons and calculated p- and q-values
for HAMP, DDX58, CD163 and CD169. When compared to the healthy reference pig population the
G allele of HAMP g.-902C>G was more frequent in the infectious disease, pneumonia, polyserositis
and septicemia disease groups with the first two being statistically significant after correcting for the
136
FDR. When compared to specific pathogen groups; the G allele was approximately 2.8, 1.8 and 2.0
times more frequent in the Mycoplasma spp., PCV2 and PRRSV pathogen groups respectively
however the PRRSV association was not statistically significant. Variant alleles of the HAMP
haplotype 2A was significantly less frequent in the infectious, pneumonia and septicemia disease
groups and PCV2 pathogen group. Decreased frequencies of this haplotype were also observed within
in the enteric, polyserositis and Mycoplasma spp. groups and trended towards statistical significance.
HAMP haplotype 1A and the three SNPs previously associated with increased hepatic expression
(HAMP g.-947T>C, HAMP g.-1405C>G and HAMP g.-1421G>C) were not associated with any
statistically significant changes in variant allele frequency in the different disease groups. HAMP
haplotype 1A was however approximately eight times less frequent in the K88+ E. coli pathogen
group while the other three SNPs were significantly less frequent in the PCV2 pathogen group.
When compared to the healthy reference pig population the G allele of DDX58 g.-293T>G
was more frequent in the infectious, septicemia, pneumonia and enteric disease groups and 1.5 times
more frequent in both the Salmonella Typhimurium and Haemophilus parasuis pathogen groups
however the pneumonia, enteric and H. parasuis groups were not statistically significant. The A allele
of DDX58 g.-309G>A was significantly less frequent in the infectious, enteric and pneumonia disease
groups and approximately 2 and 1.3 times less frequent in the K88+ E. coli and PCV2 pathogen
groups respectively. The A allele was also decreased in the APP, H. parasuis and S. Typhimurium
pathogen groups however only the latter two trended towards statistical significance. DDX58 g.-
817G>A, DDX58 g.-194-195insGAGGG and DDX58 haplotype 1 had no statistically significant
changes in variant allele frequency in the different disease groups but statistically significant changes
were observed for some pathogen groups with the variant allele being approximately twice as frequent
in both the K88+ E. coli and S. Typhimurium pathogen groups. Although no statistically significant
variations in variant allele frequency of the DDX58 g.-1748-1751delGAGA, DDX58 g.-86A>C,
DDX58 g.-1309A>C and DDX58 haplotype 2 variants were identified in the tested disease syndrome
groups, statistically significant changes were observed for some pathogen groups. The C allele of both
DDX58 g.-86A>C and DDX58 g.-1309A>C was 3.5 and 3.4 times less frequent in the K88+ E. coli
pathogen group respectively and the GAGA deletion of the DDX58 g.-1748-1751delGAGA variant
137
was 1.4 times less frequent in the H. parasuis pathogen group. Variant alleles of DDX58 haplotype 2
were 1.9 times more frequent in the H. parasuis pathogen group and 1.3 times more frequent in the
septicemia disease group and with the latter only tending towards statistical significance.
A recent study (Ren et al. 2012) reported specific CD163 and CD169 polymorphism
genotypes that were associated with resistance to PRRSV infection in commercial Chinese crossbred
pigs (Duroc X Landrace X Large White) and these SNPs were also tested in this study to determine if
the sample SNPs were present in North American pigs and what impact they had on infectious disease
resistance. These genotypes included the AA of CD169 g.1654C>A, CT of CD169 g.4175C>T and
AA of CD163 g.2552A>G. The CD169 (Siglec-1) sialoadhesin, present on macrophage cell
membranes, interacts with sialic acids present on the surface of PRRSV thereby mediating its
attachment in a clathrin-dependent manner and ultimately resulting in internalization of the virus
along with its receptor (De Baere et al. 2012, Delputte and Nauwynck 2004, Vanderheijden et al.
2003). CD163 is a macrophage-specific scavenger receptor belonging to the cysteine-rich receptor
superfamily and functions as a cellular receptor for PRRSV as well as assisting in uncoating of the
virus and subsequent cellular replication (Welch and Calvert 2010). When compared to the healthy
reference pig population, the G allele of CD163 g.2552A>G was significantly more frequent in the
PRRSV pathogen group (1.4 times) and all disease groups except polyserositis. The G allele was also
more frequent in most of the remaining pathogen groups (approximately 1.8 times in APP, 1.3 times
in Streptococcus suis and 1.2 times in PCV2, K88+ E. coli and Mycoplasma spp.) however none were
statistically significant with the APP, S. suis and PCV2 associations tending towards significance. The
A allele of the CD169 g.1654C>A SNP did not vary significantly between different disease groups
and most pathogens however was approximately 1.2 times more frequent in the K88+ E. coli
pathogen group in which case the association trended towards statistical significance. Genotyping
failed for the CD169 g.4175C>T SNP and could not be further assessed.
With the exception of DDX58 g.-293 G>T in the Hampshire and Landrace breeds, all
genotyped HAMP, DDX58, CD169 and CD163 polymorphisms were represented in all examined
North American purebred boars. Variant genotype frequency varied significantly between the
138
different purebred pig breeds included in this study (Table 4.16 and Table 4.17). Three
polymorphisms displayed less variable frequencies between breeds: variant positive genotype
frequencies of the G allele of HAMP g.-902C>G ranged from 6.0 % (Large White) to 19.0 %
(Landrace) while the GAGA deletion of DDX58 g.-1748-1751delGAGA ranged from 79.0 % (Large
White) to 91.8 % (Pietrain). The third, DDX58 g.-219T>G SNP, was found to be extremely rare
across all genotyped pig populations and the G allele frequency ranged from 0.0 (Landrace) to only
2.0 % (Large White) with no homozygous individuals identified. Variant genotype frequencies were
also compared to that of different weighted purebred crosses in an attempt to see how closely our
commercial population of crossbred pigs compared to that of commonly implemented cross breeding
strategies. Variant genotype frequencies of the different weighted crossbred pig populations were
found to be more similar to that observed with our healthy market weight pig population (Table 4.18).
Individuals that were homozygous for the variant allele were rare in almost all identified promoter
polymorhisms and included CD163 g.2552A>G (69 individuals or 5.1 %; n = 1358); HAMP
haplotype 1A (23 individuals or 1.7 %; n = 1356); HAMP g.-947T>C (54 individuals or 3.9 %; n =
1358); HAMP g.-1405C>G (51 individuals or 3.8 %; n = 1357); HAMP g.-1421G>C (51 individuals
or 3.8 %; n = 1358); HAMP haplotype 2A (159 individuals or 11.8 %; n = 1353); HAMP g.-902C>G
(8 individuals or 0.6 %; n = 1358); DDX58 g.-219T>G (0 individuals or 0.0%; n = 1358); DDX58 g.-
309G>A (119 individuals or 8.8 %; n = 1356); DDX58 g.-293T>G (111 individuals or 8.2 %; n =
1358); DDX58 g.-817G>A (39 individuals or 2.9 %; n = 1355); DDX58 g.-194-195insGAGGG (10
individuals or 0.7 %; n = 1358); DDX58 haplotype 1 (10 individuals or 0.7 %; n = 1354); DDX58 g.-
86A>C (15 individuals or 1.1 %; n = 1357); DDX58 g.-1309A>C (15 individuals or 1.1 %; n = 1356)
and DDX58 haplotype 2 (47 individuals or 3.5 %; n = 1352).
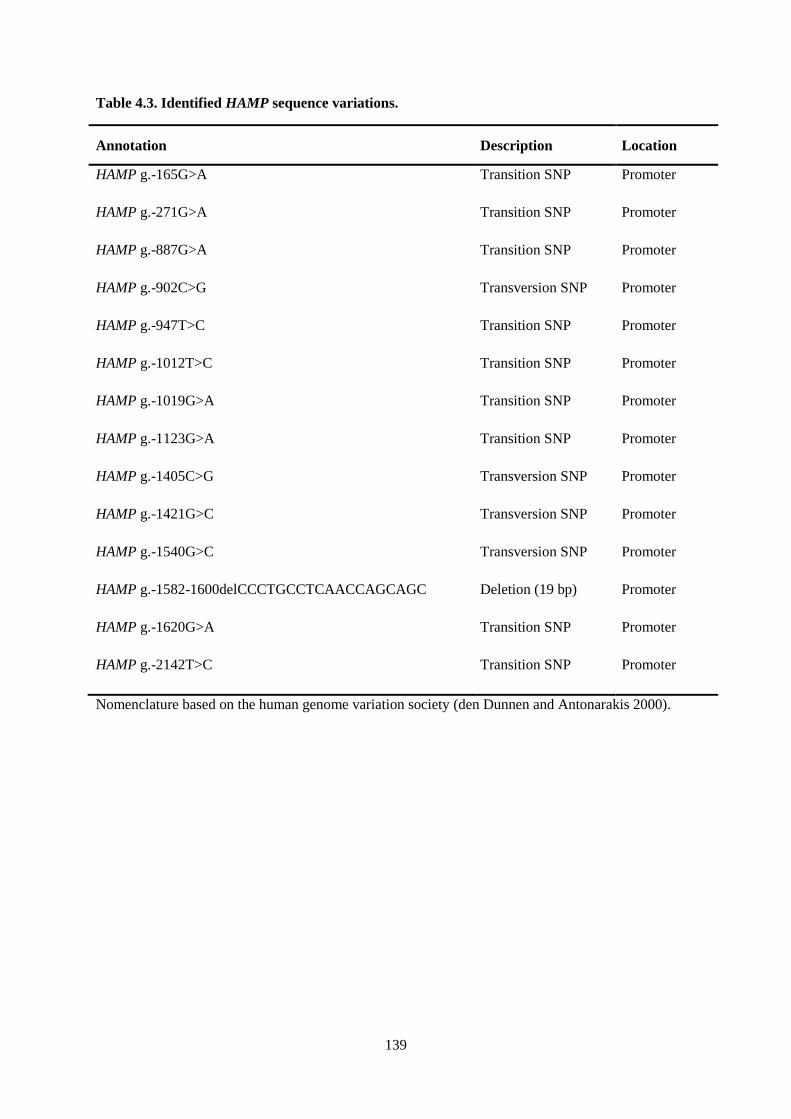
139
Table 4.3. Identified HAMP sequence variations.
Annotation Description Location
HAMP g.-165G>A Transition SNP Promoter
HAMP g.-271G>A Transition SNP Promoter
HAMP g.-887G>A Transition SNP Promoter
HAMP g.-902C>G Transversion SNP Promoter
HAMP g.-947T>C Transition SNP Promoter
HAMP g.-1012T>C Transition SNP Promoter
HAMP g.-1019G>A Transition SNP Promoter
HAMP g.-1123G>A Transition SNP Promoter
HAMP g.-1405C>G Transversion SNP Promoter
HAMP g.-1421G>C Transversion SNP Promoter
HAMP g.-1540G>C Transversion SNP Promoter
HAMP g.-1582-1600delCCCTGCCTCAACCAGCAGC Deletion (19 bp) Promoter
HAMP g.-1620G>A Transition SNP Promoter
HAMP g.-2142T>C Transition SNP Promoter
Nomenclature based on the human genome variation society (den Dunnen and Antonarakis 2000).
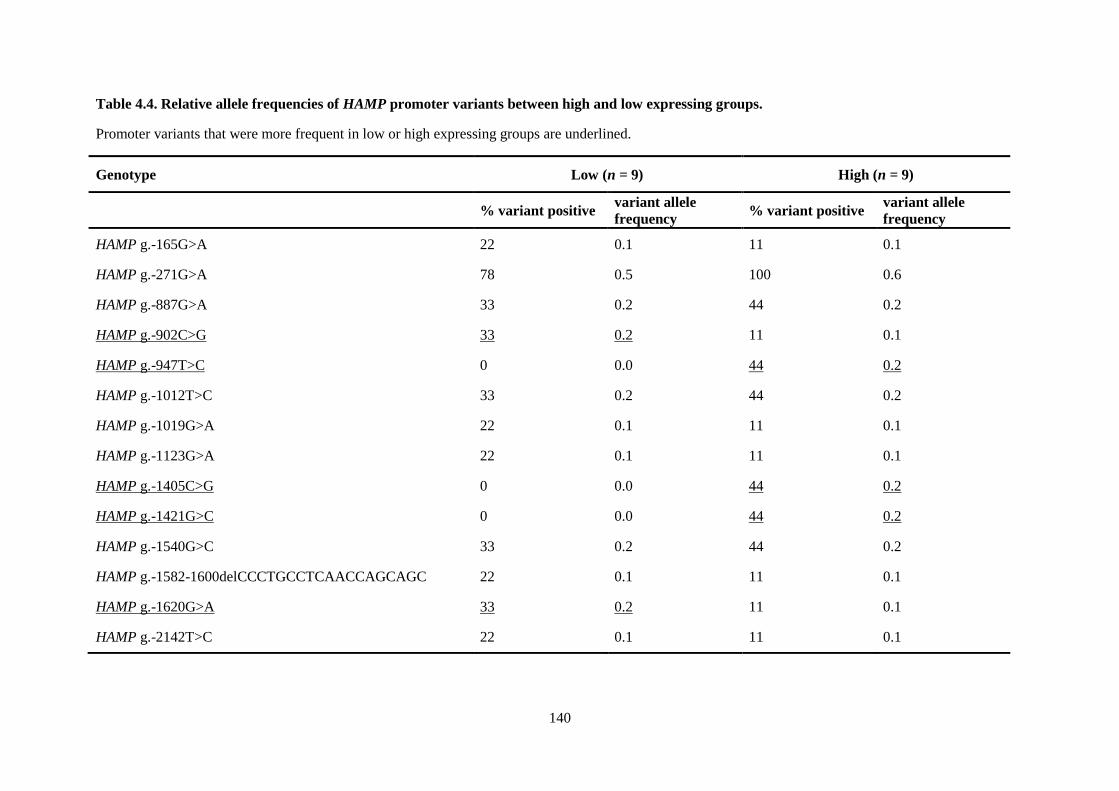
140
Table 4.4. Relative allele frequencies of HAMP promoter variants between high and low expressing groups.
Promoter variants that were more frequent in low or high expressing groups are underlined.
Genotype Low (n = 9) High (n = 9)
% variant positive variant allele
frequency % variant positive
variant allele
frequency
HAMP g.-165G>A 22 0.1 11 0.1
HAMP g.-271G>A 78 0.5 100 0.6
HAMP g.-887G>A 33 0.2 44 0.2
HAMP g.-902C>G 33 0.2 11 0.1
HAMP g.-947T>C 0 0.0 44 0.2
HAMP g.-1012T>C 33 0.2 44 0.2
HAMP g.-1019G>A 22 0.1 11 0.1
HAMP g.-1123G>A 22 0.1 11 0.1
HAMP g.-1405C>G 0 0.0 44 0.2
HAMP g.-1421G>C 0 0.0 44 0.2
HAMP g.-1540G>C 33 0.2 44 0.2
HAMP g.-1582-1600delCCCTGCCTCAACCAGCAGC 22 0.1 11 0.1
HAMP g.-1620G>A 33 0.2 11 0.1
HAMP g.-2142T>C 22 0.1 11 0.1
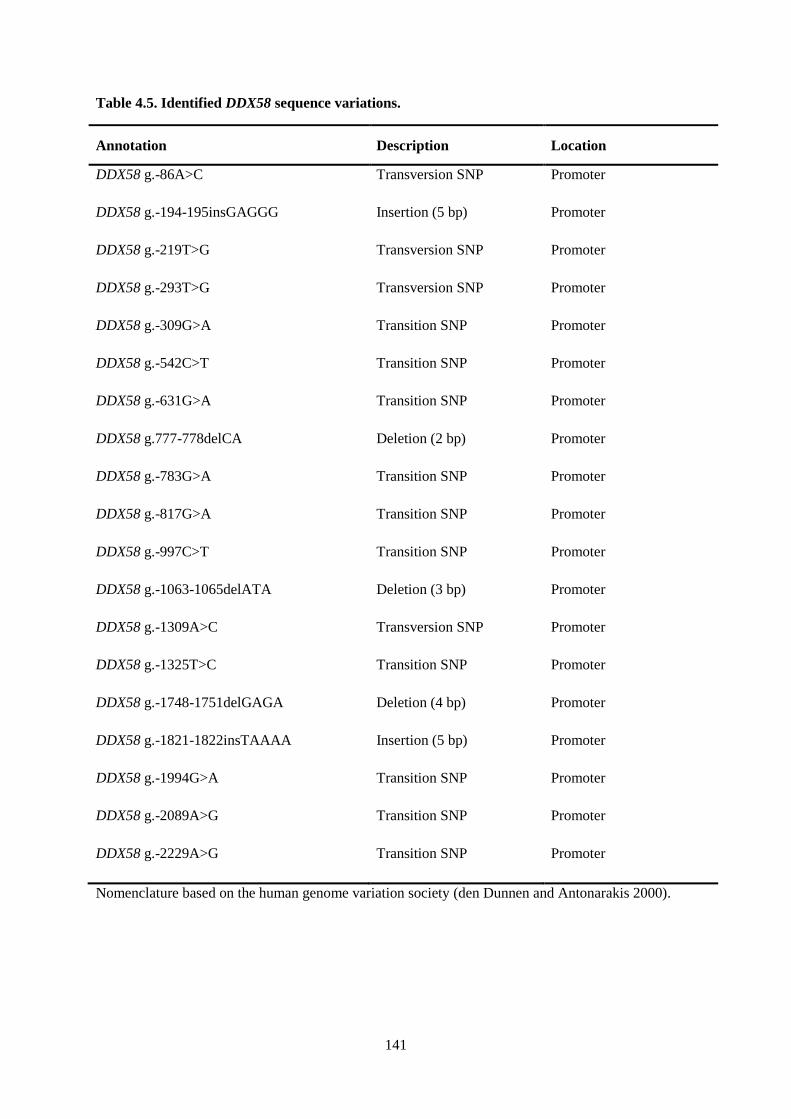
141
Table 4.5. Identified DDX58 sequence variations.
Annotation Description Location
DDX58 g.-86A>C Transversion SNP Promoter
DDX58 g.-194-195insGAGGG Insertion (5 bp) Promoter
DDX58 g.-219T>G Transversion SNP Promoter
DDX58 g.-293T>G Transversion SNP Promoter
DDX58 g.-309G>A Transition SNP Promoter
DDX58 g.-542C>T Transition SNP Promoter
DDX58 g.-631G>A Transition SNP Promoter
DDX58 g.777-778delCA Deletion (2 bp) Promoter
DDX58 g.-783G>A Transition SNP Promoter
DDX58 g.-817G>A Transition SNP Promoter
DDX58 g.-997C>T Transition SNP Promoter
DDX58 g.-1063-1065delATA Deletion (3 bp) Promoter
DDX58 g.-1309A>C Transversion SNP Promoter
DDX58 g.-1325T>C Transition SNP Promoter
DDX58 g.-1748-1751delGAGA Deletion (4 bp) Promoter
DDX58 g.-1821-1822insTAAAA Insertion (5 bp) Promoter
DDX58 g.-1994G>A Transition SNP Promoter
DDX58 g.-2089A>G Transition SNP Promoter
DDX58 g.-2229A>G Transition SNP Promoter
Nomenclature based on the human genome variation society (den Dunnen and Antonarakis 2000).
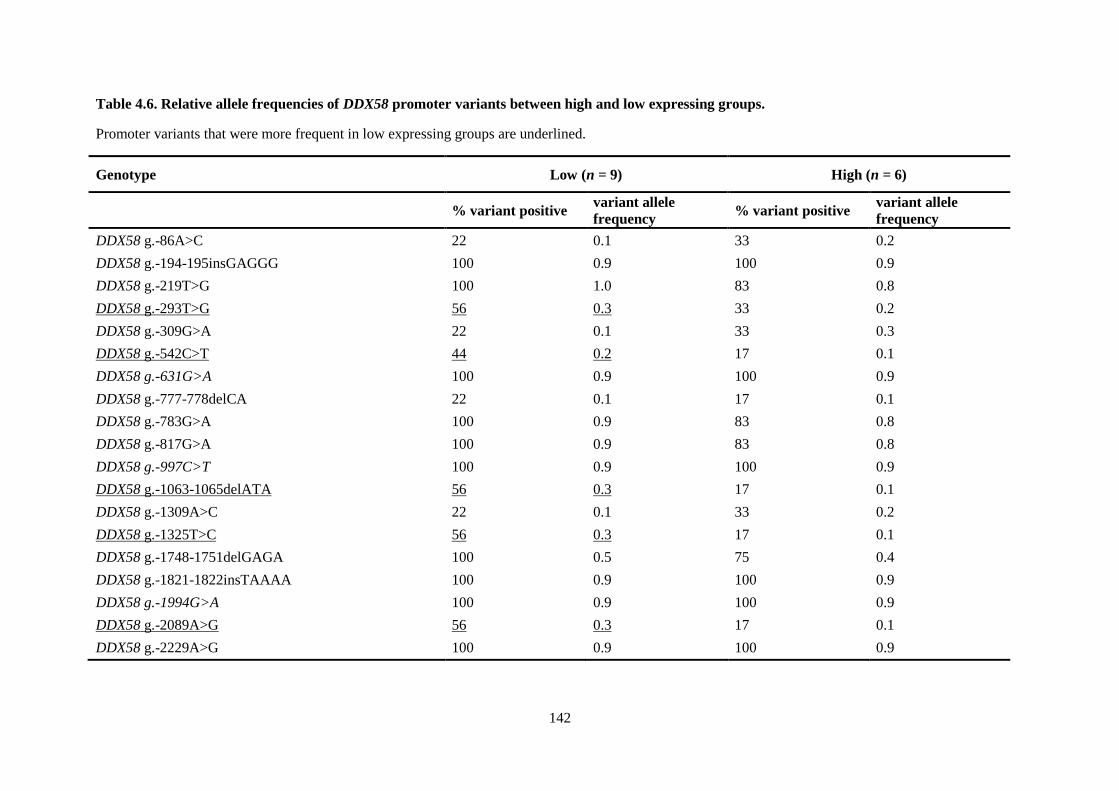
142
Table 4.6. Relative allele frequencies of DDX58 promoter variants between high and low expressing groups.
Promoter variants that were more frequent in low expressing groups are underlined.
Genotype Low (n = 9) High (n = 6)
% variant positive variant allele
frequency % variant positive
variant allele
frequency
DDX58 g.-86A>C 22 0.1 33 0.2
DDX58 g.-194-195insGAGGG 100 0.9 100 0.9
DDX58 g.-219T>G 100 1.0 83 0.8
DDX58 g.-293T>G 56 0.3 33 0.2
DDX58 g.-309G>A 22 0.1 33 0.3
DDX58 g.-542C>T 44 0.2 17 0.1
DDX58 g.-631G>A 100 0.9 100 0.9
DDX58 g.-777-778delCA 22 0.1 17 0.1
DDX58 g.-783G>A 100 0.9 83 0.8
DDX58 g.-817G>A 100 0.9 83 0.8
DDX58 g.-997C>T 100 0.9 100 0.9
DDX58 g.-1063-1065delATA 56 0.3 17 0.1
DDX58 g.-1309A>C 22 0.1 33 0.2
DDX58 g.-1325T>C 56 0.3 17 0.1
DDX58 g.-1748-1751delGAGA 100 0.5 75 0.4
DDX58 g.-1821-1822insTAAAA 100 0.9 100 0.9
DDX58 g.-1994G>A 100 0.9 100 0.9
DDX58 g.-2089A>G 56 0.3 17 0.1
DDX58 g.-2229A>G 100 0.9 100 0.9
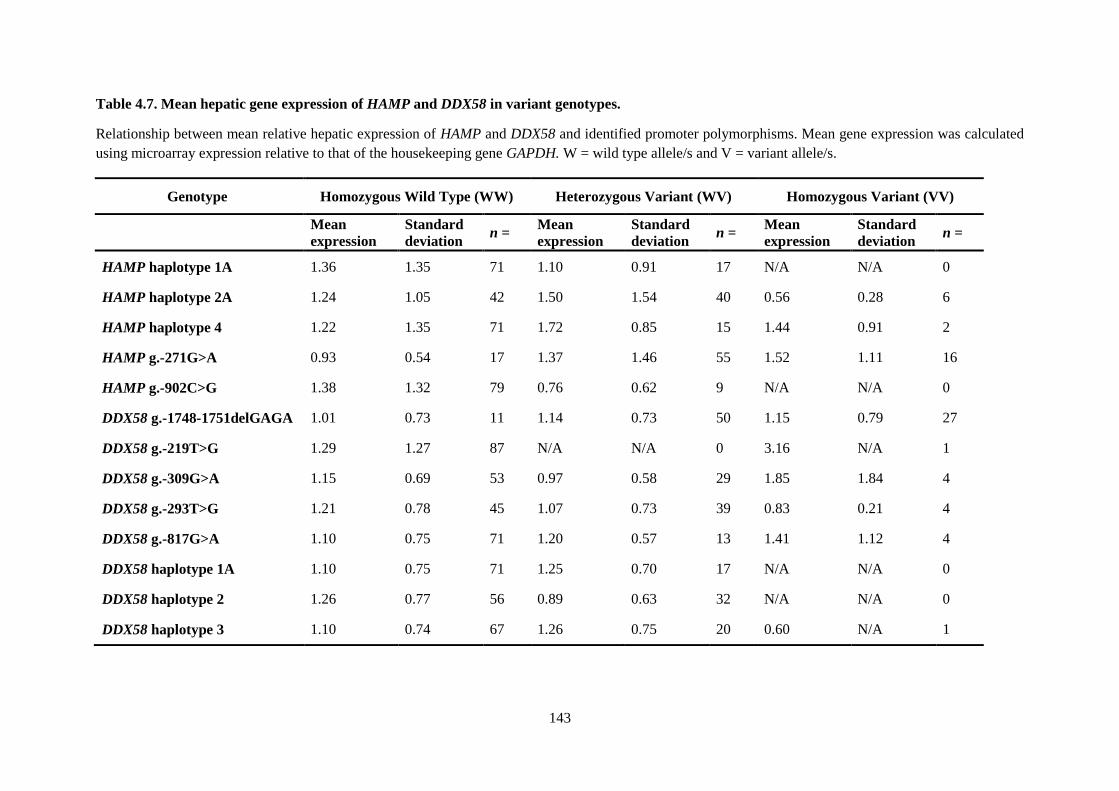
143
Table 4.7. Mean hepatic gene expression of HAMP and DDX58 in variant genotypes.
Relationship between mean relative hepatic expression of HAMP and DDX58 and identified promoter polymorphisms. Mean gene expression was calculated
using microarray expression relative to that of the housekeeping gene GAPDH. W = wild type allele/s and V = variant allele/s.
Genotype Homozygous Wild Type (WW) Heterozygous Variant (WV) Homozygous Variant (VV)
Mean
expression
Standard
deviation n =
Mean
expression
Standard
deviation n =
Mean
expression
Standard
deviation n =
HAMP haplotype 1A 1.36 1.35 71 1.10 0.91 17 N/A N/A 0
HAMP haplotype 2A 1.24 1.05 42 1.50 1.54 40 0.56 0.28 6
HAMP haplotype 4 1.22 1.35 71 1.72 0.85 15 1.44 0.91 2
HAMP g.-271G>A 0.93 0.54 17 1.37 1.46 55 1.52 1.11 16
HAMP g.-902C>G 1.38 1.32 79 0.76 0.62 9 N/A N/A 0
DDX58 g.-1748-1751delGAGA 1.01 0.73 11 1.14 0.73 50 1.15 0.79 27
DDX58 g.-219T>G 1.29 1.27 87 N/A N/A 0 3.16 N/A 1
DDX58 g.-309G>A 1.15 0.69 53 0.97 0.58 29 1.85 1.84 4
DDX58 g.-293T>G 1.21 0.78 45 1.07 0.73 39 0.83 0.21 4
DDX58 g.-817G>A 1.10 0.75 71 1.20 0.57 13 1.41 1.12 4
DDX58 haplotype 1A 1.10 0.75 71 1.25 0.70 17 N/A N/A 0
DDX58 haplotype 2 1.26 0.77 56 0.89 0.63 32 N/A N/A 0
DDX58 haplotype 3 1.10 0.74 67 1.26 0.75 20 0.60 N/A 1
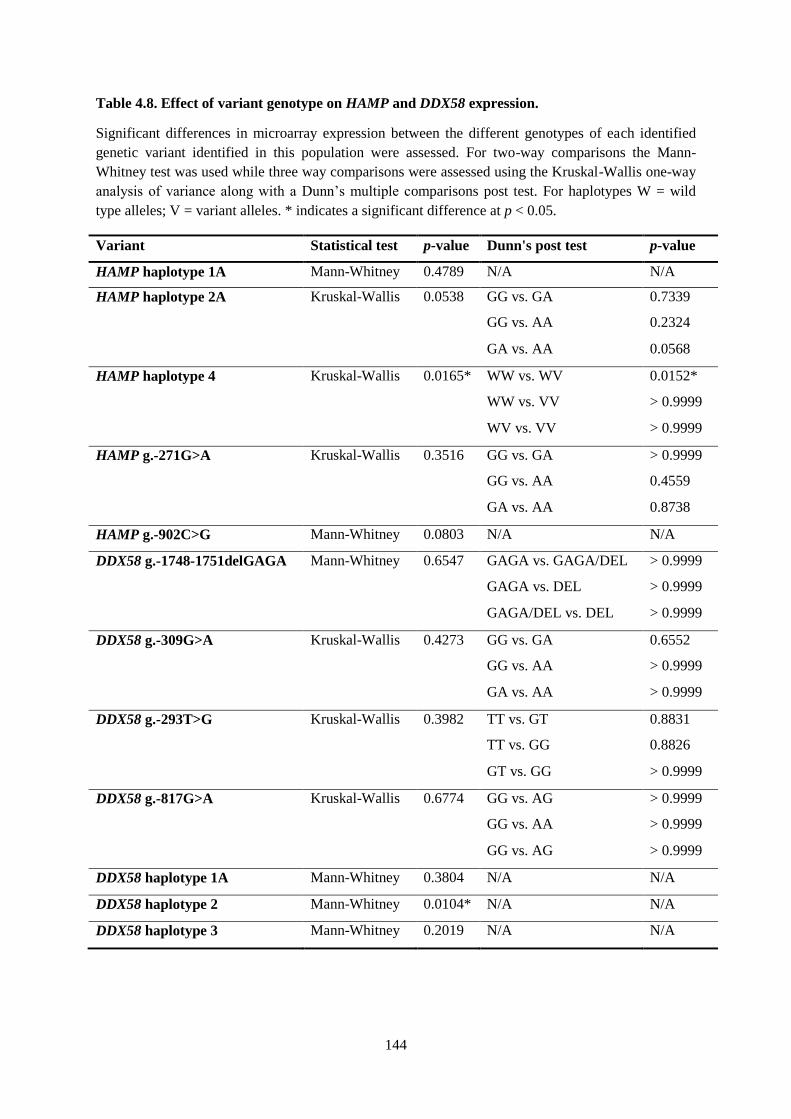
144
Table 4.8. Effect of variant genotype on HAMP and DDX58 expression.
Significant differences in microarray expression between the different genotypes of each identified
genetic variant identified in this population were assessed. For two-way comparisons the Mann-
Whitney test was used while three way comparisons were assessed using the Kruskal-Wallis one-way
analysis of variance along with a Dunn’s multiple comparisons post test. For haplotypes W = wild
type alleles; V = variant alleles. * indicates a significant difference at p < 0.05.
Variant Statistical test p-value Dunn's post test p-value
HAMP haplotype 1A Mann-Whitney 0.4789 N/A N/A
HAMP haplotype 2A Kruskal-Wallis 0.0538 GG vs. GA 0.7339
GG vs. AA 0.2324
GA vs. AA 0.0568
HAMP haplotype 4 Kruskal-Wallis 0.0165* WW vs. WV 0.0152*
WW vs. VV > 0.9999
WV vs. VV > 0.9999
HAMP g.-271G>A Kruskal-Wallis 0.3516 GG vs. GA > 0.9999
GG vs. AA 0.4559
GA vs. AA 0.8738
HAMP g.-902C>G Mann-Whitney 0.0803 N/A N/A
DDX58 g.-1748-1751delGAGA Mann-Whitney 0.6547 GAGA vs. GAGA/DEL > 0.9999
GAGA vs. DEL > 0.9999
GAGA/DEL vs. DEL > 0.9999
DDX58 g.-309G>A Kruskal-Wallis 0.4273 GG vs. GA 0.6552
GG vs. AA > 0.9999
GA vs. AA > 0.9999
DDX58 g.-293T>G Kruskal-Wallis 0.3982 TT vs. GT 0.8831
TT vs. GG 0.8826
GT vs. GG > 0.9999
DDX58 g.-817G>A Kruskal-Wallis 0.6774 GG vs. AG > 0.9999
GG vs. AA > 0.9999
GG vs. AG > 0.9999
DDX58 haplotype 1A Mann-Whitney 0.3804 N/A N/A
DDX58 haplotype 2 Mann-Whitney 0.0104* N/A N/A
DDX58 haplotype 3 Mann-Whitney 0.2019 N/A N/A
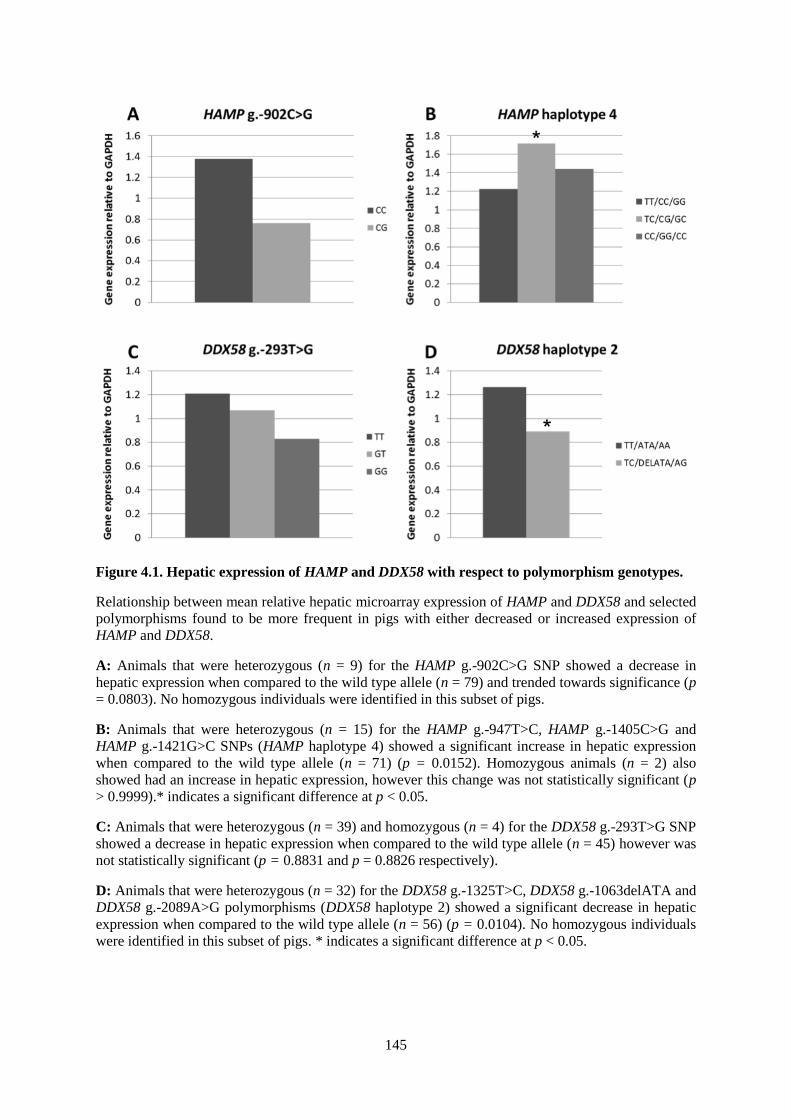
145
Figure 4.1. Hepatic expression of HAMP and DDX58 with respect to polymorphism genotypes.
Relationship between mean relative hepatic microarray expression of HAMP and DDX58 and selected
polymorphisms found to be more frequent in pigs with either decreased or increased expression of
HAMP and DDX58.
A: Animals that were heterozygous (n = 9) for the HAMP g.-902C>G SNP showed a decrease in
hepatic expression when compared to the wild type allele (n = 79) and trended towards significance (p
= 0.0803). No homozygous individuals were identified in this subset of pigs.
B: Animals that were heterozygous (n = 15) for the HAMP g.-947T>C, HAMP g.-1405C>G and
HAMP g.-1421G>C SNPs (HAMP haplotype 4) showed a significant increase in hepatic expression
when compared to the wild type allele (n = 71) (p = 0.0152). Homozygous animals (n = 2) also
showed had an increase in hepatic expression, however this change was not statistically significant (p
> 0.9999).* indicates a significant difference at p < 0.05.
C: Animals that were heterozygous (n = 39) and homozygous (n = 4) for the DDX58 g.-293T>G SNP
showed a decrease in hepatic expression when compared to the wild type allele (n = 45) however was
not statistically significant (p = 0.8831 and p = 0.8826 respectively).
D: Animals that were heterozygous (n = 32) for the DDX58 g.-1325T>C, DDX58 g.-1063delATA and
DDX58 g.-2089A>G polymorphisms (DDX58 haplotype 2) showed a significant decrease in hepatic
expression when compared to the wild type allele (n = 56) (p = 0.0104). No homozygous individuals
were identified in this subset of pigs. * indicates a significant difference at p < 0.05.
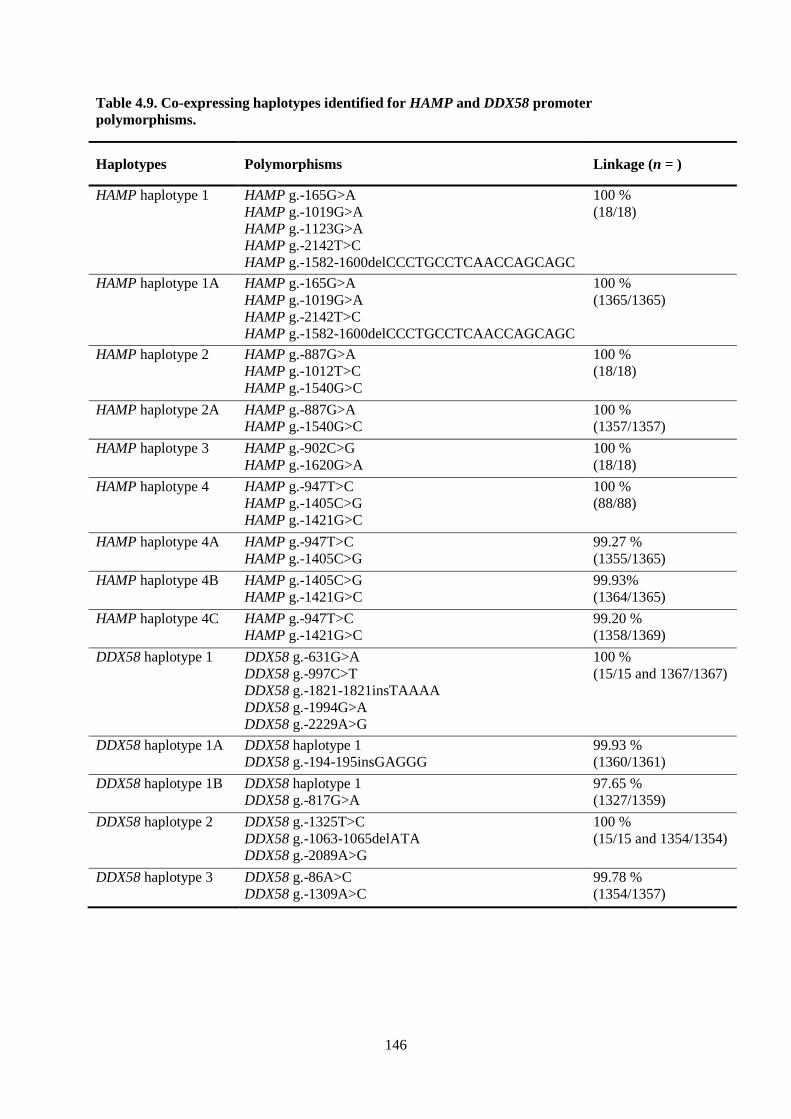
146
Table 4.9. Co-expressing haplotypes identified for HAMP and DDX58 promoter
polymorphisms.
Haplotypes Polymorphisms Linkage (n = )
HAMP haplotype 1 HAMP g.-165G>A
HAMP g.-1019G>A
HAMP g.-1123G>A
HAMP g.-2142T>C
HAMP g.-1582-1600delCCCTGCCTCAACCAGCAGC
100 %
(18/18)
HAMP haplotype 1A HAMP g.-165G>A
HAMP g.-1019G>A
HAMP g.-2142T>C
HAMP g.-1582-1600delCCCTGCCTCAACCAGCAGC
100 %
(1365/1365)
HAMP haplotype 2 HAMP g.-887G>A
HAMP g.-1012T>C
HAMP g.-1540G>C
100 %
(18/18)
HAMP haplotype 2A HAMP g.-887G>A
HAMP g.-1540G>C
100 %
(1357/1357)
HAMP haplotype 3 HAMP g.-902C>G
HAMP g.-1620G>A
100 %
(18/18)
HAMP haplotype 4 HAMP g.-947T>C
HAMP g.-1405C>G
HAMP g.-1421G>C
100 %
(88/88)
HAMP haplotype 4A HAMP g.-947T>C
HAMP g.-1405C>G
99.27 %
(1355/1365)
HAMP haplotype 4B HAMP g.-1405C>G
HAMP g.-1421G>C
99.93%
(1364/1365)
HAMP haplotype 4C HAMP g.-947T>C
HAMP g.-1421G>C
99.20 %
(1358/1369)
DDX58 haplotype 1 DDX58 g.-631G>A
DDX58 g.-997C>T
DDX58 g.-1821-1821insTAAAA
DDX58 g.-1994G>A
DDX58 g.-2229A>G
100 %
(15/15 and 1367/1367)
DDX58 haplotype 1A
DDX58 haplotype 1
DDX58 g.-194-195insGAGGG
99.93 %
(1360/1361)
DDX58 haplotype 1B
DDX58 haplotype 1
DDX58 g.-817G>A
97.65 %
(1327/1359)
DDX58 haplotype 2 DDX58 g.-1325T>C
DDX58 g.-1063-1065delATA
DDX58 g.-2089A>G
100 %
(15/15 and 1354/1354)
DDX58 haplotype 3 DDX58 g.-86A>C
DDX58 g.-1309A>C
99.78 %
(1354/1357)
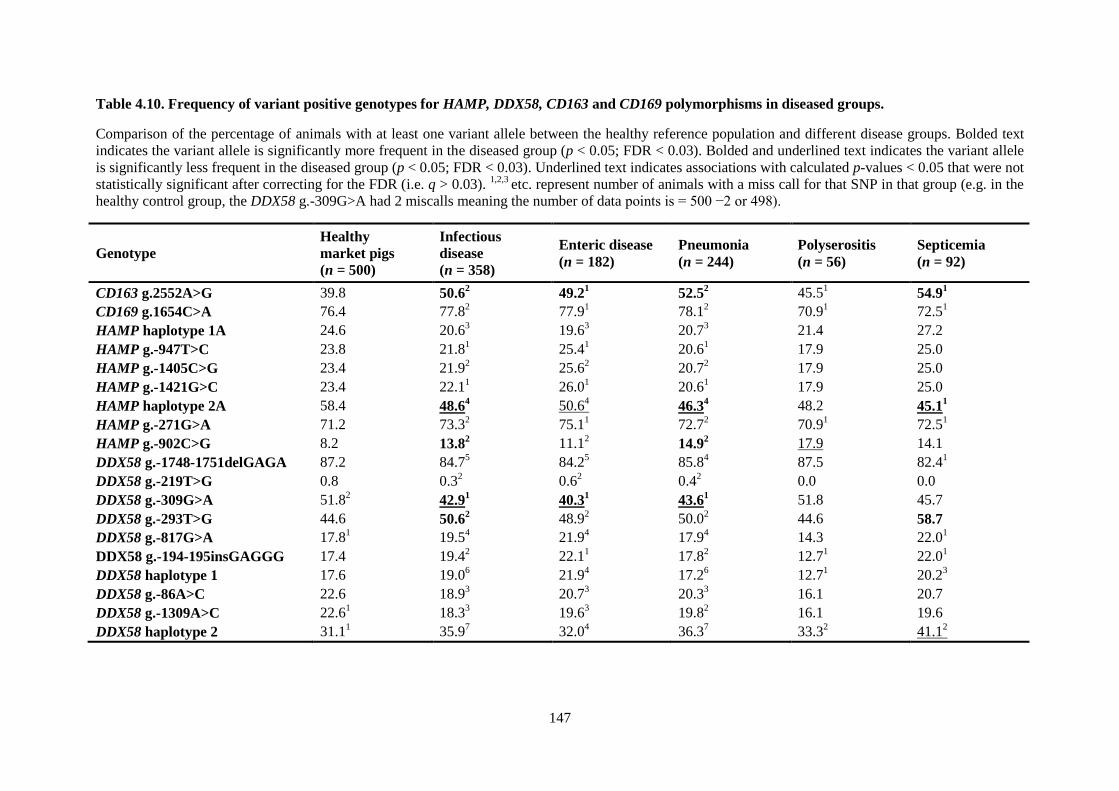
147
Table 4.10. Frequency of variant positive genotypes for HAMP, DDX58, CD163 and CD169 polymorphisms in diseased groups.
Comparison of the percentage of animals with at least one variant allele between the healthy reference population and different disease groups. Bolded text
indicates the variant allele is significantly more frequent in the diseased group (p < 0.05; FDR < 0.03). Bolded and underlined text indicates the variant allele
is significantly less frequent in the diseased group (p < 0.05; FDR < 0.03). Underlined text indicates associations with calculated p-values < 0.05 that were not
statistically significant after correcting for the FDR (i.e. q > 0.03). 1,2,3
etc. represent number of animals with a miss call for that SNP in that group (e.g. in the
healthy control group, the DDX58 g.-309G>A had 2 miscalls meaning the number of data points is = 500 −2 or 498).
Genotype
Healthy
market pigs
(n = 500)
Infectious
disease
(n = 358)
Enteric disease
(n = 182)
Pneumonia
(n = 244)
Polyserositis
(n = 56)
Septicemia
(n = 92)
CD163 g.2552A>G 39.8 50.62
49.21
52.52 45.5
1 54.9
1
CD169 g.1654C>A 76.4 77.82
77.91
78.12
70.91
72.51
HAMP haplotype 1A 24.6 20.63
19.63
20.73
21.4 27.2
HAMP g.-947T>C 23.8 21.81
25.41
20.61
17.9 25.0
HAMP g.-1405C>G 23.4 21.92
25.62
20.72
17.9 25.0
HAMP g.-1421G>C 23.4 22.11
26.01
20.61
17.9 25.0
HAMP haplotype 2A 58.4 48.64 50.6
4 46.3
4 48.2 45.11
HAMP g.-271G>A 71.2 73.32
75.11
72.72
70.91
72.51
HAMP g.-902C>G 8.2 13.82 11.1
2 14.9
2 17.9 14.1
DDX58 g.-1748-1751delGAGA 87.2 84.75
84.25
85.84
87.5 82.41
DDX58 g.-219T>G 0.8 0.32
0.62
0.42
0.0 0.0
DDX58 g.-309G>A 51.82
42.91
40.31
43.61 51.8 45.7
DDX58 g.-293T>G 44.6 50.62 48.9
2 50.0
2 44.6 58.7
DDX58 g.-817G>A 17.81
19.54
21.94
17.94
14.3 22.01
DDX58 g.-194-195insGAGGG 17.4 19.42
22.11
17.82
12.71
22.01
DDX58 haplotype 1 17.6 19.06
21.94
17.26
12.71
20.23
DDX58 g.-86A>C 22.6 18.93
20.73
20.33
16.1 20.7
DDX58 g.-1309A>C 22.61
18.33
19.63
19.82
16.1 19.6
DDX58 haplotype 2 31.11
35.97
32.04
36.37
33.32
41.12
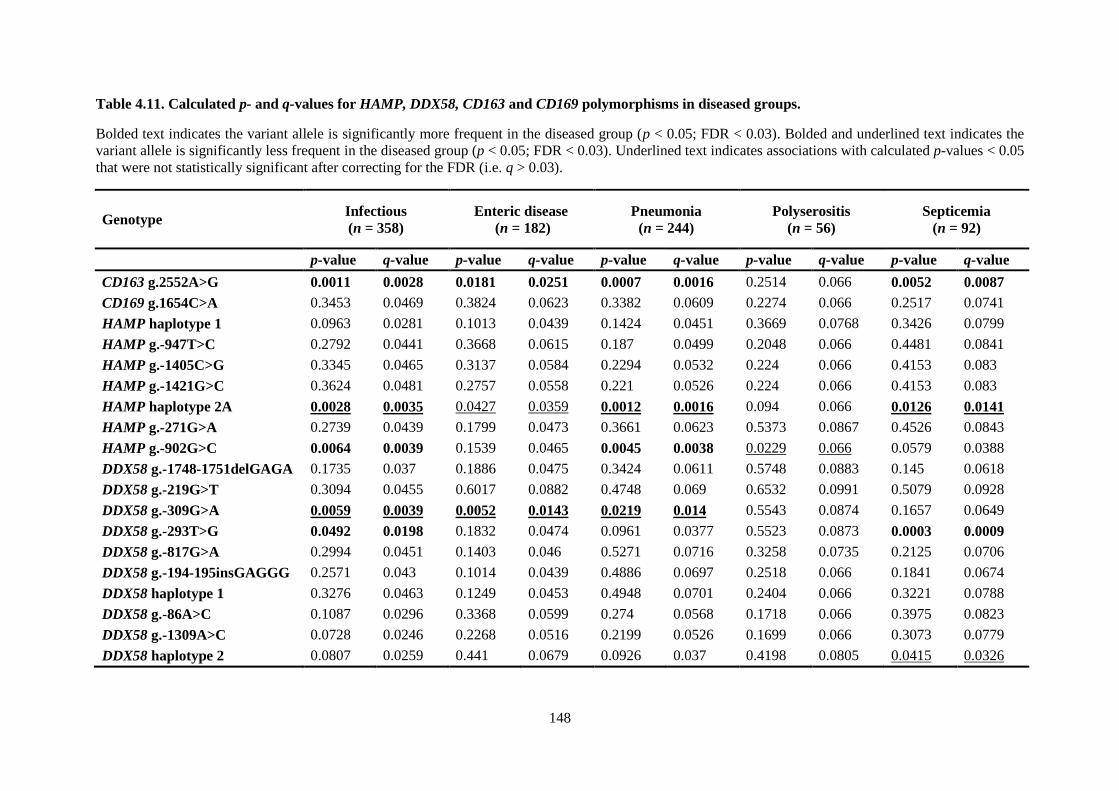
148
Table 4.11. Calculated p- and q-values for HAMP, DDX58, CD163 and CD169 polymorphisms in diseased groups.
Bolded text indicates the variant allele is significantly more frequent in the diseased group (p < 0.05; FDR < 0.03). Bolded and underlined text indicates the
variant allele is significantly less frequent in the diseased group (p < 0.05; FDR < 0.03). Underlined text indicates associations with calculated p-values < 0.05
that were not statistically significant after correcting for the FDR (i.e. q > 0.03).
Genotype Infectious
(n = 358)
Enteric disease
(n = 182)
Pneumonia
(n = 244)
Polyserositis
(n = 56)
Septicemia
(n = 92)
p-value q-value p-value q-value p-value q-value p-value q-value p-value q-value
CD163 g.2552A>G 0.0011 0.0028 0.0181 0.0251 0.0007 0.0016 0.2514 0.066 0.0052 0.0087
CD169 g.1654C>A 0.3453 0.0469 0.3824 0.0623 0.3382 0.0609 0.2274 0.066 0.2517 0.0741
HAMP haplotype 1 0.0963 0.0281 0.1013 0.0439 0.1424 0.0451 0.3669 0.0768 0.3426 0.0799
HAMP g.-947T>C 0.2792 0.0441 0.3668 0.0615 0.187 0.0499 0.2048 0.066 0.4481 0.0841
HAMP g.-1405C>G 0.3345 0.0465 0.3137 0.0584 0.2294 0.0532 0.224 0.066 0.4153 0.083
HAMP g.-1421G>C 0.3624 0.0481 0.2757 0.0558 0.221 0.0526 0.224 0.066 0.4153 0.083
HAMP haplotype 2A 0.0028 0.0035 0.0427 0.0359 0.0012 0.0016 0.094 0.066 0.0126 0.0141
HAMP g.-271G>A 0.2739 0.0439 0.1799 0.0473 0.3661 0.0623 0.5373 0.0867 0.4526 0.0843
HAMP g.-902G>C 0.0064 0.0039 0.1539 0.0465 0.0045 0.0038 0.0229 0.066 0.0579 0.0388
DDX58 g.-1748-1751delGAGA 0.1735 0.037 0.1886 0.0475 0.3424 0.0611 0.5748 0.0883 0.145 0.0618
DDX58 g.-219G>T 0.3094 0.0455 0.6017 0.0882 0.4748 0.069 0.6532 0.0991 0.5079 0.0928
DDX58 g.-309G>A 0.0059 0.0039 0.0052 0.0143 0.0219 0.014 0.5543 0.0874 0.1657 0.0649
DDX58 g.-293T>G 0.0492 0.0198 0.1832 0.0474 0.0961 0.0377 0.5523 0.0873 0.0003 0.0009
DDX58 g.-817G>A 0.2994 0.0451 0.1403 0.046 0.5271 0.0716 0.3258 0.0735 0.2125 0.0706
DDX58 g.-194-195insGAGGG 0.2571 0.043 0.1014 0.0439 0.4886 0.0697 0.2518 0.066 0.1841 0.0674
DDX58 haplotype 1 0.3276 0.0463 0.1249 0.0453 0.4948 0.0701 0.2404 0.066 0.3221 0.0788
DDX58 g.-86A>C 0.1087 0.0296 0.3368 0.0599 0.274 0.0568 0.1718 0.066 0.3975 0.0823
DDX58 g.-1309A>C 0.0728 0.0246 0.2268 0.0516 0.2199 0.0526 0.1699 0.066 0.3073 0.0779
DDX58 haplotype 2 0.0807 0.0259 0.441 0.0679 0.0926 0.037 0.4198 0.0805 0.0415 0.0326
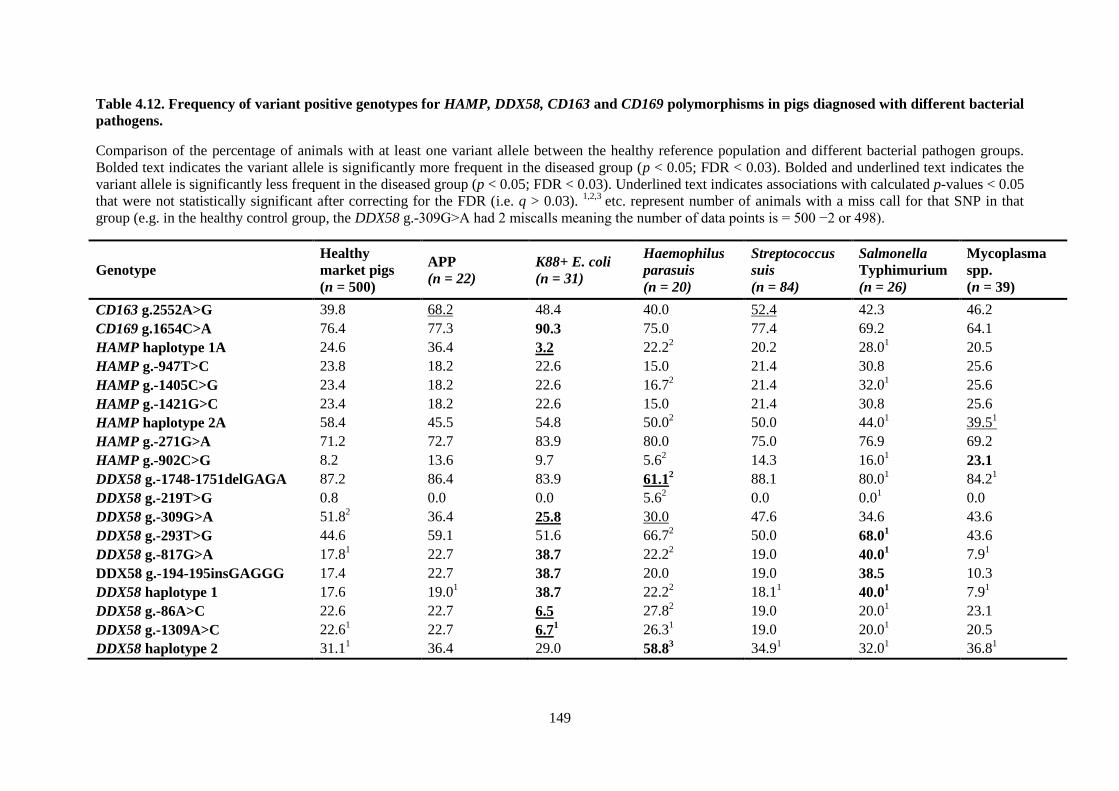
149
Table 4.12. Frequency of variant positive genotypes for HAMP, DDX58, CD163 and CD169 polymorphisms in pigs diagnosed with different bacterial
pathogens.
Comparison of the percentage of animals with at least one variant allele between the healthy reference population and different bacterial pathogen groups.
Bolded text indicates the variant allele is significantly more frequent in the diseased group (p < 0.05; FDR < 0.03). Bolded and underlined text indicates the
variant allele is significantly less frequent in the diseased group (p < 0.05; FDR < 0.03). Underlined text indicates associations with calculated p-values < 0.05
that were not statistically significant after correcting for the FDR (i.e. q > 0.03). 1,2,3
etc. represent number of animals with a miss call for that SNP in that
group (e.g. in the healthy control group, the DDX58 g.-309G>A had 2 miscalls meaning the number of data points is = 500 −2 or 498).
Genotype
Healthy
market pigs
(n = 500)
APP
(n = 22)
K88+ E. coli
(n = 31)
Haemophilus
parasuis
(n = 20)
Streptococcus
suis
(n = 84)
Salmonella
Typhimurium
(n = 26)
Mycoplasma
spp.
(n = 39)
CD163 g.2552A>G 39.8 68.2 48.4 40.0 52.4 42.3 46.2
CD169 g.1654C>A 76.4 77.3 90.3 75.0 77.4 69.2 64.1
HAMP haplotype 1A 24.6 36.4 3.2 22.22
20.2 28.01
20.5
HAMP g.-947T>C 23.8 18.2 22.6 15.0 21.4 30.8 25.6
HAMP g.-1405C>G 23.4 18.2 22.6 16.72
21.4 32.01
25.6
HAMP g.-1421G>C 23.4 18.2 22.6 15.0 21.4 30.8 25.6
HAMP haplotype 2A 58.4 45.5 54.8 50.02
50.0 44.01
39.51
HAMP g.-271G>A 71.2 72.7 83.9 80.0 75.0 76.9 69.2
HAMP g.-902C>G 8.2 13.6 9.7 5.62
14.3 16.01
23.1
DDX58 g.-1748-1751delGAGA 87.2 86.4 83.9 61.12 88.1 80.0
1 84.2
1
DDX58 g.-219T>G 0.8 0.0 0.0 5.62
0.0 0.01
0.0
DDX58 g.-309G>A 51.82
36.4 25.8 30.0
47.6 34.6 43.6
DDX58 g.-293T>G 44.6 59.1 51.6 66.72
50.0 68.01 43.6
DDX58 g.-817G>A 17.81
22.7 38.7 22.22
19.0 40.01 7.9
1
DDX58 g.-194-195insGAGGG 17.4 22.7 38.7 20.0 19.0 38.5 10.3
DDX58 haplotype 1 17.6 19.01
38.7 22.22
18.11
40.01 7.9
1
DDX58 g.-86A>C 22.6 22.7 6.5 27.82
19.0 20.01
23.1
DDX58 g.-1309A>C 22.61
22.7 6.71 26.3
1 19.0 20.0
1 20.5
DDX58 haplotype 2 31.11
36.4 29.0 58.83 34.9
1 32.0
1 36.8
1
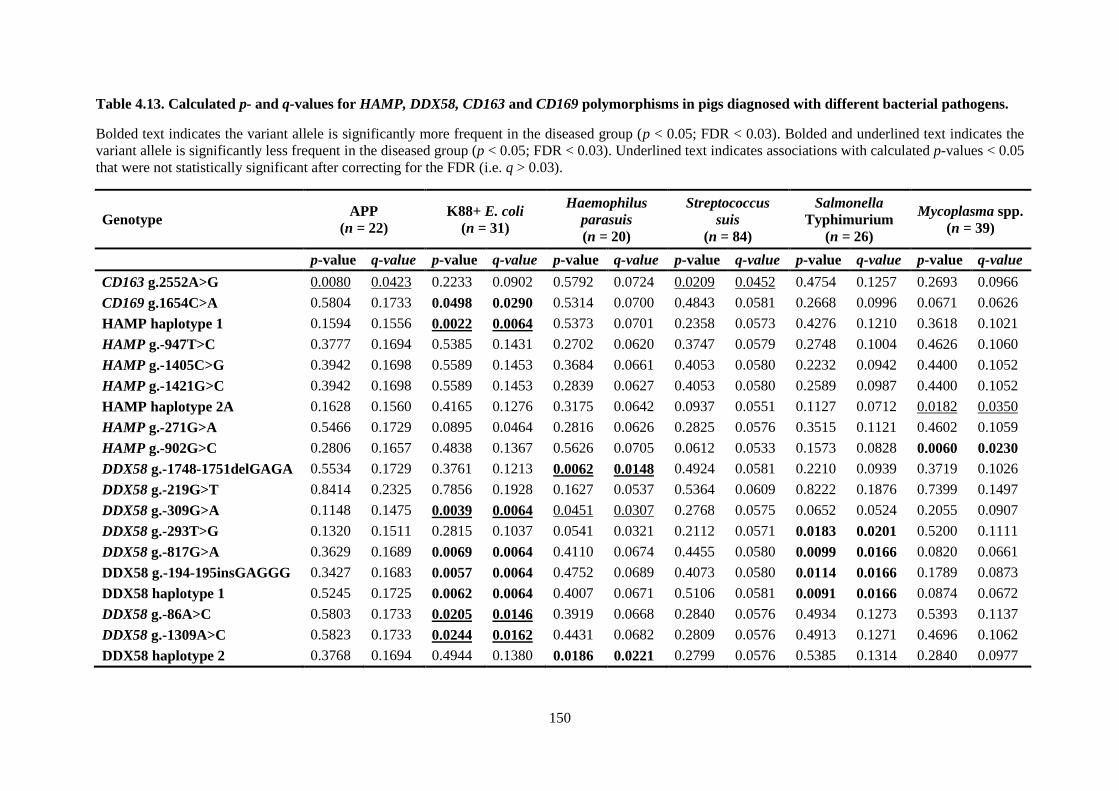
150
Table 4.13. Calculated p- and q-values for HAMP, DDX58, CD163 and CD169 polymorphisms in pigs diagnosed with different bacterial pathogens.
Bolded text indicates the variant allele is significantly more frequent in the diseased group (p < 0.05; FDR < 0.03). Bolded and underlined text indicates the
variant allele is significantly less frequent in the diseased group (p < 0.05; FDR < 0.03). Underlined text indicates associations with calculated p-values < 0.05
that were not statistically significant after correcting for the FDR (i.e. q > 0.03).
Genotype APP
(n = 22)
K88+ E. coli
(n = 31)
Haemophilus
parasuis
(n = 20)
Streptococcus
suis
(n = 84)
Salmonella
Typhimurium
(n = 26)
Mycoplasma spp.
(n = 39)
p-value q-value p-value q-value p-value q-value p-value q-value p-value q-value p-value q-value
CD163 g.2552A>G 0.0080
0.0423 0.2233 0.0902 0.5792 0.0724 0.0209 0.0452 0.4754 0.1257 0.2693 0.0966
CD169 g.1654C>A 0.5804 0.1733 0.0498 0.0290 0.5314 0.0700 0.4843 0.0581 0.2668 0.0996 0.0671 0.0626
HAMP haplotype 1 0.1594 0.1556 0.0022 0.0064 0.5373 0.0701 0.2358 0.0573 0.4276 0.1210 0.3618 0.1021
HAMP g.-947T>C 0.3777 0.1694 0.5385 0.1431 0.2702 0.0620 0.3747 0.0579 0.2748 0.1004 0.4626 0.1060
HAMP g.-1405C>G 0.3942 0.1698 0.5589 0.1453 0.3684 0.0661 0.4053 0.0580 0.2232 0.0942 0.4400 0.1052
HAMP g.-1421G>C 0.3942 0.1698 0.5589 0.1453 0.2839 0.0627 0.4053 0.0580 0.2589 0.0987 0.4400 0.1052
HAMP haplotype 2A 0.1628 0.1560 0.4165 0.1276 0.3175 0.0642 0.0937 0.0551 0.1127 0.0712 0.0182 0.0350
HAMP g.-271G>A 0.5466 0.1729 0.0895 0.0464 0.2816 0.0626 0.2825 0.0576 0.3515 0.1121 0.4602 0.1059
HAMP g.-902G>C 0.2806 0.1657 0.4838 0.1367 0.5626 0.0705 0.0612 0.0533 0.1573 0.0828 0.0060 0.0230
DDX58 g.-1748-1751delGAGA 0.5534 0.1729 0.3761 0.1213 0.0062 0.0148 0.4924 0.0581 0.2210 0.0939 0.3719 0.1026
DDX58 g.-219G>T 0.8414 0.2325 0.7856 0.1928 0.1627 0.0537 0.5364 0.0609 0.8222 0.1876 0.7399 0.1497
DDX58 g.-309G>A 0.1148 0.1475 0.0039 0.0064 0.0451 0.0307 0.2768 0.0575 0.0652 0.0524 0.2055 0.0907
DDX58 g.-293T>G 0.1320 0.1511 0.2815 0.1037 0.0541 0.0321 0.2112 0.0571 0.0183 0.0201 0.5200 0.1111
DDX58 g.-817G>A 0.3629 0.1689 0.0069 0.0064 0.4110 0.0674 0.4455 0.0580 0.0099 0.0166 0.0820 0.0661
DDX58 g.-194-195insGAGGG 0.3427 0.1683 0.0057 0.0064 0.4752 0.0689 0.4073 0.0580 0.0114 0.0166 0.1789 0.0873
DDX58 haplotype 1 0.5245 0.1725 0.0062 0.0064 0.4007 0.0671 0.5106 0.0581 0.0091 0.0166 0.0874 0.0672
DDX58 g.-86A>C 0.5803 0.1733 0.0205 0.0146 0.3919 0.0668 0.2840 0.0576 0.4934 0.1273 0.5393 0.1137
DDX58 g.-1309A>C 0.5823 0.1733 0.0244 0.0162 0.4431 0.0682 0.2809 0.0576 0.4913 0.1271 0.4696 0.1062
DDX58 haplotype 2 0.3768 0.1694 0.4944 0.1380 0.0186 0.0221 0.2799 0.0576 0.5385 0.1314 0.2840 0.0977
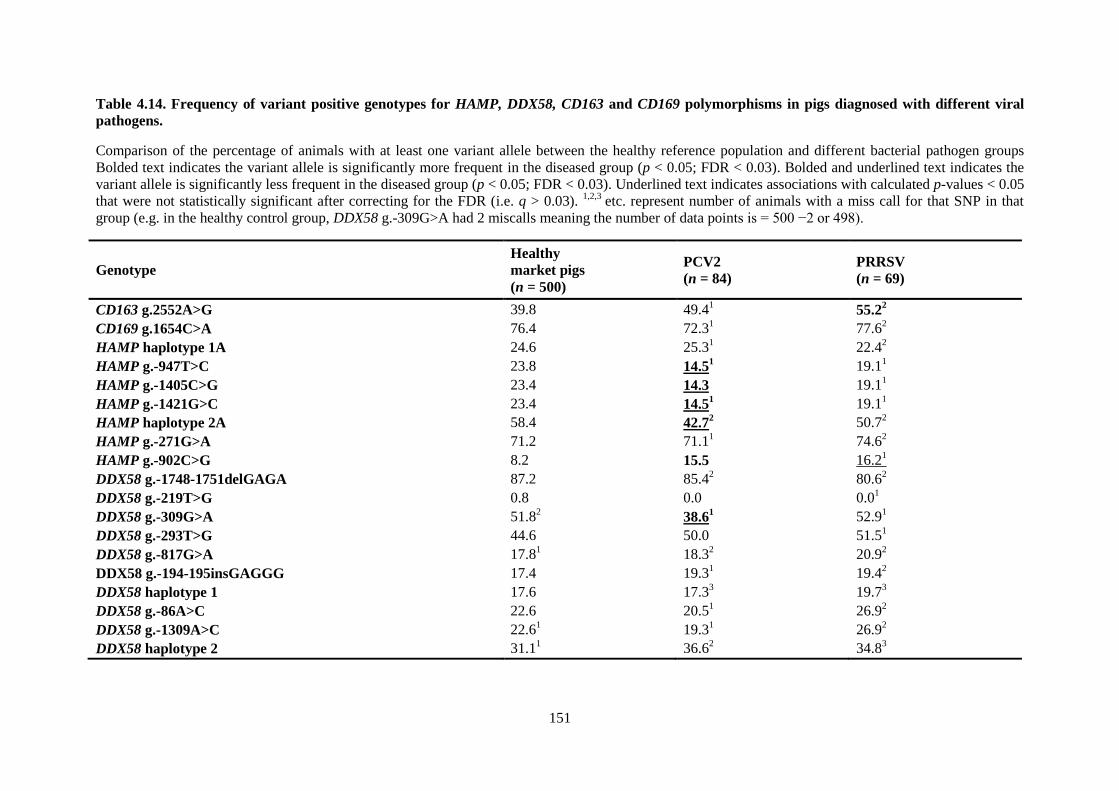
151
Table 4.14. Frequency of variant positive genotypes for HAMP, DDX58, CD163 and CD169 polymorphisms in pigs diagnosed with different viral
pathogens.
Comparison of the percentage of animals with at least one variant allele between the healthy reference population and different bacterial pathogen groups
Bolded text indicates the variant allele is significantly more frequent in the diseased group (p < 0.05; FDR < 0.03). Bolded and underlined text indicates the
variant allele is significantly less frequent in the diseased group (p < 0.05; FDR < 0.03). Underlined text indicates associations with calculated p-values < 0.05
that were not statistically significant after correcting for the FDR (i.e. q > 0.03). 1,2,3
etc. represent number of animals with a miss call for that SNP in that
group (e.g. in the healthy control group, DDX58 g.-309G>A had 2 miscalls meaning the number of data points is = 500 −2 or 498).
Genotype
Healthy
market pigs
(n = 500)
PCV2
(n = 84)
PRRSV
(n = 69)
CD163 g.2552A>G 39.8 49.41
55.22
CD169 g.1654C>A 76.4 72.31
77.62
HAMP haplotype 1A 24.6 25.31
22.42
HAMP g.-947T>C 23.8 14.51 19.1
1
HAMP g.-1405C>G 23.4 14.3 19.11
HAMP g.-1421G>C 23.4 14.51 19.1
1
HAMP haplotype 2A 58.4 42.72 50.7
2
HAMP g.-271G>A 71.2 71.11
74.62
HAMP g.-902C>G 8.2 15.5 16.21
DDX58 g.-1748-1751delGAGA 87.2 85.42
80.62
DDX58 g.-219T>G 0.8 0.0 0.01
DDX58 g.-309G>A 51.82
38.61 52.9
1
DDX58 g.-293T>G 44.6 50.0 51.51
DDX58 g.-817G>A 17.81
18.32
20.92
DDX58 g.-194-195insGAGGG 17.4 19.31
19.42
DDX58 haplotype 1 17.6 17.33
19.73
DDX58 g.-86A>C 22.6 20.51
26.92
DDX58 g.-1309A>C 22.61
19.31
26.92
DDX58 haplotype 2 31.11
36.62
34.83
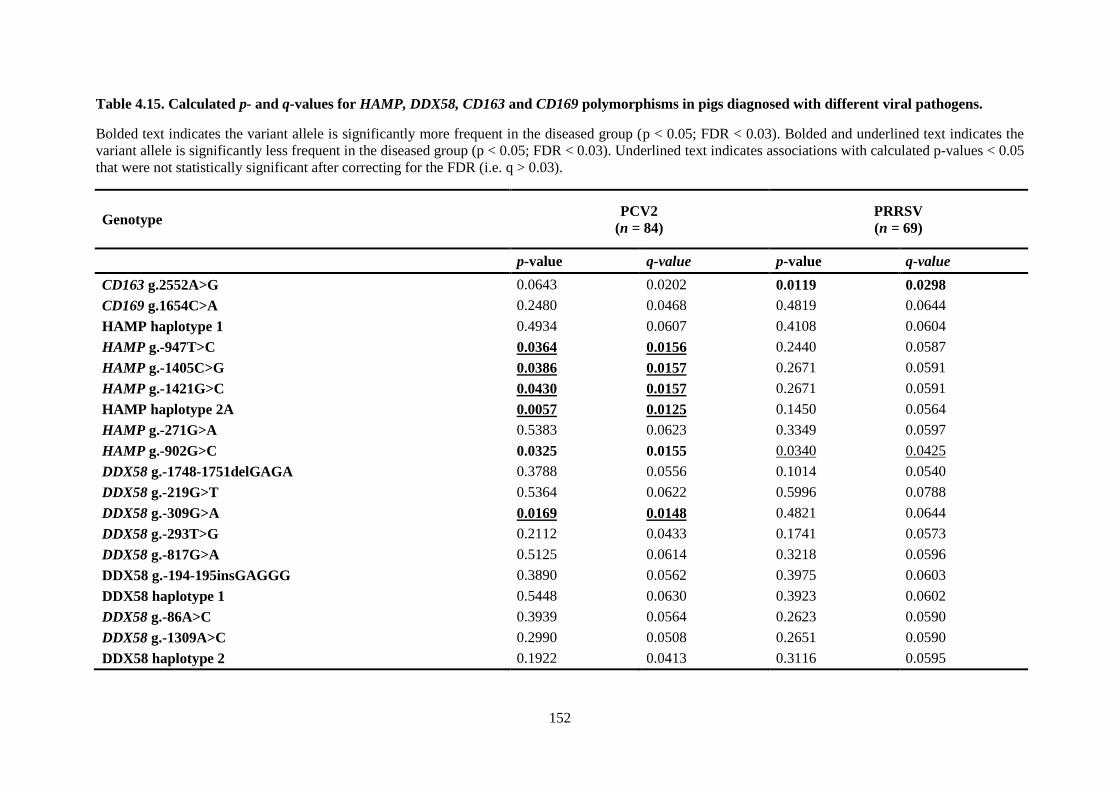
152
Table 4.15. Calculated p- and q-values for HAMP, DDX58, CD163 and CD169 polymorphisms in pigs diagnosed with different viral pathogens.
Bolded text indicates the variant allele is significantly more frequent in the diseased group (p < 0.05; FDR < 0.03). Bolded and underlined text indicates the
variant allele is significantly less frequent in the diseased group (p < 0.05; FDR < 0.03). Underlined text indicates associations with calculated p-values < 0.05
that were not statistically significant after correcting for the FDR (i.e. q > 0.03).
Genotype PCV2
(n = 84)
PRRSV
(n = 69)
p-value q-value p-value q-value
CD163 g.2552A>G 0.0643 0.0202 0.0119 0.0298
CD169 g.1654C>A 0.2480 0.0468 0.4819 0.0644
HAMP haplotype 1 0.4934 0.0607 0.4108 0.0604
HAMP g.-947T>C 0.0364 0.0156 0.2440 0.0587
HAMP g.-1405C>G 0.0386 0.0157 0.2671 0.0591
HAMP g.-1421G>C 0.0430 0.0157 0.2671 0.0591
HAMP haplotype 2A 0.0057 0.0125 0.1450 0.0564
HAMP g.-271G>A 0.5383 0.0623 0.3349 0.0597
HAMP g.-902G>C 0.0325 0.0155 0.0340 0.0425
DDX58 g.-1748-1751delGAGA 0.3788 0.0556 0.1014 0.0540
DDX58 g.-219G>T 0.5364 0.0622 0.5996 0.0788
DDX58 g.-309G>A 0.0169 0.0148 0.4821 0.0644
DDX58 g.-293T>G 0.2112 0.0433 0.1741 0.0573
DDX58 g.-817G>A 0.5125 0.0614 0.3218 0.0596
DDX58 g.-194-195insGAGGG 0.3890 0.0562 0.3975 0.0603
DDX58 haplotype 1 0.5448 0.0630 0.3923 0.0602
DDX58 g.-86A>C 0.3939 0.0564 0.2623 0.0590
DDX58 g.-1309A>C 0.2990 0.0508 0.2651 0.0590
DDX58 haplotype 2 0.1922 0.0413 0.3116 0.0595
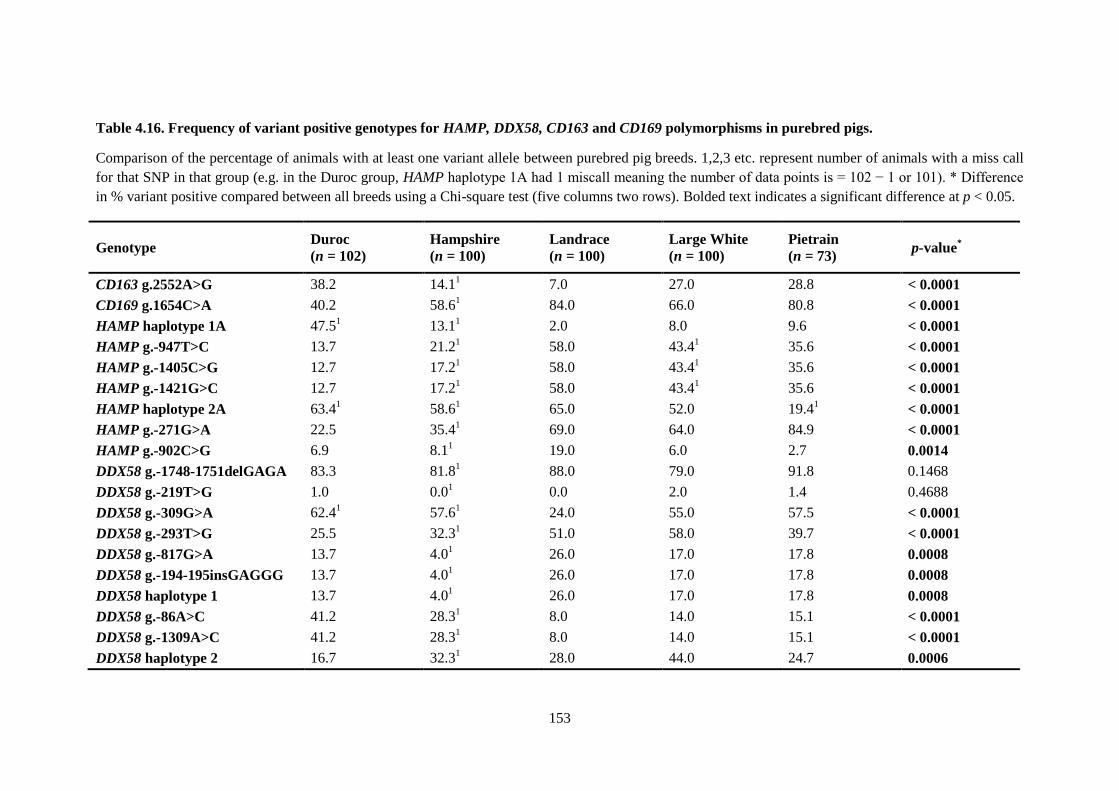
153
Table 4.16. Frequency of variant positive genotypes for HAMP, DDX58, CD163 and CD169 polymorphisms in purebred pigs.
Comparison of the percentage of animals with at least one variant allele between purebred pig breeds. 1,2,3 etc. represent number of animals with a miss call
for that SNP in that group (e.g. in the Duroc group, HAMP haplotype 1A had 1 miscall meaning the number of data points is = 102 − 1 or 101). * Difference
in % variant positive compared between all breeds using a Chi-square test (five columns two rows). Bolded text indicates a significant difference at p < 0.05.
Genotype Duroc
(n = 102)
Hampshire
(n = 100)
Landrace
(n = 100)
Large White
(n = 100)
Pietrain
(n = 73) p-value
*
CD163 g.2552A>G 38.2 14.11 7.0 27.0 28.8 < 0.0001
CD169 g.1654C>A 40.2 58.61 84.0 66.0 80.8 < 0.0001
HAMP haplotype 1A 47.51 13.1
1 2.0 8.0 9.6 < 0.0001
HAMP g.-947T>C 13.7 21.21 58.0 43.4
1 35.6 < 0.0001
HAMP g.-1405C>G 12.7 17.21 58.0 43.4
1 35.6 < 0.0001
HAMP g.-1421G>C 12.7 17.21 58.0 43.4
1 35.6 < 0.0001
HAMP haplotype 2A 63.41 58.6
1 65.0 52.0 19.4
1 < 0.0001
HAMP g.-271G>A 22.5 35.41 69.0 64.0 84.9 < 0.0001
HAMP g.-902C>G 6.9 8.11 19.0 6.0 2.7 0.0014
DDX58 g.-1748-1751delGAGA 83.3 81.81 88.0 79.0 91.8 0.1468
DDX58 g.-219T>G 1.0 0.01 0.0 2.0 1.4 0.4688
DDX58 g.-309G>A 62.41 57.6
1 24.0 55.0 57.5 < 0.0001
DDX58 g.-293T>G 25.5 32.31 51.0 58.0 39.7 < 0.0001
DDX58 g.-817G>A 13.7 4.01 26.0 17.0 17.8 0.0008
DDX58 g.-194-195insGAGGG 13.7 4.01 26.0 17.0 17.8 0.0008
DDX58 haplotype 1 13.7 4.01 26.0 17.0 17.8 0.0008
DDX58 g.-86A>C 41.2 28.31 8.0 14.0 15.1 < 0.0001
DDX58 g.-1309A>C 41.2 28.31 8.0 14.0 15.1 < 0.0001
DDX58 haplotype 2 16.7 32.31 28.0 44.0 24.7 0.0006
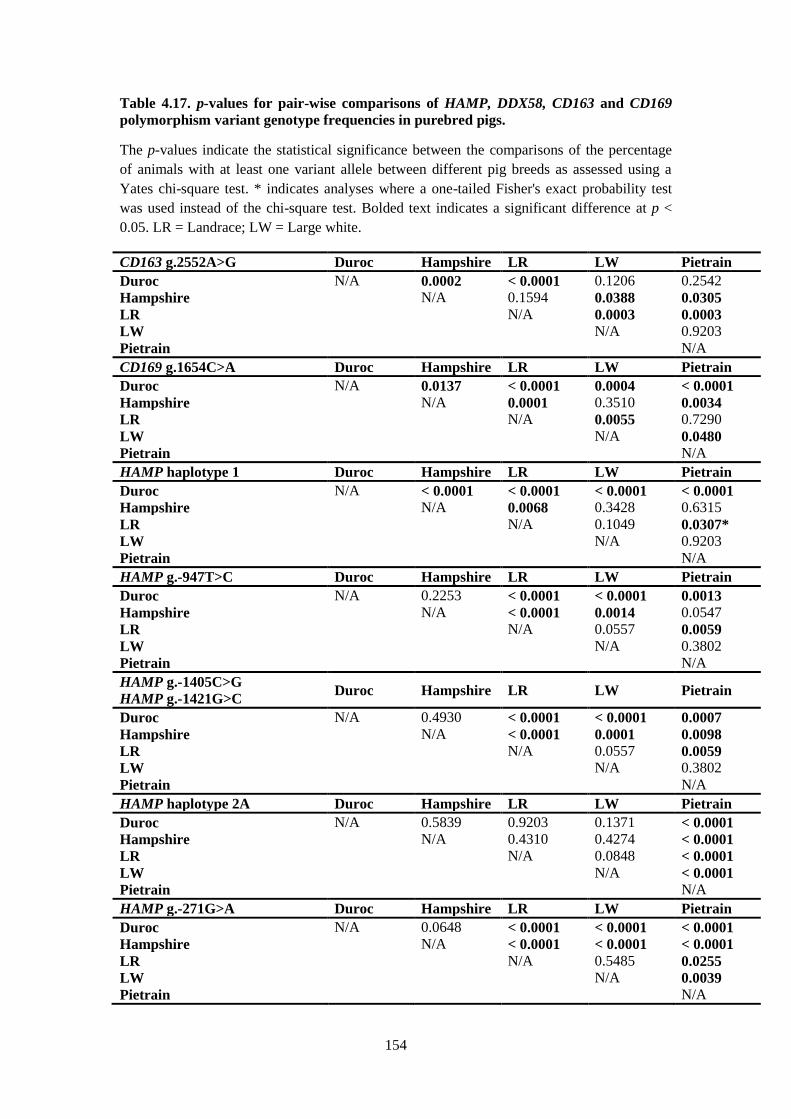
154
Table 4.17. p-values for pair-wise comparisons of HAMP, DDX58, CD163 and CD169
polymorphism variant genotype frequencies in purebred pigs.
The p-values indicate the statistical significance between the comparisons of the percentage
of animals with at least one variant allele between different pig breeds as assessed using a
Yates chi-square test. * indicates analyses where a one-tailed Fisher's exact probability test
was used instead of the chi-square test. Bolded text indicates a significant difference at p <
0.05. LR = Landrace; LW = Large white.
CD163 g.2552A>G Duroc Hampshire LR LW Pietrain
Duroc N/A 0.0002 < 0.0001 0.1206 0.2542
Hampshire N/A 0.1594 0.0388 0.0305
LR N/A 0.0003 0.0003
LW N/A 0.9203
Pietrain N/A
CD169 g.1654C>A Duroc Hampshire LR LW Pietrain
Duroc N/A 0.0137 < 0.0001 0.0004 < 0.0001
Hampshire N/A 0.0001 0.3510 0.0034
LR N/A 0.0055 0.7290
LW N/A 0.0480
Pietrain N/A
HAMP haplotype 1 Duroc Hampshire LR LW Pietrain
Duroc N/A < 0.0001 < 0.0001 < 0.0001 < 0.0001
Hampshire N/A 0.0068 0.3428 0.6315
LR N/A 0.1049 0.0307*
LW N/A 0.9203
Pietrain N/A
HAMP g.-947T>C Duroc Hampshire LR LW Pietrain
Duroc N/A 0.2253 < 0.0001 < 0.0001 0.0013
Hampshire N/A < 0.0001 0.0014 0.0547
LR N/A 0.0557 0.0059
LW N/A 0.3802
Pietrain N/A
HAMP g.-1405C>G
HAMP g.-1421G>C Duroc Hampshire LR LW Pietrain
Duroc N/A 0.4930 < 0.0001 < 0.0001 0.0007
Hampshire N/A < 0.0001 0.0001 0.0098
LR N/A 0.0557 0.0059
LW N/A 0.3802
Pietrain N/A
HAMP haplotype 2A Duroc Hampshire LR LW Pietrain
Duroc N/A 0.5839 0.9203 0.1371 < 0.0001
Hampshire N/A 0.4310 0.4274 < 0.0001
LR N/A 0.0848 < 0.0001
LW N/A < 0.0001
Pietrain N/A
HAMP g.-271G>A Duroc Hampshire LR LW Pietrain
Duroc N/A 0.0648 < 0.0001 < 0.0001 < 0.0001
Hampshire N/A < 0.0001 < 0.0001 < 0.0001
LR N/A 0.5485 0.0255
LW N/A 0.0039
Pietrain N/A
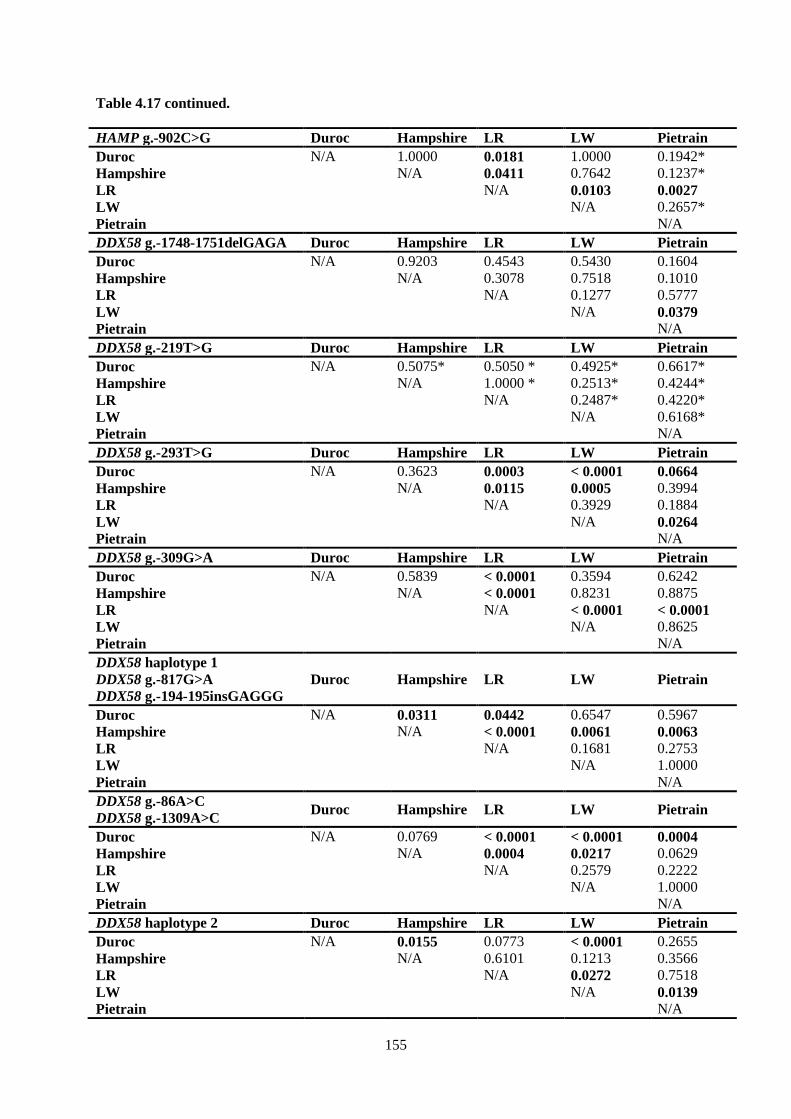
155
Table 4.17 continued.
HAMP g.-902C>G Duroc Hampshire LR LW Pietrain
Duroc N/A 1.0000 0.0181 1.0000 0.1942*
Hampshire N/A 0.0411 0.7642 0.1237*
LR N/A 0.0103 0.0027
LW N/A 0.2657*
Pietrain N/A
DDX58 g.-1748-1751delGAGA Duroc Hampshire LR LW Pietrain
Duroc N/A 0.9203 0.4543 0.5430 0.1604
Hampshire N/A 0.3078 0.7518 0.1010
LR N/A 0.1277 0.5777
LW N/A 0.0379
Pietrain N/A
DDX58 g.-219T>G Duroc Hampshire LR LW Pietrain
Duroc N/A 0.5075* 0.5050 * 0.4925* 0.6617*
Hampshire N/A 1.0000 * 0.2513* 0.4244*
LR N/A 0.2487* 0.4220*
LW N/A 0.6168*
Pietrain N/A
DDX58 g.-293T>G Duroc Hampshire LR LW Pietrain
Duroc N/A 0.3623 0.0003 < 0.0001 0.0664
Hampshire N/A 0.0115 0.0005 0.3994
LR N/A 0.3929 0.1884
LW N/A 0.0264
Pietrain N/A
DDX58 g.-309G>A Duroc Hampshire LR LW Pietrain
Duroc N/A 0.5839 < 0.0001 0.3594 0.6242
Hampshire N/A < 0.0001 0.8231 0.8875
LR N/A < 0.0001 < 0.0001
LW N/A 0.8625
Pietrain N/A
DDX58 haplotype 1
DDX58 g.-817G>A
DDX58 g.-194-195insGAGGG
Duroc Hampshire LR LW Pietrain
Duroc N/A 0.0311 0.0442 0.6547 0.5967
Hampshire N/A < 0.0001 0.0061 0.0063
LR N/A 0.1681 0.2753
LW N/A 1.0000
Pietrain N/A
DDX58 g.-86A>C
DDX58 g.-1309A>C Duroc Hampshire LR LW Pietrain
Duroc N/A 0.0769 < 0.0001 < 0.0001 0.0004
Hampshire N/A 0.0004 0.0217 0.0629
LR N/A 0.2579 0.2222
LW N/A 1.0000
Pietrain N/A
DDX58 haplotype 2 Duroc Hampshire LR LW Pietrain
Duroc N/A 0.0155 0.0773 < 0.0001 0.2655
Hampshire N/A 0.6101 0.1213 0.3566
LR N/A 0.0272 0.7518
LW N/A 0.0139
Pietrain N/A
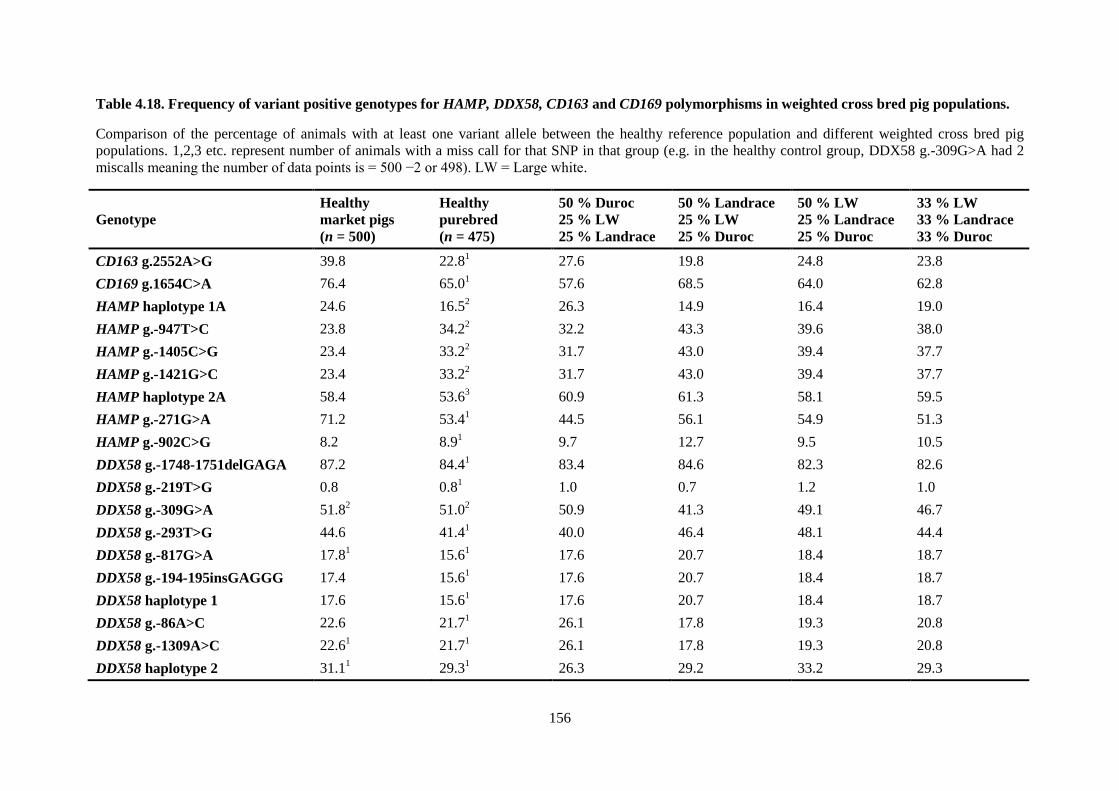
156
Table 4.18. Frequency of variant positive genotypes for HAMP, DDX58, CD163 and CD169 polymorphisms in weighted cross bred pig populations.
Comparison of the percentage of animals with at least one variant allele between the healthy reference population and different weighted cross bred pig
populations. 1,2,3 etc. represent number of animals with a miss call for that SNP in that group (e.g. in the healthy control group, DDX58 g.-309G>A had 2
miscalls meaning the number of data points is = 500 −2 or 498). LW = Large white.
Genotype
Healthy
market pigs
(n = 500)
Healthy
purebred
(n = 475)
50 % Duroc
25 % LW
25 % Landrace
50 % Landrace
25 % LW
25 % Duroc
50 % LW
25 % Landrace
25 % Duroc
33 % LW
33 % Landrace
33 % Duroc
CD163 g.2552A>G 39.8 22.81
27.6 19.8 24.8 23.8
CD169 g.1654C>A 76.4 65.01
57.6 68.5 64.0 62.8
HAMP haplotype 1A 24.6 16.52
26.3 14.9 16.4 19.0
HAMP g.-947T>C 23.8 34.22
32.2 43.3 39.6 38.0
HAMP g.-1405C>G 23.4 33.22
31.7 43.0 39.4 37.7
HAMP g.-1421G>C 23.4 33.22
31.7 43.0 39.4 37.7
HAMP haplotype 2A 58.4 53.63
60.9 61.3 58.1 59.5
HAMP g.-271G>A 71.2 53.41
44.5 56.1 54.9 51.3
HAMP g.-902C>G 8.2 8.91
9.7 12.7 9.5 10.5
DDX58 g.-1748-1751delGAGA 87.2 84.41
83.4 84.6 82.3 82.6
DDX58 g.-219T>G 0.8 0.81
1.0 0.7 1.2 1.0
DDX58 g.-309G>A 51.82
51.02
50.9 41.3 49.1 46.7
DDX58 g.-293T>G 44.6 41.41
40.0 46.4 48.1 44.4
DDX58 g.-817G>A 17.81
15.61
17.6 20.7 18.4 18.7
DDX58 g.-194-195insGAGGG 17.4 15.61
17.6 20.7 18.4 18.7
DDX58 haplotype 1 17.6 15.61
17.6 20.7 18.4 18.7
DDX58 g.-86A>C 22.6 21.71
26.1 17.8 19.3 20.8
DDX58 g.-1309A>C 22.61
21.71
26.1 17.8 19.3 20.8
DDX58 haplotype 2 31.11
29.31
26.3 29.2 33.2 29.3
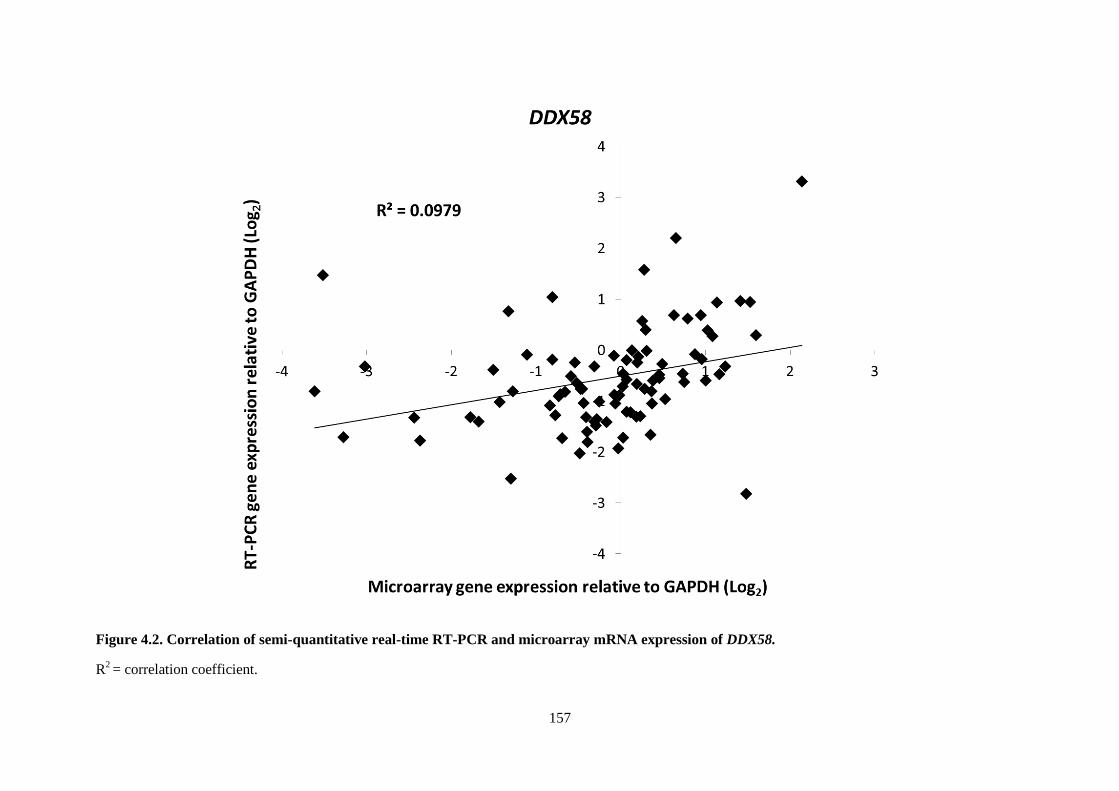
157
Figure 4.2. Correlation of semi-quantitative real-time RT-PCR and microarray mRNA expression of DDX58.
R2 = correlation coefficient.
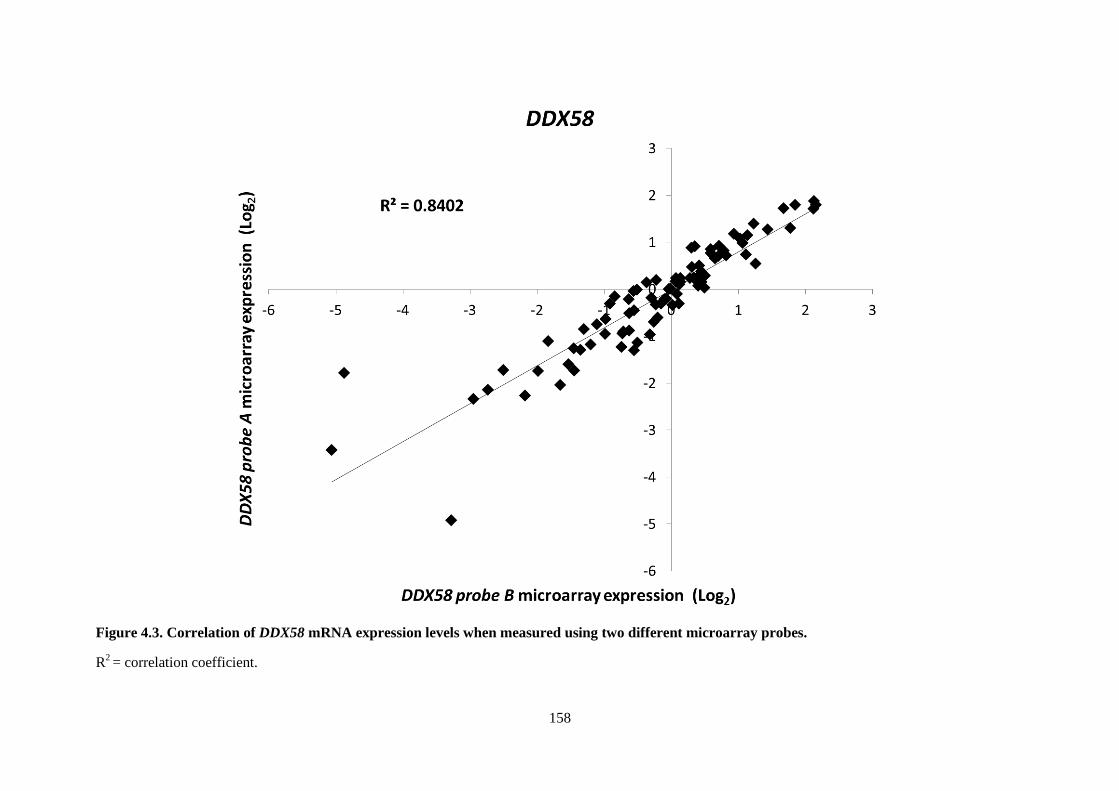
158
Figure 4.3. Correlation of DDX58 mRNA expression levels when measured using two different microarray probes.
R2 = correlation coefficient.
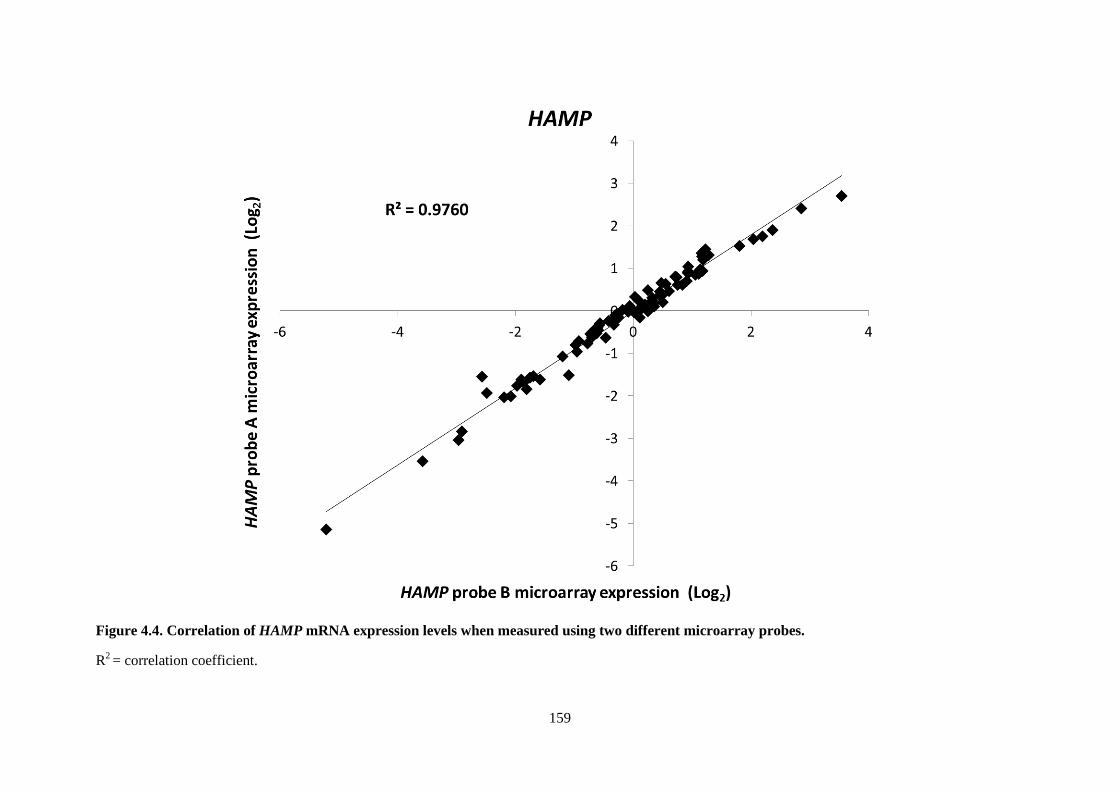
159
Figure 4.4. Correlation of HAMP mRNA expression levels when measured using two different microarray probes.
R2 = correlation coefficient.
160
DISCUSSION
In this study, we identified a large number of novel SNPs, insertions and deletions in the 5'-
promoter regions of the HAMP and DDX58 genes of healthy market weight pigs. These
polymorphisms were identified in a group of pigs that exhibited marked variation in mRNA
expression of these genes as measured by microarray (Chapter 2). Some HAMP SNPs (n = 3) were
more frequent in pigs with increased relative mRNA expression; others (n = 2) with decreased
relative hepatic expression. Additionally five polymorphic variants in DDX58 were more frequent in
pigs with decreased hepatic expression of DDX58 mRNA.
At present, little is known about the antimicrobial properties of hepcidin, the protein product
of the HAMP gene (Badial et al. 2011, Fry et al. 2004, Krause et al. 2000, Sang et al. 2006). HAMP
mRNA expression is increased during inflammation and some bacterial infections and, as a result,
hepcidin has been classified as a type II acute-phase protein (Hocquellet et al. 2012, Nemeth et al.
2003, Sang et al. 2006). A synthetic human peptide, Hepc25, has been shown to be active against both
Gram-positive and Gram-negative bacteria but, unlike other cationic AMPs, this antibacterial activity
is not dependent on disruption of the cell membrane and the exact mechanism remains unclear
(Hocquellet et al. 2012). In other studies, increased levels of hepcidin were linked to the inhibition of
iron absorption in the small intestine and the uptake of iron by tissue macrophages sequestering its
availability from bacterial pathogens (Nemeth et al. 2003). We found no evidence of inflammation,
clinical disease or an increase in acute phase mRNA expression in any of our healthy market weight
pigs, including the pigs with high levels of HAMP mRNA. This suggests that the mRNA variations
observed in our study were due to naturally-occurring differences in constitutive gene expression
rather than the changes in response to inflammation or disease.
A number of SNPs and deletions have been identified within both coding and non-coding
regions of the human HAMP gene and these polymorphisms have been linked to clinical iron overload
disorders (Matthes et al. 2004, Nemeth et al. 2006, Roetto and Camaschella 2005). Polymorphisms
have also been detected in the promoter region of the human gene but these variations did not affect
161
mRNA expression. Instead, they resulted in the generation of a new start codon (ATG) at position -25
(g.-25G>A) and the production of an abnormal protein. In contrast, some of the porcine SNPs
identified in our study were more frequent in pigs with either decreased or increased HAMP
expression, suggesting that these SNPs impact the transcriptional regulation of HAMP. These findings
pave the way for additional studies to better define the role of these SNPs in the regulation of HAMP
expression. As highlighted by the difficulties we encountered during the development of RT-PCR,
assays for the quantification of HAMP mRNA will need to be carefully designed to ensure they
quantify all known transcripts of the gene. Our results provide the rationale and baseline for further
development of these porcine-specific assays.
In this study the HAMP g.-902C>G SNP was one of the polymorphisms associated with
decreased microarray expression, although not statistically significantly so. This SNP was
significantly more frequent in the infectious and pneumonia disease groups with significant increases
also identified with Mycoplasma spp. and PCV2 pathogen groups. Mycoplasma spp. do not contain
bacterial cell membranes and, although there is no reported evidence of hepcidin antimycoplasmal
activity, some antimicrobial peptides have been shown to have inhibitory effects against this group of
pathogens (Nir-Paz et al. 2002). Additionally, as mentioned above, the antibacterial mechanism of
hepcidin appears to be independent of bacterial membrane disruption (Hocquellet et al. 2012). The
HAMP g.-902C>G SNP was also increased in frequency in the PRRSV group and trended towards
statistical significance; genotyping additional pigs may be useful in clarifying this association. In
contrast the variant HAMP haplotype 2A alleles were significantly lower in the infectious, pneumonia
and septicemia disease groups and significantly less frequent in the PCV2 pathogen group while the
three SNPs that were significantly associated with increased hepatic gene expression, HAMP g.-
947T>C, HAMP g.-1405C>G and HAMP g.-1421G>C were also significantly less frequent in the
PCV2 pathogen group. The reason for the associations observed between these polymorphisms in a
cationic antibacterial peptide and viral pathogens such as PCV2 and PRRSV is not directly evident
and the most likely explanation is that it may be linked to a functionally significant mutation
somewhere else, either on the same chromosome or within other genes of the porcine genome that
162
may play an important role in antiviral functions. Recent evidence has shown direct antiviral functions
of human hepcidin against hepatitis C virus (HCV) in cultured cells and supports the potential for
porcine hepcidin to exhibit similar antiviral activity against viral pathogens in pigs (Bartolomei et al.
2011, Liu et al. 2012). HAMP haplotype 1A was also approximately eight times less frequent in the
K88+ E. coli pathogen group suggesting a protective phenotype associated with this variant haplotype
combination. Although in this study the majority of pigs included in the K88+ E. coli pathogen group
were from unrelated farms (68 %; n = 21/31), care should be taken with this interpretation as some of
the diseased E. coli submissions may be from the same litter which may have underrepresented this
specific SNP haplotype. Larger numbers are needed to better assess the biological and clinical
significance of hepcidin expression and the role of promoter polymorphisms plays in such disease
susceptibility.
To our knowledge, this is the first study to detect polymorphisms in the promoter region of
DDX58. This gene, which is located on Sus scrofa chromosome 10 (Zhang et al. 2000), codes for
RIG-1, a pattern recognition receptor that is widely distributed in tissues including, but not limited to,
the kidney, liver, muscle, testis and thymus (Lech et al. 2010). Using microarray technology and DNA
sequencing, we identified 19 polymorphisms in the promoter region of DDX58, five of which were
more frequent in pigs with a decrease in constitutive gene expression with three of these being
statistically significant (DDX58 haplotype 2). Some of the five polymorphisms were also present in
pigs with higher levels of DDX58 mRNA, but at a reduced frequency relative to pigs with low levels
expression (Table 4.6 and 4.7).
In another recent study, Kojima-Shibata et al (2009) identified seventeen SNPs in the coding
region of the porcine DDX58 gene including six non-synonymous SNPs, four of which are proposed
to result in structural changes that may affected ligand binding and signalling via RIG-1 (Kojima-
Shibata et al. 2009). Numerous SNPs, including seven non-synonymous SNPs, have also been
described in coding regions of the human DDX58 gene. Based on biochemical and structural
modeling, two of these SNPs were flagged as having an adverse effect on RIG-1 binding and
signaling (Pothlichet et al. 2009). One of the variants was a frame shift mutation (P(229)fs) that
163
generated a truncated receptor that resulted in exaggerated signalling. The second resulted in a serine
to isoleucine (S(183)I) substitution that alters the structure of the second CARD domain of RIG-1 and
interferes with CARD-mediated antiviral signalling. Another study reported two additional amino
acid substitutions, T(55)I and K(172)R located in the first and second CARD domains, that have been
shown to have a detrimental effect on RIG-1/IPS-1 interactions (Gack et al. 2008). Other studies have
reported that RIG-1-/-
knockout mice are more susceptible to viral infections ((Kato et al. 2006). This
high degree of polymorphism within the DDX58 gene may suggest that variation may increase the
range of ligand recognition increasing the ability to recognise a large variety of pathogens and may
have evolved as a result of strong selective pressure. In contrast a high level of redundancy between
different innate immune factors may allow polymorphisms to accumulate as a result of genetic drift.
The central role that DDX58 plays in antiviral signalling and the adverse effects associated with
mutations and loss of this innate immune factor in knockout mouse studies would suggest that
redundancy and genetic drift is less likely (Kato et al. 2006, Pothlichet et al. 2009).
In this study, we identified five promoter polymorphisms that were more frequent in pigs with
a relative decrease in DDX58 mRNA expression. When interpreted in the context of the above studies,
it suggests that pigs with low level expression of DDX58 may be at increased risk of acquiring
PPRSV and other viral and infectious diseases and that selective breeding for pigs with higher levels
of DDX58/RIG-1 will result in improved resistance to these diseases. Of these five promoter variants,
significant disease associations were identified for all variants except the DDX58 g.-542C>T SNP for
which MALDI-TOF mass spectrometry SNP genotyping failed. The first of these, DDX58 g.-293T>G
SNP was significantly more frequent in the infectious, septicemia and S. Typhimurium groups while
DDX58 haplotype 2 was more frequent in individuals diagnosed with H. parasuis.
In this study additional associations were also identified in gene variants not associated with
altered constitutive hepatic gene expression. The DDX58 g.-309G>A was significantly less frequent
in the infectious, enteric and pneumonia disease groups as well as the K88+ E. coli and PCV2
pathogen groups. DDX58 g.-1748-1751delGAGA as well as the DDX58 g.-86A>C and DDX58 g.-
1309A>C variants were less frequent in the H. parasuis and K88+ E. coli pathogen group respectively
164
suggesting a protective phenotype. In contrast the DDX58 g.-817G>A, DDX58 g.-194-195insGAGGG
and DDX58 haplotype 1 were more frequent in both the K88+ E. coli and S. Typhimurium pathogen
groups. As mentioned for the HAMP promoter variants present at decreased frequencies in the E. coli
pathogen group, care should be taken in cases of artifactual over or under representation of the
DDX58 promoter variants in this group. Concomitant associations with other enteric pathogens such
as S. Typhimurium in the case of DDX58 g.-817G>A, DDX58 g.-194-195insGAGGG and DDX58
haplotype 1 however further supports the significance of these associations.
It is interesting to note that despite the critical role RIG-1 plays as an antiviral sensor across
species, only a single association between PCV2 (A allele of DDX58 g.-309G>A was significantly
less frequent in this disease group), and no associations with PRRSV were identified in the current
study. In pigs, RIG-1 is induced following infection with porcine reproductive and respiratory
syndrome virus (PRRSV) and this induction has been proposed to be essential for combating PRRSV
(Zhang et al. 2000). Other studies, however, have also reported an inhibitory effect of PRRSV
infection on RIG-1 signaling through inactivation of the IPS-1 adapter molecule (Luo et al. 2008, Zhu
et al. 2012). Although decreased constitutive production of RIG-1 in association with promoter
polymorphisms may further impair antiviral innate responses to PRRSV, independent inhibition of the
downstream adaptor IPS-1, as reported by Luo et al. and Zhu et al., perhaps plays a more significant
role regardless of the level of DDX58 expression.
Recently certain CD169 and CD163 SNP genotypes have been associated with PRRSV
resistance (Ren et al. 2012). CD169 g.1654C>A is a non-synonymous SNP resulting in a Leu552Ile
substitution and is situated in the region encoding the immunoglobulin C-2 type (IGc2) domain. This
domain is associated with the formation of a disulfide bond that may be critical for the native
conformation and stability of the protein and may impair the effective adhesion and subsequent
endocytosis of PRRSV (Ren et al. 2012). CD163 g.2552A>G, also a non-synonymous SNP that
results in a Lys851Arg substitution, in turn is situated in the region encoding the eighth scavenger
receptor domain of CD163 (Ren et al. 2012). This domain contains six conserved cysteine residues
that act as bacterial antigen binding sites; however it is unclear how these binding sites are proposed
165
to interact with PRRSV. In this study we assessed the frequencies of these identified SNPs in North
American pigs and looked to determine if similar associations with PRRSV existed in these pigs. The
CD163 g.2552A>G SNP was present in all North American pig breeds and the A allele was also
significantly associated with a decreased risk of PRRSV infection in North American pigs. The G
allele of this SNP was also more frequent in most disease groups and all remaining pathogen groups.
Infectious diseases in pigs are often caused by a variety of concomitant viral and bacterial infections
and this broad association with infectious diseases may indeed reflect this multifactorial nature. In
comparison the variant genotype frequency (A allele) of the CD169 g.1654C>A SNP did not vary
significantly between different breeds, disease groups and most pathogens and was only
approximately 1.2 times more frequent in the K88+ E. coli pathogen group. The exact reason for this
lack of association is not clear and perhaps genotyping larger populations of both healthy and diseased
pigs exposed to PRRSV may result in the identification of similar associations as observed in
commercial crossbred pigs in China.
To date, very few SNPs have been described in the genes coding for mammalian PGLYRPs.
A single non-synonymous SNP, C(419)A, has been reported in the coding region of human PGLYRP2
gene (Dziarski and Gupta 2010, Wang et al. 2003). The SNP, which involves the replacement of a
highly conserved cysteine with an alanine residue, disrupts the amidase activity of this PGRP (Wang
et al. 2003). No SNPs have been identified in 5'-promoter region of the bovine PGLYRP1 gene,
however two synonymous coding region SNPs [c.102G>C, c.480G>A] and a single 3'UTR SNP
[c.625C>A], were identified in the bovine PGLYRP1 gene (Pant et al. 2011). The c.480G>A SNP was
associated with a marginally increased risk in Mycobacterium avium (subsp. paratuberculosis)
infection. In the current study, no polymorphisms were detected in the 5'-upstream promoter regions
of the porcine PGLYRP1 and PGLYRP2 genes, despite significant variation in constitutive hepatic
expression. However, our sequencing studies were limited to include 1,332 and 787 bp of the 5'-
upstream promoter region of the PGLYRP1 and PGLYRP2 genes respectively. The remaining regions
of the 5'-UTRs as well as other non-coding and coding regions are still to be characterized and may
contain polymorphisms that alter the expression of these genes. It is also known that the pig genome
166
contains two splice variants of PGLYRP2 that may be regulated by different transcriptional control
mechanisms (Sang et al. 2005). The long isoform is predominantly expressed within the liver while
the short isoform is expressed in a variety of tissues including the bone marrow, intestine, spleen, and
kidney as well as the liver (Li et al. 2006, Sang et al. 2005). Alignment of our microarray probes with
sequences available in the Ensembl online genome browser indicated that one of the probes aligned
with both the long [ENSSSCT00000022764] and short [ENSSSCT00000023031] (Flicek et al. 2013)
isoforms of PGLYRP2, whereas the second probe aligned with only the long isoform. Thus,
differential expression of these transcript variants could also contribute to observed variation in
PGLYRP2 mRNA levels in different pigs. PGLYRP1 is abundantly expressed in polymorphonuclear
granulocytes and upon degranulation localize in neutrophil extracellular traps (NETs) where they play
an essential role in neutrophil-mediated bacterial killing (Cho et al. 2005, Dziarski and Gupta 2010,
Tydell et al. 2006). Thus, differences in the relative number of circulating granulocytes and in blood
flow to different lobes of the liver that may have been sampled might have contribute to observed
variations in PGLYRP1 mRNA levels in healthy pigs.
Although relatively large segments of the promoter regions of these four genes were
sequenced in this study and a large number of polymorphisms were identified for some of these genes,
further sequencing of the 5'-UTRs as well as other coding and non-coding regions of these genes may
result in the detection of additional disease-conferring polymorphisms that alter mRNA expression
and protein function. Increasing the sample size and screening additional pigs may also further expand
the identification of additional genetic markers and will be valuable to strengthen the observations of
this study. The continued refinement of RT-PCR assays will be needed to further validate the
observed associations with altered gene expression of both HAMP and DDX58 and to clarify
discrepancies noted for DDX58 expression. The genetic variations detected in HAMP and DDX58
may represent a valuable set of markers for assessing disease susceptibility in pigs and represents an
important step in developing a genetic selection panel that can be used to increase disease resistance
in the commercial swine population.
167
GENERAL DISCUSSION
The original objective of this research was to identify porcine innate immune genes with
substantially increased, or decreased, constitutive gene expression in healthy pigs. Further
investigation was then aimed at whether or not any observed changes in expression could be attributed
to underlying genetic variations within proposed regions of transcriptional regulation or control.
Finally disease- and breed-association studies were used to evaluate their potential impact on disease
resistance or susceptibility. The study was based on the premise that this information could become
useful in selective breeding of pigs with enhanced innate resistance to common infectious diseases
that have an adverse effect on commercial swine production.
The majority of porcine microarray studies to date have aimed at identify differentially
expressed genes following experimental or natural infection with a limited number of pathogens (Bao
et al. 2012, Fernandes et al. 2012, Gladue et al. 2010, Hedegaard et al. 2007, Lee et al. 2010, Li et al.
2010, Li et al. 2013, Ma et al. 2012, Mortensen et al. 2011, Moser et al. 2004, Moser et al. 2008,
Sanz-Santos et al. 2011, Skovgaard et al. 2010, Tomas et al. 2010, Wysocki et al. 2012, Zuo et al.
2013). Other studies have also evaluated differential expression patterns among different
physiological states (Jensen et al. 2012, Ostrup et al. 2010, Shu et al. 2012). The contribution of these
studies to our knowledge of the porcine transcriptome serve as a valuable resource however does not
provide insight on the constitutive expression of the genes of the innate immune system. A single
recent microarray experiment by Freeman et al. was the first to attempt to establish a porcine gene
expression atlas and evaluated the expression profiles of 62 different tissue/cell types (Freeman et al.
2012). This study was however limited to four pigs and does not address the potential of variation in
constitutive gene expression between individuals. Therefore, to my knowledge, this is the first study
to use whole genome microarray technology specifically focussed on measuring the constitutive
expression of innate immune genes in the liver of healthy pigs to identify innate immune genes that
exhibit marked variation in constitutive gene expression. This study is also unique in the fact that
similar focussed studies have not been performed in any other tissue or species.
168
A large number of genes proposed to play a role in innate immune defense exhibited widely
variable constitutive gene expression. One of the identified genes, MBL2, has previously been studied
and an association between two specific promoter polymorphisms, the MBL2 g.-1091G>A and MBL2
g.-261C>T SNPs, and reduced hepatic gene expression was identified (Lillie et al. 2007). Microarray
and genotyping analysis indicated that both of these polymorphisms were also associated with
decreased hepatic expression of MBL2 in this microarray study. The high degree of concordance
between these two studies supports my hypothesis that microarray technology in combination with
sequencing can be used to identify novel polymorphisms (SNPs, insertions, deletions) associated with
altered expression of innate immune genes. These initial proof-of-concept studies pave the way for
additional investigations aimed at identifying genetic mutations (SNPs, insertions, deletions) that are
responsible for the alterations observed in the expression of other variably expressed innate immune
genes identified in this study. An understanding of these defects is likely to prove valuable in the
development of improved strategies for the prevention and control of infectious disease. Applying
these same techniques in other immunologically important tissues may lead to the identification of
additional variably expressed innate immune genes that can be included in future investigations.
Additionally the opportunity exists to apply the same validated methods of this study, and perhaps our
microarray dataset as a starting point, to evaluate the constitutive gene expression of other groups or
sets of genes that may affect economically important traits. For example, such investigations could be
aimed at other tissues with a focus on genes involved in metabolism, fertility and/or other recognised
and important production characteristics. The continued refinement and especially improvement of
gene annotation of porcine specific microarray platforms will be essential for the success of such
future studies.
In chapter 3 and 4, I further expanded the investigations of some of these genes, SCGB1A1,
SFTPD, HAMP, DDX58, PGLYRP1 and PGLYRP2, that exhibited the widest variation in hepatic gene
expression when analyzed by microarray technology and for which no previous investigation had
been attempted. Further characterization of the promoter regions of these genes resulted in the
identification of a large number of novel polymorphisms, including single nucleotide polymorphisms,
insertions and deletions in the 5'-upstream promoter regions of SCGB1A1, SFTPD, HAMP and
169
DDX58; some of which were more prevalent in pigs with increased or decreased mRNA expression.
No polymorphisms were identified in the genes encoding PGLYRP1 and PGLYRP2 and other causes
for variation in expression of these genes should be sought.
A particularly interesting and unexpected finding of these investigations is that of a potential
second gene copy for the porcine SCGB1A1 gene and the association between this variant sequence
and increased hepatic SCGB1A1 expression. Hepatic expression of this gene could not be confirmed
in previous studies however the present study confirmed hepatic expression of this gene using both
microarray and RT-PCR techniques. A possible reason for these discrepancies with previous studies
may lie in the techniques used; with RT-PCR and microarray expression being regarded as more
sensitive techniques as compared to northern blot analysis (Gutierrez Sagal and Nieto 1998). Further
investigation is warranted, and the careful design of PCR assays able to discern between the two
distinct SCGB1A1 sequences may be helpful to further confirm the existence of two distinct
SCGB1A1 gene copies in the pig. Further evaluation of the biological and functional significance of
these two different SCBG1A1 sequences within the liver, lung and other tissues is necessary to further
understand the role this immunomodulatory protein may play within the porcine innate immune
system. In the present study the identified genetic variants were also associated with increased
constitutive hepatic gene expression. It remains to be determined whether or not a relative increase in
expression results in increased functional protein. Disease association studies of SCGB1A1 genotypes
could not be assessed with the other innate immune polymorphisms identified in this study and the
consequences of increased gene expression in light of inflammation and disease susceptibility or
resistance is still unknown.
Using MALDI-TOF mass spectrometry SNP genotyping I compared the variant genotype
frequencies for all characterized promoter polymorphisms, including those associated with variable
hepatic gene expression, between a population of healthy market weight pigs (n = 500) and pigs that
were submitted for autopsy evaluation and that have been diagnosed with a variety of disease
syndromes and pathogens (n = 386). A number of disease and pathogen group associations were
identified for a number of HAMP and DDX58 polymorphisms and are discussed in detail in Chapter 3
170
and 4. Except for the SFTPD SNPs, significant disease associations were identified for all
polymorphisms and polymorphic haplotypes that were more frequent in pigs with either increased or
decreased mRNA expression and that could be evaluated using MALDI-TOF genotyping.
Only three statistically significant associations were identified between specific
polymorphisms and increased (HAMP haplotype 4 and SFTPD g.-4509A>G) or decreased (DDX58
haplotype 2) constitutive gene expression respectively. Due to low sample numbers, the effect of the
identified polymorphisms on gene expression needs further clarification, especially in cases were only
heterozygous individuals or few homozygous variant individuals were identified. The identification of
significant disease associations for these polymorphisms does however suggest that these
polymorphisms may indeed significantly impact gene expression. Along with significant disease
associations, the relative scarcity of homozygous variant individuals may also point to a markedly
detrimental phenotype for some of these identified promoter polymorphisms including CD163
g.2552A>G; HAMP haplotype 1A; HAMP g.-947T>C; HAMP g.-1405C>G; HAMP g.-1421G>C;
HAMP haplotype 2A; HAMP g.-902C>G; DDX58 g.-219T>G; DDX58 g.-309G>A; DDX58 g.-
293T>G; DDX58 g.-817G>A; DDX58 g.-194-195insGAGGG; DDX58 haplotype 1; DDX58 g.-
86A>C; DDX58 g.-1309A>C; DDX58 haplotype 2 and SFTPD g.-4509A>G. It may be the case that
selective pressure may have resulted in the progressive elimination of such detrimental genotypes
from the population.
All three SFTPD promoter SNPs were found only in pigs with high relative SFTPD
expression with the SFTPD g.-4509A>G SNP being statistically significantly so. Because of the
established role this lectin plays in innate pulmonary defense (Haagsman et al. 2008, Hartl and Griese
2006), I originally hypothesized that increased expression of SFTPD would result in a beneficial
phenotype to infectious disease, especially with regard to pulmonary pathogens. In this study however
the variant G allele of SFTPD g.-4509A>G, although not statistically so, was increased two- to four-
fold in pigs diagnosed with pathogens playing a role in pulmonary disease, including Haemophilus
parasuis, Mycoplasma spp., PCV2 and PRRSV and a protective effect was therefore not observed. As
a result of tissue specific transcription factors such as NFAT and TTF-1 in the lung, the regulation of
171
expression of pulmonary and hepatic SFTPD may differ. Whether or not the identified
polymorphisms in this study would affect these specific transcription factor binding sites in the lung
will need further investigation. SP-D has been shown to have a regulatory role in pulmonary
inflammation and SFTPD-/-
mice challenged with intraperitoneal injection of lipopolysaccharide (LPS)
showed better survival rates than wild type mice (King and Kingma 2011). As an alternative it should
therefore also be considered that enhanced expression of SFTPD may in fact be detrimental and may
result in excessive inflammation and local tissue damage thereby increasing disease morbidity.
It is interesting to note that a number of HAMP SNPs, including those associated with
alterations in gene expression, had significant associations in the viral disease groups, an unexpected
finding for hepcidin as a cationic antimicrobial peptide (Krause et al. 2000). This may indicate the
existence of a linked functionally significant mutation somewhere else within antiviral components of
the innate immune genome. Interestingly human hepcidin has recently been shown to have direct
antiviral activity against hepatitis C virus (HCV) in infected cell cultures (Bartolomei et al. 2011, Liu
et al. 2012). Therefore the associations observed between specific HAMP SNPs and viral diseases in
this study may perhaps indicates a similar role for hepcidin in the defense against viral pathogens in
pigs. Alternatively it should also be considered that this may be the result of co-infection between
bacterial and viral pathogens, which is a common occurrence in many porcine disease syndromes.
Some discrepant results were also seen with identified DDX58 SNPs. RIG-1, the protein
product of this gene, is considered an essential component of the antiviral innate immune response
(Kato et al. 2006, Schlee et al. 2009, Wilkins and Gale 2010, Yoneyama et al. 2005). Despite this
critical role only a single statistically significant viral (PCV2) disease association was identified in
this study. This discrepancy may suggest an effective evasion mechanism inherent to the specific viral
pathogens tested. This does appear to be a possibility for PRRSV, which has been shown to have an
inhibitory effect on RIG-1 signaling by inactivation IPS-1, a downstream adapter molecule involved
in RIG-1 signaling (Luo et al. 2008, Zhu et al. 2012). Similar mechanisms have however not been
identified for PCV2. Increasing sample size and testing other viral pathogens in pigs may identify
additional associations.
172
Additionally in Chapter 4, genotype frequencies of two additional SNPs, within the genes
encoding for the CD163 and CD169 macrophage receptors, were also investigated. Both these
receptors act as essential PRRSV receptors and specific SNP genotypes have been associated with
PRRSV resistance in commercial pigs in China (Ren et al. 2012). These SNPs have not been
evaluated in the North American pig population. This study aimed to investigate if these SNPs also
existed within this population and if similar associations with PRRSV resistance could be identified in
North American pigs. As observed in Chinese pigs the G allele of CD163 g.2552A>G SNP was
significantly more frequent in pigs diagnosed with PRRSV however similar associations were not
identified for the A allele of CD169 g.1654C>A SNP. Increased sample size and carefully designed
infection trials may prove useful for further evaluation of these SNPs and the pathogenesis they play
in PRRSV resistance before they can be adopted into strategies to control PRRSV in commercial
herds, both in North America and elsewhere in the world.
In this study I focussed my search within the 5'-promoter region, upstream of the ATG start
codon, of these genes in an attempt to identify polymorphisms that may be situated within regions
important for the initiation or regulation of gene transcription. Although relatively large segments of
the promoter regions of these six genes were sequenced in this study, further sequencing of the 5'-
UTRs may result in the identification of additional polymorphisms affecting gene transcription.
Increasing the sample size and screening additional groups of diseased pigs may also further expand
the identification of other markers. Polymorphisms within regions other than the putative promoter
region have also been reported to affect expression levels of some innate immune genes, although the
exact mechanisms by which these polymorphisms affect gene transcription remain unknown (Juul-
Madsen et al. 2011, Lillie et al. 2006). Further sequencing of other coding and non-coding regions of
the innate immune genes in this study may result in the detection of such additional polymorphisms
that may affect gene transcription. Increasing sample size, especially through using DNA extracted
from formalin-fixed, paraffin embedded tissue sections may be beneficial in further evaluating
identified disease associations especially where pathogen sample sizes were low. The careful planning
of large prospective infection trials may also prove useful in determining the significance of identified
173
genetic markers. It is also imperative to evaluate these identified markers in conjunction with
important production characteristics. This will ensure that the selection of genotypes associated with
improved innate disease resistance also reflects in improved production.
In conclusion, the polymorphisms described in this thesis, together with previously identified
markers, and newly identified disease and expression variation associations form an important early
step in the development of a genetic selection strategy aimed at increasing innate disease resistance in
pigs. The ability to select for higher levels of innate disease resistance would result in increased
production, promote pig health and welfare and decrease the need for antimicrobial drugs in
commercial pig populations.
174
SUMMARY AND CONCLUSIONS
1. Using whole genome transcriptome analysis we found that the constitutive hepatic expression
of a number of innate immune genes varied quite widely in healthy market weight pigs. Thirty
innate immune genes (26.3 %, n = 114) exhibited a calculated gene expression ratio of > 10
when comparing mean gene expression values of either the top 50 % to the bottom 6 % of pigs
or the mean gene expression of the top 6 % of pigs compared to the bottom 50 % of pigs.
2. As expected MBL2 was one of the most variably expressed innate immune genes. Pigs that
were homozygous for the MBL2 g.-1091G>A SNP exhibited a statistically significant decrease
in MBL2 gene expression while pigs that were heterozygous for this SNP exhibited a less
profound decrease. This confirmation of previous RT-PCR findings for this promoter SNP
indicates that promoter polymorphisms that affect gene expression can be reliably revealed by
expression microarray surveys.
3. We designed a duplex RT-PCR assay for sex-genotyping pigs; targeting the Y-encoded, testis-
specific protein (TSPY) and mitochondrial cytochrome b (MT-CYB) genes. Comparison of RT-
PCR sex-typing results and microarray mRNA expression resulted in the identification of a
sexually dimorphic expressed innate immune gene; ATP-dependent DEAD (Asp-Glu-Ala-
Asp) box polypeptide 3, Y-linked gene (DDX3Y). This duplex RT-PCR assay, as well as
microarrays containing the DDX3Y gene, can be used for accurate sex-genotyping of pigs.
4. Three novel SNPs, SFTPD g.-4509A>G; SFTPD g.-4394G>A and SFTPD g.-4350C>T, were
identified in the 2682 bp of the 5'-promoter region, upstream of the putative exon 0 of SFTPD.
We successfully designed restriction fragment length polymorphism assays to genotype pigs
for these three identified SNPs using NspI, AciI and EcoNI as restriction enzyme
175
endonucleases and all three SNPs were found to be more frequent in pigs with increased
hepatic expression.
5. We identified a novel polymorphic sequence in the 5'-upstream promoter region of the porcine
SCGB1A1 gene. This sequence was nearly identical to a second annotated SCGB1A1 gene
within the Ensembl genome browser; reportedly located 44,396 bp upstream on the reverse
strand on Sus scrofa chromosome 2 [ENSSSCT00000014276]. Our preliminary data suggests
that this sequence, which contains a 334 bp insertion and numerous other polymorphisms,
represents a second unique SCGB1A1 gene copy that is associated with high levels of mRNA
expression.
6. Fourteen novel polymorphisms were identified in a 2441 bp segment of the 5'-upstream
promoter of the HAMP gene, including four transversion SNPs, nine transition SNPs and one
deletion. Two of the four variant haplotypes, HAMP haplotype 3 and HAMP haplotype 4, were
present at an increased frequency in pigs with low or high HAMP expression respectively. The
TC/CG/GC genotype of HAMP haplotype 4 was significantly associated with increased
hepatic expression of HAMP. Comparison of allele frequencies between diseased pigs
submitted for autopsy evaluation and healthy market weight cross bred pigs identified a
number of significant disease and pathogen associations for many of these polymorphisms.
7. Nineteen novel polymorphisms were identified in a 2364 bp segment of the 5'-upstream
promoter of the DDX58 gene, including four transversion SNPs, ten transition SNPs, three
deletions and two insertions. One of the three identified polymorphic haplotypes, DDX58
haplotype 2, as well as two SNPs, DDX58 g.-293T>G and DDX58 g.-542C>T, were found to
be more frequent in pigs with low DDX58 expression. DDX58 haplotype 2 was significantly
associated with decreased hepatic expression of this gene. Comparison of allele frequencies
176
between diseased pigs submitted for autopsy evaluation and healthy market weight cross bred
pigs identified a number of significant disease and pathogen associations for many of these
polymorphisms.
8. The CD163 g.2552A>G SNP, previously associated with resistance to PRRSV infection in
commercial Chinese pigs was present in all evaluated North American pig breeds and
populations and the A allele was associated with a decreased risk of PRRSV infection in North
American pigs. In comparison the variant genotype frequency (A allele) of the CD169
g.1654C>A SNP, also previously associated with resistance to PRRSV infection, did not vary
significantly between healthy pigs and pigs infected with PRRSV.
9. No SNPs, insertions or deletions were detected in the 5'-upstream promoter and first coding
exons of PGLYRP1 and PGLYRP2. Although the reason(s) is not known, variations in the
expression of these genes may be due to polymorphisms further upstream in the promoter
regions of these genes as well as the existence of two PGLYRP2 splice variants. In addition,
the main site of expression of PGLYRP1 is within polymorphonuclear granulocytes and
variation in the circulating granulocyte pool and differences in blood flow to different liver
lobes may have contributed to the observed variation of PGLYRP1 expression.
177
REFERENCES
Agah A, Montalto MC, Young K, Stahl GL (2001) Isolation, cloning and functional characterization
of porcine mannose-binding lectin. Immunology 102:338-343
Akira S, Uematsu S, Takeuchi O (2006) Pathogen recognition and innate immunity. Cell 124:783-801
Andersen CL, Jensen JL, Orntoft TF (2004) Normalization of real-time quantitative reverse
transcription-PCR data: a model-based variance estimation approach to identify genes suited for
normalization, applied to bladder and colon cancer data sets. Cancer Res 64:5245-5250
Arbour NC, Lorenz E, Schutte BC, Zabner J, Kline JN, Jones M, Frees K, Watt JL, Schwartz DA
(2000) TLR4 mutations are associated with endotoxin hyporesponsiveness in humans. Nat Genet
25:187-191
Arnoult D, Soares F, Tattoli I, Castanier C, Philpott DJ, Girardin SE (2009) An N-terminal addressing
sequence targets NLRX1 to the mitochondrial matrix. J Cell Sci 122:3161-3168
Arora M, Munoz E, Tenner AJ (2001) Identification of a site on mannan-binding lectin critical for
enhancement of phagocytosis. J Biol Chem 276:43087-43094
Auvynet C, Rosenstein Y (2009) Multifunctional host defense peptides: antimicrobial peptides, the
small yet big players in innate and adaptive immunity. FEBS J 276:6497-6508
Badial PR, Oliveira Filho JP, Cunha PH, Cagnini DQ, Araujo JP,Jr, Winand NJ, Borges AS (2011)
Identification, characterization and expression analysis of hepcidin gene in sheep. Res Vet Sci 90:443-
450
Bao WB, Ye L, Pan ZY, Zhu J, Du ZD, Zhu GQ, Huang XG, Wu SL (2012) Microarray analysis of
differential gene expression in sensitive and resistant pig to Escherichia coli F18. Anim Genet 43:525-
534
Bartel DP (2004) MicroRNAs: genomics, biogenesis, mechanism, and function. Cell 116:281-297
Barthe C, Hocquellet A, Garbay B (2011) Bacteriostatic activity of the proregion of human hepcidin.
Protein Pept Lett 18:36-40
Bartolomei G, Cevik RE, Marcello A (2011) Modulation of hepatitis C virus replication by iron and
hepcidin in Huh7 hepatocytes. J Gen Virol 92:2072-2081
Bauernfeind FG, Horvath G, Stutz A, Alnemri ES, MacDonald K, Speert D, Fernandes-Alnemri T,
Wu J, Monks BG, Fitzgerald KA, Hornung V, Latz E (2009) Cutting edge: NF-kappaB activating
pattern recognition and cytokine receptors license NLRP3 inflammasome activation by regulating
NLRP3 expression. J Immunol 183:787-791
Beier HM (1968) Uteroglobin: a hormone-sensitive endometrial protein involved in blastocyst
development. Biochim Biophys Acta 160:289-291
Ben-Ali M, Barbouche MR, Bousnina S, Chabbou A, Dellagi K (2004) Toll-like receptor 2
Arg677Trp polymorphism is associated with susceptibility to tuberculosis in Tunisian patients. Clin
Diagn Lab Immunol 11:625-626
178
Bergman IM, Edman K, Ekdahl KN, Rosengren KJ, Edfors I (2012) Extensive polymorphism in the
porcine Toll-like receptor 10 gene. Int J Immunogenet 39:68-76
Bergman IM, Rosengren JK, Edman K, Edfors I (2010) European wild boars and domestic pigs
display different polymorphic patterns in the Toll-like receptor (TLR) 1, TLR2, and TLR6 genes.
Immunogenetics 62:49-58
Bordet J, Streng O (1909) <br />Les phenomenes d’absorption du laconglutinine du serum de boeuf.
Zbl Bakteriol Parasitenk Infektionskr Hyg Abt I Orig:260-276
Botto M, Dell'Agnola C, Bygrave AE, Thompson EM, Cook HT, Petry F, Loos M, Pandolfi PP,
Walport MJ (1998) Homozygous C1q deficiency causes glomerulonephritis associated with multiple
apoptotic bodies. Nat Genet 19:56-59
Botto M, Fong KY, So AK, Koch C, Walport MJ (1990) Molecular basis of polymorphisms of human
complement component C3. J Exp Med 172:1011-1017
Brennan KM, Graugnard DE, Xiao R, Spry ML, Pierce JL, Lumpkins B, Mathis GF (2013)
Comparison of gene expression profiles of the jejunum of broilers supplemented with a yeast cell
wall-derived mannan oligosaccharide versus bacitractin methylene disalicylate. Br Poult Sci 54:238-
246
Brogden KA, Ackermann M, Huttner KM (1997) Small, anionic, and charge-neutralizing propeptide
fragments of zymogens are antimicrobial. Antimicrob Agents Chemother 41:1615-1617
Brooks AS, DeLay JP, Hayes MA (2003a) Purification and binding properties of porcine plasma
ficolin that binds Actinobacillus pleuropneumoniae. Dev Comp Immunol 27:835-844
Brooks AS, DeLay JP, Hayes MA (2003b) Characterization of porcine plasma ficolins that bind
Actinobacillus pleuropneumoniae serotype 5B. Immunobiology 207:327-337
Brooks AS, Hammermueller J, DeLay JP, Hayes MA (2003c) Expression and secretion of ficolin beta
by porcine neutrophils. Biochim Biophys Acta 1624:36-45
Callebaut I, Poupon A, Bally R, Demaret JP, Housset D, Delettre J, Hossenlopp P, Mornon JP (2000)
The uteroglobin fold. Ann N Y Acad Sci 923:90-112
Candelaria PV, Backer V, Laing IA, Porsbjerg C, Nepper-Christensen S, de Klerk N, Goldblatt J, Le
Souef PN (2005) Association between asthma-related phenotypes and the CC16 A38G polymorphism
in an unselected population of young adult Danes. Immunogenetics 57:25-32
Carninci P, Kasukawa T, Katayama S, Gough J, Frith MC, Maeda N, Oyama R, Ravasi T, Lenhard B,
Wells C, Kodzius R, Shimokawa K, Bajic VB, Brenner SE, Batalov S, Forrest AR, Zavolan M, Davis
MJ, Wilming LG, Aidinis V, Allen JE, Ambesi-Impiombato A, Apweiler R, Aturaliya RN, Bailey TL,
Bansal M, Baxter L, Beisel KW, Bersano T, Bono H, Chalk AM, Chiu KP, Choudhary V, Christoffels
A, Clutterbuck DR, Crowe ML, Dalla E, Dalrymple BP, de Bono B, Della Gatta G, di Bernardo D,
Down T, Engstrom P, Fagiolini M, Faulkner G, Fletcher CF, Fukushima T, Furuno M, Futaki S,
Gariboldi M, Georgii-Hemming P, Gingeras TR, Gojobori T, Green RE, Gustincich S, Harbers M,
Hayashi Y, Hensch TK, Hirokawa N, Hill D, Huminiecki L, Iacono M, Ikeo K, Iwama A, Ishikawa T,
Jakt M, Kanapin A, Katoh M, Kawasawa Y, Kelso J, Kitamura H, Kitano H, Kollias G, Krishnan SP,
Kruger A, Kummerfeld SK, Kurochkin IV, Lareau LF, Lazarevic D, Lipovich L, Liu J, Liuni S,
McWilliam S, Madan Babu M, Madera M, Marchionni L, Matsuda H, Matsuzawa S, Miki H,
Mignone F, Miyake S, Morris K, Mottagui-Tabar S, Mulder N, Nakano N, Nakauchi H, Ng P, Nilsson
179
R, Nishiguchi S, Nishikawa S, Nori F, Ohara O, Okazaki Y, Orlando V, Pang KC, Pavan WJ, Pavesi
G, Pesole G, Petrovsky N, Piazza S, Reed J, Reid JF, Ring BZ, Ringwald M, Rost B, Ruan Y,
Salzberg SL, Sandelin A, Schneider C, Schonbach C, Sekiguchi K, Semple CA, Seno S, Sessa L,
Sheng Y, Shibata Y, Shimada H, Shimada K, Silva D, Sinclair B, Sperling S, Stupka E, Sugiura K,
Sultana R, Takenaka Y, Taki K, Tammoja K, Tan SL, Tang S, Taylor MS, Tegner J, Teichmann SA,
Ueda HR, van Nimwegen E, Verardo R, Wei CL, Yagi K, Yamanishi H, Zabarovsky E, Zhu S,
Zimmer A, Hide W, Bult C, Grimmond SM, Teasdale RD, Liu ET, Brusic V, Quackenbush J,
Wahlestedt C, Mattick JS, Hume DA, Kai C, Sasaki D, Tomaru Y, Fukuda S, Kanamori-Katayama M,
Suzuki M, Aoki J, Arakawa T, Iida J, Imamura K, Itoh M, Kato T, Kawaji H, Kawagashira N,
Kawashima T, Kojima M, Kondo S, Konno H, Nakano K, Ninomiya N, Nishio T, Okada M, Plessy C,
Shibata K, Shiraki T, Suzuki S, Tagami M, Waki K, Watahiki A, Okamura-Oho Y, Suzuki H, Kawai
J, Hayashizaki Y, FANTOM Consortium, RIKEN Genome Exploration Research Group and Genome
Science Group (Genome Network Project Core Group) (2005) The transcriptional landscape of the
mammalian genome. Science 309:1559-1563
Casel P, Moreews F, Lagarrigue S, Klopp C (2009) sigReannot: an oligo-set re-annotation pipeline
based on similarities with the Ensembl transcripts and Unigene clusters. BMC Proc 3 Suppl 4:S3-
6561-3-S4-S3
Cassel SL, Eisenbarth SC, Iyer SS, Sadler JJ, Colegio OR, Tephly LA, Carter AB, Rothman PB,
Flavell RA, Sutterwala FS (2008) The Nalp3 inflammasome is essential for the development of
silicosis. Proc Natl Acad Sci U S A 105:9035-9040
Chen CB, Wallis R (2004) Two mechanisms for mannose-binding protein modulation of the activity
of its associated serine proteases. J Biol Chem 279:26058-26065
Cho JH, Fraser IP, Fukase K, Kusumoto S, Fujimoto Y, Stahl GL, Ezekowitz RA (2005) Human
peptidoglycan recognition protein S is an effector of neutrophil-mediated innate immunity. Blood
106:2551-2558
Choi M, Zhang Z, Ten Kate LP, Collee JM, Gerritsen J, Mukherjee AB (2000) Human uteroglobin
gene polymorphisms and genetic susceptibility to asthma. Ann N Y Acad Sci 923:303-306
Civitareale D, Lonigro R, Sinclair AJ, Di Lauro R (1989) A thyroid-specific nuclear protein essential
for tissue-specific expression of the thyroglobulin promoter. EMBO J 8:2537-2542
Clapperton M, Diack AB, Matika O, Glass EJ, Gladney CD, Mellencamp MA, Hoste A, Bishop SC
(2009) Traits associated with innate and adaptive immunity in pigs: heritability and associations with
performance under different health status conditions. Genet Sel Evol 41:54-9686-41-54
Coban C, Igari Y, Yagi M, Reimer T, Koyama S, Aoshi T, Ohata K, Tsukui T, Takeshita F, Sakurai
K, Ikegami T, Nakagawa A, Horii T, Nunez G, Ishii KJ, Akira S (2010) Immunogenicity of whole-
parasite vaccines against Plasmodium falciparum involves malarial hemozoin and host TLR9. Cell
Host Microbe 7:50-61
Coller J, Parker R (2004) Eukaryotic mRNA decapping. Annu Rev Biochem 73:861-890
Colley KJ, Baenziger JU (1987) Identification of the post-translational modifications of the core-
specific lectin. The core-specific lectin contains hydroxyproline, hydroxylysine, and
glucosylgalactosylhydroxylysine residues. J Biol Chem 262:10290-10295
180
Conesa A, Gotz S, Garcia-Gomez JM, Terol J, Talon M, Robles M (2005) Blast2GO: a universal tool
for annotation, visualization and analysis in functional genomics research. Bioinformatics 21:3674-
3676
Cote O, Lillie BN, Hayes MA, Clark ME, van den Bosch L, Katavolos P, Viel L, Bienzle D (2012)
Multiple secretoglobin 1A1 genes are differentially expressed in horses. BMC Genomics 13:712-
2164-13-712
Creuwels LA, van Golde LM, Haagsman HP (1997) The pulmonary surfactant system: biochemical
and clinical aspects. Lung 175:1-39
Crouch E, Rust K, Veile R, Donis-Keller H, Grosso L (1993) Genomic organization of human
surfactant protein D (SP-D). SP-D is encoded on chromosome 10q22.2-23.1. J Biol Chem 268:2976-
2983
Cui S, Eisenacher K, Kirchhofer A, Brzozka K, Lammens A, Lammens K, Fujita T, Conzelmann KK,
Krug A, Hopfner KP (2008) The C-terminal regulatory domain is the RNA 5'-triphosphate sensor of
RIG-I. Mol Cell 29:169-179
Dave V, Childs T, Whitsett JA (2004) Nuclear factor of activated T cells regulates transcription of the
surfactant protein D gene (Sftpd) via direct interaction with thyroid transcription factor-1 in lung
epithelial cells. J Biol Chem 279:34578-34588
De Baere MI, Van Gorp H, Delputte PL, Nauwynck HJ (2012) Interaction of the European genotype
porcine reproductive and respiratory syndrome virus (PRRSV) with sialoadhesin (CD169/Siglec-1)
inhibits alveolar macrophage phagocytosis. Vet Res 43:47-9716-43-47
de Bruijn MH, Fey GH (1985) Human complement component C3: cDNA coding sequence and
derived primary structure. Proc Natl Acad Sci U S A 82:708-712
de la Cruz X, Lee B (1996) The structural homology between uteroglobin and the pore-forming
domain of colicin A suggests a possible mechanism of action for uteroglobin. Protein Sci 5:857-861
De Lay J (1999) Biochemical characterization and bacterial binding functions of porcine ficolins.
Dissertation or Thesis
Delputte PL, Nauwynck HJ (2004) Porcine arterivirus infection of alveolar macrophages is mediated
by sialic acid on the virus. J Virol 78:8094-8101
den Dunnen JT, Antonarakis SE (2000) Mutation nomenclature extensions and suggestions to
describe complex mutations: a discussion. Hum Mutat 15:7-12
Deneke C, Lipowsky R, Valleriani A (2013) Complex degradation processes lead to non-exponential
decay patterns and age-dependent decay rates of messenger RNA. PLoS One 8:e55442
DiAngelo S, Lin Z, Wang G, Phillips S, Ramet M, Luo J, Floros J (1999) Novel, non-radioactive,
simple and multiplex PCR-cRFLP methods for genotyping human SP-A and SP-D marker alleles. Dis
Markers 15:269-281
Diepenhorst GM, van Gulik TM, Hack CE (2009) Complement-mediated ischemia-reperfusion
injury: lessons learned from animal and clinical studies. Ann Surg 249:889-899
181
Dobo J, Harmat V, Beinrohr L, Sebestyen E, Zavodszky P, Gal P (2009) MASP-1, a promiscuous
complement protease: structure of its catalytic region reveals the basis of its broad specificity. J
Immunol 183:1207-1214
Dostert C, Petrilli V, Van Bruggen R, Steele C, Mossman BT, Tschopp J (2008) Innate immune
activation through Nalp3 inflammasome sensing of asbestos and silica. Science 320:674-677
Du X, Poltorak A, Silva M, Beutler B (1999) Analysis of Tlr4-mediated LPS signal transduction in
macrophages by mutational modification of the receptor. Blood Cells Mol Dis 25:328-338
Du Z, Zhou X, Ling Y, Zhang Z, Su Z (2010) agriGO: a GO analysis toolkit for the agricultural
community. Nucleic Acids Res 38:W64-70
Dziarski R, Kashyap DR, Gupta D (2012) Mammalian peptidoglycan recognition proteins kill
bacteria by activating two-component systems and modulate microbiome and inflammation. Microb
Drug Resist 18:280-285
Dziarski R, Gupta D (2010) Review: Mammalian peptidoglycan recognition proteins (PGRPs) in
innate immunity. Innate Immun 16:168-174
Dziarski R, Platt KA, Gelius E, Steiner H, Gupta D (2003) Defect in neutrophil killing and increased
susceptibility to infection with nonpathogenic gram-positive bacteria in peptidoglycan recognition
protein-S (PGRP-S)-deficient mice. Blood 102:689-697
Eisen MB, Spellman PT, Brown PO, Botstein D (1998) Cluster analysis and display of genome-wide
expression patterns. Proc Natl Acad Sci U S A 95:14863-14868
Eisenbarth SC, Flavell RA (2009) Innate instruction of adaptive immunity revisited: the
inflammasome. EMBO Mol Med 1:92-98
Elola MT, Wolfenstein-Todel C, Troncoso MF, Vasta GR, Rabinovich GA (2007) Galectins:
matricellular glycan-binding proteins linking cell adhesion, migration, and survival. Cell Mol Life Sci
64:1679-1700
Endo Y, Matsushita M, Fujita T (2007) Role of ficolin in innate immunity and its molecular basis.
Immunobiology 212:371-379
Endo Y, Liu Y, Fujita T (2006) Structure and function of ficolins. Adv Exp Med Biol 586:265-279
Endo Y, Liu Y, Kanno K, Takahashi M, Matsushita M, Fujita T (2004) Identification of the mouse H-
ficolin gene as a pseudogene and orthology between mouse ficolins A/B and human L-/M-ficolins.
Genomics 84:737-744
Endo Y, Sato Y, Matsushita M, Fujita T (1996) Cloning and characterization of the human lectin P35
gene and its related gene. Genomics 36:515-521
Exley MA, Koziel MJ (2004) To be or not to be NKT: natural killer T cells in the liver. Hepatology
40:1033-1040
Feinberg H, Uitdehaag JC, Davies JM, Wallis R, Drickamer K, Weis WI (2003) Crystal structure of
the CUB1-EGF-CUB2 region of mannose-binding protein associated serine protease-2. EMBO J
22:2348-2359
182
Ferguson JS, Voelker DR, Ufnar JA, Dawson AJ, Schlesinger LS (2002) Surfactant protein D
inhibition of human macrophage uptake of Mycobacterium tuberculosis is independent of bacterial
agglutination. J Immunol 168:1309-1314
Fernandes LT, Tomas A, Bensaid A, Sibila M, Sanchez A, Segales J (2012) Microarray analysis of
mediastinal lymph node of pigs naturally affected by postweaning multisystemic wasting syndrome.
Virus Res 165:134-142
Fernandes-Alnemri T, Yu JW, Datta P, Wu J, Alnemri ES (2009) AIM2 activates the inflammasome
and cell death in response to cytoplasmic DNA. Nature 458:509-513
Fire A, Xu S, Montgomery MK, Kostas SA, Driver SE, Mello CC (1998) Potent and specific genetic
interference by double-stranded RNA in Caenorhabditis elegans. Nature 391:806-811
Flicek P, Ahmed I, Amode MR, Barrell D, Beal K, Brent S, Carvalho-Silva D, Clapham P, Coates G,
Fairley S, Fitzgerald S, Gil L, Garcia-Giron C, Gordon L, Hourlier T, Hunt S, Juettemann T, Kahari
AK, Keenan S, Komorowska M, Kulesha E, Longden I, Maurel T, McLaren WM, Muffato M, Nag R,
Overduin B, Pignatelli M, Pritchard B, Pritchard E, Riat HS, Ritchie GR, Ruffier M, Schuster M,
Sheppard D, Sobral D, Taylor K, Thormann A, Trevanion S, White S, Wilder SP, Aken BL, Birney E,
Cunningham F, Dunham I, Harrow J, Herrero J, Hubbard TJ, Johnson N, Kinsella R, Parker A,
Spudich G, Yates A, Zadissa A, Searle SM (2013) Ensembl 2013. Nucleic Acids Res 41:D48-55
Franchi L, Eigenbrod T, Nunez G (2009) Cutting edge: TNF-alpha mediates sensitization to ATP and
silica via the NLRP3 inflammasome in the absence of microbial stimulation. J Immunol 183:792-796
Freeman TC, Ivens A, Baillie JK, Beraldi D, Barnett MW, Dorward D, Downing A, Fairbairn L,
Kapetanovic R, Raza S, Tomoiu A, Alberio R, Wu C, Su AI, Summers KM, Tuggle CK, Archibald
AL, Hume DA (2012) A gene expression atlas of the domestic pig. BMC Biol 10:90-7007-10-90
Frerking I, Sengler C, Gunther A, Walmrath HD, Stevens P, Witt H, Landt O, Pison U, Nickel R
(2005) Evaluation of the -26G>A CC16 polymorphism in acute respiratory distress syndrome. Crit
Care Med 33:2404-2406
Fry MM, Liggett JL, Baek SJ (2004) Molecular cloning and expression of canine hepcidin. Vet Clin
Pathol 33:223-227
Fujita T, Matsushita M, Endo Y (2004b) The lectin-complement pathway--its role in innate immunity
and evolution. Immunol Rev 198:185-202
Fujita T, Endo Y, Nonaka M (2004a) Primitive complement system--recognition and activation. Mol
Immunol 41:103-111
Gabriel S, Ziaugra L, Tabbaa D (2009) SNP genotyping using the Sequenom MassARRAY iPLEX
platform. Curr Protoc Hum Genet Chapter 2:Unit 2.12
Gack MU, Kirchhofer A, Shin YC, Inn KS, Liang C, Cui S, Myong S, Ha T, Hopfner KP, Jung JU
(2008) Roles of RIG-I N-terminal tandem CARD and splice variant in TRIM25-mediated antiviral
signal transduction. Proc Natl Acad Sci U S A 105:16743-16748
Ganz T (2003) Defensins: antimicrobial peptides of innate immunity. Nat Rev Immunol 3:710-720
Ganz T, Selsted ME, Szklarek D, Harwig SS, Daher K, Bainton DF, Lehrer RI (1985) Defensins.
Natural peptide antibiotics of human neutrophils. J Clin Invest 76:1427-1435
183
Garbelli A, Beermann S, Di Cicco G, Dietrich U, Maga G (2011) A motif unique to the human
DEAD-box protein DDX3 is important for nucleic acid binding, ATP hydrolysis, RNA/DNA
unwinding and HIV-1 replication. PLoS One 6:e19810
Garred P, Larsen F, Seyfarth J, Fujita R, Madsen HO (2006) Mannose-binding lectin and its genetic
variants. Genes Immun 7:85-94
Garred P, Larsen F, Seyfarth J, Fujita R, Madsen HO (2006) Mannose-binding lectin and its genetic
variants. Genes Immun 7:85-94
Garred P, Madsen HO (2004) Genetic Susceptibility to Sepsis: A Possible Role for Mannose-binding
Lectin. Curr Infect Dis Rep 6:367-373
Garred P, Larsen F, Madsen HO, Koch C (2003) Mannose-binding lectin deficiency--revisited. Mol
Immunol 40:73-84
Garred P, Larsen F, Madsen HO, Koch C (2003) Mannose-binding lectin deficiency--revisited. Mol
Immunol 40:73-84
Gay NJ, Keith FJ (1991) Drosophila Toll and IL-1 receptor. Nature 351:355-356
Ge X, Yamamoto S, Tsutsumi S, Midorikawa Y, Ihara S, Wang SM, Aburatani H (2005) Interpreting
expression profiles of cancers by genome-wide survey of breadth of expression in normal tissues.
Genomics 86:127-141
Geijtenbeek TB, Gringhuis SI (2009) Signalling through C-type lectin receptors: shaping immune
responses. Nat Rev Immunol 9:465-479
Gennaro R, Zanetti M (2000) Structural features and biological activities of the cathelicidin-derived
antimicrobial peptides. Biopolymers 55:31-49
Gillenwaters EN, Seabury CM, Elliott JS, Womack JE (2009) Sequence analysis and polymorphism
discovery in 4 members of the bovine cathelicidin gene family. J Hered 100:241-245
Girija UV, Dodds AW, Roscher S, Reid KB, Wallis R (2007) Localization and characterization of the
mannose-binding lectin (MBL)-associated-serine protease-2 binding site in rat ficolin-A: equivalent
binding sites within the collagenous domains of MBLs and ficolins. J Immunol 179:455-462
Gjerstorff M, Hansen S, Jensen B, Dueholm B, Horn P, Bendixen C, Holmskov U (2004) The genes
encoding bovine SP-A, SP-D, MBL-A, conglutinin, CL-43 and CL-46 form a distinct collectin locus
on Bos taurus chromosome 28 (BTA28) at position q.1.8-1.9. Anim Genet 35:333-337
Gladue DP, Zhu J, Holinka LG, Fernandez-Sainz I, Carrillo C, Prarat MV, O'Donnell V, Borca MV
(2010) Patterns of gene expression in swine macrophages infected with classical swine fever virus
detected by microarray. Virus Res 151:10-18
Gottar M, Gobert V, Michel T, Belvin M, Duyk G, Hoffmann JA, Ferrandon D, Royet J (2002) The
Drosophila immune response against Gram-negative bacteria is mediated by a peptidoglycan
recognition protein. Nature 416:640-644
Gregory LA, Thielens NM, Matsushita M, Sorensen R, Arlaud GJ, Fontecilla-Camps JC, Gaboriaud C
(2004) The X-ray structure of human mannan-binding lectin-associated protein 19 (MAp19) and its
interaction site with mannan-binding lectin and L-ficolin. J Biol Chem 279:29391-29397
184
Gross O, Poeck H, Bscheider M, Dostert C, Hannesschlager N, Endres S, Hartmann G, Tardivel A,
Schweighoffer E, Tybulewicz V, Mocsai A, Tschopp J, Ruland J (2009) Syk kinase signalling couples
to the Nlrp3 inflammasome for anti-fungal host defence. Nature 459:433-436
Guan R, Wang Q, Sundberg EJ, Mariuzza RA (2005) Crystal structure of human peptidoglycan
recognition protein S (PGRP-S) at 1.70 A resolution. J Mol Biol 347:683-691
Guan R, Malchiodi EL, Wang Q, Schuck P, Mariuzza RA (2004) Crystal structure of the C-terminal
peptidoglycan-binding domain of human peptidoglycan recognition protein Ialpha. J Biol Chem
279:31873-31882
Guan R, Roychowdhury A, Ember B, Kumar S, Boons GJ, Mariuzza RA (2004) Structural basis for
peptidoglycan binding by peptidoglycan recognition proteins. Proc Natl Acad Sci U S A 101:17168-
17173
Guan Y, Ranoa DR, Jiang S, Mutha SK, Li X, Baudry J, Tapping RI (2010) Human TLRs 10 and 1
share common mechanisms of innate immune sensing but not signaling. J Immunol 184:5094-5103
Guazzi S, Price M, De Felice M, Damante G, Mattei MG, Di Lauro R (1990) Thyroid nuclear factor 1
(TTF-1) contains a homeodomain and displays a novel DNA binding specificity. EMBO J 9:3631-
3639
Gunawan AM, Richert BT, Schinckel AP, Grant AL, Gerrard DE (2007) Ractopamine induces
differential gene expression in porcine skeletal muscles. J Anim Sci 85:2115-2124
Guo N, Mogues T, Weremowicz S, Morton CC, Sastry KN (1998) The human ortholog of rhesus
mannose-binding protein-A gene is an expressed pseudogene that localizes to chromosome 10.
Mamm Genome 9:246-249
Gutierrez Sagal R, Nieto A (1998) Cloning and sequencing of the cDNA coding for pig pre-
uteroglobin/Clara cell 10 kDa protein. Biochem Mol Biol Int 45:205-213
Ha SC, Kim D, Hwang HY, Rich A, Kim YG, Kim KK (2008) The crystal structure of the second Z-
DNA binding domain of human DAI (ZBP1) in complex with Z-DNA reveals an unusual binding
mode to Z-DNA. Proc Natl Acad Sci U S A 105:20671-20676
Haagsman HP, Hogenkamp A, van Eijk M, Veldhuizen EJ (2008) Surfactant collectins and innate
immunity. Neonatology 93:288-294
Haas T, Metzger J, Schmitz F, Heit A, Muller T, Latz E, Wagner H (2008) The DNA sugar backbone
2' deoxyribose determines toll-like receptor 9 activation. Immunity 28:315-323
Halle A, Hornung V, Petzold GC, Stewart CR, Monks BG, Reinheckel T, Fitzgerald KA, Latz E,
Moore KJ, Golenbock DT (2008) The NALP3 inflammasome is involved in the innate immune
response to amyloid-beta. Nat Immunol 9:857-865
Hallman M, Haataja R (2006) Surfactant protein polymorphisms and neonatal lung disease. Semin
Perinatol 30:350-361
Halsey CH, Weber PS, Reiter SS, Stronach BN, Bartosh JL, Bergen WG (2011) The effect of
ractopamine hydrochloride on gene expression in adipose tissues of finishing pigs. J Anim Sci
89:1011-1019
185
Hamvas RM, Johnson M, Vlieger AM, Ling C, Sherriff A, Wade A, Klein NJ, Turner MW, Webster
AD (2005) Role for mannose binding lectin in the prevention of Mycoplasma infection. Infect Immun
73:5238-5240
Han J (2006) MyD88 beyond Toll. Nat Immunol 7:370-371
Harboe M, Mollnes TE (2008) The alternative complement pathway revisited. J Cell Mol Med
12:1074-1084
Hartl D, Griese M (2006) Surfactant protein D in human lung diseases. Eur J Clin Invest 36:423-435
Hartshorn KL, White MR, Voelker DR, Coburn J, Zaner K, Crouch EC (2000) Mechanism of binding
of surfactant protein D to influenza A viruses: importance of binding to haemagglutinin to antiviral
activity. Biochem J 351 Pt 2:449-458
Hartshorn KL, White MR, Shepherd V, Reid K, Jensenius JC, Crouch EC (1997) Mechanisms of anti-
influenza activity of surfactant proteins A and D: comparison with serum collectins. Am J Physiol
273:L1156-66
Hartshorn KL, Crouch EC, White MR, Eggleton P, Tauber AI, Chang D, Sastry K (1994) Evidence
for a protective role of pulmonary surfactant protein D (SP-D) against influenza A viruses. J Clin
Invest 94:311-319
Hasan U, Chaffois C, Gaillard C, Saulnier V, Merck E, Tancredi S, Guiet C, Briere F, Vlach J,
Lebecque S, Trinchieri G, Bates EE (2005) Human TLR10 is a functional receptor, expressed by B
cells and plasmacytoid dendritic cells, which activates gene transcription through MyD88. J Immunol
174:2942-2950
Hashimoto C, Hudson KL, Anderson KV (1988) The Toll gene of Drosophila, required for dorsal-
ventral embryonic polarity, appears to encode a transmembrane protein. Cell 52:269-279
Hawgood S, Brown C, Edmondson J, Stumbaugh A, Allen L, Goerke J, Clark H, Poulain F (2004)
Pulmonary collectins modulate strain-specific influenza a virus infection and host responses. J Virol
78:8565-8572
Hedegaard J, Skovgaard K, Mortensen S, Sorensen P, Jensen TK, Hornshoj H, Bendixen C, Heegaard
PM (2007) Molecular characterisation of the early response in pigs to experimental infection with
Actinobacillus pleuropneumoniae using cDNA microarrays. Acta Vet Scand 49:11
Heidinger K, Konig IR, Bohnert A, Kleinsteiber A, Hilgendorff A, Gortner L, Ziegler A, Chakraborty
T, Bein G (2005) Polymorphisms in the human surfactant protein-D (SFTPD) gene: strong evidence
that serum levels of surfactant protein-D (SP-D) are genetically influenced. Immunogenetics 57:1-7
Herias MV, Hogenkamp A, van Asten AJ, Tersteeg MH, van Eijk M, Haagsman HP (2007)
Expression sites of the collectin SP-D suggest its importance in first line host defence: power of
combining in situ hybridisation, RT-PCR and immunohistochemistry. Mol Immunol 44:3324-3332
Hillaire ML, Haagsman HP, Osterhaus AD, Rimmelzwaan GF, van Eijk M (2013) Pulmonary
Surfactant Protein D in First-Line Innate Defence against Influenza A Virus Infections. J Innate
Immun
Hillaire ML, van Eijk M, Nieuwkoop NJ, Vogelzang-van Trierum SE, Fouchier RA, Osterhaus AD,
Haagsman HP, Rimmelzwaan GF (2012) The number and position of N-linked glycosylation sites in
186
the hemagglutinin determine differential recognition of seasonal and 2009 pandemic H1N1 influenza
virus by porcine surfactant protein D. Virus Res 169:301-305
Hillaire ML, van Eijk M, van Trierum SE, van Riel D, Saelens X, Romijn RA, Hemrika W, Fouchier
RA, Kuiken T, Osterhaus AD, Haagsman HP, Rimmelzwaan GF (2011) Assessment of the antiviral
properties of recombinant porcine SP-D against various influenza A viruses in vitro. PLoS One
6:e25005
Hitomi Y, Ebisawa M, Tomikawa M, Imai T, Komata T, Hirota T, Harada M, Sakashita M, Suzuki Y,
Shimojo N, Kohno Y, Fujita K, Miyatake A, Doi S, Enomoto T, Taniguchi M, Higashi N, Nakamura
Y, Tamari M (2009) Associations of functional NLRP3 polymorphisms with susceptibility to food-
induced anaphylaxis and aspirin-induced asthma. J Allergy Clin Immunol 124:779-85.e6
Hocquellet A, le Senechal C, Garbay B (2012) Importance of the disulfide bridges in the antibacterial
activity of human hepcidin. Peptides 36:303-307
Hocquellet A, Odaert B, Cabanne C, Noubhani A, Dieryck W, Joucla G, Le Senechal C, Milenkov M,
Chaignepain S, Schmitter JM, Claverol S, Santarelli X, Dufourc EJ, Bonneu M, Garbay B, Costaglioli
P (2010) Structure-activity relationship of human liver-expressed antimicrobial peptide 2. Peptides
31:58-66
Hoffmann JA, Kafatos FC, Janeway CA, Ezekowitz RA (1999) Phylogenetic perspectives in innate
immunity. Science 284:1313-1318
Hogasen K, Jansen JH, Harboe M (1997) Eradication of porcine factor H deficiency in Norway. Vet
Rec 140:392-395
Holmskov U, Thiel S, Jensenius JC (2003) Collections and ficolins: humoral lectins of the innate
immune defense. Annu Rev Immunol 21:547-578
Holmskov U, Malhotra R, Sim RB, Jensenius JC (1994) Collectins: collagenous C-type lectins of the
innate immune defense system. Immunol Today 15:67-74
Holmskov U, Jensenius JC (1993) Structure and function of collectins: humoral C-type lectins with
collagenous regions. Behring Inst Mitt (93):224-235
Honda K, Takaoka A, Taniguchi T (2006) Type I interferon [corrected] gene induction by the
interferon regulatory factor family of transcription factors. Immunity 25:349-360
Hu W, Sweet TJ, Chamnongpol S, Baker KE, Coller J (2009) Co-translational mRNA decay in
Saccharomyces cerevisiae. Nature 461:225-229
Huntzinger E, Izaurralde E (2011) Gene silencing by microRNAs: contributions of translational
repression and mRNA decay. Nat Rev Genet 12:99-110
Husby S, Herskind AM, Jensenius JC, Holmskov U (2002) Heritability estimates for the
constitutional levels of the collectins mannan-binding lectin and lung surfactant protein D. A study of
unselected like-sexed mono- and dizygotic twins at the age of 6-9 years. Immunology 106:389-394
Ibeagha-Awemu EM, Kgwatalala P, Ibeagha AE, Zhao X (2008) A critical analysis of disease-
associated DNA polymorphisms in the genes of cattle, goat, sheep, and pig. Mamm Genome 19:226-
245
187
Ichijo H, Hellman U, Wernstedt C, Gonez LJ, Claesson-Welsh L, Heldin CH, Miyazono K (1993)
Molecular cloning and characterization of ficolin, a multimeric protein with fibrinogen- and collagen-
like domains. J Biol Chem 268:14505-14513
Ip WK, Takahashi K, Ezekowitz RA, Stuart LM (2009) Mannose-binding lectin and innate immunity.
Immunol Rev 230:9-21
Irwin DM, Kocher TD, Wilson AC (1991) Evolution of the cytochrome b gene of mammals. J Mol
Evol 32:128-144
Janeway CA,Jr (1989) Approaching the asymptote? Evolution and revolution in immunology. Cold
Spring Harb Symp Quant Biol 54 Pt 1:1-13
Jann OC, King A, Corrales NL, Anderson SI, Jensen K, Ait-Ali T, Tang H, Wu C, Cockett NE,
Archibald AL, Glass EJ (2009) Comparative genomics of Toll-like receptor signalling in five species.
BMC Genomics 10:216
Jansen JH, Hogasen K, Grondahl AM (1995) Porcine membranoproliferative glomerulonephritis type
II: an autosomal recessive deficiency of factor H. Vet Rec 137:240-244
Jensen JH, Conley LN, Hedegaard J, Nielsen M, Young JF, Oksbjerg N, Hornshoj H, Bendixen C,
Thomsen B (2012) Gene expression profiling of porcine skeletal muscle in the early recovery phase
following acute physical activity. Exp Physiol 97:833-848
Jensen PH, Weilguny D, Matthiesen F, McGuire KA, Shi L, Hojrup P (2005) Characterization of the
oligomer structure of recombinant human mannan-binding lectin. J Biol Chem 280:11043-11051
Jin Y, Mailloux CM, Gowan K, Riccardi SL, LaBerge G, Bennett DC, Fain PR, Spritz RA (2007)
NALP1 in vitiligo-associated multiple autoimmune disease. N Engl J Med 356:1216-1225
Jozaki K, Shinkai H, Tanaka-Matsuda M, Morozumi T, Matsumoto T, Toki D, Okumura N, Eguchi-
Ogawa T, Kojima-Shibata C, Kadowaki H, Suzuki E, Wada Y, Uenishi H (2009) Influence of
polymorphisms in porcine NOD2 on ligand recognition. Mol Immunol 47:247-252
Juul-Madsen HR, Kjaerup RM, Toft C, Henryon M, Heegaard PM, Berg P, Dalgaard TS (2011)
Structural gene variants in the porcine mannose-binding lectin 1 (MBL1) gene are associated with low
serum MBL-A concentrations. Immunogenetics 63:309-317
Juul-Madsen HR, Krogh-Meibom T, Henryon M, Palaniyar N, Heegaard PM, Purup S, Willis AC,
Tornoe I, Ingvartsen KL, Hansen S, Holmskov U (2006) Identification and characterization of porcine
mannan-binding lectin A (pMBL-A), and determination of serum concentration heritability.
Immunogenetics 58:129-137
Kakinuma Y, Endo Y, Takahashi M, Nakata M, Matsushita M, Takenoshita S, Fujita T (2003)
Molecular cloning and characterization of novel ficolins from Xenopus laevis. Immunogenetics
55:29-37
Kang D, Liu G, Lundstrom A, Gelius E, Steiner H (1998) A peptidoglycan recognition protein in
innate immunity conserved from insects to humans. Proc Natl Acad Sci U S A 95:10078-10082
Kanneganti TD, Ozoren N, Body-Malapel M, Amer A, Park JH, Franchi L, Whitfield J, Barchet W,
Colonna M, Vandenabeele P, Bertin J, Coyle A, Grant EP, Akira S, Nunez G (2006) Bacterial RNA
and small antiviral compounds activate caspase-1 through cryopyrin/Nalp3. Nature 440:233-236
188
Kappeler SR, Heuberger C, Farah Z, Puhan Z (2004) Expression of the peptidoglycan recognition
protein, PGRP, in the lactating mammary gland. J Dairy Sci 87:2660-2668
Kasahara T, Miyazaki T, Nitta H, Ono A, Miyagishima T, Nagao T, Urushidani T (2006) Evaluation
of methods for duration of preservation of RNA quality in rat liver used for transcriptome analysis. J
Toxicol Sci 31:509-519
Kato H, Takeuchi O, Sato S, Yoneyama M, Yamamoto M, Matsui K, Uematsu S, Jung A, Kawai T,
Ishii KJ, Yamaguchi O, Otsu K, Tsujimura T, Koh CS, Reis e Sousa C, Matsuura Y, Fujita T, Akira S
(2006) Differential roles of MDA5 and RIG-I helicases in the recognition of RNA viruses. Nature
441:101-105
Kawai T, Takahashi K, Sato S, Coban C, Kumar H, Kato H, Ishii KJ, Takeuchi O, Akira S (2005)
IPS-1, an adaptor triggering RIG-I- and Mda5-mediated type I interferon induction. Nat Immunol
6:981-988
Keirstead ND, Hayes MA, Vandervoort GE, Brooks AS, Squires EJ, Lillie BN (2011) Single
nucleotide polymorphisms in collagenous lectins and other innate immune genes in pigs with common
infectious diseases. Vet Immunol Immunopathol 142:1-13
Keirstead ND, Lee C, Yoo D, Brooks AS, Hayes MA (2008) Porcine plasma ficolin binds and reduces
infectivity of porcine reproductive and respiratory syndrome virus (PRRSV) in vitro. Antiviral Res
77:28-38
Kemper C, Atkinson JP, Hourcade DE (2010) Properdin: emerging roles of a pattern-recognition
molecule. Annu Rev Immunol 28:131-155
Kenjo A, Takahashi M, Matsushita M, Endo Y, Nakata M, Mizuochi T, Fujita T (2001) Cloning and
characterization of novel ficolins from the solitary ascidian, Halocynthia roretzi. J Biol Chem
276:19959-19965
Kim YS, Lee SG, Park SH, Song K (2001) Gene structure of the human DDX3 and chromosome
mapping of its related sequences. Mol Cells 12:209-214
Kimchi-Sarfaty C, Oh JM, Kim IW, Sauna ZE, Calcagno AM, Ambudkar SV, Gottesman MM (2007)
A "silent" polymorphism in the MDR1 gene changes substrate specificity. Science 315:525-528
King BA, Kingma PS (2011) Surfactant protein D deficiency increases lung injury during
endotoxemia. Am J Respir Cell Mol Biol 44:709-715
Kojima-Shibata C, Shinkai H, Morozumi T, Jozaki K, Toki D, Matsumoto T, Kadowaki H, Suzuki E,
Uenishi H (2009) Differences in distribution of single nucleotide polymorphisms among intracellular
pattern recognition receptors in pigs. Immunogenetics 61:153-160
Kokryakov VN, Harwig SS, Panyutich EA, Shevchenko AA, Aleshina GM, Shamova OV, Korneva
HA, Lehrer RI (1993) Protegrins: leukocyte antimicrobial peptides that combine features of
corticostatic defensins and tachyplesins. FEBS Lett 327:231-236
Krarup A, Thiel S, Hansen A, Fujita T, Jensenius JC (2004) L-ficolin is a pattern recognition
molecule specific for acetyl groups. J Biol Chem 279:47513-47519
189
Krause A, Neitz S, Magert HJ, Schulz A, Forssmann WG, Schulz-Knappe P, Adermann K (2000)
LEAP-1, a novel highly disulfide-bonded human peptide, exhibits antimicrobial activity. FEBS Lett
480:147-150
Krishnan RS, Daniel JC,Jr (1967) "Blastokinin": inducer and regulator of blastocyst development in
the rabbit uterus. Science 158:490-492
Ku MS, Sun HL, Lu KH, Sheu JN, Lee HS, Yang SF, Lue KH (2011) The CC16 A38G
polymorphism is associated with the development of asthma in children with allergic rhinitis. Clin
Exp Allergy 41:794-800
Kufer TA, Banks DJ, Philpott DJ (2006) Innate immune sensing of microbes by Nod proteins. Ann N
Y Acad Sci 1072:19-27
Kumar KG, Ponsuksili S, Schellander K, Wimmers K (2004) Molecular cloning and sequencing of
porcine C5 gene and its association with immunological traits. Immunogenetics 55:811-817
Kumar S, Roychowdhury A, Ember B, Wang Q, Guan R, Mariuzza RA, Boons GJ (2005) Selective
recognition of synthetic lysine and meso-diaminopimelic acid-type peptidoglycan fragments by
human peptidoglycan recognition proteins I{alpha} and S. J Biol Chem 280:37005-37012
Kuroki Y, Takahashi M, Nishitani C (2007) Pulmonary collectins in innate immunity of the lung. Cell
Microbiol 9:1871-1879
Lahn BT, Page DC (1997) Functional coherence of the human Y chromosome. Science 278:675-680
Lahti M, Lofgren J, Marttila R, Renko M, Klaavuniemi T, Haataja R, Ramet M, Hallman M (2002)
Surfactant protein D gene polymorphism associated with severe respiratory syncytial virus infection.
Pediatr Res 51:696-699
Laing IA, Goldblatt J, Eber E, Hayden CM, Rye PJ, Gibson NA, Palmer LJ, Burton PR, Le Souef PN
(1998) A polymorphism of the CC16 gene is associated with an increased risk of asthma. J Med
Genet 35:463-467
Lawson PR, Reid KB (2000) The roles of surfactant proteins A and D in innate immunity. Immunol
Rev 173:66-78
Lech M, Avila-Ferrufino A, Skuginna V, Susanti HE, Anders HJ (2010) Quantitative expression of
RIG-like helicase, NOD-like receptor and inflammasome-related mRNAs in humans and mice. Int
Immunol 22:717-728
Lee G, Han D, Song JY, Lee YS, Kang KS, Yoon S (2010) Genomic expression profiling in lymph
nodes with lymphoid depletion from porcine circovirus 2-infected pigs. J Gen Virol 91:2585-2591
Lee JC, Stiles D, Lu J, Cam MC (2007) A detailed transcript-level probe annotation reveals
alternative splicing based microarray platform differences. BMC Genomics 8:284
Lee MH, Osaki T, Lee JY, Baek MJ, Zhang R, Park JW, Kawabata S, Soderhall K, Lee BL (2004)
Peptidoglycan recognition proteins involved in 1,3-beta-D-glucan-dependent prophenoloxidase
activation system of insect. J Biol Chem 279:3218-3227
190
Lee RT, Ichikawa Y, Fay M, Drickamer K, Shao MC, Lee YC (1991) Ligand-binding characteristics
of rat serum-type mannose-binding protein (MBP-A). Homology of binding site architecture with
mammalian and chicken hepatic lectins. J Biol Chem 266:4810-4815
Lehrer RI, Ganz T (2002b) Defensins of vertebrate animals. Curr Opin Immunol 14:96-102
Lehrer RI, Ganz T (2002a) Cathelicidins: a family of endogenous antimicrobial peptides. Curr Opin
Hematol 9:18-22
Lemaitre B, Nicolas E, Michaut L, Reichhart JM, Hoffmann JA (1996) The dorsoventral regulatory
gene cassette spatzle/Toll/cactus controls the potent antifungal response in Drosophila adults. Cell
86:973-983
Leth-Larsen R, Garred P, Jensenius H, Meschi J, Hartshorn K, Madsen J, Tornoe I, Madsen HO,
Sorensen G, Crouch E, Holmskov U (2005) A common polymorphism in the SFTPD gene influences
assembly, function, and concentration of surfactant protein D. J Immunol 174:1532-1538
Leveque G, Forgetta V, Morroll S, Smith AL, Bumstead N, Barrow P, Loredo-Osti JC, Morgan K,
Malo D (2003) Allelic variation in TLR4 is linked to susceptibility to Salmonella enterica serovar
Typhimurium infection in chickens. Infect Immun 71:1116-1124
LeVine AM, Whitsett JA, Hartshorn KL, Crouch EC, Korfhagen TR (2001) Surfactant protein D
enhances clearance of influenza A virus from the lung in vivo. J Immunol 167:5868-5873
Lewis MJ, Botto M (2006) Complement deficiencies in humans and animals: links to autoimmunity.
Autoimmunity 39:367-378
Li J, Yu YJ, Feng L, Cai XB, Tang HB, Sun SK, Zhang HY, Liang JJ, Luo TR (2010) Global
transcriptional profiles in peripheral blood mononuclear cell during classical swine fever virus
infection. Virus Res 148:60-70
Li W, Liu S, Wang Y, Deng F, Yan W, Yang K, Chen H, He Q, Charreyre C, Audoneet JC (2013)
Transcription analysis of the porcine alveolar macrophage response to porcine circovirus type 2. BMC
Genomics 14:353-2164-14-353
Li X, Ranjith-Kumar CT, Brooks MT, Dharmaiah S, Herr AB, Kao C, Li P (2009) The RIG-I-like
receptor LGP2 recognizes the termini of double-stranded RNA. J Biol Chem 284:13881-13891
Li X, Wang S, Wang H, Gupta D (2006) Differential expression of peptidoglycan recognition protein
2 in the skin and liver requires different transcription factors. J Biol Chem 281:20738-20748
Li XY, Han CM, Wang Y, Liu HZ, Wu ZF, Gao QH, Zhao SH (2010) Expression patterns and
association analysis of the porcine DHX58 gene. Anim Genet 41:537-540
Lillie BN, Keirstead ND, Squires EJ, Hayes MA (2007) Gene polymorphisms associated with reduced
hepatic expression of porcine mannan-binding lectin C. Dev Comp Immunol 31:830-846
Lillie BN, Keirstead ND, Squires EJ, Hayes MA (2006) Single-nucleotide polymorphisms in porcine
mannan-binding lectin A. Immunogenetics 58:983-993
Lillie BN, Brooks AS, Keirstead ND, Hayes MA (2005) Comparative genetics and innate immune
functions of collagenous lectins in animals. Vet Immunol Immunopathol 108:97-110
191
Lin YT, Verma A, Hodgkinson CP (2012) Toll-like receptors and human disease: lessons from single
nucleotide polymorphisms. Curr Genomics 13:633-645
Linde A, Ross CR, Davis EG, Dib L, Blecha F, Melgarejo T (2008) Innate immunity and host defense
peptides in veterinary medicine. J Vet Intern Med 22:247-265
Lipscombe RJ, Sumiya M, Hill AV, Lau YL, Levinsky RJ, Summerfield JA, Turner MW (1992) High
frequencies in African and non-African populations of independent mutations in the mannose binding
protein gene. Hum Mol Genet 1:709-715
Liu C, Xu Z, Gupta D, Dziarski R (2001) Peptidoglycan recognition proteins: a novel family of four
human innate immunity pattern recognition molecules. J Biol Chem 276:34686-34694
Liu FT, Rabinovich GA (2010) Galectins: regulators of acute and chronic inflammation. Ann N Y
Acad Sci 1183:158-182
Liu H, Trinh TL, Dong H, Keith R, Nelson D, Liu C (2012) Iron regulator hepcidin exhibits antiviral
activity against hepatitis C virus. PLoS One 7:e46631
Liu L, Zhao C, Heng HH, Ganz T (1997) The human beta-defensin-1 and alpha-defensins are encoded
by adjacent genes: two peptide families with differing disulfide topology share a common ancestry.
Genomics 43:316-320
Lorenz E, Mira JP, Cornish KL, Arbour NC, Schwartz DA (2000) A novel polymorphism in the toll-
like receptor 2 gene and its potential association with staphylococcal infection. Infect Immun
68:6398-6401
Lu J, Teh C, Kishore U, Reid KB (2002) Collectins and ficolins: sugar pattern recognition molecules
of the mammalian innate immune system. Biochim Biophys Acta 1572:387-400
Lu JH, Teh BK, Wang L, Wang YN, Tan YS, Lai MC, Reid KB (2008) The classical and regulatory
functions of C1q in immunity and autoimmunity. Cell Mol Immunol 5:9-21
Lukk M, Kapushesky M, Nikkila J, Parkinson H, Goncalves A, Huber W, Ukkonen E, Brazma A
(2010) A global map of human gene expression. Nat Biotechnol 28:322-324
Luo R, Xiao S, Jiang Y, Jin H, Wang D, Liu M, Chen H, Fang L (2008) Porcine reproductive and
respiratory syndrome virus (PRRSV) suppresses interferon-beta production by interfering with the
RIG-I signaling pathway. Mol Immunol 45:2839-2846
Ma Z, Zhang H, Yi L, Fan H, Lu C (2012) Microarray analysis of the effect of Streptococcus equi
subsp. zooepidemicus M-like protein in infecting porcine pulmonary alveolar macrophage. PLoS One
7:e36452
Madabusi LV, Latham GJ, Andruss BF (2006) RNA extraction for arrays. Methods Enzymol 411:1-
14
Madsen HO, Satz ML, Hogh B, Svejgaard A, Garred P (1998) Different molecular events result in
low protein levels of mannan-binding lectin in populations from southeast Africa and South America.
J Immunol 161:3169-3175
192
Madsen HO, Garred P, Kurtzhals JA, Lamm LU, Ryder LP, Thiel S, Svejgaard A (1994) A new
frequent allele is the missing link in the structural polymorphism of the human mannan-binding
protein. Immunogenetics 40:37-44
Madsen J, Kliem A, Tornoe I, Skjodt K, Koch C, Holmskov U (2000) Localization of lung surfactant
protein D on mucosal surfaces in human tissues. J Immunol 164:5866-5870
Mariathasan S, Weiss DS, Newton K, McBride J, O'Rourke K, Roose-Girma M, Lee WP, Weinrauch
Y, Monack DM, Dixit VM (2006) Cryopyrin activates the inflammasome in response to toxins and
ATP. Nature 440:228-232
Marklund L, Shi X, Tuggle CK (2000) Rapid communication: mapping of the Mannose-Binding
Lectin 2 (MBL2) gene to pig chromosome 14. J Anim Sci 78:2992-2993
Martinon F, Mayor A, Tschopp J (2009) The inflammasomes: guardians of the body. Annu Rev
Immunol 27:229-265
Martinon F, Petrilli V, Mayor A, Tardivel A, Tschopp J (2006) Gout-associated uric acid crystals
activate the NALP3 inflammasome. Nature 440:237-241
Martinon F, Burns K, Tschopp J (2002) The inflammasome: a molecular platform triggering
activation of inflammatory caspases and processing of proIL-beta. Mol Cell 10:417-426
Matthes T, Aguilar-Martinez P, Pizzi-Bosman L, Darbellay R, Rubbia-Brandt L, Giostra E, Michel
M, Ganz T, Beris P (2004) Severe hemochromatosis in a Portuguese family associated with a new
mutation in the 5'-UTR of the HAMP gene. Blood 104:2181-2183
McCormack FX, Whitsett JA (2002) The pulmonary collectins, SP-A and SP-D, orchestrate innate
immunity in the lung. J Clin Invest 109:707-712
Medzhitov R (2009) Approaching the asymptote: 20 years later. Immunity 30:766-775
Medzhitov R, Preston-Hurlburt P, Janeway CA,Jr (1997) A human homologue of the Drosophila Toll
protein signals activation of adaptive immunity. Nature 388:394-397
Mellencamp MA, Galina-Pantoja L, Gladney CD, Torremorell M (2008) Improving pig health
through genomics: a view from the industry. Dev Biol (Basel) 132:35-41
Michallet MC, Meylan E, Ermolaeva MA, Vazquez J, Rebsamen M, Curran J, Poeck H, Bscheider M,
Hartmann G, Konig M, Kalinke U, Pasparakis M, Tschopp J (2008) TRADD protein is an essential
component of the RIG-like helicase antiviral pathway. Immunity 28:651-661
Michel T, Reichhart JM, Hoffmann JA, Royet J (2001) Drosophila Toll is activated by Gram-positive
bacteria through a circulating peptidoglycan recognition protein. Nature 414:756-759
Miyashita M, Oshiumi H, Matsumoto M, Seya T (2011) DDX60, a DEXD/H box helicase, is a novel
antiviral factor promoting RIG-I-like receptor-mediated signaling. Mol Cell Biol 31:3802-3819
Mogensen TH (2009) Pathogen recognition and inflammatory signaling in innate immune defenses.
Clin Microbiol Rev 22:240-73
Mollnes TE, Song WC, Lambris JD (2002) Complement in inflammatory tissue damage and disease.
Trends Immunol 23:61-64
193
Moore CB, Bergstralh DT, Duncan JA, Lei Y, Morrison TE, Zimmermann AG, Accavitti-Loper MA,
Madden VJ, Sun L, Ye Z, Lich JD, Heise MT, Chen Z, Ting JP (2008) NLRX1 is a regulator of
mitochondrial antiviral immunity. Nature 451:573-577
Moresco EM, Beutler B (2010) LGP2: positive about viral sensing. Proc Natl Acad Sci U S A
107:1261-1262
Morozumi T, Uenishi H (2009) Polymorphism distribution and structural conservation in RNA-
sensing Toll-like receptors 3, 7, and 8 in pigs. Biochim Biophys Acta 1790:267-274
Mortensen S, Skovgaard K, Hedegaard J, Bendixen C, Heegaard PM (2011) Transcriptional profiling
at different sites in lungs of pigs during acute bacterial respiratory infection. Innate Immun 17:41-53
Moser RJ, Reverter A, Lehnert SA (2008) Gene expression profiling of porcine peripheral blood
leukocytes after infection with Actinobacillus pleuropneumoniae. Vet Immunol Immunopathol
121:260-274
Moser RJ, Reverter A, Kerr CA, Beh KJ, Lehnert SA (2004) A mixed-model approach for the
analysis of cDNA microarray gene expression data from extreme-performing pigs after infection with
Actinobacillus pleuropneumoniae. J Anim Sci 82:1261-1271
Mukherjee AB, Zhang Z, Chilton BS (2007) Uteroglobin: a steroid-inducible immunomodulatory
protein that founded the Secretoglobin superfamily. Endocr Rev 28:707-725
Mukhopadhyay S, Varin A, Chen Y, Liu B, Tryggvason K, Gordon S (2011) SR-A/MARCO-
mediated ligand delivery enhances intracellular TLR and NLR function, but ligand scavenging from
cell surface limits TLR4 response to pathogens. Blood 117:1319-1328
Mullighan CG, Heatley S, Doherty K, Szabo F, Grigg A, Hughes TP, Schwarer AP, Szer J, Tait BD,
Bik To L, Bardy PG (2002) Mannose-binding lectin gene polymorphisms are associated with major
infection following allogeneic hemopoietic stem cell transplantation. Blood 99:3524-3529
Muneta Y, Uenishi H, Kikuma R, Yoshihara K, Shimoji Y, Yamamoto R, Hamashima N, Yokomizo
Y, Mori Y (2003) Porcine TLR2 and TLR6: identification and their involvement in Mycoplasma
hyopneumoniae infection. J Interferon Cytokine Res 23:583-590
Murali A, Li X, Ranjith-Kumar CT, Bhardwaj K, Holzenburg A, Li P, Kao CC (2008) Structure and
function of LGP2, a DEX(D/H) helicase that regulates the innate immunity response. J Biol Chem
283:15825-15833
Murata H, Shimada N, Yoshioka M (2004) Current research on acute phase proteins in veterinary
diagnosis: an overview. Vet J 168:28-40
Neerincx PB, Casel P, Prickett D, Nie H, Watson M, Leunissen JA, Groenen MA, Klopp C (2009)
Comparison of three microarray probe annotation pipelines: differences in strategies and their effect
on downstream analysis. BMC Proc 3 Suppl 4:S1-6561-3-S4-S1
Neerincx PB, Rauwerda H, Nie H, Groenen MA, Breit TM, Leunissen JA (2009) OligoRAP - an
Oligo Re-Annotation Pipeline to improve annotation and estimate target specificity. BMC Proc 3
Suppl 4:S4-6561-3-S4-S4
Nemeth E, Preza GC, Jung CL, Kaplan J, Waring AJ, Ganz T (2006) The N-terminus of hepcidin is
essential for its interaction with ferroportin: structure-function study. Blood 107:328-333
194
Nemeth E, Valore EV, Territo M, Schiller G, Lichtenstein A, Ganz T (2003) Hepcidin, a putative
mediator of anemia of inflammation, is a type II acute-phase protein. Blood 101:2461-2463
Ng KK, Drickamer K, Weis WI (1996) Structural analysis of monosaccharide recognition by rat liver
mannose-binding protein. J Biol Chem 271:663-674
Nir-Paz R, Prevost MC, Nicolas P, Blanchard A, Wroblewski H (2002) Susceptibilities of
Mycoplasma fermentans and Mycoplasma hyorhinis to membrane-active peptides and enrofloxacin in
human tissue cell cultures. Antimicrob Agents Chemother 46:1218-1225
Ohashi K, Burkart V, Flohe S, Kolb H (2000) Cutting edge: heat shock protein 60 is a putative
endogenous ligand of the toll-like receptor-4 complex. J Immunol 164:558-561
Ohashi T, Erickson HP (2004) The disulfide bonding pattern in ficolin multimers. J Biol Chem
279:6534-6539
Ohashi T, Erickson HP (1998) Oligomeric structure and tissue distribution of ficolins from mouse, pig
and human. Arch Biochem Biophys 360:223-232
Ohashi T, Erickson HP (1997) Two oligomeric forms of plasma ficolin have differential lectin
activity. J Biol Chem 272:14220-14226
Ohtani K, Suzuki Y, Eda S, Kawai T, Kase T, Keshi H, Sakai Y, Fukuoh A, Sakamoto T, Itabe H,
Suzutani T, Ogasawara M, Yoshida I, Wakamiya N (2001) The membrane-type collectin CL-P1 is a
scavenger receptor on vascular endothelial cells. J Biol Chem 276:44222-44228
Ohtani K, Suzuki Y, Eda S, Kawai T, Kase T, Yamazaki H, Shimada T, Keshi H, Sakai Y, Fukuoh A,
Sakamoto T, Wakamiya N (1999) Molecular cloning of a novel human collectin from liver (CL-L1). J
Biol Chem 274:13681-13689
Ostrup E, Bauersachs S, Blum H, Wolf E, Hyttel P (2010) Differential endometrial gene expression in
pregnant and nonpregnant sows. Biol Reprod 83:277-285
Owsianka AM, Patel AH (1999) Hepatitis C virus core protein interacts with a human DEAD box
protein DDX3. Virology 257:330-340
Ozinsky A, Underhill DM, Fontenot JD, Hajjar AM, Smith KD, Wilson CB, Schroeder L, Aderem A
(2000) The repertoire for pattern recognition of pathogens by the innate immune system is defined by
cooperation between toll-like receptors. Proc Natl Acad Sci U S A 97:13766-13771
Pabst S, Yenice V, Lennarz M, Tuleta I, Nickenig G, Gillissen A, Grohe C (2009) Toll-like receptor 2
gene polymorphisms Arg677Trp and Arg753Gln in chronic obstructive pulmonary disease. Lung
187:173-178
Palermo S, Capra E, Torremorell M, Dolzan M, Davoli R, Haley CS, Giuffra E (2009) Toll-like
receptor 4 genetic diversity among pig populations. Anim Genet 40:289-299
Pant SD, Verschoor CP, Schenkel FS, You Q, Kelton DF, Karrow NA (2011) Bovine PGLYRP1
polymorphisms and their association with resistance to Mycobacterium avium ssp. paratuberculosis.
Anim Genet 42:354-360
Park BS, Song DH, Kim HM, Choi BS, Lee H, Lee JO (2009) The structural basis of
lipopolysaccharide recognition by the TLR4-MD-2 complex. Nature 458:1191-1195
195
Park CH, Valore EV, Waring AJ, Ganz T (2001) Hepcidin, a urinary antimicrobial peptide
synthesized in the liver. J Biol Chem 276:7806-7810
Park SH, Lee SG, Kim Y, Song K (1998) Assignment of a human putative RNA helicase gene,
DDX3, to human X chromosome bands p11.3-->p11.23. Cytogenet Cell Genet 81:178-179
Parker R (2012) RNA degradation in Saccharomyces cerevisae. Genetics 191:671-702
Parroche P, Lauw FN, Goutagny N, Latz E, Monks BG, Visintin A, Halmen KA, Lamphier M,
Olivier M, Bartholomeu DC, Gazzinelli RT, Golenbock DT (2007) Malaria hemozoin is
immunologically inert but radically enhances innate responses by presenting malaria DNA to Toll-
like receptor 9. Proc Natl Acad Sci U S A 104:1919-1924
Pastva AM, Wright JR, Williams KL (2007) Immunomodulatory roles of surfactant proteins A and D:
implications in lung disease. Proc Am Thorac Soc 4:252-257
Pattabiraman N, Matthews JH, Ward KB, Mantile-Selvaggi G, Miele L, Mukherjee AB (2000)
Crystal structure analysis of recombinant human uteroglobin and molecular modeling of ligand
binding. Ann N Y Acad Sci 923:113-127
Pelegrin P, Surprenant A (2006) Pannexin-1 mediates large pore formation and interleukin-1beta
release by the ATP-gated P2X7 receptor. EMBO J 25:5071-5082
Peri A, Cordella-Miele E, Miele L, Mukherjee AB (1993) Tissue-specific expression of the gene
coding for human Clara cell 10-kD protein, a phospholipase A2-inhibitory protein. J Clin Invest
92:2099-2109
Petrilli V, Papin S, Dostert C, Mayor A, Martinon F, Tschopp J (2007) Activation of the NALP3
inflammasome is triggered by low intracellular potassium concentration. Cell Death Differ 14:1583-
1589
Pfaffl MW, Tichopad A, Prgomet C, Neuvians TP (2004) Determination of stable housekeeping
genes, differentially regulated target genes and sample integrity: BestKeeper--Excel-based tool using
pair-wise correlations. Biotechnol Lett 26:509-515
Phatsara C, Jennen DG, Ponsuksili S, Murani E, Tesfaye D, Schellander K, Wimmers K (2007)
Molecular genetic analysis of porcine mannose-binding lectin genes, MBL1 and MBL2, and their
association with complement activity. Int J Immunogenet 34:55-63
Pichlmair A, Schulz O, Tan CP, Rehwinkel J, Kato H, Takeuchi O, Akira S, Way M, Schiavo G, Reis
e Sousa C (2009) Activation of MDA5 requires higher-order RNA structures generated during virus
infection. J Virol 83:10761-10769
Poltorak A, He X, Smirnova I, Liu MY, Van Huffel C, Du X, Birdwell D, Alejos E, Silva M, Galanos
C, Freudenberg M, Ricciardi-Castagnoli P, Layton B, Beutler B (1998) Defective LPS signaling in
C3H/HeJ and C57BL/10ScCr mice: mutations in Tlr4 gene. Science 282:2085-2088
Pothlichet J, Burtey A, Kubarenko AV, Caignard G, Solhonne B, Tangy F, Ben-Ali M, Quintana-
Murci L, Heinzmann A, Chiche JD, Vidalain PO, Weber AN, Chignard M, Si-Tahar M (2009) Study
of human RIG-I polymorphisms identifies two variants with an opposite impact on the antiviral
immune response. PLoS One 4:e7582
196
Prickett D, Watson M (2009) IMAD: flexible annotation of microarray sequences. BMC Proc 3 Suppl
4:S2-6561-3-S4-S2
Rallabhandi P, Bell J, Boukhvalova MS, Medvedev A, Lorenz E, Arditi M, Hemming VG, Blanco JC,
Segal DM, Vogel SN (2006) Analysis of TLR4 polymorphic variants: new insights into TLR4/MD-
2/CD14 stoichiometry, structure, and signaling. J Immunol 177:322-332
Rao A, Luo C, Hogan PG (1997) Transcription factors of the NFAT family: regulation and function.
Annu Rev Immunol 15:707-747
Rapoport EM, Kurmyshkina OV, Bovin NV (2008) Mammalian galectins: structure, carbohydrate
specificity, and functions. Biochemistry (Mosc) 73:393-405
Rawal N, Rajagopalan R, Salvi VP (2008) Activation of complement component C5: comparison of
C5 convertases of the lectin pathway and the classical pathway of complement. J Biol Chem
283:7853-7863
Ren YW, Zhang YY, Affara NA, Sargent CA, Yang LG, Zhao JL, Fang LR, Wu JJ, Fang R, Tong Q,
Xiao J, Li JL, Jiang YB, Chen HC, Zhang SJ (2012) The polymorphism analysis of CD169 and
CD163 related with the risk of porcine reproductive and respiratory syndrome virus (PRRSV)
infection. Mol Biol Rep 39:9903-9909
Ricklin D, Hajishengallis G, Yang K, Lambris JD (2010) Complement: a key system for immune
surveillance and homeostasis. Nat Immunol 11:785-797
Robinson MJ, Osorio F, Rosas M, Freitas RP, Schweighoffer E, Gross O, Verbeek JS, Ruland J,
Tybulewicz V, Brown GD, Moita LF, Taylor PR, Reis e Sousa C (2009) Dectin-2 is a Syk-coupled
pattern recognition receptor crucial for Th17 responses to fungal infection. J Exp Med 206:2037-2051
Roetto A, Camaschella C (2005) New insights into iron homeostasis through the study of non-HFE
hereditary haemochromatosis. Best Pract Res Clin Haematol 18:235-250
Rossi V, Cseh S, Bally I, Thielens NM, Jensenius JC, Arlaud GJ (2001) Substrate specificities of
recombinant mannan-binding lectin-associated serine proteases-1 and -2. J Biol Chem 276:40880-
40887
Rothenfusser S, Goutagny N, DiPerna G, Gong M, Monks BG, Schoenemeyer A, Yamamoto M,
Akira S, Fitzgerald KA (2005) The RNA helicase Lgp2 inhibits TLR-independent sensing of viral
replication by retinoic acid-inducible gene-I. J Immunol 175:5260-5268
Rothschild MF, Hu ZL, Jiang Z (2007) Advances in QTL mapping in pigs. Int J Biol Sci 3:192-197
Rothschild MF (2004) Porcine genomics delivers new tools and results: this little piggy did more than
just go to market. Genet Res 83:1-6
Royet J, Dziarski R (2007) Peptidoglycan recognition proteins: pleiotropic sensors and effectors of
antimicrobial defences. Nat Rev Microbiol 5:264-277
Rozen S, Skaletsky H (2000) Primer3 on the WWW for general users and for biologist programmers.
Methods Mol Biol 132:365-386
197
Saha S, Qi J, Wang S, Wang M, Li X, Kim YG, Nunez G, Gupta D, Dziarski R (2009) PGLYRP-2
and Nod2 are both required for peptidoglycan-induced arthritis and local inflammation. Cell Host
Microbe 5:137-150
Saito T, Hirai R, Loo YM, Owen D, Johnson CL, Sinha SC, Akira S, Fujita T, Gale M,Jr (2007)
Regulation of innate antiviral defenses through a shared repressor domain in RIG-I and LGP2. Proc
Natl Acad Sci U S A 104:582-587
Sang Y, Blecha F (2009) Porcine host defense peptides: expanding repertoire and functions. Dev
Comp Immunol 33:334-343
Sang Y, Ramanathan B, Minton JE, Ross CR, Blecha F (2006) Porcine liver-expressed antimicrobial
peptides, hepcidin and LEAP-2: cloning and induction by bacterial infection. Dev Comp Immunol
30:357-366
Sang Y, Ramanathan B, Ross CR, Blecha F (2005) Gene silencing and overexpression of porcine
peptidoglycan recognition protein long isoforms: involvement in beta-defensin-1 expression. Infect
Immun 73:7133-7141
Sanz-Santos G, Jimenez-Marin A, Bautista R, Fernandez N, Claros GM, Garrido JJ (2011) Gene
expression pattern in swine neutrophils after lipopolysaccharide exposure: a time course comparison.
BMC Proc 5 Suppl 4:S11-6561-5-S4-S11
Sato S, St-Pierre C, Bhaumik P, Nieminen J (2009) Galectins in innate immunity: dual functions of
host soluble beta-galactoside-binding lectins as damage-associated molecular patterns (DAMPs) and
as receptors for pathogen-associated molecular patterns (PAMPs). Immunol Rev 230:172-187
Satoh T, Kato H, Kumagai Y, Yoneyama M, Sato S, Matsushita K, Tsujimura T, Fujita T, Akira S,
Takeuchi O (2010) LGP2 is a positive regulator of RIG-I- and MDA5-mediated antiviral responses.
Proc Natl Acad Sci U S A 107:1512-1517
Schaeffer LM, McCormack FX, Wu H, Weiss AA (2004) Interactions of pulmonary collectins with
Bordetella bronchiseptica and Bordetella pertussis lipopolysaccharide elucidate the structural basis of
their antimicrobial activities. Infect Immun 72:7124-7130
Schlee M, Roth A, Hornung V, Hagmann CA, Wimmenauer V, Barchet W, Coch C, Janke M,
Mihailovic A, Wardle G, Juranek S, Kato H, Kawai T, Poeck H, Fitzgerald KA, Takeuchi O, Akira S,
Tuschl T, Latz E, Ludwig J, Hartmann G (2009) Recognition of 5' triphosphate by RIG-I helicase
requires short blunt double-stranded RNA as contained in panhandle of negative-strand virus.
Immunity 31:25-34
Schmidt A, Schwerd T, Hamm W, Hellmuth JC, Cui S, Wenzel M, Hoffmann FS, Michallet MC,
Besch R, Hopfner KP, Endres S, Rothenfusser S (2009) 5'-triphosphate RNA requires base-paired
structures to activate antiviral signaling via RIG-I. Proc Natl Acad Sci U S A 106:12067-12072
Schroder K, Tschopp J (2010) The inflammasomes. Cell 140:821-832
Schroder M (2011) Viruses and the human DEAD-box helicase DDX3: inhibition or exploitation?.
Biochem Soc Trans 39:679-683
Schroder NW, Schumann RR (2005) Single nucleotide polymorphisms of Toll-like receptors and
susceptibility to infectious disease. Lancet Infect Dis 5:156-164
198
Schroder NW, Hermann C, Hamann L, Gobel UB, Hartung T, Schumann RR (2003) High frequency
of polymorphism Arg753Gln of the Toll-like receptor-2 gene detected by a novel allele-specific PCR.
J Mol Med 81:368-372
Schroeder A, Mueller O, Stocker S, Salowsky R, Leiber M, Gassmann M, Lightfoot S, Menzel W,
Granzow M, Ragg T (2006) The RIN: an RNA integrity number for assigning integrity values to RNA
measurements. BMC Mol Biol 7:3
Schwaeble W, Dahl MR, Thiel S, Stover C, Jensenius JC (2002) The mannan-binding lectin-
associated serine proteases (MASPs) and MAp19: four components of the lectin pathway activation
complex encoded by two genes. Immunobiology 205:455-466
Sekiguchi T, Sasaki H, Kurihara Y, Watanabe S, Moriyama D, Kurose N, Matsuki R, Yamazaki K,
Saeki M (2010) New methods for species and sex determination in three sympatric Mustelids,
Mustela itatsi, Mustela sibirica and Martes melampus. Mol Ecol Resour 10:1089-1091
Sekiguchi T, Iida H, Fukumura J, Nishimoto T (2004) Human DDX3Y, the Y-encoded isoform of
RNA helicase DDX3, rescues a hamster temperature-sensitive ET24 mutant cell line with a DDX3X
mutation. Exp Cell Res 300:213-222
Selsted ME, Harwig SS, Ganz T, Schilling JW, Lehrer RI (1985) Primary structures of three human
neutrophil defensins. J Clin Invest 76:1436-1439
Senthilselvan A, Dosman JA, Chenard L, Burch LH, Predicala BZ, Sorowski R, Schneberger D, Hurst
T, Kirychuk S, Gerdts V, Cormier Y, Rennie DC, Schwartz DA (2009) Toll-like receptor 4 variants
reduce airway response in human subjects at high endotoxin levels in a swine facility. J Allergy Clin
Immunol 123:1034-40, 1040.e1-2
Seyfarth J, Garred P, Madsen HO (2005) The 'involution' of mannose-binding lectin. Hum Mol Genet
14:2859-2869
Shi J, Zhang G, Wu H, Ross C, Blecha F, Ganz T (1999) Porcine epithelial beta-defensin 1 is
expressed in the dorsal tongue at antimicrobial concentrations. Infect Immun 67:3121-3127
Shinkai H, Okumura N, Suzuki R, Muneta Y, Uenishi H (2012) Toll-like receptor 4 polymorphism
impairing lipopolysaccharide signaling in Sus scrofa, and its restricted distribution among Japanese
wild boar populations. DNA Cell Biol 31:575-581
Shinkai H, Muneta Y, Suzuki K, Eguchi-Ogawa T, Awata T, Uenishi H (2006) Porcine Toll-like
receptor 1, 6, and 10 genes: complete sequencing of genomic region and expression analysis. Mol
Immunol 43:1474-1480
Shinkai H, Tanaka M, Morozumi T, Eguchi-Ogawa T, Okumura N, Muneta Y, Awata T, Uenishi H
(2006) Biased distribution of single nucleotide polymorphisms (SNPs) in porcine Toll-like receptor 1
(TLR1), TLR2, TLR4, TLR5, and TLR6 genes. Immunogenetics 58:324-330
Shinnar AE, Butler KL, Park HJ (2003) Cathelicidin family of antimicrobial peptides: proteolytic
processing and protease resistance. Bioorg Chem 31:425-436
Shu DP, Chen BL, Hong J, Liu PP, Hou DX, Huang X, Zhang FT, Wei JL, Guan WT (2012) Global
transcriptional profiling in porcine mammary glands from late pregnancy to peak lactation. OMICS
16:123-137
199
Silver N, Best S, Jiang J, Thein SL (2006) Selection of housekeeping genes for gene expression
studies in human reticulocytes using real-time PCR. BMC Mol Biol 7:33
Sim RB, Kishore U, Villiers CL, Marche PN, Mitchell DA (2007) C1q binding and complement
activation by prions and amyloids. Immunobiology 212:355-362
Singh G, Katyal SL (2000) Clara cell proteins. Ann N Y Acad Sci 923:43-58
Skovgaard K, Mortensen S, Boye M, Hedegaard J, Heegaard PM (2010) Hepatic gene expression
changes in pigs experimentally infected with the lung pathogen Actinobacillus pleuropneumoniae as
analysed with an innate immunity focused microarray. Innate Immun 16:343-353
Sorensen GL, Husby S, Holmskov U (2007) Surfactant protein A and surfactant protein D variation in
pulmonary disease. Immunobiology 212:381-416
Sorensen GL, Hjelmborg J, Kyvik KO, Fenger M, Hoj A, Bendixen C, Sorensen TI, Holmskov U
(2006) Genetic and environmental influences of surfactant protein D serum levels. Am J Physiol Lung
Cell Mol Physiol 290:L1010-7
Soulat D, Burckstummer T, Westermayer S, Goncalves A, Bauch A, Stefanovic A, Hantschel O,
Bennett KL, Decker T, Superti-Furga G (2008) The DEAD-box helicase DDX3X is a critical
component of the TANK-binding kinase 1-dependent innate immune response. EMBO J 27:2135-
2146
Spitzer D, Mitchell LM, Atkinson JP, Hourcade DE (2007) Properdin can initiate complement
activation by binding specific target surfaces and providing a platform for de novo convertase
assembly. J Immunol 179:2600-2608
Steimle V, Otten LA, Zufferey M, Mach B (2007) Complementation cloning of an MHC class II
transactivator mutated in hereditary MHC class II deficiency (or bare lymphocyte syndrome). 1993. J
Immunol 178:6677-6688
Storey J (2003) The positive false discovery rate: A Bayesian interpretation and the q-value. Annals
of Statistics 31:2013-2035
Storey J (2002) A direct approach to false discovery rates. J R Statist Soc B 64:479-498
Strimmer K (2008) A unified approach to false discovery rate estimation. BMC Bioinformatics 9:303-
2105-9-303
Su AI, Wiltshire T, Batalov S, Lapp H, Ching KA, Block D, Zhang J, Soden R, Hayakawa M,
Kreiman G, Cooke MP, Walker JR, Hogenesch JB (2004) A gene atlas of the mouse and human
protein-encoding transcriptomes. Proc Natl Acad Sci U S A 101:6062-6067
Su AI, Cooke MP, Ching KA, Hakak Y, Walker JR, Wiltshire T, Orth AP, Vega RG, Sapinoso LM,
Moqrich A, Patapoutian A, Hampton GM, Schultz PG, Hogenesch JB (2002) Large-scale analysis of
the human and mouse transcriptomes. Proc Natl Acad Sci U S A 99:4465-4470
Sumiya M, Super M, Tabona P, Levinsky RJ, Arai T, Turner MW, Summerfield JA (1991) Molecular
basis of opsonic defect in immunodeficient children. Lancet 337:1569-1570
Takahasi K, Kumeta H, Tsuduki N, Narita R, Shigemoto T, Hirai R, Yoneyama M, Horiuchi M,
Ogura K, Fujita T, Inagaki F (2009) Solution structures of cytosolic RNA sensor MDA5 and LGP2 C-

200
terminal domains: identification of the RNA recognition loop in RIG-I-like receptors. J Biol Chem
284:17465-17474
Takahasi K, Yoneyama M, Nishihori T, Hirai R, Kumeta H, Narita R, Gale M,Jr, Inagaki F, Fujita T
(2008) Nonself RNA-sensing mechanism of RIG-I helicase and activation of antiviral immune
responses. Mol Cell 29:428-440
Takeda K, Akira S (2007) Toll-like receptors. Curr Protoc Immunol Chapter 14:Unit 14.12
Takeuchi O, Akira S (2010) Pattern recognition receptors and inflammation. Cell 140:805-820
Teillet F, Gaboriaud C, Lacroix M, Martin L, Arlaud GJ, Thielens NM (2008) Crystal structure of the
CUB1-EGF-CUB2 domain of human MASP-1/3 and identification of its interaction sites with
mannan-binding lectin and ficolins. J Biol Chem 283:25715-25724
Thiel S (2007) Complement activating soluble pattern recognition molecules with collagen-like
regions, mannan-binding lectin, ficolins and associated proteins. Mol Immunol 44:3875-3888
Thompson KL, Pine PS, Rosenzweig BA, Turpaz Y, Retief J (2007) Characterization of the effect of
sample quality on high density oligonucleotide microarray data using progressively degraded rat liver
RNA. BMC Biotechnol 7:57
Ting JP, Willingham SB, Bergstralh DT (2008b) NLRs at the intersection of cell death and immunity.
Nat Rev Immunol 8:372-379
Ting JP, Lovering RC, Alnemri ES, Bertin J, Boss JM, Davis BK, Flavell RA, Girardin SE, Godzik
A, Harton JA, Hoffman HM, Hugot JP, Inohara N, Mackenzie A, Maltais LJ, Nunez G, Ogura Y,
Otten LA, Philpott D, Reed JC, Reith W, Schreiber S, Steimle V, Ward PA (2008a) The NLR gene
family: a standard nomenclature. Immunity 28:285-287
Tohno M, Shimazu T, Aso H, Uehara A, Takada H, Kawasaki A, Fujimoto Y, Fukase K, Saito T,
Kitazawa H (2008a) Molecular cloning and functional characterization of porcine nucleotide-binding
oligomerization domain-1 (NOD1) recognizing minimum agonists, meso-diaminopimelic acid and
meso-lanthionine. Mol Immunol 45:1807-1817
Tohno M, Ueda W, Azuma Y, Shimazu T, Katoh S, Wang JM, Aso H, Takada H, Kawai Y, Saito T,
Kitazawa H (2008b) Molecular cloning and functional characterization of porcine nucleotide-binding
oligomerization domain-2 (NOD2). Mol Immunol 45:194-203
Tomas A, Fernandes LT, Sanchez A, Segales J (2010) Time course differential gene expression in
response to porcine circovirus type 2 subclinical infection. Vet Res 41:12
Tomasinsig L, Zanetti M (2005) The cathelicidins--structure, function and evolution. Curr Protein
Pept Sci 6:23-34
Tuggle CK, Wang Y, Couture O (2007) Advances in swine transcriptomics. Int J Biol Sci 3:132-152
Turner MW (2003) The role of mannose-binding lectin in health and disease. Mol Immunol 40:423-
429
Tydell CC, Yuan J, Tran P, Selsted ME (2006) Bovine peptidoglycan recognition protein-S:
antimicrobial activity, localization, secretion, and binding properties. J Immunol 176:1154-1162
201
Ueda W, Tohno M, Shimazu T, Fujie H, Aso H, Kawai Y, Numasaki M, Saito T, Kitazawa H (2011)
Molecular cloning, tissue expression, and subcellular localization of porcine peptidoglycan
recognition proteins 3 and 4. Vet Immunol Immunopathol 143:148-154
Uehara A, Sugawara Y, Kurata S, Fujimoto Y, Fukase K, Kusumoto S, Satta Y, Sasano T, Sugawara
S, Takada H (2005) Chemically synthesized pathogen-associated molecular patterns increase the
expression of peptidoglycan recognition proteins via toll-like receptors, NOD1 and NOD2 in human
oral epithelial cells. Cell Microbiol 7:675-686
Uenishi H, Shinkai H, Morozumi T, Muneta Y (2012) Genomic survey of polymorphisms in pattern
recognition receptors and their possible relationship to infections in pigs. Vet Immunol Immunopathol
148:69-73
Uenishi H, Shinkai H, Morozumi T, Muneta Y, Jozaki K, Kojima-Shibata C, Suzuki E (2011)
Polymorphisms in pattern recognition receptors and their relationship to infectious disease
susceptibility in pigs. BMC Proc 5 Suppl 4:S27-6561-5-S4-S27
Uenishi H, Shinkai H (2009) Porcine Toll-like receptors: the front line of pathogen monitoring and
possible implications for disease resistance. Dev Comp Immunol 33:353-361
van de Wetering JK, van Golde LM, Batenburg JJ (2004) Collectins: players of the innate immune
system. Eur J Biochem 271:1229-1249
van Eijk M, Rynkiewicz MJ, White MR, Hartshorn KL, Zou X, Schulten K, Luo D, Crouch EC,
Cafarella TR, Head JF, Haagsman HP, Seaton BA (2012) A unique sugar-binding site mediates the
distinct anti-influenza activity of pig surfactant protein D. J Biol Chem 287:26666-26677
van Eijk M, van de Lest CH, Batenburg JJ, Vaandrager AB, Meschi J, Hartshorn KL, van Golde LM,
Haagsman HP (2002) Porcine surfactant protein D is N-glycosylated in its carbohydrate recognition
domain and is assembled into differently charged oligomers. Am J Respir Cell Mol Biol 26:739-747
van Eijk M, Haagsman HP, Skinner T, Archibald A, Reid KB, Lawson PR (2000) Porcine lung
surfactant protein D: complementary DNA cloning, chromosomal localization, and tissue distribution.
J Immunol 164:1442-1450
van Hoof A, Parker R (2002) Messenger RNA degradation: beginning at the end. Curr Biol 12:R285-
7
Vanderheijden N, Delputte PL, Favoreel HW, Vandekerckhove J, Van Damme J, van Woensel PA,
Nauwynck HJ (2003) Involvement of sialoadhesin in entry of porcine reproductive and respiratory
syndrome virus into porcine alveolar macrophages. J Virol 77:8207-8215
Vandesompele J, De Preter K, Pattyn F, Poppe B, Van Roy N, De Paepe A, Speleman F (2002)
Accurate normalization of real-time quantitative RT-PCR data by geometric averaging of multiple
internal control genes. Genome Biol 3:RESEARCH0034
Vasta GR (2009) Roles of galectins in infection. Nat Rev Microbiol 7:424-438
Veldhuizen EJ, van Eijk M, Haagsman HP (2011) The carbohydrate recognition domain of collectins.
FEBS J 278:3930-3941
Vincze T, Posfai J, Roberts RJ (2003) NEBcutter: A program to cleave DNA with restriction
enzymes. Nucleic Acids Res 31:3688-3691
202
Wallis R, Mitchell DA, Schmid R, Schwaeble WJ, Keeble AH (2010) Paths reunited: Initiation of the
classical and lectin pathways of complement activation. Immunobiology 215:1-11
Wallis R, Shaw JM, Uitdehaag J, Chen CB, Torgersen D, Drickamer K (2004) Localization of the
serine protease-binding sites in the collagen-like domain of mannose-binding protein: indirect effects
of naturally occurring mutations on protease binding and activation. J Biol Chem 279:14065-14073
Walport MJ (2001) Complement. First of two parts. N Engl J Med 344:1058-1066
Wang C, Liu M, Li Q, Ju Z, Huang J, Li J, Wang H, Zhong J (2011) Three novel single-nucleotide
polymorphisms of MBL1 gene in Chinese native cattle and their associations with milk performance
traits. Vet Immunol Immunopathol 139:229-236
Wang Z, Choi MK, Ban T, Yanai H, Negishi H, Lu Y, Tamura T, Takaoka A, Nishikura K, Taniguchi
T (2008) Regulation of innate immune responses by DAI (DLM-1/ZBP1) and other DNA-sensing
molecules. Proc Natl Acad Sci U S A 105:5477-5482
Wang ZM, Li X, Cocklin RR, Wang M, Wang M, Fukase K, Inamura S, Kusumoto S, Gupta D,
Dziarski R (2003) Human peptidoglycan recognition protein-L is an N-acetylmuramoyl-L-alanine
amidase. J Biol Chem 278:49044-49052
Weis WI, Drickamer K, Hendrickson WA (1992) Structure of a C-type mannose-binding protein
complexed with an oligosaccharide. Nature 360:127-134
Welch SK, Calvert JG (2010) A brief review of CD163 and its role in PRRSV infection. Virus Res
154:98-103
Werling D, Jann OC, Offord V, Glass EJ, Coffey TJ (2009) Variation matters: TLR structure and
species-specific pathogen recognition. Trends Immunol 30:124-130
Wilkie B, Mallard B (1999) Selection for high immune response: an alternative approach to animal
health maintenance?. Vet Immunol Immunopathol 72:231-235
Wilkins C, Gale M,Jr (2010) Recognition of viruses by cytoplasmic sensors. Curr Opin Immunol
22:41-47
Williams A, Flavell RA, Eisenbarth SC (2010) The role of NOD-like Receptors in shaping adaptive
immunity. Curr Opin Immunol 22:34-40
Wimmers K, Mekchay S, Schellander K, Ponsuksili S (2003) Molecular characterization of the pig C3
gene and its association with complement activity. Immunogenetics 54:714-724
Wimmers K, Mekchay S, Ponsuksili S, Hardge T, Yerle M, Schellander K (2001) Polymorphic sites
in exon 15 and 30 of the porcine C3 gene. Anim Genet 32:46-47
Wong AP, Keating A, Waddell TK (2009) Airway regeneration: the role of the Clara cell secretory
protein and the cells that express it. Cytotherapy 11:676-687
Wooters MA, Hildreth MB, Nelson EA, Erickson AK (2005) Immunohistochemical characterization
of the distribution of galectin-4 in porcine small intestine. J Histochem Cytochem 53:197-205
203
Wysocki M, Chen H, Steibel JP, Kuhar D, Petry D, Bates J, Johnson R, Ernst CW, Lunney JK (2012)
Identifying putative candidate genes and pathways involved in immune responses to porcine
reproductive and respiratory syndrome virus (PRRSV) infection. Anim Genet 43:328-332
Xiao Z, Wang C, Mo D, Li J, Chen Y, Zhang Z, Cong P (2012) Promoter CpG methylation status in
porcine Lyn is associated with its expression levels. Gene 511:73-78
Yamakawa N, Ohto U, Akashi-Takamura S, Takahashi K, Saitoh S, Tanimura N, Suganami T, Ogawa
Y, Shibata T, Shimizu T, Miyake K (2013) Human TLR4 polymorphism D299G/T399I alters
TLR4/MD-2 conformation and response to a weak ligand monophosphoryl lipid A. Int Immunol
25:45-52
Yamasaki K, Muto J, Taylor KR, Cogen AL, Audish D, Bertin J, Grant EP, Coyle AJ, Misaghi A,
Hoffman HM, Gallo RL (2009) NLRP3/cryopyrin is necessary for interleukin-1beta (IL-1beta)
release in response to hyaluronan, an endogenous trigger of inflammation in response to injury. J Biol
Chem 284:12762-12771
Yamasaki S, Matsumoto M, Takeuchi O, Matsuzawa T, Ishikawa E, Sakuma M, Tateno H, Uno J,
Hirabayashi J, Mikami Y, Takeda K, Akira S, Saito T (2009) C-type lectin Mincle is an activating
receptor for pathogenic fungus, Malassezia. Proc Natl Acad Sci U S A 106:1897-1902
Yamasaki S, Ishikawa E, Sakuma M, Hara H, Ogata K, Saito T (2008) Mincle is an ITAM-coupled
activating receptor that senses damaged cells. Nat Immunol 9:1179-1188
Yanai H, Savitsky D, Tamura T, Taniguchi T (2009) Regulation of the cytosolic DNA-sensing system
in innate immunity: a current view. Curr Opin Immunol 21:17-22
Yang RB, Mark MR, Gray A, Huang A, Xie MH, Zhang M, Goddard A, Wood WI, Gurney AL,
Godowski PJ (1998) Toll-like receptor-2 mediates lipopolysaccharide-induced cellular signalling.
Nature 395:284-288
Yang RY, Rabinovich GA, Liu FT (2008) Galectins: structure, function and therapeutic potential.
Expert Rev Mol Med 10:e17
Yang XJ, Seto E (2008) Lysine acetylation: codified crosstalk with other posttranslational
modifications. Mol Cell 31:449-461
Yarovinsky F, Zhang D, Andersen JF, Bannenberg GL, Serhan CN, Hayden MS, Hieny S, Sutterwala
FS, Flavell RA, Ghosh S, Sher A (2005) TLR11 activation of dendritic cells by a protozoan profilin-
like protein. Science 308:1626-1629
Yasojima K, Schwab C, McGeer EG, McGeer PL (1999) Up-regulated production and activation of
the complement system in Alzheimer's disease brain. Am J Pathol 154:927-936
Ye L, Su X, Wu Z, Zheng X, Wang J, Zi C, Zhu G, Wu S, Bao W (2012) Analysis of differential
miRNA expression in the duodenum of Escherichia coli F18-sensitive and -resistant weaned piglets.
PLoS One 7:e43741
Yoneyama M, Kikuchi M, Matsumoto K, Imaizumi T, Miyagishi M, Taira K, Foy E, Loo YM, Gale
M,Jr, Akira S, Yonehara S, Kato A, Fujita T (2005) Shared and unique functions of the DExD/H-box
helicases RIG-I, MDA5, and LGP2 in antiviral innate immunity. J Immunol 175:2851-2858
204
Yoshida H, Kinoshita K, Ashida M (1996) Purification of a peptidoglycan recognition protein from
hemolymph of the silkworm, Bombyx mori. J Biol Chem 271:13854-13860
Zaiou M, Gallo RL (2002) Cathelicidins, essential gene-encoded mammalian antibiotics. J Mol Med
80:549-561
Zanetti M (2005) The role of cathelicidins in the innate host defenses of mammals. Curr Issues Mol
Biol 7:179-196
Zanetti M, Gennaro R, Romeo D (1995) Cathelicidins: a novel protein family with a common
proregion and a variable C-terminal antimicrobial domain. FEBS Lett 374:1-5
Zhang G, Wu H, Shi J, Ganz T, Ross CR, Blecha F (1998) Molecular cloning and tissue expression of
porcine beta-defensin-1. FEBS Lett 424:37-40
Zhang H, Zhou G, Zhi L, Yang H, Zhai Y, Dong X, Zhang X, Gao X, Zhu Y, He F (2005)
Association between mannose-binding lectin gene polymorphisms and susceptibility to severe acute
respiratory syndrome coronavirus infection. J Infect Dis 192:1355-1361
Zhang X, Wang C, Schook LB, Hawken RJ, Rutherford MS (2000) An RNA helicase, RHIV -1,
induced by porcine reproductive and respiratory syndrome virus (PRRSV) is mapped on porcine
chromosome 10q13. Microb Pathog 28:267-278
Zhang XL, Ali MA (2008) Ficolins: structure, function and associated diseases. Adv Exp Med Biol
632:105-115
Zhang Y, van der Fits L, Voerman JS, Melief MJ, Laman JD, Wang M, Wang H, Wang M, Li X,
Walls CD, Gupta D, Dziarski R (2005) Identification of serum N-acetylmuramoyl-l-alanine amidase
as liver peptidoglycan recognition protein 2. Biochim Biophys Acta 1752:34-46
Zhang Z, Zimonjic DB, Popescu NC, Wang N, Gerhard DS, Stone EM, Arbour NC, De Vries HG,
Scheffer H, Gerritsen J, Colle'e JM, Ten Kate LP, Mukherjee AB (1997) Human uteroglobin gene:
structure, subchromosomal localization, and polymorphism. DNA Cell Biol 16:73-83
Zhao ZL, Wang CF, Li QL, Ju ZH, Huang JM, Li JB, Zhong JF, Zhang JB (2012) Novel SNPs of the
mannan-binding lectin 2 gene and their association with production traits in Chinese Holsteins. Genet
Mol Res 11:3744-3754
Zheng Q, Wang XJ (2008) GOEAST: a web-based software toolkit for Gene Ontology enrichment
analysis. Nucleic Acids Res 36:W358-63
Zhou H, Hu J, Luo Y, Hickford JG (2010) Variation in the ovine C-type lectin dectin-1 gene
(CLEC7A). Dev Comp Immunol 34:246-249
Zhou H, Hickford JG, Fang Q, Lin YS (2007) Allelic variation of the ovine Toll-like receptor 4 gene.
Dev Comp Immunol 31:105-108
Zhou X, Su Z (2007) EasyGO: Gene Ontology-based annotation and functional enrichment analysis
tool for agronomical species. BMC Genomics 8:246
Zhu L, Zhou Y, Tong G (2012) Mechanisms of suppression of interferon production by porcine
reproductive and respiratory syndrome virus. Acta Virol 56:3-9

205
Zuo D, Cai X, Zhao N, Zhang L, Chen Z (2010) Location of MBL-associated serine proteases binding
motifs on human mannan-binding lectin (MBL). Protein Pept Lett 17:131-136
Zuo Z, Cui H, Li M, Peng X, Zhu L, Zhang M, Ma J, Xu Z, Gan M, Deng J, Li X, Fang J (2013)
Transcriptional Profiling of Swine Lung Tissue after Experimental Infection with Actinobacillus
pleuropneumoniae. Int J Mol Sci 14:10626-10660
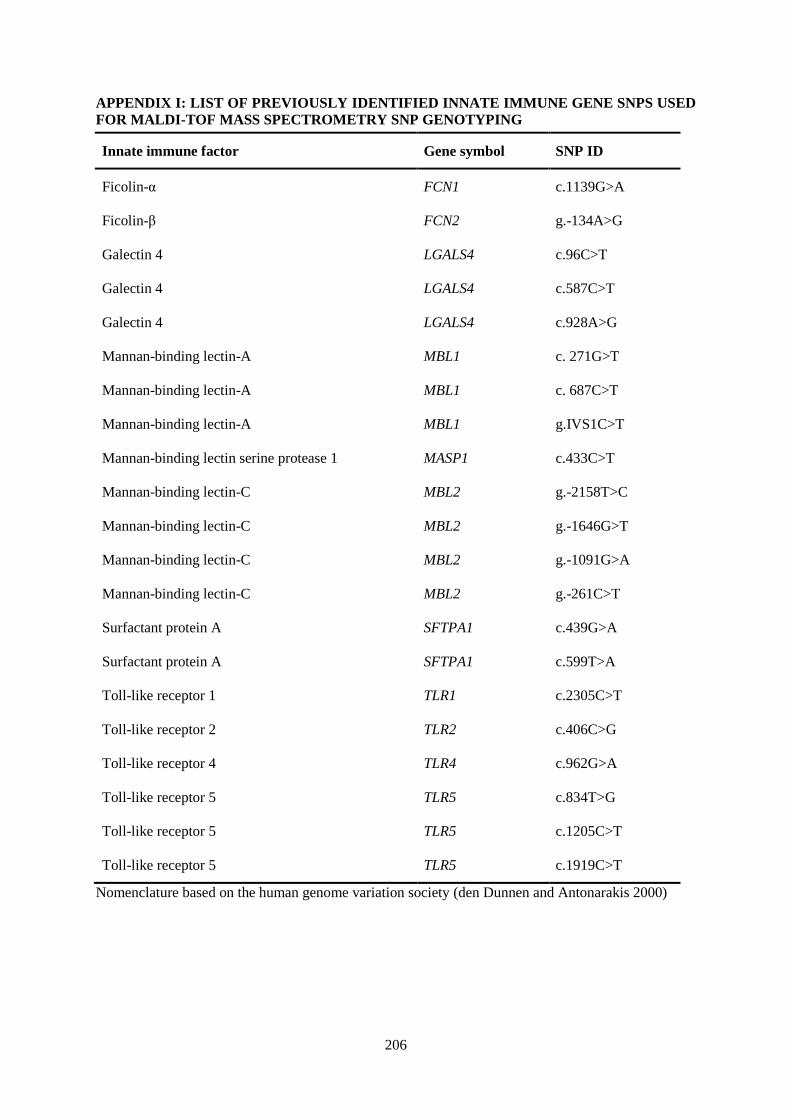
206
APPENDIX I: LIST OF PREVIOUSLY IDENTIFIED INNATE IMMUNE GENE SNPS USED
FOR MALDI-TOF MASS SPECTROMETRY SNP GENOTYPING
Innate immune factor Gene symbol SNP ID
Ficolin-α FCN1 c.1139G>A
Ficolin-β FCN2 g.-134A>G
Galectin 4 LGALS4 c.96C>T
Galectin 4 LGALS4 c.587C>T
Galectin 4 LGALS4 c.928A>G
Mannan-binding lectin-A MBL1 c. 271G>T
Mannan-binding lectin-A MBL1 c. 687C>T
Mannan-binding lectin-A MBL1 g.IVS1C>T
Mannan-binding lectin serine protease 1 MASP1 c.433C>T
Mannan-binding lectin-C MBL2 g.-2158T>C
Mannan-binding lectin-C MBL2 g.-1646G>T
Mannan-binding lectin-C MBL2 g.-1091G>A
Mannan-binding lectin-C MBL2 g.-261C>T
Surfactant protein A SFTPA1 c.439G>A
Surfactant protein A SFTPA1 c.599T>A
Toll-like receptor 1 TLR1 c.2305C>T
Toll-like receptor 2 TLR2 c.406C>G
Toll-like receptor 4 TLR4 c.962G>A
Toll-like receptor 5 TLR5 c.834T>G
Toll-like receptor 5 TLR5 c.1205C>T
Toll-like receptor 5 TLR5 c.1919C>T
Nomenclature based on the human genome variation society (den Dunnen and Antonarakis 2000)
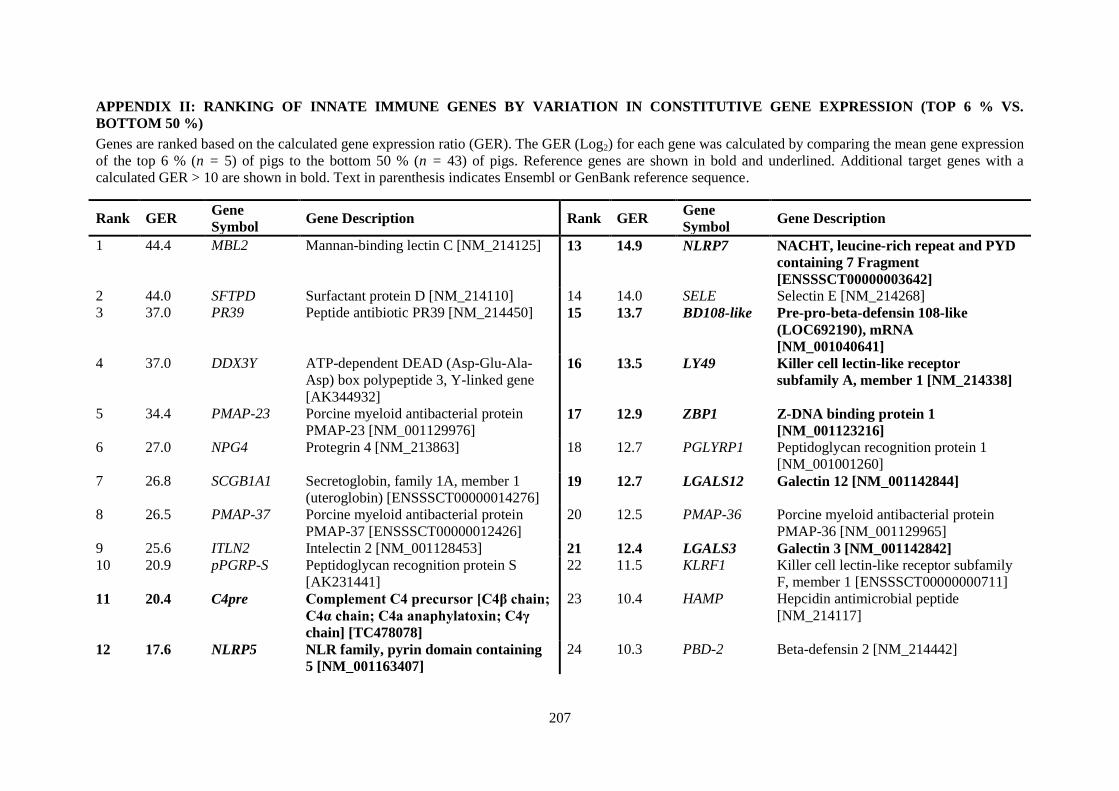
207
APPENDIX II: RANKING OF INNATE IMMUNE GENES BY VARIATION IN CONSTITUTIVE GENE EXPRESSION (TOP 6 % VS.
BOTTOM 50 %)
Genes are ranked based on the calculated gene expression ratio (GER). The GER (Log2) for each gene was calculated by comparing the mean gene expression
of the top 6 % (n = 5) of pigs to the bottom 50 % (n = 43) of pigs. Reference genes are shown in bold and underlined. Additional target genes with a
calculated GER > 10 are shown in bold. Text in parenthesis indicates Ensembl or GenBank reference sequence.
Rank GER Gene
Symbol Gene Description Rank GER
Gene
Symbol Gene Description
1 44.4 MBL2 Mannan-binding lectin C [NM_214125] 13 14.9 NLRP7 NACHT, leucine-rich repeat and PYD
containing 7 Fragment
[ENSSSCT00000003642]
2 44.0 SFTPD Surfactant protein D [NM_214110] 14 14.0 SELE Selectin E [NM_214268]
3 37.0 PR39 Peptide antibiotic PR39 [NM_214450] 15 13.7 BD108-like Pre-pro-beta-defensin 108-like
(LOC692190), mRNA
[NM_001040641]
4 37.0 DDX3Y ATP-dependent DEAD (Asp-Glu-Ala-
Asp) box polypeptide 3, Y-linked gene
[AK344932]
16 13.5 LY49 Killer cell lectin-like receptor
subfamily A, member 1 [NM_214338]
5 34.4 PMAP-23 Porcine myeloid antibacterial protein
PMAP-23 [NM_001129976] 17 12.9 ZBP1 Z-DNA binding protein 1
[NM_001123216]
6 27.0 NPG4 Protegrin 4 [NM_213863] 18 12.7 PGLYRP1 Peptidoglycan recognition protein 1
[NM_001001260]
7 26.8 SCGB1A1 Secretoglobin, family 1A, member 1
(uteroglobin) [ENSSSCT00000014276] 19 12.7 LGALS12 Galectin 12 [NM_001142844]
8 26.5 PMAP-37 Porcine myeloid antibacterial protein
PMAP-37 [ENSSSCT00000012426]
20 12.5 PMAP-36 Porcine myeloid antibacterial protein
PMAP-36 [NM_001129965]
9 25.6 ITLN2 Intelectin 2 [NM_001128453] 21 12.4 LGALS3 Galectin 3 [NM_001142842]
10 20.9 pPGRP-S Peptidoglycan recognition protein S
[AK231441]
22 11.5 KLRF1 Killer cell lectin-like receptor subfamily
F, member 1 [ENSSSCT00000000711]
11 20.4 C4pre Complement C4 precursor [C4β chain;
C4α chain; C4a anaphylatoxin; C4γ
chain] [TC478078]
23 10.4 HAMP Hepcidin antimicrobial peptide
[NM_214117]
12 17.6 NLRP5 NLR family, pyrin domain containing
5 [NM_001163407]
24 10.3 PBD-2 Beta-defensin 2 [NM_214442]
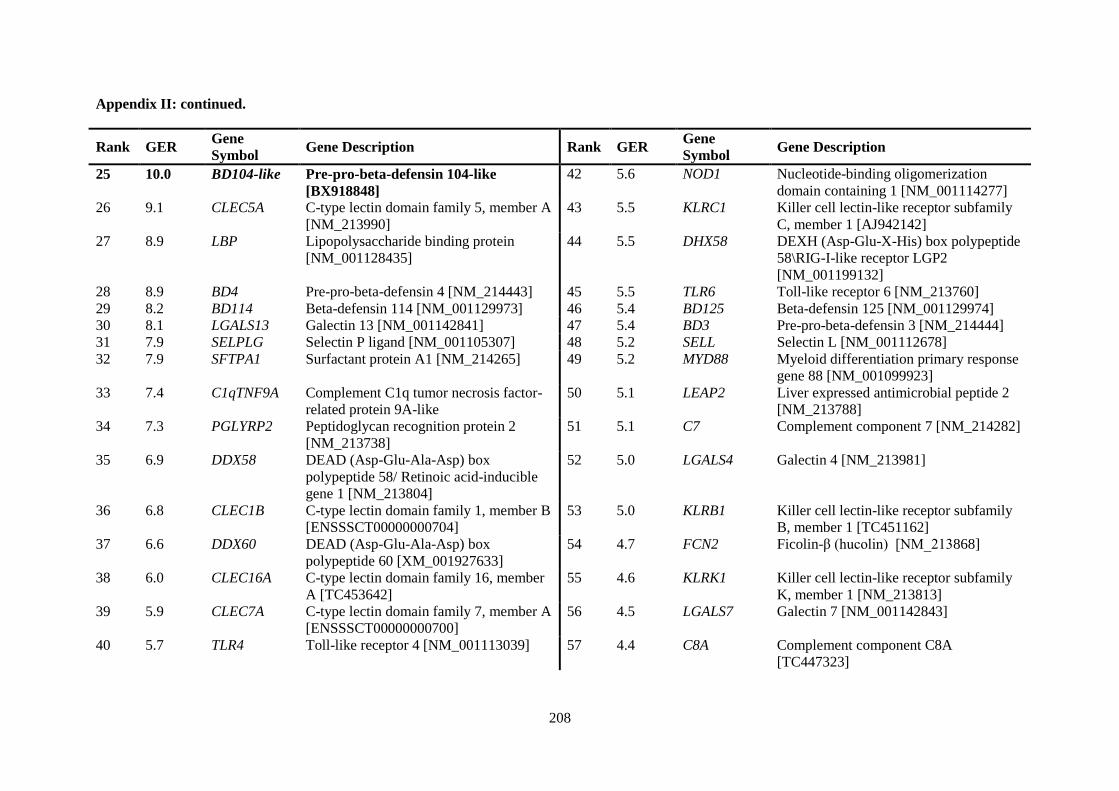
208
Appendix II: continued.
Rank GER Gene
Symbol Gene Description Rank GER
Gene
Symbol Gene Description
25 10.0 BD104-like Pre-pro-beta-defensin 104-like
[BX918848]
42 5.6 NOD1 Nucleotide-binding oligomerization
domain containing 1 [NM_001114277]
26 9.1 CLEC5A C-type lectin domain family 5, member A
[NM_213990]
43 5.5 KLRC1 Killer cell lectin-like receptor subfamily
C, member 1 [AJ942142]
27 8.9 LBP Lipopolysaccharide binding protein
[NM_001128435]
44 5.5 DHX58 DEXH (Asp-Glu-X-His) box polypeptide
58\RIG-I-like receptor LGP2
[NM_001199132]
28 8.9 BD4 Pre-pro-beta-defensin 4 [NM_214443] 45 5.5 TLR6 Toll-like receptor 6 [NM_213760]
29 8.2 BD114 Beta-defensin 114 [NM_001129973] 46 5.4 BD125 Beta-defensin 125 [NM_001129974]
30 8.1 LGALS13 Galectin 13 [NM_001142841] 47 5.4 BD3 Pre-pro-beta-defensin 3 [NM_214444]
31 7.9 SELPLG Selectin P ligand [NM_001105307] 48 5.2 SELL Selectin L [NM_001112678]
32 7.9 SFTPA1 Surfactant protein A1 [NM_214265] 49 5.2 MYD88 Myeloid differentiation primary response
gene 88 [NM_001099923]
33 7.4 C1qTNF9A Complement C1q tumor necrosis factor-
related protein 9A-like
50 5.1 LEAP2 Liver expressed antimicrobial peptide 2
[NM_213788]
34 7.3 PGLYRP2 Peptidoglycan recognition protein 2
[NM_213738]
51 5.1 C7 Complement component 7 [NM_214282]
35 6.9 DDX58 DEAD (Asp-Glu-Ala-Asp) box
polypeptide 58/ Retinoic acid-inducible
gene 1 [NM_213804]
52 5.0 LGALS4 Galectin 4 [NM_213981]
36 6.8 CLEC1B C-type lectin domain family 1, member B
[ENSSSCT00000000704]
53 5.0 KLRB1 Killer cell lectin-like receptor subfamily
B, member 1 [TC451162]
37 6.6 DDX60 DEAD (Asp-Glu-Ala-Asp) box
polypeptide 60 [XM_001927633]
54 4.7 FCN2 Ficolin-β (hucolin) [NM_213868]
38 6.0 CLEC16A C-type lectin domain family 16, member
A [TC453642]
55 4.6 KLRK1 Killer cell lectin-like receptor subfamily
K, member 1 [NM_213813]
39 5.9 CLEC7A C-type lectin domain family 7, member A
[ENSSSCT00000000700]
56 4.5 LGALS7 Galectin 7 [NM_001142843]
40 5.7 TLR4 Toll-like receptor 4 [NM_001113039] 57 4.4 C8A Complement component C8A
[TC447323]
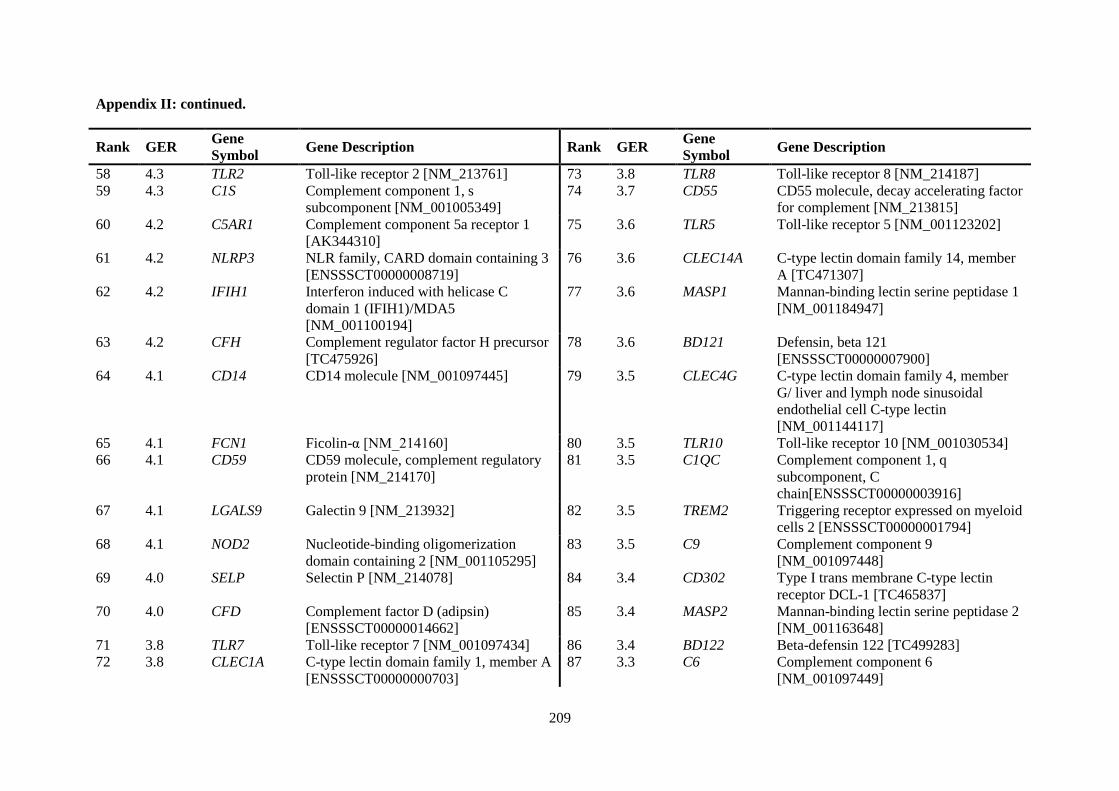
209
Appendix II: continued.
Rank GER Gene
Symbol Gene Description Rank GER
Gene
Symbol Gene Description
58 4.3 TLR2 Toll-like receptor 2 [NM_213761] 73 3.8 TLR8 Toll-like receptor 8 [NM_214187]
59 4.3 C1S Complement component 1, s
subcomponent [NM_001005349]
74 3.7 CD55 CD55 molecule, decay accelerating factor
for complement [NM_213815]
60 4.2 C5AR1 Complement component 5a receptor 1
[AK344310]
75 3.6 TLR5 Toll-like receptor 5 [NM_001123202]
61 4.2 NLRP3 NLR family, CARD domain containing 3
[ENSSSCT00000008719]
76 3.6 CLEC14A C-type lectin domain family 14, member
A [TC471307]
62 4.2 IFIH1 Interferon induced with helicase C
domain 1 (IFIH1)/MDA5
[NM_001100194]
77 3.6 MASP1 Mannan-binding lectin serine peptidase 1
[NM_001184947]
63 4.2 CFH Complement regulator factor H precursor
[TC475926]
78 3.6 BD121 Defensin, beta 121
[ENSSSCT00000007900]
64 4.1 CD14 CD14 molecule [NM_001097445] 79 3.5 CLEC4G C-type lectin domain family 4, member
G/ liver and lymph node sinusoidal
endothelial cell C-type lectin
[NM_001144117]
65 4.1 FCN1 Ficolin-α [NM_214160] 80 3.5 TLR10 Toll-like receptor 10 [NM_001030534]
66 4.1 CD59 CD59 molecule, complement regulatory
protein [NM_214170]
81 3.5 C1QC Complement component 1, q
subcomponent, C
chain[ENSSSCT00000003916]
67 4.1 LGALS9 Galectin 9 [NM_213932] 82 3.5 TREM2 Triggering receptor expressed on myeloid
cells 2 [ENSSSCT00000001794]
68 4.1 NOD2 Nucleotide-binding oligomerization
domain containing 2 [NM_001105295]
83 3.5 C9 Complement component 9
[NM_001097448]
69 4.0 SELP Selectin P [NM_214078] 84 3.4 CD302 Type I trans membrane C-type lectin
receptor DCL-1 [TC465837]
70 4.0 CFD Complement factor D (adipsin)
[ENSSSCT00000014662]
85 3.4 MASP2 Mannan-binding lectin serine peptidase 2
[NM_001163648]
71 3.8 TLR7 Toll-like receptor 7 [NM_001097434] 86 3.4 BD122 Beta-defensin 122 [TC499283]
72 3.8 CLEC1A C-type lectin domain family 1, member A
[ENSSSCT00000000703]
87 3.3 C6 Complement component 6
[NM_001097449]
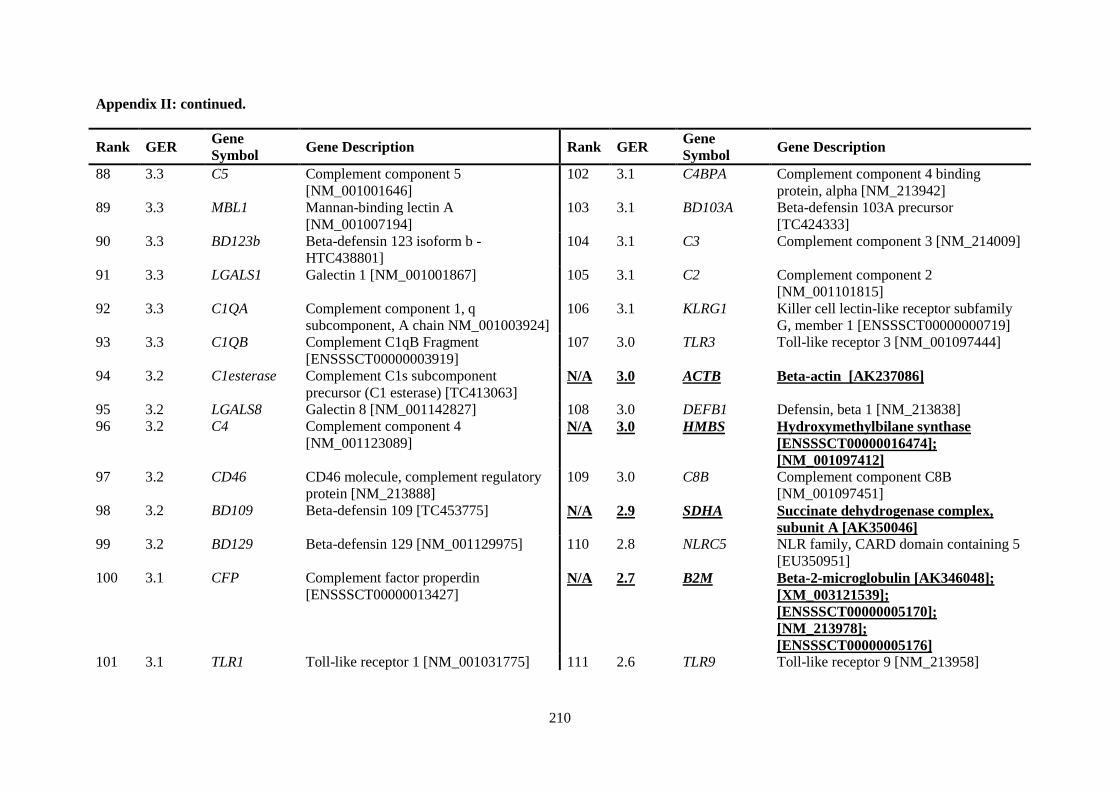
210
Appendix II: continued.
Rank GER Gene
Symbol Gene Description Rank GER
Gene
Symbol Gene Description
88 3.3 C5 Complement component 5
[NM_001001646]
102 3.1 C4BPA Complement component 4 binding
protein, alpha [NM_213942]
89 3.3 MBL1 Mannan-binding lectin A
[NM_001007194]
103 3.1 BD103A Beta-defensin 103A precursor
[TC424333]
90 3.3 BD123b Beta-defensin 123 isoform b -
HTC438801]
104 3.1 C3 Complement component 3 [NM_214009]
91 3.3 LGALS1 Galectin 1 [NM_001001867] 105 3.1 C2 Complement component 2
[NM_001101815]
92 3.3 C1QA Complement component 1, q
subcomponent, A chain NM_001003924]
106 3.1 KLRG1 Killer cell lectin-like receptor subfamily
G, member 1 [ENSSSCT00000000719]
93 3.3 C1QB Complement C1qB Fragment
[ENSSSCT00000003919]
107 3.0 TLR3 Toll-like receptor 3 [NM_001097444]
94 3.2 C1esterase Complement C1s subcomponent
precursor (C1 esterase) [TC413063] N/A 3.0 ACTB Beta-actin [AK237086]
95 3.2 LGALS8 Galectin 8 [NM_001142827] 108 3.0 DEFB1 Defensin, beta 1 [NM_213838]
96 3.2 C4 Complement component 4
[NM_001123089] N/A 3.0 HMBS Hydroxymethylbilane synthase
[ENSSSCT00000016474];
[NM_001097412]
97 3.2 CD46 CD46 molecule, complement regulatory
protein [NM_213888]
109 3.0 C8B Complement component C8B
[NM_001097451]
98 3.2 BD109 Beta-defensin 109 [TC453775] N/A 2.9 SDHA Succinate dehydrogenase complex,
subunit A [AK350046]
99 3.2 BD129 Beta-defensin 129 [NM_001129975] 110 2.8 NLRC5 NLR family, CARD domain containing 5
[EU350951]
100 3.1 CFP Complement factor properdin
[ENSSSCT00000013427] N/A 2.7 B2M Beta-2-microglobulin [AK346048];
[XM_003121539];
[ENSSSCT00000005170];
[NM_213978];
[ENSSSCT00000005176]
101 3.1 TLR1 Toll-like receptor 1 [NM_001031775] 111 2.6 TLR9 Toll-like receptor 9 [NM_213958]
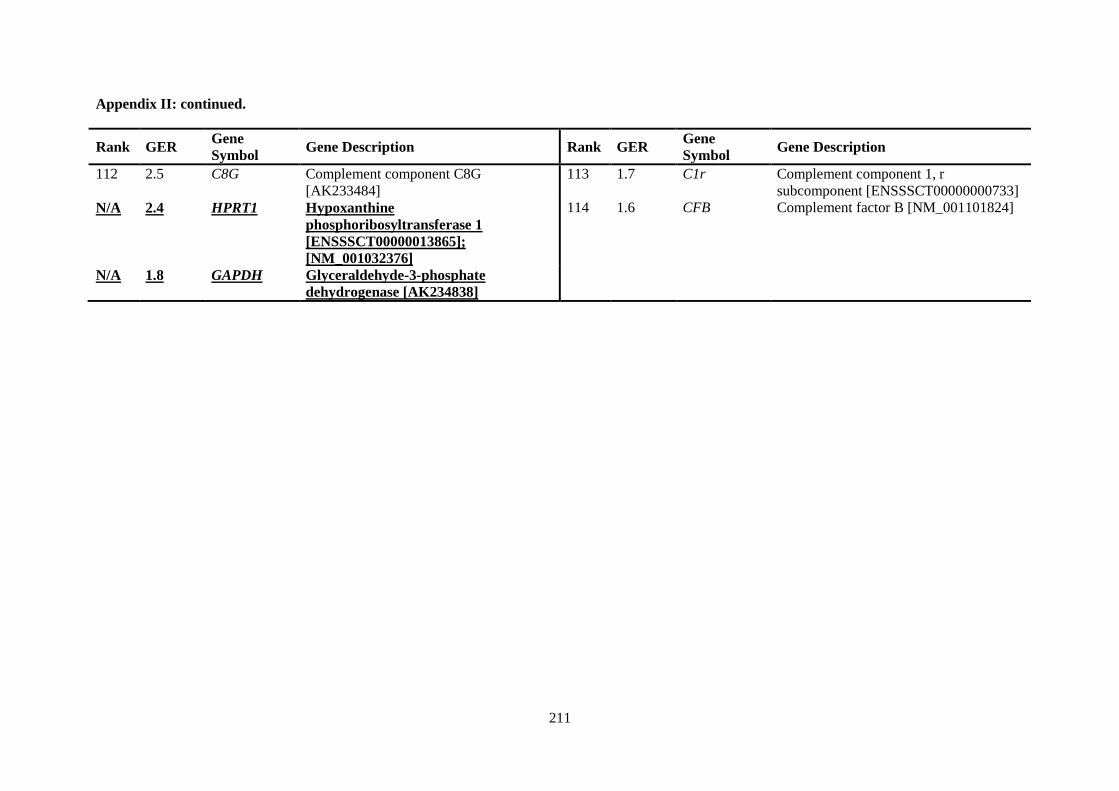
211
Appendix II: continued.
Rank GER Gene
Symbol Gene Description Rank GER
Gene
Symbol Gene Description
112 2.5 C8G Complement component C8G
[AK233484]
113 1.7 C1r Complement component 1, r
subcomponent [ENSSSCT00000000733]
N/A 2.4 HPRT1 Hypoxanthine
phosphoribosyltransferase 1
[ENSSSCT00000013865];
[NM_001032376]
114 1.6 CFB Complement factor B [NM_001101824]
N/A 1.8 GAPDH Glyceraldehyde-3-phosphate
dehydrogenase [AK234838]
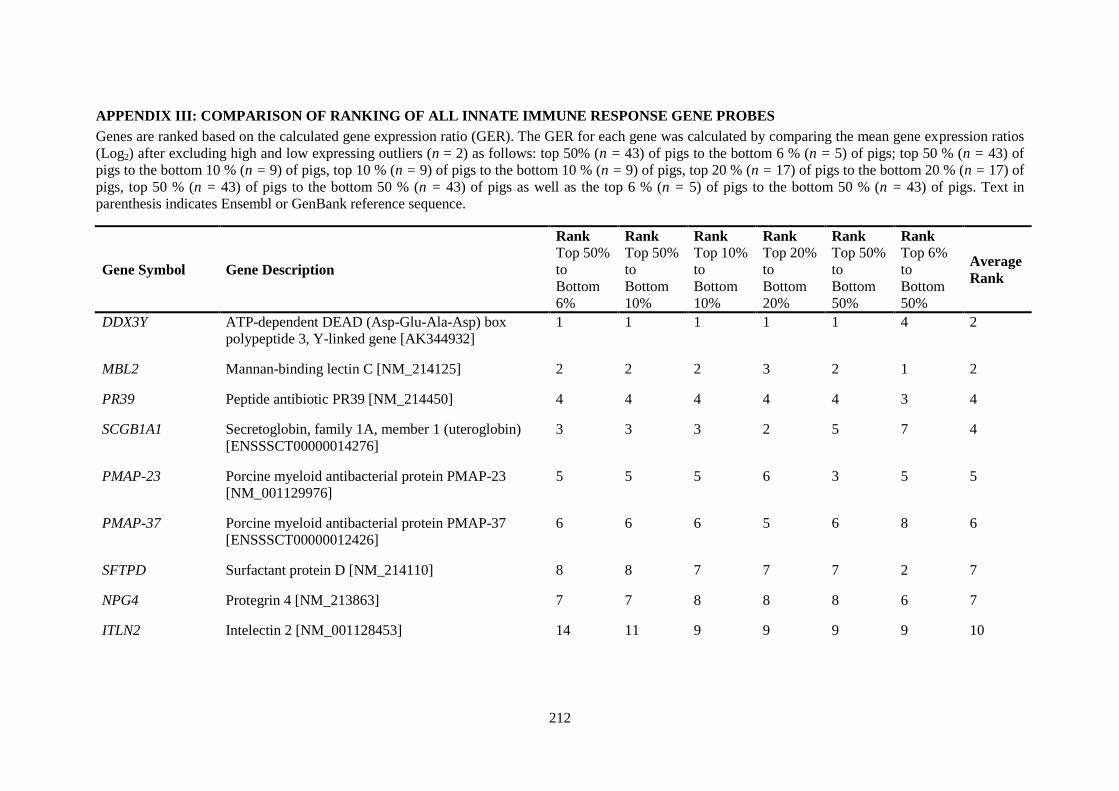
212
APPENDIX III: COMPARISON OF RANKING OF ALL INNATE IMMUNE RESPONSE GENE PROBES
Genes are ranked based on the calculated gene expression ratio (GER). The GER for each gene was calculated by comparing the mean gene expression ratios
(Log2) after excluding high and low expressing outliers (n = 2) as follows: top 50% (n = 43) of pigs to the bottom 6 % (n = 5) of pigs; top 50 % (n = 43) of
pigs to the bottom 10 % (n = 9) of pigs, top 10 % (n = 9) of pigs to the bottom 10 % (n = 9) of pigs, top 20 % (n = 17) of pigs to the bottom 20 % (n = 17) of
pigs, top 50 % (n = 43) of pigs to the bottom 50 % (n = 43) of pigs as well as the top 6 % (n = 5) of pigs to the bottom 50 % (n = 43) of pigs. Text in
parenthesis indicates Ensembl or GenBank reference sequence.
Gene Symbol Gene Description
Rank
Top 50%
to
Bottom
6%
Rank
Top 50%
to
Bottom
10%
Rank
Top 10%
to
Bottom
10%
Rank
Top 20%
to
Bottom
20%
Rank
Top 50%
to
Bottom
50%
Rank
Top 6%
to
Bottom
50%
Average
Rank
DDX3Y ATP-dependent DEAD (Asp-Glu-Ala-Asp) box
polypeptide 3, Y-linked gene [AK344932]
1 1 1 1 1 4 2
MBL2 Mannan-binding lectin C [NM_214125] 2 2 2 3 2 1 2
PR39 Peptide antibiotic PR39 [NM_214450] 4 4 4 4 4 3 4
SCGB1A1 Secretoglobin, family 1A, member 1 (uteroglobin)
[ENSSSCT00000014276]
3 3 3 2 5 7 4
PMAP-23 Porcine myeloid antibacterial protein PMAP-23
[NM_001129976]
5 5 5 6 3 5 5
PMAP-37 Porcine myeloid antibacterial protein PMAP-37
[ENSSSCT00000012426]
6 6 6 5 6 8 6
SFTPD Surfactant protein D [NM_214110] 8 8 7 7 7 2 7
NPG4 Protegrin 4 [NM_213863] 7 7 8 8 8 6 7
ITLN2 Intelectin 2 [NM_001128453] 14 11 9 9 9 9 10
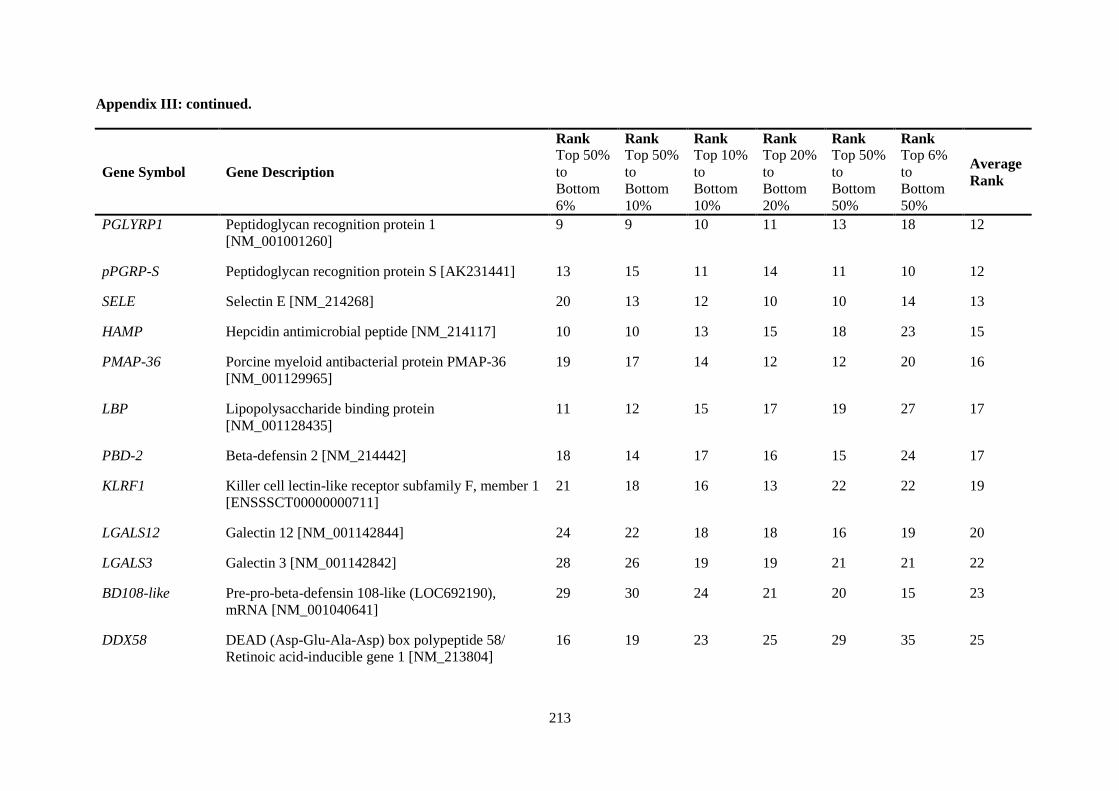
213
Appendix III: continued.
Gene Symbol Gene Description
Rank
Top 50%
to
Bottom
6%
Rank
Top 50%
to
Bottom
10%
Rank
Top 10%
to
Bottom
10%
Rank
Top 20%
to
Bottom
20%
Rank
Top 50%
to
Bottom
50%
Rank
Top 6%
to
Bottom
50%
Average
Rank
PGLYRP1 Peptidoglycan recognition protein 1
[NM_001001260]
9 9 10 11 13 18 12
pPGRP-S Peptidoglycan recognition protein S [AK231441] 13 15 11 14 11 10 12
SELE Selectin E [NM_214268] 20 13 12 10 10 14 13
HAMP Hepcidin antimicrobial peptide [NM_214117] 10 10 13 15 18 23 15
PMAP-36 Porcine myeloid antibacterial protein PMAP-36
[NM_001129965]
19 17 14 12 12 20 16
LBP Lipopolysaccharide binding protein
[NM_001128435]
11 12 15 17 19 27 17
PBD-2 Beta-defensin 2 [NM_214442] 18 14 17 16 15 24 17
KLRF1 Killer cell lectin-like receptor subfamily F, member 1
[ENSSSCT00000000711]
21 18 16 13 22 22 19
LGALS12 Galectin 12 [NM_001142844] 24 22 18 18 16 19 20
LGALS3 Galectin 3 [NM_001142842] 28 26 19 19 21 21 22
BD108-like Pre-pro-beta-defensin 108-like (LOC692190),
mRNA [NM_001040641]
29 30 24 21 20 15 23
DDX58 DEAD (Asp-Glu-Ala-Asp) box polypeptide 58/
Retinoic acid-inducible gene 1 [NM_213804]
16 19 23 25 29 35 25
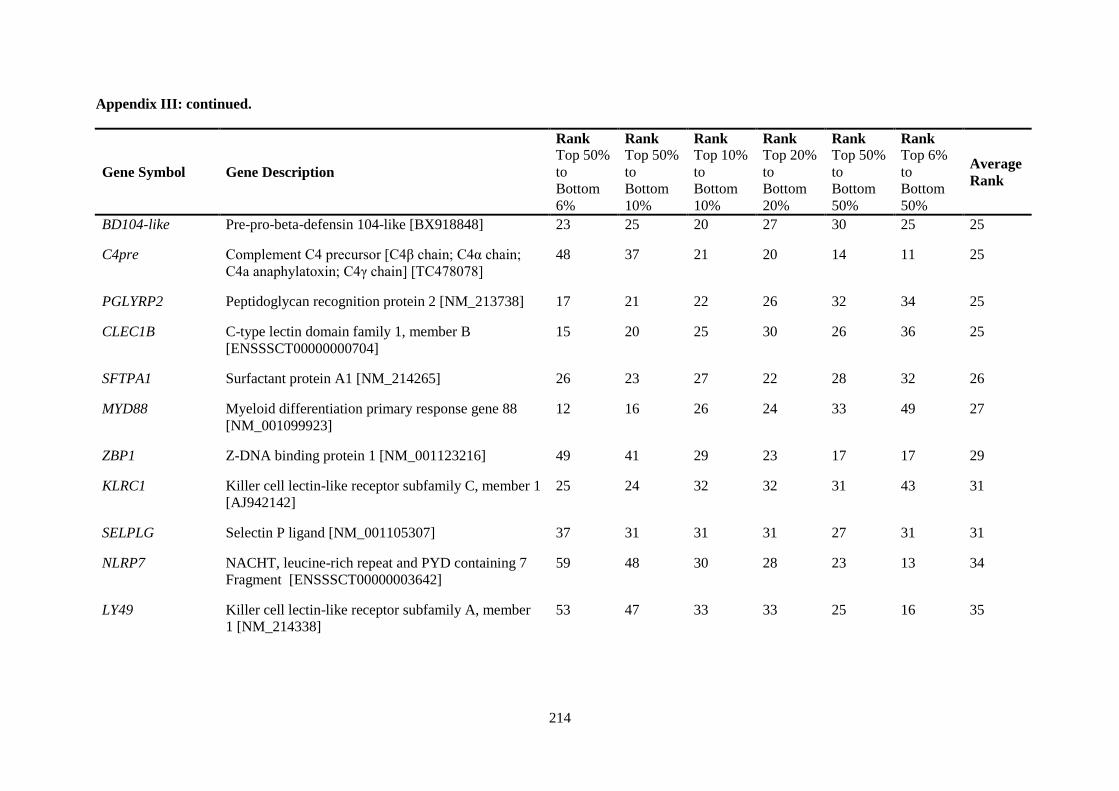
214
Appendix III: continued.
Gene Symbol Gene Description
Rank
Top 50%
to
Bottom
6%
Rank
Top 50%
to
Bottom
10%
Rank
Top 10%
to
Bottom
10%
Rank
Top 20%
to
Bottom
20%
Rank
Top 50%
to
Bottom
50%
Rank
Top 6%
to
Bottom
50%
Average
Rank
BD104-like Pre-pro-beta-defensin 104-like [BX918848] 23 25 20 27 30 25 25
C4pre Complement C4 precursor [C4β chain; C4α chain;
C4a anaphylatoxin; C4γ chain] [TC478078]
48 37 21 20 14 11 25
PGLYRP2 Peptidoglycan recognition protein 2 [NM_213738] 17 21 22 26 32 34 25
CLEC1B C-type lectin domain family 1, member B
[ENSSSCT00000000704]
15 20 25 30 26 36 25
SFTPA1 Surfactant protein A1 [NM_214265] 26 23 27 22 28 32 26
MYD88 Myeloid differentiation primary response gene 88
[NM_001099923]
12 16 26 24 33 49 27
ZBP1 Z-DNA binding protein 1 [NM_001123216] 49 41 29 23 17 17 29
KLRC1 Killer cell lectin-like receptor subfamily C, member 1
[AJ942142]
25 24 32 32 31 43 31
SELPLG Selectin P ligand [NM_001105307] 37 31 31 31 27 31 31
NLRP7 NACHT, leucine-rich repeat and PYD containing 7
Fragment [ENSSSCT00000003642]
59 48 30 28 23 13 34
LY49 Killer cell lectin-like receptor subfamily A, member
1 [NM_214338]
53 47 33 33 25 16 35
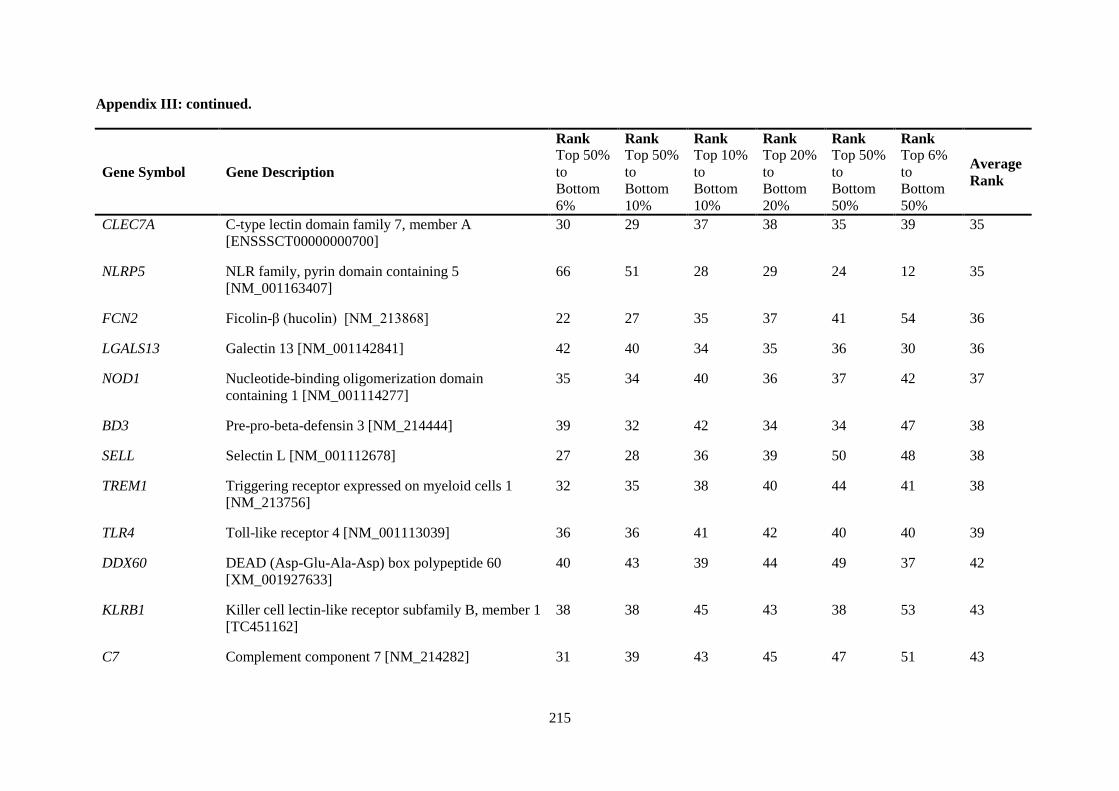
215
Appendix III: continued.
Gene Symbol Gene Description
Rank
Top 50%
to
Bottom
6%
Rank
Top 50%
to
Bottom
10%
Rank
Top 10%
to
Bottom
10%
Rank
Top 20%
to
Bottom
20%
Rank
Top 50%
to
Bottom
50%
Rank
Top 6%
to
Bottom
50%
Average
Rank
CLEC7A C-type lectin domain family 7, member A
[ENSSSCT00000000700]
30 29 37 38 35 39 35
NLRP5 NLR family, pyrin domain containing 5
[NM_001163407]
66 51 28 29 24 12 35
FCN2 Ficolin-β (hucolin) [NM_213868] 22 27 35 37 41 54 36
LGALS13 Galectin 13 [NM_001142841] 42 40 34 35 36 30 36
NOD1 Nucleotide-binding oligomerization domain
containing 1 [NM_001114277]
35 34 40 36 37 42 37
BD3 Pre-pro-beta-defensin 3 [NM_214444] 39 32 42 34 34 47 38
SELL Selectin L [NM_001112678] 27 28 36 39 50 48 38
TREM1 Triggering receptor expressed on myeloid cells 1
[NM_213756]
32 35 38 40 44 41 38
TLR4 Toll-like receptor 4 [NM_001113039] 36 36 41 42 40 40 39
DDX60 DEAD (Asp-Glu-Ala-Asp) box polypeptide 60
[XM_001927633]
40 43 39 44 49 37 42
KLRB1 Killer cell lectin-like receptor subfamily B, member 1
[TC451162]
38 38 45 43 38 53 43
C7 Complement component 7 [NM_214282] 31 39 43 45 47 51 43
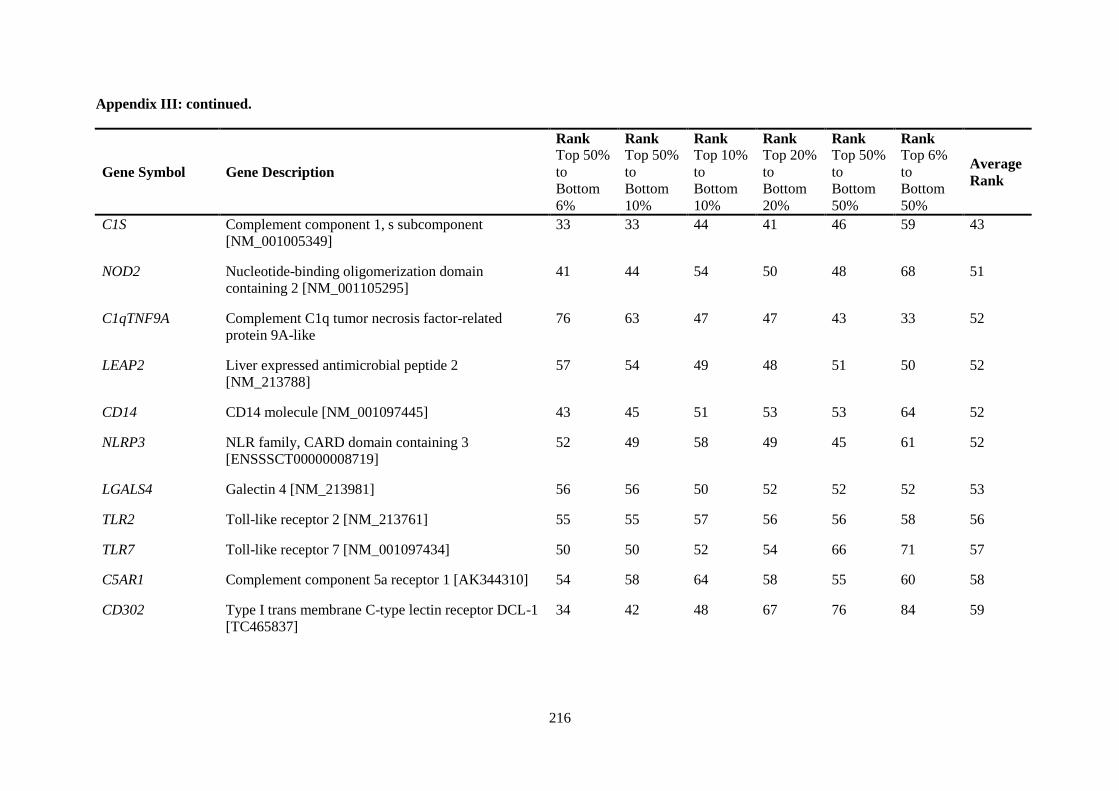
216
Appendix III: continued.
Gene Symbol Gene Description
Rank
Top 50%
to
Bottom
6%
Rank
Top 50%
to
Bottom
10%
Rank
Top 10%
to
Bottom
10%
Rank
Top 20%
to
Bottom
20%
Rank
Top 50%
to
Bottom
50%
Rank
Top 6%
to
Bottom
50%
Average
Rank
C1S Complement component 1, s subcomponent
[NM_001005349]
33 33 44 41 46 59 43
NOD2 Nucleotide-binding oligomerization domain
containing 2 [NM_001105295]
41 44 54 50 48 68 51
C1qTNF9A Complement C1q tumor necrosis factor-related
protein 9A-like
76 63 47 47 43 33 52
LEAP2 Liver expressed antimicrobial peptide 2
[NM_213788]
57 54 49 48 51 50 52
CD14 CD14 molecule [NM_001097445] 43 45 51 53 53 64 52
NLRP3 NLR family, CARD domain containing 3
[ENSSSCT00000008719]
52 49 58 49 45 61 52
LGALS4 Galectin 4 [NM_213981] 56 56 50 52 52 52 53
TLR2 Toll-like receptor 2 [NM_213761] 55 55 57 56 56 58 56
TLR7 Toll-like receptor 7 [NM_001097434] 50 50 52 54 66 71 57
C5AR1 Complement component 5a receptor 1 [AK344310] 54 58 64 58 55 60 58
CD302 Type I trans membrane C-type lectin receptor DCL-1
[TC465837]
34 42 48 67 76 84 59
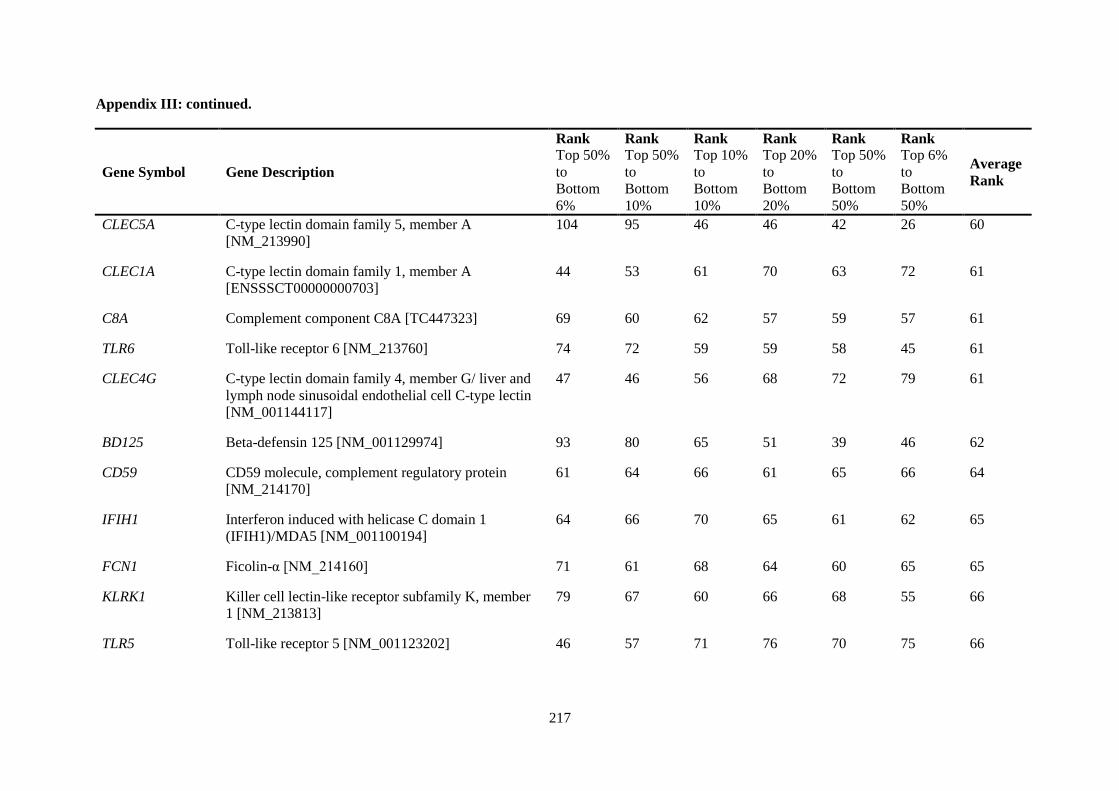
217
Appendix III: continued.
Gene Symbol Gene Description
Rank
Top 50%
to
Bottom
6%
Rank
Top 50%
to
Bottom
10%
Rank
Top 10%
to
Bottom
10%
Rank
Top 20%
to
Bottom
20%
Rank
Top 50%
to
Bottom
50%
Rank
Top 6%
to
Bottom
50%
Average
Rank
CLEC5A C-type lectin domain family 5, member A
[NM_213990]
104 95 46 46 42 26 60
CLEC1A C-type lectin domain family 1, member A
[ENSSSCT00000000703]
44 53 61 70 63 72 61
C8A Complement component C8A [TC447323] 69 60 62 57 59 57 61
TLR6 Toll-like receptor 6 [NM_213760] 74 72 59 59 58 45 61
CLEC4G C-type lectin domain family 4, member G/ liver and
lymph node sinusoidal endothelial cell C-type lectin
[NM_001144117]
47 46 56 68 72 79 61
BD125 Beta-defensin 125 [NM_001129974] 93 80 65 51 39 46 62
CD59 CD59 molecule, complement regulatory protein
[NM_214170]
61 64 66 61 65 66 64
IFIH1 Interferon induced with helicase C domain 1
(IFIH1)/MDA5 [NM_001100194]
64 66 70 65 61 62 65
FCN1 Ficolin-α [NM_214160] 71 61 68 64 60 65 65
KLRK1 Killer cell lectin-like receptor subfamily K, member
1 [NM_213813]
79 67 60 66 68 55 66
TLR5 Toll-like receptor 5 [NM_001123202] 46 57 71 76 70 75 66
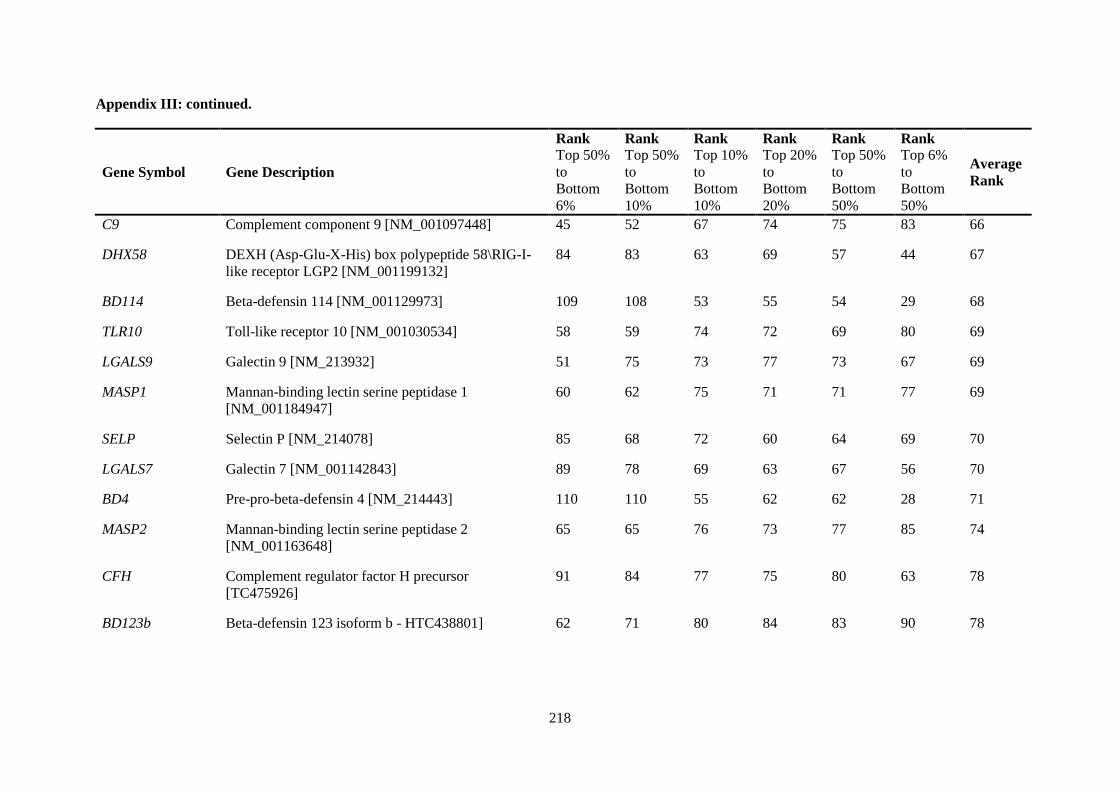
218
Appendix III: continued.
Gene Symbol Gene Description
Rank
Top 50%
to
Bottom
6%
Rank
Top 50%
to
Bottom
10%
Rank
Top 10%
to
Bottom
10%
Rank
Top 20%
to
Bottom
20%
Rank
Top 50%
to
Bottom
50%
Rank
Top 6%
to
Bottom
50%
Average
Rank
C9 Complement component 9 [NM_001097448] 45 52 67 74 75 83 66
DHX58 DEXH (Asp-Glu-X-His) box polypeptide 58\RIG-I-
like receptor LGP2 [NM_001199132]
84 83 63 69 57 44 67
BD114 Beta-defensin 114 [NM_001129973] 109 108 53 55 54 29 68
TLR10 Toll-like receptor 10 [NM_001030534] 58 59 74 72 69 80 69
LGALS9 Galectin 9 [NM_213932] 51 75 73 77 73 67 69
MASP1 Mannan-binding lectin serine peptidase 1
[NM_001184947]
60 62 75 71 71 77 69
SELP Selectin P [NM_214078] 85 68 72 60 64 69 70
LGALS7 Galectin 7 [NM_001142843] 89 78 69 63 67 56 70
BD4 Pre-pro-beta-defensin 4 [NM_214443] 110 110 55 62 62 28 71
MASP2 Mannan-binding lectin serine peptidase 2
[NM_001163648]
65 65 76 73 77 85 74
CFH Complement regulator factor H precursor
[TC475926]
91 84 77 75 80 63 78
BD123b Beta-defensin 123 isoform b - HTC438801] 62 71 80 84 83 90 78
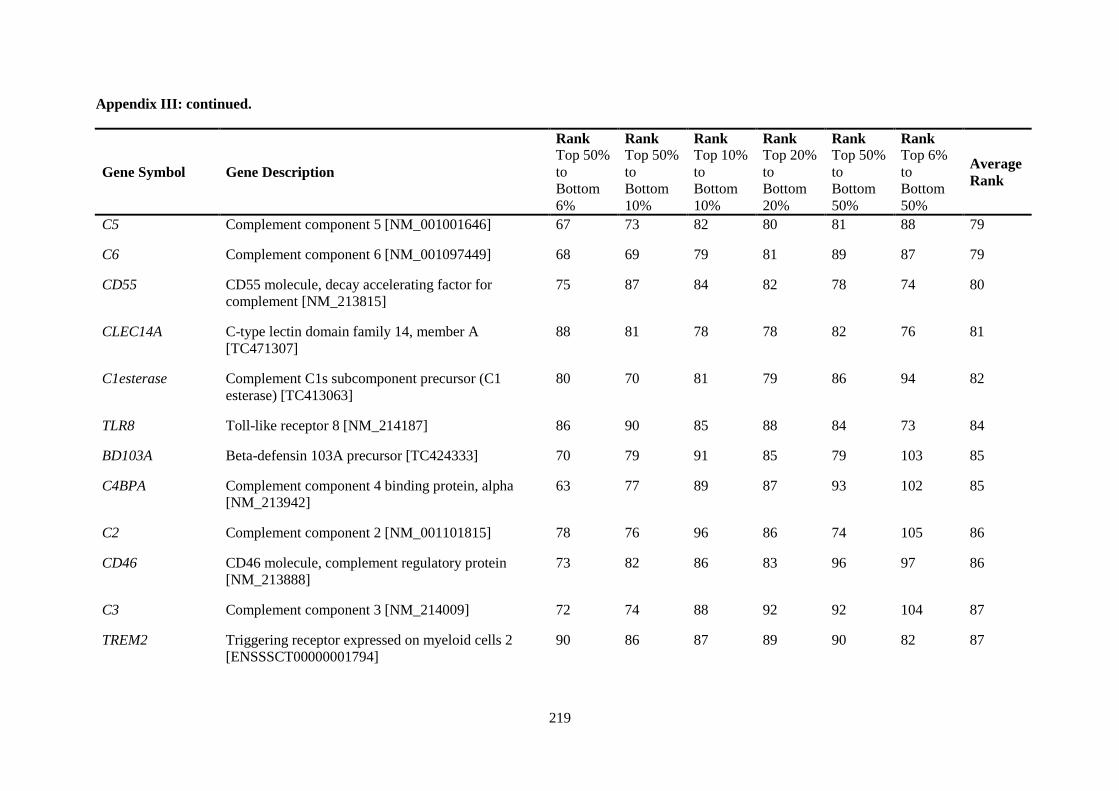
219
Appendix III: continued.
Gene Symbol Gene Description
Rank
Top 50%
to
Bottom
6%
Rank
Top 50%
to
Bottom
10%
Rank
Top 10%
to
Bottom
10%
Rank
Top 20%
to
Bottom
20%
Rank
Top 50%
to
Bottom
50%
Rank
Top 6%
to
Bottom
50%
Average
Rank
C5 Complement component 5 [NM_001001646] 67 73 82 80 81 88 79
C6 Complement component 6 [NM_001097449] 68 69 79 81 89 87 79
CD55 CD55 molecule, decay accelerating factor for
complement [NM_213815]
75 87 84 82 78 74 80
CLEC14A C-type lectin domain family 14, member A
[TC471307]
88 81 78 78 82 76 81
C1esterase Complement C1s subcomponent precursor (C1
esterase) [TC413063]
80 70 81 79 86 94 82
TLR8 Toll-like receptor 8 [NM_214187] 86 90 85 88 84 73 84
BD103A Beta-defensin 103A precursor [TC424333] 70 79 91 85 79 103 85
C4BPA Complement component 4 binding protein, alpha
[NM_213942]
63 77 89 87 93 102 85
C2 Complement component 2 [NM_001101815] 78 76 96 86 74 105 86
CD46 CD46 molecule, complement regulatory protein
[NM_213888]
73 82 86 83 96 97 86
C3 Complement component 3 [NM_214009] 72 74 88 92 92 104 87
TREM2 Triggering receptor expressed on myeloid cells 2
[ENSSSCT00000001794]
90 86 87 89 90 82 87
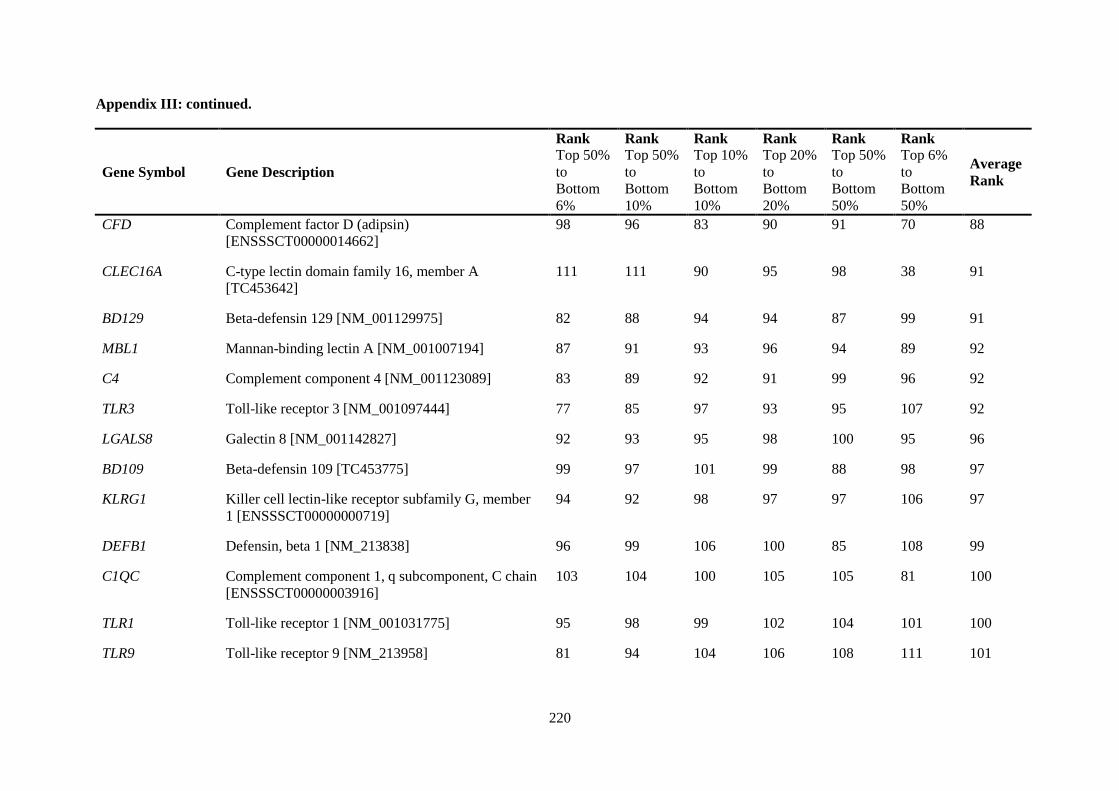
220
Appendix III: continued.
Gene Symbol Gene Description
Rank
Top 50%
to
Bottom
6%
Rank
Top 50%
to
Bottom
10%
Rank
Top 10%
to
Bottom
10%
Rank
Top 20%
to
Bottom
20%
Rank
Top 50%
to
Bottom
50%
Rank
Top 6%
to
Bottom
50%
Average
Rank
CFD Complement factor D (adipsin)
[ENSSSCT00000014662]
98 96 83 90 91 70 88
CLEC16A C-type lectin domain family 16, member A
[TC453642]
111 111 90 95 98 38 91
BD129 Beta-defensin 129 [NM_001129975] 82 88 94 94 87 99 91
MBL1 Mannan-binding lectin A [NM_001007194] 87 91 93 96 94 89 92
C4 Complement component 4 [NM_001123089] 83 89 92 91 99 96 92
TLR3 Toll-like receptor 3 [NM_001097444] 77 85 97 93 95 107 92
LGALS8 Galectin 8 [NM_001142827] 92 93 95 98 100 95 96
BD109 Beta-defensin 109 [TC453775] 99 97 101 99 88 98 97
KLRG1 Killer cell lectin-like receptor subfamily G, member
1 [ENSSSCT00000000719]
94 92 98 97 97 106 97
DEFB1 Defensin, beta 1 [NM_213838] 96 99 106 100 85 108 99
C1QC Complement component 1, q subcomponent, C chain
[ENSSSCT00000003916]
103 104 100 105 105 81 100
TLR1 Toll-like receptor 1 [NM_001031775] 95 98 99 102 104 101 100
TLR9 Toll-like receptor 9 [NM_213958] 81 94 104 106 108 111 101
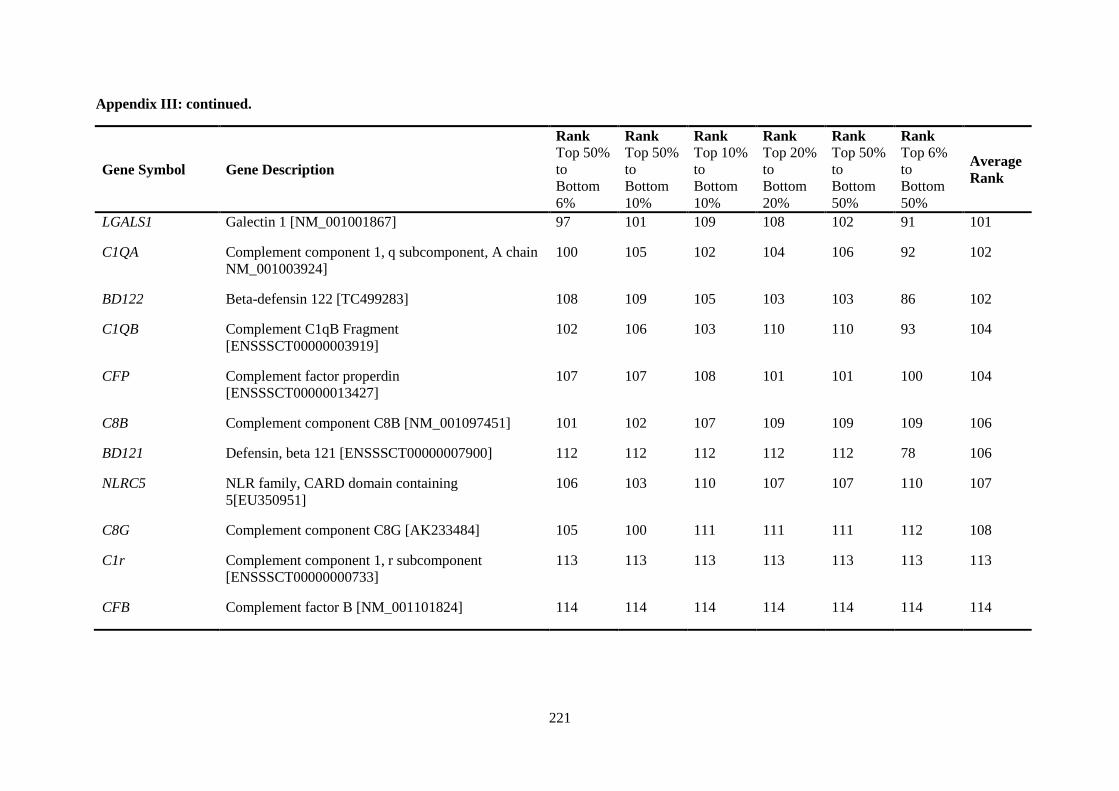
221
Appendix III: continued.
Gene Symbol Gene Description
Rank
Top 50%
to
Bottom
6%
Rank
Top 50%
to
Bottom
10%
Rank
Top 10%
to
Bottom
10%
Rank
Top 20%
to
Bottom
20%
Rank
Top 50%
to
Bottom
50%
Rank
Top 6%
to
Bottom
50%
Average
Rank
LGALS1 Galectin 1 [NM_001001867] 97 101 109 108 102 91 101
C1QA Complement component 1, q subcomponent, A chain
NM_001003924]
100 105 102 104 106 92 102
BD122 Beta-defensin 122 [TC499283] 108 109 105 103 103 86 102
C1QB Complement C1qB Fragment
[ENSSSCT00000003919]
102 106 103 110 110 93 104
CFP Complement factor properdin
[ENSSSCT00000013427]
107 107 108 101 101 100 104
C8B Complement component C8B [NM_001097451] 101 102 107 109 109 109 106
BD121 Defensin, beta 121 [ENSSSCT00000007900] 112 112 112 112 112 78 106
NLRC5 NLR family, CARD domain containing
5[EU350951]
106 103 110 107 107 110 107
C8G Complement component C8G [AK233484] 105 100 111 111 111 112 108
C1r Complement component 1, r subcomponent
[ENSSSCT00000000733]
113 113 113 113 113 113 113
CFB Complement factor B [NM_001101824] 114 114 114 114 114 114 114
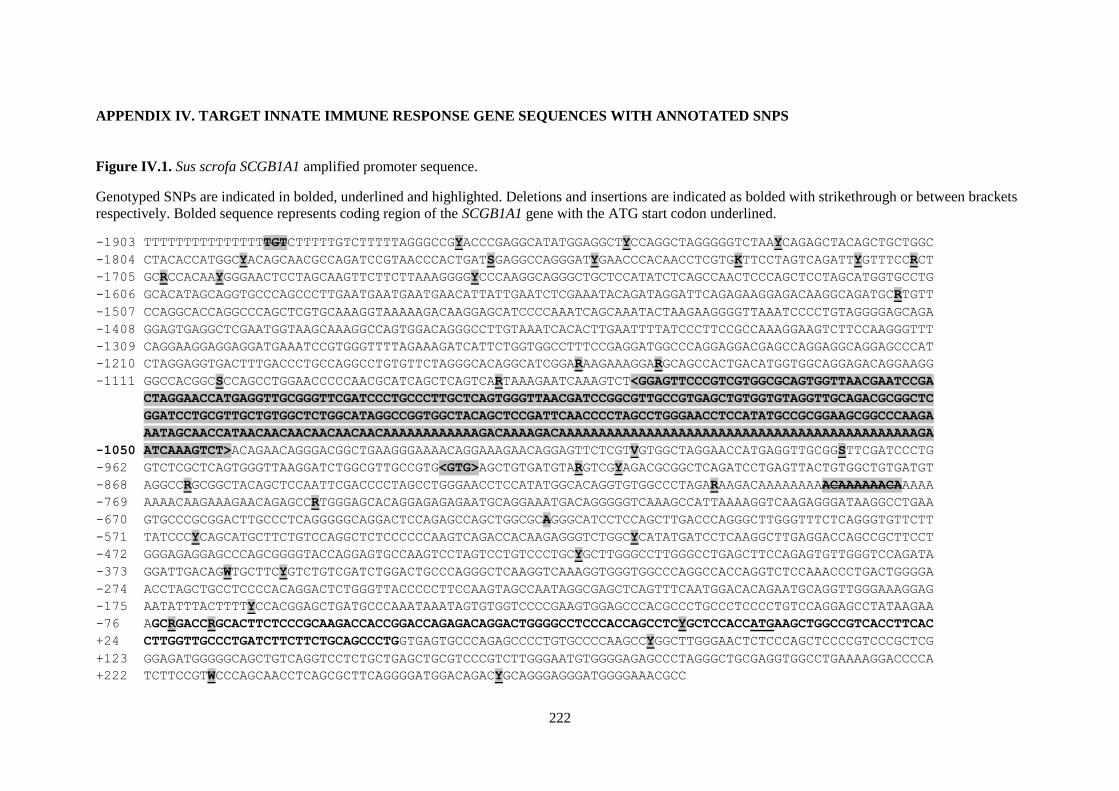
222
APPENDIX IV. TARGET INNATE IMMUNE RESPONSE GENE SEQUENCES WITH ANNOTATED SNPS
Figure IV.1. Sus scrofa SCGB1A1 amplified promoter sequence.
Genotyped SNPs are indicated in bolded, underlined and highlighted. Deletions and insertions are indicated as bolded with strikethrough or between brackets
respectively. Bolded sequence represents coding region of the SCGB1A1 gene with the ATG start codon underlined.
-1903 TTTTTTTTTTTTTTTTGTCTTTTTGTCTTTTTAGGGCCGYACCCGAGGCATATGGAGGCTYCCAGGCTAGGGGGTCTAAYCAGAGCTACAGCTGCTGGC
-1804 CTACACCATGGCYACAGCAACGCCAGATCCGTAACCCACTGATSGAGGCCAGGGATYGAACCCACAACCTCGTGKTTCCTAGTCAGATTYGTTTCCRCT
-1705 GCRCCACAAYGGGAACTCCTAGCAAGTTCTTCTTAAAGGGGYCCCAAGGCAGGGCTGCTCCATATCTCAGCCAACTCCCAGCTCCTAGCATGGTGCCTG
-1606 GCACATAGCAGGTGCCCAGCCCTTGAATGAATGAATGAACATTATTGAATCTCGAAATACAGATAGGATTCAGAGAAGGAGACAAGGCAGATGCRTGTT
-1507 CCAGGCACCAGGCCCAGCTCGTGCAAAGGTAAAAAGACAAGGAGCATCCCCAAATCAGCAAATACTAAGAAGGGGTTAAATCCCCTGTAGGGGAGCAGA
-1408 GGAGTGAGGCTCGAATGGTAAGCAAAGGCCAGTGGACAGGGCCTTGTAAATCACACTTGAATTTTATCCCTTCCGCCAAAGGAAGTCTTCCAAGGGTTT
-1309 CAGGAAGGAGGAGGATGAAATCCGTGGGTTTTAGAAAGATCATTCTGGTGGCCTTTCCGAGGATGGCCCAGGAGGACGAGCCAGGAGGCAGGAGCCCAT
-1210 CTAGGAGGTGACTTTGACCCTGCCAGGCCTGTGTTCTAGGGCACAGGCATCGGARAAGAAAGGARGCAGCCACTGACATGGTGGCAGGAGACAGGAAGG
-1111 GGCCACGGCSCCAGCCTGGAACCCCCAACGCATCAGCTCAGTCARTAAAGAATCAAAGTCT<GGAGTTCCCGTCGTGGCGCAGTGGTTAACGAATCCGA
CTAGGAACCATGAGGTTGCGGGTTCGATCCCTGCCCTTGCTCAGTGGGTTAACGATCCGGCGTTGCCGTGAGCTGTGGTGTAGGTTGCAGACGCGGCTC
GGATCCTGCGTTGCTGTGGCTCTGGCATAGGCCGGTGGCTACAGCTCCGATTCAACCCCTAGCCTGGGAACCTCCATATGCCGCGGAAGCGGCCCAAGA
AATAGCAACCATAACAACAACAACAACAACAAAAAAAAAAAAGACAAAAGACAAAAAAAAAAAAAAAAAAAAAAAAAAAAAAAAAAAAAAAAAAAAAGA
-1050 ATCAAAGTCT>ACAGAACAGGGACGGCTGAAGGGAAAACAGGAAAGAACAGGAGTTCTCGTVGTGGCTAGGAACCATGAGGTTGCGGSTTCGATCCCTG
-962 GTCTCGCTCAGTGGGTTAAGGATCTGGCGTTGCCGTG<GTG>AGCTGTGATGTARGTCGYAGACGCGGCTCAGATCCTGAGTTACTGTGGCTGTGATGT
-868 AGGCCRGCGGCTACAGCTCCAATTCGACCCCTAGCCTGGGAACCTCCATATGGCACAGGTGTGGCCCTAGARAAGACAAAAAAAAACAAAAAACAAAAA
-769 AAAACAAGAAAGAACAGAGCCRTGGGAGCACAGGAGAGAGAATGCAGGAAATGACAGGGGGTCAAAGCCATTAAAAGGTCAAGAGGGATAAGGCCTGAA
-670 GTGCCCGCGGACTTGCCCTCAGGGGGCAGGACTCCAGAGCCAGCTGGCGCAGGGCATCCTCCAGCTTGACCCAGGGCTTGGGTTTCTCAGGGTGTTCTT
-571 TATCCCYCAGCATGCTTCTGTCCAGGCTCTCCCCCCAAGTCAGACCACAAGAGGGTCTGGCYCATATGATCCTCAAGGCTTGAGGACCAGCCGCTTCCT
-472 GGGAGAGGAGCCCAGCGGGGTACCAGGAGTGCCAAGTCCTAGTCCTGTCCCTGCYGCTTGGGCCTTGGGCCTGAGCTTCCAGAGTGTTGGGTCCAGATA
-373 GGATTGACAGWTGCTTCYGTCTGTCGATCTGGACTGCCCAGGGCTCAAGGTCAAAGGTGGGTGGCCCAGGCCACCAGGTCTCCAAACCCTGACTGGGGA
-274 ACCTAGCTGCCTCCCCACAGGACTCTGGGTTACCCCCTTCCAAGTAGCCAATAGGCGAGCTCAGTTTCAATGGACACAGAATGCAGGTTGGGAAAGGAG
-175 AATATTTACTTTTYCCACGGAGCTGATGCCCAAATAAATAGTGTGGTCCCCGAAGTGGAGCCCACGCCCTGCCCTCCCCTGTCCAGGAGCCTATAAGAA
-76 AGCRGACCRGCACTTCTCCCGCAAGACCACCGGACCAGAGACAGGACTGGGGCCTCCCACCAGCCTCYGCTCCACCATGAAGCTGGCCGTCACCTTCAC
+24 CTTGGTTGCCCTGATCTTCTTCTGCAGCCCTGGTGAGTGCCCAGAGCCCCTGTGCCCCAAGCCYGGCTTGGGAACTCTCCCAGCTCCCCGTCCCGCTCG
+123 GGAGATGGGGGCAGCTGTCAGGTCCTCTGCTGAGCTGCGTCCCGTCTTGGGAATGTGGGGAGAGCCCTAGGGCTGCGAGGTGGCCTGAAAAGGACCCCA
+222 TCTTCCGTWCCCAGCAACCTCAGCGCTTCAGGGGATGGACAGACYGCAGGGAGGGATGGGGAAACGCC
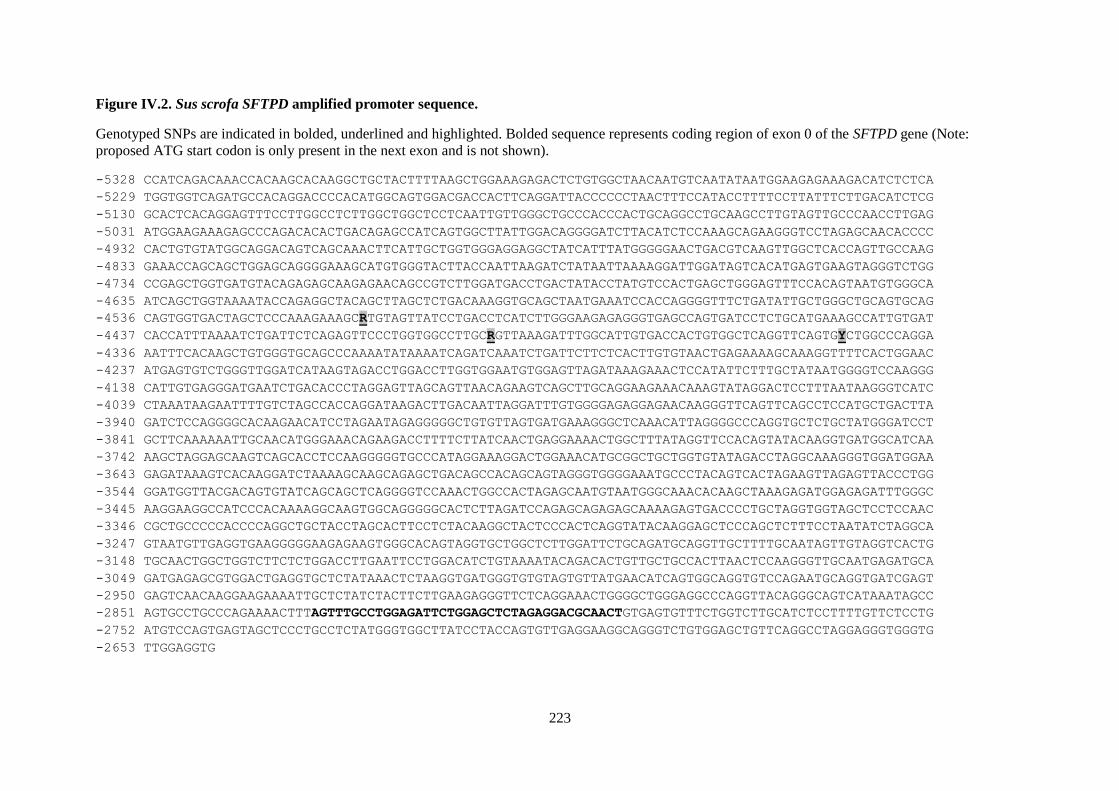
223
Figure IV.2. Sus scrofa SFTPD amplified promoter sequence.
Genotyped SNPs are indicated in bolded, underlined and highlighted. Bolded sequence represents coding region of exon 0 of the SFTPD gene (Note:
proposed ATG start codon is only present in the next exon and is not shown).
-5328 CCATCAGACAAACCACAAGCACAAGGCTGCTACTTTTAAGCTGGAAAGAGACTCTGTGGCTAACAATGTCAATATAATGGAAGAGAAAGACATCTCTCA
-5229 TGGTGGTCAGATGCCACAGGACCCCACATGGCAGTGGACGACCACTTCAGGATTACCCCCCTAACTTTCCATACCTTTTCCTTATTTCTTGACATCTCG
-5130 GCACTCACAGGAGTTTCCTTGGCCTCTTGGCTGGCTCCTCAATTGTTGGGCTGCCCACCCACTGCAGGCCTGCAAGCCTTGTAGTTGCCCAACCTTGAG
-5031 ATGGAAGAAAGAGCCCAGACACACTGACAGAGCCATCAGTGGCTTATTGGACAGGGGATCTTACATCTCCAAAGCAGAAGGGTCCTAGAGCAACACCCC
-4932 CACTGTGTATGGCAGGACAGTCAGCAAACTTCATTGCTGGTGGGAGGAGGCTATCATTTATGGGGGAACTGACGTCAAGTTGGCTCACCAGTTGCCAAG
-4833 GAAACCAGCAGCTGGAGCAGGGGAAAGCATGTGGGTACTTACCAATTAAGATCTATAATTAAAAGGATTGGATAGTCACATGAGTGAAGTAGGGTCTGG
-4734 CCGAGCTGGTGATGTACAGAGAGCAAGAGAACAGCCGTCTTGGATGACCTGACTATACCTATGTCCACTGAGCTGGGAGTTTCCACAGTAATGTGGGCA
-4635 ATCAGCTGGTAAAATACCAGAGGCTACAGCTTAGCTCTGACAAAGGTGCAGCTAATGAAATCCACCAGGGGTTTCTGATATTGCTGGGCTGCAGTGCAG
-4536 CAGTGGTGACTAGCTCCCAAAGAAAGCRTGTAGTTATCCTGACCTCATCTTGGGAAGAGAGGGTGAGCCAGTGATCCTCTGCATGAAAGCCATTGTGAT
-4437 CACCATTTAAAATCTGATTCTCAGAGTTCCCTGGTGGCCTTGCRGTTAAAGATTTGGCATTGTGACCACTGTGGCTCAGGTTCAGTGYCTGGCCCAGGA
-4336 AATTTCACAAGCTGTGGGTGCAGCCCAAAATATAAAATCAGATCAAATCTGATTCTTCTCACTTGTGTAACTGAGAAAAGCAAAGGTTTTCACTGGAAC
-4237 ATGAGTGTCTGGGTTGGATCATAAGTAGACCTGGACCTTGGTGGAATGTGGAGTTAGATAAAGAAACTCCATATTCTTTGCTATAATGGGGTCCAAGGG
-4138 CATTGTGAGGGATGAATCTGACACCCTAGGAGTTAGCAGTTAACAGAAGTCAGCTTGCAGGAAGAAACAAAGTATAGGACTCCTTTAATAAGGGTCATC
-4039 CTAAATAAGAATTTTGTCTAGCCACCAGGATAAGACTTGACAATTAGGATTTGTGGGGAGAGGAGAACAAGGGTTCAGTTCAGCCTCCATGCTGACTTA
-3940 GATCTCCAGGGGCACAAGAACATCCTAGAATAGAGGGGGCTGTGTTAGTGATGAAAGGGCTCAAACATTAGGGGCCCAGGTGCTCTGCTATGGGATCCT
-3841 GCTTCAAAAAATTGCAACATGGGAAACAGAAGACCTTTTCTTATCAACTGAGGAAAACTGGCTTTATAGGTTCCACAGTATACAAGGTGATGGCATCAA
-3742 AAGCTAGGAGCAAGTCAGCACCTCCAAGGGGGTGCCCATAGGAAAGGACTGGAAACATGCGGCTGCTGGTGTATAGACCTAGGCAAAGGGTGGATGGAA
-3643 GAGATAAAGTCACAAGGATCTAAAAGCAAGCAGAGCTGACAGCCACAGCAGTAGGGTGGGGAAATGCCCTACAGTCACTAGAAGTTAGAGTTACCCTGG
-3544 GGATGGTTACGACAGTGTATCAGCAGCTCAGGGGTCCAAACTGGCCACTAGAGCAATGTAATGGGCAAACACAAGCTAAAGAGATGGAGAGATTTGGGC
-3445 AAGGAAGGCCATCCCACAAAAGGCAAGTGGCAGGGGGCACTCTTAGATCCAGAGCAGAGAGCAAAAGAGTGACCCCTGCTAGGTGGTAGCTCCTCCAAC
-3346 CGCTGCCCCCACCCCAGGCTGCTACCTAGCACTTCCTCTACAAGGCTACTCCCACTCAGGTATACAAGGAGCTCCCAGCTCTTTCCTAATATCTAGGCA
-3247 GTAATGTTGAGGTGAAGGGGGAAGAGAAGTGGGCACAGTAGGTGCTGGCTCTTGGATTCTGCAGATGCAGGTTGCTTTTGCAATAGTTGTAGGTCACTG
-3148 TGCAACTGGCTGGTCTTCTCTGGACCTTGAATTCCTGGACATCTGTAAAATACAGACACTGTTGCTGCCACTTAACTCCAAGGGTTGCAATGAGATGCA
-3049 GATGAGAGCGTGGACTGAGGTGCTCTATAAACTCTAAGGTGATGGGTGTGTAGTGTTATGAACATCAGTGGCAGGTGTCCAGAATGCAGGTGATCGAGT
-2950 GAGTCAACAAGGAAGAAAATTGCTCTATCTACTTCTTGAAGAGGGTTCTCAGGAAACTGGGGCTGGGAGGCCCAGGTTACAGGGCAGTCATAAATAGCC
-2851 AGTGCCTGCCCAGAAAACTTTAGTTTGCCTGGAGATTCTGGAGCTCTAGAGGACGCAACTGTGAGTGTTTCTGGTCTTGCATCTCCTTTTGTTCTCCTG
-2752 ATGTCCAGTGAGTAGCTCCCTGCCTCTATGGGTGGCTTATCCTACCAGTGTTGAGGAAGGCAGGGTCTGTGGAGCTGTTCAGGCCTAGGAGGGTGGGTG
-2653 TTGGAGGTG
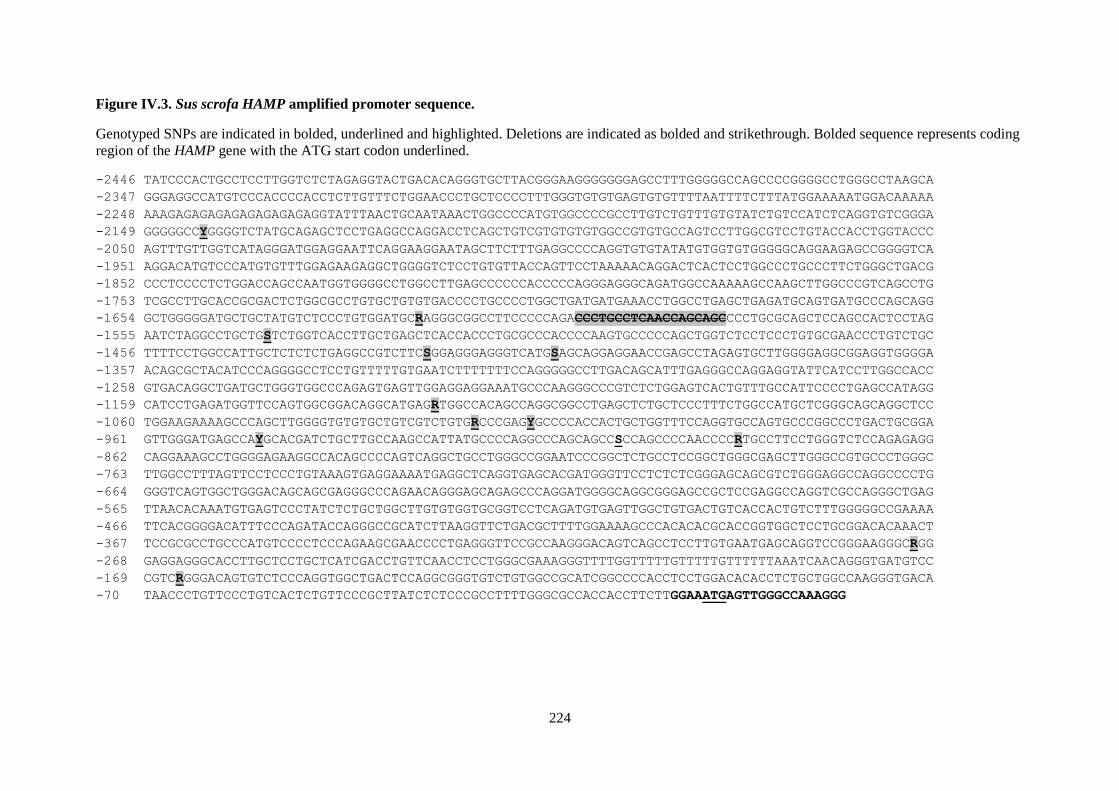
224
Figure IV.3. Sus scrofa HAMP amplified promoter sequence.
Genotyped SNPs are indicated in bolded, underlined and highlighted. Deletions are indicated as bolded and strikethrough. Bolded sequence represents coding
region of the HAMP gene with the ATG start codon underlined.
-2446 TATCCCACTGCCTCCTTGGTCTCTAGAGGTACTGACACAGGGTGCTTACGGGAAGGGGGGGAGCCTTTGGGGGCCAGCCCCGGGGCCTGGGCCTAAGCA
-2347 GGGAGGCCATGTCCCACCCCACCTCTTGTTTCTGGAACCCTGCTCCCCTTTGGGTGTGTGAGTGTGTTTTAATTTTCTTTATGGAAAAATGGACAAAAA
-2248 AAAGAGAGAGAGAGAGAGAGAGGTATTTAACTGCAATAAACTGGCCCCATGTGGCCCCGCCTTGTCTGTTTGTGTATCTGTCCATCTCAGGTGTCGGGA
-2149 GGGGGCCYGGGGTCTATGCAGAGCTCCTGAGGCCAGGACCTCAGCTGTCGTGTGTGTGGCCGTGTGCCAGTCCTTGGCGTCCTGTACCACCTGGTACCC
-2050 AGTTTGTTGGTCATAGGGATGGAGGAATTCAGGAAGGAATAGCTTCTTTGAGGCCCCAGGTGTGTATATGTGGTGTGGGGGCAGGAAGAGCCGGGGTCA
-1951 AGGACATGTCCCATGTGTTTGGAGAAGAGGCTGGGGTCTCCTGTGTTACCAGTTCCTAAAAACAGGACTCACTCCTGGCCCTGCCCTTCTGGGCTGACG
-1852 CCCTCCCCTCTGGACCAGCCAATGGTGGGGCCTGGCCTTGAGCCCCCCACCCCCAGGGAGGGCAGATGGCCAAAAAGCCAAGCTTGGCCCGTCAGCCTG
-1753 TCGCCTTGCACCGCGACTCTGGCGCCTGTGCTGTGTGACCCCTGCCCCTGGCTGATGATGAAACCTGGCCTGAGCTGAGATGCAGTGATGCCCAGCAGG
-1654 GCTGGGGGATGCTGCTATGTCTCCCTGTGGATGCRAGGGCGGCCTTCCCCCAGACCCTGCCTCAACCAGCAGCCCCTGCGCAGCTCCAGCCACTCCTAG
-1555 AATCTAGGCCTGCTGSTCTGGTCACCTTGCTGAGCTCACCACCCTGCGCCCACCCCAAGTGCCCCCAGCTGGTCTCCTCCCTGTGCGAACCCTGTCTGC
-1456 TTTTCCTGGCCATTGCTCTCTCTGAGGCCGTCTTCSGGAGGGAGGGTCATGSAGCAGGAGGAACCGAGCCTAGAGTGCTTGGGGAGGCGGAGGTGGGGA
-1357 ACAGCGCTACATCCCAGGGGCCTCCTGTTTTTGTGAATCTTTTTTTCCAGGGGGCCTTGACAGCATTTGAGGGCCAGGAGGTATTCATCCTTGGCCACC
-1258 GTGACAGGCTGATGCTGGGTGGCCCAGAGTGAGTTGGAGGAGGAAATGCCCAAGGGCCCGTCTCTGGAGTCACTGTTTGCCATTCCCCTGAGCCATAGG
-1159 CATCCTGAGATGGTTCCAGTGGCGGACAGGCATGAGRTGGCCACAGCCAGGCGGCCTGAGCTCTGCTCCCTTTCTGGCCATGCTCGGGCAGCAGGCTCC
-1060 TGGAAGAAAAGCCCAGCTTGGGGTGTGTGCTGTCGTCTGTGRCCCGAGYGCCCCACCACTGCTGGTTTCCAGGTGCCAGTGCCCGGCCCTGACTGCGGA
-961 GTTGGGATGAGCCAYGCACGATCTGCTTGCCAAGCCATTATGCCCCAGGCCCAGCAGCCSCCAGCCCCAACCCCRTGCCTTCCTGGGTCTCCAGAGAGG
-862 CAGGAAAGCCTGGGGAGAAGGCCACAGCCCCAGTCAGGCTGCCTGGGCCGGAATCCCGGCTCTGCCTCCGGCTGGGCGAGCTTGGGCCGTGCCCTGGGC
-763 TTGGCCTTTAGTTCCTCCCTGTAAAGTGAGGAAAATGAGGCTCAGGTGAGCACGATGGGTTCCTCTCTCGGGAGCAGCGTCTGGGAGGCCAGGCCCCTG
-664 GGGTCAGTGGCTGGGACAGCAGCGAGGGCCCAGAACAGGGAGCAGAGCCCAGGATGGGGCAGGCGGGAGCCGCTCCGAGGCCAGGTCGCCAGGGCTGAG
-565 TTAACACAAATGTGAGTCCCTATCTCTGCTGGCTTGTGTGGTGCGGTCCTCAGATGTGAGTTGGCTGTGACTGTCACCACTGTCTTTGGGGGCCGAAAA
-466 TTCACGGGGACATTTCCCAGATACCAGGGCCGCATCTTAAGGTTCTGACGCTTTTGGAAAAGCCCACACACGCACCGGTGGCTCCTGCGGACACAAACT
-367 TCCGCGCCTGCCCATGTCCCCTCCCAGAAGCGAACCCCTGAGGGTTCCGCCAAGGGACAGTCAGCCTCCTTGTGAATGAGCAGGTCCGGGAAGGGCRGG
-268 GAGGAGGGCACCTTGCTCCTGCTCATCGACCTGTTCAACCTCCTGGGCGAAAGGGTTTTGGTTTTTGTTTTTGTTTTTTAAATCAACAGGGTGATGTCC
-169 CGTCRGGGACAGTGTCTCCCAGGTGGCTGACTCCAGGCGGGTGTCTGTGGCCGCATCGGCCCCACCTCCTGGACACACCTCTGCTGGCCAAGGGTGACA
-70 TAACCCTGTTCCCTGTCACTCTGTTCCCGCTTATCTCTCCCGCCTTTTGGGCGCCACCACCTTCTTGGAAATGAGTTGGGCCAAAGGG
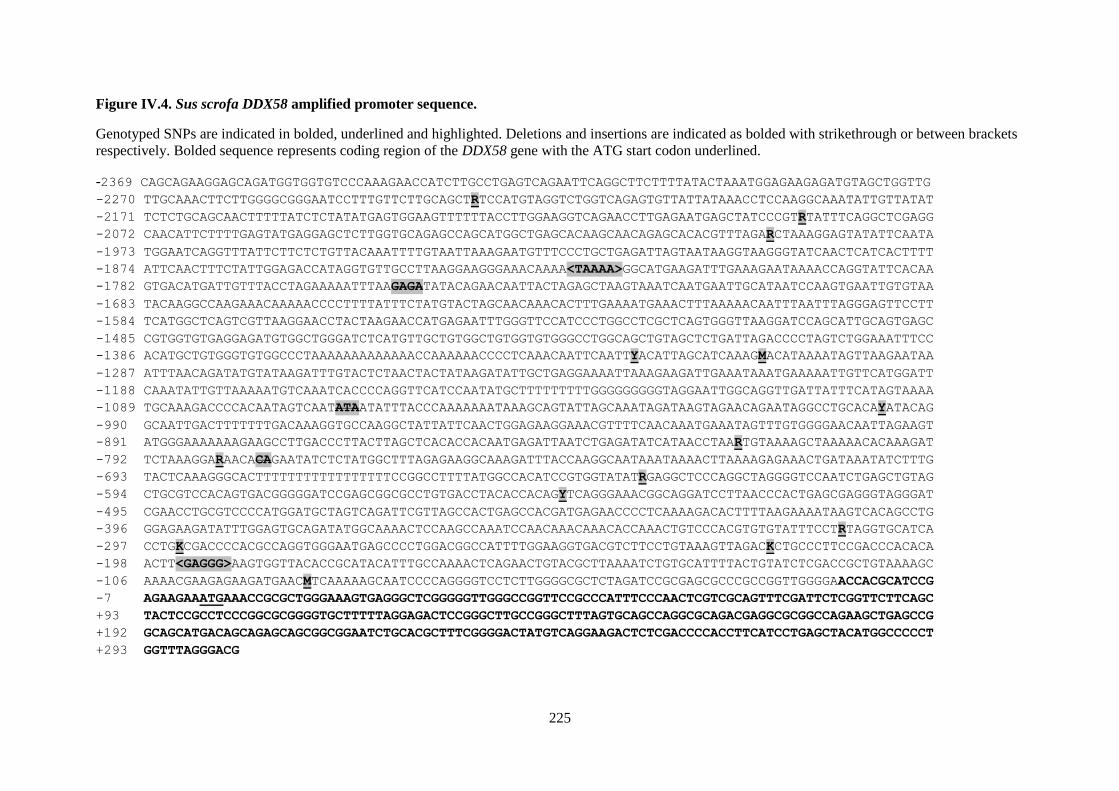
225
Figure IV.4. Sus scrofa DDX58 amplified promoter sequence.
Genotyped SNPs are indicated in bolded, underlined and highlighted. Deletions and insertions are indicated as bolded with strikethrough or between brackets
respectively. Bolded sequence represents coding region of the DDX58 gene with the ATG start codon underlined.
-2369 CAGCAGAAGGAGCAGATGGTGGTGTCCCAAAGAACCATCTTGCCTGAGTCAGAATTCAGGCTTCTTTTATACTAAATGGAGAAGAGATGTAGCTGGTTG
-2270 TTGCAAACTTCTTGGGGCGGGAATCCTTTGTTCTTGCAGCTRTCCATGTAGGTCTGGTCAGAGTGTTATTATAAACCTCCAAGGCAAATATTGTTATAT
-2171 TCTCTGCAGCAACTTTTTATCTCTATATGAGTGGAAGTTTTTTACCTTGGAAGGTCAGAACCTTGAGAATGAGCTATCCCGTRTATTTCAGGCTCGAGG
-2072 CAACATTCTTTTGAGTATGAGGAGCTCTTGGTGCAGAGCCAGCATGGCTGAGCACAAGCAACAGAGCACACGTTTAGARCTAAAGGAGTATATTCAATA
-1973 TGGAATCAGGTTTATTCTTCTCTGTTACAAATTTTGTAATTAAAGAATGTTTCCCTGCTGAGATTAGTAATAAGGTAAGGGTATCAACTCATCACTTTT
-1874 ATTCAACTTTCTATTGGAGACCATAGGTGTTGCCTTAAGGAAGGGAAACAAAA<TAAAA>GGCATGAAGATTTGAAAGAATAAAACCAGGTATTCACAA
-1782 GTGACATGATTGTTTACCTAGAAAAATTTAAGAGATATACAGAACAATTACTAGAGCTAAGTAAATCAATGAATTGCATAATCCAAGTGAATTGTGTAA
-1683 TACAAGGCCAAGAAACAAAAACCCCTTTTATTTCTATGTACTAGCAACAAACACTTTGAAAATGAAACTTTAAAAACAATTTAATTTAGGGAGTTCCTT
-1584 TCATGGCTCAGTCGTTAAGGAACCTACTAAGAACCATGAGAATTTGGGTTCCATCCCTGGCCTCGCTCAGTGGGTTAAGGATCCAGCATTGCAGTGAGC
-1485 CGTGGTGTGAGGAGATGTGGCTGGGATCTCATGTTGCTGTGGCTGTGGTGTGGGCCTGGCAGCTGTAGCTCTGATTAGACCCCTAGTCTGGAAATTTCC
-1386 ACATGCTGTGGGTGTGGCCCTAAAAAAAAAAAAACCAAAAAACCCCTCAAACAATTCAATTYACATTAGCATCAAAGMACATAAAATAGTTAAGAATAA
-1287 ATTTAACAGATATGTATAAGATTTGTACTCTAACTACTATAAGATATTGCTGAGGAAAATTAAAGAAGATTGAAATAAATGAAAAATTGTTCATGGATT
-1188 CAAATATTGTTAAAAATGTCAAATCACCCCAGGTTCATCCAATATGCTTTTTTTTTGGGGGGGGGTAGGAATTGGCAGGTTGATTATTTCATAGTAAAA
-1089 TGCAAAGACCCCACAATAGTCAATATAATATTTACCCAAAAAAATAAAGCAGTATTAGCAAATAGATAAGTAGAACAGAATAGGCCTGCACAYATACAG
-990 GCAATTGACTTTTTTTGACAAAGGTGCCAAGGCTATTATTCAACTGGAGAAGGAAACGTTTTCAACAAATGAAATAGTTTGTGGGGAACAATTAGAAGT
-891 ATGGGAAAAAAAGAAGCCTTGACCCTTACTTAGCTCACACCACAATGAGATTAATCTGAGATATCATAACCTAARTGTAAAAGCTAAAAACACAAAGAT
-792 TCTAAAGGARAACACAGAATATCTCTATGGCTTTAGAGAAGGCAAAGATTTACCAAGGCAATAAATAAAACTTAAAAGAGAAACTGATAAATATCTTTG
-693 TACTCAAAGGGCACTTTTTTTTTTTTTTTTTCCGGCCTTTTATGGCCACATCCGTGGTATATRGAGGCTCCCAGGCTAGGGGTCCAATCTGAGCTGTAG
-594 CTGCGTCCACAGTGACGGGGGATCCGAGCGGCGCCTGTGACCTACACCACAGYTCAGGGAAACGGCAGGATCCTTAACCCACTGAGCGAGGGTAGGGAT
-495 CGAACCTGCGTCCCCATGGATGCTAGTCAGATTCGTTAGCCACTGAGCCACGATGAGAACCCCTCAAAAGACACTTTTAAGAAAATAAGTCACAGCCTG
-396 GGAGAAGATATTTGGAGTGCAGATATGGCAAAACTCCAAGCCAAATCCAACAAACAAACACCAAACTGTCCCACGTGTGTATTTCCTRTAGGTGCATCA
-297 CCTGKCGACCCCACGCCAGGTGGGAATGAGCCCCTGGACGGCCATTTTGGAAGGTGACGTCTTCCTGTAAAGTTAGACKCTGCCCTTCCGACCCACACA
-198 ACTT<GAGGG>AAGTGGTTACACCGCATACATTTGCCAAAACTCAGAACTGTACGCTTAAAATCTGTGCATTTTACTGTATCTCGACCGCTGTAAAAGC
-106 AAAACGAAGAGAAGATGAACMTCAAAAAGCAATCCCCAGGGGTCCTCTTGGGGCGCTCTAGATCCGCGAGCGCCCGCCGGTTGGGGAACCACGCATCCG
-7 AGAAGAAATGAAACCGCGCTGGGAAAGTGAGGGCTCGGGGGTTGGGCCGGTTCCGCCCATTTCCCAACTCGTCGCAGTTTCGATTCTCGGTTCTTCAGC
+93 TACTCCGCCTCCCGGCGCGGGGTGCTTTTTAGGAGACTCCGGGCTTGCCGGGCTTTAGTGCAGCCAGGCGCAGACGAGGCGCGGCCAGAAGCTGAGCCG
+192 GCAGCATGACAGCAGAGCAGCGGCGGAATCTGCACGCTTTCGGGGACTATGTCAGGAAGACTCTCGACCCCACCTTCATCCTGAGCTACATGGCCCCCT
+293 GGTTTAGGGACG
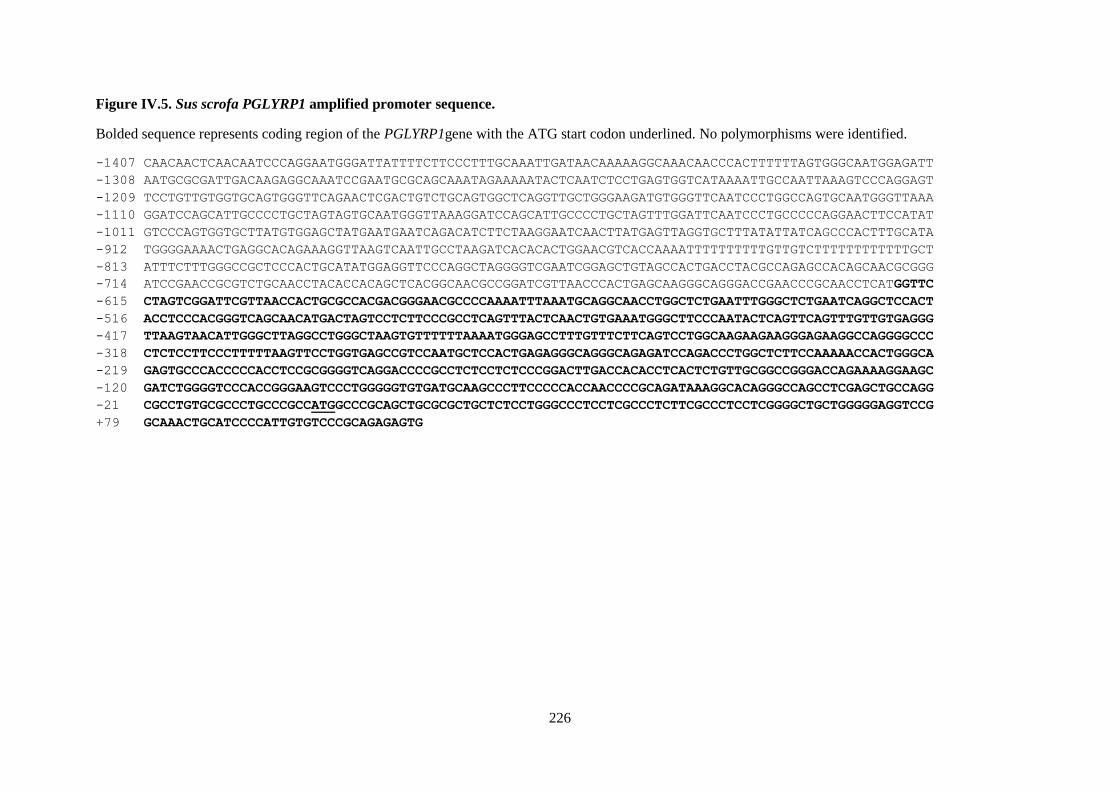
226
Figure IV.5. Sus scrofa PGLYRP1 amplified promoter sequence.
Bolded sequence represents coding region of the PGLYRP1gene with the ATG start codon underlined. No polymorphisms were identified.
-1407 CAACAACTCAACAATCCCAGGAATGGGATTATTTTCTTCCCTTTGCAAATTGATAACAAAAAGGCAAACAACCCACTTTTTTAGTGGGCAATGGAGATT
-1308 AATGCGCGATTGACAAGAGGCAAATCCGAATGCGCAGCAAATAGAAAAATACTCAATCTCCTGAGTGGTCATAAAATTGCCAATTAAAGTCCCAGGAGT
-1209 TCCTGTTGTGGTGCAGTGGGTTCAGAACTCGACTGTCTGCAGTGGCTCAGGTTGCTGGGAAGATGTGGGTTCAATCCCTGGCCAGTGCAATGGGTTAAA
-1110 GGATCCAGCATTGCCCCTGCTAGTAGTGCAATGGGTTAAAGGATCCAGCATTGCCCCTGCTAGTTTGGATTCAATCCCTGCCCCCAGGAACTTCCATAT
-1011 GTCCCAGTGGTGCTTATGTGGAGCTATGAATGAATCAGACATCTTCTAAGGAATCAACTTATGAGTTAGGTGCTTTATATTATCAGCCCACTTTGCATA
-912 TGGGGAAAACTGAGGCACAGAAAGGTTAAGTCAATTGCCTAAGATCACACACTGGAACGTCACCAAAATTTTTTTTTTGTTGTCTTTTTTTTTTTTGCT
-813 ATTTCTTTGGGCCGCTCCCACTGCATATGGAGGTTCCCAGGCTAGGGGTCGAATCGGAGCTGTAGCCACTGACCTACGCCAGAGCCACAGCAACGCGGG
-714 ATCCGAACCGCGTCTGCAACCTACACCACAGCTCACGGCAACGCCGGATCGTTAACCCACTGAGCAAGGGCAGGGACCGAACCCGCAACCTCATGGTTC
-615 CTAGTCGGATTCGTTAACCACTGCGCCACGACGGGAACGCCCCAAAATTTAAATGCAGGCAACCTGGCTCTGAATTTGGGCTCTGAATCAGGCTCCACT
-516 ACCTCCCACGGGTCAGCAACATGACTAGTCCTCTTCCCGCCTCAGTTTACTCAACTGTGAAATGGGCTTCCCAATACTCAGTTCAGTTTGTTGTGAGGG
-417 TTAAGTAACATTGGGCTTAGGCCTGGGCTAAGTGTTTTTTAAAATGGGAGCCTTTGTTTCTTCAGTCCTGGCAAGAAGAAGGGAGAAGGCCAGGGGCCC
-318 CTCTCCTTCCCTTTTTAAGTTCCTGGTGAGCCGTCCAATGCTCCACTGAGAGGGCAGGGCAGAGATCCAGACCCTGGCTCTTCCAAAAACCACTGGGCA
-219 GAGTGCCCACCCCCACCTCCGCGGGGTCAGGACCCCGCCTCTCCTCTCCCGGACTTGACCACACCTCACTCTGTTGCGGCCGGGACCAGAAAAGGAAGC
-120 GATCTGGGGTCCCACCGGGAAGTCCCTGGGGGTGTGATGCAAGCCCTTCCCCCACCAACCCCGCAGATAAAGGCACAGGGCCAGCCTCGAGCTGCCAGG
-21 CGCCTGTGCGCCCTGCCCGCCATGGCCCGCAGCTGCGCGCTGCTCTCCTGGGCCCTCCTCGCCCTCTTCGCCCTCCTCGGGGCTGCTGGGGGAGGTCCG
+79 GCAAACTGCATCCCCATTGTGTCCCGCAGAGAGTG
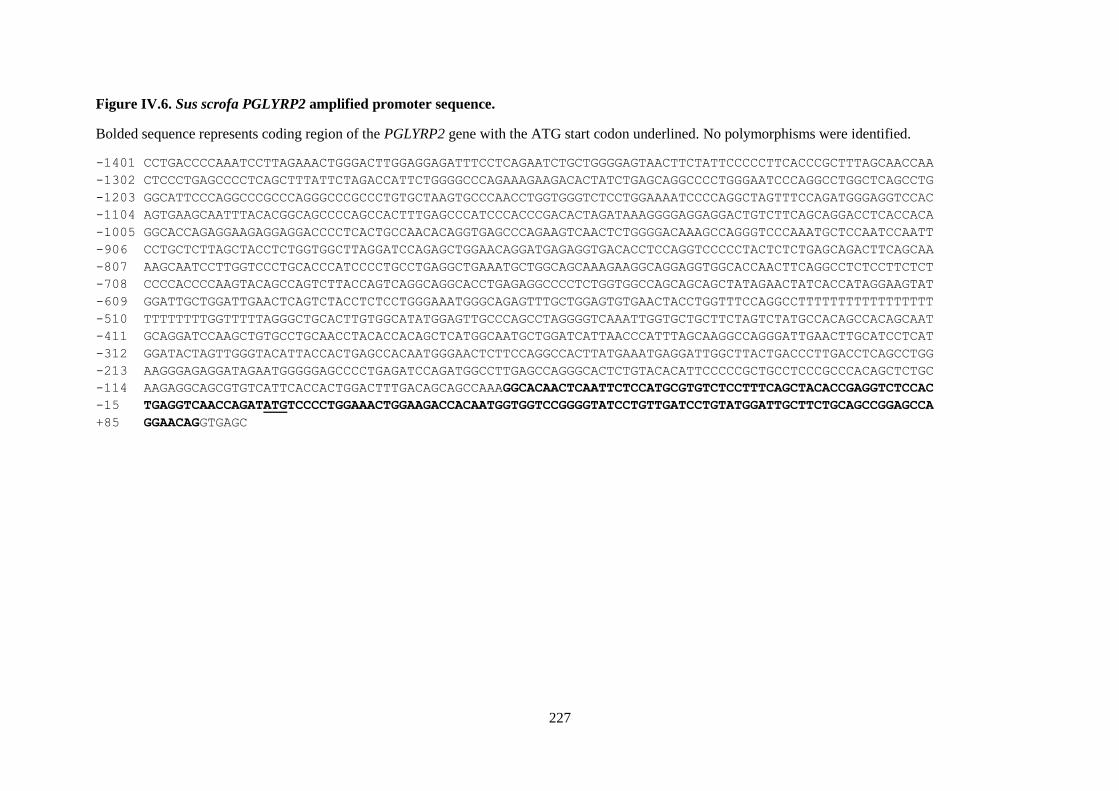
227
Figure IV.6. Sus scrofa PGLYRP2 amplified promoter sequence.
Bolded sequence represents coding region of the PGLYRP2 gene with the ATG start codon underlined. No polymorphisms were identified.
-1401 CCTGACCCCAAATCCTTAGAAACTGGGACTTGGAGGAGATTTCCTCAGAATCTGCTGGGGAGTAACTTCTATTCCCCCTTCACCCGCTTTAGCAACCAA
-1302 CTCCCTGAGCCCCTCAGCTTTATTCTAGACCATTCTGGGGCCCAGAAAGAAGACACTATCTGAGCAGGCCCCTGGGAATCCCAGGCCTGGCTCAGCCTG
-1203 GGCATTCCCAGGCCCGCCCAGGGCCCGCCCTGTGCTAAGTGCCCAACCTGGTGGGTCTCCTGGAAAATCCCCAGGCTAGTTTCCAGATGGGAGGTCCAC
-1104 AGTGAAGCAATTTACACGGCAGCCCCAGCCACTTTGAGCCCATCCCACCCGACACTAGATAAAGGGGAGGAGGACTGTCTTCAGCAGGACCTCACCACA
-1005 GGCACCAGAGGAAGAGGAGGACCCCTCACTGCCAACACAGGTGAGCCCAGAAGTCAACTCTGGGGACAAAGCCAGGGTCCCAAATGCTCCAATCCAATT
-906 CCTGCTCTTAGCTACCTCTGGTGGCTTAGGATCCAGAGCTGGAACAGGATGAGAGGTGACACCTCCAGGTCCCCCTACTCTCTGAGCAGACTTCAGCAA
-807 AAGCAATCCTTGGTCCCTGCACCCATCCCCTGCCTGAGGCTGAAATGCTGGCAGCAAAGAAGGCAGGAGGTGGCACCAACTTCAGGCCTCTCCTTCTCT
-708 CCCCACCCCAAGTACAGCCAGTCTTACCAGTCAGGCAGGCACCTGAGAGGCCCCTCTGGTGGCCAGCAGCAGCTATAGAACTATCACCATAGGAAGTAT
-609 GGATTGCTGGATTGAACTCAGTCTACCTCTCCTGGGAAATGGGCAGAGTTTGCTGGAGTGTGAACTACCTGGTTTCCAGGCCTTTTTTTTTTTTTTTTT
-510 TTTTTTTTGGTTTTTAGGGCTGCACTTGTGGCATATGGAGTTGCCCAGCCTAGGGGTCAAATTGGTGCTGCTTCTAGTCTATGCCACAGCCACAGCAAT
-411 GCAGGATCCAAGCTGTGCCTGCAACCTACACCACAGCTCATGGCAATGCTGGATCATTAACCCATTTAGCAAGGCCAGGGATTGAACTTGCATCCTCAT
-312 GGATACTAGTTGGGTACATTACCACTGAGCCACAATGGGAACTCTTCCAGGCCACTTATGAAATGAGGATTGGCTTACTGACCCTTGACCTCAGCCTGG
-213 AAGGGAGAGGATAGAATGGGGGAGCCCCTGAGATCCAGATGGCCTTGAGCCAGGGCACTCTGTACACATTCCCCCGCTGCCTCCCGCCCACAGCTCTGC
-114 AAGAGGCAGCGTGTCATTCACCACTGGACTTTGACAGCAGCCAAAGGCACAACTCAATTCTCCATGCGTGTCTCCTTTCAGCTACACCGAGGTCTCCAC
-15 TGAGGTCAACCAGATATGTCCCCTGGAAACTGGAAGACCACAATGGTGGTCCGGGGTATCCTGTTGATCCTGTATGGATTGCTTCTGCAGCCGGAGCCA
+85 GGAACAGGTGAGC


