Embed Size (px)
Citation preview

F O RU M
Consider a Spherical ManA Simple Model to Include Human Excretionin Life Cycle Assessment of Food Products
Ivan Munoz, Llorenc Mila i Canals, and Roland Clift
Keywords:
carbon cyclefecesindustrial ecologynutrients cycleurinewastewater
Summary
Emissions derived from human digestion of food and subse-quent excretion are very relevant from a life cycle perspective,and yet they are often omitted from food life cycle assessment(LCA) studies. This article offers a simple model to allocateand include these emissions in LCAs of specific foodstuffs.The model requires basic food composition values and calcu-lates the mass and energy balance for carbon, water, nutrients(mainly nitrogen [N] and phosphorus [P]), and other inorganicsubstances through different excretion paths: breathing, feces,and urine. In addition to direct excretion, the model also allo-cates some auxiliary materials and energy related to toilet use,such as flushing and washing and drying hands. Wastewatercomposition is also an output of the model, enabling watertreatment to be modeled in LCA studies. The sensitivity ofthe model to food composition is illustrated with differentfood products, and the relative importance of excretion in aproduct’s life cycle is shown with an example of broccoli. Theresults show that this model is sensitive to food compositionand thus useful for assessing the environmental consequencesof shifts in diet. From a life cycle perspective, the results showthat postconsumption nutrient emissions may dominate theimpacts on eutrophication potential, and they illustrate howthe carbon cycle is closed with the human emissions after foodpreparation and consumption.
Address correspondence to:Llorenc Mila i CanalsSEAC, Unilever ColworthColworth House, SharnbrookBedfordshire MK44 1LQ, United [email protected]
c© 2008 by Yale UniversityDOI: 10.1111/j.1530-9290.2008.00060.x
Volume 12, Number 4
www.blackwellpublishing.com/jie Journal of Industrial Ecology 521

F O RU M
Introduction
Food is a basic human need, recognized asone of our most resource-demanding and pollut-ing daily activities when the complete life cy-cle of food is considered. Food production causesmany environmental impacts through its sup-ply chain, which includes agricultural produc-tion, storage, several transport steps, processing,cooking and consumption, and waste disposal.Several studies have identified food as one ofthe main contributors to the environmental im-pact of private consumption at both the na-tional and the international level (Nijdam et al.2005; Tukker et al. 2006). It is not surprising,then, that life cycle assessment (LCA) studiesare increasingly directed at food to find ways tomake its production and consumption patternssustainable.
LCA has been applied to many different foodproducts, including basic carbohydrate foods,fruits and vegetables, dairy products, meat, fish,and alcoholic and nonalcoholic drinks, amongothers (Foster et al. 2006). Although some prac-titioners have conducted full LCAs for partic-ular products or product groups (Andersson andOhlsson 1998; Jungbluth et al. 2000; Ziegler et al.2003), many studies tend to focus on a partic-ular stage of the product’s life cycle, such asagriculture (Anton et al. 2004; Mila i Canalset al. 2006), industrial processing (Sonesson,Mattsson, et al. 2005), transport (Mila i Canalset al. 2007; Sim et al. 2007), retailing (Carlsonand Sonesson 2000), industrial processing andpackaging (Hospido et al. 2006), home storageand processing (Sonesson et al. 2003; Sonesson,Anteson, et al. 2005; Sonesson, Mattsson, et al.2005), and waste management (Sonesson et al.2004; Lundie and Peters 2005).
Human digestion and excretion remains theleast studied life cycle stage of food products; sofar, only nutrients in food have been included. Intheir case study on seafood, Ziegler and colleagues(2003) included nutrients in the food and theirfate through sewage treatment. Sonesson and col-leagues (2004) studied the importance of post-consumption waste treatment in the life cycle offood products, proposing a systematic procedurefor modeling the nutrients balance. Nonethe-less, besides nutrients, published studies have not
covered human metabolism and excretion as awhole.
The biochemical transformations undergoneby food in the human body give rise to differ-ent pollutants released to air and water, whichshould be included within the system boundariesof a complete food LCA, similar to the way foodwaste is treated when it is landfilled or composted.Therefore, why has human excretion been sys-tematically omitted by LCA practitioners up todate? We can envisage at least three reasons forthis:
1. It is not necessary in case studies compar-ing similar products, because the environ-mental burdens would also be similar.
2. LCA is a tool intended to support decisionmaking at many levels in the food chain;it can guide decisions about producing orconsuming more or less organic food, freshor frozen products, and so forth, but humanmetabolism is a constraint, something wecan hardly influence and therefore mustaccept as a limitation. In particular, LCAhas been traditionally used mostly for sus-tainable production, and hence the focushas been on cradle-to-gate studies.
3. There are no available models to calculatethe environmental burdens of this stage asa function of the type of food; that is, thereis no allocation procedure analogous tothose developed for other multi-input pro-cesses, such as solid waste and wastewatertreatment (Doka and Hischier 2005). Eventhough Sonesson and colleagues (2004)suggest some hints for calculating post-consumption emissions from food, to ourknowledge, these have not been used inany published food LCA studies.
As pointed out by Andersson (2000) andSonesson and colleagues (2004), the relevanceof including human excretion depends on thegoal of the study. Digestion and excretion areclearly relevant when the aim is to close the bal-ance of materials in the life cycle or to com-pare the environmental effects of different diets(Jungbluth et al. 2000; Alfredsson 2002; Kytziaet al. 2004) or ways to provide food (Sonesson,Mattsson, et al. 2005) due to the dependence ofexcretion emissions on food composition. Human
522 Journal of Industrial Ecology
F O RU M
excretion should also be included in attributionalfood LCA studies, which aim to identify the lifecycle hot spots.1
In this work, we address this methodologi-cal gap by providing a simple model to calcu-late product-related life cycle inventories of hu-man excretion. The title of this article refers tothe spherical cow metaphor, where a theoreticalphysicist started a calculation on a dairy’s pro-duction with “Consider a spherical cow. . .”. Thismetaphor is often used to refer to simplified sci-entific models of reality, which help understandmore complex problems. The article sets out themodel fundamentals, tests the model with differ-ent food types, and positions it in the context ofthe whole life cycle of a particular product, broc-coli. The final section discusses the results andhighlights the main conclusions of the article.
Model Description
The model has been designed as a MS Ex-cel spreadsheet, a comprehensive description ofwhich is offered by Munoz and colleagues (2007).
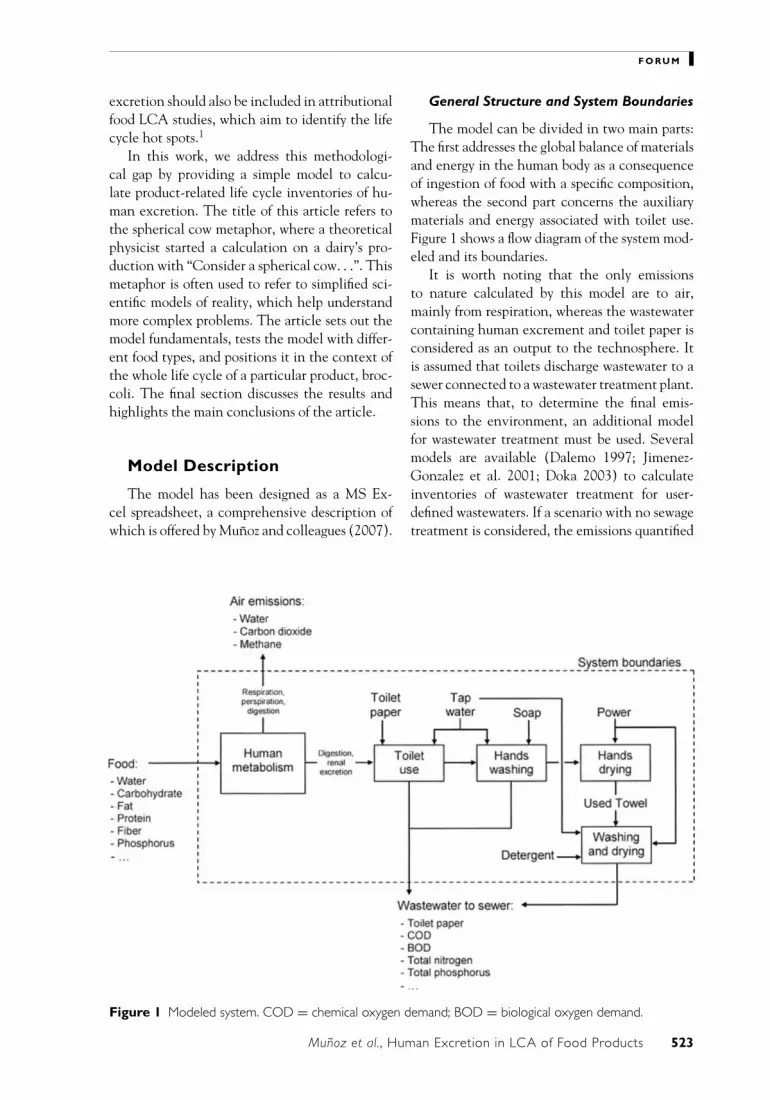
Figure 1 Modeled system. COD = chemical oxygen demand; BOD = biological oxygen demand.
General Structure and System Boundaries
The model can be divided in two main parts:The first addresses the global balance of materialsand energy in the human body as a consequenceof ingestion of food with a specific composition,whereas the second part concerns the auxiliarymaterials and energy associated with toilet use.Figure 1 shows a flow diagram of the system mod-eled and its boundaries.
It is worth noting that the only emissionsto nature calculated by this model are to air,mainly from respiration, whereas the wastewatercontaining human excrement and toilet paper isconsidered as an output to the technosphere. Itis assumed that toilets discharge wastewater to asewer connected to a wastewater treatment plant.This means that, to determine the final emis-sions to the environment, an additional modelfor wastewater treatment must be used. Severalmodels are available (Dalemo 1997; Jimenez-Gonzalez et al. 2001; Doka 2003) to calculateinventories of wastewater treatment for user-defined wastewaters. If a scenario with no sewagetreatment is considered, the emissions quantified
Munoz et al., Human Excretion in LCA of Food Products 523

F O RU M
by the human excretion model must be taken asthe final mass of pollutants released to the aquaticenvironment.
Food Composition
Any kind of food, including plain water, canbe assessed by the model, as long as its compo-sition is known. The input parameters to be de-fined, as g/100 g on a fresh weight basis, are thefollowing:
• water content;• protein content;• fat content, including all lipids (saturated
and nonsaturated fatty acids, cholesterol,etc.);
• carbohydrate content, including all sugarsand starch;
• Fiber content, including lignin, pectin, andcellulose;
• alcohol;• organic acids not covered by any of the
above categories, such as acetic acid or lac-tic acid;
• inorganic elements, such as phosphorus,sodium, chloride, magnesium, potassium,iron, and heavy metals.
Raw and cooked food composition can befound in handbooks such as that published bythe UK Food Standards Agency (2002). It is im-portant to consider the composition of the food asit is ingested, because cooked or boiled food canhave a very different composition as compared toraw food. As an example, broccoli loses 30% of
Figure 2 Overview of the fate of food constituents in the human body as considered in the model.
its protein and 39% of its carbohydrate contentwhen boiled (Food Standards Agency 2002).
Inorganic constituents must also be included,especially if they represent a significant partof the food. The occurrence of toxic organiccompounds, such as pesticide residues, is nottaken into account because the added complex-ity that would be introduced by their modelingin the human body is out of the scope of this ar-ticle. In fact, pesticides’ (and other substances’)metabolites are not even considered in sophisti-cated pesticide fate models in LCA. Only heavymetals are included in the food composition, butit is important to bear in mind that the purposeof this model is to obtain a life cycle inventory;impacts on human toxicity of exposure to heavymetals in food are not assessed.
Human Metabolism Modeling
One of the basic assumptions of the model isthat a “steady-state” person is considered. Thismeans that all material entering the body as foodis excreted, including proteins and fat. No accu-mulation of fat or synthesis of additional proteinsis considered; this is in accordance with the anal-ysis of Sonesson and colleagues (2004). Food isentirely converted to excretion products and ex-pelled from the body in one of the following flows:breath, urine, feces, and skin/sweat.
Figure 2 shows an overview of the transforma-tions and fate of food entering the human bodyaccording to this model. Food constituents aredivided into four categories: water, degradablematerial, nondegradable material, and inorgan-ics. The model considers as degradable organic
524 Journal of Industrial Ecology

F O RU M
Table 1 Elemental composition of organic constituents in food
Elemental composition (kg/kg)Foodconstituents C H O N S Comments
Protein 0.47 0.07 0.29 0.15 0.02 Average C, H, N, O, and S content in each ofthe 20 amino acids: alanine, arginine,asparagine, aspartic acid, cysteine, glutamicacid, glutamine, glycine, histidine, isoleucine,leucine, lysine, methionine, phenylalanine,proline, serine, threonine, tryptophan,tyrosine, valine
Fat 0.77 0.12 0.12 0.00 0.00 Based only on triglycerides, which constitutemore than 90% of total fat intake in westerndiets (Boron and Boulpaep 2003). As C, H,and O content in two triglycerides used asmodels: triglyceride of palmitic acid, oleic acid,alpha-linoleic acid, and triglyceride of palmiticacid, palmitic acid, palmitoleic acid.
Carbohydrate 0.42 0.06 0.52 0.00 0.00 Average obtained by the sum of C, H, and Ocontent of the following carbohydrates:fructose, sucrose, maltose, lactose, and starch
Alcohol 0.52 0.13 0.35 0.00 0.00 Based on the empirical formula of ethanol,C2H5OH
Organic acids 0.40 0.07 0.53 0.00 0.00 Based on the empirical formula of acetic acid,CH3COOH. The weight fractions are equallyvalid for lactic acid, C3H6O3, and for anycarbohydrate with formula (CH2O)n
Fiber 0.44 0.06 0.49 0.00 0.00 Dietary fiber includes lignins, pectins, andcellulose (Boron and Boulpaep 2003). Thecomposition of fiber is based on the empiricalformula of cellulose (C6H10O5)n
Note: C = carbon; H = hydrogen; O = oxygen; N = nitrogen; S = sulfur.
materials all the organic constituents listed inthe section on food composition above, with theexception of fiber (nondegradable organic mat-ter in figure 2). For carbohydrates, particularlystarch, the availability for digestion seems to belower in processed and reheated food (Clifford2007); this might introduce differences between,for example, ready-meal and home-prepared ver-sions of the same foodstuffs. This has not beentaken into account in the model, however: Allorganic degradable materials are assumed to befully available for digestion.
Inorganics and water are not subject to anychemical transformation; the latter is partitionedbetween air and wastewater, whereas the for-mer are assumed to report entirely to wastewa-ter. The main transformation described by themodel is that undergone by degradable organic
material as a result of human digestion. Tomodel this transformation, a general biochem-ical reaction has been defined, which, in turn,requires the chemical composition of the reac-tants to be defined. Table 1 summarizes the av-erage elemental composition of the food con-stituents and how they have been estimated. Thedata in table 1, with the exclusion of fiber, areused along with food composition to estimate aweighted empirical formula for digestible organicmatter.
Nondegradable material is basically excretedvia feces without taking part in any humanmetabolic process. An allowance has been madefor fiber, however, as well as for degradable or-ganic matter, to be converted to methane by thecolon bacterial flora. This is further described inthe next section.
Munoz et al., Human Excretion in LCA of Food Products 525

F O RU M
The overall biochemical reaction proposed fordegradable organic matter is shown in equation 1.This equation implies that organic degradablematter is converted, by cell respiration, to car-bon dioxide and water, whereas some carbon islost in urea (CH4ON2) and feces (C2H4O). Tosimplify the calculations, it is assumed that allnitrogen from protein degradation ends up inurea, so that feces contain only carbon, hydro-gen, and oxygen, in molar proportions similar tothose in activated sludge in wastewater treatmentplants. All sulphur ends up as sulphate, reportedas H2SO4. Some sulphur will actually be “ex-creted” via growth of hair and nails, but this hasbeen omitted from the model in the interest ofsimplicity.
Ca Hb Oc Nd Se + A O2 → B CO2
+ C H2 O + D CH4 ON2
+ E H2SO4 + F C2 H4 O (1)
where
E = e (2)
D = d/2 (3)
F = 0.055a (4)
B = a − D − F (5)
C = (b − 4D − 2E − 4F )/2 (6)
A = (C + D + 4E + 2F + 2B − c)/2 (7)
For equation 1 to be solved, the share of car-bon incorporated in either carbon dioxide (B) orfeces (F) has to be defined. We have done thisby calculating a balance for degradable carbon inthe human body, with the following assumptions:
• Alveolar volume in respiratory system is350 milliliters (mL),2 of which 5% is car-bon dioxide (Boron and Boulpaep 2003).Breathing rate is taken as the averageof 12/min (Boron and Boulpaep, 2003)and 20/min (Marieb 1995). This leadsto an average output of 195 grams car-bon/person/day as carbon dioxide exhaled.
• Urine production is 1.5 L/day (Boron andBoulpaep 2003), with a dry weight of 5%
(Mara 2003) and a carbon content 14% indry weight (Feachem et al. 1983). The car-bon loss in urine follows as 11 g/person/day.
• Feces production is around 0.15 kilogram(kg)3 per day, with a dry matter contentof 25% and a carbon content of 50% inthe dry matter (Feachem et al. 1983). Thisgives 19 g C, from which the contribution ofnondegradable fiber must be excluded. Av-erage intake of fiber is 15 g/person/day, witha carbon content of 44% (table 1). If weassume that fiber is excreted in feces with-out any transformation, the contribution offiber to carbon in feces is 7 g. Therefore,the output of degradable carbon via feces is19 − 7 = 12 g C/person/day.
These calculations lead to a loss of degradablecarbon via feces of 5.5% (equation 4). It is worthnoting that a similar amount is lost via urine,around 90% of the amount of carbon effectivelyused by cell respiration and transformed to carbondioxide. This balance has omitted several carbonflows that were estimated and found to be negli-gible: carbon dioxide and methane via intestinalgas, and methane expelled via lungs; altogether,these account for less than 0.1% of the carbonoutput.
The fate of each of the final products obtainedin equation 1 is defined in the model as follows:
• Carbon dioxide is entirely emitted to atmo-sphere via the lungs.
• Urea, sulphate, and feces are expelled asliquid and solid excreta: urea dissolved inurine, and feces as solid, whereas sulphateseems to be almost entirely excreted inurine (Florin et al. 1991).
• Water will be emitted both as a liquid andas a gas. To determine the share of each,we have used the water balance suggestedby Boron and Boulpaep (2003), accordingto which 64% of the water output corre-sponds to the liquid phase (60% by urineand 4% by feces), whereas the remaining36% corresponds to the air phase (22% byskin/sweat and 14% by breathing). In ad-dition to the water produced by cell respi-ration, the model must also determine thefate of water originally present in food, usu-ally a much larger quantity. The fate factors
526 Journal of Industrial Ecology
F O RU M
already above also apply to the water infood.
Fiber is the only category of organic con-stituents in food not affected by the biochemicaltransformation in equation 1. Fiber is assumed tobe emitted to wastewater via feces with no chem-ical transformation except methane production,as described below.
Methane Emissions
Besides cell respiration, the only additionalchemical transformation considered by the modelis the formation of methane by colonic bacteria.In carbon terms, the amounts may seem negligi-ble (see above), but from a greenhouse gas per-spective they may not be. For this reason, an at-tempt has been made to estimate the amount ofmethane emitted by the human body due to theactivity of anaerobic bacteria in the intestine.
Human cells have no metabolic pathway capa-ble of producing or metabolizing methane. There-fore, the model attributes all methane productionto the action of intestinal bacteria and assumesthat all methane is excreted in intestinal gas orexhaled breath (Bond et al. 1971). Methane pro-duction varies widely among individual humans:Some subjects, approximately one third of thepopulation, continually produce large quantitiesof this gas, whereas others consistently excrete lit-tle or no methane at all. This appears to be relatedto the presence or absence of methane-producingflora: Familial (not necessarily genetic) factorsplay an important role in determining whethera subject produces methane (Levitt and Bond1980).4
According to Bond and colleagues (1971), theaverage methane excretion rate of methane pro-ducers is 0.33 mL/min and 0.45 mL/min via lungsand intestine gas, respectively. If a pressure of1 atmosphere (atm)5 and a body temperature of310 kelvin (K)6 are considered, this suggests thata methane producer emits 0.52 g C in CH4 perday, or 0.69 g CH4 per day. If this is corrected totake into account that only 33% of the popula-tion are considered to be significant methane pro-ducers, we obtain an average emission of 0.17 g C-CH4 per person per day, or 0.23 g CH4 per personper day. This implies that around 0.08% of the
total carbon emitted by the human population isin the form of methane.
Degradable organic material contributes tomethane production, but so does dietary fiber.Tomlin and colleagues (1991) found that a fiber-rich diet implies an increase in intestinal gas pro-duction as compared to a fiber-free diet. Bond andcolleagues (1971), however, found that methaneproduction is insensitive to changes in nonab-sorbable carbon intake, whereas the productionof other gases, in particular hydrogen, is clearlyenhanced by fiber intake. In view of this uncer-tainty, the model allocates methane emissions toall carbohydrates present in the food ingested onthe basis of carbon content, regardless of whetherthey are digestible.
Metabolic Energy Balance
With regard to the energy balance of the over-all process, the chemical energy stored in all theinputs and outputs to and from the human bodyis calculated, on the basis of their heating values.The model uses the upper heating value, becausemost water is excreted as the liquid, whereas eventhe vapor emissions (exhaling and perspiration)actually pass through the skin and lung surfacesas liquid. Upper heating values are calculated forfood, methane, urea, and feces derived from bothdegradable and nondegradable organic material(fiber). All the remaining materials (oxygen, wa-ter, carbon dioxide, sulphate, and phosphorus)are assigned a null energy content. The heatcontent calculation is based on elemental com-positions according to the formula proposed byMichel (1938):
Upper Heating Value (MJ/kg)
= −9.8324O + 124.265H
+ 34.016C + 19.079S + 6.276N (8)
where C, H, O, N, and S are the mass fractions ofeach element. The figures obtained with equation8 for the energy input in fiber-rich food will behigher than those reported in food labels, whichnormally exclude the calorific value of fiber be-cause it is nonabsorbable and not actually di-gested.
The difference between the energy input andoutput, each calculated with equation 8, is the
Munoz et al., Human Excretion in LCA of Food Products 527

F O RU M
fraction of energy effectively used by the cellsin their metabolic processes. The model assumesthis energy to be emitted eventually to the envi-ronment as heat.
Allocation of Technosphere Processes
Using the toilet to evacuate liquid and solidexcretion products implies, directly or indirectly,the use of ancillary materials and energy. Themodel allocates these processes to food intakeon the basis of mass of excretion products. Thefollowing basic assumptions are made:
• Every time the toilet is used, it is flushed.• After each toilet use, hands are washed with
soap and water at ambient temperature.• At home toilets, hands are dried by means
of a towel, whereas at workplace toilets,hands are dried by means of a hot airblower.
• Towel production is excluded because ofthe long service life of the towel, but wash-ing and drying at home are included.
• Transport of ancillary materials (soap, de-tergent, toilet paper) is not included.
A set of parameters have been defined andgiven default values intended to be representativeof UK conditions (table 2). The user can modifythe parameter values to make them representa-tive of other regions or scenarios.
The different environmental burdens can becalculated per person per day with the data intable 2. Next, these figures are divided by theaverage daily solid plus liquid excreta productionby an average person, which is taken as 1.65 kg,made up of 1.5 kg (i.e., 1.5 L) urine and 0.15 kgfeces. The allocation to food intake on the basisof food excreta is finally carried out by means ofequation 9:
Toilet related burdenkg food intake
= Toilet related burdenkg solid and liquid excreta
× kg solid and liquid excretakg food intake
(9)
Model Output
The output of the human excretion modelconsists of a disaggregated inventory table includ-ing inputs from nature (oxygen), inputs from thetechnosphere (food itself and those related to toi-let use), outputs to nature (emissions to air fromrespiration and digestion), and outputs to thetechnosphere (wastewater). The pollution load ofthe resulting wastewater is expressed in the modelby the parameters total organic carbon (TOC),biological oxygen demand (BOD), chemical oxy-gen demand (COD), N-total, P-total, and otherinorganic elements. A small amount of these pol-lutants arises from toilet use (hands washing withsoap, towel washing, etc.), but the highest shareis related to human excreta; they are calculatedby the model as follows:
• TOC is determined from the carbon con-tent in the solid and liquid excretion prod-ucts, namely fiber, and products of equa-tion 1: feces and urea. COD and BOD areestimated from TOC according to the fol-lowing ratios (Doka 2007): TOC/BOD =0.641, and TOC/COD = 0.479. It mustbe noted that these three parameters arerelated; just one of them—COD in thiswork—must be used in the eutrophicationpotential, because otherwise we would bedouble counting carbon emissions.
• Nitrogen from human metabolism is con-sidered in the model to be excreted only asurea. Thus, from the amount of urea pro-duced and its empirical formula, the nitro-gen released into wastewater is calculated.
• Phosphorus and other inorganics are justexpressed as the initial amounts in food,because they are not subject to any trans-formation in the model.
We can calculate the concentration of pol-lutants in wastewater by dividing the amountsreleased by the total water discharged, includingwater from toilet use and water in the food it-self and resulting from digestion (see equation 1).Impacts related to wastewater treatment and thefinal amount of pollutants released to the envi-ronment must be subsequently modeled by theLCA practitioner, using, for example, the modelssuggested in the General Structure and System
528 Journal of Industrial Ecology

F O RU M
Table 2 Parameters and default values used for allocation of toilet use processes
DefaultParameter value Comments
Toilet flush volume(L)
11 Measured volume of a standard toilet tank at the University ofSurrey
Hand-washing wateruse (L/wash)
1.5 Assumption
Toilet uses(times/day)
5 Assumption; this includes both urination and defecation
Toilet uses at home(%)
57 This parameter is used to estimate the share of hand drying bymeans of a cotton towel. The remaining 33% is assumed tobe done at work with a hot air blower. The value is anassumption based on the following figures: 5 working daysper week, 2 weekend days per week. In a working day, threetoilet trips are made at the workplace, and two at home. Onweekends, all toilet trips are made at home.
Toilet paper use(kg/day/person)
0.02 Calculated with the following data: tissue paper consumptionin Western Europe in 2004 was 4.1 million tonnes, of which62% was toilet tissue, and 18% was consumed in the UnitedKingdom and Ireland (European Tissue Symposium, 2005).The population of the United Kingdom and Ireland in 2004was 63,727,560 (Eurostat 2007).
Hand-washing(liquid) soap use(g/wash)
3.3 Measured weight at University of Surrey toilet was 100 g liquidsoap dispensed per 60 pushings. The figure considers twodispenser pushings per wash.
Electric hot airblower power(kW)
2 Average power of a hand dryer (Handryers.net 2005)
Time needed to dryhands (s)
30 Average drying time of a hand dryer (Handryers.net 2005)
Towel weight (kg) 0.35 Assumed for a cotton towelNumber of persons
per household2.4 Average for the United Kingdom (Office for National
Statistics 2007)Frequency of towel
washing (days)7 Assumption
Power demand ofwashing machine(kWh/kg towel)
0.43 Washing of the cotton towel (Group for Efficient Appliances1995)
Detergent use bywashing machine(g/kg towel)
45 135 g detergent for a typical 3-kg load. Process related towashing of the cotton towel (Group for Efficient Appliances1995)
Water use bywashing machine(L/kg towel)
17.2 Washing of the cotton towel (Group for Efficient Appliances1995)
Power demand oftowel drier(kWh/kg towel)
0.7 Drying of the cotton towel (Group for Efficient Appliances1995). Average of three technologies: air vented tumbledriers, condenser tumble driers, and condenser washer driers
Hand-washingwastewatercomposition(mg/L)
COD: 400 Representative averages from several studies (Eriksson et al.2002)
Continued
Munoz et al., Human Excretion in LCA of Food Products 529

F O RU M
Table 2 Continued
DefaultParameter value Comments
BOD: 190N-total: 10P-total: 1
Laundry wastewatercomposition(mg/L)
COD: 1270 Representative averages from several studies (Eriksson et al.2002)
BOD: 260N-total: 10P-total: 25
Note: COD = chemical oxygen demand; BOD = biological oxygen demand; N-total = nitrogen total; P-total =phosphorus total. One kilowatt (kW) ≈ 56.91 British Thermal Units (BTU)/minute ≈ 1.341 horsepower(HP).
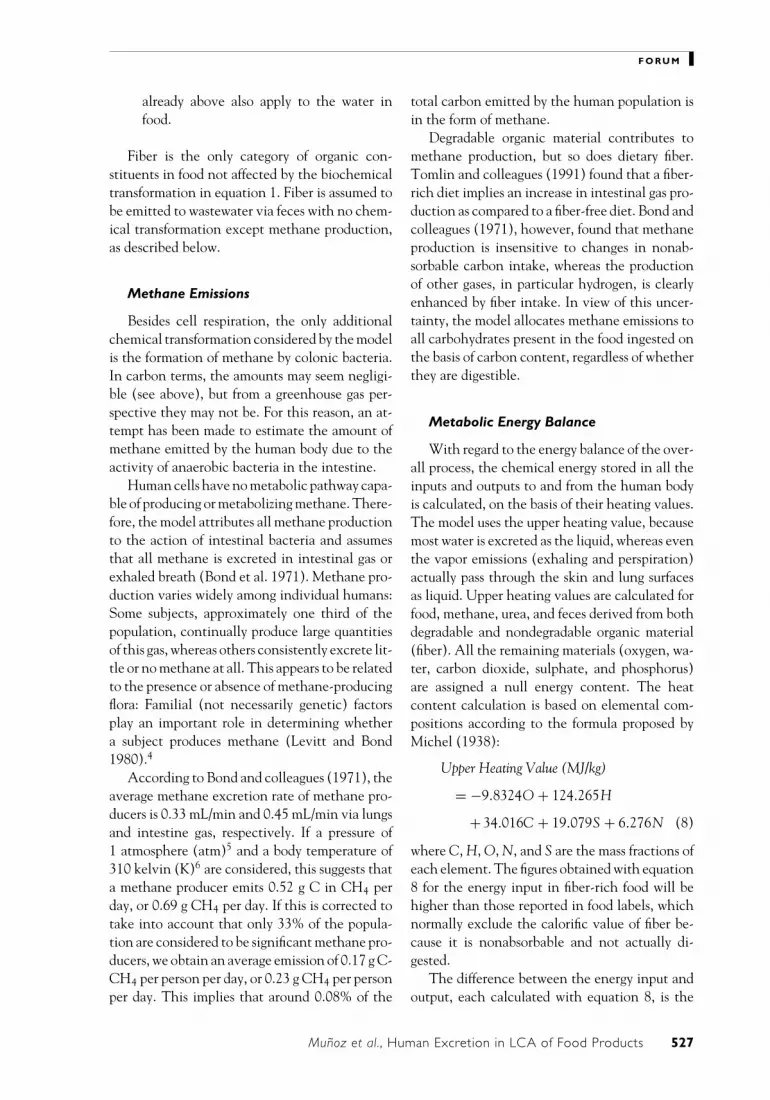
Boundaries section of this article. Table 3 showsan example of an inventory table obtained fora particular product, namely boiled broccoli, byapplying the model to the composition for thisproduct given in table 4.
Results
Model Sensitivity to Different Food Types
The sensitivity of the model to food compo-sition has been tested on eight food productscommonly present in daily western diets, withtypical compositions given in table 4: bread, broc-coli, apple, chicken meat, beer, cheese, a choco-late snack, and coffee. Selected inventory resultsare given in figure 3. Rather than comparing theenvironmental performance of these food items,the following discussion aims at exploring howthe model responds to extremely different datainputs.
Figure 3 shows that some parameters arehighly variable from one food type to another,whereas others remain quite similar. The amountof solid and liquid excretion products emitted towastewater (figure 3a), for example, is rather sim-ilar for all these food products, in the range 0.5to 0.65 kg per kg food, primarily because wateris one of the main components in food and 64%of the water is assumed to report to urine andfeces regardless of the food type. Nevertheless,foods with low water content, such as the choco-
late snack or the parmesan cheese, lead to similarvalues. This is explained by the fact that one ofthe main outputs of the organic degradation reac-tion, as shown in equation 1, is also water. If themass of excretion products per kilogram ingestedis broadly comparable for all foods, then the en-vironmental burdens from the technosphere pro-cesses described above (e.g., wastewater volume,figure 3d) will also be similar for all food products,because all these processes are allocated on thebasis of the amount of solid and liquid excretionproducts.
Carbon dioxide emissions due to respiration(figure 3b), conversely, are highly variable de-pending on the food type; between coffee and thechocolate snack, for instance, there is a differenceof three orders of magnitude. This is clearly re-lated to the degradable carbon content in food,which is very high in dry foods, such as cheeseand chocolate, and very low in drinks, such ascoffee or beer. Methane emissions (figure 3c) fol-low a pattern similar to that for carbon dioxideemissions, because this pollutant is allocated onthe basis of carbon content in food. In this case,not only degradable carbon but also nondegrad-able carbon (present as fiber) contributes; how-ever, we see in table 4 that in most of the foodproducts considered, the main source of carbon isother than fiber.
The volume of wastewater discharged to thesewer (figure 3d) shows a similar pattern for allfoodstuffs. Across all products, the quantity ofwastewater is 20 to 26 liters per kilogram of food,
530 Journal of Industrial Ecology
F O RU M
Table 3 Inventory table for excretion of boiled broccoli
Inputs and outputs Comments
InputsFrom natureOxygen (g) 71 Oxygen needed for cell respiration of degradable constituents in
food (carbohydrates, fat, and protein)From the technosphereBroccoli, boiled in
unsalted water (g)985 Grams of food ingested
Toilet paper (g) 7.8 Allocated on the basis of solid plus liquid excreta massTap water (L) 24.4 Toilet flushing plus hand washing, plus towel washing, allocated
on the basis of solid plus liquid excreta massSoap (g) 6.5 Hand washing, allocated on the basis of solid plus liquid excreta
massDetergent (g) 0.36 Detergent for washing machine used for towel washing, which, in
turn, has been used to wash handsPower (kWh) 0.023 Electricity for hot air blower, washing machine, and drier. All
these processes are related to hand dryingOutputsTo natureAir emissions:Carbon dioxide (g) 80 Produced by catabolism of degradable constituents in food
(carbohydrates, fat, and protein)Methane (g) 0.037 Produced by colonic bacteria. Degradation of all
carbon-containing compounds, including fiberWater (g) 337 36% of all water ingested or produced by catabolism is evaporated
by the body through skin or breathing. Main source of waterhere is the initial content in food, but there is also waterproduced in cell respiration
Heat (MJ) 1.0 Energy actually used by metabolic processesTo the technosphereToilet paper (g) 7.8 Present in wastewaterWastewater volume (L) 25 Sum of solid plus liquid excreta plus tap waterWastewater emissions from food:Urea (g) 9.8 All nitrogen in food is assumed to be included hereN-urea (g) 4.6 Urea expressed as nitrogen massTOC (g) 13 Carbon content in urea and fiberBOD (g) 21 Related to carbon content from urea and fiberCOD (g) 28 Related to carbon content from urea and fiberSulphate (g) 2.2 From protein metabolismP-total (g) 0.57 Inorganic constituents in food are 100% allocated to solid plus
liquid excreta.Na (g) 0.13 Inorganic constituents in food are 100% allocated to solid plus
liquid excreta.K (g) 1.7 Inorganic constituents in food are 100% allocated to solid plus
liquid excreta.Ca (g) 0.4 Inorganic constituents in food are 100% allocated to solid plus
liquid excreta.Cl (g) 0.23 Inorganic constituents in food are 100% allocated to solid plus
liquid excreta
Continued
Munoz et al., Human Excretion in LCA of Food Products 531

F O RU M
Table 3 Continued
Inputs and outputs Comments
Wastewater emissions from toilet use:BOD (g) 0.59 Related to gray wastewater: hand washing and towel washingCOD (g) 1.3 Related to gray wastewater: hand washing and towel washingN-total (g) 0.030 Related to gray wastewater: hand washing and towel washingP-total (g) 0.0064 Related to gray wastewater: hand washing and towel washing
Note: N, P, Na, K, Ca, and Cl refer to the elemental symbols. COD = chemical oxygen demand; BOD = biologicaloxygen demand; N-total = nitrogen total; P-total = phosphorus total.Megajoule (MJ) = 106 joules (J, SI) ≈ 239 kilocalories (kcal) ≈ 948 British Thermal Units (BTU).
associated mainly with toilet use (flushing, wash-ing hands, etc.).
The mass of pollutants discharged to the sewer(figure 3e) shows a different picture. In this case,big differences are seen between products, up totwo orders of magnitude in all three parameters.There is a clear relationship between protein con-tent and discharge of urea and sulphate, as pro-teins are the only food constituents containingnitrogen and sulphur in their empirical formula.Carbonaceous organic matter, measured as COD,is related not only to proteins but also to fiber anddegradable organic matter in general. This figureshows only the amount of pollutants derived fromsolid and liquid excretion products, whereas thecontribution of toilet use (gray wastewater fromhands washing and towel washing) is excluded.
Table 4 Composition of several food products, in grams per 100 g edible portion
Coffee, WhiteBroccoli, Roasted Lager Chocolate Parmesan Apple, infusion, bread,
Component boiled chicken beer snack cheese nonpeeled average sliced
Water (g) 91.1 65.3 93 2 27.6 84.5 98.3 38.6Protein (g) 3.1 27.3 0.3 7.5 36.2 0.4 0.2 7.9Fat (g) 0.8 7.5 Tr 26 29.7 0.1 Tr 1.6Carbohydrate (g) 1.1 0 Tr 63 0.9 11.8 0.3 46.1Fiber (g) 2.3 0 Tr N 0 1.8 0 1.9Alcohol (g) 0 0 4 0 0 0 0 0P (g) 0.057 0.2 0.019 0.2 0.68 0.011 0.007 0.095Na (g) 0.013 0.1 0.007 0.12 0.756 0.003 Tr 0.461K (g) 0.17 0.3 0.039 0.33 0.152 0.12 0.092 0.137Ca (g) 0.04 0.017 0.005 0.2 1.025 0.004 0.003 0.177Cl (g) 0.023 0.088 0.02 0.21 1.26 Tr 0.003 0.829
Source: Food Standards Agency (2002).Note: P, Na, K, Ca, and Cl refer to the elemental symbols. Tr = trace (considered as zero); N = no reliable information(considered as zero).
Nonetheless, table 3 shows that the contributionof toilet use is one order of magnitude lower forthe particular case of broccoli.
Finally, as expected, the energy content offood is also highly variable (shown in parenthe-ses on top of the bars in figure 3f), as also is theenergy efficiency of the human body, dependingon the composition of food. The efficiencies go ashigh as 95% for beer and as low as 63% for broc-coli. The most energy-efficient foods appear to bealcoholic drinks, due to the ethanol content, andalso fat- and carbohydrate-rich foods, whereas theleast efficient are those containing a high shareof proteins, such as chicken, and especially, fiber,as in the case of broccoli. Proteins show a lowerefficiency due to an important energy loss in theform of urea, whereas the human body is simply
532 Journal of Industrial Ecology

F O RU M
Figure 3 Selected model results for several food products.
unable to digest the fiber in fiber-rich foods anduse its chemical energy.
Importance of Human-Excretion-RelatedImpacts in the Overall Life Cycleof Foodstuffs
Figure 4 shows the cradle-to-grave results forconsumption in the United Kingdom of 1 kgbroccoli grown in Spain. Details of the life cy-cle modeling for these crops are provided by Milai Canals and colleagues (2008). The excretionand wastewater stage includes the emissions de-scribed in this article in addition to the treat-ment of the wastewater described in table 3; thelatter has been modeled as described by Munozand colleagues (2007). Global warming potential(GWP) and eutrophication potential (EP) havebeen assessed according to the CML2001 method
(Guinee et al. 2002); in addition, the inventoryindicators water use (WU) and primary energyuse (PEU) are shown in figure 4.
EP (figure 4a) is dominated by the homeand excretion and wastewater stages, which con-tribute 32% and 45%, respectively, to the totalEP related to the broccoli life cycle. The formercontributes due to the loss of nitrogen and phos-phorus from broccoli to the boiling water duringcooking. Nitrogen and phosphorus are not effec-tively removed in the sewage plant and so becomeemissions to aquatic ecosystems; note that thesefigures assume that only 11% of wastewater istreated in plants equipped with nutrient-removalprocesses, because this is the current situation inthe United Kingdom (Munoz et al. 2007). Also,there is the contribution from leachate emissionsfrom landfilling of food waste (uneaten broccoli;see the top section in the Home bar in figure 4a).
Munoz et al., Human Excretion in LCA of Food Products 533

F O RU M
Figure 4 Contribution of different life cycle stages and items to eutrophication potential, global warmingpotential, water use, and primary energy use for consumption in the United Kingdom of 1 kg Spain-grownbroccoli. WWT = wastewater.
Nonetheless, wastewater treatment of feces andurine creates the biggest contribution to EP; thisis mostly due to nitrogen and phosphorus com-pounds.
In the case of GWP (figure 4b), the contribu-tion from the excretion and wastewater phase isnot as significant as in the nutrient-related im-pact. Energy use at home (mainly for boilingthe broccoli) dominates GWP through carbondioxide (CO2) emissions, whereas fertilizer re-lated nitrous oxide (N2O) and CO2 from fueluse by farm machinery dominate the croppingstage. The GWP reduction in cultivation, due tothe C embodied in broccoli through photosyn-thesis (seen as a negative bar in Figure 4b), isalmost entirely reemitted to the atmosphere dur-ing the excretion and wastewater stage. The re-maining C is emitted in the landfilled food wasteand/or remains in the landfill or sewage sludgefrom wastewater.
Concerning WU (figure 4c), the croppingstage is clearly the most important one, as it isresponsible for 73% of the overall water consump-
tion. Broccoli is an irrigated crop in Spain, usingsomething less than 200 L/kg. The contributionsof the home (15%) and excretion and wastewater(9%) stages are not negligible, however. It mustbe highlighted that the water use associated withthe home stage is mainly cooling water used inelectricity production, rather than water actuallyused in the kitchen for cooking. Although thecontribution of these two stages may seem low,it must be borne in mind that if UK-grown broc-coli were considered, these relative contributionswould be much higher, because in the UnitedKingdom broccoli is rain fed.
Finally, PEU (figure 4d) is clearly dominatedby the home stage, due to the electricity and gasconsumed for broccoli cooking, which accountfor 65% of the PEU. Retail and distribution andcropping are responsible for 22% and 11%, re-spectively. In this case study, it is concludedthat human excretion and further wastewatertreatment have a negligible contribution from aPEU perspective. Nevertheless, it is interestingto observe that the PEU of toilet use processes
534 Journal of Industrial Ecology

F O RU M
(production and delivery of toilet paper, soap,tap water, etc.) is three times higher than thatrelated to treating the fecal wastewater in thesewage plant.
Discussion and Conclusions
Human excretion has proven to be signifi-cant in the overall life cycle of food products.Particularly for the nutrient-related EP, emis-sions from postconsumer wastewater treatmentare of paramount importance, together with otherhome-related nutrient losses through boiling wa-ter and food waste. This is crucial, as it is oftenconcluded from partial LCA studies, cradle-to-gate or cradle-to-retail, that EP is dominated bythe cropping stage. Obviously, nutrient emissionsfrom agriculture merit attention due to their dif-fuse nature and the fact that it is possible to reducethem. Nonetheless, nutrient emissions from do-mestic activities should not be overlooked. Theresults obtained in this work suggest the impor-tance of educating consumers on “healthy cook-ing” to avoid flushing so much of the food’s nutri-ent content down the drain (e.g., 30% of proteinsand 34% of phosphorus are lost to the water whenbroccoli is boiled). The amount of nutrients lostin the cooking stage will vary significantly withfood type, particularly with foodstuffs that areeaten raw (e.g., lettuce, fruit); in this case, therewould be less nutrient loss in the kitchen butmore releases after treatment of fecal wastewater.It should be noted that the contribution of excre-tion and wastewater to GWP would also be moresignificant for foodstuffs that are eaten raw (i.e.,when no energy is used for cooking). In addi-tion, the contribution from the distribution stageis relatively high, and the relative importance ofexcretion is therefore reduced in the example pre-sented here because broccoli is transported over2,600 kilometers (km).7
The model presented here provides a tool toenable human excretion to be included in foodLCAs. This tool might also be of interest for otherenvironmental analysis methods, such as mate-rial flow analysis and substance flow analysis, asthe model can be used to close the balances forcarbon, nitrogen, and phosphorus, among othersubstances present in food.
Concerning the application of this model toregions different from the United Kingdom andother western countries, we can make a distinc-tion between human body modeling, on the onehand, and toilet use and wastewater treatmentplants, on the other. The default values usedhere to model the latter are representative ofthe United Kingdom, but they can be modifiedat will by the user. The balances obtained fromhuman body modeling are based on figures fromwestern sources but should be generally applica-ble. For most of the variables included, data fromdifferent regions have not been found, but themodel should give reasonable estimates of emis-sions from the macronutrients in food.
The case study presented here can be con-sidered as an attributional LCA. Our model hasproven to be useful in highlighting the relativeimportance of excretion in a food product’s lifecycle. Nevertheless, it has also been shown to bevery sensitive to food composition, which sug-gests that it may also be useful in consequentialLCA, dealing with such topics as the environ-mental assessment of dietary shifts. Until now,only the comparative environmental impacts ofproducing the ingredients for different diets havebeen assessed; this study shows that differencesrelated to excretion emissions from different dietcompositions may also be important, particularlywhen changes in the balance of macronutrients(proteins, fats, carbohydrates, fiber) occur. Futureresearch should check the significance of the ex-cretion stage for a range of food products. In addi-tion, the model could be developed further to al-low for differing N content in proteins from differ-ent sources (e.g., to distinguish between animal-based and plant-based proteins); however, ini-tial exploration of variations in protein/N factorssuggests that the resultant changes in excretionimpacts are likely to be small.
Acknowledgements
This research was carried out underproject RES-224-25-0044 (http://www.bangor.ac.uk/relu), funded as part of the UK RuralEconomy and Land Use (RELU) programme.Dr. Mila i Canals acknowledges GIRO CT(http://www.giroct.net) for its logistic support.The authors kindly thank Prof. Mike Clifford for
Munoz et al., Human Excretion in LCA of Food Products 535

F O RU M
his useful comments on the model, Gabor Dokafor his support in wastewater treatment modeling,and the three anonymous reviewers who haveprovided constructive comments on this article.
Notes
1. Depending on the goal of the study, LCAsare usually classified as follows (Weidema, 2003):• Attributional: life cycle assessments of the ac-countancy type, typically applied for hot-spotidentification, for product declarations, and forgeneric consumer information. This would cor-respond to the type of study carried out in ourarticle.• Consequential: they study the environmentalconsequences of possible (future) changes be-tween alternative product systems, typically ap-plied in product development and in public policymaking. This type of LCA would correspond to acase study dealing with diet shifting.
2. One milliliter (mL) = 10−3 liters (L) ≈0.034 fluid ounces.
3. One kilogram (kg, SI) ≈ 2.204 pounds (lb).4. The presence of mercaptans in intestinal
gas is regarded as a local environmental qualityissue and not included in the model.
5. One atmosphere (atm) ≈ 760 torr ≈ 14.70pounds/inch2.
6. 310 ◦K ≈ 36.85 ◦ C ≈ 98.33 ◦F.7. One kilometer (km, SI) ≈ 0.621 miles
(mi).
References
Alfredsson, E. C. 2002. “Green” consumption—no so-lution for climate change. Energy 29(4): 513–524.
Andersson, K. 2000. LCA of food products and productsystems. International Journal of Life Cycle Assess-ment 5(4): 239–248.
Andersson, K. and T. Ohlsson. 1999. Including en-vironmental aspects in production development:A case study of tomato ketchup. Lebensmittel-Wissenschaft und-Technologie [LWT—Food Sci-ence and Technology] 32(3): 134–141.
Anton A., F. Castells, J. I. Montero, and M. Hui-jbregts. 2004. Comparison of toxicological im-pacts of integrated and chemical pest manage-ment in Mediterranean greenhouses. Chemosphere54(8): 1225–1235.
Bond, J. H., R. R. Engel, and M. D. Levitt. 1971.Factors influencing pulmonary methane excre-tion in man: An indirect method of studyingthe in situ metabolism of the methane-producingcolonic bacteria. Journal of Experimental Medicine133: 572–588.
Boron, W. F. and E. L. Boulpaep. 2003. Medical physi-ology. Philadelphia: Saunders.
Carlson, K. and U. Sonesson. 2000. Livscykelinventer-ing av butiker—data och metoder for att beracknabutikkens roll vid LCA av livsmidel [Life cycle in-ventory of grocery stores—Data and methods tocalculate the impact of retail in LCAs of foods,in Swedish]. SIK report no. 676 2000. Goteborg,Sweden: Institutet for Livsmedel och BioteknikAB.
Clifford, M. 2007. Personal communication with M.Clifford, Professor of Food Safety, School ofBiomedical and Molecular Sciences, Universityof Surrey, Surrey, United Kingdom, 13 Septem-ber 2007.
Dalemo, M. 1997. The ORWARE simulation model:Anaerobic digestion and sewage plant sub-models. Licenthiate thesis, Swedish Institute ofAgricultural Engineering, Swedish University ofAgricultural Sciences (SLU), Uppsala, Sweden.AFR-report 152, Swedish Environmental Protec-tion Agency.
Doka G. 2003. Life cycle inventories of waste treatmentservices. Part IV: Wastewater treatment. Final re-port ecoinvent 2000 No. 13. Duebendorf, Switzer-land: Swiss Centre for Life Cycle Inventories.
Doka, G. 2007. Personal communication with G. Doka,Independent Life Cycle Researcher, Doka LifeCycle Assessments, Zurich, Switzerland, August2008.
Doka, G. and R. Hischier. 2005. Waste treatment andassessment of long-term emissions. InternationalJournal of Life Cycle Assessment 10(1): 77–84.
Eriksson E., K. Auffarth, M. Henze, and A. Led. 2002.Characteristics of grey wastewater. Urban Water4(1): 85–104.
European Tissue Symposium. 2005. Facts and figures.www.europeantissue.com. Accessed August 2007.
EUROSTAT. 2007. Average population by sex andfive-year age groups. epp.eurostat.ec.europa.eu/portal/page?_pageid=1996,45323734&_dad=portal&_schema=PORTAL&screen=welcomeref&open=/popula/pop/demo/demo_pop&language=en&product=EU_MASTER_population&root=EU_MASTER_population&scrollto=88. Ac-cessed August 2007.
Feachem, R. G., D. J. Bradley, H. Garelick, and D. D.Mara. 1983. Sanitation and disease: Health aspects
536 Journal of Industrial Ecology

F O RU M
of excreta and wastewater management. World BankStudies in Water Supply and Sanitation 3. Bath,UK: Wiley.
Florin, T., G. Neale, G. R. Gibson, S. U. Christl, andJ. H. Cummings. 1991. Metabolism of dietary sul-phate: Absorption and excretion in humans. Gut32(7): 766–773.
Food Standards Agency. 2002. McCance and Wid-dowson’s The composition of foods, sixth sum-mary edition. Cambridge, UK: Royal Society ofChemistry.
Foster, C., K. Green, M. Bleda, P. Dewick, B. Evans,A. Flynn, and J. Mylan. 2006. Environmental im-pacts of food production and consumption: A reportto the Department for Environment, Food, and RuralAffairs. London: Manchester Business School.
Group for Efficient Appliances. 1995. Washing ma-chines, driers and dishwashers. Copenhagen, Den-mark: Danish Energy Authority.
Guinee, J. B., M. Gorree, R. Heijungs, G. Huppes, R.Kleijn, H. A. Udo de Haes, E. van der Voet, andM. N. Wrisberg. 2002. Life cycle assessment: Anoperational guide to ISO standards. Vols. 1, 2, 3.Leiden, the Netherlands: Centre of Environmen-tal Science, Leiden University (CML).
Handryers.net. 2005. www.handryers.net/index.html.Accessed August 2007.
Hospido, A., M. E. Vazquez, A. Cuevas, G. Feijoo,and M. T. Moreira. 2006. Environmental assess-ment of canned tuna manufacture with a life-cycleperspective. Resources Conservation and Recycling47(1): 56–72.
Jimenez-Gonzalez, C., M. R. Overcash, and A. Cur-zons. 2001. Waste treatment modules: A partiallife cycle inventory. Journal of Chemical Technol-ogy and Biotechnology 76(7): 707–716.
Jungbluth, N., O. Tietje, and R. W. Scholz. 2000. Foodpurchases: Impacts from the consumers’ point ofview investigated with a modular LCA. Interna-tional Journal of Life Cycle Assessment 5(3): 134–142.
Kytzia, S., M. Faist, and P. Baccini. 2004. Economicallyextended—MFA: A material flow approach for abetter understanding of food production chain.Journal of Cleaner Production 12(8-10): 877–889
Levitt, M. D. and J. H. Bond. 1980. Intestinal gas.In Scientific foundations of gastroenterology, editedbyW. Sircus and A. N. Smith. Bath, UK: WilliamHeinemann Medical Books Ltd.
Lundie, S. and G. M. Peters. 2005. Life cycle assess-ment of food waste management options. Journalof Cleaner Production 13(3): 275–286.
Mara, D. 2003. Domestic wastewater treatment in devel-oping countries. London: Earthscan.
Marieb, E. N. 1995. Human anatomy and physiol-ogy. Third edition. Redwood City, CA: Ben-jamin/Cummings Publishing Company.
Michel, R. 1938. Berechnung der Verbren-nungswarmen fester und flussiger Brennstoffenach den Warmewerten ihrer Einzelbestandteile[Calculation of the combustion heat of solidand liquid fuels according to the heat ratings(or: calorific value) of their components].Feuerungstechnik [Fuel Technology] 26(9):273–278.
Mila i Canals, L., G. M. Burnip, and S. J. Cowell.2006. Evaluation of the environmental impactsof apple production using life cycle assessment(LCA): Case study in New Zealand. Agriculture,Ecosystems and Environment 114(2-4): 226–238.
Mila i Canals, L., S. J. Cowell, S. Sim, and L. Basson.2007. Comparing domestic versus imported ap-ples: A focus on energy use. Environmental Scienceand Pollution Research 14(5): 338–344.
Mila i Canals, L., I. Munoz, A. Hospido, K. Plass-mann and S. J McLaren. 2008. Life cycle assess-ment (LCA) of domestic vs. imported vegetables:Case studies on broccoli, salad crops and green beans.CES Working Papers 01/08. Guildford, UK: Cen-tre for Environmental Strategy, University of Sur-rey. Available from www.ces-surrey.org.uk/.
Munoz, I., L. Mila i Canals, R. Clift, and G. Doka.2007. A simple model to include human excretionand wastewater treatment in life cycle assessment offood products. CES Working Paper 01/07. Guild-ford, UK: Centre for Environmental Strategy,University of Surrey. Available from www.ces-surrey.org.uk.
Nijdam, D. S., H. C. Wilting, M. J. Goedkoop, and J.Madsen. 2005. Environmental load from Dutchprivate consumption—How much damage takesplace abroad? Journal of Industrial Ecology 9(1–2):147–168.
Office for National Statistics (UK). 2007. So-cial Trends 37. Whole issue. www.statistics.gov.uk/Socialtrends/. Accessed 23 August 2007.
Sim, S., M. Barry, R. Clift, and S. J. Cowell. 2006.The relative importance of transport in determin-ing an appropriate sustainability strategy for foodsourcing. International Journal of Life Cycle Assess-ment 12(6): 422–431.
Sonesson, U., H. Jonsson, and B. Mattsson. 2004. Post-consumption sewage treatment in environmentalsystems analysis of foods: A method for includ-ing potential eutrophication. Journal of IndustrialEcology 8(3) 51–64.
Sonesson, U., F. Anteson, J. Davis, and P.-O.Sjoden. 2005. Home transport and wastage:
Munoz et al., Human Excretion in LCA of Food Products 537
F O RU M
Environmentally relevant household activities inthe life cycle of food. AMBIO 34(4–5): 371–375.
Sonesson, U., B. Mattsson, T. Nybrant, and T. Ohls-son. 2005. Industrial processing versus homecooking: An environmental comparison betweenthree ways to prepare a meal. AMBIO 34(4–5):414–421.
Tomlin, J., C. Lowis, and N. W. Read. 1991. Inves-tigation of normal flatus production in healthyvolunteers. Gut 32(6): 665–669.
Tukker, A., G. Huppes, J. Guinee, R. Heijungs, A. deKoning, L. van Oers, S. Suh, T. Geerken, M. vanHolderbeke, B. Jansen, and P. Nielsen. 2006. En-vironmental impact of products (EIPRO): Analysisof the life cycle environmental impacts related to thefinal consumption of the EU-25. Technical ReportEUR 22284 EN. Seville, Spain: IPTS/ESTO.
Weidema, B. 2003. Market information in life cycle as-sessment. Environmental project no. 863. Copen-hagen, Denmark: Danish Environmental Protec-tion Agency.
Ziegler, F., P. Nilsson, B. Mattsson, and Y. Walther.2003. Life cycle assessment of frozen cod filletsincluding fishery-specific environmental impacts.
International Journal of Life Cycle Assessment 8(1):39–47.
About the Authors
Ivan Munoz was a research fellow at the Cen-tre for Environmental Strategy, University ofSurrey, Surrey, United Kingdom, at the time thearticle was written. He is currently a researcherat the Department of Hydrogeology and Analy-tical Chemistry, University of Almeria, Almeria,Spain. Llorenc Mila i Canals was a research fel-low at the Centre for Environmental Strategy,University of Surrey, at the time the article waswritten. He is currently life cycle analysis man-ager within Unilever’s Safety and EnvironmentalAssurance Centre (SEAC) group, Unilever Col-worth, Colworth, United Kingdom. Roland Cliftis distinguished professor of environmental tech-nology in the Centre for Environmental Strat-egy at the University of Surrey and president-elect of the International Society for IndustrialEcology.
538 Journal of Industrial Ecology