Embed Size (px)
Citation preview

&HFLO�&RXQW\�3XEOLF�6FKRROV $�&RPSRQHQW�8QLW�RI�&HFLO�&RXQW\ *HRUJH�:DVKLQJWRQ�&DUYHU�(GXFDWLRQ�/HDGHUVKLS�&HQWHU ����%RRWK�6WUHHW (ONWRQ��0DU\ODQG������� ZZZ�FFSV�RUJ 6HUYLQJ�/($51(56��)$0,/,(6��DQG�WKH�
&20081,7<
)LVFDO�<HDU�(QGHG�-XQH���������
&RPSUHKHQVLYH�$QQXDO )LQDQFLDO�5HSRUW
������&HFLO�&RXQW\�3XEOLF�6FKRROV

NONDISCRIMINATION POLICY: The Cecil County Public Schools does not discriminate in admissions, access, treatment or employment in its programs and activities on the basis of race, color, gender and gender identity, age, national origin, religion, sexual orientation, or disabling condition.

COMPREHENSIVE ANNUAL FINANCIAL REPORT
Cecil County Public Schools A Component Unit of Cecil County, Maryland
George Washington Carver Education Leadership Center 201 Booth Street, Elkton, Maryland 21921
FISCAL YEAR ENDED JUNE 30, 2021
BOARD OF EDUCATION
William H. Malesh, President
Diana B. Hawley, Vice President Christie L. Stephens, Member
Tierney F. Davis, Member Dianne L. Heath, Member
Simone D. Foye, Student Member
Jeffrey A. Lawson, Ed.D., Superintendent of Schools and Secretary/Treasurer Carolyn J. Teigland, Ed.D., Associate Superintendent for Education Services
R. Joseph Buckley, Ed.D. Associate Superintendent for Administrative Services Sandra T. Jack, Chief Financial Officer
Prepared by the Department of Business Services

THIS PAGE INTENTIONALLY LEFT BLANK

CECIL COUNTY PUBLIC SCHOOLS COMPREHENSIVE ANNUAL FINANCIAL REPORT
FOR THE FISCAL YEAR ENDED JUNE 30, 2021
Table of Contents INTRODUCTORY SECTION ............................................................................................................... 7
Organization Chart ...................................................................................................................... 9 Leadership Team ....................................................................................................................... 10 Letter of Transmittal ................................................................................................................. 11 GFOA Certificate of Excellence ................................................................................................. 24 ASBO International Certificate of Excellence ............................................................................ 25
FINANCIAL SECTION ...................................................................................................................... 27 Independent Auditor’s Report .................................................................................................. 29 Management’s Discussion and Analysis (required supplementary information) .................... 32 BASIC FINANCIAL STATEMENTS ................................................................................................ 47
Statement of Net Position .................................................................................................... 49 Statement of Activities.......................................................................................................... 50 Balance Sheet - Governmental Funds ................................................................................... 51 Reconciliation of Governmental Funds Balance Sheet with the Statement of Net Position with the Statement of Net Position ...................................................................................... 52 Statement of Revenue, Expenditures, and Changes in Fund Balances - Governmental Funds............................................................................................................................................... 53 Reconciliation of Net Change in Fund Balance with Change in Net Position ....................... 54 Statement of Revenue, Expenditures, Encumbrances, and Changes in Fund Balance - Budget (non-GAAP Budgetary Basis) and Actual - General Fund...................................................... 55 Statement of Fiduciary Net Position ..................................................................................... 56 Statement of Changes in Fiduciary Net Position .................................................................. 57 Notes to Basic Financial Statements ..................................................................................... 58
REQUIRED SUPPLEMENTARY INFORMATION ........................................................................... 93 Schedule of Changes in Net OPEB Liability and Related Ratios ............................................ 95 Schedule of Board Contributions .......................................................................................... 96 Schedule of Investment Returns ........................................................................................... 96 Schedule of the Proportionate Share of the Net Pension Liability for the Employee's Retirement and Pension System ........................................................................................... 96
STATISTICAL SECTION.................................................................................................................... 99 Statistical Section Contents .................................................................................................... 101
Net Position by Component ................................................................................................ 103 Changes in Net Position, Governmental Funds .................................................................. 104 Fund Balances of Governmental Funds .............................................................................. 105 Changes in Fund Balance of Governmental Funds ............................................................. 106 General Fund, Final Approved Budget by Function ............................................................ 107 General Fund, Revenues by Source .................................................................................... 108

General Fund, Expenditures by Function, Budgetary Basis (non-GAAP) ............................ 109 Special Revenue Fund, Revenues by Source ....................................................................... 110 Special Revenue Fund, Expenditures by Object ................................................................. 111 Capital Project Fund, Revenues by Source ......................................................................... 112 Capital Project Fund, Expenditures by Type ....................................................................... 113 Government-wide, Revenues by Source ............................................................................ 114 Government-wide, Expenditures by Function .................................................................... 115 Enrollments by School ........................................................................................................ 116 Principal Employers ............................................................................................................. 117 Demographics and Economic Statistics .............................................................................. 118 Full-Time Equivalent Employees Budgeted by Function-General Fund ............................. 119 Cost per Student Budgetary Basis (non-GAAP)................................................................... 120 Other Operating Data ......................................................................................................... 121 Capital Asset Information ................................................................................................... 122 Student Academic Performance ......................................................................................... 123 Outstanding Capital Leases ................................................................................................. 124 Schedule of Capital Leases .................................................................................................. 124
INDEPENDENT AUDITOR’S REPORTS AND OTHER SUPPLEMENTARY INFORMATION................ 125 Independent Auditor’s Report on Internal Control Over Financial Reporting and on Compliance and Other Matters Based on an Audit of Financial Statements Performed in Accordance with Government Auditing Standards ............................................................................................ 127 Independent Auditor’s Report on Compliance for Each Major Federal Program and on Internal Control over Compliance Required by the Uniform Guidance ............................................... 129 Schedule of Findings and Questioned Costs ........................................................................... 131 Schedule of Expenditures of Federal Awards ......................................................................... 133 Notes to Schedule of Expenditures of Federal Awards .......................................................... 136

INTRODUCTORY SECTION
7

8

Cecil County Public Schools
Organization Chart As of July 1, 2021
Our Mission: CCPS serves equitably through positive relationships as a safe, collaborative community. We will ensure all learners acquire the knowledge, skills, and qualities to be responsible, caring, and etical citizens.
Superintendent
Associate Superintendent for Education Services
Associate Superintendent for Administrative Services
Executive Director for Secondary School
Educa tion
Chief Financial OfficerExecutive Director for Support Services
Board of Education
Executive Director for Elementary School
Education
Voters
Executive Director for Staff Re lations
9

Leadership Team As of July 1, 2021
Jeffrey A. Lawson, Ed.D. Superintendent of Schools and Secretary/Treasurer/Executive Officer of the Board of Education
Carolyn J. Teigland, Ed.D. Associate Superintendent for Education Services Robert J. Buckley, Ed.D. Associate Superintendent for Administrative Services Sandra T. Jack Chief Financial Officer David B. Foye, Ed.D. Executive Director for Secondary School Education Jennifer F. Hammer, Ed.D. Executive Director for Elementary School Education Sean A. Cannon Executive Director for Staff Relations Perry A. Willis
Executive Director for Support Services
10

CECIL COUNTY PUBLIC SCHOOLS Jeffrey A. Lawson, Ed.D., Superintendent 201 Booth Street, Elkton, MD 21921
September 30, 2021 Letter of Transmittal To the Board of Education of Cecil County and Citizens of Cecil County, The Comprehensive Annual Financial Report of the Cecil County Public Schools (School System) for the fiscal year ended June 30, 2021 is prepared pursuant to the requirements of Section 5-109 of the Public School Laws of Maryland. The School System is one governed by a Board of Education (Board) consisting of five elected members pursuant to state law and to which Cecil County provides partial fiscal support. Because of this fiscal relationship and the County’s control over the budget process, the School System is a component unit of the County for financial reporting purposes, a requirement of the Governmental Accounting Standards Board (GASB). Responsibilities for both the accuracy of the presented data and the completeness and fairness of the presentation, including all disclosures, rests with the management of the School System. We believe the data is accurate in all material respects and presented in a manner that fairly reflects the financial position and the results of operations of the School System. All disclosures necessary to enable the readers to gain maximum understanding of the School System’s financial affairs are provided. Generally Accepted Accounting Principles (GAAP) require that management provide a narrative introduction, overview, and analysis to accompany the basic financial statements in the form of Management’s Discussion and Analysis (MD&A). The design of this letter of transmittal complements the MD&A and should be read in conjunction with it. The School System’s MD&A can be found at the beginning of the Financial Section. The report is available to all interested parties. Copies are forwarded to Board members, Leadership Team members, appropriate officials of the State of Maryland and Cecil County, all of the schools, and public libraries. Copies are also distributed to other school districts, individuals, and organizations upon request. It is also available to the public on our web site www.ccps.org. THE REPORTING ENTITY AND ITS SERVICES The report includes the financial activities of the Cecil County School System, a component unit of the Cecil County Government, as they relate to the services provided for a comprehensive preschool, elementary, and secondary public school education. The School System serves 14,718 students in 30 schools throughout our county including 17 elementary, 6 middle, 5 high schools, a career and technology center and an alternative school. The School System projects enrollment
11

CECIL COUNTY PUBLIC SCHOOLS Jeffrey A. Lawson, Ed.D., Superintendent 201 Booth Street, Elkton, MD 21921
to increase by 5.55% by fiscal year 2030. Enrollment numbers were down in fiscal year 2021 due to COVID-19. Our fleet of buses travel 2.3 million miles annually transporting students safely to and from school. Cecil County Public Schools is the 14th largest of the 24 school systems in Maryland. Cecil County has no charter schools. Approximately 2.4 million square feet of building space and 733 acres of land is proudly maintained to ensure a safe and secure learning environment. Since 1998, the Maryland Public School Construction Program (IAC inspection) has rated our schools "superior" a total of 37 times; thirteen schools have received this rating twice. Since 2008, fourteen schools have received a rating of "adequate". The oldest building in use by the system is a school facility built in 1923. The newest building in use is the fully renovated Chesapeake City Elementary School which opened for the 2021-2022 school year. The school was relocated beside the current Bohemia Manor High/Middle School. The old school building will be returned to the County. Twenty-one of the 32 buildings have undergone renovation at some point. The school buildings are multi-use facilities, serving many community groups and organizations for meetings and recreational use when school is not in session. Of the total $17.7 million in deferred maintenance expense, $6.4 million will be eliminated with the implementation of our five-year capital improvement plan. This includes the replacement of North East Middle and High schools and the roof replacement at Elkton Middle School. The annual operating budget of the School System is approved by the County Council of Cecil County in June each year for the following fiscal year. The School System’s approved budget for fiscal year 2022 totals $231,532,533, funded 38.2% by the County, 48.3% by the State and 13.4% by Federal and other sources. Capital projects are funded by Cecil County Government and the State of Maryland. The Board of Education has no authority to issue general obligation debt. Funds are budgeted and appropriated on both project and annual basis. Capital project funds do not lapse at the end of each year and may be expended through the duration of a project. Budget transfers between projects require the approval of the Board and the Cecil County Council. Long-term Financial Planning In 2002, the state legislature enacted the Bridge to Excellence in Public Schools Act (BTE). This law initiated major changes in state financing of local schools to achieve adequate and equitable funding to Maryland’s twenty-four districts. The state legislature is expected to again review the current funding formulas in light of recent Federal and State mandates, the requirements of the Every Student Succeeds Act (ESSA) signed into law on December 10, 2015, and teachers’ pension funding. Current state funding formulas are based on a foundation per student amount.
12

CECIL COUNTY PUBLIC SCHOOLS Jeffrey A. Lawson, Ed.D., Superintendent 201 Booth Street, Elkton, MD 21921
Preschool and prekindergarten students are not included in the State or County MOE funding formulas. Federal funding is largely dependent on changes in student demographics among those receiving federally funded Free and Reduced Meals (FaRMs) and students with Individual Education Plans (IEP). Federal funding has increased with several programs in support of the COVID-19 pandemic. In order to receive an increase in State Foundation Aid, the County must appropriate an amount equal to, or greater than, the prior year per student appropriation. This Maintenance of Effort (MOE) calculation ensures equal funding relative to enrollment as that of prior years on a per student basis. For fiscal 2022, Maryland House Bill 1372 excluded September 30, 2020 enrollment from the MOE calculation due to COVID-19 and the related decrease in enrollment. In addition, an escalator was applied to Counties whose education effort was below the five-year statewide average. As a result, the School System will receive a 2.5% increase in County funding for a total regular appropriation of $88,527,026. This is an increase of $2,159,161. This amount is $2,159,161 more than the Board’s request. Total projected revenue for fiscal year 2022 is $230,774,642. Projected expenses of $231,532,533 will require the use of fund balance in the amount of $757,891.
$67.2 $69.7 $72.1 $75.8
$80.6 $81.7 $82.5 $84.9 $86.4 $88.5
$35
$40
$45
$50
$55
$60
$65
$70
$75
$80
$85
20132014 20152016 201720182019 20202021 2022
Mill
ions
2013-2016Excludes mandated teacher pension
13

CECIL COUNTY PUBLIC SCHOOLS Jeffrey A. Lawson, Ed.D., Superintendent 201 Booth Street, Elkton, MD 21921
ECONOMIC CONDITION AND OUTLOOK According to the U.S. Census Population Estimates, the population of Cecil County as of July 2019 was 102,522. The Maryland Department of Planning projects that this number will increase to 135,450 residents by 2040. The labor force in Cecil County continues to remain around 52,000. The most recent monthly labor force number is 53,741 as of May 2020. The number of in-county jobs has increased to over 33,000, a 9% increase over five years. The March 2020 unemployment rate was 3.9%, increased to 8.6% during COVID-19, and as of July 2021 is back down to 3.9%. Data USA reports that the median household income for Cecil County is $76,887 in 2020, a growth of 5.5%; Cecil County’s median household income is $7,000 lower than the Maryland median household income, but $11,890 greater than the USA median household income. Cecil County's median income is, however, $8,000 higher than the regional average. 89% of Cecil County citizens have attained a high school or higher degree. Located in the center of the Boston-Atlanta corridor, Cecil County provides overnight access to markets of over 90 million people and one-third ($5.7 trillion) of the nation’s effective buying income. Cecil County is ideally located halfway between Baltimore and Philadelphia and halfway between Washington DC and New York. The Maryland Department of Labor, Licensing, and Regulation reported a total of 1,963 active businesses in Cecil County in the first quarter of 2020. With direct access to the major thoroughfares of I-95 and U.S. Route 40, 22% of the employers in Cecil County are in the trade, transportation, and utility industry. Local government, trade and transportation, education and health services, and leisure and hospitality sectors provide employment opportunities for over 60% of those employed in the county. The manufacturing sector in Cecil County continues to be strong, employing 5,013 positions or 15% of the total in-County jobs with increases expected over the next two years. Further, the County’s manufacturing sector employment concentration is over three times that of the State of Maryland and is the highest in the region. Those employed in manufacturing earn an average weekly wage in excess of $2,000. Major manufacturers in the County include W.L. Gore, Northrop Grumman, Terumo Medical Corporation, Terumo Cardiovascular Systems, TIM Plastics, and Clene Nanomedicine. The top employer in Cecil County is W.L. Gore, which specializes in polymer and plastic membranes, medical products, and research and development, currently employing over 2,400 people. Cecil County is also home to several large logistics and transportation organizations such as Amazon, IKEA, Restoration Hardware, Burris Logistics, Medline, and KeHE. The county's prime location along the I-95 corridor makes it a great place for businesses to locate and grow. This
14

CECIL COUNTY PUBLIC SCHOOLS Jeffrey A. Lawson, Ed.D., Superintendent 201 Booth Street, Elkton, MD 21921
sector has grown over 8% over the past five years, leading to new centers for Lidl, Medline, and Smithfield Foods. The average wage for logistics center employees is $57,500. The Enterprise Zone, which provides tax incentives to both property and business owners who meet certain criteria, continues to be attractive to businesses looking to expand in or relocate to Cecil County. Other helpful tools include the Job Creation Tax Credit, More Jobs for Marylanders, More Opportunities for Marylanders, the Opportunity Zone program, the Cecil County Workforce Training Partnership Program, and the Cecil Catalyst loan program. The first three programs are offered through the Maryland Department of Commerce. There are a number of major projects currently underway in Cecil County. First among them is the largest Great Wolf Lodge in the US (GWL), with over 700 rooms and the company’s largest indoor water park to date. Ground has been broken and we expect the GWL to open in 2023. Elkton Commerce Center, along Route 40, has broken ground on its first building of 760,000 square feet, with two more buildings of similar size to be built within the next couple of years. After many false starts, Bainbridge’s industrial development is well underway, and the developers are beginning to search for tenants for Phase I of the industrial development there. An additional 500,000 square feet is being built on Red Toad Road, which brings the total of industrial building up to over 5 million square feet. Thousands of jobs are expected to be created in data, logistics, and manufacturing. There are many smaller projects underway in the towns and County, and the demand for land in Cecil County is at an all-time high. This is also a boom time for housing in Cecil County, with more starts for new homes than ever, and the demand for new land and homes continues unabated. An important segment of Cecil County's economy involves the tourism industry. A Tourism Impact Study that measures the impact on Cecil County revealed that visitors spent $182.6 million in 2019. This resulted in approximately $30 million in local and state taxes. In addition, the tourism industry employed 2,576 people. Cecil County comprises 222,824 acres, of which approximately 33% is farmland. The County’s working landscapes are devoted mainly to cash grain crops (corn, soybeans, wheat, hay, and barley) although its unique topography offers many other agricultural land uses including tree fruits (apples, peaches, and pears), table grapes and berries, plant nurseries and vegetables. Warwick Mushroom Farms is the largest single-site, high tech energy efficient mushroom growing operation in the Western hemisphere with over a half-million square feet of growing surface. Warwick Mushroom is currently undergoing its third expansion. Equine is big business in Cecil County. In fact, Cecil County has the largest market value of horses sold in the state of Maryland. The County is home to equine operations of all sizes, from backyard
15

CECIL COUNTY PUBLIC SCHOOLS Jeffrey A. Lawson, Ed.D., Superintendent 201 Booth Street, Elkton, MD 21921
pastures with a single pleasure riding horse to the largest Standardbred operation in North America and everything in between, including the Fair Hill Training Center, Select Breeders Services International headquarters, Hassler Dressage’s world class facility at Riveredge, and Northview Stallion Station – a renowned Thoroughbred operation. Cecil County farmers continue to diversify with value-added products, such as cheese making. The County is also home to vineyards, wineries, on-farm breweries and distilleries, pub breweries, and a growing agri-tourism sector. STRATEGIC PLAN Our Mission Cecil County Public Schools serves equitably through positive relationships as a safe, collaborative community. We will ensure all learners acquire the knowledge, skills, and qualities to be responsible, caring, and ethical citizens. Our Vision To educate and empower every Cecil County learner through equitable opportunities to build and strengthen our community. Our Values
16

CECIL COUNTY PUBLIC SCHOOLS Jeffrey A. Lawson, Ed.D., Superintendent 201 Booth Street, Elkton, MD 21921
The School System has set five main themes within the Strategic Plan for student success:
Safe schools - We will provide a safe, secure learning environment. Safety addresses not only physical well-being through facilities and emergency preparedness, but also effective aspects of safety, including mental health, drug and alcohol awareness, and social-emotional wellbeing. We will know we are successful by attending to the following indicators:
1. Structural, staff, and student physical well-being 2. Staff and student mental health wellness 3. Student climate information 4. Emergency preparedness
Equitable, rigorous learning opportunities - A rigorous, relevant and culturally responsive
curriculum will be in place, continually reviewed, and implemented by quality educators. We will challenge and support every learner to excel to high standards through equitable opportunities. We will know we are successful by attending to the following indicators:
1. Rigorous, relevant, and culturally responsive curriculum 2. Equitable student opportunity in all areas of school function 3. High expectations 4. Diverse workforce
Communication and trust - We will model and foster transparency throughout the organization to promote a culture founded in mutual respect. Internal and external communication plans will encourage dialogue and show value for everyone’s voice and role in the system. We will know we are successful by attending to the following indicators:
1. Consistent communication processes 2. Ongoing two-way communication with all learners 3. Communicating a clear rationale for initiatives 4. Including multiple perspectives during decision-making
Recruitment and retention of a high-quality workforce - A high quality workforce will be recruited and retained to support the diverse needs of every learner. They will be supported through timely and relevant professional development. We will attend to the mental, physical, and social-emotional well-being of all employees. We will know we are successful by attending to the following indicators:
1. Strategic planning for all areas of workforce needs 2. Excellent professional culture and staff climate 3. Professional development for all employees 4. Employees feel supported as a person
17

CECIL COUNTY PUBLIC SCHOOLS Jeffrey A. Lawson, Ed.D., Superintendent 201 Booth Street, Elkton, MD 21921
5. Establish and maintain regionally competitive wages
Community engagement - We will create networks of support throughout our community. We will expand and enhance mutually beneficial and purposeful partnerships, engaging our community about opportunities and decisions. We will know we are successful by attending to the following indicators:
1. Community outreach to internal and external stakeholders 2. Community partnerships 3. Social media outreach 4. Community advocacy
In a school system with nearly 15,000 students and more than 2,000 employees, establishing a path forward that is reflective of the values of our community is crucial in providing our students with a world-class education. Coordinating services and resources in alignment with the system’s goals requires tremendous communication and trust among stakeholders; it will be successful only if there is a united effort to move forward towards a common goal. The School System submits an annual update to its Strategic Plan every October in accordance with the Every Student Succeeds Act (ESSA) Consolidated State plan subject to the approval of the Maryland State Board of Education. It serves as the framework for the School System’s continuous improvement efforts to achieve our Mission. Recent Accomplishments
The School System is a diverse learning community where stakeholders are respected, valued and contribute to an excellent educational program in a rapidly changing global society. The following are the major programmatic initiatives accomplished before or within fiscal year 2021: Our efforts to improve the academic achievement and opportunities of our students included:
Implementation of virtual learning platform, Schoology, for students in grades 1-12 and SeaSaw in grades Preschool, Prekindergarten, and Kindergarten
Professional development for all teachers and paraprofessionals on engagement and management in virtual classrooms
Summer School Program to support students at all levels Twilight School as an alternative to suspension in all secondary schools Differentiated instruction designed to meet the needs of all students Curricular programs aligned with state and national standards Serving the needs of students with disabilities in an inclusive, least restrictive
environment
18

CECIL COUNTY PUBLIC SCHOOLS Jeffrey A. Lawson, Ed.D., Superintendent 201 Booth Street, Elkton, MD 21921
Revised Grading and Reporting Policy and Procedures Freshman Academy in each high school Focus on literacy in all content areas Stipends for staff to provide after-school clubs/activities for students Internet access with hotspots to support students without internet access in their home
when quarantined due to the pandemic Our efforts to improve the learning environment of our schools included:
Ongoing implementation of Positive Behavior Interventions and Supports (PBIS) programs to all schools
Training in restorative practices Active partnerships with business and community leaders Ongoing implementation of a revised Student Code of Conduct Regular safety reviews at each school to assess readiness to respond to incidents Training for all schools in A.L.I.C.E. (Alert, Lockdown, Inform, Counter, Evacuate) active
intruder/threat protocols Academic supports for students with behavioral challenges available in all schools Cultural proficiency training for administrators and all staff Behavioral support classrooms in 3 elementary schools and 2 middle schools Student Support Centers in all schools
Our efforts to improve support and services for our students and staff included:
A schedule of training opportunities for administrative professionals A wellness policy by our Food and Nutrition Department to provide nutritious meals Ongoing implementation of a comprehensive wellness program for staff Increased access and integration to technology through the deployment of Chromebook
carts in all schools Chromebook technology across all levels of schooling, currently in the “refresh” phase
which targets replacing the oldest Chromebooks Over 14,000 Chromebook devices available to students for daily instruction as well as
supporting online testing requirement Substitute release time for teachers to participate in professional development Special educators to provide specialized instruction Stipends for teachers to participate in professional development in the summer and
beyond the duty day Step increases and COLA for employees per collective bargaining arrangements Resources to support the implementation of new curricula Continued implementation of AVID (Advancement Via Individual Determination) in a
19

CECIL COUNTY PUBLIC SCHOOLS Jeffrey A. Lawson, Ed.D., Superintendent 201 Booth Street, Elkton, MD 21921
variety of elementary, middle, and high schools Two high schools will participate in the Equal Opportunity Schools Project to increase the
participation in honors and advanced placement level course work The Future Funding for the following major programmatic initiatives are included in the fiscal year 2022 budget: Our efforts to improve the academic achievement and opportunities of our students include:
Full-day prekindergarten for qualified students in all 17 elementary schools Implementation Manufacturing program at School of Technology Performance Matters, a data analytics resource, utilized in all schools Continue Chromebook refresh Continue to offer a full range of athletic extra-curricular opportunities Support and focus on more preventative maintenance work orders to save money and
ensure the longevity of equipment Created the Blended Virtual Learning Program to support students choosing or unable to
attend face-to-face programs in grades 3-12 Implement supports to address student learning loss due to the pandemic
FINANCIAL INFORMATION Relevant Financial Policies The Board of Education of Cecil County establishes and maintains fiscal oversight and control of funds appropriated to the School System. The Board must adopt an annual balanced budget (total expenditures equal to total revenues) and establish policies to implement a system of adequate internal controls and special grants management to assure fiscal accountability. The School System has no authority to levy and collect taxes. All funding is provided by the Federal, State, and County governments. In order to receive an increase in State Foundation Aid, the County must appropriate an amount equal to, or greater than, the prior year per student appropriation. This Maintenance of Effort (MOE) calculation ensures equal funding relative to enrollment as that of prior years on a per student basis. All appropriated unrestricted funds not spent at the end of the fiscal year accrue to the operating fund balance. By Board policy, the target is to maintain a total fund balance of not less than 2%
20

CECIL COUNTY PUBLIC SCHOOLS Jeffrey A. Lawson, Ed.D., Superintendent 201 Booth Street, Elkton, MD 21921
with a goal of 5% of annual operating expenditures for the fiscal year. Any excess funds may be appropriated for one-time expenditures or used to manage revenue shortfalls in subsequent years’ budgets. All funds must remain in the fund originally appropriated. Budgetary Requirements The School System maintains a chart of accounts that fulfills the reporting requirements of the Maryland State Department of Education and specific needs of the organization itself. The chart of accounts is composed of the following elements: fund, category, program, object and location to fulfill state requirements and project, department, and discipline to fulfill organizational needs. Revenues are classified as local, state, federal, or other. Expenses are classified by category and further classified by object. These categories include:
Administration Student transportation Instruction leadership and support Operation of plant Instruction salaries Maintenance of plant Instruction materials and supplies Fixed charges Instruction other costs Community services Special education Capital outlay Student personnel services Student health services
Student activities
Revenues are categorized by funding source as mandated by Maryland statute. These categories are:
Local appropriation State revenue Federal revenue Other revenue
A complete chart of accounts is available on the School System’s website at www.ccps.org. The School System may transfer funds between major categories with approval of the County Council. The School System has the authority to transfer funds between objects of expenditures (i.e. salaries and wages, contracted services, materials and supplies, other charges, and equipment) within major categories, but must notify the County Council of such action at the end of each month. In accordance with the Education Article, Title 5, §5-105, of Maryland Annotated Code, the School System may not exceed the appropriation by category.
21

CECIL COUNTY PUBLIC SCHOOLS Jeffrey A. Lawson, Ed.D., Superintendent 201 Booth Street, Elkton, MD 21921
The management and staff of the School System are responsible for preparing the budget, monitoring budgetary expenditures, reporting, and making recommendations for transfers between objects of expenditure and major categories. Internal Controls To assure the integrity of the financial records supporting the financial statements, consideration is given to the adequacy of internal accounting controls sufficient to provide reasonable assurance that assets are properly safeguarded and accounted for and are utilized only in accordance with management authorization. The concept of reasonable assurance recognizes that (1) the cost of control should not exceed the benefits likely to be derived and (2) the evaluation of costs and benefits requires estimates and judgments by management. INDEPENDENT AUDIT State statutes require an annual audit by independent certified public accountants. The Board of Education selected the accounting firm of CohnReznick LLP to perform this audit under a contract awarded in fiscal year 2019, renewable for four succeeding years. In addition to meeting the requirements set forth in state statutes, the audit also was designed to meet the requirements of the Title 2 U. S. Code of Federal Regulations Part 200, Uniform Administrative Requirements, Cost Principles, and Audit Requirements of Federal Awards (the Uniform Guidance). The Independent Auditor’s Report on the financial statements is included in the Financial Section of this report. The Independent Auditor’s Report on Internal Control over Financial Reporting and on Compliance and Other Matters Based on an Audit of Financial Statements Performed in Accordance with Government Auditing Standards and the Independent Auditor’s Report on Compliance for Each Major Program and on Internal Control over Compliance Required by the Uniform Guidance are included as Other Supplementary Information following the Statistical Section of the report. We are pleased to report that the auditor’s report on the School System’s basic financial statements is without qualification, the highest possible outcome of the audit process. AWARDS AND ACKNOWLEDGEMENTS The Government Finance Officers Association of the United States and Canada (GFOA) awarded a Certificate of Achievement for Excellence in Financial Reporting to Cecil County Public Schools for its Comprehensive Annual Financial Report (CAFR) for the fiscal year ended June 30, 2020. This is the eighteenth consecutive year that the School System achieved this prestigious award. In order to be awarded a Certificate of Achievement, a government must publish an easily readable and efficiently organized CAFR. The report must satisfy both generally accepted
22

CECIL COUNTY PUBLIC SCHOOLS Jeffrey A. Lawson, Ed.D., Superintendent 201 Booth Street, Elkton, MD 21921
accounting principles and applicable legal requirements. A Certificate of Achievement is valid for a period of one year only. We believe that our current CAFR continues to meet the Certificate of Achievement Program’s requirements and we are submitting it to the GFOA to determine its eligibility for another certificate. The Association of School Business Officials (ASBO) International has awarded a Certificate of Excellence in Financial Reporting to Cecil County Public Schools for its CAFR for the fiscal year ended June 30, 2020. The Certificate of Excellence in Financial Reporting is the highest recognition in school system financial reporting issued by ASBO International and is only conferred to school systems that have met or exceeded the standards of the program. This is the eighteenth consecutive year the School System was awarded the ASBO Certificate of Excellence in Financial Reporting. We believe our current CAFR continues to conform to the Certificate of Excellence Program requirements and we are submitting it to ASBO International for consideration. We would like to acknowledge the effective, valuable work of our School System employees, the commitment of parents and families to their children’s education, and the support for public education by the citizens of this community and our state and local officials. All have contributed significantly to the success of our students and this School System. The preparation of this report could not have been accomplished without the efficient and dedicated services of the entire staff in the Department of Business Services. The high standards to which this report conforms reflects the professional competence of all individuals responsible for its preparation. We wish to express our appreciation for a job well done. Sincerely,
Jeffrey A. Lawson, Ed.D. Sandra T. Jack Superintendent of Schools Chief Financial Officer Secretary/Treasurer
23

GFOA Certificate of Excellence
24

ASBO International Certificate of Excellence
25

THIS PAGE INTENTIONALLY LEFT BLANK
26

FINANCIAL SECTION
27

28

Independent Auditor's Report
To the Board of Education Cecil County, Maryland
Report on the Financial Statements
We have audited the accompanying financial statements of the governmental activities, each major fund, and the aggregate remaining fund information of Cecil County Public Schools (the "School System"), a component unit of Cecil County, Maryland, as of and for the year ended June 30, 2021, and the related notes to the financial statements, which collectively comprise the School System's basic financial statements as listed in the table of contents.
Management's Responsibility for the Financial Statements
Management is responsible for the preparation and fair presentation of these financial statements in accordance with accounting principles generally accepted in the United States of America; this includes the design, implementation, and maintenance of internal control relevant to the preparation and fair presentation of financial statements that are free from material misstatement, whether due to fraud or error.
Auditor's Responsibility
Our responsibility is to express opinions on these financial statements based on our audit. We conducted our audit in accordance with auditing standards generally accepted in the United States of America and the standards applicable to financial audits contained in Government Auditing Standards, issued by the Comptroller General of the United States. Those standards require that we plan and perform the audit to obtain reasonable assurance about whether the financial statements are free from material misstatement.
An audit involves performing procedures to obtain audit evidence about the amounts and disclosures in the financial statements. The procedures selected depend on the auditor's judgment, including the assessment of the risks of material misstatement of the financial statements, whether due to fraud or error. In making those risk assessments, the auditor considers internal control relevant to the entity's preparation and fair presentation of the financial statements in order to design audit procedures that are appropriate in the circumstances, but not for the purpose of expressing an opinion on the effectiveness of the entity's internal control. Accordingly, we express no such opinion. An audit also includes evaluating the appropriateness of accounting policies used and the reasonableness of significant accounting estimates made by management, as well as evaluating the overall presentation of the financial statements.
We believe that the audit evidence we have obtained is sufficient and appropriate to provide a basis for our audit opinions.
Opinions
In our opinion, the financial statements referred to above present fairly, in all material respects, the respective financial position of the governmental activities, each major fund, and the aggregate remaining fund information of Cecil County Public Schools as of June 30, 2021, and the respective changes in financial position and the respective budgetary comparison for the General Fund for the year then ended in accordance with accounting principles generally accepted in the United States of America.
29

Other Matters
Required Supplementary Information
Accounting principles generally accepted in the United States of America require that the Management's Discussion and Analysis on pages 32 to 46, the Schedules of Required OPEB Related Supplementary Information on pages 95 to 96, and Schedules of Required Pension Related Supplementary Information on pages 96 to 97 be presented to supplement the basic financial statements. Such information, although not a part of the basic financial statements, is required by the Governmental Accounting Standards Board, who considers it to be an essential part of the financial reporting for placing the basic financial statements in an appropriate operational, economic, or historical context. We have applied certain limited procedures to the required supplementary information in accordance with auditing standards generally accepted in the United States of America, which consisted of inquiries of management about the methods of preparing the information and comparing the information for consistency with management's responses to our inquiries, the basic financial statements, and other knowledge we obtained during our audit of the basic financial statements. We do not express an opinion or provide any assurance on the information because the limited procedures do not provide us with sufficient evidence to express an opinion or provide any assurance.
Other Information
Our audit was conducted for the purpose of forming opinions on the financial statements that collectively comprise the Cecil County Public Schools' basic financial statements. The Introductory and Statistical Sections are presented for purposes of additional analysis and are not a required part of the basic financial statements. The Schedule of Expenditures of Federal Awards is presented for purposes of additional analysis as required by Title 2 U.S. Code of Federal Regulations ("CFR") Part 200, Uniform Administrative Requirements, Cost Principles, and Audit Requirements for Federal Awards, and is also not a required part of the basic financial statements.
The Schedule of Expenditures of Federal Awards is the responsibility of management and was derived from and relates directly to the underlying accounting and other records used to prepare the basic financial statements. Such information has been subjected to the auditing procedures applied in the audit of the basic financial statements and certain additional procedures, including comparing and reconciling such information directly to the underlying accounting and other records used to prepare the basic financial statements or to the basic financial statements themselves, and other additional procedures in accordance with auditing standards generally accepted in the United States of America. In our opinion, the Schedule of Expenditures of Federal Awards is fairly stated in all material respects in relation to the basic financial statements as a whole.
The Introductory and Statistical Sections have not been subjected to the auditing procedures applied in the audit of the basic financial statements, and accordingly, we do not express an opinion or provide any assurance on them.
30

Other Reporting Required by Government Auditing Standards
In accordance with Government Auditing Standards, we have also issued our report dated September 30, 2021 on our consideration of the School System's internal control over financial reporting and on our tests of its compliance with certain provisions of laws, regulations, contracts, and grant agreements and other matters. The purpose of that report is solely to describe the scope of our testing of internal control over financial reporting and compliance and the results of that testing, and not to provide an opinion on the effectiveness of the School System's internal control over financial reporting or on compliance. That report is an integral part of an audit performed in accordance with Government Auditing Standards in considering the School System's internal control over financial reporting and compliance.
Baltimore, Maryland September 30, 2021
31

CECIL COUNTY PUBLIC SCHOOLS Management’s Discussion and Analysis Year Ended June 30, 2021
This section of Cecil County Public Schools’ Comprehensive Annual Financial Report (CAFR) represents our discussion and analysis of the School System’s financial performance during the fiscal year ending June 30, 2021. The Management’s Discussion and Analysis, Financial Statements, and related footnotes are the responsibility of management. Please read this section in conjunction with the transmittal letter, the School System’s financial statements and the notes to the basic financial statements that follow. Management’s Discussion and Analysis (required supplementary information) FINANCIAL HIGHLIGHTS
The School System’s net position at the end of the fiscal year totaled $125,274,721 of which $177,122,996 is a net investment in capital assets.
Net position increased $7,235,168 for the year, most of which is attributable to an increase in cash and cash equivalents of $7,566,437, an increase in capital assets of $2,493,495, and an increase in accounts payable and accrued expenses of $2,359,515. $1,656,044 of this increase is due to an accounting change related to GASB 84.
General revenues of $155,471,793 account for 60.3% of all revenues; program revenues of $102,238,083 account for 39.7%.
The Food and Nutrition department received $16,865 from charges for services, accounting for 0.2% of Food and Nutrition total revenue. Charges for services revenue decreased drastically this year due to Federal funding for meals for all students due to the COVID-19 pandemic.
The operating budget was amended during the year for a net increase of $26,852,322. This included additional revenue from Federal grants of $24,482,763, an increase in revenue from State grants of $1,074,674, and additional other revenue of $1,294,885. Implementation of GASB 84 – Fiduciary funds attributed to $1,656,044 moved from an agency fund for student activities to the general fund. OVERVIEW OF THE FINANCIAL STATEMENTS This discussion and analysis is intended to serve as an introduction to the School System’s basic financial statements and provides a framework and context for understanding the information they contain. The School System’s financial statements consist of four components: government-wide financial statements, fund financial statements, budget vs. actual statements, and notes to the financial statements.
32

CECIL COUNTY PUBLIC SCHOOLS Management’s Discussion and Analysis Year Ended June 30, 2021
Required Components of Cecil County Public Schools' Comprehensive Annual Financial Report
Summary Detail
Management's Discussion and
Analysis
Basic Financial Statements
Government-wide Financial
Statements
FundFinancial
Statements
Notes to the Financial
Statements
Budget vs. Actual Statements
The following chart summarizes the major features of the School System’s financial statements, including the portion of the School System’s activities they cover and the types of information contained therein. The remainder of this overview section of Management’s Discussion and Analysis highlights the structure and contents of each of the statements.
Major Features of the Government-wide and Fund Financial Statements Government-wide
Statements Fund Financial Statements
Government Funds Fiduciary Funds Scope Entire system (except
fiduciary funds) The activities of the School System that are not proprietary or fiduciary
Instances in which the School System administers resources on behalf of someone else, such as funds held in trust for a specific purpose, such as retiree healthcare
Required financial statements
-Statement of Net Position -Statement of Activities
-Balance Sheet -Statement of Revenues, Expenditures, and Changes in Fund Balance
-Statement of Fiduciary Net Position -Statement of Changes in Fiduciary Net Position
Accounting basis and measurement focus
Accrual accounting and economic resource focus
Modified accrual basis and current financial resources focus
Accrual accounting and economic resources focus
Type of asset/liability information
All assets and liabilities, both fiscal and capital, short-term and long term
Generally, assets expected to be used up and liabilities that come due during the year or soon
All assets and liabilities, both short term and long term; the School System’s fiduciary funds do not currently
33

CECIL COUNTY PUBLIC SCHOOLS Management’s Discussion and Analysis Year Ended June 30, 2021
thereafter; no capital assets or long-term liabilities included
contain capital assets, although they can
Type of inflow/outflow information
All revenues and expenses during the year, regardless of when cash is received or paid
Revenues for which cash is received during or soon after the end of the year; expenditures when goods and services have been received and the related liabilities are due and payable
All additions and deletions during the year, regardless of when cash is received or paid
Deferred outflows/inflows of resources
Changes in the net pension or net OPEB liability as applies to a future period and will not be recognized as an inflow or outflow of resources.
N/A N/A
BASIC FINANCIAL STATEMENTS The Basic Financial Statements section includes three kinds of financial statements that present different views of the School System’s activities and financial position. These include the Government-wide Financial Statements: Statement of Net Position and Statement of Activities, the Fund Financial Statements: Balance Sheet - Governmental Funds, Statement of Revenue, Expenditures and Changes in Fund Balances - Governmental Funds, Budget vs. Actual Financial Statement: Statement of Revenue, Expenditures, Encumbrances, and Changes in Fund Balance – Budget (Non-GAAP Budgetary Basis) and Actual - General Fund, and the Fiduciary Fund Statements: Statement of Fiduciary Net Position, and the Statement of Changes in Fiduciary Net Position. The Notes to the Basic Financial Statements are an integral part of these financial statements. They explain some of the information in the financial statements and provide more detail.
34

CECIL COUNTY PUBLIC SCHOOLS Management’s Discussion and Analysis Year Ended June 30, 2021
Recent Accounting Pronouncements During the fiscal year ended June 30, 2021, the School System adopted GASB Statement No. 84 – Fiduciary Activities (GASB 84), which is effective for reporting periods beginning after December 15, 2019. GASB 84 enhances the consistency and comparability of fiduciary activity reported by state and local governments. This Statement also is intended to improve the usefulness of fiduciary activity information primarily for assessing the accountability of governments in their roles as fiduciaries. Government-wide Statements The School System’s government-wide financial statements provide both short-term and long-term information about the School System’s overall financial status. Accounting methods similar to those used by private-sector companies are used to prepare these statements. They report information about the School System as a whole using the full accrual basis of accounting. They take into account all revenue and expenses associated with the fiscal year even if the cash was not received or the expenses paid. The government-wide financial statements include:
The Statement of Net Position presents all of the School System’s assets and deferred outflows, and liabilities and deferred inflows with the difference between the two reported as net position. The statement consolidates all of the School System’s current financial resources with capital assets net of depreciation and total liabilities. The Statement of Activities presents all of the current year’s revenues and expenses regardless of when cash is received or paid. This statement also presents a comparison between direct expenses and program revenues for each program of the School System. The majority of the School System’s revenue is general revenue grants and contributions from the County, State, and Federal governments.
The two government-wide statements report the School System’s net position and how it has changed. Net position, the difference between the School System’s assets plus deferred outflows of resources and liabilities plus deferred inflows of resources, are one way to measure the School System’s financial health. Over time, the increases or decreases in the School System’s net position can be an indicator of whether its financial position is improving or deteriorating. To assess the School System’s overall health, you need to consider additional non-financial factors such as the county’s economic condition, trends in enrollment, changes to the property tax base, and the condition of school buildings and other facilities. In the government-wide financial statements, the School System’s activities include administration, regular instruction and special education, student personnel and health services, transportation, plant operations and maintenance, food and nutrition, community services. and student activities. County appropriations funded by taxes and other fees, as well as state formula
35

CECIL COUNTY PUBLIC SCHOOLS Management’s Discussion and Analysis Year Ended June 30, 2021
aid, finance most of these activities. The School System’s Food and Nutrition program serves breakfast and lunch at all schools. The food and nutrition operation is supported by charges for meals, donated Federal food commodities, and reimbursements in accordance with government food programs. The government-wide financial statements can be found immediately following this Management’s Discussion and Analysis. Fund Financial Statements The fund financial statements focus on individual parts of the School System, reporting the School System’s operations in more detail than the government-wide statements using a modified accrual basis of accounting. These statements provide more detailed information about the School System’s funds focusing on its most significant or “major” funds as opposed to focusing on the School System as a whole. Funds are used by the School System to track specific sources of revenue and expenditures on a particular program. Because the focus of governmental funds is narrower than that of the government-wide financial statements, there are differences in the information presented for government funds with similar information presented in the government-wide statements. A reconciliation and description of the relationship between governmental activities (Statement of Net Position and Statement of Activities) and government funds can be found in the Financial Section. The School System uses three major funds. These funds are described below:
The General Fund is used to focus upon the operation of the School System’s educational and support services programs. It accounts for all financial resources for the School System except those resources required to be accounted for in another fund.
The Special Revenue Fund is used to record the financial transactions of the Food and Nutrition program. Revenue is primarily generated from the State and Federal grants, Federal commodities, and the sale of student meals and a la carte items. The expenses are those related to providing student meals.
The Capital Projects Fund reports the revenue and expenditures related to school
construction projects ranging from site improvements to minor and major building renovation and addition projects. County and State resources primarily fund these expenditures.
36

CECIL COUNTY PUBLIC SCHOOLS Management’s Discussion and Analysis Year Ended June 30, 2021
The Fiduciary Funds financial statements are used to account for resources held for the benefit of parties outside the School System. Fiduciary funds are not included in the government-wide financial statements because the resources of those funds are not available to support the School System’s own programs. Additionally, there is no analysis of the School System’s Fiduciary Fund in this Management’s Discussion and Analysis. Fiduciary funds use the accrual basis of accounting. The School System’s Fiduciary Funds consist of the following:
The Retiree Benefit Trust Fund consists of contributions of the School System to establish a reserve to pay for health and welfare benefits of future retirees. Contributions to the trust qualify as contributions within the meaning of Governmental Accounting Standards Board Statement Numbers 43 and 45. The basic fiduciary fund statements include the Statement of Fiduciary Net Position and the Statement of Changes in Fiduciary Net Position both in the Basic Financial Statements section.
Budget vs. Actual Financial Statements A Statement of Revenue, Expenditures and Changes in Fund Balance – Budget and Actual is presented for the General Fund which is a legally adopted budget. This statement found in the Financial Section, shows original and final adopted budgets, along with actual revenues and expenditures compared to the final budget. Open encumbrances are treated as expenditures in this statement. The Special Revenue Fund does not require a legally adopted budget, and therefore, a budget vs. actual comparison is not reported here. The Capital Projects Fund is used to account for revenues and expenditures associated with the acquisition or construction of major capital projects. Projects are approved by the State and County governments on a project basis. Funds are appropriated as expenditures are recognized; therefore, a budget vs. actual comparison is not reported here.
37

CECIL COUNTY PUBLIC SCHOOLS Management’s Discussion and Analysis Year Ended June 30, 2021
GOVERNMENT-WIDE FINANCIAL ANALYSIS Net Position A comparison of Net Position for 2021 vs. 2020 is shown below:
2021 2020, as restated
AssetsCurrent assets 48,041,333$ 36,945,727$ 11,095,606$ 30.0%Capital assets, net 177,122,996 174,629,501 2,493,495 1.4%Total assets 225,164,329 211,575,228 13,589,101 6.4%
Deferred Outflow of ResourcesDeferred OPEB 11,073,903 490,523 10,583,380$ 2157.6%Deferred pension 3,233,095 2,864,032 369,063 12.9%
14,306,998 3,354,555 10,952,443 326.5%
LiabilitiesOther liabilities 27,950,936 25,245,009 2,705,927 10.7%Long-term liabilities 81,123,660 66,047,584 15,076,076 22.8%Total liabilities 109,074,596 91,292,593 17,782,003 19.5%
Deferred Inflow of ResourcesOPEB related 4,176,879 2,263,397 1,913,482 84.5%Pension related 945,132 1,421,427 (476,295) (33.5)%
5,122,011 3,684,824 1,437,187 39.0%
Net PositionNet investment in capital assets 176,527,252 173,044,220 3,483,032 2.0%Restricted 32,260 32,207 53 0.2%Unrestricted (51,284,791) (53,380,830) 2,096,039 (3.9)%Net Position, end of year 125,274,721$ 119,695,597$ 5,579,124$ 4.7%
Increase/(Decrease)
Change in Net Position The School System’s combined net position increased by $5,579,124 or 4.7% on June 30, 2021, to $125,274,721. Current assets increased by $11,095,606, or 30.0% mainly due to an increase in cash and cash equivalents of $7,566,437. Capital assets increased by $2,493,495 or 1.4%. Other liabilities increased by $2,705,927 or 10.7% mainly due to the increase in accounts payables and deferred State revenue. Long-term liabilities increased by $15,076,076 mainly due to the increase in net OPEB liability.
38

CECIL COUNTY PUBLIC SCHOOLS Management’s Discussion and Analysis Year Ended June 30, 2021
There was a cumulative effect of accounting change to net position related to GASB 84 of $1,656,044. Statement of Activities A comparison of revenue by source and expense by function for 2021 vs. 2020 is shown below:
2021 2020, as restatedRevenueProgram Revenues
Charges for Services 329,238$ 1,761,674$ (1,432,436)$ (81.3)%Operating grants and contributions 85,040,320 74,474,290 10,566,030 14.2%Capital grants and contributions 16,868,525 10,129,147 6,739,378 66.5%
General RevenuesGrants and contributions not restricted
to certain programs 152,104,295 151,711,156 393,139 0.3%Other 3,367,498 607,001 2,760,497 454.8%Total revenue 257,709,876 238,683,268 19,026,608 8.0%
ExpensesAdministration 7,664,519 7,454,359 210,160 2.8%Mid-level administration 20,330,749 20,651,392 (320,643) (1.6)%Instruction 141,533,496 136,314,740 5,218,756 3.8%Special education 40,899,373 41,489,255 (589,882) (1.4)%Student personnel services 2,748,813 2,509,375 239,438 9.5%Student health services 2,719,452 2,576,710 142,742 5.5%Student transportation 10,225,156 11,270,075 (1,044,919) (9.3)%Operation of plant 14,379,276 13,842,969 536,307 3.9%Maintenance of plant 5,091,246 5,170,793 (79,547) (1.5)%Food and nutrition 5,399,918 5,647,066 (247,148) (4.4)%Community services 536,247 319,578 216,669 67.8%Student activities 602,507 - 602,507 100.0%Total expenses 252,130,752 247,246,312 4,884,440 2.0%
Change in net position 5,579,124 (8,563,044) 14,142,168 165.2%Cumulative effect of accounting change related to GASB 84 1,656,044 Net position - beginning, as restated 119,695,597 126,602,597 Net position - ending 125,274,721$ 119,695,597$
Increase/(Decrease)
Revenue (Statement of Activities) Cecil County Public Schools’ revenues from fiscal year 2021 were in the amount of $257,709,876. Program revenue came from three major sources. These include charges for services of $329,238; operating program grants from the State and Federal government of $85,040,320, and capital grants from the State of Maryland and Cecil County Government of $16,868,525. In addition to program sources, the School System received general revenue from the State of Maryland of $65,736,430, Cecil County Government of $86,367,865, and investment earnings of $14,360 and other miscellaneous income of $3,353,138 which includes $3 million from the OPEB trust fund.
39

CECIL COUNTY PUBLIC SCHOOLS Management’s Discussion and Analysis Year Ended June 30, 2021
Charges for services decreased by $1,432,436 or 81.3% due to decreased meal sales and facility rental due to COVID-19. Operating grants and contributions increased $10,566,030 or 14.2% mainly due to increased Federal aid for COVID-19. Capital grants and contributions increased by $6,739,378 or 66.5% due to the timing of construction projects.
Expenses (Statement of Activities) The revenues received during 2021 were used to pay expenses of $252,130,752. This is an increase of $4,884,440 or 2.0% over 2020. These expenses are reported by functional categories of activities established by the Maryland State Department of Education. Fringe benefit costs for employees have been distributed across each functional category to more accurately report the expenses of each function. Instruction salaries and wages, supplies and materials, instruction technology and equipment resulted in an overall increase of $5,218,756 or 3.8% in the instruction categories. Special Education decreased by $589,882 or 1.4%. Student transportation decreased by $1,044,919 or 9.3%. There was an increase in student services of $382,180 or 13.3% and an increase in community services of $216,669 or 67.8%. Due to implementation of GASB 84, a new category of student activities was added in the amount of $602,507.
State formula aid25.5%
County33.5%
Categorical grants33.0%
Capital grants6.6%
Services0.1%
Interest & Other1.3%
Cecil County Public Schools’ Revenue SourcesFiscal Year 2021
40

CECIL COUNTY PUBLIC SCHOOLS Management’s Discussion and Analysis Year Ended June 30, 2021
Overall spending increased by $4,884,440 or 2.0% and revenue increased by $19,026,608 or 8.0%. This along with a cumulative effect of accounting change due to GASB 84 resulted in a increase in net position of $7,235,168. The expenses classified by the state’s categorical functions can be further summarized for 2021 as follows:
GOVERNMENT FUNDS FINANCIAL HIGHLIGHTS The total assets of the School System’s government funds exceeded liabilities at the end of the fiscal year by $20,815,225. Total government fund revenues increased by $16,026,609 with a $8,062,540 increase in the General Fund due to an increase in local and federal funding and a $6,738,649 increase in the Capital Project Fund due to the timing of projects. The School System received $97,587,339 or 38.1% of its governmental activities funding from the County, $131,578,402 or 51.3% from the State, and $24,048,783 or 9.4% from federal grants.
Administration, 3.0%
Special Education, 16.2%
Instruction, 56.1%
Mid-level Administration,
Student Personnel, Health, and
Transportation, and Community Services,
Student Activities, 14.8%
Operations and Maintenance of Plant, Capital Outlay, 7.7%
Food and Nutrition, 2.2%
Combined Expenses for Cecil County Public Schoolsfor Fiscal Year 2021
41

CECIL COUNTY PUBLIC SCHOOLS Management’s Discussion and Analysis Year Ended June 30, 2021
GOVERNMENT FUNDS FINANCIAL ANALYSIS Major Fund Balances The following schedule shows the School System’s change in fund balances:
Total
GeneralSpecial
RevenueCapitalProjects
Governmental Funds
Fund balance, beginning of year, as restated 11,448,431$ 1,355,272$ 32,207$ 12,835,910$ Fund balance, end of year 17,828,408 2,954,557 32,260 20,815,225
Net change in fund balances 6,379,977$ 1,599,285$ 53$ 7,979,315$
The General Fund increased $6,379,977 from the previous year to $17,828,408. The implementation of GASB 84 – Fiduciary funds moved $1,656,044 of Student Activity funds previously reported as agency funds to the general fund. Also due to the COVID-19 pandemic additional federal funds were received and traditional spending was decreased. The Special Revenue Fund increased $1,599,285 from the previous year to $2,954,557 This represents 48.5% of total fund expenditures. This increase is attributed to savings in salaries and contracted services as well as increased revenue from the federal government. The Capital Projects Fund increased $53 from the previous year to $32,260. All capital expenditures are approved on a project basis. Any fluctuation in the fund balance is due to the timing of expenditures and miscellaneous income not related to expenditures. General Fund Budgetary Highlights This measure can be useful as a measure of the General Fund’s liquidity. However, it is important to note that the School System is fiscally dependent on grants and appropriations from the County, State and Federal governments. The School System is authorized to transfer funds between major categories of the budget. The following schedule shows the budget amendments, the actual revenue and expenditures, and the remaining budget in each major category:
42

CECIL COUNTY PUBLIC SCHOOLS Management’s Discussion and Analysis Year Ended June 30, 2021
OriginalBudget
BudgetAmendments
Final Budget Actual
Final Budget vs. Actual
RevenueIntergovernmental
Cecil County, Maryland 86,367,865$ -$ 86,367,865$ 86,367,865$ -$ State of Maryland 112,782,994 1,074,674 113,857,668 112,408,495 (1,449,173) United States government 9,653,234 24,482,763 34,135,997 17,825,315 (16,310,682)
Other sourcesInvestment interest 200,000 - 200,000 14,177 (185,823) Other 8,930,019 1,294,885 10,224,904 4,423,030 (5,801,874)
Total revenue 217,934,112$ 26,852,322$ 244,786,434$ 221,038,882$ (23,747,552)$
ExpendituresCurrent
Administration 5,747,570$ 2,582,250$ 8,329,820 5,824,917$ 2,504,903$ Mid-level administration 14,838,310 246,477 15,084,787 14,301,253 783,534 Instruction salaries 83,028,169 5,452,610 88,480,779 81,150,736 7,330,043 Instruction materials and supplies 2,222,432 5,404,233 7,626,665 4,170,138 3,456,527 Instruction other costs 3,957,204 6,214,246 10,171,450 6,670,290 3,501,160 Special education 34,011,775 2,107,658 36,119,433 29,860,980 6,258,453 Student personnel services 1,703,483 1,262,067 2,965,550 2,048,031 917,519 Student health services 1,749,090 298,113 2,047,203 1,897,687 149,516 Student transportation 11,515,284 803,245 12,318,529 9,877,749 2,440,780 Operation of plant 12,081,908 (174,416) 11,907,492 11,840,330 67,162 Maintenance of plant 3,674,202 379,437 4,053,639 3,939,441 114,198 Fixed charges 42,701,788 1,158,928 43,860,716 41,317,129 2,543,587 Community services 254,406 1,118,874 1,373,280 738,729 634,551 Capital outlay 448,491 (1,400) 447,091 418,988 28,103 Student activity fees - - - 602,507 (602,507)
Total expenditures 217,934,112$ 26,852,322$ 244,786,434$ 214,658,905$ 30,127,529$
The General Fund is the School System’s primary operating fund. The final budget of $244,786,434 exceeded the original budget by $26,852,322 including $25,557,437 in Federal and State funding. Those funds are primarily in the categories of administration, instruction salaries, instruction materials and supplies, instruction other costs, special education, and fixed charges. Actual expenditures were less than the final budget by $30,127,529. $17,540,797 is related to Federal and State grants that will carry over to fiscal 2022. Unrestricted revenue exceeded expenditures by $6,379,977. An increase in Federal restricted funding due to COVID-19 contributed to a savings in unrestricted expenditures. Capital Assets and Long-Term Debt Activity The School System’s investment in capital assets for its governmental activities as of June 30, 2021 amounts to $177,122,996 (net of accumulated depreciation). This investment in capital assets includes land, buildings, improvements, equipment, and construction in progress. The School System has no infrastructure assets (roads, bridges, streets, etc.).
43

CECIL COUNTY PUBLIC SCHOOLS Management’s Discussion and Analysis Year Ended June 30, 2021
The following schedule shows the School System’s capital assets by type:
2021 2020Land 7,602,491$ 5,743,759$ Buildings 128,821,775 140,274,101 Improvements other than buildings 8,018,705 8,777,479 Furniture, fixtures, and equipment 11,572,989 12,418,802 Construction in progress 21,107,036 7,415,360
Total 177,122,996$ 174,629,501$
(net of depreciation)Cecil County Public Schools Capital Assets
The total increase in the School System’s net capital assets during the year including depreciation was $2,493,495. Major capital project expenditures during the fiscal year ended June 30, 2021 included:Continuation of a new school for Chesapeake City Elementary totaling $11,608,658 Start of a new school for North East Middle/High totaling $1,911,000 Start of Leeds Elementary boiler replacement totaling $27,002 Start of Bohemia Manor Middle/High cooling tower replacement totaling $22,055 Start of Cecil Manor Elementary HVAC replacement totaling $18,940
By state statute, the School System owns assets but not the debt associated with those facilities as it is fully dependent on the State and County governments. Capital expenditures are approved and funded by the state and local governments on a project basis. Future commitments on projects in progress total $3,206,377. See Note 5 for details of changes in capital assets and construction commitments and Note 6 for long-term obligations. Capital Leases The School System’s capital leases represent obligations incurred to finance the purchase of school maintenance vehicles, security cameras, and improvements to buildings. These lease agreements qualify as capital leases for accounting purposes and, therefore, have been recorded at the present value of the future minimum lease payments at the inception date. Both the General Fund and the Capital Projects Fund are being used to liquidate capital leases. Additional information on capital leases can be found in Note 6 to the financial statements. Fiduciary Fund The Governmental Accounting Standards Board (GASB) has issued Statement No. 45, Accounting and Financial Reporting by Employers for Post-Employment Benefits Other Than Pensions, commonly referred to as Other Post-Employment Benefits (OPEB). The School System
44

CECIL COUNTY PUBLIC SCHOOLS Management’s Discussion and Analysis Year Ended June 30, 2021
implemented GASB Statement No. 45 in fiscal year 2008. This addressed how governmental entities should account for and report their cost and obligation related to post employment healthcare and other non-pension benefits. Annual OPEB cost for employers our size will be based on actuarially determined amounts that, if paid on an ongoing basis, will provide sufficient resources to pay retiree benefits accrued during active service. The School System established an OPEB Trust and entered that Trust in a Pooled OPEB Investment Trust. Fiduciary responsibilities remain with the member Trustees serving as Trustees of the Pooled OPEB Investment Trust. In 2015, the GASB issued Statement No. 75, Accounting and Financial Reporting for Postemployment Benefits Other Than Pensions. GASB 75 specifies that employers recognize their net OPEB liability, and the related deferred outflows of resources, deferred inflows of resources and OPEB expense on their books and stipulates the incremental note disclosures and Required Supplementary Information in the financial reports of employers with defined benefit OPEB plans. The School System implemented GASB Statement No. 75 in fiscal year 2018. The School System withdrew $3 million from the Trust in fiscal year 2021 to contribute toward retiree health care costs. FUTURE FINANCIAL IMPACTS The State of Maryland Bridge to Excellence in Public Schools and the federal No Child Left Behind Acts established several requirements for public school systems. Some of these requirements include full-day kindergarten for all elementary schools, all teachers must be highly qualified and expanded choice options for parents. In addition, there are new certification and assessment standards for paraprofessionals and extensive data tracking and reporting requirements. All of these requirements have cost impacts. The financial well-being of the State and County has a significant impact upon the School System’s ability to meet the requirements of the Bridge to Excellence and No Child Left Behind Acts. The state legislature is currently reviewing funding formulas in light of recent Federal and State mandates, the requirements of the Every Student Succeeds Act (ESSA) signed into law on December 10, 2015, and teachers’ pension funding. Current state funding formulas are based on a foundation per student amount. Preschool and prekindergarten students are not included in the State or County MOE funding formulas. The Blueprint for Maryland’s Future addresses these funding issues for Fiscal Year 2020 and beyond. Initiatives include addressing poverty, teacher salaries, full-day prekindergarten, student mental health, students with disabilities, teacher collaboration, and transitional supplemental instruction for struggling learners. During fiscal year 2019, the Board of Education developed a new Strategic Plan to monitor progress and School System priorities. Generally, the School System has been very successful in addressing all aspects of the Strategic Plan. The Strategic Plan, which is reviewed each year, will continue to serve as a guide to the School System to monitor performance in fiscal year 2022 and plan for fiscal year 2023 and beyond.
45

CECIL COUNTY PUBLIC SCHOOLS Management’s Discussion and Analysis Year Ended June 30, 2021
The Coronavirus Response and Relief Supplemental Appropriations Act, 2021 (CRRSA), was signed into law on December 27, 2020 and provides an additional funding source for the Elementary and Secondary School Emergency Relief Fund (ESSER II Fund) and the Governor’s Emergency Education Relief (GEER) Fund. On March 11, 2021, the American Rescue Plan (ARP) Act was signed into law. It is unprecedented funding for the ARP Elementary and Secondary School Emergency Relief (ARP ESSER) Fund. Funds are provided to State educational agencies and school districts to help safely reopen and sustain the safe operation of schools and address the impact of the coronavirus pandemic on the nation’s students. THE BUDGET PROCESS The fiscal year 2022 approved operating budget, adopted in June 2021, was constructed using a modified application of zero-based budgeting based upon the School System’s Strategic Plan and long-range fiscal plan. This budget supports the School System’s mission by addressing the three primary goals and thirteen major objectives of the Board of Education. Throughout the process of preparing the operating budget request, input is received from various stakeholder groups. All requests for additions, changes, and reductions are evaluated at the department and leadership level before the Superintendent makes a recommendation to the Board of Education for final adoption. The following are priorities that were considered during the fiscal year 2022 budget process:
Maintain teacher positions Increase Student Support Centers Continue laptop and Chromebook refresh for staff and students Manufacturing Program at Cecil School of Technology Tutoring programs to support students' learning loss from COVID-19 Pandemic Summer School Program Learning Management System for grades 3-12 Replacement of school buses Maintenance of aging systems
CONTACT FOR ADDITIONAL INFORMATION This financial report is designed to provide our citizens, taxpayers, customers, vendors and creditors with a general overview of the School System’s finances and to demonstrate the School System’s accountability for the funding it receives. If you have questions about this report or need additional financial information, contact the Chief Financial Officer, Cecil County Public Schools, George Washington Carver Education Leadership Center, 201 Booth Street, Elkton, Maryland 21921.
46

BASIC FINANCIAL STATEMENTS
47

48

ASSETSCurrent assets
Cash, cash equivalents, and investments 35,340,243$ Due from Cecil County, Maryland 2,437,254 Due from State of Maryland 4,469,773 Due from United States Government 4,770,763 Accounts receivable 584,828 Prepaid items 301,200 Inventories 137,272
Total current assets 48,041,333
Noncurrent assetsLand 7,602,491 Construction in progress 21,107,036 Buildings, net of accumulated depreciation 128,821,775 Improvements other than buildings, net of accumulated depreciation 8,018,705 Furniture, fixtures, and equipment, net of accumulated depreciation 11,572,989
Total noncurrent assets 177,122,996
Total assets 225,164,329
DEFERRED OUTFLOW OF RESOURCESOPEB related 11,073,903 Pension related 3,233,095 Total deferred outflows 14,306,998
LIABILITIESCurrent liabilities
Accounts payable and accrued expenses 24,664,650 Advances from others 1,772,672 Capital leases due within one year 294,613 Compensated absences due within one year 430,214 Unearned revenue from State of Maryland 103,872 Unearned revenue from United States government 684,915
Total current liabilities 27,950,936
Noncurrent liabilitiesCapital leases due in more than one year 301,131 Compensated absences due in more than one year 3,164,021 Net OBEP liability 65,346,965 Net pension liability 12,311,543
Total noncurrent liabilities 81,123,660
Total liabilities 109,074,596
DEFERRED INFLOW OF RESOURCESOPEB related 4,176,879 Pension related 945,132
Total deferred inflows 5,122,011
NET POSITIONNet Investment in capital assets 176,527,252 Restricted for:
Capital projects 32,260 Unrestricted (51,284,791)
Total net position 125,274,721$
The notes to the basic financial statements are an integral part of this statement.
CECIL COUNTY PUBLIC SCHOOLSSTATEMENT OF NET POSITION
JUNE 30, 2021
49

Net (Expenses)Operating Capital Revenue and
Charges for Grants and Grants and Changes in Expenses Services Contributions Contributions Net Position
Function/programsAdministration 7,664,519$ -$ 1,430,236$ -$ (6,234,283)$ Mid-level administration 20,330,749 - 1,502,418 - (18,828,331) Instruction salaries 117,362,024 150,108 33,968,989 - (83,242,927) Instruction materials and supplies 4,228,356 - 5,639,287 16,868,525 18,279,456 Instruction other costs 19,943,116 - 5,252,026 - (14,691,090) Special education 40,899,373 - 19,234,749 - (21,664,624) Student personnel services 2,748,813 - 895,880 - (1,852,933) Student health services 2,719,452 - 501,049 - (2,218,403) Student transportation 10,225,156 - 6,222,082 - (4,003,074) Operation of plant 14,379,276 - 1,512,756 - (12,866,520) Maintenance of plant 5,091,246 - 263,406 - (4,827,840) Food and nutrition 5,399,918 16,865 7,668,943 - 2,285,890 Community services 536,247 162,265 414,294 40,312 Student activities 602,507 - 534,205 - (68,302)
Total government activities 252,130,752$ 329,238$ 85,040,320$ 16,868,525$ (149,892,669)
General revenuesState aid not restricted to specific purposes 65,736,430 Local aid not restricted to specific purposes 86,367,865 Interest and investment earnings 14,360 Miscellaneous 3,353,138
Total general revenues 155,471,793
Change in net position 5,579,124
Net position - beginning, as previously stated 118,039,553
Cumulative effect of accounting change related to GASB 84 1,656,044
Net position - beginning, as restated 119,695,597
Net position - ending 125,274,721$
The notes to the basic financial statements are an integral part of this statement.
CECIL COUNTY PUBLIC SCHOOLS
Program Revenue
STATEMENT OF ACTIVITIESYEAR ENDED JUNE 30, 2021
50

GeneralFund
Special Revenue Fund
Capital ProjectsFund
Total Governmental
Funds
Cash, cash equivalents, and investments 35,135,084$ 157,384$ 47,775$ 35,340,243$ Due from Cecil County, Maryland - - 2,437,254 2,437,254 Due from State of Maryland 2,143,571 - 2,326,202 4,469,773 Due from United States Government 4,213,956 556,807 - 4,770,763 Due from General fund - 2,319,413 - 2,319,413 Due from Capital Projects fund 1,264,483 - - 1,264,483 Accounts receivable 552,960 31,868 - 584,828 Prepaid items 301,200 - - 301,200 Inventory - 137,272 - 137,272
Total assets 43,611,254$ 3,202,744$ 4,811,231$ 51,625,229$
Accounts payable 3,218,760$ 112,147$ 2,485,505$ 5,816,412$ Accrued salaries 17,196,180 13,057 - 17,209,237 Estimated claims incurred but not reported 1,639,000 - - 1,639,000 Advances from others 628,111 115,578 1,028,983 1,772,672 Due to General fund - - 1,264,483 1,264,483 Due to Special Revenue fund 2,319,413 - - 2,319,413 Unearned revenue from State 103,872 - - 103,872 Unearned revenue from United States government 677,510 7,405 - 684,915
Total liabilities 25,782,846 248,187 4,778,971 30,810,004
Fund balanceNon-spendable
Inventory - 137,272 - 137,272 Prepaid expenditures 301,200 - - 301,200
Restricted - 2,817,285 32,260 2,849,545 Committed
Budget contingency 3,517,966 - - 3,517,966 Subsequent year's expenditures 757,891 - - 757,891
AssignedStudent activites 1,588,754 - - 1,588,754 Health care 2,660,000 - - 2,660,000
Unassigned 9,002,597 - - 9,002,597
Total fund balance 17,828,408 2,954,557 32,260 20,815,225
Total liabilities and fund balance 43,611,254$ 3,202,744$ 4,811,231$ 51,625,229$
The notes to the basic financial statements are an integral part of this statement.
CECIL COUNTY PUBLIC SCHOOLS
LIABILITIES AND FUND BALANCE
ASSETS
BALANCE SHEET - GOVERNMENTAL FUNDSJUNE 30, 2021
51

Total fund balance 20,815,225$
Amounts reported in the statement of net position are different because:
Capital assets used in governmental activities are not financial resources and therefore are not reported as assets in governmental funds.
Capital assets 395,446,022$ Accumulated depreciation (218,323,026) 177,122,996
Long-term liabilities are not due and payable in the current period and therefore are not reported as liabilities in the funds. Long-term liabilities at year end consist of:
Net OPEB liability (65,346,965)$ Net pension liability (12,311,543)
Capital leases payable (595,744) Accrued vacation leave (3,594,235) (81,848,487)
Deferred outflows related to pensions 3,233,095 Deferred outflows related to OPEB 11,073,903
Deferred inflows related to OPEB (4,176,879) Deferred inflows related to pensions (945,132)
Total net position 125,274,721$
The notes to the basic financial statements are an integral part of this statement.
JUNE 30, 2021
RECONCILIATION OF GOVERNMENTAL FUNDS BALANCE SHEETWITH THE STATEMENT OF NET POSITION
CECIL COUNTY PUBLIC SCHOOLS
52

Total General
Fund
Special
Revenue Fund
Capital
Projects Fund
Governmental
Funds Revenue
IntergovernmentalCecil County, Maryland 86,367,865$ -$ 11,219,474$ 97,587,339$ State of Maryland 125,627,388 301,962 5,649,052 131,578,402 United States government 16,713,333 7,335,450 - 24,048,783
Other sourcesSale of food - 16,865 - 16,865 Investment interest 14,177 130 53 14,360 Other 1,431,412 32,715 - 1,464,127
Total revenue 230,154,175 7,687,122 16,868,579 254,709,876
ExpendituresCurrent
Administration 5,872,882 254,819 - 6,127,701 Mid-level administration 14,301,253 - - 14,301,253 Instruction salaries 81,150,735 - - 81,150,735 Instruction materials and supplies 4,153,599 - 72,755 4,226,354 Instruction other costs 5,970,038 - 15,991,859 21,961,897 Special education 29,728,451 - - 29,728,451 Student personnel services 1,993,721 - - 1,993,721 Student health services 1,897,687 - - 1,897,687 Student transportation 9,929,866 - - 9,929,866 Operation of plant 11,801,812 - - 11,801,812 Maintenance of plant 3,915,661 - - 3,915,661 Fixed charges 54,410,863 744,634 - 55,155,497 Community services 533,280 - - 533,280 Food service
Salaries and wages - 2,377,849 - 2,377,849 Food - 2,268,678 - 2,268,678 Contracted services - 49,595 - 49,595 Supplies and materials - 320,587 - 320,587 Other operating cost - 71,675 - 71,675
Capital outlay 301,730 - - 301,730 Student activities 602,507 - - 602,507 Debt service
Principal 312,205 - 796,559 1,108,764 Interest 17,135 - 7,353 24,488
Total expenditures 226,893,425 6,087,837 16,868,526 249,849,788
3,260,750 1,599,285 53 4,860,088
Other financing sourcesCapital leases 119,227 - - 119,227 Transfers from Retiree Benefit Trust Fund 3,000,000 - - 3,000,000
Total other financing sources (uses) 3,119,227 - - 3,119,227
Net change in fund balances 6,379,977 1,599,285 53 7,979,315
Fund balance, beginning of year, as previously stated 9,792,387 1,355,272 32,207 11,179,866
Cumulative effect of accounting change related to GASB 84 1,656,044 - - 1,656,044 Net position - beginning, as restated 11,448,431 1,355,272 32,207 12,835,910
Fund balance, ending 17,828,408$ 2,954,557$ 32,260$ 20,815,225$
The notes to the basic financial statements are an integral part of this statement.
Excess (deficiency) of revenue over expenditures
CECIL COUNTY PUBLIC SCHOOLS
YEAR ENDED JUNE 30, 2021STATEMENT OF REVENUE, EXPENDITURES, AND CHANGES IN FUND BALANCES - GOVERNMENTAL FUNDS
53

Total change in fund balance 7,979,315$
Amounts reported in the statement of activities are different because:
Capital outlays to purchase or build capital assets are reported in government funds as expenditures. However, for governmental activities those costs are shown in the statement of net position and allocated over their estimated useful lives as annual depreciation in the statement of activities. This is the amount by which depreciation exceeds capital outlays in the period.
Depreciation expense (13,729,263) Capital outlays 16,263,086 Disposal of capital assets net of depreciation (40,328)
Net repayment and recognition of capital lease principal is an expenditure in the governmental funds, but these changes reduce long-term liabilities in the statement of net position and do not affect the statement of activities.
Repayment of existing capital leases 1,108,764 Capital lease additions (119,227)
Pension costs reported in the statement of activities do not require the use of current financial resources and, therefore, are not reported as expenditures in governmental funds. (318,836)
OPEB costs reported in the statement of activities do no require the use of current financial resources and, therefore, are not reported as expenditures in governmental funds. (5,548,530)
In the Statement of Activities accrued leave is measured by amounts earned during the year. In the governmental funds, however, expenditures for this item are measured by the amount of financial resources used. This year, vacation earned was more than the amounts used. (15,857)
Total change in net position 5,579,124$
The notes to the basic financial statements are an integral part of this statement.
CECIL COUNTY PUBLIC SCHOOLSRECONCILIATION OF NET CHANGE IN FUND BALANCE WITH CHANGE IN NET POSITION
YEAR ENDED JUNE 30, 2021
54

Original Final Actual VarianceRevenue
IntergovernmentalCecil County, Maryland 86,367,865$ 86,367,865$ 86,367,865$ -$ State of Maryland 112,782,994 113,857,668 112,408,495 (1,449,173) United States government 9,653,234 34,135,997 17,825,315 (16,310,682)
Other sourcesInvestment interest 200,000 200,000 14,177 (185,823) Other 8,930,019 10,224,904 4,423,030 (5,801,874)
Total revenue 217,934,112 244,786,434 221,038,882 (23,747,552)
ExpendituresCurrent
Administration 5,747,570 8,329,820 5,824,917 2,504,903 Mid-level administration 14,838,310 15,084,787 14,301,253 783,534 Instruction salaries 83,028,169 88,480,779 81,150,736 7,330,043 Instruction materials and supplies 2,222,432 7,626,665 4,170,138 3,456,527 Instruction other costs 3,957,204 10,171,450 6,670,290 3,501,160 Special education 34,011,775 36,119,433 29,860,980 6,258,453 Student personnel services 1,703,483 2,965,550 2,048,031 917,519 Student health services 1,749,090 2,047,203 1,897,687 149,516 Student transportation 11,515,284 12,318,529 9,877,749 2,440,780 Operation of plant 12,081,908 11,907,492 11,840,330 67,162 Maintenance of plant 3,674,202 4,053,639 3,939,441 114,198 Fixed charges 42,701,788 43,860,716 41,317,129 2,543,587 Community services 254,406 1,373,280 738,729 634,551 Capital outlay 448,491 447,091 418,988 28,103 Student activities - - 602,507 (602,507)
Total expenditures and encumbrances 217,934,112 244,786,434 214,658,905 30,127,529
EXCESS OF REVENUE OVER EXPENDITURES -$ -$ 6,379,977$ 6,379,977$
Fund balance, beginning, as previously stated 9,792,387
Cumulative effect of accounting change related to GASB 84 1,656,044 Fund balance - beginning, as restated 11,448,431$
Fund balance, ending 17,828,408$
The notes to the basic financial statements are an integral part of this statement.
CECIL COUNTY PUBLIC SCHOOLSSTATEMENT OF REVENUE, EXPENDITURES, ENCUMBRANCES, AND CHANGES IN FUND BALANCE
BUDGET (NON-GAAP BUDGETARY BASIS) AND ACTUAL - GENERAL FUNDYEAR ENDED JUNE 30, 2021
Budgeted Amounts
55

Retiree Benefit Trust Fund
Cash and cash equivalents $ - Investments
MABE - OPEB Investment Trust 17,305,748
Total assets 17,305,748
Accounts payable -
Total liabilities -
Restricted for other post-employment benefits 17,305,748$
Individuals and organizations -
17,305,748$
The notes to the basic financial statements are an integral part of this statement.
NET POSITION
CECIL COUNTY PUBLIC SCHOOLSSTATEMENT OF FIDUCIARY NET POSITION
LIABILITIES
ASSETS
JUNE 30, 2021FIDUCIARY FUNDS
56

Retiree Benefit Trust Fund
ADDITIONSInterest/dividends 3,836,067$
Total investment activity 3,836,067
Investment activity expenses:Investment custodial fees (48,570)
Total investment expenses (48,570)
Total net additions 3,787,497$
DEDUCTIONSAdministration service fees 1,801 Auditing fees 3,483 Insurance expense 2,986 Consulting fees 5 General legal fees 33 Miscellaneous 2
Total deductions 8,310
OTHERRedemption 3,000,000
Total other 3,000,000
Change in net position 779,187 Net position - beginning 16,526,561 Net position - ending 17,305,748$
The notes to the basic financial statements are an integral part of this statement.
CECIL COUNTY PUBLIC SCHOOLSSTATEMENT OF CHANGES IN FIDUCIARY NET POSITION
FIDUCIARY FUNDSYEAR ENDED JUNE 30, 2021
57

CECIL COUNTY PUBLIC SCHOOLS Notes to Basic Financial Statements Year Ended June 30, 2021
NOTE 1 SUMMARY OF SIGNIFICANT ACCOUNTING POLICIES Notes to Basic Financial Statements A. Reporting Entity The School System is a body politic and corporate established through the Education Article of the Annotated Code of Maryland in 1868. Educational services are provided to students prekindergarten through graduation in 30 school facilities owned and operated in Cecil County, Maryland by the Board of Education of Cecil County, a five member Board elected to four-year terms and one student member who serves for one year. The Board has the responsibility to maintain a reasonable, uniform system of public schools to provide quality education for all youth of Cecil County. A small number of students are placed in state-operated and non-public educational facilities to meet their special needs. The School System is a component unit of Cecil County, Maryland and the School System’s financial results are included in the County’s Comprehensive Annual Financial Report. An elected County Council is responsible for approving the School System’s budget. The County is responsible for levying taxes and collecting and distributing funds to the School System. The School System is financially dependent upon appropriations from the County. The financial statements of the School System are prepared in accordance with Generally Accepted Accounting Principles (GAAP) in the United States of America, applicable to governmental entities, as prescribed by the Governmental Accounting Standards Board (GASB). B. Government-wide Financial Statements The government-wide financial statements report on all of the non-fiduciary activities of the primary government. Activities between funds that are representative of lending/borrowing arrangements outstanding at the end of the fiscal year are referred to as due to/from other funds and are eliminated from the statements. Inter-fund charges to the Special Revenue Fund representing administrative overhead charges from the General Fund are included in direct expenses and not eliminated. The School System does not have business-type activities; therefore, the statements only include governmental activities.
The Statement of Activities demonstrates the degree to which the direct expenses of a given function are offset by program revenue. Direct expenses are those that are clearly identifiable with a specific function. Program revenue includes: 1) charges to individuals who directly benefit from the goods or services provided by the function, and 2) grants and contributions that are restricted to meeting the operational or capital requirements of a particular function. Items not included among program revenue are reported instead as general revenue.
58

CECIL COUNTY PUBLIC SCHOOLS Notes to Basic Financial Statements Year Ended June 30, 2021
C. Measurement Focus, Basis of Accounting and Financial Statement Presentation Government-wide financial statements are reported using the economic resources measurement focus and the accrual basis of accounting. Revenue is recorded when earned and expenses are recorded when a liability is incurred, regardless of the timing of related cash flows. Grants and similar items are recognized as revenue as soon as all eligibility requirements imposed by the provider have been met. Governmental funds financial statements are reported using the current financial resources measurement focus and the modified accrual basis of accounting. Revenues are recognized as soon as they are measurable and available. Generally, the School System considers revenue measurable and available when appropriated or otherwise known to be forthcoming from the funding sources. For this purpose, the School System considers revenues available if they are collected within 60 days of the end of the fiscal year. Special grant program revenue is recognized in accordance with the terms of the grant; generally, at the time program funds are expended. Principal revenue sources considered susceptible to accrual include Federal and State grants and local County government appropriations. The School System, on a direct basis, generates no tax revenue. Expenditures are recognized in the accounting period in which the fund liability is incurred, if measurable. Exceptions to this practice include Special Revenue Fund inventory items considered expenditures at the time the items are used and debt service recorded as an expenditure at the time payment is made by the County government. Special Revenue Fund revenue and expenditures include the value of commodities donated by the United States Department of Agriculture which were consumed during the fiscal year. The value of donated commodities in inventory at year-end is reported as unearned revenue. Revenues are considered available when they are collectable within the current period or soon enough thereafter to pay liabilities of the current period. For this purpose, the School System considers revenue to be available if they are collected within 60 days of the end of the current fiscal year. The funds are separately accounted for in accordance with the purpose of the related revenue and expenditures. The financial statements present the results of operations of the funds with the measurement focus on the sources, uses, and balance of financial resources.
59

CECIL COUNTY PUBLIC SCHOOLS Notes to Basic Financial Statements Year Ended June 30, 2021
The School System uses three major funds. These funds comprise the total governmental funds as described below:
The General Fund is used to focus upon the operation of the School System’s educational and support services programs. It accounts for all financial resources for the School System except those resources required to be accounted for in another fund. Major revenue sources are the County, State and Federal governments. Minor sources of revenue come from other sources such as rebates, tuition, and interest.
The Special Revenue Fund is used to record the financial transactions of the Food and Nutrition program. Revenue is primarily generated from the State and Federal grants, Federal commodities, and the sale of student meals and a la carte items.
The Capital Projects Fund reports the revenue and expenditures related to school construction projects ranging from site improvements to minor and major building renovation and addition projects. County and State resources primarily fund these expenditures.
The School System’s Fiduciary Funds consist of the following: The Retiree Benefit Fiduciary Trust Fund consists of contributions of the School
System to establish a reserve to pay for health and welfare benefits of future retirees. Contributions to the trust qualify as contributions and are reported using the economic resources measurement focus and the accrual basis of accounting under which expenses are recorded when the liability is incurred. Fiduciary funds are not reported in the government-wide financial statements.
D. Assets, Liabilities, and Net Position or Equity Cash, Cash Equivalents and Investments The School System follows Governmental Accounting Standards Board Statement 31, “Accounting and Financial Reporting for Certain Investments and for External Investment Pools,” which requires marketable securities to be carried at fair value. The School System also follows Governmental Accounting Standards Board Statement 79, “Certain External Investment Pools and Pool Participants,” which requires disclosure of specific criteria regarding external investment pools. The School System has an Investment Pool account with the Maryland Local Government Investment Pool (MLGIP) and other funds designated for Other Post-Employment Benefits held by the Maryland Association of Boards of Education (MABE).
60

CECIL COUNTY PUBLIC SCHOOLS Notes to Basic Financial Statements Year Ended June 30, 2021
The School System is bound by Maryland law (COMAR 6-222) to minimize credit and interest rate risk by investing only in the highest quality investments, and therefore, has no formal Board investment policy. The law states that permissible investments are limited to U.S. Treasury and U.S. Government Agency obligations, collateralized repurchase agreements and certificates of deposit, money market mutual funds of the highest rating and any investment portfolio created under the MLGIP. No direct investment may have a maturity date of more than 13 months after its acquisition. Securities of the MLGIP are valued daily on an amortized cost basis, which approximates market value, and are held to maturity under normal circumstances. MLGIP seeks to maintain constant unit value of $1.00 per unit. Unit value is computed using the amortized cost method. In addition, the net asset value of the MLGIP, marked to market, is calculated and maintained on a daily basis to ensure a $1.00 per unit constant value. Investment guidelines and limits require liquidity and diversification regarding the MLGIP. There is no formal minimum overnight liquidity position; however, it is anticipated that the MLGIP generally will operate with a minimum of 10% of the total assets in next business day maturities. Generally, the MLGIP’s average life will range between 25-55 days. Maximum overnight liquidity position may be 100% of assets. The MLGIP has set standards regarding exposure to specific diversification. The limits are set to minimize risk. The fair value of the position in the MLGIP is the same as the value of the MLGIP net assets (shares). The Maryland Local Government Investment Pool is duly chartered, administered, and subject to regulatory oversight by the State of Maryland. This pool is managed in a “Rule 2(a)-7 like” manner and has an S&P rating of AAAm. This report can be obtained in writing: Maryland Local Government Investment Pool, c/o PNC Institutional Investments Group, One East Pratt Street, Baltimore, Maryland, 21202; by calling 1-800-492-5160; or the website, www.mlgip.com. The Board has funds designated for Other Post- Employment Benefits that are held by MABE. As of June 30, 2021, MABE held $17,305,748 in cash and cash equivalents in the investment pool for the Board. The investment policy of MABE is set and monitored by MABE’s Board of Trustees. MABE primarily invests in registered securities and mutual funds. The MABE Trust is a Common trust fund which is comprised of shares or units in a commingled fund that is not publicly traded. Underlying assets in these funds include money market funds, U.S. government securities, fixed income securities, asset backed securities, equity securities, mutual funds and exchange traded funds and are valued at their Net Asset Values (“NAVs”) calculated by the Trust Administrator. The School System may terminate its membership in the Trust and withdraw its allocated investment balance by providing written notification to the Trust six months prior to the intended withdrawal date. The Annotated Code of Maryland authorizes the School System to invest in the following: time deposits, savings accounts, and demand deposit accounts in banks and savings and loan associations that are secured with collateral as set forth in the State Finance and Procurement Article; any investment portfolio created under the Maryland Local Government Investment Pool that is administered by the Office of the State Treasurer; an obligation for which the United States
61

CECIL COUNTY PUBLIC SCHOOLS Notes to Basic Financial Statements Year Ended June 30, 2021
has pledged its full faith and credit for the payment of the principal and interest; an obligation that a federal agency or a federal instrumentality has issued in accordance with an act of congress; a repurchase agreement collateralized in an amount not less than 102% of the principal amount by an obligation of the United States, its agencies or instrumentalities; bankers’ acceptances guaranteed by a financial institution with a short-term debt rating in the highest letter; commercial paper and money market mutual funds that contain only securities listed above receiving the highest possible rating. Receivables Accounts receivable in all funds report amounts that have arisen in the ordinary course of business. Governmental fund type receivables consist primarily of amounts due from the County, State, or Federal governments, or other Maryland Boards of Education. These intergovernmental receivables are generally collected within 90 days of the end of the fiscal year. Inter-fund Balances/Inter-fund Activity Inter-fund receivable and payable balances are non-interest bearing and are normally settled in the subsequent period. All governmental funds’ payables are disbursed through the General Fund. Inter-fund activity consists primarily of transfers from other funds to the General Fund to cover accounts payable. Most inter-fund expenditures disbursed from the General Fund are reimbursed the following period. Inventories and Prepaid Items The Special Revenue Fund inventories include Federal government donated food commodities that are valued at estimated market value. The remaining inventories are accounted for under the consumption method and are stated at average cost. Certain payments to vendors reflect costs applicable to future periods and are recorded as prepaid items in both the government-wide and fund financial statements. These payments are expended in future periods using the consumption method of accounting. Capital Assets Capital assets which include land, land improvements, buildings and equipment are defined by the School System as assets with an initial individual cost of more than $5,000 and an estimated useful life in excess of one year. Such assets are recorded at historical cost. Sensitive items, such as cameras, computers and computer peripherals are tracked similarly to a capital asset but are not capitalized or depreciated over the life of the item. Donated capital assets are recorded at acquisition value at the date of the donation.
62

CECIL COUNTY PUBLIC SCHOOLS Notes to Basic Financial Statements Year Ended June 30, 2021
Major outlays for capital assets and improvements are capitalized as projects when completed. Costs of uncompleted projects are accumulated in construction-in-progress and are carried at the lower of cost or market. The School System does not incur debt for the construction of capital projects; therefore, construction period interest is not capitalized. Land improvements, buildings and equipment with a value in excess of $5,000 are depreciated using the straight-line method over the following estimated useful life:
Accrued Salaries Teachers’ salaries are considered earned at the completion of the school year. Teachers who are eligible may elect to be paid their ten-month salary over twelve months. The salaries are paid within the first two months of the succeeding fiscal year. Health Insurance and Estimated Claims Incurred But Not Reported The School System participates in a “minimum premium plan” for its two healthcare insurance plans. Under these plans, the School System is responsible for paying all claims up to an agreed upon level. Individual stop loss insurance policies are responsible for claims in excess of $275,000. The School System has provided an accrual for claims incurred for the current fiscal year but not reported. Compensated Absences Twelve-month employees may earn annual vacation leave at various accrual rates dependent on length of service and the bargaining unit that represents them. Unused annual leave may be accrued up to a maximum of fifty days. All accrued annual leave is payable upon separation of employment. The governmental fund financial statements record expenditures when employees are paid for leave. The government-wide financial statements present the cost of accumulated vacation leave as a liability. Employees are also eligible to earn sick leave and accrue unused balances throughout their employment. There is no liability reported for sick leave because employees are not paid their unused balance upon separation, except for up to 10 days upon retirement. Based on experience, management does not expect such amounts to be significant. Long-term Obligations The School System has no authority to issue bonded debt. Debt incurred by the County or State
Assets Years Improvements 20 - 30 Buildings 10 - 50 Equipment 5 - 20
63

CECIL COUNTY PUBLIC SCHOOLS Notes to Basic Financial Statements Year Ended June 30, 2021
governments to finance school construction remains a debt of the issuing government and along with the related debt service, is not reported in the School System’s financial statements. The School System occasionally finances the purchase of school buses, maintenance vehicles and building improvements, over periods ranging from three to five years. All long-term obligations are subject to the School System’s annual appropriation from the state and local governments. Unearned Revenue Unearned revenue occurs when the School System receives funds before it has a legal claim to them or when funds received do not meet the criteria for recognition in the current period. Unearned revenue for governmental activities consists of tuition payments received in advance of summer school, restricted grant funds advanced to the School System and the value of donated food commodities not used. Net Position and Fund Balance In the Statement of Net Position, net position is reported as net investment in capital assets, restricted (based on some externally imposed restrictions on use of funds, such as grant funding for a specific purpose), or unrestricted. In the Balance Sheet - Governmental Funds, the fund balance is reported in five components – non-spendable, restricted, committed, assigned and unassigned in accordance with Board adopted Fund Balance Policy. The fund balance of the Board has been accumulated to provide stability and flexibility to respond to unexpected adversity and/or opportunities. The target is to maintain a fund balance of not less than 2% with a goal of 5% of annual operating expenditures for the fiscal year. The Board’s basic goal is to maintain annual expenditure increases at a growth rate, and to limit expenditures to anticipated revenue in order to maintain a balanced budget. The decision to retain a total fund balance of not less than 2% with a goal of 5% of operating expenditures is governed by Board Policy DFAA, and stems from the following:
This amount provides the liquidity necessary to accommodate the Board’s uneven cash flow.
This amount provides the liquidity to cover contingent liabilities. Any amount above 2% of operating expenditures is reported as unassigned fund balance.
The Board policy states that most restricted dollars will be spent before less restricted dollars in the following order:
1. Non-spendable (if funds become spendable) 2. Restricted
64

CECIL COUNTY PUBLIC SCHOOLS Notes to Basic Financial Statements Year Ended June 30, 2021
3. Committed 4. Assigned 5. Unassigned
Non-spendable – Amounts that cannot be spent either because they are in a non-spendable form or because they are legally or contractually required to be maintained intact. This component includes prepaid expenses related to healthcare and inventory related to food services. Restricted – This component includes funds that are constrained to specific purposes by their providers (such as grantors, bondholders, and higher levels of government) through constitutional provisions or by enabling legislation. Committed – This component includes amounts for which constraints have been imposed by the Board, using the highest level of decision-making authority via Board vote in accordance with the Fund Balance policy. In addition, these constraints can only be removed or changed through formal action by the Board. This component includes funds approved in the current fiscal year for use in the subsequent fiscal year. Board Policy states that the target is to maintain a total fund balance of not less than 2% with a goal of 5% of annual operating expenditures for the fiscal year. Any portion of the fund balance required to meet the 2% policy is automatically considered a committed balance. Any additional amount greater than 2% must be determined by Board vote prior to June 30 of the current reporting period. Assigned – This component includes a contingency for the projected maximum liability for the medical, dental, vision and drug plans in excess of established premiums and a budget contingency due to unforeseen events in the General Fund. The authority of assigning fund balance is expressed by the Superintendent and Chief Financial Officer. Unassigned – This component consists of the amount that has not been committed or assigned to a specific purpose and exceeds the 2% of the annual operating budget fund balance minimum requirement. A negative unassigned balance may be reported if expenditures incurred for specific purposes exceed the amounts restricted, committed, or assigned to those purposes. In other funds, the unassigned classification should be used only to report a deficit balance resulting from overspending for specific purposes for which amounts had been restricted, committed, or assigned. For the General Fund, the School System’s $17,828,408 fund balance is 8.3% of the fiscal year 2021 total expenditures. $301,200 is non-spendable, $4,248,754 is assigned, and $4,275,857 is committed as a reserve for contingencies for fiscal year 2022 and to satisfy the fund balance policy.
65

CECIL COUNTY PUBLIC SCHOOLS Notes to Basic Financial Statements Year Ended June 30, 2021
GeneralFund
Special Revenue
Fund
Capital Projects
Fund
Total Governmental
Funds
Fund balanceNon-spendable
Inventory -$ 137,272$ -$ 137,272$ Prepaid expenditures 301,200 - - 301,200
301,200 137,272 - 438,472
RestrictedCost of operations food service - 2,817,285 - 2,817,285 Cost of operations capital outlay - - 32,260 32,260
- 2,817,285 32,260 2,849,545 Committed
Subsequent year's expenditures 757,891 - - 757,891 Budget contingency 3,517,966 - - 3,517,966
4,275,857 - - 4,275,857 Assigned
Health care 2,660,000 - - 2,660,000 Student activities 1,588,754 - - 1,588,754
4,248,754 - - 4,248,754
Unassigned 9,002,597 - - 9,002,597 Total fund balance, June 30, 2021 17,828,408$ 2,954,557$ 32,260$ 20,815,225$
Recent Accounting Pronouncements During the fiscal year ended June 30, 2021, the School System adopted GASB Statement No. 84 – Fiduciary Activities (GASB 84), which is effective for reporting periods beginning after December 15, 2019. GASB 84 enhances the consistency and comparability of fiduciary activity reported by state and local governments. This Statement also is intended to improve the usefulness of fiduciary activity information primarily for assessing the accountability of governments in their roles as fiduciaries. NOTE 2 BUDGETARY INFORMATION A. Budgetary Requirements The School System follows the budget requirements for local school systems within the State of Maryland as specified by state law:
1. The School System must submit an annual budget for its General Fund and project budgets for its Capital Projects Fund to the County Executive prior to February 28.
66

CECIL COUNTY PUBLIC SCHOOLS Notes to Basic Financial Statements Year Ended June 30, 2021
2. The County Executive must submit a complete County budget to the County Council by
March 31. 3. Following public hearings, the County Council must approve the budgets by June 15.
4. Subsequent supplemental appropriations also require the County Executive and County
Council’s approval.
5. The General Fund budget is prepared and approved by major expenditure categories as specified by state law. Actual expenditures may not exceed appropriations for a category. These categories include:
Administration Student transportation Instruction leadership and support Operation of plant Instruction salaries Maintenance of plant Instruction materials and supplies Fixed charges Instruction other costs Community services Special education Capital outlay Student personnel services Student activities Student health services
6. The School System has the authority to transfer funds between objects of expenditures
(i.e. salaries and wages, contracted services, materials and supplies, other charges, and equipment) within major categories, but must notify the County of such action at the end of each month. In accordance with the Education Article, Title 5, §5-105, of Maryland Annotated Code, the School System may not exceed the appropriation by category.
7. The management and staff of the School System are responsible for preparing the budget, monitoring budgetary expenditures, reporting, and making recommendations for transfers between objects of expenditure and major categories.
8. Unencumbered appropriations lapse at the end of each year, except in the capital projects
fund where appropriations do not lapse. Encumbered appropriations are liquidated through expenditures in the subsequent fiscal year. The portion of fund balance related to lapsed appropriations must be re-appropriated.
B. Reconciliation between GAAP and Budgetary Basis Budgets are not established on a basis consistent with Generally Accepted Accounting Principles (GAAP) in the United States of America. The Schedule of Revenue, Expenditures, Encumbrances, and Changes in Fund Balance – Budget (non-GAAP budgetary basis) and Actual – General Fund has been prepared on a prescribed budgetary basis of accounting to demonstrate compliance
67

CECIL COUNTY PUBLIC SCHOOLS Notes to Basic Financial Statements Year Ended June 30, 2021
with legal requirements of Cecil County, the State of Maryland, and special Federal and State grant programs. The differences between the GAAP and budgetary basis relating to the General Fund are shown below.
Fund Balance Ending, June 30, 2021 – Non-GAAP 17,828,408$
Maryland State Department payments to State Retirement and Pension System on behalf of the School System for eligible employees
Revenue 13,100,597 Expenditures (13,100,597)
Net encumbrances reported as expenditures for budget purposes and not in GAAP statements
Revenue 985,303 Expenditures (985,303)
Fund Balance Ending, June 30, 2021– GAAP Basis 17,828,408$
General Fund
NOTE 3 CASH, CASH EQUIVALENTS, AND INVESTMENTS By statute, the School System is authorized to invest in obligations of the U.S. Government and agencies, bankers’ acceptance agreements, repurchase agreements fully collateralized by U.S. Government securities, mutual funds which invest in U.S. Government securities, and the Maryland Local Government Investment Pool. At June 30, 2021, the carrying amount and bank balances of the School System’s deposits with financial institutions totaled $52,645,991 and $54,158,252 respectively. Custodial credit risk is the risk that, in the event of a bank failure, the government’s deposits may not be returned to it. As of June 30, 2021, the School System’s bank balances were not exposed to any custodial risk since all deposits were either covered by the Federal Deposit Insurance Corporation (“FDIC”) or fully collateralized with the collateral held by a third party in the School System’s name.
68

CECIL COUNTY PUBLIC SCHOOLS Notes to Basic Financial Statements Year Ended June 30, 2021
Government Funds Carrying Amount Bank Balance
Insured-Federal Deposit Insurance Corporation 1,320,991$ 1,395,896$ Uninsured-collateral held by bank in school system's name 16,178,221 17,615,702 Total Deposits 17,499,212 19,011,598 Petty Cash 125 - Investments-Maryland Local Government Investment Pool 17,840,906 17,840,906 Investments-MABE OPEB Investment Trust 17,305,748 17,305,748 Total cash, cash equivalents, and Investments 52,645,991$ 54,158,252$
Reconciliation of above to the Statement of Net PositionGeneral Fund 35,135,084$ 36,647,907$ Special Revenue Fund 157,384 156,822 Capital Projects Fund 47,775 47,775 Total cash and cash equivalents-Statement of Net Position 35,340,243 36,852,504 Fiduciary Funds 17,305,748 17,305,748 Total cash, cash equivalents, and investments 52,645,991$ 54,158,252$ Credit and Interest Rate Risk - The School System is bound by Maryland law (COMAR 6-222) to minimize credit and interest rate risk by investing only in the highest quality investments, and therefore, has no formal Board investment policy. The law states that permissible investments are limited to U.S. Treasury and U.S. Government Agency obligations, collateralized repurchase agreements and certificates of deposit, money market mutual funds of the highest rating, and any investment portfolio created under the Maryland Local Government Investment Pool. The Maryland Local Government Investment Pool is duly chartered, administered and subject to regulatory oversight by the State of Maryland. This pool is managed in a “Rule 2(a)-7 like” manner and has an S&P rating of AAAm. The fair value of our position in the pool is equal to the shares outstanding. Investment in External Investment Pool - The Board has funds designated for Other Post-Employment Benefits that are held by Maryland Association of Boards of Education (MABE). As of June 30, 2021, MABE held $17,305,748 in cash and cash equivalents in the investment pool for the Board. Cash and cash equivalents includes cash and an investment in a money market mutual fund. At June 30, 2021 and 2020, the weighted average maturity (WAM) for the Trust’s money market mutual fund investment is 1 day. At June 30, 2021 and 2020, the short-term rating of the money market mutual fund is AAA by Standard & Poor’s. At June 30, 2021, the Trust maintained sweep accounts with Fidelity Brokerage Services LLC (Fidelity), which deposits cash in bank accounts. Such deposits may, at times, exceed federally insured limits. In the event of a financial institution’s insolvency, recovery of cash on deposit may
69

CECIL COUNTY PUBLIC SCHOOLS Notes to Basic Financial Statements Year Ended June 30, 2021
be limited to account insurance or other protection afforded such deposits. NOTE 4 INTER-FUND RECEIVABLES, PAYABLES The composition of inter-fund balances as of June 30, 2021, is as follows:
Due to/from other funds:
Receivable Fund Payable Fund Purpose Amount
Special Revenue General Timing of payment 2,319,413$ General Capital Projects Timing of payment 1,264,483
Total 3,583,896$ NOTE 5 CAPITAL ASSETS A. Activity The following is a summary of the changes in the capital assets owned by the School System during the fiscal year 2021:
BeginningBalance Increases Decreases
EndingBalance
Capital assets not being depreciatedLand 5,743,759$ 1,858,732$ -$ 7,602,491$ Construction-in-progress 7,415,360 13,691,676 - 21,107,036 Total capital assets not being depreciated 13,159,119 15,550,408 - 28,709,527
Capital assets being depreciatedBuildings 321,143,980 - - 321,143,980 Improvements other than buildings 18,709,556 106,726 - 18,816,282 Furniture, equipment and vehicles 26,541,465 605,952 (371,184) 26,776,233 Total capital assets being depreciated 366,395,001 712,678 (371,184) 366,736,495
Less accumulated depreciation forBuildings (180,869,879) (11,452,326) - (192,322,205) Improvements other than buildings (9,932,077) (865,500) - (10,797,577) Furniture, equipment and vehicles (14,122,663) (1,411,437) 330,856 (15,203,244) Total accumulated depreciation (204,924,619) (13,729,263) 330,856 (218,323,026)
Total capital assets, net of depreciation 174,629,501$ 2,533,823$ (40,328)$ 177,122,996$
70

CECIL COUNTY PUBLIC SCHOOLS Notes to Basic Financial Statements Year Ended June 30, 2021
Depreciation expense was charged to functions/programs as follows:
B. Construction Commitments The School System has active construction projects as of June 30, 2021. These projects are additions and renovations to school buildings. At year-end the School System commitments with contractors are as follows:
Projects Spent to Date
Remaining
Commitments
Chesapeake City Elementary new school 21,114,753$ 2,610,331$ North East Middle/High new school 1,908,020 102,200 Leeds Elementary boiler 59,600 442,631 Bohemia Manor cooling tower 22,055 9,075 Cecil Manor Elementary HVAC 18,940 42,140
Total 23,123,368$ 3,206,377$
NOTE 6 Long-term obligations A. Compensated Absences School system employees who are employed on a twelve-month basis are granted annual leave at varying rates based on years of service. Those employees may accumulate annual leave up to a maximum of fifty days. Upon termination of employment, accumulated annual leave is paid to the employee and is reported in the form of salary expenditures in the General Fund and Special Revenue Fund. Annual leave pay is accrued when incurred in the government-wide statement. B. Capital Leases
AmountAdministration 873,243$ Mid-level administration 343 Instruction materials and supplies 2,002 Instruction other costs 12,465,372 Special education 9,949 Student health services 67 Student transportation 49,885 Operation of plant 60,995 Maintenance of plant 139,200 Food and nutrition 119,101 Community serivces 9,106
13,729,264$
Government activities:
71

CECIL COUNTY PUBLIC SCHOOLS Notes to Basic Financial Statements Year Ended June 30, 2021
The School System’s capital leases represent obligations incurred to finance the purchase of school maintenance vehicles, security cameras, and improvements to buildings. These lease agreements qualify as capital leases for accounting purposes and, therefore, have been recorded at the present value of the future minimum lease payments at the inception date. Both the General Fund and the Capital Projects Fund are being used to liquidate capital leases. For the fiscal year ended June 30, 2021, amortization expense of $1,130,878 related to the assets acquired through capital leases was recognized in depreciation expense. The assets acquired through capital leases are as follows:
Asset TotalBuildings 9,399,961$ Furniture, fixtures and equipment 1,999,430 Less accumulated depreciation (6,530,807)
4,868,584$
The following are the future minimum payments under the School System’s capital lease obligations and represent the present value of the minimum lease payments for the amount capitalized as of the fiscal year ended June 30, 2021:
Fiscal years ending June 30: Total2022 305,271 2023 305,272
Total payments 610,543 Less interest (14,799) Capitalized lease obligations 595,744$
C. Changes in Long-term Liabilities Noncurrent liabilities reported in the Statement of Net Position include capital leases and compensated absences. A portion of the capital leases are liquidated through the capital projects fund and a portion is liquidated through the general fund. The other liabilities are liquidated through the general fund. The schedule below presents the current year activity and year-end balances for the School System’s noncurrent liabilities:
Beginning Balance Additions Reductions
Ending Balance
Due Within One Year
Capital leases 1,585,281$ 119,227$ (1,108,764)$ 595,744$ 294,613$ Compensated absences 3,578,378 409,225 (393,368) 3,594,235 430,214 Net OPEB liability 51,128,537 18,365,711 (4,147,283) 65,346,965 - Net pension liability 11,147,349 1,164,194 - 12,311,543 - Long-term liabilities 67,439,545$ 20,058,357$ (5,649,415)$ 81,848,487$ 724,827$
72

CECIL COUNTY PUBLIC SCHOOLS Notes to Basic Financial Statements Year Ended June 30, 2021
NOTE 7 OPERATING LEASES The School System has long-term commitments as the lessee under various non-cancelable operating leases for various operational and instructional equipment. Total expenditures incurred in fiscal year 2021 under these leases amounted to $126,644. The aggregate future rental payments under these commitments are $248,144 summarized as follows:
Fiscal year ending June 30: Various Equipment2022 119,546$ 2023 64,299 2024 64,299
Total 248,144$
NOTE 8 GRANT PROGRAM REVENUE Certain programs serving specific needs and purposes of the School System and the welfare of the students are funded by restricted Federal and State grants. Monies so acquired, amounting to $101,908,845 during the fiscal year ended June 30, 2021, were used in the designated programs and did not supplant funding for the unrestricted programs. The General and Special Revenue Funds accounted for $85,040,320 and the Capital Project Fund accounted for $16,868,525. NOTE 9 COMMITMENTS AND CONTINGENCIES A. Risk Management The School System is exposed to various risks of loss related to torts, theft of, damage to, and destruction of assets, errors and omissions, injuries to employees, and related disasters. The School System is a member of the Maryland Association of Boards of Education Group Insurance Pool (MABE) and the Workers’ Compensation Group Self-Insurance Fund. MABE is a public entity risk pool currently operating as a common risk management and insurance program for fourteen member counties to reduce the amount of claims expenditures incurred. Under the group insurance pool, coverage for casualty losses are at the replacement cost of the asset. General liability losses are limited to $400,000 per incident beginning October 1, 2016 as provided by the State of Maryland’s Sovereign Immunity Law. If the Sovereign Immunity Law is not applicable, the School System is covered up to $1,000,000 per incident. There have been no reductions in the insurance coverage in the current year and settlements have not exceeded insurance coverage for the last three fiscal years. The Workers’ Compensation Group Self-Insurance Fund provides coverage for up to the statutory limit of each incident.
73

CECIL COUNTY PUBLIC SCHOOLS Notes to Basic Financial Statements Year Ended June 30, 2021
B. Healthcare Claims Incurred but Not Reported The School System is self-insured for the core healthcare plan. Healthcare claims incurred but not reported as of June 30, 2021 are estimated to be in the amount of $1,639,000. This amount is $26,000 less than the claims estimated to be outstanding in the prior year and the total is expected to be paid within the next fiscal year.
Fiscal Year
BeginningBalance
ClaimsIncurred
ClaimsPaid
Ending Balance
2019 1,426,000$ 25,620,380$ 25,573,380$ 1,473,000$ 2020 1,473,000$ 29,570,686$ 29,378,686$ 1,665,000$ 2021 1,665,000$ 27,567,710$ 27,593,710$ 1,639,000$
C. Sick Leave As of June 30, 2021, the amount of accumulated unused sick leave was estimated to be $31,671,925. It is not practical to estimate the portion of such amount that will ultimately be paid because payment is contingent upon employees’ future illnesses. Management expects the School System’s commitment to provide sick leave to be met during the normal course of activities over the working lives of its present employees. As a condition of retirement, the School System will pay employees up to ten days accumulated sick leave. All accrued sick leave above 10 days is applied to each employee’s service record. Management, based on experience, does not expect such amounts to be significant. D. Sick Leave Bank As of June 30, 2021, the amount of accumulated unused sick leave included in the sick leave bank was estimated to be $3,404,883. The sick leave bank is an extra source of sick leave available to those employees who are eligible and elect to participate. Participation is based on a formula for donating sick days to the bank based on the employees’ classification and accrued sick leave. Management believes it is not practical to estimate the portion of such amount which will ultimately be paid because payment is contingent upon employees’ future illnesses. Management expects the School System’s commitment to provide sick leave to be met during the normal course of activities over the working lives of its present employees. E. Special Grants The School System participates in several Federal and State assisted programs. These programs are generally subject to program compliance audits by the grantors or their representatives. As of June 30, 2021, the compliance audits of certain programs have not yet been conducted and/or
74

CECIL COUNTY PUBLIC SCHOOLS Notes to Basic Financial Statements Year Ended June 30, 2021
accepted by the appropriate authorities. Accordingly, the School System’s compliance with applicable program requirements for these programs will be established conclusively at some future date. The amount, if any, of expenditures which may be disallowed by the granting agencies cannot be determined at this time. Based on experience, the School System does not expect such amounts, if any, to be significant. F. Labor Relations The collective bargaining agreement with the Cecil County Classroom Teachers’ Association (CCCTA) for the period July 1, 2019 through June 30, 2022 is a three year agreement with a restructured salary schedule that includes a COLA and step increases while also incorporating the Blueprint for Maryland’s future funding to improve teacher salaries for year one; a COLA for years 2 and 3 that are based on the CPI-U not to exceed 2.5% or fall below 1.5% as reported in November 2019 for fiscal year 2021 and in November 2020 for fiscal year 2022. Incremental steps are to be funded for each of the three years. The collective bargaining agreement with the Cecil County Public Schools Administrators’ and Supervisors’ Association (CCPSASA) for the period July 1, 2019 through June 30, 2022 is a three-year agreement with a restructured salary schedule occurring each year whereas a lane will be removed each year. Members will receive a COLA each year. The collective bargaining agreement with the Cecil Education Support Personnel Association (CESPA) for the period July 1, 2018 through June 30, 2022 is a four-year agreement with a 2.0% COLA for the first year and COLA for years 2, 3, and 4 will be based on the CPI-U not to exceed 2.0% as reported in November 2020 for fiscal year 2022. Meet and Confer discussions with the Central Office Support Services Leadership Association (COSSLA) for the period July 1, 2018 through June 30, 2022 resulted in a four-year agreement with a 2.0% COLA for the first year and COLA for years 2 and 3 will be based on the CPI-U not to exceed 2.0% as reported in November. A 3% increase was negotiated for fiscal year 2022. G. Litigation The School System is a defendant in lawsuits and other claims that occur in the ordinary course of school system operations. Most lawsuits and claims are covered by the Maryland Association of Boards of Education Group Insurance Pool. During the year ended June 30, 2021, the School System was named in suits that could result in a liability not covered by insurance, although such costs are not estimable and determinable due to the early stage of the case. It is the opinion of management that such lawsuits and claims will not have a material, adverse impact on the School System’s financial condition.
75

CECIL COUNTY PUBLIC SCHOOLS Notes to Basic Financial Statements Year Ended June 30, 2021
H. Other Contingencies In December 2019 and early 2020, the coronavirus that causes COVID-19 was reported to have surfaced in China. The spread of this virus globally, throughout 2020 and 2021 has caused business disruption in the United States and the area in which the School System primarily operates. While the disruption is currently expected to be temporary, there is considerable uncertainty around the duration of this uncertainty. Therefore, while the School System expects this matter to negatively impact the School System’s financial position, the extent of the financial impact and duration cannot be reasonably estimated at this time. NOTE 10 OTHER POST EMPLOYMENT BENEFITS A. Plan Description and Benefits Provided
The Cecil County Public Schools Retiree Health and Welfare Plan (the “Plan”) is a single employer defined benefit healthcare plan administered by the School System. In May 2008, the School System entered into an agreement with the Maryland Association of Boards of Education (MABE), together with certain member Boards of Education in Maryland to establish the MABE Pooled OPEB Investment Trust (MABE Pool) in order to pool assets of the member Boards of Education for investment purposes only. Each member of the MABE Pool is required to designate a member trustee who is a trustee of the member trust. The member trustees of the MABE Pool shall ensure that the MABE Pool keep such records as are necessary to maintain a separation of the assets of the Trust from the assets of trusts maintained by other governmental employers. Assets of the member trusts are reported in their respective CAFR using the economic resources measurement focus and the accrual basis of accounting under which expenses are recorded when the liability is incurred. Employer contributions are recorded in the accounting period in which they are earned and become measurable. Investments are reported at fair value and are based on published prices and quotations from major investment brokers at current exchange rates, as available. The Trust prohibits any part of the Trust to be used for or diverted to purposes other than providing benefits to participants and beneficiaries under the Plan. The Trust provides that in no event will the assets of the Trust be transferred to an entity that is not a state, a political subdivision or an entity the income of which is excluded from taxation under taxation under Section 115 of the IRS Code. The MABE Pool issues a publicly available audited GAAP-basis report that includes financial statements and required supplementary information for the Trust. This report may be obtained by writing to Mr. Steven James, Trust Administrator, Maryland Association of Boards of Education, 621 Ridgely Avenue, Suite 300, Annapolis, MD 21401 or calling (410) 841-5414. The Plan provides medical, prescription drug, dental, and vision benefits to eligible retirees, their spouses, and eligible dependents. All classes of employees are eligible to participate in the Plan
76

CECIL COUNTY PUBLIC SCHOOLS Notes to Basic Financial Statements Year Ended June 30, 2021
upon retirement. Participants must meet the eligibility requirements of the Maryland State Teachers’ pension system, which are age 55 with 15 years of service, 30 years of service, or age 62 with 5 years of service. To be eligible for continued retiree healthcare coverage, the retiree must have been enrolled in the School System’s sponsored Plan for at least one full year immediately prior to retirement. In addition, eligible spouses and dependents desiring coverage through the eligible retiree’s plan must be enrolled in the Plan immediately prior to the retiree’s effective date of retirement. As of June 30, 2020, the measurement date of the last actuarial valuation, approximately 754 retirees and their beneficiaries were receiving benefits and an estimated 2,206 active and no inactive employees were potentially eligible to receive future benefits. B. Contributions The School System contributes towards the retirees’ healthcare premiums based on the retiree’s age and years-of-service. Under 65/non-Medicare eligible retirees may receive from $3,592 annually for 14 years-of-service up to $8,583 annually for 30 or more years of service. Over age 65, Medicare eligible retirees may receive from $2,239 annually for 14 years of service up to $3,878 annually for 30 or more years of service. The retiree pays the remaining premium for the selected plan, including the cost of eligible dependents. The amount of the subsidy may be subject to the collective bargaining process and/or the School System’s determination of contribution limits. The authority to establish and amend benefit provisions of the Plan rests with the School System. The School System establishes rates based on an actuarially determined rate. For the fiscal year 2021, the School System made no contribution. A redemption of $3 million was made to apply to FY 2021 retiree healthcare claims. For the fiscal year 2021, retirees contributed $3,552,747 or 49.6% of the total premiums and benefits cost of $7,166,777. In May 2008, the School System created the Retiree Benefit Trust of the Board of Education of Cecil County (the “Trust”) in order to arrange for the establishment of a reserve to pay promised future health and welfare benefits for employee services that have already occurred. The School System intends the contributions to the Trust qualify as “contributions in relation to the actuarial required contribution” that the Trust will qualify as a “trust or equivalent arrangement.” Contributions by the School System are solely dependent on the governmental entities that provide funding for the School System. Employee and retiree contributions are not permitted. The Chief Financial Officer, Associate Superintendent for Administrative Services, and the Supervisor of Human Resources are the trustees of the Trust with final authority in all matters pertaining to the Trust.
77

CECIL COUNTY PUBLIC SCHOOLS Notes to Basic Financial Statements Year Ended June 30, 2021
C. Net OPEB Liability
The School System's net OPEB liability was measured as of June 30, 2020, and the total OPEB liability used to calculate the net OPEB liability was determined by an actuarial valuation as of that date. The total OPEB liability in the June 30, 2020, actuarial valuation was determined using the following actuarial assumptions, applied to all periods included in the measurement, unless otherwise specified: As of the measurement date of June 30, 2021:
Entry Age Normal Funding Method Future Salary Increases:
Years of Service General 0 8.65% 1 7.15%
2-9 5.65% 10 and above Varies by age
88% of employees with coverage are assumed to elect coverage in retirement A discount rate of 5.46% was used in this valuation. Employer subsidy amounts are assumed to increase at a rate of 2.5% per year Below is a summary of decrements used in this valuation. Sample Retirement, Disability,
and Termination rates are illustrated in the tables below. Mortality Decrements Description Healthy Pre-Retirement Pub-2010 Teacher Employees Headcount-Weighted
Mortality Projected with Fully Generational MP2019 Mortality Improvement Scale
Healthy Post Retirement Pub-2010 Teacher Retirees Headcount-Weighted
Mortality Projected with Fully Generational MP2019 Mortality Improvement Scale
Disabled Pub-2010 Teacher Disabled Retirees Headcount- Weighted Mortality Projected with Fully Generational MP2019 Mortality Improvement Scale
The actuarial determined contribution (ADC) is calculated as of June 30, 2020. Actuarial valuations are done every other year.
The long-term expected rate of return on OPEB plan investments was determined using a building block method in which best-estimate ranges of expected future real rates of return (expected returns, net of investment expense and inflation) are developed for each major asset class. These
78

CECIL COUNTY PUBLIC SCHOOLS Notes to Basic Financial Statements Year Ended June 30, 2021
ranges are combined to produce the long-term expected rate of return by weighting the expected future real rates of return by the target asset allocation percentage and by adding expected inflation. Best estimates of real rates of return for each major asset class included in the target asset allocation as of June 30, 2021, (see the discussion of the MABE Trust’s investment policy) are summarized in the following table:
Asset ClassTarget
Allocation
Longterm Expected
Nominal Rate of Return¹
Weighted Average
CalculationUS Large Cap Equity 20.00% 6.97% 1.39%US Mid Cap Equity 7.00% 7.64% 0.53%US Small Cap Equity 6.00% 8.30% 0.50%Emerging Markets Equity 13.00% 8.11% 1.05%Non-US Developed Large Cap Equity 9.00% 10.59% 0.95%US Real Estate - REITs 5.00% 7.55% 0.38%US aggregate Fixed Income 28.50% 2.68% 0.76%US High Yield Fixed Income 5.00% 4.60% 0.23%EM Gov't FI - Hard Currency 3.50% 4.90% 0.17%US Cash 3.00% 2.08% 0.06%Total (Nominal Rate of Return) 100.00% 6.04%Inflation -2.20%Total (Real Rate of Return) 100.00% 3.84%
¹The 20 year capital market assumptions referenced above were developed by Mercer and are as of July 2021. A detailed explanation of Mercer's methodology can be provided upon request. The discount rate used to measure the total OPEB liability was 5.46%. The discount rate was determined by using the bond rate as of June 30, 2021 to discount expected future benefits payments in years when the plan assets are projected to be exhausted and the expected rate of return of 6.75% discount expected future benefits payments when the plan is expected to remain solvent.
79

CECIL COUNTY PUBLIC SCHOOLS Notes to Basic Financial Statements Year Ended June 30, 2021
D. Net OPEB Plan's Fiduciary Net Position
Plan Fiduciary Net Postion (b)
Net OPEB Liability (a)-(b)
Balances at June 30, 2020 67,655,098$ 16,526,561$ 51,128,537$ Changes for the year:
Service Cost 1,565,808 - 1,565,808 Interest 4,454,434 - 4,454,434 Changes of Benefit Terms - - - Experience Losses (359,787) - (359,787) ER Trust Contribution - (32,823) 32,823 Net Investment Income - 3,787,497 (3,787,497) Changes in Assumptions 12,304,337 - 12,304,337 Benefit Payments (2,967,177) (2,967,177) - Administrative Expense - (8,310) 8,310
Net Changes 14,997,615 779,187 14,218,428 Balance as of June 30, 2021 82,652,713$ 17,305,748$ 65,346,965$
Funded status 20.94%
Increase (Decrease)Total OPEB Liability (a)
Sensitivity of the net OPEB liability to changes in the discount rate: The following presents the net OPEB liability of the School System, as well as what the School System's net OPEB liability would be if it were calculated using a discount rate that is 1-percentage-point lower (4.46%) or 1-percentage-point higher (6.46%) than the current discount rate:
Discount Rate1% Decrease
4.46%Discount Rate
5.46%1% Increase
6.46%Total OPEB Liability 94,531,151$ 82,652,713$ 72,861,598$ Net OPEB Liability 77,225,403$ 65,346,965$ 55,555,850$ Sensitivity of the net OPEB liability to changes in the healthcare cost trend rates: The following presents the net OPEB liability of the School System, as well as what the School System's net OPEB liability would be if it were calculated using the healthcare cost trend rates that are 1-percentage-point lower (1.50%) or 1-percentage-point higher (3.50%) than the current healthcare cost trend rates:
Ultimate Trend1% Decrease
1.50%Medical Trend
2.50%1% Increase
3.50%Total OPEB Liability 70,492,753$ 82,652,713$ 98,175,255$ Net OPEB Liability 53,187,005$ 65,346,965$ 80,869,507$
80

CECIL COUNTY PUBLIC SCHOOLS Notes to Basic Financial Statements Year Ended June 30, 2021
The elements of the OPEB Plan's basic financial statements are included within the Statement of Fiduciary Net Position - Fiduciary Funds and Statement of Changes in Fiduciary Net Position - Fiduciary Funds, in the accompanying financial statements. E. OPEB Expense and Deferred Outflows of Resources Related to OPEB For the year ended June 30, 2021, the School System recognized OPEB expense of $5,515,707. At June 30, 2021, the School System reported deferred outflows of resources and deferred inflows of resources related to OPEB from the following sources:
Deferred Outflows of Resources
Deferred Inflows of Resources
Differences between expected and actual experience -$ 2,108,441$ Changes in assumptions 11,073,903 206,470 Net difference between projected and actual earnings on OPEB plan investments - 1,861,968
Total 11,073,903$ 4,176,879$
Other amounts reported as deferred outflows of resources and deferred inflows of resources related to OPEB will be recognized in OPEB expense as follows:
Fiscal Year ending June 30
MeasurementDate
Earnings(Inflow)/Outflow
2022 6/30/2022 501,168$ 2023 6/30/2023 509,562 2024 6/30/2024 510,901 2025 6/30/2025 388,273 2026 6/30/2026 942,968 Thereafter 6/30/2027 and after 4,044,152
NOTE 11 PENSION PLAN A. Summary The School System follows GASB Statement No. 68 - Accounting and Financial Reporting for Pensions (GASB No. 68). The School System participates in the Maryland State Retirement and Pension System (the System) and qualifies as a Participating Governmental Unit (PGU). The State Retirement Agency (the Agency) is the Plan administrator and fiduciary. GASB No. 68 requires that a PGU recognize its proportionate share of the System’s net pension liability (i.e. unfunded pension liability) and pension expense. The System is comprised of the Teachers’ Retirement and Pension Systems, Employees’ Retirement and Pension Systems, State Police Retirement Pension System, Judges’ Retirement System, and the Law Enforcement Officers’ Pension System. The School System’s employees participate in both the Teachers’ Retirement and Pension Systems and the Employees’ Retirement and Pension Systems. The contribution requirements of the active employees and the participating governmental units are established and may be amended
81

CECIL COUNTY PUBLIC SCHOOLS Notes to Basic Financial Statements Year Ended June 30, 2021
by the System. The School System’s proportionate share for employees participating in the Employee’s Retirement and Pension Systems is based on total System contributions and approximates 0.0545% as of the measurement date of June 30, 2020, which increased 0.0005% from the prior measurement date of June 30, 2019. The School System adopted GASB No. 71 – Pension Transition for Contributions Made Subsequent to the Measurement Date-An Amendment of GASB No. 68. GASB No. 71, which is only applicable during the year GASB No. 68 was adopted, requires that contributions to the pension plan subsequent to the beginning measurement date be recognized as the beginning deferred outflow of resources. The School System’s employees participate in the System and contributed 7 percent of their compensation during fiscal 2021 as stipulated by the System. For employees participating in the Employees’ Retirement and Pension Systems, the School System contributed $1,304,242 to the System for fiscal 2021 which was actuarially determined based on statutory provisions. In relation to these employees, the School System has also recognized in Pension Expense its proportionate share of the System’s deferred outflow of resources (a decrease in Pension Expense) attributable to the net difference between projected and actual investment earnings on pension plan assets, its proportionate share of the System's deferred inflows of resources (an increase in Pension Expense) attributable to the difference between actual and expected experience, its proportionate share of the System's deferred inflows and deferred outflows of resources attributable to the change in proportion, and its proportionate share of the System’s deferred outflows and deferred inflows of resources attributable to changes in assumptions. For employees participating in the Teachers’ Retirement and Pension Systems, the State of Maryland (the non-employer contributing entity) pays the full employer pension cost, except for those employees eligible under the Teachers’ Pension System working on federal grant programs. During the year ended June 30, 2021, the State of Maryland paid $13,100,597 in pension costs, relating to employees of the School System participating in the Teachers’ Retirement and Pension Systems, which equaled approximately 10.9% of the covered payroll. Therefore, any pension liability, deferred outflow of resources, deferred inflow of resources and related financial reporting disclosures, in relation to these employees are included in the State of Maryland Comprehensive Annual Financial Report. Basis of presentation and basis of accounting In relation to the Employee’s Retirement and Pension Systems of the System:
1. Employers participating in the System’s cost-sharing multiple-employer defined benefit plans are required to report pension information in their financial statements for fiscal periods beginning on or after June 15, 2014, in accordance with GASB Statement No. 68, Accounting and Financial Reporting for Pensions. The Schedule of Employer Allocations and Schedule of Pension Amounts by Employer (pension allocation schedules) provide
82

CECIL COUNTY PUBLIC SCHOOLS Notes to Basic Financial Statements Year Ended June 30, 2021
employers with the required information for financial reporting. The System’s financial statements are prepared on the accrual basis of accounting and are prepared in accordance with accounting principles generally accepted in the United States of America (GAAP) that apply to governmental accounting for the fiduciary funds.
2. Actual employer contributions billed to participating government units for the year ending June 30, 2020, are used as the basis for determining each employer’s proportionate share of the collective pension amounts reported in the Schedule of Employer Allocations. Because the State of Maryland contributed 100% of the actuarial determined contributions, there were no adjustments for the year ended June 30, 2019.
3. The components of the calculation of the net pension liability for the system of June 30, 2020, calculated in accordance with GASB Statement No. 67, are shown in the following table. Total Pension Liability 77,187,397,000$ Plan Fiduciary Net Position 54,586,037,000 Net Pension Liabiltiy 22,601,360,000$
Plan fiduciary net position as a percentage of total pension liability 70.72%
Actuarial Assumptions As of the measurement date of June 30, 2020:
Actuarial - Entry Age Normal Amortization Method - Level Percentage of Payroll, Closed Inflation - 2.60% general, 3.10% wage Salary Increases – 3.10% to 11.6% Discount Rate - 7.40% Investment Rate of Return - 7.40% Retirement Age - Experienced-based table of rates that is specific to the type of eligibility
condition. Last updated for the 2018 valuation pursuant to an experience study of the period 2014-2018.
Mortality – Public Sector 2010 Mortality Tables calibrated to MSRPS experience with generational projections using MP-2018 (2-dimensional) mortality improvement scale.
Investments The long-term expected rate of return on pension plan investments was determined using a building-block method in which best-estimates ranges of expected future real rates of return (expected returns, net of pension plan investment expense and inflation) are developed for each major asset class. These ranges are combined to produce the long-term expected rate of return
83

CECIL COUNTY PUBLIC SCHOOLS Notes to Basic Financial Statements Year Ended June 30, 2021
by weighting the expected future real rates of return by the target asset allocation percentage and by adding expected inflation. Best estimates of geometric real rates of return were adopted by the Pension System’s Board after considering input from the investment consultant(s) and actuary(s). For each major asset class that is included in the Pension System’s target asset allocation, these best estimates are summarized in the following table:
Asset ClassTarget
AllocationsLong-Term Expected Real Rate of Return
Public Equity 37% 5.2%Private Equity 13% 6.5%Rate Sensitive 19% -0.3%Credit Opportunity 9% 2.8%Real Assets 14% 4.3%Absolute Return 8% 1.8%
Total 100% The above was the Pension System’s Board of Trustees adopted asset allocation policy and best estimate of geometric real rates of return for each major asset class as of June 30, 2020. Discount Rate A single discount rate of 7.40% was used to measure the total pension liability at the measurement date of June 30, 2020, which is the same discount rate used at the prior measurement date of June 30, 2019. The single discount rate was based on the expected rate of return on pension plan investments of 7.40%. The projection of cash flows used to determine this single discount rate assumed that plan member contributions will be made at the current contribution rate and that employer contributions will be made at rates equal to the difference between actuarially determined contribution rates and the member rate. Based on these assumptions, the pension plan’s fiduciary net position was projected to be available to make all projected future benefit payments of current plan members. Therefore, the long-term expected rate of return on pension plan investments was applied to all periods of projected benefit payments to determine the total pension liability. Sensitivity of the Net Pension Liability Regarding the sensitivity of the net pension liability to changes in the single discount rate, the following presents the System’s net pension liability and the School System’s proportionate share of the System’s net pension liability, calculated using a single discount rate of 7.40%, a single discount rate that is 1-percentage point lower (i.e. 6.40%) and a single discount rate that is 1-percentage point higher (i.e. 8.40%):
84

CECIL COUNTY PUBLIC SCHOOLS Notes to Basic Financial Statements Year Ended June 30, 2021
1% Lower - 6.40% Current Rate - 7.40% 1% Higher - 8.40%
The System’s Net Pension Liability 32,176,695,000$ 22,601,360,000$ 14,626,005,000$
The School System's Proportionate Share of Net Pension Liability for Employees' Retirement & Pension Systems 17,527,482$ 12,311,543$ 7,967,165$
The School System's Proportionate Share of Net Pension Liability for Teachers' Retirement & Pension Systems -$ -$ -$ Pension Plan Description Organization The State Retirement Agency (the Agency) is administrator of the System. The System was established by the State Personnel and Pensions Article of the Annotated Code of Maryland to provide retirement allowances and other benefits to State employees, teachers, police, judges, legislators, and employees of participating governmental units. Responsibility for the System’s administration and operation is vested in a 15-member Board of Trustees. The system is made up of two cost-sharing employer pools: the “State Pool” consists of the State agencies, boards of education, community colleges, and libraries. The “Municipal Pool” consists of the participating governmental units that elected to join the System. Neither pool shares in each other’s actuarial liabilities, thus participating governmental units that elect to join the System (the “Municipal Pool”), share in the liabilities of the Municipal Pool only. The State of Maryland is the statutory guarantor for the payment of all pensions, annuities, retirement allowances, refunds, reserves, and other benefits of the System. The Agency is legally authorized to use all assets accumulated for the payment of benefits to pay such obligations to any plan member or beneficiary as defined by the terms of the plan. Consequently, the System is accounted for as a single plan as defined in Governmental Accounting Standards Board (GASB) Statement No. 67, Financial Reporting for Pension Plans - An Amendment of GASB Statement No. 25. Additionally, the System is fiscally dependent on the State by virtue of the legislative and executive controls exercised with respect to its operations, policies, and administrative budget. Accordingly, the System is included in the State’s reporting entity and disclosed in its financial statements as a pension trust fund. The System is comprised of the Teachers’ Retirement and Pension Systems, Employees’ Retirement and Pension Systems, State Police Retirement System, Judges’ Retirement System, and the Law Enforcement Officers’ Pension System. The School System’s employees participate in both the Teachers’ Retirement and Pension System and the Employees’ Retirement and Pension System. Covered Members The Teachers’ Retirement System was established on August 1, 1927, to provide retirement allowances and other benefits to teachers in the State. Effective January 1, 1980, the Teachers’ Retirement System was closed to new members and the Teachers’ Pension System was established. As a result, teachers hired after December 31, 1979, became members of the Teachers’ Pension System as a condition of employment. On or after January 1, 2005, an
85

CECIL COUNTY PUBLIC SCHOOLS Notes to Basic Financial Statements Year Ended June 30, 2021
individual who is a member of the Teachers’ Retirement System may not transfer membership to the Teachers’ Pension System. On October 1, 1941, the Employees’ Retirement System was established to provide retirement allowances and other benefits to State employees, elected and appointed officials and the employees of participating governmental units. Effective January 1, 1980, the Employees’ Retirement System was essentially closed to new members and the Employees’ Pension System was established. As a result, State employees (other than correctional officers) and employees of participating units hired after December 31, 1979, became members of the Employees’ Pension System as a condition of employment, while all State correctional officers and members of the Maryland General Assembly continue to be enrolled as members of the Employee’s Retirement System. On or after January 1, 2005, an individual who is a member of the Employee’s Retirement System may not transfer membership to the Employees’ Pension System. Currently, more than 150 governmental units participate in the Employees’ Retirement System. Summary of Significant Plan Provisions All plan benefits are specified by the State Personnel and Pensions Article of the Annotated Code of Maryland. For all individuals who are members of the System on or before June 30, 2011, pension allowances are computed using both the highest three consecutive years’ Average Final Compensation (AFC) and the actual number of years of accumulated creditable service. For any individual who becomes a member of one of the pension systems on or after July 1, 2011, pension allowances are computed using both the highest five consecutive years’ AFC and the actual number of years accumulated creditable services. Various retirement options are available under each system which ultimately determines how a retiree’s benefit allowance will be computed. Some of these options require actuarial reductions based on the retiree’s and/or designated beneficiary’s attained age and similar actuarial factors. The member contribution rate for members of the Teachers’ Retirement Pension System and Employees’ Retirement Pension System is 7% and 6%, respectively. In addition, the benefit attributable to service on or after July 1, 2011 in many of the pension systems now will be subject to different cost-of-living adjustments (COLA) that is based on the increase in the Consumer Price Index (CPI) and capped at 2.5% or 1.0% based on whether the market value investment return for the preceding calendar year was higher or lower than the investment return assumption used in the valuation. A brief summary of the retirement eligibility requirements of and the benefits available under various systems in effect during fiscal year 2021, are as follows: Service Retirement Allowances A member of the Teachers’ or Employee’s Retirement System is generally eligible for full retirement benefits upon the earlier of attaining age 60 or accumulating 30 years of creditable service regardless of age. The annual retirement allowance equals 1/55 (1.81%) of the member’s AFC multiplied by the number of years of accumulated creditable service. An individual who is a member of the Teachers’ or Employees’ Pension System on or before June 30, 2011, is eligible
86

CECIL COUNTY PUBLIC SCHOOLS Notes to Basic Financial Statements Year Ended June 30, 2021
for full retirement benefits upon the earlier of attaining age 62, with specified years of eligibility service, or accumulating 30 years of eligibility service regardless of age. An individual who becomes a member of the Teachers’ or Employees’ Pension System on or after July 1, 2011, is eligible for full retirement benefits if the member’s combined age and eligibility service equals at least 90 years or if the member is at least age 65 and as accrued at least 10 years of eligibility service. For most individuals who retired from either the Teachers' or Employees' Pension System on or before June 30, 2006, the annual pension allowance equals 1.2% of the member's AFC, multiplied by the number of years of creditable service accumulated prior to July 1, 1998, plus 1.4% of the member's AFC, multiplied by the number of years of creditable service accumulated subsequent to June 30, 1998. With certain exceptions, for individuals who are members of the Teachers’ or Employees’ Pension System on or after July 1, 2006, the annual pension allowance equals 1.2% of the member’s AFC, multiplied by the number of years of credible service accumulated prior to July 1, 1998, plus 1.8% of the member’s AFC, multiplied by the number of years of creditable service accumulated subsequent to June 30, 1998. Beginning July 1, 2011, any new member of the Teachers’ or Employees’ Pension System shall earn an annual pension allowance equal to 1.5% of the member’s AFC multiplied by the number of years of creditable service accumulated as a member of the Teachers’ or Employees’ Pension System. Exceptions to these benefit formulas apply to members of the Employees’ Pension System, who are employed by a participating governmental unit that does not provide the 1998 or 2006 enhanced pension benefits or the 2011 reformed pension benefits. The pension allowance for these members equals 0.8% of the member’s AFC up to the social security integration level (SSIL), plus 1.5% of the member’s AFC in excess of the SSIL, multiplied by the number of years of accumulated creditable service. For the purpose of computing pension allowances, the SSIL is the average of the social security wage bases for the past 35 calendar years ending with the year the retiree separated from services. Vested Allowances Any individual who is a member of the System on or before June 30, 2011 (other than a judge or a legislator), and who terminates employment before attaining retirement age but after accumulating 5 years of eligibility service is eligible for a vested retirement allowance. Any individual who joins the System on or after July 1, 2011 (other than a judge or a legislator), and who terminates employment before attaining retirement age but after accumulating 10 years of eligibility services is eligible for a vested retirement allowance. A member, who terminates employment prior to attaining retirement age and before vesting, receives a refund of all member contributions and interest. Early Service Retirement A member of the Teachers’ or Employees’ Retirement System may retire with reduced benefits after completing 25 years of eligibility service. Benefits are reduced by 0.5% per month for each month remaining until the retiree either attains age 60 or would have accumulated 30 years of credible service, whichever is less. The maximum reduction for a Teachers’ or an Employees’
87

CECIL COUNTY PUBLIC SCHOOLS Notes to Basic Financial Statements Year Ended June 30, 2021
Retirement System member is 30%. An individual who is a member of the Teachers’ or Employees’ Pension System on or before June 30, 2011, may retire with reduced benefits upon attaining age 55 with at least 15 years of eligibility service. Benefits are reduced by 0.5% per month for each month remaining until the retiree attains age 62. The maximum reduction for these members of the Teachers’ or Employees’ Pension System is 42%. An individual who becomes a member of the either the Teachers’ or Employees’ Pension System on or after July 1, 2011, may retire with reduced benefits upon attaining age 60 with at least 15 years of eligibility service. Benefits are reduced by 0.5% per month for each month remaining until the retiree attains age 65. The maximum reduction for these members of the Teachers’ or Employees’ Pension System is 30%. Disability and Death Benefits Generally, a member covered under retirement plan provisions who is permanently disabled after 5 years of service receives a service allowance based on a minimum (usually 25%) of the member’s AFC. A member covered under pension plan provisions who is permanently disabled after accumulating 5 years of eligibility service receives a service allowance computed as if service had continued with no change in salary until the retiree attained age 62. A member (other than a member of the Maryland General Assembly or a judge, both of which are ineligible for accidental disability benefits) who is permanently and totally disabled as a result of an accident occurring in the line of duty receives 2/3 (66.7%) of the member’s annual salary as of the date of death plus all member contributions and interest. Death benefits are equal to a member’s annual salary as of the date of death plus all member contributions and interest. Adjusted Retirement Allowances (as applicable) Retirement and pension allowances are increased annually to provide for changes in the cost of living according to prescribed formulae. Such adjustments for retirees are based on the annual change in the CPI. For the Teachers’ and Employees’ Retirement Systems (TRS/ERS) the method by which the annual COLA’s are computed depends upon elections made by members who were active on July 1, 1984 (or within 90 days of returning to service, for members who were active on July 1, 1984) enabling the member to receive either an unlimited COLA, a COLA limited to 5% or a two part combination COLA depending upon the COLA election by the member. However, beginning July 1, 2011, for benefits attributable to service earned on or after July 1, 2011, in all of the systems except the judges’ and legislators’ systems, the adjustment is capped at the lesser of 2.5% or the increase in CPI if the most recent calendar year market value of return was greater than or equal to the assumed rate. The adjustment is capped at the lesser of 1% or the increase in CPI if the market value return was less that the assumed rate of return. In years in which COLAs would be less than zero due to a decline in CPI, retirement allowances will not be adjusted. COLAs in succeeding years are adjusted until the difference between the negative COLA that would have applied and the zero COLA is fully recovered.
88

CECIL COUNTY PUBLIC SCHOOLS Notes to Basic Financial Statements Year Ended June 30, 2021
Pension Liabilities, Pension Expense, and Deferred Outflow of Resources and Deferred Inflows of Resources Related to Pensions In relation to employees participating in the Employees' Retirement and Pension System, at June 30, 2021, the School System reported a liability of $12,311,543 for its proportionate share of the net pension liability. The net pension liability was measured as of June 30, 2020, and the total pension liability used to calculate the net pension liability was determined by an actuarial valuation of that date. The School System’s proportion of the net pension liability was based on a projection of the School System’s long-term share of contributions to the pension plan relative to the projected contributions of all participating governmental units, actuarially determined. At June 30, 2020, the School System’s proportion was approximately 0.0545%. In relation to these employees, for the year ended June 30, 2021, the School System recognized pension expense of $318,836. At the measurement date of June 30, 2020, the School System reported deferred outflows of resources and deferred inflows of resources related to pensions from the following sources: Measurement Date of June 30, 2020 Deferred Outflows Deferred Inflows
Changes in assumptions 56,787$ 88,113$ Difference between actual and expected experience - 628,764 Net difference between projected and actual earnings on pension plan investments 922,821 - Change in proportion 949,245 228,255 Contributions subsequent to the measurement date 1,304,242 -
Total 3,233,095$ 945,132$ The deferred outflow of resources of $1,304,242 relating to contributions subsequent to the measurement date of June 30, 2020 will be recognized as a reduction of the School System's net pension liability during the fiscal year ended June 30, 2022. The deferred outflows and inflows of resources due to changes in assumptions, differences between actual and expected experience, change in proportion, and differences between projected and actual investment earnings represent the School System’s proportionate share of the unamortized portions of the System’s original amounts. The deferred inflows and outflows related to non-investment activity for 2020, 2019, 2018, 2017, and 2016 are being amortized over the remaining service lives ranging from 5.00 to 5.87 years. The deferred outflows and inflow balances related to net difference in investment earnings for 2020, 2019, 2018, 2017, and 2016 are being amortized over a closed 5-year period. These unamortized amounts will be ratably recognized in pension expense over these services lives and closed 5-year period.
89

CECIL COUNTY PUBLIC SCHOOLS Notes to Basic Financial Statements Year Ended June 30, 2021
The following table shows the amortization of these deferred outflows and inflows:
Net Pension Liability The components of the School System’s proportionate share of the Pension System’s net pension liability as of the measurement date of June 30, 2020 were as follows:
In relation to employees
participating in the Employees'
Retirement and Pension System
In relation to employees
participating in the Teachers'
Retirement and Pension System Total
Total Pension Liability 42,045,975$ 471,628,390$ 513,674,365$ Plan Fiduciary Net Position 29,734,434 333,530,159 363,264,592 Net Pension Liability 12,311,543 - 12,311,543 Plan fiduciary net position as a percentage of total pension 70.72% 70.72% 70.72% The School System’s proportionate share for the employees participating in the Employee’s Retirement and Pension Systems and the State of Maryland’s (the non-employer contributing entity’s) proportionate share for the employees participating in the Teachers’ Retirement and Pension Systems are both based on total System contributions for fiscal year 2021 approximate 0.0545% and 0.611% respectively, at a measurement date of June 30, 2020. The Pension Plan Fiduciary Plan Information as well as the Comprehensive Annual Financial Report the Maryland State Retirement and Pension System for the year ended June 30, 2020 is available from: State Retirement and Pension System of Maryland 120 East Baltimore Street Baltimore, MD 21202 https://sra.maryland.gov/annual-financial-reports
Fiscal Year Ending June 30,
Deferred Outflows
Deferred Inflows Net
2022 488,435$ (444,265)$ 44,170$ 2023 587,090 (296,685) 290,405 2024 544,655 (137,032) 407,623 2025 300,472 (64,929) 235,543 2026 8,201 (2,221) 5,980
Total 1,928,853$ (945,132)$ 983,721$
90

CECIL COUNTY PUBLIC SCHOOLS Notes to Basic Financial Statements Year Ended June 30, 2021
NOTE 12 INSURANCE POOLS The School System participates in the Maryland Association of Boards of Education Group Insurance Pool (the Pool) and Workmen’s Compensation Group Self-Insurance Fund (the Fund) for its general liability, property, and workmen’s compensation insurance coverage. Annual contributions are made based on historical loss, exposure factors, and payroll levels. The Pool and the Fund have excess loss insurance for both specific and aggregate losses. Although the Pool and the Fund maintain reserves, the School System could be assessed for its share of any future shortfalls. The School System’s Other Post Employment Benefit Plan (OPEB Plan) is administered through the School System’s Retiree Benefits Trust Fund as an irrevocable trust and a member trust of the Maryland Association of Boards of Education (MABE) Pooled OPEB Investment Trust (MABE Pool). Assets of the Trust fund are dedicated to providing post-retirement health insurance coverage to current and eligible future retirees. NOTE 13 FAIR VALUE MEASUREMENTS The School System previously adopted GASB Statement No 72 - Fair Value Measurement and Application. This Statement establishes a hierarchy of inputs to valuation techniques used to measure fair value:
Level 1 - quoted market prices in active markets Level 2 - inputs other than quoted market prices that are observable either directly or
indirectly Level 3 - unobservable inputs
The School System currently has the following investments and maturities as of June 30, 2021:
Investment TypePooled Investments Fair Value Less than 1 1-5 5+
MLGIP - Mutual Funds (General Fund) 16,904,555$ 16,904,555$ -$ -$ MLGIP - Mutual Funds (Special Revenue Fund) 131,393 131,393 - - MLGIP - Mutual Funds (Capital Projects Fund) 47,775 47,775 - - MLGIP - Mutual Funds (Student Activities) 542,945 542,945 - - MLGIP - Mutual Funds (Scholarships) 214,238 214,238 - - MABE OPEB Trust - Mutual Funds (Fiduciary-Trust Fund) 17,305,748 17,305,748 - -
Total Investments 35,146,654$ 35,146,654$ -$ -$
Investment Maturities (Years)
91

CECIL COUNTY PUBLIC SCHOOLS Notes to Basic Financial Statements Year Ended June 30, 2021
The following table presents the financial assets that the School System measures at fair value or amortized cost:
Investments carried at fair value Level 1 Redemption Redemption None -$ -$ -$ -$
Investments carried at amortized cost MLGIP - Mutual Funds (General Fund) 16,904,555$
MLGIP - Mutual Funds (Special Revenue Fund) 131,393 MLGIP - Mutual Funds (Capital Projects Fund) 47,775 MLGIP - Mutual Funds (Student Activities) 542,945 MLGIP - Mutual Funds (Scholarships) 214,238
17,840,906$
Investments carried at net asset value (NAV) MABE OPEB Trust 17,305,748$ N/A Daily Six months
Fair ValueUnfunded
CommitmentsRedemption Frequency
Redemption Notice Period
NOTE 14 PRIOR PERIOD ADJUSTMENT The School System adopted GASB No. 84 – Fiduciary Activities (GASB 84) during the year ended June 30, 2021. GASB 84 establishes standards of accounting and financial reporting for fiduciary activities. The requirements of this Statement required the School System to move Student Activity Funds from a fiduciary fund to the Operating Fund. Accordingly, the beginning of the year net position and General Fund fund balance were increased by the June 30, 2020 Student Activity Fund balance of $1,656,044.
92

REQUIRED SUPPLEMENTARY INFORMATION
93

94

CECIL COUNTY PUBLIC SCHOOLS Required Supplementary Information Year Ended June 30, 2021
Schedule of Changes in Net OPEB Liability and Related Ratios
2012 2013 2014 2015 2016 2017 2018 2019 2020 2021Total OPEB liability
Service cost 1,446,260$ 1,482,416$ 1,519,476$ 1,565,808$ Interest 4,053,094 4,214,871 4,381,459 4,454,434 Changes of benefit terms - - - - Differences between expected and actual experience - (207,879) (2,048,898) (359,787) Changes of assumptions - - (258,088) 12,304,337 Benefit payments (3,017,488) (2,979,948) (2,484,757) (2,967,177) Net change in total OPEB liability 2,481,866 2,509,460 1,109,192 14,997,615 Total OPEB liability - beginning 61,554,580 64,036,446 66,545,906 67,655,098$ Total OPEB liability - ending (a) 64,036,446$ 66,545,906$ 67,655,098$ 82,652,713$
Information for fiscal year 2017 and earlier is not availablePlan fiduciary net position
Contributions - employer 3,895,952$ 4,715,305$ 2,484,757$ (32,823)$ Net investment income 856,893 967,433 470,896 3,787,497 Benefit payments (3,017,488) (2,979,948) (2,484,757) (2,967,177) Administrative expense - (7,972) (8,405) (8,310) Net change in plan fiduciary net position 1,735,357 2,694,818 462,491 779,187 Plan fiduciary net position - beginning 11,633,904 13,369,252 16,064,070 16,526,561 Plan fiduciary net position - ending (b) 13,369,261 16,064,070 16,526,561 17,305,748
School System's net OPEB liability - ending (a) - (b) 50,667,185 50,481,827 51,128,537 65,346,965
Plan fiduciary net position as a percentage of the total OPEB liability 20.88% 24.14% 24.43% 20.94%Covered - employee payroll¹Net OPEB liability as a percentage of covered-employee payroll¹
Expected Average Remaining Service Years of All Participants 14 10 10 10
Notes to Schedule:Benefit changes: NoneChanges of assumptions: The discount rate was changed as follows: The discount rate changes year-to-year: 6.75% 6.75% 6.75% 5.46% The mortality assumption was updated to th e latest experience study on public sector empoyees and retirees released by the SOAMethods and asssumptions used to determine contribution rates:
Valuation date 6/30/2020Actuarial cost method Entry age normalAmortization method Straight lineRemaining amortization period Liabilities gains or losses are recognized over 14 years, asset gains or losses over 5 yearsAsset valuation method Market value of assetsInvestment rate of return 6.75%Payroll growth rate State of Maryland Teachers Plan AssumptionsRetirement age State of Maryland Teachers Plan AssumptionsInflation 2.50%Healthcare cost trend rates Employer subsidy amounts are expected to increase 2.5% per year. There is no other benefit provided.
¹Because this OPEB plan does not depend on salary, we do not have salary information.
Fiscal Year
Last 10 Fiscal Years
95

CECIL COUNTY PUBLIC SCHOOLS Required Supplementary Information Year Ended June 30, 2021
Schedule of Board Contributions Last 10 Fiscal Years
2012 2013 2014 2015 2016 2017 2018 2019 2020 2021Actuarially determined contribution Information for the fiscal year 2017 4,676,026$ 4,714,013$ 4,686,710$ 5,515,707$ Contributions in relation to the actuarially determined contribution
and earlier not available3,895,952 4,715,305 2,484,757 (32,823)
Contributon deficiency (excess) 780,074$ (1,292)$ 2,201,953$ 5,548,530$ Covered payroll¹Contribution as a percentage of covered employee payroll¹
¹Because this OPEB plan does not depend on salary, we do not have salary information
Schedule of Investment Returns
2012 2013 2014 2015 2016 2017 2018 2019 2020 2021Annual money-weighted rate of return, net of 11.24% 7.36% 7.09% 2.87% 24.11%
Fiscal Year
Information for fiscal year 2016 and earlier is not available
Last 10 Fiscal Years
Additional Information - Schedule of Required Pension Related Supplementary Information
Schedule of the Proportionate Share of the Net Pension Liability for the Employee's Retirement and Pension System
FY 2021 FY 2020 FY 2019 FY 2018 FY 2017 FY 2016
Proportion (%) of collective net pension liability 0.0545% 0.0540% 0.0518% 0.0468% 0.0489% 0.0521%
Proportionate share ($) of collective net pension liability $12,311,543 $11,147,349 $10,874,488 $10,110,254 $11,543,395 $10,817,616School System's covered payroll ($)1 $12,658,117 $12,698,881 $12,319,095 $12,003,972 $11,442,991 $11,297,736Proportionate share of collective net pension liability as a percentage of its covered payroll 97.3% 87.8% 88.3% 82.1% 96.2% 94.5%Pension plan's fiduciary net position as a percentage of the total pension liability 70.72% 72.34% 71.18% 69.38% 65.79% 68.78%
1 - In accordance with GASB No. 82, amounts shown represent the payroll on which contributions to the pension plan are based. Schedule of the Proportionate Share of Net Pension Liability for the Teachers’ Retirement & Pension Systems
FY 2021 FY 2020 FY 2019 FY 2018 FY 2017Proportion (%) of collective net pension liability 0.0% 0.0% 0.0% 0.0% 0.0%Proportionate share ($) of collective net pension liability -$ -$ -$ -$ -$ Portion of the State of Maryland's total proportionate share ($) of collective net pension liability that is associated with the School System 138,098,231$ 133,335,709$ 136,183,281$ 134,727,764$ 161,402,938$
Sum of the School System's and portion of the State of Maryland's total proportionate share ($) of collective net pension liability that is associated with the School System 138,098,231$ 133,335,709$ 136,183,281$ 134,727,764$ 161,402,938$
School System's covered payroll ($)1 120,701,622$ 121,121,364$ 114,916,145$ 110,154,901$ 108,244,834$
School System's proportionate share of collective net pension liability as a percentage of its covered payroll 0.0% 0.0% 0.0% 0.0% 0.0%Pension plan's fiduciary net position as a percentage of the total pension liability 70.72% 72.34% 71.18% 69.38% 65.79%1 - In accordance with GASB No. 82, amounts shown represent the payroll on which contributions to the pension plan are based.
96

CECIL COUNTY PUBLIC SCHOOLS Required Supplementary Information Year Ended June 30, 2021
Notes to Schedule Assumption Measurement Date June 30, 2021Actuarial Entry Age NormalAmortization method Level Percentage of Payroll, ClosedInflation 2.60% General; 3.10% WagesSalary increases 3.10% to 11.6%Investment rate of return 7.40%Mortality Pub-2010 Mortality Tables - Weighted Mortality Projection with
Fully Generational MP2019 Mortality Improvement Scale.Retirement age Experience-based table of rates that are specific to the type of
eligibility condition. Last updated for the 2020 valuation.
Changes in Benefit TermsThere were no benefit changes during the year. Changes In Assumptions
Changes from Fiscal Year 2017 to 2018
Changes from Fiscal Year 2018 to 2019
Changes from Fiscal Year 2019 to 2020
Inflation General 2.65% to 2.60% 2.60% to 2.65% 2.65% to 2.60%Inflation Wages 3.15% to 3.10% 3.10% to 3.15% 3.15% to 3.10%
The above schedules are presented to illustrate the requirement for specified information for 10 years. However, until a full 10-year trend is compiled, information is only presented for those years for which information is available.
2021 2020 2019 2018 2017 2016 2015 2014 2013 2012
Contractua l ly required contribution 1,304,242$ 1,167,926$ 1,109,837$ 1,033,503$ 951,633$ 953,101$ 1,097,148$ 1,117,019$ 998,507$ 1,229,056$
Contributions in rela tion to the contractual ly required contribution 1,304,242 1,167,926 1,109,837 1,033,503 951,633 953,101 1,097,148 1,117,019 998,507 1,229,056
Contribution deficiency (excess) -$ -$ -$ -$ -$ -$ -$ -$ -$ -$
Ceci l County Publ ic Schools ' covered pa yrol l 12,658,117$ 12,770,486$ 12,698,882$ 12,319,095$ 12,003,972$ 11,442,991$ 11,297,736$ 11,192,273$ 11,106,870$ 11,234,516$
Contributions as a percenta ge of covered payrol l 10.30% 9.15% 8.74% 8.39% 7.93% 8.33% 9.71% 9.98% 8.99% 10.94%
SCHEDULE OF PENSION PLAN CONTRIBUTIONS FOR THE EMPLOYEES' RETIRMENT AND PENSION SYSTEM
97

THIS PAGE INTENTIONALLY LEFT BLANK
98

STATISTICAL SECTION
99

100

Statistical Section Contents
This part of the Cecil County Public School’s comprehensive annual financial report presents detailed information as a context for understanding what the information in the financial statements, note disclosures, and required supplementary information says about the government’s overall financial health. Page FINANCIAL 103
These schedules contain trend information to help the reader understand how the School System’s financial performance and well-being have changed over time.
REVENUE AND EXPENSE 108
These schedules contain information to help the reader assess the School System’s most significant revenue by source and expenditures by function.
DEMOGRAPHIC 116
These schedules offer demographic indicators to help the reader understand the environment within which the School System’s financial activities take place.
OPERATING 119
These schedules contain data to help the reader understand how the information in the School System’s financial report relates to the services the School System provides.
101

THIS PAGE INTENTIONALLY LEFT BLANK
102

2021 2020 2019 2018 2017 2016 2015 2014 2013 2012
Governmental activities
Net Investment in capital assets 176,527,252$ 173,044,220$ 175,701,356$ 179,047,057$ 177,415,257$ 181,891,093$ 178,073,096$ 162,961,619$ 165,066,192$ 169,073,812$ Restricted for capital projects 32,260 32,207 49,995 48,973 48,402 42,732 47,954 (156,795) 47,905 47,848 Unrestricted (51,284,791) (55,036,874) (49,148,754) (44,461,926) 4,936,382 608,767 (1,968,607) (4,182,772) 9,271,769 12,411,027
Total governmental activities net position 125,274,721$ 118,039,553$ 126,602,597$ 134,634,104$ 182,400,041$ 182,542,592$ 176,152,443$ 158,622,052$ 174,385,866$ 181,532,687$
CECIL COUNTY PUBLIC SCHOOLS
NET POSITION BY COMPONENT
LAST TEN FISCAL YEARS
Source: Statement of Net Position
103
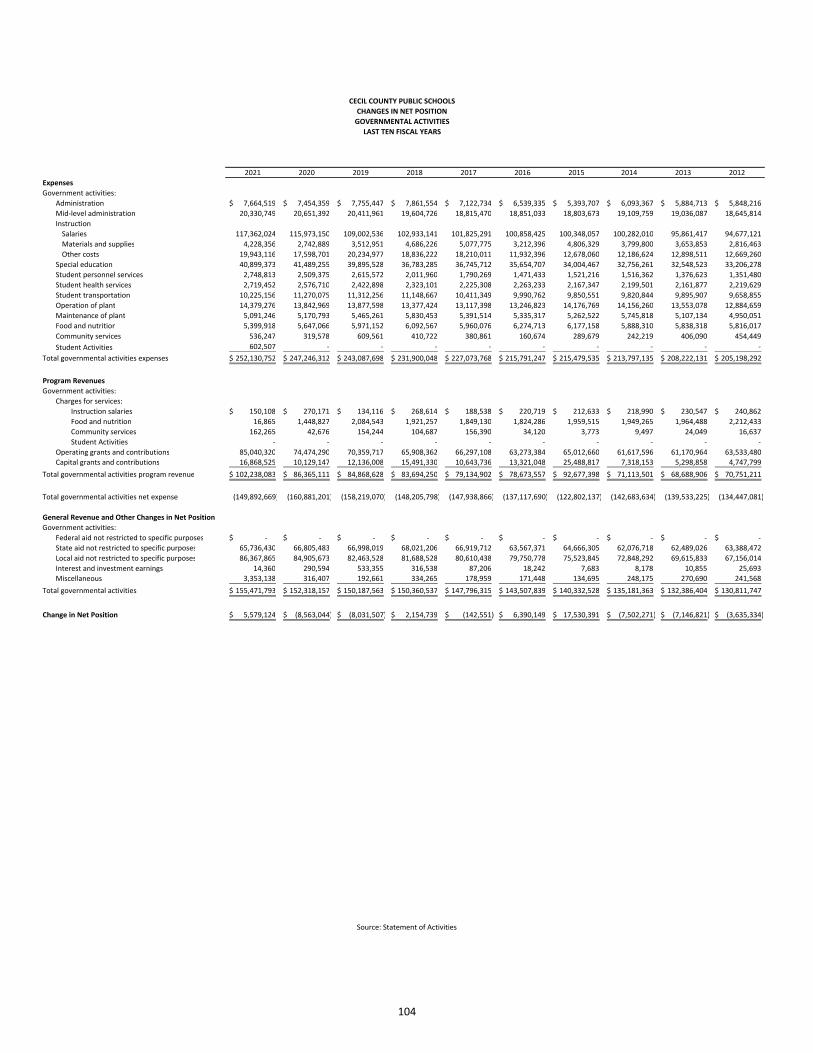
2021 2020 2019 2018 2017 2016 2015 2014 2013 2012
Expenses
Government activities:
Administration 7,664,519$ 7,454,359$ 7,755,447$ 7,861,554$ 7,122,734$ 6,539,335$ 5,393,707$ 6,093,367$ 5,884,713$ 5,848,216$
Mid‐level administration 20,330,749 20,651,392 20,411,961 19,604,726 18,815,470 18,851,033 18,803,673 19,109,759 19,036,087 18,645,814
Instruction
Salaries 117,362,024 115,973,150 109,002,536 102,933,141 101,825,291 100,858,425 100,348,057 100,282,010 95,861,417 94,677,121
Materials and supplies 4,228,356 2,742,889 3,512,951 4,686,226 5,077,775 3,212,396 4,806,329 3,799,800 3,653,853 2,816,463
Other costs 19,943,116 17,598,701 20,234,977 18,836,222 18,210,011 11,932,396 12,678,060 12,186,624 12,898,511 12,669,260
Special education 40,899,373 41,489,255 39,895,528 36,783,285 36,745,712 35,654,707 34,004,467 32,756,261 32,548,523 33,206,278
Student personnel services 2,748,813 2,509,375 2,615,572 2,011,960 1,790,269 1,471,433 1,521,216 1,516,362 1,376,623 1,351,480
Student health services 2,719,452 2,576,710 2,422,898 2,323,101 2,225,308 2,263,233 2,167,347 2,199,501 2,161,877 2,219,629
Student transportation 10,225,156 11,270,075 11,312,256 11,148,667 10,411,349 9,990,762 9,850,551 9,820,844 9,895,907 9,658,855
Operation of plant 14,379,276 13,842,969 13,877,598 13,377,424 13,117,398 13,246,823 14,176,769 14,156,260 13,553,078 12,884,659
Maintenance of plant 5,091,246 5,170,793 5,465,261 5,830,453 5,391,514 5,335,317 5,262,522 5,745,818 5,107,134 4,950,051
Food and nutrition 5,399,918 5,647,066 5,971,152 6,092,567 5,960,076 6,274,713 6,177,158 5,888,310 5,838,318 5,816,017
Community services 536,247 319,578 609,561 410,722 380,861 160,674 289,679 242,219 406,090 454,449
Student Activities 602,507 ‐ ‐ ‐ ‐ ‐ ‐ ‐ ‐ ‐
Total governmental activities expenses 252,130,752$ 247,246,312$ 243,087,698$ 231,900,048$ 227,073,768$ 215,791,247$ 215,479,535$ 213,797,135$ 208,222,131$ 205,198,292$
Program Revenues
Government activities:
Charges for services:
Instruction salaries 150,108$ 270,171$ 134,116$ 268,614$ 188,538$ 220,719$ 212,633$ 218,990$ 230,547$ 240,862$
Food and nutrition 16,865 1,448,827 2,084,543 1,921,257 1,849,130 1,824,286 1,959,515 1,949,265 1,964,488 2,212,433
Community services 162,265 42,676 154,244 104,687 156,390 34,120 3,773 9,497 24,049 16,637
Student Activities ‐ ‐ ‐ ‐ ‐ ‐ ‐ ‐ ‐ ‐
Operating grants and contributions 85,040,320 74,474,290 70,359,717 65,908,362 66,297,108 63,273,384 65,012,660 61,617,596 61,170,964 63,533,480
Capital grants and contributions 16,868,525 10,129,147 12,136,008 15,491,330 10,643,736 13,321,048 25,488,817 7,318,153 5,298,858 4,747,799
Total governmental activities program revenue 102,238,083$ 86,365,111$ 84,868,628$ 83,694,250$ 79,134,902$ 78,673,557$ 92,677,398$ 71,113,501$ 68,688,906$ 70,751,211$
Total governmental activities net expense (149,892,669) (160,881,201) (158,219,070) (148,205,798) (147,938,866) (137,117,690) (122,802,137) (142,683,634) (139,533,225) (134,447,081)
General Revenue and Other Changes in Net Position
Government activities:
Federal aid not restricted to specific purposes ‐$ ‐$ ‐$ ‐$ ‐$ ‐$ ‐$ ‐$ ‐$ ‐$
State aid not restricted to specific purposes 65,736,430 66,805,483 66,998,019 68,021,206 66,919,712 63,567,371 64,666,305 62,076,718 62,489,026 63,388,472
Local aid not restricted to specific purposes 86,367,865 84,905,673 82,463,528 81,688,528 80,610,438 79,750,778 75,523,845 72,848,292 69,615,833 67,156,014
Interest and investment earnings 14,360 290,594 533,355 316,538 87,206 18,242 7,683 8,178 10,855 25,693
Miscellaneous 3,353,138 316,407 192,661 334,265 178,959 171,448 134,695 248,175 270,690 241,568
Total governmental activities 155,471,793$ 152,318,157$ 150,187,563$ 150,360,537$ 147,796,315$ 143,507,839$ 140,332,528$ 135,181,363$ 132,386,404$ 130,811,747$
Change in Net Position 5,579,124$ (8,563,044)$ (8,031,507)$ 2,154,739$ (142,551)$ 6,390,149$ 17,530,391$ (7,502,271)$ (7,146,821)$ (3,635,334)$
CECIL COUNTY PUBLIC SCHOOLS
CHANGES IN NET POSITION
GOVERNMENTAL ACTIVITIES
LAST TEN FISCAL YEARS
Source: Statement of Activities
104

2021 2020 2019 2018 2017 2016 2015 2014 2013 2012
General fund:
Non‐spendable 301,200$ 410,629$ 523,678$ 483,753$ 484,018$ 640,769$ 614,961$ 579,811$ 787,321$ 777,885$
Committed 4,275,857 6,302,758 6,625,121 5,710,472 5,888,839 5,737,241 4,742,665 2,847,015 1,784,391 1,588,063
Assigned 4,248,754 3,079,000 3,319,000 3,873,000 3,550,000 3,418,012 3,615,469 3,700,741 6,317,721 4,045,024
Unassigned 9,002,597 ‐ 2,169,481 7,421,672 6,416,521 2,212,204 ‐ ‐ 3,470,767 8,552,567
Total general fund 17,828,408$ 9,792,387$ 12,637,280$ 17,488,897$ 16,339,378$ 12,008,226$ 8,973,095$ 7,127,567$ 12,360,200$ 14,963,539$
All other governmental funds
Special Revenue Fund:
Non‐spendable 137,272$ 192,936$ 105,236$ 128,645$ 149,762$ 193,823$ 142,032$ 175,435$ 258,595$ 223,646$
Restricted 2,817,285 1,162,336 ‐ ‐ ‐ ‐ ‐ ‐ ‐ ‐
Unassigned ‐ ‐ 1,221,023 779,106 370,487 (20,693) 76,303 (116,840) (226,543) 36,591
Assigned ‐ ‐ ‐ ‐ ‐ ‐ ‐ ‐ ‐ ‐
Capital Project Fund:
Restricted 32,260 32,207 49,995 48,973 48,402 42,732 47,954 (156,795) 47,905 47,848
Total all other governmental funds 2,986,817$ 1,387,479$ 1,376,254$ 956,724$ 568,651$ 215,862$ 266,289$ (98,200)$ 79,957$ 308,085$
CECIL COUNTY PUBLIC SCHOOLS
FUND BALANCES OF GOVERNMENTAL FUNDS
LAST TEN FISCAL YEARS
(modified accrual basis of accounting)
Source: Balance Sheet ‐ Governmental Funds
105

2021 2020 2019 2018 2017 2016 2015 2014 2013 2012
Revenue
Intergovernmental
Cecil County 97,587,339$ 90,378,236$ 89,721,741$ 89,881,090$ 86,107,741$ 88,050,984$ 92,411,466$ 77,613,523$ 73,121,775$ 69,361,935$
State of Maryland 131,578,402 129,955,431 125,374,800 127,274,639 124,517,950 117,552,193 123,360,144 112,692,627 111,289,209 115,057,469
United States government 24,048,783 15,656,001 16,556,091 13,720,838 13,616,684 13,549,190 14,502,361 13,167,657 13,869,753 13,956,731
Other sources
Sale of food 16,865 1,448,827 2,084,542 1,921,257 1,849,130 1,824,286 1,959,515 1,917,694 1,964,487 2,212,794
Investment interest 14,360 290,594 533,355 316,539 87,206 18,242 7,683 8,178 10,855 25,693 Other 1,464,127 954,178 785,662 940,424 752,506 1,186,502 768,753 895,188 819,232 916,622
Total revenue 254,709,876$ 238,683,267$ 235,056,191$ 234,054,787$ 226,931,217$ 222,181,397$ 233,009,922$ 206,294,867$ 201,075,311$ 201,531,244$
Expenditures
Administration 6,127,701$ 6,017,872$ 5,945,377$ 5,845,485$ 6,088,651$ 5,140,935$ 5,196,245$ 5,238,087$ 4,957,485$ 4,392,050$
Mid‐level administration 14,301,253 14,657,585 14,555,005 14,136,118 13,901,636 13,336,761 13,375,657 13,274,860 13,539,533 13,286,921
Instruction
Salaries 81,150,735 81,039,544 76,319,344 73,105,335 72,519,546 70,388,331 70,323,326 69,545,018 68,237,315 66,720,063
Materials and supplies 4,226,354 2,760,748 3,469,427 4,728,922 5,077,775 3,212,396 5,102,917 3,799,800 3,653,853 2,816,463
Other costs 21,961,897 13,116,856 15,167,372 19,195,545 4,068,239 3,270,618 26,028,685 8,752,929 7,134,392 6,073,506
Special education 29,728,451 30,771,185 29,508,632 27,330,111 26,279,454 26,318,771 25,217,748 24,583,137 25,108,086 24,894,481
Student personnel services 1,993,721 1,877,257 1,965,536 1,499,819 1,321,324 1,035,422 1,071,994 1,073,218 995,116 996,861
Student health services 1,897,687 1,810,039 1,710,844 1,669,881 1,631,860 1,592,818 1,520,898 1,506,440 1,524,399 1,564,001
Student transportation 9,929,866 10,855,021 11,034,883 10,786,695 10,021,991 9,621,041 9,456,522 9,391,768 9,599,678 9,248,641
Operation of plant 11,801,812 11,271,550 11,398,341 11,084,642 11,114,043 10,928,625 11,900,684 11,636,532 11,284,622 10,653,100
Maintenance of plant 3,915,661 4,109,347 4,323,819 4,908,868 4,619,523 4,364,425 4,206,479 4,542,525 4,218,355 3,784,767
Fixed charges 55,155,497 55,946,057 55,815,795 50,199,827 50,077,857 51,160,478 50,518,337 51,298,438 46,076,241 47,510,605
Community services 533,280 266,206 534,771 317,915 358,580 145,387 281,964 235,790 388,028 405,943
Food service
Salaries and wages 2,377,849 2,536,416 2,536,100 2,423,903 2,377,355 2,408,133 2,391,077 2,350,508 2,408,000 2,380,172
Food 2,268,678 2,474,015 2,653,125 2,916,677 2,746,848 3,134,844 3,084,534 2,726,121 2,718,438 2,685,361
Contracted services 49,595 69,650 46,874 48,553 67,642 69,757 57,648 46,449 58,193 67,903
Supplies and materials 320,587 155,204 289,003 292,904 280,868 197,128 180,388 313,708 223,287 232,765
Other operating cost 71,675 226,509 203,695 105,413 102,955 46,018 80,892 39,876 45,721 71,782
Capital outlay 301,730 1,030,658 1,364,740 1,119,804 8,792,710 12,170,838 ‐ ‐ ‐ ‐
Student Activity Fees 602,507 ‐ ‐ ‐ ‐ ‐ ‐ ‐ ‐ ‐
Debt service
Principal 1,108,764 1,177,978 961,801 1,030,894 933,021 563,457 647,404 1,162,359 1,517,120 1,487,251
Interest 24,488 43,698 34,086 47,489 56,940 90,510 156,506 188,094 218,916 248,785
Total expenditures 249,849,788$ 242,213,395$ 239,838,570$ 232,794,800$ 222,438,818$ 219,196,693$ 230,799,905$ 211,705,657$ 203,906,778$ 199,521,421$
Excess of revenues
over (under) expenditures 4,860,088 (3,530,128) (4,782,379) 1,259,987 4,492,399 2,984,704 2,210,017 (5,410,790) (2,831,467) 2,009,823
Other financing sources (uses)
Sale of capital assets ‐$ ‐$ ‐$ ‐$ ‐$ ‐$ ‐$ ‐$ ‐$ 31,709$
Capital lease proceeds 119,227 696,460 350,292 277,605 191,542 ‐ ‐ ‐ ‐ ‐ Transfers from Retiree Benefit Trust Fund 3,000,000 ‐ ‐ ‐ ‐ ‐ ‐ ‐ ‐ ‐
Total other financing sources (uses) 3,119,227 696,460 350,292 277,605 191,542 ‐ ‐ ‐ ‐ 31,709
Net change in fund balances 7,979,315$ (2,833,668)$ (4,432,087)$ 1,537,592$ 4,683,941$ 2,984,704$ 2,210,017$ (5,410,790)$ (2,831,467)$ 2,041,532$
Debt Service as a percentage of
noncapital expenditures* 0.49% 0.53% 0.44% 0.50% 0.47% 0.32% 0.39% 0.66% 0.87% 0.89%
Note: Capital Outlay was allocated to other functions from 2010‐2015. See Reconciliation Of Net Change in Fund Balance and Note 6B to Basic Financial Statements.
*Debt issued to finance school construction is not an obligation of the School System, therefore the debt service relating to those obligations is not included in these financial statements.
CECIL COUNTY PUBLIC SCHOOLS
CHANGES IN FUND BALANCE OF GOVERNMENTAL FUNDS
LAST TEN FISCAL YEARS
(modified accrual basis of accounting)
Source: Statement of Revenue, Expenditures, and Changes in Fund Balances ‐ Governmental Funds
106

2021 2020 2019 2018 2017 2016 2015 2014 2013 2012
Administration 8,329,820$ 6,731,117$ 5,957,180$ 5,908,844$ 5,351,755$ 4,727,924$ 4,160,664$ 4,297,023$ 4,773,500$ 4,336,427$
Mid‐level administration 15,084,787 14,958,576 14,686,232 14,452,246 14,201,864 13,702,313 13,639,776 13,361,918 13,578,940 13,701,040
Instruction salaries 88,480,779 82,754,595 77,043,275 73,580,097 72,863,252 70,710,787 71,260,303 70,108,553 68,715,627 67,631,258
Instruction supplies 7,626,665 6,491,532 4,191,739 5,845,823 5,367,155 3,932,606 5,682,783 4,278,504 3,850,647 3,032,117
Instruction other costs 10,171,450 6,131,342 4,674,182 4,922,099 4,165,556 3,405,349 2,769,555 3,173,948 3,583,950 3,312,599
Special education 36,119,433 31,409,476 30,229,203 27,786,201 26,941,588 26,725,642 25,839,074 24,750,029 25,206,821 25,847,801
Student personnel services 2,965,550 2,607,544 2,442,636 1,671,314 1,363,081 1,054,619 1,084,219 1,096,029 999,151 1,098,301
Student health services 2,047,203 1,952,045 1,726,135 1,699,653 1,639,661 1,624,600 1,554,309 1,547,755 1,531,252 1,576,333
Student transportation 12,318,529 11,144,762 11,340,369 10,911,699 10,274,308 9,767,803 9,597,565 9,491,291 9,633,236 9,502,420
Operation of plant 11,907,492 11,187,264 11,536,987 11,487,301 11,469,440 11,198,162 11,965,460 11,643,949 11,288,368 10,924,044
Maintenance of plant 4,053,639 4,159,819 4,683,803 5,022,506 4,847,291 4,579,484 4,272,707 4,863,548 4,750,480 3,936,360
Fixed charges 43,860,716 42,454,528 42,638,415 39,338,254 39,088,641 38,626,623 37,360,619 37,987,729 33,921,087 34,323,737
Community services 1,373,280 512,092 642,541 415,008 414,371 274,349 410,387 337,697 404,215 459,768
Capital outlay 447,091 679,910 3,369,972 2,288,016 485,113 307,078 324,786 406,424 211,797 182,347
Student school/activity fees ‐ ‐ ‐ ‐ ‐ ‐ ‐ ‐ ‐ ‐
Total Budget by Function 244,786,434$ 223,174,602$ 215,162,669$ 205,329,061$ 198,473,076$ 190,637,339$ 189,922,207$ 187,344,397$ 182,449,071$ 179,864,552$
Increase over prior year 21,611,832$ 8,011,933$ 9,833,608$ 6,855,985$ 7,835,737$ 715,132$ 2,577,810$ 4,895,326$ 2,584,519$ (8,052,068)$
9.7% 3.7% 4.8% 3.5% 4.1% 0.4% 1.4% 2.7% 1.4% ‐4.3%
CECIL COUNTY PUBLIC SCHOOLS
GENERAL FUND
FINAL APPROVED BUDGET BY FUNCTION
LAST TEN FISCAL YEARS
$‐
$20,000,000
$40,000,000
$60,000,000
$80,000,000
$100,000,000
$120,000,000
$140,000,000
$160,000,000
$180,000,000
$200,000,000
$220,000,000
$240,000,000
$260,000,000
2021 2020 2019 2018 2017 2016 2015 2014 2013 2012
Total Budget by Function
Source: Statement of Revenue, Expenditures, Encumbrances, and Changes in Fund Balance ‐ Budget (Non‐GAAP Budgetary Basis) and Actual ‐ General Fund
107

2021 2020 2019 2018 2017 2016 2015 2014 2013 2012
Cecil County 86,367,865$ 84,905,673$ 82,463,528$ 81,688,528$ 80,610,438$ 79,750,778$ 75,523,845$ 72,848,292$ 69,615,833$ 67,156,014$
State of Maryland 125,627,388 124,959,492 120,214,466 119,689,250 119,046,123 112,703,145 114,520,872 109,977,425 109,272,301 112,323,918
Federal government 16,713,333 10,986,159 11,862,236 8,881,924 9,031,345 8,991,912 10,009,922 9,065,853 10,022,655 10,274,500
Other sources
Interest earned 14,177 289,406 531,943 315,785 86,795 18,136 7,571 8,099 9,997 22,946
Other 1,431,412 950,905 781,919 925,538 728,980 685,434 614,039 680,852 781,438 765,778
Total revenue by source 230,154,175$ 222,091,635$ 215,854,092$ 211,501,025$ 209,503,681$ 202,149,405$ 200,676,249$ 192,580,521$ 189,702,224$ 190,543,156$
Increase/(decrease) over prior year 8,062,540$ 6,237,543$ 4,353,067$ 1,997,344$ 7,354,276$ 1,473,156$ 8,095,728$ 2,878,297$ (840,932)$ (6,272,274)$
3.6% 2.9% 2.1% 1.0% 3.6% 0.7% 4.2% 1.5% ‐0.4% ‐3.2%
CECIL COUNTY PUBLIC SCHOOLS
GENERAL FUND
REVENUES BY SOURCE
LAST TEN FISCAL YEARS
$‐
$20,000,000
$40,000,000
$60,000,000
$80,000,000
$100,000,000
$120,000,000
$140,000,000
$160,000,000
$180,000,000
$200,000,000
$220,000,000
$240,000,000
$260,000,000
2021 2020 2019 2018 2017 2016 2015 2014 2013 2012
Total Revenue by Source
Source: Statement of Revenue, Expenditures, and Changes in Fund Balances ‐ Governmental Funds
108

2021 2020 2019 2018 2017 2016 2015 2014 2013 2012
Administration 5,824,917$ 5,886,830$ 5,362,639$ 5,623,851$ 5,150,687$ 4,239,139$ 4,074,201$ 4,221,468$ 4,717,989$ 4,064,357$
Mid‐level administration 14,301,253 14,657,585 14,555,005 14,136,118 13,901,636 13,336,761 13,375,657 13,275,794 13,566,354 13,313,116
Instruction
Salaries 81,150,736 81,039,544 76,319,344 73,105,335 72,519,546 70,388,331 70,323,326 69,545,018 68,237,315 66,720,063
Materials and supplies 4,170,138 2,662,529 2,978,821 4,718,208 4,679,832 3,064,304 4,631,463 3,790,757 3,643,215 2,767,490
Other costs 6,670,290 3,772,646 4,433,462 4,526,454 3,735,052 3,264,019 2,574,449 2,923,302 3,227,280 2,955,980
Special education 29,860,980 30,771,185 29,504,035 27,334,708 26,279,454 26,310,303 25,226,216 24,609,671 25,134,429 24,922,960
Student personnel services 2,048,031 1,750,915 2,130,476 1,499,819 1,321,324 1,035,422 1,071,994 1,073,218 996,891 998,593
Student health services 1,897,687 1,810,039 1,710,844 1,669,881 1,631,860 1,592,818 1,520,898 1,506,440 1,526,033 1,565,596
Student transportation 9,877,749 10,888,794 11,077,824 10,745,460 10,057,070 9,621,041 9,456,522 9,391,768 9,599,678 9,247,557
Operation of plant 11,840,330 11,273,037 11,398,341 11,084,642 11,114,043 10,928,625 11,900,684 11,638,301 11,286,391 10,654,869
Maintenance of plant 3,939,441 4,032,850 4,478,228 4,906,775 4,492,271 4,352,612 4,092,319 4,315,867 4,472,504 3,778,356
Fixed charges 41,317,129 41,998,540 42,233,257 36,916,283 36,163,739 37,760,931 36,882,453 37,690,447 33,796,877 31,912,483
Community services 738,729 266,206 534,771 317,915 358,580 122,357 304,995 235,790 388,028 392,844
Capital outlay 418,988 679,910 1,364,740 1,119,804 421,328 296,564 296,588 391,580 211,609 181,910
Student school/activity fees 602,507 ‐ ‐ ‐ ‐ ‐ ‐ ‐ ‐ ‐
Total expenditures by function 214,658,905$ 211,490,610$ 208,081,787$ 197,705,253$ 191,826,422$ 186,313,227$ 185,731,765$ 184,609,421$ 180,804,593$ 173,476,174$
Increase/(decrease) over prior year 3,168,295 3,408,823 10,376,534 5,878,831 5,513,195 581,462 1,122,344 3,804,828 7,328,419 (7,372,290)
1.5% 1.6% 5.2% 3.1% 3.0% 0.3% 0.6% 2.1% 4.2% ‐4.1%
#DIV/0!
CECIL COUNTY PUBLIC SCHOOLS
LAST TEN FISCAL YEARS
GENERAL FUND
EXPENDITURES BY FUNCTION
BUDGETARY BASIS (non‐GAAP)
$‐
$20,000,000
$40,000,000
$60,000,000
$80,000,000
$100,000,000
$120,000,000
$140,000,000
$160,000,000
$180,000,000
$200,000,000
$220,000,000
$240,000,000
2021 2020 2019 2018 2017 2016 2015 2014 2013 2012
Total Expenditures by Function
Source: Statement of Revenue, Expenditures, Encumbrances, and Changes in Fund Balance ‐ Budget (Non‐GAAP Budgetary Basis) and Actual ‐ General Fund
109

2021 2020 2019 2018 2017 2016 2015 2014 2013 2012
State of Maryland 301,962$ 339,356$ 282,539$ 286,621$ 325,394$ 329,274$ 392,790$ 345,042$ 298,946$ 282,936$
United States government 7,335,450 4,669,842 4,693,855 4,838,914 4,585,339 4,557,278 4,492,439 4,101,804 3,772,143 3,682,231
Sale of food 16,865 1,448,827 2,084,542 1,921,257 1,849,130 1,824,286 1,959,515 1,917,694 1,964,487 2,212,794
Investment Interest 130 404 389 182 176 19 14 52 801 2,702 Other 32,715 3,273 3,743 14,887 23,526 ‐ ‐ 31,573 37,794 59,581
Total revenue by source 7,687,122$ 6,461,702$ 7,065,068$ 7,061,861$ 6,783,565$ 6,710,857$ 6,844,758$ 6,396,165$ 6,074,171$ 6,240,244$
Increase/(decrease) over prior year 1,225,420$ (603,366)$ 3,207$ 278,296$ 72,708$ (133,901)$ 448,593$ 321,994$ (166,073)$ (19,222)$
18.96% ‐8.54% 0.05% 4.1% 1.1% ‐2.0% 7.0% 5.3% ‐2.7% ‐0.3%
CECIL COUNTY PUBLIC SCHOOLS
LAST TEN FISCAL YEARS
SPECIAL REVENUE FUND
REVENUES BY SOURCE
$‐
$1,000,000
$2,000,000
$3,000,000
$4,000,000
$5,000,000
$6,000,000
$7,000,000
$8,000,000
$9,000,000
2021 2020 2019 2018 2017 2016 2015 2014 2013 2012
Total Revenue by Source
Source: Statement of Revenue, Expenditures, and Changes in Fund Balances ‐ Governmental Funds
110

2021 2020 2019 2018 2017 2016 2015 2014 2013 2012 2011
Salaries and wages 2,377,849$ 2,536,416$ 2,536,100$ 2,423,903$ 2,377,355$ 2,408,133$ 2,391,077$ 2,350,508$ 2,408,000$ 2,380,172$ 2,404,221$
Food 2,268,678 2,474,015 2,653,125 2,916,677 2,746,848 3,134,844 3,084,534 2,726,121 2,718,438 2,685,361 2,435,173
Contracted services 49,595 69,650 46,874 48,553 67,642 69,757 57,648 46,449 58,193 67,903 66,763
Supplies and materials 320,587 155,204 289,003 292,904 280,868 197,128 180,388 313,708 223,287 232,765 165,428
Other operating cost 1,008,459 1,000,103 961,945 913,666 887,047 930,701 925,743 921,611 872,758 897,140 1,065,984
Equipment 62,669 197,301 159,513 78,656 76,686 15,499 45,628 11,225 21,680 44,726 84,086
Total expenditures by object 6,087,837$ 6,432,689$ 6,646,560$ 6,674,359$ 6,436,446$ 6,756,062$ 6,685,018$ 6,369,622$ 6,302,356$ 6,308,067$ 6,221,655$
Increase/(decrease) over prior year (344,852)$ (213,871)$ (27,799)$ 237,913$ (319,616)$ 71,044$ 315,396$ 67,266$ (5,711)$ 86,412$ 256,860$
‐5.4% ‐3.2% ‐0.4% 3.7% ‐4.7% 1.1% 5.0% 1.1% ‐0.1% 1.4% 4.3%
CECIL COUNTY PUBLIC SCHOOLS
LAST TEN FISCAL YEARS
SPECIAL REVENUE FUND
EXPENDITURES BY OBJECT
$5,000,000
$6,000,000
$7,000,000
2021 2020 2019 2018 2017 2016 2015 2014 2013 2012
Total Expenditures by Object
Source: Statement of Revenue, Expenditures, and Changes in Fund Balances ‐ Governmental Funds
111

2021 2020 2019 2018 2017 2016 2015 2014 2013 2012
Cecil County 11,219,474$ 5,472,563$ 7,258,213$ 8,192,562$ 5,497,303$ 8,300,206$ 16,887,621$ 4,765,231$ 3,505,942$ 2,205,921$
State of Maryland 5,649,052 4,656,583 4,877,795 7,298,768 5,146,433 4,519,774 8,446,482 2,370,160 1,717,962 2,450,615
United States government ‐ ‐ ‐ ‐ ‐ ‐ ‐ ‐ 74,955 ‐
Investment interest 53 784 1,023 571 235 87 98 27 57 45
Other ‐ ‐ ‐ ‐ ‐ 501,068 154,714 182,763 ‐ 91,263
Total 16,868,579$ 10,129,930$ 12,137,031$ 15,491,901$ 10,643,971$ 13,321,135$ 25,488,915$ 7,318,181$ 5,298,916$ 4,747,844$
Increase/(decrease) over prior year 6,738,649$ (2,007,101)$ (3,354,870)$ 4,847,930$ (2,677,164)$ (12,167,780)$ 18,170,734$ 2,019,265$ 551,072$ 134,286$
66.5% ‐16.5% ‐21.7% 45.5% ‐20.1% ‐47.7% 248.3% 38.1% 11.6% 2.9%
CECIL COUNTY PUBLIC SCHOOLS
LAST TEN FISCAL YEARS
CAPITAL PROJECT FUND
REVENUES BY SOURCE
$‐
$5,000,000
$10,000,000
$15,000,000
$20,000,000
$25,000,000
$30,000,000
2021 2020 2019 2018 2017 2016 2015 2014 2013 2012
Total Revenue by Source
Source: Statement of Revenue, Expenditures, and Changes in Fund Balances ‐ Governmental Funds
112

2021 2020 2019 2018 2017 2016 2015 2014 2013 2012
Land 1,858,733$ ‐$ 164,305$ 18,000$ ‐$ ‐$ 4,359,300$ ‐$ ‐$ ‐$
Building 803,913 803,913 803,913 803,913 3,572,593 1,250,687 6,712,725 5,083,238 4,039,217 4,087,168
Site improvement ‐ ‐ ‐ 503,511 448,505 222,487 609,423 396,775 1,140,566 191,162
Remodeling 14,041,973 8,619,840 10,492,899 14,165,906 6,592,128 11,685,030 13,362,079 2,042,868 119,075 235,136 Equipment 163,907 723,966 674,891 ‐ 25,075 168,153 240,639 ‐ ‐ 234,174
Total expenditures by type 16,868,526$ 10,147,719$ 12,136,008$ 15,491,330$ 10,638,301$ 13,326,357$ 25,284,166$ 7,522,881$ 5,298,858$ 4,747,640$
Increase/(decrease) over prior year 6,720,807$ (1,988,289)$ (3,355,322)$ 4,853,029$ (2,688,056)$ (11,957,809)$ 17,761,285$ 2,224,023$ 551,218$ 134,163$
66.2% ‐16.4% ‐21.7% 45.6% ‐20.2% ‐47.3% 236.1% 42.0% 11.6% 2.9%
CECIL COUNTY PUBLIC SCHOOLS
LAST TEN FISCAL YEARS
CAPITAL PROJECT FUND
EXPENDITURES BY TYPE
$‐
$5,000,000
$10,000,000
$15,000,000
$20,000,000
$25,000,000
$30,000,000
2021 2020 2019 2018 2017 2016 2015 2014 2013 2012
Total Expenditures by Type
Source: Statement of Revenue, Expenditures, and Changes in Fund Balances ‐ Governmental Funds
113

2021 2020 2019 2018 2017 2016 2015 2014 2013 2012
Cecil County 97,587,339$ 90,378,236$ 89,721,741$ 89,881,090$ 86,107,741$ 88,050,984$ 92,411,466$ 77,613,523$ 73,121,775$ 69,361,935$
State of Maryland 131,578,402 129,955,431 125,374,800 127,274,639 124,517,950 117,552,193 123,360,144 112,692,627 111,289,209 115,057,469
Federal government 24,048,783 15,656,001 16,556,091 13,720,838 13,616,684 13,549,190 14,502,361 13,167,657 13,869,753 13,956,731
Sale of meals 16,865 1,448,827 2,084,542 1,921,257 1,849,130 1,824,286 1,959,515 1,917,694 1,964,487 2,212,794
Interest earned 14,360 290,594 533,355 316,539 87,206 18,242 7,683 8,178 10,855 25,693 Other 1,464,127 954,178 785,662 940,424 752,506 1,186,502 768,753 895,188 819,232 916,622
Total revenue by source 254,709,876$ 238,683,267$ 235,056,191$ 234,054,787$ 226,931,217$ 222,181,397$ 233,009,922$ 206,294,867$ 201,075,311$ 201,531,244$
Increase/(decrease) over prior year 16,026,609$ 3,627,076$ 1,001,404$ 7,123,570$ 4,749,820$ (10,828,525)$ 26,715,055$ 5,219,556$ (455,933)$ (6,157,210)$
6.7% 1.5% 0.4% 3.1% 2.1% ‐4.6% 12.9% 2.6% ‐0.2% ‐3.0%
GOVERNMENT‐WIDE
CECIL COUNTY PUBLIC SCHOOLS
REVENUES BY SOURCE
LAST TEN FISCAL YEARS
$‐
$50,000,000
$100,000,000
$150,000,000
$200,000,000
$250,000,000
2021 2020 2019 2018 2017 2016 2015 2014 2013 2012
Total Revenue by Source
Source: Statement of Revenue, Expenditures, and Changes in Fund Balances ‐ Governmental Funds
114

2021 2020 2019 2018 2017 2016 2015 2014 2013 2012
Administration 6,127,701$ 6,017,872$ 5,945,377$ 5,845,485$ 6,088,651$ 5,140,935$ 5,196,245$ 5,238,087$ 4,969,511$ 4,403,811$
Mid‐level administration 14,301,253 14,657,585 14,555,005 14,136,118 13,901,636 13,336,761 13,375,657 13,274,860 13,566,354 13,313,116
Instruction
Salaries 81,150,735 81,039,544 76,319,344 73,105,335 72,519,546 70,388,331 70,323,326 69,545,018 68,237,315 66,720,063
Materials and supplies 4,226,354 2,760,748 3,469,427 4,728,922 5,077,775 3,212,396 5,102,917 3,799,800 3,653,853 2,816,463
Other costs 21,961,897 13,116,856 15,167,372 19,195,545 4,068,239 3,270,618 26,028,685 8,752,929 8,788,310 7,719,258
Special education 29,728,451 30,771,185 29,508,632 27,330,111 26,279,454 26,318,771 25,217,748 24,583,137 25,135,508 24,921,881
Student personnel services 1,993,721 1,877,257 1,965,536 1,499,819 1,321,324 1,035,422 1,071,994 1,073,218 996,891 998,593
Student health services 1,897,687 1,810,039 1,710,844 1,669,881 1,631,860 1,592,818 1,520,898 1,506,440 1,526,033 1,565,596
Student transportation 9,929,866 10,855,021 11,034,883 10,786,695 10,021,991 9,621,041 9,456,522 9,391,768 9,599,678 9,248,641
Operation of plant 11,801,812 11,271,550 11,398,341 11,084,642 11,114,043 10,928,625 11,900,684 11,636,532 11,286,391 10,654,869
Maintenance of plant 3,915,661 4,109,347 4,323,819 4,908,868 4,619,523 4,364,425 4,206,479 4,542,525 4,219,071 3,784,948
Fixed charges 55,155,497 55,946,057 55,815,795 50,199,827 50,077,857 51,160,478 50,518,337 51,298,438 46,086,196 47,530,256
Community services 533,280 266,206 534,771 317,915 358,580 145,387 281,964 235,790 388,028 405,943
Food and nutrition 5,088,384 5,461,794 5,728,797 5,787,450 5,575,668 5,855,880 5,794,539 5,476,662 5,453,639 5,437,983
Capital outlay 301,730 1,030,658 1,364,740 1,119,804 8,792,710 12,170,838 ‐ ‐ ‐ ‐
Student Activity Fees 602,507 ‐ ‐ ‐ ‐ ‐ ‐ ‐ ‐ ‐
Debt service 1,133,252 1,221,676 995,887 1,078,383 989,961 653,967 803,910 813,910 ‐ ‐
Total expenditures by function 249,849,788$ 242,213,395$ 239,838,570$ 232,794,800$ 222,438,818$ 219,196,693$ 230,799,905$ 211,169,114$ 203,906,778$ 199,521,421$
Increase/(decrease) over prior year 7,636,393$ 2,374,825$ 7,043,770$ 10,355,982$ 3,242,125$ (11,603,212)$ 19,630,791$ 7,262,336$ 4,385,357$ (8,971,412)$
3.2% 1.0% 3.0% 4.7% 1.5% ‐5.0% 9.3% 3.6% 2.2% ‐4.3%
CECIL COUNTY PUBLIC SCHOOLS
GOVERNMENT‐WIDE
EXPENDITURES BY FUNCTION
LAST TEN FISCAL YEARS
$‐
$50,000,000
$100,000,000
$150,000,000
$200,000,000
$250,000,000
2021 2020 2019 2018 2017 2016 2015 2014 2013 2012
Total Expenditures by Function
Source: Statement of Revenue, Expenditures, and Changes in Fund Balances ‐ Governmental Funds
Note: Capital Outlay was allocated to other functions beginning in 2010.
115

2021
Capacity 2021 2020 2019 2018 2017 2016 2015 2014 2013 2012
County Population 103,419 102,855 102,826 102,746 102,603 102,382 102,383 101,108 101,696 101,694
Elementary Schools
Bainbridge Elementary 449 265 284 287 311 313 532 515 358 402 396
Bay View Elementary 608 413 464 513 542 591 609 617 571 619 641
Calvert Elementary 433 404 432 443 455 472 479 483 516 420 323
Cecil Manor Elementary 523 374 408 439 424 453 470 450 462 501 530
Cecilton Elementary 350 282 319 285 301 324 345 309 303 297 319
Charlestown Elementary 292 254 257 235 249 246 436 406 224 213 205
Chesapeake City Elementary 353 349 349 347 323 314 343 357 337 314 306
Conowingo Elementary 534 407 464 462 451 466 474 476 480 527 542
Elk Neck Elementary 501 430 443 440 443 446 408 428 434 412 424
Gilpin Manor Elementary 416 392 425 404 405 412 466 457 490 429 405
Holly Hall Elementary 624 392 430 470 512 578 650 629 625 632 633
Kenmore Elementary 306 303 305 309 317 310 339 331 346 326 331
Leeds Elementary 408 350 423 378 393 384 407 402 404 396 406
North East Elementary 542 520 542 548 561 564 527 524 486 512 501
Perryville Elementary 500 371 393 394 405 407 ‐ ‐ 371 371 368
Rising Sun Elementary 715 634 681 719 703 699 755 690 665 615 665
Thomson Estates Elementary 614 453 493 509 495 527 456 469 510 491 473
Elementary School Total 8,168 6,593 7,112 7,182 7,290 7,506 7,696 7,543 7,582 7,477 7,468
Middle Schools
Bohemia Manor Middle 601 470 495 499 494 502 506 472 473 473 477
Cherry Hill Middle 775 414 431 456 412 426 416 442 465 439 479
Elkton Middle 712 574 571 556 547 557 554 551 554 569 589
North East Middle 712 798 786 773 753 750 732 754 780 726 725
Perryville Middle 860 585 590 589 558 554 556 550 558 565 597
Rising Sun Middle 818 685 702 684 674 649 679 677 718 713 714
Middle School Total 4,478 3,526 3,575 3,557 3,438 3,438 3,443 3,446 3,548 3,485 3,581
High Schools
Bohemia Manor High 643 632 647 670 643 650 656 620 629 641 635
Elkton High 1,380 1,061 1,004 983 993 982 1,026 1,067 1,124 1,105 1,097
North East High 1,009 1,020 1,016 1,029 1,098 1,083 1,065 1,028 1,005 1,037 1,078
Perryville High 944 810 801 764 763 802 802 810 789 775 812
Rising Sun High 924 1,076 1,100 1,122 1,139 1,172 1,171 1,167 1,147 1,114 1,156
High School Total 4,900 4,599 4,568 4,568 4,636 4,689 4,720 4,692 4,694 4,672 4,778
Other Schools
Cecil County High School* 106 15 67 98 79 87 75 97 71 72 62
School of Technology* 459 814 796 726 744 674 387 258 247 253 254
Grand Total 18,111 14,718 15,255 15,307 15,364 15,633 15,859 15,681 15,824 15,634 15,827
Increase / (Decrease) (537) (52) (57) (269) (226) 178 (143) 190 (193) (110)
% Increase / Decrease ‐3.5% ‐0.3% ‐0.4% ‐1.7% ‐1.4% 1.1% ‐0.9% 1.2% ‐1.2% ‐0.7%
High School Graduates 1,060 1,068 1,031 1,097 1,071 1,143 1,059 1,082 1,085 1,132
*Includes schools that are not home based. Students are taken from their primary location for a period of time during the school day.
CECIL COUNTY PUBLIC SCHOOLS
ENROLLMENTS BY SCHOOL
LAST TEN FISCAL YEARS
Source: U.S. Census Bureau, Cecil County Public Schools Department of Student Services
116

Employer Employees Rank
Percentage of
Total County
Employment Employees Rank
Percentage of
Total County
Employment
W. L. Gore & Associates, Inc. 2,405 1 4.91% 2,387 1 5.17%
Cecil County Board of Education 2,016 2 4.12% 2,052 2 4.44%
Perry Point V.A. Medical Center 1,500 3 3.06% 1,500 3 3.25%
Union Hospital / Affinity Health System 1,236 4 2.52% 1,236 4 2.68%
Terumo Corporation* 1,027 5 2.10% 342 9 0.74%
Amazon 810 6 1.65% ‐
Cecil County Government 655 7 1.34% 479 6 1.04%
IKEA 625 8 1.28% 370 8 0.80%
Cecil College 565 9 1.15% ‐
Northrop Grumman (formerly Orbital ATK, Inc.) 550 10 1.12% 436 7 0.94%
Terumo Cardiovascular Systems* * 297 10 0.64%
Wal‐Mart Stores, Inc.** ** 500 5 1.08%
Totals 11,389 23.25% 9,599 20.78%
*Terumo Medical and Terumo Cardiovascular totals are combined under Terumo Corporation
**Nationwide retailers excluded effective 2021
2021 2012
CECIL COUNTY, MARYLAND
PRINCIPAL EMPLOYERS
CURRENT YEAR AND NINE YEARS AGO
Source: Maryland Department of Commerce, Cecil County Public Schools Approved Budget, Cecil County Government
117

Calendar
Year Population
Personal Income
(amounts
expressed in
thousands)
Per Capita
Income Employment
Unemployment
Rate
Median
Price of
Housing
Sales
School
Enrollment
2020 103,419 3,600,015$ 34,810$ 53,741 5.9% 257,500$ 14,718
2019 102,855 3,391,746 32,976 51,323 4.0% 229,900 15,255
2018 102,826 3,346,164 32,542 50,558 4.8% 225,308 15,307
2017 102,746 3,151,836 30,676 50,558 4.8% 216,484 15,364
2016 102,603 3,030,687 29,538 49,918 5.1% 194,765 15,633
2015 102,382 2,971,638 29,025 50,042 6.0% 197,902 15,859
2014 102,383 3,022,141 29,518 48,665 6.6% 194,000 15,681
2013 101,108 2,934,660 29,025 51,202 6.1% 195,000 15,824
2012 101,696 2,864,776 28,170 51,078 8.2% 199,900 15,634
2011 101,694 2,957,160 29,079 46,188 8.9% 199,900 15,827
DEMOGRAPHIC AND ECONOMIC STATISTICSLAST TEN CALENDAR YEARS
CECIL COUNTY, MARYLAND
Source: Cecil County Office of Economic Development, Maryland Association of Realtors, U.S. Census Bureau
118

2021 2020 2019 2018 2017 2016 2015 2014 2013 2012
Administration 44.50 47.50 47.50 47.50 47.00 47.00 47.00 47.00 47.50 49.75
Mid‐level administration 178.00 191.00 194.60 194.60 195.10 197.10 196.10 196.10 196.60 201.25
Instruction salaries 1,081.00 1,104.70 1,102.40 1,099.70 1,102.40 1,101.10 1,103.40 1,120.66 1,126.86 1,131.56
Special education 454.40 453.90 451.90 437.40 437.50 419.90 411.10 418.20 414.20 412.70
Student personnel services 16.50 18.50 14.90 15.90 13.90 15.90 15.90 15.90 14.70 14.60
Student health services 32.00 32.00 31.00 32.00 31.00 31.00 31.00 31.00 32.00 32.00
Student transportation 20.90 21.40 23.00 23.00 23.00 23.00 25.00 25.00 25.00 27.00
Operation of plant 135.50 136.50 135.50 134.50 134.50 132.00 130.50 131.00 131.00 132.00
Maintenance of plant 47.00 48.00 48.00 48.00 48.00 49.00 48.50 47.50 47.50 47.50
Community services 2.00 1.00 3.00 3.00 3.00 ‐ ‐ ‐ 1.00 1.00
Capital outlay 4.00 3.00 4.00 3.00 3.00 3.00 2.50 2.50 2.50 2.50
Total by function 2,015.80 2,057.50 2,055.80 2,038.60 2,038.40 2,019.00 2,011.00 2,034.86 2,038.86 2,051.86
Increase/(decrease) over prior year ‐41.70 1.70 17.20 0.20 19.40 8.00 ‐23.86 ‐4.00 ‐13.00 ‐84.64
‐2.0% 0.1% 0.8% 0.0% 1.0% 0.4% ‐1.2% ‐0.2% ‐0.6% ‐4.0%
CECIL COUNTY PUBLIC SCHOOLS
FULL‐TIME EQUIVALENT EMPLOYEES BUDGETED BY FUNCTION
GENERAL FUND
LAST TEN FISCAL YEARS
1,980
1,990
2,000
2,010
2,020
2,030
2,040
2,050
2,060
2,070
2021 2020 2019 2018 2017 2016 2015 2014 2013 2012
Total FTE
Full‐Time Equivalent Employees Budgeted
Source: Cecil County Public Schools, Approved Budget
119

2021 2020 2019 2018 2017 2016 2015 2014 2013 2012
Total student enrollment 14,718 15,255 15,307 15,364 15,633 15,859 15,681 15,824 15,634 15,827
Administration 396$ 386$ 350$ 366$ 329$ 267$ 260$ 267$ 302$ 257$
Mid‐level administration 972 961 951 920 889 841 853 839 868 841
Instruction
Salaries 5,514 5,312 4,986 4,758 4,639 4,438 4,485 4,395 4,365 4,216
Materials and supplies 283 175 195 307 299 193 295 240 233 175
Other costs 453 247 290 295 239 206 164 185 206 187
Special education 2,029 2,017 1,927 1,779 1,681 1,659 1,609 1,555 1,608 1,575
Student personnel services 139 115 139 98 85 65 68 68 64 63
Student health services 129 119 112 109 104 100 97 95 98 99
Student transportation 671 714 724 699 643 607 603 594 614 584
Operation of plant 804 739 745 721 711 689 759 735 722 673
Maintenance of plant 268 264 293 319 287 274 261 273 286 239
Fixed charges 2,807 2,753 2,759 2,403 2,313 2,381 2,352 2,382 2,162 2,016
Community services 50 17 35 21 23 8 19 15 25 25
Capital outlay 28 45 89 73 27 19 19 25 14 11
Student school/activity fees 41 ‐ ‐ ‐ ‐ ‐ ‐ ‐ ‐ ‐
Total cost per student 14,584$ 13,864$ 13,595$ 12,868$ 12,269$ 11,747$ 11,844$ 11,668$ 11,567$ 10,961$
Increase/(decrease) over prior year 720$ 269$ 727$ 599$ 522$ (97)$ 176$ 101$ 606$ (386)$
5.2% 2.0% 5.6% 4.9% 4.4% ‐0.8% 1.5% 0.9% 5.5% ‐3.4%
CECIL COUNTY PUBLIC SCHOOLS
COST PER STUDENT
BUDGETARY BASIS (non‐GAAP)
LAST TEN FISCAL YEARS
Source: Statement of Revenue, Expenditures, Encumbrances, and Changes in Fund Balance ‐ Budget (Non‐GAAP Budgetary Basis) and Actual ‐ General
Fund
120

2021 2020 2019 2018 2017 2016 2015 2014 2013 2012
Total student enrollment 14,718 15,255 15,307 15,364 15,633 15,859 15,681 15,824 15,634 15,827
FOOD & NUTRITION
Number of days lunch served 260* 123** 180 180 180 180 178 177 179 179
Average number of lunches served daily:
Free lunch 3,991 4,148 3,964 4,186 4,041 4,156 4,182 4,100 3,841 4,023
Reduced price ‐ 608 475 429 471 508 523 504 519 547
Regular price ‐ 2,349 2,281 2,194 2,109 2,209 2,291 2,269 2,449 2,740
Total average number of lunches served daily 3,991 7,105 6,720 6,809 6,621 6,873 6,996 6,873 6,809 7,310
Percentage of student participation:
Students receiving free lunch 27.1% 27.2% 25.9% 27.2% 25.8% 26.2% 26.7% 25.9% 24.6% 25.4%
Students paying reduced price 0.0% 4.0% 3.1% 2.8% 3.0% 3.2% 3.3% 3.2% 3.3% 3.5%
Students paying regular price 0.0% 15.4% 14.9% 14.3% 13.5% 13.9% 14.6% 14.3% 15.7% 17.3%
Total percentage of student participation 27.1% 46.6% 43.9% 44.3% 42.3% 43.3% 44.6% 43.4% 43.6% 46.2%
Cost per lunch to student:
Elementary $ ‐ $ 2.75 $ 2.75 $ 2.60 $ 2.60 $ 2.50 $ 2.50 $2.45 $2.25 $2.15
Secondary $ ‐ $ 2.75 $ 2.60 $ 2.60 $ 2.75 $ 2.65 $ 2.65 $2.60 $2.40 $2.30
STUDENT TRANSPORTATION
Number of students eligible to ride the bus 13,710 13,998 14,430 14,731 14,286 14,373 14,735 14,565 14,673 14,664
Number of school bus riders daily 11,511 11,457 10,859 10,091 10,718 11,355 10,914 10,459 11,117 11,390
Percentage of student participation 78.2% 75.1% 70.9% 65.7% 68.6% 71.6% 69.6% 66.1% 71.1% 72.0%
Number of school bus routes:
County 8 8 8 8 8 8 8 9 9 9
Private contractor 139 146 144 144 235 145 143 142 142 147
TEACHER DATA
Total number of budgeted teachers 1,278.60 1,341.60 1,336.80 1,330.60 1,328.40 1310.50 1,296.50 1,296.90 1,299.20 1,280.20
Minimum salary (190 days) 49,245$ 48,232$ 46,804$ 45,886$ 45,208$ 44,760$ 44,186$ $ 43,662 $ 42,890 $ 42,890
Maximum salary *** (190 days) 90,963$ 89,337$ 86,092$ 84,638$ 83,563$ 80,829$ 79,919$ $ 79,089 $ 77,866 $ 77,866
Average annual salary 73,788$ 70,406$ 68,140$ 65,535$ 64,373$ 63,100$ 63,520$ $ 61,061 $ 60,943 $ 60,440
Increase/decrease over prior year 4.8% 3.3% 4.0% 1.8% 2.0% ‐0.7% 4.0% 0.2% 0.8% 1.1%
Percentage of teachers with Master's and/or APC 78.1% 70.5% 70.7% 66.6% 66.4% 65.9% 68.7% 67.8% 67.0% 65.9%
Percentage of teachers with Master's plus credits 9.6% 7.9% 7.5% 6.2% 5.6% 6.0% 6.3% 6.4% 6.2% 6.1%
Percentage of teachers with Doctorate 1.4% 1.0% 0.9% 0.4% 0.5% 0.3% 0.3% 0.5% 0.5% 0.3%
Student/Teacher ratio 11.5 11.4 11.5 11.5 11.8 12.1 12.1 12.2 12.0 12.4
*Breakfast and lunch were provided Monday through Friday from July 2020 through June 2021.
**Due to COVID‐19 closure, lunch served for 123 days between 9/2/2019 and 3/13/2020. 135,955 lunches were served from 3/16/2020 through 6/30/2020 at no cost
to all children 18 and under regardless of whether they were students or not.
CECIL COUNTY PUBLIC SCHOOLS
OTHER OPERATING DATA
LAST TEN FISCAL YEARS
***Includes additional stipends for advanced training and longevity
Source: Cecil County Public Schools Department of Food and Nutrition, Department of Student Transportation, Department of Human Resources
121

Square Feet Acres Capacity
Year
Constructed
Most Recent
Total RenoCentral OfficesG.W. Carver Center 32,357 3 N/A 1953 2008Administrative Services Center 76,700 50 500 1965 1965
Elementary SchoolsBainbridge Elementary 51,818 15 428 1956 2001Bay View Elementary 61,884 15 608 1961 2003Calvert Elementary 58,857 16 433 1981 2012Cecil Manor Elementary 49,586 10 522 1955 1995Cecilton Elementary 35,321 8 350 1939 1997Charlestown Elementary 42,522 20 291 1959 2003Chesapeake City Elementary 41,027 10 352 1939 1939Conowingo Elementary 44,696 19 533 1955 1993Elk Neck Elementary 50,156 29 499 1991 1991Gilpin Manor Elementary 65,749 9 556 2018 ‐Holly Hall Elementary 61,711 15 643 1963 2000Kenmore Elementary 35,225 11 306 1985 1985Leeds Elementary 40,414 17 408 1968 1968North East Elementary 61,396 11 545 1951 2002Perryville Elementary 69,649 10 500 1955 2016Rising Sun Elementary 62,496 12 716 1957 1991Thomson Estates Elementary 70,130 17 614 1976 1976
Middle SchoolsBohemia Manor Middle* N/A N/A 601 1958 1995Cherry Hill Middle 92,990 39 775 1968 1968Elkton Middle 72,600 14 711 1937 1998North East Middle 101,200 10 711 1932 1932Perryville Middle 102,746 26 860 1928 2008Rising Sun Middle 104,765 20 818 1931 1999
High SchoolsBohemia Manor High* 136,024 35 643 1958 1995Elkton High 187,046 37 1,380 1958 2008North East High 123,890 50 1,009 1970 1970Perryville High 130,672 39 860 1978 1978Rising Sun High 114,400 42 924 1991 1991
Other SchoolsProvidence 16,645 9 106 1923 1994School of Technology 162,930 90 657 1991 2016
Total: 2,357,602 708 18,859
CECIL COUNTY PUBLIC SCHOOLSCAPITAL ASSET INFORMATION
AS OF JUNE 30, 2021
*See Bohemia Manor High School; Bohemia Manor Middle School and Bohemia Manor High School share the
same building.
Source: Educational Facilities Master Plan
122

CECIL
COUNTY STATE
CECIL
COUNTY STATE
Grade 3Meeting or Exceeding the Standard
(Performance Level 4 or 5)38.7 41.2 37.7 42.5
Grade 4Meeting or Exceeding the Standard
(Performance Level 4 or 5)43.5 43.6 38.6 39.4
Grade 5Meeting or Exceeding the Standard
(Performance Level 4 or 5)44.0 43.9 34.8 36.7
Grade 6Meeting or Exceeding the Standard
(Performance Level 4 or 5)40.5 41.1 28.4 30.1
Grade 7Meeting or Exceeding the Standard
(Performance Level 4 or 5)47.3 47.3 31.9 26.6
Grade 8Meeting or Exceeding the Standard
(Performance Level 4 or 5)44.7 45.1 14.7 12.5
CECIL
COUNTY STATE
English 10Meeting or Exceeding the Standard
(Performance Level 4 or 5)55.4 42.6
Algebra 1Meeting or Exceeding the Standard
(Performance Level 4 or 5)31.5 27.2
CECIL
COUNTY
STATE OF
MARYLAND NATION Evidence‐Based Reading and Wri ng 538 522 528
Math 525 507 523Total 1,063 1,029 1,051
*Due to the COVID‐19 pandemic, CCPS did not participate in MCAP testing for the period ending 6/30/20 or 6/30/21.
Scholastic Assessment Test ‐ Average Score, 2020 Data Reported
CECIL COUNTY PUBLIC SCHOOLSSTUDENT ACADEMIC PERFORMANCE
AS OF JUNE 30, 2019*
English/Language Arts Math
Maryland Comprehensive Assessment Program (MCAP)Percentage of Students Meeting or Exceeding the Standard ‐ 2019
Maryland Comprehensive Assessment Program (MCAP)Percentage of Students Meeting or Exceeding the Standard ‐ 2019
Source: MD Report Card, CollegeBoard
123

Fiscal Year Total Outstanding Debt Debt per Capita
Ratio of debt to total
personal income2021 595,744$ 5.76 604%2020 1,585,280 15.41 214%2019 2,066,796 20.10 162%2018 2,678,306 26.07 118%2017 3,431,626 33.45 88%2016 4,173,074 40.76 71%
2015 4,381,287 42.79 69%2014 5,028,691 49.74 58%2013 6,191,050 60.88 46%2012 7,708,171 75.80 38%
Fiscal Year Principal Interest Total Debt Service2022 $ 294,613 10,658 305,271$ 2023 301,132 4,140 305,272 2024 ‐ ‐ ‐ 2025 ‐ ‐ ‐
595,744$ 14,798$ 610,543$
CECIL COUNTY PUBLIC SCHOOLSOUTSTANDING CAPITAL LEASES
LAST TEN FISCAL YEARS
CECIL COUNTY PUBLIC SCHOOLSSCHEDULE OF CAPITAL LEASES
AS OF JUNE 30, 2021
Source: Reconciliation of Net Change in Fund Balance with Change in Net Position, Cecil County Office of Economic Development, Notes
to Financial Statements
124

INDEPENDENT AUDITOR’S REPORTS AND OTHER
SUPPLEMENTARY INFORMATION
125

126

Independent Auditor's Report on Internal Control over Financial Reporting and on Compliance and Other Matters Based on an Audit
of Financial Statements Performed in Accordance with Government Auditing Standards
To the Board of Education Cecil County, Maryland
We have audited, in accordance with the auditing standards generally accepted in the United States of America and the standards applicable to financial audits contained in Government Auditing Standards issued by the Comptroller General of the United States, the financial statements of the governmental activities, each major fund, and the aggregate remaining fund information of Cecil County Public Schools (the "School System"), a component unit of Cecil County, Maryland, as of and for the year ended June 30, 2021, and the related notes to the financial statements, which collectively comprise the School System's basic financial statements, and have issued our report thereon dated September 30, 2021.
Internal Control over Financial Reporting
In planning and performing our audit of the financial statements, we considered the School System's internal control over financial reporting ("internal control") as a basis for designing audit procedures that are appropriate in the circumstances for the purpose of expressing our opinions on the financial statements, but not for the purpose of expressing an opinion on the effectiveness of the School System's internal control. Accordingly, we do not express an opinion on the effectiveness of the School System's internal control.
A deficiency in internal control exists when the design or operation of a control does not allow management or employees, in the normal course of performing their assigned functions, to prevent, or detect and correct, misstatements on a timely basis. A material weakness is a deficiency, or a combination of deficiencies, in internal control such that there is a reasonable possibility that a material misstatement of the entity's financial statements will not be prevented, or detected and corrected, on a timely basis. A significant deficiency is a deficiency, or a combination of deficiencies, in internal control that is less severe than a material weakness, yet important enough to merit attention by those charged with governance.
Our consideration of internal control was for the limited purpose described in the first paragraph of this section and was not designed to identify all deficiencies in internal control that might be material weaknesses or significant deficiencies. Given these limitations, during our audit we did not identify any deficiencies in internal control that we consider to be material weaknesses. However, material weaknesses may exist that have not been identified.
Compliance and Other Matters
As part of obtaining reasonable assurance about whether the School System's financial statements are free from material misstatement, we performed tests of its compliance with certain provisions of laws, regulations, contracts, and grant agreements, noncompliance with which could have a direct and material effect on the financial statements. However, providing an opinion on compliance with those provisions was not an objective of our audit, and accordingly, we do not express such an opinion. The results of our tests disclosed no instances of noncompliance or other matters that are required to be reported under Government Auditing Standards.
127

Purpose of this Report
The purpose of this report is solely to describe the scope of our testing of internal control and compliance and the results of that testing, and not to provide an opinion on the effectiveness of the entity's internal control or on compliance. This report is an integral part of an audit performed in accordance with Government Auditing Standards in considering the entity's internal control and compliance. Accordingly, this communication is not suitable for any other purpose.
Baltimore, Maryland September 30, 2021
128

Independent Auditor's Report on Compliance for Each Major Federal Program and on Internal Control over Compliance Required by the Uniform Guidance
To the Board of Education Cecil County, Maryland
Report on Compliance for Each Major Federal Program
We have audited Cecil County Public Schools' (the "School System") compliance with the types of compliance requirements described in the OMB Compliance Supplement that could have a direct and material effect on each of Cecil County Public Schools' major federal programs for the year ended June 30, 2021. The School System's major federal programs are identified in the summary of auditor's results section of the accompanying schedule of findings and questioned costs.
Management's Responsibility
Management is responsible for compliance with federal statutes, regulations, and the terms and conditions of its federal awards applicable to its federal programs.
Auditor's Responsibility
Our responsibility is to express an opinion on compliance for each of the School System's major federal programs based on our audit of the types of compliance requirements referred to above. We conducted our audit of compliance in accordance with auditing standards generally accepted in the United States of America; the standards applicable to financial audits contained in Government Auditing Standards, issued by the Comptroller General of the United States; and the audit requirements of Title 2 U.S. Code of Federal Regulations (CFR) Part 200, Uniform Administrative Requirements, Cost Principles, and Audit Requirements for Federal Awards (Uniform Guidance). Those standards and the Uniform Guidance require that we plan and perform the audit to obtain reasonable assurance about whether noncompliance with the types of compliance requirements referred to above that could have a direct and material effect on a major federal program occurred. An audit includes examining, on a test basis, evidence about the School System's compliance with those requirements and performing such other procedures as we considered necessary in the circumstances.
We believe that our audit provides a reasonable basis for our opinion on compliance for each major federal program. However, our audit does not provide a legal determination of the School System's compliance.
Opinion on Each Major Federal Program
In our opinion, Cecil County Public Schools complied, in all material respects, with the types of compliance requirements referred to above that could have a direct and material effect on each of its major federal programs for the year ended June 30, 2021.
129

Report on Internal Control over Compliance
Management of the School System is responsible for establishing and maintaining effective internal control over compliance with the types of compliance requirements referred to above. In planning and performing our audit of compliance, we considered the School System's internal control over compliance with the types of requirements that could have a direct and material effect on each major federal program to determine the auditing procedures that are appropriate in the circumstances for the purpose of expressing an opinion on compliance for each major federal program and to test and report on internal control over compliance in accordance with the Uniform Guidance, but not for the purpose of expressing an opinion on the effectiveness of internal control over compliance. Accordingly, we do not express an opinion on the effectiveness of the School System's internal control over compliance.
A deficiency in internal control over compliance exists when the design or operation of a control over compliance does not allow management or employees, in the normal course of performing their assigned functions, to prevent, or detect and correct, noncompliance with a type of compliance requirement of a federal program on a timely basis. A material weakness in internal control over compliance is a deficiency, or a combination of deficiencies, in internal control over compliance, such that there is a reasonable possibility that material noncompliance with a type of compliance requirement of a federal program will not be prevented, or detected and corrected, on a timely basis. A significant deficiency in internal control over compliance is a deficiency, or a combination of deficiencies, in internal control over compliance with a type of compliance requirement of a federal program that is less severe than a material weakness in internal control over compliance, yet important enough to merit attention by those charged with governance.
Our consideration of internal control over compliance was for the limited purpose described in the first paragraph of this section and was not designed to identify all deficiencies in internal control over compliance that might be material weaknesses or significant deficiencies. We did not identify any deficiencies in internal control over compliance that we consider to be material weaknesses. However, material weaknesses may exist that have not been identified.
The purpose of this report on internal control over compliance is solely to describe the scope of our testing of internal control over compliance and the results of that testing based on the requirements of the Uniform Guidance. Accordingly, this report is not suitable for any other purpose.
Baltimore, Maryland September 30, 2021
130

Cecil County Public Schools
Schedule of Findings and Questioned Costs
Year ended June 30, 2021
I. Summary of Independent Auditor's Results
Financial Statements
Type of report the auditor issued on whether the financial statements audited were prepared in accordance with GAAP: Unmodified opinion
Internal control over financial reporting:
Material weakness(es) identified? Yes X No Significant deficiency(ies) identified? Yes X None reported Noncompliance material to financial statements noted? Yes X No
Federal Awards
Internal control over major programs: Material weakness(es) identified? Yes X No Significant deficiency(ies) identified? Yes X None reported Type of auditor's report issued on compliance for major programs: Unmodified opinion Any audit findings disclosed that are
required to be reported in accordance with 2 CFR 200.516(a)? Yes X No
131

Identification of Major Programs
Name of Federal Program or Cluster
CFDA Number Expenditures
Coronavirus Relief Fund 21.019 $3,802,183
Title I Grants to Local Educational Agencies
84.010 $2,898,391
Education Stabilization Fund
84.425 $3,537,959
Dollar threshold used to distinguish between type A and type B programs $750,000
Auditee qualified as low‐risk auditee? X Yes No II. Financial Statement Findings
None reported.
III. Federal Award Findings and Questioned Costs
None reported.
132

PassedCFDA Grant Through to Federal
Number Number Subrecipients Expenditures
United States Department of Agriculture
Federal Programs administered through the Maryland State Department of Education
Child Nutrition Cluster
National School Lunch Program 10.555 07 ‐$ 304,612$
National School Lunch Program 10.555 07 ‐ 230,000
Total National School Lunch Program ‐ 534,612
10.559 07 ‐ 6,776,598
Total Child Nutrition Cluster ‐ 7,311,210
State Administrative Expenses for Child Nutrition 10.560 07 ‐ 1,741
Total United States Department of Agriculture ‐ 7,312,951
United States Department of Justice
Federal programs administered through the University of Maryland, Baltimore
National Institute of Justice Research, Evaluation, and Development Project Grants 16.560 2017‐CK‐BX‐0014 ‐ 362,115
Total United States Department of Justice ‐ 362,115
United States Department of the Treasury
Federal Programs administered through the Maryland State Department of Education
COVID ‐ 19 Coronavirus Relief Fund 21.019 201940‐03 ‐ 1,557,053
COVID ‐ 19 Coronavirus Relief Fund 21.019 201952‐01 ‐ 1,652,956
‐ 3,210,009
Federal Programs administered through Cecil County Government
COVID ‐ 19 Coronavirus Relief Fund 21.019 N/A ‐ 578,174
‐ 578,174
Federal Programs administered through the Governor's Office of Rural Broadband of Maryland
COVID ‐ 19 Coronavirus Relief Fund 21.019 N/A ‐ 14,000
‐ 14,000
Total COVID ‐ 19 Coronavirus Relief Fund ‐ 3,802,183
Federal Programs administered through the Maryland State Department of Education
COVID ‐ 19 Coronavirus State and Local Fiscal Recovery Funds 21.027 211822‐01 ‐ 118,718
‐ 118,718
Total United States Department of the Treasury ‐ 3,920,901
United States Department of Education
Federal programs administered through the Maryland State Department of Education
Title I Grants to Local Educational Agencies 84.010 190539‐01 ‐ 219,424
Title I Grants to Local Educational Agencies 84.010 200986‐01 ‐ 484,327
Title I Grants to Local Educational Agencies 84.010 211090‐01 ‐ 2,194,640
‐ 2,898,391
CECIL COUNTY PUBLIC SCHOOLSSCHEDULE OF EXPENDITURES OF FEDERAL AWARDS
Year ended June 30, 2021
Grant Name
Summer Food Service Program for Children
133

PassedCFDA Grant Through to Federal
Number Number Subrecipients Expenditures
United States Department of Education (continued)
Federal programs administered through the Maryland State Department of Education (continued)
Special Education Cluster (IDEA)
Special Education Grants to States 84.027A 190276‐02 ‐$ 16,935$ Special Education Grants to States 84.027 190276‐05 ‐ 15,118
Special Education Grants to States 84.027 190276‐06 ‐ 7,747
Special Education Grants to States 84.027A 200434‐02 ‐ 51,460 Special Education Grants to States 84.027 200434‐03 ‐ 9,641
Special Education Grants to States 84.027 200434‐04 ‐ 18
Special Education Grants to States 84.027 200434‐05 ‐ 3,387
Special Education Grants to States 84.027 200434‐07 ‐ 6,115
Special Education Grants to States 84.027 201098‐01 ‐ 49,658
Special Education Grants to States 84.027 201098‐02 ‐ 28,376
Special Education Grants to States 84.027 201098‐03 ‐ 13,919
Special Education Grants to States 84.027A 210295‐01 ‐ 17,799
Special Education Grants to States 84.027 210402‐01 ‐ 2,666,550 Special Education Grants to States 84.027 210402‐03 ‐ 1,349
Special Education Grants to States 84.027 210402‐04 ‐ 12,378
Special Education Grants to States 84.027 210402‐05 ‐ 98,562
Special Education Grants to States 84.027 211025‐01 ‐ 2,744
Special Education Grants to States 84.027 211025‐02 ‐ 8,455
Total Special Education Grants to States ‐ 3,010,211
Special Education Preschool Grants 84.173 200327‐01 ‐ 14,893
Special Education Preschool Grants 84.173 200327‐02 ‐ 1,495
Special Education Preschool Grants 84.173 200327‐03 ‐ 4,012
Special Education Preschool Grants 84.173 200447‐01 ‐ 667
Special Education Preschool Grants 84.173 201851‐01 ‐ 7,000
Special Education Preschool Grants 84.173 201851‐02 ‐ 4,193 Special Education Preschool Grants 84.173 210410‐01 ‐ 103,573
Special Education Preschool Grants 84.173 210410‐02 ‐ 1,338
Total Special Education Preschool Grants ‐ 137,171
Total Special Education Cluster (IDEA) ‐ 3,147,382
Career and Technical Education ‐ Basic Grants to States 84.048 200602‐01 ‐ 1,533
Career and Technical Education ‐ Basic Grants to States 84.048 200661‐01 ‐ 10,330
Career and Technical Education ‐ Basic Grants to States 84.048A 210522‐01 ‐ 143,239
Career and Technical Education ‐ Basic Grants to States 84.048 210538‐01 ‐ 38,300
‐ 193,402
Rehabilitation Services Vocational Rehabilitation Grants to States 84.126 211674‐01 ‐ 31,817
‐ 31,817
Special Education ‐ Grants for Infants and Families 84.181A 200468‐02 ‐ 8,082
Special Education ‐ Grants for Infants and Families 84.181A 210317‐06 ‐ 130,444
Special Education ‐ Grants for Infants and Families 84.181A 210317‐07 ‐ 31,566
‐ 170,092
Education for Homeless Children and Youth 84.196A 211310‐01 ‐ 200,000
‐ 200,000
English Language Acquisition State Grants 84.365A 200746‐01 ‐ 30,329
English Language Acquisition State Grants 84.365A 200746‐02 ‐ 13,398
English Language Acquisition State Grants 84.365A 210475‐01 ‐ 7,854
‐ 51,581
CECIL COUNTY PUBLIC SCHOOLSSCHEDULE OF EXPENDITURES OF FEDERAL AWARDS
Year ended June 30, 2021
Grant Name
134

PassedCFDA Grant Through to Federal
Number Number Subrecipients Expenditures
United States Department of Education (continued)
Federal programs administered through the Maryland State Department of Education (continued)
Supporting Effective Instruction State Grants 84.367 191353‐01 ‐$ 7,913$
Supporting Effective Instruction State Grants 84.367 201063‐01 ‐ 70,250
Supporting Effective Instruction State Grants 84.367 210788‐01 ‐ 414,531
‐ 492,694
Comprehensive Literacy Development 84.371C 191082‐01 ‐ 20,467
Comprehensive Literacy Development 84.371C 201315‐01 ‐ 362,311
‐ 382,778
Student Support and Academic Enrichment Program 84.424A 191280‐01 ‐ 36,744
Student Support and Academic Enrichment Program 84.424A 201568‐01 ‐ 138,372
Student Support and Academic Enrichment Program 84.424A 210846‐01 ‐ 10,000
Student Support and Academic Enrichment Program 84.424A 211375‐01 ‐ 106,508
‐ 291,624
COVID ‐ 19 Education Stabilization Fund 84.425C 201886‐01 ‐ 31,158
COVID ‐ 19 Education Stabilization Fund 84.425D 201790‐01 ‐ 2,060,321
COVID ‐ 19 Education Stabilization Fund 84.425D 202038‐01 ‐ 580,337
COVID ‐ 19 Education Stabilization Fund 84.425D 202238‐01 ‐ 866,143
‐ 3,537,959
Total United States Department of Education ‐ 11,397,720
United States Department of Health and Human Services
Federal Programs administered through the Maryland State Department of Education
Every Student Succeeds Act / Preschool Development Grants 93.434 201799‐01 ‐ 25,000
Every Student Succeeds Act / Preschool Development Grants 93.434 201820‐01 ‐ 12,500
Every Student Succeeds Act / Preschool Development Grants 93.434 211329‐01 ‐ 2,015
Total United States Department of Health and Human Services ‐ 39,515
Total Federal Expenditures ‐$ 23,033,202$
See Notes to Schedule of Expenditurs of Federal Awards.
SCHEDULE OF EXPENDITURES OF FEDERAL AWARDS
Year ended June 30, 2021
Grant Name
CECIL COUNTY PUBLIC SCHOOLS
135

CECIL COUNTY PUBLIC SCHOOLS
NOTES TO SCHEDULE OF EXPENDITURES OF FEDERAL AWARDS Year ended June 30, 2021
NOTE A—BASIS OF PRESENTATION The accompanying schedule of expenditures of federal awards (the Schedule) includes the federal award activity of Cecil County Public Schools under programs of the federal government for the year ended June 30, 2021. The information in this Schedule is presented in accordance with the requirements of Title 2 U.S. Code of Federal Regulations Part 200, Uniform Administrative Requirements, Cost Principles, and Audit Requirements for Federal Awards (Uniform Guidance). Because the Schedule presents only a selected portion of the operations of the Cecil County Public Schools (“the School System”), it is not intended to and does not present the financial position, changes in net position, or cash flows of the School System. NOTE B ‐ SCOPE OF SINGLE AUDIT PURSUANT TO UNIFORM GUIDANCE All federal financial assistance programs operated by the Cecil County Public Schools are included in the scope of the Uniform Guidance audit. The Maryland State Department of Education has been designated as the cognizant audit agency for the Uniform Guidance audit. NOTE C – SUMMARY OF SIGNIFICANT ACCOUNTING POLICIES (1) Expenditures reported on the Schedule are reported on the accrual basis of accounting. Such expenditures are recognized following the cost principles contained in the Uniform Guidance, wherein certain types of expenditures are not allowable or are limited as to reimbursement. (2) The School System has not elected to use the 10 percent de minimis indirect cost rate as allowed under the Uniform Guidance. NOTE D ‐ FISCAL PERIOD AUDIT Single Audit testing procedures were performed for program transactions occurring during the fiscal year ended June 30, 2021 for the following programs:
Name of Federal Program or Cluster
CFDA Number Expenditures
Coronavirus Relief Fund 21.019 $3,802,183
Title I Grants to Local Educational Agencies
84.010 $2,898,391
Education Stabilization Fund 84.425 $3,537,959
136

CECIL COUNTY PUBLIC SCHOOLS
NOTES TO SCHEDULE OF EXPENDITURES OF FEDERAL AWARDS Year ended June 30, 2021
NOTE E ‐ MEDICAL ASSISTANCE BUDGET The Medical Assistance Budget is considered to be charges for services and is not considered a grant; therefore, these grants are not included in the Schedule of Expenditures of Federal Awards. During fiscal year 2021, Cecil County Public Schools received $1,015,581 in Medical Assistance monies.
Total Federal Grant Expenditures per financial statements 24,048,783$ Medical Assistance Program (1,015,581)
Total Schedule of Expenditures of Federal Awards 23,033,202$
137


