Embed Size (px)
Citation preview
Comprehensive Annual Financial Report
For the year ended June 30, 2018
1702 N. Main Street, Davenport, Iowa 52803
In the counties of Scott and Muscatine, State of Iowa

Comprehensive Annual Financial Report of the
Davenport Community School District Davenport, Iowa
For the Fiscal Year Ended June 30, 2018
Official Issuing Report
Claudia Wood, Chief Financial Officer
Office Issuing Report
Achievement Services Center


Introductory Section

Table of Contents INTRODUCTORY SECTION (Unaudited) 2017-2018 organizational chart iPriorities and mission statement iiBoard of education and school district officials IiiLetter of transmittal iv – xvGFOA certificate of achievement xviASBO certificate of achievement xviiDiversity statement xviiiFINANCIAL SECTION Independent auditor’s report 1 – 3 Management’s discussion and analysis 4 – 16Basic financial statements:
District-wide financial statements: Statement of net position 17Statement of activities 18 – 19
Governmental fund financial statements: Balance sheet 20Reconciliation of the balance sheet – governmental funds to the statement of
net position 21Statement of revenues, expenditures and changes in fund balances 22Reconciliation of the statement of revenues, expenditures and changes in
fund balances – governmental funds to the statement of activities 23Proprietary fund financial statements:
Statement of net position 24Statement of revenues, expenses and changes in net position 25Statement of cash flows 26 – 27
Fiduciary fund financial statements: Statement of fiduciary assets and liabilities 28
Notes to basic financial statements 29 – 54 Required supplementary information:
Schedule of changes in the district’s total OPEB liability and related ratios 55Budgetary comparison schedule of revenues, expenditures/expenses and
changes in balances –budget and actual – all governmental funds and enterprise fund 56 - 57
Iowa Public Employees’ Retirement System Schedule of the District’s proportionate share of the net pension liability 58 Schedule of District contributions (in thousands) 59 – 60Notes to required supplementary information 61 - 62
Other supplementary information:
Nonmajor governmental funds – combining balance sheet 63Nonmajor governmental funds – combining schedule of revenues, expenditures
and changes in fund balances 64Schedule of changes in special revenue fund, student activity accounts 65 Schedule of combining balance sheet, capital projects fund-by account 66Schedule of combining statement of revenues, expenditures and changes in fund
balances, capital projects fund-by account 67Statement of changes in fiduciary assets and liabilities, agency fund 68Schedule of changes in amounts due to activity groups, agency fund 69
Table of Contents STATISTICAL SECTION (UNAUDITED) Statistical section contents 70Net position by component 71- 72Expenses, program revenues and net (expense)/revenue 73- 74General revenues and total change in net position 75- 76Fund balances, governmental funds 77- 78Change in fund balances, governmental funds 79 -80Assessed value and actual value of taxable property 81– 82Direct and overlapping property tax rates 83Principal property tax payers 84Property tax levies and collections 85Outstanding debt by type 86Direct and overlapping governmental activities debt 87Legal debt margin information 88- 89Pledged-revenue coverage 90Demographic and economic statistics 91Principal employers 92Demographic and miscellaneous statistics 93 – 102Full-time equivalent district employees by type 103 – 104Operating statistics 105School building information 106 - 111 COMPLIANCE SECTION Schedule of expenditures of federal awards 112 – 113Notes to the schedule of expenditures of federal awards Summary schedule of prior audit findings
114 115
Independent auditor’s report on internal control over financial reporting and on compliance and other matters based on an audit of financial statements performed in accordance with government auditing standards 116–117
Independent auditor’s report on compliance for each major federal program and on internal control over compliance required by the Uniform Guidance 118–119Schedule of findings and questioned costs 120–126 Corrective action plan 127
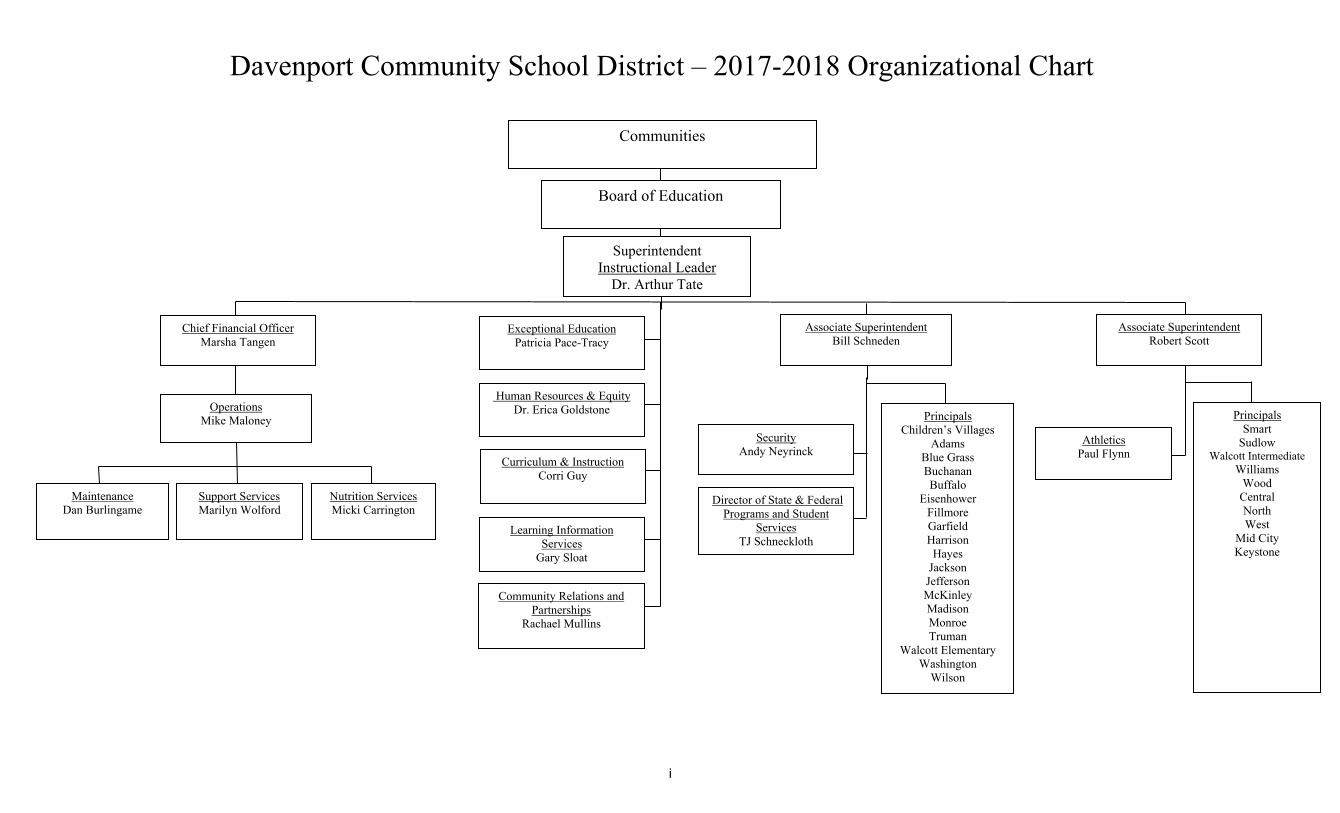
Davenport Community School District – 2017-2018 Organizational Chart
Board of Education
Superintendent Instructional Leader
Dr. Arthur Tate
Chief Financial Officer Marsha Tangen
Operations Mike Maloney
Human Resources & Equity Dr. Erica Goldstone
Maintenance Dan Burlingame
Support Services Marilyn Wolford
Associate Superintendent Bill Schneden
Associate Superintendent Robert Scott
Principals Children’s Villages
Adams Blue Grass Buchanan Buffalo
Eisenhower Fillmore Garfield Harrison Hayes
Jackson Jefferson McKinley Madison Monroe Truman
Walcott Elementary Washington
Wilson
Security Andy Neyrinck
Exceptional Education Patricia Pace-Tracy
Athletics Paul Flynn
Director of State & Federal Programs and Student
Services TJ Schneckloth
Learning Information Services
Gary Sloat
Principals Smart
Sudlow Walcott Intermediate
Williams Wood
Central North West
Mid City Keystone
Nutrition Services Micki Carrington
Curriculum & Instruction Corri Guy
Communities
Community Relations and Partnerships
Rachael Mullins
i
DAVENPORT COMMUNITY SCHOOL DISTRICT
Priorities The Davenport School Board establishes the following priorities to ensure
the academic success of all students:
Provide leadership and direction to improve the overall learning
environment in our classrooms, schools and district including the
health, safety, security and happiness of students and staff;
Direct and support actions, programs, and activities which reduce the
impacts of poverty on our students, their families and our community.
Mission Statement
Enhance each student’s abilities by providing a quality education enriched
by our diverse community.
Vision Statement
Education that challenges conventional thinking, prepares all students to
compete in a global society, and inspires our students, parents, staff and
community to answer the question, “What if?”
ii
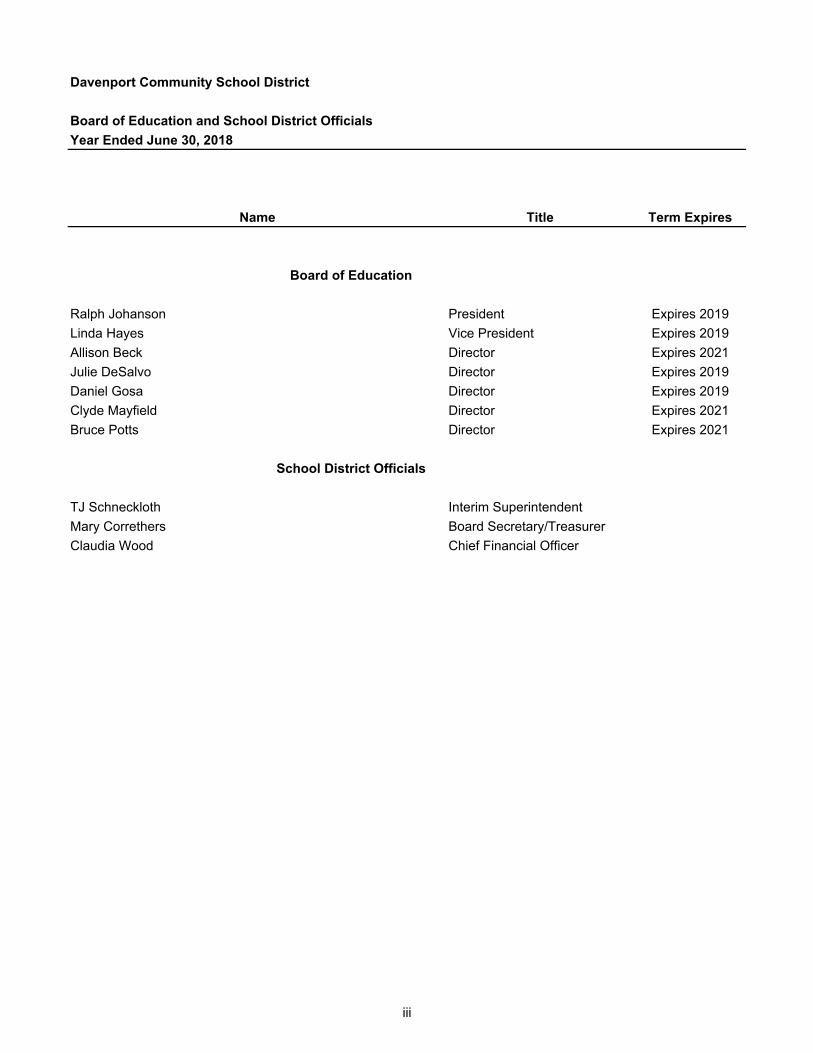
Davenport Community School District
Board of Education and School District Officials
Year Ended June 30, 2018
Name Title Term Expires
Board of Education
Ralph Johanson President Expires 2019
Linda Hayes Vice President Expires 2019
Allison Beck Director Expires 2021
Julie DeSalvo Director Expires 2019
Daniel Gosa Director Expires 2019
Clyde Mayfield Director Expires 2021
Bruce Potts Director Expires 2021
School District Officials
TJ Schneckloth Interim Superintendent
Mary Correthers Board Secretary/Treasurer
Claudia Wood Chief Financial Officer
iii

www.davenportschools.org
December 18, 2018 To President Johanson, Members of the Board of Directors and Citizens of the Davenport Community School District: It is indeed our pleasure to submit to you the Comprehensive Annual Financial Report, (CAFR) for the Davenport Community School District, (the “District”) for the year ending June 30, 2018. This report has been prepared to conform to guidelines recommended by the Association of School Business Officials International and the Government Finance Officers Association of the United States and Canada. The Code of the State of Iowa requires an annual audit of the District to be performed by an accounting firm selected in a competitively bid process. The annual audit meets the requirements of the Code of Iowa, generally accepted auditing standards and the requirements of the 1996 Amendment to the Single Audit Act, and related OMB Circular A-133. The auditor’s report on the general purpose financial statements and combining and individual fund statements is included in the financial section of this report. The auditor’s reports related specifically to the single audit are included in a separate section for internal controls and compliance Responsibility for both the accuracy of the data and the completeness and fairness of the presentation, including all disclosures, rests with the officials of the District. To the best of our knowledge and belief, the enclosed information is fairly stated in all material respects and is presented in a manner which sets forth the financial position and results of operations of the various funds and account groups of the District in accordance with generally accepted accounting principles, (GAAP). It includes all funds of the District. The District is not included in any other reporting entity, nor are any other entities included within this report. All disclosures necessary to enable a reader to gain maximum understanding of the District’s financial activities have been included. Designed to meet the needs of a broad range of readers of financial statements, this CAFR is divided into four major sections:
1. The Introductory Section. This section includes the organizational chart for the District, a list of the Board of Directors and District officials, the District Mission Statement, a transmittal letter, and District accomplishments.
Claudia Wood, Chief Financial Officer Achievement Service Center
1702 N. Main Street Davenport, Iowa, 52803
Voice: 563-336-7514 Email: [email protected]
iv
2. The Financial Section. The School District’s financial statements and schedules are presented in accordance with the financial reporting pyramid set forth by the Governmental Accounting Standards Board. The financial section consists of the independent auditor’s report, Management’s Discussion and Analysis, audited basic financial statements, required supplemental information, and combining and individual fund statements and schedules. The audited basic financial statements present both an overview and a broad long-term perspective of the School District as a whole in the government-wide financial statements.
3. The Statistical Section. The statistical section sets forth selected unaudited financial and demographic information, generally presented on a multi-year basis. 4. The Internal Controls and Compliance Section. The School District is required to undergo an annual single audit in conformity with the provisions of the Single Audit Act Amendments of 1996 and the U.S. Office of Management and Budget Circular A-133, Audits of State, Local Governments, and Non-Profit Organizations. This section contains all necessary schedules and auditor’s reports required for the District to comply with these regulations. Management of the District is responsible for establishing and maintaining an internal control structure designed to ensure that the assets of the District are protected from loss, theft or misuse and to ensure that adequate accounting data are compiled to allow for the preparation of financial statements in conformity with generally accepted accounting principles. The internal control structure is designed to provide reasonable, but not absolute, assurance that these objectives are met. The concept of reasonable assurance recognizes that: (1) the cost of a control should not exceed the benefits likely to be derived; and (2) the evaluation of costs and benefits requires estimates and judgments by management. All internal accounting controls adequately safeguard assets and provide reasonable assurance of proper recording of financial transactions. As a recipient of federal, state and local financial assistance, the District is also responsible for ensuring that adequate internal control is in place to ensure compliance with applicable laws and regulations related to those programs. As a part of the District’s single audit, described earlier, tests are made to determine the adequacy of internal control, including that portion related to federal awards programs, as well as to determine that the District has complied with applicable laws and regulations. Bohnsack & Frommelt, Certified Public Accountants have issued an unqualified (“clean”) opinion on the Davenport Community School District’s financial statements for the year ended June 30, 2018. The independent auditor’s report is located at the front of the financial section of this report. Management’s Discussion and Analysis (MD&A) immediately follows the independent auditor’s report and provides a narrative introduction, overview, and analysis of the basic financial statement. The letter of transmittal is designed to complement the MD&A and should be read in conjunction with it.
v
Profile of the District
Davenport is the County seat and the largest city in Scott County, Iowa. Centrally located on the banks of the Mississippi River, Davenport is Iowa’s third largest city, and one of its oldest. Davenport was incorporated in 1838, eight years before Iowa became a state. It is a “special charter” city with special governing perogatives.
The Davenport area is the home of hard-working, industrious people with both urban and rural ancestry. Boasting some of the most fertile farm ground in the world, Davenport is a community whose founder, Antoine LeClaire, played a role in the exploration of the Mississippi River region in the early 1800s. It also is a community where the first female public school superintendent served from 1874 to 1878 and a major school building program was accomplished during the throes of the Great Depression of the 1930s.
In 1858 LeClaire provided a $500 loan to help establish the present Davenport Community Schools from several separate school systems in the area. Since then, the District has grown by building on its industrious heritage with innovative programs that serve the needs of all children.
Today over 15,000 students attend the Davenport Community Schools, one of the largest school districts in a state that is well-known for its excellent educational programming.
The Davenport Community School District (the “District”) is a political subdivision of the State of Iowa and operates public schools for children in grades pre-school through twelve. The geographic area served includes the cities of Davenport, Blue Grass, Walcott and Buffalo, Iowa and portions of the agricultural territory in Scott and Muscatine Counties. The District is governed by a seven member Board of Education whose members serve four-year terms and are elected on a nonpartisan basis. The District is the third largest in the state of Iowa. The Board of Directors is a policy-making and planning body whose decisions are carried out by school administrators. The District is composed of four high schools, four intermediate schools, one kindergarten through eighth grade school, seventeen elementary schools, and various off-campus alternative educational programs. Early childhood learning programs are offered at several sites, as well as the state four year old preschool program and Early Headstart/Headstart programs at additional sites. Student enrollment for grades kindergarten through twelfth for the 2017-18 school year was approximately 15,490 regular and special education students. The District employs approximately 2,284 persons of whom approximately 1,569 are professional staff and 715 are support staff. Quality instruction and comprehensive education services require state-of-the-art facilities and technology. Professionally led Long Range Facilities Planning promotes excellence in the learning environment, with a $125 million investment in facilities and $25 million in technology over a decade. District-wide interactive technology is at a 1:1 status with an individual computer for each student and teacher district-wide.
vi

The average age of our elementary buildings is 65. There are two buildings that were built in 1923 and five were built in 1939. In 2002 the district built an elementary building in Buffalo, Iowa. The average age of our intermediate buildings is 73 with 3 buildings built in 1917. Wood Intermediate was the last intermediate building constructed and that was in 1984. The district has four high schools; Central High constructed in 1904, West High in 1960, North High School which was originally built in 1972 as Wood Intermediate and was converted to a high school setting in 1984, and Mid City High School which was built in 2014. All of our facilities are in excellent condition as we follow a rigorous maintenance schedule in order to maintain and enhance the historical beauty and integrity of our older facilities as well as preserve all the facilities in the District. In Davenport Community Schools, education is tailored to meet the needs of and inspire each student. Quality educational experiences provide the fundamentals while exploring innovative teaching methods from early childhood education to graduation and beyond. College and career readiness is integrated at all levels in the Davenport Community Schools, with Davenport high schools offering award-winning programming to prepare graduates for college, career, and citizenry. The heart of the Davenport Community Schools is the teaching and learning that occurs every day in our classrooms. The success of classroom teachers is fostered by a supportive building climate, a district-wide support system ensuring high quality instruction and responsive student interventions. Principals serve as instructional leaders, and curriculum specialists provide professional development and ensure implementation of curriculum. The Teacher Leadership program creates a culture where teachers work collectively to analyze and improve their instructional practice through peer observation and collaboration. This work is supported by a committed and innovative school board and administration that ensures classroom and school leaders have resources, including continuing the fight to address inequality in state funding and challenge state-imposed spending limits.
The District is supported financially by state aid, property taxes, state and federal grants for special projects, and local revenue received for tuition and other services.
Budgetary controls are maintained by the District. The objective of these budgetary controls is to ensure compliance with legal provisions embodied in the annual budget approved by the District’s governing body. Activities of the General Fund, Special Revenue Funds, Enterprise Fund, Debt Service Fund and Capital Projects Fund are included in the annual budget. The Board of Directors is required to adopt a final budget no later than April 15th each year. The level of budgetary control (that is, the level at which expenditures cannot legally exceed the budgeted amount) is established by function and encompasses all fund types. To facilitate the monitoring of the legal provisions, and to provide more complete information to interested parties the District prepares a more detailed budget for each fund. The District also maintains an encumbrance accounting system as one technique of accomplishing budgetary control.
vii
Economic Condition and Outlook
Scott and Muscatine counties in Iowa along with Mercer, Rock Island and Henry counties in Illinois are considered to be a single Metropolitan Statistical Area (MSA) by the Federal Office of Management and Budget. The Davenport School District is located in Scott County, Iowa. The Bi-State Regional Commission works closely with this group addressing a broad range of issues associated with economic development in the Region. The Commission released a draft of the Comprehensive Economic Development Strategy Progress Report in June of 2016. Information from that report is included to provide a look at the current challenges facing the area and opportunities available. The CEDS is produced every five years, with annual progress reports published during interim years.
Data are presented in three areas: people, economy and place to frame the condition of the region today.
People: This provides a general demographic profile for the Bi-State Region
Population and Age: The region’s total population is expected to increase 2.6% over the next 30 years. The age group of 55-59 years old is the largest age group in the region compared to the U.S. which is 45 to 54 years with a national median age of 37.7.
Race and Ethnicity: The region’s population is 13.6% racial minority, with African American being the predominant minority population at 6.8%. In comparison, the US population is 26.7% racial minority. The region has seen a slight increase in the amount of Hispanic or Latino residents since 2010, from 8.0% to 9.2%.
Poverty: The Bi-State region has less poverty in all age cohorts and gender categories compared to national rates of poverty. The total rate of poverty for the region has increased slightly since 2010, from 12.4% to 13.0%.
Language spoken at home: 91.2% of the population age 5 and over speak English only compared to 78.9% of the US population. The most common language spoken in the region other than English is Spanish which is spoken among 5.4% of the population.
Educational Attainment: Over a third (33.4%) of the region’s population aged 25 and over has some college or an associate’s degree which is slightly higher than the US population 29.2%.
Income: The region’s median household income is $52,239 compared to the US median income of $56,124.
Labor Force: 83.7% of all males aged 16 and over are actively in the labor force while 75.5% of all women aged 16 and over are in the labor force, both of which are slightly below the national average.
Economy: This provides an overview of economic conditions in the region
Gross Regional Product (GRP) and Personal Income: o Total GRP for the region has declined $1.9 billion in 2016, a decline of 10.18%,
compared to the national Gross Domestic Product, which grew 8.58% during this same time period.
o The per capita income has increased a total of 4.86% from 2012-16.
viii
Employment: o From 2012-16 the average unemployment rate has steadily decreased since its
peak 2012 at 6.8%, to 2016 annual rate of 5.3%, on parity with the national average also at 5.3%.
o The region’s labor force has also been decreasing from 2012 to 2016 by 1.8%. Labor shed – the area from which an employment centers draws its commuting workers
o The Quad Cities Chamber of Commerce shows that the labor shed has a potential labor force of 588,213 people, and a total population of 721,219 for those aged 18-64.
Forecasted Industry Growth: o The region is only forecasted to experience a growth of 257 jobs across all
industries in the next five years. o Health Care and Social Assistance has the highest percent growth of any industry
with a total predicted growth rate of 6.4% over five years. Retail Sales:
o When adjusted for inflation, retail sales of the region have grown by 12.9% from Fiscal Year 2013 to 2017.
Place: This provides an overview of cost of living, housing, utilities, transportation and natural resources
Cost of Living index: The composite score of the region increased slightly in the past year from 95.8 to 96.3.
Housing: o Multi Family building permits for structures with 5 or more units saw an all-time
high in 2015 with 24 structures built in the area, but decreased to 10 structures in 2016.
o The percent of cost burdened home owners and renters in the BiState region is significantly below the national average, particularly for owner occupied housing units.
Analysis of Regional Economy
A SWOT (Strengths, Weaknesses (Challenges), Opportunities, and Threats) analysis was done of the region. Strengths are established qualities that are viewed as positively affecting economic development. Challenges are defined as ongoing items that may have a negative impact on economic development over a long period of time. Opportunities are identified as new or emerging items that will or could have positive impact on economic development. Threats are items that have been identified with both ongoing and future effects that have a large, negative impact on economic development.
Change from Opportunity to Strength:
The Interstate 74 Corridor reconstruction project, the largest public works project in the region’s history, is underway. This project will create/retain 1,137 construction jobs and 643 induced jobs. Once the project is complete, it will add significant capacity for the
ix
freight movement, traffic, and bike/pedestrian use. It has already spurred development along the corridor.
Change from Challenge to Opportunity:
Work on a Chicago to Quad City passenger rail line has begun. The State of Illinois has received approval for an extension on a transportation grant; at this time, there is no anticipated completion date for the rail line.
New Challenges:
An increase in truck traffic accounts for 37% of the traffic on Interstate 80. Local representatives believe 6-laning of I-80 would allow for merging and weaving movements at interchanges and mitigate traffic issues.
The retirement of small business owners with no one to purchase or continue their business has become a growing issue in the region, especially in smaller communities.
The Illinois Regional Workforce Innovation and Opportunity Act identified an aging workforce and recruiting a younger workforce into entry level positions as a challenge in the region.
(Economic Condition and Outlook Source: Comprehensive Economic Development Strategy for the Bi-State Region –Progress Report Draft 2018 prepared by Bi-State Regional Commission)
Long term financial planning Unassigned fund balance in the general fund is down from 2016-17. The District’s solvency ratio for 2017-18 is 6.14%, down slightly from 6.67% in 2016-17. With a solvency ratio between 0% -5% a fund balance is considered adequate for short term credit purposes as long as other economic trends such as property tax collections and enrollment are sound. Continued close monitoring of the budget is necessary to prevent operation shortfalls and the deterioration of financial position. In order to meet unforeseen financing requirements it is recommended that the District have a solvency ratio of 5-10%. The State of Iowa has implemented mid year budget reductions or not provided on time funding over the past ten years. With careful planning and constant budget review, the District has been building reserves since the 2003-04 school year and is now drawing upon those reserves during this period of under funding by the State. The District was able to identify approximately $5 million in reductions for the 2017-18 school year, leaving additional requirements to be covered through cash reserves or fund balance. With the exception of one year, the District’s enrollment has declined for the past ten years. Future projections indicate a steady decrease in enrollment over the next five years. The District’s funding is dependent on enrollment. Declining enrollment equates to a decrease in funding. With over 80% of the District’s resources required for salaries and benefits, staffing efficiencies will become a priority for review if the projections are accurate and enrollment continues to decline as projected.
x
The five year budget plan previously presented to the Board of Education continues to be revised and currently outlines budget reductions totaling $33 million. The broad categories of budget reduction include:
Increasing class size at all levels Repurposing schools; consolidating schools Shared leadership teams to manage a sector of schools Increase walk zones to maximum allowed by the state Reduce department and school discretionary budgets Cap salary increases to match SSA (increases in budget by the state) Change bell times to maximize use of buses Restructure the employee/employer cost of health insurance premiums Convert from block to traditional schedule at the high schools Right-size our staff numbers; examine student:teacher ratio Review all administrative positions in the district Study potential for savings through outsourcing
The Interim Superintendent shared his philosophical approach behind his recommendation:
1. Right-size the district staff to recognize the fewer number of students currently enrolled compared to ten years ago.
2. Balance reductions so that no particular segment of the employee force is inordinately affected by reductions.
3. As much as possible, assure that the effects of reductions on student achievement can be overcome or minimized through restructuring or re-prioritizing.
Relevant financial policies Since the funding formula is pupil driven, an increase in total spending authority occurs by increasing the number of pupils or by increasing the cost per pupil. The cost per pupil can be increased by the legislature in setting the amount of allowable growth each year. Under the law, the legislature has 30 days after receiving the governor’s budget recommendation to set the state percent of growth for the year following the budget year. To illustrate, the 2016 legislature sets the FY2018 state percent of growth. The allowable growth becomes increasingly important because as a District we are dependent on the amount of allowable growth as it often will dictate budget reductions that will take place. For the past several years the legislature has not adhered to their legal responsibility in setting the growth rate 30 days after receiving the governor’s budget recommendation. The state’s general fund revenue forecast is made each year by the Revenue Estimating Conference (REC), which consists of the Director of Legislative Services Agency serving as the representative of the Legislature, the Director of the Department of Management serving as the representative of the Governor and a third person agreed upon by the other two members. Historically the REC has met three times a year; in September or October to provide a framework for developing the state budget, in December to set the revenue estimate that the Governor and General Assembly must use in developing a budget for the subsequent fiscal year
xi
and in March, to consider revisions to the December estimate. If the REC lowers the estimate in March, the Governor is required to submit a revised budget to the General Assembly, and the General Assembly is required to use the lower estimate for developing next year’s budget. School districts’ budgets are subject to reductions as a result of a lower estimate in the budget. Major initiatives Superintendent’s Priority Initiatives: The superintendent identified nine priority initiatives for the 2017-18 school year.
1. Promote accountability at all levels. 2. Champion the Teaching and Learning Plan implementation. 3. Initiate an internal grow-your-own program to encourage and promote pathways to
administrative positions. 4. Continue to support and guide the work of the Poverty Task Force. 5. Re-energize an emphasis on parental involvement to positively affect student
achievement. 6. Write and execute a plan to identify and reduce the opportunity gap. 7. Work with the Board to enact policies and procedures to encourage greater contractor
accountability. 8. Provide leadership and assistance to assure that the district attendance program is
successful. 9. Prepare and action plan to promote increased awareness of the building and skilled trades
among students. Equity in Funding: The effort begun in the 2016-17 year by Dr. Tate and the school board inspired a study bill for the Iowa Legislature to address inequity in state funding and challenge the state imposed spending limits. The legislature did make a small change of $5/student in the per pupil amount. Representatives from the school board along with a lobbyist from the Urban Education Network continue to work trying to garner support for additional legislation which will permit districts to bring per pupil spending to the same levels as the highest districts in the state. The effort will continue into the fiscal 2018-19 school year. The district’s request for the additional spending authority was again denied. The district is now committed to reducing expenditures in order to be in compliance with the state spending authority requirements. Davenport Schools Teaching and Learning Plan: The school board and district leadership are calling for a renewed focus on the basics of strong instructional practices and meaningful assessment tools, while providing multi-tiered student supports and high expectations for behavior in our classrooms and schools. A comprehensive Teaching and Learning Plan that supports these ideals will guide our work over the next several years. Developed in the spring of 2016, the Davenport Community Schools Teaching and Learning Plan serves as a framework for best practices in education and classroom management. The framework includes four elements under which the work of our schools is organized. These four pillars include:
xii
• Instructional Practices • Multi-Tiered System of Support • Standards-Based Assessment and Reporting • The Davenport Way
The category Instructional Practices focuses on teachers’ growth and development through research-based best practices and integrated technology resources. The Multi-Tiered System of Support process includes engaging a school’s staff in a collective process which will guarantee every student receives time and support to meet their academic and behavior needs. Standards based assessment and reporting allows an educational system to have a clearly articulated K-12 curriculum and to understand the extent to which students are mastering subject matter. The Davenport Way Student Support System supports teachers and student with a specialized support system for struggling learners. This offers a variety of resources, strategies, structure and practices to support student achievement and improve student behavior: Capital Improvements: The District is continuing to complete projects identified on the Long Range Facilities Plan for the next ten years. The Plan was reviewed, revised and projects were prioritized within the plan based on the district priorities of: Safety and security Increase conformance to:
o Educational Specifications o Commitment to District of Distinction o Making improvements supporting work of teachers, student achievement and
graduation Right sizing inventory of buildings Increasing energy efficiency and environmental sustainability Generating general fund savings
The Davenport community continues to invest in the quality of education for our young people and support infrastructure upgrades in our schools. Voter approved sales tax and Physical Plant and Equipment Levy proceeds touched every building in the district, bringing safety improvements, increased energy efficiencies, and upgrades to instructional spaces with a total of over $16 million invested in building enhancements during the 2017-18 school year. The current Physical Plant and Equipment Levy expires on June 30, 2019. The Davenport community just voted to renew that levy for another ten years and at a rate of $1.34/$1,000 assessed value compared to the current rate of $.97/$1,000 assess value. Some highlights of this investment in facilities include: Central High School – Completion of the construction of new pool and auditorium, tennis
courts and parking, roof repairs, office and ADA work, locker room renovation, repurposing old auditorium, renovation of original pool for physical education use, softball field renovation and tuck pointing
District Wide – Roof and parking lot repairs Brady Street Stadium – Renovation of the football field surface and the track Sudlow Intermediate School – entrance, gym and office renovations; LED lighting
xiii
West High School – Corridor renovations; LED lighting District Wide – Installation of secured entrances District Wide – Restroom renovations Achievement Service Center – formerly JB Young Intermediate School was renovated
for administrative offices and community partners. Cash Management Policies and Practices The District, in its effort to be a good manager of public funds, competitively bids its banking services every three years. The district competitively bid banking services during 2016-17 and entered into a new contract on July 1, 2017. The District has been able to increase the amount of interest revenue with this new banking contract. To maximize investment return, the District informally bids its investments with all local interested financial institutions, the Iowa Schools Joint Investment Trust and TELF education program. The recent increases implemented by the Federal Reserve has increased the District’s investment earnings. Risk Management The District currently covers property, liability and workers compensation losses with traditional insurance coverage through the Iowa Association of School Board’s group plan carried by Employer’s Mutual Insurance Company. The District monitors insurance coverage and costs with the assistance of an insurance committee made up of local insurance providers from Ruhl & Ruhl Insurance. Awards The Government Finance Officers Association of the United States and Canada, (GFOA) awarded a Certificate of Achievement for Excellence in Financial Reporting to the Davenport School District for its comprehensive annual financial report for the fiscal year ended June 30, 2017. In order to be awarded a Certificate of Achievement, a government must publish an easily readable and efficiently organized comprehensive annual financial report. This report must satisfy both generally accepted accounting principles and applicable legal requirements. A Certificate of Achievement is valid for a period of one year only. We believe that our current comprehensive annual financial report continues to meet the Certificate of Achievement Program’s requirements and we are submitting it to the GFOA to determine its eligibility for another certificate. The Association of School Business Officials International, (ASBO) awarded a Certificate of Excellence in Financial Reporting to the Davenport Community School District for its comprehensive annual financial report for the fiscal year ended June 30, 2017. This Certificate is a prestigious national award, recognizing conformance with the highest standards for preparation of government financial reports.
xiv
We believe that our current CAFR also conforms to the requirements for the Certificate of Excellence in Financial Reporting and we are submitting it to ASBO to determine its eligibility for a Certificate.
Acknowledgments
The publication of this report is a major step toward the commitment to professionalism in financial reporting and significantly increases the accountability of the District to the taxpayers. This report would not have been possible without the help of several people. We would like to express our appreciation to all District, City and County employees who assisted in the preparation of this report as well as administrative support staff. Sincere appreciation is extended to the Board of Directors, where the commitment to excellence begins. It is with great pride that this year’s Comprehensive Annual Financial Report is submitted to the Board of Directors.
Claudia Wood, SFO TJ Schneckloth Chief Financial Officer Interim Superintendent
xv
xvi
The Certificate of Excellence in Financial Reporting
is presented to
Davenport Community School District
for its Comprehensive Annual Financial Report (CAFR) for the Fiscal Year Ended June 30, 2017.
xvii
It is the policy of the Davenport Community School District not to discriminate on the basis of race, color, national origin, sex, disability, religion, creed, age (for employment), marital status (for programs), sexual orientation, gender identity and socioeconomic status (for programs) in its educational programs and its employment practices. There is a grievance procedure for processing complaints of discrimination. If you have questions or a grievance related to this policy please contact the district’s equity coordinator: Dr. Erica Goldstone, Director of Equity & Diversity, 1606 Brady Street, Davenport, Iowa 52803; Phone: 563-336-3812.
xviii


Financial Section

Independent Auditor’s Report
To the Board of Education Davenport Community School District Davenport, Iowa
Report on the Financial Statements
We have audited the accompanying financial statements of the governmental activities, the business-type activities, each major fund, and the aggregate remaining fund information of the Davenport Community School District, as of and for the year ended June 30, 2018, and the related notes to the financial statements, which collectively comprise the District’s basic financial statements as listed in the table of contents.
Management’s Responsibility for the Financial Statements
Management is responsible for the preparation and fair presentation of these financial statements in accordance with accounting principles generally accepted in the United States of America; this includes the design, implementation, and maintenance of internal control relevant to the preparation and fair presentation of financial statements that are free from material misstatement, whether due to fraud or error.
Auditor’s Responsibility
Our responsibility is to express opinions on these financial statements based on our audit. We conducted our audit in accordance with auditing standards generally accepted in the United States of America and the standards applicable to financial audits contained in Government Auditing Standards, issued by the Comptroller General of the United States. Those standards require that we plan and perform the audit to obtain reasonable assurance about whether the financial statements are free from material misstatement.
An audit involves performing procedures to obtain audit evidence about the amounts and disclosures in the financial statements. The procedures selected depend on the auditor’s judgment, including the assessment of the risks of material misstatement of the financial statements, whether due to fraud or error. In making those risk assessments, the auditor considers internal control relevant to the entity’s preparation and fair presentation of the financial statements in order to design audit procedures that are appropriate in the circumstances, but not for the purpose of expressing an opinion on the effectiveness of the entity’s internal control. Accordingly, we express no such opinion. An audit also includes evaluating the appropriateness of accounting policies used and the reasonableness of significant accounting estimates made by management, as well as evaluating the overall presentation of the financial statements.
We believe that the audit evidence we have obtained is sufficient and appropriate to provide a basis for our audit opinions.
1
Opinions
In our opinion, the financial statements referred to above present fairly, in all material respects, the respective financial position of the governmental activities, the business-type activities, each major fund, and the aggregate remaining fund information of the Davenport Community School District, as of June 30, 2018, and the respective changes in financial position and, where applicable, cash flows thereof for the year then ended in accordance with accounting principles generally accepted in the United States of America.
Emphasis of Matter
As discussed in Note 13 to the basic financial statements, the District implemented Governmental Accounting Standards Board Statement No. 75, Accounting and Financial Reporting for Postemployment Benefits Other Than Pensions. As a result, the District’s net positions for governmental activities and business-type activities, the School Nutrition Fund major fund and Out of School Time nonmajor enterprise fund has been restated. As discussed in Note 13 to the basic financial statements, the District restated the General Fund fund balance and governmental activities net position for state categorical funding. Our opinions are not modified with respect to these matters.
Required Supplementary Information
Accounting principles generally accepted in the United States of America require that the management’s discussion and analysis, schedules of changes in the District’s total OPEB liability and related ratios, budgetary comparison information, and schedule of the District’s proportionate share of the net pension liability and schedule of District contributions on pages 4-16 and 55-62 be presented to supplement the basic financial statements. Such information, although not a part of the basic financial statements, is required by the Governmental Accounting Standards Board who considers it to be an essential part of financial reporting for placing the basic financial statements in an appropriate operational, economic, or historical context. We have applied certain limited procedures to the required supplementary information in accordance with auditing standards generally accepted in the United States of America, which consisted of inquiries of management about the methods of preparing the information and comparing the information for consistency with management’s responses to our inquiries, the basic financial statements, and other knowledge we obtained during our audit of the basic financial statements. We do not express an opinion or provide any assurance on the information because the limited procedures do not provide us with sufficient evidence to express an opinion or provide any assurance.
Other Information
Our audit was conducted for the purpose of forming opinions on the financial statements that collectively comprise the District’s basic financial statements. The other supplementary information, as listed in the table of contents, and schedule of expenditures of federal awards, as required by Title 2 U.S. Code of Federal Regulations Part 200, Uniform Administrative Requirements, Cost Principles, and Audit Requirements for Federal Awards, and the other information, including the introductory and statistical sections and are presented for purposes of additional analysis and are not a required part of the basic financial statements.
The other supplementary information, as listed in the table of contents and the schedule of expenditures of federal awards are the responsibility of management and were derived from and relate directly to the underlying accounting and other records used to prepare the basic financial statements. Such information has been subjected to the auditing procedures applied in the audit of the basic financial statements and certain additional procedures, including comparing and reconciling such information directly to the underlying accounting and other records used to prepare the basic financial statements or to the basic financial statements themselves, and other additional procedures in accordance with auditing standards generally accepted in the United States of America. In our opinion, the supplementary information and schedule of expenditures of federal awards is fairly stated, in all material respects, in relation to the basic financial statements as a whole.
2
The introductory and statistical sections have not been subjected to the auditing procedures applied in the audit of the basic financial statements, and accordingly, we do not express an opinion or provide any assurance on it.
Other Reporting Required by Government Auditing Standards
In accordance with Government Auditing Standards, we have also issued our report dated December 18, 2018 on our consideration of the District's internal control over financial reporting and on our tests of its compliance with certain provisions of laws, regulations, contracts, and grant agreements and other matters. The purpose of that report is to describe the scope of our testing of internal control over financial reporting and compliance and the results of that testing, and not to provide an opinion on internal control over financial reporting or on compliance. That report is an integral part of an audit performed in accordance with Government Auditing Standards in considering the District’s internal control over financial reporting and compliance.
Moline, Illinois December 18, 2018
3

Davenport Community School District Management’s Discussion and Analysis Year Ended June 30, 2018
Davenport Community School District provides this Management’s Discussion and Analysis of its financial statements. This narrative overview and analysis of the financial activities is for the fiscal year ended June 30, 2018. We encourage readers to consider this information in conjunction with additional information that we have furnished in our transmittal letter and the District’s financial statements, which follow:
2017-18 FINANCIAL HIGHLIGHTS
The General Fund June 30, 2018 fund balance decreased $599,798 from the June 30, 2017 restated fund balance of $16,524,243 to $15,924,445.
The District restated beginning net position of the governmental activities, business-type activities and each enterprise fund for the implementation of Governmental Accounting Standard No. 75, Accounting and Financial Reporting for Postemployment Benefits Other than Pensions. The District restated beginning fund balance of the General Fund and beginning net position of governmental activities $2.9 million for state categorical funding.
The District continues to be successful in receiving donations and local, state and federal grants. In 2018, the District received approximately $45.5 million in operating grants.
USING THIS ANNUAL REPORT The annual report consists of a series of financial statements and other information, as follows:
Management’s Discussion and Analysis introduces the basic financial statements and provides an analytical overview of the District’s financial activities.
The government-wide financial statements consist of a Statement of Net Position and a Statement of Activities. These provide information about the activities of Davenport Community School District as a whole and present an overall view of the District’s finances.
The fund financial statements tell how governmental services were financed in the short-term as well as what remains for future spending. Fund financial statements report Davenport Community School District’s operations in more detail than the government-wide statements by providing information about the most significant funds. The remaining statements provide financial information about activities for which Davenport Community School District acts solely as an agent or custodian for the benefit of those outside of the District.
Notes to financial statements provide additional information essential to a full understanding of the data provided in the basic financial statements.
Required supplementary information further explains and supports the financial statements with a comparison of the District’s budget for the year and information regarding the District’s retiree health plan and pension plan.
4
Davenport Community School District Management’s Discussion and Analysis Year Ended June 30, 2018
Other supplementary information provides detailed information about the nonmajor governmental funds. In addition, the Schedule of Expenditures of Federal Awards provides details of various programs benefitting the District.
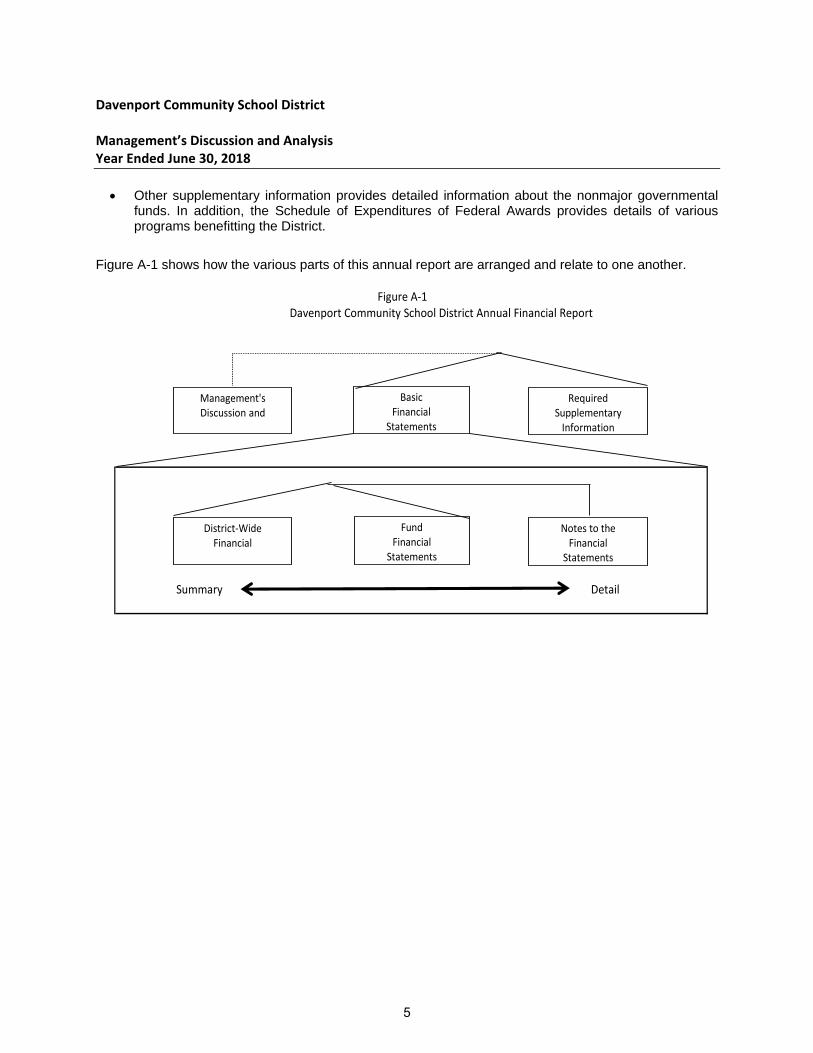
Figure A-1 shows how the various parts of this annual report are arranged and relate to one another.
Figure A‐1Davenport Community School District Annual Financial Report
Summary Detail
Management's Discussion and
BasicFinancial
Statements
Required Supplementary Information
District‐Wide Financial
Fund Financial
Statements
Notes to theFinancial
Statements
5
Davenport Community School District Management’s Discussion and Analysis Year Ended June 30, 2018
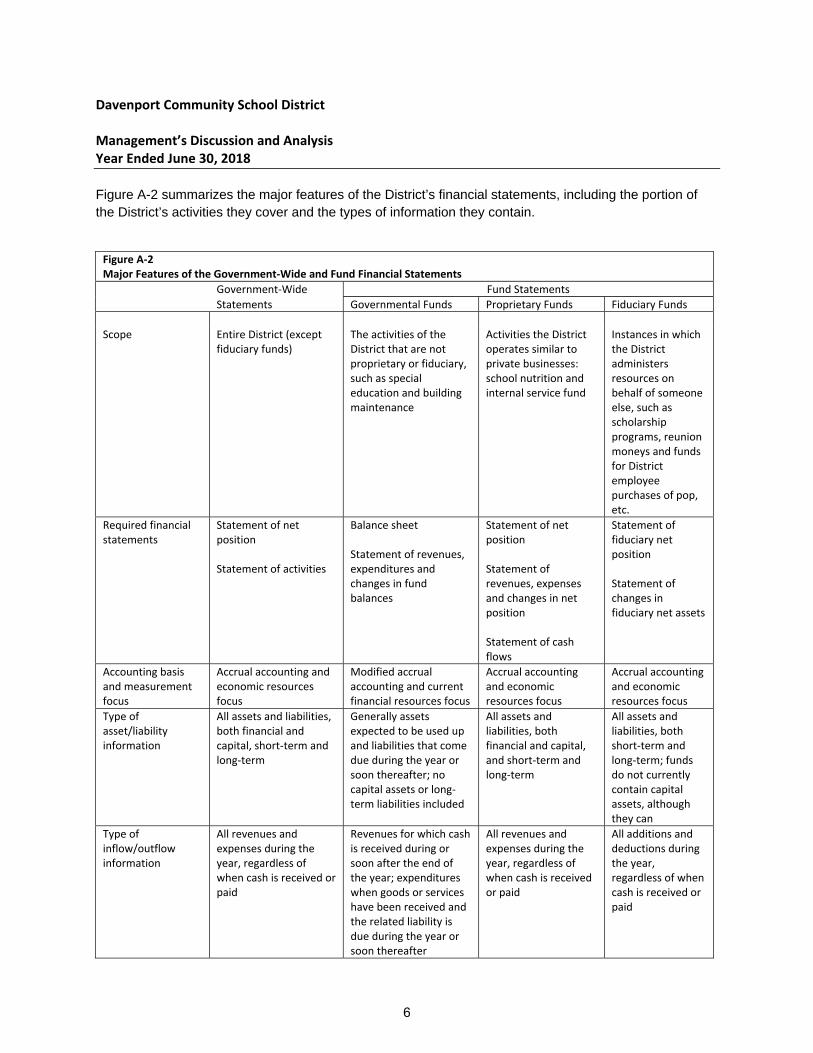
Figure A-2 summarizes the major features of the District’s financial statements, including the portion of the District’s activities they cover and the types of information they contain.
Figure A‐2 Major Features of the Government‐Wide and Fund Financial Statements
Government‐Wide Fund Statements
Statements Governmental Funds Proprietary Funds Fiduciary Funds
Scope Entire District (except
fiduciary funds) The activities of the District that are not proprietary or fiduciary, such as special education and building maintenance
Activities the District operates similar to private businesses: school nutrition and internal service fund
Instances in which the District administers resources on behalf of someone else, such as scholarship programs, reunion moneys and funds for District employee purchases of pop, etc.
Required financial statements
Statement of net position Statement of activities
Balance sheet Statement of revenues, expenditures and changes in fund balances
Statement of net position Statement of revenues, expenses and changes in net position Statement of cash flows
Statement of fiduciary net position Statement of changes in fiduciary net assets
Accounting basis and measurement focus
Accrual accounting and economic resources focus
Modified accrual accounting and current financial resources focus
Accrual accounting and economic resources focus
Accrual accounting and economic resources focus
Type of asset/liability information
All assets and liabilities, both financial and capital, short‐term and long‐term
Generally assets expected to be used up and liabilities that come due during the year or soon thereafter; no capital assets or long‐term liabilities included
All assets and liabilities, both financial and capital, and short‐term and long‐term
All assets and liabilities, both short‐term and long‐term; funds do not currently contain capital assets, although they can
Type of inflow/outflow information
All revenues and expenses during the year, regardless of when cash is received or paid
Revenues for which cash is received during or soon after the end of the year; expenditures when goods or services have been received and the related liability is due during the year or soon thereafter
All revenues and expenses during the year, regardless of when cash is received or paid
All additions and deductions during the year, regardless of when cash is received or paid
6
Davenport Community School District Management’s Discussion and Analysis Year Ended June 30, 2018
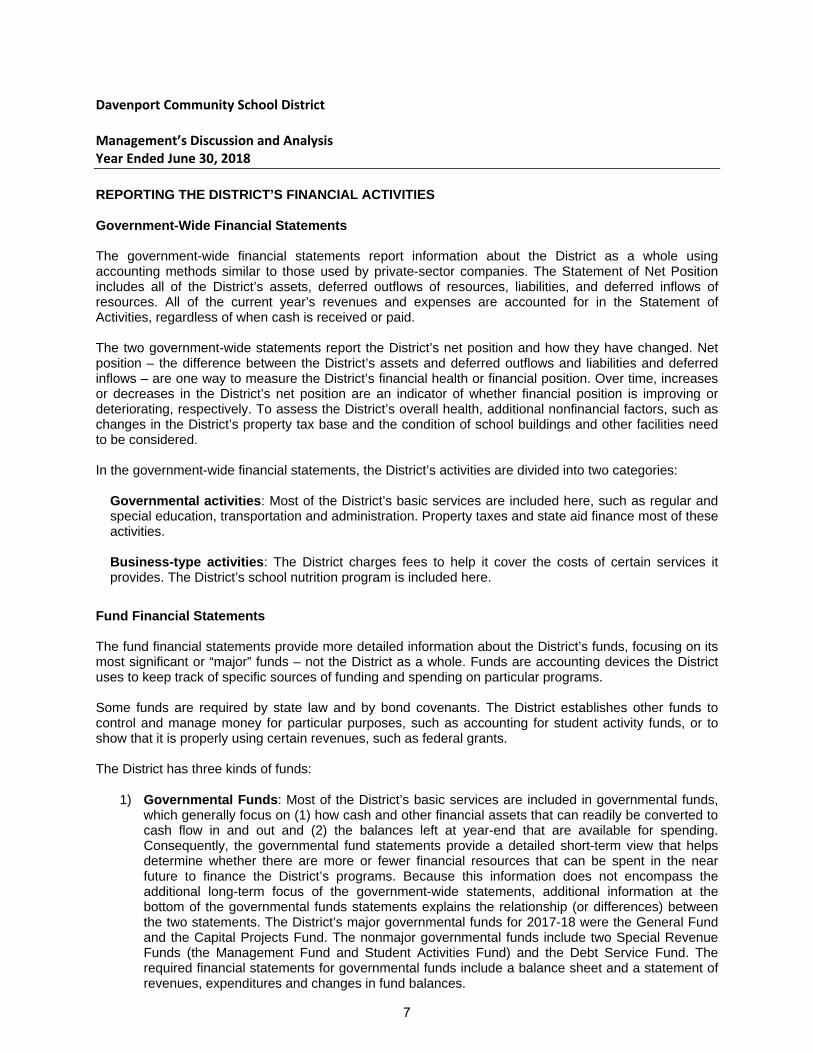
REPORTING THE DISTRICT’S FINANCIAL ACTIVITIES
Government-Wide Financial Statements The government-wide financial statements report information about the District as a whole using accounting methods similar to those used by private-sector companies. The Statement of Net Position includes all of the District’s assets, deferred outflows of resources, liabilities, and deferred inflows of resources. All of the current year’s revenues and expenses are accounted for in the Statement of Activities, regardless of when cash is received or paid. The two government-wide statements report the District’s net position and how they have changed. Net position – the difference between the District’s assets and deferred outflows and liabilities and deferred inflows – are one way to measure the District’s financial health or financial position. Over time, increases or decreases in the District’s net position are an indicator of whether financial position is improving or deteriorating, respectively. To assess the District’s overall health, additional nonfinancial factors, such as changes in the District’s property tax base and the condition of school buildings and other facilities need to be considered. In the government-wide financial statements, the District’s activities are divided into two categories:
Governmental activities: Most of the District’s basic services are included here, such as regular and special education, transportation and administration. Property taxes and state aid finance most of these activities. Business-type activities: The District charges fees to help it cover the costs of certain services it provides. The District’s school nutrition program is included here.
Fund Financial Statements The fund financial statements provide more detailed information about the District’s funds, focusing on its most significant or “major” funds – not the District as a whole. Funds are accounting devices the District uses to keep track of specific sources of funding and spending on particular programs. Some funds are required by state law and by bond covenants. The District establishes other funds to control and manage money for particular purposes, such as accounting for student activity funds, or to show that it is properly using certain revenues, such as federal grants. The District has three kinds of funds:
1) Governmental Funds: Most of the District’s basic services are included in governmental funds, which generally focus on (1) how cash and other financial assets that can readily be converted to cash flow in and out and (2) the balances left at year-end that are available for spending. Consequently, the governmental fund statements provide a detailed short-term view that helps determine whether there are more or fewer financial resources that can be spent in the near future to finance the District’s programs. Because this information does not encompass the additional long-term focus of the government-wide statements, additional information at the bottom of the governmental funds statements explains the relationship (or differences) between the two statements. The District’s major governmental funds for 2017-18 were the General Fund and the Capital Projects Fund. The nonmajor governmental funds include two Special Revenue Funds (the Management Fund and Student Activities Fund) and the Debt Service Fund. The required financial statements for governmental funds include a balance sheet and a statement of revenues, expenditures and changes in fund balances.
7
Davenport Community School District Management’s Discussion and Analysis Year Ended June 30, 2018
2) Proprietary funds: Services for which the District charges a fee are generally reported in proprietary funds. Proprietary funds are reported in the same way as the government-wide financial statements. The District’s Enterprise Funds, one type of proprietary fund, are the same as its business-type activities but provides more detail and additional information, such as cash flows. The District currently has two Enterprise Funds, the School Nutrition Fund which is a major fund and the nonmajor Out of School Time Fund. The District uses an internal service fund, the other kind of proprietary fund, to report activities that provide supplies and services for other District programs and activities. The District currently has one internal service fund, which is used to account for the District’s self-funded health and dental insurance plans.
The required financial statements for proprietary funds include a statement of net position, a statement of revenues, expenses and changes in net position and a statement of cash flows.
3) Fiduciary funds: The District is the trustee, or fiduciary, for assets that belong to others. This fund type includes Agency Funds.
Agency Funds: These are funds for which the District faculty accounts for certain revenue collected for District employee purchases of pop, funeral flowers, etc. and related expenditures and for revenues and expenditures of other various club accounts.
The District is responsible for ensuring the assets reported in the fiduciary funds are used only for their intended purposes and by those to whom the assets belong. The District excludes these activities from the government-wide financial statements because it cannot use these assets to finance its operations.
The required financial statements for fiduciary funds of the District include a statement of fiduciary assets and liabilities.
Reconciliations between the government-wide financial statements and the fund financial statements follow the fund financial statements.
8
Davenport Community School District Management’s Discussion and Analysis Year Ended June 30, 2018
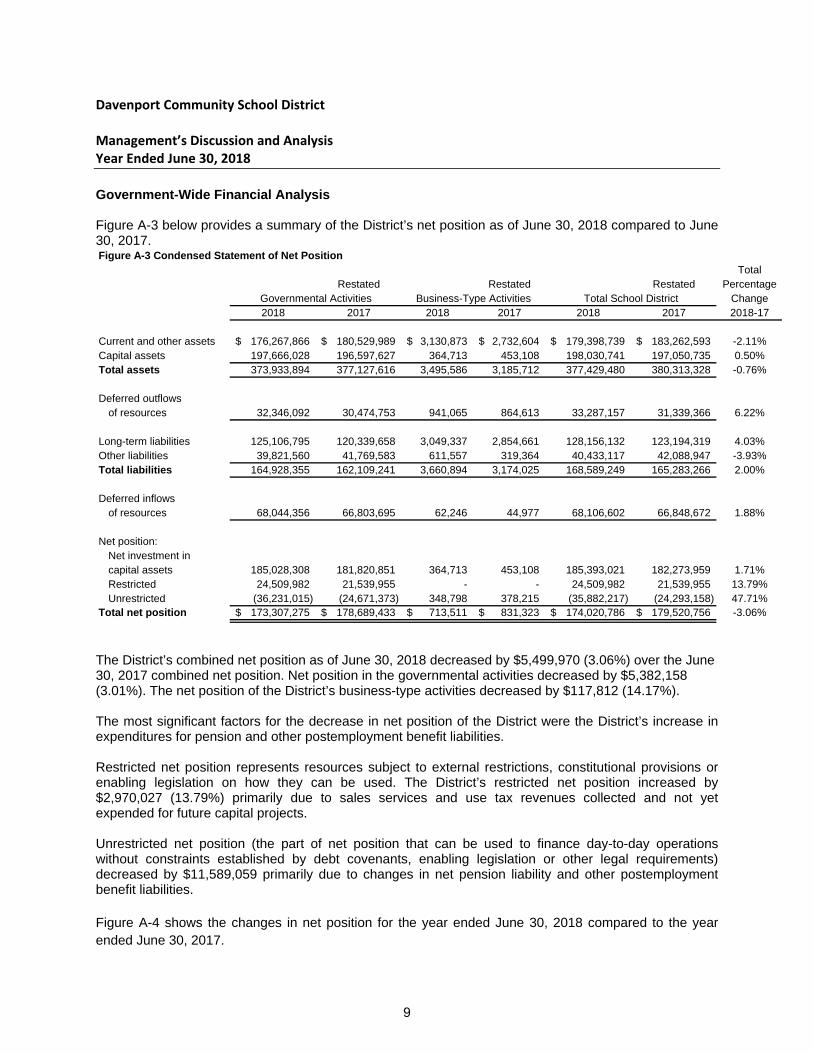
Government-Wide Financial Analysis Figure A-3 below provides a summary of the District’s net position as of June 30, 2018 compared to June 30, 2017. Figure A-3 Condensed Statement of Net Position
TotalRestated Restated Restated Percentage
Governmental Activities Business-Type Activities Total School District Change2018 2017 2018 2017 2018 2017 2018-17
Current and other assets 176,267,866$ 180,529,989$ 3,130,873$ 2,732,604$ 179,398,739$ 183,262,593$ -2.11%Capital assets 197,666,028 196,597,627 364,713 453,108 198,030,741 197,050,735 0.50%Total assets 373,933,894 377,127,616 3,495,586 3,185,712 377,429,480 380,313,328 -0.76%
Deferred outflowsof resources 32,346,092 30,474,753 941,065 864,613 33,287,157 31,339,366 6.22%
Long-term liabilities 125,106,795 120,339,658 3,049,337 2,854,661 128,156,132 123,194,319 4.03%Other liabilities 39,821,560 41,769,583 611,557 319,364 40,433,117 42,088,947 -3.93%Total liabilities 164,928,355 162,109,241 3,660,894 3,174,025 168,589,249 165,283,266 2.00%
Deferred inflowsof resources 68,044,356 66,803,695 62,246 44,977 68,106,602 66,848,672 1.88%
Net position:Net investment in capital assets 185,028,308 181,820,851 364,713 453,108 185,393,021 182,273,959 1.71%Restricted 24,509,982 21,539,955 - - 24,509,982 21,539,955 13.79%Unrestricted (36,231,015) (24,671,373) 348,798 378,215 (35,882,217) (24,293,158) 47.71%
Total net position 173,307,275$ 178,689,433$ 713,511$ 831,323$ 174,020,786$ 179,520,756$ -3.06%
The District’s combined net position as of June 30, 2018 decreased by $5,499,970 (3.06%) over the June 30, 2017 combined net position. Net position in the governmental activities decreased by $5,382,158 (3.01%). The net position of the District’s business-type activities decreased by $117,812 (14.17%). The most significant factors for the decrease in net position of the District were the District’s increase in expenditures for pension and other postemployment benefit liabilities. Restricted net position represents resources subject to external restrictions, constitutional provisions or enabling legislation on how they can be used. The District’s restricted net position increased by $2,970,027 (13.79%) primarily due to sales services and use tax revenues collected and not yet expended for future capital projects. Unrestricted net position (the part of net position that can be used to finance day-to-day operations without constraints established by debt covenants, enabling legislation or other legal requirements) decreased by $11,589,059 primarily due to changes in net pension liability and other postemployment benefit liabilities. Figure A-4 shows the changes in net position for the year ended June 30, 2018 compared to the year ended June 30, 2017.
9
Davenport Community School District Management’s Discussion and Analysis Year Ended June 30, 2018
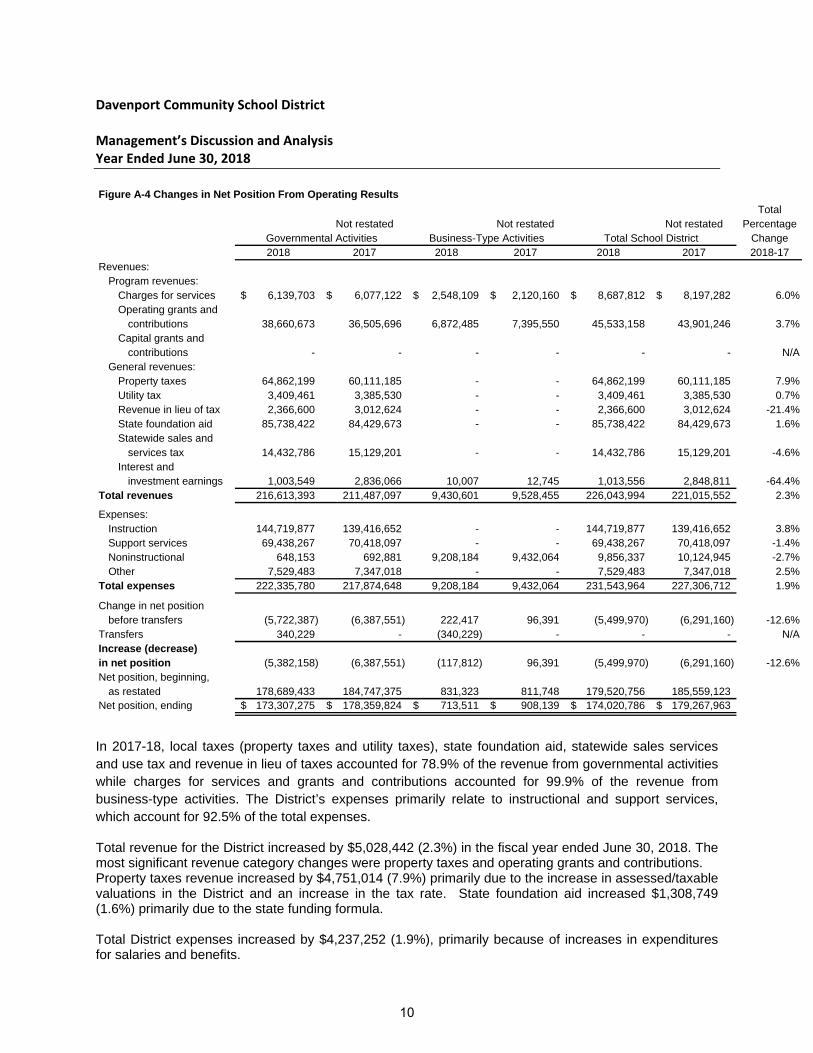
Figure A-4 Changes in Net Position From Operating Results
TotalNot restated Not restated Not restated Percentage
Governmental Activities Business-Type Activities Total School District Change2018 2017 2018 2017 2018 2017 2018-17
Revenues:Program revenues:
Charges for services 6,139,703$ 6,077,122$ 2,548,109$ 2,120,160$ 8,687,812$ 8,197,282$ 6.0%Operating grants and
contributions 38,660,673 36,505,696 6,872,485 7,395,550 45,533,158 43,901,246 3.7%Capital grants and
contributions - - - - - - N/AGeneral revenues:
Property taxes 64,862,199 60,111,185 - - 64,862,199 60,111,185 7.9%Utility tax 3,409,461 3,385,530 - - 3,409,461 3,385,530 0.7%Revenue in lieu of tax 2,366,600 3,012,624 - - 2,366,600 3,012,624 -21.4%State foundation aid 85,738,422 84,429,673 - - 85,738,422 84,429,673 1.6%Statewide sales and
services tax 14,432,786 15,129,201 - - 14,432,786 15,129,201 -4.6%Interest and
investment earnings 1,003,549 2,836,066 10,007 12,745 1,013,556 2,848,811 -64.4%Total revenues 216,613,393 211,487,097 9,430,601 9,528,455 226,043,994 221,015,552 2.3%
Expenses:Instruction 144,719,877 139,416,652 - - 144,719,877 139,416,652 3.8%Support services 69,438,267 70,418,097 - - 69,438,267 70,418,097 -1.4%Noninstructional 648,153 692,881 9,208,184 9,432,064 9,856,337 10,124,945 -2.7%Other 7,529,483 7,347,018 - - 7,529,483 7,347,018 2.5%
Total expenses 222,335,780 217,874,648 9,208,184 9,432,064 231,543,964 227,306,712 1.9%
Change in net positionbefore transfers (5,722,387) (6,387,551) 222,417 96,391 (5,499,970) (6,291,160) -12.6%
Transfers 340,229 - (340,229) - - - N/AIncrease (decrease)in net position (5,382,158) (6,387,551) (117,812) 96,391 (5,499,970) (6,291,160) -12.6%Net position, beginning,
as restated 178,689,433 184,747,375 831,323 811,748 179,520,756 185,559,123 Net position, ending 173,307,275$ 178,359,824$ 713,511$ 908,139$ 174,020,786$ 179,267,963$
In 2017-18, local taxes (property taxes and utility taxes), state foundation aid, statewide sales services and use tax and revenue in lieu of taxes accounted for 78.9% of the revenue from governmental activities while charges for services and grants and contributions accounted for 99.9% of the revenue from business-type activities. The District’s expenses primarily relate to instructional and support services, which account for 92.5% of the total expenses.
Total revenue for the District increased by $5,028,442 (2.3%) in the fiscal year ended June 30, 2018. The most significant revenue category changes were property taxes and operating grants and contributions. Property taxes revenue increased by $4,751,014 (7.9%) primarily due to the increase in assessed/taxable valuations in the District and an increase in the tax rate. State foundation aid increased $1,308,749 (1.6%) primarily due to the state funding formula. Total District expenses increased by $4,237,252 (1.9%), primarily because of increases in expenditures for salaries and benefits.
10
Davenport Community School District Management’s Discussion and Analysis Year Ended June 30, 2018
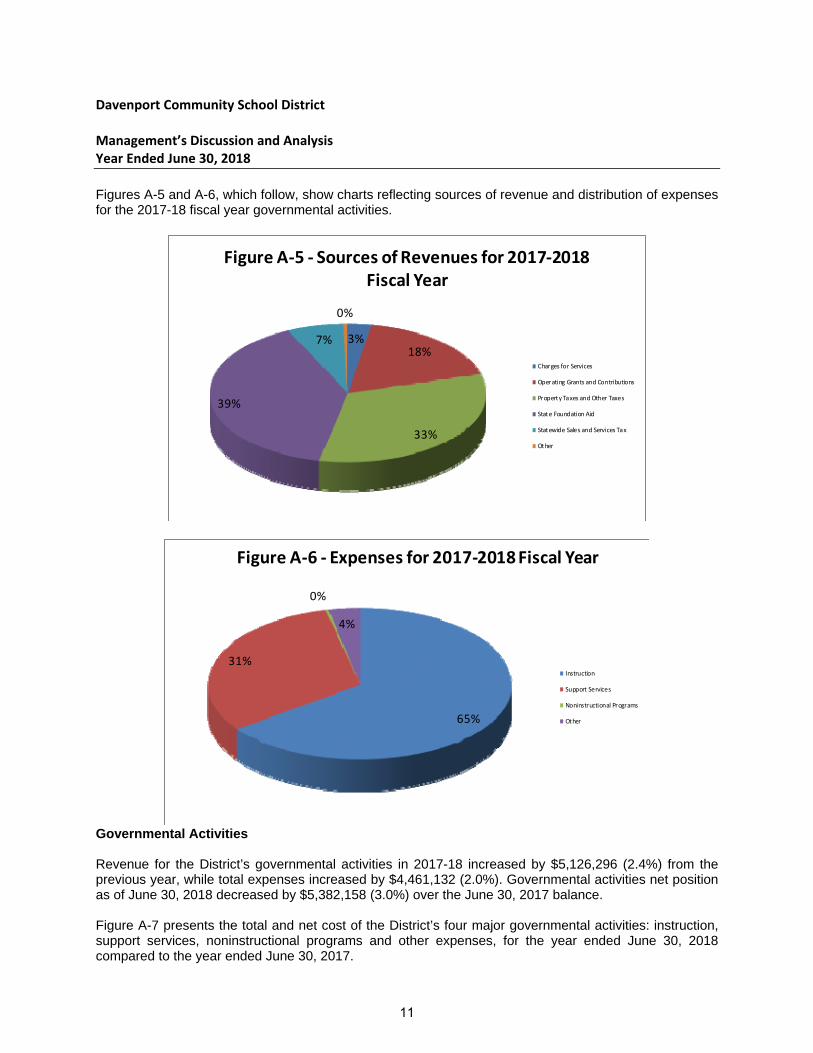
Figures A-5 and A-6, which follow, show charts reflecting sources of revenue and distribution of expenses for the 2017-18 fiscal year governmental activities.
3%18%
33%
39%
7%
0%
Figure A‐5 ‐ Sources of Revenues for 2017‐2018 Fiscal Year
Charges for Services
Operating Grants and Contributions
Property Taxes and Other Taxes
State Foundation Aid
Statewide Sales and Services Tax
Other
65%
31%
0%
4%
Figure A‐6 ‐ Expenses for 2017‐2018 Fiscal Year
Instruction
Support Services
Noninstructional Programs
Other
Governmental Activities Revenue for the District’s governmental activities in 2017-18 increased by $5,126,296 (2.4%) from the previous year, while total expenses increased by $4,461,132 (2.0%). Governmental activities net position as of June 30, 2018 decreased by $5,382,158 (3.0%) over the June 30, 2017 balance. Figure A-7 presents the total and net cost of the District’s four major governmental activities: instruction, support services, noninstructional programs and other expenses, for the year ended June 30, 2018 compared to the year ended June 30, 2017.
11
Davenport Community School District Management’s Discussion and Analysis Year Ended June 30, 2018
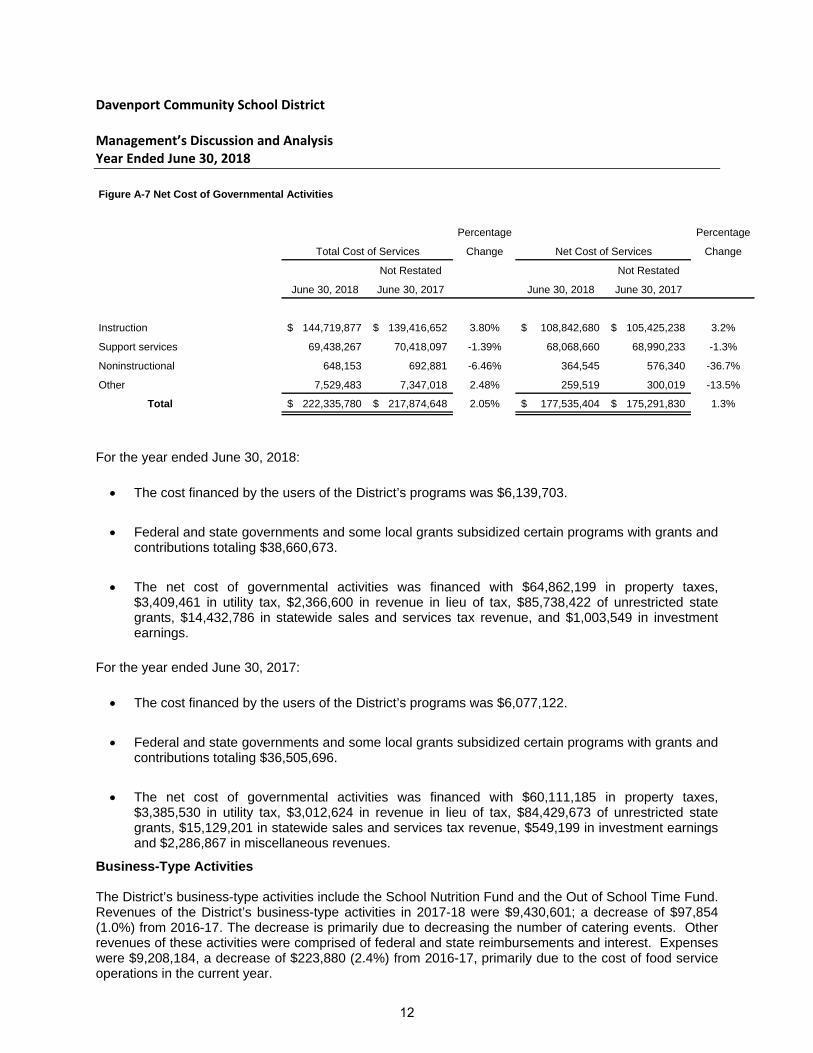
Figure A-7 Net Cost of Governmental Activities
Percentage Percentage
Total Cost of Services Change Net Cost of Services Change
Not Restated Not Restated
June 30, 2018 June 30, 2017 June 30, 2018 June 30, 2017
Instruction 144,719,877$ 139,416,652$ 3.80% 108,842,680$ 105,425,238$ 3.2%
Support services 69,438,267 70,418,097 -1.39% 68,068,660 68,990,233 -1.3%
Noninstructional 648,153 692,881 -6.46% 364,545 576,340 -36.7%
Other 7,529,483 7,347,018 2.48% 259,519 300,019 -13.5%
Total 222,335,780$ 217,874,648$ 2.05% 177,535,404$ 175,291,830$ 1.3%
For the year ended June 30, 2018:
The cost financed by the users of the District’s programs was $6,139,703.
Federal and state governments and some local grants subsidized certain programs with grants and contributions totaling $38,660,673.
The net cost of governmental activities was financed with $64,862,199 in property taxes, $3,409,461 in utility tax, $2,366,600 in revenue in lieu of tax, $85,738,422 of unrestricted state grants, $14,432,786 in statewide sales and services tax revenue, and $1,003,549 in investment earnings.
For the year ended June 30, 2017:
The cost financed by the users of the District’s programs was $6,077,122.
Federal and state governments and some local grants subsidized certain programs with grants and contributions totaling $36,505,696.
The net cost of governmental activities was financed with $60,111,185 in property taxes, $3,385,530 in utility tax, $3,012,624 in revenue in lieu of tax, $84,429,673 of unrestricted state grants, $15,129,201 in statewide sales and services tax revenue, $549,199 in investment earnings and $2,286,867 in miscellaneous revenues.
Business-Type Activities The District’s business-type activities include the School Nutrition Fund and the Out of School Time Fund. Revenues of the District’s business-type activities in 2017-18 were $9,430,601; a decrease of $97,854 (1.0%) from 2016-17. The decrease is primarily due to decreasing the number of catering events. Other revenues of these activities were comprised of federal and state reimbursements and interest. Expenses were $9,208,184, a decrease of $223,880 (2.4%) from 2016-17, primarily due to the cost of food service operations in the current year.
12
Davenport Community School District Management’s Discussion and Analysis Year Ended June 30, 2018
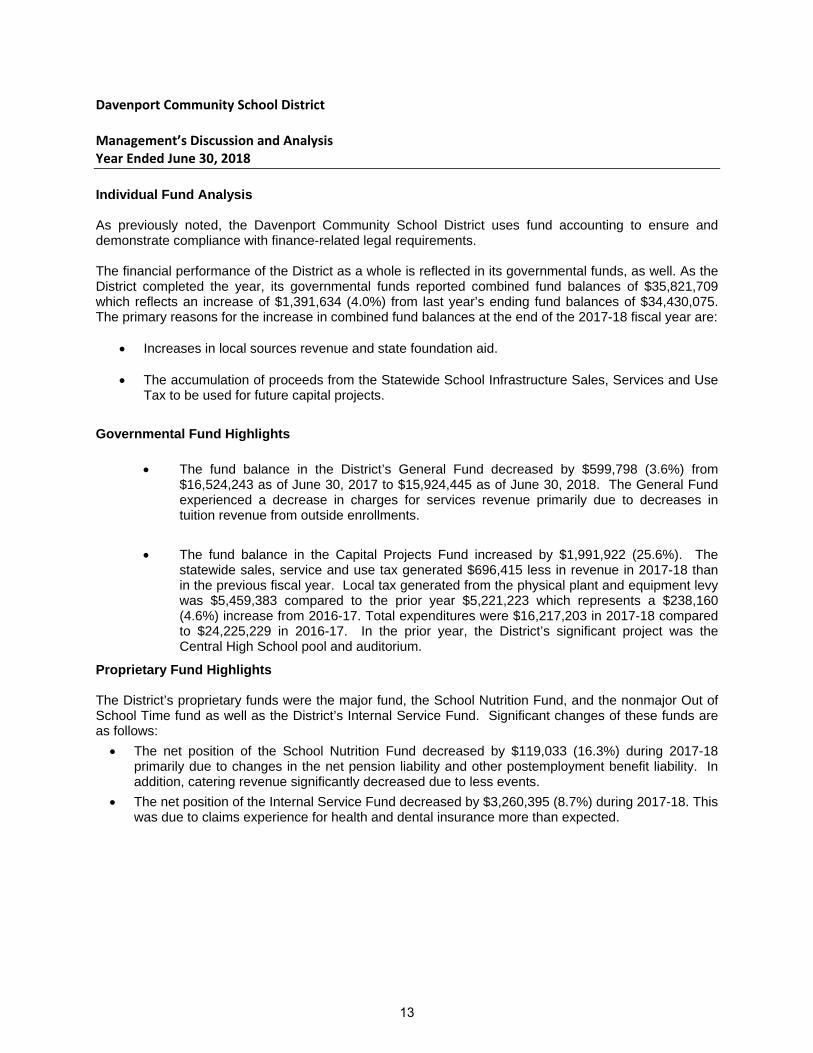
Individual Fund Analysis As previously noted, the Davenport Community School District uses fund accounting to ensure and demonstrate compliance with finance-related legal requirements. The financial performance of the District as a whole is reflected in its governmental funds, as well. As the District completed the year, its governmental funds reported combined fund balances of $35,821,709 which reflects an increase of $1,391,634 (4.0%) from last year’s ending fund balances of $34,430,075. The primary reasons for the increase in combined fund balances at the end of the 2017-18 fiscal year are:
Increases in local sources revenue and state foundation aid.
The accumulation of proceeds from the Statewide School Infrastructure Sales, Services and Use Tax to be used for future capital projects.
Governmental Fund Highlights
The fund balance in the District’s General Fund decreased by $599,798 (3.6%) from $16,524,243 as of June 30, 2017 to $15,924,445 as of June 30, 2018. The General Fund experienced a decrease in charges for services revenue primarily due to decreases in tuition revenue from outside enrollments.
The fund balance in the Capital Projects Fund increased by $1,991,922 (25.6%). The statewide sales, service and use tax generated $696,415 less in revenue in 2017-18 than in the previous fiscal year. Local tax generated from the physical plant and equipment levy was $5,459,383 compared to the prior year $5,221,223 which represents a $238,160 (4.6%) increase from 2016-17. Total expenditures were $16,217,203 in 2017-18 compared to $24,225,229 in 2016-17. In the prior year, the District’s significant project was the Central High School pool and auditorium.
Proprietary Fund Highlights The District’s proprietary funds were the major fund, the School Nutrition Fund, and the nonmajor Out of School Time fund as well as the District’s Internal Service Fund. Significant changes of these funds are as follows:
The net position of the School Nutrition Fund decreased by $119,033 (16.3%) during 2017-18 primarily due to changes in the net pension liability and other postemployment benefit liability. In addition, catering revenue significantly decreased due to less events.
The net position of the Internal Service Fund decreased by $3,260,395 (8.7%) during 2017-18. This was due to claims experience for health and dental insurance more than expected.
13
Davenport Community School District Management’s Discussion and Analysis Year Ended June 30, 2018
Budgetary Highlights A schedule showing the original and final budget amounts compared to the District’s actual financial activity is included in the required supplementary information section of this report. In accordance with the Code of Iowa, the Board of Education annually adopts a budget following required public notice and hearing for all funds, except internal service and agency funds. Although the budget document presents functional area expenditures for expenses by fund, the legal level of control is at the aggregated functional level, not at the fund or fund type level. The budget may be amended during the year utilizing similar statutorily prescribed procedures. The District’s budget is prepared on the GAAP basis. Over the course of the year the District amended its operating budget one time to reflect additional expenditures projected. The District modified its original budget in 2017-18 from $230,889,943 to $237,766,816. It is the District’s practice to budget expenditures at the maximum authorized spending authority for the General Fund. The District then manages or controls General Fund spending through its line item budget. As a result, the District’s certified budget should always exceed the actual expenditures during the year.
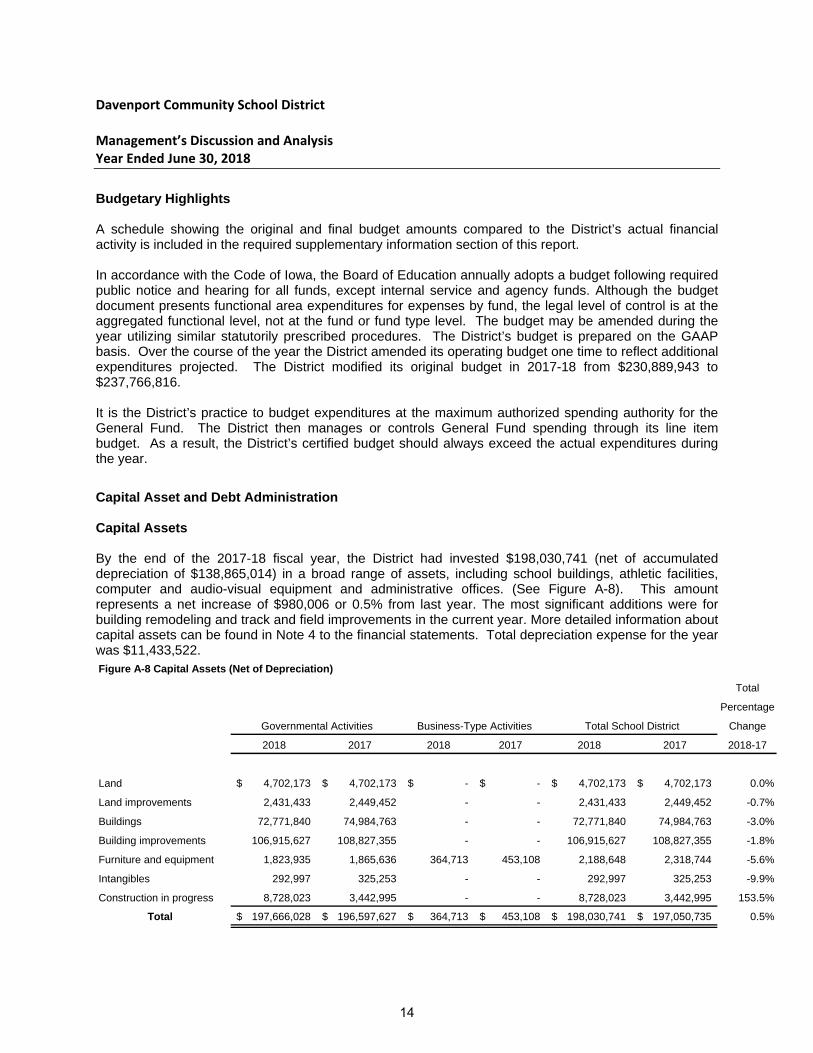
Capital Asset and Debt Administration Capital Assets By the end of the 2017-18 fiscal year, the District had invested $198,030,741 (net of accumulated depreciation of $138,865,014) in a broad range of assets, including school buildings, athletic facilities, computer and audio-visual equipment and administrative offices. (See Figure A-8). This amount represents a net increase of $980,006 or 0.5% from last year. The most significant additions were for building remodeling and track and field improvements in the current year. More detailed information about capital assets can be found in Note 4 to the financial statements. Total depreciation expense for the year was $11,433,522. Figure A-8 Capital Assets (Net of Depreciation)
Total
Percentage
Governmental Activities Business-Type Activities Total School District Change
2018 2017 2018 2017 2018 2017 2018-17
Land 4,702,173$ 4,702,173$ -$ -$ 4,702,173$ 4,702,173$ 0.0%
Land improvements 2,431,433 2,449,452 - - 2,431,433 2,449,452 -0.7%
Buildings 72,771,840 74,984,763 - - 72,771,840 74,984,763 -3.0%
Building improvements 106,915,627 108,827,355 - - 106,915,627 108,827,355 -1.8%
Furniture and equipment 1,823,935 1,865,636 364,713 453,108 2,188,648 2,318,744 -5.6%
Intangibles 292,997 325,253 - - 292,997 325,253 -9.9%
Construction in progress 8,728,023 3,442,995 - - 8,728,023 3,442,995 153.5%
Total 197,666,028$ 196,597,627$ 364,713$ 453,108$ 198,030,741$ 197,050,735$ 0.5%
14
Davenport Community School District Management’s Discussion and Analysis Year Ended June 30, 2018
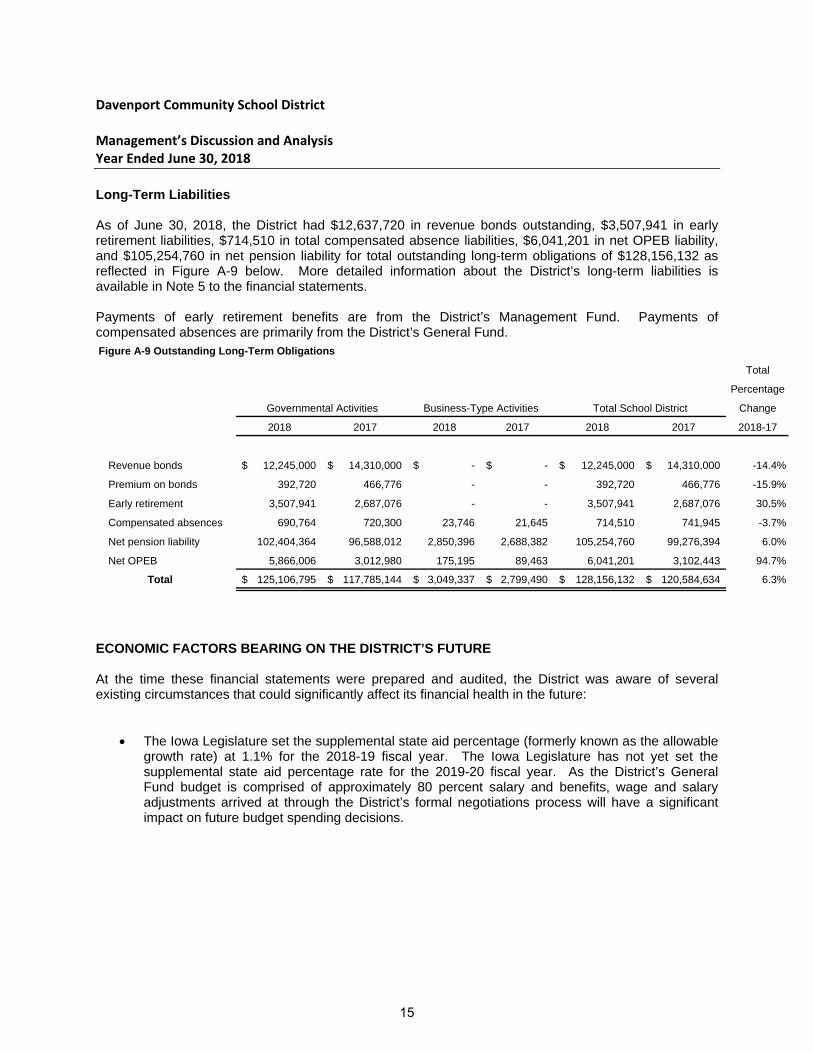
Long-Term Liabilities As of June 30, 2018, the District had $12,637,720 in revenue bonds outstanding, $3,507,941 in early retirement liabilities, $714,510 in total compensated absence liabilities, $6,041,201 in net OPEB liability, and $105,254,760 in net pension liability for total outstanding long-term obligations of $128,156,132 as reflected in Figure A-9 below. More detailed information about the District’s long-term liabilities is available in Note 5 to the financial statements. Payments of early retirement benefits are from the District’s Management Fund. Payments of compensated absences are primarily from the District’s General Fund. Figure A-9 Outstanding Long-Term Obligations
Total
Percentage
Governmental Activities Business-Type Activities Total School District Change
2018 2017 2018 2017 2018 2017 2018-17
Revenue bonds 12,245,000$ 14,310,000$ -$ -$ 12,245,000$ 14,310,000$ -14.4%
Premium on bonds 392,720 466,776 - - 392,720 466,776 -15.9%
Early retirement 3,507,941 2,687,076 - - 3,507,941 2,687,076 30.5%
Compensated absences 690,764 720,300 23,746 21,645 714,510 741,945 -3.7%
Net pension liability 102,404,364 96,588,012 2,850,396 2,688,382 105,254,760 99,276,394 6.0%
Net OPEB 5,866,006 3,012,980 175,195 89,463 6,041,201 3,102,443 94.7%
Total 125,106,795$ 117,785,144$ 3,049,337$ 2,799,490$ 128,156,132$ 120,584,634$ 6.3%
ECONOMIC FACTORS BEARING ON THE DISTRICT’S FUTURE At the time these financial statements were prepared and audited, the District was aware of several existing circumstances that could significantly affect its financial health in the future:
The Iowa Legislature set the supplemental state aid percentage (formerly known as the allowable growth rate) at 1.1% for the 2018-19 fiscal year. The Iowa Legislature has not yet set the supplemental state aid percentage rate for the 2019-20 fiscal year. As the District’s General Fund budget is comprised of approximately 80 percent salary and benefits, wage and salary adjustments arrived at through the District’s formal negotiations process will have a significant impact on future budget spending decisions.
15
Davenport Community School District Management’s Discussion and Analysis Year Ended June 30, 2018
The District ended fiscal years 2016, 2017 and 2018 with a negative unspent balance; the district spent more than allowed by the funding formula. The result is that the district is required to appear before the state’s School Budget Review Committee and present a corrective action plan identifying budget reductions that will be implemented over the next five years. It is estimated those reductions may total up to $32 million.
The District’s certified enrollment count on October 1, 2018 shows a decline in enrollment of 255
students. That equates to lost funding of approximately $1.7 million. CONTACTING THE DISTRICT’S FINANCIAL MANAGEMENT This financial report is designed to provide the District’s citizens, taxpayers, customers, and investors and creditors with a general overview of the District’s finances and to demonstrate the District’s accountability of the money it receives. If you have questions about this report or need additional financial information, contact Claudia Wood, Chief Financial Officer, Davenport Community School District, 1702 N. Main Street, Davenport, Iowa 52803
16

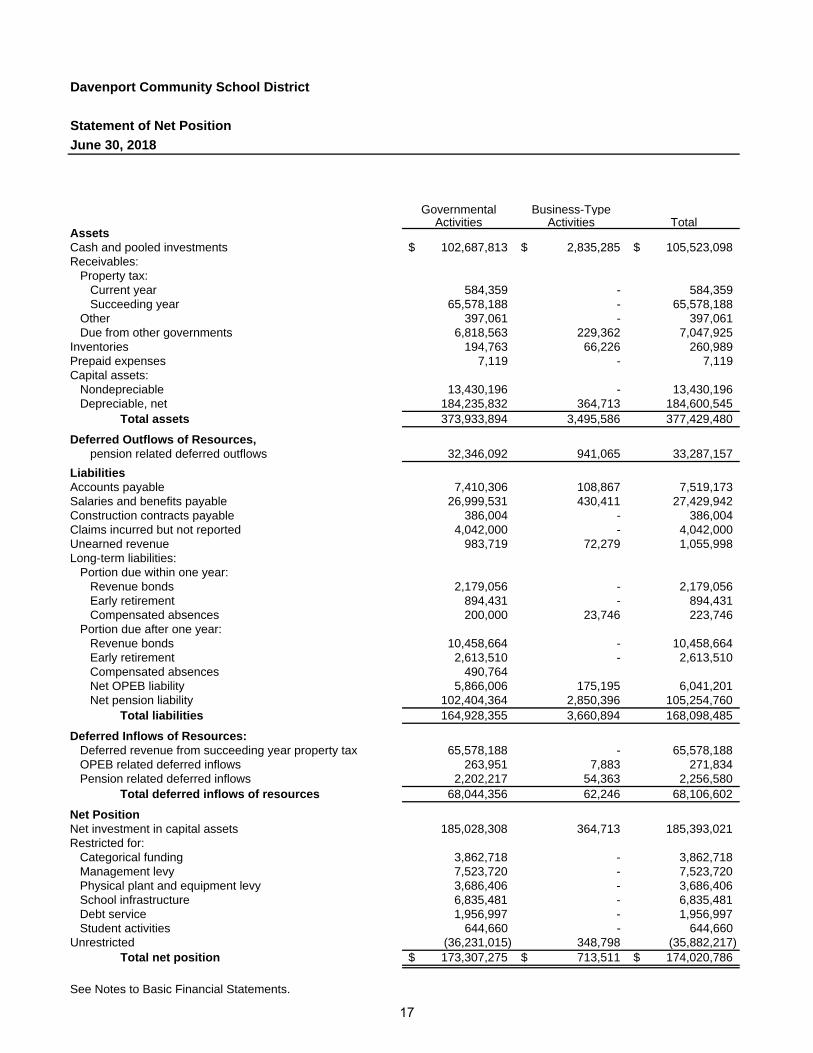
Davenport Community School District
Statement of Net Position
June 30, 2018
Governmental Business-TypeActivities Activities Total
AssetsCash and pooled investments 102,687,813$ 2,835,285$ 105,523,098$ Receivables:
Property tax:Current year 584,359 - 584,359 Succeeding year 65,578,188 - 65,578,188
Other 397,061 - 397,061 Due from other governments 6,818,563 229,362 7,047,925
Inventories 194,763 66,226 260,989 Prepaid expenses 7,119 - 7,119 Capital assets:
Nondepreciable 13,430,196 - 13,430,196 Depreciable, net 184,235,832 364,713 184,600,545
Total assets 373,933,894 3,495,586 377,429,480
Deferred Outflows of Resources,pension related deferred outflows 32,346,092 941,065 33,287,157
LiabilitiesAccounts payable 7,410,306 108,867 7,519,173 Salaries and benefits payable 26,999,531 430,411 27,429,942 Construction contracts payable 386,004 - 386,004 Claims incurred but not reported 4,042,000 - 4,042,000 Unearned revenue 983,719 72,279 1,055,998 Long-term liabilities:
Portion due within one year:Revenue bonds 2,179,056 - 2,179,056 Early retirement 894,431 - 894,431 Compensated absences 200,000 23,746 223,746
Portion due after one year:Revenue bonds 10,458,664 - 10,458,664 Early retirement 2,613,510 - 2,613,510 Compensated absences 490,764 Net OPEB liability 5,866,006 175,195 6,041,201 Net pension liability 102,404,364 2,850,396 105,254,760
Total liabilities 164,928,355 3,660,894 168,098,485
Deferred Inflows of Resources:Deferred revenue from succeeding year property tax 65,578,188 - 65,578,188 OPEB related deferred inflows 263,951 7,883 271,834 Pension related deferred inflows 2,202,217 54,363 2,256,580
Total deferred inflows of resources 68,044,356 62,246 68,106,602
Net PositionNet investment in capital assets 185,028,308 364,713 185,393,021 Restricted for:
Categorical funding 3,862,718 - 3,862,718 Management levy 7,523,720 - 7,523,720 Physical plant and equipment levy 3,686,406 - 3,686,406 School infrastructure 6,835,481 - 6,835,481 Debt service 1,956,997 - 1,956,997 Student activities 644,660 - 644,660
Unrestricted (36,231,015) 348,798 (35,882,217) Total net position 173,307,275$ 713,511$ 174,020,786$
See Notes to Basic Financial Statements.
17
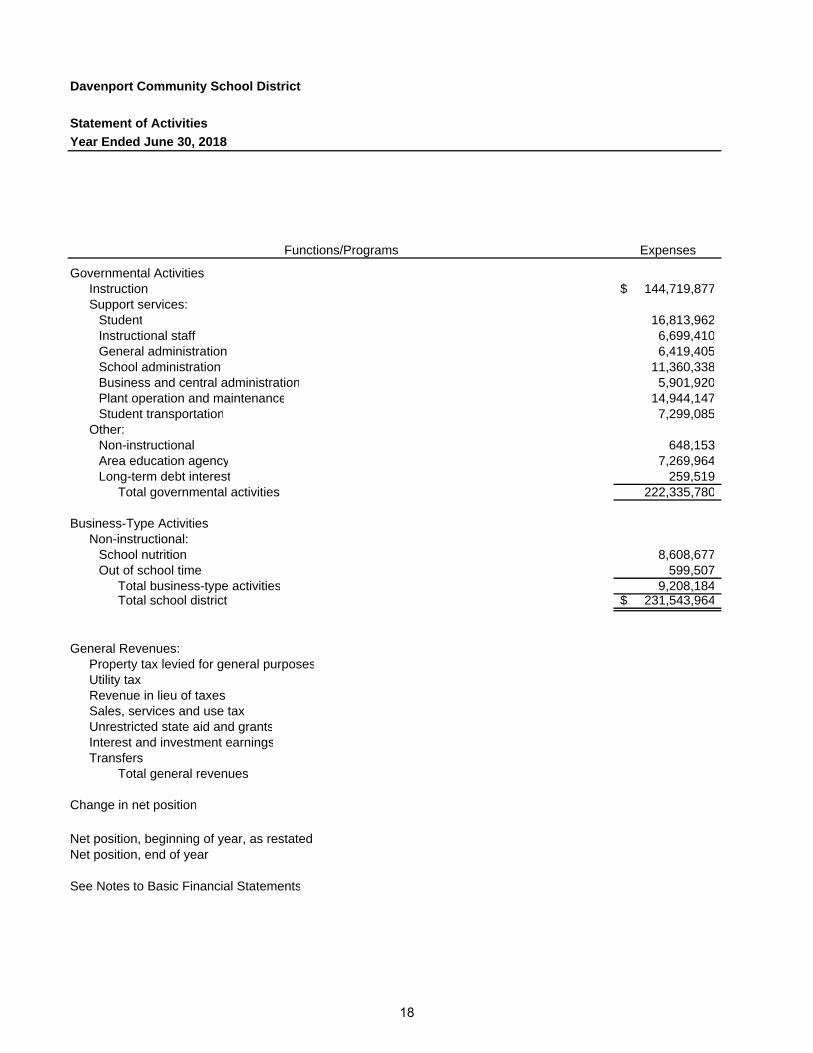
Davenport Community School District
Statement of Activities
Year Ended June 30, 2018
Functions/Programs Expenses
Governmental ActivitiesInstruction 144,719,877$ Support services:
Student 16,813,962 Instructional staff 6,699,410 General administration 6,419,405 School administration 11,360,338 Business and central administration 5,901,920 Plant operation and maintenance 14,944,147 Student transportation 7,299,085
Other:Non-instructional 648,153 Area education agency 7,269,964 Long-term debt interest 259,519
Total governmental activities 222,335,780
Business-Type ActivitiesNon-instructional:
School nutrition 8,608,677 Out of school time 599,507
Total business-type activities 9,208,184 Total school district 231,543,964$
General Revenues:Property tax levied for general purposesUtility taxRevenue in lieu of taxesSales, services and use taxUnrestricted state aid and grantsInterest and investment earningsTransfers
Total general revenues
Change in net position
Net position, beginning of year, as restatedNet position, end of year
See Notes to Basic Financial Statements
18
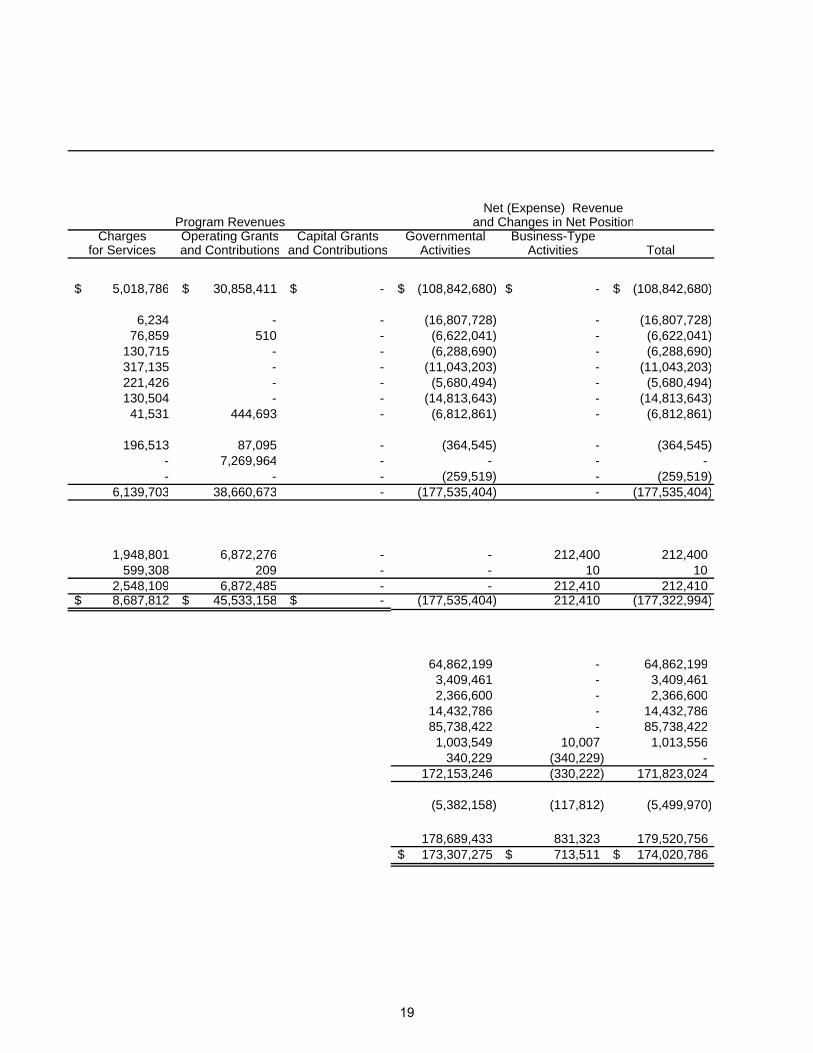
Net (Expense) RevenueProgram Revenues and Changes in Net Position
Charges Operating Grants Capital Grants Governmental Business-Typefor Services and Contributions and Contributions Activities Activities Total
5,018,786$ 30,858,411$ -$ (108,842,680)$ -$ (108,842,680)$
6,234 - - (16,807,728) - (16,807,728) 76,859 510 - (6,622,041) - (6,622,041)
130,715 - - (6,288,690) - (6,288,690) 317,135 - - (11,043,203) - (11,043,203) 221,426 - - (5,680,494) - (5,680,494) 130,504 - - (14,813,643) - (14,813,643) 41,531 444,693 - (6,812,861) - (6,812,861)
196,513 87,095 - (364,545) - (364,545) - 7,269,964 - - - - - - - (259,519) - (259,519)
6,139,703 38,660,673 - (177,535,404) - (177,535,404)
1,948,801 6,872,276 - - 212,400 212,400 599,308 209 - - 10 10
2,548,109 6,872,485 - - 212,410 212,410 8,687,812$ 45,533,158$ -$ (177,535,404) 212,410 (177,322,994)
64,862,199 - 64,862,199 3,409,461 - 3,409,461 2,366,600 - 2,366,600
14,432,786 - 14,432,786 85,738,422 - 85,738,422 1,003,549 10,007 1,013,556
340,229 (340,229) - 172,153,246 (330,222) 171,823,024
(5,382,158) (117,812) (5,499,970)
178,689,433 831,323 179,520,756 173,307,275$ 713,511$ 174,020,786$
19
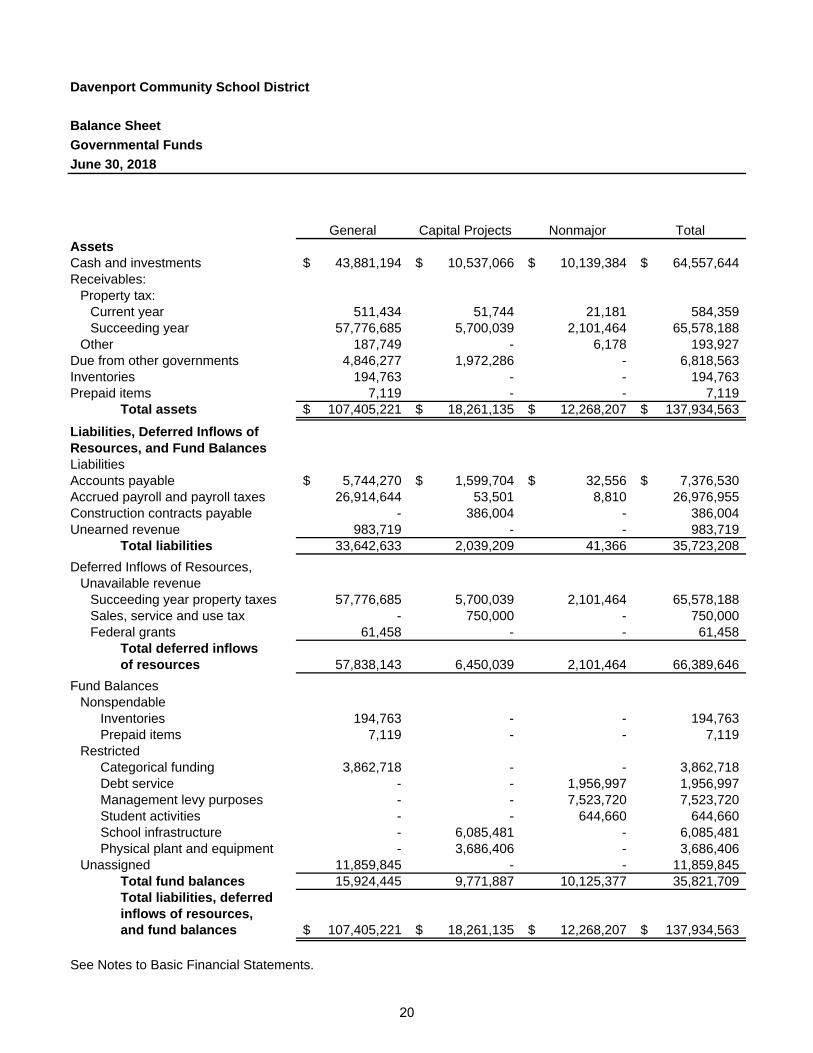
Davenport Community School District
Balance Sheet
Governmental Funds
June 30, 2018
General Capital Projects Nonmajor TotalAssetsCash and investments 43,881,194$ 10,537,066$ 10,139,384$ 64,557,644$ Receivables:
Property tax:Current year 511,434 51,744 21,181 584,359 Succeeding year 57,776,685 5,700,039 2,101,464 65,578,188
Other 187,749 - 6,178 193,927 Due from other governments 4,846,277 1,972,286 - 6,818,563 Inventories 194,763 - - 194,763 Prepaid items 7,119 - - 7,119
Total assets 107,405,221$ 18,261,135$ 12,268,207$ 137,934,563$
Liabilities, Deferred Inflows ofResources, and Fund BalancesLiabilitiesAccounts payable 5,744,270$ 1,599,704$ 32,556$ 7,376,530$ Accrued payroll and payroll taxes 26,914,644 53,501 8,810 26,976,955 Construction contracts payable - 386,004 - 386,004 Unearned revenue 983,719 - - 983,719
Total liabilities 33,642,633 2,039,209 41,366 35,723,208
Deferred Inflows of Resources,Unavailable revenue
Succeeding year property taxes 57,776,685 5,700,039 2,101,464 65,578,188 Sales, service and use tax - 750,000 - 750,000 Federal grants 61,458 - - 61,458
Total deferred inflowsof resources 57,838,143 6,450,039 2,101,464 66,389,646
Fund BalancesNonspendable
Inventories 194,763 - - 194,763 Prepaid items 7,119 - - 7,119
RestrictedCategorical funding 3,862,718 - - 3,862,718 Debt service - - 1,956,997 1,956,997 Management levy purposes - - 7,523,720 7,523,720 Student activities - - 644,660 644,660 School infrastructure - 6,085,481 - 6,085,481 Physical plant and equipment - 3,686,406 - 3,686,406
Unassigned 11,859,845 - - 11,859,845 Total fund balances 15,924,445 9,771,887 10,125,377 35,821,709 Total liabilities, deferredinflows of resources,and fund balances 107,405,221$ 18,261,135$ 12,268,207$ 137,934,563$
See Notes to Basic Financial Statements.
20
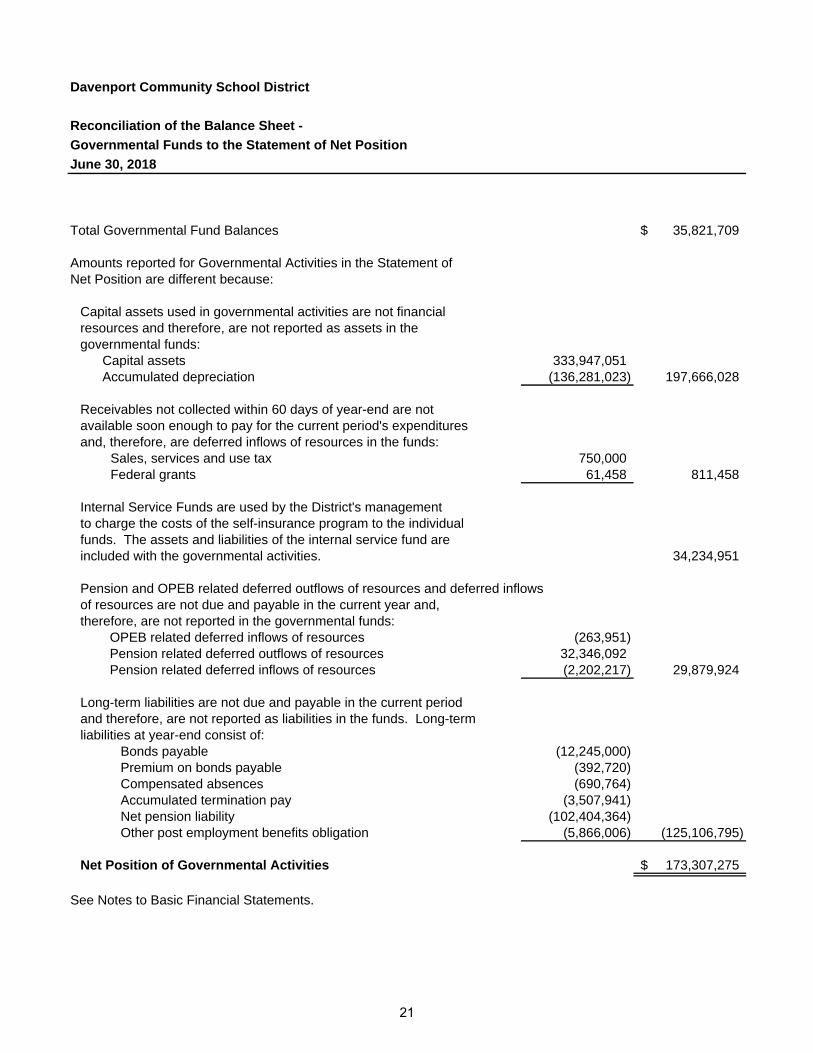
Davenport Community School District
Reconciliation of the Balance Sheet -
Governmental Funds to the Statement of Net Position
June 30, 2018
Total Governmental Fund Balances 35,821,709$
Amounts reported for Governmental Activities in the Statement ofNet Position are different because:
Capital assets used in governmental activities are not financial resources and therefore, are not reported as assets in the governmental funds: Capital assets 333,947,051 Accumulated depreciation (136,281,023) 197,666,028
Receivables not collected within 60 days of year-end are notavailable soon enough to pay for the current period's expenditures and, therefore, are deferred inflows of resources in the funds:
Sales, services and use tax 750,000 Federal grants 61,458 811,458
Internal Service Funds are used by the District's managementto charge the costs of the self-insurance program to the individualfunds. The assets and liabilities of the internal service fund are included with the governmental activities. 34,234,951
Pension and OPEB related deferred outflows of resources and deferred inflows of resources are not due and payable in the current year and,therefore, are not reported in the governmental funds: OPEB related deferred inflows of resources (263,951) Pension related deferred outflows of resources 32,346,092 Pension related deferred inflows of resources (2,202,217) 29,879,924
Long-term liabilities are not due and payable in the current period and therefore, are not reported as liabilities in the funds. Long-termliabilities at year-end consist of:
Bonds payable (12,245,000) Premium on bonds payable (392,720) Compensated absences (690,764) Accumulated termination pay (3,507,941) Net pension liability (102,404,364) Other post employment benefits obligation (5,866,006) (125,106,795)
Net Position of Governmental Activities 173,307,275$
See Notes to Basic Financial Statements.
21
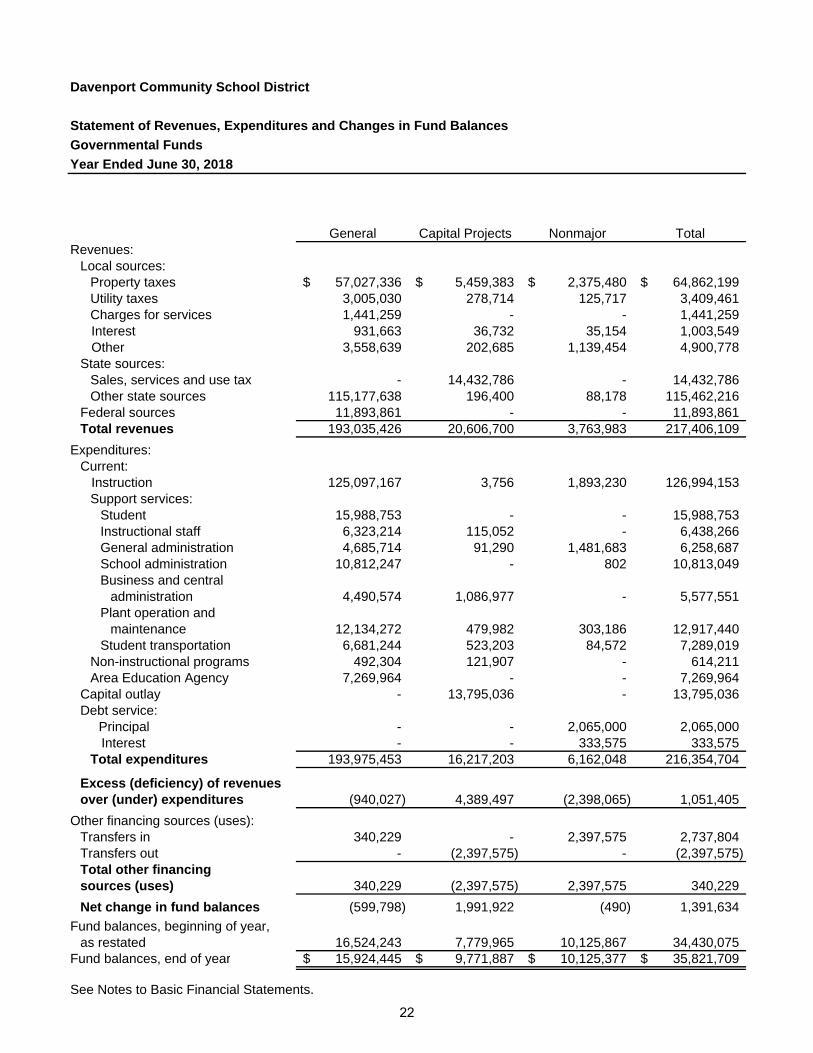
Davenport Community School District
Statement of Revenues, Expenditures and Changes in Fund Balances
Governmental Funds
Year Ended June 30, 2018
General Capital Projects Nonmajor TotalRevenues:
Local sources:Property taxes 57,027,336$ 5,459,383$ 2,375,480$ 64,862,199$ Utility taxes 3,005,030 278,714 125,717 3,409,461 Charges for services 1,441,259 - - 1,441,259
Interest 931,663 36,732 35,154 1,003,549 Other 3,558,639 202,685 1,139,454 4,900,778 State sources:
Sales, services and use tax - 14,432,786 - 14,432,786 Other state sources 115,177,638 196,400 88,178 115,462,216
Federal sources 11,893,861 - - 11,893,861 Total revenues 193,035,426 20,606,700 3,763,983 217,406,109
Expenditures:Current: Instruction 125,097,167 3,756 1,893,230 126,994,153
Support services:Student 15,988,753 - - 15,988,753 Instructional staff 6,323,214 115,052 - 6,438,266 General administration 4,685,714 91,290 1,481,683 6,258,687 School administration 10,812,247 - 802 10,813,049 Business and central
administration 4,490,574 1,086,977 - 5,577,551 Plant operation and
maintenance 12,134,272 479,982 303,186 12,917,440 Student transportation 6,681,244 523,203 84,572 7,289,019
Non-instructional programs 492,304 121,907 - 614,211 Area Education Agency 7,269,964 - - 7,269,964
Capital outlay - 13,795,036 - 13,795,036 Debt service: Principal - - 2,065,000 2,065,000
Interest - - 333,575 333,575 Total expenditures 193,975,453 16,217,203 6,162,048 216,354,704
Excess (deficiency) of revenuesover (under) expenditures (940,027) 4,389,497 (2,398,065) 1,051,405
Other financing sources (uses):Transfers in 340,229 - 2,397,575 2,737,804 Transfers out - (2,397,575) - (2,397,575) Total other financingsources (uses) 340,229 (2,397,575) 2,397,575 340,229
Net change in fund balances (599,798) 1,991,922 (490) 1,391,634
Fund balances, beginning of year,as restated 16,524,243 7,779,965 10,125,867 34,430,075
Fund balances, end of year 15,924,445$ 9,771,887$ 10,125,377$ 35,821,709$
See Notes to Basic Financial Statements.
22
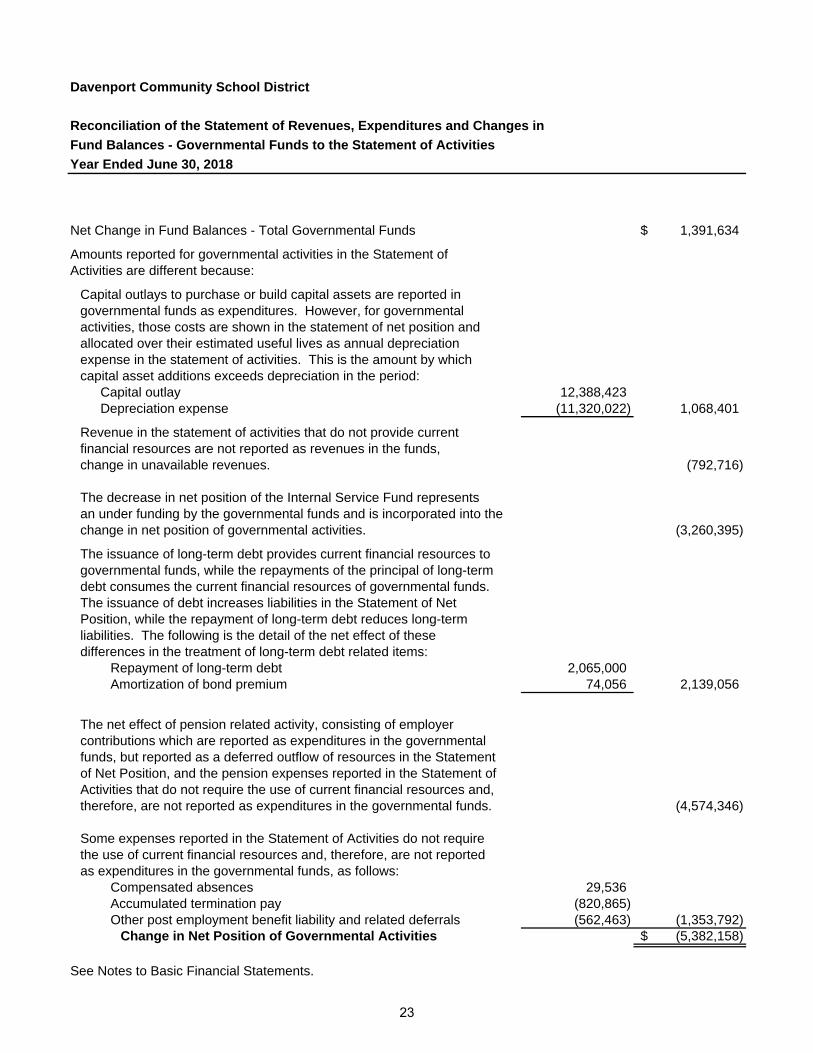
Davenport Community School District
Reconciliation of the Statement of Revenues, Expenditures and Changes in
Fund Balances - Governmental Funds to the Statement of Activities
Year Ended June 30, 2018
Net Change in Fund Balances - Total Governmental Funds 1,391,634$
Amounts reported for governmental activities in the Statement ofActivities are different because:
Capital outlays to purchase or build capital assets are reported in governmental funds as expenditures. However, for governmentalactivities, those costs are shown in the statement of net position andallocated over their estimated useful lives as annual depreciationexpense in the statement of activities. This is the amount by whichcapital asset additions exceeds depreciation in the period:
Capital outlay 12,388,423 Depreciation expense (11,320,022) 1,068,401
Revenue in the statement of activities that do not provide currentfinancial resources are not reported as revenues in the funds, change in unavailable revenues. (792,716)
The decrease in net position of the Internal Service Fund representsan under funding by the governmental funds and is incorporated into thechange in net position of governmental activities. (3,260,395)
The issuance of long-term debt provides current financial resources togovernmental funds, while the repayments of the principal of long-termdebt consumes the current financial resources of governmental funds.The issuance of debt increases liabilities in the Statement of NetPosition, while the repayment of long-term debt reduces long-termliabilities. The following is the detail of the net effect of these differences in the treatment of long-term debt related items:
Repayment of long-term debt 2,065,000 Amortization of bond premium 74,056 2,139,056
The net effect of pension related activity, consisting of employercontributions which are reported as expenditures in the governmentalfunds, but reported as a deferred outflow of resources in the Statementof Net Position, and the pension expenses reported in the Statement ofActivities that do not require the use of current financial resources and,therefore, are not reported as expenditures in the governmental funds. (4,574,346)
Some expenses reported in the Statement of Activities do not requirethe use of current financial resources and, therefore, are not reportedas expenditures in the governmental funds, as follows:
Compensated absences 29,536 Accumulated termination pay (820,865) Other post employment benefit liability and related deferrals (562,463) (1,353,792)
Change in Net Position of Governmental Activities (5,382,158)$
See Notes to Basic Financial Statements.
23
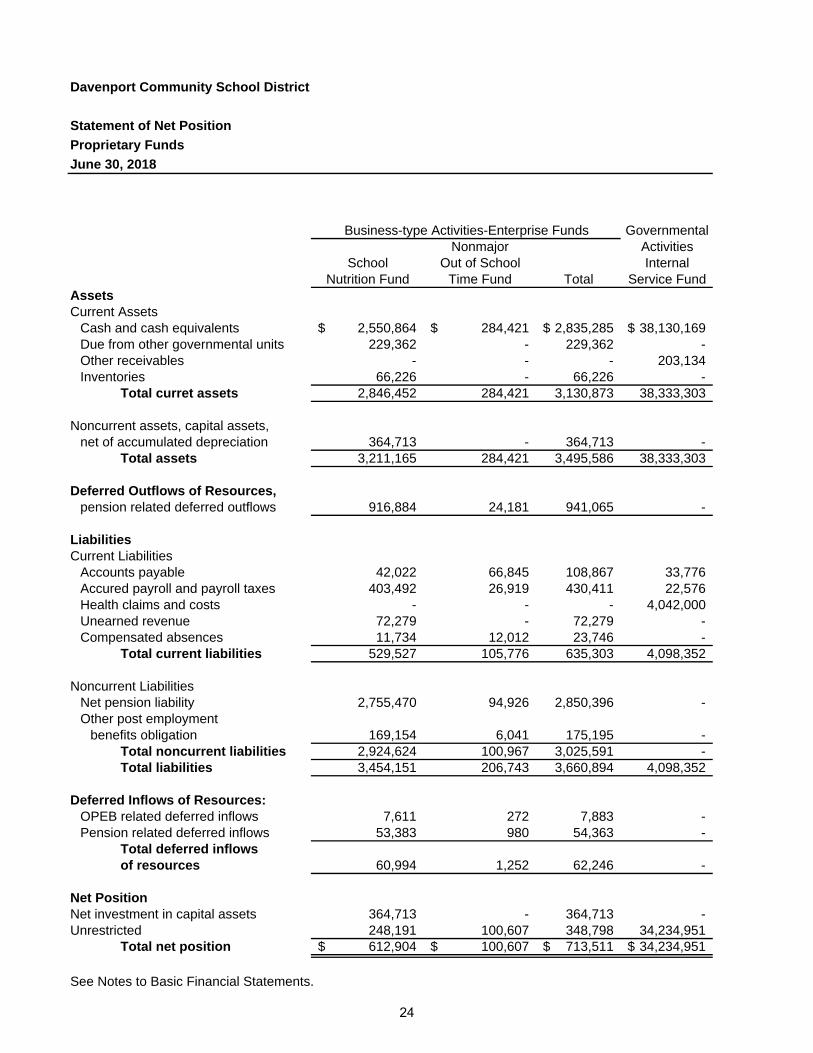
Davenport Community School District
Statement of Net Position
Proprietary Funds
June 30, 2018
GovernmentalNonmajor Activities
School Out of School InternalNutrition Fund Time Fund Total Service Fund
AssetsCurrent Assets
Cash and cash equivalents 2,550,864$ 284,421$ 2,835,285$ 38,130,169$ Due from other governmental units 229,362 - 229,362 - Other receivables - - - 203,134 Inventories 66,226 - 66,226 -
Total curret assets 2,846,452 284,421 3,130,873 38,333,303
Noncurrent assets, capital assets, net of accumulated depreciation 364,713 - 364,713 -
Total assets 3,211,165 284,421 3,495,586 38,333,303
Deferred Outflows of Resources,pension related deferred outflows 916,884 24,181 941,065 -
LiabilitiesCurrent Liabilities
Accounts payable 42,022 66,845 108,867 33,776 Accured payroll and payroll taxes 403,492 26,919 430,411 22,576 Health claims and costs - - - 4,042,000 Unearned revenue 72,279 - 72,279 - Compensated absences 11,734 12,012 23,746 -
Total current liabilities 529,527 105,776 635,303 4,098,352
Noncurrent LiabilitiesNet pension liability 2,755,470 94,926 2,850,396 - Other post employment
benefits obligation 169,154 6,041 175,195 - Total noncurrent liabilities 2,924,624 100,967 3,025,591 - Total liabilities 3,454,151 206,743 3,660,894 4,098,352
Deferred Inflows of Resources:OPEB related deferred inflows 7,611 272 7,883 - Pension related deferred inflows 53,383 980 54,363 -
Total deferred inflowsof resources 60,994 1,252 62,246 -
Net PositionNet investment in capital assets 364,713 - 364,713 - Unrestricted 248,191 100,607 348,798 34,234,951
Total net position 612,904$ 100,607$ 713,511$ 34,234,951$
See Notes to Basic Financial Statements.
Business-type Activities-Enterprise Funds
24
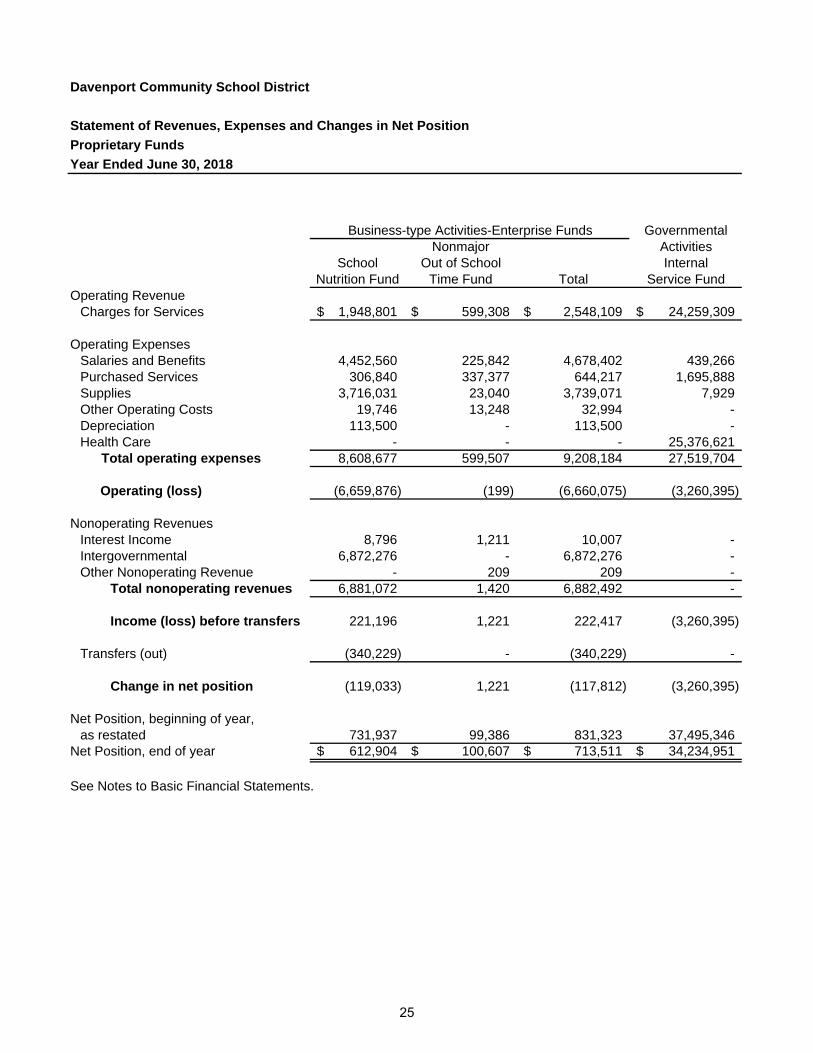
Davenport Community School District
Statement of Revenues, Expenses and Changes in Net Position
Proprietary Funds
Year Ended June 30, 2018
GovernmentalNonmajor Activities
School Out of School InternalNutrition Fund Time Fund Total Service Fund
Operating RevenueCharges for Services 1,948,801$ 599,308$ 2,548,109$ 24,259,309$
Operating ExpensesSalaries and Benefits 4,452,560 225,842 4,678,402 439,266 Purchased Services 306,840 337,377 644,217 1,695,888 Supplies 3,716,031 23,040 3,739,071 7,929 Other Operating Costs 19,746 13,248 32,994 - Depreciation 113,500 - 113,500 - Health Care - - - 25,376,621
Total operating expenses 8,608,677 599,507 9,208,184 27,519,704
Operating (loss) (6,659,876) (199) (6,660,075) (3,260,395)
Nonoperating RevenuesInterest Income 8,796 1,211 10,007 - Intergovernmental 6,872,276 - 6,872,276 - Other Nonoperating Revenue - 209 209 -
Total nonoperating revenues 6,881,072 1,420 6,882,492 -
Income (loss) before transfers 221,196 1,221 222,417 (3,260,395)
Transfers (out) (340,229) - (340,229) -
Change in net position (119,033) 1,221 (117,812) (3,260,395)
Net Position, beginning of year,as restated 731,937 99,386 831,323 37,495,346
Net Position, end of year 612,904$ 100,607$ 713,511$ 34,234,951$
See Notes to Basic Financial Statements.
Business-type Activities-Enterprise Funds
25
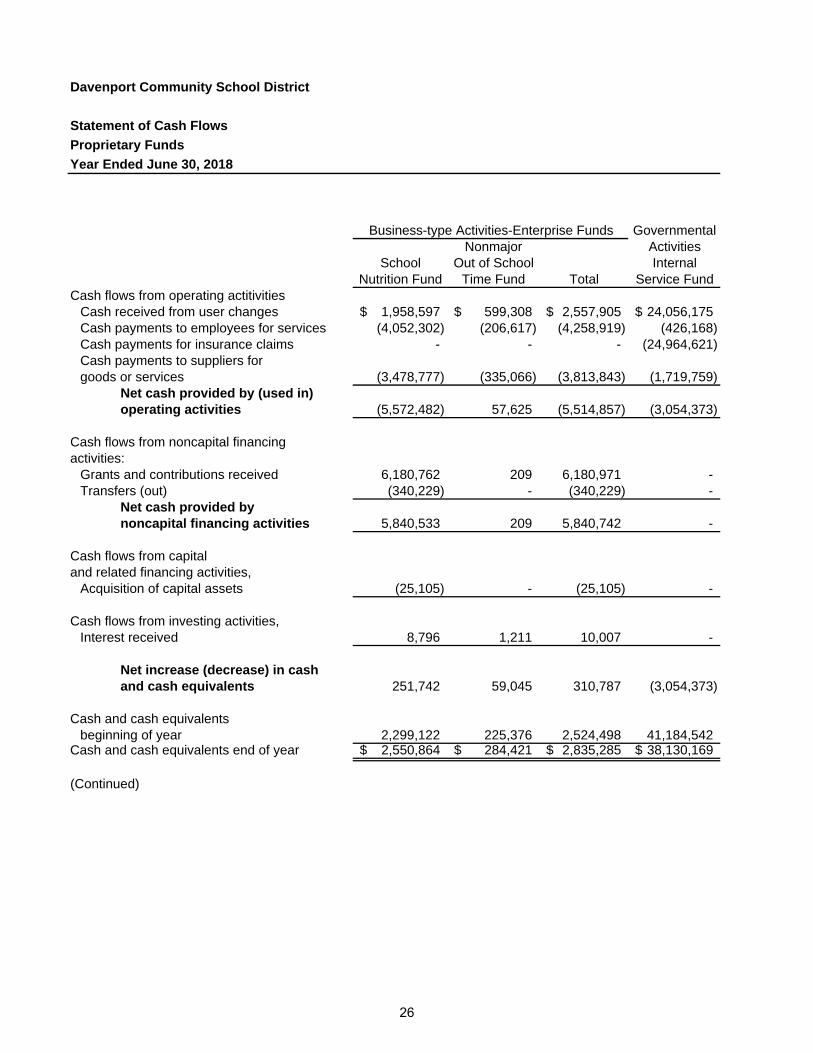
Davenport Community School District
Statement of Cash Flows
Proprietary Funds
Year Ended June 30, 2018
GovernmentalNonmajor Activities
School Out of School InternalNutrition Fund Time Fund Total Service Fund
Cash flows from operating actitivitiesCash received from user changes 1,958,597$ 599,308$ 2,557,905$ 24,056,175$ Cash payments to employees for services (4,052,302) (206,617) (4,258,919) (426,168) Cash payments for insurance claims - - - (24,964,621) Cash payments to suppliers for goods or services (3,478,777) (335,066) (3,813,843) (1,719,759)
Net cash provided by (used in)operating activities (5,572,482) 57,625 (5,514,857) (3,054,373)
Cash flows from noncapital financing activities:
Grants and contributions received 6,180,762 209 6,180,971 - Transfers (out) (340,229) - (340,229) -
Net cash provided bynoncapital financing activities 5,840,533 209 5,840,742 -
Cash flows from capital and related financing activities,
Acquisition of capital assets (25,105) - (25,105) -
Cash flows from investing activities,Interest received 8,796 1,211 10,007 -
Net increase (decrease) in cash and cash equivalents 251,742 59,045 310,787 (3,054,373)
Cash and cash equivalents beginning of year 2,299,122 225,376 2,524,498 41,184,542
Cash and cash equivalents end of year 2,550,864$ 284,421$ 2,835,285$ 38,130,169$
(Continued)
Business-type Activities-Enterprise Funds
26
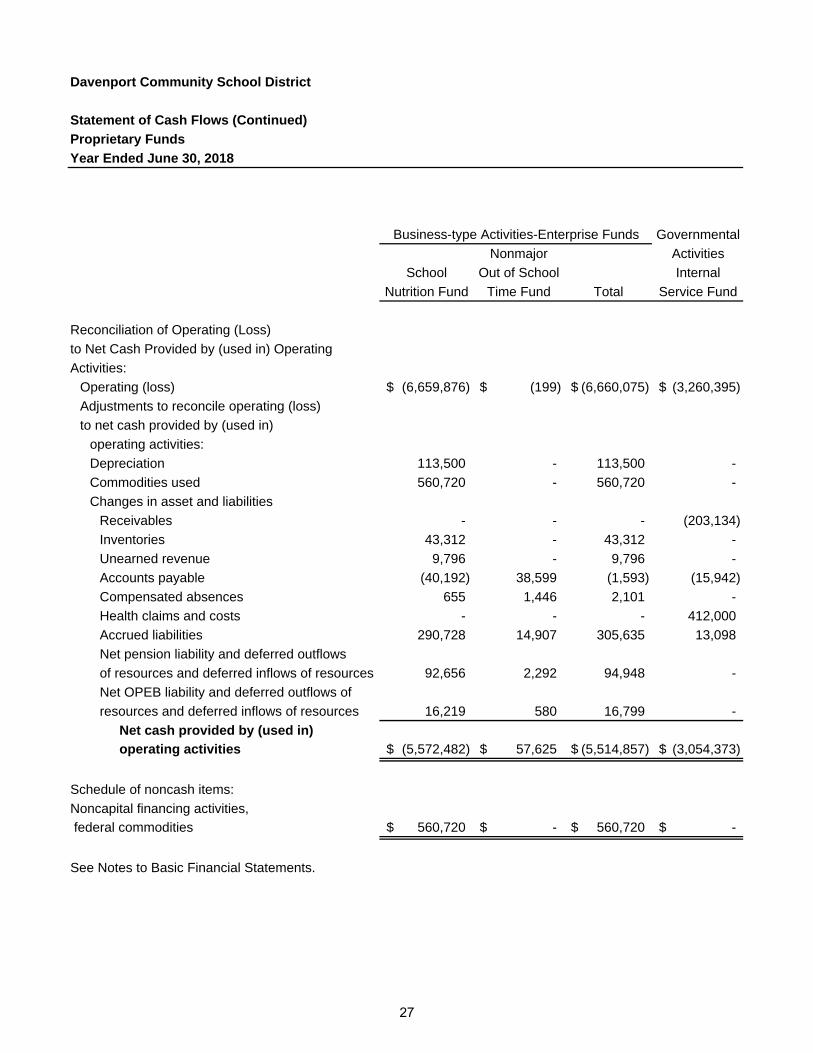
Davenport Community School District
Statement of Cash Flows (Continued)
Proprietary Funds
Year Ended June 30, 2018
Governmental
Nonmajor Activities
School Out of School Internal
Nutrition Fund Time Fund Total Service Fund
Reconciliation of Operating (Loss)
to Net Cash Provided by (used in) Operating
Activities:
Operating (loss) (6,659,876)$ (199)$ (6,660,075)$ (3,260,395)$
Adjustments to reconcile operating (loss)
to net cash provided by (used in)
operating activities:
Depreciation 113,500 - 113,500 -
Commodities used 560,720 - 560,720 -
Changes in asset and liabilities
Receivables - - - (203,134)
Inventories 43,312 - 43,312 -
Unearned revenue 9,796 - 9,796 -
Accounts payable (40,192) 38,599 (1,593) (15,942)
Compensated absences 655 1,446 2,101 -
Health claims and costs - - - 412,000
Accrued liabilities 290,728 14,907 305,635 13,098
Net pension liability and deferred outflows
of resources and deferred inflows of resources 92,656 2,292 94,948 -
Net OPEB liability and deferred outflows of
resources and deferred inflows of resources 16,219 580 16,799 -
Net cash provided by (used in)
operating activities (5,572,482)$ 57,625$ (5,514,857)$ (3,054,373)$
Schedule of noncash items:
Noncapital financing activities,
federal commodities 560,720$ -$ 560,720$ -$
See Notes to Basic Financial Statements.
Business-type Activities-Enterprise Funds
27
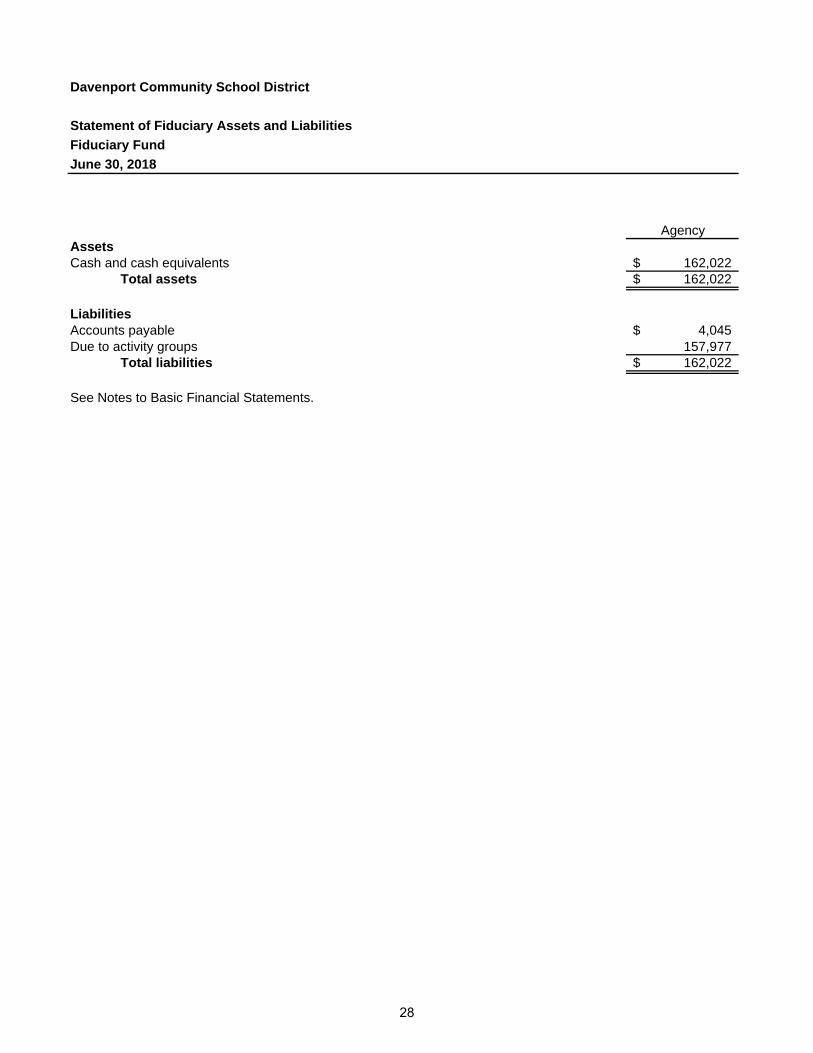
Davenport Community School District
Statement of Fiduciary Assets and Liabilities
Fiduciary Fund
June 30, 2018
AgencyAssetsCash and cash equivalents 162,022$
Total assets 162,022$
LiabilitiesAccounts payable 4,045$ Due to activity groups 157,977
Total liabilities 162,022$
See Notes to Basic Financial Statements.
28
Davenport Community School District Notes to Basic Financial Statements Year Ended June 30, 2018
Note 1. Nature of Operations, Reporting Entity, Measurement Focus, Basis of Accounting and Financial Statement Presentation and Significant Accounting Policies
Nature of Operations The Davenport Community School District (the District) is a political subdivision of the state of Iowa and operates public schools for children in grades pre-school through twelve. The geographic area served includes the cities of Davenport, Blue Grass, Walcott and Buffalo, Iowa, and portions of the agricultural territory in Scott and Muscatine Counties. The District is governed by a Board of Education whose members are elected on a nonpartisan basis. The District is composed of four high schools, four intermediate schools, one K-8 schools, 17 elementary schools and various off-campus alternative education programs. Student enrollment (pre-school through high school) for the 2017-2018 school year was approximately 15,490 regular and special education students. The District employs approximately 2,300 individuals.
Reporting Entity
For financial reporting purposes, the District has considered all potential component units for which it is financially accountable and other organizations for which the nature and significance of their relationship with the District are such that exclusion would cause the District’s financial statements to be misleading or incomplete. The Governmental Accounting Standards Board (GASB) has set forth criteria to be considered in determining financial accountability. These criteria are: a) appointing a voting majority of an organization’s governing board, and b) the ability of the District to impose its will on that organization or b) the potential for the organization to provide specific benefits to, or impose specific financial burdens on, the District; and c) fiscal dependency. The District has no component units which meet the GASB criteria.
Measurement Focus, Basis of Accounting and Financial Statement Presentation These financial statements have been prepared in conformity with the accounting principles generally accepted in the United States of America (GAAP) that apply to governmental units. The Governmental Accounting Standards Board (GASB) is the accepted standard-setting body for establishing governmental accounting and financial reporting principles. The accounts of the District are organized and operated on the basis of funds. A fund is an independent fiscal and accounting entity with a self-balancing set of accounts. Fund accounting segregates funds according to their intended purpose and is used to aid management in demonstrating compliance with finance-related legal and contractual provisions. The minimum number of funds are maintained consistent with legal and managerial requirements. The District has the following fund types: Governmental Funds – are used to account for the District’s general governmental activities. Governmental fund types use the flow of current financial resources measurement focus and the modified accrual basis of accounting. Under the modified accrual basis of accounting, revenues are recognized when susceptible to accrual (i.e., when they are “measurable and available”). “Measurable” means that the amount of the transaction can be determined and “available” means collected within the current period or expected to be collected soon enough thereafter to pay liabilities of the current period. The District considers all revenues to be available if they are collected within 60 days after year-end.
29
Davenport Community School District Notes to Basic Financial Statements Year Ended June 30, 2018
Note 1. Nature of Operations, Reporting Entity, Measurement Focus, Basis of Accounting and Financial Statement Presentation and Significant Accounting Policies (Continued)
Property taxes, sales taxes and service charges are susceptible to accrual. Other taxes collected and being held by the state or other levying authority at year-end on behalf of the District are recognized as revenue. Intergovernmental revenues are considered to be measurable and are recognized as revenue if available and when eligibility requirements have been met. Other receipts become measurable and available when cash is received by the District and are recognized as revenue at that time. Expenditures are recorded when the related fund liability is incurred, except for certain long-term obligations including debt service principal and interest, compensated absences, and claims and judgments. Expenditures related to such liabilities are only recognized under modified accrual accounting when they mature (when due). GASB Statement No. 34 sets forth the minimum criteria for the determination of major funds. If a fund’s assets and deferred outflows of resources, liabilities and deferred inflows of resources, revenues or expenditures/expenses are at least 10 percent of those of its fund type and at least 5 percent of those of both governmental and enterprise fund types, then it must be a major fund. The District also elects to report the School Nutrition Funds as major fund. This fund does not meet the percentage test, but is considered of special interest to the Board of Education and the community. The District reports the following major governmental funds: General Fund: is the District’s primary operating fund. It is used to account for and report all financial resources not accounted for and reported in another fund. Capital Projects Fund: accounts for acquisition of capital assets or construction of major capital projects not being financed by proprietary or fiduciary funds. The other governmental funds of the District are considered nonmajor and are as follows: The special revenue funds account for and report the proceeds of specific revenue sources that are restricted or committed to expenditure for specified purposes other than debt service or capital projects. The Debt Service Fund is utilized to account for property tax and other revenues to be used for the payment of interest and principal on the District’s general long-term debt. Proprietary Funds – are accounted for using the flow of economic resources measurement focus and the full accrual basis of accounting. Under this method, revenues are recognized when earned and expenses are recognized at the time the liabilities are incurred. Proprietary funds distinguish operating revenues and expenses from nonoperating items. Operating revenues and expenses generally result from providing services and producing and delivering goods in connection with a proprietary fund’s principle ongoing operations. The principal operating revenues from the District’s proprietary funds are charges to customers for sales and services. Operating expenses for the proprietary funds include cost of personnel services, contractual services, operating supplies, self-insurance claims and depreciation on capital assets. All revenues and expenses not meeting this definition are reported as nonoperating revenues and expenses.
30
Davenport Community School District Notes to Basic Financial Statements Year Ended June 30, 2018
Note 1. Nature of Operations, Reporting Entity, Measurement Focus, Basis of Accounting and Financial Statement Presentation and Significant Accounting Policies (Continued)
The District reports the following major proprietary fund: School Nutrition Fund – accounts for the activities of the District’s school lunch, breakfast and summer fund programs. This fund is reported as major for public interest purposes. The District also reports the Out of School Time Fund as a nonmajor enterprise fund. This fund accounts for before and after school programs. Additionally, internal service fund type consists of the Self-Insurance Fund, which accounts for the financing of services provided by one department or other departments of the District on a cost reimbursement basis. The District uses the fund for the purpose of providing self-insurance for medical, dental and vision claims. Fiduciary Funds – account for assets held by the District in a trustee or agency capacity for the benefit of others and cannot be used to support District activities. Fiduciary funds, other than agency funds, use the economic resources measurement focus and the full accrual basis of accounting. Agency funds use the full accrual basis of accounting but do not have a measurement focus and, therefore, report only assets and liabilities. The District reports an Agency Fund to account for assets held by the District as an agent for individuals, private organizations and other governments, which includes assets held for staff activities not funded by the District. The basic financial statements include the government-wide financial statements (based on the District as a whole) and the fund financial statements. The government-wide statements present consolidated information from both the governmental and business-type activities using the economic resource measurement focus and the accrual basis of accounting. The government-wide statements are the statement of net position and the statement of activities. The statement of activities presents, for each District activity, the extent to which direct expenses are being supported by program revenues or by general revenues. Direct expenses are those that are clearly identifiable with the specific activity (including depreciation). Program revenues are charges for services, grants, contributions, or other revenues that are either restricted for use or are directly associated with the particular activity. General revenues include interest, taxes and other revenues used to support the District’s operations that are not directly associated with a particular activity. Governmental activities in the government-wide statements include the operations from the governmental funds: the General Fund, the special revenue funds, Debt Service Fund, and Capital Projects Fund adjusted from the modified accrual to the full accrual basis of accounting. Governmental activities also include the activities from the Internal Service Fund. Business-type activities in the government-wide statements are comprised of the enterprise funds. Fiduciary funds are not reported in the government-wide statements because these funds cannot be used to support District activities. As a general rule, interfund activity has been eliminated from the government-wide statements. However, interfund services provided and used are not eliminated. Elimination of these changes would distort the direct costs and program revenues reported for the various functions concerned. In addition, certain indirect costs are included in program expenses reported for individual functions and activities.
31
Davenport Community School District Notes to Basic Financial Statements Year Ended June 30, 2018
Note 1. Nature of Operations, Reporting Entity, Measurement Focus, Basis of Accounting and Financial Statement Presentation and Significant Accounting Policies (Continued)
The fund financial statements present the District’s activities at the fund level rather than on a government-wide basis. The fund financial statements report the governmental funds using the modified accrual basis of accounting and proprietary funds using the full accrual basis of accounting. Fund financial statements also include a statement for the fiduciary funds. The fund financial statements for both the governmental and the proprietary funds report the major funds individually and the nonmajor funds combined. The Internal Service Fund is shown at the far right of the proprietary fund financial statements. The modified accrual basis of accounting as employed by the governmental funds and full accrual basis of accounting as employed by the proprietary and fiduciary funds have numerous timing and treatment differences. Differences include the recording of long-term liabilities, the recording of capital asset purchases and disposals and the timing of recognized revenues. Reconciliations are provided for governmental funds to reconcile fund balance to net position and to reconcile the changes in fund balance to the changes in net position. These reconciliations are a part of the fund financial statements. Significant Accounting Policies Pass-Through Revenues – GASB Statement No. 24 establishes standards of accounting and financial reporting for pass-through grants, food stamps and on-behalf payments for fringe benefits and salaries. GASB Statement No. 24 requires that all cash pass-through grants received by a governmental entity be recognized as revenue and expenditures or expenses in a governmental, proprietary or trust fund. The District recorded the $7,269,964 pass-through grant from the Area Education Agency in fiscal year 2017-2018 as revenue and a related expense/expenditure in the Governmental Activities and General Fund. Cash and Investments – The cash balances of District funds are pooled and invested. Investment income from this internal pooling is allocated to the respective funds based upon the sources of funds invested. Investments are stated at fair value except for the investments in money market funds, which are valued at amortized cost under the Investment Company Act of 1940, and nonnegotiable certificates of deposits, which are stated at cost. Securities traded on a national or international exchange are valued at the last reported sales price at current exchange rates. The Iowa Schools Joint Investment Trust and the Education Liquidity Fund are “money market funds” that seek to maintain a stable net asset value of $1.00 per share. The funds qualify as a legal investment for the District under Iowa Law. All short-term cash investments that are highly liquid are considered to be cash equivalents. Cash equivalents are readily convertible to known amounts of cash and, at the day of purchases, they have a maturity date no longer than three months. Property Taxes Receivable – Property taxes in governmental funds are accounted for using the modified accrual basis of accounting. Property taxes receivable is recognized in these funds on the levy or lien date, which is the date that the tax asking is certified by the Board of Education to the County Board of Supervisors. The property taxes receivable includes current year delinquent property taxes receivable which represents unpaid taxes from the current year. The receivable also includes the succeeding year property tax receivable which represents taxes certified by the Board of Education to be collected in the next fiscal year for the purposes set out in the budget for the next fiscal year. By statute, the Board of Education is required to certify its budget to the County Auditor by April 15 of each year for the subsequent fiscal year. However, by the statue, the tax asking and budget certification for the following fiscal year becomes effective on the first day of that year. Although the succeeding year property tax receivable has been recorded, the related revenue is deferred and will not be recognized as revenue until the year for which it is levied and budgeted for.
32
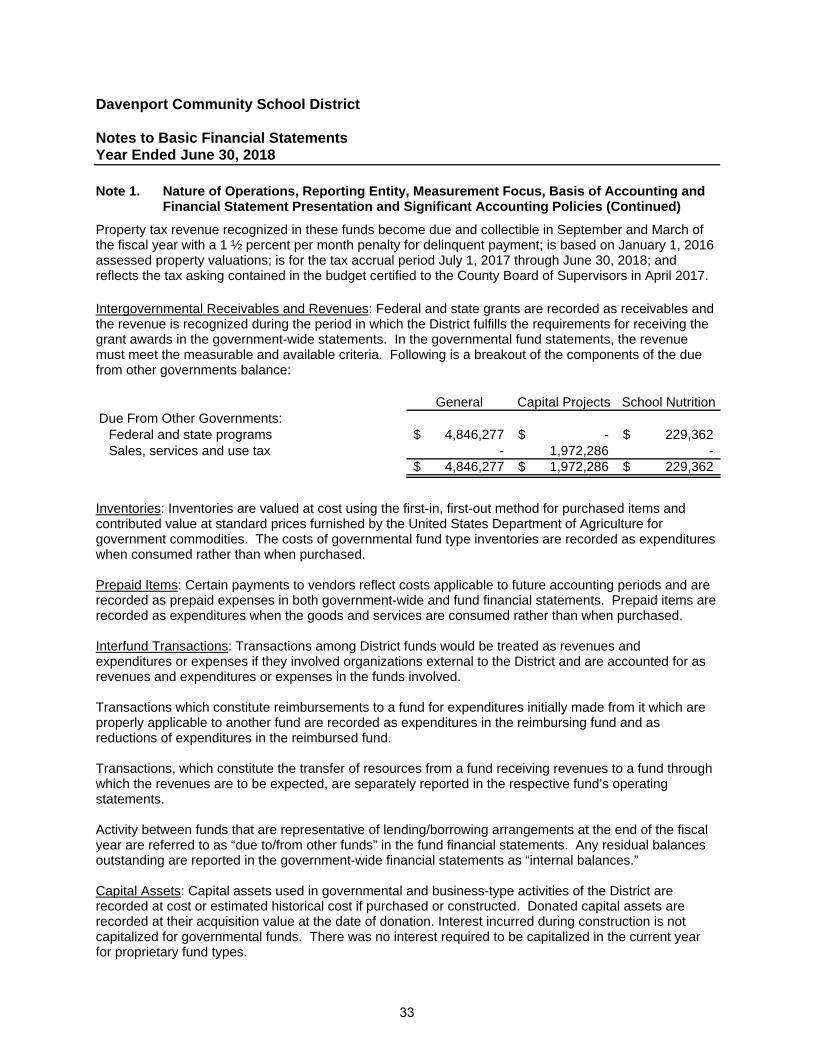
Davenport Community School District Notes to Basic Financial Statements Year Ended June 30, 2018
Note 1. Nature of Operations, Reporting Entity, Measurement Focus, Basis of Accounting and Financial Statement Presentation and Significant Accounting Policies (Continued)
Property tax revenue recognized in these funds become due and collectible in September and March of the fiscal year with a 1 ½ percent per month penalty for delinquent payment; is based on January 1, 2016 assessed property valuations; is for the tax accrual period July 1, 2017 through June 30, 2018; and reflects the tax asking contained in the budget certified to the County Board of Supervisors in April 2017. Intergovernmental Receivables and Revenues: Federal and state grants are recorded as receivables and the revenue is recognized during the period in which the District fulfills the requirements for receiving the grant awards in the government-wide statements. In the governmental fund statements, the revenue must meet the measurable and available criteria. Following is a breakout of the components of the due from other governments balance:
General Capital Projects School NutritionDue From Other Governments:
Federal and state programs 4,846,277$ -$ 229,362$ Sales, services and use tax - 1,972,286 -
4,846,277$ 1,972,286$ 229,362$
Inventories: Inventories are valued at cost using the first-in, first-out method for purchased items and contributed value at standard prices furnished by the United States Department of Agriculture for government commodities. The costs of governmental fund type inventories are recorded as expenditures when consumed rather than when purchased. Prepaid Items: Certain payments to vendors reflect costs applicable to future accounting periods and are recorded as prepaid expenses in both government-wide and fund financial statements. Prepaid items are recorded as expenditures when the goods and services are consumed rather than when purchased. Interfund Transactions: Transactions among District funds would be treated as revenues and expenditures or expenses if they involved organizations external to the District and are accounted for as revenues and expenditures or expenses in the funds involved. Transactions which constitute reimbursements to a fund for expenditures initially made from it which are properly applicable to another fund are recorded as expenditures in the reimbursing fund and as reductions of expenditures in the reimbursed fund. Transactions, which constitute the transfer of resources from a fund receiving revenues to a fund through which the revenues are to be expected, are separately reported in the respective fund’s operating statements.
Activity between funds that are representative of lending/borrowing arrangements at the end of the fiscal year are referred to as “due to/from other funds” in the fund financial statements. Any residual balances outstanding are reported in the government-wide financial statements as “internal balances.” Capital Assets: Capital assets used in governmental and business-type activities of the District are recorded at cost or estimated historical cost if purchased or constructed. Donated capital assets are recorded at their acquisition value at the date of donation. Interest incurred during construction is not capitalized for governmental funds. There was no interest required to be capitalized in the current year for proprietary fund types.
33
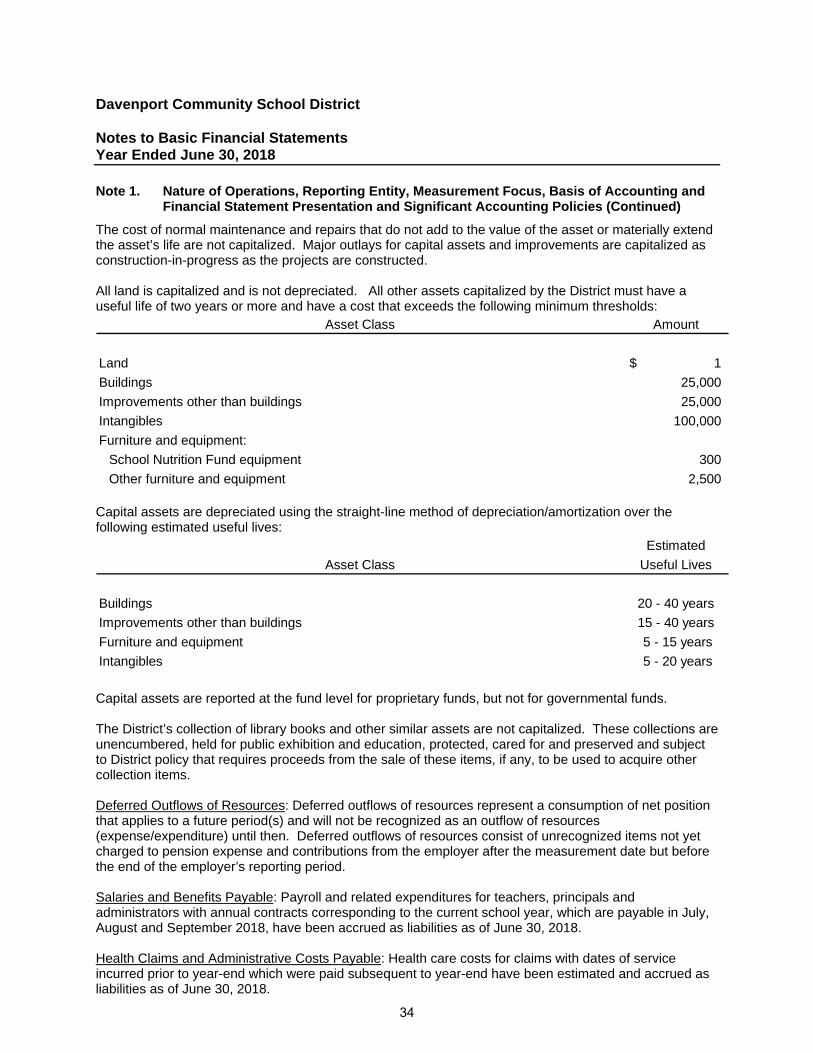
Davenport Community School District Notes to Basic Financial Statements Year Ended June 30, 2018
Note 1. Nature of Operations, Reporting Entity, Measurement Focus, Basis of Accounting and Financial Statement Presentation and Significant Accounting Policies (Continued)
The cost of normal maintenance and repairs that do not add to the value of the asset or materially extend the asset’s life are not capitalized. Major outlays for capital assets and improvements are capitalized as construction-in-progress as the projects are constructed. All land is capitalized and is not depreciated. All other assets capitalized by the District must have a useful life of two years or more and have a cost that exceeds the following minimum thresholds:
Asset Class Amount
Land 1$
Buildings 25,000
Improvements other than buildings 25,000
Intangibles 100,000
Furniture and equipment:
School Nutrition Fund equipment 300
Other furniture and equipment 2,500 Capital assets are depreciated using the straight-line method of depreciation/amortization over the following estimated useful lives:
Estimated
Asset Class Useful Lives
Buildings 20 - 40 years
Improvements other than buildings 15 - 40 years
Furniture and equipment 5 - 15 years
Intangibles 5 - 20 years
Capital assets are reported at the fund level for proprietary funds, but not for governmental funds. The District’s collection of library books and other similar assets are not capitalized. These collections are unencumbered, held for public exhibition and education, protected, cared for and preserved and subject to District policy that requires proceeds from the sale of these items, if any, to be used to acquire other collection items. Deferred Outflows of Resources: Deferred outflows of resources represent a consumption of net position that applies to a future period(s) and will not be recognized as an outflow of resources (expense/expenditure) until then. Deferred outflows of resources consist of unrecognized items not yet charged to pension expense and contributions from the employer after the measurement date but before the end of the employer’s reporting period. Salaries and Benefits Payable: Payroll and related expenditures for teachers, principals and administrators with annual contracts corresponding to the current school year, which are payable in July, August and September 2018, have been accrued as liabilities as of June 30, 2018. Health Claims and Administrative Costs Payable: Health care costs for claims with dates of service incurred prior to year-end which were paid subsequent to year-end have been estimated and accrued as liabilities as of June 30, 2018.
34
Davenport Community School District Notes to Basic Financial Statements Year Ended June 30, 2018
Note 1. Nature of Operations, Reporting Entity, Measurement Focus, Basis of Accounting and Financial Statement Presentation and Significant Accounting Policies (Continued)
Compensated Absences: Noninstructional District employees accumulate vacation hours for subsequent use or for payment upon termination. The compensated absences liability has been computed based on rates of pay in effect as June 30, 2018, and includes certain salary related payments. The compensated absences liability is reported as a liability in the government-wide statements. In governmental funds, however, these accrued benefits are not considered due and, therefore, are not reported as a fund liability. Vacation time accrued is expected to be paid out or utilized within one year. Unearned revenue: Proprietary funds defer revenue recognition in connection with resources that have been received, but not earned. Unearned revenue in governmental funds arises when assets are recognized before revenue recognition criteria have been satisfied. Grants and entitlements received before the eligibility requirements are met are also recorded as unearned revenue. Unearned revenue consists primarily of grant awards received but not yet expended and meal revenues and fees collected for the programs and services in the next school year. Long-Term Obligations: In the government-wide financial statements and proprietary fund types in the fund financial statements, long-term debt and other long-term obligations are reported as liabilities in the applicable governmental activities, business-type activities or proprietary fund type statement of net position. Pensions: For purposes of measuring the net pension liability, deferred outflows of resources and deferred inflows of resources related to pensions, and pension expense, information about the fiduciary net position of the Iowa Public Employees’ Retirement System (IPERS) and additions to/deductions from IPERS’ fiduciary net position have been determined on the same basis as they are reported by IPERS. For this purpose, benefit payments (including refunds of employee contributions) are recognized when due and payable in accordance with the benefit terms. Investments are reported at fair value. Deferred Inflows of Resources: Deferred inflows of resources represents an acquisition of net position that applies to a future period(s) and will not recognized as an inflow of resources (revenue) until that time. Available means collected within the current year or expected to be collected soon enough thereafter to be used to pay liabilities of the current year. Deferred inflows of resources in the governmental fund financial statements represent the amount of assets that have been recognized, but the related revenue has not been recognized since the assets are not collected within the current year or expected to be collected soon enough thereafter to be used to pay liabilities of the current year. Deferred inflows of resources consist of property tax receivable and other receivables not collected within sixty days after year end. Deferred inflows of resources in the Statement of Net Position consist of succeeding year property tax receivables that will not be recognized until the year for which it is levied and other unrecognized items not yet credited to pension expense and other post-employment benefit expense. Net Position: Net position represents the difference between assets, deferred outflows of resources, liabilities and deferred inflows of resources. Net investment in capital assets consists of capital assets, net of accumulated depreciation. Net position is reported as restricted when there are limitations imposed on their use either through enabling legislation or through external restrictions imposed by creditors, grantors or laws or regulations of other governments. When an expense is incurred for purposes for which both restricted net position is available, the District first applies restricted resources.
35
Davenport Community School District Notes to Basic Financial Statements Year Ended June 30, 2018
Note 1. Nature of Operations, Reporting Entity, Measurement Focus, Basis of Accounting and Financial Statement Presentation and Significant Accounting Policies (Continued)
Net position restricted through enabling legislation include $3,862,718 for categorical funding, $7,523,720 for management levy, $3,686,406 for physical plant and equipment, $6,835,481 for school infrastructure, and $1,956,997 for debt service. Net position restricted by donations and fundraising are student activities of $644,660. Fund Balance: In the governmental fund financial statements, fund balances are classified as follows:
Nonspendable: Amounts which cannot be spent either because they are in a nonspendable form or because they are legally or contractually required to be maintained intact.
Restricted: Amounts restricted to specific purposes when constraints placed on the use of the resources are either externally imposed by creditors, grantors or state or federal laws or imposed by law through constitutional provisions or enabling legislation.
Committed: Amounts which can be used only for specific purposes pursuant to constraints formally imposed by the Board of Education through resolution approved prior to year-end. Those committed amounts cannot be used for any other purpose unless the Board of Education removes or changes the specified use by taking the same action it employed to commit those amounts.
Assigned: Amounts constrained by the District’s intent to use them for a specific purpose. Intent can be expressed by the Board of Education or by an official or body to which the Board delegates the authority. The authority to assign fund balances has been delegated by the Board to the Superintendent or Chief Financial Officer. Unassigned: All amounts not included in other spendable classifications. The General Fund is the only fund that would report a positive amount in unassigned fund balance. Residual deficit amounts of other governmental funds would also be reported as unassigned.
When an expenditure is incurred in governmental funds which can be paid using either restricted or unrestricted resources, the District’s policy is to pay the expenditure from restricted fund balance and then from less-restrictive classifications – committed, assigned and then unassigned fund balances.
Budgets and Budgetary Accounting: As allowed by GASB Statement No. 41, Budgetary Comparison Schedules – Perspective Differences, the District presents budgetary comparison schedules as required supplementary information based on the program structure of four functional areas as required by state statute for its legally adopted budget.
36
Davenport Community School District Notes to Basic Financial Statements Year Ended June 30, 2018
Note 2. Cash and Pooled Investments
The District is authorized by state statute to invest public funds in obligations of the United States government, its agencies and instrumentalities; certificates of deposit or other evidences of deposit at federally insured depository institutions approved by the Board of Education; prime eligible bankers acceptances; certain high rated commercial paper; perfected repurchase agreements; certain registered open-end management investment companies; certain joint investment trusts; and warrants or improvement certificates of a drainage district. As of June 30, 2018, the book balance of the District’s cash deposits plus petty cash totaled $49,638,951, including certificates of deposit of $5,229,739 and the bank balances totaled $54,868,525. As of June 30, 2018, the District also had investments in the Education Liquidity Money Market Fund totaling $44,642,715 and the Iowa Schools Joint Investment Trust Fund totaling $11,403,454, which are also valued at an amortized cost pursuant to under the Investment Company Act of 1940. There were no limitations or restrictions on withdrawals. The investment in the Education Liquidity Money Market Fund is not rated. The investment in the Iowa Schools Joint Investment Trust Fund was rated AAAm by Standard and Poors rating service. The District has no investments meeting the disclosure requirements of Governmental Accounting Standards Board Statement No. 72. Interest Rate Risk: The District’s investment policy, which is accordance with the Code of Iowa, limits the investments of operating funds (funds expected to be expended in the current budget year or within 15 months of receipt) in instructions that mature within 397 days. Funds not identified as operating funds may be invested in instruments with maturities longer than 397 days, but the maturities shall be consistent with the needs and use of the District. The District did not hold any instruments with a maturity greater than 397 days during the year. Credit Risk: The District’s investment polity limits investments in commercial paper and other corporate debt to the top two higher classifications. The District did not hold any commercial paper or other corporate debt at June 30, 2018. Concentration of Credit Risk: The District’s investment policy does not allow for a prime bankers’ acceptance or commercial paper and other corporate debt balances to be greater than 10 percent of its total deposits and investments. The policy also limits the amount that can be invested in a single issue to 5 percent of its total deposits and investments. The District did not hold any commercial paper or other corporate debt at June 30, 2018. Custodial Credit Risk Deposits: In the case of deposits, this is the risk that in the event of a bank failure, the District’s deposits may not be returned to it. The District’s deposits are entirely covered by federal depository insurance or by the State Sinking Fund in accordance with Chapter 12C of the Code of Iowa. This chapter provides for additional assessments against the depositories to ensure there will be no loss of public funds. Custodial Credit Risk Investments: For an investment, this is the risk that, in the event of the failure of the counterparty, the District will not to be able to recover the value of its investments or collateral securities that are in the possession of an outside party. The District had no custodial credit risk with regards to investments as all investments were held by the District or its agent in the District’s name.
37
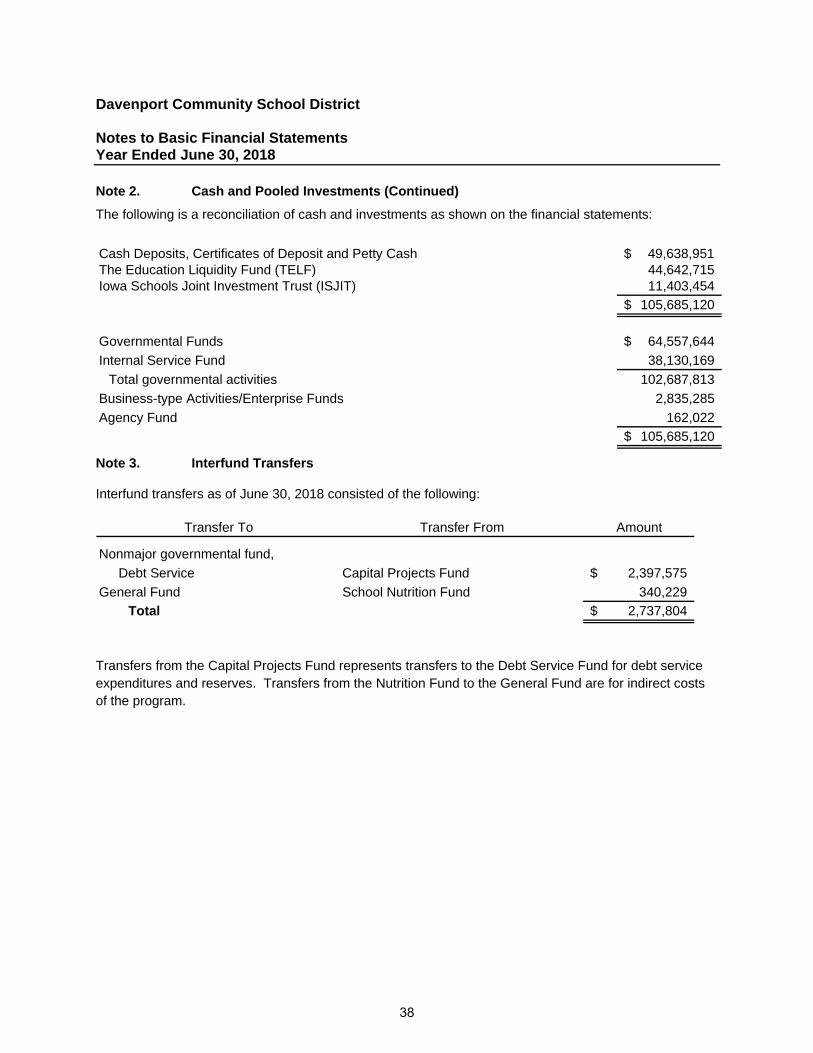
Davenport Community School District Notes to Basic Financial Statements Year Ended June 30, 2018
Note 2. Cash and Pooled Investments (Continued)
The following is a reconciliation of cash and investments as shown on the financial statements:
Cash Deposits, Certificates of Deposit and Petty Cash 49,638,951$ The Education Liquidity Fund (TELF) 44,642,715 Iowa Schools Joint Investment Trust (ISJIT) 11,403,454
105,685,120$
Governmental Funds 64,557,644$
Internal Service Fund 38,130,169
Total governmental activities 102,687,813
Business-type Activities/Enterprise Funds 2,835,285
Agency Fund 162,022
105,685,120$
Note 3. Interfund Transfers
Interfund transfers as of June 30, 2018 consisted of the following:
Transfer To Transfer From Amount
Nonmajor governmental fund,
Debt Service Capital Projects Fund 2,397,575$
General Fund School Nutrition Fund 340,229
Total 2,737,804$
Transfers from the Capital Projects Fund represents transfers to the Debt Service Fund for debt service expenditures and reserves. Transfers from the Nutrition Fund to the General Fund are for indirect costs of the program.
38
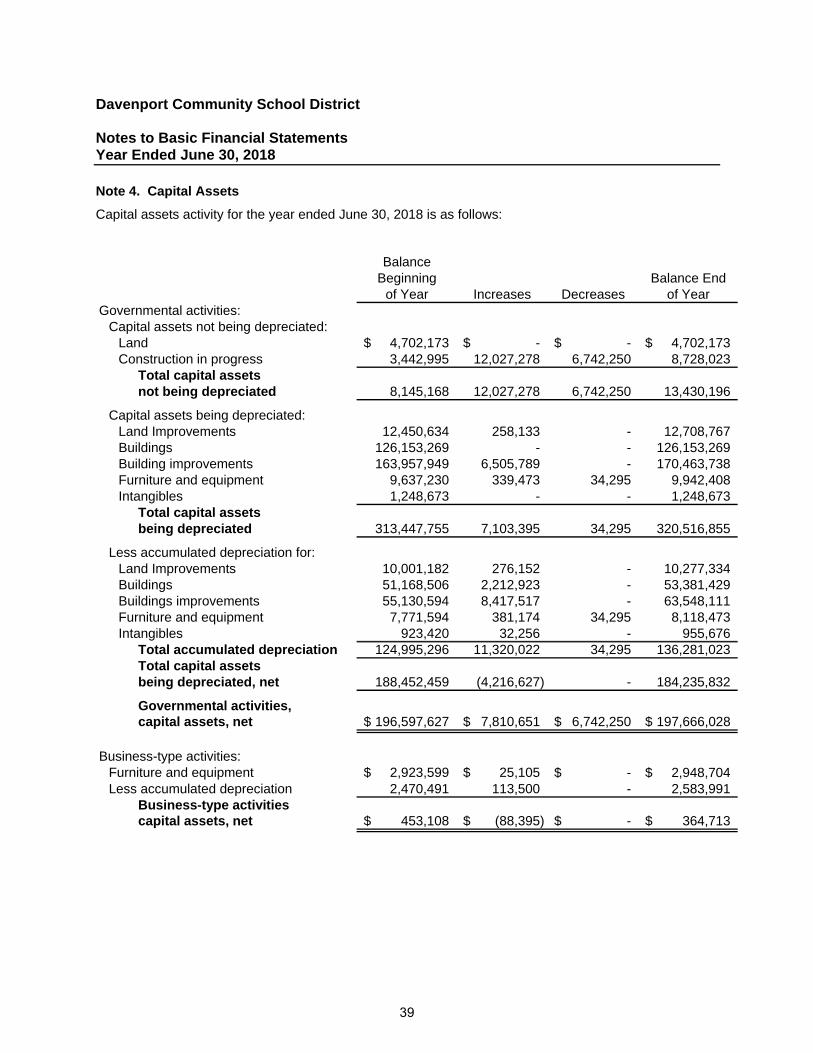
Davenport Community School District Notes to Basic Financial Statements Year Ended June 30, 2018
Note 4. Capital Assets
Capital assets activity for the year ended June 30, 2018 is as follows:
BalanceBeginning Balance End
of Year Increases Decreases of YearGovernmental activities:
Capital assets not being depreciated:Land 4,702,173$ -$ -$ 4,702,173$ Construction in progress 3,442,995 12,027,278 6,742,250 8,728,023
Total capital assetsnot being depreciated 8,145,168 12,027,278 6,742,250 13,430,196
Capital assets being depreciated:Land Improvements 12,450,634 258,133 - 12,708,767 Buildings 126,153,269 - - 126,153,269 Building improvements 163,957,949 6,505,789 - 170,463,738 Furniture and equipment 9,637,230 339,473 34,295 9,942,408 Intangibles 1,248,673 - - 1,248,673
Total capital assetsbeing depreciated 313,447,755 7,103,395 34,295 320,516,855
Less accumulated depreciation for:Land Improvements 10,001,182 276,152 - 10,277,334 Buildings 51,168,506 2,212,923 - 53,381,429 Buildings improvements 55,130,594 8,417,517 - 63,548,111 Furniture and equipment 7,771,594 381,174 34,295 8,118,473 Intangibles 923,420 32,256 - 955,676
Total accumulated depreciation 124,995,296 11,320,022 34,295 136,281,023 Total capital assetsbeing depreciated, net 188,452,459 (4,216,627) - 184,235,832
Governmental activities,capital assets, net 196,597,627$ 7,810,651$ 6,742,250$ 197,666,028$
Business-type activities:Furniture and equipment 2,923,599$ 25,105$ -$ 2,948,704$ Less accumulated depreciation 2,470,491 113,500 - 2,583,991
Business-type activities capital assets, net 453,108$ (88,395)$ -$ 364,713$
39
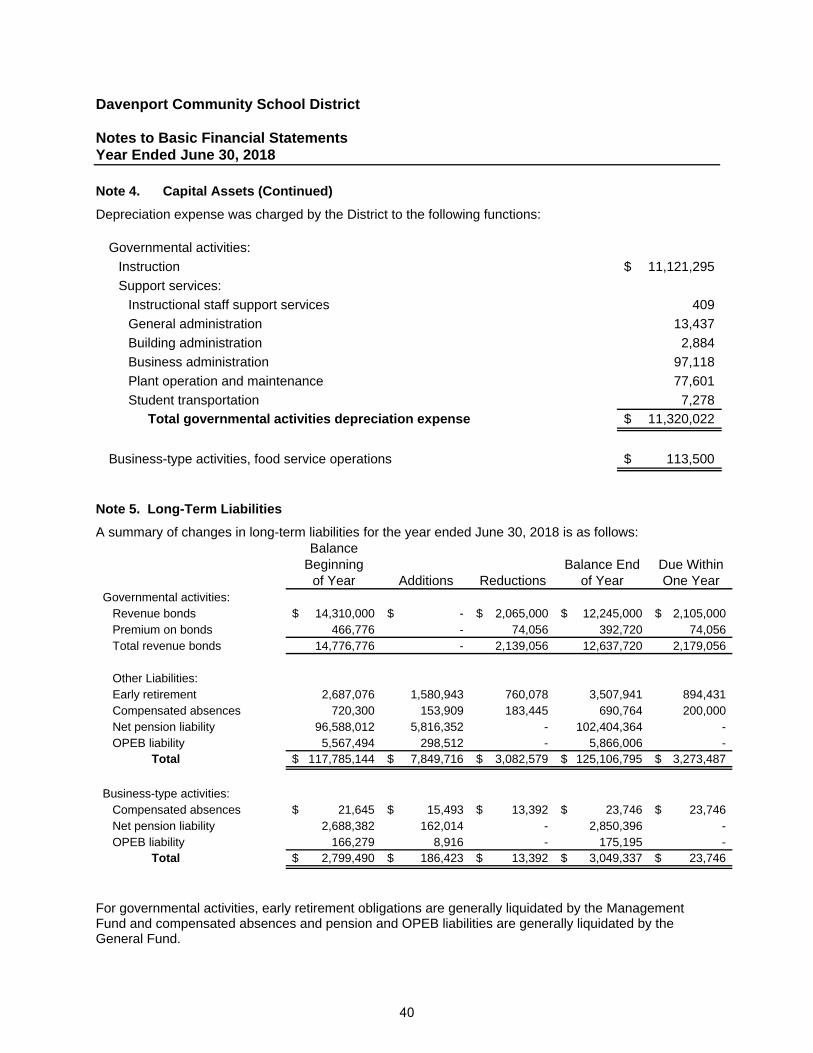
Davenport Community School District Notes to Basic Financial Statements Year Ended June 30, 2018
Note 4. Capital Assets (Continued)
Depreciation expense was charged by the District to the following functions:
Governmental activities:
Instruction 11,121,295$
Support services:
Instructional staff support services 409
General administration 13,437
Building administration 2,884
Business administration 97,118
Plant operation and maintenance 77,601
Student transportation 7,278
Total governmental activities depreciation expense 11,320,022$
Business-type activities, food service operations 113,500$
Note 5. Long-Term Liabilities
A summary of changes in long-term liabilities for the year ended June 30, 2018 is as follows: Balance
Beginning Balance End Due Withinof Year Additions Reductions of Year One Year
Governmental activities:Revenue bonds 14,310,000$ -$ 2,065,000$ 12,245,000$ 2,105,000$ Premium on bonds 466,776 - 74,056 392,720 74,056 Total revenue bonds 14,776,776 - 2,139,056 12,637,720 2,179,056
Other Liabilities:Early retirement 2,687,076 1,580,943 760,078 3,507,941 894,431 Compensated absences 720,300 153,909 183,445 690,764 200,000 Net pension liability 96,588,012 5,816,352 - 102,404,364 - OPEB liability 5,567,494 298,512 - 5,866,006 -
Total 117,785,144$ 7,849,716$ 3,082,579$ 125,106,795$ 3,273,487$
Business-type activities:Compensated absences 21,645$ 15,493$ 13,392$ 23,746$ 23,746$ Net pension liability 2,688,382 162,014 - 2,850,396 - OPEB liability 166,279 8,916 - 175,195 -
Total 2,799,490$ 186,423$ 13,392$ 3,049,337$ 23,746$
For governmental activities, early retirement obligations are generally liquidated by the Management Fund and compensated absences and pension and OPEB liabilities are generally liquidated by the General Fund.
40
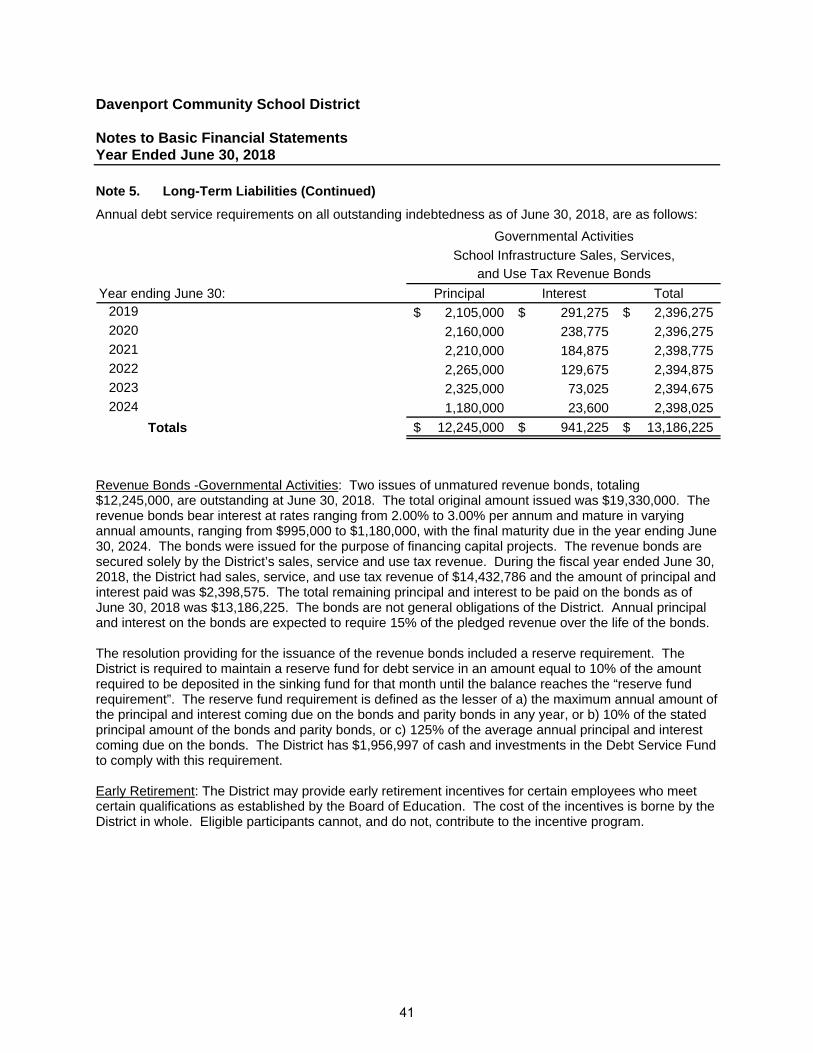
Davenport Community School District Notes to Basic Financial Statements Year Ended June 30, 2018
Note 5. Long-Term Liabilities (Continued)
Annual debt service requirements on all outstanding indebtedness as of June 30, 2018, are as follows:
Year ending June 30: Principal Interest Total2019 2,105,000$ 291,275$ 2,396,275$ 2020 2,160,000 238,775 2,396,275 2021 2,210,000 184,875 2,398,775 2022 2,265,000 129,675 2,394,875 2023 2,325,000 73,025 2,394,675 2024 1,180,000 23,600 2,398,025
Totals 12,245,000$ 941,225$ 13,186,225$
Governmental Activities
School Infrastructure Sales, Services,and Use Tax Revenue Bonds
Revenue Bonds -Governmental Activities: Two issues of unmatured revenue bonds, totaling $12,245,000, are outstanding at June 30, 2018. The total original amount issued was $19,330,000. The revenue bonds bear interest at rates ranging from 2.00% to 3.00% per annum and mature in varying annual amounts, ranging from $995,000 to $1,180,000, with the final maturity due in the year ending June 30, 2024. The bonds were issued for the purpose of financing capital projects. The revenue bonds are secured solely by the District’s sales, service and use tax revenue. During the fiscal year ended June 30, 2018, the District had sales, service, and use tax revenue of $14,432,786 and the amount of principal and interest paid was $2,398,575. The total remaining principal and interest to be paid on the bonds as of June 30, 2018 was $13,186,225. The bonds are not general obligations of the District. Annual principal and interest on the bonds are expected to require 15% of the pledged revenue over the life of the bonds. The resolution providing for the issuance of the revenue bonds included a reserve requirement. The District is required to maintain a reserve fund for debt service in an amount equal to 10% of the amount required to be deposited in the sinking fund for that month until the balance reaches the “reserve fund requirement”. The reserve fund requirement is defined as the lesser of a) the maximum annual amount of the principal and interest coming due on the bonds and parity bonds in any year, or b) 10% of the stated principal amount of the bonds and parity bonds, or c) 125% of the average annual principal and interest coming due on the bonds. The District has $1,956,997 of cash and investments in the Debt Service Fund to comply with this requirement. Early Retirement: The District may provide early retirement incentives for certain employees who meet certain qualifications as established by the Board of Education. The cost of the incentives is borne by the District in whole. Eligible participants cannot, and do not, contribute to the incentive program.
41
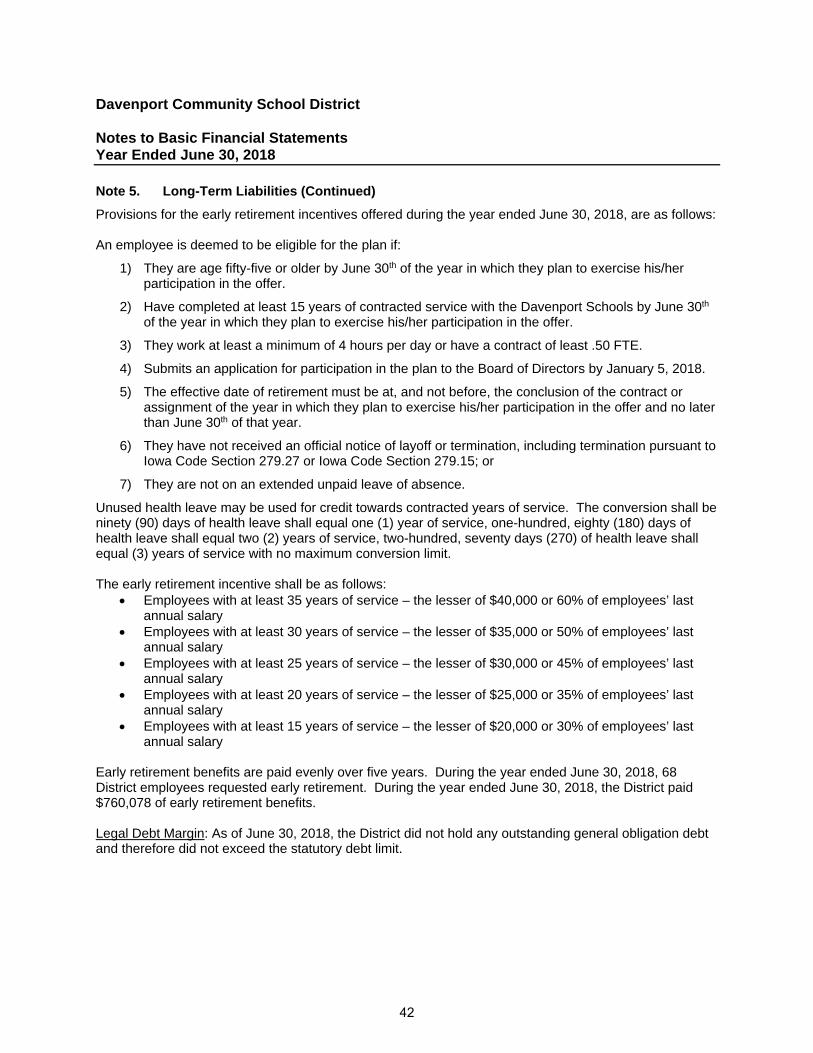
Davenport Community School District Notes to Basic Financial Statements Year Ended June 30, 2018
Note 5. Long-Term Liabilities (Continued)
Provisions for the early retirement incentives offered during the year ended June 30, 2018, are as follows: An employee is deemed to be eligible for the plan if:
1) They are age fifty-five or older by June 30th of the year in which they plan to exercise his/her participation in the offer.
2) Have completed at least 15 years of contracted service with the Davenport Schools by June 30th of the year in which they plan to exercise his/her participation in the offer.
3) They work at least a minimum of 4 hours per day or have a contract of least .50 FTE.
4) Submits an application for participation in the plan to the Board of Directors by January 5, 2018.
5) The effective date of retirement must be at, and not before, the conclusion of the contract or assignment of the year in which they plan to exercise his/her participation in the offer and no later than June 30th of that year.
6) They have not received an official notice of layoff or termination, including termination pursuant to Iowa Code Section 279.27 or Iowa Code Section 279.15; or
7) They are not on an extended unpaid leave of absence.
Unused health leave may be used for credit towards contracted years of service. The conversion shall be ninety (90) days of health leave shall equal one (1) year of service, one-hundred, eighty (180) days of health leave shall equal two (2) years of service, two-hundred, seventy days (270) of health leave shall equal (3) years of service with no maximum conversion limit. The early retirement incentive shall be as follows:
Employees with at least 35 years of service – the lesser of $40,000 or 60% of employees’ last annual salary
Employees with at least 30 years of service – the lesser of $35,000 or 50% of employees’ last annual salary
Employees with at least 25 years of service – the lesser of $30,000 or 45% of employees’ last annual salary
Employees with at least 20 years of service – the lesser of $25,000 or 35% of employees’ last annual salary
Employees with at least 15 years of service – the lesser of $20,000 or 30% of employees’ last annual salary
Early retirement benefits are paid evenly over five years. During the year ended June 30, 2018, 68 District employees requested early retirement. During the year ended June 30, 2018, the District paid $760,078 of early retirement benefits. Legal Debt Margin: As of June 30, 2018, the District did not hold any outstanding general obligation debt and therefore did not exceed the statutory debt limit.
42
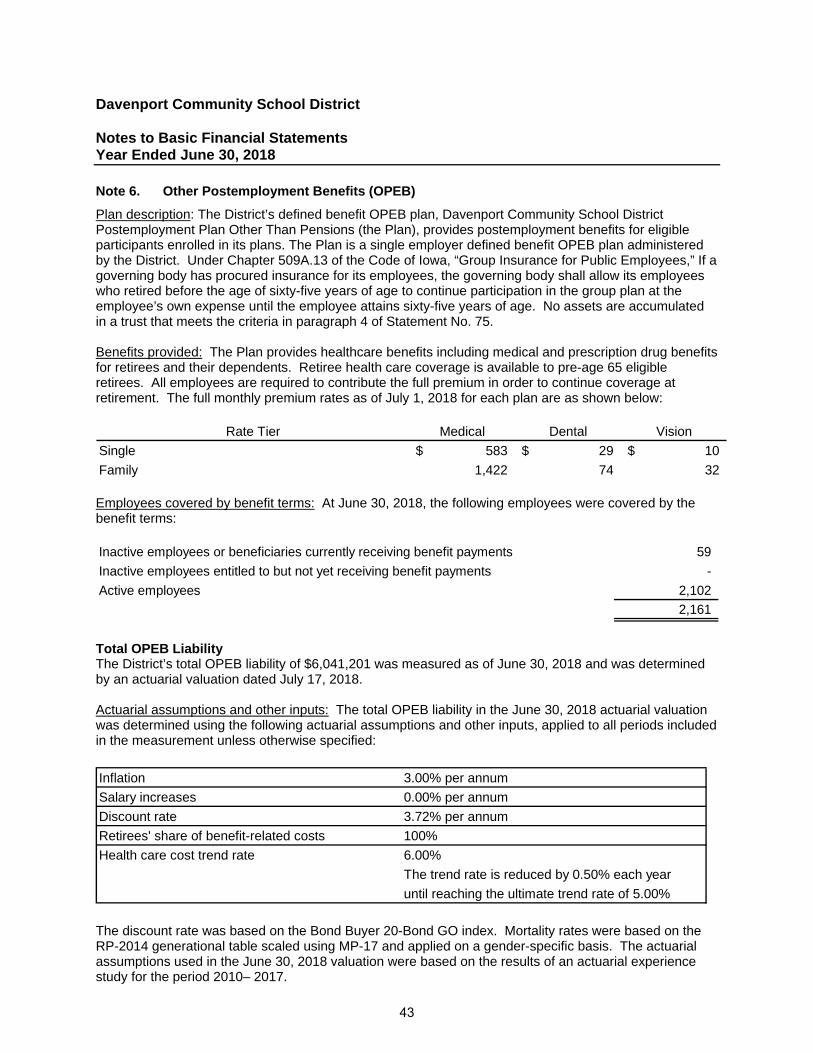
Davenport Community School District Notes to Basic Financial Statements Year Ended June 30, 2018
Note 6. Other Postemployment Benefits (OPEB)
Plan description: The District’s defined benefit OPEB plan, Davenport Community School District Postemployment Plan Other Than Pensions (the Plan), provides postemployment benefits for eligible participants enrolled in its plans. The Plan is a single employer defined benefit OPEB plan administered by the District. Under Chapter 509A.13 of the Code of Iowa, “Group Insurance for Public Employees,” If a governing body has procured insurance for its employees, the governing body shall allow its employees who retired before the age of sixty-five years of age to continue participation in the group plan at the employee’s own expense until the employee attains sixty-five years of age. No assets are accumulated in a trust that meets the criteria in paragraph 4 of Statement No. 75. Benefits provided: The Plan provides healthcare benefits including medical and prescription drug benefits for retirees and their dependents. Retiree health care coverage is available to pre-age 65 eligible retirees. All employees are required to contribute the full premium in order to continue coverage at retirement. The full monthly premium rates as of July 1, 2018 for each plan are as shown below:
Rate Tier Medical Dental Vision
Single 583$ 29$ 10$
Family 1,422 74 32 Employees covered by benefit terms: At June 30, 2018, the following employees were covered by the benefit terms: Inactive employees or beneficiaries currently receiving benefit payments 59
Inactive employees entitled to but not yet receiving benefit payments -
Active employees 2,102
2,161
Total OPEB Liability The District’s total OPEB liability of $6,041,201 was measured as of June 30, 2018 and was determined by an actuarial valuation dated July 17, 2018. Actuarial assumptions and other inputs: The total OPEB liability in the June 30, 2018 actuarial valuation was determined using the following actuarial assumptions and other inputs, applied to all periods included in the measurement unless otherwise specified:
Inflation 3.00% per annum
Salary increases 0.00% per annum
Discount rate 3.72% per annum
Retirees' share of benefit-related costs 100%
Health care cost trend rate 6.00%
The trend rate is reduced by 0.50% each year
until reaching the ultimate trend rate of 5.00%
The discount rate was based on the Bond Buyer 20-Bond GO index. Mortality rates were based on the RP-2014 generational table scaled using MP-17 and applied on a gender-specific basis. The actuarial assumptions used in the June 30, 2018 valuation were based on the results of an actuarial experience study for the period 2010– 2017.
43
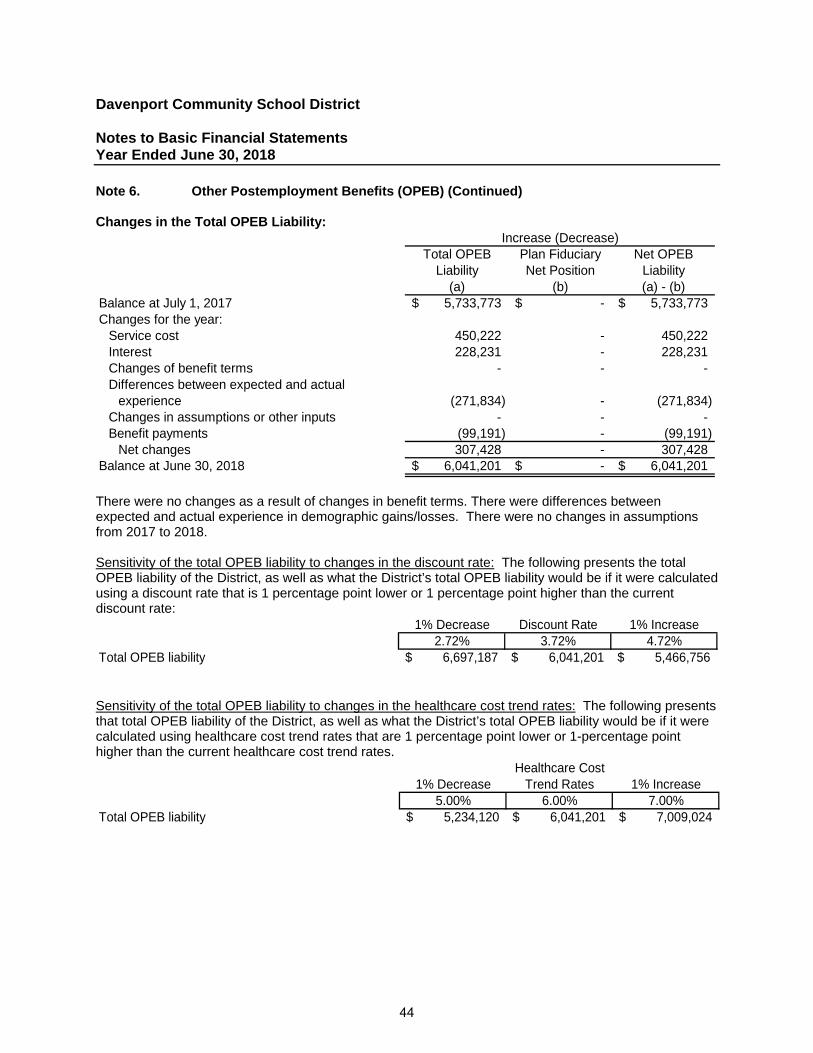
Davenport Community School District Notes to Basic Financial Statements Year Ended June 30, 2018
Note 6. Other Postemployment Benefits (OPEB) (Continued) Changes in the Total OPEB Liability:
Total OPEB Plan Fiduciary Net OPEBLiability Net Position Liability
(a) (b) (a) - (b)Balance at July 1, 2017 5,733,773$ -$ 5,733,773$ Changes for the year:
Service cost 450,222 - 450,222 Interest 228,231 - 228,231 Changes of benefit terms - - - Differences between expected and actual
experience (271,834) - (271,834) Changes in assumptions or other inputs - - - Benefit payments (99,191) - (99,191)
Net changes 307,428 - 307,428 Balance at June 30, 2018 6,041,201$ -$ 6,041,201$
Increase (Decrease)
There were no changes as a result of changes in benefit terms. There were differences between expected and actual experience in demographic gains/losses. There were no changes in assumptions from 2017 to 2018. Sensitivity of the total OPEB liability to changes in the discount rate: The following presents the total OPEB liability of the District, as well as what the District’s total OPEB liability would be if it were calculated using a discount rate that is 1 percentage point lower or 1 percentage point higher than the current discount rate:
1% Decrease Discount Rate 1% Increase2.72% 3.72% 4.72%
Total OPEB liability 6,697,187$ 6,041,201$ 5,466,756$
Sensitivity of the total OPEB liability to changes in the healthcare cost trend rates: The following presents that total OPEB liability of the District, as well as what the District’s total OPEB liability would be if it were calculated using healthcare cost trend rates that are 1 percentage point lower or 1-percentage point higher than the current healthcare cost trend rates.
Healthcare Cost1% Decrease Trend Rates 1% Increase
5.00% 6.00% 7.00%Total OPEB liability 5,234,120$ 6,041,201$ 7,009,024$
44
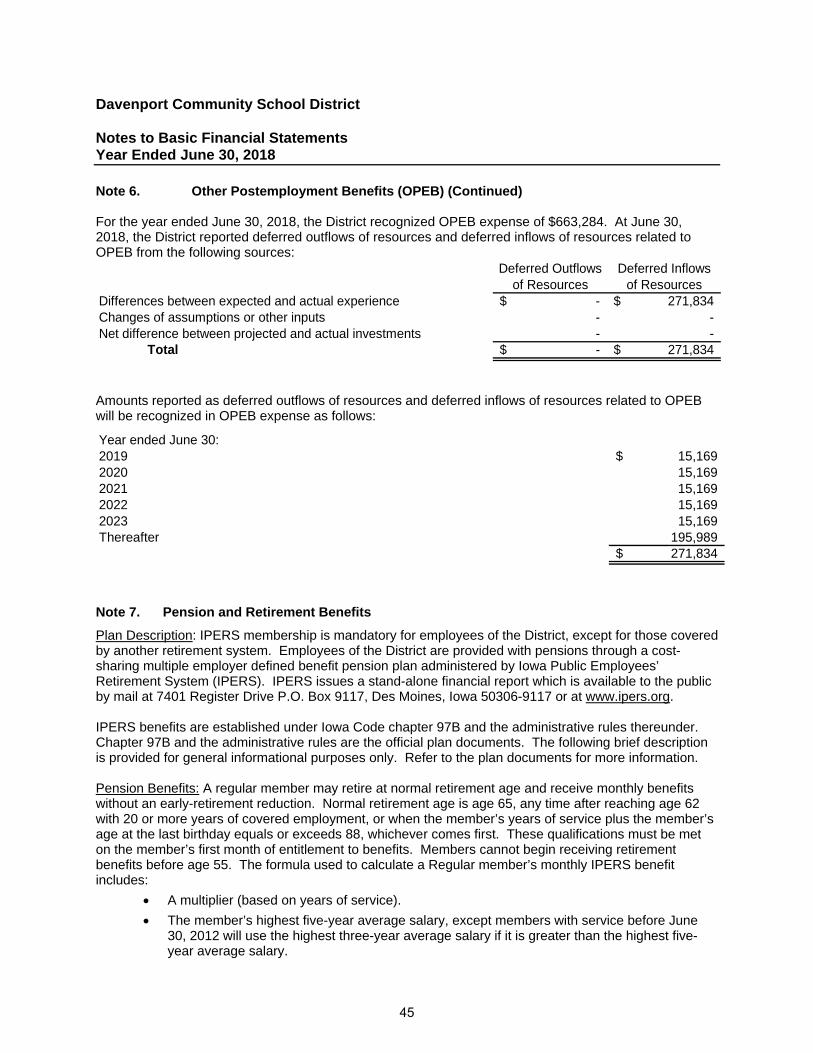
Davenport Community School District Notes to Basic Financial Statements Year Ended June 30, 2018
Note 6. Other Postemployment Benefits (OPEB) (Continued) For the year ended June 30, 2018, the District recognized OPEB expense of $663,284. At June 30, 2018, the District reported deferred outflows of resources and deferred inflows of resources related to OPEB from the following sources:
Deferred Outflows Deferred Inflowsof Resources of Resources
Differences between expected and actual experience -$ 271,834$ Changes of assumptions or other inputs - - Net difference between projected and actual investments - -
Total -$ 271,834$
Amounts reported as deferred outflows of resources and deferred inflows of resources related to OPEB will be recognized in OPEB expense as follows:
Year ended June 30:2019 15,169$ 2020 15,169 2021 15,169 2022 15,169 2023 15,169 Thereafter 195,989
271,834$
Note 7. Pension and Retirement Benefits
Plan Description: IPERS membership is mandatory for employees of the District, except for those covered by another retirement system. Employees of the District are provided with pensions through a cost-sharing multiple employer defined benefit pension plan administered by Iowa Public Employees’ Retirement System (IPERS). IPERS issues a stand-alone financial report which is available to the public by mail at 7401 Register Drive P.O. Box 9117, Des Moines, Iowa 50306-9117 or at www.ipers.org. IPERS benefits are established under Iowa Code chapter 97B and the administrative rules thereunder. Chapter 97B and the administrative rules are the official plan documents. The following brief description is provided for general informational purposes only. Refer to the plan documents for more information. Pension Benefits: A regular member may retire at normal retirement age and receive monthly benefits without an early-retirement reduction. Normal retirement age is age 65, any time after reaching age 62 with 20 or more years of covered employment, or when the member’s years of service plus the member’s age at the last birthday equals or exceeds 88, whichever comes first. These qualifications must be met on the member’s first month of entitlement to benefits. Members cannot begin receiving retirement benefits before age 55. The formula used to calculate a Regular member’s monthly IPERS benefit includes:
A multiplier (based on years of service).
The member’s highest five-year average salary, except members with service before June 30, 2012 will use the highest three-year average salary if it is greater than the highest five-year average salary.
45
Davenport Community School District Notes to Basic Financial Statements Year Ended June 30, 2018
Note 7. Pension and Retirement Benefits (Continued)
If a member retires before normal retirement age, the member’s monthly retirement benefit will be permanently reduced by an early-retirement reduction. The early-retirement reduction is calculated differently for service earned before and after July 1, 2012. For service earned before July 1, 2012, the reduction is 0.25 percent for each month that the member receives benefits before the member’s earliest normal retirement age. For service earned starting July 1, 2012, the reduction is 0.50 percent for each month that the member receives benefits before age 65. Generally, once a member selects a benefit option, a monthly benefit is calculated and remains the same for the rest of the member’s lifetime. However, to combat the effects of inflation, retirees who began receiving benefits prior to July 1990 receive a guaranteed dividend with their regular November benefit payments. Disability and Death Benefits: A vested member who is awarded federal Social Security disability or Railroad Retirement disability benefits is eligible to claim IPERS benefits regardless of age. Disability benefits are not reduced for early retirement. If a member dies before retirement, the member’s beneficiary will receive a lifetime annuity or a lump-sum payment equal to the present actuarial value of the member’s accrued benefit or calculated with a set formula, whichever is greater. When a member dies after retirement, death benefits depend on the benefit option the member selected at retirement.
Contributions: Contribution rates are established by IPERS following the annual actuarial valuation, which applies IPERS’ Contribution Rate Funding Policy and Actuarial Amortization Method. State statute limits the amount rates can increase or decrease each year to 1 percentage point. IPERS Contribution Rate Funding Policy requires that the actuarial contribution rate be determined using the “entry age normal” actuarial cost method and the actuarial assumptions and methods approved by the IPERS Investment Board. The actuarial contribution rate covers normal cost plus the unfunded actuarial liability payment based on a 30-year amortization period. The payment to amortize the unfunded actuarial liability is determined as a level percentage of payroll, based on the Actuarial Amortization Method adopted by the Investment Board. In fiscal year 2018, pursuant to the required rate, regular members contributed 5.95 percent of covered payroll and the District contributed 8.93 percent of covered payroll for a total rate of 14.88 percent. The District’s contributions to IPERS for the year ended June 30, 2018 were $10,845,472. Net Pension Liabilities, Pension Expense, and Deferred Outflows of Resources and Deferred Inflows of Resources Related to Pensions: At June 30, 2018, the District reported a liability of $105,254,760 for its proportionate share of the net pension liability. The net pension liability was measured as of June 30, 2017, and the total pension liability used to calculate the net pension liability was determined by an actuarial valuation as of that date. The District’s proportion of the net pension liability was based on the District’s share of contributions to the pension plan relative to the contributions of all IPERS participating employers. At June 30, 2017, the District’s proportion was 1.5801015 percent, which was an increase of 0.0026115 percent from its proportion measured as of June 30, 2016.
46
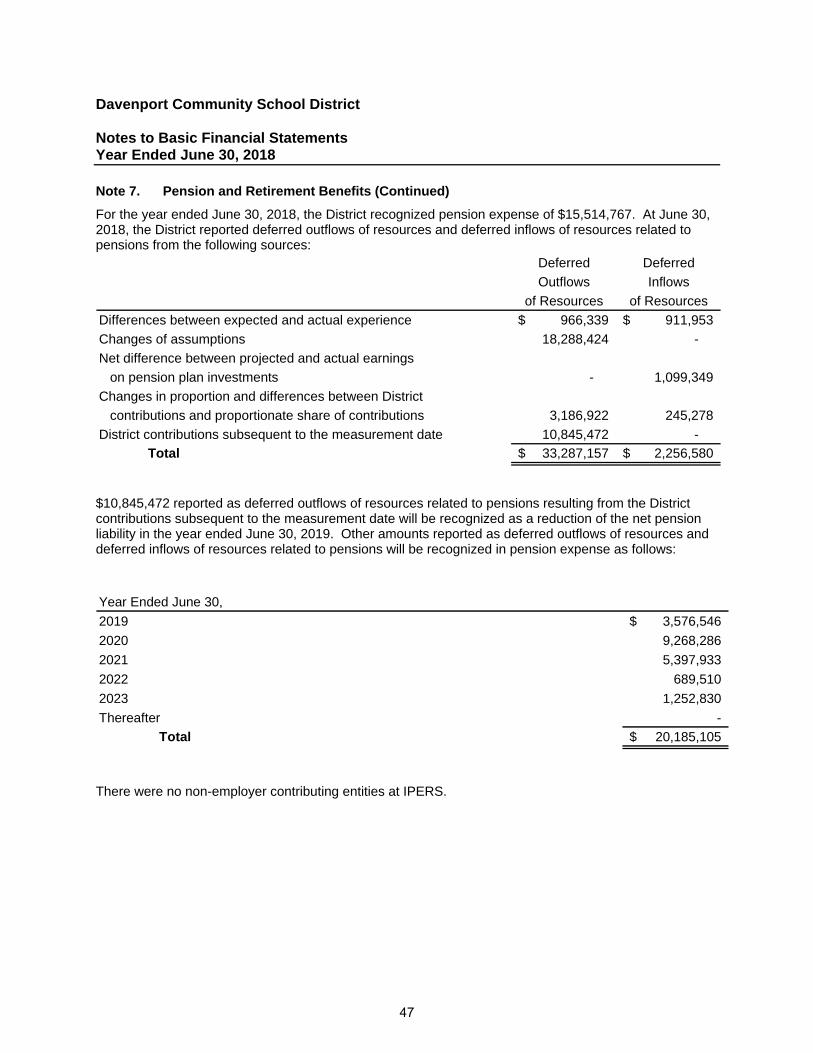
Davenport Community School District Notes to Basic Financial Statements Year Ended June 30, 2018
Note 7. Pension and Retirement Benefits (Continued)
For the year ended June 30, 2018, the District recognized pension expense of $15,514,767. At June 30, 2018, the District reported deferred outflows of resources and deferred inflows of resources related to pensions from the following sources:
Deferred Deferred
Outflows Inflows
of Resources of Resources
Differences between expected and actual experience 966,339$ 911,953$
Changes of assumptions 18,288,424 -
Net difference between projected and actual earnings
on pension plan investments - 1,099,349
Changes in proportion and differences between District
contributions and proportionate share of contributions 3,186,922 245,278
District contributions subsequent to the measurement date 10,845,472 -
Total 33,287,157$ 2,256,580$
$10,845,472 reported as deferred outflows of resources related to pensions resulting from the District contributions subsequent to the measurement date will be recognized as a reduction of the net pension liability in the year ended June 30, 2019. Other amounts reported as deferred outflows of resources and deferred inflows of resources related to pensions will be recognized in pension expense as follows:
Year Ended June 30,
2019 3,576,546$
2020 9,268,286
2021 5,397,933
2022 689,510
2023 1,252,830
Thereafter -
Total 20,185,105$
There were no non-employer contributing entities at IPERS.
47
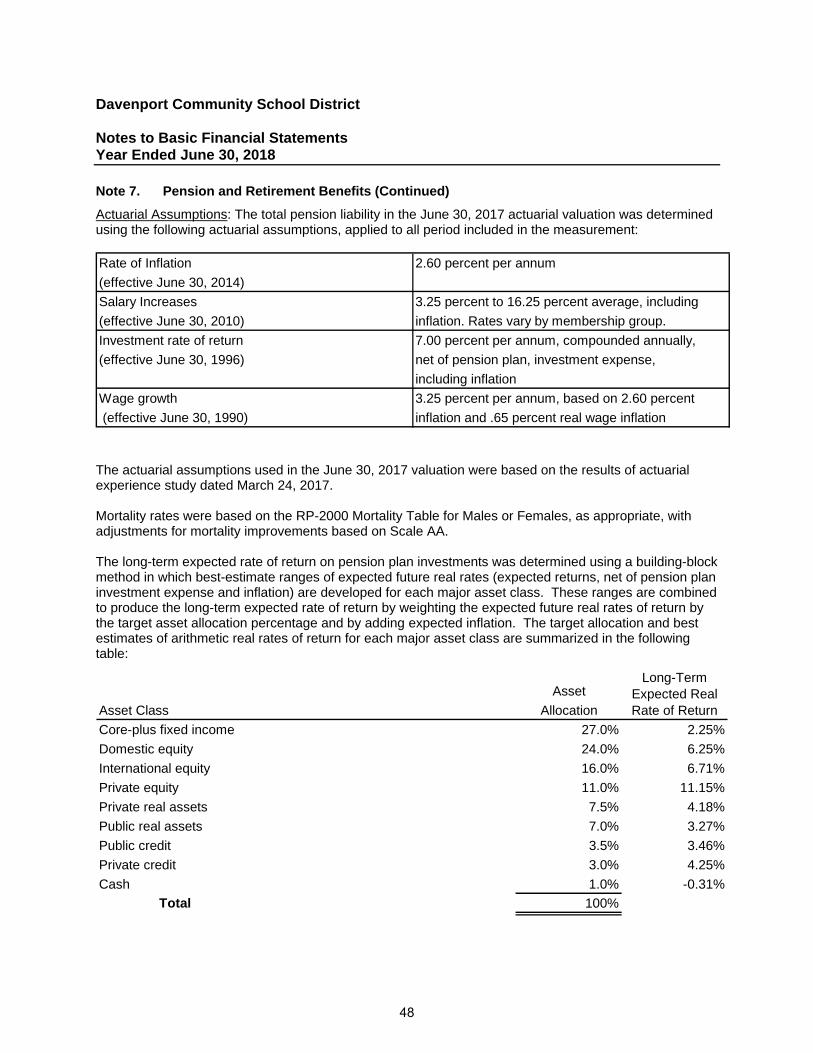
Davenport Community School District Notes to Basic Financial Statements Year Ended June 30, 2018
Note 7. Pension and Retirement Benefits (Continued)
Actuarial Assumptions: The total pension liability in the June 30, 2017 actuarial valuation was determined using the following actuarial assumptions, applied to all period included in the measurement: Rate of Inflation 2.60 percent per annum
(effective June 30, 2014)
Salary Increases 3.25 percent to 16.25 percent average, including
(effective June 30, 2010) inflation. Rates vary by membership group.
Investment rate of return 7.00 percent per annum, compounded annually,
(effective June 30, 1996) net of pension plan, investment expense,
including inflation
Wage growth 3.25 percent per annum, based on 2.60 percent
(effective June 30, 1990) inflation and .65 percent real wage inflation
The actuarial assumptions used in the June 30, 2017 valuation were based on the results of actuarial experience study dated March 24, 2017. Mortality rates were based on the RP-2000 Mortality Table for Males or Females, as appropriate, with adjustments for mortality improvements based on Scale AA. The long-term expected rate of return on pension plan investments was determined using a building-block method in which best-estimate ranges of expected future real rates (expected returns, net of pension plan investment expense and inflation) are developed for each major asset class. These ranges are combined to produce the long-term expected rate of return by weighting the expected future real rates of return by the target asset allocation percentage and by adding expected inflation. The target allocation and best estimates of arithmetic real rates of return for each major asset class are summarized in the following table:
Asset
Asset Class Allocation
Core-plus fixed income 27.0% 2.25%
Domestic equity 24.0% 6.25%
International equity 16.0% 6.71%
Private equity 11.0% 11.15%
Private real assets 7.5% 4.18%
Public real assets 7.0% 3.27%
Public credit 3.5% 3.46%
Private credit 3.0% 4.25%
Cash 1.0% -0.31%
Total 100%
Long-Term Expected Real Rate of Return
48
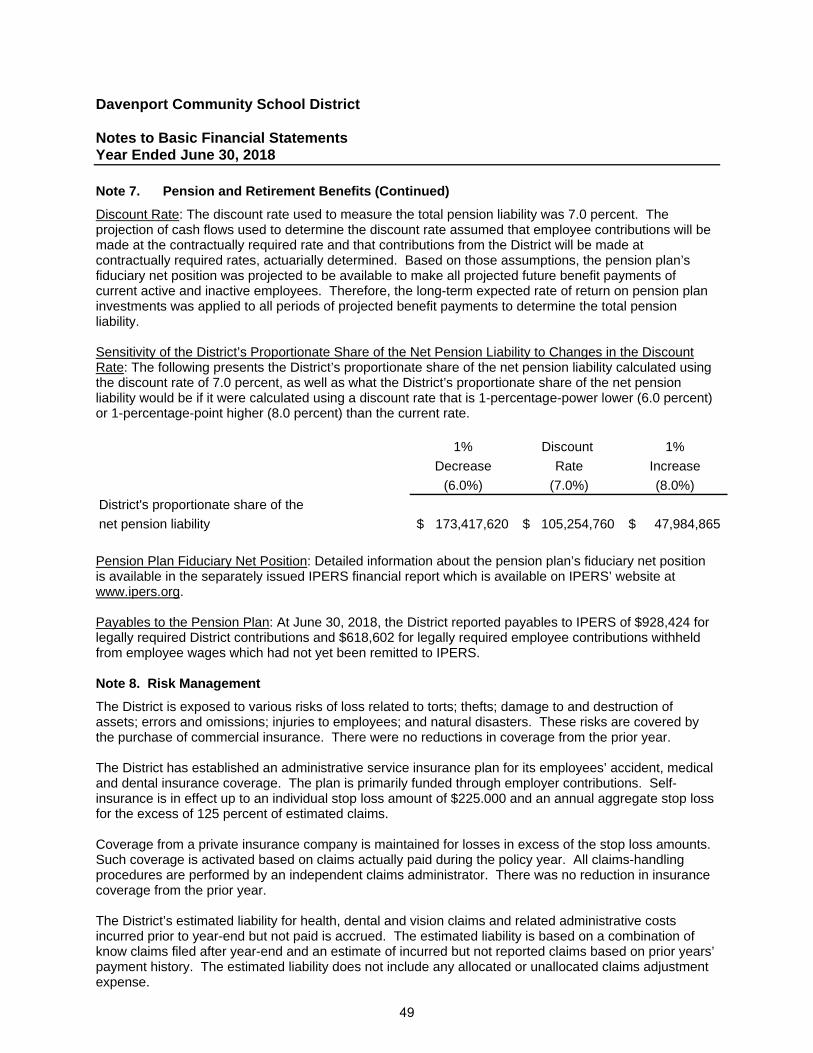
Davenport Community School District Notes to Basic Financial Statements Year Ended June 30, 2018
Note 7. Pension and Retirement Benefits (Continued)
Discount Rate: The discount rate used to measure the total pension liability was 7.0 percent. The projection of cash flows used to determine the discount rate assumed that employee contributions will be made at the contractually required rate and that contributions from the District will be made at contractually required rates, actuarially determined. Based on those assumptions, the pension plan’s fiduciary net position was projected to be available to make all projected future benefit payments of current active and inactive employees. Therefore, the long-term expected rate of return on pension plan investments was applied to all periods of projected benefit payments to determine the total pension liability. Sensitivity of the District’s Proportionate Share of the Net Pension Liability to Changes in the Discount Rate: The following presents the District’s proportionate share of the net pension liability calculated using the discount rate of 7.0 percent, as well as what the District’s proportionate share of the net pension liability would be if it were calculated using a discount rate that is 1-percentage-power lower (6.0 percent) or 1-percentage-point higher (8.0 percent) than the current rate.
1% Discount 1%
Decrease Rate Increase
(6.0%) (7.0%) (8.0%)
District's proportionate share of the
net pension liability 173,417,620$ 105,254,760$ 47,984,865$
Pension Plan Fiduciary Net Position: Detailed information about the pension plan’s fiduciary net position is available in the separately issued IPERS financial report which is available on IPERS’ website at www.ipers.org. Payables to the Pension Plan: At June 30, 2018, the District reported payables to IPERS of $928,424 for legally required District contributions and $618,602 for legally required employee contributions withheld from employee wages which had not yet been remitted to IPERS. Note 8. Risk Management
The District is exposed to various risks of loss related to torts; thefts; damage to and destruction of assets; errors and omissions; injuries to employees; and natural disasters. These risks are covered by the purchase of commercial insurance. There were no reductions in coverage from the prior year. The District has established an administrative service insurance plan for its employees’ accident, medical and dental insurance coverage. The plan is primarily funded through employer contributions. Self- insurance is in effect up to an individual stop loss amount of $225.000 and an annual aggregate stop loss for the excess of 125 percent of estimated claims. Coverage from a private insurance company is maintained for losses in excess of the stop loss amounts. Such coverage is activated based on claims actually paid during the policy year. All claims-handling procedures are performed by an independent claims administrator. There was no reduction in insurance coverage from the prior year. The District’s estimated liability for health, dental and vision claims and related administrative costs incurred prior to year-end but not paid is accrued. The estimated liability is based on a combination of know claims filed after year-end and an estimate of incurred but not reported claims based on prior years’ payment history. The estimated liability does not include any allocated or unallocated claims adjustment expense.
49
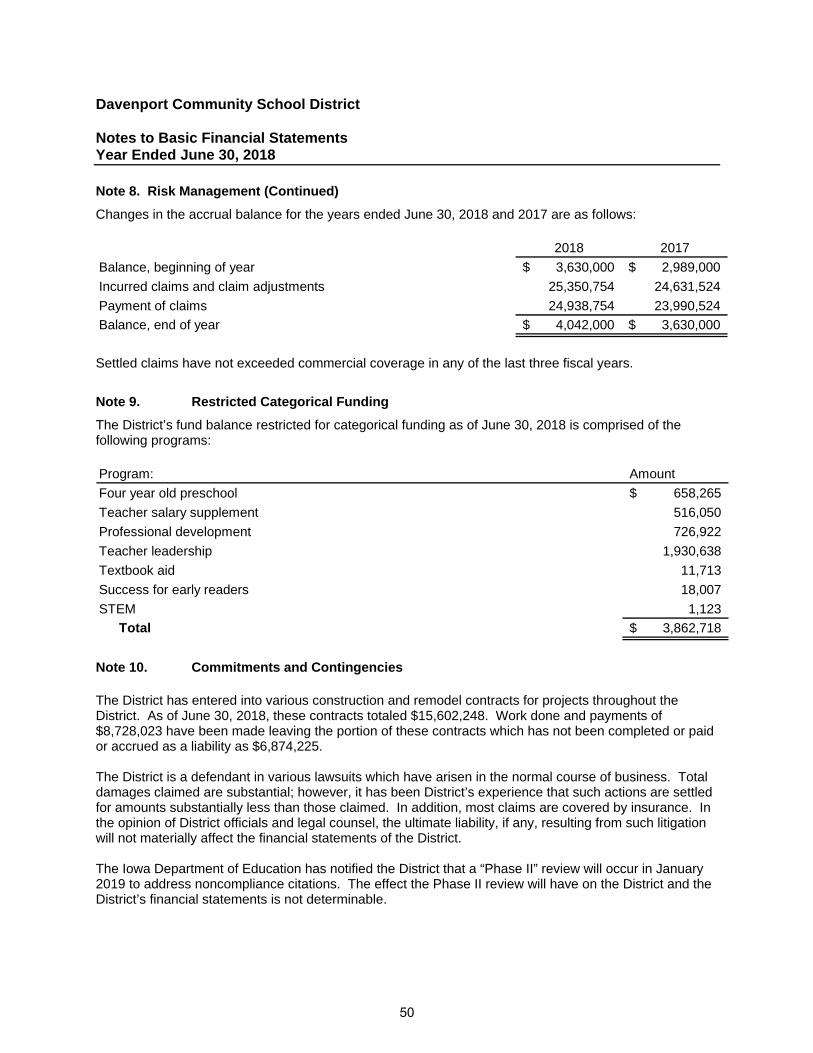
Davenport Community School District Notes to Basic Financial Statements Year Ended June 30, 2018
Note 8. Risk Management (Continued)
Changes in the accrual balance for the years ended June 30, 2018 and 2017 are as follows:
2018 2017
Balance, beginning of year 3,630,000$ 2,989,000$
Incurred claims and claim adjustments 25,350,754 24,631,524
Payment of claims 24,938,754 23,990,524
Balance, end of year 4,042,000$ 3,630,000$
Settled claims have not exceeded commercial coverage in any of the last three fiscal years.
Note 9. Restricted Categorical Funding
The District’s fund balance restricted for categorical funding as of June 30, 2018 is comprised of the following programs: Program: Amount
Four year old preschool 658,265$
Teacher salary supplement 516,050
Professional development 726,922
Teacher leadership 1,930,638
Textbook aid 11,713
Success for early readers 18,007
STEM 1,123
Total 3,862,718$
Note 10. Commitments and Contingencies The District has entered into various construction and remodel contracts for projects throughout the District. As of June 30, 2018, these contracts totaled $15,602,248. Work done and payments of $8,728,023 have been made leaving the portion of these contracts which has not been completed or paid or accrued as a liability as $6,874,225. The District is a defendant in various lawsuits which have arisen in the normal course of business. Total damages claimed are substantial; however, it has been District’s experience that such actions are settled for amounts substantially less than those claimed. In addition, most claims are covered by insurance. In the opinion of District officials and legal counsel, the ultimate liability, if any, resulting from such litigation will not materially affect the financial statements of the District. The Iowa Department of Education has notified the District that a “Phase II” review will occur in January 2019 to address noncompliance citations. The effect the Phase II review will have on the District and the District’s financial statements is not determinable.
50
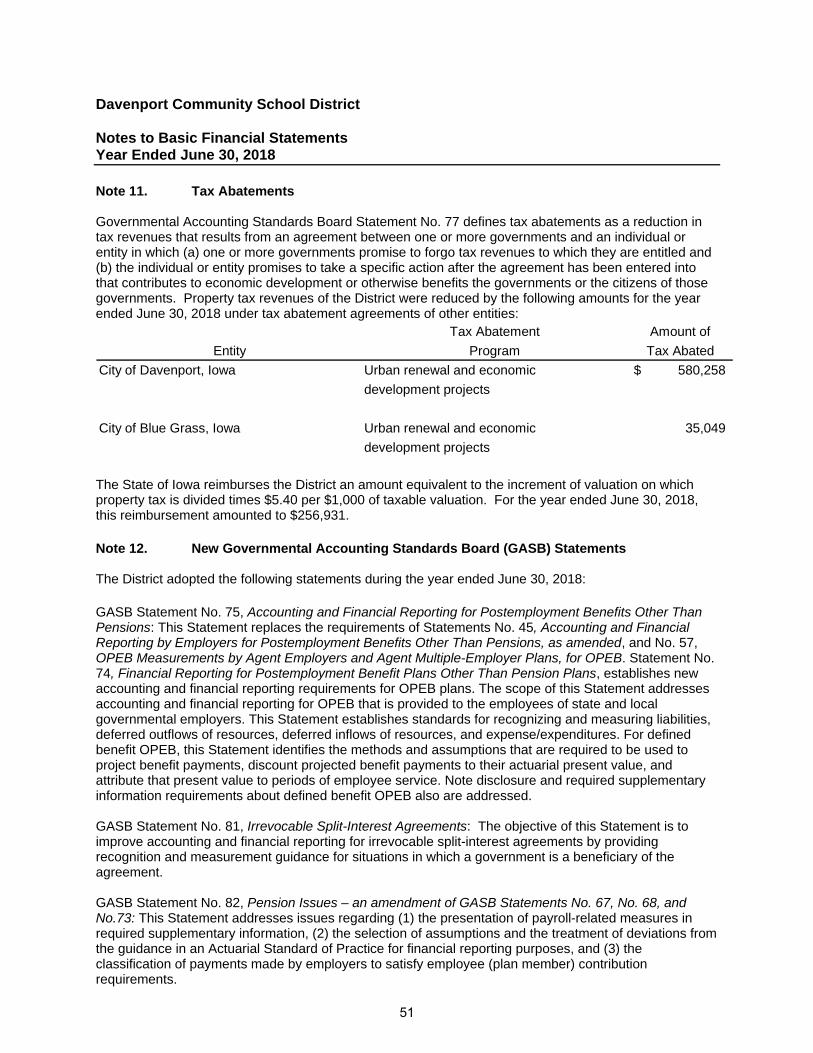
Davenport Community School District Notes to Basic Financial Statements Year Ended June 30, 2018
Note 11. Tax Abatements Governmental Accounting Standards Board Statement No. 77 defines tax abatements as a reduction in tax revenues that results from an agreement between one or more governments and an individual or entity in which (a) one or more governments promise to forgo tax revenues to which they are entitled and (b) the individual or entity promises to take a specific action after the agreement has been entered into that contributes to economic development or otherwise benefits the governments or the citizens of those governments. Property tax revenues of the District were reduced by the following amounts for the year ended June 30, 2018 under tax abatement agreements of other entities:
Tax Abatement Amount of
Entity Program Tax Abated
City of Davenport, Iowa Urban renewal and economic 580,258$
development projects
City of Blue Grass, Iowa Urban renewal and economic 35,049
development projects
The State of Iowa reimburses the District an amount equivalent to the increment of valuation on which property tax is divided times $5.40 per $1,000 of taxable valuation. For the year ended June 30, 2018, this reimbursement amounted to $256,931. Note 12. New Governmental Accounting Standards Board (GASB) Statements The District adopted the following statements during the year ended June 30, 2018: GASB Statement No. 75, Accounting and Financial Reporting for Postemployment Benefits Other Than Pensions: This Statement replaces the requirements of Statements No. 45, Accounting and Financial Reporting by Employers for Postemployment Benefits Other Than Pensions, as amended, and No. 57, OPEB Measurements by Agent Employers and Agent Multiple-Employer Plans, for OPEB. Statement No. 74, Financial Reporting for Postemployment Benefit Plans Other Than Pension Plans, establishes new accounting and financial reporting requirements for OPEB plans. The scope of this Statement addresses accounting and financial reporting for OPEB that is provided to the employees of state and local governmental employers. This Statement establishes standards for recognizing and measuring liabilities, deferred outflows of resources, deferred inflows of resources, and expense/expenditures. For defined benefit OPEB, this Statement identifies the methods and assumptions that are required to be used to project benefit payments, discount projected benefit payments to their actuarial present value, and attribute that present value to periods of employee service. Note disclosure and required supplementary information requirements about defined benefit OPEB also are addressed. GASB Statement No. 81, Irrevocable Split-Interest Agreements: The objective of this Statement is to improve accounting and financial reporting for irrevocable split-interest agreements by providing recognition and measurement guidance for situations in which a government is a beneficiary of the agreement. GASB Statement No. 82, Pension Issues – an amendment of GASB Statements No. 67, No. 68, and No.73: This Statement addresses issues regarding (1) the presentation of payroll-related measures in required supplementary information, (2) the selection of assumptions and the treatment of deviations from the guidance in an Actuarial Standard of Practice for financial reporting purposes, and (3) the classification of payments made by employers to satisfy employee (plan member) contribution requirements.
51
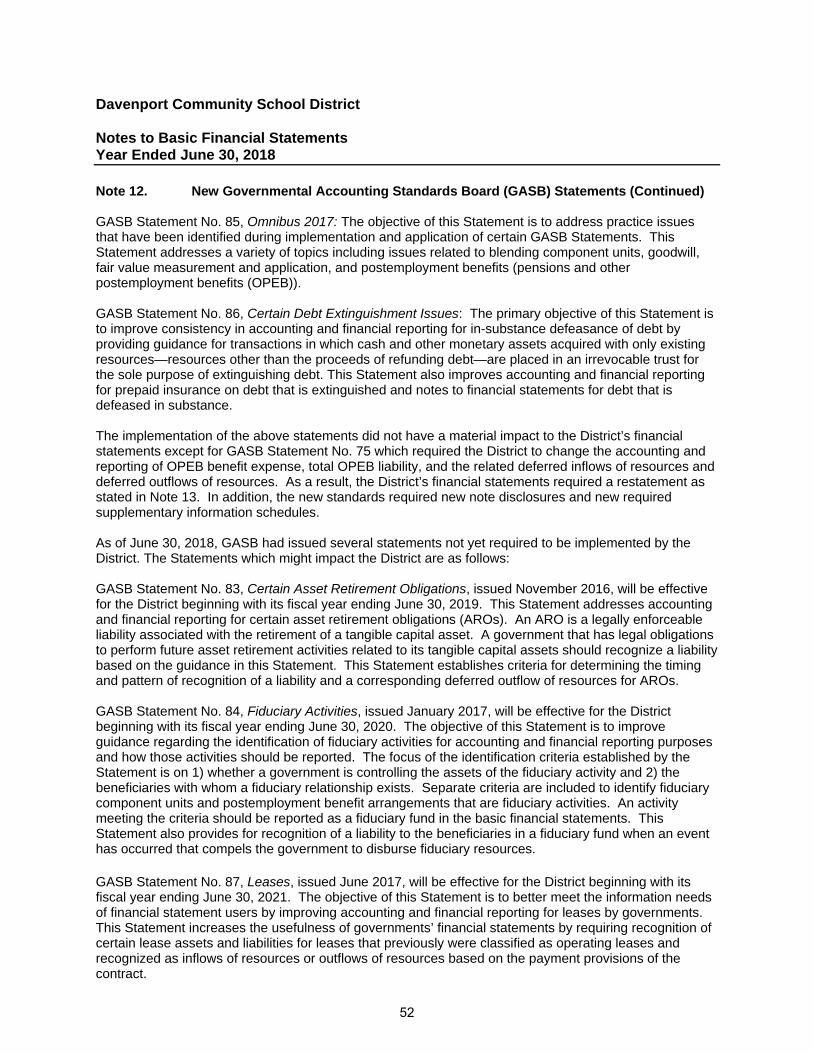
Davenport Community School District Notes to Basic Financial Statements Year Ended June 30, 2018
Note 12. New Governmental Accounting Standards Board (GASB) Statements (Continued) GASB Statement No. 85, Omnibus 2017: The objective of this Statement is to address practice issues that have been identified during implementation and application of certain GASB Statements. This Statement addresses a variety of topics including issues related to blending component units, goodwill, fair value measurement and application, and postemployment benefits (pensions and other postemployment benefits (OPEB)). GASB Statement No. 86, Certain Debt Extinguishment Issues: The primary objective of this Statement is to improve consistency in accounting and financial reporting for in-substance defeasance of debt by providing guidance for transactions in which cash and other monetary assets acquired with only existing resources—resources other than the proceeds of refunding debt—are placed in an irrevocable trust for the sole purpose of extinguishing debt. This Statement also improves accounting and financial reporting for prepaid insurance on debt that is extinguished and notes to financial statements for debt that is defeased in substance. The implementation of the above statements did not have a material impact to the District’s financial statements except for GASB Statement No. 75 which required the District to change the accounting and reporting of OPEB benefit expense, total OPEB liability, and the related deferred inflows of resources and deferred outflows of resources. As a result, the District’s financial statements required a restatement as stated in Note 13. In addition, the new standards required new note disclosures and new required supplementary information schedules. As of June 30, 2018, GASB had issued several statements not yet required to be implemented by the District. The Statements which might impact the District are as follows: GASB Statement No. 83, Certain Asset Retirement Obligations, issued November 2016, will be effective for the District beginning with its fiscal year ending June 30, 2019. This Statement addresses accounting and financial reporting for certain asset retirement obligations (AROs). An ARO is a legally enforceable liability associated with the retirement of a tangible capital asset. A government that has legal obligations to perform future asset retirement activities related to its tangible capital assets should recognize a liability based on the guidance in this Statement. This Statement establishes criteria for determining the timing and pattern of recognition of a liability and a corresponding deferred outflow of resources for AROs. GASB Statement No. 84, Fiduciary Activities, issued January 2017, will be effective for the District beginning with its fiscal year ending June 30, 2020. The objective of this Statement is to improve guidance regarding the identification of fiduciary activities for accounting and financial reporting purposes and how those activities should be reported. The focus of the identification criteria established by the Statement is on 1) whether a government is controlling the assets of the fiduciary activity and 2) the beneficiaries with whom a fiduciary relationship exists. Separate criteria are included to identify fiduciary component units and postemployment benefit arrangements that are fiduciary activities. An activity meeting the criteria should be reported as a fiduciary fund in the basic financial statements. This Statement also provides for recognition of a liability to the beneficiaries in a fiduciary fund when an event has occurred that compels the government to disburse fiduciary resources. GASB Statement No. 87, Leases, issued June 2017, will be effective for the District beginning with its fiscal year ending June 30, 2021. The objective of this Statement is to better meet the information needs of financial statement users by improving accounting and financial reporting for leases by governments. This Statement increases the usefulness of governments’ financial statements by requiring recognition of certain lease assets and liabilities for leases that previously were classified as operating leases and recognized as inflows of resources or outflows of resources based on the payment provisions of the contract.
52
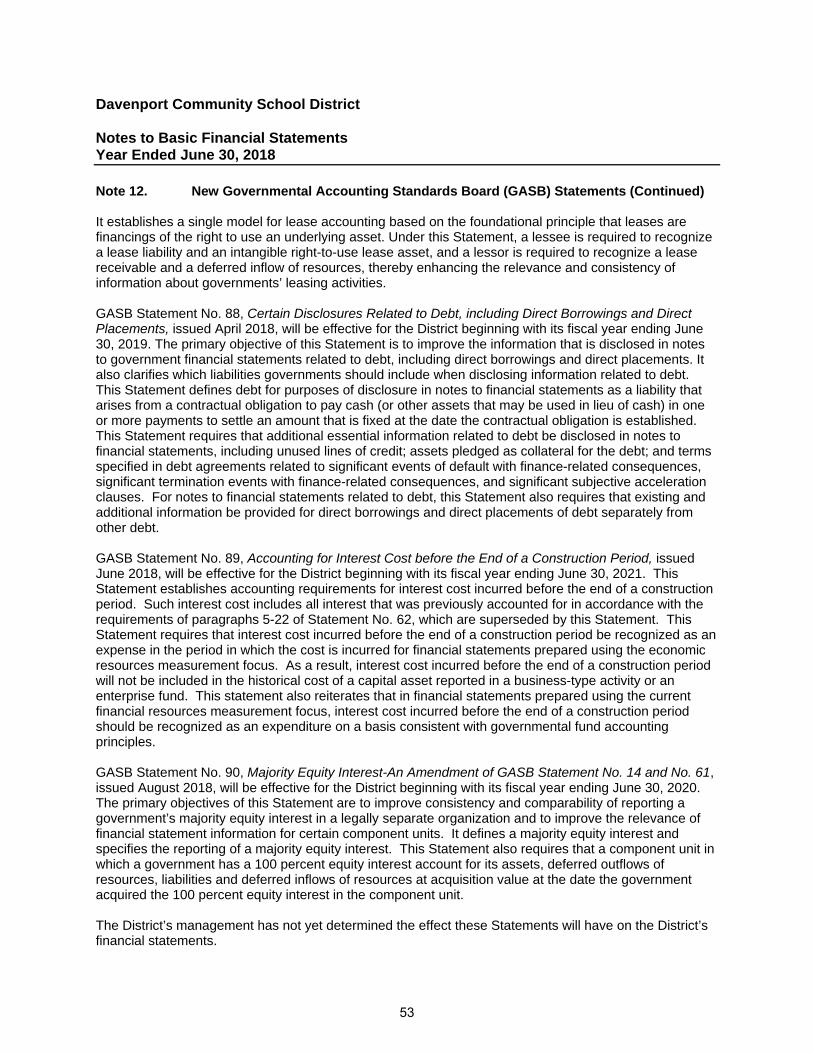
Davenport Community School District Notes to Basic Financial Statements Year Ended June 30, 2018
Note 12. New Governmental Accounting Standards Board (GASB) Statements (Continued) It establishes a single model for lease accounting based on the foundational principle that leases are financings of the right to use an underlying asset. Under this Statement, a lessee is required to recognize a lease liability and an intangible right-to-use lease asset, and a lessor is required to recognize a lease receivable and a deferred inflow of resources, thereby enhancing the relevance and consistency of information about governments’ leasing activities. GASB Statement No. 88, Certain Disclosures Related to Debt, including Direct Borrowings and Direct Placements, issued April 2018, will be effective for the District beginning with its fiscal year ending June 30, 2019. The primary objective of this Statement is to improve the information that is disclosed in notes to government financial statements related to debt, including direct borrowings and direct placements. It also clarifies which liabilities governments should include when disclosing information related to debt. This Statement defines debt for purposes of disclosure in notes to financial statements as a liability that arises from a contractual obligation to pay cash (or other assets that may be used in lieu of cash) in one or more payments to settle an amount that is fixed at the date the contractual obligation is established. This Statement requires that additional essential information related to debt be disclosed in notes to financial statements, including unused lines of credit; assets pledged as collateral for the debt; and terms specified in debt agreements related to significant events of default with finance-related consequences, significant termination events with finance-related consequences, and significant subjective acceleration clauses. For notes to financial statements related to debt, this Statement also requires that existing and additional information be provided for direct borrowings and direct placements of debt separately from other debt. GASB Statement No. 89, Accounting for Interest Cost before the End of a Construction Period, issued June 2018, will be effective for the District beginning with its fiscal year ending June 30, 2021. This Statement establishes accounting requirements for interest cost incurred before the end of a construction period. Such interest cost includes all interest that was previously accounted for in accordance with the requirements of paragraphs 5-22 of Statement No. 62, which are superseded by this Statement. This Statement requires that interest cost incurred before the end of a construction period be recognized as an expense in the period in which the cost is incurred for financial statements prepared using the economic resources measurement focus. As a result, interest cost incurred before the end of a construction period will not be included in the historical cost of a capital asset reported in a business-type activity or an enterprise fund. This statement also reiterates that in financial statements prepared using the current financial resources measurement focus, interest cost incurred before the end of a construction period should be recognized as an expenditure on a basis consistent with governmental fund accounting principles. GASB Statement No. 90, Majority Equity Interest-An Amendment of GASB Statement No. 14 and No. 61, issued August 2018, will be effective for the District beginning with its fiscal year ending June 30, 2020. The primary objectives of this Statement are to improve consistency and comparability of reporting a government’s majority equity interest in a legally separate organization and to improve the relevance of financial statement information for certain component units. It defines a majority equity interest and specifies the reporting of a majority equity interest. This Statement also requires that a component unit in which a government has a 100 percent equity interest account for its assets, deferred outflows of resources, liabilities and deferred inflows of resources at acquisition value at the date the government acquired the 100 percent equity interest in the component unit. The District’s management has not yet determined the effect these Statements will have on the District’s financial statements.
53
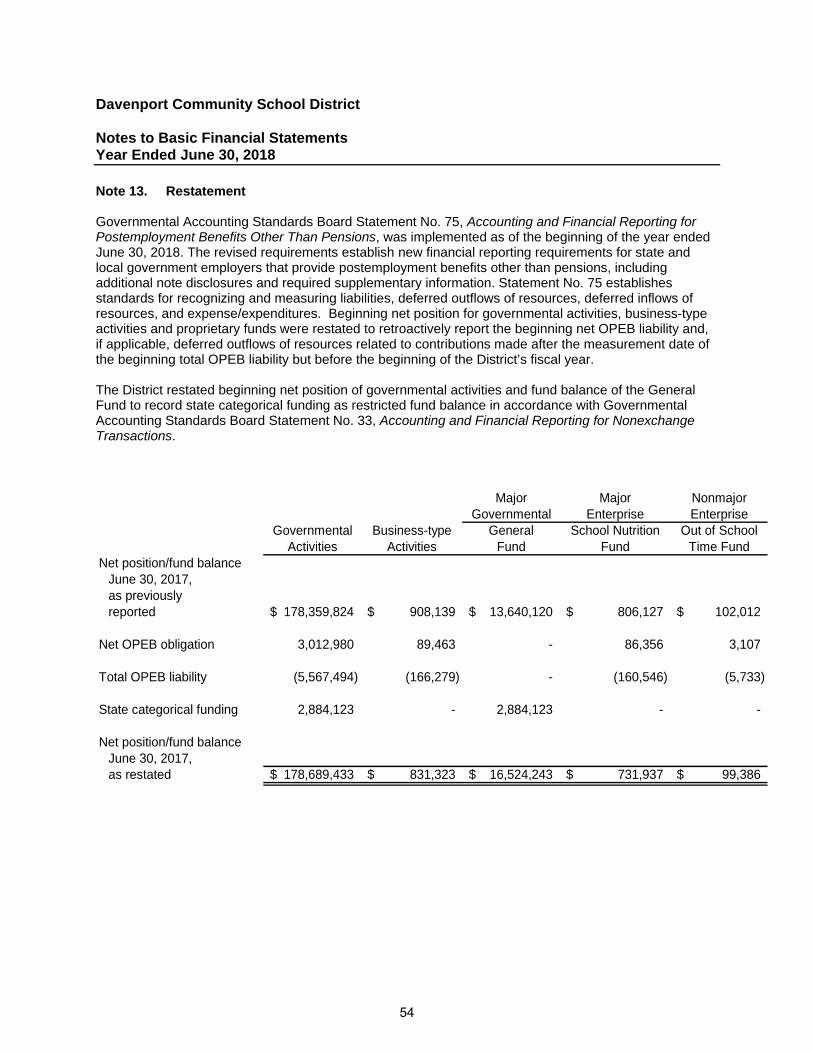
Davenport Community School District Notes to Basic Financial Statements Year Ended June 30, 2018
Note 13. Restatement Governmental Accounting Standards Board Statement No. 75, Accounting and Financial Reporting for Postemployment Benefits Other Than Pensions, was implemented as of the beginning of the year ended June 30, 2018. The revised requirements establish new financial reporting requirements for state and local government employers that provide postemployment benefits other than pensions, including additional note disclosures and required supplementary information. Statement No. 75 establishes standards for recognizing and measuring liabilities, deferred outflows of resources, deferred inflows of resources, and expense/expenditures. Beginning net position for governmental activities, business-type activities and proprietary funds were restated to retroactively report the beginning net OPEB liability and, if applicable, deferred outflows of resources related to contributions made after the measurement date of the beginning total OPEB liability but before the beginning of the District’s fiscal year. The District restated beginning net position of governmental activities and fund balance of the General Fund to record state categorical funding as restricted fund balance in accordance with Governmental Accounting Standards Board Statement No. 33, Accounting and Financial Reporting for Nonexchange Transactions.
Major Major NonmajorGovernmental Enterprise Enterprise
Governmental Business-type General School Nutrition Out of SchoolActivities Activities Fund Fund Time Fund
Net position/fund balanceJune 30, 2017,as previouslyreported 178,359,824$ 908,139$ 13,640,120$ 806,127$ 102,012$
Net OPEB obligation 3,012,980 89,463 - 86,356 3,107
Total OPEB liability (5,567,494) (166,279) - (160,546) (5,733)
State categorical funding 2,884,123 - 2,884,123 - -
Net position/fund balanceJune 30, 2017,as restated 178,689,433$ 831,323$ 16,524,243$ 731,937$ 99,386$
54
Required Supplementary Information

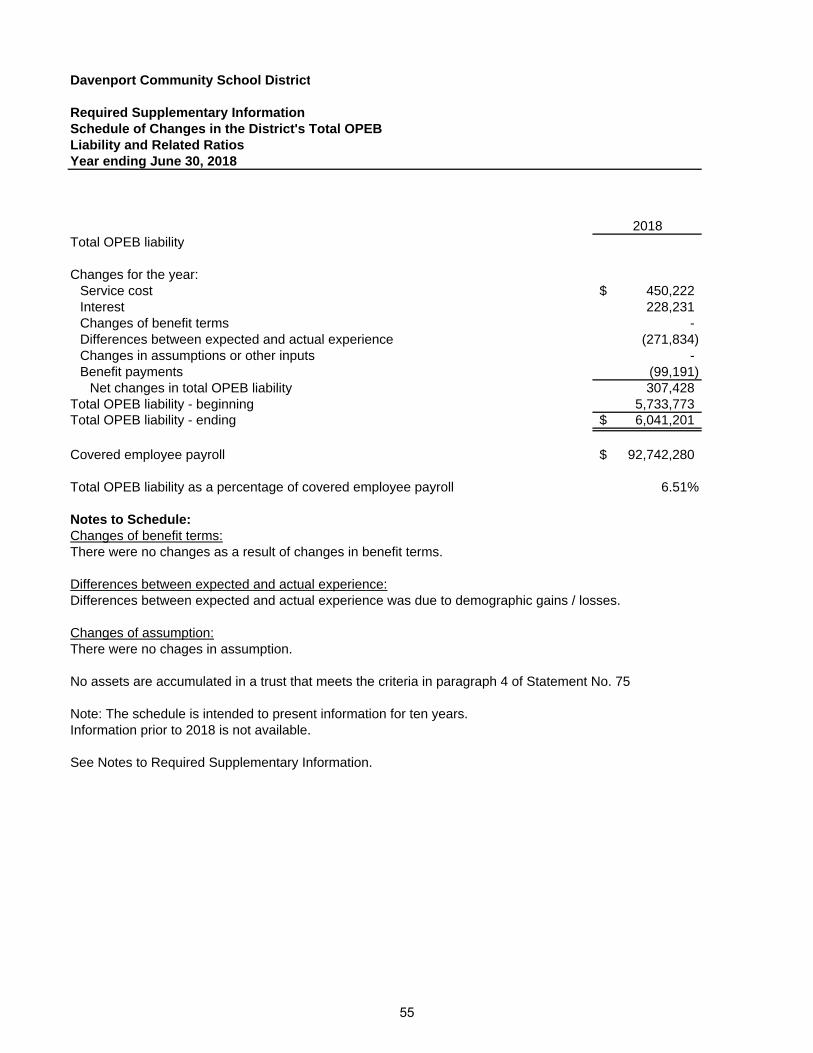
Davenport Community School District
Required Supplementary InformationSchedule of Changes in the District's Total OPEBLiability and Related RatiosYear ending June 30, 2018
2018Total OPEB liability
Changes for the year:Service cost 450,222$ Interest 228,231 Changes of benefit terms - Differences between expected and actual experience (271,834) Changes in assumptions or other inputs - Benefit payments (99,191)
Net changes in total OPEB liability 307,428 Total OPEB liability - beginning 5,733,773 Total OPEB liability - ending 6,041,201$
Covered employee payroll 92,742,280$
Total OPEB liability as a percentage of covered employee payroll 6.51%
Notes to Schedule:Changes of benefit terms:There were no changes as a result of changes in benefit terms.
Differences between expected and actual experience:Differences between expected and actual experience was due to demographic gains / losses.
Changes of assumption:There were no chages in assumption.
No assets are accumulated in a trust that meets the criteria in paragraph 4 of Statement No. 75
Note: The schedule is intended to present information for ten years. Information prior to 2018 is not available.
See Notes to Required Supplementary Information.
55
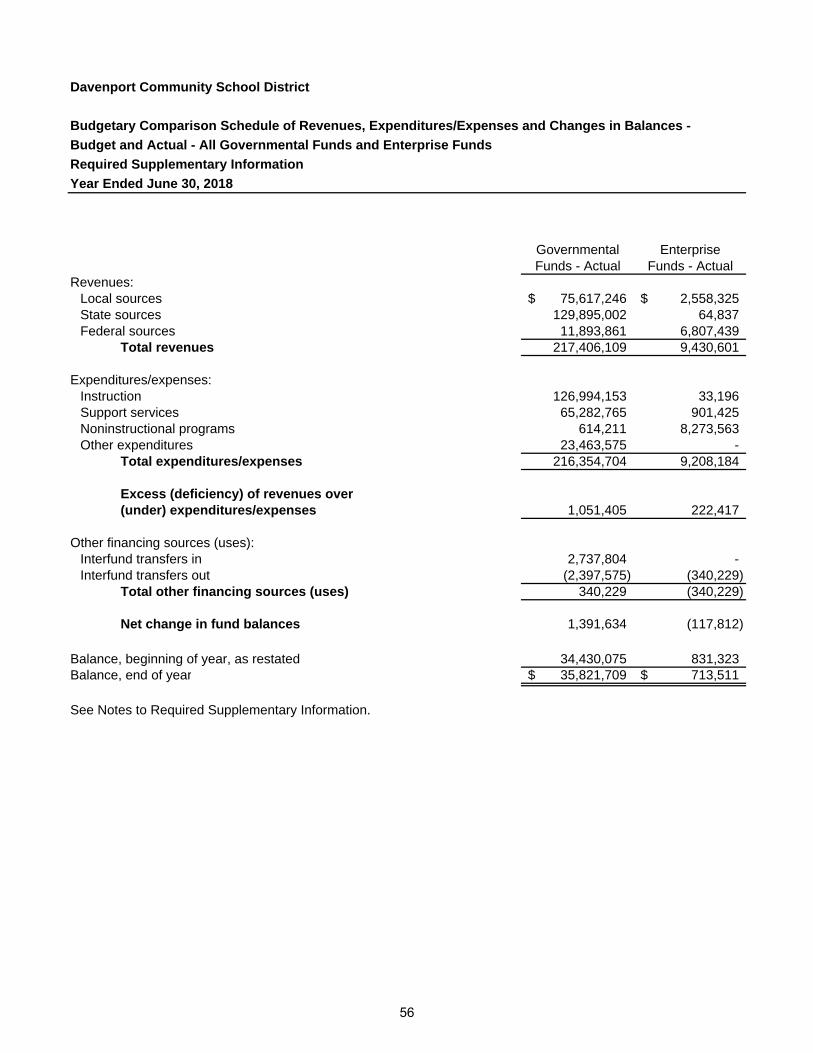
Davenport Community School District
Budgetary Comparison Schedule of Revenues, Expenditures/Expenses and Changes in Balances -
Budget and Actual - All Governmental Funds and Enterprise Funds
Required Supplementary Information
Year Ended June 30, 2018
Governmental EnterpriseFunds - Actual Funds - Actual
Revenues:Local sources 75,617,246$ 2,558,325$ State sources 129,895,002 64,837 Federal sources 11,893,861 6,807,439
Total revenues 217,406,109 9,430,601
Expenditures/expenses:Instruction 126,994,153 33,196 Support services 65,282,765 901,425 Noninstructional programs 614,211 8,273,563 Other expenditures 23,463,575 -
Total expenditures/expenses 216,354,704 9,208,184
Excess (deficiency) of revenues over(under) expenditures/expenses 1,051,405 222,417
Other financing sources (uses):Interfund transfers in 2,737,804 - Interfund transfers out (2,397,575) (340,229)
Total other financing sources (uses) 340,229 (340,229)
Net change in fund balances 1,391,634 (117,812)
Balance, beginning of year, as restated 34,430,075 831,323 Balance, end of year 35,821,709$ 713,511$
See Notes to Required Supplementary Information.
56
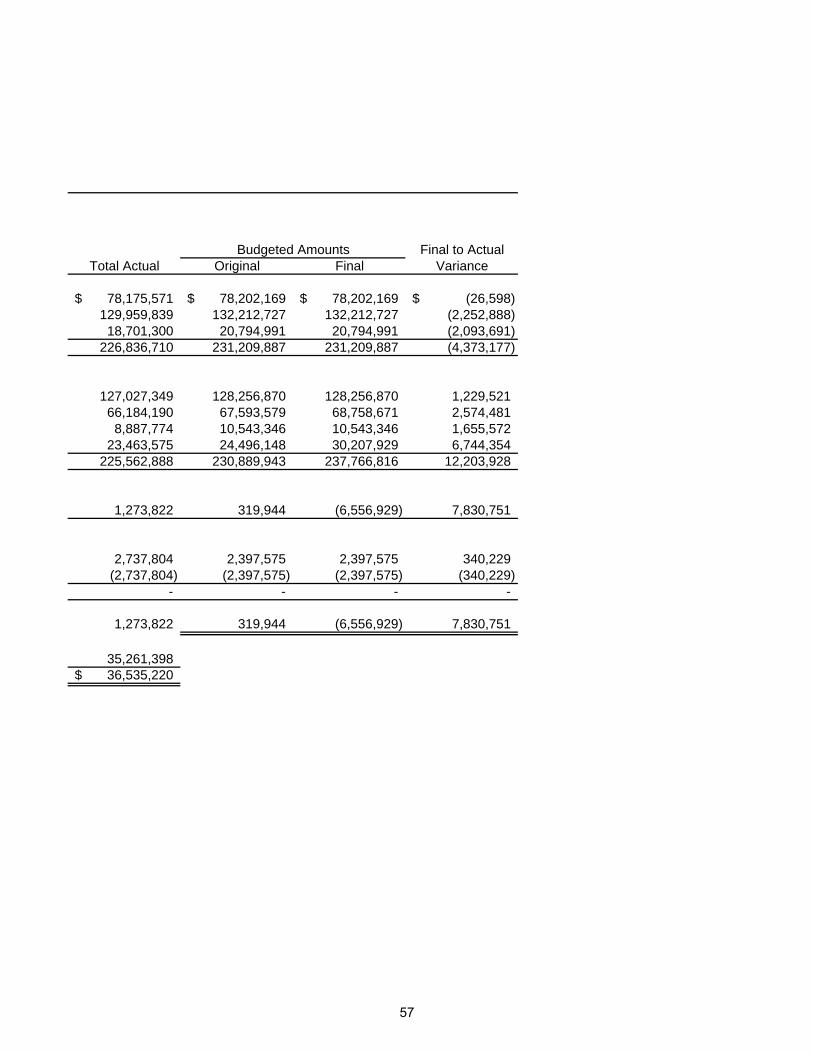
Budgeted Amounts Final to ActualTotal Actual Original Final Variance
78,175,571$ 78,202,169$ 78,202,169$ (26,598)$ 129,959,839 132,212,727 132,212,727 (2,252,888) 18,701,300 20,794,991 20,794,991 (2,093,691)
226,836,710 231,209,887 231,209,887 (4,373,177)
127,027,349 128,256,870 128,256,870 1,229,521 66,184,190 67,593,579 68,758,671 2,574,481 8,887,774 10,543,346 10,543,346 1,655,572
23,463,575 24,496,148 30,207,929 6,744,354 225,562,888 230,889,943 237,766,816 12,203,928
1,273,822 319,944 (6,556,929) 7,830,751
2,737,804 2,397,575 2,397,575 340,229 (2,737,804) (2,397,575) (2,397,575) (340,229)
- - - -
1,273,822 319,944 (6,556,929) 7,830,751
35,261,398 36,535,220$
57

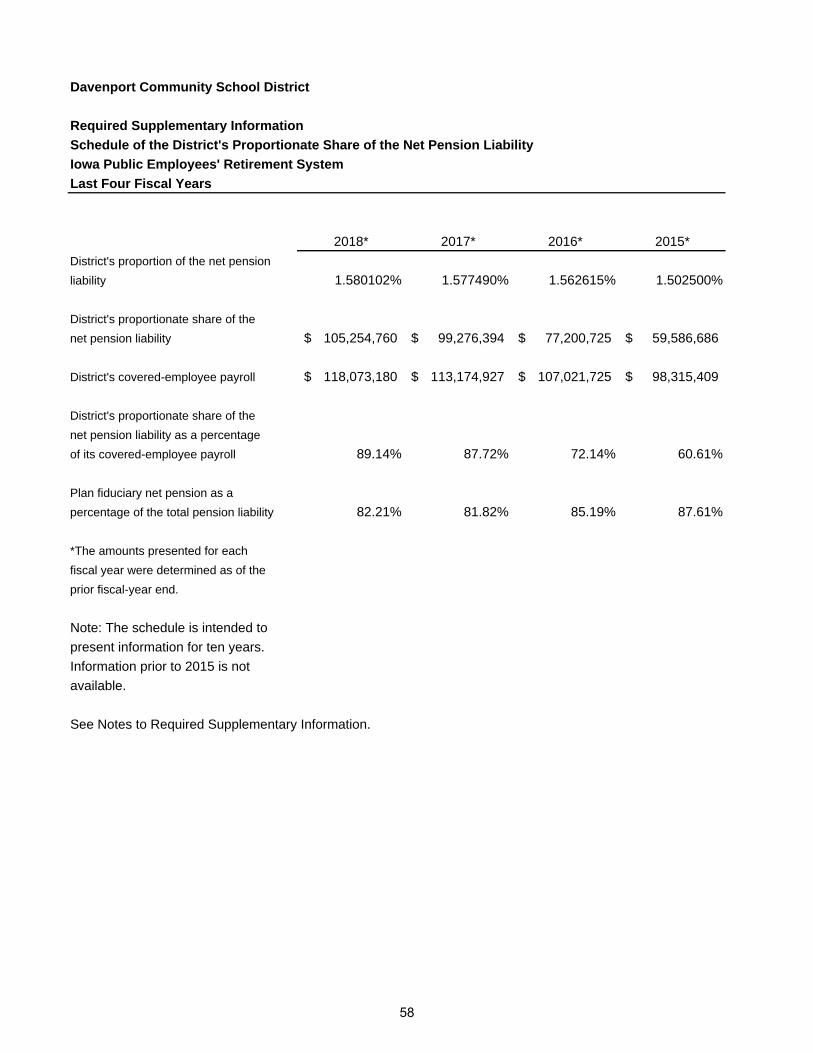
Davenport Community School District
Required Supplementary Information
Schedule of the District's Proportionate Share of the Net Pension Liability
Iowa Public Employees' Retirement System
Last Four Fiscal Years
2018* 2017* 2016* 2015*
District's proportion of the net pension
liability 1.580102% 1.577490% 1.562615% 1.502500%
District's proportionate share of the
net pension liability 105,254,760$ 99,276,394$ 77,200,725$ 59,586,686$
District's covered-employee payroll 118,073,180$ 113,174,927$ 107,021,725$ 98,315,409$
District's proportionate share of the
net pension liability as a percentage
of its covered-employee payroll 89.14% 87.72% 72.14% 60.61%
Plan fiduciary net pension as a
percentage of the total pension liability 82.21% 81.82% 85.19% 87.61%
*The amounts presented for each
fiscal year were determined as of the
prior fiscal-year end.
Note: The schedule is intended to
present information for ten years.
Information prior to 2015 is not
available.
See Notes to Required Supplementary Information.
58
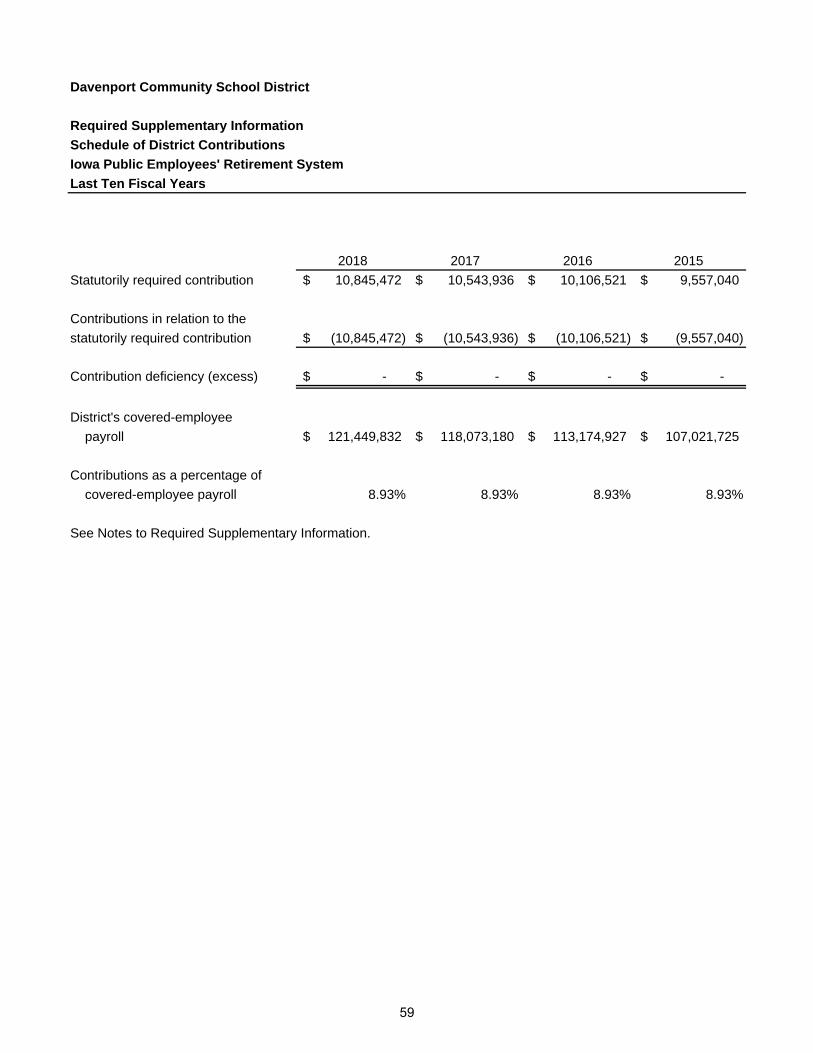
Davenport Community School District
Required Supplementary Information
Schedule of District Contributions
Iowa Public Employees' Retirement System
Last Ten Fiscal Years
2018 2017 2016 2015
Statutorily required contribution 10,845,472$ 10,543,936$ 10,106,521$ 9,557,040$
Contributions in relation to the
statutorily required contribution (10,845,472)$ (10,543,936)$ (10,106,521)$ (9,557,040)$
Contribution deficiency (excess) -$ -$ -$ -$
District's covered-employee
payroll 121,449,832$ 118,073,180$ 113,174,927$ 107,021,725$
Contributions as a percentage of
covered-employee payroll 8.93% 8.93% 8.93% 8.93%
See Notes to Required Supplementary Information.
59
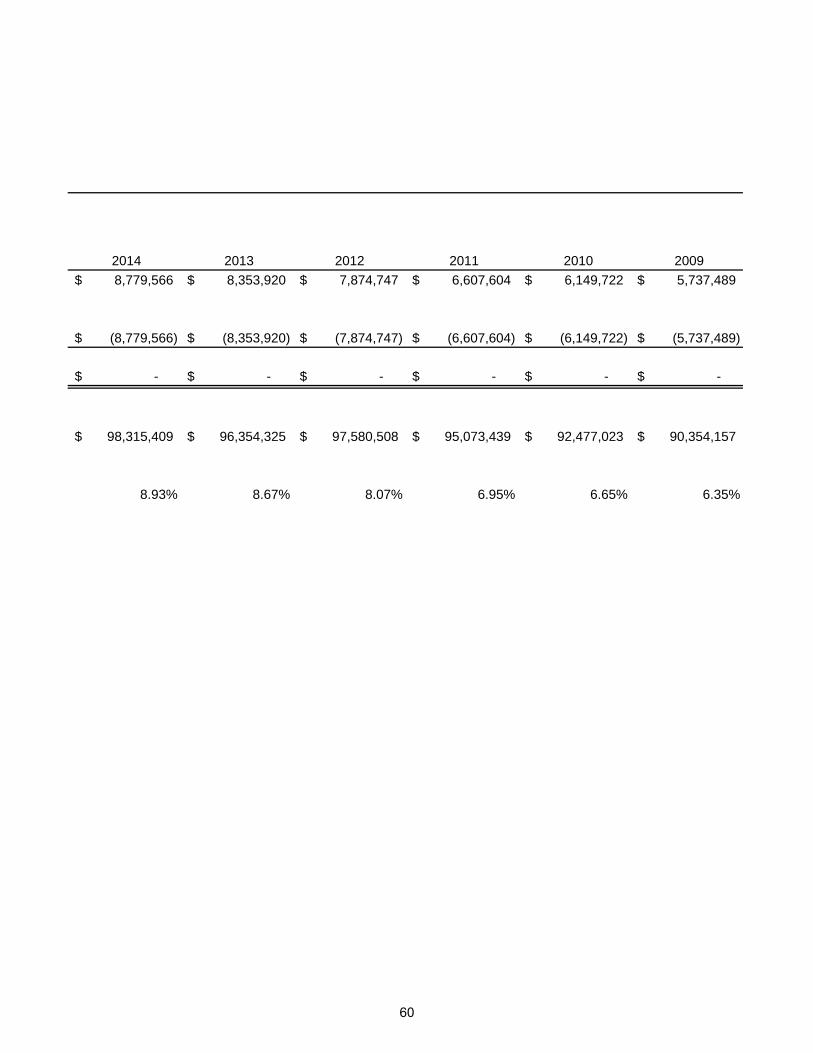
2014 2013 2012 2011 2010 2009
8,779,566$ 8,353,920$ 7,874,747$ 6,607,604$ 6,149,722$ 5,737,489$
(8,779,566)$ (8,353,920)$ (7,874,747)$ (6,607,604)$ (6,149,722)$ (5,737,489)$
-$ -$ -$ -$ -$ -$
98,315,409$ 96,354,325$ 97,580,508$ 95,073,439$ 92,477,023$ 90,354,157$
8.93% 8.67% 8.07% 6.95% 6.65% 6.35%
60

Davenport Community School District Notes to Required Supplementary Information
Note 1. Budgets and Budgetary Information
This budgetary comparison is presented as Required Supplementary Information in accordance with Governmental Accounting Standards Board Statement No. 41 for governments with significant budgetary perspective differences resulting from not being able to present budgetary comparisons for the General Fund and each major Special Revenue Fund. In accordance with the Code of Iowa, the Board of Education annually adopts a budget following required public notice and hearing for all funds except internal service, and agency funds. The budget may be amended during the year utilizing similar statutorily prescribed procedures. The District’s budget is prepared on a basis consistent with accounting principles generally accepted in the United States of America. Formal and legal budgetary control for the certified budget is based upon four major classes or expenditures known as functional areas, not by fund or fund type. These four functional areas are instruction, support services, noninstructional programs and other expenditures. Although the budget document presents functional expenditures or expenses by fund, the legal level of control is at the aggregated functional area level, not at the fund or fund type level. The Code of Iowa also provides that District expenditures in the General Fund may not exceed the amount authorized by the school finance formula. During the year, the District adopted one budget amendment increasing budgeted expenditures by $6,876,873. The District follows these procedures in establishing budgetary data:
1. The Administration submits to the Board of Education a proposed operating budget for the year commencing July 1. The operating budget includes proposed expenditures and the means of financing them.
2. Public hearings are conducted and the proposed budget is available for inspection to obtain taxpayer comments. The proposed budget is readily available at least 30 days prior to final action by the Board.
3. Prior to April 15, the budget is legally adopted through passage of a resolution which is filed with the County Auditor to obtain tax revenues.
4. The Board of Education may amend the budget after it is approved using the same procedures required to approve the original budget.
5. All annual appropriations lapse at fiscal year-end.
Note 2. Iowa Public Employees’ Retirement System Pension Liability
Changes of benefit terms: Legislation passed in 2010 modified benefit terms for current Regular members. The definition of final average salary changed from the highest three to the highest five years of covered wages. The vesting requirement changed from four years of service to seven years. The early retirement reduction increased from 3 percent per year measured from the member’s first unreduced retirement age to a 6 percent reduction for each year of retirement before age 65.
61
Davenport Community School District Notes to Required Supplementary Information
Note 2. Iowa Public Employees’ Retirement System Pension Liability (Continued)
Changes of assumptions: The 2017 valuation implemented the following refinements as a result of an experience study dated March 24, 2017:
Decreased the inflations assumption from 3.00% to 2.60% Decreased the assumed rate of interest on member accounts from 3.75% to 3.50% per year. Decreased the discount rate from 7.50% to 7.00% Decreased the wage growth assumption from 4.00% to 3.25% Decreased the payroll growth assumption from 4.00% to 3.25%
The 2014 valuation implemented the following refinements as a result of quadrennial experience study:
Decreased the inflation assumption from 3.25 percent to 3.00 percent. Decreased the assumed rate of interest on member accounts from 4.00 percent to 3.75 percent
per year. Adjusted male mortality rates for retirees in the Regular membership group. Reduced retirement rates for sheriffs and deputies between the ages of 55 and 64. Moved from an open 30 year amortization period to a closed 30 year amortization period for the
UAL beginning June 30, 2014. Each year thereafter, changes in the UAL from plan experience will be amortized on a separate closed 20 year period.
The 2010 valuation implemented the following refinements as a result of a quadrennial experience study:
Adjusted retiree mortality assumptions. Modified retirement rates to reflect fewer retirements. Lowered disability rates at most ages. Lowered employment termination rates. Generally increased the probability of terminating members receiving a deferred retirement
benefit. Modified salary increase assumptions based on various service duration.
62
Other Supplementary Information

Nonmajor Governmental Funds
The other governmental funds of the District are considered nonmajor and are as follows: The special revenue funds account for and report the proceeds of specific revenue sources that are restricted or committed to expenditure for specified purposes other than debt service or capital projects. A brief description of each of the District’s special revenue funds follows: Management Fund – This fund accounts for tort liability insurance premiums, unemployment compensation insurance claims and early retirement incentive payments. Student Activity Fund – This fund accounts for money held by the District on behalf of the students who have raised these funds and are responsible for their disposition for co-curricular or extracurricular activities of the District. Debt Service – This fund accounts for the accumulation of resources for the payment of general long-term debt principal, interest and related costs.
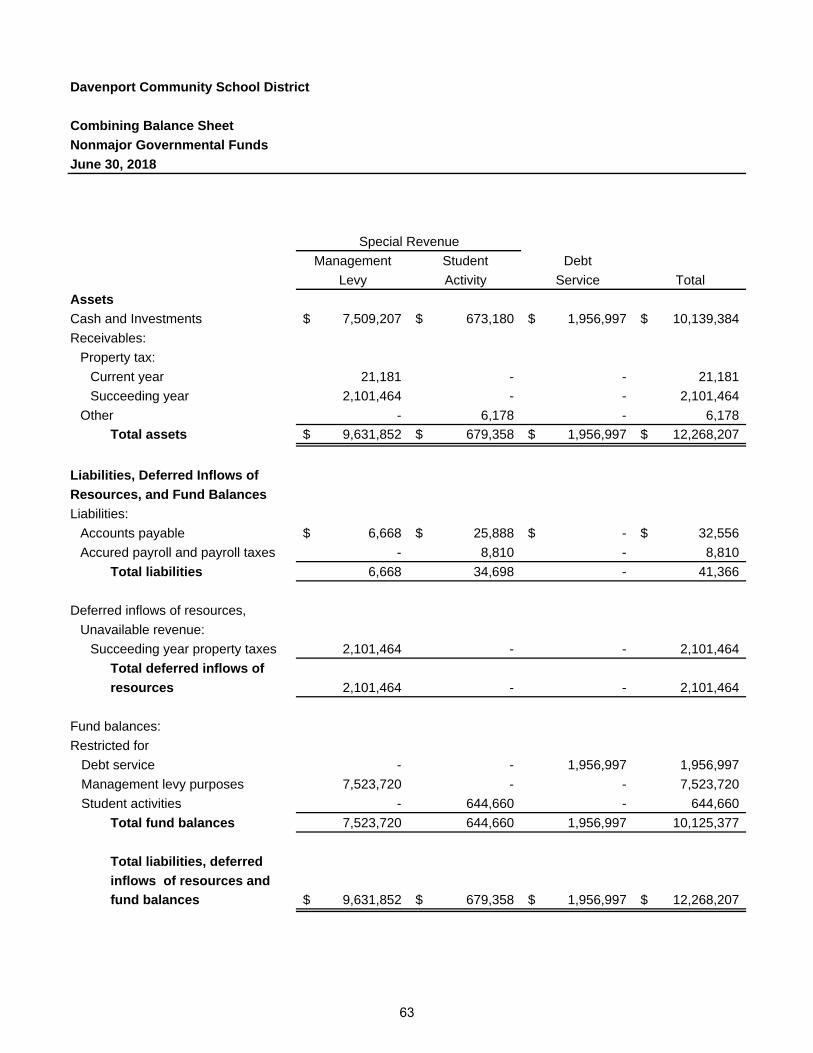
Davenport Community School District
Combining Balance Sheet
Nonmajor Governmental Funds
June 30, 2018
Management Student Debt
Levy Activity Service Total
Assets
Cash and Investments 7,509,207$ 673,180$ 1,956,997$ 10,139,384$
Receivables:
Property tax:
Current year 21,181 - - 21,181
Succeeding year 2,101,464 - - 2,101,464
Other - 6,178 - 6,178
Total assets 9,631,852$ 679,358$ 1,956,997$ 12,268,207$
Liabilities, Deferred Inflows of
Resources, and Fund Balances
Liabilities:
Accounts payable 6,668$ 25,888$ -$ 32,556$
Accured payroll and payroll taxes - 8,810 - 8,810
Total liabilities 6,668 34,698 - 41,366
Deferred inflows of resources,
Unavailable revenue:
Succeeding year property taxes 2,101,464 - - 2,101,464
Total deferred inflows of
resources 2,101,464 - - 2,101,464
Fund balances:
Restricted for
Debt service - - 1,956,997 1,956,997
Management levy purposes 7,523,720 - - 7,523,720
Student activities - 644,660 - 644,660
Total fund balances 7,523,720 644,660 1,956,997 10,125,377
Total liabilities, deferred
inflows of resources and
fund balances 9,631,852$ 679,358$ 1,956,997$ 12,268,207$
Special Revenue
63
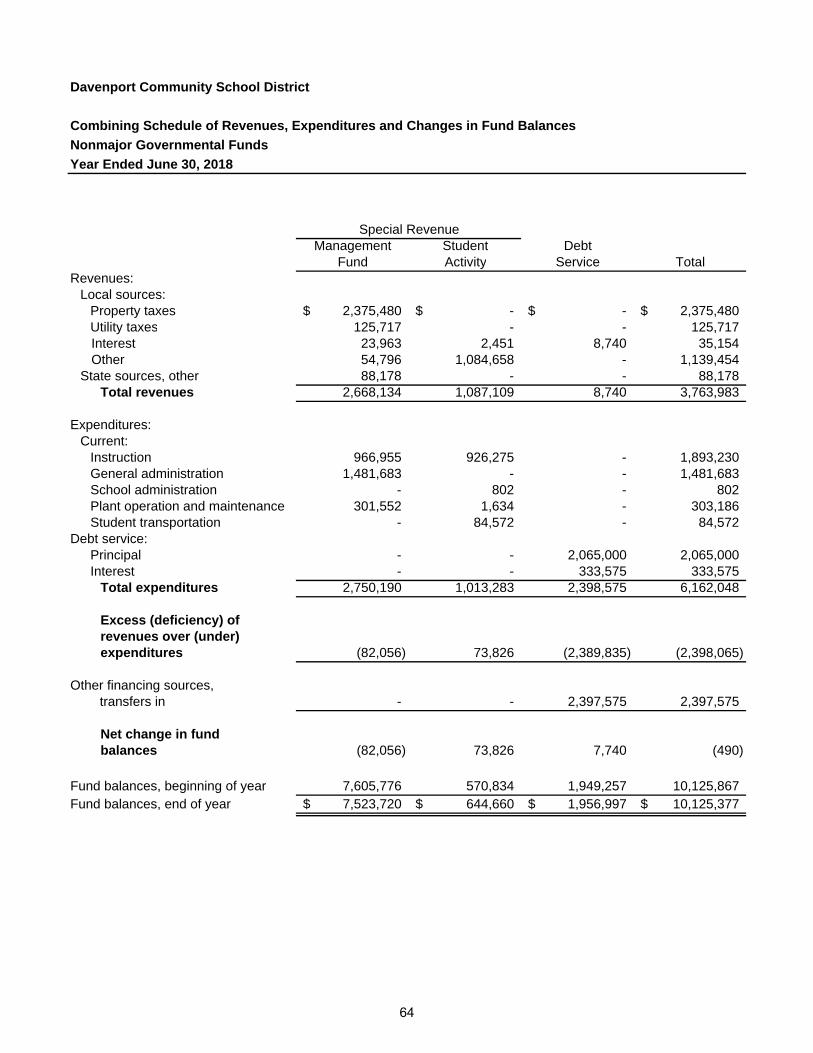
Davenport Community School District
Combining Schedule of Revenues, Expenditures and Changes in Fund Balances
Nonmajor Governmental Funds
Year Ended June 30, 2018
Management Student DebtFund Activity Service Total
Revenues:Local sources:
Property taxes 2,375,480$ -$ -$ 2,375,480$ Utility taxes 125,717 - - 125,717
Interest 23,963 2,451 8,740 35,154 Other 54,796 1,084,658 - 1,139,454 State sources, other 88,178 - - 88,178
Total revenues 2,668,134 1,087,109 8,740 3,763,983 Expenditures:
Current:Instruction 966,955 926,275 - 1,893,230 General administration 1,481,683 - - 1,481,683 School administration - 802 - 802 Plant operation and maintenance 301,552 1,634 - 303,186 Student transportation - 84,572 - 84,572
Debt service:Principal - - 2,065,000 2,065,000 Interest - - 333,575 333,575
Total expenditures 2,750,190 1,013,283 2,398,575 6,162,048
Excess (deficiency) of revenues over (under) expenditures (82,056) 73,826 (2,389,835) (2,398,065)
Other financing sources, transfers in - - 2,397,575 2,397,575
Net change in fundbalances (82,056) 73,826 7,740 (490)
Fund balances, beginning of year 7,605,776 570,834 1,949,257 10,125,867 Fund balances, end of year 7,523,720$ 644,660$ 1,956,997$ 10,125,377$
Special Revenue
64

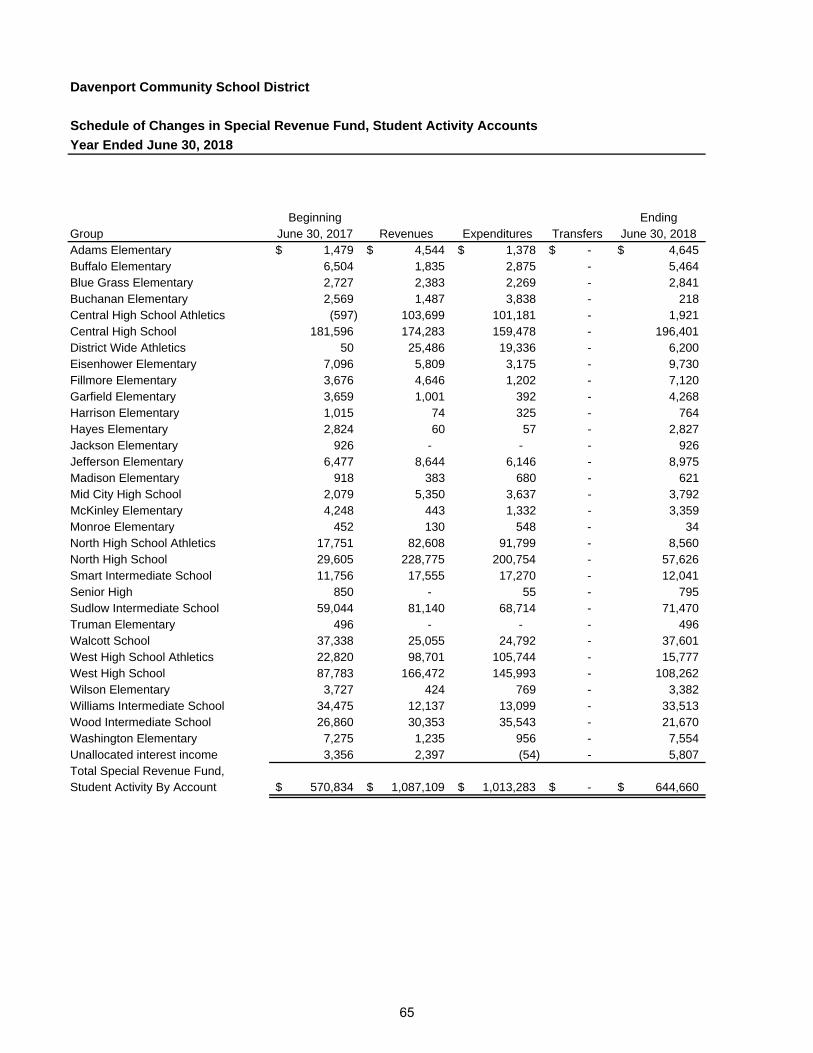
Davenport Community School District
Schedule of Changes in Special Revenue Fund, Student Activity Accounts
Year Ended June 30, 2018
Beginning EndingGroup June 30, 2017 Revenues Expenditures Transfers June 30, 2018Adams Elementary 1,479$ 4,544$ 1,378$ -$ 4,645$ Buffalo Elementary 6,504 1,835 2,875 - 5,464 Blue Grass Elementary 2,727 2,383 2,269 - 2,841 Buchanan Elementary 2,569 1,487 3,838 - 218 Central High School Athletics (597) 103,699 101,181 - 1,921 Central High School 181,596 174,283 159,478 - 196,401 District Wide Athletics 50 25,486 19,336 - 6,200 Eisenhower Elementary 7,096 5,809 3,175 - 9,730 Fillmore Elementary 3,676 4,646 1,202 - 7,120 Garfield Elementary 3,659 1,001 392 - 4,268 Harrison Elementary 1,015 74 325 - 764 Hayes Elementary 2,824 60 57 - 2,827 Jackson Elementary 926 - - - 926 Jefferson Elementary 6,477 8,644 6,146 - 8,975 Madison Elementary 918 383 680 - 621 Mid City High School 2,079 5,350 3,637 - 3,792 McKinley Elementary 4,248 443 1,332 - 3,359 Monroe Elementary 452 130 548 - 34 North High School Athletics 17,751 82,608 91,799 - 8,560 North High School 29,605 228,775 200,754 - 57,626 Smart Intermediate School 11,756 17,555 17,270 - 12,041 Senior High 850 - 55 - 795 Sudlow Intermediate School 59,044 81,140 68,714 - 71,470 Truman Elementary 496 - - - 496 Walcott School 37,338 25,055 24,792 - 37,601 West High School Athletics 22,820 98,701 105,744 - 15,777 West High School 87,783 166,472 145,993 - 108,262 Wilson Elementary 3,727 424 769 - 3,382 Williams Intermediate School 34,475 12,137 13,099 - 33,513 Wood Intermediate School 26,860 30,353 35,543 - 21,670 Washington Elementary 7,275 1,235 956 - 7,554 Unallocated interest income 3,356 2,397 (54) - 5,807 Total Special Revenue Fund,Student Activity By Account 570,834$ 1,087,109$ 1,013,283$ -$ 644,660$
65
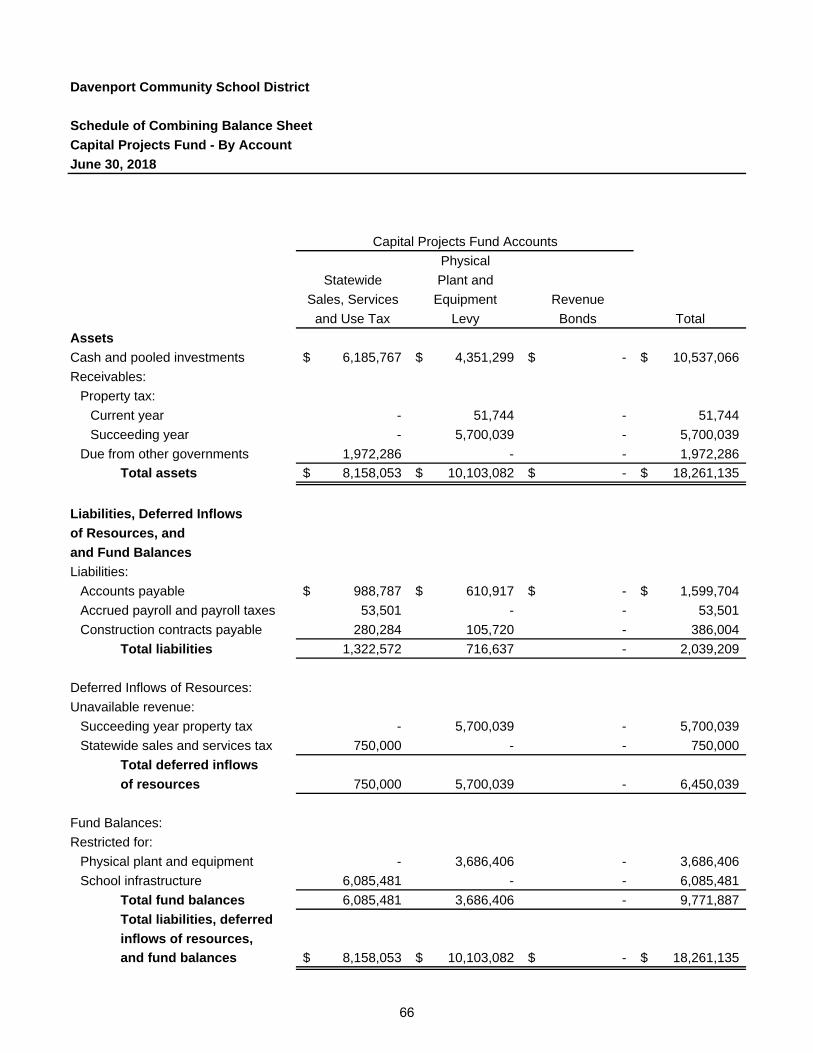
Davenport Community School District
Schedule of Combining Balance Sheet
Capital Projects Fund - By Account
June 30, 2018
Physical
Statewide Plant and
Sales, Services Equipment Revenue
and Use Tax Levy Bonds Total
Assets
Cash and pooled investments 6,185,767$ 4,351,299$ -$ 10,537,066$
Receivables:
Property tax:
Current year - 51,744 - 51,744
Succeeding year - 5,700,039 - 5,700,039
Due from other governments 1,972,286 - - 1,972,286
Total assets 8,158,053$ 10,103,082$ -$ 18,261,135$
Liabilities, Deferred Inflows
of Resources, and
and Fund Balances
Liabilities:
Accounts payable 988,787$ 610,917$ -$ 1,599,704$
Accrued payroll and payroll taxes 53,501 - - 53,501
Construction contracts payable 280,284 105,720 - 386,004
Total liabilities 1,322,572 716,637 - 2,039,209
Deferred Inflows of Resources:
Unavailable revenue:
Succeeding year property tax - 5,700,039 - 5,700,039
Statewide sales and services tax 750,000 - - 750,000
Total deferred inflows
of resources 750,000 5,700,039 - 6,450,039
Fund Balances:
Restricted for:
Physical plant and equipment - 3,686,406 - 3,686,406
School infrastructure 6,085,481 - - 6,085,481
Total fund balances 6,085,481 3,686,406 - 9,771,887
Total liabilities, deferred
inflows of resources,
and fund balances 8,158,053$ 10,103,082$ -$ 18,261,135$
Capital Projects Fund Accounts
66
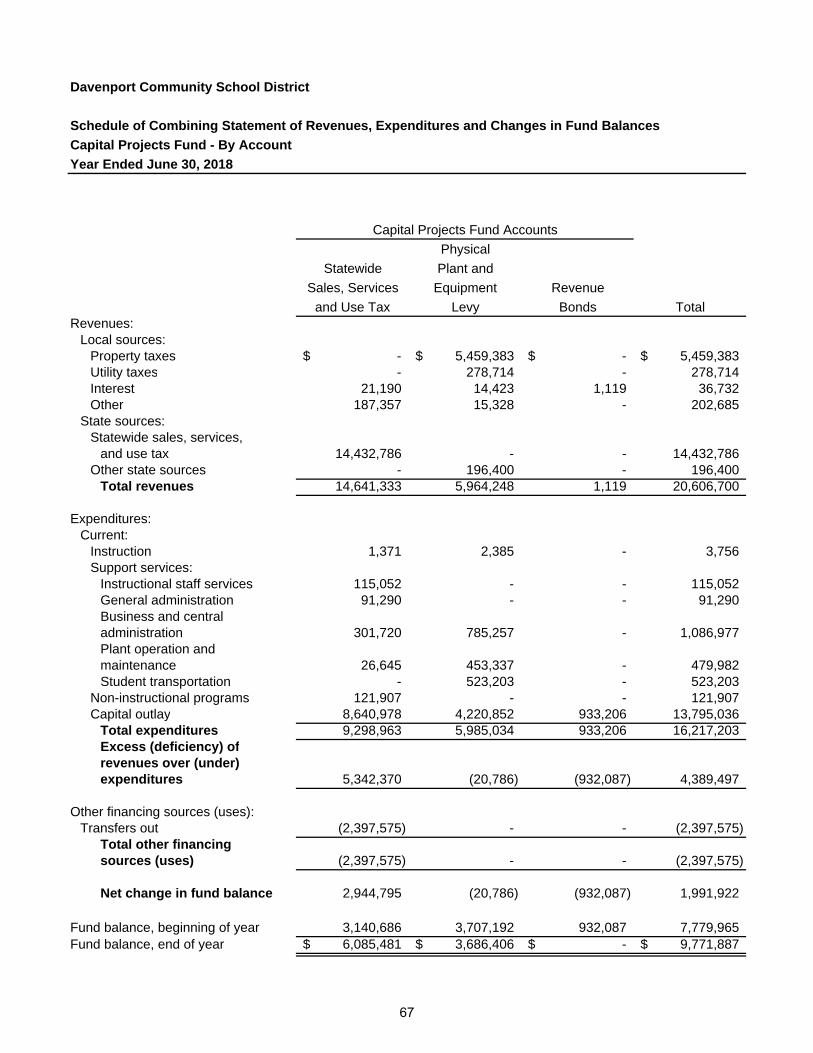
Davenport Community School District
Schedule of Combining Statement of Revenues, Expenditures and Changes in Fund Balances
Capital Projects Fund - By Account
Year Ended June 30, 2018
Physical
Statewide Plant and
Sales, Services Equipment Revenue
and Use Tax Levy Bonds TotalRevenues:
Local sources:Property taxes -$ 5,459,383$ -$ 5,459,383$ Utility taxes - 278,714 - 278,714 Interest 21,190 14,423 1,119 36,732 Other 187,357 15,328 - 202,685
State sources:Statewide sales, services,
and use tax 14,432,786 - - 14,432,786 Other state sources - 196,400 - 196,400
Total revenues 14,641,333 5,964,248 1,119 20,606,700
Expenditures:Current:
Instruction 1,371 2,385 - 3,756 Support services:
Instructional staff services 115,052 - - 115,052 General administration 91,290 - - 91,290 Business and centraladministration 301,720 785,257 - 1,086,977 Plant operation and maintenance 26,645 453,337 - 479,982 Student transportation - 523,203 - 523,203
Non-instructional programs 121,907 - - 121,907 Capital outlay 8,640,978 4,220,852 933,206 13,795,036
Total expenditures 9,298,963 5,985,034 933,206 16,217,203 Excess (deficiency) ofrevenues over (under) expenditures 5,342,370 (20,786) (932,087) 4,389,497
Other financing sources (uses):Transfers out (2,397,575) - - (2,397,575)
Total other financingsources (uses) (2,397,575) - - (2,397,575)
Net change in fund balance 2,944,795 (20,786) (932,087) 1,991,922
Fund balance, beginning of year 3,140,686 3,707,192 932,087 7,779,965 Fund balance, end of year 6,085,481$ 3,686,406$ -$ 9,771,887$
Capital Projects Fund Accounts
67
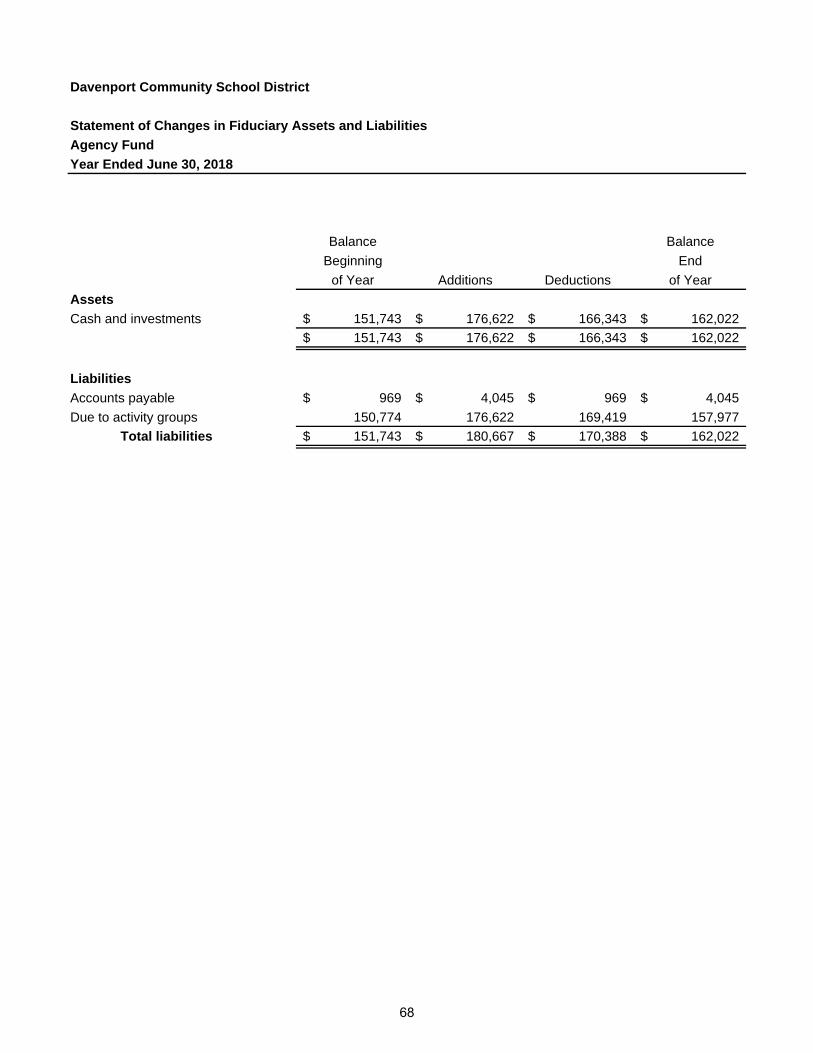
Davenport Community School District
Statement of Changes in Fiduciary Assets and Liabilities
Agency Fund
Year Ended June 30, 2018
Balance Balance
Beginning End
of Year Additions Deductions of Year
Assets
Cash and investments 151,743$ 176,622$ 166,343$ 162,022$
151,743$ 176,622$ 166,343$ 162,022$
Liabilities
Accounts payable 969$ 4,045$ 969$ 4,045$
Due to activity groups 150,774 176,622 169,419 157,977
Total liabilities 151,743$ 180,667$ 170,388$ 162,022$
68
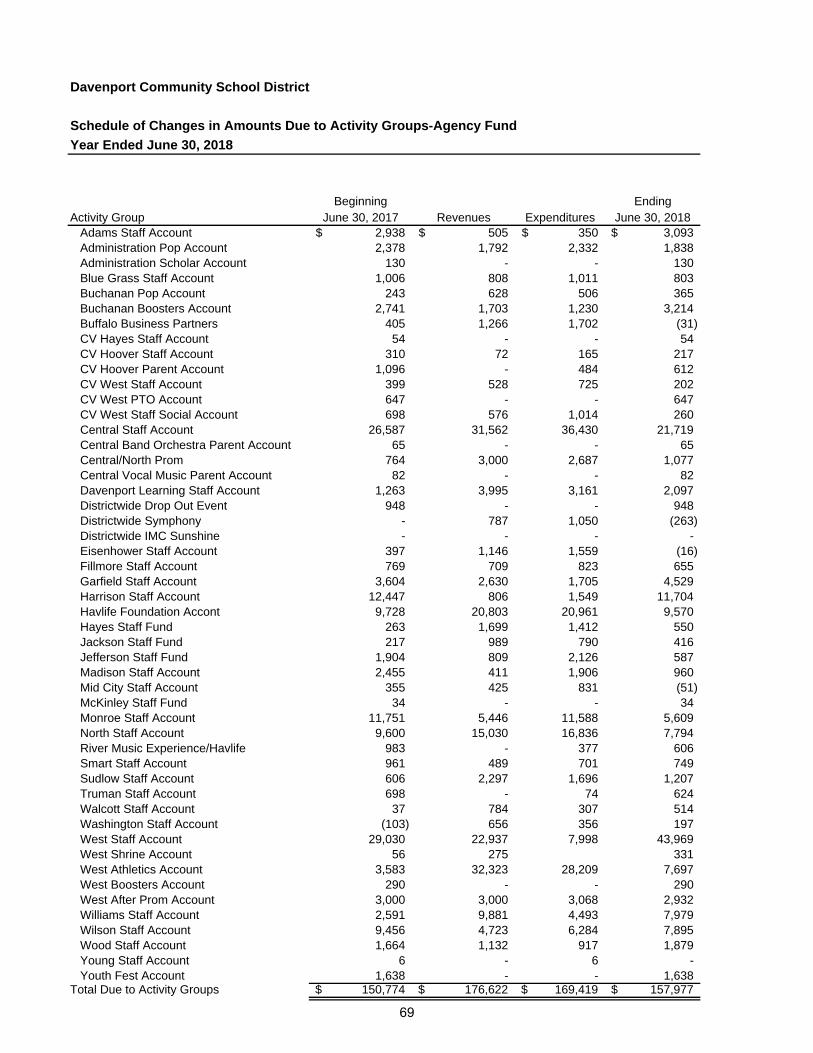
Davenport Community School District
Schedule of Changes in Amounts Due to Activity Groups-Agency Fund
Year Ended June 30, 2018
Beginning EndingActivity Group June 30, 2017 Revenues Expenditures June 30, 2018
Adams Staff Account 2,938$ 505$ 350$ 3,093$ Administration Pop Account 2,378 1,792 2,332 1,838 Administration Scholar Account 130 - - 130 Blue Grass Staff Account 1,006 808 1,011 803 Buchanan Pop Account 243 628 506 365 Buchanan Boosters Account 2,741 1,703 1,230 3,214 Buffalo Business Partners 405 1,266 1,702 (31) CV Hayes Staff Account 54 - - 54 CV Hoover Staff Account 310 72 165 217 CV Hoover Parent Account 1,096 - 484 612 CV West Staff Account 399 528 725 202 CV West PTO Account 647 - - 647 CV West Staff Social Account 698 576 1,014 260 Central Staff Account 26,587 31,562 36,430 21,719 Central Band Orchestra Parent Account 65 - - 65 Central/North Prom 764 3,000 2,687 1,077 Central Vocal Music Parent Account 82 - - 82 Davenport Learning Staff Account 1,263 3,995 3,161 2,097 Districtwide Drop Out Event 948 - - 948 Districtwide Symphony - 787 1,050 (263) Districtwide IMC Sunshine - - - - Eisenhower Staff Account 397 1,146 1,559 (16) Fillmore Staff Account 769 709 823 655 Garfield Staff Account 3,604 2,630 1,705 4,529 Harrison Staff Account 12,447 806 1,549 11,704 Havlife Foundation Accont 9,728 20,803 20,961 9,570 Hayes Staff Fund 263 1,699 1,412 550 Jackson Staff Fund 217 989 790 416 Jefferson Staff Fund 1,904 809 2,126 587 Madison Staff Account 2,455 411 1,906 960 Mid City Staff Account 355 425 831 (51) McKinley Staff Fund 34 - - 34 Monroe Staff Account 11,751 5,446 11,588 5,609 North Staff Account 9,600 15,030 16,836 7,794 River Music Experience/Havlife 983 - 377 606 Smart Staff Account 961 489 701 749 Sudlow Staff Account 606 2,297 1,696 1,207 Truman Staff Account 698 - 74 624 Walcott Staff Account 37 784 307 514 Washington Staff Account (103) 656 356 197 West Staff Account 29,030 22,937 7,998 43,969 West Shrine Account 56 275 331 West Athletics Account 3,583 32,323 28,209 7,697 West Boosters Account 290 - - 290 West After Prom Account 3,000 3,000 3,068 2,932 Williams Staff Account 2,591 9,881 4,493 7,979 Wilson Staff Account 9,456 4,723 6,284 7,895 Wood Staff Account 1,664 1,132 917 1,879 Young Staff Account 6 - 6 - Youth Fest Account 1,638 - - 1,638
Total Due to Activity Groups 150,774$ 176,622$ 169,419$ 157,977$
69

Statistical Section

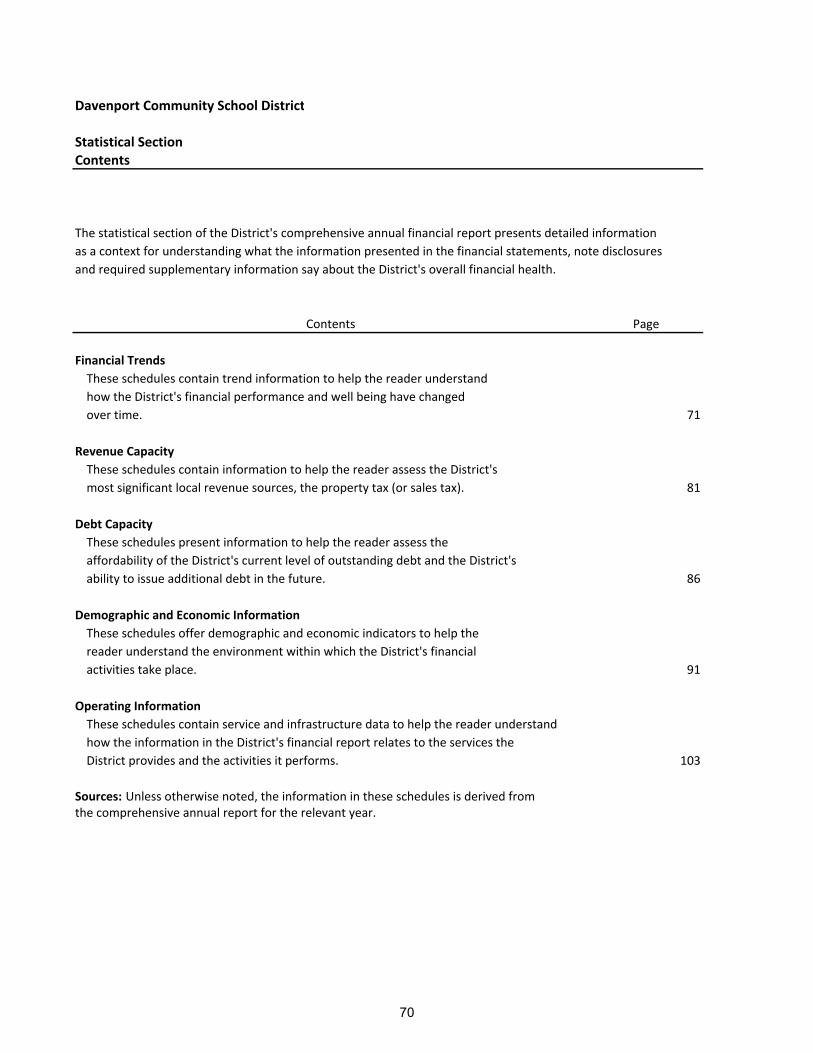
Davenport Community School District
Statistical SectionContents
The statistical section of the District's comprehensive annual financial report presents detailed information
as a context for understanding what the information presented in the financial statements, note disclosures
and required supplementary information say about the District's overall financial health.
Contents Page
Financial Trends
These schedules contain trend information to help the reader understand
how the District's financial performance and well being have changed
over time. 71
Revenue Capacity
These schedules contain information to help the reader assess the District's
most significant local revenue sources, the property tax (or sales tax). 81
Debt Capacity
These schedules present information to help the reader assess the
affordability of the District's current level of outstanding debt and the District's
ability to issue additional debt in the future. 86
Demographic and Economic Information
These schedules offer demographic and economic indicators to help the
reader understand the environment within which the District's financial
activities take place. 91
Operating Information
These schedules contain service and infrastructure data to help the reader understand
how the information in the District's financial report relates to the services the
District provides and the activities it performs. 103
Sources: Unless otherwise noted, the information in these schedules is derived from the comprehensive annual report for the relevant year.
70
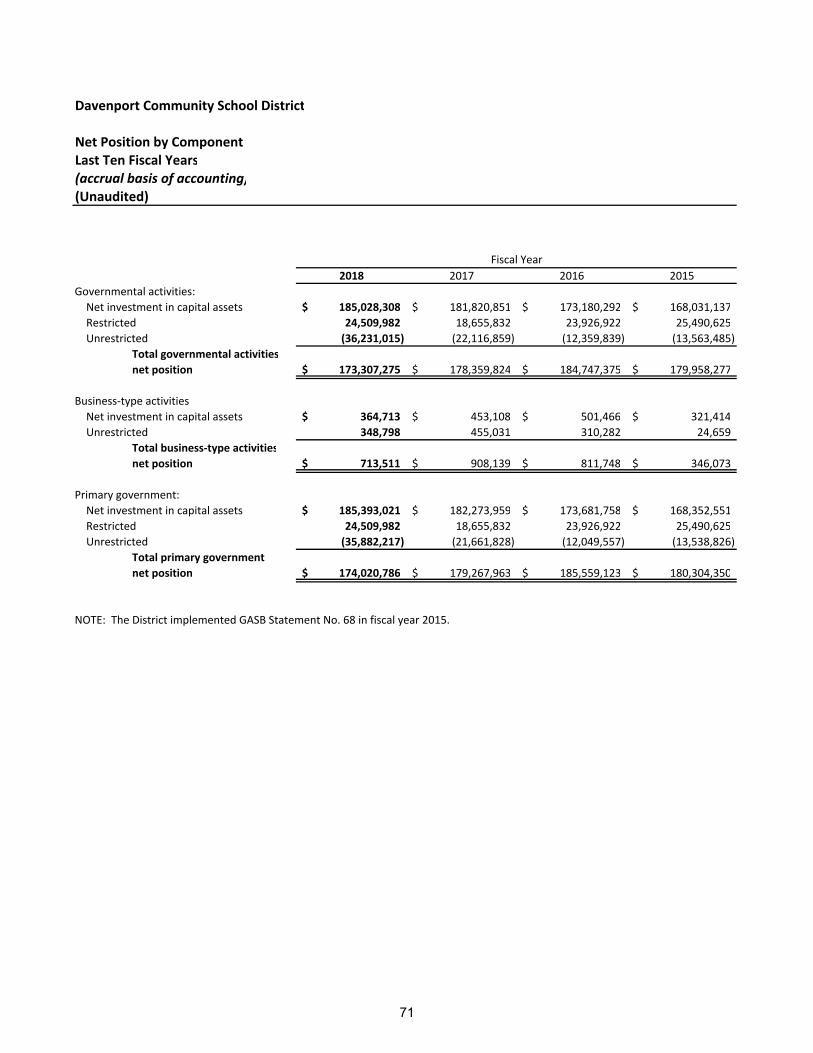
Davenport Community School District
Net Position by ComponentLast Ten Fiscal Years(accrual basis of accounting)(Unaudited)
2018 2017 2016 2015
Governmental activities:
Net investment in capital assets 185,028,308$ 181,820,851$ 173,180,292$ 168,031,137$
Restricted 24,509,982 18,655,832 23,926,922 25,490,625
Unrestricted (36,231,015) (22,116,859) (12,359,839) (13,563,485)
Total governmental activities
net position 173,307,275$ 178,359,824$ 184,747,375$ 179,958,277$
Business‐type activities
Net investment in capital assets 364,713$ 453,108$ 501,466$ 321,414$
Unrestricted 348,798 455,031 310,282 24,659
Total business‐type activities
net position 713,511$ 908,139$ 811,748$ 346,073$
Primary government:
Net investment in capital assets 185,393,021$ 182,273,959$ 173,681,758$ 168,352,551$
Restricted 24,509,982 18,655,832 23,926,922 25,490,625
Unrestricted (35,882,217) (21,661,828) (12,049,557) (13,538,826)
Total primary government
net position 174,020,786$ 179,267,963$ 185,559,123$ 180,304,350$
NOTE: The District implemented GASB Statement No. 68 in fiscal year 2015.
Fiscal Year
71
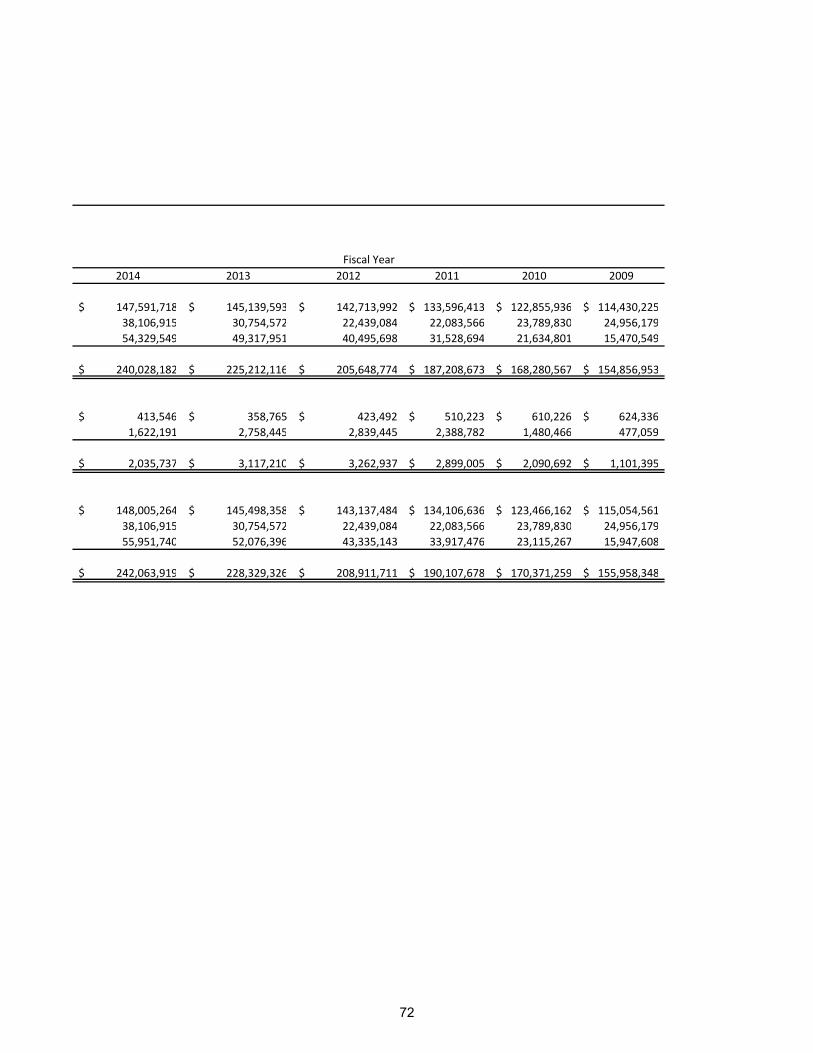
2014 2013 2012 2011 2010 2009
147,591,718$ 145,139,593$ 142,713,992$ 133,596,413$ 122,855,936$ 114,430,225$
38,106,915 30,754,572 22,439,084 22,083,566 23,789,830 24,956,179
54,329,549 49,317,951 40,495,698 31,528,694 21,634,801 15,470,549
240,028,182$ 225,212,116$ 205,648,774$ 187,208,673$ 168,280,567$ 154,856,953$
413,546$ 358,765$ 423,492$ 510,223$ 610,226$ 624,336$
1,622,191 2,758,445 2,839,445 2,388,782 1,480,466 477,059
2,035,737$ 3,117,210$ 3,262,937$ 2,899,005$ 2,090,692$ 1,101,395$
148,005,264$ 145,498,358$ 143,137,484$ 134,106,636$ 123,466,162$ 115,054,561$
38,106,915 30,754,572 22,439,084 22,083,566 23,789,830 24,956,179
55,951,740 52,076,396 43,335,143 33,917,476 23,115,267 15,947,608
242,063,919$ 228,329,326$ 208,911,711$ 190,107,678$ 170,371,259$ 155,958,348$
Fiscal Year
72
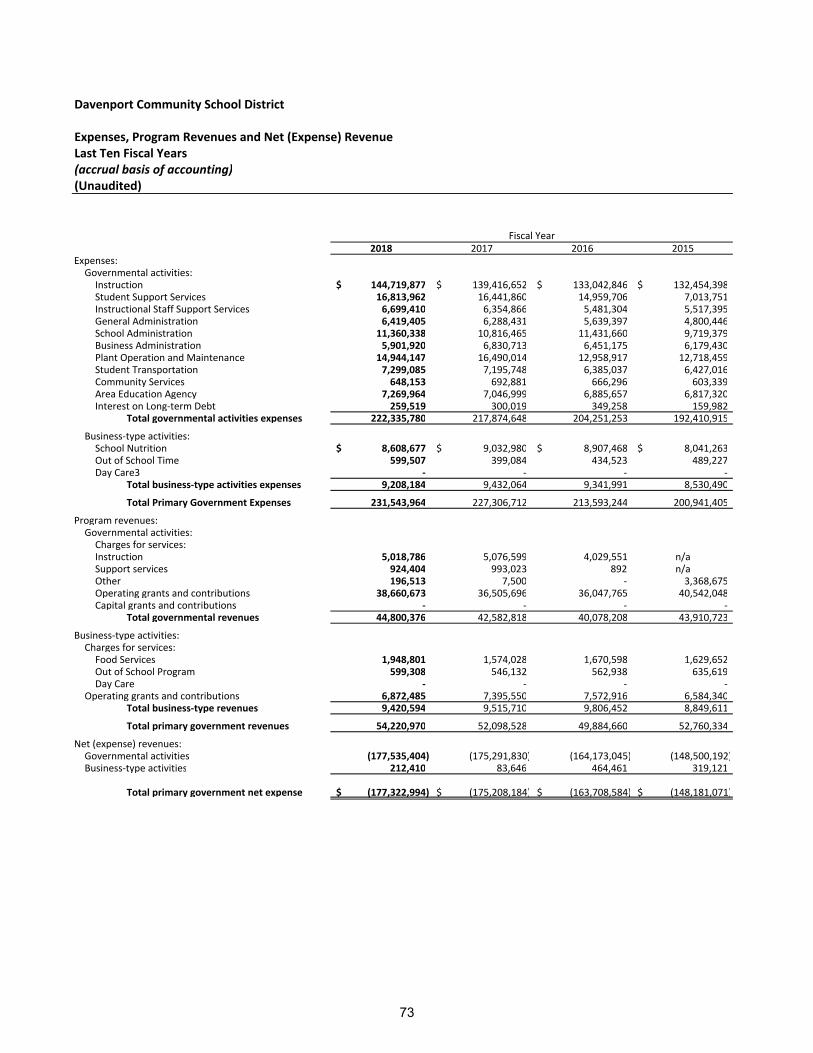
Davenport Community School District
Expenses, Program Revenues and Net (Expense) RevenueLast Ten Fiscal Years(accrual basis of accounting)(Unaudited)
2018 2017 2016 2015Expenses:Governmental activities:Instruction 144,719,877$ 139,416,652$ 133,042,846$ 132,454,398$ Student Support Services 16,813,962 16,441,860 14,959,706 7,013,751 Instructional Staff Support Services 6,699,410 6,354,866 5,481,304 5,517,395 General Administration 6,419,405 6,288,431 5,639,397 4,800,446 School Administration 11,360,338 10,816,465 11,431,660 9,719,379 Business Administration 5,901,920 6,830,713 6,451,175 6,179,430 Plant Operation and Maintenance 14,944,147 16,490,014 12,958,917 12,718,459 Student Transportation 7,299,085 7,195,748 6,385,037 6,427,016 Community Services 648,153 692,881 666,296 603,339 Area Education Agency 7,269,964 7,046,999 6,885,657 6,817,320 Interest on Long‐term Debt 259,519 300,019 349,258 159,982
Total governmental activities expenses 222,335,780 217,874,648 204,251,253 192,410,915
Business‐type activities:School Nutrition 8,608,677$ 9,032,980$ 8,907,468$ 8,041,263$ Out of School Time 599,507 399,084 434,523 489,227 Day Care3 ‐ ‐ ‐ ‐
Total business‐type activities expenses 9,208,184 9,432,064 9,341,991 8,530,490
Total Primary Government Expenses 231,543,964 227,306,712 213,593,244 200,941,405
Program revenues:Governmental activities:Charges for services:Instruction 5,018,786 5,076,599 4,029,551 n/aSupport services 924,404 993,023 892 n/aOther 196,513 7,500 ‐ 3,368,675 Operating grants and contributions 38,660,673 36,505,696 36,047,765 40,542,048 Capital grants and contributions ‐ ‐ ‐ ‐
Total governmental revenues 44,800,376 42,582,818 40,078,208 43,910,723
Business‐type activities:Charges for services:Food Services 1,948,801 1,574,028 1,670,598 1,629,652 Out of School Program 599,308 546,132 562,938 635,619 Day Care ‐ ‐ ‐ ‐
Operating grants and contributions 6,872,485 7,395,550 7,572,916 6,584,340 Total business‐type revenues 9,420,594 9,515,710 9,806,452 8,849,611
Total primary government revenues 54,220,970 52,098,528 49,884,660 52,760,334
Net (expense) revenues:Governmental activities (177,535,404) (175,291,830) (164,173,045) (148,500,192) Business‐type activities 212,410 83,646 464,461 319,121
Total primary government net expense (177,322,994)$ (175,208,184)$ (163,708,584)$ (148,181,071)$
Fiscal Year
73
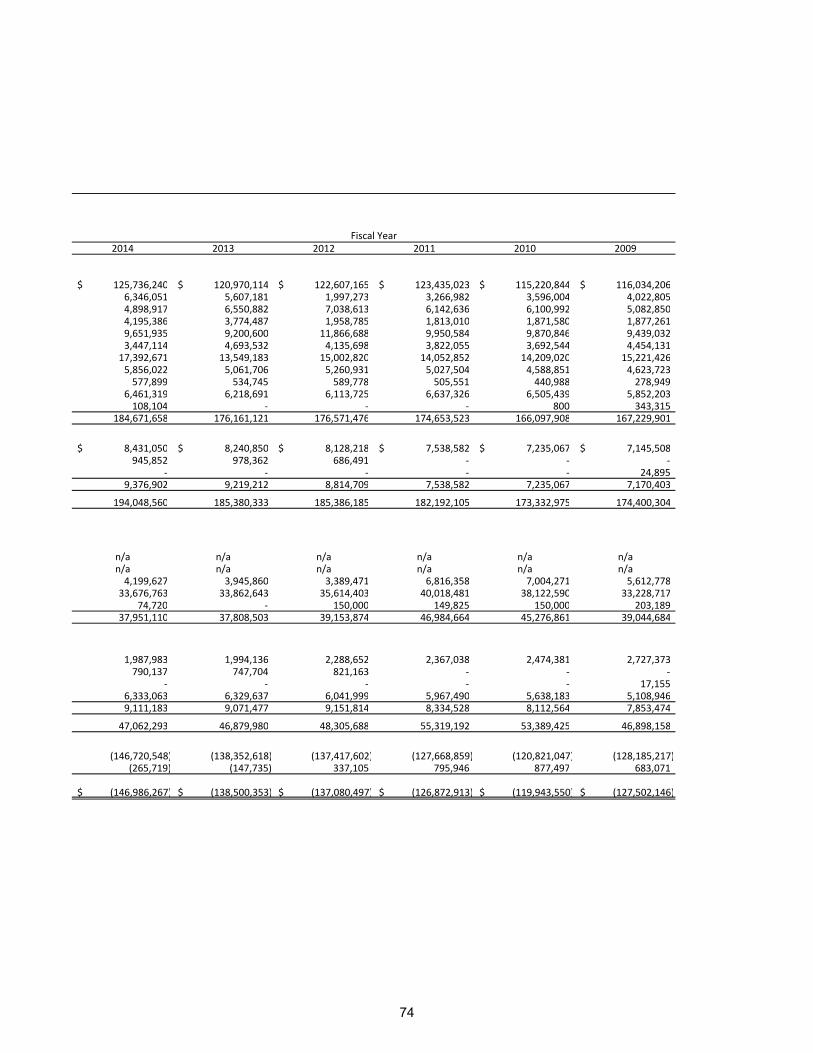
2014 2013 2012 2011 2010 2009
125,736,240$ 120,970,114$ 122,607,165$ 123,435,023$ 115,220,844$ 116,034,206$ 6,346,051 5,607,181 1,997,273 3,266,982 3,596,004 4,022,805 4,898,917 6,550,882 7,038,613 6,142,636 6,100,992 5,082,850 4,195,386 3,774,487 1,958,785 1,813,010 1,871,580 1,877,261 9,651,935 9,200,600 11,866,688 9,950,584 9,870,846 9,439,032 3,447,114 4,693,532 4,135,698 3,822,055 3,692,544 4,454,131 17,392,671 13,549,183 15,002,820 14,052,852 14,209,020 15,221,426 5,856,022 5,061,706 5,260,931 5,027,504 4,588,851 4,623,723 577,899 534,745 589,778 505,551 440,988 278,949
6,461,319 6,218,691 6,113,725 6,637,326 6,505,439 5,852,203 108,104 ‐ ‐ ‐ 800 343,315
184,671,658 176,161,121 176,571,476 174,653,523 166,097,908 167,229,901
8,431,050$ 8,240,850$ 8,128,218$ 7,538,582$ 7,235,067$ 7,145,508$ 945,852 978,362 686,491 ‐ ‐ ‐
‐ ‐ ‐ ‐ ‐ 24,895 9,376,902 9,219,212 8,814,709 7,538,582 7,235,067 7,170,403
194,048,560 185,380,333 185,386,185 182,192,105 173,332,975 174,400,304
n/a n/a n/a n/a n/a n/an/a n/a n/a n/a n/a n/a4,199,627 3,945,860 3,389,471 6,816,358 7,004,271 5,612,778 33,676,763 33,862,643 35,614,403 40,018,481 38,122,590 33,228,717
74,720 ‐ 150,000 149,825 150,000 203,189 37,951,110 37,808,503 39,153,874 46,984,664 45,276,861 39,044,684
1,987,983 1,994,136 2,288,652 2,367,038 2,474,381 2,727,373 790,137 747,704 821,163 ‐ ‐ ‐
‐ ‐ ‐ ‐ ‐ 17,155 6,333,063 6,329,637 6,041,999 5,967,490 5,638,183 5,108,946 9,111,183 9,071,477 9,151,814 8,334,528 8,112,564 7,853,474
47,062,293 46,879,980 48,305,688 55,319,192 53,389,425 46,898,158
(146,720,548) (138,352,618) (137,417,602) (127,668,859) (120,821,047) (128,185,217) (265,719) (147,735) 337,105 795,946 877,497 683,071
(146,986,267)$ (138,500,353)$ (137,080,497)$ (126,872,913)$ (119,943,550)$ (127,502,146)$
Fiscal Year
74
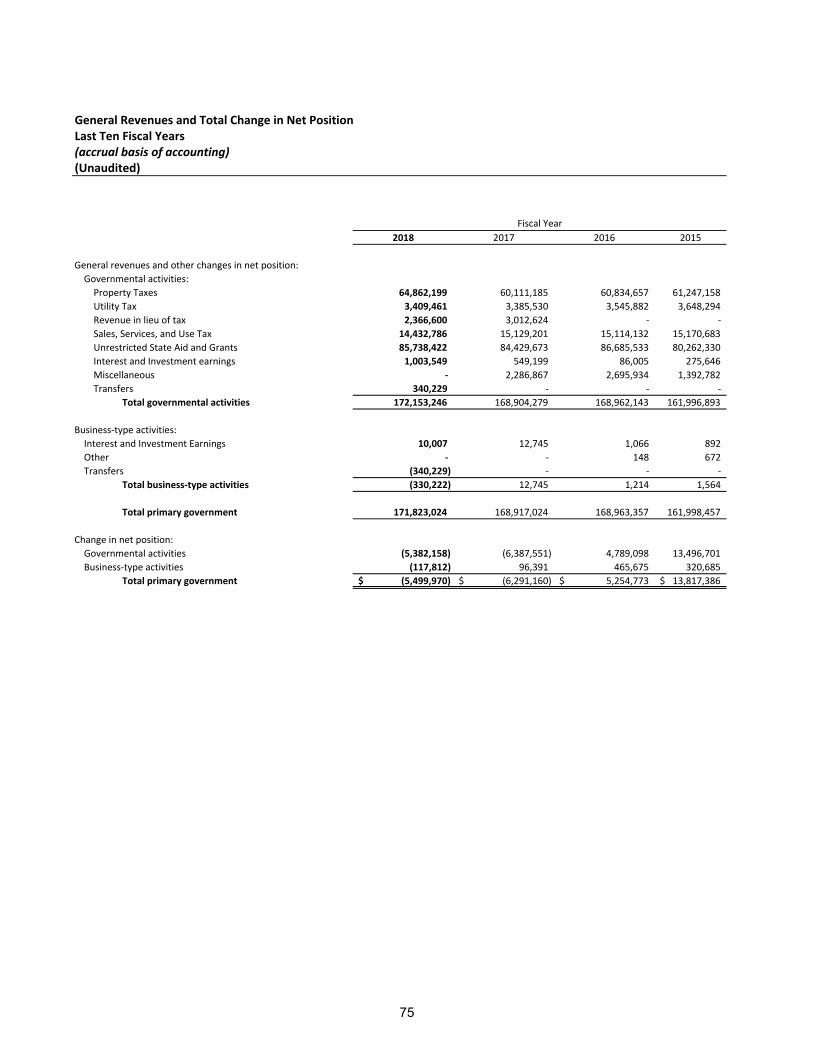
General Revenues and Total Change in Net PositionLast Ten Fiscal Years(accrual basis of accounting)(Unaudited)
2018 2017 2016 2015
General revenues and other changes in net position:
Governmental activities:
Property Taxes 64,862,199 60,111,185 60,834,657 61,247,158
Utility Tax 3,409,461 3,385,530 3,545,882 3,648,294
Revenue in lieu of tax 2,366,600 3,012,624 ‐ ‐
Sales, Services, and Use Tax 14,432,786 15,129,201 15,114,132 15,170,683
Unrestricted State Aid and Grants 85,738,422 84,429,673 86,685,533 80,262,330
Interest and Investment earnings 1,003,549 549,199 86,005 275,646
Miscellaneous ‐ 2,286,867 2,695,934 1,392,782
Transfers 340,229 ‐ ‐ ‐
Total governmental activities 172,153,246 168,904,279 168,962,143 161,996,893
Business‐type activities:
Interest and Investment Earnings 10,007 12,745 1,066 892
Other ‐ ‐ 148 672
Transfers (340,229) ‐ ‐ ‐
Total business‐type activities (330,222) 12,745 1,214 1,564
Total primary government 171,823,024 168,917,024 168,963,357 161,998,457
Change in net position:
Governmental activities (5,382,158) (6,387,551) 4,789,098 13,496,701
Business‐type activities (117,812) 96,391 465,675 320,685
Total primary government (5,499,970)$ (6,291,160)$ 5,254,773$ 13,817,386$
Fiscal Year
75
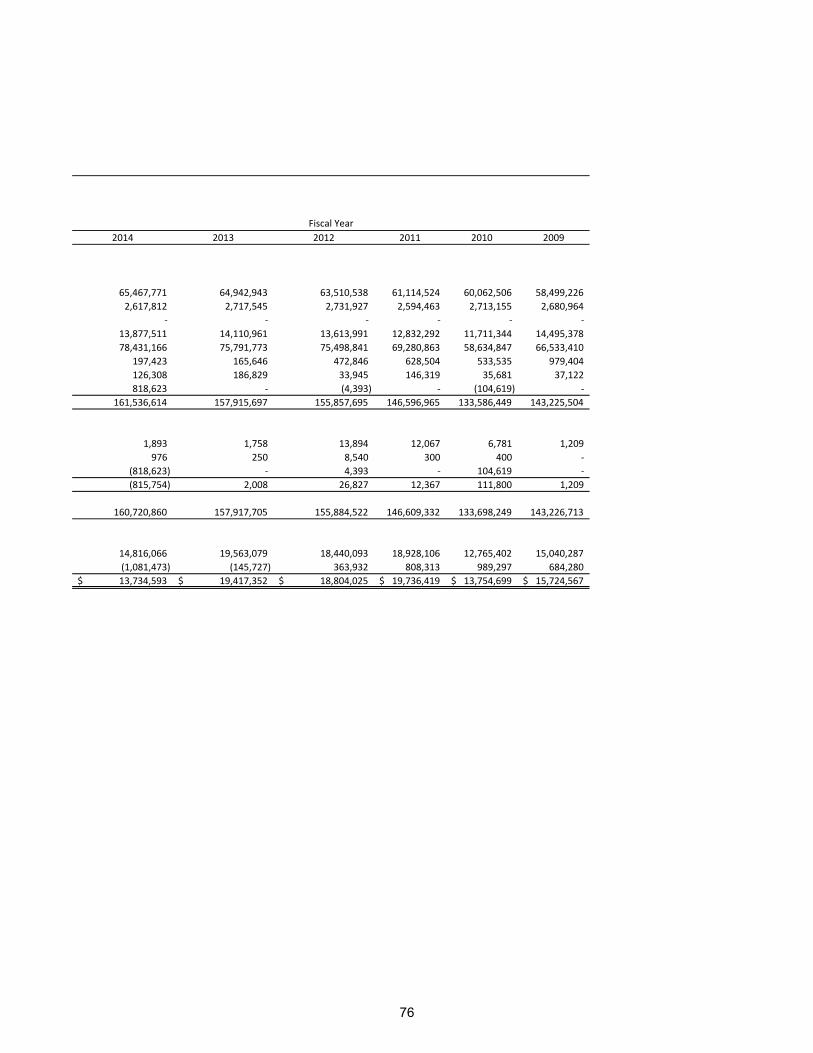
2014 2013 2012 2011 2010 2009
65,467,771 64,942,943 63,510,538 61,114,524 60,062,506 58,499,226
2,617,812 2,717,545 2,731,927 2,594,463 2,713,155 2,680,964
‐ ‐ ‐ ‐ ‐ ‐
13,877,511 14,110,961 13,613,991 12,832,292 11,711,344 14,495,378
78,431,166 75,791,773 75,498,841 69,280,863 58,634,847 66,533,410
197,423 165,646 472,846 628,504 533,535 979,404
126,308 186,829 33,945 146,319 35,681 37,122
818,623 ‐ (4,393) ‐ (104,619) ‐
161,536,614 157,915,697 155,857,695 146,596,965 133,586,449 143,225,504
1,893 1,758 13,894 12,067 6,781 1,209
976 250 8,540 300 400 ‐
(818,623) ‐ 4,393 ‐ 104,619 ‐
(815,754) 2,008 26,827 12,367 111,800 1,209
160,720,860 157,917,705 155,884,522 146,609,332 133,698,249 143,226,713
14,816,066 19,563,079 18,440,093 18,928,106 12,765,402 15,040,287
(1,081,473) (145,727) 363,932 808,313 989,297 684,280
13,734,593$ 19,417,352$ 18,804,025$ 19,736,419$ 13,754,699$ 15,724,567$
Fiscal Year
76
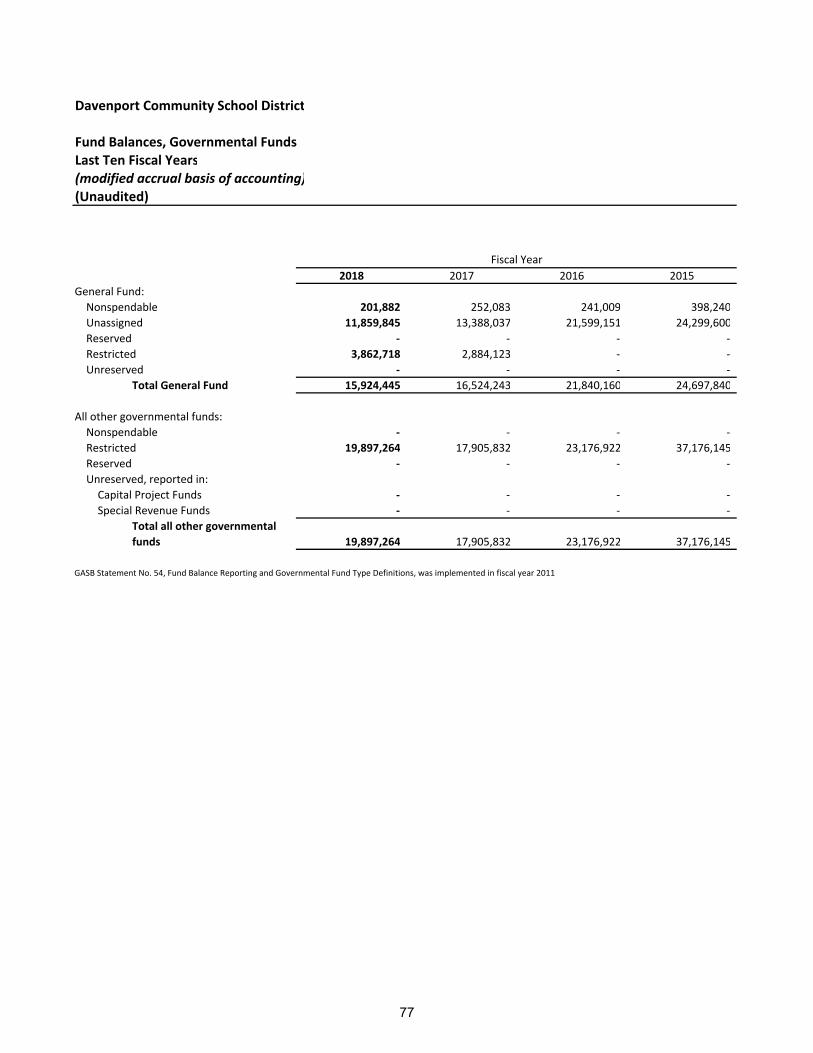
Davenport Community School District
Fund Balances, Governmental FundsLast Ten Fiscal Years(modified accrual basis of accounting)(Unaudited)
2018 2017 2016 2015
General Fund:
Nonspendable 201,882 252,083 241,009 398,240
Unassigned 11,859,845 13,388,037 21,599,151 24,299,600
Reserved ‐ ‐ ‐ ‐
Restricted 3,862,718 2,884,123 ‐ ‐
Unreserved ‐ ‐ ‐ ‐
Total General Fund 15,924,445 16,524,243 21,840,160 24,697,840
All other governmental funds:
Nonspendable ‐ ‐ ‐ ‐
Restricted 19,897,264 17,905,832 23,176,922 37,176,145
Reserved ‐ ‐ ‐ ‐
Unreserved, reported in:
Capital Project Funds ‐ ‐ ‐ ‐
Special Revenue Funds ‐ ‐ ‐ ‐
Total all other governmental
funds 19,897,264 17,905,832 23,176,922 37,176,145
GASB Statement No. 54, Fund Balance Reporting and Governmental Fund Type Definitions, was implemented in fiscal year 2011
Fiscal Year
77
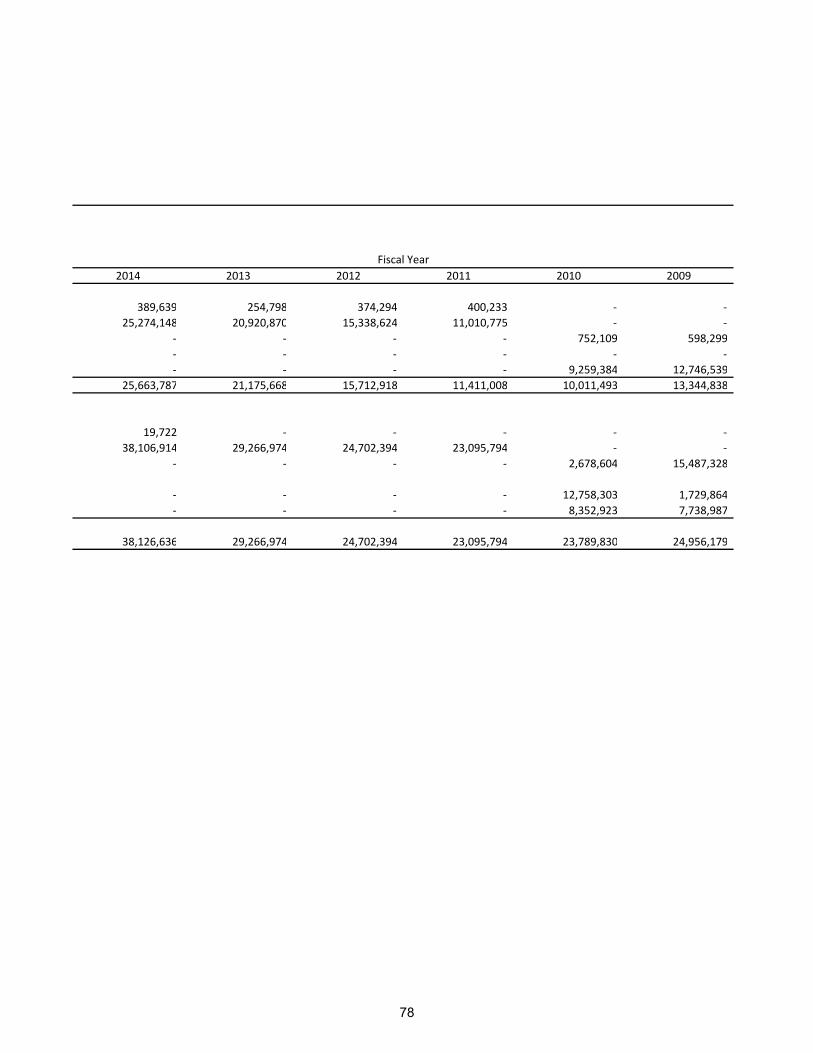
2014 2013 2012 2011 2010 2009
389,639 254,798 374,294 400,233 ‐ ‐
25,274,148 20,920,870 15,338,624 11,010,775 ‐ ‐
‐ ‐ ‐ ‐ 752,109 598,299
‐ ‐ ‐ ‐ ‐ ‐
‐ ‐ ‐ ‐ 9,259,384 12,746,539
25,663,787 21,175,668 15,712,918 11,411,008 10,011,493 13,344,838
19,722 ‐ ‐ ‐ ‐ ‐
38,106,914 29,266,974 24,702,394 23,095,794 ‐ ‐
‐ ‐ ‐ ‐ 2,678,604 15,487,328
‐ ‐ ‐ ‐ 12,758,303 1,729,864
‐ ‐ ‐ ‐ 8,352,923 7,738,987
38,126,636 29,266,974 24,702,394 23,095,794 23,789,830 24,956,179
Fiscal Year
78
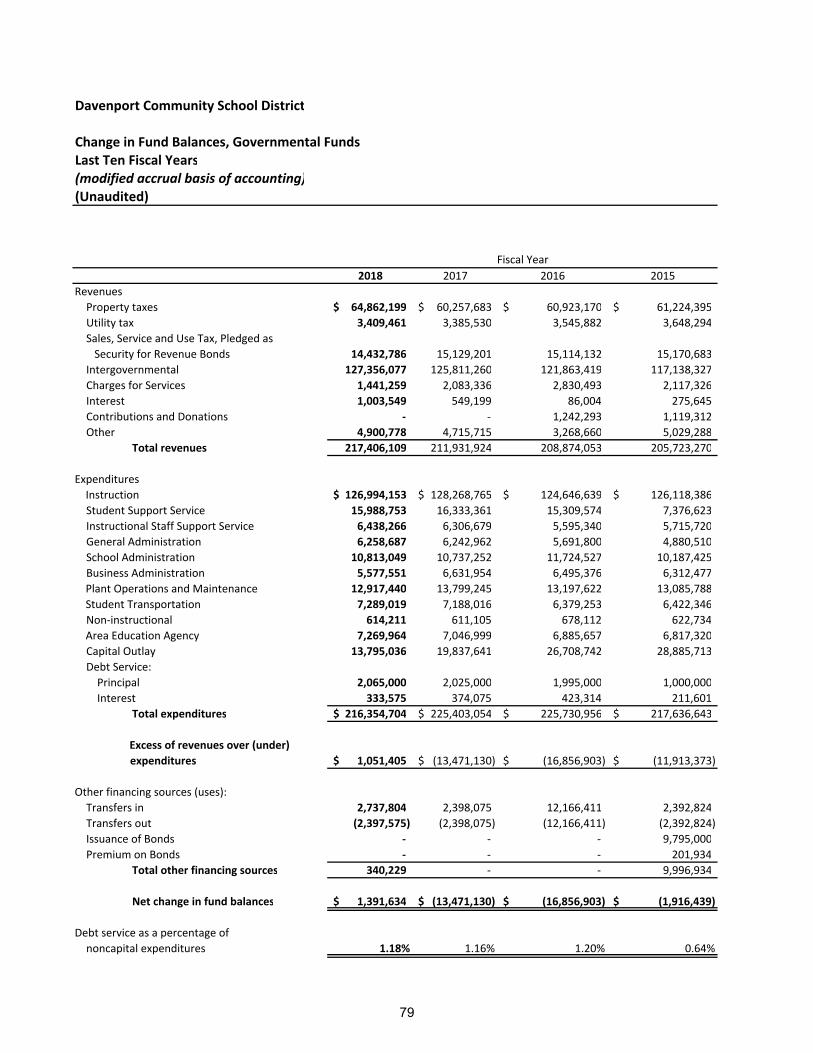
Davenport Community School District
Change in Fund Balances, Governmental FundsLast Ten Fiscal Years(modified accrual basis of accounting)(Unaudited)
2018 2017 2016 2015
Revenues
Property taxes 64,862,199$ 60,257,683$ 60,923,170$ 61,224,395$
Utility tax 3,409,461 3,385,530 3,545,882 3,648,294
Sales, Service and Use Tax, Pledged as
Security for Revenue Bonds 14,432,786 15,129,201 15,114,132 15,170,683
Intergovernmental 127,356,077 125,811,260 121,863,419 117,138,327
Charges for Services 1,441,259 2,083,336 2,830,493 2,117,326
Interest 1,003,549 549,199 86,004 275,645
Contributions and Donations ‐ ‐ 1,242,293 1,119,312
Other 4,900,778 4,715,715 3,268,660 5,029,288
Total revenues 217,406,109 211,931,924 208,874,053 205,723,270
Expenditures
Instruction 126,994,153$ 128,268,765$ 124,646,639$ 126,118,386$
Student Support Service 15,988,753 16,333,361 15,309,574 7,376,623
Instructional Staff Support Service 6,438,266 6,306,679 5,595,340 5,715,720
General Administration 6,258,687 6,242,962 5,691,800 4,880,510
School Administration 10,813,049 10,737,252 11,724,527 10,187,425
Business Administration 5,577,551 6,631,954 6,495,376 6,312,477
Plant Operations and Maintenance 12,917,440 13,799,245 13,197,622 13,085,788
Student Transportation 7,289,019 7,188,016 6,379,253 6,422,346
Non‐instructional 614,211 611,105 678,112 622,734
Area Education Agency 7,269,964 7,046,999 6,885,657 6,817,320
Capital Outlay 13,795,036 19,837,641 26,708,742 28,885,713
Debt Service:
Principal 2,065,000 2,025,000 1,995,000 1,000,000
Interest 333,575 374,075 423,314 211,601
Total expenditures 216,354,704$ 225,403,054$ 225,730,956$ 217,636,643$
Excess of revenues over (under)
expenditures 1,051,405$ (13,471,130)$ (16,856,903)$ (11,913,373)$
Other financing sources (uses):
Transfers in 2,737,804 2,398,075 12,166,411 2,392,824
Transfers out (2,397,575) (2,398,075) (12,166,411) (2,392,824)
Issuance of Bonds ‐ ‐ ‐ 9,795,000
Premium on Bonds ‐ ‐ ‐ 201,934
Total other financing sources 340,229 ‐ ‐ 9,996,934
Net change in fund balances 1,391,634$ (13,471,130)$ (16,856,903)$ (1,916,439)$
Debt service as a percentage of
noncapital expenditures 1.18% 1.16% 1.20% 0.64%
Fiscal Year
79
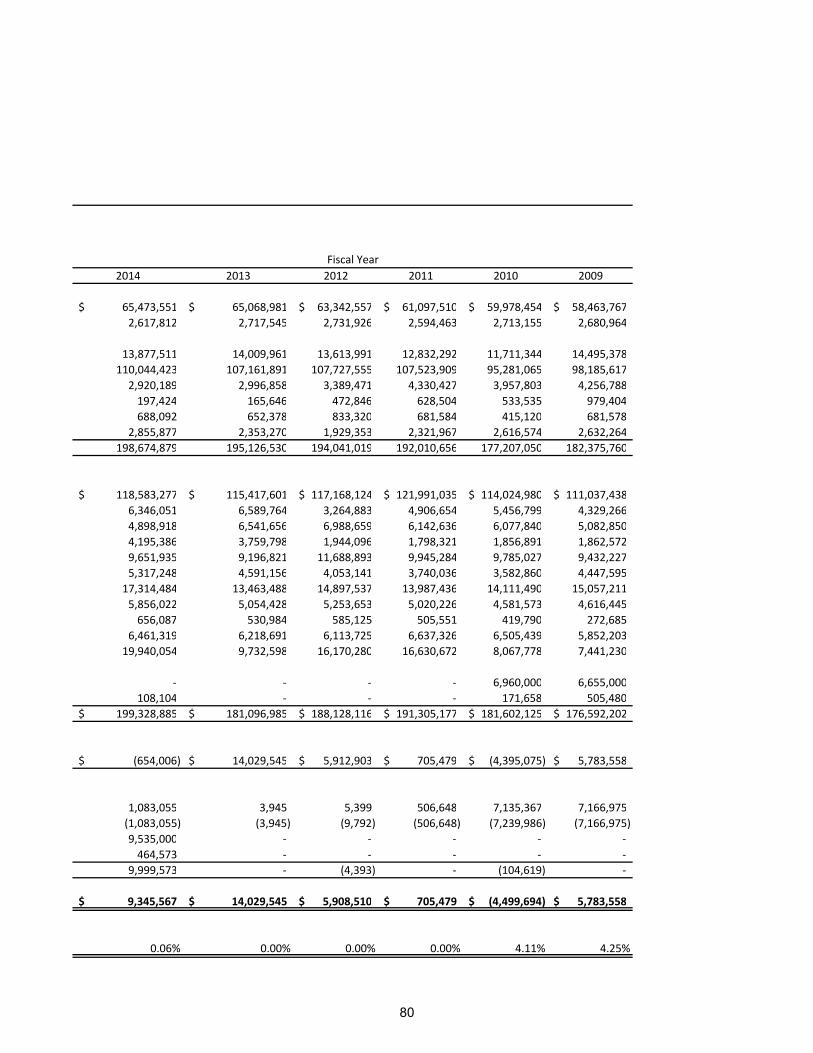
2014 2013 2012 2011 2010 2009
65,473,551$ 65,068,981$ 63,342,557$ 61,097,510$ 59,978,454$ 58,463,767$
2,617,812 2,717,545 2,731,926 2,594,463 2,713,155 2,680,964
13,877,511 14,009,961 13,613,991 12,832,292 11,711,344 14,495,378
110,044,423 107,161,891 107,727,555 107,523,909 95,281,065 98,185,617
2,920,189 2,996,858 3,389,471 4,330,427 3,957,803 4,256,788
197,424 165,646 472,846 628,504 533,535 979,404
688,092 652,378 833,320 681,584 415,120 681,578
2,855,877 2,353,270 1,929,353 2,321,967 2,616,574 2,632,264
198,674,879 195,126,530 194,041,019 192,010,656 177,207,050 182,375,760
118,583,277$ 115,417,601$ 117,168,124$ 121,991,035$ 114,024,980$ 111,037,438$
6,346,051 6,589,764 3,264,883 4,906,654 5,456,799 4,329,266
4,898,918 6,541,656 6,988,659 6,142,636 6,077,840 5,082,850
4,195,386 3,759,798 1,944,096 1,798,321 1,856,891 1,862,572
9,651,935 9,196,821 11,688,893 9,945,284 9,785,027 9,432,227
5,317,248 4,591,156 4,053,141 3,740,036 3,582,860 4,447,595
17,314,484 13,463,488 14,897,537 13,987,436 14,111,490 15,057,211
5,856,022 5,054,428 5,253,653 5,020,226 4,581,573 4,616,445
656,087 530,984 585,125 505,551 419,790 272,685
6,461,319 6,218,691 6,113,725 6,637,326 6,505,439 5,852,203
19,940,054 9,732,598 16,170,280 16,630,672 8,067,778 7,441,230
‐ ‐ ‐ ‐ 6,960,000 6,655,000
108,104 ‐ ‐ ‐ 171,658 505,480
199,328,885$ 181,096,985$ 188,128,116$ 191,305,177$ 181,602,125$ 176,592,202$
(654,006)$ 14,029,545$ 5,912,903$ 705,479$ (4,395,075)$ 5,783,558$
1,083,055 3,945 5,399 506,648 7,135,367 7,166,975
(1,083,055) (3,945) (9,792) (506,648) (7,239,986) (7,166,975)
9,535,000 ‐ ‐ ‐ ‐ ‐
464,573 ‐ ‐ ‐ ‐ ‐
9,999,573 ‐ (4,393) ‐ (104,619) ‐
9,345,567$ 14,029,545$ 5,908,510$ 705,479$ (4,499,694)$ 5,783,558$
0.06% 0.00% 0.00% 0.00% 4.11% 4.25%
Fiscal Year
80
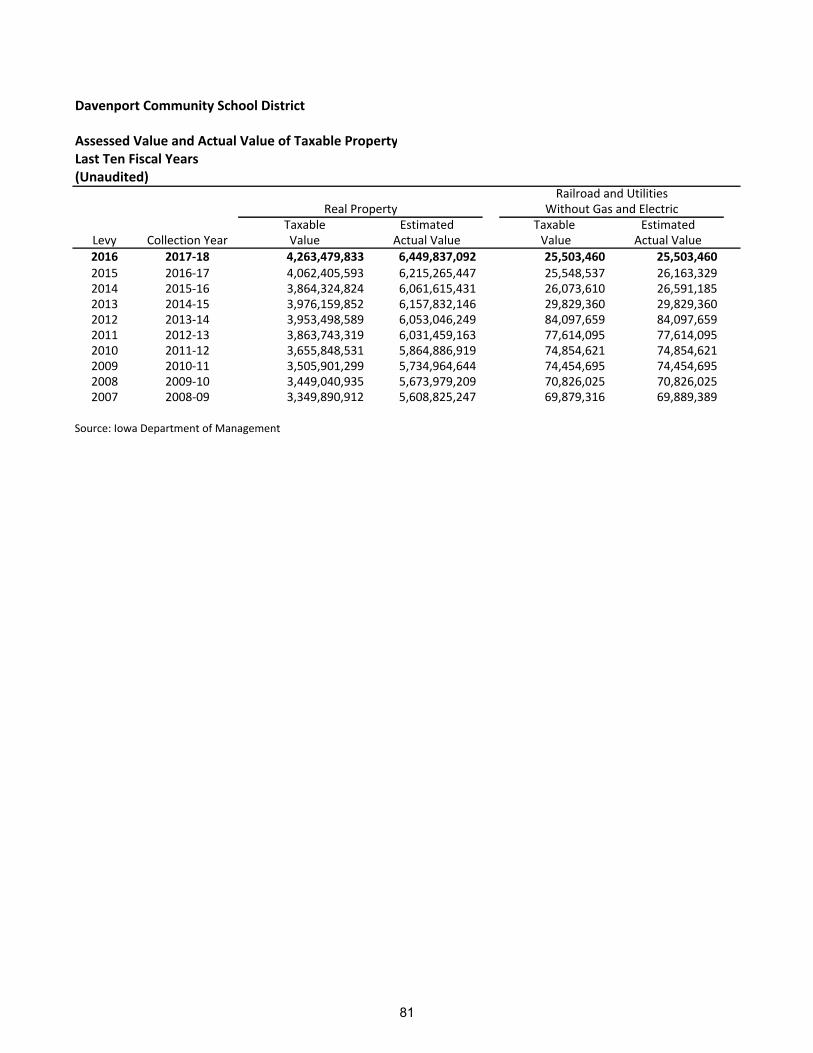
Davenport Community School District
Assessed Value and Actual Value of Taxable PropertyLast Ten Fiscal Years(Unaudited)
Taxable Estimated Taxable EstimatedLevy Collection Year Value Actual Value Value Actual Value2016 2017‐18 4,263,479,833 6,449,837,092 25,503,460 25,503,460 2015 2016‐17 4,062,405,593 6,215,265,447 25,548,537 26,163,329 2014 2015‐16 3,864,324,824 6,061,615,431 26,073,610 26,591,185 2013 2014‐15 3,976,159,852 6,157,832,146 29,829,360 29,829,360 2012 2013‐14 3,953,498,589 6,053,046,249 84,097,659 84,097,659 2011 2012‐13 3,863,743,319 6,031,459,163 77,614,095 77,614,095 2010 2011‐12 3,655,848,531 5,864,886,919 74,854,621 74,854,621 2009 2010‐11 3,505,901,299 5,734,964,644 74,454,695 74,454,695 2008 2009‐10 3,449,040,935 5,673,979,209 70,826,025 70,826,025 2007 2008‐09 3,349,890,912 5,608,825,247 69,879,316 69,889,389
Source: Iowa Department of Management
Real PropertyRailroad and Utilities
Without Gas and Electric
81
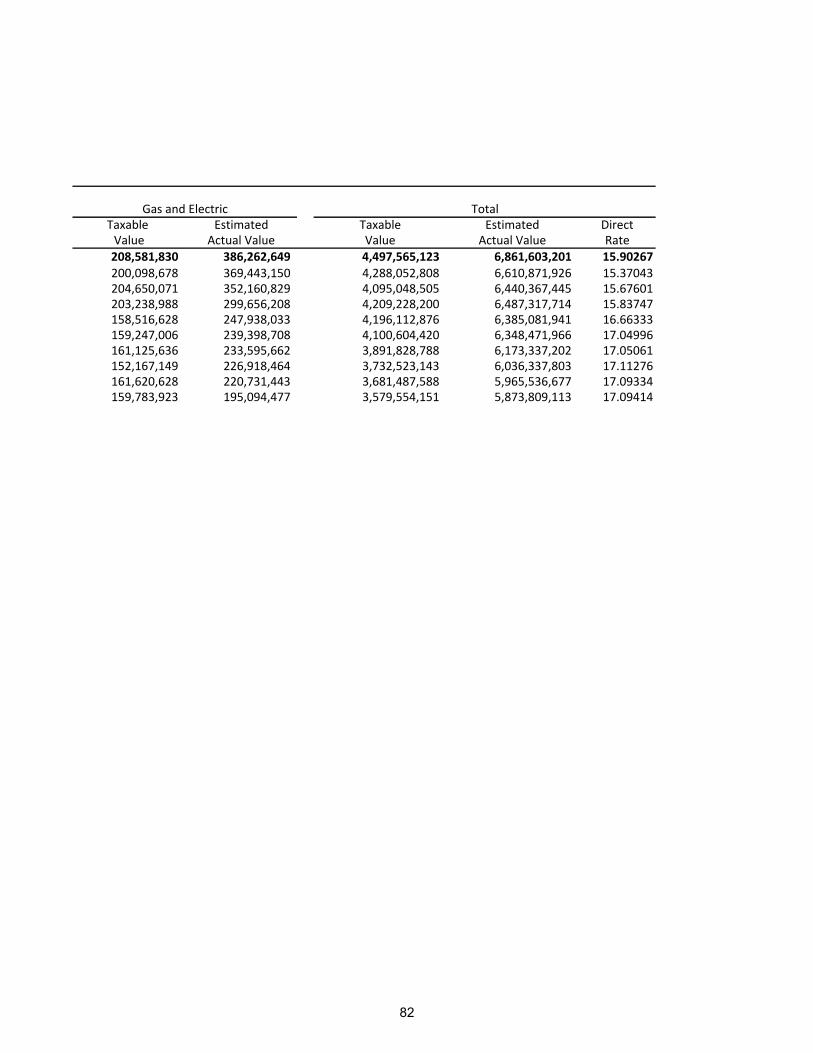
Taxable Estimated Taxable Estimated DirectValue Actual Value Value Actual Value Rate208,581,830 386,262,649 4,497,565,123 6,861,603,201 15.90267200,098,678 369,443,150 4,288,052,808 6,610,871,926 15.37043204,650,071 352,160,829 4,095,048,505 6,440,367,445 15.67601203,238,988 299,656,208 4,209,228,200 6,487,317,714 15.83747158,516,628 247,938,033 4,196,112,876 6,385,081,941 16.66333159,247,006 239,398,708 4,100,604,420 6,348,471,966 17.04996161,125,636 233,595,662 3,891,828,788 6,173,337,202 17.05061152,167,149 226,918,464 3,732,523,143 6,036,337,803 17.11276161,620,628 220,731,443 3,681,487,588 5,965,536,677 17.09334159,783,923 195,094,477 3,579,554,151 5,873,809,113 17.09414
TotalGas and Electric
82
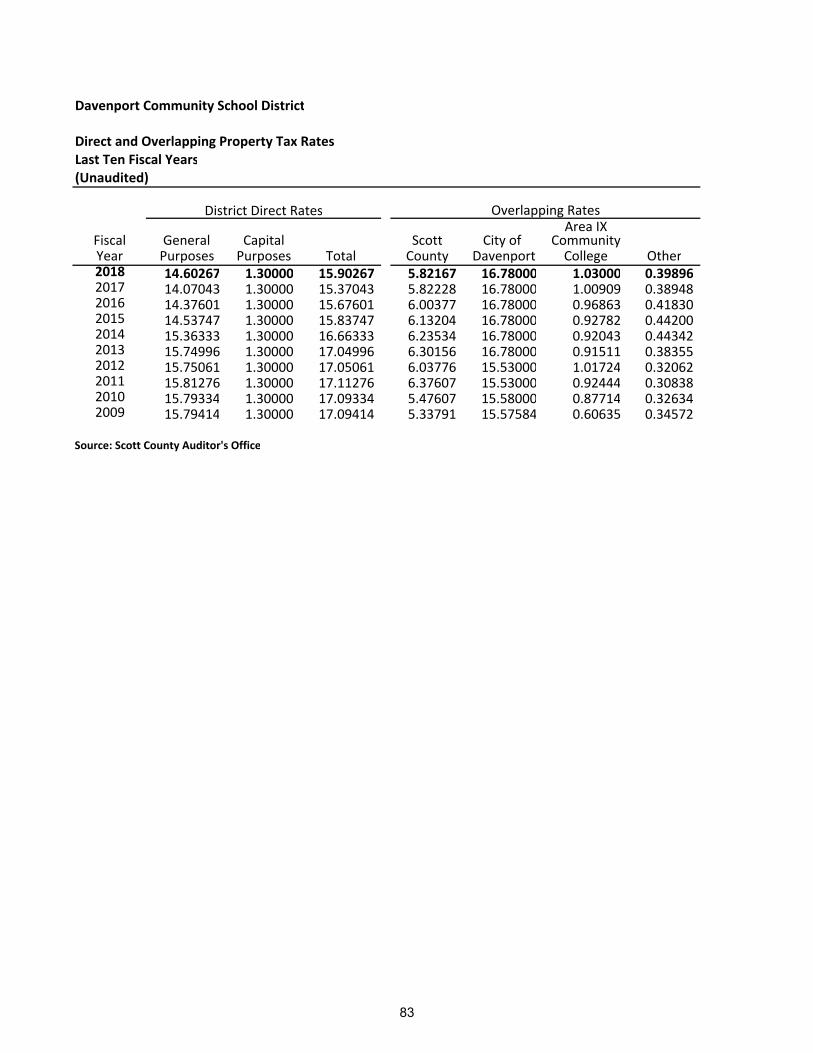
Davenport Community School District
Direct and Overlapping Property Tax RatesLast Ten Fiscal Years(Unaudited)
Area IXFiscal General Capital Scott City of CommunityYear Purposes Purposes Total County Davenport College Other2018 14.60267 1.30000 15.90267 5.82167 16.78000 1.03000 0.39896 2017 14.07043 1.30000 15.37043 5.82228 16.78000 1.00909 0.38948 2016 14.37601 1.30000 15.67601 6.00377 16.78000 0.96863 0.41830 2015 14.53747 1.30000 15.83747 6.13204 16.78000 0.92782 0.44200 2014 15.36333 1.30000 16.66333 6.23534 16.78000 0.92043 0.44342 2013 15.74996 1.30000 17.04996 6.30156 16.78000 0.91511 0.38355 2012 15.75061 1.30000 17.05061 6.03776 15.53000 1.01724 0.32062 2011 15.81276 1.30000 17.11276 6.37607 15.53000 0.92444 0.30838 2010 15.79334 1.30000 17.09334 5.47607 15.58000 0.87714 0.32634 2009 15.79414 1.30000 17.09414 5.33791 15.57584 0.60635 0.34572
Source: Scott County Auditor's Office
Overlapping RatesDistrict Direct Rates
83
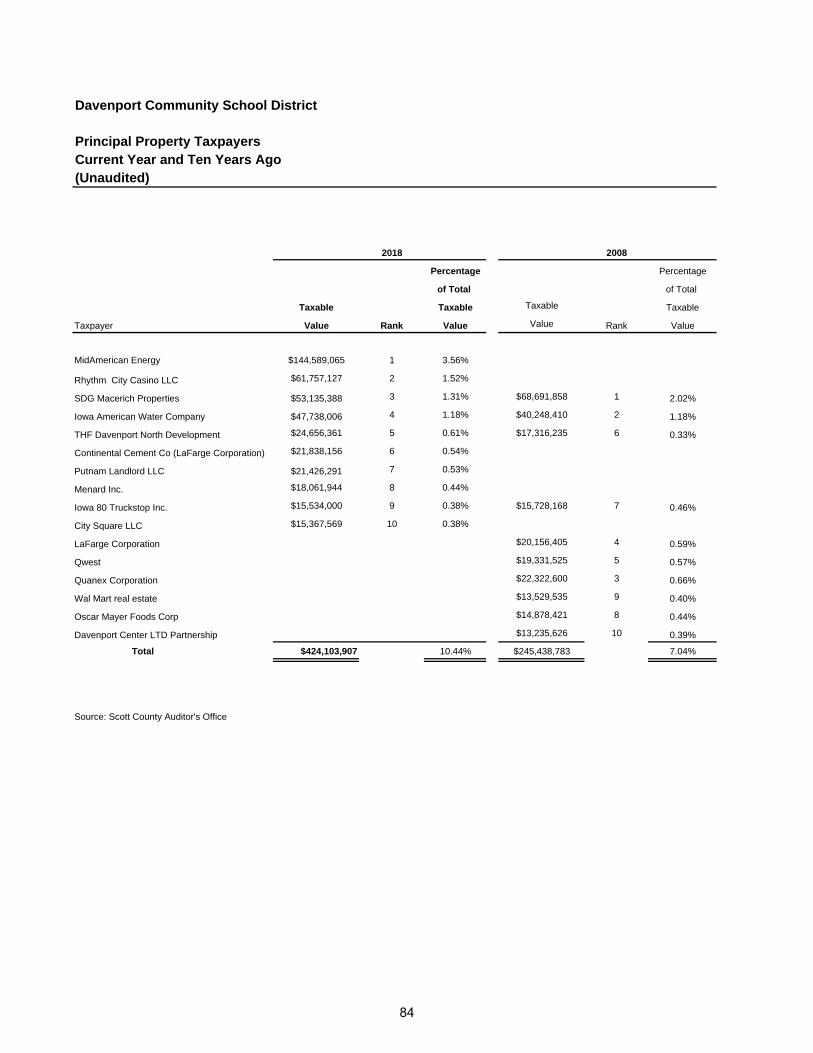
Davenport Community School District
Principal Property TaxpayersCurrent Year and Ten Years Ago(Unaudited)
2018 2008
Percentage Percentage
of Total of Total
Taxable Taxable Taxable Taxable
Taxpayer Value Rank Value Value Rank Value
MidAmerican Energy $144,589,065 1 3.56%
Rhythm City Casino LLC $61,757,127 2 1.52%
SDG Macerich Properties $53,135,388 3 1.31% $68,691,858 1 2.02%
Iowa American Water Company $47,738,006 4 1.18% $40,248,410 2 1.18%
THF Davenport North Development $24,656,361 5 0.61% $17,316,235 6 0.33%
Continental Cement Co (LaFarge Corporation) $21,838,156 6 0.54%
Putnam Landlord LLC $21,426,291 7 0.53%
Menard Inc. $18,061,944 8 0.44%
Iowa 80 Truckstop Inc. $15,534,000 9 0.38% $15,728,168 7 0.46%
City Square LLC $15,367,569 10 0.38%
LaFarge Corporation $20,156,405 4 0.59%
Qwest $19,331,525 5 0.57%
Quanex Corporation $22,322,600 3 0.66%
Wal Mart real estate $13,529,535 9 0.40%
Oscar Mayer Foods Corp $14,878,421 8 0.44%
Davenport Center LTD Partnership $13,235,626 10 0.39%
Total $424,103,907 10.44% $245,438,783 7.04%
Source: Scott County Auditor's Office
84
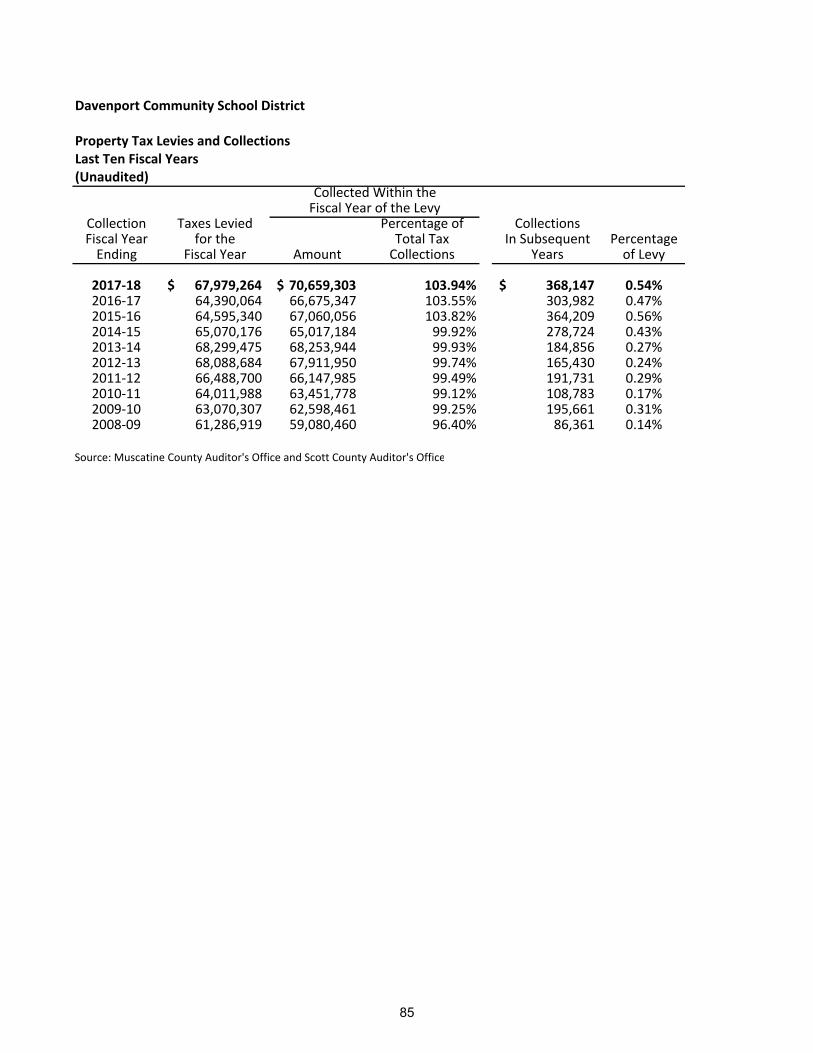
Davenport Community School District
Property Tax Levies and CollectionsLast Ten Fiscal Years(Unaudited)
Collection Taxes Levied Percentage of CollectionsFiscal Year for the Total Tax In Subsequent PercentageEnding Fiscal Year Amount Collections Years of Levy
2017‐18 67,979,264$ 70,659,303$ 103.94% 368,147$ 0.54%2016‐17 64,390,064 66,675,347 103.55% 303,982 0.47%2015‐16 64,595,340 67,060,056 103.82% 364,209 0.56%2014‐15 65,070,176 65,017,184 99.92% 278,724 0.43%2013‐14 68,299,475 68,253,944 99.93% 184,856 0.27%2012‐13 68,088,684 67,911,950 99.74% 165,430 0.24%2011‐12 66,488,700 66,147,985 99.49% 191,731 0.29%2010‐11 64,011,988 63,451,778 99.12% 108,783 0.17%2009‐10 63,070,307 62,598,461 99.25% 195,661 0.31%2008‐09 61,286,919 59,080,460 96.40% 86,361 0.14%
Source: Muscatine County Auditor's Office and Scott County Auditor's Office
Collected Within theFiscal Year of the Levy
85
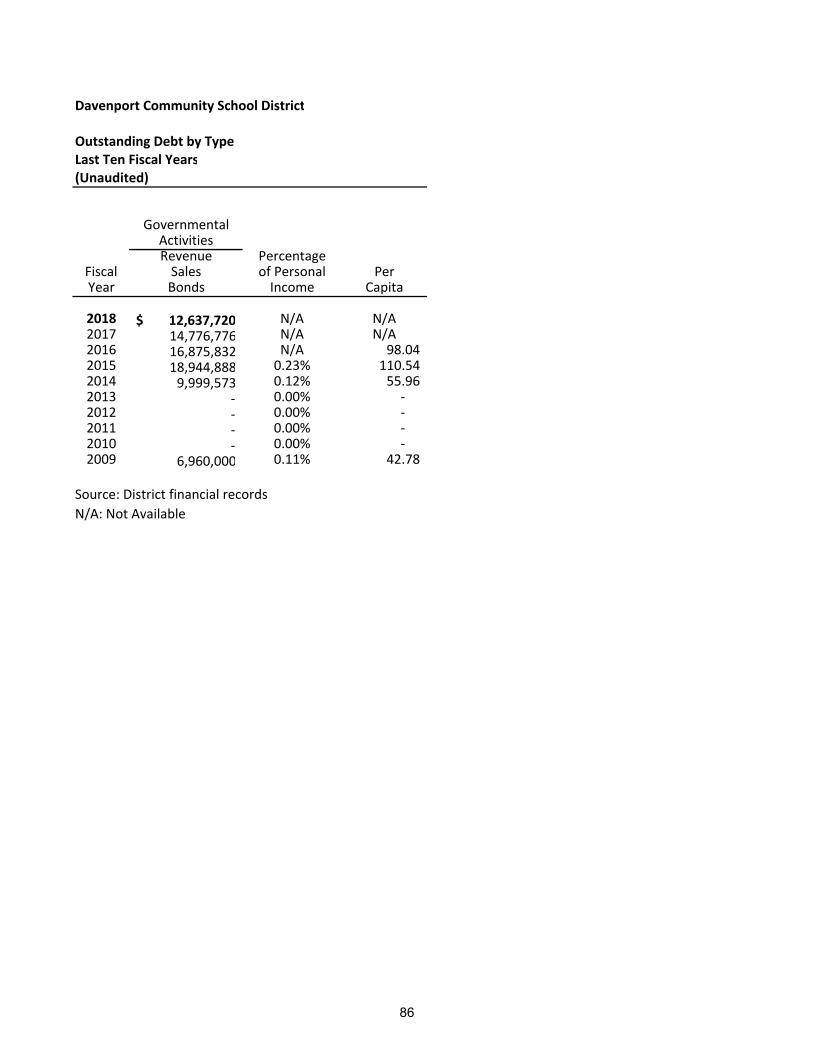
Davenport Community School District
Outstanding Debt by TypeLast Ten Fiscal Years(Unaudited)
GovernmentalActivitiesRevenue Percentage
Fiscal Sales of Personal PerYear Bonds Income Capita
2018 12,637,720$ N/A N/A2017 14,776,776 N/A N/A2016 16,875,832 N/A 98.04 2015 18,944,888 0.23% 110.54 2014 9,999,573 0.12% 55.96 2013 ‐ 0.00% ‐ 2012 ‐ 0.00% ‐ 2011 ‐ 0.00% ‐ 2010 ‐ 0.00% ‐ 2009 6,960,000 0.11% 42.78
Source: District financial records
N/A: Not Available
86

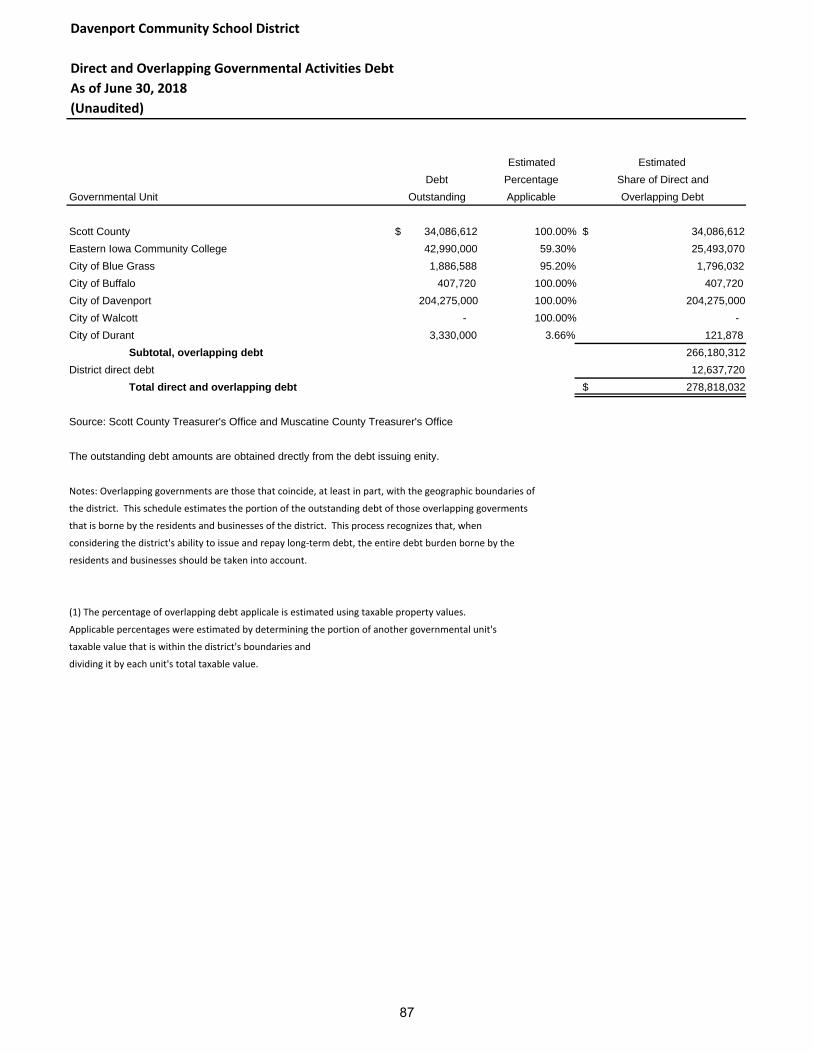
Davenport Community School District
Direct and Overlapping Governmental Activities Debt
As of June 30, 2018
(Unaudited)
Estimated Estimated
Debt Percentage Share of Direct and
Governmental Unit Outstanding Applicable Overlapping Debt
Scott County 34,086,612 $ 100.00% 34,086,612$
Eastern Iowa Community College 42,990,000 59.30% 25,493,070
City of Blue Grass 1,886,588 95.20% 1,796,032
City of Buffalo 407,720 100.00% 407,720
City of Davenport 204,275,000 100.00% 204,275,000
City of Walcott - 100.00% -
City of Durant 3,330,000 3.66% 121,878
Subtotal, overlapping debt 266,180,312
District direct debt 12,637,720
Total direct and overlapping debt 278,818,032$
Source: Scott County Treasurer's Office and Muscatine County Treasurer's Office
The outstanding debt amounts are obtained drectly from the debt issuing enity.
Notes: Overlapping governments are those that coincide, at least in part, with the geographic boundaries of
the district. This schedule estimates the portion of the outstanding debt of those overlapping goverments
that is borne by the residents and businesses of the district. This process recognizes that, when
considering the district's ability to issue and repay long‐term debt, the entire debt burden borne by the
residents and businesses should be taken into account.
(1) The percentage of overlapping debt applicale is estimated using taxable property values.
Applicable percentages were estimated by determining the portion of another governmental unit's
taxable value that is within the district's boundaries and
dividing it by each unit's total taxable value.
87
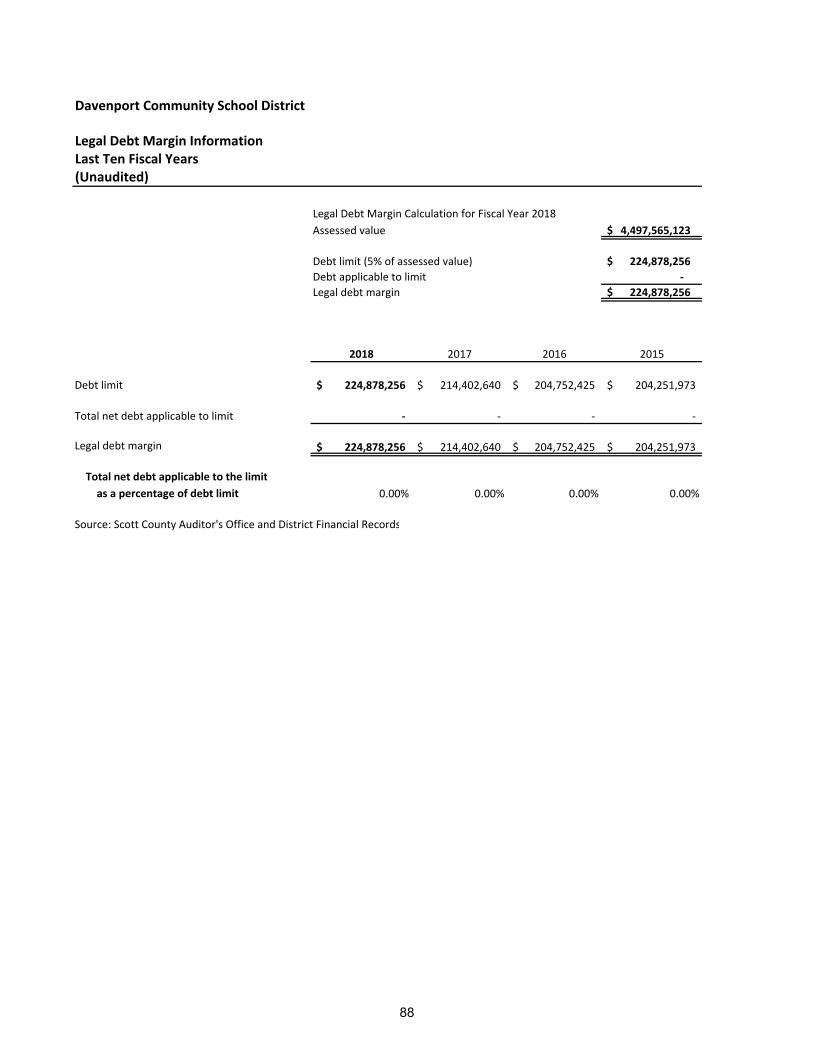
Davenport Community School District
Legal Debt Margin InformationLast Ten Fiscal Years(Unaudited)
Legal Debt Margin Calculation for Fiscal Year 2018
Assessed value 4,497,565,123 $
Debt limit (5% of assessed value) 224,878,256 $
Debt applicable to limit ‐
Legal debt margin 224,878,256 $
2018 2017 2016 2015
Debt limit 224,878,256$ 214,402,640$ 204,752,425$ 204,251,973$
Total net debt applicable to limit ‐ ‐ ‐ ‐
Legal debt margin 224,878,256$ 214,402,640$ 204,752,425$ 204,251,973$
Total net debt applicable to the limit
as a percentage of debt limit 0.00% 0.00% 0.00% 0.00%
Source: Scott County Auditor's Office and District Financial Records
88
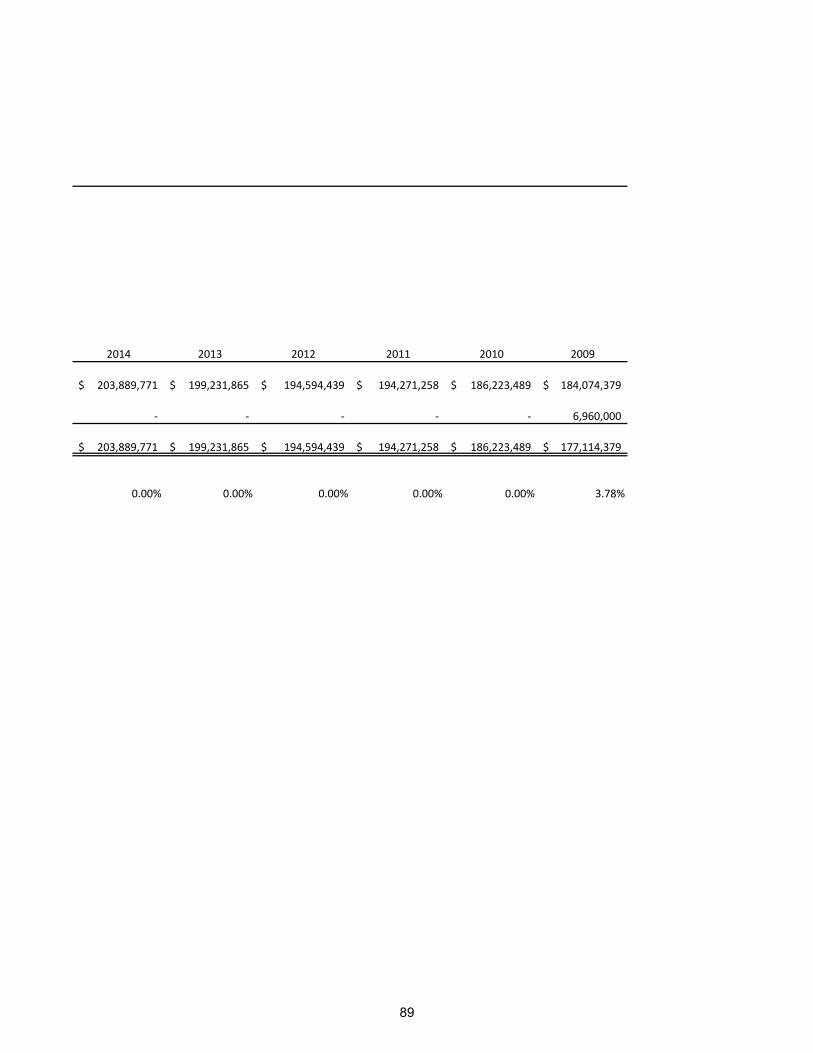
2014 2013 2012 2011 2010 2009
203,889,771$ 199,231,865$ 194,594,439$ 194,271,258$ 186,223,489$ 184,074,379$
‐ ‐ ‐ ‐ ‐ 6,960,000
203,889,771$ 199,231,865$ 194,594,439$ 194,271,258$ 186,223,489$ 177,114,379$
0.00% 0.00% 0.00% 0.00% 0.00% 3.78%
89
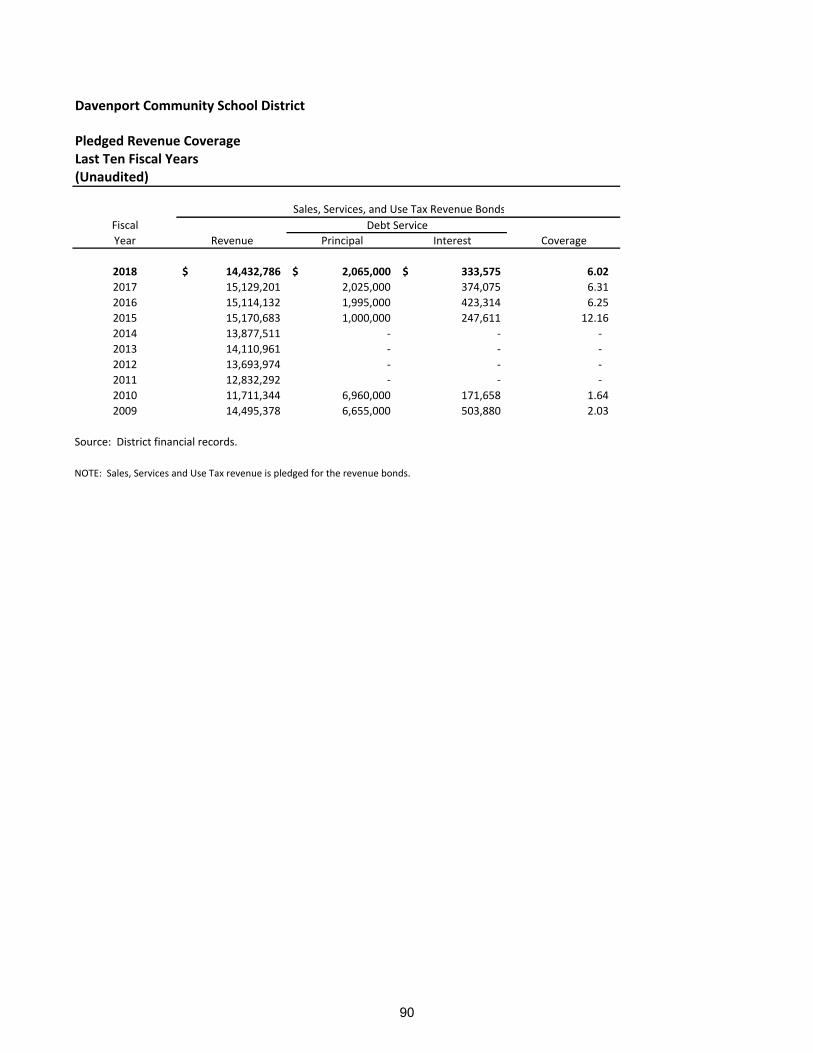
Davenport Community School District
Pledged Revenue CoverageLast Ten Fiscal Years(Unaudited)
Fiscal Debt Service
Year Revenue Principal Interest Coverage
2018 14,432,786$ 2,065,000$ 333,575$ 6.02
2017 15,129,201 2,025,000 374,075 6.31
2016 15,114,132 1,995,000 423,314 6.25
2015 15,170,683 1,000,000 247,611 12.16
2014 13,877,511 ‐ ‐ ‐
2013 14,110,961 ‐ ‐ ‐
2012 13,693,974 ‐ ‐ ‐
2011 12,832,292 ‐ ‐ ‐
2010 11,711,344 6,960,000 171,658 1.64
2009 14,495,378 6,655,000 503,880 2.03
Source: District financial records.
NOTE: Sales, Services and Use Tax revenue is pledged for the revenue bonds.
Sales, Services, and Use Tax Revenue Bonds
90
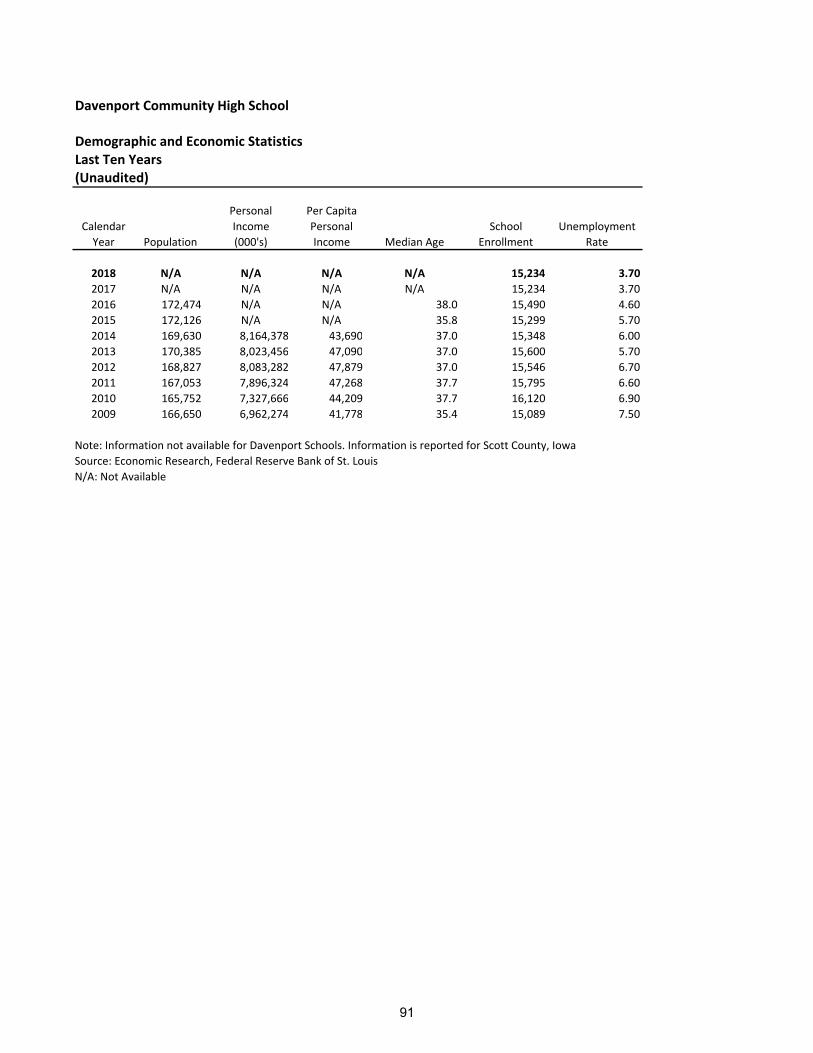
Davenport Community High School
Demographic and Economic StatisticsLast Ten Years(Unaudited)
Personal Per Capita
Calendar Income Personal School Unemployment
Year Population (000's) Income Median Age Enrollment Rate
2018 N/A N/A N/A N/A 15,234 3.70
2017 N/A N/A N/A N/A 15,234 3.70
2016 172,474 N/A N/A 38.0 15,490 4.60
2015 172,126 N/A N/A 35.8 15,299 5.70
2014 169,630 8,164,378 43,690 37.0 15,348 6.00
2013 170,385 8,023,456 47,090 37.0 15,600 5.70
2012 168,827 8,083,282 47,879 37.0 15,546 6.70
2011 167,053 7,896,324 47,268 37.7 15,795 6.60
2010 165,752 7,327,666 44,209 37.7 16,120 6.90
2009 166,650 6,962,274 41,778 35.4 15,089 7.50
Note: Information not available for Davenport Schools. Information is reported for Scott County, Iowa
Source: Economic Research, Federal Reserve Bank of St. Louis
N/A: Not Available
91
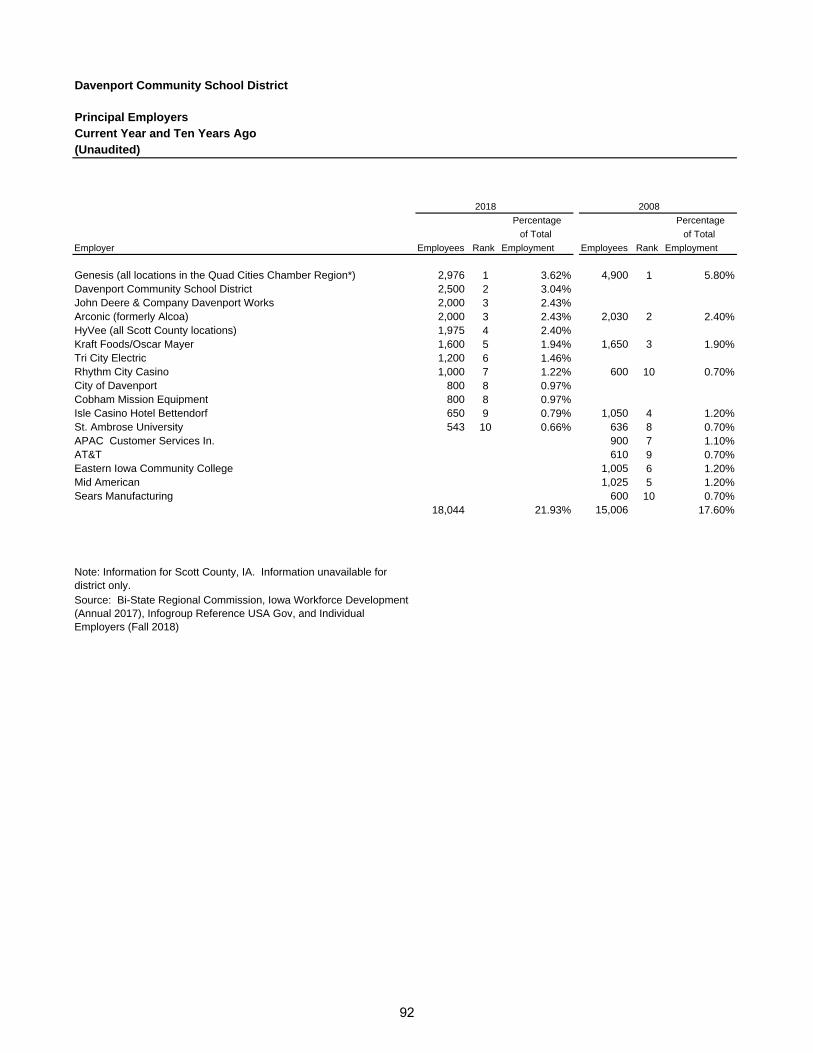
Davenport Community School District
Principal EmployersCurrent Year and Ten Years Ago(Unaudited)
2018 2008
Percentage Percentage
of Total of Total
Employer Employees Rank Employment Employees Rank Employment
Genesis (all locations in the Quad Cities Chamber Region*) 2,976 1 3.62% 4,900 1 5.80%Davenport Community School District 2,500 2 3.04%John Deere & Company Davenport Works 2,000 3 2.43%Arconic (formerly Alcoa) 2,000 3 2.43% 2,030 2 2.40%HyVee (all Scott County locations) 1,975 4 2.40%Kraft Foods/Oscar Mayer 1,600 5 1.94% 1,650 3 1.90%Tri City Electric 1,200 6 1.46%Rhythm City Casino 1,000 7 1.22% 600 10 0.70%City of Davenport 800 8 0.97%Cobham Mission Equipment 800 8 0.97%Isle Casino Hotel Bettendorf 650 9 0.79% 1,050 4 1.20%St. Ambrose University 543 10 0.66% 636 8 0.70%APAC Customer Services In. 900 7 1.10%AT&T 610 9 0.70%Eastern Iowa Community College 1,005 6 1.20%Mid American 1,025 5 1.20%Sears Manufacturing 600 10 0.70%
18,044 21.93% 15,006 17.60%
Note: Information for Scott County, IA. Information unavailable for district only.Source: Bi-State Regional Commission, Iowa Workforce Development (Annual 2017), Infogroup Reference USA Gov, and Individual Employers (Fall 2018)
92
Davenport Community School District Demographic and Miscellaneous Statistics (Continued) The ABCs about Davenport Community Schools ... Davenport lies within the Quad Cities Metropolitan area, which is located in eastern Iowa and western Illinois on the Mississippi River, 165 miles west of Chicago. The Quad Cities is midway between Minneapolis and St. Louis. The area's 300-mile market of nearly 36.5 million people comprises nearly 15% of the nation's population. Our Beliefs We believe all children can and will learn in the Davenport Community School District. We believe each child deserves respect. We believe we must have high expectations for each child. We believe we must never limit children. We believe in the power of effective instruction. We believe effective instruction encourages students to be inquisitive and to explore and
discover. We believe every child has the right to a safe environment. We believe a caring environment is important for student success because relationships
impact learning. We believe extracurricular activities engage students in the educational environment. We believe effective schools nurture relationships and impact learning. We believe in the universal benefits of continuous quality improvement.
Budget: $237,766,816 in 2017-18 Collaboration with Community Leaders and Agency Partners:
Leading a network of over 20 preschool partners to provide access to high-quality early learning opportunities for all of Davenport’s 4 year-olds
Davenport Schools Foundation scholarships and Great Minds enrichment activities for all students
Afterschool and summer program expertise in partnership with ISU Extension, Davenport Parks and Recreation, YMCA and others
Free CitiBus service on all City of Davenport transit routes 7 days a week Agency-led community-to-classroom program partnerships with ISU Extension, Jr.
Achievement, Figge Art Museum, Iowa Jobs for America’s Graduates, and more Learning Supports partners from the youth development and faith communities provide
academic and social supports for students and families Postsecondary collaborations prepare students and families for life after graduation
Communities Served: Blue Grass, Buffalo, Davenport and Walcott - covering 109 square miles
93
Davenport Community School District Demographic and Miscellaneous Statistics (Continued) Comprehensive School Improvement Plan: or CSIP, is a detailed plan of actions for accomplishing the district goals. Creating and sustaining a high performance education environment takes both dedication and thoughtful planning. The CSIP is a planning document, featuring both broad-based perspectives on the priorities of our district as well as specific learning goals for our students. These goals provide an important measure of accountability. Davenport’s student learning goals are the general expectations for all its graduates. Students graduating from Davenport Community School District will:
Apply reading, writing, and speaking skills to communicate effectively Understand and apply mathematical ideas Understand our earth, ecological impact, the physical world, and the cycles of life Understand the development of civic responsibility and the influence of history,
geography, government, and economics on individuals and societies Understand, perform, and value music Understand, produce, and value visual art Demonstrate appropriate physical movement and form Demonstrate skills and knowledge needed for making life-long health decisions Demonstrate technical knowledge and skills needed to be productive within the context
of real life Be knowledgeable about career choices across a variety of areas Apply critical thinking skills when making decisions and solving problems Use technology and other sources of information for a variety of purposes Demonstrate attitudes and skills that support self-directed lifelong learning, personal
pursuits, productivity, and conflict resolution Demonstrate attitudes and behaviors that support global understanding, collaboration,
diversity, and interdependence
Computers and Technology:
We are a 1:1 school district with over 25,000 devices serving our students and staff All elementary classrooms have interactive whiteboards, with many intermediate and
high schools utilizing the technology Google Apps for Education workspaces facilitate “anytime, anywhere” learning for
students
94
Davenport Community School District Demographic and Miscellaneous Statistics (Continued) Curriculum Highlights:
Elementary (K-Grade 5)
Preschool opportunities Concept Based Brain Compatible (CBBC)/”Brain Friendly” Classrooms Skills for Life initiative Emphasis on reading proficiency in primary grades Balanced Literacy approach Special, visiting artists programs Vocal music performance opportunities Instrumental music program beginning in 4th grade Departmental instruction in 4th and 5th grade in art, mathematics, music, physical
education, science, and social studies Special education programming Talented and gifted programming State-of-the-art library media centers – the first library media centers in elementary
schools in Iowa and west of the Mississippi River
Intermediate (Grades 6-8)
Individual school-based middle school programming Writing across the curriculum Multiple-year sequence in French and Spanish School-to-Work programming Individual student lessons in instrumental music Special education programming Talented and gifted programming State-of-the-art library media centers
High Schools (Grades 9-12)
All high schools have Talented and Gifted teachers who support the unique learning needs of our gifted students. No other district in the area has this strong of a TAG program presence.
Currently offering 15 advanced placement and 58 dual credit college courses at our high schools
High quality fine arts, extracurricular, and athletic programs Nationally-recognized Project Lead the Way engineering program Award-winning ProStart culinary arts program Junior ROTC programs, numerous school and community clubs, and service learning
opportunities Options within required course areas Foreign language offerings in French, Spanish, German, and some Latin & Greek School-to-Work programming Special education programming State-of-the-art library media centers
95
Davenport Community School District Demographic and Miscellaneous Statistics (Continued)
District of Distinction Programs: The Accelerated Associate Degree Program at North High School, where accepted
students can earn an Associate Degree during their 4-year high school career; the District offers 58 dual credit college courses at our high schools; in the 2017-18 school year, 53 students received their Associate Degree while still seniors in high school
The Student-Built Homes Program, where participating high school students experience hands-on learning as they build a home from start to finish
The ProStart program, a high school culinary arts program taught by an Iowa ProStart Teacher of the Year
Army and Marine Corps Junior Reserve Officer Training Corps (JROTC) Programs— two of only six in the state of Iowa, and the only programs in the Quad Cities
Over 250 courses are offered in our high school course guide, including specialized offerings such as international foods, civil engineering, sports medicine, interior design, and invertebrate zoology.
The Creative Arts Academy of the Quad Cities offers a rigorous arts-integrated curriculum and intensive, project-based activities that prepare students for exciting career paths in the arts and develop the skills of communication, collaboration, critical thinking, and creativity.
The urban farm at Mid City High School: Participating students use a variety of skills to operate an urban farm, from planning the layout of each year’s crops, to the “labor of love” of planting and caring for the farm, to turning the harvest into food.
The INSPIRE Academy at West High School features career academies that provide real-world learning experiences to prepare students for success in college and career, including a rigorous capstone experience that challenges teams to solve a real-world problem through technology. Students choose from the following five career pathways:
Engineering: This pathway is home to the Combustible Lemons – West High’s robotics team that was crowned the 2017 FIRST Tech Challenge Champion.
Advanced Manufacturing/Engineering Tech: students learn woodworking, welding, construction, engineering, robotics, and Computer Integrated Manufacturing
Health Sciences: Students have the opportunity to earn CNA certification (Certified Nursing Assistant), and this pathway soon expands to include Biomedical Technology and Pharmaceutical Sciences
Business/Finance: Students have the opportunity to work at the student-run Falcon DuTrac branch
Computer Science: Students learn Cyber Security, Java programing, C# and C++ programming, Visual Basic, and Web Design and Development
The award-winning Stepping Stones afterschool program serves our elementary schools with high-quality afterschool enrichment programs, as well as top-notch summer programming.
Award-winning Children’s Villages and progressive early childhood partnerships that provide voluntary preschool programs for all area 4 year olds
96
Davenport Community School District Demographic and Miscellaneous Statistics (Continued) Employee Top Awards:
West High’s Jay Swords was the recipient of the 2017 Iowa Talented and Gifted Association’s Distinguished Service Award.
Five more teachers became National Board Certified this year, bringing the District’s total to 25, the most out of any Quad Cities school district.
North High art teacher Dave Schaeffer won the 1st place Teacher Award, his fourth in a row, at the 41st Annual High School Art Invitational at Quad City Arts.
Facilities:
4 High Schools 4 Intermediate Schools 1 K-8 School 17 Elementary Schools The Creative Arts Academy of the Quad Cities Keystone Academy A network of Early Childhood Learning Centers 1 Athletic Stadium 1 Operations Center 1 Achievement Services Center
Facility Maintenance: Recognized as environmental leader receiving Governor’s Iowa Environmental
Excellence Award, Iowa Recycling Award, and the U.S. Environmental Protection Agency ENERGY STAR Partner of the Year
Facilities upgrades of nearly $130 million over the past 12 years, earning the Association of School Business Officials International Facilities Masters Award
An ENERGY STAR partner since 1998 the district has assessed the energy performance of 100 percent of its schools. Undertaken improvements and elevated the average rating across the portfolio by ten percent.
Family Services Graduation Support & At-Risk Services – We offer an array of support services that help
students be successful in school and graduate on time Home School Services and Support – A resource that assists homeschooling parents in
the education of their children Military Family Support – Information on the ways we serve the military-connected child
in pre-Kindergarten through high school Olweus Bullying Prevention Program – Information on the Olweus Bully Prevention
Program Parent Portal – A secure web site that parents & guardians can use to track their child’s
progress in school, including items such as attendance, grades, and fees
97
Davenport Community School District Demographic and Miscellaneous Statistics (Continued) Student Support and Federal Programs – Information on Title 1 funds that assist schools
with improving student achievement, staff development, and parent and community involvement
TouchBase – Pay student fees online Translations – Important documents translated into Spanish and Vietnamese Virtual Backpack – Our paperless resource for the student-focused programs and
opportunities currently available in our community The work of the Davenport School Board is guided by two student-centered priorities:
enhancing a positive school climate and reducing the impact of poverty on student achievement.
The Board leads a community Poverty Committee that identifies and addresses barriers to learning.
Food Service: Innovative and award-winning breakfast and lunch programs provided in all schools. 65.99% Free or reduced Highly trained nutrition experts serve every building in the school district. Each day
nearly 20,000 meals are served to students in over 30 locations. Meal service extends into the summer months with our “Community Café” program
serving an estimated 40,000 meals across 20 community parks, schools and community centers.
Guidelines for Elementary Class Sizes: Kindergarten through first grade – 20 students Second grade – 21 students Third grade – 22 students Fourth through fifth grade – 26 students
98
Davenport Community School District Demographic and Miscellaneous Statistics (Continued) Iowa Core Curriculum: In 2010 the State Board of Education voted to blend the Iowa Core with the Common Core. The Iowa Core goes beyond the Common Core. Essential Concepts & Skill Sets include:
Literacy: reading, writing, speaking, listening, viewing Math: number and operations, quantitative literacy, algebra, geometry and
measurement, data analysis/statistics/probability Science: science as inquiry, earth and space, life science, physical science Social Studies: behavioral sciences, economics, geography, history, politic science/civic
literacy 21St Century Skills: employability skills, financial literacy, health literacy, technology
literacy Some of our Outstanding Alumni… Jim Skinner, class of 1962, Chief Executive Officer of McDonald’s Corporation Roger Craig, class of 1978, 3-time Super Bowl champion Dana Davis, class of 1997, television actress Jim Leach, class of 1960, Chair of the National Endowment for the Humanities and
former member of the U.S. House of Representatives Susan Glaspell, class of 1894, Pulitzer Prize-winning playwright, actress, director,
novelist, biographer and poet Julian Vandervelde, class of 2006, professional football player Tom Hudson, class of 1990, co-host of PBS national broadcast “Nightly Business
Review” Parents as our Partners Watch D.O.G.S. (Dads Of Great Students) enlists fathers to volunteer at their child’s
school by interacting with students before & after school, during lunch, and in classrooms Parent engagement, PTA, and PTO opportunities at all of our schools Online Parent Portal and other communication tools ensure families have regular contact
with classroom teachers Title I Parent Involvement activities engage parents as volunteers and education
supporters Home School Assistance Program offers academic and enrichment supports for families
choosing to home school their child Professional Employees' Credentials: Bachelors' Degrees – 100% Masters' Degrees – 55.76% Specialist or Doctorate Degrees – 2.03%
99
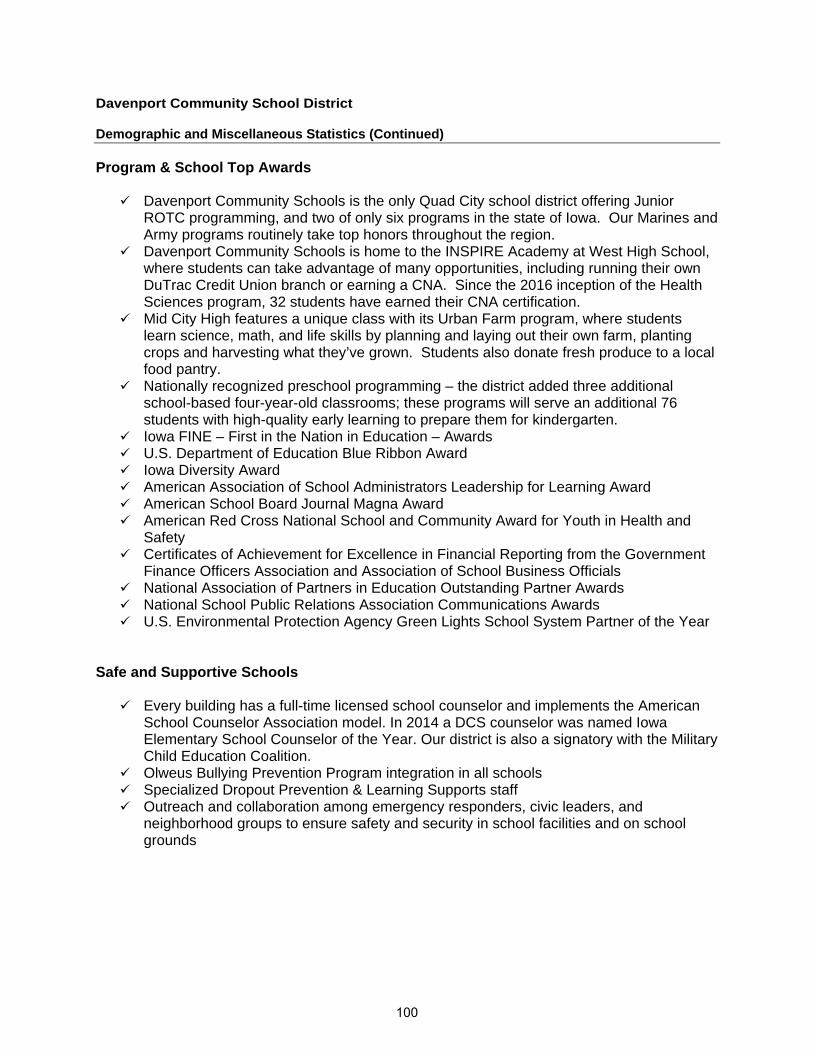
Davenport Community School District Demographic and Miscellaneous Statistics (Continued) Program & School Top Awards
Davenport Community Schools is the only Quad City school district offering Junior ROTC programming, and two of only six programs in the state of Iowa. Our Marines and Army programs routinely take top honors throughout the region.
Davenport Community Schools is home to the INSPIRE Academy at West High School, where students can take advantage of many opportunities, including running their own DuTrac Credit Union branch or earning a CNA. Since the 2016 inception of the Health Sciences program, 32 students have earned their CNA certification.
Mid City High features a unique class with its Urban Farm program, where students learn science, math, and life skills by planning and laying out their own farm, planting crops and harvesting what they’ve grown. Students also donate fresh produce to a local food pantry.
Nationally recognized preschool programming – the district added three additional school-based four-year-old classrooms; these programs will serve an additional 76 students with high-quality early learning to prepare them for kindergarten.
Iowa FINE – First in the Nation in Education – Awards U.S. Department of Education Blue Ribbon Award Iowa Diversity Award American Association of School Administrators Leadership for Learning Award American School Board Journal Magna Award American Red Cross National School and Community Award for Youth in Health and
Safety Certificates of Achievement for Excellence in Financial Reporting from the Government
Finance Officers Association and Association of School Business Officials National Association of Partners in Education Outstanding Partner Awards National School Public Relations Association Communications Awards U.S. Environmental Protection Agency Green Lights School System Partner of the Year
Safe and Supportive Schools
Every building has a full-time licensed school counselor and implements the American School Counselor Association model. In 2014 a DCS counselor was named Iowa Elementary School Counselor of the Year. Our district is also a signatory with the Military Child Education Coalition.
Olweus Bullying Prevention Program integration in all schools Specialized Dropout Prevention & Learning Supports staff Outreach and collaboration among emergency responders, civic leaders, and
neighborhood groups to ensure safety and security in school facilities and on school grounds
100
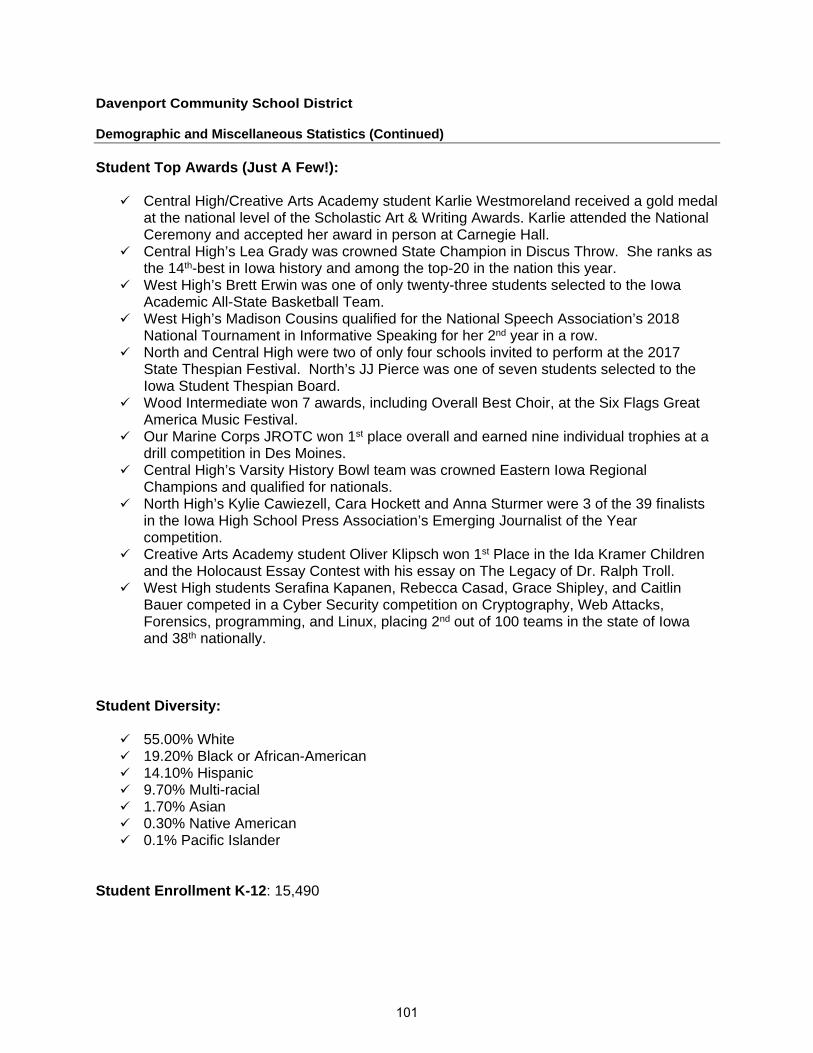
Davenport Community School District Demographic and Miscellaneous Statistics (Continued) Student Top Awards (Just A Few!):
Central High/Creative Arts Academy student Karlie Westmoreland received a gold medal at the national level of the Scholastic Art & Writing Awards. Karlie attended the National Ceremony and accepted her award in person at Carnegie Hall.
Central High’s Lea Grady was crowned State Champion in Discus Throw. She ranks as the 14th-best in Iowa history and among the top-20 in the nation this year.
West High’s Brett Erwin was one of only twenty-three students selected to the Iowa Academic All-State Basketball Team.
West High’s Madison Cousins qualified for the National Speech Association’s 2018 National Tournament in Informative Speaking for her 2nd year in a row.
North and Central High were two of only four schools invited to perform at the 2017 State Thespian Festival. North’s JJ Pierce was one of seven students selected to the Iowa Student Thespian Board.
Wood Intermediate won 7 awards, including Overall Best Choir, at the Six Flags Great America Music Festival.
Our Marine Corps JROTC won 1st place overall and earned nine individual trophies at a drill competition in Des Moines.
Central High’s Varsity History Bowl team was crowned Eastern Iowa Regional Champions and qualified for nationals.
North High’s Kylie Cawiezell, Cara Hockett and Anna Sturmer were 3 of the 39 finalists in the Iowa High School Press Association’s Emerging Journalist of the Year competition.
Creative Arts Academy student Oliver Klipsch won 1st Place in the Ida Kramer Children and the Holocaust Essay Contest with his essay on The Legacy of Dr. Ralph Troll.
West High students Serafina Kapanen, Rebecca Casad, Grace Shipley, and Caitlin Bauer competed in a Cyber Security competition on Cryptography, Web Attacks, Forensics, programming, and Linux, placing 2nd out of 100 teams in the state of Iowa and 38th nationally.
Student Diversity:
55.00% White 19.20% Black or African-American 14.10% Hispanic 9.70% Multi-racial 1.70% Asian 0.30% Native American 0.1% Pacific Islander
Student Enrollment K-12: 15,490
101
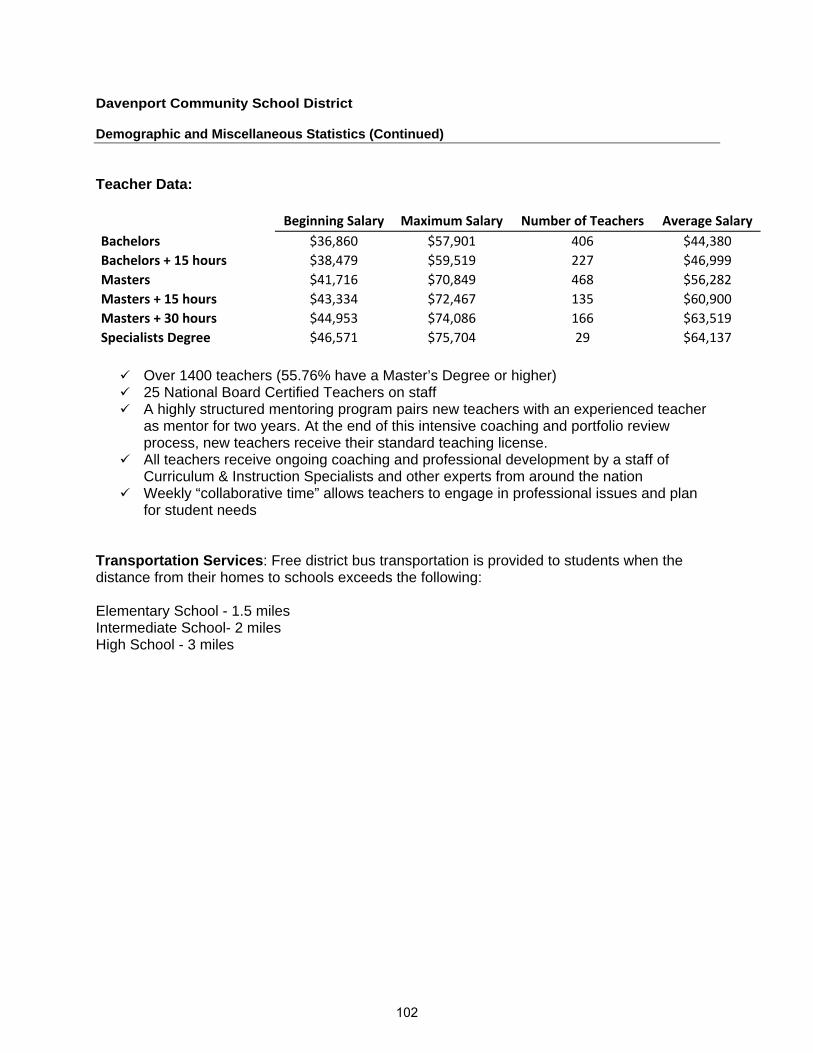
Davenport Community School District Demographic and Miscellaneous Statistics (Continued) Teacher Data:
Beginning Salary Maximum Salary Number of Teachers Average Salary
Bachelors $36,860 $57,901 406 $44,380
Bachelors + 15 hours $38,479 $59,519 227 $46,999
Masters $41,716 $70,849 468 $56,282
Masters + 15 hours $43,334 $72,467 135 $60,900
Masters + 30 hours $44,953 $74,086 166 $63,519
Specialists Degree $46,571 $75,704 29 $64,137
Over 1400 teachers (55.76% have a Master’s Degree or higher) 25 National Board Certified Teachers on staff A highly structured mentoring program pairs new teachers with an experienced teacher
as mentor for two years. At the end of this intensive coaching and portfolio review process, new teachers receive their standard teaching license.
All teachers receive ongoing coaching and professional development by a staff of Curriculum & Instruction Specialists and other experts from around the nation
Weekly “collaborative time” allows teachers to engage in professional issues and plan for student needs
Transportation Services: Free district bus transportation is provided to students when the distance from their homes to schools exceeds the following: Elementary School - 1.5 miles Intermediate School- 2 miles High School - 3 miles
102

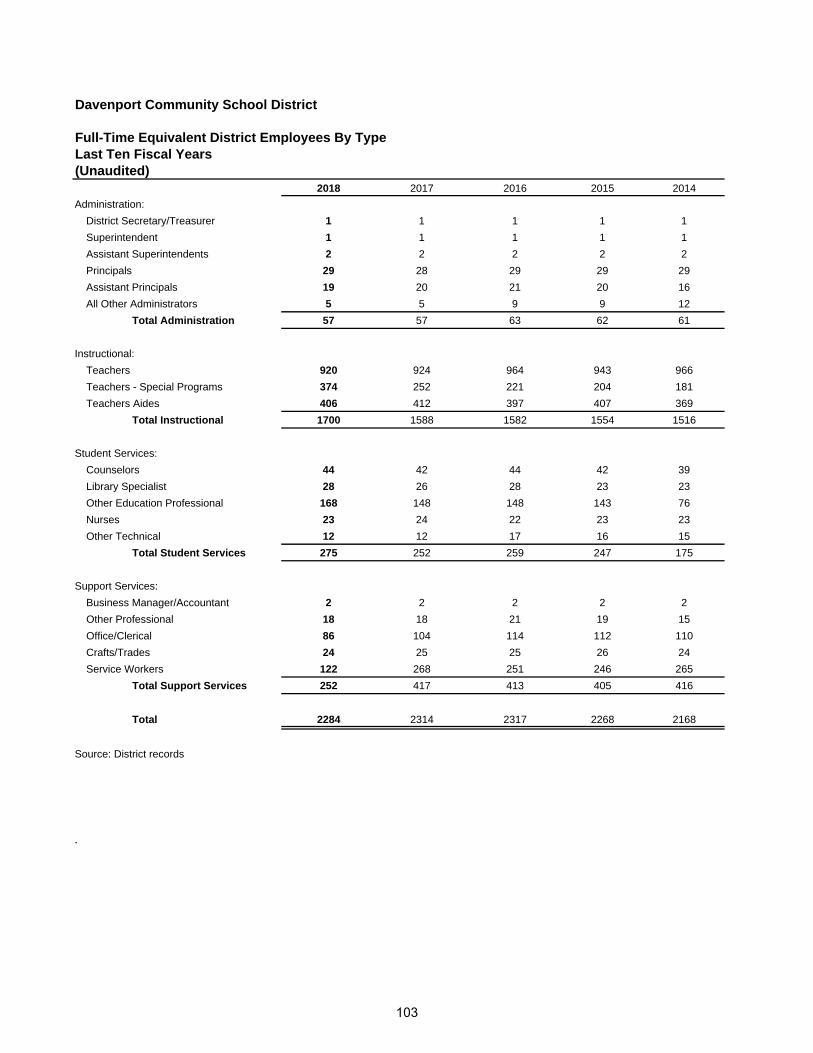
Davenport Community School District
Full-Time Equivalent District Employees By TypeLast Ten Fiscal Years(Unaudited)
2018 2017 2016 2015 2014
Administration:
District Secretary/Treasurer 1 1 1 1 1
Superintendent 1 1 1 1 1
Assistant Superintendents 2 2 2 2 2
Principals 29 28 29 29 29
Assistant Principals 19 20 21 20 16
All Other Administrators 5 5 9 9 12
Total Administration 57 57 63 62 61
Instructional:
Teachers 920 924 964 943 966
Teachers - Special Programs 374 252 221 204 181
Teachers Aides 406 412 397 407 369
Total Instructional 1700 1588 1582 1554 1516
Student Services:
Counselors 44 42 44 42 39
Library Specialist 28 26 28 23 23
Other Education Professional 168 148 148 143 76
Nurses 23 24 22 23 23
Other Technical 12 12 17 16 15
Total Student Services 275 252 259 247 175
Support Services:
Business Manager/Accountant 2 2 2 2 2
Other Professional 18 18 21 19 15
Office/Clerical 86 104 114 112 110
Crafts/Trades 24 25 25 26 24
Service Workers 122 268 251 246 265
Total Support Services 252 417 413 405 416
Total 2284 2314 2317 2268 2168
Source: District records
.
103
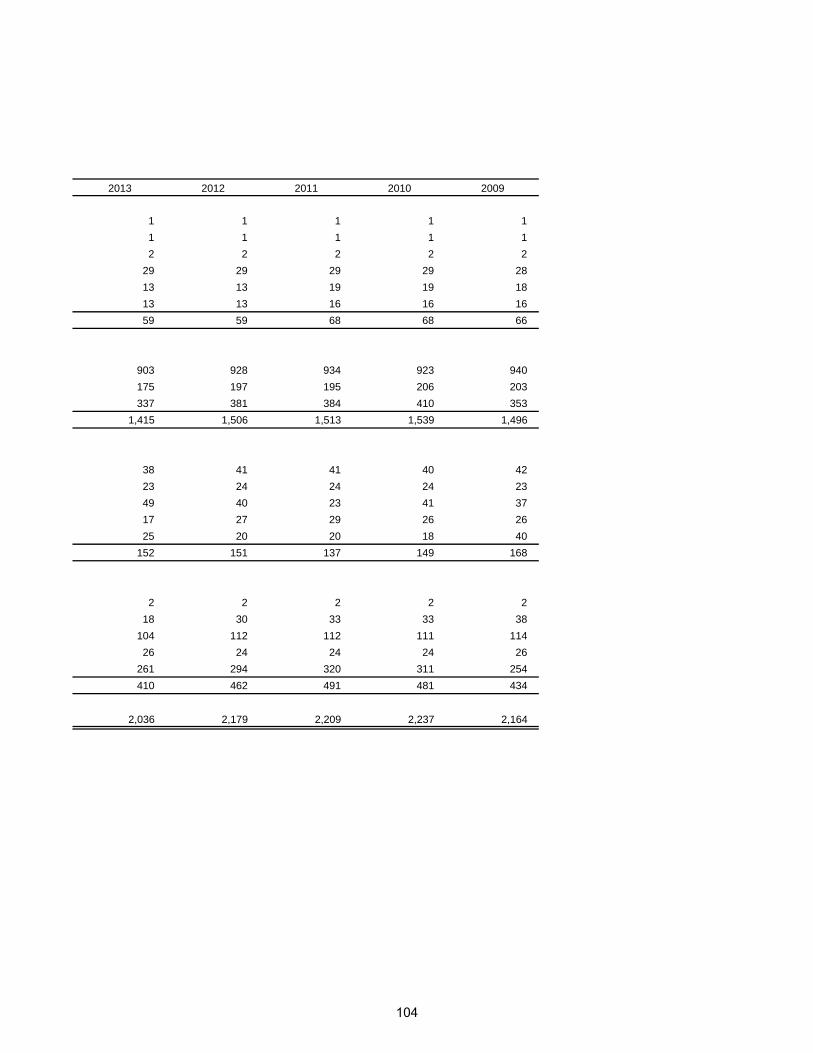
2013 2012 2011 2010 2009
1 1 1 1 1
1 1 1 1 1
2 2 2 2 2
29 29 29 29 28
13 13 19 19 18
13 13 16 16 16
59 59 68 68 66
903 928 934 923 940
175 197 195 206 203
337 381 384 410 353
1,415 1,506 1,513 1,539 1,496
38 41 41 40 42
23 24 24 24 23
49 40 23 41 37
17 27 29 26 26
25 20 20 18 40
152 151 137 149 168
2 2 2 2 2
18 30 33 33 38
104 112 112 111 114
26 24 24 24 26
261 294 320 311 254
410 462 491 481 434
2,036 2,179 2,209 2,237 2,164
104

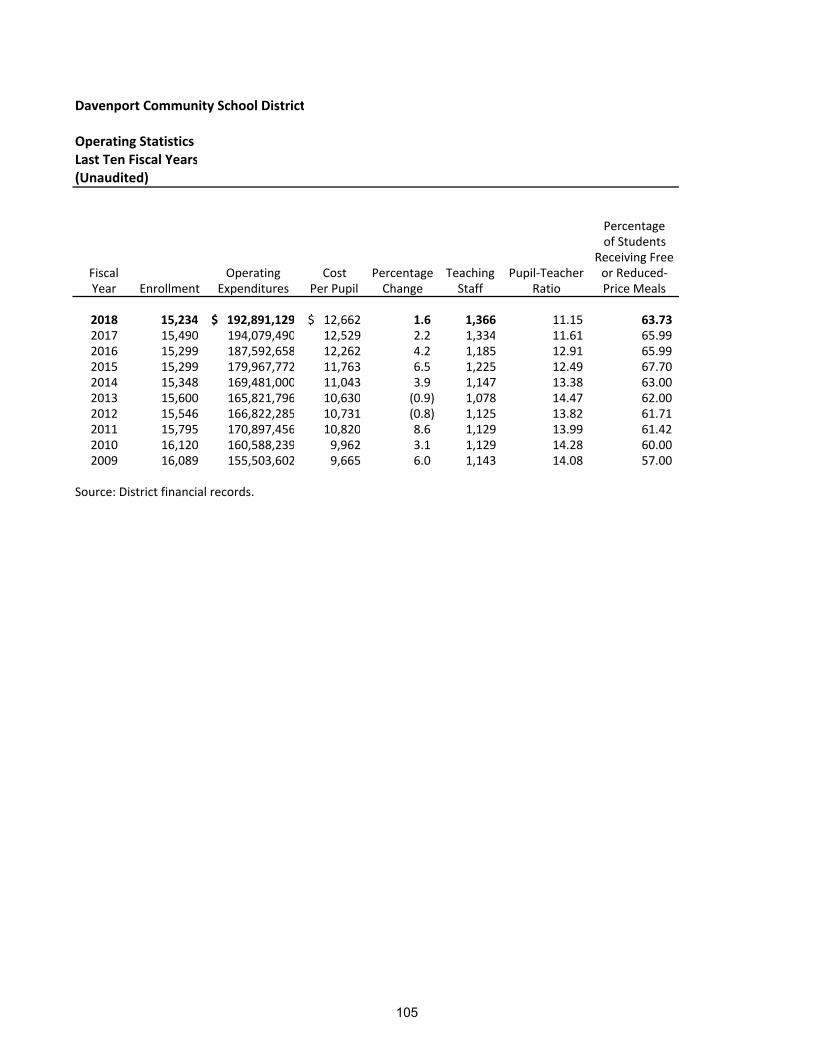
Davenport Community School District
Operating StatisticsLast Ten Fiscal Years(Unaudited)
Percentageof Students
Receiving FreeFiscal Operating Cost Percentage Teaching Pupil‐Teacher or Reduced‐Year Enrollment Expenditures Per Pupil Change Staff Ratio Price Meals
2018 15,234 192,891,129$ 12,662$ 1.6 1,366 11.15 63.73 2017 15,490 194,079,490 12,529 2.2 1,334 11.61 65.99 2016 15,299 187,592,658 12,262 4.2 1,185 12.91 65.99 2015 15,299 179,967,772 11,763 6.5 1,225 12.49 67.70 2014 15,348 169,481,000 11,043 3.9 1,147 13.38 63.00 2013 15,600 165,821,796 10,630 (0.9) 1,078 14.47 62.00 2012 15,546 166,822,285 10,731 (0.8) 1,125 13.82 61.71 2011 15,795 170,897,456 10,820 8.6 1,129 13.99 61.42 2010 16,120 160,588,239 9,962 3.1 1,129 14.28 60.00 2009 16,089 155,503,602 9,665 6.0 1,143 14.08 57.00
Source: District financial records.
105
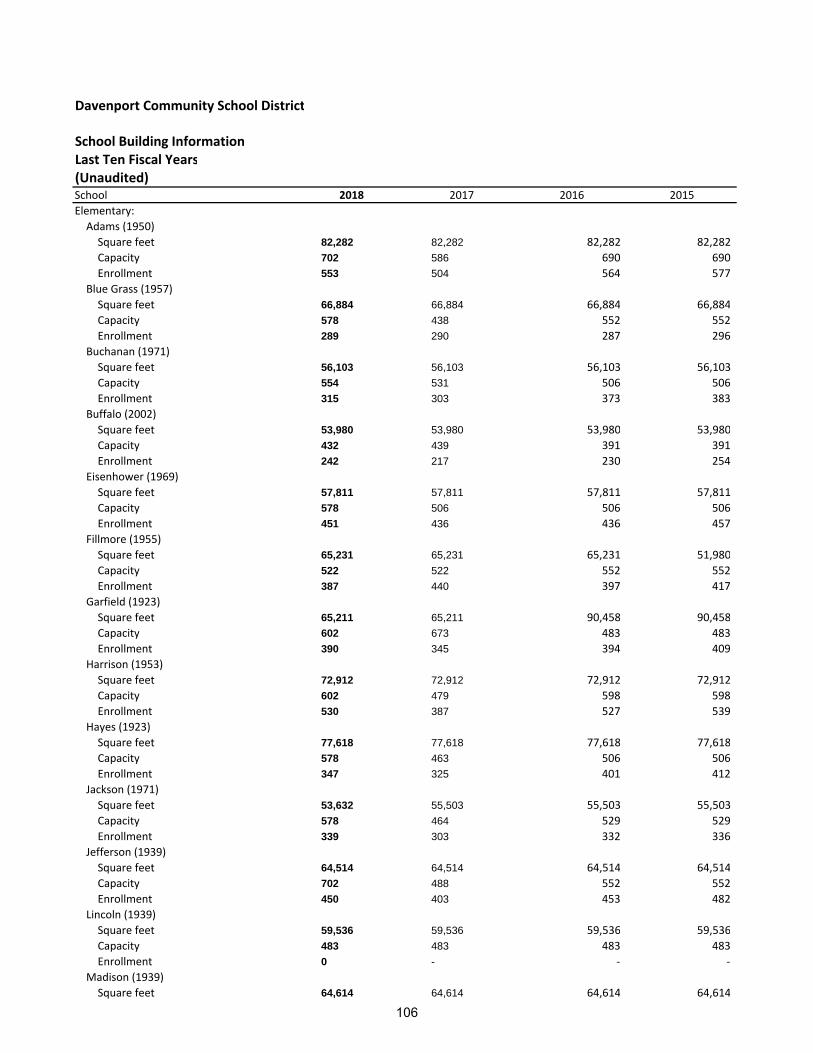
Davenport Community School District
School Building InformationLast Ten Fiscal Years(Unaudited)School 2018 2017 2016 2015
Elementary:
Adams (1950)
Square feet 82,282 82,282 82,282 82,282
Capacity 702 586 690 690
Enrollment 553 504 564 577
Blue Grass (1957)
Square feet 66,884 66,884 66,884 66,884
Capacity 578 438 552 552
Enrollment 289 290 287 296
Buchanan (1971)
Square feet 56,103 56,103 56,103 56,103
Capacity 554 531 506 506
Enrollment 315 303 373 383
Buffalo (2002)
Square feet 53,980 53,980 53,980 53,980
Capacity 432 439 391 391
Enrollment 242 217 230 254
Eisenhower (1969)
Square feet 57,811 57,811 57,811 57,811
Capacity 578 506 506 506
Enrollment 451 436 436 457
Fillmore (1955)
Square feet 65,231 65,231 65,231 51,980
Capacity 522 522 552 552
Enrollment 387 440 397 417
Garfield (1923)
Square feet 65,211 65,211 90,458 90,458
Capacity 602 673 483 483
Enrollment 390 345 394 409
Harrison (1953)
Square feet 72,912 72,912 72,912 72,912
Capacity 602 479 598 598
Enrollment 530 387 527 539
Hayes (1923)
Square feet 77,618 77,618 77,618 77,618
Capacity 578 463 506 506
Enrollment 347 325 401 412
Jackson (1971)
Square feet 53,632 55,503 55,503 55,503
Capacity 578 464 529 529
Enrollment 339 303 332 336
Jefferson (1939)
Square feet 64,514 64,514 64,514 64,514
Capacity 702 488 552 552
Enrollment 450 403 453 482
Lincoln (1939)
Square feet 59,536 59,536 59,536 59,536
Capacity 483 483 483 483
Enrollment 0 - ‐ ‐
Madison (1939)
Square feet 64,614 64,614 64,614 64,614
106
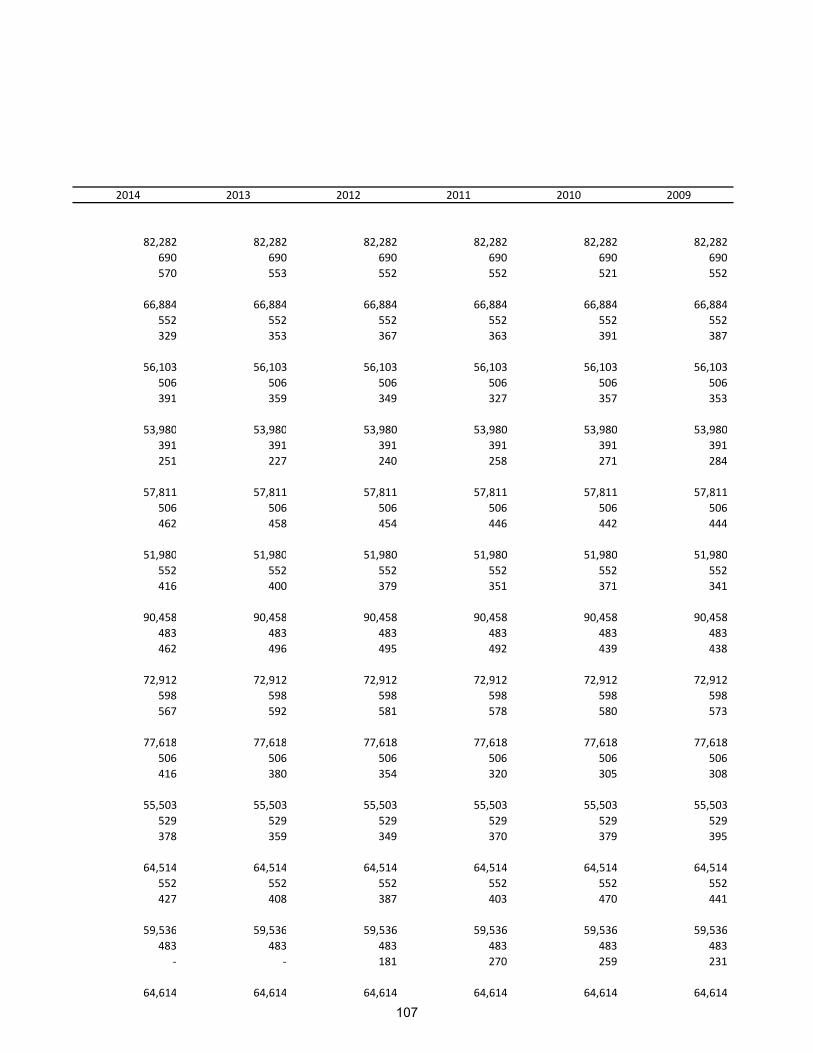
2014 2013 2012 2011 2010 2009
82,282 82,282 82,282 82,282 82,282 82,282
690 690 690 690 690 690
570 553 552 552 521 552
66,884 66,884 66,884 66,884 66,884 66,884
552 552 552 552 552 552
329 353 367 363 391 387
56,103 56,103 56,103 56,103 56,103 56,103
506 506 506 506 506 506
391 359 349 327 357 353
53,980 53,980 53,980 53,980 53,980 53,980
391 391 391 391 391 391
251 227 240 258 271 284
57,811 57,811 57,811 57,811 57,811 57,811
506 506 506 506 506 506
462 458 454 446 442 444
51,980 51,980 51,980 51,980 51,980 51,980
552 552 552 552 552 552
416 400 379 351 371 341
90,458 90,458 90,458 90,458 90,458 90,458
483 483 483 483 483 483
462 496 495 492 439 438
72,912 72,912 72,912 72,912 72,912 72,912
598 598 598 598 598 598
567 592 581 578 580 573
77,618 77,618 77,618 77,618 77,618 77,618
506 506 506 506 506 506
416 380 354 320 305 308
55,503 55,503 55,503 55,503 55,503 55,503
529 529 529 529 529 529
378 359 349 370 379 395
64,514 64,514 64,514 64,514 64,514 64,514
552 552 552 552 552 552
427 408 387 403 470 441
59,536 59,536 59,536 59,536 59,536 59,536
483 483 483 483 483 483
‐ ‐ 181 270 259 231
64,614 64,614 64,614 64,614 64,614 64,614
107
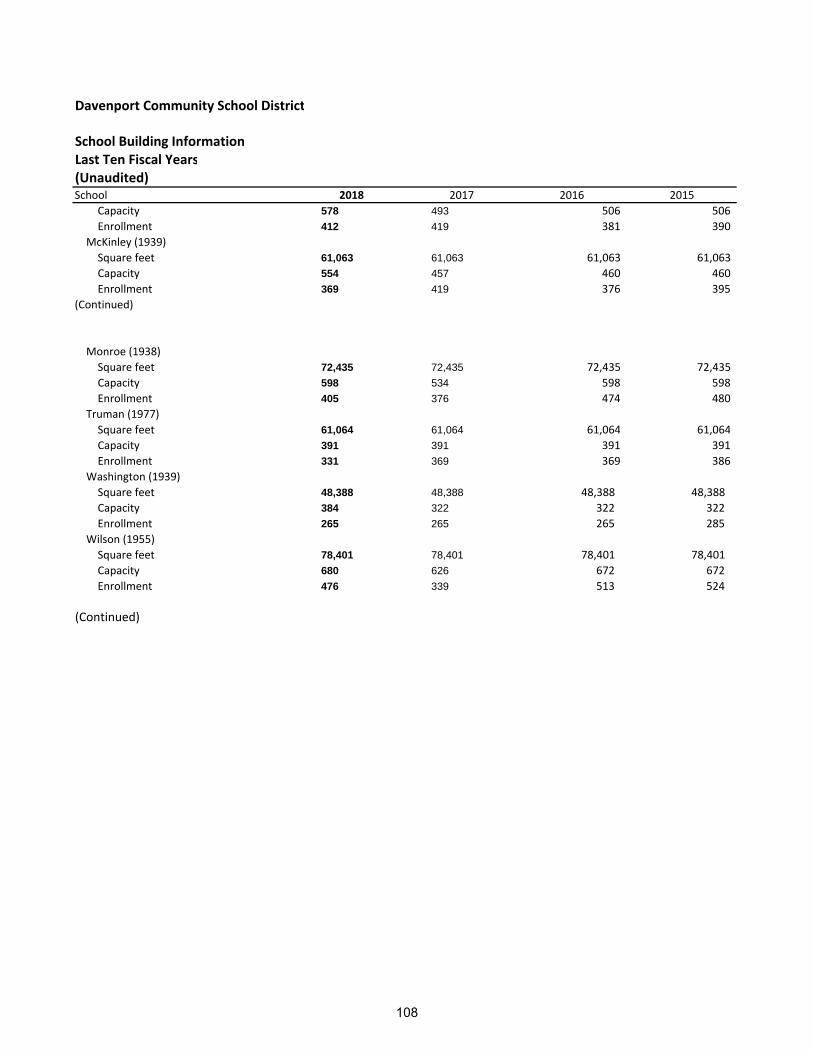
Davenport Community School District
School Building InformationLast Ten Fiscal Years(Unaudited)School 2018 2017 2016 2015
Capacity 578 493 506 506
Enrollment 412 419 381 390
McKinley (1939)
Square feet 61,063 61,063 61,063 61,063
Capacity 554 457 460 460
Enrollment 369 419 376 395
(Continued)
Monroe (1938)
Square feet 72,435 72,435 72,435 72,435
Capacity 598 534 598 598
Enrollment 405 376 474 480
Truman (1977)
Square feet 61,064 61,064 61,064 61,064
Capacity 391 391 391 391
Enrollment 331 369 369 386
Washington (1939)
Square feet 48,388 48,388 48,388 48,388
Capacity 384 322 322 322
Enrollment 265 265 265 285
Wilson (1955)
Square feet 78,401 78,401 78,401 78,401
Capacity 680 626 672 672
Enrollment 476 339 513 524
(Continued)
108
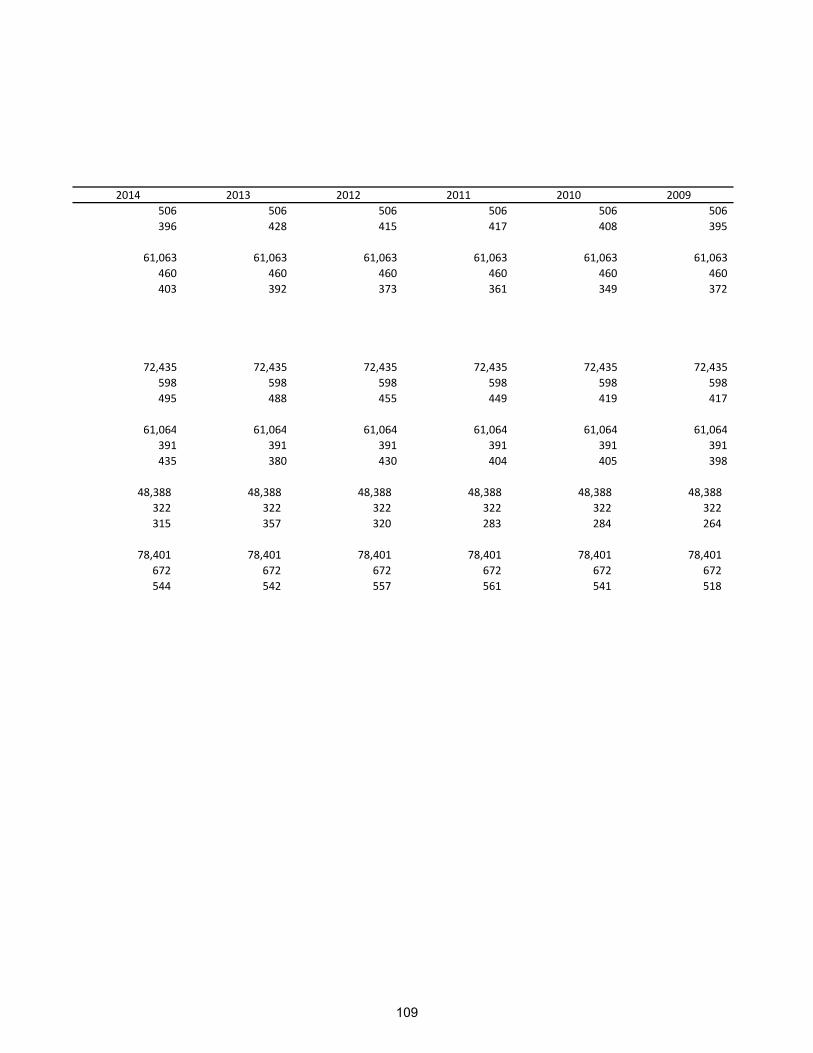
2014 2013 2012 2011 2010 2009
506 506 506 506 506 506
396 428 415 417 408 395
61,063 61,063 61,063 61,063 61,063 61,063
460 460 460 460 460 460
403 392 373 361 349 372
72,435 72,435 72,435 72,435 72,435 72,435
598 598 598 598 598 598
495 488 455 449 419 417
61,064 61,064 61,064 61,064 61,064 61,064
391 391 391 391 391 391
435 380 430 404 405 398
48,388 48,388 48,388 48,388 48,388 48,388
322 322 322 322 322 322
315 357 320 283 284 264
78,401 78,401 78,401 78,401 78,401 78,401
672 672 672 672 672 672
544 542 557 561 541 518
109
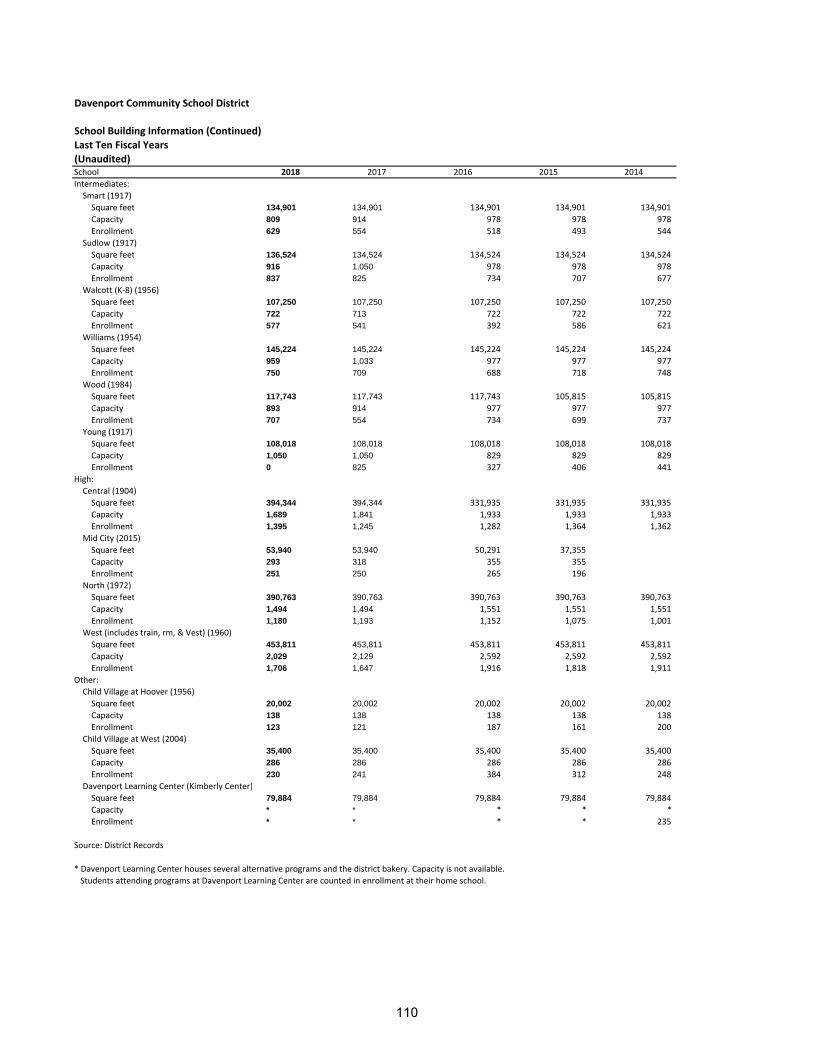
Davenport Community School District
School Building Information (Continued)
Last Ten Fiscal Years
(Unaudited)School 2018 2017 2016 2015 2014
Intermediates:
Smart (1917)
Square feet 134,901 134,901 134,901 134,901 134,901
Capacity 809 914 978 978 978
Enrollment 629 554 518 493 544
Sudlow (1917)
Square feet 136,524 134,524 134,524 134,524 134,524
Capacity 916 1,050 978 978 978
Enrollment 837 825 734 707 677
Walcott (K‐8) (1956)
Square feet 107,250 107,250 107,250 107,250 107,250
Capacity 722 713 722 722 722
Enrollment 577 541 392 586 621
Williams (1954)
Square feet 145,224 145,224 145,224 145,224 145,224
Capacity 959 1,033 977 977 977
Enrollment 750 709 688 718 748
Wood (1984)
Square feet 117,743 117,743 117,743 105,815 105,815
Capacity 893 914 977 977 977
Enrollment 707 554 734 699 737
Young (1917)
Square feet 108,018 108,018 108,018 108,018 108,018
Capacity 1,050 1,050 829 829 829
Enrollment 0 825 327 406 441
High:
Central (1904)
Square feet 394,344 394,344 331,935 331,935 331,935
Capacity 1,689 1,841 1,933 1,933 1,933
Enrollment 1,395 1,245 1,282 1,364 1,362
Mid City (2015)
Square feet 53,940 53,940 50,291 37,355
Capacity 293 318 355 355
Enrollment 251 250 265 196
North (1972)
Square feet 390,763 390,763 390,763 390,763 390,763
Capacity 1,494 1,494 1,551 1,551 1,551
Enrollment 1,180 1,193 1,152 1,075 1,001
West (includes train, rm, & Vest) (1960)
Square feet 453,811 453,811 453,811 453,811 453,811
Capacity 2,029 2,129 2,592 2,592 2,592
Enrollment 1,706 1,647 1,916 1,818 1,911
Other:
Child Village at Hoover (1956)
Square feet 20,002 20,002 20,002 20,002 20,002
Capacity 138 138 138 138 138
Enrollment 123 121 187 161 200
Child Village at West (2004)
Square feet 35,400 35,400 35,400 35,400 35,400
Capacity 286 286 286 286 286
Enrollment 230 241 384 312 248
Davenport Learning Center (Kimberly Center)
Square feet 79,884 79,884 79,884 79,884 79,884
Capacity * * * * *
Enrollment * * * * 235
Source: District Records
* Davenport Learning Center houses several alternative programs and the district bakery. Capacity is not available.
Students attending programs at Davenport Learning Center are counted in enrollment at their home school.
110
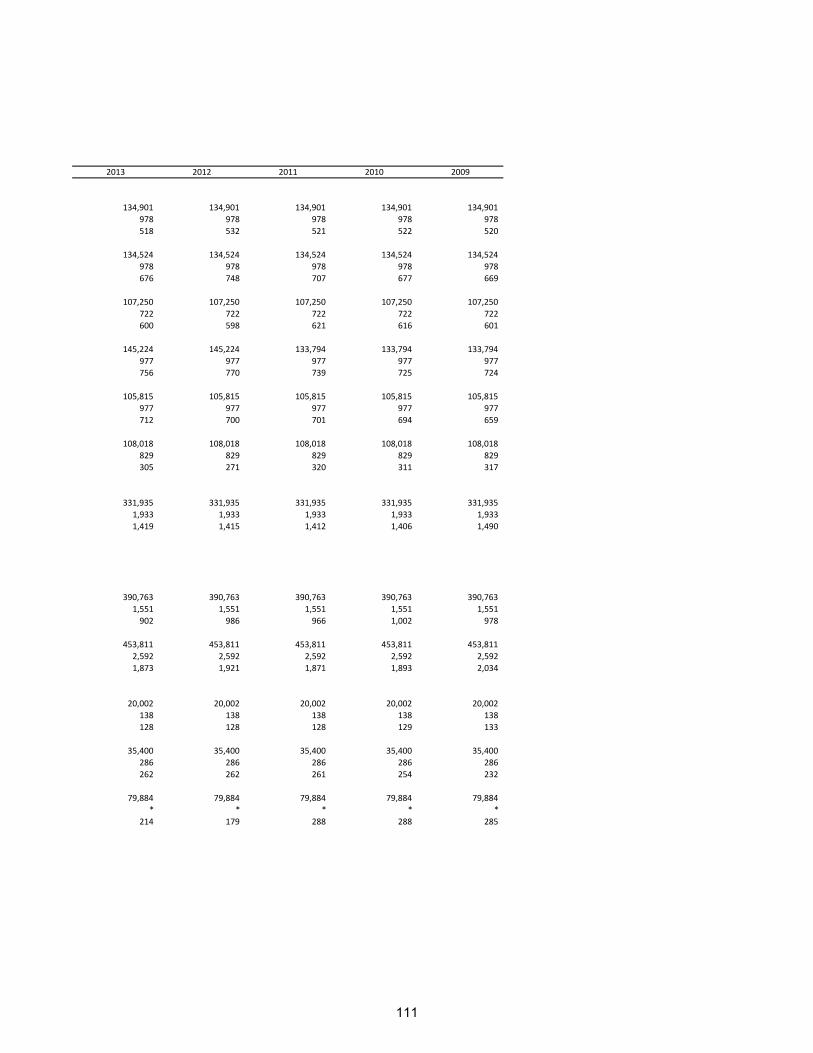
2013 2012 2011 2010 2009
134,901 134,901 134,901 134,901 134,901
978 978 978 978 978
518 532 521 522 520
134,524 134,524 134,524 134,524 134,524
978 978 978 978 978
676 748 707 677 669
107,250 107,250 107,250 107,250 107,250
722 722 722 722 722
600 598 621 616 601
145,224 145,224 133,794 133,794 133,794
977 977 977 977 977
756 770 739 725 724
105,815 105,815 105,815 105,815 105,815
977 977 977 977 977
712 700 701 694 659
108,018 108,018 108,018 108,018 108,018
829 829 829 829 829
305 271 320 311 317
331,935 331,935 331,935 331,935 331,935
1,933 1,933 1,933 1,933 1,933
1,419 1,415 1,412 1,406 1,490
390,763 390,763 390,763 390,763 390,763
1,551 1,551 1,551 1,551 1,551
902 986 966 1,002 978
453,811 453,811 453,811 453,811 453,811
2,592 2,592 2,592 2,592 2,592
1,873 1,921 1,871 1,893 2,034
20,002 20,002 20,002 20,002 20,002
138 138 138 138 138
128 128 128 129 133
35,400 35,400 35,400 35,400 35,400
286 286 286 286 286
262 262 261 254 232
79,884 79,884 79,884 79,884 79,884
* * * * *
214 179 288 288 285
111


Compliance Section

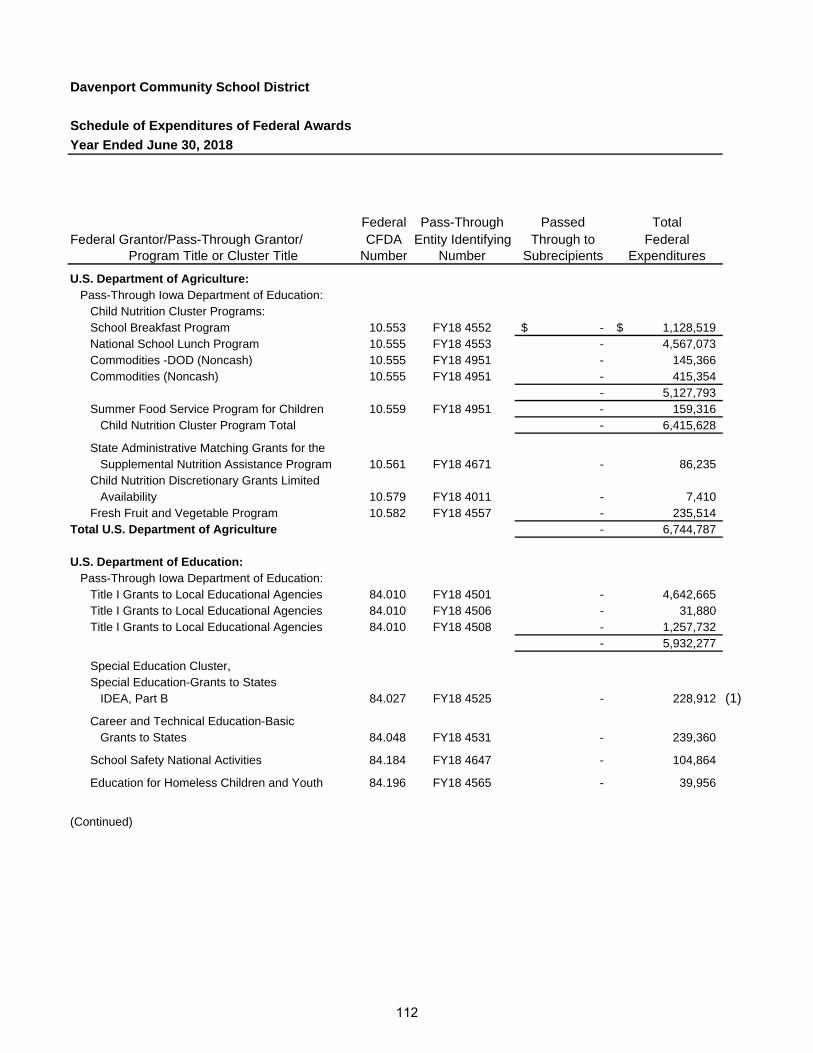
Davenport Community School District
Schedule of Expenditures of Federal Awards
Year Ended June 30, 2018
Federal Pass-Through Passed TotalFederal Grantor/Pass-Through Grantor/ CFDA Entity Identifying Through to Federal
Program Title or Cluster Title Number Number Subrecipients Expenditures
U.S. Department of Agriculture:Pass-Through Iowa Department of Education:
Child Nutrition Cluster Programs:School Breakfast Program 10.553 FY18 4552 -$ 1,128,519$ National School Lunch Program 10.555 FY18 4553 - 4,567,073 Commodities -DOD (Noncash) 10.555 FY18 4951 - 145,366 Commodities (Noncash) 10.555 FY18 4951 - 415,354
- 5,127,793 Summer Food Service Program for Children 10.559 FY18 4951 - 159,316
Child Nutrition Cluster Program Total - 6,415,628
State Administrative Matching Grants for theSupplemental Nutrition Assistance Program 10.561 FY18 4671 - 86,235
Child Nutrition Discretionary Grants LimitedAvailability 10.579 FY18 4011 - 7,410
Fresh Fruit and Vegetable Program 10.582 FY18 4557 - 235,514 Total U.S. Department of Agriculture - 6,744,787
U.S. Department of Education:Pass-Through Iowa Department of Education:
Title I Grants to Local Educational Agencies 84.010 FY18 4501 - 4,642,665 Title I Grants to Local Educational Agencies 84.010 FY18 4506 - 31,880 Title I Grants to Local Educational Agencies 84.010 FY18 4508 - 1,257,732
- 5,932,277
Special Education Cluster,Special Education-Grants to States
IDEA, Part B 84.027 FY18 4525 - 228,912 (1)
Career and Technical Education-BasicGrants to States 84.048 FY18 4531 - 239,360
School Safety National Activities 84.184 FY18 4647 - 104,864
Education for Homeless Children and Youth 84.196 FY18 4565 - 39,956
(Continued)
112
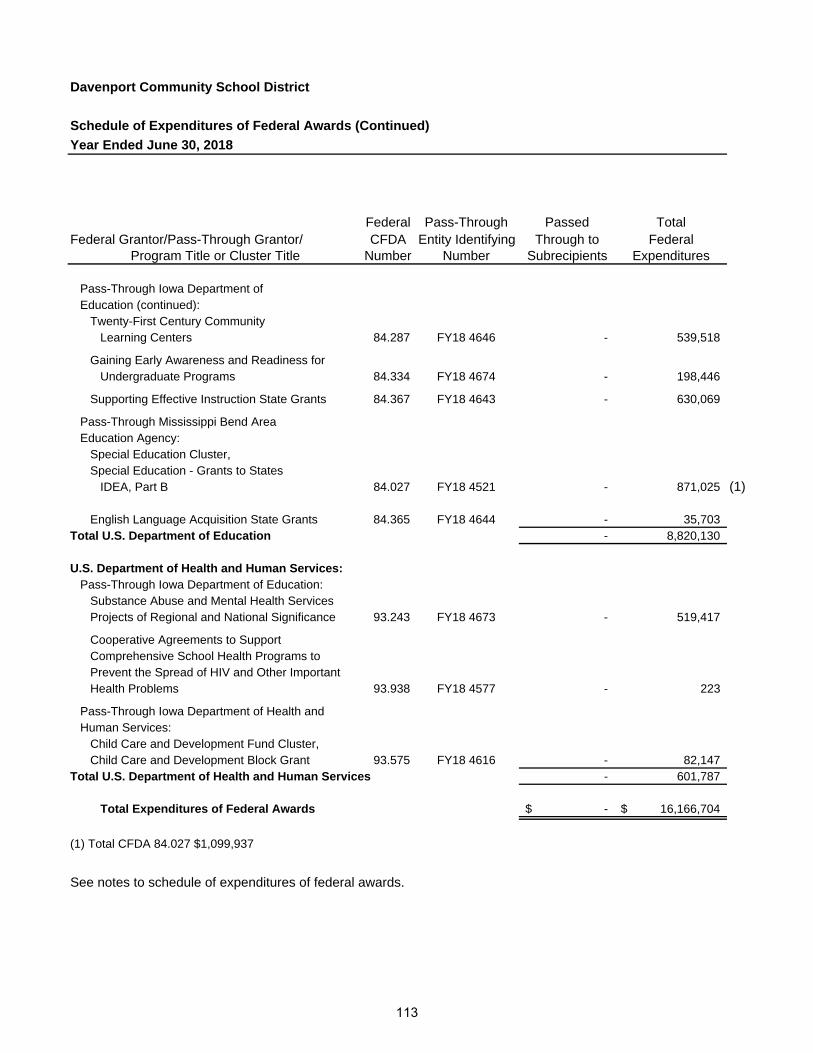
Davenport Community School District
Schedule of Expenditures of Federal Awards (Continued)
Year Ended June 30, 2018
Federal Pass-Through Passed TotalFederal Grantor/Pass-Through Grantor/ CFDA Entity Identifying Through to Federal
Program Title or Cluster Title Number Number Subrecipients Expenditures
Pass-Through Iowa Department of Education (continued):
Twenty-First Century Community Learning Centers 84.287 FY18 4646 - 539,518
Gaining Early Awareness and Readiness forUndergraduate Programs 84.334 FY18 4674 - 198,446
Supporting Effective Instruction State Grants 84.367 FY18 4643 - 630,069
Pass-Through Mississippi Bend AreaEducation Agency:
Special Education Cluster, Special Education - Grants to States
IDEA, Part B 84.027 FY18 4521 - 871,025 (1)
English Language Acquisition State Grants 84.365 FY18 4644 - 35,703 Total U.S. Department of Education - 8,820,130
U.S. Department of Health and Human Services:Pass-Through Iowa Department of Education:
Substance Abuse and Mental Health ServicesProjects of Regional and National Significance 93.243 FY18 4673 - 519,417
Cooperative Agreements to SupportComprehensive School Health Programs to Prevent the Spread of HIV and Other ImportantHealth Problems 93.938 FY18 4577 - 223
Pass-Through Iowa Department of Health andHuman Services:
Child Care and Development Fund Cluster,Child Care and Development Block Grant 93.575 FY18 4616 - 82,147
Total U.S. Department of Health and Human Services - 601,787
Total Expenditures of Federal Awards -$ 16,166,704$
(1) Total CFDA 84.027 $1,099,937
See notes to schedule of expenditures of federal awards.
113
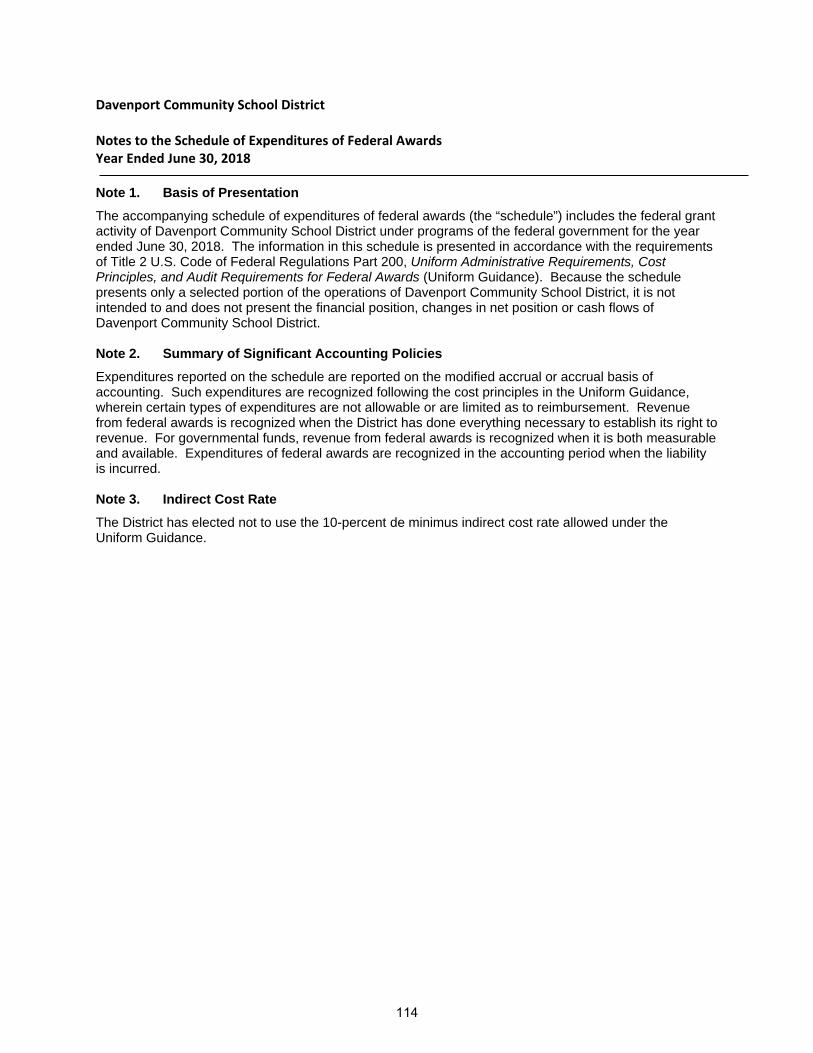
Davenport Community School District Notes to the Schedule of Expenditures of Federal Awards Year Ended June 30, 2018
Note 1. Basis of Presentation
The accompanying schedule of expenditures of federal awards (the “schedule”) includes the federal grant activity of Davenport Community School District under programs of the federal government for the year ended June 30, 2018. The information in this schedule is presented in accordance with the requirements of Title 2 U.S. Code of Federal Regulations Part 200, Uniform Administrative Requirements, Cost Principles, and Audit Requirements for Federal Awards (Uniform Guidance). Because the schedule presents only a selected portion of the operations of Davenport Community School District, it is not intended to and does not present the financial position, changes in net position or cash flows of Davenport Community School District. Note 2. Summary of Significant Accounting Policies
Expenditures reported on the schedule are reported on the modified accrual or accrual basis of accounting. Such expenditures are recognized following the cost principles in the Uniform Guidance, wherein certain types of expenditures are not allowable or are limited as to reimbursement. Revenue from federal awards is recognized when the District has done everything necessary to establish its right to revenue. For governmental funds, revenue from federal awards is recognized when it is both measurable and available. Expenditures of federal awards are recognized in the accounting period when the liability is incurred. Note 3. Indirect Cost Rate
The District has elected not to use the 10-percent de minimus indirect cost rate allowed under the Uniform Guidance.
114
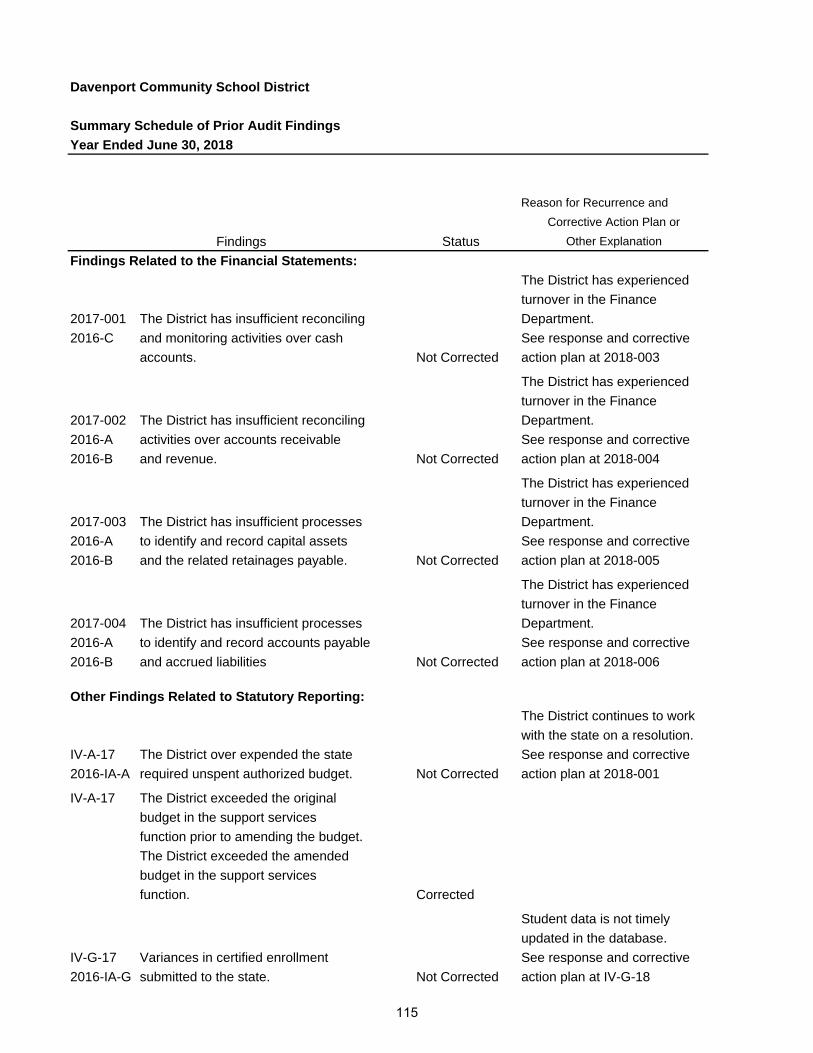
Davenport Community School District
Summary Schedule of Prior Audit Findings
Year Ended June 30, 2018
Reason for Recurrence and
Corrective Action Plan or
Status Other Explanation
Findings Related to the Financial Statements:
The District has experienced
turnover in the Finance
2017-001 The District has insufficient reconciling Department.
2016-C and monitoring activities over cash See response and corrective
accounts. Not Corrected action plan at 2018-003
The District has experienced
turnover in the Finance
2017-002 The District has insufficient reconciling Department.
2016-A activities over accounts receivable See response and corrective
2016-B and revenue. Not Corrected action plan at 2018-004
The District has experienced
turnover in the Finance
2017-003 The District has insufficient processes Department.
2016-A to identify and record capital assets See response and corrective
2016-B and the related retainages payable. Not Corrected action plan at 2018-005
The District has experienced
turnover in the Finance
2017-004 The District has insufficient processes Department.
2016-A to identify and record accounts payable See response and corrective
2016-B and accrued liabilities Not Corrected action plan at 2018-006
Other Findings Related to Statutory Reporting:
The District continues to work
with the state on a resolution.
IV-A-17 The District over expended the state See response and corrective
2016-IA-A required unspent authorized budget. Not Corrected action plan at 2018-001
IV-A-17 The District exceeded the original
budget in the support services
function prior to amending the budget.
The District exceeded the amended
budget in the support services
function. Corrected
Student data is not timely
updated in the database.
IV-G-17 Variances in certified enrollment See response and corrective
2016-IA-G submitted to the state. Not Corrected action plan at IV-G-18
Findings
115
Independent Auditor’s Report on Internal Control Over Financial Reporting and on Compliance and Other Matters Based on an Audit of Financial Statements Performed in Accordance With Government Auditing Standards To the Board of Education Davenport Community School District Davenport, Iowa We have audited, in accordance with the auditing standards generally accepted in the United States of America and the standards applicable to financial audits contained in Government Auditing Standards issued by the Comptroller General of the United States, the financial statements of the governmental activities, the business-type activities, each major fund and the aggregate remaining fund information of Davenport Community School District (the District) as of and for the year ended June 30, 2018, and the related notes to the financial statements, which collectively comprise the District’s basic financial statements and have issued our report thereon dated December 18, 2018. Our report included an emphasis of matter paragraph for the implementation of Governmental Accounting Standards Board Statement No. 75. Internal Control Over Financial Reporting In planning and performing our audit of the financial statements, we considered the District’s internal control over financial reporting (internal control) to determine the audit procedures that are appropriate in the circumstances for the purpose of expressing our opinions on the financial statements, but not for the purpose of expressing an opinion on the effectiveness of the District’s internal control. Accordingly, we do not express an opinion on the effectiveness of Davenport Community School District’s internal control. A deficiency in internal control exists when the design or operation of a control does not allow management or employees, in the normal course of performing their assigned functions, to prevent, or detect and correct misstatements on a timely basis. A material weakness is a deficiency, or a combination of deficiencies, in internal control such that there is a reasonable possibility that a material misstatement of the District’s financial statements will not be prevented, or detected and corrected on a timely basis. A significant deficiency is a deficiency, or a combination of deficiencies, in internal control that is less severe than a material weakness, yet important enough to merit attention by those charged with governance. Our consideration of internal control was for the limited purpose described in the first paragraph of this section and was not designed to identify all deficiencies in internal control that might be material weaknesses or significant deficiencies and therefore, material weaknesses or significant deficiencies may exist that have not been identified. We did identify certain deficiencies in internal control, described in the accompanying Schedule of Findings and Questioned Costs as items 2018-002 through 2018-006 that we consider to be material weaknesses.
116
Compliance and Other Matters As part of obtaining reasonable assurance about whether the District’s financial statements are free of material misstatement, we performed tests of its compliance with certain provisions of laws, regulations, contracts and grant agreements, noncompliance with which could have a direct and material effect on the determination of financial statement amounts. However, providing an opinion on compliance with those provisions was not an objective of our audit and, accordingly, we do not express such an opinion. The results of our tests disclosed an instance of noncompliance or other matters that is required to be reported under Government Auditing Standards and which is described in the accompanying Schedule of Findings and Questioned Costs as item 2018-001. We noted certain immaterial instances of noncompliance or other matters which are described in Part IV of the accompanying Schedule of Findings and Questioned Costs. Comments involving statutory and other legal matters about the District’s operations for the year ended June 30, 2018 are based exclusively on knowledge obtained from procedures performed during our audit of the financial statements of the District. Since our audit was based on tests and samples, not all transactions that might have had an impact on the comments were necessarily audited. The comments involving statutory and other legal matters are not intended to constitute legal interpretations of those statutes. District’s Response to the Findings The District’s response to the findings identified in our audit are described in the accompanying Schedule of Findings and Questioned Costs. The District’s response was not subjected to the auditing procedures applied in the audit of the financial statements and, accordingly, we express no opinion on it. Purpose of this Report The purpose of this report is solely to describe the scope of our testing of internal control and compliance and the results of that testing, and not to provide an opinion on the effectiveness of the District’s internal control or on compliance. This report is an integral part of an audit performed in accordance with Government Auditing Standards in considering the District’s internal control and compliance. Accordingly, this communication is not suitable for any other purpose.
Moline, Illinois December 18, 2018
117
Independent Auditor’s Report on Compliance For Each Major Federal Program and Report on Internal Control Over Compliance Required by the Uniform Guidance To the Board of Education Davenport Community School District Davenport, Iowa Report on Compliance for Each Major Federal Program We have audited Davenport Community School District’s (the District) compliance with the types of compliance requirements described in the OMB Compliance Supplement that could have a direct and material effect on each of the District’s major federal programs for the year ended June 30, 2018. The District’s major federal programs are identified in the summary of auditor’s results section of the accompanying Schedule of Findings and Questioned Costs. Management’s Responsibility Management is responsible for compliance with the federal statutes, regulations, and the terms and conditions of its federal awards applicable to its federal programs. Auditor’s Responsibility Our responsibility is to express an opinion on compliance for each of the District’s major federal programs based on our audit of the types of compliance requirements referred to above. We conducted our audit of compliance in accordance with auditing standards generally accepted in the United States of America, the standards applicable to financial audits contained in Government Auditing Standards, issued by the Comptroller General of the United States and the audit requirements of Title 2 U.S. Code of Federal Regulations Part 200, Uniform Administrative Requirements, Cost Principles, and Audit Requirements for Federal Awards (Uniform Guidance) Those standards and the Uniform Guidance require that we plan and perform the audit to obtain reasonable assurance about whether noncompliance with the types of compliance requirements referred to above that could have a direct and material effect on a major federal program occurred. An audit includes examining, on a test basis, evidence about the District’s compliance with those requirements and performing such other procedures as we considered necessary in the circumstances. We believe that our audit provides a reasonable basis for our opinion on compliance for each major federal program. However, our audit does not provide a legal determination on the District’s compliance. Opinion on Each Major Federal Program In our opinion, the District complied, in all material respects, with the types of compliance requirements referred to above that could have a direct and material effect on each of its major federal programs for the year ended June 30, 2018.
118
Report on Internal Control Over Compliance Management of the District is responsible for establishing and maintaining effective internal control over compliance with the types of compliance requirements referred to above. In planning and performing our audit of compliance, we considered the District’s internal control over compliance with the types of requirements that could have a direct and material effect on each major federal program to determine the auditing procedures that are appropriate in the circumstances for the purpose of expressing an opinion on compliance for each major federal program and to test and report on internal control over compliance in accordance with the Uniform Guidance, but not for the purpose of expressing an opinion on the effectiveness of internal control over compliance. Accordingly, we do not express an opinion on the effectiveness of the District’s internal control over compliance. A deficiency in internal control over compliance exists when the design or operation of a control over compliance does not allow management or employees, in the normal course of performing their assigned functions, to prevent or detect and correct noncompliance with a type of compliance requirement of a federal program on a timely basis. A material weakness in internal control over compliance is a deficiency, or combination of deficiencies, in internal control over compliance such that there is a reasonable possibility that material noncompliance with a type of compliance requirement of a federal program will not be prevented or detected and corrected on a timely basis. A significant deficiency in internal control over compliance is a deficiency, or a combination of deficiencies, in internal control over compliance with a type of compliance requirement of a federal program that is less severe than a material weakness in internal control over compliance, yet important enough to merit attention by those charged with governance. Our consideration of internal control over compliance was for the limited purpose described in the first paragraph of this section and was not designed to identify all deficiencies in internal control over compliance that might be material weaknesses or significant deficiencies. We did not identify any deficiencies in internal control over compliance that we consider to be material weaknesses. However, material weaknesses may exist that have not been identified. The purpose of this report on internal control over compliance is solely to describe the scope of our testing of internal control over compliance and the results of that testing based on the requirements of the Uniform Guidance. Accordingly, this report is not suitable for any other purpose.
Moline, Illinois December 18, 2018
119
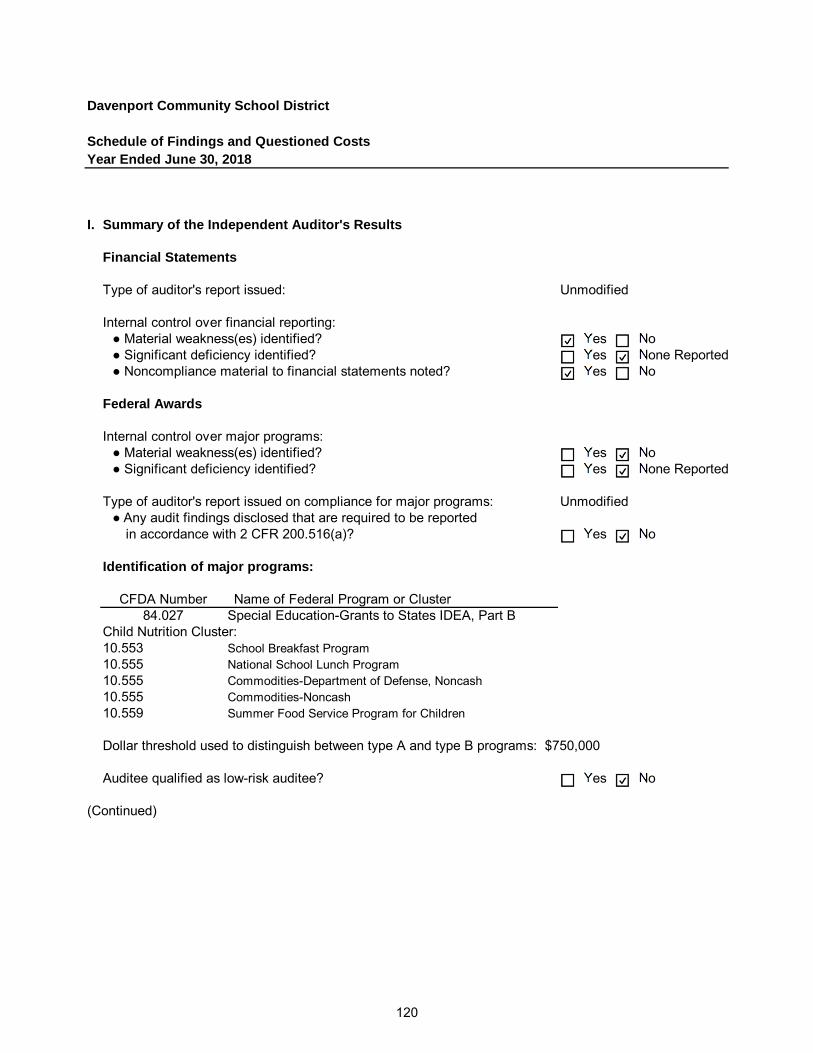
Davenport Community School District
Schedule of Findings and Questioned CostsYear Ended June 30, 2018
I. Summary of the Independent Auditor's Results
Financial Statements
Type of auditor's report issued: Unmodified
Internal control over financial reporting:● Material weakness(es) identified? Yes No● Significant deficiency identified? Yes None Reported● Noncompliance material to financial statements noted? Yes No
Federal Awards
Internal control over major programs:● Material weakness(es) identified? Yes No● Significant deficiency identified? Yes None Reported
Type of auditor's report issued on compliance for major programs: Unmodified● Any audit findings disclosed that are required to be reported
in accordance with 2 CFR 200.516(a)? Yes No
Identification of major programs:
CFDA Number Name of Federal Program or Cluster84.027 Special Education-Grants to States IDEA, Part B
Child Nutrition Cluster:10.553 School Breakfast Program10.555 National School Lunch Program10.555 Commodities-Department of Defense, Noncash10.555 Commodities-Noncash10.559 Summer Food Service Program for Children
Dollar threshold used to distinguish between type A and type B programs: $750,000
Auditee qualified as low-risk auditee? Yes No
(Continued)
120
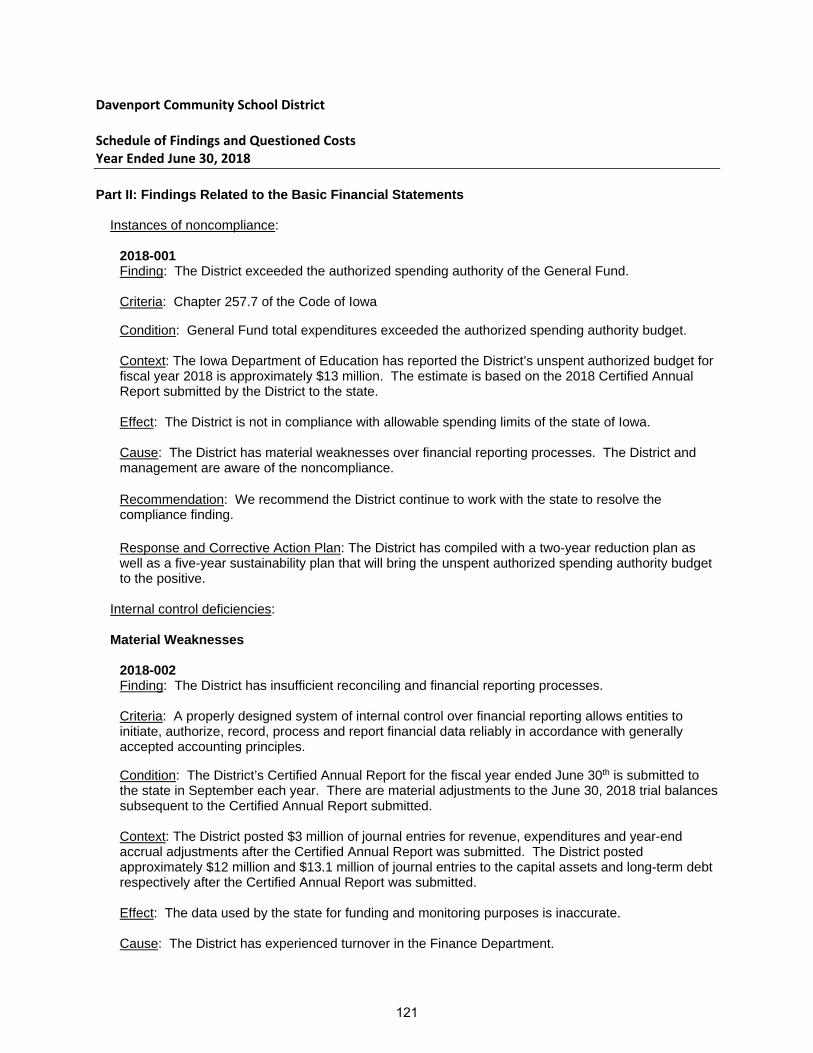
Davenport Community School District Schedule of Findings and Questioned Costs Year Ended June 30, 2018
Part II: Findings Related to the Basic Financial Statements Instances of noncompliance:
2018-001 Finding: The District exceeded the authorized spending authority of the General Fund. Criteria: Chapter 257.7 of the Code of Iowa
Condition: General Fund total expenditures exceeded the authorized spending authority budget. Context: The Iowa Department of Education has reported the District’s unspent authorized budget for fiscal year 2018 is approximately $13 million. The estimate is based on the 2018 Certified Annual Report submitted by the District to the state. Effect: The District is not in compliance with allowable spending limits of the state of Iowa. Cause: The District has material weaknesses over financial reporting processes. The District and management are aware of the noncompliance.
Recommendation: We recommend the District continue to work with the state to resolve the compliance finding. Response and Corrective Action Plan: The District has compiled with a two-year reduction plan as well as a five-year sustainability plan that will bring the unspent authorized spending authority budget to the positive.
Internal control deficiencies:
Material Weaknesses
2018-002 Finding: The District has insufficient reconciling and financial reporting processes. Criteria: A properly designed system of internal control over financial reporting allows entities to initiate, authorize, record, process and report financial data reliably in accordance with generally accepted accounting principles.
Condition: The District’s Certified Annual Report for the fiscal year ended June 30th is submitted to the state in September each year. There are material adjustments to the June 30, 2018 trial balances subsequent to the Certified Annual Report submitted.
Context: The District posted $3 million of journal entries for revenue, expenditures and year-end accrual adjustments after the Certified Annual Report was submitted. The District posted approximately $12 million and $13.1 million of journal entries to the capital assets and long-term debt respectively after the Certified Annual Report was submitted. Effect: The data used by the state for funding and monitoring purposes is inaccurate. Cause: The District has experienced turnover in the Finance Department.
121
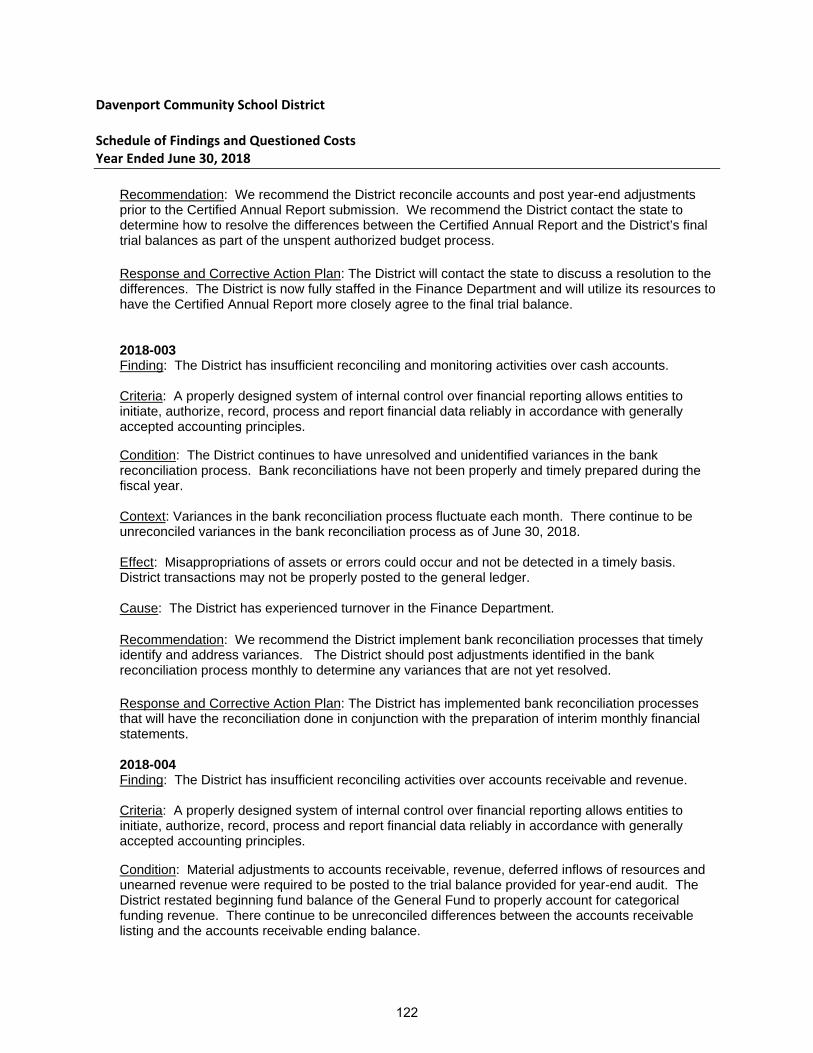
Davenport Community School District Schedule of Findings and Questioned Costs Year Ended June 30, 2018
Recommendation: We recommend the District reconcile accounts and post year-end adjustments prior to the Certified Annual Report submission. We recommend the District contact the state to determine how to resolve the differences between the Certified Annual Report and the District’s final trial balances as part of the unspent authorized budget process.
Response and Corrective Action Plan: The District will contact the state to discuss a resolution to the differences. The District is now fully staffed in the Finance Department and will utilize its resources to have the Certified Annual Report more closely agree to the final trial balance.
2018-003 Finding: The District has insufficient reconciling and monitoring activities over cash accounts. Criteria: A properly designed system of internal control over financial reporting allows entities to initiate, authorize, record, process and report financial data reliably in accordance with generally accepted accounting principles.
Condition: The District continues to have unresolved and unidentified variances in the bank reconciliation process. Bank reconciliations have not been properly and timely prepared during the fiscal year. Context: Variances in the bank reconciliation process fluctuate each month. There continue to be unreconciled variances in the bank reconciliation process as of June 30, 2018. Effect: Misappropriations of assets or errors could occur and not be detected in a timely basis. District transactions may not be properly posted to the general ledger. Cause: The District has experienced turnover in the Finance Department.
Recommendation: We recommend the District implement bank reconciliation processes that timely identify and address variances. The District should post adjustments identified in the bank reconciliation process monthly to determine any variances that are not yet resolved.
Response and Corrective Action Plan: The District has implemented bank reconciliation processes that will have the reconciliation done in conjunction with the preparation of interim monthly financial statements. 2018-004 Finding: The District has insufficient reconciling activities over accounts receivable and revenue. Criteria: A properly designed system of internal control over financial reporting allows entities to initiate, authorize, record, process and report financial data reliably in accordance with generally accepted accounting principles.
Condition: Material adjustments to accounts receivable, revenue, deferred inflows of resources and unearned revenue were required to be posted to the trial balance provided for year-end audit. The District restated beginning fund balance of the General Fund to properly account for categorical funding revenue. There continue to be unreconciled differences between the accounts receivable listing and the accounts receivable ending balance.
122
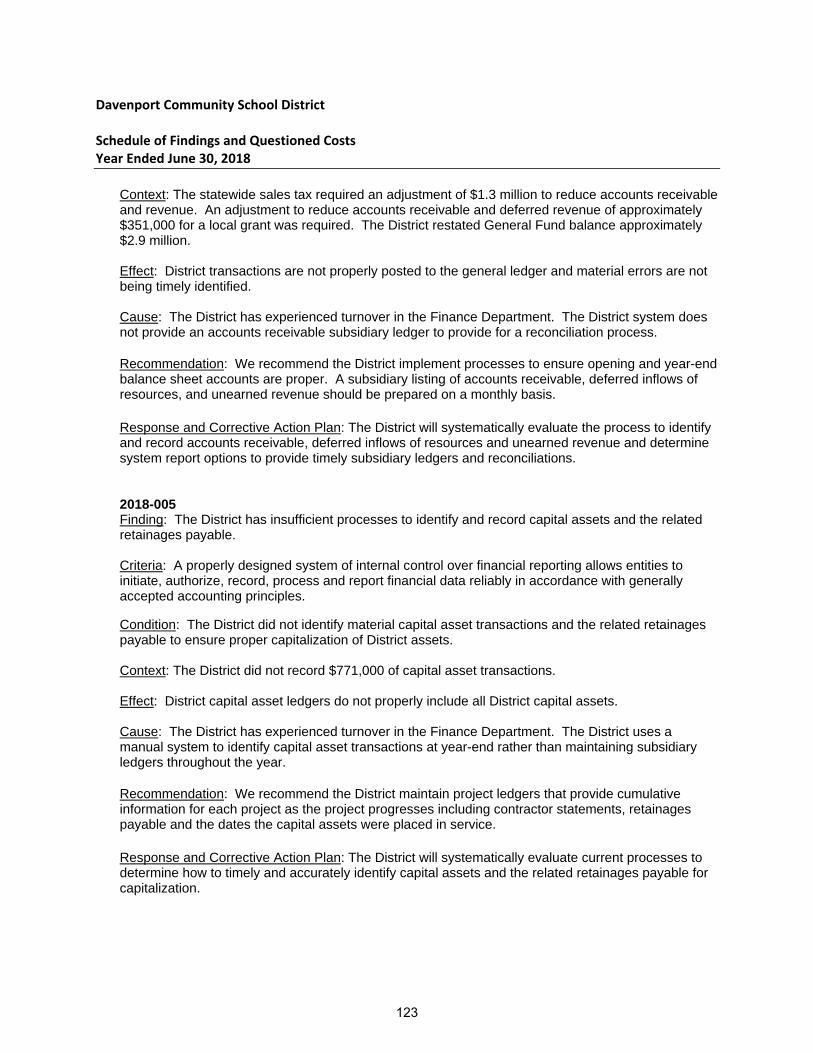
Davenport Community School District Schedule of Findings and Questioned Costs Year Ended June 30, 2018
Context: The statewide sales tax required an adjustment of $1.3 million to reduce accounts receivable and revenue. An adjustment to reduce accounts receivable and deferred revenue of approximately $351,000 for a local grant was required. The District restated General Fund balance approximately $2.9 million. Effect: District transactions are not properly posted to the general ledger and material errors are not being timely identified. Cause: The District has experienced turnover in the Finance Department. The District system does not provide an accounts receivable subsidiary ledger to provide for a reconciliation process.
Recommendation: We recommend the District implement processes to ensure opening and year-end balance sheet accounts are proper. A subsidiary listing of accounts receivable, deferred inflows of resources, and unearned revenue should be prepared on a monthly basis. Response and Corrective Action Plan: The District will systematically evaluate the process to identify and record accounts receivable, deferred inflows of resources and unearned revenue and determine system report options to provide timely subsidiary ledgers and reconciliations.
2018-005 Finding: The District has insufficient processes to identify and record capital assets and the related retainages payable. Criteria: A properly designed system of internal control over financial reporting allows entities to initiate, authorize, record, process and report financial data reliably in accordance with generally accepted accounting principles.
Condition: The District did not identify material capital asset transactions and the related retainages payable to ensure proper capitalization of District assets. Context: The District did not record $771,000 of capital asset transactions. Effect: District capital asset ledgers do not properly include all District capital assets. Cause: The District has experienced turnover in the Finance Department. The District uses a manual system to identify capital asset transactions at year-end rather than maintaining subsidiary ledgers throughout the year.
Recommendation: We recommend the District maintain project ledgers that provide cumulative information for each project as the project progresses including contractor statements, retainages payable and the dates the capital assets were placed in service. Response and Corrective Action Plan: The District will systematically evaluate current processes to determine how to timely and accurately identify capital assets and the related retainages payable for capitalization.
123
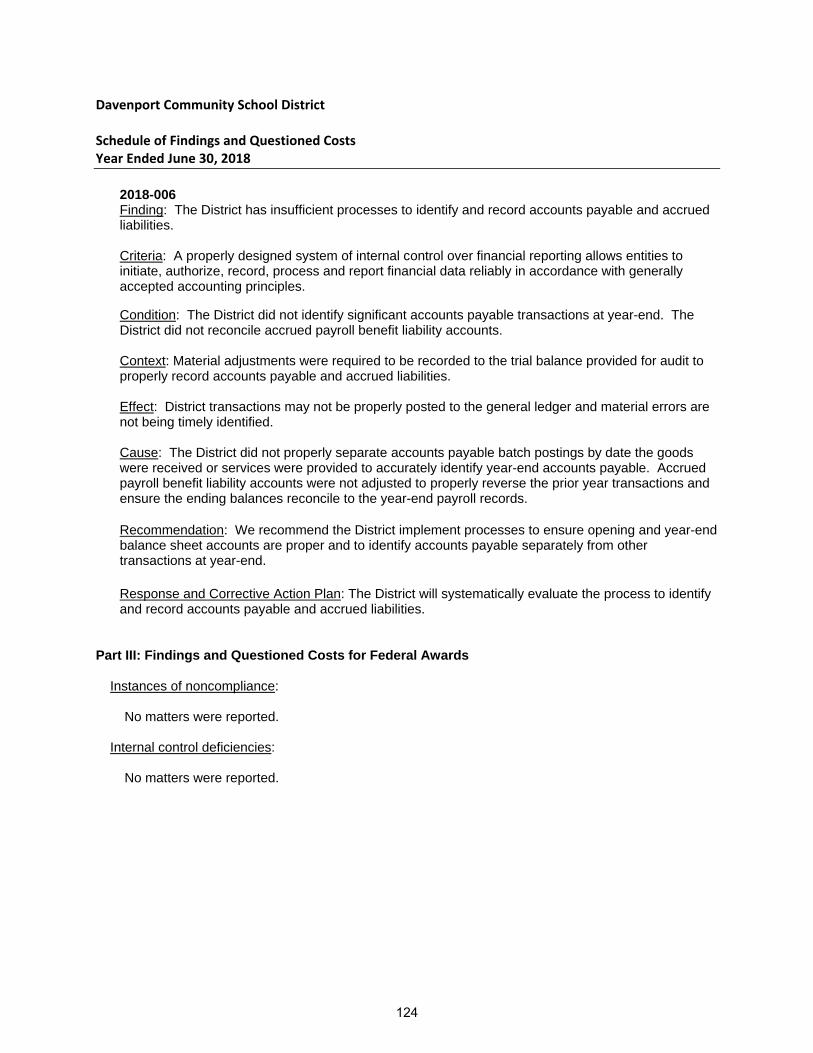
Davenport Community School District Schedule of Findings and Questioned Costs Year Ended June 30, 2018
2018-006 Finding: The District has insufficient processes to identify and record accounts payable and accrued liabilities. Criteria: A properly designed system of internal control over financial reporting allows entities to initiate, authorize, record, process and report financial data reliably in accordance with generally accepted accounting principles.
Condition: The District did not identify significant accounts payable transactions at year-end. The District did not reconcile accrued payroll benefit liability accounts. Context: Material adjustments were required to be recorded to the trial balance provided for audit to properly record accounts payable and accrued liabilities. Effect: District transactions may not be properly posted to the general ledger and material errors are not being timely identified. Cause: The District did not properly separate accounts payable batch postings by date the goods were received or services were provided to accurately identify year-end accounts payable. Accrued payroll benefit liability accounts were not adjusted to properly reverse the prior year transactions and ensure the ending balances reconcile to the year-end payroll records.
Recommendation: We recommend the District implement processes to ensure opening and year-end balance sheet accounts are proper and to identify accounts payable separately from other transactions at year-end. Response and Corrective Action Plan: The District will systematically evaluate the process to identify and record accounts payable and accrued liabilities.
Part III: Findings and Questioned Costs for Federal Awards
Instances of noncompliance:
No matters were reported.
Internal control deficiencies:
No matters were reported.
124
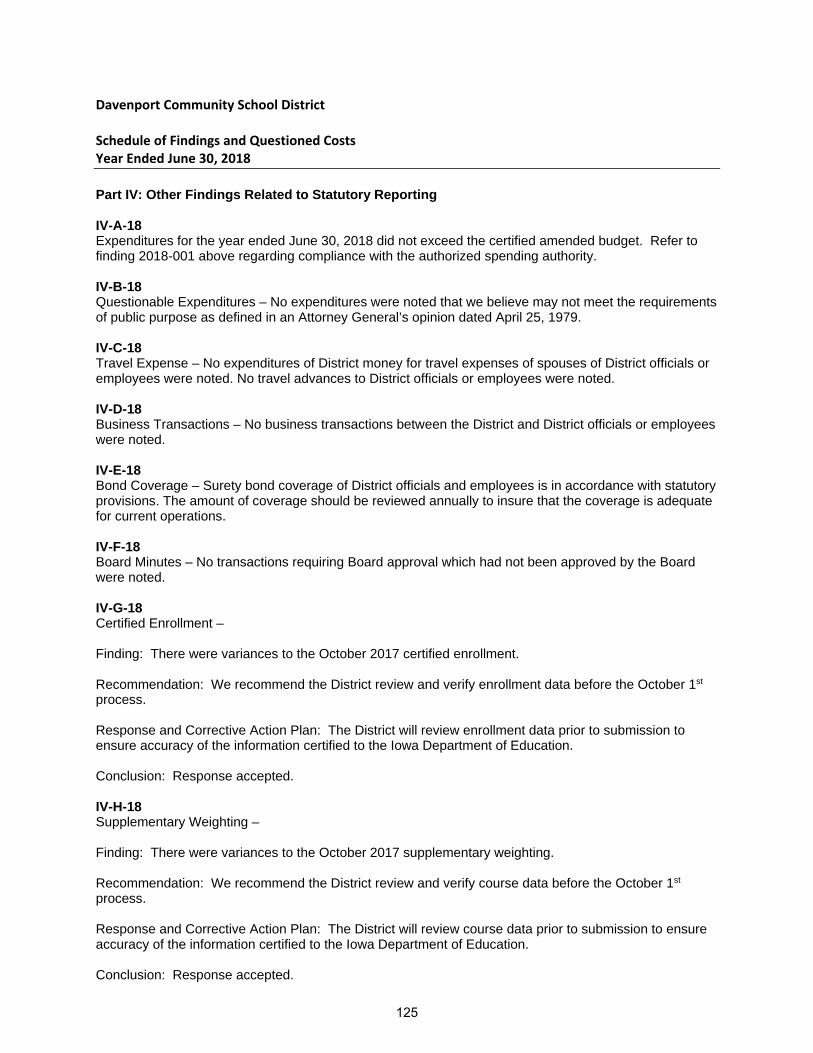
Davenport Community School District Schedule of Findings and Questioned Costs Year Ended June 30, 2018
Part IV: Other Findings Related to Statutory Reporting
IV-A-18 Expenditures for the year ended June 30, 2018 did not exceed the certified amended budget. Refer to finding 2018-001 above regarding compliance with the authorized spending authority. IV-B-18 Questionable Expenditures – No expenditures were noted that we believe may not meet the requirements of public purpose as defined in an Attorney General’s opinion dated April 25, 1979. IV-C-18 Travel Expense – No expenditures of District money for travel expenses of spouses of District officials or employees were noted. No travel advances to District officials or employees were noted. IV-D-18 Business Transactions – No business transactions between the District and District officials or employees were noted. IV-E-18 Bond Coverage – Surety bond coverage of District officials and employees is in accordance with statutory provisions. The amount of coverage should be reviewed annually to insure that the coverage is adequate for current operations. IV-F-18 Board Minutes – No transactions requiring Board approval which had not been approved by the Board were noted. IV-G-18 Certified Enrollment – Finding: There were variances to the October 2017 certified enrollment. Recommendation: We recommend the District review and verify enrollment data before the October 1st process. Response and Corrective Action Plan: The District will review enrollment data prior to submission to ensure accuracy of the information certified to the Iowa Department of Education. Conclusion: Response accepted. IV-H-18 Supplementary Weighting – Finding: There were variances to the October 2017 supplementary weighting. Recommendation: We recommend the District review and verify course data before the October 1st process. Response and Corrective Action Plan: The District will review course data prior to submission to ensure accuracy of the information certified to the Iowa Department of Education. Conclusion: Response accepted.
125
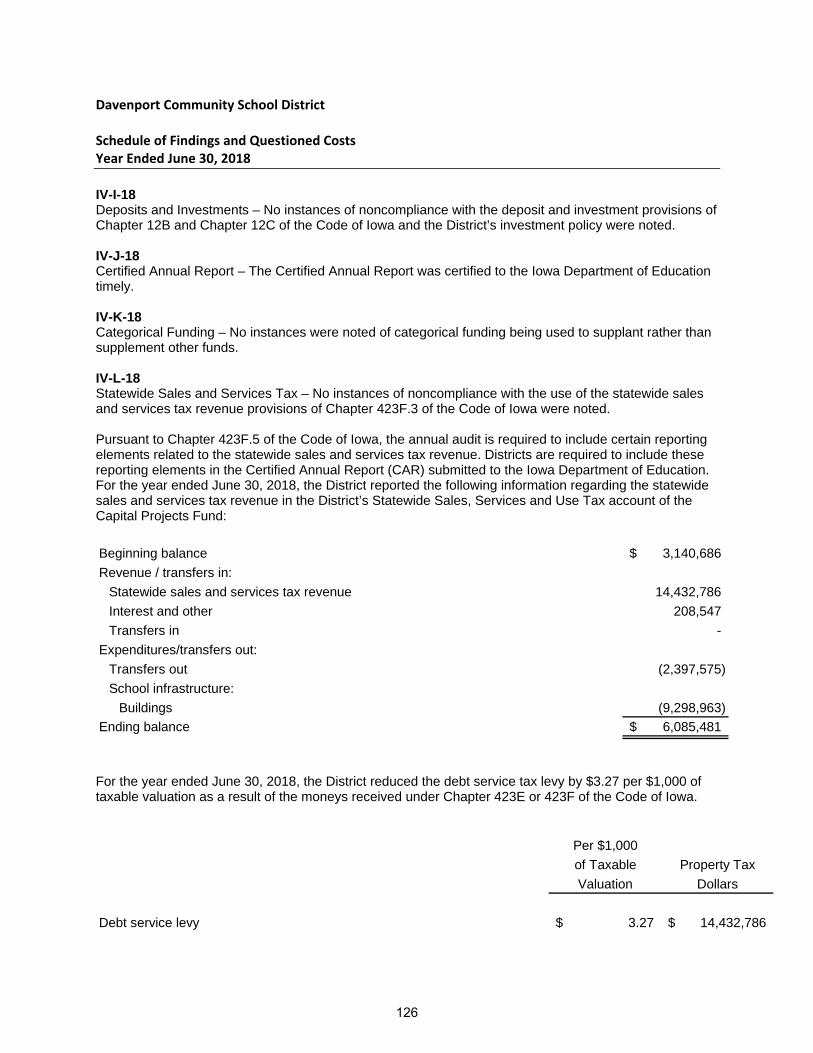
Davenport Community School District Schedule of Findings and Questioned Costs Year Ended June 30, 2018
IV-I-18 Deposits and Investments – No instances of noncompliance with the deposit and investment provisions of Chapter 12B and Chapter 12C of the Code of Iowa and the District’s investment policy were noted. IV-J-18 Certified Annual Report – The Certified Annual Report was certified to the Iowa Department of Education timely. IV-K-18 Categorical Funding – No instances were noted of categorical funding being used to supplant rather than supplement other funds. IV-L-18 Statewide Sales and Services Tax – No instances of noncompliance with the use of the statewide sales and services tax revenue provisions of Chapter 423F.3 of the Code of Iowa were noted. Pursuant to Chapter 423F.5 of the Code of Iowa, the annual audit is required to include certain reporting elements related to the statewide sales and services tax revenue. Districts are required to include these reporting elements in the Certified Annual Report (CAR) submitted to the Iowa Department of Education. For the year ended June 30, 2018, the District reported the following information regarding the statewide sales and services tax revenue in the District’s Statewide Sales, Services and Use Tax account of the Capital Projects Fund:
Beginning balance 3,140,686$
Revenue / transfers in:
Statewide sales and services tax revenue 14,432,786
Interest and other 208,547
Transfers in -
Expenditures/transfers out:
Transfers out (2,397,575)
School infrastructure:
Buildings (9,298,963)
Ending balance 6,085,481$
For the year ended June 30, 2018, the District reduced the debt service tax levy by $3.27 per $1,000 of taxable valuation as a result of the moneys received under Chapter 423E or 423F of the Code of Iowa.
Per $1,000
of Taxable Property Tax
Valuation Dollars
Debt service levy 3.27$ 14,432,786$
126
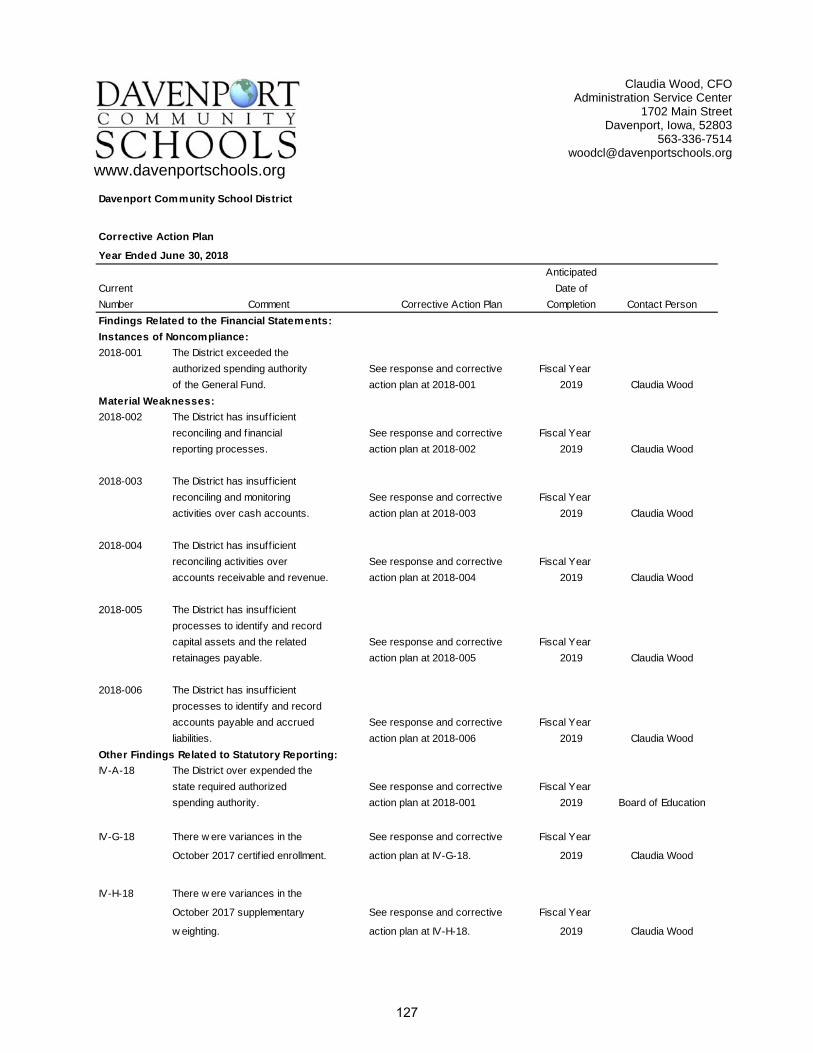
www.davenportschools.org
Davenport Community School District
Corrective Action Plan
Year Ended June 30, 2018
Anticipated
Current Date of
Number Comment Corrective Action Plan Completion Contact Person
Findings Related to the Financial Statements:
Instances of Noncompliance:
2018-001 The District exceeded the
authorized spending authority See response and corrective Fiscal Year
of the General Fund. action plan at 2018-001 2019 Claudia Wood
Material Weaknesses:
2018-002 The District has insuff icient
reconciling and f inancial See response and corrective Fiscal Year
reporting processes. action plan at 2018-002 2019 Claudia Wood
2018-003 The District has insuff icient
reconciling and monitoring See response and corrective Fiscal Year
activities over cash accounts. action plan at 2018-003 2019 Claudia Wood
2018-004 The District has insuff icient
reconciling activities over See response and corrective Fiscal Year
accounts receivable and revenue. action plan at 2018-004 2019 Claudia Wood
2018-005 The District has insuff icient
processes to identify and record
capital assets and the related See response and corrective Fiscal Year
retainages payable. action plan at 2018-005 2019 Claudia Wood
2018-006 The District has insuff icient
processes to identify and record
accounts payable and accrued See response and corrective Fiscal Year
liabilities. action plan at 2018-006 2019 Claudia Wood
Other Findings Related to Statutory Reporting:
IV-A-18 The District over expended the
state required authorized See response and corrective Fiscal Year
spending authority. action plan at 2018-001 2019 Board of Education
IV-G-18 There w ere variances in the See response and corrective Fiscal Year
October 2017 certif ied enrollment. action plan at IV-G-18. 2019 Claudia Wood
IV-H-18 There w ere variances in the
October 2017 supplementary See response and corrective Fiscal Year
w eighting. action plan at IV-H-18. 2019 Claudia Wood
Claudia Wood, CFO Administration Service Center
1702 Main Street Davenport, Iowa, 52803
563-336-7514 [email protected]
127


