Embed Size (px)
Citation preview
COMPENDIUM OF BUDGET INFORMATION FOR THE
2008 GENERAL SESSION
JOINT APPROPRIATIONS SUBCOMMITTEE FOR CAPITAL FACILITIES AND GOVERNMENT OPERATIONS
OFFICE OF THE LEGISLATIVE FISCAL ANALYST STEVEN ALLRED, RICHARD AMON, AND TODD WARDROP
NOVEMBER 16, 2007

UTAH STATE LEGISLATURE
COMPENDIUM OF BUDGET INFORMATION FOR THE
2008 GENERAL SESSION
JONATHAN C. BALL, DIRECTOR
OFFICE OF THE LEGISLATIVE FISCAL ANALYST W310 STATE CAPITOL COMPLEX
SALT LAKE CITY, UTAH 84114-5310
801-538-1034 WWW.LE.UTAH.GOV


OFFICE OF THE LEGISLATIVE FISCAL ANALYSTW 3 1 0 S T A T E C A P I T O L C O M P L E X • P . O . B O X 1 4 5 3 1 0
S A L T L A K E C I T Y , U T A H 8 4 1 1 4 - 5 3 1 0 • W W W . L E . S T A T E . U T . U S / L F A P H O N E : ( 8 0 1 ) 5 3 8 - 1 0 3 4 • F A X : ( 8 0 1 ) 5 3 8 - 1 6 9 2 J O N A T H A N C. B A L L
L E G I S L A T I V E F I S C A L A N A L Y S T
November 16, 2007 Members of the Capital Facilities and Government Operations Appropriations Subcommittee Utah State Capitol Salt Lake City, UT 84114 Dear Legislators: Please find attached the fourth edition of the Utah Legislature’s Compendium of Budget Information (COBI). COBI is one part of a three-pronged approach to staff budget analysis. It is designed as a reference document in which you will find detail on Utah state government activities within your subcommittee’s jurisdiction. It includes program descriptions, references to statutory authority, accountability information, and, of course, budget data. COBI sets a baseline against which you can evaluate budgets proposed during the 2008 General Session. Parts two and three of the Legislature’s budget analysis – Budget Briefs and Issue Briefs – will be available throughout the 2008 General Session beginning in January. Both are succinct, decision oriented papers that build on COBI, presenting future budget options rather than COBI’s status quo. Budget Briefs follow the structure of state appropriations, documenting proposals for current year supplemental and future year budget action. Issue Briefs cut across “silos” to discuss subjects that impact state appropriations independent of program structure. Detail on current state appropriations as they relate to your subcommittee are included in the “2008 Appropriated” column of the budget tables herein. Utah’s total budget, by funding source, subcommittee, and category of expenditure, is summarized in the table on the following page. If I or another member of your budget staff can assist you further regarding this document or any other matter, please do not hesitate to contact me at (801) 538-1034. Sincerely, Jonathan C. Ball Legislative Fiscal Analyst
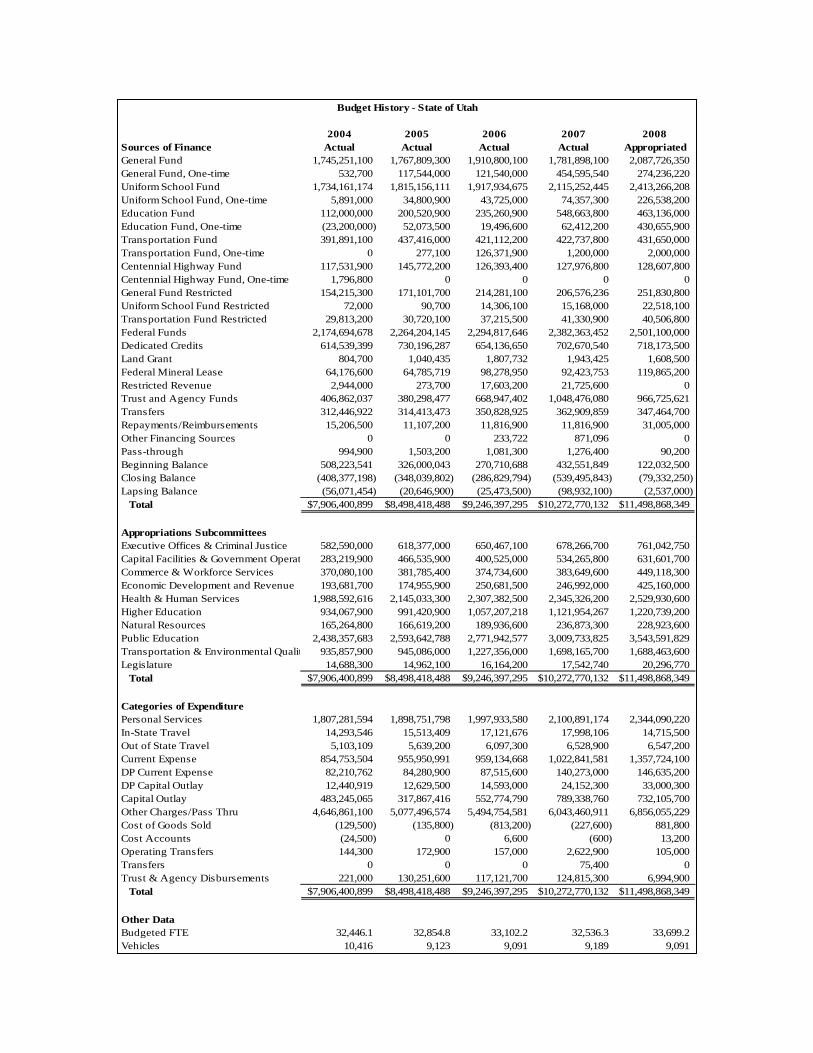
Table 1 Budget History - State of Utah
2004 2005 2006 2007 2008Sources of Finance Actual Actual Actual Actual AppropriatedGeneral Fund 1,745,251,100 1,767,809,300 1,910,800,100 1,781,898,100 2,087,726,350General Fund, One-time 532,700 117,544,000 121,540,000 454,595,540 274,236,220Uniform School Fund 1,734,161,174 1,815,156,111 1,917,934,675 2,115,252,445 2,413,266,208Uniform School Fund, One-time 5,891,000 34,800,900 43,725,000 74,357,300 226,538,200Education Fund 112,000,000 200,520,900 235,260,900 548,663,800 463,136,000Education Fund, One-time (23,200,000) 52,073,500 19,496,600 62,412,200 430,655,900Transportation Fund 391,891,100 437,416,000 421,112,200 422,737,800 431,650,000Transportation Fund, One-time 0 277,100 126,371,900 1,200,000 2,000,000Centennial Highway Fund 117,531,900 145,772,200 126,393,400 127,976,800 128,607,800Centennial Highway Fund, One-time 1,796,800 0 0 0 0General Fund Restricted 154,215,300 171,101,700 214,281,100 206,576,236 251,830,800Uniform School Fund Restricted 72,000 90,700 14,306,100 15,168,000 22,518,100Transportation Fund Restricted 29,813,200 30,720,100 37,215,500 41,330,900 40,506,800Federal Funds 2,174,694,678 2,264,204,145 2,294,817,646 2,382,363,452 2,501,100,000Dedicated Credits 614,539,399 730,196,287 654,136,650 702,670,540 718,173,500Land Grant 804,700 1,040,435 1,807,732 1,943,425 1,608,500Federal Mineral Lease 64,176,600 64,785,719 98,278,950 92,423,753 119,865,200Restricted Revenue 2,944,000 273,700 17,603,200 21,725,600 0Trust and Agency Funds 406,862,037 380,298,477 668,947,402 1,048,476,080 966,725,621Transfers 312,446,922 314,413,473 350,828,925 362,909,859 347,464,700Repayments/Reimbursements 15,206,500 11,107,200 11,816,900 11,816,900 31,005,000Other Financing Sources 0 0 233,722 871,096 0Pass-through 994,900 1,503,200 1,081,300 1,276,400 90,200Beginning Balance 508,223,541 326,000,043 270,710,688 432,551,849 122,032,500Closing Balance (408,377,198) (348,039,802) (286,829,794) (539,495,843) (79,332,250)Lapsing Balance (56,071,454) (20,646,900) (25,473,500) (98,932,100) (2,537,000)
Total $7,906,400,899 $8,498,418,488 $9,246,397,295 $10,272,770,132 $11,498,868,349
Appropriations SubcommitteesExecutive Offices & Criminal Justice 582,590,000 618,377,000 650,467,100 678,266,700 761,042,750Capital Facilities & Government Operat 283,219,900 466,535,900 400,525,000 534,265,800 631,601,700Commerce & Workforce Services 370,080,100 381,785,400 374,734,600 383,649,600 449,118,300Economic Development and Revenue 193,681,700 174,955,900 250,681,500 246,992,000 425,160,000Health & Human Services 1,988,592,616 2,145,033,300 2,307,382,500 2,345,326,200 2,529,930,600Higher Education 934,067,900 991,420,900 1,057,207,218 1,121,954,267 1,220,739,200Natural Resources 165,264,800 166,619,200 189,936,600 236,873,300 228,923,600Public Education 2,438,357,683 2,593,642,788 2,771,942,577 3,009,733,825 3,543,591,829Transportation & Environmental Qualit 935,857,900 945,086,000 1,227,356,000 1,698,165,700 1,688,463,600Legislature 14,688,300 14,962,100 16,164,200 17,542,740 20,296,770
Total $7,906,400,899 $8,498,418,488 $9,246,397,295 $10,272,770,132 $11,498,868,349
Categories of ExpenditurePersonal Services 1,807,281,594 1,898,751,798 1,997,933,580 2,100,891,174 2,344,090,220In-State Travel 14,293,546 15,513,409 17,121,676 17,998,106 14,715,500Out of State Travel 5,103,109 5,639,200 6,097,300 6,528,900 6,547,200Current Expense 854,753,504 955,950,991 959,134,668 1,022,841,581 1,357,724,100DP Current Expense 82,210,762 84,280,900 87,515,600 140,273,000 146,635,200DP Capital Outlay 12,440,919 12,629,500 14,593,000 24,152,300 33,000,300Capital Outlay 483,245,065 317,867,416 552,774,790 789,338,760 732,105,700Other Charges/Pass Thru 4,646,861,100 5,077,496,574 5,494,754,581 6,043,460,911 6,856,055,229Cost of Goods Sold (129,500) (135,800) (813,200) (227,600) 881,800Cost Accounts (24,500) 0 6,600 (600) 13,200Operating Transfers 144,300 172,900 157,000 2,622,900 105,000Transfers 0 0 0 75,400 0Trust & Agency Disbursements 221,000 130,251,600 117,121,700 124,815,300 6,994,900
Total $7,906,400,899 $8,498,418,488 $9,246,397,295 $10,272,770,132 $11,498,868,349
Other DataBudgeted FTE 32,446.1 32,854.8 33,102.2 32,536.3 33,699.2Vehicles 10,416 9,123 9,091 9,189 9,091
CAPITAL FACILITIES AND GOVERNMENT OPS. 2008 GS
- i - OFFICE OF THE LEGISLATIVE FISCAL ANALYST
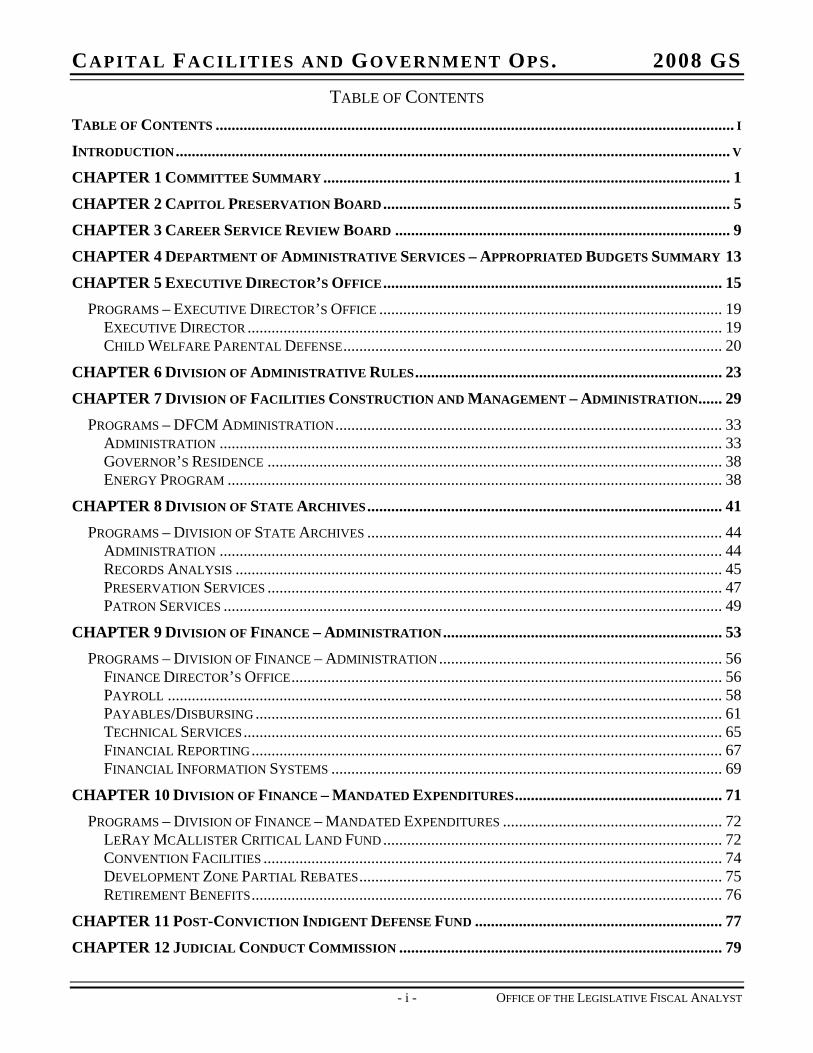
TABLE OF CONTENTS TABLE OF CONTENTS .................................................................................................................................. I
INTRODUCTION........................................................................................................................................... V
CHAPTER 1 COMMITTEE SUMMARY ...................................................................................................... 1
CHAPTER 2 CAPITOL PRESERVATION BOARD....................................................................................... 5
CHAPTER 3 CAREER SERVICE REVIEW BOARD .................................................................................... 9
CHAPTER 4 DEPARTMENT OF ADMINISTRATIVE SERVICES – APPROPRIATED BUDGETS SUMMARY 13
CHAPTER 5 EXECUTIVE DIRECTOR’S OFFICE..................................................................................... 15 PROGRAMS – EXECUTIVE DIRECTOR’S OFFICE ...................................................................................... 19
EXECUTIVE DIRECTOR ....................................................................................................................... 19 CHILD WELFARE PARENTAL DEFENSE............................................................................................... 20
CHAPTER 6 DIVISION OF ADMINISTRATIVE RULES............................................................................. 23
CHAPTER 7 DIVISION OF FACILITIES CONSTRUCTION AND MANAGEMENT – ADMINISTRATION...... 29 PROGRAMS – DFCM ADMINISTRATION................................................................................................. 33
ADMINISTRATION .............................................................................................................................. 33 GOVERNOR’S RESIDENCE .................................................................................................................. 38 ENERGY PROGRAM ............................................................................................................................ 38
CHAPTER 8 DIVISION OF STATE ARCHIVES......................................................................................... 41 PROGRAMS – DIVISION OF STATE ARCHIVES ......................................................................................... 44
ADMINISTRATION .............................................................................................................................. 44 RECORDS ANALYSIS .......................................................................................................................... 45 PRESERVATION SERVICES .................................................................................................................. 47 PATRON SERVICES ............................................................................................................................. 49
CHAPTER 9 DIVISION OF FINANCE – ADMINISTRATION...................................................................... 53 PROGRAMS – DIVISION OF FINANCE – ADMINISTRATION....................................................................... 56
FINANCE DIRECTOR’S OFFICE............................................................................................................ 56 PAYROLL ........................................................................................................................................... 58 PAYABLES/DISBURSING ..................................................................................................................... 61 TECHNICAL SERVICES........................................................................................................................ 65 FINANCIAL REPORTING...................................................................................................................... 67 FINANCIAL INFORMATION SYSTEMS .................................................................................................. 69
CHAPTER 10 DIVISION OF FINANCE – MANDATED EXPENDITURES.................................................... 71
PROGRAMS – DIVISION OF FINANCE – MANDATED EXPENDITURES ....................................................... 72 LERAY MCALLISTER CRITICAL LAND FUND ..................................................................................... 72 CONVENTION FACILITIES ................................................................................................................... 74 DEVELOPMENT ZONE PARTIAL REBATES........................................................................................... 75 RETIREMENT BENEFITS...................................................................................................................... 76
CHAPTER 11 POST-CONVICTION INDIGENT DEFENSE FUND .............................................................. 77
CHAPTER 12 JUDICIAL CONDUCT COMMISSION ................................................................................. 79
CAPITAL FACILITIES AND GOVERNMENT OPS. 2008 GS
- ii - OFFICE OF THE LEGISLATIVE FISCAL ANALYST
CHAPTER 13 PURCHASING AND GENERAL SERVICES.......................................................................... 83
CHAPTER 14 CHILD WELFARE PARENTAL DEFENSE.......................................................................... 87
CHAPTER 15 OFFICE OF STATE DEBT COLLECTION (RESTRICTED SPECIAL REVENUE FUND) ........ 89
CHAPTER 16 DEPARTMENT OF ADMINISTRATIVE SERVICES – ISF SUMMARY.................................. 95
CHAPTER 17 PURCHASING AND GENERAL SERVICES (ISF).............................................................. 101 PROGRAMS – PURCHASING AND GENERAL SERVICES .......................................................................... 103
ADMINISTRATION ............................................................................................................................ 103 CENTRAL MAILING .......................................................................................................................... 105 ELECTRONIC PURCHASING............................................................................................................... 107 PRINT SERVICES............................................................................................................................... 110
CHAPTER 18 DIVISION OF INFORMATION TECHNOLOGY SERVICES (ISF)....................................... 113
CHAPTER 19 DIVISION OF FLEET OPERATIONS (ISF)....................................................................... 115 PROGRAMS – DIVISION OF FLEET OPERATIONS.................................................................................... 117
ADMINISTRATION ............................................................................................................................ 117 MOTOR POOL................................................................................................................................... 119 FUEL NETWORK............................................................................................................................... 124 STATE SURPLUS PROPERTY.............................................................................................................. 126 FEDERAL SURPLUS PROPERTY ......................................................................................................... 129
CHAPTER 20 DIVISION OF RISK MANAGEMENT (ISF) ...................................................................... 131 PROGRAMS – DIVISION OF RISK MANAGEMENT................................................................................... 133
ADMINISTRATION ............................................................................................................................ 133 WORKERS’ COMPENSATION............................................................................................................. 135
CHAPTER 21 DFCM FACILITIES MAINTENANCE (ISF) .................................................................... 137
CHAPTER 22 DEPARTMENT OF HUMAN RESOURCE MANAGEMENT – APPROPRIATED BUDGET..... 143 PROGRAMS – DEPARTMENT OF HUMAN RESOURCE MANAGEMENT..................................................... 145
ADMINISTRATION ............................................................................................................................ 145 POLICY............................................................................................................................................. 147 CENTRAL OPERATIONS .................................................................................................................... 149 FLEX BENEFITS ................................................................................................................................ 150 MANAGEMENT TRAINING ................................................................................................................ 151 INFORMATION TECHNOLOGY ........................................................................................................... 153
CHAPTER 23 DEPARTMENT OF HUMAN RESOURCE MANAGEMENT – INTERNAL SERVICE FUND... 155 PROGRAMS: DHRM INTERNAL SERVICE FUND.................................................................................... 157
FIELD SERVICES............................................................................................................................... 157 PAYROLL FIELD SERVICES ............................................................................................................... 158
CHAPTER 24 DEPARTMENT OF TECHNOLOGY SERVICES – APPROPRIATED .................................... 159 LINE ITEMS – DEPARTMENT OF TECHNOLOGY SERVICES..................................................................... 161
CHIEF INFORMATION OFFICER ......................................................................................................... 161 INTEGRATED TECHNOLOGY.............................................................................................................. 163 TECHNOLOGY ACQUISITION PROJECTS ............................................................................................ 166
CAPITAL FACILITIES AND GOVERNMENT OPS. 2008 GS
- iii - OFFICE OF THE LEGISLATIVE FISCAL ANALYST
CHAPTER 25 DEPARTMENT OF TECHNOLOGY SERVICES – OPERATIONS – ISF .............................. 169 AGENCY SERVICES DIVISION ........................................................................................................... 171 ENTERPRISE TECHNOLOGY DIVISION............................................................................................... 173
CHAPTER 26 CAPITAL BUDGET.......................................................................................................... 175 LINE ITEMS – CAPITAL BUDGET........................................................................................................... 179
STATE FUNDED CAPITAL DEVELOPMENT......................................................................................... 179 “OTHER”-FUNDED CAPITAL DEVELOPMENTS.................................................................................. 185 CAPITAL IMPROVEMENTS LINE ITEM ............................................................................................... 186 PROPERTY ACQUISITION LINE ITEM................................................................................................. 189 LEASE INFORMATION....................................................................................................................... 190
CHAPTER 27 DEBT SERVICE............................................................................................................... 193 FURTHER INFORMATION .................................................................................................................. 195
GLOSSARY .............................................................................................................................................. 205
INDEX ...................................................................................................................................................... 209

CAPITAL FACILITIES AND GOVERNMENT OPS. 2008 GS
OFFICE OF THE LEGISLATIVE FISCAL ANALYST - v - INTRODUCTION
INTRODUCTION
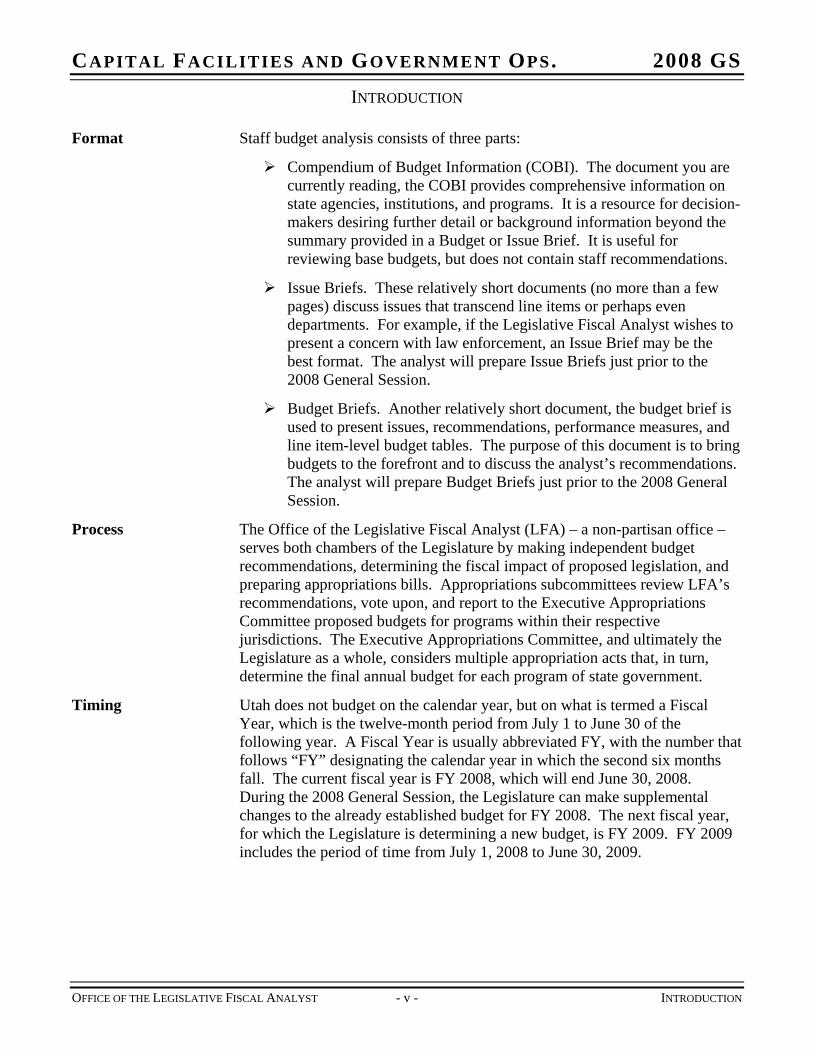
Format Staff budget analysis consists of three parts:
Compendium of Budget Information (COBI). The document you are currently reading, the COBI provides comprehensive information on state agencies, institutions, and programs. It is a resource for decision-makers desiring further detail or background information beyond the summary provided in a Budget or Issue Brief. It is useful for reviewing base budgets, but does not contain staff recommendations.
Issue Briefs. These relatively short documents (no more than a few pages) discuss issues that transcend line items or perhaps even departments. For example, if the Legislative Fiscal Analyst wishes to present a concern with law enforcement, an Issue Brief may be the best format. The analyst will prepare Issue Briefs just prior to the 2008 General Session.
Budget Briefs. Another relatively short document, the budget brief is used to present issues, recommendations, performance measures, and line item-level budget tables. The purpose of this document is to bring budgets to the forefront and to discuss the analyst’s recommendations. The analyst will prepare Budget Briefs just prior to the 2008 General Session.
Process The Office of the Legislative Fiscal Analyst (LFA) – a non-partisan office – serves both chambers of the Legislature by making independent budget recommendations, determining the fiscal impact of proposed legislation, and preparing appropriations bills. Appropriations subcommittees review LFA’s recommendations, vote upon, and report to the Executive Appropriations Committee proposed budgets for programs within their respective jurisdictions. The Executive Appropriations Committee, and ultimately the Legislature as a whole, considers multiple appropriation acts that, in turn, determine the final annual budget for each program of state government.
Timing Utah does not budget on the calendar year, but on what is termed a Fiscal Year, which is the twelve-month period from July 1 to June 30 of the following year. A Fiscal Year is usually abbreviated FY, with the number that follows “FY” designating the calendar year in which the second six months fall. The current fiscal year is FY 2008, which will end June 30, 2008. During the 2008 General Session, the Legislature can make supplemental changes to the already established budget for FY 2008. The next fiscal year, for which the Legislature is determining a new budget, is FY 2009. FY 2009 includes the period of time from July 1, 2008 to June 30, 2009.
CAPITAL FACILITIES AND GOVERNMENT OPS. 2008 GS
OFFICE OF THE LEGISLATIVE FISCAL ANALYST - vi - INTRODUCTION
Sources In allocating resources for state government use, appropriations subcommittees may use funding from several sources. The following funding sources most commonly used by the subcommittees:
General Fund
School Funds
Transportation Funds
Federal Funds
Dedicated Credits
Restricted Funds
Other Funds
A glossary of terms – included at the end of this document – defines these funding sources as well as other terms commonly used in Utah state budgeting.
CAPITAL FACILITIES AND GOVERNMENT OPS. 2008 GS CHAPTER 1 COMMITTEE SUMMARY
Overview The Capital Facilities and Government Operations (CFGO) Appropriations Subcommittee reviews and approves the budgets for seven principal areas of state government. The subcommittee makes a recommendation to the Executive Appropriations Committee and the whole Legislature for final approval. The areas for which this subcommittee is responsible are:
Capitol Preservation Board
Career Service Review Board
Department of Administrative Services
Department of Human Resource Management
Department of Technology Services
Capital Facilities
Debt Service
During the 2007 General Session, the Legislature passed H.J.R. 6, “Joint Rules Resolution – Appropriation Subcommittees” which changed the subcommittee’s name from “Capital Facilities and Administrative Services” to “Capital Facilities and Government Operations” to better indicate the broad array of agencies and budgets overseen by the subcommittee. The name is also consistent with other standing and interim committees.
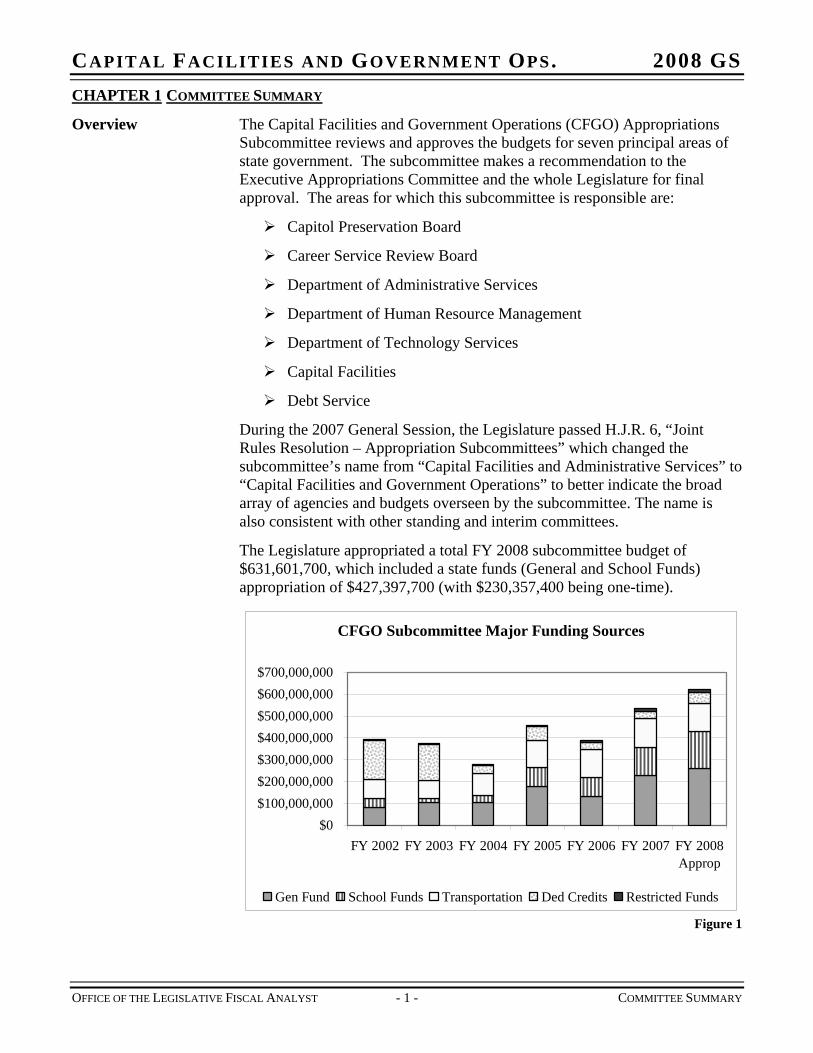
The Legislature appropriated a total FY 2008 subcommittee budget of $631,601,700, which included a state funds (General and School Funds) appropriation of $427,397,700 (with $230,357,400 being one-time).
CFGO Subcommittee Major Funding Sources
$0$100,000,000$200,000,000$300,000,000$400,000,000$500,000,000$600,000,000$700,000,000
FY 2002 FY 2003 FY 2004 FY 2005 FY 2006 FY 2007 FY 2008Approp
Gen Fund School Funds Transportation Ded Credits Restricted Funds
Figure 1
OFFICE OF THE LEGISLATIVE FISCAL ANALYST - 1 - COMMITTEE SUMMARY
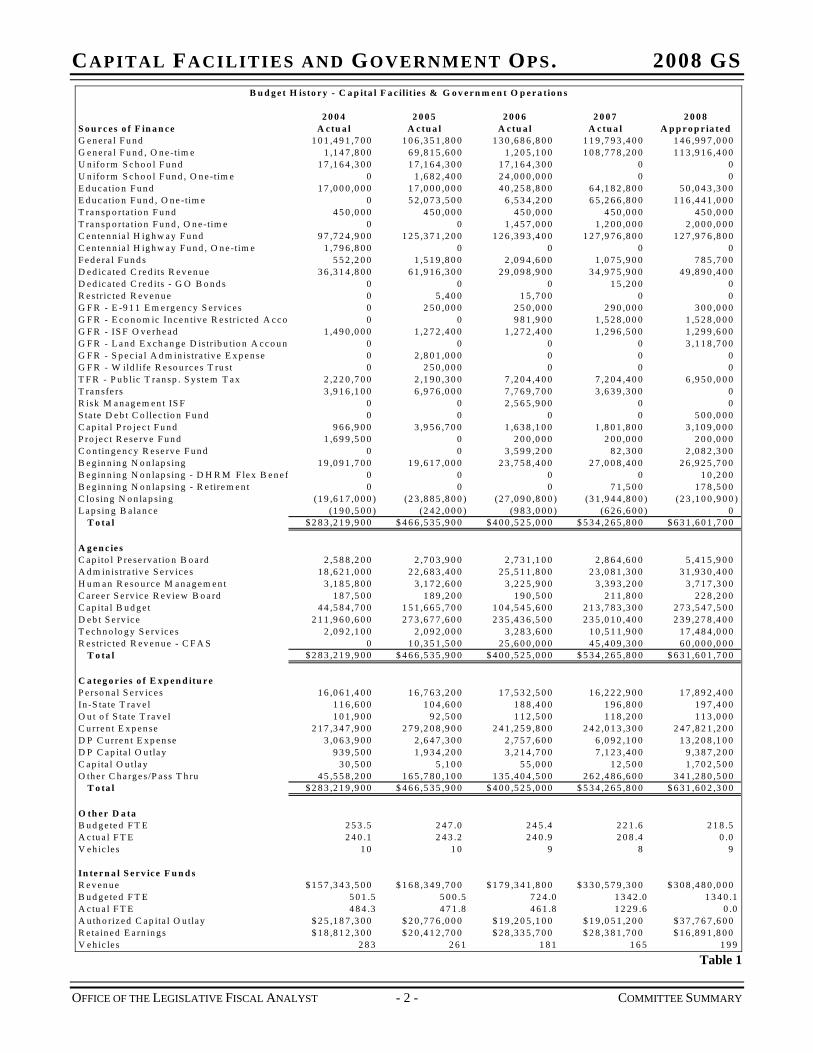
CAPITAL FACILITIES AND GOVERNMENT OPS. 2008 GS B u d g e t H isto r y - C a p ita l F a c ilit ie s & G o v e r n m e n t O p e r a tio n s
2 0 0 4 2 0 0 5 2 0 0 6 2 0 0 7 2 0 0 8S o u r c e s o f F in a n c e A c tu a l A c tu a l A c tu a l A c tu a l A p p r o p r ia te dG e n e ra l F u n d 1 0 1 ,4 9 1 ,7 0 0 1 0 6 ,3 5 1 ,8 0 0 1 3 0 ,6 8 6 ,8 0 0 1 1 9 ,7 9 3 ,4 0 0 1 4 6 ,9 9 7 ,0 0 0G e n e ra l F u n d , O n e -tim e 1 ,1 4 7 ,8 0 0 6 9 ,8 1 5 ,6 0 0 1 ,2 0 5 ,1 0 0 1 0 8 ,7 7 8 ,2 0 0 1 1 3 ,9 1 6 ,4 0 0U n ifo rm S c h o o l F u n d 1 7 ,1 6 4 ,3 0 0 1 7 ,1 6 4 ,3 0 0 1 7 ,1 6 4 ,3 0 0 0 0U n ifo rm S c h o o l F u n d , O n e -tim e 0 1 ,6 8 2 ,4 0 0 2 4 ,0 0 0 ,0 0 0 0 0E d u c a tio n F u n d 1 7 ,0 0 0 ,0 0 0 1 7 ,0 0 0 ,0 0 0 4 0 ,2 5 8 ,8 0 0 6 4 ,1 8 2 ,8 0 0 5 0 ,0 4 3 ,3 0 0E d u c a tio n F u n d , O n e -tim e 0 5 2 ,0 7 3 ,5 0 0 6 ,5 3 4 ,2 0 0 6 5 ,2 6 6 ,8 0 0 1 1 6 ,4 4 1 ,0 0 0T ra n sp o rta tio n F u n d 4 5 0 ,0 0 0 4 5 0 ,0 0 0 4 5 0 ,0 0 0 4 5 0 ,0 0 0 4 5 0 ,0 0 0T ra n sp o rta tio n F u n d , O n e -tim e 0 0 1 ,4 5 7 ,0 0 0 1 ,2 0 0 ,0 0 0 2 ,0 0 0 ,0 0 0C e n te n n ia l H ig h w a y F u n d 9 7 ,7 2 4 ,9 0 0 1 2 5 ,3 7 1 ,2 0 0 1 2 6 ,3 9 3 ,4 0 0 1 2 7 ,9 7 6 ,8 0 0 1 2 7 ,9 7 6 ,8 0 0C e n te n n ia l H ig h w a y F u n d , O n e -tim e 1 ,7 9 6 ,8 0 0 0 0 0 0F e d e ra l F u n d s 5 5 2 ,2 0 0 1 ,5 1 9 ,8 0 0 2 ,0 9 4 ,6 0 0 1 ,0 7 5 ,9 0 0 7 8 5 ,7 0 0D e d ic a te d C re d its R e v e n u e 3 6 ,3 1 4 ,8 0 0 6 1 ,9 1 6 ,3 0 0 2 9 ,0 9 8 ,9 0 0 3 4 ,9 7 5 ,9 0 0 4 9 ,8 9 0 ,4 0 0D e d ic a te d C re d its - G O B o n d s 0 0 0 1 5 ,2 0 0 0R e str ic te d R e v e n u e 0 5 ,4 0 0 1 5 ,7 0 0 0 0G F R - E -9 1 1 E m e rg e n c y S e rv ic e s 0 2 5 0 ,0 0 0 2 5 0 ,0 0 0 2 9 0 ,0 0 0 3 0 0 ,0 0 0G F R - E c o n o m ic In c e n tiv e R e str ic te d A c c o 0 0 9 8 1 ,9 0 0 1 ,5 2 8 ,0 0 0 1 ,5 2 8 ,0 0 0G F R - IS F O v e rh e a d 1 ,4 9 0 ,0 0 0 1 ,2 7 2 ,4 0 0 1 ,2 7 2 ,4 0 0 1 ,2 9 6 ,5 0 0 1 ,2 9 9 ,6 0 0G F R - L a n d E x c h a n g e D is tr ib u tio n A c c o u n 0 0 0 0 3 ,1 1 8 ,7 0 0G F R - S p e c ia l A d m in is tra tiv e E x p e n se 0 2 ,8 0 1 ,0 0 0 0 0 0G F R - W ild life R e so u rc e s T ru s t 0 2 5 0 ,0 0 0 0 0 0T F R - P u b lic T ra n sp . S ys te m T a x 2 ,2 2 0 ,7 0 0 2 ,1 9 0 ,3 0 0 7 ,2 0 4 ,4 0 0 7 ,2 0 4 ,4 0 0 6 ,9 5 0 ,0 0 0T ra n sfe rs 3 ,9 1 6 ,1 0 0 6 ,9 7 6 ,0 0 0 7 ,7 6 9 ,7 0 0 3 ,6 3 9 ,3 0 0 0R isk M a n a g e m e n t IS F 0 0 2 ,5 6 5 ,9 0 0 0 0S ta te D e b t C o lle c tio n F u n d 0 0 0 0 5 0 0 ,0 0 0C a p ita l P ro je c t F u n d 9 6 6 ,9 0 0 3 ,9 5 6 ,7 0 0 1 ,6 3 8 ,1 0 0 1 ,8 0 1 ,8 0 0 3 ,1 0 9 ,0 0 0P ro je c t R e se rv e F u n d 1 ,6 9 9 ,5 0 0 0 2 0 0 ,0 0 0 2 0 0 ,0 0 0 2 0 0 ,0 0 0C o n tin g e n c y R e se rv e F u n d 0 0 3 ,5 9 9 ,2 0 0 8 2 ,3 0 0 2 ,0 8 2 ,3 0 0B e g in n in g N o n la p s in g 1 9 ,0 9 1 ,7 0 0 1 9 ,6 1 7 ,0 0 0 2 3 ,7 5 8 ,4 0 0 2 7 ,0 0 8 ,4 0 0 2 6 ,9 2 5 ,7 0 0B e g in n in g N o n la p s in g - D H R M F le x B e n e f 0 0 0 0B e g in n in g N o n la p s in g - R e tire m e n t 0 0 0 7 1 ,5 0 0 1 7 8 ,5 0 0C lo sin g N o n la p s in g (1 9 ,6 1 7 ,0 0 0 ) (2 3 ,8 8 5 ,8 0 0 ) (2 7 ,0 9 0 ,8 0 0 ) (3 1 ,9 4 4 ,8 0 0 ) (2 3 ,1 0 0 ,9 0 0 )L a p s in g B a la n c e (1 9 0 ,5 0 0 ) (2 4 2 ,0 0 0 ) (9 8 3 ,0 0 0 ) (6 2 6 ,6 0 0 ) 0
T o ta l $ 2 8 3 ,2 1 9 ,9 0 0 $ 4 6 6 ,5 3 5 ,9 0 0 $ 4 0 0 ,5 2 5 ,0 0 0 $ 5 3 4 ,2 6 5 ,8 0 0 $ 6 3 1 ,6 0 1 ,7 0 0
A g e n c ie sC a p ito l P re se rv a tio n B o a rd 2 ,5 8 8 ,2 0 0 2 ,7 0 3 ,9 0 0 2 ,7 3 1 ,1 0 0 2 ,8 6 4 ,6 0 0 5 ,4 1 5 ,9 0 0A d m in is tra tiv e S e rv ic e s 1 8 ,6 2 1 ,0 0 0 2 2 ,6 8 3 ,4 0 0 2 5 ,5 1 1 ,8 0 0 2 3 ,0 8 1 ,3 0 0 3 1 ,9 3 0 ,4 0 0H u m a n R e so u rc e M a n a g e m e n t 3 ,1 8 5 ,8 0 0 3 ,1 7 2 ,6 0 0 3 ,2 2 5 ,9 0 0 3 ,3 9 3 ,2 0 0 3 ,7 1 7 ,3 0 0C a re e r S e rv ic e R e v ie w B o a rd 1 8 7 ,5 0 0 1 8 9 ,2 0 0 1 9 0 ,5 0 0 2 1 1 ,8 0 0 2 2 8 ,2 0 0C a p ita l B u d g e t 4 4 ,5 8 4 ,7 0 0 1 5 1 ,6 6 5 ,7 0 0 1 0 4 ,5 4 5 ,6 0 0 2 1 3 ,7 8 3 ,3 0 0 2 7 3 ,5 4 7 ,5 0 0D e b t S e rv ic e 2 1 1 ,9 6 0 ,6 0 0 2 7 3 ,6 7 7 ,6 0 0 2 3 5 ,4 3 6 ,5 0 0 2 3 5 ,0 1 0 ,4 0 0 2 3 9 ,2 7 8 ,4 0 0T e c h n o lo g y S e rv ic e s 2 ,0 9 2 ,1 0 0 2 ,0 9 2 ,0 0 0 3 ,2 8 3 ,6 0 0 1 0 ,5 1 1 ,9 0 0 1 7 ,4 8 4 ,0 0 0R e str ic te d R e v e n u e - C F A S 0 1 0 ,3 5 1 ,5 0 0 2 5 ,6 0 0 ,0 0 0 4 5 ,4 0 9 ,3 0 0 6 0 ,0 0 0 ,0 0 0
T o ta l $ 2 8 3 ,2 1 9 ,9 0 0 $ 4 6 6 ,5 3 5 ,9 0 0 $ 4 0 0 ,5 2 5 ,0 0 0 $ 5 3 4 ,2 6 5 ,8 0 0 $ 6 3 1 ,6 0 1 ,7 0 0
C a te g o r ie s o f E x p e n d itu r eP e rso n a l S e rv ic e s 1 6 ,0 6 1 ,4 0 0 1 6 ,7 6 3 ,2 0 0 1 7 ,5 3 2 ,5 0 0 1 6 ,2 2 2 ,9 0 0 1 7 ,8 9 2 ,4 0 0In -S ta te T ra v e l 1 1 6 ,6 0 0 1 0 4 ,6 0 0 1 8 8 ,4 0 0 1 9 6 ,8 0 0 1 9 7 ,4 0 0O u t o f S ta te T ra v e l 1 0 1 ,9 0 0 9 2 ,5 0 0 1 1 2 ,5 0 0 1 1 8 ,2 0 0 1 1 3 ,0 0 0C u rre n t E x p e n se 2 1 7 ,3 4 7 ,9 0 0 2 7 9 ,2 0 8 ,9 0 0 2 4 1 ,2 5 9 ,8 0 0 2 4 2 ,0 1 3 ,3 0 0 2 4 7 ,8 2 1 ,2 0 0D P C u rre n t E x p e n se 3 ,0 6 3 ,9 0 0 2 ,6 4 7 ,3 0 0 2 ,7 5 7 ,6 0 0 6 ,0 9 2 ,1 0 0 1 3 ,2 0 8 ,1 0 0D P C a p ita l O u tla y 9 3 9 ,5 0 0 1 ,9 3 4 ,2 0 0 3 ,2 1 4 ,7 0 0 7 ,1 2 3 ,4 0 0 9 ,3 8 7 ,2 0 0C a p ita l O u tla y 3 0 ,5 0 0 5 ,1 0 0 5 5 ,0 0 0 1 2 ,5 0 0 1 ,7 0 2 ,5 0 0O th e r C h a rg e s /P a ss T h ru 4 5 ,5 5 8 ,2 0 0 1 6 5 ,7 8 0 ,1 0 0 1 3 5 ,4 0 4 ,5 0 0 2 6 2 ,4 8 6 ,6 0 0 3 4 1 ,2 8 0 ,5 0 0
T o ta l $ 2 8 3 ,2 1 9 ,9 0 0 $ 4 6 6 ,5 3 5 ,9 0 0 $ 4 0 0 ,5 2 5 ,0 0 0 $ 5 3 4 ,2 6 5 ,8 0 0 $ 6 3 1 ,6 0 2 ,3 0 0
O th e r D a taB u d g e te d F T E 2 5 3 .5 2 4 7 .0 2 4 5 .4 2 2 1 .6 2 1 8 .5A c tu a l F T E 2 4 0 .1 2 4 3 .2 2 4 0 .9 2 0 8 .4 0 .0V e h ic le s 1 0 1 0 9 8 9
In te r n a l S e r v ic e F u n d sR e v e n u e $ 1 5 7 ,3 4 3 ,5 0 0 $ 1 6 8 ,3 4 9 ,7 0 0 $ 1 7 9 ,3 4 1 ,8 0 0 $ 3 3 0 ,5 7 9 ,3 0 0 $ 3 0 8 ,4 8 0 ,0 0 0B u d g e te d F T E 5 0 1 .5 5 0 0 .5 7 2 4 .0 1 3 4 2 .0 1 3 4 0 .1A c tu a l F T E 4 8 4 .3 4 7 1 .8 4 6 1 .8 1 2 2 9 .6 0 .0A u th o r iz e d C a p ita l O u tla y $ 2 5 ,1 8 7 ,3 0 0 $ 2 0 ,7 7 6 ,0 0 0 $ 1 9 ,2 0 5 ,1 0 0 $ 1 9 ,0 5 1 ,2 0 0 $ 3 7 ,7 6 7 ,6 0 0R e ta in e d E a rn in g s $ 1 8 ,8 1 2 ,3 0 0 $ 2 0 ,4 1 2 ,7 0 0 $ 2 8 ,3 3 5 ,7 0 0 $ 2 8 ,3 8 1 ,7 0 0 $ 1 6 ,8 9 1 ,8 0 0V e h ic le s 2 8 3 2 6 1 1 8 1 1 6 5 1 9 9
1 0 ,2 0 0
Table 1
OFFICE OF THE LEGISLATIVE FISCAL ANALYST - 2 - COMMITTEE SUMMARY
CAPITAL FACILITIES AND GOVERNMENT OPS. 2008 GS
OFFICE OF THE LEGISLATIVE FISCAL ANALYST - 3 - COMMITTEE SUMMARY
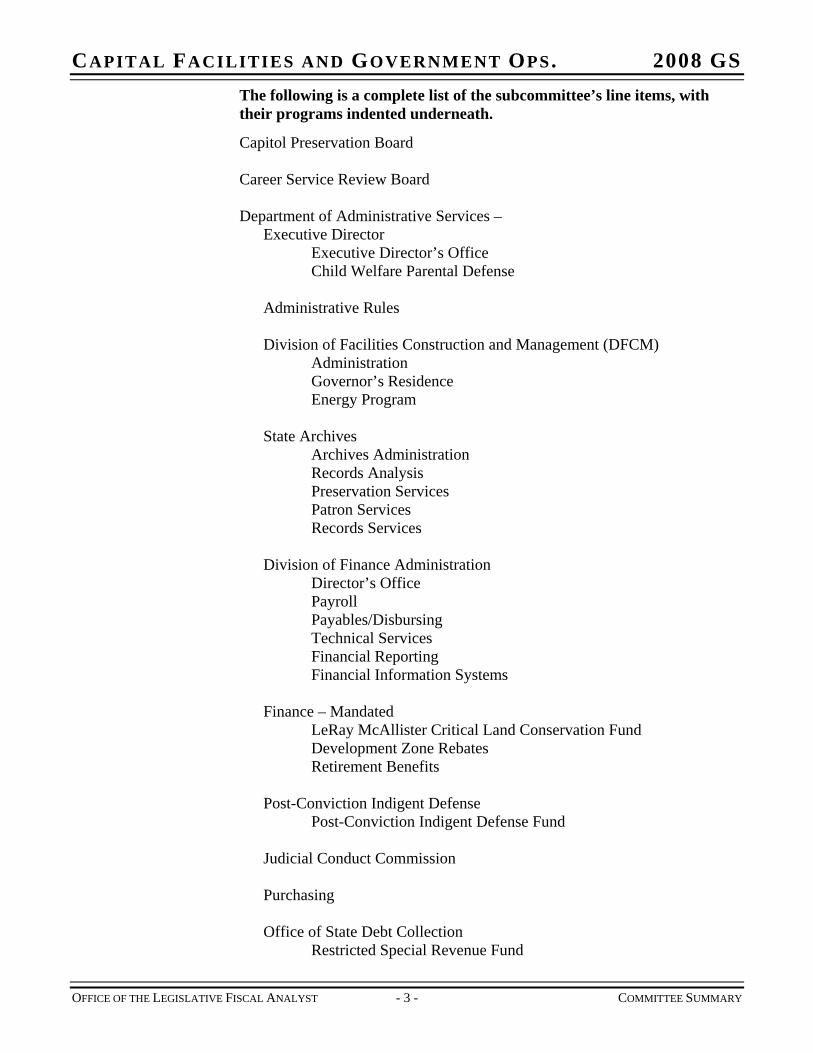
The following is a complete list of the subcommittee’s line items, with their programs indented underneath.
Capitol Preservation Board Career Service Review Board Department of Administrative Services – Executive Director Executive Director’s Office Child Welfare Parental Defense Administrative Rules Division of Facilities Construction and Management (DFCM) Administration Governor’s Residence Energy Program State Archives Archives Administration Records Analysis Preservation Services Patron Services Records Services Division of Finance Administration Director’s Office Payroll Payables/Disbursing Technical Services Financial Reporting Financial Information Systems Finance – Mandated LeRay McAllister Critical Land Conservation Fund Development Zone Rebates Retirement Benefits Post-Conviction Indigent Defense Post-Conviction Indigent Defense Fund Judicial Conduct Commission Purchasing Office of State Debt Collection Restricted Special Revenue Fund
CAPITAL FACILITIES AND GOVERNMENT OPS. 2008 GS
OFFICE OF THE LEGISLATIVE FISCAL ANALYST - 4 - COMMITTEE SUMMARY
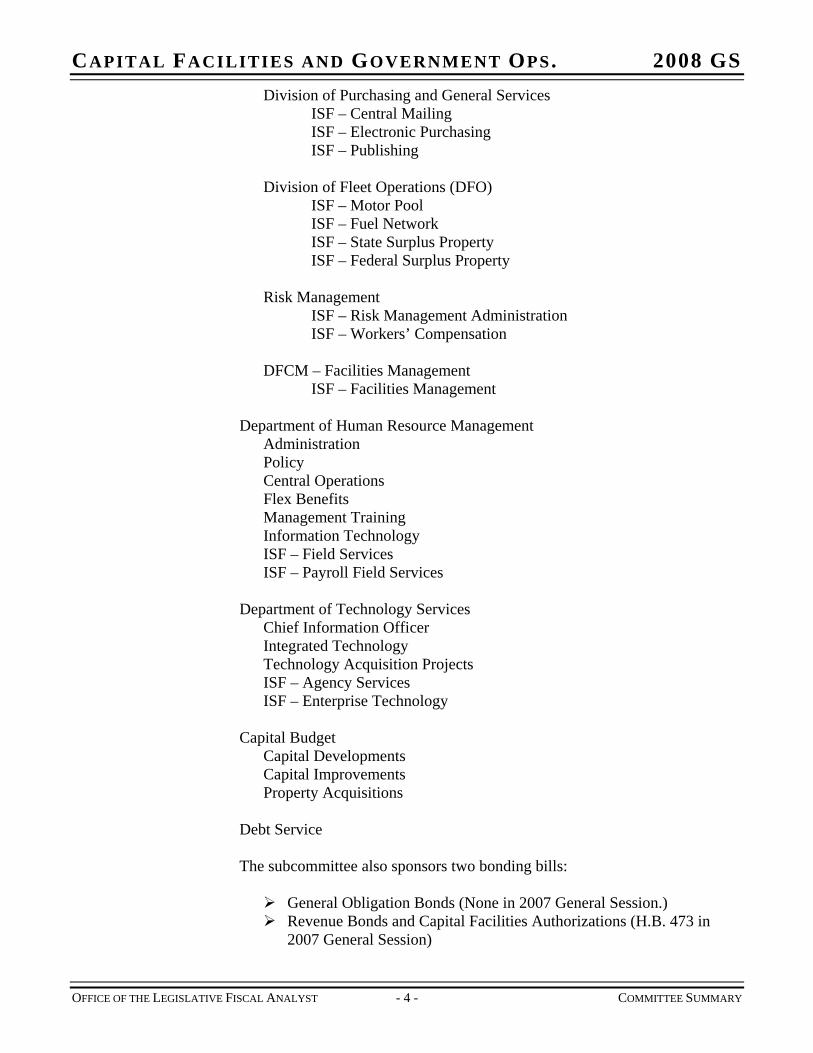
Division of Purchasing and General Services ISF – Central Mailing ISF – Electronic Purchasing ISF – Publishing Division of Fleet Operations (DFO) ISF – Motor Pool ISF – Fuel Network ISF – State Surplus Property ISF – Federal Surplus Property Risk Management ISF – Risk Management Administration ISF – Workers’ Compensation DFCM – Facilities Management ISF – Facilities Management Department of Human Resource Management Administration Policy Central Operations Flex Benefits Management Training Information Technology ISF – Field Services ISF – Payroll Field Services Department of Technology Services Chief Information Officer Integrated Technology Technology Acquisition Projects ISF – Agency Services ISF – Enterprise Technology Capital Budget Capital Developments Capital Improvements Property Acquisitions Debt Service The subcommittee also sponsors two bonding bills:
General Obligation Bonds (None in 2007 General Session.) Revenue Bonds and Capital Facilities Authorizations (H.B. 473 in
2007 General Session)
CAPITAL FACILITIES AND GOVERNMENT OPS. 2008 GS
OFFICE OF THE LEGISLATIVE FISCAL ANALYST - 5 - CAPITOL PRESERVATION BOARD
CHAPTER 2 CAPITOL PRESERVATION BOARD
Function The Capitol Preservation Board manages all functions associated with Capitol Hill facilities and grounds. This includes maintenance, furnishings, occupancy, public usage and long range master planning.
The first duty of the Capitol Preservation Board is to manage the day-to-day operations of Capitol Hill, including the State Office Building, the DUP Museum, the Travel Council Building, the Greenhouse and the White Chapel. Grounds maintenance and facility management are provided through a contract with the State Division of Facilities Construction and Management (DFCM).
The second duty of the board is to manage the restoration of the State Capitol. The Executive Director is also the Architect of the Capitol. The first phase of the restoration was completed when the east parking structure opened along with the east and west buildings. Construction on the second phase—a new heat plant and total restoration of the Capitol—officially began in September 2004.
Statutory Authority The following statutes govern operation of the board:
UCA 63C-9-201 establishes the 15-member board, comprised of:
The governor or the lieutenant governor
The president of the Senate or a designee
The speaker of the House of Representatives or a designee
The state treasurer
The state attorney general
Two members of the Senate appointed by the president, one from each party
Two members of the House appointed by the speaker, one from each party
The chief justice of the Supreme Court or a designee
The state historic preservation officer
UCA 63C-9-301 gives the board power to exercise complete jurisdiction over Capitol Hill facilities and grounds, except that control of the legislative area is reserved to the Legislature.
UCA 63-9-301 also requires the board to:
Preserve, maintain, and restore the capitol hill complex, facilities, grounds, and their contents
Submit annual budget requests to the governor and Legislature
Approve the executive director’s work plans and master plans
CAPITAL FACILITIES AND GOVERNMENT OPS. 2008 GS
OFFICE OF THE LEGISLATIVE FISCAL ANALYST - 6 - CAPITOL PRESERVATION BOARD
Approve all changes to buildings and grounds
In consultation with other relevant agencies, identify and inventory all significant contents of the buildings and all state-owned items of historical significance that were at one time in the buildings
Keep archives relating to the construction and content of the buildings and grounds
Make rules to administer Capitol Hill
Adopt procurement procedures substantially equal to the Utah Procurement Code, though it is exempt from the code
UCA 63C-9-402 lists the duties of the executive director, some of which are to:
Develop a twenty-year master plan concerning the maintenance, preservation, restoration, and modification of the Capitol Hill facilities and grounds
Develop a furnishings plan for the placement and care of objects under the care of the Board
Prepare and recommend an annual budget
Prepare an annual detailed report accounting for all funds received and disbursed by the Board during the previous fiscal year
Develop a program to locate and acquire state-owned items of historical significance that were at one time in the buildings
Approve all art and exhibits placed on Capitol Hill
Develop and manage a visitor services program for Capitol Hill with duties that include conducting tours, managing a gift shop, and providing communication services
UCA 63C-9-602 requires any state-owned item identified by the board as historically significant and that was at one time located on Capitol Hill to be transferred to the inventory of the board within sixty days.
UCA 63C-9-702 creates an eleven-member Art Placement Subcommittee of the board to oversee the content and placement of each piece of art.
Intent Language During the 2007 General Session the Legislature adopted the following intent language for FY 2007 in S.B. 1:
Under Section 63-38-8.1 of the Utah Code the Legislature intends that up to $75,000 provided by Item 32, Chapter 1, and Item 34, Chapter 366, Laws of Utah 2006 not lapse at the close of Fiscal Year 2007. The use of nonlapsing funds is limited to design, construction, or one-time administrative costs associated with the Capitol restoration.
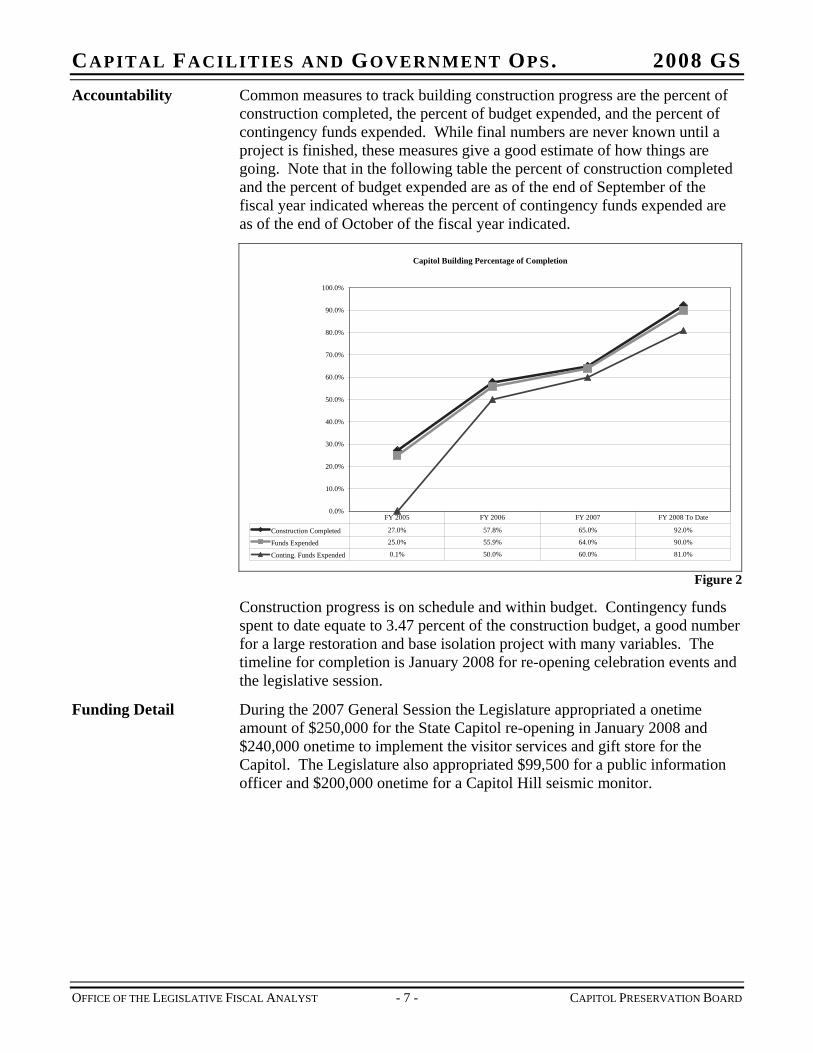
CAPITAL FACILITIES AND GOVERNMENT OPS. 2008 GS Accountability Common measures to track building construction progress are the percent of
construction completed, the percent of budget expended, and the percent of contingency funds expended. While final numbers are never known until a project is finished, these measures give a good estimate of how things are going. Note that in the following table the percent of construction completed and the percent of budget expended are as of the end of September of the fiscal year indicated whereas the percent of contingency funds expended are as of the end of October of the fiscal year indicated.
Capitol Building Percentage of Completion
0.0%
10.0%
20.0%
30.0%
40.0%
50.0%
60.0%
70.0%
80.0%
90.0%
100.0%
Construction Completed 27.0% 57.8% 65.0% 92.0%
Funds Expended 25.0% 55.9% 64.0% 90.0%
Conting. Funds Expended 0.1% 50.0% 60.0% 81.0%
FY 2005 FY 2006 FY 2007 FY 2008 To Date
Figure 2
Construction progress is on schedule and within budget. Contingency funds spent to date equate to 3.47 percent of the construction budget, a good number for a large restoration and base isolation project with many variables. The timeline for completion is January 2008 for re-opening celebration events and the legislative session.
Funding Detail During the 2007 General Session the Legislature appropriated a onetime amount of $250,000 for the State Capitol re-opening in January 2008 and $240,000 onetime to implement the visitor services and gift store for the Capitol. The Legislature also appropriated $99,500 for a public information officer and $200,000 onetime for a Capitol Hill seismic monitor.
OFFICE OF THE LEGISLATIVE FISCAL ANALYST - 7 - CAPITOL PRESERVATION BOARD
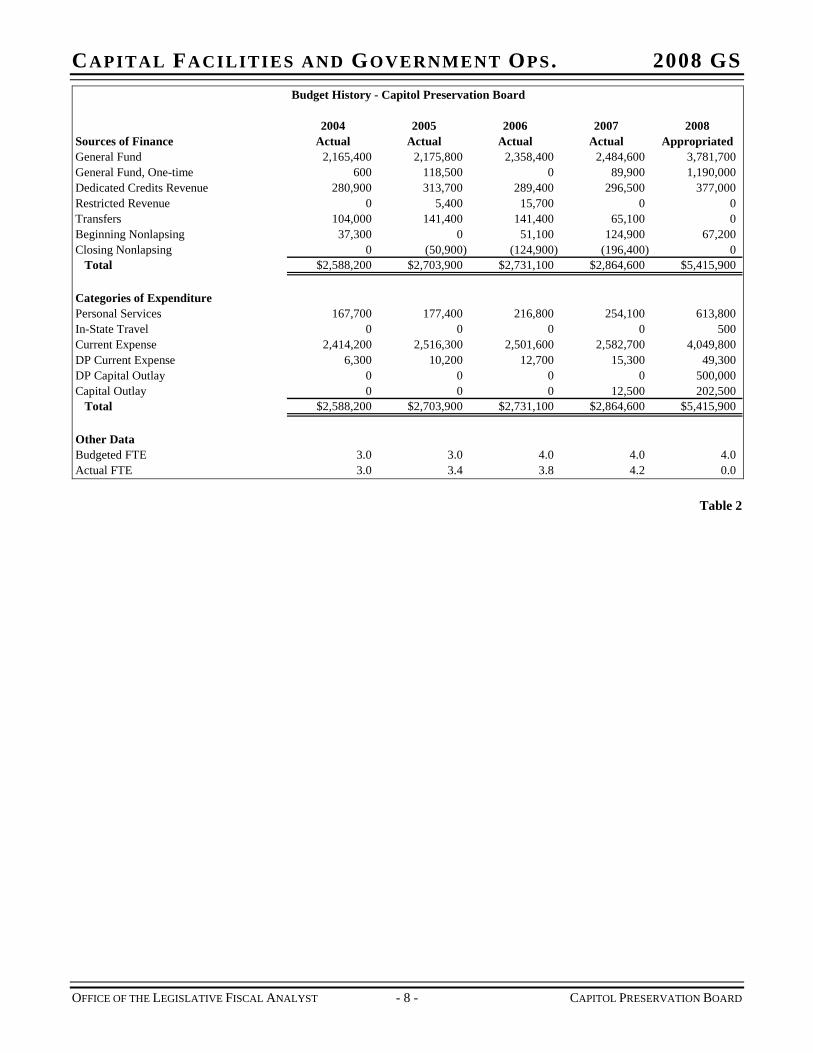
CAPITAL FACILITIES AND GOVERNMENT OPS. 2008 GS Budget History - Capitol Preservation Board
2004 2005 2006 2007 2008Sources of Finance Actual Actual Actual Actual AppropriatedGeneral Fund 2,165,400 2,175,800 2,358,400 2,484,600 3,781,700General Fund, One-time 600 118,500 0 89,900 1,190,000Dedicated Credits Revenue 280,900 313,700 289,400 296,500 377,000Restricted Revenue 0 5,400 15,700 0 0Transfers 104,000 141,400 141,400 65,100 0Beginning Nonlapsing 37,300 0 51,100 124,900 67,200Closing Nonlapsing 0 (50,900) (124,900) (196,400) 0
Total $2,588,200 $2,703,900 $2,731,100 $2,864,600 $5,415,900
Categories of ExpenditurePersonal Services 167,700 177,400 216,800 254,100 613,800In-State Travel 0 0 0 0 500Current Expense 2,414,200 2,516,300 2,501,600 2,582,700 4,049,800DP Current Expense 6,300 10,200 12,700 15,300 49,300DP Capital Outlay 0 0 0 0 500,000Capital Outlay 0 0 0 12,500 202,500
Total $2,588,200 $2,703,900 $2,731,100 $2,864,600 $5,415,900
Other DataBudgeted FTE 3.0 3.0 4.0 4.0 4.0Actual FTE 3.0 3.4 3.8 4.2 0.0
Table 2
OFFICE OF THE LEGISLATIVE FISCAL ANALYST - 8 - CAPITOL PRESERVATION BOARD
CAPITAL FACILITIES AND GOVERNMENT OPS. 2008 GS
OFFICE OF THE LEGISLATIVE FISCAL ANALYST - 9 - CAREER SERVICE REVIEW BOARD
CHAPTER 3 CAREER SERVICE REVIEW BOARD
Function The Career Service Review Board (CSRB) administers the state’s grievance and appeals process. Its policy is to resolve grievances at the lowest possible managerial level. It has hearing officers, is a quasi-judicial body, and hears final administrative appeals. The board hears cases related to decisions about promotions, dismissals, demotions, suspensions, written reprimands, wages, salary, violations of personnel rules, issues concerning the equitable administration of benefits, reductions in force, and disputes concerning abandonment of position. It has no jurisdiction over classification grievances and is required to send them to the Department of Human Resource Management.
The CSRB conducts pre-hearing conferences in an attempt to mediate many of the cases which come before them. When necessary however, they conduct jurisdictional, evidentiary, and appellate levels of adjudications as a means of resolving disputes.
The CSRB conducts hearings as efficiently as possible using hearing officers who are under contract. As such the only ongoing salary costs are for the administrator and a secretary to research, write and issue legal decisions.
Statutory Authority UCA 67-19a-101 defines “grievance” as a complaint by a career service employee concerning any matter touching upon the relationship between the employee and his/her employer; and any dispute between a career service employee and his/her employer.
UCA 67-19a-202 gives the board jurisdiction to serve as the final administrative body to review appeals from career service employees and agencies.
UCA 67-19a-204 requires the board to make rules governing the appeals process.
UCA 67-19a-204 requires the governor to appoint the administrator, who may assign hearing officers to each case, subpoena witnesses, documents and other evidence, and quash unreasonable subpoenas.
UCA 67-19a-303 spells out employees’ rights in a grievance and appeals procedure. Employees may have representation, use a reasonable amount of time during work hours to confer with the representative, and may not have reprisals taken against them for using grievance procedures.
UCA 67-19a-401 through 408 list the procedural steps to be followed by the employee and the employer, including the administrator’s power to require a pre-hearing conference.
Intent Language During the 2007 General Session the Legislature adopted the following intent language for FY 2007 in S.B. 1:
Under Section 63-38-8.1 of the Utah Code the Legislature intends that up to $5,000 provided by Item 44, Chapter 1, and Item 46,
CAPITAL FACILITIES AND GOVERNMENT OPS. 2008 GS Chapter 366, Laws of Utah 2006 not lapse at the close of Fiscal Year 2007. The use of nonlapsing funds is limited to grievance resolution.
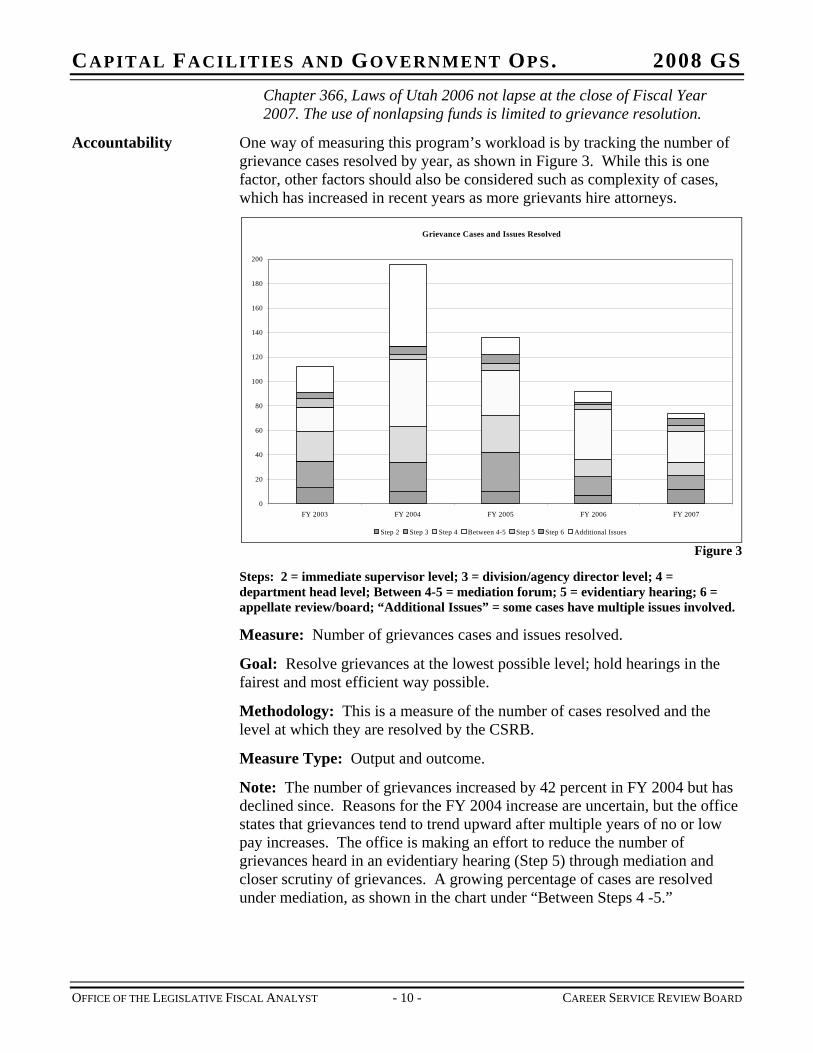
Accountability One way of measuring this program’s workload is by tracking the number of grievance cases resolved by year, as shown in Figure 3. While this is one factor, other factors should also be considered such as complexity of cases, which has increased in recent years as more grievants hire attorneys.
Grievance Cases and Issues Resolved
0
20
40
60
80
100
120
140
160
180
200
FY 2003 FY 2004 FY 2005 FY 2006 FY 2007
Step 2 Step 3 Step 4 Between 4-5 Step 5 Step 6 Additional Issues Figure 3
Steps: 2 = immediate supervisor level; 3 = division/agency director level; 4 = department head level; Between 4-5 = mediation forum; 5 = evidentiary hearing; 6 = appellate review/board; “Additional Issues” = some cases have multiple issues involved.
Measure: Number of grievances cases and issues resolved.
Goal: Resolve grievances at the lowest possible level; hold hearings in the fairest and most efficient way possible.
Methodology: This is a measure of the number of cases resolved and the level at which they are resolved by the CSRB.
Measure Type: Output and outcome.
Note: The number of grievances increased by 42 percent in FY 2004 but has declined since. Reasons for the FY 2004 increase are uncertain, but the office states that grievances tend to trend upward after multiple years of no or low pay increases. The office is making an effort to reduce the number of grievances heard in an evidentiary hearing (Step 5) through mediation and closer scrutiny of grievances. A growing percentage of cases are resolved under mediation, as shown in the chart under “Between Steps 4 -5.”
OFFICE OF THE LEGISLATIVE FISCAL ANALYST - 10 - CAREER SERVICE REVIEW BOARD
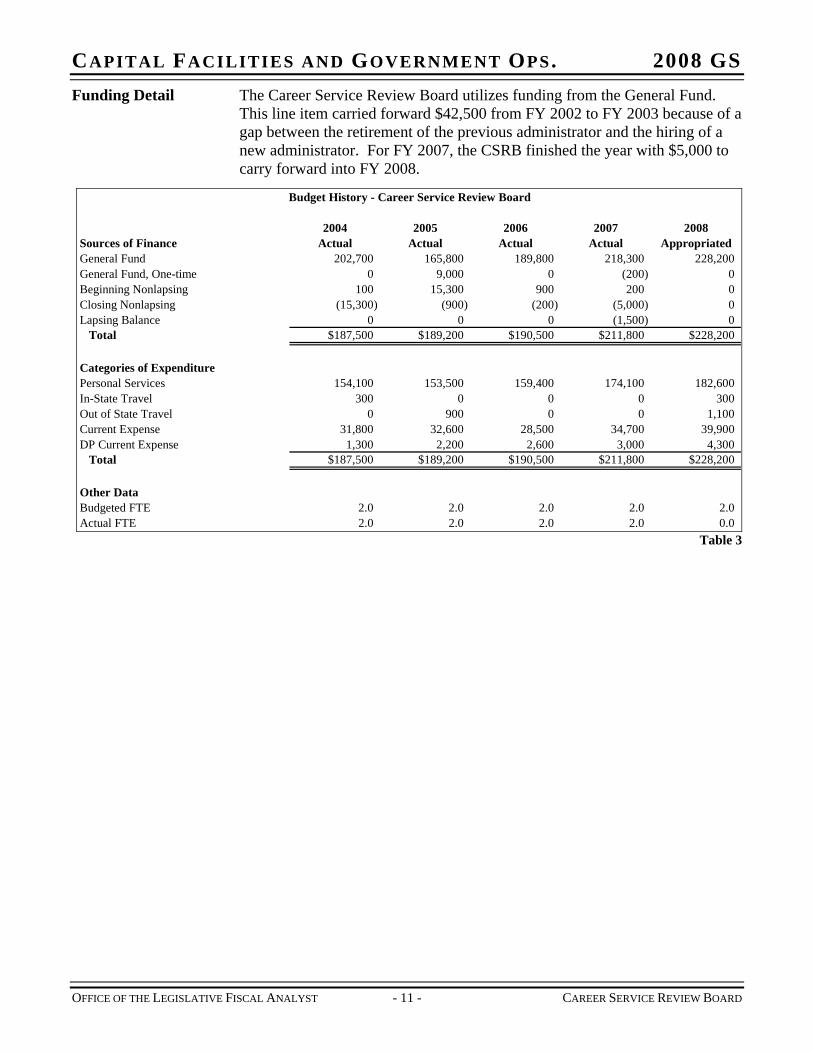
CAPITAL FACILITIES AND GOVERNMENT OPS. 2008 GS Funding Detail The Career Service Review Board utilizes funding from the General Fund.
This line item carried forward $42,500 from FY 2002 to FY 2003 because of a gap between the retirement of the previous administrator and the hiring of a new administrator. For FY 2007, the CSRB finished the year with $5,000 to carry forward into FY 2008.
Budget History - Career Service Review Board
2004 2005 2006 2007 2008Sources of Finance Actual Actual Actual Actual AppropriatedGeneral Fund 202,700 165,800 189,800 218,300 228,200General Fund, One-time 0 9,000 0 (200) 0Beginning Nonlapsing 100 15,300 900 200 0Closing Nonlapsing (15,300) (900) (200) (5,000) 0Lapsing Balance 0 0 0 (1,500) 0
Total $187,500 $189,200 $190,500 $211,800 $228,200
Categories of ExpenditurePersonal Services 154,100 153,500 159,400 174,100 182,600In-State Travel 300 0 0 0 300Out of State Travel 0 900 0 0 1,100Current Expense 31,800 32,600 28,500 34,700 39,900DP Current Expense 1,300 2,200 2,600 3,000 4,300
Total $187,500 $189,200 $190,500 $211,800 $228,200
Other DataBudgeted FTE 2.0 2.0 2.0 2.0 2.0Actual FTE 2.0 2.0 2.0 2.0 0.0
Table 3
OFFICE OF THE LEGISLATIVE FISCAL ANALYST - 11 - CAREER SERVICE REVIEW BOARD

CAPITAL FACILITIES AND GOVERNMENT OPS. 2008 GS
OFFICE OF THE LEGISLATIVE FISCAL ANALYST - 13 - DAS APPROPRIATED BUDGETS SUMMARY
CHAPTER 4 DEPARTMENT OF ADMINISTRATIVE SERVICES – APPROPRIATED BUDGETS SUMMARY
Function The Department of Administrative Services (DAS) was created in 1981 by the Utah Administrative Services Act. Current statute (UCA 63A-1-102) sets forth seven purposes for the department:
1. Provide specialized agency support services commonly needed;
2. Provide effective, coordinated management of state administrative services;
3. Serve the public interest by providing services in a cost-effective and efficient manner, eliminating unnecessary duplication;
4. Enable administrators to respond effectively to technological improvements;
5. Emphasize the service role of state administrative service agencies in meeting the needs of user agencies;
6. Use flexibility in meeting the service needs of state agencies;
7. Protect the public interest by insuring the integrity of the fiscal accounting procedures and policies that govern the operation of agencies and institutions to assure funds are expended properly and lawfully.
Funding Detail The following table is a five-year summary of the appropriated fund line items under DAS. More information can be found by looking at each line item.
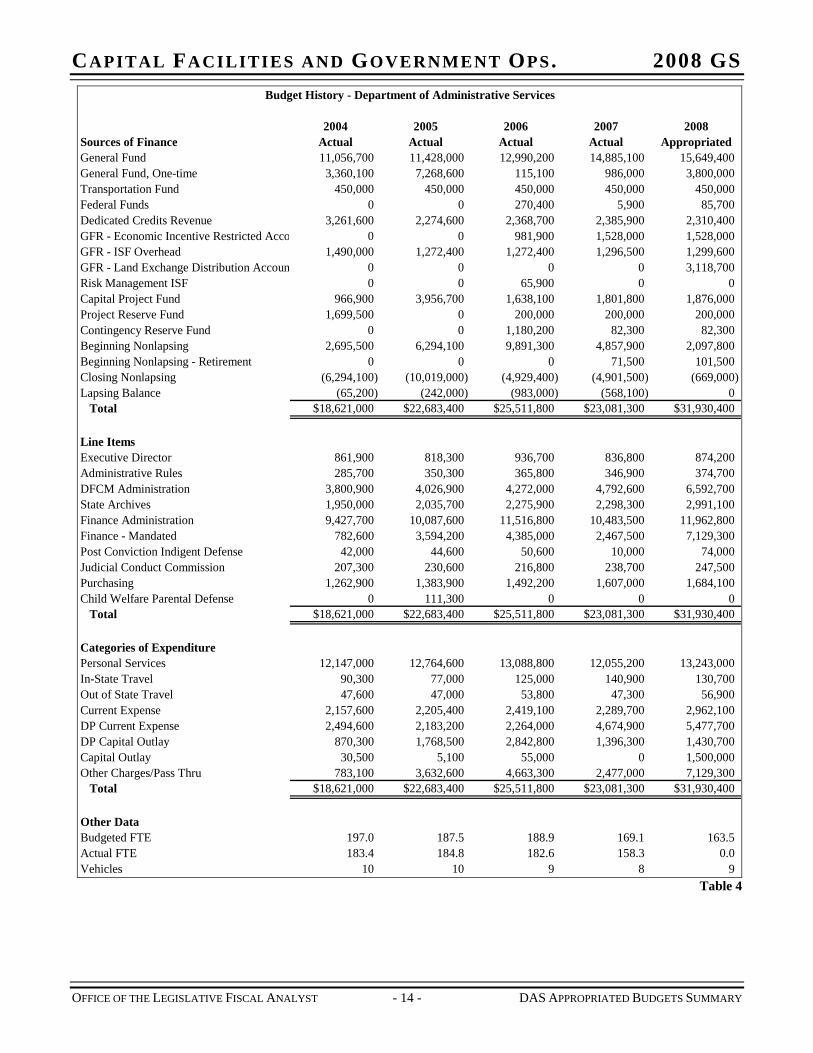
CAPITAL FACILITIES AND GOVERNMENT OPS. 2008 GS Budget History - Department of Administrative Services
2004 2005 2006 2007 2008Sources of Finance Actual Actual Actual Actual AppropriatedGeneral Fund 11,056,700 11,428,000 12,990,200 14,885,100 15,649,400General Fund, One-time 3,360,100 7,268,600 115,100 986,000 3,800,000Transportation Fund 450,000 450,000 450,000 450,000 450,000Federal Funds 0 0 270,400 5,900 85,700Dedicated Credits Revenue 3,261,600 2,274,600 2,368,700 2,385,900 2,310,400GFR - Economic Incentive Restricted Acco 0 0 981,900 1,528,000 1,528,000GFR - ISF Overhead 1,490,000 1,272,400 1,272,400 1,296,500 1,299,600GFR - Land Exchange Distribution Accoun 0 0 0 0 3,118,700Risk Management ISF 0 0 65,900 0 0Capital Project Fund 966,900 3,956,700 1,638,100 1,801,800 1,876,000Project Reserve Fund 1,699,500 0 200,000 200,000 200,000Contingency Reserve Fund 0 0 1,180,200 82,300 82,300Beginning Nonlapsing 2,695,500 6,294,100 9,891,300 4,857,900 2,097,800Beginning Nonlapsing - Retirement 0 0 0 71,500 101,500Closing Nonlapsing (6,294,100) (10,019,000) (4,929,400) (4,901,500) (669,000)Lapsing Balance (65,200) (242,000) (983,000) (568,100) 0
Total $18,621,000 $22,683,400 $25,511,800 $23,081,300 $31,930,400
Line ItemsExecutive Director 861,900 818,300 936,700 836,800 874,200Administrative Rules 285,700 350,300 365,800 346,900 374,700DFCM Administration 3,800,900 4,026,900 4,272,000 4,792,600 6,592,700State Archives 1,950,000 2,035,700 2,275,900 2,298,300 2,991,100Finance Administration 9,427,700 10,087,600 11,516,800 10,483,500 11,962,800Finance - Mandated 782,600 3,594,200 4,385,000 2,467,500 7,129,300Post Conviction Indigent Defense 42,000 44,600 50,600 10,000 74,000Judicial Conduct Commission 207,300 230,600 216,800 238,700 247,500Purchasing 1,262,900 1,383,900 1,492,200 1,607,000 1,684,100Child Welfare Parental Defense 0 111,300 0 0 0
Total $18,621,000 $22,683,400 $25,511,800 $23,081,300 $31,930,400
Categories of ExpenditurePersonal Services 12,147,000 12,764,600 13,088,800 12,055,200 13,243,000In-State Travel 90,300 77,000 125,000 140,900 130,700Out of State Travel 47,600 47,000 53,800 47,300 56,900Current Expense 2,157,600 2,205,400 2,419,100 2,289,700 2,962,100DP Current Expense 2,494,600 2,183,200 2,264,000 4,674,900 5,477,700DP Capital Outlay 870,300 1,768,500 2,842,800 1,396,300 1,430,700Capital Outlay 30,500 5,100 55,000 0 1,500,000Other Charges/Pass Thru 783,100 3,632,600 4,663,300 2,477,000 7,129,300
Total $18,621,000 $22,683,400 $25,511,800 $23,081,300 $31,930,400
Other DataBudgeted FTE 197.0 187.5 188.9 169.1 163.5Actual FTE 183.4 184.8 182.6 158.3 0.0Vehicles 10 10 9 8 9
Table 4
OFFICE OF THE LEGISLATIVE FISCAL ANALYST - 14 - DAS APPROPRIATED BUDGETS SUMMARY
CAPITAL FACILITIES AND GOVERNMENT OPS. 2008 GS
OFFICE OF THE LEGISLATIVE FISCAL ANALYST - 15 - DAS EXECUTIVE DIRECTOR’S OFFICE
CHAPTER 5 EXECUTIVE DIRECTOR’S OFFICE
Function The Executive Director's Office (EDO) provides financial management, strategic planning, organizational development, internal auditing and public relations for the Department of Administrative Services. While the client base for most state agencies is taxpayers, the primary customers for the Department of Administrative Services are other state agencies. The director helps coordinate inter-agency cooperation on issues such as fleet consolidation, archival procedures and purchasing guidelines.
The auditing staff within EDO provides information that is valuable not only to the director, but also to the Legislature and its staff.
Statutory Authority The following laws govern operation of the EDO:
UCA 63A is the “Utah Administrative Services Code”
UCA 63A-1-105 requires the governor to appoint the executive director with the consent of the Senate
UCA 63A-1-105.5 gives the executive director rulemaking authority
UCA 63A-1-106 allows the executive director to accept federal funds and bind the state to the terms of federal assistance
UCA 63A-1-107 requires the executive director to provide administrative support to the State Building Board and State Building Ownership Authority
UCA 63A-1-111 requires each division of DAS to formulate annual service plans describing services to be rendered, methods of providing those services, standards of performance, and performance measures used to gauge compliance with those standards. A copy must be sent to each customer agency before the beginning of each fiscal year.
UCA 63A-1-112 prohibits the issuance of certificates of participation for capital projects by the department or any other state agency without prior legislative approval
UCA 63A-1-114 creates the ISF Rate Committee and requires the executive director or a designee to be a member
UCA 63A-9-301 requires the executive director or a designee to sit on the Motor Vehicle Review Committee
Intent Language During the 2007 General Session the Legislature adopted the following intent language for FY 2007 in S.B. 1:
Under Section 63-38-8.1 of the Utah Code the Legislature intends that up to $75,000 provided by Item 33, Chapter 1, and Item 35, Chapter 366, Laws of Utah 2006 not lapse at the close of Fiscal Year 2007. The use of nonlapsing funds is limited to: current expenses - up to $50,000; child welfare parental defense contracting - up to $25,000.
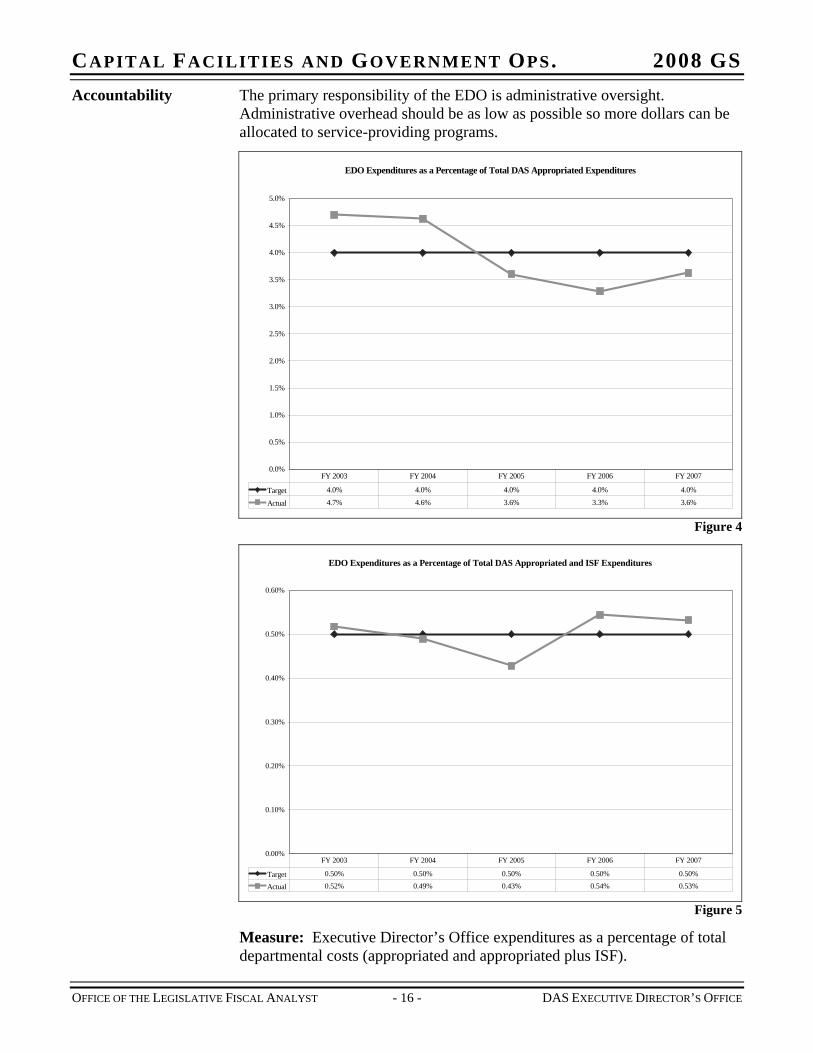
CAPITAL FACILITIES AND GOVERNMENT OPS. 2008 GS Accountability The primary responsibility of the EDO is administrative oversight.
Administrative overhead should be as low as possible so more dollars can be allocated to service-providing programs.
EDO Expenditures as a Percentage of Total DAS Appropriated Expenditures
0.0%
0.5%
1.0%
1.5%
2.0%
2.5%
3.0%
3.5%
4.0%
4.5%
5.0%
Target 4.0% 4.0% 4.0% 4.0% 4.0%
Actual 4.7% 4.6% 3.6% 3.3% 3.6%
FY 2003 FY 2004 FY 2005 FY 2006 FY 2007
Figure 4
EDO Expenditures as a Percentage of Total DAS Appropriated and ISF Expenditures
0.00%
0.10%
0.20%
0.30%
0.40%
0.50%
0.60%
Target 0.50% 0.50% 0.50% 0.50% 0.50%
Actual 0.52% 0.49% 0.43% 0.54% 0.53%
FY 2003 FY 2004 FY 2005 FY 2006 FY 2007
Figure 5
Measure: Executive Director’s Office expenditures as a percentage of total departmental costs (appropriated and appropriated plus ISF).
OFFICE OF THE LEGISLATIVE FISCAL ANALYST - 16 - DAS EXECUTIVE DIRECTOR’S OFFICE
CAPITAL FACILITIES AND GOVERNMENT OPS. 2008 GS
OFFICE OF THE LEGISLATIVE FISCAL ANALYST - 17 - DAS EXECUTIVE DIRECTOR’S OFFICE
Goal: Administrative overhead should be as low as possible (below four percent of total expenditures for DAS appropriated entities, and below 0.5 percent of total expenditures for DAS appropriated and ISF entities combined) so more dollars can be allocated to service-providing programs.
Methodology: This measure is a calculation of the Executive Director’s expenditures divided by the total departmental costs.
Measure Type: Efficiency.
Notes: In FY 2007 DEO expenditures remained the same while total expenditures declined for the DAS appropriated side and increased for the DAS internal service fund side.
Funding Detail In FY 2006 the line item received an additional $125,000 General Fund from the transfer of the Office of Child Welfare Parental Defense (thus closing the office) to the EDO for contract oversight.
In FY 2007 two significant changes occurred in the Executive Director’s Office. First, creation of the Department of Human Resource Management (DHRM) internal service fund resulted in a transfer of three FTE from the EDO to DHRM. Second, the loss of Division of Information Technology Services (ITS) to the new Department of Technology Services resulted in a loss of dedicated credits revenue. With ITS (the largest ISF in department) moving to another department, the EDO will no longer oversee its operations nor collect the administrative fees.
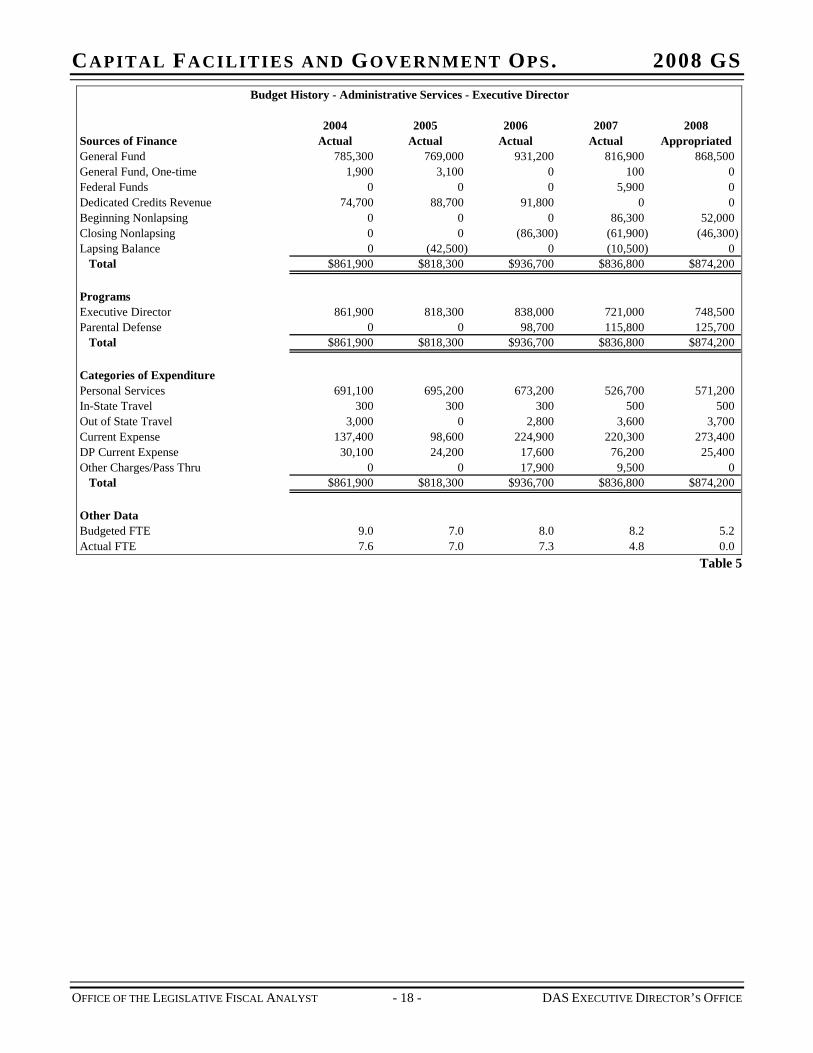
CAPITAL FACILITIES AND GOVERNMENT OPS. 2008 GS Budget History - Administrative Services - Executive Director
2004 2005 2006 2007 2008Sources of Finance Actual Actual Actual Actual AppropriatedGeneral Fund 785,300 769,000 931,200 816,900 868,500General Fund, One-time 1,900 3,100 0 100 0Federal Funds 0 0 0 5,900 0Dedicated Credits Revenue 74,700 88,700 91,800 0 0Beginning Nonlapsing 0 0 0 86,300 52,000Closing Nonlapsing 0 0 (86,300) (61,900) (46,300)Lapsing Balance 0 (42,500) 0 (10,500) 0
Total $861,900 $818,300 $936,700 $836,800 $874,200
ProgramsExecutive Director 861,900 818,300 838,000 721,000 748,500Parental Defense 0 0 98,700 115,800 125,700
Total $861,900 $818,300 $936,700 $836,800 $874,200
Categories of ExpenditurePersonal Services 691,100 695,200 673,200 526,700 571,200In-State Travel 300 300 300 500 500Out of State Travel 3,000 0 2,800 3,600 3,700Current Expense 137,400 98,600 224,900 220,300 273,400DP Current Expense 30,100 24,200 17,600 76,200 25,400Other Charges/Pass Thru 0 0 17,900 9,500 0
Total $861,900 $818,300 $936,700 $836,800 $874,200
Other DataBudgeted FTE 9.0 7.0 8.0 8.2 5.2Actual FTE 7.6 7.0 7.3 4.8 0.0
Table 5
OFFICE OF THE LEGISLATIVE FISCAL ANALYST - 18 - DAS EXECUTIVE DIRECTOR’S OFFICE
CAPITAL FACILITIES AND GOVERNMENT OPS. 2008 GS PROGRAMS – EXECUTIVE DIRECTOR’S OFFICE
EXECUTIVE DIRECTOR
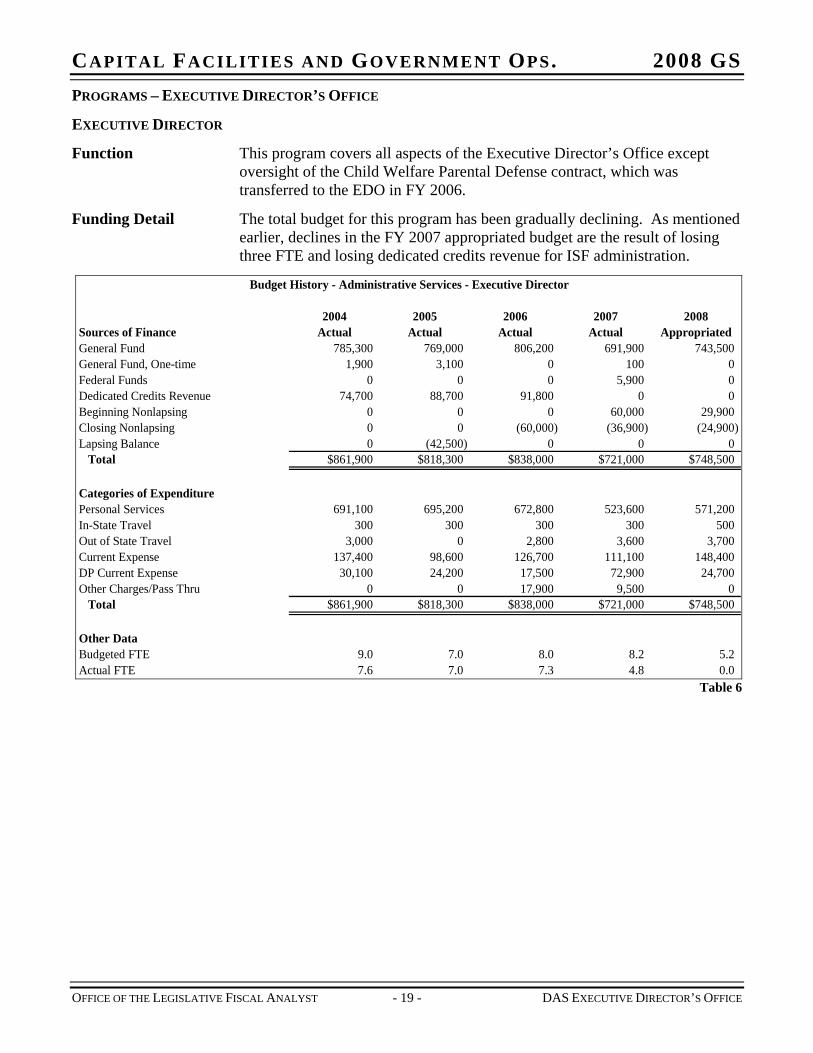
Function This program covers all aspects of the Executive Director’s Office except oversight of the Child Welfare Parental Defense contract, which was transferred to the EDO in FY 2006.
Funding Detail The total budget for this program has been gradually declining. As mentioned earlier, declines in the FY 2007 appropriated budget are the result of losing three FTE and losing dedicated credits revenue for ISF administration.
Budget History - Administrative Services - Executive Director
2004 2005 2006 2007 2008Sources of Finance Actual Actual Actual Actual AppropriatedGeneral Fund 785,300 769,000 806,200 691,900 743,500General Fund, One-time 1,900 3,100 0 100 0Federal Funds 0 0 0 5,900 0Dedicated Credits Revenue 74,700 88,700 91,800 0 0Beginning Nonlapsing 0 0 0 60,000 29,900Closing Nonlapsing 0 0 (60,000) (36,900) (24,900)Lapsing Balance 0 (42,500) 0 0 0
Total $861,900 $818,300 $838,000 $721,000 $748,500
Categories of ExpenditurePersonal Services 691,100 695,200 672,800 523,600 571,200In-State Travel 300 300 300 300 500Out of State Travel 3,000 0 2,800 3,600 3,700Current Expense 137,400 98,600 126,700 111,100 148,400DP Current Expense 30,100 24,200 17,500 72,900 24,700Other Charges/Pass Thru 0 0 17,900 9,500 0
Total $861,900 $818,300 $838,000 $721,000 $748,500
Other DataBudgeted FTE 9.0 7.0 8.0 8.2 5.2Actual FTE 7.6 7.0 7.3 4.8 0.0
Table 6
OFFICE OF THE LEGISLATIVE FISCAL ANALYST - 19 - DAS EXECUTIVE DIRECTOR’S OFFICE
CAPITAL FACILITIES AND GOVERNMENT OPS. 2008 GS
OFFICE OF THE LEGISLATIVE FISCAL ANALYST - 20 - DAS EXECUTIVE DIRECTOR’S OFFICE
CHILD WELFARE PARENTAL DEFENSE
Function House Bill 268 (2004 General Session) created the Office of Child Welfare Parental Defense and transferred ongoing funds from the Department of Human Services to the Child Welfare Parental Defense Fund line item.
During the 2005 Session the Legislature opted to outsource the services formerly provided by this program. Therefore the Legislature redirected the program’s budget to the DAS Executive Director’s Office for the purpose of overseeing the contract.
The office has the ability to contract with licensed attorneys to represent indigent parents, and to assist the attorneys in fulfilling their duties. The purpose is to strengthen the role of the parents’ attorney in juvenile court and to assist with family reunification. Typically, parents are under-represented in child custody hearings.
Statutory Authority The following statutes govern operation of the office:
UCA 63A-11-103 creates within the Department of Administrative Services the Office of Child Welfare Parental Defense
UCA 63A-11-104 requires the DAS executive director appoint an attorney as office director. However, if the DAS executive director does not appoint an office director, he/she becomes the office director.
UCA 63A-11-105 gives the office the following duties:
8. Provide assistance and advice to parental defense attorneys.
9. Develop and provide education and training programs to parental defense attorneys
10. Provide information and advice to help parental defense attorneys meet their professional, contractual, and ethical duties.
UCA 63A-11-106 requires the director to report by October 1st each year to the governor and Child Welfare Legislative Oversight Panel regarding the preceding fiscal year of operations, and submit a budget for the upcoming fiscal year.
UCA 63A-11-201 allows the office to contract with a qualified attorney to defend an indigent parent. Payment shall come from the Child Welfare Parental Defense Fund.
UCA 63A-11-202 outlines the duties of a contracted parental defense attorney.
UCA 63A-11-203 creates the nonlapsing Child Welfare Parental Defense Fund.
UCA 63A-11-204 allows counties to annually enter into written agreement with the office to provide for payment of parental defense attorney costs out of the fund.
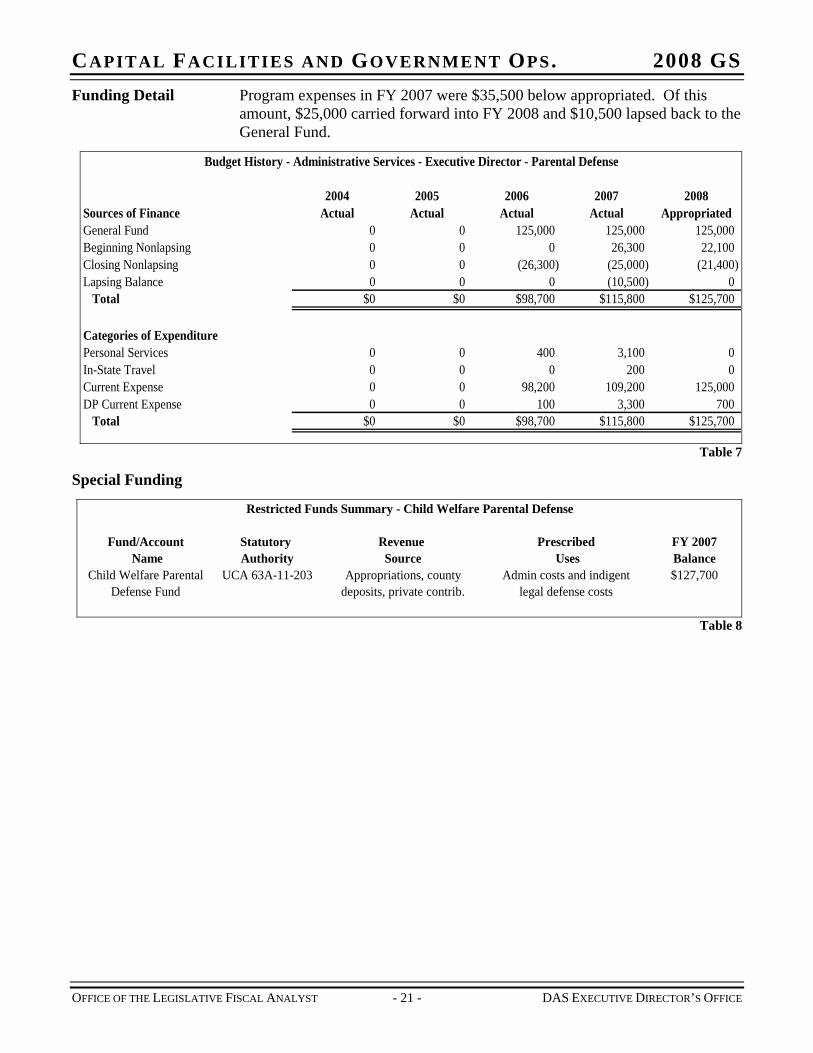
CAPITAL FACILITIES AND GOVERNMENT OPS. 2008 GS Funding Detail Program expenses in FY 2007 were $35,500 below appropriated. Of this
amount, $25,000 carried forward into FY 2008 and $10,500 lapsed back to the General Fund.
Budget History - Administrative Services - Executive Director - Parental Defense
2004 2005 2006 2007 2008Sources of Finance Actual Actual Actual Actual AppropriatedGeneral Fund 0 0 125,000 125,000 125,000Beginning Nonlapsing 0 0 0 26,300 22,100Closing Nonlapsing 0 0 (26,300) (25,000) (21,400)Lapsing Balance 0 0 0 (10,500) 0
Total $0 $0 $98,700 $115,800 $125,700
Categories of ExpenditurePersonal Services 0 0 400 3,100 0In-State Travel 0 0 0 200 0Current Expense 0 0 98,200 109,200 125,000DP Current Expense 0 0 100 3,300 700
Total $0 $0 $98,700 $115,800 $125,700
Table 7
Special Funding
Restricted Funds Summary - Child Welfare Parental Defense
Fund/Account Statutory Revenue Prescribed FY 2007 Name Authority Source Uses Balance
Child Welfare Parental UCA 63A-11-203 Appropriations, county Admin costs and indigent $127,700 Defense Fund deposits, private contrib. legal defense costs
Table 8
OFFICE OF THE LEGISLATIVE FISCAL ANALYST - 21 - DAS EXECUTIVE DIRECTOR’S OFFICE

CAPITAL FACILITIES AND GOVERNMENT OPS. 2008 GS
OFFICE OF THE LEGISLATIVE FISCAL ANALYST - 23 - DAS ADMINISTRATIVE RULES
CHAPTER 6 DIVISION OF ADMINISTRATIVE RULES
Function The Division of Administrative Rules establishes procedures for administrative rulemaking, records administrative rules, and makes administrative rules available to the public. As a member of the Department of Administrative Services, the division administers the Utah Administrative Rulemaking Act and ensures state agencies comply with filing, publication and hearing procedures. To accomplish these mandates, the division provides training to agency rule writers and administrators, performs individual consultations, publishes a periodic newsletter and distributes the Rulewriting Manual for Utah. The division also provides regular notices to agencies of rules due for five-year review, rules about to expire, or rules about to lapse.
Statutory Authority The Utah Administrative Rulemaking Act is codified as UCA 63-46a and outlines the rulemaking process.
UCA 63-46a-2 defines a “rule” as an agency’s written statement that is explicitly or implicitly required by law, implements or interprets a state or federal mandate, and applies to a class of persons or another agency.
UCA 63-46a-3 requires each agency to maintain a current version of its rules and make it available to the public. Each agency must make rules when agency action authorizes or prohibits an action, provides or prohibits a material benefit, applies to a class of persons or another agency, and is explicitly or implicitly authorized by statute.
UCA 63-46a-3.5 gives agency rules the effect of law if they are properly established.
UCA 63-46a-4 outlines the proper rulemaking procedure. Subsection (3) requires each agency to develop flexible approaches in its rulemaking that meet the agency needs and involve the people affected by the rules. Subsection (4)(a) requires each agency to file its proposed rule and rule analysis with the Division of Administrative Rules.
The division must publish the rule and rule analysis in its bulletin. The rule analysis must comment on anticipated costs or savings to governments and citizens.
UCA 63-46a-7 allows for emergency rulemaking in extreme cases. These rules are effective for 120 days
UCA 63-46a-9.5 creates the Division of Administrative Rules within the Department of Administrative Services.
UCA 63-46a-9.6 requires the division to maintain the official compilation of the Utah Administrative Code and be the repository for administrative rules.
UCA 63-46a-10 charges the division with the responsibility of regulating the filing, publishing, and hearing of proposed rules. It also
CAPITAL FACILITIES AND GOVERNMENT OPS. 2008 GS
OFFICE OF THE LEGISLATIVE FISCAL ANALYST - 24 - DAS ADMINISTRATIVE RULES
requires the division to publish effective rules and proposed rule changes through two primary publications: the Utah Administrative Code and the Utah State Bulletin. All funds appropriated or collected for publishing these publications are made nonlapsing.
UCA 63-46a-11 creates a legislative Administrative Rules Review Committee to exercise continuous oversight of the rulemaking process.
The Utah State Bulletin acts as state government’s main means of notifying the public of rules being proposed by state agencies as well as the basic tool for soliciting public comment. The Bulletin, issued electronically on the first and fifteenth each month, is Utah's version of the Federal Register. In addition to proposed rules, the Bulletin includes emergency rules, notices of five-year reviews, effective notices, other public notices from state agencies, indexes of effective rules, and executive orders.
The Utah Administrative Code provides a unified source for effective rules with which state government, local entities and citizens are required to comply. The Code is Utah's version of the Code of Federal Regulations. The Code is available electronically over the Internet. Print and CD-ROM versions are available from private source vendors. In addition to effective rules, the printed Code contains research aids such as indexes, tables that correlate statutes and rules, case annotations, and history notes.
Accountability Administrative rules have the effect of law – implying that they might have a fiscal impact on state government or on citizens and businesses. The division enacted amendments to Section R15-4-10, outlining the detail necessary in answering the budget-related questions required by law. Further, UCA 63-46a-11 creates an Administrative Rules Review Committee to exercise continuous oversight of the rulemaking process.
The following three measures are used to gauge the division’s ability to disseminate accurate rules in a timely manner.
CAPITAL FACILITIES AND GOVERNMENT OPS. 2008 GS
Percent of Administrative Rule Filings Requiring Correction
0%
5%
10%
15%
20%
25%
30%
35%
40%
45%
50%
Target 10% 10% 10%
Actual 27% 42% 46% 41% 30%
FY 2003 FY 2004 FY 2005 FY 2006 FY 2007
Figure 6
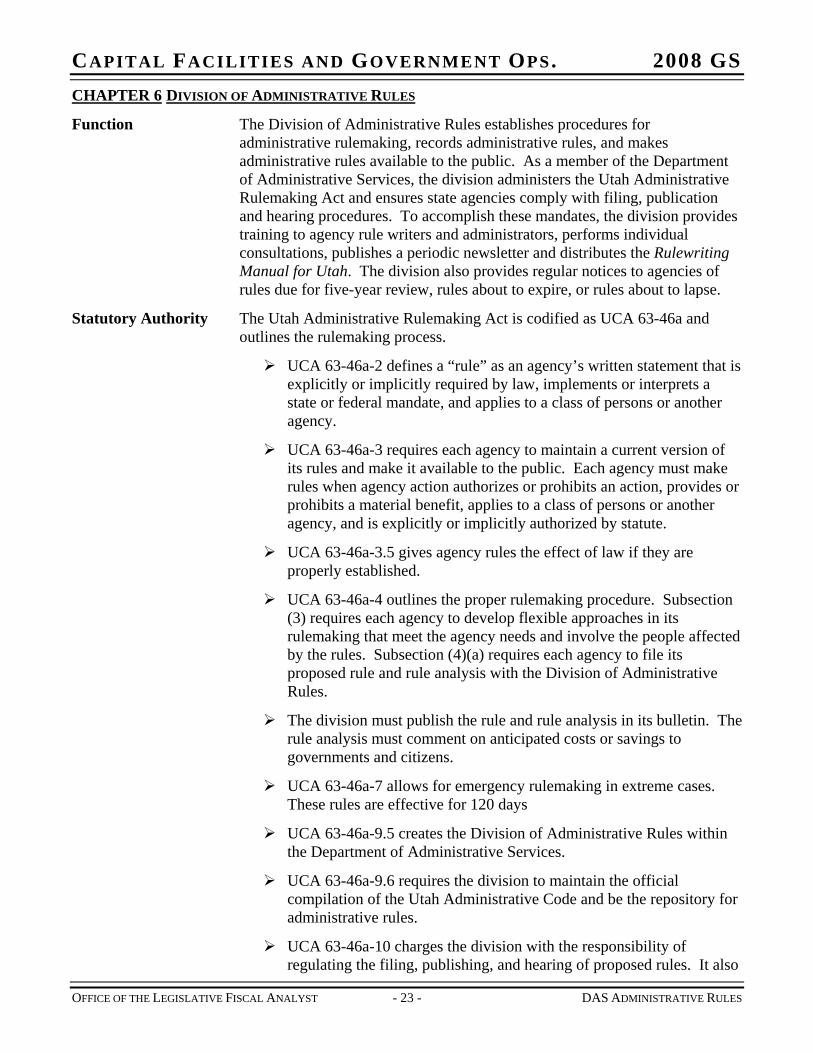
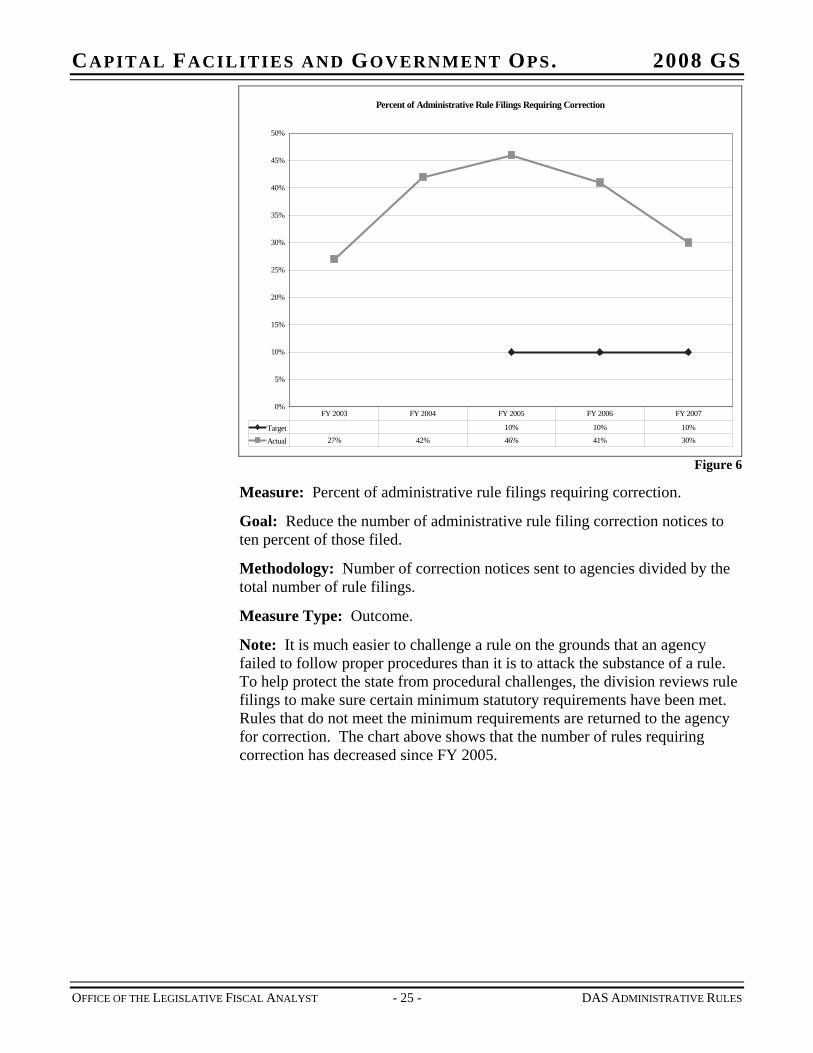
Measure: Percent of administrative rule filings requiring correction.
Goal: Reduce the number of administrative rule filing correction notices to ten percent of those filed.
Methodology: Number of correction notices sent to agencies divided by the total number of rule filings.
Measure Type: Outcome.
Note: It is much easier to challenge a rule on the grounds that an agency failed to follow proper procedures than it is to attack the substance of a rule. To help protect the state from procedural challenges, the division reviews rule filings to make sure certain minimum statutory requirements have been met. Rules that do not meet the minimum requirements are returned to the agency for correction. The chart above shows that the number of rules requiring correction has decreased since FY 2005.
OFFICE OF THE LEGISLATIVE FISCAL ANALYST - 25 - DAS ADMINISTRATIVE RULES

CAPITAL FACILITIES AND GOVERNMENT OPS. 2008 GS
Average Time to Update the Utah Administrative Code on the Web
0
10
20
30
40
50
60
70
80
90
100
Target 0 0 0
Actual 74 86 36 16 2
FY 2003 FY 2004 FY 2005 FY 2006 FY 2007
Figure 7
Measure: Average number of days to update the Utah Administrative Code (UAC) on the Web.
Goal: Reduce the average time between the tenth day of the month and the actual availability of the UAC on the Web. Anything after the tenth of the month is considered late. Target is zero days late.
Methodology: The division records the date on which UAC monthly updates are posted on the Web. These monthly figures are averaged over the fiscal year.
Measure Type: Outcome.
Note: Timely availability of the UAC (effective rules) plays a critical role in how Utah’s regulatory system works. Public access to administrative rules increases the likelihood of compliance. Public access also provides citizens with an understanding of government’s expectations and requirements. Being informed, citizens can then act accordingly or recommend changes to rules.
OFFICE OF THE LEGISLATIVE FISCAL ANALYST - 26 - DAS ADMINISTRATIVE RULES
CAPITAL FACILITIES AND GOVERNMENT OPS. 2008 GS
Average Number of Rules by Fiscal Year
1,550
1,600
1,650
1,700
1,750
1,800
1,850
1,900
FY97 FY98 FY99 FY00 FY01 FY02 FY03 FY04 FY05 FY06 FY07
Figure 8
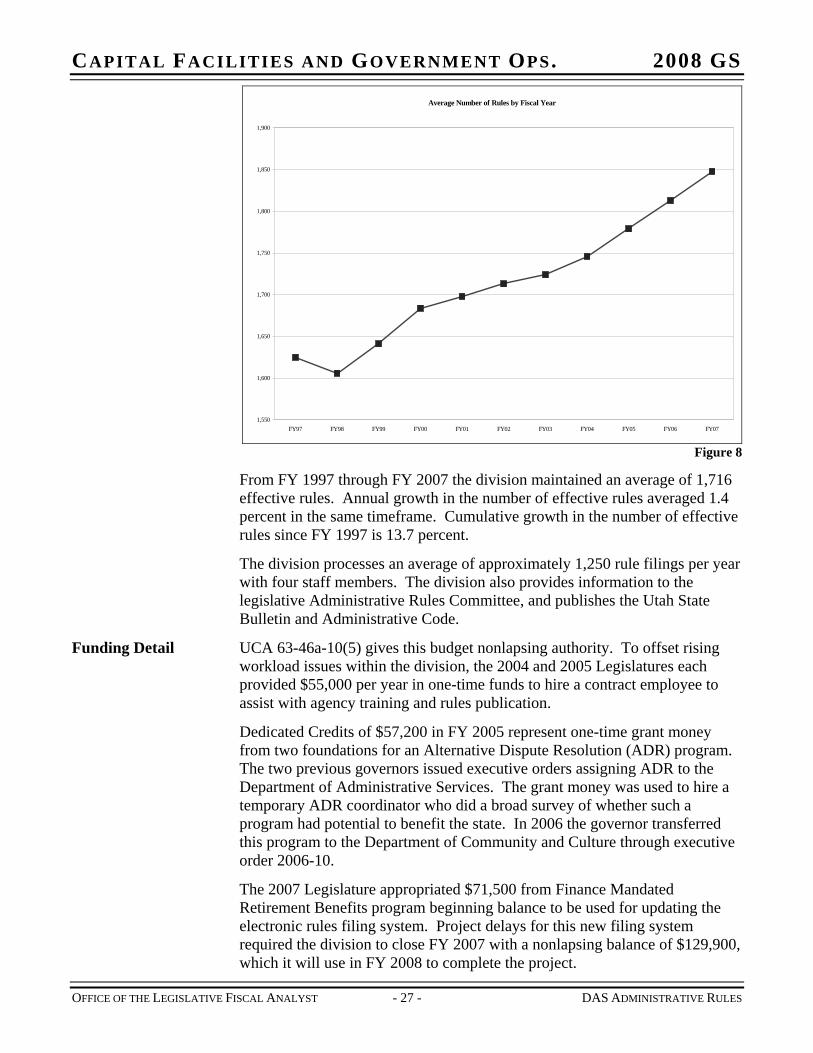
From FY 1997 through FY 2007 the division maintained an average of 1,716 effective rules. Annual growth in the number of effective rules averaged 1.4 percent in the same timeframe. Cumulative growth in the number of effective rules since FY 1997 is 13.7 percent.
The division processes an average of approximately 1,250 rule filings per year with four staff members. The division also provides information to the legislative Administrative Rules Committee, and publishes the Utah State Bulletin and Administrative Code.
Funding Detail UCA 63-46a-10(5) gives this budget nonlapsing authority. To offset rising workload issues within the division, the 2004 and 2005 Legislatures each provided $55,000 per year in one-time funds to hire a contract employee to assist with agency training and rules publication.
Dedicated Credits of $57,200 in FY 2005 represent one-time grant money from two foundations for an Alternative Dispute Resolution (ADR) program. The two previous governors issued executive orders assigning ADR to the Department of Administrative Services. The grant money was used to hire a temporary ADR coordinator who did a broad survey of whether such a program had potential to benefit the state. In 2006 the governor transferred this program to the Department of Community and Culture through executive order 2006-10.
The 2007 Legislature appropriated $71,500 from Finance Mandated Retirement Benefits program beginning balance to be used for updating the electronic rules filing system. Project delays for this new filing system required the division to close FY 2007 with a nonlapsing balance of $129,900, which it will use in FY 2008 to complete the project.
OFFICE OF THE LEGISLATIVE FISCAL ANALYST - 27 - DAS ADMINISTRATIVE RULES
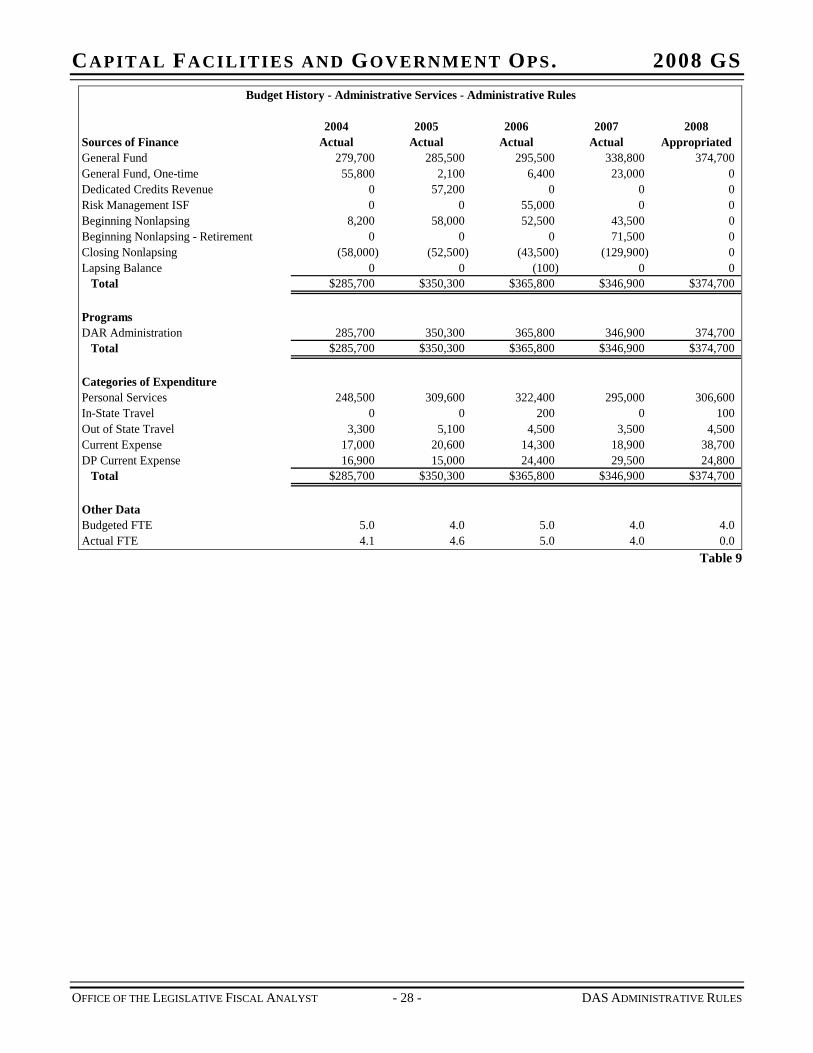
CAPITAL FACILITIES AND GOVERNMENT OPS. 2008 GS Budget History - Administrative Services - Administrative Rules
2004 2005 2006 2007 2008Sources of Finance Actual Actual Actual Actual AppropriatedGeneral Fund 279,700 285,500 295,500 338,800 374,700General Fund, One-time 55,800 2,100 6,400 23,000 0Dedicated Credits Revenue 0 57,200 0 0 0Risk Management ISF 0 0 55,000 0 0Beginning Nonlapsing 8,200 58,000 52,500 43,500 0Beginning Nonlapsing - Retirement 0 0 0 71,500 0Closing Nonlapsing (58,000) (52,500) (43,500) (129,900) 0Lapsing Balance 0 0 (100) 0 0
Total $285,700 $350,300 $365,800 $346,900 $374,700
ProgramsDAR Administration 285,700 350,300 365,800 346,900 374,700
Total $285,700 $350,300 $365,800 $346,900 $374,700
Categories of ExpenditurePersonal Services 248,500 309,600 322,400 295,000 306,600In-State Travel 0 0 200 0 100Out of State Travel 3,300 5,100 4,500 3,500 4,500Current Expense 17,000 20,600 14,300 18,900 38,700DP Current Expense 16,900 15,000 24,400 29,500 24,800
Total $285,700 $350,300 $365,800 $346,900 $374,700
Other DataBudgeted FTE 5.0 4.0 5.0 4.0 4.0Actual FTE 4.1 4.6 5.0 4.0 0.0
Table 9
OFFICE OF THE LEGISLATIVE FISCAL ANALYST - 28 - DAS ADMINISTRATIVE RULES
CAPITAL FACILITIES AND GOVERNMENT OPS. 2008 GS
OFFICE OF THE LEGISLATIVE FISCAL ANALYST - 29 - DAS DFCM
CHAPTER 7 DIVISION OF FACILITIES CONSTRUCTION AND MANAGEMENT – ADMINISTRATION
Function The Division of Facilities Construction and Management (DFCM) is the building manager for all state owned facilities. The division is responsible for all aspects of construction for state buildings and assists the Building Board in developing its recommendations for capital development projects and in allocating capital improvement funds.
Statute (UCA 63A-5-104) defines “capital developments” as any of the following:
Remodeling, site, or utility projects with a total cost of $2,500,000 or more
New facility with total construction cost of $500,000 or more, regardless of funding source, or
Purchase of real property where an appropriation is requested
Statute defines “capital improvement” as any of the following:
Remodeling, alteration, replacement, repair, site, or utility improvement costing less than $2,500,000
New facility with total construction cost less than $500,000
As the State Building Manager, the Director of DFCM oversees the following activities:
Construction of state buildings
Space utilization studies
Establishment of statewide space standards
Agency and institution master planning
Staff support for the State Building Board
Lease administration
Statutory Authority As described in UCA 63A-5-Part 2, DFCM, under the general powers of the director, has the following broad responsibilities:
Exercise direct supervision over the design and construction of all new facilities, and all alterations, repairs, and improvements to existing facilities if the total project construction cost exceeds $100,000 regardless of funding source. Exceptions are made for the Capitol Preservation Board, research parks at the University of Utah and Utah State University, This is the Place State Park, other agencies to whom the Building Board may delegate such control on a project by project basis, and donated buildings on donated land for higher education whose maintenance will not require state funds.
CAPITAL FACILITIES AND GOVERNMENT OPS. 2008 GS
OFFICE OF THE LEGISLATIVE FISCAL ANALYST - 30 - DAS DFCM
Lease, in the name of the division, all real property space to be occupied by an agency.
Evaluate each lease under the division’s control to determine whether or not the lease is cost effective, sufficiently flexible, and competitive. Exception: The Board of Regents must establish its own written lease policies which must be followed by higher education institutions.
Recommend rules to the executive director for use and management of facilities and grounds owned or occupied by the state for use of its departments and agencies.
Supervise and control the allocation of space, in accordance with legislative directive, to the various state agencies. Exceptions are made for Capitol Hill facilities, legislative areas, judicial area, and public and higher education systems. In allocating space, the division must conduct studies to determine the actual needs of each agency.
Acquire and hold title to, in the name of the division, all real property, buildings, fixtures, or appurtenances owned by the state. The division does not need legislative approval for acquisitions that cost less than $250,000. However, the following agencies may hold title to any real property possessed by them:
-Office of Trust Administrator -Department of Transportation -Division of Forestry, Fire and State Lands -Department of Natural Resources -Utah National Guard -Any vocational center or other State Board of Education institution -Any institution of higher learning -USTAR Governing Authority -School and Institutional Trust Lands Administration
Implement the State Building Energy Efficiency Program
Collect and maintain all deeds, abstracts of title, and all other documents showing title to or interest in property belonging to the state, except higher education institutions and SITLA.
Direct or delegate maintenance and operations, preventive maintenance, and facility inspection programs for any agency except the Capitol Preservation Board and institutions of higher education.
Enter into contracts for any work or professional services which the division or the State Building Board may require.
Ensure that state-owned facilities, except Capitol Preservation Board facilities, are life cycle cost-effective. “Life cycle cost effective” is defined as the lowest cost of owning and operating a facility over a 25-year period.
CAPITAL FACILITIES AND GOVERNMENT OPS. 2008 GS
OFFICE OF THE LEGISLATIVE FISCAL ANALYST - 31 - DAS DFCM
Submit cost summary data for capital development and improvement projects to the Office of the Legislative Fiscal Analyst.
Notify local governments before constructing student housing on property owned by the state.
Supervise the expenditure of funds in providing plans, engineering specifications, sites, and construction of buildings as authorized by the Legislature.
Hold contingency and reserve funds set aside from construction projects.
Use one percent of the amount appropriated for construction of any new building for the Utah Percent-for-Art program.
Upon legislative approval, transfer $100,000 annually from project reserves to the General Fund to pay for personal service expenses associated with the management of construction projects.
Funding Detail During the 2002 General Session the Legislature shifted funding sources for DFCM Administration from the General Fund to the Project Reserve Fund, Contingency Reserve Fund and capital improvement funds. During the 2005 General Session the Legislature restored $1.1M in General Funds, and then another $1.1 million in the 2006 General Session, thereby completing the restoration of General Funds. Other funding sources include:
The Project Reserve Fund receives state funds resulting from construction bids coming in under the amount budgeted for construction. This fund also receives any residual funds left over in the project. This reserve may only be used by DFCM to award construction bids that exceed the amount budgeted. However, the Legislature retains the right to make appropriations from the fund for other building needs, including the cost of administration.
The Contingency Reserve Fund receives state funds budgeted for contingencies. The amount budgeted is based on a statutory sliding scale percentage of the construction cost which ranges from 4.5 percent to 6.5 percent for new construction, and from 6 percent to 9.5 percent for remodeling projects, depending on the size and complexity of the project. The Contingency Reserve is used to fund all unforeseen project costs, except the award of construction bids that exceed the construction budget. The primary use of this reserve is to fund construction change orders. Other uses include covering actual costs which exceed amounts budgeted for design, testing services, soils investigations, surveys, and construction insurance. The Legislature may re-appropriate these funds to other building needs, including administrative costs, in any amount that is determined to be in excess of the reserve required to meet future contingency needs (see UCA 63A-5-209).
Table 10 summarizes funding for the three current programs in this line item.
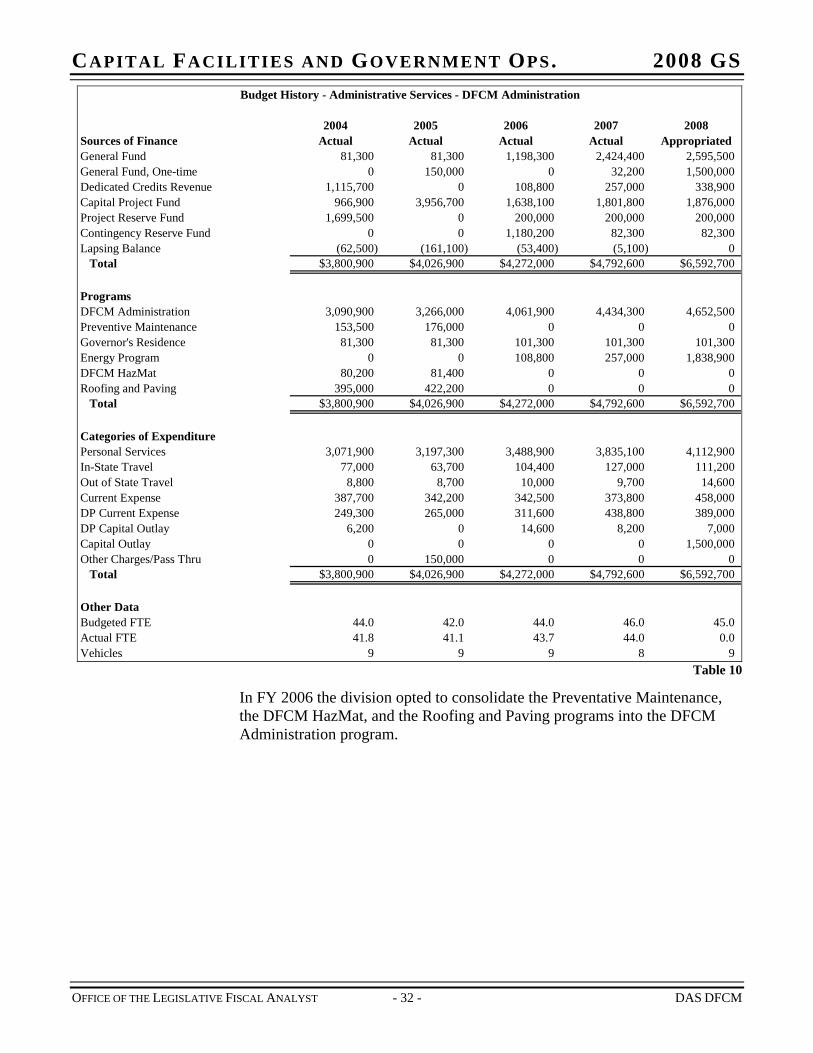
CAPITAL FACILITIES AND GOVERNMENT OPS. 2008 GS Budget History - Administrative Services - DFCM Administration
2004 2005 2006 2007 2008Sources of Finance Actual Actual Actual Actual AppropriatedGeneral Fund 81,300 81,300 1,198,300 2,424,400 2,595,500General Fund, One-time 0 150,000 0 32,200 1,500,000Dedicated Credits Revenue 1,115,700 0 108,800 257,000 338,900Capital Project Fund 966,900 3,956,700 1,638,100 1,801,800 1,876,000Project Reserve Fund 1,699,500 0 200,000 200,000 200,000Contingency Reserve Fund 0 0 1,180,200 82,300 82,300Lapsing Balance (62,500) (161,100) (53,400) (5,100) 0
Total $3,800,900 $4,026,900 $4,272,000 $4,792,600 $6,592,700
ProgramsDFCM Administration 3,090,900 3,266,000 4,061,900 4,434,300 4,652,500Preventive Maintenance 153,500 176,000 0 0 0Governor's Residence 81,300 81,300 101,300 101,300 101,300Energy Program 0 0 108,800 257,000 1,838,900DFCM HazMat 80,200 81,400 0 0 0Roofing and Paving 395,000 422,200 0 0 0
Total $3,800,900 $4,026,900 $4,272,000 $4,792,600 $6,592,700
Categories of ExpenditurePersonal Services 3,071,900 3,197,300 3,488,900 3,835,100 4,112,900In-State Travel 77,000 63,700 104,400 127,000 111,200Out of State Travel 8,800 8,700 10,000 9,700 14,600Current Expense 387,700 342,200 342,500 373,800 458,000DP Current Expense 249,300 265,000 311,600 438,800 389,000DP Capital Outlay 6,200 0 14,600 8,200 7,000Capital Outlay 0 0 0 0 1,500,000Other Charges/Pass Thru 0 150,000 0 0 0
Total $3,800,900 $4,026,900 $4,272,000 $4,792,600 $6,592,700
Other DataBudgeted FTE 44.0 42.0 44.0 46.0 45.0Actual FTE 41.8 41.1 43.7 44.0 0.0Vehicles 9 9 9 8 9
Table 10
In FY 2006 the division opted to consolidate the Preventative Maintenance, the DFCM HazMat, and the Roofing and Paving programs into the DFCM Administration program.
OFFICE OF THE LEGISLATIVE FISCAL ANALYST - 32 - DAS DFCM
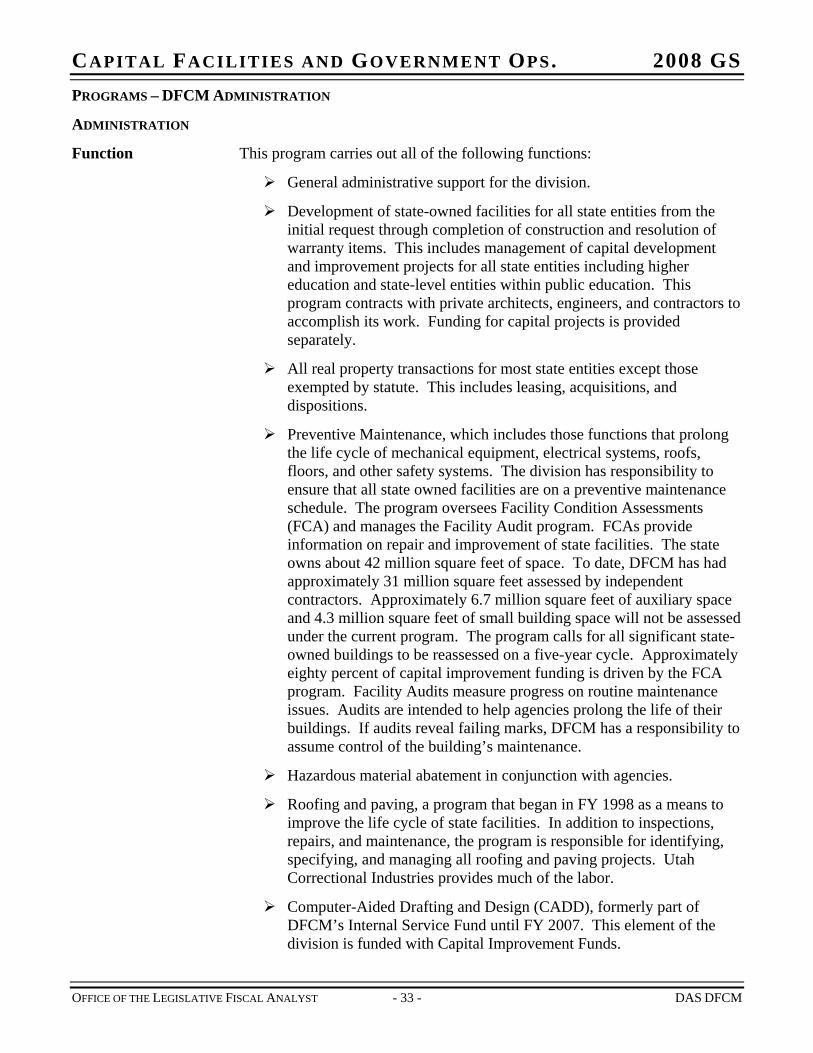
CAPITAL FACILITIES AND GOVERNMENT OPS. 2008 GS
OFFICE OF THE LEGISLATIVE FISCAL ANALYST - 33 - DAS DFCM
PROGRAMS – DFCM ADMINISTRATION
ADMINISTRATION
Function This program carries out all of the following functions:
General administrative support for the division.
Development of state-owned facilities for all state entities from the initial request through completion of construction and resolution of warranty items. This includes management of capital development and improvement projects for all state entities including higher education and state-level entities within public education. This program contracts with private architects, engineers, and contractors to accomplish its work. Funding for capital projects is provided separately.
All real property transactions for most state entities except those exempted by statute. This includes leasing, acquisitions, and dispositions.
Preventive Maintenance, which includes those functions that prolong the life cycle of mechanical equipment, electrical systems, roofs, floors, and other safety systems. The division has responsibility to ensure that all state owned facilities are on a preventive maintenance schedule. The program oversees Facility Condition Assessments (FCA) and manages the Facility Audit program. FCAs provide information on repair and improvement of state facilities. The state owns about 42 million square feet of space. To date, DFCM has had approximately 31 million square feet assessed by independent contractors. Approximately 6.7 million square feet of auxiliary space and 4.3 million square feet of small building space will not be assessed under the current program. The program calls for all significant state-owned buildings to be reassessed on a five-year cycle. Approximately eighty percent of capital improvement funding is driven by the FCA program. Facility Audits measure progress on routine maintenance issues. Audits are intended to help agencies prolong the life of their buildings. If audits reveal failing marks, DFCM has a responsibility to assume control of the building’s maintenance.
Hazardous material abatement in conjunction with agencies.
Roofing and paving, a program that began in FY 1998 as a means to improve the life cycle of state facilities. In addition to inspections, repairs, and maintenance, the program is responsible for identifying, specifying, and managing all roofing and paving projects. Utah Correctional Industries provides much of the labor.
Computer-Aided Drafting and Design (CADD), formerly part of DFCM’s Internal Service Fund until FY 2007. This element of the division is funded with Capital Improvement Funds.
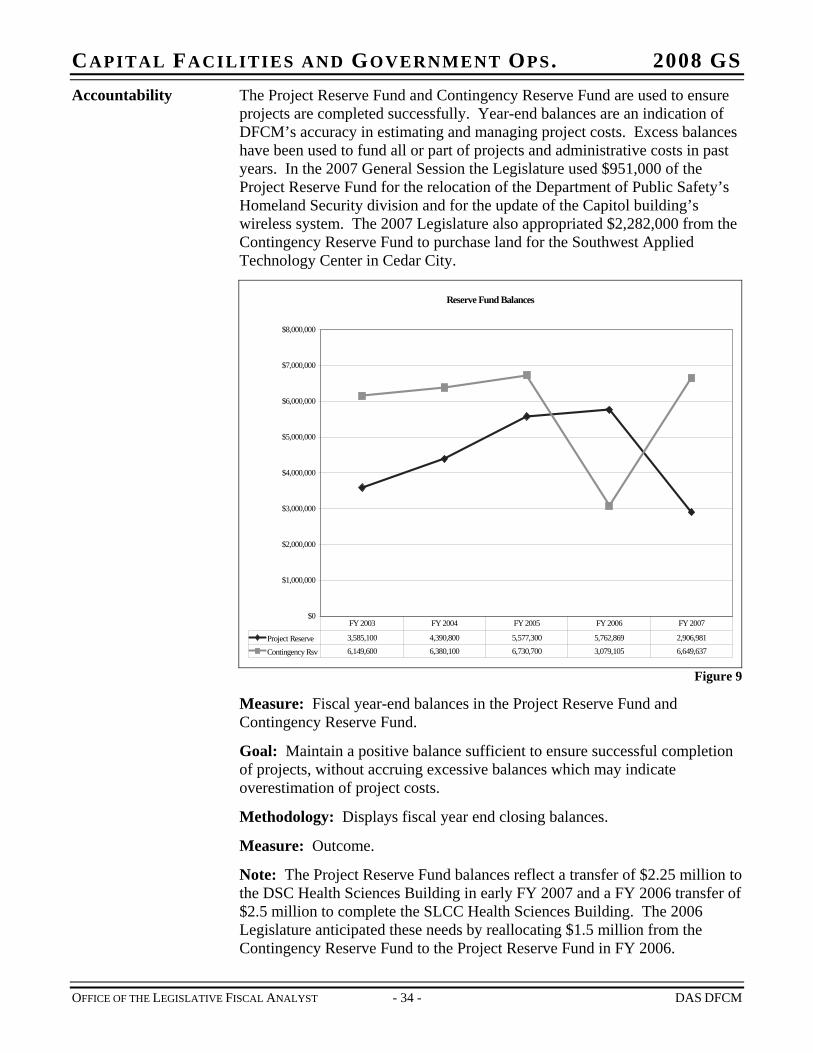
CAPITAL FACILITIES AND GOVERNMENT OPS. 2008 GS Accountability The Project Reserve Fund and Contingency Reserve Fund are used to ensure
projects are completed successfully. Year-end balances are an indication of DFCM’s accuracy in estimating and managing project costs. Excess balances have been used to fund all or part of projects and administrative costs in past years. In the 2007 General Session the Legislature used $951,000 of the Project Reserve Fund for the relocation of the Department of Public Safety’s Homeland Security division and for the update of the Capitol building’s wireless system. The 2007 Legislature also appropriated $2,282,000 from the Contingency Reserve Fund to purchase land for the Southwest Applied Technology Center in Cedar City.
Reserve Fund Balances
$0
$1,000,000
$2,000,000
$3,000,000
$4,000,000
$5,000,000
$6,000,000
$7,000,000
$8,000,000
Project Reserve 3,585,100 4,390,800 5,577,300 5,762,869 2,906,981
Contingency Rsv 6,149,600 6,380,100 6,730,700 3,079,105 6,649,637
FY 2003 FY 2004 FY 2005 FY 2006 FY 2007
Figure 9
Measure: Fiscal year-end balances in the Project Reserve Fund and Contingency Reserve Fund.
Goal: Maintain a positive balance sufficient to ensure successful completion of projects, without accruing excessive balances which may indicate overestimation of project costs.
Methodology: Displays fiscal year end closing balances.
Measure: Outcome.
Note: The Project Reserve Fund balances reflect a transfer of $2.25 million to the DSC Health Sciences Building in early FY 2007 and a FY 2006 transfer of $2.5 million to complete the SLCC Health Sciences Building. The 2006 Legislature anticipated these needs by reallocating $1.5 million from the Contingency Reserve Fund to the Project Reserve Fund in FY 2006.
OFFICE OF THE LEGISLATIVE FISCAL ANALYST - 34 - DAS DFCM
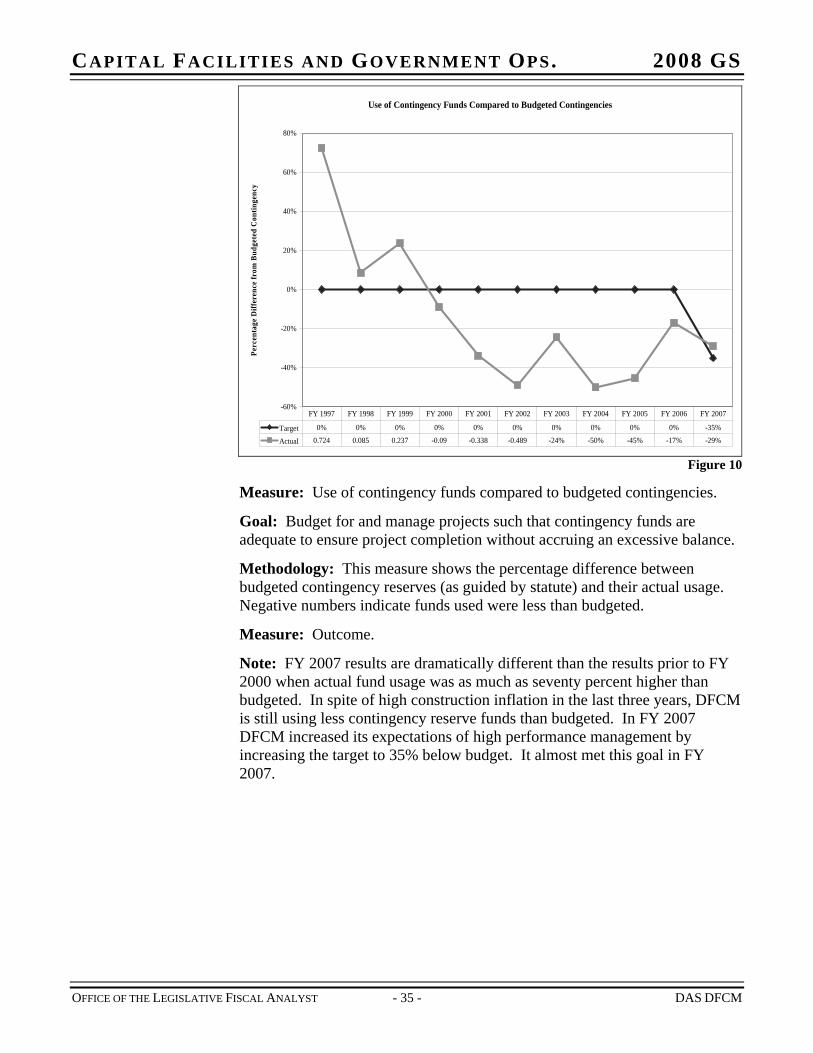
CAPITAL FACILITIES AND GOVERNMENT OPS. 2008 GS
Use of Contingency Funds Compared to Budgeted Contingencies
-60%
-40%
-20%
0%
20%
40%
60%
80%
Perc
enta
ge D
iffer
ence
from
Bud
gete
d C
ontin
genc
y
Target 0% 0% 0% 0% 0% 0% 0% 0% 0% 0% -35%
Actual 0.724 0.085 0.237 -0.09 -0.338 -0.489 -24% -50% -45% -17% -29%
FY 1997 FY 1998 FY 1999 FY 2000 FY 2001 FY 2002 FY 2003 FY 2004 FY 2005 FY 2006 FY 2007
Figure 10
Measure: Use of contingency funds compared to budgeted contingencies.
Goal: Budget for and manage projects such that contingency funds are adequate to ensure project completion without accruing an excessive balance.
Methodology: This measure shows the percentage difference between budgeted contingency reserves (as guided by statute) and their actual usage. Negative numbers indicate funds used were less than budgeted.
Measure: Outcome.
Note: FY 2007 results are dramatically different than the results prior to FY 2000 when actual fund usage was as much as seventy percent higher than budgeted. In spite of high construction inflation in the last three years, DFCM is still using less contingency reserve funds than budgeted. In FY 2007 DFCM increased its expectations of high performance management by increasing the target to 35% below budget. It almost met this goal in FY 2007.
OFFICE OF THE LEGISLATIVE FISCAL ANALYST - 35 - DAS DFCM
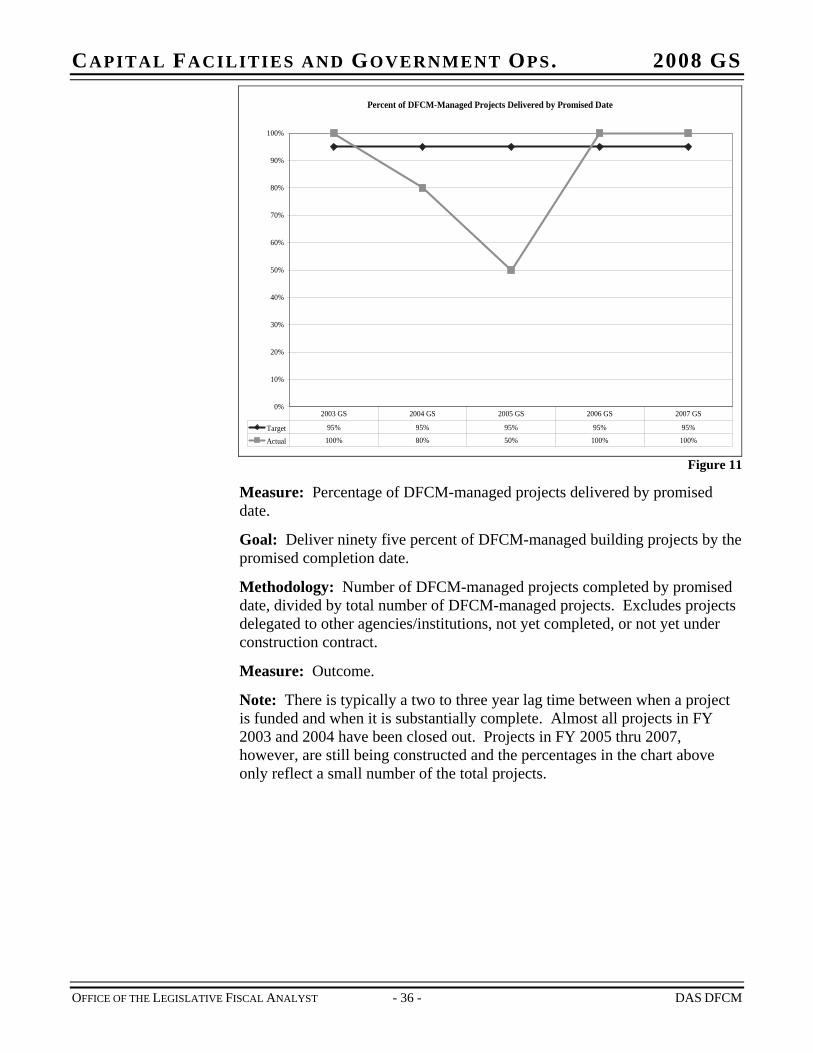
CAPITAL FACILITIES AND GOVERNMENT OPS. 2008 GS
Percent of DFCM-Managed Projects Delivered by Promised Date
0%
10%
20%
30%
40%
50%
60%
70%
80%
90%
100%
Target 95% 95% 95% 95% 95%
Actual 100% 80% 50% 100% 100%
2003 GS 2004 GS 2005 GS 2006 GS 2007 GS
Figure 11
Measure: Percentage of DFCM-managed projects delivered by promised date.
Goal: Deliver ninety five percent of DFCM-managed building projects by the promised completion date.
Methodology: Number of DFCM-managed projects completed by promised date, divided by total number of DFCM-managed projects. Excludes projects delegated to other agencies/institutions, not yet completed, or not yet under construction contract.
Measure: Outcome.
Note: There is typically a two to three year lag time between when a project is funded and when it is substantially complete. Almost all projects in FY 2003 and 2004 have been closed out. Projects in FY 2005 thru 2007, however, are still being constructed and the percentages in the chart above only reflect a small number of the total projects.
OFFICE OF THE LEGISLATIVE FISCAL ANALYST - 36 - DAS DFCM
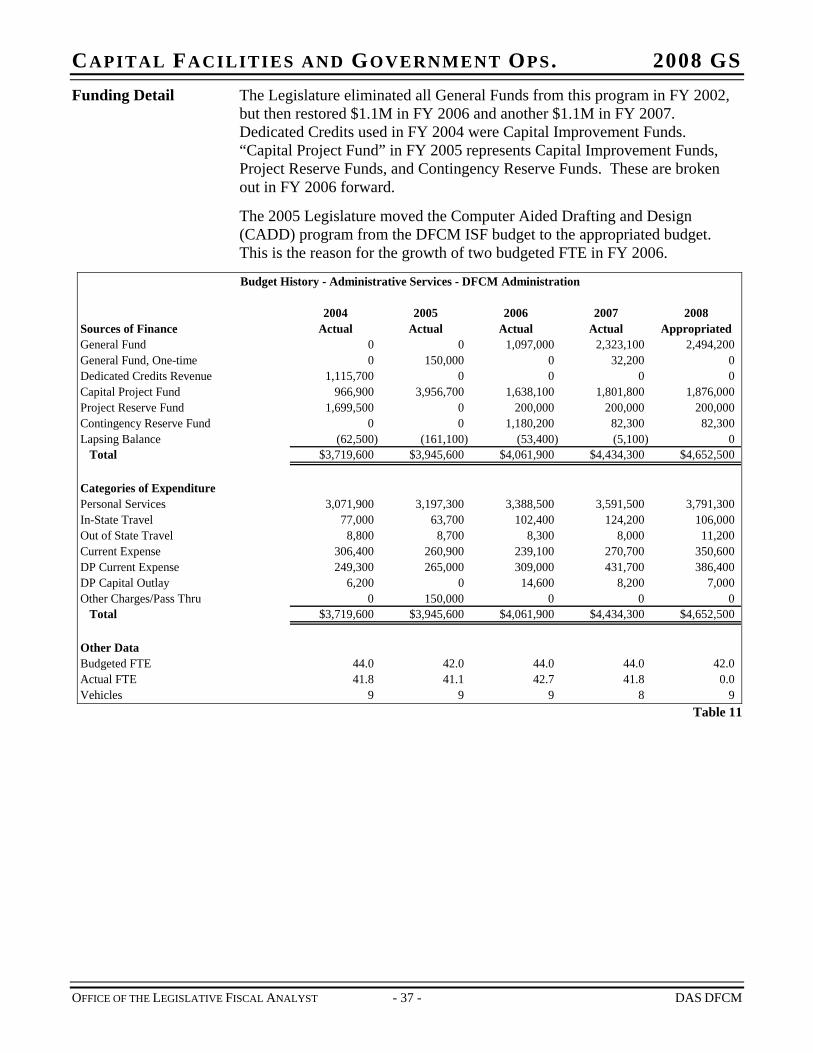
CAPITAL FACILITIES AND GOVERNMENT OPS. 2008 GS Funding Detail The Legislature eliminated all General Funds from this program in FY 2002,
but then restored $1.1M in FY 2006 and another $1.1M in FY 2007. Dedicated Credits used in FY 2004 were Capital Improvement Funds. “Capital Project Fund” in FY 2005 represents Capital Improvement Funds, Project Reserve Funds, and Contingency Reserve Funds. These are broken out in FY 2006 forward.
The 2005 Legislature moved the Computer Aided Drafting and Design (CADD) program from the DFCM ISF budget to the appropriated budget. This is the reason for the growth of two budgeted FTE in FY 2006.
Budget History - Administrative Services - DFCM Administration
2004 2005 2006 2007 2008Sources of Finance Actual Actual Actual Actual AppropriatedGeneral Fund 0 0 1,097,000 2,323,100 2,494,200General Fund, One-time 0 150,000 0 32,200 0Dedicated Credits Revenue 1,115,700 0 0 0Capital Project Fund 966,900 3,956,700 1,638,100 1,801,800 1,876,000Project Reserve Fund 1,699,500 0 200,000 200,000 200,000Contingency Reserve Fund 0 0 1,180,200 82,300 82,300Lapsing Balance (62,500) (161,100) (53,400) (5,100) 0
Total $3,719,600 $3,945,600 $4,061,900 $4,434,300 $4,652,500
Categories of ExpenditurePersonal Services 3,071,900 3,197,300 3,388,500 3,591,500 3,791,300In-State Travel 77,000 63,700 102,400 124,200 106,000Out of State Travel 8,800 8,700 8,300 8,000 11,200Current Expense 306,400 260,900 239,100 270,700 350,600DP Current Expense 249,300 265,000 309,000 431,700 386,400DP Capital Outlay 6,200 0 14,600 8,200 7,000Other Charges/Pass Thru 0 150,000 0 0 0
Total $3,719,600 $3,945,600 $4,061,900 $4,434,300 $4,652,500
Other DataBudgeted FTE 44.0 42.0 44.0 44.0 42.0Actual FTE 41.8 41.1 42.7 41.8 0.0Vehicles 9 9 9 8
0
9 Table 11
OFFICE OF THE LEGISLATIVE FISCAL ANALYST - 37 - DAS DFCM
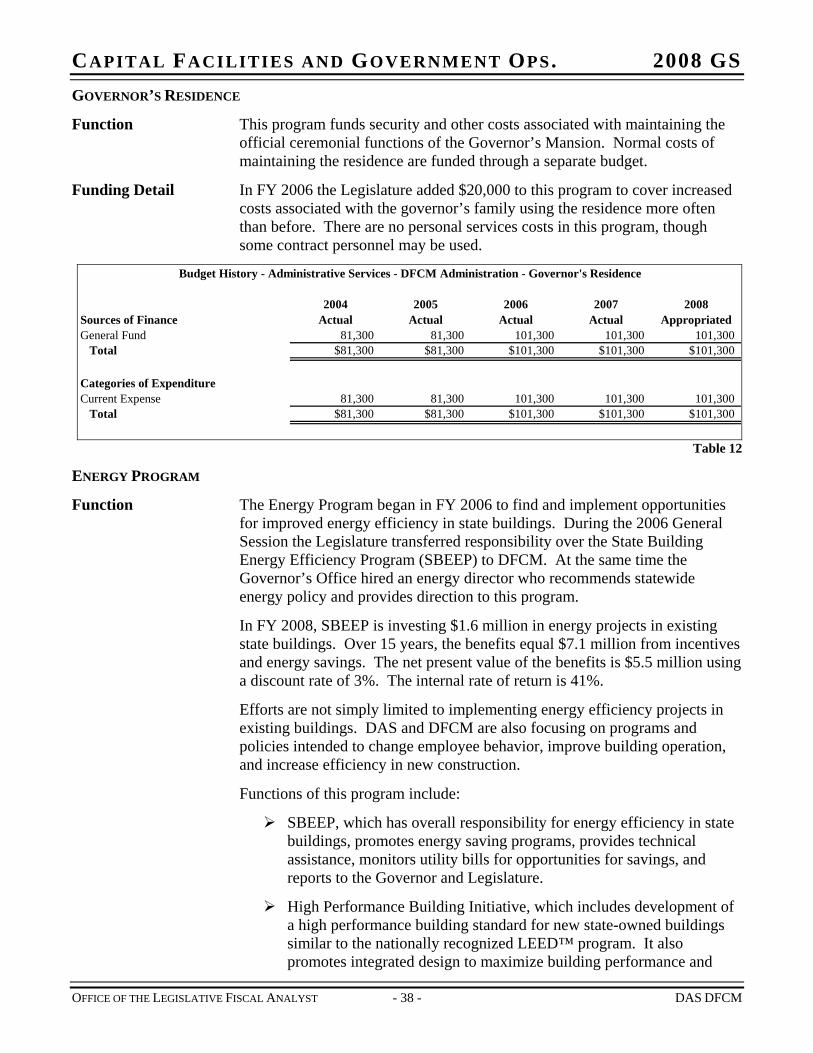
CAPITAL FACILITIES AND GOVERNMENT OPS. 2008 GS GOVERNOR’S RESIDENCE
Function This program funds security and other costs associated with maintaining the official ceremonial functions of the Governor’s Mansion. Normal costs of maintaining the residence are funded through a separate budget.
Funding Detail In FY 2006 the Legislature added $20,000 to this program to cover increased costs associated with the governor’s family using the residence more often than before. There are no personal services costs in this program, though some contract personnel may be used.
Budget History - Administrative Services - DFCM Administration - Governor's Residence
2004 2005 2006 2007 2008Sources of Finance Actual Actual Actual Actual AppropriatedGeneral Fund 81,300 81,300 101,300 101,300 101,300
Total $81,300 $81,300 $101,300 $101,300 $101,300
Categories of ExpenditureCurrent Expense 81,300 81,300 101,300 101,300 101,300
Total $81,300 $81,300 $101,300 $101,300 $101,300
Table 12
ENERGY PROGRAM
Function The Energy Program began in FY 2006 to find and implement opportunities for improved energy efficiency in state buildings. During the 2006 General Session the Legislature transferred responsibility over the State Building Energy Efficiency Program (SBEEP) to DFCM. At the same time the Governor’s Office hired an energy director who recommends statewide energy policy and provides direction to this program.
In FY 2008, SBEEP is investing $1.6 million in energy projects in existing state buildings. Over 15 years, the benefits equal $7.1 million from incentives and energy savings. The net present value of the benefits is $5.5 million using a discount rate of 3%. The internal rate of return is 41%.
Efforts are not simply limited to implementing energy efficiency projects in existing buildings. DAS and DFCM are also focusing on programs and policies intended to change employee behavior, improve building operation, and increase efficiency in new construction.
Functions of this program include:
SBEEP, which has overall responsibility for energy efficiency in state buildings, promotes energy saving programs, provides technical assistance, monitors utility bills for opportunities for savings, and reports to the Governor and Legislature.
High Performance Building Initiative, which includes development of a high performance building standard for new state-owned buildings similar to the nationally recognized LEED™ program. It also promotes integrated design to maximize building performance and
OFFICE OF THE LEGISLATIVE FISCAL ANALYST - 38 - DAS DFCM
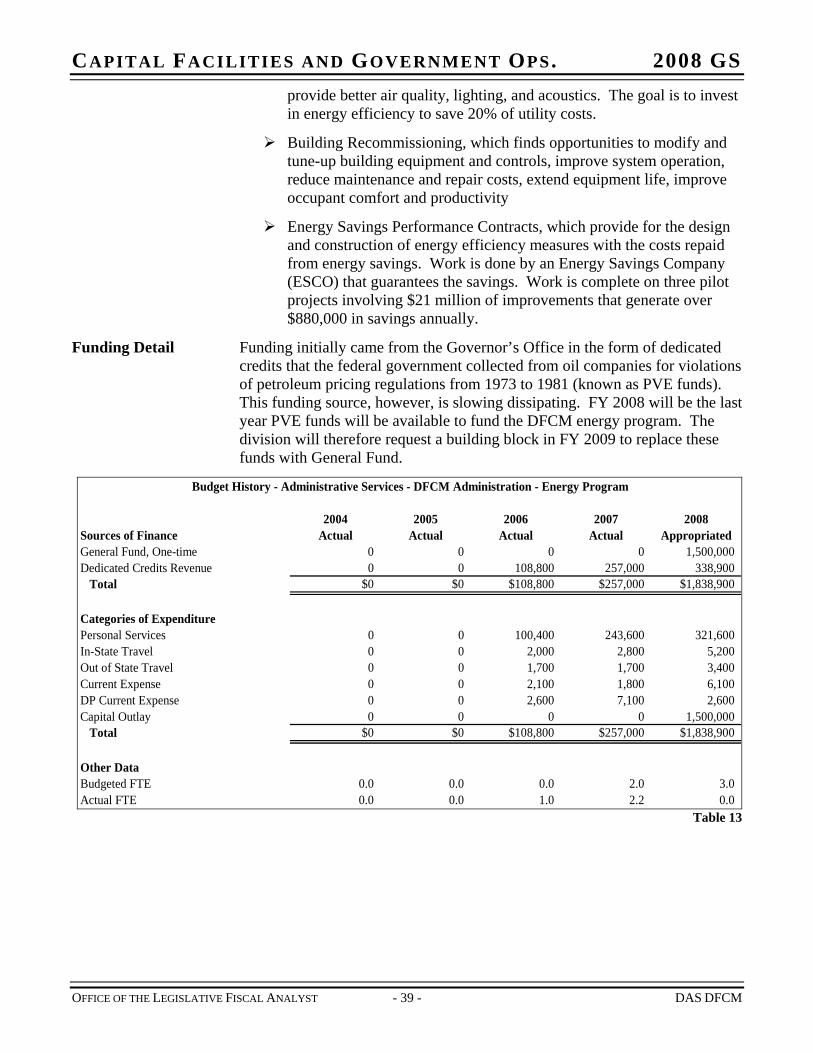
CAPITAL FACILITIES AND GOVERNMENT OPS. 2008 GS provide better air quality, lighting, and acoustics. The goal is to invest in energy efficiency to save 20% of utility costs.
Building Recommissioning, which finds opportunities to modify and tune-up building equipment and controls, improve system operation, reduce maintenance and repair costs, extend equipment life, improve occupant comfort and productivity
Energy Savings Performance Contracts, which provide for the design and construction of energy efficiency measures with the costs repaid from energy savings. Work is done by an Energy Savings Company (ESCO) that guarantees the savings. Work is complete on three pilot projects involving $21 million of improvements that generate over $880,000 in savings annually.
Funding Detail Funding initially came from the Governor’s Office in the form of dedicated credits that the federal government collected from oil companies for violations of petroleum pricing regulations from 1973 to 1981 (known as PVE funds). This funding source, however, is slowing dissipating. FY 2008 will be the last year PVE funds will be available to fund the DFCM energy program. The division will therefore request a building block in FY 2009 to replace these funds with General Fund.
Budget History - Administrative Services - DFCM Administration - Energy Program
2004 2005 2006 2007 2008Sources of Finance Actual Actual Actual Actual AppropriatedGeneral Fund, One-time 0 0 0 0 1,500,000Dedicated Credits Revenue 0 0 108,800 257,000 338,900
Total $0 $0 $108,800 $257,000 $1,838,900
Categories of ExpenditurePersonal Services 0 0 100,400 243,600 321,600In-State Travel 0 0 2,000 2,800 5,200Out of State Travel 0 0 1,700 1,700 3,400Current Expense 0 0 2,100 1,800 6,100DP Current Expense 0 0 2,600 7,100 2,600Capital Outlay 0 0 0 0 1,500,000
Total $0 $0 $108,800 $257,000 $1,838,900
Other DataBudgeted FTE 0.0 0.0 0.0 2.0 3.0Actual FTE 0.0 0.0 1.0 2.2 0.0
Table 13
OFFICE OF THE LEGISLATIVE FISCAL ANALYST - 39 - DAS DFCM

CAPITAL FACILITIES AND GOVERNMENT OPS. 2008 GS
OFFICE OF THE LEGISLATIVE FISCAL ANALYST - 41 - DAS STATE ARCHIVES
CHAPTER 8 DIVISION OF STATE ARCHIVES
Function The Utah State Archives is the repository for official records of the state and its political subdivisions. The division serves state government and the public by managing records created by the legislative, judicial, and executive branches. Records created by government agencies are divided into record series, or documents of like purpose, that reflect the various functions of the agency.
The Division of Archives is the official custodian of all non-current public records of permanent value that are not required by law to remain in the custody of the agency of origin.
The State Archives building is located at 346 S. Rio Grande, Salt Lake City. This location contains the administrative offices, archival records, and research room. The former location on Capitol Hill has been demolished and replaced with a physical plant as part of the Capitol renovation.
The State Records Center is located at 2341 S. 2300 W., Salt Lake City. This location warehouses governmental records for all state and local agencies.
The 2007 Legislature approved House Bill 222, Open and Public Meetings – Electronic Notice, which created the Utah Public Notice Website and required the division to maintain and operate the program. The website will contain notices of public meetings for the state and its political subdivisions.
Statutory Authority UCA 63-2-901 defines the duties of the Division of Archives and Records Service:
Administer the state’s archives and records management programs, including storage of records, central microphotography programs, and quality control.
Apply fair, efficient and economical management methods.
Establish standards, procedures and techniques for best management of records.
Conduct surveys of office operations and recommend improvements in current records management practices.
Establish schedules for storing and disposing of records.
Establish, maintain, and operate centralized microphotography lab facilities and quality control for the state.
Develop training programs to assist records officers and other interested officers of governmental entities.
Follow directions from the executive director of the department.
Provide access to public records deposited in the archives.
CAPITAL FACILITIES AND GOVERNMENT OPS. 2008 GS
OFFICE OF THE LEGISLATIVE FISCAL ANALYST - 42 - DAS STATE ARCHIVES
UCA 63-2-902 requires the state archivist to be qualified by archival training, education and experience. Further, the archivist is charged with custody of important documents, some of which are:
Enrolled copy of the state constitution.
Acts and resolutions passed by the Legislature.
Journals of the Legislature.
Indian War records.
UCA 63-2-906 requires State Archives to furnish certified copies of a record in its exclusive custody that is classified “public.”
UCA 63-2-909 requires any record to be presumed “public” 75 years after its creation, except a record that contains information about an individual 21 years old or younger must wait 100 years.
UCA 63F-1-701 requires State Archives to administer and maintain the Utah Public Notice Website to assist the public in finding posted public meeting notices of the state and its political subdivisions
Intent Language During the 2007 General Session the Legislature adopted the following intent language for FY 2007 in S.B. 1:
Under Section 63-38-8.1 of the Utah Code the Legislature intends 260 that up to $30,000 provided by Item 36, Chapter 1, and Item 38, Chapter 366, Laws of Utah 2006 not lapse at the close of Fiscal Year 2007. Expenditure of these funds is limited to digitizing and microfilming significant historical documents generated by former Utah legislators and governors for preservation and access.
Funding Detail The following table summarizes funding for the five programs in this line item. The 2007 Legislature appropriated $100,000 one time General Fund to implement the Utah Public Notice Website, $200,000 one-time General Fund for regional repositories, $53,500 ongoing General Fund to digitize public records, and $100,000 beginning balance from Finance Mandated to develop an electronic records management business plan.
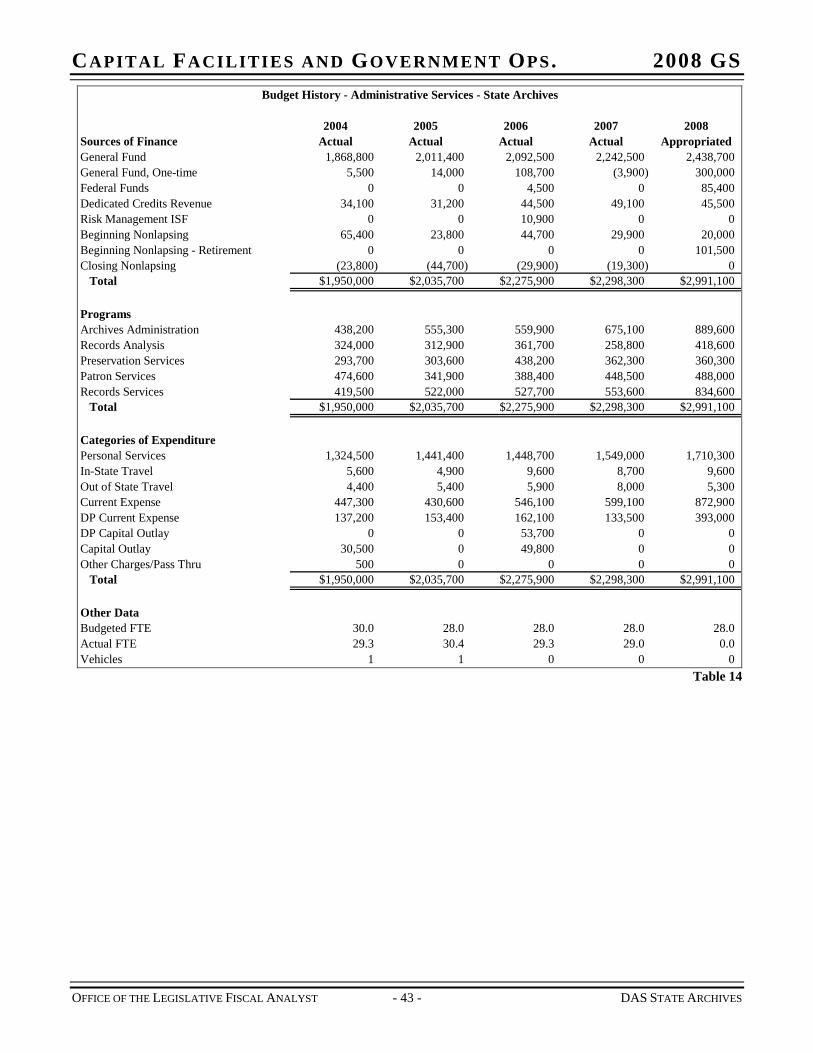
CAPITAL FACILITIES AND GOVERNMENT OPS. 2008 GS Budget History - Administrative Services - State Archives
2004 2005 2006 2007 2008Sources of Finance Actual Actual Actual Actual AppropriatedGeneral Fund 1,868,800 2,011,400 2,092,500 2,242,500 2,438,700General Fund, One-time 5,500 14,000 108,700 (3,900) 300,000Federal Funds 0 0 4,500 0 85,400Dedicated Credits Revenue 34,100 31,200 44,500 49,100 45,500Risk Management ISF 0 0 10,900 0 0Beginning Nonlapsing 65,400 23,800 44,700 29,900 20,000Beginning Nonlapsing - Retirement 0 0 0 0 101,500Closing Nonlapsing (23,800) (44,700) (29,900) (19,300) 0
Total $1,950,000 $2,035,700 $2,275,900 $2,298,300 $2,991,100
ProgramsArchives Administration 438,200 555,300 559,900 675,100 889,600Records Analysis 324,000 312,900 361,700 258,800 418,600Preservation Services 293,700 303,600 438,200 362,300 360,300Patron Services 474,600 341,900 388,400 448,500 488,000Records Services 419,500 522,000 527,700 553,600 834,600
Total $1,950,000 $2,035,700 $2,275,900 $2,298,300 $2,991,100
Categories of ExpenditurePersonal Services 1,324,500 1,441,400 1,448,700 1,549,000 1,710,300In-State Travel 5,600 4,900 9,600 8,700 9,600Out of State Travel 4,400 5,400 5,900 8,000 5,300Current Expense 447,300 430,600 546,100 599,100 872,900DP Current Expense 137,200 153,400 162,100 133,500 393,000DP Capital Outlay 0 0 53,700 0 0Capital Outlay 30,500 0 49,800 0 0Other Charges/Pass Thru 500 0 0 0
Total $1,950,000 $2,035,700 $2,275,900 $2,298,300 $2,991,100
Other DataBudgeted FTE 30.0 28.0 28.0 28.0 28.0Actual FTE 29.3 30.4 29.3 29.0 0.0Vehicles 1 1 0 0
0
0 Table 14
OFFICE OF THE LEGISLATIVE FISCAL ANALYST - 43 - DAS STATE ARCHIVES
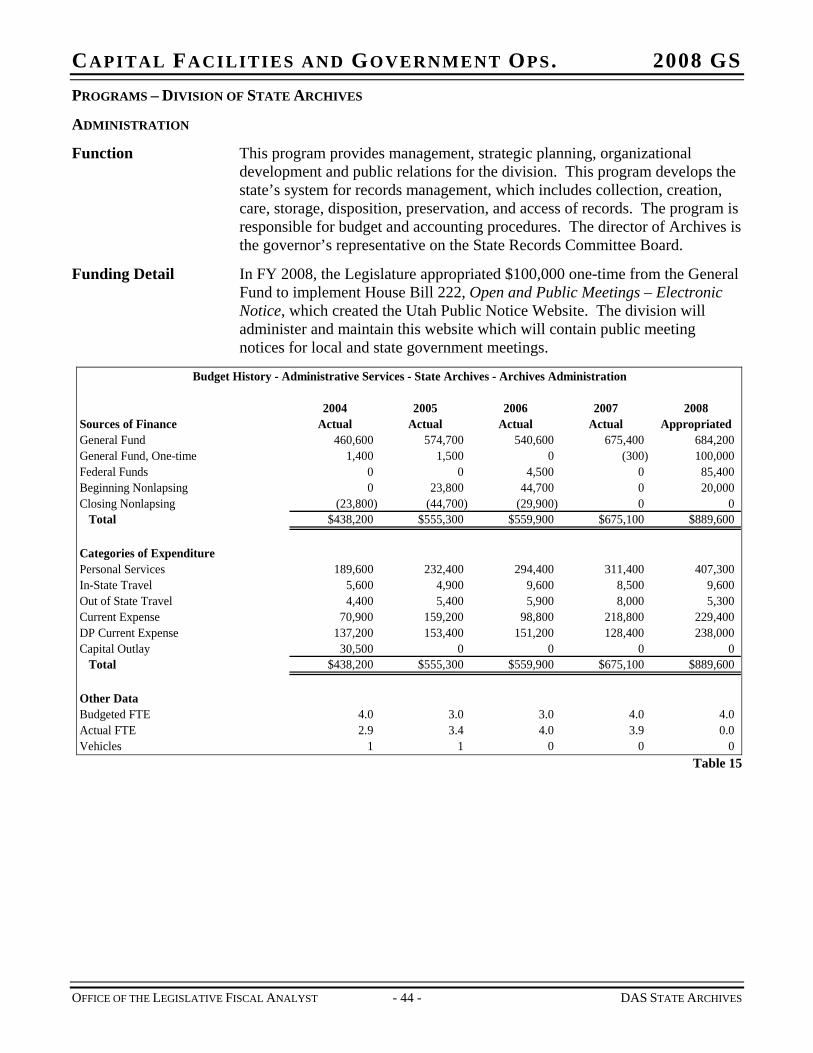
CAPITAL FACILITIES AND GOVERNMENT OPS. 2008 GS PROGRAMS – DIVISION OF STATE ARCHIVES
ADMINISTRATION
Function This program provides management, strategic planning, organizational development and public relations for the division. This program develops the state’s system for records management, which includes collection, creation, care, storage, disposition, preservation, and access of records. The program is responsible for budget and accounting procedures. The director of Archives is the governor’s representative on the State Records Committee Board.
Funding Detail In FY 2008, the Legislature appropriated $100,000 one-time from the General Fund to implement House Bill 222, Open and Public Meetings – Electronic Notice, which created the Utah Public Notice Website. The division will administer and maintain this website which will contain public meeting notices for local and state government meetings.
Budget History - Administrative Services - State Archives - Archives Administration
2004 2005 2006 2007 2008Sources of Finance Actual Actual Actual Actual AppropriatedGeneral Fund 460,600 574,700 540,600 675,400 684,200General Fund, One-time 1,400 1,500 0 (300) 100,000Federal Funds 0 0 4,500 0 85,400Beginning Nonlapsing 0 23,800 44,700 0 20,000Closing Nonlapsing (23,800) (44,700) (29,900) 0 0
Total $438,200 $555,300 $559,900 $675,100 $889,600
Categories of ExpenditurePersonal Services 189,600 232,400 294,400 311,400 407,300In-State Travel 5,600 4,900 9,600 8,500 9,600Out of State Travel 4,400 5,400 5,900 8,000 5,300Current Expense 70,900 159,200 98,800 218,800 229,400DP Current Expense 137,200 153,400 151,200 128,400 238,000Capital Outlay 30,500 0 0 0 0
Total $438,200 $555,300 $559,900 $675,100 $889,600
Other DataBudgeted FTE 4.0 3.0 3.0 4.0 4.0Actual FTE 2.9 3.4 4.0 3.9 0.0Vehicles 1 1 0 0 0
Table 15
OFFICE OF THE LEGISLATIVE FISCAL ANALYST - 44 - DAS STATE ARCHIVES
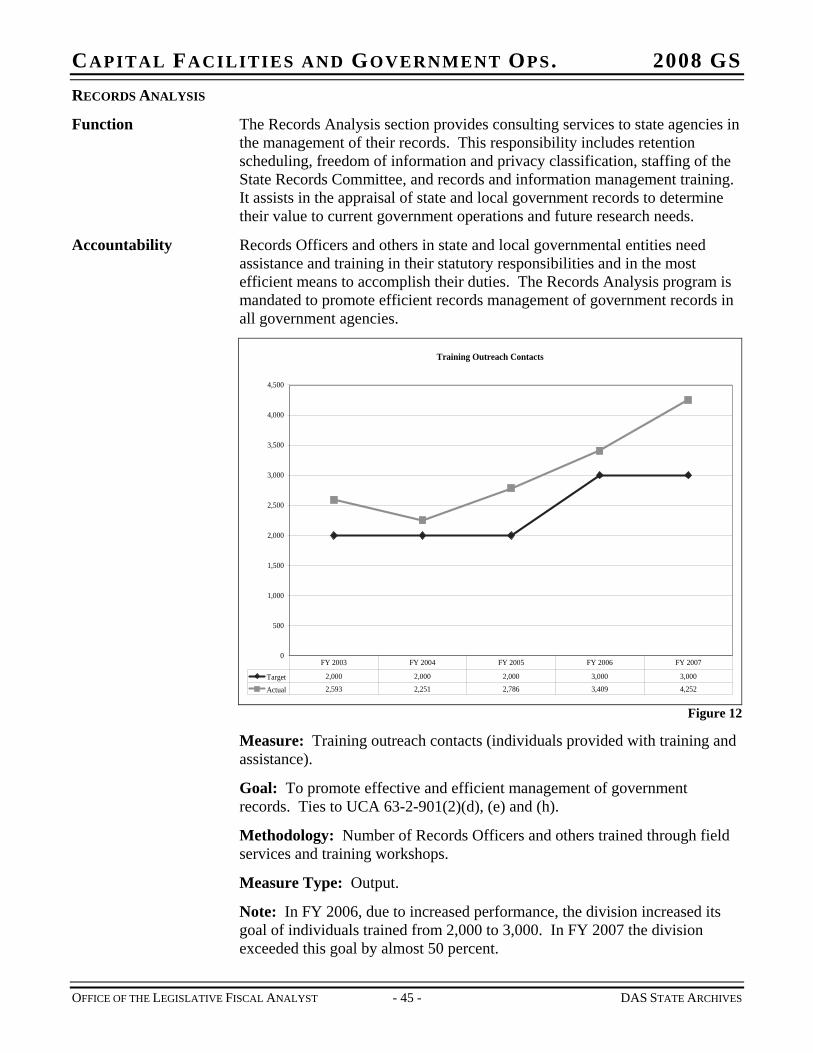
CAPITAL FACILITIES AND GOVERNMENT OPS. 2008 GS RECORDS ANALYSIS
Function The Records Analysis section provides consulting services to state agencies in the management of their records. This responsibility includes retention scheduling, freedom of information and privacy classification, staffing of the State Records Committee, and records and information management training. It assists in the appraisal of state and local government records to determine their value to current government operations and future research needs.
Accountability Records Officers and others in state and local governmental entities need assistance and training in their statutory responsibilities and in the most efficient means to accomplish their duties. The Records Analysis program is mandated to promote efficient records management of government records in all government agencies.
Training Outreach Contacts
0
500
1,000
1,500
2,000
2,500
3,000
3,500
4,000
4,500
Target 2,000 2,000 2,000 3,000 3,000
Actual 2,593 2,251 2,786 3,409 4,252
FY 2003 FY 2004 FY 2005 FY 2006 FY 2007
Figure 12
Measure: Training outreach contacts (individuals provided with training and assistance).
Goal: To promote effective and efficient management of government records. Ties to UCA 63-2-901(2)(d), (e) and (h).
Methodology: Number of Records Officers and others trained through field services and training workshops.
Measure Type: Output.
Note: In FY 2006, due to increased performance, the division increased its goal of individuals trained from 2,000 to 3,000. In FY 2007 the division exceeded this goal by almost 50 percent.
OFFICE OF THE LEGISLATIVE FISCAL ANALYST - 45 - DAS STATE ARCHIVES
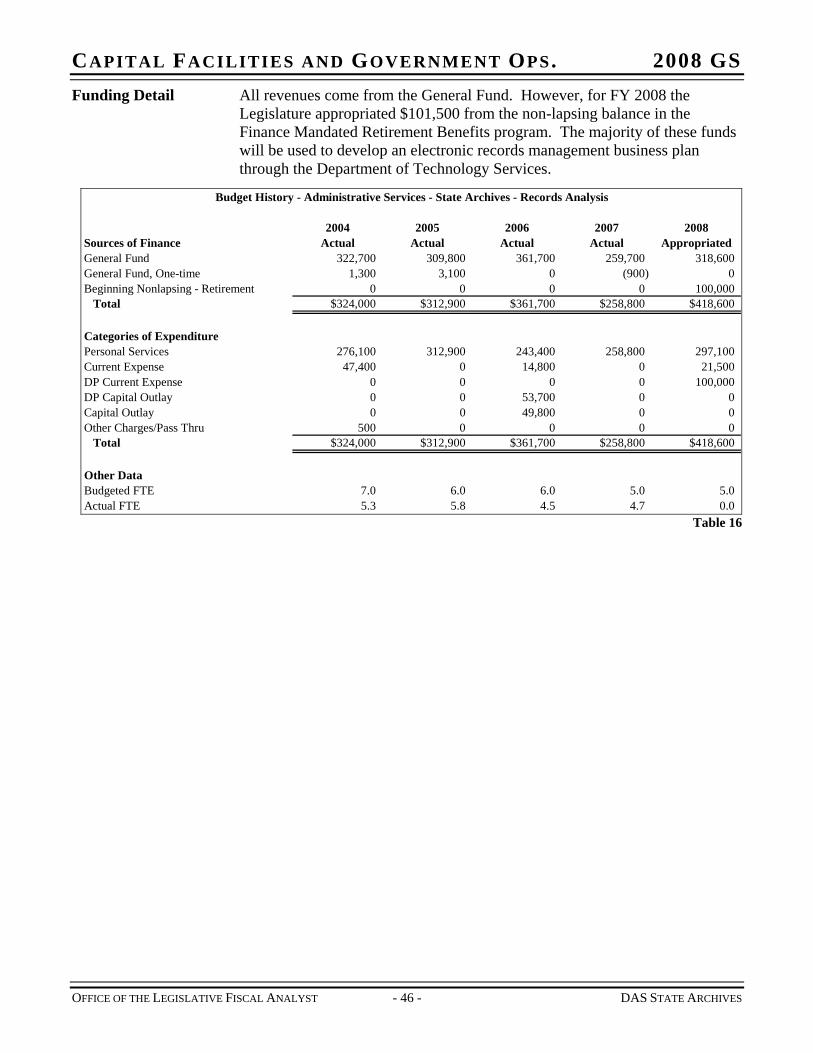
CAPITAL FACILITIES AND GOVERNMENT OPS. 2008 GS Funding Detail All revenues come from the General Fund. However, for FY 2008 the
Legislature appropriated $101,500 from the non-lapsing balance in the Finance Mandated Retirement Benefits program. The majority of these funds will be used to develop an electronic records management business plan through the Department of Technology Services.
Budget History - Administrative Services - State Archives - Records Analysis
2004 2005 2006 2007 2008Sources of Finance Actual Actual Actual Actual AppropriatedGeneral Fund 322,700 309,800 361,700 259,700 318,600General Fund, One-time 1,300 3,100 0 (900) 0Beginning Nonlapsing - Retirement 0 0 0 0 100,000
Total $324,000 $312,900 $361,700 $258,800 $418,600
Categories of ExpenditurePersonal Services 276,100 312,900 243,400 258,800 297,100Current Expense 47,400 0 14,800 0 21,500DP Current Expense 0 0 0 0 100,000DP Capital Outlay 0 0 53,700 0 0Capital Outlay 0 0 49,800 0 0Other Charges/Pass Thru 500 0 0 0 0
Total $324,000 $312,900 $361,700 $258,800 $418,600
Other DataBudgeted FTE 7.0 6.0 6.0 5.0 5.0Actual FTE 5.3 5.8 4.5 4.7 0.0
Table 16
OFFICE OF THE LEGISLATIVE FISCAL ANALYST - 46 - DAS STATE ARCHIVES
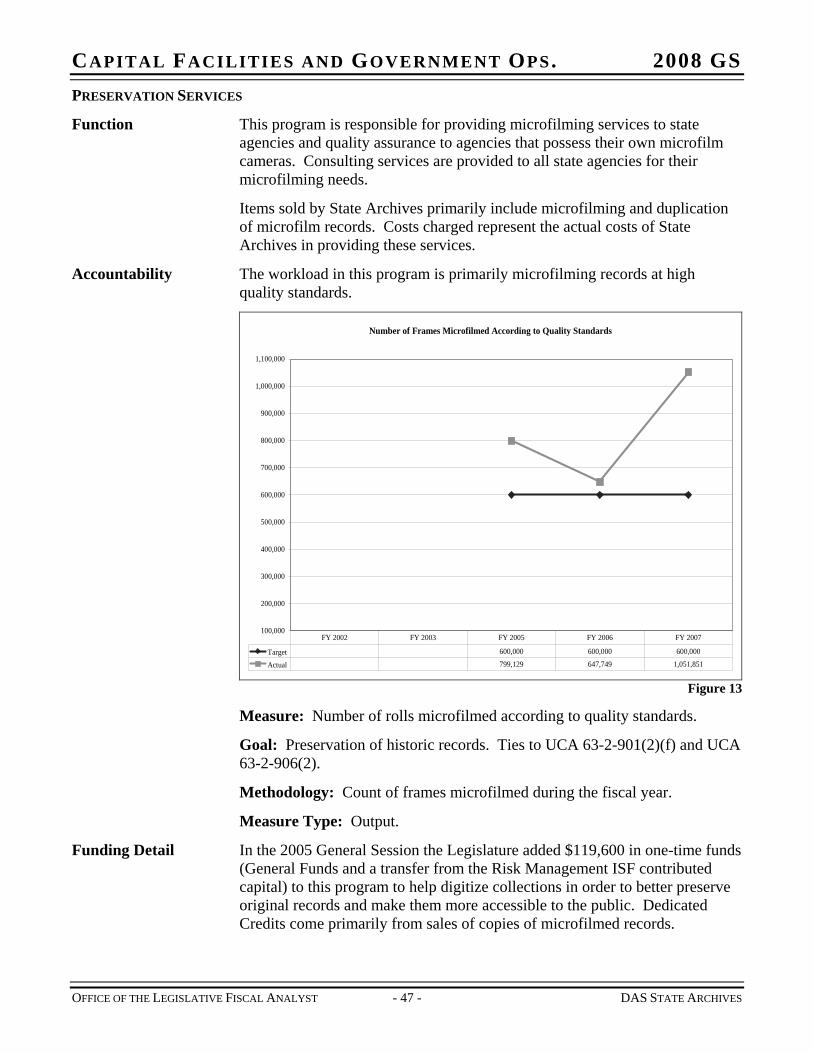
CAPITAL FACILITIES AND GOVERNMENT OPS. 2008 GS PRESERVATION SERVICES
Function This program is responsible for providing microfilming services to state agencies and quality assurance to agencies that possess their own microfilm cameras. Consulting services are provided to all state agencies for their microfilming needs.
Items sold by State Archives primarily include microfilming and duplication of microfilm records. Costs charged represent the actual costs of State Archives in providing these services.
Accountability The workload in this program is primarily microfilming records at high quality standards.
Number of Frames Microfilmed According to Quality Standards
100,000
200,000
300,000
400,000
500,000
600,000
700,000
800,000
900,000
1,000,000
1,100,000
Target 600,000 600,000 600,000
Actual 799,129 647,749 1,051,851
FY 2002 FY 2003 FY 2005 FY 2006 FY 2007
Figure 13
Measure: Number of rolls microfilmed according to quality standards.
Goal: Preservation of historic records. Ties to UCA 63-2-901(2)(f) and UCA 63-2-906(2).
Methodology: Count of frames microfilmed during the fiscal year.
Measure Type: Output.
Funding Detail In the 2005 General Session the Legislature added $119,600 in one-time funds (General Funds and a transfer from the Risk Management ISF contributed capital) to this program to help digitize collections in order to better preserve original records and make them more accessible to the public. Dedicated Credits come primarily from sales of copies of microfilmed records.
OFFICE OF THE LEGISLATIVE FISCAL ANALYST - 47 - DAS STATE ARCHIVES
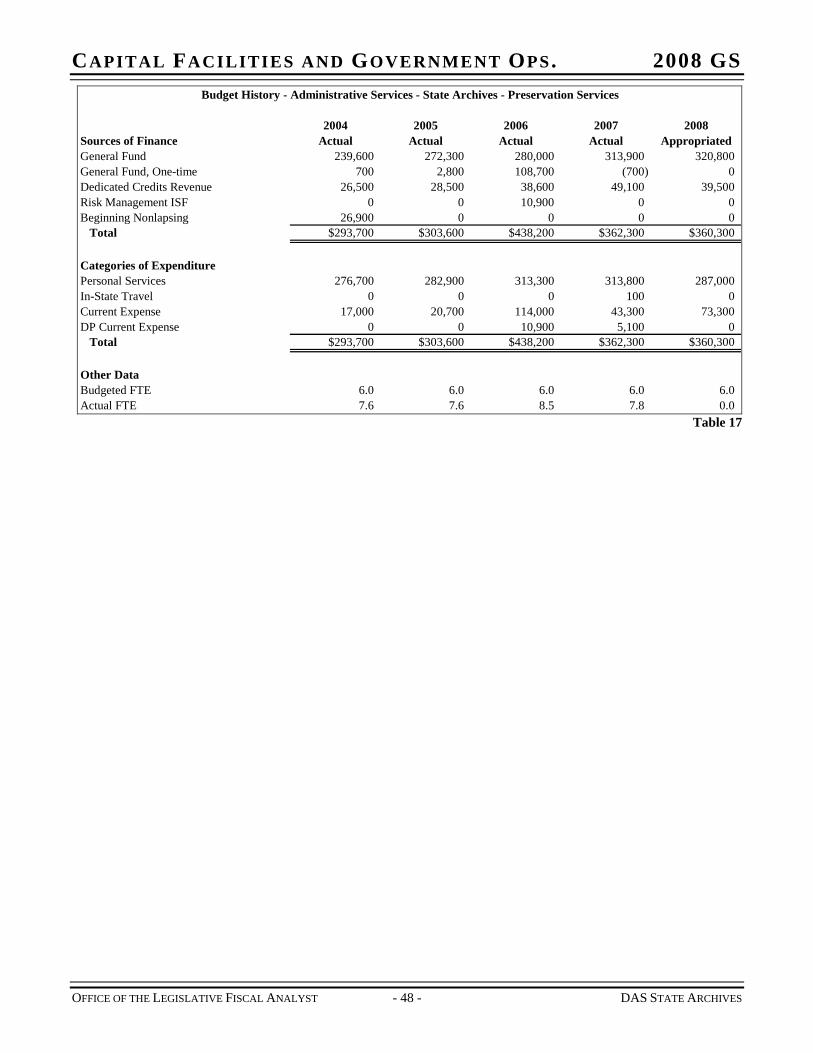
CAPITAL FACILITIES AND GOVERNMENT OPS. 2008 GS Budget History - Administrative Services - State Archives - Preservation Services
2004 2005 2006 2007 2008Sources of Finance Actual Actual Actual Actual AppropriatedGeneral Fund 239,600 272,300 280,000 313,900 320,800General Fund, One-time 700 2,800 108,700 (700) 0Dedicated Credits Revenue 26,500 28,500 38,600 49,100 39,500Risk Management ISF 0 0 10,900 0 0Beginning Nonlapsing 26,900 0 0 0
Total $293,700 $303,600 $438,200 $362,300 $360,300
Categories of ExpenditurePersonal Services 276,700 282,900 313,300 313,800 287,000In-State Travel 0 0 0 100 0Current Expense 17,000 20,700 114,000 43,300 73,300DP Current Expense 0 0 10,900 5,100 0
Total $293,700 $303,600 $438,200 $362,300 $360,300
Other DataBudgeted FTE 6.0 6.0 6.0 6.0 6.0Actual FTE 7.6 7.6 8.5 7.8 0.0
0
Table 17
OFFICE OF THE LEGISLATIVE FISCAL ANALYST - 48 - DAS STATE ARCHIVES
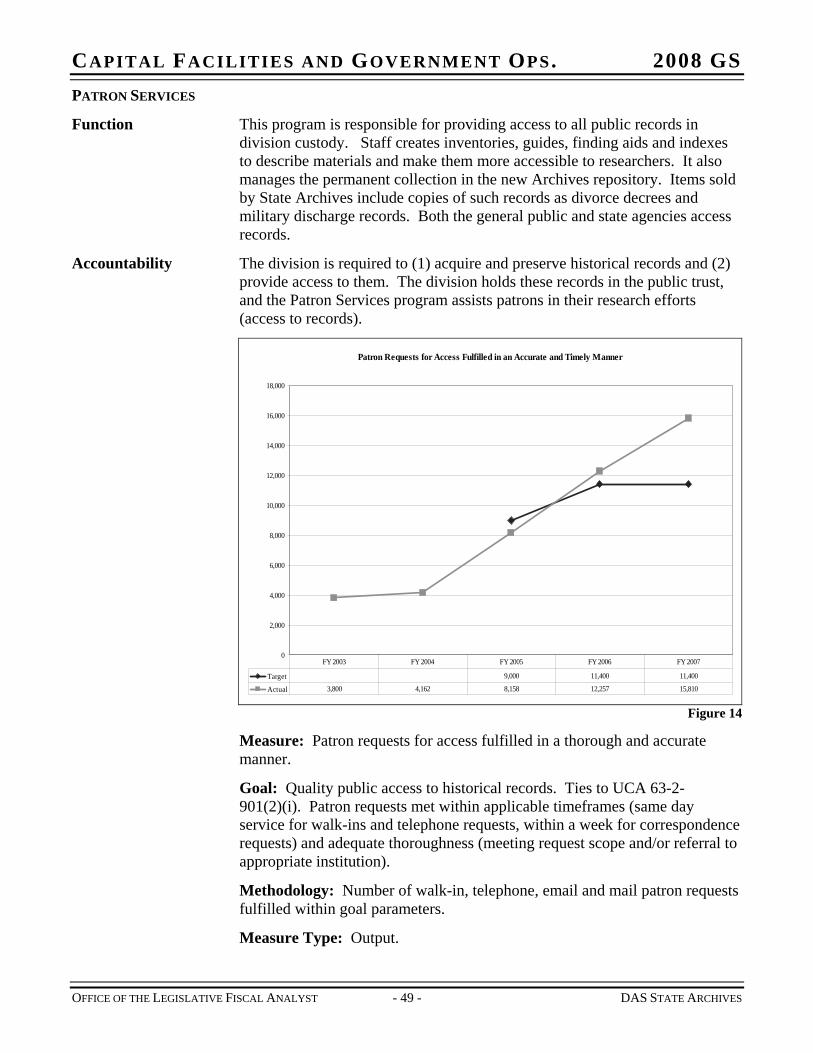
CAPITAL FACILITIES AND GOVERNMENT OPS. 2008 GS PATRON SERVICES
Function This program is responsible for providing access to all public records in division custody. Staff creates inventories, guides, finding aids and indexes to describe materials and make them more accessible to researchers. It also manages the permanent collection in the new Archives repository. Items sold by State Archives include copies of such records as divorce decrees and military discharge records. Both the general public and state agencies access records.
Accountability The division is required to (1) acquire and preserve historical records and (2) provide access to them. The division holds these records in the public trust, and the Patron Services program assists patrons in their research efforts (access to records).
Patron Requests for Access Fulfilled in an Accurate and Timely Manner
0
2,000
4,000
6,000
8,000
10,000
12,000
14,000
16,000
18,000
Target 9,000 11,400 11,400
Actual 3,800 4,162 8,158 12,257 15,810
FY 2003 FY 2004 FY 2005 FY 2006 FY 2007
Figure 14
Measure: Patron requests for access fulfilled in a thorough and accurate manner.
Goal: Quality public access to historical records. Ties to UCA 63-2-901(2)(i). Patron requests met within applicable timeframes (same day service for walk-ins and telephone requests, within a week for correspondence requests) and adequate thoroughness (meeting request scope and/or referral to appropriate institution).
Methodology: Number of walk-in, telephone, email and mail patron requests fulfilled within goal parameters.
Measure Type: Output.
OFFICE OF THE LEGISLATIVE FISCAL ANALYST - 49 - DAS STATE ARCHIVES
CAPITAL FACILITIES AND GOVERNMENT OPS. 2008 GS Note: As of January 2005, the new Utah History Research Center has provided increased services and opportunities for patrons.
Funding Detail Dedicated Credits in this program are the result of sales of copies of archived records.
Budget History - Administrative Services - State Archives - Patron Services
2004 2005 2006 2007 2008Sources of Finance Actual Actual Actual Actual AppropriatedGeneral Fund 427,700 335,600 382,500 439,100 482,000General Fund, One-time 800 3,600 0 (1,200) 0Dedicated Credits Revenue 7,600 2,700 5,900 0 6,000Beginning Nonlapsing 38,500 0 0 29,900 0Closing Nonlapsing 0 0 0 (19,300) 0
Total $474,600 $341,900 $388,400 $448,500 $488,000
Categories of ExpenditurePersonal Services 374,300 384,800 374,100 436,300 468,500In-State Travel 0 0 0 100 0Current Expense 100,300 (42,900) 14,300 12,100 19,500
Total $474,600 $341,900 $388,400 $448,500 $488,000
Other DataBudgeted FTE 7.0 7.0 7.0 7.0 8.0Actual FTE 7.9 7.7 7.0 7.9 0.0
Table 18
OFFICE OF THE LEGISLATIVE FISCAL ANALYST - 50 - DAS STATE ARCHIVES
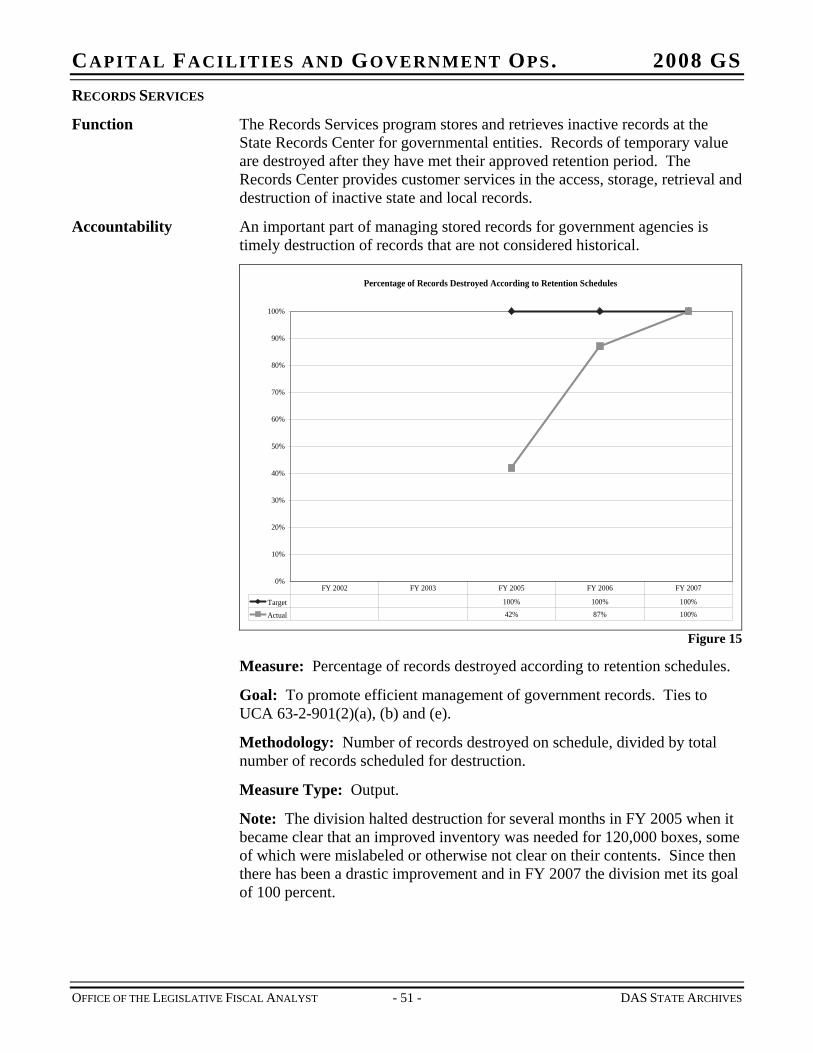
CAPITAL FACILITIES AND GOVERNMENT OPS. 2008 GS RECORDS SERVICES
Function The Records Services program stores and retrieves inactive records at the State Records Center for governmental entities. Records of temporary value are destroyed after they have met their approved retention period. The Records Center provides customer services in the access, storage, retrieval and destruction of inactive state and local records.
Accountability An important part of managing stored records for government agencies is timely destruction of records that are not considered historical.
Percentage of Records Destroyed According to Retention Schedules
0%
10%
20%
30%
40%
50%
60%
70%
80%
90%
100%
Target 100% 100% 100%
Actual 42% 87% 100%
FY 2002 FY 2003 FY 2005 FY 2006 FY 2007
Figure 15
Measure: Percentage of records destroyed according to retention schedules.
Goal: To promote efficient management of government records. Ties to UCA 63-2-901(2)(a), (b) and (e).
Methodology: Number of records destroyed on schedule, divided by total number of records scheduled for destruction.
Measure Type: Output.
Note: The division halted destruction for several months in FY 2005 when it became clear that an improved inventory was needed for 120,000 boxes, some of which were mislabeled or otherwise not clear on their contents. Since then there has been a drastic improvement and in FY 2007 the division met its goal of 100 percent.
OFFICE OF THE LEGISLATIVE FISCAL ANALYST - 51 - DAS STATE ARCHIVES
CAPITAL FACILITIES AND GOVERNMENT OPS. 2008 GS Funding Detail All financing comes from the General Fund. In FY 2008, the Legislature
appropriated $200,000 one-time to the division to help local regional repositories care for and maintain vital historical documents. The 2007 Legislature also appropriated $53,500 ongoing General Fund for the storage and maintenance of the division’s digital assets.
Budget History - Administrative Services - State Archives - Records Services
2004 2005 2006 2007 2008Sources of Finance Actual Actual Actual Actual AppropriatedGeneral Fund 418,200 519,000 527,700 554,400 633,100General Fund, One-time 1,300 3,000 0 (800) 200,000Beginning Nonlapsing - Retirement 0 0 0 0
Total $419,500 $522,000 $527,700 $553,600 $834,600
Categories of ExpenditurePersonal Services 207,800 228,400 223,500 228,700 250,400Current Expense 211,700 293,600 304,200 324,900 529,200DP Current Expense 0 0 0 0
Total $419,500 $522,000 $527,700 $553,600 $834,600
Other DataBudgeted FTE 6.0 6.0 6.0 6.0 5.0Actual FTE 5.6 5.9 5.4 4.7 0.0
1,500
55,000
Table 19
OFFICE OF THE LEGISLATIVE FISCAL ANALYST - 52 - DAS STATE ARCHIVES
CAPITAL FACILITIES AND GOVERNMENT OPS. 2008 GS
OFFICE OF THE LEGISLATIVE FISCAL ANALYST - 53 - DAS FINANCE
CHAPTER 9 DIVISION OF FINANCE – ADMINISTRATION
Function The Division of Finance is the State of Utah's central financial accounting office. The division provides direction regarding fiscal matters, financial systems, processes and information. This includes maintaining accounting and payroll systems; ensuring compliance with state financial laws; maintaining a data warehouse of financial information; producing the state's financial reports; processing the state's payments; and operating the state's travel agency.
The Division of Finance is divided into six programs (Director, Payroll, Payables/Disbursing, Technical Services, Financial Reporting and Financial Information Systems) to accomplish its mission. Some of its key functions are to:
Produce the State's Comprehensive Annual Financial Report
Ensure compliance with generally accepted accounting principles
Disburse all payments to vendors/contractors and employees
Develop, operate, and maintain accounting systems to control spending, state assets and state loans
Process the state’s payroll
Account for revenues collected by all agencies
Statutory Authority The following are some of the many statutes governing operations of the Division of Finance:
UCA 51-5-2 requires the division to establish procedures for the administration and collection of taxes, licenses, fees, and other revenues to allow them to be credited directly into the funds for which they are designated.
UCA 51-5-6 requires the division to use generally accepted accounting principles applicable to government units. The division must follow GASB standards, calculate liabilities associated with post-employment benefits, post revenues to the appropriate funds, prepare revenue and expenditure statements, and determine ISF costs that are eligible for federal reimbursement.
UCA 63A Chapter 3 is entitled “Division of Finance.” Among its key provisions are:
The division director is the state’s chief fiscal officer and the state’s accounting officer.
The division must define fiscal procedures, provide accounting controls, approve proposed expenditures, establish procedures to account for leases, and prepare financial reports for the state auditor’s examination. Higher Education institutions are subject to this statute only to the extent required by the Board of Regents.
CAPITAL FACILITIES AND GOVERNMENT OPS. 2008 GS
OFFICE OF THE LEGISLATIVE FISCAL ANALYST - 54 - DAS FINANCE
The director must establish per diem rates for all state officers and employees of the executive branch, except higher education.
The director must adopt rules governing in-state and out-of-state travel by employees of the executive branch, except higher education.
The director must appoint an accounting officer and other officers necessary to economically perform the functions of the division. The director must also establish a comprehensive state accounting system and exercise accounting control over all state agencies except higher education.
The director must maintain a financial control system according to generally accepted accounting principles, to include keeping accounts in balance and giving the governor and legislature reports.
The division must collect accounts receivable as described in UCA 63A-3-Part 3.
UCA 63-38-2.5 requires the division to make transfers out of any General Fund surplus at the end of a fiscal year to the General Fund Budget Reserve Account.
UCA 63-38-2.6 requires the division to make transfers out of any Education Fund or Uniform School Fund surplus at the end of a fiscal year to the Education Budget Reserve Account.
UCA 77-32-401 creates within the division the Indigent Defense Funds Board to oversee the use of funds from the Indigent Inmate Trust Fund and Indigent Capital Defense Trust Fund.
Intent Language During the 2007 General Session the Legislature adopted the following language in H.B. 150 for FY 2008:
Under Section 63-38-8 of the Utah Code the Legislature intends that funds provided by Item 39 of House Bill 1, State Agency and Higher Education Base Budget Appropriations (2007 General Session) for the Division of Finance not lapse at the close of Fiscal Year 2008. The use of nonlapsing funds is limited to an actuarial study of post-employment benefits and to maintenance, operation, and development of statewide accounting systems.
Funding Detail Table 20 (next page) is a roll-up of funding for the programs in this line item. Financing from the General Fund Restricted – ISF Overhead account represents charges to the internal service funds for overhead services such as accounting and auditing, building space, maintenance, security, etc. These funds are used in the Financial Information Systems program for FINET (statewide accounting system) support.
In FY 2007 the division transferred twenty-two FTEs, equating to 27 percent of previously existing positions, to the new Department of Technology Services. Although these FTE no longer work for the division per se, they continue to support division programs.
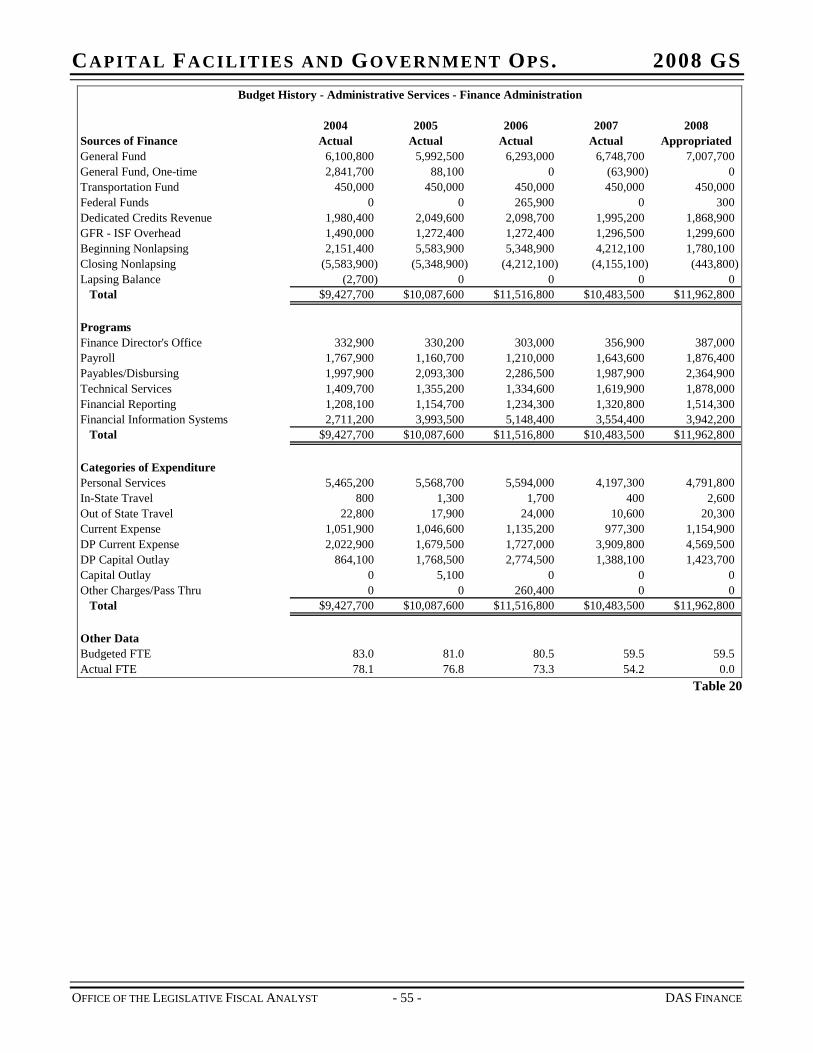
CAPITAL FACILITIES AND GOVERNMENT OPS. 2008 GS Budget History - Administrative Services - Finance Administration
2004 2005 2006 2007 2008Sources of Finance Actual Actual Actual Actual AppropriatedGeneral Fund 6,100,800 5,992,500 6,293,000 6,748,700 7,007,700General Fund, One-time 2,841,700 88,100 0 (63,900) 0Transportation Fund 450,000 450,000 450,000 450,000 450,000Federal Funds 0 0 265,900 0 300Dedicated Credits Revenue 1,980,400 2,049,600 2,098,700 1,995,200 1,868,900GFR - ISF Overhead 1,490,000 1,272,400 1,272,400 1,296,500 1,299,600Beginning Nonlapsing 2,151,400 5,583,900 5,348,900 4,212,100 1,780,100Closing Nonlapsing (5,583,900) (5,348,900) (4,212,100) (4,155,100) (443,800)Lapsing Balance (2,700) 0 0 0 0
Total $9,427,700 $10,087,600 $11,516,800 $10,483,500 $11,962,800
ProgramsFinance Director's Office 332,900 330,200 303,000 356,900 387,000Payroll 1,767,900 1,160,700 1,210,000 1,643,600 1,876,400Payables/Disbursing 1,997,900 2,093,300 2,286,500 1,987,900 2,364,900Technical Services 1,409,700 1,355,200 1,334,600 1,619,900 1,878,000Financial Reporting 1,208,100 1,154,700 1,234,300 1,320,800 1,514,300Financial Information Systems 2,711,200 3,993,500 5,148,400 3,554,400 3,942,200
Total $9,427,700 $10,087,600 $11,516,800 $10,483,500 $11,962,800
Categories of ExpenditurePersonal Services 5,465,200 5,568,700 5,594,000 4,197,300 4,791,800In-State Travel 800 1,300 1,700 400 2,600Out of State Travel 22,800 17,900 24,000 10,600 20,300Current Expense 1,051,900 1,046,600 1,135,200 977,300 1,154,900DP Current Expense 2,022,900 1,679,500 1,727,000 3,909,800 4,569,500DP Capital Outlay 864,100 1,768,500 2,774,500 1,388,100 1,423,700Capital Outlay 0 5,100 0 0 0Other Charges/Pass Thru 0 0 260,400 0 0
Total $9,427,700 $10,087,600 $11,516,800 $10,483,500 $11,962,800
Other DataBudgeted FTE 83.0 81.0 80.5 59.5 59.5Actual FTE 78.1 76.8 73.3 54.2 0.0
Table 20
OFFICE OF THE LEGISLATIVE FISCAL ANALYST - 55 - DAS FINANCE
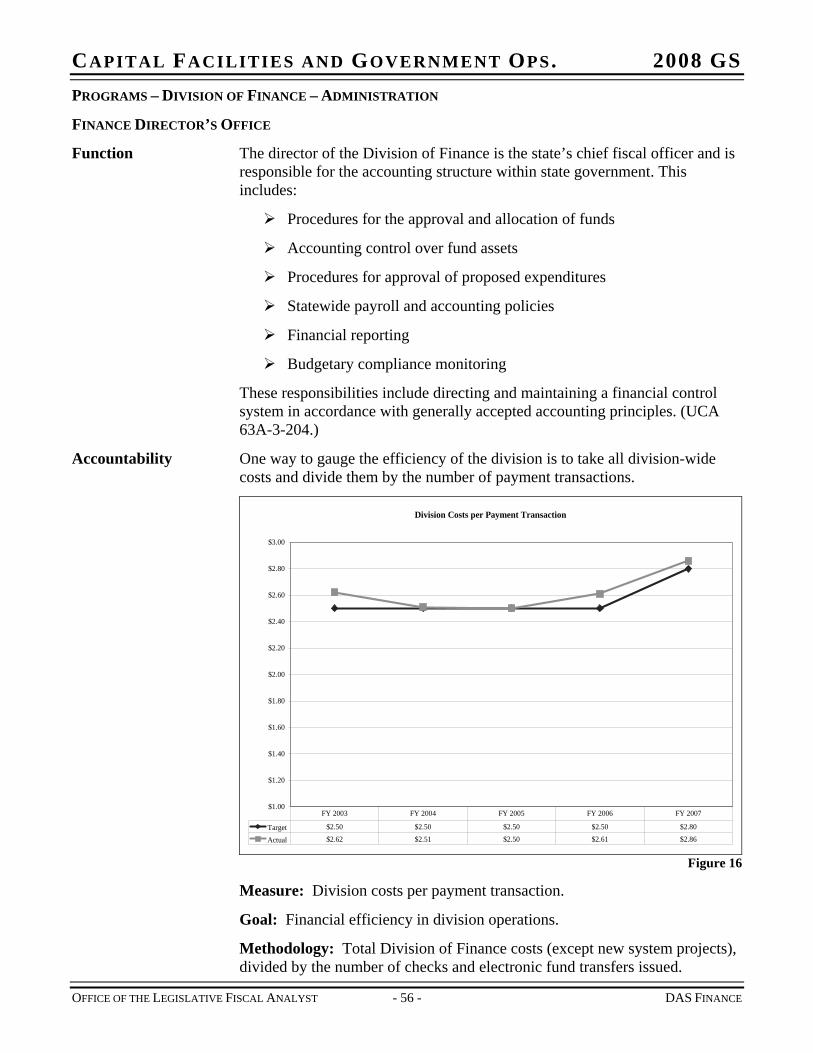
CAPITAL FACILITIES AND GOVERNMENT OPS. 2008 GS PROGRAMS – DIVISION OF FINANCE – ADMINISTRATION
FINANCE DIRECTOR’S OFFICE
Function The director of the Division of Finance is the state’s chief fiscal officer and is responsible for the accounting structure within state government. This includes:
Procedures for the approval and allocation of funds
Accounting control over fund assets
Procedures for approval of proposed expenditures
Statewide payroll and accounting policies
Financial reporting
Budgetary compliance monitoring
These responsibilities include directing and maintaining a financial control system in accordance with generally accepted accounting principles. (UCA 63A-3-204.)
Accountability One way to gauge the efficiency of the division is to take all division-wide costs and divide them by the number of payment transactions.
Division Costs per Payment Transaction
$1.00
$1.20
$1.40
$1.60
$1.80
$2.00
$2.20
$2.40
$2.60
$2.80
$3.00
Target $2.50 $2.50 $2.50 $2.50 $2.80
Actual $2.62 $2.51 $2.50 $2.61 $2.86
FY 2003 FY 2004 FY 2005 FY 2006 FY 2007
Figure 16
Measure: Division costs per payment transaction.
Goal: Financial efficiency in division operations.
Methodology: Total Division of Finance costs (except new system projects), divided by the number of checks and electronic fund transfers issued.
OFFICE OF THE LEGISLATIVE FISCAL ANALYST - 56 - DAS FINANCE
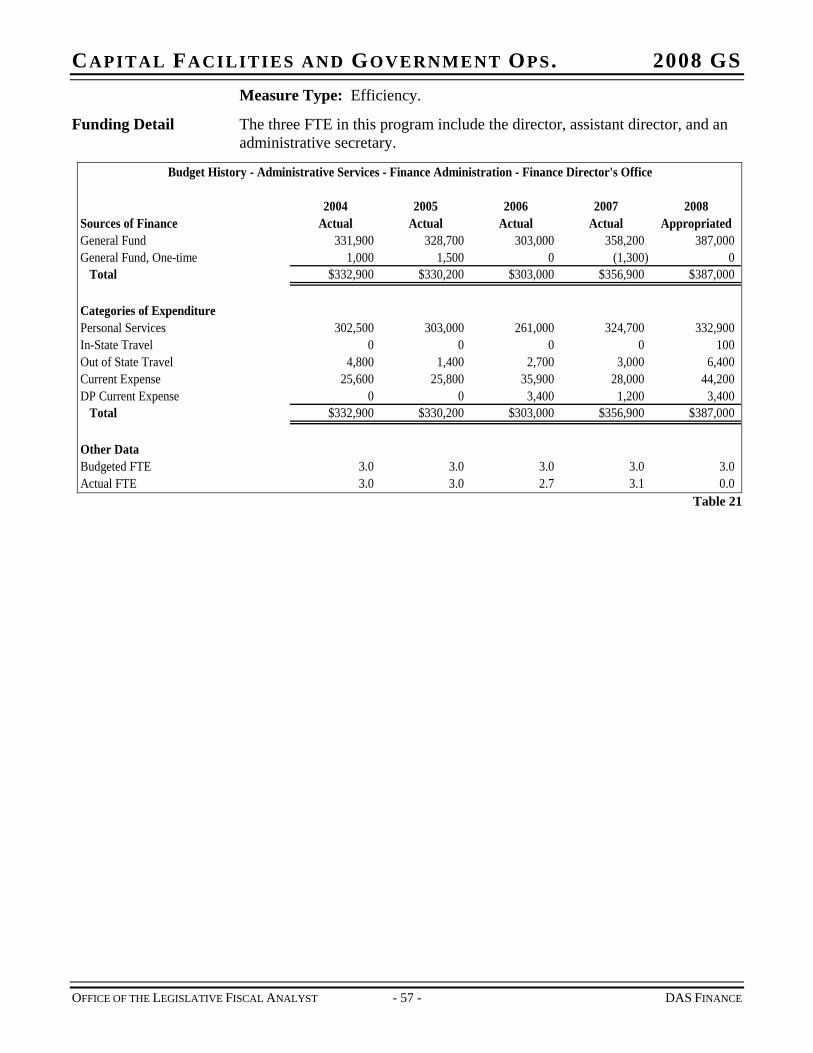
CAPITAL FACILITIES AND GOVERNMENT OPS. 2008 GS Measure Type: Efficiency.
Funding Detail The three FTE in this program include the director, assistant director, and an administrative secretary.
Budget History - Administrative Services - Finance Administration - Finance Director's Office
2004 2005 2006 2007 2008Sources of Finance Actual Actual Actual Actual AppropriatedGeneral Fund 331,900 328,700 303,000 358,200 387,000General Fund, One-time 1,000 1,500 0 (1,300) 0
Total $332,900 $330,200 $303,000 $356,900 $387,000
Categories of ExpenditurePersonal Services 302,500 303,000 261,000 324,700 332,900In-State Travel 0 0 0 0Out of State Travel 4,800 1,400 2,700 3,000 6,400Current Expense 25,600 25,800 35,900 28,000 44,200DP Current Expense 0 0 3,400 1,200 3,400
Total $332,900 $330,200 $303,000 $356,900 $387,000
Other DataBudgeted FTE 3.0 3.0 3.0 3.0 3.0Actual FTE 3.0 3.0 2.7 3.1 0.0
100
Table 21
OFFICE OF THE LEGISLATIVE FISCAL ANALYST - 57 - DAS FINANCE
CAPITAL FACILITIES AND GOVERNMENT OPS. 2008 GS
OFFICE OF THE LEGISLATIVE FISCAL ANALYST - 58 - DAS FINANCE
PAYROLL
Function The Payroll section is responsible for maintaining and operating the state’s time and attendance and payroll systems. The Payroll section also produces a variety of reports and files, including:
Payroll register
Utah Retirement Systems reports
Detail labor distribution file
General ledger journal vouchers
Various federal reports
This program develops and delivers payroll policy, procedures, and training.
Every two weeks approximately 3,300 checks and 19,800 direct deposits are issued, accounting for over $35,610,000 in wages.
Payroll services include collecting and processing employee time, calculating gross and net pay, calculating benefits, payments to employees, payments to third parties (such as benefit providers, taxing authorities and employee associations), calculating and distributing labor costs that are passed to the state’s financial systems and data warehouse, adhering to federal and state employment laws and regulations, and maintaining current and historical employee and payroll data.
The program also oversees Employee Self-Service (ESS), a payroll and time processing system that allows employees to enter their time on-line, view their own payroll data, and update certain information such as W-4 forms without involving a payroll technician. This system has reduced administration costs and improved employee satisfaction. In July, 2007 the system had 11,897 time entry users and an additional 9,652 employees have access to ESS for payroll data entry and updates.
Accountability Perhaps the most important function of this program is to issue payments on time. In FY 2007 the program had 100 percent on-time payroll. This is an indication that the payroll system was available to agencies for timely data entry. Total value of payroll processed is always increasing, as shown below:
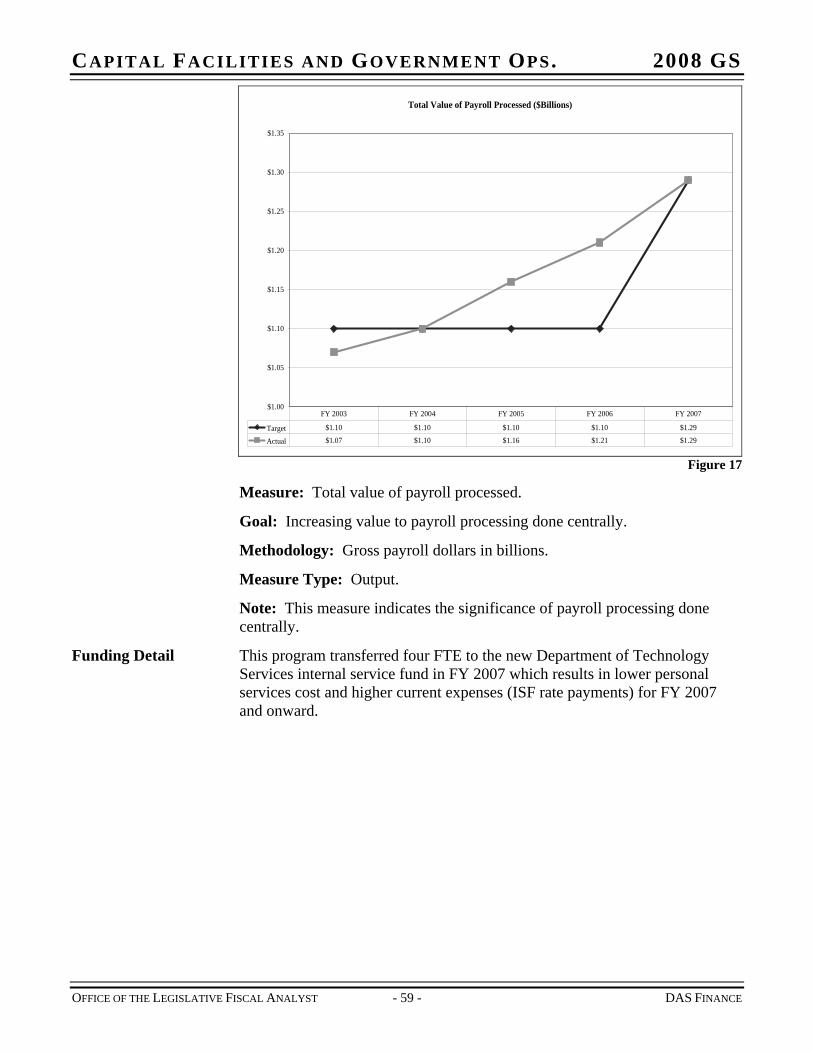
CAPITAL FACILITIES AND GOVERNMENT OPS. 2008 GS
Total Value of Payroll Processed ($Billions)
$1.00
$1.05
$1.10
$1.15
$1.20
$1.25
$1.30
$1.35
Target $1.10 $1.10 $1.10 $1.10 $1.29
Actual $1.07 $1.10 $1.16 $1.21 $1.29
FY 2003 FY 2004 FY 2005 FY 2006 FY 2007
Figure 17
Measure: Total value of payroll processed.
Goal: Increasing value to payroll processing done centrally.
Methodology: Gross payroll dollars in billions.
Measure Type: Output.
Note: This measure indicates the significance of payroll processing done centrally.
Funding Detail This program transferred four FTE to the new Department of Technology Services internal service fund in FY 2007 which results in lower personal services cost and higher current expenses (ISF rate payments) for FY 2007 and onward.
OFFICE OF THE LEGISLATIVE FISCAL ANALYST - 59 - DAS FINANCE
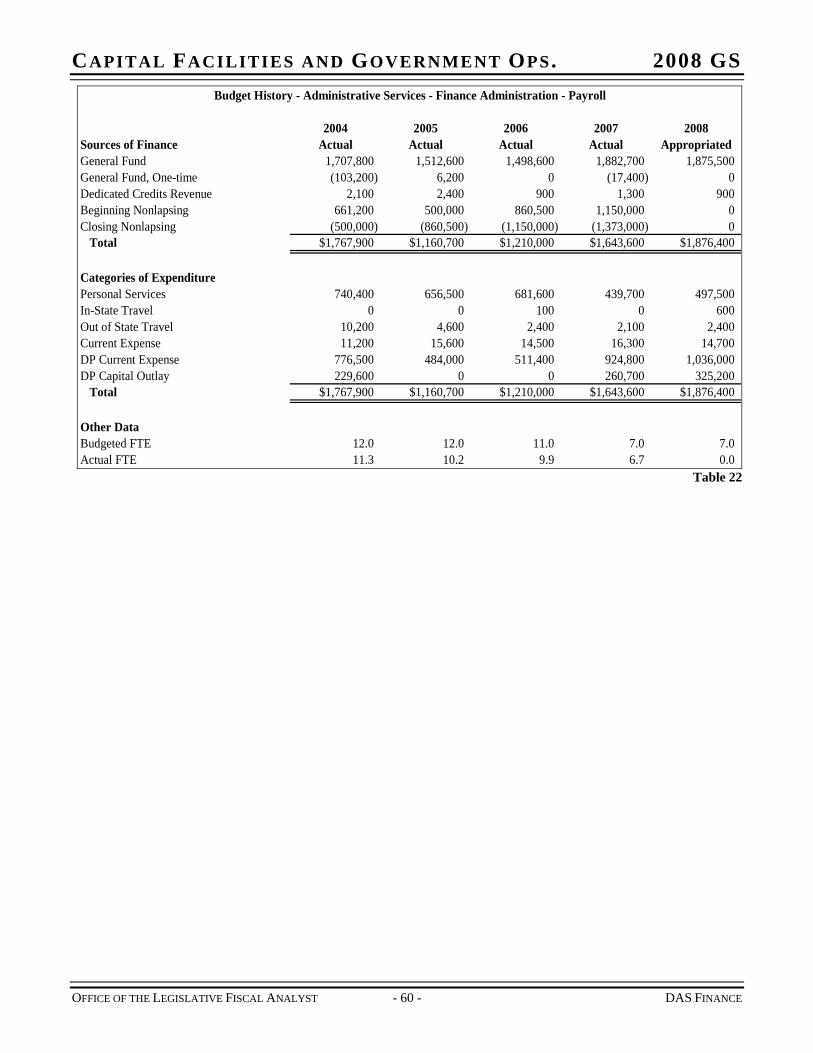
CAPITAL FACILITIES AND GOVERNMENT OPS. 2008 GS Budget History - Administrative Services - Finance Administration - Payroll
2004 2005 2006 2007 2008Sources of Finance Actual Actual Actual Actual AppropriatedGeneral Fund 1,707,800 1,512,600 1,498,600 1,882,700 1,875,500General Fund, One-time (103,200) 6,200 0 (17,400) 0Dedicated Credits Revenue 2,100 2,400 900 1,300 900Beginning Nonlapsing 661,200 500,000 860,500 1,150,000 0Closing Nonlapsing (500,000) (860,500) (1,150,000) (1,373,000) 0
Total $1,767,900 $1,160,700 $1,210,000 $1,643,600 $1,876,400
Categories of ExpenditurePersonal Services 740,400 656,500 681,600 439,700 497,500In-State Travel 0 0 100 0 600Out of State Travel 10,200 4,600 2,400 2,100 2,400Current Expense 11,200 15,600 14,500 16,300 14,700DP Current Expense 776,500 484,000 511,400 924,800 1,036,000DP Capital Outlay 229,600 0 0 260,700 325,200
Total $1,767,900 $1,160,700 $1,210,000 $1,643,600 $1,876,400
Other DataBudgeted FTE 12.0 12.0 11.0 7.0 7.0Actual FTE 11.3 10.2 9.9 6.7 0.0
Table 22
OFFICE OF THE LEGISLATIVE FISCAL ANALYST - 60 - DAS FINANCE
CAPITAL FACILITIES AND GOVERNMENT OPS. 2008 GS PAYABLES/DISBURSING
Function This program:
Audits payment and employee reimbursement requests
Manages the FINDER collections program
Manages vendor information in FINET
Manages all checks redeemed by the bank
Provides information to the public and other agencies about the status of lost, missing, or cashed checks
Distributes tax money to cities and counties
Manages the State Travel Office
Finance manages a program called FINDER with the aim of improving the collection of funds owed to the state. The program matches tax refunds and vendor payments with outstanding receivables due the State. Those receivables include tax bills, child support, student loans, parking and moving violations, and unemployment insurance. If a match is made, the payment or tax refund is intercepted and paid to the entity. This function is fully funded by the administrative fees collected as debts are paid. A fee of $15 per transaction funds the program.
The disbursement function also handles the mailing and distribution of all centrally processed payments. Annually, there are approximately 2.54 million payments made. Payments include electronic fund transfers and checks mailed for such things as vendor payments, tax refunds, and payroll.
The Travel Office is a part of this section and is responsible for arranging travel for state employees and employees of political subdivisions that choose to participate. Airline tickets, hotels, rental vehicles, and conference sites are ticketed and arranged for by this office. Although the Travel Office contracts with a private sector travel agency which is on-site in the State Office Building, it is managed by State Finance.
Personal Vehicle Use Reimbursement
Since the 2000 General Session the Legislature has asked the Department of Administrative Services to follow a mileage reimbursement program. This program requires agencies to reimburse employees for personal vehicle use at one of two levels: (1) if a state motor pool vehicle is available, employees are reimbursed at a rate equal to, or less than, the per mile cost of a mid-size sedan operated by the Division of Fleet Operations; (2) if a state motor pool vehicle is unavailable, employees are reimbursed at a higher rate tied to IRS approved rates.
The goal of the policy is to encourage employees to use vehicles already in the state motor pool. When employees request reimbursement for using a personal vehicle on long trips the state pays for a vehicle twice – once for the employee’s mileage and again for the unused state vehicle. The following table shows personal vehicle mileage reimbursements since FY 2003.
OFFICE OF THE LEGISLATIVE FISCAL ANALYST - 61 - DAS FINANCE
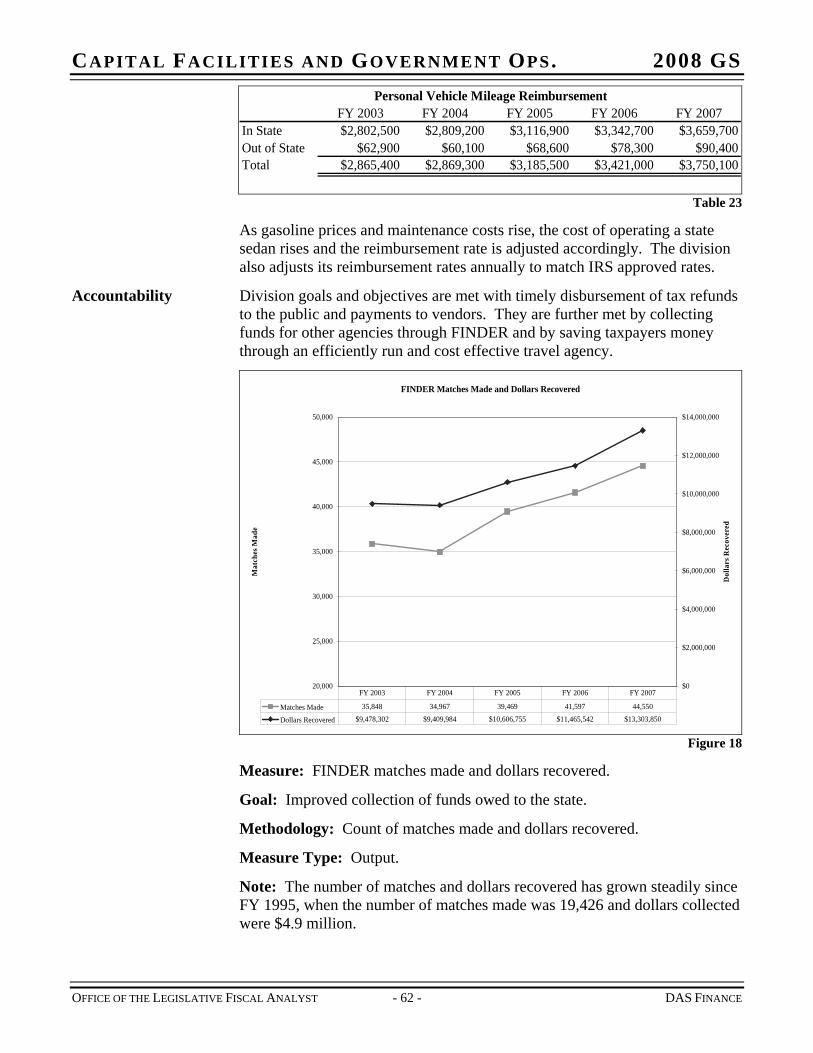
CAPITAL FACILITIES AND GOVERNMENT OPS. 2008 GS
FY 2003 FY 2004 FY 2005 FY 2006 FY 2007In State $2,802,500 $2,809,200 $3,116,900 $3,342,700 $3,659,700Out of State $62,900 $60,100 $68,600 $78,300 $90,400Total $2,865,400 $2,869,300 $3,185,500 $3,421,000 $3,750,100
Personal Vehicle Mileage Reimbursement
Table 23
As gasoline prices and maintenance costs rise, the cost of operating a state sedan rises and the reimbursement rate is adjusted accordingly. The division also adjusts its reimbursement rates annually to match IRS approved rates.
Accountability Division goals and objectives are met with timely disbursement of tax refunds to the public and payments to vendors. They are further met by collecting funds for other agencies through FINDER and by saving taxpayers money through an efficiently run and cost effective travel agency.
FINDER Matches Made and Dollars Recovered
20,000
25,000
30,000
35,000
40,000
45,000
50,000
Mat
ches
Mad
e
$0
$2,000,000
$4,000,000
$6,000,000
$8,000,000
$10,000,000
$12,000,000
$14,000,000
Dol
lars
Rec
over
ed
Matches Made 35,848 34,967 39,469 41,597 44,550
Dollars Recovered $9,478,302 $9,409,984 $10,606,755 $11,465,542 $13,303,850
FY 2003 FY 2004 FY 2005 FY 2006 FY 2007
Figure 18
Measure: FINDER matches made and dollars recovered.
Goal: Improved collection of funds owed to the state.
Methodology: Count of matches made and dollars recovered.
Measure Type: Output.
Note: The number of matches and dollars recovered has grown steadily since FY 1995, when the number of matches made was 19,426 and dollars collected were $4.9 million.
OFFICE OF THE LEGISLATIVE FISCAL ANALYST - 62 - DAS FINANCE
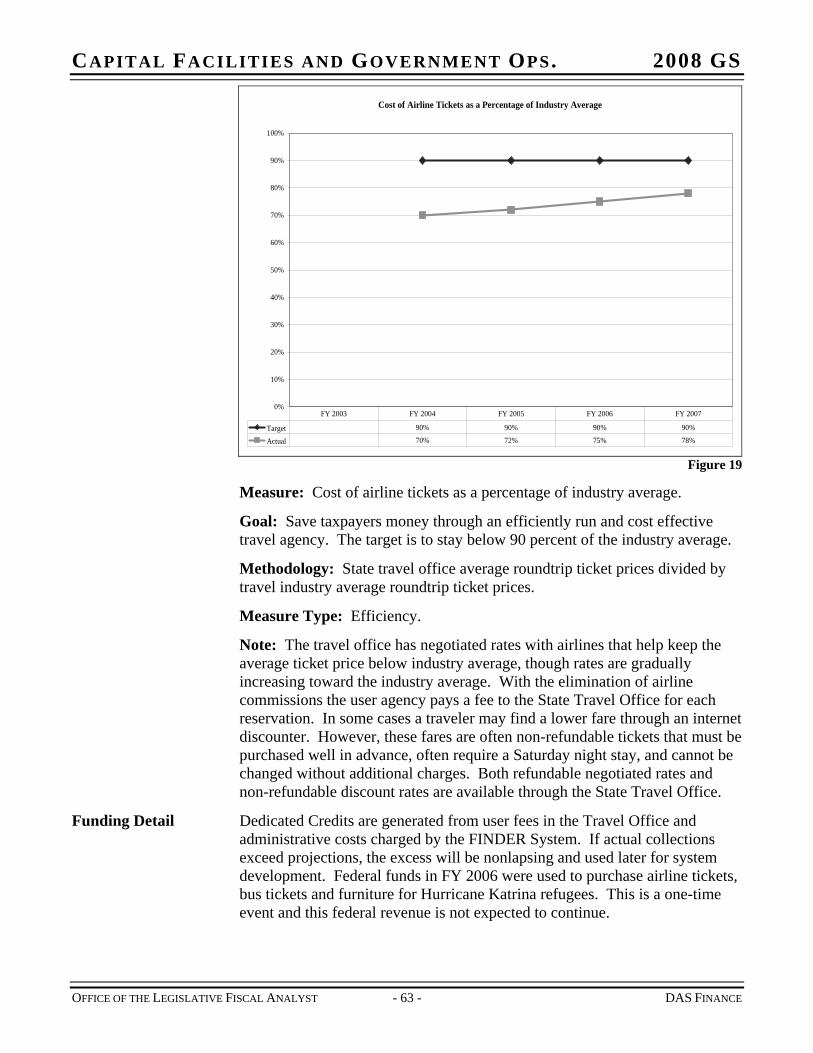
CAPITAL FACILITIES AND GOVERNMENT OPS. 2008 GS
Cost of Airline Tickets as a Percentage of Industry Average
0%
10%
20%
30%
40%
50%
60%
70%
80%
90%
100%
Target 90% 90% 90% 90%
Actual 70% 72% 75% 78%
FY 2003 FY 2004 FY 2005 FY 2006 FY 2007
Figure 19
Measure: Cost of airline tickets as a percentage of industry average.
Goal: Save taxpayers money through an efficiently run and cost effective travel agency. The target is to stay below 90 percent of the industry average.
Methodology: State travel office average roundtrip ticket prices divided by travel industry average roundtrip ticket prices.
Measure Type: Efficiency.
Note: The travel office has negotiated rates with airlines that help keep the average ticket price below industry average, though rates are gradually increasing toward the industry average. With the elimination of airline commissions the user agency pays a fee to the State Travel Office for each reservation. In some cases a traveler may find a lower fare through an internet discounter. However, these fares are often non-refundable tickets that must be purchased well in advance, often require a Saturday night stay, and cannot be changed without additional charges. Both refundable negotiated rates and non-refundable discount rates are available through the State Travel Office.
Funding Detail Dedicated Credits are generated from user fees in the Travel Office and administrative costs charged by the FINDER System. If actual collections exceed projections, the excess will be nonlapsing and used later for system development. Federal funds in FY 2006 were used to purchase airline tickets, bus tickets and furniture for Hurricane Katrina refugees. This is a one-time event and this federal revenue is not expected to continue.
OFFICE OF THE LEGISLATIVE FISCAL ANALYST - 63 - DAS FINANCE
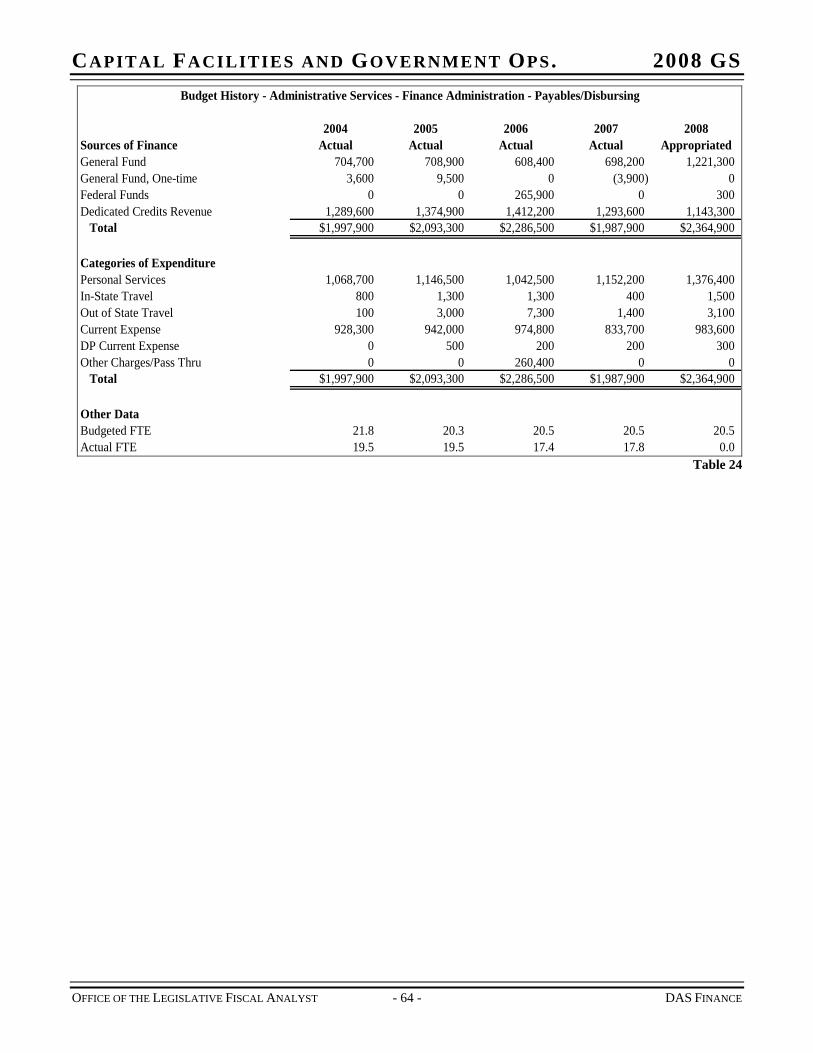
CAPITAL FACILITIES AND GOVERNMENT OPS. 2008 GS Budget History - Administrative Services - Finance Administration - Payables/Disbursing
2004 2005 2006 2007 2008Sources of Finance Actual Actual Actual Actual AppropriatedGeneral Fund 704,700 708,900 608,400 698,200 1,221,300General Fund, One-time 3,600 9,500 0 (3,900) 0Federal Funds 0 0 265,900 0 300Dedicated Credits Revenue 1,289,600 1,374,900 1,412,200 1,293,600 1,143,300
Total $1,997,900 $2,093,300 $2,286,500 $1,987,900 $2,364,900
Categories of ExpenditurePersonal Services 1,068,700 1,146,500 1,042,500 1,152,200 1,376,400In-State Travel 800 1,300 1,300 400 1,500Out of State Travel 100 3,000 7,300 1,400 3,100Current Expense 928,300 942,000 974,800 833,700 983,600DP Current Expense 0 500 200 200 300Other Charges/Pass Thru 0 0 260,400 0 0
Total $1,997,900 $2,093,300 $2,286,500 $1,987,900 $2,364,900
Other DataBudgeted FTE 21.8 20.3 20.5 20.5 20.5Actual FTE 19.5 19.5 17.4 17.8 0.0
Table 24
OFFICE OF THE LEGISLATIVE FISCAL ANALYST - 64 - DAS FINANCE
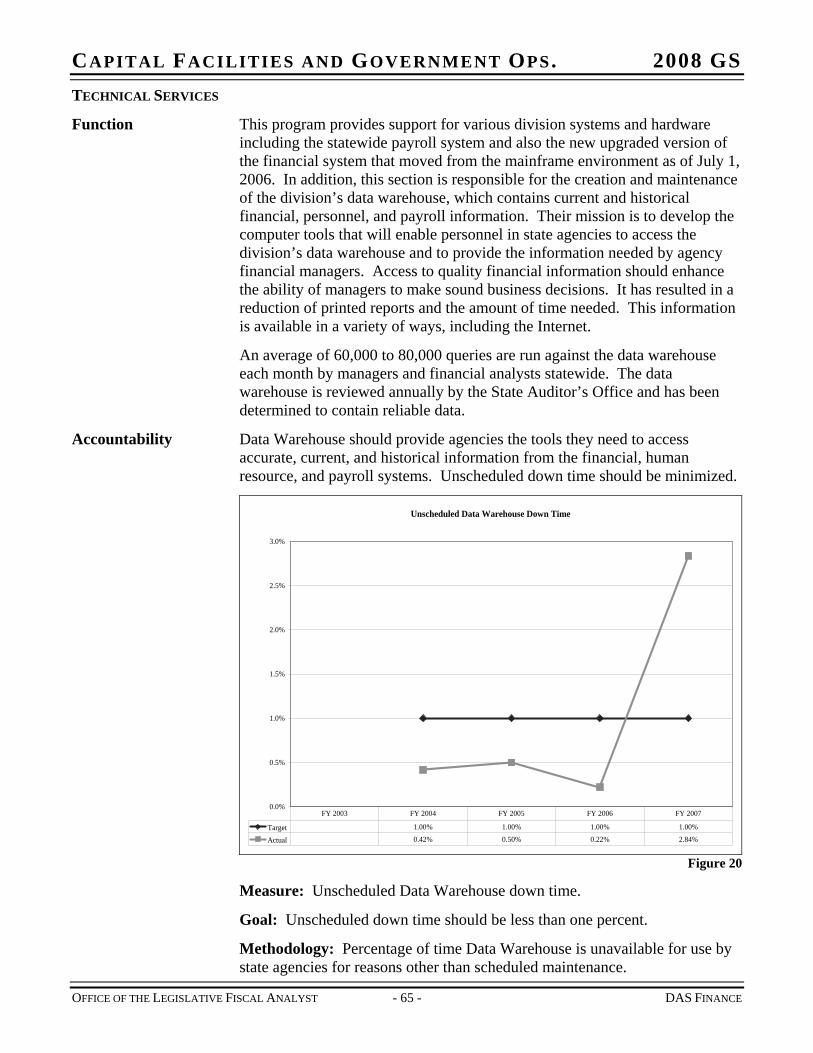
CAPITAL FACILITIES AND GOVERNMENT OPS. 2008 GS TECHNICAL SERVICES
Function This program provides support for various division systems and hardware including the statewide payroll system and also the new upgraded version of the financial system that moved from the mainframe environment as of July 1, 2006. In addition, this section is responsible for the creation and maintenance of the division’s data warehouse, which contains current and historical financial, personnel, and payroll information. Their mission is to develop the computer tools that will enable personnel in state agencies to access the division’s data warehouse and to provide the information needed by agency financial managers. Access to quality financial information should enhance the ability of managers to make sound business decisions. It has resulted in a reduction of printed reports and the amount of time needed. This information is available in a variety of ways, including the Internet.
An average of 60,000 to 80,000 queries are run against the data warehouse each month by managers and financial analysts statewide. The data warehouse is reviewed annually by the State Auditor’s Office and has been determined to contain reliable data.
Accountability Data Warehouse should provide agencies the tools they need to access accurate, current, and historical information from the financial, human resource, and payroll systems. Unscheduled down time should be minimized.
Unscheduled Data Warehouse Down Time
0.0%
0.5%
1.0%
1.5%
2.0%
2.5%
3.0%
Target 1.00% 1.00% 1.00% 1.00%
Actual 0.42% 0.50% 0.22% 2.84%
FY 2003 FY 2004 FY 2005 FY 2006 FY 2007
Figure 20
Measure: Unscheduled Data Warehouse down time.
Goal: Unscheduled down time should be less than one percent.
Methodology: Percentage of time Data Warehouse is unavailable for use by state agencies for reasons other than scheduled maintenance.
OFFICE OF THE LEGISLATIVE FISCAL ANALYST - 65 - DAS FINANCE
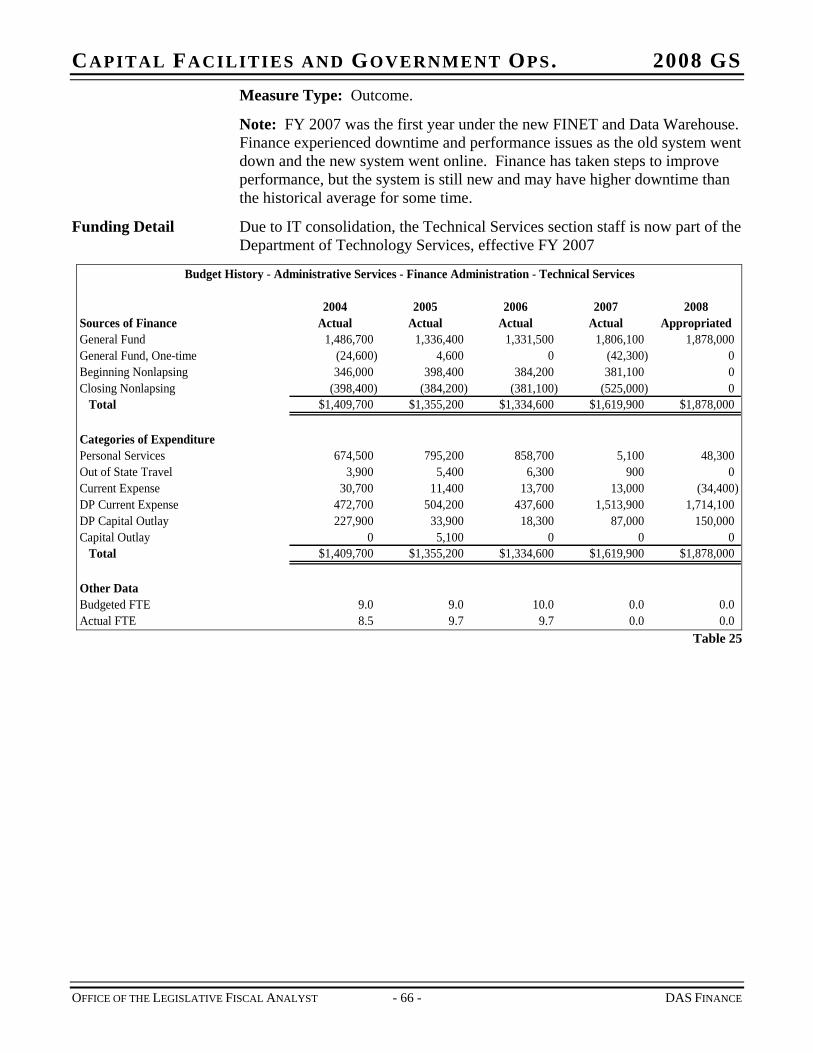
CAPITAL FACILITIES AND GOVERNMENT OPS. 2008 GS Measure Type: Outcome.
Note: FY 2007 was the first year under the new FINET and Data Warehouse. Finance experienced downtime and performance issues as the old system went down and the new system went online. Finance has taken steps to improve performance, but the system is still new and may have higher downtime than the historical average for some time.
Funding Detail Due to IT consolidation, the Technical Services section staff is now part of the Department of Technology Services, effective FY 2007
Budget History - Administrative Services - Finance Administration - Technical Services
2004 2005 2006 2007 2008Sources of Finance Actual Actual Actual Actual AppropriatedGeneral Fund 1,486,700 1,336,400 1,331,500 1,806,100 1,878,000General Fund, One-time (24,600) 4,600 0 (42,300) 0Beginning Nonlapsing 346,000 398,400 384,200 381,100 0Closing Nonlapsing (398,400) (384,200) (381,100) (525,000) 0
Total $1,409,700 $1,355,200 $1,334,600 $1,619,900 $1,878,000
Categories of ExpenditurePersonal Services 674,500 795,200 858,700 5,100 48,300Out of State Travel 3,900 5,400 6,300 900 0Current Expense 30,700 11,400 13,700 13,000 (34,400)DP Current Expense 472,700 504,200 437,600 1,513,900 1,714,100DP Capital Outlay 227,900 33,900 18,300 87,000 150,000Capital Outlay 0 5,100 0 0 0
Total $1,409,700 $1,355,200 $1,334,600 $1,619,900 $1,878,000
Other DataBudgeted FTE 9.0 9.0 10.0 0.0 0.0Actual FTE 8.5 9.7 9.7 0.0 0.0
Table 25
OFFICE OF THE LEGISLATIVE FISCAL ANALYST - 66 - DAS FINANCE
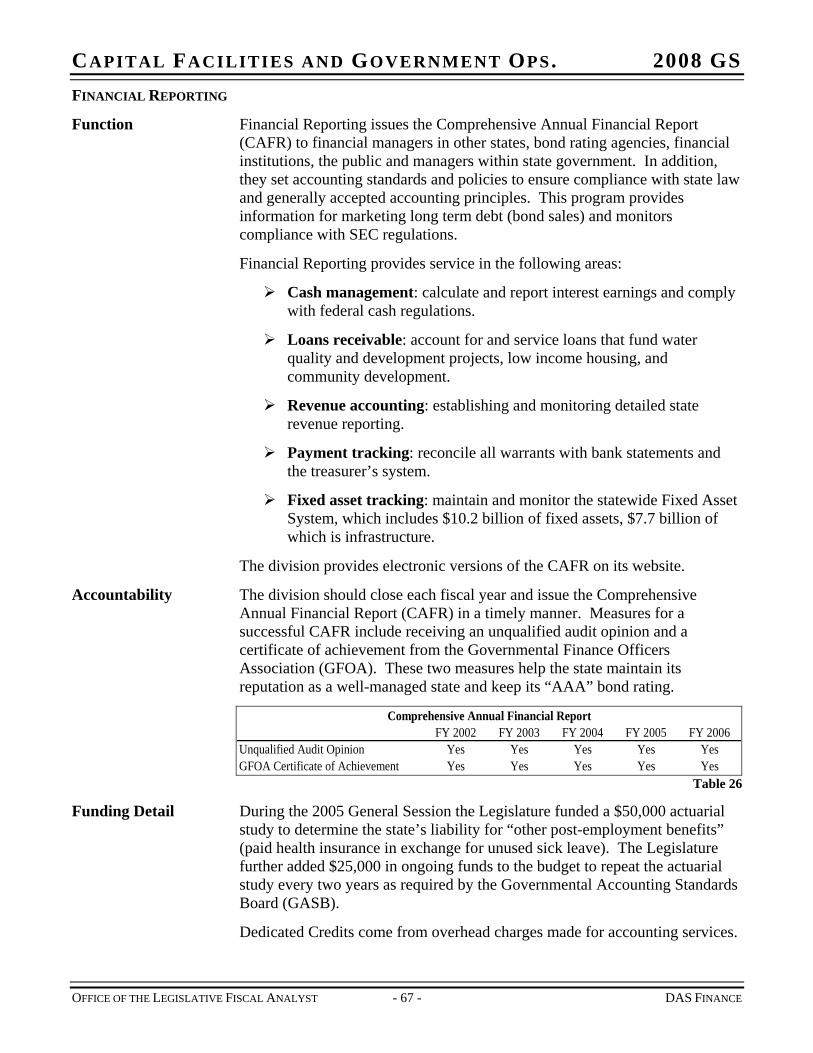
CAPITAL FACILITIES AND GOVERNMENT OPS. 2008 GS FINANCIAL REPORTING
Function Financial Reporting issues the Comprehensive Annual Financial Report (CAFR) to financial managers in other states, bond rating agencies, financial institutions, the public and managers within state government. In addition, they set accounting standards and policies to ensure compliance with state law and generally accepted accounting principles. This program provides information for marketing long term debt (bond sales) and monitors compliance with SEC regulations.
Financial Reporting provides service in the following areas:
Cash management: calculate and report interest earnings and comply with federal cash regulations.
Loans receivable: account for and service loans that fund water quality and development projects, low income housing, and community development.
Revenue accounting: establishing and monitoring detailed state revenue reporting.
Payment tracking: reconcile all warrants with bank statements and the treasurer’s system.
Fixed asset tracking: maintain and monitor the statewide Fixed Asset System, which includes $10.2 billion of fixed assets, $7.7 billion of which is infrastructure.
The division provides electronic versions of the CAFR on its website.
Accountability The division should close each fiscal year and issue the Comprehensive Annual Financial Report (CAFR) in a timely manner. Measures for a successful CAFR include receiving an unqualified audit opinion and a certificate of achievement from the Governmental Finance Officers Association (GFOA). These two measures help the state maintain its reputation as a well-managed state and keep its “AAA” bond rating.
FY 2002 FY 2003 FY 2004 FY 2005 FY 2006Unqualified Audit Opinion Yes Yes Yes Yes YesGFOA Certificate of Achievement Yes Yes Yes Yes Yes
Comprehensive Annual Financial Report
Table 26
Funding Detail During the 2005 General Session the Legislature funded a $50,000 actuarial study to determine the state’s liability for “other post-employment benefits” (paid health insurance in exchange for unused sick leave). The Legislature further added $25,000 in ongoing funds to the budget to repeat the actuarial study every two years as required by the Governmental Accounting Standards Board (GASB).
Dedicated Credits come from overhead charges made for accounting services.
OFFICE OF THE LEGISLATIVE FISCAL ANALYST - 67 - DAS FINANCE
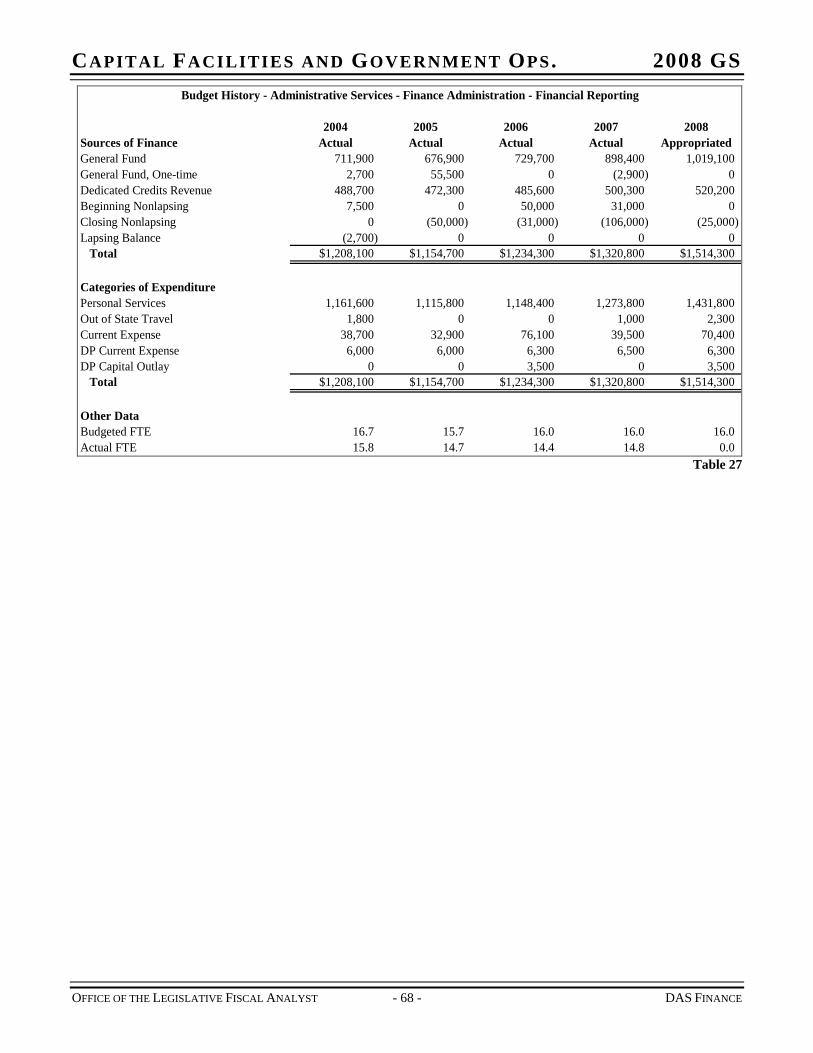
CAPITAL FACILITIES AND GOVERNMENT OPS. 2008 GS Budget History - Administrative Services - Finance Administration - Financial Reporting
2004 2005 2006 2007 2008Sources of Finance Actual Actual Actual Actual AppropriatedGeneral Fund 711,900 676,900 729,700 898,400 1,019,100General Fund, One-time 2,700 55,500 0 (2,900) 0Dedicated Credits Revenue 488,700 472,300 485,600 500,300 520,200Beginning Nonlapsing 7,500 0 50,000 31,000 0Closing Nonlapsing 0 (50,000) (31,000) (106,000) (25,000)Lapsing Balance (2,700) 0 0 0 0
Total $1,208,100 $1,154,700 $1,234,300 $1,320,800 $1,514,300
Categories of ExpenditurePersonal Services 1,161,600 1,115,800 1,148,400 1,273,800 1,431,800Out of State Travel 1,800 0 0 1,000 2,300Current Expense 38,700 32,900 76,100 39,500 70,400DP Current Expense 6,000 6,000 6,300 6,500 6,300DP Capital Outlay 0 0 3,500 0 3,500
Total $1,208,100 $1,154,700 $1,234,300 $1,320,800 $1,514,300
Other DataBudgeted FTE 16.7 15.7 16.0 16.0 16.0Actual FTE 15.8 14.7 14.4 14.8 0.0
Table 27
OFFICE OF THE LEGISLATIVE FISCAL ANALYST - 68 - DAS FINANCE
CAPITAL FACILITIES AND GOVERNMENT OPS. 2008 GS
OFFICE OF THE LEGISLATIVE FISCAL ANALYST - 69 - DAS FINANCE
FINANCIAL INFORMATION SYSTEMS
Function The Financial Information Systems group maintains the state central accounting system (FINET) and is responsible for coordinating incoming financial data, processing the information, generating warrants, and distributing reports to the departments each month. This section is also responsible for:
User coordination among all state agencies
Training
Garnishment and Tax systems: maintaining and operating the Tax and Wage Garnishments systems
Payment Tracking System: maintaining and operating the state Warrant and Electronic Funds Transfer (EFT) Payment System
Unclaimed Property application: developing, testing, and implementing changes and upgrades to the Unclaimed Property System
Check Writer System: developing, testing, and implementing changes and upgrades to the Check Writer System that prints warrants for agencies outside of the Division of Finance
Funding Detail Because of the large amount of data processed for the Department of Transportation, a portion of this program is funded from the Transportation Fund.
Due to IT consolidation, eight FTE from this section are now part of the Department of Technology Services, effective FY 2007.
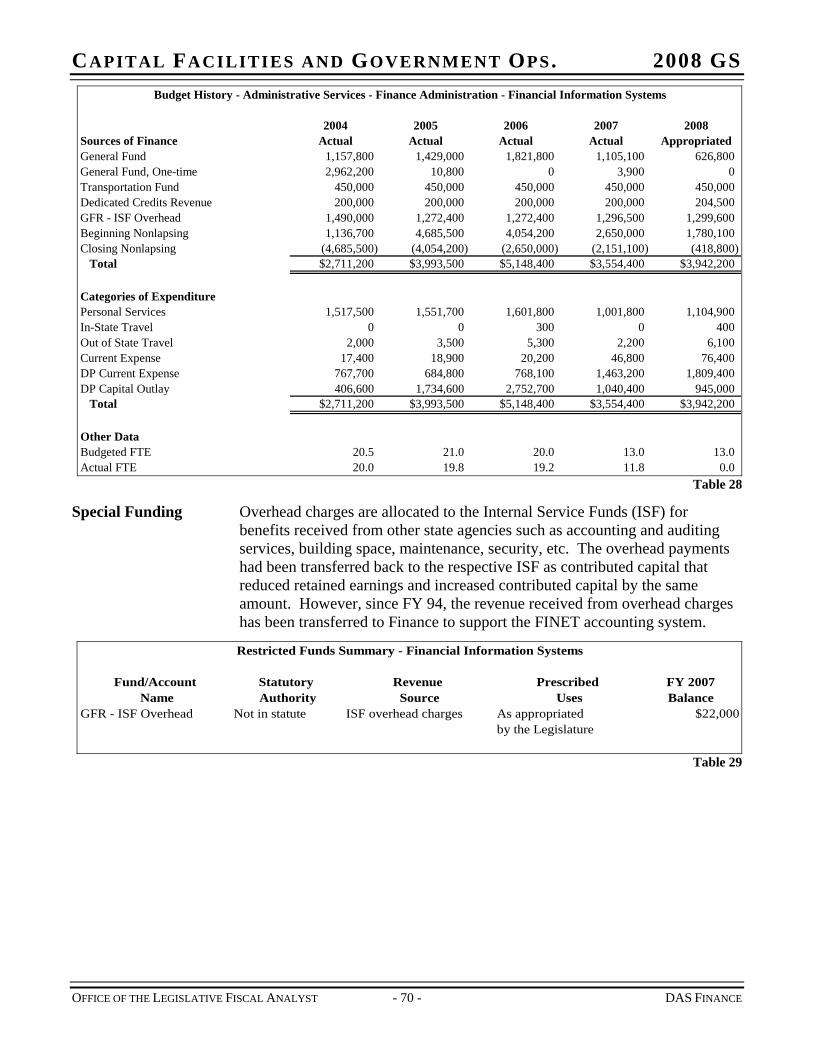
CAPITAL FACILITIES AND GOVERNMENT OPS. 2008 GS Budget History - Administrative Services - Finance Administration - Financial Information Systems
2004 2005 2006 2007 2008Sources of Finance Actual Actual Actual Actual AppropriatedGeneral Fund 1,157,800 1,429,000 1,821,800 1,105,100 626,800General Fund, One-time 2,962,200 10,800 0 3,900 0Transportation Fund 450,000 450,000 450,000 450,000 450,000Dedicated Credits Revenue 200,000 200,000 200,000 200,000 204,500GFR - ISF Overhead 1,490,000 1,272,400 1,272,400 1,296,500 1,299,600Beginning Nonlapsing 1,136,700 4,685,500 4,054,200 2,650,000 1,780,100Closing Nonlapsing (4,685,500) (4,054,200) (2,650,000) (2,151,100) (418,800)
Total $2,711,200 $3,993,500 $5,148,400 $3,554,400 $3,942,200
Categories of ExpenditurePersonal Services 1,517,500 1,551,700 1,601,800 1,001,800 1,104,900In-State Travel 0 0 300 0 400Out of State Travel 2,000 3,500 5,300 2,200 6,100Current Expense 17,400 18,900 20,200 46,800 76,400DP Current Expense 767,700 684,800 768,100 1,463,200 1,809,400DP Capital Outlay 406,600 1,734,600 2,752,700 1,040,400 945,000
Total $2,711,200 $3,993,500 $5,148,400 $3,554,400 $3,942,200
Other DataBudgeted FTE 20.5 21.0 20.0 13.0 13.0Actual FTE 20.0 19.8 19.2 11.8 0.0
Table 28
Special Funding Overhead charges are allocated to the Internal Service Funds (ISF) for benefits received from other state agencies such as accounting and auditing services, building space, maintenance, security, etc. The overhead payments had been transferred back to the respective ISF as contributed capital that reduced retained earnings and increased contributed capital by the same amount. However, since FY 94, the revenue received from overhead charges has been transferred to Finance to support the FINET accounting system.
Restricted Funds Summary - Financial Information Systems
Fund/Account Statutory Revenue Prescribed FY 2007 Name Authority Source Uses Balance
GFR - ISF Overhead Not in statute ISF overhead charges As appropriated $22,000 by the Legislature
Table 29
OFFICE OF THE LEGISLATIVE FISCAL ANALYST - 70 - DAS FINANCE
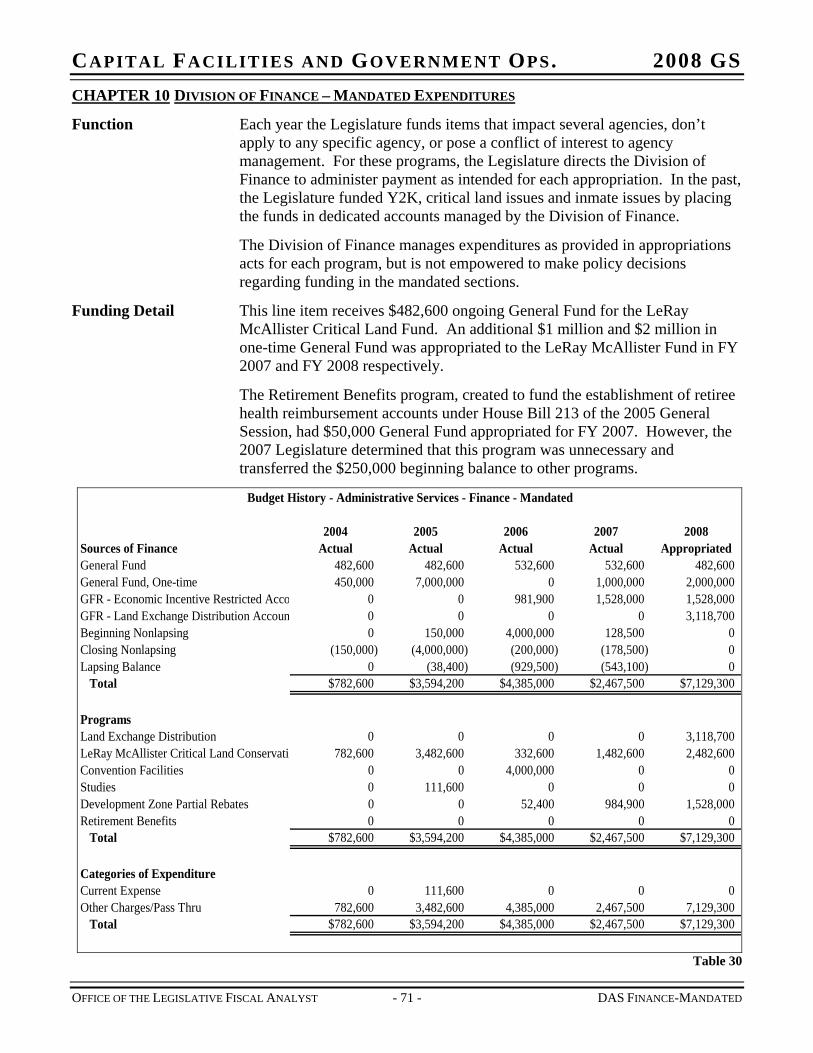
CAPITAL FACILITIES AND GOVERNMENT OPS. 2008 GS CHAPTER 10 DIVISION OF FINANCE – MANDATED EXPENDITURES
Function Each year the Legislature funds items that impact several agencies, don’t apply to any specific agency, or pose a conflict of interest to agency management. For these programs, the Legislature directs the Division of Finance to administer payment as intended for each appropriation. In the past, the Legislature funded Y2K, critical land issues and inmate issues by placing the funds in dedicated accounts managed by the Division of Finance.
The Division of Finance manages expenditures as provided in appropriations acts for each program, but is not empowered to make policy decisions regarding funding in the mandated sections.
Funding Detail This line item receives $482,600 ongoing General Fund for the LeRay McAllister Critical Land Fund. An additional $1 million and $2 million in one-time General Fund was appropriated to the LeRay McAllister Fund in FY 2007 and FY 2008 respectively.
The Retirement Benefits program, created to fund the establishment of retiree health reimbursement accounts under House Bill 213 of the 2005 General Session, had $50,000 General Fund appropriated for FY 2007. However, the 2007 Legislature determined that this program was unnecessary and transferred the $250,000 beginning balance to other programs.
Budget History - Administrative Services - Finance - Mandated
2004 2005 2006 2007 2008Sources of Finance Actual Actual Actual Actual AppropriatedGeneral Fund 482,600 482,600 532,600 532,600 482,600General Fund, One-time 450,000 7,000,000 0 1,000,000 2,000,000GFR - Economic Incentive Restricted Acco 0 0 981,900 1,528,000 1,528,000GFR - Land Exchange Distribution Accoun 0 0 0 0 3,118,700Beginning Nonlapsing 0 150,000 4,000,000 128,500 0Closing Nonlapsing (150,000) (4,000,000) (200,000) (178,500) 0Lapsing Balance 0 (38,400) (929,500) (543,100) 0
Total $782,600 $3,594,200 $4,385,000 $2,467,500 $7,129,300
ProgramsLand Exchange Distribution 0 0 0 0 3,118,700LeRay McAllister Critical Land Conservatio 782,600 3,482,600 332,600 1,482,600 2,482,600Convention Facilities 0 0 4,000,000 0 0Studies 0 111,600 0 0 0Development Zone Partial Rebates 0 0 52,400 984,900 1,528,000Retirement Benefits 0 0 0 0
Total $782,600 $3,594,200 $4,385,000 $2,467,500 $7,129,300
Categories of ExpenditureCurrent Expense 0 111,600 0 0 0Other Charges/Pass Thru 782,600 3,482,600 4,385,000 2,467,500 7,129,300
Total $782,600 $3,594,200 $4,385,000 $2,467,500 $7,129,300
0
Table 30
OFFICE OF THE LEGISLATIVE FISCAL ANALYST - 71 - DAS FINANCE-MANDATED
CAPITAL FACILITIES AND GOVERNMENT OPS. 2008 GS
OFFICE OF THE LEGISLATIVE FISCAL ANALYST - 72 - DAS FINANCE-MANDATED
PROGRAMS – DIVISION OF FINANCE – MANDATED EXPENDITURES
LERAY MCALLISTER CRITICAL LAND FUND
Function The creation of LeRay McAllister Critical Land Conservation Fund (CLCF) allows non-profit organizations, the Department of Agriculture and Food, the Department of Natural Resources, and local governments access to funds for open space preservation. Money from the CLCF must be used to preserve or restore open lands and agricultural lands. Generally, municipal parks, ball fields, and other types of developed, active recreation areas are not critical lands as defined by the Quality Growth Act.
Statutory Authority The following laws govern use of the McAllister Fund:
UCA 11-38 is entitled the “Quality Growth Act.” Part two of this act creates the Quality Growth Commission (QGC).
UCA 11-38-202 gives the QGC the duty to administer the McAllister Fund.
UCA 11-38-301 creates the LeRay McAllister Critical Land Conservation Fund consisting of:
Appropriations by the Legislature
Contributions from federal agencies, political subdivisions, persons, or corporations
Proceeds a department chooses to place in the fund from sales of surplus land
The Departments of Administrative Services, Agriculture and Food, Natural Resources, and Transportation may place proceeds from sales of surplus land into the fund.
The total in the fund may not exceed $6 million.
UCA 11-38-302 allows the QGC to authorize grants or loans from the fund to local agencies, the Department of Natural Resources, the Department of Agriculture and Food, or charitable organizations.
Funds must be used for preserving or restoring open land and agricultural land. Funds may not generally be used to purchase a fee interest but may be used to establish a conservation easement.
Eminent domain may not be used to acquire lands for this purpose
A county, city, town, department or organization may not receive money from the fund unless it provides matching funds equal to or greater than the amount of money received from the fund.
Accountability Since Calendar Year 1999 the QGC has authorized 69 projects totaling $17.0 million in McAllister Fund grants. Partners in open space preservation have contributed (or are expected to contribute) about six dollars for every dollar of McAllister Fund grants.
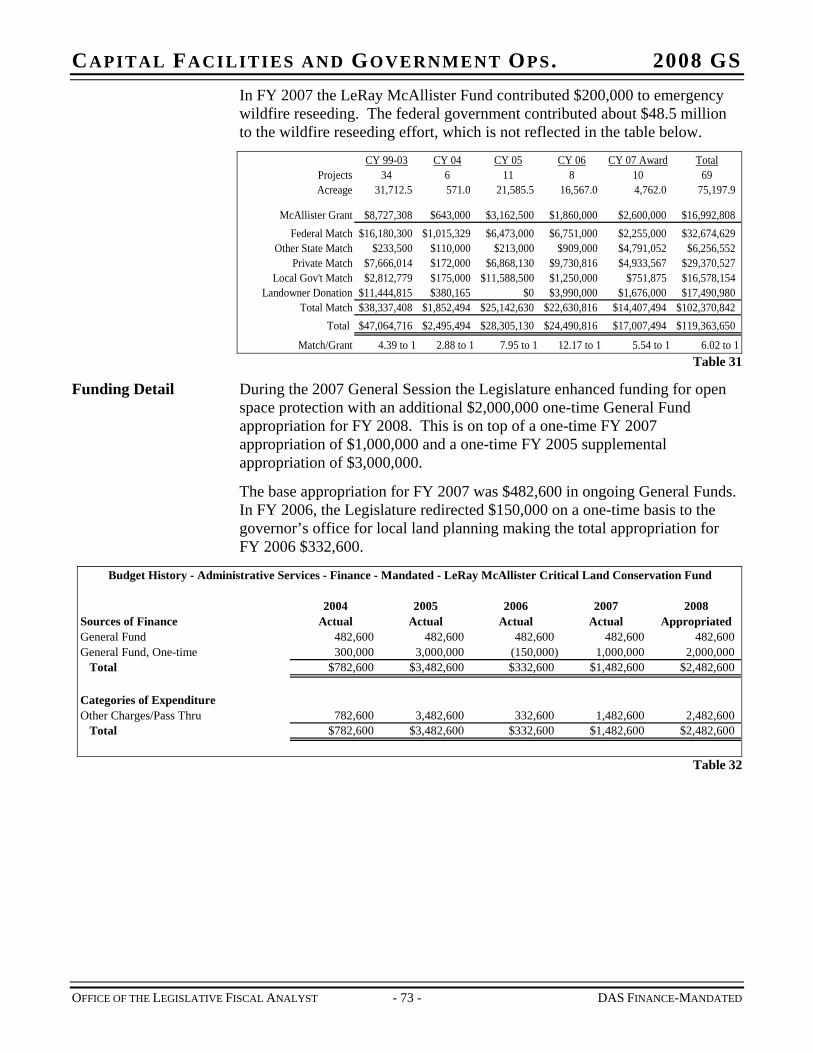
CAPITAL FACILITIES AND GOVERNMENT OPS. 2008 GS In FY 2007 the LeRay McAllister Fund contributed $200,000 to emergency wildfire reseeding. The federal government contributed about $48.5 million to the wildfire reseeding effort, which is not reflected in the table below.
CY 99-03 CY 04 CY 05 CY 06 CY 07 Award TotalProjects 34 6 11 8 10 69Acreage 31,712.5 571.0 21,585.5 16,567.0 4,762.0 75,197.9
McAllister Grant $8,727,308 $643,000 $3,162,500 $1,860,000 $2,600,000 $16,992,808Federal Match $16,180,300 $1,015,329 $6,473,000 $6,751,000 $2,255,000 $32,674,629
Other State Match $233,500 $110,000 $213,000 $909,000 $4,791,052 $6,256,552Private Match $7,666,014 $172,000 $6,868,130 $9,730,816 $4,933,567 $29,370,527
Local Gov't Match $2,812,779 $175,000 $11,588,500 $1,250,000 $751,875 $16,578,154Landowner Donation $11,444,815 $380,165 $0 $3,990,000 $1,676,000 $17,490,980
Total Match $38,337,408 $1,852,494 $25,142,630 $22,630,816 $14,407,494 $102,370,842Total $47,064,716 $2,495,494 $28,305,130 $24,490,816 $17,007,494 $119,363,650
Match/Grant 4.39 to 1 2.88 to 1 7.95 to 1 12.17 to 1 5.54 to 1 6.02 to 1 Table 31
Funding Detail During the 2007 General Session the Legislature enhanced funding for open space protection with an additional $2,000,000 one-time General Fund appropriation for FY 2008. This is on top of a one-time FY 2007 appropriation of $1,000,000 and a one-time FY 2005 supplemental appropriation of $3,000,000.
The base appropriation for FY 2007 was $482,600 in ongoing General Funds. In FY 2006, the Legislature redirected $150,000 on a one-time basis to the governor’s office for local land planning making the total appropriation for FY 2006 $332,600.
Budget History - Administrative Services - Finance - Mandated - LeRay McAllister Critical Land Conservation Fund
2004 2005 2006 2007 2008Sources of Finance Actual Actual Actual Actual AppropriatedGeneral Fund 482,600 482,600 482,600 482,600 482,600General Fund, One-time 300,000 3,000,000 (150,000) 1,000,000 2,000,000
Total $782,600 $3,482,600 $332,600 $1,482,600 $2,482,600
Categories of ExpenditureOther Charges/Pass Thru 782,600 3,482,600 332,600 1,482,600 2,482,600
Total $782,600 $3,482,600 $332,600 $1,482,600 $2,482,600
Table 32
OFFICE OF THE LEGISLATIVE FISCAL ANALYST - 73 - DAS FINANCE-MANDATED
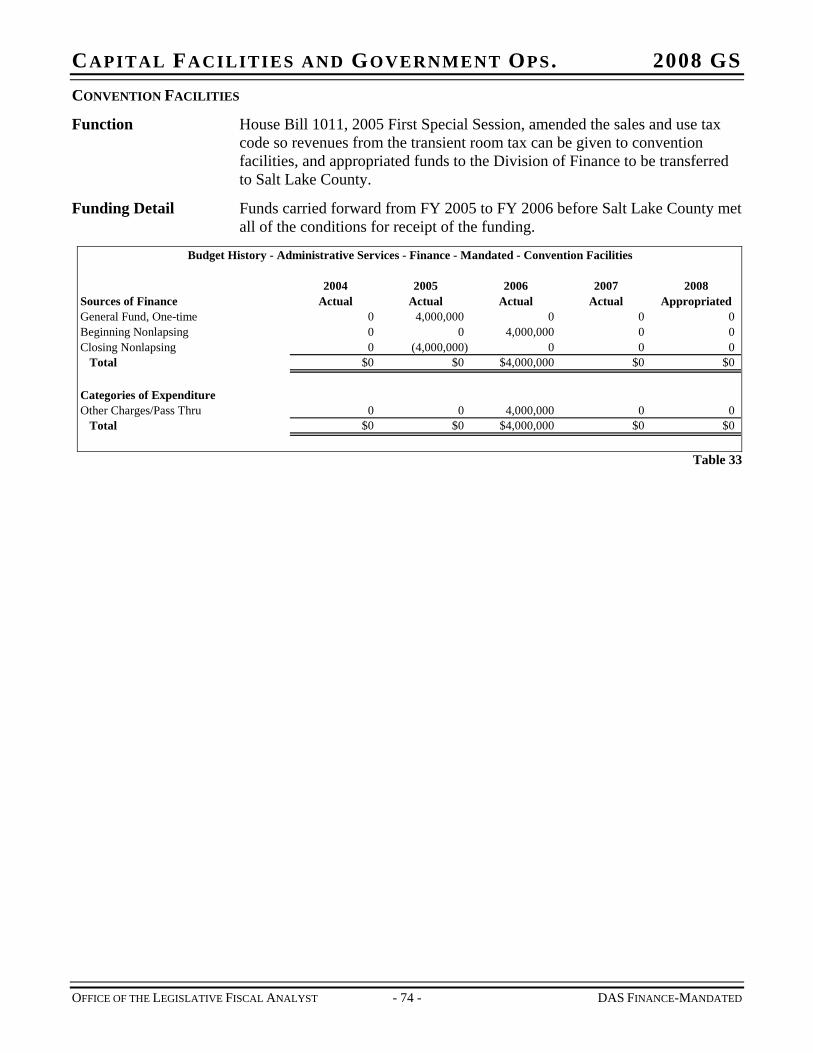
CAPITAL FACILITIES AND GOVERNMENT OPS. 2008 GS CONVENTION FACILITIES
Function House Bill 1011, 2005 First Special Session, amended the sales and use tax code so revenues from the transient room tax can be given to convention facilities, and appropriated funds to the Division of Finance to be transferred to Salt Lake County.
Funding Detail Funds carried forward from FY 2005 to FY 2006 before Salt Lake County met all of the conditions for receipt of the funding.
Budget History - Administrative Services - Finance - Mandated - Convention Facilities
2004 2005 2006 2007 2008Sources of Finance Actual Actual Actual Actual AppropriatedGeneral Fund, One-time 0 4,000,000 0 0 0Beginning Nonlapsing 0 0 4,000,000 0 0Closing Nonlapsing 0 (4,000,000) 0 0 0
Total $0 $0 $4,000,000 $0 $0
Categories of ExpenditureOther Charges/Pass Thru 0 0 4,000,000 0 0
Total $0 $0 $4,000,000 $0 $0
Table 33
OFFICE OF THE LEGISLATIVE FISCAL ANALYST - 74 - DAS FINANCE-MANDATED
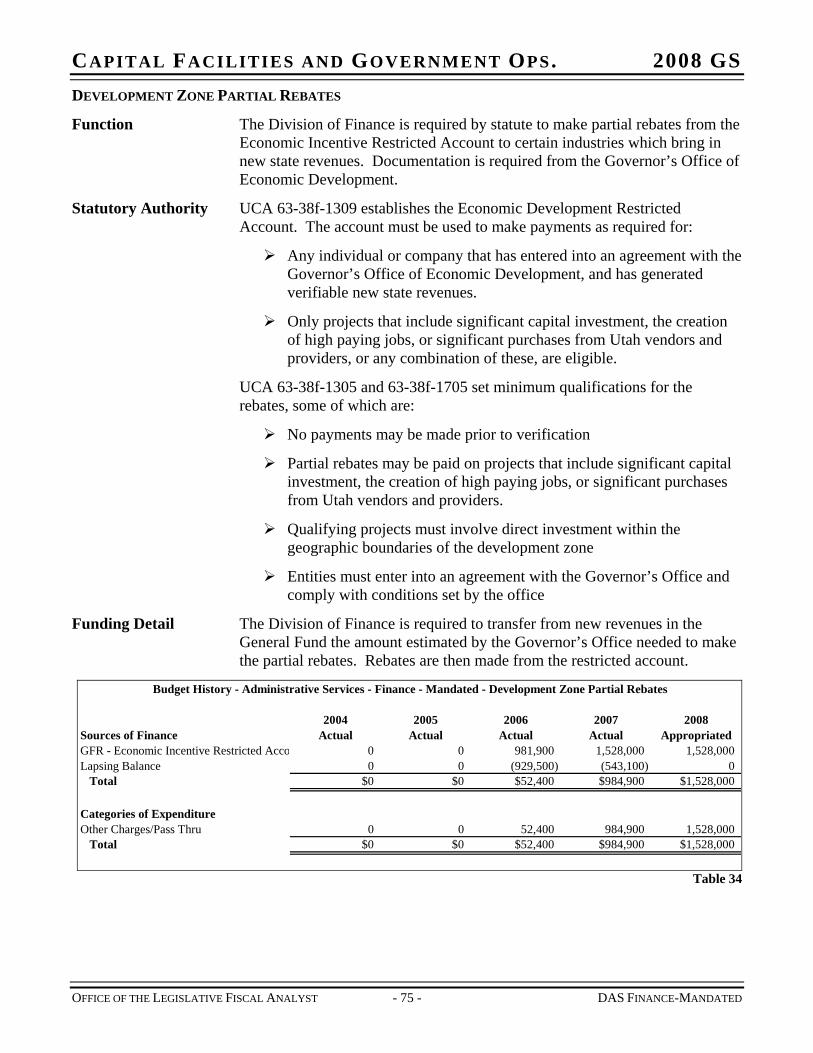
CAPITAL FACILITIES AND GOVERNMENT OPS. 2008 GS DEVELOPMENT ZONE PARTIAL REBATES
Function The Division of Finance is required by statute to make partial rebates from the Economic Incentive Restricted Account to certain industries which bring in new state revenues. Documentation is required from the Governor’s Office of Economic Development.
Statutory Authority UCA 63-38f-1309 establishes the Economic Development Restricted Account. The account must be used to make payments as required for:
Any individual or company that has entered into an agreement with the Governor’s Office of Economic Development, and has generated verifiable new state revenues.
Only projects that include significant capital investment, the creation of high paying jobs, or significant purchases from Utah vendors and providers, or any combination of these, are eligible.
UCA 63-38f-1305 and 63-38f-1705 set minimum qualifications for the rebates, some of which are:
No payments may be made prior to verification
Partial rebates may be paid on projects that include significant capital investment, the creation of high paying jobs, or significant purchases from Utah vendors and providers.
Qualifying projects must involve direct investment within the geographic boundaries of the development zone
Entities must enter into an agreement with the Governor’s Office and comply with conditions set by the office
Funding Detail The Division of Finance is required to transfer from new revenues in the General Fund the amount estimated by the Governor’s Office needed to make the partial rebates. Rebates are then made from the restricted account.
Budget History - Administrative Services - Finance - Mandated - Development Zone Partial Rebates
2004 2005 2006 2007 2008Sources of Finance Actual Actual Actual Actual AppropriatedGFR - Economic Incentive Restricted Acco 0 0 981,900 1,528,000 1,528,000Lapsing Balance 0 0 (929,500) (543,100) 0
Total $0 $0 $52,400 $984,900 $1,528,000
Categories of ExpenditureOther Charges/Pass Thru 0 0 52,400 984,900 1,528,000
Total $0 $0 $52,400 $984,900 $1,528,000
Table 34
OFFICE OF THE LEGISLATIVE FISCAL ANALYST - 75 - DAS FINANCE-MANDATED
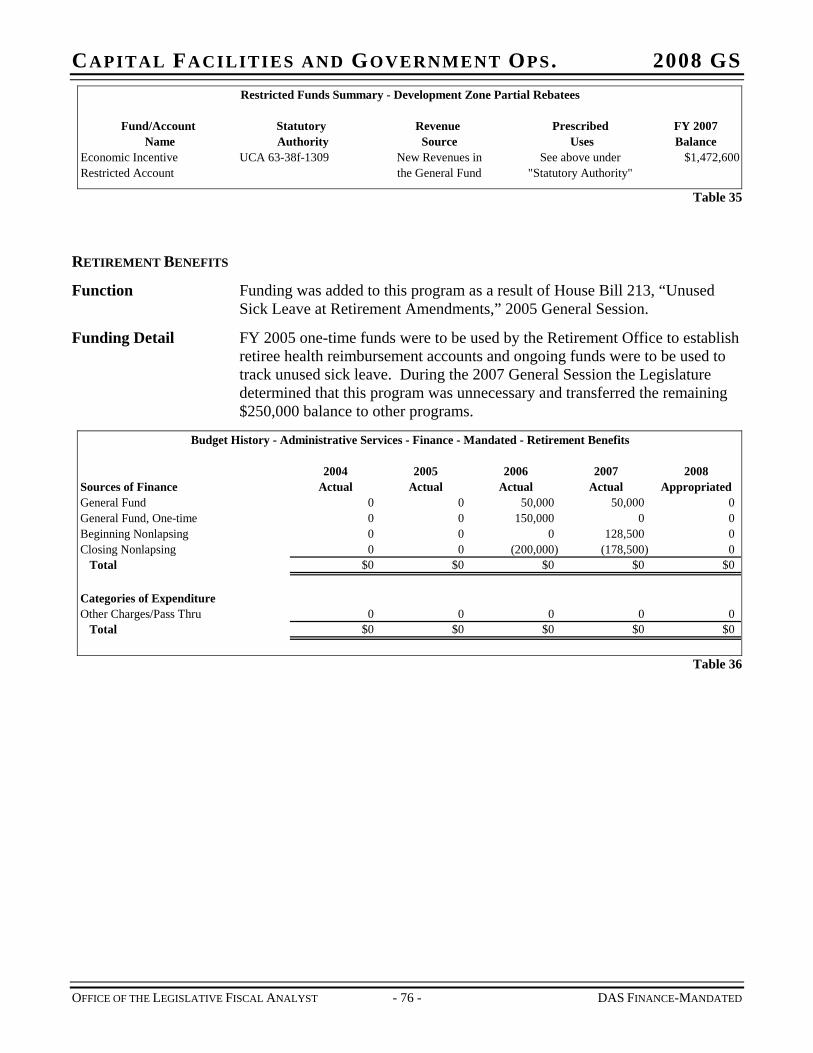
CAPITAL FACILITIES AND GOVERNMENT OPS. 2008 GS Restricted Funds Summary - Development Zone Partial Rebatees
Fund/Account Statutory Revenue Prescribed FY 2007 Name Authority Source Uses Balance
Economic Incentive UCA 63-38f-1309 New Revenues in See above under $1,472,600 Restricted Account the General Fund "Statutory Authority"
Table 35
RETIREMENT BENEFITS
Function Funding was added to this program as a result of House Bill 213, “Unused Sick Leave at Retirement Amendments,” 2005 General Session.
Funding Detail FY 2005 one-time funds were to be used by the Retirement Office to establish retiree health reimbursement accounts and ongoing funds were to be used to track unused sick leave. During the 2007 General Session the Legislature determined that this program was unnecessary and transferred the remaining $250,000 balance to other programs.
Budget History - Administrative Services - Finance - Mandated - Retirement Benefits
2004 2005 2006 2007 2008Sources of Finance Actual Actual Actual Actual AppropriatedGeneral Fund 0 0 50,000 50,000 0General Fund, One-time 0 0 150,000 0 0Beginning Nonlapsing 0 0 0 128,500 0Closing Nonlapsing 0 0 (200,000) (178,500) 0
Total $0 $0 $0 $0 $0
Categories of ExpenditureOther Charges/Pass Thru 0 0 0 0
Total $0 $0 $0 $0 $00
Table 36
OFFICE OF THE LEGISLATIVE FISCAL ANALYST - 76 - DAS FINANCE-MANDATED
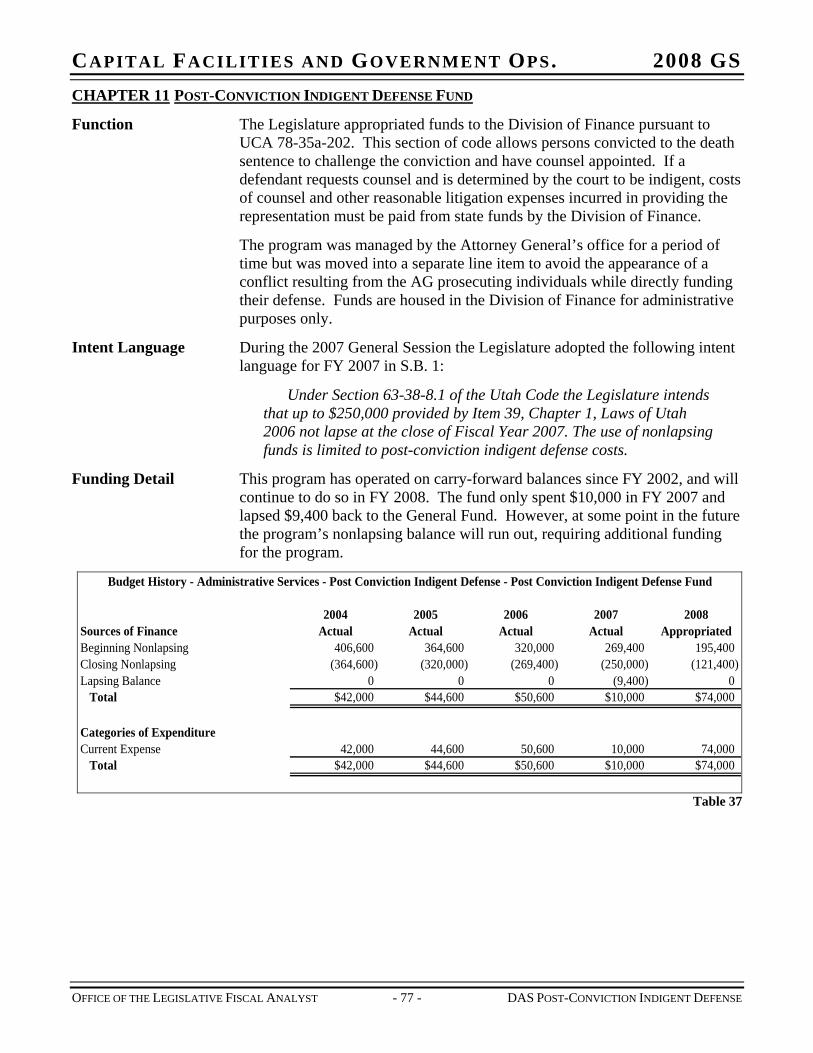
CAPITAL FACILITIES AND GOVERNMENT OPS. 2008 GS CHAPTER 11 POST-CONVICTION INDIGENT DEFENSE FUND
Function The Legislature appropriated funds to the Division of Finance pursuant to UCA 78-35a-202. This section of code allows persons convicted to the death sentence to challenge the conviction and have counsel appointed. If a defendant requests counsel and is determined by the court to be indigent, costs of counsel and other reasonable litigation expenses incurred in providing the representation must be paid from state funds by the Division of Finance.
The program was managed by the Attorney General’s office for a period of time but was moved into a separate line item to avoid the appearance of a conflict resulting from the AG prosecuting individuals while directly funding their defense. Funds are housed in the Division of Finance for administrative purposes only.
Intent Language During the 2007 General Session the Legislature adopted the following intent language for FY 2007 in S.B. 1:
Under Section 63-38-8.1 of the Utah Code the Legislature intends that up to $250,000 provided by Item 39, Chapter 1, Laws of Utah 2006 not lapse at the close of Fiscal Year 2007. The use of nonlapsing funds is limited to post-conviction indigent defense costs.
Funding Detail This program has operated on carry-forward balances since FY 2002, and will continue to do so in FY 2008. The fund only spent $10,000 in FY 2007 and lapsed $9,400 back to the General Fund. However, at some point in the future the program’s nonlapsing balance will run out, requiring additional funding for the program.
Budget History - Administrative Services - Post Conviction Indigent Defense - Post Conviction Indigent Defense Fund
2004 2005 2006 2007 2008Sources of Finance Actual Actual Actual Actual AppropriatedBeginning Nonlapsing 406,600 364,600 320,000 269,400 195,400Closing Nonlapsing (364,600) (320,000) (269,400) (250,000) (121,400)Lapsing Balance 0 0 0 (9,400) 0
Total $42,000 $44,600 $50,600 $10,000 $74,000
Categories of ExpenditureCurrent Expense 42,000 44,600 50,600 10,000 74,000
Total $42,000 $44,600 $50,600 $10,000 $74,000
Table 37
OFFICE OF THE LEGISLATIVE FISCAL ANALYST - 77 - DAS POST-CONVICTION INDIGENT DEFENSE

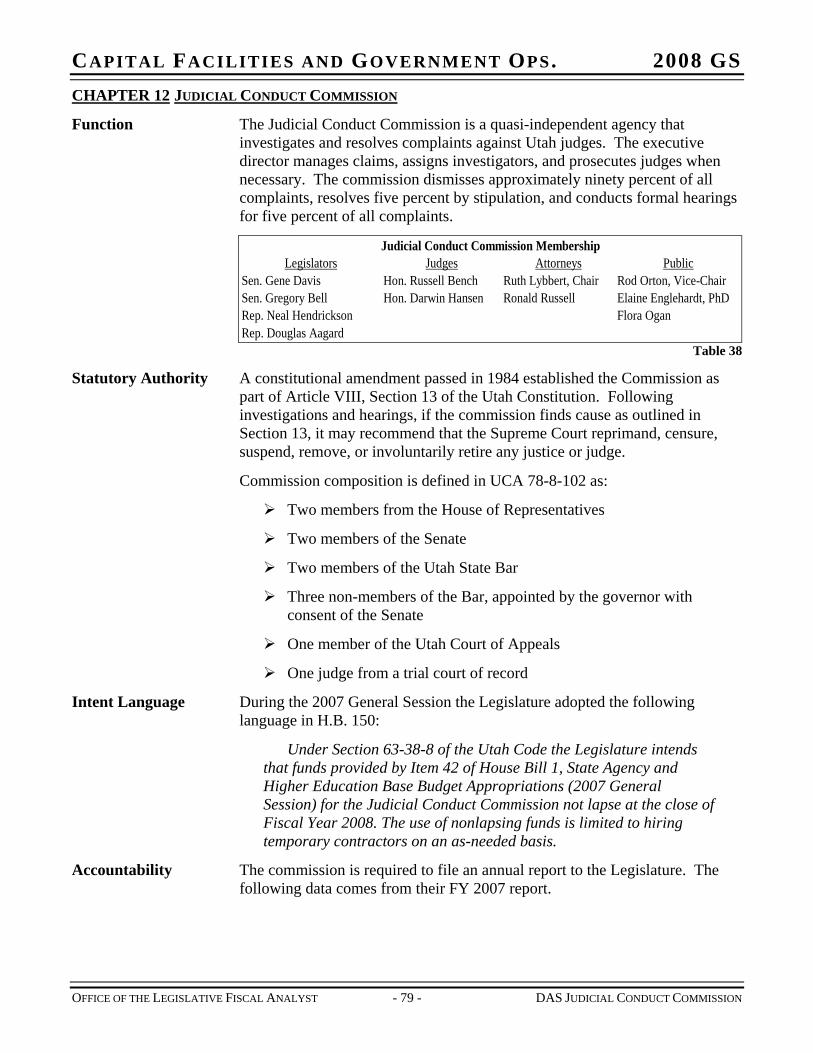
CAPITAL FACILITIES AND GOVERNMENT OPS. 2008 GS CHAPTER 12 JUDICIAL CONDUCT COMMISSION
Function The Judicial Conduct Commission is a quasi-independent agency that investigates and resolves complaints against Utah judges. The executive director manages claims, assigns investigators, and prosecutes judges when necessary. The commission dismisses approximately ninety percent of all complaints, resolves five percent by stipulation, and conducts formal hearings for five percent of all complaints.
Legislators Judges Attorneys PublicSen. Gene Davis Hon. Russell Bench Ruth Lybbert, Chair Rod Orton, Vice-ChairSen. Gregory Bell Hon. Darwin Hansen Ronald Russell Elaine Englehardt, PhDRep. Neal Hendrickson Flora OganRep. Douglas Aagard
Judicial Conduct Commission Membership
Table 38
Statutory Authority A constitutional amendment passed in 1984 established the Commission as part of Article VIII, Section 13 of the Utah Constitution. Following investigations and hearings, if the commission finds cause as outlined in Section 13, it may recommend that the Supreme Court reprimand, censure, suspend, remove, or involuntarily retire any justice or judge.
Commission composition is defined in UCA 78-8-102 as:
Two members from the House of Representatives
Two members of the Senate
Two members of the Utah State Bar
Three non-members of the Bar, appointed by the governor with consent of the Senate
One member of the Utah Court of Appeals
One judge from a trial court of record
Intent Language During the 2007 General Session the Legislature adopted the following language in H.B. 150:
Under Section 63-38-8 of the Utah Code the Legislature intends that funds provided by Item 42 of House Bill 1, State Agency and Higher Education Base Budget Appropriations (2007 General Session) for the Judicial Conduct Commission not lapse at the close of Fiscal Year 2008. The use of nonlapsing funds is limited to hiring temporary contractors on an as-needed basis.
Accountability The commission is required to file an annual report to the Legislature. The following data comes from their FY 2007 report.
OFFICE OF THE LEGISLATIVE FISCAL ANALYST - 79 - DAS JUDICIAL CONDUCT COMMISSION
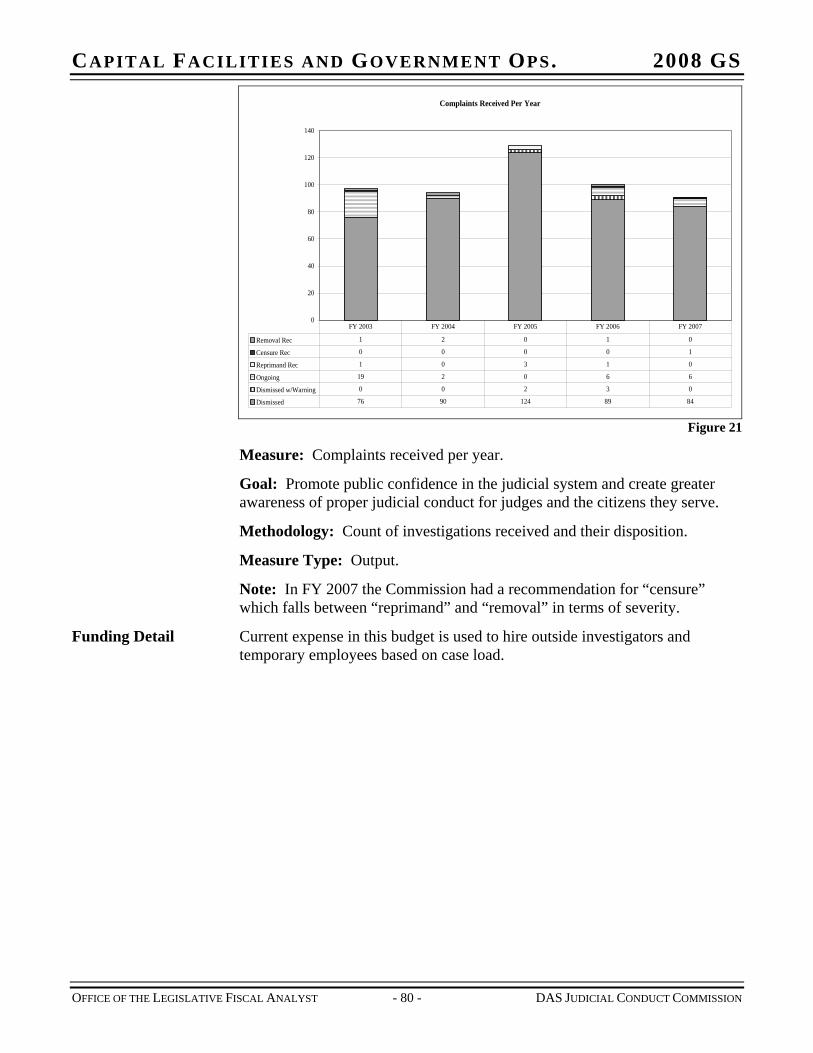
CAPITAL FACILITIES AND GOVERNMENT OPS. 2008 GS
Complaints Received Per Year
0
20
40
60
80
100
120
140
Removal Rec 1 2 0 1 0
Censure Rec 0 0 0 0 1
Reprimand Rec 1 0 3 1 0
Ongoing 19 2 0 6 6
Dismissed w/Warning 0 0 2 3 0
Dismissed 76 90 124 89 84
FY 2003 FY 2004 FY 2005 FY 2006 FY 2007
Figure 21
Measure: Complaints received per year.
Goal: Promote public confidence in the judicial system and create greater awareness of proper judicial conduct for judges and the citizens they serve.
Methodology: Count of investigations received and their disposition.
Measure Type: Output.
Note: In FY 2007 the Commission had a recommendation for “censure” which falls between “reprimand” and “removal” in terms of severity.
Funding Detail Current expense in this budget is used to hire outside investigators and temporary employees based on case load.
OFFICE OF THE LEGISLATIVE FISCAL ANALYST - 80 - DAS JUDICIAL CONDUCT COMMISSION
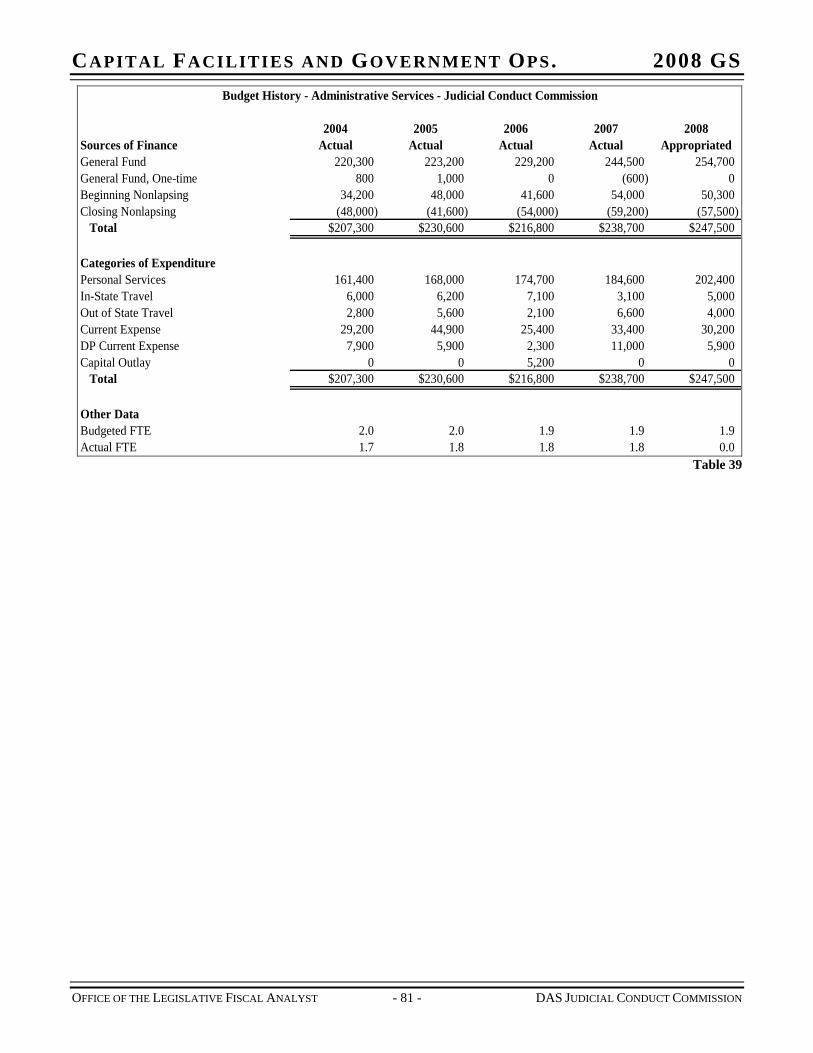
CAPITAL FACILITIES AND GOVERNMENT OPS. 2008 GS Budget History - Administrative Services - Judicial Conduct Commission
2004 2005 2006 2007 2008Sources of Finance Actual Actual Actual Actual AppropriatedGeneral Fund 220,300 223,200 229,200 244,500 254,700General Fund, One-time 800 1,000 0 (600) 0Beginning Nonlapsing 34,200 48,000 41,600 54,000 50,300Closing Nonlapsing (48,000) (41,600) (54,000) (59,200) (57,500)
Total $207,300 $230,600 $216,800 $238,700 $247,500
Categories of ExpenditurePersonal Services 161,400 168,000 174,700 184,600 202,400In-State Travel 6,000 6,200 7,100 3,100 5,000Out of State Travel 2,800 5,600 2,100 6,600 4,000Current Expense 29,200 44,900 25,400 33,400 30,200DP Current Expense 7,900 5,900 2,300 11,000 5,900Capital Outlay 0 0 5,200 0 0
Total $207,300 $230,600 $216,800 $238,700 $247,500
Other DataBudgeted FTE 2.0 2.0 1.9 1.9 1.9Actual FTE 1.7 1.8 1.8 1.8 0.0
Table 39
OFFICE OF THE LEGISLATIVE FISCAL ANALYST - 81 - DAS JUDICIAL CONDUCT COMMISSION

CAPITAL FACILITIES AND GOVERNMENT OPS. 2008 GS
OFFICE OF THE LEGISLATIVE FISCAL ANALYST - 83 - DAS PURCHASING AND GENERAL SERVICES
CHAPTER 13 PURCHASING AND GENERAL SERVICES
Function In 1997 the Legislature reorganized the Department of Administrative Services, merging Central Copying, Central Mail, and Central Stores into the Division of Purchasing. The new division became the Division of Purchasing and General Services. The procurement function that enables other agencies to contract for goods and services remains an appropriated function. Other programs operate as Internal Service Funds and are budgeted separately in the ISF section of the budget.
The division provides a centralized purchasing function for all state agencies. The Purchasing Program manages 750 statewide contracts that are used by state agencies, education, and local governments, and oversees more than 2,000 agency contracts and more than 1,500 procurement processes per year. The value of these contracts and procurements exceeds a billion dollars annually.
Statutory Authority The Utah Procurement Code (UCA 63-56-204) requires the director to:
Procure or supervise procurement of all supplies, services, and construction needed by the state
Exercise supervision and control over all inventories or supplies belonging to the state
Establish and maintain programs for the inspection, testing and acceptance of supplies, services, and construction
Prepare statistical data concerning the procurement and usage of all supplies, services and construction
Approve new information technology contract only after the chief information officer has submitted a written needs analysis
Intent Language During the 2007 General Session the Legislature adopted the following intent language for FY 2007 in S.B. 1:
Under Section 63-38-8.1 of the Utah Code the Legislature intends that up to $50,000 provided by Item 42, Chapter 1, or Item 42, Chapter 366, Laws of Utah 2006 not lapse at the close of Fiscal Year 2007. The use of nonlapsing funds is limited to electronic commerce.
Accountability State Purchasing manages cooperative contracts that are utilized by state agencies, institutions of higher education, school districts, and local governments. Usage of the contracts is mandatory by state agencies, but voluntary by political subdivisions. Thus political subdivision usage of the contracts is a barometer of whether the contracts provide best value.
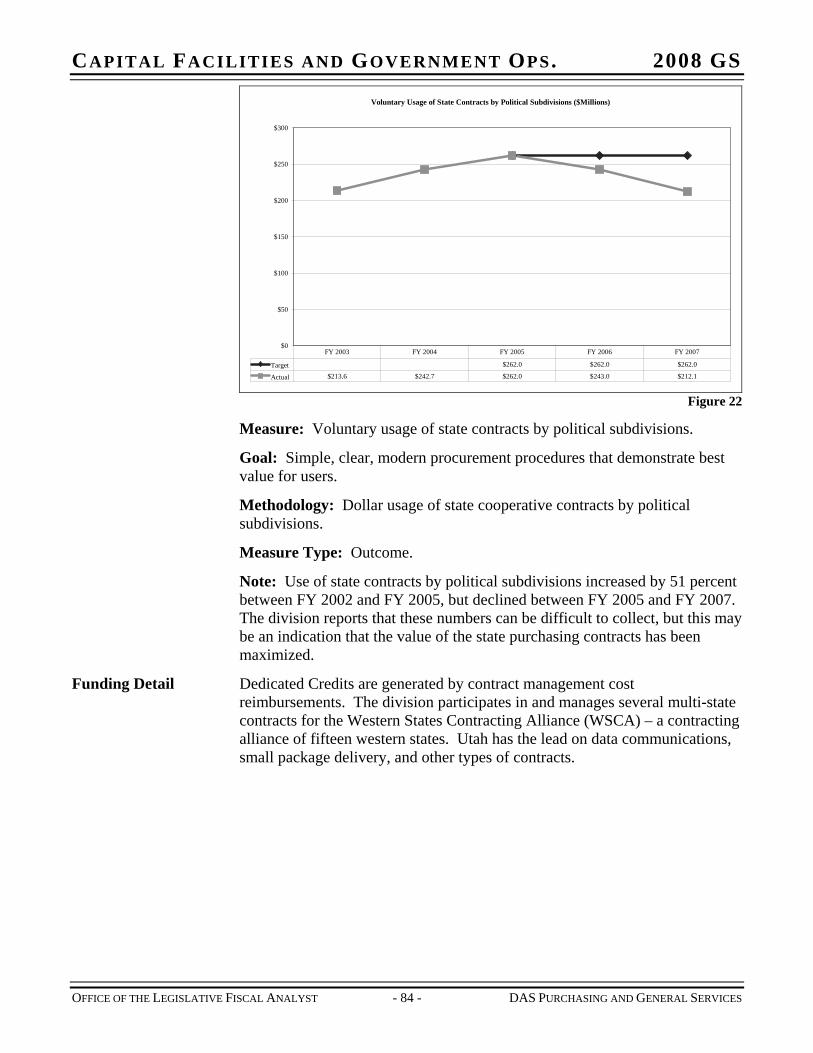
CAPITAL FACILITIES AND GOVERNMENT OPS. 2008 GS
Voluntary Usage of State Contracts by Political Subdivisions ($Millions)
$0
$50
$100
$150
$200
$250
$300
Target $262.0 $262.0 $262.0
Actual $213.6 $242.7 $262.0 $243.0 $212.1
FY 2003 FY 2004 FY 2005 FY 2006 FY 2007
Figure 22
Measure: Voluntary usage of state contracts by political subdivisions.
Goal: Simple, clear, modern procurement procedures that demonstrate best value for users.
Methodology: Dollar usage of state cooperative contracts by political subdivisions.
Measure Type: Outcome.
Note: Use of state contracts by political subdivisions increased by 51 percent between FY 2002 and FY 2005, but declined between FY 2005 and FY 2007. The division reports that these numbers can be difficult to collect, but this may be an indication that the value of the state purchasing contracts has been maximized.
Funding Detail Dedicated Credits are generated by contract management cost reimbursements. The division participates in and manages several multi-state contracts for the Western States Contracting Alliance (WSCA) – a contracting alliance of fifteen western states. Utah has the lead on data communications, small package delivery, and other types of contracts.
OFFICE OF THE LEGISLATIVE FISCAL ANALYST - 84 - DAS PURCHASING AND GENERAL SERVICES
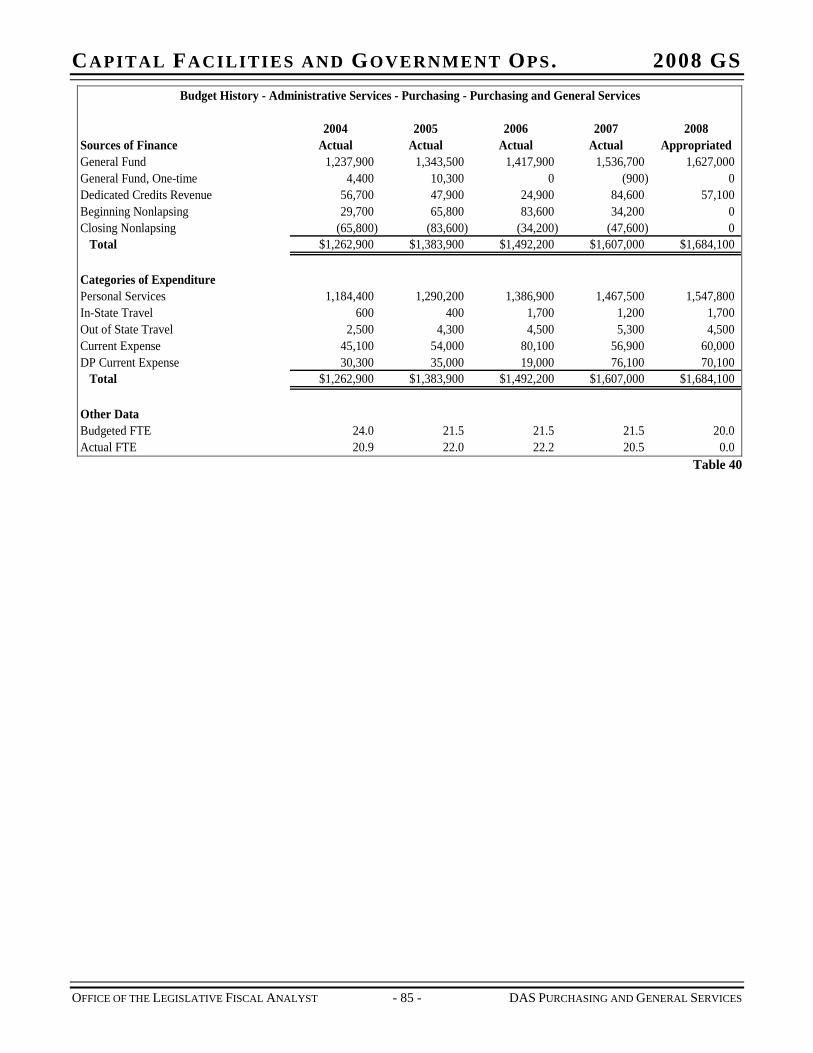
CAPITAL FACILITIES AND GOVERNMENT OPS. 2008 GS Budget History - Administrative Services - Purchasing - Purchasing and General Services
2004 2005 2006 2007 2008Sources of Finance Actual Actual Actual Actual AppropriatedGeneral Fund 1,237,900 1,343,500 1,417,900 1,536,700 1,627,000General Fund, One-time 4,400 10,300 0 (900) 0Dedicated Credits Revenue 56,700 47,900 24,900 84,600 57,100Beginning Nonlapsing 29,700 65,800 83,600 34,200 0Closing Nonlapsing (65,800) (83,600) (34,200) (47,600) 0
Total $1,262,900 $1,383,900 $1,492,200 $1,607,000 $1,684,100
Categories of ExpenditurePersonal Services 1,184,400 1,290,200 1,386,900 1,467,500 1,547,800In-State Travel 600 400 1,700 1,200 1,700Out of State Travel 2,500 4,300 4,500 5,300 4,500Current Expense 45,100 54,000 80,100 56,900 60,000DP Current Expense 30,300 35,000 19,000 76,100 70,100
Total $1,262,900 $1,383,900 $1,492,200 $1,607,000 $1,684,100
Other DataBudgeted FTE 24.0 21.5 21.5 21.5 20.0Actual FTE 20.9 22.0 22.2 20.5 0.0
Table 40
OFFICE OF THE LEGISLATIVE FISCAL ANALYST - 85 - DAS PURCHASING AND GENERAL SERVICES

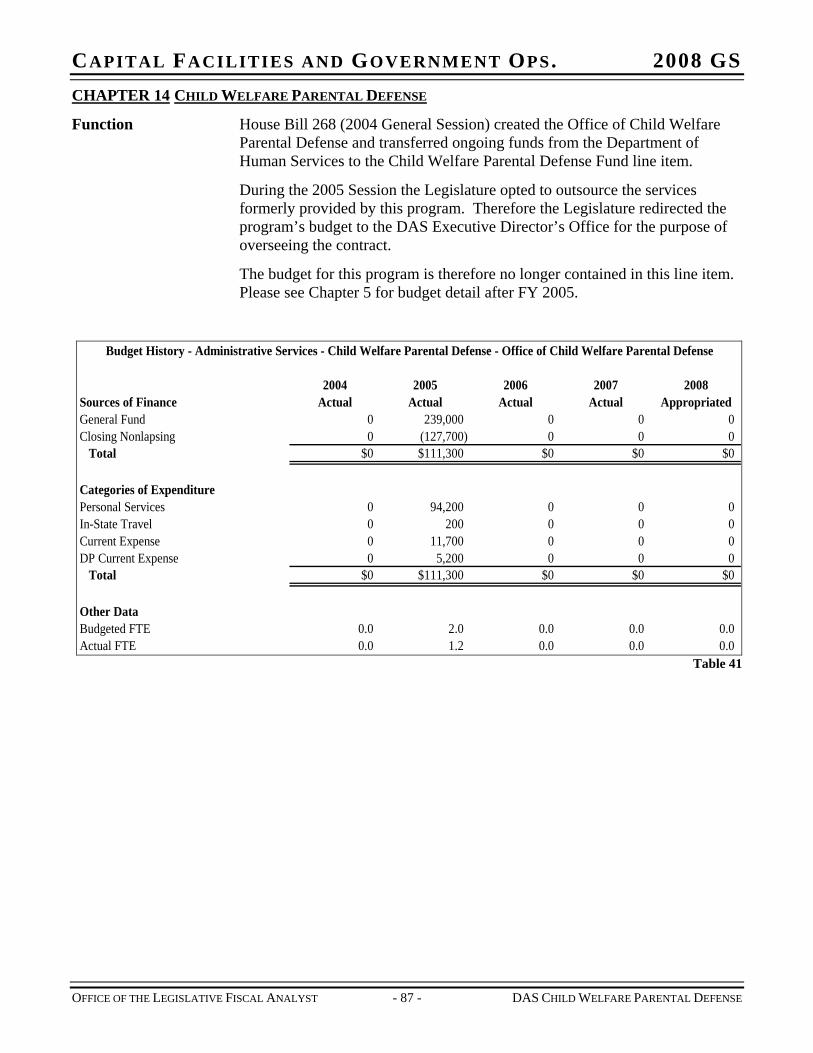
CAPITAL FACILITIES AND GOVERNMENT OPS. 2008 GS CHAPTER 14 CHILD WELFARE PARENTAL DEFENSE
Function House Bill 268 (2004 General Session) created the Office of Child Welfare Parental Defense and transferred ongoing funds from the Department of Human Services to the Child Welfare Parental Defense Fund line item.
During the 2005 Session the Legislature opted to outsource the services formerly provided by this program. Therefore the Legislature redirected the program’s budget to the DAS Executive Director’s Office for the purpose of overseeing the contract.
The budget for this program is therefore no longer contained in this line item. Please see Chapter 5 for budget detail after FY 2005.
Budget History - Administrative Services - Child Welfare Parental Defense - Office of Child Welfare Parental Defense
2004 2005 2006 2007 2008Sources of Finance Actual Actual Actual Actual AppropriatedGeneral Fund 0 239,000 0 0 0Closing Nonlapsing 0 (127,700) 0 0 0
Total $0 $111,300 $0 $0 $
Categories of ExpenditurePersonal Services 0 94,200 0 0 0In-State Travel 0 200 0 0 0Current Expense 0 11,700 0 0 0DP Current Expense 0 5,200 0 0 0
Total $0 $111,300 $0 $0 $
Other DataBudgeted FTE 0.0 2.0 0.0 0.0 0.0Actual FTE 0.0 1.2 0.0 0.0 0.0
0
0
Table 41
OFFICE OF THE LEGISLATIVE FISCAL ANALYST - 87 - DAS CHILD WELFARE PARENTAL DEFENSE

CAPITAL FACILITIES AND GOVERNMENT OPS. 2008 GS
OFFICE OF THE LEGISLATIVE FISCAL ANALYST - 89 - DAS ISF SUMMARY
CHAPTER 15 OFFICE OF STATE DEBT COLLECTION (RESTRICTED SPECIAL REVENUE FUND)
Function The Office of State Debt Collections (OSDC) had been an internal service fund (ISF) since 1995. In reality, however, it operated differently than other ISF agencies. Whereas internal service funds provide general services to other state agencies, the OSDC collects past due bills for other agencies, but charges its fees to debtors rather than customer agencies. To recognize the difference, the Legislature passed S.B. 214, Office of State Debt Collection Amendments, 2006 General Session, which changed the State Debt Collection Fund from an ISF to a restricted special revenue fund.
The program contracts with private vendors to assist in collection of outstanding debt.
Statutory Authority Created in UCA 63A-8-201, the office has the following duties:
Overall responsibility for collecting and managing state receivables
Develop consistent policies governing collection and management of state receivables
Oversee and monitor state receivables to make sure state agencies are implementing all appropriate collection methods, following established guidelines, and accounting for receivables appropriately
Develop policies for accounting, reporting and collecting monies owed to the state
Provide information and training to state agencies on collection-related topics
Write an inclusive receivables management and collection manual
Prepare quarterly and annual reports of the state’s receivables
Create and coordinate a state accounts receivable database
Develop reasonable criteria to gauge agencies’ efforts in maintaining an effective accounts receivables program
Identify those agencies that are not making satisfactory progress toward collecting accounts receivable
Coordinate procedures between agencies to maximize collection of past-due accounts receivable
Establish an automated cash receipt process between agencies
Establish procedures for writing off accounts receivable
Establish time limits after which an agency will delegate responsibility to collect debts to the office
Among other things, the office may:
Collect reasonable attorney’s fees and reasonable collection costs
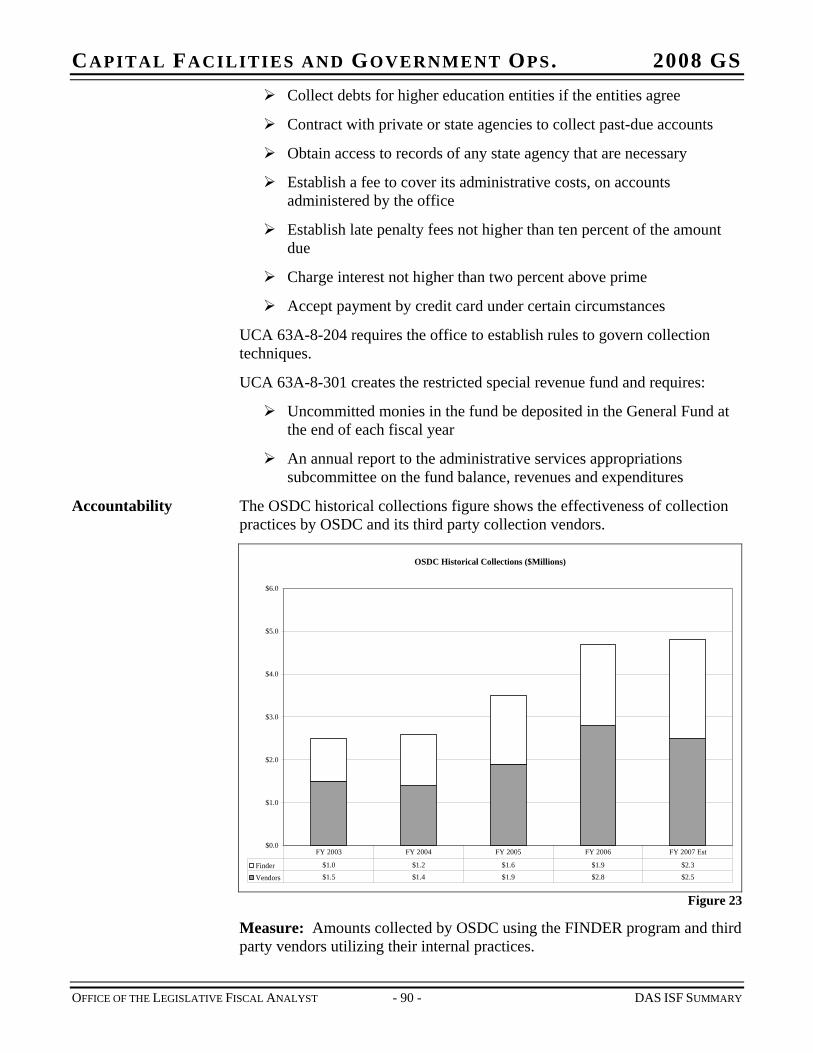
CAPITAL FACILITIES AND GOVERNMENT OPS. 2008 GS Collect debts for higher education entities if the entities agree
Contract with private or state agencies to collect past-due accounts
Obtain access to records of any state agency that are necessary
Establish a fee to cover its administrative costs, on accounts administered by the office
Establish late penalty fees not higher than ten percent of the amount due
Charge interest not higher than two percent above prime
Accept payment by credit card under certain circumstances
UCA 63A-8-204 requires the office to establish rules to govern collection techniques.
UCA 63A-8-301 creates the restricted special revenue fund and requires:
Uncommitted monies in the fund be deposited in the General Fund at the end of each fiscal year
An annual report to the administrative services appropriations subcommittee on the fund balance, revenues and expenditures
Accountability The OSDC historical collections figure shows the effectiveness of collection practices by OSDC and its third party collection vendors.
OSDC Historical Collections ($Millions)
$0.0
$1.0
$2.0
$3.0
$4.0
$5.0
$6.0
Finder $1.0 $1.2 $1.6 $1.9 $2.3
Vendors $1.5 $1.4 $1.9 $2.8 $2.5
FY 2003 FY 2004 FY 2005 FY 2006 FY 2007 Est
Figure 23
Measure: Amounts collected by OSDC using the FINDER program and third party vendors utilizing their internal practices.
OFFICE OF THE LEGISLATIVE FISCAL ANALYST - 90 - DAS ISF SUMMARY
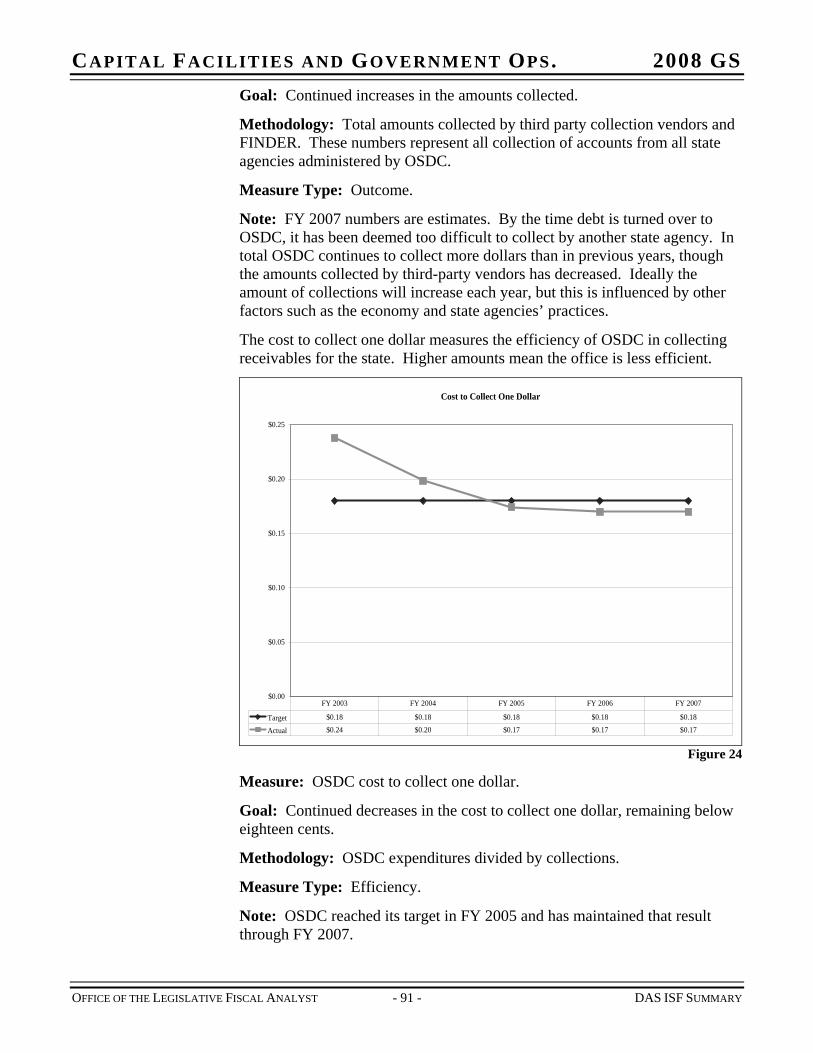
CAPITAL FACILITIES AND GOVERNMENT OPS. 2008 GS Goal: Continued increases in the amounts collected.
Methodology: Total amounts collected by third party collection vendors and FINDER. These numbers represent all collection of accounts from all state agencies administered by OSDC.
Measure Type: Outcome.
Note: FY 2007 numbers are estimates. By the time debt is turned over to OSDC, it has been deemed too difficult to collect by another state agency. In total OSDC continues to collect more dollars than in previous years, though the amounts collected by third-party vendors has decreased. Ideally the amount of collections will increase each year, but this is influenced by other factors such as the economy and state agencies’ practices.
The cost to collect one dollar measures the efficiency of OSDC in collecting receivables for the state. Higher amounts mean the office is less efficient.
Cost to Collect One Dollar
$0.00
$0.05
$0.10
$0.15
$0.20
$0.25
Target $0.18 $0.18 $0.18 $0.18 $0.18
Actual $0.24 $0.20 $0.17 $0.17 $0.17
FY 2003 FY 2004 FY 2005 FY 2006 FY 2007
Figure 24
Measure: OSDC cost to collect one dollar.
Goal: Continued decreases in the cost to collect one dollar, remaining below eighteen cents.
Methodology: OSDC expenditures divided by collections.
Measure Type: Efficiency.
Note: OSDC reached its target in FY 2005 and has maintained that result through FY 2007.
OFFICE OF THE LEGISLATIVE FISCAL ANALYST - 91 - DAS ISF SUMMARY

CAPITAL FACILITIES AND GOVERNMENT OPS. 2008 GS Another indicator of efficient collections is the percentage of delinquent receivables collected by OSDC.
Percent of Delinquent Receivables Collected
0.00%
2.00%
4.00%
6.00%
8.00%
10.00%
12.00%
Target 10.00% 10.00% 10.00% 10.00% 10.00%
Actual 8.27% 10.62% 9.55% 9.29% 9.29%
FY 2003 FY 2004 FY 2005 FY 2006 FY 2007 Est
Figure 25
Measure: Percent of delinquent receivables collected.
Goal: OSDC will maximize collections of debt owed to the state. The target is ten percent.
Methodology: The percentage is calculated by dividing the total collected by the net receivable balance.
Measure Type: Outcome and efficiency.
Note: FY 2007 numbers are estimates. OSDC received thousands of new accounts from the Department of Corrections in FY 2005. OSDC hoped that as its vendors became familiar with collecting this type of debt, the percentage would increase. However, FY 2006 and FY 2007 show roughly the same achievement.
Deposits to State General Fund
OSDC’s statute requires that they return uncommitted monies to the General Fund at the end of each fiscal year. Here are actual amounts returned:
FY 2002 $350,000 FY 2003 $667,100 FY 2004 $50,000 FY 2005 $50,000 FY 2006 $0 FY 2007 $0
OSDC opted not to transfer any money to the General Fund at the close of FY 2006 and FY 2007 even though their retained earnings were higher than usual.
OFFICE OF THE LEGISLATIVE FISCAL ANALYST - 92 - DAS ISF SUMMARY

CAPITAL FACILITIES AND GOVERNMENT OPS. 2008 GS Though OSDC is no longer an ISF, the standard amount of retained earnings allowed by federal auditors is sixty days’ worth of reserves. The FY 2006 retained earnings of $941,600 represents approximately eight months of reserves and the FY 2007 retained earnings of $1,411,100 represents almost a year’s worth of reserves.
In FY 2008, OSDC will transfer $500,000 of its retained earnings to the Capital Facilities and Government Operations Appropriations Subcommittee.
The office also transfers approximately $400,000 to the district courts each year to fund collection programs.
Funding Detail Revenue is generated for the program by assessing an administrative fee against each collection. As a special revenue fund OSDC does not receive appropriations and no tax funds are appropriated to this program.
Budget History - ISF - Administrative Services - ISF - Office of State Debt Collection - ISF - Debt Collection
2004 2005 2006 2007 2008Sources of Finance Actual Actual Actual Actual AppropriatedDedicated Credits Revenue 668,300 771,400 866,400 832,300 970,000Licenses/Fees 21,800 9,200 4,600 8,100 9,700Interest Income 550,900 611,500 756,300 437,100 474,500Other Financing Sources (800) 7,500 15,000 7,300 8,200
Total $1,240,200 $1,399,600 $1,642,300 $1,284,800 $1,462,400
Categories of ExpenditurePersonal Services 339,400 353,100 328,200 326,100 408,400In-State Travel 200 200 0 0 0Current Expense 378,900 373,600 315,500 345,200 743,000DP Current Expense 9,800 20,000 25,800 130,400 297,000Other Charges/Pass Thru 431,700 439,200 430,900 13,500 14,000Operating Transfers 50,000 50,000 0 0 0
Total $1,210,000 $1,236,100 $1,100,400 $815,200 $1,462,400
Profit/Loss $30,200 $163,500 $541,900 $469,600 $0
Other DataBudgeted FTE 5.0 5.0 5.0 5.0 5.0Actual FTE 5.2 5.0 4.7 4.6 0.0Retained Earnings $236,100 $399,600 $941,600 $1,411,100 $911,100
Table 42
OFFICE OF THE LEGISLATIVE FISCAL ANALYST - 93 - DAS ISF SUMMARY

CAPITAL FACILITIES AND GOVERNMENT OPS. 2008 GS
OFFICE OF THE LEGISLATIVE FISCAL ANALYST - 95 - DAS ISF SUMMARY
CHAPTER 16 DEPARTMENT OF ADMINISTRATIVE SERVICES – ISF SUMMARY
Function Internal Service Funds (ISF) employ business practices to provide a service or product for other state and governmental agencies. Typical services include motor pools, computer centers, mail processing, facility management, or other large functions that can be centrally coordinated. They are set up to take advantage of economies of scale, to avoid duplication of efforts and to provide an accounting mechanism to adequately identify costs of certain governmental services.
ISFs operated by the Department of Administrative Services provide consolidated services to all state agencies. DAS operates four ISFs that are funded by state agencies.
Division of Purchasing and General Services (Central Mailing, Electronic Purchasing, and Publishing)
Division of Fleet Operations
Risk Management
Division of Facilities Construction and Management
The Legislature removed the Division of Information Technology Services (ITS) from DAS during the 2005 General Session and placed it in the new Department of Technology Services (H.B. 109). The change became effective on July 1, 2006, the beginning of FY 2007.
In the 2006 General Session the Legislature changed the Office of State Debt Collections from an internal service fund to a restricted special revenue fund by passing S.B. 214, Office of State Debt Collection Amendments.
Statutory Authority In order to control the size, mission and fees charged to state agencies, the Legislature imposed statutory controls (UCA 63-38-3.5) that require ISFs to respond to the legislative budget process. No ISF can bill another agency for its services unless the Legislature has:
Approved the ISF’s budget request
Approved the ISF’s rates, fees, and other charges, and included those rates and fees in an appropriation a
Approved the number of FTE as part of the annual appropriation process
Appropriated the ISF’s estimated revenue based upon the rates and fee structure
No capital acquisitions can be made by an Internal Service Fund without legislative approval.
No capital assets can be transferred to an Internal Service Fund without legislative approval.
CAPITAL FACILITIES AND GOVERNMENT OPS. 2008 GS
OFFICE OF THE LEGISLATIVE FISCAL ANALYST - 96 - DAS ISF SUMMARY
Working capital for operations must be provided from the following sources in the following order:
Operating revenues
Long-term debt
Appropriation from the Legislature
To eliminate negative working capital, an ISF may borrow from the General Fund as long as:
The debt is repaid over the useful life of the asset
The Division of Finance does not allow the ISF to have deficit working capital (defined as Current Assets less Current Liabilities less Long Term General Fund Borrowing) greater than ninety percent of the value of the ISF’s fixed assets.
Accountability General Fund borrowing occurs when an agency needs cash to purchase assets to carry out its business. Examples include photocopiers and vehicles. These assets are depreciated and charged to customer agencies through the ISF’s rates. Although the Legislature expresses a preference for capitalizing assets through operating revenues, borrowing from the General Fund is allowed under the conditions mentioned above.
The table on the following page shows General Fund debt carried by the DAS ISFs, along with their working capital positions. Trends show improving financial conditions with reduced General Fund borrowing and increased working capital.
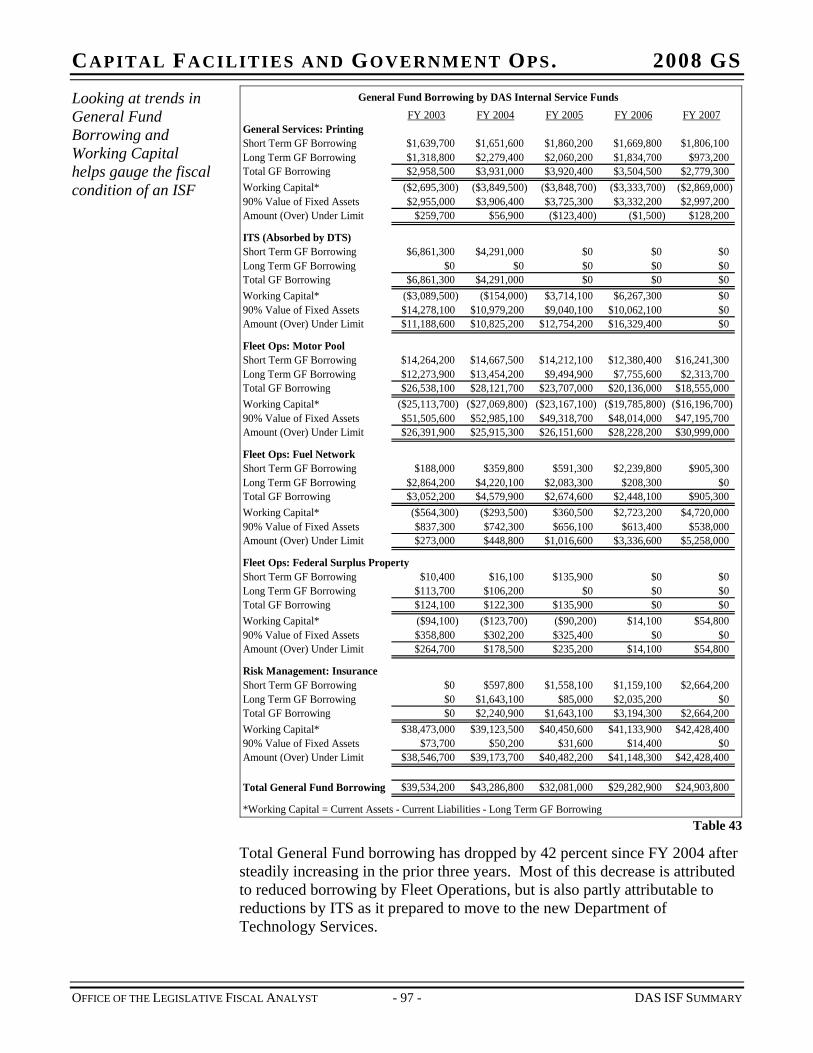
CAPITAL FACILITIES AND GOVERNMENT OPS. 2008 GS
FY 2003 FY 2004 FY 2005 FY 2006 FY 2007General Services: PrintingShort Term GF Borrowing $1,639,700 $1,651,600 $1,860,200 $1,669,800 $1,806,100Long Term GF Borrowing $1,318,800 $2,279,400 $2,060,200 $1,834,700 $973,200Total GF Borrowing $2,958,500 $3,931,000 $3,920,400 $3,504,500 $2,779,300Working Capital* ($2,695,300) ($3,849,500) ($3,848,700) ($3,333,700) ($2,869,000)90% Value of Fixed Assets $2,955,000 $3,906,400 $3,725,300 $3,332,200 $2,997,200Amount (Over) Under Limit $259,700 $56,900 ($123,400) ($1,500) $128,200
ITS (Absorbed by DTS)Short Term GF Borrowing $6,861,300 $4,291,000 $0 $0 $0Long Term GF Borrowing $0 $0 $0 $0 $0Total GF Borrowing $6,861,300 $4,291,000 $0 $0 $0Working Capital* ($3,089,500) ($154,000) $3,714,100 $6,267,300 $090% Value of Fixed Assets $14,278,100 $10,979,200 $9,040,100 $10,062,100 $0Amount (Over) Under Limit $11,188,600 $10,825,200 $12,754,200 $16,329,400 $0
Fleet Ops: Motor PoolShort Term GF Borrowing $14,264,200 $14,667,500 $14,212,100 $12,380,400 $16,241,300Long Term GF Borrowing $12,273,900 $13,454,200 $9,494,900 $7,755,600 $2,313,700Total GF Borrowing $26,538,100 $28,121,700 $23,707,000 $20,136,000 $18,555,000Working Capital* ($25,113,700) ($27,069,800) ($23,167,100) ($19,785,800) ($16,196,700)90% Value of Fixed Assets $51,505,600 $52,985,100 $49,318,700 $48,014,000 $47,195,700Amount (Over) Under Limit $26,391,900 $25,915,300 $26,151,600 $28,228,200 $30,999,000
Fleet Ops: Fuel NetworkShort Term GF Borrowing $188,000 $359,800 $591,300 $2,239,800 $905,300Long Term GF Borrowing $2,864,200 $4,220,100 $2,083,300 $208,300 $0Total GF Borrowing $3,052,200 $4,579,900 $2,674,600 $2,448,100 $905,300Working Capital* ($564,300) ($293,500) $360,500 $2,723,200 $4,720,00090% Value of Fixed Assets $837,300 $742,300 $656,100 $613,400 $538,000Amount (Over) Under Limit $273,000 $448,800 $1,016,600 $3,336,600 $5,258,000
Fleet Ops: Federal Surplus PropertyShort Term GF Borrowing $10,400 $16,100 $135,900 $0 $0Long Term GF Borrowing $113,700 $106,200 $0 $0 $0Total GF Borrowing $124,100 $122,300 $135,900 $0 $0Working Capital* ($94,100) ($123,700) ($90,200) $14,100 $54,80090% Value of Fixed Assets $358,800 $302,200 $325,400 $0 $0Amount (Over) Under Limit $264,700 $178,500 $235,200 $14,100 $54,800
Risk Management: InsuranceShort Term GF Borrowing $0 $597,800 $1,558,100 $1,159,100 $2,664,200Long Term GF Borrowing $0 $1,643,100 $85,000 $2,035,200 $0Total GF Borrowing $0 $2,240,900 $1,643,100 $3,194,300 $2,664,200Working Capital* $38,473,000 $39,123,500 $40,450,600 $41,133,900 $42,428,40090% Value of Fixed Assets $73,700 $50,200 $31,600 $14,400 $0Amount (Over) Under Limit $38,546,700 $39,173,700 $40,482,200 $41,148,300 $42,428,400
Total General Fund Borrowing $39,534,200 $43,286,800 $32,081,000 $29,282,900 $24,903,800
*Working Capital = Current Assets - Current Liabilities - Long Term GF Borrowing
General Fund Borrowing by DAS Internal Service Funds
Looking at trends in General Fund Borrowing and Working Capital helps gauge the fiscal condition of an ISF
Table 43
Total General Fund borrowing has dropped by 42 percent since FY 2004 after steadily increasing in the prior three years. Most of this decrease is attributed to reduced borrowing by Fleet Operations, but is also partly attributable to reductions by ITS as it prepared to move to the new Department of Technology Services.
OFFICE OF THE LEGISLATIVE FISCAL ANALYST - 97 - DAS ISF SUMMARY
CAPITAL FACILITIES AND GOVERNMENT OPS. 2008 GS Publishing Program Outsourced
The General Services Printing program’s deficit working capital exceeded 90 percent of the value of its fixed assets in FY 2005, a situation that put it out of compliance with statute. The division took significant steps to correct the problem, primarily outsourcing the program to a private vendor, and by FY 2007 the program came back into compliance. By privatizing, the division hopes to save customer agencies as much as forty percent while still reducing debt through a $0.004 per page debt elimination fee. The division’s goal is to eliminate its General Fund debt and deficit working capital within five years.
Agencies must pay approved ISF rates
Internal Service Fund rates are set by the Legislature based on the recommendations of a Rate Committee composed of user agencies. Even though some ISF services are optional, agencies that use the services must pay the rates regardless of additional appropriations to their budgets.
Agencies may pay more each year for two reasons: increases due to ISF rate adjustments and increased agency utilization of services. Over the years, the Legislature has typically provided agencies with additional funds to pay for rate increases, though in times of significant budget constraints the Legislature could not always provide such funding. The Legislature, however, has made it a policy to require agencies to fund increases due to utilization themselves or through a building block request. This gives agencies an incentive to more carefully monitor their utilization of ISF services.
Funding for increased Internal Service Fund rates can come through an appropriation to the agency or from savings in other rates. When funding through appropriation, the Legislature splits the funding among all agency funding sources, not just the General Fund. This gives agencies another incentive to more carefully monitor the services they purchase and the rates they pay.
If agencies do not believe the rates are appropriate, they may take their complaint to the Rate Committee, which has the power to lower rates during the interim. Agencies can lower costs by turning in vehicles, driving fewer miles, cutting down on mail, or finding other types of efficiencies.
OFFICE OF THE LEGISLATIVE FISCAL ANALYST - 98 - DAS ISF SUMMARY
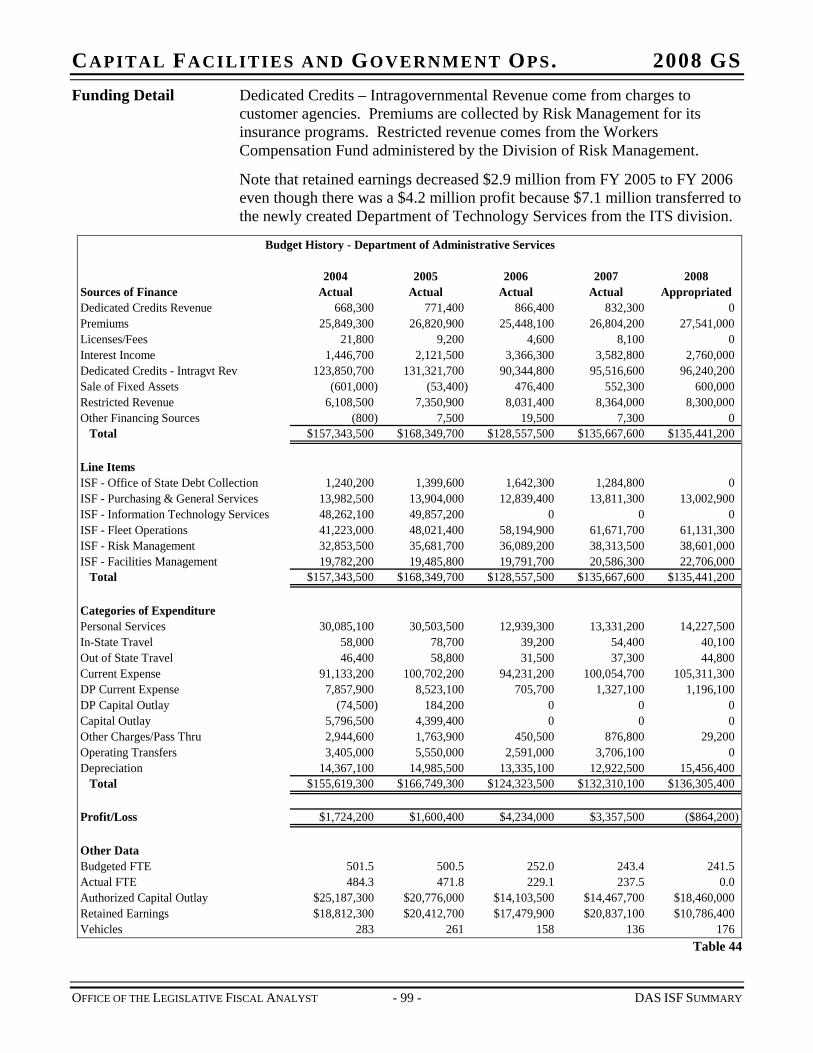
CAPITAL FACILITIES AND GOVERNMENT OPS. 2008 GS Funding Detail Dedicated Credits – Intragovernmental Revenue come from charges to
customer agencies. Premiums are collected by Risk Management for its insurance programs. Restricted revenue comes from the Workers Compensation Fund administered by the Division of Risk Management.
Note that retained earnings decreased $2.9 million from FY 2005 to FY 2006 even though there was a $4.2 million profit because $7.1 million transferred to the newly created Department of Technology Services from the ITS division.
Budget History - Department of Administrative Services
2004 2005 2006 2007 2008Sources of Finance Actual Actual Actual Actual AppropriatedDedicated Credits Revenue 668,300 771,400 866,400 832,300 0Premiums 25,849,300 26,820,900 25,448,100 26,804,200 27,541,000Licenses/Fees 21,800 9,200 4,600 8,100 0Interest Income 1,446,700 2,121,500 3,366,300 3,582,800 2,760,000Dedicated Credits - Intragvt Rev 123,850,700 131,321,700 90,344,800 95,516,600 96,240,200Sale of Fixed Assets (601,000) (53,400) 476,400 552,300 600,000Restricted Revenue 6,108,500 7,350,900 8,031,400 8,364,000 8,300,000Other Financing Sources (800) 7,500 19,500 7,300 0
Total $157,343,500 $168,349,700 $128,557,500 $135,667,600 $135,441,200
Line ItemsISF - Office of State Debt Collection 1,240,200 1,399,600 1,642,300 1,284,800 0ISF - Purchasing & General Services 13,982,500 13,904,000 12,839,400 13,811,300 13,002,900ISF - Information Technology Services 48,262,100 49,857,200 0 0 0ISF - Fleet Operations 41,223,000 48,021,400 58,194,900 61,671,700 61,131,300ISF - Risk Management 32,853,500 35,681,700 36,089,200 38,313,500 38,601,000ISF - Facilities Management 19,782,200 19,485,800 19,791,700 20,586,300 22,706,000
Total $157,343,500 $168,349,700 $128,557,500 $135,667,600 $135,441,200
Categories of ExpenditurePersonal Services 30,085,100 30,503,500 12,939,300 13,331,200 14,227,500In-State Travel 58,000 78,700 39,200 54,400 40,100Out of State Travel 46,400 58,800 31,500 37,300 44,800Current Expense 91,133,200 100,702,200 94,231,200 100,054,700 105,311,300DP Current Expense 7,857,900 8,523,100 705,700 1,327,100 1,196,100DP Capital Outlay (74,500) 184,200 0 0 0Capital Outlay 5,796,500 4,399,400 0 0 0Other Charges/Pass Thru 2,944,600 1,763,900 450,500 876,800 29,200Operating Transfers 3,405,000 5,550,000 2,591,000 3,706,100 0Depreciation 14,367,100 14,985,500 13,335,100 12,922,500 15,456,400
Total $155,619,300 $166,749,300 $124,323,500 $132,310,100 $136,305,400
Profit/Loss $1,724,200 $1,600,400 $4,234,000 $3,357,500 ($864,200)
Other DataBudgeted FTE 501.5 500.5 252.0 243.4 241.5Actual FTE 484.3 471.8 229.1 237.5 0.0Authorized Capital Outlay $25,187,300 $20,776,000 $14,103,500 $14,467,700 $18,460,000Retained Earnings $18,812,300 $20,412,700 $17,479,900 $20,837,100 $10,786,400Vehicles 283 261 158 136 176
Table 44
OFFICE OF THE LEGISLATIVE FISCAL ANALYST - 99 - DAS ISF SUMMARY

CAPITAL FACILITIES AND GOVERNMENT OPS. 2008 GS
OFFICE OF THE LEGISLATIVE FISCAL ANALYST - 101 - DAS GENERAL SERVICES (ISF)
CHAPTER 17 PURCHASING AND GENERAL SERVICES (ISF)
Function In 1997 the Legislature reorganized the Department of Administrative Services, merging Central Copying, Central Mail, and Central Stores into the Division of Purchasing. The new division became the Division of Purchasing and General Services. The General Services functions of the division are budgeted as internal service funds. The procurement function that enables other agencies to contract for goods and services is budgeted separately in the appropriated fund section.
The programs in this line item include:
Administration
Central Mailing
Electronic Purchasing
Print Services
Statutory Authority Utah Code (63A-2-103) directs the Division of Purchasing and General Services to operate and maintain:
A central mailing service
An electronic central store system for procuring goods and services
The director may establish microfilming, duplicating, printing, addressograph, and other central services.
Each state agency must subscribe to the division’s central services unless the director delegates this authority as required by UCA 63A-2-104.
Regarding the ISF, UCA 63A-2-103(3) requires the director to:
Establish a schedule of fees to be charged for all services provided to any department or agency
Submit proposed fees for services to the Rate Committee and obtain approval from the Legislature
Ensure that fees are approximately equal to the cost of providing the service
Conduct a market analysis by July 1, 2005 and periodically thereafter of fees, comparing division rates with fees of other public or private sector providers
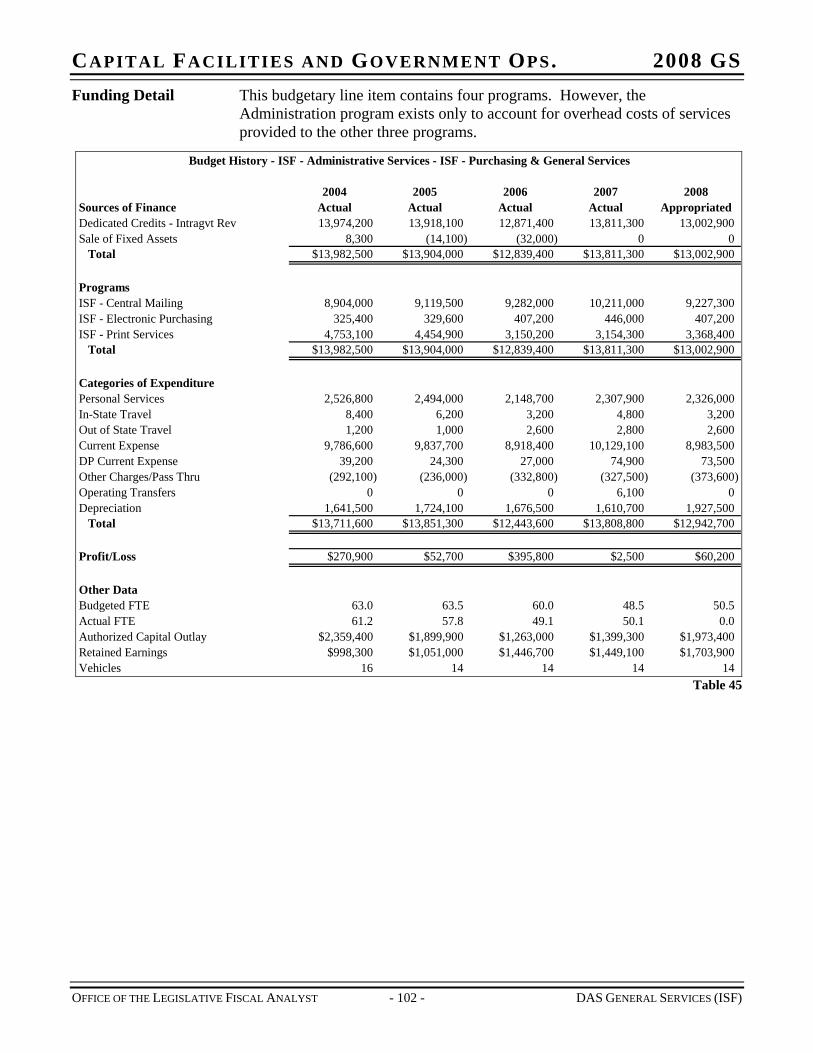
CAPITAL FACILITIES AND GOVERNMENT OPS. 2008 GS Funding Detail This budgetary line item contains four programs. However, the
Administration program exists only to account for overhead costs of services provided to the other three programs.
Budget History - ISF - Administrative Services - ISF - Purchasing & General Services
2004 2005 2006 2007 2008Sources of Finance Actual Actual Actual Actual AppropriatedDedicated Credits - Intragvt Rev 13,974,200 13,918,100 12,871,400 13,811,300 13,002,900Sale of Fixed Assets 8,300 (14,100) (32,000) 0 0
Total $13,982,500 $13,904,000 $12,839,400 $13,811,300 $13,002,900
ProgramsISF - Central Mailing 8,904,000 9,119,500 9,282,000 10,211,000 9,227,300ISF - Electronic Purchasing 325,400 329,600 407,200 446,000 407,200ISF - Print Services 4,753,100 4,454,900 3,150,200 3,154,300 3,368,400
Total $13,982,500 $13,904,000 $12,839,400 $13,811,300 $13,002,900
Categories of ExpenditurePersonal Services 2,526,800 2,494,000 2,148,700 2,307,900 2,326,000In-State Travel 8,400 6,200 3,200 4,800 3,200Out of State Travel 1,200 1,000 2,600 2,800 2,600Current Expense 9,786,600 9,837,700 8,918,400 10,129,100 8,983,500DP Current Expense 39,200 24,300 27,000 74,900 73,500Other Charges/Pass Thru (292,100) (236,000) (332,800) (327,500) (373,600)Operating Transfers 0 0 0 6,100 0Depreciation 1,641,500 1,724,100 1,676,500 1,610,700 1,927,500
Total $13,711,600 $13,851,300 $12,443,600 $13,808,800 $12,942,700
Profit/Loss $270,900 $52,700 $395,800 $2,500 $60,200
Other DataBudgeted FTE 63.0 63.5 60.0 48.5 50.5Actual FTE 61.2 57.8 49.1 50.1 0.0Authorized Capital Outlay $2,359,400 $1,899,900 $1,263,000 $1,399,300 $1,973,400Retained Earnings $998,300 $1,051,000 $1,446,700 $1,449,100 $1,703,900Vehicles 16 14 14 14 14
Table 45
OFFICE OF THE LEGISLATIVE FISCAL ANALYST - 102 - DAS GENERAL SERVICES (ISF)
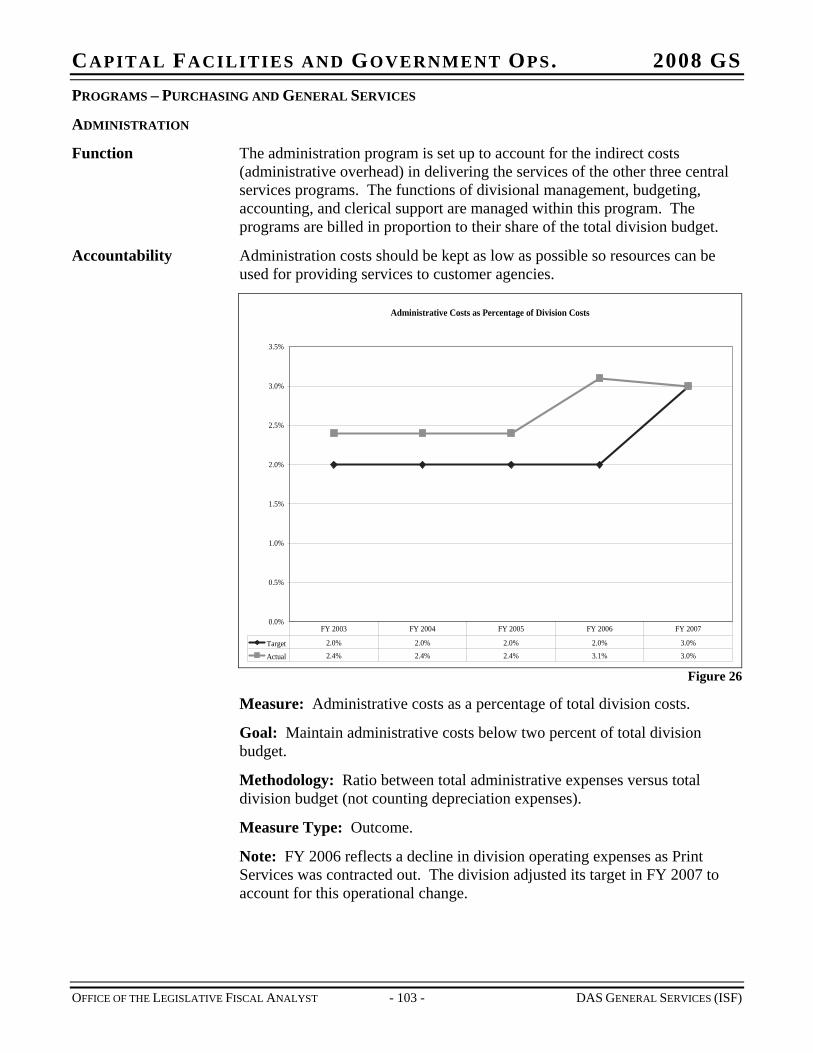
CAPITAL FACILITIES AND GOVERNMENT OPS. 2008 GS PROGRAMS – PURCHASING AND GENERAL SERVICES
ADMINISTRATION
Function The administration program is set up to account for the indirect costs (administrative overhead) in delivering the services of the other three central services programs. The functions of divisional management, budgeting, accounting, and clerical support are managed within this program. The programs are billed in proportion to their share of the total division budget.
Accountability Administration costs should be kept as low as possible so resources can be used for providing services to customer agencies.
Administrative Costs as Percentage of Division Costs
0.0%
0.5%
1.0%
1.5%
2.0%
2.5%
3.0%
3.5%
Target 2.0% 2.0% 2.0% 2.0% 3.0%
Actual 2.4% 2.4% 2.4% 3.1% 3.0%
FY 2003 FY 2004 FY 2005 FY 2006 FY 2007
Figure 26
Measure: Administrative costs as a percentage of total division costs.
Goal: Maintain administrative costs below two percent of total division budget.
Methodology: Ratio between total administrative expenses versus total division budget (not counting depreciation expenses).
Measure Type: Outcome.
Note: FY 2006 reflects a decline in division operating expenses as Print Services was contracted out. The division adjusted its target in FY 2007 to account for this operational change.
OFFICE OF THE LEGISLATIVE FISCAL ANALYST - 103 - DAS GENERAL SERVICES (ISF)
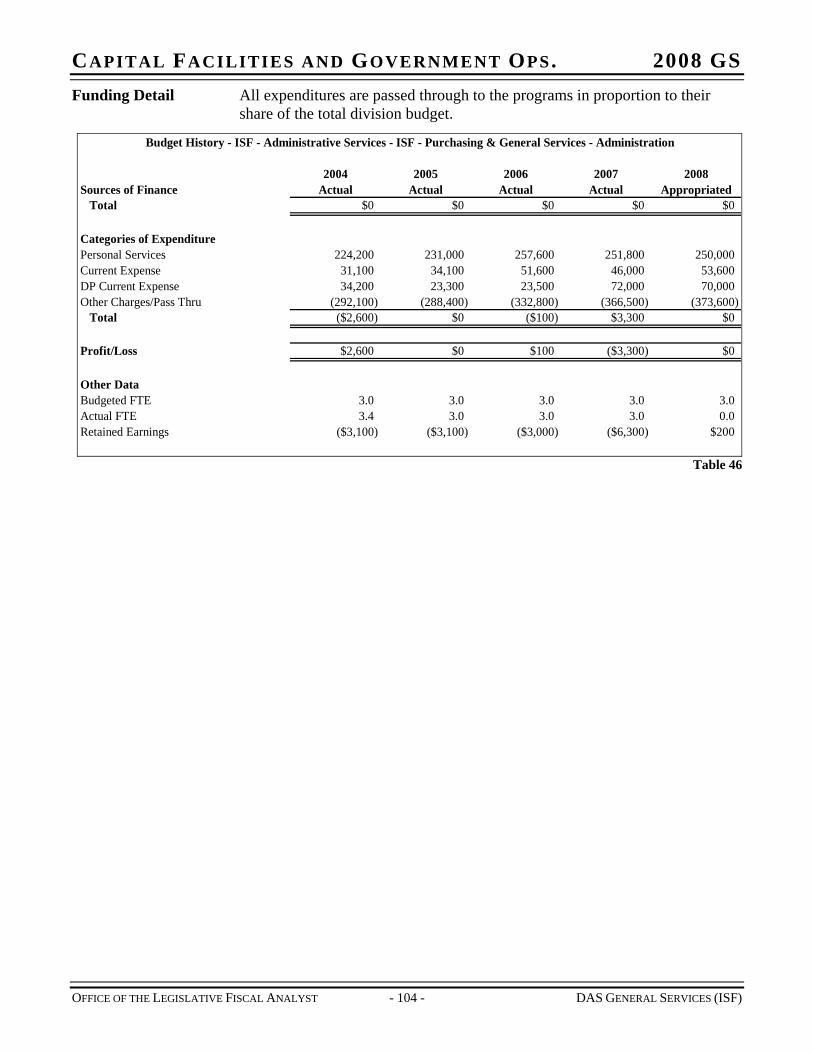
CAPITAL FACILITIES AND GOVERNMENT OPS. 2008 GS Funding Detail All expenditures are passed through to the programs in proportion to their
share of the total division budget.
Budget History - ISF - Administrative Services - ISF - Purchasing & General Services - Administration
2004 2005 2006 2007 2008Sources of Finance Actual Actual Actual Actual Appropriated
Total $0 $0 $0 $0 $0
Categories of ExpenditurePersonal Services 224,200 231,000 257,600 251,800 250,000Current Expense 31,100 34,100 51,600 46,000 53,600DP Current Expense 34,200 23,300 23,500 72,000 70,000Other Charges/Pass Thru (292,100) (288,400) (332,800) (366,500) (373,600)
Total ($2,600) $0 ($100) $3,300 $0
Profit/Loss $2,600 $0 $100 ($3,300) $0
Other DataBudgeted FTE 3.0 3.0 3.0 3.0 3.0Actual FTE 3.4 3.0 3.0 3.0 0.0Retained Earnings ($3,100) ($3,100) ($3,000) ($6,300) $200
Table 46
OFFICE OF THE LEGISLATIVE FISCAL ANALYST - 104 - DAS GENERAL SERVICES (ISF)
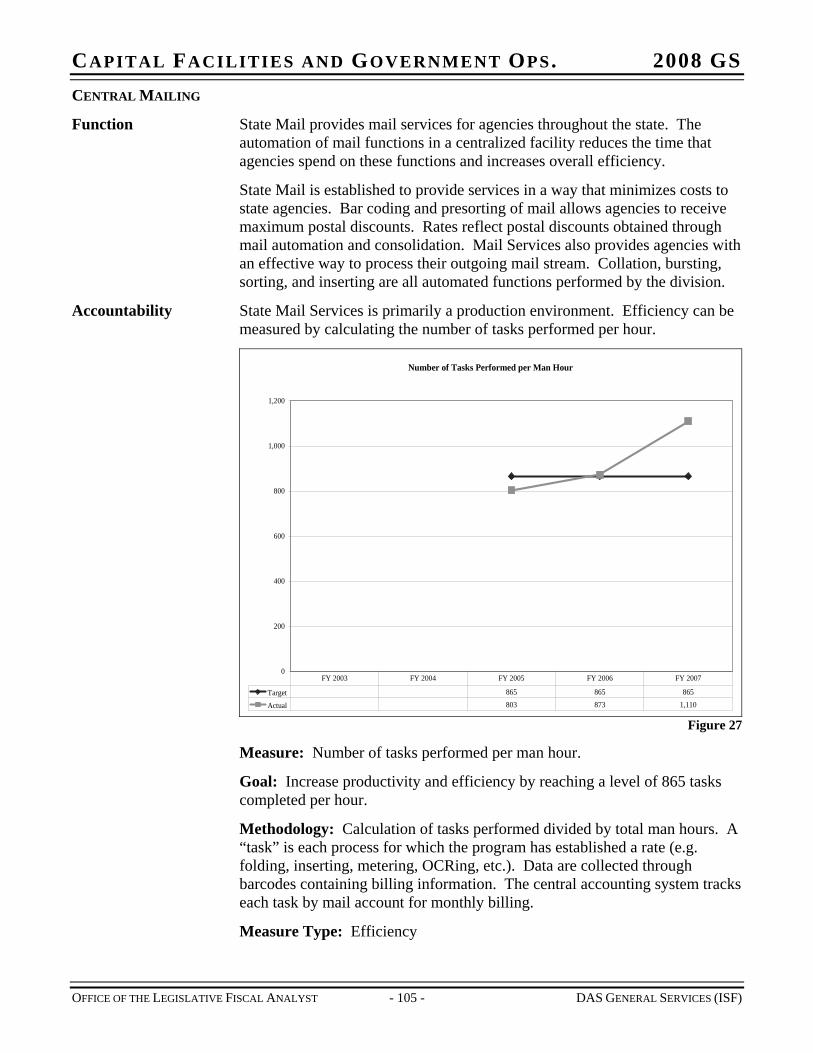
CAPITAL FACILITIES AND GOVERNMENT OPS. 2008 GS CENTRAL MAILING
Function State Mail provides mail services for agencies throughout the state. The automation of mail functions in a centralized facility reduces the time that agencies spend on these functions and increases overall efficiency.
State Mail is established to provide services in a way that minimizes costs to state agencies. Bar coding and presorting of mail allows agencies to receive maximum postal discounts. Rates reflect postal discounts obtained through mail automation and consolidation. Mail Services also provides agencies with an effective way to process their outgoing mail stream. Collation, bursting, sorting, and inserting are all automated functions performed by the division.
Accountability State Mail Services is primarily a production environment. Efficiency can be measured by calculating the number of tasks performed per hour.
Number of Tasks Performed per Man Hour
0
200
400
600
800
1,000
1,200
Target 865 865 865
Actual 803 873 1,110
FY 2003 FY 2004 FY 2005 FY 2006 FY 2007
Figure 27
Measure: Number of tasks performed per man hour.
Goal: Increase productivity and efficiency by reaching a level of 865 tasks completed per hour.
Methodology: Calculation of tasks performed divided by total man hours. A “task” is each process for which the program has established a rate (e.g. folding, inserting, metering, OCRing, etc.). Data are collected through barcodes containing billing information. The central accounting system tracks each task by mail account for monthly billing.
Measure Type: Efficiency
OFFICE OF THE LEGISLATIVE FISCAL ANALYST - 105 - DAS GENERAL SERVICES (ISF)
CAPITAL FACILITIES AND GOVERNMENT OPS. 2008 GS Note: State Mail established an aggressive target to reach 865 tasks completed per hour, and was able to surpass it by almost a third in FY 2007. Improvements are due to upgrading most of their postage meters (eliminating a number of preliminary screening steps), ongoing training and retraining programs, and employee recognition.
Funding Detail Rates charged by this ISF will be provided to the Legislature for its review and approval during the 2008 General Session.
Budget History - ISF - Administrative Services - ISF - Purchasing & General Services - ISF - Central Mailing
2004 2005 2006 2007 2008Sources of Finance Actual Actual Actual Actual AppropriatedDedicated Credits - Intragvt Rev 8,904,000 9,131,900 9,316,300 10,211,000 9,227,300Sale of Fixed Assets 0 (12,400) (34,300) 0 0
Total $8,904,000 $9,119,500 $9,282,000 $10,211,000 $9,227,300
Categories of ExpenditurePersonal Services 1,427,000 1,490,800 1,574,900 1,679,100 1,696,400In-State Travel 3,800 3,800 500 2,300 500Out of State Travel 800 500 1,400 2,400 1,400Current Expense 7,118,800 7,307,700 7,428,400 8,566,600 7,487,500DP Current Expense 200 100 3,400 2,300 3,400Operating Transfers 0 0 0 6,100 0Depreciation 102,900 136,000 167,600 163,000 200,800
Total $8,653,500 $8,938,900 $9,176,200 $10,421,800 $9,390,000
Profit/Loss $250,500 $180,600 $105,800 ($210,800) ($162,700)
Other DataBudgeted FTE 38.0 38.8 38.8 39.5 41.5Actual FTE 38.7 40.0 41.1 41.3 0.0Authorized Capital Outlay $73,500 $492,400 $157,700 $259,600 $160,000Retained Earnings $1,850,700 $2,031,300 $2,137,100 $1,926,300 $1,944,100Vehicles 14 14 14 14 14
Table 47
OFFICE OF THE LEGISLATIVE FISCAL ANALYST - 106 - DAS GENERAL SERVICES (ISF)
CAPITAL FACILITIES AND GOVERNMENT OPS. 2008 GS ELECTRONIC PURCHASING
Function Prior to 1997, Central Stores was the state's outlet for office and specialty supplies. Supplies were furnished at a lower markup than that charged by wholesale/retail operations. Beginning in 1997 Central Stores became a stockless, vendor direct operation. Instead of warehousing supplies purchased in bulk, the program uses private sector vendors to make direct deliveries and invoicing to state agencies and institutions. Office supplies are delivered directly to agencies within 24 hours of order receipt. The division provides contract management services for these outsourced contracts.
The “P-Card” streamlines processes
The Purchasing Card or P-Card is a Visa card that is designed to supplement or eliminate a variety of processes including petty cash, local check writing, low-value authorizations and small dollar purchase orders. It provides a more efficient, cost effective method of purchasing and payment for small dollar transactions.
The P-Card can be used for in-store purchases as well as mail, e-mail, telephone and fax orders. Each card carries pre-established transaction and monthly credit limits. Agencies may further limit transaction amounts and the number of daily transactions.
An audit conducted in the summer of 2006 concluded that the purchasing card is an efficient tool, but lacked sufficient oversight to prevent fraud or abuse. The auditors didn’t find any evidence of fraud or abuse. The agency agreed with the findings and promised to take steps to improve oversight including the addition of one FTE in FY 2008 to monitor agency compliance with P-Card policies and procedures.
Accountability Since use of the P-Card has established itself as the most efficient way to make small purchases, the volume of P-Card purchasing is an indicator of statewide efficiency in making small transactions.
OFFICE OF THE LEGISLATIVE FISCAL ANALYST - 107 - DAS GENERAL SERVICES (ISF)
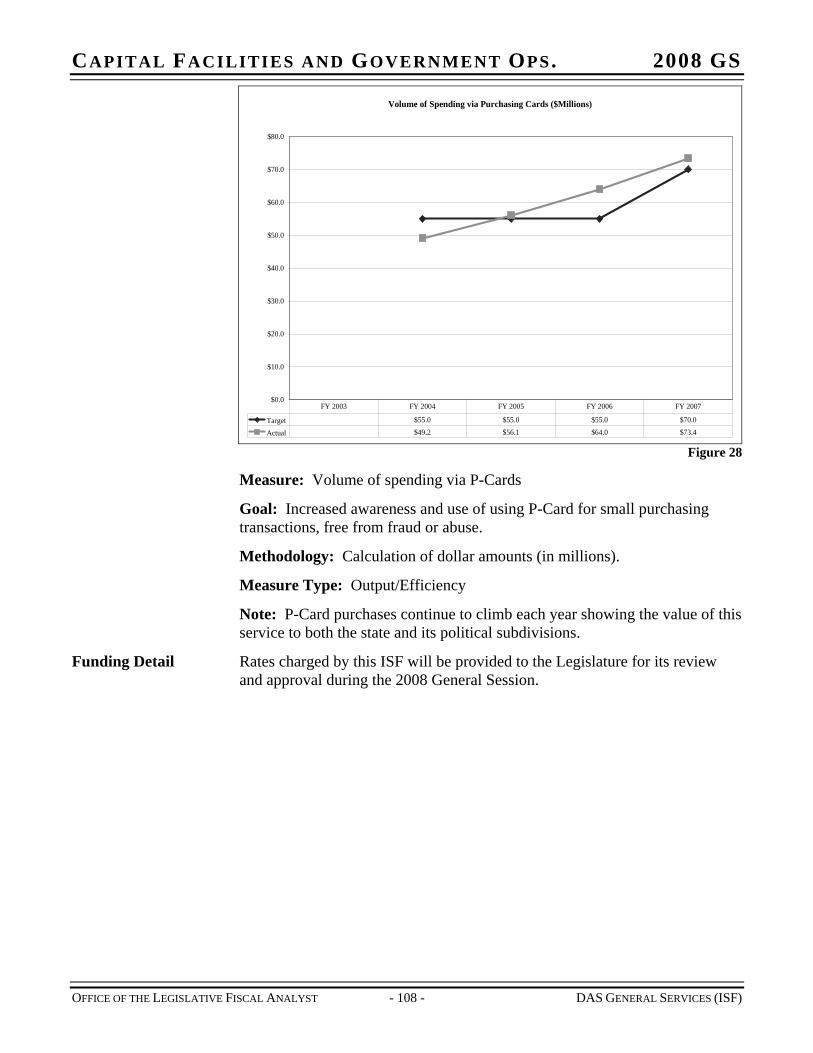
CAPITAL FACILITIES AND GOVERNMENT OPS. 2008 GS
Volume of Spending via Purchasing Cards ($Millions)
$0.0
$10.0
$20.0
$30.0
$40.0
$50.0
$60.0
$70.0
$80.0
Target $55.0 $55.0 $55.0 $70.0
Actual $49.2 $56.1 $64.0 $73.4
FY 2003 FY 2004 FY 2005 FY 2006 FY 2007
Figure 28
Measure: Volume of spending via P-Cards
Goal: Increased awareness and use of using P-Card for small purchasing transactions, free from fraud or abuse.
Methodology: Calculation of dollar amounts (in millions).
Measure Type: Output/Efficiency
Note: P-Card purchases continue to climb each year showing the value of this service to both the state and its political subdivisions.
Funding Detail Rates charged by this ISF will be provided to the Legislature for its review and approval during the 2008 General Session.
OFFICE OF THE LEGISLATIVE FISCAL ANALYST - 108 - DAS GENERAL SERVICES (ISF)
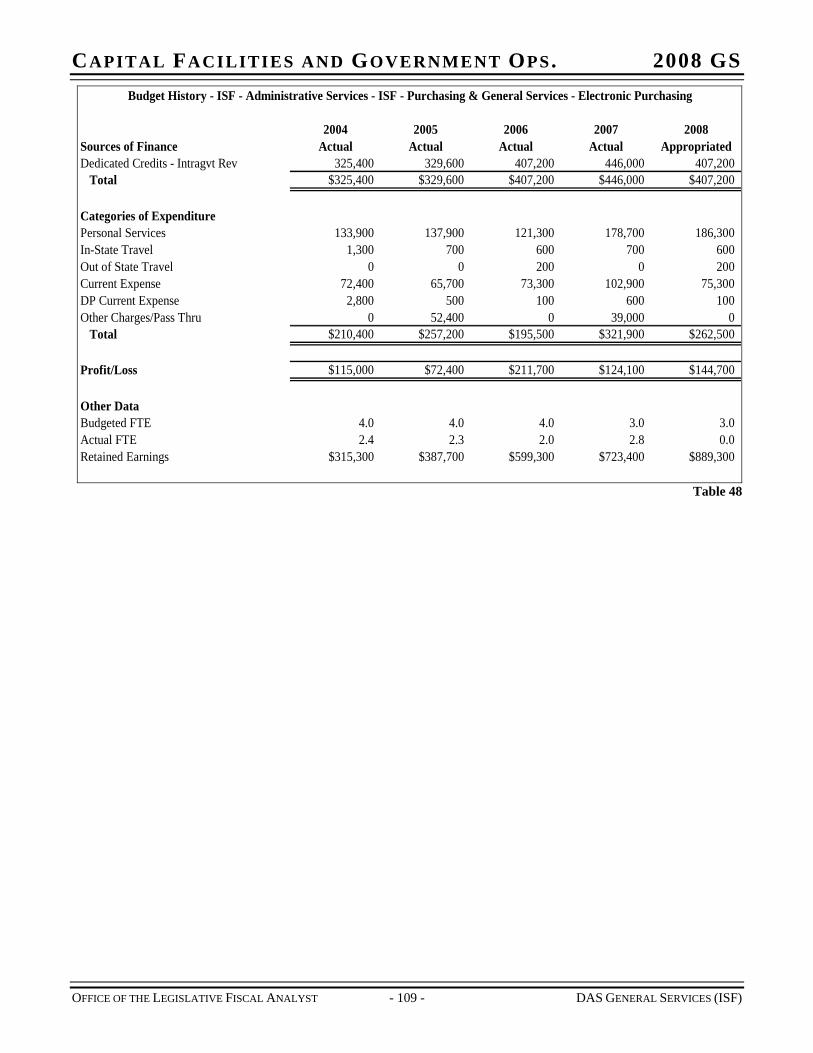
CAPITAL FACILITIES AND GOVERNMENT OPS. 2008 GS Budget History - ISF - Administrative Services - ISF - Purchasing & General Services - Electronic Purchasing
2004 2005 2006 2007 2008Sources of Finance Actual Actual Actual Actual AppropriatedDedicated Credits - Intragvt Rev 325,400 329,600 407,200 446,000 407,200
Total $325,400 $329,600 $407,200 $446,000 $407,200
Categories of ExpenditurePersonal Services 133,900 137,900 121,300 178,700 186,300In-State Travel 1,300 700 600 700 600Out of State Travel 0 0 200 0 200Current Expense 72,400 65,700 73,300 102,900 75,300DP Current Expense 2,800 500 100 600 100Other Charges/Pass Thru 0 52,400 0 39,000 0
Total $210,400 $257,200 $195,500 $321,900 $262,500
Profit/Loss $115,000 $72,400 $211,700 $124,100 $144,700
Other DataBudgeted FTE 4.0 4.0 4.0 3.0 3.0Actual FTE 2.4 2.3 2.0 2.8 0.0Retained Earnings $315,300 $387,700 $599,300 $723,400 $889,300
Table 48
OFFICE OF THE LEGISLATIVE FISCAL ANALYST - 109 - DAS GENERAL SERVICES (ISF)
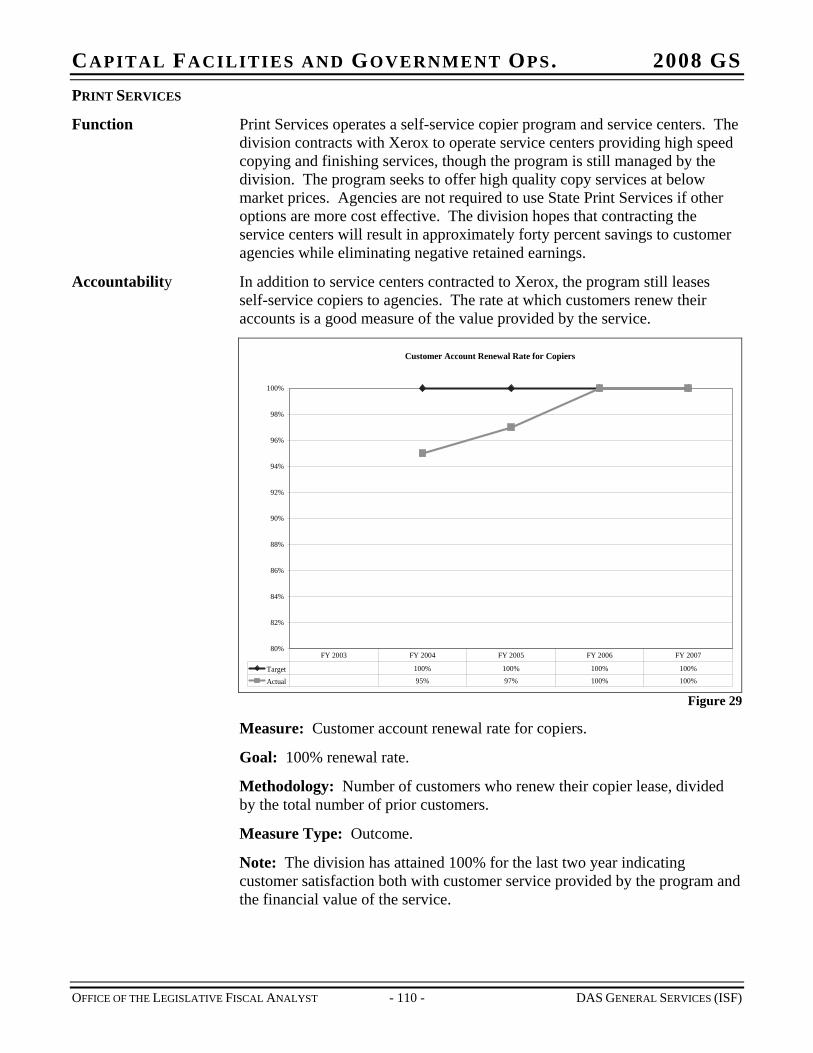
CAPITAL FACILITIES AND GOVERNMENT OPS. 2008 GS PRINT SERVICES
Function Print Services operates a self-service copier program and service centers. The division contracts with Xerox to operate service centers providing high speed copying and finishing services, though the program is still managed by the division. The program seeks to offer high quality copy services at below market prices. Agencies are not required to use State Print Services if other options are more cost effective. The division hopes that contracting the service centers will result in approximately forty percent savings to customer agencies while eliminating negative retained earnings.
Accountability In addition to service centers contracted to Xerox, the program still leases self-service copiers to agencies. The rate at which customers renew their accounts is a good measure of the value provided by the service.
Customer Account Renewal Rate for Copiers
80%
82%
84%
86%
88%
90%
92%
94%
96%
98%
100%
Target 100% 100% 100% 100%
Actual 95% 97% 100% 100%
FY 2003 FY 2004 FY 2005 FY 2006 FY 2007
Figure 29
Measure: Customer account renewal rate for copiers.
Goal: 100% renewal rate.
Methodology: Number of customers who renew their copier lease, divided by the total number of prior customers.
Measure Type: Outcome.
Note: The division has attained 100% for the last two year indicating customer satisfaction both with customer service provided by the program and the financial value of the service.
OFFICE OF THE LEGISLATIVE FISCAL ANALYST - 110 - DAS GENERAL SERVICES (ISF)
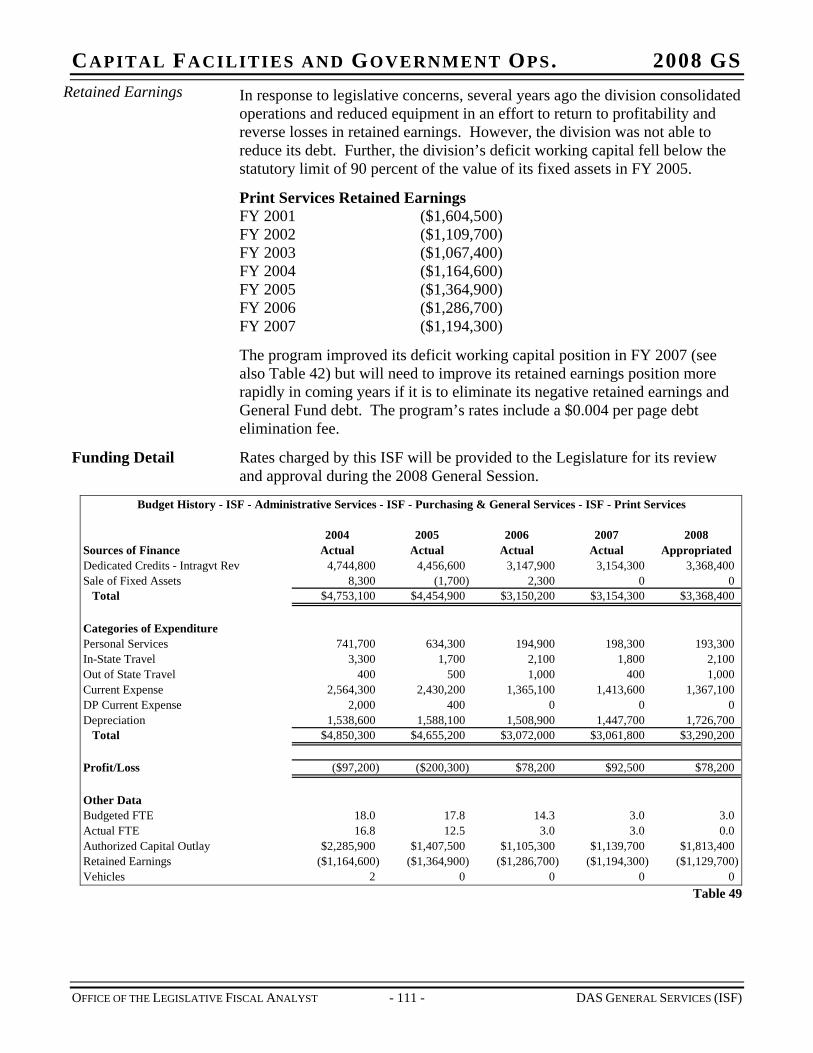
CAPITAL FACILITIES AND GOVERNMENT OPS. 2008 GS Retained Earnings In response to legislative concerns, several years ago the division consolidated
operations and reduced equipment in an effort to return to profitability and reverse losses in retained earnings. However, the division was not able to reduce its debt. Further, the division’s deficit working capital fell below the statutory limit of 90 percent of the value of its fixed assets in FY 2005.
Print Services Retained Earnings FY 2001 ($1,604,500) FY 2002 ($1,109,700) FY 2003 ($1,067,400) FY 2004 ($1,164,600) FY 2005 ($1,364,900) FY 2006 ($1,286,700) FY 2007 ($1,194,300)
The program improved its deficit working capital position in FY 2007 (see also Table 42) but will need to improve its retained earnings position more rapidly in coming years if it is to eliminate its negative retained earnings and General Fund debt. The program’s rates include a $0.004 per page debt elimination fee.
Funding Detail Rates charged by this ISF will be provided to the Legislature for its review and approval during the 2008 General Session.
Budget History - ISF - Administrative Services - ISF - Purchasing & General Services - ISF - Print Services
2004 2005 2006 2007 2008Sources of Finance Actual Actual Actual Actual AppropriatedDedicated Credits - Intragvt Rev 4,744,800 4,456,600 3,147,900 3,154,300 3,368,400Sale of Fixed Assets 8,300 (1,700) 2,300 0 0
Total $4,753,100 $4,454,900 $3,150,200 $3,154,300 $3,368,400
Categories of ExpenditurePersonal Services 741,700 634,300 194,900 198,300 193,300In-State Travel 3,300 1,700 2,100 1,800 2,100Out of State Travel 400 500 1,000 400 1,000Current Expense 2,564,300 2,430,200 1,365,100 1,413,600 1,367,100DP Current Expense 2,000 400 0 0 0Depreciation 1,538,600 1,588,100 1,508,900 1,447,700 1,726,700
Total $4,850,300 $4,655,200 $3,072,000 $3,061,800 $3,290,200
Profit/Loss ($97,200) ($200,300) $78,200 $92,500 $78,200
Other DataBudgeted FTE 18.0 17.8 14.3 3.0 3.0Actual FTE 16.8 12.5 3.0 3.0 0.0Authorized Capital Outlay $2,285,900 $1,407,500 $1,105,300 $1,139,700 $1,813,400Retained Earnings ($1,164,600) ($1,364,900) ($1,286,700) ($1,194,300) ($1,129,700)Vehicles 2 0 0 0 0
Table 49
OFFICE OF THE LEGISLATIVE FISCAL ANALYST - 111 - DAS GENERAL SERVICES (ISF)

CAPITAL FACILITIES AND GOVERNMENT OPS. 2008 GS
OFFICE OF THE LEGISLATIVE FISCAL ANALYST - 113 - DAS INFORMATION TECHNOLOGY SERVICES (ISF)
CHAPTER 18 DIVISION OF INFORMATION TECHNOLOGY SERVICES (ISF)
Function The Division of Information Technology Services (ITS) was part of the Department of Administrative Services through fiscal year 2006. House Bill 109, Information Technology Governance Amendments (2005 General Session) created the Department of Technology Services (DTS) and transferred ITS’ functions to the new department. For more information on DTS, see chapters 24 and 25.
ITS provided centralized data processing and communication service to all agencies of state government as well as various local entities. The division was an internal service fund.
ITS’ data processing services included software licensing and development, central computing, wide area network connectivity, and consultation. Its telecommunications services included negotiating the purchase, lease or rental of private or public telecommunications services, and operating the state’s network of microwave sites.
Statutory Authority The following sections of Utah code governed the Division of Information Technology Services. The first title is repealed by Information Technology Governance Amendments (H.B. 109, 2005 General Session).
Title 63A Chapter 6 “Utah Administrative Services Code" creates ITS within the Department of Administrative Services, and delineates the division’s responsibilities;
Title 63 Chapter 38 “Budgetary Procedures Act” defines internal service funds, including ITS, and sets guidelines for their operations.
Funding Detail There were fourteen separate programs in this division prior to FY 2006. Detail on the ITS budget is included below for historical purposes.
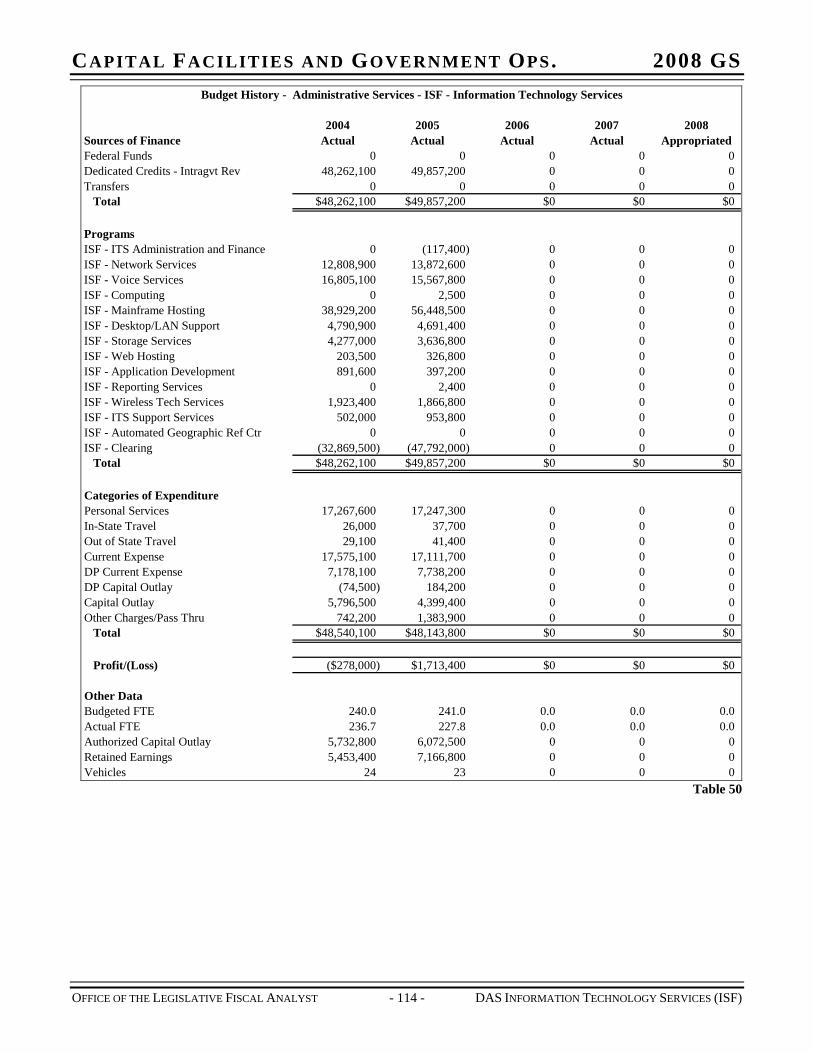
CAPITAL FACILITIES AND GOVERNMENT OPS. 2008 GS Budget History - Administrative Services - ISF - Information Technology Services
2004 2005 2006 2007 2008Sources of Finance Actual Actual Actual Actual AppropriatedFederal Funds 0 0 0 0 0Dedicated Credits - Intragvt Rev 48,262,100 49,857,200 0 0 0Transfers 0 0 0 0 0
Total $48,262,100 $49,857,200 $0 $0 $0
ProgramsISF - ITS Administration and Finance 0 (117,400) 0 0 0ISF - Network Services 12,808,900 13,872,600 0 0 0ISF - Voice Services 16,805,100 15,567,800 0 0 0ISF - Computing 0 2,500 0 0 0ISF - Mainframe Hosting 38,929,200 56,448,500 0 0 0ISF - Desktop/LAN Support 4,790,900 4,691,400 0 0 0ISF - Storage Services 4,277,000 3,636,800 0 0 0ISF - Web Hosting 203,500 326,800 0 0 0ISF - Application Development 891,600 397,200 0 0 0ISF - Reporting Services 0 2,400 0 0 0ISF - Wireless Tech Services 1,923,400 1,866,800 0 0 0ISF - ITS Support Services 502,000 953,800 0 0 0ISF - Automated Geographic Ref Ctr 0 0 0 0 0ISF - Clearing (32,869,500) (47,792,000) 0 0 0
Total $48,262,100 $49,857,200 $0 $0 $0
Categories of ExpenditurePersonal Services 17,267,600 17,247,300 0 0 0In-State Travel 26,000 37,700 0 0 0Out of State Travel 29,100 41,400 0 0 0Current Expense 17,575,100 17,111,700 0 0 0DP Current Expense 7,178,100 7,738,200 0 0 0DP Capital Outlay (74,500) 184,200 0 0 0Capital Outlay 5,796,500 4,399,400 0 0 0Other Charges/Pass Thru 742,200 1,383,900 0 0 0
Total $48,540,100 $48,143,800 $0 $0 $0
Profit/(Loss) ($278,000) $1,713,400 $0 $0 $0
Other DataBudgeted FTE 240.0 241.0 0.0 0.0 0.0Actual FTE 236.7 227.8 0.0 0.0 0.0Authorized Capital Outlay 5,732,800 6,072,500 0 0 0Retained Earnings 5,453,400 7,166,800 0 0 0Vehicles 24 23 0 0 0
Table 50
OFFICE OF THE LEGISLATIVE FISCAL ANALYST - 114 - DAS INFORMATION TECHNOLOGY SERVICES (ISF)
CAPITAL FACILITIES AND GOVERNMENT OPS. 2008 GS
OFFICE OF THE LEGISLATIVE FISCAL ANALYST - 115 - DAS FLEET OPERATIONS (ISF)
CHAPTER 19 DIVISION OF FLEET OPERATIONS (ISF)
Function The Division of Fleet Operations was established as a new division of Administrative Services in 1997. The division also includes the State and Federal Surplus property programs, which were housed in the Division of Purchasing and General Services prior to 1997.
Statutory Authority UCA 63A Chapter 9 creates the Division of Fleet Operations (Section 201) and spells out the division’s duties (Section 401). Duties include:
Perform all administrative duties related to managing the state’s vehicles
Coordinate all purchases of state vehicles
Establish fleet information system(s) for state vehicles
Make rules regarding maintenance, safety, loss prevention, procurement, fuel management, cost management, disposal, reallocation, rate structures, and insurance requirements for state vehicles
Establish a parts inventory
Create and administer a fuel dispensing service
Emphasize customer service
Conduct an annual audit of all state vehicles
Charge rates approved by the Rate Committee and Legislature
Conduct a market analysis by July 1, 2005
By November 1 of each year submit a state-owned vehicle report to the governor and legislative fiscal analyst
UCA 63A-9-501 mandates that the division refer complaints from the public about misuse or illegal operation of vehicles to the agency that owns/leases the vehicle
UCA 63A-9-601 requires the division to ensure that vehicles owned or leased by the state are properly marked
UCA 63A-9-801 requires the division to establish a state surplus property system
UCA 63A-9-805 allows the division to establish a federal surplus property system
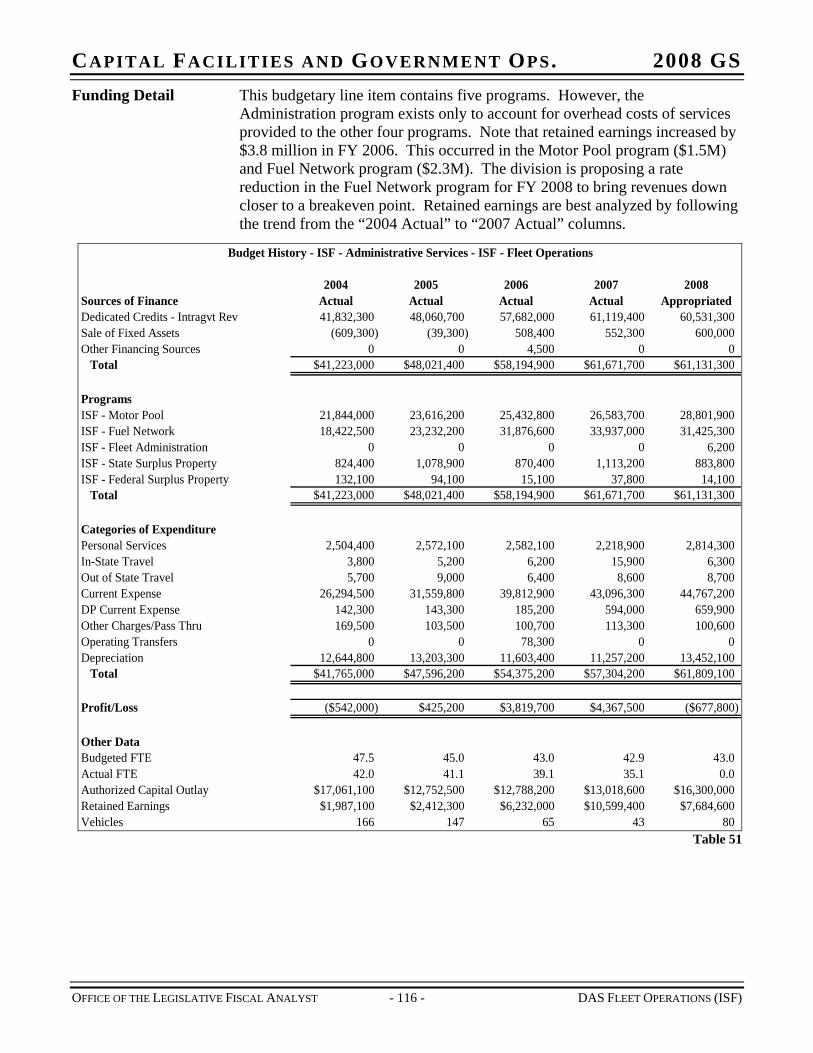
CAPITAL FACILITIES AND GOVERNMENT OPS. 2008 GS Funding Detail This budgetary line item contains five programs. However, the
Administration program exists only to account for overhead costs of services provided to the other four programs. Note that retained earnings increased by $3.8 million in FY 2006. This occurred in the Motor Pool program ($1.5M) and Fuel Network program ($2.3M). The division is proposing a rate reduction in the Fuel Network program for FY 2008 to bring revenues down closer to a breakeven point. Retained earnings are best analyzed by following the trend from the “2004 Actual” to “2007 Actual” columns.
Budget History - ISF - Administrative Services - ISF - Fleet Operations
2004 2005 2006 2007 2008Sources of Finance Actual Actual Actual Actual AppropriatedDedicated Credits - Intragvt Rev 41,832,300 48,060,700 57,682,000 61,119,400 60,531,300Sale of Fixed Assets (609,300) (39,300) 508,400 552,300 600,000Other Financing Sources 0 0 4,500 0 0
Total $41,223,000 $48,021,400 $58,194,900 $61,671,700 $61,131,300
ProgramsISF - Motor Pool 21,844,000 23,616,200 25,432,800 26,583,700 28,801,900ISF - Fuel Network 18,422,500 23,232,200 31,876,600 33,937,000 31,425,300ISF - Fleet Administration 0 0 0 0ISF - State Surplus Property 824,400 1,078,900 870,400 1,113,200 883,800ISF - Federal Surplus Property 132,100 94,100 15,100 37,800 14,100
Total $41,223,000 $48,021,400 $58,194,900 $61,671,700 $61,131,300
Categories of ExpenditurePersonal Services 2,504,400 2,572,100 2,582,100 2,218,900 2,814,300In-State Travel 3,800 5,200 6,200 15,900 6,300Out of State Travel 5,700 9,000 6,400 8,600 8,700Current Expense 26,294,500 31,559,800 39,812,900 43,096,300 44,767,200DP Current Expense 142,300 143,300 185,200 594,000 659,900Other Charges/Pass Thru 169,500 103,500 100,700 113,300 100,600Operating Transfers 0 0 78,300 0 0Depreciation 12,644,800 13,203,300 11,603,400 11,257,200 13,452,100
Total $41,765,000 $47,596,200 $54,375,200 $57,304,200 $61,809,100
Profit/Loss ($542,000) $425,200 $3,819,700 $4,367,500 ($677,800)
Other DataBudgeted FTE 47.5 45.0 43.0 42.9 43.0Actual FTE 42.0 41.1 39.1 35.1 0.0Authorized Capital Outlay $17,061,100 $12,752,500 $12,788,200 $13,018,600 $16,300,000Retained Earnings $1,987,100 $2,412,300 $6,232,000 $10,599,400 $7,684,600Vehicles 166 147 65 43 80
6,200
Table 51
OFFICE OF THE LEGISLATIVE FISCAL ANALYST - 116 - DAS FLEET OPERATIONS (ISF)
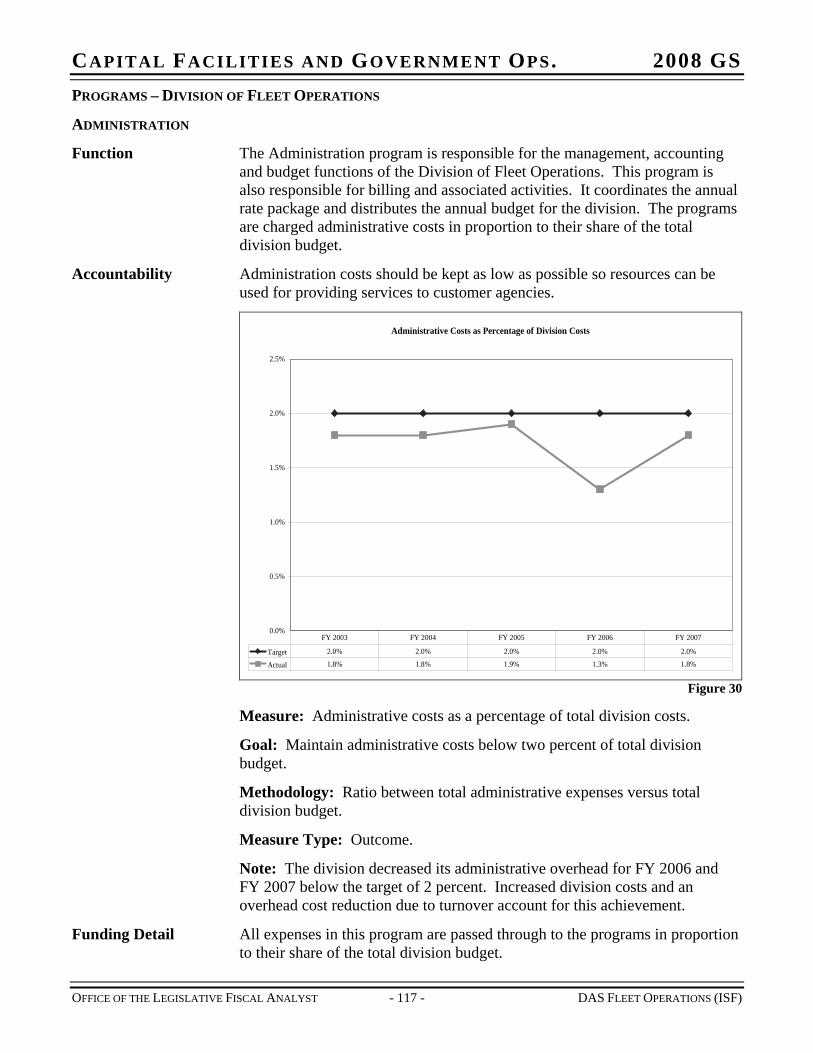
CAPITAL FACILITIES AND GOVERNMENT OPS. 2008 GS PROGRAMS – DIVISION OF FLEET OPERATIONS
ADMINISTRATION
Function The Administration program is responsible for the management, accounting and budget functions of the Division of Fleet Operations. This program is also responsible for billing and associated activities. It coordinates the annual rate package and distributes the annual budget for the division. The programs are charged administrative costs in proportion to their share of the total division budget.
Accountability Administration costs should be kept as low as possible so resources can be used for providing services to customer agencies.
Administrative Costs as Percentage of Division Costs
0.0%
0.5%
1.0%
1.5%
2.0%
2.5%
Target 2.0% 2.0% 2.0% 2.0% 2.0%
Actual 1.8% 1.8% 1.9% 1.3% 1.8%
FY 2003 FY 2004 FY 2005 FY 2006 FY 2007
Figure 30
Measure: Administrative costs as a percentage of total division costs.
Goal: Maintain administrative costs below two percent of total division budget.
Methodology: Ratio between total administrative expenses versus total division budget.
Measure Type: Outcome.
Note: The division decreased its administrative overhead for FY 2006 and FY 2007 below the target of 2 percent. Increased division costs and an overhead cost reduction due to turnover account for this achievement.
Funding Detail All expenses in this program are passed through to the programs in proportion to their share of the total division budget.
OFFICE OF THE LEGISLATIVE FISCAL ANALYST - 117 - DAS FLEET OPERATIONS (ISF)
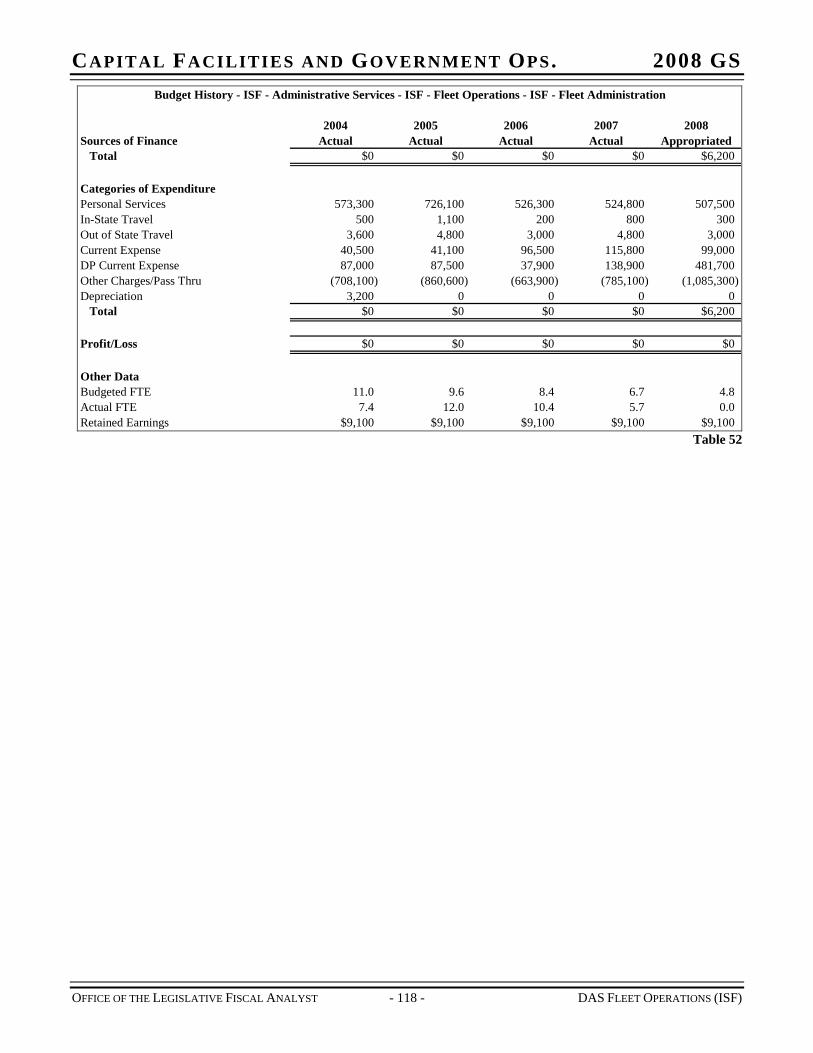
CAPITAL FACILITIES AND GOVERNMENT OPS. 2008 GS Budget History - ISF - Administrative Services - ISF - Fleet Operations - ISF - Fleet Administration
2004 2005 2006 2007 2008Sources of Finance Actual Actual Actual Actual Appropriated
Total $0 $0 $0 $0 $6,200
Categories of ExpenditurePersonal Services 573,300 726,100 526,300 524,800 507,500In-State Travel 500 1,100 200 800 300Out of State Travel 3,600 4,800 3,000 4,800 3,000Current Expense 40,500 41,100 96,500 115,800 99,000DP Current Expense 87,000 87,500 37,900 138,900 481,700Other Charges/Pass Thru (708,100) (860,600) (663,900) (785,100) (1,085,300)Depreciation 3,200 0 0 0
Total $0 $0 $0 $0 $6,200
Profit/Loss $0 $0 $0 $0 $0
Other DataBudgeted FTE 11.0 9.6 8.4 6.7 4.8Actual FTE 7.4 12.0 10.4 5.7 0.0Retained Earnings $9,100 $9,100 $9,100 $9,100 $9,100
0
Table 52
OFFICE OF THE LEGISLATIVE FISCAL ANALYST - 118 - DAS FLEET OPERATIONS (ISF)
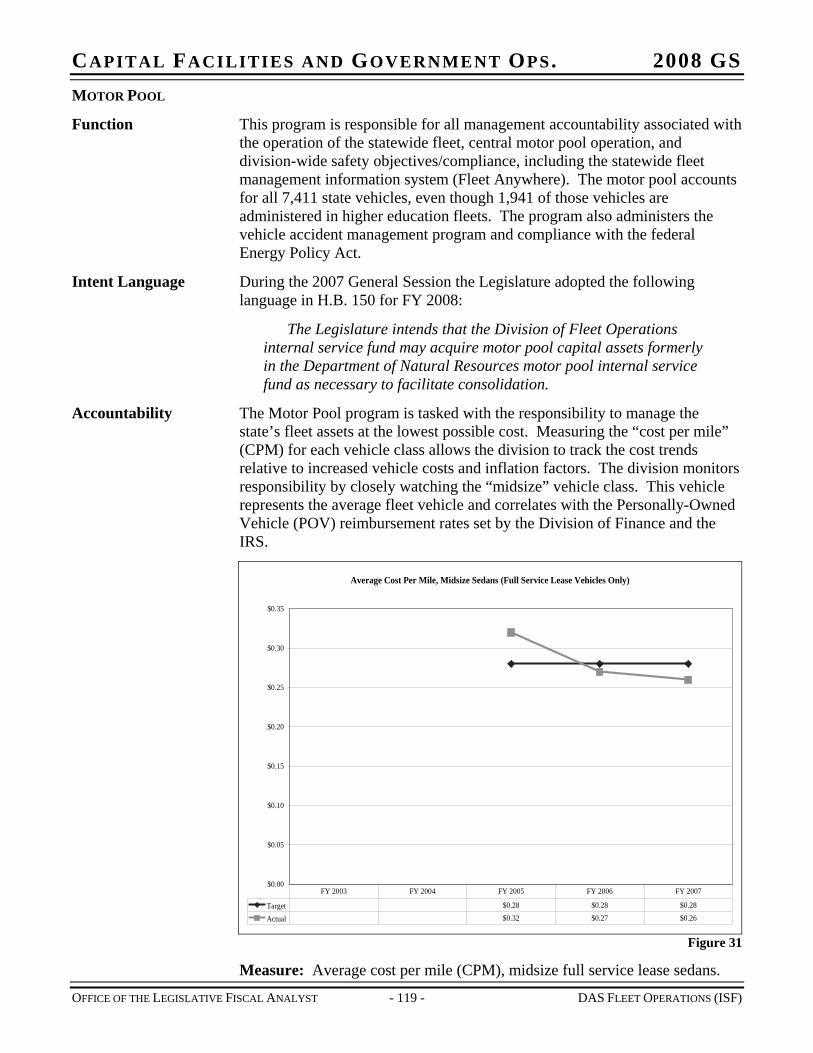
CAPITAL FACILITIES AND GOVERNMENT OPS. 2008 GS MOTOR POOL
Function This program is responsible for all management accountability associated with the operation of the statewide fleet, central motor pool operation, and division-wide safety objectives/compliance, including the statewide fleet management information system (Fleet Anywhere). The motor pool accounts for all 7,411 state vehicles, even though 1,941 of those vehicles are administered in higher education fleets. The program also administers the vehicle accident management program and compliance with the federal Energy Policy Act.
Intent Language During the 2007 General Session the Legislature adopted the following language in H.B. 150 for FY 2008:
The Legislature intends that the Division of Fleet Operations internal service fund may acquire motor pool capital assets formerly in the Department of Natural Resources motor pool internal service fund as necessary to facilitate consolidation.
Accountability The Motor Pool program is tasked with the responsibility to manage the state’s fleet assets at the lowest possible cost. Measuring the “cost per mile” (CPM) for each vehicle class allows the division to track the cost trends relative to increased vehicle costs and inflation factors. The division monitors responsibility by closely watching the “midsize” vehicle class. This vehicle represents the average fleet vehicle and correlates with the Personally-Owned Vehicle (POV) reimbursement rates set by the Division of Finance and the IRS.
Average Cost Per Mile, Midsize Sedans (Full Service Lease Vehicles Only)
$0.00
$0.05
$0.10
$0.15
$0.20
$0.25
$0.30
$0.35
Target $0.28 $0.28 $0.28
Actual $0.32 $0.27 $0.26
FY 2003 FY 2004 FY 2005 FY 2006 FY 2007
Figure 31
Measure: Average cost per mile (CPM), midsize full service lease sedans.
OFFICE OF THE LEGISLATIVE FISCAL ANALYST - 119 - DAS FLEET OPERATIONS (ISF)
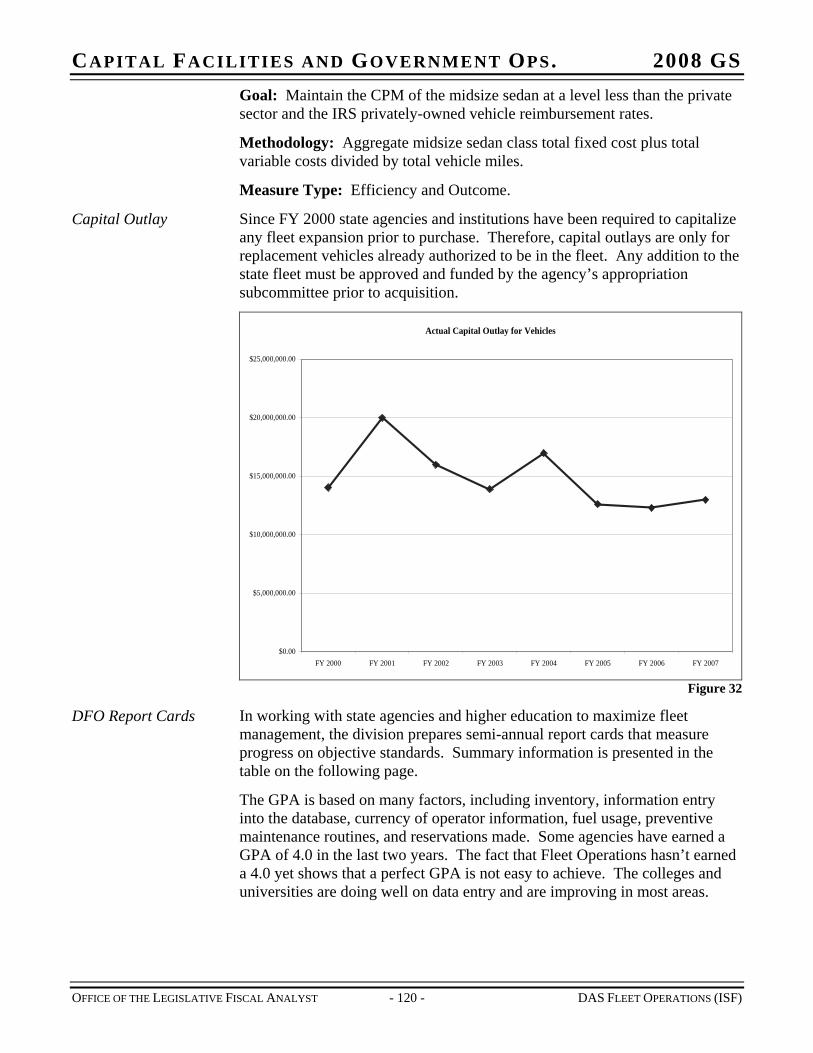
CAPITAL FACILITIES AND GOVERNMENT OPS. 2008 GS Goal: Maintain the CPM of the midsize sedan at a level less than the private sector and the IRS privately-owned vehicle reimbursement rates.
Methodology: Aggregate midsize sedan class total fixed cost plus total variable costs divided by total vehicle miles.
Measure Type: Efficiency and Outcome.
Capital Outlay Since FY 2000 state agencies and institutions have been required to capitalize any fleet expansion prior to purchase. Therefore, capital outlays are only for replacement vehicles already authorized to be in the fleet. Any addition to the state fleet must be approved and funded by the agency’s appropriation subcommittee prior to acquisition.
Actual Capital Outlay for Vehicles
$0.00
$5,000,000.00
$10,000,000.00
$15,000,000.00
$20,000,000.00
$25,000,000.00
FY 2000 FY 2001 FY 2002 FY 2003 FY 2004 FY 2005 FY 2006 FY 2007
Figure 32
DFO Report Cards In working with state agencies and higher education to maximize fleet management, the division prepares semi-annual report cards that measure progress on objective standards. Summary information is presented in the table on the following page.
The GPA is based on many factors, including inventory, information entry into the database, currency of operator information, fuel usage, preventive maintenance routines, and reservations made. Some agencies have earned a GPA of 4.0 in the last two years. The fact that Fleet Operations hasn’t earned a 4.0 yet shows that a perfect GPA is not easy to achieve. The colleges and universities are doing well on data entry and are improving in most areas.
OFFICE OF THE LEGISLATIVE FISCAL ANALYST - 120 - DAS FLEET OPERATIONS (ISF)
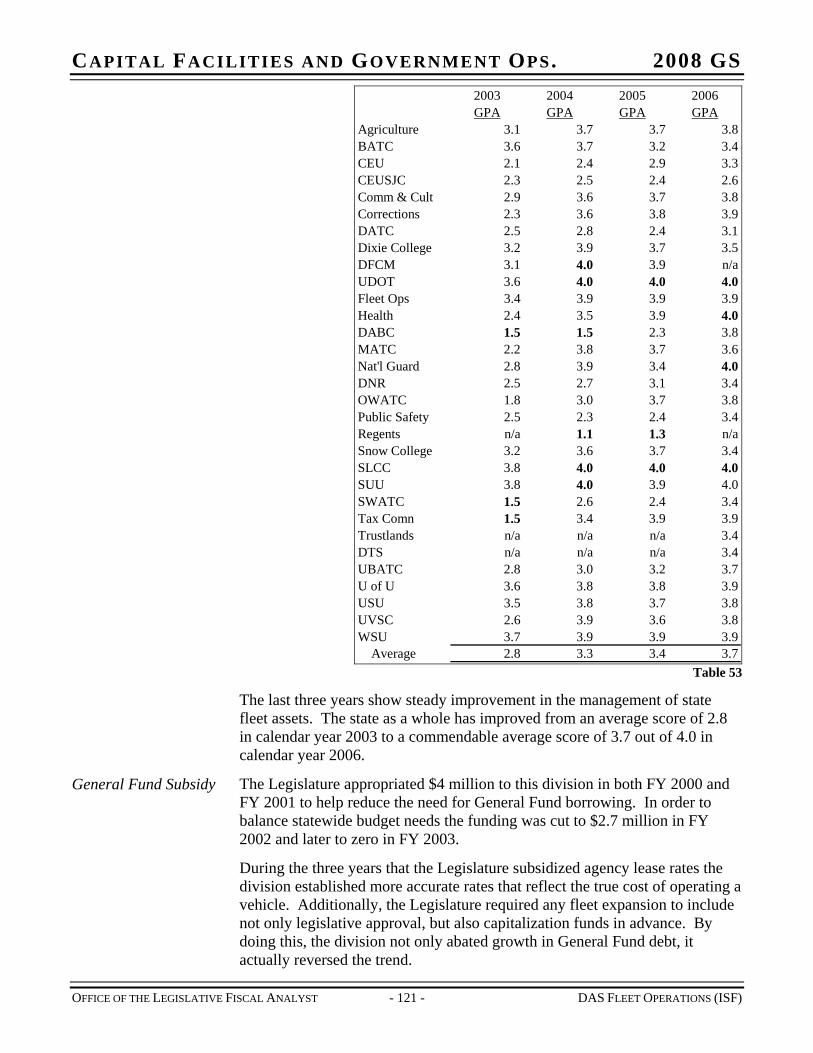
CAPITAL FACILITIES AND GOVERNMENT OPS. 2008 GS 2003 2004 2005 2006GPA GPA GPA GPA
Agriculture 3.1 3.7 3.7 3.8BATC 3.6 3.7 3.2 3CEU 2.1 2.4 2.9 3.3CEUSJC 2.3 2.5 2.4 2Comm & Cult 2.9 3.6 3.7 3.8Corrections 2.3 3.6 3.8 3DATC 2.5 2.8 2.4 3Dixie College 3.2 3.9 3.7 3.5DFCM 3.1 4.0 3.9 n/aUDOT 3.6 4.0 4.0 4.0Fleet Ops 3.4 3.9 3.9 3.9Health 2.4 3.5 3.9 4.0DABC 1.5 1.5 2.3 3.8MATC 2.2 3.8 3.7 3Nat'l Guard 2.8 3.9 3.4 4.0DNR 2.5 2.7 3.1 3OWATC 1.8 3.0 3.7 3.8Public Safety 2.5 2.3 2.4 3.4Regents n/a 1.1 1.3 n/aSnow College 3.2 3.6 3.7 3.4SLCC 3.8 4.0 4.0 4.0SUU 3.8 4.0 3.9 4.0SWATC 1.5 2.6 2.4 3.4Tax Comn 1.5 3.4 3.9 3.9Trustlands n/a n/a n/a 3.4DTS n/a n/a n/a 3.4UBATC 2.8 3.0 3.2 3.7U of U 3.6 3.8 3.8 3.9USU 3.5 3.8 3.7 3.8UVSC 2.6 3.9 3.6 3.8WSU 3.7 3.9 3.9 3.9 Average 2.8 3.3 3.4 3.7
.4
.6
.9
.1
.6
.4
Table 53
The last three years show steady improvement in the management of state fleet assets. The state as a whole has improved from an average score of 2.8 in calendar year 2003 to a commendable average score of 3.7 out of 4.0 in calendar year 2006.
General Fund Subsidy The Legislature appropriated $4 million to this division in both FY 2000 and FY 2001 to help reduce the need for General Fund borrowing. In order to balance statewide budget needs the funding was cut to $2.7 million in FY 2002 and later to zero in FY 2003.
During the three years that the Legislature subsidized agency lease rates the division established more accurate rates that reflect the true cost of operating a vehicle. Additionally, the Legislature required any fleet expansion to include not only legislative approval, but also capitalization funds in advance. By doing this, the division not only abated growth in General Fund debt, it actually reversed the trend.
OFFICE OF THE LEGISLATIVE FISCAL ANALYST - 121 - DAS FLEET OPERATIONS (ISF)
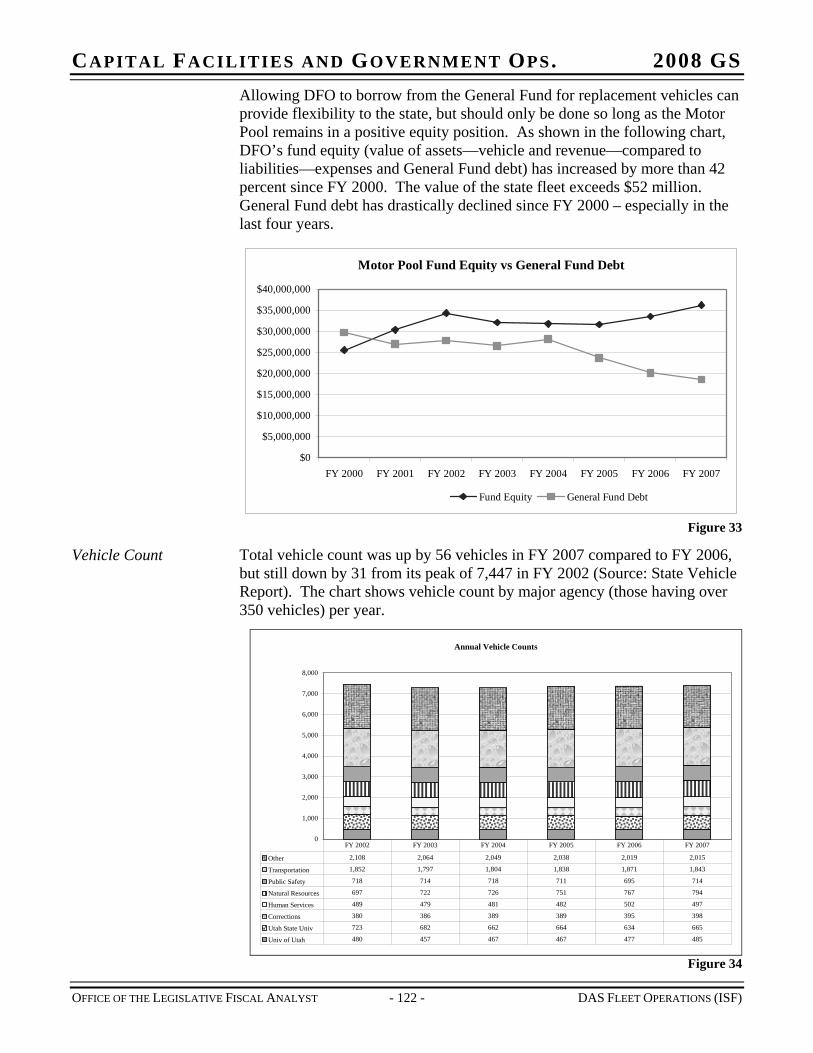
CAPITAL FACILITIES AND GOVERNMENT OPS. 2008 GS Allowing DFO to borrow from the General Fund for replacement vehicles can provide flexibility to the state, but should only be done so long as the Motor Pool remains in a positive equity position. As shown in the following chart, DFO’s fund equity (value of assets—vehicle and revenue—compared to liabilities—expenses and General Fund debt) has increased by more than 42 percent since FY 2000. The value of the state fleet exceeds $52 million. General Fund debt has drastically declined since FY 2000 – especially in the last four years.
Motor Pool Fund Equity vs General Fund Debt
$0
$5,000,000
$10,000,000
$15,000,000
$20,000,000
$25,000,000
$30,000,000
$35,000,000
$40,000,000
FY 2000 FY 2001 FY 2002 FY 2003 FY 2004 FY 2005 FY 2006 FY 2007
Fund Equity General Fund Debt
Figure 33
Vehicle Count Total vehicle count was up by 56 vehicles in FY 2007 compared to FY 2006, but still down by 31 from its peak of 7,447 in FY 2002 (Source: State Vehicle Report). The chart shows vehicle count by major agency (those having over 350 vehicles) per year.
Annual Vehicle Counts
0
1,000
2,000
3,000
4,000
5,000
6,000
7,000
8,000
Other 2,108 2,064 2,049 2,038 2,019 2,015
Transportation 1,852 1,797 1,804 1,838 1,871 1,843
Public Safety 718 714 718 711 695 714
Natural Resources 697 722 726 751 767 794
Human Services 489 479 481 482 502 497
Corrections 380 386 389 389 395 398
Utah State Univ 723 682 662 664 634 665
Univ of Utah 480 457 467 467 477 485
FY 2002 FY 2003 FY 2004 FY 2005 FY 2006 FY 2007
Figure 34
OFFICE OF THE LEGISLATIVE FISCAL ANALYST - 122 - DAS FLEET OPERATIONS (ISF)
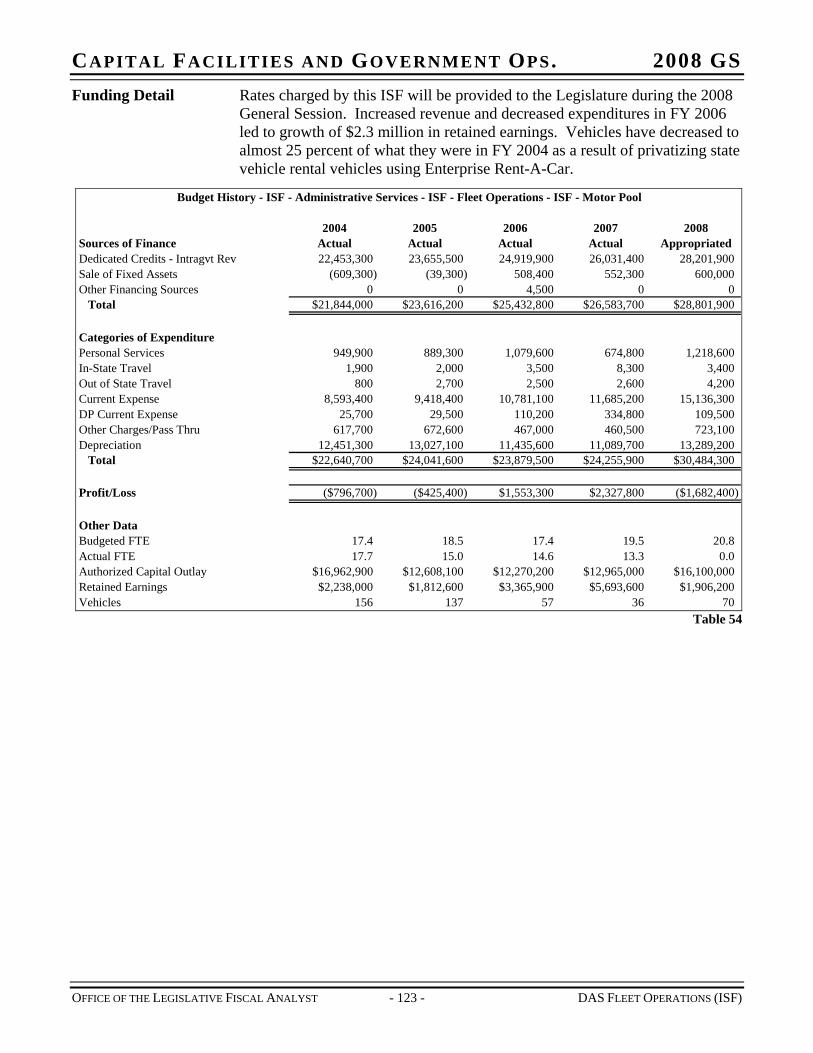
CAPITAL FACILITIES AND GOVERNMENT OPS. 2008 GS Funding Detail Rates charged by this ISF will be provided to the Legislature during the 2008
General Session. Increased revenue and decreased expenditures in FY 2006 led to growth of $2.3 million in retained earnings. Vehicles have decreased to almost 25 percent of what they were in FY 2004 as a result of privatizing state vehicle rental vehicles using Enterprise Rent-A-Car.
Budget History - ISF - Administrative Services - ISF - Fleet Operations - ISF - Motor Pool
2004 2005 2006 2007 2008Sources of Finance Actual Actual Actual Actual AppropriatedDedicated Credits - Intragvt Rev 22,453,300 23,655,500 24,919,900 26,031,400 28,201,900Sale of Fixed Assets (609,300) (39,300) 508,400 552,300 600,000Other Financing Sources 0 0 4,500 0 0
Total $21,844,000 $23,616,200 $25,432,800 $26,583,700 $28,801,900
Categories of ExpenditurePersonal Services 949,900 889,300 1,079,600 674,800 1,218,600In-State Travel 1,900 2,000 3,500 8,300 3,400Out of State Travel 800 2,700 2,500 2,600 4,200Current Expense 8,593,400 9,418,400 10,781,100 11,685,200 15,136,300DP Current Expense 25,700 29,500 110,200 334,800 109,500Other Charges/Pass Thru 617,700 672,600 467,000 460,500 723,100Depreciation 12,451,300 13,027,100 11,435,600 11,089,700 13,289,200
Total $22,640,700 $24,041,600 $23,879,500 $24,255,900 $30,484,300
Profit/Loss ($796,700) ($425,400) $1,553,300 $2,327,800 ($1,682,400)
Other DataBudgeted FTE 17.4 18.5 17.4 19.5 20.8Actual FTE 17.7 15.0 14.6 13.3 0.0Authorized Capital Outlay $16,962,900 $12,608,100 $12,270,200 $12,965,000 $16,100,000Retained Earnings $2,238,000 $1,812,600 $3,365,900 $5,693,600 $1,906,200Vehicles 156 137 57 36 70
Table 54
OFFICE OF THE LEGISLATIVE FISCAL ANALYST - 123 - DAS FLEET OPERATIONS (ISF)
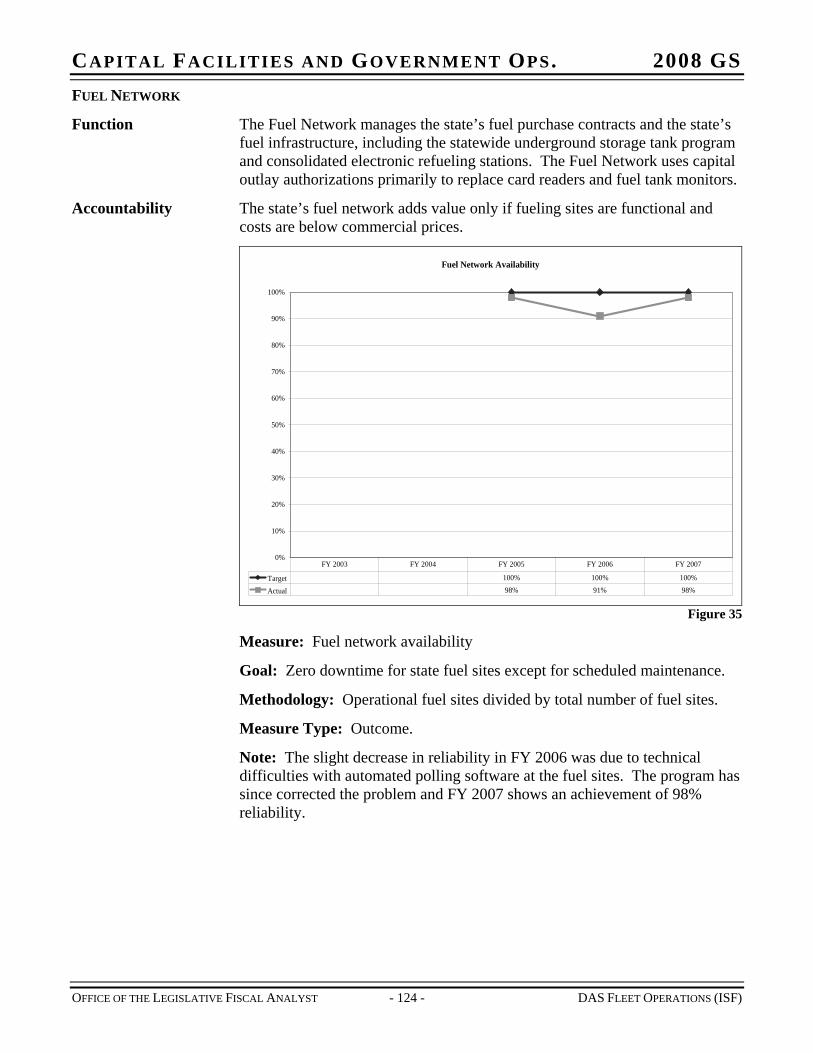
CAPITAL FACILITIES AND GOVERNMENT OPS. 2008 GS FUEL NETWORK
Function The Fuel Network manages the state’s fuel purchase contracts and the state’s fuel infrastructure, including the statewide underground storage tank program and consolidated electronic refueling stations. The Fuel Network uses capital outlay authorizations primarily to replace card readers and fuel tank monitors.
Accountability The state’s fuel network adds value only if fueling sites are functional and costs are below commercial prices.
Fuel Network Availability
0%
10%
20%
30%
40%
50%
60%
70%
80%
90%
100%
Target 100% 100% 100%
Actual 98% 91% 98%
FY 2003 FY 2004 FY 2005 FY 2006 FY 2007
Figure 35
Measure: Fuel network availability
Goal: Zero downtime for state fuel sites except for scheduled maintenance.
Methodology: Operational fuel sites divided by total number of fuel sites.
Measure Type: Outcome.
Note: The slight decrease in reliability in FY 2006 was due to technical difficulties with automated polling software at the fuel sites. The program has since corrected the problem and FY 2007 shows an achievement of 98% reliability.
OFFICE OF THE LEGISLATIVE FISCAL ANALYST - 124 - DAS FLEET OPERATIONS (ISF)
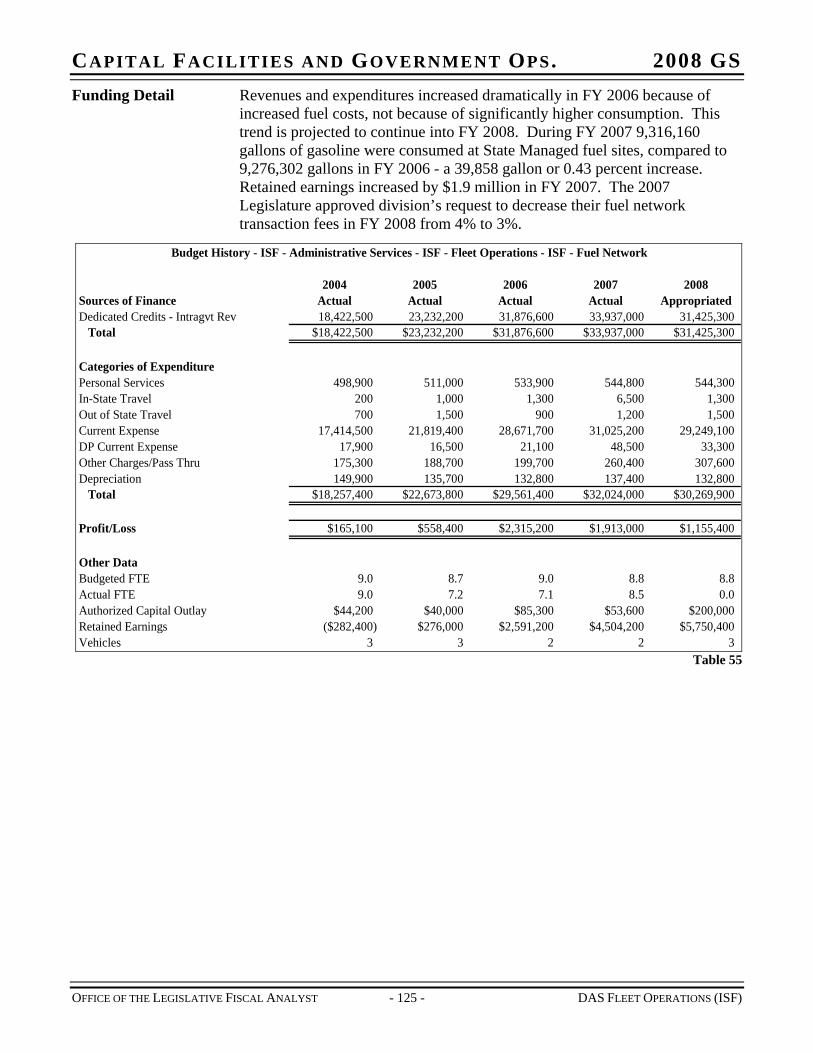
CAPITAL FACILITIES AND GOVERNMENT OPS. 2008 GS Funding Detail Revenues and expenditures increased dramatically in FY 2006 because of
increased fuel costs, not because of significantly higher consumption. This trend is projected to continue into FY 2008. During FY 2007 9,316,160 gallons of gasoline were consumed at State Managed fuel sites, compared to 9,276,302 gallons in FY 2006 - a 39,858 gallon or 0.43 percent increase. Retained earnings increased by $1.9 million in FY 2007. The 2007 Legislature approved division’s request to decrease their fuel network transaction fees in FY 2008 from 4% to 3%.
Budget History - ISF - Administrative Services - ISF - Fleet Operations - ISF - Fuel Network
2004 2005 2006 2007 2008Sources of Finance Actual Actual Actual Actual AppropriatedDedicated Credits - Intragvt Rev 18,422,500 23,232,200 31,876,600 33,937,000 31,425,300
Total $18,422,500 $23,232,200 $31,876,600 $33,937,000 $31,425,300
Categories of ExpenditurePersonal Services 498,900 511,000 533,900 544,800 544,300In-State Travel 200 1,000 1,300 6,500 1,300Out of State Travel 700 1,500 900 1,200 1,500Current Expense 17,414,500 21,819,400 28,671,700 31,025,200 29,249,100DP Current Expense 17,900 16,500 21,100 48,500 33,300Other Charges/Pass Thru 175,300 188,700 199,700 260,400 307,600Depreciation 149,900 135,700 132,800 137,400 132,800
Total $18,257,400 $22,673,800 $29,561,400 $32,024,000 $30,269,900
Profit/Loss $165,100 $558,400 $2,315,200 $1,913,000 $1,155,400
Other DataBudgeted FTE 9.0 8.7 9.0 8.8 8.8Actual FTE 9.0 7.2 7.1 8.5 0.0Authorized Capital Outlay $44,200 $40,000 $85,300 $53,600 $200,000Retained Earnings ($282,400) $276,000 $2,591,200 $4,504,200 $5,750,400Vehicles 3 3 2 2 3
Table 55
OFFICE OF THE LEGISLATIVE FISCAL ANALYST - 125 - DAS FLEET OPERATIONS (ISF)
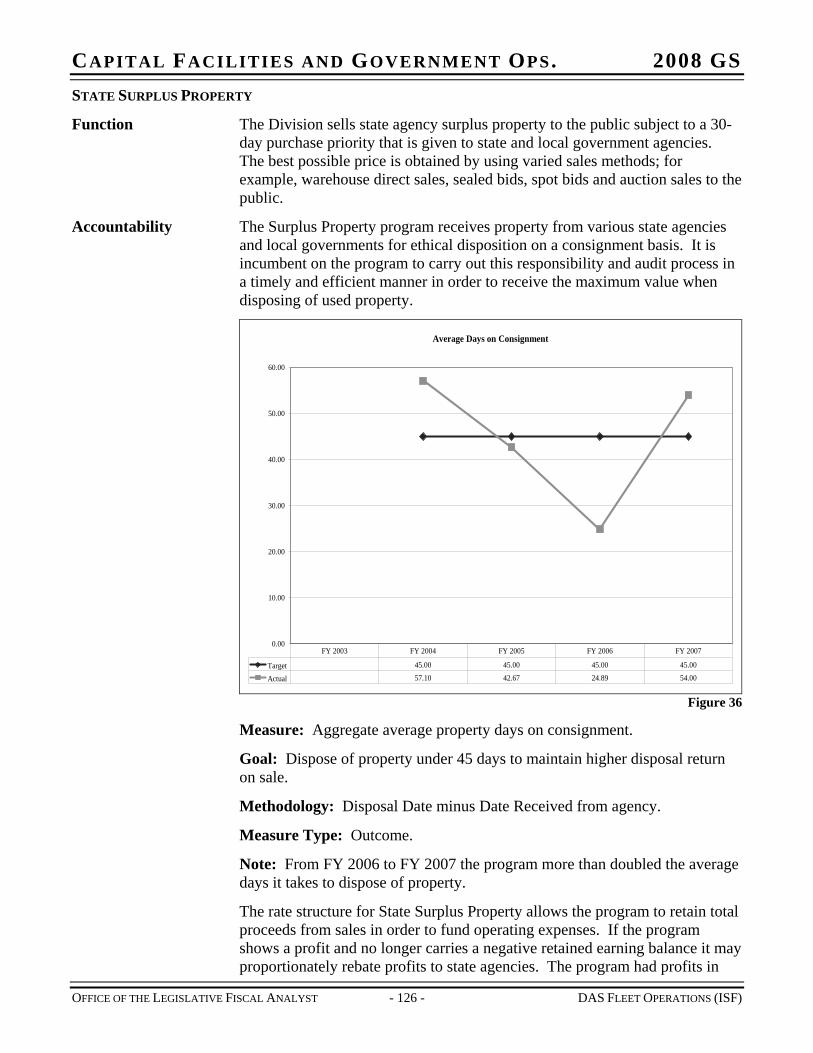
CAPITAL FACILITIES AND GOVERNMENT OPS. 2008 GS STATE SURPLUS PROPERTY
Function The Division sells state agency surplus property to the public subject to a 30-day purchase priority that is given to state and local government agencies. The best possible price is obtained by using varied sales methods; for example, warehouse direct sales, sealed bids, spot bids and auction sales to the public.
Accountability The Surplus Property program receives property from various state agencies and local governments for ethical disposition on a consignment basis. It is incumbent on the program to carry out this responsibility and audit process in a timely and efficient manner in order to receive the maximum value when disposing of used property.
Average Days on Consignment
0.00
10.00
20.00
30.00
40.00
50.00
60.00
Target 45.00 45.00 45.00 45.00
Actual 57.10 42.67 24.89 54.00
FY 2003 FY 2004 FY 2005 FY 2006 FY 2007
Figure 36
Measure: Aggregate average property days on consignment.
Goal: Dispose of property under 45 days to maintain higher disposal return on sale.
Methodology: Disposal Date minus Date Received from agency.
Measure Type: Outcome.
Note: From FY 2006 to FY 2007 the program more than doubled the average days it takes to dispose of property.
The rate structure for State Surplus Property allows the program to retain total proceeds from sales in order to fund operating expenses. If the program shows a profit and no longer carries a negative retained earning balance it may proportionately rebate profits to state agencies. The program had profits in
OFFICE OF THE LEGISLATIVE FISCAL ANALYST - 126 - DAS FLEET OPERATIONS (ISF)
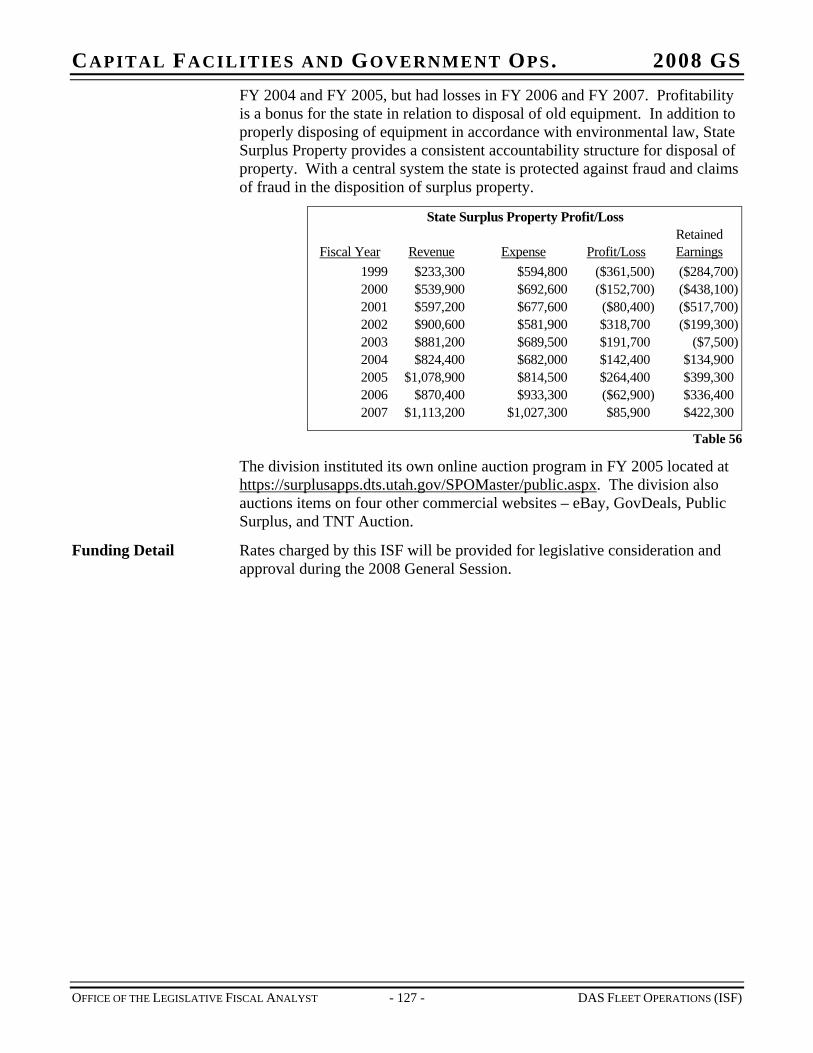
CAPITAL FACILITIES AND GOVERNMENT OPS. 2008 GS FY 2004 and FY 2005, but had losses in FY 2006 and FY 2007. Profitability is a bonus for the state in relation to disposal of old equipment. In addition to properly disposing of equipment in accordance with environmental law, State Surplus Property provides a consistent accountability structure for disposal of property. With a central system the state is protected against fraud and claims of fraud in the disposition of surplus property.
RetainedFiscal Year Revenue Expense Profit/Loss Earnings
1999 $233,300 $594,800 ($361,500) ($284,700)2000 $539,900 $692,600 ($152,700) ($438,100)2001 $597,200 $677,600 ($80,400) ($517,700)2002 $900,600 $581,900 $318,700 ($199,300)2003 $881,200 $689,500 $191,700 ($7,500)2004 $824,400 $682,000 $142,400 $134,9002005 $1,078,900 $814,500 $264,400 $399,3002006 $870,400 $933,300 ($62,900) $336,4002007 $1,113,200 $1,027,300 $85,900 $422,300
State Surplus Property Profit/Loss
Table 56
The division instituted its own online auction program in FY 2005 located at https://surplusapps.dts.utah.gov/SPOMaster/public.aspx. The division also auctions items on four other commercial websites – eBay, GovDeals, Public Surplus, and TNT Auction.
Funding Detail Rates charged by this ISF will be provided for legislative consideration and approval during the 2008 General Session.
OFFICE OF THE LEGISLATIVE FISCAL ANALYST - 127 - DAS FLEET OPERATIONS (ISF)
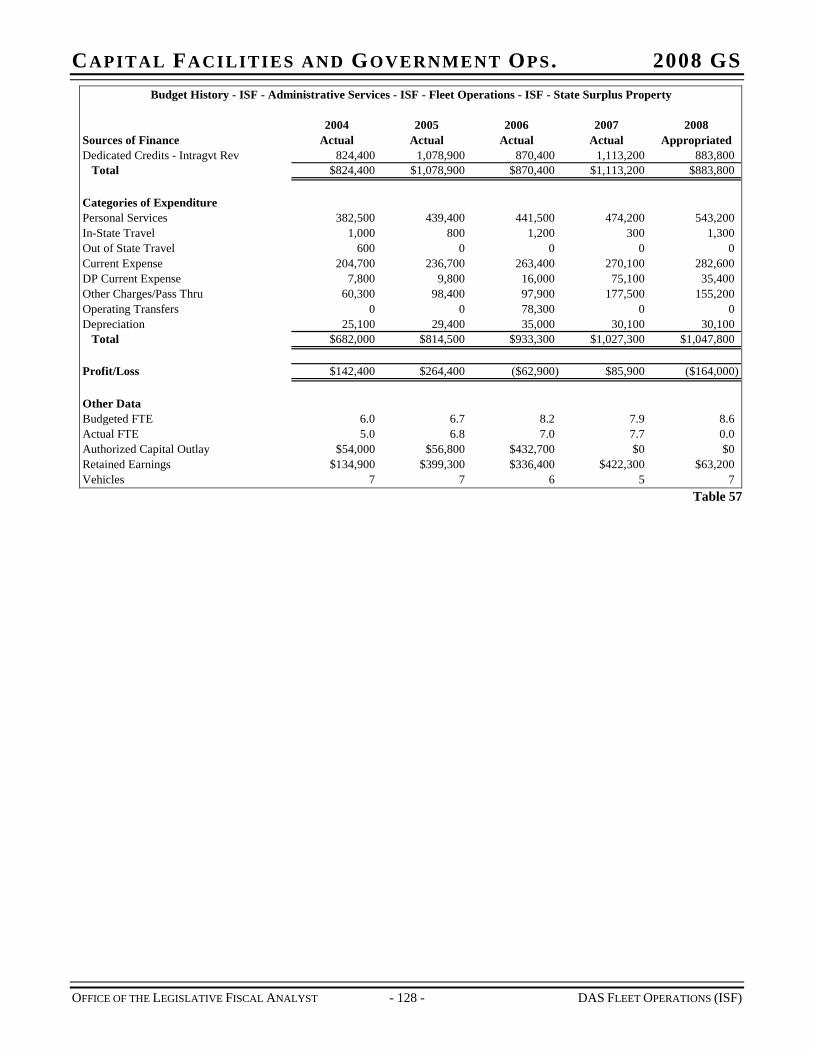
CAPITAL FACILITIES AND GOVERNMENT OPS. 2008 GS Budget History - ISF - Administrative Services - ISF - Fleet Operations - ISF - State Surplus Property
2004 2005 2006 2007 2008Sources of Finance Actual Actual Actual Actual AppropriatedDedicated Credits - Intragvt Rev 824,400 1,078,900 870,400 1,113,200 883,800
Total $824,400 $1,078,900 $870,400 $1,113,200 $883,800
Categories of ExpenditurePersonal Services 382,500 439,400 441,500 474,200 543,200In-State Travel 1,000 800 1,200 300 1,300Out of State Travel 600 0 0 0 0Current Expense 204,700 236,700 263,400 270,100 282,600DP Current Expense 7,800 9,800 16,000 75,100 35,400Other Charges/Pass Thru 60,300 98,400 97,900 177,500 155,200Operating Transfers 0 0 78,300 0 0Depreciation 25,100 29,400 35,000 30,100 30,100
Total $682,000 $814,500 $933,300 $1,027,300 $1,047,800
Profit/Loss $142,400 $264,400 ($62,900) $85,900 ($164,000)
Other DataBudgeted FTE 6.0 6.7 8.2 7.9 8.6Actual FTE 5.0 6.8 7.0 7.7 0.0Authorized Capital Outlay $54,000 $56,800 $432,700 $0 $0Retained Earnings $134,900 $399,300 $336,400 $422,300 $63,200Vehicles 7 7 6 5 7
Table 57
OFFICE OF THE LEGISLATIVE FISCAL ANALYST - 128 - DAS FLEET OPERATIONS (ISF)
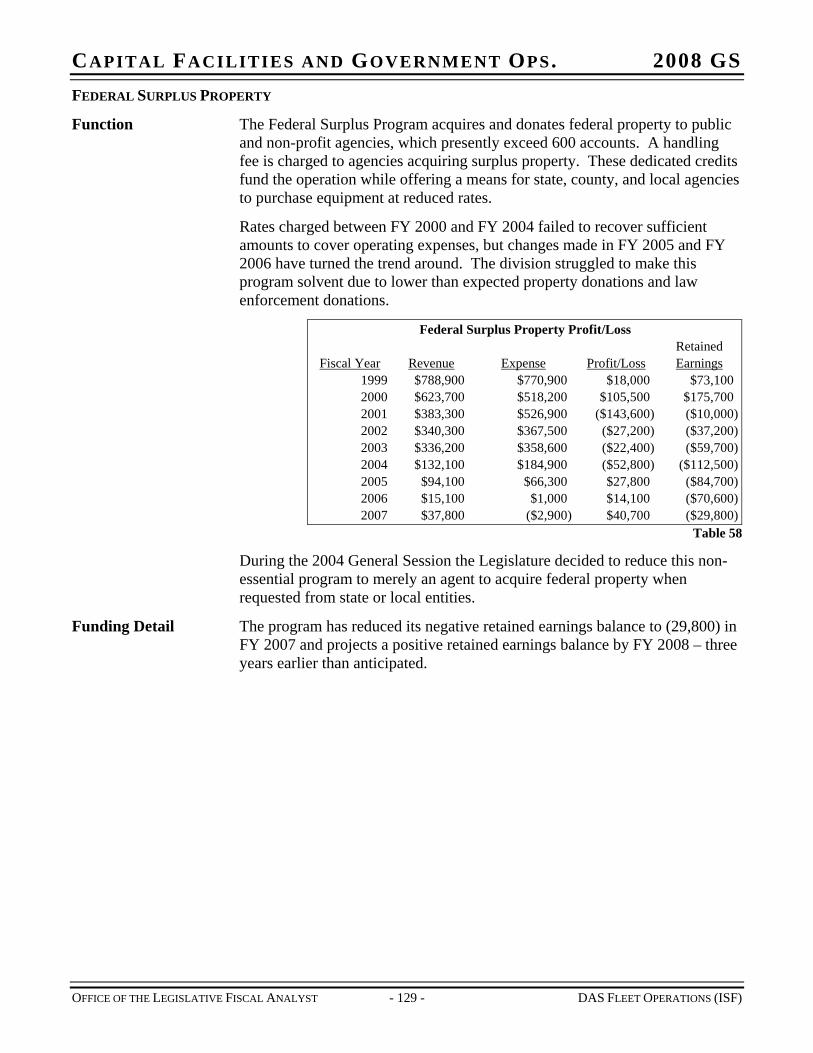
CAPITAL FACILITIES AND GOVERNMENT OPS. 2008 GS FEDERAL SURPLUS PROPERTY
Function The Federal Surplus Program acquires and donates federal property to public and non-profit agencies, which presently exceed 600 accounts. A handling fee is charged to agencies acquiring surplus property. These dedicated credits fund the operation while offering a means for state, county, and local agencies to purchase equipment at reduced rates.
Rates charged between FY 2000 and FY 2004 failed to recover sufficient amounts to cover operating expenses, but changes made in FY 2005 and FY 2006 have turned the trend around. The division struggled to make this program solvent due to lower than expected property donations and law enforcement donations.
RetainedFiscal Year Revenue Expense Profit/Loss Earnings
1999 $788,900 $770,900 $18,000 $73,1002000 $623,700 $518,200 $105,500 $175,7002001 $383,300 $526,900 ($143,600) ($10,000)2002 $340,300 $367,500 ($27,200) ($37,200)2003 $336,200 $358,600 ($22,400) ($59,700)2004 $132,100 $184,900 ($52,800) ($112,500)2005 $94,100 $66,300 $27,800 ($84,700)2006 $15,100 $1,000 $14,100 ($70,600)2007 $37,800 ($2,900) $40,700 ($29,800)
Federal Surplus Property Profit/Loss
Table 58
During the 2004 General Session the Legislature decided to reduce this non-essential program to merely an agent to acquire federal property when requested from state or local entities.
Funding Detail The program has reduced its negative retained earnings balance to (29,800) in FY 2007 and projects a positive retained earnings balance by FY 2008 – three years earlier than anticipated.
OFFICE OF THE LEGISLATIVE FISCAL ANALYST - 129 - DAS FLEET OPERATIONS (ISF)
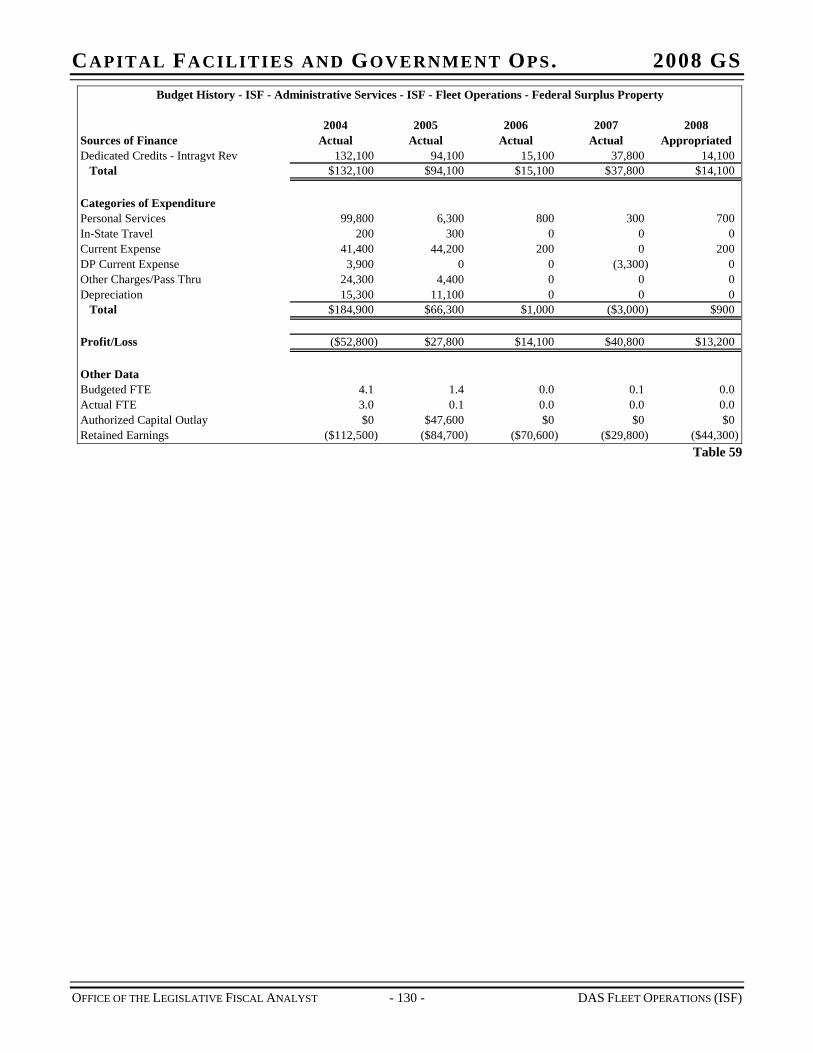
CAPITAL FACILITIES AND GOVERNMENT OPS. 2008 GS Budget History - ISF - Administrative Services - ISF - Fleet Operations - Federal Surplus Property
2004 2005 2006 2007 2008Sources of Finance Actual Actual Actual Actual AppropriatedDedicated Credits - Intragvt Rev 132,100 94,100 15,100 37,800 14,100
Total $132,100 $94,100 $15,100 $37,800 $14,100
Categories of ExpenditurePersonal Services 99,800 6,300 800 300 700In-State Travel 200 300 0 0 0Current Expense 41,400 44,200 200 0 200DP Current Expense 3,900 0 0 (3,300) 0Other Charges/Pass Thru 24,300 4,400 0 0 0Depreciation 15,300 11,100 0 0 0
Total $184,900 $66,300 $1,000 ($3,000) $900
Profit/Loss ($52,800) $27,800 $14,100 $40,800 $13,200
Other DataBudgeted FTE 4.1 1.4 0.0 0.1 0.0Actual FTE 3.0 0.1 0.0 0.0 0.0Authorized Capital Outlay $0 $47,600 $0 $0 $0Retained Earnings ($112,500) ($84,700) ($70,600) ($29,800) ($44,300)
Table 59
OFFICE OF THE LEGISLATIVE FISCAL ANALYST - 130 - DAS FLEET OPERATIONS (ISF)
CAPITAL FACILITIES AND GOVERNMENT OPS. 2008 GS
OFFICE OF THE LEGISLATIVE FISCAL ANALYST - 131 - DAS RISK MANAGEMENT (ISF)
CHAPTER 20 DIVISION OF RISK MANAGEMENT (ISF)
Function The Division of Risk Management was organized in 1980 to implement a self-insurance program for the state. The division provides liability, property and auto physical damage coverage to all state agencies, the forty school districts, over 50 charter schools, and all state-owned colleges and universities except medical malpractice coverage at the University of Utah. The division also offers the Owner Controlled Insurance Program (OCIP) to provide optional insurance on construction projects, but due to the lack of interest and funding concerns, the division will be phasing out this program. The division also acts as an agent in purchasing aircraft insurance for various state entities that have airplanes or flight instruction programs.
Statutory Authority UCA 63A Chapter 4 outlines the duties and powers of the division. Duties include:
Acquire and administer all property, casualty insurance, and workers’ compensation insurance purchased by the state
Make rules setting forth reasonable underwriting and risk control standards, risks that will be covered by the Risk Management Fund, eligibility for payments from the fund, procedures for making claims, and procedures for settling disputes
Implement a risk management and loss prevention program for state agencies
Work with state agencies that manage and protect state property, such as the state fire marshal or DFCM.
Maintain necessary records
Manage the Risk Management Fund according to economically and actuarially sound principles
Purchase insurance or reinsurance as necessary
Submit rates and fees to the Rate Committee and Legislature for approval
Conduct a market analysis by July 1, 2005 (done)
The division may:
Enter into contracts
Purchase insurance
Adjust, settle, and pay claims
Pay expenses and costs
Study the risks of all state agencies and properties
Issue certificates of coverage to state agencies
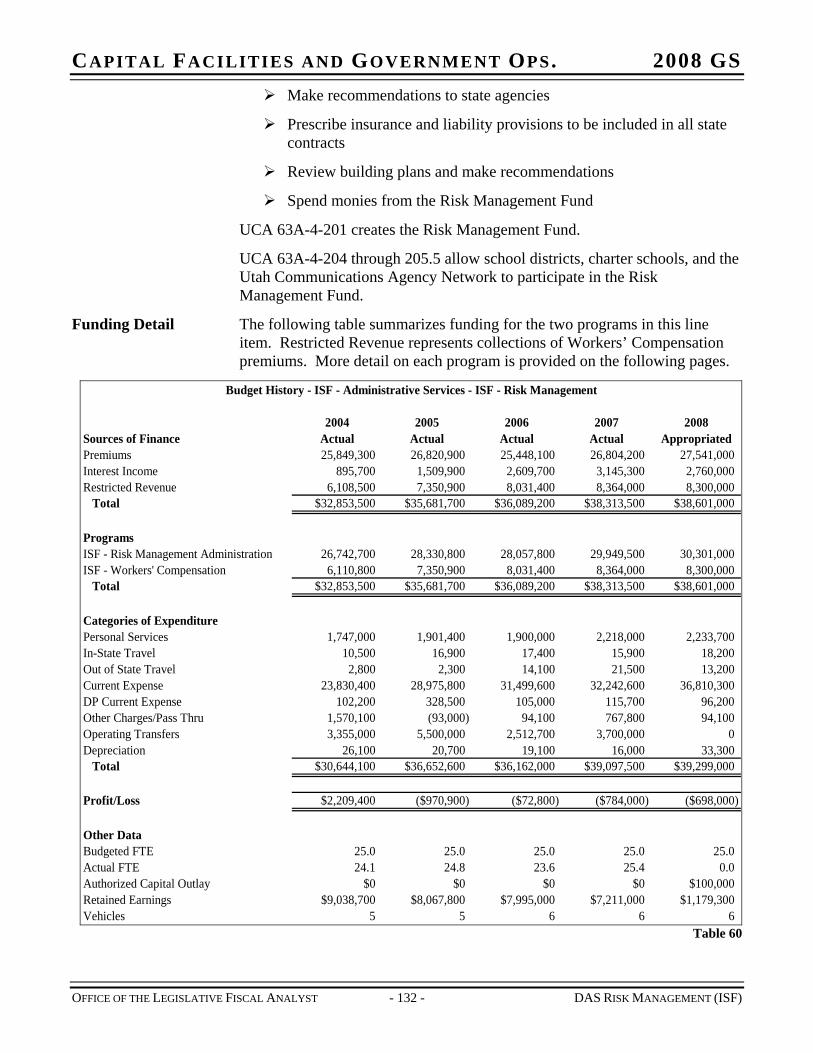
CAPITAL FACILITIES AND GOVERNMENT OPS. 2008 GS Make recommendations to state agencies
Prescribe insurance and liability provisions to be included in all state contracts
Review building plans and make recommendations
Spend monies from the Risk Management Fund
UCA 63A-4-201 creates the Risk Management Fund.
UCA 63A-4-204 through 205.5 allow school districts, charter schools, and the Utah Communications Agency Network to participate in the Risk Management Fund.
Funding Detail The following table summarizes funding for the two programs in this line item. Restricted Revenue represents collections of Workers’ Compensation premiums. More detail on each program is provided on the following pages.
Budget History - ISF - Administrative Services - ISF - Risk Management
2004 2005 2006 2007 2008Sources of Finance Actual Actual Actual Actual AppropriatedPremiums 25,849,300 26,820,900 25,448,100 26,804,200 27,541,000Interest Income 895,700 1,509,900 2,609,700 3,145,300 2,760,000Restricted Revenue 6,108,500 7,350,900 8,031,400 8,364,000 8,300,000
Total $32,853,500 $35,681,700 $36,089,200 $38,313,500 $38,601,000
ProgramsISF - Risk Management Administration 26,742,700 28,330,800 28,057,800 29,949,500 30,301,000ISF - Workers' Compensation 6,110,800 7,350,900 8,031,400 8,364,000 8,300,000
Total $32,853,500 $35,681,700 $36,089,200 $38,313,500 $38,601,000
Categories of ExpenditurePersonal Services 1,747,000 1,901,400 1,900,000 2,218,000 2,233,700In-State Travel 10,500 16,900 17,400 15,900 18,200Out of State Travel 2,800 2,300 14,100 21,500 13,200Current Expense 23,830,400 28,975,800 31,499,600 32,242,600 36,810,300DP Current Expense 102,200 328,500 105,000 115,700 96,200Other Charges/Pass Thru 1,570,100 (93,000) 94,100 767,800 94,100Operating Transfers 3,355,000 5,500,000 2,512,700 3,700,000 0Depreciation 26,100 20,700 19,100 16,000 33,300
Total $30,644,100 $36,652,600 $36,162,000 $39,097,500 $39,299,000
Profit/Loss $2,209,400 ($970,900) ($72,800) ($784,000) ($698,000)
Other DataBudgeted FTE 25.0 25.0 25.0 25.0 25.0Actual FTE 24.1 24.8 23.6 25.4 0.0Authorized Capital Outlay $0 $0 $0 $0 $100,000Retained Earnings $9,038,700 $8,067,800 $7,995,000 $7,211,000 $1,179,300Vehicles 5 5 6 6 6
Table 60
OFFICE OF THE LEGISLATIVE FISCAL ANALYST - 132 - DAS RISK MANAGEMENT (ISF)
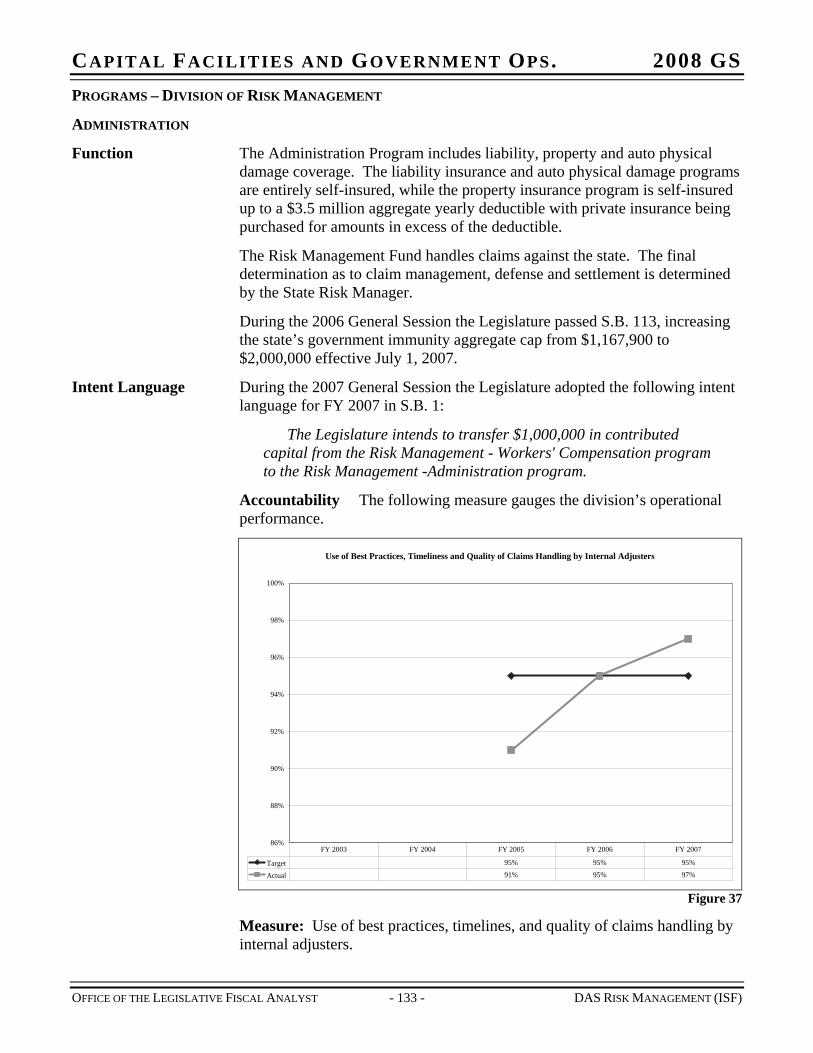
CAPITAL FACILITIES AND GOVERNMENT OPS. 2008 GS PROGRAMS – DIVISION OF RISK MANAGEMENT
ADMINISTRATION
Function The Administration Program includes liability, property and auto physical damage coverage. The liability insurance and auto physical damage programs are entirely self-insured, while the property insurance program is self-insured up to a $3.5 million aggregate yearly deductible with private insurance being purchased for amounts in excess of the deductible.
The Risk Management Fund handles claims against the state. The final determination as to claim management, defense and settlement is determined by the State Risk Manager.
During the 2006 General Session the Legislature passed S.B. 113, increasing the state’s government immunity aggregate cap from $1,167,900 to $2,000,000 effective July 1, 2007.
Intent Language During the 2007 General Session the Legislature adopted the following intent language for FY 2007 in S.B. 1:
The Legislature intends to transfer $1,000,000 in contributed capital from the Risk Management - Workers' Compensation program to the Risk Management -Administration program.
Accountability The following measure gauges the division’s operational performance.
Use of Best Practices, Timeliness and Quality of Claims Handling by Internal Adjusters
86%
88%
90%
92%
94%
96%
98%
100%
Target 95% 95% 95%
Actual 91% 95% 97%
FY 2003 FY 2004 FY 2005 FY 2006 FY 2007
Figure 37
Measure: Use of best practices, timelines, and quality of claims handling by internal adjusters.
OFFICE OF THE LEGISLATIVE FISCAL ANALYST - 133 - DAS RISK MANAGEMENT (ISF)
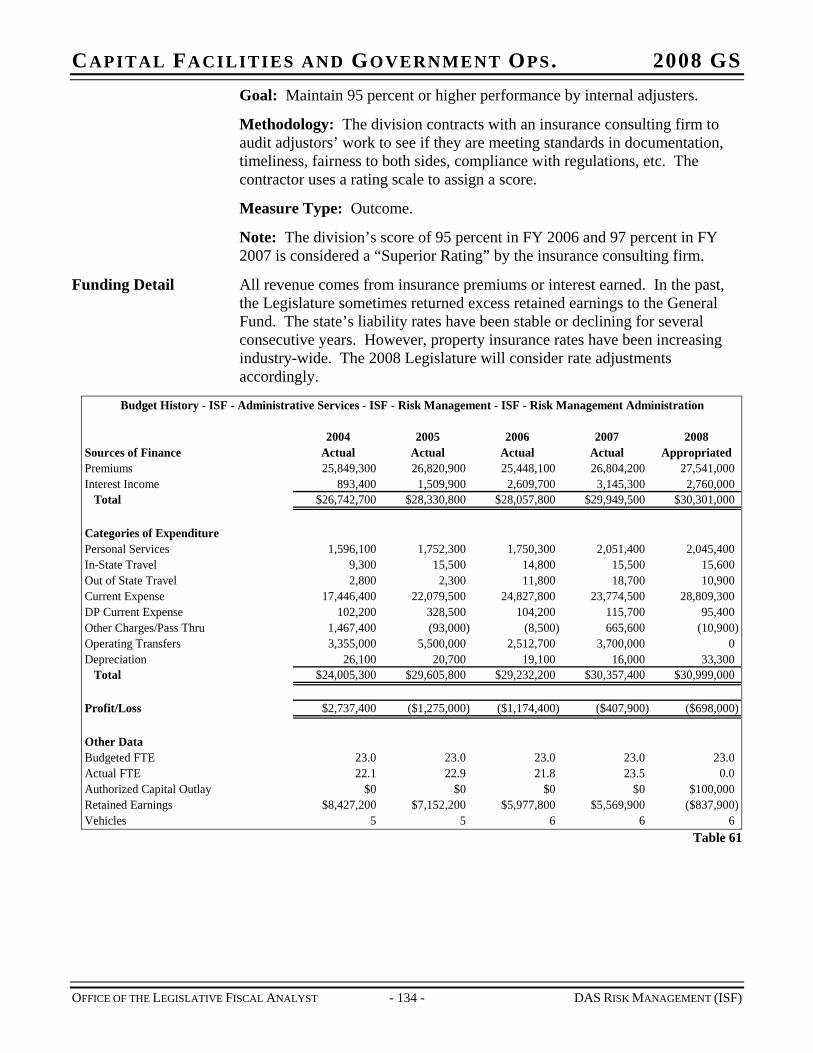
CAPITAL FACILITIES AND GOVERNMENT OPS. 2008 GS Goal: Maintain 95 percent or higher performance by internal adjusters.
Methodology: The division contracts with an insurance consulting firm to audit adjustors’ work to see if they are meeting standards in documentation, timeliness, fairness to both sides, compliance with regulations, etc. The contractor uses a rating scale to assign a score.
Measure Type: Outcome.
Note: The division’s score of 95 percent in FY 2006 and 97 percent in FY 2007 is considered a “Superior Rating” by the insurance consulting firm.
Funding Detail All revenue comes from insurance premiums or interest earned. In the past, the Legislature sometimes returned excess retained earnings to the General Fund. The state’s liability rates have been stable or declining for several consecutive years. However, property insurance rates have been increasing industry-wide. The 2008 Legislature will consider rate adjustments accordingly.
Budget History - ISF - Administrative Services - ISF - Risk Management - ISF - Risk Management Administration
2004 2005 2006 2007 2008Sources of Finance Actual Actual Actual Actual AppropriatedPremiums 25,849,300 26,820,900 25,448,100 26,804,200 27,541,000Interest Income 893,400 1,509,900 2,609,700 3,145,300 2,760,000
Total $26,742,700 $28,330,800 $28,057,800 $29,949,500 $30,301,000
Categories of ExpenditurePersonal Services 1,596,100 1,752,300 1,750,300 2,051,400 2,045,400In-State Travel 9,300 15,500 14,800 15,500 15,600Out of State Travel 2,800 2,300 11,800 18,700 10,900Current Expense 17,446,400 22,079,500 24,827,800 23,774,500 28,809,300DP Current Expense 102,200 328,500 104,200 115,700 95,400Other Charges/Pass Thru 1,467,400 (93,000) (8,500) 665,600 (10,900)Operating Transfers 3,355,000 5,500,000 2,512,700 3,700,000 0Depreciation 26,100 20,700 19,100 16,000 33,300
Total $24,005,300 $29,605,800 $29,232,200 $30,357,400 $30,999,000
Profit/Loss $2,737,400 ($1,275,000) ($1,174,400) ($407,900) ($698,000)
Other DataBudgeted FTE 23.0 23.0 23.0 23.0 23.0Actual FTE 22.1 22.9 21.8 23.5 0.0Authorized Capital Outlay $0 $0 $0 $0 $100,000Retained Earnings $8,427,200 $7,152,200 $5,977,800 $5,569,900 ($837,900)Vehicles 5 5 6 6 6
Table 61
OFFICE OF THE LEGISLATIVE FISCAL ANALYST - 134 - DAS RISK MANAGEMENT (ISF)
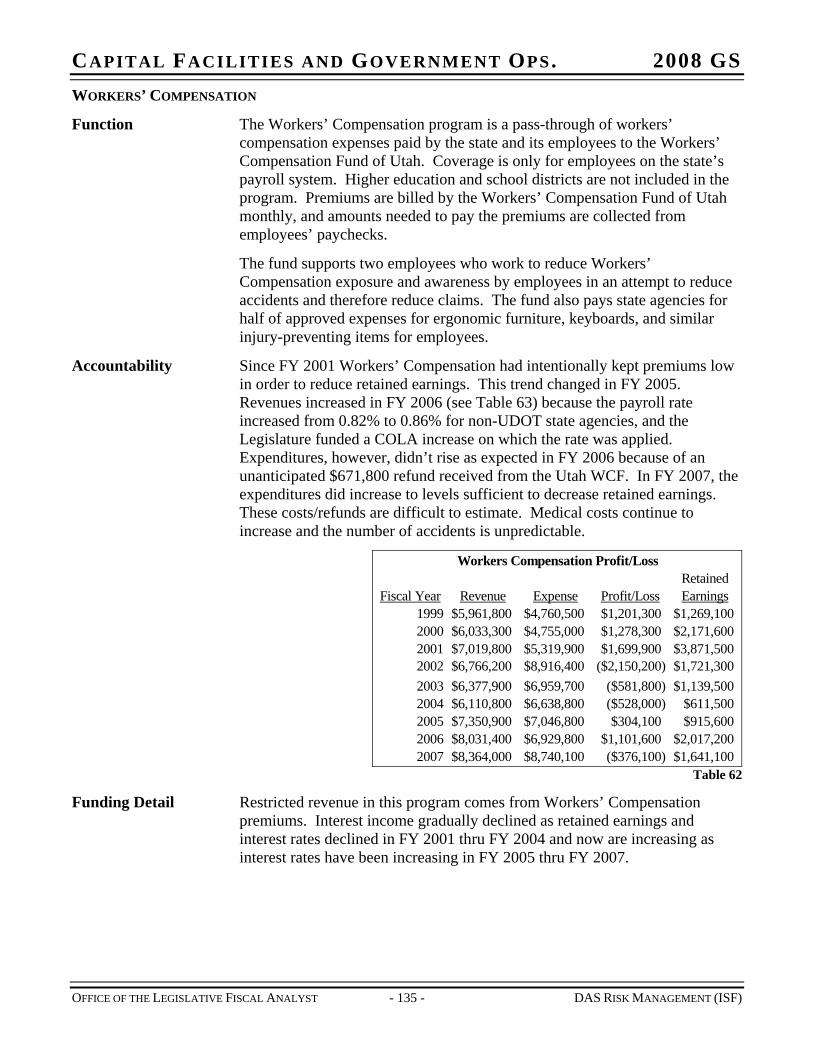
CAPITAL FACILITIES AND GOVERNMENT OPS. 2008 GS WORKERS’ COMPENSATION
Function The Workers’ Compensation program is a pass-through of workers’ compensation expenses paid by the state and its employees to the Workers’ Compensation Fund of Utah. Coverage is only for employees on the state’s payroll system. Higher education and school districts are not included in the program. Premiums are billed by the Workers’ Compensation Fund of Utah monthly, and amounts needed to pay the premiums are collected from employees’ paychecks.
The fund supports two employees who work to reduce Workers’ Compensation exposure and awareness by employees in an attempt to reduce accidents and therefore reduce claims. The fund also pays state agencies for half of approved expenses for ergonomic furniture, keyboards, and similar injury-preventing items for employees.
Accountability Since FY 2001 Workers’ Compensation had intentionally kept premiums low in order to reduce retained earnings. This trend changed in FY 2005. Revenues increased in FY 2006 (see Table 63) because the payroll rate increased from 0.82% to 0.86% for non-UDOT state agencies, and the Legislature funded a COLA increase on which the rate was applied. Expenditures, however, didn’t rise as expected in FY 2006 because of an unanticipated $671,800 refund received from the Utah WCF. In FY 2007, the expenditures did increase to levels sufficient to decrease retained earnings. These costs/refunds are difficult to estimate. Medical costs continue to increase and the number of accidents is unpredictable.
RetainedFiscal Year Revenue Expense Profit/Loss Earnings
1999 $5,961,800 $4,760,500 $1,201,300 $1,269,1002000 $6,033,300 $4,755,000 $1,278,300 $2,171,6002001 $7,019,800 $5,319,900 $1,699,900 $3,871,5002002 $6,766,200 $8,916,400 ($2,150,200) $1,721,3002003 $6,377,900 $6,959,700 ($581,800) $1,139,5002004 $6,110,800 $6,638,800 ($528,000) $611,5002005 $7,350,900 $7,046,800 $304,100 $915,6002006 $8,031,400 $6,929,800 $1,101,600 $2,017,2002007 $8,364,000 $8,740,100 ($376,100) $1,641,100
Workers Compensation Profit/Loss
Table 62
Funding Detail Restricted revenue in this program comes from Workers’ Compensation premiums. Interest income gradually declined as retained earnings and interest rates declined in FY 2001 thru FY 2004 and now are increasing as interest rates have been increasing in FY 2005 thru FY 2007.
OFFICE OF THE LEGISLATIVE FISCAL ANALYST - 135 - DAS RISK MANAGEMENT (ISF)
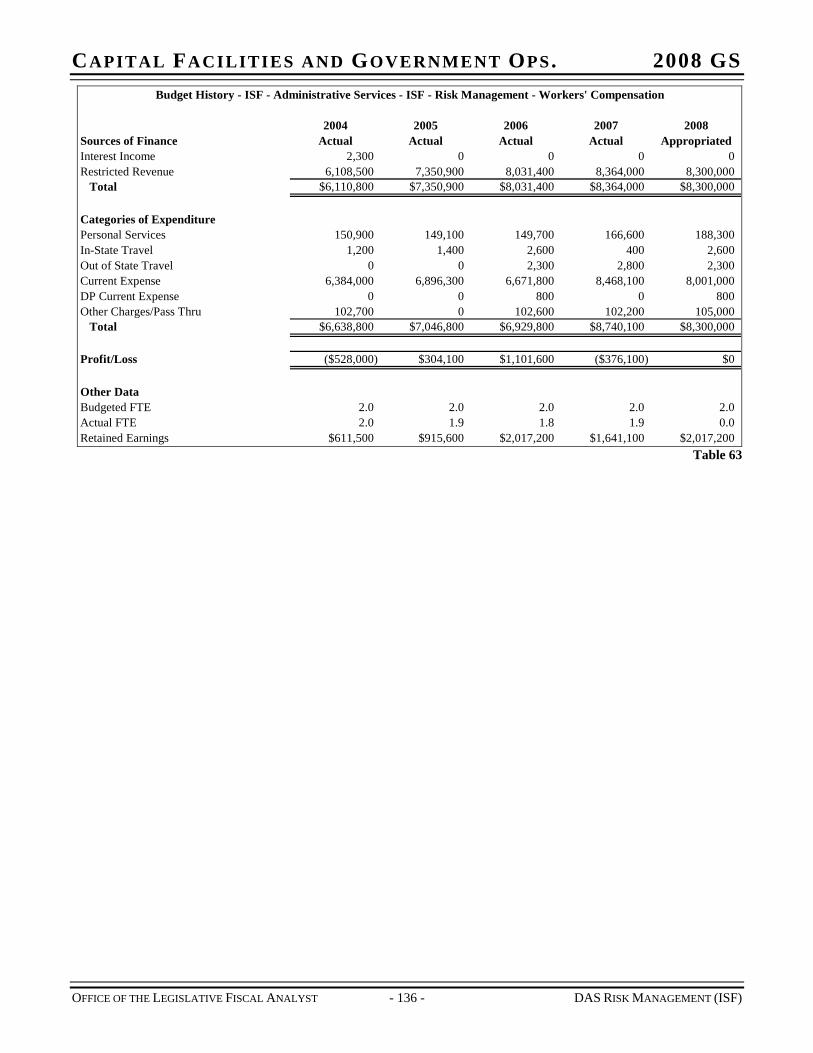
CAPITAL FACILITIES AND GOVERNMENT OPS. 2008 GS Budget History - ISF - Administrative Services - ISF - Risk Management - Workers' Compensation
2004 2005 2006 2007 2008Sources of Finance Actual Actual Actual Actual AppropriatedInterest Income 2,300 0 0 0Restricted Revenue 6,108,500 7,350,900 8,031,400 8,364,000 8,300,000
Total $6,110,800 $7,350,900 $8,031,400 $8,364,000 $8,300,000
Categories of ExpenditurePersonal Services 150,900 149,100 149,700 166,600 188,300In-State Travel 1,200 1,400 2,600 400 2,600Out of State Travel 0 0 2,300 2,800 2,300Current Expense 6,384,000 6,896,300 6,671,800 8,468,100 8,001,000DP Current Expense 0 0 800 0 800Other Charges/Pass Thru 102,700 0 102,600 102,200 105,000
Total $6,638,800 $7,046,800 $6,929,800 $8,740,100 $8,300,000
Profit/Loss ($528,000) $304,100 $1,101,600 ($376,100) $0
Other DataBudgeted FTE 2.0 2.0 2.0 2.0 2.0Actual FTE 2.0 1.9 1.8 1.9 0.0Retained Earnings $611,500 $915,600 $2,017,200 $1,641,100 $2,017,200
0
Table 63
OFFICE OF THE LEGISLATIVE FISCAL ANALYST - 136 - DAS RISK MANAGEMENT (ISF)
CAPITAL FACILITIES AND GOVERNMENT OPS. 2008 GS
OFFICE OF THE LEGISLATIVE FISCAL ANALYST - 137 - DAS FACILITIES MANAGEMENT (ISF)
CHAPTER 21 DFCM FACILITIES MAINTENANCE (ISF)
Function The internal service fund within DFCM provides building maintenance, management and preventive maintenance services to its state agency subscribers. The ISF performs maintenance and services such as janitorial, security, grounds maintenance, heating/air conditioning equipment repair, etc. to ensure each building’s specific maintenance concerns are resolved in a timely and cost effective manner. The ISF also coordinates small building construction projects that may be required by various state agencies on a cost-reimbursement basis.
Services of the DFCM internal service fund are optional. Currently DFCM contracts with agencies to provide services for over 150 facilities throughout the state. However, if an agency not using a DFCM contract fails to meet maintenance standards, DFCM is required by Building Board policy to take the necessary action to correct the problem.
Statutory Authority While chapter 7 lists DFCM’s statutory authority, the following statutes apply specifically to the ISF:
UCA 63A-5-204(2) requires the ISF to receive approval for its rates and fees from the Rate Committee and the Legislature. DFCM must also conduct a market analysis of its rates and fees by July 1, 2005 and periodically thereafter.
UCA 63A-5-204(3) requires the division to direct or delegate maintenance and operations, preventive maintenance, and facilities inspection programs and activities for any department, commission, institution or agency except the Capitol Preservation Board and higher education institutions. Maintenance can be delegated only if requested, the agency has proven ability to comply with state maintenance standards, and the delegation would save the state money.
Intent Language During the 2007 General Session the Legislature adopted the following language in H.B. 150:
The Legislature intends that DFCM's internal service fund may add up to twenty-five FTEs and up to five vehicles beyond the authorized level if new facilities come on line or maintenance agreements are requested at the College of Eastern Utah and at the State Developmental Center. Any added FTEs or vehicles will be reviewed and may be approved by the Legislature in the next legislative session.
Agencies often request new or expanded services from DFCM during the course of the year. Without flexibility to add employees or vehicles, DFCM’s customer service and competitive abilities may suffer. To alleviate this problem, the Legislature approved the above intent language.
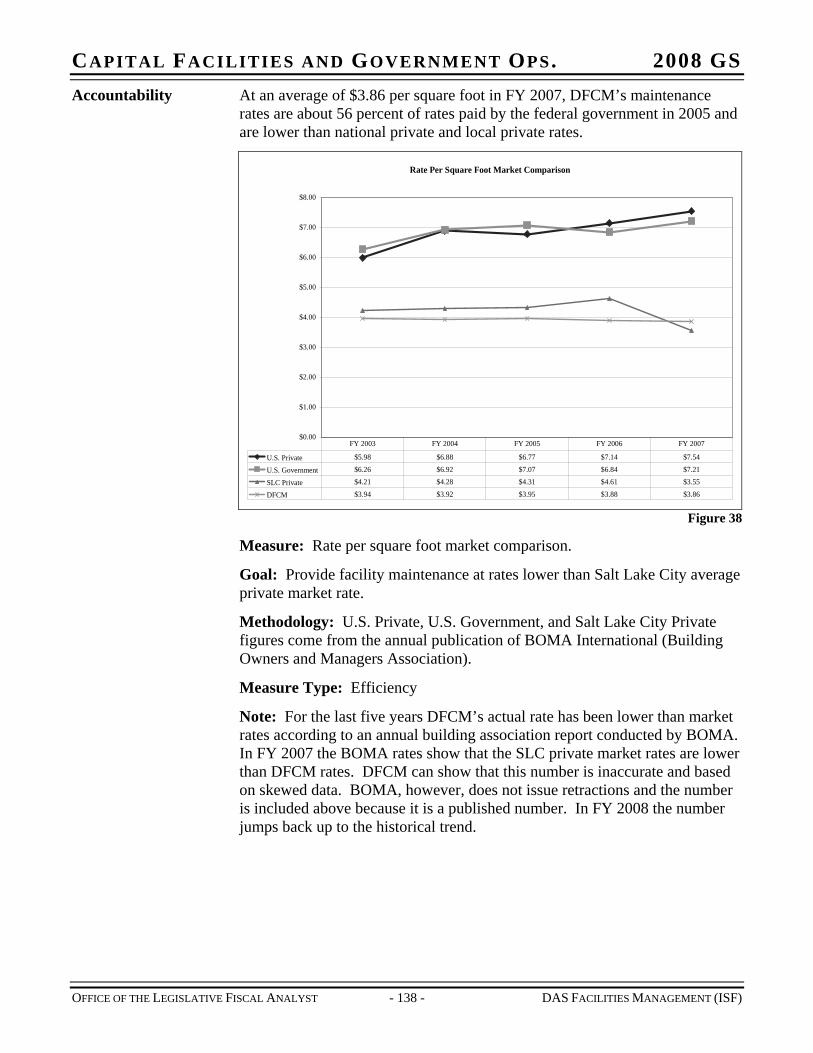
CAPITAL FACILITIES AND GOVERNMENT OPS. 2008 GS Accountability At an average of $3.86 per square foot in FY 2007, DFCM’s maintenance
rates are about 56 percent of rates paid by the federal government in 2005 and are lower than national private and local private rates.
Rate Per Square Foot Market Comparison
$0.00
$1.00
$2.00
$3.00
$4.00
$5.00
$6.00
$7.00
$8.00
U.S. Private $5.98 $6.88 $6.77 $7.14 $7.54
U.S. Government $6.26 $6.92 $7.07 $6.84 $7.21
SLC Private $4.21 $4.28 $4.31 $4.61 $3.55
DFCM $3.94 $3.92 $3.95 $3.88 $3.86
FY 2003 FY 2004 FY 2005 FY 2006 FY 2007
Figure 38
Measure: Rate per square foot market comparison.
Goal: Provide facility maintenance at rates lower than Salt Lake City average private market rate.
Methodology: U.S. Private, U.S. Government, and Salt Lake City Private figures come from the annual publication of BOMA International (Building Owners and Managers Association).
Measure Type: Efficiency
Note: For the last five years DFCM’s actual rate has been lower than market rates according to an annual building association report conducted by BOMA. In FY 2007 the BOMA rates show that the SLC private market rates are lower than DFCM rates. DFCM can show that this number is inaccurate and based on skewed data. BOMA, however, does not issue retractions and the number is included above because it is a published number. In FY 2008 the number jumps back up to the historical trend.
OFFICE OF THE LEGISLATIVE FISCAL ANALYST - 138 - DAS FACILITIES MANAGEMENT (ISF)
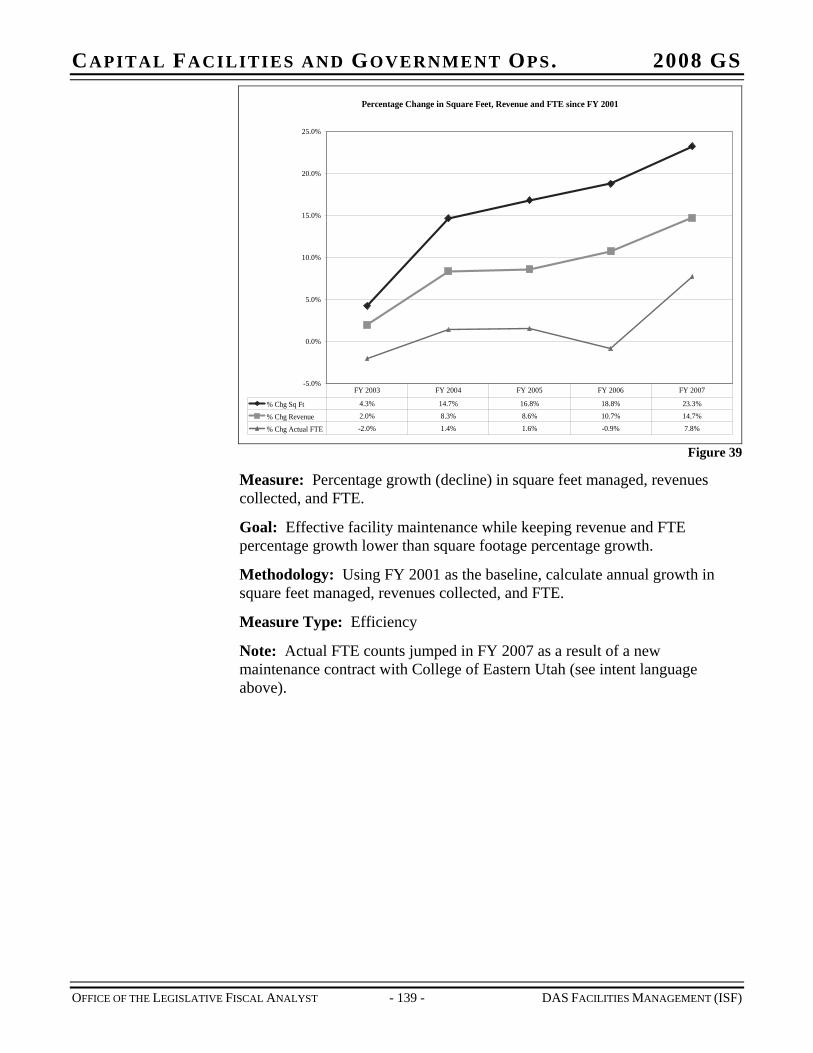
CAPITAL FACILITIES AND GOVERNMENT OPS. 2008 GS
Percentage Change in Square Feet, Revenue and FTE since FY 2001
-5.0%
0.0%
5.0%
10.0%
15.0%
20.0%
25.0%
% Chg Sq Ft 4.3% 14.7% 16.8% 18.8% 23.3%
% Chg Revenue 2.0% 8.3% 8.6% 10.7% 14.7%
% Chg Actual FTE -2.0% 1.4% 1.6% -0.9% 7.8%
FY 2003 FY 2004 FY 2005 FY 2006 FY 2007
Figure 39
Measure: Percentage growth (decline) in square feet managed, revenues collected, and FTE.
Goal: Effective facility maintenance while keeping revenue and FTE percentage growth lower than square footage percentage growth.
Methodology: Using FY 2001 as the baseline, calculate annual growth in square feet managed, revenues collected, and FTE.
Measure Type: Efficiency
Note: Actual FTE counts jumped in FY 2007 as a result of a new maintenance contract with College of Eastern Utah (see intent language above).
OFFICE OF THE LEGISLATIVE FISCAL ANALYST - 139 - DAS FACILITIES MANAGEMENT (ISF)
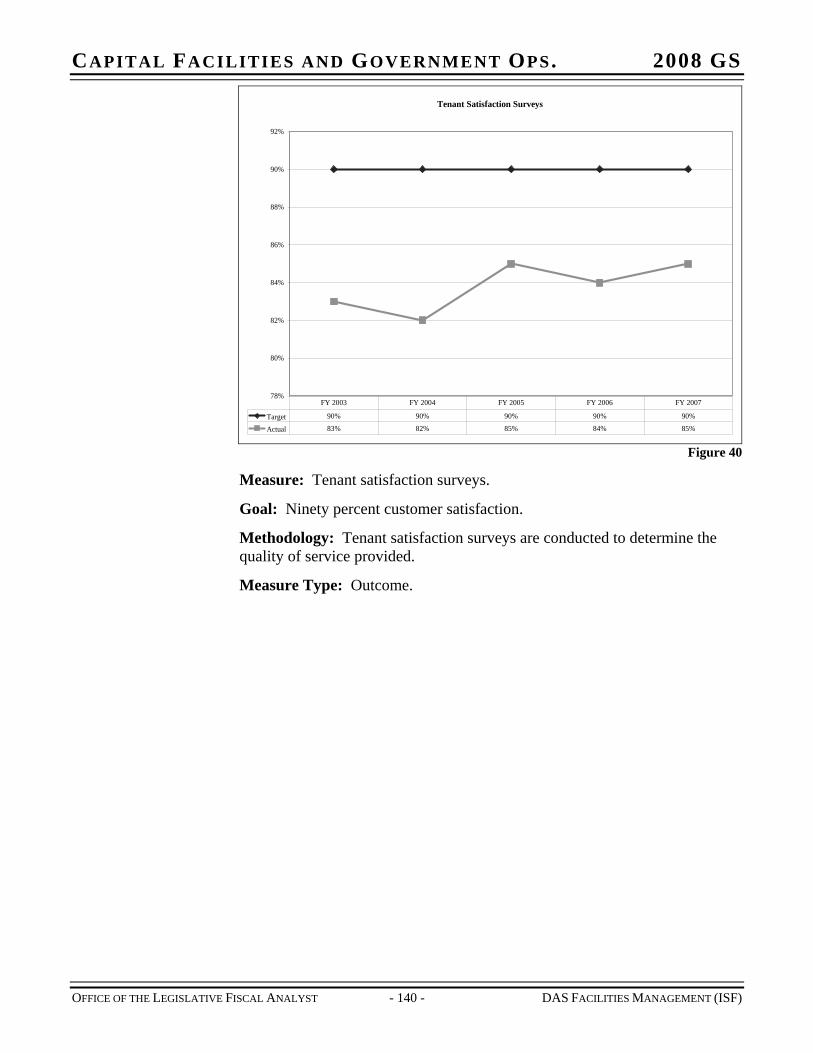
CAPITAL FACILITIES AND GOVERNMENT OPS. 2008 GS
Tenant Satisfaction Surveys
78%
80%
82%
84%
86%
88%
90%
92%
Target 90% 90% 90% 90% 90%
Actual 83% 82% 85% 84% 85%
FY 2003 FY 2004 FY 2005 FY 2006 FY 2007
Figure 40
Measure: Tenant satisfaction surveys.
Goal: Ninety percent customer satisfaction.
Methodology: Tenant satisfaction surveys are conducted to determine the quality of service provided.
Measure Type: Outcome.
OFFICE OF THE LEGISLATIVE FISCAL ANALYST - 140 - DAS FACILITIES MANAGEMENT (ISF)
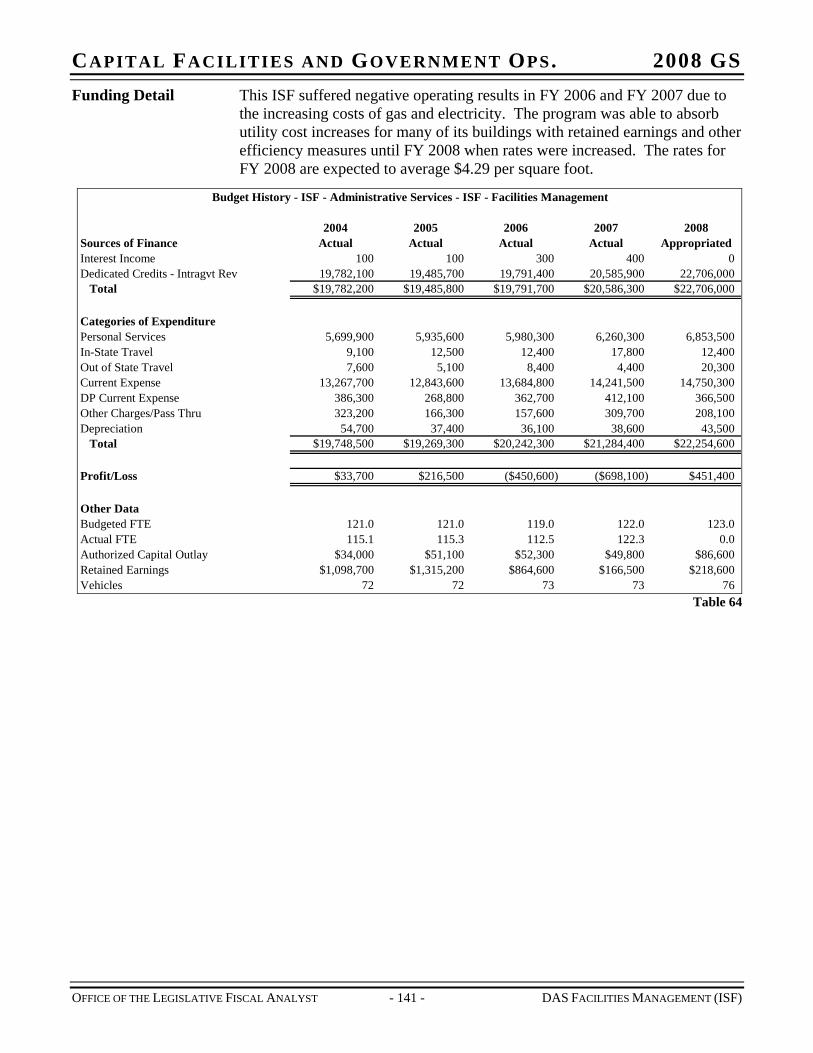
CAPITAL FACILITIES AND GOVERNMENT OPS. 2008 GS Funding Detail This ISF suffered negative operating results in FY 2006 and FY 2007 due to
the increasing costs of gas and electricity. The program was able to absorb utility cost increases for many of its buildings with retained earnings and other efficiency measures until FY 2008 when rates were increased. The rates for FY 2008 are expected to average $4.29 per square foot.
Budget History - ISF - Administrative Services - ISF - Facilities Management
2004 2005 2006 2007 2008Sources of Finance Actual Actual Actual Actual AppropriatedInterest Income 100 100 300 400 0Dedicated Credits - Intragvt Rev 19,782,100 19,485,700 19,791,400 20,585,900 22,706,000
Total $19,782,200 $19,485,800 $19,791,700 $20,586,300 $22,706,000
Categories of ExpenditurePersonal Services 5,699,900 5,935,600 5,980,300 6,260,300 6,853,500In-State Travel 9,100 12,500 12,400 17,800 12,400Out of State Travel 7,600 5,100 8,400 4,400 20,300Current Expense 13,267,700 12,843,600 13,684,800 14,241,500 14,750,300DP Current Expense 386,300 268,800 362,700 412,100 366,500Other Charges/Pass Thru 323,200 166,300 157,600 309,700 208,100Depreciation 54,700 37,400 36,100 38,600 43,500
Total $19,748,500 $19,269,300 $20,242,300 $21,284,400 $22,254,600
Profit/Loss $33,700 $216,500 ($450,600) ($698,100) $451,400
Other DataBudgeted FTE 121.0 121.0 119.0 122.0 123.0Actual FTE 115.1 115.3 112.5 122.3 0.0Authorized Capital Outlay $34,000 $51,100 $52,300 $49,800 $86,600Retained Earnings $1,098,700 $1,315,200 $864,600 $166,500 $218,600Vehicles 72 72 73 73 76
Table 64
OFFICE OF THE LEGISLATIVE FISCAL ANALYST - 141 - DAS FACILITIES MANAGEMENT (ISF)

CAPITAL FACILITIES AND GOVERNMENT OPS. 2008 GS
OFFICE OF THE LEGISLATIVE FISCAL ANALYST - 143 - DHRM – APPROPRIATED BUDGET
CHAPTER 22 DEPARTMENT OF HUMAN RESOURCE MANAGEMENT – APPROPRIATED BUDGET
Function The Department of Human Resource Management (DHRM) is the central human resource office for the state’s workforce. Department staff is responsible for recruitment, training, classification and compensation systems for the state. The mission of DHRM is to “develop, implement and administer a statewide human resource management system for state employees that will:
Promote quality government that aids in the effective execution of public policy
Attract and retain quality employees and foster productive and meaningful careers in public service
Develop effective relationships that aid in rendering assistance to agencies in performing their missions and working with customers and stakeholders.”
During the 2006 General Session the Legislature passed House Bill 269, Human Resource Management Amendments, which allowed DHRM to stay as an independent department rather than becoming a division in DAS. Further, the bill allowed DHRM to operate an internal service fund. More information on DHRM’s internal service fund is located in Chapter 23.
Statutory Authority The powers and duties of DHRM are established in UCA 67-19-5. The director is given full responsibility and accountability for administration of statewide human resource management.
Responsibilities for the department are identified in UCA 67-19-6, some of which include:
Administer a statewide personnel management program that aids efficient execution of public policy, fosters careers, and assists state agencies in performing their missions
Design and administer the state pay plan
Design and administer the state classification system
Design and administer the state recruitment and selection system
Ensure human resource practices comply with federal law, state law and state rules
Perform duties assigned by the governor or statute
Adopt rules for personnel management
Maintain a management information system that will provide current information on authorized positions, payroll, and related matters
Help eliminate discrimination in state employment
Advise local governments on effective personnel management
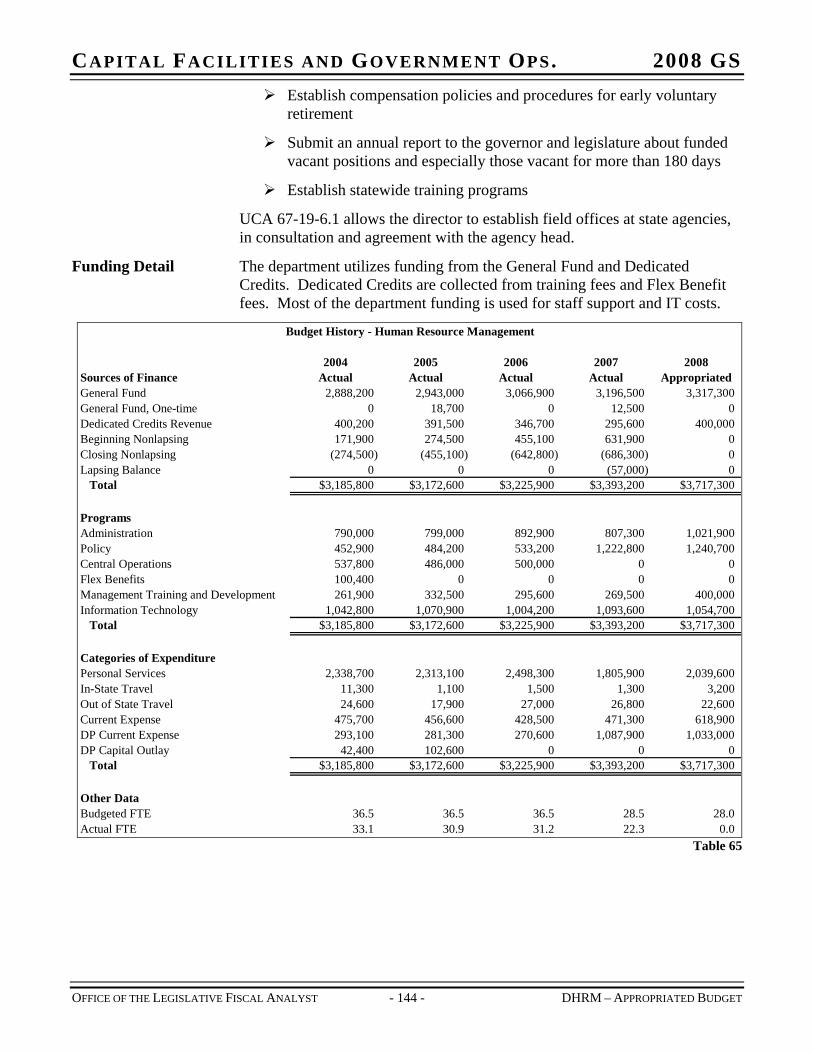
CAPITAL FACILITIES AND GOVERNMENT OPS. 2008 GS Establish compensation policies and procedures for early voluntary
retirement
Submit an annual report to the governor and legislature about funded vacant positions and especially those vacant for more than 180 days
Establish statewide training programs
UCA 67-19-6.1 allows the director to establish field offices at state agencies, in consultation and agreement with the agency head.
Funding Detail The department utilizes funding from the General Fund and Dedicated Credits. Dedicated Credits are collected from training fees and Flex Benefit fees. Most of the department funding is used for staff support and IT costs.
Budget History - Human Resource Management
2004 2005 2006 2007 2008Sources of Finance Actual Actual Actual Actual AppropriatedGeneral Fund 2,888,200 2,943,000 3,066,900 3,196,500 3,317,300General Fund, One-time 0 18,700 0 12,500 0Dedicated Credits Revenue 400,200 391,500 346,700 295,600 400,000Beginning Nonlapsing 171,900 274,500 455,100 631,900 0Closing Nonlapsing (274,500) (455,100) (642,800) (686,300) 0Lapsing Balance 0 0 0 (57,000) 0
Total $3,185,800 $3,172,600 $3,225,900 $3,393,200 $3,717,300
ProgramsAdministration 790,000 799,000 892,900 807,300 1,021,900Policy 452,900 484,200 533,200 1,222,800 1,240,700Central Operations 537,800 486,000 500,000 0 0Flex Benefits 100,400 0 0 0Management Training and Development 261,900 332,500 295,600 269,500 400,000Information Technology 1,042,800 1,070,900 1,004,200 1,093,600 1,054,700
Total $3,185,800 $3,172,600 $3,225,900 $3,393,200 $3,717,300
Categories of ExpenditurePersonal Services 2,338,700 2,313,100 2,498,300 1,805,900 2,039,600In-State Travel 11,300 1,100 1,500 1,300 3,200Out of State Travel 24,600 17,900 27,000 26,800 22,600Current Expense 475,700 456,600 428,500 471,300 618,900DP Current Expense 293,100 281,300 270,600 1,087,900 1,033,000DP Capital Outlay 42,400 102,600 0 0 0
Total $3,185,800 $3,172,600 $3,225,900 $3,393,200 $3,717,300
Other DataBudgeted FTE 36.5 36.5 36.5 28.5 28.0Actual FTE 33.1 30.9 31.2 22.3 0.0
0
Table 65
OFFICE OF THE LEGISLATIVE FISCAL ANALYST - 144 - DHRM – APPROPRIATED BUDGET
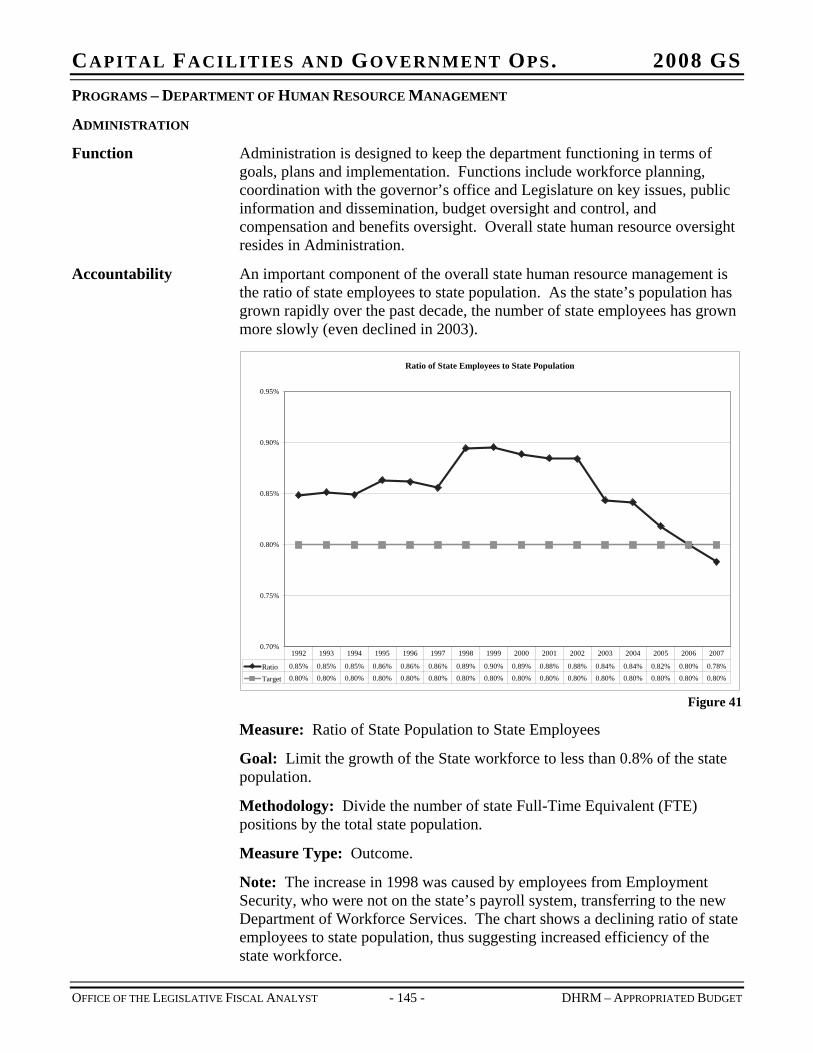
CAPITAL FACILITIES AND GOVERNMENT OPS. 2008 GS PROGRAMS – DEPARTMENT OF HUMAN RESOURCE MANAGEMENT
ADMINISTRATION
Function Administration is designed to keep the department functioning in terms of goals, plans and implementation. Functions include workforce planning, coordination with the governor’s office and Legislature on key issues, public information and dissemination, budget oversight and control, and compensation and benefits oversight. Overall state human resource oversight resides in Administration.
Accountability An important component of the overall state human resource management is the ratio of state employees to state population. As the state’s population has grown rapidly over the past decade, the number of state employees has grown more slowly (even declined in 2003).
Ratio of State Employees to State Population
0.70%
0.75%
0.80%
0.85%
0.90%
0.95%
Ratio 0.85% 0.85% 0.85% 0.86% 0.86% 0.86% 0.89% 0.90% 0.89% 0.88% 0.88% 0.84% 0.84% 0.82% 0.80% 0.78%
Target 0.80% 0.80% 0.80% 0.80% 0.80% 0.80% 0.80% 0.80% 0.80% 0.80% 0.80% 0.80% 0.80% 0.80% 0.80% 0.80%
1992 1993 1994 1995 1996 1997 1998 1999 2000 2001 2002 2003 2004 2005 2006 2007
Figure 41
Measure: Ratio of State Population to State Employees
Goal: Limit the growth of the State workforce to less than 0.8% of the state population.
Methodology: Divide the number of state Full-Time Equivalent (FTE) positions by the total state population.
Measure Type: Outcome.
Note: The increase in 1998 was caused by employees from Employment Security, who were not on the state’s payroll system, transferring to the new Department of Workforce Services. The chart shows a declining ratio of state employees to state population, thus suggesting increased efficiency of the state workforce.
OFFICE OF THE LEGISLATIVE FISCAL ANALYST - 145 - DHRM – APPROPRIATED BUDGET
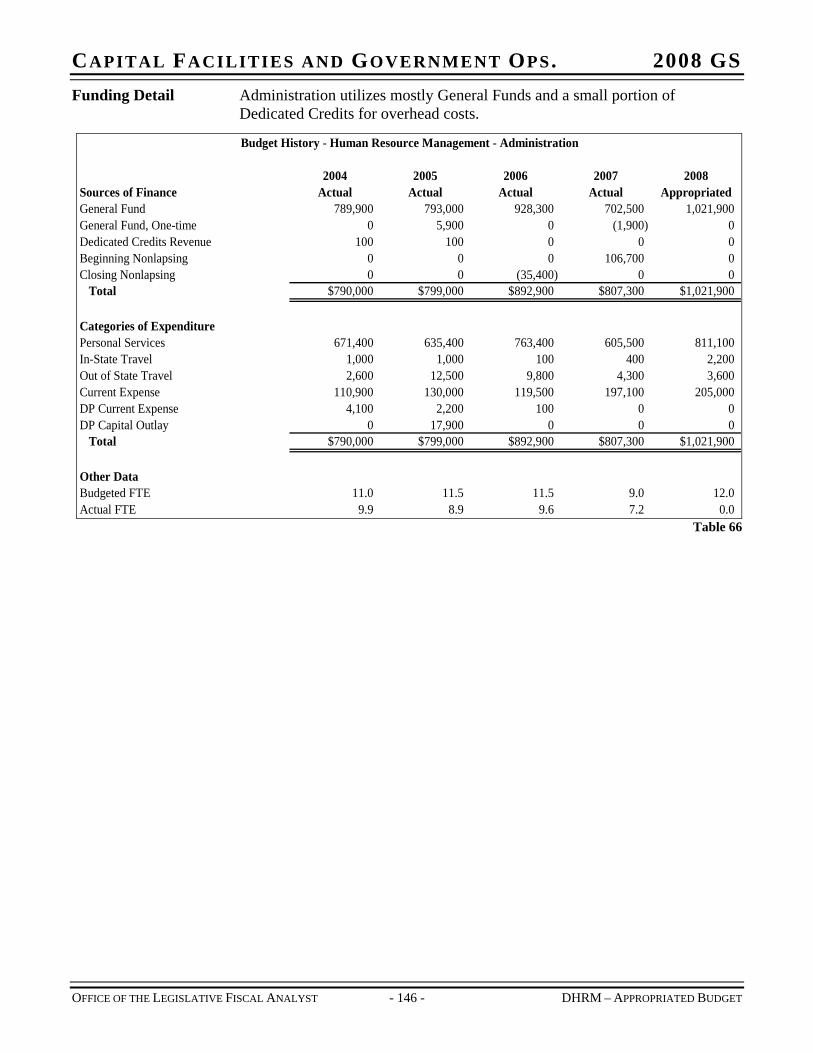
CAPITAL FACILITIES AND GOVERNMENT OPS. 2008 GS Funding Detail Administration utilizes mostly General Funds and a small portion of
Dedicated Credits for overhead costs.
Budget History - Human Resource Management - Administration
2004 2005 2006 2007 2008Sources of Finance Actual Actual Actual Actual AppropriatedGeneral Fund 789,900 793,000 928,300 702,500 1,021,900General Fund, One-time 0 5,900 0 (1,900) 0Dedicated Credits Revenue 100 100 0 0 0Beginning Nonlapsing 0 0 0 106,700 0Closing Nonlapsing 0 0 (35,400) 0 0
Total $790,000 $799,000 $892,900 $807,300 $1,021,900
Categories of ExpenditurePersonal Services 671,400 635,400 763,400 605,500 811,100In-State Travel 1,000 1,000 100 400 2,200Out of State Travel 2,600 12,500 9,800 4,300 3,600Current Expense 110,900 130,000 119,500 197,100 205,000DP Current Expense 4,100 2,200 100 0 0DP Capital Outlay 0 17,900 0 0 0
Total $790,000 $799,000 $892,900 $807,300 $1,021,900
Other DataBudgeted FTE 11.0 11.5 11.5 9.0 12.0Actual FTE 9.9 8.9 9.6 7.2 0.0
Table 66
OFFICE OF THE LEGISLATIVE FISCAL ANALYST - 146 - DHRM – APPROPRIATED BUDGET
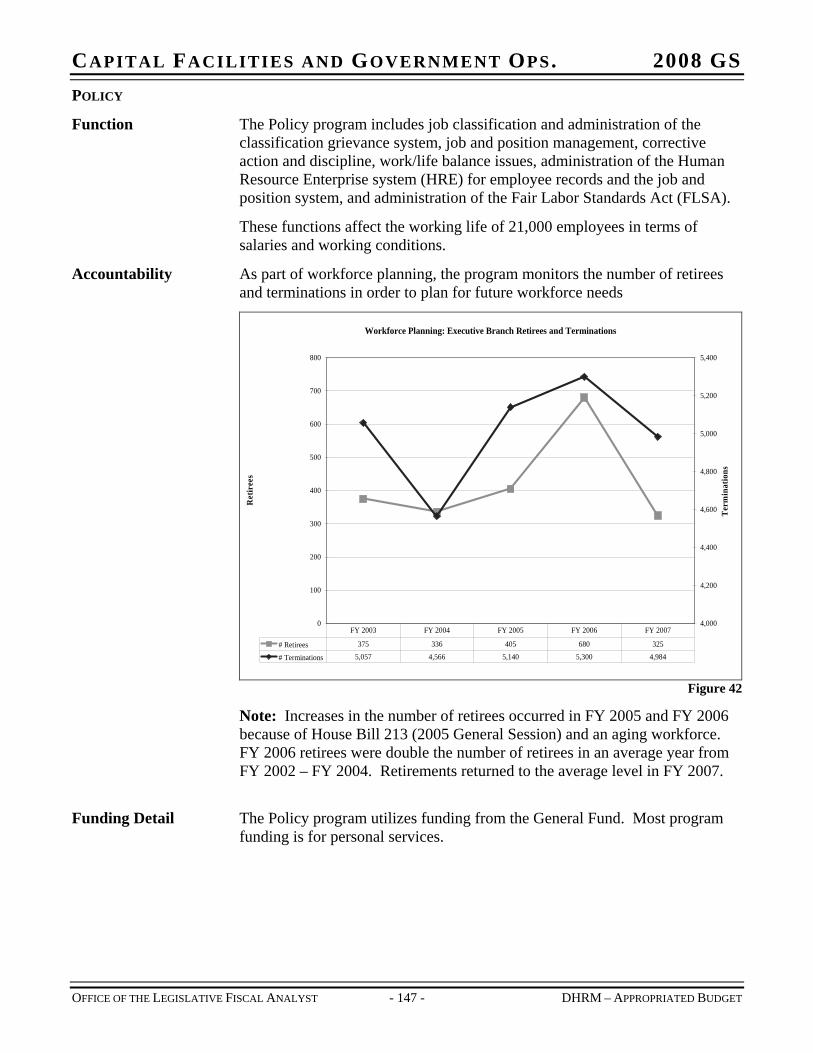
CAPITAL FACILITIES AND GOVERNMENT OPS. 2008 GS POLICY
Function The Policy program includes job classification and administration of the classification grievance system, job and position management, corrective action and discipline, work/life balance issues, administration of the Human Resource Enterprise system (HRE) for employee records and the job and position system, and administration of the Fair Labor Standards Act (FLSA).
These functions affect the working life of 21,000 employees in terms of salaries and working conditions.
Accountability As part of workforce planning, the program monitors the number of retirees and terminations in order to plan for future workforce needs
Workforce Planning: Executive Branch Retirees and Terminations
0
100
200
300
400
500
600
700
800
Ret
iree
s
4,000
4,200
4,400
4,600
4,800
5,000
5,200
5,400
Ter
min
atio
ns
# Retirees 375 336 405 680 325
# Terminations 5,057 4,566 5,140 5,300 4,984
FY 2003 FY 2004 FY 2005 FY 2006 FY 2007
Figure 42
Note: Increases in the number of retirees occurred in FY 2005 and FY 2006 because of House Bill 213 (2005 General Session) and an aging workforce. FY 2006 retirees were double the number of retirees in an average year from FY 2002 – FY 2004. Retirements returned to the average level in FY 2007.
Funding Detail The Policy program utilizes funding from the General Fund. Most program
funding is for personal services.
OFFICE OF THE LEGISLATIVE FISCAL ANALYST - 147 - DHRM – APPROPRIATED BUDGET
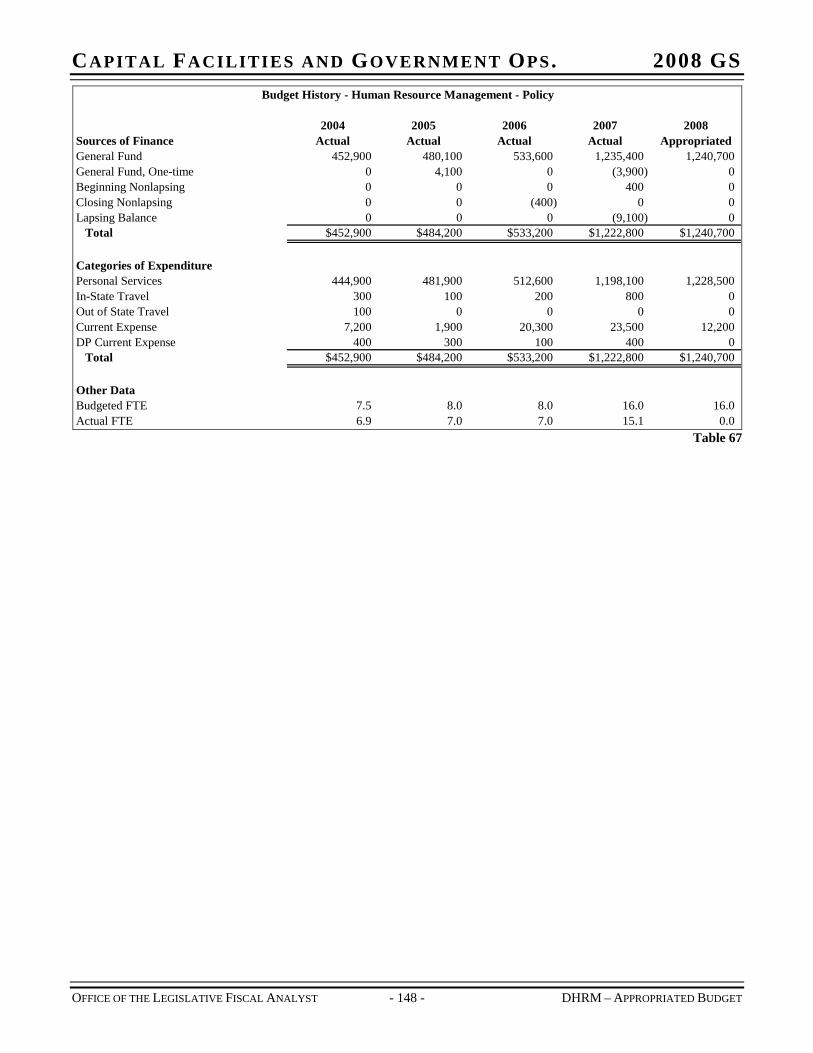
CAPITAL FACILITIES AND GOVERNMENT OPS. 2008 GS Budget History - Human Resource Management - Policy
2004 2005 2006 2007 2008Sources of Finance Actual Actual Actual Actual AppropriatedGeneral Fund 452,900 480,100 533,600 1,235,400 1,240,700General Fund, One-time 0 4,100 0 (3,900) 0Beginning Nonlapsing 0 0 0 400 0Closing Nonlapsing 0 0 (400) 0 0Lapsing Balance 0 0 0 (9,100) 0
Total $452,900 $484,200 $533,200 $1,222,800 $1,240,700
Categories of ExpenditurePersonal Services 444,900 481,900 512,600 1,198,100 1,228,500In-State Travel 300 100 200 800 0Out of State Travel 100 0 0 0 0Current Expense 7,200 1,900 20,300 23,500 12,200DP Current Expense 400 300 100 400 0
Total $452,900 $484,200 $533,200 $1,222,800 $1,240,700
Other DataBudgeted FTE 7.5 8.0 8.0 16.0 16.0Actual FTE 6.9 7.0 7.0 15.1 0.0
Table 67
OFFICE OF THE LEGISLATIVE FISCAL ANALYST - 148 - DHRM – APPROPRIATED BUDGET
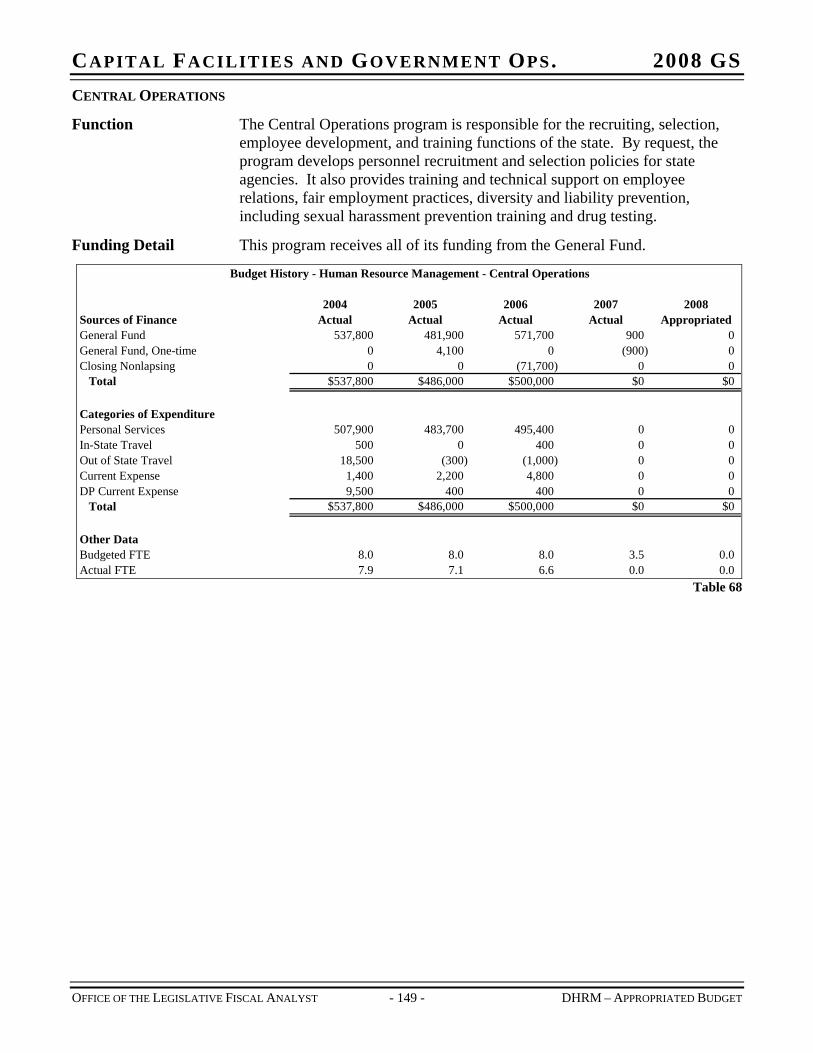
CAPITAL FACILITIES AND GOVERNMENT OPS. 2008 GS CENTRAL OPERATIONS
Function The Central Operations program is responsible for the recruiting, selection, employee development, and training functions of the state. By request, the program develops personnel recruitment and selection policies for state agencies. It also provides training and technical support on employee relations, fair employment practices, diversity and liability prevention, including sexual harassment prevention training and drug testing.
Funding Detail This program receives all of its funding from the General Fund.
Budget History - Human Resource Management - Central Operations
2004 2005 2006 2007 2008Sources of Finance Actual Actual Actual Actual AppropriatedGeneral Fund 537,800 481,900 571,700 900 0General Fund, One-time 0 4,100 0 (900) 0Closing Nonlapsing 0 0 (71,700) 0 0
Total $537,800 $486,000 $500,000 $0 $0
Categories of ExpenditurePersonal Services 507,900 483,700 495,400 0 0In-State Travel 500 0 400 0 0Out of State Travel 18,500 (300) (1,000) 0 0Current Expense 1,400 2,200 4,800 0 0DP Current Expense 9,500 400 400 0 0
Total $537,800 $486,000 $500,000 $0 $0
Other DataBudgeted FTE 8.0 8.0 8.0 3.5 0.0Actual FTE 7.9 7.1 6.6 0.0 0.0
Table 68
OFFICE OF THE LEGISLATIVE FISCAL ANALYST - 149 - DHRM – APPROPRIATED BUDGET
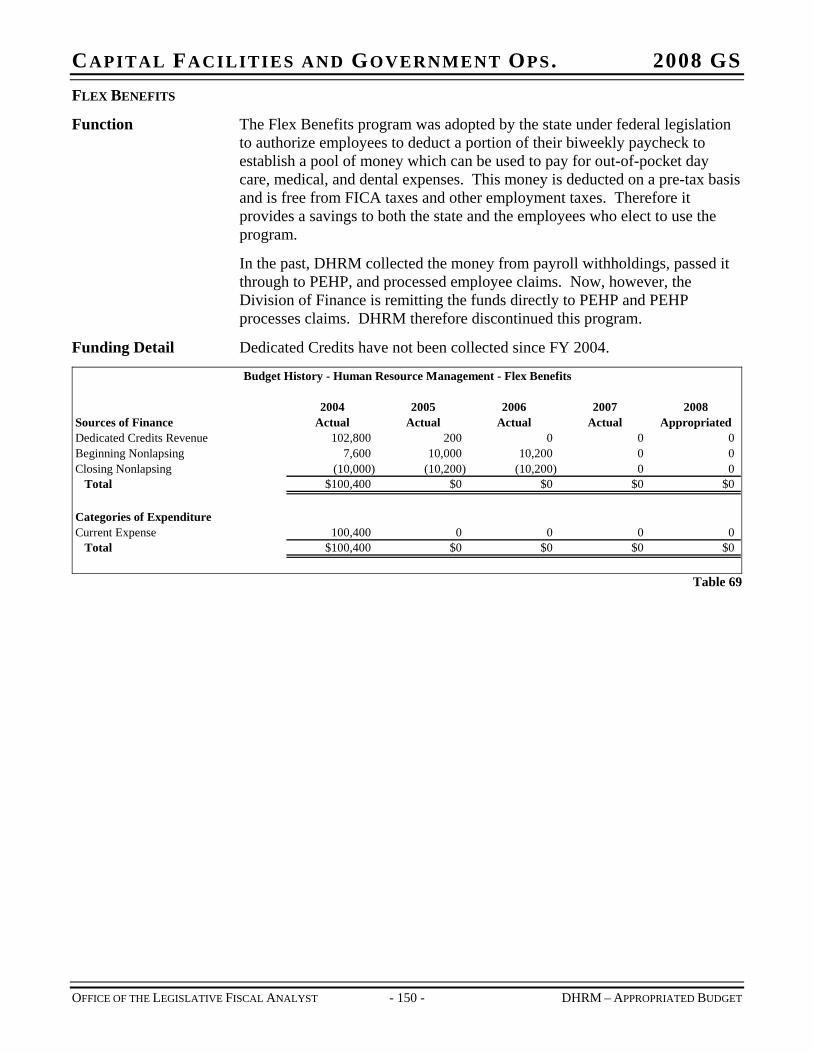
CAPITAL FACILITIES AND GOVERNMENT OPS. 2008 GS FLEX BENEFITS
Function The Flex Benefits program was adopted by the state under federal legislation to authorize employees to deduct a portion of their biweekly paycheck to establish a pool of money which can be used to pay for out-of-pocket day care, medical, and dental expenses. This money is deducted on a pre-tax basis and is free from FICA taxes and other employment taxes. Therefore it provides a savings to both the state and the employees who elect to use the program.
In the past, DHRM collected the money from payroll withholdings, passed it through to PEHP, and processed employee claims. Now, however, the Division of Finance is remitting the funds directly to PEHP and PEHP processes claims. DHRM therefore discontinued this program.
Funding Detail Dedicated Credits have not been collected since FY 2004.
Budget History - Human Resource Management - Flex Benefits
2004 2005 2006 2007 2008Sources of Finance Actual Actual Actual Actual AppropriatedDedicated Credits Revenue 102,800 200 0 0 0Beginning Nonlapsing 7,600 10,000 10,200 0 0Closing Nonlapsing (10,000) (10,200) (10,200) 0 0
Total $100,400 $0 $0 $0 $0
Categories of ExpenditureCurrent Expense 100,400 0 0 0 0
Total $100,400 $0 $0 $0 $0
Table 69
OFFICE OF THE LEGISLATIVE FISCAL ANALYST - 150 - DHRM – APPROPRIATED BUDGET
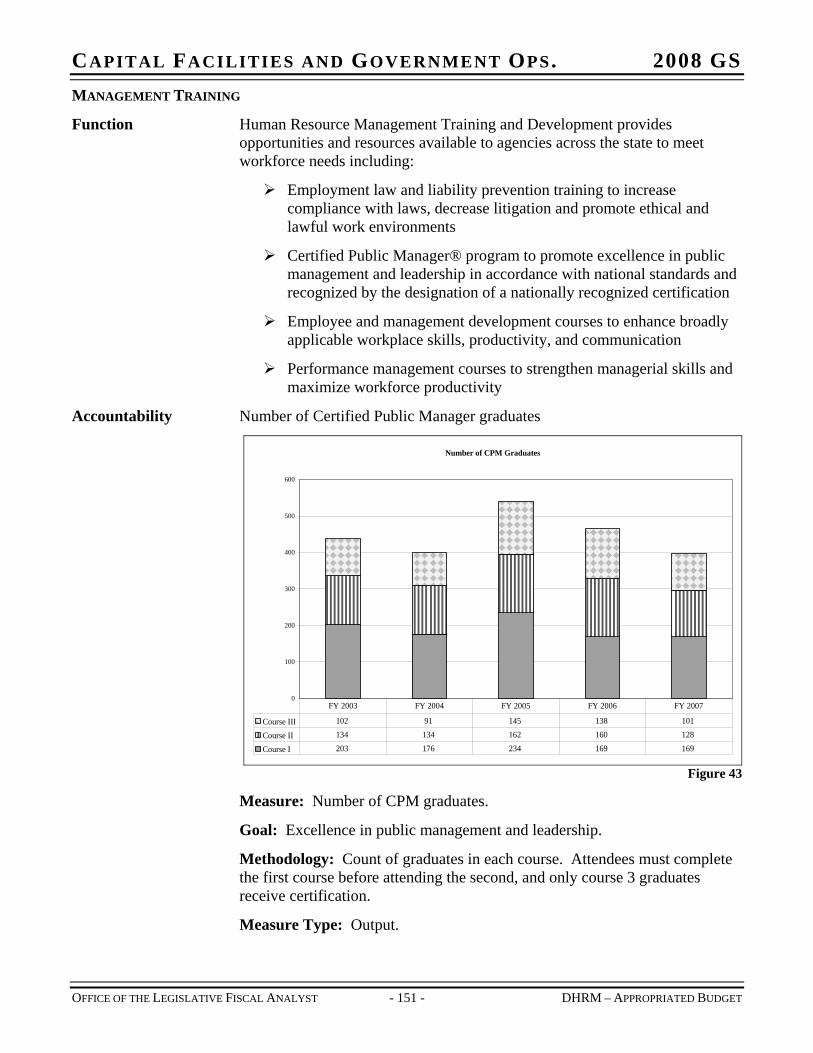
CAPITAL FACILITIES AND GOVERNMENT OPS. 2008 GS MANAGEMENT TRAINING
Function Human Resource Management Training and Development provides opportunities and resources available to agencies across the state to meet workforce needs including:
Employment law and liability prevention training to increase compliance with laws, decrease litigation and promote ethical and lawful work environments
Certified Public Manager® program to promote excellence in public management and leadership in accordance with national standards and recognized by the designation of a nationally recognized certification
Employee and management development courses to enhance broadly applicable workplace skills, productivity, and communication
Performance management courses to strengthen managerial skills and maximize workforce productivity
Accountability Number of Certified Public Manager graduates
Number of CPM Graduates
0
100
200
300
400
500
600
Course III 102 91 145 138 101
Course II 134 134 162 160 128
Course I 203 176 234 169 169
FY 2003 FY 2004 FY 2005 FY 2006 FY 2007
Figure 43
Measure: Number of CPM graduates.
Goal: Excellence in public management and leadership.
Methodology: Count of graduates in each course. Attendees must complete the first course before attending the second, and only course 3 graduates receive certification.
Measure Type: Output.
OFFICE OF THE LEGISLATIVE FISCAL ANALYST - 151 - DHRM – APPROPRIATED BUDGET
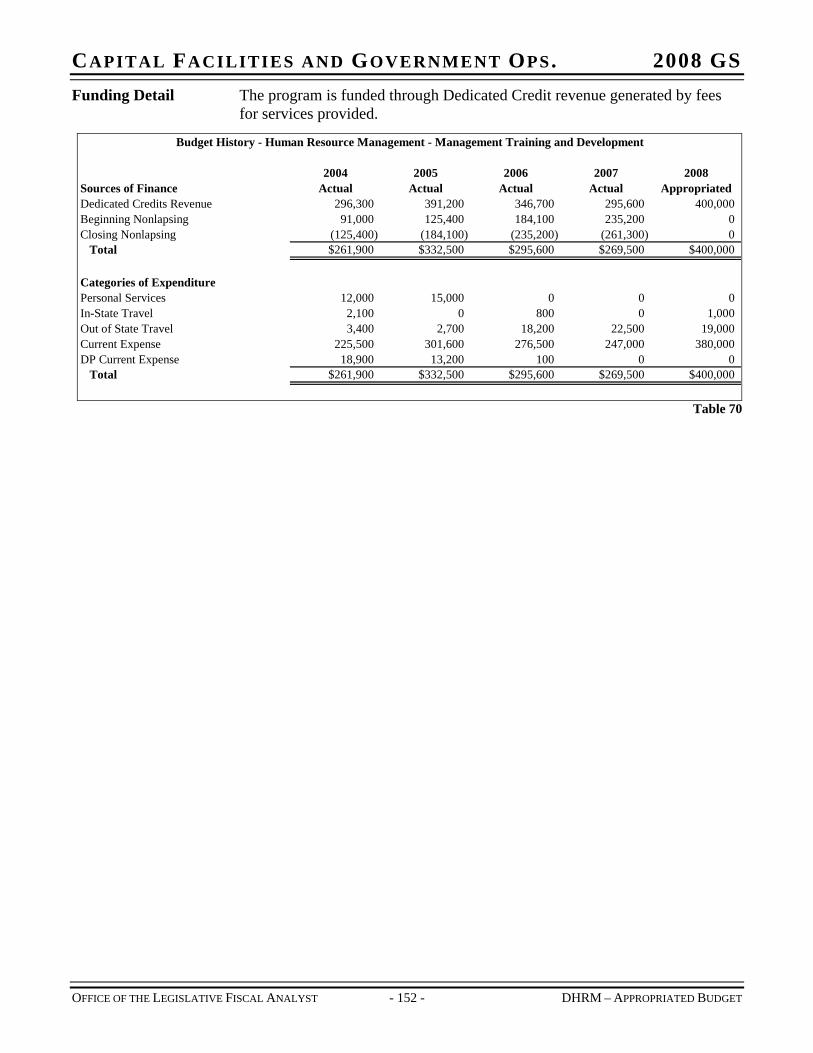
CAPITAL FACILITIES AND GOVERNMENT OPS. 2008 GS Funding Detail The program is funded through Dedicated Credit revenue generated by fees
for services provided.
Budget History - Human Resource Management - Management Training and Development
2004 2005 2006 2007 2008Sources of Finance Actual Actual Actual Actual AppropriatedDedicated Credits Revenue 296,300 391,200 346,700 295,600 400,000Beginning Nonlapsing 91,000 125,400 184,100 235,200 0Closing Nonlapsing (125,400) (184,100) (235,200) (261,300) 0
Total $261,900 $332,500 $295,600 $269,500 $400,000
Categories of ExpenditurePersonal Services 12,000 15,000 0 0 0In-State Travel 2,100 0 800 0 1,000Out of State Travel 3,400 2,700 18,200 22,500 19,000Current Expense 225,500 301,600 276,500 247,000 380,000DP Current Expense 18,900 13,200 100 0 0
Total $261,900 $332,500 $295,600 $269,500 $400,000
Table 70
OFFICE OF THE LEGISLATIVE FISCAL ANALYST - 152 - DHRM – APPROPRIATED BUDGET
CAPITAL FACILITIES AND GOVERNMENT OPS. 2008 GS
OFFICE OF THE LEGISLATIVE FISCAL ANALYST - 153 - DHRM – APPROPRIATED BUDGET
INFORMATION TECHNOLOGY
Function Information Technology is used to provide automated systems for the enterprise Human Resource Management system. This system provides support to all agencies relative to employee recruitment, employment, pay and all other employee related functions.
Statewide systems supported by DHRM include:
HRE (Human Resource Enterprise)
TRM (Training Records Management)
Employee Profile
HR Data Warehouse
UJM (Utah Job Match)
UJM Job & Position Analysis
Lifestyle Benefits
UMD (Utah Master Directory)
HR Web-Reports
The Information Technology program provides the technology support for the department. It provides support for internal DHRM needs as well as other state agencies in processing HR business. This includes processing from recruitment through termination.
The program provides direct access to human resource information to employees. It also provides information to the public and employees through the Web.
Intent Language During the 2007 General Session the Legislature adopted the following intent language for FY 2007 in S.B. 1:
Under Section 63-38-8 of the Utah Code the Legislature intends that up to $425,000 provided by Item 39, Chapter 367, Laws of Utah 2006 not lapse at the close of Fiscal Year 2007. The use of nonlapsing funds is limited to: information technology - up to $325,000; consulting services - up to $100,000.
Funding Detail In FY 2007 all FTE in this program transferred to the new Department of Technology Services, which will bill them back to DHRM as current expenses.
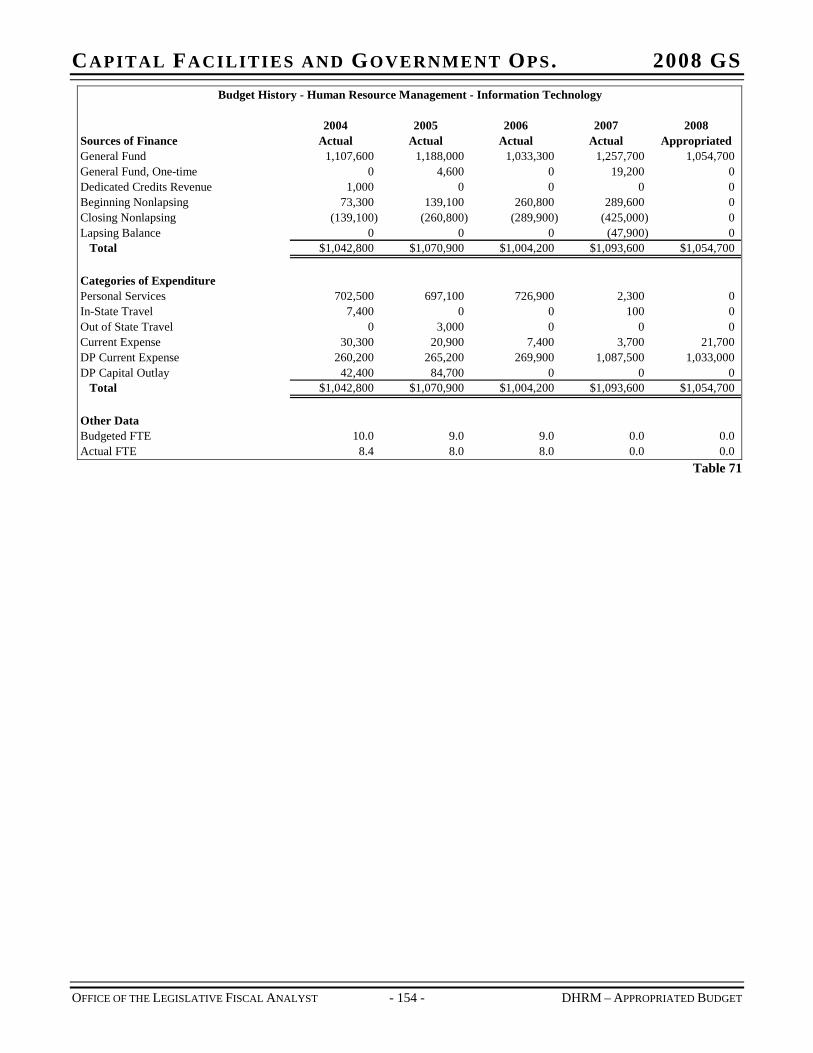
CAPITAL FACILITIES AND GOVERNMENT OPS. 2008 GS Budget History - Human Resource Management - Information Technology
2004 2005 2006 2007 2008Sources of Finance Actual Actual Actual Actual AppropriatedGeneral Fund 1,107,600 1,188,000 1,033,300 1,257,700 1,054,700General Fund, One-time 0 4,600 0 19,200 0Dedicated Credits Revenue 1,000 0 0 0Beginning Nonlapsing 73,300 139,100 260,800 289,600 0Closing Nonlapsing (139,100) (260,800) (289,900) (425,000) 0Lapsing Balance 0 0 0 (47,900) 0
Total $1,042,800 $1,070,900 $1,004,200 $1,093,600 $1,054,700
Categories of ExpenditurePersonal Services 702,500 697,100 726,900 2,300 0In-State Travel 7,400 0 0 100 0Out of State Travel 0 3,000 0 0 0Current Expense 30,300 20,900 7,400 3,700 21,700DP Current Expense 260,200 265,200 269,900 1,087,500 1,033,000DP Capital Outlay 42,400 84,700 0 0 0
Total $1,042,800 $1,070,900 $1,004,200 $1,093,600 $1,054,700
Other DataBudgeted FTE 10.0 9.0 9.0 0.0 0.0Actual FTE 8.4 8.0 8.0 0.0 0.0
0
Table 71
OFFICE OF THE LEGISLATIVE FISCAL ANALYST - 154 - DHRM – APPROPRIATED BUDGET
CAPITAL FACILITIES AND GOVERNMENT OPS. 2008 GS
OFFICE OF THE LEGISLATIVE FISCAL ANALYST - 155 - DHRM – INTERNAL SERVICE FUND
CHAPTER 23 DEPARTMENT OF HUMAN RESOURCE MANAGEMENT – INTERNAL SERVICE FUND
Function The Department of Human Resource Management (DHRM) Internal Service
Fund was established by House Bill 269 in the 2006 General Session.
Internal Service Funds (ISF) employ business practices to provide a service or product for other state and governmental agencies. Typical services include large functions that can be centrally coordinated. They are set up to take advantage of economies of scale, to avoid duplication of efforts and to provide an accounting mechanism to adequately identify costs of certain governmental services.
Upon establishing the ISF, DHRM consolidated all human resource employees statewide. Whereas previously most HR staff in the “field” worked for the agency where they were housed, they now work for DHRM. The consolidation should allow for efficiencies by avoiding duplication of effort, particularly in rural or remote locations. Consolidation should also result in better control and coordination over HR functions.
The ISF operated by DHRM provides consolidated services to all state agencies. The ISF has two programs:
Field Services
Payroll Field Services
Statutory Authority UCA 67-19-5 (6) allows the department to operate an internal service fund in accordance with Section 63-38-3.5 for the human resource functions the department provides.
In order to control the size, mission and fees charged to state agencies, the Legislature imposed statutory controls (UCA 63-38-3.5) that require ISFs to respond to the legislative budget process. No ISF can bill another agency for its services unless the Legislature has:
Approved the ISF’s budget request
Approved the ISF’s rates, fees, and other charges, and included those rates and fees in an appropriation act
Approved the number of FTE as part of the annual appropriation process
Appropriated the ISF’s estimated revenue based upon the rates and fee structure
No capital acquisitions can be made by an Internal Service Fund without legislative approval.
No capital assets can be transferred to an Internal Service Fund without legislative approval.
Working capital for operations must be provided from the following sources in the following order:
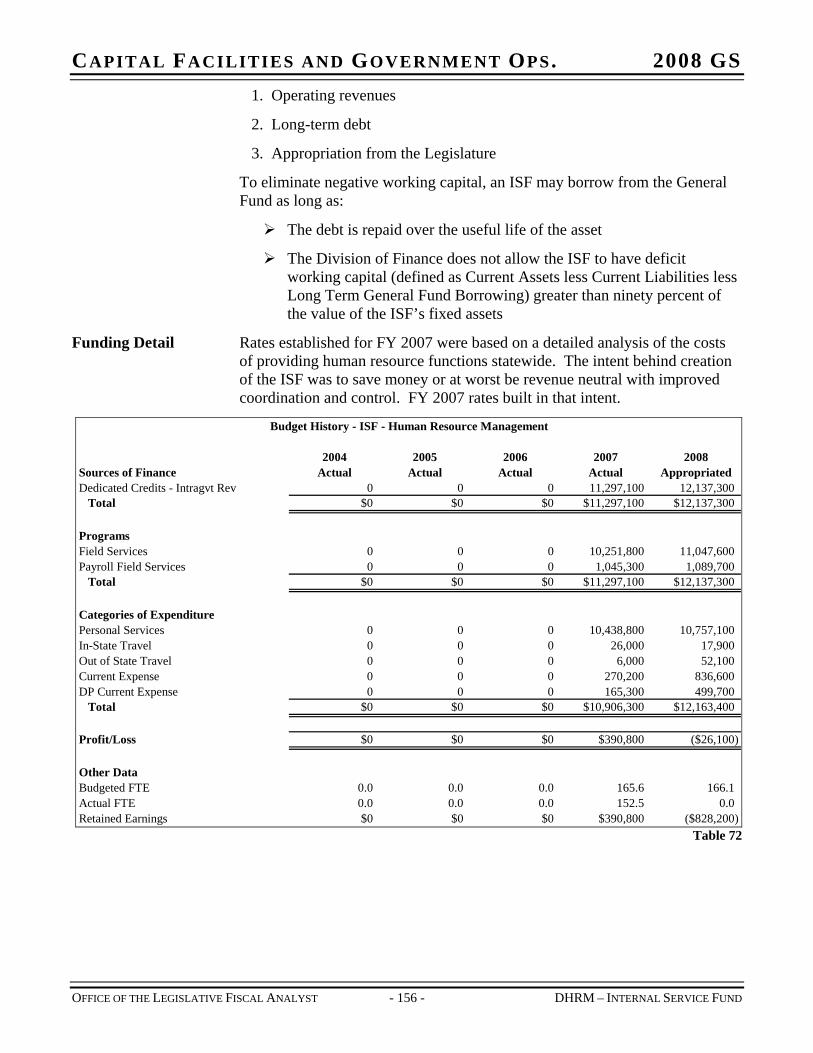
CAPITAL FACILITIES AND GOVERNMENT OPS. 2008 GS 1. Operating revenues
2. Long-term debt
3. Appropriation from the Legislature
To eliminate negative working capital, an ISF may borrow from the General Fund as long as:
The debt is repaid over the useful life of the asset
The Division of Finance does not allow the ISF to have deficit working capital (defined as Current Assets less Current Liabilities less Long Term General Fund Borrowing) greater than ninety percent of the value of the ISF’s fixed assets
Funding Detail Rates established for FY 2007 were based on a detailed analysis of the costs of providing human resource functions statewide. The intent behind creation of the ISF was to save money or at worst be revenue neutral with improved coordination and control. FY 2007 rates built in that intent.
Budget History - ISF - Human Resource Management
2004 2005 2006 2007 2008Sources of Finance Actual Actual Actual Actual AppropriatedDedicated Credits - Intragvt Rev 0 0 0 11,297,100 12,137,300
Total $0 $0 $0 $11,297,100 $12,137,300
ProgramsField Services 0 0 0 10,251,800 11,047,600Payroll Field Services 0 0 0 1,045,300 1,089,700
Total $0 $0 $0 $11,297,100 $12,137,300
Categories of ExpenditurePersonal Services 0 0 0 10,438,800 10,757,100In-State Travel 0 0 0 26,000 17,900Out of State Travel 0 0 0 6,000 52,100Current Expense 0 0 0 270,200 836,600DP Current Expense 0 0 0 165,300 499,700
Total $0 $0 $0 $10,906,300 $12,163,400
Profit/Loss $0 $0 $0 $390,800 ($26,100)
Other DataBudgeted FTE 0.0 0.0 0.0 165.6 166.1Actual FTE 0.0 0.0 0.0 152.5 0.0Retained Earnings $0 $0 $0 $390,800 ($828,200)
Table 72
OFFICE OF THE LEGISLATIVE FISCAL ANALYST - 156 - DHRM – INTERNAL SERVICE FUND
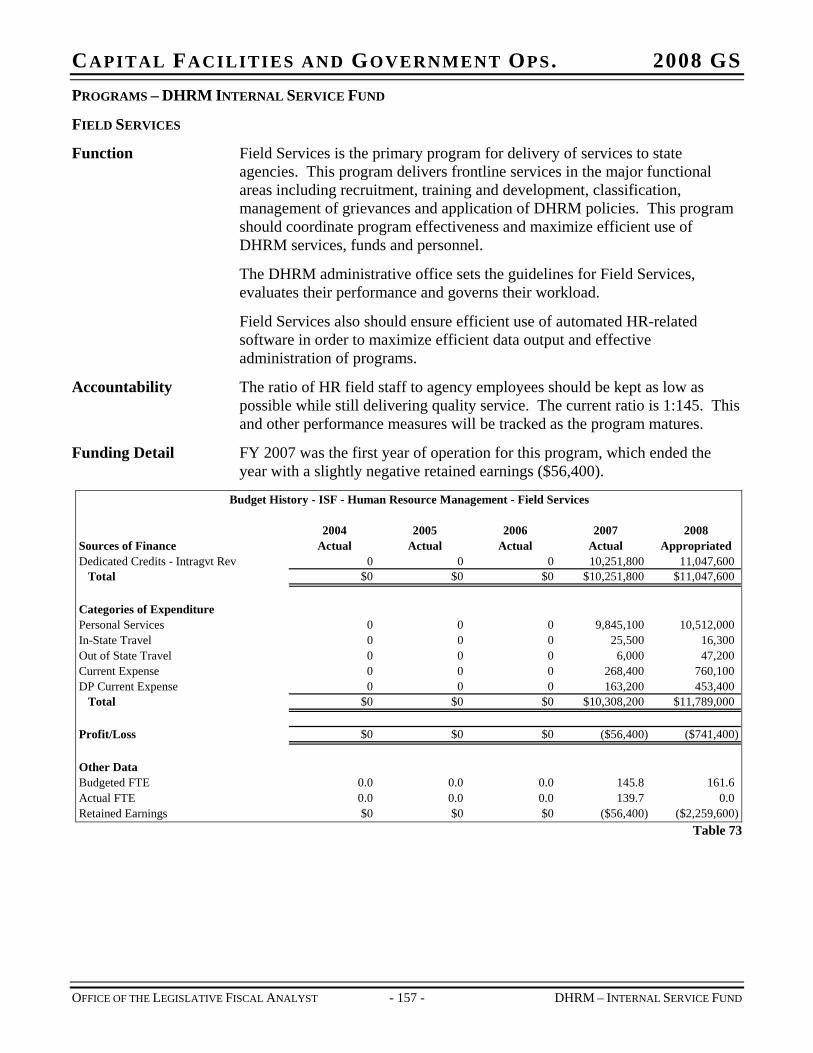
CAPITAL FACILITIES AND GOVERNMENT OPS. 2008 GS PROGRAMS – DHRM INTERNAL SERVICE FUND
FIELD SERVICES
Function Field Services is the primary program for delivery of services to state agencies. This program delivers frontline services in the major functional areas including recruitment, training and development, classification, management of grievances and application of DHRM policies. This program should coordinate program effectiveness and maximize efficient use of DHRM services, funds and personnel.
The DHRM administrative office sets the guidelines for Field Services, evaluates their performance and governs their workload.
Field Services also should ensure efficient use of automated HR-related software in order to maximize efficient data output and effective administration of programs.
Accountability The ratio of HR field staff to agency employees should be kept as low as possible while still delivering quality service. The current ratio is 1:145. This and other performance measures will be tracked as the program matures.
Funding Detail FY 2007 was the first year of operation for this program, which ended the year with a slightly negative retained earnings ($56,400).
Budget History - ISF - Human Resource Management - Field Services
2004 2005 2006 2007 2008Sources of Finance Actual Actual Actual Actual AppropriatedDedicated Credits - Intragvt Rev 0 0 0 10,251,800 11,047,600
Total $0 $0 $0 $10,251,800 $11,047,600
Categories of ExpenditurePersonal Services 0 0 0 9,845,100 10,512,000In-State Travel 0 0 0 25,500 16,300Out of State Travel 0 0 0 6,000 47,200Current Expense 0 0 0 268,400 760,100DP Current Expense 0 0 0 163,200 453,400
Total $0 $0 $0 $10,308,200 $11,789,000
Profit/Loss $0 $0 $0 ($56,400) ($741,400)
Other DataBudgeted FTE 0.0 0.0 0.0 145.8 161.6Actual FTE 0.0 0.0 0.0 139.7 0.0Retained Earnings $0 $0 $0 ($56,400) ($2,259,600)
Table 73
OFFICE OF THE LEGISLATIVE FISCAL ANALYST - 157 - DHRM – INTERNAL SERVICE FUND
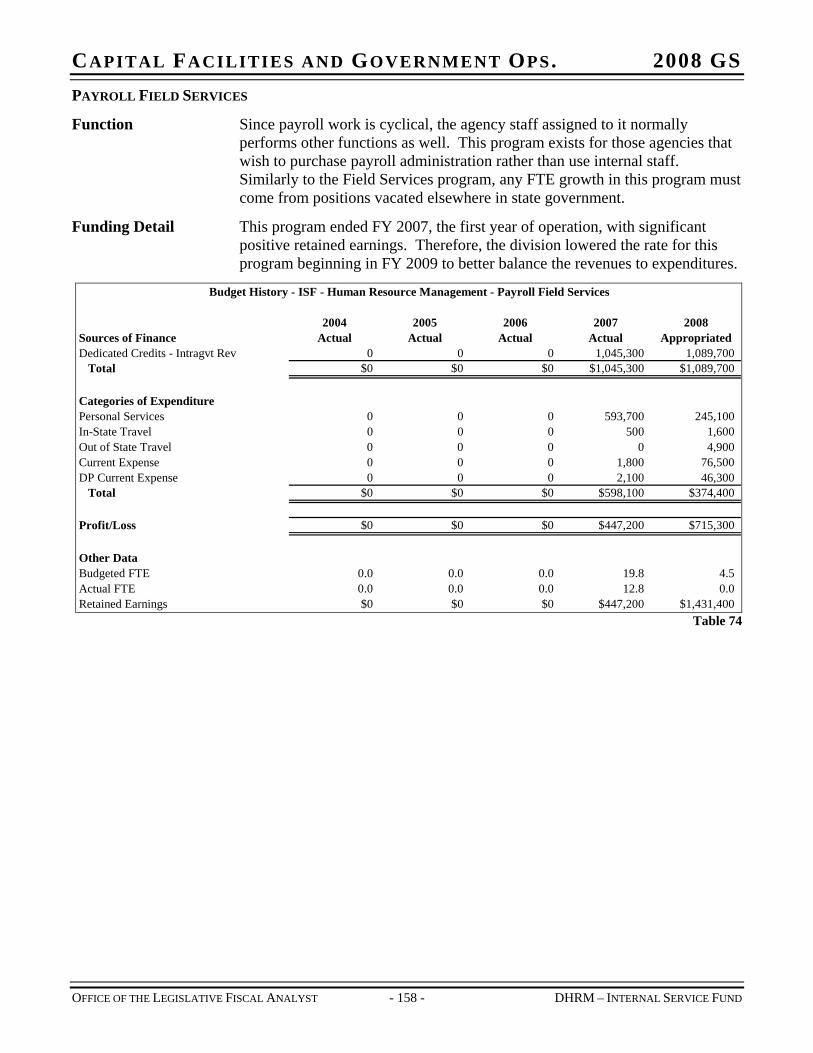
CAPITAL FACILITIES AND GOVERNMENT OPS. 2008 GS PAYROLL FIELD SERVICES
Function Since payroll work is cyclical, the agency staff assigned to it normally performs other functions as well. This program exists for those agencies that wish to purchase payroll administration rather than use internal staff. Similarly to the Field Services program, any FTE growth in this program must come from positions vacated elsewhere in state government.
Funding Detail This program ended FY 2007, the first year of operation, with significant positive retained earnings. Therefore, the division lowered the rate for this program beginning in FY 2009 to better balance the revenues to expenditures.
Budget History - ISF - Human Resource Management - Payroll Field Services
2004 2005 2006 2007 2008Sources of Finance Actual Actual Actual Actual AppropriatedDedicated Credits - Intragvt Rev 0 0 0 1,045,300 1,089,700
Total $0 $0 $0 $1,045,300 $1,089,700
Categories of ExpenditurePersonal Services 0 0 0 593,700 245,100In-State Travel 0 0 0 500 1,600Out of State Travel 0 0 0 0 4,900Current Expense 0 0 0 1,800 76,500DP Current Expense 0 0 0 2,100 46,300
Total $0 $0 $0 $598,100 $374,400
Profit/Loss $0 $0 $0 $447,200 $715,300
Other DataBudgeted FTE 0.0 0.0 0.0 19.8 4.5Actual FTE 0.0 0.0 0.0 12.8 0.0Retained Earnings $0 $0 $0 $447,200 $1,431,400
Table 74
OFFICE OF THE LEGISLATIVE FISCAL ANALYST - 158 - DHRM – INTERNAL SERVICE FUND
CAPITAL FACILITIES AND GOVERNMENT OPS. 2008 GS
OFFICE OF THE LEGISLATIVE FISCAL ANALYST - 159 - DTS – APPROPRIATED BUDGET
CHAPTER 24 DEPARTMENT OF TECHNOLOGY SERVICES – APPROPRIATED
Function The Department of Technology Services (DTS) manages information technology (IT) programs and resources statewide. It acts as the Executive Branch’s lead agency on IT, working with all other state agencies to ensure efficient and effective investment in and operation of IT. It responds first and foremost to the business needs of its customers – other agencies in the state.
Information Technology Governance Amendments (House Bill 109, 2005 General Session) created DTS. The bill immediately moved the Office of the Chief Information Officer and the Automated Geographic Reference Center into DTS as appropriated budget items. Subsequent appropriations acts added Technology Acquisition projects as appropriated items. Those directly appropriated functions are addressed in this chapter.
H.B. 109 also provided mechanisms through which the governor consolidated the Division of Information Technology Services (ITS) and all agency information technology functions into DTS before July 1, 2006. The internal service fund portion of DTS, including what was formerly known as ITS, will be addressed in the following chapter.
Statutory Authority UCA 63F-1-103 creates the Department of Technology Services and gives DTS authority to operate as an internal service fund. The statute requires DTS to:
Reengineer state government IT architecture and governance
Coordinate strategic planning and best meet the business needs of customer agencies
Improve efficiency of state IT resources through certain defined best practices
Act as the General Contractor for acquisition of IT resources statewide
Assist the Governor’s Office of Planning and Budget with development of statewide IT budgets
Funding Detail The following table illustrated funds appropriated to DTS for fiscal years 2006 and 2007. For comparison purposes, it also includes historical information for the Chief Information Officer – which prior to FY 2006 was in the Governor’s Office – and the Automated Geographic Reference Center – which prior to FY 2006 was in the Department of Administrative Services.

CAPITAL FACILITIES AND GOVERNMENT OPS. 2008 GS Budget History - Department of Technology Services
2004 2005 2006 2007 2008Sources of Finance Actual Actual Actual Actual AppropriatedGeneral Fund 760,300 940,700 1,299,000 1,426,400 2,159,800General Fund, One-time 456,500 509,300 400,000 7,885,500 112,800Federal Funds 552,200 495,500 440,400 1,070,000 700,000Dedicated Credits Revenue 458,000 428,400 841,400 1,790,100 12,224,200GFR - E-911 Emergency Services 0 250,000 250,000 290,000 300,000State Debt Collection Fund 0 0 0 0 500,000Beginning Nonlapsing 182,500 192,100 724,100 671,300 1,400,000Beginning Nonlapsing - DHRM Flex Benef 0 0 0 0 10,200Beginning Nonlapsing - Retirement 0 0 0 0 77,000Closing Nonlapsing (192,100) (724,000) (671,300) (2,621,400) 0Lapsing Balance (125,300) 0 0 0 0
Total $2,092,100 $2,092,000 $3,283,600 $10,511,900 $17,484,000
Line ItemsChief Information Officer 532,900 563,200 895,200 792,400 640,100Integrated Technology 1,559,200 1,528,800 2,388,400 3,997,400 3,750,400Technology Acquisition Projects 0 0 0 5,722,100 13,093,500
Total $2,092,100 $2,092,000 $3,283,600 $10,511,900 $17,484,000
Categories of ExpenditurePersonal Services 1,253,900 1,354,600 1,569,200 1,933,600 1,813,400In-State Travel 14,700 26,500 61,900 54,600 62,700Out of State Travel 29,700 26,700 31,700 44,100 31,800Current Expense 308,000 320,400 445,600 1,624,500 872,100DP Current Expense 268,600 170,400 207,700 311,000 6,643,800DP Capital Outlay 26,800 63,100 371,900 5,727,100 7,456,500Other Charges/Pass Thru 190,400 130,300 595,600 817,000 603,700
Total $2,092,100 $2,092,000 $3,283,600 $10,511,900 $17,484,000
Other DataBudgeted FTE 15.0 18.0 14.0 18.0 21.0Actual FTE 18.6 22.1 21.3 21.6 0.0
Table 75
OFFICE OF THE LEGISLATIVE FISCAL ANALYST - 160 - DTS – APPROPRIATED BUDGET
CAPITAL FACILITIES AND GOVERNMENT OPS. 2008 GS
OFFICE OF THE LEGISLATIVE FISCAL ANALYST - 161 - DTS – APPROPRIATED BUDGET
LINE ITEMS – DEPARTMENT OF TECHNOLOGY SERVICES
CHIEF INFORMATION OFFICER
Function By statute, the Executive Director of the Department of Technology Services serves as the State’s Chief Information Officer (CIO). In addition to administering the Department, the CIO provides policy direction and strategic vision for state information technology endeavors. The CIO reports directly to the governor, as well as to the Utah Technology Commission and Public Utilities and Technology Interim Committee. He or she has a seven member advisory board from which to seek input.
Statutory Authority The following statutes govern the Chief Information Officer:
UCA 63F-1-201 creates the CIO and assigns reporting requirements
UCA 63F-1-202 creates a Technology Advisory Board from which the CIO can seek advice
UCA 63F-1-203 and 204 require the CIO to develop and review information technology strategic plans
UCA 63F-1-205 empowers the CIO to acquire information technology assets for state agencies only after thorough business needs assessments
UCA 63F-1-206 gives the CIO rulemaking authority
UCA 63F-1-207 directs the CIO to coordinate executive branch IT plans with those of other branches of state government
UCA 63F-1-208 and 209 give the CIO sole authority to hire information technology staff and discretion to delegate those staff and associated functions to other agencies of state government
Intent Language During the 2007 General Session the Legislature adopted the following intent language for FY 2007 in S.B. 1:
Under Section 63-38-8 of the Utah Code the Legislature intends that funds provided in this item, Item 50 of Chapter 1, Laws of Utah 2006, Item 48 of Chapter 366, Laws of Utah 2006, and Item 33 of Chapter 361, Laws of Utah 2006 for the Department of Technology Services - Chief Information Officer not lapse at the close of fiscal year 2007.
Funding Detail The following table shows the CIO’s budget, as well as budget history for years prior to FY 2006 during which the CIO was part of the Governor’s Office.
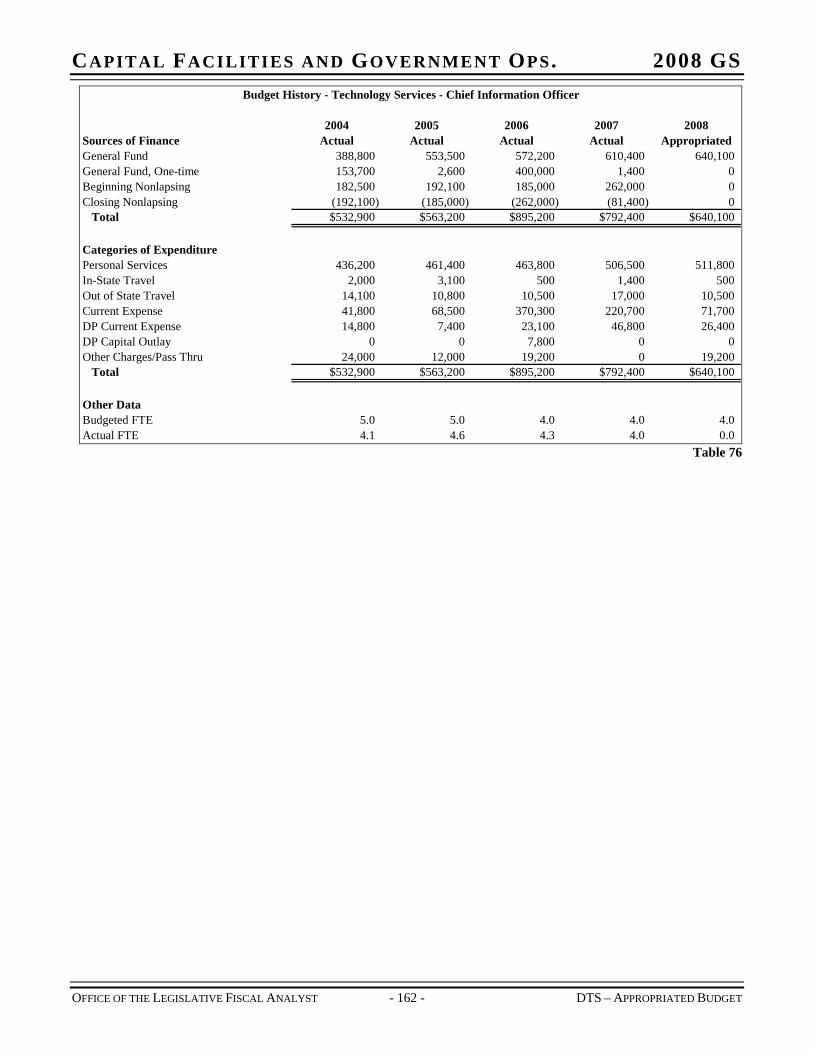
CAPITAL FACILITIES AND GOVERNMENT OPS. 2008 GS Budget History - Technology Services - Chief Information Officer
2004 2005 2006 2007 2008Sources of Finance Actual Actual Actual Actual AppropriatedGeneral Fund 388,800 553,500 572,200 610,400 640,100General Fund, One-time 153,700 2,600 400,000 1,400 0Beginning Nonlapsing 182,500 192,100 185,000 262,000 0Closing Nonlapsing (192,100) (185,000) (262,000) (81,400) 0
Total $532,900 $563,200 $895,200 $792,400 $640,100
Categories of ExpenditurePersonal Services 436,200 461,400 463,800 506,500 511,800In-State Travel 2,000 3,100 500 1,400 500Out of State Travel 14,100 10,800 10,500 17,000 10,500Current Expense 41,800 68,500 370,300 220,700 71,700DP Current Expense 14,800 7,400 23,100 46,800 26,400DP Capital Outlay 0 0 7,800 0 0Other Charges/Pass Thru 24,000 12,000 19,200 0 19,200
Total $532,900 $563,200 $895,200 $792,400 $640,100
Other DataBudgeted FTE 5.0 5.0 4.0 4.0 4.0Actual FTE 4.1 4.6 4.3 4.0 0.0
Table 76
OFFICE OF THE LEGISLATIVE FISCAL ANALYST - 162 - DTS – APPROPRIATED BUDGET
CAPITAL FACILITIES AND GOVERNMENT OPS. 2008 GS
OFFICE OF THE LEGISLATIVE FISCAL ANALYST - 163 - DTS – APPROPRIATED BUDGET
INTEGRATED TECHNOLOGY
Function The division of Integrated Technology coordinates application development and project management for agencies and programs that share common needs. As opposed to the division of Enterprise Technology, which oversees the information technology that affects all state agencies, the division of Integrated Technology oversees the information technology that affects multiple, but not all, agencies.
The biggest component of the division is the Automated Geographic Reference Center (AGRC) which maintains and operates Utah’s State Geographic Information Database (SGID). The AGRC works with state agencies to collect and retain geospatial data and assists agencies in culling information from that data using computer applications. Examples of its work include collection of high-resolution geographically correct images, mapping of rural RS-2477 roads, and depiction of legislative district boundaries.
Statutory Authority The following laws govern operation of the division of Integrated Technology:
UCA 63F-1-501 creates the division of Integrated Technology.
UCA 63F-1-504 specifies the duties of the division which include:
Establish standards for the project management, application development, and procurement of information technology for executive branch agencies that share common stakeholders
Provide oversight of information technology standards that impact multiple executive branch agency IT services in order to control costs, ensure business value, maximize resources, apply best practices, and avoid the duplication of resources
Review agency IT plans for compliance with state information architecture and DTS policies and rules for projects that impact multiple agencies
UCA 63F-1-506 creates the AGRC as part of the division in order to:
Provide Geographic Information System (GIS) services to state agencies, federal government, local political subdivisions, and private persons under rules established by the division
Manage the SGID
Assist the Leutenant Governor, state agencies, and local entities with boundary creation, changes, collection, tracking, and mapping
The division may make rules, establish policies, and set fees for its services
UCA 63F-1-507 creates the State Geographic Information Database (SGID) to be managed by the AGRC. The database serves as the central reference for all information contained in any GIS database by any state agency and the
CAPITAL FACILITIES AND GOVERNMENT OPS. 2008 GS
OFFICE OF THE LEGISLATIVE FISCAL ANALYST - 164 - DTS – APPROPRIATED BUDGET
standard for geographic information acquired, purchased, or produced by any state agency.
UCA 63F-1-507 also stipulates that each agency that has geographic information data must allow the AGRC access to all public data and requires the Tax Commission to annually submit information on the creation or modification of political subdivisions.
UCA 72-5-304 requires AGRC to create and maintain records of RS-2477 roads, and 72-5-309 directs AGRC to make those records available to the public. UCA 63F-1-508 creates within the AGRC a subcommittee to award grants to counties to inventory and map RS-2477 rights-of-way.
UCA 63F-1-204 requires state agencies develop Information Technology Strategic Plans. In coordination with the Chief Information Officer, AGRC reviews and consults with agencies on agency IT plans, especially data acquisition efforts.
A number of statutes require AGRC to maintain certain records in its geospatial database. They include:
UCA 10-9a-203 which requires localities to submit zoning and general plan information to AGRC;
11-36-201 which requires submission of capital facilities plans to AGRC; and
20A-5-303 requires municipalities submit voting precinct data to AGRC.
UCA 63F-1-509 creates a statewide Global Positioning Reference Network to provide more accurate location information. The statute directs AGRC to administer the GPS reference system.
Intent Language During the 2007 General Session the Legislature adopted the following intent language for FY 2007 in S.B. 1:
Under Section 63-38-8 of the Utah Code the Legislature intends that funds provided in this item, Item 51 of Chapter 1, Laws of Utah 2006, Item 49 of Chapter 366, Laws of Utah 2006, and Item 34 of Chapter 361, Laws of Utah 2006 for the Department of Technology Services - Integrated Technology Division - Automated Geographic Reference Center not lapse at the close of fiscal year 2007.
Funding Detail Prior to FY 2004, the AGRC was subsidized by revenue generated within the Department of Administrative Services, Division of Information Technology Services Internal Service Fund. In FY 2004, the Legislature changed the budget structure of the AGRC to receive direct appropriations instead of subsidies by internal service fund customers. Prior to FY 2006, the AGRC resided within the Department of Administrative Services (DAS).
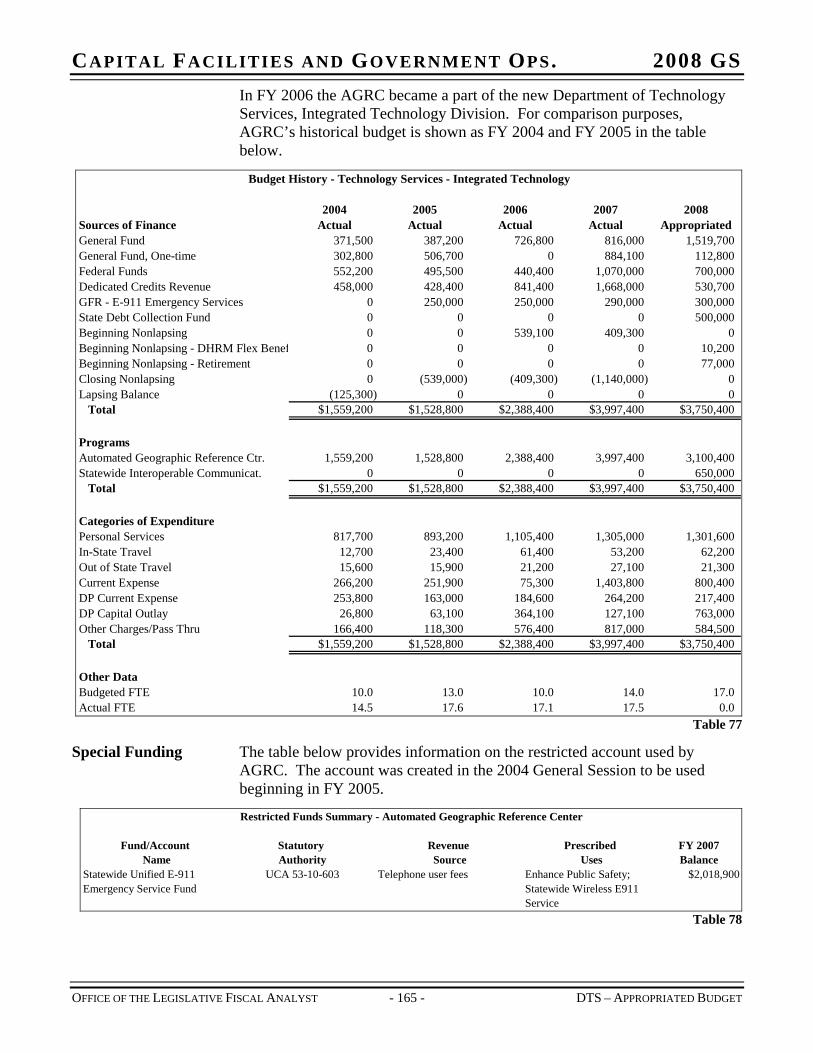
CAPITAL FACILITIES AND GOVERNMENT OPS. 2008 GS In FY 2006 the AGRC became a part of the new Department of Technology Services, Integrated Technology Division. For comparison purposes, AGRC’s historical budget is shown as FY 2004 and FY 2005 in the table below.
Budget History - Technology Services - Integrated Technology
2004 2005 2006 2007 2008Sources of Finance Actual Actual Actual Actual AppropriatedGeneral Fund 371,500 387,200 726,800 816,000 1,519,700General Fund, One-time 302,800 506,700 0 884,100 112,800Federal Funds 552,200 495,500 440,400 1,070,000 700,000Dedicated Credits Revenue 458,000 428,400 841,400 1,668,000 530,700GFR - E-911 Emergency Services 0 250,000 250,000 290,000 300,000State Debt Collection Fund 0 0 0 0 500,000Beginning Nonlapsing 0 0 539,100 409,300 0Beginning Nonlapsing - DHRM Flex Benef 0 0 0 0 10,200Beginning Nonlapsing - Retirement 0 0 0 0 77,000Closing Nonlapsing 0 (539,000) (409,300) (1,140,000) 0Lapsing Balance (125,300) 0 0 0 0
Total $1,559,200 $1,528,800 $2,388,400 $3,997,400 $3,750,400
ProgramsAutomated Geographic Reference Ctr. 1,559,200 1,528,800 2,388,400 3,997,400 3,100,400Statewide Interoperable Communicat. 0 0 0 0 650,000
Total $1,559,200 $1,528,800 $2,388,400 $3,997,400 $3,750,400
Categories of ExpenditurePersonal Services 817,700 893,200 1,105,400 1,305,000 1,301,600In-State Travel 12,700 23,400 61,400 53,200 62,200Out of State Travel 15,600 15,900 21,200 27,100 21,300Current Expense 266,200 251,900 75,300 1,403,800 800,400DP Current Expense 253,800 163,000 184,600 264,200 217,400DP Capital Outlay 26,800 63,100 364,100 127,100 763,000Other Charges/Pass Thru 166,400 118,300 576,400 817,000 584,500
Total $1,559,200 $1,528,800 $2,388,400 $3,997,400 $3,750,400
Other DataBudgeted FTE 10.0 13.0 10.0 14.0 17.0Actual FTE 14.5 17.6 17.1 17.5 0.0
Table 77
Special Funding The table below provides information on the restricted account used by AGRC. The account was created in the 2004 General Session to be used beginning in FY 2005.
Restricted Funds Summary - Automated Geographic Reference Center
Fund/Account Statutory Revenue Prescribed FY 2007 Name Authority Source Uses Balance
Statewide Unified E-911 Emergency Service Fund
UCA 53-10-603 Telephone user fees Enhance Public Safety; Statewide Wireless E911 Service
$2,018,900
Table 78
OFFICE OF THE LEGISLATIVE FISCAL ANALYST - 165 - DTS – APPROPRIATED BUDGET
CAPITAL FACILITIES AND GOVERNMENT OPS. 2008 GS
OFFICE OF THE LEGISLATIVE FISCAL ANALYST - 166 - DTS – APPROPRIATED BUDGET
TECHNOLOGY ACQUISITION PROJECTS
Function DTS is responsible for managing all information technology statewide. As such, it acts as the systems integrator for new technology projects acquired by individual state agencies.
In FY 2007, the Legislature funded the following computer system upgrades in the Technology Acquisition Projects program:
Tax System Modernization: $7 million from the General Fund and $5 million from Dedicated Credits paid by the Tax Commission to replace sales, income, and corporate tax accounting systems, among others, facilitating income tax reform and streamlined sales tax. The first phase, beginning in FY 2007, would provide core functionality plus the income tax code set.
UDOT Maintenance Management System: $3 million from Dedicated Credits paid by the Department of Transportation to replace existing systems that have not kept pace with changing technology, are time consuming, and do not easily answer the types of questions asked by UDOT managers. The MMS will store and retrieve information about repair needs on state roads and roadside appurtenances. The system will allow UDOT to more accurately target its resources and prolong the life of the state’s assets.
DNR Oil and Gas Electronic Permitting System: $100,000 from Dedicated Credits paid by the Department of Natural Resources to develop computer applications to process, approve, and monitor oil and gas drilling permits and other activities. The new system will allow the Department of Natural Resources to meet the increased demands for oil & gas exploration and drilling in Utah.
UCC Online Filing System: $100,000 from Dedicated Credits paid by the Department of Commerce to enhance Commerce’s on-line filing system so that it is more efficient and offers additional functionality to users. Commerce especially wants to add the ability to upload images, serve agricultural users, and improve reporting capabilities.
Electronic Resource Eligibility Project (eREP): $3 million from Dedicated Credits to be paid by the Departments of Health, Human Services, and Workforce Services to automate management of certain social service programs. The FY 2007 appropriation is intended to add a Medicaid eligibility module to eRep.
Intent Language During the 2007 General Session the Legislature adopted the following intent language for FY 2007 in S.B. 1:
Under Section 63-38-8.1 of the Utah Code the Legislature intends that up to $1,400,000 provided in Item 43 of Chapter 367, Laws of Utah 2006 not lapse at the close of fiscal year 2007. The use of any nonlapsing funds is limited to the Arches Tax System Modernization project.
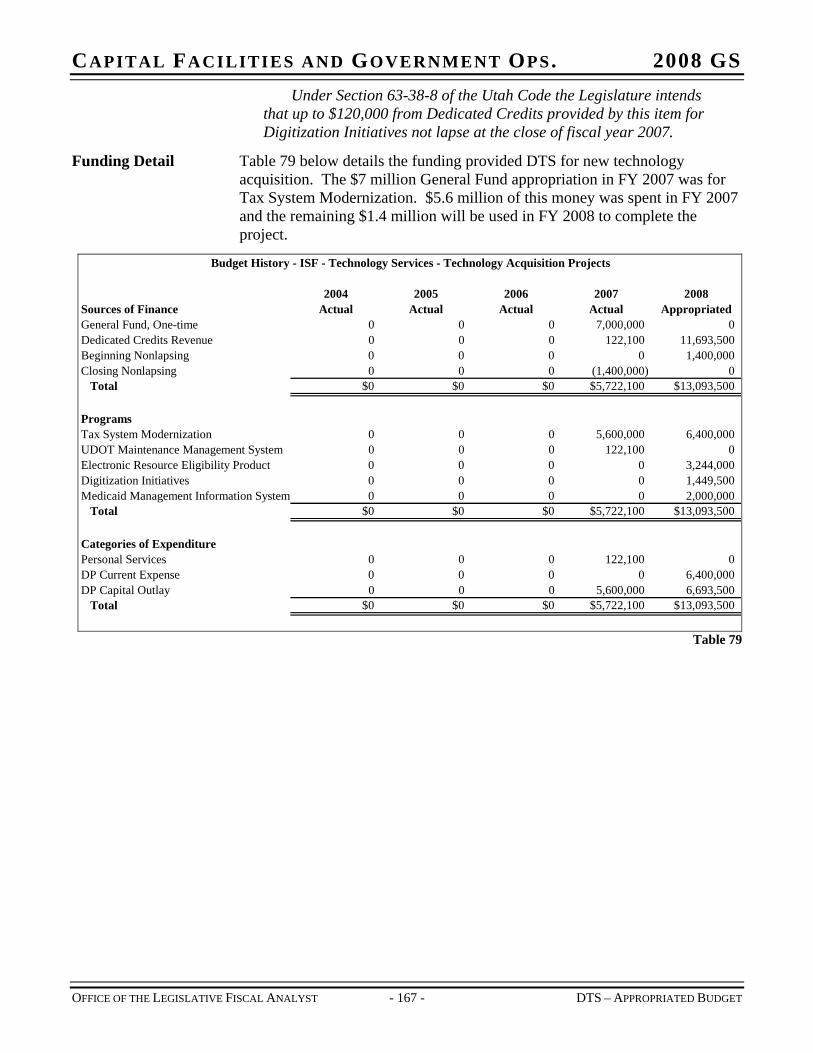
CAPITAL FACILITIES AND GOVERNMENT OPS. 2008 GS Under Section 63-38-8 of the Utah Code the Legislature intends
that up to $120,000 from Dedicated Credits provided by this item for Digitization Initiatives not lapse at the close of fiscal year 2007.
Funding Detail Table 79 below details the funding provided DTS for new technology acquisition. The $7 million General Fund appropriation in FY 2007 was for Tax System Modernization. $5.6 million of this money was spent in FY 2007 and the remaining $1.4 million will be used in FY 2008 to complete the project.
Budget History - ISF - Technology Services - Technology Acquisition Projects
2004 2005 2006 2007 2008Sources of Finance Actual Actual Actual Actual AppropriatedGeneral Fund, One-time 0 0 0 7,000,000 0Dedicated Credits Revenue 0 0 0 122,100 11,693,500Beginning Nonlapsing 0 0 0 0 1,4Closing Nonlapsing 0 0 0 (1,400,000) 0
Total $0 $0 $0 $5,722,100 $13,093,500
ProgramsTax System Modernization 0 0 0 5,600,000 6,400,000UDOT Maintenance Management System 0 0 0 122,100 0Electronic Resource Eligibility Product 0 0 0 0 3,2Digitization Initiatives 0 0 0 0 1,4Medicaid Management Information Syste
00,000
44,00049,500
m 0 0 0 0 2,0Total $0 $0 $0 $5,722,100 $13,093,500
Categories of ExpenditurePersonal Services 0 0 0 122,100 0DP Current Expense 0 0 0 0 6,4DP Capital Outlay 0 0 0 5,600,000 6,693,500
Total $0 $0 $0 $5,722,100 $13,093,500
00,000
00,000
Table 79
OFFICE OF THE LEGISLATIVE FISCAL ANALYST - 167 - DTS – APPROPRIATED BUDGET

CAPITAL FACILITIES AND GOVERNMENT OPS. 2008 GS
OFFICE OF THE LEGISLATIVE FISCAL ANALYST - 169 - DTS – INTERNAL SERVICE FUND
CHAPTER 25 DEPARTMENT OF TECHNOLOGY SERVICES – OPERATIONS – ISF
Function As noted in Chapter 23, the Department of Technology Services (DTS) acts as Utah’s central service provider for information technology (IT) related activities. While part of DTS’ budget is directly appropriated, another part will be financed by billing customer agencies. This chapter addresses that latter portion of DTS, the Internal Service Fund (ISF) portion.
Statutory Authority The following statutes govern the Department of Technology Services Internal Service Fund:
UCA 63F-1-103 creates the Department of Technology Services and gives DTS authority to operate as an internal service fund.
UCA 63F-1-301 creates an Information Technology Rate Committee that reviews and approves all rates before they are charged by DTS. The rate committee forwards such rates to the Legislature for final authorization.
UCA 63-38, “Budgetary Procedures Act” defines internal service funds and sets guidelines for their operations.
Intent Language During the 2007 General Session the Legislature adopted the following intent language for FY 2007 in S.B. 1 allowing DTS to carry-forward capital acquisition authority for certain capital projects.
The Legislature intends that, under the terms and conditions of Utah Code Annotated 63-38-8.2, $996,000 in capital outlay authority granted to the Department of Technology Services in Item 50 of Chapter 366, Laws of Utah 2006 not lapse at the close of fiscal year 2007. The Legislature intends that this authority only be used for the following projects: Network Convergence ($425,000), Data Archiving ($345,000), Information Life Cycle ($226,000).
Funding Detail The following table shows budget information for DTS internal service fund. Consolidation of the former Department of Administrative Service Division of Information Technology Services (ITS) into DTS began in FY 2006. The FY 2007 budget reflects the addition of all state agency IT employees to the former ITS budget. Historical budgets for ITS can be found in chapter 18, and historical information on IT budgets prior to FY 2007 is spread throughout the agencies of state government.
For FY 2006, the Legislature provided Full Time Equivalent employment authorization to both DTS and ITS. While this appears to double count DTS employees (236 positions), the Legislature included intent language stating that each time a position was filled in DTS, one must be eliminated elsewhere. The FY 2006 FTE authorization did not include Agency Services employees as those employees were not consolidated with DTS until FY 2007.
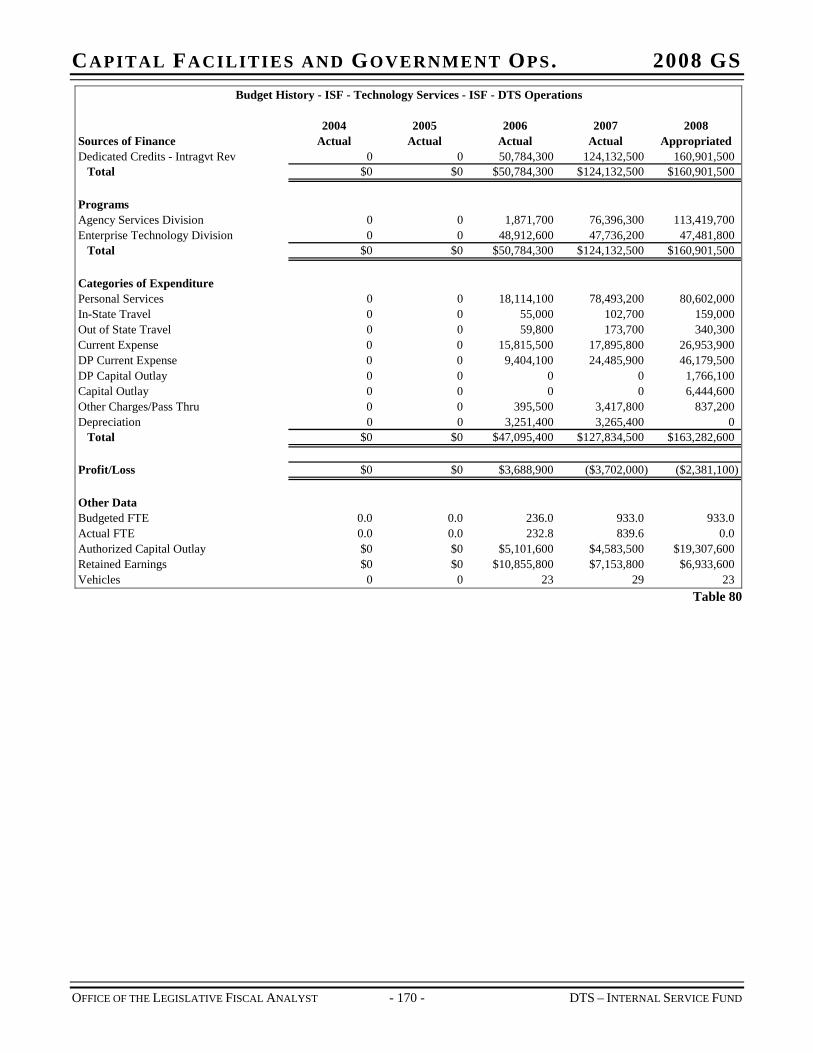
CAPITAL FACILITIES AND GOVERNMENT OPS. 2008 GS Budget History - ISF - Technology Services - ISF - DTS Operations
2004 2005 2006 2007 2008Sources of Finance Actual Actual Actual Actual AppropriatedDedicated Credits - Intragvt Rev 0 0 50,784,300 124,132,500 160,901,500
Total $0 $0 $50,784,300 $124,132,500 $160,901,500
ProgramsAgency Services Division 0 0 1,871,700 76,396,300 113,419,700Enterprise Technology Division 0 0 48,912,600 47,736,200 47,481,800
Total $0 $0 $50,784,300 $124,132,500 $160,901,500
Categories of ExpenditurePersonal Services 0 0 18,114,100 78,493,200 80,602,000In-State Travel 0 0 55,000 102,700 159,000Out of State Travel 0 0 59,800 173,700 340,300Current Expense 0 0 15,815,500 17,895,800 26,953,900DP Current Expense 0 0 9,404,100 24,485,900 46,179,500DP Capital Outlay 0 0 0 0 1,7Capital Outlay 0 0 0 0 6,4Other Charges/Pass Thru 0 0 395,500 3,417,800 837,200Depreciation 0 0 3,251,400 3,265,400 0
Total $0 $0 $47,095,400 $127,834,500 $163,282,600
Profit/Loss $0 $0 $3,688,900 ($3,702,000) ($2,381,100)
Other DataBudgeted FTE 0.0 0.0 236.0 933.0 933.0Actual FTE 0.0 0.0 232.8 839.6 0.0Authorized Capital Outlay $0 $0 $5,101,600 $4,583,500 $19,307,600Retained Earnings $0 $0 $10,855,800 $7,153,800 $6,933,600Vehicles 0 0 23 29 23
66,10044,600
Table 80
OFFICE OF THE LEGISLATIVE FISCAL ANALYST - 170 - DTS – INTERNAL SERVICE FUND
CAPITAL FACILITIES AND GOVERNMENT OPS. 2008 GS
OFFICE OF THE LEGISLATIVE FISCAL ANALYST - 171 - DTS – INTERNAL SERVICE FUND
PROGRAMS – DTS INTERNAL SERVICE FUND
AGENCY SERVICES DIVISION
Function The DTS Agency Services Division provides direct IT support to agencies of state government. Agency Services employs information technology professionals that prior to FY 2007 were employed directly by individual state agencies. Through the DTS internal service fund, these employees now work for DTS but provide services to their “home” agencies on a cost reimbursement basis.
The rates charged by DTS for Agency Services for FY 2007 are equal to the estimated cost of employees on an agency-by-agency basis. For future years, DTS is optimizing services so that rates for Agency Services will be based on products not pre-existing personnel costs.
Statutory Authority The duties of the Department of Technology Services Agency Services Division are enumerated in Utah Code 63F-1-604. They include but are not limited to providing support for information technology projects, programs, or functions that are unique to a given executive branch agency.
Intent Language During the 2007 General Session the Legislature adopted the following intent language for FY 2008 in S.B. 3 allowing DTS to adjust rates in order to cover the cost of compensation increases.
The Legislature intends that the Department of Technology Services adjust its rates for the Agency Services Division downward as allowed by law to match the compensation package provided in 'State Agency and Higher Education Compensation Amendments' 408 (S.B. 228, 2007 General Session) The Legislature further intends that the Department of Technology Services charge such adjusted rates to customer agencies to cover the cost of compensation increases in the Agency Services Division, and that customer agencies pay the rates using amounts appropriated for that purpose throughout Senate Bill 228.
Funding Detail The following table depicts the FY 2007 budget for Agency Services. Prior to FY 2007, the employees and budgets reflected here were disbursed throughout state government.
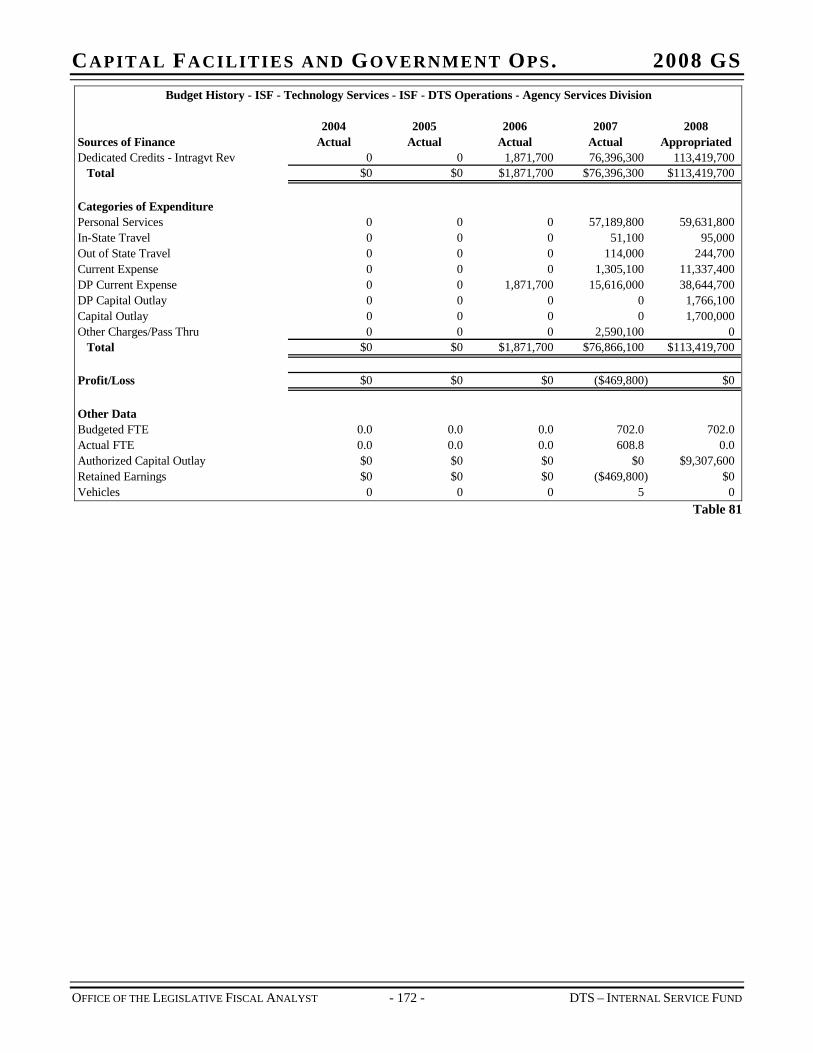
CAPITAL FACILITIES AND GOVERNMENT OPS. 2008 GS Budget History - ISF - Technology Services - ISF - DTS Operations - Agency Services Division
2004 2005 2006 2007 2008Sources of Finance Actual Actual Actual Actual AppropriatedDedicated Credits - Intragvt Rev 0 0 1,871,700 76,396,300 113,419,700
Total $0 $0 $1,871,700 $76,396,300 $113,419,700
Categories of ExpenditurePersonal Services 0 0 0 57,189,800 59,631,800In-State Travel 0 0 0 51,100 95,000Out of State Travel 0 0 0 114,000 244,700Current Expense 0 0 0 1,305,100 11,337,400DP Current Expense 0 0 1,871,700 15,616,000 38,644,700DP Capital Outlay 0 0 0 0 1,766,100Capital Outlay 0 0 0 0 1,700,000Other Charges/Pass Thru 0 0 0 2,590,100 0
Total $0 $0 $1,871,700 $76,866,100 $113,419,700
Profit/Loss $0 $0 $0 ($469,800) $0
Other DataBudgeted FTE 0.0 0.0 0.0 702.0 702.0Actual FTE 0.0 0.0 0.0 608.8 0.0Authorized Capital Outlay $0 $0 $0 $0 $9,307,600Retained Earnings $0 $0 $0 ($469,800) $0Vehicles 0 0 0 5 0
Table 81
OFFICE OF THE LEGISLATIVE FISCAL ANALYST - 172 - DTS – INTERNAL SERVICE FUND
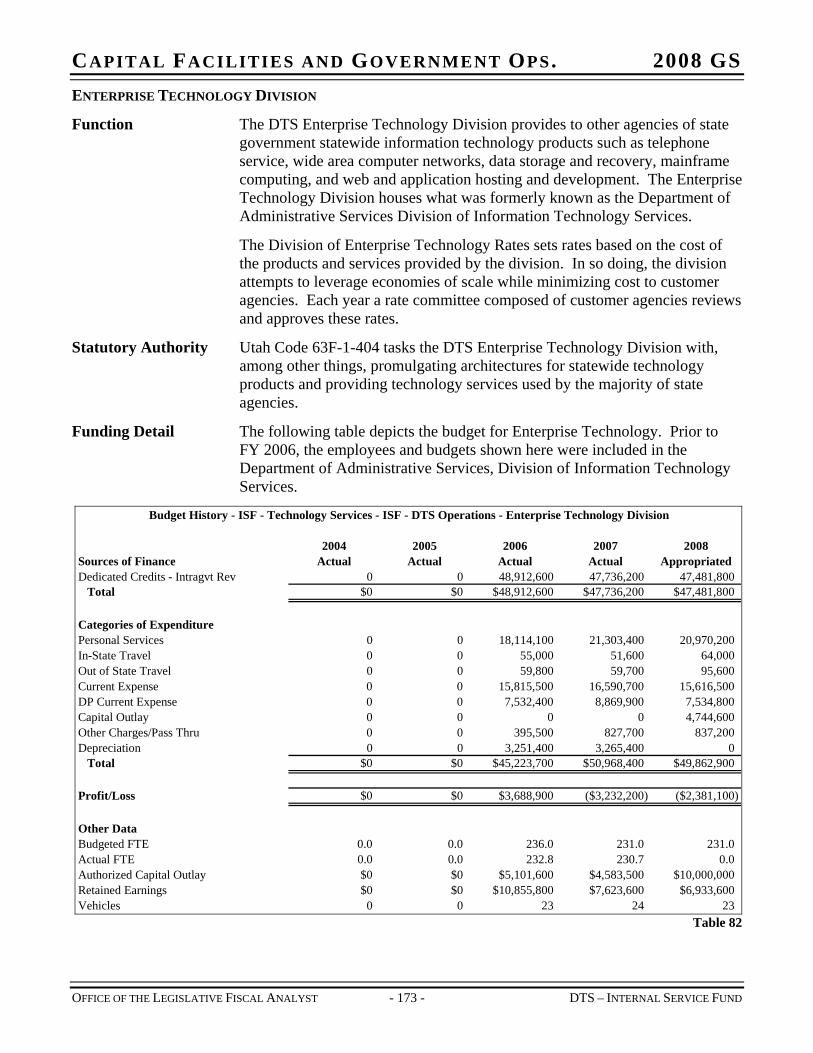
CAPITAL FACILITIES AND GOVERNMENT OPS. 2008 GS ENTERPRISE TECHNOLOGY DIVISION
Function The DTS Enterprise Technology Division provides to other agencies of state government statewide information technology products such as telephone service, wide area computer networks, data storage and recovery, mainframe computing, and web and application hosting and development. The Enterprise Technology Division houses what was formerly known as the Department of Administrative Services Division of Information Technology Services.
The Division of Enterprise Technology Rates sets rates based on the cost of the products and services provided by the division. In so doing, the division attempts to leverage economies of scale while minimizing cost to customer agencies. Each year a rate committee composed of customer agencies reviews and approves these rates.
Statutory Authority Utah Code 63F-1-404 tasks the DTS Enterprise Technology Division with, among other things, promulgating architectures for statewide technology products and providing technology services used by the majority of state agencies.
Funding Detail The following table depicts the budget for Enterprise Technology. Prior to FY 2006, the employees and budgets shown here were included in the Department of Administrative Services, Division of Information Technology Services.
Budget History - ISF - Technology Services - ISF - DTS Operations - Enterprise Technology Division
2004 2005 2006 2007 2008Sources of Finance Actual Actual Actual Actual AppropriatedDedicated Credits - Intragvt Rev 0 0 48,912,600 47,736,200 47,481,800
Total $0 $0 $48,912,600 $47,736,200 $47,481,800
Categories of ExpenditurePersonal Services 0 0 18,114,100 21,303,400 20,970,200In-State Travel 0 0 55,000 51,600 64,000Out of State Travel 0 0 59,800 59,700 95,600Current Expense 0 0 15,815,500 16,590,700 15,616,500DP Current Expense 0 0 7,532,400 8,869,900 7,534,800Capital Outlay 0 0 0 0 4,7Other Charges/Pass Thru 0 0 395,500 827,700 837,200Depreciation 0 0 3,251,400 3,265,400 0
Total $0 $0 $45,223,700 $50,968,400 $49,862,900
Profit/Loss $0 $0 $3,688,900 ($3,232,200) ($2,381,100)
Other DataBudgeted FTE 0.0 0.0 236.0 231.0 231.0Actual FTE 0.0 0.0 232.8 230.7 0.0Authorized Capital Outlay $0 $0 $5,101,600 $4,583,500 $10,000,000Retained Earnings $0 $0 $10,855,800 $7,623,600 $6,933,600Vehicles 0 0 23 24 23
44,600
Table 82
OFFICE OF THE LEGISLATIVE FISCAL ANALYST - 173 - DTS – INTERNAL SERVICE FUND

CAPITAL FACILITIES AND GOVERNMENT OPS. 2008 GS
OFFICE OF THE LEGISLATIVE FISCAL ANALYST - 175 - CAPITAL BUDGET
CHAPTER 26 CAPITAL BUDGET
Function The Capital Budget funds new construction, major remodeling, alterations, repairs, improvements, real estate, roofing and paving projects.
The Capital Budget is divided into three line items:
1. Capital Developments
2. Capital Improvements
3. Property Acquisition
Statutory Authority UCA 63A-5-104 defines “Capital Developments” as either of the following:
A remodeling, site, or utility project with a cost of $2,500,000 or more
A new facility with a construction cost of $500,000 or more
A purchase of real property where an appropriation is requested to fund the purchase
The same statute defines “Capital Improvements” as either of the following:
A remodeling, alteration, replacement or repair project with a total cost of less than $2,500,000
A site and utility improvement with a total cost less than $2,500,000
New facility with a total construction cost of less than $500,000
UCA 63A-5-103 requires the State Building Board to develop and maintain a Five-Year Building Program for submission to the governor and Legislature that includes:
A priority list of capital development projects
Detailed information for each project recommended in the first two years of the plan
A summary of Contingency Reserve and Project Reserve balances
Information about state leased facilities
The results of facility condition assessments including the cost of needed improvements
UCA 63A-5-104(2) requires the State Building Board to submit its capital development recommendations and priorities to the Legislature for approval and prioritization. The SBB makes recommendations on behalf of all state agencies, commissions, departments and institutions.
A capital development project may not be constructed on state property without legislative approval unless:
The Building Board determines that a requesting higher education institution has provided adequate assurance that state funds will not be used for construction, O&M, or future capital improvements of the
CAPITAL FACILITIES AND GOVERNMENT OPS. 2008 GS
OFFICE OF THE LEGISLATIVE FISCAL ANALYST - 176 - CAPITAL BUDGET
facility, and the new facility is consistent with the needs of the institution and the state
The renovation, remodeling, or retrofitting of an existing facility will be done with non-state funds
Facilities will be built with non-state funds and owned by non-state entities within research park areas at the U of U or USU
Facilities will be built at This is the Place State Park
Projects are funded by the Navajo Trust Fund and Uintah Basin Revitalization Fund, and do not provide a new facility for a state agency or higher education institution
Projects are on school and institutional trust lands and funded from the Land Grant Management Fund, and do not provide a new facility for a state agency or higher education institution
The project will be constructed by UDOT as a result of an exchange of real property under UCA 72-5-111, however, when UDOT approves these exchanges it must notify the Senate President, House Speaker, and CFAS co-chairs about any new facilities to be built under this exemption
UCA 63A-5-104(4) requires the State Building Board, on behalf of all state agencies and institutions, to submit by January 15 of each year a list of anticipated capital improvement requirements to the Legislature. Unless otherwise directed by the Legislature, the Building Board must prioritize capital improvements from the list submitted to the Legislature up to the level of money appropriated. In an emergency situation the Building Board may reallocate capital improvement funds.
UCA 63A-5-104(6) prohibits the Legislature from funding the design or construction of any new capital development projects, except to complete already begun projects, until the Legislature has appropriated 1.1 percent of the replacement cost of existing state facilities to capital improvements. However, if the Legislature determines that an operating deficit exists, it may help reduce the deficit by reducing the appropriation to 0.9 percent.
“Replacement cost” is determined by the Division of Risk Management, except for auxiliary facilities as defined by the Building Board.
The Building Board may make rules allocating to institutions and agencies their proportionate share of capital improvement funding.
In UCA 63A-5-104(9) the Legislature declares its intention to fund at least half of the capital improvement requirement with the General Fund.
UCA 63-38-8(3)(d) prohibits transfers from a line item of any agency or institution into the Capital Projects Fund without the prior express approval of the Legislature.
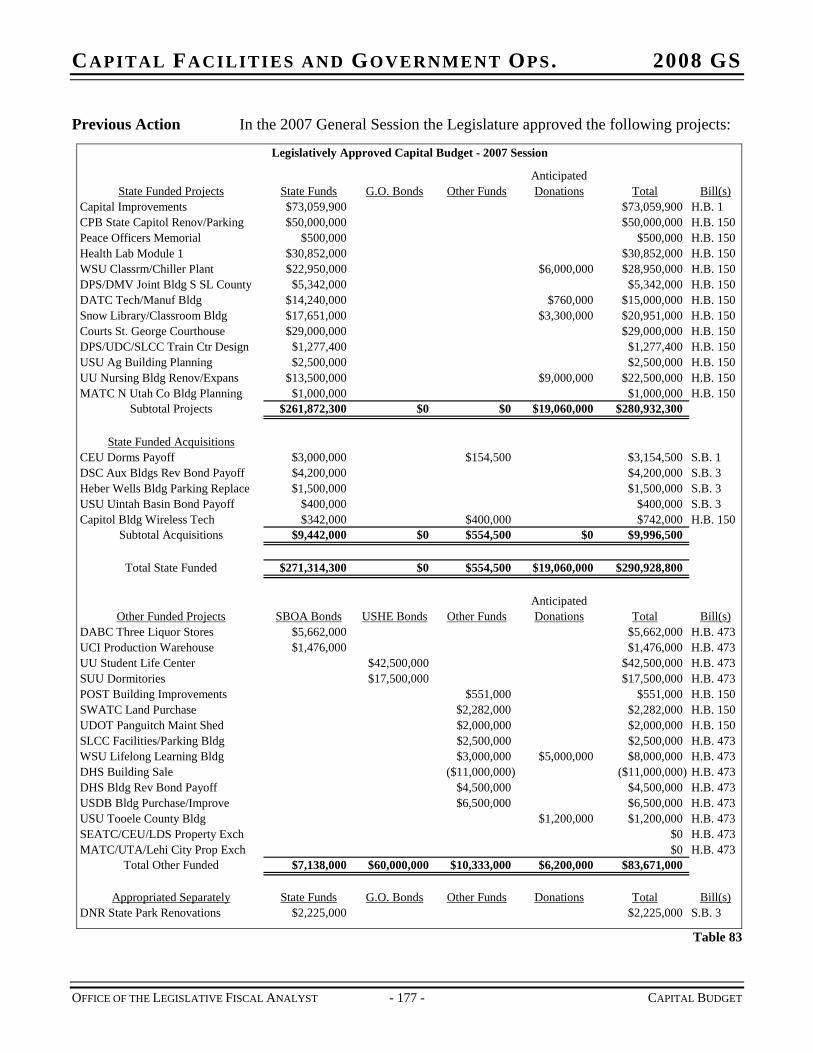
CAPITAL FACILITIES AND GOVERNMENT OPS. 2008 GS
Previous Action In the 2007 General Session the Legislature approved the following projects:
AnticipatedState Funded Projects State Funds G.O. Bonds Other Funds Donations Total Bill(s)
Capital Improvements $73,059,900 $73,059,900 H.B. 1CPB State Capitol Renov/Parking $50,000,000 $50,000,000 H.B. 150Peace Officers Memorial $500,000 $500,000 H.B. 150Health Lab Module 1 $30,852,000 $30,852,000 H.B. 150WSU Classrm/Chiller Plant $22,950,000 $6,000,000 $28,950,000 H.B. 150DPS/DMV Joint Bldg S SL County $5,342,000 $5,342,000 H.B. 150DATC Tech/Manuf Bldg $14,240,000 $760,000 $15,000,000 H.B. 150Snow Library/Classroom Bldg $17,651,000 $3,300,000 $20,951,000 H.B. 150Courts St. George Courthouse $29,000,000 $29,000,000 H.B. 150DPS/UDC/SLCC Train Ctr Design $1,277,400 $1,277,400 H.B. 150USU Ag Building Planning $2,500,000 $2,500,000 H.B. 150UU Nursing Bldg Renov/Expans $13,500,000 $9,000,000 $22,500,000 H.B. 150MATC N Utah Co Bldg Planning $1,000,000 $1,000,000 H.B. 150
Subtotal Projects $261,872,300 $0 $0 $19,060,000 $280,932,300
State Funded AcquisitionsCEU Dorms Payoff $3,000,000 $154,500 $3,154,500 S.B. 1DSC Aux Bldgs Rev Bond Payoff $4,200,000 $4,200,000 S.B. 3Heber Wells Bldg Parking Replace $1,500,000 $1,500,000 S.B. 3USU Uintah Basin Bond Payoff $400,000 $400,000 S.B. 3Capitol Bldg Wireless Tech $342,000 $400,000 $742,000 H.B. 150
Subtotal Acquisitions $9,442,000 $0 $554,500 $0 $9,996,500
Total State Funded $271,314,300 $0 $554,500 $19,060,000 $290,928,800
AnticipatedOther Funded Projects SBOA Bonds USHE Bonds Other Funds Donations Total Bill(s)
DABC Three Liquor Stores $5,662,000 $5,662,000 H.B. 473UCI Production Warehouse $1,476,000 $1,476,000 H.B. 473UU Student Life Center $42,500,000 $42,500,000 H.B. 473SUU Dormitories $17,500,000 $17,500,000 H.B. 473POST Building Improvements $551,000 $551,000 H.B. 150SWATC Land Purchase $2,282,000 $2,282,000 H.B. 150UDOT Panguitch Maint Shed $2,000,000 $2,000,000 H.B. 150SLCC Facilities/Parking Bldg $2,500,000 $2,500,000 H.B. 473WSU Lifelong Learning Bldg $3,000,000 $5,000,000 $8,000,000 H.B. 473DHS Building Sale ($11,000,000) ($11,000,000) H.B. 473DHS Bldg Rev Bond Payoff $4,500,000 $4,500,000 H.B. 473USDB Bldg Purchase/Improve $6,500,000 $6,500,000 H.B. 473USU Tooele County Bldg $1,200,000 $1,200,000 H.B. 473SEATC/CEU/LDS Property Exch $0 H.B. 473MATC/UTA/Lehi City Prop Exch $0 H.B. 473
Total Other Funded $7,138,000 $60,000,000 $10,333,000 $6,200,000 $83,671,000
Appropriated Separately State Funds G.O. Bonds Other Funds Donations Total Bill(s)DNR State Park Renovations $2,225,000 $2,225,000 S.B. 3
Legislatively Approved Capital Budget - 2007 Session
Table 83
OFFICE OF THE LEGISLATIVE FISCAL ANALYST - 177 - CAPITAL BUDGET
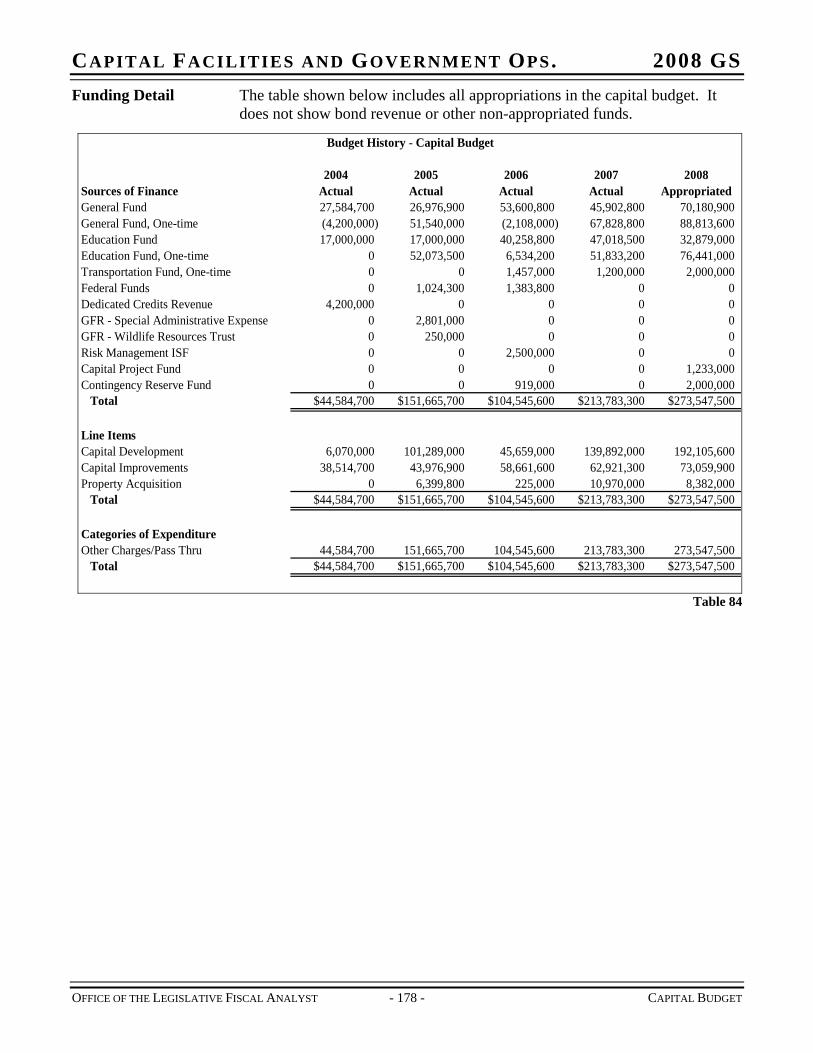
CAPITAL FACILITIES AND GOVERNMENT OPS. 2008 GS Funding Detail The table shown below includes all appropriations in the capital budget. It
does not show bond revenue or other non-appropriated funds.
Budget History - Capital Budget
2004 2005 2006 2007 2008Sources of Finance Actual Actual Actual Actual AppropriatedGeneral Fund 27,584,700 26,976,900 53,600,800 45,902,800 70,180,900General Fund, One-time (4,200,000) 51,540,000 (2,108,000) 67,828,800 88,813,600Education Fund 17,000,000 17,000,000 40,258,800 47,018,500 32,879,000Education Fund, One-time 0 52,073,500 6,534,200 51,833,200 76,441,000Transportation Fund, One-time 0 0 1,457,000 1,200,000 2,000,000Federal Funds 0 1,024,300 1,383,800 0 0Dedicated Credits Revenue 4,200,000 0 0 0 0GFR - Special Administrative Expense 0 2,801,000 0 0 0GFR - Wildlife Resources Trust 0 250,000 0 0 0Risk Management ISF 0 0 2,500,000 0 0Capital Project Fund 0 0 0 0 1,2Contingency Reserve Fund 0 0 919,000 0 2,000,000
Total $44,584,700 $151,665,700 $104,545,600 $213,783,300 $273,547,500
Line ItemsCapital Development 6,070,000 101,289,000 45,659,000 139,892,000 192,105,600Capital Improvements 38,514,700 43,976,900 58,661,600 62,921,300 73,059,900Property Acquisition 0 6,399,800 225,000 10,970,000 8,382,000
Total $44,584,700 $151,665,700 $104,545,600 $213,783,300 $273,547,500
Categories of ExpenditureOther Charges/Pass Thru 44,584,700 151,665,700 104,545,600 213,783,300 273,547,500
Total $44,584,700 $151,665,700 $104,545,600 $213,783,300 $273,547,500
33,000
Table 84
OFFICE OF THE LEGISLATIVE FISCAL ANALYST - 178 - CAPITAL BUDGET
CAPITAL FACILITIES AND GOVERNMENT OPS. 2008 GS
OFFICE OF THE LEGISLATIVE FISCAL ANALYST - 179 - CAPITAL BUDGET
LINE ITEMS – CAPITAL BUDGET
STATE FUNDED CAPITAL DEVELOPMENT
Function Capital developments include renovations or other projects costing $2,500,000 or more, new facilities costing $500,000 or more, or real property purchases needing an appropriation for financing. The purpose of this section is to provide information on proposed state funded capital developments. Non-state funded capital development proposals (also known as “other fund” projects) will be presented in the next section.
Funding Detail The Legislature used $30 million in ongoing General Funds for capital development projects in the 2007 General Session. These funds will make up the ongoing base budget for the 2008 General Session. The state can also take advantage of one-time funds, bonds, donations and federal funds to pay for projects. A list of capital projects funded in this line item is provided in Table 85 under “Programs.”
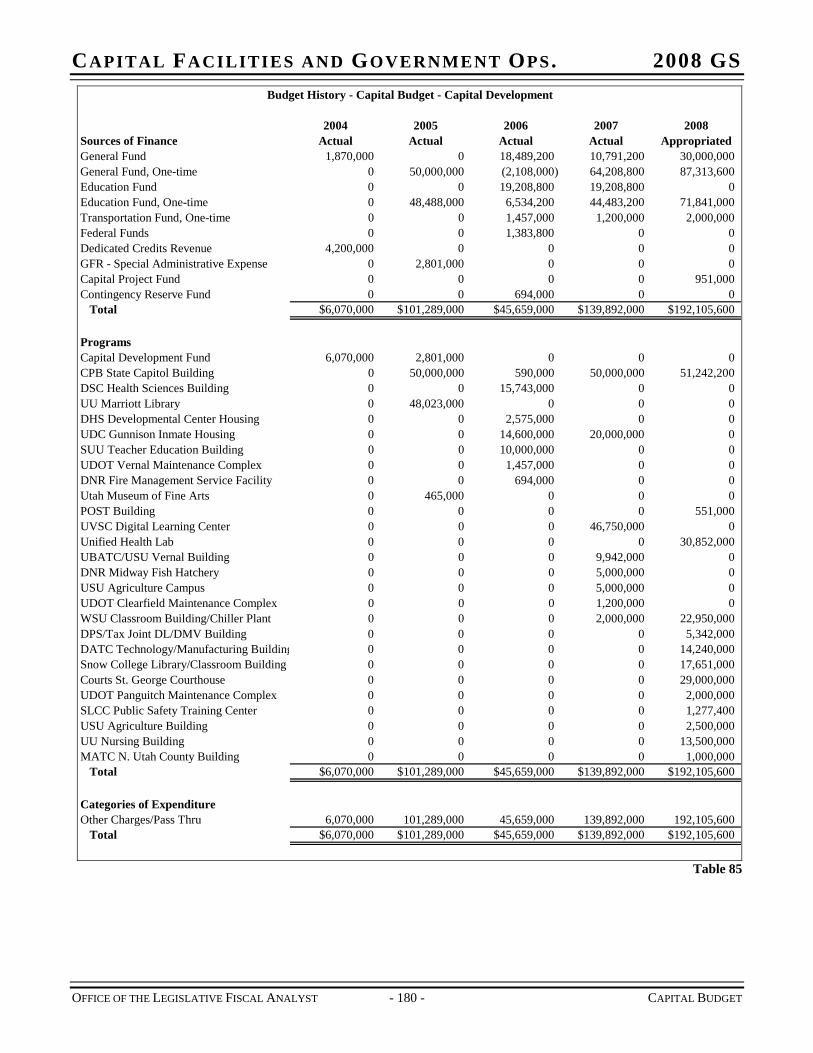
CAPITAL FACILITIES AND GOVERNMENT OPS. 2008 GS Budget History - Capital Budget - Capital Development
2004 2005 2006 2007 2008Sources of Finance Actual Actual Actual Actual AppropriatedGeneral Fund 1,870,000 0 18,489,200 10,791,200 30,000,000General Fund, One-time 0 50,000,000 (2,108,000) 64,208,800 87,313,600Education Fund 0 0 19,208,800 19,208,800 0Education Fund, One-time 0 48,488,000 6,534,200 44,483,200 71,841,000Transportation Fund, One-time 0 0 1,457,000 1,200,000 2,000,000Federal Funds 0 0 1,383,800 0 0Dedicated Credits Revenue 4,200,000 0 0 0GFR - Special Administrative Expense 0 2,801,000 0 0 0Capital Project Fund 0 0 0 0 951,000Contingency Reserve Fund 0 0 694,000 0 0
Total $6,070,000 $101,289,000 $45,659,000 $139,892,000 $192,105,600
ProgramsCapital Development Fund 6,070,000 2,801,000 0 0 0CPB State Capitol Building 0 50,000,000 590,000 50,000,000 51,242,200DSC Health Sciences Building 0 0 15,743,000 0 0UU Marriott Library 0 48,023,000 0 0 0DHS Developmental Center Housing 0 0 2,575,000 0 0UDC Gunnison Inmate Housing 0 0 14,600,000 20,000,000 0SUU Teacher Education Building 0 0 10,000,000 0 0UDOT Vernal Maintenance Complex 0 0 1,457,000 0 0DNR Fire Management Service Facility 0 0 694,000 0 0Utah Museum of Fine Arts 0 465,000 0 0 0POST Building 0 0 0 0 551,000UVSC Digital Learning Center 0 0 0 46,750,000 0Unified Health Lab 0 0 0 0 30,852,000UBATC/USU Vernal Building 0 0 0 9,942,000 0DNR Midway Fish Hatchery 0 0 0 5,000,000 0USU Agriculture Campus 0 0 0 5,000,000 0UDOT Clearfield Maintenance Complex 0 0 0 1,200,000 0WSU Classroom Building/Chiller Plant 0 0 0 2,000,000 22,950,000DPS/Tax Joint DL/DMV Building 0 0 0 0 5,342,000DATC Technology/Manufacturing Buildin
0
g 0 0 0 0 14,240,000Snow College Library/Classroom Building 0 0 0 0 17,651,000Courts St. George Courthouse 0 0 0 0 29,000,000UDOT Panguitch Maintenance Complex 0 0 0 0 2,000,000SLCC Public Safety Training Center 0 0 0 0 1,277,400USU Agriculture Building 0 0 0 0 2,500,000UU Nursing Building 0 0 0 0 13,500,000MATC N. Utah County Building 0 0 0 0 1,000,000
Total $6,070,000 $101,289,000 $45,659,000 $139,892,000 $192,105,600
Categories of ExpenditureOther Charges/Pass Thru 6,070,000 101,289,000 45,659,000 139,892,000 192,105,600
Total $6,070,000 $101,289,000 $45,659,000 $139,892,000 $192,105,600
Table 85
OFFICE OF THE LEGISLATIVE FISCAL ANALYST - 180 - CAPITAL BUDGET
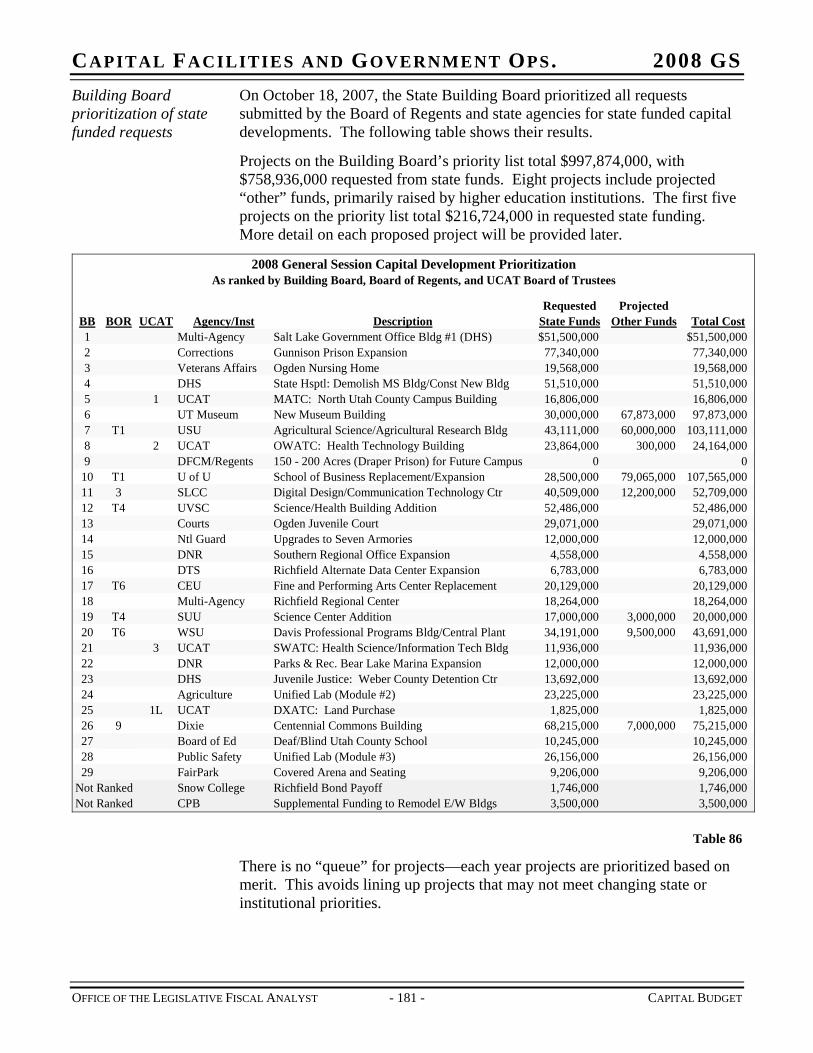
CAPITAL FACILITIES AND GOVERNMENT OPS. 2008 GS Building Board prioritization of state funded requests
On October 18, 2007, the State Building Board prioritized all requests submitted by the Board of Regents and state agencies for state funded capital developments. The following table shows their results.
Projects on the Building Board’s priority list total $997,874,000, with $758,936,000 requested from state funds. Eight projects include projected “other” funds, primarily raised by higher education institutions. The first five projects on the priority list total $216,724,000 in requested state funding. More detail on each proposed project will be provided later.
Requested ProjectedBB BOR UCAT Agency/Inst Description State Funds Other Funds Total Cost1 Multi-Agency Salt Lake Government Office Bldg #1 (DHS) $51,500,000 $51,500,0002 Corrections Gunnison Prison Expansion 77,340,000 77,340,0003 Veterans Affairs Ogden Nursing Home 19,568,000 19,568,0004 DHS State Hsptl: Demolish MS Bldg/Const New Bldg 51,510,000 51,510,0005 1 UCAT MATC: North Utah County Campus Building 16,806,000 16,806,0006 UT Museum New Museum Building 30,000,000 67,873,000 97,873,0007 T1 USU Agricultural Science/Agricultural Research Bldg 43,111,000 60,000,000 103,111,0008 2 UCAT OWATC: Health Technology Building 23,864,000 300,000 24,164,0009 DFCM/Regents 150 - 200 Acres (Draper Prison) for Future Campus 0 0
10 T1 U of U School of Business Replacement/Expansion 28,500,000 79,065,000 107,565,00011 3 SLCC Digital Design/Communication Technology Ctr 40,509,000 12,200,000 52,709,00012 T4 UVSC Science/Health Building Addition 52,486,000 52,486,00013 Courts Ogden Juvenile Court 29,071,000 29,071,00014 Ntl Guard Upgrades to Seven Armories 12,000,000 12,000,00015 DNR Southern Regional Office Expansion 4,558,000 4,558,00016 DTS Richfield Alternate Data Center Expansion 6,783,000 6,783,00017 T6 CEU Fine and Performing Arts Center Replacement 20,129,000 20,129,00018 Multi-Agency Richfield Regional Center 18,264,000 18,264,00019 T4 SUU Science Center Addition 17,000,000 3,000,000 20,000,00020 T6 WSU Davis Professional Programs Bldg/Central Plant 34,191,000 9,500,000 43,691,00021 3 UCAT SWATC: Health Science/Information Tech Bldg 11,936,000 11,936,00022 DNR Parks & Rec. Bear Lake Marina Expansion 12,000,000 12,000,00023 DHS Juvenile Justice: Weber County Detention Ctr 13,692,000 13,692,00024 Agriculture Unified Lab (Module #2) 23,225,000 23,225,00025 1L UCAT DXATC: Land Purchase 1,825,000 1,825,00026 9 Dixie Centennial Commons Building 68,215,000 7,000,000 75,215,00027 Board of Ed Deaf/Blind Utah County School 10,245,000 10,245,00028 Public Safety Unified Lab (Module #3) 26,156,000 26,156,00029 FairPark Covered Arena and Seating 9,206,000 9,206,000
Not Ranked Snow College Richfield Bond Payoff 1,746,000 1,746,000Not Ranked CPB Supplemental Funding to Remodel E/W Bldgs 3,500,000 3,500,000
2008 General Session Capital Development PrioritizationAs ranked by Building Board, Board of Regents, and UCAT Board of Trustees
Table 86
There is no “queue” for projects—each year projects are prioritized based on merit. This avoids lining up projects that may not meet changing state or institutional priorities.
OFFICE OF THE LEGISLATIVE FISCAL ANALYST - 181 - CAPITAL BUDGET
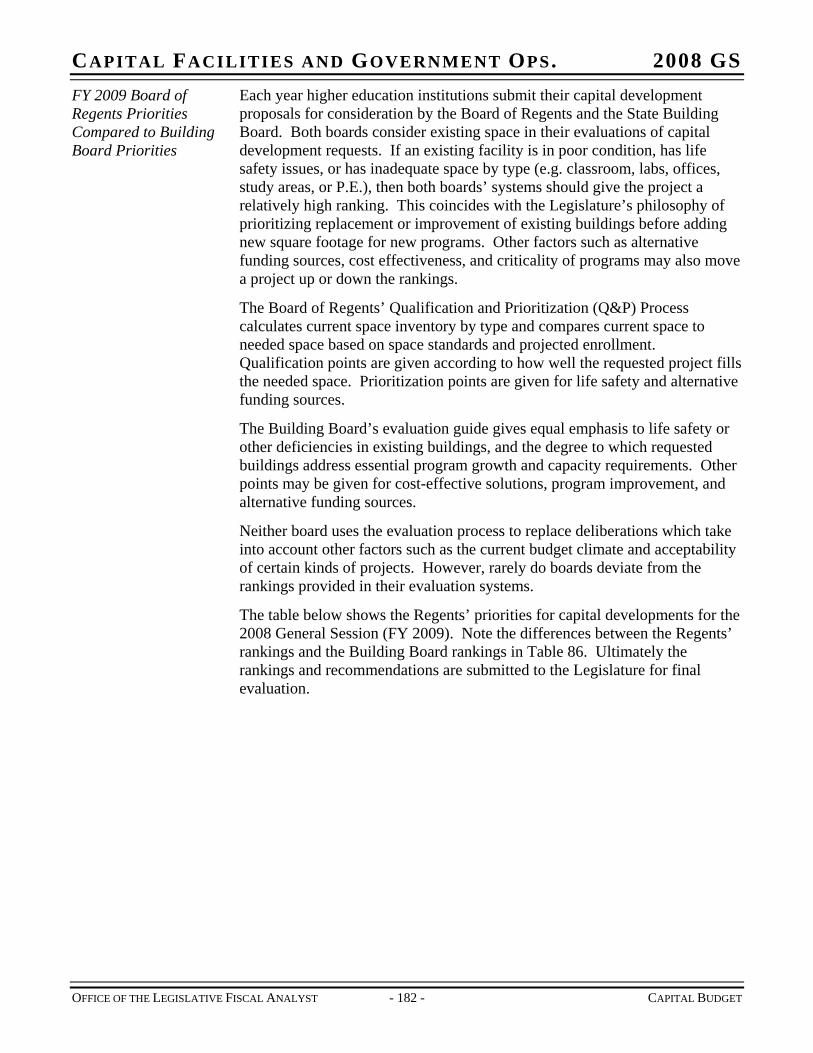
CAPITAL FACILITIES AND GOVERNMENT OPS. 2008 GS FY 2009 Board of Regents Priorities Compared to Building Board Priorities
Each year higher education institutions submit their capital development proposals for consideration by the Board of Regents and the State Building Board. Both boards consider existing space in their evaluations of capital development requests. If an existing facility is in poor condition, has life safety issues, or has inadequate space by type (e.g. classroom, labs, offices, study areas, or P.E.), then both boards’ systems should give the project a relatively high ranking. This coincides with the Legislature’s philosophy of prioritizing replacement or improvement of existing buildings before adding new square footage for new programs. Other factors such as alternative funding sources, cost effectiveness, and criticality of programs may also move a project up or down the rankings.
The Board of Regents’ Qualification and Prioritization (Q&P) Process calculates current space inventory by type and compares current space to needed space based on space standards and projected enrollment. Qualification points are given according to how well the requested project fills the needed space. Prioritization points are given for life safety and alternative funding sources.
The Building Board’s evaluation guide gives equal emphasis to life safety or other deficiencies in existing buildings, and the degree to which requested buildings address essential program growth and capacity requirements. Other points may be given for cost-effective solutions, program improvement, and alternative funding sources.
Neither board uses the evaluation process to replace deliberations which take into account other factors such as the current budget climate and acceptability of certain kinds of projects. However, rarely do boards deviate from the rankings provided in their evaluation systems.
The table below shows the Regents’ priorities for capital developments for the 2008 General Session (FY 2009). Note the differences between the Regents’ rankings and the Building Board rankings in Table 86. Ultimately the rankings and recommendations are submitted to the Legislature for final evaluation.
OFFICE OF THE LEGISLATIVE FISCAL ANALYST - 182 - CAPITAL BUDGET
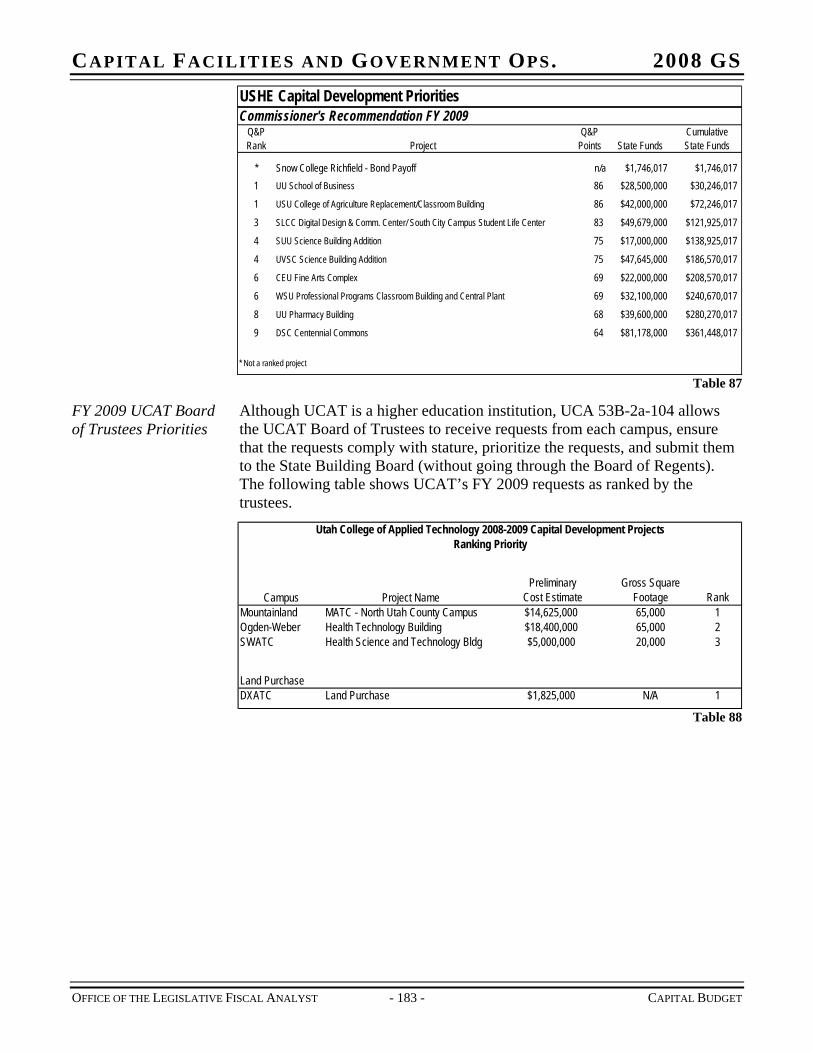
CAPITAL FACILITIES AND GOVERNMENT OPS. 2008 GS
Q&P Q&P CumulativeRank Project Points State Funds State Funds
* Snow College Richfield - Bond Payoff n/a $1,746,017 $1,746,0171 UU School of Business 86 $28,500,000 $30,246,0171 USU College of Agriculture Replacement/Classroom Building 86 $42,000,000 $72,246,017
3 SLCC Digital Design & Comm. Center/ South City Campus Student Life Center 83 $49,679,000 $121,925,0174 SUU Science Building Addition 75 $17,000,000 $138,925,017
4 UVSC Science Building Addition 75 $47,645,000 $186,570,0176 CEU Fine Arts Complex 69 $22,000,000 $208,570,0176 WSU Professional Programs Classroom Building and Central Plant 69 $32,100,000 $240,670,017
8 UU Pharmacy Building 68 $39,600,000 $280,270,0179 DSC Centennial Commons 64 $81,178,000 $361,448,017
* Not a ranked project
USHE Capital Development PrioritiesCommissioner's Recommendation FY 2009
Table 87
FY 2009 UCAT Board of Trustees Priorities
Although UCAT is a higher education institution, UCA 53B-2a-104 allows the UCAT Board of Trustees to receive requests from each campus, ensure that the requests comply with stature, prioritize the requests, and submit them to the State Building Board (without going through the Board of Regents). The following table shows UCAT’s FY 2009 requests as ranked by the trustees.
Campus Project NamePreliminary
Cost EstimateGross Square
Footage RankMountainland MATC - North Utah County Campus $14,625,000 65,000 1Ogden-Weber Health Technology Building $18,400,000 65,000 2SWATC Health Science and Technology Bldg $5,000,000 20,000 3
Land PurchaseDXATC Land Purchase $1,825,000 N/A 1
Utah College of Applied Technology 2008-2009 Capital Development ProjectsRanking Priority
Table 88
OFFICE OF THE LEGISLATIVE FISCAL ANALYST - 183 - CAPITAL BUDGET
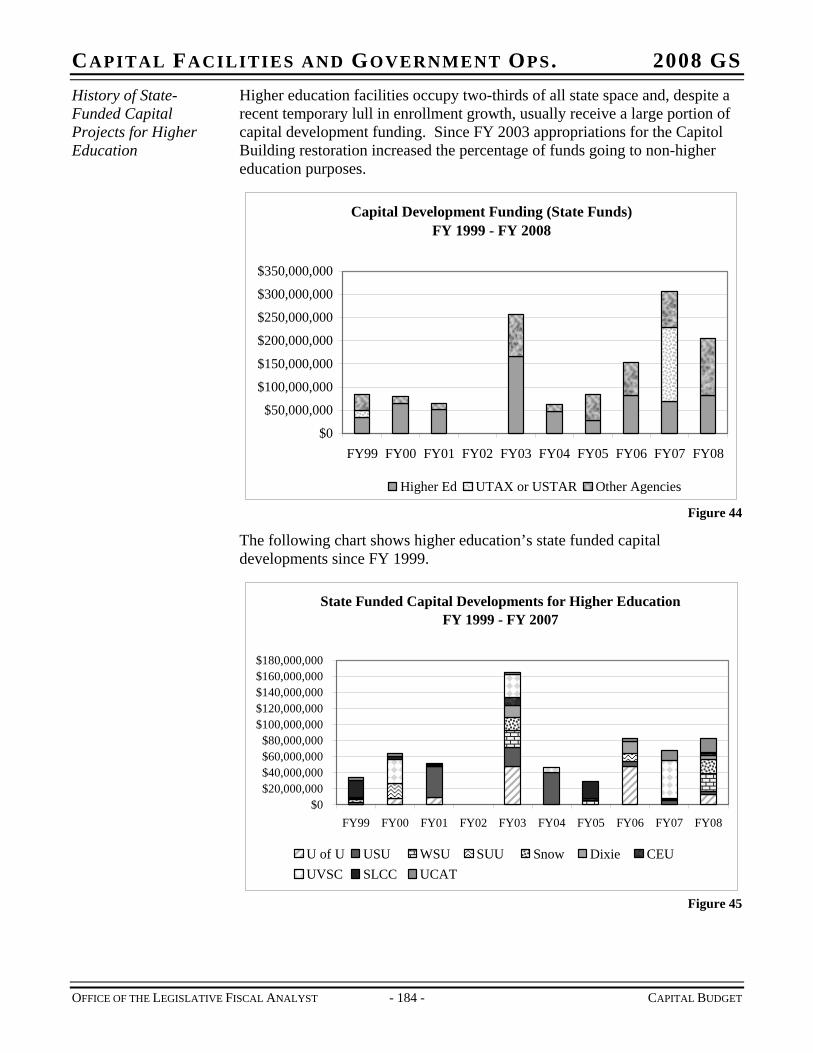
CAPITAL FACILITIES AND GOVERNMENT OPS. 2008 GS History of State-Funded Capital Projects for Higher Education
Higher education facilities occupy two-thirds of all state space and, despite a recent temporary lull in enrollment growth, usually receive a large portion of capital development funding. Since FY 2003 appropriations for the Capitol Building restoration increased the percentage of funds going to non-higher education purposes.
Capital Development Funding (State Funds)FY 1999 - FY 2008
$0
$50,000,000
$100,000,000
$150,000,000
$200,000,000
$250,000,000
$300,000,000
$350,000,000
FY99 FY00 FY01 FY02 FY03 FY04 FY05 FY06 FY07 FY08
Higher Ed UTAX or USTAR Other Agencies
Figure 44
The following chart shows higher education’s state funded capital developments since FY 1999.
State Funded Capital Developments for Higher Education FY 1999 - FY 2007
$0$20,000,000$40,000,000$60,000,000$80,000,000
$100,000,000$120,000,000$140,000,000$160,000,000$180,000,000
FY99 FY00 FY01 FY02 FY03 FY04 FY05 FY06 FY07 FY08
U of U USU WSU SUU Snow Dixie CEUUVSC SLCC UCAT
Figure 45
OFFICE OF THE LEGISLATIVE FISCAL ANALYST - 184 - CAPITAL BUDGET
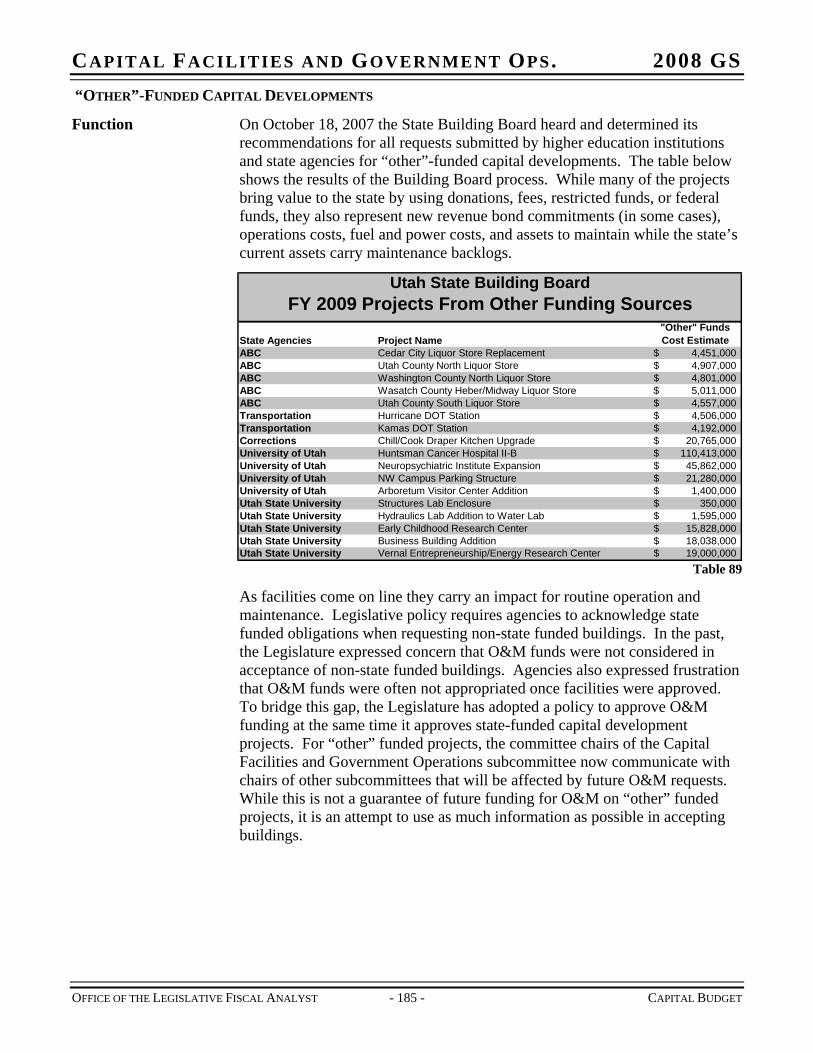
CAPITAL FACILITIES AND GOVERNMENT OPS. 2008 GS “OTHER”-FUNDED CAPITAL DEVELOPMENTS
Function On October 18, 2007 the State Building Board heard and determined its recommendations for all requests submitted by higher education institutions and state agencies for “other”-funded capital developments. The table below shows the results of the Building Board process. While many of the projects bring value to the state by using donations, fees, restricted funds, or federal funds, they also represent new revenue bond commitments (in some cases), operations costs, fuel and power costs, and assets to maintain while the state’s current assets carry maintenance backlogs.
State Agencies Project Name"Other" Funds Cost Estimate
Cedar City Liquor Store Replacement 4,451,000$ Utah County North Liquor Store 4,907,000$ Washington County North Liquor Store 4,801,000$ Wasatch County Heber/Midway Liquor Store 5,011,000$ Utah County South Liquor Store 4,557,000$ Hurricane DOT Station 4,506,000$ Kamas DOT Station 4,192,000$ Chill/Cook Draper Kitchen Upgrade 20,765,000$ Huntsman Cancer Hospital II-B 110,413,000$ Neuropsychiatric Institute Expansion 45,862,000$ NW Campus Parking Structure 21,280,000$ Arboretum Visitor Center Addition 1,400,000$ Structures Lab Enclosure 350,000$ Hydraulics Lab Addition to Water Lab 1,595,000$ Early Childhood Research Center 15,828,000$ Business Building Addition 18,038,000$ Vernal Entrepreneurship/Energy Research Center 19,000,000$
Utah State UniversityUtah State UniversityUtah State University
University of UtahUniversity of UtahUtah State UniversityUtah State University
TransportationCorrectionsUniversity of UtahUniversity of Utah
ABCABCABCTransportation
Utah State Building BoardFY 2009 Projects From Other Funding Sources
ABCABC
Table 89
As facilities come on line they carry an impact for routine operation and maintenance. Legislative policy requires agencies to acknowledge state funded obligations when requesting non-state funded buildings. In the past, the Legislature expressed concern that O&M funds were not considered in acceptance of non-state funded buildings. Agencies also expressed frustration that O&M funds were often not appropriated once facilities were approved. To bridge this gap, the Legislature has adopted a policy to approve O&M funding at the same time it approves state-funded capital development projects. For “other” funded projects, the committee chairs of the Capital Facilities and Government Operations subcommittee now communicate with chairs of other subcommittees that will be affected by future O&M requests. While this is not a guarantee of future funding for O&M on “other” funded projects, it is an attempt to use as much information as possible in accepting buildings.
OFFICE OF THE LEGISLATIVE FISCAL ANALYST - 185 - CAPITAL BUDGET
CAPITAL FACILITIES AND GOVERNMENT OPS. 2008 GS CAPITAL IMPROVEMENTS LINE ITEM
Function Capital improvements (defined earlier in this chapter under “Statutory Authority”), formerly known as “Alterations, Repair and Improvements” (AR&I), are improvement projects on the state’s existing fixed capital assets. Capital improvement funds may not be used for program equipment or routine maintenance.
Capital improvements must be funded before any new capital development project can be approved. During the 2001 General Session the Legislature increased the minimum improvement funding formula from 0.9 percent to 1.1 percent of the value of all state buildings and increased funding to this line item by transferring existing funds within the capital budget. As revenue projections went unmet in FY 2002 and FY 2003, the Legislature amended statute to allow for more flexibility. The change allowed the Legislature to fund the program at the original 0.9 percent level during times of budget deficits.
As construction costs have escalated since FY 2005, so has the value of the state’s buildings, which in turn has led to large funding increases to this line item. Please refer to Figure 46 for a graphic representation of this funding growth.
Maintenance Backlog DFCM’s Facility Condition Assessment Program has identified $250 million in “immediate” repair needs to buildings and infrastructure, and $1.3 billion in needs over the next ten years (not including the State Capitol). Even though funding for capital improvements will almost always climb to new highs each year due to inflation and new facilities coming on line, it alone cannot address all issues, since many facilities have significant problems that require more than the $2,500,000 statutory cap allowed for capital improvements (for example, Weber State University’s Buildings 1 and 2). In these cases, funds must be used from the Capital Development portion of the budget. The Legislature has focused on taking care of existing needs before allocating funds to expansion. This recognizes the fact that capital improvements alone cannot alleviate the maintenance backlog, and helps the state’s bond rating.
OFFICE OF THE LEGISLATIVE FISCAL ANALYST - 186 - CAPITAL BUDGET
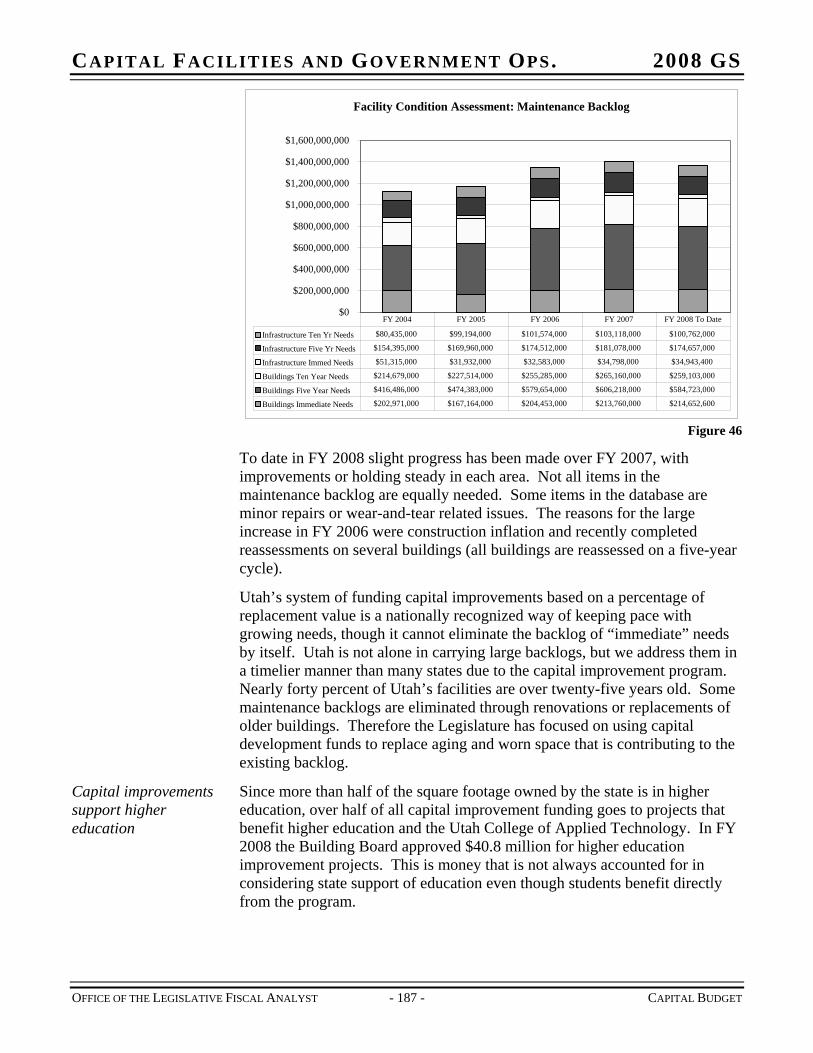
CAPITAL FACILITIES AND GOVERNMENT OPS. 2008 GS
Facility Condition Assessment: Maintenance Backlog
$0
$200,000,000
$400,000,000
$600,000,000
$800,000,000
$1,000,000,000
$1,200,000,000
$1,400,000,000
$1,600,000,000
Infrastructure Ten Yr Needs $80,435,000 $99,194,000 $101,574,000 $103,118,000 $100,762,000
Infrastructure Five Yr Needs $154,395,000 $169,960,000 $174,512,000 $181,078,000 $174,657,000
Infrastructure Immed Needs $51,315,000 $31,932,000 $32,583,000 $34,798,000 $34,943,400
Buildings Ten Year Needs $214,679,000 $227,514,000 $255,285,000 $265,160,000 $259,103,000
Buildings Five Year Needs $416,486,000 $474,383,000 $579,654,000 $606,218,000 $584,723,000
Buildings Immediate Needs $202,971,000 $167,164,000 $204,453,000 $213,760,000 $214,652,600
FY 2004 FY 2005 FY 2006 FY 2007 FY 2008 To Date
Figure 46
To date in FY 2008 slight progress has been made over FY 2007, with improvements or holding steady in each area. Not all items in the maintenance backlog are equally needed. Some items in the database are minor repairs or wear-and-tear related issues. The reasons for the large increase in FY 2006 were construction inflation and recently completed reassessments on several buildings (all buildings are reassessed on a five-year cycle).
Utah’s system of funding capital improvements based on a percentage of replacement value is a nationally recognized way of keeping pace with growing needs, though it cannot eliminate the backlog of “immediate” needs by itself. Utah is not alone in carrying large backlogs, but we address them in a timelier manner than many states due to the capital improvement program. Nearly forty percent of Utah’s facilities are over twenty-five years old. Some maintenance backlogs are eliminated through renovations or replacements of older buildings. Therefore the Legislature has focused on using capital development funds to replace aging and worn space that is contributing to the existing backlog.
Capital improvements support higher education
Since more than half of the square footage owned by the state is in higher education, over half of all capital improvement funding goes to projects that benefit higher education and the Utah College of Applied Technology. In FY 2008 the Building Board approved $40.8 million for higher education improvement projects. This is money that is not always accounted for in considering state support of education even though students benefit directly from the program.
OFFICE OF THE LEGISLATIVE FISCAL ANALYST - 187 - CAPITAL BUDGET
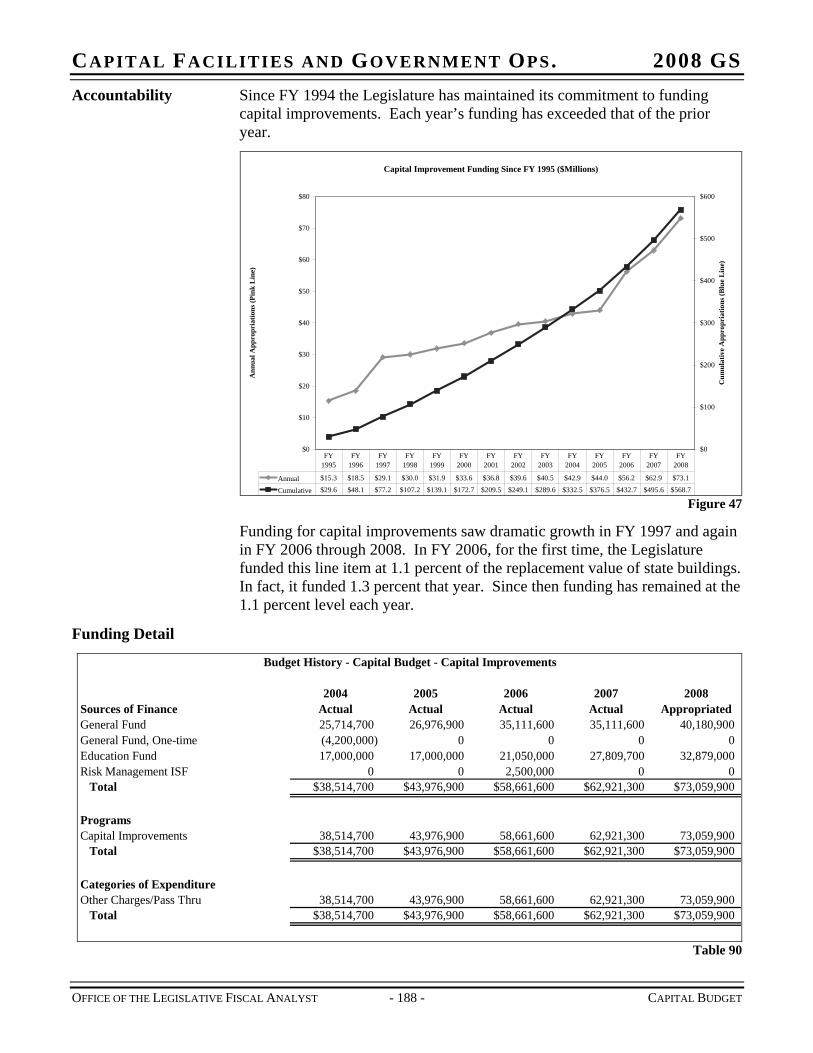
CAPITAL FACILITIES AND GOVERNMENT OPS. 2008 GS Accountability Since FY 1994 the Legislature has maintained its commitment to funding
capital improvements. Each year’s funding has exceeded that of the prior year.
Capital Improvement Funding Since FY 1995 ($Millions)
$0
$10
$20
$30
$40
$50
$60
$70
$80
Ann
ual A
ppro
pria
tions
(Pin
k L
ine)
$0
$100
$200
$300
$400
$500
$600
Cum
ulat
ive
App
ropr
iatio
ns (B
lue
Line
)
Annual $15.3 $18.5 $29.1 $30.0 $31.9 $33.6 $36.8 $39.6 $40.5 $42.9 $44.0 $56.2 $62.9 $73.1
Cumulative $29.6 $48.1 $77.2 $107.2 $139.1 $172.7 $209.5 $249.1 $289.6 $332.5 $376.5 $432.7 $495.6 $568.7
FY 1995
FY 1996
FY 1997
FY 1998
FY 1999
FY 2000
FY 2001
FY 2002
FY 2003
FY 2004
FY 2005
FY 2006
FY 2007
FY 2008
Figure 47
Funding for capital improvements saw dramatic growth in FY 1997 and again in FY 2006 through 2008. In FY 2006, for the first time, the Legislature funded this line item at 1.1 percent of the replacement value of state buildings. In fact, it funded 1.3 percent that year. Since then funding has remained at the 1.1 percent level each year.
Funding Detail
Budget History - Capital Budget - Capital Improvements
2004 2005 2006 2007 2008Sources of Finance Actual Actual Actual Actual AppropriatedGeneral Fund 25,714,700 26,976,900 35,111,600 35,111,600 40,180,900General Fund, One-time (4,200,000) 0 0 0 0Education Fund 17,000,000 17,000,000 21,050,000 27,809,700 32,879,000Risk Management ISF 0 0 2,500,000 0 0
Total $38,514,700 $43,976,900 $58,661,600 $62,921,300 $73,059,900
ProgramsCapital Improvements 38,514,700 43,976,900 58,661,600 62,921,300 73,059,900
Total $38,514,700 $43,976,900 $58,661,600 $62,921,300 $73,059,900
Categories of ExpenditureOther Charges/Pass Thru 38,514,700 43,976,900 58,661,600 62,921,300 73,059,900
Total $38,514,700 $43,976,900 $58,661,600 $62,921,300 $73,059,900
Table 90
OFFICE OF THE LEGISLATIVE FISCAL ANALYST - 188 - CAPITAL BUDGET
CAPITAL FACILITIES AND GOVERNMENT OPS. 2008 GS PROPERTY ACQUISITION LINE ITEM
Function This budgetary line item was established for real property acquisitions. Real property acquisitions requiring a legislative appropriation to finance the acquisition are considered capital developments.
Funding Detail During the 2007 General Session the Legislature used $2 million from the Contingency Reserve Fund plus a reallocation of $282,000 from the Capital Project Fund to acquire land for the Southwest ATC in Cedar City. Education funds were used to pay off revenue bonds at USU-Vernal and Dixie State College. Finally, $1.5 million in General Funds were used to acquire new parking for employees in the Heber Wells Building.
Budget History - Capital Budget - Property Acquisition
2004 2005 2006 2007 2008Sources of Finance Actual Actual Actual Actual AppropriatedGeneral Fund, One-time 0 1,540,000 0 3,620,000 1,500,000Education Fund, One-time 0 3,585,500 0 7,350,000 4,600,000Federal Funds 0 1,024,300 0 0 0GFR - Wildlife Resources Trust 0 250,000 0 0 0Capital Project Fund 0 0 0 0 282,000Contingency Reserve Fund 0 0 225,000 0 2,000,000
Total $0 $6,399,800 $225,000 $10,970,000 $8,382,000
ProgramsBuilding/Land Purchases 0 2,814,300 0 0 0BATC Bourns Building 0 3,585,500 0 0 0Courts Provo Land Purchase 0 0 225,000 0 0Courts St. George Land Purchase 0 0 0 3,620,000 0MATC Northern Utah County Land Purcha 0 0 0 3,250,000 0SWATC Land Purchase 0 0 0 0 2,282,000CEU Dormitories 0 0 0 3,000,000 0USU Uintah Basin Building 0 0 0 0 400,000DSC Auxiliary Facilities 0 0 0 0 4,200,000Heber Wells Building Parking 0 0 0 0 1,500,000CEU Energy Training Center 0 0 0 1,100,000 0
Total $0 $6,399,800 $225,000 $10,970,000 $8,382,000
Categories of ExpenditureOther Charges/Pass Thru 0 6,399,800 225,000 10,970,000 8,382,000
Total $0 $6,399,800 $225,000 $10,970,000 $8,382,000
Table 91
OFFICE OF THE LEGISLATIVE FISCAL ANALYST - 189 - CAPITAL BUDGET
CAPITAL FACILITIES AND GOVERNMENT OPS. 2008 GS LEASE INFORMATION
Function The Legislature provides flexibility to state agencies/institutions to manage their programs with leases without requiring formal legislative approval of each lease. Nevertheless, an agency’s program size and ability to lease is ultimately controlled by legislative appropriations. The Legislature also requires that lease terms be economically advantageous, sufficiently flexible, and competitive in the market. In order to ensure these conditions are met, the Legislature has given oversight duties to DFCM, the Judicial Council, and the Board of Regents.
Leasing offers the state a substantial value when used appropriately. Lease space can offer low cost and flexibility while tying the cost of facilities directly to agency budgets.
Statutory Authority UCA 63A-5-303. Lease reporting and coordination. (1) The director shall: (a) prepare a standard form upon which agencies and other state institutions and entities can report their current and proposed lease activity, including any lease renewals; and (b) develop procedures and mechanisms within the division to: (i) obtain and share information about each agency's real property needs; and (ii) provide oversight and review of lessors and lessees during the term of each lease. (2) Each agency, the Judicial Council, and the Board of Regents for each institution of higher education shall report all current and proposed lease activity on the standard form prepared by the division to: (a) the State Building Board; and (b) the Office of Legislative Fiscal Analyst.
Other duties and powers of DFCM
DFCM must lease, in the name of the division, all real property space to be occupied by an agency (other than Courts of Higher Education). Subject to legislative appropriation, DFCM may enter into facility leases with terms of up to ten years when the length of the lease is economically advantageous to the state, or subject to State Building Board approval and legislative appropriation, enter into longer leases.
DFCM must evaluate each lease under its control to determine whether or not the lease is cost effective, sufficiently flexible, and competitive. If evaluations show these conditions are not being met, the division should recommend viable alternatives, including such possibilities as lease/purchase and outright ownership.
Each year DFCM presents a lease report as part of the Five Year Book. The Legislature provides a flexible system of reporting that allows agencies to manage their programs with leases when appropriate by simply reporting their intention rather than gaining formal approval for each lease. Current statute requires DFCM or Judicial Council oversight for high cost leases, defined as a lease that:
OFFICE OF THE LEGISLATIVE FISCAL ANALYST - 190 - CAPITAL BUDGET
CAPITAL FACILITIES AND GOVERNMENT OPS. 2008 GS (a) has an initial term including any agency optional term of ten years or more; or (b) will require lease payments of more than $5,000,000 over the term of the lease including any agency optional term (UCA 63A-5-301.)
This provision is not applicable to the Utah System of Higher Education which has the ability to establish its own policies:
Responsibilities of the Utah System of Higher Education
UCA 63A-5-305. Leasing by higher education institutions. (1) The Board of Regents shall establish written policies and procedures governing leasing by higher education institutions. (2) Each higher education institution shall comply with the procedures and requirements of the Board of Regents' policies before signing or renewing any lease.
Colleges and universities are allowed to seek lease space with Regent approval but are prohibited from coming to the Legislature to seek funds for the new leases. In meeting their statutory goal, the Regents commit to:
Review and approve institutional requests for plans to lease capital facilities space with state-appropriated funds for programs of instruction, research, or service when contracts for leasing such facilities: (1) exceed $50,000 per year; (2) commit the institution to space rentals for a 5-year duration or beyond; or (3) lead to the establishment of regular state-supported daytime programs of instruction in leased space. An annual report of all space leased by the institutions, including space leased for off-campus continuing education programs and space leased in research parks, shall be compiled by the Commissioner's Office for review by the Board of Regents and forwarding to the State Building Board for possible inclusion its comprehensive 5-year building plan. (Regent Policy R710-4.5.7. - Leased Space)
Before entering into a high-cost lease, the Administrative Office of the Courts must submit a draft of the new lease to the Judicial Council and DFCM. Within thirty days DFCM must review the drafts and submit a report detailing its opinion on whether the lease meets the Courts’ needs, whether another option would be more cost effective, and whether the lease terms are flexible and competitive. The Judicial Council must review DFCM’s report and approve all high-cost leases before the leases can be signed.
Responsibilities of the Courts
Location of Latest Leasing Report
The most recent detailed state leasing information is available in the Building Board’s 2007 Five Year Program, located on their Web Site at:
http://buildingboard.utah.gov/fy2007_5yrplan.pdf
OFFICE OF THE LEGISLATIVE FISCAL ANALYST - 191 - CAPITAL BUDGET

CAPITAL FACILITIES AND GOVERNMENT OPS. 2008 GS
OFFICE OF THE LEGISLATIVE FISCAL ANALYST - 193 - DEBT SERVICE
CHAPTER 27 DEBT SERVICE
Function Debt Service is made up of interest and principal due on the state's bonded indebtedness. The state uses long-term debt to finance large capital expenditures including new construction, major remodeling and highway projects. Dedicated revenue streams such as enterprise fund revenue or dedicated lease payments secure some bonds. Debt service on general obligation and revenue bonds is included in this appropriation.
Statutory Authority Constitutional Debt Limit: Article XIV, Section 1 of the State Constitution limits the total general obligation indebtedness of the state to an amount equal to 1.5 percent of the value of the total taxable property of the state.
Statutory Debt Limit: UCA 63-38c-402 limits the maximum general obligation borrowing ability of the state at any given time to no more than forty five percent of the maximum allowable state budget appropriations limit set in UCA 63-38c-201. The maximum allowable budget appropriation is based on a formula that reflects changes in population and inflation. However, the Legislature has amended the statute to exempt some highway bonds from the limitation.
UCA 63B-1-201 creates the State Bonding Commission composed of the governor, state treasurer, and a third person appointed by the governor.
UCA 63B-1-202 requires all legislation authorizing the State Bonding Commission to issue bonds to contain an estimate of the annual amount of funds necessary for operation and maintenance of each project.
UCA 63B-1-304 creates the State Building Ownership Authority composed of the governor, state treasurer, and the chair of the State Building Board. The authority may, among other things, borrow money and issue obligations (including refunding obligations), pledge revenues from any facility to secure the payment of obligations relating to that facility, cause to be executed mortgages, trust deeds, and other documents, own, lease, operate and encumber facilities, and rent or lease any facility to any state body. However, any obligations issued by the authority may not constitute general obligation debt of the state and must be legislatively authorized.
UCA 63B-1-307 requires the State Building Ownership Authority to lease space back to the agency for which obligations were issued, and rent amounts must be sufficient to pay off the principal and interest as they come due.
UCA 63B-1a, known as the “Master General Obligation Bond Act,” authorizes the State Bonding Commission to issue bonds only if the Legislature has affirmatively authorized the issuance of the bonds, the capital projects to be funded, and the maximum amount of the bonds.
Article XIII Section 5(3) of the State Constitution requires a tax levy (property tax was the sole form of taxation available when the Constitution was written) to pay off general obligation bonds within 20 years. UCA 63B-1a-101(4) requires the State Bonding Commission to comply with any maturity dates set
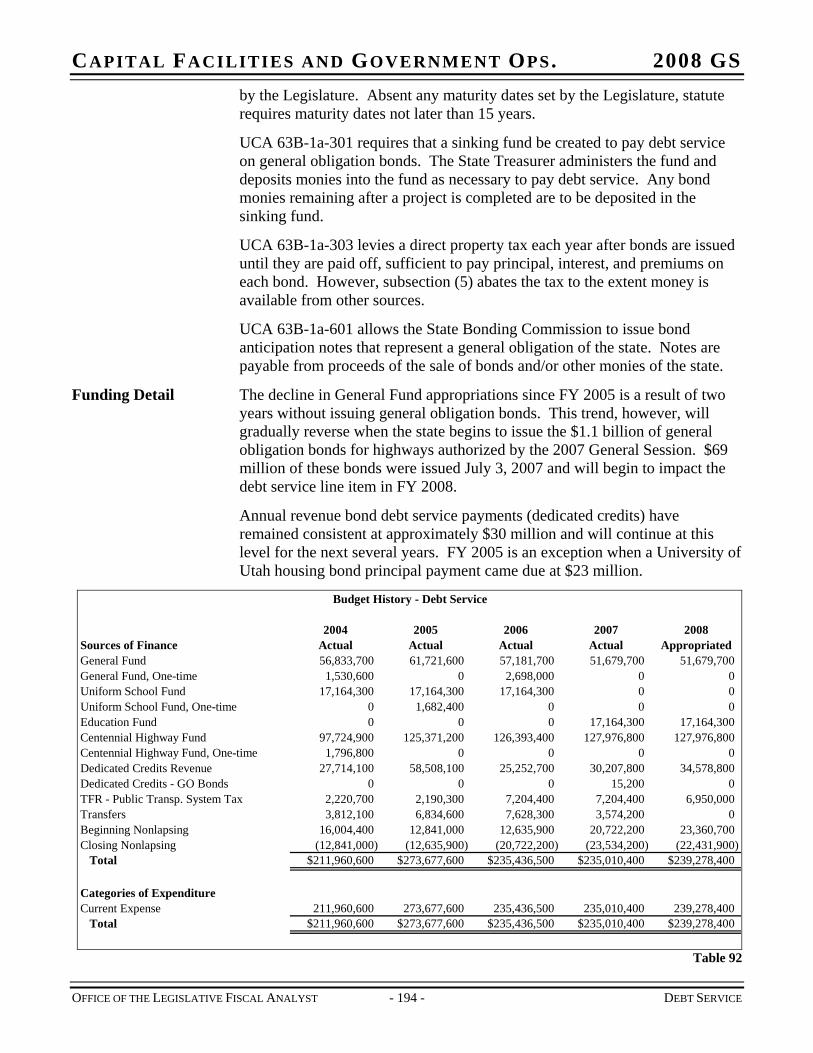
CAPITAL FACILITIES AND GOVERNMENT OPS. 2008 GS by the Legislature. Absent any maturity dates set by the Legislature, statute requires maturity dates not later than 15 years.
UCA 63B-1a-301 requires that a sinking fund be created to pay debt service on general obligation bonds. The State Treasurer administers the fund and deposits monies into the fund as necessary to pay debt service. Any bond monies remaining after a project is completed are to be deposited in the sinking fund.
UCA 63B-1a-303 levies a direct property tax each year after bonds are issued until they are paid off, sufficient to pay principal, interest, and premiums on each bond. However, subsection (5) abates the tax to the extent money is available from other sources.
UCA 63B-1a-601 allows the State Bonding Commission to issue bond anticipation notes that represent a general obligation of the state. Notes are payable from proceeds of the sale of bonds and/or other monies of the state.
Funding Detail The decline in General Fund appropriations since FY 2005 is a result of two years without issuing general obligation bonds. This trend, however, will gradually reverse when the state begins to issue the $1.1 billion of general obligation bonds for highways authorized by the 2007 General Session. $69 million of these bonds were issued July 3, 2007 and will begin to impact the debt service line item in FY 2008.
Annual revenue bond debt service payments (dedicated credits) have remained consistent at approximately $30 million and will continue at this level for the next several years. FY 2005 is an exception when a University of Utah housing bond principal payment came due at $23 million.
Budget History - Debt Service
2004 2005 2006 2007 2008Sources of Finance Actual Actual Actual Actual AppropriatedGeneral Fund 56,833,700 61,721,600 57,181,700 51,679,700 51,679,700General Fund, One-time 1,530,600 0 2,698,000 0 0Uniform School Fund 17,164,300 17,164,300 17,164,300 0 0Uniform School Fund, One-time 0 1,682,400 0 0 0Education Fund 0 0 0 17,164,300 17,164,300Centennial Highway Fund 97,724,900 125,371,200 126,393,400 127,976,800 127,976,800Centennial Highway Fund, One-time 1,796,800 0 0 0Dedicated Credits Revenue 27,714,100 58,508,100 25,252,700 30,207,800 34,578,800Dedicated Credits - GO Bonds 0 0 0 15,200 0TFR - Public Transp. System Tax 2,220,700 2,190,300 7,204,400 7,204,400 6,950,000Transfers 3,812,100 6,834,600 7,628,300 3,574,200 0Beginning Nonlapsing 16,004,400 12,841,000 12,635,900 20,722,200 23,360,700Closing Nonlapsing (12,841,000) (12,635,900) (20,722,200) (23,534,200) (22,431,900)
Total $211,960,600 $273,677,600 $235,436,500 $235,010,400 $239,278,400
Categories of ExpenditureCurrent Expense 211,960,600 273,677,600 235,436,500 235,010,400 239,278,400
Total $211,960,600 $273,677,600 $235,436,500 $235,010,400 $239,278,400
0
Table 92
OFFICE OF THE LEGISLATIVE FISCAL ANALYST - 194 - DEBT SERVICE
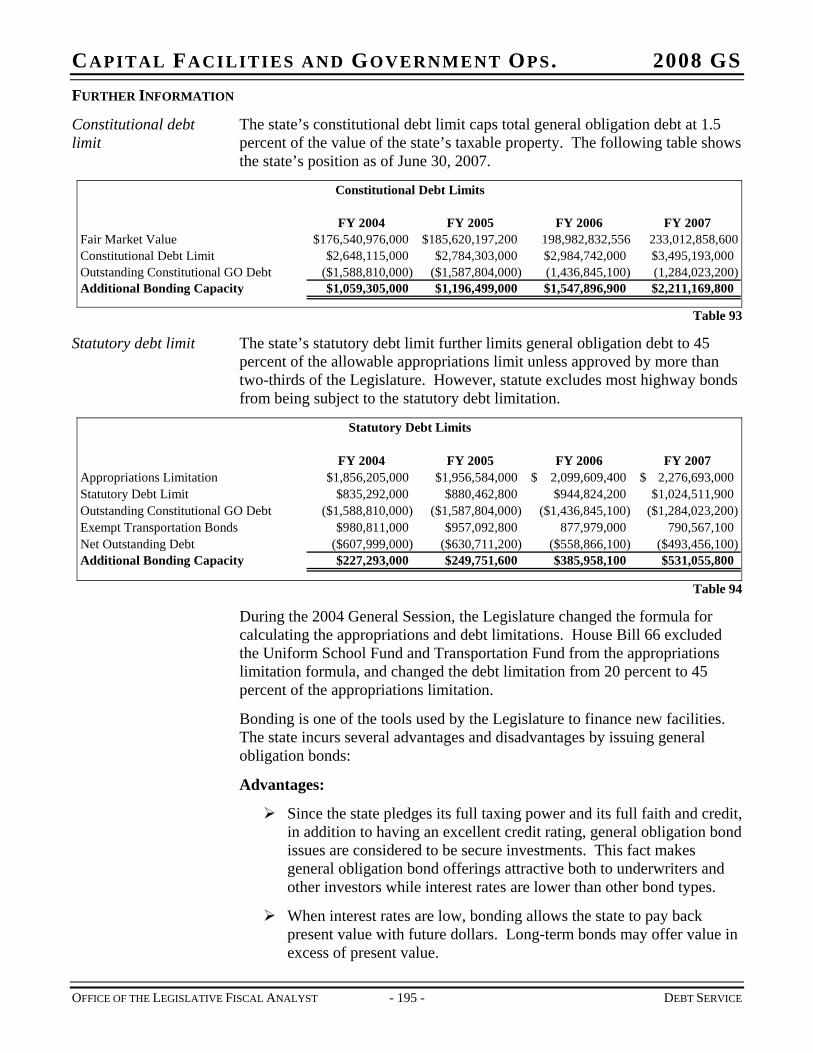
CAPITAL FACILITIES AND GOVERNMENT OPS. 2008 GS FURTHER INFORMATION
Constitutional debt limit
The state’s constitutional debt limit caps total general obligation debt at 1.5 percent of the value of the state’s taxable property. The following table shows the state’s position as of June 30, 2007.
FY 2004 FY 2005 FY 2006 FY 2007Fair Market Value $176,540,976,000 $185,620,197,200 198,982,832,556 233,012,858,600Constitutional Debt Limit $2,648,115,000 $2,784,303,000 $2,984,742,000 $3,495,193,000Outstanding Constitutional GO Debt ($1,588,810,000) ($1,587,804,000) (1,436,845,100) (1,284,023,200) Additional Bonding Capacity $1,059,305,000 $1,196,499,000 $1,547,896,900 $2,211,169,800
Constitutional Debt Limits
Table 93
Statutory debt limit The state’s statutory debt limit further limits general obligation debt to 45 percent of the allowable appropriations limit unless approved by more than two-thirds of the Legislature. However, statute excludes most highway bonds from being subject to the statutory debt limitation.
FY 2004 FY 2005 FY 2006 FY 2007Appropriations Limitation $1,856,205,000 $1,956,584,000 2,099,609,400$ 2,276,693,000$ Statutory Debt Limit $835,292,000 $880,462,800 $944,824,200 $1,024,511,900Outstanding Constitutional GO Debt ($1,588,810,000) ($1,587,804,000) ($1,436,845,100) ($1,284,023,200)Exempt Transportation Bonds $980,811,000 $957,092,800 877,979,000 790,567,100 Net Outstanding Debt ($607,999,000) ($630,711,200) ($558,866,100) ($493,456,100)Additional Bonding Capacity $227,293,000 $249,751,600 $385,958,100 $531,055,800
Statutory Debt Limits
Table 94
During the 2004 General Session, the Legislature changed the formula for calculating the appropriations and debt limitations. House Bill 66 excluded the Uniform School Fund and Transportation Fund from the appropriations limitation formula, and changed the debt limitation from 20 percent to 45 percent of the appropriations limitation.
Bonding is one of the tools used by the Legislature to finance new facilities. The state incurs several advantages and disadvantages by issuing general obligation bonds:
Advantages:
Since the state pledges its full taxing power and its full faith and credit, in addition to having an excellent credit rating, general obligation bond issues are considered to be secure investments. This fact makes general obligation bond offerings attractive both to underwriters and other investors while interest rates are lower than other bond types.
When interest rates are low, bonding allows the state to pay back present value with future dollars. Long-term bonds may offer value in excess of present value.
OFFICE OF THE LEGISLATIVE FISCAL ANALYST - 195 - DEBT SERVICE
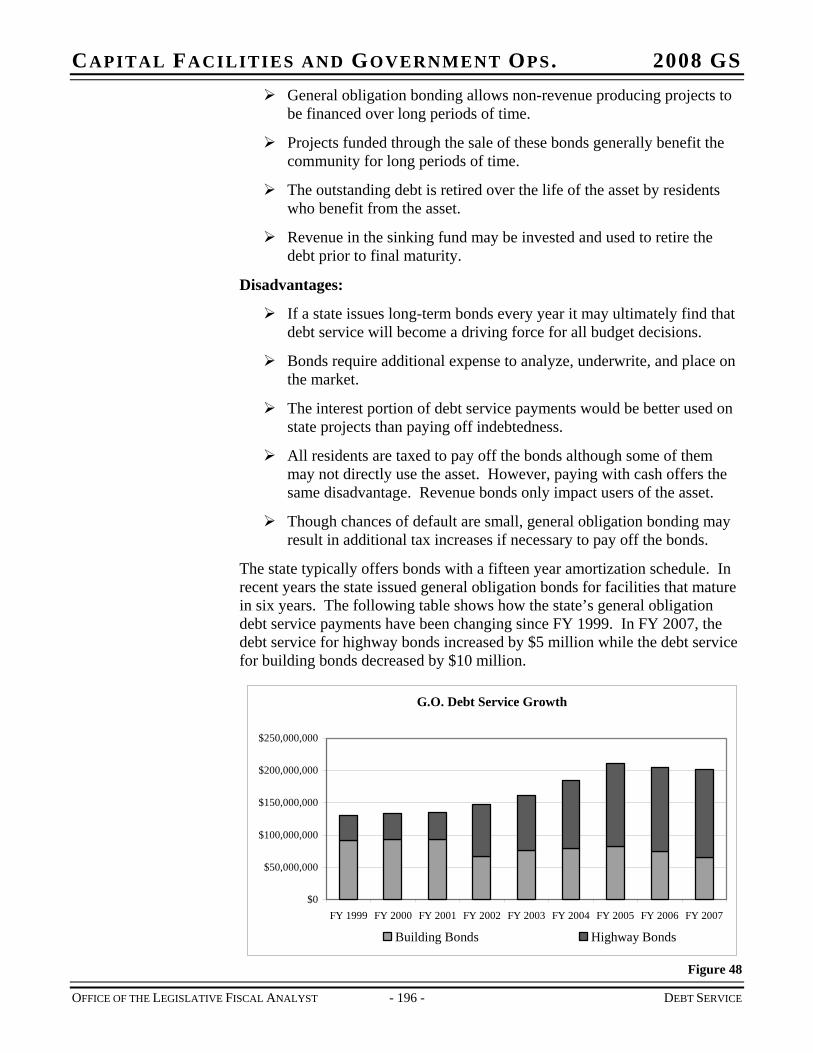
CAPITAL FACILITIES AND GOVERNMENT OPS. 2008 GS General obligation bonding allows non-revenue producing projects to
be financed over long periods of time.
Projects funded through the sale of these bonds generally benefit the community for long periods of time.
The outstanding debt is retired over the life of the asset by residents who benefit from the asset.
Revenue in the sinking fund may be invested and used to retire the debt prior to final maturity.
Disadvantages:
If a state issues long-term bonds every year it may ultimately find that debt service will become a driving force for all budget decisions.
Bonds require additional expense to analyze, underwrite, and place on the market.
The interest portion of debt service payments would be better used on state projects than paying off indebtedness.
All residents are taxed to pay off the bonds although some of them may not directly use the asset. However, paying with cash offers the same disadvantage. Revenue bonds only impact users of the asset.
Though chances of default are small, general obligation bonding may result in additional tax increases if necessary to pay off the bonds.
The state typically offers bonds with a fifteen year amortization schedule. In recent years the state issued general obligation bonds for facilities that mature in six years. The following table shows how the state’s general obligation debt service payments have been changing since FY 1999. In FY 2007, the debt service for highway bonds increased by $5 million while the debt service for building bonds decreased by $10 million.
G.O. Debt Service Growth
$0
$50,000,000
$100,000,000
$150,000,000
$200,000,000
$250,000,000
FY 1999 FY 2000 FY 2001 FY 2002 FY 2003 FY 2004 FY 2005 FY 2006 FY 2007
Building Bonds Highway Bonds
Figure 48
OFFICE OF THE LEGISLATIVE FISCAL ANALYST - 196 - DEBT SERVICE
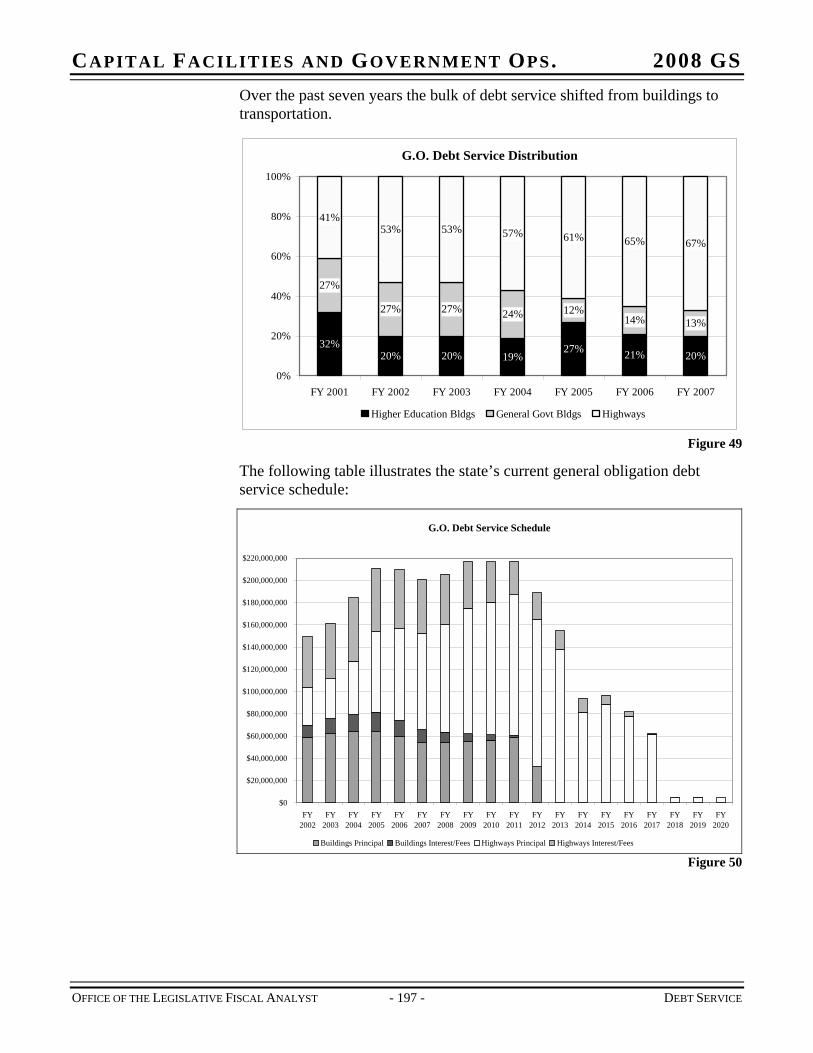
CAPITAL FACILITIES AND GOVERNMENT OPS. 2008 GS Over the past seven years the bulk of debt service shifted from buildings to transportation.
G.O. Debt Service Distribution
32%20% 20% 19%
27% 21% 20%
27%
27% 27% 24% 12%14% 13%
41%53% 53% 57% 61% 65% 67%
0%
20%
40%
60%
80%
100%
FY 2001 FY 2002 FY 2003 FY 2004 FY 2005 FY 2006 FY 2007
Higher Education Bldgs General Govt Bldgs Highways
Figure 49
The following table illustrates the state’s current general obligation debt service schedule:
G.O. Debt Service Schedule
$0
$20,000,000
$40,000,000
$60,000,000
$80,000,000
$100,000,000
$120,000,000
$140,000,000
$160,000,000
$180,000,000
$200,000,000
$220,000,000
FY2002
FY2003
FY2004
FY2005
FY2006
FY2007
FY2008
FY2009
FY2010
FY2011
FY2012
FY2013
FY2014
FY2015
FY2016
FY2017
FY2018
FY2019
FY2020
Buildings Principal Buildings Interest/Fees Highways Principal Highways Interest/Fees Figure 50
OFFICE OF THE LEGISLATIVE FISCAL ANALYST - 197 - DEBT SERVICE
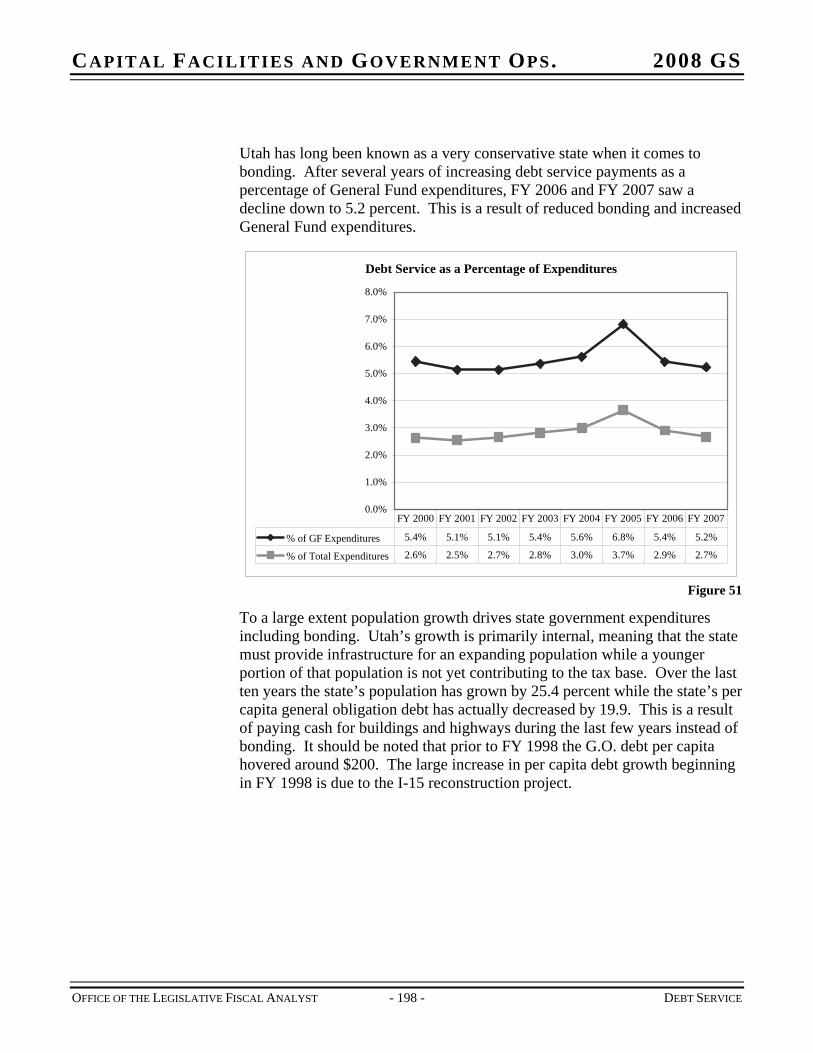
CAPITAL FACILITIES AND GOVERNMENT OPS. 2008 GS
Utah has long been known as a very conservative state when it comes to bonding. After several years of increasing debt service payments as a percentage of General Fund expenditures, FY 2006 and FY 2007 saw a decline down to 5.2 percent. This is a result of reduced bonding and increased General Fund expenditures.
Debt Service as a Percentage of Expenditures
0.0%
1.0%
2.0%
3.0%
4.0%
5.0%
6.0%
7.0%
8.0%
% of GF Expenditures 5.4% 5.1% 5.1% 5.4% 5.6% 6.8% 5.4% 5.2%
% of Total Expenditures 2.6% 2.5% 2.7% 2.8% 3.0% 3.7% 2.9% 2.7%
FY 2000 FY 2001 FY 2002 FY 2003 FY 2004 FY 2005 FY 2006 FY 2007
Figure 51
To a large extent population growth drives state government expenditures including bonding. Utah’s growth is primarily internal, meaning that the state must provide infrastructure for an expanding population while a younger portion of that population is not yet contributing to the tax base. Over the last ten years the state’s population has grown by 25.4 percent while the state’s per capita general obligation debt has actually decreased by 19.9. This is a result of paying cash for buildings and highways during the last few years instead of bonding. It should be noted that prior to FY 1998 the G.O. debt per capita hovered around $200. The large increase in per capita debt growth beginning in FY 1998 is due to the I-15 reconstruction project.
OFFICE OF THE LEGISLATIVE FISCAL ANALYST - 198 - DEBT SERVICE
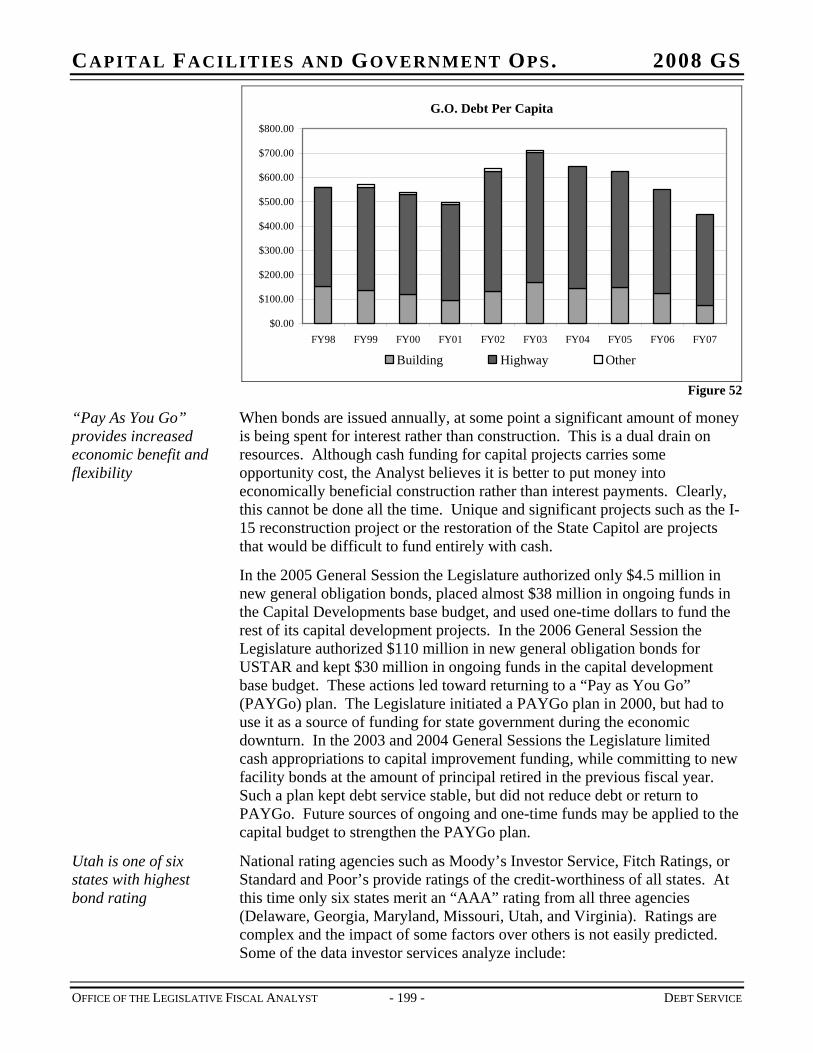
CAPITAL FACILITIES AND GOVERNMENT OPS. 2008 GS
G.O. Debt Per Capita
$0.00
$100.00
$200.00
$300.00
$400.00
$500.00
$600.00
$700.00
$800.00
FY98 FY99 FY00 FY01 FY02 FY03 FY04 FY05 FY06 FY07
Building Highway Other
Figure 52
“Pay As You Go” provides increased economic benefit and flexibility
When bonds are issued annually, at some point a significant amount of money is being spent for interest rather than construction. This is a dual drain on resources. Although cash funding for capital projects carries some opportunity cost, the Analyst believes it is better to put money into economically beneficial construction rather than interest payments. Clearly, this cannot be done all the time. Unique and significant projects such as the I-15 reconstruction project or the restoration of the State Capitol are projects that would be difficult to fund entirely with cash.
In the 2005 General Session the Legislature authorized only $4.5 million in new general obligation bonds, placed almost $38 million in ongoing funds in the Capital Developments base budget, and used one-time dollars to fund the rest of its capital development projects. In the 2006 General Session the Legislature authorized $110 million in new general obligation bonds for USTAR and kept $30 million in ongoing funds in the capital development base budget. These actions led toward returning to a “Pay as You Go” (PAYGo) plan. The Legislature initiated a PAYGo plan in 2000, but had to use it as a source of funding for state government during the economic downturn. In the 2003 and 2004 General Sessions the Legislature limited cash appropriations to capital improvement funding, while committing to new facility bonds at the amount of principal retired in the previous fiscal year. Such a plan kept debt service stable, but did not reduce debt or return to PAYGo. Future sources of ongoing and one-time funds may be applied to the capital budget to strengthen the PAYGo plan.
Utah is one of six states with highest bond rating
National rating agencies such as Moody’s Investor Service, Fitch Ratings, or Standard and Poor’s provide ratings of the credit-worthiness of all states. At this time only six states merit an “AAA” rating from all three agencies (Delaware, Georgia, Maryland, Missouri, Utah, and Virginia). Ratings are complex and the impact of some factors over others is not easily predicted. Some of the data investor services analyze include:
OFFICE OF THE LEGISLATIVE FISCAL ANALYST - 199 - DEBT SERVICE
CAPITAL FACILITIES AND GOVERNMENT OPS. 2008 GS Structural gap between ongoing tax revenues and ongoing spending
Planning
Economic (industrial) conditions
Reserve fund balances and use of reserves to balance budgets
Flexibility in finances
Debt burden
Infrastructure maintenance
Management policies and stability
Utah maintains an “AAA” rating in large part because of the commitment to good management shown by both the Executive and Legislative Branches. Utah’s stable economy with a young and growing population provides a ready and future source of labor and a growing tax base. Utah also maintains a diverse revenue collection system and takes the issue of structural balance seriously (matching ongoing revenue to ongoing expenses). While debt levels are near all-time highs, the debt is tied to fixed assets rather than operating costs. Repayment plans are aggressive and workable – rating agencies believe that Utah can and will maintain its ability to pay.
Inter-branch cooperation and management are among the strongest factors in Utah’s “AAA” rating. In the Executive Branch, the Division of Finance follows Generally Accepted Accounting Principles (GAAP) and Governmental Accounting Standards Board (GASB) accounting practices. The timely publication of the Comprehensive Annual Financial Report (CAFR) assures rating agencies that oversight systems are in place. In the Legislative Branch, the commitment to limited indebtedness, restoration of aging facilities and the ability to present a balanced budget on time are key factors to planning.
Rating agencies seem to focus more on planning than anything else. They do not expect rainy day funds to be restored overnight, but they expect states to have a workable plan to prepare for the next downturn. Utah has replenished its rainy day funds to pre-2002 levels and continues to annually deposit money in the funds. Rating agencies want to see development plans such as the DFCM Five Year Program for buildings or the Centennial Highway Plan for roads. Ratings are based on a state’s ability to manage. So long as the state’s tax base is solid, its economy sound, and state managers (both elected officials and professional staff) are committed to fiscal discipline then Utah should maintain an “AAA” rating.
Planning and management are keys to AAA rating
Although no single policy or decision (within the realm of reason) will change the strength of Utah’s rating, the Analyst does note that several bond-rating factors should be considered in preparing the FY 2009 budget.
Structural Balance – In a report presented to Executive Appropriations Committee in 2003, the Analyst noted the state could balance “ongoing
OFFICE OF THE LEGISLATIVE FISCAL ANALYST - 200 - DEBT SERVICE
CAPITAL FACILITIES AND GOVERNMENT OPS. 2008 GS appropriations with ongoing revenue at the close of each appropriations session. Such balancing could be accomplished by providing one-time rather than ongoing appropriations for discrete projects such as capital investment, all the while analyzing the impact of such action on long-term needs.”
Planning – The state’s Five Year Building Plan and Centennial Highway Plan are examples of taking a long-term view of future needs. The Legislature must also maintain a plan for debt service – any funding plan that omits a reasonable plan for repayment of debt obligations is likely to be viewed negatively by rating agencies. Continued commitment to restoring rainy day funds over time will also strengthen the state’s credit rating.
Balancing Growth vs. Infrastructure – Utah will spend almost $63 million in FY 2007 and $73 million FY 2008 to repair and upgrade state facilities. Over the past five years the Legislature has devoted funds to replacing large facilities that no longer were safe or able to function properly. This focus on preventing an infrastructure crisis is a plus with rating agencies, but that does not obviate the need to provide facilities for the needs of a growing population, such as on college campuses.
Capital facility financing
The State employs several methods of financing to meet state needs.
General Obligation Bonds – General obligation debt is secured by the full faith and credit of the State and its ability to tax its citizens. General obligation debt is counted against the state’s constitutional and statutory debt limits (certain highway bonds are exempt from the statutory limit). In recent years the State of Utah issued general obligation bonds for facilities that mature in six years. Other states and government entities typically issue general obligation bonds with terms of 10 to 20 years. Debt service interest begins to accrue when the bonds are issued.
Revenue Bonds - This type of bond may be issued when a revenue stream can be identified and legally restricted for repayment of the bonds. The only state facilities which have been financed using pure revenue bonds have been higher education facilities where the revenues pledged have included student fees, auxiliary services revenues, or reimbursable overhead. In order for the bonds to be marketable, the pledged revenue stream must be substantially larger than the debt service requirements. This type of debt is exempted from calculations of the state’s constitutional and statutory debt limits because it is neither secured by the full faith and credit of the state nor its taxing power.
Lease Revenue Bonds - The State Building Ownership Authority (SBOA), the official owner of state facilities, issues lease revenue bonds. The occupying agency pays rent to the SBOA which is used to pay debt service. A pledge of future rental payments (subject to legislative appropriation) and a mortgage on the financed project secure debt.
Since neither the full faith and credit of the state nor its taxing power secure lease revenue bonds, they are not counted against debt limits. However, UCA 63B-1-306 states the debt issued by the SBOA plus other debt issued by the state (less $791 million in highway debt) cannot exceed 1.5 percent of the
OFFICE OF THE LEGISLATIVE FISCAL ANALYST - 201 - DEBT SERVICE
CAPITAL FACILITIES AND GOVERNMENT OPS. 2008 GS value of the state’s taxable property. A statutory change would be required for SBOA bonds if general obligation bonds were authorized up to the constitutional limit. Unlike general obligation bonds, revenue bonds are typically issued with a repayment period of 20 years. An additional amount is borrowed to cover interest payments during construction.
Certificates of Participation (COP) - COPs are very similar to lease revenue bonds with one major difference – instead of being a bond issued directly by a governmental entity, COPs represent an undivided interest in a lease agreement. This lease agreement may be entered into by any entity that has the ability to lease space. Although either the state or a private entity may initially hold title to the facility, title must pass to the state by the end of the lease term in order for the interest on the COP to be exempt from federal income tax.
Summary - All of the above are accounted for as debt on the state’s financial statements and are considered to be debt by national rating agencies. In addition, the State Auditor issued an opinion in December of 1995 that any General Fund, Uniform School Fund, or Transportation Fund used to retire lease purchase and revenue bond obligations should be counted in the spending limitation formula.
Relative costs The total cost associated with various options for financing projects are listed below, ranked from least expensive to most expensive. Specific projects may have circumstances that would affect this ranking. The order for revenue bonds and certificates of participation depends on the nature of the project and the source of funding for the debt service.
1. Cash (state funds)
2. General Obligation Bonds
3. Lease Revenue Bonds
4. Revenue Bonds
5. Certificates of Participation
6. Leasing (long-term)
The relative cost of different types and terms of debt fluctuates with the financial market. As a general rule, a twenty year general obligation bond carries an interest cost which is about two-thirds of one percentage point higher than a six year general obligation bond. A twenty year lease revenue bond carries an interest cost which is about one-third of one percentage point higher than a twenty year general obligation bond. Interest rates for certificates of participation are generally higher than lease revenue bonds. By far the largest costs occur when the state enters into a long-term lease instead of purchasing a building that an agency will need for fifteen or twenty years.
Suggested policy issues
During the 1996 General Session, the Legislature adopted general guidelines for issuing state debt. The Analyst recommends the adoption of those guidelines again for the 2008 General Session.
OFFICE OF THE LEGISLATIVE FISCAL ANALYST - 202 - DEBT SERVICE
CAPITAL FACILITIES AND GOVERNMENT OPS. 2008 GS
OFFICE OF THE LEGISLATIVE FISCAL ANALYST - 203 - DEBT SERVICE
General Obligation Bonds should be the preferred method for critical facilities whose costs exceed the availability of current funding. It is assumed that the need for the facility has received full analysis for justification. Short-term bonds (6 to 10 years) should be used when a facility has no present funding base to service debt and when the facility fulfills a critical need that cannot be funded within the base budget for capital facilities. Long-term bonds should be used (15 to 20 years) when there are current facility occupancy costs within the agency base budget that could be used to assist the funding of debt service.
Current market conditions should also be considered when bonding is discussed. For example, if current rates are lower than what the State Treasurer is earning on the Public Treasurer’s Investment Fund, it may be a favorable time to bond. This is especially true with short-term bonds that will not recover interest costs through inflation.
Revenue Bonds should be considered when a dedicated source of revenue is available to cover underwriting requirements. Generally, a coverage ratio is required that is in excess of actual debt service. Examples would include higher education facilities such as dormitories and parking lots where the funding source for debt service is derived from rents or fees.
Lease Revenue Bonds or Certificates of Participation should be used if the Legislature is willing to fund a lease for a long-term facility. This type of funding could be considered when an agency has an outside source of revenue in addition to any existing costs in the budget base. An example would be the State Library where federal funds are available as lease costs but federal regulation may not allow the funds to be used for debt retirement. Caution should be exercised by the Legislature to avoid excessive lease purchase obligations since they are treated like debt once funds have been committed. If funds were not appropriated in a given year the state would enter into a default position. Lease revenue bonds should be issued with a repayment period not to exceed twenty years.
Leasing provides the least expensive option for space only when short-term needs are an issue. Some programs are temporary in nature or provide a function that needs to be able to change locations frequently. The Analyst recommends that the Division of Facilities Construction and Management (DFCM) continue to provide funding alternatives for the Legislature when agency high-cost leases are requested. High-cost leases are defined in statute as real property leases that have an initial term of ten years or more or will require lease payments of more than $1 million over the term of the lease, including any renewal options.

CAPITAL FACILITIES AND GOVERNMENT OPS. 2008 GS
GLOSSARY
Finance categories used by the state are:
OFFICE OF THE LEGISLATIVE FISCAL ANALYST - 205 - GLOSSARY
This is one of the state's most important sources of income. The primary revenue source is the sales tax, although there are other taxes and fees which are deposited into this fund. General Funds may be spent at the discretion of the Legislature, as the Constitution allows. Personal income taxes and corporate franchise taxes are not deposited into the General Fund, but into the Uniform School Fund.
General Fund
This is another of the state’s most important sources of income. Revenues come primarily from personal income taxes and corporate franchise taxes. Funds are constitutionally restricted to public and higher education. In the Capital Facilities subcommittee, these funds are used for debt service, higher education capital developments, and higher education capital improvements (alteration, repair and improvements).
Education Fund
Transportation funds are derived primarily from the gas tax and are constitutionally restricted to road and highway related issues. In the Capital Facilities subcommittee, these funds are used for debt service on highway bonds, especially for Centennial Highway Fund projects.
Transportation Funds
Federal agencies often make funds available to the state for programs that are consistent with the needs and goals of the state and its citizens and are not prohibited by law. Generally, federal funds are accompanied by certain requirements. A common requirement is some form of state match in order to receive the federal dollars. The Legislature must review and approve most large federal grants before state agencies may receive and expend them.
Federal Funds
Dedicated Credits are funds that are paid to an agency for specific services and are dedicated to financing that service. For example, fees collected by an internal service fund agency from another state agency are dedicated credits. By law, these funds must be spent before other appropriated state funds are spent. An agency must estimate the level of its service for the following fiscal year, and thus its level of dedicated credits.
Dedicated Credits
Restricted funds are statutorily restricted to designated purposes. The restricted funds usually receive money from specific sources, with the understanding that those funds will then be used for related purposes.
Restricted Funds
Several other small funds are used by certain agencies. These will be discussed in further detail as the budgets are presented. Lapsing funds, however, should be addressed. Funds lapse, or revert back to the state, if the full appropriation is not spent by the end of the fiscal year. Since it is against the law to spend more than the Legislature has appropriated, all programs will either spend all the money or have some left over. The funds left over lapse to the state, unless specifically exempted. Those exceptions include funds that are setup as nonlapsing in their enabling legislation, or appropriations designated nonlapsing by annual intent language per UCA 63-38-8.1. In these cases, left over funds do not lapse back to the state, but remain with the
Lapsing/Nonlapsing
CAPITAL FACILITIES AND GOVERNMENT OPS. 2008 GS agency in a special nonlapsing balance, for use in the next fiscal year. In the budgets, the Beginning Nonlapsing balance is the balance on July 1, while the balance on the next June 30 is termed the Closing Nonlapsing balance. The Closing Nonlapsing balance from one fiscal year becomes the Beginning Nonlapsing balance of the following fiscal year. The reasoning behind nonlapsing funds is that a specific task may take an indeterminate amount of time, or span more than one fiscal year. By allowing departments to keep their unexpended funds, the state not only eliminates the rush to spend money at the end of a fiscal year, but also encourages managers to save money.
Expenditure categories used by the state are:
OFFICE OF THE LEGISLATIVE FISCAL ANALYST - 206 - GLOSSARY
Includes employee compensation and benefits such as health insurance, retirement, and employer taxes.
Personal Services
Includes general expenses such as utilities, subscriptions, communications, postage, professional and technical services, maintenance, laundry, office supplies, small tools, etc. that cost less than $5,000 or are consumed in less than one year.
Current Expenses
Includes items such as small computer hardware and software, port charges, programming, training, supplies, etc.
Data Processing Current Expense
Includes items that cost over $5,000 and have a useful life greater than one year.
Capital Outlays
Includes funds passed on to other non-state entities for use by those entities, such as grants to local governments.
Pass Through
Other budgeting terms and concepts that the Legislature will encounter include the following:
In recent years, performance based budgeting has received more attention as citizens and decision-makers demand evidence of improved results from the use of tax dollars.
Performance Measures
Care must be exercised in crafting performance measures to avoid misdirected results. Moving to performance based budgeting is a long term commitment. The Analyst has drafted some ideas for performance measures in the write-up, however, it is recognized that the measures are a work in progress and that long-term tracking of measures would require a statewide commitment in both the executive and legislative branches.
Intent language may be added to an appropriation bill to explain or put conditions on the use of the funds in the line item. Intent language may restrict usage, require reporting, or impose other conditions within the item of appropriation. However, intent language cannot contradict or change statutory language.
Intent Language
The current legislative session is determining appropriations for the following fiscal year. However, it may be determined that unexpected circumstances have arisen which require additional funding for the current year. The appropriations subcommittee can recommend to the Executive Appropriations
Supplemental Appropriation
CAPITAL FACILITIES AND GOVERNMENT OPS. 2008 GS Committee that a supplemental appropriation be made for the current fiscal year.
OFFICE OF THE LEGISLATIVE FISCAL ANALYST - 207 - GLOSSARY
An abbreviation for Full Time Equivalent, this is a method of standardizing personnel counts. A full time equivalent is equal to one employee working 40 hours per week. Four employees each working ten hours per week would also count as 1 FTE.
FTE
This is a term that applies to an appropriation bill. A line number in the appropriations bill identifies each appropriated sum. Generally, each line item may contain several programs. Once the appropriation becomes law, the money may be moved from program to program within the line item, but cannot be moved to another line item of appropriation.
Line Item

CAPITAL FACILITIES AND GOVERNMENT OPS. 2008 GS
OFFICE OF THE LEGISLATIVE FISCAL ANALYST - 209 - INDEX
INDEX
Administrative Rules Division, 23 Archives – Administration Program, 44 Archives – Line Item Summary, 41 Archives – Patron Services, 49 Archives – Preservation Services, 47 Archives – Records Analysis, 45 Archives – Records Services, 51 Board of Regents, 182, 183, 191 Building Board, 15, 29, 30, 175, 176, 181, 185,
187, 190, 193 Capital Budget, 175 Capital Development – Property Acquisition,
189 Capital Development – State Funded, 179 Capital Developments – Other Funds, 185 Capital Improvements, 186 Capitol Preservation Board, 5, 29, 30, 137 Career Service Review Board, 9 Child Welfare Parental Defense, 17, 87 DAS – Appropriated Budgets Summary, 13 DAS – Executive Director’s Office, 15, 87 DAS – Internal Service Funds Summary, 95 Debt Limit – Constitutional, 195 Debt Limit – Statutory, 195, 201 Debt Service, 193 DFCM – Administration Program, 33 DFCM – Energy Program, 38 DFCM – Governor’s Residence, 38 DFCM – Line Item Summary, 29 DHRM – Administration, 145 DHRM – Central Operations, 149 DHRM – Field Services ISF, 157 DHRM – Flex Benefits, 150 DHRM – Information Technology, 153 DHRM – ISF Summary, 155 DHRM – Line Item Summary, 143 DHRM – Management Training, 151 DHRM – Payroll Field Services ISF, 157 DHRM – Policy, 147 DTS – Agency Services ISF, 171 DTS – Appropriated Budgets Summary, 159 DTS – Automated Geographic Reference
Center, 163
DTS – Chief Information Officer, 161 DTS – Enterprise Technology ISF, 173 DTS – ISF Summary, 169 DTS – Technology Acquisition Projects, 166 Facilities Maintenance – DFCM (ISF), 137 Finance – Director’s Office, 56 Finance – Financial Information Systems, 69 Finance – Financial Reporting, 67 Finance – Line Item Summary, 53 Finance – Mandated Expenditures, 71 Finance – Payables/Disbursing, 61 Finance – Payroll, 58 Finance – Technical Services, 65 Finance Mandated – Convention Facilities, 74 Finance Mandated – Development Rebates, 75 Finance Mandated – LeRay McAllister, 72 Finance Mandated – Retirement Benefits, 76 Fleet Operations (ISF) – Line Item, 115 Fleet Ops – Administration, 117 Fleet Ops – Federal Surplus Property, 129 Fleet Ops – Fuel Network, 124 Fleet Ops – Motor Pool, 119 Fleet Ops – State Surplus Property, 126 General Services – Administration, 103 General Services – Central Mailing, 105 General Services – ePurchasing, 107 General Services – Print Services, 110 General Services (ISF) – Line Item, 101 Glossary, 205 Information Technology Services – Summary,
113 Judicial Conduct Commission, 79 Lease Information, 190 Line Items and Programs List, 3 Office of State Debt Collection, 89 Post Conviction Indigent Defense Fund, 77 Purchasing and General Services, 83 Risk Management – Administration, 133 Risk Management – Workers’ Compensation,
135 Risk Management (ISF) – Line Item, 131 Subcommittee Summary, 1


