Embed Size (px)
Citation preview

This article appeared in a journal published by Elsevier. The attachedcopy is furnished to the author for internal non-commercial researchand education use, including for instruction at the authors institution
and sharing with colleagues.
Other uses, including reproduction and distribution, or selling orlicensing copies, or posting to personal, institutional or third party
websites are prohibited.
In most cases authors are permitted to post their version of thearticle (e.g. in Word or Tex form) to their personal website orinstitutional repository. Authors requiring further information
regarding Elsevier’s archiving and manuscript policies areencouraged to visit:
http://www.elsevier.com/copyright

Author's personal copy
Journal of Chromatography A, 1228 (2012) 329– 337
Contents lists available at SciVerse ScienceDirect
Journal of Chromatography A
jou rn al h om epage: www.elsev ier .com/ locat e/chroma
Comparison of reversed-phase and hydrophilic interaction liquidchromatography for the separation of ephedrines
James Heatona, Nicola Graya, David A. Cowana, Robert S. Plumba,b, Cristina Legido-Quigleya,Norman W. Smitha,∗
a Analytical and Environmental Sciences, School of Biomedical Sciences, King’s College, London, United Kingdomb Waters Corporation, Milford, MA, USA
a r t i c l e i n f o
Article history:Available online 24 September 2011
Keywords:Hydrophilic interaction liquidchromatography (HILIC)Reversed-phase liquid chromatography(RPLC)EphedrinesTemperatureKinetic plots
a b s t r a c t
The separation of highly basic solutes is an ongoing challenge, especially in achieving suitable reten-tion and peak shapes for compounds such as ephedrines that have both high pKa values (≥9.3) andlow lipophilicity (log P ≤ 1.74). In this study we investigate the application of HILIC as a potential alter-native approach for the fast separation of the ephedrines phenylpropanolamine, cathine, ephedrine,pseudoephedrine and methylephedrine in doping control analysis. Using sub-2 �m bare silica bridged-ethylene hybrid (BEH) HILIC material, we evaluate the effects of organic modifier, buffer pH andconcentration and column temperature on the retention and selectivity of these compounds. Highlysymmetrical peak shapes for all ephedrines were achieved under HILIC conditions (As0.1 ≤ 1.1). We alsocompare the kinetic performance of the optimised HILIC separation with a previously developed high pHreversed-phase approach. van Deemter curves and kinetic plots for the two approaches are constructedand illustrate the kinetic benefits of HILIC over the reversed-phase approach. Improved mass transfercharacteristics and enhanced diffusion with HILIC offers lower C-term coefficients of 1.46 and 5.68 forephedrine with HILIC and RPLC, respectively.
© 2011 Elsevier B.V. All rights reserved.
1. Introduction
Achieving symmetrical peak shapes and acceptable retentionfactors for hydrophilic basic compounds with high perfor-mance liquid chromatography (HPLC) is challenging by traditionalreversed-phase approaches. In cases where these types of solutesare also polar, such as ephedrines which are highly basic (pKa
values > 9.3) and hydrophilic (log P values < 1.74), the challenge isamplified and provokes alternative solutions for separation by LC(see Table 1 for analyte properties). In human sport, the WorldAnti-Doping Agency (WADA) prohibits the use of many of theephedrines since they are regarded as stimulants [1]. At present,cathine (norpseudoephedrine), ephedrine, pseudoephedrine andmethylephedrine are prohibited in competition above thresholdconcentrations. To control use, urine samples from athletes must beanalysed for their presence and quantitative confirmation analysesperformed where necessary [1]. Ephedrine and pseudoephedrineare diastereoisomers, as are their related demethylated substancescathine and phenylpropanolamine. Also related is the compoundmethylephedrine, differing only by a single methyl group from theephedrine geometric isomers. Mass spectrometric (MS) detection
∗ Corresponding author. Tel.: +44 207 848 4462; fax: +44 207 848 4980.E-mail address: [email protected] (N.W. Smith).
is necessary for the unequivocal identification of these ana-lytes in doping control, presenting a further challenge since thediastereoisomers share very similar fragmentation patterns, andhence each analyte must be separated chromatographically priorto detection.
Previous methods of separation have included gas chromatog-raphy coupled to nitrogen phosphorous detection (GC–NPD) [2]or mass spectrometry (GC–MS) [3], high performance liquid chro-matography coupled to ultra-violet detection (HPLC–UV) [4],where GC–MS requires derivatisation and HPLC–UV lacks the sen-sitivity and selectivity of MS. Hyphenation to mass spectrometry,when dealing with analytes in biological matrices, offers decidedlymore information for identification and confirmation of a positivedoping suspect. More recently, anti-doping drug analysis method-ology is being transferred to LC–MS, offering faster analysis timesand simple sample preparation, critical factors where fast turn-around times are required, as well as increased sensitivity [5–8].However, certain approaches to achieving good retention and peakshape for basic compounds with reversed-phase (RP) LC are notamenable to MS detection, such as ion-pairing reagents and highionic strength buffers. The impact of utilising perfluorinated ion-pairing reagents for LC–MS analysis of a range of basic drugs wasevaluated by Schubert and Oberacher [9] noting that under over-loading conditions simple carboxylic acid additives provide muchinferior peak shapes and poor retention for hydrophilic analytes
0021-9673/$ – see front matter © 2011 Elsevier B.V. All rights reserved.doi:10.1016/j.chroma.2011.09.026

Author's personal copy
330 J. Heaton et al. / J. Chromatogr. A 1228 (2012) 329– 337
Table 1Properties of the compounds considered in the present study.
Compound Structure pKaa log Pb log D (pH 5)c log D (pH 10)c
Phenylpropanolamine (norephedrine)
NH2
OH
CH3 9.4 0.81 −3.59 0.71
Cathine (norpseudoephedrine)
NH2
CH3
OH
9.4 0.81 −3.59 0.71
Ephedrine
HN
CH3
OH
CH39.6 1.05 −3.55 0.90
Pseudoephedrine
HN
CH3
CH3
OH
9.8 1.05 −3.75 0.84
Methylephedrine
OH
NCH3
CH3
CH3 9.3 1.74 −2.56 1.66
a pKa values obtained from Clarke’s Analysis of Drugs and Poisons.b log P values obtained from ChemSpider.c log D values calculated from pKa and log P values using the equation: log D = log P + log[1/(1 + 10pKa−pH)].
such as nicotine. The use of fluorinated ion-pairing reagents wereshown to significantly improve peak shape, however this was at thedetriment of mass spectrometric performance. Fleiger [10] inves-tigated the use of perfluorinated ion-pairing reagents as appliedto the reversed-phase separation of �-blockers reporting usefulincreases in retention and improved peak shapes when comparedto acetic acid. Stuppner and co-workers [11] utilised the ion-pairingreagent sodium dodecyl sulfate (SDS) for the separation of ephedraalkaloids in dietary supplements. Alternative solutions involve theuse of highly aqueous mobile phases in order to retain these polaranalytes [12,13] but such approaches are associated with poor MSdesolvation and stationary phase de-wetting. Other strategies suchas the use of chaotropic salts and ionic liquids [14,15] as mobilephase additives for the analysis of hydrophilic amines have beenshown to yield highly symmetrical and efficient separations, how-ever such approaches are unsuitable for interfacing to electrosprayionisation mass spectrometry. Suitable retention has also previ-ously been achieved by manipulating the mobile phase so as toreduce the degree of analyte ionisation, recently made possiblewith high pH stable stationary phases [16], or by utilising comple-mentary stationary phase materials such as the pentafluorophenylvariant [17,18].
Hydrophilic interaction chromatography (HILIC) has recentlybecome a widespread alternative to RPLC for achieving good reten-tion and peak shapes for polar or ionisable analytes, and is alsoamenable to MS detection [19–21]. In addition, HILIC offers par-ticular advantages over RPLC approaches, including lower backpressures and enhanced desolvation with electrospray ionisation
(ESI) owing to the large percentage of organic modifier in the mobilephase. The resulting lower back pressures permit the use of fasterflow rates for increased sample throughput, longer columns forenhanced resolution or use of sub-2 �m particle materials withtraditional pumping systems, while improved desolvation withESI mass spectrometry offers better sensitivity and lower lim-its of detection. Nevertheless, the technique also brings with itcertain disadvantages over RPLC, in particular regarding the com-plex and poorly understood retention mechanisms. Unlike thewell-identified mechanisms of retention in RPLC, there are sev-eral proposed mechanisms of interaction at play in HILIC [22–24],complicating the predication of retention which is widely valued inRPLC. Nor does HILIC offer the flexibility and applicability that RPLCdoes, with only limited tools available to manipulate a separation,and is associated with longer re-equilibration times and problemswith sample solubility.
However, where other methods cannot provide appropriateretention or peak symmetry, HILIC has been shown to be a power-ful alternative for separating polar, hydrophilic compounds. Herewe investigate the suitability of HILIC as an alternative to RPLCfor the fast chromatographic separation of ephedrine isomers. Thecompounds in question are structurally similar, and without thepresence of a shape selective moiety bonded to the stationaryphase, as is the case with bare silica, the separation of these solutesmay prove difficult. We investigate the effects chromatographicparameters including the proportion of acetonitrile, buffer pH andconcentration and column temperature on the HILIC separation inorder to determine whether HILIC is a viable option for the retention

Author's personal copy
J. Heaton et al. / J. Chromatogr. A 1228 (2012) 329– 337 331
and separation of the distinct ephedrines. With these parametersoptimised, the same bridged-ethylene hybrid (BEH) material func-tionalised with C18 ligands is used as a comparator technique toevaluate the benefits of HILIC over RPLC. A kinetic performancecomparison is presented between RPLC and HILIC as two possibleapproaches for the separation of ephedrines.
2. Experimental
2.1. Chemicals and reagents
Acetonitrile (HPLC grade), ammonium bicarbonate, ammo-nium hydroxide solution (35%) and formic acid (98%) wereobtained from Fisher Scientific (Loughborough, UK). Ammoniumacetate, ammonium formate, uracil and toluene were purchasedfrom Sigma (Poole, UK). Norephedrine, norpseudoephedrine,ephedrine, pseudoephedrine and methylephedrine were pur-chased as hydrochloride salts from Sigma (Poole, UK). Water waspurified by an ultra-pure water system (Millipore, UK).
2.2. Solutions
2.2.1. Reversed-phase mobile phaseAmmonium bicarbonate buffer was prepared at 10 mM in puri-
fied water and adjusted to pH 10 with ammonium hydroxidesolution (35%). The mobile phase was pre-mixed at a composition of90:10 (v/v) 10 mM ammonium bicarbonate pH 10:CH3CN by adding100 mL of acetonitrile to 900 mL 10 mM ammonium bicarbonate pH10.
2.2.2. HILIC mobile phaseAmmonium formate (pH 3 and 4) and ammonium acetate (pH 5)
buffers were prepared separately at 200 mM in purified water andadjusted to the appropriate pH with formic acid (98%). Typically, themobile phase preparation consisted of 95:5 (v/v) CH3CN:200 mMbuffer prepared by taking 50 mL of the 200 mM stock buffer andadding to 950 mL acetonitrile. The pre-mixed mobile phase wasthen sonicated to ensure complete dissolution of the buffer salt.
2.2.3. Sample preparationStock solutions were prepared at a concentration of 1 mg/mL
for norephedrine, norpseudoephedrine, ephedrine and methyle-phedrine and pseudoephedrine in methanol at −20 ◦C untilrequired. Standard working solutions at 50 �g/mL were preparedby diluting stock solutions with the appropriate mobile phase foreither HILIC or reversed-phase operations.
2.3. LC conditions
Liquid chromatography was carried out on a Waters AcquityUPLC® (Waters Corp., Milford, USA) which consisted of a samplemanager, binary solvent delivery system and a PDA detector. Theautosampler was thermostatted at 6 ◦C. All injections were madein duplicate and averaged for all experiments. For the van’t Hoffexperiments a Waters Xevo QTof-MS (Waters Corp., Manchester,UK) was used to track the compounds of interest. The columns wereconnected to the injection valve using the temperature stabilisertubing so as to ensure that adequate eluent pre-conditioning tookplace. For the kinetic performance experiments sample injectionsof 1 �L were made using a 2 �L loop in the partial loop with nee-dle overfill mode and for the mass spectrometry experiments 5 �Linjections were made using a 5 �L loop in full loop mode. Empower2 or MassLynx V4.1 software (Waters Corp., Milford, USA) was usedfor data acquisition.
2.3.1. Reversed-phase conditionsSeparations were carried out on an Acquity UPLC® sys-
tem (Waters Corp., Milford, USA) with an Acquity BEH C181.7 �m, 2.1 mm × 50 mm column for the reversed-phase separa-tion equipped with a 0.2 �m in-line filter. Isocratic chromatographywas performed using a prefixed mobile phase of 90:10 (v/v)10 mM ammonium bicarbonate pH 10:CH3CN. The flow rate was500 �L/min and column temperature set at 60 ◦C. The weak andstrong needle wash lines of the Acquity UPLC® system wereplaced in 90:10 H2O:CH3OH (v/v) and 10:90 H2O:CH3OH (v/v)respectively. The elution conditions were slightly modified froma previously reported separation of ephedrines by Gray et al. [16]except performed using sub-2 �m BEH C18.
2.3.2. HILIC conditionsAcquity BEH HILIC 1.7 �m, 2.1 × 50 or 100 mm columns were
used for the HILIC separation using a 0.2 �m in-line filter. Themobile phase comprised of premixed 95:5 (v/v) CH3CN:200 mMbuffer for the HILIC separation. Flow rate was 500 �L/min andcolumn temperature set at 50 ◦C unless otherwise specified. Theweak and strong needle wash lines of the Acquity UPLC systemwere placed in 95:5 (v/v) CH3CN:H2O and 50:50 (v/v) CH3CN:H2O,respectively, so as not to cause any interference with the sampleplug.
2.4. Detection
Analyte detection was performed using an Acquity PDA detec-tor or a Xevo QToF mass spectrometer (Waters Corp., Milford, USA)equipped with an electrospray ionisation (ESI) source operated inpositive ion mode. UV data was collected at 210 nm using a sam-pling rate of 40 Hz. Columns were connected to either the massspectrometer ion source or PDA-UV detector using minimal lengthsof 0.004 in. ID PEEK tubing.
The MS was operated in MSE mode collecting two channels ofdata throughout the run, one with low collision energy (4 V) andone high (ramp from 10 to 20 V) in order to obtain both the precur-sor and product ions. Source conditions were optimised for eachmobile phase composition and for reversed-phase separation thecapillary voltage was set at 1.0 kV, the sample cone 10 V, sourcetemperature 120 ◦C, desolvation temperature 400 ◦C. In HILIC thecapillary voltage was set at 3.0 kV, sampling cone 20 V, source tem-perature was 120 ◦C, desolvation temperature 350 ◦C. For both LCsetups the cone gas flow was set at 10 L/h and the desolvation gaswas set at 800 L/h. The micro-channel plate detector was oper-ated at 2150 V. Data were collected in centroid mode over an m/zrange of 100–1000 Da with a scan time of 0.05 s. Leucine enkephalin(5 ng/mL) was used as the accurate mass reference material, infusedthrough the LockSpray probe at 5 �L/min and acquired every 20 swith a 0.3 s scan time scans (3 scans were averaged).
2.5. Methodology for the construction of van Deemter plots
The kinetic study was performed using phenylpropanolamine,ephedrine and methylephedrine as the test solutes. Column effi-ciency (Ncol) was determined from peak widths at half height for theHILIC study. The asymmetry factor (As) and peak widths (w0.1) weredetermined at 10% of the peak height for the reversed-phase study.All reported data were obtained after correction for extra-columnband broadening (�2
sys) caused by the instrument, determined byremoving the column and replacing it with a zero volume connector

Author's personal copy
332 J. Heaton et al. / J. Chromatogr. A 1228 (2012) 329– 337
and injecting each solute individually in the relative mobile phasefor each study.
Ncol = (tR,total − tR,sys)2
�2total
− �2sys
(1)
Data was transformed into on-column plate height as follows:
Hcol = L
Ncol(2)
where L is the column length (m) and Hcol is plate height (�m).Plate height data were fitted to the van Deemter equation:
Hcol = A + B
u0+ Cu0 (3)
where A, B and C are the Eddy diffusion, longitudinal dispersionand resistance to mass transfer coefficients respectively, and u0 isthe mobile phase linear velocity, determined in cm/s in this study.SigmaPlot (version 11.0, Systat Software Inc.) software was used tofit the (u0, H) data to Eq. (3).
2.6. Methodology for the construction of kinetic plots
Based on experimental van Deemter data (u0, Hcol) and columnpermeability values (KvO), kinetic plots were constructed to bettervisualise the potential of the two analytical systems investigated,accounting for mobile phase flow rate, chromatographic efficiency,generated back pressure and column geometry. Two equations arenecessary to transform this experimental data into extrapolatedplots of analysis time versus efficiency, as outlined by Desmet et al.[25,26]:
N = �Pmax
�
(KvO
�0Hcol
)experimental
(4)
t0 = �Pmax
�
(KvO
�20
)experimental
(5)
where �Pmax is the maximum allowed pressure drop with anygiven support material, pending also the constraints of the chro-matographic apparatus, and � is the mobile phase viscosity (cP).Data was processed and curve fittings made using the Kinetic PlotCreator 3.1 (Vrije Universiteit Brussel, Belgium) for generation ofkinetic plots.
3. Results and discussion
3.1. Effect of CH3CN composition on retention ofphenylpropanolamine, ephedrine and methylephedrine
Retention in HILIC is achieved through the establishment of awater rich layer immobilised on the surface of the polar station-ary phase, thereby facilitating a multitude of chemical interactions.Upon increasing the concentration of acetonitrile in the mobilephase relative to the aqueous component, an increase in retention isgenerally observed. As illustrated by McCalley [19], it is essential toinclude buffer at the appropriate concentration when using HILICas poor peak shapes are observed if only weak acids are used asmobile phase additives. It is therefore essential to employ a bufferwhich is soluble in the acetonitrile rich mobile phase. Ammoniumacetate and ammonium formate were chosen as suitable buffers inthis study, which have the added benefit of being MS compatible.Also of importance is the concentration of the buffer as long equi-libration will be necessary if low concentrations are used, whereasthey will precipitate in the organic rich mobile phase at high con-centrations and contamination within the LC–MS ion source mayoccur causing signal suppression. In the first instance an overallconcentration of 10 mM was employed, and it was noted that higher
0.00
1.00
2.00
3.00
4.00
5.00
6.00
7.00
65 70 75 80 85 90 95 10 0
% CH CN
kFig. 1. HILIC retention behaviour (k) of methylephedrine (crosses), phenyl-propanolamine (triangles) and ephedrine (diamonds) at 50 ◦C, constant 10 mMammonium acetate pH 5.0, as a function of percentage acetonitrile. Column was10 cm × 2.1 mm ID, HILIC BEH 1.7 �m operated at 500 �L/min.
concentrations resulted in a precipitate being formed when mixedwith acetonitrile. Initially, prior to attempting the separation of thegeometric isomers, retention of the individual amines was estab-lished using 10 mM ammonium acetate buffer adjusted to pH 5. Asobserved in Fig. 1, there was an increase in retention with increas-ing acetonitrile concentration for phenylpropanolamine, ephedrineand methylephedrine. Although retention was adequate at 90%acetonitrile (k ∼ 2) for all compounds, little or no separation wasachieved between the three compounds. However, by increasingthe acetonitrile content further, to 95%, the separation of phenyl-propanolamine, ephedrine and methylephedrine was achieved.
3.2. Dependence on retention of mobile phase pH
Residual silanols on the surface of silica are reported to have apKa of 7.1 ± 0.5 [27], although the bridged-ethylene hybrid (BEH)material used here has been reported to be less acidic than con-ventional silicas due to surface deactivation [28,29]. According toNeue et al. [29], the pKa of hybrid packings decreases with increas-ing organic modifier concentrations by as much as 0.63 units per30% increase in acetonitrile content. As already shown by Grum-bach et al. [30] and McCalley [19], this further highlights theimportance of pH as a variable in developing separations, espe-cially where retention is poor and selectivity must be maximisedin order to separate structurally similar compounds. In order toinvestigate the effect of pH so as to improve the retention of theephedrines, pH 3.0 and 4.0 using 10 mM ammonium formate andpH 5.0 using 10 mM ammonium acetate, measured in the aque-ous phase were used. As shown in Fig. 2, a marked change in theselectivity of these analytes is noted with increasing pH. This maybe explained by the dissociation of the silanol groups allowingfor cation exchange contributions to take place with the chargedbasic solutes. The strongest retention of the secondary (ephedrineand pseudoephedrine) and tertiary (methylephedrine) amines wasencountered at pH 5. Interestingly, the primary amines (phenyl-propanolamine and cathine) slightly decreased in retention withincreasing pH, which may be the result of interplay between the pKa
of the analytes and dissociation of silanol groups. It appears overallthat the resolution of the ephedrine isomers is in fact improved withincreasing pH on bare silica, where dissociation of silanols is clearly
Author's personal copy
J. Heaton et al. / J. Chromatogr. A 1228 (2012) 329– 337 333
2.5
3.0
3.5
4.0
4.5
5.0
5.5
6.0
6.5
7.0
2.5 3.0 3.5 4.0 4.5 5.0 5.5pH
k
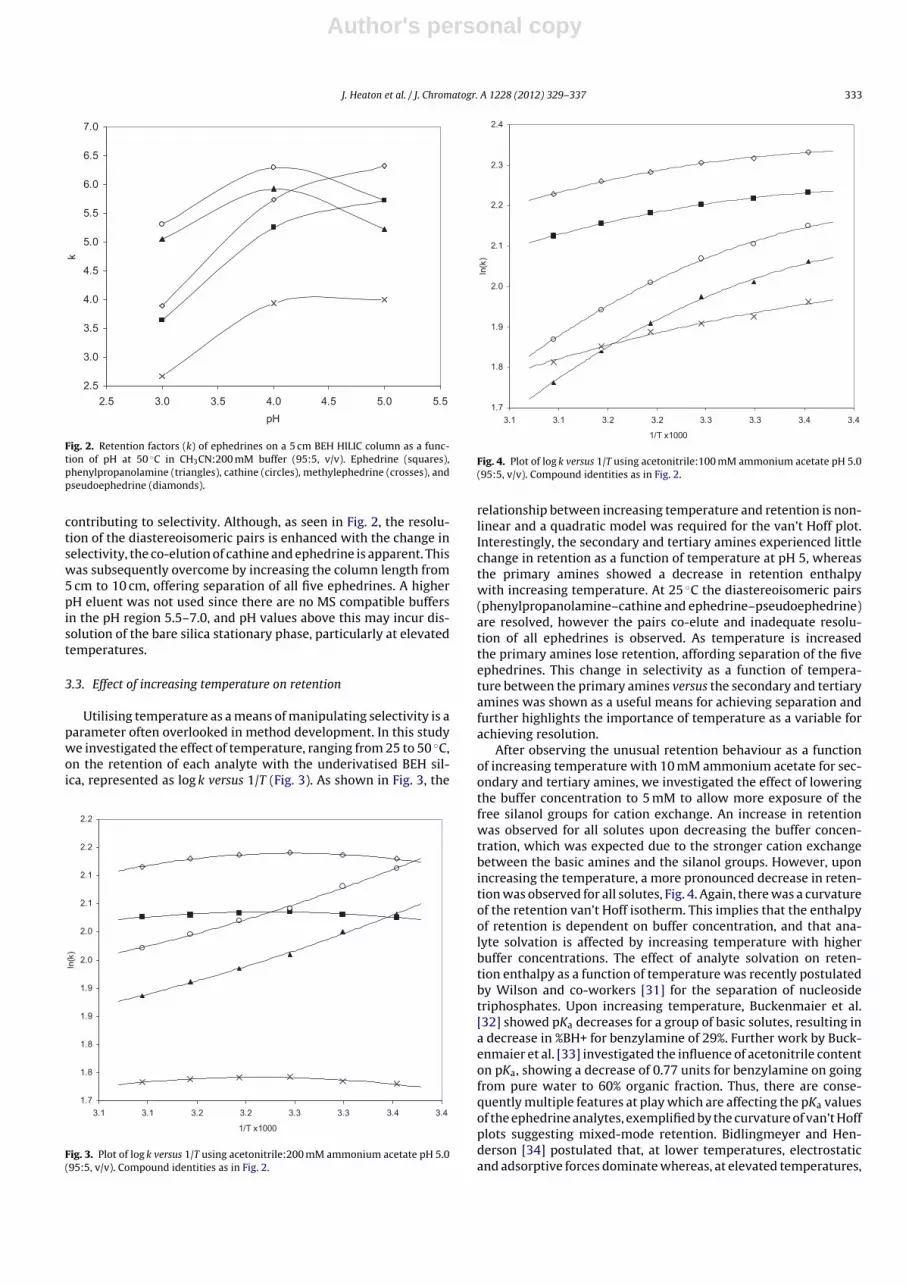
Fig. 2. Retention factors (k) of ephedrines on a 5 cm BEH HILIC column as a func-tion of pH at 50 ◦C in CH3CN:200 mM buffer (95:5, v/v). Ephedrine (squares),phenylpropanolamine (triangles), cathine (circles), methylephedrine (crosses), andpseudoephedrine (diamonds).
contributing to selectivity. Although, as seen in Fig. 2, the resolu-tion of the diastereoisomeric pairs is enhanced with the change inselectivity, the co-elution of cathine and ephedrine is apparent. Thiswas subsequently overcome by increasing the column length from5 cm to 10 cm, offering separation of all five ephedrines. A higherpH eluent was not used since there are no MS compatible buffersin the pH region 5.5–7.0, and pH values above this may incur dis-solution of the bare silica stationary phase, particularly at elevatedtemperatures.
3.3. Effect of increasing temperature on retention
Utilising temperature as a means of manipulating selectivity is aparameter often overlooked in method development. In this studywe investigated the effect of temperature, ranging from 25 to 50 ◦C,on the retention of each analyte with the underivatised BEH sil-ica, represented as log k versus 1/T (Fig. 3). As shown in Fig. 3, the
1.7
1.8
1.8
1.9
1.9
2.0
2.0
2.1
2.1
2.2
2.2
3.1 3.1 3.2 3.2 3.3 3.3 3.4 3.4
1/T x10 00
ln(k
)
Fig. 3. Plot of log k versus 1/T using acetonitrile:200 mM ammonium acetate pH 5.0(95:5, v/v). Compound identities as in Fig. 2.
1.7
1.8
1.9
2.0
2.1
2.2
2.3
2.4
3.1 3.1 3.2 3.2 3.3 3.3 3.4 3.4
1/T x10 00
ln(k
)
Fig. 4. Plot of log k versus 1/T using acetonitrile:100 mM ammonium acetate pH 5.0(95:5, v/v). Compound identities as in Fig. 2.
relationship between increasing temperature and retention is non-linear and a quadratic model was required for the van’t Hoff plot.Interestingly, the secondary and tertiary amines experienced littlechange in retention as a function of temperature at pH 5, whereasthe primary amines showed a decrease in retention enthalpywith increasing temperature. At 25 ◦C the diastereoisomeric pairs(phenylpropanolamine–cathine and ephedrine–pseudoephedrine)are resolved, however the pairs co-elute and inadequate resolu-tion of all ephedrines is observed. As temperature is increasedthe primary amines lose retention, affording separation of the fiveephedrines. This change in selectivity as a function of tempera-ture between the primary amines versus the secondary and tertiaryamines was shown as a useful means for achieving separation andfurther highlights the importance of temperature as a variable forachieving resolution.
After observing the unusual retention behaviour as a functionof increasing temperature with 10 mM ammonium acetate for sec-ondary and tertiary amines, we investigated the effect of loweringthe buffer concentration to 5 mM to allow more exposure of thefree silanol groups for cation exchange. An increase in retentionwas observed for all solutes upon decreasing the buffer concen-tration, which was expected due to the stronger cation exchangebetween the basic amines and the silanol groups. However, uponincreasing the temperature, a more pronounced decrease in reten-tion was observed for all solutes, Fig. 4. Again, there was a curvatureof the retention van’t Hoff isotherm. This implies that the enthalpyof retention is dependent on buffer concentration, and that ana-lyte solvation is affected by increasing temperature with higherbuffer concentrations. The effect of analyte solvation on reten-tion enthalpy as a function of temperature was recently postulatedby Wilson and co-workers [31] for the separation of nucleosidetriphosphates. Upon increasing temperature, Buckenmaier et al.[32] showed pKa decreases for a group of basic solutes, resulting ina decrease in %BH+ for benzylamine of 29%. Further work by Buck-enmaier et al. [33] investigated the influence of acetonitrile contenton pKa, showing a decrease of 0.77 units for benzylamine on goingfrom pure water to 60% organic fraction. Thus, there are conse-quently multiple features at play which are affecting the pKa valuesof the ephedrine analytes, exemplified by the curvature of van’t Hoffplots suggesting mixed-mode retention. Bidlingmeyer and Hen-derson [34] postulated that, at lower temperatures, electrostaticand adsorptive forces dominate whereas, at elevated temperatures,

Author's personal copy
334 J. Heaton et al. / J. Chromatogr. A 1228 (2012) 329– 337
the former is weakened. They also indicated that the amount ofadsorbed solvent on the silica surface may also be changing therebyaffecting the immobilised phase-ratio found with HILIC.
3.4. Performance comparison between reversed-phase and HILIC
Typically, to retain and separate ephedrine-type compounds byRPLC highly aqueous mobile phases are required, which may yieldunfavorable desolvation properties and poor peak shapes makingpeak integration difficult. This also entails the use of comparativelyhigh viscosity mobile phases in relation to those encountered inHILIC, and as such separation speed is restricted by the high back-pressures generated, especially with the use of sub-2 �m particles.As a comparative method, a RPLC approach modified from a previ-ously reported one [16], which utilised a high pH mobile phase andsupra-2 �m C18 BEH particles, was used.
3.4.1. Peak shape comparison between HILIC and reversed-phaseapproach
The analysis of basic solutes has been of significant interestnot only academically but also in the pharmaceutical arena wheremany drug molecules contain amine groups, as has been recentlyreviewed [21]. Achieving suitable peak shapes for these moleculesrequires careful consideration of the chromatographic conditions,particularly where solvent systems must be compatible with MSdetection. In order to investigate the column performance obtainedwith either HILIC or reversed-phase, we constructed van Deemtercurves for each system generated using phenylpropanolamine,ephedrine and methylephedrine as test solutes. In the case of thereversed-phase separation, peak asymmetry was problematic, evenat the increased temperature (60 ◦C) and high pH (10.0) employed.In order to ascertain an estimate of the true column efficiency, theDorsey–Foley procedure [35] was applied where necessary to takeinto account the peak asymmetry when calculating performancefor the reversed-phase study:
Ndf = 41.7(tr/w0.1)2
As + 1.25(6)
Phenylpropanolamine and ephedrine both yield skewed peakshapes under RP conditions as a function of flow rate and peakasymmetry measured at 10% peak height, as illustrated in Fig. 5.The peak shapes for methylephedrine were found to be similarto those found with HILIC for the flow study, possibly due to thehigh retention factor (k ∼ 22) obscuring peak symmetry issues dueto on column band broadening. Another possibility is the stericeffect of the protecting methyl groups surrounding the tertiaryamino group, affording fewer secondary interactions with acidicsilanol groups as well as the combined effect of high pH and ele-vated temperature used here on the analyte pKa. With increasingflow rate, the peak asymmetry of phenylpropanolamine was foundto deteriorate rapidly, with severe peak fronting observed, whilefor ephedrine, peak tailing was reduced and excellent peak sym-metry was achieved. This finding of improved peak asymmetrywith increasing flow rate for ephedrine resembles that observedby McCalley [36] for quinine and nortriptyline at intermediate pH.Peak fronting for oxycodone was investigated by Ornaf et al. [37]explaining that the formation of interconverting solvent adductswere involved. However, in their study, this was a temperaturedependent effect. As referred to by McCalley [38], based on the workof Neue and co-workers [28] another possibility could be a partialexclusion effect taking place in the stationary phase, which is theresult of residual cationic sites that remain from silica manufac-ture resulting in analyte repulsion. This effect is known to be morepronounced in mobile phases of lower ionic strength. Although, intheir study, this was not observed for hybrid-silica packings.
0.4
0.6
0.8
1.0
1.2
1.4
1.6
0 100 200 300 40 0
Flow rate (μL/min)
As
(0.1
)Fig. 5. Effect of increasing flow rate on peak asymmetry (measured at 10% peakheight) for ephedrine and phenylpropanolamine using reversed-phase conditions.Compound identities as in Fig. 2.
3.4.2. van Deemter flow study to compare HILIC andreversed-phase
The mobile phase composition used for the reversed-phaseapproach was mainly aqueous, with 10% CH3CN compared to the95% used with HILIC. It has been suggested previously by Walterset al. [39] that working with highly aqueous mobile phases, belowthe composition used here, can cause de-wetting of C18 station-ary phases resulting in retention losses. Due to the hydrophilicityof the ephedrine alkaloids, this approach was essential for ade-quate retention and a high pH mobile phase was also necessaryto improve peak shape and resolution as reported previously [16].In contrast, with the HILIC retention mechanism, superior peakshapes and performance for all analytes were observed. As seenin Fig. 6(a), the deterioration in column performance for phenyl-propanolamine is inherently linked to the effect of flow rate on peakasymmetry and hence poor efficiency (Hmin = 12 �m) was observedfor this analyte. The low log P and log D values (Table 1) for thiscompound, in comparison to the secondary and tertiary aminocontaining solutes, can somewhat explain the poor mass transferproperties observed. This low efficiency is not due to the effect ofsystem dead volume as the solute k is 3.5 and losses in performancewere calculated to be only 1–2% when correcting for extra-columnband broadening. For ephedrine and methylephedrine the benefitsof using sub-2 �m stationary phases are apparent due to the C-term flattening of their respective van Deemter curves. We appliedthe Dorsey–Foley correction to the former due to peak tailing atlow flow rate, as alluded to previously. Fig. 6(b), in comparison,shows the van Deemter curve for phenylpropanolamine, ephedrineand methylephedrine under HILIC conditions, where similar col-umn performance is achieved for each compound, approximately200,000 plates/m. Table 2 shows the van Deemter coefficients fromcurve fitting for the RPLC and HILIC approaches. As stated elsewhere[40], the retention factor has an impact on the B-term and thereforethis coefficient cannot be fairly compared unless similar retentionfactors are obtained on the two chromatographic systems due tothe impact of viscosity and therefore solute diffusivity. Larger B-terms were found for the reversed-phase conditions in all cases,and it is noteworthy that there is a 10 ◦C difference in column tem-perature between the evaluations which also contributes to theaforementioned longitudinal band broadening. Clearly, the C-term

Author's personal copy
J. Heaton et al. / J. Chromatogr. A 1228 (2012) 329– 337 335
Table 2van Deemter coefficients determined for HILIC and reversed-phase conditions.
Analyte k A B C uopt (cm/s) HETPmin (�m)
HILIC (95% CH3CN)Phenylpropanolamine 5.6 3.7 0.47 0.02 0.4 4.7Ephedrine 6.9 3.2 0.57 1.46 0.6 4.9Methylephedrine 5.1 2.6 0.59 2.19 0.4 4.7Reversed-phase (10% CH3CN)Phenylpropanolamine 3.5 5.3 0.54 20.2 0.1 11.8Ephedrine 8.1 3.0 0.91 5.68 0.5 7.4Methylephedrine 22.6 3.6 1.02 0.91 0.5 5.7
for phenylpropanolamine under RPLC conditions was much largerthan that under HILIC conditions. The fairest comparison for C-term values would be the relative performances of ephedrine sincethe retention factors are similar on both systems, found to be 1.46for HILIC and 5.68 for reversed-phase. Overall, A-term coefficientswere in the range of 2.5–5 for both columns, with the exception ofphenylpropanolamine, suggesting similar packing qualities.
3.4.3. Kinetic plots of HILIC and reversed-phaseAs shown in Table 3, the viscosity of the organic rich mobile
phase used in HILIC, 0.32 cP, was far lower than that of the reversed-phase eluent, 0.51 cP. This affords faster analyte diffusivity inthe mobile phase, enhancing solute mass transfer and thereby
Linear velo cit y (cm/s)
0.0 0. 2 0.4 0.6
H (μ
m)
2
4
6
8
10
12
14
16
18
20
22
24
Linear velo cit y (cm/s)
0.0 0. 2 0.4 0.6 0.8 1. 0
H (μ
m)
0
5
10
15
20
25
30
35(a)
(b)
Fig. 6. van Deemter curves for reversed-phase (a) and HILIC (b) phenyl-propanolamine (squares), ephedrine (diamonds) and methylephedrine (crosses).
preserving column efficiency when higher flow rates are desired forhigh throughput analyses. For this reason, the kinetic benefits of theHILIC approach are unparalleled, since instrument pressure limita-tions restrict high flow rates in RPLC due to the large back pressuresgenerated, a function of packing particle diameter, column lengthand bed permeability. The latter is denoted by:
KvO = �0�L
�Pcol(7)
where �0 is the linear velocity (m/s), � is viscosity (cP), L is columnlength (m) and �Pcol is the system corrected pressure drop (Pa).Using eluents of lower viscosity affords the chromatographer to uselonger columns than those limited by higher viscosity operationsresulting in enhanced resolution, or faster flow rates for reducedanalysis time. This concept was shown by McCalley [41] using con-ventional pressures (280 bar) with long columns (45 cm) packedwith 2.7 �m superficially porous particles yielding 100,000 plateswith analysis times between 7.5 and 15 min. Using the approachof Desmet et al. [25,26] we constructed kinetic plots based on theexperimental data generated for the van Deemter flow study.
Fig. 7(a) and (b) represents kinetic plots for phenyl-propanolamine, ephedrine and methylephedrine generated underHILIC and reversed-phase conditions. As shown in Fig. 7(b),significant gains in plate number versus analysis time can berealised using HILIC conditions. For example, at a t0 value of 100 sapproximately 100,000 theoretical plates per meter are gener-ated, whereas the corresponding reversed-phase system generatesaround 20,000 for phenylpropanolamine or 30,000 for ephedrineand methylephedrine. This clearly demonstrates the kinetic ben-efits of performing HILIC for this solute type, and is furtheremphasised in Fig. 7(a) which fundamentally represents a plot ofseparation impedance versus theoretical plate number. The con-trast in separation performance is essentially a function of eluentviscosity, dictated by column permeability, since not only arehigher plate numbers achievable using HILIC, but this can be per-formed at lower pressures using equivalent particle sizes. It istherefore possible to accommodate sub-2 �m materials in the HILICmode using conventional instruments, however the advantageswould only be preserved using well optimised equipment as pre-viously highlighted [42,43]. Column permeability using the HILICconditions was found to be double that of reversed-phase, reflectedin the 50% lower flow resistance, shown in Table 3. Minimumseparation impedances (E) for ephedrines under HILIC conditionswere found to be <5000 for the three probe solutes, compared to12,000–50,000 for RPLC yielding significantly lower plate numbers.
Table 3Kinetic plot parameters determined for HILIC and reversed-phase systems. Viscosity(�) was calculated using the Chen–Horvath correlation [44].
Kinetic parameter HILIC (50 ◦C) Reversed-phase (60 ◦C)
Permeability, Kvo (m2) 5.50E−15 2.83E−15Viscosity, � (cP) 0.318 0.506Flow resistance, 526 1020Max. �P (bar) 564 702

Author's personal copy
336 J. Heaton et al. / J. Chromatogr. A 1228 (2012) 329– 337
1.E-08
1.E-07
1.E-06
1.E-051.E+031.E+041.E+051.E+06 N (/)
t /N² (s)
1.E+00
1.E+01
1.E+02
1.E+03
1.E+04
1.E+051.E+061.E+051.E+041.E+03 N (/)
t (s)
(a)
(b)
Fig. 7. Kinetic plot representation of pressure drop limited plate number based onvan Deemter data were (a) impedance and (b) are plate time dependent. Dotted andfull lines represent the reversed-phase and HILIC systems, respectively. Data pointsare as in Fig. 6.
Fig. 8. Chromatograms illustrating the separation of phenylpropanolamine (1),cathine (2), ephedrine (3), pseudoephedrine (4) and methylephedrine (5) underthe reversed-phase conditions as in Section 2.3.1 (a) and HILIC conditions (b).HILIC was performed using 95:5 (v/v) CH3CN:200 mM ammonium acetate pH 5,100 mm × 2.1 mm ID Acquity BEH HILIC 1.7 �m, column temperature 50 ◦C. Flowrate for both separations was 500 �L/min.
3.5. Application: analysis of ephedrines by LC–QTof-MS
The final separation of structurally related hydrophilicephedrine solutes is shown in Fig. 8 as by the overlaid extracted ionchromatograms obtained by interfacing with a fast scanning QTofmass spectrometer. Our separation compares very favorably topreviously reported methodologies for the analysis of ephedrines,using mobile phase eluents and flow rates (typically ≤ 500 �L/min)amenable to mass spectrometry. The five compounds can be sepa-rated by HILIC in under 5 min with high column efficiency (∼20,000plates on column) and excellent peak shapes (As0.1 ≤ 1.1) withWADA acceptable retention factors (Table 2).
4. Conclusions
We have demonstrated the advantages of HILIC as an attractivealternative to RPLC for the separation of hydrophilic ephedrines.Our study highlights the ability of pH and temperature to manipu-late the separation of critical pairs, particularly where analytes arestructurally similar. Superior peak shapes are obtained under HILICconditions compared to the tailing peaks inherently observed withbasic compounds under reversed-phase conditions. The HILIC sep-aration also affords significantly lower mobile phase viscosity andhigher solute diffusivity allowing yet faster separations without theexpense of column performance.
We fully intend in later studies to compare a quantitativemethod between the two techniques encompassing typical val-idation parameters, since it is proposed that HILIC will provideenhanced sensitivity owing to improved desolvation of the organicrich mobile phase with ESI. This additional advantage will be ofparticular significance for analytes where sensitivity is a problemand lower limits of detection are required, and may also permitthe use of small sample volumes and reduced sample preparationefforts, such as direct dilution and injection of a sample. The HILICapproach must also be assessed for repeatability and robustness toensure suitability as a routine technique. This would then allow forfull comparison of the technologies evaluated herein to be realised.
Acknowledgement
The authors are sincerely grateful to Waters Corp. (Milford, USA)for funding.
References
[1] World Anti-Doping Agency, Montreal, Canada, available: http://www.wada-ama.org, 2011.
[2] P. Van Eenoo, F.T. Delbeke, K. Roels, P. De Backer, J. Chromatogr. B: Biomed. Sci.Appl. 760 (2001) 255.
[3] M.H. Spyridaki, C.J. Tsitsimpikou, P.A. Siskos, C.G. Georgakopoulos, J. Chro-matogr. B: Biomed. Sci. Appl. 758 (2001) 311.
[4] P.J. van der Merwe, L.W. Brown, S.E. Hendrikz, J. Chromatogr. B: Biomed. Appl.661 (1994) 357.
[5] M. Kolmonen, A. Leinonen, A. Pelander, I. Ojanperä, Anal. Chim. Acta 585 (2007)94.
[6] M.H. Spyridaki, P. Kiousi, A. Vonaparti, P. Valavani, V. Zonaras, M. Zahariou, E.Sianos, G. Tsoupras, C. Georgakopoulos, Anal. Chim. Acta 573–574 (2006) 242.
[7] J.-O. Thörngren, F. Östervall, M. Garle, J. Mass Spectrom. 43 (2008) 980.[8] M. Mazzarino, X. de la Torre, F. Botrè, N. Gray, D. Cowan, Drug Test. Anal. 2
(2010) 311.[9] B. Schubert, H. Oberacher, J. Chromatogr. A 1218 (2011) 3413.
[10] J. Flieger, J. Chromatogr. A 1217 (2010) 540.[11] M. Ganzera, C. Lanser, H. Stuppner, Talanta 66 (2005) 889.[12] K. Deventer, O.J. Pozo, P. Van Eenoo, F.T. Delbeke, J. Chromatogr. B 877 (2009)
369.[13] F. Badoud, E. Grata, L. Perrenoud, M. Saugy, S. Rudaz, J.L. Veuthey, J. Chromatogr.
A 1217 (2010) 4109.[14] J. Flieger, A. Czajkowska-Zelazko, J. Sep. Sci. 34 (2011) 733.[15] L. Pan, R. LoBrutto, Y.V. Kazakevich, R. Thompson, J. Chromatogr. A 1049 (2004)
63.[16] N. Gray, A. Musenga, D.A. Cowan, R. Plumb, N.W. Smith, J. Chromatogr. A 1218
(2011) 2098.

Author's personal copy
J. Heaton et al. / J. Chromatogr. A 1228 (2012) 329– 337 337
[17] D.S. Bell, H.M. Cramer, A.D. Jones, J. Chromatogr. A 1095 (2005) 113.[18] F. Pellati, S. Benvenuti, J. Pharm. Biomed. 48 (2008) 254.[19] D.V. McCalley, J. Chromatogr. A 1171 (2007) 46.[20] Z. Aturki, G. D’Orazio, A. Rocco, K. Si-Ahmed, S. Fanali, Anal. Chim. Acta 685
(2011) 103.[21] D.V. McCalley, J. Chromatogr. A 1217 (2010) 858.[22] P. Hemström, K. Irgum, J. Sep. Sci. 29 (2006) 1784.[23] D.V. McCalley, U.D. Neue, J. Chromatogr. A 1192 (2008) 225.[24] A.E. Karatapanis, Y.C. Fiamegos, C.D. Stalikas, J. Chromatogr. A 1218 (2011)
2871.[25] G. Desmet, D. Clicq, P. Gzil, Anal. Chem. 77 (2005) 4058.[26] G. Desmet, D. Clicq, D.T. Nguyen, D. Guillarme, S. Rudaz, J.L. Veuthey, N. Ver-
voort, G. Torok, D. Cabooter, P. Gzil, Anal. Chem. 78 (2006) 2150.[27] J. Nawrocki, J. Chromatogr. A 779 (1997) 29.[28] A. Mendez, E. Bosch, M. Roses, U.D. Neue, J. Chromatogr. A 986 (2003) 33.[29] U.D. Neue, C.H. Phoebe, K. Tran, Y.F. Cheng, Z. Lu, J. Chromatogr. A 925 (2001)
49.[30] E.S. Grumbach, D.M. Diehl, U.D. Neue, J. Sep. Sci. 31 (2008) 1511.
[31] E. Johnsen, S.R. Wilson, I. Odsbu, A. Krapp, H. Malerod, K. Skarstad, E. Lundanes,J. Chromatogr. A 1218 (2011) 5981.
[32] S.M. Buckenmaier, D.V. McCalley, M.R. Euerby, J. Chromatogr. A 1060 (2004)117.
[33] S.M. Buckenmaier, D.V. McCalley, M.R. Euerby, J. Chromatogr. A 1004 (2003)71.
[34] B.A. Bidlingmeyer, J. Henderson, J. Chromatogr. A 1060 (2004) 187.[35] J.P. Foley, J.G. Dorsey, Anal. Chem. 55 (1983) 730.[36] D.V. McCalley, J. Chromatogr. A 902 (2000) 311.[37] K. Broglé, R.M. Ornaf, D. Wu, P.J. Palermo, J. Pharm. Biomed. 19 (1999) 669.[38] D.V. McCalley, J. Chromatogr. A 987 (2003) 17.[39] T.H. Walter, P. Iraneta, M. Capparella, J. Chromatogr. A 1075 (2005) 177.[40] R.W. Stout, J.J. DeStefano, L.R. Snyder, J. Chromatogr. A 282 (1983) 263.[41] D.V. McCalley, J. Chromatogr. A 1193 (2008) 85.[42] D.V. McCalley, J. Chromatogr. A 1217 (2010) 4561.[43] K.J. Fountain, U.D. Neue, E.S. Grumbach, D.M. Diehl, J. Chromatogr. A 1216
(2009) 5979.[44] H. Chen, C. Horvath, Anal. Methods Instrum. (1993) 213.


