Embed Size (px)
Citation preview

Sergio David Bolívar Leguizamón
Comparative phylogeography of Passerine
birds with a circum-Amazonian distribution
Filogeografia comparada de Passeriformes com uma
distribuição circum-Amazônica
SÃO PAULO
2019

Sergio David Bolívar Leguizamón
Comparative phylogeography of Passerine
birds with a circum-Amazonian distribution
Filogeografia comparada de Passeriformes com uma
distribuição circum-Amazônica
Original Version
Thesis submitted to the Graduate Program of the Museu de Zoologia da Universidade de São Paulo in partial fulfillment of the requirements for the degree of Doctor of Science (Systematics, Animal Taxonomy and Biodiversity).
Advisor: Prof. Dr. Luís Fábio Silveira
SÃO PAULO
2019

I
I do not authorize the reproduction and dissemination of this work in part or entirely by any
electronic or conventional means.
Catalogação na Publicação
Serviço de Biblioteca e Documentação
Museu de Zoologia da Universidade de São Paulo
CRB 8-3805
Bolívar-Leguizamón, Sergio David
Filogeografia comparada de Passeriformes com uma distribuição
circum-Amazônica = Comparative phylogeography of Passerine birds
with a circum-Amazonian distribution/ Sergio David Bolívar
Leguizamón; orientador Luiz Fabio Silveira. São Paulo, 2019.
219 p.
Tese apresentada ao Programa de Pós-Graduação em Sistemática,
Taxonomia e Biodiversidade, Museu de Zoologia, Universidade de São
Paulo, 2019.
Versão original
1. Filogeografia - Passeriformes. 2. Passeriformes - distribuição 3.
circum-Amazônica. I. Silveira, Luis Fábio, orient. . II. Título.
CDU 598.2(811)

II
Bolívar-Leguizamón, Sergio David
Comparative phylogeography of Passerine birds with a circum-Amazonian distribution.
Filogeografia comparada de Passeriformes com uma distribuição circum-Amazônica.
Dissertation submitted to the Graduate Program of the Museu de Zoologia da Universidade de São
Paulo in partial fulfillment of the requirements for the degree of Doctor of Science (Systematics,
Animal Taxonomy and Biodiversity).
Date approved: _____/_____/__________
COMMITTEE MEMBERS
Prof. Dr. ___________________________ Institution: ____________________________
Decision: __________________________ Signature: _____________________________
Prof. Dr. ___________________________ Institution: ____________________________
Decision: __________________________ Signature: _____________________________
Prof. Dr. ___________________________ Institution: ____________________________
Decision: __________________________ Signature: _____________________________
Prof. Dr. ___________________________ Institution: ____________________________
Decision: __________________________ Signature: _____________________________
Prof. Dr. ___________________________ Institution: ____________________________
Decision: __________________________ Signature: _____________________________

III
A mi familia

IV
Acknowledgements
This project was funded by Coordenação de Aperfeiçoamento de pessoal de Nível Superior
(CAPES, 05/2015 to 01/2016) and by Fundação de Amparo à Pesquisa do Estado de São Paulo
(FAPESP 2015-16092-7, 02/2016 to 06/2019). In addition, I gratefully acknowledge financial
support from the Frank M. Chapman Memorial Fund from the American Museum of Natural
History (AMNH).
This work could not have been accomplished without the help and cooperation of various
institutions and individuals: First, I want to thank the PhD. Luís F. Silveira, for the opportunity to
continue working in the research group of Ornithology of the MZUSP, and for his continuous
support during my PhD program. In the same way, I want to thank my co-adviser Gustavo A.
Bravo, for his assistance in the conception and development of the project. I also thank to the staff
MZUSP for helped me resolve questions and problems here at the Museum (especially Marta,
Sonia, and Dione).
I want to thank the multiple collections that sent tissue samples for this project: Robb Brumfield
and Donna Dittmann from LSU Museum of Natural Science Collection of Genetic Resources
(LSUMNS), Mark B. Robbins from University of Kansas Biodiversity Institute (KU), John Bates
and B. Marks from Field Museum of Natural History (FMNH), Christopher Milensky from the
National Museum of Natural History of the Smithsonian Institute (NMNH), Alexandre Aleixo and
Antonita Santana from Museu Paraense Emílio Goeldi (MPEG), Carla Suertegaray Fontana and
Maiara Flores from Laboratório de Ornitologia da Pontifícia Universidade Católica do Rio
Grande do Sul (PUC-RS), and the PhD Prof. Fabio Raposo do Amaral (UNIFESP).

V
Thanks to the MZUSP taxidermists Marina Lima and Marcelo Felix, for the preparation of some
specimens collected during the PhD. I am very grateful to Jaqueline Battilana from Laboratory of
Molecular Biology (MZUSP), who help me in all processing of samples and DNA extractions. I
want to thank Denis Machado, Luciana dos Santos and Taran Grant for the help in the use of the
cluster of MZUSP.
Thanks to my colleagues in the laboratory (alphabetical order): Aline, Anna, Ariane, Cristiane,
Deborah, Diego A., Erica P., Fabio, Fernanda, Glaucia, Karlla, Marcelo F., Marco, Marina L.,
Natalia, Oscar Diego, Thiago, and Vitor. Thanks to my friend Fernanda Bocalini for her
collaboration in this project: “someday we will be rich!” Finally, I want to thank specially to Aline,
Fernanda, Glaucia and Fabinho by the funny moments in this drama titled ‘é mestrado ou
doutorado?’ Thanks to Aline Pepe for his help and friendship during these years.
¡Gracias a MI FAMILIA por su apoyo y cariño!

VI
[…] Siguió con tanta atención las peripecias del
entierro que nadie dudó de que lo estaba viendo,
sobre todo porque su alzada mano de arcángel
anunciador se movía con los cabeceos de la
carreta.
-Adiós, Gerineldo, hijo mío -gritó-. Salúdame a
mi gente y dile que nos vemos cuando escampe.
Aureliano Segundo la ayudó a volver a la cama, y
con la misma informalidad con que la trataba
siempre le preguntó el significado de su
despedida.
-Es verdad -dijo ella-. Nada más estoy esperando
que pase la lluvia para morirme.
Cien años de soledad. Gabriel García Márquez

VII
Abstract
There are a number of common distributional patterns that have provided the foundations of our
current knowledge of Neotropical biogeography. A distinctive pattern is the so-called “circum-
Amazonian distribution”, which expands across the forested lowlands south and east of Amazonia,
the Andean foothills, the Venezuelan Coastal Range, and the Tepuis. To date, there is no clear
understanding of the processes giving rise to this distribution. To understand the evolutionary
history of taxa exhibiting this pattern it is necessary to test biogeographic hypotheses offering
mechanistic explanations. Comparative phylogeography allows more accurate phylogeographic
hypotheses for these taxa, as well as better population genetic parameters. Comprehensive
comparative studies aiming at unraveling the evolutionary and biogeographic mechanisms
underlying the circum-Amazonian distribution have not been conducted yet, and only scarce
descriptive information has been published. Therefore, the objective of this work was to elucidate
the historical and biogeographic mechanisms underpinning circum-Amazonian distribution by
performing comparative genomic analyses of a group of Suboscine passerines. Ultraconserved
Elements (UCEs) were obtained for eight taxonomic groups to estimate population parameters and
genealogical trees. For the Thamnophilidae species were inferred demographic histories with
momi2. The best models of each taxon were analyzed in a comparative framework to relate them
with previously proposed biogeographic hypotheses for the Neotropics and to propose plausible
biogeographical scenarios for the circum-Amazonian pattern. The circum-Amazonian
distributional pattern has two main phylogeographic units: an Andean (plus Central America
region) and an eastern-forested region (Atlantic Forest ecoregion, forested areas around southeast
of Amazonia), interconnected by a northern and southern corridor, allowing biotic interchanges

VIII
between them (mainly from the southern) and hybridization. Species-tree analyses recovered (a)
an Andean clade with two Andean subgroups in the northern Peru and central Andes, and (b) an
eastern-forested clade including northern and central/southern Atlantic Forest subgroups. The
demographic histories of the Thamnophilidae taxa suggest that diversification of the circum-
Amazonian taxa have a strong influence of climatic fluctuations during the Pleistocene, with
interconnected refugia allowing phenotypic/genetic differentiation but maintaining a considerable
level of gene flow during varying dry/cool and warm/humid periods. In addition, the results of this
work opened interesting taxonomic questions about some taxa that could be covered in the future
(T. ruficapillus/torquatus complex, Xiphocolaptes complex).

IX
Resumo
Existe um número de padrões de distribuição comuns que forneceram os fundamentos do nosso
atual conhecimento da Biogeografia Neotropical. Um padrão distintivo é o chamado padrão de
distribuição circum-Amazônico, apresentado por grupos filogeneticamente relacionados habitando
as florestas de baixada ao sul-leste da Amazônia, as encostas úmidas dos Andes, a área costeira da
Venezuela e os Tepuis. Atualmente não existe um entendimento claro dos processos que deram
surgimento a este padrão de distribuição. Para compreender a história evolutiva dos táxons
exibindo este tipo de padrão é necessário testar hipóteses biogeográficas que ofereçam explicações
mecanicistas. A Genômica comparativa permite hipóteses filogeográficas mais exatas para estes
táxons, assim como melhores parâmetros demográficos. Estudos comparativos abrangentes
visando em esclarecer os mecanismos evolutivos e biogeográficos relacionados a distribuição
circum-Amazônica não tem sido elaborados ainda, e só informação descritiva escassa tem sido
publicada. Portanto, os objetivo fundamental do projeto foi elucidar os mecanismos históricos e
biogeográficos subjacentes à distribuição circum-Amazônica desenvolvendo analises genômicos
comparativos de um grupo de Passeriformes Suboscines. Dados do gene ND2 e de Elementos
Ultraconservados (UCEs) foram obtidos de oito grupos taxonômicos para estimar parâmetros
populacionais e arvores genealógicas. Histórias demográficas foram inferidas só para as espécies
da família Thamnophilidae usando momi2. Os melhores modelos de cada táxon foram analisados
num marco comparativo para relaciona-os ás hipóteses biogeográficas propostas para o Neotrópico
e propor cenários possíveis para a distribuição circum-Amazônica. O padrão de distribuição
circum-Amazônico possui duas unidades filogeográficas principais: uma unidade Andina
(incluindo a região de Centro América) e uma segunda unidade incluindo as regiões florestais do

X
leste (Mata Atlântica, áreas florestais ao sudeste da Amazônia). Estas unidades estão
interconectadas por corredores ao norte e sul da distribuição, permitindo intercâmbios de biota
entre elas (principalmente pelo corredor sul). SNAPP identificou o clado Andino subdividido em
norte do Peru e central Andes, e um segundo clado das Florestas do Leste incluindo dois subgrupos,
um do norte e outro do centro-sul da Mata Atlântica. As histórias demográficas dos
Thamnophilidae sugerem que a diversificação na distribuição circum-Amazônica foi altamente
influenciada pelas flutuações climáticas durante o Pleistoceno, com refúgios interconectados
gerando diferenciação fenotípica/genética mas mantendo certo grau de fluxo gênico nos períodos
secos/frios e quentes/húmidos. Adicionalmente, algumas questões taxonômicas sobre alguns
táxons estudados que poderiam ser estudadas no em futuros estudos (o complexo T.
ruficapillus/torquatus e o gênero Xiphocolaptes).

XI
List of Figures
Chapter I. Out of northeastern Brazil: demographic and evolutionary history of the Variable
Antshrike, Thamnophilus caerulescens (Aves, Thamnophilidae).
Figure 1. (a) Map showing the samples collected of T. caerulescens (codes of samples in Table
S1.). (b) median-joining network depicting relationships among the haplotypes in T. caerulescens.
……………………………………………………………………………………………………68
Figure 2. Demographic models tested in momi2 for the clusters identified for T. caerulescens….69
Figure 3. (a) Bayesian reconstruction and divergence times for T. caerulescens. (b) Clusters
identified by DAPC in T. caerulescens. (c) Graphical representation of admixture estimates of
three clusters in T. caerulescens. Estimated admixture coefficients using sNMF using K = 3 and
alpha = 100 (cross-entropy=0,379352)…………………………………………………………...70
Figure 4. (a) Species trees inferred by SNAPP for the T. caerulescens data. (b) Demographic
reconstruction with the best model for the complete matrix of SNPs (324 loci). (c) Demographic
reconstruction with the best model for the incomplete matrix of SNPs (2,036 loci)………………71
Figure 5. Plausible scenarios of diversification of T. caerulescens, with the migration pulses
inferred by momi2. (a) Best model in the complete matrix of SNPs (324 loci). (b) Best model in
the incomplete matrix of SNPs (2,036 loci)………………………………………………………72

XII
Figure S1a. Graphical representation of all models tested in momi2 (part 1)…………………….73
Figure S1b. Graphical representation of all models tested in momi2 (part 2)…………………….74
Figure S2. Topologies reconstructed for the mtDNA data of T. caerulescens. (a) Maximum
Likelihood in RAxML. (b) Bayesian inference with BEAST…………………………………….75
Figure S3. Clusters identified with the incomplete matrix for T. caerulescens. The central Andean
samples can be separated in a southern Peru-Bolivia and a central Peru subgroups………………76
Figure S4. DAPC depicting a clinal pattern in the central Andean samples of T. caerulescens. (a)
Complete matrix. (b) Incomplete matrix……………………………………………………….77
Figure S5. Values of cross-entropy for six values of α (1, 10, 50, 100, 500, 1000). (a) Complete
matrix. (b) Incomplete matrix…………………………………………………………………….78

XIII
Chapter II. Comparative phylogeography of passerine birds with a circum-Amazonian
distribution.
Figure 1. Distribution of Dysithamnus mentalis (BirdLife International, 2019), a circum-
Amazonian species (sensu Remsem et al., 1991)……………………………………………….133
Figure 2. Basic models tested for the four species of Thamnophilidae. Divergence times (red
square). Events of migration (blue arrows). Bottleneck events (green circles). All models tested
were variations of these basic models, these variations consisted in change number of events and
direction of the migrations..……………………………………………….…………………….134
Figure 3a. Divergence times among intraspecific lineages for the four species of Thamnophilidae.
Blue bars are confidence intervals of divergence time estimates. Collapsed clades indicate
geographical clusters identified by DAPC/sNMF: Red: northern Atlantic Forest; Green: central-
southern Atlantic Forest; Pink: Andean (or central Andean); Brown-Yellow: forests southeast of
the Amazon; Pale-Blue: southern Peru-Bolivia region; Blue: Outgroups............................….....135
Figure 3b. Divergence times among intraspecific lineages for L. nematura, P. rufum, and the
Xiphocolaptes complex. Blue bars are confidence intervals of divergence time estimates.
Collapsed clades indicate geographical clusters identified by DAPC/sNMF: Red: northern Atlantic
Forest; Green: central-southern Atlantic Forest; Pink: Andean (or central Andean); Brown-Yellow:
forests southeast of the Amazon; Pale-Blue: southern Peru-Bolivia region; Gray: Tepuis-Central
America; Yellow: Amazonian region; Blue: Outgroups…….…………….…………………….136

XIV
Figure 3c. Divergence times among intraspecific lineages for P. mystaceus. Blue bars are
confidence intervals of divergence time estimates. Collapsed clades indicate geographical clusters
identified by DAPC/sNMF: Red: northern Atlantic Forest; Green: central-southern Atlantic Forest;
Pink: Andean (or central Andean); Brown-Yellow: forests southeast of the Amazon; Blue:
Outgroups……………………………………………………….………………………………137
Figure 4 (page 1). Results of DAPC and find.cluster() analyses for the genomic data (UCEs) of
the Thamnophilid species. (a) D. mentalis. (b) T. caerulescens. (c) T. palliatus/tenuepunctatus
complex. (d) T. ruficapillus/torquatus complex.…….…………….………………………...….138
Figure 4 (page 2). Results of DAPC and find.cluster() analyses for the genomic data (UCEs). (e)
L. nematura. (f) P. rufum. (g) P. mystaceus. (h) Xiphocolaptes complex.……………………….139
Figure 5 (page 1). Results of sNMF analysis for the genomic data (UCEs) of the Thamnophilid
species. (e) D. mentalis. (f) T. caerulescens. (g) T. palliatus/tenuepunctatus. (h) T.
ruficapillus/torquatus.………………………………………………………………….……….140
Figure 5 (page 2). Results of sNMF analysis for the genomic data (UCEs). (e) L. nematura. (f) P.
rufum. (g) P. mystaceus..………………………………...….…………….…………………….141
Figure 5 (page 3). Results of sNMF analysis for the genomic data (UCEs). (h) Xiphocolaptes
complex..…….…………….………………………………………………………………...….142

XV
Figure 6a. Values of the cross-entropy criterion for the sNMF runs (six α values). Green: α=1;
Red: α=10; Brown-Yellow: α=50; Pink: α=100; Gray: α=500; Blue: α=1000………….……….143
Figure 6b. Values of the cross-entropy criterion for the sNMF runs (six α values). Green: α=1;
Red: α=10; Brown-Yellow: α=50; Pink: α=100; Gray: α=500; Blue: α=1000..…….…..……...144
Figure 7a. Species trees inferred by SNAPP for the thamnophilid taxa data. Red: northern Atlantic
Forest; Green: central-southern Atlantic Forest; Pink: Andean (or central Andean); Brown-Yellow:
forests southeast of the Amazon; Pale-Blue: southern Peru-Bolivia region; Blue:
Outgroups……………………………………………………………………………………….145
Figure 7b. Species trees inferred by SNAPP for the thamnophilid taxa data. Red: northern Atlantic
Forest; Green: central-southern Atlantic Forest; Pink: Andean (or central Andean); Brown-Yellow:
forests southeast of the Amazon; Pale-Blue: southern Peru-Bolivia region; Blue: Outgroups.
Numbers in the figures represents the species in the Xiphocolaptes complex…...…………...….146
Figure 8. Best models inferred by momi2 for the foyr thamnophilid taxa. Red: northern Atlantic
Forest; Green: central-southern Atlantic Forest; Pink: Andean (or central Andean); Brown-Yellow:
forests southeast of the Amazon; Pale-Blue: southern Peru-Bolivia region….………………….147
Figure 9. Plausible scenarios of diversification and migration pulses inferred by momi2 for the D.
mentalis and the T. palliatus/teunuepunctatus complex. Red: northern Atlantic Forest; Green:

XVI
central-southern Atlantic Forest; Pink: Andean (or central Andean); Brown-Yellow: forests
southeast of the Amazon; Pale-Blue: southern Peru-Bolivia region..…….……………….…….148
Figure 10. Plausible scenarios of diversification and migration pulses inferred by momi2 for T.
caerulescens. (a) Complete matrix of SNPs (324 loci). (b) Incomplete matrix of SNPs (2,036 loci).
Red: northern Atlantic Forest; Green: central-southern Atlantic Forest; Pink: Andean (or central
Andean) region..…….…………….…………………………………………………………….149
Figure 11. Plausible scenarios of diversification and migration pulses inferred by momi2 for T.
ruficapillus/tenuepunctatus complex. Red: northern Atlantic Forest; Green: central-southern
Atlantic Forest; Pink: Andean (or central Andean) region..…….……………………………….150
Figure S1. median-joining network depicting relationships among the haplotypes in the
thamnophilid taxa. (a) D. mentalis. (b) T. caerulescens. (c) T. palliatus/tenuepunctatus complex.
(d) T. ruficapillus/torquatus complex. Red: northern Atlantic Forest; Green: central-southern
Atlantic Forest; Pink: Andean (or central Andean); Brown-Yellow: forests southeast of the
Amazon; Pale-Blue: southern Peru-Bolivia region; Gray: Tepuis-Central America; Yellow:
Amazonian region...…….…………….……………………………………………..………….151
Figure S2. median-joining network depicting relationships among the haplotypes in (a) L.
nematura. (b) P. rufum. (c) P. mystaceus. Red: northern Atlantic Forest; Green: central-southern
Atlantic Forest; Pink: Andean (or central Andean); Brown-Yellow: forests southeast of the

XVII
Amazon; Pale-Blue: southern Peru-Bolivia region; Gray: Tepuis-Central America; Yellow:
Amazonian region...…….…………….……………………………………..………………….152
Figure S3. median-joining network depicting relationships among the haplotypes in
Xiphocolaptes complex………………………………………………..….…………………….153
Figure S4. Phylogenetic reconstruction for D. mentalis (Maximum Likelihood)...........……….154
Figure S5. Phylogenetic reconstruction for (a) T. caerulescens. (b) T. palliatus/tenuepunctatus.
(c) T. ruficapillus/torquatus (Maximum Likelihood)...…….…………….……………...…….155
Figure S6. Phylogenetic reconstruction for (a) L. nematura. (b) P. rufum. (c) P. mystaceus
(Maximum Likelihood)………………………………………………………………………....156
Figure S7. Phylogenetic reconstruction for Xiphocolaptes complex (Maximum
Likelihood)...…………………………………………………………………………………....157
Figure S8. Alternative scenarios tested in SNAPP for (a) T. palliatus/tenuepunctatus. (b) T.
ruficapillus/torquatus. (c) L. nematura. (d) P. mystaceus...…….……………………………….158
Figure S9. Alternative scenarios tested in SNAPP for Xiphocolaptes complex...…………….159

XVIII
Contents
GENERAL INTRODUCTION .................................................................................................... 1
The circum-Amazonian distribution pattern ....................................................................................................... 3
Comparative Phylogeography .............................................................................................................................. 5
Ultraconserved Elements...................................................................................................................................... 7
Justification .......................................................................................................................................................... 8
GENERAL REFERENCES ....................................................................................................... 10
CHAPTER I ................................................................................................................................ 26
Abstract .............................................................................................................................................................. 28
Introduction ........................................................................................................................................................ 30
Methods .............................................................................................................................................................. 34 Sampling and DNA extractions ............................................................................................................................... 34 Mitochondrial DNA ................................................................................................................................................. 34 Sequence capture .................................................................................................................................................... 35 Edition and assembly of UCEs ................................................................................................................................ 36 Single Nucleotide Polymorphism (SNP) calling ...................................................................................................... 36 Population structure ................................................................................................................................................ 38 Species trees and gene trees .................................................................................................................................... 38 Demographic history ............................................................................................................................................... 39
Results ................................................................................................................................................................ 40 Time calibration based on mtDNA .......................................................................................................................... 40 Genomic data quality .............................................................................................................................................. 40 Population structure ................................................................................................................................................ 41 Species trees and gene trees .................................................................................................................................... 42 Demographic history ............................................................................................................................................... 42
Discussion ........................................................................................................................................................... 44 Population structure in Thamnophilus caerulescens .............................................................................................. 44 Demography and biogeographical remarks ............................................................................................................ 45 A likely scenario for the demographic history of T.caerulescens ............................................................................ 48 Taxonomic considerations ....................................................................................................................................... 50
Final remarks ..................................................................................................................................................... 51
Acknowledgements ............................................................................................................................................. 52

XIX
Funding ............................................................................................................................................................... 52
References ........................................................................................................................................................... 53
Appendix (Chapter I) ......................................................................................................................................... 68
CHAPTER II ............................................................................................................................... 86
Abstract .............................................................................................................................................................. 87
Introduction ........................................................................................................................................................ 89
Methods .............................................................................................................................................................. 93 Analyzed taxa and sampling efforts ......................................................................................................................... 93 DNA extraction ........................................................................................................................................................ 93 Mitochondrial DNA ................................................................................................................................................. 94 Edition and assembly of UCEs ................................................................................................................................ 95 SNP calling.............................................................................................................................................................. 96 Population structure ................................................................................................................................................ 97 Species trees and gene trees .................................................................................................................................... 97 Demographic history ............................................................................................................................................... 98
Results ................................................................................................................................................................ 99 mtDNA preliminary analyses and times of divergence ........................................................................................... 99 UCE statistics and sequencing .............................................................................................................................. 100 Population Structure in circum-Amazonian Passerines ........................................................................................ 100 Species trees .......................................................................................................................................................... 102 Demographic modelling ........................................................................................................................................ 103
Discussion ......................................................................................................................................................... 105 Population structure of circum-Amazonian Passerines ........................................................................................ 105 Species trees and phylogenetics patterns .............................................................................................................. 107 Demographic modeling and the rise of the circum-Amazonian distribution ......................................................... 108 Some taxonomic and phylogenetic considerations of circum-Amazonian Passerines .......................................... 111
Conclusions ....................................................................................................................................................... 113
References ......................................................................................................................................................... 115
Appendix (Chapter II) ...................................................................................................................................... 133

1
General Introduction
Neotropical biomes and ecosystems exhibit high biodiversity and a wide range of
ecological/geological characteristics (Connell, 1978; Stotz et al., 1996; Myers et al., 2000; Rull,
2011; Richardson & Pennington, 2016).
The Neotropics contains about 100,000 species of seed plants (37% of the world’s species,
Antonelli & Sanmartín, 2011), more of 3,000 species of amphibians (50% of all amphibian
richness, Young et al., 2004) and have high levels of richness in reptiles (Böhm et al., 2013). In
the same way, the Neotropical areas harbor approximately 3,800 species of birds (Stotz et al.,
1996) a 36% of all known landbird species and the highest level of endemicity in the world
(Newton & Dale, 2001), and probably these values are being underestimated.
Several theoretical and empirical approaches have been performed to identify and understand the
processes involved in the evolution of such high diversity in the Neotropics (e.g. Sick, 1967;
Haffer, 1969; Vuilleumier, 1971; Brown, 1979; Cracraft, 1985; Cracraft & Prum, 1988;
Hooghiemstra & van der Hammen, 1998; Garzón-Orduña et al., 2014; Antonelli et al., 2018; Rull,
2018).
Mainly, these efforts have focused in the analysis of the Amazonian region. Thus, several
hypotheses about the origin and maintenance of diversity of the Amazonia have been proposed
(reviewed by Haffer, 1997 and Rull, 2018). Two of these hypotheses are based in the presence of
rivers acting as barriers among populations/species. In the first one, the River Hypothesis (Sick,
1967; Capparella, 1988), the rise/presence of rivers in the Amazonian basin are the main cause in
the separation of animal ancestral populations in this region (originally, the idea about rivers acting
like barriers was outlined by Wallace, 1854). In the second one, the River-refuge Hypothesis

2
(Haffer, 1993), the isolation of ancestral populations in the Amazonia was a consequence of (a)
several emerging rivers and (b) “ecologically unsuitable terrain” in the northern and southern
Amazonia during the dry glacial periods in the Quaternary. Also, the Paleogeography Hypothesis
(Croizat, 1976), states that geological processes (tectonic movements and level sea fluctuations)
influence (indirectly) the diversity/distribution of species/subspecies allowing the isolation and re-
connection of Amazonian populations. Lastly, the Refugia Hypothesis proposes that the
biodiversity in Amazonia was molded by a series of climatic fluctuations during the Cenozoic,
producing a reduction of the Neotropical Forests (Haffer, 1969; Vanzolini & Williams, 1970).
(Cracraft, 1985) proposed other alternative to the “refugia” hypothesis; using the South American
Avifauna, stated that endemism areas in these regions could be older (and, subsequently, the origin
of its biodiversity) than the Pleistocene.
All these hypotheses have been subject to wide discussion, and several tests have been
implemented to corroborate or refute their assumptions (Mayr & O’Hara, 1986; Salo, 1987; Nores,
1999; Lougheed et al., 1999; Colinvaux et al., 2000; Haffer & Prance, 2001; Haffer, 2008;
FernAndes et al., 2012; Maldonado-Coelho et al., 2013; Garzón-Orduña et al., 2015; Rocha &
Kaefer, 2019, among others). For instance, Bennett et al., (2012) broadly discuss about the origin
of biodiversity in Neotropics and the influence of the ‘refugia’ proposed by Haffer (1969), while
Ramírez-Barahona & Eguiarte (2013), Leite et al., (2016) and Arruda et al., (2017) tested the
influence of climatic fluctuations during the Pleistocene in Neotropical regions. In the same way,
Albert et al. (2018) review the impact of the change of course of the Amazon River in the
diversification of Neotropics, and Nazareno et al. (2018) tested the importance of the riverine
barriers (Wallace hypothesis) in some species of plants. Côrtes et al. and Mogni et al. (2015) tested
the Pleistocene arcs as driver of diversification in the South American Seasonally Forests for some

3
species of plants. Finally, in a study based on 27 avian lineages, Smith et al. (2014) propose that
the high diversification of Neotropical birds was not mainly affected by the changes in the South
American landscape, but also due to dispersal events creating isolation and speciation.
Because of this bias in the quantity and quality of studies about Amazonia in relation to
others Neotropical regions, the information about the evolutionary and biogeographic processes
acting on the non-Amazonian regions is relatively scarce. However, some theoretical and empirical
approaches have been performed to identify and understand the processes involved in the
biodiversity of non-Amazonian areas/taxa. Initially, multiple works covered general descriptions
and classifications of the different Neotropical regions (e.g. Haffer, 1969; Cabrera & Willink,
1980; Rivas-Martínez & Tovar, 1983; Cracraft, 1985; Dinerstein et al., 1995; and Morrone, 2014).
Others were focused in open lowlands from South America, like the Cerrado, the Caatinga and the
Chaco (Prado & Gibbs, 1993; da Silva, 1995; Bridgewater et al., 2004; Mayle, 2006; Roig-Juñent
et al., 2006; and Caetano & Naciri, 2011). In the same way, the Andean region (Fjeldså, 1992;
Knapp, 2002; Doan, 2003; Brumfield & Edwards, 2007; Ribas et al., 2007; Graham, 2009; Cadena
et al., 2016; Chazot et al., 2016; Cuesta et al., 2016) and the Atlantic Forest have been studied
(Damasceno et al., 2014; Amaral et al., 2016; Dalapicolla et al., 2018). Among these works, there
is no consensus in the explanations about the basic evolutionary processes/patterns acting on these
regions.
The circum-Amazonian distribution pattern
Despite a wide variety of proposed evolutionary and biogeographic mechanisms intended to
explain Neotropical diversity, our understanding remains scarce for some of these patterns. For

4
instance, a considerable number of birds are distributed in those areas surrounding Amazonia but
are absent from Amazonia itself (Remsen et al., 1991; Bates, 1997; Lovette, 2004), and we have
no clear understanding of the mechanisms responsible for those distributions. Such distributional
pattern is known as the “circum-Amazonian distribution” (Figure 1) and is characterized by the
presence of phylogenetically related groups mainly in “(a) montane forested areas on the humid
slopes of the Andes and the Coastal Range of Venezuela or the Tepui region; and in (b) lowland
forested areas south and east of the lowland forests of Amazonia” (Remsen et al., 1991).
Figure 1. Circum-Amazonian distribution pattern sensu Remsen et al. (1991). Left map: Distribution of
Platyrinchus mystaceus (modified from Remsen et al. (1991). Rigth map: Distribution of Dysithamnus mentalis
(BirdLife International, 2016).
In the first study describing the circum-Amazonian pattern, Remsen et al. (1991) describe that
species like Platyrinchus mystaceus, some Hemitriccus, Dysithamnus mentalis, Phyllomyias
burmeisteri, and the Elaenia species albiceps, parvirostris, and obscura, among others, share this
distributional pattern. Subsequent works have identified other taxa as circum-Amazonian. Bates
(1997) stated that two species of Tiaris, T. obscura and T. fuliginosa, have a geographical

5
distribution congruent with the proposed by Remsen et al. (1991). Also, populations of
Phaeothlypis (Lovette, 2004); and the species Synallaxis ruficapilla and S. moesta (Batalha-Filho
et al., 2013) share this pattern. Some species of genus Cercomacra (C. melanaria, C. ferdinandi,
C. carbonaria, and C. nigricans complex) fit partially into this distributional pattern (see Tello et
al., 2014). In a recent study, Savit & Bates (2015) described the intraspecific genetic structure of
the burnished-buff tanager (Tangara cayana), another ‘circum-Amazonian’ bird.
There are also examples in non-passerines such as the genus Pionus, in which the sordidus-
maximiliani complex seem to exhibit complementary geographical ranges resulting in a circum-
Amazonian distribution (see Ribas et al., 2007). Moreover, the circum-Amazonian distribution
pattern can also be found in other non-avian groups such as some insects and plants (e.g. Prado &
Gibbs, 1993; Erwin, 2000; Canals & Johnson, 2000; Knapp, 2002; Irmler, 2009).
Nevertheless, whereas the diversity and distribution patterns in adjacent Neotropical
regions have been the focus of more studies, this complex pattern of distribution has not received
enough attention, and the events and evolutionary processes behind it have not been thoroughly
revealed.
Comparative Phylogeography
Phylogeography is a relatively recent and successful field that, in a broad definition, aims at
studying the geographical history of a particular clade using populations as terminals instead of
species (see Avise et al., 1987; Zink, 2002). Phylogeography starts with the rise of mitochondrial
DNA sequencing, allowing analyses to identify genealogical patterns among individuals, and link
these patterns with the geographic distributions of populations (Avise, 2009). The advent of new

6
mathematical and molecular tools now allows comparison of genealogical patterns (based in the
estimates of gene flow/divergence among species) across different lineages/taxa (‘Multi-species
phylogeographic’ studies) co-occurring in time and space (Hickerson et al., 2010). Such multi-
taxon approach is known as comparative phylogeography (Arbogast & Kenagy, 2001) and its main
objective is to search for concordant splits within contemporaneous, co-distributed species
(Bermingham & Avise, 1986). In this way, the level of “phylogeographic congruence is a measure
of the historical stability of the current species assemblage” (Zink, 2002), namely, a particular
evolutionary reconstruction (a hypothesis) on co-distributed species affected by similar
climatic/geological events would be more 'supported' while more individuals phylogeographic
patterns being congruent. This approach would be analog to some analyses in historical
biogeography that use phylogenies and “area cladograms” of several groups to identify common
biogeographic patterns across space (see Nelson & Platnick, 1981; Humphries & Parenti, 1999).
Among the methodologies developed to access the level of phylogeographic congruence of co-
distributed taxa, the hierarchical approximate Bayesian Computational (hABC) framework
proposed by Hickerson et al. (2006). This methodology allows to quantify the probability of
simultaneous divergence among populations/taxa, estimating demographic parameters (e.g.
across-species demographic variation, divergence times, inter-gene variability in coalescent times,
DNA mutation rate heterogeneity, among others, see Hickerson et al., 2007) from multiple
phylogeographic datasets (from these populations/taxa) in a single analysis. Posteriorly, this
pipeline was upgraded to test evolutionary and biogeographical scenarios (e.g.
dispersal/vicariance/extinctions); to include climatic, ecological and geological (palinological)
data into the prior parameters of tested model(s); and, to allow the use of multi-locus DNA
sequences data (see Huang et al., 2011). This method has been widely used. For instance,

7
Hickerson & Meyer (2008) implemented a hierarchical approximate Bayesian computation
(hABC) to test vicariance/dispersal explanations of allopatric diversification across co-distributed
cowrie gastropods (Cypraeidae, Mollusca), and Bell et al. (2011) used five species co-distributed
rainforest frogs multi-locus datasets to test evidence of single/multiple vicariance events in the
Australian Wet Tropics rainforests. Recently, Robinson et al. (2014) applied a hABC method to
infer population history from genomic data, using as example populations of Biorhiza pallida.
Ultraconserved Elements
Initially, the empirical works in comparative phylogeography were based on the DNA information
from the mitochondrial, nuclear or a few individual genes (Hickerson et al., 2006). With the advent
of Massively Parallel Sequencing (MPS, Shendure & Ji, 2008), the possibility to obtain multiple
sets of sequences from genomes has increased (Edwards et al., 2015; Edwards et al., 2016).
Additionally, the use of highly conserved genomic sequences or 'ultraconserved elements' (UCEs,
see Bejerano et al., 2004) allows the use of a large set of universal markers to infer relationships
among lineages (Faircloth et al., 2012; Faircloth et al., 2015). UCEs are “highly conserved regions
of organismal genomes shared among evolutionary distant taxa” whose function in the genome is
associated with gene regulation (Pennacchio et al., 2006) and development (Sandelin et al., 2004;
Woolfe et al., 2004). For any given UCE, levels of sequence variation increase as one moves away
toward the flanking regions. Therefore, sequence data from this gradient of variation, allows
sampling several levels of sequence diversity that reflect different evolutionary timescales
(Faircloth et al., 2012). Hence, UCEs can be used with MPS protocols to generate huge numbers
of orthologous sequence data among taxonomically diverse groups. In recent reviews, Heyduk et

8
al. (2016) and Harvey et al. (2016) show the advantages/precautions in the use of the target
enrichment methodologies, like as UCEs.
Since their application as molecular markers in phylogeny and evolution, the UCEs has been
increasing recently. For instance, UCEs have proven to be useful in the reconstruction of
phylogenetic relationships in Hymenoptera (Faircloth et al., 2015), in New World Sparrows
(Passerellidae, Bryson Jr. et al., 2016), phylogeny and genetic relationships in the salamander
Plethodon serratus (Newman & Austin, 2016). Also, the estimation of demographic and
population parameters based on UCE data has been shown to improve relative to those based on
mtDNA or other genomic markers (Smith et al., 2013; Harvey et al., 2013; Zarza et al., 2016;
Myers et al., 2019).
Justification
Here, I implemented a comparative phylogeographic approach to study the evolutionary history of
a number of passerine birds with circum-Amazonian distribution using genomic data (UCEs).
First, I tested whether these circum-Amazonian distributions are the result of a congruent history
across taxa or whether it is the result of lineage-specific histories. Also was possible test whether
congruent topologies are associated to dispersal and vicariance events, which allow me to do
inferences on the various proposed hypotheses for Neotropical diversity (e.g. paleogeography,
refugia and riverine hypotheses). Additionally, it was possible to estimate the level of influence of
the environmental variables on the species of these regions, and the constraints imposed by these
factors. Furthermore, the genealogical/evolutionary information of each lineage was useful to
determine levels of demographic structure and the dynamics among isolated populations from the

9
same lineages (e.g. migration rates, speciation), which generated information on the role of
lineage-specific histories and idiosyncrasies in shaping circum-Amazonian populations.

10
General references
Albert, J. S., Val, P., & Hoorn, C. (2018). The changing course of the Amazon River in the
Neogene: center stage for Neotropical diversification. Neotropical Ichthyology, 16(3), e180033.
Antonelli, A. & Sanmartín, I. (2011). Why are there so many plant species in the Neotropics?
TAXON, 60(2), 403–414.
Antonelli, A., Zizka, A., Carvalho, F. A., Scharn, R., Bacon, C. D., Silvestro, D., & Condamine,
F. L. (2018). Amazonia is the primary source of Neotropical biodiversity. Proceedings of the
National Academy of Sciences, 115(23), 6034–6039.
Arbogast, B. S. & Kenagy, G. J. (2001). Comparative phylogeography as an integrative approach
to historical biogeography. Journal of Biogeography, 28, 819–825.
Arruda, D. M., Schaefer, C. E. G. R., Fonseca, R. S., Solar, R. R. C., & FernAndes-Filho, E. I.
(2018). Vegetation cover of Brazil in the last 21 ka: New insights into the Amazonian refugia and
Pleistocenic Arc Hypotheses. Global Ecology and Biogeography, 27, 47–56.
Avise, J. C. (2009). Phylogeography: retrospect and prospect. Journal of Biogeography, 36, 3–15.
Avise, J. C., Arnold, J., Ball, R. M., Bermingham, E., Lamb, T., Neigel, J. E., Reeb, C. A., &
Saunders, N. C. (1987). Intraspecific phylogeography: The mitochondrial DNA bridge between
population genetics and systematics. Annual Review of Ecology and Systematics, 18, 489–522.
Batalha-Filho, H., Irestedt, M., Fjeldså, J., Ericson, P. G. P., Silveira, L. F., & Miyaki, C. Y. (2013).
Molecular systematics and evolution of the Synallaxis ruficapilla complex (Aves: Furnariidae) in
the Atlantic Forest. Molecular Phylogenetics and Evolution, 67, 86–94.

11
Bates, J. M. (1997). Distribution and geographic variation in three South American grassquits
(Emberizinae, Tiaris). Ornithological Monographs, 48, 91–110.
Bejerano, G., Pheasant, M., Makunin, I., Stephen, S., Kent, W. J., Mattick, J. S., & Haussler, D.
(2004). Ultraconserved elements in the human genome. Science, 304, 1321–1325.
Bell, R. C., MacKenzie, J. B., Hickerson, M. J., Chavarría, K. L., Cunningham, M., Williams, S.,
& Moritz, C. (2011). Comparative multi-locus phylogeography confirms multiple vicariance
events in co-distributed rainforest frogs. Proceedings of the Royal Society of London B: Biological
Sciences, 279(1730), 991–999.
Bennett, K. D., Bhagwat, S. A., & Willis, K. J. (2012). Neotropical refugia. The Holocene, 22(1),
1207–1214.
Bermingham, E. & Avise, J. C. (1986). Molecular zoogeography of freshwater fishes in the
southeastern United States. Genetics, 113, 939–965.
BirdLife International (2016). Species factsheet: Dysithamnus mentalis. downloaded from:
http://www.birdlife.org on 28/11/2016.
Böhm, M., Collen, B., Baillie, J. E., Bowles, P., Chanson, J., Cox, N., Hammerson, G., Hoffmann,
M., Livingstone, S. R., Ram, M., Rhodin, A. G., Stuart, S. N., van Dijk, P. P., Young, B. E.,
Afuang, L. E., Aghasyan, A., García, A., Aguilar, C., Ajtic, R., Akarsu, F., Alencar, L. R., Allison,
A., Ananjeva, N., Anderson, S., Andrén, C., Ariano-Sánchez, D., Arredondo, J. C., Auliya, M.,
Austin, C. C., Avci, A., Baker, P. J., Barreto-Lima, A. F., Barrio-Amorós, C. L., Basu, D., Bates,
M. F., Batistella, A., Bauer, A., Bennett, D., Böhme, W., Broadley, D., Brown, R., Burgess, J.,
Captain, A., Carreira, S., del Rosario Castañeda, M., Castro, F., Catenazzi, A., Cedeño-Vázquez,
J. R., Chapple, D. G., Cheylan, M., Cisneros-Heredia, D. F., Cogalniceanu, D., Cogger, H., Corti,

12
C., Costa, G. C., Couper, P. J., Courtney, T., Crnobrnja-Isailovic, J., Crochet, P.-A., Crother, B.,
Cruz, F., Daltry, J. C., Daniels, R. R., Das, I., de Silva, A., Diesmos, A. C., Dirksen, L., Doan,
T. M., Dodd, C. K., Doody, J. S., Dorcas, M. E., de Barros Filho, J. D., Egan, V. T., Mouden, E.
H. E., Embert, D., Espinoza, R. E., Fallabrino, A., Feng, X., Feng, Z.-J., Fitzgerald, L., Flores-
Villela, O., França, F. G., Frost, D., Gadsden, H., Gamble, T., Ganesh, S., Garcia, M. A., García-
Pérez, J. E., Gatus, J., Gaulke, M., Geniez, P., Georges, A., Gerlach, J., Goldberg, S., Gonzalez,
J.-C. T., Gower, D. J., Grant, T., Greenbaum, E., Grieco, C., Guo, P., Hamilton, A. M., Hare, K.,
Hedges, S. B., Heideman, N., Hilton-Taylor, C., Hitchmough, R., Hollingsworth, B., Hutchinson,
M., Ineich, I., Iverson, J., Jaksic, F. M., Jenkins, R., Joger, U., Jose, R., Kaska, Y., Kaya, U.,
Keogh, J. S., Köhler, G., Kuchling, G., Kumlutas, Y., Kwet, A., Marca, E. L., Lamar, W., Lane,
A., Lardner, B., Latta, C., Latta, G., Lau, M., Lavin, P., Lawson, D., LeBreton, M., Lehr, E.,
Limpus, D., Lipczynski, N., Lobo, A. S., López-Luna, M. A., Luiselli, L., Lukoschek, V.,
Lundberg, M., Lymberakis, P., Macey, R., Magnusson, W. E., Mahler, D. L., Malhotra, A.,
Mariaux, J., Maritz, B., Marques, O. A., Márquez, R., Martins, M., Masterson, G., Mateo, J. A.,
Mathew, R., Mathews, N., Mayer, G., McCranie, J. R., Measey, G. J., Mendoza-Quijano, F.,
Menegon, M., Métrailler, S., Milton, D. A., Montgomery, C., Morato, S. A., Mott, T., Muñoz-
Alonso, A., Murphy, J., Nguyen, T. Q., Nilson, G., Nogueira, C., Núñez, H., Orlov, N., Ota, H.,
Ottenwalder, J., Papenfuss, T., Pasachnik, S., Passos, P., Pauwels, O. S., Pérez-Buitrago, N., Pérez-
Mellado, V., Pianka, E. R., Pleguezuelos, J., Pollock, C., Ponce-Campos, P., Powell, R., Pupin, F.,
Díaz, G. E. Q., Radder, R., Ramer, J., Rasmussen, A. R., Raxworthy, C., Reynolds, R., Richman,
N., Rico, E. L., Riservato, E., Rivas, G., da Rocha, P. L., Rödel, M.-O., Schettino, L. R.,
Roosenburg, W. M., Ross, J. P., Sadek, R., Sanders, K., Santos-Barrera, G., Schleich, H. H.,
Schmidt, B. R., Schmitz, A., Sharifi, M., Shea, G., Shi, H.-T., Shine, R., Sindaco, R., Slimani, T.,

13
Somaweera, R., Spawls, S., Stafford, P., Stuebing, R., Sweet, S., Sy, E., Temple, H. J., Tognelli,
M. F., Tolley, K., Tolson, P. J., Tuniyev, B., Tuniyev, S., Üzüm, N., van Buurt, G., Sluys, M. V.,
Velasco, A., Vences, M., Veselý, M., Vinke, S., Vinke, T., Vogel, G., Vogrin, M., Vogt, R. C.,
Wearn, O. R., Werner, Y. L., Whiting, M. J., Wiewandt, T., Wilkinson, J., Wilson, B., Wren, S.,
Zamin, T., Zhou, K., & Zug, G. (2013). The conservation status of the world’s reptiles. Biological
Conservation, 157, 372 – 385.
Bridgewater, S., Ratter, J. A., & Ribeiro, J. F. (2004). Biogeographic patterns, b-diversity and
dominance in the Cerrado biome of Brazil. Biodiversity and Conservation, 13, 2295–2318.
Brown, K. S. (1979). Ecologia Geográfica e Evolução nas Florestas Neotropicais. Universidade
Estadual de Campinas.
Brumfield, R. T. & Edwards, S. V. (2007). Evolution into and out of the Andes: A bayesian
analysis of historical diversification in Thamnophilus antshrikes. Evolution, 61, 346–367.
Bryson Jr., R. W., Faircloth, B. C., Tsai, W. L. E., McCormack, J. E., & Klicka, J. (2016). Target
enrichment of thousands of ultraconserved elements sheds new light on early relationships within
New World Sparrows (Aves: Passerellidae). The Auk, 133, 451–458.
Cabrera, A. & Willink, A. (1980). Biogeografía de América Latina. O.E.A.
Cadena, C. D., Pedraza, C. A., & Brumfield, R. T. (2016). Climate, habitat associations and the
potential distributions of Neotropical birds: Implications for diversification across the Andes.
Revista de la Academia Colombiana de Ciencias Exactas, Físicas y Naturales, 40(155), 275–287.

14
Caetano, S. & Naciri, Y. (2011). The Biogeography of Seasonally Dry Tropical Forests in South
America. In Seasonally Dry Tropical Forests: Ecology and Conservation, chapter 2, (pp. 23–44).
Island Press.
Canals, G. & Johnson, K. (2000). A new species of Angulopis (Lycaenidae, Eumaeini) from relict
coastal forest in east-central Argentina. The taxonomic report of the International Lepidoptera
Survey, 2(3), 1–5.
Capparella, A. (1988). Genetic variation in Neotropical birds: implication for the speciation
process. Acta XIX Congr. Intern. Ornith., 2, 1658–1664.
Chazot, N., Willmott, K. R., Condamine, F. L., De-silva, D. L., Freitas, A. V. L., Lamas, G.,
Morlon, H., Giraldo, C. E., Jiggins, C. D., Joron, M., Mallet, J., Uribe, S., & Elias, M. (2016). Into
the Andes: multiple independent colonizations drive montane diversity in the Neotropical
clearwing butterflies Godyridina. Molecular Ecology.
Colinvaux, P. A., Oliveira, P. E. D., & Bush, M. B. (2000). Amazonian and Neotropical plant
communities on glacial time-scales: The failure of the aridity and refuge hypotheses. Quaternary
Science Reviews, 19, 141–169.
Connell, J. H. (1978). Diversity in tropical rain forest and costal reefs. Science, 199(4335), 1302–
1310.
Côrtes, A. L. A., Rapini, A., & Daniel, T. F. (2015). The Tetramerium lineage (Acanthaceae:
Justicieae) does not support the Pleistocene Arc Hypothesis for South American Seasonally Dry
Forests. American Journal of Botany, 102(6), 1–16.

15
Cracraft, J. (1985). Historical biogeography and patterns of differentiation within the South
American avifauna: areas of endemism. Ornithological Monographs, 36, 49–84.
Cracraft, J. & Prum, R. O. (1988). Patterns and process of diversification: Speciation and historical
congruence in some Neotropical birds. Evolution, 42, 603–620.
Croizat, L. (1976). Biogeografía analítica y sintética (’Panbiogeografía’) de las américas.
Biblioteca de la Academia de Ciencias Físicas, Matemáticas y Naturales, 35, 1–890.
Cuesta, F., Muriel, P., Llambí, L. D., Halloy, S., Aguirre, N., Beck, S., Carilla, J., Meneses, R. I.,
Cuello, S., Grau, A., Gámez, L. E., Irazábal, J., Jácome, J., Jaramillo, R., Ramírez, L., Samaniego,
N., Suárez-Duque, D., Thompson, N., Tupayachi, A., nas, P. V., Yager, K., Becerra, M. T., Pauli,
H., & Gosling, W. D. (2016). Latitudinal and altitudinal patterns of plant community diversity on
mountain summits across the tropical Andes. Ecography, 40, 1381–1394.
Dalapicolla, J., Leite, Y. L. R., & Calafell, F. (2018). Historical connections among river basins
and climatic changes explain the biogeographic history of a water rat. PeerJ, 6, e5333.
Damasceno, R., Strangas, M. L., Carnaval, A. C., Rodrigues, M. T., & Moritz, C. (2014).
Revisiting the vanishing refuge model of diversification. Frontiers in Genetics, 5, 353.
da Silva, J. M. C. (1995). Biogeographical analysis of the South American Cerrado avifauna.
Steenstrupia, 21, 49–67.
Dinerstein, E., Olson, D. M., Graham, D. J., Webster, A. L., Primm, S. A., Bokkbinder, M. P., &
Ledec, G. (1995). A Conservation Assessment of the Terrestrial Ecoregions of Latin America and
the Caribbean. The World Bank Washington, D.C.

16
Doan, T. M. (2003). A south-to-north biogeographic hypothesis for Andean speciation: evidence
from the lizard genus Proctoporus (Reptilia, Gymnophthalmidae). Journal of Biogeography, 30,
361–374.
Edwards, S. V., Potter, S., Schmitt, C. J., Bragg, J. G., & Moritz, C. (2016). Reticulation,
divergence, and the phylogeography-phylogenetics continuum. Proceedings of the National
Academy of Sciences of the United States of America, 113(29), 8025–8032.
Edwards, S. V., Shultz, A. J., & Campbell-Staton, S. C. (2015). Next-generation sequencing and
the expanding domain of phylogeography. Folia Zoologica, 64(3), 187–206.
Erwin, T. L. (2000). Arboreal beetles of Neotropical forests: Taxonomic supplement for the Agra
virgata and ohausi groups with a new species and additional distribution records (Coleoptera:
Carabidae). The Coleopterists Bulletin, 54(2), 251–262.
Faircloth, B. C., Branstetter, M. G., White, N. D., & Brady, S. G. (2015). Target enrichment of
ultraconserved elements from arthropods provides a genomic perspective on relationships among
hymenoptera. Molecular Ecology Resources, 15, 489–501.
Faircloth, B. C., Mccormack, J. E., Crawford, N. G., Harvey, M. G., Brumfield, R. T., & Glenn,
T. C. (2012). Ultraconserved elements anchor thousands of genetic markers spanning multiple
evolutionary timescales. Systematic Biology, 61(5), 717–726.
FernAndes, A. M., Wink, M., & Aleixo, A. (2012). Phylogeography of the chestnut-tailed antbird
(Myrmeciza hemimelaena) clarifies the role of rivers in Amazonian biogeography. Journal of
Biogeography, 39, 1524–1535.

17
Fjeldså, J. (1992). Biogeographic pattern and evolution of the avifauna of relict high-altitude
woodlands of the Andes. Steenstrupia, 18, 9–62.
Garzón-Orduña, I. J., Benetti-Longhini, J. E., & Brower, A. V. Z. (2014). Timing the
diversification of the Amazonian biota: butterfly divergences are consistent with Pleistocene
refugia. Journal of Biogeography, 41, 1631–1638.
Garzón-Orduña, I. J., Benetti-Longhini, J. E., & Brower, A. V. Z. (2015). Competing paradigms
of Amazonian diversification and the Pleistocene refugium hypothesis. Journal of Biogeography,
42, 1349–1363.
Graham, A. (2009). The Andes: a geological overview from a biological perspective. Annals of
the Missouri Botanical Garden, 96(3), 371–385.
Haffer, J. (1969). Speciation in Amazonian forest birds. Science, New Series, 165, 131–137.
Haffer, J. (1993). On the ’river effect’ in some forest birds of southern Amazonia. Boletim do
Museu Paraense Emilio Goeldi Serie Zoologia, 8(1), 217–245.
Haffer, J. (1997). Alternative models of vertebrate speciation in Amazonia: an overview.
Biodiversity and Conservation, 6, 451–476.
Haffer, J. (2008). Hypotheses to explain the origin of species in Amazonia. Brazilian Journal of
Biology, 68(4), 917–947.
Haffer, J. & Prance, G. (2001). Climatic forcing of evolution in Amazonia during the Cenozoic:
on the refuge theory of biotic differentiation. Amazoniana, 16, 579–607.

18
Harvey, M. G., Smith, B. T., Glenn, T. C., Faircloth, B. C., & Brumfield, R. T. (2013). Sequence
capture versus restriction sites associated DNA sequencing for phylogeography. arXiv preprint
arXiv:1312.6439.
Harvey, M. G., Smith, B. T., Glenn, T. C., Faircloth, B. C., & Brumfield, R. T. (2016). Sequence
capture versus restriction site associated DNA sequencing for shallow systematics. Systematic
Biology, 65(5), 910–924.
Heyduk, K., Stephens, J. D., Faircloth, B. C., & Glenn, T. C. (2016). Targeted DNA Region Re-
sequencing. In Field Guidelines for Genetic Experimental Designs in High-Throughput
Sequencing, chapter 3, (pp. 43–68). Springer International Publishing Switzerland.
Hickerson, M. J., Carstens, B., Cavender-Bares, J., Crandall, K., Graham, C., Johnson, J., Rissler,
L., Victoriano, P., & Yoder, A. (2010). Phylogeography’s past, present, and future: 10 years after
Avise, 2000. Molecular Phylogenetics and Evolution, 54, 291–301.
Hickerson, M. J. & Meyer, C. P. (2008). Testing comparative phylogeographic models of marine
vicariance and dispersal using a hierarchical bayesian approach. BMC Evolutionary Biology, 8,
322.
Hickerson, M. J., Stahl, E., & Takebayashi, N. (2007). msbayes: Pipeline for testing comparative
phylogeographic histories using hierarchical approximate bayesian computation. BMC
Bioinformatics, 8, 268.
Hickerson, M. J., Stahl, E. A., & Lessios, H. A. (2006). Test for simultaneous divergence using
approximate bayesian computation. Evolution, 60(12), 2435–2453.

19
Hooghiemstra, H. & van der Hammen, T. (1998). Neogene and Quaternary development of the
Neotropical rain forest: the forest refugia hypothesis, and a literature overview. Earth-Science
Reviews, 44, 147–183.
Huang, W., Takebayashi, N., Qi, Y., & Hickerson, M. J. (2011). Mtml-msbayes: Approximate
bayesian comparative phylogeographic inference from multiple taxa and multiple loci with rate
heterogeneity. BMC Bioinformatics, 12(1), 1.
Humphries, C. & Parenti, L. (1999). Cladistic Biogeography. Oxford University Press, 2nd ed
edition.
Irmler, U. (2009). New species and records of the genus Lispinus with a key to the species from
Peru (Coleoptera: Staphylinidae: Osoriinae). Zootaxa, 2263, 42–58.
Knapp, S. (2002). Assessing patterns of plant endemism in Neotropical uplands. The Botanical
Review, 68(1), 22–37.
Leite, Y. L. R., Costa, L. P., Loss, A. C., Rocha, R. G., Batalha-Filho, H., Bastos, A. C., Quaresma,
V. S., Fagundes, V., Paresque, R., Passamani, M., & Pardini, R. (2016). Neotropical forest
expansion during the last glacial period challenges Refuge Hypothesis. Proceedings of the
National Academy of Sciences, 113(4), 1008–1013.
Lougheed, S. C., Gascon, C., Jones, D. A., Bogart, J. P., & Boag, P. T. (1999). Ridges and rivers:
a test of competing hypotheses of Amazonian diversification using a dart-poison frog
(Epipedobates femoralis). Proceedings of the Royal Society of London B: Biological Sciences,
266(1431), 1829–1835.

20
Lovette, I. J. (2004). Molecular phylogeny and plumage signal evolution in a Trans Andean and
circum Amazonian avian species complex. Molecular Phylogenetics and Evolution, 32, 512–523.
Maldonado-Coelho, M., Blake, J. G., Silveira, L. F., Batalha-filho, H., & Ricklefs, R. E. (2013).
Rivers, refuges and population divergence of fire-eye antbirds (Pyriglena) in the amazon basin.
Journal of Evolutionary Biology, 26, 1090–1107.
Mayle, F. E. (2006). The Late Quaternary Biogeographical History of South American Seasonally
Dry Tropical Forests: Insights from Palaeo-Ecological Data. In Neotropical Savannas and
Seasonally Dry Forests: Plant Diversity, Biogeography and Conservation, chapter 17, (pp. 395–
416). CRC Press.
Mayr, E. & O’Hara, R. J. (1986). The biogeographic evidence supporting the Pleistocene forest
refuge hypothesis. Evolution, 40(1), 55–67.
Mogni, V. Y., Oakley, L. J., & Prado, D. E. (2015). The distribution of woody legumes in
Neotropical Dry Forests: the Pleistocene Arc Theory 20 years on*. Edinburgh Journal of Botany,
72(1), 35–60.
Morrone, J. J. (2014). Biogeographical regionalization of the Neotropical region. Zootaxa,
3782(1), 001–110.
Myers, N., Mittermeier, R. A., Mittermeier, C. G., da Fonseca, G. A. B., & Kent, J. (2000).
Biodiversity hotspots for conservation priorities. Nature, 403, 853–858.
Myers, E. A., Bryson, R. W., Hansen, R. W., Aardema, M. L., Lazcano, D., & Burbrink, F. T.
(2019). Exploring Chihuahuan desert diversification in the gray-banded kingsnake, Lampropeltis
alterna (Serpentes: Colubridae). Molecular Phylogenetics and Evolution, 131, 211–218.

21
Nazareno, A. G., Dick, C. W., & Lohmann, L. G. (2018). Tangled banks: a landscape genomic
evaluation of Wallace’s Riverine Barrier Hypothesis for three Amazon plant species. Molecular
Ecology, 28(5), 980–997
Nelson, G. J. & Platnick, N. I. (1981). Systematics and Biogeography: Cladistics and Vicariance.
Columbia University Press, New York.
Newman, C. E. & Austin, C. C. (2016). Sequence capture and next-generation sequencing of
ultraconserved elements in a largegenome salamander. Molecular Ecology, 25(24), 6162–6174.
Newton, I. & Dale, L. (2001). A comparative analysis of the avifaunas of different zoogeographical
regions. Journal of Zoology, 254(2), 207–218.
Nores, M. (1999). An alternative hypothesis for the origin of Amazonian bird diversity. Journal
of Biogeography, 26, 475–485.
Pennacchio, L. A., Ahituv, N., Moses, A. M., Prabhakar, S., Nobrega, M. A., Shoukry, M.,
Minovitsky, S., Dubchak, I., Holt, A., Lewis, K. D., Plajzer-Frick, I., Akiyama, J., Val, S. D.,
Afzal, V., Black, B. L., Couronne, O., Eisen, M. B., Visel, A., & Rubin, E. M. (2006). In vivo
enhancer analysis of human conserved non-coding sequences. Nature, 444, 499–502.
Prado, D. E. & Gibbs, P. E. (1993). Patterns of species distributions in the dry seasonal forests of
South America. Annals of the Missouri Botanical Garden, 80, 902–927.
Ramírez-Barahona, S. & Eguiarte, L. E. (2013). The role of glacial cycles in promoting genetic
diversity in the Neotropics: the case of cloud forests during the last glacial maximum. Ecology and
Evolution, 3(3), 725–738.

22
Raposo do Amaral, F., Edwards, S. V., Pie, M. R., Jennings, W. B., Svensson-Coelho, M., d’Horta,
F. M., Schmitt, C. J., & Maldonado-Coelho, M. (2016). The ‘Atlantic Forest Hypothesis’ does not
explain Atlantic Forest phylogeography. Proceedings of the National Academy of Sciences of the
United States of America, 113(15), 2097–2098.
Remsen Jr., J. V., 0., O. R., Schmitt, C. G., & Schmitt, D. C. (1991). Zoogeography and geographic
variation of Platyrinchus mystaceus in Bolivia and Peru, and the Circum-Amazonian distribution
pattern. Ornitologia Neotropical, 2, 77–83.
Ribas, C. C., Moyle, R. G., Miyaki, C. Y., & Cracraft, J. (2007). The assembly of montane biotas:
linking Andean tectonics and climatic oscillations to independent regimes of diversification in
pionus parrots. Proceedings of the Royal Society of London B: Biological Sciences, 274, 2399–
2408.
Richardson, J. E. & Pennington, R. T. (2016). Editorial: Origin of tropical diversity: From clades
to communities. Frontiers in Genetics, 7, 186.
Rivas-Martínez, S. & Tovar, O. (1983). Síntesis biogeográfica de los Andes. Collectanea
Botanica, 14, 515–521.
Robinson, J. D., Bunnefeld, L., Hearn, J., Stone, G. N., & Hickerson, M. J. (2014). Abc inference
of multi-population divergence with admixture from unphased population genomic data.
Molecular Ecology, 23, 4458–4471.
Rocha, D. G. d. & Kaefer, I. L. (2019). What has become of the refugia hypothesis to explain
biological diversity in Amazonia? Ecology and Evolution, 9(7), 4302–4309.

23
Roig-Juñent, S., Domínguez, M., Flores, G., & Mattoni, C. (2006). Biogeographic history of South
American arid lands: A view from its arthropods using TASS analysis. Journal of Arid
Environments, 66, 404–420.
Rull, V. (2011). Neotropical biodiversity: timing and potential drivers. Trends in Ecology and
Evolution, 26(10), 508–513.
Rull, V. (2018). Neotropical diversification: historical overview and conceptual insights. PeerJ
Preprints, 6, e27294v1.
Salo, J. (1987). Pleistocene forest refuges in the amazon: evaluation of the biostratigraphical,
lithostratigraphical and geomorphological data. Annales Zoologici Fennici, 24(3), 203–211.
Sandelin, A., Bailey, P., Bruce, S., Engstrom, P. G., Klos, J. M., Wasserman, W. W., Ericson, J.,
& Lenhard, B. (2004). Arrays of ultraconserved non-coding regions span the loci of key
developmental genes in vertebrate genomes. BMC Genomics, 5(99), 1–9.
Savit, A. Z. & Bates, J. M. (2015). Right around the amazon: the origin of the Circum-Amazonian
distribution in Tangara cayana. Folia Zoologica, 64(3), 273–283.
Shendure, J. & Ji, H. (2008). Next-generation DNA sequencing. Nature Biotechnology, 26(10),
1135–1145.
Sick, H. (1967). Rios e enchentes na Amazônia como obstáculo para a avifauna. Atas Simp. Sobre
a Biota Amazonica, 5, 495–520.
Smith, B. T., McCormack, J. E., Cuervo, A. M., Hickerson, M. J., Aleixo, A., Cadena, C. D.,
Pérez-Emán, J., Burney, C. W., Xie, X., Harvey, M. G., Faircloth, B. C., Glenn, T. C., Derryberry,

24
E. P., Prejean, J., Fields, S., & Brumfield, R. T. (2014b). The drivers of tropical speciation. Nature,
515, 406–409.
Smith, B. T., Ribas, C. C., Whitney, B. M., nos, B. E. H.-B., & Klicka, J. (2013). Identifying biases
at different spatial and temporal scales of diversification: a case study in the Neotropical parrotlet
genus Forpus. Molecular Ecology, 22, 483–494.
Stotz, D. F., Fitzpatrick, J. W., Parker, T. A. I., & Moskovits, D. K. (1996). Neotropical birds:
Ecology and Conservation. University of Chicago Press.
Tello, J. G., Raposo, M., Bates, J. M., Bravo, G. A., Cadena, C. D., & Maldonado-Coelho, M.
(2014). Reassessment of the systematics of the widespread Neotropical genus Cercomacra (Aves:
Thamnophilidae). Zoological Journal of the Linnean Society, 170, 546–565.
Vanzolini, P. & Williams, E. E. (1970). South American anoles: The geographic differentiation
and evolution of the anolis Chrysolepis species group (Sauria, Iguanidae), volume 19 of Arquivos
de zoologia. Museu de Zoologia.
Vuilleumier, B. S. (1971). Pleistocene changes in the fauna and flora of South America. Science,
New Series, 173(3999), 771–780.
Wallace, A. R. (1854). On the monkeys of the amazon. Annals and Magazine of Natural History,
14(84), 451–454.
Woolfe, A., Goodson, M., Goode, D. K., Snell, P., McEwen, G. K., Vavouri, T., Smith, S. F.,
North, P., Callaway, H., Kelly, K., Walter, K., Abnizova, I., Gilks, W., Edwards, Y. J. K., Cooke,
J. E., & Elgar, G. (2004). Highly conserved non-coding sequences are associated with vertebrate
development. PLoS Biology, 3(1), e7.

25
Young, B. E., Stuart, S. N., Chanson, J., Cox, N. A. and Boucher, T. M. (2004). Joyas que están
desapareciendo: el estado de los anfibios en el Nuevo Mundo. NatureServe, Arlington, Virginia,
53 p.
Zarza, E., Faircloth, B. C., Tsai, W. L., Jr., R. W. B., Klicka, J., & nd John E. Mccormack (2016).
Hidden histories of gene flow in highland birds revealed with genomic markers. Molecular
Ecology, 25(20), 5144–5157.
Zink, R. M. (2002). Methods in comparative phylogeography, and their application to studying
evolution in the North American aridlands. Integrative & Comparative Biology, 42, 953–959.

26
Chapter I
Out of northeastern Brazil: demographic and evolutionary history
of the Variable Antshrike, Thamnophilus caerulescens (Aves,
Thamnophilidae)

27
Out of northeastern Brazil: demographic and evolutionary history of the Variable Antshrike,
Thamnophilus caerulescens (Aves, Thamnophilidae)
Authors: Sergio D. Bolívar-Leguizamón1, Luís F. Silveira1, Elizabeth P. Derryberry2, Robb T.
Brumfield3,4, Gustavo A. Bravo5,6,*
1Museu de Zoologia da Universidade de São Paulo, 04263-000 Ipiranga, São Paulo, SP, Brazil.
2Department of Ecology and Evolutionary Biology, University of Tennessee, Knoxville, TN
37996, USA.
3Department of Biological Sciences, Louisiana State University, Baton Rouge, LA 70803, USA.
4Museum of Natural Science, Louisiana State University, Baton Rouge, LA 70803, USA.
5Department of Organismic and Evolutionary Biology, Harvard University, Cambridge, MA
02138, USA.
6Museum of Comparative Zoology, Harvard University, Cambridge, MA 02138, USA.
*Corresponding author =

28
Abstract
The Neotropics exhibit a wealth of distributional patterns that are often shared by a number of co-
distributed species. A distinctive pattern is the so-called “circum-Amazonian distribution”, which
is observed in species that do not occur in Amazonia but rather in forested habitats around it
forming a continuous belt that extends south and east of Amazonia, the Andean foothills, and often
into the Venezuelan Coastal Range and the Tepuis. Although this pattern is widespread across a
wealth of animals and plants, the historical and biogeographic mechanisms giving rise to it remain
poorly understood. The Variable Antshrike (Thamnophilus caerulescens) is a sexually dimorphic
suboscine passerine bird that is distributed along the southern portion of the circum-Amazonian
belt. It comprises eight currently recognized subspecies that exhibits extreme levels of plumage
variation. Our objective was to describe the phylogeographic and demographic history of
Thamnophilus caerulescens using Ultraconserved Elements (UCEs). We inferred populational
structure and divergence times, as well as modeled the demographic history of the species based
on comprehensive sampling across the entire distribution of the species. Structure analyses allowed
to identify three genomic clusters within the species: a) northeastern Atlantic Forests; b)
southeastern Cerrado, central, and southern Atlantic Forests, and c) Chacoan and Andean
populations. Demoraphic analyses revealed a history of gene flow, mainly between birds from the
central and southern Atlantic Forest, the Chacoan, and Andean populations. Differentiation took
place during the Pleistocene, with a possible origin in the northern Atlantic Forest during the
Pliocene. The recent diversification of the Variable Antshrike was probably affected by series of
humid and dry periods throughout the Quaternary, allowing the intermittent connection between

29
the central-southern Atlantic Forests and the Chacoan – Andean populations, and, to a lesser
extent, with the northern Atlantic Forest populations.

30
Introduction
The Neotropics harbor the highest levels of species diversity and endemism across multiple
taxonomic groups (Halffter, 1992; Mittermeier et al., 1998; Myers et al., 2000; Olson et al., 2001;
Dinerstein et al., 2017). In general, the spatial distribution of Neotropical organisms results from
large-scale geological processes, such as the uplift of the Andes, that generate opportunities for
allopatric differentiation and promote diversification into novel environments (Hooghiemstra et
al., 2002, Graham, 2009, Hoorn et al., 2010, Herzog et al., 2011, Prieto-Torres et al., 2018). These
processes are also shaped by species’ ecological affinities and dispersal abilities to disperse across
barriers and persist over time (Burney & Brumfield, 2009; Smith et al., 2014), resulting in a
complex mosaic of distributional ranges, often shared by large numbers of co-distributed species,
from which some general patterns have emerged. For instance, coarse distributional limits of South
American taxa have allowed us to recognize the main domains of forested areas, such as the
Atlantic Forest and Amazonia, or open areas such as the Llanos and the Cerrado (Darlington, 1957;
Sánchez-González et al., 2008; Morrone, 2014; Prieto-Torres et al., 2018). However, there is
prevalent taxon-specific and scale-dependent variation in demographic and geologic histories that
obfuscate our understanding of the mechanisms driving the evolutionary history of co-existing
populations (Smith et al., 2014).
Distributional patterns of Neotropical birds are largely bounded by the main biogeographic
domains. Yet, there are numerous instances in which several widely distributed co-occurring taxa
exhibit rather odd distributions that expand beyond the boundaries of these domains. One of these
common patterns is known as the circum-Amazonian distribution (sensu Remsen et al., 1991),
which largely mirrors the extend of Seasonally Dry Tropical Forests – SDTF (sensu Mooney et
al., 1995) surrounding Amazonia (Chaco, Caatinga, Interandean valleys) but that expands into

31
neighboring forested formations in seasonal savannah environments (Cerrado, Llanos, Pampas)
and humid forests (Atlantic Forest, Andean Foothills, Guiana Shield). The circum-Amazonian
distribution is shared by a considerable number of species of birds, insects, and plants (Bates, 1997;
Lovette, 2004; Knapp, 2002; Irmler, 2009) but we still lack a thorough understanding of the
historical events and evolutionary processes generating this pattern.
Although a wealth of hypotheses about the origin and maintenance of diversity in the
Neotropics has been proposed for the Amazonia (reviewed by Haffer, 1997), they can be relevant
shed light on the circum-Amazonian patterns of distribution. For example, hypotheses based in the
presence of rivers acting as barriers between populations – the Riverine Hypothesis (Sick, 1967;
Capparella, 1988; Wallace, 1854) – could explain the distribution of some species with an
incomplete/intermittent circum-Amazonian distribution (an idea proposed for Amazonian taxa,
initially by Wallace, 1854). In the same way, the Refugia Hypothesis (Haffer, 1969; Vanzolini &
Williams, 1970), that proposes that the biodiversity in Amazonia was molded by a series of
climatic fluctuations during the Cenozoic producing a reduction of the Neotropical Forests, could
be extrapolated to explain the diversification of species of this distribution. In addition, the
combined effect of these rivers and the refugia created during the dry glacial periods in the
Quaternary would be another suitable explanation for circum-Amazonia taxa (River-refuge
Hypothesis Haffer, 1993). Lastly, it is possible that geological processes (tectonic movements and
level sea fluctuations) influence (indirectly) the diversity/distribution of species/subspecies
allowing the isolation and re-connection among the different areas of the circum-Amazonian
region(s) (Paleogeography Hypothesis, Croizat, 1976).
The Variable Antshrike (Thamnophilus caerulescens) is a suboscine passerine that exhibits
circum-Amazonian distribution. It inhabits the forest understory, second-growth woodland, and

32
patches of thickets and trees in more open regions, and can be found in patches of degraded
remnants of forest (Zimmer & Isler, 2019). The Variable Antshrike is sexually dimorphic and
exhibits extreme levels of plumage variation across its range. Hence, taxonomists have recognized
a number of subspecies, some of which have been recently synonymized (see Zimmer & Isler,
2019), that exhibit clinal variation in vocalizations and plumage (Brumfield, 2005; Isler et al.,
2005). Although this high levels of phenotypic variation lacking clear-cut geographic structure are
extraordinary in the avian world, a thorough understanding of the mechanisms giving rise to the
remain poorly understood.
Ultraconserved Elements (UCEs Bejerano et al., 2004) are highly conserved genomic
sequences that allow the use of a large set of universal markers to infer relationships among
lineages (Faircloth et al., 2012; Faircloth et al., 2015). The estimation of demographic and
population parameters based on UCE data has been shown to improve relative to those based on
mtDNA or other genomic markers (Smith et al., 2013). For example, Zarza et al. (2018) used
UCEs to identify the demographic patterns in some groups of vertebrates. In the same way, Myers
et al. (2019) infer historical demography in a species of snakes. Also, UCEs were used to
delimitation of species (Ješovnik et al., 2017; Pie et al., 2017).
Here, we describe the large-scale phylogeographic and demographic history of
Thamnophilus caerulescens using genome-scale. Specifically, we used ultraconserved Elements
(Faircloth et al., 2012; UCEs) to a) describe the populational structure and estimate divergence
times, and b) identify plausible historical and evolutionary processes responsible for generating
the circum-Amazonian distributional pattern of T. caerulescens. Specifically, we aim at testing
scenarios such as a possible isolation among their populations after an initial period of expansion
due to climatic fluctuations in the Cenozoic, and assess migration events between populations

33
during the Quaternary. To this end, we use demographic modeling to test for different scenarios
contemplating different rates and directions of migration and growth rates across populations of
T. caerulescens. In addition, we describe a plausible phylogeographic scenario of the species and
propose one possible change to refine the taxonomy of this polytypic taxon. The evolutionary and
demographic information of the populations of T. caerulescens will be useful to shed light on the
role of lineage-specific histories and idiosyncrasies in shaping circum-Amazonian populations.

34
Methods
Sampling and DNA extractions
We sampled a total of 53 vouchered specimens of T. caerulescens, covering the total extent of its
geographical distribution and including at least two individuals of each of the eight subspecies
currently recognized (but see T. c. ochraceiventer, taxonomy sensu Zimmer & Isler 2019, Table
S1; Fig. 1a). Additionally, following results by Brumfield and Edwards (2007), we sampled five
vouchered specimens of the closely related species T. aethiops. We extracted total genomic DNA
from muscle tissues using the PureLink® Genomic DNA Mini kit (Invitrogen Inc) and following
guidelines by the manufacturer. We quantified genomic DNA concentrations using a Qubit 2.0
fluorometer with the dsDNA BR assay kit (Life Technologies, Inc).
Mitochondrial DNA
We sequenced the mitochondrial gene NADH dehydrogenase 2 (ND2) from all individuals of T
caeurlescens and 5 individuals of the outgroup. We amplified and sequenced ND2 using standard
PCR and Sanger sequencing protocols described elsewhere (Brumfield et al., 2007). We edited
sequences and checked that they did not include stop codons or anomalous residues using
Geneious v. 11.1.4 (www.geneious.com, Kearse et al. 2012). We aligned sequences with the
MAFFT v.7 multiple alignment plugin (Katoh & Standley, 2013) implemented in Geneious.
Newly obtained sequences were deposited in GenBank (Accession numbers XXXXX-XXXXXX).

35
We built a Median Joining Network – MJN – haplotype network (Bandelt et al., 1999)
implemented in POPART (Leigh & Bryant, 2015). Outgroup samples and short ingroup sequences
(<700 bp) were excluded from the analysis and the matrix was trimmed to exclude any positions
containing missing data (Final 1,041 bp, 53 samples).
Using the corrected Akaike Information Criterion (AICc; Hurvich and Tsai 1989)
implemented in jModeltest2 (Darriba et al., 2012) on the Cipres Science Gateway V 3.3 (Miller et
al., 2010), we selected a TrN+I+G model as the best substitution model. We estimated a time-
calibrated gene tree within a Bayesian framework implemented in the program BEAST2 v2.4.4
(Bouckaert et al. 2014). Based on the avian mtDNA substitution rate of 2.1%/My (Weir &
Schluter, 2008), we used a lognormal relaxed molecular clock with a mean rate of 0.0105 for
mtDNA. We used a Coalescent Constant Population prior with no restrictions on tree shape and a
randomly generated tree as a starting tree. We ran analyses for a total of 50 million generations
with a sampling frequency of 1,000. We determined that replicate analyses converged (effective
sample size values > 400) using Tracer 1.7.1 (Rambaut et al. 2018). Using TreeAnnotator v2.4.4
(Drummond et al. 2012, Bouckaert et al. 2014) and a burn-in of 30%, we estimated a posterior
distribution of topologies and a 50% maximum clade credibility (MCC) tree.
Sequence capture
Based on results of the mitochondrial analyses, we selected 28 samples of T. caerulescens and
three samples of T. aethiops to sequence ultraconserved elements (UCEs; Faircloth et al., 2012)
following a target enrichment approach. The genomic enrichment and Illumina sequencing was
performed by Rapid Genomics (Gainesville, FL) using 1,000 ng of input genomic DNA for each

36
sample. Libraries were enriched from 2,386 UCE loci that targeted a set of 2,560 probes (Faircloth
et al., 2012, Tetrapods-UCE-2.5K version 1; Microarray, Ann Arbor, MI), following an open-
source protocol available at www.ultraconserved.org. Samples were multiplexed at 192 samples
per lane on a 125 bp paired-end Illumina HiSeq 2500 run, yielding an average coverage of 18.61X
per sample.
Edition and assembly of UCEs
We followed the Phyluce pipeline (Faircloth, 2016, https://github.com/faircloth-lab/phyluce) to
process the raw reads and assembly contigs corresponding to target loci. Initially, Illumiprocessor
2.0.7 (Faircloth, 2013) and Trimmomatic 0.32 (Bolger et al., 2014) were used to trimm adapters,
barcodes and low quality regions. We used Trinity 2.0.6 (Grabherr et al., 2011) to perform the
assembly (script phyluce_assembly_assemblo_trinity). To avoid including markers of different
ploidy, we identified, extracted, and removed Z-linked UCEs from the assemblies using Blast
2.7.7 (see Altschul et al., 1990; Camacho et al., 2009). Finally, we implemented the script
phyluce_assembly_match_contigs_to_probes to match the assembled contigs to the UCE probes
(uce-2.5k-probes.fasta). The results were exported in a *fasta.
Single Nucleotide Polymorphism (SNP) calling
We extracted Single Nucleotide Polymorphisms (SNPs) from the UCE alignments using the
methods described by Harvey et al. (2016), which are largely based on Phyluce (Faircloth, 2016).
We extracted SNPs following two approaches using the script phyluce_assembly_match_counts.

37
The first one yielded a 100% complete matrix with no missing data for any individual in all loci
(individuals = 28, loci = 324), and the second one yielded an incomplete matrix including all data
matching the target loci (individuals = 28, loci = 2,036). When outgroups were included these
matrices contained 201 and 1,954 loci, respectively. The average number of loci per individual
was 2,004 and the average number of individuals per locus was 27.
To call SNPs, we first created a *fasta file with the loci extracted from each matrix
(phyluce_assembly_explode_get_fastas_file) and we chose as reference the individual with the
deepest coverage and longest mean length of recovered contigs (script
phyluce_assembly_get_trinity_coverage, and phyluce_assembly_get_fasta_lengths). Then, we
used bwa 0.7.7 (Li & Durbin, 2009) to map raw reads from the samples for each group with their
respective reference (Li, 2013), Samtools 0.1.19 (Li et al., 2009) and Picard
(http://broadinstitute.github.io/picard/) to create *bam files, mark duplicates from the PCRF and
prepare the files for the next phase. We used GATK 3.8.0 (McKenna et al., 2010) to extract indels,
SNPs, and phase sequences. Created *vcf files were exported into other formats for downstream
demographic analyzes (*nexus, *sfs.gz). Finally, we filtered loci in the complete and incomplete
*vcf by selecting one random SNP per locus from the biallelic SNPs recovered in each file (script
randSnps.pl). Before filtering, our datasets contained 324 and 2.036 SNPs in the complete and
incomplete matrices, respectively. After filtering, whereas In the end, we have two SNPs dataset:
one with 324 loci (from the complete matrix) and another with 2,036 loci (incomplete matrix). We
implemented all the analysis in this work on the two matrices to compare the results in each of
them.

38
Population structure
To infer population structure from the SNPs, we implemented two multivariate approaches; a
Principal Components Analysis (PCA) with the R packages adegenet/ape (Jombart, 2008 and
Paradis et al., 2004), and a coefficients of mixture analyses with sparse nonnegative matrix
factorization for clustering (sNMF) in the R package LEA (Frichot et al., 2014, Frichot & François,
2015) with the following parameters; five α values (10, 50, 100, 500, 1000), K values of 1 to 10
(K = 1:10), and 100 runs per K value, and the minimum cross entropy as TRUE to estimate the
best number of K. Additionally, we implemented a Discriminant Analysis of Principal
Components (DAPC; Jombart et al., 2010) within the adegenet package recovering PCs with 80%
of variance, and a maximum of 10 groups.
Species trees and gene trees
We ran two million iterations in SNAPP (Bryant et al., 2012) to identify the relationships among
the clusters recovered in the PCA and sNMF analyzes using the SNPs extracted from the UCEs.
Therefore, we tested three possible scenarios. The first one considered all the samples from T.
caerulescens and T. aethiops (outgroup) to test the monophily of T. caerulescens. The second one
considered T. caerulescens divided into three clusters: a) northern Atlantic Forest; b) the remaining
samples of T. caerulescens; and c) T. aethiops. The third scenario included five clusters: a)
northern Atlantic Forest; b) southeastern Cerrado, central and southern Atlantic Forest; c) Chaco;
d) Andes; and e) T. aethiops. We used Tracer 1.7.1 (Rambaut et al., 2018) and Figtree 1.4.4
(Rambaut, 2009) to evaluate and visualize the results.

39
Demographic history
We used the software momi2 (https://github.com/popgenmethods/momi2) to infer possible
demographic scenarios in T. caerulescens. momi2 used a SFS file that can be obtained from the
SNPs extracted from the UCEs to infer demographic histories by fitting the observed value of the
SFS to its expected value in a composite likelihood framework (Kamm et al., 2018). In this way,
multiple demographic models were tested and the most informative was selected using the Akaike
Information Criterion (AIC, Akaike, 1973). We tested multiple models with different demographic
scenarios for the populations in T. caerulescens, based on the results of PCA, DAPC, and sNMF
analyzes. Thus, we tested three main types of models (Fig. 2, all models in Figure S1a-S1b) on a
scenario with three clusters: a) northern Atlantic Forest; b) southeastern Cerrado, central and
southern Atlantic Forests; and c; the Andean and Chacoan populations. The first group of models
infer possible events of migration and divergence times among the three clusters (Fig. 2a); the
second group includes the parameters of the first group plus possible events of expansion of the
caerulescens and Andean clusters (Fig. 2b). Finally, the third group of models includes a
bottleneck event in the northern Atlantic Forest cluster after the split from the remaining
populations (Fig 2c).
For each model, we implemented 100 runs to avoid suboptimal results. Based on the run
with the highest likelihood for each model, we evaluated the relative weight of the best model
using the Akaike Information Criterion (AIC, Akaike, 1973). Finally, we ran 100 bootstrap
simulations to estimate confidence intervals of the parameters of the best selected model.

40
Results
Time calibration based on mtDNA
Preliminary analyses of the 53 ND2 sequences identified 30 unique haplotypes and a considerable
levels of admixture among the individuals of populations collected (Fig. 1b). Maximum-likelihood
and Bayesian phylogenetic reconstructions showed four strongly supported groups: a) northern
Atlantic Forest; b) southeastern Cerrado, central and southern Atlantic Forest; c) Chaco; and d)
Andes (see Supplementary information, Fig. S2a-S2b).
Analyses of divergence times estimated that T. caerulescens diverged from its closest
relatives close to 5 Mya [6.5 – 3.6 Mya] in the Zanclean period of the early Pliocene. The primary
divergence between the population of the northern Atlantic Forest and the others populations took
place around 1.2 Mya [1.7 – 0.8 Mya] during the Calabrian stage of the Pleistocene. The
diversification of the remaining clusters took place during the Middle Pleistocene [0.8 – 0.3 Mya],
showing that T. caerulescens has deversified primarly during the last million years (Fig. 3a).
Genomic data quality
We recovered 5,702,659 reads per sample (N = 28; min=1,904,001 and max=10,284,782) after
trimming. The assembly produced 17,803 contigs per sample (total=498,503, min= 4,888,
max=143,662) with an average length of 464.53 bp, for a total of 185,331,752 bp. Were recovered
a total of 4,697 contigs with more of 1 kb of length (2,385 from 2,560 loci in the Tetrapods-UCE-
2.5K probe). We built two SNPs datasets one with 324 and another with 2,036 loci with the

41
samples of T. caerulescens (see Methods: SNP calling). Here we show unified results, but when
results differed between the two datasets, we will show both.
Population structure
Principal component analyses support the existence of three genetic clusters within T. caerulescens
(Fig. 3b). One group represented the northernmost region of the Atlantic Forest (subspecies
cearensis), the second one included individuals from the southeastern Cerrado and the central and
southern Atlantic Forest (subspecies caerulescens, gilvigaster, and ochraceiventer), and the third
one comprised populations in the Andean and Chacoan regions (remaining subspecies). Analyses
based on the incomplete matrix showed further structure within this last group: one Andean cluster
(subspecies aspersiventer and melanochrous) and one Chacoan cluster (subspecies dinellii and
paraguayensis; Fig. S3). In addition, structure in this third group reflected a pattern of continuous
or clinal variation running from north to south (melanochrous – aspersiventer –
dinellii/paraguayensis; Fig. S4a-S4b), consistent with previous description of phenotypic and
genetic variation in Bolivia (Brumfield, 2005; Isler et al., 2005).
The sNMF analyses also infer the three main clusters described above (Fig. 3c). However,
the use of different values of the α regularization parameter and the use of either the complete or
the incomplete matrix, could alter the number of identified clusters (see Table S2 and Fig. S5).
With the complete matrix the number of inferred groups varied from two to five, whereas the
incomplete matrix led to defining two or three clusters. Most importantly, the main pattern that
emerged from these results is that highest levels of admixture were primarily observed in those
individuals in the Andean and Chacoan populations (see Tables S3 – S4 from DAPC).

42
Species trees and gene trees
Under the scenarios analyzed, SNAPP consistently showed that T. caerulescens, as currently
defined, is monophyletic and is composed of three well-supported groups (Fig. 4a). The firest one
corresponds to the northern Atlantic Forest group (hereafter cearensis group), the second one to
the the Andes and Chaco populations (hereafter Andean group), and the third one to the eastern
Cerrado, central and southern Atlantic Forest (hereafter caerulescens group). Support levels using
both complete and incomplete matrices varied, but groupings and topologies were congruent.
Demographic history
The demographic history of the cearensis, caerulescens, and Andean groups was best explained
by models considering asymmetrical gene flow. For the complete matrix (Fig. 5a), the most
informative model proposed unidirectional asymmetrical migration (cearensis caerulescens
Andean, log-lik = -1229.45, AIC = 2476.91 i = 1; Table 1). In this model, the events of migration
took place after the LGM (cearensis caerulescens 19,228 year; caerulescens Andean 10,000
years). Additionally, the percentage of migrations was higher from the caerulescens Andean
populations that the cearensis caerulescens, congruent with the patterns of admixture showed
in the sNMF analyses. After bootstrapping, we dated the divergence of the cearensis from the
others groups approximately 743,054 years ago (95% CI 700,975 – 785,133), whereas the Andean
– caerulescens divergence took place 385,122 years ago (95% CI 361,096 – 409,149).

43
For the incomplete matrix (Fig. 5b), a model with bidirectional and asymmetrical migration was
identified as the best (cearensis caerulescens Andean, log-lik = -7274.51, AIC =
14,575.02; i = 1, Table 2). After bootstrapping, we dated the divergence of the cearensis from
the others groups approximately 630,469 years ago (95% CI 616,307 – 644,631), whereas the
Andean – caerulescens divergence occurred 377,685 years ago (95% CI 367,612 – 387,758). In
this model, the events of migration took place before and after the LGM. The migration from
cearensis caerulescens occurred 25,526 year ago. The caerulescens Andean migration
occurred 365,700 years ago, and the Andean caerulescens migration 13,857 years ago).
Additionally, the percentage of migrations was higher in the caerulescens Andean
populations that in the cearensis caerulescens, congruent with the patterns of admixture
identified. In general, the divergence events between populations of T. caerulescens occurred
during the Middle Pleistocene (0.78 – 0.12 Myr), consistent with the results obtained with
mitochondrial phylogenetic analyses. However, the divergence between the northern Atlantic
Forest (the cearensis group) and the other populations were older in the ND2 analysis (835,592
years, Calabrian). Similarly, incomplete and complete matrices differed in the time of divergence
of cearensis group from all other populations and in the time of the events of migration. However,
there is a consistent signal of the idea that cearensis is the most divergent and isolated population
in T. caerulescens and that the percentage of migration between caerulescens and the Andean
group is higher than that between cearensis and caerulescens.

44
Discussion
Population structure in Thamnophilus caerulescens
This is the first phylogeographic study about the Variable Antshrike (T. caerulescens) using
genomic data. Previous research focused on specific populations and mitochondrial DNA only
(Brumfield, 2005; Isler et al., 2005) or as part of analyses at a higher taxonomic level (Brumfield
& Edwards, 2007). Here, we identified three main genetic clusters in the Variable Antshrike:
cearensis in the northern Atlantic Forest, caerulescens in the southeastern Cerradao, central, and
southern Atlanic forest, and an Andean – Chacoan group. These results are congruent across
phylogenetic, structure, and demographic analyses and they provide a good starting point toward
the understanding of the demographic history of this species, as well as the mechanisms
underlaying circum-Amazonian distributions.
Moreover, these results highlight the high levels of admixture in the Andean and Chacoan
populations, all of which are phenotypically distinct and that seem to be varying clinally, as
previously suggested based on mitochondrial, plumage, and vocal data (Brumfield, 2005; Isler et
al., 2005). Clinal variation has been described in a number of Andean birds (Graves, 1991; Areta
& Pearman, 2013; Doren et al., 2018; Seeholzer & Brumfield, 2018) and other taxa (Premoli,
2003), but mechanisms driving this pattern remain to be studied in greater detail. Some of the most
likely explanations largely fall within the realm of local adaptation in response to latitudinal and
environmental gradients, geological events, climatic variation during the Pleistocene, secondary
contact between isolated populations, and hybridization (Miller et al., 2010b; Herzog & Kattan,
2011; Luebert & Weigend, 2014; Chattopadhyay et al., 2017; Polato et al., 2018). For T.

45
caerulescens, a larger sampling effort and others methodological approaches will be necessary to
clarify this phenomenon in specific.
In addition, it seems that there is an effect of the amount of data used on the ability to detect
population structure. The level of resolution of PCA and sNMF analyses was affected possibly
because the number of loci was dramatically reduced (324 loci from the 2,036 in the incomplete
matrix), likely representing information loss. Frichot et al. (2014) warns about the influence of the
α parameter (regularization parameter α) in the results in the sNMF program, especially in the
complete matrix dataset. It is could be a factor that allowed discordant results (multiple K values
for different α values). The level of admixture among the clusters varies between the two matrices
and is affected for α parameter, but it is clear that there was a considerable genic flow among the
clusters, mainly between the caerulescens and Andean groups.
Demography and biogeographical remarks
Mitochoondrial estimates indicated that T. caerulescens diverged from its closest relative between
6.5 and 3.6 Mya, a time older than estimated by Brumfield & Edwards (2007) for the ‘montane T.
caerulescens clade’ (1.6 Myr), whereas the most recent divergences within the T. caerulescens
started to take place close to 1.2 Mya during the Pleistocene. These values are older than those
inferred in demographic analyses (0.75/0.63 and 0.38/0.37 Myr, complete/incomplete matrices),
but a direct comparison between these two analyses could be difficult, given that they are based
on different methodological approaches. The mitochondrial gene ND2 is thought to evolve at a
unique clock-like substitution rate, whereas UCEs represent a wider spectrum of the heterogeneous
history of the genome comprising hundreds of loci with hundreds of possible different rates.

46
Demographic analyses identified as the best models those scenarios with migration from
cearensis caerulescens Andean and bidirectional migrations among all them (complete and
incomplete matrix, respectively), without expansion or bottleneck effects affecting their
populational size. In addition, the migration rate between the caerulescens Andean groups is
higher than that with cearensis. The underlying explanation of these models can be grounded on
various hypotheses proposed for the diversification of Neotropical organisms. For example,
climatic fluctuations leading to forest retractions and expansions (i.e., Refuge Hypothesis; Haffer,
1969; Vanzolini & Williams, 1970) during the Cenozoic have been a recurrent explanation for
diversification of lineages of multiple taxonomic groups (see Richardson et al., 2001; Thomaz et
al., 2015; Pérez-Escobar et al., 2017; García-Vázquez et al., 2017; Leal et al., 2018). The
formation of refuges during cycles of humid and dry periods in the Quaternary has been described
as one of the main mechanisms driving the proliferation of new lineages. For non-Amazonian
regions, refuges has been proposed as drivers of differentiation and speciation in some species
(Carnaval & Moritz, 2008; Campagna et al., 2012; Ramos et al., 2018; de Oliveira Miranda et al.,
2019). Following this reasoning, the early divergence and the high level of differentiation of
cearensis from the others could be a consequence of the persistence of a refuge in the northeastern
Brazil (the Pernambuco refuge, see Carnaval & Moritz, 2008; Carnaval et al., 2009) during the
Pliocene-Pleistocene, and the barrier effect of Rio São Francisco (i.e., Riverine Hypothesis; Sick,
1967; Capparella, 1988; Wallace, 1854). This region has been also considered a center of
endemism for passerine birds (Silveira et al., 2003; da Silva et al., 2004) and has been represented
as a unit separated from the central-southern Atlantic Forest in subsequent works (Batalha-Filho
et al., 2013; DaSilva et al., 2015). On the other hand, Carvalho et al. (2017) and Maldonado-
Coelho et al. (2013) showed that in the Atlantic Forests rivers are not efficient primary barriers to

47
break the migration among populations, with climatic fluctuations (‘bioclimatic units’ based in
altitudinal gradients) having a greater impact on these regions (Carnaval & Moritz, 2008). In the
T. caerulescens case, it is possible that the São Francisco River currently acts as a secondary
barrier, preventing gene flow between the northern and the central/southern Atlantic Forest
populations (D’horta et al., 2011; Werneck et al., 2012).
The level of admixture and the migration rate between the caerulescens and Andean
clusters suggest a recent expansion and a possible incipient differentiation of these populations. It
is plausible that, after an expansion period (late Miocene – early Pleistocene, see Prates et al.,
2017), these two clusters began to separate due the isolation during the Quaternary, but
maintaining considerable amounts of intrapopulational gene flow, and, to a lesser extent, along an
Atlantic Forest – Cerrado – Chaco corridor. There are some examples about the connections
between the eastern forests in Brazil and the Andes. For example, Batalha-Filho et al. (2013)
suggests a plausible connection between some species of Synallaxis from the central-south Atlantic
Forest and the Andes during the Pleistocene. In addition, Trujillo-Arias et al. (2017, 2018) shows
that there were possible connections between the Atlantic Forest and central Andes during the
Pleistocene, possibly through Cerrado and Chaco ecoregions (see Cabanne et al., 2019).
The existence of these corridors are consistent with the Pleistocene Arch Hypothesis (PAH,
Prado & Gibbs, 1993; Mogni et al., 2015). The PAH could be invoked to explain these
demographic scenarios, wherein a continuum of relatively stable areas of non-Amazonian forests
(Seasonally Dry Tropical Forests – SDTFs –) allows the migration and colonization of taxa during
the Cenozoic. Under this scenario, T. caerulescens could have migrated southward from the
territory currently comprised by northeastern Brazil colonizing the Chacoan and central Andean
regions during the Quaternary. Climatic cycles during this same period could also have allowed

48
the posterior isolation of different populations. For example, Florentín et al. (2018) suggest that
the existence of these connections between areas of SDTFs from the eastern Brazil and the
Chacoan region was an important force in the diversification of the plant genus Galianthe.
However, Arruda et al. (2018) concluded that the presence of refugia had a greated effect on the
diversification of organisms than the presence of a continuum of forested areas, at least during the
last 21 ka. Similarly, Werneck et al. (2011) reject the idea of a stable PAH connecting patches of
SDTF in those areas known today as the Caatinga, Cerrado and Chaco and proposed an alternative
scenario in which such an arch might have existed earlier, either during the Lower Pleistocene or
the Tertiary) followed by cycles of fragmentation and secondary expansion during the Holocene.
Although our results are inconclusive as to whether such SDTF corridor was present during the
Pleistocene or the late Tertiary, they are consistent with the idea of a once continuous population
that underwent divergence and subsequent secondary contact during the Pleistocene. In that sense,
the idea of refugia in northeastern Brazil (cearensis), the forested areas of the Cerrado and the
central and souther Antlantic Forest (caerulescens) and the Andean-Chacon regions are consistent
with the demographic parameters and population structure of T. caerulescens. Further expansion,
was possibly affected by the Rio São Francisco and the Rio Paraná, which seem to be playing an
a role in maintaining, to some extent, the separation between cearensis and caerulescens and
caerulescens and Andean populations, respectively.
A likely scenario for the demographic history of T.caerulescens
The results of our analyses suggests that the history of T. caerulescens began in the Late Miocene-
Pliocene, with an initial population that originated in the northern Atlantic Forest (Pernambuco

49
refuge sensu Carnaval & Moritz, 2008) and expanded southward during the Pleistocene, thereby
colonizing the Cerrado, central and southern Atlantic Forests, the Chaco and the central Andes
(Fig. 5b). In this way, while the northern Atlantic Forest populations remained isolated via climatic
and geological secondary barriers, the two last groups of populations have maintained intermitent
contact due to cycles of retractions and expansions of their habitat during the Pleistocene-
Holocene, with a considerable grade of hybridization and polymorphism (phenotypic/genetic
clinal variation). This scenario is partially congruent with that proposed by Brumfield & Edwards
(2007) for the Variable Antshrike, in which the geographical origin of the species was placed in
the ‘lowlands of eastern Brazil’. However, the authors did not have enough power to infer whether
those ‘lowlands’ were located in northern, central, or southern portions of eastern Brazil (see
Brumfield, 2005). On the other hand, Thomé et al. (2010) refute the idea of taxa diverged initially
in northern Atlantic Forest with posterior expansion via southward in the Pleistocene using data
from some endemic species of toads, with simultaneous presence of central-southern refugia in the
Atlantic Forest in the same period of time.
The most intriguing situation regarding the evolutionary history of T. caerulescens is
related to the patterns and processes driving the outstanding phenotypic differentiation within the
the Andean and Chacoan regions. These populations represent an extremely heterogeneous cluster
of phenotypically distinct individuals with relatively shallow, albeit somewhat structured, genetic
diverences. There is robust evidence of clinal plumage, vocal, and mitochondrial variation
(Brumfield, 2005; Isler et al., 2005), but a most intense sampling effort, both geographic and
genetic, will be necessary to elucidate the causes of this variation.

50
Taxonomic considerations
Although this work does not aim at conducting a taxonomic revision of T. caerulescens, here we
have sufficient information to propose one modification in the taxonomy of the species. The
considerable genetic differentiation and geographical isolation of the northern Atlantic forest
populations in the species would be sufficient evidence to elevate the subspecies T. caerulescens
cearensis to species-level status. In addition, the plumage pattern of cearensis is diagnosable from
that of nominal form, with a ‘male with less black on crown and upperparts, while the female have
a crown rufous, wing-coverts ochraceous olive-brown (edges brightest), tail tinged clay colour,
throat pale ochraceous’ (Zimmer & Isler, 2019). We observed this plumage differentiation in
specimens analyzed from the MZUSP (Museu de Zoologia da Universidade de São Paulo, Brazil).
A formal taxonomic revision on Thamnophilus caerulescens has not been elaborated until now,
and we believe that our study represents a starting point for a more in-depth taxonomic analysis
on this species.

51
Final remarks
The lineages identified here for Thamnophilus caerulescens are congruent with the geographical
distribution of the species; having an isolate clade from northeastern Atlantic Forests, and other
two with high level of admixture, plumage and vocal variation in the central-southern Atlantic
Forests (plus eastern Cerrado) and Andes + Chaco. The level of admixture, times of divergence
and demographic history support a scenario of recent diversification in the taxon, with climatic
fluctuations during the Quaternary as its main influence. Specifically, the isolation of cearensis
group could be increased by the presence of São Francisco River as a secondary barrier, illustrate
an actual process of speciation. In this way, we think that the cearensis group (northern Atlantic
Forest) has the potential to be considered a full taxonomic species. Finally, the species T.
caerulescens needs a complete taxonomic review to corroborate this affirmation.

52
Acknowledgements
We are grateful to the following museums and their staff for assistance in obtaining tissue samples:
Museu Paraense Emílio Goeldi (MPEG), University of Kansas (Biodiversity Institute, Division of
Ornithology), Museu de Ciências e Tecnologia PUC-RS, Field Museum of Natural History
(FMNH), and Fábio Raposo do Amaral.
Funding
Financial support was provided by Fundação de Amparo para a Pesquisa do Estado de São Paulo
(FAPESP, project 2015/16092-7) and Coordenação de Aperfeiçoamento de Pessoal de Nível
Superior (CAPES). The first author gratefully acknowledge financial support from the Frank M.
Chapman Memorial Fund from the American Museum of Natural History (AMNH).

53
References
Akaike, H. (1973). Information theory and an extension of the maximum likelihood principle.
International Symposium Information on theory Information and an extension Theory, (pp. 267–
281).
Altschul, S. F., Gish, W., Miller, W., Myers, E. W., & Lipman, D. J. (1990). Basic local alignment
search tool. Journal of Molecular Biology, 215(3), 403 – 410.
Areta, J. I. & Pearman, M. (2013). Species Limits and Clinal Variation in a Widespread High
Andean Furnariid: The Buff-Breasted Earthcreeper (Upucerthia validirostris). The Condor:
Ornithological Applications, 115(1), 131–142.
Arruda, D. M., Schaefer, C. E. G. R., Fonseca, R. S., Solar, R. R. C., & FernAndes-Filho, E. I.
(2018). Vegetation cover of Brazil in the last 21 ka: New insights into the Amazonian refugia and
pleistocenic arc hypotheses. Global Ecology and Biogeography, 27, 47–56.
Bandelt, H.-J., Forster, P., & Röhl, A. (1999). Median-joining networks for inferring intraspecific
phylogenies. Molecular Biology and Evolution, 16(1), 37–48.
Batalha-Filho, H., Irestedt, M., Fjeldså, J., Ericson, P. G. P., Silveira, L. F., & Miyaki, C. Y. (2013).
Molecular systematics and evolution of the Synallaxis ruficapilla complex (Aves: Furnariidae) in
the Atlantic Forest. Molecular Phylogenetics and Evolution, 67, 86–94.
Bates, J. M. (1997). Distribution and geographic variation in three South American grassquits
(Emberizinae, Tiaris). Ornithological Monographs, 48, 91–110.
Bejerano, G., Pheasant, M., Makunin, I., Stephen, S., Kent, W. J., Mattick, J. S., & Haussler, D.
(2004). Ultraconserved elements in the human genome. Science, 304, 1321–1325.

54
Bolger, A. M., Lohse, M., & Usadel, B. (2014). Trimmomatic: A flexible trimmer for illumina
sequence data. bioinformatics. Bioinfor, 30(15), 2114–2120.
Bouckaert, R., Heled, J., Kühnert, D., Vaughan, T., Wu, C.-H., Xie, D., Suchard, M. A., Rambaut,
A., & Drummond, A. J. (2014). Beast 2: A software platform for bayesian evolutionary analysis.
PLOS Computational Biology, 10(4), 1–6.
Brumfield, R. T. (2005). Mitochondrial variation in Bolivian populations of the variable Antshrike
(THAMNOPHILUS CAERULESCENS). The Auk, 122(2), 414–432.
Brumfield, R. T. & Edwards, S. V. (2007). Evolution into and out of the Andes: A bayesian
analysis of historical diversification in Thamnophilus Antshrikes. Evolution, 61(2), 346–367.
Brumfield, R. T., Tello, J. G., Cheviron, Z., Carling, M. D., Crochet, N., & Rosenberg, K. V.
(2007). Phylogenetic conservatism and antiquity of a tropical specialization: Army-ant-following
in the typical antbirds (Thamnophilidae). Molecular Phylogenetics and Evolution, 45, 1–13.
Bryant, D., Bouckaert, R., Felsenstein, J., Rosenberg, N. A., & RoyChoudhury, A. (2012).
Inferring species trees directly from biallelic genetic markers: Bypassing gene trees in a full
coalescent analysis. Molecular Biology and Evolution, 29(8), 1917–1932.
Burney, C. & Brumfield, R. (2009). Ecology predicts levels of genetic differentiation in
Neotropical birds. The American Naturalist, 174(3), 358–368. PMID: 19627230.
Cabanne, G. S., Campagna, L., Trujillo-Arias, N., Naoki, K., Gómez, I., Miyaki, C. Y., Santos,
F. R., Dantas, G. P. M., Aleixo, A., Claramunt, S., Rocha, A., Caparroz, R., Lovette, I. J., &
Tubaro, P. L. (2019). Phylogeographic variation within the buff-browed foliage-gleaner (Aves:
Furnariidae: Syndactyla rufosuperciliata) supports an Andean-Atlantic forests connection via the
Cerrado. Molecular Phylogenetics and Evolution.

55
Camacho, C., Coulouris, G., Avagyan, V., Ma, N., Papadopoulos, J., Bealer, K., & Madden, T. L.
(2009). Blast+: architecture and applications. BMC Bioinformatics, 10(1), 421.
Campagna, L., Benites, P., Lougheed, S. C., Lijtmaer, D. A., Giacomo, A. S. D., Eaton, M. D., &
Tubaro, P. L. (2012). Rapid phenotypic evolution during incipient speciation in a continental avian
radiation. Proceedings of the Royal Society of London B: Biological Sciences, 279, 1847–1856.
Capparella, A. (1988). Genetic variation in Neotropical birds: implication for the speciation
process. Acta XIX Congr. Intern. Ornith., 2, 1658–1664.
Carnaval, A. C., Hickerson, M. J., Haddad, C. F. B., Rodrigues, M. T., & Moritz, C. (2009).
Stability predicts genetic diversity in the Brazilian Atlantic Forest hotspot. Science, 323(5915),
785–789.
Carnaval, A. C. & Moritz, C. (2008). Historical climate modelling predicts patterns of current
biodiversity in the Brazilian Atlantic Forest. Journal of Biogeography, 35(7), 1187–1201.
Carvalho, C. D. S., Nascimento, N. F. F. D., & Araujo, H. F. P. D. (2017). Bird distributional
patterns support biogeographical histories and are associated with bioclimatic units in the Atlantic
Forest, Brazil. Zootaxa, 4337(2), 223–242.
Chattopadhyay, B., Garg, K. M., Gwee, C. Y., Edwards, S. V., & Rheindt, F. E. (2017). Gene flow
during glacial habitat shifts facilitates character displacement in a Neotropical flycatcher radiation.
BMC Evolutionary Biology, 17(1), 210.
Croizat, L. (1976). Biogeografía analítica y sintética (’Panbiogeografía’) de las Américas.
Biblioteca de la Academia de Ciencias Físicas, Matemáticas y Naturales, 35, 1–890.
da Silva, J. M. C., de Sousa, M. C., & Castelletti, C. H. M. (2004). Areas of endemism for passerine
birds in the Atlantic Forest, South America. Global Ecology and Biogeography, 13(1), 85–92.

56
Darlington, Jr., P. J. (1957). Zoogeography: The geographical distribution of animals. Jhon Wiley
& sons Inc.
Darriba, D., Taboada, G. L., Doallo, R., & Posada, D. (2012). jmodeltest 2: more models, new
heuristics and parallel computing. Nature Methods, 9(8), 772.
DaSilva, M. B., Pinto-da Rocha, R., & DeSouza, A. M. (2015). A protocol for the delimitation of
areas of endemism and the historical regionalization of the Brazilian Atlantic rain forest using
harvestmen distribution data. Cladistics, 31(6), 692–705.
de Oliveira Miranda, N. E., Maciel, N. M., Lima-Ribeiro, M. S., Colli, G. R., Haddad, C. F. B., &
Collevatti, R. G. (2019). Diversification of the widespread Neotropical frog Physalaemus cuvieri
in response to Neogene-Quaternary geological events and climate dynamics. Molecular
Phylogenetics and Evolution, 132, 67–80.
D’horta, F. M., Cabanne, G. S., Meyer, D., & Miyaki, C. Y. (2011). The genetic effects of late
Quaternary climatic changes over a tropical latitudinal gradient: diversification of an Atlantic
forest passerine. Molecular Ecology, 20(9), 1923–1935.
Dinerstein, E., Olson, D., Joshi, A., Vynne, C., Burgess, N. D., Wikramanayake, E., Hahn, N.,
Palminteri, S., Hedao, P., Noss, R., Hansen, M., Locke, H., Ellis, E. C., Jones, B., Barber, C. V.,
Hayes, R., Kormos, C., Martin, V., Crist, E., Sechrest, W., Price, L., Baillie, J. E. M., Weeden, D.,
Suckling, K., Davis, C., Sizer, N., Moore, R., Thau, D., Birch, T., Potapov, P., Turubanova, S.,
Tyukavina, A., de Souza, N., Pintea, L., Brito, J. C., Llewellyn, O. A., Miller, A. G., Patzelt, A.,
Ghazanfar, S. A., Timberlake, J., Klöser, H., Shennan-Farpón, Y., Kindt, R., Lillesø, J.-P. B.,
van Breugel, P., Graudal, L., Voge, M., Al-Shammari, K. F., & Saleem, M. (2017). An ecoregion-
based approach to protecting half the terrestrial realm. BioScience, (pp. 1–12).

57
Doren, B. M. V., Freeman, B. G., Aristizabal, N., Alvarez-R, M., Pérez-Emán, J., Cuervo, A. M.,
& Bravo, G. A. (2018). Species limits in the Rusty-breasted Antpitta (Grallaricula
ferrugineipectus) complex. The Wilson Journal of Ornithology, 130, 130 – 130 – 16.
Drummond, A. J., Suchard, M. A., Xie, D., & Rambaut, A. (2012). Bayesian phylogenetics with
beauti and the beast 1.7. Molecular Biology and Evolution, 29(8), 1969–1973.
Faircloth, B. C. (2013). illumiprocessor: a trimmomatic wrapper for parallel adapter and quality
trimming.
Faircloth, B. C. (2016). Phyluce is a software package for the analysis of conserved genomic loci.
Bioinformatics, 32(5), 786–788.
Faircloth, B. C., Branstetter, M. G., White, N. D., & Brady, S. G. (2015). Target enrichment of
ultraconserved elements from arthropods provides a genomic perspective on relationships among
Hymenoptera. Molecular Ecology Resources, 15, 489–501.
Faircloth, B. C., Mccormack, J. E., Crawford, N. G., Harvey, M. G., Brumfield, R. T., & Glenn,
T. C. (2012). Ultraconserved elements anchor thousands of genetic markers spanning multiple
evolutionary timescales. Systematic Biology, 61(5), 717–726.
Florentín, J. E., Arana, M. D., Prado, D. E., Morrone, J. J., & Salas, R. M. (2018). Diversification
of Galianthe species (Rubiaceae) in the Neotropical seasonally dry forests: a case study of a mainly
subshrubby genus. Plant Ecology and Evolution, 151(2), 161–174.
Frichot, E. & François, O. (2015). LEA: An R package for landscape and ecological association
studies. Methods in Ecology and Evolution, 6, 925–929.
Frichot, E., Mathieu, F., Trouillon, T., Bouchard, G., & François, O. (2014). Fast and efficient
estimation of individual ancestry coefficients. Genetics, 196, 973–983.

58
García-Vázquez, D., Bilton, D. T., Foster, G. N., & Ribera, I. (2017). Pleistocene range shifts,
refugia and the origin of widespread species in western Palaearctic water beetles. Molecular
Phylogenetics and Evolution, 114, 122–136.
Grabherr, M. G., Haas, B. J., Yassour, M., Levin, J. Z., Thompson, D. A., Amit, I., Adiconis, X.,
Fan, L., Raychowdhury, R., Zeng, Q., Chen, Z., Mauceli, E., Hacohen, N., Gnirke, A., Rhind, N.,
di Palma, F., Birren, B. W., Nusbaum, C., Lindblad-Toh, K., Friedman, N., & Regev, A. (2011).
Full-length transcriptome assembly from RNA-Seq data without a reference genome. Nature
Biotechnology, 29(7), 644–652.
Graham, A. (2009). The Andes: a geological overview from a biological perspective. Annals of
the Missouri Botanical Garden, 96(3), 371–385.
Graves, G. R. (1991). Bergmann’s rule near the equator: latitudinal clines in body size of an
Andean passerine bird. Proc. Natl. Acad. Sci. USA., 88, 2322–2325.
Haffer, J. (1969). Speciation in Amazonian forest birds. Science, New Series, 165, 131–137.
Halffter, G. (1992). La Diversidad Biológica De Iberoamérica I, Volume I. Instituto De Ecología,
A.C. Secretaria De Desarrollo Social.
Haffer, J. (1993). On the ‘river effect’ in some forest birds of southern Amazonia. Boletim do
Museu Paraense Emilio Goeldi Serie Zoologia, 8(1), 217–245.
Haffer, J. (1997). Alternative models of vertebrate speciation in Amazonia: an overview.
Biodiversity and Conservation, 6, 451–476.
Harvey, M. G., Smith, B. T., Glenn, T. C., Faircloth, B. C., & Brumfield, R. T. (2016). Sequence
capture versus restriction site associated DNA sequencing for shallow systematics. Systematic
Biology, 65(5), 910–924.

59
Herzog, S. K., Martínez, R., Jørgensen, P. M., & Tiessen, H. (2011). Climate Change and
Biodiversity in the Tropical Andes. IAI.
Herzog, S. K. & Kattan, G. H. (2011). Patterns of Diversity and Endemism in the Birds of the
Tropical Andes. In Climate Change and Biodiversity in the Tropical Andes, chapter 18, (pp. 245–
259). Inter-American Institute for Global Change Research (IAI) and Scientific Committee on
Problems of the Environment (SCOPE), Paris.
Hooghiemstra, H., der Hammen, T. V., & Cleef, A. (2002). Evolution of forests in the northern
Andes and Amazonian lowlands during the Tertiary and Quaternary in Ecology of Neotropical
rain forests. Editorial Cartago, Libro Universitario Regional (EULAC-GTZ), CR.
Hoorn, C., Wesselingh, F. P., ter Steege, H., Bermudez, M. A., Mora, A., Sevink, J., Sanmartín,
I., Sanchez-Meseguer, A., Anderson, C. L., Figueiredo, J. P., Jaramillo, C., Riff, D., Negri, F. R.,
Hooghiemstra, H., Lundberg, J., Stadler, T., Sarkinen, T., & Antonelli, A. (2010). Amazonia
through time: Andean uplift, climate change, landscape evolution, and biodiversity. Science, 330,
927–931.
Hurvich, C. M. & Tsai, C.-L. (1989). Regression and time series model selection in small samples.
Biometrika, 76(2), 297–307.
Irmler, U. (2009). New species and records of the genus Lispinus with a key to the species from
Peru (Coleoptera: Staphylinidae: Osoriinae). Zootaxa, 2263, 42–58.
Isler, M. L., Isler, P. R., Brumfield, R. T., & Zink, R. M. (2005). Clinal variation in vocalizations
of an antbird (Thamnophilidae) and implications for defining species limits. The Auk, 122(2), 433–
444.
Ješovnik, A., Sosa-calvo, J., Lloyd, M. W., Branstetter, M. G., Fernández, F., & Schultz, T. R.
(2017). Phylogenomic species delimitation and host-symbiont coevolution in the fungus-farming

60
ant genus Sericomyrmex Mayr (Hymenoptera: Formicidae): Ultraconserved Elements (UCEs)
resolve a recent radiation. Systematic Entomology, 42(3).
Jombart, T. (2008). adegenet: a R package for the multivariate analysis of genetic markers.
Bioinformatics, 24(11), 1403–1405.
Jombart, T., Devillard, S., & Balloux, F. (2010). Discriminant analysis of principal components: a
new method for the analysis of genetically structured populations. BMC Genetics, 11(1), 94.
Kamm, J. A., Terhorst, J., Durbin, R., & Song, Y. S. (2018). Efficiently inferring the demographic
history of many populations with allele count data. bioRxiv.
Katoh, K. & Standley, D. M. (2013). MAFFT Multiple Sequence Alignment Software Version 7:
Improvements in Performance and Usability. Molecular Biology and Evolution, 30(4), 772–780.
Kearse, M., Moir, R., Wilson, A., Stones-Havas, S., Cheung, M., Sturrock, S., Buxton, S., Cooper,
A., Markowitz, S., Duran, C., Thierer, T., Ashton, B., Meintjes, P., & Drummond, A. (2012).
Geneious basic: An integrated and extendable desktop software platform for the organization and
analysis of sequence data. BIOINFORMATICS, 28(12), 1647–1649.
Knapp, S. (2002). Assessing patterns of plant endemism in Neotropical uplands. The Botanical
Review, 68(1), 22–37.
Leal, B. S. S., Medeiros, L. R., Peres, E. A., Sobral-Souza, T., Palma-Silva, C., Romero, G. Q., &
Carareto, C. M. A. (2018). Insights into the evolutionary dynamics of Neotropical biomes from
the phylogeography and Paleodistribution modeling of Bromelia balansae. American Journal of
Botany, 105(10), 1725–1734.
Leigh, J. W. & Bryant, D. (2015). popart: full-feature software for haplotype network construction.
Methods in Ecology and Evolution, 6(9), 1110–1116.

61
Li, H. (2013). Aligning sequence reads, clone sequences and assembly contigs with bwa-mem.
arXiv.
Li, H. & Durbin, R. (2009). Fast and accurate short read alignment with burrows-wheeler
transform. Bioinformatics, 25(14), 1754–1760.
Li, H., Handsaker, B., Wysoker, A., Fennell, T., Ruan, J., Homer, N., Marth, G., Abecasis, G.,
Durbin, R., & Subgroup. G. P. D. P. (2009). The sequence alignment/map format and samtools.
Bioinformatics, 25(16), 2078–2079.
Lovette, I. J. (2004). Molecular phylogeny and plumage signal evolution in a trans Andean and
circum Amazonian avian species complex. Molecular Phylogenetics and Evolution, 32, 512–523.
Luebert, F. & Weigend, M. (2014). Phylogenetic insights into Andean plant diversification.
Frontiers in Genetics, 2, 27.
Maldonado-Coelho, M., Blake, J. G., Silveira, L. F., Batalha-filho, H., & Ricklefs, R. E. (2013).
Rivers, refuges and population divergence of fire-eye antbirds (Pyriglena) in the Amazon basin.
Journal of Evolutionary Biology, 26, 1090–1107.
McKenna, A., Hanna, M., Banks, E., Sivachenko, A., Cibulskis, K., Kernytsky, A., Garimella, K.,
Altshuler, D., Gabriel, S., Daly, M., & DePristo, M. A. (2010). The genome analysis toolkit: A
MapReduce framework for analyzing next-generation DNA sequencing data. Genome Research,
20(9), 1297–1303.
Miller, M. A., Pfeiffer, W., & Schwartz, T. (2010). Creating the CIPRES science gateway for
inference of large phylogenetic trees. In Proceedings of the Gateway Computing Environments
Workshop (GCE) (pp. 1–8). New Orleans, LA.

62
Miller, M. J., Bermingham, E., Klicka, J., Escalante, P., & Winker, K. (2010). Neotropical birds
show a humped distribution of within-population genetic diversity along a latitudinal transect.
Ecology Letters, 13(5), 576–586.
Mittermeier, R. A., Myers, N., Thomsen, J. B., da Fonseca, G. A. B., & Olivieri, S. (1998).
Biodiversity hotspots and major tropical wilderness areas: Approaches to setting conservation
priorities. Conservation Biology, 12(3), 516–520.
Mogni, V. Y., Oakley, L. J., & Prado, D. E. (2015). The distribution of woody legumes in
Neotropical dry forests: the Pleistocene Arc Theory 20 years on*. Edinburgh Journal of Botany,
72(1), 35–60.
Mooney, H. A., Bullock, S. H., & Medina, E. (1995). Introduction. In Seasonally Dry Tropical
Forests, (pp. 1–8). Cambridge University Press.
Morrone, J. J. (2014). Biogeographical regionalisation of the Neotropical region. Zootaxa,
3782(1), 001–110.
Myers, E. A., Bryson, R. W., Hansen, R. W., Aardema, M. L., Lazcano, D., & Burbrink, F. T.
(2019). Exploring Chihuahuan Desert diversification in the gray-banded kingsnake, Lampropeltis
alterna (Serpentes: Colubridae). Molecular Phylogenetics and Evolution, 131, 211–218.
Myers, N., Mittermeier, R. A., Mittermeier, C. G., da Fonseca, G. A. B., & Kent, J. (2000).
Biodiversity hotspots for conservation priorities. Nature, 403, 853–858.
Olson, D. M., Dinerstein, E., Wikramanayake, E. D., Burgess, N. D., Powell, G. V. N.,
Underwood, E. C., D’Amico, J. A., Itoua, I., Strand, H. E., Morrison, J. C., Loucks, C. J., Allnutt,
T. F., Ricketts, T. H., Kura, Y., Lamoreux, J. F., Wettengel, W. W., Hedao, P., & Kassem, K. R.
(2001). Terrestrial ecoregions of the world: A new map of life on earth. BioScience, 52(11), 933–
938.

63
Paradis, E., Claude, J., & Strimmer, K. (2004). Ape: Analyses of phylogenetics and evolution in
R language. Bioinformatics, 20(2), 289–290.
Pérez-Escobar, O. A., Chomicki, G., Condamine, F. L., Karremans, A. P., Bogarín, D., Matzke,
N. J., Silvestro, D., & Antonelli, A. (2017). Recent origin and rapid speciation of Neotropical
orchids in the world’s richest plant biodiversity hotspot. New Phytologist, 215(2), 891–905. 2017-
23782.
Pie, M. R., Bornschein, M. R., Ribeiro, L. F., Faircloth, B. C., & McCormack, J. E. (2017).
Phylogenomic species delimitation in microendemic frogs of the Brazilian Atlantic forest. bioRxiv.
Prado, D. E. & Gibbs, P. E. (1993). Patterns of species distributions in the dry seasonal forests of
South America. Annals of the Missouri Botanical Garden, 80, 902–927.
Polato, N. R., Gill, B. A., Shah, A. A., Gray, M. M., Casner, K. L., Barthelet, A., Messer, P. W.,
Simmons, M. P., Guayasamin, J. M., Encalada, A. C., Kondratieff, B. C., Flecker, A. S., Thomas,
S. A., Ghalambor, C. K., Poff, N. L., Funk, W. C., & Zamudio, K. R. (2018). Narrow thermal
tolerance and low dispersal drive higher speciation in Tropical mountains. Proceedings of the
National Academy of Sciences.
Prates, I., Melo-Sampaio, P. R., de Oliveira Drummond, L., Jr., M. T., Rodrigues, M. T., &
Carnaval, A. C. (2017). Biogeographic links between southern Atlantic forest and western South
America: rediscovery, re-description, and phylogenetic relationships of two rare montane anole
lizards from Brazil. Molecular Phylogenetics and Evolution, 113, 49 – 58.
Prieto-Torres, D. A., Cuervo, A. M., & Bonaccorso, E. (2018). On geographic barriers and
Pleistocene glaciations: Tracing the diversification of the russet-crowned warbler (Myiothlypis
coronata) along the Andes. PLOS ONE, 13(3), 1–15.

64
Premoli, A. C. (2003). Isozyme Polymorphisms Provide Evidence of Clinal Variation with
Elevation in Nothofagus pumilio. Journal of Heredity, 94(3), 218–226.
Rambaut, A. (2009). Figtree version 1.3.1.
Rambaut, A., Drummond, A. J., Xie, D., Baele, G., & Suchard, M. A. (2018). Posterior
summarization in bayesian phylogenetics using tracer 1.7. Systematic Biology, 67(5), 901–904.
Ramos, E. K. S., de Magalhães, R. F., Marques, N. C. S., Baêta, D., Garcia, P. C. A., & Santos,
F. R. (2018). Cryptic diversity in Brazilian endemic monkey frogs (Hylidae, Phyllomedusinae,
Pithecopus) revealed by multispecies coalescent and integrative approaches. Molecular
Phylogenetics and Evolution, 132, 105–116.
Remsen, J. V., Rocha, O., Schmitt, C. G., & Schmitt, D. C. (1991). Zoogeography and geographic
variation of Platyrinchus mystaceus in Bolivia and Peru, and the circum-Amazonian distribution
pattern. Ornitologia Neotropical, 2, 77–83.
Richardson, J. E., Pennington, R. T., Pennington, T. D., & Hollingsworth, P. M. (2001). Rapid
diversification of a species-rich genus of Neotropical rain forest trees. Science, 293(5538), 2242–
2245.
Sánchez-González, L. A., Morrone, J. J., & Navarro-Sigüenza, A. G. (2008). Distributional
patterns of the Neotropical humid montane forest avifaunas. Biological Journal of the Linnean
Society, 94, 175–194.
Sick, H. (1967). Rios e enchentes na Amazônia como obstáculo para a Avifauna. Atas Simp. Sobre
a Biota Amazonica, 5, 495–520.
Seeholzer, G. F. & Brumfield, R. T. (2018). Isolation by distance, not incipient ecological
speciation, explains genetic differentiation in an Andean songbird (Aves: Furnariidae:

65
Cranioleuca antisiensis, line-cheeked spinetail) despite near threefold body size change across an
environmental gradient. Molecular Ecology, 27(1), 279–296.
Silveira, L., Olmos, F., & J. Long, A. (2003). Birds in Atlantic Forest fragments in north-east
Brazil. Cotinga, 20, 32–46.
Smith, B. T., Ribas, C. C., Whitney, B. M., Hernández-Baños, B. E., & Klicka, J. (2013).
Identifying biases at different spatial and temporal scales of diversification: a case study in the
Neotropical parrotlet genus Forpus. Molecular Ecology, 22, 483–494.
Smith, B. T., McCormack, J. E., Cuervo, A. M., Hickerson, M. J., Aleixo, A., Cadena, C. D.,
Pérez-Emán, J., Burney, C. W., Xie, X., Harvey, M. G., Faircloth, B. C., Glenn, T. C., Derryberry,
E. P., Prejean, J., Fields, S., & Brumfield, R. T. (2014). The drivers of tropical speciation. Nature,
515, 406–409.
Thomaz, A. T., Malabarba, L. R., Bonatto, S. L., & Knowles, L. L. (2015). Testing the effect of
palaeodrainages versus habitat stability on genetic divergence in riverine systems: study of a
Neotropical fish of the Brazilian coastal Atlantic Forest. Journal of Biogeography, 42(12), 2389–
2401.
Thomé, M. T. C., Zamudio, K. R., Giovanelli, J. G., Haddad, C. F., Jr., F. A. B., & Alexandrino,
J. (2010). Phylogeography of endemic toads and post-Pliocene persistence of the Brazilian Atlantic
Forest. Molecular Phylogenetics and Evolution, 55(3), 1018 – 1031.
Trujillo-Arias, N., Dantas, G., Arbeláez-Cortés, E., Naoki, K., Gómez, M. I., Santos, F. R., Miyaki,
C. Y., Aleixo, A., Tubaro, P. L., & Cabanne, G. S. (2017). The niche and phylogeography of a
passerine reveal the history of biological diversification between the Andean and the Atlantic
forests. Molecular Phylogenetics and Evolution, 112, 107 – 121.

66
Trujillo-Arias, N., Calderón, L., Santos, F. R., Miyaki, C. Y., Aleixo, A., Witt, C. C., Tubaro, P. L.,
& Cabanne, G. S. (2018). Forest corridors between the central Andes and the southern Atlantic
Forest enabled dispersal and peripatric diversification without niche divergence in a passerine.
Molecular Phylogenetics and Evolution, 128, 221 – 232.
Vanzolini, P. & Williams, E. E. (1970). South American anoles: The geographic differentiation
and evolution of the anolis Chrysolepis species group (Sauria, Iguanidae), volume 19 of Arquivos
de Zoologia. Museu de Zoologia.
Weir, J. T. & Schluter, D. (2008). Calibrating the avian molecular clock. Molecular Ecology, 17,
2321–2328.
Wallace, A. R. (1854). On the monkeys of the amazon. Annals and Magazine of Natural History,
14(84), 451–454.
Werneck, F. P., Costa, G. C., Colli, G. R., Prado, D. E., & Sites Jr, J. W. (2011). Revisiting the
historical distribution of seasonally dry tropical forests: new insights based on palaeodistribution
modelling and palynological evidencegeb. Global Ecology and Biogeography, 20(2), 272–288.
Werneck, F. P., Gamble, T., Colli, G. R., Rodrigues, M. T., & Sites, Jr, J. W. (2012). Deep
diversification and long-term persistence in the South American ‘dry diagonal’: Integrating
continent-wide phylogeography and distribution modeling of geckos. Evolution, 66(10), 3014–
3034.
Zarza, E., Connors, E. M., Maley, J. M., Tsai, W. L., Heimes, P., Kaplan, M., & McCormack, J. E.
(2018). Combining ultraconserved elements and mtdna data to uncover lineage diversity in a
Mexican highland frog (Sarcohyla; hylidae). PeerJ, 6, e6045.

67
Zimmer, K. & Isler, M. L. (2019). Variable Antshrike (Thamnophilus caerulescens). In J. del
Hoyo, A. Elliott, J. Sargatal, D. Christie, & E. de Juana (Eds), Handbook of the Birds of the World
Alive. Lynx Editions, Barcelona.

10 samples
1 sample
T. caerulescens aspersiventer
T. caerulescens caerulescensT. caerulescens cearensisT. caerulescens dinelliiT. caerulescens gilvigasterT. caerulescens melanochrousT. caerulescens paraguayensisT. caerulescens ochraceiventerThamnophilus aethiops
20
45
4941,50
6
5
1,2,4,7
34,42
46
5223
24
40,48
51
8,13,26,28,36
37
14,16,39
25
938
35
1519
17,18,27
32,43,53
12,21,22,29,30,33,47
11
10,44
31
68Appendix (Chapter I)
1a
1b
Figure 1. (a) Map showing the samples collected of T. caerulescens (codes of samples in Table S1.).
(b) median-joining network depicting relationships among the haplotypes in T. caerulescens.

69
Figure 2. Demographic models tested in momi2 for the clusters
identified for T. caerulescens.

PleistocenePlioceneMiocene
caerulescensgroup
Andeangroup
cearensisgroup
T. aethiops
cearensis
cluster
Andean
cluster
caerulescens
cluster
3a
3b 3c
0.0
0.2
0.4
0.6
0.8
1.0
Thamnophilus caerulescens, k = 3/alpha = 100
20 24 45 48 49 50 51 522 4 5 6 7 429 10 11 12 14 21 22 25 26 29 31 32 35 53
Ad
mix
ture
coe
ffic
ien
ts
Samples
Figure 3. (a) Bayesian reconstruction and divergence times for T. caerulescens. (b) Clusters
identified by DAPC in T. caerulescens. (c) Graphical representation of admixture estimates of
three clusters in T. caerulescens. Estimated admixture coefficients using sNMF using K = 3 and
alpha = 100 (cross-entropy=0,379352).
0.6
70

Andean
caerulescens
cearensis
Andean
caerulescens
cearensis
T. aethiops
cearensisgroup
caerulescensgroup
Andeangroup
4a
4b 4c
71
Figure 4. (a) Species trees inferred by SNAPP for the T. caerulescens data. (b) Demographic
reconstruction with the best model for the complete matrix of SNPs (324 loci). (c) Demographic
reconstruction with the best model for the incomplete matrix of SNPs (2,036 loci).

cearensis
caerulescens
Andean
Migration pulses
Divergence times
0.63 Myr
0.37 Myr
25 kyr (2.5%)0.36 Myr (6.2%)
13 Kyr (8.3%)
cearensis
caerulescens
Andean0.75 Myr
0.38 Myr
20 kyr (3.4%)10 kyr (12.6%)
Migration pulses
Divergence timesAndean
caerulescens
cearensis
Andean
caerulescens
cearensis
72
Figure 5. Plausible scenarios of diversification of T. caerulescens, with the migration pulses
inferred by momi2. (a) Best model in the complete matrix of SNPs (324 loci). (b) Best model in
the incomplete matrix of SNPs (2,036 loci).
5a
5b
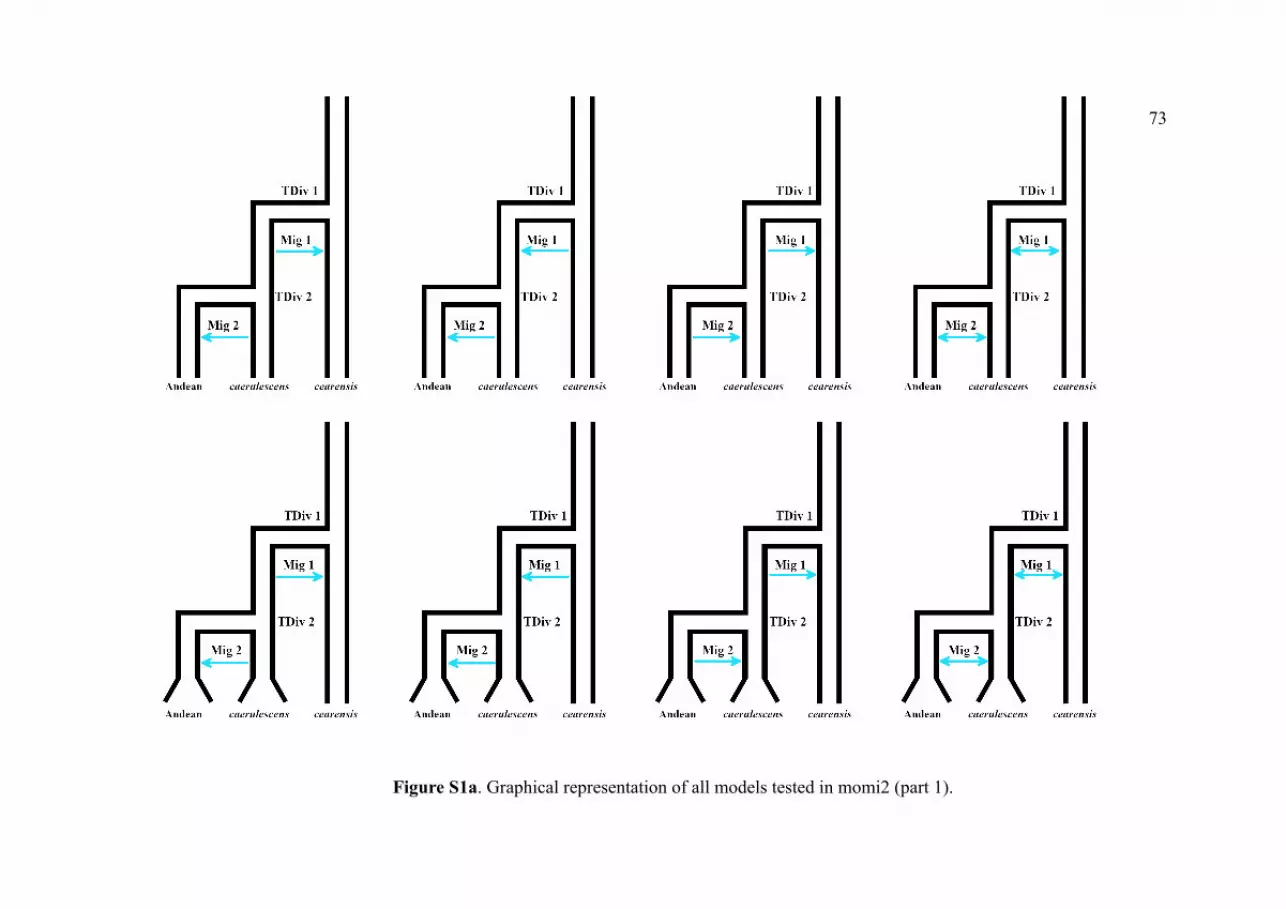
73
Figure S1a. Graphical representation of all models tested in momi2 (part 1).

74
Figure S1b. Graphical representation of all models tested in momi2 (part 2).

s2b s2b
75
Figure S2. Topologies reconstructed for the mtDNA data of T.
caerulescens. (a) Maximum Likelihood in RAxML. (b) Bayesian
inference with BEAST.

cearensiscluster
central Andes
caerulescenscluster
Chaco
76
Figure S3. Clusters identified with the incomplete matrix for T.
caerulescens. The central Andean samples can be separated in a
southern Peru-Bolivia and a central Peru subgroups.

S4a
S4b
cearensis
caerulescensgilvigaster
paraguayensis
aspersiventer
ochraceiventer
dinellii
melanochrous
subandinus
cearensis
caerulescensgilvigaster
paraguayensis
aspersiventer
ochraceiventer
dinellii
melanochrous
subandinus
DA eigenvalues
central Andes
Intermediate
Chaco
caerulescenscluster
cearensiscluster
cearensis_BR_AL
caerulescens_BR_MGgilvigaster_BR_SC
paraguayensis_PA_ALT
caerulescens_PA_ITAcaerulescens_PA_CAA_ITA
aspersiventer_PE_PU
ochraceiventer_BR_GOgilvigaster_BR_RS
cearensis_BR_PE
dinellii_BO_TJ
melanochrous_PE_PAS
paraguayensis_BO_SaC
caerulescens_BR_SP
cearensis_BR_AL
caerulescens_BR_MGgilvigaster_BR_SC
paraguayensis_PA_ALT
caerulescens_PA_ITAcaerulescens_PA_CAA_ITA
aspersiventer_PE_PU
ochraceiventer_BR_GOgilvigaster_BR_RS
cearensis_BR_PE
dinellii_BO_TJ
melanochrous_PE_PAS
paraguayensis_BO_SaC
caerulescens_BR_SP
DA eigenvalues
cearensiscluster
caerulescenscluster
Chaco
central Andes
Intermediate
77
Figure S4. DAPC depicting a clinal pattern in the central Andean
samples of T. caerulescens. (a) Complete matrix. (b) Incomplete
matrix.

●
●
●
●
● ●●
●● ● ●
●
2 4 6 8 10 12
0.30
0.35
0.40
0.45
0.50
0.55
Number of ancestral populations
Cro
ss−e
ntro
py
●
● ●●
●
●
●
●
●
●●
●
●
●● ●
● ●
●●
●
●
●●
●
● ●
●
●
●
●● ●
●
●
●
●
●●
●
●
● ●●
●
●
●
●
●
● ●●
● ●●
●
● ●
●
●
●
● ●●
● ●
●●
● ●
●
●
2 4 6 8 10 12
0.35
0.40
0.45
0.50
0.55
0.60
Number of ancestral populations
Cro
ss−e
ntro
py
●
●●
● ●
● ●
●
●
●
●●
●
●● ● ●
●●
●●
● ●
●
●
● ●●
●
●
●
●
●●
●●
●
● ●
●●
● ●
●●
●
●
●
●
●●
●
●
●
●●
●
●
●
●
S5a
S5b
78
α = 1
α = 10
α = 50
α = 100
α = 500
α = 1000
Alpha values
Figure S5. Values of cross-entropy for six values of α (1, 10, 50, 100,
500, 1000). (a) Complete matrix. (b) Incomplete matrix.

79
Table 1. List of tested models for the complete matrix in T. caerulescens.
Model number Log likelihood
Number parameters
model AICs Delta AIC Weight AICs
Model 1 -1258.51153 2 2521.023061 44.1059732 2.65E-10
Model 2 -1249.760663 5 2509.521326 32.60423837 8.32E-08
Model 3 -1252.647448 5 2515.294896 38.37780816 4.64E-09
Model 4* -1229.458544 9 2476.917088 0 1
Model 5 -1240.297117 9 2498.594234 21.67714629 1.96E-05
Model 6 -1235.112871 9 2488.225743 11.30865505 0.003502328
Model 7 -1225.937369 13 2477.874737 0.957649748 0.619510968
Model 8 -1252.889427 11 2527.778853 50.86176583 9.03E-12
Model 9 -1266.947654 11 2555.895309 78.97822097 7.08E-18
Model 10 -1243.957441 16 2519.914881 42.99779359 4.60E-10
Model 11 -1247.822782 16 2527.645565 50.72847734 9.65E-12
Model 12 -1273.973514 11 2569.947027 93.02993993 6.29E-21
Model 13 -1255.509493 16 2543.018986 66.10189838 4.43E-15
Model 14 -1284.761711 11 2591.523422 114.6063348 1.30E-25
Model 15 -1293.999998 11 2609.732288 132.8152009 1.44E-29
Model 16 -1293.866144 11 2609.732288 132.8152009 1.44E-29
* Chosen model.
Table 2. List of tested models for the incomplete matrix in T. caerulescens.
Model number Log likelihood Number parameters model AICs Delta AIC Weight AICs
Model 1 -7481.577811 2 14967.15562 392.1354344 7.06E-86
Model 2 -7383.252541 5 14776.50508 201.4848944 1.77E-44
Model 3 -7386.643388 5 14783.28678 208.2665891 5.96E-46
Model 4 -7323.523233 9 14665.04647 90.02627891 2.83E-20
Model 5 -7345.247239 9 14708.49448 133.4742895 1.04E-29
Model 6 -7299.864124 9 14617.72825 42.70805956 5.32E-10
Model 7* -7274.510094 13 14575.02019 0 1
Model 8 -7574.598842 11 15171.19768 596.1774969 3.48E-130
Model 9 -7528.523218 11 15079.04644 504.026249 3.57E-110
Model 10 -7388.482618 16 14808.96524 233.9450474 1.58E-51
Model 11 -7394.500327 16 14821.00065 245.9804667 3.85E-54
Model 12 -7522.21469 11 15066.42938 491.4091924 1.96E-107
Model 13 -7394.482314 16 14820.96463 245.9444395 3.93E-54
Model 14 -7807.853685 11 15637.70737 1062.687182 1.74E-231
Model 15 -7621.885811 19 15281.77162 706.7514342 3.40E-154
Model 16 -7724.954811 11 15471.90962 896.8894352 1.75E-195

80
Table S1. Samples collected of T. caerulescens for this study.
Code in
Graphics Voucher Taxon State
Count
ry Locality UCEs
1 ALG-014 Thamnophilus caerulescens Alagoas Brazil AL, São José da Lage, Usina Serra Grande
2 ALG-020 Thamnophilus caerulescens Alagoas Brazil AL, São José da Lage, Usina Serra Grande YES
3 ALG-053 Thamnophilus caerulescens Alagoas Brazil AL, São José da Lage, Usina Serra Grande
4 ALG-080 Thamnophilus caerulescens Alagoas Brazil AL, São José da Lage, Usina Serra Grande YES
5 ALG-085 Thamnophilus caerulescens Alagoas Brazil AL, São José da Lage, Usina Serra Grande YES
6 ALG-086 Thamnophilus caerulescens Alagoas Brazil AL, São José da Lage, Usina Serra Grande YES
7 ALG-102 Thamnophilus caerulescens Alagoas Brazil AL, São José da Lage, Usina Serra Grande YES
8 MZ 82619
Thamnophilus caerulescens
caerulescens São Paulo Brazil Cunha, estrada para o Parque Estadual
9 MZ 82637
Thamnophilus caerulescens
caerulescens
Minas
Gerais Brazil Itamonte YES
10 MZ 91196
Thamnophilus caerulescens
gilvigaster
Santa
Catarina Brazil Nova Trento YES
11 MZ 91197
Thamnophilus caerulescens
gilvigaster
Santa
Catarina Brazil Nova Trento YES
12 MZ 91661
Thamnophilus caerulescens
caerulescens São Paulo Brazil Angatuba, Fazenda Entre Rios YES
13 MZ 91755
Thamnophilus caerulescens
caerulescens
Minas
Gerais Brazil Passa Tempo, Fazenda Ribeirão das Cachoeiras
14 MZ 93176
Thamnophilus caerulescens
caerulescens São Paulo Brazil Estação Biológica de Boracéia, Salesópolis YES
15 MZ 96752
Thamnophilus caerulescens
caerulescens São Paulo Brazil Campos do Jordão, Fazenda Prana
16 MZ 96753
Thamnophilus caerulescens
caerulescens São Paulo Brazil Campos do Jordão, Fazenda Prana
17 MZ 96754
Thamnophilus caerulescens
caerulescens São Paulo Brazil Campos do Jordão, Fazenda Prana
18 MZ 96755
Thamnophilus caerulescens
caerulescens São Paulo Brazil Campos do Jordão, Fazenda Prana
19 FRA 258* Thamnophilus caerulescens São Paulo Brazil Delfim Moreira (8 Km SE)

81
Code in
Graphics Voucher Taxon State
Count
ry Locality UCEs
20 KU 3195 Thamnophilus caerulescens
Alto
Paraguay
Parag
uay Bahia Negra, 14 km W, Estancia Triunfo YES
21 KU 3700 Thamnophilus caerulescens Itapua
Parag
uay San Rafael N.P., San Pedro Mi YES
22 KU 3721 Thamnophilus caerulescens
Caazapa/Ita
pua
Parag
uay San Rafael N.P., Parabel YES
23 KU 21634 Thamnophilus caerulescens Puno Peru above San Juan del Oro
24 KU 21654 Thamnophilus caerulescens Puno Peru above San Juan del Oro YES
25 ML 2030* Thamnophilus caerulescens
Minas
Gerais Brazil Patrocinio YES
26 ML 2031* Thamnophilus caerulescens Goiás Brazil Cristalina YES
27 BOR-14-32 Thamnophilus caerulescens São Paulo Brazil Estação Biológica de Boracéia
28 ML 2032* Thamnophilus caerulescens
Minas
Gerais Brazil Patrocinio
29 MCP 3306 Thamnophilus caerulescens
Rio Grande
do Sul Brazil São Gabriel YES
30 MCP 4053 Thamnophilus caerulescens
Rio Grande
do Sul Brazil Jaquirana
31 MCP 4843 Thamnophilus caerulescens
Santa
Catarina Brazil São Bonifácio YES
32 MPEG T14940 Thamnophilus caerulescens
Santa
Catarina Brazil Pomerode, Morro da Turquia YES
33 MPEG T14991 Thamnophilus caerulescens
Santa
Catarina Brazil Caçador, Linha São Francisco
34 MPEG T15207 Thamnophilus caerulescens Pernambuco Brazil Barreiros, Engenho Cachoeira Linda (08o48'S;35o19'W)
35 MPEG T15691 Thamnophilus caerulescens
Minas
Gerais Brazil
Fazenda Princesa da Serra, Córrego do Mota, Serra Azul,
Itatiaiuçu YES
36 MPEG T15720 Thamnophilus caerulescens
Minas
Gerais Brazil Barragem de rejeito da USIMINAS, Serra Azul, Itatiaiuçu
37 MPEG T15783 Thamnophilus caerulescens
Minas
Gerais Brazil Barragem de rejeito da USIMINAS, Serra Azul, Itatiaiuçu
38
BO513
EU295759** Thamnophilus caerulescens
Minas
Gerais Brazil Araponga
39 FMNH 395426 Thamnophilus caerulescens São Paulo Brazil Boraceia
40 LSUB 1684 Thamnophilus caerulescens Pasco Peru Santa Cruz; about 9 km SSE Oxapampa

82
Code in
Graphics Voucher Taxon State
Count
ry Locality UCEs
41 LSU 38284 Thamnophilus caerulescens Santa Cruz
Bolivi
a La Pajcha, 28 km S Samaipata;
42
MPEG
CPEII037 Thamnophilus caerulescens Pernambuco Brazil Barreiros, Engenho Cachoeira Linda (08o48'S;35o19'W) YES
43 MZ 81155 Thamnophilus caerulescens São Paulo Brazil E. E. Bananal, Bananal
44 MZ 84352 Thamnophilus caerulescens
Santa
Catarina Brazil SC-407, Rancho Queimado
45 UWBM 77213 Thamnophilus caerulescens Tarija
Bolivi
a Entre Rios, O'connor YES
46 UWBMRTB 407 Thamnophilus caerulescens
Cochabamb
a
Bolivi
a Provincia de Chapare, San Onofre
47
YPM 10106 KJ
810434 Thamnophilus caerulescens Artigas
Argen
tina Artigas
48 LSUMZ 105988
Thamnophilus caerulescens
melanochrous Pasco Peru Santa Cruz; about 9 km SSE Oxapampa YES
49 LSUMZ 171295
Thamnophilus caerulescens
paraguayensis Santa Cruz
Bolivi
a
Santa Cruz, Prov. Cordillera, 38.4 km E Abapo, 18 degrees
44' 48" S, 63 degrees 04' 06" W YES
50 LSUMZ 168944
Thamnophilus caerulescens
connectens Santa Cruz
Bolivi
a Santa Cruz, La Chuchial YES
51 LSUMZ 170871
Thamnophilus caerulescens
subandinus Loreto Peru Ca. 80 km SE Juanjui on E. bank upper Río Pauya YES
52 LSUMZ 179678
Thamnophilus caerulescens
aspersiventer Puno Peru Abra de Maruncunea, 14 degrees 12' S, 69 degrees 13' W YES
53 MZUSP 81155
Thamnophilus caerulescens
caerulescens São Paulo Brazil E. E. de Bananal, Bananal YES
54 MZ 81269
Thamnophilus aethiops
incertus Maranhão Brazil Açailândia, Fazenda Itabaiana YES
55 MZ 93741
Thamnophilus aethiops
polionotus Roraima Brazil
Caracaraí, rio Jufari, Igarapé Caicubi, Trilha Paraguai,
Sitio do Valdir YES
56 J 1799*
Thamnophilus aethiops
injunctus Rondônia Brazil JIRAU, margen esquerda Rio Madeira, Caiçara T1P2 YES
57 FMNH 399223 Thamnophilus aethiops Alagoas Brazil Ibateouara, Engenho Coimbra, Usina Serra Grande
58 MPEG 62216 Thamnophilus aethiops Amazonas Brazil Juruti, Base Capiranga
* Field number
** Genebank code access

83
Table S2. Cross-entropy values for T. caerulescens (α=1, 10, 50, 100, 500, 1000).
Alpha=1 K=1 K=2 K=3 K=4 K=5 K=6 K=7 K=8 K=9 K=10 K=11 K=12 lowest 2d. lowest Difference
min 0.41463 0.37810 0.37439 0.38679 0.40498 0.40998 0.42651 0.43924 0.46538 0.46480 0.488458 0.5041613 0.37439 0.37810 0.00370
mean 0.46818 0.43040 0.42527 0.43747 0.45027 0.46680 0.48686 0.50796 0.52824 0.54831 0.5722283 0.5980912 0.42527 0.43040 0.00513
max 0.51230 0.47448 0.47385 0.49359 0.50404 0.52809 0.56818 0.57198 0.62220 0.63828 0.660845 0.6886311 0.47385 0.47448 0.00063
Alpha=10 K=1 K=2 K=3 K=4 K=5 K=6 K=7 K=8 K=9 K=10 K=11 K=12 lowest 2d. lowest Difference
min 0.42668 0.38206 0.37474 0.39066 0.38981 0.41915 0.41590 0.43532 0.45610 0.49724 0.5225096 0.5146925 0.37474 0.38206 0.00732
mean 0.46730 0.42947 0.42333 0.43588 0.44978 0.46952 0.48733 0.50797 0.53013 0.54987 0.5744045 0.5983819 0.42333 0.42947 0.00614
max 0.51302 0.47696 0.50495 0.50696 0.51499 0.53598 0.53778 0.57670 0.62257 0.63576 0.7052284 0.6887136 0.47696 0.50495 0.02799
Alpha=50 K=1 K=2 K=3 K=4 K=5 K=6 K=7 K=8 K=9 K=10 K=11 K=12 lowest 2d. lowest Difference
min 0.42023 0.38590 0.37785 0.38267 0.38716 0.42027 0.41344 0.45151 0.46307 0.49679 0.4992932 0.5330865 0.37785 0.38267 0.00482
mean 0.46999 0.43371 0.42788 0.44203 0.45580 0.47623 0.49685 0.51848 0.53777 0.56201 0.5846736 0.6082007 0.42788 0.43371 0.00583
max 0.51047 0.46892 0.49179 0.49246 0.52463 0.53898 0.54475 0.59322 0.59113 0.65335 0.6883291 0.7150304 0.46892 0.49179 0.02287
Alpha=100 K=1 K=2 K=3 K=4 K=5 K=6 K=7 K=8 K=9 K=10 K=11 K=12 lowest 2d. lowest Difference
min 0.41976 0.38379 0.37935 0.38487 0.39180 0.40879 0.43221 0.46163 0.48039 0.49214 0.5288857 0.5362145 0.37935 0.38379 0.00443
mean 0.46993 0.43360 0.42808 0.44140 0.45668 0.47602 0.49718 0.52316 0.53976 0.56591 0.5922528 0.6147111 0.42808 0.43360 0.00552
max 0.51528 0.48304 0.48267 0.50933 0.50896 0.54028 0.55194 0.59271 0.62097 0.65933 0.7248343 0.6998336 0.48267 0.48304 0.00037
Alpha=500 K=1 K=2 K=3 K=4 K=5 K=6 K=7 K=8 K=9 K=10 K=11 K=12 lowest 2d. lowest Difference
min 0.41880 0.38092 0.38137 0.39765 0.40557 0.44746 0.44972 0.50243 0.50964 0.53512 0.5661571 0.5901958 0.38092 0.38137 0.00045
mean 0.46720 0.43245 0.43261 0.44980 0.47214 0.49230 0.52136 0.54960 0.57662 0.60627 0.6349305 0.6638951 0.43245 0.43261 0.00016
max 0.53756 0.50182 0.50858 0.52420 0.54205 0.57109 0.62757 0.60047 0.65621 0.68353 0.7254975 0.7601563 0.50182 0.50858 0.00675
Alpha=1000 K=1 K=2 K=3 K=4 K=5 K=6 K=7 K=8 K=9 K=10 K=11 K=12 lowest 2d. lowest Difference
min 0.43014 0.39367 0.39913 0.40786 0.43649 0.45183 0.48806 0.50107 0.50813 0.55429 0.5805905 0.596142 0.39367 0.39913 0.00546
mean 0.46897 0.43501 0.43493 0.45501 0.47874 0.51062 0.53522 0.56459 0.59446 0.62411 0.6530534 0.6837274 0.43493 0.43501 0.00008
max 0.52614 0.48990 0.48405 0.52469 0.54719 0.60167 0.60715 0.64636 0.66495 0.73103 0.7408487 0.7669721 0.48405 0.48990 0.00586

84
Table S3. Group membership in samples of UCEs of T. caerulescens (complete matrix).
Clusters cearensis caerulescens Andean
Samples/Subspecies* cearensis caerulescens gilvigaster ochraceiventer paraguayensis dinellii aspersiventer melanochrous
O002_Tha_cae_ALG_020_BR_AL 1 0 0 0 0 0 0 0
O006_Tha_cae_ALG_080_BR_AL 1 0 0 0 0 0 0 0
O007_Tha_cae_ALG_085_BR_AL 1 0 0 0 0 0 0 0
O008_Tha_cae_ALG_086_BR_AL 1 0 0 0 0 0 0 0
O010_Tha_cae_ALG_102_BR_AL 1 0 0 0 0 0 0 0
O032_Tha_cae_MZ_82637_BR_MG 0 0.452 0.547 0 0 0 0 0
O078_Tha_cae_MZ_91196_BR_SC 0 0.591 0.397 0.012 0 0 0 0
O079_Tha_cae_MZ_91197_BR_SC 0 0.311 0.689 0 0 0 0 0
O097_Tha_cae_MZ_91661_BR_SP 0 0.67 0.295 0.035 0 0 0 0
O134_Tha_cae_MZ_93176_BR_SP 0 0.76 0.226 0.014 0 0 0 0
O214_Tha_cae_KU_3195_PA_ALT 0 0 0 0 0.869 0.13 0 0
O216_Tha_cae_KU_3700_PA_ITA 0 0.752 0.242 0.006 0 0 0 0
O217_Tha_cae_KU_3721_PA_CAA_ITA 0 0.691 0.221 0.088 0 0 0 0
O230_Tha_cae_KU_21654_PE_PU 0 0 0 0 0 0 0.708 0.292
O272_Tha_cae_ML_2030_BR_MG 0 0.693 0.303 0.005 0 0 0 0
O273_Tha_cae_ML_2031_BR_G0 0 0.332 0.109 0.56 0 0 0 0
O288_Tha_cae_MCP_3306_BR_RS 0 0.695 0.304 0.001 0 0 0 0
O299_Tha_cae_MCP_4843_BR_SC 0 0.721 0.215 0.064 0 0 0 0
O349_Tha_cae_MPEG_T14940_BR_SC 0 0.343 0.653 0.005 0 0 0 0
O390_Tha_cae_MPEG_T15691_BR_MG 0 0.71 0.29 0 0 0 0 0
O450_Tha_cae_MPEG_CPEII037_BR_PE 1 0 0 0 0 0 0 0
O453_Tha_cae_UWBM_77213_B0_TJ 0 0 0 0 0.046 0.954 0 0
O603_Tha_cae_LSUMZ_105988_PE_PAS 0 0 0 0 0 0 0.328 0.672
O604_Tha_cae_LSUMZ_171295_B0_SaC 0 0 0 0 0.897 0.103 0 0
O605_Tha_cae_LSUMZ_168944_B0_SaC 0 0 0 0 0.024 0.976 0 0
O606_Tha_cae_LSUMZ_170871_PE_L0 0 0 0 0 0 0 0 1
O607_Tha_cae_LSUMZ_179678_PE_PU 0 0 0 0 0 0 0.964 0.036
O608_Tha_cae_MZUSP_81155_BR_SP 0 0.51 0.471 0.018 0 0 0 0

85
Table S4. Group membership in samples of UCEs of T. caerulescens (incomplete matrix).
Clusters cearensis caerulescens Andean
Samples/Subspecies* cearensis caerulescens gilvigaster ochraceiventer paraguayensis dinellii aspersiventer melanochrous
O002_Tha_cae_ALG_020_BR_AL 1 0 0 0 0 0 0 0
O006_Tha_cae_ALG_080_BR_AL 1 0 0 0 0 0 0 0
O007_Tha_cae_ALG_085_BR_AL 1 0 0 0 0 0 0 0
O008_Tha_cae_ALG_086_BR_AL 1 0 0 0 0 0 0 0
O010_Tha_cae_ALG_102_BR_AL 1 0 0 0 0 0 0 0
O032_Tha_cae_MZ_82637_BR_MG 0 0.934 0.065 0 0 0 0 0
O078_Tha_cae_MZ_91196_BR_SC 0 0.732 0.239 0.028 0 0 0 0
O079_Tha_cae_MZ_91197_BR_SC 0 0.038 0.962 0 0 0 0 0
O097_Tha_cae_MZ_91661_BR_SP 0 0.742 0.257 0.001 0 0 0 0
O134_Tha_cae_MZ_93176_BR_SP 0 0.98 0.017 0.002 0 0 0 0
O214_Tha_cae_KU_3195_PA_ALT 0 0 0 0 0.923 0.077 0 0
O216_Tha_cae_KU_3700_PA_ITA 0 0.288 0.709 0.003 0 0 0 0
O217_Tha_cae_KU_3721_PA_CAA_ITA 0 0.429 0.57 0.001 0 0 0 0
O230_Tha_cae_KU_21654_PE_PU 0 0 0 0 0 0 1 0
O272_Tha_cae_ML_2030_BR_MG 0 0.345 0.011 0.644 0 0 0 0
O273_Tha_cae_ML_2031_BR_GO 0 0.346 0.019 0.635 0 0 0 0
O288_Tha_cae_MCP_3306_BR_RS 0 0.38 0.62 0 0 0 0 0
O299_Tha_cae_MCP_4843_BR_SC 0 0.281 0.715 0.004 0 0 0 0
O349_Tha_cae_MPEG_T14940_BR_SC 0 0.368 0.629 0.003 0 0 0 0
O390_Tha_cae_MPEG_T15691_BR_MG 0 0.949 0.01 0.042 0 0 0 0
O450_Tha_cae_MPEG_CPEII037_BR_PE 1 0 0 0 0 0 0 0
O453_Tha_cae_UWBM_77213_B0_TJ 0 0 0 0 0.238 0.762 0 0
O603_Tha_cae_LSUMZ_105988_PE_PAS 0 0 0 0 0 0 0 1
O604_Tha_cae_LSUMZ_171295_B0_SaC 0 0 0 0 0.932 0.068 0 0
O605_Tha_cae_LSUMZ_168944_B0_SaC 0 0 0 0 0 1 0 0
O606_Tha_cae_LSUMZ_170871_PE_L0 0 0 0 0 0 0 0 1
O607_Tha_cae_LSUMZ_179678_PE_PU 0 0 0 0 0 0 1 0
O608_Tha_cae_MZUSP_81155_BR_SP 0 0.364 0.631 0.005 0 0 0 0

86
Chapter II
Comparative phylogeography of passerine birds with a circum-
Amazonian distribution

87
Comparative phylogeography of passerine birds with a circum-Amazonian distribution
Abstract
There are a number of common distributional patterns that have provided the foundations of our
current knowledge of Neotropical biogeography. A distinctive pattern is the so-called “circum-
Amazonian distribution”, which expands across the forested lowlands south and east of Amazonia,
the Andean foothills, the Venezuelan Coastal Range, and the Tepuis. To date, there is no clear
understanding of the processes giving rise to this distribution. To understand the evolutionary
history of taxa exhibiting this pattern it is necessary to test biogeographic hypotheses offering
mechanistic explanations. Comparative phylogeography allows more accurate phylogeographic
hypotheses for these taxa, as well as better population genetic parameters. Comprehensive
comparative studies aiming at unraveling the evolutionary and biogeographic mechanisms
underlying the circum-Amazonian distribution have not been conducted yet, and only scarce
descriptive information has been published. Therefore, the objective of this work was to elucidate
the historical and biogeographic mechanisms underpinning circum-Amazonian distribution by
performing comparative genomic analyses of a group of Suboscine passerines. Ultraconserved
Elements (UCEs) were obtained for eight taxonomic groups to estimate population parameters and
genealogical trees. For the Thamnophilidae species were inferred demographic histories with
momi2. The best models of each taxon were analyzed in a comparative framework to relate them
with previously proposed biogeographic hypotheses for the Neotropics and to propose plausible
biogeographical scenarios for the circum-Amazonian pattern. The circum-Amazonian
distributional pattern has two main phylogeographic units: an Andean (plus Central America

88
region) and an eastern-forested region (Atlantic Forest ecoregion, forested areas around southeast
of Amazonia), interconnected by a northern and southern corridor, allowing biotic interchanges
between them (mainly from the southern) and hybridization. Species-tree analyses recovered (a)
an Andean clade with two Andean subgroups in the northern Peru and central Andes, and (b) an
eastern-forested clade including northern and central/southern Atlantic Forest subgroups. The
demographic histories of the Thamnophilidae taxa suggest that diversification of the circum-
Amazonian taxa have a strong influence of climatic fluctuations during the Pleistocene, with
interconnected refugia allowing phenotypic/genetic differentiation but maintaining a considerable
level of gene flow during varying dry/cool and warm/humid periods. In addition, the results of this
work opened interesting taxonomic questions about some taxa that could be covered in the future
(T. ruficapillus/torquatus complex, Xiphocolaptes complex).

89
Introduction
A major breakthrough in the understanding of earth’s biodiversity is the different evolutionary,
biogeographical, and environmental processes affecting the distribution of the species and the
response to these processes (Darlington, 1959). In this sense, it is expected that species with similar
geographical distributions would have also common history of processes/events molding their
habitats (Humphries & Parenti, 1999). Relatively new groups of analysis were developed in order
to identify and understand the relationship between co-distributed species and the
biogeographical/evolutionary processes affecting them, called as Comparative Phylogeography
(CP) (Arbogast & Kenagy, 2001; Hickerson et al., 2010). The main objective of CP is to search
for concordant splits within contemporaneous, co-distributed species (Bermingham & Avise,
1986). In this framework, the level of “phylogeographic congruence is a measure of the historical
stability of the current species assemblage” (Zink, 2002), namely, a particular evolutionary
reconstruction (a hypothesis) on co-distributed species affected by similar climatic/geological
events would be more 'supported' while more individuals phylogeographic patterns being
congruent. The CP has been applied in the study of multiple co-distributed taxa (Barker et al.,
2015; Potter et al., 2017), mainly in areas of interest as the Neotropics (Françoso et al., 2016;
Rincon-Sandoval et al., 2019; Sartorato Zanchetta et al., 2019).
As proved by several studies, the Neotropical biomes and ecosystems exhibit high
biodiversity and a wide range of ecological/geological characteristics (Myers et al., 2000; Rull,
2011; Richardson & Pennington, 2016; Dinerstein et al., 2017). In this way, extensive work has
being developed to explain and understand this high diversity in the Neotropics, as the processes
involved in that phenomenon, arising a varying number of hypotheses, based in both theoretical

90
and empirical approaches (e.g. Sick, 1967; Haffer, 1969; Vuilleumier, 1971; Brown, 1979;
Cracraft, 1985; Hooghiemstra & van der Hammen, 1998; Garzón-Orduña et al., 2014). These
hypotheses cover proposals from ecological perspectives like the Gradient Hypothesis (Endler,
1982) to those based on geographical isolation as Refuges (Haffer, 1969; Vanzolini & Williams,
1970) and Rivers (see Wallace, 1854; Sick, 1967), and Paleogeographic ones as the Arch and the
Lagoon Hypotheses (Patton & Silva, 1997; Marroig & Cerqueira, 1997). All these hypotheses have
been subject to wide discussion, and several tests have been implemented to corroborate or refute
their assumptions (Mayr & O’Hara, 1986; Salo, 1987; Nores, 1999; Lougheed et al., 1999;
Colinvaux et al., 2000; Haffer, 2008; FernAndes et al., 2012; Maldonado-Coelho et al., 2013;
Garzón-Orduña et al., 2015; Rocha & Kaefer, 2019, among others).
Despite the large variety of proposed evolutionary and biogeographic mechanisms
intended to explain Neotropical diversity, our understanding remains scarce for some of these
patterns. For instance, a considerable number of birds are distributed in the surroundings of the
Amazonia but they are absent in the Amazonia itself (Remsen et al., 1991; Bates, 1997; Lovette,
2004), and there is no clear understanding of the mechanisms involved in that kind of distributions.
Such distributional pattern is known as “circum-Amazonian distribution” (Figure 1) and is
characterized by the presence of phylogenetically related groups mainly in “(a) montane forested
areas on the humid slopes of the Andes and the Coastal Range of Venezuela or the Tepui region;
and in (b) lowland forested areas south and east of the lowland forests of Amazonia” (Remsen et
al., 1991). Remsen et al. (1991), in the first study describing the circum-Amazonian pattern,
described that species as Platyrinchus mystaceus, Hemitriccus spp., Dysithamnus mentalis,
Phyllomyias burmeisteri, and Elaenia albiceps, E. parvirostris, and E. obscura, among others,
share this distributional pattern. Subsequent works have identified other taxa as circum-

91
Amazonian. Bates (1997) stated that two species of Tiaris, T. obscura and T. fuliginosa, have a
geographical distribution congruent with the proposed by Remsen et al. (1991). More examples of
species exhibiting this circum-Amazonian pattern were presented by Lovette (2004) in the case of
Phaeothlypis and by Batalha-Filho et al. (2013) in Synallaxis ruficapilla and S. moesta.
Additionally, some species of Cercomacra (C. melanaria, C. ferdinandi, C. carbonaria, and the
C. nigricans complex) and Tangara cayana fit partially into this distributional pattern (see Tello
et al., 2014; Savit & Bates, 2015). There are also examples in non-passerines such as the genus
Pionus, in which the sordidus-maximiliani complex seem to exhibit complementary geographical
ranges resulting in a circum-Amazonian distribution (see Ribas et al., 2007). Moreover, the
circum-Amazonian distribution pattern was identified in other non-avian groups such as some
insects (references related to insects) and plants (references related to plants) (e.g. Prado & Gibbs,
1993; Erwin, 2000; Canals & Johnson, 2000; Knapp, 2002; Irmler, 2009). Nevertheless, whereas
the diversity and distribution patterns in adjacent Neotropical regions have been the focus of
several studies, this complex pattern of distribution has not received enough attention, and the
events and evolutionary processes behind it have not been thoroughly revealed.
Here, we implemented a comparative phylogeographic approach to infer common evolutionary
histories from eight taxa of Passeriformes with circum-Amazonian distribution, using genomic
information from Ultraconserved Elements (UCEs, Bejerano et al., 2004). The UCEs are highly
conserved genomic sequences that allow the use of a large set of universal markers to infer
relationships among lineages (Faircloth et al., 2012; Faircloth et al., 2015), and they can be used
to estimate demographic and population parameters (Smith et al., 2013; Zarza et al., 2018; Myers
et al., 2019; Oswald et al., 2019). We estimated the populational parameters and demographic
history for each species, followed by the comparative analysis of their evolutionary histories.

92
Lastly, we proposed plausible scenarios in order to explain the formation of this distributional
pattern based mainly in the proposed hypotheses of diversification for the Neotropics.

93
Methods
Analyzed taxa and sampling efforts
We used samples from eight taxonomic groups with a circum-Amazonian distributional pattern
(see Table 1). These were: 1) Platyrinchus mystaceus (Tyrannidae); 2) the complex Xiphocolaptes
albicollis, X. falcirostris, X. promeropirhynchus and X. major (Dendrocolaptidae) 3) Philydor
rufum and 4) Lochmias nematura (Furnariidae); 5) the complexes Thamnophilus palliatus/T.
tenuepunctatus; and 6) Thamnophilus ruficapillus/T. torquatus, 7) Dysithamnus mentalis and 8)
Thamnophilus caerulescens (Thamnophilidae).
We gathered samples from ornithological collections in Brazil and the USA (see Table 2).
In total, we included 602 vouchered tissue samples. Our sampling covered the majority of the
species geographic ranges, but samples from the northernmost region of the Northern Andes (the
montane-forested areas of the Colombian Andes and the Coastal Range of Venezuela and the
Tepuis) were missing for some species (see Table S1).
DNA extraction
We extracted total genomic DNA from muscle tissues using the PureLink® Genomic DNA Mini
kit (Invitrogen Inc.). We quantified genomic DNA concentrations using a Qubit 2.0 fluorometer
(Life Technologies, Inc.). We sent at least 1,000 ng of genomic DNA for each sample (301
samples) to Rapid Genomics (Gainesville, FL). Libraries were enriched from 2,386 UCE loci that
targeted a set of 2,560 probes (Faircloth et al., 2012, Tetrapods-UCE-2.5K version 1; Microarray,

94
Ann Arbor, MI), following an open-source protocol (available at www.ultraconserved.org).
Samples were multiplexed at 192 samples per lane on a 125 bp paired-end Illumina HiSeq 2500
run, yielding an average coverage of 18.66X per sample.
Mitochondrial DNA
As a preliminary assessment of population structure for each complex, we sequenced the
mitochondrial gene NADH dehydrogenase 2 (ND2) for all individuals of each species and at least
three individuals of their respective outgroups (see Table S2). We amplified and sequenced ND2
using standard PCR and Sanger sequencing protocols described elsewhere (Brumfield et al., 2007).
We edited sequences and checked that they did not include stop codons or anomalous residues
using Geneious v. 11.1.4 (www.geneious.com, Kearse et al. 2012). We aligned sequences with the
MAFFT v.7 multiple alignment plugin (Katoh & Standley, 2013) implemented in Geneious. We
will be deposited the newly obtained sequences in GenBank (Accession numbers XXXXX-
XXXXXX).
We built a Median Joining Network – MJN – haplotype network (Bandelt et al., 1999)
implemented in POPART (Leigh & Bryant, 2015). Outgroup samples and short ingroup sequences
(<700 bp) were excluded from the analysis and the matrix was trimmed to exclude any positions
containing missing data (see Supplementary Material, Table S1). We selected the best substitution
model for each species (see Table 3) using the corrected Akaike Information Criterion (AICc;
Hurvich and Tsai 1989) implemented in jModeltest2 (Darriba et al., 2012) on the Cipres Science
Gateway V 3.3 (Miller et al., 2010). We estimated a time-calibrated gene tree within a Bayesian
framework implemented in the program BEAST2 v2.4.4 (Bouckaert et al. 2014). Based on the

95
avian mtDNA substitution rate of 2.1%/My (Weir & Schluter, 2008), we used a lognormal relaxed
molecular clock with a mean rate of 0.0105 for mtDNA. We used a Coalescent Constant
Population prior with no restrictions on tree shape and a randomly generated tree as a starting tree.
We ran analyses for a total of 50 million generations with a sampling frequency of 1,000. We
determined that replicate analyses converged (effective sample size values > 400) using Tracer
1.7.1 (Rambaut et al. 2018). Using TreeAnnotator v2.4.4 (Drummond et al. 2012, Bouckaert et al.
2014) and a burn-in of 30%, we estimated a posterior distribution of topologies and the maximum
clade credibility (MCC) tree.
Edition and assembly of UCEs
We followed the Phyluce pipeline (Faircloth, 2016, https://github.com/faircloth-lab/phyluce) to
process the raw sequences of the UCEs sequenced. Initially, Illumiprocessor 2.0.7 (Faircloth,
2013) and Trimmomatic 0.32 (Bolger et al., 2014) were implemented to trim adapters, barcodes
and low quality regions. We used Trinity 2.0.6 (Grabherr et al., 2011) to perform the assembly
(script phyluce_assembly_assemblo_trinity). To avoid including markers of different ploidy, we
identified, extracted, and removed Z-linked UCEs from the assemblies using Blast 2.7.7 (see
Altschul et al., 1990; Camacho et al., 2009). Finally, we implemented the script
phyluce_assembly_match_contigs_to_probes to match the assembled contigs to the UCE probes
(uce-2.5k-probes.fasta). The results were exported in a *fasta format.

96
SNP calling
For each species, we extracted Single Nucleotide Polymorphisms (SNPs) from the UCE
alignments using the methods described by Harvey et al. (2016), which are largely based on
Phyluce (Faircloth, 2016). We extracted SNPs following two approaches using the script
phyluce_assembly_match_counts. The first one yielded a 100% complete matrix with no missing
data for any individual in all loci, and the second one yielded an incomplete matrix including all
data matching the target loci.
First, we created a *fasta file with the loci extracted from the complete matrix of each species
(phyluce_assembly_explode_get_fastas_file), and we chose a reference from the sequences
analyzed; estimating the coverage and the mean length of recovered contigs (script
phyluce_assembly_get_trinity_coverage, and phyluce_assembly_get_fasta_lengths). Secondly,
we used bwa 0.7.7 (Li & Durbin, 2009) to map raw reads from the samples for each species with
their respective reference (Li, 2013), Samtools 0.1.19 (Li et al., 2009) and Picard
(http://broadinstitute.github.io/picard/) to create *bam files, mark duplicates from the PCRF and
prepare the files to the next phase. We used the GATK 3.8.0 (McKenna et al., 2010) to extract the
indels, SNPs, and do the phasing of sequences. The *vcf files created were exported in other
formats to posterior demographic analyzes. Finally, we filter the loci in the complete and
incomplete *vcf selecting one random SNP per locus from the biallelic SNPs recovered in each
file (script randSnps.pl). In the end, we have two SNPs datasets (matrices), one complete and
incomplete by each species. We implemented all the analysis in this work on the two matrices to
compare the results in each of them. The complete matrices with few (<300 loci by matrix) or zero
loci extracted were excluded from de demographic analyses (see Table 4).

97
Population structure
We inferred population structure from the SNPs matrices for each species using two multivariate
approaches; a Principal Components Analysis – PCA – with the R packages adegenet/ape
(Jombart, 2008 and Paradis et al., 2004), and a coefficients of mixture analyses with sNMF in the
R package LEA (Frichot et al., 2014, Frichot & François, 2015). The sNMF analyses were
implemented with the following parameters; five α values (10, 50, 100, 500, 1000), K values of 1
to 10 (K = 1:10), and 100 runs per K value, and the minimum cross-entropy as TRUE to estimate
the best number of K. In the same way, we implemented a Discriminant Analysis of Principal
Components – DAPC – (Jombart et al., 2010) within adegenet package recovering PCs with 80%
of variance, and a maximum of 10 groups.
Species trees and gene trees
We ran three million iterations in SNAPP (Bryant et al., 2012) in two runs to identify the
relationships among the clusters recovered in the PCA/sNMF analyzes using the SNPs extracted
from the UCEs for each species. We evaluated the ESS values of the runs with Tracer 1.7.1
(Rambaut et al., 2018), merges the runs with logcombiner, and visualizes the topology with
densitree to (programs from BEAST).

98
Demographic history
For the species with an optimal sampling effort, we used the software momi2 to infer possible
demographic scenarios for each species. momi2 used an SFS file that can be obtained from the
SNPs extracted from the UCEs to infer demographic histories by fitting the observed value of the
SFS to its expected value in a composite likelihood framework (Kamm et al., 2018).
We tested multiple models with different demographic scenarios for the populations of each
species based on the results of PCA/DAPC/sNMF and SNAPP analyzes (see Figure 2), and the
most informative were selected using the Akaike Information Criterion (AIC, Akaike, 1973). In
general, we tested models that (a) are framed into the main hypothesis of diversification proposed
(e.g. Refuge, Rivers hypotheses), models depicting (b) events of migration among the populations
proposed for the taxa, (c) the effects glacial periods during the Pleistocene (Last Glacial Maximum,
LGM), and (d) levels of population expansion. For each model (in each series of runs), we
implemented 100 runs to avoid suboptimal results. With the run with the highest likelihood for
each model, we evaluate the relative weight of the best model the Akaike Information Criterion
(AIC, Akaike, 1973). In the same way, we run 100 bootstraps simulations to estimate confidence
intervals of the parameters in the best model chosen in the AIC. Finally, based in the most
informative models for each species, we looked for common scenarios across taxa that could
explain a common history underlaying circum-Amazonian distributions.

99
Results
mtDNA preliminary analyses and times of divergence
In general, we found evidence of considerable intraspecific genetic variation across taxa with
signatures of recent population expansions (but see L. nematura and T. ruficapillus/torquatus
complex). Haplotype networks are congruent with this signal in depicting geographical structure
(see Figure S1 – S3) and Tables S3-S22 for a summary of these results).
Maximum likelihood and Bayesian gene tree estimation approaches (from this point, called ML
and BI analyses, respectively, see Figures 3a – 3c and S4 – S7) recovered all species as
monophyletic, except for the T. palliatus/tenuepunctatus and T. ruficapillus/torquatus complexes,
wherein current taxonomy is not in agreement with our results. In the first case, T. tenuepunctatus
is embedded within the Andean clade of T. palliatus (northernmost individuals in the central
Andes). In the second case, the T. ruficapillus from southern Atlantic Forest is more closely-related
to the T. torquatus than it is to other T. ruficapillus Andean and Chacoan (see Figures 3a – S5).
In general, the ML and BI topologies across taxa give rise to some commonalities across
taxa. First, there is a deep division between the Andean and Atlantic Forest populations (L.
nematura, P. rufum, T. caerulescens and T. ruficapillus/torquatus complex) and persistent and
well-supported clades restricted to the central and southern Atlantic Forest (D. mentalis, L.
nematura, P. mystaceus, P. rufum and T. caerulescens). Furthermore, we were able to identify
isolated and divergent populations restricted to the northern Atlantic Forest (P. mystaceus and T.
caerulescens).

100
Divergence times of Thamnophilid species (D. mentalis, T. caerulescens, T.
palliatus/tenuepunctatus and T. ruficapillus/torquatus) from their outgroups varied from the Late
Miocene to the Middle Pleistocene, with posterior divergences occurred since the early
Pleistocene. For the Furnariid species (L. nematura and P. rufum) and P. mystaceus divergence
starts in the Miocene/Pliocene, while the Xiphocolaptes complex have a most recent and rapid
diversification, starting in the Calabrian (from X. ocellatus) and the Middle Pleistocene. A
common pattern is a high rate of diversification from the early/middle Pleistocene in all taxa (see
Figure 3a – 3c).
UCE statistics and sequencing
UCEs sequencing, considering the samples from the 8 species complexes, resulted in an average
of 4,139,618 (min=72,929, max=13,782,612) read pairs per sample after trimming with
Illumiprocessor; after assembling the reads we gathered an average of 12,441.86 UCEs contigs
with a mean coverage (x) of 18.66 (see Tables 5 – 6). In the end, we processed and analyzed 302
UCEs samples.
Population Structure in circum-Amazonian Passerines
Based on the geographical distributions and population structure of each species analyzed here,
we identified three common demographical units (Figures 4 – 5). Maybe the most persistent unit
is the central-southern Atlantic Forest cluster(s), shared by populations of almost all species
analyzed (D. mentalis, T. caerulescens, the T. ruficapillus/torquatus complex, P. mystaceus, L.

101
nematura, P. rufum, the species albicollis in the Xiphocolaptes complex). In these species, all
analyzes recovered this cluster (PCA/DAPC, sNMF), with a considerable level of admixture in
some species with populations of adjacent areas like the northern Atlantic Forest (e.g. T.
ruficapillus/torquatus complex) and the central Andean regions (P. mystaceus, T. caerulescens).
In addition, for D. mentalis and P. mystaceus, sNMF runs showed admixture between the central-
southern Atlantic Forest and individuals of the Tepuis region (see Figures 5a and 5g).
A second main unit, recovered in T. caerulescens and P. mystaceus, was a northern Atlantic
Forest cluster from the forested remnants of the Atlantic Forest ecoregion in the states of Alagoas
and Pernambuco in Brazil (‘Pernambuco Endemism Centre’, see Figures 4b/5g – 4b/5g). In this
area we observe signatures of admixture between the central-southern Atlantic Forest and central
Andean populations in T. caerulescens, and with populations from the eastern Amazonian, Bolivia,
and the Tepuis in P. mystaceus.
We also identified a complex of ‘Andean’ cluster across all taxa not as geographically
delimited as in the previous two clusters. We identified a ‘complete’ Andean cluster that covers
the northern/central Andes including the Tepuis and Central America regions (see maps of D.
mentalis and P. mystaceus, and P. rufum in Figures 4a/5a – 4f/5f – 4g/5g). In the same way,
populations from T. caerulescens and the T. ruficapillus/torquatus complex shared a central
Andean cluster from northern Argentina/Bolivia to central Peru (Figures 4b/5b – 4d/5d). Finally,
a northern Peru cluster was recovered by Lochmias nematura T. palliatus/tenuepunctatus complex
populations (Figures 4c/5c – 4e/5e).
sNMF analyses inferred a substantial level of admixture in the Andean clusters, mainly in
individuals from two areas (Figures 5a – 5c – 5g – 5h). A first area from Bolivia to southern Peru
as result of the contact between the southern Atlantic Forest and the Central Andean populations

102
of species with a continuous distribution like D. mentalis, T. caerulescens, and P. mystaceus. A
second contact zone is that between the northern and the central Andes (maybe influenced by the
Huancabamba depression) that showed considerable admixture with forested areas of Brazil (D.
mentalis) or with adjacent regions like central Andes, Central America and the Tepuis (L.
nematura, P. mystaceus, Xiphocolaptes and T. palliatus/tenuepunctatus complexes. In some
species, the number of optimal clusters inferred by sNMF was ambiguous due to very close values
of cross-entropy estimates (see Tables S23-S30). In this case, we used the results from PCA/DAPC
analyses and identified common results among all them (PCA/DAPC + sNMF). We summarized
the results of the admixture analyses performed in sNMF the Figure 6a-6b.
Species trees
In general, the topologies recovered by SNAPP showed high support for all scenarios/species
analyzed (>60%). We identified an Andean – forested Brazilian regions sister relationship, except
for D. mentalis, T. caerulescens, and Xiphocolaptes complex (Figures 7a – 7b). For D. mentalis, a
northern Brazilian clade (subspecies emiliae) and its closest relative (subspecies affinis) are sisters
to a comprehensive Andean clade (northern/central Andes + Tepuis + Central America). In turn,
this clade is sister to the mentalis from the central-southern Atlantic Forest region (Figure 7a). In
the Xiphocolaptes complex, the four scenarios tested (three to six clusters), showed mixed results,
but it is clear that X. albicollis is monophyletic (see Figures 7b and S9). For T. caerulescens, the
central Andean and the southern Atlantic Forest clades formed a clade, related to a third group
from the northern Atlantic Forest region (see Figure 7a).

103
The phylogenetic relationships of clades from the eastern part of the circum-Amazonia
distributional pattern (here ‘the lowland forested areas south and east of the lowland forests of
Amazonia’ sensu Remsen et al., 1991) present some commonalities. A first pattern identified for
the P. mystaceus and T. ruficapillus/torquatus complexes showed the sister relationship between
the clades from the northeastern and the central/southern forested regions in Brazil. Also a second
sister relationship between the Atlantic Forest populations of L. nematura and T.
palliatus/tenuepunctatus with clades from forested areas of eastern Amazonia and Tepuis (a
northern connection, see Figures S8 – S9).
Similarly, we identified common patterns in the western portion of the circum-Amazonian
region. First, a central Andean group with two sub-clades, a north central and a south-central
Andean clades, from northern to central Peru and from here to northern Argentina (south Bolivia),
present in the L. nematura and T. palliatus/tenuepunctatus complex. Secondly, a most ‘extended’
clade, covering the Andes plus adjacent areas like the Tepuis and individuals from Central America
in D. mentalis, P. mystaceus, Xiphocolaptes complex (Figures 7a – 7b).
Demographic modelling
Due to the scarce sampling effort for some species analyzed (see Fig. S2a – S2h), we only
conducted the demographic analyses of the antbird taxa (D. mentalis, T. caerulescens, the T.
palliatus/tenuepunctatus and T. ruficapillus/torquatus complexes from Thamnophilidae), each
with a three population scheme (based on the populational structure analyses).
We identified commons patterns among the best models inferred by momi2 for each species
(Figure 8). Detailed results for each species complex with AIC and parameters values can be found

104
on table (see Tables 7 – 10). In general, the models presented bidirectional migration among their
populations, but with relatively low rates of migration (maximum values 25% - 36% in T.
palliatus/tenuepunctatus complex model). For T. palliatus/tenuepunctatus complex and D.
mentalis, the rate of migration is higher from the populations of forested areas in Brazil to the
Andean region that in the opposite direction. In T. caerulescens and the T. ruficapillus/torquatus
complex, the higher migration rates seem to occur between the southern Atlantic Forest and
Andean populations, congruent some results of the admixture analyses of sNMF, where
populations from the connection between the regions have a ‘high’ levels of admixture (Figure 5).
Mean divergence times also was inferred in these models, the populations of the four antbird
species seems have a starting point of divergence in the Pleistocene, from early Gelasian (T.
ruficapillus/torquatus complex) to Middle Pleistocene (T. caerulescens), similar to the found by
BEAST in the ND2 analyses. Finally, the time of the events of migration among the populations
also were estimated, and for three species (less T. caerulescens) these ‘pulses’ happened prior the
Last Glacial Maximum (LGM) (Figure 8).

105
Discussion
Population structure of circum-Amazonian Passerines
In this first phylogeograhic approach to the circum-Amazonian distributional pattern, we found
considerable level of populational structure in the species cohabiting this distribution, well-
supported phylogroups and certain geographical congruence. In general, the identified clusters fit
with biogeographical units proposed in diverse type of studies and taxonomic groups (Bates et al.,
1998; Morrone, 2001; Silva et al., 2004; Dinerstein et al., 2017), and the phylogenetic relationships
among the populations of almost all species showed a ‘common’ pattern.
First, we identified two main regions in the circum-Amazonian distributional pattern, the
Andean and the Brazilian forested populations. This division can be ‘strict’ like P. rufum, L.
nematura or T. ruficapillus/torquatus complex, with a clear separation between the two units with
no admixture, or a relaxed like T. caerulescens, D. mentalis, and P. mystaceus, with intermediate
clusters, contact zones and a considerable level of gene flow. Hybridization and clinal variation
have been documented for these regions for T. caerulescens and D. mentalis (Todd, 1916;
Brumfield, 2005; Isler et al., 2005; Zimmer & Isler, 2019a), species with a continuous distribution
along of a southern arch of the circum-Amazonian distribution (central Andes southern
Atlantic Forest/SDTFs connections). In turn, the presence of geographical variation/hybrid zones
seems be influenced by latitudinal gradients, geological events, climatic variations during the
Pleistocene, and secondary contact among isolated populations (Miller et al., 2010b; Herzog &
Kattan, 2011; Luebert & Weigend, 2014; Chattopadhyay et al., 2017; Polato et al., 2018).

106
Within the Brazilian forested regions, our analyses inferred other phylogeographic subunits,
mainly related to the Atlantic Forest ecoregion. This forested areas have been continuously
proposed as a region with high-levels of biodiversity, endemism, and a priority hotspot for
conservation efforts (Myers et al., 2000). In addition, the populational analyses defined the
northern portion of the Atlantic Forest as an independent cluster from the central-southern regions
(see T. caerulescens, P. mystaceus). A refuge in this region during the Quaternary (Pernambuco
refuge, see Carnaval & Moritz, 2008; Carnaval et al., 2009), and the presence of the Rio São
Francisco as barrier can have potential effect in the isolation of this region from the
central/southern Atlantic Forest (but see Carnaval & Moritz, 2008; Carvalho et al., 2017).
The demographic patterns in the Andean unit of the circum-Amazonia distribution is more
complex, and the sampling effort did not allow us to make solid inferences about its populational
structure and phylogenetic relationships (samples from Colombia, Venezuela, Ecuador and Tepuis
were scarce). However, the clusters identified in this region present similarities to the identified
by previous works. Morrone & Uturbey (1997) identified a northern Peru area of endemism (our
cluster from northern to central Peru) in a cladistics analysis about the historical biogeography of
the northern Andes (see also Morrone, 1994). In addition, several authors considered this area as
a ‘transitional zone’ between the northern and Central Andes (see Berry, 1982; Weigend, 2002).
In this zone, the presence of the Huancabamba Depression is considered as a geographical barrier
that prevents the passage of organisms through the mountainous chain. However, the isolation
effect of this barrier does not seem relevant for certain groups as some amphibians and reptiles as
the same species have a continuous distribution at both sides of the depression (Duellman, 1979).
In the same way, similar analyses identified our central Andes cluster (central Peru to northern

107
Argentina/Bolivia) as part of a biogeographical unit and possibly an important center of speciation
(Cracraft, 1985; Morrone, 2014; Perez-Escobar et al., 2017).
Species trees and phylogenetics patterns
Similar to the populational structure results, the phylogenetic relationship of the circum-
Amazonian taxa analyzed here suggest certain level of geographical congruence. In the Brazilian
forested populations were identified two clades, the northern and the central – southern Atlantic
Forest groups, previously identified in phylogenetic reconstructions using toads and birds (Thomé
et al., 2010; Batalha-Filho et al., 2013). However, we found that the species with a complete
distribution in the Atlantic Forests regions (and adjacent forested areas) do not have a sister
relationship between the two clades (see D’Horta et al., 2011; Franco et al., 2017 for examples
with sister relationship between these two areas). In P. mystaceus, the central – southern clade is
closest to the eastern-forested area of Amazonia (subspecies cancromus) that to the niveigularis
clade (northern Atlantic Forest clade). In similar way, SNAPP inferred that in D. mentalis, the
emiliae clade (northern Atlantic Forest + eastern Amazonia) as most related to the affinis clade
(SDTFs south of Amazonia) that with the central – southern Atlantic Forest group. These results
are congruent with studies of taxa with Atlantic Forest distribution (Carvalho et al., 2017; Lima et
al., 2018; Machado et al., 2018).
The phylogenetic relationship within the Andean clusters seems defined in SNAPP, with
the northern Peru and the central Andes clusters being monophyletic and related to the eastern-
forested areas (but see ND2 results). In the same way, previous analyses showed that these two
areas are part of a central Andean subunit (Berry, 1982; Morrone & Uturbey, 1997). However, the

108
relationships of the Andean unit with adjacent areas are not clear, maybe due to the missing
samples in the northern Andes or the evolutionary complexity of the region. The reviewed
literature identified the Tropical Andes as a complex geological/biogeographical unit, including
areas the mountainous region of Venezuela but not the Tepuis (Gansser, 1973; Rivas-Martinez,
1983; Graham, 2009). Borges et al. (2018) concluded that the Pantepui region a biogeographic
unit separated from the Andes, with probable past interconnections with the northern Andes
(Bonaccorso & Guayasamin, 2013). On the other hand, Dal Vechio et al. (2018) found a highly
supported sister relationship between Atlantic Forest and Tepuis populations of Bothrops
bilineatus, with a diversification from the Guiana shield to the northern Atlantic Forest via a forest
corridor in the northeastern South America, also in concordance with the inferred by Lovette
(2004) for Phaeothlypis populations. In relation to the Andes – Central American regions, the
species covers this distribution showed two results, in D. mentalis the Andes + Central American
samples forms a unique cluster, while P. mystaceus and the Xiphocolaptes complex presented a
Central American and north Andean clusters.
Demographic modeling and the rise of the circum-Amazonian distribution
Summarizing the populational structure and modelling analyses, the formation of a circum-
Amazonian distributional pattern can be explained by two not exclusive types of
expansion/diversification: a diversification via forested areas north to the Amazon forested
lowlands (northern diversification, via Tepuis), and a southern diversification, via forested
lowlands of east/southern Brazil joining to the Andes.

109
Using as reference the models inferred for the thamnophilid species and their geographical
distribution, a southern diversification seems more probable, with initial populations from forested
regions from Brazil – e.g. Atlantic Forest ecoregion – expanding to southwest to central Andes (in
T. caerulescens, D. mentalis, and the T. palliatus/tenuepunctatus complex), congruent with the
proposed by Chapman (1926). Brumfield & Edwards (2007) also suggested that the Andean
populations (at least for T. caerulescens) represents a secondary invasion of the species via a ‘forest
bridge’ between the southeastern Brazil and the central Andes. Multiple authors studied these
possible connections between Andes and Atlantic Forest (Batalha-Filho et al., 2013; Trujillo-Arias
et al., 2017; Cabanne et al., 2019). In a work about the biotic interchange between the Amazonian
and the Atlantic Forest regions, Ledo & Colli (2017) concluded that a southern route (southeastern
forested western Amazonian areas) were the most probable scenario to explain the connection
between these regions, this same scenario can be framed into the central Andes southern
Atlantic Forest connection(s).
Among the hypotheses proposed to explain the diversification in the Neotropics
summarized in the introduction, these models seems fit with the presence of refuges/forested spots
interconnected during the climatic fluctuations in the Pliocene – Pleistocene (Refugia Hypothesis,
Haffer, 1969, Vanzolini & Williams, 1970), allowing partial isolations and intermittent gene flow
among their populations, and proliferation of new lineages (see Figures 9 – 11). From this proposal
in 1969, several authors used the climatic fluctuations during the Cenozoic as explanation for
diversification of lineages of multiple groups for the Amazonian (Richardson et al., 2001; Silva et
al., 2018; Pupim et al., 2019), and non-Amazonian biotas (Madriñan et al., 2013; Thomaz et al.,
2015; Pérez-Escobar et al., 2017; García-Vázquez et al., 2017).

110
Another hypothesis, the Pleistocene Arch Hypothesis, can to explain the diversification of
the species modelled (PAH, Prado & Gibbs, 1993; ‘PAT’ in Mogni et al., 2015). In PAH, a
continuum of relatively stable areas of non-Amazonian forests (Seasonally Dry Tropical Forests –
SDTFs) allows the migration and colonization of taxa during the Cenozoic. For instance, in the
phylogeographic pattern of D. mentalis and the T. palliatus/tenuepunctatus complex, the SDTFs
to south of the Amazonian forests could be serve as a corridor between the northeastern forested
areas of Brazil and the central Andes during the Pleistocene (see Figure 9a – 9b). SNAPP/sNMF
supported this configuration, with continuous populations forming an ‘arch’ around of the
Amazonian rainforest region. Despite the lack of widespread support of this hypothesis (see Mogni
et al., 2015), some authors have supported PAH as a driver in the diversification in the Neotropics
(Collevatti et al., 2012; Florentín et al., 2018), mainly using species of plants. On the other hand,
the presence of refuges has more theoretical/empirical support in the reviewed literature (see
Werneck et al., 2011; Arruda et al., 2018). For the species of Thamnophilidae analyzed here, the
models fit better a refugia scenario, and for species like D. mentalis and the T.
palliatus/tenuepunctatus complex, further methodological approaches are yet needed to elucidate
this question.
Regarding divergence times, the four species of Thamnophilidae analyzed by momi2 showed
events of diversification in the Pleistocene (but see T. ruficapillus/torquatus). These results were
congruent with the BEATS analyses (mtDNA) and in general with the divergence times for others
Thamnophilidae (e.g. Choueri et al., 2017; Ribas et al., 2018). In momi2, the estimation of
divergence times seems very dependent of other parameters in the models (specially the
populational size, Ne), and it is necessary to be careful in the construction of the initial models.
Additionally, due to the fact that UCEs do not have just one rate of substitution like the ND2 gene

111
(a UCE contains hundreds of loci with hundreds of possible rates) a comparison of the times of
divergence between mtDNA and UCEs analyses could be difficult. We tried to minimize these
problems by testing multiple Ne values for the initial models, and used the substitution rate
proposed by Nadachowska-Brzyska et al. (2015).
Some taxonomic and phylogenetic considerations of circum-Amazonian Passerines
The T. ruficapillus/torquatus complex was challenging to frame in the patterns explained so far.
This taxonomic complex is a not monophyletic group, with the southern populations of T.
ruficapillus being closest to T. torquatus (sNMF identified hybrid individuals between these two
clusters) that with the Andean populations of the same taxon, result supported by mtDNA and
UCEs information. In the reviewed literature, there are not studies specifically about this complex.
In their work about the genus Thamnophilus, Brumfield & Edwards (2007) found that in the group
called the ‘barred clade’, the ruficapillus/torquatus complex was indeed a monophyletic group,
with a common ancestor that could be a highland-restricted or a lowlands-to-highlands taxon. A
possible scenario is that of “lowlands-to-highlands” origin from the southern Atlantic Forest region
moving west to the central Andes (Andean ruficapillus populations) and north to the forested areas
in central/northern Brazil, with posterior isolation of the morphologically differentiated T.
torquatus. A recent secondary contact could explain the hybrid zone between the southern T.
ruficapillus and the T. torquatus populations. A deeper analysis of this complex that include
taxonomy, ecology and evolutionary will be important to elucidate what is going on in these
species.

112
In the Thamnophilus palliatus/tenuepunctatus complex, the populational analyses presented not
recognizable differences between the two species (but see the ND2 topologies). The only two
samples of T. tenuepunctatus (extreme northern Peru and southern Ecuador) fall into the northern
Peru cluster of T. palliatus, but with high levels of admixture (sNMF analysis). In the same way,
the sample collected in eastern Colombia (department of Vichada), a locality outside of the species
distributions, seems to be part of the Amazonian cluster, possibly representing an undescribed
taxon. Based on the handbook of the Birds of the World (HBW, Zimmer & Isler, 2019b), the
species have adjoining ranges with no apparent barriers and no intergradation. However, our
results imply a possible contact zone and hybridization at a genetic level. A better sampling effort
help to clarify this complex.
In the Xiphocolaptes complex, all structural analyses support the existence of a X. albicollis
cluster/clade (from Atlantic Forest ecoregion), being the only taxon recovered as an independent
unit within the complex. In the same way, X. falcirostris seems be an independent cluster, but fails
in the DAPC analyses and one scenario of sNMF, doing part of a cluster including the
promeropirhynchus samples from the Tepuis and lowland samples of Central America.
The phylogenetic relationships in Xiphocolaptes are obscure. Nevertheless, we recovered X.
albicollis as a well-supported clade consistent in all scenarios tested by SNAPP (see Figures 7b –
S7). In addition, we recovered a well-supported clade formed by the Andean cluster of X.
promeropirhynchus (promeropirhynchus group of Marantz et al. 2019) and X. major, in
concordance with the found by Raikow (1994) and Derryberry et al. (2011). X. falcirostris was
also recovered by the analysis. Finally, T. promeropirhynchus is not monophyletic, but, like
proposed by Marantz et al. (2019), this species can be divided in three groups, an Andean clade
(including montane individuals of Central America + X. major), a Amazonian, and a lowlands of

113
central America (plus Tepuis) clade. Like the two anterior complexes, other type of information
will be useful to resolve the taxonomy/systematics of this group of species.
Conclusions
In this first phylogeographic comparative approach to the understanding of the circum-Amazonian
distributional pattern using genomic data of Passerines, we found general congruence among the
populational structure, phylogenetic relationships, and demographic histories of the taxa analyzed.
We defined two main units: the Andean and the Brazilian forested phylogeographic region(s),
disjointed complete or partially via a northern (northern Andes Tepuis Atlantic Forest)
or southern interconnection (southern Atlantic Forest central Andes). Contact zones among
clusters included individuals with considerable levels of admixture, supports the possibility of
events of hybridization among populations, mainly in the northern – southern interconnections.
Species trees analyses inferred well-supported clades from central/southern and northern Atlantic
Forest populations. In the same way, we identified central Andean clades (northern Peru and
central Peru - Bolivia), but a bigger sampling effort will be necessary in the north Andean region.
Demographic histories of the Thamnophilidae taxa seems to be product of a recent diversification
with climatic fluctuations throughout the Quaternary as its main influence, fitting into a Refugia
context previously proposed by other authors. However, at least to D. mentalis and the
Thamnophilus palliatus/tenuepunctatus complex, alternative hypotheses (like corridors of STDFs
vegetation during the Pleistocene) could not be discarded. In addition, our results raise new
question about the taxonomy and systematics of the circum-Amazonian species (the T.
ruficapillus/torquatus, T. palliatus/tenuepunctatus, and the Xiphocolaptes complexes). Future

114
studies about the circum-Amazonian distribution have to cover other taxonomic groups outside
Aves, phenotypic and ecological data, and the implementation of comparative methodologies that
can include all those parameters for estimation of demographic/evolutionary scenarios that explain
in deep the past and current dynamics of the circum-Amazonian distributional pattern.

115
References
Akaike, H. (1973). Information theory and an extension of the maximum likelihood principle.
International Symposium Information on theory Information and an extension Theory, (pp. 267–
281).
Altschul, S. F., Gish, W., Miller, W., Myers, E. W., & Lipman, D. J. (1990). Basic local alignment
search tool. Journal of Molecular Biology, 215(3), 403 – 410.
Arbogast, B. S. & Kenagy, G. J. (2001). Comparative phylogeography as an integrative approach
to historical biogeography. Journal of Biogeography, 28, 819–825.
Arruda, D. M., Schaefer, C. E. G. R., Fonseca, R. S., Solar, R. R. C., & FernAndes-Filho, E. I.
(2018). Vegetation cover of Brazil in the last 21 ka: New insights into the Amazonian refugia and
Pleistocenic Arc Hypotheses. Global Ecology and Biogeography, 27, 47–56.
Bandelt, H.-J., Forster, P., & Röhl, A. (1999). Median-joining networks for inferring intraspecific
phylogenies. Molecular Biology and Evolution, 16(1), 37–48.
Barker, B. S., Rodríguez-Robles, J. A., & Cook, J. A. (2015). Climate as a driver of tropical insular
diversity: comparative phylogeography of two ecologically distinctive frogs in Puerto Rico.
Ecography, 38(8), 769–781.
Batalha-Filho, H., Irestedt, M., Fjeldså, J., Ericson, P. G. P., Silveira, L. F., & Miyaki, C. Y. (2013).
Molecular systematics and evolution of the Synallaxis ruficapilla complex (Aves: Furnariidae) in
the Atlantic Forest. Molecular Phylogenetics and Evolution, 67, 86–94.
Bates, J. M. (1997). Distribution and geographic variation in three South American grassquits
(Emberizinae, Tiaris). Ornithological Monographs, 48, 91–110.

116
Bates, J. M., Hackett, S. J., & Cracraft, J. (1998). Area-relationships in the Neotropical lowlands:
an hypothesis based on raw distributions of passerine birds. Journal of Biogeography, 25, 783–
793.
Bejerano, G., Pheasant, M., Makunin, I., Stephen, S., Kent, W. J., Mattick, J. S., & Haussler, D.
(2004). Ultraconserved elements in the human genome. Science, 304, 1321–1325.
Bermingham, E. & Avise, J. C. (1986). Molecular zoogeography of freshwater fishes in the
southeastern United States. Genetics, 113, 939–965.
Berry, P. E. (1982). The systematics and evolution of Fuchsia sect. fuchsia (Onagraceae). Annals
of the Missouri Botanical Garden, 69, 1–198.
Bolger, A. M., Lohse, M., & Usadel, B. (2014). Trimmomatic: A flexible trimmer for illumina
sequence data. bioinformatics. Bioinfor, 30(15), 2114–2120.
Bonaccorso, E. & Guayasamin, J. M. (2013). On the origin of pantepui montane biotas: A
perspective based on the phylogeny of Aulacorhynchus toucanets. PLoS ONE, 8(6), e67321.
Borges, S. H., Santos, M. P. D., Moreira, M., Baccaro, F., Capurucho, J. M. G., & Ribas, C. (2018).
Dissecting bird diversity in the pantepui area of endemism, northern South America. Journal of
Ornithology, 159(4), 1073–1086.
Bouckaert, R., Heled, J., Kühnert, D., Vaughan, T., Wu, C.-H., Xie, D., Suchard, M. A., Rambaut,
A., & Drummond, A. J. (2014). Beast 2: A software platform for bayesian evolutionary analysis.
PLOS Computational Biology, 10(4), 1–6.
Brown, K. S. (1979). Ecologia Geográfica e Evolução nas Florestas Neotropicais. Universidade
Estadual de Campinas.

117
Brumfield, R. T. (2005). Mitochondrial variation in Bolivian populations of the variable Antshrike
(THAMNOPHILUS CAERULESCENS). The Auk, 122(2), 414–432.
Brumfield, R. T. & Edwards, S. V. (2007). Evolution into and out of the Andes: A bayesian
analysis of historical diversification in Thamnophilus antshrikes. Evolution, 61, 346–367.
Brumfield, R. T., Tello, J. G., Cheviron, Z., Carling, M. D., Crochet, N., & Rosenberg, K. V.
(2007). Phylogenetic conservatism and antiquity of a tropical specialization: Army-ant-following
in the typical antbirds (Thamnophilidae). Molecular Phylogenetics and Evolution, 45, 1–13.
Bryant, D., Bouckaert, R., Felsenstein, J., Rosenberg, N. A., & RoyChoudhury, A. (2012).
Inferring species trees directly from biallelic genetic markers: Bypassing gene trees in a full
coalescent analysis. Molecular Biology and Evolution, 29(8), 1917–1932.
Cabanne, G. S., Campagna, L., Trujillo-Arias, N., Naoki, K., Gómez, I., Miyaki, C. Y., Santos,
F. R., Dantas, G. P. M., Aleixo, A., Claramunt, S., Rocha, A., Caparroz, R., Lovette, I. J., &
Tubaro, P. L. (2019). Phylogeographic variation within the buff-browed foliage-gleaner (Aves:
Furnariidae: Syndactyla rufosuperciliata) supports an Andean-Atlantic forests connection via the
Cerrado. Molecular Phylogenetics and Evolution.
Camacho, C., Coulouris, G., Avagyan, V., Ma, N., Papadopoulos, J., Bealer, K., & Madden, T. L.
(2009). Blast+: architecture and applications. BMC Bioinformatics, 10(1), 421.
Canals, G. & Johnson, K. (2000). A new species of Angulopis (Lycaenidae, Eumaeini) from relict
coastal forest in east-central Argentina. The taxonomic report of the International Lepidoptera
Survey, 2(3), 1–5.
Carnaval, A. C., Hickerson, M. J., Haddad, C. F. B., Rodrigues, M. T., & Moritz, C. (2009).
Stability predicts genetic diversity in the Brazilian Atlantic Forest hotspot. Science, 323(5915),
785–789.

118
Carnaval, A. C. & Moritz, C. (2008). Historical climate modelling predicts patterns of current
biodiversity in the Brazilian Atlantic Forest. Journal of Biogeography, 35(7), 1187–1201.
Carvalho, C. D. S., Nascimento, N. F. F. D., & Araujo, H. F. P. D. (2017). Bird distributional
patterns support biogeographical histories and are associated with bioclimatic units in the Atlantic
Forest, Brazil. Zootaxa, 4337(2), 223–242.
Chapman, F. M. (1926). The distribution of bird-life in Ecuador. Bull. Am. Mus. Nat. Hist., 55, 1–
784. chapman.1926_p87.
Chattopadhyay, B., Garg, K. M., Gwee, C. Y., Edwards, S. V., & Rheindt, F. E. (2017). Gene flow
during glacial habitat shifts facilitates character displacement in a Neotropical flycatcher radiation.
BMC Evolutionary Biology, 17(1), 210.
Choueri, É. L., Gubili, C., Borges, S. H., Thom, G., Sawakuchi, A. O., Soares, E. A. A., & Ribas,
C. C. (2017). Phylogeography and population dynamics of antbirds (Thamnophilidae) from
Amazonian fluvial islands. Journal of Biogeography, (pp. n/a–n/a).
Colinvaux, P. A., Oliveira, P. E. D., & Bush, M. B. (2000). Amazonian and Neotropical plant
communities on glacial time-scales: The failure of the aridity and refuge hypotheses. Quaternary
Science Reviews, 19, 141–169.
Collevatti, R. G., Terribile, L. C., Lima-Ribeiro, M. S., Nabout, J. C., de Oliveira, G., Rangel,
T. F., Rabelo, S. G., & Diniz-Filho, J. A. F. (2012). A coupled phylogeographical and species
distribution modelling approach recovers the demographical history of a Neotropical seasonally
dry forest tree species. Molecular Ecology, 21(23), 5845–5863.
Cracraft, J. (1985). Historical biogeography and patterns of differentiation within the South
American avifauna: areas of endemism. Ornithological Monographs, 36, 49–84.

119
D’horta, F. M., Cabanne, G. S., Meyer, D., & Miyaki, C. Y. (2011). The genetic effects of late
Quaternary climatic changes over a tropical latitudinal gradient: diversification of an Atlantic
forest passerine. Molecular Ecology, 20(9), 1923–1935.
Dal Vechio, F., Prates, I., Grazziotin, F. G., Zaher, H., & Rodrigues, M. T. (2018). Phylogeography
and historical demography of the arboreal pit viper Bothrops bilineatus (Serpentes, Crotalinae)
reveal multiple connections between Amazonian and Atlantic rain forests. Journal of
Biogeography, 45(10), 2415–2426.
Darlington, Jr., P. J. (1959). Area, climate, and evolution. Evolution, 13(4), 488–510.
Darriba, D., Taboada, G. L., Doallo, R., & Posada, D. (2012). jmodeltest 2: more models, new
heuristics and parallel computing. Nature Methods, 9(8), 772.
Derryberry, E. P., Claramunt, S., Derryberry, G., Chesser, R. T., Cracraft, J., Aleixo, A., Pérez-
Emán, J., Remsen, J. V., & Brumfield, R. T. (2011). Lineage diversification and morphological
evolution in a large-scale continental radiation: The Neotropical ovenbirds and woodcreepers
(Aves: Furnariidae). Evolution, 65(10), 2973–2986.
Dinerstein, E., Olson, D., Joshi, A., Vynne, C., Burgess, N. D., Wikramanayake, E., Hahn, N.,
Palminteri, S., Hedao, P., Noss, R., Hansen, M., Locke, H., Ellis, E. C., Jones, B., Barber, C. V.,
Hayes, R., Kormos, C., Martin, V., Crist, E., Sechrest, W., Price, L., Baillie, J. E. M., Weeden, D.,
Suckling, K., Davis, C., Sizer, N., Moore, R., Thau, D., Birch, T., Potapov, P., Turubanova, S.,
Tyukavina, A., de Souza, N., Pintea, L., Brito, J. C., Llewellyn, O. A., Miller, A. G., Patzelt, A.,
Ghazanfar, S. A., Timberlake, J., Klöser, H., Shennan-Farpón, Y., Kindt, R., Lillesø, J.-P. B.,
van Breugel, P., Graudal, L., Voge, M., Al-Shammari, K. F., & Saleem, M. (2017). An ecoregion-
based approach to protecting half the terrestrial realm. BioScience, (pp. 1–12).

120
Drummond, A. J., Suchard, M. A., Xie, D., & Rambaut, A. (2012). Bayesian phylogenetics with
beauti and the Beast 1.7. Molecular Biology and Evolution, 29(8), 1969–1973.
Duellman, W. E. (1979). The herpetofauna of the Andes: Patterns of distribution, origin,
differentiation, and present communities. In The South American Herpetofauna: It’s Origin,
Evolution and Dispersal, chapter 15, (pp. 371–460). Number 7. The Museum of Natural History,
University of Kansas.
Endler, J. (1982). Pleistocene forest refuges: fact or fancy? In Biological Diversification in the
Tropics, chapter 35, (pp. 641–657). New York: Columbia University Press.
Erwin, T. L. (2000). Arboreal beetles of Neotropical forests: Taxonomic supplement for the Agra
virgata and ohausi groups with a new species and additional distribution records (Coleoptera:
Carabidae). The Coleopterists Bulletin, 54(2), 251–262.
Faircloth, B. C. (2013). illumiprocessor: a trimmomatic wrapper for parallel adapter and quality
trimming.
Faircloth, B. C. (2016). Phyluce is a software package for the analysis of conserved genomic loci.
Bioinformatics, 32(5), 786–788.
Faircloth, B. C., Branstetter, M. G., White, N. D., & Brady, S. G. (2015). Target enrichment of
ultraconserved elements from arthropods provides a genomic perspective on relationships among
hymenoptera. Molecular Ecology Resources, 15, 489–501.
Faircloth, B. C., Mccormack, J. E., Crawford, N. G., Harvey, M. G., Brumfield, R. T., & Glenn,
T. C. (2012). Ultraconserved elements anchor thousands of genetic markers spanning multiple
evolutionary timescales. Systematic Biology, 61(5), 717–726.

121
FernAndes, A. M., Wink, M., & Aleixo, A. (2012). Phylogeography of the chestnut-tailed antbird
(Myrmeciza hemimelaena) clarifies the role of rivers in Amazonian biogeography. Journal of
Biogeography, 39, 1524–1535.
Florentín, J. E., Arana, M. D., Prado, D. E., Morrone, J. J., & Salas, R. M. (2018). Diversification
of Galianthe species (rubiaceae) in the Neotropical seasonally dry forests: a case study of a mainly
subshrubby genus. Plant Ecology and Evolution, 151(2), 161–174.
Franco, F. F., Jojima, C. L., Perez, M. F., Zappi, D. C., Taylor, N., & Moraes, E. M. (2017). The
xeric side of the Brazilian Atlantic forest: The forces shaping phylogeographic structure of cacti.
Ecology and Evolution, (pp. n/a–n/a).
Françoso, E., Zuntini, A. R., Carnaval, A. C., & Arias, M. C. (2016). Comparative phylogeography
in the Atlantic forest and Brazilian savannas: pleistocene fluctuations and dispersal shape spatial
patterns in two bumblebees. BMC Evolutionary Biology, 16, 267.
Frichot, E. & François, O. (2015). LEA: An R package for landscape and ecological association
studies. Methods in Ecology and Evolution, 6, 925–929.
Frichot, E., Mathieu, F., Trouillon, T., Bouchard, G., & François, O. (2014). Fast and efficient
estimation of individual ancestry coefficients. Genetics, 196, 973–983.
Gansser, A. (1973). Facts and theories on the Andes: Twenty-sixth William Smith lecture. Journal
of the Geological Society, 129, 93–131.
García-Vázquez, D., Bilton, D. T., Foster, G. N., & Ribera, I. (2017). Pleistocene range shifts,
refugia and the origin of widespread species in western Palaearctic water beetles. Molecular
Phylogenetics and Evolution, 114, 122–136.

122
Garzón-Orduña, I. J., Benetti-Longhini, J. E., & Brower, A. V. Z. (2014). Timing the
diversification of the Amazonian biota: butterfly divergences are consistent with Pleistocene
refugia. Journal of Biogeography, 41, 1631–1638.
Garzón-Orduña, I. J., Benetti-Longhini, J. E., & Brower, A. V. Z. (2015). Competing paradigms
of Amazonian diversification and the Pleistocene refugium hypothesis. Journal of Biogeography,
42, 1349–1363.
Grabherr, M. G., Haas, B. J., Yassour, M., Levin, J. Z., Thompson, D. A., Amit, I., Adiconis, X.,
Fan, L., Raychowdhury, R., Zeng, Q., Chen, Z., Mauceli, E., Hacohen, N., Gnirke, A., Rhind, N.,
di Palma, F., Birren, B. W., Nusbaum, C., Lindblad-Toh, K., Friedman, N., & Regev, A. (2011).
Full-length transcriptome assembly from RNA-Seq data without a reference genome. Nature
Biotechnology, 29(7), 644–652.
Graham, A. (2009). The Andes: a geological overview from a biological perspective. Annals of
the Missouri Botanical Garden, 96(3), 371–385.
Haffer, J. (1969). Speciation in Amazonian forest birds. Science, New Series, 165, 131–137.
Haffer, J. (2008). Hypotheses to explain the origin of species in Amazonia. Brazilian Journal of
Biology, 68(4), 917–947.
Harvey, M. G., Smith, B. T., Glenn, T. C., Faircloth, B. C., & Brumfield, R. T. (2016). Sequence
capture versus restriction site associated DNA sequencing for shallow systematics. Systematic
Biology, 65(5), 910–924.
Herzog, S. K. & Kattan, G. H. (2011). Patterns of Diversity and Endemism in the Birds of the
Tropical Andes. In Climate Change and Biodiversity in the Tropical Andes, chapter 18, (pp. 245–

123
259). Inter-American Institute for Global Change Research (IAI) and Scientific Committee on
Problems of the Environment (SCOPE), Paris.
Hickerson, M. J., Carstens, B., Cavender-Bares, J., Crandall, K., Graham, C., Johnson, J., Rissler,
L., Victoriano, P., & Yoder, A. (2010). Phylogeography’s past, present, and future: 10 years after
Avise, 2000. Molecular Phylogenetics and Evolution, 54, 291–301.
Hooghiemstra, H. & van der Hammen, T. (1998). Neogene and Quaternary development of the
Neotropical rain forest: the forest refugia hypothesis, and a literature overview. Earth-Science
Reviews, 44, 147–183.
Humphries, C. & Parenti, L. (1999). Cladistic Biogeography. Oxford University Press, 2nd ed
edition.
Hurvich, C. M. & Tsai, C.-L. (1989). Regression and time series model selection in small samples.
Biometrika, 76(2), 297–307.
Irmler, U. (2009). New species and records of the genus Lispinus with a key to the species from
peru (Coleoptera: Staphylinidae: Osoriinae). Zootaxa, 2263, 42–58.
Isler, M. L., Isler, P. R., Brumfield, R. T., & Zink, R. M. (2005). Clinal variation in vocalizations
of an antbird (Thamnophilidae) and implications for defining species limits. The Auk, 122(2), 433–
444.
Jombart, T. (2008). adegenet: a R package for the multivariate analysis of genetic markers.
Bioinformatics, 24(11), 1403–1405.
Jombart, T., Devillard, S., & Balloux, F. (2010). Discriminant analysis of principal components: a
new method for the analysis of genetically structured populations. BMC Genetics, 11(1), 94.

124
Kamm, J. A., Terhorst, J., Durbin, R., & Song, Y. S. (2018). Efficiently inferring the demographic
history of many populations with allele count data. bioRxiv.
Katoh, K. & Standley, D. M. (2013). MAFFT Multiple Sequence Alignment Software Version 7:
Improvements in Performance and Usability. Molecular Biology and Evolution, 30(4), 772–780.
Kearse, M., Moir, R., Wilson, A., Stones-Havas, S., Cheung, M., Sturrock, S., Buxton, S., Cooper,
A., Markowitz, S., Duran, C., Thierer, T., Ashton, B., Meintjes, P., & Drummond, A. (2012).
Geneious basic: An integrated and extendable desktop software platform for the organization and
analysis of sequence data. BIOINFORMATICS, 28(12), 1647–1649.
Knapp, S. (2002). Assessing patterns of plant endemism in Neotropical uplands. The Botanical
Review, 68(1), 22–37.
Ledo, R. M. D. & Colli, G. R. (2017). The historical connections between the Amazon and the
Atlantic forest revisited. Journal of Biogeography, 44(11), 2551–2563.
Leigh, J. W. & Bryant, D. (2015). popart: full-feature software for haplotype network construction.
Methods in Ecology and Evolution, 6(9), 1110–1116.
Li, H. (2013). Aligning sequence reads, clone sequences and assembly contigs with bwa-mem.
arXiv.
Li, H. & Durbin, R. (2009). Fast and accurate short read alignment with burrows-wheeler
transform. Bioinformatics, 25(14), 1754–1760.
Li, H., Handsaker, B., Wysoker, A., Fennell, T., Ruan, J., Homer, N., Marth, G., Abecasis, G.,
Durbin, R., & Subgroup. G. P. D. P. (2009). The sequence alignment/map format and samtools.
Bioinformatics, 25(16), 2078–2079.
Lima, M. G., de Sousa e Silva-Júnior, J., Cerný, D., Buckner, J. C., Aleixo, A., Chang, J., Zheng,
J., Alfaro, M. E., Martins, A., Fiore, A. D., Boubli, J. P., & Alfaro, J. W. L. (2018). A

125
phylogenomic perspective on the robust capuchin monkey (Sapajus) radiation: First evidence for
extensive population admixture across South America. Molecular Phylogenetics and Evolution,
124, 137 – 150.
Lougheed, S. C., Gascon, C., Jones, D. A., Bogart, J. P., & Boag, P. T. (1999). Ridges and rivers:
a test of competing hypotheses of Amazonian diversification using a dart-poison frog
(Epipedobates femoralis). Proceedings of the Royal Society of London B: Biological Sciences,
266(1431), 1829–1835.
Lovette, I. J. (2004). Molecular phylogeny and plumage signal evolution in a Trans Andean and
circum Amazonian avian species complex. Molecular Phylogenetics and Evolution, 32, 512–523.
Luebert, F. & Weigend, M. (2014). Phylogenetic insights into Andean plant diversification.
Frontiers in Genetics, 2, 27.
Machado, L. F., Loss, A. C., Paz, A., Vieira, E. M., Rodrigues, F. P., & Marinho-Filho, J. (2018).
Phylogeny and biogeography of Phyllomys (Rodentia: Echimyidae) reveal a new species from the
cerrado and suggest miocene connections of the amazon and Atlantic forest. Journal of
Mammalogy, 99(2), 377–396.
Madriñán, S., Cortés, A. J., & Richardson, J. E. (2013). Páramo is the world’s fastest evolving and
coolest biodiversity hotspot. Frontiers in Genetics, 4, 192.
Maldonado-Coelho, M., Blake, J. G., Silveira, L. F., Batalha-filho, H., & Ricklefs, R. E. (2013).
Rivers, refuges and population divergence of fire-eye antbirds (Pyriglena) in the amazon basin.
Journal of Evolutionary Biology, 26, 1090–1107.
Marantz, C.A., Aleixo, A., Bevier, L.R. & Patten, M.A. (2019). Strong-billed Woodcreeper
(Xiphocolaptes promeropirhynchus). In: del Hoyo, J., Elliott, A., Sargatal, J., Christie, D.A. & de

126
Juana, E. (eds.). Handbook of the Birds of the World Alive. Lynx Edicions, Barcelona. (retrieved
from https://www.hbw.com/node/56609 on 24 July 2019).
Marroig, G. & Cerqueira, R. (1997). Plio-pleistocene South American history and the amazon
Lagoon Hypothesis: a piece in the puzzle of Amazonian diversification. Journal of Comparative
Biology, 2(2), 103–119.
Mayr, E. & O’Hara, R. J. (1986). The biogeographic evidence supporting the Pleistocene forest
refuge hypothesis. Evolution, 40(1), 55–67.
McKenna, A., Hanna, M., Banks, E., Sivachenko, A., Cibulskis, K., Kernytsky, A., Garimella, K.,
Altshuler, D., Gabriel, S., Daly, M., & DePristo, M. A. (2010). The genome analysis toolkit: A
MapReduce framework for analyzing next-generation DNA sequencing data. Genome Research,
20(9), 1297–1303.
Miller, M. A., Pfeiffer, W., & Schwartz, T. (2010). Creating the CIPRES science gateway for
inference of large phylogenetic trees. In Proceedings of the Gateway Computing Environments
Workshop (GCE) (pp. 1–8). New Orleans, LA.
Miller, M. J., Bermingham, E., Klicka, J., Escalante, P., & Winker, K. (2010). Neotropical birds
show a humped distribution of within-population genetic diversity along a latitudinal transect.
Ecology Letters, 13(5), 576–586.
Mogni, V. Y., Oakley, L. J., & Prado, D. E. (2015). The distribution of woody legumes in
Neotropical Dry Forests: the Pleistocene Arc Theory 20 years on*. Edinburgh Journal of Botany,
72(1), 35–60.
Morrone, J. J. (1994). On the identification of areas of endemism. Systematic Biology, 43, 438–
441.

127
Morrone, J. J. & Urtubey, E. (1997). Historical biogeography of the northern Andes: A cladistics
analysis based of five genera of Rhytirrhinini (Coleoptera: Curculionidae) and barnadesia
(asteraceae). Biogeographica, 73, 115–121.
Morrone, J. J. (2001). Biogeografía de América Latina y el Caribe. GORFI, S.A.
Myers, N., Mittermeier, R. A., Mittermeier, C. G., da Fonseca, G. A. B., & Kent, J. (2000).
Biodiversity hotspots for conservation priorities. Nature, 403, 853–858.
Myers, E. A., Bryson, R. W., Hansen, R. W., Aardema, M. L., Lazcano, D., & Burbrink, F. T.
(2019). Exploring Chihuahuan desert diversification in the gray-banded kingsnake, Lampropeltis
alterna (Serpentes: Colubridae). Molecular Phylogenetics and Evolution, 131, 211–218.
Nadachowska-Brzyska, K., Li, C., Smeds, L., Zhang, G., & Ellegren, H. (2015). Temporal
dynamics of avian populations during pleistocene revealed by whole-genome sequences. Current
Biology, 25(10), 1375–1380.
Nores, M. (1999). An alternative hypothesis for the origin of Amazonian bird diversity. Journal
of Biogeography, 26, 475–485.
Oswald, J. A., Harvey, M. G., Remsen, R. C., Foxworth, D. U., Dittmann, D. L., Cardiff, S. W.,
& Brumfield, R. T. (2019). Evolutionary dynamics of hybridization and introgression following
the recent colonization of glossy ibis (Aves: Plegadis falcinellus) into the new world. Molecular
Ecology, 28(7), 1675–1691.
Paradis, E., Claude, J., & Strimmer, K. (2004). Ape: Analyses of phylogenetics and evolution in
R language. Bioinformatics, 20(2), 289–290.
Patton, J. L., da Silva, M. N. F., Lara, M. C., & Mustrangi, M. A. (1997). Diversity, differentiation,
and the historical biogeography of nonvolant small mammals of the Neotropical forests. In W. F.

128
Laurance & R. O. B. Jr. (Eds.), Tropical Forest Remnants: Ecology, Management and
Conservation of Fragmented Communities. Chicago, Illinois: University of Chicago Press.
Pérez-Escobar, O. A., Chomicki, G., Condamine, F. L., Karremans, A. P., Bogarín, D., Matzke,
N. J., Silvestro, D., & Antonelli, A. (2017). Recent origin and rapid speciation of Neotropical
orchids in the world’s richest plant biodiversity hotspot. New Phytologist, 215(2), 891–905. 2017-
23782.
Polato, N. R., Gill, B. A., Shah, A. A., Gray, M. M., Casner, K. L., Barthelet, A., Messer, P. W.,
Simmons, M. P., Guayasamin, J. M., Encalada, A. C., Kondratieff, B. C., Flecker, A. S., Thomas,
S. A., Ghalambor, C. K., Poff, N. L., Funk, W. C., & Zamudio, K. R. (2018). Narrow thermal
tolerance and low dispersal drive higher speciation in Tropical mountains. Proceedings of the
National Academy of Sciences.
Potter, S., Xue, A. T., Bragg, J. G., Rosauer, D. F., Roycroft, E. J., & Moritz, C. (2017). Pleistocene
climatic changes drive diversification across a tropical savanna. Molecular Ecology, 27(2), 520–
532.
Prado, D. E. & Gibbs, P. E. (1993). Patterns of species distributions in the dry seasonal forests of
South America. Annals of the Missouri Botanical Garden, 80, 902–927.
Pupim, F., Sawakuchi, A., Almeida, R., Ribas, C., Kern, A., Hartmann, G., Chiessi, C., Tamura,
L., Mineli, T., Savian, J., Grohmann, C., Bertassoli, D., Stern, A., Cruz, F., & Cracraft, J. (2019).
Chronology of terra firme formation in Amazonian lowlands reveals a dynamic Quaternary
landscape. Quaternary Science Reviews, 210, 154 – 163.
Raikow, R. J. (1994). A phylogeny of the woodcreepers (Dendrocolaptinae). The Auk:
Ornithological Advances, 111(1), 104–114.

129
Rambaut, A., Drummond, A. J., Xie, D., Baele, G., & Suchard, M. A. (2018). Posterior
summarization in bayesian phylogenetics using tracer 1.7. Systematic Biology, 67(5), 901–904.
Remsen Jr., J. V., 0., O. R., Schmitt, C. G., & Schmitt, D. C. (1991). Zoogeography and geographic
variation of Platyrinchus mystaceus in Bolivia and Peru, and the Circum-Amazonian distribution
pattern. Ornitologia Neotropical, 2, 77–83.
Ribas, C. C., Moyle, R. G., Miyaki, C. Y., & Cracraft, J. (2007). The assembly of montane biotas:
linking Andean tectonics and climatic oscillations to independent regimes of diversification in
pionus parrots. Proceedings of the Royal Society of London B: Biological Sciences, 274, 2399–
2408.
Ribas, C. C., Aleixo, A., Gubili, C., d’Horta, F. M., Brumfield, R. T., & Cracraft, J. (2018).
Biogeography and diversification of Rhegmatorhina (Aves: Thamnophilidae): Implications for the
evolution of Amazonian landscapes during the Quaternary. Journal of Biogeography, 45(4), 917–
928.
Richardson, J. E., Pennington, R. T., Pennington, T. D., & Hollingsworth, P. M. (2001). Rapid
diversification of a species-rich genus of Neotropical rain forest trees. Science, 293(5538), 2242–
2245.
Richardson, J. E. & Pennington, R. T. (2016). Editorial: Origin of tropical diversity: From clades
to communities. Frontiers in Genetics, 7, 186.
Rincon-Sandoval, M., Betancur-R, R., & Maldonado-Ocampo, J. A. (2019). Comparative
phylogeography of trans-andean freshwater fishes based on genome-wide nuclear and
mitochondrial markers. Molecular Ecology, 28(5), 1096–1115.
Rivas-Martínez, S. & Tovar, O. (1983). Síntesis biogeográfica de los Andes. Collectanea
Botanica, 14, 515–521.

130
Rocha, D. G. d. & Kaefer, I. L. (2019). What has become of the refugia hypothesis to explain
biological diversity in Amazonia? Ecology and Evolution, 9(7), 4302–4309.
Rull, V. (2011). Neotropical biodiversity: timing and potential drivers. Trends in Ecology and
Evolution, 26(10), 508–513.
Salo, J. (1987). Pleistocene forest refuges in the amazon: evaluation of the biostratigraphical,
lithostratigraphical and geomorphological data. Annales Zoologici Fennici, 24(3), 203–211.
Sartorato Zanchetta, L., Gomes Rocha, R., & Reis Leite, Y. L. (2019). Comparative
phylogeography and demographic history of two marsupials of the Atlantic forest in eastern Brazil.
Journal of Zoological Systematics and Evolutionary Research, 0(0).
Savit, A. Z. & Bates, J. M. (2015). Right around the amazon: the origin of the Circum-Amazonian
distribution in Tangara cayana. Folia Zoologica, 64(3), 273–283.
Sick, H. (1967). Rios e enchentes na Amazônia como obstáculo para a avifauna. Atas Simp. Sobre
a Biota Amazonica, 5, 495–520.
da Silva, J. M. C., de Sousa, M. C., & Castelletti, C. H. M. (2004). Areas of endemism for passerine
birds in the Atlantic Forest, South America. Global Ecology and Biogeography, 13(1), 85–92.
Silva, C. R., Ribas, C. C., Da Silva, M. N. F., Leite, R. N., Catzeflis, F., Rogers, D. S., & De Thoisy,
B. (2018). The role of pleistocene climate change in the genetic variability, distribution and
demography of Proechimys cuvieri and P. guyannensis (Rodentia: Echimyidae) in northeastern
Amazonia. PLOS ONE, 13(12), 1–20.
Smith, B. T., Ribas, C. C., Whitney, B. M., nos, B. E. H.-B., & Klicka, J. (2013). Identifying biases
at different spatial and temporal scales of diversification: a case study in the Neotropical parrotlet
genus Forpus. Molecular Ecology, 22, 483–494.

131
Tello, J. G., Raposo, M., Bates, J. M., Bravo, G. A., Cadena, C. D., & Maldonado-Coelho, M.
(2014). Reassessment of the systematics of the widespread Neotropical genus Cercomacra (Aves:
Thamnophilidae). Zoological Journal of the Linnean Society, 170, 546–565.
Thomaz, A. T., Malabarba, L. R., Bonatto, S. L., & Knowles, L. L. (2015). Testing the effect of
palaeodrainages versus habitat stability on genetic divergence in riverine systems: study of a
Neotropical fish of the Brazilian coastal Atlantic Forest. Journal of Biogeography, 42(12), 2389–
2401.
Thomé, M. T. C., Zamudio, K. R., Giovanelli, J. G., Haddad, C. F., Jr., F. A. B., & Alexandrino,
J. (2010). Phylogeography of endemic toads and post-Pliocene persistence of the Brazilian Atlantic
Forest. Molecular Phylogenetics and Evolution, 55(3), 1018 – 1031.
Todd, W. E. C. (1916). On Dysithamnus mentalis and its allies. Bulletin American Museum of
Natural History, 25, 533–558.
Trujillo-Arias, N., Dantas, G., Arbeláez-Cortés, E., Naoki, K., Gómez, M. I., Santos, F. R., Miyaki,
C. Y., Aleixo, A., Tubaro, P. L., & Cabanne, G. S. (2017). The niche and phylogeography of a
passerine reveal the history of biological diversification between the Andean and the Atlantic
forests. Molecular Phylogenetics and Evolution, 112, 107 – 121.
Vanzolini, P. & Williams, E. E. (1970). South American anoles: The geographic differentiation
and evolution of the anolis Chrysolepis species group (Sauria, Iguanidae), volume 19 of Arquivos
de zoologia. Museu de Zoologia.
Vuilleumier, B. S. (1971). Pleistocene changes in the fauna and flora of South America. Science,
New Series, 173(3999), 771–780.
Wallace, A. R. (1854). On the monkeys of the Amazon. Annals and Magazine of Natural History,
14(84), 451–454.

132
Weigend, M. (2002). Observations on the biogeography of the Amotape-Huancabamba Zone in
northern Peru. The Botanical Review, 68(1), 38–54.
Weir, J. T. & Schluter, D. (2008). Calibrating the avian molecular clock. Molecular Ecology, 17,
2321–2328.
Werneck, F. P., Costa, G. C., Colli, G. R., Prado, D. E., & Sites Jr, J. W. (2011). Revisiting the
historical distribution of seasonally dry tropical forests: new insights based on palaeodistribution
modelling and palynological evidence. Global Ecology and Biogeography, 20(2), 272–288.
Zarza, E., Connors, E. M., Maley, J. M., Tsai, W. L., Heimes, P., Kaplan, M., & McCormack, J. E.
(2018). Combining ultraconserved elements and mtdna data to uncover lineage diversity in a
Mexican highland frog (Sarcohyla; hylidae). PeerJ, 6, e6045.
Zimmer, K. & Isler, M. L. (2019a). Variable Antshrike (Thamnophilus caerulescens). In J. del
Hoyo, A. Elliott, J. Sargatal, D. Christie, & E. de Juana (Eds), Handbook of the Birds of the World
Alive. Lynx Editions, Barcelona.
Zimmer, K. & Isler, M.L. (2019b). Chestnut-backed Antshrike (Thamnophilus palliatus). In: del
Hoyo, J., Elliott, A., Sargatal, J., Christie, D.A. & de Juana, E. (eds.). Handbook of the Birds of
the World Alive. Lynx Edicions, Barcelona. (retrieved from https://www.hbw.com/node/56666 on
24 July 2019).
Zink, R. M. (2002). Methods in comparative phylogeography, and their application to studying
evolution in the North American aridlands. Integrative & Comparative Biology, 42, 953–959.

Figure 1. Distribution of Dysithamnus mentalis (BirdLife
International, 2019), a circum-Amazonian species (sensu Remsem et
al., 1991).
133
Appendix (Chapter II)

Figure 2. Basic models tested for the four species of Thamnophilidae. Divergence
times (red square). Events of migration (blue arrows). Bottleneck events (green
circles). All models tested were variations of these basic models, these variations
consisted in change number of events and direction of the migrations..
134

PleistocenePlioceneMiocene
2.5885.33223.03 0
D. leucostictus
T. aethiops
T. zarumae
T. tenuepunctatus(Ecuador)
T. tenuepunctatus(Peru)
T. palliatus(Colombia)
*
T. doliatus
northernAtlantic Forests
central-southernAtlantic Forests
Andes/northern Peru*
southern Peru
SDTFssouth Amazon
Tepuis/Central América
Amazon
Outgroup
T. ruficapillus/torquatus
T. palliatus/tenuepunctatus
T. caerulescens
D.mentalis
Figure 3a. Divergence times among intraspecific lineages for the four species of
Thamnophilidae. Blue bars are confidence intervals of divergence time estimates. Collapsed
clades indicate geographical clusters identified by DAPC/sNMF: Red: northern Atlantic Forest;
Green: central-southern Atlantic Forest; Pink: Andean (or central Andean); Brown-Yellow:
forests southeast of the Amazon; Pale-Blue: southern Peru-Bolivia region; Blue: Outgroups.
0.6
Scale
135

northernAtlantic Forests
central-southernAtlantic Forests
Andes/northern Peru*
southern Peru
SDTFssouth Amazon
Tepuis/Central América
Amazon
Outgroup
Miocene Pliocene Pleistocene
02.5885.33223.03
P. melanops
*
PleistocenePlioceneMiocene
02.5885.33223.03
P. erythropterum
Pleistocene
0.126 00.7811.8062.588
X. ocellatus
X. albicollis
X. major
X. falcirostris
X. promeropirhynchus(Mexico)
X. promeropirhynchus(Colombia)
P. rufum
Xiphocolaptescomplex
L. nematura
Figure 3b. Divergence times among intraspecific lineages for L. nematura, P. rufum, and the
Xiphocolaptes complex. Blue bars are confidence intervals of divergence time estimates.
Collapsed clades indicate geographical clusters identified by DAPC/sNMF: Red: northern
Atlantic Forest; Green: central-southern Atlantic Forest; Pink: Andean (or central Andean);
Brown-Yellow: forests southeast of the Amazon; Pale-Blue: southern Peru-Bolivia region; Gray:
Tepuis-Central America; Yellow: Amazonian region; Blue: Outgroups. 136

PleistocenePlioceneOligocene Miocene
02.5885.33223.0333.9
P. leucoryphus
P. mystaceus(Panama)
P. mystaceus(Pará, Brasil)
P. mystaceus(Beni, Bolivia)
P. flavigularis
northernAtlantic Forests
central-southernAtlantic Forests
Andes/northern Peru*
southern Peru
SDTFssouth Amazon
Tepuis/Central América
Amazon
Outgroup
P. mystaceus
Figure 3c. Divergence times among intraspecific lineages for P. mystaceus. Blue bars are
confidence intervals of divergence time estimates. Collapsed clades indicate geographical
clusters identified by DAPC/sNMF: Red: northern Atlantic Forest; Green: central-southern
Atlantic Forest; Pink: Andean (or central Andean); Brown-Yellow: forests southeast of the
Amazon; Blue: Outgroups.
137

northern_brazilmentalisAndes
DA eigenvalues
PCA eigenvalues
cearensiscaerulescensAndean
DA eigenvalues
PCA eigenvalues
braziliannorthern_Andescentral_Andes
DA eigenvalues
PCA eigenvalues
ruficapillus_AFruficapillus_Andestorquatus
DA eigenvaluesPCA eigenvalues
T. ruficapillus/torquatus
T. palliatus/tenuepunctatus
T. caerulescens
D.mentalis
Figure 4. Results of DAPC and find.cluster() analyses for the genomic data (UCEs) of the
Thamnophilid species. (a) D. mentalis. (b) T. caerulescens. (c) T. palliatus/tenuepunctatus
complex. (d) T. ruficapillus/torquatus complex.
0.6
Scale
138
4a
4b
4c
4d

Atlantic_forestscentral_Andesnorthern_Peru
DA eigenvaluesPCA eigenvalues
−20 −10 0 10 20
0.0
0.1
0.2
0.3
0.4
Discriminant function 1
Den
sity
| | || || || ||| || |||Atlantic_ForestAndes
PCA eigenvalues
niveigularisbrazilianAndescentral_America
DA eigenvaluesPCA eigenvalues
albicollispromero_majorfalcirostris
DA eigenvalues
PCA eigenvalues
2 4 6 8 10
9510
010
5
Value of BICversus number of clusters
Number of clusters
BIC
2 4 6 8 10
178
180
182
184
186
188
190
Value of BICversus number of clusters
Number of clusters
BIC
Xiphocolaptescomplex
P. mystaceus
P. rufum
L. nematura
Figure 4. Results of DAPC and find.cluster() analyses for the genomic data (UCEs). (e) L.
nematura. (f) P. rufum. (g) P. mystaceus. (h) Xiphocolaptes complex.
0.6
Scale
139
4e
4f
4g
4h

Admixtu
re coef
ficients
0.0
0.2
0.4
0.6
0.8
1.0
α=100, K=4, cross-entropy=0,2870
D. mentalis
Admixtu
re coef
ficients
0.0
0.2
0.4
0.6
0.8
1.0
α=50, K=3, cross-entropy=0,3778
T. caerulescens
Admixtu
re coef
ficients
0.0
0.2
0.4
0.6
0.8
1.0
Admixtu
re coef
ficients
0.0
0.2
0.4
0.6
0.8
1.0
α=50, K=3,
cross-entropy=0,3325
T. palliatus/tenuepunctatus
α=10, K=4,
cross-entropy=0,3345
Admixtu
re coef
ficients
0.0
0.2
0.4
0.6
0.8
1.0
Admixtu
re coef
ficients
0.0
0.2
0.4
0.6
0.8
1.0
α=100, K=3,
cross-entropy=0,4287
α=10, K=4,
cross-entropy=0,4163
T. ruficapillus/torquatus
Figure 5. Results of sNMF analysis for the genomic data (UCEs) of the Thamnophilid
species. (e) D. mentalis. (f) T. caerulescens. (g) T. palliatus/tenuepunctatus. (h) T.
ruficapillus/torquatus.
140
5a
5b
5c
5d

L. nematura
Figure 5. Results of sNMF analysis for the genomic data (UCEs). (e) L. nematura. (f) P.
rufum. (g) P. mystaceus.
141
5e
5f
5g
α=50, K=4cross-entropy=0,4710
α=500, K=3cross-entropy=0,4852
Admixtu
re coef
ficients
0.0
0.2
0.4
0.6
0.8
1.0
P. rufum
α=50, K=2, cross-entropy=0,2572
Admixtu
re coef
ficients
0.0
0.2
0.4
0.6
0.8
1.0
α=50, K=4,cross-entropy=0,1562
Admixtu
re coef
ficients
0.0
0.2
0.4
0.6
0.8
1.0
α=100, K=5,cross-entropy=0,1553
Admixtu
re coef
ficients
0.0
0.2
0.4
0.6
0.8
1.0
α=1, K=3,cross-entropy=0,1593
Admixtu
re coef
ficients
0.0
0.2
0.4
0.6
0.8
1.0
Admixtu
re coef
ficients
0.0
0.2
0.4
0.6
0.8
1.0

Figure 5. Results of sNMF analysis for the genomic data (UCEs). (h) Xiphocolaptes
complex.
142
5h
α=500, K=4,cross-entropy=0,2296Adm
ixture c
oefficie
nts
0.0
0.2
0.4
0.6
0.8
1.0
Admixtu
re coef
ficients
0.0
0.2
0.4
0.6
0.8
1.0
α=100, K=5,cross-entropy=0,2352
Admixtu
re coef
ficients
0.0
0.2
0.4
0.6
0.8
1.0
α=10, K=6,cross-entropy=0,2308

D. mentalis
T. palliatus/tenuepunctatus
L. nematuraT. ruficapillus/
torquatus
T. caerulescens T. caerulescens
●
●
●
●
● ●●
●● ● ●
●
2 4 6 8 10 12
0.30
0.35
0.40
0.45
0.50
0.55
Number of ancestral populations
Cro
ss−e
ntro
py
●
● ●●
●
●
●
●
●
●●
●
●
●● ●
● ●
●●
●
●
●●
●
● ●
●
●
●
●● ●
●
●
●
●
●●
●
●
● ●●
●
●
●
●
●
● ●●
● ●●
●
● ●
●
●complete
●
● ●●
● ●
●●
● ●
●
●
2 4 6 8 10 12
0.35
0.40
0.45
0.50
0.55
0.60
Number of ancestral populations
Cro
ss−e
ntro
py
●
●●
● ●
● ●
●
●
●
●●
●
●● ● ●
●●
●●
● ●
●
●
● ●●
●
●
●
●
●●
●●
●
● ●
●●
● ●
●●
●
●
●
●
●●
●
●
●
●●
●
●
●
●
incomplete
●
●
●●
●
● ●
● ●
●
2 4 6 8 10
0.29
0.30
0.31
0.32
0.33
0.34
0.35
Number of ancestral populations
Cro
ss−e
ntro
py
●
●
●
●
●
● ●
●
●
●●
●
●●
● ●
●●
● ●●
●
●●
●
●
●
●
●
●
●
● ●
●●
●
●
●
● ●
●
●
● ●
●
●
●
●
●
●
●
● ●●
● ●
●
●●
●
2 4 6 8 10
0.30
0.35
0.40
0.45
0.50
Number of ancestral populations
Cro
ss−e
ntro
py
●
● ●●
●●
● ●
●
●
●
● ●●
●
●
●●
●
●
●
● ●●
●●
●●
●
●
●● ●
●
●●
●
●
●
●
●● ●
●
●●
●
●
●
●
●
●
● ●
●
●●
●●
●
2 4 6 8 10
0.40
0.45
0.50
0.55
0.60
0.65
Number of ancestral populations
Cro
ss−e
ntro
py
●
●●
●
●●
●
●●
●
●
●
● ●
●
●
●
●
●
●
●
●
●
● ●
●
●
●
●
●
●
●
●
●●
●
●
●
●
●
●
●
● ●
●
●
●
●
●
●
●
● ● ●
●
●
●
●
●
●
2 4 6 8 10
0.4
0.5
0.6
0.7
0.8
0.9
Number of ancestral populations
Cro
ss−e
ntro
py
●
● ● ●
●
●●
●●
●
●
● ● ●
●
●
●
●
●
●
●
● ● ●
●
●
●
●
●
●
●
● ●●
●
●
●
●●
●
●
● ●●
●
●
●
●
●
●
Figure 6a. Values of the cross-entropy criterion for the sNMF runs (six α values). Green:
α=1; Red: α=10; Brown-Yellow: α=50; Pink: α=100; Gray: α=500; Blue: α=1000.
143
northernAtlantic Forests
central-southernAtlantic Forests
Andes/northern Peru*
southern Peru
SDTFssouth Amazon
Tepuis/Central América
Amazon
Outgroup

●
●●
●
●●
●
● ●
●
2 4 6 8 10
0.10
0.15
0.20
0.25
0.30
0.35
Number of ancestral populations
Cro
ss−e
ntro
py
●●
● ●
●●
●
●●
●
●
● ●●
●
●
●
●
●
●
●
●
●
●●
●
●
●●
●
●
●
●
●
●
●
●
●
●
●
●
●
●● ●
●
●
●
●
●complete
●
●●
●
●●
●
●
●●
2 4 6 8 10
0.25
0.30
0.35
0.40
0.45
0.50
0.55
Number of ancestral populationsC
ross
−ent
ropy
●
●
●●
●
●
●●
●
●
●
● ●
●
●●
●●
●
●
●
●●
●●
●
●
●
●
●
●
●●
●●
●
●
●
●
●
●
●
●
●●
●
●●
●
●
incomplete
●
●
●● ● ●
●
●
● ●
2 4 6 8 10
0.16
0.17
0.18
0.19
0.20
Number of ancestral populations
Cro
ss−e
ntro
py
●
●
●
●
●
● ●
● ●●
●
●
●●
●
●
●
●
●
●
●
●
●●
●●
●
●●
●●
●
●●
●
● ● ●
● ●
●
●● ●
●
●
●
●
●
●
●
●
●●
● ●●
●
●●
2 4 6 8 10
0.22
0.24
0.26
0.28
0.30
Number of ancestral populations
Cro
ss−e
ntro
py
●
●
●
●●
●
●●
●
●
●
●
●●
● ●●
● ●
●
●
●
●●
● ●
●
●
●
●
●
●
●
●●
● ●
●
● ●
●
●
●
●●
●
●●
●
●
P. rufum
P. mystaceus Xiphocolaptescomplex
P. rufum
Figure 6b. Values of the cross-entropy criterion for the sNMF runs (six α values). Green:
α=1; Red: α=10; Brown-Yellow: α=50; Pink: α=100; Gray: α=500; Blue: α=1000.
144
northernAtlantic Forests
central-southernAtlantic Forests
Andes/northern Peru*
southern Peru
SDTFssouth Amazon
Tepuis/Central América
Amazon
Outgroup

northernAtlantic Forests
central-southernAtlantic Forests
Andes/northern Peru*
southern Peru
SDTFssouth Amazon
Tepuis/Central América
Amazon
Outgroup
D. mentalis
T. caerulescens
T. palliatus/tenuepunctatus
*
*samples of T. tenuepunctatus
*
T. ruficapillus/torquatus *
*T. torquatus
**
**T. ruficapillus
145
Figure 7a. Species trees inferred by SNAPP for the thamnophilid taxa data. Red: northern
Atlantic Forest; Green: central-southern Atlantic Forest; Pink: Andean (or central Andean);
Brown-Yellow: forests southeast of the Amazon; Pale-Blue: southern Peru-Bolivia region;
Blue: Outgroups.
.

146
Figure 7b. Species trees inferred by SNAPP for the thamnophilid taxa data. Red: northern
Atlantic Forest; Green: central-southern Atlantic Forest; Pink: Andean (or central Andean);
Brown-Yellow: forests southeast of the Amazon; Pale-Blue: southern Peru-Bolivia region;
Blue: Outgroups. Numbers in the figures represents the species in the Xiphocolaptes
complex.
.
northernAtlantic Forests
central-southernAtlantic Forests
Andes/northern Peru*
southern Peru
SDTFssouth Amazon
Tepuis/Central América
Amazon
Outgroup
L. nematura
P. rufum
P. mystaceus
Xiphocolaptescomplex
(1)
(2)
(3)
(4)
(5)
(6) X. albicollis
(1) X. falcirostris
(2) X. major + X. promeropirhynchus
(3) X. promeropirhynchus (orenocensis group)
(4) X. falcirostris + X. promeropirhynchus (emigrans group)
(5) X. major + X. promeropirhynchus (promeropirhynchus group)
(6)

T. palliatus/tenuepunctatus
*
*samples of T. tenuepunctatus
T. ruficapillus/torquatus
D. mentalis T. caerulescens
**
**T. torquatus
147
Figure 8. Best models inferred by momi2 for the foyr thamnophilid taxa. Red: northern
Atlantic Forest; Green: central-southern Atlantic Forest; Pink: Andean (or central Andean);
Brown-Yellow: forests southeast of the Amazon; Pale-Blue: southern Peru-Bolivia region.
northernAtlantic Forests
central-southernAtlantic Forests
Andes/northern Peru*
southern Peru
SDTFssouth Amazon
Tepuis/Central América
Amazon
Outgroup

1.92 Myr
Andean 0.63 Myr
Divergence times
9a
Andean
southernPeru
T. p palliatus
AtlanticForests
0.96 Myr
0.7 Myr
Divergence times
9b
148
Figure 9. Plausible scenarios of diversification and migration pulses inferred by momi2 for
the D. mentalis and the T. palliatus/teunuepunctatus complex. Red: northern Atlantic
Forest; Green: central-southern Atlantic Forest; Pink: Andean (or central Andean); Brown-
Yellow: forests southeast of the Amazon; Pale-Blue: southern Peru-Bolivia region.
northernAtlantic Forests
central-southernAtlantic Forests
Andes/northern Peru*
southern Peru
SDTFssouth Amazon

cearensis
caerulescens
Andean
Divergence times
0.63 Myr
0.37 Myr
cearensis
caerulescens
Andean0.75 Myr
0.38 Myr
Divergence timesAndean
caerulescens
cearensis
Andean
caerulescens
cearensis
10a
10b
149
Figure 10. Plausible scenarios of diversification and migration pulses inferred by momi2
for T. caerulescens. (a) Complete matrix of SNPs (324 loci). (b) Incomplete matrix of
SNPs (2,036 loci). Red: northern Atlantic Forest; Green: central-southern Atlantic Forest;
Pink: Andean (or central Andean) region.
northernAtlantic Forests
central-southernAtlantic Forests
Andes/northern Peru*

T. ruficapillussouthern Atlantic Forest
T. torquatusT. ruficapilluscentral Andes
??? 1.90 Myr2.1 Myr
Divergence times
150
Figure 11. Plausible scenarios of diversification and migration pulses inferred by momi2
for T. ruficapillus/tenuepunctatus complex. Red: northern Atlantic Forest; Green: central-
southern Atlantic Forest; Pink: Andean (or central Andean) region.
northernAtlantic Forests
central-southernAtlantic Forests
Andes/northern Peru*

10 samples
1 sample
T. palliatus/tenuepunctatus
*samples of T. tenuepunctatus
T. ruficapillus/torquatus
D. mentalis
T. caerulescens
*
*
Figure S1. median-joining network depicting relationships among the haplotypes in the
thamnophilid taxa. (a) D. mentalis. (b) T. caerulescens. (c) T. palliatus/tenuepunctatus
complex. (d) T. ruficapillus/torquatus complex. Red: northern Atlantic Forest; Green:
central-southern Atlantic Forest; Pink: Andean (or central Andean); Brown-Yellow: forests
southeast of the Amazon; Pale-Blue: southern Peru-Bolivia region; Gray: Tepuis-Central
America; Yellow: Amazonian region.
S1a
S1b
S1c
S1d
northernAtlantic Forests
central-southernAtlantic Forests
Andes/northern Peru*
southern Peru
SDTFssouth Amazon
Tepuis/Central América
Amazon
Outgroup
151

10 samples
1 sample
P. mystaceus
L. nematura
P. rufum
Figure S2. median-joining network depicting relationships among the haplotypes in (a) L.
nematura. (b) P. rufum. (c) P. mystaceus. Red: northern Atlantic Forest; Green: central-
southern Atlantic Forest; Pink: Andean (or central Andean); Brown-Yellow: forests
southeast of the Amazon; Pale-Blue: southern Peru-Bolivia region; Gray: Tepuis-Central
America; Yellow: Amazonian region.
S2a
S2b
S2c
northernAtlantic Forests
central-southernAtlantic Forests
Andes/northern Peru*
southern Peru
SDTFssouth Amazon
Tepuis/Central América
Amazon
Outgroup
152

10 samples
1 sample
X. albicollisX. major castaneusX. promeropirhynchus emigransX. falcirostrisX. major majorX. promeropirhynchus orenocensisX. promeropirhynchus promeropirhynchus
Xiphocolaptes complex
Figure S3. median-joining network depicting relationships among the haplotypes in
Xiphocolaptes complex.
153

3.0
O595_Dys_men_LSUMZ_105996_PE_PAS
O164_Dys_men_MZ_94638_BR_GO
O326_Dys_men_MPEG_T09855_BR_PI
O611_Dys_men_LSUMZ_B13848_BO_SaC
O105_Dys_men_MZ_91760_BR_MG_2
O266_Dys_men_FMNH_474104_PE_AM
O425_Dys_men_MPEG_T21688_BR_TO
O417_Dys_men_MPEG_T21092_BR_MG
O311_Dys_men_MPEG_T02234_BR_PA
O337_Dys_men_MPEG_T12505_BR_PA
O412_Dys_men_MPEG_T19877_BR_MA
O364_Dys_men_MPEG_T15223_BR_MG
O438_Dys_men_MPEG_T24997_BR_PA
O413_Dys_men_MPEG_T19906_BR_MA
O009_Dys_men_ALG_087_BR_AL
O267_Dys_men_FMNH_481065_PE_CAJ
O263_Dys_men_FMNH_474100_PE_AM
O361_Dys_men_MPEG_T15175_BR_PI
O432_Dys_men_MPEG_T23983_BR_BA
O341_Dys_men_MPEG_T12901_BR_MA
O327_Dys_men_MPEG_T09867_BR_PI
O016_Dys_men_ALG_136_BR_AL
O246_Dys_men_FMNH_399228_BR_PE
O035_Dys_men_MZ_85740_BR_AL
O615_Dys_men_LSUMZ_B68224_BO_BE
O371_Dys_men_MPEG_T15353_BR_GO
O387_Dys_men_MPEG_T15662_BR_TO
O475_Dys_men_LSUB_48490_GU_PO_SI
O247_Dys_men_FMNH_399229_BR_PE
O386_Dys_men_MPEG_T15661_BR_TO
O249_Dys_men_FMNH_399231_BR_AL
O259_Dys_men_FMNH_433395_PE_CUS
O431_Dys_men_MPEG_T23982_BR_BA
O426_Dys_men_MPEG_T21702_BR_TO
O105_Dys_men_MZ_91760_BR_MG
O476_Dys_men_LSYUB_33085_PE_CAJ
O012_Dys_men_ALG_111_BR_AL
O225_Dys_men_KU_18706_PE_CUS
O599_Dys_men_LSUMZ_162665_B0_PAZ
O617_Dys_men_LSUMZ_B76452_PE_UY
O325_Dys_men_MPEG_T09706_BR_PI
O411_Dys_men_MPEG_T19876_BR_MA
O264_Dys_men_FMNH_474102_PE_AM
O424_Dys_men_MPEG_T21651_BR_TO
O609_Dys_men_LSUMZ_B1134_BO_PAZ
O420_Dys_men_MPEG_T21152_BR_TO
O003_Dys_men_ALG_021_BR_AL
O610_Dys_men_LSUMZ_B6155_EC_MS
O021_Dys_men_MZ_79195_BR_MG
O163_Dys_men_MZ_94637_BR_G0
O366_Dys_men_MPEG_T15231_BR_MG
O428_Dys_men_MPEG_T23096_BR_TO
O019_Dys_men_MZ_79194_BR_MG
O261_Dys_men_FMNH_474098_PE_AM
O015_Dys_men_ALG_135_BR_AL
O370_Dys_men_MPEG_T15352_BR_GO
O396_Dys_men_MPEG_T15750_BR_MG
O051_Dys_men_MZ_86384_BR_T0
O398_Dys_men_MPEG_T15752_BR_MG
O422_Dys_men_MPEG_T21161_BR_TO
O618_Dys_men_LSUMZ_B89140_PE_UY
O429_Dys_men_MPEG_T23098_BR_TO
O614_Dys_men_LSUMZ_B40022_PE_LO
O037_Dys_men_MZ_85741_BR_AL
O004_Dys_men_ALG_046_BR_AL
O265_Dys_men_FMNH_474103_PE_AM
O685_Dys_leu_LSU_6111_EC_MS
O468_Dys_men_FMNH_293443_BR_PE
O250_Dys_men_FMNH_399232_BR_AL
O664_Dys_men_USNM_625181_GU_TUE_MIXED
O023_Dys_men_MZ_79196_BR_MG
O313_Dys_men_MPEG_T03450_BR_MT
O024_Dys_men_MZ_79196_BR_MG
O262_Dys_men_FMNH_474099_PE_AM
O598_Dys_men_ANSP_185449_EC_NA
O260_Dys_men_FMNH_433397_PE_CUS
O612_Dys_men_LSUMZ_B38408_BO_SaC
O226_Dys_men_KU__18868_PE_CUS
O051_Dys_men_MZ_86384_BR_TO
O104_Dys_men_MZ_91759_BR_MG
O397_Dys_men_MPEG_T15751_BR_MG
O482_Dys_men_ML_2733_BR_AL
O342_Dys_men_MPEG_T12907_BR_MA
O421_Dys_men_MPEG_T21155_BR_TO
100
87,21
70,89
71,71
85,8
92,14
60,45
74,65
64,67
61,62
83,92
72,65
63,15
74,53
69,6
99,77
D. mentalis
Figure S4. Phylogenetic reconstruction for D. mentalis (Maximum Likelihood).
154
northernAtlantic Forests
central-southernAtlantic Forests
Andes/northern Peru*
southern Peru
SDTFssouth Amazon
Tepuis/Central América
Amazon
Outgroup

1.0
Tha_dol_UAM_8070
100
91,78
99,77
99,77
100
100
61,97
2.0
O639_Tha_pal_LSUMZ_B46060_PE_SaM
Tha_zar_LSUMZ_B191_PE_PI
O509_Tha_ten_LSUB44648_PE_SaM
O500_Tha_ten_ANSP1686_EC_ZC
O499_Tha_pal_IAvH8245_CO_VI
62,441
66,667
98,474
92,254
69,836
66,197
100
69,718
77,817
71,714
89,906
2.0
79,9
100
100
85,64
75,2
82,77
97,13
70,5
T. palliatus/tenuepunctatus
T. ruficapillus/torquatus
*T. torquatus
T. caerulescens
*
Figure S5. Phylogenetic reconstruction for (a) T. caerulescens. (b) T. palliatus/
tenuepunctatus. (c) T. ruficapillus/torquatus (Maximum Likelihood).
155
S5a
S5b
S5c
northernAtlantic Forests
central-southernAtlantic Forests
Andes/northern Peru*
southern Peru
SDTFssouth Amazon
Tepuis/Central América
Amazon
Outgroup

2.0
O624_Loc_nem_LSUMZ_B43594_PE_SaM
Phl_mel_AMNH_DOT_9917
O623_Loc_nem_LSUMZ_B33710_PE_CAJ
O619_Loc_nem_LSUMZ_B2033_PE_PAS
99,53
100
99,3
73,94
99,53
2.0
O632_Phi_ruf_LSUMZ_B40199_PE_LO
O630_Phi_ruf_LSUMZ_B29942_EC_IM
O695_Phi_ery_LSU_10571_PE_UY
O310_Phi_ruf_MPEG_T01987_BR_AC
O626_Phi_ruf_LSUMZ_B38369_BO_SaC
O629_Phi_ruf_LSUMZ_B12127_EC_PiC
O506_Phi_ruf_LSU_40199_PE_LO
O627_Phi_ruf_LSUMZ_B81957_CR_SaM
O628_Phi_ruf_LSUMZ_B11885_EC_ES
Phi_atr_B25833
O633_Phi_ruf_LSUMZ_B89099_PE_UY
99,18
99,06
100
93,54
87,79
62,32
64,08
4.0
O586_Pla_mys_MPEG_74361_BR_PI
O536_Pla_mys_UFG_4483_BR_MA
O563_Pla_mys_COUFT_0515_BR_TO
O565_Pla_mys_MPEG_70184_BR_MA
O576_Pla_mys_MPEG_79462_BR_TO
O709_Pla_mys_LSUMZ_B7434_VE_AM
O218_Pla_mys_KU_4023_GY
O579_Pla_mys_MPEG_79463_BR_TO
O587_Pla_mys_MPEG_79461_BR_TO
O713_Pla_mys_LSUMZ_B22637_BO_PAZ
O710_Pla_mys_LSUMZ_B7616_BO_BE
O443_Pla_mys_UFG_4978_BR_MA
O502_Pla_mys_SI_607841_EF501889_PM_BdT
O223_Pla_mys_KU_18426_PE_CUS
O578_Pla_mys_MPEG_79466_BR_TO
O560_Pla_mys_LZUFPI_0174_BR_PI
O592_Pla_mys_MPEG_76444_BR_PA
O564_Pla_mys_MPEG_T23638_BR_PI
O726_Pla_mys_MPEG_74361_BR_TO
O717_Pla_mys_LSUMZ_B35967_TT_CA
O224_Pla_mys_KU_18521_PE_CUS
O577_Pla_mys_MPEG_79465_BR_TO
O584_Pla_mys_COUFT_0531_BR_TO
O585_Pla_mys_COUFT_0434_BR_TO
100
84,04
85,45
98,59
65,49
99,53
99,65
61,38
99,3
88,03
100
98,94
L. nematura
P. rufum
P. mystaceus
Figure S6. Phylogenetic reconstruction for (a) L. nematura. (b) P. rufum. (c) P. mystaceus
(Maximum Likelihood).
156
S6a
S6b
S6b
northernAtlantic Forests
central-southernAtlantic Forests
Andes/northern Peru*
southern Peru
SDTFssouth Amazon
Tepuis/Central América
Amazon
Outgroup

2.0
O651_Xip_pro_LSUMZ_B41765_BO_CB
O669_Xip_pro_USNM_637091_GU_TUE
O691_Xip_oce_LSUMZ_35598_BR_PA
O670_Xip_pro_USNM_586354_GU_BW
O593_Xip_pro_FMNH_394013_MX_HI
O648_Xip_pro_LSUMZ_B7774_EC_PiC
O655_Xip_pro_LSUMZ_B87638_BO_CB
O235_Xip_maj_FMNH_334428_BO_BEN
O650_Xip_pro_LSUMZ_B32421_PE_CAJ
O522_Xip_pro_Xip_pro_41765_BO_CB
O503_Xip_pro_AY089872_PE_CAJ
O594_Xip_pro_IAvH_14827_H11442_COL_NS
O504_Xip_pro_JF975342_PE_CAJ
87,56
79,23
89,08
67,72
99,06
94,25
94,01
98,94
87,79
80,63
100
89,44
100
Xiphocolaptes complex
Figure S7. Phylogenetic reconstruction for Xiphocolaptes complex (Maximum
Likelihood).
157
northernAtlantic Forests
central-southernAtlantic Forests
Andes/northern Peru*
southern Peru
SDTFssouth Amazon
Tepuis/Central América
Amazon
Outgroup

P. mystaceus
T. palliatus/tenuepunctatus
*samples of T. tenuepunctatus
T. ruficapillus/torquatus
*T. torquatus
*
*
L. nematura
*Central America samples
*
Figure S8. Alternative scenarios tested in SNAPP for (a) T. palliatus/tenuepunctatus. (b) T.
ruficapillus/torquatus. (c) L. nematura. (d) P. mystaceus.
158
northernAtlantic Forests
central-southernAtlantic Forests
Andes/northern Peru*
southern Peru
SDTFssouth Amazon
Tepuis/Central América
Amazon
Outgroup
S8a
S8b
S8c
S8d

Xiphocolaptescomplex
(6) X. albicollis
(1) X. falcirostris
(2) X. major
(3) X. promeropirhynchus (orenocensis group)
(4) X. promeropirhynchus (emigrans group)
(5) X. promeropirhynchus (promeropirhynchus group)
(1)
(2)
(3)
(4)
(5)
(6)
(1)
(2)
(3)
(4)
(5)
(1) X. falcirostris
(3) X. promeropirhynchus (orenocensis group)
(4) X. promeropirhynchus (emigrans group)
(5) X. albicollis
(2) X. major + X. promeropirhynchus (promeropirhynchus group)
Figure S9. Alternative scenarios tested in SNAPP for Xiphocolaptes complex.
159

160
Chapter II: Comparative phylogeography of passerine birds with a circum-Amazonian
distribution (Main Tables).
Table 1.
Portuguese Species Common name (English/Portuguese)
Thamnophilidae Dysithamnus mentalis Plain Antvireo/Choquinha-lisa
Thamnophilidae Thamnophilus caerulescens Variable Antshrike/Choca-da-mata
Thamnophilidae Thamnophilus palliatus Chestnut-backed Antshrike/Choca-listrada
Thamnophilidae Thamnophilus tenuepunctatus ‘Lined Antshrike’ (inglês)
Thamnophilidae Thamnophilus ruficapillus Southern Rufous-capped Antshrike/Choca-de-chapéu-
vermelho
Thamnophilidae Thamnophilus torquatus Rufous-winged Antshrike/Choca-de-asa-vermelha
Furnariidae Lochmias nematura Streamcreeper/João-porca
Furnariidae Philydor rufum Buff-fronted Foliage-gleaner/Limpa-folha-de-testa-baia
Platyrinchidae Platyrinchus mystaceus White-throated Spadebill/Patinho
Dendrocolaptidae Xiphocolaptes albicollis White-throated Woodcreeper/Arapaçu-de-garganta-
branca
Dendrocolaptidae Xiphocolaptes falcirostris Moustached Woodcreeper/Arapaçu-do-nordeste
Dendrocolaptidae Xiphocolaptes major Great Rufous Woodcreeper/Arapaçu-do-campo
Dendrocolaptidae Xiphocolaptes promeropirhynchus Strong-billed Woodcreeper/Arapaçu-do-campo
Table 2. List of ornithological collections used in this study.
Museum/Collection Samples
MZUSP1 217
MPEG2 131
PUC-RS3 16
KU4 25
FMNH5 34
LSU6 50
NMNH7 6
Fabio Raposo Amaral 7
Total 486
Collections: (1) Museu de Zoologia da Universidade de São Paulo, (2) Museu Paraense Emílio Goeldi, (3)
Pontifícia Universidade Católica do Rio Grande do Sul, (4) University of Kansas, (5) Field Museum of Natural
History, (6) LSU Museum of Natural Science, (7) National Museum of Natural History of the Smithsonian Institute

161
Table 3. Best substitution model for the ND2 samples of each species (jModeltest2).
Species Model AICc Model BIC
Dysithamnus mentalis TIM3+I+G TIM3+I+G
Lochmias nematura TVM+G TPM2uf+G
Philydor rufum TIM2+G TPM2uf+I
Platyrinchus mystaceus TIM1+I+G TIM1+G
Thamnophilus caerulescens TrN+I+G TrN+G
Thamnophilus palliatus/tenuepunctatus complex TIM1+G HKY+G
Thamnophilus ruficapillus/torquatus complex TPM1uf+G HKY+G
Xiphocolaptes complex TIM2+I TPM2uf+I
Table 4. Number of loci recovered in the complete and incomplete matrices for each species.
Species Complete Incomplete
Dysithamnus mentalis 6 1848
Lochmias nematura 0 1950
Philydor rufum 209 1901
Platyrinchus mystaceus 9 1843
Thamnophilus caerulescens 324 2,036
Thamnophilus palliatus/tenuepunctatus complex 65 1855
Thamnophilus ruficapillus/torquatus complex 74 1845
Xiphocolaptes complex 18 1887
* Matrix with few loci, not used for analyses.

162
Table 5. Statistics of UCEs after the Illumiprocessor trimming.
Species Mean of reads* Minimum Maximum
Dysithamnus mentalis 4,097,390.07 712,910 11,636,996
Lochmias nematura 3,476,554.27 1,214,882 9,107,376
Philydor rufum 4,114,619.60 72,929 9,687,756
Platyrinchus mystaceus 3,381,776.76 1,463,758 6,144,094
Thamnophilus caerulescens 5,702,659.25 1,904,001 10,284,782
Thamnophilus palliatus/tenuepunctatus complex 3,884,606.87 1,149,098 8,008,501
Thamnophilus ruficapillus/torquatus complex 3,890,676.52 1,380,904 8,066,334
Xiphocolaptes complex 3,147,543.00 948,950 13,782,612
*After trimming
Table 6. Statistics of UCEs after the assemble process.
Species Mean of
reads* Minimum Maximum
Total
contigs
Mean
length Total bp
Contigs
>1K
Dysithamnus mentalis 13,737.31 4,896 157,428 810,501 500.72 337,268,803 18,608
Lochmias nematura 10,836.91 3,595 29,696 238,412 646.91 132,156,469 21,910
Philydor rufum 9,145.31 1,642 25,486 539,573 516.59 262,997,817 18,393
Platyrinchus mystaceus 13,086.41 2,961 29,403 222,469 535.97 107,686,462 15,323
Thamnophilus caerulescens 17,803.68 4,888 143,662 498,503 464.53 185,331,752 4,697
T. palliatus/tenuepunctatus
complex 13,747.19 5,743 75,200 426,163 521.32 191,133,806 14,929
T. ruficapillus/torquatus
complex 10,998.04 5,517 21,193 252,955 530.60 121,822,170 6,347
Xiphocolaptes complex 10,551.93 2,825 32,323 453,733 566.11 235,914,712 30,777
*After Trinity

163
Table 7. Values of AIC and AIC for D. mentalis (incomplete matrix).
Model Log_likelihood n_parameters AICs Delta_AIC weight_AICs
Model 1 -5309.276383 8 10634.55277 81.76809762 1.76E-18
Model 2 -5275.603138 12 10575.20628 22.42160665 1.35E-05
Model 3* -5262.392335 14 10552.78467 0 1
Model 4 -5261.258098 16 10554.5162 1.731526292 0.420730351
Model 5 -5480.279081 18 10996.55816 443.7734919 4.32E-97
Model 6 -5407.541805 18 10851.08361 298.2989407 1.68E-65
Model 7 -5486.576572 18 11009.15314 456.3684745 7.96E-100
Model 8 -5491.428656 22 11026.85731 474.0726424 1.14E-103
Model 9 -7152.90404 22 14349.80808 3797.023411 0
Model 10 -18294.94633 22 36633.89266 26081.10799 0
Model 11 -5279.918669 16 10591.83734 39.05266805 3.31E-09
Model 12 -5262.817181 16 10557.63436 4.84969321 0.088491692
Model 13 -9709.965268 22 19463.93054 8911.145868 0
* Best model for D. mentalis.
Table 8. Values of AIC and AIC for T. caerulescens (incomplete matrix).
Model Log_likelihood n_parameters AICs Delta_AIC weight_AICs
Model 1 -7481.577811 2 14967.15562 392.1354344 7.06E-86
Model 2 -7383.252541 5 14776.50508 201.4848944 1.77E-44
Model 3 -7386.643388 5 14783.28678 208.2665891 5.96E-46
Model 4 -7323.523233 9 14665.04647 90.02627891 2.83E-20
Model 5 -7345.247239 9 14708.49448 133.4742895 1.04E-29
Model 6 -7299.864124 9 14617.72825 42.70805956 5.32E-10
Model 7* -7274.510094 13 14575.02019 0 1
Model 8 -7574.598842 11 15171.19768 596.1774969 3.48E-130
Model 9 -7528.523218 11 15079.04644 504.026249 3.57E-110
Model 10 -7388.482618 16 14808.96524 233.9450474 1.58E-51
Model 11 -7394.500327 16 14821.00065 245.9804667 3.85E-54
Model 12 -7522.21469 11 15066.42938 491.4091924 1.96E-107
Model 13 -7394.482314 16 14820.96463 245.9444395 3.93E-54
Model 14 -7807.853685 11 15637.70737 1062.687182 1.74E-231
Model 15 -7621.885811 19 15281.77162 706.7514342 3.40E-154
Model 16 -7724.954811 11 15471.90962 896.8894352 1.75E-195
* Best model for T. caerulescens.

164
Table 9. Values of AIC and AIC for T. palliatus/tenuepunctatus complex.
Model Log_likelihood n_parameters AICs Delta_AIC weight_AICs
Model 1 -6488.079556 7 12990.15911 29.50880915 3.91E-07
Model 2* -6465.325151 15 12960.6503 0 1
Model 3 -6468.525541 17 12971.05108 10.4007799 0.005514414
Model 4 -6469.110862 18 12974.22172 13.57142202 0.001129804
Model 5 -6473.793174 18 12983.58635 22.93604613 1.05E-05
Model 6 -6470.946603 18 12977.89321 17.24290411 0.000180198
Model 7 -6477.629595 18 12991.25919 30.60888845 2.26E-07
Model 8 -6477.486628 18 12990.97326 30.3229544 2.60E-07
Model 9 -6470.352923 15 12970.70585 10.05554331 0.006553398
Model 10 -6473.685497 17 12981.37099 20.72069164 3.17E-05
Model 11 -6568.463888 18 13172.92778 212.277474 8.03E-47
Model 12 -6555.799502 0 13111.599 150.9487024 1.67E-33
Model 13 -6602.795104 20 13245.59021 284.9399062 1.34E-62
Model 14 -6626.392417 20 13292.78483 332.1345312 7.55E-73
Model 15 -6563.466586 28 13182.93317 222.282869 5.39E-49
Model 16 -7937.080681 23 15920.16136 2959.511059 0
Model 17 -7814.284258 21 15670.56852 2709.918214 0
Model 18 -6469.870035 20 12979.74007 19.0897677 7.16E-05
Model 19 -6605.452577 21 13252.90515 292.2548514 3.45E-64
* Best model for T. palliatus/tenuepunctatus complex.
Table 10. Values of AIC and AIC for T. ruficapillus/torquatus complex.
Model Log_likelihood n_parameters AICs Delta_AIC weight_AICs
Model 1 -6774.176937 7 13562.35387 173.1198488 2.56E-38
Model 2* -6675.617013 19 13389.23403 0 1
Model 3 -6676.236177 19 13390.47235 1.238327941 0.538394363
Model 4 -6693.848291 19 13425.69658 36.46255731 1.21E-08
Model 5 -6687.52161 19 13413.04322 23.80919384 6.76E-06
Model 6 -7569.224441 23 15184.44888 1795.214857 0
Model 7* -7582.263814 23 15210.52763 1821.293602 0
Model 8 -7683.624616 23 15413.24923 2024.015207 0
* Best model for T. ruficapillus/torquatus complex.

165
Chapter II: Comparative phylogeography of passerine birds with a circum-Amazonian
distribution (Supplementary material).
Table S1. List summarized of all samples gathered for this study.
Internal
number
number/field
number Taxon State
UCEs
Sequences
ND2
Sequences
0001 ALG-014 Thamnophilus caerulescens Alagoas YES
0002 ALG-020 Thamnophilus caerulescens Alagoas YES YES
0003 ALG-021 Dysithamnus mentalis Alagoas YES
0004 ALG-046 Dysithamnus mentalis Alagoas YES YES
0005 ALG-053 Thamnophilus caerulescens Alagoas
0006 ALG-080 Thamnophilus caerulescens Alagoas YES YES
0007 ALG-085 Thamnophilus caerulescens Alagoas YES YES
0008 ALG-086 Thamnophilus caerulescens Alagoas YES YES
0009 ALG-087 Dysithamnus mentalis Alagoas YES YES
0010 ALG-102 Thamnophilus caerulescens Alagoas YES YES
0011 ALG-110 Dysithamnus mentalis Alagoas
0012 ALG-111 Dysithamnus mentalis Alagoas YES
0013 ALG-116 Platyrinchus mystaceus Alagoas YES
0014 ALG-117 Platyrinchus mystaceus Alagoas YES
0015 ALG-135 Dysithamnus mentalis Alagoas YES
0016 ALG-136 Dysithamnus mentalis Alagoas YES
0017 J_2216
Thamnophilus palliatus
puncticeps Rondônia YES YES
0018 J_2217
Thamnophilus palliatus
puncticeps Rondônia YES YES
0019 MZ_79194 Dysithamnus mentalis Minas Gerais YES YES
0021 MZ_79195 Dysithamnus mentalis Minas Gerais YES YES
0023 MZ_79196 Dysithamnus mentalis Minas Gerais YES YES
0026 MZ_79203 Dysithamnus mentalis Minas Gerais YES
0027 MZ_81479 Dysithamnus mentalis São Paulo YES
0028 MZ_81480 Dysithamnus mentalis São Paulo YES
0030 MZ_82619
Thamnophilus caerulescens
caerulescens São Paulo
YES
0032 MZ_82637
Thamnophilus caerulescens
caerulescens Minas Gerais
YES YES
0033 MZ_85427 Thamnophilus ruficapillus Minas Gerais YES YES
0034 MZ_85660 Platyrinchus mystaceus São Paulo YES
0035 MZ_85740 Dysithamnus mentalis Alagoas YES YES

166
Internal
number
number/field
number Taxon State
UCEs
Sequences
ND2
Sequences
0037 MZ_85741 Dysithamnus mentalis Alagoas YES YES
0038 MZ_85745 Platyrinchus mystaceus Alagoas YES YES
0039 MZ_85759 Platyrinchus mystaceus Alagoas
0040 MZ_85760 Platyrinchus mystaceus Alagoas YES YES
0042 MZ_85805 Platyrinchus mystaceus Pernambuco YES YES
0043 MZ_85806 Platyrinchus mystaceus Pernambuco YES
0044 MZ_85832 Platyrinchus mystaceus Alagoas YES
0046 MZ_85833 Platyrinchus mystaceus Alagoas YES YES
0047 MZ_86001 Thamnophilus palliatus Minas Gerais YES YES
0049 MZ_86016 Thamnophilus palliatus Bahia YES YES
0051 MZ_86384 Dysithamnus mentalis Tocantins YES YES
0052 MZ_87826 Platyrinchus mystaceus São Paulo YES
0053 MZ_87827 Platyrinchus mystaceus São Paulo YES
0054 MZ_87828 Platyrinchus mystaceus São Paulo YES
0055 MZ_87829 Platyrinchus mystaceus São Paulo YES
0056 MZ_87833 Dysithamnus mentalis São Paulo YES
0057 MZ_87834 Dysithamnus mentalis São Paulo YES YES
0058 MZ_88334 Platyrinchus mystaceus Rio de Janeiro YES YES
0059 MZ_88399 Dysithamnus mentalis São Paulo YES
0066 MZ_90916 Thamnophilus palliatus Bahia YES YES
0067 MZ_90917 Thamnophilus palliatus Bahia YES YES
0068 MZ_90946 Xiphocolaptes albicollis Bahia YES
0069 MZ_90947 Xiphocolaptes albicollis Bahia YES YES
0070 MZ_90971 Platyrinchus mystaceus Bahia YES
0071 MZ_90972 Platyrinchus mystaceus Bahia YES
0072 MZ_90973 Platyrinchus mystaceus Bahia YES
0073 MZ_90974 Platyrinchus mystaceus Bahia YES YES
0074 MZ_90975 Platyrinchus mystaceus Bahia YES YES
0075 MZ_90976 Platyrinchus mystaceus Bahia YES
0076 MZ_90977 Platyrinchus mystaceus Bahia YES
0077 MZ_90978 Platyrinchus mystaceus Bahia YES YES
0078 MZ_91196
Thamnophilus caerulescens
gilvigaster Santa Catarina
YES YES
0079 MZ_91197
Thamnophilus caerulescens
gilvigaster Santa Catarina
YES
0080 MZ_91201 Dysithamnus mentalis Santa Catarina YES YES
0084 MZ_91246 Lochmias nematura Santa Catarina YES YES
0085 MZ_91254 Philydor rufum Santa Catarina YES YES
0086 MZ_91267 Platyrinchus mystaceus Santa Catarina YES

167
Internal
number
number/field
number Taxon State
UCEs
Sequences
ND2
Sequences
0087 MZ_91268 Platyrinchus mystaceus Santa Catarina YES YES
0088 MZ_91269 Platyrinchus mystaceus Santa Catarina YES YES
0089 MZ_91380 Thamnophilus palliatus Bahia YES
0090 MZ_91465 Platyrinchus mystaceus Bahia YES YES
0091 MZ_91466 Platyrinchus mystaceus Bahia YES YES
0092 MZ_91467 Platyrinchus mystaceus Bahia YES
0097 MZ_91661
Thamnophilus caerulescens
caerulescens São Paulo
YES YES
0098 MZ_91681 Platyrinchus mystaceus São Paulo YES YES
0099 MZ_91682 Platyrinchus mystaceus São Paulo YES
0100 MZ_91683 Platyrinchus mystaceus São Paulo YES
0101 MZ_91684 Platyrinchus mystaceus São Paulo YES
0102 MZ_91685 Platyrinchus mystaceus São Paulo YES
0103 MZ_91755
Thamnophilus caerulescens
caerulescens Minas Gerais
YES
0104 MZ_91759 Dysithamnus mentalis Minas Gerais YES YES
0105 MZ_91760 Dysithamnus mentalis Minas Gerais YES YES
0107 MZ_92136 Xiphocolaptes albicollis São Paulo YES
0108 MZ_92160 Dysithamnus mentalis São Paulo YES
0109 MZ_92161 Dysithamnus mentalis São Paulo YES
0110 MZ_92162 Dysithamnus mentalis São Paulo YES
0111 MZ_92163 Dysithamnus mentalis São Paulo YES
0112 MZ_92164 Dysithamnus mentalis São Paulo YES
0113 MZ_92165 Dysithamnus mentalis São Paulo YES
0116 MZ_92168 Platyrinchus mystaceus São Paulo YES
0117 MZ_92169 Platyrinchus mystaceus São Paulo YES
0118 MZ_92170 Platyrinchus mystaceus São Paulo YES
0119 MZ_92171 Platyrinchus mystaceus São Paulo YES
0120 MZ_92172 Platyrinchus mystaceus São Paulo YES
0121 MZ_92173 Platyrinchus mystaceus São Paulo YES
0123 MZ_92478 Lochmias nematura São Paulo YES YES
0127 MZ_92487 Platyrinchus mystaceus São Paulo YES YES
0128 MZ_92488 Platyrinchus mystaceus São Paulo YES
0129 MZ_92489 Platyrinchus mystaceus São Paulo YES
0130 MZ_92490 Platyrinchus mystaceus São Paulo
0131 MZ_93101 Dysithamnus mentalis São Paulo YES
0133 MZ_93175 Dysithamnus mentalis São Paulo YES YES
0134 MZ_93176
Thamnophilus caerulescens
caerulescens São Paulo
YES YES
0135 MZ_93203 Xiphocolaptes albicollis São Paulo YES YES

168
Internal
number
number/field
number Taxon State
UCEs
Sequences
ND2
Sequences
0136 MZ_93204 Xiphocolaptes albicollis São Paulo YES YES
0137 MZ_93208 Lochmias nematura São Paulo YES
0138 MZ_93226 Platyrinchus mystaceus São Paulo YES
0139 MZ_93227 Platyrinchus mystaceus São Paulo YES
0140 MZ_93228 Platyrinchus mystaceus São Paulo YES
0141 MZ_93229 Platyrinchus mystaceus São Paulo YES
0142 MZ_93230 Platyrinchus mystaceus São Paulo YES
0143 MZ_93231 Platyrinchus mystaceus São Paulo YES
0144 MZ_93232 Platyrinchus mystaceus São Paulo YES
0145 MZ_93233 Platyrinchus mystaceus São Paulo YES
0146 MZ_93234 Platyrinchus mystaceus São Paulo YES YES
0147 MZ_93408 Thamnophilus palliatus Pará YES YES
0148 MZ_93501 Dysithamnus mentalis São Paulo YES
0149 MZ_93502 Dysithamnus mentalis São Paulo YES
0150 MZ_93511 Xiphocolaptes albicollis São Paulo YES YES
0151 MZ_93512 Xiphocolaptes albicollis São Paulo YES
0152 MZ_93513 Xiphocolaptes albicollis São Paulo YES
0153 MZ_93514 Philydor rufum São Paulo YES YES
0161 MZ_94441 Platyrinchus mystaceus Minas Gerais YES
0163 MZ_94637 Dysithamnus mentalis Goiás YES YES
0164 MZ_94638 Dysithamnus mentalis Goiás YES YES
0165 MZ_95594 Thamnophilus palliatus Pará YES
0166 MZ_96752
Thamnophilus caerulescens
caerulescens São Paulo
YES
0167 MZ_96753
Thamnophilus caerulescens
caerulescens São Paulo
0168 MZ_96754
Thamnophilus caerulescens
caerulescens São Paulo
YES
0169 MZ_96755
Thamnophilus caerulescens
caerulescens São Paulo
YES
0170 MZ_96769 Xiphocolaptes albicollis São Paulo YES YES
0176 MZ_98298 Platyrinchus mystaceus Minas Gerais YES
0177 MZ_98297 Dysithamnus mentalis Minas Gerais YES
0183 MZ_92715
Xiphocolaptes
promeropirhynchus paraensis Mato Grosso YES
0184 MZ_94552
Xiphocolaptes
promeropirhynchus paraensis Pará YES
0185 ML 1529 Platyrinchus mystaceus São Paulo YES
0186 SM 19 Dysithamnus mentalis São Paulo YES
0188 FRA_168 Dysithamnus mentalis Paraná YES
0189 FRA_178 Lochmias nematura Paraná YES
0190 FRA_230 Philydor rufum Paraná YES

169
Internal
number
number/field
number Taxon State
UCEs
Sequences
ND2
Sequences
0191 FRA_233 Philydor rufum Paraná YES
0192 BOR-14-27 Dysithamnus mentalis São Paulo YES
0193 BOR-14-75 Dysithamnus mentalis São Paulo YES
0194 BOR-14-76 Dysithamnus mentalis São Paulo YES
0195 BOR-14-94 Platyrinchus mystaceus São Paulo YES
0196 BOR-14-95 Platyrinchus mystaceus São Paulo YES
0198 FRA_258 Thamnophilus caerulescens São Paulo YES
0199 PQP_16 Philydor rufum Paraná YES YES
0200 PQP_21 Dysithamnus mentalis São Paulo YES YES
0202 OBR-026 Platyrinchus mystaceus Mato Grosso do Sul YES YES
0206 KU_ 40 Platyrinchus mystaceus Concepcion YES YES
0207 KU_57 Platyrinchus mystaceus Concepcion YES YES
0208 KU_ 160 Xiphocolaptes major Concepcion YES YES
0209 KU_ 273 Dysithamnus mentalis Caazapa YES YES
0210 KU_ 274 Dysithamnus mentalis Caazapa YES YES
0211 KU_ 405 Philydor rufus Concepcion YES YES
0212 KU_ 406 Philydor rufus Concepcion YES
0213 KU_ 3187 Xiphocolaptes major Alto Paraguay YES
0214 KU_ 3195 Thamnophilus caerulescens Alto Paraguay YES YES
0215 KU_3215 Xiphocolaptes major Alto Paraguay YES
0216 KU_ 3700 Thamnophilus caerulescens Itapua YES YES
0217 KU_ 3721 Thamnophilus caerulescens Caazapa/Itapua YES YES
0218 KU_ 4023 Platyrinchus mystaceus duidae Guyana YES YES
0219 KU_ 9040
Xiphocolaptes
promeropirhynchus
El Salvador,
Chalatenango YES YES
0220 KU_ 9772 Xiphocolaptes major Jujuy YES YES
0221 KU_ 9864
Thamnophilus ruficapillus
cochabambae Jujuy YES YES
0222 KU_ 17412 Thamnophilus palliatus Junin YES YES
0223 KU_ 18426 Platyrinchus mystaceus Cusco YES YES
0224 KU_ 18521 Platyrinchus mystaceus Cusco YES YES
0225 KU_ 18706 Dysithamnus mentalis Cusco YES YES
0226 KU_ 18868 Dysithamnus mentalis Cusco YES
0227 KU_ 21588 Thamnophilus ruficapillus Puno YES YES
0228 KU_ 21589 Thamnophilus ruficapillus Puno YES YES
0229 KU_ 21634 Thamnophilus caerulescens Puno YES
0230 KU_ 21654 Thamnophilus caerulescens Puno YES YES
0234 FMNH_334427 Xiphocolaptes major castaneus Santa Cruz YES YES
0235 FMNH_334428 Xiphocolaptes major castaneus El Beni YES YES

170
Internal
number
number/field
number Taxon State
UCEs
Sequences
ND2
Sequences
0243 FMNH_397978 Lochmias nematura obscurata Cusco YES YES
0244 FMNH_397980 Lochmias nematura obscurata Cusco YES
0245 FMNH_397982 Lochmias nematura obscurata Cusco YES
0246 FMNH_399228 Dysithamnus mentalis emiliae Pernambuco YES
0247 FMNH_399229 Dysithamnus mentalis emiliae Pernambuco YES
0248 FMNH_399230 Dysithamnus mentalis emiliae Alagoas YES
0249 FMNH_399231 Dysithamnus mentalis emiliae Alagoas YES YES
0250 FMNH_399232 Dysithamnus mentalis emiliae Alagoas YES
0254 FMNH_429981 Lochmias nematura obscurata Cusco YES YES
0255 FMNH_429983 Lochmias nematura obscurata Cusco YES YES
0256 FMNH_429984
Thamnophilus palliatus
puncticeps Cusco YES YES
0257 FMNH_433368 Lochmias nematura obscurata Cusco YES YES
0258 FMNH_433393 Dysithamnus mentalis tavarae Cusco YES
0259 FMNH_433395 Dysithamnus mentalis tavarae Cusco YES YES
0260 FMNH_433397 Dysithamnus mentalis tavarae Cusco YES YES
0261 FMNH_474098
Dysithamnus mentalis
tambillanus Amazonas YES YES
0262 FMNH_474099
Dysithamnus mentalis
tambillanus Amazonas YES
0263 FMNH_474100
Dysithamnus mentalis
tambillanus Amazonas YES YES
0264 FMNH_474102
Dysithamnus mentalis
tambillanus Amazonas YES
0265 FMNH_474103
Dysithamnus mentalis
tambillanus Amazonas YES
0266 FMNH_474104
Dysithamnus mentalis
tambillanus Amazonas YES
0267 FMNH_481065
Dysithamnus mentalis
tambillanus Cajamarca YES YES
0268 ML 1862 Lochmias nematura Minas Gerais YES YES
0269 ML 1863 Lochmias nematura Minas Gerais YES YES
0270 ESS_196 Lochmias nematura Santa Catarina YES YES
0271 ESS_198 Lochmias nematura Santa Catarina YES
0272 ML 2030 Thamnophilus caerulescens Minas Gerais YES YES
0273 ML 2031 Thamnophilus caerulescens Goiás YES YES
0274 BOR-14-23 Dysithamnus mentalis São Paulo YES
0275 BOR-14-32 Thamnophilus caerulescens São Paulo YES
0276 RM_06 Lochmias nematura Minas Gerais YES YES
0277 MZ_85248
Xiphocolaptes albicollis
albicollis São Paulo YES YES
0278 MZ_95442 Xiphocolaptes carajaensis Pará YES YES
0279 MZ_92713
Xiphocolaptes
promeropirhynchus paraensis Amazonas YES
0280 MZ_92714
Xiphocolaptes
promeropirhynchus paraensis Amazonas YES

171
Internal
number
number/field
number Taxon State
UCEs
Sequences
ND2
Sequences
0281 MZ_99818
Xiphocolaptes
promeropirhynchus berlepschi Rondônia YES
0282 BML_444 Xiphocolaptes carajaensis Pará YES YES
0283 ML_2032 Thamnophilus caerulescens Minas Gerais YES
0284 MCP_2896 Thamnophilus ruficapillus Rio Grande do Sul YES YES
0285 MCP_3110 Thamnophilus ruficapillus Rio Grande do Sul YES YES
0286 MCP_3189 Thamnophilus ruficapillus Rio Grande do Sul YES
0287 MCP_3190 Thamnophilus ruficapillus Rio Grande do Sul YES
0288 MCP_3306 Thamnophilus caerulescens Rio Grande do Sul YES YES
0290 MCP_3509 Thamnophilus caerulescens Rio Grande do Sul YES
0291 MCP_4038 Thamnophilus ruficapillus Rio Grande do Sul YES
0292 MCP_4051 Lochmias nematura Rio Grande do Sul YES
0293 MCP_4053 Thamnophilus caerulescens Rio Grande do Sul YES
0294 MCP_4058 Thamnophilus ruficapillus Rio Grande do Sul YES
0295 MCP_4085 Dysithamnus mentalis Mato Grosso YES
0296 MCP_4129 Thamnophilus ruficapillus Rio Grande do Sul YES YES
0297 MCP_4389 Philydor rufum Rio Grande do Sul YES YES
0298 MCP_4679 Dysithamnus mentalis Santa Catarina YES
0299 MCP_4843 Thamnophilus caerulescens Santa Catarina YES YES
0300 MZ_70025
Thamnophilus caerulescens
ochraceiventer Goiás
0306 ML_2030 Thamnophilus caerulescens Minas Gerais
0307 ML_2031 Thamnophilus caerulescens Goiás
0309 MPEG_T01670 Thamnophilus palliatus Pará YES YES
0310 MPEG_T01987 Philydor rufum Acre YES YES
0311 MPEG_T02234 Dysithamnus mentalis Pará YES YES
0312 MPEG_T02538
Xiphocolaptes
promeropirhynchus Pará YES YES
0313 MPEG_T03450 Dysithamnus mentalis Mato Grosso YES YES
0314 MPEG_T04522
Xiphocolaptes
promeropirhynchus Mato Grosso YES YES
0315 MPEG_T06852 Thamnophilus torquatus Piauí YES
0316 MPEG_T06873 Thamnophilus torquatus Piauí YES YES
0317 MPEG_T06905 Thamnophilus torquatus Piauí YES YES
0318 MPEG_T06924 Thamnophilus torquatus Piauí YES YES
0319 MPEG_T08265 Xiphocolaptes falcirostris Maranhão YES YES
0323 MPEG_T09657 Thamnophilus torquatus Piauí YES YES
0325 MPEG_T09706 Dysithamnus mentalis Piauí YES
0326 MPEG_T09855 Dysithamnus mentalis Piauí YES
0327 MPEG_T09867 Dysithamnus mentalis Piauí YES
0328 MPEG_T10072 Thamnophilus torquatus Piauí YES

172
Internal
number
number/field
number Taxon State
UCEs
Sequences
ND2
Sequences
0329 MPEG_T10588
Xiphocolaptes
promeropirhynchus Mato Grosso YES YES
0332 MPEG_T11172 Thamnophilus palliatus Mato Grosso YES YES
0333 MPEG_T11577
Xiphocolaptes
promeropirhynchus Mato Grosso YES
0335 MPEG_T12338
Xiphocolaptes
promeropirhynchus Pará YES
0336 MPEG_T12490 Thamnophilus palliatus Pará YES YES
0337 MPEG_T12505 Dysithamnus mentalis Pará YES
0338 MPEG_T12705 Thamnophilus palliatus Alagoas YES YES
0340 MPEG_T12861 Dysithamnus mentalis Maranhão
0341 MPEG_T12901 Dysithamnus mentalis Maranhão YES
0342 MPEG_T12907 Dysithamnus mentalis Maranhão YES
0343 MPEG_T12923 Thamnophilus palliatus Maranhão YES YES
0344 MPEG_T12995 Xiphocolaptes falcirostris Piauí YES YES
0347 MPEG_T13444 Thamnophilus palliatus Bahia YES YES
0349 MPEG_T14940 Thamnophilus caerulescens Santa Catarina YES YES
0351 MPEG_T14991 Thamnophilus caerulescens Santa Catarina YES
0352 MPEG_T15045 Xiphocolaptes albicollis Santa Catarina YES YES
0353 MPEG_T15046 Philydor rufum Santa Catarina YES
0354 MPEG_T15047 Philydor rufum Santa Catarina YES YES
0355 MPEG_T15048 Philydor rufum Santa Catarina YES
0356 MPEG_T15060 Dysithamnus mentalis Santa Catarina YES
0357 MPEG_T15076 Lochmias nematura Santa Catarina YES YES
0358 MPEG_T15078 Dysithamnus mentalis Santa Catarina YES
0359 MPEG_T15098 Dysithamnus mentalis Santa Catarina YES YES
0361 MPEG_T15175 Dysithamnus mentalis Piauí YES YES
0362 MPEG_T15178 Dysithamnus mentalis Piauí
0363 MPEG_T15207 Thamnophilus caerulescens Pernambuco YES
0364 MPEG_T15223 Dysithamnus mentalis Minas Gerais YES
0365 MPEG_T15230 Dysithamnus mentalis Minas Gerais YES
0366 MPEG_T15231 Dysithamnus mentalis Minas Gerais YES
0367 MPEG_T15287 Dysithamnus mentalis Mato Grosso YES YES
0368 MPEG_T15288 Dysithamnus mentalis Mato Grosso YES YES
0369 MPEG_T15289 Dysithamnus mentalis Mato Grosso YES YES
0370 MPEG_T15352 Dysithamnus mentalis Goiás YES
0371 MPEG_T15353 Dysithamnus mentalis Goiás YES
0372 MPEG_T15413 Thamnophilus torquatus Minas Gerais YES
0373 MPEG_T15414 Thamnophilus torquatus Minas Gerais YES YES
0374 MPEG_T15415 Thamnophilus torquatus Minas Gerais YES YES

173
Internal
number
number/field
number Taxon State
UCEs
Sequences
ND2
Sequences
0375 MPEG_T15453 Dysithamnus mentalis Mato Grosso YES
0376 MPEG_T15454 Dysithamnus mentalis Mato Grosso YES
0377 MPEG_T15455 Dysithamnus mentalis Mato Grosso YES
0381 MPEG_T15530 Dysithamnus mentalis Mato Grosso YES
0386 MPEG_T15661 Dysithamnus mentalis Tocantins YES YES
0387 MPEG_T15662 Dysithamnus mentalis Tocantins YES
0388 MPEG_T15683 Philydor rufum Minas Gerais
0389 MPEG_T15689 Lochmias nematura Minas Gerais YES
0390 MPEG_T15691 Thamnophilus caerulescens Minas Gerais YES YES
0392 MPEG_T15720 Thamnophilus caerulescens Minas Gerais YES
0395 MPEG_T15741 Thamnophilus torquatus Minas Gerais YES YES
0396 MPEG_T15750 Dysithamnus mentalis Minas Gerais YES
0397 MPEG_T15751 Dysithamnus mentalis Minas Gerais YES
0398 MPEG_T15752 Dysithamnus mentalis Minas Gerais YES
0399 MPEG_T15762 Philydor rufum Minas Gerais YES
0400 MPEG_T15783 Thamnophilus caerulescens Minas Gerais YES
0401 MPEG_T15786 Philydor rufum Minas Gerais YES YES
0402 MPEG_T15792 Dysithamnus mentalis Minas Gerais
0403 MPEG_T16708
Xiphocolaptes
promeropirhynchus Pará YES
0404 MPEG_T18772
Xiphocolaptes
promeropirhynchus Pará YES
0405 MPEG_T18835
Xiphocolaptes
promeropirhynchus Pará YES
0408 MPEG_T19396
Xiphocolaptes
promeropirhynchus Pará YES
0409 MPEG_T19397
Xiphocolaptes
promeropirhynchus Pará YES
0410 MPEG_T19427
Xiphocolaptes
promeropirhynchus Pará YES
0411 MPEG_T19876 Dysithamnus mentalis Maranhão YES
0412 MPEG_T19877 Dysithamnus mentalis Maranhão YES
0413 MPEG_T19906 Dysithamnus mentalis Maranhão YES
0414 MPEG_T19916 Thamnophilus palliatus Maranhão YES
0415 MPEG_T20164 Xiphocolaptes falcirostris Piauí YES
0416 MPEG_T20167 Xiphocolaptes falcirostris Piauí YES YES
0417 MPEG_T21092 Dysithamnus mentalis Minas Gerais YES
0418 MPEG_T21098 Thamnophilus caerulescens Minas Gerais
0419 MPEG_T21113 Lochmias nematura Minas Gerais YES YES
0420 MPEG_T21152 Dysithamnus mentalis Tocantins YES
0421 MPEG_T21155 Dysithamnus mentalis Tocantins YES YES
0422 MPEG_T21161 Dysithamnus mentalis Tocantins YES

174
Internal
number
number/field
number Taxon State
UCEs
Sequences
ND2
Sequences
0423 MPEG_T21639 Dysithamnus mentalis Tocantins
0424 MPEG_T21651 Dysithamnus mentalis Tocantins YES YES
0425 MPEG_T21688 Dysithamnus mentalis Tocantins YES
0426 MPEG_T21702 Dysithamnus mentalis Tocantins YES
0427 MPEG_T23067 Thamnophilus palliatus Mato Grosso YES YES
0428 MPEG_T23096 Dysithamnus mentalis Tocantins YES
0429 MPEG_T23098 Dysithamnus mentalis Tocantins YES
0430 MPEG_T23718 Thamnophilus palliatus Pará YES YES
0431 MPEG_T23982 Dysithamnus mentalis Bahia YES
0432 MPEG_T23983 Dysithamnus mentalis Bahia YES
0437 MPEG_T24942
Xiphocolaptes
promeropirhynchus Amazonas YES
0438 MPEG_T24997 Dysithamnus mentalis Pará YES
0439 ML_5532 Philydor rufum Santa Catarina YES
0440 ML_5546 Thamnophilus caerulescens Santa Catarina YES
0442 ML_5590 Philydor rufum Santa Catarina YES
0443 UFG_4978 Platyrinchus mystaceus Maranhão YES
0444 LSUB_12144 Thamnophilus unicolor Ecuador YES YES
0445 BO475_EU295760 Thamnophilus caerulescens Minas Gerais YES
0446 BO513_EU295759 Thamnophilus caerulescens Minas Gerais YES
0447 FMNH_395426 Thamnophilus caerulescens São Paulo YES
0448 LSUB_1684 Thamnophilus caerulescens Pasco YES
0449 LSU_38284 Thamnophilus caerulescens Santa Cruz YES
0450 MPEG_CPEII037 Thamnophilus caerulescens Pernambuco YES YES
0451 MZ_81155 Thamnophilus caerulescens São Paulo YES
0452 MZ_84352 Thamnophilus caerulescens Santa Catarina YES
0453 UWBM_77213 Thamnophilus caerulescens Tarija YES YES
0454 UWBMRTB_407 Thamnophilus caerulescens Cochabamba YES
0455
YPM_10106_KJ_81
0434 Thamnophilus caerulescens Artigas YES
0456 MZ_90922 Dysithamnus stictothorax Bahia YES
0457 AMC_1266 Dysithamnus mentalis Tachira YES
0458 AMC_1310 Dysithamnus mentalis Tachira YES
0459 JM_1042 Dysithamnus mentalis Tachira YES
0460 JM_1102 Dysithamnus mentalis Tachira YES
0461 JPL_340 Dysithamnus mentalis Tachira YES
0462 JPL_341 Dysithamnus mentalis Tachira YES
0463 KCC_160 Dysithamnus mentalis Tachira YES
0464 KCC_178 Dysithamnus mentalis Tachira YES

175
Internal
number
number/field
number Taxon State
UCEs
Sequences
ND2
Sequences
0465 KCC_246 Dysithamnus mentalis Tachira YES
0466 KCC_248 Dysithamnus mentalis Tachira YES
0467 KCC_255 Dysithamnus mentalis Tachira YES
0468 FMNH_293443 Dysithamnus mentalis Pernambuco YES
0469 IAvH_BT_112 Dysithamnus mentalis Norte de Santander YES
0470 IAvH_BT_114 Dysithamnus mentalis Norte de Santander YES
0471 LSU_72027 Dysithamnus mentalis Costa Rica? YES
0472 LSUB_25839 Dysithamnus mentalis Caaguazu YES
0473 LSUB_26463 Dysithamnus mentalis Chiquiri YES YES
0474 LSUB_43612 Dysithamnus mentalis San Martin YES
0475 LSUB_48490 Dysithamnus mentalis Guyana YES YES
0476 LSYUB_33085 Dysithamnus mentalis Cajamarca YES YES
0477 ML_2720 Platyrinchus mystaceus Alagoas
0478 ML_2721 Platyrinchus mystaceus Alagoas
0479 ML_2731 Platyrinchus mystaceus Alagoas
0480 ML_2732 Platyrinchus mystaceus Alagoas
0481 ML_2716 Dysithamnus mentalis Alagoas YES
0482 ML_2733 Dysithamnus mentalis Alagoas YES YES
0483 ML_2736 Dysithamnus mentalis Alagoas YES
0484 ML_2768 Dysithamnus mentalis Alagoas YES
0485
AMNH_12074_JF9
75324 Lochmias nematura Misiones YES YES
0486
LSU_38510_KF705
454 Lochmias nematura SantaCruz YES YES
0487 GQ906717 Xiphocolaptes major SantaCruz YES
0488 UWBMMAB02 Thamnophilus palliatus SantaCruz YES
0489 UWBMRTB390 Thamnophilus doliatus SantaCruz YES
0490 LSUB38230 Thamnophilus ruficapillus SantaCruz YES YES
0491 UWBMRTB347 Thamnophilus ruficapillus SantaCruz YES
0492 LSUB13900 Thamnophilus torquatus SantaCruz YES YES
0493 LSUB14631 Thamnophilus torquatus SantaCruz YES
0494 MZ_85427 Thamnophilus ruficapillus Minas Gerais YES
0495
MPEG_55411_T16
70 Thamnophilus palliatus Pará YES
0496
LSUMZ_B35610_K
F705463
Xiphocolaptes
promeropirhynchus Pará YES YES
0497
LGEMA_P2333_JF
975343 Xiphocolaptes falcirostris Piauí YES YES
0498 IAvH2379 Thamnophilus multistriatus Valle YES
0499 IAvH8245 Thamnophilus palliatus Vichada YES YES
0500 ANSP1686 Thamnophilus tenuepunctatus Ecuador YES YES

176
Internal
number
number/field
number Taxon State
UCEs
Sequences
ND2
Sequences
0501 KF705462
Xiphocolaptes
promeropirhynchus Honduras YES
0502
SI_607841_EF5018
89 Platyrinchus mystaceus Panamá YES
0503 AY089872
Xiphocolaptes
promeropirhynchus Cajamarca YES
0504 JF975342
Xiphocolaptes
promeropirhynchus Cajamarca YES
0505 LSUB32657 Thamnophilus ruficapillus Cajamarca YES YES
0506
LSU_40199_JF975
306 Philydor rufum Loreto YES YES
0507 LSUB58400 Thamnophilus palliatus Puno YES YES
0508 LSUB58333 Thamnophilus ruficapillus Puno YES YES
0509 LSUB44648 Thamnophilus tenuepunctatus San Martin YES YES
0510 JF975349 Dendrocolaptes platyrostris Paraguay YES
0511
LSUMZ_25944_JF
975344 Xiphocolaptes albicollis Paraguay YES YES
0512
NRM_976724_KF2
28509 Platyrinchus mystaceus Concepcion YES
0515
YPM_1141_KJ8103
87 Lochmias nematura Uruguay YES
0516
LSU_7481_HM125
593 Lochmias nematura Amazonas YES
0518 Pla_mys_28375 Platyrinchus mystaceus Panama YES
0519 LSUMZ_25794 Xiphocolaptes major Paraguay YES YES
0520 Xip_pro_4526
Xiphocolaptes
promeropirhynchus Loreto YES
0521 Xip_pro_7998
Xiphocolaptes
promeropirhynchus Pasco YES
0522 Xip_pro_41765
Xiphocolaptes
promeropirhynchus Cochabamba YES
0523 MZ_92166
Platyrinchus mystaceus
mystaceus São Paulo
0524 MZ_92167
Platyrinchus mystaceus
mystaceus São Paulo
0525 MZ_92484
Platyrinchus mystaceus
mystaceus São Paulo
0526 MZ_92485
Platyrinchus mystaceus
mystaceus São Paulo
0527 MZ_92486
Platyrinchus mystaceus
mystaceus São Paulo
0528 MZ_93536
Platyrinchus mystaceus
mystaceus São Paulo
0529 MZ_93537
Platyrinchus mystaceus
mystaceus São Paulo
0530 MZ_93538
Platyrinchus mystaceus
mystaceus São Paulo
0531 BOR 14-46
Platyrinchus mystaceus
mystaceus São Paulo YES
0532 BOR 14-78
Platyrinchus mystaceus
mystaceus São Paulo YES
0533 SM_04
Platyrinchus mystaceus
mystaceus São Paulo YES
0534 BOR 14-05
Platyrinchus mystaceus
mystaceus São Paulo YES

177
Internal
number
number/field
number Taxon State
UCEs
Sequences
ND2
Sequences
0535 MZ_94442
Platyrinchus mystaceus
cancromus Minas Gerais
0536 UFG_4483
Platyrinchus mystaceus
cancromus Maranhão YES
0537 MCP_5493
Platyrinchus mystaceus
cancromus Santa Catarina YES
0538 MCP_5495
Platyrinchus mystaceus
cancromus Santa Catarina YES
0539 MCP_5514
Platyrinchus mystaceus
cancromus Santa Catarina YES YES
0540 MCP_5527
Platyrinchus mystaceus
cancromus Santa Catarina YES YES
0541 ALG-159
Platyrinchus mystaceus
niveigularis Alagoas YES
0542 ALG-158
Platyrinchus mystaceus
niveigularis Alagoas YES
0543 ALG-39
Platyrinchus mystaceus
niveigularis Alagoas YES
0544 ALG-48
Platyrinchus mystaceus
niveigularis Alagoas YES
0545 FMNH_427096
Platyrinchus mystaceus
niveigularis Pernambuco YES
0546 FMNH_427097
Platyrinchus mystaceus
niveigularis Pernambuco YES
0547 FMNH_427098
Platyrinchus mystaceus
niveigularis Pernambuco YES
0548 FMNH_427099
Platyrinchus mystaceus
niveigularis Pernambuco YES
0549 FMNH_427100
Platyrinchus mystaceus
niveigularis Pernambuco YES YES
0550 FMNH_427101
Platyrinchus mystaceus
niveigularis Alagoas YES
0551 FMNH_427102
Platyrinchus mystaceus
niveigularis Alagoas YES
0552 FMNH_427103
Platyrinchus mystaceus
niveigularis Alagoas YES
0553 FMNH_427104
Platyrinchus mystaceus
niveigularis Alagoas YES
0554 FMNH_427105
Platyrinchus mystaceus
niveigularis Alagoas YES
0555 FMNH_427106
Platyrinchus mystaceus
niveigularis Alagoas YES
0556 MCP_3089
Platyrinchus mystaceus
mystaceus Rio Grande do Sul YES YES
0557 MCP_4699
Platyrinchus mystaceus
cancromus Santa Catarina YES
0558 MPEG_68442
Platyrinchus mystaceus
cancromus Maranhão
0559 MPEG_68441
Platyrinchus mystaceus
cancromus Maranhão
0560 LZUFPI_0174
Platyrinchus mystaceus
cancromus Piauí YES YES
0561 LZUFPI_0176
Platyrinchus mystaceus
cancromus Piauí
0562 LZUFPI_0322
Platyrinchus mystaceus
cancromus Piauí
0563 COUFT_0515
Platyrinchus mystaceus
cancromus Tocantins YES YES

178
Internal
number
number/field
number Taxon State
UCEs
Sequences
ND2
Sequences
0564 MPEG_T23638
Platyrinchus mystaceus
cancromus Piauí YES YES
0565 MPEG_70184
Platyrinchus mystaceus
cancromus Maranhão YES YES
0566 MPEG_DZ_4934
Platyrinchus mystaceus
cancromus Minas Gerais YES YES
0567 MPEG_DZ_6768
Platyrinchus mystaceus
cancromus Minas Gerais
0568 DZ_4935
Platyrinchus mystaceus
cancromus Minas Gerais YES
0569 DZ_5020
Platyrinchus mystaceus
cancromus Minas Gerais YES YES
0570 DZ_6769
Platyrinchus mystaceus
cancromus Minas Gerais
0571 DZ_6772
Platyrinchus mystaceus
cancromus Minas Gerais YES YES
0572 DZ_6770
Platyrinchus mystaceus
cancromus Minas Gerais YES
0573 MPEG_74929
Platyrinchus mystaceus
cancromus Pará YES YES
0574 CFL-CO_122
Platyrinchus mystaceus
cancromus Minas Gerais YES
0575 MPEG_74360
Platyrinchus mystaceus
cancromus Piauí
0576 MPEG_79462
Platyrinchus mystaceus
cancromus Tocantins YES
0577 MPEG_79465
Platyrinchus mystaceus
cancromus Tocantins YES
0578 MPEG_79466
Platyrinchus mystaceus
cancromus Tocantins YES YES
0579 MPEG_79463
Platyrinchus mystaceus
cancromus Tocantins YES
0580 MPEG_72017
Platyrinchus mystaceus
cancromus Santa Catarina YES
0581 MPEG_71977
Platyrinchus mystaceus
cancromus Santa Catarina YES
0582 MPEG_71978
Platyrinchus mystaceus
cancromus Santa Catarina YES
0583 DZ_6771
Platyrinchus mystaceus
cancromus Minas Gerais YES
0584 COUFT_0531
Platyrinchus mystaceus
cancromus Tocantins YES
0585 COUFT_0434
Platyrinchus mystaceus
cancromus Tocantins YES
0586 MPEG_74361
Platyrinchus mystaceus
cancromus Piauí YES
0587 MPEG_79461
Platyrinchus mystaceus
cancromus Tocantins YES YES
0588 MPEG_70476
Platyrinchus mystaceus
niveigularis Alagoas YES
0589 MPEG_71880
Platyrinchus mystaceus
mystaceus Bahia YES
0590 MPEG_71881
Platyrinchus mystaceus
mystaceus Bahia YES
0591 MPEG_76409
Platyrinchus m.c.
(platyrinchos) Pará YES
0592 MPEG_76444
Platyrinchus mystaceus
cancromus Pará YES YES

179
Internal
number
number/field
number Taxon State
UCEs
Sequences
ND2
Sequences
0593 FMNH_394013
Xiphocolaptes
promeropirhynchus Hidalgo YES YES
0594
IAvH_14827_H114
42
Xiphocolaptes
promeropirhynchus Norte de Santander YES YES
0595 LSUMZ_105996
Dysithamnus mentalis
olivaceus Pasco YES YES
0596 IAvH-BT_4241 Dysithamnus mentalis extremus Valle del Cauca YES YES
0597 IAvH-BT_34527
Dysithamnus mentalis
semicinereus Antioquia YES YES
0598 ANSP_185449 Dysithamnus mentalis napensis Napo YES YES
0599 LSUMZ_162665 Dysithamnus mentalis tavarae La Paz YES YES
0600 LSUMZ_183140
Dysithamnus mentalis
aequatorialis Tumbes YES YES
0601 LSUMZ_45867 Dysithamnus mentalis andrei Trinidad YES YES
0602 LSUMZ_46017 Dysithamnus mentalis oberi Tobago YES YES
0603 LSUMZ_105988
Thamnophilus caerulescens
melanochrous Pasco YES YES
0604 LSUMZ_171295
Thamnophilus caerulescens
paraguayensis Santa Cruz YES YES
0605 LSUMZ_168944
Thamnophilus caerulescens
connectens Santa Cruz YES YES
0606 LSUMZ_170871
Thamnophilus caerulescens
subandinus Loreto YES YES
0607 LSUMZ_179678
Thamnophilus caerulescens
aspersiventer Puno YES YES
0608 MZUSP_81155
Thamnophilus caerulescens
caerulescens São Paulo YES YES
0609 LSUMZ_B1134 Dysithamnus mentalis La Paz YES YES
0610 LSUMZ_B6155 Dysithamnus mentalis Morona-Santiago YES YES
0611 LSUMZ_B13848 Dysithamnus mentalis Santa Cruz YES YES
0612 LSUMZ_B38408 Dysithamnus mentalis Santa Cruz YES YES
0613 LSUMZ_B38935 Dysithamnus mentalis Cochabamba YES YES
0614 LSUMZ_B40022 Dysithamnus mentalis Loreto YES YES
0615 LSUMZ_B68224 Dysithamnus mentalis Beni YES YES
0616 LSUMZ_B72029 Dysithamnus mentalis Cartago YES YES
0617 LSUMZ_B76452 Dysithamnus mentalis Ucayali YES YES
0618 LSUMZ_B89140 Dysithamnus mentalis Ucayali YES YES
0619 LSUMZ_B2033 Lochmias nematura Pasco YES YES
0620 LSUMZ_B7488 Lochmias nematura Amazonas YES YES
0621 LSUMZ_B22682 Lochmias nematura La Paz YES YES
0622 LSUMZ_B25963 Lochmias nematura Caazapa YES YES
0623 LSUMZ_B33710 Lochmias nematura Cajamarca YES YES
0624 LSUMZ_B43594 Lochmias nematura San Martin YES YES
0625 LSUMZ_B48459 Lochmias nematura Potaro-Siparuni YES YES
0626 LSUMZ_B38369 Philydor rufum Santa Cruz YES YES
0627 LSUMZ_B81957 Philydor rufum San Jose YES YES

180
Internal
number
number/field
number Taxon State
UCEs
Sequences
ND2
Sequences
0628 LSUMZ_B11885 Philydor rufum Esmeraldas YES YES
0629 LSUMZ_B12127 Philydor rufum Pichincha YES YES
0630 LSUMZ_B29942 Philydor rufum Imbabura YES YES
0631 LSUMZ_B25966 Philydor rufum Caazapa YES YES
0632 LSUMZ_B40199 Philydor rufum Loreto YES YES
0633 LSUMZ_B89099 Philydor rufum Ucayali YES YES
0637 LSUMZ_B22863 Thamnophilus palliatus La Paz YES YES
0638 LSUMZ_B38417 Thamnophilus palliatus Santa Cruz YES YES
0639 LSUMZ_B46060 Thamnophilus palliatus San Martin YES YES
0640 LSUMZ_B68260 Thamnophilus palliatus Beni YES YES
0641 LSUMZ_B89121 Thamnophilus palliatus Ucayali YES YES
0642 LSUMZ_B87886 Thamnophilus ruficapillus La Paz YES YES
0643 LSUMZ_B25944 Xiphocolaptes albicollis Caaguazu YES YES
0644 LSUMZ_B25756 Xiphocolaptes major Alto Paraguay YES YES
0645 LSUMZ_B38885 Xiphocolaptes major Santa Cruz YES YES
0646 LSUMZ_B1874
Xiphocolaptes
promeropirhynchus Pasco YES YES
0647 LSUMZ_B4526
Xiphocolaptes
promeropirhynchus Loreto YES YES
0648 LSUMZ_B7774
Xiphocolaptes
promeropirhynchus Pichincha YES YES
0649 LSUMZ_B8795
Xiphocolaptes
promeropirhynchus Toledo YES YES
0650 LSUMZ_B32421
Xiphocolaptes
promeropirhynchus Cajamarca YES YES
0651 LSUMZ_B41765
Xiphocolaptes
promeropirhynchus Cochabamba YES YES
0652 LSUMZ_B44821
Xiphocolaptes
promeropirhynchus Loreto YES YES
0653 LSUMZ_B60983
Xiphocolaptes
promeropirhynchus Francisco Morazan YES YES
0654 LSUMZ_B66570
Xiphocolaptes
promeropirhynchus Tumbes YES YES
0655 LSUMZ_B87638
Xiphocolaptes
promeropirhynchus Cochabamba YES YES
0656 LSUMZ_B89012
Xiphocolaptes
promeropirhynchus Ucayali YES YES
0657 LSUMZ_B103529
Xiphocolaptes
promeropirhynchus Loreto YES YES
0659 MZ_81269
Thamnophilus aethiops
incertus Maranhão YES YES
0660 MZ_93741
Thamnophilus aethiops
polionotus Roraima YES YES
0661 J_1799
Thamnophilus aethiops
injunctus Rondônia YES YES
0662 LSU_58402 Thamnophilus aroyae Puno YES YES
0663 H_2314 Thamnophilus unicolor Huila YES YES
0664
USNM_625181_C
MM 981 Dysithamnus mentalis
Upper Takutu-Upper
Essequibo YES YES

181
Internal
number
number/field
number Taxon State
UCEs
Sequences
ND2
Sequences
0665
USNM_635781_C
MM_3056 Lochmias nematura Maldonado YES YES
0668
USNM_630526_CA
G_773
Thamnophilus ruficapillus
ruficapillus Colonia YES YES
0669
USNM_637091_C
MM_3391
Xiphocolaptes
promeropirhynchus
Upper Takutu-Upper
Essequibo YES YES
0670 USNM_586354
Xiphocolaptes
promeropirhynchus Barima-Waini YES YES
0671 LSU_58381 Thamnophilus palliatus Puno YES YES
0672 LSU_58414 Thamnophilus palliatus Puno YES YES
0673 LSU_31651 Thamnophilus ruficapillus SantaCruz YES YES
0674 LSU_14842 Thamnophilus torquatus SantaCruz YES YES
0675 YPM_148411
Thamnophilus ruficapillus
ruficapillus Cerro Largo YES YES
0685 LSU_6111 Dysithamnus leucostictus Morona-Santiago YES YES
0686 LSU_10637 Ancistrops strigilatus Ucayali YES YES
0687 AMNH_12102 Phleocryptes melanops Buenos Aires YES YES
0688 LSUMZ_39987 Platyrinchus mystaceus Loreto YES YES
0691 LSUMZ_35598 Xiphorhynchus ocellatus Pará YES YES
0692 LSU_25854 Philydor atricapillus Caazapa YES YES
0693 LSU_6965 Philydor erythrocercum Loreto YES YES
0694 LSU_2250 Philydor fuscipenne Darien YES YES
0695 LSU_10571 Philydor erythropterum Ucayali YES YES
0696 LSU_10585 Philydor pyrrhodes Ucayali YES YES
0697 LSUMZ_178807 Thamnophilus doliatus Veraguas YES YES
0698 IAvH_12330 Thamnophilus multistriatus Valle YES YES
0699 LSUMZ_183135 Thamnophilus zarumae Tumbes YES YES
0700 MZ_94442
Platyrinchus mystaceus
cancromus Minas Gerais YES YES
0701 MZ_92167 Platyrinchus mystaceus São Paulo YES YES
0702 MZ_92484 Platyrinchus mystaceus São Paulo YES YES
0703 MZ_92485 Platyrinchus mystaceus São Paulo YES YES
0704 MZ_93536 Platyrinchus mystaceus São Paulo YES YES
0705 MZ_99454 Platyrinchus mystaceus Alagoas YES YES
0706 MZ_99412 Platyrinchus mystaceus Alagoas YES YES
0707 LSUMZ_B5542
Platyrinchus mystaceus
zamorae San Martin YES YES
0708 LSUMZ_B5970
Platyrinchus mystaceus
zamorae Morona-Santiago YES YES
0709 LSUMZ_B7434 Platyrinchus mystaceus duidae Amazonas YES YES
0710 LSUMZ_B7616
Platyrinchus mystaceus
bifasciatus Beni YES YES
0711 LSUMZ_B11966
Platyrinchus mystaceus
albogularis Esmeraldas YES YES
0712 LSUMZ_B16047
Platyrinchus mystaceus
neglectus Heredia YES YES

182
Internal
number
number/field
number Taxon State
UCEs
Sequences
ND2
Sequences
0713 LSUMZ_B22637
Platyrinchus mystaceus
partridgei La Paz YES YES
0714 LSUMZ_B26448
Platyrinchus mystaceus
neglectus Chiriqui YES YES
0715 LSUMZ_B27767
Platyrinchus mystaceus
zamorae Loreto YES YES
0716 LSUMZ_B32985 Platyrinchus mystaceus Cajamarca YES YES
0717 LSUMZ_B35967
Platyrinchus mystaceus
insularis Caroni YES YES
0718 LSUMZ_B39987 Platyrinchus mystaceus Loreto YES
0719 L_28375 Platyrinchus mystaceus Panama District YES YES
0720 USNM_607842 Platyrinchus cancrominus Bocas del Toro YES YES
0721 L_55356 Platyrinchus saturatus Sipaliwini YES YES
0722 USNM_625250 Platyrinchus platyrhynchos
Upper Takutu-Upper
Essequibo YES YES
0723 LSUMZ_33080 Platyrinchus flavigularis Cajamarca YES YES
0724 KU_88454 Platyrinchus leucoryphus Caazapa YES YES
0725 L_11136 Platyrinchus coronatus Ucayali YES YES
0726 MPEG_79461
Platyrinchus mystaceus
cancromus Tocantins YES YES
0727 FMNH_399223 Thamnophilus aethiops Alagoas YES
0728 MPEG_62216 Thamnophilus aethiops Amazonas YES
Table S2. Samples of ND2 gene for all species analyzed.
Species Number ND2 samples Outgroup
Dysithamnus mentalis 135 D. leucostictus
Lochmias nematura 26 Phleocryptes melanops
Philydor rufum 23 P. erythropterum/P. atricapillus
Platyrinchus mystaceus 136 P. flavigularis/P. leucoryphus
Thamnophilus caerulescens 53 Thamnophilus aethiops
T. palliatus/tenuepunctatus complex 26/2 Thamnophilus zarumae
T. ruficapillus/torquatus complex 13/12 Thamnophilus doliatus
Xiphocolaptes complex 68 Xiphorhynchus ocellatus

183
Table S3. Nucleotide diversity all species.
Species Nucleotide Diversity Variance
Dysithamnus mentalis 0.00869463 1.99E-05
Lochmias nematura 0.031939979 0.000256931
Platyrinchus mystaceus 0.023392946 0.000131059
Philydor rufum 0.012618761 4.32E-05
Thamnophilus caerulescens 0.012732651 4.17E-05
Thamnophilus palliatus/tenuepunctatus complex 0.006864306 1.36E-05
Thamnophilus ruficapillus/torquatus complex 0.023857934 0.000145938
Xiphocolaptes complex 0.020094585 9.91E-05
Table S4. D’ Tajima test for all species.
Species D' Tajima Pval_normal Pval_beta
Dysithamnus mentalis -2.251003653 0.024385306 0.005592793
Lochmias nematura -0.620660997 0.534822697 0.575138869
Platyrinchus mystaceus -3.045099416 0.002326034 2.93E-12
Philydor rufum -3.383077795 0.000716783 0
Thamnophilus caerulescens -2.9958257 0.002737028 9.17E-11
Thamnophilus palliatus/tenuepunctatus complex -2.413419957 0.015803599 0.001768009
Thamnophilus ruficapillus/torquatus complex -0.157467034 0.874876787 0.910419562
Xiphocolaptes complex -2.268353921 0.023307644 0.005799934

184
Table S5. AMOVA values for all species.
Species
Variations
between groups
Variations between
samples within groups
Variations within
samples
Total
variations
Dysithamnus mentalis 34.76625693 43.54157179 21.69217128 100
Lochmias nematura 51.70021181 20.68458654 27.61520165 100
Platyrinchus mystaceus 67.69385985 27.05626627 5.249873881 100
Philydor rufum 62.52351139 31.9792931 5.497195517 100
Thamnophilus
caerulescens 43.20605233 34.08672707 22.70722059 100
T. palliatus/tenuepunctatus
complex 33.82054327 38.80766396 27.37179277 100
T. ruficapillus/torquatus
complex 14.67363551 21.94052388 63.38584061 100
Xiphocolaptes complex 53.34949299 23.51860245 23.13190457 100
Table S6. Watterson test for all species.
Species Theta Variance
Dysithamnus mentalis 27.0873717 42.85078595
Lochmias nematura 35.37774622 132.6569364
Platyrinchus mystaceus 123.370606 810.7423874
Philydor rufum 38.20296245 162.7101482
Thamnophilus caerulescens 61.74187531 293.7406216
Thamnophilus palliatus/tenuepunctatus complex 13.61957831 20.97534304
Thamnophilus ruficapillus/torquatus complex 25.4240104 71.42068774
Xiphocolaptes complex 52.19912396 190.966409
Table S7. Nucleotide diversity of populations of D. mentalis.
Groups/D. mentalis Nucleotide diversity Variance
affinis 0.003418803 4.3574E-06
mentalis 0.007060315 0.000014104
Andes 0.006964809 1.36037E-05
Northern Brazil 0.004392126 6.0192E-06

185
Table S8. Fst values for the populations of D. mentalis.
fst - Groups/D. mentalis Northern Brazil mentalis affinis Andes
Northern Brazil 0 0.28071366 0.208782539 0.186198921
mentalis 0.28071366 0 0.259570255 0.262508232
affinis 0.208782539 0.259570255 0 0.109405627
Andes 0.186198921 0.262508232 0.109405627 0
Table S9. Nucleotide diversity of populations of L. nematura.
Groups/L. nematura Nucleotide diversity Variance
Atlantic Forest 0.005226719 0.00000915
Central Andes 0.032928693 0.000308371
Tepuis 0.000970874 0.00000188
Table S10. Fst values for the populations of L. nematura.
fst – Groups/L. nematura Atlantic Forest Central Andes Tepuis
Atlantic Forest 0 0.47698182 0.276255343
Central Andes 0.47698182 0 0.255304392
Tepuis 0.276255343 0.255304392 0
Table S11. Nucleotide diversity of populations of P. mystaceus.
Groups/P. mystaceus Nucleotide diversity Variance
Andes 0.032865845 0.000296936
Atlantic Forest 0.01040153 0.000028
niveigularis 0.003384841 0.0000039

186
Table S12. Fst values for the populations of P. mystaceus.
fst – Groups/P. mystaceus niveigularis Atlantic Forest Andes
niveigularis 0 0.577715915 0.510731188
Atlantic Forest 0.577715915 0 0.253501627
Andes 0.510731188 0.253501627 0
Table S13. Nucleotide diversity of populations of P. rufum.
Groups/P. rufum Nucleotide diversity Variance
Atlantic Forest 0.001905654 1.69E-06
Andes 0.012045925 4.42E-05
Table S14. Fst values for the populations of P. rufum.
fst – Groups/P. rufum Atlantic Forest Andes
Atlantic Forest 0 0.510964386
Andes 0.510964386 0
Table S15. Nucleotide diversity of populations of T. caerulescens.
Groups/T. caerulescens Nucleotide diversity Variance
Andean 0.013748868 0.0000558
caerulescens 0.005067237 0.00000782
cearensis 0.001976422 0.00000198
Table S16. Fst values for the populations of T. caerulescens.
fst – Groups/T. caerulescens cearensis caerulescens Andean
cearensis 0 0.538138706 0.423313568
caerulescens 0.538138706 0 0.229798545
Andean 0.423313568 0.229798545 0

187
Table S17. Nucleotide diversity of populations of T. palliatus-tenuepunctatus complex.
Groups/T. palliatus-tenuepunctatus Nucleotide diversity Variance
Atlantic Forest (T. p. vestitus) 0.000455996 0.000000274
Central Andes (T. p. puncticeps) 0.005723577 0.0000135
Northern Andes 0.007284553 0.000021
palliatus 0.004054054 0.00000617
Table S18. Fst values for the populations of T. palliatus-tenuepunctatus complex.
fst – Groups/T. palliatus-
tenuepunctatus
Northern
Andes
Atlantic Forest (T. p.
vestitus) palliatus
Central Andes (T. p.
vestitus)
Northern Andes 0 0.333535855 0.175842
82 0.374625835
Atlantic Forest (T. p. vestitus) 0.333535855 0 0.117723
638 0.584490405
palliatus 0.17584282 0.117723638 0 0.425881627
Central Andes (T. p.
puncticeps) 0.374625835 0.584490405
0.425881
627 0
Table S19. Nucleotide diversity of populations of T. ruficapillus-torquatus complex.
Groups/T. ruficapillus-torquatus Nucleotide diversity Variance
Northern Atlantic Forest 0.027636364 0.00021892
Southern Atlantic Forest 0.005774783 0.0000137
Central Andes 0.021707317 0.000149177

188
Table S20. Fst values for the populations of T. ruficapillus-torquatus complex.
fst – Groups/T. ruficapillus-
torquatus
Central
Andes
Southern Atlantic
Forest
Northern Atlantic
Forest
Central Andes 0 0.221523446 0.08710577
Southern Atlantic Forest 0.221523446 0 0.258282196
Northern Atlantic Forest 0.08710577 0.258282196 0
Table S21. Nucleotide diversity of populations of Xiphocolaptes complex.
Groups/Xiphocolaptes complex Nucleotide diversity Variance
Amazonian (X. p. orenocensis) 0.007103464 0.0000148
Andes (highlands) 0.010997632 0.0000335
Atlantic Forest (X. albicollis) 0.002405396 0.00000242
Caatinga (X. falcirostris) 0.000768492 0.000000586
Tepuis + Central America 0.009450338 0.000034
Table S22. Fst values for the populations of Xiphocolaptes complex.
fst –
Groups/Xiphocolaptes
complex
Atlantic Forest
(X. albicollis)
Amazonian (X. p.
orenocensis)
Andes
(highlands)
Tepuis +
Central
America
Caatinga (X.
falcirostris)
Atlantic Forest (X.
albicollis) 0 0.672407001 0.488897976 0.667094017 0.864127982
Amazonian (X. p.
orenocensis) 0.672407001 0 0.480218347 0.380000248 0.580884235
Andes (highlands) 0.488897976 0.480218347 0 0.255366951 0.4195593
Tepuis + Central
America 0.667094017 0.380000248 0.255366951 0 0.703045975
Caatinga (X.
falcirostris) 0.864127982 0.580884235 0.4195593 0.703045975 0

189
Table S23. Cross-entropy values for D. mentalis (α=1, 10, 50, 100, 500, 1000).
Alpha=1 K=1 K=2 K=3 K=4 K=5 K=6 K=7 K=8 K=9 K=10 lowest 2d. lowest Difference
min 0.32819 0.30028 0.29311 0.28945 0.29359 0.30219 0.30352 0.31382 0.31463 0.33262 0.28945 0.29311 0.00365
mean 0.35265 0.32493 0.31938 0.31803 0.32229 0.32807 0.33356 0.34061 0.34734 0.35557 0.31803 0.31938 0.00135
max 0.38116 0.34961 0.34756 0.34027 0.34762 0.35868 0.36573 0.37150 0.38269 0.39560 0.34027 0.34756 0.00729
Alpha=10 K=1 K=2 K=3 K=4 K=5 K=6 K=7 K=8 K=9 K=10 lowest 2d. lowest Difference
min 0.32956 0.30167 0.29540 0.29131 0.29841 0.30421 0.30558 0.31345 0.32293 0.32694 0.29131 0.29540 0.00410
mean 0.35537 0.32758 0.32189 0.32119 0.32558 0.33108 0.33663 0.34414 0.35163 0.35897 0.32119 0.32189 0.00071
max 0.37523 0.34639 0.34331 0.34755 0.35264 0.35410 0.37069 0.37017 0.37785 0.38424 0.34331 0.34639 0.00308
Alpha=50 K=1 K=2 K=3 K=4 K=5 K=6 K=7 K=8 K=9 K=10 lowest 2d. lowest Difference
min 0.32465 0.29819 0.29250 0.28969 0.29700 0.29708 0.30786 0.31099 0.32365 0.32405 0.28969 0.29250 0.00281
mean 0.35385 0.32599 0.32034 0.31986 0.32394 0.32970 0.33658 0.34437 0.35298 0.36065 0.31986 0.32034 0.00048
max 0.38727 0.36026 0.36137 0.35683 0.35866 0.36559 0.36770 0.38910 0.39455 0.39349 0.35683 0.35866 0.00183
Alpha=100 K=1 K=2 K=3 K=4 K=5 K=6 K=7 K=8 K=9 K=10 lowest 2d. lowest Difference
min 0.32414 0.29326 0.28900 0.28704 0.28995 0.29752 0.30972 0.31400 0.32447 0.32914 0.28704 0.28900 0.00196
mean 0.35298 0.32518 0.31965 0.31890 0.32444 0.33036 0.33944 0.34641 0.35376 0.36420 0.31890 0.31965 0.00074
max 0.37519 0.34766 0.34597 0.34249 0.34764 0.36089 0.36607 0.37134 0.38263 0.39334 0.34249 0.34597 0.00348
Alpha=500 K=1 K=2 K=3 K=4 K=5 K=6 K=7 K=8 K=9 K=10 lowest 2d. lowest Difference
min 0.31913 0.29234 0.29297 0.28644 0.28949 0.30357 0.30913 0.31466 0.33568 0.33667 0.28644 0.28949 0.00305
mean 0.35284 0.32592 0.32475 0.32428 0.33154 0.34014 0.35030 0.36028 0.37206 0.38411 0.32428 0.32475 0.00047
max 0.39593 0.36736 0.36236 0.37350 0.37060 0.38341 0.39135 0.40364 0.42117 0.43984 0.36236 0.36736 0.00500
Alpha=1000 K=1 K=2 K=3 K=4 K=5 K=6 K=7 K=8 K=9 K=10 lowest 2d. lowest Difference
min 0.32370 0.29830 0.29160 0.29250 0.30225 0.30658 0.31613 0.33990 0.34588 0.35339 0.29160 0.29250 0.00090
mean 0.35325 0.32749 0.32929 0.32995 0.33873 0.34953 0.36085 0.37407 0.38759 0.40072 0.32749 0.32929 0.00180
max 0.38054 0.35459 0.35662 0.36867 0.37101 0.38151 0.40102 0.40207 0.42617 0.44522 0.35459 0.35662 0.00202

190
Table S24. Cross-entropy values for T. caerulescens (α=1, 10, 50, 100, 500, 1000).
Alpha=1 K=1 K=2 K=3 K=4 K=5 K=6 K=7 K=8 K=9 K=10 K=11 K=12 lowest 2d. lowest Difference
min 0.41463 0.37810 0.37439 0.38679 0.40498 0.40998 0.42651 0.43924 0.46538 0.46480 0.488458 0.5041613 0.37439 0.37810 0.00370
mean 0.46818 0.43040 0.42527 0.43747 0.45027 0.46680 0.48686 0.50796 0.52824 0.54831 0.5722283 0.5980912 0.42527 0.43040 0.00513
max 0.51230 0.47448 0.47385 0.49359 0.50404 0.52809 0.56818 0.57198 0.62220 0.63828 0.660845 0.6886311 0.47385 0.47448 0.00063
Alpha=10 K=1 K=2 K=3 K=4 K=5 K=6 K=7 K=8 K=9 K=10 K=11 K=12 lowest 2d. lowest Difference
min 0.42668 0.38206 0.37474 0.39066 0.38981 0.41915 0.41590 0.43532 0.45610 0.49724 0.5225096 0.5146925 0.37474 0.38206 0.00732
mean 0.46730 0.42947 0.42333 0.43588 0.44978 0.46952 0.48733 0.50797 0.53013 0.54987 0.5744045 0.5983819 0.42333 0.42947 0.00614
max 0.51302 0.47696 0.50495 0.50696 0.51499 0.53598 0.53778 0.57670 0.62257 0.63576 0.7052284 0.6887136 0.47696 0.50495 0.02799
Alpha=50 K=1 K=2 K=3 K=4 K=5 K=6 K=7 K=8 K=9 K=10 K=11 K=12 lowest 2d. lowest Difference
min 0.42023 0.38590 0.37785 0.38267 0.38716 0.42027 0.41344 0.45151 0.46307 0.49679 0.4992932 0.5330865 0.37785 0.38267 0.00482
mean 0.46999 0.43371 0.42788 0.44203 0.45580 0.47623 0.49685 0.51848 0.53777 0.56201 0.5846736 0.6082007 0.42788 0.43371 0.00583
max 0.51047 0.46892 0.49179 0.49246 0.52463 0.53898 0.54475 0.59322 0.59113 0.65335 0.6883291 0.7150304 0.46892 0.49179 0.02287
Alpha=100 K=1 K=2 K=3 K=4 K=5 K=6 K=7 K=8 K=9 K=10 K=11 K=12 lowest 2d. lowest Difference
min 0.41976 0.38379 0.37935 0.38487 0.39180 0.40879 0.43221 0.46163 0.48039 0.49214 0.5288857 0.5362145 0.37935 0.38379 0.00443
mean 0.46993 0.43360 0.42808 0.44140 0.45668 0.47602 0.49718 0.52316 0.53976 0.56591 0.5922528 0.6147111 0.42808 0.43360 0.00552
max 0.51528 0.48304 0.48267 0.50933 0.50896 0.54028 0.55194 0.59271 0.62097 0.65933 0.7248343 0.6998336 0.48267 0.48304 0.00037
Alpha=500 K=1 K=2 K=3 K=4 K=5 K=6 K=7 K=8 K=9 K=10 K=11 K=12 lowest 2d. lowest Difference
min 0.41880 0.38092 0.38137 0.39765 0.40557 0.44746 0.44972 0.50243 0.50964 0.53512 0.5661571 0.5901958 0.38092 0.38137 0.00045
mean 0.46720 0.43245 0.43261 0.44980 0.47214 0.49230 0.52136 0.54960 0.57662 0.60627 0.6349305 0.6638951 0.43245 0.43261 0.00016
max 0.53756 0.50182 0.50858 0.52420 0.54205 0.57109 0.62757 0.60047 0.65621 0.68353 0.7254975 0.7601563 0.50182 0.50858 0.00675
Alpha=1000 K=1 K=2 K=3 K=4 K=5 K=6 K=7 K=8 K=9 K=10 K=11 K=12 lowest 2d. lowest Difference
min 0.43014 0.39367 0.39913 0.40786 0.43649 0.45183 0.48806 0.50107 0.50813 0.55429 0.5805905 0.596142 0.39367 0.39913 0.00546
mean 0.46897 0.43501 0.43493 0.45501 0.47874 0.51062 0.53522 0.56459 0.59446 0.62411 0.6530534 0.6837274 0.43493 0.43501 0.00008
max 0.52614 0.48990 0.48405 0.52469 0.54719 0.60167 0.60715 0.64636 0.66495 0.73103 0.7408487 0.7669721 0.48405 0.48990 0.00586

191
Table S25. Cross-entropy values for T. palliatus/tenuepunctatus complex (α=1, 10, 50, 100, 500, 1000).
Alpha=1 K=1 K=2 K=3 K=4 K=5 K=6 K=7 K=8 K=9 K=10 lowest 2d. lowest Difference
min 0.34895 0.33344 0.33610 0.33175 0.34725 0.34923 0.36967 0.39404 0.40350 0.42788 0.33175 0.33344 0.00169
mean 0.39979 0.38348 0.38244 0.38363 0.39358 0.41104 0.42897 0.44658 0.46690 0.48372 0.38244 0.38348 0.00105
max 0.46923 0.44864 0.44268 0.45043 0.46121 0.48465 0.48939 0.51920 0.55222 0.56433 0.44268 0.44864 0.00597
Alpha=10 K=1 K=2 K=3 K=4 K=5 K=6 K=7 K=8 K=9 K=10 lowest 2d. lowest Difference
min 0.34911 0.33645 0.33948 0.33458 0.34774 0.36080 0.38066 0.39031 0.41705 0.43733 0.33458 0.33645 0.00186
mean 0.40088 0.38381 0.38356 0.38616 0.39666 0.41333 0.43294 0.45061 0.46812 0.48892 0.38356 0.38381 0.00025
max 0.45002 0.42801 0.43283 0.43207 0.44712 0.47304 0.51356 0.51810 0.52441 0.55911 0.42801 0.43207 0.00406
Alpha=50 K=1 K=2 K=3 K=4 K=5 K=6 K=7 K=8 K=9 K=10 lowest 2d. lowest Difference
min 0.35037 0.33511 0.33255 0.33746 0.34944 0.35679 0.39422 0.39104 0.40386 0.44513 0.33255 0.33511 0.00256
mean 0.40163 0.38466 0.38509 0.38744 0.40167 0.41723 0.43627 0.45454 0.47645 0.49463 0.38466 0.38509 0.00042
max 0.45600 0.44169 0.44560 0.44520 0.47858 0.47270 0.50525 0.53611 0.54382 0.55767 0.44169 0.44520 0.00351
Alpha=100 K=1 K=2 K=3 K=4 K=5 K=6 K=7 K=8 K=9 K=10 lowest 2d. lowest Difference
min 0.34138 0.32672 0.32561 0.33214 0.34836 0.35298 0.38003 0.38453 0.40861 0.43222 0.32561 0.32672 0.00111
mean 0.39995 0.38330 0.38415 0.38862 0.40233 0.42361 0.43781 0.46068 0.48396 0.50154 0.38330 0.38415 0.00085
max 0.44814 0.43570 0.45058 0.46120 0.47361 0.49105 0.50345 0.54608 0.54568 0.57023 0.43570 0.44814 0.01244
Alpha=500 K=1 K=2 K=3 K=4 K=5 K=6 K=7 K=8 K=9 K=10 lowest 2d. lowest Difference
min 0.35293 0.34328 0.34314 0.33252 0.36548 0.37437 0.40765 0.42799 0.46215 0.47329 0.33252 0.34314 0.01062
mean 0.40472 0.39165 0.39462 0.40667 0.42093 0.44532 0.47135 0.49721 0.52539 0.55383 0.39165 0.39462 0.00297
max 0.44992 0.43264 0.44195 0.45572 0.47572 0.52132 0.54690 0.58767 0.58607 0.61253 0.43264 0.44195 0.00931
Alpha=1000 K=1 K=2 K=3 K=4 K=5 K=6 K=7 K=8 K=9 K=10 lowest 2d. lowest Difference
min 0.34914 0.33894 0.33566 0.36650 0.38738 0.39328 0.42309 0.43808 0.48324 0.49422 0.33566 0.33894 0.00328
mean 0.39999 0.39048 0.40488 0.42179 0.44114 0.46430 0.48548 0.51226 0.54096 0.56743 0.39048 0.39999 0.00951
max 0.45629 0.44835 0.47233 0.49399 0.52017 0.54224 0.57160 0.58032 0.62198 0.65834 0.44835 0.45629 0.00795

192
Table S26. Cross-entropy values for T. ruficapillus/torquatus complex (α=1, 10, 50, 100, 500, 1000).
Alpha=1 K=1 K=2 K=3 K=4 K=5 K=6 K=7 K=8 K=9 K=10 lowest 2d. lowest Difference
min 0.49267 0.45822 0.44005 0.43519 0.45563 0.47468 0.48782 0.53188 0.54545 0.59507 0.43519 0.44005 0.00486
mean 0.53785 0.50804 0.49211 0.49673 0.51557 0.53964 0.56732 0.59732 0.63337 0.66947 0.49211 0.49673 0.00462
max 0.58564 0.56009 0.54069 0.56506 0.56672 0.59606 0.63945 0.67310 0.72644 0.77273 0.54069 0.56009 0.01940
Alpha=10 K=1 K=2 K=3 K=4 K=5 K=6 K=7 K=8 K=9 K=10 lowest 2d. lowest Difference
min 0.46682 0.43610 0.42425 0.41637 0.44501 0.45089 0.48852 0.51167 0.52053 0.59207 0.41637 0.42425 0.00787
mean 0.53148 0.50230 0.48742 0.49250 0.51089 0.53285 0.56017 0.59181 0.62984 0.66798 0.48742 0.49250 0.00507
Max 0.58154 0.55338 0.54329 0.55808 0.58843 0.59285 0.62205 0.68291 0.73418 0.74853 0.54329 0.55338 0.01009
Alpha=50 K=1 K=2 K=3 K=4 K=5 K=6 K=7 K=8 K=9 K=10 lowest 2d. lowest Difference
Min 0.47516 0.44728 0.42825 0.42897 0.44527 0.46398 0.48714 0.51459 0.54588 0.57311 0.42825 0.42897 0.00072
Mean 0.53615 0.50717 0.49143 0.49911 0.51397 0.53731 0.56801 0.60317 0.64069 0.67418 0.49143 0.49911 0.00768
Max 0.61079 0.58361 0.57282 0.56192 0.58625 0.61433 0.65623 0.68508 0.75240 0.75916 0.56192 0.57282 0.01091
Alpha=100 K=1 K=2 K=3 K=4 K=5 K=6 K=7 K=8 K=9 K=10 lowest 2d. lowest Difference
Min 0.46698 0.44859 0.42876 0.44289 0.43808 0.46306 0.49952 0.51819 0.54936 0.61190 0.42876 0.43808 0.00932
Mean 0.53595 0.50805 0.49237 0.49764 0.51958 0.54381 0.57597 0.60946 0.65168 0.69041 0.49237 0.49764 0.00527
Max 0.59661 0.56510 0.55050 0.58079 0.60414 0.62367 0.64650 0.70146 0.73459 0.77481 0.55050 0.56510 0.01460
Alpha=500 K=1 K=2 K=3 K=4 K=5 K=6 K=7 K=8 K=9 K=10 lowest 2d. lowest Difference
Min 0.47058 0.43982 0.42161 0.43688 0.44823 0.49136 0.50839 0.55517 0.61079 0.66015 0.42161 0.43688 0.01527
Mean 0.53154 0.50704 0.49501 0.50784 0.53177 0.56256 0.60173 0.64527 0.68518 0.72822 0.49501 0.50704 0.01203
Max 0.57850 0.55387 0.54696 0.59900 0.61060 0.67794 0.67169 0.71967 0.76535 0.84939 0.54696 0.55387 0.00691
Alpha=1000 K=1 K=2 K=3 K=4 K=5 K=6 K=7 K=8 K=9 K=10 lowest 2d. lowest Difference
Min 0.45984 0.42380 0.40959 0.41128 0.45259 0.50030 0.51632 0.54784 0.59120 0.64796 0.40959 0.41128 0.00169
Mean 0.53262 0.51052 0.49733 0.51221 0.53596 0.57540 0.61159 0.65855 0.69569 0.74571 0.49733 0.51052 0.01318
Max 0.60933 0.59433 0.58038 0.58370 0.63600 0.70071 0.72283 0.75752 0.76529 0.85972 0.58038 0.58370 0.00332

193
Table S27. Cross-entropy values for L.nematura (α=1, 10, 50, 100, 500, 1000).
Alpha=1 K=1 K=2 K=3 K=4 K=5 K=6 K=7 K=8 K=9 K=10 lowest 2d. lowest Difference
min 0.60990 0.50516 0.49789 0.50455 0.54089 0.59930 0.63869 0.67622 0.72909 0.79960 0.49789 0.50455 0.00666
mean 0.67894 0.57528 0.57236 0.59124 0.63297 0.68865 0.75285 0.81761 0.88684 0.95141 0.57236 0.57528 0.00291
max 0.76157 0.66113 0.65799 0.72633 0.80373 0.85768 0.88816 1.00061 1.08490 1.07347 0.65799 0.66113 0.00314
Alpha=10 K=1 K=2 K=3 K=4 K=5 K=6 K=7 K=8 K=9 K=10 lowest 2d. lowest Difference
min 0.60583 0.50068 0.49812 0.48955 0.52676 0.58458 0.60548 0.71512 0.73705 0.79033 0.48955 0.49812 0.00857
mean 0.68653 0.58135 0.57854 0.59676 0.64035 0.69457 0.75948 0.82949 0.89897 0.96412 0.57854 0.58135 0.00281
max 0.75950 0.65388 0.66649 0.69955 0.79747 0.87338 0.89724 0.98309 1.03404 1.15642 0.65388 0.66649 0.01261
Alpha=50 K=1 K=2 K=3 K=4 K=5 K=6 K=7 K=8 K=9 K=10 lowest 2d. lowest Difference
min 0.58726 0.48435 0.47930 0.47105 0.54175 0.58140 0.61452 0.67960 0.72863 0.77279 0.47105 0.47930 0.00825
mean 0.67698 0.57311 0.57030 0.58382 0.63684 0.70106 0.76477 0.83526 0.89544 0.96835 0.57030 0.57311 0.00281
max 0.74773 0.65196 0.64423 0.69917 0.83364 0.89204 0.94157 1.00155 1.08856 1.11811 0.64423 0.65196 0.00773
Alpha=100 K=1 K=2 K=3 K=4 K=5 K=6 K=7 K=8 K=9 K=10 lowest 2d. lowest Difference
min 0.61372 0.52019 0.50996 0.50916 0.53555 0.57746 0.64699 0.69644 0.76304 0.80170 0.50916 0.50996 0.00080
mean 0.68213 0.57974 0.57757 0.59005 0.64189 0.70745 0.78626 0.84383 0.91216 0.98891 0.57757 0.57974 0.00217
max 0.76549 0.66742 0.66446 0.75013 0.82982 0.84172 0.99709 0.99283 1.07436 1.13987 0.66446 0.66742 0.00296
Alpha=500 K=1 K=2 K=3 K=4 K=5 K=6 K=7 K=8 K=9 K=10 lowest 2d. lowest Difference
min 0.59193 0.49169 0.48529 0.50993 0.54894 0.61209 0.66448 0.74065 0.76002 0.86159 0.48529 0.49169 0.00640
mean 0.68041 0.57942 0.58073 0.60745 0.65791 0.73229 0.81180 0.88615 0.95348 1.02939 0.57942 0.58073 0.00131
max 0.74564 0.65041 0.66054 0.76708 0.84825 0.95444 0.98711 1.02362 1.15037 1.17684 0.65041 0.66054 0.01014
Alpha=1000 K=1 K=2 K=3 K=4 K=5 K=6 K=7 K=8 K=9 K=10 lowest 2d. lowest Difference
min 0.57567 0.47543 0.47271 0.49585 0.55774 0.59862 0.66333 0.74396 0.83439 0.86933 0.47271 0.47543 0.00272
mean 0.68131 0.58246 0.58827 0.61537 0.66507 0.73841 0.81357 0.88680 0.96906 1.05242 0.58246 0.58827 0.00581
max 0.76504 0.67127 0.66495 0.75899 0.76899 0.92900 1.01810 1.02045 1.13161 1.19925 0.66495 0.67127 0.00633

194
Table S28. Cross-entropy values for P. rufum (α=1, 10, 50, 100, 500, 1000).
Alpha=1 K=1 K=2 K=3 K=4 K=5 K=6 K=7 K=8 K=9 K=10 lowest 2d. lowest Difference
min 0.31044 0.27201 0.28697 0.31353 0.33774 0.35125 0.37481 0.41477 0.44228 0.45762 0.27201 0.28697 0.01496
mean 0.36205 0.32661 0.34514 0.36504 0.38786 0.41427 0.44186 0.47992 0.51629 0.55625 0.32661 0.34514 0.01853
max 0.42185 0.38370 0.41824 0.42217 0.46327 0.49052 0.51465 0.59850 0.59157 0.67275 0.38370 0.41824 0.03454
Alpha=10 K=1 K=2 K=3 K=4 K=5 K=6 K=7 K=8 K=9 K=10 lowest 2d. lowest Difference
min 0.30334 0.26469 0.28441 0.29492 0.31050 0.33977 0.35876 0.36902 0.41875 0.45656 0.26469 0.28441 0.01972
mean 0.36051 0.32529 0.34337 0.36134 0.38384 0.41670 0.44491 0.47955 0.51770 0.56055 0.32529 0.34337 0.01807
max 0.42982 0.39010 0.42236 0.43071 0.48111 0.51442 0.53007 0.58329 0.64714 0.67959 0.39010 0.42236 0.03226
Alpha=50 K=1 K=2 K=3 K=4 K=5 K=6 K=7 K=8 K=9 K=10 lowest 2d. lowest Difference
min 0.29159 0.25728 0.25877 0.28289 0.30713 0.32088 0.38363 0.39929 0.41533 0.44315 0.25728 0.25877 0.00149
mean 0.35749 0.32280 0.34230 0.36297 0.38523 0.41561 0.44910 0.48102 0.51776 0.55742 0.32280 0.34230 0.01950
max 0.43079 0.41189 0.45423 0.44276 0.47825 0.49644 0.53566 0.56467 0.62612 0.65629 0.41189 0.43079 0.01890
Alpha=100 K=1 K=2 K=3 K=4 K=5 K=6 K=7 K=8 K=9 K=10 lowest 2d. lowest Difference
min 0.29832 0.26831 0.27690 0.29277 0.30278 0.31990 0.34859 0.36864 0.42728 0.47106 0.26831 0.27690 0.00859
mean 0.35655 0.32185 0.34327 0.36266 0.38670 0.41870 0.45477 0.48473 0.52319 0.56132 0.32185 0.34327 0.02143
max 0.41137 0.37335 0.39114 0.42963 0.48056 0.51216 0.54805 0.57355 0.62134 0.65445 0.37335 0.39114 0.01779
Alpha=500 K=1 K=2 K=3 K=4 K=5 K=6 K=7 K=8 K=9 K=10 lowest 2d. lowest Difference
min 0.31543 0.28907 0.29545 0.32749 0.33800 0.37552 0.40172 0.44676 0.46345 0.52845 0.28907 0.29545 0.00638
mean 0.36166 0.32923 0.35565 0.38201 0.41578 0.45352 0.48747 0.52850 0.56820 0.61253 0.32923 0.35565 0.02641
max 0.40986 0.37512 0.41986 0.45842 0.50136 0.51847 0.56323 0.60460 0.64806 0.69836 0.37512 0.40986 0.03474
Alpha=1000 K=1 K=2 K=3 K=4 K=5 K=6 K=7 K=8 K=9 K=10 lowest 2d. lowest Difference
min 0.28654 0.24859 0.29454 0.31303 0.32210 0.37667 0.42101 0.43086 0.48324 0.52566 0.24859 0.28654 0.03795
mean 0.35563 0.32400 0.35669 0.38764 0.41807 0.45284 0.49172 0.53007 0.57011 0.61268 0.32400 0.35563 0.03163
max 0.41902 0.38822 0.42991 0.48016 0.49164 0.55102 0.55387 0.63554 0.70410 0.69169 0.38822 0.41902 0.03080

195
Table S29. Cross-entropy values for P. mystaceus (α=1, 10, 50, 100, 500, 1000).
Alpha=1 K=1 K=2 K=3 K=4 K=5 K=6 K=7 K=8 K=9 K=10 lowest 2d. lowest Difference
min 0.17063 0.16457 0.15936 0.16100 0.16135 0.16188 0.16830 0.17090 0.17686 0.17724 0.15936 0.16100 0.00164
mean 0.19440 0.18902 0.18582 0.18642 0.18768 0.18937 0.19259 0.19670 0.20032 0.20440 0.18582 0.18642 0.00060
max 0.21482 0.21139 0.20753 0.20862 0.20738 0.21028 0.21794 0.21977 0.22350 0.22530 0.20738 0.20753 0.00015
Alpha=10 K=1 K=2 K=3 K=4 K=5 K=6 K=7 K=8 K=9 K=10 lowest 2d. lowest Difference
min 0.17180 0.16532 0.16100 0.16498 0.15977 0.16680 0.16764 0.17238 0.17262 0.17428 0.15977 0.16100 0.00123
mean 0.19452 0.18931 0.18584 0.18706 0.18791 0.19032 0.19397 0.19730 0.20167 0.20539 0.18584 0.18706 0.00121
max 0.22272 0.21375 0.21058 0.21656 0.21626 0.21627 0.22619 0.22747 0.23292 0.23403 0.21058 0.21375 0.00317
Alpha=50 K=1 K=2 K=3 K=4 K=5 K=6 K=7 K=8 K=9 K=10 lowest 2d. lowest Difference
min 0.16758 0.16065 0.15754 0.15630 0.16153 0.15866 0.16290 0.16672 0.17011 0.17264 0.15630 0.15754 0.00124
mean 0.19227 0.18732 0.18421 0.18488 0.18648 0.18921 0.19187 0.19561 0.20009 0.20426 0.18421 0.18488 0.00068
max 0.21440 0.20820 0.20909 0.20905 0.20802 0.21692 0.21694 0.21847 0.23055 0.22869 0.20802 0.20820 0.00018
Alpha=100 K=1 K=2 K=3 K=4 K=5 K=6 K=7 K=8 K=9 K=10 lowest 2d. lowest Difference
min 0.16700 0.16232 0.15982 0.15815 0.15538 0.15698 0.16088 0.17101 0.16957 0.17281 0.15538 0.15698 0.00159
mean 0.19370 0.18872 0.18583 0.18668 0.18865 0.19112 0.19468 0.19937 0.20279 0.20727 0.18583 0.18668 0.00086
max 0.22094 0.21474 0.21060 0.21205 0.21403 0.21905 0.21791 0.22889 0.23068 0.23783 0.21060 0.21205 0.00145
Alpha=500 K=1 K=2 K=3 K=4 K=5 K=6 K=7 K=8 K=9 K=10 lowest 2d. lowest Difference
min 0.17171 0.16776 0.16440 0.16213 0.16387 0.17265 0.17346 0.17347 0.18600 0.18632 0.16213 0.16387 0.00175
mean 0.19309 0.18812 0.18573 0.18810 0.19052 0.19435 0.19909 0.20377 0.20955 0.21424 0.18573 0.18810 0.00238
max 0.22274 0.21628 0.21059 0.21801 0.21803 0.23174 0.22885 0.23824 0.24377 0.24171 0.21059 0.21628 0.00569
Alpha=1000 K=1 K=2 K=3 K=4 K=5 K=6 K=7 K=8 K=9 K=10 lowest 2d. lowest Difference
min 0.17638 0.17234 0.17039 0.17066 0.17580 0.17876 0.18613 0.19017 0.19645 0.20003 0.17039 0.17066 0.00027
mean 0.19364 0.18927 0.18836 0.19100 0.19435 0.19998 0.20595 0.21244 0.21762 0.22477 0.18836 0.18927 0.00091
max 0.21227 0.20941 0.20802 0.22116 0.21540 0.22620 0.23964 0.23640 0.25325 0.25085 0.20802 0.20941 0.00138

196
Table S30. Cross-entropy values for Xiphocolaptes complex (α=1, 10, 50, 100, 500, 1000).
Alpha=1 K=1 K=2 K=3 K=4 K=5 K=6 K=7 K=8 K=9 K=10 lowest 2d. lowest Difference
min 0.27354 0.26023 0.24399 0.24131 0.23824 0.23665 0.23950 0.24753 0.26189 0.26460 0.23665 0.23824 0.00159
mean 0.30609 0.29141 0.27811 0.27427 0.27312 0.27428 0.27765 0.28696 0.29530 0.30216 0.27312 0.27427 0.00115
max 0.33309 0.32076 0.31275 0.31368 0.31105 0.31851 0.32231 0.32889 0.33255 0.33964 0.31105 0.31275 0.00170
Alpha=10 K=1 K=2 K=3 K=4 K=5 K=6 K=7 K=8 K=9 K=10 lowest 2d. lowest Difference
min 0.26958 0.25436 0.24392 0.23730 0.23501 0.23088 0.23932 0.24116 0.25107 0.25905 0.23088 0.23501 0.00414
mean 0.30466 0.29012 0.27690 0.27345 0.27207 0.27519 0.27792 0.28396 0.29261 0.30192 0.27207 0.27345 0.00138
max 0.33972 0.32788 0.31496 0.31114 0.30871 0.31987 0.32370 0.32972 0.34480 0.34448 0.30871 0.31114 0.00243
Alpha=50 K=1 K=2 K=3 K=4 K=5 K=6 K=7 K=8 K=9 K=10 lowest 2d. lowest Difference
min 0.26547 0.25174 0.23822 0.23541 0.23209 0.23363 0.22994 0.24003 0.23853 0.24587 0.22994 0.23209 0.00215
mean 0.30547 0.29153 0.27839 0.27522 0.27506 0.27478 0.28039 0.28679 0.29662 0.30409 0.27478 0.27506 0.00028
max 0.34057 0.32617 0.30782 0.30944 0.30991 0.30547 0.32172 0.31462 0.33297 0.34702 0.30547 0.30782 0.00235
Alpha=100 K=1 K=2 K=3 K=4 K=5 K=6 K=7 K=8 K=9 K=10 lowest 2d. lowest Difference
min 0.27471 0.25807 0.24397 0.24006 0.23523 0.23593 0.24656 0.25281 0.25774 0.26924 0.23523 0.23593 0.00070
mean 0.30491 0.29078 0.27854 0.27500 0.27451 0.27683 0.28062 0.28561 0.29675 0.30679 0.27451 0.27500 0.00050
max 0.34388 0.33194 0.31695 0.31229 0.31345 0.31807 0.32608 0.32344 0.34684 0.35690 0.31229 0.31345 0.00116
Alpha=500 K=1 K=2 K=3 K=4 K=5 K=6 K=7 K=8 K=9 K=10 lowest 2d. lowest Difference
min 0.25738 0.24768 0.23483 0.22961 0.23350 0.23887 0.23803 0.24626 0.26431 0.26446 0.22961 0.23350 0.00390
mean 0.30361 0.29056 0.27834 0.27715 0.27854 0.27993 0.28740 0.29643 0.30581 0.32117 0.27715 0.27834 0.00119
max 0.33605 0.32535 0.31317 0.31300 0.34625 0.31976 0.33051 0.35014 0.35485 0.37093 0.31300 0.31317 0.00016
Alpha=1000 K=1 K=2 K=3 K=4 K=5 K=6 K=7 K=8 K=9 K=10 lowest 2d. lowest Difference
min 0.26983 0.25686 0.24715 0.24260 0.24513 0.23913 0.25871 0.26255 0.26954 0.29460 0.23913 0.24260 0.00347
mean 0.30520 0.29312 0.28227 0.28120 0.28487 0.28976 0.29473 0.30535 0.31685 0.32941 0.28120 0.28227 0.00107
max 0.34083 0.32566 0.31874 0.31764 0.33631 0.33389 0.33714 0.35137 0.37321 0.37445 0.31764 0.31874 0.00110

197
Last page.


