Embed Size (px)
Citation preview
Author's personal copy
Comparative assessment of nonlinear metrics to quantifyorganization-related events in surface electrocardiogramsof atrial fibrillation
M. Julián a,n, R. Alcaraz b, J.J. Rieta a
a Biomedical Synergy, Electronic Engineering Department, Universidad Politécnica de Valencia, Edificio 7F, 5a. Camino de Vera s/n. 46022, Valencia, Spainb Innovation in Bioengineering Research Group, University of Castilla-La Mancha, Cuenca, Spain
a r t i c l e i n f o
Article history:Received 5 September 2013Accepted 17 February 2014
Keywords:Atrial fibrillationElectrocardiogramMain atrial waveNonlinear analysis metricsOrganization
a b s t r a c t
Atrial fibrillation (AF) is today the most common sustained arrhythmia, its treatment being notcompletely satisfactory. Electrical activity organization analysis within the atria could play a key rolein the improvement of current AF therapies. The application of a nonlinear regularity index, such assample entropy (SampEn), to the atrial activity (AA) fundamental waveform has proven to be a successfulnoninvasive AF organization estimator. However, the use of alternative nonlinear metrics within thiscontext is a pending issue. The present work analyzes the ability of several nonlinear indices to assessregularity of patterns and, thus, organization, in the AA signal and its fundamental waveform, defined asthe main atrial wave (MAW). Precisely, Fuzzy Entropy, Spectral Entropy, Lempel–Ziv Complexity andHurst Exponents were studied, achieving more robust and accurate AF organization estimates thanSampEn. Results also provided better AF organization estimates from the MAW than from the AA signalfor all the tested nonlinear metrics, which agrees with previous works only focused on SampEn.Furthermore, some of these indices reported a discriminant ability close to 95% in the classification of AForganization-dependent events, thus outperforming the diagnostic accuracy of SampEn and other widelyused noninvasive estimators, such as the dominant atrial frequency (DAF). As a conclusion, thesenonlinear metrics could be considered as promising estimators of noninvasive AF organization and couldbe helpful in making appropriate decisions on the patients’ management.
& 2014 Elsevier Ltd. All rights reserved.
1. Introduction
Atrial fibrillation (AF) is the most frequently diagnosed supra-ventricular arrhythmia in clinical practice [1]. It is associated withdecreased survival and quality of life in older adults as well asincreased health care costs [2]. However, the mechanisms provok-ing the onset and termination of this arrhythmia still are not fullyunderstood [2]. Nevertheless, a widely accepted theory, the multi-ple wavelet hypothesis, associates AF to multiple wavefrontswandering randomly throughout the atria [3,4]. A variety ofelectrophysiological characteristics, such as the atrial refractoryperiod, mass and conduction velocity can alter substantially thenumber of simultaneous propagating waves [2]. Thus, the higherthe number of circulating wavelets simultaneously propagating inthe atria, the lower the likelihood of paroxysmal (i.e. spontaneousself-terminating) AF termination [3]. Similarly, the probability ofAF perpetuation in a self-sustained arrhythmia increases with thenumber of simultaneously circulating wavefronts.
Although AF mechanisms are far from being entirely under-stood, it is clear that self-sustained complex spatio-temporalpatterns of excitation provoke a hierarchical disorganization inthe atrial activation [4–6]. AF organization estimates can hence beobtained by quantifying the repetitiveness degree of the atrialactivity (AA) signal pattern, thus providing a qualitative idea aboutthe number of simultaneous wavelets wandering throughout theatria. To this respect, several previous works have quantified theregularity in the morphology of fibrillatory (f) waves from invasiverecordings [7]. Because of abnormal atrial activation patternsduring AF such as slow conduction, wave collision and conductionblocks are reflected by very different morphologies of the fwaves [8],this kind of AF organization analysis can play an interesting role inthe understanding of the mechanisms governing its induction andmaintenance. In this way, useful information could be reached toimprove the non-totally satisfactory current AF knowledge andtreatment as well as contributing to make better tailored decisionson the patients' management.
From a clinical point of view, a noninvasive AF organizationestimation is very interesting given that the electrocardiogram(ECG) can be acquired in an easy and cheap fashion. Moreover, this
Contents lists available at ScienceDirect
journal homepage: www.elsevier.com/locate/cbm
Computers in Biology and Medicine
http://dx.doi.org/10.1016/j.compbiomed.2014.02.0100010-4825 & 2014 Elsevier Ltd. All rights reserved.
n Corresponding author. Tel.: þ34 699 615 892.E-mail address: [email protected] (M. Julián).
Computers in Biology and Medicine 48 (2014) 66–76
Author's personal copy
recording can avoid the typical risks associated to invasive record-ings [9]. A widely accepted qualitative AF organization estimatorfrom the ECG is the dominant atrial frequency (DAF) [10]. It is definedas the highest amplitude frequency within the 3–9 Hz band of the AAspectral content [11], its inverse being directly related to atrialrefractoriness [12] and, hence, to atrial cycle length [11]. Indeed,previous works have shown that patients with low fibrillatoryfrequency are associated to longer wavelengths and therefore alower number of waves circulating simultaneously in the atria. Incontrast, patients with shorter wavelengths and higher number ofsimultaneous wavefronts have reported higher DAF values [13]. Onthe other hand, a second extended alternative to get a non-invasiveestimate of AF organization has been based on a nonlinear regularityindex, such as sample entropy (SampEn) [14]. This algorithmquantifies the regularity appreciated in the morphology of thef waves from the AA signal fundamental waveform, which has beennamed in previous works as the main atrial wave (MAW), thusquantifying accurately AA organization [15].
Considering this latter finding together with the fact thatnonlinear metrics can provide “hidden information” related tounderlying mechanisms in the assessment of physiological timeseries [16], a variety of nonlinear indices are considered to studyAF organization in the present work. Therefore, the aim of thestudy is to analyze the usefulness of time and spectral seriesregularity, complexity and statistical self-similarity provided bynonlinear estimators in order to compare the discriminatoryability of the proposed measures in AF organization-dependentevents. As a result, pattern repetitiveness in the AA signal and itsMAW would be assessed to yield a more robust and accuratenoninvasive AF organization estimation. Moreover, the possiblecomplementary information provided by these metrics in theclassification of AF organization-dependent events will also beevaluated through a logistic regression analysis.
The remainder of the paper is structured as follows. Section 2describes the analyzed database, the preprocessing applied to ECGrecordings, the nonlinear indices used to estimate AF organization andhow their performance is evaluated. Section 3 summarizes theobtained results, which will be next discussed in Section 4. Finally,Section 5 presents the concluding remarks that will lead the manu-script to its end.
2. Methods
2.1. Database
The database analyzed was proposed for the Computers inCardiology Challenge 2004 and is freely available at PhysioNet [17].It consists of 80 two-lead (II and V1), 1 min-length ECG signalsextracted from Holter recordings of 60 different paroxysmal AFpatients. The signals were acquired with a sampling rate of 128 Hz,16 bits/sample and 5 μV resolution. In addition, they were divided intothree groups following their different termination properties. Thus, thedatabase includes 26 non-terminating AF episodes (group N), whichcontinued at least 1 h in AF after the end of the recording, 20 soon-terminating episodes (group S), which terminated 1 min after the endof the recording and 34 immediately terminating episodes (group T),whose termination happened 1 s after the end of the recording.A more detailed description of the database can be found in [18].
2.2. Signal preprocessing
Nonlinear indices were computed from surface lead V1 becausethe atrial component presents the highest amplitude with respectto the ventricular counterpart in this lead [9]. Additionally, pre-vious works have suggested that the atrial fibrillatory activity is
mainly reflected on lead V1 [14,11]. With the aim of improvinglater analysis, the recordings were forward/backward high-pass(0.5 Hz cut-off frequency) and low-pass (70 Hz cut-off frequency)filtered. In this way, baseline wander and high frequency noisewere notably minimized, respectively. Moreover, to remove powerline interference, an adaptive band-stop filtering matched at 50 Hzwas also applied to the signals [19].
On the other hand, for an appropriate AA study the cancellation ofthe ventricular activity from the ECG is a mandatory first step. Thisoperationwas accomplished by an adaptive QRSTcancellationmethod,which relies on the fact that the atrial and ventricular activitiesare statistically uncoupled during AF [20]. Briefly, each beat wascanceled by subtracting the highest variance eigenvector of its mostsimilar QRST complexes. Before this step, the original ECG signalwas upsampled to 1 kHz, using a cubic spline interpolation method.Upsampling improves the time alignment accuracy needed for optimalfit between each single beat and the cancellation template [10].
2.3. Estimation of AF organization through nonlinear metrics
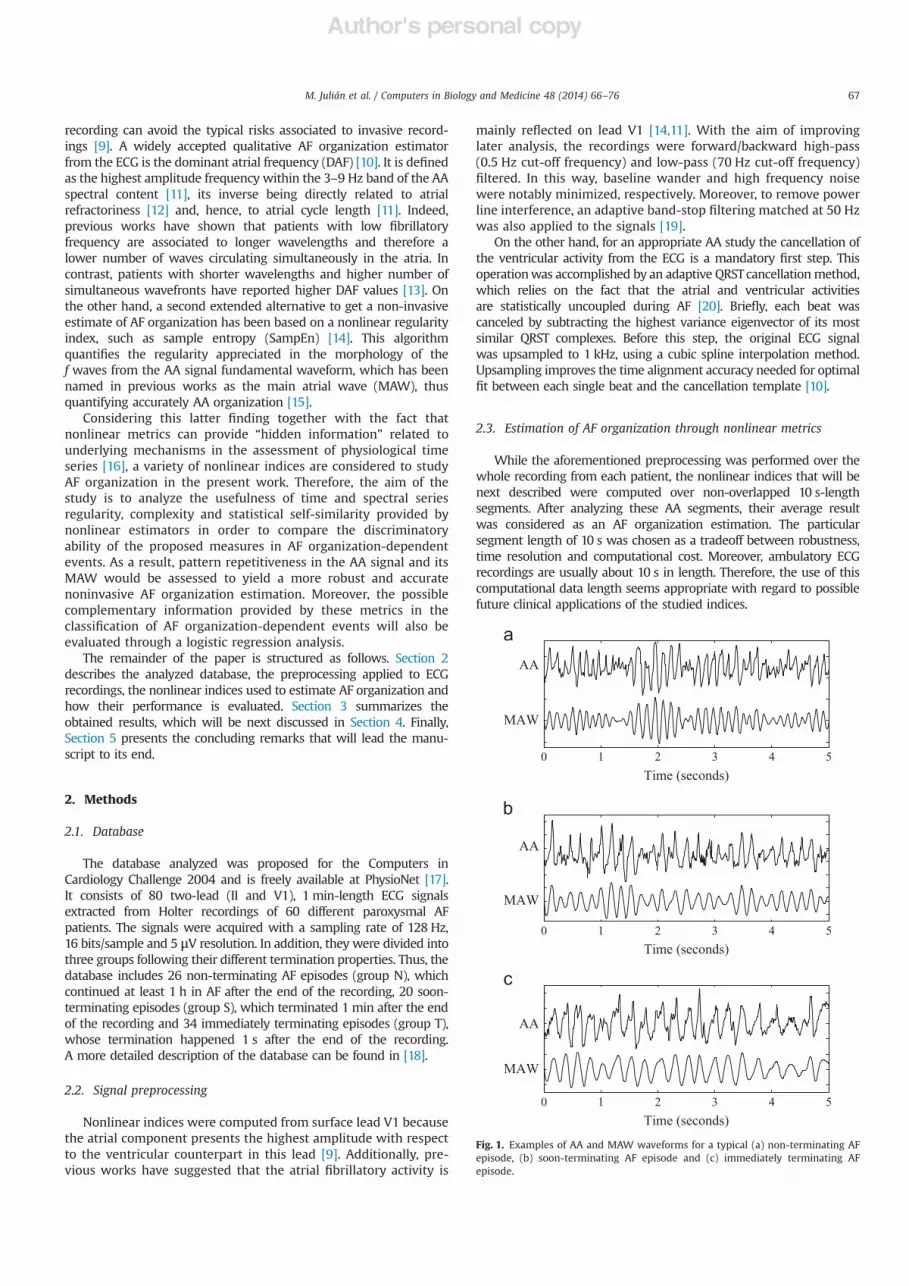
While the aforementioned preprocessing was performed over thewhole recording from each patient, the nonlinear indices that will benext described were computed over non-overlapped 10 s-lengthsegments. After analyzing these AA segments, their average resultwas considered as an AF organization estimation. The particularsegment length of 10 s was chosen as a tradeoff between robustness,time resolution and computational cost. Moreover, ambulatory ECGrecordings are usually about 10 s in length. Therefore, the use of thiscomputational data length seems appropriate with regard to possiblefuture clinical applications of the studied indices.
0 1 2 3 4 5
MAW
AA
Time (seconds)
0 1 2 3 4 5
MAW
AA
Time (seconds)
0 1 2 3 4 5
MAW
AA
Time (seconds)Fig. 1. Examples of AA and MAW waveforms for a typical (a) non-terminating AFepisode, (b) soon-terminating AF episode and (c) immediately terminating AFepisode.
M. Julián et al. / Computers in Biology and Medicine 48 (2014) 66–76 67

Author's personal copy
On the other hand, it is interesting to note that previous workshave proved that the presence of QRST residuals and noise in the AAsignal extracted from the ECG can hinder an accurate AF organizationestimation through a nonlinear metric, such as SampEn [21,15]. Hence,in the present work nonlinear indices were also computed from non-overlapped 10 s-length segments of the MAW. To obtain this wave, aselective band-pass filtering centered around the DAF was applied tothe AA. The filter was designed with a linear phase FIR structure toachieve a Chebyshev window with 40 decibels of relative sidelobeattenuation and 3 Hz bandwidth [15]. To this respect, Fig. 1 showsexamples of AA and MAW waveforms for each group in the studieddatabase. The next subsections will describe briefly the fundamentalconcepts surrounding each analyzed nonlinear metric as well as thereasons justifying their selection as AA organization estimators fromthe surface ECG.
2.3.1. Reference metricsNonlinear indices performance was compared with DAF and
SampEn because, as stated before, these metrics have been widelyused to estimate AF organization from surface single-lead ECGrecordings. The DAF was obtained from the AA signal power spectraldensity (PSD), which was computed making use of the WelchPeriodogram. As computational parameters for this approach, aHamming window of 4096 points in length, a 50% overlappingbetween adjacent windowed sections and a 8192-point fast Fouriertransform (FFT), thus providing a spectral resolution of 0.122 Hz,were used in a similar way to previous works [14].
On the other hand, SampEn estimates the existence of repeti-tive patterns in a time series [22], higher entropy values corre-sponding to more irregularity in the data. Mathematically, given atime series xðnÞ ¼ fxð1Þ; xð2Þ;…; xðNÞg of length N samples, SampEncan be computed following the next sequence [22]:
1. The first step is to form vectors Xmi ¼ fxðiÞ; xðiþ1Þ;…; xðiþm%1Þg,
for 1r irN%m%1, which represent m consecutive x(n) valuesstarting with the ith point.
2. Then, the distance between two vectors Xmi and Xm
j is definedas the absolute maximum difference between their scalarcomponents, i.e.
dmij ¼ maxkA ð0;m%1Þ
ðjxðiþkÞ%xðjþkÞjÞ: ð1Þ
3. Next, the probability of two m-length sequences match with atolerance lower than r is computed as
ϕmðrÞ ¼1
N%m∑
N%m
i ¼ 1
1N%m%1
∑N%m
j ¼ 1;ja iΘðr%dmij Þ
!
; ð2Þ
where ΘðxÞ is the Heaviside function, which is defined as
ΘðxÞ ¼1 if xZ0;0 if xo0:
!ð3Þ
4. Thereafter, the dimension is increased to mþ1 and the prob-ability that two patterns match for mþ1 points is computed as
ϕmþ1ðrÞ ¼1
N%m∑
N%m
i ¼ 1
1N%m%1
∑N%m
j ¼ 1;ja iΘðr%dmþ1
ij Þ
!
: ð4Þ
5. Finally, SampEn is defined as
SampEnðm; rÞ ¼ % limN-1
lnϕmþ1ðrÞϕmðrÞ
!
; ð5Þ
which, for finite datasets, can be estimated by the statistic
SampEnðm; r;NÞ ¼ % lnϕmþ1ðrÞϕmðrÞ
: ð6Þ
Regarding the values of the computational parameters, SampEnwas computed over the MAW with two-sample-length patterns(m¼2) and a patterns similarity tolerance of 0.35 times thestandard deviation of the analyzed data (r¼0.35). These valuesof m and r have been previously recommended by a thoroughstudy about optimal parameters selection for the application ofSampEn to AF signals [23]. It is worth noting that, in the presentwork, SampEn was calculated only on the MAW because ourprevious studies have demonstrated that the use of the MAWimproves significantly the results obtained with this metric [23].
2.3.2. Fuzzy entropyFuzzy Entropy (FuzzEn) has been proposed by Chen et al. [24]
as a modification of SampEn to estimate time series regularity.SampEn sometimes exhibits a poor statistical stability, because theabsolute two-state classifier of the Heaviside function is used to decidewhether two patterns are equal or different, such as aforementioned.To overcome this limitation, FuzzEn makes use of fuzzy setstheory to measure the similarity degree among patterns. Thus, theconventional two-state classifier is replaced with a continuous mem-bership degree. More precisely, given N data points from atime series xðnÞ ¼ fxð1Þ; xð2Þ;…; xðNÞg, FuzzEn can be defined asfollows.
1. Form N%m vectors Xmi of length m for 1r irN%mþ1.
Each vector Xmi represents m consecutive x values, com-
mencing with the ith point and generalized by removingits baseline, i.e.
Xmi ¼ xðiÞ; xðiþ1Þ;…; xðiþm%1Þ
" #%
1m
∑m%1
l ¼ 0xðiþ lÞ: ð7Þ
2. Define the distance between vectors Xmi and Xm
j , dijm, as the
absolute maximum difference between their scalar com-ponents, i.e.
dmij ¼ maxkA ð0;m%1Þ
xðiþkÞ%1m
∑m%1
l ¼ 0xðiþ lÞ
!$$$$$
% xðjþkÞ%1m
∑m%1
l ¼ 0xðjþ lÞ
!$$$$$: ð8Þ
3. Calculate the similarity degree Dijm between Xm
i and Xmj
through a fuzzy function, such that
Dmij ðn; rÞ ¼ exp %
ðdmij Þn
r
!: ð9Þ
4. Determine the probability that two m-length sequencesmatch with a tolerance lower than r as
ϕmðn; rÞ ¼1
N%m∑
N%m
i ¼ 1
1N%m%1
∑N%m
j ¼ 1;ja iDmij
!
: ð10Þ
5. Increase the dimension to mþ1 and calculate the prob-ability that two patterns match for mþ1 points as
ϕmþ1ðn; rÞ ¼1
N%m∑
N%m
i ¼ 1
1N%m%1
∑N%m
j ¼ 1;ja iDmþ1ij
!
: ð11Þ
M. Julián et al. / Computers in Biology and Medicine 48 (2014) 66–7668
Author's personal copy
6. Finally, compute FuzzEn as the negative natural logarithmof the deviation of ϕm from ϕmþ1, i.e.
FuzzEnðm;n; rÞ ¼ % limN-1
lnϕmþ1ðn; rÞϕmðn; rÞ
!
; ð12Þ
which, for finite datasets, can be estimated by the statistic
FuzzEnðm;n; r;NÞ ¼ % lnϕmþ1ðn; rÞϕmðn; rÞ
: ð13Þ
Hence, FuzzEn analyzes time series for similar epochs reporting anon-negative number with larger values associated to more irregular-ity in the data [24]. Althoughm, n and r are critical in determining theoutcome of FuzzEn, no guidelines exist for optimizing their values.In the present work the widely used values ofm¼2 and r¼0.25 timesthe standard deviation of the original data for SampEn computa-tion [15] and n¼2 for FuzzEn estimation [24] were used to computethis entropy for both AA and MAW signals.
2.3.3. Spectral entropySpectral Entropy (SpecEn) is a statistic measure able to quantify
the spectral disorder of a signal x(n) by applying Shannon'sentropy to its normalized PSD [25]. Briefly, the PSD in the selectedband has to be normalized via its total power, i.e.
PSDn ¼PSD
∑fmaxf ¼ fmin
PSDðf Þ; ð14Þ
such that ∑f maxf ¼ f min
PSDnðf Þ ¼ 1. From this probability distributionfunction, SpecEn can be computed as
SpecEn¼ %1
log ðMÞ∑fmax
f ¼ fmin
PSDnðf Þlog ðPSDnðf ÞÞ; ð15Þ
where M is the number of frequency bins. The division by log ðMÞnormalizes the metric to a scale from 0 to 1 [26]. Bearing thisdefinition in mind, SpecEn can be considered as an irregularityestimator, because it measures the frequency spectrum flatness [26].Thus, low SpecEn values indicate that the signal's power spectrum ismainly concentrated into few frequency bins (e.g. a sum of sinusoids),whereas signals having a flat, uniform spectrumwith a broad spectralcontent (e.g. white noise) produce high SpecEn values [27].
It is worth noting that the PSD of the AA signal and its MAWwas computed as is described in Section 2.3.1. Nonetheless, it hasto be remarked that SpecEn was only computed from the 3–9 Hzband, because it is the AF frequency band of interest [11].
2.3.4. Lempel–Ziv ComplexityLempel–Ziv Complexity (LZC) was introduced by Lempel and
Ziv in 1976 [28]. It is a non-parametric measure of complexitywhich requires one-dimensional and not excessively long datasegments [29]. Precisely, this metric provides a measure of com-plexity based on the number of different substrings existing in thedata and their appearance rate, larger values being associated withmore complex time series. Because LZC analysis is based on acoarse-graining of the measurements, which means that thedetailed information is not considered, the original signal x(n)must be transformed into a finite symbol sequence before calcu-lating the complexity measure c(n). In this study two differentsequence conversion methods were used:
1. Two-symbol sequence conversion. The signal x(n) is convertedinto a binary sequence defined by
sðiÞ ¼0 if xðiÞoxm;1 if xðiÞZxm;
(
xm being the median of x(n). This value is estimated as athreshold, since partitioning about the median is robust tooutliers [30].
2. Three-symbol sequence conversion. The signal is convertedinto a 0-1-2 sequence defined by
sðiÞ ¼
0 if xðiÞrTd1;
1 if Td1oxðiÞoTd2;
2 if xðiÞZTd2;
8><
>:
the thresholds Td1 and Td2 being defined as Td1 ¼ xm% jxminj=16and Td2 ¼ xmþ jxmaxj=16, where xmin and x max are the mini-mum and maximum values of x(n), respectively [31].
In order to compute the LZC, the sequence s(n) has to bescanned from left to right. Every time a new sequence ofconsecutive symbols is detected, a complexity counter c(n) isincreased by one unit. Thereby, if two subsequences of s(n) aredenoted as P and Q and their concatenation is represented as PQ,the sequence PQπ can be obtained by removing the last characterof PQ and the vocabulary of PQπ can be denoted as vðPQπÞ. Then,c(n) can be estimated as follows [29]:
1. The following initial values are assigned: cðnÞ ¼ 1, P ¼ sð1Þ,Q ¼ sð2Þ.
2. In general, P ¼ fsð1Þ; sð2Þ;…; sðrÞg and Q ¼ fsðrþ1Þg. Therefore,PQπ ¼ fsð1Þ; sð2Þ;…; sðrÞg.
3. If Q belongs to vðPQπÞ, its value is renewed to be Q ¼fsðrþ1Þ; sðrþ2Þg. Otherwise, a new subsequence has beenfound and thus c(n) is increased by one.
4. The previous step is repeated while Q belongs to vðPQπÞ.5. Next, P is renewed to be P ¼ fsð1Þ; sð2Þ;…; sðrþ iÞg and Q ¼
fsðrþ iþ1Þg and the previous steps are repeated. This procedureis repeated until Q is the last character of s(n).
Finally, c(n) has to be normalized in order to obtain a complex-ity measure which does not depend on the data length. For asymbol set of α different symbols and a sequence length N, it hasbeen demonstrated that the upper bound of c(n) is given by theexpression [28]
cðnÞo Nð1%εÞlog αðNÞ
; ð16Þ
where ε is a small number and ε-0 ðN-1Þ. In general, N=log αðNÞrepresents the upper bound of c(n), i.e.
limN-1
cðnÞ ¼N
log αðNÞ; ð17Þ
and c(n) can be normalized as
CðnÞ ¼cðnÞN
log αðNÞ
: ð18Þ
Then, this metric can reflect the temporal structure of a signal,given that the occurrence rate of new substrings along thesequence determines its value.
2.3.5. Hurst exponent and its generalizationThe scaling properties in time series can be quantified through
a measure called the Hurst Exponent (HE) [32]. Scaling in datagives useful information on the underlying process and the HEanalysis examines if some statistical properties of a time seriesx(n) scale with the observation period and the time resolution.Thus, HE is commonly associated with the long-term statisticaldependence of the signal and, therefore, quantifies the statisticalself-similarity of time series, providing information on the recur-rence rate of similar patterns in time series at different scales [33].
M. Julián et al. / Computers in Biology and Medicine 48 (2014) 66–76 69
Author's personal copy
In order to estimate the HE from a time series, the first step isto divide the series into segments Xk(n) of length k¼N, N=2,N=4, …, where N represents the series total length. Next, therescaled range RðnÞ=SðnÞ is computed in each segment. For thispurpose, the accumulated deviation from the mean value, denotedas Yk(n) for n¼ 1;2;…; k, is calculated as
YkðnÞ ¼ ∑n
i ¼ 1XkðiÞ%
1k
∑k
l ¼ 1XkðlÞ
!
: ð19Þ
The range of this deviation, denoted as R(n), can be defined as thedifference between its maximum and minimum, i.e.
RðnÞ ¼maxðYkðnÞÞ%minðYkðnÞÞ: ð20Þ
and can be normalized by the standard deviation of each segment,S(n), to obtain the rescaled range. Finally, the HE can be estimatedas the slope of the line produced by lnðRðnÞ=SðnÞÞ vs. lnðnÞ. Theseestimates range between 0 and 1. Thus, a value of 0.5 indicates nocorrelation in the time series. In contrast, a value between 0 and0.5 denotes that the time series has long-range anti-correlations,whereas values between 0.5 up to 1 evidence long-range correla-tions [33].
However, some physiological time series, such as the heart rate,present more complex dynamics and, thus, their complete char-acterization requires the use of multiple exponents [34]. In thissense, a HE generalization has been associated with the scalingbehavior of statistically significant properties of the signal [35].Thus, the generalized HE is basically a tool to examine directly thescaling properties of the data via the qth order moments of thedistribution of the increments. Different exponents q are asso-ciated with different characterizations of the multi-scaling beha-vior of the signal x(n). Therefore, considering the q-order momentof the distribution of the increments of a time series x(n) as
KqðτÞ ¼1
N%τþ1∑
N% τ
i ¼ 1jxðiþτÞ%xðiÞjq; ð21Þ
the time interval τ being between 1 and N, the generalized HE ofq-order, H(q), can be defined from the scaling behavior of KqðτÞ,which can be assumed to follow the relation [35]
KqðτÞpτqHðqÞ: ð22Þ
Processes exhibiting this scaling behavior can be classified intotwo groups: (i) Uniscaling (or unifractal) processes, in which H(q)is independent of q and their scaling behavior is uniquelydetermined by the HE. (ii) Multiscaling (or multifractal) processes,where H(q) depends on the value of q and, therefore, each momentscales with a different exponent. Within this context, for thepurposes of long-range dependence detection, the case of q¼2 isimportant as K2ðτÞ is connected to the scaling of the autocorrela-tion function of the increments. For q¼1, Hð1Þ describes thescaling behavior of the absolute values of the increments [35].
2.4. Surrogate data
It is commonly accepted that chaotic behavior is present in thediseased heart with AF at cellular level [36]. Furthermore, atrialelectrophysiological remodeling during the arrhythmia is a far-from-linear process [37]. However, it is not possible to guaranteethat ECG signals reflect the nonlinear features of the heart [38].Therefore, a surrogate data method was necessary to determinewhether nonlinear dynamics could be detected in the analyzedsignals by the studied metrics [39]. For a minimal significancerequirement of 95% (po0:05), 40 surrogate data from eachanalyzed original signal, both for AA and MAW were generatedwith the iterative amplitude adjusted Fourier transform algo-rithm [38]. Briefly, a rescaled version of each original signal,having a normal amplitude distribution, was first generated. Next,
the phases in the rescaled series were randomized in order togenerate surrogate series and then each surrogate series wasrescaled to the amplitude distribution of the original signal.Finally, the surrogate data power spectrum and amplitude dis-tribution were corrected iteratively towards those of the originalsignal. A more detailed description of this algorithm can be foundin [38]. Using this procedure, original and surrogate data had thesame amplitude distribution and Fourier power spectra [38].Hence, surrogate data retained the same linear properties thanthe original series, but not the possible nonlinear ones. Then,significant differences between the values computed by an indexfrom both original and surrogate data will indicate that nonlineardynamics in the signals can be successfully detected by it [39]. Inorder to compare statistically nonlinear values from the originaland surrogate data, a rank-order test was used. Thus, the hypoth-esis of linearity was rejected if the original signal produced anindex value that was either higher or lower than all its corre-sponding surrogate data sets.
2.5. Performance evaluation and statistical analysis
For an exhaustive assessment of AF organization estimationreached by each nonlinear metric, four different classificationscenarios were considered, i.e. (i) discrimination among N andT episodes, (ii) discrimination among S and T episodes, (iii)discrimination among N and S episodes and (iv) discriminationamong N and all terminating episodes (S and T). In each case, areceiver operating characteristics (ROC) curve was used to deter-mine the optimal classification threshold corresponding to eachsingle parameter, which was selected as the value minimizing theclassification error. Due to the size of the studied database, aresubstitution validation approach, in which the classifier istrained and tested using the same data, was first applied. Thediagnostic accuracy was computed as the percentage ratiobetween the correctly classified episodes and the total numberof analyzed episodes. Next, to improve the statistical robustness ofthe classification, a leave-one-out cross-validation scheme wasused. Additionally, a stepwise logistic regression analysis wasperformed in order to improve patients' group classification. Thisanalysis combined the possible complementary information pro-vided by each analyzed nonlinear index. Variable selection wasperformed by a forward stepwise approach including, at each step,the feature which led to the Wald statistic maximization.
Finally, statistical differences among non-terminating, soon-terminating and immediately terminating AF episodes were eval-uated by a Kruskal–Wallis analysis of variance. Furthermore,differences between each pair of groups were assessed makinguse of a Mann–Whitney U-test. These non-parametric tests wereused because the Kolmogorov–Smirnov and Levene tests provideddistributions not normal and homoscedastic for all the nonlinearindices. In both cases, a value of statistical significance po0:05was considered as significant.
3. Results
3.1. Surrogate data analysis
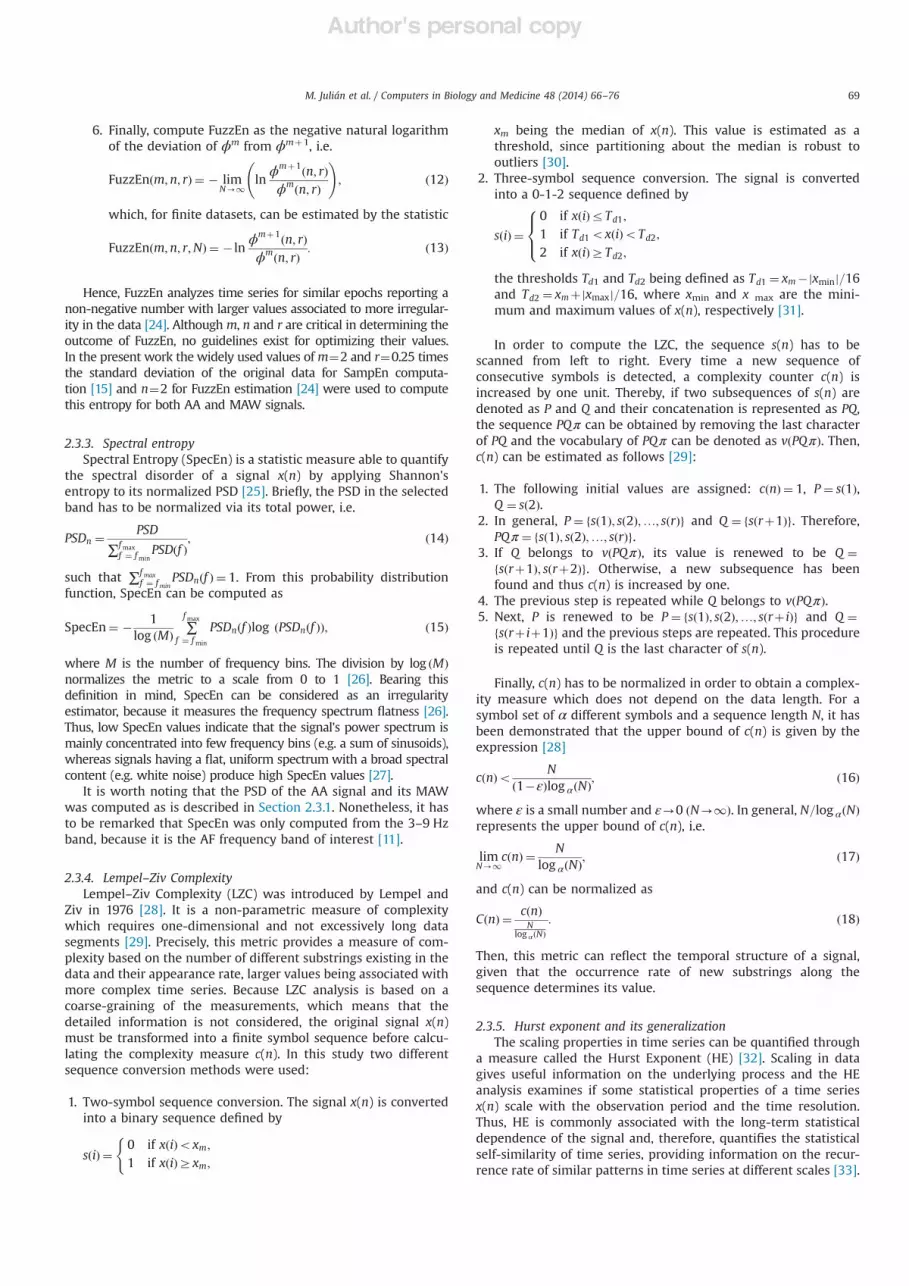
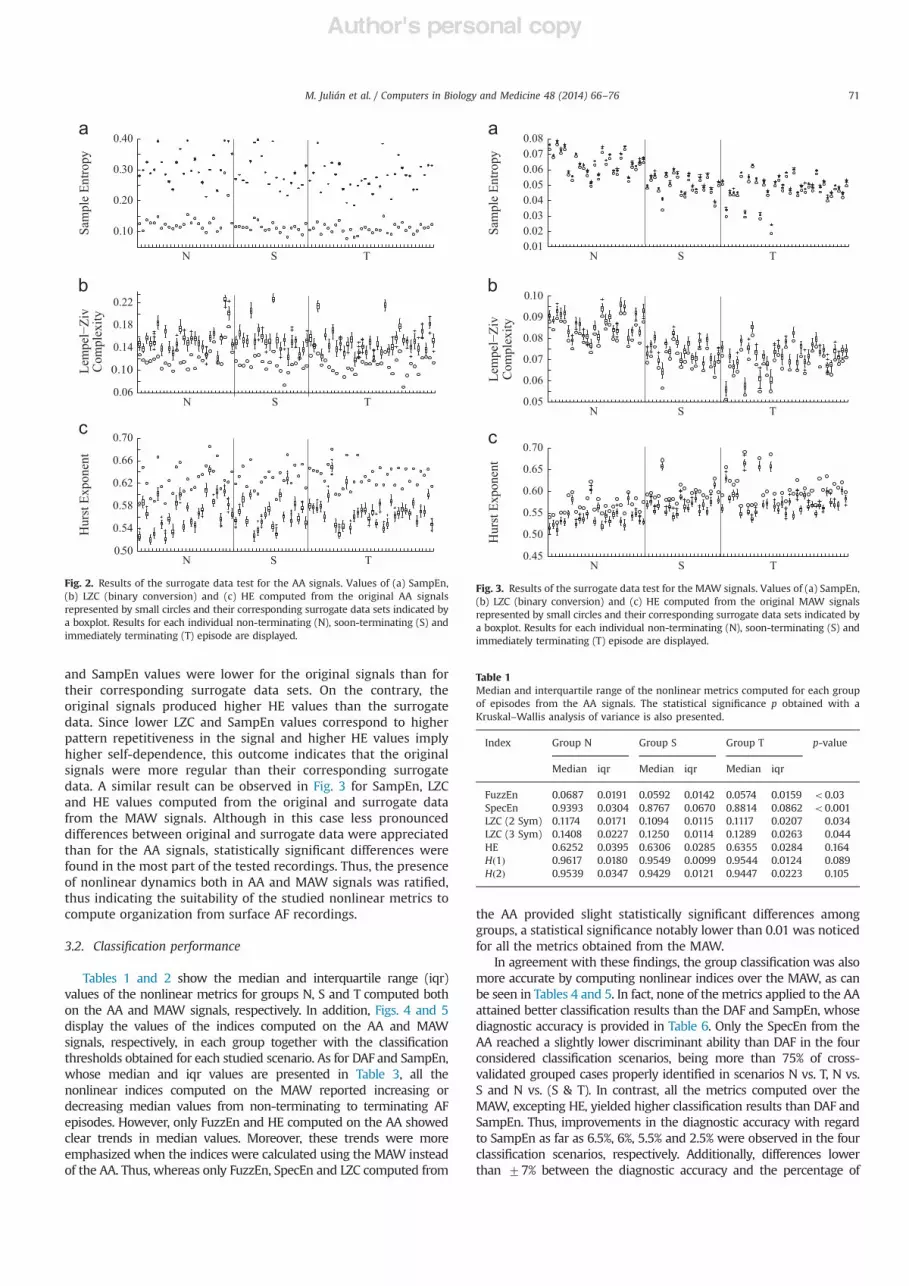
In order to analyze the possibility of detecting nonlineardynamics both from the AA and MAW signals, all the studiedmetrics were computed from the 40 surrogate data generated foreach original signal. As can be appreciated in Fig. 2, SampEn, LZCand HE values for original and surrogate data from the AA signalsdiffered notably. Although not presented in figure, the remainingnonlinear metrics also produced different values from the originaland surrogate signals. Moreover, it is interesting to note that LZC
M. Julián et al. / Computers in Biology and Medicine 48 (2014) 66–7670
Author's personal copy
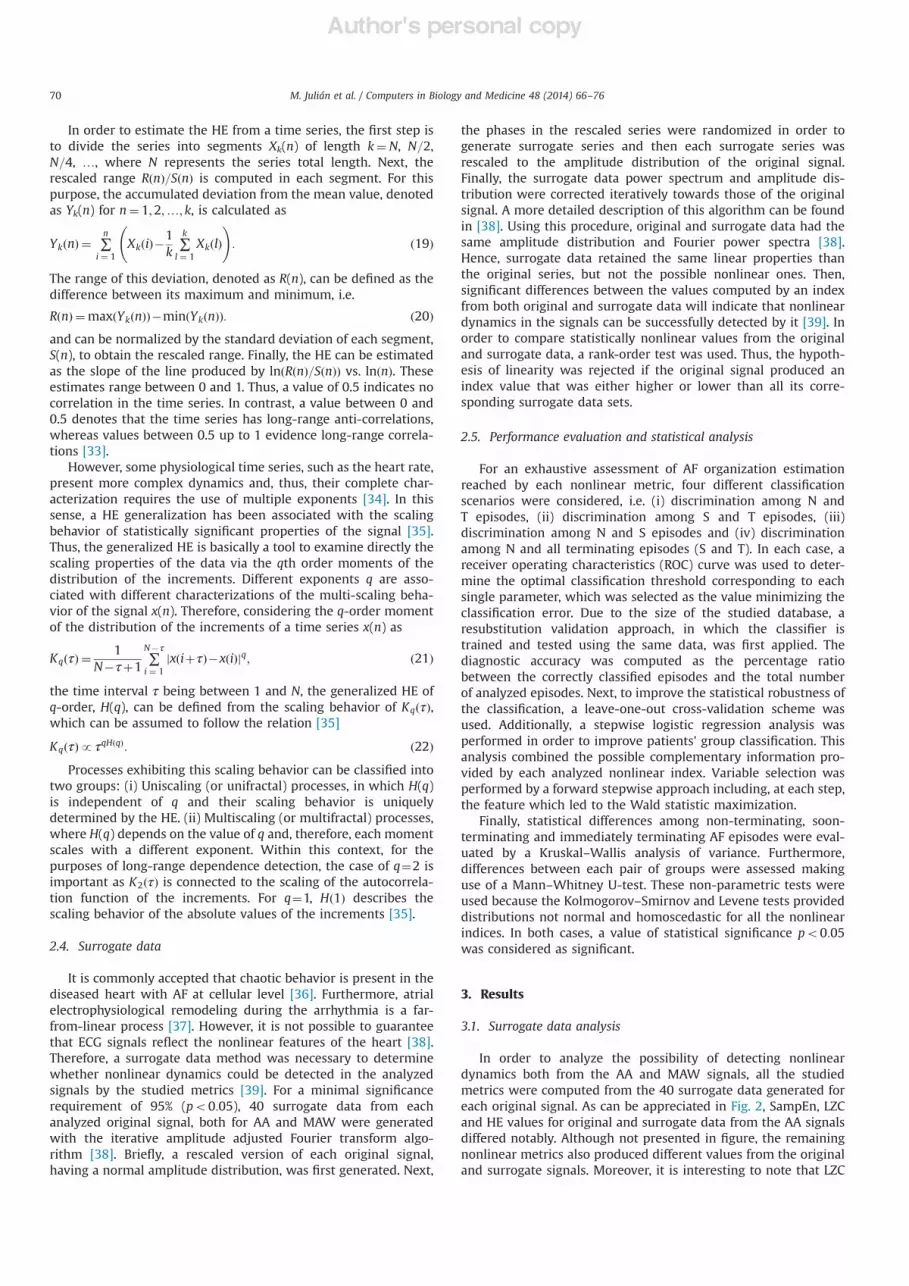
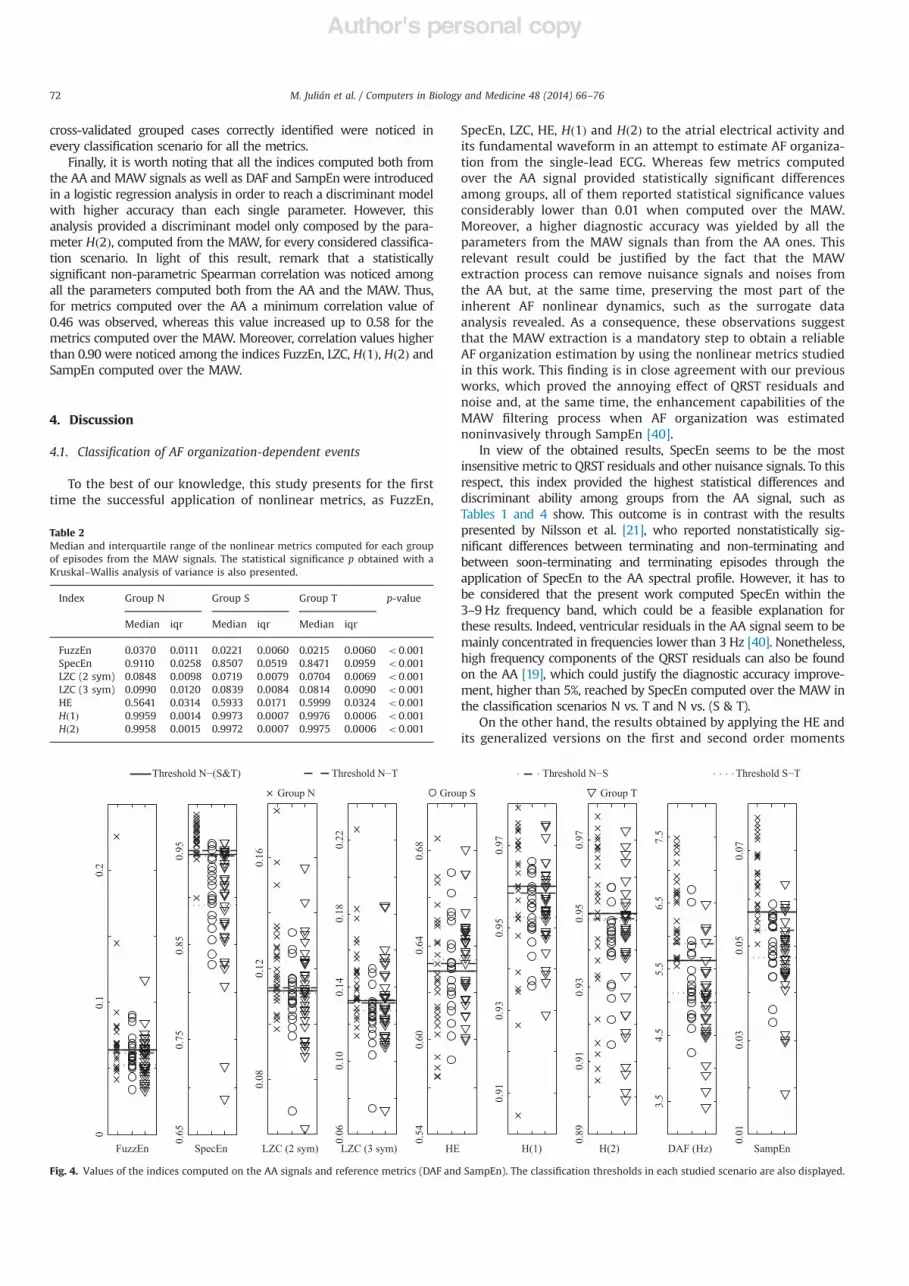
and SampEn values were lower for the original signals than fortheir corresponding surrogate data sets. On the contrary, theoriginal signals produced higher HE values than the surrogatedata. Since lower LZC and SampEn values correspond to higherpattern repetitiveness in the signal and higher HE values implyhigher self-dependence, this outcome indicates that the originalsignals were more regular than their corresponding surrogatedata. A similar result can be observed in Fig. 3 for SampEn, LZCand HE values computed from the original and surrogate datafrom the MAW signals. Although in this case less pronounceddifferences between original and surrogate data were appreciatedthan for the AA signals, statistically significant differences werefound in the most part of the tested recordings. Thus, the presenceof nonlinear dynamics both in AA and MAW signals was ratified,thus indicating the suitability of the studied nonlinear metrics tocompute organization from surface AF recordings.
3.2. Classification performance
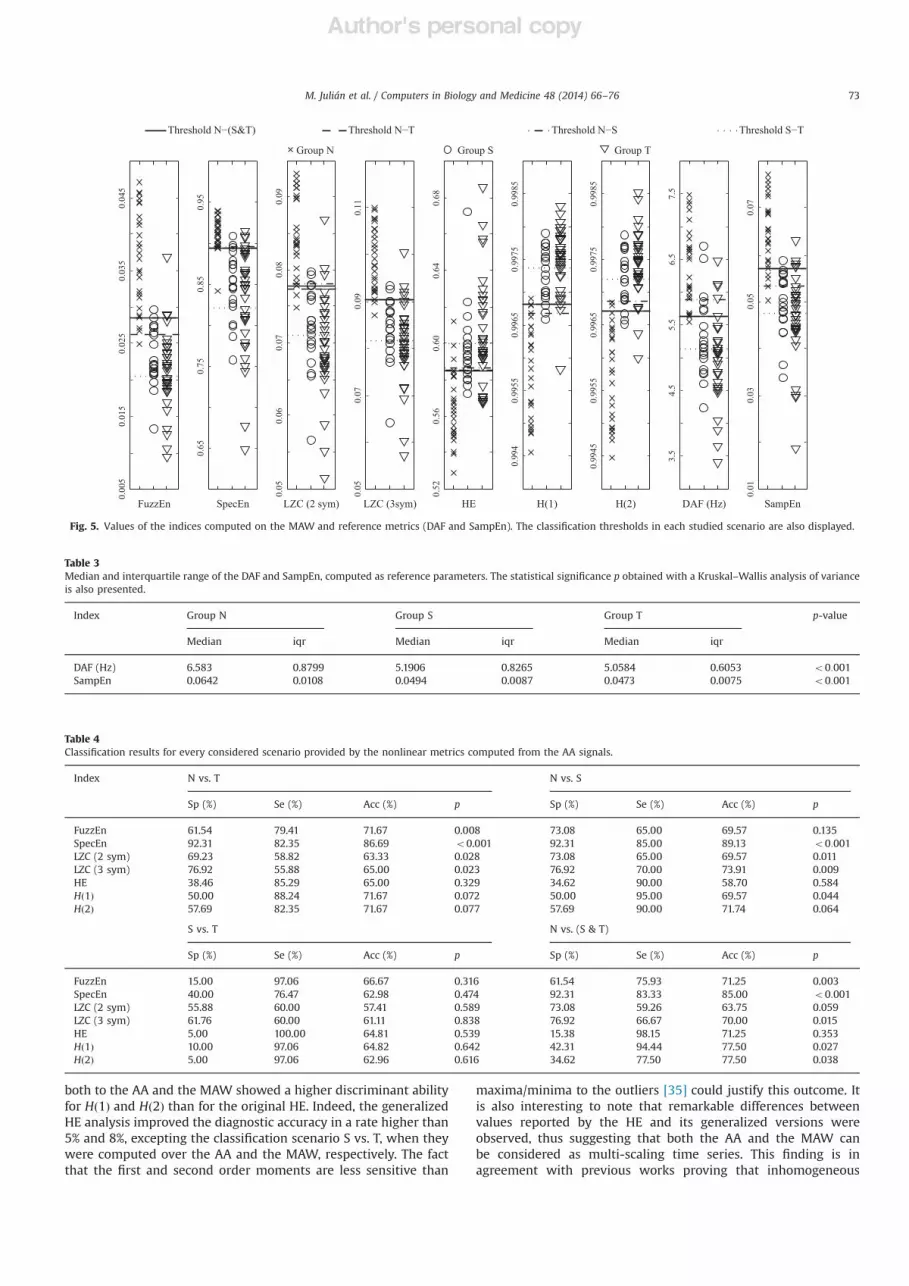
Tables 1 and 2 show the median and interquartile range (iqr)values of the nonlinear metrics for groups N, S and T computed bothon the AA and MAW signals, respectively. In addition, Figs. 4 and 5display the values of the indices computed on the AA and MAWsignals, respectively, in each group together with the classificationthresholds obtained for each studied scenario. As for DAF and SampEn,whose median and iqr values are presented in Table 3, all thenonlinear indices computed on the MAW reported increasing ordecreasing median values from non-terminating to terminating AFepisodes. However, only FuzzEn and HE computed on the AA showedclear trends in median values. Moreover, these trends were moreemphasized when the indices were calculated using the MAW insteadof the AA. Thus, whereas only FuzzEn, SpecEn and LZC computed from
the AA provided slight statistically significant differences amonggroups, a statistical significance notably lower than 0.01 was noticedfor all the metrics obtained from the MAW.
In agreement with these findings, the group classification was alsomore accurate by computing nonlinear indices over the MAW, as canbe seen in Tables 4 and 5. In fact, none of the metrics applied to the AAattained better classification results than the DAF and SampEn, whosediagnostic accuracy is provided in Table 6. Only the SpecEn from theAA reached a slightly lower discriminant ability than DAF in the fourconsidered classification scenarios, being more than 75% of cross-validated grouped cases properly identified in scenarios N vs. T, N vs.S and N vs. (S & T). In contrast, all the metrics computed over theMAW, excepting HE, yielded higher classification results than DAF andSampEn. Thus, improvements in the diagnostic accuracy with regardto SampEn as far as 6.5%, 6%, 5.5% and 2.5% were observed in the fourclassification scenarios, respectively. Additionally, differences lowerthan 77% between the diagnostic accuracy and the percentage of
0.10
0.20
0.30
0.40
Sam
ple
Entro
py
N S T
Lem
pel−
Ziv
Com
plex
ity
0.50
0.54
0.58
0.62
0.66
Hur
st Ex
pone
nt
N S T
0.06
0.10
0.14
0.18
0.22
N S T
0.70
Fig. 2. Results of the surrogate data test for the AA signals. Values of (a) SampEn,(b) LZC (binary conversion) and (c) HE computed from the original AA signalsrepresented by small circles and their corresponding surrogate data sets indicated bya boxplot. Results for each individual non-terminating (N), soon-terminating (S) andimmediately terminating (T) episode are displayed.
0.010.020.030.040.050.060.070.08
Sam
ple
Entro
py
N S T
0.05
0.06
0.07
0.08
0.09
0.10
Lem
pel−
Ziv
Com
plex
ity
N S T
0.45
0.50
0.55
0.60
0.65
0.70
Hur
st Ex
pone
nt
N S T
Fig. 3. Results of the surrogate data test for the MAW signals. Values of (a) SampEn,(b) LZC (binary conversion) and (c) HE computed from the original MAW signalsrepresented by small circles and their corresponding surrogate data sets indicated bya boxplot. Results for each individual non-terminating (N), soon-terminating (S) andimmediately terminating (T) episode are displayed.
Table 1Median and interquartile range of the nonlinear metrics computed for each groupof episodes from the AA signals. The statistical significance p obtained with aKruskal–Wallis analysis of variance is also presented.
Index Group N Group S Group T p-value
Median iqr Median iqr Median iqr
FuzzEn 0.0687 0.0191 0.0592 0.0142 0.0574 0.0159 o0.03SpecEn 0.9393 0.0304 0.8767 0.0670 0.8814 0.0862 o0.001LZC (2 Sym) 0.1174 0.0171 0.1094 0.0115 0.1117 0.0207 0.034LZC (3 Sym) 0.1408 0.0227 0.1250 0.0114 0.1289 0.0263 0.044HE 0.6252 0.0395 0.6306 0.0285 0.6355 0.0284 0.164Hð1Þ 0.9617 0.0180 0.9549 0.0099 0.9544 0.0124 0.089Hð2Þ 0.9539 0.0347 0.9429 0.0121 0.9447 0.0223 0.105
M. Julián et al. / Computers in Biology and Medicine 48 (2014) 66–76 71
Author's personal copy
cross-validated grouped cases correctly identified were noticed inevery classification scenario for all the metrics.
Finally, it is worth noting that all the indices computed both fromthe AA and MAW signals as well as DAF and SampEnwere introducedin a logistic regression analysis in order to reach a discriminant modelwith higher accuracy than each single parameter. However, thisanalysis provided a discriminant model only composed by the para-meter Hð2Þ, computed from the MAW, for every considered classifica-tion scenario. In light of this result, remark that a statisticallysignificant non-parametric Spearman correlation was noticed amongall the parameters computed both from the AA and the MAW. Thus,for metrics computed over the AA a minimum correlation value of0.46 was observed, whereas this value increased up to 0.58 for themetrics computed over the MAW. Moreover, correlation values higherthan 0.90 were noticed among the indices FuzzEn, LZC, Hð1Þ, Hð2Þ andSampEn computed over the MAW.
4. Discussion
4.1. Classification of AF organization-dependent events
To the best of our knowledge, this study presents for the firsttime the successful application of nonlinear metrics, as FuzzEn,
SpecEn, LZC, HE, Hð1Þ and Hð2Þ to the atrial electrical activity andits fundamental waveform in an attempt to estimate AF organiza-tion from the single-lead ECG. Whereas few metrics computedover the AA signal provided statistically significant differencesamong groups, all of them reported statistical significance valuesconsiderably lower than 0.01 when computed over the MAW.Moreover, a higher diagnostic accuracy was yielded by all theparameters from the MAW signals than from the AA ones. Thisrelevant result could be justified by the fact that the MAWextraction process can remove nuisance signals and noises fromthe AA but, at the same time, preserving the most part of theinherent AF nonlinear dynamics, such as the surrogate dataanalysis revealed. As a consequence, these observations suggestthat the MAW extraction is a mandatory step to obtain a reliableAF organization estimation by using the nonlinear metrics studiedin this work. This finding is in close agreement with our previousworks, which proved the annoying effect of QRST residuals andnoise and, at the same time, the enhancement capabilities of theMAW filtering process when AF organization was estimatednoninvasively through SampEn [40].
In view of the obtained results, SpecEn seems to be the mostinsensitive metric to QRST residuals and other nuisance signals. To thisrespect, this index provided the highest statistical differences anddiscriminant ability among groups from the AA signal, such asTables 1 and 4 show. This outcome is in contrast with the resultspresented by Nilsson et al. [21], who reported nonstatistically sig-nificant differences between terminating and non-terminating andbetween soon-terminating and terminating episodes through theapplication of SpecEn to the AA spectral profile. However, it has tobe considered that the present work computed SpecEn within the3–9 Hz frequency band, which could be a feasible explanation forthese results. Indeed, ventricular residuals in the AA signal seem to bemainly concentrated in frequencies lower than 3 Hz [40]. Nonetheless,high frequency components of the QRST residuals can also be foundon the AA [19], which could justify the diagnostic accuracy improve-ment, higher than 5%, reached by SpecEn computed over the MAW inthe classification scenarios N vs. T and N vs. (S & T).
On the other hand, the results obtained by applying the HE andits generalized versions on the first and second order moments
0.01
0.05
0.07
SampEn
Group N Group S Group T
Threshold N−(S&T) Threshold N−T Threshold N−S
0.03
Threshold S−T
0.89
0.91
0.93
0.95
0.97
H(2)
0.91
0.93
0.95
0.97
H(1)
0.60
0.64
0.68
HE
0.54
0.06
0.10
0.14
0.18
0.22
LZC (3 sym)
0.08
0.12
0.16
LZC (2 sym)
0.65
0.75
0.85
0.95
SpecEn
00.
10.
2
FuzzEn DAF (Hz)
3.5
4.5
5.5
6.5
7.5
Fig. 4. Values of the indices computed on the AA signals and reference metrics (DAF and SampEn). The classification thresholds in each studied scenario are also displayed.
Table 2Median and interquartile range of the nonlinear metrics computed for each groupof episodes from the MAW signals. The statistical significance p obtained with aKruskal–Wallis analysis of variance is also presented.
Index Group N Group S Group T p-value
Median iqr Median iqr Median iqr
FuzzEn 0.0370 0.0111 0.0221 0.0060 0.0215 0.0060 o0:001SpecEn 0.9110 0.0258 0.8507 0.0519 0.8471 0.0959 o0:001LZC (2 sym) 0.0848 0.0098 0.0719 0.0079 0.0704 0.0069 o0:001LZC (3 sym) 0.0990 0.0120 0.0839 0.0084 0.0814 0.0090 o0:001HE 0.5641 0.0314 0.5933 0.0171 0.5999 0.0324 o0:001Hð1Þ 0.9959 0.0014 0.9973 0.0007 0.9976 0.0006 o0:001Hð2Þ 0.9958 0.0015 0.9972 0.0007 0.9975 0.0006 o0:001
M. Julián et al. / Computers in Biology and Medicine 48 (2014) 66–7672
Author's personal copy
both to the AA and the MAW showed a higher discriminant abilityfor Hð1Þ and Hð2Þ than for the original HE. Indeed, the generalizedHE analysis improved the diagnostic accuracy in a rate higher than5% and 8%, excepting the classification scenario S vs. T, when theywere computed over the AA and the MAW, respectively. The factthat the first and second order moments are less sensitive than
maxima/minima to the outliers [35] could justify this outcome. Itis also interesting to note that remarkable differences betweenvalues reported by the HE and its generalized versions wereobserved, thus suggesting that both the AA and the MAW canbe considered as multi-scaling time series. This finding is inagreement with previous works proving that inhomogeneous
0.01
0.03
0.05
0.07
SampEnDAF (Hz)
3.5
4.5
5.5
6.5
7.5
0.99
450.
9955
0.99
650.
9975
0.99
85
H(2)0.
994
0.99
550.
9965
0.99
750.
9985
H(1)
0.52
0.56
0.60
0.64
0.68
HE
0.05
0.07
0.09
0.11
LZC (3sym)
0.65
0.75
0.85
0.95
SpecEn
0.00
50.
015
0.02
50.
035
0.04
5
FuzzEn
Group N Group S Group T
Threshold N−(S&T) Threshold N−T Threshold N−S Threshold S−T
0.05
0.06
0.07
0.08
0.09
LZC (2 sym)
Fig. 5. Values of the indices computed on the MAW and reference metrics (DAF and SampEn). The classification thresholds in each studied scenario are also displayed.
Table 3Median and interquartile range of the DAF and SampEn, computed as reference parameters. The statistical significance p obtained with a Kruskal–Wallis analysis of varianceis also presented.
Index Group N Group S Group T p-value
Median iqr Median iqr Median iqr
DAF (Hz) 6.583 0.8799 5.1906 0.8265 5.0584 0.6053 o0:001SampEn 0.0642 0.0108 0.0494 0.0087 0.0473 0.0075 o0:001
Table 4Classification results for every considered scenario provided by the nonlinear metrics computed from the AA signals.
Index N vs. T N vs. S
Sp (%) Se (%) Acc (%) p Sp (%) Se (%) Acc (%) p
FuzzEn 61.54 79.41 71.67 0.008 73.08 65.00 69.57 0.135SpecEn 92.31 82.35 86.69 o0.001 92.31 85.00 89.13 o0:001LZC (2 sym) 69.23 58.82 63.33 0.028 73.08 65.00 69.57 0.011LZC (3 sym) 76.92 55.88 65.00 0.023 76.92 70.00 73.91 0.009HE 38.46 85.29 65.00 0.329 34.62 90.00 58.70 0.584Hð1Þ 50.00 88.24 71.67 0.072 50.00 95.00 69.57 0.044Hð2Þ 57.69 82.35 71.67 0.077 57.69 90.00 71.74 0.064
S vs. T N vs. (S & T)
Sp (%) Se (%) Acc (%) p Sp (%) Se (%) Acc (%) p
FuzzEn 15.00 97.06 66.67 0.316 61.54 75.93 71.25 0.003SpecEn 40.00 76.47 62.98 0.474 92.31 83.33 85.00 o0:001LZC (2 sym) 55.88 60.00 57.41 0.589 73.08 59.26 63.75 0.059LZC (3 sym) 61.76 60.00 61.11 0.838 76.92 66.67 70.00 0.015HE 5.00 100.00 64.81 0.539 15.38 98.15 71.25 0.353Hð1Þ 10.00 97.06 64.82 0.642 42.31 94.44 77.50 0.027Hð2Þ 5.00 97.06 62.96 0.616 34.62 77.50 77.50 0.038
M. Julián et al. / Computers in Biology and Medicine 48 (2014) 66–76 73

Author's personal copy
and nonstationary time series generated by complex physiologicalcontrol systems present multi-scaling dynamics [34].
Regarding the application of LZC both to the AA and the MAW,the best diagnostic accuracy was obtained when a two-symbolsequence conversion was used. A possible explanation could bethat more information from the signals is kept during the coarse-graining process when a binary conversion is used. Indeed, thisresult is in agreement with previous works which have claimedthat a two-symbol sequence conversion is enough to study thedynamic complexity of other physiological signals [41]. None-theless, significant differences with respect to the use of a three-symbol sequence conversion were unappreciated. Therefore,results were not conclusive and further analysis with widerdatabases are needed to elucidate which symbol conversion choiceis optimal in order to compute LZC in the context of AForganization.
On the other hand, FuzzEn has been proposed in previousworks as a more accurate regularity estimator than SampEn [24].According to its authors, FuzzEn not only owns stronger relativeconsistency and less dependence on data length, which means lessbias, but also achieves continuity, freer parameter selections andmore robustness to noise than SampEn [24]. As a possibleconsequence of this behavior, FuzzEn showed statistically signifi-cant differences among groups N, S and T for the AA signalanalysis. In addition, it also provided a better result in three outof the four considered classification scenarios than SampEn for theMAW, reaching an improvement higher than 6% in the discrimina-tion of N vs. S and N vs. (S & T). Regarding the computationalparameters selection for FuzzEn and SampEn, it is interesting to
note that a recent study has addressed the effect of m and r valueson SampEn [42]. However, this study analyzed electromyogram(EMG) and mechanomyogram (MMG) signals, which present fasterdynamics and more impulsive morphologies than AA signals. Theoptimal use of SampEn in the study of AF organization has beenanalyzed in a previous work [23] and these recommendationshave been followed in the present study. Moreover, it has to beremarked that FuzzEn was also computed both on the AA andMAW signals using the optimal parameter set defined for SampEn.However, its diagnostic accuracy was not improved and thus theseresults have not been included in Section 3.2.
Another interesting observation is that all the metrics, except-ing the HE, computed over the MAW reached a similar diagnosticaccuracy or slightly higher than FuzzEn and, therefore, higher thanSampEn and DAF. Indeed, these parameters have provided thehighest diagnostic ability in the classification of AF organization-dependent events as single predictors published to date [15]. Tothis respect, Hð1Þ and Hð2Þ computed on the MAW achieved thehighest classification accuracy in three out of the four analyzedscenarios. Furthermore, the stepwise logistic regression selectedHð2Þ as the best predictor of AF termination. Hence, the study ofthe second order moments may provide useful clinicalinformation on AF.
4.2. Increasing AF organization trend before its termination
According to previous works providing evidences of a progres-sive merging of wavelets into one massive wavefront prior tospontaneous AF termination [43,44], all the analyzed indices
Table 5Classification results for every considered scenario provided by the nonlinear metrics computed from the MAW signals.
Index N vs. T N vs. S
Sp (%) Se (%) Acc (%) p Sp (%) Se (%) Acc (%) p
FuzzEn 80.77 97.06 90.00 o0:001 88.46 95.00 91.30 o0:001SpecEn 88.24 96.15 91.67 o0:001 90.00 88.46 89.13 o0:001LZC (2 sym) 92.31 94.12 93.34 o0:001 88.46 95.00 91.30 o0:001LZC (3 sym) 84.62 94.12 90.00 o0:001 92.31 90.00 91.30 o0:001HE 92.31 76.74 83.33 o0:001 88.46 75.00 82.61 o0:001Hð1Þ 96.15 94.12 95.00 o0:001 95.00 88.46 91.30 o0:001Hð2Þ 92.30 94.12 93.34 o0:001 100.00 85.00 93.48 o0:001
S vs. T N vs. (S & T)
Sp (%) Se (%) Acc (%) p Sp (%) Se (%) Acc (%) p
FuzzEn 35.00 85.29 66.67 0.152 80.77 98.15 92.50 o0:001SpecEn 80.00 41.18 55.56 0.513 87.04 96.15 90.00 o0:001LZC (2 sym) 35.00 91.18 70.37 0.103 88.46 94.44 92.50 o0:001LZC (3 sym) 40.00 82.35 66.67 0.078 84.62 92.59 90.00 o0:001HE 45.00 76.47 64.81 0.237 57.69 98.15 85.00 o0:001Hð1Þ 55.00 73.53 66.67 0.072 90.74 96.15 92.50 o0:001Hð2Þ 55.00 73.53 66.67 0.067 90.74 96.15 92.50 o0:001
Table 6Classification results for every considered scenario provided by DAF and SampEn, computed as reference parameters.
Index N vs. T N vs. S
Sp (%) Se (%) Acc (%) p Sp (%) Se (%) Acc (%) p
DAF 92.31 85.30 88.33 o0:001 96.00 70.00 84.70 o0:001SampEn 76.92 97.06 88.33 o0:001 76.92 100.00 86.95 o0:001
S vs. T N vs. (S & T)
Sp (%) Se (%) Acc (%) p Sp (%) Se (%) Acc (%) p
DAF 45.00 79.41 66.67 0.118 76.92 90.74 86.25 o0:001SampEn 35.00 82.35 64.81 0.159 76.92 98.15 91.25 o0:001
M. Julián et al. / Computers in Biology and Medicine 48 (2014) 66–7674

Author's personal copy
computed on the MAW presented clear trends in median valuesfrom non-terminating to terminating episodes. In addition, someof the indices computed on the AA also presented these trends.This result suggests a progressive increase in AF global organiza-tion prior to its spontaneous termination. Thus, FuzzEn, SpecEnand LZC reported higher median values for non-terminating thanfor soon-terminating episodes. In a similar way, these indicesprovided higher values for soon-terminating than for immediatelyterminating episodes. As a global consideration, they provided lesstime irregularity, lower spectral disorganization and lower com-plexity in the MAW signal as AF termination approximated.Similarly, the HE and its generalized versions showed an increas-ing trend in median values through non-terminating, soon-terminating and immediately terminating episodes, thus present-ing higher statistical self-similarity in the MAW signal prior to AFtermination. Therefore, bearing these findings in mind, FuzzEn,SpecEn, LZC, Hð1Þ and Hð2Þ could be considered as promising toolsfor the study of AF organization-related events from the surfaceECG. Nonetheless, once a more accurate AF organization estima-tion than SampEn has been proved, optimal parameters for theapplication of these nonlinear metrics to the MAW signal wouldhave to be evaluated thoroughly in future studies.
Additionally, given that a progressive wavelet fusion producessimpler wavefronts into the atrial tissue, thus turning irregular fwaves to regular P waves on the ECG [9], it could be consideredthat all the analyzed metrics provide evidences on the patternrepetitiveness in the MAW. This aspect could justify the notablecorrelation observed among all of them. To this respect, it isinteresting to note that previous works have shown that LZC isrelated to the spectral features of the signal, is affected by changesin the frequency of periodic signals, is sensitive to signal band-width changes in stochastic processes and is sensible to changesin the variability of the signal harmonics in quasi-periodicsignals [29]. In the same sense, it should be noticed that Hð2Þ isrelated to the autocorrelation function of the signal and, therefore,to its spectral content [35]. Anyway, these findings could justifythe absence of complementary information among the AF organi-zation estimates reached by the tested nonlinear metrics, such asthe logistic regression analysis outcomes highlight.
4.3. Comparison with previous AF organization estimators
In previous works other nonlinear metrics have been analyzed toestimate AF organization from the surface ECG. They have presentedsimilar diagnostic accuracy values to the here reported, but usingnotably more complex strategies to extract the information. Thus, Sunand Wang used recurrence and Poincaré plots to characterize, from astructural point of view, nonlinear dynamics of the atrial [45] andventricular [46] activities. In both cases, a variety of different featureswere extracted, selected by means of a sequential forward searchalgorithm and combined by using an advanced classifier, such as amultilayer perceptron neural network and a fuzzy support vectormachine, respectively. However, the use of this type of classifiers turnsdifficult a direct and clear clinical interpretation of the results. Indeed,the complex classification approach can blur significantly the possibleclinical meaning of each single parameter. In a similar way, Shannon'sEntropy [47] and the central tendency measure from the firstdifferences scatter plot [48] have been recently applied to the AAwavelet decomposition to estimate pattern repetitiveness in surface fwaves. However, the need to transform the AA signal to a set of scaledwavelet coefficient vectors, which contain simultaneous time andfrequency information [48], can also make difficult the interpretationof the results in comparison with the direct application of nonlinearmetrics to the AA or its spectrum, such as in the present work.
Finally, it is important to remark that an unique and freelyavailable database was used to compare the studied nonlinear
indices with SampEn and DAF, thus avoiding any bias in theanalysis. In the Computers in Cardiology Challenge 2004, thedatabase was divided into a training set, composed by tenrecordings from each of the three groups (N, S and T), and twotesting data sets: test A, containing 16 non-terminating and 14immediately terminating recordings and test B, containing tenpairs of soon-terminating and terminating recordings from thesame AF episode of the same subject. To avoid the bias introducedfor the test set B and reach a more exhaustive analysis in theclassification of AF organization-dependent events, that databasedivision was not maintained, as described in Section 2.5. That isthe reason why slight differences between diagnostic accuracyvalues reached by SampEn in this work and our previous studies,such as [15], can be appreciated. Moreover, since the observationswere not independent in the S vs. T and N vs. (S & T) cases, thestatistical analysis was repeated for these scenarios using only onerecording per patient in order to ensure its validity. Although asmall bias could be appreciated, the average accuracy variationwas lower than 1% in both cases (0.74% and 0.20%, respectively).Therefore, as in previous studies, the results obtained from theanalysis of the whole database have been presented in this work.
More precisely, a resubstitution validation approach was used forall the considered classification scenarios, each single metric beinglearned from all the available data and then tested on the same set ofdata. Given that this process can suffer seriously from over-fitting, aleave-one-out cross-validation approach was also used. Results fromthis approach showed only classification rates slightly lower than fromthe resubstitution process for all the considered scenarios. However,whereas more than 63% and 72% of cross-validated grouped caseswere properly classified for the scenarios N vs. T, N vs. S and N vs.(S & T) both for AA and MAW signals, respectively, more than 50% inboth cases were inappropriately identified in the scenario S vs. T. Thisresult suggests the absence of bias in the studied classificationsexcepting the scenario S vs. T. In agreement with this finding,statistically non-significant differences between groups S and T wereobserved by any single nonlinear metric. A similar outcome has beenalso reported by previous works making use of the same databasedivision [49,46]. However, this result also is in contrast with otherclassification rates higher than 85% reported by some previous workswhich only made use of the test set B [45,50]. Nonetheless, it has to beremarked that all the tested nonlinear metrics computed on the MAWcorresponding to the test set B also provided statistically significantdifferences between groups and diagnostics accuracy values higherthan 85%. Therefore, further analysis with wider, homogeneous andindependent databases are required to thoroughly clarify the studiednonlinear metrics accuracy in AF organization estimation.
5. Conclusions
The present work has demonstrated the ability of several nonlinearmetrics to estimate successfully temporal AF organization from thesurface single-lead ECG. Moreover, most of them have proved a higherdiscriminant ability in the classification of AF organization-dependentevents than the most widely used current estimators, such as DAF andSampEn. Hence, these promising tools could be helpful for improvingcurrent AF treatment and making more appropriate decisions on thepatients' management. Further studies are required to provide optimalparameters in the application of these nonlinear metrics to AF signalsand validate the robustness and repeatability of the obtained resultson wider and independent databases.
Conflict of interest statement
There is no conflict of interest.
M. Julián et al. / Computers in Biology and Medicine 48 (2014) 66–76 75

Author's personal copy
Acknowledgments
Work supported by TEC2010–20633 from the Spanish Ministryof Science and Innovation, TEC2013–41428–R from the SpanishMinistry of Economy and Competitiveness and PPII11–0194–8121from Junta de Comunidades de Castilla-La Mancha.
References
[1] M.W. Rich, Epidemiology of atrial fibrillation, J. Interv. Card. Electrophysiol. 25(1) (2009) 3–8.
[2] J.L. Anderson, J.L. Halperin, N.M. Albert, B. Bozkurt, R.G. Brindis, L.H. Curtis,et al., Management of patients with atrial fibrillation (compilation of 2006ACCF/AHA/ESC and 2011 ACCF/AHA/HRS recommendations): a report of theAmerican College of Cardiology/American Heart Association Task Force onpractice guidelines, J. Am. Coll. Cardiol. 61 (18) (2013) 1935–1944, http://dx.doi.org/10.1016/j.jacc.2013.02.001.
[3] M.A. Allessie, W.J.E.P. Lammers, F.I.M. Bonke, J. Hollen, Experimental evalua-tion of Moe's multiple wavelet hypothesis of atrial fibrillation, in: D.P. Zipes,J. Jalife (Eds.), Cardiac Electrophysiology and Arrhythmias, Grune & Stratton,Orlando, FL, 1985, pp. 265–275.
[4] K. Konings, C. Kirchhof, J. Smeets, H. Wellens, O.C. Penn, M.A. Allessie, High-density mapping of electrically induced atrial fibrillation in humans, Circula-tion 89 (4) (1994) 1665–1680.
[5] H.J. Sih, D.P. Zipes, E.J. Berbari, J.E. Olgin, A high-temporal resolution algorithmfor quantifying organization during atrial fibrillation, IEEE Trans. Biomed. Eng.46 (4) (1999) 440–450.
[6] H.J. Sih, D.P. Zipes, E.J. Berbari, D.E. Adams, J.E. Olgin, Differences in organiza-tion between acute and chronic atrial fibrillation in dogs, J. Am. Coll. Cardiol.36 (3) (2000) 924–931.
[7] G. Nollo, M. Marconcini, L. Faes, F. Bovolo, F. Ravelli, L. Bruzzone, An automaticsystem for the analysis and classification of human atrial fibrillation patternsfrom intracardiac electrograms, IEEE Trans. Biomed. Eng. 55 (9) (2008)2275–2285.
[8] K.T. Konings, J.L. Smeets, O.C. Penn, H.J. Wellens, M.A. Allessie, Configuration ofunipolar atrial electrograms during electrically induced atrial fibrillation inhumans, Circulation 95 (5) (1997) 1231–1241.
[9] S. Petrutiu, J. Ng, G.M. Nijm, H. Al-Angari, S. Swiryn, A.V. Sahakian, Atrialfibrillation and waveform characterization, IEEE Eng. Med. Biol. Mag. 25 (6)(2006) 24–30.
[10] A. Bollmann, D. Husser, L. Mainardi, F. Lombardi, P. Langley, A. Murray,J.J. Rieta, J. Millet, S.B. Olsson, M. Stridh, L. Sörnmo, Analysis of surfaceelectrocardiograms in atrial fibrillation: techniques, research, and clinicalapplications, Europace 8 (11) (2006) 911–926, http://dx.doi.org/10.1093/euro-pace/eul113.
[11] M. Holm, S. Pehrson, M. Ingemansson, L. Sörnmo, R. Johansson, L. Sandhall,M. Sunemark, B. Smideberg, C. Olsson, S.B. Olsson, Non-invasive assessment ofthe atrial cycle length during atrial fibrillation in man: introducing, validatingand illustrating a new ECG method, Cardiovasc. Res. 38 (1) (1998) 69–81.
[12] A. Capucci, M. Biffi, G. Boriani, F. Ravelli, G. Nollo, P. Sabbatani, C. Orsi,B. Magnani, Dynamic electrophysiological behavior of human atria duringparoxysmal atrial fibrillation, Circulation 92 (5) (1995) 1193–1202.
[13] A. Bollmann, K. Sonne, H.D. Esperer, I. Toepffer, J.J. Langberg, H.U. Klein, Non-invasive assessment of fibrillatory activity in patients with paroxysmal andpersistent atrial fibrillation using the Holter ECG, Cardiovasc. Res. 44 (1)(1999) 60–66.
[14] R. Alcaraz, F. Hornero, J.J. Rieta, Assessment of non-invasive time andfrequency atrial fibrillation organization markers with unipolar atrial electro-grams, Physiol. Meas. 32 (1) (2011) 99.
[15] R. Alcaraz, J.J. Rieta, A review on sample entropy applications for the non-invasive analysis of atrial fibrillation electrocardiograms, Biomed. SignalProcess. Control 5 (1) (2010) 1–14.
[16] S.M. Pincus, A.L. Goldberger, Physiological time-series analysis: what doesregularity quantify? Am. J. Physiol. Heart Circul. Physiol. 266 (4) (1994)H1643–H1656.
[17] A.L. Goldberger, L.A. Amaral, L. Glass, J.M. Hausdorff, P.C. Ivanov, R.G. Mark,J.E. Mietus, G.B. Moody, C.-K. Peng, H.E. Stanley, Physiobank, physiotoolkit, andphysionet components of a new research resource for complex physiologicsignals, Circulation 101 (23) (2000) e215–e220.
[18] G. Moody, Spontaneous termination of atrial fibrillation: a challenge fromphysionet and computers in cardiology 2004, Comput. Cardiol. 31 (2004) 101.
[19] L. Sörnmo, P. Laguna, Biomedical Signal Processing in Cardiac and NeurologicalApplications, Elsevier Academic Press, London. 2005.
[20] R. Alcaraz, J.J. Rieta, Adaptive singular value cancelation of ventricular activityin single-lead atrial fibrillation electrocardiograms, Physiol. Meas. 29 (12)(2008) 1351.
[21] F. Nilsson, M. Stridh, A. Bollmann, L. Sörnmo, Predicting spontaneous termina-tion of atrial fibrillation using the surface ECG, Med. Eng. Phys. 28 (8) (2006)802–808, http://dx.doi.org/10.1016/j.medengphy.2005.11.010.
[22] J.S. Richman, J.R. Moorman, Physiological time-series analysis using approx-imate entropy and sample entropy, Am. J. Physiol. Heart Circul. Physiol. 278 (6)(2000) H2039–H2049.
[23] R. Alcaraz, D. Abásolo, R. Hornero, J.J. Rieta, Optimal parameters study forsample entropy-based atrial fibrillation organization analysis, Comput. Meth-ods Programs Biomed. 99 (1) (2010) 124–132, http://dx.doi.org/10.1016/j.cmpb.2010.02.009.
[24] W. Chen, Z. Wang, H. Xie, W. Yu, Characterization of surface EMG signal basedon fuzzy entropy, IEEE Trans. Neural Syst. Rehabil. Eng. 15 (2) (2007) 266–272.
[25] I. Rezek, S.J. Roberts, Stochastic complexity measures for physiological signalanalysis, IEEE Trans. Biomed. Eng. 45 (9) (1998) 1186–1191.
[26] T. Inouye, K. Shinosaki, H. Sakamoto, S. Toi, S. Ukai, A. Iyama, Y. Katsuda,M. Hirano, Quantification of EEG irregularity by use of the entropy of thepower spectrum, Electroencephalogr. Clin. Neurophysiol. 79 (3) (1991)204–210.
[27] J.W. Sleigh, D.A. Steyn-Ross, M.L. Steyn-Ross, C. Grant, G. Ludbrook, Corticalentropy changes with general anaesthesia: theory and experiment, Physiol.Meas. 25 (4) (2004) 921–934.
[28] A. Lempel, J. Ziv, On the complexity of finite sequences, IEEE Trans. Inf. Theory22 (1) (1976) 75–81.
[29] M. Aboy, R. Hornero, D. Abásolo, D. Alvarez, Interpretation of the Lempel–Zivcomplexity measure in the context of biomedical signal analysis, IEEETrans. Biomed. Eng. 53 (11) (2006) 2282–2288, http://dx.doi.org/10.1109/TBME.2006.883696.
[30] R. Nagarajan, Quantifying physiological data with Lempel–Ziv complexity –certain issues, IEEE Trans. Biomed. Eng. 49 (11) (2002) 1371–1373, http://dx.doi.org/10.1109/TBME.2002.804582.
[31] X.S. Zhang, R.J. Roy, E.W. Jensen, EEG complexity as a measure of depth ofanesthesia for patients, IEEE Trans. Biomed. Eng. 48 (12) (2001) 1424–1433,http://dx.doi.org/10.1109/10.966601.
[32] H.E. Hurst, Long-term storage capacity of reservoirs, Trans. Am. Soc. Civil Eng.116 (1951) 770–808.
[33] M. Akay, Nonlinear Biomedical Signal Processing Volumen II, IEEE Press,New York. 2001.
[34] P.C. Ivanov, L.A. Amaral, A.L. Goldberger, S. Havlin, M.G. Rosenblum, Z.R. Struzik, H.E. Stanley, Multifractality in human heartbeat dynamics, Nature399 (6735) (1999) 461–465, http://dx.doi.org/10.1038/20924.
[35] T. Di Matteo, T. Aste, M. Dacorogna, Scaling behaviors in differently developedmarkets, Physica A: Stat. Mech. Appl. 324 (1) (2003) 183–188.
[36] Z. Qu, Chaos in the genesis and maintenance of cardiac arrhythmias, Progr.Biophys. Mol. Biol. 105 (3) (2011) 247–257 http://dx.doi.org/10.1016/j.pbiomolbio.2010.11.001.
[37] D.M. Bers, E. Grandi, Human atrial fibrillation: insights from computationalelectrophysiological models, Trends Cardiovasc. Med. 21 (5) (2011) 145–150,http://dx.doi.org/10.1016/j.tcm.2012.04.004.
[38] T. Schreiber, A. Schmitz, Surrogate time series, Physica D: Nonlinear Phenom.142 (3) (2000) 346–382.
[39] J. Theiler, S. Eubank, A. Longtin, B. Galdrikian, J. Doyne Farmer, Testing fornonlinearity in time series: the method of surrogate data, Physica D: Non-linear Phenom. 58 (1) (1992) 77–94.
[40] R. Alcaraz, J.J. Rieta, Surface ECG organization analysis to predict paroxysmalatrial fibrillation termination, Comput. Biol. Med. 39 (8) (2009) 697–706, http://dx.doi.org/10.1016/j.compbiomed.2009.05.004.
[41] N. Radhakrishnan, B.N. Gangadhar, Estimating regularity in epileptic seizuretime-series data. A complexity-measure approach, IEEE Eng. Med. Biol. Mag.17 (3) (1998) 89–94.
[42] P. Castiglioni, S. Zurek, J. Piskorski, M. Kosmider, P. Guzik, E. Cè, S. Rampichini,G. Merati, Assessing sample entropy of physiological signals by the normcomponent matrix algorithm: application on muscular signals during iso-metric contraction, in: Engineering in Medicine and Biology Society (EMBC),2013 35th Annual International Conference of the IEEE, IEEE, 2013, pp. 5053–5056.
[43] G. Ndrepepa, S. Weber, M.R. Karch, M.A.E. Schneider, J.ü. Schreieck,A. Schömig, C. Schmitt, Electrophysiologic characteristics of the spontaneousonset and termination of atrial fibrillation, Am. J. Cardiol. 90 (11) (2002)1215–1220.
[44] J. Kneller, J. Kalifa, R. Zou, A.V. Zaitsev, M. Warren, O. Berenfeld, E.J. Vigmond,L.J. Leon, S. Nattel, J. Jalife, Mechanisms of atrial fibrillation termination by puresodium channel blockade in an ionically-realistic mathematical model, Circ. Res. 96(5) (2005) e35–e47, http://dx.doi.org/10.1161/01.RES.0000160709.49633.2b.
[45] R. Sun, Y. Wang, Predicting termination of atrial fibrillation based on thestructure and quantification of the recurrence plot, Med. Eng. Phys. 30 (9)(2008) 1105–1111, http://dx.doi.org/10.1016/j.medengphy.2008.01.008.
[46] R.R. Sun, Y.Y. Wang, Predicting spontaneous termination of atrial fibrillationbased on the RR interval, Proc. Inst. Mech. Eng. H 223 (6) (2009) 713–726.
[47] R. Alcaraz, J.J. Rieta, Application of wavelet entropy to predict atrial fibrillationprogression from the surface ECG, Comput. Math. Methods Med. (2012).
[48] R. Alcaraz, J.J. Rieta, et al., Central tendency measure and wavelet transformcombined in the non-invasive analysis of atrial fibrillation recordings, Biomed.Eng. Online 11 (1) (2012) 1–19.
[49] F. Chiarugi, M. Varanini, F. Cantini, F. Conforti, G. Vrouchos, Noninvasive ECG as atool for predicting termination of paroxysmal atrial fibrillation, IEEE Trans. Biomed.Eng. 54 (8) (2007) 1399–1406, http://dx.doi.org/10.1109/TBME.2007.890741.
[50] S. Petrutiu, A. Sahakian, J. Ng, S. Swiryn, Analysis of the surface electrocardio-gram to predict termination of atrial fibrillation: the 2004 computers incardiology/physionet challenge, Comput. Cardiol. 31 (2004) 105–108.
M. Julián et al. / Computers in Biology and Medicine 48 (2014) 66–7676


