Embed Size (px)
Citation preview
I
Department of Automotive, Combustion
Engine and Railway Engineering
COMPACT EXCAVATOR NOISE
REDUCTION
Master Theses
2020
Bc. Jan BÁRTA
Study program: N0716A27001 Transportation and Handling Technology
Specialization: Combustion Engines
Supervisors: Ing. Vít Doleček Ph.D., Ing. Petr Smejk

II

III

VI
Declaration
I hereby declare that I have worked on this master thesis independently, and all the sources
of information I have used have been listed in the bibliography.
In Prague, 14. July 2020
…………………………………………..

V
Acknowledgment
I would like to express my sincere gratitude to my two supervisors Ing. Petr Smejkal and
Ing. Vit Doleček Ph.D. Ing. Petr Smejkal is the engineering group leader, of the powertrain
integration team, in Doosan Bobcat EMEA. I thank him for the technical guidance and
support throughout my master thesis and I am equally thankful to Mr. Vit Doleček, Ph.D.
at Czech Technical University for the technical consultation with a friendly attitude. I would
also like to thank the powertrain integration team and other colleagues, for their help
throughout this master thesis. Special thanks go to the manufacturer for providing me with
all the financial means and the equipment, without which this thesis wouldn’t be possible.
I would like to thank my family, who provided me with the means to study and supported
me throughout my years of study.
VI
Annotation
Author Bc. Jan Bárta
Title Compact Excavator Noise Reduction
Název Snížení hluku mini-rypadla
Year 2020
Department 12120 Department of Automotive, Combustion Engine and Railway Engineering
Supervisors Ing. Vít Doleček Ph.D., Ing. Petr Smejkal
# Pages 80
# Pictures 77
# Tables 8
Abstract
Noise pollution is recognized as a leading cause of environmental health issues and
government bodies around the world are releasing new legislation to decrees the noise
limits for different industries. The European Union noise limits for construction
equipment, especially for excavators are already so tight, that new product
homologation takes significant resources to pass. In this thesis, a solution, that can make
homologation of new machines easier, is a preparation for possible lower noise limits in
the future and is a step forward in cooling management for compact construction
equipment will be introduced. Added possible benefits can be lower fuel consumption
and more engine power available for the hydraulic system.
Abstrakt
Hluk je všeobecně vnímán jako hlavní zdroj zdravotních problému, způsobených okolním
prostředím a vlády po celém světě vydávají novou legislativu, jejíchž cílem je snížení
hlukových limitů pro jednotlivá odvětví. Hlukové limity Evropské Unie pro stavební
techniku, specificky pro rypadla už jsou aktuálně na tak nízké úrovni, že pro homologaci
nových strojů je potřeba investovat hodně času a finančních prostředků. V této
diplomové práci bude představeno řešení, které má potenciál zjednodušit homologaci
nových strojů, je přípravou pro budoucí možné snížení hlukových limitů a posunout
systém kontroly chlazení pro kompaktní stavební stroje. Jako přidaný benefit je možné
snížení spotřeby paliva a uvolnění výkonu motoru pro hydraulický systém.
Keywords
Noise, Viscous Fan Clutch, Cooling system, Excavator, Compact Excavator, Earth
Moving Machinery, Cooling Management, Fuel consumption, Noise legislation, Engine Power, Fan, Health Issues, Efficiency
Klíčová slova
Hluk, Viskózní spojka, Chladící systém, Rypadlo, Mini-rypadlo, Zařízení pro zemní práce, Systém kontroly chlazení, Spotřeba paliva, Hluková legislativa, Výkon
motoru, Ventilátor, Zdravotní problémy, Účinnost

VII
Table of contents 1. Introduction ................................................................................................................... 1
1.1. Motivation............................................................................................................... 1
1.2. Objectives:............................................................................................................... 2
1.3. Tested object........................................................................................................... 2
1.3.1. Earthmoving machinery................................................................................... 2
1.3.2. Compact excavator .......................................................................................... 2
1.3.3. Tested 2-3 tonne excavator ............................................................................. 3
1.3.4. Powertrain layout ............................................................................................ 4
2. Noise requirements from legislation point of view....................................................... 5
2.1. Maximal noise levels ............................................................................................... 5
2.2. Test procedure ........................................................................................................ 6
2.2.1. Test area .......................................................................................................... 6
2.2.2. Operation of the source during the test.......................................................... 7
2.2.3. Determination of sound power level............................................................... 9
3. Noise sources in the compact excavator ..................................................................... 11
3.1. Powertrain noise sources...................................................................................... 12
3.1.1. Engine noise sources...................................................................................... 12
3.1.2. Hydraulic noise sources ................................................................................. 16
3.1.3. Cooling system noise sources ........................................................................ 17
3.2. Noise camera measurement................................................................................. 18
4. Noise reduction possibilities........................................................................................ 21
4.1. More efficient fan ................................................................................................. 21
4.1.1. Fan position ................................................................................................... 21
4.1.2. Tip clearance .................................................................................................. 22
4.1.3. Higher efficiency fan integration ................................................................... 25
4.2. Viscous fan clutch.................................................................................................. 25
4.2.1. Bimetal viscous fan clutch ............................................................................. 25
4.2.2. Controlled viscous fan clutch......................................................................... 28
4.3. Electric fan............................................................................................................. 29
4.3.1. Brushed vs brushless electric engines ........................................................... 30
4.3.2. Electric fan integration .................................................................................. 30
4.4. Variable pitch fan .................................................................................................. 32
4.4.1. Variable pitch fan integration ........................................................................ 33
4.5. Multi-Criteria Decision Analysis ............................................................................ 33
5. Bimetal viscous clutch integration process ................................................................. 35
5.1. Baseline measurement ......................................................................................... 35
5.1.1. Airflow measurement .................................................................................... 35
5.1.2. Airflow calculation ......................................................................................... 36
5.1.3. Determining the static pressure .................................................................... 37
VIII
5.2. Fan with viscous fan clutch prototypes selection ................................................. 38
5.2.1. Supplier 1 ....................................................................................................... 38
5.2.2. Supplier 2 ....................................................................................................... 39
5.2.3. Supplier 3 ....................................................................................................... 40
5.2.4. Supplier 4 ....................................................................................................... 41
5.2.5. Multi-Criteria Decision Analysis ..................................................................... 41
5.3. Kuli cooling system simulation.............................................................................. 42
5.3.1. Kuli software .................................................................................................. 42
5.3.2. Simulation build ............................................................................................. 42
5.3.3. Simulation results .......................................................................................... 47
5.4. Integration of selected options............................................................................. 50
5.4.1. New parts for clutch integration ................................................................... 50
5.4.2. New parts for measurement ......................................................................... 52
5.5. Selecting final fan-clutch variant .......................................................................... 52
5.5.1. Airflow performance validation..................................................................... 52
5.5.2. Noise Test ...................................................................................................... 57
5.5.3. Airflow measurement and noise test conclusion .......................................... 59
5.6. Viscous clutch parameters .................................................................................... 59
5.6.1. Viscous fan clutch operation ......................................................................... 59
5.6.2. Viscous fan clutch setting parameters .......................................................... 60
5.6.3. Viscous fan clutch options ............................................................................. 61
6. Field test in winter temperatures with the proposed design ..................................... 63
6.1. Test setup .............................................................................................................. 63
6.1.1. Temperature measurement .......................................................................... 63
6.1.2. Fan/water pump speed ................................................................................. 63
6.1.3. Data acquisition ............................................................................................. 64
6.2. Test results ............................................................................................................ 64
6.2.1. Test Introduction ........................................................................................... 64
6.2.2. Roading duty cycle (R1) ................................................................................. 65
6.2.3. Light digging duty cycle (D1) .......................................................................... 67
6.2.4. Heavy digging duty cycle (D2)........................................................................ 68
6.2.5. Heavy digging duty cycle (D3)........................................................................ 69
6.2.6. Overload duty cycle (D4) ............................................................................... 70
6.3. Test conclusion...................................................................................................... 72
7. Conclusion.................................................................................................................... 73
References ........................................................................................................................... 74
List of Figures ....................................................................................................................... 76
List of Tables ........................................................................................................................ 79
List of Abbreviations ............................................................................................................ 80

1
1. Introduction
1.1. Motivation Since the start of the new century noise reduction in construction machinery has
become an important issue for manufactures and customers alike. An increasing number
of construction projects are being carried out in urban areas even during the night.
According to the latest WHO environmental noise guidelines for the European region,
environmental noise is the leading cause of environmental health problems in Europe and
most citizens are exposed to dangerous noise levels, causing sleep disturbance,
cardiovascular problems, negative psychological effects, stress-related changes in social
behavior, performance reduction and interference with people’s daily activities. One-fifth
of Europeans is regularly exposed to sound levels at night, which can significantly damage
health. [22]
To reduce the health risks, governments around the world are coming up with new
noise limitations every few years, and especially in the EU or Japan, high noise levels for
operators, bystanders, or residents living close to construction projects are not acceptable
anymore. The European Union noise limits applicable from 2006 for construction
equipment, especially excavators, are already tight and new products can take significant
financial and time resources to pass the noise test. From July 1, 2020 phase 2 of noise limits
for on-highway vehicles is applicable and phase 3 will follow in July 2024. Each phase lowers
the permissible noise levels by 1-2 dBA depending on the vehicle category. [21] As the last
change in permissible noise levels for construction equipment was in 2006, a similar trend
as for on-highway vehicles can be expected in the near future.
Further noise reduction will come at a high cost. It will be high development costs
or increased production costs, due to the introduction of new parts, which can have a
positive effect on noise emissions. It is also important to mention, that machine noise can
be perceived differently by different people, for example, loud high pitch noise can mean
just discomfort to residents, but for the operator, it can be a very important diagnostic tool.
That’s why there can be a very fine line between discomfort and usefulness, and it must be
kept in mind.
For these reasons in this master theses an economically viable solution, which does
not require any major changes to already developed compact excavator and may entail a
reduction in homologation noise level and reduction in real-world noise level for
bystanders and operators, while not impairing the ability of the operator to get information
about the machine’s technical status, will be introduced.

2
1.2. Objectives: 1. Summarize noise requirements from a legislation point of view
2. Identify noise sources in the compact excavator
3. Propose and check the possibility to use components for noise reduction
4. Select, integrate, and test viscous fan clutch to reach the same parameters as with
a directly driven fan.
a) Define required fan and viscous fan clutch parameters
b) Select fan with viscous clutch options to maintain same cooling performance
c) Use Kuli to simulate the compact excavator cooling system performance with
viscous clutch
d) Propose and design new parts to integrate Viscous fan clutch
e) Perform airflow measurements and noise tests of selected options
5. Perform the real-world test in winter temperatures with a proposed design
1.3. Tested object In this master thesis, a solution that applies to more types of earthmoving
machinery will be presented, but all the testing and design work will be performed on mid-
size 2-3 tonnes compact excavator.
1.3.1. Earthmoving machinery
Earthmoving machinery is a self-propelled or towed machine with attachment (working tool). It can stand on wheels, tracks, or legs. This kind of machine is designed to perform excavation, loading, transportation, drilling, spreading, compacting, or trenching
of earth, rock, and other materials. [1]
Earthmoving machinery can be controlled either by an operator riding this machine or by an operator controlling this machine by wired or wireless means. [1]
1.3.2. Compact excavator
Excavator is a type of Earth moving machinery. It is a self-propelled machine on wheels, tracks, or legs. It has a rotating upper structure with the ability to perform 360 degrees swing (rotation) and it is designed for excavating without movement of the undercarriage. [2]
The main instrument of the excavator is called a workgroup, it consists of boom,
arm, and attachment. Normal workgroup work cycle comprises excavating, elevating, swinging, and discharging of material. Excavators can also be used for object or material
handling. Besides the workgroup used for excavating, excavators usually also have a
backfill blade for grading, leveling, backfilling, and general dozer work. [2]
The compact excavator is the smallest class of excavators. ISO 7135 states that compact excavators have a maximum operating mass of 6 000 kg, but manufacturers are
using the term compact excavator for machines with operating mass up to 10 000 kg. [2]
Compact excavators are powered by two to four-cylinder diesel engines with engine power ranging from 10 hp to 70 hp. Depending on excavator size these engines
can range from non-ECU to ECU controlled. Turbocharging is more frequent in larger machines, but both options are possible.
3
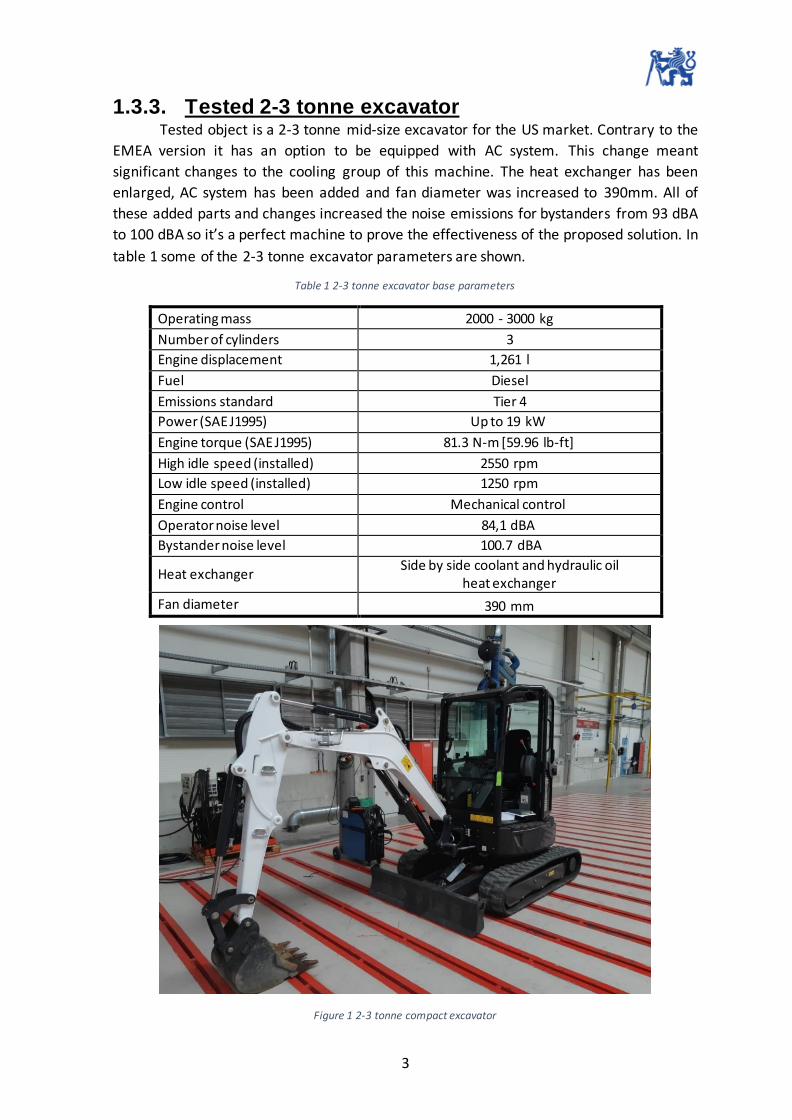
1.3.3. Tested 2-3 tonne excavator Tested object is a 2-3 tonne mid-size excavator for the US market. Contrary to the
EMEA version it has an option to be equipped with AC system. This change meant
significant changes to the cooling group of this machine. The heat exchanger has been
enlarged, AC system has been added and fan diameter was increased to 390mm. All of
these added parts and changes increased the noise emissions for bystanders from 93 dBA
to 100 dBA so it’s a perfect machine to prove the effectiveness of the proposed solution. In
table 1 some of the 2-3 tonne excavator parameters are shown.
Table 1 2-3 tonne excavator base parameters
Operating mass 2000 - 3000 kg
Number of cylinders 3
Engine displacement 1,261 l
Fuel Diesel
Emissions standard Tier 4
Power (SAE J1995) Up to 19 kW
Engine torque (SAE J1995) 81.3 N-m [59.96 lb-ft]
High idle speed (installed) 2550 rpm
Low idle speed (installed) 1250 rpm
Engine control Mechanical control
Operator noise level 84,1 dBA
Bystander noise level 100.7 dBA
Heat exchanger Side by side coolant and hydraulic oil
heat exchanger
Fan diameter 390 mm
Figure 1 2-3 tonne compact excavator

4
1.3.4. Powertrain layout Compact excavators in general have a transversely mounted engine behind the
operator cab or canopy. This model has a three-cylinder naturally aspirated water-cooled
diesel engine with 2 valves per cylinder and mechanical injection system. The hydraulic
pump is mounted longitudinally with the engine, connected to the flywheel using a
coupling. The cooling group is mounted in front of the engine with a fan usually mounted
on the water pump pulley. This kind of setup has a lot of advantages, including the fact that
powertrain acts as a counterweight to the workgroup and lower engine bay temperature
thanks to the fan pulling air into the engine bay, compared to cooling systems with airflow
separated from the engine bay. Lower engine bay temperature has a positive effect on
intake and hydraulic oil temperatures and protects temperature-sensitive parts like an air
filter. There are also some disadvantages like the overall width of the assembled system.
As a result of the system width, there is not enough space to fit better shroud or to keep
recommended distances between the heat exchanger, fan, and front engine face. The
second disadvantage is a substantial flow resistance, caused by the components in the
engine bay, that the fan must overcome. Fans in machines this size can take up to 3 kW of
engine power. The CAD model of the powertrain layout is displayed in Figure 2 below.
Figure 2 2-3 tonne excavator powertrain layout
5
2. Noise requirements from legislation point
of view
2.1. Maximal noise levels Maximal noise levels in the European Union are subjected to directive 2000/14/EC
of the European Parliament and of the Council. This directive applies to equipment used
outdoors and was aimed to harmonize the laws of member states relating to noise
emissions. [11]
The manufacturer is responsible to draw up a declaration of conformity with
provisions of this directive for each type of equipment manufactured. This means that the
manufacturer is responsible to test and to proof that each type of manufactured
equipment is in fact in conformity with this directive. If the equipment complies with this
directive, it shall bear CE markings of conformity accompanied by an indication of sound
power level. [11]
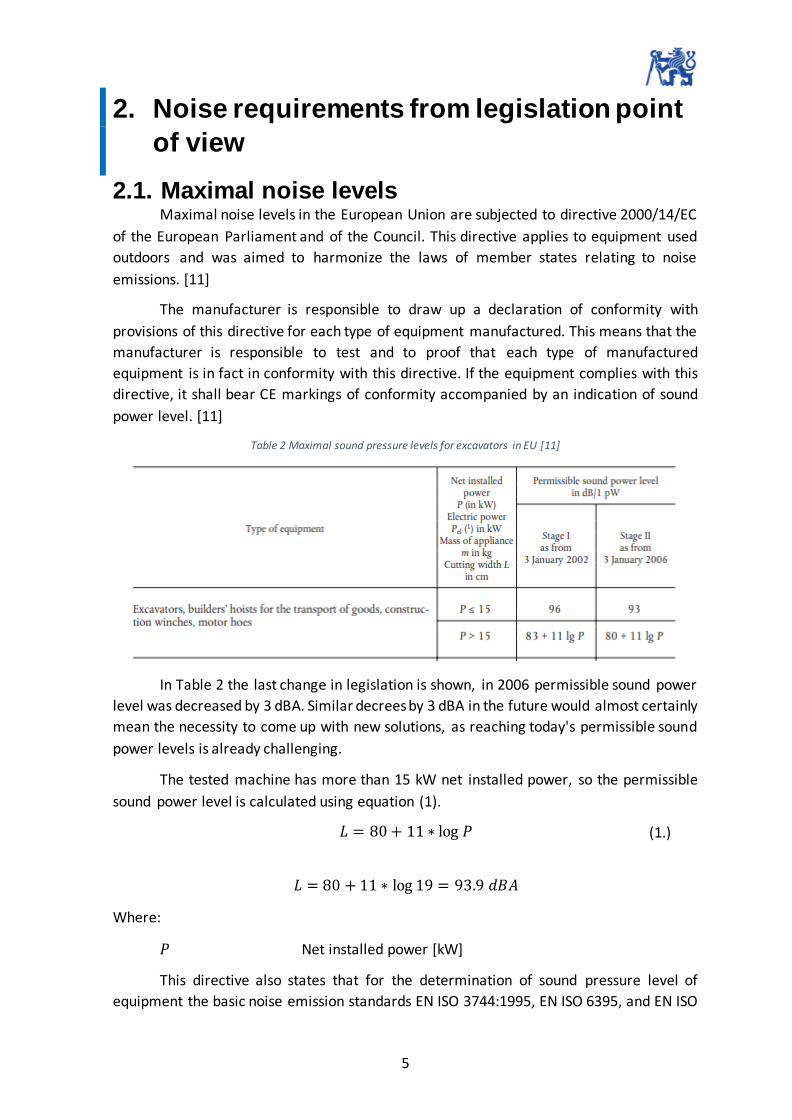
Table 2 Maximal sound pressure levels for excavators in EU [11]
In Table 2 the last change in legislation is shown, in 2006 permissible sound power
level was decreased by 3 dBA. Similar decrees by 3 dBA in the future would almost certainly
mean the necessity to come up with new solutions, as reaching today's permissible sound
power levels is already challenging.
The tested machine has more than 15 kW net installed power, so the permissible
sound power level is calculated using equation (1).
𝐿 = 80 + 11 ∗ log 𝑃 (1.)
𝐿 = 80 + 11 ∗ log 19 = 93.9 𝑑𝐵𝐴
Where:
𝑃 Net installed power [kW]
This directive also states that for the determination of sound pressure level of
equipment the basic noise emission standards EN ISO 3744:1995, EN ISO 6395, and EN ISO

6
3746:1995 may be generally used as subject to general supplements from this directive.
These ISO standards for example defines sound power level and the A-weighted filter. [11]
2.2. Test procedure The test procedure is defined by standards EN ISO 3744:1995, EN ISO 3746:1995, EN
ISO 6395, and by EU directive 2000/14/EC.
2.2.1. Test area
2.2.1.1. Reference box
“The reference box is a hypothetical surface defined by the smallest right
parallelepiped that just encloses the source under test.” No significant elements, that are
known to be significant sources of noise emissions can’t be disregarded. The microphones,
reference box, and measurement surface shall be located on the co-ordinate system “O”
with an origin on the ground plane as shown in Figure 3. [19]
Figure 3 Reference box on one reflecting plane [19]
The dimensions of the measurement surface are calculated from the characteristic source
dimension dO. The characteristic source dimension calculation and position depend on the
number of reflecting planes. Below an example of calculation for one reflecting plan can be
seen. [19]
𝑑𝑂 = √(𝑙1
2)
2
+ (𝑙2
2)
2
+ 𝑙32
(2.)
2.2.1.2. Measurement surface
The microphone positions lie on the measurement surface that envelopes the
reference box and terminates on the reflecting planes. The measurement surface shall be
a hemisphere, a right parallelepiped, a cylinder, or a combination of two segments of the
same type. [19]

7
The type of measurement surface may be selected based on the shape and size of
the noise source. In this case, a hemispherical measurement surface with six microphones
was used to measure noise emissions. European directive prescribes 12 possible
microphone positions as can be seen in Figure 4. The minimum number of microphones is
six, numbers 2, 4, 6, 8, 10, and 12. The hemisphere radius shall be equal or greater than
twice the characteristic source dimension dO and rounded to the nearest higher of the
following values 4, 10, and 16 m. [19] [11]
The microphones shall be oriented, so the reference direction of the microphone is
normal to the measurement surface. [19]
Figure 4 Microphone array on the hemisphere (12 microphone positions) [11]
2.2.2. Operation of the source during the test
2.2.2.1. Engine speed
The engine speed shall be set to high idle, determined by the engine manufacture,
with no load. [11]
2.2.2.2. Fan speed
This part states that if the equipment is fitted with a fan(s), these fans must operate
during the test. Fan speed is determined by one of the following conditions and must be
stated in the manufacturer’s declaration of conformity. [11]
a) Fan drive directly connected to the engine
This is the case of tested 2-3 tonne excavator’s current solution. This directive
states that the fan must operate during the test at normal fan speed. [11]
b) Fan drive with several distinct speeds
If the fan can operate at several distinct speeds, like for example two speed
viscous clutches or two-speed electric fans, the test shall be carried out either
at maximum rotations or is the first test at zero speed and in the second test
8
at maximum fan speed. The resulting sound pressure level is determined by
the following equation. [11]
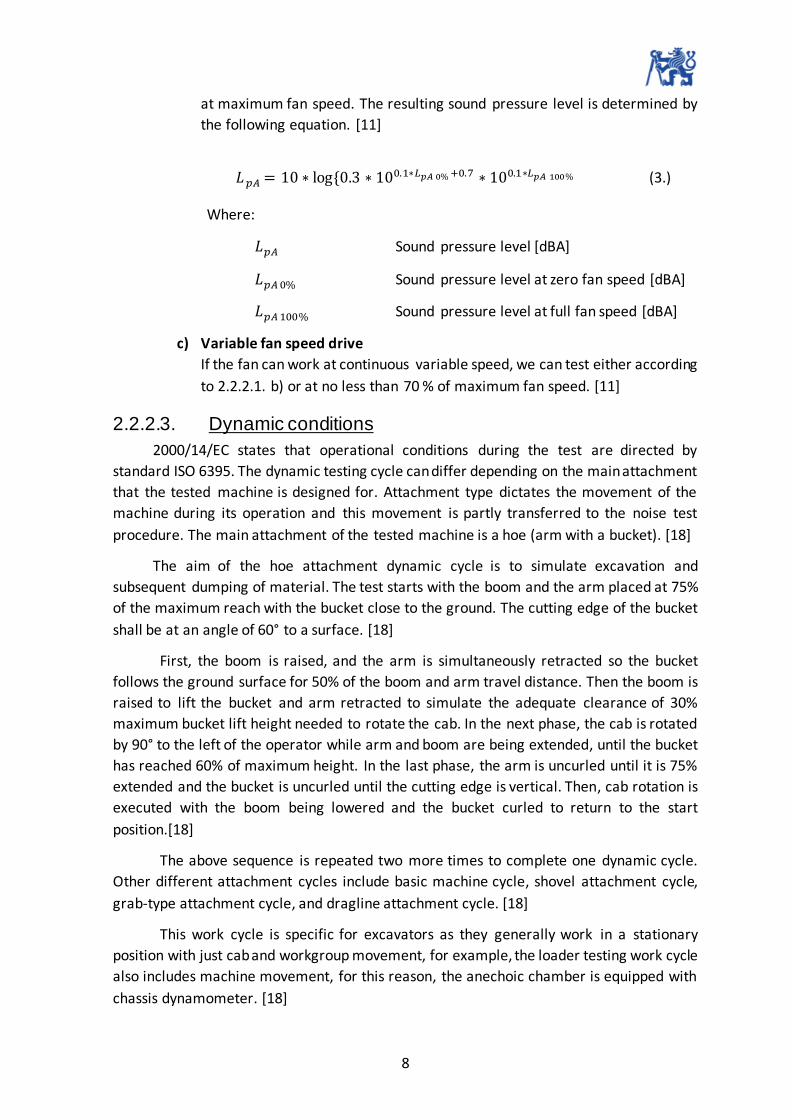
𝐿𝑝𝐴 = 10 ∗ log{0.3 ∗ 100.1∗𝐿𝑝𝐴 0% +0.7 ∗ 100.1∗𝐿𝑝𝐴 100% (3.)
Where:
𝐿𝑝𝐴 Sound pressure level [dBA]
𝐿𝑝𝐴 0% Sound pressure level at zero fan speed [dBA]
𝐿𝑝𝐴 100% Sound pressure level at full fan speed [dBA]
c) Variable fan speed drive
If the fan can work at continuous variable speed, we can test either according
to 2.2.2.1. b) or at no less than 70 % of maximum fan speed. [11]
2.2.2.3. Dynamic conditions
2000/14/EC states that operational conditions during the test are directed by
standard ISO 6395. The dynamic testing cycle can differ depending on the main attachment
that the tested machine is designed for. Attachment type dictates the movement of the
machine during its operation and this movement is partly transferred to the noise test
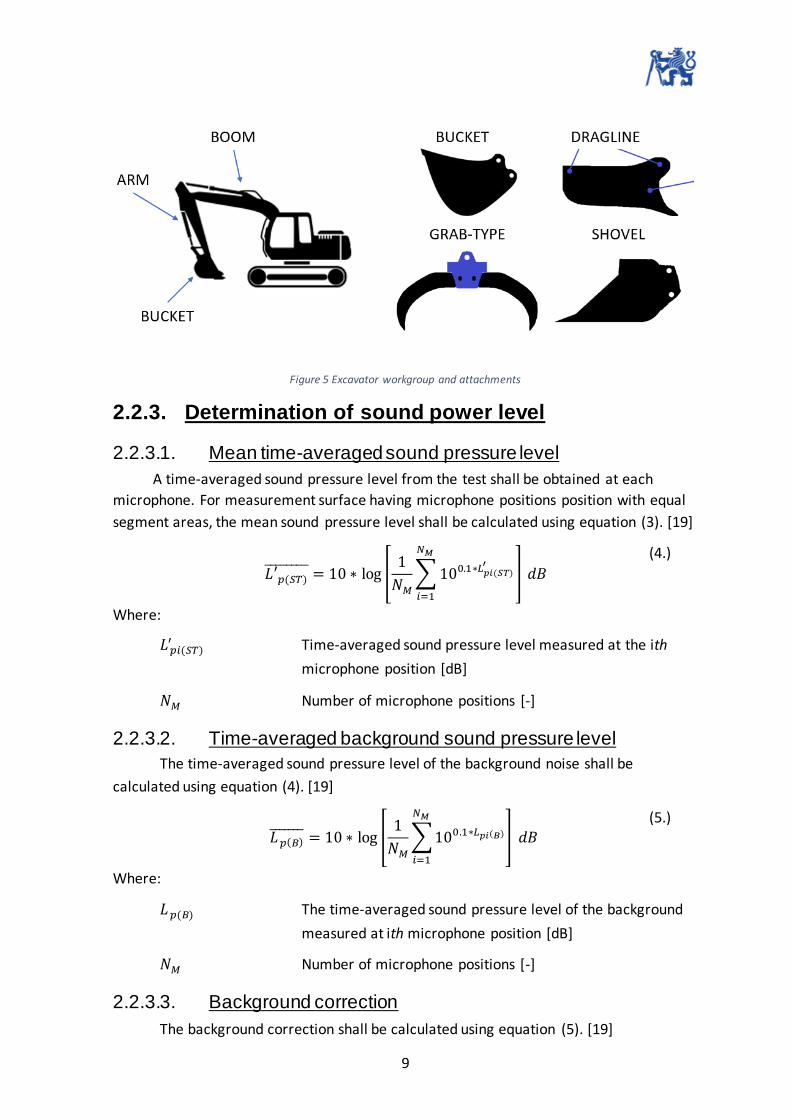
procedure. The main attachment of the tested machine is a hoe (arm with a bucket). [18]
The aim of the hoe attachment dynamic cycle is to simulate excavation and
subsequent dumping of material. The test starts with the boom and the arm placed at 75%
of the maximum reach with the bucket close to the ground. The cutting edge of the bucket
shall be at an angle of 60° to a surface. [18]
First, the boom is raised, and the arm is simultaneously retracted so the bucket
follows the ground surface for 50% of the boom and arm travel distance. Then the boom is
raised to lift the bucket and arm retracted to simulate the adequate clearance of 30%
maximum bucket lift height needed to rotate the cab. In the next phase, the cab is rotated
by 90° to the left of the operator while arm and boom are being extended, until the bucket
has reached 60% of maximum height. In the last phase, the arm is uncurled until it is 75%
extended and the bucket is uncurled until the cutting edge is vertical. Then, cab rotation is
executed with the boom being lowered and the bucket curled to return to the start
position.[18]
The above sequence is repeated two more times to complete one dynamic cycle.
Other different attachment cycles include basic machine cycle, shovel attachment cycle,
grab-type attachment cycle, and dragline attachment cycle. [18]
This work cycle is specific for excavators as they generally work in a stationary
position with just cab and workgroup movement, for example, the loader testing work cycle
also includes machine movement, for this reason, the anechoic chamber is equipped with
chassis dynamometer. [18]
9
Figure 5 Excavator workgroup and attachments
2.2.3. Determination of sound power level
2.2.3.1. Mean time-averaged sound pressure level
A time-averaged sound pressure level from the test shall be obtained at each
microphone. For measurement surface having microphone positions position with equal
segment areas, the mean sound pressure level shall be calculated using equation (3). [19]
𝐿′𝑝(𝑆𝑇) = 10 ∗ log [
1
𝑁𝑀
∑ 100.1∗𝐿𝑝𝑖(𝑆𝑇)′
𝑁𝑀
𝑖=1
] 𝑑𝐵
(4.)
Where:
𝐿 𝑝𝑖(𝑆𝑇)′ Time-averaged sound pressure level measured at the ith
microphone position [dB]
𝑁𝑀 Number of microphone positions [-]
2.2.3.2. Time-averaged background sound pressure level
The time-averaged sound pressure level of the background noise shall be
calculated using equation (4). [19]
𝐿 𝑝(𝐵) = 10 ∗ log [
1
𝑁𝑀
∑ 100.1∗𝐿𝑝𝑖(𝐵)
𝑁𝑀
𝑖=1
] 𝑑𝐵 (5.)
Where:
𝐿 𝑝(𝐵) The time-averaged sound pressure level of the background
measured at ith microphone position [dB]
𝑁𝑀 Number of microphone positions [-]
2.2.3.3. Background correction
The background correction shall be calculated using equation (5). [19]

10
𝐾1 = −10 ∗ log(1 − 10−0.1∗∆𝐿𝑝 ) 𝑑𝐵 (6.)
Where:
∆𝐿𝑝 = 𝐿 𝑝(𝑆𝑇)′ − 𝐿𝑝(𝐵)
If ∆𝐿𝑝 > 15 𝑑𝐵, 𝐾1 is zero and no correction is applied.
If 6 𝑑𝐵 < ∆𝐿𝑝 < 15 𝑑𝐵,𝐾1 shall be calculated using equation (4).
If ∆𝐿𝑝 < 6 𝑑𝐵, 𝐾1 shall be 1.3 𝑑𝐵, This must be clearly stated in the report.
2.2.3.4. Environmental correction
The environmental correction shall be calculated from equation (6). [19]
𝐾2 = 10 ∗ log [1 + 4 ∗
𝑆
𝐴] 𝑑𝐵
(7.)
Where:
𝑆 Area of measurement surface [m2]
𝐴 Equivalent sound absorption area [m2] (ISO 3744, Annex A)
2.2.3.5. Surface time-averaged pressure level
The surface time-averaged pressure level shall be calculated by applying corrections
on the mean time-averaged sound pressure level. [19]
𝐿 𝑝 = 𝐿 𝑝(𝑆𝑇)
′ − 𝐾1 − 𝐾2 (8.)
Where:
𝐾1 Background correction [dB]
𝐾2 Environmental correction [dB]
2.2.3.6. Sound power level
The final sound power level shall be calculated using equation (8). [19]
𝐿 𝑊 = 𝐿𝑝
+ 10 ∗ log𝑆
𝑆0
𝑑𝐵 (9.)
Where:
𝑆 Area of measurement surface [m2]
𝑆0 1 m2

11
3. Noise sources in the compact excavator
To successfully reduce noise emissions of compact excavator, noise sources must be
first identified, their impact on overall noise emissions evaluated, and economical and
engineering challenges of decreasing noise emissions from these sources assessed.
Only noise sources that have an impact on noise emissions during the homologation
noise test are considered, as evaluating noise sources from field data would be very difficult
due to background noises, bucket generated noises like rock impacts, and other unknown
variables. As mentioned in chapter 2, excavator doesn’t have to move during homologation
noise test, so noise sources like sprockets, hydraulic engines, and tracks are also not
included.
A-weighting filter is used to evaluate the noise emissions. A-weighting filter simulates
the sensitivity of the human ear to different frequencies. Lower frequencies (0-500 Hz) will
have a lower impact on the final noise emissions than higher frequencies (500-10 000 Hz),
the impact of frequencies over 10 kHz is also lower. The important point for this filter is
1kHz, where the correction is 0 dB. [10]
Figure 6 Frequency response of the A-weighting filter [10]

12
3.1. Powertrain noise sources
Figure 7 Powertrain noise sources
3.1.1. Engine noise sources The combustion engine and exhaust are leading sources of vibrations and noises.
Noise sources in the combustion engine include noise caused by crankshaft, firing, water
pump, valvetrain, and injection system.
Some manufactures are using four-cylinder larger displacement engines to lower
noise emissions. This solution comes with increased cost per engine and large development
costs to integrate the different engines into this machine.
The major amount of noise emissions from the engine bay escapes through the
cooling intake openings, balancing cooling performance and the reduction of noise
escaping can be a challenge. There has been some development in construction machinery
encloser design but implementing it would require a major redesign of the engine bay and
the encloser to implement it. [9]
3.1.1.1. Crankshaft and firing
Most important frequencies, for this engine at high idle, are firing frequency 64 Hz
and crank frequency 42 Hz and their multiples.
The firing frequency is the frequency of gas pressure forces in the combustion
chamber. The firing occurs ones per two rotations of the engine for each cylinder. Inertial
forces and moments of the reciprocating masses also cause vibration at multiples of firing
frequency. [17]

13
Crankshaft frequency represents the frequency of torsional, bending, and axial
vibrations of the crankshaft. The inertial forces of the rotating masses cause excitation
equal to crank rotational frequency. Torsional vibration also causes excitation at multiples
of the crank rotational frequency. [17]
At these frequencies and respected harmonics, we can find major spikes on FFT
spectrum. The frequency spectrum in Figure 8 goes only to 500 Hz, since the major spikes
in sound pressure levels from engine occur on this range, after 500 Hz, they are hard to
point out.
Firing 1st frequency calculation:
𝑓𝑓𝑖𝑟𝑒 =
𝑛𝑒 ∗ #𝑐
60 ∗ 2
(10.)
𝑓𝑓𝑖𝑟𝑒 =2560 ∗ 3
60 ∗ 2= 64 𝐻𝑧
Where:
𝑛𝑒 Engine rotations [min-1]
#𝑐 Number of cylinders [-]
Crankshaft 1st frequency calculation:
𝑓𝑐𝑟𝑎𝑛𝑘 =𝑛𝑒
60 (11.)
𝑓𝑐𝑟𝑎𝑛𝑘 =2560
60= 42.7 𝐻𝑧
Where:
𝑛𝑒 Engine rotations [min-1]
3.1.1.2. Water pump
The water pump is not a very significant source of noise compared to other parts of
the combustion engine. The water pump is a simple centrifugal pump driven by a belt from
the crankshaft pulley. The most common design of the engine water pump comprises of
housing, pulley, and rotor. The number of blades can vary, but six is the most common.
Water pump 1st frequency calculation:
𝑓𝑤𝑝 =
𝑛𝑒 ∗ 𝑖𝑏 ∗ 𝛿𝑏
60 ∗ 100∗ #𝑏𝑙
(12.)
𝑓𝑤𝑝 =2560 ∗ 1.22 ∗ 98
60 ∗ 100∗ 6 = 306 𝐻𝑧

14
Where:
𝑛𝑒 Engine rotations [min-1]
��𝑏 Belt ratio [-]
𝛿𝑏 Belt efficiency [%]
#𝑏𝑙 Number of blades [-]
Figure 8 FFT spectrum from homologation noise test, firing, crank and water pump frequencies indicated
3.1.1.3. Exhaust system
The exhaust system is already outfitted with a muffler. Adding another muffler or
making other changes to the exhaust system would be expensive and it would increase
exhaust backpressure. There is also very little space in the engine bay to add any other
components to the exhaust system. As exhaust discharge follows firing, the same frequency
can be expected.
3.1.1.4. Valvetrain
Typically, diesel engines for off-highway purposes use the OHV valvetrain system
with gears responsible for transferring the rotational movement from crankshaft to the
camshaft located in the block. Multiple noise sources are originating in the valvetrain, main
examples being the gear noise and noise caused by vibration excited by inertial forces of
rotating and reciprocating masses of the valvetrain. Expected frequencies for rotating
masses are multiples of half the crankshaft rotational frequency and for reciprocating
masses multiples of firing frequency. The noise originating from gears is usually called gear
whine and its frequency is dependent on the number of teeth. [17]
3.1.1.5. Injection system
The injection pump has also an impact on engine noise, it excites in a wide range of
frequencies, typically 10-10 000 Hz. The frequency depends on the type of injection,
pressure variation in the pump, number of cylinders, and number of nozzles. Mechanical
fuel pumps typical for similar diesel engines have a significate spike in torque drain after

15
each injection, so some excitation should occur on frequency equal to multiples of firing
frequency. [17]
Figure 9 Example of torque on the injection pump drive [17] and mechanical diesel injection pump [16] for a 6-cylinder inline diesel engine
3.1.1.6. Intake system
Intake noise is mostly caused by the moving mass of air hitting a closed intake valve
and reflecting into the intake duct. This pressure wave travels out of the intake duck or
reflects from some surface back towards to intake valve. This can happen multiple times
between two following valve openings. The integration of Helmholtz resonator can result
in decreased noise emissions if designed properly.
Figure 10 Geometry of an expansion chamber muffler
Transmission loss calculation for an exemplar expansion chamber for a specific wavelength.
𝑇𝐿 = 10 log [1 +
1
4(
𝑆𝐶
𝑆𝐸
−𝑆𝐸
𝑆𝐶
)2
(sin2𝜋𝐿 𝐶
𝜆)
2
] (13.)
𝑇𝐿−63𝐻𝑧 = 10 log [1 +1
4(
0.0314
0.0028−
0.0028
0.0314)
2
(sin2𝜋 ∗ 0.10
5.63)
2
] = 1.39 𝑑𝐵
Where:
𝑆𝐶 Expansion chamber area [m2]
𝑆𝐸 Intake duct area [m2]
𝐿 𝐶 Expansion chamber length [m]
16
𝜆 Wavelength for 63Hz [m] (Sound speed 355 m/s) [-]
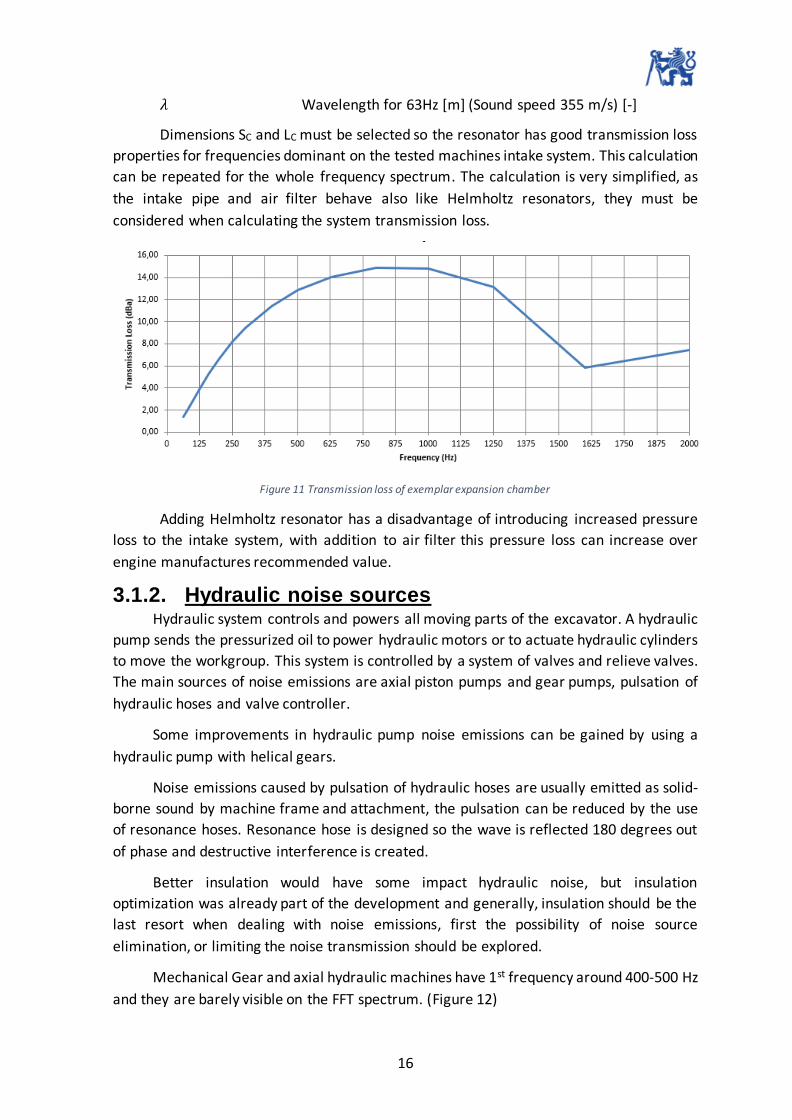
Dimensions SC and LC must be selected so the resonator has good transmission loss
properties for frequencies dominant on the tested machines intake system. This calculation
can be repeated for the whole frequency spectrum. The calculation is very simplified, as
the intake pipe and air filter behave also like Helmholtz resonators, they must be
considered when calculating the system transmission loss.
Figure 11 Transmission loss of exemplar expansion chamber
Adding Helmholtz resonator has a disadvantage of introducing increased pressure
loss to the intake system, with addition to air filter this pressure loss can increase over
engine manufactures recommended value.
3.1.2. Hydraulic noise sources Hydraulic system controls and powers all moving parts of the excavator. A hydraulic
pump sends the pressurized oil to power hydraulic motors or to actuate hydraulic cylinders
to move the workgroup. This system is controlled by a system of valves and relieve valves.
The main sources of noise emissions are axial piston pumps and gear pumps, pulsation of
hydraulic hoses and valve controller.
Some improvements in hydraulic pump noise emissions can be gained by using a
hydraulic pump with helical gears.
Noise emissions caused by pulsation of hydraulic hoses are usually emitted as solid-
borne sound by machine frame and attachment, the pulsation can be reduced by the use
of resonance hoses. Resonance hose is designed so the wave is reflected 180 degrees out
of phase and destructive interference is created.
Better insulation would have some impact hydraulic noise, but insulation
optimization was already part of the development and generally, insulation should be the
last resort when dealing with noise emissions, first the possibility of noise source
elimination, or limiting the noise transmission should be explored.
Mechanical Gear and axial hydraulic machines have 1st frequency around 400-500 Hz
and they are barely visible on the FFT spectrum. (Figure 12)

17
Gear pump 1st frequency calculation:
𝑓𝑔𝑝 =
𝑛𝑒 ∗ #𝑡
60
(14.)
𝑓𝑔𝑝 =2560 ∗ 12
60= 512 𝐻𝑧
Where:
𝑛𝑒 Engine rotations [min-1]
#𝑡 Number of teeth [-]
Axial pump 1st frequency calculation:
𝑓𝑎𝑝 =
𝑛𝑒 ∗ #𝑝
60 ∗ 2
(15.)
𝑓𝑎𝑝 =2560 ∗ 10
60= 426 𝐻𝑧
Where:
𝑛𝑒 Engine rotations [min-1]
#𝑝 Number of pistons [-]
3.1.3. Cooling system noise sources Unlike on-highway vehicles, excavators are used mainly for stationary work at high
engine load for an extended time, that can reach more than 10 hours. Due to the invariant
environment where this work can take place, these machines must be able to also
withstand ambient temperatures even close to 40°C. These demands placed on the cooling
system result in high airflow and static pressure requirements, much higher than we would
be seen in other power-wise comparable machines. To meet these requirements fan size
usually goes up and due to size limitations, it leads to high fan speed.
In tested 2-3 tonne excavator the AC system adds another 6 kW of heat to the
engines and hydraulic system combined 27kW and furthermore, the AC condenser
positioned in front of the heat exchanger ads more resistance and increases the air
temperature that cools the heat exchanger, which results in lower temperature
differential, thus lower heat transfer efficiency, that leads to increase in heat exchanger
thickness, which results in another resistance increase. All of this amounted to a 20 mm
difference in fan diameter, more than 500 min-1 increase in fan speed, and 7 dBA noise
emissions increase for bystanders compared to similar machines without AC. Generally,
noise emission increase by 3 dBA means double the sound energy So by adding AC the noise
energy was more than quadrupled. All this increase comes from one device, the fan. A fan
is a relatively easily changed inexpensive device, that can, even without any expensive
changes to other parts of the cooling system, like a shroud, heat exchanger, inlet grille, etc,
introduce big decrees in noise emissions for everyday use.

18
In Figure 12 the impact of fan noise is shown on the FFT spectrum. The 1st frequency
of the fan is around 400 Hz. At this frequency, a significant increase in sound pressure level
can be seen. The impact of the A-weighting filter is also shown, as the sound pressure level
at lower frequencies goes to zero, due to the increasing correction.
Figure 12 FFT spectrum from homologation noise test, fan, and hydraulic devices frequencies indicated
Fan 1st frequency calculation:
𝑓𝑓1
=𝑛𝑒 ∗ 𝑖𝑏 ∗ 𝛿𝑏
60 ∗ 100∗ #𝑏𝑙
(16.)
𝑓𝑓1=
2540 ∗ 1.22 ∗ 98
60 ∗ 100∗ 8 = 405 𝐻𝑧
Where:
𝑛𝑒 Engine rotations [min-1]
��𝑏 Belt ratio [-]
𝛿𝑏 Belt efficiency [%]
#𝑏𝑙 Number of blades [-]
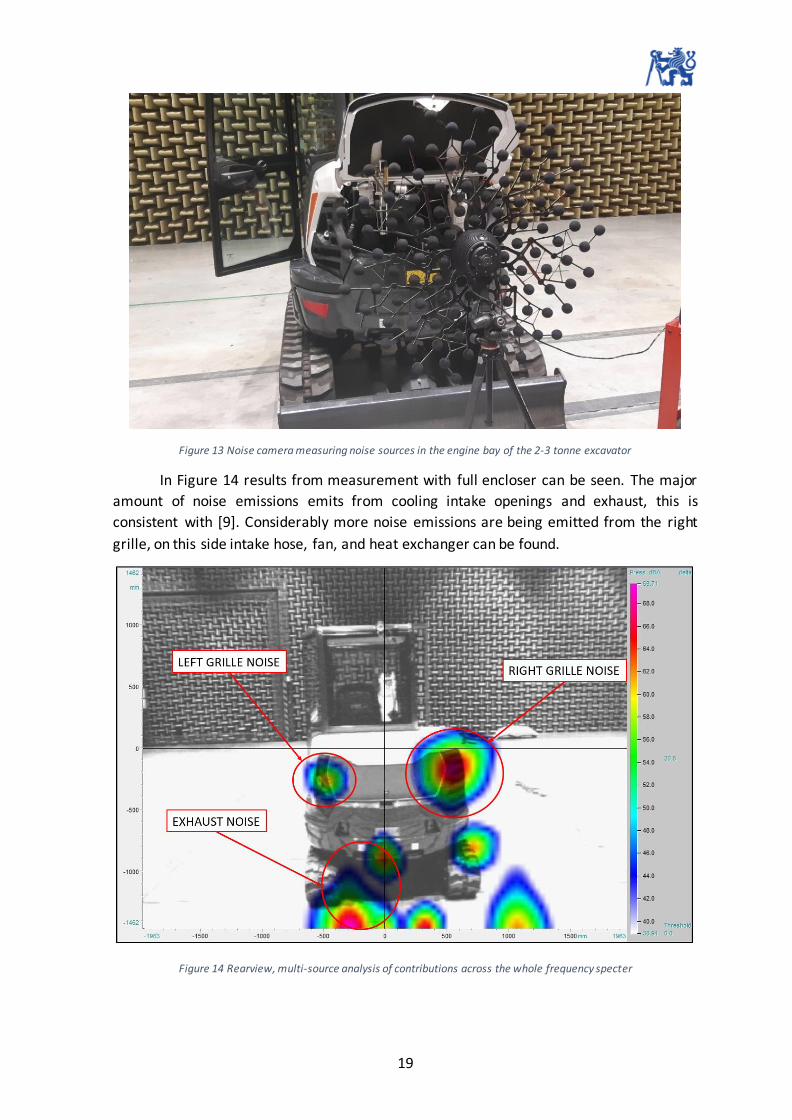
3.2. Noise camera measurement To support the list of noise sources, noise camera measurement was conducted in
an anechoic chamber. Noise camera combines a microphone array with an optical camera
to display the noise source position. The microphone array triangulates the noise source
position and combines it with a frame from the optical camera. This way frequency,
position, and sound power level of the noise source can be displayed. In Figure 13 the noise
camera measurement in the anechoic chamber is shown.
19
Figure 13 Noise camera measuring noise sources in the engine bay of the 2-3 tonne excavator
In Figure 14 results from measurement with full encloser can be seen. The major
amount of noise emissions emits from cooling intake openings and exhaust, this is
consistent with [9]. Considerably more noise emissions are being emitted from the right
grille, on this side intake hose, fan, and heat exchanger can be found.
Figure 14 Rearview, multi-source analysis of contributions across the whole frequency specter

20
In Figure 15 the results from measurement, with encloser and counterweight taken
off, are shown. The major noise sources are the engine, intake, exhaust, and fan noise as
expected.
Figure 15 Rearview, multi-source analysis of contributions across the whole frequency specter, without encloser and
counterweight
21
4. Noise reduction possibilities
Cooling packages with conventional fans are designed to safely cool the engine on
the hottest day of the year with engine load on 100%. This fact means that all the other
days of the year the fan over cools the engine. Engine overcooling causes low-temperature
difference on the heat exchanger thus low cooling efficiency. Integrating a variable drive
system for the fan can increase productivity by freeing up engine power for the machine,
result in significant fuel savings, and most importantly decrees in noise emissions in
situations when 100% of the cooling performance is not needed.
Also as mentioned in chapter 2, introducing a continually variable drive system
means that testing of the homologation noise emissions can be done at 70% of maximal
fan rotations. This introduces the potential option to homologate versions of manufactures
machines in Europe, that has been so far too noisy. For example, the tested 2-3 tone
excavator, sold on the NA market, is very similar to the EU’s version of the excavator but
has the optional AC system.
In this chapter, options that have the potential to reach the goal of this project will
be introduced.
4.1. More efficient fan Increasing the efficiency of the current fan or integrating new more efficient fan is
the most time and cost-effective solution. Increasing the efficiency will lead to more airflow
and with higher airflow the fan speed can be lowered or fan with a lower blade angle can
be used. These changes can lower fan noise emissions up to 5 dBA. [6] One of the options
is to select the best fan for this machine, with the cooperation of fan suppliers, and position
it for maximal efficiency. Important parameters for fan position are distance OOS (“out of
shroud”) and tip clearance.
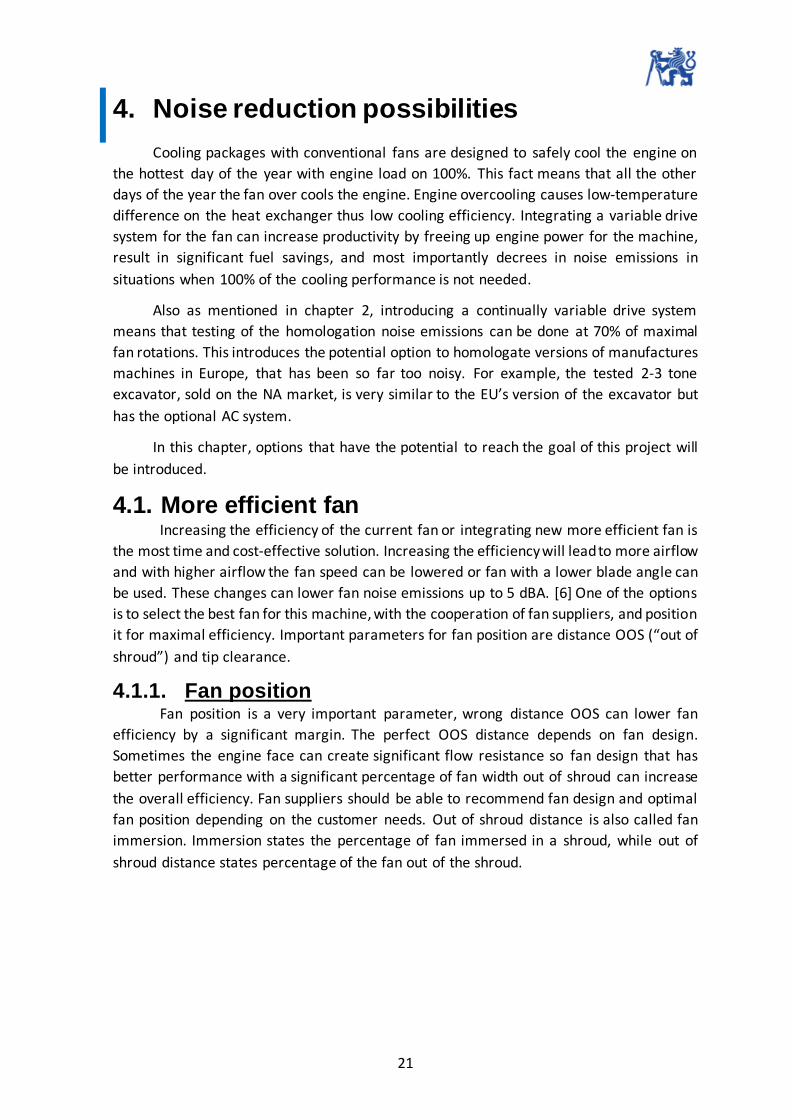
4.1.1. Fan position Fan position is a very important parameter, wrong distance OOS can lower fan
efficiency by a significant margin. The perfect OOS distance depends on fan design.
Sometimes the engine face can create significant flow resistance so fan design that has
better performance with a significant percentage of fan width out of shroud can increase
the overall efficiency. Fan suppliers should be able to recommend fan design and optimal
fan position depending on the customer needs. Out of shroud distance is also called fan
immersion. Immersion states the percentage of fan immersed in a shroud, while out of
shroud distance states percentage of the fan out of the shroud.
22
Figure 16 OOS and fan immersion dimensions
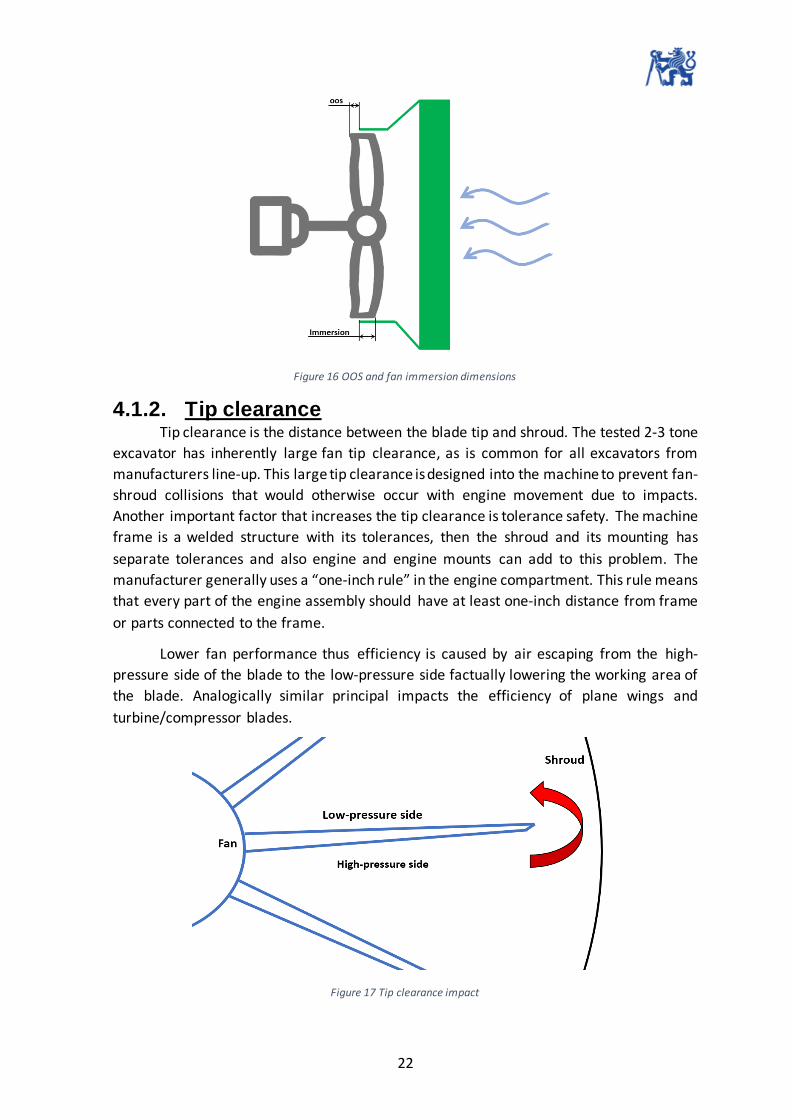
4.1.2. Tip clearance Tip clearance is the distance between the blade tip and shroud. The tested 2-3 tone
excavator has inherently large fan tip clearance, as is common for all excavators from
manufacturers line-up. This large tip clearance is designed into the machine to prevent fan-
shroud collisions that would otherwise occur with engine movement due to impacts.
Another important factor that increases the tip clearance is tolerance safety. The machine
frame is a welded structure with its tolerances, then the shroud and its mounting has
separate tolerances and also engine and engine mounts can add to this problem. The
manufacturer generally uses a “one-inch rule” in the engine compartment. This rule means
that every part of the engine assembly should have at least one-inch distance from frame
or parts connected to the frame.
Lower fan performance thus efficiency is caused by air escaping from the high-
pressure side of the blade to the low-pressure side factually lowering the working area of
the blade. Analogically similar principal impacts the efficiency of plane wings and
turbine/compressor blades.
Figure 17 Tip clearance impact

23
Tip clearance can be lowered by installing a flexible blade extension which fills the
space between the blade tip and shroud. These flexible extensions should in theory bring
the benefit of low tip clearance while still preventing fan-shroud hard collisions. The
impact on a fan’s performance can be seen in Figure 18.
Figure 18 Impact of flexible extensions on fan performance on general Multi wing fan [6]
Examples of this technology are Wingfan’s Blex technology, Multi wing εps, and
Flex-tips from Cleanfix. The price increase compared to a normal fan is 10-15%.
Figure 19 Wing fan Blex technology [5]

24
As mentioned in the first paragraph of this chapter, higher fan efficiency leads to
decrees in fan speed or lower blade angle, while maintaining the fan performance. Lower
fan speed or lower blade angle has the potential of lower fan noise, as a 5% increase in
efficiency translates to about 1 dBA decrees in fan noise. [23] Figure 20 shows a
performance comparison between two fans with the same blade design and diameter. The
first fan has a blade angle of 30 degrees and the second one has a blade angle of 40 degrees.
The fan with a lower blade angle is equipped with 4mm of flexible extensions.
Figure 20 Performance comparison between a fan with and without flexible extensions (data for 3000 min-1)
The data suggest that by integrating flexible blade extensions fan power
consumption can be reduced by up to 0.5 kW, while the cooling performance stays the
same in the range 0.5-1.5 m3/s. This data was acquired for 3000 min-1 at 200°C ambient
temperature from a supplier’s fan simulation software.
The only major concern with this solution is its reliability. Suppliers advertise that
the flexible extensions can withstand up to 400 000 impacts, temperatures up to 120°C,
and have good chemical resistance [6], but the practical test showed dissatisfactory
results, the major problem being the blade extensions falling off or being slowly filed
down. This presents a high risk for the manufacture and the customer. With the flexible
extensions gone, the fan can’t deliver necessary airflow to cool the machine and in high
ambient temperature, the machine will overheat. Adding fan condition check every 10-50
hours to the maintenance schedule is inevitable. Changing the fan on this machine would
take approximately 8 work hours for the customer and require a coolant drain.

25
4.1.3. Higher efficiency fan integration Integration is very simple, proposed changes can be implemented to the tested
machine’s current production fan and most other fans can be modified by suppliers to fit
to the current water pump pulley. Depending on the options used, the pulley size can be
adjusted to reach specific airflow required for cooling performance.
4.2. Viscous fan clutch A viscous fan clutch uses viscous fluid to transfer torque and rotation. A viscous fan
clutch is primarily developed to replace a directly driven fan and its main advantages are
lower noise emissions, more available horsepower, and better fuel economy. Viscous fan
clutch engages only to the point that is needed for proper cooling, otherwise, the clutch
slips. For water pump mounted viscous clutches, there is also a small advantage of inherent
slip (3-7%), that every viscous clutch has by design, to negate this effect the water pump
rpm must be increased accordingly. More water pump rpm generally results in more flow
and more flow induces better cooling performance (Figure 21). The slip of fan viscous clutch
is dependent on the engine load and ambient temperature. For maximal designed
temperatures, the viscous clutch is fully coupled and there are no benefits, but as was have
already mentioned, the manufacturer designs its machines to work at 37°C ambient
temperature and in Europe’s and US’s climate these kinds of conditions can’t be called
normal.
Figure 21 Pump affinity laws, the increase in water pump speed will increase the flow in a cooling system [12]
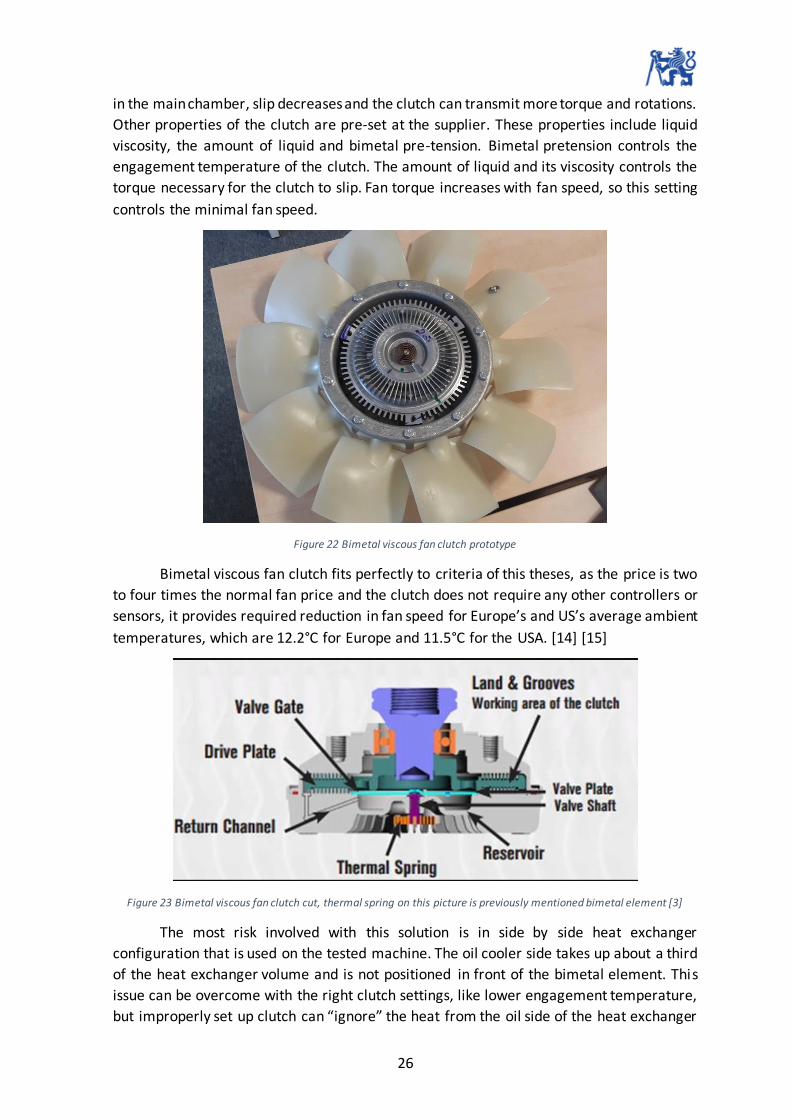
4.2.1. Bimetal viscous fan clutch Bimetal viscous fan clutch works without any electronic control. The rotations are
controlled by a bimetal element. If the cooling is not sufficient radiator (airflow)
temperature rises, and the bimetal element extends. Extending the bimetal element opens
inner valves in viscous fan clutch and more oil can enter the main chamber. With more fluid
26
in the main chamber, slip decreases and the clutch can transmit more torque and rotations.
Other properties of the clutch are pre-set at the supplier. These properties include liquid
viscosity, the amount of liquid and bimetal pre-tension. Bimetal pretension controls the
engagement temperature of the clutch. The amount of liquid and its viscosity controls the
torque necessary for the clutch to slip. Fan torque increases with fan speed, so this setting
controls the minimal fan speed.
Figure 22 Bimetal viscous fan clutch prototype
Bimetal viscous fan clutch fits perfectly to criteria of this theses, as the price is two
to four times the normal fan price and the clutch does not require any other controllers or
sensors, it provides required reduction in fan speed for Europe’s and US’s average ambient
temperatures, which are 12.2°C for Europe and 11.5°C for the USA. [14] [15]
Figure 23 Bimetal viscous fan clutch cut, thermal spring on this picture is previously mentioned bimetal element [3]
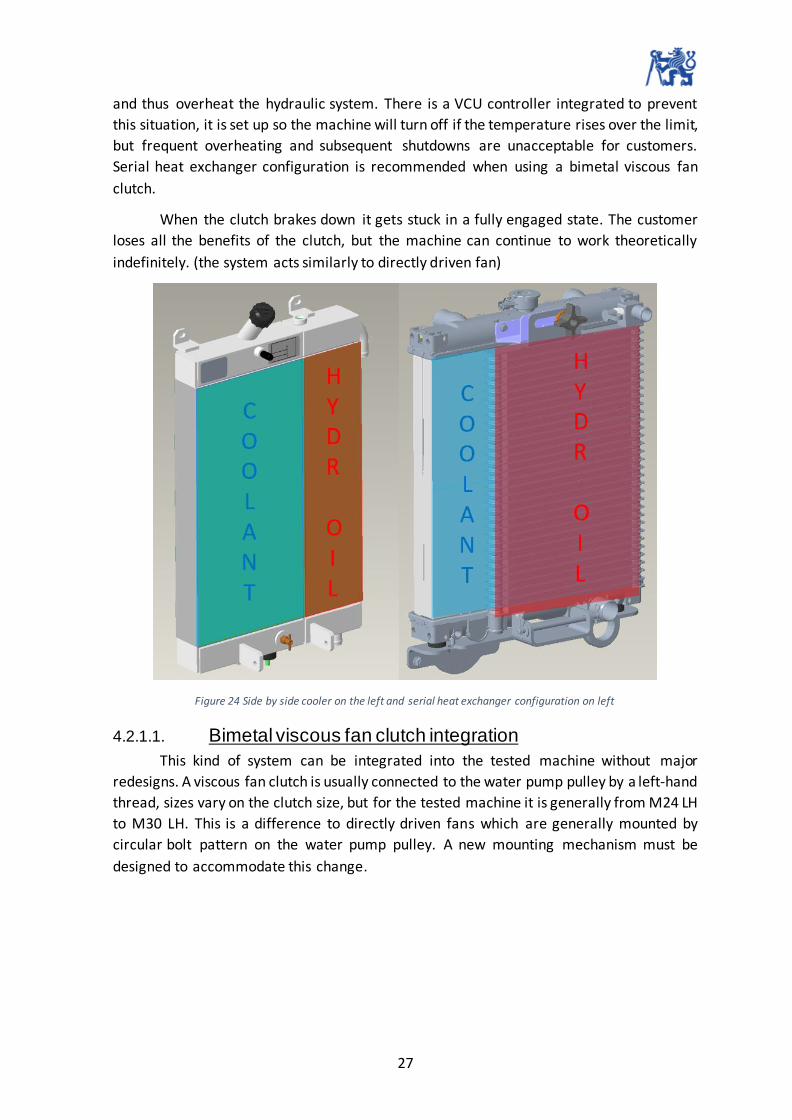
The most risk involved with this solution is in side by side heat exchanger
configuration that is used on the tested machine. The oil cooler side takes up about a third
of the heat exchanger volume and is not positioned in front of the bimetal element. This
issue can be overcome with the right clutch settings, like lower engagement temperature,
but improperly set up clutch can “ignore” the heat from the oil side of the heat exchanger
27
and thus overheat the hydraulic system. There is a VCU controller integrated to prevent
this situation, it is set up so the machine will turn off if the temperature rises over the limit,
but frequent overheating and subsequent shutdowns are unacceptable for customers.
Serial heat exchanger configuration is recommended when using a bimetal viscous fan
clutch.
When the clutch brakes down it gets stuck in a fully engaged state. The customer
loses all the benefits of the clutch, but the machine can continue to work theoretically
indefinitely. (the system acts similarly to directly driven fan)
Figure 24 Side by side cooler on the left and serial heat exchanger configuration on left
4.2.1.1. Bimetal viscous fan clutch integration
This kind of system can be integrated into the tested machine without major
redesigns. A viscous fan clutch is usually connected to the water pump pulley by a left-hand
thread, sizes vary on the clutch size, but for the tested machine it is generally from M24 LH
to M30 LH. This is a difference to directly driven fans which are generally mounted by
circular bolt pattern on the water pump pulley. A new mounting mechanism must be
designed to accommodate this change.

28
Figure 25 Bimetal viscous clutch integrated into the 2-3 tonne excavator
4.2.2. Controlled viscous fan clutch
The controlled viscous fan clutch works on a very similar principle as a bimetal
viscous fan clutch. The main difference being, that valve controlling the amount of liquid in
the main chamber is not operated by the bimetal element, but with an electric system. This
system can be controlled by engine ECU (some of them have preinstalled systems to control
vicious clutches) or by separate controlled. This allows the fan speed to be directly
dependent on the temperature of the coolant, hydraulic oil, or both and it’s a big
advantage. Controlled viscous fan clutch can cost up to 15 times the price of a normal fan,
but the final price can be much higher. Sensors and controllers aren’t a part of the clutch
package and they can cost additional hundreds of euros. The second disadvantage is that
the clutch needs to be connected to the 12 V power system of the machine.
The expected reduction in noise emissions is slightly better to the bimetal viscous
fan clutch, due to the possibility of continuous control depended on the actual
temperatures in the cooling system and for average ambient temperature significantly
better than the directly driven more efficient fan.
As was mentioned in the introduction, the tested machine does not have ECU to
control the clutch, so the integration of this clutch would be expensive. This option was
eliminated very early in the project. This type of clutch is used for more expensive, larger
excavators with modern engines.

29
Figure 26 Horton LCV40 controlled viscous fan clutch [4]
4.3. Electric fan The main benefit of electric fans is efficiency and controllability, there are two
options, either on-off or variable speed. On/off control system fits with requirements of
on-highway lightweight vehicles, but for off-highway use, where little to none ram air can
be expected, the benefits are lacking. With variable speed control, better performance can
be expected, but this system suffers from the same disadvantage as a controlled viscous
fan clutch, the necessity of temperature sensors, and controller, which adds to the cost
significantly. Power consumption of electric fan or any other fan can be calculated from
equation 3.
𝑃𝑒 =
�� ∗ 𝑝
𝜂
(17.)
𝑃𝑒 =0.8 ∗ 500
0.4= 1000 𝑊
Where:
Pe Fan electrical power consumption [W]
�� Fan airflow [m3*s-1] (expected)
p Static pressure [Pa] (expected)
η Fan efficiency (supplier approximate number)
30
From this equation, it's calculated that the electrical draw of the fan will be around
1kW. With belt and alternator efficiency mechanical power drawn from the engine can be
calculated.
𝑃𝑚 =
𝑃𝐹
𝜂𝑏 ∗ 𝜂𝑎
(18.)
𝑃𝑚 =1000
0.98 ∗ 0.55= 1855 𝑊
Where:
Pm Fan mechanical power consumption [W]
ηb Belt efficiency (ηb=0.98 [7])
ηa Alternator efficiency (ηa=0.55 [7])
1.9 kW of mechanical power drawn from the engine does not seem that good but it
is still by 0.4-1 kW lower than the power consumption of mechanical fan and with fan speed
control these numbers will appear only in the highest ambient temperature that machine
was designed for.
From a noise point of view, the electrical system makes little to no noise relative to
the machine so the alternator and belt efficiency does not need to be considered. Slightly
lower noise emissions than controlled viscous fan clutch can be expected, due to higher fan
efficiency. The advantage over a directly driven efficient fan is obvious.
4.3.1. Brushed vs brushless electric engines Fan with brushless electric engine, while more expensive, can provide lifetime
expectancy 4 to 10 times higher than with brushed electric engine. Fan with brushless
electric engines has expected lifetime up to 40 000 hours. This number depends on the
mission profile and for excavator work cycle fan with a brushed electric engine can
withstand at best 100 workdays. As for reasons mentioned in the first paragraph this might
be enough for on-highway lightweight vehicles, but for off-highway vehicles, this would
mean regular downtime every 100 workdays due to fan maintenance.
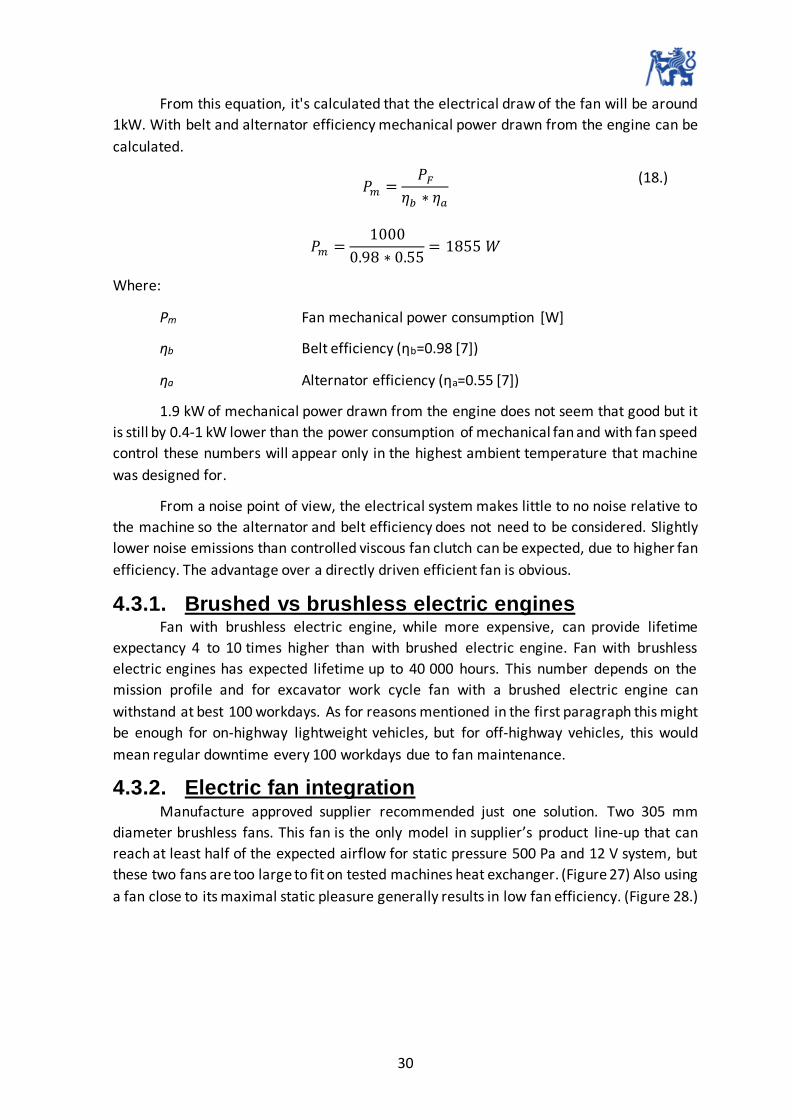
4.3.2. Electric fan integration Manufacture approved supplier recommended just one solution. Two 305 mm
diameter brushless fans. This fan is the only model in supplier’s product line-up that can
reach at least half of the expected airflow for static pressure 500 Pa and 12 V system, but
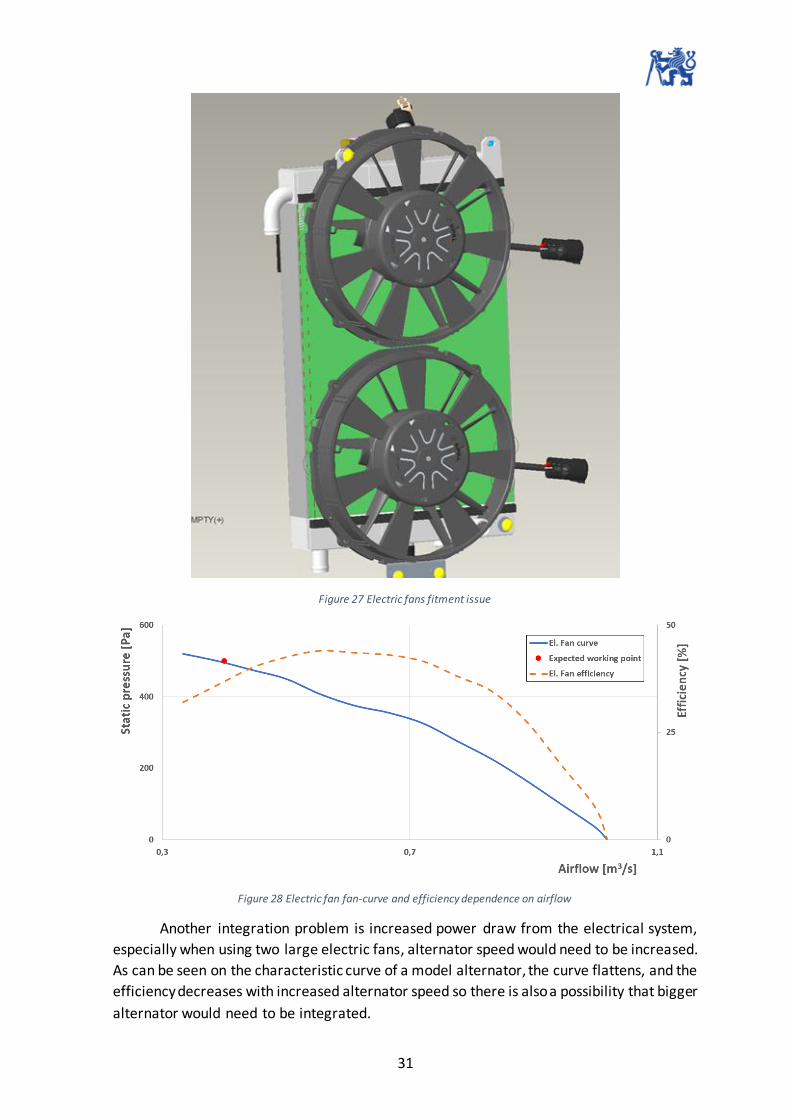
these two fans are too large to fit on tested machines heat exchanger. (Figure 27) Also using
a fan close to its maximal static pleasure generally results in low fan efficiency. (Figure 28.)
31
Figure 27 Electric fans fitment issue
Figure 28 Electric fan fan-curve and efficiency dependence on airflow
Another integration problem is increased power draw from the electrical system,
especially when using two large electric fans, alternator speed would need to be increased.
As can be seen on the characteristic curve of a model alternator, the curve flattens, and the
efficiency decreases with increased alternator speed so there is also a possibility that bigger
alternator would need to be integrated.

32
Figure 29 Model alternator characteristic [13]
For previously mentioned disadvantages, risks and challenges this option wasn’t
explored further, even though noise emissions reduction would be significant.
4.4. Variable pitch fan A variable pitch fan can adjust the blade angle depending on the cooling
performance needed. The blade angle is altered by thermal actuators. Variable pitch fans
can run without any electronic controllers on a similar principle as the bimetal viscous fan
clutch with a big advantage in fully reversible operation. Thermal actuators are filled with
a wax substance that has pre-set thermal properties. With higher temperatures, the wax
expands pushing on the blade to increase the angle of attack. The fully reverse operation
is generally used for quick heat exchanger clean during operation. Heat exchanger cleaned
from debris and dust has a higher heat transfer coefficient and thus better cooling
performance. The reverse operation is usually engaged by the machine hydraulic system,
connected to the fan. [8]
Figure 30 Variable pitch fan

33
4.4.1. Variable pitch fan integration The reversible mechanism located in the central hub of the fan and the hydraulic
actuator hanging from the fan hub makes this system very bulky and a lot of space between
the face of the engine and heat exchanger is necessary. When integrated into the tested
machine the fan hub is too close to the heat exchanger. When positioned in the supplier's
recommended position, there is also not enough space between the fan and the water
pump pulley for fitting connecting flange. All of these problems can be clearly seen in Figure
31.
Figure 31 Variable pitch fan integrated into the 2-3 tonne excavator
It is expected that this system will have similar noise benefits as a vicious van clutch with
the added benefit of reversible action. The advantages of this system come with a price
over 20 times the price of the normal fan, which makes it economically viable only for large
and expensive machines, where the disadvantage of large central hub is also negated.
4.5. Multi-Criteria Decision Analysis Out of all the introduced alternatives, by weighing the possible noise emissions
reduction, advantages, disadvantages, prices, and engineering risks, it was selected that
the bimetal viscous fan clutch option, will be explored. The results can be seen in Table 3.
This alternative has the potential to greatly reduce noise emissions, power consumption
and fuel consumption at lower ambient temperature while accomplishing the continually
variable drive criteria, which allows the homologation test to be run at 70% of maximal fan
speed. (Chapter 2)

34
Table 3 Multiple-criteria decision analysis
𝑆𝑈𝑀 = 𝑁𝑜𝑖𝑠𝑒 𝐵𝑒𝑛.∗ 2 + 𝐸𝑓𝑓𝑖𝑐.∗ 2 + 𝑃𝑟𝑖𝑐𝑒 ∗ 3 + 𝑅𝑖𝑠𝑘 ∗ 2 + 70% 𝑟𝑝𝑚
+ 𝑂𝑡ℎ𝑒𝑟 𝑝𝑟𝑜𝑝.
35
5. Bimetal viscous clutch integration process
In this chapter, the process to select, integrate, and evaluate the viscous fan clutch
will be described. Firstly, to establish a precise working point of the fan, current production
fan airflow was measured, then based on that working point, fan – viscous clutch options,
proposed by several suppliers, were evaluated. With prototypes selected, simulation to
prove that viscous clutch will have an impact on noise emissions was conducted before
prototypes were ordered. Next, the parts to integrate the viscous fan clutch in the machine
were designed and lastly, airflow and noise emissions were measured to select the best
fan-viscous fan clutch combination for the tested machine.
5.1. Baseline measurement Maintain cooling performance, as with the directly driven fan, was the initial
requirement from the beginning of the project. The cooling performance of the machine is
heavily dependent on the fan airflow, so to maintain the cooling performance, new fan to
has to reach the same or higher airflow than the current fan. As a result of the project being
oriented on sound emissions levels, it was decided that a significant increase of fan speed
is unacceptable.
To select a new fan that will maintain the same cooling performance, airflow
measurement with the current fan has to be performed to get accurate base airflow
numbers, so far for the initial research numbers from previously done tests were used. The
fan curve of the current fan is known, so if the airflow is measured in specific rotations, the
static pressure can be determined from the fan curve. Static pressure is the pressure
difference that the fan must create to reach certain airflow.
5.1.1. Airflow measurement Airflow was measured with a digital environment meter Omega HHEM-SD1. It was
used as an anemometer and with type J thermocouple as a thermometer to get reference
ambient temperature and temperature behind the heat exchanger.
In the first step, all other holes and vents were blocked to ensure that all the airflow
enters through the side grille. This side grille was separated into 80 small rectangular
sections. The area of the rectangular section is easily calculated. One by one, the airspeed
in each section was measured. Table 4 shows the measured airspeed for rated engine
rotations.

36
Figure 32 Measuring device, Grille separated to sections, measuring device and blocked air passages
Table 4 Airspeed measured at rated engine rotations
5.1.2. Airflow calculation The airflow can be calculated from equation 19.
��𝑔 = ∑ 𝑣𝑖,𝑗 ∗ 𝐴
𝑛
1
(19.)
��𝑔 = ∑ 𝑣𝑖,𝑗 ∗ 0.00281 = 0.683 𝑚3/𝑠
80
1
Where:
��𝑔 Airflow (grille) [m3*s-1]
𝑣𝑖,𝑗 Measured air speed [m*s-1]
A Section area [m2]

37
In the heat exchanger the heat from the hydraulic system and coolant transfers to
the air, this increases the air temperature. The temperature difference for the test setup is
more than 20°C, this means that neglecting air density change would result in a notable
increase in the inaccuracy of this measurement.
��𝑓 = ��𝑔 ∗𝜌𝑔
𝜌𝑓
(20.)
��𝑓 = 0.683 ∗1.193
1.076= 0.683 ∗ 1.108 = 0.757 𝑚3/𝑠
Where:
��𝑓 Airflow (fan) [m3 *s-1]
𝜌𝑔 Air density (fan) [kg*m-3]
𝜌𝑔 Air density (grille) [kg*m-3]
5.1.3. Determining the static pressure The static pressure can be determined from the fan curve. The supplier of the fan
provides a computer program that can simulate fan curves for all rotations and
temperature ranges.
Figure 33 Fan curve for rated engine rotations
This process was repeated for multiple engine rotations to get, the static pressure
dependence on airflow.

38
Figure 34 Static pressure dependence on airflow
5.2. Fan with viscous fan clutch prototypes
selection In chapter 4 multiple options for noise reduction were explored, out of these the
viscous fan clutch came out as the best option. As the current fan cannot be used with a
viscous clutch, in addition to selecting a viscous clutch, a suitable fan also needs to be
selected. This fan must satisfy two major conditions, airflow performance defined in
chapter 5.1 and the possibility to be mounted on the viscous clutch. During the selection
process, it was also decided that a one-piece molded fan will be preferred, as they are
generally much lighter than modular fans.
Four major cooling fan suppliers proposed, their options and four fan designs and
four clutches were selected for future testing. Important parameters for this selection were
the airflow performance, fan efficiency, serial production price, and prototype price.
5.2.1. Supplier 1 The first supplier introduced a viscous clutch with a modular fan, that offers very
similar performance to the current production fan as can be seen in Figure 35. The modular
construction of this fan has the advantage of multiple blade angles and blade design
options. The main disadvantage of being heavy and bulky construction. This vicious clutch
and fan combination can fit in the machine while maintaining one inch of clearance from
other parts.
39
Figure 35 Supplier 1 vs. current product fan airflow performance comparison
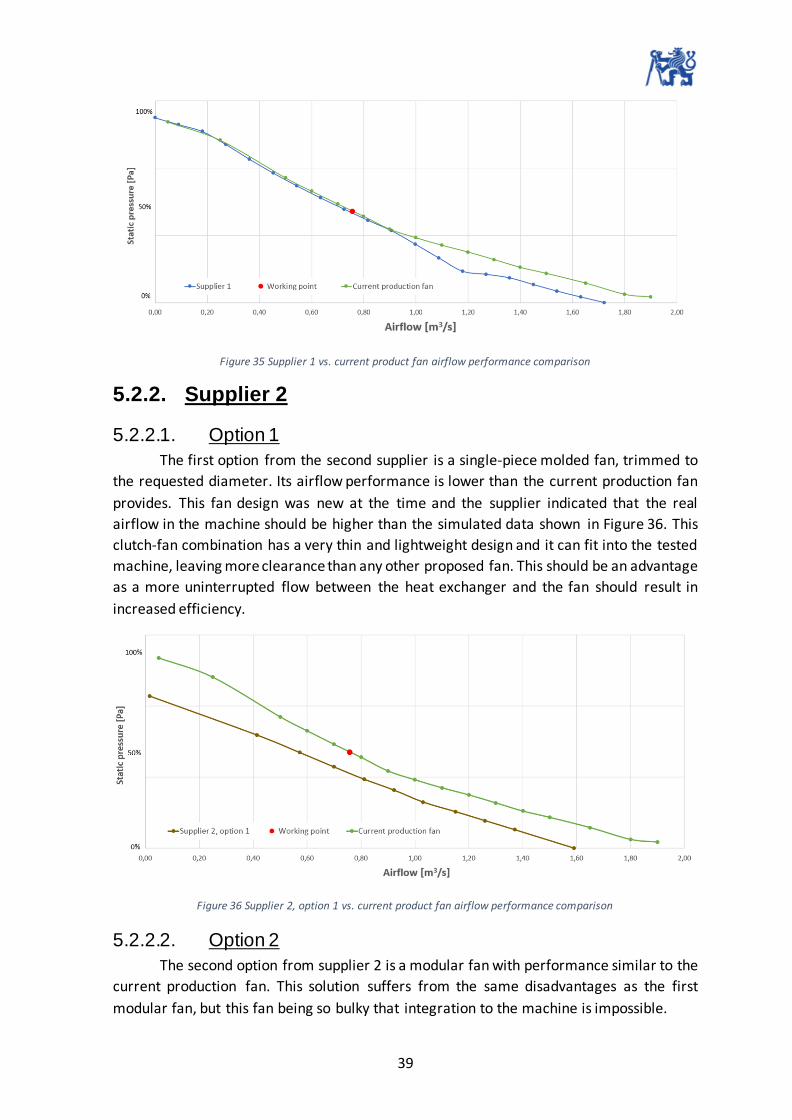
5.2.2. Supplier 2
5.2.2.1. Option 1
The first option from the second supplier is a single-piece molded fan, trimmed to
the requested diameter. Its airflow performance is lower than the current production fan
provides. This fan design was new at the time and the supplier indicated that the real
airflow in the machine should be higher than the simulated data shown in Figure 36. This
clutch-fan combination has a very thin and lightweight design and it can fit into the tested
machine, leaving more clearance than any other proposed fan. This should be an advantage
as a more uninterrupted flow between the heat exchanger and the fan should result in
increased efficiency.
Figure 36 Supplier 2, option 1 vs. current product fan airflow performance comparison
5.2.2.2. Option 2
The second option from supplier 2 is a modular fan with performance similar to the
current production fan. This solution suffers from the same disadvantages as the first
modular fan, but this fan being so bulky that integration to the machine is impossible.
40
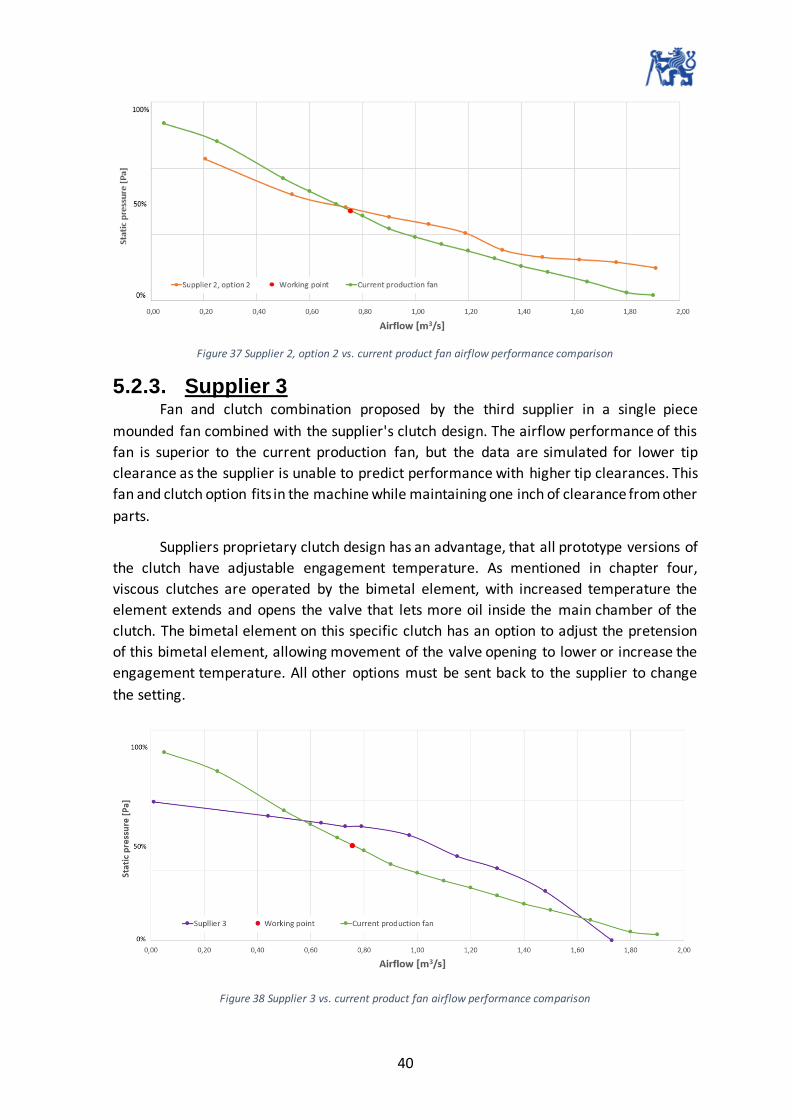
Figure 37 Supplier 2, option 2 vs. current product fan airflow performance comparison
5.2.3. Supplier 3 Fan and clutch combination proposed by the third supplier in a single piece
mounded fan combined with the supplier's clutch design. The airflow performance of this
fan is superior to the current production fan, but the data are simulated for lower tip
clearance as the supplier is unable to predict performance with higher tip clearances. This
fan and clutch option fits in the machine while maintaining one inch of clearance from other
parts.
Suppliers proprietary clutch design has an advantage, that all prototype versions of
the clutch have adjustable engagement temperature. As mentioned in chapter four,
viscous clutches are operated by the bimetal element, with increased temperature the
element extends and opens the valve that lets more oil inside the main chamber of the
clutch. The bimetal element on this specific clutch has an option to adjust the pretension
of this bimetal element, allowing movement of the valve opening to lower or increase the
engagement temperature. All other options must be sent back to the supplier to change
the setting.
Figure 38 Supplier 3 vs. current product fan airflow performance comparison

41
5.2.4. Supplier 4 Fourth suppliers introduced a single piece mounded fan and clutch combination.
The airflow performance is higher than the current production fan offers. As can be seen
in Figure 39, this fans airflow performance decreases significantly with just a small increase
in static pressure. This can introduce problems with fouled heat exchanger, as this fan's
performance would decrees significantly. This vicious clutch and fan combination can fit in
the machine while maintaining one inch of clearance from other parts.
Figure 39 Supplier 4 vs. current product fan airflow performance comparison
5.2.5. Multi-Criteria Decision Analysis Out of these options, the best three were selected and prototypes were ordered for
testing. As mentioned, important parameters for this selection were the airflow
performance, fan efficiency, serial production price, and prototype price. Selected options
are highlighted green in Table 5.
Table 5 Multiple-criteria decision analysis
𝑆𝑈𝑀 = 𝑃𝑟𝑜𝑡. 𝑝𝑟𝑖𝑐𝑒 + 𝑆𝑒𝑟. 𝑝𝑟𝑜𝑑. 𝑝𝑟𝑖𝑐𝑒 ∗ 2 + 𝐴𝑖𝑟𝑓𝑙𝑜𝑤 𝑝𝑒𝑟𝑓𝑜𝑟𝑚𝑎𝑛𝑐𝑒 ∗ 2 + 𝐸𝑓𝑓𝑖𝑐𝑖𝑒𝑛𝑐𝑦
Option One from the second supplier was also accepted for testing as the supplier
offered to send the prototype free of charge and options from this supplier were initially
declined mainly due to a very high prototype price.

42
5.3. Kuli cooling system simulation To predict the impact of the viscous fan clutch and to get a general idea of the cooling
system performance in different conditions, simulation of the excavator cooling system
was made. The simulation was conducted at different ambient temperatures at 100% heat
rejection from the engine, hydraulic system, and AC system. In combination with fan
parameter prediction software from the fan supplier, all the fan parameters were
estimated for ambient temperatures ranging from -5°C to 37°C. For lower temperatures (-
5°C to 5°C) the computational error increased. Based on engine manufacturer data, fuel
consumption was also calculated for each ambient temperature.
This simulation was not conducted to get precise numbers, but to show the data
trend that can be expected with a viscous fan clutch. For this reason, the current production
fan was used instead of a new viscous clutch fan, that with its different parameters, would
influence the results.
5.3.1. Kuli software Kuli software is a 1D thermal management simulation software developed by
Magna International. This software is perfect for quick thermal management simulation,
that can be run on any computer. The software can be used for all phases of the
development process from the first dimensioning to finetuning and component testing, like
for example changing radiator cores, radiator sizes, cooling package arrangements, fan
designs, and fan sizes. By setting up different boundary conditions, the optimization can be
used to determine for example, like in our case, different minimal fan speed to safely cool
the system at different ambient temperatures. If properly set up and calibrated the
precision of the model can be high. [24]
5.3.2. Simulation build The first part of the simulation process is building the model of the cooling system.
To do that, component data from our suppliers are needed. It is possible to upload finished
components, but generally, the supplier sends general data and a test result with boundary
conditions. The component can be created, the general information filled, and then with
the boundary conditions and test results from the supplier, it is checked if the component
performs as expected. This way the cooling circuit, hydraulic oil circuit, fan, and AC system
are created. Test data, for example from the cooling test of the simulated cooling system,
are required to set up inputs and to calibrate the model.

43
Figure 40 Cooling system model in Kuli software
5.3.2.1. Coolant circuit
The coolant circuit is the main source of heat in the excavator cooling system. Creating the heat exchanger component properly can be challenging, but otherwise, this process is straight forward. There are just 3 components, the water pump, the heat exchanger, and tubing. For the water pump it’s important to insert volume flow dependence on water pump rotations, the quantity of heat generated by the engine, and pressure, all these parameters should be shared by the engine manufacture. The heat exchanger component can be created based on supplier data or the supplier can share already created components directly. As the water pump component can be generally considered as input, the heat exchanger component can be considered as output. Multiple calculated parameters can be displayed, as is shown in Figure 41.
Figure 41 Coolant circuit model in Kuli software
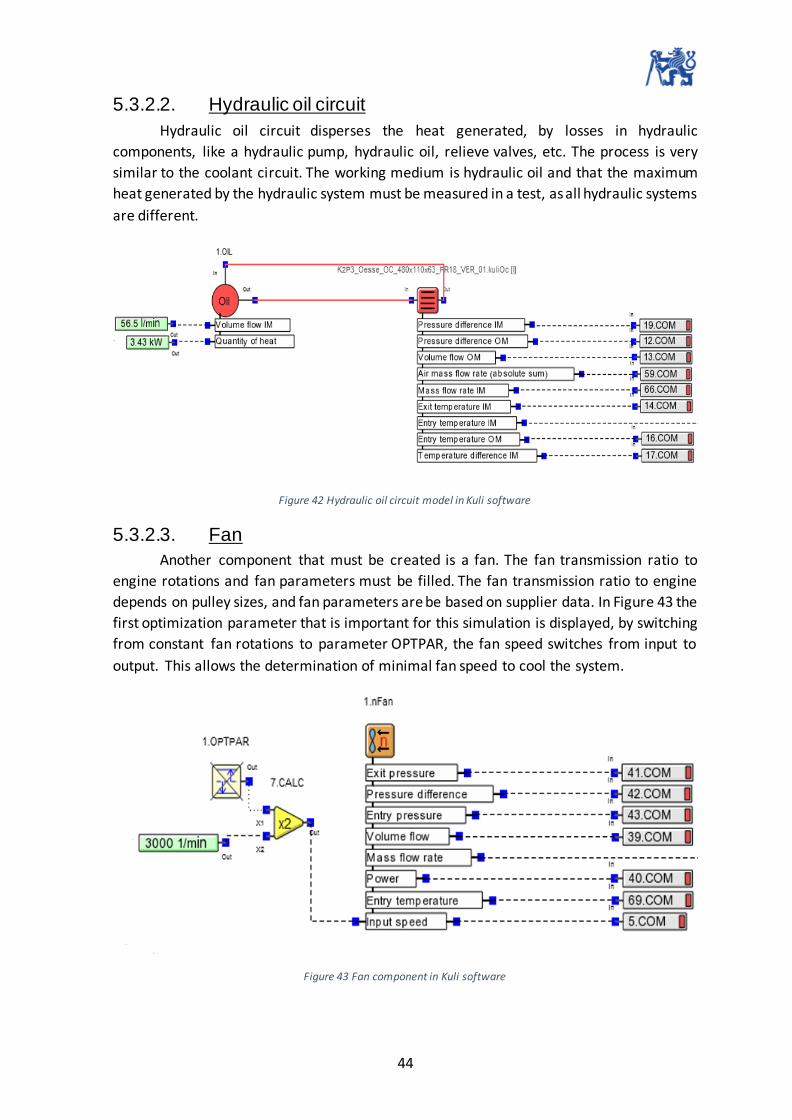
44
5.3.2.2. Hydraulic oil circuit
Hydraulic oil circuit disperses the heat generated, by losses in hydraulic
components, like a hydraulic pump, hydraulic oil, relieve valves, etc. The process is very
similar to the coolant circuit. The working medium is hydraulic oil and that the maximum
heat generated by the hydraulic system must be measured in a test, as all hydraulic systems
are different.
Figure 42 Hydraulic oil circuit model in Kuli software
5.3.2.3. Fan
Another component that must be created is a fan. The fan transmission ratio to
engine rotations and fan parameters must be filled. The fan transmission ratio to engine
depends on pulley sizes, and fan parameters are be based on supplier data. In Figure 43 the
first optimization parameter that is important for this simulation is displayed, by switching
from constant fan rotations to parameter OPTPAR, the fan speed switches from input to
output. This allows the determination of minimal fan speed to cool the system.
Figure 43 Fan component in Kuli software
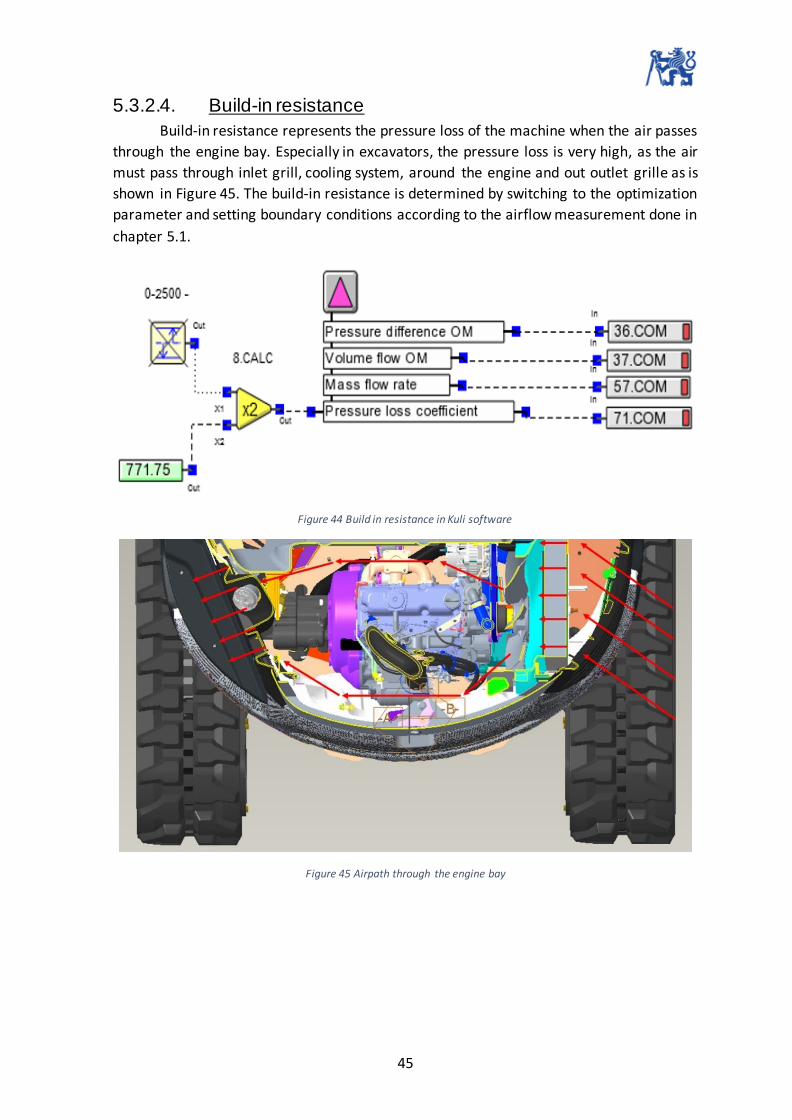
45
5.3.2.4. Build-in resistance
Build-in resistance represents the pressure loss of the machine when the air passes
through the engine bay. Especially in excavators, the pressure loss is very high, as the air
must pass through inlet grill, cooling system, around the engine and out outlet grille as is
shown in Figure 45. The build-in resistance is determined by switching to the optimization
parameter and setting boundary conditions according to the airflow measurement done in
chapter 5.1.
Figure 44 Build in resistance in Kuli software
Figure 45 Airpath through the engine bay

46
5.3.2.5. AC system
The AC condenser was simplified as an area resistance model with a heating feature,
as only the resistance and heat from the condenser impacts the cooling system. This thesis
has no interest in inner AC temperatures. As is shown in Figure 46, the only parameters
needed are pressure difference, radiated heat, and the size of the condenser. Other
parameters are calculated.
Figure 46 HVAC in Kuli software
5.3.2.6. Airpath
Setting the airpath is the last step in the cooling system simulation preparation
process. The components must be connected, from the ambient condition through
component models and back to ambient conditions. These connections can be seen in
Figure 47.
Figure 47 Airpath connecting the component models in Kuli software

47
5.3.3. Simulation results
5.3.3.1. Minimal fan speed
In Figure 48 the simulated minimal fan speed is displayed. With an ambient
temperature of 25°C, the minimal fan speed is already lower by 500 min-1 and at 10°C
ambient temperature, the minimal fan speed goes down by 1000 min-1 (orange line in
Figure 48). These results show great promise, but as these results are simulated, it was
decided to use fan speed that is calculated as an average between directly driven fan and
this simulated minimal fan speed to establish other parameters. (blue line in Figure 48).
The major issue with the simulated minimal fan speed is that the coolant and
hydraulic oil temperatures are high, which results in increased air temperature that passes
through the heat exchanger. With the clutch reacting to this higher air temperature, by
increasing fan speed, the minimal fan speed can’t be reached.
Figure 48 Minimal fan speed dependence on ambient temperature for directly driven fan and for variable drive fan
5.3.3.2. Fan noise
In Figure 49 the fan noise dependence on ambient temperature is displayed. For
directly driven fan 1 dBA increase in fan noise is indicated, this is caused by air density
increases with decreasing ambient temperature as for fans the air volume flow rate is
constant with temperature (green line in Figure 49). For average fan speed, the noise
emissions decrees is up to 7 dBA. (blue line in Figure 49). As only the fan noise emissions
are taken in account, the precise impact on the noise emissions of the whole machine must
be tested, but as per manufacturer experience, the impact of fan noise reduction by 1 dBA
would translate to 0.5 dBA reduction in machine noise.
The data were acquired from suppliers’ fan parameter prediction software, that can
predict fan parameters based on the air temperature, airflow, and static pressure.

48
Figure 49 Fan noise dependence on ambient temperature for directly driven fan and variable drive fan
5.3.3.3. Fan power and fuel consumption
Supplier fan parameter prediction software can also determine the power that the
fan will drain from the engine. The results are shown in Figure 50. The power consumption
for a directly driven fan goes up with decreasing ambient temperature, due to the increased
air density. For the average fan speed, decrees in fan power drain up to 1.3 kW, can be
observed. This is significant especially relative to the maximum engine power output of 19
kW. Decrees in fan power drain can introduce lower fuel consumption or more available
power for the hydraulic system.
In Figure 50, fuel consumption dependency on ambient temperature is also shown.
The estimation of the fuel consumption difference is not precise. The basic idea behind the
calculation is that with less power drain from the fan, the engine can operate with higher
engine speed. Just to clarify, the off-highway engine operates on high idle (max engine
speed), with increasing load from the hydraulic system, the engine speed will decrease,
until it reaches the rated engine speed, where the engine has maximum power. For this
case with the same load from the hydraulic system, but the lower load from the fan, the
engine speed should be higher. With fuel consumption data for different engine speeds,
the fuel consumption was estimated. With this wide range of ambient temperatures, it is
not useful to recalculate the fuel consumption to liters per hour as it would introduce more
imprecision as the fuel density would have a great impact on the results.

49
Figure 50 Fan power dependence on ambient temperature for directly driven fan and for variable drive fan, and fuel consumption reduction dependance on ambient temperature
5.3.3.4. Simulation conclusion
In conclusion, the simulation predicts a significant decrease in noise emissions and
in theory some fuel savings. For 0°C ambient temperature, the simulation predicts fan noise
emissions reduction by 7 dBA and fuel consumption lower by up to 9%. For 20°C ambient
temperature, the reduction in fan noise emissions by 4 dBA and fuel consumption lower by
up to 6% is predicted. The fan power drain from the engine drops to less than half of its
value with a directly driven fan.
An important point is that this simulation is not specific to the viscous fan clutch. A
similar trend can be expected with other fan systems that offer variable airflow. With
correct settings and optimized cooling system design the system can operate on or closer
to the lowest fan speed shown in Figure 48, and thus even lower noise emissions and more
significant fuel savings can be expected.
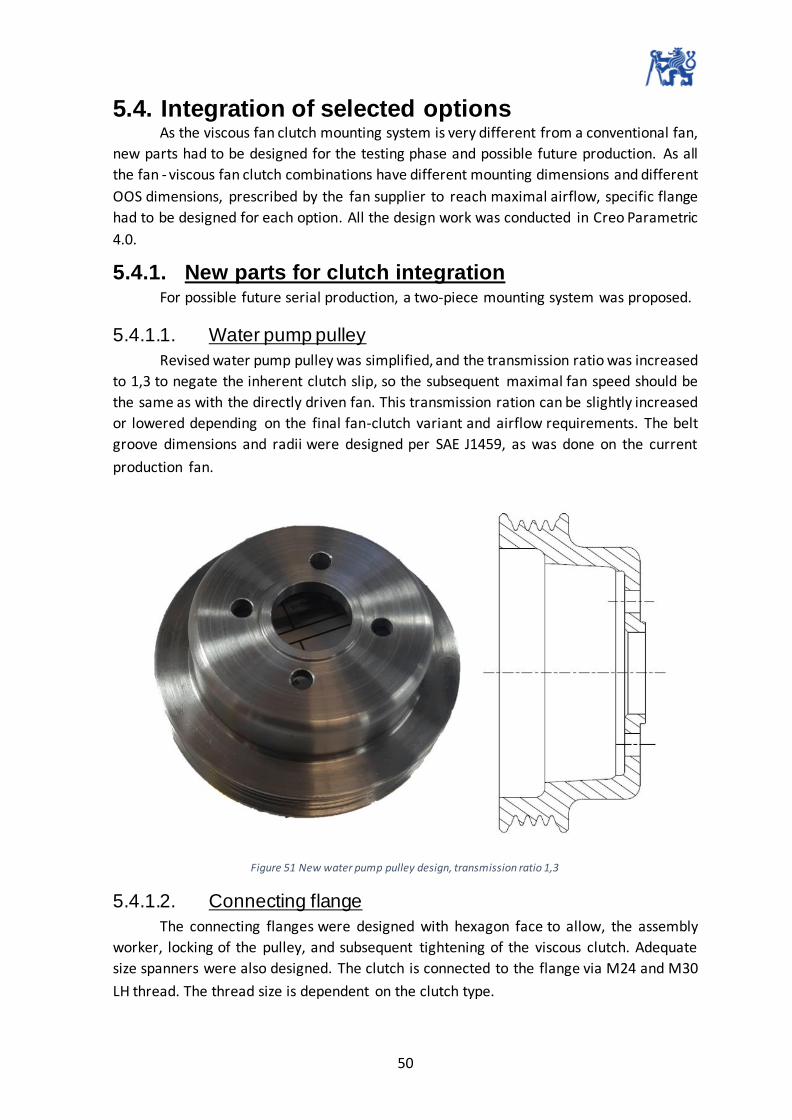
50
5.4. Integration of selected options As the viscous fan clutch mounting system is very different from a conventional fan,
new parts had to be designed for the testing phase and possible future production. As all
the fan - viscous fan clutch combinations have different mounting dimensions and different
OOS dimensions, prescribed by the fan supplier to reach maximal airflow, specific flange
had to be designed for each option. All the design work was conducted in Creo Parametric
4.0.
5.4.1. New parts for clutch integration For possible future serial production, a two-piece mounting system was proposed.
5.4.1.1. Water pump pulley
Revised water pump pulley was simplified, and the transmission ratio was increased
to 1,3 to negate the inherent clutch slip, so the subsequent maximal fan speed should be
the same as with the directly driven fan. This transmission ration can be slightly increased
or lowered depending on the final fan-clutch variant and airflow requirements. The belt
groove dimensions and radii were designed per SAE J1459, as was done on the current
production fan.
Figure 51 New water pump pulley design, transmission ratio 1,3
5.4.1.2. Connecting flange
The connecting flanges were designed with hexagon face to allow, the assembly
worker, locking of the pulley, and subsequent tightening of the viscous clutch. Adequate
size spanners were also designed. The clutch is connected to the flange via M24 and M30
LH thread. The thread size is dependent on the clutch type.
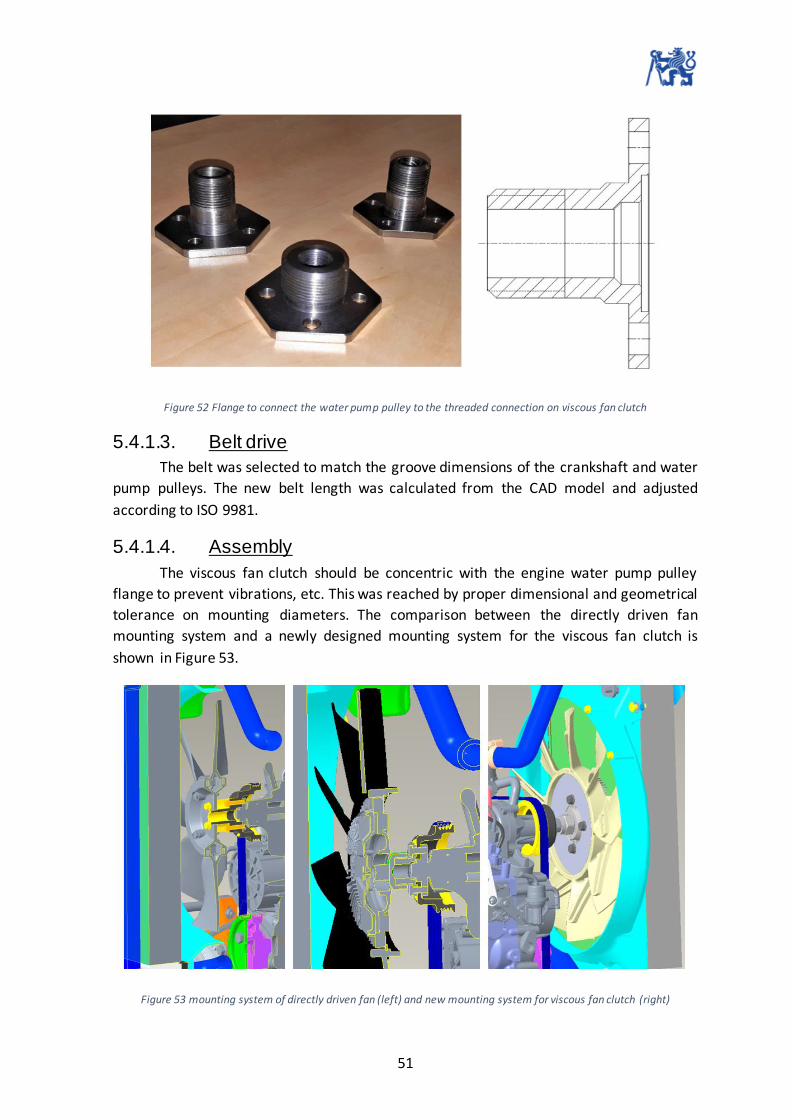
51
Figure 52 Flange to connect the water pump pulley to the threaded connection on viscous fan clutch
5.4.1.3. Belt drive
The belt was selected to match the groove dimensions of the crankshaft and water
pump pulleys. The new belt length was calculated from the CAD model and adjusted
according to ISO 9981.
5.4.1.4. Assembly
The viscous fan clutch should be concentric with the engine water pump pulley
flange to prevent vibrations, etc. This was reached by proper dimensional and geometrical
tolerance on mounting diameters. The comparison between the directly driven fan
mounting system and a newly designed mounting system for the viscous fan clutch is
shown in Figure 53.
Figure 53 mounting system of directly driven fan (left) and new mounting system for viscous fan clutch (right)
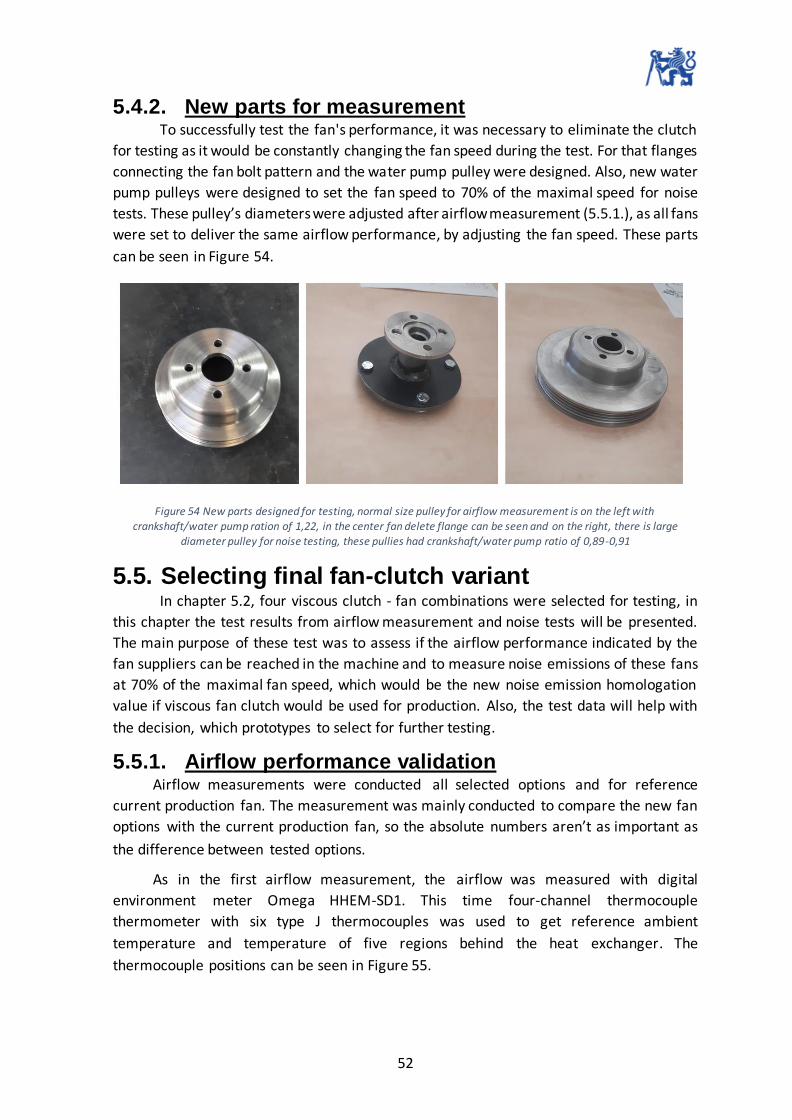
52
5.4.2. New parts for measurement To successfully test the fan's performance, it was necessary to eliminate the clutch
for testing as it would be constantly changing the fan speed during the test. For that flanges
connecting the fan bolt pattern and the water pump pulley were designed. Also, new water
pump pulleys were designed to set the fan speed to 70% of the maximal speed for noise
tests. These pulley’s diameters were adjusted after airflow measurement (5.5.1.), as all fans
were set to deliver the same airflow performance, by adjusting the fan speed. These parts
can be seen in Figure 54.
Figure 54 New parts designed for testing, normal size pulley for airflow measurement is on the left with crankshaft/water pump ration of 1,22, in the center fan delete flange can be seen and on the right, there is large
diameter pulley for noise testing, these pullies had crankshaft/water pump ratio of 0,89-0,91
5.5. Selecting final fan-clutch variant In chapter 5.2, four viscous clutch - fan combinations were selected for testing, in
this chapter the test results from airflow measurement and noise tests will be presented.
The main purpose of these test was to assess if the airflow performance indicated by the
fan suppliers can be reached in the machine and to measure noise emissions of these fans
at 70% of the maximal fan speed, which would be the new noise emission homologation
value if viscous fan clutch would be used for production. Also, the test data will help with
the decision, which prototypes to select for further testing.
5.5.1. Airflow performance validation Airflow measurements were conducted all selected options and for reference
current production fan. The measurement was mainly conducted to compare the new fan
options with the current production fan, so the absolute numbers aren’t as important as
the difference between tested options.
As in the first airflow measurement, the airflow was measured with digital
environment meter Omega HHEM-SD1. This time four-channel thermocouple
thermometer with six type J thermocouples was used to get reference ambient
temperature and temperature of five regions behind the heat exchanger. The
thermocouple positions can be seen in Figure 55.

53
Figure 55 Thermocouple positions during the airflow measurement
Temperatures measured behind the heat exchanger were averaged to get the
temperature of the air passing through the fan.
The measurement process was very similar to the first airflow measurement
described in chapter 5.1., only this time the side grille was separated into just 30 small
rectangular sections, as in the first airflow measurement it was determined that measuring
in 80 squares areas does not increase the accuracy enough to justify the increased time
required for each measurement.
The airflow was measured at rated engine speed and on high idle and calculated the
same way as in the first airflow measurement, the calculation will be repeated only for the
first option, for the other options just results will be displayed.
Figure 56 2-3 tonne excavator, before airflow measurement

54
5.5.1.1. Supplier 1
The airflow can be calculated from equation 21.
��𝑔 = ∑ 𝑣𝑖,𝑗 ∗ 𝐴
𝑛
1
(21.)
��𝑔 = ∑ 𝑣𝑖,𝑗 ∗ 0.00678 = 0.602 𝑚3/𝑠
30
1
Where:
��𝑔 Airflow (grille) [m3*s-1]
𝑣𝑖,𝑗 Measured air speed [m*s-1]
A Section area [m2]
In the heat exchanger, the heat from the hydraulic system and coolant transfers to
the air, this increases the air temperature. The temperature difference for the test setup is
more than 20°C, this means that neglecting air density change would result in a notable
increase in the inaccuracy of this measurement.
��𝑓 = ��𝑔 ∗𝜌𝑔
𝜌𝑓
(22.)
��𝑓 = 0.602 ∗1.195
1.080= 0.602 ∗ 1.106 = 0.666 𝑚3/𝑠
Where:
��𝑓 Airflow (fan) [m3 *s-1]
𝜌𝑔 Air density (fan) [kg*m-3]
𝜌𝑔 Air density (grille) [kg*m-3]

55
5.5.1.2. Supplier 2
5.5.1.3. Supplier 3
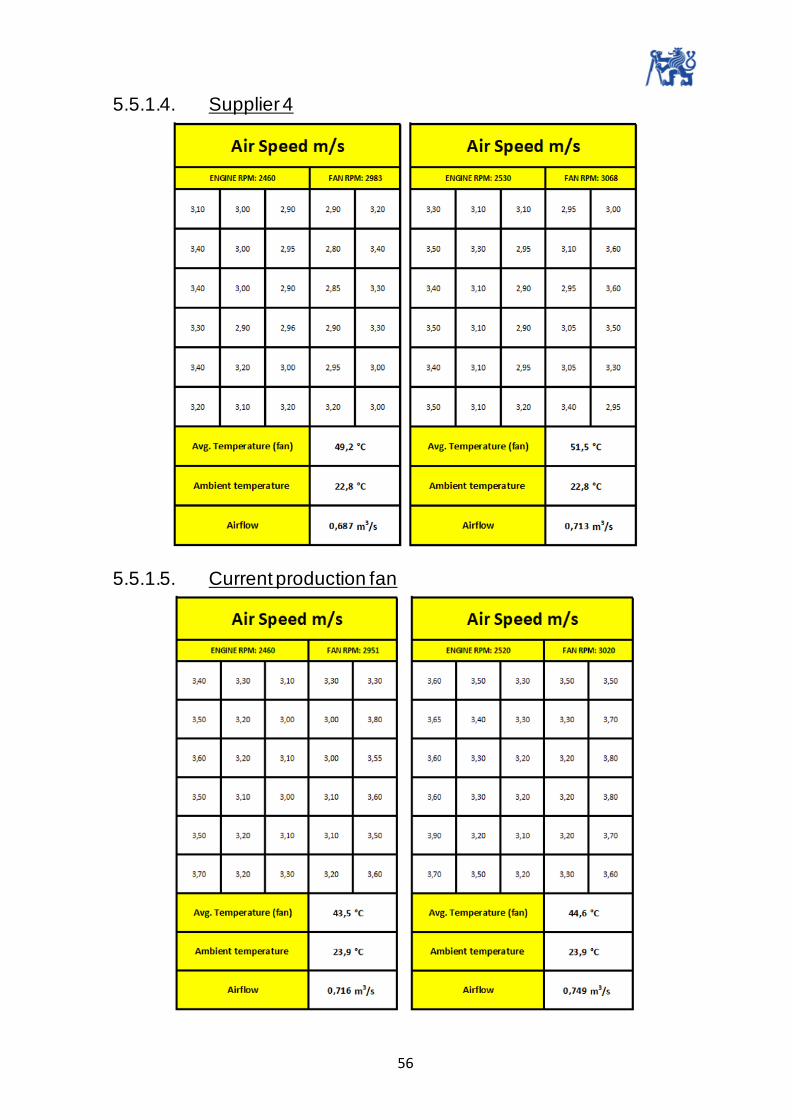
56
5.5.1.4. Supplier 4
5.5.1.5. Current production fan

57
5.5.1.6. Airflow measurement result comparison Table 6 Airflow measurement results comparison
5.5.2. Noise Test The noise was measured in an anechoic chamber in agreement with the legislative
requirements described in chapter two. Both bystander and operator noise levels were
measured during the test. The significant decrees in noise emissions for machines equipped
with new fan options were mainly caused by the fact that the fan speed was set to 70% of
the maximal fan speed as the EU directive allows for variable speed drive. As the new fan
options were measured at very similar fan speed, and the fan speed was calculated so all
the fans would reach the same airflow as the current production fan at rated engine speed,
the comparison between the new fan options can be used to select the candidate with the
best performance and lowest noise emissions.
Figure 57 2-3 tonne excavator in the anechoic chamber
In Figures 58, 59 CPB and FFT spectrum can be seen. At all frequencies, the current
production fan has higher sound pressure levels than the new options, which was
expectable as the new options were measured at 70% of maximal fan speed.
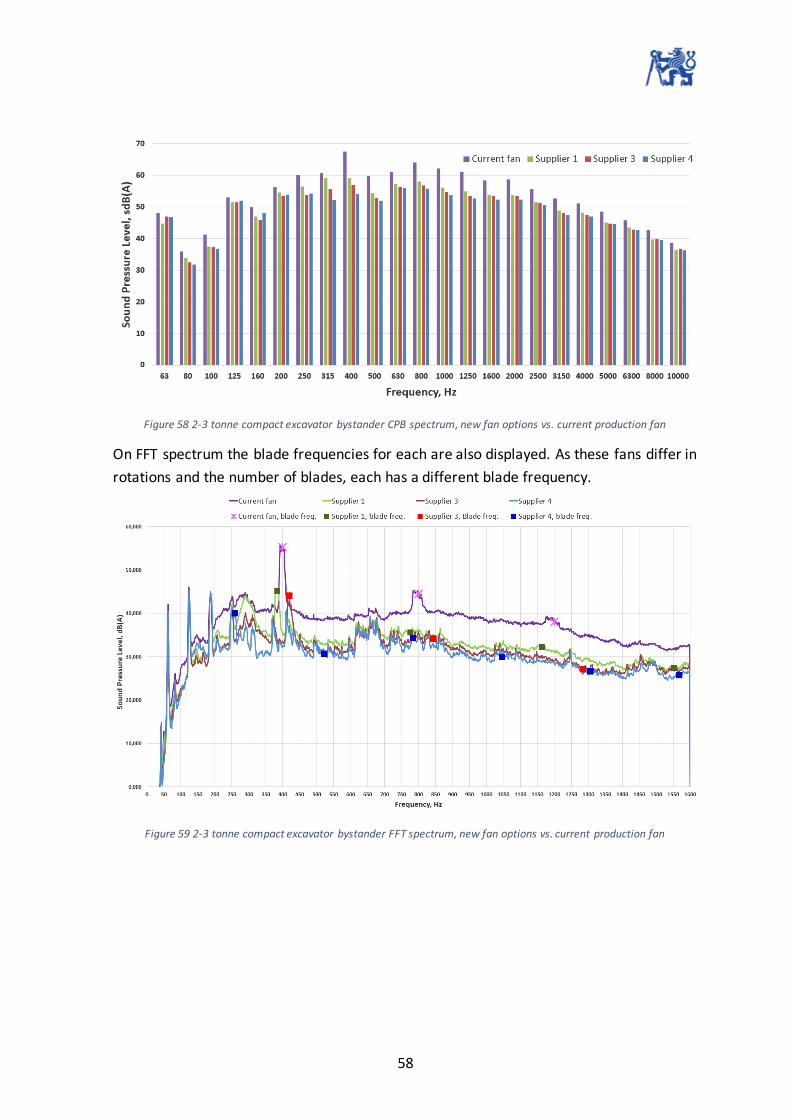
58
Figure 58 2-3 tonne compact excavator bystander CPB spectrum, new fan options vs. current production fan
On FFT spectrum the blade frequencies for each are also displayed. As these fans differ in
rotations and the number of blades, each has a different blade frequency.
Figure 59 2-3 tonne compact excavator bystander FFT spectrum, new fan options vs. current production fan
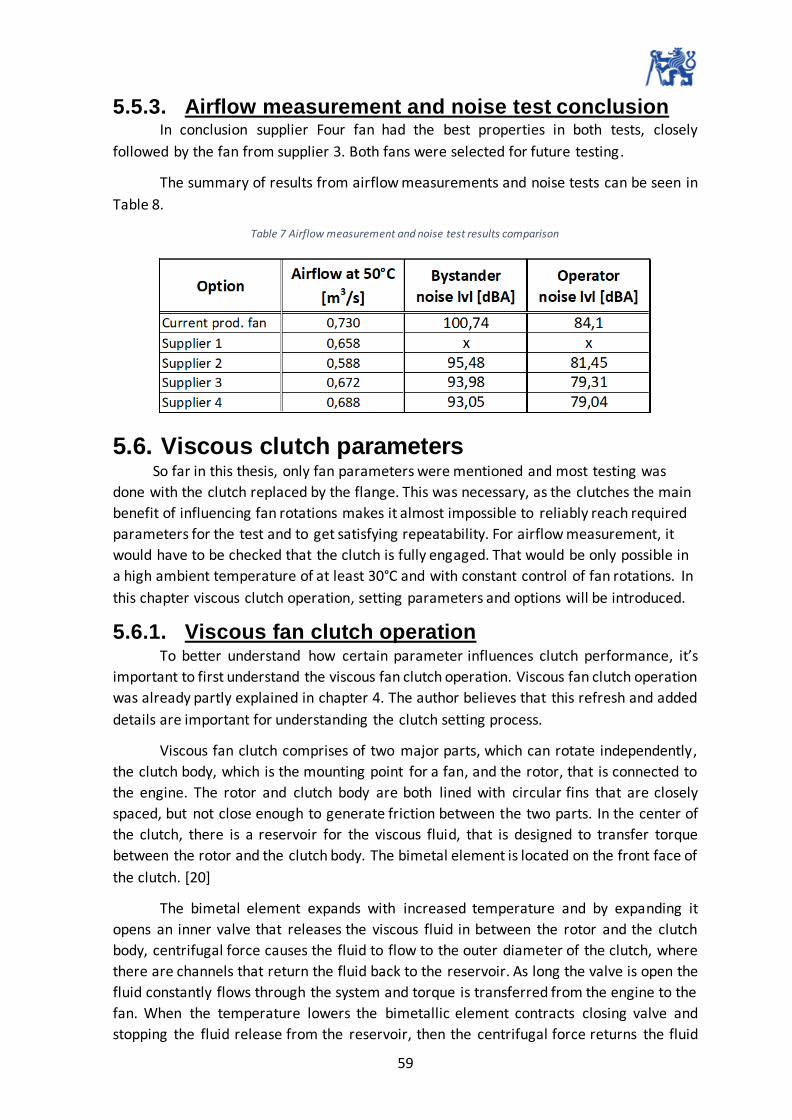
59
5.5.3. Airflow measurement and noise test conclusion In conclusion supplier Four fan had the best properties in both tests, closely
followed by the fan from supplier 3. Both fans were selected for future testing.
The summary of results from airflow measurements and noise tests can be seen in
Table 8.
Table 7 Airflow measurement and noise test results comparison
5.6. Viscous clutch parameters So far in this thesis, only fan parameters were mentioned and most testing was
done with the clutch replaced by the flange. This was necessary, as the clutches the main
benefit of influencing fan rotations makes it almost impossible to reliably reach required
parameters for the test and to get satisfying repeatability. For airflow measurement, it
would have to be checked that the clutch is fully engaged. That would be only possible in
a high ambient temperature of at least 30°C and with constant control of fan rotations. In
this chapter viscous clutch operation, setting parameters and options will be introduced.
5.6.1. Viscous fan clutch operation To better understand how certain parameter influences clutch performance, it’s
important to first understand the viscous fan clutch operation. Viscous fan clutch operation
was already partly explained in chapter 4. The author believes that this refresh and added
details are important for understanding the clutch setting process.
Viscous fan clutch comprises of two major parts, which can rotate independently,
the clutch body, which is the mounting point for a fan, and the rotor, that is connected to
the engine. The rotor and clutch body are both lined with circular fins that are closely
spaced, but not close enough to generate friction between the two parts. In the center of
the clutch, there is a reservoir for the viscous fluid, that is designed to transfer torque
between the rotor and the clutch body. The bimetal element is located on the front face of
the clutch. [20]
The bimetal element expands with increased temperature and by expanding it
opens an inner valve that releases the viscous fluid in between the rotor and the clutch
body, centrifugal force causes the fluid to flow to the outer diameter of the clutch, where
there are channels that return the fluid back to the reservoir. As long the valve is open the
fluid constantly flows through the system and torque is transferred from the engine to the
fan. When the temperature lowers the bimetallic element contracts closing valve and
stopping the fluid release from the reservoir, then the centrifugal force returns the fluid

60
from clutch body back to the reservoir and the clutch body and the rotor can again rotate
independently. [20]
Depending on the design viscous fan clutch can function either in on/off, two speed,
or in continuously variable drive configuration. On/off configuration is used only in
automotive applications. [20]
Figure 60 Viscous fan clutch parts
5.6.2. Viscous fan clutch setting parameters To reach the desired performance, a viscous fan clutch must be properly set up. The
clutch is set up by combining the amount of the fluid, viscosity of the fluid, and bimetal
element pretension. The best setting for the clutch, which combines maximum efficiency
and 100% cooling reliability, can be perfected in the vehicle environmental test chamber.
In this chapter, the clutch setting process will be shortly presented.
5.6.2.1. Base setting
Viscous fan clutch must be adapted to the engine - fan combination, to avoid
situations, where the fan can’t reach enough torque to generate desired clutch slip, when
the cooling is not necessary, resulting in a system with similar parameters as the directly
driven fan would have, or situations, where the clutch is not able to transfer enough torque
to the fan, resulting in the permanent clutch slip, when the cooling is necessary, which
would result in insufficient cooling. This setting is usually performed by the clutch
manufacturer based on machine data and tested on a viscous fan clutch testbed. The
satisfiable setting is reached by a combination of changes in the amount and viscosity of
the clutch fluid.
5.6.2.2. Engagement temperature setting
The engagement temperatures must be set, to guarantee machine cooling
performance, while increasing cooling system efficiency in all possible conditions, for

61
example, if the engagement temperature would be set too low, the machine would
probably have no cooling problems, but the clutch benefits would be minimized, as fan
speed would be increasing too soon. This setting is specific for every engine machine
design, and it's derived from a combination of known data, experience, simulations, and
testing. Desired properties are usually reached by changing the bimetal element
pretension. Increasing the bimetal element pretension results in the inner valve opening at
a lower temperature. Some manufactures allow changes in bimetal element pretension on
the testing site, this is a great advantage as it speeds up the setting process significantly,
compared to being forced to send the clutch back to the manufacture for each change.
5.6.3. Viscous fan clutch options From the test results presented in chapter 5.5. two fan – clutch combinations were
selected for testing and each supplier recommended different base settings for the viscous
fan clutch. For both options, the charts are simplified with generic hysteresis loop, for
privacy reasons. Some form of a hysteresis loop is a natural property of this kind of closed
system, as the clutch is controlled only by air temperature behind the heat exchanger, the
heat transfer between the air and bimetal element introduces some delay.
5.6.3.1. Supplier 3 viscous fan clutch
As can be seen in Figure 61 the fan speed range on this viscous fan clutch is close to
2000 min-1. The inner valve opening starts at around 50°C and the inner valve fully opened
when the air temperature passing through the heat exchanger reaches 70°C. The idle
speed is 1050 min-1 and the maximum speed is 3000 min-1. The engagement temperature
of this viscous fan clutch is easily adjusted by changing the bimetal element pretension with
a hex socket screw. Changing the bimetal element pretension moves the chart horizontally
by approximately ±12°C. This setting as has an advantage of increased cooling efficiency
as the fan power drain on the system and fan noise emissions are significantly lower at
1050 min-1, but as the airflow provided by the fan is very low at 1050 min-1 there is a risk of
the hydraulic system overheating at specific conditions.
Figure 61 Supplier 3 viscous fan clutch characteristic for input rotational speed of 3200 min-1

62
5.6.3.2. Supplier 4 viscous fan clutch setting
The supplier 4 viscous fan clutch does have a much higher idle speed of 2200 min-1.
The maximum fan speed is also around 3000 min-1. The inner valve starts to open at 55°C
and its fully open when the air temperature at the bimetal element reaches 82°C. This
means that with low engine load in lower ambient temperature this viscous fan clutch will
stay at around 2200 min-1, even if less cooling is necessary, this means lower efficiency and
higher noise emissions at these conditions, but lower risk of hydraulic system overheating.
This viscous fan clutch has no option of changing the bimetal element pretension, so the
engagement temperature can be changed only by the clutch manufacturer.
Figure 62 Supplier 4 viscous fan clutch characteristic for input rotational speed of 3200 min-1
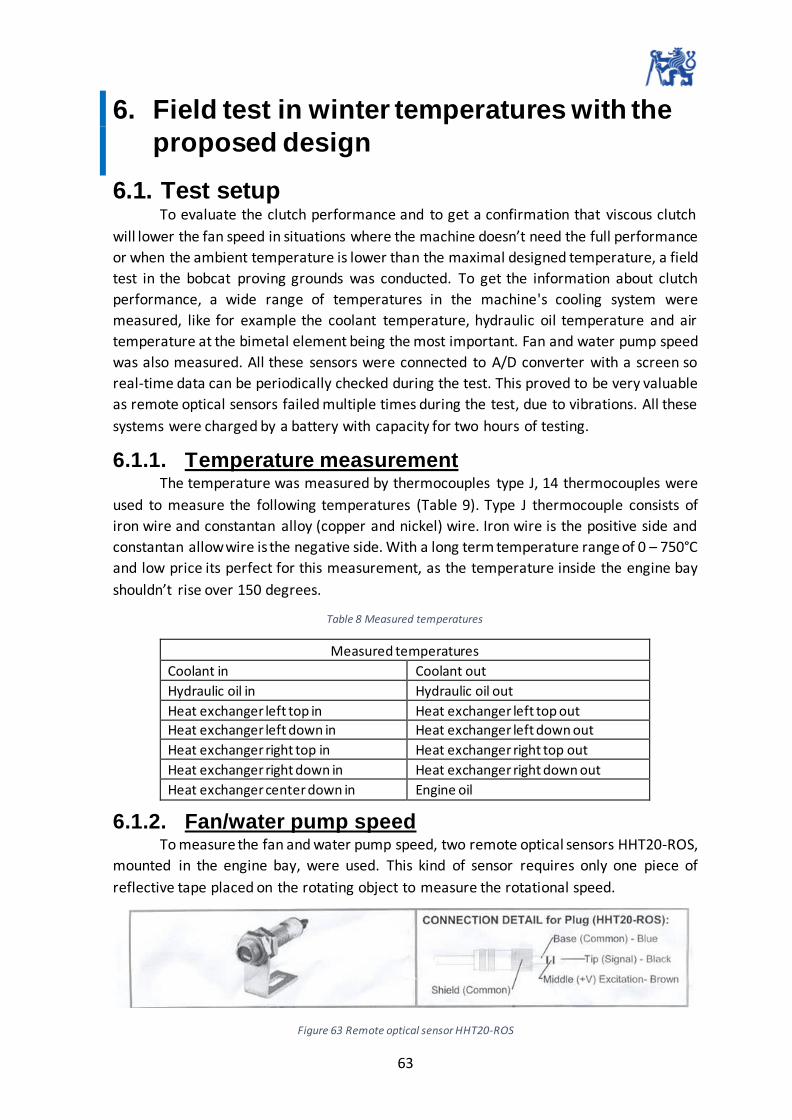
63
6. Field test in winter temperatures with the
proposed design
6.1. Test setup To evaluate the clutch performance and to get a confirmation that viscous clutch
will lower the fan speed in situations where the machine doesn’t need the full performance
or when the ambient temperature is lower than the maximal designed temperature, a field
test in the bobcat proving grounds was conducted. To get the information about clutch
performance, a wide range of temperatures in the machine's cooling system were
measured, like for example the coolant temperature, hydraulic oil temperature and air
temperature at the bimetal element being the most important. Fan and water pump speed
was also measured. All these sensors were connected to A/D converter with a screen so
real-time data can be periodically checked during the test. This proved to be very valuable
as remote optical sensors failed multiple times during the test, due to vibrations. All these
systems were charged by a battery with capacity for two hours of testing.
6.1.1. Temperature measurement The temperature was measured by thermocouples type J, 14 thermocouples were
used to measure the following temperatures (Table 9). Type J thermocouple consists of
iron wire and constantan alloy (copper and nickel) wire. Iron wire is the positive side and
constantan allow wire is the negative side. With a long term temperature range of 0 – 750°C
and low price its perfect for this measurement, as the temperature inside the engine bay
shouldn’t rise over 150 degrees.
Table 8 Measured temperatures
Measured temperatures
Coolant in Coolant out
Hydraulic oil in Hydraulic oil out
Heat exchanger left top in Heat exchanger left top out
Heat exchanger left down in Heat exchanger left down out
Heat exchanger right top in Heat exchanger right top out
Heat exchanger right down in Heat exchanger right down out
Heat exchanger center down in Engine oil
6.1.2. Fan/water pump speed To measure the fan and water pump speed, two remote optical sensors HHT20-ROS,
mounted in the engine bay, were used. This kind of sensor requires only one piece of
reflective tape placed on the rotating object to measure the rotational speed.
Figure 63 Remote optical sensor HHT20-ROS
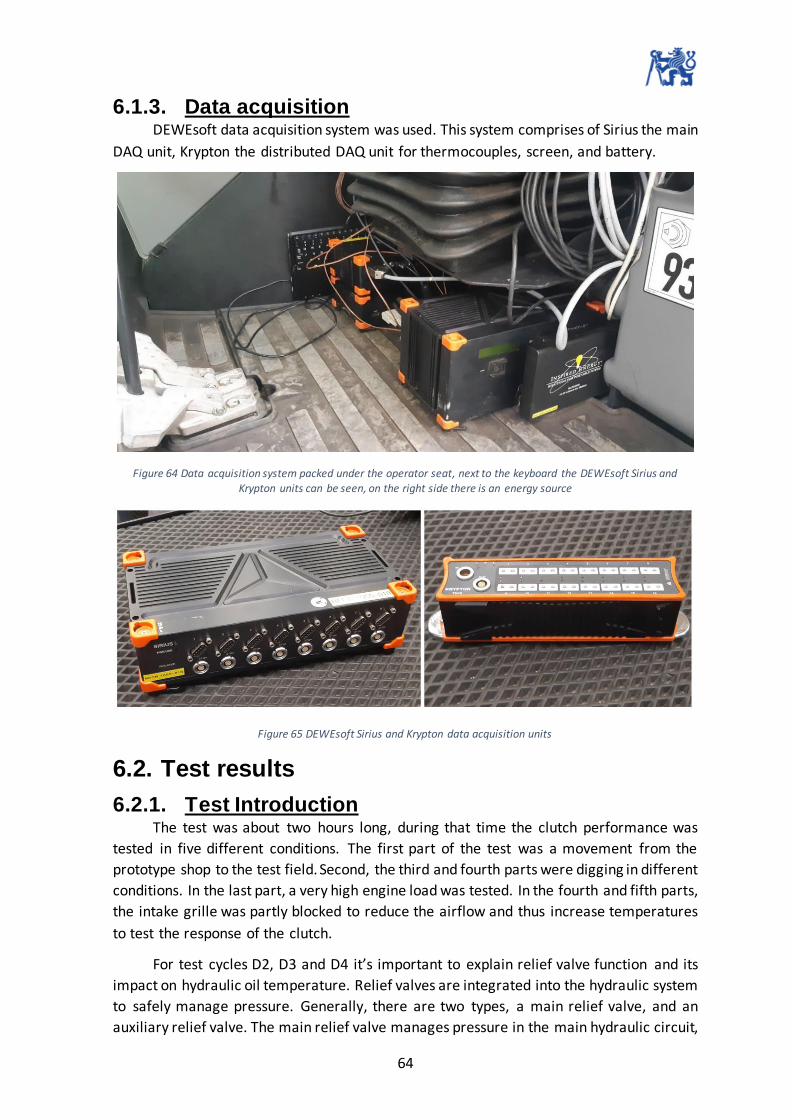
64
6.1.3. Data acquisition DEWEsoft data acquisition system was used. This system comprises of Sirius the main
DAQ unit, Krypton the distributed DAQ unit for thermocouples, screen, and battery.
Figure 64 Data acquisition system packed under the operator seat, next to the keyboard the DEWEsoft Sirius and Krypton units can be seen, on the right side there is an energy source
Figure 65 DEWEsoft Sirius and Krypton data acquisition units
6.2. Test results
6.2.1. Test Introduction The test was about two hours long, during that time the clutch performance was
tested in five different conditions. The first part of the test was a movement from the
prototype shop to the test field. Second, the third and fourth parts were digging in different
conditions. In the last part, a very high engine load was tested. In the fourth and fifth parts,
the intake grille was partly blocked to reduce the airflow and thus increase temperatures
to test the response of the clutch.
For test cycles D2, D3 and D4 it’s important to explain relief valve function and its
impact on hydraulic oil temperature. Relief valves are integrated into the hydraulic system
to safely manage pressure. Generally, there are two types, a main relief valve, and an
auxiliary relief valve. The main relief valve manages pressure in the main hydraulic circuit,
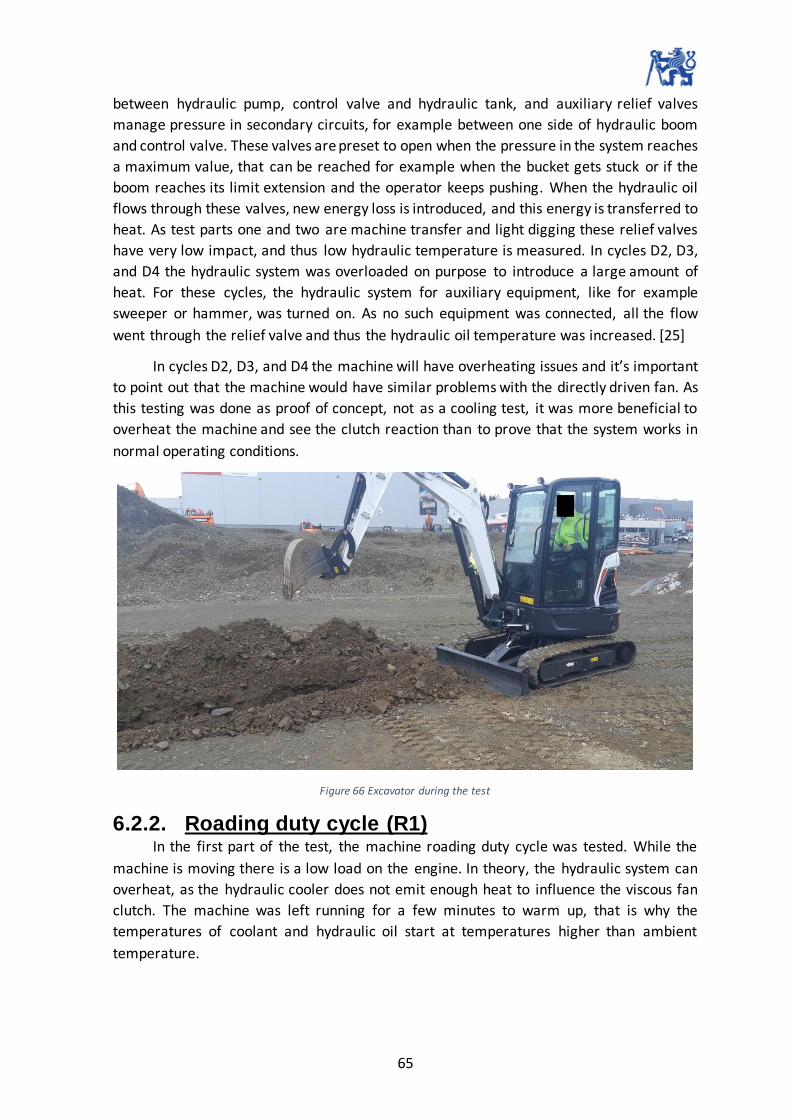
65
between hydraulic pump, control valve and hydraulic tank, and auxiliary relief valves
manage pressure in secondary circuits, for example between one side of hydraulic boom
and control valve. These valves are preset to open when the pressure in the system reaches
a maximum value, that can be reached for example when the bucket gets stuck or if the
boom reaches its limit extension and the operator keeps pushing. When the hydraulic oil
flows through these valves, new energy loss is introduced, and this energy is transferred to
heat. As test parts one and two are machine transfer and light digging these relief valves
have very low impact, and thus low hydraulic temperature is measured. In cycles D2, D3,
and D4 the hydraulic system was overloaded on purpose to introduce a large amount of
heat. For these cycles, the hydraulic system for auxiliary equipment, like for example
sweeper or hammer, was turned on. As no such equipment was connected, all the flow
went through the relief valve and thus the hydraulic oil temperature was increased. [25]
In cycles D2, D3, and D4 the machine will have overheating issues and it’s important
to point out that the machine would have similar problems with the directly driven fan. As
this testing was done as proof of concept, not as a cooling test, it was more beneficial to
overheat the machine and see the clutch reaction than to prove that the system works in
normal operating conditions.
Figure 66 Excavator during the test
6.2.2. Roading duty cycle (R1) In the first part of the test, the machine roading duty cycle was tested. While the
machine is moving there is a low load on the engine. In theory, the hydraulic system can
overheat, as the hydraulic cooler does not emit enough heat to influence the viscous fan
clutch. The machine was left running for a few minutes to warm up, that is why the
temperatures of coolant and hydraulic oil start at temperatures higher than ambient
temperature.

66
Figure 67 Water pump rotations, fan rotations, and clutch slip during the first part of the test
The blue line represents water pump rotations which in case of directly driven fan
would also represent fan rotations. Figure 67 shows that fan rotations are lower by almost
1000 min-1, this would mean theoretically lower noise emissions by 7 dBA. The clutch is set
up so under 2000 min-1 there is not enough torque to generate slip, this state is present at
around 115-120 s and 375 s marks. The water pump rotations decrease under 2200 min-1
and the slip decreases to around 5%. This inherent slip is always present and can be an
advantage as was mentioned in chapter 4.
Figure 68 Temperatures and fan rotations during the first part of the test
Figure 68 shows that hydraulic oil temperature slowly increases during the test, but
the temperature stays under 55°C during the whole tests, at the end of the test the
hydraulic oil temperature starts to influence the air temperature at clutch bimetal, but the
temperature never rises over 45°C so there is no reaction from the clutch and the fan stays
at stable rotations.

67
6.2.3. Light digging duty cycle (D1) In light-duty digging operation, low engine load was expected. This resulted in high engine
rotations close to high idle and low coolant and hydraulic oil temperatures. The machine
was warmed up from the previous test. Figure 69 shows that during this test the water
pump rotations are around 3200 min-1 thus there is a low engine load, as was expected.
The fan rotations are stable and at the minimum that the clutch allows. The clutch slip is
around 32%. At this fan rotations, significant noise emissions reduction can be expected.
Figure 69 Water pump rotations, fan rotations, and clutch slip during the second part of the test
Figure 70 shows that the hydraulic oil temperature rises almost up to 70°C, where
it stabilizes. Engine temperature, as in the first part of the testing, is between 70 and 75°C.
The air temperature at the clutch bimetal is again under 45°C, well under 55°C that would
result in a reaction from the viscous clutch.
Figure 70 Temperatures and fan rotations during the second part of the test

68
6.2.4. Heavy digging duty cycle (D2) In the heavy digging duty cycle, the tested machine was operated close to engine
rated speed. A combination of heavy digging and auxiliary hydraulic system activation, as
described in the test introduction, increased the hydraulic temperature to its limit of 105°C.
Every time the hydraulic oil temperature reached 105°C, the load was decreased, this can
be seen in figure x as water pump rotations go up. From the point of 1300 s increase in fan
speed can be seen, which is the result of a sudden spike of air temperature at the bimetal
element.
Figure 71 Water pump rotations, fan rotations, and clutch slip during the third part of the test
In Figure 72 the hydraulic temperature spikes can be seen, in the second half of the
test. The hydraulic temperature has some impact on the air temperature at the bimetal
element, thus on fan speed, but not enough to increase the fan speed significantly. This
points toward the side by side heat exchanger problem described in chapter four. This
problem can be solved by different heat exchanger configuration or by adjusting the clutch
sensitivity.
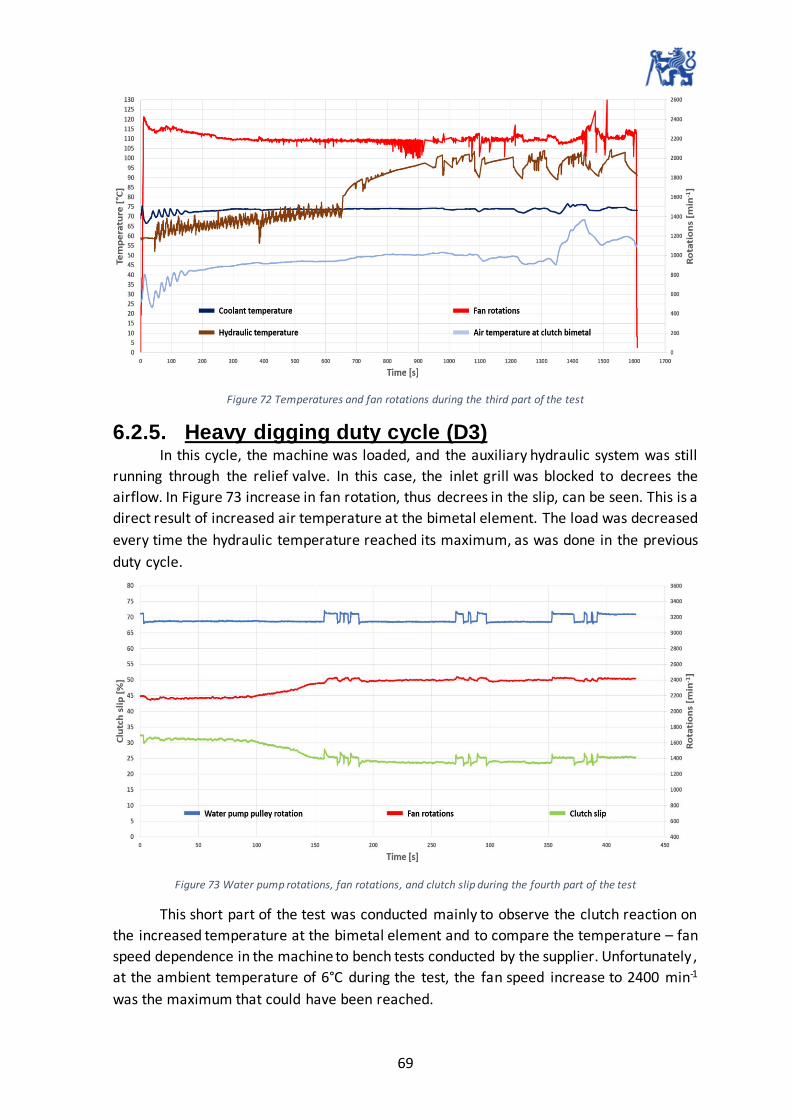
69
Figure 72 Temperatures and fan rotations during the third part of the test
6.2.5. Heavy digging duty cycle (D3) In this cycle, the machine was loaded, and the auxiliary hydraulic system was still
running through the relief valve. In this case, the inlet grill was blocked to decrees the
airflow. In Figure 73 increase in fan rotation, thus decrees in the slip, can be seen. This is a
direct result of increased air temperature at the bimetal element. The load was decreased
every time the hydraulic temperature reached its maximum, as was done in the previous
duty cycle.
Figure 73 Water pump rotations, fan rotations, and clutch slip during the fourth part of the test
This short part of the test was conducted mainly to observe the clutch reaction on
the increased temperature at the bimetal element and to compare the temperature – fan
speed dependence in the machine to bench tests conducted by the supplier. Unfortunately ,
at the ambient temperature of 6°C during the test, the fan speed increase to 2400 min-1
was the maximum that could have been reached.

70
Figure 74 Temperatures and fan rotations during the fourth part of the test
6.2.6. Overload duty cycle (D4) In the last part of testing the machine was overloaded by running into a pile of dirt.
With no possibility of moving this pile the machine overloaded. The engine speed
decreased to 2000 min-1 and the combination of high load and grille blocking resulted in
temperature increase. Lower engine speed translates to lower fan torque, which results in
lower maximal slip. In this case, the maximal slip (the clutch fully decoupled) is around 22%.
With the increased temperature the clutch reaches full coupling.
Figure 75 Water pump rotations, fan rotations, and clutch slip during the fifth part of the test
The temperature at the clutch bimetal element rises to 75°C. The hydraulic system
overheats but considering the conditions it is not surprising. And considering that it took
600s for the overheating to happen it is not a bad result.

71
Figure 76 Temperatures and fan rotations during the fifth part of the test
Figure 77 Excavator is pushing into a pile of dirt to overload the engine
72
6.3. Test conclusion In conclusion, it was proven that the viscous fan clutch can significantly reduce fan
speed in lower ambient temperatures. Further testing is needed for confirmation, but the
test results suggest that for light digging, idle and roading cycle, viscous fan clutch works
without major risks, the coolant and hydraulic oil temperatures are stable, and the fan
speed is significantly lower than with the directly driven fan. For the heavy digging cycle
and overload cycle the viscous clutch is also effective, but the problem with side by side
heat exchanger was highlighted. The solution could be changing the heat exchanger
configuration or changing the clutch setting. Lower clutch engagement temperature would
increase the sensitivity of the clutch and thus eliminate overheating.

73
7. Conclusion
In the first part of this thesis theory of the noise legislation, excavator noise sources
and noise reduction technologies and their principles were explained. With knowledge of
noise legislation, noise test procedure, and noise sources of the excavators, it was decided
to proceed with the reduction of cooling system noise, and the bimetal viscous fan clutch
was selected as an optimal solution to reach the objective of this thesis. Electric fans,
variable pitch fan, fan witch flexible extensions, and controlled viscous fan clutch were also
considered.
The second part details the viscous fan clutch integration process from the baseline
measurements to final viscous fan clutch selection in chronological order. I this part an
excavator cooling system simulation was also run. The obtained simulation results
indicated that the viscous fan clutch can decrees noise emissions by 4 dBA and lower fuel
consumption by up to 6% for 20°C ambient temperature. To select the best option out of 5
possible candidates, proposed by suppliers, an airflow measurement and noise test were
performed. Two candidates witch the best airflow performance and lowest noise emissions
were selected for further testing. The data from the noise test suggest that, with viscous
fan clutch, noise emissions can be lowered to 93 dBA in homologation noise test, this would
introduce the possibility to homologate and sell this machine on EU market, as the
permissible sound power level for this machine is 93.9 dBA.
In the last part of the thesis, a field test was conducted to evaluate the clutch
performance in real-world conditions and to gain data and experience important to
establish a base for efficient and safe viscous fan clutch settings. This test confirmed that
the viscous fan clutch reduces fan speed, thus reduces noise emissions in lower ambient
temperatures or conditions with lower load requirements.
The author strongly believes that with gained experience and knowledge from this thesis,
a similar solution can be developed for any similar or larger machine, resulting in lower
real-world and homologation noise emissions and lower accessory power drain, thus lower
fuel consumption, while keeping the design changes to the machine on a minimal level and
managing the increase in development and production costs for the manufacturer on a
reasonable level.

74
References
[1] ISO 6165:2012. Earth Moving Machinery: Basic Types. Sixth edition. Geneva,
Switzerland: International Organization for Standardization, 2012.
[2] ISO 7135:2009. Earth Moving Machinery: Hydraulic Excavators. Second edition.
Geneva, Switzerland: International Organization for Standardization, 2009.
[3] Fuller, D. and Fuller, D., 2020. Understanding Fan Clutches — And When It's Time
to Replace Yours - Onallcylinders. [online] OnAllCylinders. [Accessed 3 March
2020]. Available at: https://www.onallcylinders.com/2016/11/10/understanding-
fan-clutches-time-replace
[4] Inicio, P., 2020. Modulator-lcv40-drive. [online] [Accessed 3 March 2020]. Available
at: https://www.hortonww.com/off-highway/drives/modulator-lcv40-drive.html
[5] Wingfan.com. 2020. BLEX® Technology | Wingfan. [online] [Accessed 5 March
2020]. Available at: https://www.wingfan.com/technology/blexr-blade-extensions/
[6] Multi-wing.com. 2020. Multi-Wing - Multi-Wing Fan Profiles. [online] [Accessed 5
March 2020]. Available at: http://www.multi-wing.com/en/products/multi-wing-
fan-profiles/#Multi-Wing%C6%90PS
[7] Brownfield, M., 2008. Improving Alternator Efficiency Measurably Reduces Fuel
Costs. Delcoremy, [online] p.28. [Accessed 30 March 2020]. Available at:
http://www.delcoremy.com/documents/high-efficiency-white-paper.aspx
[8] Cleanfix.org. 2020. Cleanfix VP. [online] [Accessed 24 April 2020]. Available at:
https://cleanfix.org/en/products/cleanfix-vp
[9] NAKASHIMA, H., UEDA, K. and TSUCHIHASHI, T., 2013. Ultra-low Noise Hydraulic
Excavators Using a Newlydeveloped Cooling System (iNDr). KOBELCO TECHNOLOGY
REVIEW, [online] (31), p.7. [Accessed 4 February 2020]. Available at:
<https://www.kobelco.co.jp/english/ktr/pdf/ktr_31/012-018.pdf
[10] Elliot, R., 1999. A-Weighting Filter. [online] Sound-au.com. [Accessed 9 May 2020].
Available at: https://sound-au.com/project17.htm
[11] Directive 2000/14/EC of the European Parliament and of the Council of 8 May 2000
on the approximation of the laws of the Member States relating to the noise
emission in the environment by equipment for use outdoors. [Online]. [Accessed 31
Feb 2020]. Available from: http://eur-lex.europa.eu/
[12] Engineering ToolBox, (2003). Pump Affinity Laws. [online] [Accessed 9 May 2020]
Available at: https://www.engineeringtoolbox.com/affinity-laws-d_408.html
[13] Creasey, J., 2017. How Do I Connect Light Bulbs to An Alternator on a Bike? [online]
Electrical Engineering Stack Exchange. [Accessed 11 April 2020] Available at:
https://electronics.stackexchange.com/questions/302712/how-do-i-connect-light-
bulbs-to-an-alternator-on-a-bike/302729#302729

75
[14] Climate.copernicus.eu. 2020. Average Surface Air Temperature Monthly Maps |
Copernicus. [online] [Accessed 12 April 2020]. Available at:
https://climate.copernicus.eu/average-surface-air-temperature-monthly-maps
[15] National Centers for Environmental Information (NCEI). 2019. Assessing the U.S.
Climate In 2018. [online] [Accessed 12 April 2020]. Available at:
https://www.ncei.noaa.gov/news/national-climate-201812
[16] Mansour, Ali, 2015. 3.9L Cummins Engine: Pros & Cons of the 4BT Diesel. [online]
DrivingLine. [Accessed 16 April 2020]. Available at:
https://www.drivingline.com/articles/39l-cummins-engine-4bt-diesel-pros-cons
[17] NOVOTNÝ, P.; PÍŠTĚK, V. Virtual Engine - A Tool for Noise and Vibration Solution.
MECCA - Journal of Middle European Construction and Design of Cars, 2009, vol.
2009, no. 1, p. 1-8. ISSN: 1214- 0821.
[18] ISO 6395:2008. Earth-moving machinery — Determination of sound power level —
Dynamic test conditions. Second edition. Geneva, Switzerland: International
Organization for Standardization, 2008.
[19] ISO 3744:2010. Acoustics — Determination of sound power levels and sound
energy levels of noise sources using sound pressure — Engineering methods for an
essentially free field over a reflecting plane. Third edition. Geneva, Switzerland:
International Organization for Standardization, 2010.
[20] Kit Masters. 2017. Tech Tips | Kit Masters. [online] [Accessed 6 June 2020].
Available at: https://kit-masters.com/video-gallery/tech-tips
[21] Regulation (EU) No 540/2014 of the European Parliament and of the Council of 16
April 2014 on the sound level of motor vehicles and of replacement silencing systems.
[Online]. [Accessed 05 June 2020]. Available from: http://eur-lex.europa.eu/
[22] Euro.WHO.int. 2020. Environmental Noise Guidelines for the European Region
(2018). [online]. [Accessed 5 July 2020] Available at:
https://www.euro.who.int/en/publications/abstracts/environmental-noise-
guidelines-for-the-european-region-2018
[23] 2019. 2019 ASHRAE Handbook Heating Ventilating and Air-Conditioning
Applications. [S.l.]: American Society of Heating Refrigerating and Air-Conditioning
Engineers Inc. (ASHRAE).
[24] Magna, K., 2018. Tutorial KULI 12. 12th ed. Magna.
[25] Gannon, M., 2019. How Do Relief Valves Work?. [online] Mobilehydraulictips.com.
[Accessed 28 June 2020]. Available at: https://www.mobilehydraulictips.com/how-
do-relief-valves-work

76
List of Figures
Figure 1 2-3 tonne compact excavator .................................................................................. 3
Figure 2 2-3 tonne excavator powertrain layout................................................................... 4
Figure 3 Reference box on one reflecting plane [19] ............................................................ 6
Figure 4 Microphone array on the hemisphere (12 microphone positions) [11] ................. 7
Figure 5 Excavator workgroup and attachments .................................................................. 9
Figure 6 Frequency response of the A-weighting filter [10]................................................ 11
Figure 7 Powertrain noise sources ...................................................................................... 12
Figure 8 FFT spectrum from homologation noise test, firing, crank and water pump
frequencies indicated .......................................................................................................... 14
Figure 9 Example of torque on the injection pump drive [17] and mechanical diesel injection
pump [16] for a 6-cylinder inline diesel engine ................................................................... 15
Figure 10 Geometry of an expansion chamber muffler ...................................................... 15
Figure 11 Transmission loss of exemplar expansion chamber ............................................ 16
Figure 12 FFT spectrum from homologation noise test, fan, and hydraulic devices
frequencies indicated .......................................................................................................... 18
Figure 13 Noise camera measuring noise sources in the engine bay of the 2-3 tonne
excavator ............................................................................................................................. 19
Figure 14 Rearview, multi-source analysis of contributions across the whole frequency
specter ................................................................................................................................. 19
Figure 15 Rearview, multi-source analysis of contributions across the whole frequency
specter, without encloser and counterweight .................................................................... 20
Figure 16 OOS and fan immersion dimensions ................................................................... 22
Figure 17 Tip clearance impact ............................................................................................ 22
Figure 18 Impact of flexible extensions on fan performance on general Multi wing fan [6]
............................................................................................................................................. 23
Figure 19 Wing fan Blex technology [5]............................................................................... 23
Figure 20 Performance comparison between a fan with and without flexible extensions
(data for 3000 min-1)............................................................................................................ 24
Figure 21 Pump affinity laws, the increase in water pump speed will increase the flow in a
cooling system [12] .............................................................................................................. 25
Figure 22 Bimetal viscous fan clutch prototype .................................................................. 26
Figure 23 Bimetal viscous fan clutch cut, thermal spring on this picture is previously
mentioned bimetal element [3] .......................................................................................... 26
Figure 24 Side by side cooler on the left and serial heat exchanger configuration on left 27
Figure 25 Bimetal viscous clutch integrated into the 2-3 tonne excavator ........................ 28
77
Figure 26 Horton LCV40 controlled viscous fan clutch [4] .................................................. 29
Figure 27 Electric fans fitment issue.................................................................................... 31
Figure 28 Electric fan fan-curve and efficiency dependence on airflow ............................. 31
Figure 29 Model alternator characteristic [13] ................................................................... 32
Figure 30 Variable pitch fan................................................................................................. 32
Figure 31 Variable pitch fan integrated into the 2-3 tonne excavator................................ 33
Figure 32 Measuring device, Grille separated to sections, measuring device and blocked air
passages ............................................................................................................................... 36
Figure 33 Fan curve for rated engine rotations................................................................... 37
Figure 34 Static pressure dependence on airflow ............................................................... 38
Figure 35 Supplier 1 vs. current product fan airflow performance comparison................. 39
Figure 36 Supplier 2, option 1 vs. current product fan airflow performance comparison . 39
Figure 37 Supplier 2, option 2 vs. current product fan airflow performance comparison . 40
Figure 38 Supplier 3 vs. current product fan airflow performance comparison................. 40
Figure 39 Supplier 4 vs. current product fan airflow performance comparison................. 41
Figure 40 Cooling system model in Kuli software ............................................................... 43
Figure 41 Coolant circuit model in Kuli software ................................................................ 43
Figure 42 Hydraulic oil circuit model in Kuli software ......................................................... 44
Figure 43 Fan component in Kuli software.......................................................................... 44
Figure 44 Build in resistance in Kuli software...................................................................... 45
Figure 45 Airpath through the engine bay .......................................................................... 45
Figure 46 HVAC in Kuli software .......................................................................................... 46
Figure 47 Airpath connecting the component models in Kuli software.............................. 46
Figure 48 Minimal fan speed dependence on ambient temperature for directly driven fan
and for variable drive fan .................................................................................................... 47
Figure 49 Fan noise dependence on ambient temperature for directly driven fan and
variable drive fan ................................................................................................................. 48
Figure 50 Fan power dependence on ambient temperature for directly driven fan and for
variable drive fan, and fuel consumption reduction dependance on ambient temperature
............................................................................................................................................. 49
Figure 51 New water pump pulley design, transmission ratio 1,3 ...................................... 50
Figure 52 Flange to connect the water pump pulley to the threaded connection on viscous
fan clutch ............................................................................................................................. 51
Figure 53 mounting system of directly driven fan (left) and new mounting system for
viscous fan clutch (right)...................................................................................................... 51

78
Figure 54 New parts designed for testing, normal size pulley for airflow measurement is on
the left with crankshaft/water pump ration of 1,22, in the center fan delete flange can be
seen and on the right, there is large diameter pulley for noise testing, these pullies had
crankshaft/water pump ratio of 0,89-0,91.......................................................................... 52
Figure 55 Thermocouple positions during the airflow measurement ................................ 53
Figure 56 2-3 tonne excavator, before airflow measurement ............................................ 53
Figure 57 2-3 tonne excavator in the anechoic chamber.................................................... 57
Figure 58 2-3 tonne compact excavator bystander CPB spectrum, new fan options vs.
current production fan ........................................................................................................ 58
Figure 59 2-3 tonne compact excavator bystander FFT spectrum, new fan options vs.
current production fan ........................................................................................................ 58
Figure 60 Viscous fan clutch parts ....................................................................................... 60
Figure 61 Supplier 3 viscous fan clutch characteristic for input rotational speed of 3200 min-
1 ............................................................................................................................................ 61
Figure 62 Supplier 4 viscous fan clutch characteristic for input rotational speed of 3200 min-
1 ............................................................................................................................................ 62
Figure 63 Remote optical sensor HHT20-ROS ..................................................................... 63
Figure 64 Data acquisition system packed under the operator seat, next to the keyboard
the DEWEsoft Sirius and Krypton units can be seen, on the right side there is an energy
source................................................................................................................................... 64
Figure 65 DEWEsoft Sirius and Krypton data acquisition units ........................................... 64
Figure 66 Excavator during the test..................................................................................... 65
Figure 67 Water pump rotations, fan rotations and clutch slip during first part of test .... 66
Figure 68 Temperatures and fan rotations during the first part of the test ....................... 66
Figure 69 Water pump rotations, fan rotations, and clutch slip during the second part of
the test ................................................................................................................................. 67
Figure 70 Temperatures and fan rotations during the second part of the test .................. 67
Figure 71 Water pump rotations, fan rotations, and clutch slip during the third part of the
test ....................................................................................................................................... 68
Figure 72 Temperatures and fan rotations during the third part of the test...................... 69
Figure 73 Water pump rotations, fan rotations, and clutch slip during the fourth part of the
test ....................................................................................................................................... 69
Figure 74 Temperatures and fan rotations during the fourth part of the test ................... 70
Figure 75 Water pump rotations, fan rotations, and clutch slip during the fifth part of the
test ....................................................................................................................................... 70
Figure 76 Temperatures and fan rotations during the fifth part of the test ....................... 71
Figure 77 Excavator is pushing into a pile of dirt to overload the engine........................... 71
79
List of Tables
Table 1 2-3 tonne excavator base parameters ...................................................................... 3
Table 2 Maximal sound pressure levels for excavators in EU [11] ........................................ 5
Table 3 Multiple-criteria decision analysis .......................................................................... 34
Table 4 Airspeed measured at rated engine rotations........................................................ 36
Table 5 Multiple-criteria decision analysis .......................................................................... 41
Table 6 Airflow measurement results comparison ............................................................. 57
Table 8 Airflow measurement and noise test results comparison...................................... 59
Table 9 Measured temperatures ......................................................................................... 63

80
List of Abbreviations
CAD Computer Aided Design
AC Air Condoning
USA United States of America
OOS Out of Shroud
EU European Union
NA North America
EC European Council
EMEA Europe, Middle east & Africa
ECU Engine Control Unit
VCU Vehicle Control Unit
FFT Fast Fourier Transform
CPB Constant Percentage Bandwidth
OHV Over Head Valve
A/D Analog/Digital
DAQ Data Acquisition
WHO World Health Organisation


