Embed Size (px)
Citation preview
METHODS AND RESOURCES
CombiANT: Antibiotic interaction testing
made easy
Nikos Fatsis-KavalopoulosID1, Roderich RoemhildID
1, Po-Cheng TangID1,2,
Johan KreugerID2, Dan I. AnderssonID
1*
1 Department of Medical Biochemistry and Microbiology, Uppsala University, Uppsala, Sweden,
2 Department of Medical Cell Biology, Uppsala University, Uppsala, Sweden
Abstract
Antibiotic combination therapies are important for the efficient treatment of many types of
infections, including those caused by antibiotic-resistant pathogens. Combination treatment
strategies are typically used under the assumption that synergies are conserved across spe-
cies and strains, even though recent results show that the combined treatment effect is
determined by specific drug–strain interactions that can vary extensively and unpredictably,
both between and within bacterial species. To address this problem, we present a new
method in which antibiotic synergy is rapidly quantified on a case-by-case basis, allowing for
improved combination therapy. The novel CombiANT methodology consists of a 3D-printed
agar plate insert that produces defined diffusion landscapes of 3 antibiotics, permitting syn-
ergy quantification between all 3 antibiotic pairs with a single test. Automated image analysis
yields fractional inhibitory concentration indices (FICis) with high accuracy and precision. A
technical validation with 3 major pathogens, Escherichia coli, Pseudomonas aeruginosa,
and Staphylococcus aureus, showed equivalent performance to checkerboard methodol-
ogy, with the advantage of strongly reduced assay complexity and costs for CombiANT. A
synergy screening of 10 antibiotic combinations for 12 E. coli urinary tract infection (UTI)
clinical isolates illustrates the need for refined combination treatment strategies. For exam-
ple, combinations of trimethoprim (TMP) + nitrofurantoin (NIT) and TMP + mecillinam
(MEC) showed synergy, but only for certain individual isolates, whereas MEC + NIT combi-
nations showed antagonistic interactions across all tested strains. These data suggest that
the CombiANT methodology could allow personalized clinical synergy testing and large-
scale screening. We anticipate that CombiANT will greatly facilitate clinical and basic
research of antibiotic synergy.
Introduction
Antibiotic therapy increasingly relies on the combined activity of 2 or more agents. Combina-
tions of antibiotics are applied for up to 50% of patient cases in the treatment of severe surgical
site infections, bacteremia, pneumonia, or septic shock [1–4]. Antibiotic combinations are also
frequently prescribed as prophylactic treatments to prevent post-operation-related infections
PLOS BIOLOGY
PLOS Biology | https://doi.org/10.1371/journal.pbio.3000856 September 17, 2020 1 / 22
a1111111111
a1111111111
a1111111111
a1111111111
a1111111111
OPEN ACCESS
Citation: Fatsis-Kavalopoulos N, Roemhild R, Tang
P-C, Kreuger J, Andersson DI (2020) CombiANT:
Antibiotic interaction testing made easy. PLoS Biol
18(9): e3000856. https://doi.org/10.1371/journal.
pbio.3000856
Academic Editor: Tobias Bollenbach, Universitat zu
Koln, GERMANY
Received: April 1, 2020
Accepted: August 20, 2020
Published: September 17, 2020
Copyright: © 2020 Fatsis-Kavalopoulos et al. This
is an open access article distributed under the
terms of the Creative Commons Attribution
License, which permits unrestricted use,
distribution, and reproduction in any medium,
provided the original author and source are
credited.
Data Availability Statement: All relevant data are
within the paper and its Supporting Information
files.
Funding: This research was funded by the Swedish
Research Council (VR grant 2017-01527 to DIA)
and Uppsala University and Uppsala Antibiotic
Centre (to JK). The funders had no role in study
design, data collection and analysis, decision to
publish, or preparation of the manuscript.
Competing interests: The authors of this
manuscript have the following competing interests:
[5,6] and in the treatment of complicated chronic infections [7–9]. The rationale for combina-
tion therapy compared to monotherapy is 3-fold: (i) a broadened activity range by combining
the different modes of action, pharmacodynamics, and pharmacokinetics of different antibiot-
ics, (ii) stronger treatment effect, and (iii) reduced risk of resistance evolution. The spread of
antibiotic resistance has put an emphasis on the latter property, in that treatments need to be
effective despite preexisting resistance and emergence of resistance during treatment needs to
be prevented [10–12]. Combinations of certain antibiotics show high efficacy against resistant
pathogens [13], and several cases exist in which combinations allow treatment of, e.g., vanco-
mycin-resistant Staphylococcus aureus (VRSA) [14], resistant bacteria that express beta-lacta-
mase [15], and heteroresistant pathogen populations that are refractory to killing by a single
antibiotic [16]. Moreover, antibiotic combinations often reduce the rate of resistance evolution
during treatment, especially for chronic infections, as highlighted by P. aeruginosa in cystic
fibrosis and other bacterial pathogens [10,17–19]. The efficacy of these multitarget treatments
is likely explained by a requirement for the co-occurrence of multiple resistance factors for
treatment escape.
The individual inhibitory effects of antibiotics on the bacterial cell can interact to produce
combination effects that are either stronger (synergistic) [20,21] or weaker (antagonistic) [22]
than expected from additivity. Antagonistic and especially suppressive drug interactions could
reduce the treatment effect, and, conversely, positive synergistic activities could provide an
edge in refined combination therapy. Thus, the proper use of combination therapy hinges
upon our ability to quantify the synergy profile of antibiotic combinations.
Synergy and antagonism are not inherent properties of an antibiotic pair but arise from the
combination of actions that the antibiotics have on bacterial cells. Thus, the interaction, be it
positive, additive, or negative, is the net effect of drug-induced damage and drug-defense
responses. As a result, variation in the genetics and physiology of the bacterial population
could potentially cause variation in antibiotic interaction type. Indeed, several recent studies
have shown that co-treatment with different pairs of clinically relevant antibiotics exhibit
interaction patterns that depend both on the bacterial species and the specific strain within a
species [23–26]. Together, these data strongly support the idea that antibiotic interactions
depend on genetic variation in the bacterium, which is currently not considered for combina-
tion therapy in clinical settings.
Refined combination therapy requires a case-by-case examination of antibiotic interactions
for each patient isolate. However, such personalized diagnostics is—because of its complexity
and high labor cost—not feasible with the current gold-standard methods, broth-based check-
erboard assays and time-kill experiments [27,28]. Agar plate-based methods are easier to per-
form and multiplex but suffer from other drawbacks. Antibiotic disk diffusion can be used for
the qualitative detection of strong interactions between antibiotics, provided that multiple
disks loaded with different antibiotics are placed in sufficient proximity to generate areas of an
agar plate with multiple antibiotics acting together [29,30]. The shape of the combined inhibi-
tion zone provides a qualitative indication of synergy or antagonism. An extension of the disk
diffusion generates more defined areas of antibiotic combination gradients using cross-forma-
tion of antibiotic gradient strips (Epsilometer tests) [27] or filter paper strips [31]. There are,
however, some drawbacks of using these assays. Gradient strips need to cross each other at
their minimal inhibitory concentration (MIC) values for the assay to allow a calculation of the
combinatory effect, while the filter paper strips need to be removed after application and can-
not be part of the plate while inoculating. Although these methods produce quantitative mea-
surements, they are restricted to 2 antibiotics per plate and require advance knowledge of the
MICs of the antibiotics tested. An assay that could produce quantitative measurements of
PLOS BIOLOGY Antibiotic interaction
PLOS Biology | https://doi.org/10.1371/journal.pbio.3000856 September 17, 2020 2 / 22
A patent comprising the described method has
been filed by the authors and is pending under
number 640 SE 2050304-1.
Abbreviations: AMP, ampicillin; CFU, colony
forming units; CIP, ciprofloxacin; CP, combination
inhibitory point; CTX, cefotaxime; EUCAST,
European Committee on Antimicrobial
Susceptibility Testing; FEM, finite elements
method; FICi, fractional inhibitory concentration
index; FOF, fosfomycin; GEN, gentamicin; IC,
inhibitory concentration; MEC, mecillinam; MIC,
minimal inhibitory concentration; NIT,
nitrofurantoin; OD, optical density at 600 nm; SD,
standard deviation; TMP, trimethoprim; UTI,
urinary tract infection; VRSA, vancomycin-resistant
Staphylococcus aureus.
antibiotic synergy while still remaining simple enough to use would ideally serve the needs
both of clinical and academic laboratories alike.
In this study, we present a new and easy-to-conduct assay for testing antibiotic synergy that
is robust and highly quantitative. Our solution, CombiANT, is a diffusion-based assay that
provides quantitative information of all pairwise interactions of 3 antibiotics in a single agar
plate. The present study shows that CombiANT performs equally well to broth-based checker-
board methodology, but due to its unique design and function, offers much reduced method
complexity that is comparable to a disk diffusion test. Similar to checkerboard assays, Com-
biANT produces fractional inhibitory concentration indices (FICis) but enables higher
throughput. The assay can be applied without previous information of the susceptibility of the
strain. We demonstrate the potential of CombiANT for antibiotic interaction screening by
applying the assay to the antibiotics used for treating E. coli urinary tract infections (UTIs).
Lastly, we identified conserved and variable antibiotic interactions that have high potential for
personalized and refined combination therapy.
Results
CombiANT assay and system design
The CombiANT assay was designed to fulfil the following criteria: (i) the generation of quanti-
tative information of antibiotic interactions, (ii) a reduction of assay complexity and work
hours for assay preparation and analysis, (iii) high throughput, and (iv) easy integration into
clinical microbiology laboratory routines. Our solution is a diffusion-based assay that provides
quantitative information of the pairwise synergy of 3 different antibiotics in a single agar plate.
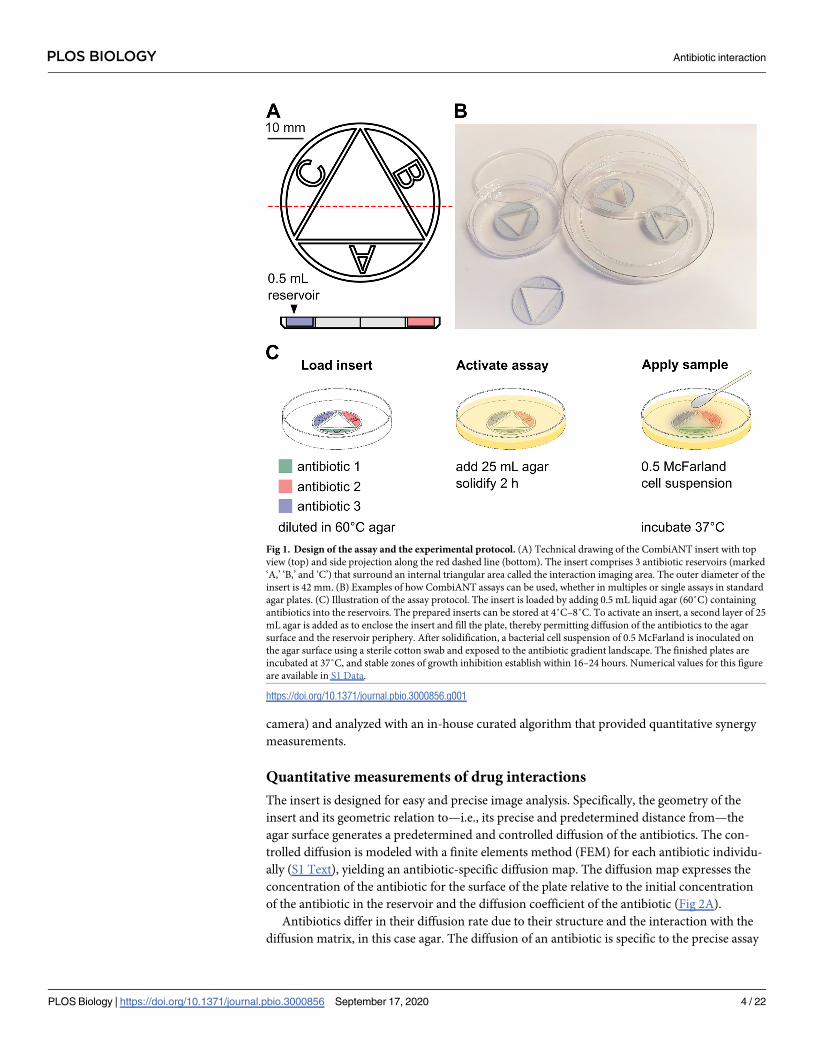
The assay consists of a custom-designed culture inserts (Fig 1A) that can be integrated into
any standard cell culture plate (Fig 1B). Multiple inserts can be used on the same plate (Fig
1B). The insert comprises 3 reservoirs (marked ‘A,’ ‘B,’ and ‘C’) housing antibiotics and a cen-
tral triangular interaction area (Fig 1A).
To run a CombiANT assay, antibiotic-containing agar is loaded into the insert reservoirs
by pipetting (Fig 1C). For most applications in this study, the reservoirs are loaded with differ-
ent antibiotics. Upon agar solidification, the assay is in an inactive state. At this point, the
inserts can be stored under refrigeration, with no loss of function for at least 1 week (depend-
ing on the antibiotics used). This allows for multiple assays, encompassing different antibiotics,
to be prepared and stored according to the user’s need so that they can be easily used without
delay.
To implement a specific synergy test, the prepared insert is placed into a culture plate and
overcast with a final layer of culture agar. This step activates the assay, which is ready for use
once the agar solidifies (Fig 1C). The final agar layer allows the antibiotics suspended in agar
and housed in the reservoirs to start diffusing into the surrounding agar and toward the agar
surface (Fig 1C). The isolate is then spread across the entire solidified agar to create a lawn by
streaking with a cotton swab. The assay is designed for an inoculum density of 0.5 McFarland,
in accordance with the European Committee on Antimicrobial Susceptibility Testing
(EUCAST) guidelines for disk diffusion tests (version 8.0). Following inoculation, plates are
incubated overnight to allow for sample growth. At this point, the CombiANT plates are iden-
tical to standard agar plates. CombiANT assays may thus be easily integrated into automated
clinical systems for overnight culture and incubation of bacterial samples on plates. During
growth, inhibition zones establish around the insert according to the diffusion-generated con-
centration landscape of the 3 antibiotics (Fig 2). For measurement of antibiotic interactions,
the plates incubated overnight were imaged (e.g., with a hand-held mobile device or a gel-doc
PLOS BIOLOGY Antibiotic interaction
PLOS Biology | https://doi.org/10.1371/journal.pbio.3000856 September 17, 2020 3 / 22
camera) and analyzed with an in-house curated algorithm that provided quantitative synergy
measurements.
Quantitative measurements of drug interactions
The insert is designed for easy and precise image analysis. Specifically, the geometry of the
insert and its geometric relation to—i.e., its precise and predetermined distance from—the
agar surface generates a predetermined and controlled diffusion of the antibiotics. The con-
trolled diffusion is modeled with a finite elements method (FEM) for each antibiotic individu-
ally (S1 Text), yielding an antibiotic-specific diffusion map. The diffusion map expresses the
concentration of the antibiotic for the surface of the plate relative to the initial concentration
of the antibiotic in the reservoir and the diffusion coefficient of the antibiotic (Fig 2A).
Antibiotics differ in their diffusion rate due to their structure and the interaction with the
diffusion matrix, in this case agar. The diffusion of an antibiotic is specific to the precise assay
Fig 1. Design of the assay and the experimental protocol. (A) Technical drawing of the CombiANT insert with top
view (top) and side projection along the red dashed line (bottom). The insert comprises 3 antibiotic reservoirs (marked
‘A,’ ‘B,’ and ‘C’) that surround an internal triangular area called the interaction imaging area. The outer diameter of the
insert is 42 mm. (B) Examples of how CombiANT assays can be used, whether in multiples or single assays in standard
agar plates. (C) Illustration of the assay protocol. The insert is loaded by adding 0.5 mL liquid agar (60˚C) containing
antibiotics into the reservoirs. The prepared inserts can be stored at 4˚C–8˚C. To activate an insert, a second layer of 25
mL agar is added as to enclose the insert and fill the plate, thereby permitting diffusion of the antibiotics to the agar
surface and the reservoir periphery. After solidification, a bacterial cell suspension of 0.5 McFarland is inoculated on
the agar surface using a sterile cotton swab and exposed to the antibiotic gradient landscape. The finished plates are
incubated at 37˚C, and stable zones of growth inhibition establish within 16–24 hours. Numerical values for this figure
are available in S1 Data.
https://doi.org/10.1371/journal.pbio.3000856.g001
PLOS BIOLOGY Antibiotic interaction
PLOS Biology | https://doi.org/10.1371/journal.pbio.3000856 September 17, 2020 4 / 22

conditions (type of agar, culture volume, incubation time) used. Therefore, an experimental
diffusion coefficient was pre-calculated for every antibiotic in an assay calibration step. To
carry out the calibration of the assay, a reference strain with known MIC is tested with 3 con-
centrations of the target antibiotic (10 ×, 20 ×, 40 × MIC; see S1 Text for a detailed protocol).
The calibration needs to be performed only once for every antibiotic, after which the diffusion
map generated is stored and applied whenever the antibiotic is tested in subsequent assays. In
addition to the diffusion coefficient generated, the recommended initial concentration of anti-
biotic to be supplemented with agar housed within the reservoirs is calculated from the one-
Fig 2. Assay technology and synergy readout. (A) Diffusion map for the antibiotic MEC after 24 hours. Lines indicate
equal surface concentrations. The chromatic scale represents concentration of MEC starting the input concentration of
4.8 mg/L denoted in red, down to negligible concentrations in blue. (B) Agar surface antibiotic diffusion landscape for 3
antibiotics. The chromatic scale represents concentrations of antibiotic starting from input concentrations with blue
indicating antibiotic A, yellow indicating antibiotic B, and pink indicating antibiotic C, down to negligibly low
concentrations expressed by white. (C) Description of CombiANT analysis using a representative assay result. The E. colistrain DA46056 that was isolated from a UTI was here tested against the antibiotics MEC, TMP, and NIT. Inhibition
zones have formed around the antibiotic reservoirs because of the antibiotic diffusion. The black triangle indicates the
interaction imaging area. Blue points outside of the interaction imaging area indicate the IC points in the agar surface of
the antibiotics acting alone. As illustrated by the blue line and ICB, the blue IC points are placed at the midpoint of the
outer inhibition zone from the corresponding reservoir, here reservoir B. Red points inside the interaction imaging area
indicate CPs of adjacent antibiotic pairs. As illustrated by the red lines and CPBC, the red CP points are placed at the
corner of the inner growth zone, in the position that is closest to the corresponding interaction are corner, here between
the reservoirs B and C for CPBC. The red dashed line indicates the radius of the solid red line circle segment. Darker
shades below the insert are trapped air bubbles. (D) Quantification of antibiotic interactions expressed as FICi for the
image in panel C. The dotted line indicates a theoretical additive interaction with FICi = 1. Numerical values for this
figure are available in S1 Data. CP, combination inhibitory point; FICi, fractional inhibitory concentration index; IC,
inhibitory concentration; MEC, mecillinam; NIT, nitrofurantoin; TMP, trimethoprim; UTI, urinary tract infection.
https://doi.org/10.1371/journal.pbio.3000856.g002
PLOS BIOLOGY Antibiotic interaction
PLOS Biology | https://doi.org/10.1371/journal.pbio.3000856 September 17, 2020 5 / 22
time calibration result. The recommended initial concentration for the 8 antibiotics used in
this study, according to EUCAST guidelines for antimicrobial susceptibility testing, are pro-
vided in S1 and S2 Tables.
The analysis algorithm uses the calibrated diffusion maps to generate a virtual antibiotic
landscape to visualize the antibiotic concentrations in all different positions at the agar surface.
First, the user indicates which antibiotic was placed in every reservoir of the assay. At this
point, the algorithm recalls the stored diffusion maps corresponding to the antibiotics used in
the assay and assembles them into an assay-specific antibiotic landscape (Fig 2B). The antibi-
otic landscape is then aligned to the assay picture, according to the geometric anchor points of
the insert. The synergy quantification of CombiANT is based on the Loewe model for dose
additivity [32]. The extent of antibiotic interaction is quantified from points on the edge of the
inhibition zone (i.e., the concentration isobole of complete growth inhibition), according to
the formula of the FICi, as specified below.
In an image of a CombiANT agar plate, certain areas of interest can be observed (Fig 2C).
On the outside of the inserts in the area to the center of the reservoirs, every antibiotic is acting
individually (the rest have negligible concentrations, see S3 Table). Since antibiotics also dif-
fuse outward from the reservoirs, the point of the inhibition zone, opposite a chamber, that is
farthest from the chamber represents the inhibitory concentration (IC) of that antibiotic when
acting alone. For analysis, IC points are placed opposite the reservoir midpoint (Fig 2C). The
IC points (shown in blue crosses in Fig 2C) are matched to the antibiotic landscape, and the
corresponding concentrations of the 3 antibiotics are extracted (ICA, ICB, and ICC).
Inside the interaction imaging area (Fig 2C, black triangle), the 3 antibiotics have diffused
out of the reservoirs and are now overlapping in pairs in the 3 corners. Every corner of the
interaction imaging area constitutes a part of the plate where the 2 closest antibiotics are acting
together. Therefore, the edge of the growth zone in the interaction imaging area that is closest
to a corner corresponds to a point where the combination of the 2 antibiotics present is inhibi-
tory to growth (shown in red points on Fig 2C). Similarly, to the 3 IC points, the 3 combina-
tion inhibitory points (CPs) are matched to points in the antibiotic landscape, and the
concentrations of both antibiotics present are extracted. Having extracted both individual ICs
and combinatorial ICs for all 3 antibiotics, the analysis algorithm proceeds to calculate FICi
for all antibiotic pairs. For the interaction between antibiotics A and B, FICiAB ¼CAICAþ
CBICB
in
which CA and CB are the concentrations of A and B, respectively, in their corresponding CP.
FICiAC and FICiBC are calculated similarly. An FICi value of 1 denotes additivity. FICi < 1
indicates synergy, whereas FICi > 1 indicates antagonism. Threshold values for clinically rele-
vant levels of synergy and antagonism are usually set at<0.5, and>2–4, respectively [33–35].
The identification of all IC and CP points in an image can be done either automatically or
manually. The analysis yields instantaneously the FICi values for all 3 antibiotic pairs (as
shown in Fig 2D from the analysis of the plate in Fig 2C).
Technical validation of assay
First, as controls, we performed self-interaction experiments in which the 3 CombiANT insert
reservoirs were filled with the same antibiotic. The self-interaction control experiments reli-
ably produced FICi close to 1 for all antibiotics used in this study (S2 Fig). Next, to verify that
the CombiANT assay produces valid synergy quantifications, we ran an accuracy and preci-
sion study. We tested all pairwise antibiotic interactions with 2 gram-negative reference strains
(E. coli K-12 MG1665 and P. aeruginosa PA14) and a gram-positive reference strain (S. aureusATCC29213) against a panel of 4 antibiotics. The antibiotics, ampicillin (AMP), cefotaxime
(CTX), ciprofloxacin (CIP), and gentamicin (GEN), span 3 distinct mechanisms of action, and
PLOS BIOLOGY Antibiotic interaction
PLOS Biology | https://doi.org/10.1371/journal.pbio.3000856 September 17, 2020 6 / 22
2 are commonly used in treatments of bacteremia and sepsis caused by the bacterial species
described. FICis were calculated for all pairwise interactions and the 3 strains (Fig 3A). To
gage the model’s experimental validity, we extracted ICs for the antibiotics acting alone, i.e.,
MIC values, from the computational pipeline and compared these to MIC values from stan-
dard broth microdilution. The MIC values computed by the pipeline showed good agreement
with those obtained from broth microdilution (S1 Fig). An extraction of MIC values from
CombiANT assumes that the concentrations of the non-focal antibiotics are negligibly low at
the IC points. We therefore calculated the expected concentrations of focal and non-focal anti-
biotics in the IC and CP points and found this assumption to be accurate (S3 Table). The high-
est concentration of non-focal antibiotic was approximately 2% of MIC.
In order to fully quantify the assay’s precision, the previously mentioned strains were
screened in multiple replicates (n> 10) using the CombiANT assay protocol (S2 Text). Half of
the replicates were tested on the same day to quantify repeatability (within-day variability).
The other half was tested the following day to quantify reproducibility (day-to-day variability).
To compare results between days, we chose to quantify relative day-to-day difference of the
same antibiotic combination and then average all 6 combinations together for every strain (Fig
3B). Average relative differences of FICi measurements between days were below 13% for all
strains, with the highest quartile being below 40%, indicating high reproducibility (Fig 3B,
right side). To quantify repeatability, we measured the relative standard error of the mean for
all FICi measurement, using same-day replicates for all antibiotic combinations. Those errors
were then averaged for every strain. All relative standard errors were below 12%, with the high-
est quartile below 15%, indicating very small technical variation between replicates (Fig 3B, left
side). Finally, we analyzed all replicates together to get an overall assessment of precision that
encompasses both repeatability and reproducibility. We chose to calculate the coefficient of
variation for each species-combination pair, an analysis that expresses the variability of mea-
surement in proportion to an interaction’s average value (Fig 3C). All coefficients of variation
were below 37% and on average 19.7%, signifying that the method was precise enough to be
replicable and repeatable.
Next, we set out to quantify CombiANT’s accuracy. To that end, we replicated all measure-
ments of antibiotic interactions using the gold standard methodology of broth-based checker-
board assays as previously described [27]. First, we tested whether the 2 methods (CombiANT
and checkerboard assays) systematically produced different results. We therefore performed a
Bland-Altman analysis of the FICi data that were obtained with the 2 methods (Fig 3D). The
Bland-Altman comparison yielded a bias of 0.049 between the checkerboard and CombiANT
assays. This low level of bias is close to the detection limit of FICi differences. Two FICi mea-
surements with a difference of 0.049 would stem from 2 different CPs that would almost
completely overlap. In CombiANT’s current dimension of 42 mm (diameter of insert) and
with the resolution of a standard camera, that kind of position differences of the CPs is beyond
the assay’s current resolution. Hence, we concluded that there is no statistically detectable dis-
crepancy between results obtained from the 2 assays.
Having shown that the 2 methods are interchangeable, we tested the effect choosing one
method over the other by performing a multivariate linear regression analysis. We tested the
correlation between 2 factors and the outcome of the experiment in the form of FICi values.
The 2 factors were the identity of the antibiotics used, and the method applied to that specific
test (either CombiANT or checkerboard). The analysis yielded a correlation coefficient and a
corresponding P value for every factor. As expected, the identity of the focal antibiotic pair had
a strong and significant effect on the FICi value measured (with a correlation coefficient = 0.55;
P< 0.01). The choice of method on the other hand was not statistically correlated with experi-
mental outcome (correlation coefficient = 0.07; P = 0.83). Altogether, we concluded that the
PLOS BIOLOGY Antibiotic interaction
PLOS Biology | https://doi.org/10.1371/journal.pbio.3000856 September 17, 2020 7 / 22
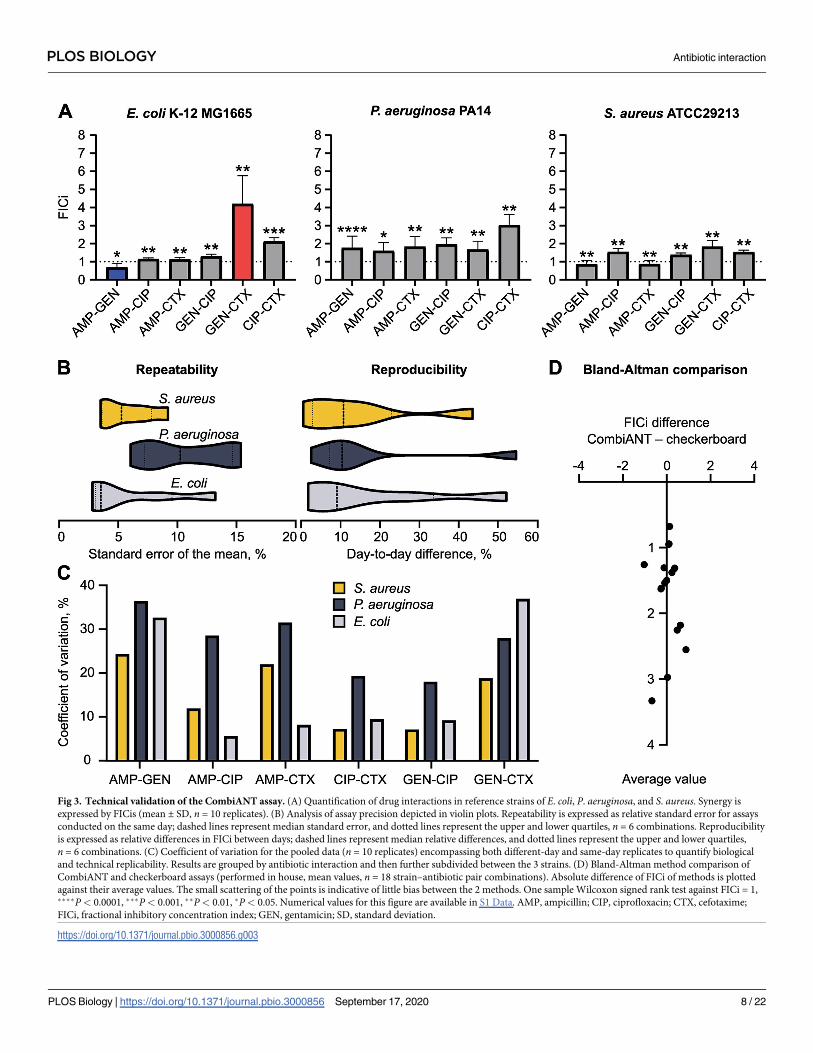
Fig 3. Technical validation of the CombiANT assay. (A) Quantification of drug interactions in reference strains of E. coli, P. aeruginosa, and S. aureus. Synergy is
expressed by FICis (mean ± SD, n = 10 replicates). (B) Analysis of assay precision depicted in violin plots. Repeatability is expressed as relative standard error for assays
conducted on the same day; dashed lines represent median standard error, and dotted lines represent the upper and lower quartiles, n = 6 combinations. Reproducibility
is expressed as relative differences in FICi between days; dashed lines represent median relative differences, and dotted lines represent the upper and lower quartiles,
n = 6 combinations. (C) Coefficient of variation for the pooled data (n = 10 replicates) encompassing both different-day and same-day replicates to quantify biological
and technical replicability. Results are grouped by antibiotic interaction and then further subdivided between the 3 strains. (D) Bland-Altman method comparison of
CombiANT and checkerboard assays (performed in house, mean values, n = 18 strain–antibiotic pair combinations). Absolute difference of FICi of methods is plotted
against their average values. The small scattering of the points is indicative of little bias between the 2 methods. One sample Wilcoxon signed rank test against FICi = 1,����P< 0.0001, ���P< 0.001, ��P< 0.01, �P< 0.05. Numerical values for this figure are available in S1 Data. AMP, ampicillin; CIP, ciprofloxacin; CTX, cefotaxime;
FICi, fractional inhibitory concentration index; GEN, gentamicin; SD, standard deviation.
https://doi.org/10.1371/journal.pbio.3000856.g003
PLOS BIOLOGY Antibiotic interaction
PLOS Biology | https://doi.org/10.1371/journal.pbio.3000856 September 17, 2020 8 / 22
CombiANT assay has an equal accuracy for the detection of antibiotic interactions as broth-
based checkerboard assays.
A difference between the CombiANT and checkerboard assays is that, by virtue of diffu-
sion, CombiANT applies a continuous concentration range, while checkerboard assays typi-
cally test discrete 2-fold dilutions. Therefore, we tested whether the high precision of the
CombiANT assay was a result of the continuous concentration range. To do that, we per-
formed refined checkerboard assays with increased linear concentration ranges. All 18 strain-
combination pairs, used in this technical validation, were replicated with this method and
quantified using a Bliss independence null model (S3 Fig). The Bliss model was preferred
because the analysis was easier computationally. Again, we observed high agreement of antibi-
otic interactions with CombiANT results (S3 Fig). Interestingly, synergy profiles occasionally
showed dose-dependent variation, with different synergy profiles at low doses than at MIC,
making interactions harder to classify (S3 Fig). Such dose-dependent variation was not
detected by the CombiANT assay as it quantifies interactions at a predetermined high inhibi-
tion level. We concluded that the precision of the CombiANT assay is not just an effect of
using a continuous concentration range.
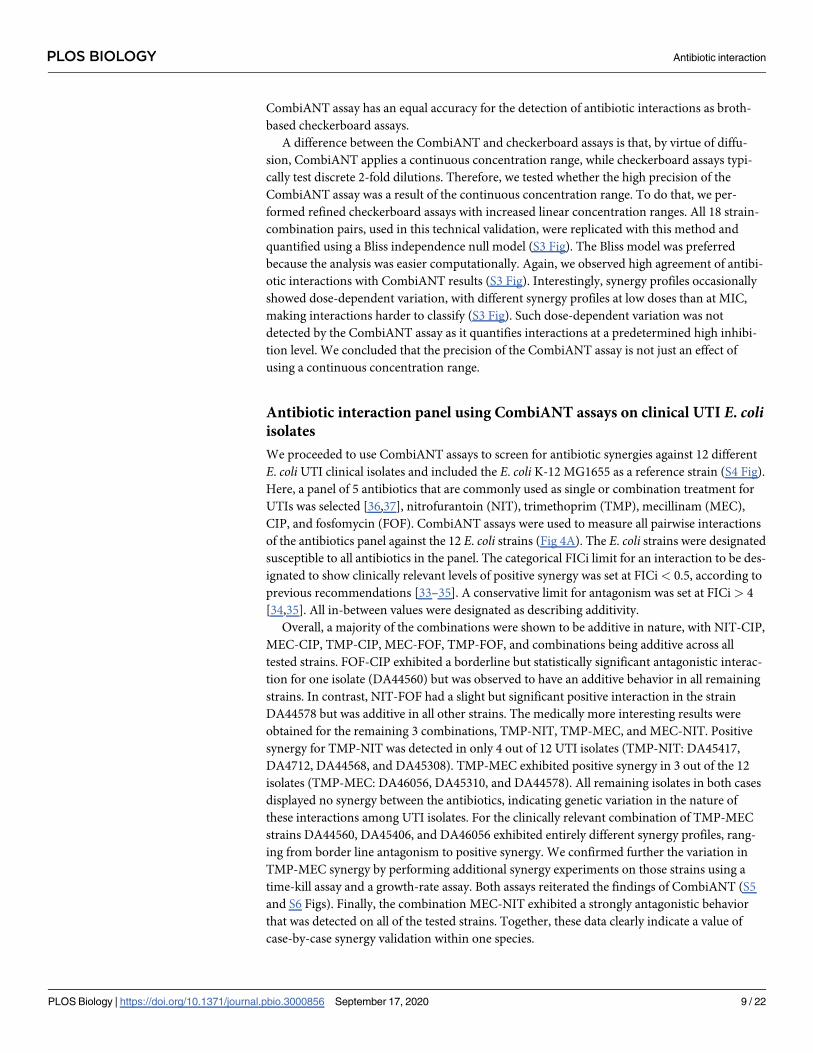
Antibiotic interaction panel using CombiANT assays on clinical UTI E. coliisolates
We proceeded to use CombiANT assays to screen for antibiotic synergies against 12 different
E. coli UTI clinical isolates and included the E. coli K-12 MG1655 as a reference strain (S4 Fig).
Here, a panel of 5 antibiotics that are commonly used as single or combination treatment for
UTIs was selected [36,37], nitrofurantoin (NIT), trimethoprim (TMP), mecillinam (MEC),
CIP, and fosfomycin (FOF). CombiANT assays were used to measure all pairwise interactions
of the antibiotics panel against the 12 E. coli strains (Fig 4A). The E. coli strains were designated
susceptible to all antibiotics in the panel. The categorical FICi limit for an interaction to be des-
ignated to show clinically relevant levels of positive synergy was set at FICi < 0.5, according to
previous recommendations [33–35]. A conservative limit for antagonism was set at FICi > 4
[34,35]. All in-between values were designated as describing additivity.
Overall, a majority of the combinations were shown to be additive in nature, with NIT-CIP,
MEC-CIP, TMP-CIP, MEC-FOF, TMP-FOF, and combinations being additive across all
tested strains. FOF-CIP exhibited a borderline but statistically significant antagonistic interac-
tion for one isolate (DA44560) but was observed to have an additive behavior in all remaining
strains. In contrast, NIT-FOF had a slight but significant positive interaction in the strain
DA44578 but was additive in all other strains. The medically more interesting results were
obtained for the remaining 3 combinations, TMP-NIT, TMP-MEC, and MEC-NIT. Positive
synergy for TMP-NIT was detected in only 4 out of 12 UTI isolates (TMP-NIT: DA45417,
DA4712, DA44568, and DA45308). TMP-MEC exhibited positive synergy in 3 out of the 12
isolates (TMP-MEC: DA46056, DA45310, and DA44578). All remaining isolates in both cases
displayed no synergy between the antibiotics, indicating genetic variation in the nature of
these interactions among UTI isolates. For the clinically relevant combination of TMP-MEC
strains DA44560, DA45406, and DA46056 exhibited entirely different synergy profiles, rang-
ing from border line antagonism to positive synergy. We confirmed further the variation in
TMP-MEC synergy by performing additional synergy experiments on those strains using a
time-kill assay and a growth-rate assay. Both assays reiterated the findings of CombiANT (S5
and S6 Figs). Finally, the combination MEC-NIT exhibited a strongly antagonistic behavior
that was detected on all of the tested strains. Together, these data clearly indicate a value of
case-by-case synergy validation within one species.
PLOS BIOLOGY Antibiotic interaction
PLOS Biology | https://doi.org/10.1371/journal.pbio.3000856 September 17, 2020 9 / 22
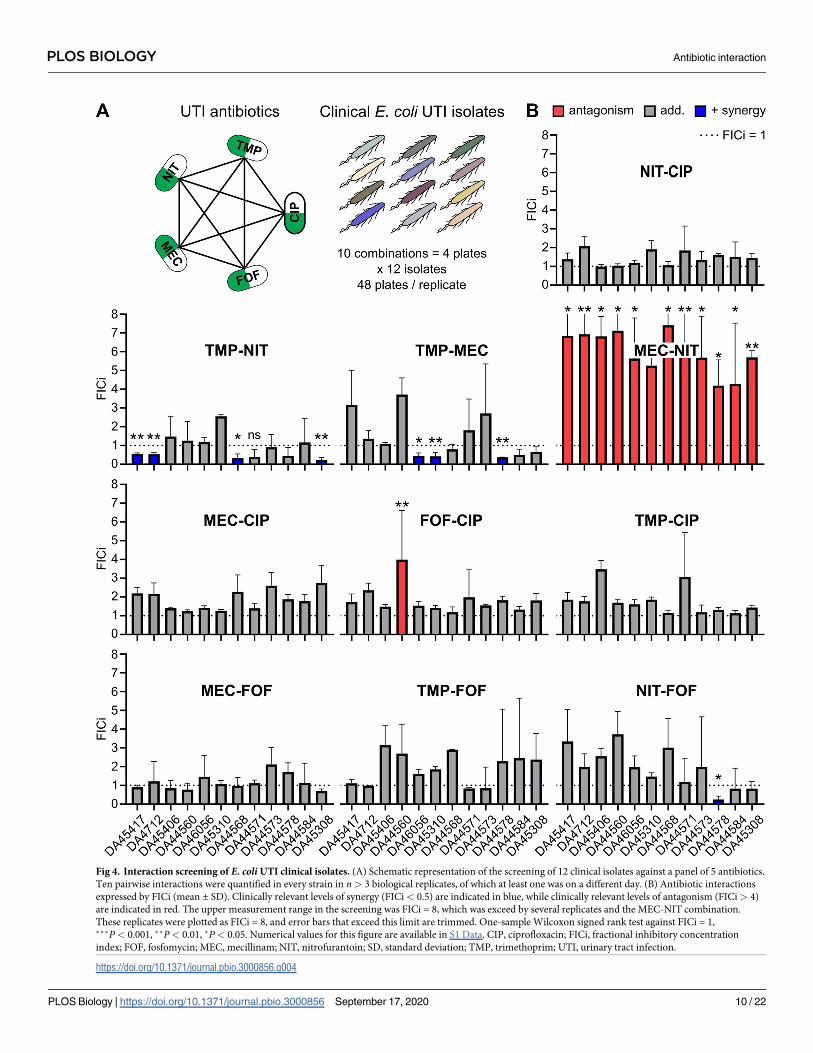
Fig 4. Interaction screening of E. coli UTI clinical isolates. (A) Schematic representation of the screening of 12 clinical isolates against a panel of 5 antibiotics.
Ten pairwise interactions were quantified in every strain in n> 3 biological replicates, of which at least one was on a different day. (B) Antibiotic interactions
expressed by FICi (mean ± SD). Clinically relevant levels of synergy (FICi< 0.5) are indicated in blue, while clinically relevant levels of antagonism (FICi> 4)
are indicated in red. The upper measurement range in the screening was FICi = 8, which was exceed by several replicates and the MEC-NIT combination.
These replicates were plotted as FICi = 8, and error bars that exceed this limit are trimmed. One-sample Wilcoxon signed rank test against FICi = 1,���P< 0.001, ��P< 0.01, �P< 0.05. Numerical values for this figure are available in S1 Data. CIP, ciprofloxacin; FICi, fractional inhibitory concentration
index; FOF, fosfomycin; MEC, mecillinam; NIT, nitrofurantoin; SD, standard deviation; TMP, trimethoprim; UTI, urinary tract infection.
https://doi.org/10.1371/journal.pbio.3000856.g004
PLOS BIOLOGY Antibiotic interaction
PLOS Biology | https://doi.org/10.1371/journal.pbio.3000856 September 17, 2020 10 / 22
Discussion
In this study, we present and characterize the new CombiANT assay, which enables an effi-
cient determination of antibiotic interactions. Our extensive technical validation indicated
high accuracy and precision, and an overall equal performance to the established checkerboard
assay. We then implemented CombiANT for a screen of antibiotic synergy among UTI iso-
lates. A consistent antagonistic interaction was discovered as well as 4 interactions with signifi-
cant strain-to-strain variation, indicating the potential of CombiANT for both individualized
clinical diagnostics and basic research.
An alternative methodology has been successfully applied for the high-throughput mea-
surement of drug interactions in basic research [26]. In this method, bacteria are treated with
low sub-MIC concentrations of different antibiotics and combinations thereof, and their expo-
nential growth rate recorded over time using absorbance. While these measurements are
highly precise, they are less applicable for clinical microbiology, requiring dedicated instru-
mentation and complex data analyses. Therefore, the CombiANT assay was specifically
designed for simplicity and practical implementation in clinical settings. In the inactive state,
inserts can be kept refrigerated, in large amounts, according to the regular shelf-life of antibi-
otic agar plates. This makes it feasible for hospitals and laboratories to pre-load inserts with the
desired antibiotics of interest and then quickly implement them when needed. Starting with
the activation step, the handling of CombiANT plates is identical to that of regular agar plates
and thus compatible with the existing clinical pipelines for the mass handling of agar plates,
including automated pouring of agar for large-scale production.
To allow for easy use of CombiANT both by clinics and academic laboratories, we designed
2 different protocols, namely (i) a resistance breakpoint-based protocol for clinical use (S2
Table, and as applied for the UTI screen in Fig 4), and (ii) a higher-sensitivity MIC-based pro-
tocol for research applications (S1 Table, as applied for Fig 3). CombiANT can be fully auto-
mated and requires a digital picture as input for image analysis. The lack of need for dedicated
machinery makes CombiANT suitable also for low-resource settings.
An important design principle of CombiANT was that antibiotic synergy is quantified at
high, clinically relevant concentrations. Synergy is measured from the edge of inhibition
zones, meaning the MIC-equipotency isobole of combination space using the FICi. The FICi
method is based on the null model of Loewe additivity of doses [32]. An alternative approach
for synergy quantification uses the Bliss independence null model that assumes additivity of
effects [32], rather than doses. The general direction of antibiotic interactions is often con-
served between Bliss and Loewe models, although exact agreement exists in only few dose-
response points. Synergy can be measured at lower antibiotic concentration and inhibition lev-
els than used in CombiANT, using, e.g., growth rates as readout. It has been shown previously
that interaction profile of a particular antibiotic combination can be dose dependent [38–40],
occasionally complicating synergy quantification from checkerboards assays (S3 Fig). These
biologically interesting cases suggests complex physiological effects. Synergy measurements by
FICi are robust (or blind) to such variation, as they are performed at a high inhibition level
(MIC), which we would suggest is more clinically relevant. Another technical difference of the
plate-based CombiANT assay compared to broth microdilution methods refers to the pheno-
typic effects of antibiotics on cell shape. Many antibiotics induce changes in cell shape, as part
of their mechanism of action. For example, beta-lactam antibiotics that inhibit PBP3 and sep-
tation induce extensive cell elongation prior to cell death [41]. Such elongation can lead to an
overestimation of viable cell numbers by optical density measurements, leading, e.g., to a dis-
agreement of MIC values called by broth and agar methods [42].
PLOS BIOLOGY Antibiotic interaction
PLOS Biology | https://doi.org/10.1371/journal.pbio.3000856 September 17, 2020 11 / 22
The results obtained in the datasets in Figs 3 and 4 agree with those described in the litera-
ture. CombiANT replicated the previously reported synergies between AMP-GEN,
TMP-MEC, and TMP-NIT combinations; the strong antagonism between MEC and NIT; and
the additivity between beta-lactams and CIP in E. coli K-12 MG1655 [26,43]. However, the
additive combination GEN-CIP was previously classified as synergistic using the low-inhibi-
tion growth rate methodology [43]. Only a few antibiotic interactions in P. aeruginosa PA14
strain and the S. aureus ATCC29213 were previously characterized, limiting comparisons to
our study. AMP-CIP additivity was previously reported for S. aureus [44], and interactions of
CIP with beta-lactams and CIP with the aminoglycoside GEN are known to be antagonistic in
P. aeruginosa [18], and CombiANT replicated these observations. Taken together, the
observed high agreement of our measurements with the literature support the accuracy and
utility of CombiANT.
The screening of 12 UTI clinical isolates presented in Fig 4 illustrates CombiANT’s usability
for clinical microbiology. To mimic a clinical scenario, we had no specific inclusion criteria for
these isolates, aside from requiring susceptibility according to EUCAST breakpoint. The
applied CombiANT protocol variant with breakpoint-based input concentrations (S2 Table)
reliably produced readable growth zones in the isolates, requiring no isolate-specific adjust-
ments. However, some of the detected antagonism was so strong that growth did occur up to
the reservoir edge and thereby exceeded the upper quantification limit of FICi = 8 in the
screen. Resistant strains were not included in this analysis. The reason for that was 2-fold.
First, we wanted to illustrate that—even in isolates that, in a clinical perspective, are viewed as
being similar (since they are all deemed susceptible)—antibiotic interaction profiles can vary
considerably from isolate to isolate. Second if resistance is detected in one of the antibiotics
that could potentially go into a multitherapy scheme, the logical first choice would be to
replace that antibiotic with another one to which the strain is susceptible. The behavior and
utility of CombiANT with resistant and multi-resistant isolates is an important future research
direction.
As the above synergy screening of 12 clinical UTI isolates iterates, there are cases, such as
the interaction between TMP and MEC, in which combining 2 antibiotics seems to have a con-
sistent antagonistic effect across most strains. Cases such as these, with antagonistic behavior
across the board, illustrate the need for clear guidance when designing combination therapies,
even when carried out empirically. Identifying such combinations of antibiotics that should be
avoided will require large-scale systematic synergy screenings. With the current methods that
quantify antibiotic synergy, a systematic screening of such a scale is unfeasible. However,
CombiANT presents a new, less labor-costly method that is still capable of quantifiable results.
Using our new approach to interaction studies makes such large-scale synergy screens attain-
able. The screening performed here illustrates CombiANT’s scalability. To get all pairwise
interactions for the 5 antibiotics that we screened one UTI isolate for and assuming that a
range of 8 concentrations is tested for all antibiotics would require 640 tubes for a time-kill
experiment or ten 96-well plates for a checkerboard assay. With CombiANT, all synergy data
were extracted from only 4 agar plates.
The screening for the interactions between TMP-NIT and TMP-MEC revealed an impor-
tant result, namely that the same 2 antibiotics might not have a consistent synergy profile
across different strains of the same species. If antibiotics can be synergistic against one strain
but additive or antagonistic for another, then we suggest that synergy screens should become a
part of standard testing in clinical microbiology laboratories. Thus, an assay such as Com-
biANT, which is quantitative and simple, could be part of routine screening in a microbiology
laboratory. Translating CombiANT’s in vitro positive synergy findings to in vivo antibiotic
synergy is not trivial. Antibiotic absorption as well as kinetics in the human body might
PLOS BIOLOGY Antibiotic interaction
PLOS Biology | https://doi.org/10.1371/journal.pbio.3000856 September 17, 2020 12 / 22

disrupt a positive synergy profile. In silica antagonistic behavior, however, represents a com-
pound-to-compound inhibition in its simplest form. Therefore, we think any detection of anti-
biotic antagonism in vitro could be a helpful guide for clinical decisions in an even more
straightforward way than antibiotic synergy.
Aside from the clinical applicability, CombiANT has high potential as a tool for basic research
in biology. For a majority of observed antibiotic interactions, a mechanistic and evolutionary
understanding is currently lacking, and these knowledge gaps may partly be explained by the
complexity of current synergy measurement methods. In our limited screen of UTI isolates, the
majority of antibiotic interactions were additive. The variable synergy profiles that were observed
with TMP-NIT, FOF-CIP, NIT-FOF, and TMP-MEC indicate interesting biological strain-to-
strain variation that warrants further investigation. The highly antagonistic interaction between
the beta-lactam MEC and NIT may potentially indicate an evolutionary conservation of this drug
interaction, implying a functional constraint between cellular functional modules. The antago-
nism could potentially be explained by an overlap in the cellular drug and stress responses to the
component drugs. It has been shown that both beta-lactams and NIT individually induce expres-
sion of the cellular SOS response for DNA repair [45,46], potentially explaining the antagonism
through a coordinated stronger defense response. Yet the antibiotics also induce other response
systems, such as the RpoS-mediated stress response for beta-lactams [47] and oxidative stress
response in the case of NIT [48]. Therefore, the antagonism observed could alternatively be
explained by potential pleiotropy of these other responses. These and other hypotheses could be
efficiently tested by implementing CombiANT for a functional genetics screen.
Finally, CombiANT is not restricted to the study of interactions between antibiotics. In prin-
ciple, the individual and combined activity of any bioactive compound can be studied with
CombiANT. We anticipate similar applications in cell biology, as well as environmental micro-
biology. A potential diversity of applications is supported by the high flexibility of CombiANT,
which can be easily implemented with different growth medium and culturing conditions (e.g.,
temperature). We anticipate that CombiANT could, e.g., be applied for the characterization of
combination effects between chemotherapy agents on hydrogel-embedded growth of spheroids
or organoids [49,50]. Thus, CombiANT may be an interesting alternative to the currently uti-
lized microfluidic approaches [51] that in our experience [52–54] entail high assay complexity.
CombiANT could also be applied to characterize biological activities, independent of several
inducers and repressors, provided that the activity can be optically tracked (e.g., fluorescence,
colorimetry). Still, we currently see the highest need for efficient interaction testing with antibi-
otic synergies. The spread of antibiotic resistance increasingly makes combination therapy
attractive, but the high pathogen diversity indicates an added value of personalized synergy vali-
dation and optimization, even for isolates that appear broadly resistant.
Materials and methods
Fabrication and design
The insert was designed with computer-aided design software (Autodesk Fusion 360, Adobe)
and manufactured by 3D printing (Formlabs, Somerville, MA; SLA 3D printer) using proprie-
tary formulations for autoclavable or dental resin version 2 (Formlabs, Somerville, MA; SLA
3D printer). The 3D printing was performed in the U-Print facility of Uppsala University. The
designs are available upon request to the authors.
Strains and growth media
For the technical validation, we tested the reference strains E. coli K-12 MG1655 (DA5438), P.
aeruginosa PA14 (DA64160), and S. aureus ATCC29213 (DA64485). For the UTI study, we
PLOS BIOLOGY Antibiotic interaction
PLOS Biology | https://doi.org/10.1371/journal.pbio.3000856 September 17, 2020 13 / 22
screened 12 clinical isolates of independent origin that were susceptible to the antibiotics CIP,
FOF, MEC, NIT, and TMP. Bacteria were cultured on Mueller-Hinton agar and in Mueller-
Hinton broth (Becton Dickinson, Sparks, MD; Refs. 275730, 225250) with incubations at
37˚C. Overnight cultures were prepared from single colonies in 1 mL and 190 rpm orbital
shaking. For the UTI isolate screening, the agar was supplemented with 25 mg/L glucose-
6-phosphate, as this is required for the action of FOF. Antibiotic stocks were prepared accord-
ing to the manufacturer’s recommendations and stored frozen at −20˚C in aliquots for single
use: AMP 100 mg/mL in water (Sigma-Aldrich, Ref. A9518-25G), CIP 25 mg/mL in 0.1 M
HCl (Sigma-Aldrich, Ref. 17850-25G-F), CTX 50 mg/mL in water (Sigma, Ref. C7039-1G),
GEN 50 mg/mL in water (Sigma, Ref. 48760-5G-F), FOF 50 mg/mL in water (Sigma-Aldrich,
Ref. P5396-5G), MEC 10 mg/mL in water (Sigma-Aldrich, Ref. 33447-100MG), NIT 10 mg/
mL in 100% DMSO (Sigma, Ref. N7878-10G), and TMP 10 mg/mL in 100% DMSO (Sigma,
Ref. T-7883-5G).
Broth microdilution
To calibrate CombiANT, we determined MIC values for antibiotics individually, using stan-
dard broth microdilution methodology in agreement with EUCAST guidelines. Two-fold
serial dilutions of antibiotics in Mueller Hinton broth were prepared in 96-well microtiter
plates. The plates were then inoculated with approximately 3 × 10⁵ cells from a dense overnight
culture (1:1000 dilution, 180 μL final volume) and incubated without shaking at 37˚C for 24
hours, after which wells were mixed by pipetting and growth was measured by optical density
at 540 nm (Thermo Fisher Scientific, Multiscan FC Type 357). MIC was called at the lowest
concentration that yielded a growth signal of uninoculated control wells. Measurements were
performed with 2 biological replicates, and their average value was designated MIC. For deter-
mination of MIC to FOF, the media were supplemented with 25 mg/L of glucose-6-phosphate,
which is required for FOF-mediated inhibition.
Input concentrations
For the technical calibration of the CombiANT assay, the antibiotic concentrations were deter-
mined based on the MIC of the antibiotic against the strains used (S1 Table). In the screening
of the UTI isolates, a set concentration of antibiotic was used for all strains (S2 Table). When
MIC is known for an antibiotic, using a MIC-based determination of the insert’s concentration
is preferable, as it will lead to the most readable results. For tests with FOF, glucose-6-phos-
phate was provided in the final agar layer at a concentration of 25 mg/L.
Checkerboard experiments
Standard checkerboard assays (8 × 8 concentrations) for FICi determination were performed
in single biological replicate and with 2-fold serial dilutions ranging from 4 × MIC to one-
quarter MIC, as previously described [27]. Inoculum size was 5 × 10⁵ cells (0.5 McFarland),
and optical density was read at 540 nm (Thermo Fisher Scientific, Multiscan FC Type 357)
after 16 hours of static incubation. For Bliss model synergy quantification, higher-resolution
checkerboards (9 × 9 concentrations) were obtained using linear concentrations up to
1 × MIC, and with 3 biological replicates. Treatments positions were fully randomized to
avoid bias from edge and gradient effects. Degree of synergy was calculated as previously
described [55]. Growth yield was expressed relative to untreated wells using background-cor-
rected optical density values. The expected relative growth Y1+2 according to a Bliss indepen-
dence model [56] was calculated by multiplication of the relative growth yields Y1 and Y2
obtained in the single-antibiotic treatments. The degree of synergy S of a combination is
PLOS BIOLOGY Antibiotic interaction
PLOS Biology | https://doi.org/10.1371/journal.pbio.3000856 September 17, 2020 14 / 22
defined as: S = Y1+2 –Yobserved. S = 0 expresses additivity, positive values denote synergy, and
negative values denote antagonism.
Physics diffusion model and image analysis
An FEM was used to model diffusion of reagents from the reservoirs. Diffusion was assumed
to follow Fick’s laws of diffusion, and concentration of the agent was calculated by solving the
convection-diffusion equation for no advective flux and no net volumetric source. The diffu-
sion coefficients used were experimentally determined for every antibiotic. As per the protocol
described in the Supporting Information (S1 Text), each experimental coefficient is unique to
the specific temperature, medium, and antibiotic used. The FEM analysis, antibiotic diffusion
modeling, and calibration as well as the antibiotic landscape assembly were performed using
COMSOL Multiphysics (Comsol, Stockholm, Sweden). The algorithm was scripted using
Matlab (Mathworks, Natick, MA) and COMSOL-Matlab bridge and is provided as S1 Code.
CombiANT plates were photographed using a vertically mounted CCD digital camera (Rasp-
berry Pi version 2 camera module). The IC and CP points were identified manually according
to these principles. IC points were placed on the inhibition edge outside the interaction imag-
ing area and opposite the midpoint of the corresponding reservoir. The CP point is selected
within the interaction imaging area as the point of the growth zone that is closest to the corre-
sponding corner of the interaction imaging area. The coordinates of the IC and CP points
were obtained from the image using the multi-point tool of the ImageJ distribution Fiji. The
coordinates of the interaction imaging area were obtained in the same way and used to align
the image with the concentration landscape. The computation of ICs and FICi is automated,
and the analysis script is provided as S1 Code. To avoid observer bias, the manual identifica-
tion of the IC and CP points was performed blind to the strains and antibiotics used on the
plate. Experiments were analyzed by a single individual to exclude potential person-to-person
bias.
Statistical analyses
Statistical analyses were performed using Graph Pad Prism and Matlab. Statistical difference
of measured FICi to the additive model (FICi = 1) was assessed using Wilcoxon signed rank
tests. In the UTI screen, only interactions that show clinically relevant levels of antibiotic inter-
action (FICi < 0.5, FICi > 4) were tested. Numerical values underlying all analyses are avail-
able in S1 Data.
Time-kill experiments
A time-kill experiment was performed with E. coli isolates DA44560, DA45406, and DA46056,
which showed different interaction profiles for the combination MEC-TMP. In brief, MHB
broth was supplemented with TMP, MEC at isolate-adjusted MIC dosage, or the MEC-TMP
combination (MIC-MIC), of which 1 mL was inoculated with approximately 3 × 10⁶ cells from
a dense overnight culture (1:1000 dilution). The MICs of the isolates were determined before
the assay using broth microdilution and were found to vary between 0.1 to 0.4 mg/L for both
antibiotics. Cultures were incubated at 37˚C with orbital shaking, and survival was measured
after 0, 2, 4, 8, and 24 hours by plating diluted samples on well-dried MHA using Miles and
Misra spotting [57] with 5 μL droplets. Colony forming units (CFU) were counted after over-
night incubation, and stability of counts was verified using extended incubation up to 48
hours. Experiment and counting were done without knowing the condition identities (blind).
The experiment was performed with 3 biological replicates. Antibiotic synergy was assessed by
PLOS BIOLOGY Antibiotic interaction
PLOS Biology | https://doi.org/10.1371/journal.pbio.3000856 September 17, 2020 15 / 22

comparison with a Bliss null model, for which the expected additive combination effects was
obtained by multiplication of the survival fractions of the antibiotics acting alone.
Growth curve experiments
Growth curves of E. coli isolates DA44560, DA45406, and DA46056 were obtained for a 5 × 5
concentration checkerboard of MEC-TMP and measurement of growth using optical density
at 600 nm (OD) in a Bioscreen C plate reader (OY Growth Curves, Helsinki, Finland; Ref. FP-
1100-C). The strains were selected for their variation in synergy profiles for this antibiotic
combination. Antibiotics were dosed at 0, 0.025, 0.05, 0.1, and 0.2 mg/L. Treatment conditions
were prepared in large volume of which 300-μL portions were aliquoted into honeycomb well
plates. To start antibiotic treatments, the wells were inoculated with approximately 3 × 10⁶
cells from a dense overnight culture. Immediately after inoculation, plates were transferred to
Bioscreen reader for incubation (37˚C, orbital shaking with medium amplitude and normal
speed) and measurements of OD every 4 minutes for a total of 12 hours. The experiment was
performed with 3 biological replicates. Data were analysed using the R statistical platform.
Raw OD values were background corrected using OD from uninoculated wells. Exponential
growth rates were calculated from log-transformed data (ln OD) in the early time window of
60 minutes to 110 minutes during which growth was strictly exponential (the fit of an expo-
nential model showed a median coefficient of determination R2 of 0.99, and a range of 0.97–
1.0; see S6 Fig). Relative growth rate inhibition effects E were calculated as 1 –(Rxy−R0), in
which R0 represents the uninhibited growth of untreated reference wells. The expected inhibi-
tion effect E1+2 was calculated by addition of the inhibition effects of the antibiotics when act-
ing alone, E1 and E2. Synergy was then quantified, using degree of synergy S, expressed as
S = E1+2 –Eobserved. Positive values denote synergy, and negative values denote antagonism. The
obtained S-values were then averaged across the checkerboard concentration grid and tested
against the null expectation (S = 0) using a one-sample Wilcoxon signed rank test. A parallel
analysis was conducted using growth yields after 12 hours, according to the procedures
described in the section ‘Checkerboard experiments,’ given earlier.
Supporting information
S1 Fig. Validity of calibrated physics models. Comparison of the MIC values obtained with
CombiANT as part of the synergy calculations with those obtained from BMD. Data of refer-
ence strains E. coli, P. aeruginosa, and S. aureus tested against the antibiotics AMP, CIP, GEN,
and CTX. CombiANT MIC predictions (indicated by solid points, mean ± SD, n = 18, 3 bio-
logical replicates of 6 technical replicates each) fall within the log2 dilution window of the
BMD assay (indicated by the shaded regions), supporting the physics diffusion model. An
accurate determination of MIC for P. aeruginosa by BMD was not possible for AMP and CTX
due to extensive cell elongation preceding cell death. Numerical values for this figure are avail-
able in S1 Data. BMD, broth microdilution.
(TIF)
S2 Fig. Self-interaction experiments of the E. coli reference strain K-12 MG1655. FICi for
all self-interactions for the 8 antibiotics AMP, CIP, CTX, GEN, FOF, NIT, MEC, and TMP.
Bars indicate average values and SD from 3 biological replicates. The dotted line indicates
additivity, i.e., FICi = 1. All interactions were additive in nature and showed no statistically sig-
nificant difference from FICi = 1 according to one-sample Wilcoxon signed rank test. Numeri-
cal values for this figure are available in S1 Data. FICi, fractional inhibitory concentration
PLOS BIOLOGY Antibiotic interaction
PLOS Biology | https://doi.org/10.1371/journal.pbio.3000856 September 17, 2020 16 / 22
index
(TIF)
S3 Fig. High-sensitivity checkerboard analysis using Bliss independence model. (A) Antibi-
otic checkerboard data with linear concentrations ranges for E. coli, P. aeruginosa, and S.
aureus tested against the antibiotics AMP, CIP, GEN, and CTX. Each antibiotic was tested
with 8 equally spaced linearly increasing concentrations (denoted 1–8) between zero and the
MIC for the respective species. Data are average growth values of 3 biological replicates relative
to untreated controls. (B) Dose-dependent synergy profiles according to a Bliss independence
additive model. Numerical values for this figure are available in S1 Data.
(TIF)
S4 Fig. CombiANT UTI antibiotic interactions for the E. coli reference strain K-12
MG1655. FICi for all pairwise combinations of the 5 antibiotics CIP, FOF, NIT, MEC, and
TMP. Bars indicate average values and SD from 3 biological replicates. The dotted line indi-
cates additivity, i.e., FICi = 1. Synergy with FICi < 0.5 is indicated in blue, antagonism with
FICi > 4 is indicated in red. One-sample Wilcoxon signed rank test against FICi = 1,�P< 0.05. Numerical values for this figure are available in S1 Data. FICi, fractional inhibitory
concentration index
(TIF)
S5 Fig. Time-kill assay with MEC-TMP for 3 E. coli clinical isolates. Time-kill assay on the
UTI strains DA44560, DA45406, and DA46056. The 3 strains showed contrasting interaction
profiles for the MEC-TMP combination in the CombiANT assay, which was additive for
DA45406, synergistic for DA46056, and mildly antagonistic for DA44560 (although FICi < 4).
Survival fraction was expressed as CFU/mL relative to time point 0 hours (mean ± SD, n = 3
biological replicates). Antibiotics were applied at isolate-adjusted MIC dosage. The circle sym-
bols (•) denote the effect of MEC on strain survival, triangles (π) denote the effect of TMP, and
open squares (ο) denote the combined effect of the MEC-TMP combination. The red lines rep-
resent the Bliss additive interaction model (calculated as the multiplication of survival rates, of
the antibiotics when acting individually). Increased survival in the combination compared to
the additivity line indicates antagonism, whereas the opposite indicates synergy. The dotted
line shows the assay’s limit of certainty. Missing data points indicate a colony count of zero
(not defined for logarithmic scales). Numerical values for this figure are available in S1 Data.
CFU, colony forming units
(TIF)
S6 Fig. Growth rate assay with MEC-TMP for 3 E. coli clinical isolates. The UTI isolates
DA44560, DA45406, and DA46056 were treated with low concentrations of MEC, TMP, or
combinations of MEC-TMP, using a 5 × 5 checkerboard setup. The 3 strains showed contrast-
ing interaction profiles for the MEC-TMP combination in the CombiANT assay, which was
additive for DA45406, synergistic for DA46056, and mildly antagonistic for DA44560
(although FICi < 4). Growth was monitored in 4-minute intervals using OD. (A) Exponential
growth rates of the checkerboard, and degree of synergy S in drug–drug combinations accord-
ing to a Bliss additive model (growth rate inhibition values are added). Positive values of Sindicate synergy, and negative values indicate antagonism. Values are averages of 3 biological
replicates. (B) Distribution of coefficient of determination R2 for fitted exponential growth
models in the measurement time window of 60 to 110 minutes after start of treatment. (C)
Average degree of growth rate synergy across the concentration grid (mean ± SD, n = 16 com-
binations). (D) Growth yields after 12 hours of treatment, and calculated degree of synergy
according to a Bliss additive model (relative yields are multiplied). Values are averages of 3
PLOS BIOLOGY Antibiotic interaction
PLOS Biology | https://doi.org/10.1371/journal.pbio.3000856 September 17, 2020 17 / 22
biological replicates. (E) Logarithmic presentation of underlying growth curves. The dotted
lines show the measurement window for exponential growth rates in panel A. (F) Average
degree of growth yield synergy across the concentration grid (mean ± SD, n = 16 combina-
tions). MEC-TMP additivity in DA45406 is replicated by growth rate and growth yield mea-
surements. MEC-TMP synergy in DA46056 is apparent in growth yields, but not growth rates.
Mild antagonism of MEC-TMP in DA44560 is replicated in growth rates, but not growth
yields. Numerical values for this figure are available in S1 Data. OD, optical density at 600 nm
(TIF)
S1 File. Stereolithography file for the CombiANT insert.
(STL)
S1 Code. Analysis script for CombiANT.
(DOCX)
S1 Table. Antibiotic input concentrations for validation study in Fig 3. MIC-based initial
concentrations for the technical calibration with reference strains E. coli, P. aeruginosa, and S.
aureus and the antibiotics AMP, CIP, GEN, and CTX.
(PNG)
S2 Table. Antibiotic input concentrations for the exploratory study in Fig 4. Breakpoint-
based initial concentrations, as applied for the synergy screening of the E. coli UTI isolates.
(PNG)
S3 Table. Antibiotic concentrations in IC and CP points. Concentrations of AMP, CIP, and
GEN in a CombiANT plate of E. coli K-12 MG1665. Concentrations in every point are
expressed as fold of MIC for that specific antibiotic in a broth microdilution.
(PNG)
S1 Text. Calibration protocol. The calibration protocol for the use of new media-antibiotic
combination in the CombiANT assay.
(DOCX)
S2 Text. Protocol for CombiANT assay. The execution protocol for the CombiANT assay.
(DOCX)
S1 Data.
(XLSX)
Acknowledgments
This work was supported by Uppsala University Innovation Office, and 3D printing was per-
formed at U-PRINT, Uppsala University’s 3D-printing facility at the Disciplinary Domain of
Medicine and Pharmacy.
Author Contributions
Conceptualization: Nikos Fatsis-Kavalopoulos, Roderich Roemhild, Dan I. Andersson.
Data curation: Nikos Fatsis-Kavalopoulos, Roderich Roemhild.
Formal analysis: Nikos Fatsis-Kavalopoulos, Roderich Roemhild, Po-Cheng Tang, Johan
Kreuger, Dan I. Andersson.
Funding acquisition: Dan I. Andersson.
PLOS BIOLOGY Antibiotic interaction
PLOS Biology | https://doi.org/10.1371/journal.pbio.3000856 September 17, 2020 18 / 22
Investigation: Roderich Roemhild, Po-Cheng Tang.
Methodology: Nikos Fatsis-Kavalopoulos, Roderich Roemhild.
Project administration: Dan I. Andersson.
Software: Nikos Fatsis-Kavalopoulos.
Supervision: Johan Kreuger, Dan I. Andersson.
Validation: Nikos Fatsis-Kavalopoulos, Roderich Roemhild.
Writing – original draft: Nikos Fatsis-Kavalopoulos, Roderich Roemhild, Po-Cheng Tang,
Johan Kreuger, Dan I. Andersson.
Writing – review & editing: Nikos Fatsis-Kavalopoulos, Roderich Roemhild, Po-Cheng Tang,
Johan Kreuger, Dan I. Andersson.
References1. Kang C-I, Kim S-H, Park WB, Lee K-D, Kim H-B, Kim E-C, et al. Bloodstream Infections Caused by Anti-
biotic-Resistant Gram-Negative Bacilli: Risk Factors for Mortality and Impact of Inappropriate Initial Anti-
microbial Therapy on Outcome. Antimicrobial Agents and Chemotherapy. 2005; 49: 760–766. https://
doi.org/10.1128/AAC.49.2.760-766.2005 PMID: 15673761
2. Montravers P, Veber B, Auboyer C, Dupont H, Gauzit R, Korinek AM, et al. Diagnostic and therapeutic
management of nosocomial pneumonia in surgical patients: Results of the Eole study: Critical Care
Medicine. 2002; 30: 368–375. https://doi.org/10.1097/00003246-200202000-00017 PMID: 11889312
3. Tangden T. Combination antibiotic therapy for multidrug-resistant Gram-negative bacteria. Upsala Jour-
nal of Medical Sciences. 2014; 119: 149–153. https://doi.org/10.3109/03009734.2014.899279 PMID:
24666223
4. Daikos GL, Tsaousi S, Tzouvelekis LS, Anyfantis I, Psichogiou M, Argyropoulou A, et al. Carbapene-
mase-producing Klebsiella pneumoniae bloodstream infections: lowering mortality by antibiotic combi-
nation schemes and the role of carbapenems. Antimicrob Agents Chemother. 2014; 58: 2322–2328.
https://doi.org/10.1128/AAC.02166-13 PMID: 24514083
5. Sewick A, Makani A, Wu C, O’Donnell J, Baldwin KD, Lee G-C. Does Dual Antibiotic Prophylaxis Better
Prevent Surgical Site Infections in Total Joint Arthroplasty? Clin Orthop Relat Res. 2012; 470: 2702–
2707. https://doi.org/10.1007/s11999-012-2255-1 PMID: 22290130
6. Marino K, Parlee A, Orlando R, Lerner L, Strymish J, Gupta K. Comparative Effectiveness of Single ver-
sus Combination Antibiotic Prophylaxis for Infections after Transrectal Prostate Biopsy. Antimicrob
Agents Chemother. 2015; 59: 7273–7275. https://doi.org/10.1128/AAC.01457-15 PMID: 26369958
7. Nseir S, Favory R, Jozefowicz E, Decamps F, Dewavrin F, Brunin G, et al. Antimicrobial treatment for
ventilator-associated tracheobronchitis: a randomized controlled multicenter study. Crit Care. 2008; 12:
R62. https://doi.org/10.1186/cc6890 PMID: 18454864
8. Doring G, Flume P, Heijerman H, Elborn JS, Consensus Study Group. Treatment of lung infection in
patients with cystic fibrosis: current and future strategies. J Cyst Fibros. 2012; 11: 461–479. https://doi.
org/10.1016/j.jcf.2012.10.004 PMID: 23137712
9. Nahid P, Dorman SE, Alipanah N, Barry PM, Brozek JL, Cattamanchi A, et al. Executive Summary: Offi-
cial American Thoracic Society/Centers for Disease Control and Prevention/Infectious Diseases Soci-
ety of America Clinical Practice Guidelines: Treatment of Drug-Susceptible Tuberculosis. Clin Infect
Dis. 2016; 63: 853–867. https://doi.org/10.1093/cid/ciw566 PMID: 27621353
10. Vestergaard M, Paulander W, Marvig RL, Clasen J, Jochumsen N, Molin S, et al. Antibiotic combination
therapy can select for broad-spectrum multidrug resistance in Pseudomonas aeruginosa. International
Journal of Antimicrobial Agents. 2016; 47: 48–55. https://doi.org/10.1016/j.ijantimicag.2015.09.014
PMID: 26597931
11. Tueffers L, Barbosa C, Bobis I, Schubert S, Hoppner M, Ruhlemann M, et al. Pseudomonas aeruginosa
populations in the cystic fibrosis lung lose susceptibility to newly applied β-lactams within 3 days. J Anti-
microb Chemother. 2019; 74: 2916–2925. https://doi.org/10.1093/jac/dkz297 PMID: 31355848
12. Bloemberg GV, Keller PM, Stucki D, Stuckia D, Trauner A, Borrell S, et al. Acquired Resistance to
Bedaquiline and Delamanid in Therapy for Tuberculosis. N Engl J Med. 2015; 373: 1986–1988. https://
doi.org/10.1056/NEJMc1505196 PMID: 26559594
PLOS BIOLOGY Antibiotic interaction
PLOS Biology | https://doi.org/10.1371/journal.pbio.3000856 September 17, 2020 19 / 22
13. Worthington RJ, Melander C. Combination approaches to combat multidrug-resistant bacteria. Trends
in Biotechnology. 2013; 31: 177–184. https://doi.org/10.1016/j.tibtech.2012.12.006 PMID: 23333434
14. Perichon B, Courvalin P. VanA-Type Vancomycin-Resistant Staphylococcus aureus. Antimicrobial
Agents and Chemotherapy. 2009; 53: 4580–4587. https://doi.org/10.1128/AAC.00346-09 PMID:
19506057
15. Bush K. Beta-lactamase inhibitors from laboratory to clinic. Clinical Microbiology Reviews. 1988; 1:
109–123. https://doi.org/10.1128/CMR.1.1.109 PMID: 3060240
16. Band VI, Hufnagel DA, Jaggavarapu S, Sherman EX, Wozniak JE, Satola SW, et al. Antibiotic combina-
tions that exploit heteroresistance to multiple drugs effectively control infection. Nature Microbiology.
2019; 1. https://doi.org/10.1038/S4_1564-019-0480-z
17. Chait R, Craney A, Kishony R. Antibiotic interactions that select against resistance. Nature. 2007; 446:
668–671. https://doi.org/10.1038/nature05685 PMID: 17410176
18. Barbosa C, Beardmore R, Schulenburg H, Jansen G. Antibiotic combination efficacy (ACE) networks
for a Pseudomonas aeruginosa model. PLoS Biol. 2018; 16: e2004356. https://doi.org/10.1371/journal.
pbio.2004356 PMID: 29708964
19. Dean Z, Maltas J, Wood K. Antibiotic interactions shape short-term evolution of resistance in E. faecalis.
PLoS Pathog. 2020; 16: e1008278. https://doi.org/10.1371/journal.ppat.1008278 PMID: 32119717
20. Plotz PH, Davis BD. Synergism between streptomycin and penicillin: a proposed mechanism. Science.
1962; 135: 1067–1068. https://doi.org/10.1126/science.135.3508.1067 PMID: 14487239
21. Gonzales PR, Pesesky MW, Bouley R, Ballard A, Biddy BA, Suckow MA, et al. Synergistic, collaterally
sensitive β-lactam combinations suppress resistance in MRSA. Nat Chem Biol. 2015; 11: 855–861.
https://doi.org/10.1038/nchembio.1911 PMID: 26368589
22. Bollenbach T, Quan S, Chait R, Kishony R. Nonoptimal Microbial Response to Antibiotics Underlies
Suppressive Drug Interactions. Cell. 2009; 139: 707–718. https://doi.org/10.1016/j.cell.2009.10.025
PMID: 19914165
23. Brochado AR, Telzerow A, Bobonis J, Banzhaf M, Mateus A, Selkrig J, et al. Species-specific activity of
antibacterial drug combinations. Nature. 2018; 559: 259–263. https://doi.org/10.1038/s41586-018-
0278-9 PMID: 29973719
24. Freschi L, Vincent AT, Jeukens J, Emond-Rheault J-G, Kukavica-Ibrulj I, Dupont M-J, et al. The Pseu-
domonas aeruginosa Pan-Genome Provides New Insights on Its Population Structure, Horizontal Gene
Transfer, and Pathogenicity. Genome Biol Evol. 2019; 11: 109–120. https://doi.org/10.1093/gbe/
evy259 PMID: 30496396
25. Pena-Miller R, Laehnemann D, Jansen G, Fuentes-Hernandez A, Rosenstiel P, Schulenburg H, et al.
When the Most Potent Combination of Antibiotics Selects for the Greatest Bacterial Load: The Smile-
Frown Transition. PLoS Biol. 2013; 11: e1001540. https://doi.org/10.1371/journal.pbio.1001540 PMID:
23630452
26. Chevereau G, Bollenbach T. Systematic discovery of drug interaction mechanisms. Molecular Systems
Biology. 2015; 11: 807. https://doi.org/10.15252/msb.20156098 PMID: 25924924
27. White RL, Burgess DS, Manduru M, Bosso JA. Comparison of three different in vitro methods of detect-
ing synergy: time-kill, checkerboard, and E test. Antimicrob Agents Chemother. 1996; 40: 1914–1918.
https://doi.org/10.1128/AAC.40.8.1914 PMID: 8843303
28. Sopirala MM, Mangino JE, Gebreyes WA, Biller B, Bannerman T, Balada-Llasat J-M, et al. Synergy
Testing by Etest, Microdilution Checkerboard, and Time-Kill Methods for Pan-Drug-Resistant Acineto-
bacter baumannii. Antimicrobial Agents and Chemotherapy. 2010; 54: 4678–4683. https://doi.org/10.
1128/AAC.00497-10 PMID: 20713678
29. Hocquet D, Dehecq B, Bertrand X, Plesiat P. Strain-Tailored Double-Disk Synergy Test Detects
Extended-Spectrum Oxacillinases in Pseudomonas aeruginosa. J Clin Microbiol. 2011; 49: 2262–2265.
https://doi.org/10.1128/JCM.02585-10 PMID: 21450950
30. Kiraz N, Dag I, Yamac M, Kiremitci A, Kasifoglu N, Oz Y. Synergistic Activities of Three Triazoles with
Caspofungin against Candida glabrata Isolates Determined by Time-Kill, Etest, and Disk Diffusion
Methods. Antimicrobial Agents and Chemotherapy. 2010; 54: 2244–2247. https://doi.org/10.1128/AAC.
01527-09 PMID: 20194697
31. Lamer J, Vincelette J. Quantitative study of the interaction between two antibiotics by agar diffusion.
Journal of Antimicrobial Chemotherapy. 1988; 21: 345–354. https://doi.org/10.1093/jac/21.3.345 PMID:
3360692
32. Greco WR, Bravo G, Parsons JC. The search for synergy: a critical review from a response surface per-
spective. Pharmacol Rev. 1995; 47: 331. PMID: 7568331
PLOS BIOLOGY Antibiotic interaction
PLOS Biology | https://doi.org/10.1371/journal.pbio.3000856 September 17, 2020 20 / 22

33. Naghmouchi K, Le Lay C, Baah J, Drider D. Antibiotic and antimicrobial peptide combinations: synergis-
tic inhibition of Pseudomonas fluorescens and antibiotic-resistant variants. Research in Microbiology.
2012; 163: 101–108. https://doi.org/10.1016/j.resmic.2011.11.002 PMID: 22172555
34. Odds FC. Synergy, antagonism, and what the chequerboard puts between them. Journal of Antimicro-
bial Chemotherapy. 2003; 52: 1–1. https://doi.org/10.1093/jac/dkg301 PMID: 12805255
35. Avery LM, Nicolau DP. Feasibility of routine synergy testing using antibiotic gradient diffusion strips in
the clinical laboratory. Journal of Antimicrobial Chemotherapy. 2018; 73: 2264–2265. https://doi.org/10.
1093/jac/dky165 PMID: 29746659
36. Hooton TM. Uncomplicated Urinary Tract Infection. New England Journal of Medicine. 2012; 366:
1028–1037. https://doi.org/10.1056/NEJMcp1104429 PMID: 22417256
37. Public Health Agency of Sweden, National Veterinary Institute of Sweden. Swedres-Svarm 2017. Con-
sumption of antibiotics and occurrence of resistance in Sweden. Solna/Uppsala: Folkhalsomyndighe-
ten; 2017 p. 118.
38. Meletiadis J, Pournaras S, Roilides E, Walsh TJ. Defining Fractional Inhibitory Concentration Index Cut-
offs for Additive Interactions Based on Self-Drug Additive Combinations, Monte Carlo Simulation Analy-
sis, and In Vitro-In Vivo Correlation Data for Antifungal Drug Combinations against Aspergillus
fumigatus. Antimicrobial Agents and Chemotherapy. 2010; 54: 602–609. https://doi.org/10.1128/AAC.
00999-09 PMID: 19995928
39. Deshpande D, Srivastava S, Nuermberger E, Pasipanodya JG, Swaminathan S, Gumbo T. Concentra-
tion-Dependent Synergy and Antagonism of Linezolid and Moxifloxacin in the Treatment of Childhood
Tuberculosis: The Dynamic Duo. Clin Infect Dis. 2016; 63: S88–S94. https://doi.org/10.1093/cid/ciw473
PMID: 27742639
40. Rezzoagli C, Archetti M, Mignot I, Baumgartner M, Kummerli R. Combining antibiotics with antivirulence
compounds can have synergistic effects and reverse selection for antibiotic resistance in Pseudomonas
aeruginosa. PLOS Biol. 2020; 18: e3000805. https://doi.org/10.1371/journal.pbio.3000805
41. Spratt BG. Distinct penicillin binding proteins involved in the division, elongation, and shape of Escheri-
chia coli K12. Proc Natl Acad Sci U S A. 1975; 72: 2999–3003. https://doi.org/10.1073/pnas.72.8.2999
PMID: 1103132
42. Rylander M, Brorson JE, Johnsson J, Norrby R. Comparison between agar and broth minimum inhibi-
tory concentrations of cefamandole, Cefoxitin, and cefuroxime. Antimicrob Agents Chemother. 1979;
15: 572–579. https://doi.org/10.1128/aac.15.4.572 PMID: 464588
43. Yeh P, Tschumi AI, Kishony R. Functional classification of drugs by properties of their pairwise interac-
tions. Nat Genet. 2006; 38: 489–494. https://doi.org/10.1038/ng1755 PMID: 16550172
44. Rodriguez de Evgrafov M, Gumpert H, Munck C, Thomsen TT, Sommer MOA. Collateral Resistance
and Sensitivity Modulate Evolution of High-Level Resistance to Drug Combination Treatment in Staphy-
lococcus aureus. Mol Biol Evol. 2015; 32: 1175–1185. https://doi.org/10.1093/molbev/msv006 PMID:
25618457
45. Chevereau G, Dravecka M, Batur T, Guvenek A, Ayhan DH, Toprak E, et al. Quantifying the Determi-
nants of Evolutionary Dynamics Leading to Drug Resistance. PLoS Biol. 2015; 13: e1002299. https://
doi.org/10.1371/journal.pbio.1002299 PMID: 26581035
46. Miller C, Thomsen LE, Gaggero C, Mosseri R, Ingmer H, Cohen SN. SOS Response Induction by ß-
Lactams and Bacterial Defense Against Antibiotic Lethality. Science. 2004; 305: 1629–1631. https://doi.
org/10.1126/science.1101630 PMID: 15308764
47. Gutierrez A, Laureti L, Crussard S, Abida H, Rodrıguez-Rojas A, Blazquez J, et al. β-Lactam antibiotics
promote bacterial mutagenesis via an RpoS-mediated reduction in replication fidelity. Nat Commun.
2013; 4: 1610. https://doi.org/10.1038/ncomms2607 PMID: 23511474
48. Mitosch K, Rieckh G, Bollenbach T. Temporal order and precision of complex stress responses in indi-
vidual bacteria. Molecular Systems Biology. 2019; 15: e8470. https://doi.org/10.15252/msb.20188470
PMID: 30765425
49. Montesano R, Mouron P, Amherdt M, Orci L. Collagen matrix promotes reorganization of pancreatic
endocrine cell monolayers into islet-like organoids. Journal of Cell Biology. 1983; 97: 935–939. https://
doi.org/10.1083/jcb.97.3.935 PMID: 6350323
50. Gjorevski N, Sachs N, Manfrin A, Giger S, Bragina ME, Ordoñez-Moran P, et al. Designer matrices for
intestinal stem cell and organoid culture. Nature. 2016; 539: 560–564. https://doi.org/10.1038/
nature20168 PMID: 27851739
51. Wlodkowic D, Cooper JM. Tumors on chips: oncology meets microfluidics. Current Opinion in Chemical
Biology. 2010; 14: 556–567. https://doi.org/10.1016/j.cbpa.2010.08.016 PMID: 20832352
52. Fatsis-Kavalopoulos N, O’Callaghan P, Xie B, Hernandez Vera R, Idevall-Hagren O, Kreuger J. Forma-
tion of precisely composed cancer cell clusters using a cell assembly generator (CAGE) for studying
PLOS BIOLOGY Antibiotic interaction
PLOS Biology | https://doi.org/10.1371/journal.pbio.3000856 September 17, 2020 21 / 22

paracrine signaling at single-cell resolution. Lab Chip. 2019; 19: 1071–1081. https://doi.org/10.1039/
c8lc01153b PMID: 30783638
53. Wistrand-Yuen P, Malmberg C, Fatsis-Kavalopoulos N, Lubke M, Tangden T, Kreuger J. A Multiplex
Fluidic Chip for Rapid Phenotypic Antibiotic Susceptibility Testing. Bomberger JM, editor. mBio. 2020;
11: e03109–19, /mbio/11/1/mBio.03109-19.atom. https://doi.org/10.1128/mBio.03109-19 PMID:
32098819
54. Baltekin O, Boucharin A, Tano E, Andersson DI, Elf J. Antibiotic susceptibility testing in less than 30 min
using direct single-cell imaging. Proc Natl Acad Sci USA. 2017; 114: 9170. https://doi.org/10.1073/
pnas.1708558114 PMID: 28790187
55. Russ D, Kishony R. Additivity of inhibitory effects in multidrug combinations. Nat Microbiol. 2018; 3:
1339–1345. https://doi.org/10.1038/s41564-018-0252-1 PMID: 30323252
56. Bliss CI. The Toxicity of Poisons Applied Jointly1. Annals of Applied Biology. 1939; 26: 585–615. https://
doi.org/10.1111/j.1744-7348.1939.tb06990.x
57. Miles AA, Misra SS, Irwin JO. The estimation of the bactericidal power of the blood. J Hyg (Lond). 1938;
38: 732–749.
PLOS BIOLOGY Antibiotic interaction
PLOS Biology | https://doi.org/10.1371/journal.pbio.3000856 September 17, 2020 22 / 22


