Embed Size (px)
Citation preview
ASPS-ABD/KCDA
COCONUT VALUE CHAIN ANALYSIS REPORT
Conducted By: INSTITUTION DEVELOPMENT & MANAGEMENT SERVICES [IDM]
Ambalal House, South Wing, 2nd Floor; P.O. Box 41825, Mombasa Tel: 041-2225403/ 020 2169840 Fax: 230084,
Cell: 0722 244686, Email: [email protected] Final Report – April 2010
A B D / K C D A : C oc o nu t V al ue C h ai n A na l y s i s , A pr i l 2 0 1 0 F i n a l R e p or t - P r e p ar e d by I D M - Se r v i c e s
ii
ASPS-ABD/KCDA
COCONUT VALUE CHAIN ANALYSIS
FINAL REPORT
Compiled By:
Githende Gachanja Muli Musinga Gitau Ngigi
Norbert Onyango John Bett
April, 2010
A B D / K C D A : C oc o nu t V al ue C h ai n A na l y s i s , A pr i l 2 0 1 0 F i n a l R e p or t - P r e p ar e d by I D M - Se r v i c e s
iii
TABLE OF CONTENTS Table of Contents …….…………………………………………….………………………………………………. iii List of Acronyms …………………………………………………………………………………………………. vi List of Tables …………..…….………………………………………………………………..………………. vii List of Charts …………..…………………………..………………………………………....………………. viii Acknowledgement …....………….…………………………………………………………………………………. ix Executive Summary ….……………………………………………………………………………………………... x 1.0 INTRODUCTION 1.1 Overview ……………………………………………………………………………………………….... 1 1.2 Background Information on the Project ...……………………………………………………..………………..…………………….. 1 1.3 Role of Agricultural Sector Programme Support (ASPS) in Kenya .....…………………………………………………………………………………………… 1 1.4 The Kenya Coconut Development Authority (KCDA) .........……………….................................................................................................... 2 1.5 Coconut Value Chain Analysis – Objectives ...…………………………………………………………………………………………….. 2 1.6 Study Methodology and Approach .....……………….………………………………………………………………………….. 3 2.0 OVERVIEW OF THE COCONUT SUB SECTOR - Trend Analysis 2.1 The Coconut Industry in Kenya - Background Information ……………………………………..………………………………………………………… 4 2.2 Population and Distribution of Coconut Trees within the Coast Province ..................................................................................................................................... 4 2.3 Coconut Products and Production ...............……………………………………………..……..………………………………. 6 2.4 Monetary Value of the Coconut Sub Sector ...…….……………………………………………………………………………………….. 7 2.5 Import and Export figures for Coconut Products 2006 – 2009 ..........………………………………………………………………………………………… 8
SECTION ONE COCONUT (MATURE NUT) VALUE CHAIN ANALYSIS
3.0 Overview of the Dry Nut Value Chain …………………………………...………………………….…….………………………… 11 3.1 The Nut Production Chain ..........…………………………………………………………..……….………….……….. 11
A B D / K C D A : C oc o nu t V al ue C h ai n A na l y s i s , A pr i l 2 0 1 0 F i n a l R e p or t - P r e p ar e d by I D M - Se r v i c e s
iv
3.2 Coconut Dry Nut Value Chain Actors and Functions ………………………………………………………………………………………………. 14 3.3 Processed Coconut Products and their Uses ..………………………………………………….……………….………………………… 25
3.4 Standards and Quality Control for Coconut Products .…………………………………….…...…................................................................... 32
4.0 VALUE CHAIN MAP AND MARKET CHANNELS 4.1 Nut Value Chain Map …………………………………………………………………………………………….... 33 4.2 Dry Nut Marketing and Distribution Channels ……..……………………………………………………………………………………….. 34
SECTION TWO COCONUT WINE INDUSTRY VALUE CHAIN
5.0 OVERVIEW OF THE COCONUT WINE CHAIN 5.1 Coconut Wine Production Clusters ……………………………………………………………………….……………………… 42 5.2 Coconut Wine Production Statistics …..………………………………………………………..………….……………………… 42 5.3 Coconut Trees Varieties and Toddy Production ………………………………………………..…….……………………………………….. 43 5.4 The Tapping Process .………………………………………………………………….………….……….………. 43 5.5 Tapping Tools ……………………………………………………………………..…………………..…….. 44 5.6 Toddy Production per Tree .………………………………………………………………………………………..……. 44 5.7 Production Seasonality ..………………………………………………………………………………………..……. 44 5.8 Analysis of Demand and Supply Gaps .………………………………………………………………..……………………………... 45 5.9 Toddy Price Variation across the Seasons .……………………………………………………….……………………………………… 46 5.10 Average Production per Farmer per Day ………………………………………………………………………………………………. 46 5.11 Quality of Toddy ……………………………………………………………………………………………….. 46 5.12 Coconut Wine Production Gross Margin Analysis ..………………………………..…………………………………………………………… 47 5.13 Coconut Toddy Products and Uses .………………………………………………………………….………………………….. 49 6.0 VALUE CHAIN FUNCTIONS AND ACTORS ….…………………………………..………………………………………………………. 53
7.0 TODDY VALUE MAP AND MARKET CHANNELS 7.1 Toddy Value Chain Map ……..…………………….…………………………………………………………………… 58
A B D / K C D A : C oc o nu t V al ue C h ai n A na l y s i s , A pr i l 2 0 1 0 F i n a l R e p or t - P r e p ar e d by I D M - Se r v i c e s
v
7.2 Coconut Wine (Toddy) Marketing/Distribution Channels ……………………………………….………………………………………………………. 59 8.0 OTHER COCONUT SUPPORTING CHAINS 8.1 Overview ………………………………………………………………………………………………. 64 8.2 The Trunk (Wood) ……………….………………………………………………….………………………….. 64 8.3 The Leaves ………………………………………………………………………………………..…….. 64 9.0 CHALLENGES FACING THE COCONUT VALUE CHAIN ………………………………………………………………………………………………. 66 10. OPPORTUNITIES WITHIN THE COCONUT VALUE CHAIN 10.1 Overview ………………………………………………………………………………………………. 68 10.2 Opportunities …………………………………..…………………………………….……………………. 68 11. SUMMARY OF FINDINGS AND CONCLUSIONS 11.1 Overview …..………………………………………………………………………………………….. 70 11.2 Summary of Key Findings ……………………………………………………………………………………………….. 70 12. RECOMMENDATIONS…..……………………………………………………………. 73
Annexes Annex 1: References Annex 2: Survey Instruments Annex 3: List of Key stakeholders for Draft Report and Dissemination workshop Annex 4: Coconut wine cash flow Annex 5: Nuts cash flow (pure stand) Annex 6: Nut cash flow (Multiple product production) Annex 7: List of Coconut Imports 2007 – 2009 Annex 8: Stakeholders’ Comments
A B D / K C D A : C oc o nu t V al ue C h ai n A na l y s i s , A pr i l 2 0 1 0 F i n a l R e p or t - P r e p ar e d by I D M - Se r v i c e s
vi
LIST OF ACRONYMS
AAEO - Assistant Agricultural Extension Officer
ABD - Agricultural Business Development
AEZ - Agro – Ecological Zones
ASPS - Agricultural Sector Programme Support
CDA - Coast Development Authority
CDO - Community Development Officer
CL - Coastal Lowlands
DAEO - District Agricultural Extension Officer
DANIDA - Danish International Development Agency
DAO - District Agricultural Officer
DCDO - District Crop Development Officer
GDP - Gross Domestic Product
KARI - Kenya Agricultural Research Institute
KCDA - Kenya Coconut Development Authority
KEBs - Kenya Bureau of Standards
KEPHIS - Kenya Plant Health Inspection Services
KenInvest - Kenya Investment Authority
KIE - Kenya Industrial Estates
KIRDI - Kenya Industrial Research Institute
KRA - Kenya Revenue Authority
Md - Man day
MoA - Ministry of Agriculture
NACADA - National Agency for the Campaign Against Drugs Abuse
PDA - Provincial Director of Agriculture
R &D - Research and Development ROI - Return on Investment
SMEs - Small and Medium Enterprises
TORs - Terms of Reference
VCA - Value Chain Analysis
VCO - Virgin Coconut Oil
A B D / K C D A : C oc o nu t V al ue C h ai n A na l y s i s , A pr i l 2 0 1 0 F i n a l R e p or t - P r e p ar e d by I D M - Se r v i c e s
vii
LIST OF TABLES TABLE PAGE Table 2.1 Population of Coconut Trees in Coast Province by District ……………………… 5 Table 2.2 Extrapolated Annual Production and Marketed Figures for various Coconut Products in 2006 - 2008 …………………………………………. 7 Table 2.3 Value of Annual Production of various Coconut Products at
Farm Level in 2006 (in Kes million) ………………………………………………………………………………………….. 8 Table 3.1 Gross Margin Analysis for Coconut Production ……………………………….….. 13 Table 3.2 Categories of Producers based on the Number of Trees Held ………….…….… 15 Table 3.3 Annual Production and Marketing of Mature Nuts in 2006 ………………..…….. 15 Table 3.4 Estimated Number of Traders in different Markets ………………………….…… 18 Table 3.5 Estimated Volumes handled by Traders in different Markets …………….…….. 19 Table 3.6 Percentage Share of various means of Transport, their
Number and Load Capacity ………………………………………………………… 19 Table 3.7 Unit costing from the Bulking Point to the Market ……………………………….. 20 Table 3.8 Unit Costing for Transport to Regional Markets ……………………………….…. 21 Table 4.1 Estimated Annual Nut Market Share per Marketing Channel ………………….. 34 Table 4.2 Gross Margin Analysis for Village Market Segment/Channel 1 …………..…. 35 Table 4.3 Gross Margin Analysis for Unprocessed Dry Nuts for Urban Market Segment/Channel 2 .………………………………………………. 35 Table 4.4 Gross Margin Analysis for Unprocessed Dry Nuts for Upcountry Market Segment/Channel 3 ……………………………………………… 36 Table 4.5 Gross Margin Analysis for Unprocessed Dry Nuts for
Export Market Segment/Channel 4 …………………………………………………. 37 Table 4.6 Value Added by Traders to Dubai Export Market ………………………….…….. 38 Table 4.7 Gross Margin Analysis for Processed Desiccated Coconut …………………….. 39 Table 4.8 Gross Margin Analysis for Processed Virgin Coconut Oil ……………………….. 40 Table 5.1 Annual Production and Marketing of Coconut Wine in 2006 …………….……… 43 Table 5.2 Category of Toddy Producers and their Average Production per day …………. 46 Table 5.3 Coconut Wine Production Gross Margin Analysis …………………………….…. 48 Table 5.4 Composition of Toddy Fermented between 12 – 24 hrs after Harvesting …….. 50 Table 6.1 Category of Toddy Producers and their Average Production per day …………. 53 Table 6.2 Number of Tappers in Coast Province ……………………………………………… 54 Table 6.3 Estimated Number of Traders in Coast Province ……………………………..…… 55 Table 6.4 Estimated Number of Transporters in Coast Province ……………………….….. 55 Table 7.1 Estimated Toddy Market Share per Marketing Channel ………………..……….. 59 Table 7.2 Selling Price per 750 ml bottle .……………………………………………………… 60 Table 7.3 Gross Margin Analysis for Unrefined Wine direct from Farmers to Low-end Rural Consumers/Scenario 1 …………….………………………………. 60 Table 7.4 Gross Margin Analysis for Unrefined Wine direct from Farmers to Low-end Rural Consumers/Scenario 2 …………………….………………………. 61 Table 7.5 Gross Margin Analysis for Unrefined Wine via Intermediaries to Low-end Urban Consumers …………………………………………………………. 61 Table 7.6 Gross Margin Analysis for Semi Processed/Refined and Packaged Coconut Wine to Middle Urban Income/Channel 3 ..………………… 62 Table 8.1 Annual Production and Marketing of Coco-Wood from 2006 - 2009 ……………………… 64 Table 8.2 Annual Production and Marketing of Roofing Materials (makuti) from 2006 - 2009 ……. 65 Table 8.3 Annual Production and Marketing of Brooms from 2006 - 2009 ……………………………. 65
A B D / K C D A : C oc o nu t V al ue C h ai n A na l y s i s , A pr i l 2 0 1 0 F i n a l R e p or t - P r e p ar e d by I D M - Se r v i c e s
viii
LIST OF CHARTS
CHART PAGE Chart 1: Distribution of Coconut Trees in Coast Province by District ………..……….…. 5 Chart 2: Growth Trend (Population of Coconut Trees) ……………………………………. 6 Chart 3: Monetary Value of Key Coconut Products ………………………………………... 6 Chart 4: Monetary Value of Annual Processed Coconut Imports in Kes ………………... 8 Chart 5: Volume of Annual Processed Coconut Imports in Kgs …………………………. 9 Chart 6: Raw Nuts Exports through Taveta Border ………………………..……………... 10 Chart 7: Nut Export through Lunga Lunga Border ………………………………………… 10 Chart 8: Nut Production Seasonality Chart ……………………………………….………… 12 Chart 9: Nut Seasonality Price Variation Chart …………………………………………….. 12 Chart 10: Comparison between Nuts Demand and Supply ……………………………… 13 Chart 11: Annual Production and Marketing of Mature Nuts for 2006-2009 ……………… 16 Chart 12: Percentage Share of various Transport Means …………………………………. 20 Chart 13: Coconut (Mature Nut) Processing ………………………………………………… 25 Flowchart 14: Coconut Fibre Extraction Process ………………………………………………… 31 Chart 15: Nut Value Chain Map …………………………………………………………….... 33 Chart 16: Coconut Wine Production Clusters ………………………………………………… 42 Chart 17: Value of Annual Production of Coconut Wine at
Farm Level in 2006 (in Kes million) ………………………………………………… 43 Chart 18: Toddy Production Seasonality Chart ………………………………………………. 45 Chart 19: Toddy Supply and Demand Curves ………………………………………………… 45 Chart 20: Toddy price Variations across the Seasons ………………………………………. 46 Flowchart 21: Coconut Processing …………………………………………………………………. 49 Figure 22: Coconut Toddy Value Chain Map ………………………………………………….. 58 Chart 23: Toddy Market Share by Channel …………………………………………………… 59
A B D / K C D A : C oc o nu t V al ue C h ai n A na l y s i s , A pr i l 2 0 1 0 F i n a l R e p or t - P r e p ar e d by I D M - Se r v i c e s
ix
ACKNOWLEDGEMENTS
We would sincerely wish to express our gratitude to many individuals and organizations, who have significantly contributed to the successful conclusion of the Coconut Value Chain Analysis Report. The funding of this project was provided by the Agricultural Business Development (ABD) programme of the Agricultural Sector Programme Support (ASPS) and implemented in collaboration with the Ministry of Agriculture, Government of Kenya. We are also grateful to the support extended by the Kenya Coconut Development Authority (KCDA) and Municipal Council of Mombasa who provided us with vital information that enabled us to compile this report. Special thanks go to the ABD team in the Coast region especially the Regional Coordinator Mr. George Mazuri; District Coordinator Malindi Mr. Genya Nyale; District Coordinator Kwale, Mrs. Claris Kionge; the Managing Director KCDA, Mr. Jonathan Sulubu and the Senior Advisor ABD, Mr. Bjarne Christensen for the support and approval of this project. Special thanks go to the staff of the Kenya Coconut Development Authority (KCDA), especially Mr. Ngugi Ticha, Mr. Patrick Onchieku and Ms Miriam Mutuku, who provided liaison throughout the project. The success of the coconut value chain analysis was a joint effort by the staff of the Ministry of Agriculture from the five targeted districts of the Coast Province, farmers, traders, processors and leading supermarkets in the country. We particularly register our appreciation to the Provincial Director of Agriculture, Mrs Phoebe Odhiambo and the District Agri-Business Development Officers who included; Amos Rukwaro of Malindi, James Njoroge of Kwale , Harrison B Mghana of Msambweni, Fredrick Aoko of Kilifi and John Ouko of Kaloleni district. We further pay special tribute to the team of over 30 research assistants for the many hours put into data collection and information gathering in all the targeted areas. We would also wish to recognize the good work performed by the IDM Team of Officers who worked tirelessly to ensure timely completion of this assignment. It is also important to acknowledge the contribution of the coconut stakeholders who provided valuable critique that shaped the final outcome of the report. We are particularly indebted to Mr. Mwangi Njoya of Msambweni Development Company, Mr Kimathi of Kenya Industrial Estate (KIE), Dr. Linus Kasambo of KIRDI and Mr. Peter Nyachwaya, Regional Co-ordinator of the Export Promotion Council, for their very valuable contributions. While many individuals and organizations have participated in varied ways to the outcome of this report including providing useful comments and observations, the opinions expressed in this report (or any errors therein) are solely those of the authors of the report and should not be misconstrued as the official position of ABD, KCDA, MoA or any other institution or persons that helped in accomplishing this work. To all those mentioned above and others who may in one way or the other have contributed to the success of this project, we are indeed very grateful. Githende Gachanja Project Lead Consultant - IDM SERVICES
A B D / K C D A : C oc o nu t V al ue C h ai n A na l y s i s , A pr i l 2 0 1 0 F i n a l R e p or t - P r e p ar e d by I D M - Se r v i c e s
x
EXECUTIVE SUMMARY The Coconut Value Chain Analysis project was commissioned by ABD and KCDA in May 2009 and contracted to Institution Development and Management (IDM) Services after an open tendering process. This Final Report gives a detailed account of the Coconut Value Chain Analysis that has been undertaken and completed by the consultant since the project was commissioned. The Terms of Reference (ToRs) provided by ABD and KCDA required that IDM undertook the assignment of the Coconut Value Chain Analysis to the satisfaction of the coconut industry stakeholders.
The main objective of this project was to analyze and document credible information within the coconut value chains (nuts and toddy) and other supporting value chains that facilitate business development in the sub-sector. The exercise was expected to identify the key players and actors along the coconut value chain; analyze all major products within the chain from the seedling/conception stage to consumption and disposal of all products generated during the life span of the coconut tree. This process involved in-depth analysis of inputs at the initial stage, thorough reviewing of the production and bulking processes, evaluating transport and storage factors, documenting marketing processes in both whole-selling and retailing, identifying business opportunities, documenting key challenges facing the sub-sector and generating recommendations to guide the way forward. The project was also expected to identify major coconut product chains and assess their respective quantities and market channels as well as analyze production costs and identify key factors that influence market pricing. It was also supposed to evaluate and establish the unit production cost of Nuts and Toddy, taking into consideration the life span of the coconut trees. The project was also required to generate reliable data in regard to coconut products, domestic consumption and export quantities in the last 3 years and identify their respective destinations. It was also expected to document coconut products, which are imported and identify their value and origin.
The Survey used the administrative structures of the Ministry of Agriculture and the coconut sub-sector market structures to collect data from major coconut growing Districts of the Coast region. It was also expected to document bulking and transport facilities, coconut processing units, market outlets in the Coast region and other areas. Primary data collection was done by a team of over 30 trained research assistants and MoA District Agri-business Development Officers, independently recruited and supervised on a daily basis by IDM Research Coordinators. In total, over 100 coconut producers, tappers, processors, retailers, transporters and middlemen were interviewed across the coconut belt of the Coast Province. Other strategically selected areas were also visited i.e. Taveta, Lunga Lunga, Nairobi, Kisumu and Busia. It is important to note that these areas are important coconut product markets and transit outlets for coconut exports. In addition, a thorough literature review was conducted to contextualize and benchmark findings of the survey. Key Findings Coconut Potential From the findings of the study, the coconut value chain has a lot of un-tapped potential. According to a recent baseline survey on the coconut sub sector, the value of the sub sector is estimated at Kes 4 billion at farm gate price. Nut and wine are the key driving products of the coconut sub-sector. It is estimated that the coconut sub-sector could potentially be generating over Kes 20 billion with better production methods and enhanced value addition. Coconut wine production currently stands at 2.5 litres per tree, which is relatively low compared to optimal productivity levels of over 5 litres expected in good yielding varieties. While wine production and marketing contributes to more than half of the sub sector value, only 36% of the coconut farmers are involved in this business. The low participation rate of farmers is generally attributable to poor development of the wine
A B D / K C D A : C oc o nu t V al ue C h ai n A na l y s i s , A pr i l 2 0 1 0 F i n a l R e p or t - P r e p ar e d by I D M - Se r v i c e s
xi
markets in some of the regions in the coconut belt. This is mostly due to religious beliefs and harassments from over zealous law enforcement agencies. The nut chain, on the other hand, reveals great untapped potential as most products are sold in unprocessed form. Information from the study indicates that most of the processed coconut products in our markets are imported at a cost of over Kes 500 million annually. This situation can only be reversed through enhanced processing and value addition; a role that can be effectively played by private sector participants. Value Chain Actors Under the mature nut value chain, the study identified the following actors: Input suppliers and service providers, coconut producers, harvestors, de-huskers, traders and agents, transporters, wholesalers and retailers, government institutions, development agencies and consumers. Similarly, under the coconut wine chain, the following actors were identified: Input suppliers and service providers, coconut wine producers, tappers, traders and agents, transporters, wholesalers and retailers, government agencies and consumers. The number of these value chain actors fluctuates with the availability of other alternative employment opportunities particularly among the young unskilled actors. For instance, many coconut toddy tappers and dehuskers are moving away from the sub-sector to other income generating activities due to the pressure of high cost of living. Socio-Cultural Issues and Coconut Wine Coconut wine is deeply entrenched in the cultural practices and way of life of coastal communities. These cultural values have dictated that almost every farming household in the coconut belt has at least a few trees. This partly explains why some farmers will attempt to grow the crop even in fairly marginal areas. Overall, this cultural attachment has contributed to the large population of trees and seems bound to continue holding ground. The cultural entrenchment is exemplified by the widespread consumption of coconut products, especially the coconut wine. Coconut wine is a local drink of choice, a factor that plays a major part in driving the coconut industry. It is however clear that the coconut product market expansions must go beyond just the coastal region. As a positive mark, this trend is already current and it only needs to be further propelled. Information from the study shows that there is great demand for coconut products in all regions of the country especially wine and mature nuts. Coconut Wine Consumption Coconut wine remains a key driver in the coconut sub-sector with its production and marketing value accounting for more than Kes 2.5 billion of the sub-sector GDP. Similarly, according to the study findings, the consumption volume of wine is believed to be in excess of 100 million litres per year at the Mangwe levels. Information from the study indicated that there are over 3,600 mangwes in all the 1,800 villages in the Coast region. Considering there are over 8 million coconut trees in the coconut belt the potential for coconut wine is enormous. The Kes 42 billion beer industry has a 40% gap that is occupied by illicit brews that can easily be replaced by coconut wine. It is important to note that growth in the wine chain is currently hindered by a variety of drawbacks that include socio-cultural and religious factors, especially in the Islamic dominated areas. Local Markets Potential There is apparent high demand for both coconut (mature nuts) and wine in the up-country markets. It should be noted that the mature nut is popular in the upcountry markets i.e. Nairobi, Kisumu, Busia, Eldoret, etc. where it fetches premium prices. Coconut wine, on the other hand, can conveniently replace the illicit brews that dominate the low end market niche in the up-country. Unfortunately, these products are in short supply in all the up-country markets visited by the survey team. It is conclusive that with proper marketing of coconut products
A B D / K C D A : C oc o nu t V al ue C h ai n A na l y s i s , A pr i l 2 0 1 0 F i n a l R e p or t - P r e p ar e d by I D M - Se r v i c e s
xii
and value addition, the opportunities in these vast areas could be fully exploited thereby enhancing the income levels of sub sector players along the value chains. The private sector can play a lead role by availing the requisite investment for processing and marketing of coconut products. Nuts Export Markets Currently, Tanzania offers the largest market for Kenyan coconut exports. In total, nearly 4 million nuts are exported annually through Taveta and Lunga Lunga border towns. The documented nut export figures through these borders by HCDA and KEPHIS are slightly lower than the 4 million. During the survey, we established that some traders cross over to Tanzania without passing through these offices. Unfortunately, the prices offered to the farmers are relatively low, a factor that is attributable to the low level of farmer organizations, which curtails their bargaining power for better prices. Processing and Product Diversification The coconut is a versatile tree and yields and provides farmers with numerous product opportunities. It is evident from the study that the numerous opportunities within the coconut sub-sector have not been fully exploited, despite the high returns. These opportunities can be realized through processing and value addition. Information from the study indicates that there is need for product diversification using simple and affordable technology. Product diversification would effectively address the issue of import substitution, generate income and create employment. During the survey, it was observed that the income of coconut farmers could be tripled by product diversification and value addition. It is important to note that most of the processed coconut products in the Kenyan markets are imported from Asia. Integration of Stakeholders into the Coconut Industry Whereas there are various stakeholders with vast knowledge and technology to develop the coconut sub sector their integration has been minimal. For example, KIRDI has technologies, which could help to set up cottage industries but sub sector integration and adoption of new ideas and technologies remains limited. There are a number of locally developed coconut processing technologies which can serve as core ideas for potential rural-based enterprises. Establishment of rural based industries will not only increase utilization of coconut products at the domestic level but will also intensify the competitiveness in the industry. Laundry and toilet soaps, for example, are more expensive in the rural than in the urban areas because of distribution and marketing costs. There are still many traditional products that could be produced by small-scale industries, which could generate rural employment, increase utilization of coconut products and enhance farmers' incomes. Some of these products include; Virgin oil, coco sugar, vinegar, coconut milk, desiccated coconut, etc. It is imperative that stakeholders and service providers with critical information and technology are integrated into the coconut growers’ fraternity to facilitate experience sharing and technology transfers at all stages of the coconut value chain. KCDA should provide leadership in this regard. Post Harvest Handling and Losses According to the study, it is evident that there are challenges related to handling of both nuts and coconut wine. Poor handling may cause the nut to crack or damage the shell, thus reducing its quality and value. Some of the key processes in product handling i.e. de-husking, transport, storage, packaging etc. are not prudently managed at various levels along the value chain. The low levels of revenue generation in the sub-sector are attributable to poor handling and inefficient management at most levels along the coconut value chain. For instance, during tapping of coconut toddy, many farmers do not own cooling equipment; hence suffering enormous loses when their products go to waste. Other factors that contribute to post harvest handling and losses include poor market development and poor infrastructure in the coconut belt. Coconut Value Chain Challenges
A B D / K C D A : C oc o nu t V al ue C h ai n A na l y s i s , A pr i l 2 0 1 0 F i n a l R e p or t - P r e p ar e d by I D M - Se r v i c e s
xiii
The main challenges facing farmers at production level include; accessibility of quality planting materials, the menace of pests and diseases, limited extension services and low yield per tree. From a development perspective, this can be viewed as a challenge for finding more drought tolerant and high yielding tree varieties for both nuts and wine which is one of the key research areas that should be focused on. Challenges at market level include, inefficient marketing systems that are dominated by middlemen and brokers who dictate the terms of trade, lack of credit facilities and a general lack of processing facilities within the coconut belt. The above constraints have resulted to below optimal utilization of the sub sector potential. As a result, relevant stakeholders ought to develop proper mechanisms and initiatives to address these challenges so as to revamp the sub sector and fully exploit the economic benefits of the coconut tree. Processing and Value Addition related Challenges From the findings of the study, it is evident that the processing capacity is not properly developed. Coconut wine is generally perceived to be handled, traded and consumed under unhygienic conditions, a factor that discourages the urban up-market consumers. There is therefore need for appropriate initiatives towards reversing this negative trend as price differentials between local Mnazi and packaged wine are wide. With little value addition the lives of the sub sector players would be greatly transformed. From the results of the survey, the processing of the nuts is still limited to a few products despite its enormous potential to generate numerous products. This is a contraction considering that the local supermarkets are flooded with imported coconut products from India and Asia Pacific countries. Apparently, there has been a general lack of innovation in terms of affordable processing technologies that can be applied in rural areas. Similarly, there has been low investment in coconut processing as a result of low participation of the private sector players. Legal and Institutional Framework related Challenges Although the legal related issues have been addressed by the repeal of the Liquor Act and creation of KCDA, the situation on the ground is still shrouded with a lot of hindrances. For instance, the transport, consumption and trading of coconut wine is still conducted in a clandestine way. This has attracted the attention of unscrupulous law enforcement agents who use the advantage to harass and demand bribes from both the Mangwe operators and transporters. It is important that KCDA harmonizes coconut wine licensing with the existing Liquor Licensing Act There is therefore need for KCDA and other stakeholders to carry out awareness creation activities and educate the farmers, as well as wine traders, on their rights. This is probably the most lucrative chain and holds the key to the development and transformation of the coconut sub-sector.
A B D / K C D A : C oc o nu t V al ue C h ai n A na l y s i s , A pr i l 2 0 1 0 F i n a l R e p or t - P r e p ar e d by I D M - Se r v i c e s
1
1.0 INTRODUCTION 1.1 Overview
This report presents findings of a coconut value chain analysis (VCA) in Kenya commissioned in May 2009 by the Agricultural Business Development (ABD) in collaboration with the Kenya Coconut Development Authority (KCDA) contracted to Institution Development and Management Services (IDM Services) a private research and management consulting firm based in Mombasa. The assignment aimed at establishing and providing critical and credible information within the coconut value chain. The assignment was carried out over a three months period using the Ministry of Agriculture (MoA) structures where the firm closely worked with Agricultural Business Development Officers (ABDO) as they were deemed to have a better insight on agri-business issues, which is the main frame of this report. Data and information gathering was carried out in the months of June to August 2009 using a team of trained researchers with requisite knowledge and experience in the coconut sub sector, supervised closely by district coordinators from IDM. The project was undertaken within all the administrative districts of the Coast province i.e. Kwale, Kilifi, Kaloleni, Msambweni, Malindi, Lamu, Tana Delta, Tana River, Taita, Taveta, Kilindini, Mombasa and Kinango. It specifically focused on the local coconut product markets i.e. Mombasa, Malindi, Kilifi, Lamu, Mpeketoni, Kipini, Garsen, Kaloleni, Mazeras, Mariakani, Lungalunga, Taveta, Voi, Kinango, Kwale, Mtwapa, Ukunda etc. Other major coconut product markets outside the Coast region that were also visited included Nairobi and Kisumu and key border towns i.e. Taveta and Busia, where exports pass through. 1.2 Background Information on the Project. Following the successful completion of a baseline survey and census of coconut trees in Kenya and the subsequent formation of the KCDA, there was dare need to establish additional information relating to the coconut value chain. Such information related to establishing the key players within the value chain and their functions, gross margin distribution along the chain, unit production costs, pricing, value addition, domestic consumption and export markets among other issues. On 19th February 2009, during a national workshop held at Mombasa Beach Hotel to validate KCDA’s 5 year Strategic Plan, ABD made a commitment to provide financial support to undertake the Coconut Product VCA to help generate credible information about the sub sector. Indeed, ASPS funded 75% of the project cost with KCDA funding the remaining 25%. The information was deemed necessary if KCDA and other Development Agencies were to promote exploitation of the sub sector potential, which remains grossly untapped. With such information at hand, it would be possible to encourage investors into the sub sector, which is base to this study report. 1.3 Role of Agricultural Sector Programme Support (ASPS) in Kenya The Agricultural Sector Programme Support (ASPS) was initiated in July 2005 as a co-operation between the Government of Kenya and the Government of Denmark (Danida). The programme aims at linking smallholder farmers and Micro and Small Enterprises (MSEs) with the potential to further develop viable agricultural businesses. The programme focuses on improving production, creating employment, increasing income levels through agri- business initiatives, especially in semi arid districts, which are the main areas of focus for the programme. ASPS gives support to farmers in several districts of Eastern and Coast provinces, namely; Kitui, Taita Taveta, Makueni, Kwale, and Kilifi, Mwingi and Malindi districts with more districts being roped in. The ASPS has got three major components through which it supports farmers that includes; Agricultural Policy Support Facility (APSF), Agricultural Business Development Support (ABD) and Decentralized Agricultural Support Structures (DASS). The three components of ASPS were established to facilitate the transition of the agricultural sector where the private sector becomes the vehicle for economic growth while the public sector establishes a conducive environment for this development (asps-ke.org). The coconut value chain analysis project was
A B D / K C D A : C oc o nu t V al ue C h ai n A na l y s i s , A pr i l 2 0 1 0 F i n a l R e p or t - P r e p ar e d by I D M - Se r v i c e s
2
initiated by ASPS and funded through the ABD component, which mainly focuses on improving productivity, initiating agri-businesses and developing market linkages among the producers/farmers, Small and Medium Enterprises (SMEs) and Financial Service Providers. 1.4 The Kenya Coconut Development Authority (KCDA) KCDA was established through a legal notice No. 165 of the Kenya Gazette of 27th August 2007 under the provisions of the State Corporations Act. Its primary mandate is to regulate the coconut industry. Its core functions include:
Provide advisory services on matters related to the coconut industry to the government and to the industry for planning purposes.
Collect and collate data, maintain a database on the coconut industry and document and monitor the industry through registration of all players in the industry.
Assist in the production, processing, grading, storage, collection, transportation and warehousing of all the produce and bi-products destined for markets.
Arbitrate on disputes arising between growers and any of the players or among other players in the industry.
Vet and witness contract agreements between growers and any other players or between other players in the industry before they are executed.
Appoint agents for the implementation or performance of any function of the Authority under this Order.
Monitor imports and exports of coconut produce and bi-products through efficient management of the coconut industry.
1.5 Coconut Value Chain Analysis - Objectives The main objective of the study was to undertake a Coconut Value Chain Analysis and disseminate detailed and credible information on the industry’s main value chains (nuts and toddy) and other supporting value chains for business development by various industry players. Specific objectives/tasks under the assignment as defined by the terms of reference -ToR included the following;
To document the key players along the coconut value chain. To analyze all the key products within the nut value chain from seedling to coco wood and by products
generated during the life span of the tree. To analyze all the key products within the toddy value chain. To identify the major coconut products and assess their respective market values. To analyze coconut products production costs and identify key factors that influence market pricing. To establish the unit production cost of nuts and toddy (litre) taking into consideration the life span of
the trees. To generate reliable data in regard to domestic consumption of coconut product and export quantities in
the last 3 years (2006 – 2008). To identify coconut product export destinations. To identify coconut products, which are imported and from which origin. To make appropriate recommendations to guide the way forward. To prepare a comprehensive coconut value chain report.
A B D / K C D A : C oc o nu t V al ue C h ai n A na l y s i s , A pr i l 2 0 1 0 F i n a l R e p or t - P r e p ar e d by I D M - Se r v i c e s
3
1.6 Study Methodology and Approach More often than not, value chain analyses are mainly qualitative opposed to quantitative. The coconut value chain analysis largely employed a survey methodology with a qualitative approach. To gather the required information, the following major activities were carried out:
Literature Review of relevant documents from various sources relating to the topic under study. Field Interviews with selected respondents/players drawn from a wide range of stakeholders and actors
from the coconut sub sector who included coconut farmers, cooperative societies, input suppliers, processors, local administration, tappers, traders, staff from the Ministry of Agriculture, Kenya Coconut Development Authority and transporters among others.
Focused Group Discussions (FDGs) with selected groups and stakeholders. The study covered seven districts of the Coastal region of Kenya, namely Kaloleni, Kilifi, Malindi, Mombasa, Taveta, Msambweni and Kwale. The main tools used for the study included an interview guide for the various value chain players and participatory observation guides during the harvesting, de-husking, bulking and transport, processing and marketing discussions with the concerned farmers, harvestors, de-huskers, traders, transporters, government agencies (Ministry of Agriculture and KCDA) and other relevant stakeholders. Telephone interviews were also used to collect vital information from key informants though on a limited scale. Stratified sampling was adopted for the study to identify all key sub sector players so as to have a sample, which is as representative as possible, to facilitate a comprehensive analysis on the coconut value chain.
A B D / K C D A : C oc o nu t V al ue C h ai n A na l y s i s , A pr i l 2 0 1 0 F i n a l R e p or t - P r e p ar e d by I D M - Se r v i c e s
4
2.0 OVERVIEW OF THE COCONUT SUB SECTOR - Trend Analysis 2.1 The Coconut Industry in Kenya - Background Information The coconut palm (coco nucifera) arrived in East Africa a long time ago; probably before the first century. The sailor’s handbook “periplus of the Erythraean Sea” records export of coconut oil from this region in the first century 100 AD (Freeman Grenville 1962). The Moroccan explorer Ibin Batuta reports the presence of large coconut groves along the East African coast in the 7th century. Similarly, in 1498, when the Portuguese arrived in Malindi in the East Coast of Africa, most settlements had large coconut palm groves, which were apparently of considerable economic interest. The Portuguese often used the tactic of cutting them down to force the towns to surrender (Strandes 1899). Coconut is a perennial and traditional tree crop that grows in the Coast region mainly in the agro-ecological zones of CL2, CL3, CL4 and marginally in CL5 along the rivers and valleys. While the coconut has been associated with the Coast region, over the years, it has found its way to the shores of Lake Victoria. The tree requires 800-1400mm of rainfall per annum with an average temperature of 260C in the Coastal lowlands and 270C in the hinterland. Its cultivation spread rapidly and became an industrial crop of considerable economic importance during the 20th century. The crop is largely grown by small scale farmers who intercrop it with other annual food crops such as cassava, sesame, maize and cowpeas. The coconut palm is often referred to as ‘the tree of life’ and is widely used both as a cash crop and food crop by all the communities in Coast province. Indeed, there are hardly any parts of the coconut palm that are left unused. The coconut palm produces food and drink, copra for oil, palm wine for ceremonies and refreshments, building materials such as wood and leaves for thatching and furniture, fibres for ropes, mats, brushes and brooms and shells for utensils and ornaments. In particular, madafu (immature nut) is a preferred coastal refreshment drink, especially during sunny weather. Palm wine is used in nearly all social and ritual affairs and traded for economic gains. In addition, a meal is hardly complete without a mixture of coconut milk from the nuts. Research and development within the coconut sector in Kenya has been very slow compared to the case of some of the other East African countries such as Tanzania and Mozambique. Kenya has not been an active participator in some of the important network organizations created in the coconut industry such as the International Coconut Genetic Reserve Network (COGENT), which has played a leading role in introducing new tree varieties based on trials in participating countries. The coconut production has been operating under unclear legal and policy framework, especially with regard to palm wine, which has been classified together with other ‘traditional brews’. Indeed, after independence, the Government labelled coffee, tea, cashew nut and coconut as protected crops. However, coconut and cashew nut were dropped from the list in 1997. Since then, the industry has continued to operate under undefined policies in terms of development in the areas of production, marketing processing and crop research. Some restrictive laws such as the Liquor Act have confined further use, development and exploitation of other related products. In general terms, the coconut sub-sector demonstrates an immense potential to drive economic development in the main coastal belt. This potential is however far from being exploited and coconut farmers remain among the poorest in Kenya. 2.2 Population and Distribution of Coconut Trees within the Coast Province According to a recent coconut tree census and baseline survey, (2007) conducted by IDM, there were 7.4 million coconut trees in 2006. The coconut trees are distributed along the coastal strip from south in Vanga to Kiunga in
A B D / K C D A : C oc o nu t V al ue C h ai n A na l y s i s , A pr i l 2 0 1 0 F i n a l R e p or t - P r e p ar e d by I D M - Se r v i c e s
5
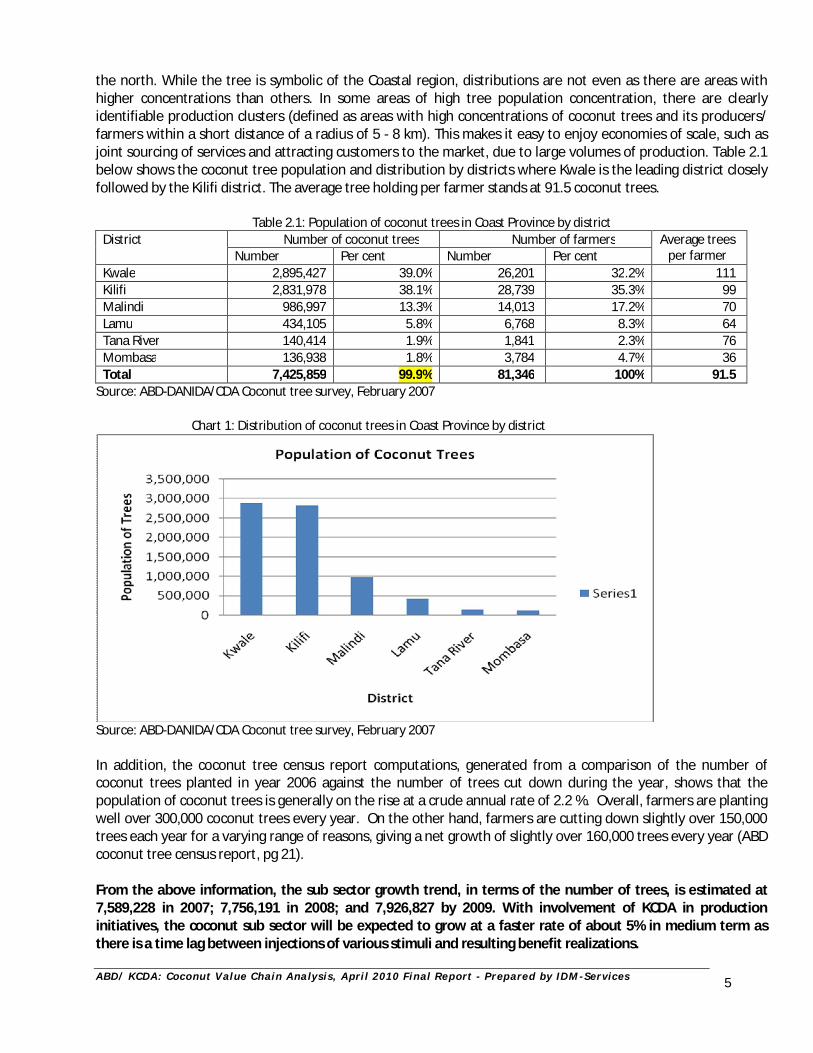
the north. While the tree is symbolic of the Coastal region, distributions are not even as there are areas with higher concentrations than others. In some areas of high tree population concentration, there are clearly identifiable production clusters (defined as areas with high concentrations of coconut trees and its producers/ farmers within a short distance of a radius of 5 - 8 km). This makes it easy to enjoy economies of scale, such as joint sourcing of services and attracting customers to the market, due to large volumes of production. Table 2.1 below shows the coconut tree population and distribution by districts where Kwale is the leading district closely followed by the Kilifi district. The average tree holding per farmer stands at 91.5 coconut trees.
Table 2.1: Population of coconut trees in Coast Province by district District Number of coconut trees Number of farmers Average trees
per farmer Number Per cent Number Per cent Kwale 2,895,427 39.0% 26,201 32.2% 111 Kilifi 2,831,978 38.1% 28,739 35.3% 99 Malindi 986,997 13.3% 14,013 17.2% 70 Lamu 434,105 5.8% 6,768 8.3% 64 Tana River 140,414 1.9% 1,841 2.3% 76 Mombasa 136,938 1.8% 3,784 4.7% 36 Total 7,425,859 99.9% 81,346 100% 91.5
Source: ABD-DANIDA/CDA Coconut tree survey, February 2007 Chart 1: Distribution of coconut trees in Coast Province by district
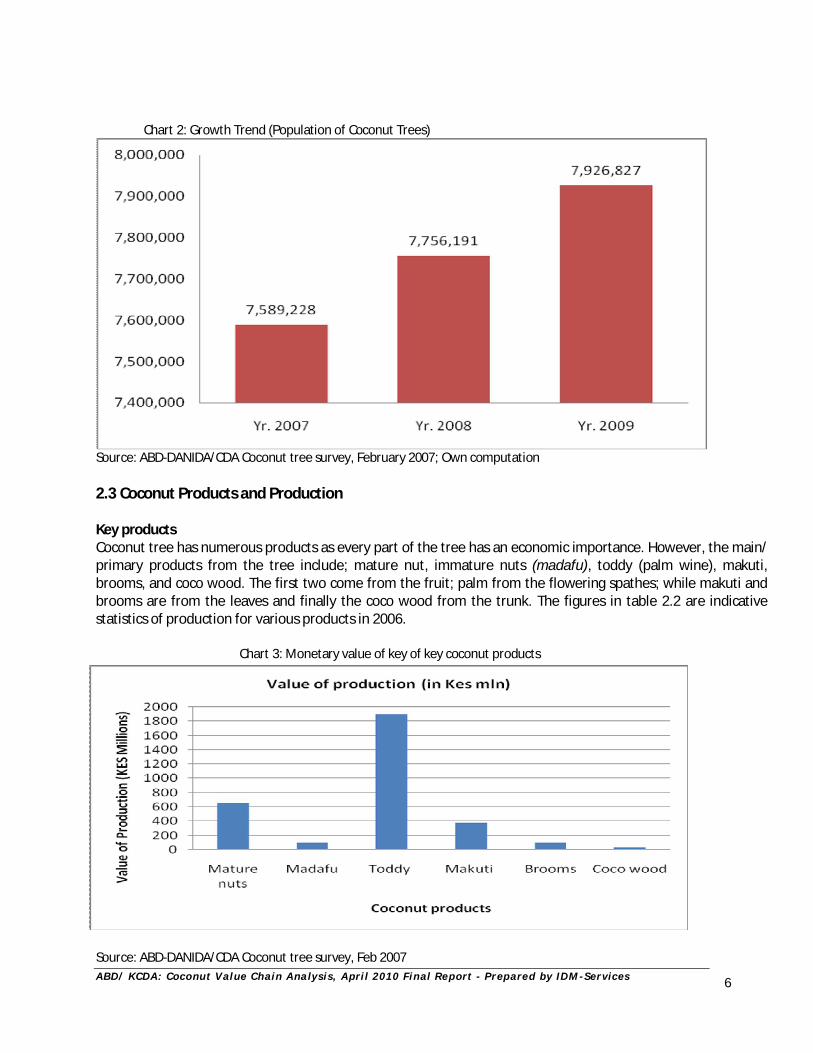
Source: ABD-DANIDA/CDA Coconut tree survey, February 2007 In addition, the coconut tree census report computations, generated from a comparison of the number of coconut trees planted in year 2006 against the number of trees cut down during the year, shows that the population of coconut trees is generally on the rise at a crude annual rate of 2.2 %. Overall, farmers are planting well over 300,000 coconut trees every year. On the other hand, farmers are cutting down slightly over 150,000 trees each year for a varying range of reasons, giving a net growth of slightly over 160,000 trees every year (ABD coconut tree census report, pg 21). From the above information, the sub sector growth trend, in terms of the number of trees, is estimated at 7,589,228 in 2007; 7,756,191 in 2008; and 7,926,827 by 2009. With involvement of KCDA in production initiatives, the coconut sub sector will be expected to grow at a faster rate of about 5% in medium term as there is a time lag between injections of various stimuli and resulting benefit realizations.
A B D / K C D A : C oc o nu t V al ue C h ai n A na l y s i s , A pr i l 2 0 1 0 F i n a l R e p or t - P r e p ar e d by I D M - Se r v i c e s
6
Chart 2: Growth Trend (Population of Coconut Trees)
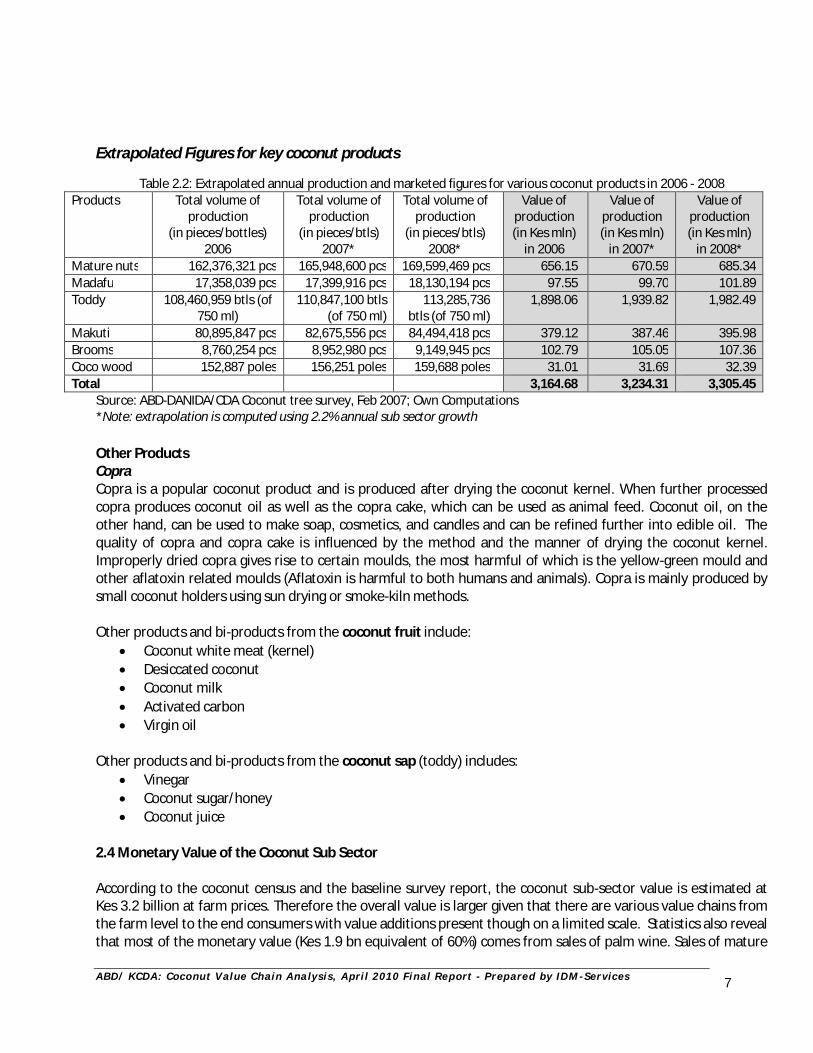
Source: ABD-DANIDA/CDA Coconut tree survey, February 2007; Own computation 2.3 Coconut Products and Production Key products Coconut tree has numerous products as every part of the tree has an economic importance. However, the main/ primary products from the tree include; mature nut, immature nuts (madafu), toddy (palm wine), makuti, brooms, and coco wood. The first two come from the fruit; palm from the flowering spathes; while makuti and brooms are from the leaves and finally the coco wood from the trunk. The figures in table 2.2 are indicative statistics of production for various products in 2006. Chart 3: Monetary value of key of key coconut products
Source: ABD-DANIDA/CDA Coconut tree survey, Feb 2007
A B D / K C D A : C oc o nu t V al ue C h ai n A na l y s i s , A pr i l 2 0 1 0 F i n a l R e p or t - P r e p ar e d by I D M - Se r v i c e s
7
Extrapolated Figures for key coconut products
Table 2.2: Extrapolated annual production and marketed figures for various coconut products in 2006 - 2008 Products Total volume of
production (in pieces/bottles)
2006
Total volume of production
(in pieces/btls) 2007*
Total volume of production
(in pieces/btls) 2008*
Value of production (in Kes mln)
in 2006
Value of production (in Kes mln)
in 2007*
Value of production (in Kes mln)
in 2008* Mature nuts 162,376,321 pcs 165,948,600 pcs 169,599,469 pcs 656.15 670.59 685.34 Madafu 17,358,039 pcs 17,399,916 pcs 18,130,194 pcs 97.55 99.70 101.89 Toddy 108,460,959 btls (of
750 ml) 110,847,100 btls
(of 750 ml) 113,285,736
btls (of 750 ml) 1,898.06 1,939.82 1,982.49
Makuti 80,895,847 pcs 82,675,556 pcs 84,494,418 pcs 379.12 387.46 395.98 Brooms 8,760,254 pcs 8,952,980 pcs 9,149,945 pcs 102.79 105.05 107.36 Coco wood 152,887 poles 156,251 poles 159,688 poles 31.01 31.69 32.39 Total 3,164.68 3,234.31 3,305.45
Source: ABD-DANIDA/CDA Coconut tree survey, Feb 2007; Own Computations *Note: extrapolation is computed using 2.2% annual sub sector growth Other Products Copra Copra is a popular coconut product and is produced after drying the coconut kernel. When further processed copra produces coconut oil as well as the copra cake, which can be used as animal feed. Coconut oil, on the other hand, can be used to make soap, cosmetics, and candles and can be refined further into edible oil. The quality of copra and copra cake is influenced by the method and the manner of drying the coconut kernel. Improperly dried copra gives rise to certain moulds, the most harmful of which is the yellow-green mould and other aflatoxin related moulds (Aflatoxin is harmful to both humans and animals). Copra is mainly produced by small coconut holders using sun drying or smoke-kiln methods. Other products and bi-products from the coconut fruit include:
Coconut white meat (kernel) Desiccated coconut Coconut milk Activated carbon Virgin oil
Other products and bi-products from the coconut sap (toddy) includes:
Vinegar Coconut sugar/honey Coconut juice
2.4 Monetary Value of the Coconut Sub Sector According to the coconut census and the baseline survey report, the coconut sub-sector value is estimated at Kes 3.2 billion at farm prices. Therefore the overall value is larger given that there are various value chains from the farm level to the end consumers with value additions present though on a limited scale. Statistics also reveal that most of the monetary value (Kes 1.9 bn equivalent of 60%) comes from sales of palm wine. Sales of mature
A B D / K C D A : C oc o nu t V al ue C h ai n A na l y s i s , A pr i l 2 0 1 0 F i n a l R e p or t - P r e p ar e d by I D M - Se r v i c e s
8
nuts accounts for less than a quarter (23.6%) of the total value of production. Other significant products of the coconut tree at the farm level are Makuti (roofing materials), accounting for 12% of the value of production, and brooms (3.3%). The emergent market for coco-wood, coir, coconut oil and other products of the coconut tree account for the remaining 1% of the value of the sub-sector, given the limited scale of processing initiatives within the sub sector,(ABD Coconut tree survey, 2007). Table 2.3: Value of annual production of various coconut products at farm level in 2006 (in Kes million)
District Mature Nuts
Immature Nuts (Madafu)
Wine Makuti Brooms Other Total in Kes
Kwale 175.43 14.99 248.47 79.07 8.68 7.85 534.49 Kilifi 234.77 32.18 1,177.30 167.58 83.50 9.73 1,705.06 Malindi 133.75 28.70 395.07 87.52 3.26 2.13 650.43 Lamu 67.08 7.33 10.79 27.39 0.84 - 113.43 Tana River 2.68 0.18 - 2.53 0.17 - 5.56 Mombasa 26.56 10.92 66.43 15.03 6.34 11.3 136.58 Total 640.27 94.3 1,898.06 379.12 102.79 31.01 3,164.68
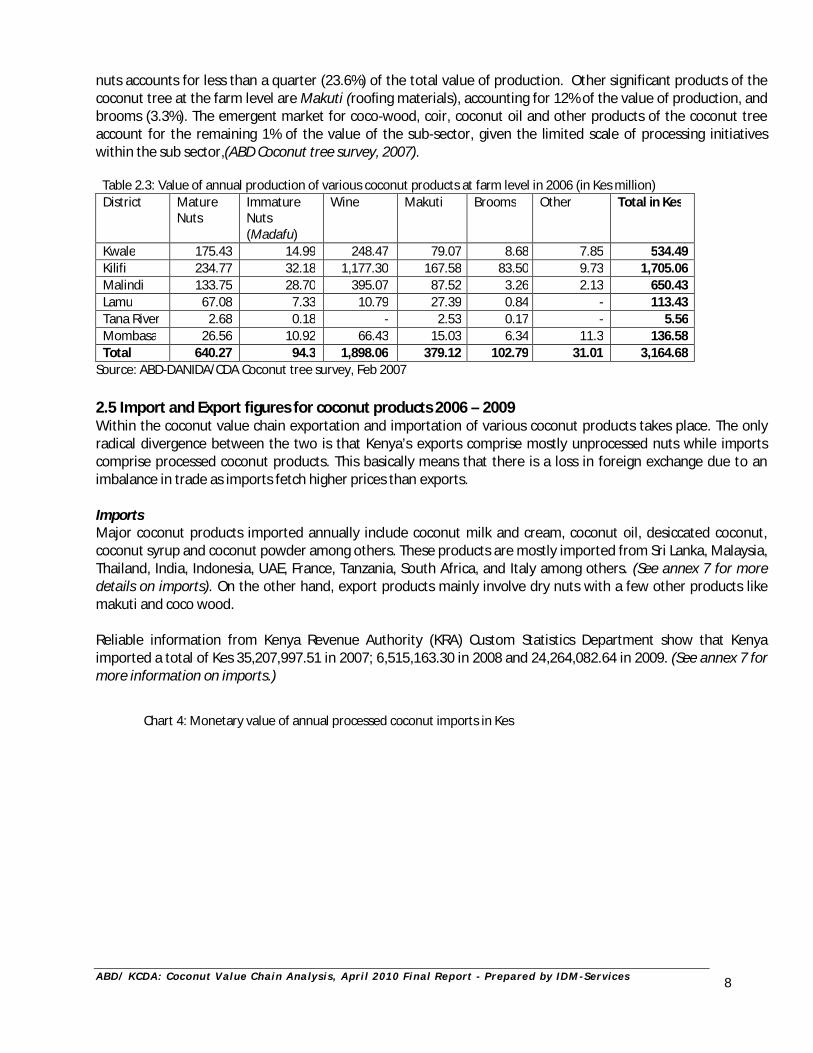
Source: ABD-DANIDA/CDA Coconut tree survey, Feb 2007 2.5 Import and Export figures for coconut products 2006 – 2009 Within the coconut value chain exportation and importation of various coconut products takes place. The only radical divergence between the two is that Kenya’s exports comprise mostly unprocessed nuts while imports comprise processed coconut products. This basically means that there is a loss in foreign exchange due to an imbalance in trade as imports fetch higher prices than exports. Imports Major coconut products imported annually include coconut milk and cream, coconut oil, desiccated coconut, coconut syrup and coconut powder among others. These products are mostly imported from Sri Lanka, Malaysia, Thailand, India, Indonesia, UAE, France, Tanzania, South Africa, and Italy among others. (See annex 7 for more details on imports). On the other hand, export products mainly involve dry nuts with a few other products like makuti and coco wood. Reliable information from Kenya Revenue Authority (KRA) Custom Statistics Department show that Kenya imported a total of Kes 35,207,997.51 in 2007; 6,515,163.30 in 2008 and 24,264,082.64 in 2009. (See annex 7 for more information on imports.)
Chart 4: Monetary value of annual processed coconut imports in Kes
A B D / K C D A : C oc o nu t V al ue C h ai n A na l y s i s , A pr i l 2 0 1 0 F i n a l R e p or t - P r e p ar e d by I D M - Se r v i c e s
9
Value of Imports
0.00
5,000,000.00
10,000,000.00
15,000,000.00
20,000,000.00
25,000,000.00
30,000,000.00
35,000,000.00
40,000,000.00
Valu
e in
Kes
.
Series1 35,207,997.51 6,515,163.30 24,264,082.64
Yr. 2007 Yr. 2008 Yr. 2009
Source: KRA Statistic Records (KRA Customs Statistic Dept, Msa), 2009
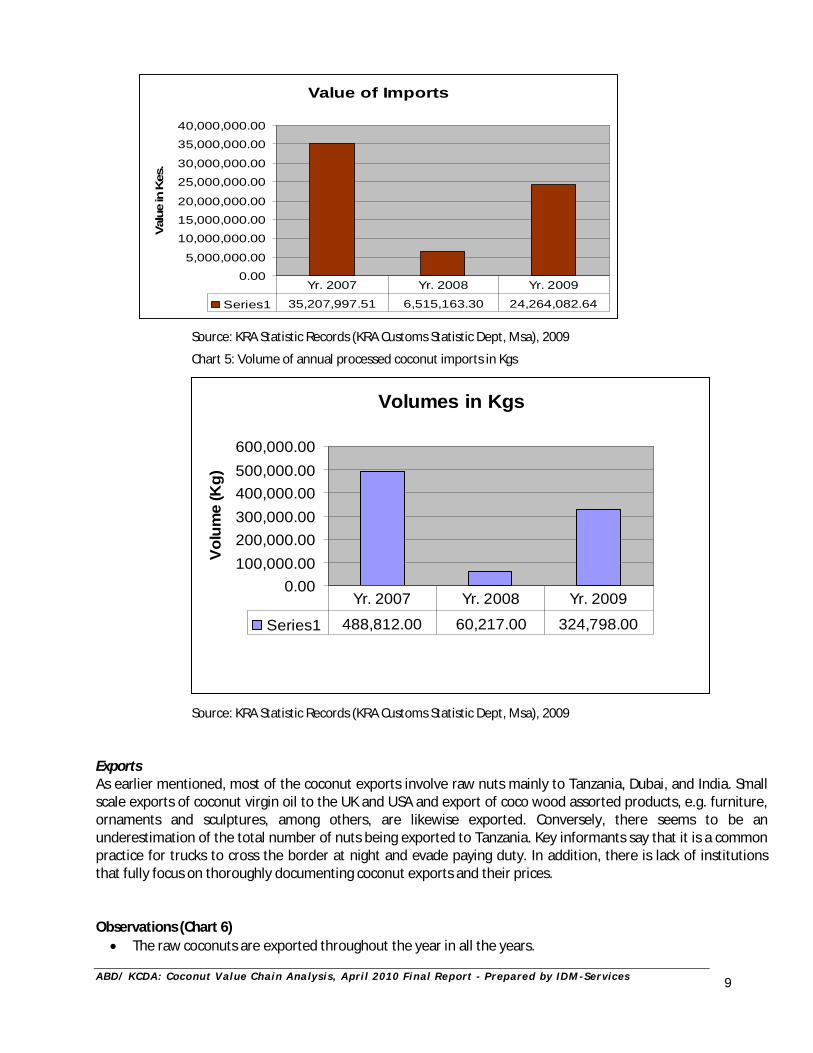
Chart 5: Volume of annual processed coconut imports in Kgs
Volumes in Kgs
0.00100,000.00200,000.00300,000.00400,000.00500,000.00600,000.00
Volu
me
(Kg)
Series1 488,812.00 60,217.00 324,798.00
Yr. 2007 Yr. 2008 Yr. 2009
Source: KRA Statistic Records (KRA Customs Statistic Dept, Msa), 2009
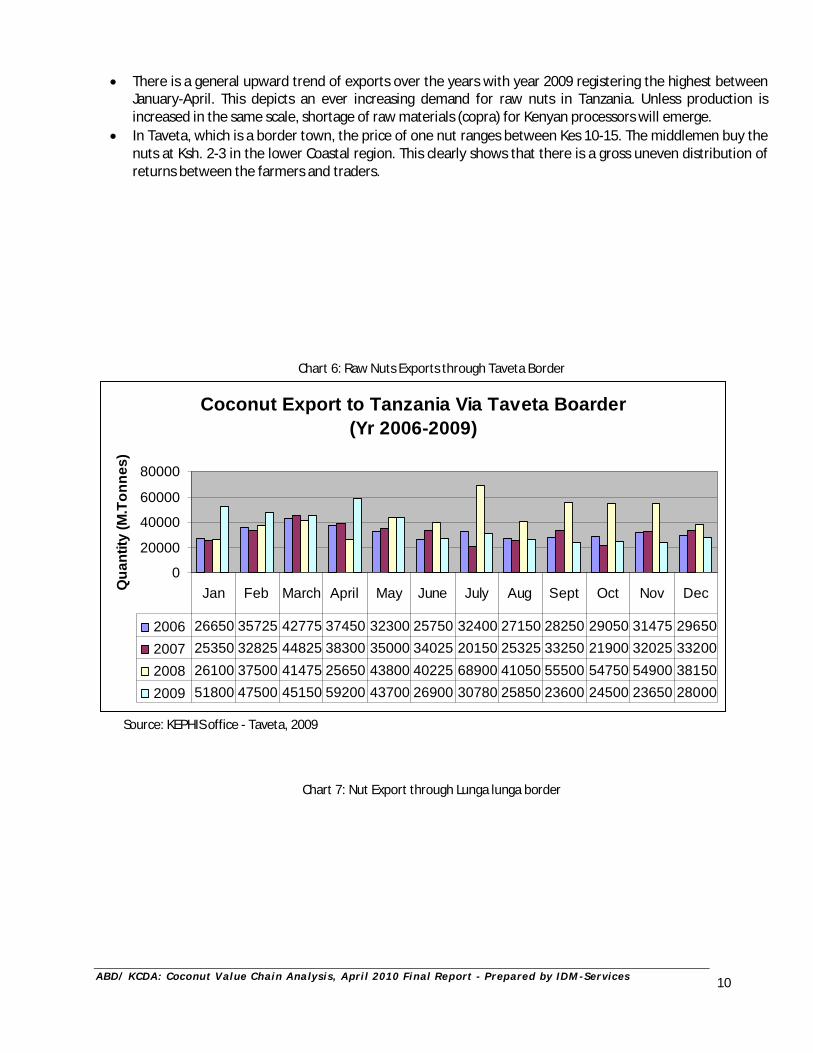
Exports As earlier mentioned, most of the coconut exports involve raw nuts mainly to Tanzania, Dubai, and India. Small scale exports of coconut virgin oil to the UK and USA and export of coco wood assorted products, e.g. furniture, ornaments and sculptures, among others, are likewise exported. Conversely, there seems to be an underestimation of the total number of nuts being exported to Tanzania. Key informants say that it is a common practice for trucks to cross the border at night and evade paying duty. In addition, there is lack of institutions that fully focus on thoroughly documenting coconut exports and their prices. Observations (Chart 6) The raw coconuts are exported throughout the year in all the years.
A B D / K C D A : C oc o nu t V al ue C h ai n A na l y s i s , A pr i l 2 0 1 0 F i n a l R e p or t - P r e p ar e d by I D M - Se r v i c e s
10
There is a general upward trend of exports over the years with year 2009 registering the highest between January-April. This depicts an ever increasing demand for raw nuts in Tanzania. Unless production is increased in the same scale, shortage of raw materials (copra) for Kenyan processors will emerge.
In Taveta, which is a border town, the price of one nut ranges between Kes 10-15. The middlemen buy the nuts at Ksh. 2-3 in the lower Coastal region. This clearly shows that there is a gross uneven distribution of returns between the farmers and traders.
Chart 6: Raw Nuts Exports through Taveta Border
Coconut Export to Tanzania Via Taveta Boarder (Yr 2006-2009)
0
20000
40000
60000
80000
Qua
ntity
(M.T
onne
s)
2006 26650 35725 42775 37450 32300 25750 32400 27150 28250 29050 31475 296502007 25350 32825 44825 38300 35000 34025 20150 25325 33250 21900 32025 332002008 26100 37500 41475 25650 43800 40225 68900 41050 55500 54750 54900 381502009 51800 47500 45150 59200 43700 26900 30780 25850 23600 24500 23650 28000
Jan Feb March April May June July Aug Sept Oct Nov Dec
Source: KEPHIS office - Taveta, 2009
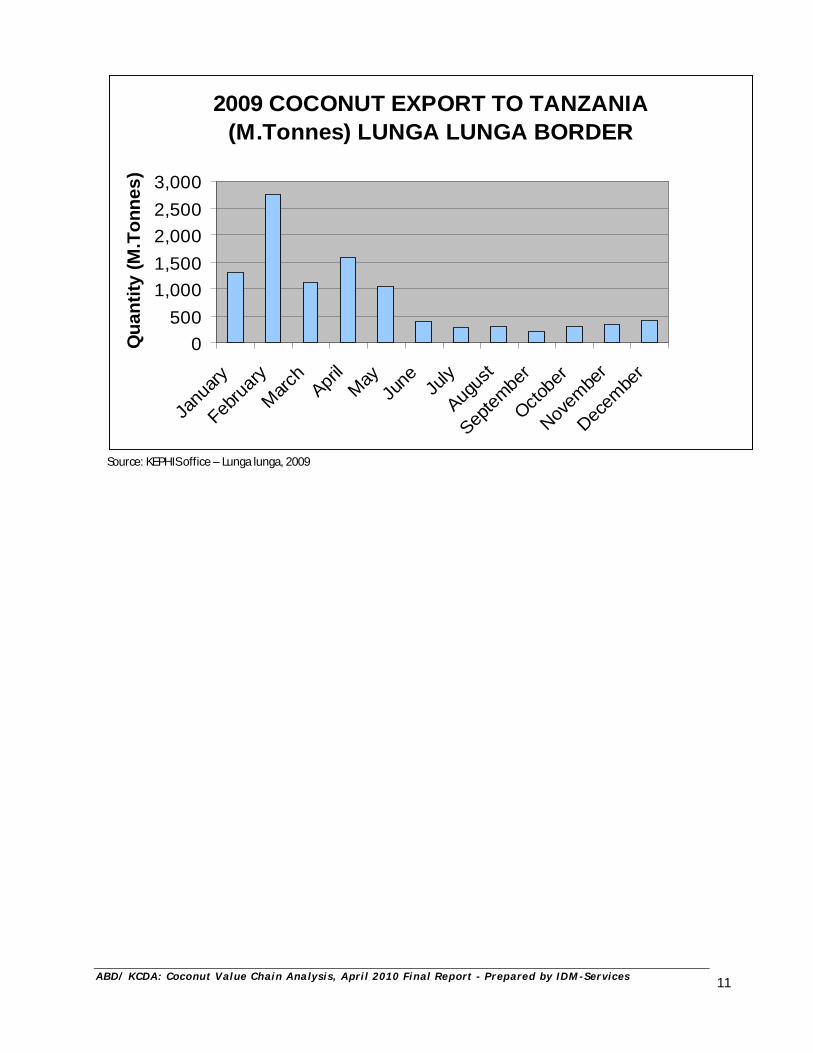
Chart 7: Nut Export through Lunga lunga border
A B D / K C D A : C oc o nu t V al ue C h ai n A na l y s i s , A pr i l 2 0 1 0 F i n a l R e p or t - P r e p ar e d by I D M - Se r v i c e s
11
2009 COCONUT EXPORT TO TANZANIA (M.Tonnes) LUNGA LUNGA BORDER
0500
1,0001,5002,0002,5003,000
Janu
ary
Februa
ryMarc
hApri
lMay
June Ju
ly
Augus
t
Septem
ber
Octobe
r
Novem
ber
Decem
ber
Qua
ntity
(M.T
onne
s)
Source: KEPHIS office – Lunga lunga, 2009
A B D / K C D A : C oc o nu t V al ue C h ai n A na l y s i s , A pr i l 2 0 1 0 F i n a l R e p or t - P r e p ar e d by I D M - Se r v i c e s
12
SECTION ONE COCONUT (MATURE NUT) VALUE CHAIN ANALYSIS
3.0 Overview of the Dry Nut Value Chain This section of the report provides resourceful information in regard to the mature nuts value chain by analyzing the various segments from input suppliers and producers to the end consumers. This information relates to key actors along the nut chain, products under the nut value chain, production costs for the nut, gross margin analysis, market pricing, challenges faced at each stage, and opportunities for growth among many others. However, it is important to note that owing to the numerous products that the coconut tree has, it was not possible to analyze all the mature nut products. Notwithstanding, effort was made to provide a detailed value chain analysis for most nut products that are processed locally. Critical leverage points that hold the key to unlocking the sub sector potential are also well documented in the section as well as areas that require urgent attention. 3.1 The Nut Production Chan During the value chain analysis about 95% of the farmers stated that they obtain their seedlings from their own farms. A few (5%) obtain seedlings from established private commercial nurseries and from neighbouring farmers where little seed selection is done from trees that have exhibited high production performance in the past. In most cases farmers will give the seedlings for free to their neighbours who may wish to plant some. They also buy from each other at an average price of Kes 50 to Kes 80 per seedling. Production and management of coconut is labour intensive and is provided mainly by family members at the small scale to medium scale level of farming. However, in most of the large scale farms, hired labourers are engaged. Most of these labourers are casuals and are engaged in managing the orchards and includes; harvesters, dehuskers and assemblers among others. 3.1.1 Nut production per tree From a list of the farmers interviewed, the average nut production per tree stands at about 30 – 60 nuts depending on the level of management. However, some indicated that production per tree may at times be as low as 20 nuts. Current nut production among most farmers seldom involves fertilizer application or use of pest and disease control measures. Normally, trees are intercropped or left to grow in grassy and bushy fields. Nuts production is mainly influenced by the management practices such as weeding, manure and fertilizer application and pests and disease control. Quality of planting materials/varieties also has a major impact on nut production.
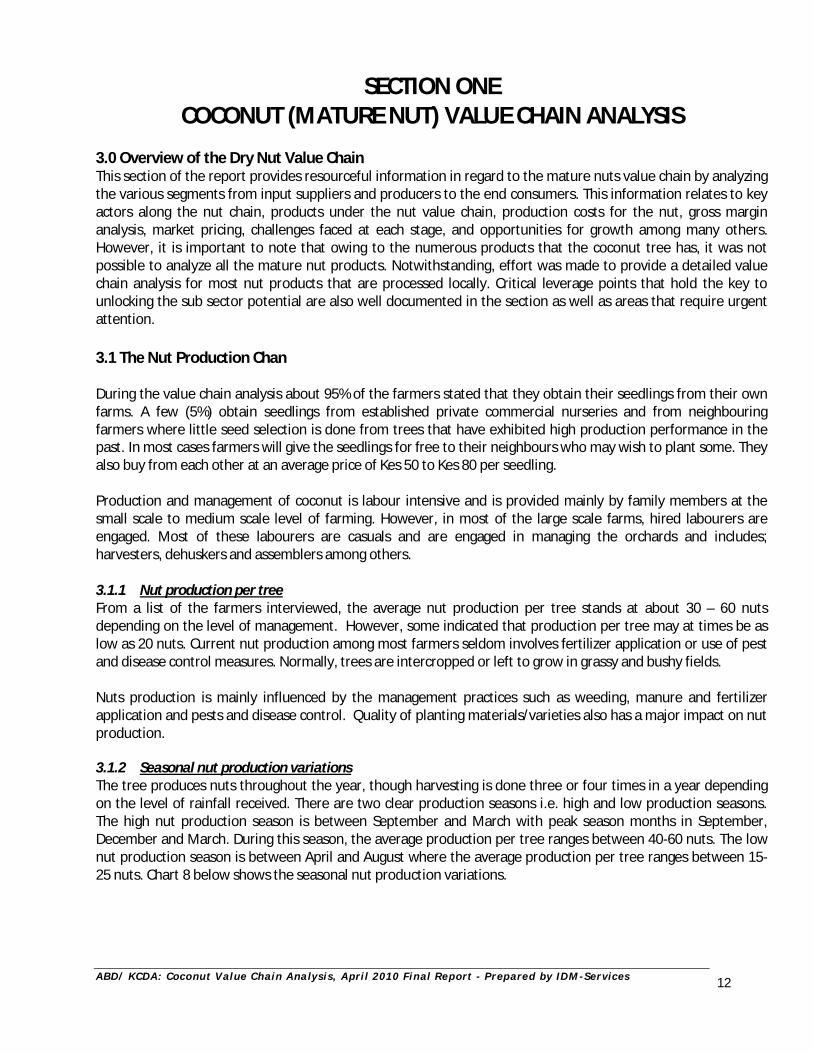
3.1.2 Seasonal nut production variations The tree produces nuts throughout the year, though harvesting is done three or four times in a year depending on the level of rainfall received. There are two clear production seasons i.e. high and low production seasons. The high nut production season is between September and March with peak season months in September, December and March. During this season, the average production per tree ranges between 40-60 nuts. The low nut production season is between April and August where the average production per tree ranges between 15-25 nuts. Chart 8 below shows the seasonal nut production variations.
A B D / K C D A : C oc o nu t V al ue C h ai n A na l y s i s , A pr i l 2 0 1 0 F i n a l R e p or t - P r e p ar e d by I D M - Se r v i c e s
13
Chart 8: Nut production seasonality chart
Source: ABD/ KCDA: Coconut Value Chain Analysis, August 2009
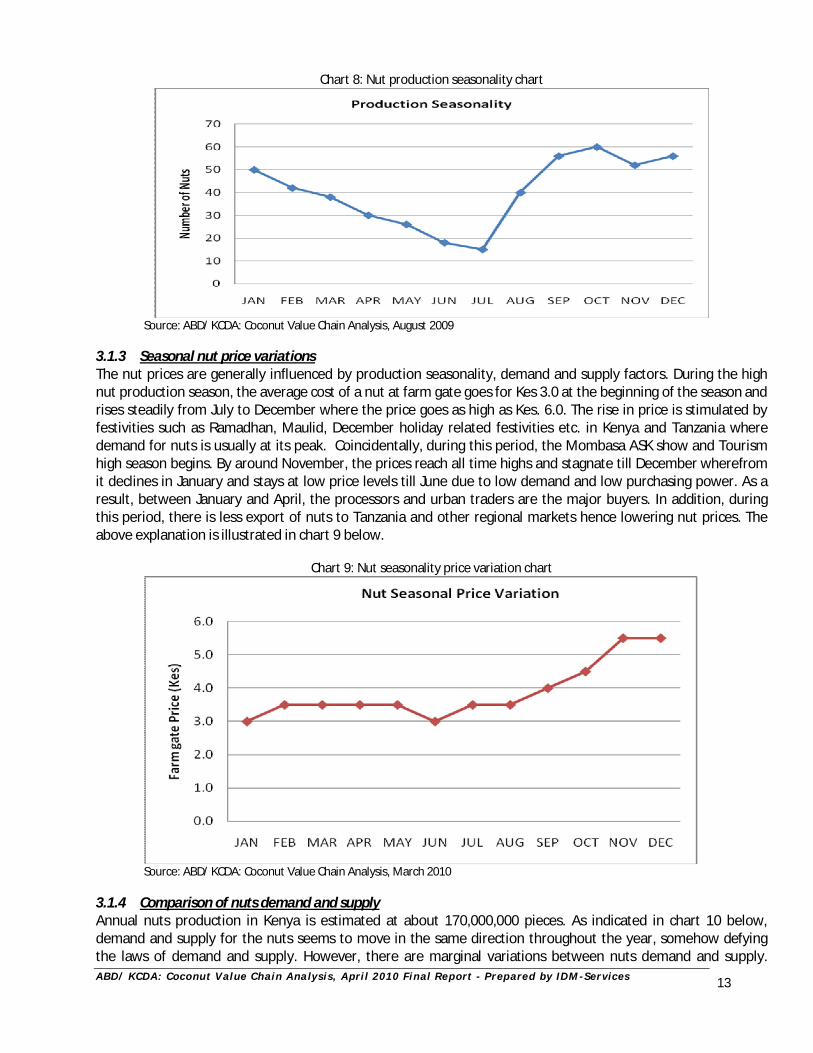
3.1.3 Seasonal nut price variations The nut prices are generally influenced by production seasonality, demand and supply factors. During the high nut production season, the average cost of a nut at farm gate goes for Kes 3.0 at the beginning of the season and rises steadily from July to December where the price goes as high as Kes. 6.0. The rise in price is stimulated by festivities such as Ramadhan, Maulid, December holiday related festivities etc. in Kenya and Tanzania where demand for nuts is usually at its peak. Coincidentally, during this period, the Mombasa ASK show and Tourism high season begins. By around November, the prices reach all time highs and stagnate till December wherefrom it declines in January and stays at low price levels till June due to low demand and low purchasing power. As a result, between January and April, the processors and urban traders are the major buyers. In addition, during this period, there is less export of nuts to Tanzania and other regional markets hence lowering nut prices. The above explanation is illustrated in chart 9 below.
Chart 9: Nut seasonality price variation chart
Source: ABD/ KCDA: Coconut Value Chain Analysis, March 2010
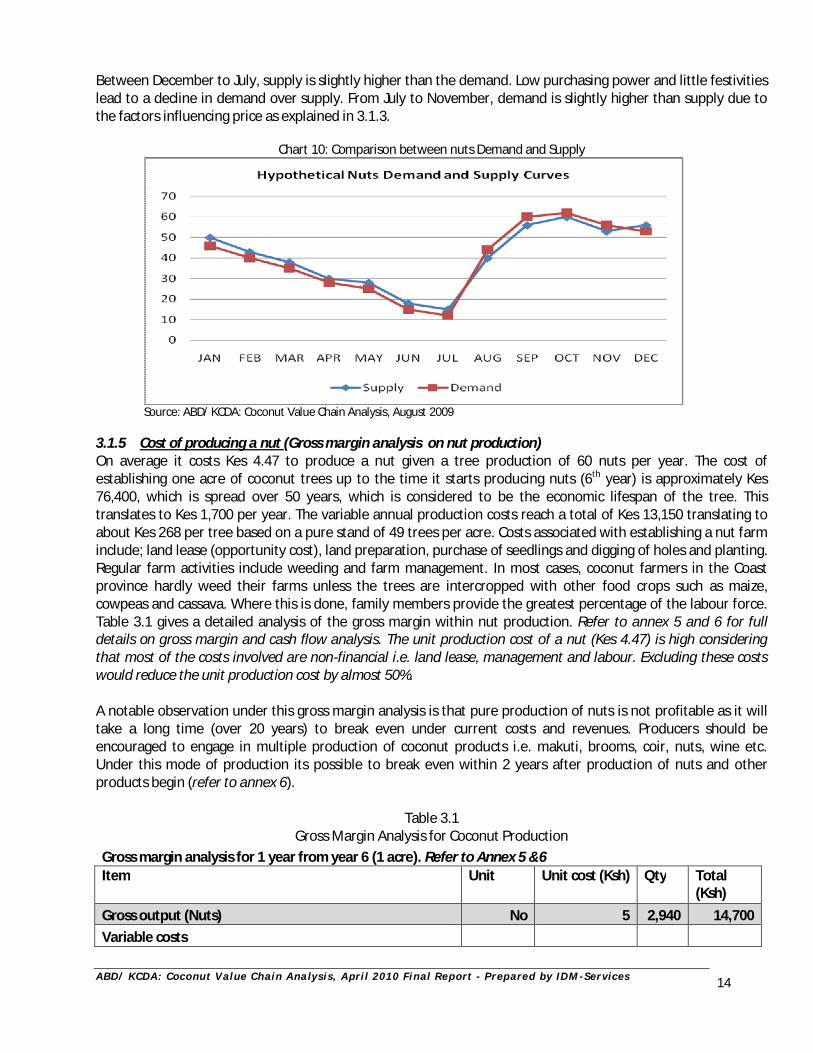
3.1.4 Comparison of nuts demand and supply Annual nuts production in Kenya is estimated at about 170,000,000 pieces. As indicated in chart 10 below, demand and supply for the nuts seems to move in the same direction throughout the year, somehow defying the laws of demand and supply. However, there are marginal variations between nuts demand and supply.
A B D / K C D A : C oc o nu t V al ue C h ai n A na l y s i s , A pr i l 2 0 1 0 F i n a l R e p or t - P r e p ar e d by I D M - Se r v i c e s
14
Between December to July, supply is slightly higher than the demand. Low purchasing power and little festivities lead to a decline in demand over supply. From July to November, demand is slightly higher than supply due to the factors influencing price as explained in 3.1.3.
Chart 10: Comparison between nuts Demand and Supply
Source: ABD/ KCDA: Coconut Value Chain Analysis, August 2009
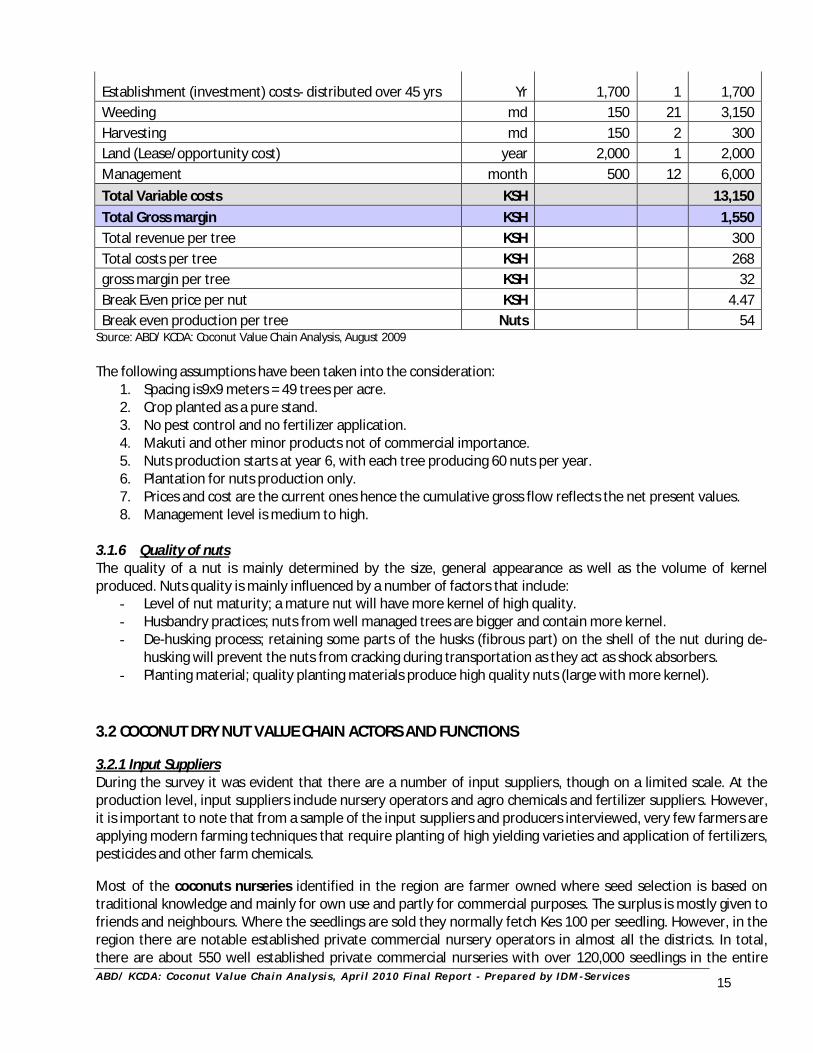
3.1.5 Cost of producing a nut (Gross margin analysis on nut production) On average it costs Kes 4.47 to produce a nut given a tree production of 60 nuts per year. The cost of establishing one acre of coconut trees up to the time it starts producing nuts (6th year) is approximately Kes 76,400, which is spread over 50 years, which is considered to be the economic lifespan of the tree. This translates to Kes 1,700 per year. The variable annual production costs reach a total of Kes 13,150 translating to about Kes 268 per tree based on a pure stand of 49 trees per acre. Costs associated with establishing a nut farm include; land lease (opportunity cost), land preparation, purchase of seedlings and digging of holes and planting. Regular farm activities include weeding and farm management. In most cases, coconut farmers in the Coast province hardly weed their farms unless the trees are intercropped with other food crops such as maize, cowpeas and cassava. Where this is done, family members provide the greatest percentage of the labour force. Table 3.1 gives a detailed analysis of the gross margin within nut production. Refer to annex 5 and 6 for full details on gross margin and cash flow analysis. The unit production cost of a nut (Kes 4.47) is high considering that most of the costs involved are non-financial i.e. land lease, management and labour. Excluding these costs would reduce the unit production cost by almost 50%. A notable observation under this gross margin analysis is that pure production of nuts is not profitable as it will take a long time (over 20 years) to break even under current costs and revenues. Producers should be encouraged to engage in multiple production of coconut products i.e. makuti, brooms, coir, nuts, wine etc. Under this mode of production its possible to break even within 2 years after production of nuts and other products begin (refer to annex 6).
Table 3.1
Gross Margin Analysis for Coconut Production Gross margin analysis for 1 year from year 6 (1 acre). Refer to Annex 5 &6 Item Unit Unit cost (Ksh) Qty Total
(Ksh) Gross output (Nuts) No 5 2,940 14,700 Variable costs
A B D / K C D A : C oc o nu t V al ue C h ai n A na l y s i s , A pr i l 2 0 1 0 F i n a l R e p or t - P r e p ar e d by I D M - Se r v i c e s
15
Establishment (investment) costs- distributed over 45 yrs Yr 1,700 1 1,700 Weeding md 150 21 3,150 Harvesting md 150 2 300 Land (Lease/opportunity cost) year 2,000 1 2,000 Management month 500 12 6,000 Total Variable costs KSH 13,150 Total Gross margin KSH 1,550 Total revenue per tree KSH 300 Total costs per tree KSH 268 gross margin per tree KSH 32 Break Even price per nut KSH 4.47 Break even production per tree Nuts 54
Source: ABD/ KCDA: Coconut Value Chain Analysis, August 2009 The following assumptions have been taken into the consideration:
1. Spacing is9x9 meters = 49 trees per acre. 2. Crop planted as a pure stand. 3. No pest control and no fertilizer application. 4. Makuti and other minor products not of commercial importance. 5. Nuts production starts at year 6, with each tree producing 60 nuts per year. 6. Plantation for nuts production only. 7. Prices and cost are the current ones hence the cumulative gross flow reflects the net present values. 8. Management level is medium to high.
3.1.6 Quality of nuts The quality of a nut is mainly determined by the size, general appearance as well as the volume of kernel produced. Nuts quality is mainly influenced by a number of factors that include:
- Level of nut maturity; a mature nut will have more kernel of high quality. - Husbandry practices; nuts from well managed trees are bigger and contain more kernel. - De-husking process; retaining some parts of the husks (fibrous part) on the shell of the nut during de-
husking will prevent the nuts from cracking during transportation as they act as shock absorbers. - Planting material; quality planting materials produce high quality nuts (large with more kernel).
3.2 COCONUT DRY NUT VALUE CHAIN ACTORS AND FUNCTIONS 3.2.1 Input Suppliers During the survey it was evident that there are a number of input suppliers, though on a limited scale. At the production level, input suppliers include nursery operators and agro chemicals and fertilizer suppliers. However, it is important to note that from a sample of the input suppliers and producers interviewed, very few farmers are applying modern farming techniques that require planting of high yielding varieties and application of fertilizers, pesticides and other farm chemicals. Most of the coconuts nurseries identified in the region are farmer owned where seed selection is based on traditional knowledge and mainly for own use and partly for commercial purposes. The surplus is mostly given to friends and neighbours. Where the seedlings are sold they normally fetch Kes 100 per seedling. However, in the region there are notable established private commercial nursery operators in almost all the districts. In total, there are about 550 well established private commercial nurseries with over 120,000 seedlings in the entire
A B D / K C D A : C oc o nu t V al ue C h ai n A na l y s i s , A pr i l 2 0 1 0 F i n a l R e p or t - P r e p ar e d by I D M - Se r v i c e s
16
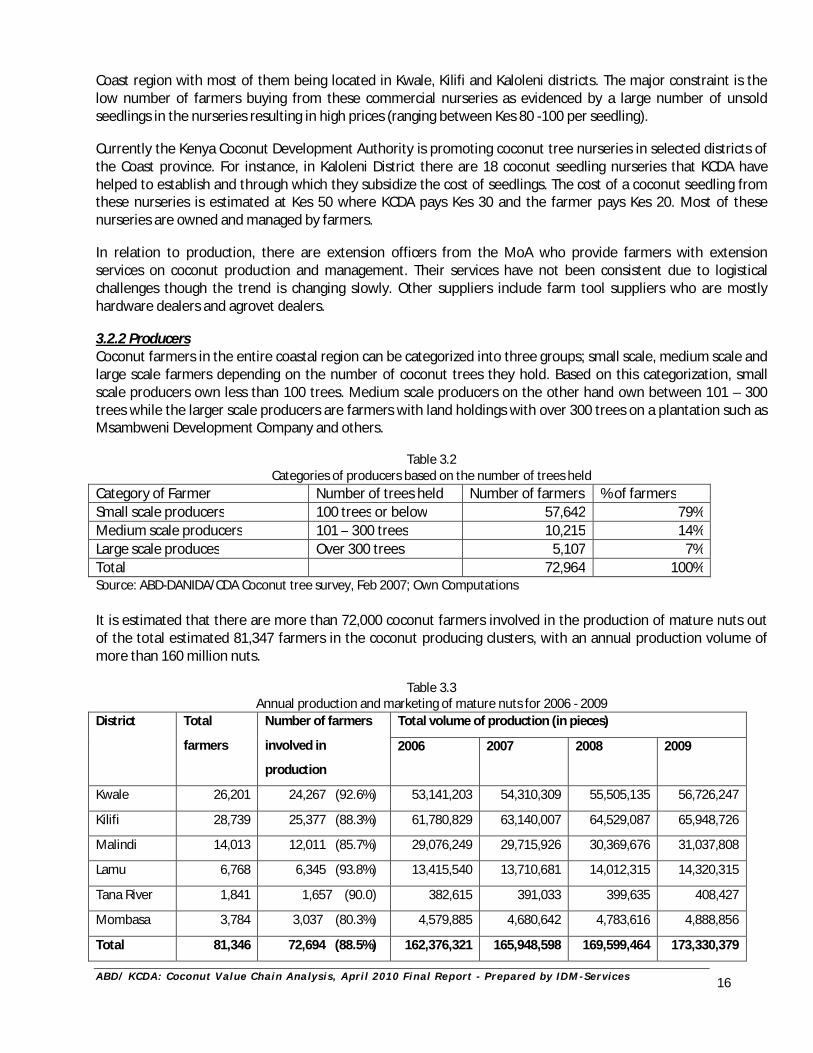
Coast region with most of them being located in Kwale, Kilifi and Kaloleni districts. The major constraint is the low number of farmers buying from these commercial nurseries as evidenced by a large number of unsold seedlings in the nurseries resulting in high prices (ranging between Kes 80 -100 per seedling). Currently the Kenya Coconut Development Authority is promoting coconut tree nurseries in selected districts of the Coast province. For instance, in Kaloleni District there are 18 coconut seedling nurseries that KCDA have helped to establish and through which they subsidize the cost of seedlings. The cost of a coconut seedling from these nurseries is estimated at Kes 50 where KCDA pays Kes 30 and the farmer pays Kes 20. Most of these nurseries are owned and managed by farmers. In relation to production, there are extension officers from the MoA who provide farmers with extension services on coconut production and management. Their services have not been consistent due to logistical challenges though the trend is changing slowly. Other suppliers include farm tool suppliers who are mostly hardware dealers and agrovet dealers. 3.2.2 Producers Coconut farmers in the entire coastal region can be categorized into three groups; small scale, medium scale and large scale farmers depending on the number of coconut trees they hold. Based on this categorization, small scale producers own less than 100 trees. Medium scale producers on the other hand own between 101 – 300 trees while the larger scale producers are farmers with land holdings with over 300 trees on a plantation such as Msambweni Development Company and others.
Table 3.2
Categories of producers based on the number of trees held Category of Farmer Number of trees held Number of farmers % of farmers Small scale producers 100 trees or below 57,642 79% Medium scale producers 101 – 300 trees 10,215 14% Large scale produces Over 300 trees 5,107 7% Total 72,964 100% Source: ABD-DANIDA/CDA Coconut tree survey, Feb 2007; Own Computations It is estimated that there are more than 72,000 coconut farmers involved in the production of mature nuts out of the total estimated 81,347 farmers in the coconut producing clusters, with an annual production volume of more than 160 million nuts.
Table 3.3
Annual production and marketing of mature nuts for 2006 - 2009 District Total
farmers
Number of farmers
involved in
production
Total volume of production (in pieces)
2006 2007 2008 2009
Kwale 26,201 24,267 (92.6%) 53,141,203 54,310,309 55,505,135 56,726,247
Kilifi 28,739 25,377 (88.3%) 61,780,829 63,140,007 64,529,087 65,948,726
Malindi 14,013 12,011 (85.7%) 29,076,249 29,715,926 30,369,676 31,037,808
Lamu 6,768 6,345 (93.8%) 13,415,540 13,710,681 14,012,315 14,320,315
Tana River 1,841 1,657 (90.0) 382,615 391,033 399,635 408,427
Mombasa 3,784 3,037 (80.3%) 4,579,885 4,680,642 4,783,616 4,888,856
Total 81,346 72,694 (88.5%) 162,376,321 165,948,598 169,599,464 173,330,379
A B D / K C D A : C oc o nu t V al ue C h ai n A na l y s i s , A pr i l 2 0 1 0 F i n a l R e p or t - P r e p ar e d by I D M - Se r v i c e s
17
Source: ABD-DANIDA/CDA Coconut tree survey, Feb 2007; Extrapolation
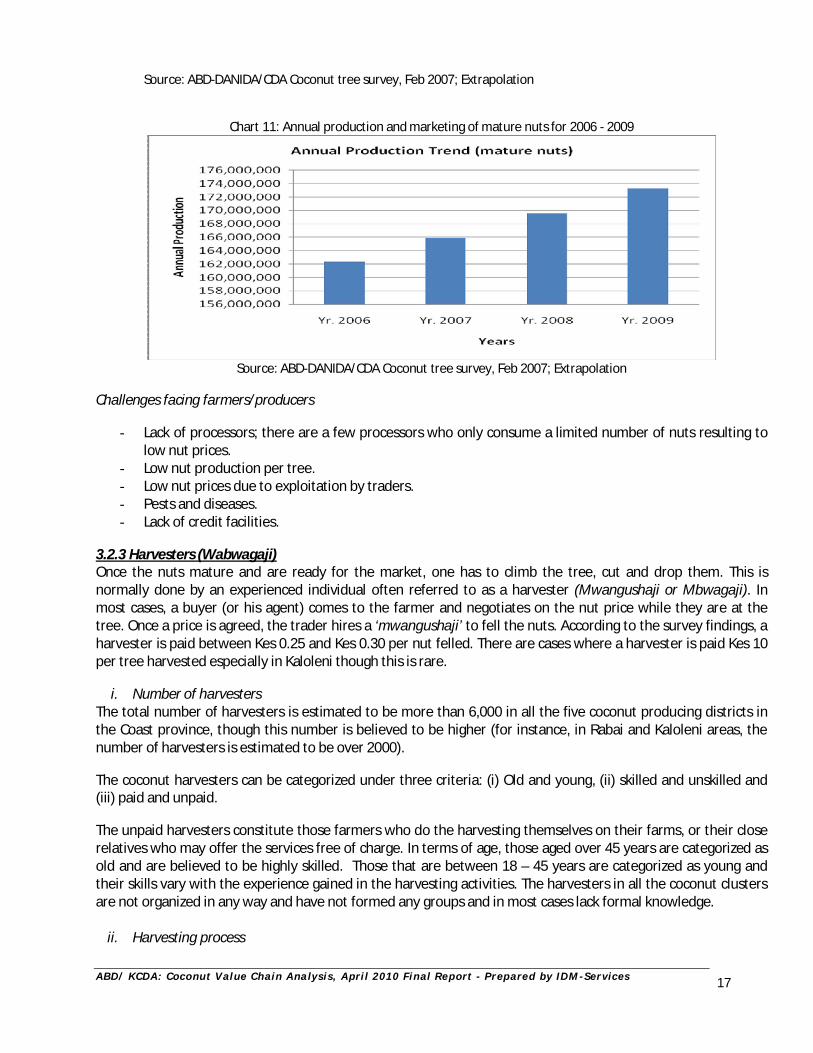
Chart 11: Annual production and marketing of mature nuts for 2006 - 2009
Source: ABD-DANIDA/CDA Coconut tree survey, Feb 2007; Extrapolation
Challenges facing farmers/producers
- Lack of processors; there are a few processors who only consume a limited number of nuts resulting to low nut prices.
- Low nut production per tree. - Low nut prices due to exploitation by traders. - Pests and diseases. - Lack of credit facilities.
3.2.3 Harvesters (Wabwagaji) Once the nuts mature and are ready for the market, one has to climb the tree, cut and drop them. This is normally done by an experienced individual often referred to as a harvester (Mwangushaji or Mbwagaji). In most cases, a buyer (or his agent) comes to the farmer and negotiates on the nut price while they are at the tree. Once a price is agreed, the trader hires a ‘mwangushaji’ to fell the nuts. According to the survey findings, a harvester is paid between Kes 0.25 and Kes 0.30 per nut felled. There are cases where a harvester is paid Kes 10 per tree harvested especially in Kaloleni though this is rare.
i. Number of harvesters The total number of harvesters is estimated to be more than 6,000 in all the five coconut producing districts in the Coast province, though this number is believed to be higher (for instance, in Rabai and Kaloleni areas, the number of harvesters is estimated to be over 2000). The coconut harvesters can be categorized under three criteria: (i) Old and young, (ii) skilled and unskilled and (iii) paid and unpaid. The unpaid harvesters constitute those farmers who do the harvesting themselves on their farms, or their close relatives who may offer the services free of charge. In terms of age, those aged over 45 years are categorized as old and are believed to be highly skilled. Those that are between 18 – 45 years are categorized as young and their skills vary with the experience gained in the harvesting activities. The harvesters in all the coconut clusters are not organized in any way and have not formed any groups and in most cases lack formal knowledge.
ii. Harvesting process
A B D / K C D A : C oc o nu t V al ue C h ai n A na l y s i s , A pr i l 2 0 1 0 F i n a l R e p or t - P r e p ar e d by I D M - Se r v i c e s
18
The nut harvesting process is simple as it involves the harvester climbing the tree using a rope, (if the tree has no ladders (engraves on the trunk)). On reaching the top, a bunch of mature nuts are cut, which is normally brown in colour, using a sharp knife. Harvesting per tree takes between 5 - 12 minutes.
iii. Volumes handled by Harvesters A harvester can harvest up to 40 trees in a day though the average is 25 trees a day. The number of trees harvested in a day is influenced by the strength of an individual, height of the tree, weather conditions, and the number of nuts to be harvested from a tree. Depending on the number of nuts per tree, a harvester can handle 400-1,500 nuts per day.
iv. Costs incurred by the harvester Costs incurred by a harvester relate to purchase of harvesting knife which costs Kes 60 for the ordinary knife and Kes 200 for good steel knife. This is only bought once lasts for many years. Sisal ropes are purchased on need basis and costs about Kes 50 and file for sharpening the knife that costs about Kes 100.
v. Challenges/issues facing harvesters According to views expressed by several harvesters the following are the main challenges facing their trade:
Low prices offered per tree or nut harvested. High risks associated with harvesting; accidental falling from trees while harvesting have been reported
including the risk of being bitten by wasps, snakes and other insects. Similarly, there is difficulty in climbing during rainy seasons as the trees get wet and slippery.
Inconsistency of harvesting exercise; Unlike tapping which is a daily activity, harvesting of nuts is not and a harvester can take a long time before getting work.
Low production per tree affects income generation. Injuries (sometimes fatal) from falling.
3.2.4 De-huskers (Wafuaji) Once the nuts are cut from the tree, the next step is to de-husk them. Under-husked nuts are normally bulky and require removal of the husk to facilitate bulking and transportation to the market. This task is carried out by individuals often referred to as dehuskers using a sharp piece of metal (‘tarimbo’ or ‘Kifulio’).
i. Number of de-huskers Since de-husking does not involve special skills and associated risks are minimal, the estimated number of de-huskers is higher than that of harvesters though it fluctuates depending on nut productivity and availability of buyers. It is estimated that there could be well over 10,000 de-huskers with the majority being located in Kilifi, Kaloleni, Malindi, Lunga Lunga, Msambweni and Kwale. In most cases, it is a trader who hires the de-huskers to collect the felled nuts, de-husk them and package them into sacks in readiness for transportation.
ii. De-husking process The process involves collecting and dehusking the felled nuts by ‘wafuaji’ using a sharp piece of metal locally referred to as ‘tarimbo’ or ‘kifulio’. In the absence of a sharp piece of metal, some de-huskers use sharpened pieces of wood with a pointed end. There are rare instances where harvesters are involved in de-husking, especially where only limited number of nuts is being harvested. In de-husking there is a gender mix unlike harvesting where it’s entirely carried out by men though the number of women de-huskers is small. During this process, care must be taken to avoid breaking the nut. Once the nuts have been de-husked, they are assembled at one point and counting is done in the presence of the farmer who is then paid. The nuts are then packaged into sacks where a sack carries about 250 – 300 nuts. A de-husker is normally paid an average of Kes 25 for every 100 nuts de-husked i.e. Kes 0.25 per nut.
A B D / K C D A : C oc o nu t V al ue C h ai n A na l y s i s , A pr i l 2 0 1 0 F i n a l R e p or t - P r e p ar e d by I D M - Se r v i c e s
19
iii. Volumes handled by a de-husker
A de-husker can de-husk an average of 500 - 600 nuts per day using the traditional de-husking methods. The average number of de-husked nuts per day will depend on the tools used in de-husking, that is, the shape and material used to make the tool.
iv. Costs related to de-husking The only major cost incurred by a de-husker is that of acquiring the sharp piece of metal which is at times negligible given that it’s cheap to acquire and takes a long time to be replaced.
v. Challenges facing de-husking Challenges associated with de-husking include the souring of the hand and peeling of the skin and/or hurting oneself with kifulio and general fatigue since de-husking utilizes a lot of energy. 3.2.5 Product Assemblers (Bulkers) After harvesting, the subsequent operation is collection of the nuts, bulking and assembling them in a central place ready for transportation to the market. Bulking does not require specialized skills and therefore anybody can do it. More often than not, it’s done by the traders or harvesters, farmers or de-huskers. Bulking normally involves putting the nuts in sacks where each sack carries about 250 – 300 nuts. Human means and bicycles are commonly used in transporting harvested nuts from the farm to the bulking points. During bulking, care must be taken not to place nuts on moist soils as there is the tendency for the nuts to germinate. 3.2.6 Traders
i. Specific roles / functions played by traders Traders play an important role in linking the farmers to the market and are therefore key actors in the business promotion of any economic venture. The roles of traders include; purchase of nuts, bulking and grading. In most cases, traders pay for de-husking, bulking and transportation. The traders assist in determining the grade or quality of nuts through careful selection at the bulking points. They also assist in bulking the nuts as well as facilitating transportation of nuts from farms to bulking points and from bulking points to various market destinations.
ii. Estimated number of traders There are several types of traders ranging from rural, urban, upcountry, regional, processors and export traders. During the survey it was not possible to enumerate all the traders but conservative estimates based on interviews with farmers, traders and agents indicate that there could be well over 12,000 nut traders scattered across the respective markets. A majority of the traders are those involved in rural, urban and upcountry markets. Though the number of those involved in regional markets is smaller, they deal with larger volumes of nuts. Table 3.4 Estimated number of traders in different markets
Category of trader Estimated number of traders Rural low-end traders 4,500 Wholesale traders to urban markets 800 Urban retail traders 6,500 Upcountry traders 500 Regional traders 40 Processors 25 Other markets (export) 3 Total 12,363
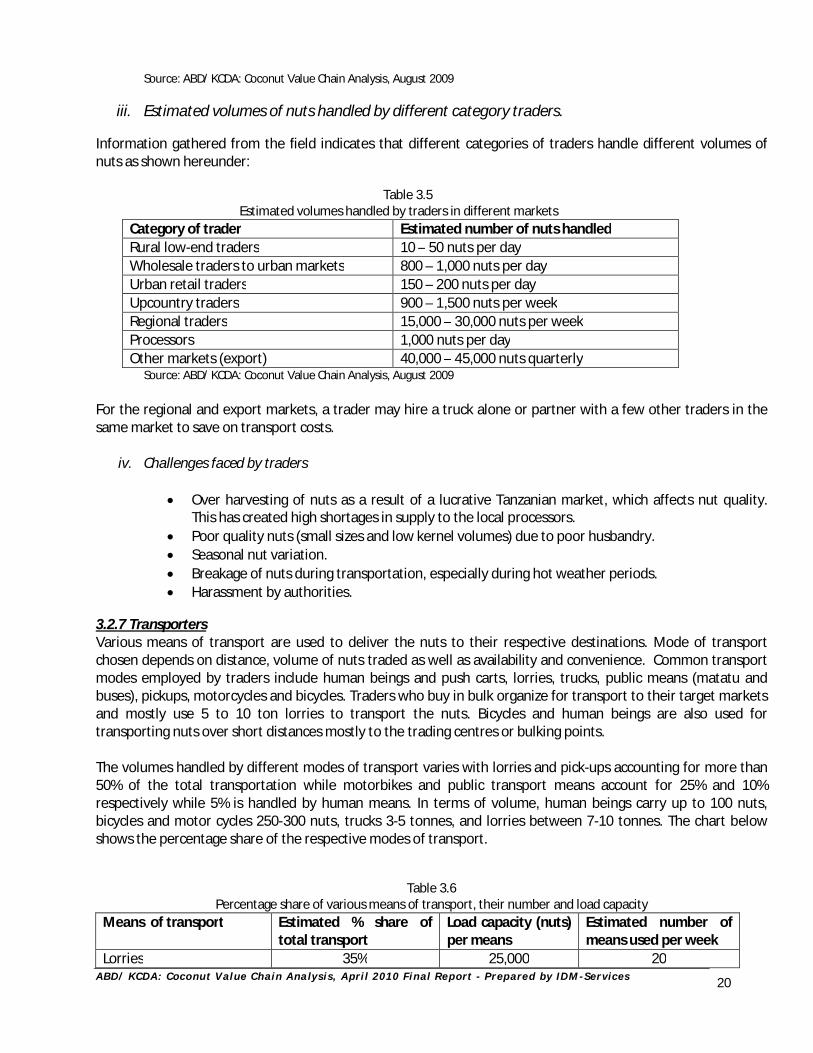
A B D / K C D A : C oc o nu t V al ue C h ai n A na l y s i s , A pr i l 2 0 1 0 F i n a l R e p or t - P r e p ar e d by I D M - Se r v i c e s
20
Source: ABD/ KCDA: Coconut Value Chain Analysis, August 2009
iii. Estimated volumes of nuts handled by different category traders.
Information gathered from the field indicates that different categories of traders handle different volumes of nuts as shown hereunder:
Table 3.5
Estimated volumes handled by traders in different markets Category of trader Estimated number of nuts handled Rural low-end traders 10 – 50 nuts per day Wholesale traders to urban markets 800 – 1,000 nuts per day Urban retail traders 150 – 200 nuts per day Upcountry traders 900 – 1,500 nuts per week Regional traders 15,000 – 30,000 nuts per week Processors 1,000 nuts per day Other markets (export) 40,000 – 45,000 nuts quarterly
Source: ABD/ KCDA: Coconut Value Chain Analysis, August 2009 For the regional and export markets, a trader may hire a truck alone or partner with a few other traders in the same market to save on transport costs.
iv. Challenges faced by traders
Over harvesting of nuts as a result of a lucrative Tanzanian market, which affects nut quality. This has created high shortages in supply to the local processors.
Poor quality nuts (small sizes and low kernel volumes) due to poor husbandry. Seasonal nut variation. Breakage of nuts during transportation, especially during hot weather periods. Harassment by authorities.
3.2.7 Transporters Various means of transport are used to deliver the nuts to their respective destinations. Mode of transport chosen depends on distance, volume of nuts traded as well as availability and convenience. Common transport modes employed by traders include human beings and push carts, lorries, trucks, public means (matatu and buses), pickups, motorcycles and bicycles. Traders who buy in bulk organize for transport to their target markets and mostly use 5 to 10 ton lorries to transport the nuts. Bicycles and human beings are also used for transporting nuts over short distances mostly to the trading centres or bulking points. The volumes handled by different modes of transport varies with lorries and pick-ups accounting for more than 50% of the total transportation while motorbikes and public transport means account for 25% and 10% respectively while 5% is handled by human means. In terms of volume, human beings carry up to 100 nuts, bicycles and motor cycles 250-300 nuts, trucks 3-5 tonnes, and lorries between 7-10 tonnes. The chart below shows the percentage share of the respective modes of transport.
Table 3.6
Percentage share of various means of transport, their number and load capacity Means of transport Estimated % share of
total transport Load capacity (nuts) per means
Estimated number of means used per week
Lorries 35% 25,000 20
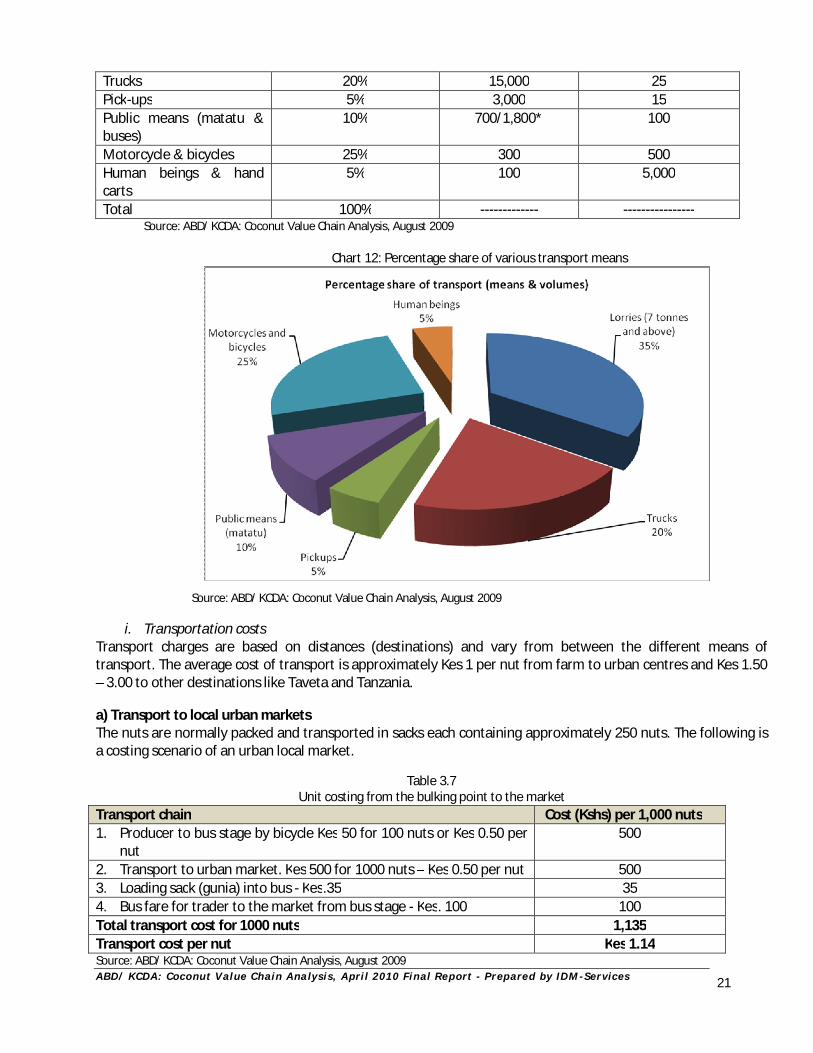
A B D / K C D A : C oc o nu t V al ue C h ai n A na l y s i s , A pr i l 2 0 1 0 F i n a l R e p or t - P r e p ar e d by I D M - Se r v i c e s
21
Trucks 20% 15,000 25 Pick-ups 5% 3,000 15 Public means (matatu & buses)
10% 700/1,800* 100
Motorcycle & bicycles 25% 300 500 Human beings & hand carts
5% 100 5,000
Total 100% ------------- ---------------- Source: ABD/ KCDA: Coconut Value Chain Analysis, August 2009
Chart 12: Percentage share of various transport means
Source: ABD/ KCDA: Coconut Value Chain Analysis, August 2009
i. Transportation costs Transport charges are based on distances (destinations) and vary from between the different means of transport. The average cost of transport is approximately Kes 1 per nut from farm to urban centres and Kes 1.50 – 3.00 to other destinations like Taveta and Tanzania. a) Transport to local urban markets The nuts are normally packed and transported in sacks each containing approximately 250 nuts. The following is a costing scenario of an urban local market.
Table 3.7 Unit costing from the bulking point to the market
Transport chain Cost (Kshs) per 1,000 nuts 1. Producer to bus stage by bicycle Kes 50 for 100 nuts or Kes 0.50 per
nut 500
2. Transport to urban market. Kes 500 for 1000 nuts – Kes 0.50 per nut 500 3. Loading sack (gunia) into bus - Kes.35 35 4. Bus fare for trader to the market from bus stage - Kes. 100 100 Total transport cost for 1000 nuts 1,135 Transport cost per nut Kes 1.14 Source: ABD/ KCDA: Coconut Value Chain Analysis, August 2009
A B D / K C D A : C oc o nu t V al ue C h ai n A na l y s i s , A pr i l 2 0 1 0 F i n a l R e p or t - P r e p ar e d by I D M - Se r v i c e s
22
b) Cost of transport to regional markets The average cost of transport to other regional markets like Taveta and Tanzania cost an average of Kes 1.50 – 3.00
Table 3.8 Unit costing for transport to regional markets
Transport chain Cost (Kes) per 1,000 nuts 1. Loading into truck at the farms - Kes 0.20 per nut 200 2. Transporting from farm to market - Kes 1.50 per nut 1,500 3. Offloading from truck - Kes 0.10 per nut 100 4. Other costs e.g. bus fare - Kes 600 (to and from market) 600 Total cost for 1000 nuts 2,400 Cost per nut Kes 2.4
Source: ABD/ KCDA: Coconut Value Chain Analysis, August 2009 N/b: where the trader hires a truck, he has to travel by separate means from the truck carrying the nuts
ii. Constraints related to transportation
High transport costs as a result of rising fuel prices. Vehicle breakages/high maintenance costs. Police harassment. Poor road infrastructure. During low nut seasons, transporters have to go into the interior areas to
pick nuts where weather roads are poor. 3.2.8 Processors Coconuts can be processed into many products and bi-products for both household and industrial consumption. While coconuts provide numerous processing options, Kenya has done little to tap into processing opportunities through value addition. Huge capital investments and lack of promotion of the processing opportunities in the coconut sub sector partly explain the minimal nut processing investments. As a result, the number of processors has remained small and mostly involves utilization of older technologies in nut processing.
i. Number of processors There are a few small and medium scale processors of coconuts in the country. The number of processors is about 25 with the main ones being; BICODE, Kentaste Products Ltd, House of Manji, Lola Lola, PZ Cussons (EA), Mnazi Development Enterprises, Coast Coconut Farms Ltd among others. Home based processors mainly process simple coconut products such as coconut milk, coconut water, coconut charcoal, shells and coconut cream. Medium scale processors mainly process products such as coconut oil, coconut milk, desiccated coconut, copra cake, ranseed oil, coconut vinegar among others.
ii. Constraints / challenges Constraints faced at this level include:
- Low supply of nuts due to poor productivity from existing trees - Over harvesting of nuts as a result of frequent Tanzanian traders. This has created shortages for quality
nuts required for domestic processing. - Poor quality nuts (small sizes and low kernel volumes).
iii. Examples of key coconut processors
The following are some of the key processors who were identified and interviewed during the study:
a. Mnazi Development Enterprises - (Kaloleni) Mombasa
A B D / K C D A : C oc o nu t V al ue C h ai n A na l y s i s , A pr i l 2 0 1 0 F i n a l R e p or t - P r e p ar e d by I D M - Se r v i c e s
23
The company is located in Mariakani and obtains its raw materials from brokers and utilizes a volume of 1,000 nuts per day. It’s involved in processing of desiccated coconut, brown testa sold as animal feeds and coconut shell powder – from coconut shells. These products are mainly sold to confectionary companies, bakeries and supermarkets. According to the firm’s management, the company currently cannot meet the high demand for its products as it faces a shortage of nuts for various reasons.
b. Coast Coconut Farms Ltd - Kwale The company uses 5000 mature nuts per day as its raw materials. The processing factory is based in Msambweni where nuts are used to process extra virgin coconut oils, soaps, charcoal and copra cakes. The company sells its products both locally (30%) and internationally (70%). The main product is extra virgin coconut oil of which they export 2-3 containers of 20 feet (20 tonnes) to UK and USA annually.
c. PZ Cussions East Africa Ltd - Nairobi The company manufactures toiletries and hair care products. PZ Cussions works together with Kapa Oil Refinery Processing Zone. Through Kapa, PZ cussions gets fatty acids produced after refining the oil, which is used as raw material for soap bar making. The company is in the process of initiating imports of coconut oil.
d. House of Manji - (countrywide) House of Manji brands include; assorted delicious creams biscuits, chocolate coated biscuits and tasty dry biscuits and cookies. Almost all products have desiccated coconut as a raw material base. The company uses 15 tonnes of desiccated coconut per month for both Nairobi and Kampala branches sourced from the Far East. The company expressed interest to work with local entrepreneurs if only they can get quality, adequate and reliable supply of desiccated coconut.
e. BICODE - Kaloleni (Mombasa) Located in Kaloleni Giriama, the company specializes in the processing of virgin coconut oil among other products. The company was formed through a community based initiative by women groups who are trained to locally manufacture virgin coconut oil using coconut. The products are processed by women from their homes and delivered at the BICODE production unit. The women are then paid for the raw materials delivered while BICODE processes, package and market the products
f. KENTASTE Product Ltd - (Mazeras) The company is located in Mazeras Kaloleni district where it processes and markets desiccated coconut, coconut milk cream, coconut virgin oil, activated carbon and coconut shell powder. The company utilizes about 10,000 nuts per day.
g. KOKOCEPT The company is located in Kaloleni district and absorbs about 2,000-4,000 nuts per day where its used to process virgin coconut oil and copra cake mainly for export markets. Processed virgin coconut oil is mainly exported to Madagascar and UK at $ 4.15 per kilo.
h. Tapioca and Lola Lola These companies were established 30 years ago and specialize in the production of copra cake and Ranseed oil and have the capacity to process 2.5 – 3 tonnes of copra per hour using an expeller. Both companies have processing capacities to produce 16 tonnes of Ranseed oil per month. Ranseed oil is mainly used for making soaps and ointments for the local markets. 3.2.9 Wholesalers and Retailers
A B D / K C D A : C oc o nu t V al ue C h ai n A na l y s i s , A pr i l 2 0 1 0 F i n a l R e p or t - P r e p ar e d by I D M - Se r v i c e s
24
Wholesalers and retailers are the major market outlets for processed coconut products. These traders stock assorted coconut products where the major target market is the high income earners. Though major wholesalers and retailers are selling coconut products, a majority of them are imported from Asia and parts of Europe. Lack of proper processing initiatives are partly to blame for this. This provides an opportunity for local production as they would take up the market share occupied by imported coconut products. During the study, the research team managed to interview some of the major wholesalers and retailers across the country. The following is a sample of the wholesalers and traders that the survey team managed to interview:
a. YITIN Supermarkets Ltd (Kisumu) The supermarket handles about 6,000 and 15,000 tonnes per year of desiccated coconut and coconut milk respectively. The desiccated stock is from Yanke Doudle Company (Formerly Delux Food Industries Ltd) Nairobi. The company sells 250 grams of desiccated coconut at Kes 160.
b. Nakumatt Supermarket The supermarket has a chain of stores across the country with Mombasa branches stocking the bulk of processed coconut products. Some of the main coconut products that were identified on the shelves include the following:
a. Renuka (Coconut cream) retails at Kes 122 per 400ml. b. Renuka (Desiccated coconut products) imported and exported by Porteros Ltd in Nairobi and retails at
Kes 122 per 250ml. c. KARA (Coconut milk) imported and distributed by Porteross and retails at a price of Kes 129 per 400ml. d. Exotic Foods (Coconut cream) retailing at a price of Kes 150. e. Crown (Coconut milk) imported and distributed by Crown Products Ltd and retailing at a price of
Kes 92 per 400ml. f. Royal Umbrella (Coconut milk) retails at a price of Kes 110 per 400ml.
3.2.10 Consumers Consumers of nuts can be classified into the following categories:
(i) Rural low-end consumers that mainly consume coconut in its unprocessed form. Semi processing is partly done to extract oil for cooking and body ointment. In essence this group consumes it as food i.e. with cowpeas (mbaazi), beans, rice and oils.
(ii) Middle and high-end consumers who consume the processed products like coconut oils (for cooking and hair application), desiccated coconut, soaps etc.
(iii) Bi-product consumers who consume the products like the shell (ornaments) and husks (fiber for making various products and also as fuel).
The dry nuts are affordable even to the low income earners and therefore have several uses within the household. In particular coastal people have a deeper cultural inclination in regard to coconut use. i) The consumption patterns The consumption patterns vary across different consumer groups whereby coconut is consumed in larger quantities by the coastal tribes than the upcountry people and is included in almost every meal. It serves well as a source of oil to the poor farmers who may not afford other types of oils, both for food and body ointments. Its consumption is therefore on a daily basis. Processed coconut products are mainly a preserve for the middle and high income individuals as they fetch higher prices. 3.2.11 Government Agencies /Other Regulatory Institutions
A B D / K C D A : C oc o nu t V al ue C h ai n A na l y s i s , A pr i l 2 0 1 0 F i n a l R e p or t - P r e p ar e d by I D M - Se r v i c e s
25
Government agencies that promote the development and regulate the coconut industry include, but are not limited to the following institutions:
a. The Kenya Coconut Development Authority (KCDA) The coconut development authority is a state corporation established through legal notice No.165 of 27th August 2007 under the state corporations Act Cap.446. The institution was established to regulate the coconut industry by providing a conducive environment to enhance the development of the coconut industry through research development and extension services. Currently the Authority is implementing a programme to support establishment of high quality planting material nurseries across the Coast region aimed at increasing production and replacing the old trees
b. KARI-Mtwapa The institution has been involved in research activities towards improving the coconut varieties as well as fertilizer trials. The research institution is seen as an important stakeholder in terms of coconut research and development. Currently the institution is working hand in hand with KCDA and other coconut stakeholders particularly in the area of planting materials. Other KARI stations in the province include Matuga and Msabaha but they have limited activities relating to research and development of the coconut tree. Research and development in coconut takes a long time to yield results and therefore the government needs to invest heavily in this venture on a long term basis.
c. Kenya Industrial Estates (KIE) The company was established in 1967 as a subsidiary of ICDC with a mandate to support entrepreneurship and indigenous enterprise development. KIE signed an M.O.U with KCDA to provide coconut value chain players with entrepreneurial skills and facilitate establishment of cottage industries. The organization will deal with industrial players and organizations along the value chain. The organization supports the incubation of small and medium enterprises as well as technology transfers in the rural areas. Currently the institution is in the process of rolling out a programme in conjunction with KCDA to support innovative, simple and affordable processing technologies at farm levels
d. Local Authorities The new Licensing Laws (Repeals and Amendment) Bill, 2006, (Section 163A of the Local Government Act), mandates all local authorities to issue all applicants with a business permit under subsection to carry out distribution of goods including wine within the area of that local authority and to pay for licenses, fees, permits and other charges imposed by every local authority.
e. KEPHIS and KEBS The role of KEPHIS and KEBS are to enforce and ensure that the set standards on planting materials and finished products respectively are applied to meet the qualitative aspect of demand from the importers, including packaging, sizes and quality, health requirements etc. In the coconut industry, KEBS in conjunction with KCDA and other stakeholders are developing standards for various coconut products including standards for coconut palm wine. Subsequently, KEPHIS is carrying out plant quarantine checks on all agricultural crops exports/imports through their inspectors at the airports and seaports.
f. Horticulture Crops Development Authority(HCDA) HCDA offices in Taveta monitor the movement of horticultural products between Kenya and Tanzania as well as linking farmers and the buyers of horticultural crops across the border. It coordinates with both KRA and KEBS for the trade of goods/services taking place across the border. With the support from HCDA office, the brokers in the Taveta town formed an association called Taveta Horticulture Association, which is registered under the
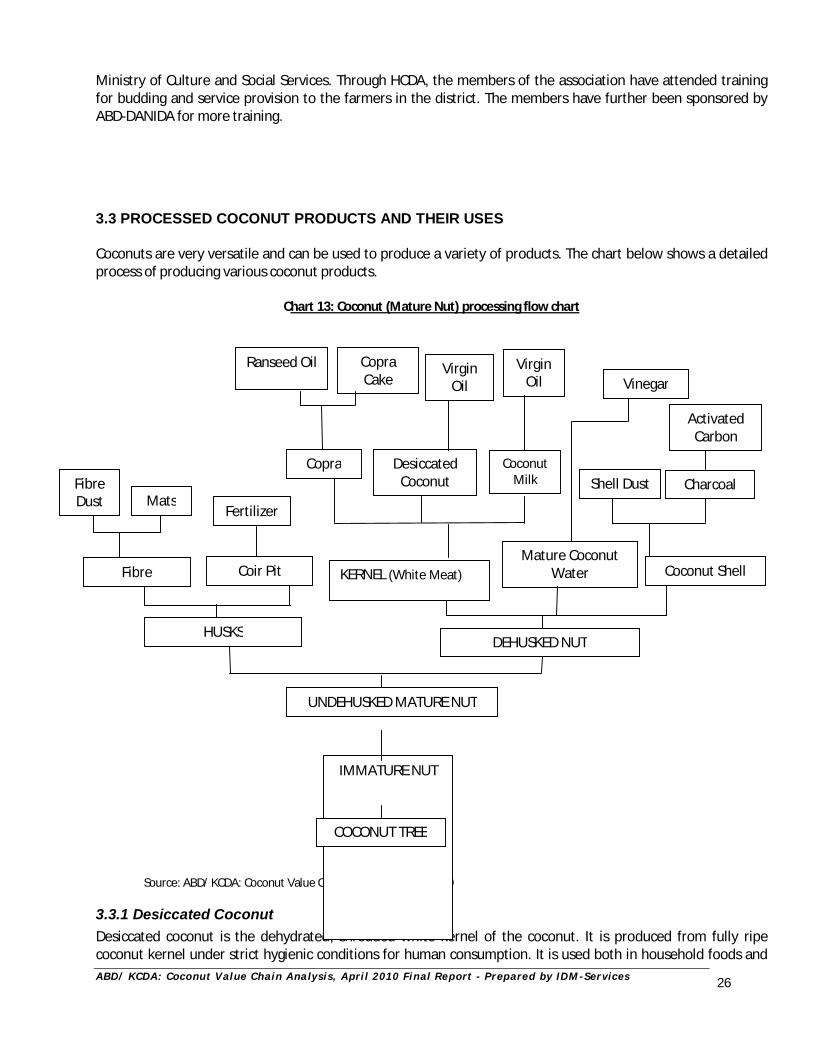
A B D / K C D A : C oc o nu t V al ue C h ai n A na l y s i s , A pr i l 2 0 1 0 F i n a l R e p or t - P r e p ar e d by I D M - Se r v i c e s
26
Ministry of Culture and Social Services. Through HCDA, the members of the association have attended training for budding and service provision to the farmers in the district. The members have further been sponsored by ABD-DANIDA for more training. 3.3 PROCESSED COCONUT PRODUCTS AND THEIR USES Coconuts are very versatile and can be used to produce a variety of products. The chart below shows a detailed process of producing various coconut products.
Chart 13: Coconut (Mature Nut) processing flow chart
Source: ABD/ KCDA: Coconut Value Chain Analysis, August 2009
3.3.1 Desiccated Coconut Desiccated coconut is the dehydrated, shredded white kernel of the coconut. It is produced from fully ripe coconut kernel under strict hygienic conditions for human consumption. It is used both in household foods and
UNDEHUSKED MATURE NUT
HUSKS
Copra Desiccated Coconut
Coconut Shell
Ranseed Oil Copra Cake
Virgin Oil
Shell Dust
Activated Carbon
DEHUSKED NUT
Coconut Milk
Virgin Oil
Fibre Coir Pit
Fertilizer
Fibre Dust Mats
Mature Coconut Water
Vinegar
Charcoal
IMMATURE NUT
COCONUT TREE
KERNEL (White Meat)
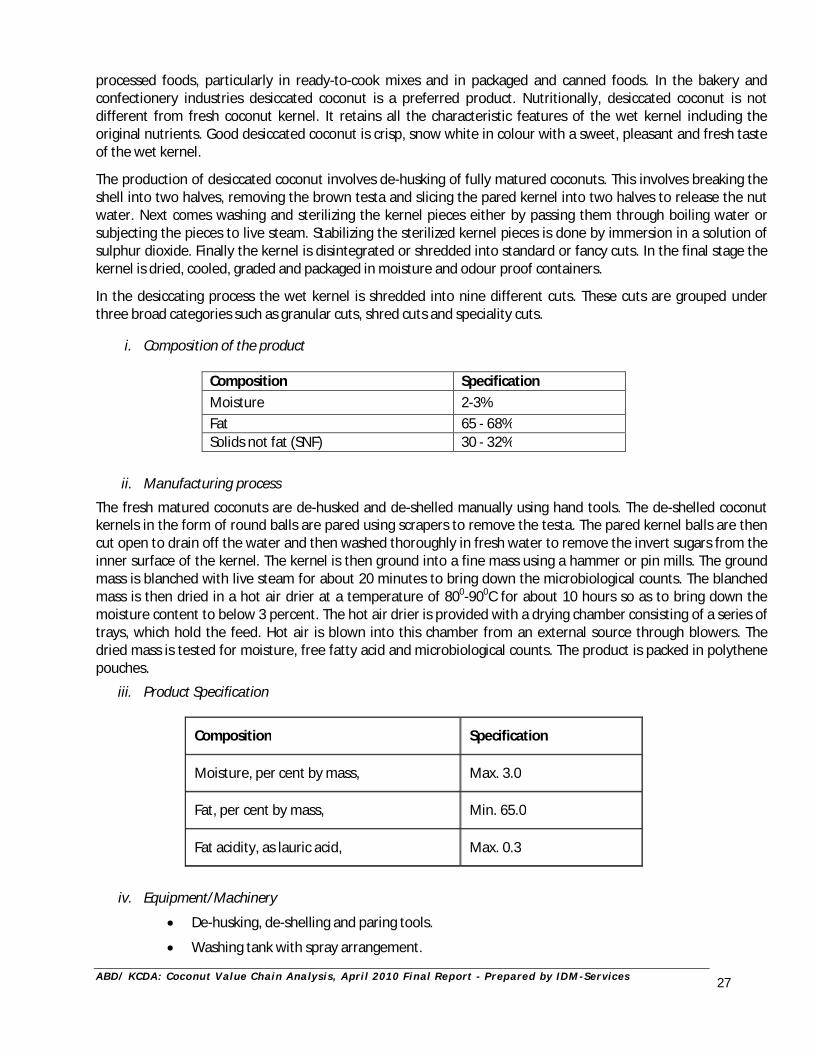
A B D / K C D A : C oc o nu t V al ue C h ai n A na l y s i s , A pr i l 2 0 1 0 F i n a l R e p or t - P r e p ar e d by I D M - Se r v i c e s
27
processed foods, particularly in ready-to-cook mixes and in packaged and canned foods. In the bakery and confectionery industries desiccated coconut is a preferred product. Nutritionally, desiccated coconut is not different from fresh coconut kernel. It retains all the characteristic features of the wet kernel including the original nutrients. Good desiccated coconut is crisp, snow white in colour with a sweet, pleasant and fresh taste of the wet kernel.
The production of desiccated coconut involves de-husking of fully matured coconuts. This involves breaking the shell into two halves, removing the brown testa and slicing the pared kernel into two halves to release the nut water. Next comes washing and sterilizing the kernel pieces either by passing them through boiling water or subjecting the pieces to live steam. Stabilizing the sterilized kernel pieces is done by immersion in a solution of sulphur dioxide. Finally the kernel is disintegrated or shredded into standard or fancy cuts. In the final stage the kernel is dried, cooled, graded and packaged in moisture and odour proof containers.
In the desiccating process the wet kernel is shredded into nine different cuts. These cuts are grouped under three broad categories such as granular cuts, shred cuts and speciality cuts.
i. Composition of the product
Composition Specification Moisture 2-3% Fat 65 - 68% Solids not fat (SNF) 30 - 32%
ii. Manufacturing process
The fresh matured coconuts are de-husked and de-shelled manually using hand tools. The de-shelled coconut kernels in the form of round balls are pared using scrapers to remove the testa. The pared kernel balls are then cut open to drain off the water and then washed thoroughly in fresh water to remove the invert sugars from the inner surface of the kernel. The kernel is then ground into a fine mass using a hammer or pin mills. The ground mass is blanched with live steam for about 20 minutes to bring down the microbiological counts. The blanched mass is then dried in a hot air drier at a temperature of 800-900C for about 10 hours so as to bring down the moisture content to below 3 percent. The hot air drier is provided with a drying chamber consisting of a series of trays, which hold the feed. Hot air is blown into this chamber from an external source through blowers. The dried mass is tested for moisture, free fatty acid and microbiological counts. The product is packed in polythene pouches.
iii. Product Specification
iv. Equipment/Machinery
De-husking, de-shelling and paring tools.
Washing tank with spray arrangement.
Composition Specification
Moisture, per cent by mass, Max. 3.0
Fat, per cent by mass, Min. 65.0
Fat acidity, as lauric acid, Max. 0.3
A B D / K C D A : C oc o nu t V al ue C h ai n A na l y s i s , A pr i l 2 0 1 0 F i n a l R e p or t - P r e p ar e d by I D M - Se r v i c e s
28
Hot dip blanching tank.
Disintegrator provided with screens and aluminum trays.
Hot air tray drier with blower.
Sieving machine.
Storage bins.
Heat sealing machine.
v. Yield
Raw material 10,000 coconuts
Desiccated coconut 1 tonne
i.e. approximately 10 nuts for a kilo of desiccated coconut. 3.3.2 Virgin Coconut Oil Virgin coconut oil (VCO), extracted from fresh coconut meat without chemical processes, is said to be the "mother of all oils". It is rich in medium chain fatty acids, particularly lauric acid and is a treasure trove of minerals, vitamins, antioxidants and is an excellent nutraceutical. It has about 50% lauric acids, having qualities similar to mother's milk, thus confirming its disease-fighting ability. When lauric acid enters the human body it gets converted to Monolaurin, which has the ability to enhance immunity. Several studies have confirmed that this compound has the ability to kill viruses including herpes and numerous other bacteria. Its antiviral effect has the ability to considerably reduce the viral load of HIV patients. VCO is not subjected to high temperatures, solvents or refinement procedures and therefore retains the fresh scent and taste of coconuts. It is rich in vitamin E, is non-greasy, non-staining and is widely used in soaps, lotions, creams and lip balms. The health benefits of VCO are second to none, ranging from speeding up the body’s metabolic system and providing immunity against a horde of commonly prevalent diseases. Coconut palms are grown widely in the coastal tracts of the country. Copra, the dried kernel, is the main commercial product from coconut, which is mainly used for oil extraction. Copra normally has an oil content varying from 65 to 72 per cent. Additionally, the oil has varied industrial applications. It is used in the manufacturing of toilet soaps, laundry soaps, surface active agents and detergents, hair tonics, cosmetics, etc. It is used throughout the country as hair oil as it increases hair growth. As massage oil it has a cooling effect on the body and is largely used in massage parlours.
i. Manufacturing Process Coconut kernels are first disintegrated into small pieces in a disintegrator and then fed into a screw press for milk extraction. The oil is then separated from the water using a mechanical centrifuge. The result is a clear coconut oil that retains the distinct scent and taste of coconuts. Laboratory tests show that this is a very high quality coconut oil, with the lauric acid content being 47 to 52%. For the extraction of oil from copra the common method still prevailing in Kenya is by using rotary chucks. However, the most efficient system of extraction of oil is by the use of expellers.
ii. Product specification
Composition Specification Composition Specification
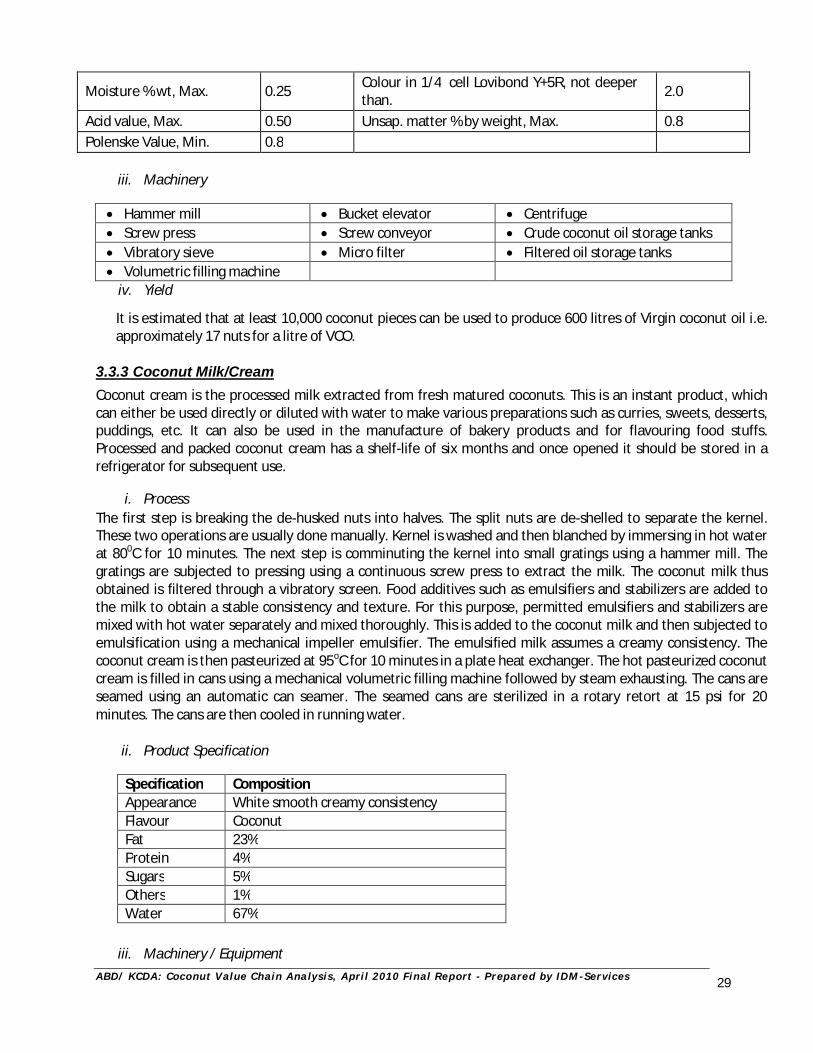
A B D / K C D A : C oc o nu t V al ue C h ai n A na l y s i s , A pr i l 2 0 1 0 F i n a l R e p or t - P r e p ar e d by I D M - Se r v i c e s
29
Moisture % wt, Max. 0.25 Colour in 1/4 cell Lovibond Y+5R, not deeper than. 2.0
Acid value, Max. 0.50 Unsap. matter % by weight, Max. 0.8 Polenske Value, Min. 0.8
iii. Machinery
Hammer mill Bucket elevator Centrifuge Screw press Screw conveyor Crude coconut oil storage tanks Vibratory sieve Micro filter Filtered oil storage tanks Volumetric filling machine
iv. Yield
It is estimated that at least 10,000 coconut pieces can be used to produce 600 litres of Virgin coconut oil i.e. approximately 17 nuts for a litre of VCO.
3.3.3 Coconut Milk/Cream Coconut cream is the processed milk extracted from fresh matured coconuts. This is an instant product, which can either be used directly or diluted with water to make various preparations such as curries, sweets, desserts, puddings, etc. It can also be used in the manufacture of bakery products and for flavouring food stuffs. Processed and packed coconut cream has a shelf-life of six months and once opened it should be stored in a refrigerator for subsequent use.
i. Process The first step is breaking the de-husked nuts into halves. The split nuts are de-shelled to separate the kernel. These two operations are usually done manually. Kernel is washed and then blanched by immersing in hot water at 800C for 10 minutes. The next step is comminuting the kernel into small gratings using a hammer mill. The gratings are subjected to pressing using a continuous screw press to extract the milk. The coconut milk thus obtained is filtered through a vibratory screen. Food additives such as emulsifiers and stabilizers are added to the milk to obtain a stable consistency and texture. For this purpose, permitted emulsifiers and stabilizers are mixed with hot water separately and mixed thoroughly. This is added to the coconut milk and then subjected to emulsification using a mechanical impeller emulsifier. The emulsified milk assumes a creamy consistency. The coconut cream is then pasteurized at 95oC for 10 minutes in a plate heat exchanger. The hot pasteurized coconut cream is filled in cans using a mechanical volumetric filling machine followed by steam exhausting. The cans are seamed using an automatic can seamer. The seamed cans are sterilized in a rotary retort at 15 psi for 20 minutes. The cans are then cooled in running water.
ii. Product Specification
Specification Composition Appearance White smooth creamy consistency Flavour Coconut Fat 23% Protein 4% Sugars 5% Others 1% Water 67%
iii. Machinery / Equipment
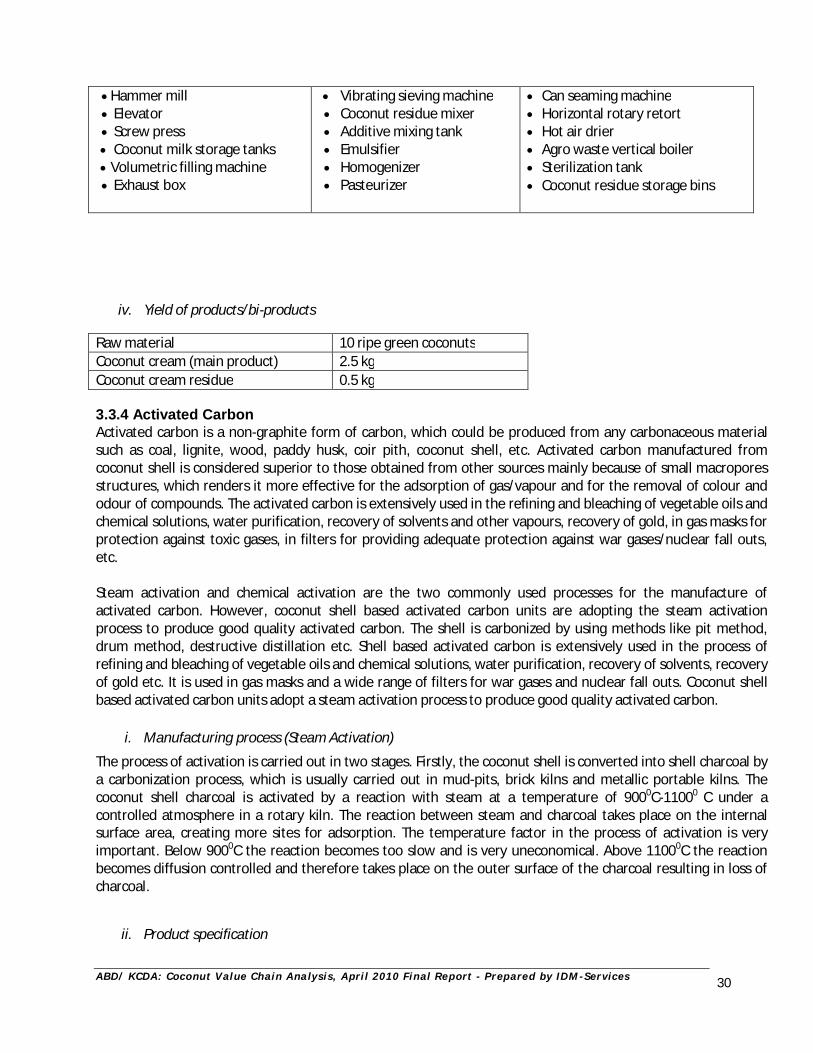
A B D / K C D A : C oc o nu t V al ue C h ai n A na l y s i s , A pr i l 2 0 1 0 F i n a l R e p or t - P r e p ar e d by I D M - Se r v i c e s
30
Hammer mill Elevator Screw press Coconut milk storage tanks Volumetric filling machine Exhaust box
Vibrating sieving machine Coconut residue mixer Additive mixing tank Emulsifier Homogenizer Pasteurizer
Can seaming machine Horizontal rotary retort Hot air drier Agro waste vertical boiler Sterilization tank Coconut residue storage bins
iv. Yield of products/bi-products Raw material 10 ripe green coconuts Coconut cream (main product) 2.5 kg Coconut cream residue 0.5 kg 3.3.4 Activated Carbon Activated carbon is a non-graphite form of carbon, which could be produced from any carbonaceous material such as coal, lignite, wood, paddy husk, coir pith, coconut shell, etc. Activated carbon manufactured from coconut shell is considered superior to those obtained from other sources mainly because of small macropores structures, which renders it more effective for the adsorption of gas/vapour and for the removal of colour and odour of compounds. The activated carbon is extensively used in the refining and bleaching of vegetable oils and chemical solutions, water purification, recovery of solvents and other vapours, recovery of gold, in gas masks for protection against toxic gases, in filters for providing adequate protection against war gases/nuclear fall outs, etc. Steam activation and chemical activation are the two commonly used processes for the manufacture of activated carbon. However, coconut shell based activated carbon units are adopting the steam activation process to produce good quality activated carbon. The shell is carbonized by using methods like pit method, drum method, destructive distillation etc. Shell based activated carbon is extensively used in the process of refining and bleaching of vegetable oils and chemical solutions, water purification, recovery of solvents, recovery of gold etc. It is used in gas masks and a wide range of filters for war gases and nuclear fall outs. Coconut shell based activated carbon units adopt a steam activation process to produce good quality activated carbon.
i. Manufacturing process (Steam Activation)
The process of activation is carried out in two stages. Firstly, the coconut shell is converted into shell charcoal by a carbonization process, which is usually carried out in mud-pits, brick kilns and metallic portable kilns. The coconut shell charcoal is activated by a reaction with steam at a temperature of 9000C-11000 C under a controlled atmosphere in a rotary kiln. The reaction between steam and charcoal takes place on the internal surface area, creating more sites for adsorption. The temperature factor in the process of activation is very important. Below 9000C the reaction becomes too slow and is very uneconomical. Above 11000C the reaction becomes diffusion controlled and therefore takes place on the outer surface of the charcoal resulting in loss of charcoal.
ii. Product specification
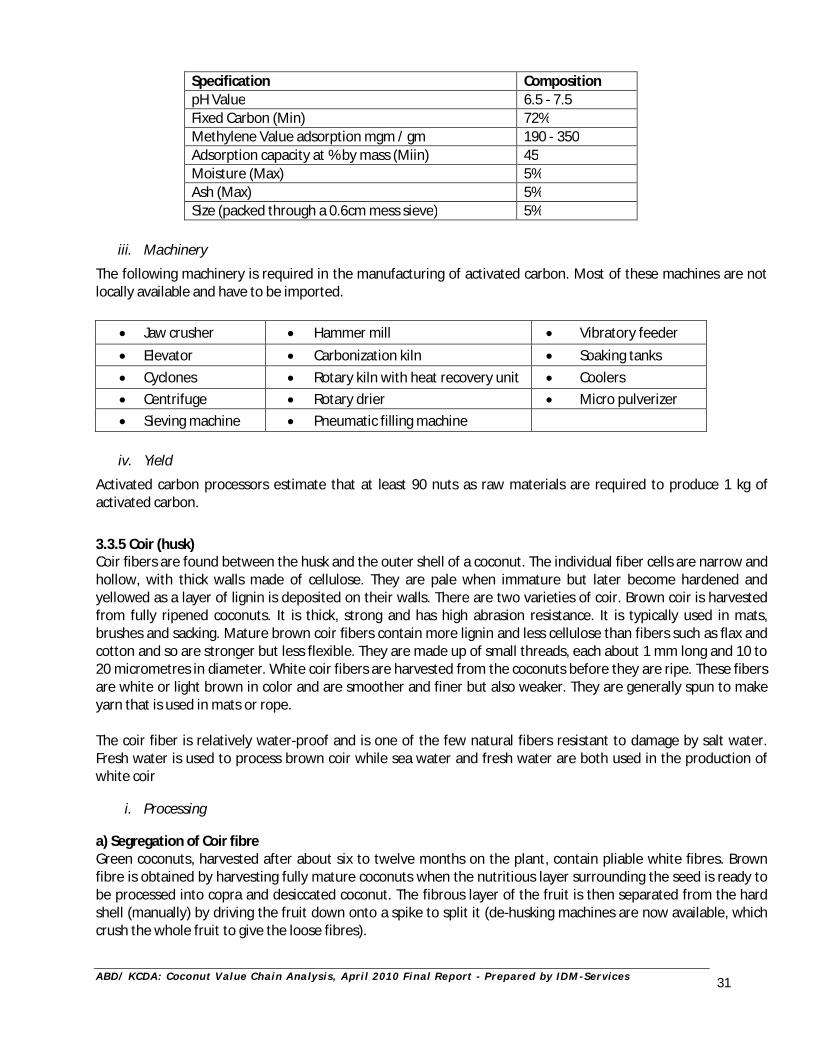
A B D / K C D A : C oc o nu t V al ue C h ai n A na l y s i s , A pr i l 2 0 1 0 F i n a l R e p or t - P r e p ar e d by I D M - Se r v i c e s
31
Specification Composition pH Value 6.5 - 7.5 Fixed Carbon (Min) 72% Methylene Value adsorption mgm / gm 190 - 350 Adsorption capacity at % by mass (Miin) 45 Moisture (Max) 5% Ash (Max) 5% Size (packed through a 0.6cm mess sieve) 5%
iii. Machinery
The following machinery is required in the manufacturing of activated carbon. Most of these machines are not locally available and have to be imported.
iv. Yield
Activated carbon processors estimate that at least 90 nuts as raw materials are required to produce 1 kg of activated carbon.
3.3.5 Coir (husk) Coir fibers are found between the husk and the outer shell of a coconut. The individual fiber cells are narrow and hollow, with thick walls made of cellulose. They are pale when immature but later become hardened and yellowed as a layer of lignin is deposited on their walls. There are two varieties of coir. Brown coir is harvested from fully ripened coconuts. It is thick, strong and has high abrasion resistance. It is typically used in mats, brushes and sacking. Mature brown coir fibers contain more lignin and less cellulose than fibers such as flax and cotton and so are stronger but less flexible. They are made up of small threads, each about 1 mm long and 10 to 20 micrometres in diameter. White coir fibers are harvested from the coconuts before they are ripe. These fibers are white or light brown in color and are smoother and finer but also weaker. They are generally spun to make yarn that is used in mats or rope. The coir fiber is relatively water-proof and is one of the few natural fibers resistant to damage by salt water. Fresh water is used to process brown coir while sea water and fresh water are both used in the production of white coir
i. Processing a) Segregation of Coir fibre Green coconuts, harvested after about six to twelve months on the plant, contain pliable white fibres. Brown fibre is obtained by harvesting fully mature coconuts when the nutritious layer surrounding the seed is ready to be processed into copra and desiccated coconut. The fibrous layer of the fruit is then separated from the hard shell (manually) by driving the fruit down onto a spike to split it (de-husking machines are now available, which crush the whole fruit to give the loose fibres).
Jaw crusher Hammer mill Vibratory feeder Elevator Carbonization kiln Soaking tanks Cyclones Rotary kiln with heat recovery unit Coolers Centrifuge Rotary drier Micro pulverizer Sieving machine Pneumatic filling machine
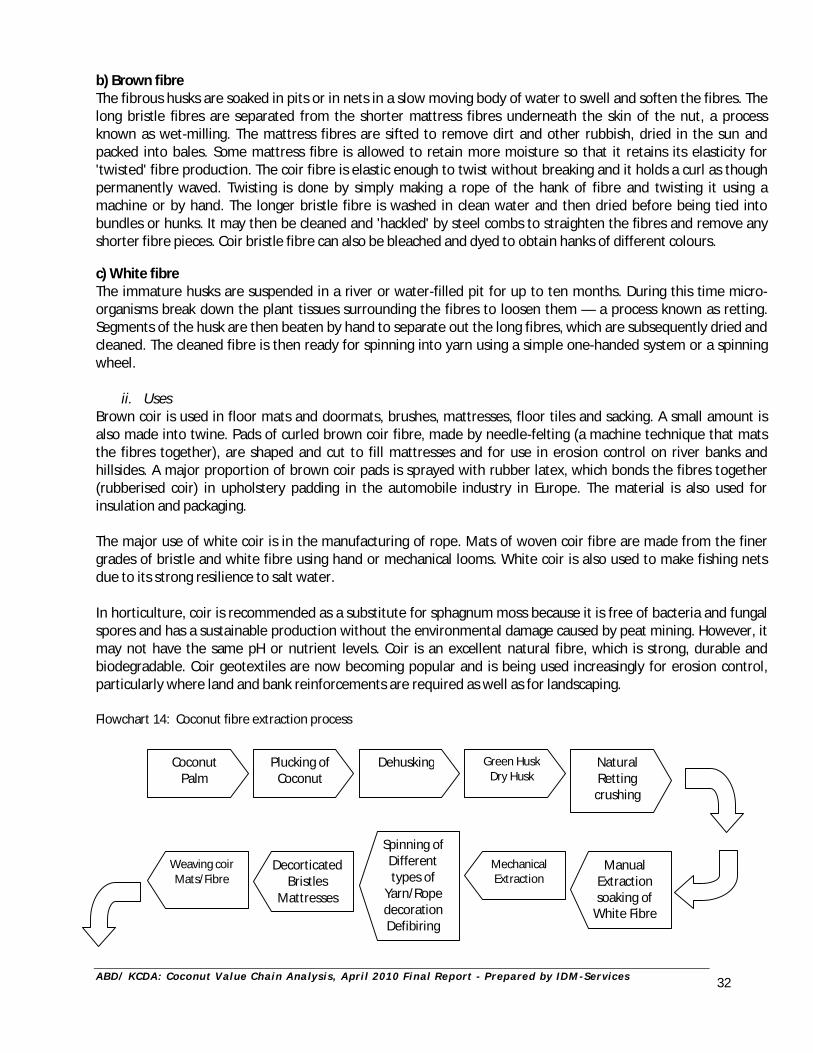
A B D / K C D A : C oc o nu t V al ue C h ai n A na l y s i s , A pr i l 2 0 1 0 F i n a l R e p or t - P r e p ar e d by I D M - Se r v i c e s
32
b) Brown fibre The fibrous husks are soaked in pits or in nets in a slow moving body of water to swell and soften the fibres. The long bristle fibres are separated from the shorter mattress fibres underneath the skin of the nut, a process known as wet-milling. The mattress fibres are sifted to remove dirt and other rubbish, dried in the sun and packed into bales. Some mattress fibre is allowed to retain more moisture so that it retains its elasticity for 'twisted' fibre production. The coir fibre is elastic enough to twist without breaking and it holds a curl as though permanently waved. Twisting is done by simply making a rope of the hank of fibre and twisting it using a machine or by hand. The longer bristle fibre is washed in clean water and then dried before being tied into bundles or hunks. It may then be cleaned and 'hackled' by steel combs to straighten the fibres and remove any shorter fibre pieces. Coir bristle fibre can also be bleached and dyed to obtain hanks of different colours. c) White fibre The immature husks are suspended in a river or water-filled pit for up to ten months. During this time micro-organisms break down the plant tissues surrounding the fibres to loosen them — a process known as retting. Segments of the husk are then beaten by hand to separate out the long fibres, which are subsequently dried and cleaned. The cleaned fibre is then ready for spinning into yarn using a simple one-handed system or a spinning wheel.
ii. Uses Brown coir is used in floor mats and doormats, brushes, mattresses, floor tiles and sacking. A small amount is also made into twine. Pads of curled brown coir fibre, made by needle-felting (a machine technique that mats the fibres together), are shaped and cut to fill mattresses and for use in erosion control on river banks and hillsides. A major proportion of brown coir pads is sprayed with rubber latex, which bonds the fibres together (rubberised coir) in upholstery padding in the automobile industry in Europe. The material is also used for insulation and packaging. The major use of white coir is in the manufacturing of rope. Mats of woven coir fibre are made from the finer grades of bristle and white fibre using hand or mechanical looms. White coir is also used to make fishing nets due to its strong resilience to salt water. In horticulture, coir is recommended as a substitute for sphagnum moss because it is free of bacteria and fungal spores and has a sustainable production without the environmental damage caused by peat mining. However, it may not have the same pH or nutrient levels. Coir is an excellent natural fibre, which is strong, durable and biodegradable. Coir geotextiles are now becoming popular and is being used increasingly for erosion control, particularly where land and bank reinforcements are required as well as for landscaping. Flowchart 14: Coconut fibre extraction process
Coconut Palm
Plucking of Coconut
Dehusking Green Husk Dry Husk
Natural Retting
crushing
Weaving coir Mats/Fibre
Decorticated Bristles
Mattresses
Spinning of Different types of
Yarn/Rope decoration Defibiring
Mechanical Extraction
Manual Extraction soaking of
White Fibre
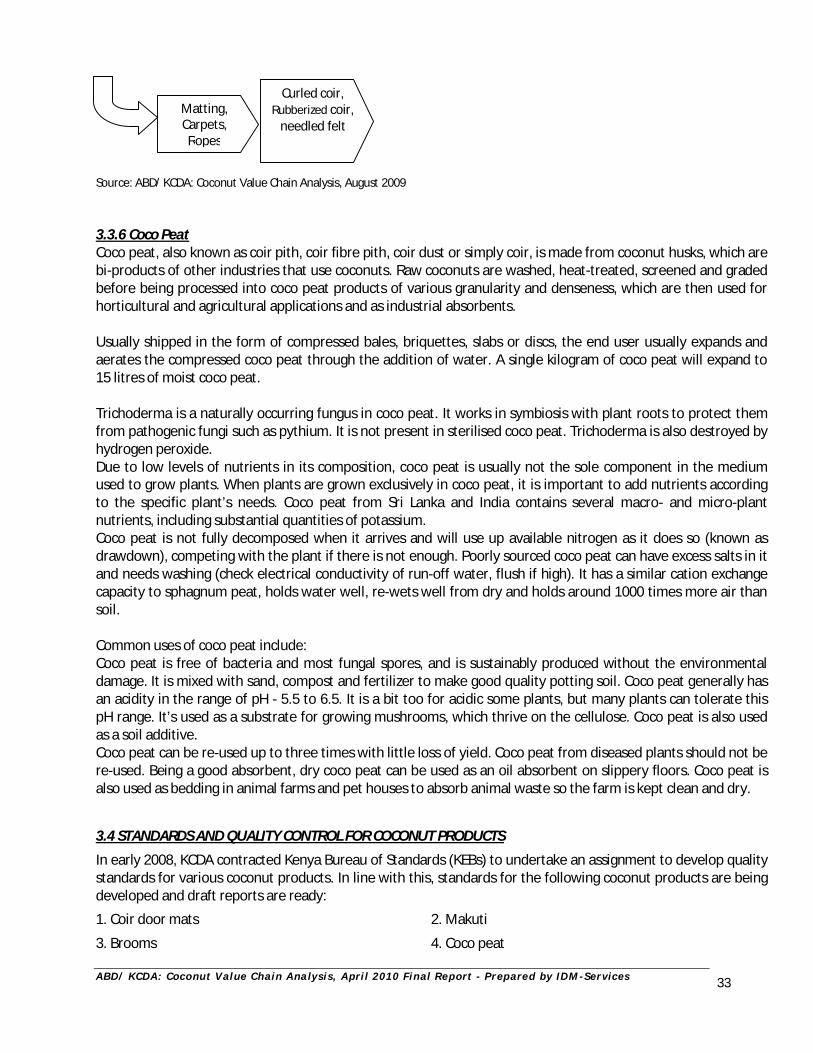
A B D / K C D A : C oc o nu t V al ue C h ai n A na l y s i s , A pr i l 2 0 1 0 F i n a l R e p or t - P r e p ar e d by I D M - Se r v i c e s
33
Source: ABD/ KCDA: Coconut Value Chain Analysis, August 2009 3.3.6 Coco Peat Coco peat, also known as coir pith, coir fibre pith, coir dust or simply coir, is made from coconut husks, which are bi-products of other industries that use coconuts. Raw coconuts are washed, heat-treated, screened and graded before being processed into coco peat products of various granularity and denseness, which are then used for horticultural and agricultural applications and as industrial absorbents. Usually shipped in the form of compressed bales, briquettes, slabs or discs, the end user usually expands and aerates the compressed coco peat through the addition of water. A single kilogram of coco peat will expand to 15 litres of moist coco peat. Trichoderma is a naturally occurring fungus in coco peat. It works in symbiosis with plant roots to protect them from pathogenic fungi such as pythium. It is not present in sterilised coco peat. Trichoderma is also destroyed by hydrogen peroxide. Due to low levels of nutrients in its composition, coco peat is usually not the sole component in the medium used to grow plants. When plants are grown exclusively in coco peat, it is important to add nutrients according to the specific plant’s needs. Coco peat from Sri Lanka and India contains several macro- and micro-plant nutrients, including substantial quantities of potassium. Coco peat is not fully decomposed when it arrives and will use up available nitrogen as it does so (known as drawdown), competing with the plant if there is not enough. Poorly sourced coco peat can have excess salts in it and needs washing (check electrical conductivity of run-off water, flush if high). It has a similar cation exchange capacity to sphagnum peat, holds water well, re-wets well from dry and holds around 1000 times more air than soil. Common uses of coco peat include: Coco peat is free of bacteria and most fungal spores, and is sustainably produced without the environmental damage. It is mixed with sand, compost and fertilizer to make good quality potting soil. Coco peat generally has an acidity in the range of pH - 5.5 to 6.5. It is a bit too for acidic some plants, but many plants can tolerate this pH range. It’s used as a substrate for growing mushrooms, which thrive on the cellulose. Coco peat is also used as a soil additive. Coco peat can be re-used up to three times with little loss of yield. Coco peat from diseased plants should not be re-used. Being a good absorbent, dry coco peat can be used as an oil absorbent on slippery floors. Coco peat is also used as bedding in animal farms and pet houses to absorb animal waste so the farm is kept clean and dry.
3.4 STANDARDS AND QUALITY CONTROL FOR COCONUT PRODUCTS
In early 2008, KCDA contracted Kenya Bureau of Standards (KEBs) to undertake an assignment to develop quality standards for various coconut products. In line with this, standards for the following coconut products are being developed and draft reports are ready:
1. Coir door mats 2. Makuti
3. Brooms 4. Coco peat
Matting, Carpets, Ropes
Curled coir, Rubberized coir,
needled felt
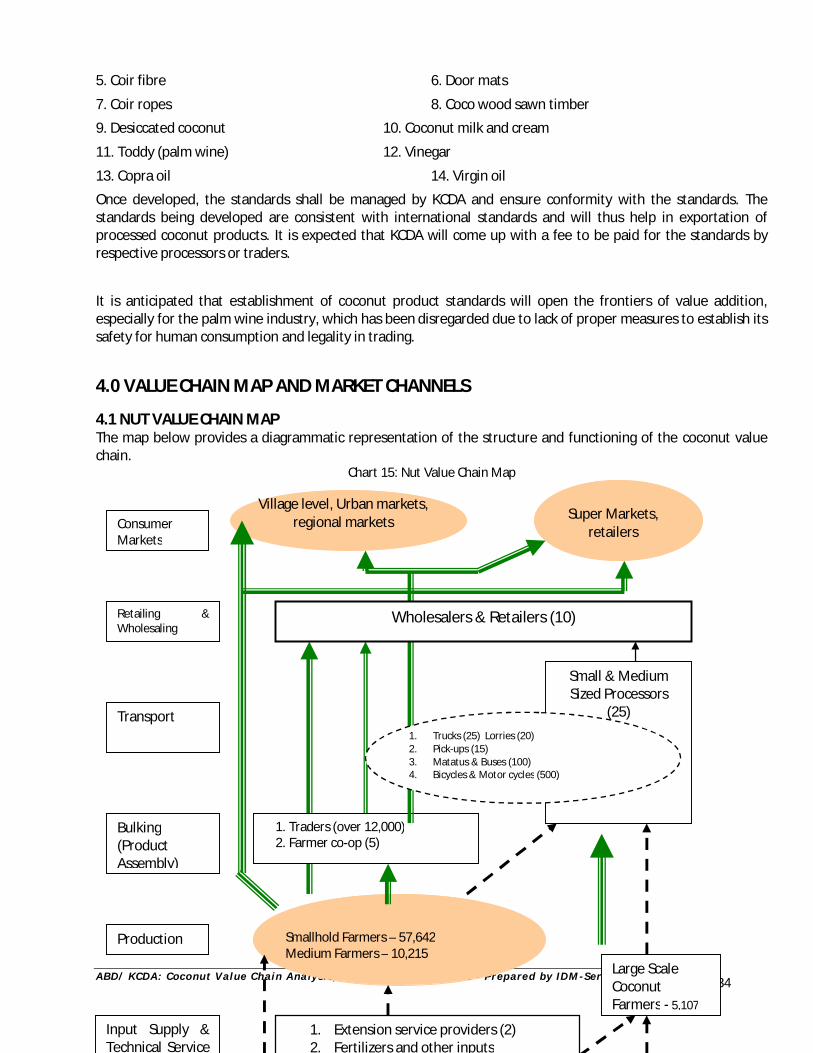
A B D / K C D A : C oc o nu t V al ue C h ai n A na l y s i s , A pr i l 2 0 1 0 F i n a l R e p or t - P r e p ar e d by I D M - Se r v i c e s
34
5. Coir fibre 6. Door mats
7. Coir ropes 8. Coco wood sawn timber
9. Desiccated coconut 10. Coconut milk and cream
11. Toddy (palm wine) 12. Vinegar
13. Copra oil 14. Virgin oil
Once developed, the standards shall be managed by KCDA and ensure conformity with the standards. The standards being developed are consistent with international standards and will thus help in exportation of processed coconut products. It is expected that KCDA will come up with a fee to be paid for the standards by respective processors or traders.
It is anticipated that establishment of coconut product standards will open the frontiers of value addition, especially for the palm wine industry, which has been disregarded due to lack of proper measures to establish its safety for human consumption and legality in trading. 4.0 VALUE CHAIN MAP AND MARKET CHANNELS 4.1 NUT VALUE CHAIN MAP The map below provides a diagrammatic representation of the structure and functioning of the coconut value chain.
Chart 15: Nut Value Chain Map Smallhold Farmers – 57,642
Medium Farmers – 10,215
1. Extension service providers (2) 2. Fertilizers and other inputs
Large Scale Coconut Farmers - 5,107
Village level, Urban markets, regional markets
Small & Medium Sized Processors
(25)
Input Supply & Technical Service
1. Traders (over 12,000) 2. Farmer co-op (5)
Production
Super Markets, retailers
Bulking (Product Assembly)
Transport
Retailing & Wholesaling
Consumer Markets
1. Trucks (25) Lorries (20) 2. Pick-ups (15) 3. Matatus & Buses (100) 4. Bicycles & Motor cycles (500)
Wholesalers & Retailers (10)
A B D / K C D A : C oc o nu t V al ue C h ai n A na l y s i s , A pr i l 2 0 1 0 F i n a l R e p or t - P r e p ar e d by I D M - Se r v i c e s
35
Source: ABD/ KCDA: Coconut Value Chain Analysis, August 2009
4.2 DRY NUT MARKETING AND DISTRIBUTION CHANNELS 4.2.1 Marketing of dry nuts Close to 85% of the nuts produced are sold, while the remaining 15% constitutes home consumption and post harvest loses. Marketing of dry nuts involves a lot of players from different market segments. Major players in marketing include; rural traders, middlemen/agents/brokers, processors, transporters and end consumers at rural, urban and regional levels. More than 25% of the nuts are sold to traders who transport them to urban centres and sell them at an average price of Kes 7 per nut to retailers and processors. 4.2.2 Markets and Market Segments From the value chain analysis survey, there are six (6) different market segments/distribution channels namely:
Channel One – Un-processed coconut direct from farmers to low-end rural consumers. Channel Two – Un-processed coconut via intermediaries to urban consumers. Channel Three – Un-processed coconut to upcountry markets. Channel Four – Un-processed nuts to regional export markets. Channel Five – Semi -processed/processed coconut to middle and upper income urban consumers. Channel Six – Other coconut products to urban consumers (import market segment).
N/B: For purposes of this report, un-refined/un-processed coconut refers to dry nuts sold without any value addition or processing directly to intermediaries or traders/agents.
Reliable information from producers, traders and other key sub sector players shows that the above market channels command different nut market shares. The percentages were arrived at by interviewing the producers on who the major buyers are and the traders on what their target markets are. The following information regarding the market shares for the respective markets is given below.
Table 4.1: Estimated annual nut market share per marketing channel Market Channel Estimated nut market
share Estimated number of nuts
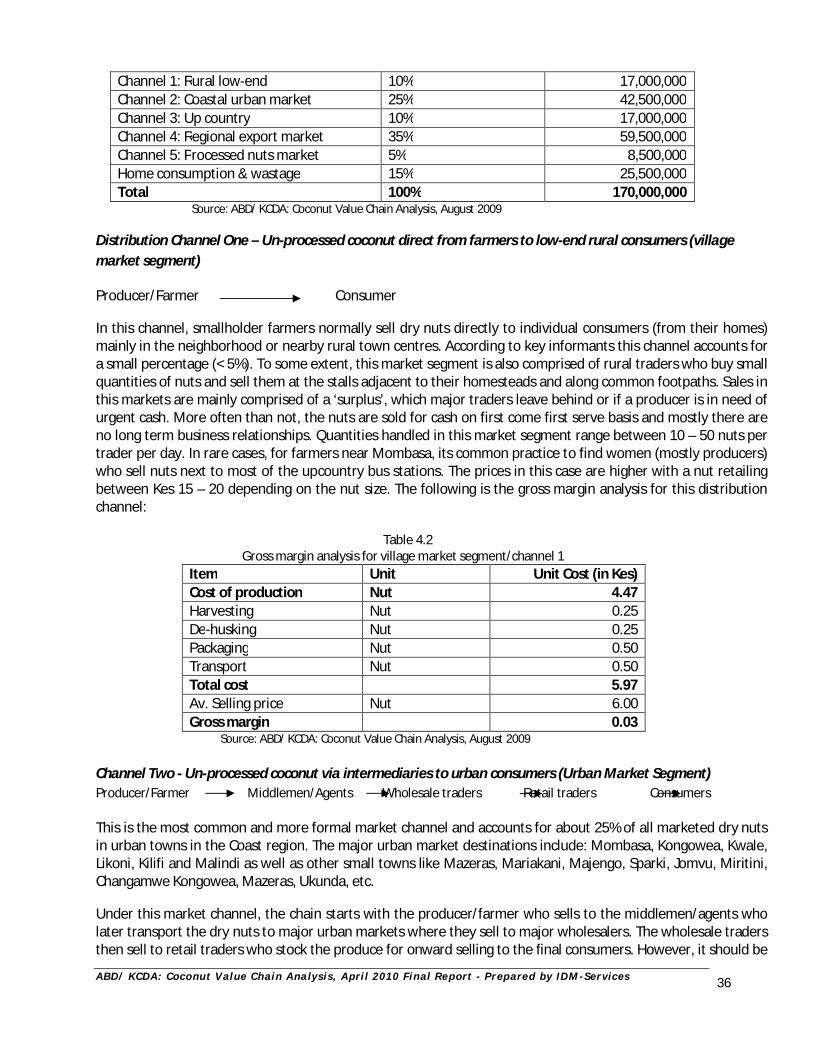
A B D / K C D A : C oc o nu t V al ue C h ai n A na l y s i s , A pr i l 2 0 1 0 F i n a l R e p or t - P r e p ar e d by I D M - Se r v i c e s
36
Channel 1: Rural low-end 10% 17,000,000 Channel 2: Coastal urban market 25% 42,500,000 Channel 3: Up country 10% 17,000,000 Channel 4: Regional export market 35% 59,500,000 Channel 5: Processed nuts market 5% 8,500,000 Home consumption & wastage 15% 25,500,000 Total 100% 170,000,000
Source: ABD/ KCDA: Coconut Value Chain Analysis, August 2009 Distribution Channel One – Un-processed coconut direct from farmers to low-end rural consumers (village market segment) Producer/Farmer Consumer In this channel, smallholder farmers normally sell dry nuts directly to individual consumers (from their homes) mainly in the neighborhood or nearby rural town centres. According to key informants this channel accounts for a small percentage (< 5%). To some extent, this market segment is also comprised of rural traders who buy small quantities of nuts and sell them at the stalls adjacent to their homesteads and along common footpaths. Sales in this markets are mainly comprised of a ‘surplus’, which major traders leave behind or if a producer is in need of urgent cash. More often than not, the nuts are sold for cash on first come first serve basis and mostly there are no long term business relationships. Quantities handled in this market segment range between 10 – 50 nuts per trader per day. In rare cases, for farmers near Mombasa, its common practice to find women (mostly producers) who sell nuts next to most of the upcountry bus stations. The prices in this case are higher with a nut retailing between Kes 15 – 20 depending on the nut size. The following is the gross margin analysis for this distribution channel:
Table 4.2 Gross margin analysis for village market segment/channel 1
Item Unit Unit Cost (in Kes) Cost of production Nut 4.47 Harvesting Nut 0.25 De-husking Nut 0.25 Packaging Nut 0.50 Transport Nut 0.50 Total cost 5.97 Av. Selling price Nut 6.00 Gross margin 0.03
Source: ABD/ KCDA: Coconut Value Chain Analysis, August 2009
Channel Two - Un-processed coconut via intermediaries to urban consumers (Urban Market Segment) Producer/Farmer Middlemen/Agents Wholesale traders Retail traders Consumers This is the most common and more formal market channel and accounts for about 25% of all marketed dry nuts in urban towns in the Coast region. The major urban market destinations include: Mombasa, Kongowea, Kwale, Likoni, Kilifi and Malindi as well as other small towns like Mazeras, Mariakani, Majengo, Sparki, Jomvu, Miritini, Changamwe Kongowea, Mazeras, Ukunda, etc. Under this market channel, the chain starts with the producer/farmer who sells to the middlemen/agents who later transport the dry nuts to major urban markets where they sell to major wholesalers. The wholesale traders then sell to retail traders who stock the produce for onward selling to the final consumers. However, it should be
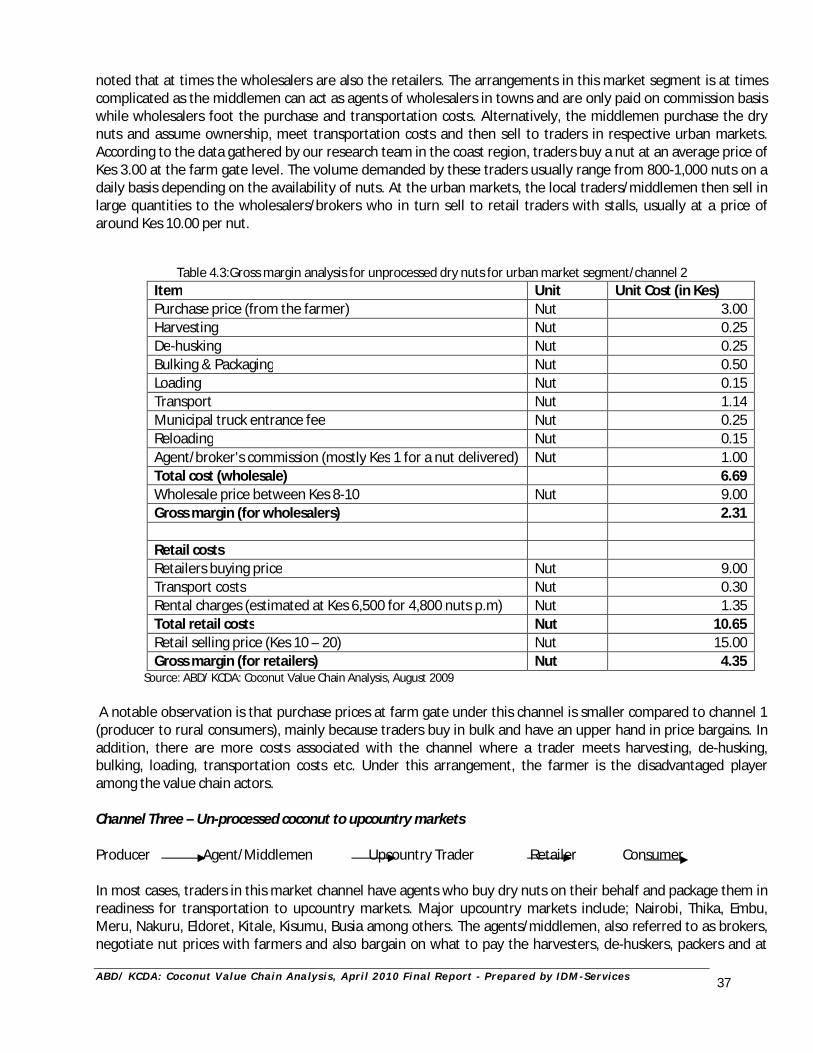
A B D / K C D A : C oc o nu t V al ue C h ai n A na l y s i s , A pr i l 2 0 1 0 F i n a l R e p or t - P r e p ar e d by I D M - Se r v i c e s
37
noted that at times the wholesalers are also the retailers. The arrangements in this market segment is at times complicated as the middlemen can act as agents of wholesalers in towns and are only paid on commission basis while wholesalers foot the purchase and transportation costs. Alternatively, the middlemen purchase the dry nuts and assume ownership, meet transportation costs and then sell to traders in respective urban markets. According to the data gathered by our research team in the coast region, traders buy a nut at an average price of Kes 3.00 at the farm gate level. The volume demanded by these traders usually range from 800-1,000 nuts on a daily basis depending on the availability of nuts. At the urban markets, the local traders/middlemen then sell in large quantities to the wholesalers/brokers who in turn sell to retail traders with stalls, usually at a price of around Kes 10.00 per nut.
Table 4.3:Gross margin analysis for unprocessed dry nuts for urban market segment/channel 2 Item Unit Unit Cost (in Kes) Purchase price (from the farmer) Nut 3.00 Harvesting Nut 0.25 De-husking Nut 0.25 Bulking & Packaging Nut 0.50 Loading Nut 0.15 Transport Nut 1.14 Municipal truck entrance fee Nut 0.25 Reloading Nut 0.15 Agent/broker’s commission (mostly Kes 1 for a nut delivered) Nut 1.00 Total cost (wholesale) 6.69 Wholesale price between Kes 8-10 Nut 9.00 Gross margin (for wholesalers) 2.31 Retail costs Retailers buying price Nut 9.00 Transport costs Nut 0.30 Rental charges (estimated at Kes 6,500 for 4,800 nuts p.m) Nut 1.35 Total retail costs Nut 10.65 Retail selling price (Kes 10 – 20) Nut 15.00 Gross margin (for retailers) Nut 4.35
Source: ABD/ KCDA: Coconut Value Chain Analysis, August 2009 A notable observation is that purchase prices at farm gate under this channel is smaller compared to channel 1 (producer to rural consumers), mainly because traders buy in bulk and have an upper hand in price bargains. In addition, there are more costs associated with the channel where a trader meets harvesting, de-husking, bulking, loading, transportation costs etc. Under this arrangement, the farmer is the disadvantaged player among the value chain actors. Channel Three – Un-processed coconut to upcountry markets Producer Agent/Middlemen Upcountry Trader Retailer Consumer In most cases, traders in this market channel have agents who buy dry nuts on their behalf and package them in readiness for transportation to upcountry markets. Major upcountry markets include; Nairobi, Thika, Embu, Meru, Nakuru, Eldoret, Kitale, Kisumu, Busia among others. The agents/middlemen, also referred to as brokers, negotiate nut prices with farmers and also bargain on what to pay the harvesters, de-huskers, packers and at
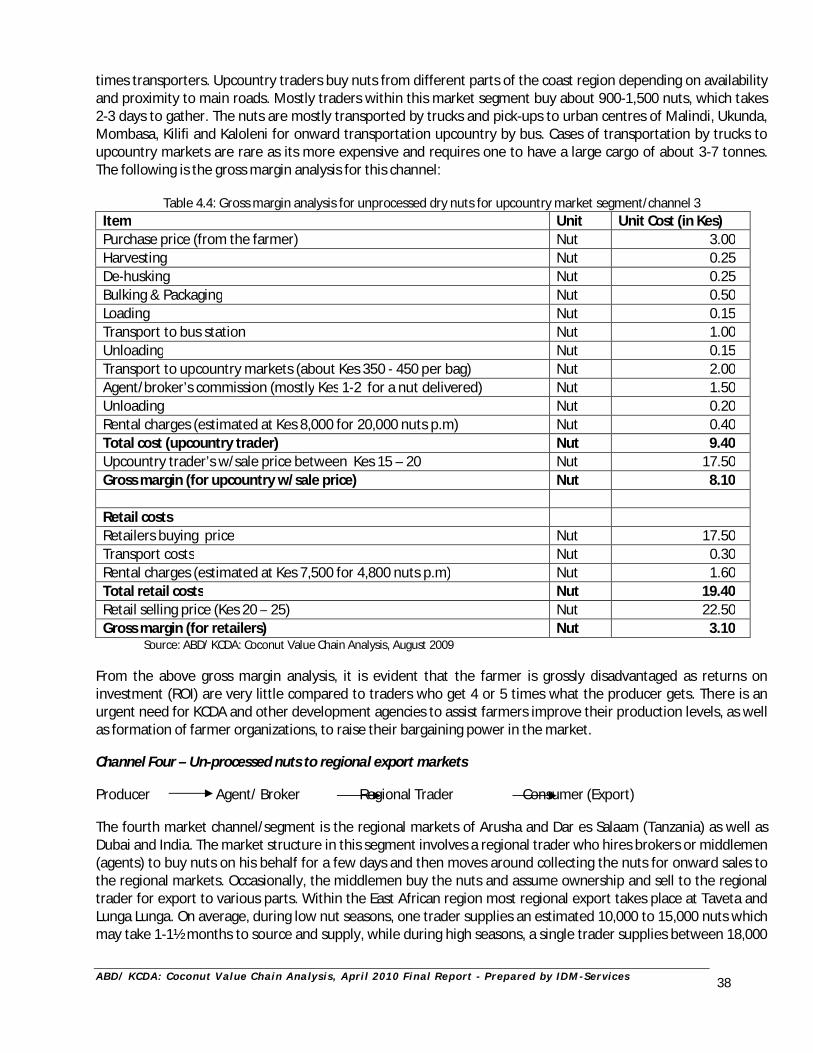
A B D / K C D A : C oc o nu t V al ue C h ai n A na l y s i s , A pr i l 2 0 1 0 F i n a l R e p or t - P r e p ar e d by I D M - Se r v i c e s
38
times transporters. Upcountry traders buy nuts from different parts of the coast region depending on availability and proximity to main roads. Mostly traders within this market segment buy about 900-1,500 nuts, which takes 2-3 days to gather. The nuts are mostly transported by trucks and pick-ups to urban centres of Malindi, Ukunda, Mombasa, Kilifi and Kaloleni for onward transportation upcountry by bus. Cases of transportation by trucks to upcountry markets are rare as its more expensive and requires one to have a large cargo of about 3-7 tonnes. The following is the gross margin analysis for this channel:
Table 4.4: Gross margin analysis for unprocessed dry nuts for upcountry market segment/channel 3 Item Unit Unit Cost (in Kes) Purchase price (from the farmer) Nut 3.00 Harvesting Nut 0.25 De-husking Nut 0.25 Bulking & Packaging Nut 0.50 Loading Nut 0.15 Transport to bus station Nut 1.00 Unloading Nut 0.15 Transport to upcountry markets (about Kes 350 - 450 per bag) Nut 2.00 Agent/broker’s commission (mostly Kes 1-2 for a nut delivered) Nut 1.50 Unloading Nut 0.20 Rental charges (estimated at Kes 8,000 for 20,000 nuts p.m) Nut 0.40 Total cost (upcountry trader) Nut 9.40 Upcountry trader’s w/sale price between Kes 15 – 20 Nut 17.50 Gross margin (for upcountry w/sale price) Nut 8.10 Retail costs Retailers buying price Nut 17.50 Transport costs Nut 0.30 Rental charges (estimated at Kes 7,500 for 4,800 nuts p.m) Nut 1.60 Total retail costs Nut 19.40 Retail selling price (Kes 20 – 25) Nut 22.50 Gross margin (for retailers) Nut 3.10
Source: ABD/ KCDA: Coconut Value Chain Analysis, August 2009 From the above gross margin analysis, it is evident that the farmer is grossly disadvantaged as returns on investment (ROI) are very little compared to traders who get 4 or 5 times what the producer gets. There is an urgent need for KCDA and other development agencies to assist farmers improve their production levels, as well as formation of farmer organizations, to raise their bargaining power in the market. Channel Four – Un-processed nuts to regional export markets Producer Agent/ Broker Regional Trader Consumer (Export) The fourth market channel/segment is the regional markets of Arusha and Dar es Salaam (Tanzania) as well as Dubai and India. The market structure in this segment involves a regional trader who hires brokers or middlemen (agents) to buy nuts on his behalf for a few days and then moves around collecting the nuts for onward sales to the regional markets. Occasionally, the middlemen buy the nuts and assume ownership and sell to the regional trader for export to various parts. Within the East African region most regional export takes place at Taveta and Lunga Lunga. On average, during low nut seasons, one trader supplies an estimated 10,000 to 15,000 nuts which may take 1-1½ months to source and supply, while during high seasons, a single trader supplies between 18,000
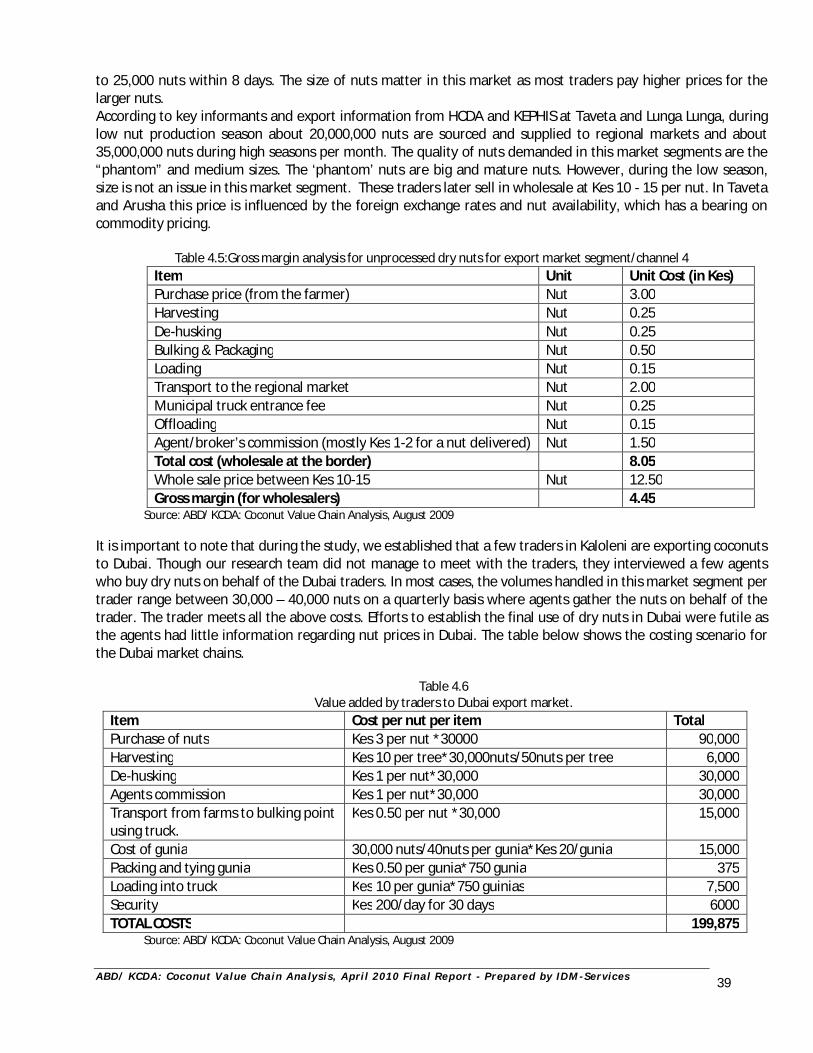
A B D / K C D A : C oc o nu t V al ue C h ai n A na l y s i s , A pr i l 2 0 1 0 F i n a l R e p or t - P r e p ar e d by I D M - Se r v i c e s
39
to 25,000 nuts within 8 days. The size of nuts matter in this market as most traders pay higher prices for the larger nuts. According to key informants and export information from HCDA and KEPHIS at Taveta and Lunga Lunga, during low nut production season about 20,000,000 nuts are sourced and supplied to regional markets and about 35,000,000 nuts during high seasons per month. The quality of nuts demanded in this market segments are the “phantom” and medium sizes. The ‘phantom’ nuts are big and mature nuts. However, during the low season, size is not an issue in this market segment. These traders later sell in wholesale at Kes 10 - 15 per nut. In Taveta and Arusha this price is influenced by the foreign exchange rates and nut availability, which has a bearing on commodity pricing.
Table 4.5:Gross margin analysis for unprocessed dry nuts for export market segment/channel 4 Item Unit Unit Cost (in Kes) Purchase price (from the farmer) Nut 3.00 Harvesting Nut 0.25 De-husking Nut 0.25 Bulking & Packaging Nut 0.50 Loading Nut 0.15 Transport to the regional market Nut 2.00 Municipal truck entrance fee Nut 0.25 Offloading Nut 0.15 Agent/broker’s commission (mostly Kes 1-2 for a nut delivered) Nut 1.50 Total cost (wholesale at the border) 8.05 Whole sale price between Kes 10-15 Nut 12.50 Gross margin (for wholesalers) 4.45
Source: ABD/ KCDA: Coconut Value Chain Analysis, August 2009 It is important to note that during the study, we established that a few traders in Kaloleni are exporting coconuts to Dubai. Though our research team did not manage to meet with the traders, they interviewed a few agents who buy dry nuts on behalf of the Dubai traders. In most cases, the volumes handled in this market segment per trader range between 30,000 – 40,000 nuts on a quarterly basis where agents gather the nuts on behalf of the trader. The trader meets all the above costs. Efforts to establish the final use of dry nuts in Dubai were futile as the agents had little information regarding nut prices in Dubai. The table below shows the costing scenario for the Dubai market chains.
Table 4.6
Value added by traders to Dubai export market. Item Cost per nut per item Total Purchase of nuts Kes 3 per nut *30000 90,000 Harvesting Kes 10 per tree*30,000nuts/50nuts per tree 6,000 De-husking Kes 1 per nut*30,000 30,000 Agents commission Kes 1 per nut*30,000 30,000 Transport from farms to bulking point using truck.
Kes 0.50 per nut *30,000 15,000
Cost of gunia 30,000 nuts/40nuts per gunia*Kes 20/gunia 15,000 Packing and tying gunia Kes 0.50 per gunia*750 gunia 375 Loading into truck Kes 10 per gunia*750 guinias 7,500 Security Kes 200/day for 30 days 6000 TOTAL COSTS 199,875
Source: ABD/ KCDA: Coconut Value Chain Analysis, August 2009
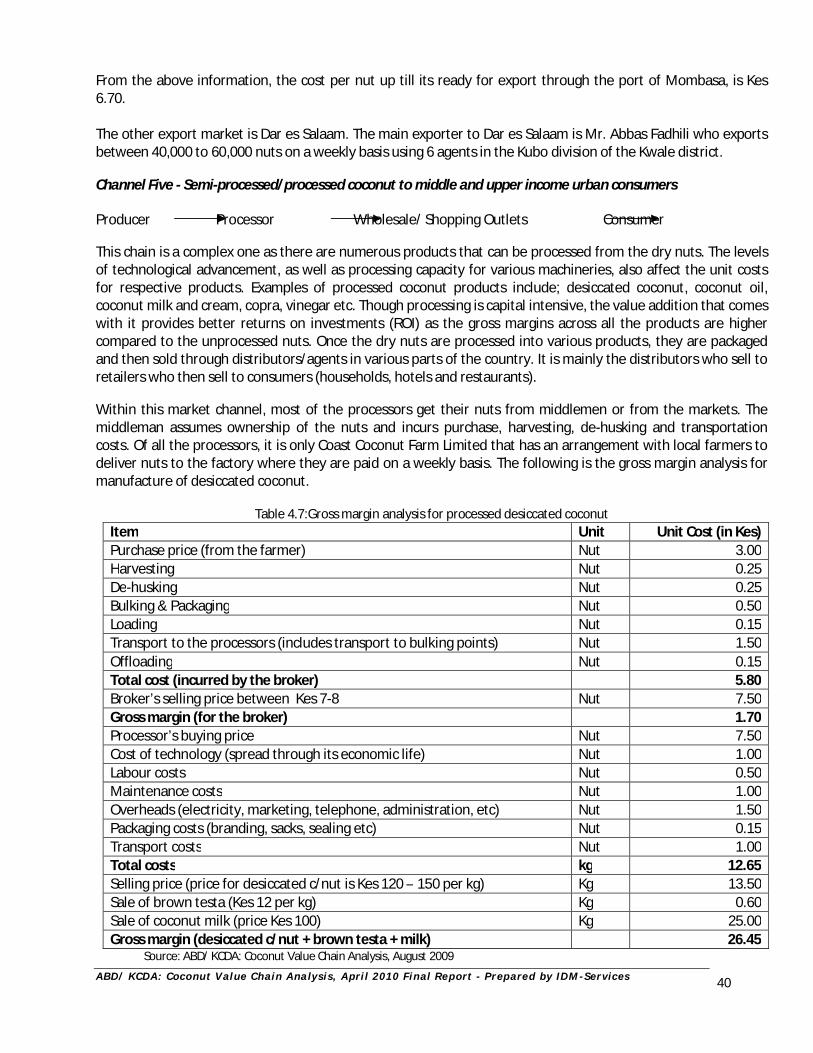
A B D / K C D A : C oc o nu t V al ue C h ai n A na l y s i s , A pr i l 2 0 1 0 F i n a l R e p or t - P r e p ar e d by I D M - Se r v i c e s
40
From the above information, the cost per nut up till its ready for export through the port of Mombasa, is Kes 6.70. The other export market is Dar es Salaam. The main exporter to Dar es Salaam is Mr. Abbas Fadhili who exports between 40,000 to 60,000 nuts on a weekly basis using 6 agents in the Kubo division of the Kwale district. Channel Five - Semi-processed/processed coconut to middle and upper income urban consumers Producer Processor Wholesale/ Shopping Outlets Consumer This chain is a complex one as there are numerous products that can be processed from the dry nuts. The levels of technological advancement, as well as processing capacity for various machineries, also affect the unit costs for respective products. Examples of processed coconut products include; desiccated coconut, coconut oil, coconut milk and cream, copra, vinegar etc. Though processing is capital intensive, the value addition that comes with it provides better returns on investments (ROI) as the gross margins across all the products are higher compared to the unprocessed nuts. Once the dry nuts are processed into various products, they are packaged and then sold through distributors/agents in various parts of the country. It is mainly the distributors who sell to retailers who then sell to consumers (households, hotels and restaurants). Within this market channel, most of the processors get their nuts from middlemen or from the markets. The middleman assumes ownership of the nuts and incurs purchase, harvesting, de-husking and transportation costs. Of all the processors, it is only Coast Coconut Farm Limited that has an arrangement with local farmers to deliver nuts to the factory where they are paid on a weekly basis. The following is the gross margin analysis for manufacture of desiccated coconut.
Table 4.7:Gross margin analysis for processed desiccated coconut Item Unit Unit Cost (in Kes) Purchase price (from the farmer) Nut 3.00 Harvesting Nut 0.25 De-husking Nut 0.25 Bulking & Packaging Nut 0.50 Loading Nut 0.15 Transport to the processors (includes transport to bulking points) Nut 1.50 Offloading Nut 0.15 Total cost (incurred by the broker) 5.80 Broker’s selling price between Kes 7-8 Nut 7.50 Gross margin (for the broker) 1.70 Processor’s buying price Nut 7.50 Cost of technology (spread through its economic life) Nut 1.00 Labour costs Nut 0.50 Maintenance costs Nut 1.00 Overheads (electricity, marketing, telephone, administration, etc) Nut 1.50 Packaging costs (branding, sacks, sealing etc) Nut 0.15 Transport costs Nut 1.00 Total costs kg 12.65 Selling price (price for desiccated c/nut is Kes 120 – 150 per kg) Kg 13.50 Sale of brown testa (Kes 12 per kg) Kg 0.60 Sale of coconut milk (price Kes 100) Kg 25.00 Gross margin (desiccated c/nut + brown testa + milk) 26.45
Source: ABD/ KCDA: Coconut Value Chain Analysis, August 2009
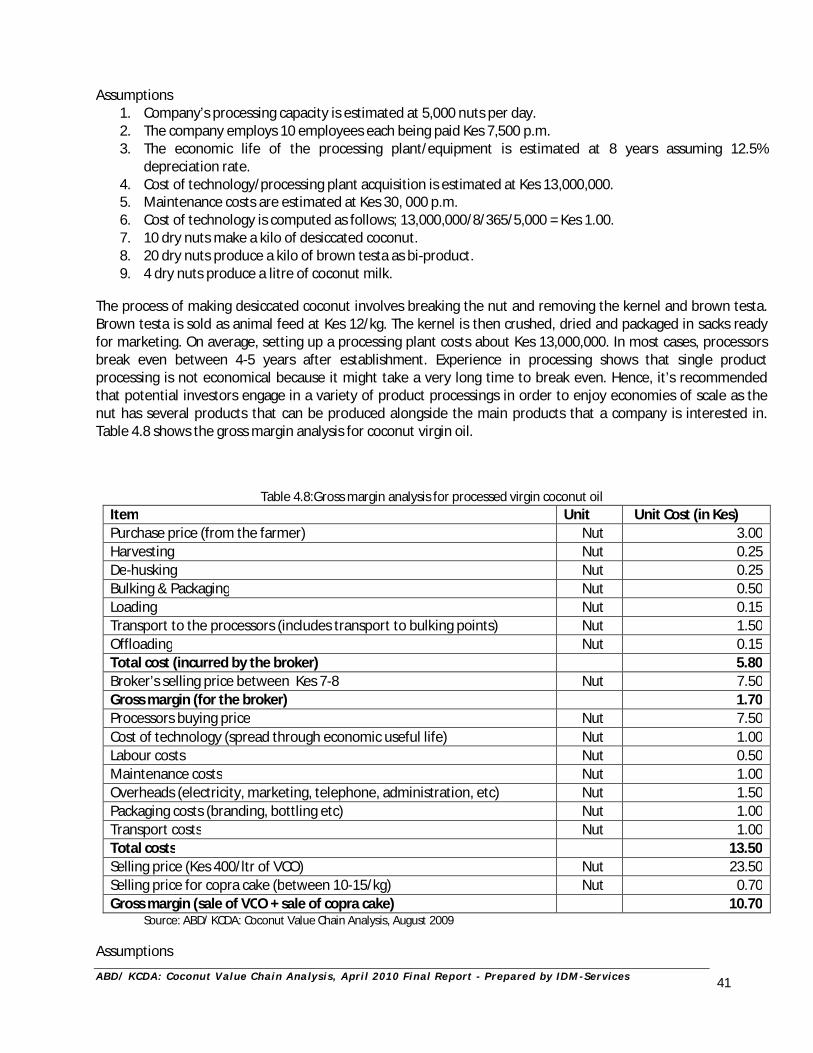
A B D / K C D A : C oc o nu t V al ue C h ai n A na l y s i s , A pr i l 2 0 1 0 F i n a l R e p or t - P r e p ar e d by I D M - Se r v i c e s
41
Assumptions
1. Company’s processing capacity is estimated at 5,000 nuts per day. 2. The company employs 10 employees each being paid Kes 7,500 p.m. 3. The economic life of the processing plant/equipment is estimated at 8 years assuming 12.5%
depreciation rate. 4. Cost of technology/processing plant acquisition is estimated at Kes 13,000,000. 5. Maintenance costs are estimated at Kes 30, 000 p.m. 6. Cost of technology is computed as follows; 13,000,000/8/365/5,000 = Kes 1.00. 7. 10 dry nuts make a kilo of desiccated coconut. 8. 20 dry nuts produce a kilo of brown testa as bi-product. 9. 4 dry nuts produce a litre of coconut milk.
The process of making desiccated coconut involves breaking the nut and removing the kernel and brown testa. Brown testa is sold as animal feed at Kes 12/kg. The kernel is then crushed, dried and packaged in sacks ready for marketing. On average, setting up a processing plant costs about Kes 13,000,000. In most cases, processors break even between 4-5 years after establishment. Experience in processing shows that single product processing is not economical because it might take a very long time to break even. Hence, it’s recommended that potential investors engage in a variety of product processings in order to enjoy economies of scale as the nut has several products that can be produced alongside the main products that a company is interested in. Table 4.8 shows the gross margin analysis for coconut virgin oil.
Table 4.8:Gross margin analysis for processed virgin coconut oil Item Unit Unit Cost (in Kes) Purchase price (from the farmer) Nut 3.00 Harvesting Nut 0.25 De-husking Nut 0.25 Bulking & Packaging Nut 0.50 Loading Nut 0.15 Transport to the processors (includes transport to bulking points) Nut 1.50 Offloading Nut 0.15 Total cost (incurred by the broker) 5.80 Broker’s selling price between Kes 7-8 Nut 7.50 Gross margin (for the broker) 1.70 Processors buying price Nut 7.50 Cost of technology (spread through economic useful life) Nut 1.00 Labour costs Nut 0.50 Maintenance costs Nut 1.00 Overheads (electricity, marketing, telephone, administration, etc) Nut 1.50 Packaging costs (branding, bottling etc) Nut 1.00 Transport costs Nut 1.00 Total costs 13.50 Selling price (Kes 400/ltr of VCO) Nut 23.50 Selling price for copra cake (between 10-15/kg) Nut 0.70 Gross margin (sale of VCO + sale of copra cake) 10.70
Source: ABD/ KCDA: Coconut Value Chain Analysis, August 2009 Assumptions
A B D / K C D A : C oc o nu t V al ue C h ai n A na l y s i s , A pr i l 2 0 1 0 F i n a l R e p or t - P r e p ar e d by I D M - Se r v i c e s
42
1. The processor buys the nuts directly from farmers. 2. Processing capacity is estimated at 5,000 nuts per day. 3. The company employs 10 employees each being paid Kes 7,500 p.m. 4. The economic life of the processing plant/equipment is estimated at 8 years assuming 12.5%
depreciation rate. 5. Cost of technology/processing plant acquisition is estimated at Kes 13,000,000. 6. Maintenance costs are estimated at Kes 30, 000 p.m. 7. Cost of technology is computed as follows; 13,000,000/8/365/5,000 = Kes 1.00. 8. Approximately 17 dry nuts make a litre of virgin coconut oil. 9. Approximately 18 nuts will give a kilo of copra cake after extracting oil.
Channel Six – Other coconut products to urban consumers (import market) While Kenya grows a substantial amount of coconut, it is a net importer of coconut products. Low level of processing and high production costs make imports relatively cheaper, especially for big processors. Under this market channel/segment, there are two scenarios, those are, one where products are imported as raw materials and the other where products are imported for end consumption. Sources of import include; Sri Lanka, Indonesia, Malaysia, Pakistan South Africa, France among others. The channel below shows importation of coconut products where most products are industrial raw materials required for the manufacture of soap, confectionary and edible oil. Common imported products include desiccated coconut, active carbon, virgin oil, coconut milk and coconut oil among others. Importers Processors Wholesalers/Retailers Consumers On the other hand, the channel for importation of final products ready for consumption by end users, involves local importers, especially supermarkets and major shopping outlets, who import for direct sale to consumers. Most of the products imported under this market channel target the high end consumers as most of the products are highly priced. This channel is outlined below. Importers (supermarkets/Retail outlets) Consumers (mostly high end consumers) According to the survey findings, Nakummatt Supermarket stocks more varieties of coconut products than any other outlet in the country. Popular coconut products/brands on the shelves include; coconut milk (KARA at Kes 129/400ml), desiccated coconut (Renuka at Kes 122/250gm), Coconut cream (Renuka at Kes 122/400ml); coconut virgin oils, vinegar among others. The prices attached to these imported products are high and clearly shows that better returns lie in value addition and this is where KCDA and other stakeholders should direct the coconut sub sector. Shortcomings associated with this market segment include low local processing potential and general lack of awareness about coconut products, especially outside Mombasa and Nairobi.
A B D / K C D A : C oc o nu t V al ue C h ai n A na l y s i s , A pr i l 2 0 1 0 F i n a l R e p or t - P r e p ar e d by I D M - Se r v i c e s
43
SECTION TWO COCONUT WINE INDUSTRY VALUE CHAIN
5.0 OVERVIEW OF THE COCONUT WINE CHAIN
5.1 Coconut Wine Production Clusters Unlike the other coconut products, wine production is not driven by the number of trees but it is a deliberate business decision by the farmer. There are well established wine production clusters in Kilifi, Malindi, Mombasa and Kwale but less wine business in Lamu, Tana River and parts of Kwale district where Islamic religion dominates. Indeed, religion plays a major role and wine production and supply is generally heavy outside areas where the Islamic faith has strong roots. Notably, even in the districts where wine production is low, the product still contributes the highest return within coconut production. Chart 16 shows the wine production growth trends in volumes of 750 ml bottles across the major production districts.
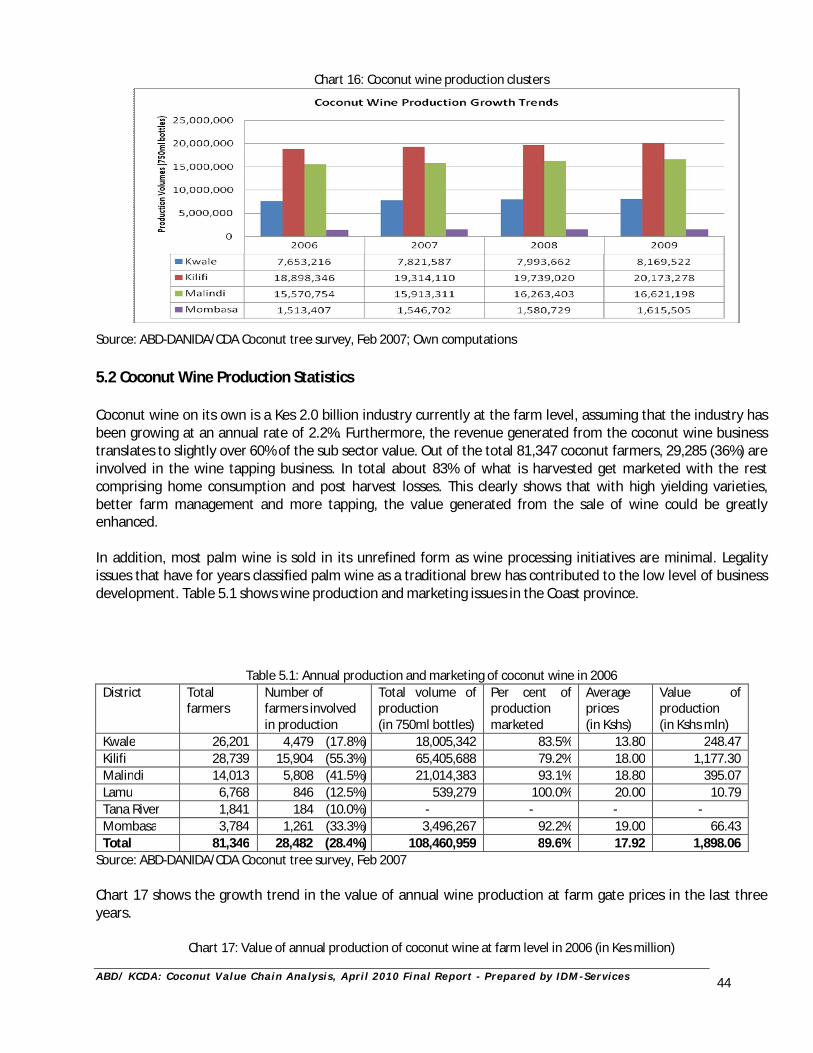
A B D / K C D A : C oc o nu t V al ue C h ai n A na l y s i s , A pr i l 2 0 1 0 F i n a l R e p or t - P r e p ar e d by I D M - Se r v i c e s
44
Chart 16: Coconut wine production clusters
Source: ABD-DANIDA/CDA Coconut tree survey, Feb 2007; Own computations
5.2 Coconut Wine Production Statistics Coconut wine on its own is a Kes 2.0 billion industry currently at the farm level, assuming that the industry has been growing at an annual rate of 2.2%. Furthermore, the revenue generated from the coconut wine business translates to slightly over 60% of the sub sector value. Out of the total 81,347 coconut farmers, 29,285 (36%) are involved in the wine tapping business. In total about 83% of what is harvested get marketed with the rest comprising home consumption and post harvest losses. This clearly shows that with high yielding varieties, better farm management and more tapping, the value generated from the sale of wine could be greatly enhanced. In addition, most palm wine is sold in its unrefined form as wine processing initiatives are minimal. Legality issues that have for years classified palm wine as a traditional brew has contributed to the low level of business development. Table 5.1 shows wine production and marketing issues in the Coast province.
Table 5.1: Annual production and marketing of coconut wine in 2006 District Total
farmers Number of farmers involved in production
Total volume of production (in 750ml bottles)
Per cent of production marketed
Average prices (in Kshs)
Value of production (in Kshs mln)
Kwale 26,201 4,479 (17.8%) 18,005,342 83.5% 13.80 248.47 Kilifi 28,739 15,904 (55.3%) 65,405,688 79.2% 18.00 1,177.30 Malindi 14,013 5,808 (41.5%) 21,014,383 93.1% 18.80 395.07 Lamu 6,768 846 (12.5%) 539,279 100.0% 20.00 10.79 Tana River 1,841 184 (10.0%) - - - - Mombasa 3,784 1,261 (33.3%) 3,496,267 92.2% 19.00 66.43 Total 81,346 28,482 (28.4%) 108,460,959 89.6% 17.92 1,898.06
Source: ABD-DANIDA/CDA Coconut tree survey, Feb 2007 Chart 17 shows the growth trend in the value of annual wine production at farm gate prices in the last three years.
Chart 17: Value of annual production of coconut wine at farm level in 2006 (in Kes million)
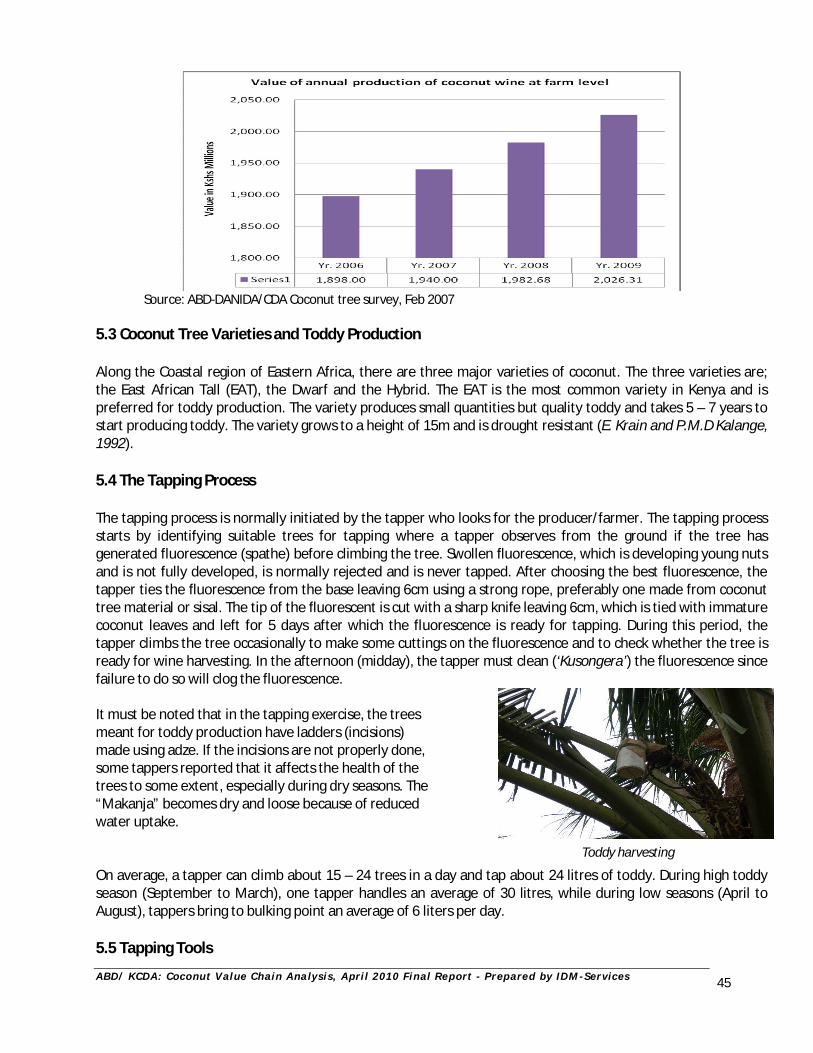
A B D / K C D A : C oc o nu t V al ue C h ai n A na l y s i s , A pr i l 2 0 1 0 F i n a l R e p or t - P r e p ar e d by I D M - Se r v i c e s
45
Toddy harvesting
Source: ABD-DANIDA/CDA Coconut tree survey, Feb 2007
5.3 Coconut Tree Varieties and Toddy Production Along the Coastal region of Eastern Africa, there are three major varieties of coconut. The three varieties are; the East African Tall (EAT), the Dwarf and the Hybrid. The EAT is the most common variety in Kenya and is preferred for toddy production. The variety produces small quantities but quality toddy and takes 5 – 7 years to start producing toddy. The variety grows to a height of 15m and is drought resistant (E. Krain and P.M.D Kalange, 1992). 5.4 The Tapping Process The tapping process is normally initiated by the tapper who looks for the producer/farmer. The tapping process starts by identifying suitable trees for tapping where a tapper observes from the ground if the tree has generated fluorescence (spathe) before climbing the tree. Swollen fluorescence, which is developing young nuts and is not fully developed, is normally rejected and is never tapped. After choosing the best fluorescence, the tapper ties the fluorescence from the base leaving 6cm using a strong rope, preferably one made from coconut tree material or sisal. The tip of the fluorescent is cut with a sharp knife leaving 6cm, which is tied with immature coconut leaves and left for 5 days after which the fluorescence is ready for tapping. During this period, the tapper climbs the tree occasionally to make some cuttings on the fluorescence and to check whether the tree is ready for wine harvesting. In the afternoon (midday), the tapper must clean (‘Kusongera’) the fluorescence since failure to do so will clog the fluorescence. It must be noted that in the tapping exercise, the trees meant for toddy production have ladders (incisions) made using adze. If the incisions are not properly done, some tappers reported that it affects the health of the trees to some extent, especially during dry seasons. The “Makanja” becomes dry and loose because of reduced water uptake. On average, a tapper can climb about 15 – 24 trees in a day and tap about 24 litres of toddy. During high toddy season (September to March), one tapper handles an average of 30 litres, while during low seasons (April to August), tappers bring to bulking point an average of 6 liters per day. 5.5 Tapping Tools
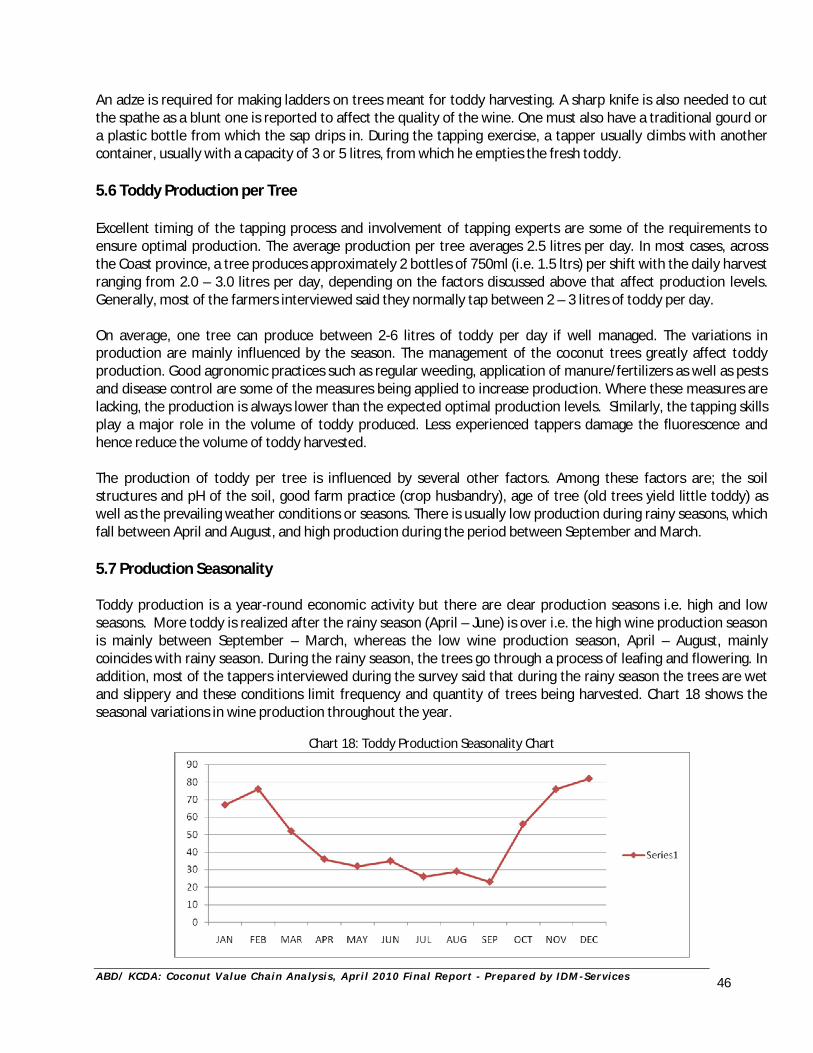
A B D / K C D A : C oc o nu t V al ue C h ai n A na l y s i s , A pr i l 2 0 1 0 F i n a l R e p or t - P r e p ar e d by I D M - Se r v i c e s
46
An adze is required for making ladders on trees meant for toddy harvesting. A sharp knife is also needed to cut the spathe as a blunt one is reported to affect the quality of the wine. One must also have a traditional gourd or a plastic bottle from which the sap drips in. During the tapping exercise, a tapper usually climbs with another container, usually with a capacity of 3 or 5 litres, from which he empties the fresh toddy. 5.6 Toddy Production per Tree Excellent timing of the tapping process and involvement of tapping experts are some of the requirements to ensure optimal production. The average production per tree averages 2.5 litres per day. In most cases, across the Coast province, a tree produces approximately 2 bottles of 750ml (i.e. 1.5 ltrs) per shift with the daily harvest ranging from 2.0 – 3.0 litres per day, depending on the factors discussed above that affect production levels. Generally, most of the farmers interviewed said they normally tap between 2 – 3 litres of toddy per day. On average, one tree can produce between 2-6 litres of toddy per day if well managed. The variations in production are mainly influenced by the season. The management of the coconut trees greatly affect toddy production. Good agronomic practices such as regular weeding, application of manure/fertilizers as well as pests and disease control are some of the measures being applied to increase production. Where these measures are lacking, the production is always lower than the expected optimal production levels. Similarly, the tapping skills play a major role in the volume of toddy produced. Less experienced tappers damage the fluorescence and hence reduce the volume of toddy harvested. The production of toddy per tree is influenced by several other factors. Among these factors are; the soil structures and pH of the soil, good farm practice (crop husbandry), age of tree (old trees yield little toddy) as well as the prevailing weather conditions or seasons. There is usually low production during rainy seasons, which fall between April and August, and high production during the period between September and March. 5.7 Production Seasonality Toddy production is a year-round economic activity but there are clear production seasons i.e. high and low seasons. More toddy is realized after the rainy season (April – June) is over i.e. the high wine production season is mainly between September – March, whereas the low wine production season, April – August, mainly coincides with rainy season. During the rainy season, the trees go through a process of leafing and flowering. In addition, most of the tappers interviewed during the survey said that during the rainy season the trees are wet and slippery and these conditions limit frequency and quantity of trees being harvested. Chart 18 shows the seasonal variations in wine production throughout the year.
Chart 18: Toddy Production Seasonality Chart
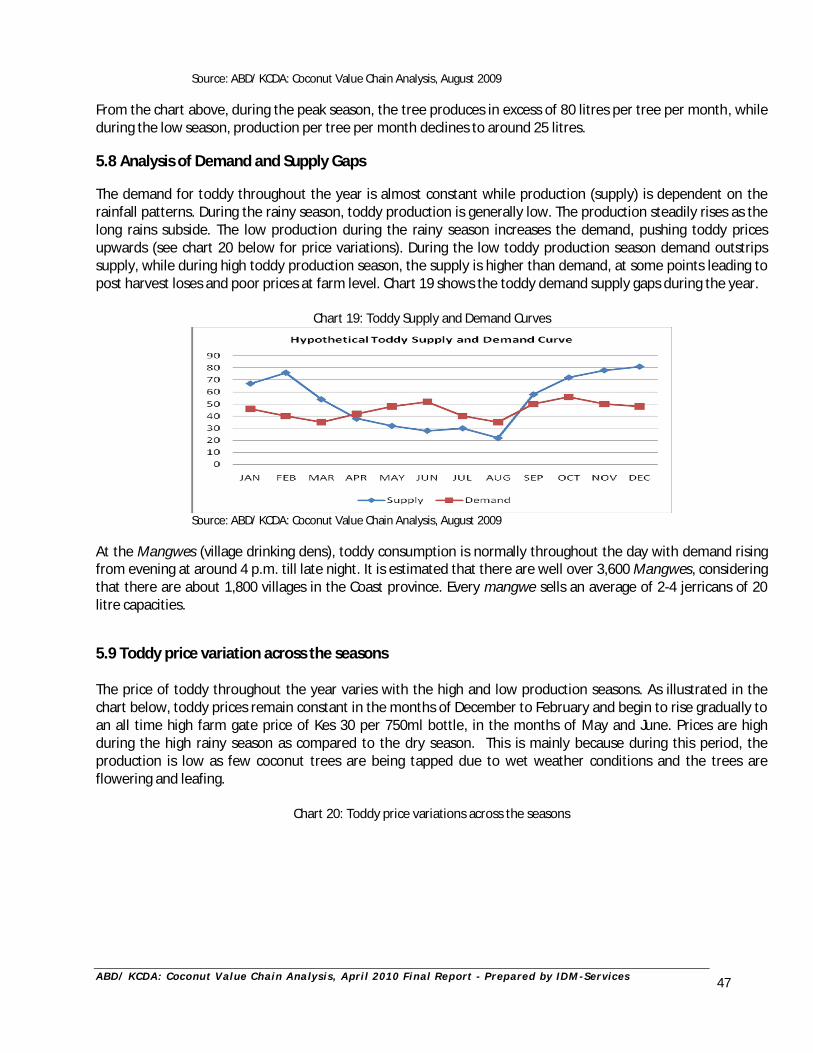
A B D / K C D A : C oc o nu t V al ue C h ai n A na l y s i s , A pr i l 2 0 1 0 F i n a l R e p or t - P r e p ar e d by I D M - Se r v i c e s
47
Source: ABD/ KCDA: Coconut Value Chain Analysis, August 2009 From the chart above, during the peak season, the tree produces in excess of 80 litres per tree per month, while during the low season, production per tree per month declines to around 25 litres. 5.8 Analysis of Demand and Supply Gaps The demand for toddy throughout the year is almost constant while production (supply) is dependent on the rainfall patterns. During the rainy season, toddy production is generally low. The production steadily rises as the long rains subside. The low production during the rainy season increases the demand, pushing toddy prices upwards (see chart 20 below for price variations). During the low toddy production season demand outstrips supply, while during high toddy production season, the supply is higher than demand, at some points leading to post harvest loses and poor prices at farm level. Chart 19 shows the toddy demand supply gaps during the year.
Chart 19: Toddy Supply and Demand Curves
Source: ABD/ KCDA: Coconut Value Chain Analysis, August 2009
At the Mangwes (village drinking dens), toddy consumption is normally throughout the day with demand rising from evening at around 4 p.m. till late night. It is estimated that there are well over 3,600 Mangwes, considering that there are about 1,800 villages in the Coast province. Every mangwe sells an average of 2-4 jerricans of 20 litre capacities. 5.9 Toddy price variation across the seasons The price of toddy throughout the year varies with the high and low production seasons. As illustrated in the chart below, toddy prices remain constant in the months of December to February and begin to rise gradually to an all time high farm gate price of Kes 30 per 750ml bottle, in the months of May and June. Prices are high during the high rainy season as compared to the dry season. This is mainly because during this period, the production is low as few coconut trees are being tapped due to wet weather conditions and the trees are flowering and leafing.
Chart 20: Toddy price variations across the seasons
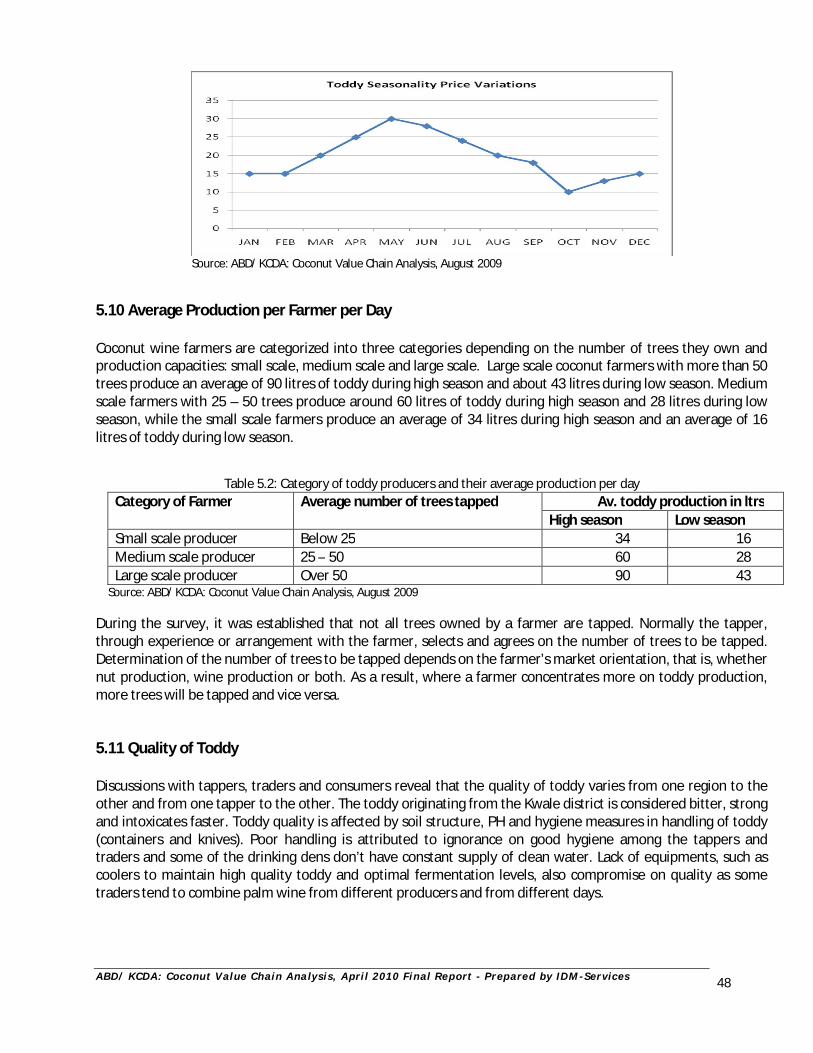
A B D / K C D A : C oc o nu t V al ue C h ai n A na l y s i s , A pr i l 2 0 1 0 F i n a l R e p or t - P r e p ar e d by I D M - Se r v i c e s
48
Source: ABD/ KCDA: Coconut Value Chain Analysis, August 2009
5.10 Average Production per Farmer per Day Coconut wine farmers are categorized into three categories depending on the number of trees they own and production capacities: small scale, medium scale and large scale. Large scale coconut farmers with more than 50 trees produce an average of 90 litres of toddy during high season and about 43 litres during low season. Medium scale farmers with 25 – 50 trees produce around 60 litres of toddy during high season and 28 litres during low season, while the small scale farmers produce an average of 34 litres during high season and an average of 16 litres of toddy during low season.
Table 5.2: Category of toddy producers and their average production per day Category of Farmer Average number of trees tapped Av. toddy production in ltrs
High season Low season Small scale producer Below 25 34 16 Medium scale producer 25 – 50 60 28 Large scale producer Over 50 90 43
Source: ABD/ KCDA: Coconut Value Chain Analysis, August 2009 During the survey, it was established that not all trees owned by a farmer are tapped. Normally the tapper, through experience or arrangement with the farmer, selects and agrees on the number of trees to be tapped. Determination of the number of trees to be tapped depends on the farmer’s market orientation, that is, whether nut production, wine production or both. As a result, where a farmer concentrates more on toddy production, more trees will be tapped and vice versa. 5.11 Quality of Toddy Discussions with tappers, traders and consumers reveal that the quality of toddy varies from one region to the other and from one tapper to the other. The toddy originating from the Kwale district is considered bitter, strong and intoxicates faster. Toddy quality is affected by soil structure, PH and hygiene measures in handling of toddy (containers and knives). Poor handling is attributed to ignorance on good hygiene among the tappers and traders and some of the drinking dens don’t have constant supply of clean water. Lack of equipments, such as coolers to maintain high quality toddy and optimal fermentation levels, also compromise on quality as some traders tend to combine palm wine from different producers and from different days.
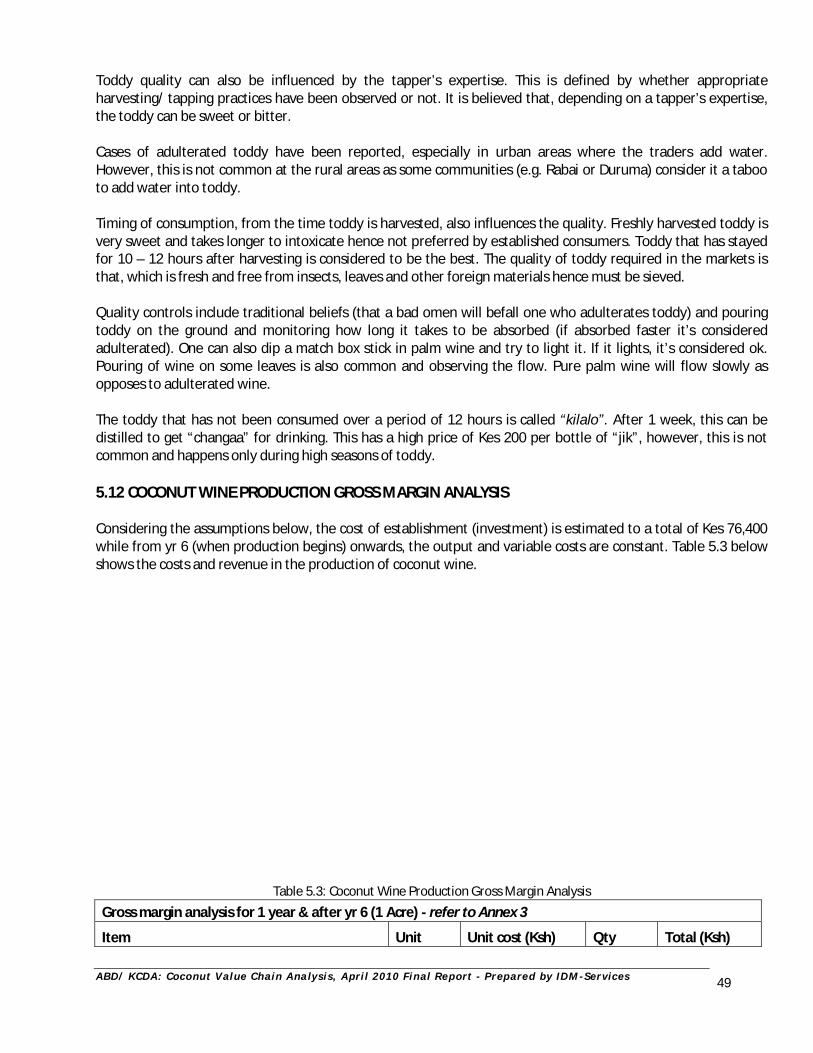
A B D / K C D A : C oc o nu t V al ue C h ai n A na l y s i s , A pr i l 2 0 1 0 F i n a l R e p or t - P r e p ar e d by I D M - Se r v i c e s
49
Toddy quality can also be influenced by the tapper’s expertise. This is defined by whether appropriate harvesting/ tapping practices have been observed or not. It is believed that, depending on a tapper’s expertise, the toddy can be sweet or bitter. Cases of adulterated toddy have been reported, especially in urban areas where the traders add water. However, this is not common at the rural areas as some communities (e.g. Rabai or Duruma) consider it a taboo to add water into toddy. Timing of consumption, from the time toddy is harvested, also influences the quality. Freshly harvested toddy is very sweet and takes longer to intoxicate hence not preferred by established consumers. Toddy that has stayed for 10 – 12 hours after harvesting is considered to be the best. The quality of toddy required in the markets is that, which is fresh and free from insects, leaves and other foreign materials hence must be sieved. Quality controls include traditional beliefs (that a bad omen will befall one who adulterates toddy) and pouring toddy on the ground and monitoring how long it takes to be absorbed (if absorbed faster it’s considered adulterated). One can also dip a match box stick in palm wine and try to light it. If it lights, it’s considered ok. Pouring of wine on some leaves is also common and observing the flow. Pure palm wine will flow slowly as opposes to adulterated wine. The toddy that has not been consumed over a period of 12 hours is called “kilalo”. After 1 week, this can be distilled to get “changaa” for drinking. This has a high price of Kes 200 per bottle of “jik”, however, this is not common and happens only during high seasons of toddy. 5.12 COCONUT WINE PRODUCTION GROSS MARGIN ANALYSIS Considering the assumptions below, the cost of establishment (investment) is estimated to a total of Kes 76,400 while from yr 6 (when production begins) onwards, the output and variable costs are constant. Table 5.3 below shows the costs and revenue in the production of coconut wine.
Table 5.3: Coconut Wine Production Gross Margin Analysis
Gross margin analysis for 1 year & after yr 6 (1 Acre) - refer to Annex 3
Item Unit Unit cost (Ksh) Qty Total (Ksh)
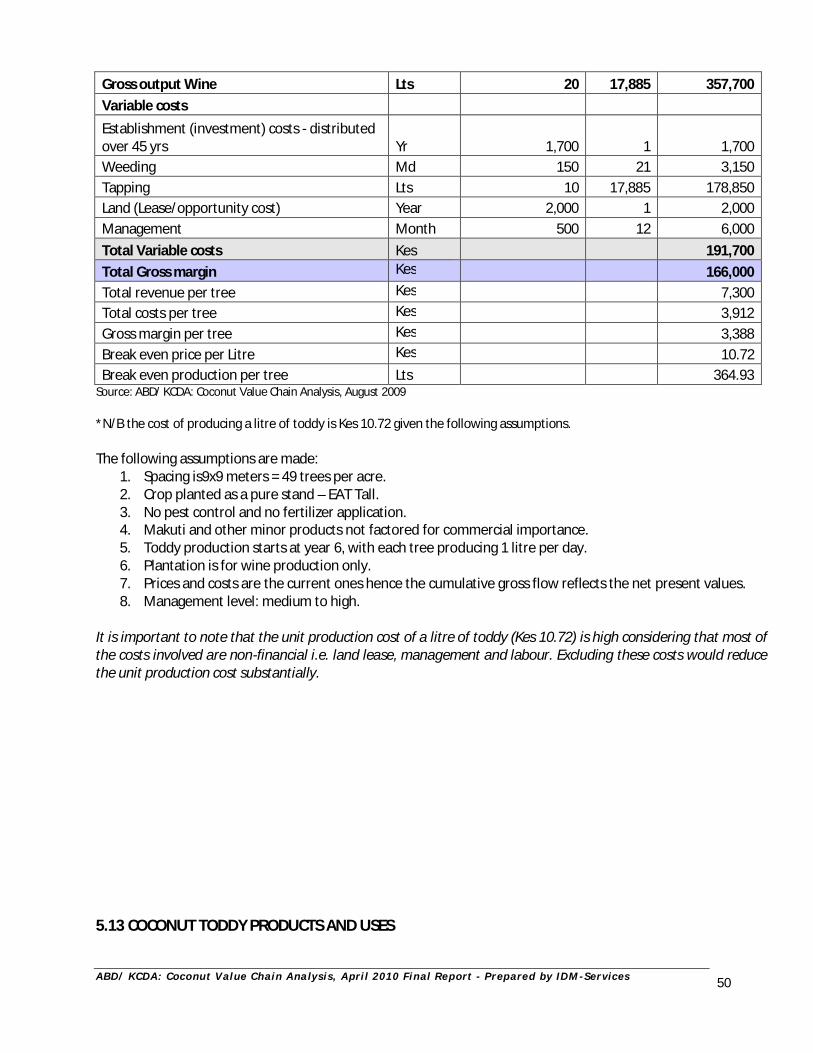
A B D / K C D A : C oc o nu t V al ue C h ai n A na l y s i s , A pr i l 2 0 1 0 F i n a l R e p or t - P r e p ar e d by I D M - Se r v i c e s
50
Gross output Wine Lts 20 17,885 357,700 Variable costs Establishment (investment) costs - distributed over 45 yrs Yr 1,700 1 1,700 Weeding Md 150 21 3,150 Tapping Lts 10 17,885 178,850 Land (Lease/opportunity cost) Year 2,000 1 2,000 Management Month 500 12 6,000 Total Variable costs Kes 191,700 Total Gross margin Kes 166,000 Total revenue per tree Kes 7,300 Total costs per tree Kes 3,912 Gross margin per tree Kes 3,388 Break even price per Litre Kes 10.72 Break even production per tree Lts 364.93
Source: ABD/ KCDA: Coconut Value Chain Analysis, August 2009 *N/B the cost of producing a litre of toddy is Kes 10.72 given the following assumptions. The following assumptions are made:
1. Spacing is9x9 meters = 49 trees per acre. 2. Crop planted as a pure stand – EAT Tall. 3. No pest control and no fertilizer application. 4. Makuti and other minor products not factored for commercial importance. 5. Toddy production starts at year 6, with each tree producing 1 litre per day. 6. Plantation is for wine production only. 7. Prices and costs are the current ones hence the cumulative gross flow reflects the net present values. 8. Management level: medium to high.
It is important to note that the unit production cost of a litre of toddy (Kes 10.72) is high considering that most of the costs involved are non-financial i.e. land lease, management and labour. Excluding these costs would reduce the unit production cost substantially. 5.13 COCONUT TODDY PRODUCTS AND USES
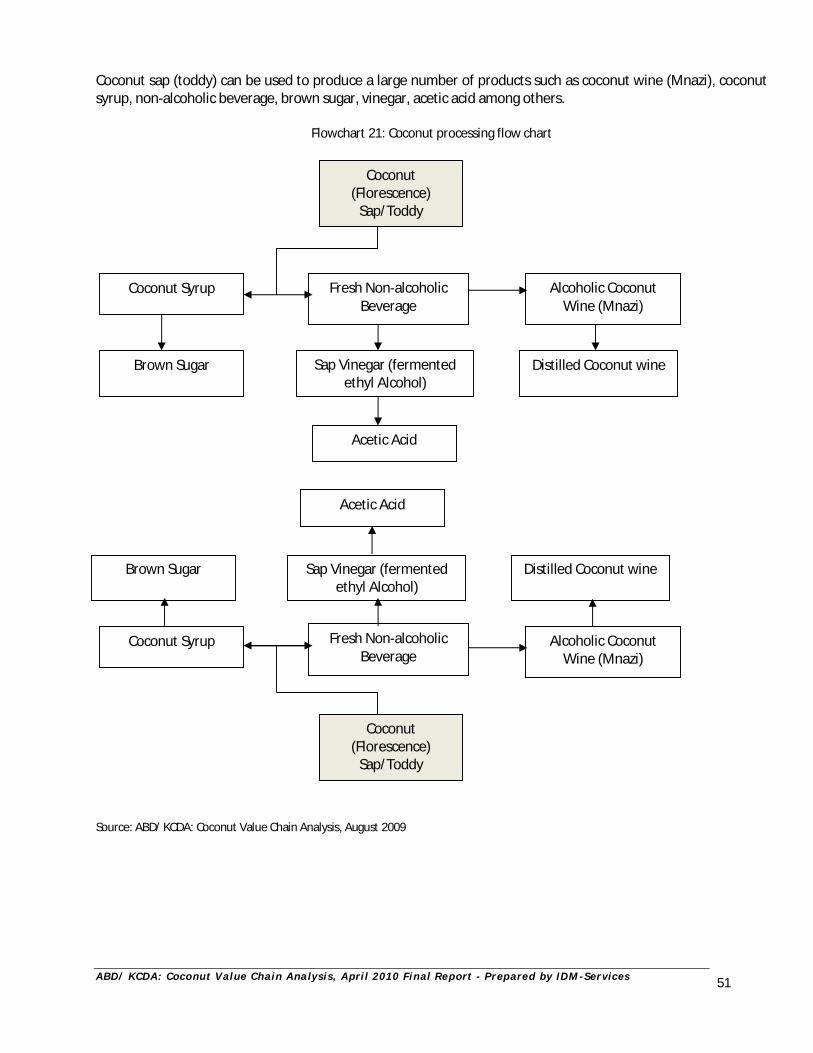
A B D / K C D A : C oc o nu t V al ue C h ai n A na l y s i s , A pr i l 2 0 1 0 F i n a l R e p or t - P r e p ar e d by I D M - Se r v i c e s
51
Coconut sap (toddy) can be used to produce a large number of products such as coconut wine (Mnazi), coconut syrup, non-alcoholic beverage, brown sugar, vinegar, acetic acid among others.
Flowchart 21: Coconut processing flow chart Source: ABD/ KCDA: Coconut Value Chain Analysis, August 2009
Coconut (Florescence)
Sap/Toddy
Coconut Syrup Fresh Non-alcoholic Beverage
Alcoholic Coconut Wine (Mnazi)
Brown Sugar Sap Vinegar (fermented ethyl Alcohol)
Distilled Coconut wine
Acetic Acid
Coconut (Florescence)
Sap/Toddy
Coconut Syrup Fresh Non-alcoholic Beverage
Alcoholic Coconut Wine (Mnazi)
Brown Sugar Sap Vinegar (fermented ethyl Alcohol)
Distilled Coconut wine
Acetic Acid
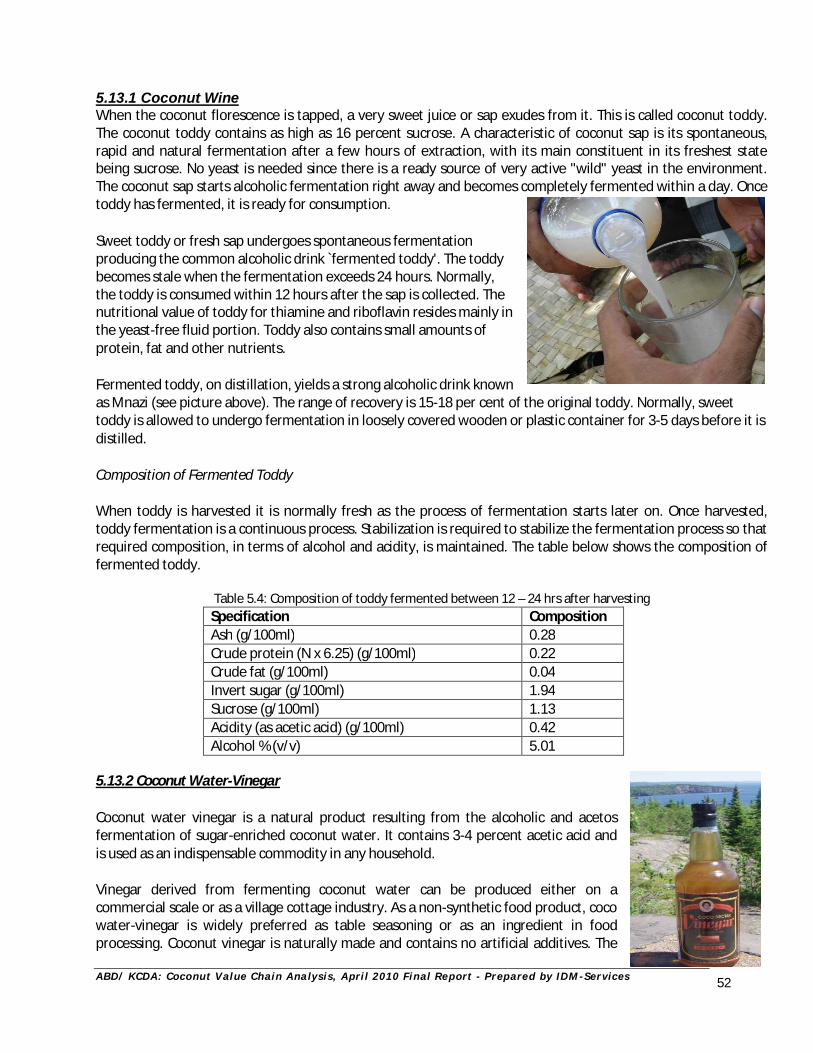
A B D / K C D A : C oc o nu t V al ue C h ai n A na l y s i s , A pr i l 2 0 1 0 F i n a l R e p or t - P r e p ar e d by I D M - Se r v i c e s
52
5.13.1 Coconut Wine When the coconut florescence is tapped, a very sweet juice or sap exudes from it. This is called coconut toddy. The coconut toddy contains as high as 16 percent sucrose. A characteristic of coconut sap is its spontaneous, rapid and natural fermentation after a few hours of extraction, with its main constituent in its freshest state being sucrose. No yeast is needed since there is a ready source of very active "wild" yeast in the environment. The coconut sap starts alcoholic fermentation right away and becomes completely fermented within a day. Once toddy has fermented, it is ready for consumption.
Sweet toddy or fresh sap undergoes spontaneous fermentation producing the common alcoholic drink `fermented toddy'. The toddy becomes stale when the fermentation exceeds 24 hours. Normally, the toddy is consumed within 12 hours after the sap is collected. The nutritional value of toddy for thiamine and riboflavin resides mainly in the yeast-free fluid portion. Toddy also contains small amounts of protein, fat and other nutrients.
Fermented toddy, on distillation, yields a strong alcoholic drink known as Mnazi (see picture above). The range of recovery is 15-18 per cent of the original toddy. Normally, sweet toddy is allowed to undergo fermentation in loosely covered wooden or plastic container for 3-5 days before it is distilled.
Composition of Fermented Toddy
When toddy is harvested it is normally fresh as the process of fermentation starts later on. Once harvested, toddy fermentation is a continuous process. Stabilization is required to stabilize the fermentation process so that required composition, in terms of alcohol and acidity, is maintained. The table below shows the composition of fermented toddy.
Table 5.4: Composition of toddy fermented between 12 – 24 hrs after harvesting Specification Composition Ash (g/100ml) 0.28 Crude protein (N x 6.25) (g/100ml) 0.22 Crude fat (g/100ml) 0.04 Invert sugar (g/100ml) 1.94 Sucrose (g/100ml) 1.13 Acidity (as acetic acid) (g/100ml) 0.42 Alcohol % (v/v) 5.01
5.13.2 Coconut Water-Vinegar
Coconut water vinegar is a natural product resulting from the alcoholic and acetos fermentation of sugar-enriched coconut water. It contains 3-4 percent acetic acid and is used as an indispensable commodity in any household.
Vinegar derived from fermenting coconut water can be produced either on a commercial scale or as a village cottage industry. As a non-synthetic food product, coco water-vinegar is widely preferred as table seasoning or as an ingredient in food processing. Coconut vinegar is naturally made and contains no artificial additives. The
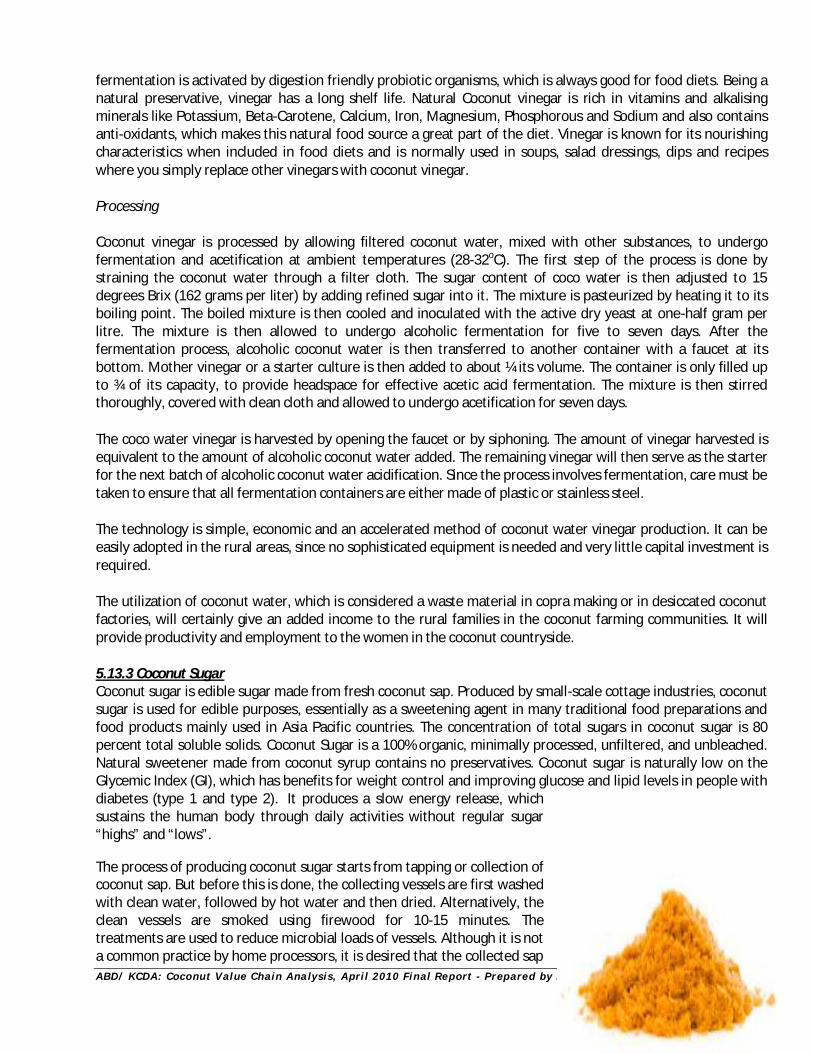
A B D / K C D A : C oc o nu t V al ue C h ai n A na l y s i s , A pr i l 2 0 1 0 F i n a l R e p or t - P r e p ar e d by I D M - Se r v i c e s
53
fermentation is activated by digestion friendly probiotic organisms, which is always good for food diets. Being a natural preservative, vinegar has a long shelf life. Natural Coconut vinegar is rich in vitamins and alkalising minerals like Potassium, Beta-Carotene, Calcium, Iron, Magnesium, Phosphorous and Sodium and also contains anti-oxidants, which makes this natural food source a great part of the diet. Vinegar is known for its nourishing characteristics when included in food diets and is normally used in soups, salad dressings, dips and recipes where you simply replace other vinegars with coconut vinegar.
Processing Coconut vinegar is processed by allowing filtered coconut water, mixed with other substances, to undergo fermentation and acetification at ambient temperatures (28-32oC). The first step of the process is done by straining the coconut water through a filter cloth. The sugar content of coco water is then adjusted to 15 degrees Brix (162 grams per liter) by adding refined sugar into it. The mixture is pasteurized by heating it to its boiling point. The boiled mixture is then cooled and inoculated with the active dry yeast at one-half gram per litre. The mixture is then allowed to undergo alcoholic fermentation for five to seven days. After the fermentation process, alcoholic coconut water is then transferred to another container with a faucet at its bottom. Mother vinegar or a starter culture is then added to about ¼ its volume. The container is only filled up to ¾ of its capacity, to provide headspace for effective acetic acid fermentation. The mixture is then stirred thoroughly, covered with clean cloth and allowed to undergo acetification for seven days.
The coco water vinegar is harvested by opening the faucet or by siphoning. The amount of vinegar harvested is equivalent to the amount of alcoholic coconut water added. The remaining vinegar will then serve as the starter for the next batch of alcoholic coconut water acidification. Since the process involves fermentation, care must be taken to ensure that all fermentation containers are either made of plastic or stainless steel.
The technology is simple, economic and an accelerated method of coconut water vinegar production. It can be easily adopted in the rural areas, since no sophisticated equipment is needed and very little capital investment is required.
The utilization of coconut water, which is considered a waste material in copra making or in desiccated coconut factories, will certainly give an added income to the rural families in the coconut farming communities. It will provide productivity and employment to the women in the coconut countryside.
5.13.3 Coconut Sugar Coconut sugar is edible sugar made from fresh coconut sap. Produced by small-scale cottage industries, coconut sugar is used for edible purposes, essentially as a sweetening agent in many traditional food preparations and food products mainly used in Asia Pacific countries. The concentration of total sugars in coconut sugar is 80 percent total soluble solids. Coconut Sugar is a 100% organic, minimally processed, unfiltered, and unbleached. Natural sweetener made from coconut syrup contains no preservatives. Coconut sugar is naturally low on the Glycemic Index (GI), which has benefits for weight control and improving glucose and lipid levels in people with diabetes (type 1 and type 2). It produces a slow energy release, which sustains the human body through daily activities without regular sugar “highs” and “lows”. The process of producing coconut sugar starts from tapping or collection of coconut sap. But before this is done, the collecting vessels are first washed with clean water, followed by hot water and then dried. Alternatively, the clean vessels are smoked using firewood for 10-15 minutes. The treatments are used to reduce microbial loads of vessels. Although it is not a common practice by home processors, it is desired that the collected sap
A B D / K C D A : C oc o nu t V al ue C h ai n A na l y s i s , A pr i l 2 0 1 0 F i n a l R e p or t - P r e p ar e d by I D M - Se r v i c e s
54
be tested for acidity using pH indicator paper. This is because the fermented or spoiled coconut palm sap is no longer suitable for brown sugar manufacturing. The collected coconut sap is then filtered through a muslin cloth to remove insects, ants and other contamination. It is then transferred into a cooking vessel. The next step involves evaporation of water from the sap to increase the concentration of the sap. Thus, the filtered sap is boiled in a cooking vessel at a temperature of 1000-1100C for 3 hours. The material will then turn into a thick liquid. During boiling, foam will be formed. This should be discarded from the vessel. A few drops of cooking oil or grated coconut are added to the mash to prevent excessive foam formation.
The mash is heated for another hour with occasional stirring. When the mash has become very thick, the cooking vessel is lifted from the stove and cooled to 600C. The cooled mash is then poured into clean coconut shells split in halves or bamboo vessels for cooling and moulded to a desired setting.
Components/Specifications The major component of coconut sugar is sucrose (70-79%) followed by glucose and fructose (3-9%) each. Minor variations will occur, due to differences in primary processing, raw material source, tree age and variety of coconut. It is also known to contain a nutritional content far richer than all other commercially available sweeteners such as sugar from sugarcane hence high in Potassium, Magnesium, Zinc and Iron and is a natural source of the vitamins B1, B2, B3, B6 and C.
Sucrose 70-79% Glucose/fructose 3-9% Vitamins B1, B2, B3, B6 and C
5.13.4 Other Toddy Products These include; Sap Drink, Coco Nectar/Syrup and sap Natural/Organic Vinegar.
A B D / K C D A : C oc o nu t V al ue C h ai n A na l y s i s , A pr i l 2 0 1 0 F i n a l R e p or t - P r e p ar e d by I D M - Se r v i c e s
55
6.0 VALUE CHAIN FUNCTIONS AND ACTORS
The main functions in the coconut palm wine value chain include input supply, technical service provision (extension services), production, post harvest handling and bulking, transportation, processing and marketing (wholesaling and retailing). The following is a discussion of the main actors within the coconut wine value chain. 6.1 Input Suppliers and Service providers Main input suppliers within the toddy value chain include; nursery operators, agrovets, appointed distributors for various farm chemicals and inputs, hardware dealers as well as jerrican suppliers among others. Main service providers include Ministry of Agriculture extension service providers, private sector extension officers (mostly farm input manufacturers), Kenya Coconut Development Authority and Coast Development Authority (CDA) among others. The number of established nurseries is the same as for the nuts and stands at 550. It is important to note that these categories of actors are not actively involved as farmers rarely utilize their services or products, due to the low levels of attention being given to coconut farming.
6.2 Producers/Farmers Coconut toddy production farmers can be categorized into three types; small, medium and large-scale farmers, a classification based on their level of production. It is estimated that about 29,367 (36%) of coconut farmers are engaged in toddy production across the Coast region.
Table 6.1: Category of toddy producers and their average production per day
Category of farmer Average number of trees tapped Estimated number of farmers
Percentage
Small scale producers Below 25 16,151 55% Medium scale producers 25 – 50 10,278 35% Large scale producers Over 50 2,938 10% Total ----------------- 29,367 100% Source: ABD/ KCDA: Coconut Value Chain Analysis, August 2009
6.3 Tappers
i. Categories and roles of tappers Tappers can be categorized into the following groups; old, young, skilled, semi-skilled, Rabias, non Rabias, paid and unpaid. Tappers between the age 20-40 years are classifies as young and experience ranges from semi – skilled to skilled while those over 40 yeas over normally old and skilled. In addition, depending on tribe, Rabais are believed to be experienced in tapping over the other coast tribes. Tapping is an economic activity and it’s therefore paid for services provided hence paid tappers. Those who do it on voluntary (unpaid) basis are few and may include a farmer or relatives tapping for own consumption. Payment mode is either by cash or in kind depending on the amount of toddy produced. The tapper and the farmer mostly share the harvest on 50:50 bases or one party takes a days harvest and the other one does the same the following day. This mode of payment is often referred to as ‘Mwenjero’. In most cases, the farmer caters for the upkeep of the tapper when he is preparing the trees for tapping until commercial production begins. Some tappers are organized into marketing groups like the Mnazi Network Association in Kaloleni, which comprises of more than 130 members, while the rest have common bulking points or selling joints where they take their toddy at specific times.
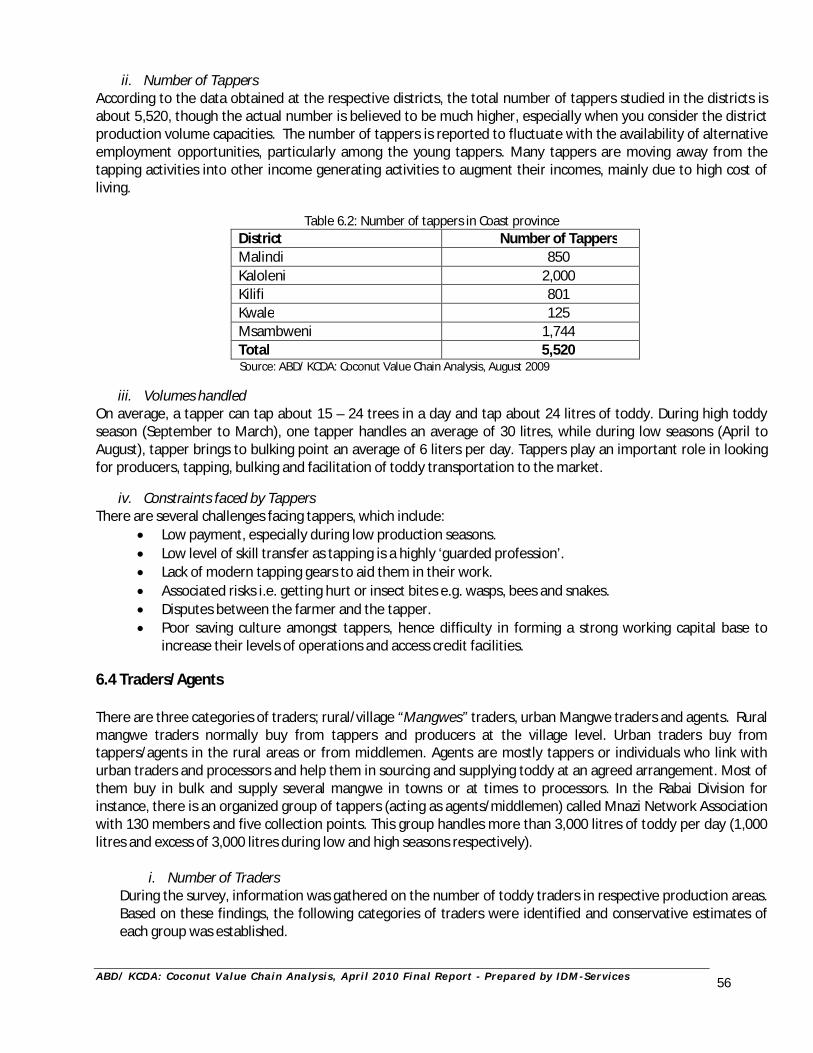
A B D / K C D A : C oc o nu t V al ue C h ai n A na l y s i s , A pr i l 2 0 1 0 F i n a l R e p or t - P r e p ar e d by I D M - Se r v i c e s
56
ii. Number of Tappers According to the data obtained at the respective districts, the total number of tappers studied in the districts is about 5,520, though the actual number is believed to be much higher, especially when you consider the district production volume capacities. The number of tappers is reported to fluctuate with the availability of alternative employment opportunities, particularly among the young tappers. Many tappers are moving away from the tapping activities into other income generating activities to augment their incomes, mainly due to high cost of living.
Table 6.2: Number of tappers in Coast province
District Number of Tappers Malindi 850 Kaloleni 2,000 Kilifi 801 Kwale 125 Msambweni 1,744 Total 5,520 Source: ABD/ KCDA: Coconut Value Chain Analysis, August 2009
iii. Volumes handled On average, a tapper can tap about 15 – 24 trees in a day and tap about 24 litres of toddy. During high toddy season (September to March), one tapper handles an average of 30 litres, while during low seasons (April to August), tapper brings to bulking point an average of 6 liters per day. Tappers play an important role in looking for producers, tapping, bulking and facilitation of toddy transportation to the market.
iv. Constraints faced by Tappers There are several challenges facing tappers, which include:
Low payment, especially during low production seasons. Low level of skill transfer as tapping is a highly ‘guarded profession’. Lack of modern tapping gears to aid them in their work. Associated risks i.e. getting hurt or insect bites e.g. wasps, bees and snakes. Disputes between the farmer and the tapper. Poor saving culture amongst tappers, hence difficulty in forming a strong working capital base to
increase their levels of operations and access credit facilities. 6.4 Traders/Agents There are three categories of traders; rural/village “Mangwes” traders, urban Mangwe traders and agents. Rural mangwe traders normally buy from tappers and producers at the village level. Urban traders buy from tappers/agents in the rural areas or from middlemen. Agents are mostly tappers or individuals who link with urban traders and processors and help them in sourcing and supplying toddy at an agreed arrangement. Most of them buy in bulk and supply several mangwe in towns or at times to processors. In the Rabai Division for instance, there is an organized group of tappers (acting as agents/middlemen) called Mnazi Network Association with 130 members and five collection points. This group handles more than 3,000 litres of toddy per day (1,000 litres and excess of 3,000 litres during low and high seasons respectively).
i. Number of Traders During the survey, information was gathered on the number of toddy traders in respective production areas. Based on these findings, the following categories of traders were identified and conservative estimates of each group was established.
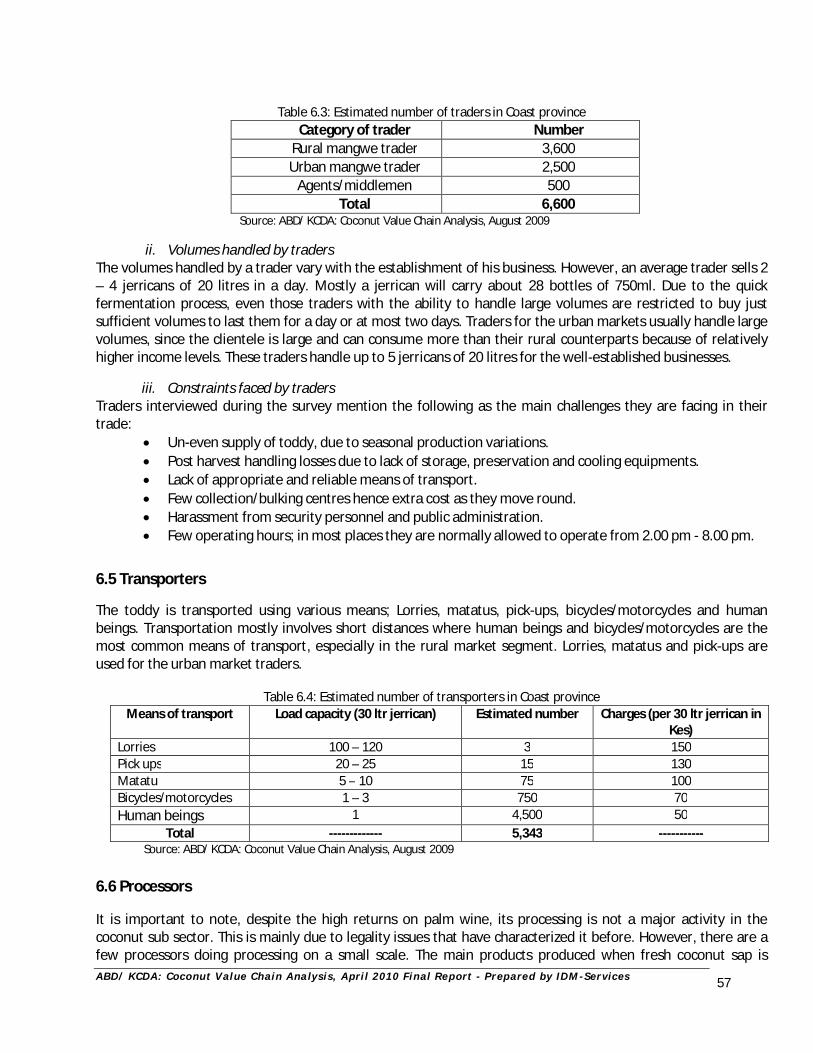
A B D / K C D A : C oc o nu t V al ue C h ai n A na l y s i s , A pr i l 2 0 1 0 F i n a l R e p or t - P r e p ar e d by I D M - Se r v i c e s
57
Table 6.3: Estimated number of traders in Coast province Category of trader Number
Rural mangwe trader 3,600 Urban mangwe trader 2,500
Agents/middlemen 500 Total 6,600
Source: ABD/ KCDA: Coconut Value Chain Analysis, August 2009
ii. Volumes handled by traders The volumes handled by a trader vary with the establishment of his business. However, an average trader sells 2 – 4 jerricans of 20 litres in a day. Mostly a jerrican will carry about 28 bottles of 750ml. Due to the quick fermentation process, even those traders with the ability to handle large volumes are restricted to buy just sufficient volumes to last them for a day or at most two days. Traders for the urban markets usually handle large volumes, since the clientele is large and can consume more than their rural counterparts because of relatively higher income levels. These traders handle up to 5 jerricans of 20 litres for the well-established businesses.
iii. Constraints faced by traders Traders interviewed during the survey mention the following as the main challenges they are facing in their trade:
Un-even supply of toddy, due to seasonal production variations. Post harvest handling losses due to lack of storage, preservation and cooling equipments. Lack of appropriate and reliable means of transport. Few collection/bulking centres hence extra cost as they move round. Harassment from security personnel and public administration. Few operating hours; in most places they are normally allowed to operate from 2.00 pm - 8.00 pm.
6.5 Transporters
The toddy is transported using various means; Lorries, matatus, pick-ups, bicycles/motorcycles and human beings. Transportation mostly involves short distances where human beings and bicycles/motorcycles are the most common means of transport, especially in the rural market segment. Lorries, matatus and pick-ups are used for the urban market traders.
Table 6.4: Estimated number of transporters in Coast province
Means of transport Load capacity (30 ltr jerrican) Estimated number Charges (per 30 ltr jerrican in Kes)
Lorries 100 – 120 3 150 Pick ups 20 – 25 15 130 Matatu 5 – 10 75 100 Bicycles/motorcycles 1 – 3 750 70 Human beings 1 4,500 50
Total ------------- 5,343 ----------- Source: ABD/ KCDA: Coconut Value Chain Analysis, August 2009
6.6 Processors It is important to note, despite the high returns on palm wine, its processing is not a major activity in the coconut sub sector. This is mainly due to legality issues that have characterized it before. However, there are a few processors doing processing on a small scale. The main products produced when fresh coconut sap is
A B D / K C D A : C oc o nu t V al ue C h ai n A na l y s i s , A pr i l 2 0 1 0 F i n a l R e p or t - P r e p ar e d by I D M - Se r v i c e s
58
processed and added value include; coconut syrup and fresh non-alcoholic beverages. When coconut syrup is further processed it produces Brown sugar while fresh non-alcoholic sap, when left fermented, produce alcoholic wine (Mnazi) and coconut vinegar (fermented ethyl Alcohol). There are about 5 companies involved in wine processing. Some of the companies involved in the processing and value addition of toddy include but are not limited to the following:
BICODE The company is situated in Kaloleni Giriama and processes fresh toddy into vinegar and coco honey/sugar. Fresh toddy harvested within six hours is brought to the company where it is evaporated by constant steaming until it becomes a jelly. It is then standardized and packed as coco honey. Fresh toddy is also placed to undergo fermentation until it becomes vinegar. The company processes the following products: (i) coconut vinegar and (ii) coco honey/sugar. The company faces constraints related to poor labeling and packaging, lack of funds for expansion and product diversification as well as marketing among others. Mnazi Development Enterprises The company is located in Mariakani, Kaloleni district, and obtains its raw materials (fresh toddy) of about 500 litres per day from brokers. The main products produced at this factory include; coconut vinegar, distilled coconut wine, coco brown sugar and acetic acids. These products are marketed at local bars and bakeries. The demand for these products are very high and normally the company does not meet it due to the erratic supply of toddy, as the vendors are not consistent in the supply as a result of poor production planning. Lack of standards on the raw material (toddy) is compromising quality as there are cases of unhygienic handling. Due to lack of cooling plants at the collection centre, the toddy tends to be contaminated, with some over-fermented, making fresh juice production very difficult. Coast Opaque Packers Ltd The company is located in Mombasa and processes and packages wine under the brand name Mnazi Bora. The company has been operational since April 2009 and is processing 1,000 litres of palm wine per day. The company has a technological capacity of 8,000 litres per day, having installed 8 tanks, each with a capacity of 1,000 litres. The company buys about 50 jerricans of 20 litres, which translates into 1,000 litres a day. The company has obtained a quality standard certificate from KEBs for its products. Processed wine is normally packed in 500ml bottles sold at Kes 25 at the factory, Kes 35 at wholesale and Kes 40 at retail. Most of the major markets include Taveta, Wote, Voi and Mombasa where it’s mostly in bars where there is security for the revelers.
Major challenges include high production costs, low acceptance of its products among the target markets and a general lack of a clear policy and legal framework to govern processing and sales of coconut wine. The company management is however optimistic that the involvement of KCDA is going to change the wine market to the benefit of all players involved. 6.7 Government agencies/Development agencies Government agencies that promote the coconut wine industry include but are not limited to the following institutions:
a. Kenya Coconut Development Authority (KCDA) The coconut development authority is a state corporation established through legal notice No.165 of 27th August 2007 under the state corporations Act Cap.446. The institution is established to provide a conducive
A B D / K C D A : C oc o nu t V al ue C h ai n A na l y s i s , A pr i l 2 0 1 0 F i n a l R e p or t - P r e p ar e d by I D M - Se r v i c e s
59
environment that will enhance the development of the coconut industry through research development and extension services. Currently the Authority is implementing a programme to support coconut nursery farmers in Kaloleni district with a bid to increase production and replace the old trees
b. Local Authorities Under the new Licensing Laws (Repeals and Amendment) Bill, 2006, (Section 163A of the Local Government Act) mandates all the local authorities to issue all applicants with a business permit under this subsection to carry out distribution of goods, including wine within the area of the local authority and to pay for licenses, fees, permits and other charges imposed by every local authority.
c. KEBS The role of KEPHIS and KEBS are to enforce and ensure that the set standards are applied to meet the qualitative aspect of demand from the importers, including packaging, sizes and quality, health requirements etc. In the coconut industry, KEBS, in conjunction with other stakeholders, are developing standards for various coconut products including standards for coconut palm wine. Subsequently, KEPHIS is carrying out plant quarantine checks on all agricultural crops exports/imports by their inspectors at the airports and seaports.
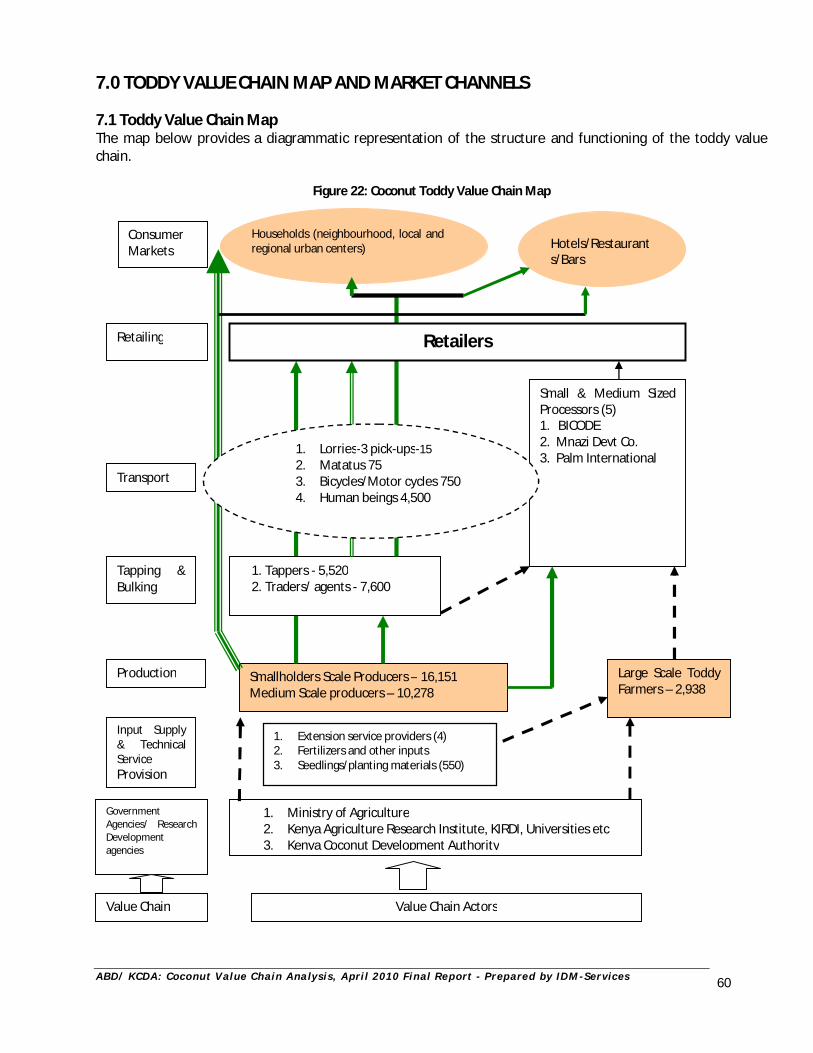
A B D / K C D A : C oc o nu t V al ue C h ai n A na l y s i s , A pr i l 2 0 1 0 F i n a l R e p or t - P r e p ar e d by I D M - Se r v i c e s
60
7.0 TODDY VALUE CHAIN MAP AND MARKET CHANNELS 7.1 Toddy Value Chain Map The map below provides a diagrammatic representation of the structure and functioning of the toddy value chain.
Figure 22: Coconut Toddy Value Chain Map
Smallholders Scale Producers – 16,151 Medium Scale producers – 10,278
1. Extension service providers (4) 2. Fertilizers and other inputs 3. Seedlings/planting materials (550)
Large Scale Toddy Farmers – 2,938
1. Ministry of Agriculture 2. Kenya Agriculture Research Institute, KIRDI, Universities etc 3. Kenya Coconut Development Authority
Government Agencies/ Research Development agencies
Households (neighbourhood, local and regional urban centers)
Small & Medium Sized Processors (5) 1. BICODE 2. Mnazi Devt Co. 3. Palm International
Input Supply & Technical Service Provision
1. Tappers - 5,520 2. Traders/ agents - 7,600
Production
Hotels/Restaurants/Bars
Tapping & Bulking
Transport
Retailing
Consumer Markets
1. Lorries-3 pick-ups-15 2. Matatus 75 3. Bicycles/Motor cycles 750 4. Human beings 4,500
Value Chain Value Chain Actors
Retailers
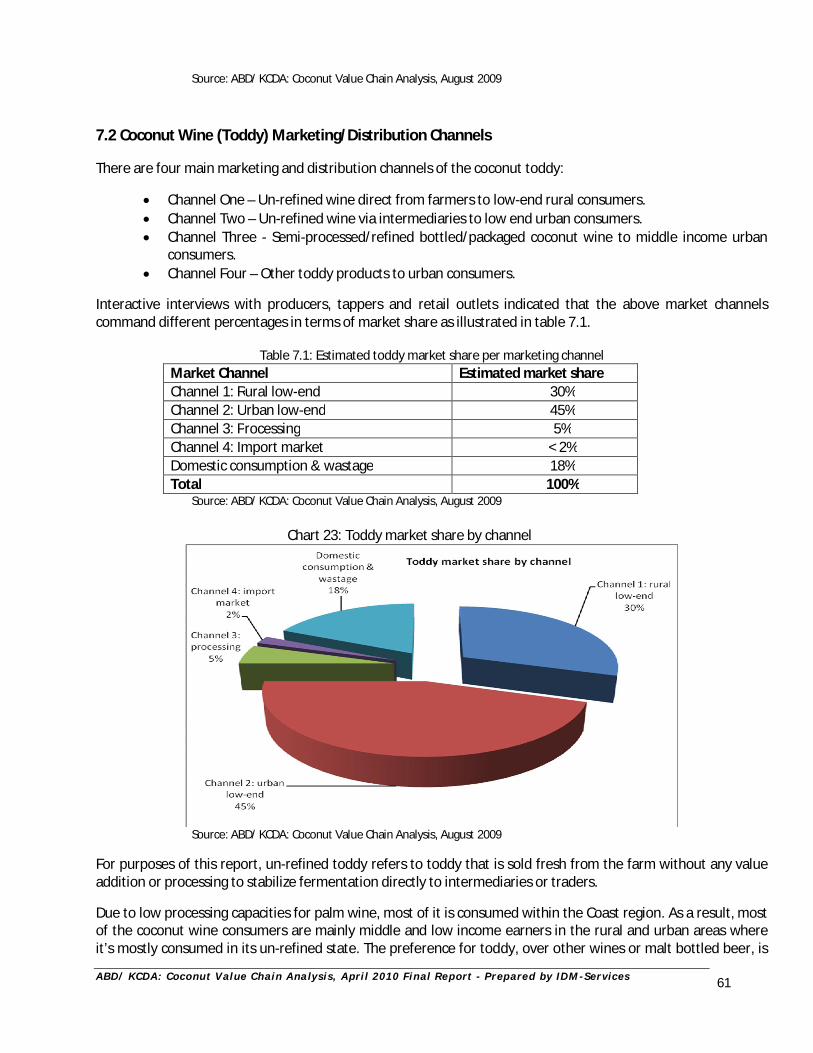
A B D / K C D A : C oc o nu t V al ue C h ai n A na l y s i s , A pr i l 2 0 1 0 F i n a l R e p or t - P r e p ar e d by I D M - Se r v i c e s
61
Source: ABD/ KCDA: Coconut Value Chain Analysis, August 2009 7.2 Coconut Wine (Toddy) Marketing/Distribution Channels There are four main marketing and distribution channels of the coconut toddy:
Channel One – Un-refined wine direct from farmers to low-end rural consumers. Channel Two – Un-refined wine via intermediaries to low end urban consumers. Channel Three - Semi-processed/refined bottled/packaged coconut wine to middle income urban
consumers. Channel Four – Other toddy products to urban consumers.
Interactive interviews with producers, tappers and retail outlets indicated that the above market channels command different percentages in terms of market share as illustrated in table 7.1.
Table 7.1: Estimated toddy market share per marketing channel
Market Channel Estimated market share Channel 1: Rural low-end 30% Channel 2: Urban low-end 45% Channel 3: Processing 5% Channel 4: Import market < 2% Domestic consumption & wastage 18% Total 100%
Source: ABD/ KCDA: Coconut Value Chain Analysis, August 2009 Chart 23: Toddy market share by channel
Source: ABD/ KCDA: Coconut Value Chain Analysis, August 2009
For purposes of this report, un-refined toddy refers to toddy that is sold fresh from the farm without any value addition or processing to stabilize fermentation directly to intermediaries or traders.
Due to low processing capacities for palm wine, most of it is consumed within the Coast region. As a result, most of the coconut wine consumers are mainly middle and low income earners in the rural and urban areas where it’s mostly consumed in its un-refined state. The preference for toddy, over other wines or malt bottled beer, is
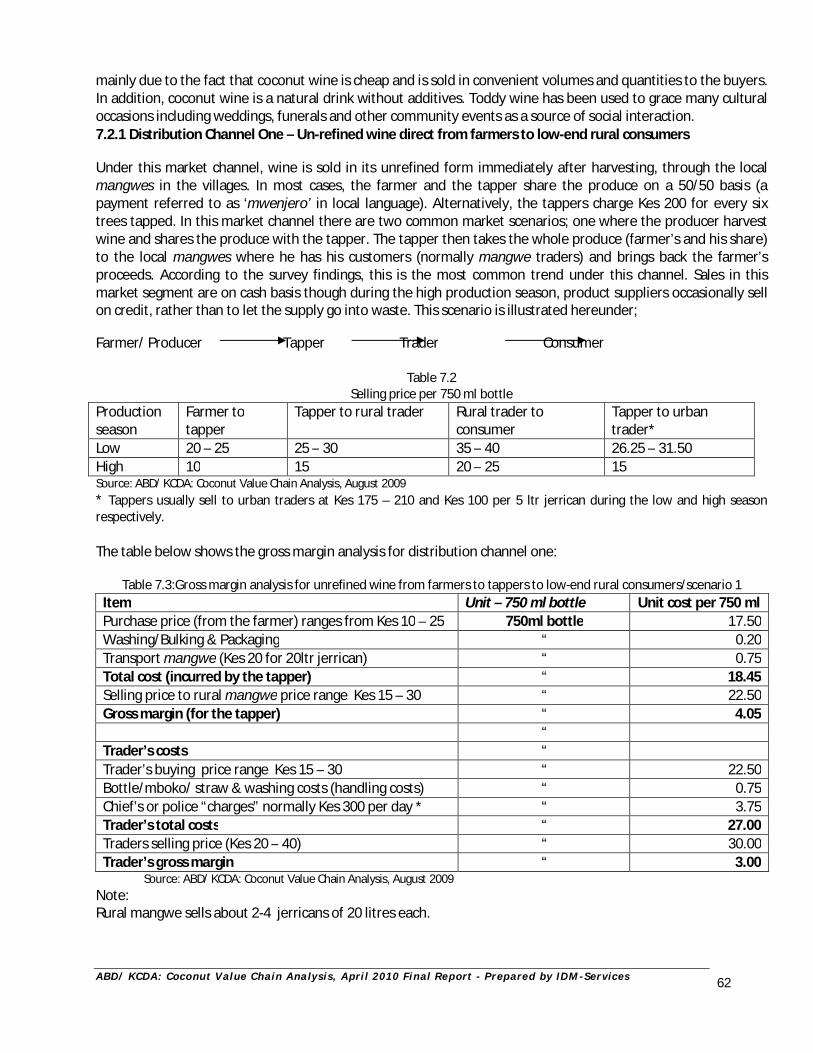
A B D / K C D A : C oc o nu t V al ue C h ai n A na l y s i s , A pr i l 2 0 1 0 F i n a l R e p or t - P r e p ar e d by I D M - Se r v i c e s
62
mainly due to the fact that coconut wine is cheap and is sold in convenient volumes and quantities to the buyers. In addition, coconut wine is a natural drink without additives. Toddy wine has been used to grace many cultural occasions including weddings, funerals and other community events as a source of social interaction. 7.2.1 Distribution Channel One – Un-refined wine direct from farmers to low-end rural consumers
Under this market channel, wine is sold in its unrefined form immediately after harvesting, through the local mangwes in the villages. In most cases, the farmer and the tapper share the produce on a 50/50 basis (a payment referred to as ‘mwenjero’ in local language). Alternatively, the tappers charge Kes 200 for every six trees tapped. In this market channel there are two common market scenarios; one where the producer harvest wine and shares the produce with the tapper. The tapper then takes the whole produce (farmer’s and his share) to the local mangwes where he has his customers (normally mangwe traders) and brings back the farmer’s proceeds. According to the survey findings, this is the most common trend under this channel. Sales in this market segment are on cash basis though during the high production season, product suppliers occasionally sell on credit, rather than to let the supply go into waste. This scenario is illustrated hereunder; Farmer/ Producer Tapper Trader Consumer
Table 7.2 Selling price per 750 ml bottle
Production season
Farmer to tapper
Tapper to rural trader Rural trader to consumer
Tapper to urban trader*
Low 20 – 25 25 – 30 35 – 40 26.25 – 31.50 High 10 15 20 – 25 15 Source: ABD/ KCDA: Coconut Value Chain Analysis, August 2009 * Tappers usually sell to urban traders at Kes 175 – 210 and Kes 100 per 5 ltr jerrican during the low and high season respectively. The table below shows the gross margin analysis for distribution channel one:
Table 7.3:Gross margin analysis for unrefined wine from farmers to tappers to low-end rural consumers/scenario 1
Item Unit – 750 ml bottle Unit cost per 750 ml Purchase price (from the farmer) ranges from Kes 10 – 25 750ml bottle 17.50 Washing/Bulking & Packaging “ 0.20 Transport mangwe (Kes 20 for 20ltr jerrican) “ 0.75 Total cost (incurred by the tapper) “ 18.45 Selling price to rural mangwe price range Kes 15 – 30 “ 22.50 Gross margin (for the tapper) “ 4.05 “ Trader’s costs “ Trader’s buying price range Kes 15 – 30 “ 22.50 Bottle/mboko/ straw & washing costs (handling costs) “ 0.75 Chief’s or police “charges” normally Kes 300 per day * “ 3.75 Trader’s total costs “ 27.00 Traders selling price (Kes 20 – 40) “ 30.00 Trader’s gross margin “ 3.00
Source: ABD/ KCDA: Coconut Value Chain Analysis, August 2009 Note: Rural mangwe sells about 2-4 jerricans of 20 litres each.
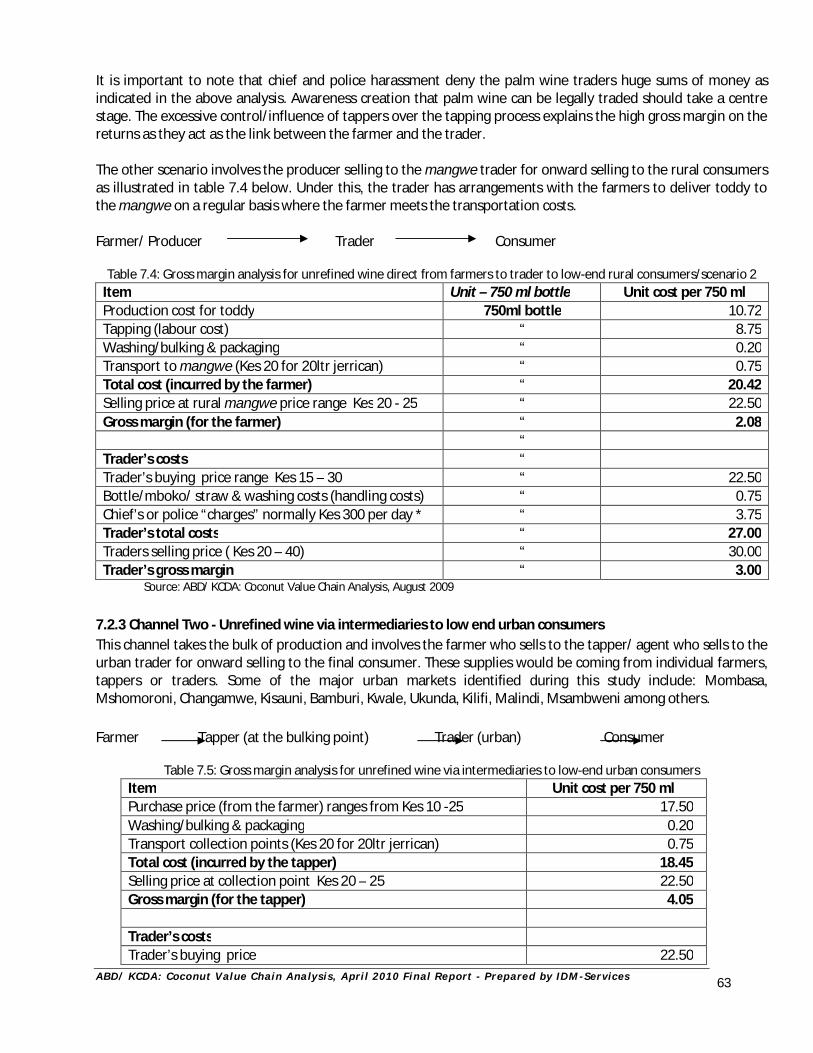
A B D / K C D A : C oc o nu t V al ue C h ai n A na l y s i s , A pr i l 2 0 1 0 F i n a l R e p or t - P r e p ar e d by I D M - Se r v i c e s
63
It is important to note that chief and police harassment deny the palm wine traders huge sums of money as indicated in the above analysis. Awareness creation that palm wine can be legally traded should take a centre stage. The excessive control/influence of tappers over the tapping process explains the high gross margin on the returns as they act as the link between the farmer and the trader. The other scenario involves the producer selling to the mangwe trader for onward selling to the rural consumers as illustrated in table 7.4 below. Under this, the trader has arrangements with the farmers to deliver toddy to the mangwe on a regular basis where the farmer meets the transportation costs. Farmer/ Producer Trader Consumer
Table 7.4: Gross margin analysis for unrefined wine direct from farmers to trader to low-end rural consumers/scenario 2
Item Unit – 750 ml bottle Unit cost per 750 ml Production cost for toddy 750ml bottle 10.72 Tapping (labour cost) “ 8.75 Washing/bulking & packaging “ 0.20 Transport to mangwe (Kes 20 for 20ltr jerrican) “ 0.75 Total cost (incurred by the farmer) “ 20.42 Selling price at rural mangwe price range Kes 20 - 25 “ 22.50 Gross margin (for the farmer) “ 2.08 “ Trader’s costs “ Trader’s buying price range Kes 15 – 30 “ 22.50 Bottle/mboko/ straw & washing costs (handling costs) “ 0.75 Chief’s or police “charges” normally Kes 300 per day * “ 3.75 Trader’s total costs “ 27.00 Traders selling price ( Kes 20 – 40) “ 30.00 Trader’s gross margin “ 3.00
Source: ABD/ KCDA: Coconut Value Chain Analysis, August 2009 7.2.3 Channel Two - Unrefined wine via intermediaries to low end urban consumers This channel takes the bulk of production and involves the farmer who sells to the tapper/ agent who sells to the urban trader for onward selling to the final consumer. These supplies would be coming from individual farmers, tappers or traders. Some of the major urban markets identified during this study include: Mombasa, Mshomoroni, Changamwe, Kisauni, Bamburi, Kwale, Ukunda, Kilifi, Malindi, Msambweni among others. Farmer Tapper (at the bulking point) Trader (urban) Consumer
Table 7.5: Gross margin analysis for unrefined wine via intermediaries to low-end urban consumers
Item Unit cost per 750 ml Purchase price (from the farmer) ranges from Kes 10 -25 17.50 Washing/bulking & packaging 0.20 Transport collection points (Kes 20 for 20ltr jerrican) 0.75 Total cost (incurred by the tapper) 18.45 Selling price at collection point Kes 20 – 25 22.50 Gross margin (for the tapper) 4.05 Trader’s costs Trader’s buying price 22.50
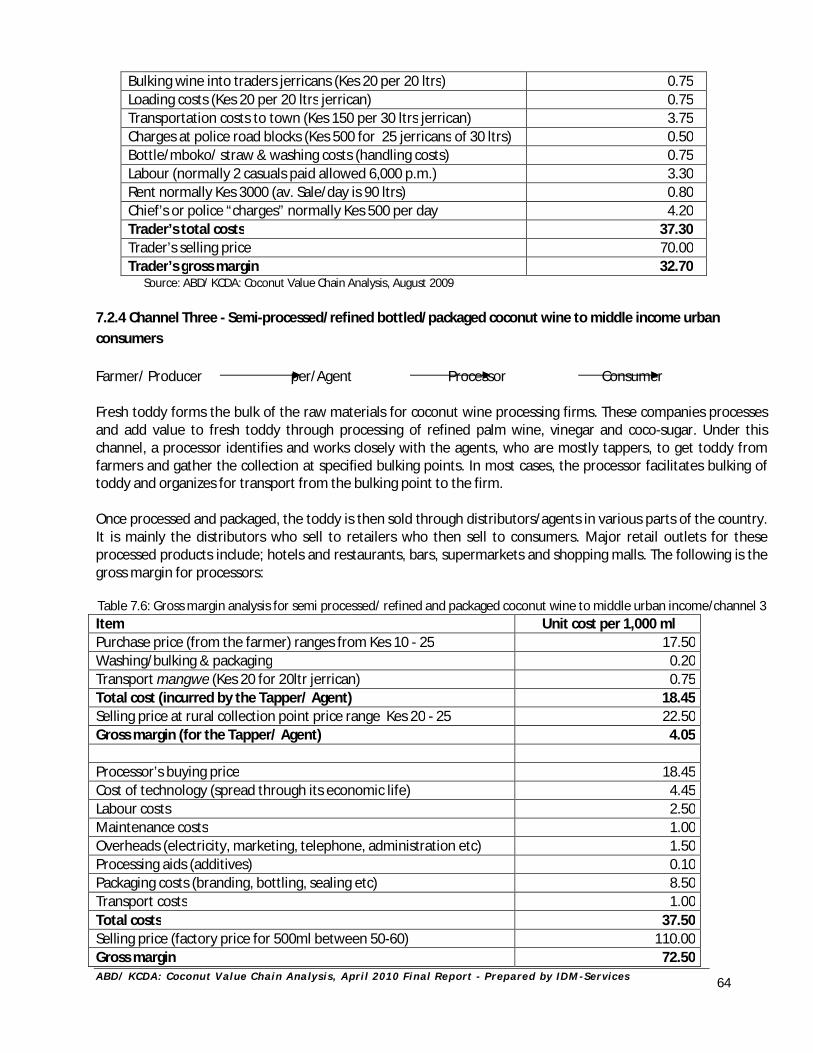
A B D / K C D A : C oc o nu t V al ue C h ai n A na l y s i s , A pr i l 2 0 1 0 F i n a l R e p or t - P r e p ar e d by I D M - Se r v i c e s
64
Bulking wine into traders jerricans (Kes 20 per 20 ltrs) 0.75 Loading costs (Kes 20 per 20 ltrs jerrican) 0.75 Transportation costs to town (Kes 150 per 30 ltrs jerrican) 3.75 Charges at police road blocks (Kes 500 for 25 jerricans of 30 ltrs) 0.50 Bottle/mboko/ straw & washing costs (handling costs) 0.75 Labour (normally 2 casuals paid allowed 6,000 p.m.) 3.30 Rent normally Kes 3000 (av. Sale/day is 90 ltrs) 0.80 Chief’s or police “charges” normally Kes 500 per day 4.20 Trader’s total costs 37.30 Trader’s selling price 70.00 Trader’s gross margin 32.70
Source: ABD/ KCDA: Coconut Value Chain Analysis, August 2009 7.2.4 Channel Three - Semi-processed/refined bottled/packaged coconut wine to middle income urban consumers Farmer/ Producer per/Agent Processor Consumer Fresh toddy forms the bulk of the raw materials for coconut wine processing firms. These companies processes and add value to fresh toddy through processing of refined palm wine, vinegar and coco-sugar. Under this channel, a processor identifies and works closely with the agents, who are mostly tappers, to get toddy from farmers and gather the collection at specified bulking points. In most cases, the processor facilitates bulking of toddy and organizes for transport from the bulking point to the firm. Once processed and packaged, the toddy is then sold through distributors/agents in various parts of the country. It is mainly the distributors who sell to retailers who then sell to consumers. Major retail outlets for these processed products include; hotels and restaurants, bars, supermarkets and shopping malls. The following is the gross margin for processors:
Table 7.6: Gross margin analysis for semi processed/ refined and packaged coconut wine to middle urban income/channel 3 Item Unit cost per 1,000 ml Purchase price (from the farmer) ranges from Kes 10 - 25 17.50 Washing/bulking & packaging 0.20 Transport mangwe (Kes 20 for 20ltr jerrican) 0.75 Total cost (incurred by the Tapper/ Agent) 18.45 Selling price at rural collection point price range Kes 20 - 25 22.50 Gross margin (for the Tapper/ Agent) 4.05 Processor’s buying price 18.45 Cost of technology (spread through its economic life) 4.45 Labour costs 2.50 Maintenance costs 1.00 Overheads (electricity, marketing, telephone, administration etc) 1.50 Processing aids (additives) 0.10 Packaging costs (branding, bottling, sealing etc) 8.50 Transport costs 1.00 Total costs 37.50 Selling price (factory price for 500ml between 50-60) 110.00 Gross margin 72.50
A B D / K C D A : C oc o nu t V al ue C h ai n A na l y s i s , A pr i l 2 0 1 0 F i n a l R e p or t - P r e p ar e d by I D M - Se r v i c e s
65
Source: ABD/ KCDA: Coconut Value Chain Analysis, August 2009 Assumptions
1. Company’s processing capacity is estimated at 1,000 litres per day. 2. The company employs 10 employees each being paid Kes 7,500 p.m. 3. The economic life of the processing plant/equipment is estimated at 8 years assuming 12.5%
depreciation rate. 4. Cost of technology/processing plant acquisition is estimated at Kes 13,000,000. 5. Maintenance costs are estimated at Kes 30,000 p.m. 6. Cost of technology is computed as follows; 13,000,000/8/365/1,000 = Kes 1.00. 7. 1 litre of fresh toddy will yield about 850ml - 900ml of processed palm wine (10 - 15% of toddy is lost
through filtration process). 8. About 200g of activated carbon is required to produce 1,000 ltrs of palm wine where 1 kg Activated
Carbon = Kes 450. 7.2.5 Channel Four – Other toddy products to Urban Consumers Most of these toddy products are imported from leading coconut toddy producing countries. These products find their markets at the supermarkets and larger stores in the bigger towns and cities. A small percentage of these products are locally manufactured and are often channeled to urban centres.
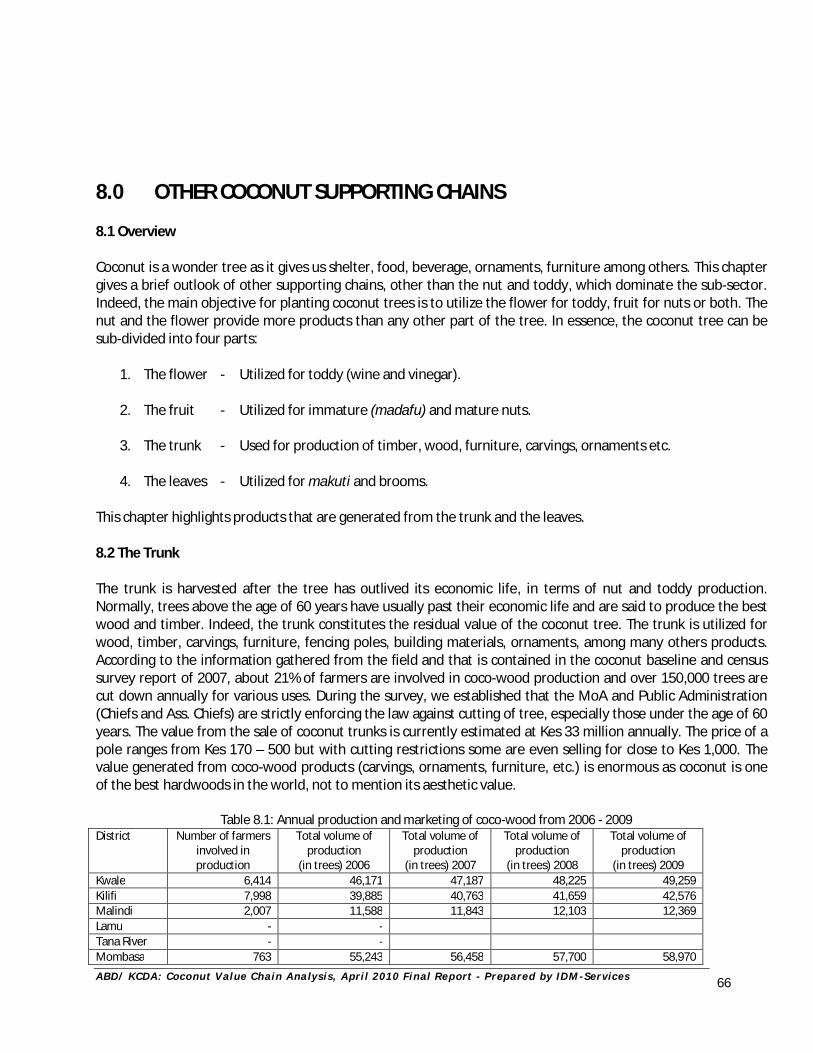
A B D / K C D A : C oc o nu t V al ue C h ai n A na l y s i s , A pr i l 2 0 1 0 F i n a l R e p or t - P r e p ar e d by I D M - Se r v i c e s
66
8.0 OTHER COCONUT SUPPORTING CHAINS 8.1 Overview
Coconut is a wonder tree as it gives us shelter, food, beverage, ornaments, furniture among others. This chapter gives a brief outlook of other supporting chains, other than the nut and toddy, which dominate the sub-sector. Indeed, the main objective for planting coconut trees is to utilize the flower for toddy, fruit for nuts or both. The nut and the flower provide more products than any other part of the tree. In essence, the coconut tree can be sub-divided into four parts:
1. The flower - Utilized for toddy (wine and vinegar).
2. The fruit - Utilized for immature (madafu) and mature nuts.
3. The trunk - Used for production of timber, wood, furniture, carvings, ornaments etc. 4. The leaves - Utilized for makuti and brooms.
This chapter highlights products that are generated from the trunk and the leaves. 8.2 The Trunk
The trunk is harvested after the tree has outlived its economic life, in terms of nut and toddy production. Normally, trees above the age of 60 years have usually past their economic life and are said to produce the best wood and timber. Indeed, the trunk constitutes the residual value of the coconut tree. The trunk is utilized for wood, timber, carvings, furniture, fencing poles, building materials, ornaments, among many others products. According to the information gathered from the field and that is contained in the coconut baseline and census survey report of 2007, about 21% of farmers are involved in coco-wood production and over 150,000 trees are cut down annually for various uses. During the survey, we established that the MoA and Public Administration (Chiefs and Ass. Chiefs) are strictly enforcing the law against cutting of tree, especially those under the age of 60 years. The value from the sale of coconut trunks is currently estimated at Kes 33 million annually. The price of a pole ranges from Kes 170 – 500 but with cutting restrictions some are even selling for close to Kes 1,000. The value generated from coco-wood products (carvings, ornaments, furniture, etc.) is enormous as coconut is one of the best hardwoods in the world, not to mention its aesthetic value.
Table 8.1: Annual production and marketing of coco-wood from 2006 - 2009
District Number of farmers involved in production
Total volume of production
(in trees) 2006
Total volume of production
(in trees) 2007
Total volume of production
(in trees) 2008
Total volume of production
(in trees) 2009 Kwale 6,414 46,171 47,187 48,225 49,259 Kilifi 7,998 39,885 40,763 41,659 42,576 Malindi 2,007 11,588 11,843 12,103 12,369 Lamu - - Tana River - - Mombasa 763 55,243 56,458 57,700 58,970
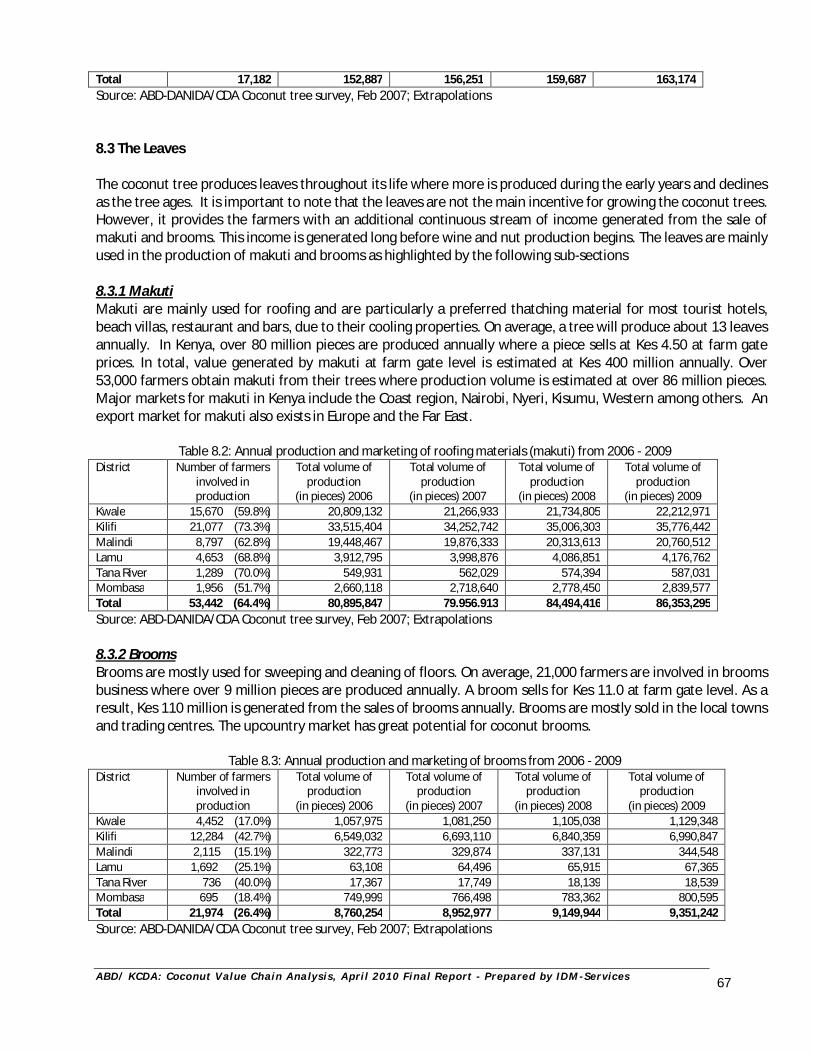
A B D / K C D A : C oc o nu t V al ue C h ai n A na l y s i s , A pr i l 2 0 1 0 F i n a l R e p or t - P r e p ar e d by I D M - Se r v i c e s
67
Total 17,182 152,887 156,251 159,687 163,174 Source: ABD-DANIDA/CDA Coconut tree survey, Feb 2007; Extrapolations 8.3 The Leaves
The coconut tree produces leaves throughout its life where more is produced during the early years and declines as the tree ages. It is important to note that the leaves are not the main incentive for growing the coconut trees. However, it provides the farmers with an additional continuous stream of income generated from the sale of makuti and brooms. This income is generated long before wine and nut production begins. The leaves are mainly used in the production of makuti and brooms as highlighted by the following sub-sections 8.3.1 Makuti Makuti are mainly used for roofing and are particularly a preferred thatching material for most tourist hotels, beach villas, restaurant and bars, due to their cooling properties. On average, a tree will produce about 13 leaves annually. In Kenya, over 80 million pieces are produced annually where a piece sells at Kes 4.50 at farm gate prices. In total, value generated by makuti at farm gate level is estimated at Kes 400 million annually. Over 53,000 farmers obtain makuti from their trees where production volume is estimated at over 86 million pieces. Major markets for makuti in Kenya include the Coast region, Nairobi, Nyeri, Kisumu, Western among others. An export market for makuti also exists in Europe and the Far East.
Table 8.2: Annual production and marketing of roofing materials (makuti) from 2006 - 2009
District Number of farmers involved in production
Total volume of production
(in pieces) 2006
Total volume of production
(in pieces) 2007
Total volume of production
(in pieces) 2008
Total volume of production
(in pieces) 2009 Kwale 15,670 (59.8%) 20,809,132 21,266,933 21,734,805 22,212,971 Kilifi 21,077 (73.3%) 33,515,404 34,252,742 35,006,303 35,776,442 Malindi 8,797 (62.8%) 19,448,467 19,876,333 20,313,613 20,760,512 Lamu 4,653 (68.8%) 3,912,795 3,998,876 4,086,851 4,176,762 Tana River 1,289 (70.0%) 549,931 562,029 574,394 587,031 Mombasa 1,956 (51.7%) 2,660,118 2,718,640 2,778,450 2,839,577 Total 53,442 (64.4%) 80,895,847 79.956.913 84,494,416 86,353,295 Source: ABD-DANIDA/CDA Coconut tree survey, Feb 2007; Extrapolations 8.3.2 Brooms Brooms are mostly used for sweeping and cleaning of floors. On average, 21,000 farmers are involved in brooms business where over 9 million pieces are produced annually. A broom sells for Kes 11.0 at farm gate level. As a result, Kes 110 million is generated from the sales of brooms annually. Brooms are mostly sold in the local towns and trading centres. The upcountry market has great potential for coconut brooms.
Table 8.3: Annual production and marketing of brooms from 2006 - 2009 District Number of farmers
involved in production
Total volume of production
(in pieces) 2006
Total volume of production
(in pieces) 2007
Total volume of production
(in pieces) 2008
Total volume of production
(in pieces) 2009 Kwale 4,452 (17.0%) 1,057,975 1,081,250 1,105,038 1,129,348 Kilifi 12,284 (42.7%) 6,549,032 6,693,110 6,840,359 6,990,847 Malindi 2,115 (15.1%) 322,773 329,874 337,131 344,548 Lamu 1,692 (25.1%) 63,108 64,496 65,915 67,365 Tana River 736 (40.0%) 17,367 17,749 18,139 18,539 Mombasa 695 (18.4%) 749,999 766,498 783,362 800,595 Total 21,974 (26.4%) 8,760,254 8,952,977 9,149,944 9,351,242 Source: ABD-DANIDA/CDA Coconut tree survey, Feb 2007; Extrapolations
A B D / K C D A : C oc o nu t V al ue C h ai n A na l y s i s , A pr i l 2 0 1 0 F i n a l R e p or t - P r e p ar e d by I D M - Se r v i c e s
68
9.0 CHALLENGES FACING THE COCONUT VALUE CHAIN It is imperative to outline the major problems besetting the coconut industry as a whole and in particular along the value chain. The future of the coconut industry hinges crucially in being able to address these major constraints. The following are some of the key challenges that were identified during the study as impeding on the realization of the sub sector’s full potential: 1. Inefficient marketing system The current coconut marketing structure is a major constraint to fair and even gross margin distributions among chain actors. The current market system puts the producer at a disadvantaged position, as a price taker rather than a price setter. In fact, producers are at the mercy of middlemen whose purchase patterns are inconsistent and offer low commodity prices that are not commensurate to the farmers’ efforts and expectations. Lack of organized farmer groups has denied them the bargaining power necessary for fair play and leverage in business. In addition, poor road network in most of the coconut belt hinders market access resulting in wastages and lower commodity prices. 2. Lack of farm support (credit and extension services) It is evident from the study that the average coconut farmer has no capital to invest in production, processing and marketing improvements. This is compounded by limited support in terms of extension services, farm inputs supply, and credit facilities. In the past, policy support meant to benefit the coconut farmers, is yet to bear fruits and make the desired impact. Lack of development of proper farmer organizations into commercially viable groups has greatly limited their access to credit and other extension support. Low income levels have pushed potential credit institutions away from lending to coconut farmers. When credit facilities are offered, they are too miniscule to create the desired impact. 3. Policy and Institutional Support The coconut industry has been operating under an ‘un-clear policy framework’. In the past, lack of policy direction has resulted in under-exploitation of the vast potential in the coconut sub sector. Legislative inconsistencies have been a major drawback to the development of the coconut sub sector, especially the coconut wine (Mnazi). Apparently, the liquor licensing act, which regulates the sale of alcoholic beverages, does not ‘recognize’ Mnazi. As a result, the chiefs and the police continue to harass coconut wine vendors with impunity. Information from the study indicate that coconut wine traders i.e. transporters, ‘mangwe’ operators and mnazi consumers face an upward task at all vital points along the value chain. This situation has had adverse effects on the commodity price and unnecessary harassment from unscrupulous law enforcement agencies. 4. Processing and value addition As evidenced by study findings, there are few processing initiatives taking place within the coconut sub sector. Marketing, therefore, largely involves selling of raw nuts and unprocessed toddy that fetch low values. This has
A B D / K C D A : C oc o nu t V al ue C h ai n A na l y s i s , A pr i l 2 0 1 0 F i n a l R e p or t - P r e p ar e d by I D M - Se r v i c e s
69
also resulted in post harvest loses, especially during high production seasons as there are no facilities to process and store the products for sale during the low seasons when prices are favourable. This situation is attributable to the low level of private sector participation that would provide the economic muscle to support coconut product processing a commercial scale 5. Processing technology The potential of the coconut industry remains largely unexploited due to inadequate technology transfer/adoption. Product development and market research has largely remained unattended due to the low SME participation in the coconut sub sector. Coconut tree is a “no waste tree”. Paradoxically, there are a lot of coconut products being wasted such as husks that could be put to commercial and economic use. Low level of technological advancement, especially in processing and value addition, has impacted negatively on revenue generation and rural employment creation. 6. Lack of quality planting materials and poor farm management Smallholder coconut farms are generally low yielding due to lack of quality high yielding planting materials and poor farm management practices, especially in fertilizer application and pest and disease control. Currently, farmers select and prepare planting materials from the existing field crops, which exhibit high yielding traits or in extreme cases, they plant seedlings that have germinated on their own. This practice greatly compromises the quality of the overall production. It is discouraging to note that while coconut has been growing in the Coast region for years, little research and development has been done on seedlings development. However, in the recent past, there are a few certified coconut tree nurseries that supply quality planting materials currently under the support of the KCDA. During the study, it was identified that most farmers rarely give coconut farms the required attention as most of the trees grow on bushy fields. Only those trees that are intercropped with food crops are weeded. Farmers do not apply manure/fertilizers or take pest and disease control measures, despite harvesting toddy and nuts yearly. This has resulted in low yields per tree both for the nuts and toddy.
A B D / K C D A : C oc o nu t V al ue C h ai n A na l y s i s , A pr i l 2 0 1 0 F i n a l R e p or t - P r e p ar e d by I D M - Se r v i c e s
70
10. OPPORTUNITIES WITHIN THE COCONUT VALUE CHAIN 10.1 Overview Information obtained during the study indicates that the coconut sub sector is vibrant and has numerous potential and opportunities for business development. These investment opportunities range from production, processing and even in the actual trading of coconut products. Some of the major opportunities within the sub sector are outlined hereunder. 10.2 Opportunities
1. Production One of the major challenges facing the coconut sub sector in the Coast province is a general lack of high yielding planting materials. KCDA has long realized this situation and has put in place initiatives to address this issue through facilitating coconut nursery development in selected pilot coconut clusters. It is important to note that government efforts in this regard have not been successful in the past. Reports from the coconut baseline survey and the value chain analysis, indicate that the growth in this sector can only be realized by private sector involvement in the establishment of commercially viable nurseries, to provide farmers with affordable high yielding planting materials. This effort can be supplemented by the public sector organizations and research institutions i.e. KARI, KEPHIS, Universities that have the technical capacity to develop appropriate coconut cultivars. The proposal for commercial coconut nurseries is supported by the fact that there are well over 80,000 coconut farmers scattered in the entire coast region. 2. Raw Materials for Cottage Industries There are 39 economically viable coconut tree clusters1 that have the potential to support small and medium processing industries for both nut and toddy product chains. It is important to note that some of these clusters have over 0.5 million trees. The clusters are scattered in the three major coconut producing districts i.e Kwale/Msambweni (13), Kilifi/Kaloleni (13) and Malindi (6). 3. Product Development and Diversification It is important to underscore that better returns in coconut production lies in value addition. Information gathered from major retail outlets (Nakumatt, Tuskys, Yatin, Ukwala Supermarkets) in the country, show that processed coconut products fetch very attractive prices on the shelves. Unfortunately, these products are imported. This is a sharp contrast with our local situation where the market is dominated by sales of un-processed coconut products. This clearly shows that with better technologies and value addition initiatives, the sub sector can realize its full potential. The coconut tree has the potential to produce numerous products. Sub sector players should therefore diversify the product range through processing and value addition as there is a ready market for such products. There is need to encourage potential private sector players to invest in the coconut sub sector and facilitate production for the high demand of coconut products i.e. desiccated coconut, coconut milk, coconut cream and powder. 4. Processing Opportunities
a. Opportunities for SMEs
1 A cluster is defined as a production zone within a radius of 5-8km with over 50,000 concentration of coconut trees
A B D / K C D A : C oc o nu t V al ue C h ai n A na l y s i s , A pr i l 2 0 1 0 F i n a l R e p or t - P r e p ar e d by I D M - Se r v i c e s
71
From the study findings, it is evident that there is adequate demand for coconut processed products as illustrated by the large number of coconut imports. The information provided by the KRA customs department and prominent coconut product importers indicate that well over 5,000 tonnes of assorted coconut products are imported annually with a total value of over Kes 500 million. Some of the major products include; desiccated coconut, coconut milk/cream, coconut syrup, coconut milk powder, etc. These products can be produced with simple and affordable technologies locally available with support from finance institutions i.e. KIE, Equity bank. Already, a few SMEs are engaged in coconut processing and are reaping good returns. With support and linkages from MESPT and ABD, more SMEs could engage in coconut processing as there are sufficient raw materials to spur growth within the sub sector, as return on investments would increase substantially. Jua kali technologies and other cottage industry based technologies should lead the way as they are relatively affordable to the majority of SMEs.
b. Opportunities for Large Scale and high-tech processing firms Currently Kenya is importing large amounts of activated carbon and coco peat. The activated carbon finds its uses in the manufacturing of batteries, water purification, wine and beverage processing, etc. Similarly, coco peat is extensively used for mulching in the horticulture industry especially in the flower farms. These two products can be produced locally as there are sufficient coconut trees to supplement the amount being imported. In addition, there is a ready market for these products. For example, the setting up of a new dry cell manufacturing factory in Kisii increases demand for activated carbon on top of existing companies like Chloride Exide, Ever-Ready batteries, Brewing industries and water purifying companies. Flower farms in Naivasha, Thika and Kajiado provide a ready market for coco peat, which they can easily take up if there is sufficient and consistent supply. 5. The Expanded EAC Market With the signing of the Common Market Protocol among the 5 member States of East African Community in 2009, member countries can now freely trade goods across the region without restrictive tariffs barriers. In essence, this has created an expanded market of nearly 200 million consumers. Coconut processing will help Kenya to reap more benefits from a wider market, bearing in mind that countries like Tanzania and Burundi already have a high demand for coconut products. Mostly Tanzania is relatively advanced in processing and buys raw nuts for processing into desiccated coconut and virgin oil. Burundi is a potential market for processed, especially desiccated coconut, coconut cream and coconut oil. 6. The National Beer Market According to the National Agency for the Campaign Against Drug Abuse (Nacada), Kenya's liquor market is estimated to be worth Kes 42 billion, with the formal mainstream segment accounting for only 60%. The remaining 40% comprises the untaxed illicit brew market worth Kes 16 billion. This illicit brew market comprises the traditional liquors including chang’aa, kumi kumi, Busaa etc. The 40% gap in the beer industry is an opportunity that can be taken up by coconut wine. Efforts should be made to encourage private sector involvement to exploit this lucrative opportunity, for the benefit of coconut farmers and the health of the alcohol consumers.
A B D / K C D A : C oc o nu t V al ue C h ai n A na l y s i s , A pr i l 2 0 1 0 F i n a l R e p or t - P r e p ar e d by I D M - Se r v i c e s
72
11. SUMMARY OF FINDINGS AND CONCLUSIONS
11.1 Overview This chapter highlights, in a summary form, the key findings of the Survey and provides the basis for discussions on the way forward in the form of recommendations. The chapter provides the reader with information in regard to critical issues that emerged from various observations, evaluations and analysis in the course of this assignment.
11.2 Summary of Key Findings
1. Coconut sub-sector potential From the findings of the study, the coconut value chain has a lot of un-tapped potential as only a small percentage has been exploited. According to a recent coconut baseline survey, only 25% of the sub sector potential has been utilized with a GDP value of Kes 4 billion at farm gate level. Nut and wine are the major products of the coconut tree. From the current production and commodity pricing, wine is by far the most lucrative chain within the coconut sub sector, generating well over Kes 2.5 at farm gate prices. In addition, gross margin analysis for both nuts and wine show that wine chain actors are relatively well off compared to their counterparts in nut value chain. Indeed, over 65% of the coconut monetary value comes from the wine value chain. With better processing initiatives for value addition and product diversification, the coconut sub-sector has the potential to generate over Kes 20 billion annually. Coconut wine production currently stands at 2.5 litres per tree per day while nut production per year stands at 28 nuts. These production figures are relatively low compared to optimal productivity levels of over 5 litres for wine and over 50 for nuts in good yielding varieties.
2. Coconut Value Chain Actors The value chain actors for the nut chain are to some extent different from those of the wine chain. Under the mature nut value chain, the study identified the following categories of actors: Input suppliers and services providers, coconut producers, harvesters, de-huskers, traders, agents, transporters, wholesalers and retailers, government institutions, development agencies and consumers. Similarly, under the coconut wine chain, the following actors were identified: Input suppliers and services providers, wine producers, tappers, traders, agents, transporters, government agencies and consumers. The number of value chain actors fluctuates with the availability of other alternative employment opportunities, particularly among the young skilled and unskilled actors. For instance, many coconut toddy tappers and nut harvesters juggle from tapping, harvesting and other income generating activities.
These actors play important and distinct roles and provide forward and backward linkages along the value chain. Strengthening of these linkages will not only improve market efficiency but also ensure even distribution of return across the chain.
3. Key Products within Coconut Value Chains There are two main products from the coconut tree i.e. the nuts and toddy. Each one of these products has the potential to generate a wide range of products. Key products within the nut chain include; desiccated coconut, coconut cream and milk, virgin oil, copra, coconut syrup, activated carbon, copra cake, coconut dust, door mats, ropes, coco peat, coir among others. On the other hand, key products under the toddy chain include; fresh toddy, wine, coconut sugar, coconut juice and vinegar etc. It is important to note that most of the above products are not being produced in the country. Rather, they are imported from Asian countries at the expense of our impoverished farmers. Unfortunately most of our coconut products are sold in raw form. This practice impacts negatively on revenue generation and employment
A B D / K C D A : C oc o nu t V al ue C h ai n A na l y s i s , A pr i l 2 0 1 0 F i n a l R e p or t - P r e p ar e d by I D M - Se r v i c e s
73
creation. For the coconut sub sector to realize its full potential, efforts must be made to increase value addition and process these products locally.
4. Unit Production Costs (nuts and toddy) The current production does not involve a lot of capital as little attention and resources are expended in coconut farming. Major costs incurred include purchase of planting materials, weeding and harvesting where the trees are intercropped. Very few individuals are applying fertilizer and pest and disease control measures on their trees. As a result, the average production cost per nut is estimated at Kes 4.47 while that of toddy stands at Kes 10.72 per litre. It is evident from the study that production of toddy has shorter break-even period than nut production. Indeed, pure production of nuts is not profitable and might take long periods to break-even. It is important to note that the unit production cost of a litre of toddy and mature nut is high considering that most of the costs involved are non-financial i.e. land lease, management and labour. Excluding these costs would reduce the unit production cost substantially. In addition, adoption of modern farming methods, the unit production costs would be drastically reduced as yield per tree would be enhanced. In return, this will reduce the break-even and pay back period. In conclusion, to maximize returns at farm level it is prudent for farmers to engage in production of a variety of coconut products i.e. toddy, makuti, nuts, brooms, etc.
5. Major Coconut Product Markets There is apparent high demand for both nuts and wine in local and export markets. From the study, major nuts markets include; Coast rural and urban markets (Kongowea, Marikiti, Kaloleni, Ukunda, Taveta, Lunga Lunga, Voi, Lamu, Malindi etc); upcountry markets include, Nairobi, Kisumu, Busia, Eldoret, Thika, Meru, Machakos, Nanyuki. Tanzania constitutes the major export market for nuts. During the study some traders indicated that there were coconut product enquiries from Dubai, India, UK, USA, UAE, etc. The market share is estimated as follows; rural low-end (10%), coastal urban markets (25%), upcountry markets (10%), regional export markets (35%), processed nuts market (5%), while about 15% of the production accounts for home consumption and post harvest losses. On the other hand, the key toddy markets include; rural low-end market (30%), urban low-end market (45%), processed palm wine market (<2%) and 18% accounting for home consumption and handling wastage. A careful analysis of the market share shows that the level of market development is relatively low as the percentage occupied by processed products only accounts for less than 5%. There is need therefore, to engage private sector players, to undertake coconut products processing initiatives for value addition as it provides opportunities for higher returns on investments.
6. Gross Margin Distribution The study findings show that distribution of margins across the chain is heavily skewed in favour of traders and processors. The average price per nut at farm level is less than Kes 5 while traders sell the same for over Kes 10. Other players in the value chain earn over Kes 20 per nut, depending on the market niche and products that they are processing.
This clearly shows a relatively low level of marketing and low level of linkages among the sector players. Market infrastructure needs to be developed to accommodate processing and efficient flow of coconut products and market information. Once this is achieved, actors along the chain will benefit on near equal margins.
7. Imported Coconut Products Information gathered from KRA Customs Department and the prominent coconut products importers, indicates that Kenya is currently importing over 5,000 tonnes of coconut products worth over Kes 500 million annually.
A B D / K C D A : C oc o nu t V al ue C h ai n A na l y s i s , A pr i l 2 0 1 0 F i n a l R e p or t - P r e p ar e d by I D M - Se r v i c e s
74
Most of these products are either industrial raw materials or for direct consumption. Major products being imported include: desiccated coconut, coconut cream and milk, coconut virgin oil, coconut syrup, coconut powder, coco peat, crude palm kernel among others. These products are mostly imported from Asian countries.
With local processing, it is possible to substitute these imports with quality local products, which will help to improve on the balance of trade, create employment and revenue creation.
8. Processing Initiatives and Private Sector Participation Information from the study shows that there is little processing initiatives in both nuts and toddy value chains as only about 5% is processed while the rest is sold in unprocessed form. Major reasons behind this include; huge capital requirement to set up processing plants, lack of private sector participation to support coconut processing and general ignorance about the processing opportunities and returns thereof. Promotion of private sector participation would enhance processing initiatives. This would positively change the coconut sub sector in terms of increased incomes and employment generation. There is need to enhance local processing and value addition to curtail the high levels of imported coconut products.
9. Low Yield per Tree Coconut toddy and nut production is characterized by low yield per tree in the Coast region. Information generated by the study indicates that this phenomenon is a result of poor farm management, inadequate access to high yielding varieties as well as low levels of extension services. For instance, the average toddy production per tree stands at 2.5 litres per day while that of the nuts, is estimated at 28 nuts per tree per year. Information from literature shows that with high yielding varieties and better farm management, a tree can produce over 5 litres of toddy per day and over 50 nuts per year.
10. Factors Affecting Market Pricing From the survey findings, there are several factors that affect market pricing within the toddy and nut value chain:
Seasonal production variations. Middlemen dominance in determining commodity prices. Poor road infrastructure in most rural areas in the coconut belt. Festivities within the year e.g. Ramadhan, Maulid, Idd, ASK Show, Christmas holidays, Tourism peak
season, etc. Normal demand and supply forces. Number of chain actors within the given product chain i.e. the more the actors the higher the price. Distance from the farm to various market destinations.
11. Challenges in the coconut value chain The main challenges facing farmers in the coconut value chain include; inefficient market systems and over domination of markets by middlemen. Production challenges include; lack of quality planting materials, the menace of pests and diseases as well as limited access to extension services. These challenges can be addressed by the development of drought tolerant, high yielding varieties for both nuts and toddy. Market challenges on the other hand, can be mitigated by promoting greater private sector participation and organizing farmers into commercially viable groups.
A B D / K C D A : C oc o nu t V al ue C h ai n A na l y s i s , A pr i l 2 0 1 0 F i n a l R e p or t - P r e p ar e d by I D M - Se r v i c e s
75
12. RECOMMENDATIONS 1. Policy and institutional support It is evident from the survey findings that the coconut sub sector operates within undefined regulatory framework. The most affected product is the palm wine, which remains classified as a traditional brew. Although some of the legal issues have been addressed by the repeal of the Traditional Liquor Act in 2007 and the creation of KCDA, the situation on the ground is still shrouded with a lot of hindrances that has negatively impacted the palm wine business development. KCDA and other relevant authorities and stakeholders must put in place the necessary arrangements to facilitate business growth in the coconut wine product line i.e. campaign for inclusion of coconut wine under the Liquor Licensing Act. They should also carry out awareness creation activities and educate the farmers and traders on their rights. It must be noted that this is the most lucrative chain and holds the key to development and transformation of the coconut sub sector, as evidenced by the study findings in this report.
2. Standards for coconut products It is important to note that KCDA and KEBs have initiated efforts to develop standards for coconut products. This is an important step towards building consumer confidence in local coconut products. Considering that Kenya imports coconut products worth over Kes 500 million annually, appropriate standards would help to improve the quality of local products and enhance their market niche. With quality local products available, it will be possible to substitute some of the coconut imports, thereby saving valuable foreign exchange. KCDA should aggressively engage KEBs to hasten the development of appropriate standards, for the identified coconut products. Developed standards must conform to the international requirements and should be managed by KEBs, in close liaison with KCDA. 3. Establishment of farmer organizations and collection centers One of the major findings of this study is that farmers are the most disadvantaged, in terms of returns from investment in the coconut sub-sector. They are not in control of market forces and prices, which are dictated by middlemen and brokers. Individual sale of products by individual farmers greatly reduce their bargaining power. KCDA must spearhead initiatives to organize farmers into commercially viable groups, to facilitate fair trade in the coconut sub sector. There is also need for the establishment of commodity collection centres, in all economically viable coconut tree clusters. Collection centres should have storage facilitates for members to avoid post harvest and other loses. 4. Private sector participation Survey findings indicate that private sector involvement, within the coconut sub sector is minimal as most coconut trade involves sales of unprocessed raw products. Private sector participation has the economic muscle for full commercialization of coconut sub sector. ABD and KCDA can work closely with Kenya Private Sector Alliance (KEPSA) and Kenya Investment Authority (KenInvest), to develop appropriate investment packages to attract private sector capital to the coconut sub sector. This will help to transform the sub sector from its agrarian form to a modern profitable commercial sector. 5. Sensitization and awareness creation on the key sector growth nodes There is need for KCDA, other relevant development agencies and stakeholders to carry out sensitization and awareness creation, on the rights of actors along the toddy value chain. Information from the study indicates
A B D / K C D A : C oc o nu t V al ue C h ai n A na l y s i s , A pr i l 2 0 1 0 F i n a l R e p or t - P r e p ar e d by I D M - Se r v i c e s
76
that despite the legal status of the coconut wine, the chiefs and police are still harassing transporters and vendors of coconut wine. The new licensing arrangement under KCDA, must be harmonized with the existing liquor Licensing Act, to give legitimacy and protect the rights of wine traders. This exercise will benefit both KCDA in terms of licensing revenue and increase incomes for the traders and coconut farmers. 6. Production and extension services The low yields that characterize coconut production are not tenable in commercial agriculture. KCDA, ABD, Ministry of Agriculture and other farm service providers, must spearhead efforts geared towards improving nut and toddy production. Programs to achieve this, should include; establishment of strong and consistent extension services provision, farmer education in tree crop husbandry and agri business mindset. 7. Research and development support Information generated from the study indicate that key challenges in the coconut sub sector include; lack of quality planting material, low yield per tree and the menace of pests and diseases. These are issues that should be addressed through R&D initiatives, a task that is well beyond the reach of the farmer. KCDA, ABD in close partnership with KARI must lead the initiative towards the development of appropriate cultivars i.e. high yielding, drought, pest and disease resistant. Once developed, the planting materials must be made available and affordable to the farmers. 8. Appropriate processing technology development. For the sub sector to benefit from processing opportunities, it is important to develop appropriate processing technologies for various products. KCDA and ABD should work closely with technology providers and research institutions e.g. TECHNOSERVE, KIRDI, JKUAT and APROTECH, to develop and utilize technologies best suited for the coconut industry. Such technologies should be efficient and affordable. It is important to note that one of the major reasons for the low level of processing in the coconut sub sector, is the high cost of accessing processing technology. 9. Vision 2030 and the coconut sub sector The coconut sub sector has the potential to play a lead role in the Coast region realization of vision 2030 goals, which seek to transform Kenya into a newly industrialized middle income country, by the year 2030. Enhanced processing and value addition in the coconut sub sector, has the potential to generate over Kes 20 billion as evidenced by this study and the coconut sub sector baseline survey of 2007. KCDA must engage the private sector, to promote coconut processing and value addition initiatives. These initiatives must be developed within the identified economically viable tree clusters in the coconut belt. In addition, KCDA and Coast region leadership must lobby to make the coconut industry a key project in vision 2030 as this would attract financial and policy support for the sub sector. 10. Coconut sub sector investment forums Information generated from this study, must be utilized for the development of the coconut sub sector in the coast region. In this regard, KCDA should work closely with KenInvest, who have expressed interest in organizing an investment forum, to promote investment in the coconut sub sector to potential investors and link them to key stakeholders within the sub sector. KCDA should also set up a coconut information and documentation centre and establish a stakeholder forum to facilitate exchange and experience sharing in the coconut industry. This will help stakeholders make informed decisions in regard to agronomy, service provision, market penetration, commodity pricing, planting materials among others. 11. Role of service providers, credit facilities and input suppliers
A B D / K C D A : C oc o nu t V al ue C h ai n A na l y s i s , A pr i l 2 0 1 0 F i n a l R e p or t - P r e p ar e d by I D M - Se r v i c e s
77
Throughout the study, it was evident that credit facility providers and input suppliers are not actively involved in the coconut sub sector. Indeed, very few coconut value chain actors have access to finance and credit facilities. Apparently, both micro-finance and banking institutions consider coconut farming an unprofitable economic activity. The low production levels, poorly developed marketing structures and lack of commercially viable farmer organizations, are the major reasons for low income levels among coconut chain actors. It is therefore recommended that KCDA and ABD engage a consultant, to develop a commercially viable farmer group model. Currently, there are various commercial farmer group models within other agricultural sub-sectors i.e. sugarcane, tea, coffee sub sectors etc. it is important to note that commercially viable farmer groups have the potential to attract finance and credit. 12. Close planting of trees Trials should be made to establish whether coconut can still yield optimally when trees are closely planted. This will not only increase production but will also save the tappers, harvesters and de-huskers the time wasted climbing from one tree to another. With leaner spacing, it’s possible to tie ropes from one tree to another as is the case in other coconut growing areas in the Far East Asia. 13. Tourism industry With domestic and international tourism making great strides, it could be tapped as a potential outlet to promote the industry. Hotels could be encouraged to serve young fresh coconuts as thirst quenchers, instead of bottled soft drinks. In tourists’ hotels, and in other places often visited by tourists, outlets for coconut handicrafts could also be provided. These hotels could also be encouraged to use rugs, carpets and mats made of coir, which in addition to being environmentally friendly, are long lasting.
A B D / K C D A : C oc o nu t V al ue C h ai n A na l y s i s , A pr i l 2 0 1 0 F i n a l R e p or t - P r e p ar e d by I D M - Se r v i c e s
78
ANNEX 1: REFERENCES
1. ABD-DANIDA/CDA (May 2007) Coconut tree survey. 2. CDA (2000): Coconut Diagnostic Survey in Kilifi District, Unpublished. 3. CDA (2003): Coast Development Authority Statistical Abstract 2004, Unpublished. 4. CDA (2003): Coast Development Authority Strategic Development Plan 2003 – 2008. Government
Printers. 5. Traditional tapping and distillation methods of coconut wine (mnazi) as practiced in
the coastal region of Kenya -Kadere Tunje, Oniang'o RK, Kutima PM, and SN Muhoho. 6. Eijanatten, C.L.M (1979): Improved productivity of Coconut through fertilization? Coast Agricultural
Research Station (CARS). Communication, Mtwapa Kenya. 7. Food and Agricultural Organization (2005); FAO Production Year Book 2005 Vol 60; Rome. 8. Kinya C. (193) Demonstration to farmers on Management of Coconut land Coast Agricultural Research
Station (CARS). Mtwapa Kenya. 9. Krain, E. and P. Kabonge (1992): Kanuni za Kilimo Bora Cha Mnazi; Dar es salaam University Press. 10. Mwangi, W and J Njoba (2000): Coconut Development in Kenya. Paper presented during and
International Coconut Workshop for Africa, Mombasa –Kenya. 11. Republic of Kenya (2002): Kilifi District Development Plan 2002 –2007 Ministry of Planning and
National Development. 12. Republic of Kenya (2002): Kwale District Development Plan 2002 –2007 Ministry of Planning and
National Development. 13. Republic of Kenya (2002): Malindi District Development Plan 2002 –2007 Ministry of Planning and
National Development. 14. Republic of Kenya (2002): Mombasa District Development Plan 2002 –2007 Ministry of Planning
and National Development. 15. Sculling, M. and Mpunami, A (1991): Lethal Yellowing disease of Coconut in Global Perspective. 16. UNEP (1998): East Africa Atlas of Coastal Resources 1: Kenya. UNEP, Nairobi, Kenya. 17. Waijenberg, H.(1993) The Coconut Palm in Coast Province of Kenya, Tree of life and bone of
contention. PHD Thesis, Netherlands. 18. Warui, N and Gethi (1980): The History of Coconut Growing and Lethal disease in the Coastal
districts of Kenya. 19. The Nutritive Value of Coconut Toddy - BY P. C. LEONG (Department of Chemistry, University of
Malaya, Singapore). 20. Banzon JA and J Velasco,(1982) Coconut Production and Utilization. Philippine Coconut Research
and Development Foundation Inc. Publication, Metro Manila, Philippines: 349. 21. Faparusi SI Microflora of Fermenting Palm Wine. J. Food Science Technology. 22. The Coconut Committee (1971). The Philippines Recommends for Coconut (Philippines). 23. Recommends Series No. 2B/(1992). PCARRD, PARRFI and PCRDF, Los Banos, Laguna. 24. Cunningham AB and AS Wehmeyer (1988). Economic Botany, University of Cape Town. 25. Browning KC and CTS Symons (1961), Coconut Toddy in Ceylon. J. Sco. Chem. Ind. 26. www.asps-ke.org 27. www.bdafrica.com (Business Daily Newspaper published on 2 November 2009)
A B D / K C D A : C oc o nu t V al ue C h ai n A na l y s i s , A pr i l 2 0 1 0 F i n a l R e p or t - P r e p ar e d by I D M - Se r v i c e s
79
Annex 2: SURVEY INSTRUMENTS Nut Value Chain Analysis
Study Methodology & Instruments 1. Key players/actors in the sub sector targeted for interview/discussions 1.1 Direct actors
Input suppliers - Seedlings suppliers – any large ones; who else - What other inputs at production level– any use of agrochemicals - Inputs at harvesting time – knives etc - Inputs at de-husking level - Inputs at product assembly level – baskets – what sizes; which commonest
Producers (how many production clusters on the ground – Coconut Report 2007 - Small scale producers – up to how many trees? – what characterizes production - Medium scale producers – how many trees? what peculiarities? - Large scale producers - plantations – Msambweni Devt. Company, others - Producer groups - any producer groups/associations/cooperatives (now/in the past?)
Harvesting - Who are the harvesters? - Any different categories (traditional/indigenous; modern etc? - What characterizes them – age, tribe, education etc. - Any groups/association?
De-husking - Who does de-husking? - Any different categories? - When is de-husking done?
Product assembly (bulking) - Who does bulking at the local/village level – association or traders/agents? - Are there specific bulking points within each of the clusters - Any organization at this level?
Transporters - Transporters to bulking points - Transporters to distribution points (to Msa, malindi etc) - Distribution from wholesale points in urban areas to consumption points
Processors - Desiccated coconut processors - Copra processors - By product processors
o Husk o Shell
Distributors/wholesalers (all product lines – nut; desiccated nut products; copra products; husk products; shell products) - Who does wholesaling/ distributions – from clusters to urban markets; are they agents or they are also
the wholesalers; - Who do they distribute to? - Are there specific points where distribution/wholesaling is done from?
Retailers - Rural households - Urban consumers
o Traditional coconut consumers o Upcountry coconut consumers
- Other coconut products markets
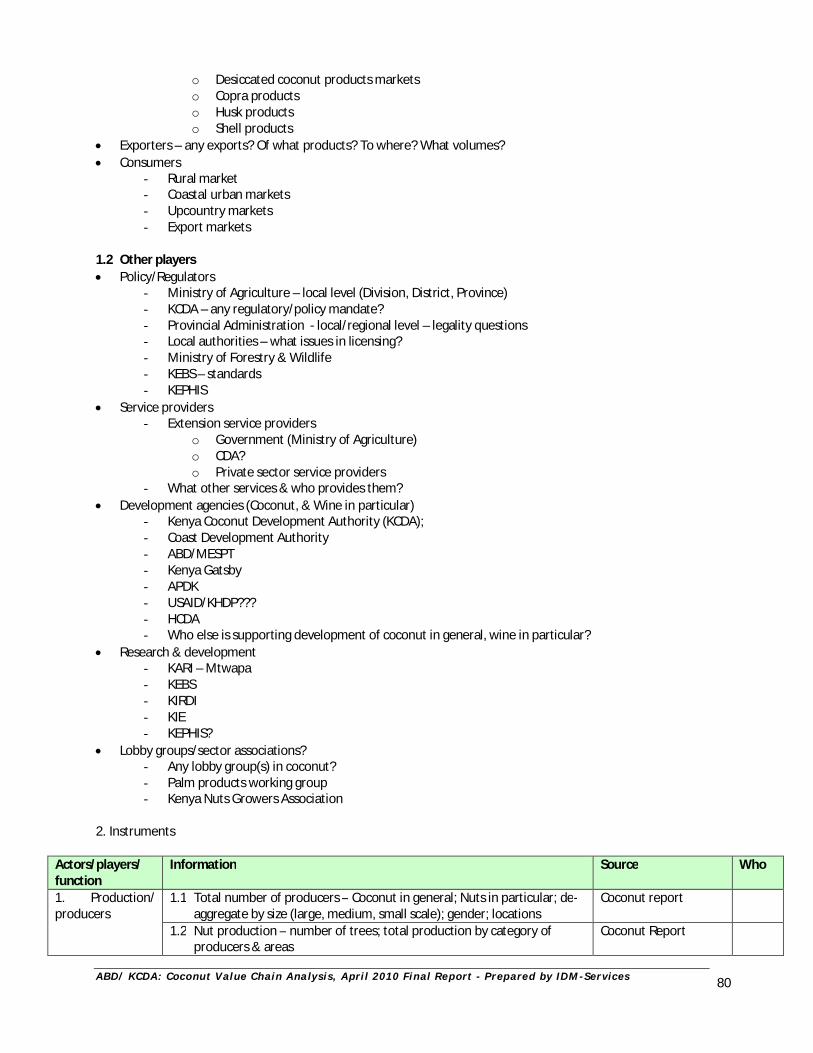
A B D / K C D A : C oc o nu t V al ue C h ai n A na l y s i s , A pr i l 2 0 1 0 F i n a l R e p or t - P r e p ar e d by I D M - Se r v i c e s
80
o Desiccated coconut products markets o Copra products o Husk products o Shell products
Exporters – any exports? Of what products? To where? What volumes? Consumers
- Rural market - Coastal urban markets - Upcountry markets - Export markets
1.2 Other players Policy/Regulators
- Ministry of Agriculture – local level (Division, District, Province) - KCDA – any regulatory/policy mandate? - Provincial Administration - local/regional level – legality questions - Local authorities – what issues in licensing? - Ministry of Forestry & Wildlife - KEBS – standards - KEPHIS
Service providers - Extension service providers
o Government (Ministry of Agriculture) o CDA? o Private sector service providers
- What other services & who provides them? Development agencies (Coconut, & Wine in particular)
- Kenya Coconut Development Authority (KCDA); - Coast Development Authority - ABD/MESPT - Kenya Gatsby - APDK - USAID/KHDP??? - HCDA - Who else is supporting development of coconut in general, wine in particular?
Research & development - KARI – Mtwapa - KEBS - KIRDI - KIE - KEPHIS?
Lobby groups/sector associations? - Any lobby group(s) in coconut? - Palm products working group - Kenya Nuts Growers Association
2. Instruments
Actors/players/ function
Information Source Who
1. Production/ producers
1.1 Total number of producers – Coconut in general; Nuts in particular; de-aggregate by size (large, medium, small scale); gender; locations
Coconut report
1.2 Nut production – number of trees; total production by category of producers & areas
Coconut Report
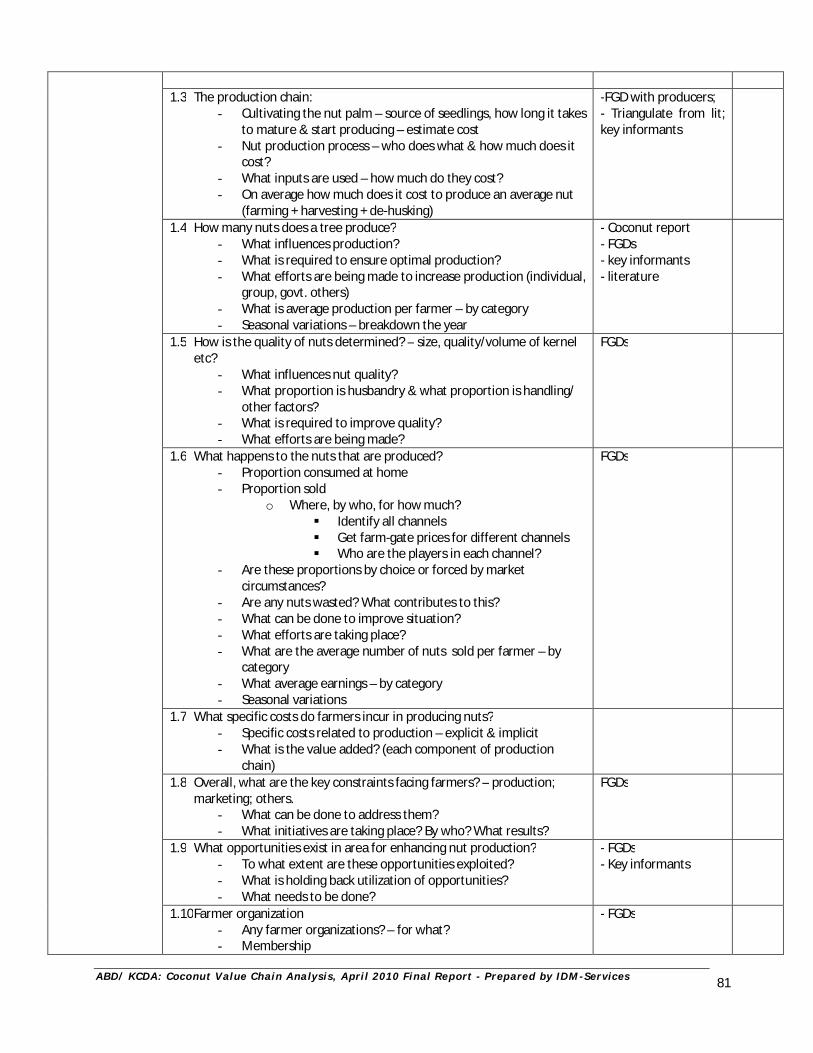
A B D / K C D A : C oc o nu t V al ue C h ai n A na l y s i s , A pr i l 2 0 1 0 F i n a l R e p or t - P r e p ar e d by I D M - Se r v i c e s
81
1.3 The production chain:
- Cultivating the nut palm – source of seedlings, how long it takes to mature & start producing – estimate cost
- Nut production process – who does what & how much does it cost?
- What inputs are used – how much do they cost? - On average how much does it cost to produce an average nut
(farming + harvesting + de-husking)
-FGD with producers; - Triangulate from lit; key informants
1.4 How many nuts does a tree produce? - What influences production? - What is required to ensure optimal production? - What efforts are being made to increase production (individual,
group, govt. others) - What is average production per farmer – by category - Seasonal variations – breakdown the year
- Coconut report - FGDs - key informants - literature
1.5 How is the quality of nuts determined? – size, quality/volume of kernel etc?
- What influences nut quality? - What proportion is husbandry & what proportion is handling/
other factors? - What is required to improve quality? - What efforts are being made?
FGDs
1.6 What happens to the nuts that are produced? - Proportion consumed at home - Proportion sold
o Where, by who, for how much? Identify all channels Get farm-gate prices for different channels Who are the players in each channel?
- Are these proportions by choice or forced by market circumstances?
- Are any nuts wasted? What contributes to this? - What can be done to improve situation? - What efforts are taking place? - What are the average number of nuts sold per farmer – by
category - What average earnings – by category - Seasonal variations
FGDs
1.7 What specific costs do farmers incur in producing nuts? - Specific costs related to production – explicit & implicit - What is the value added? (each component of production
chain)
1.8 Overall, what are the key constraints facing farmers? – production; marketing; others.
- What can be done to address them? - What initiatives are taking place? By who? What results?
FGDs
1.9 What opportunities exist in area for enhancing nut production? - To what extent are these opportunities exploited? - What is holding back utilization of opportunities? - What needs to be done?
- FGDs - Key informants
1.10 Farmer organization - Any farmer organizations? – for what? - Membership
- FGDs
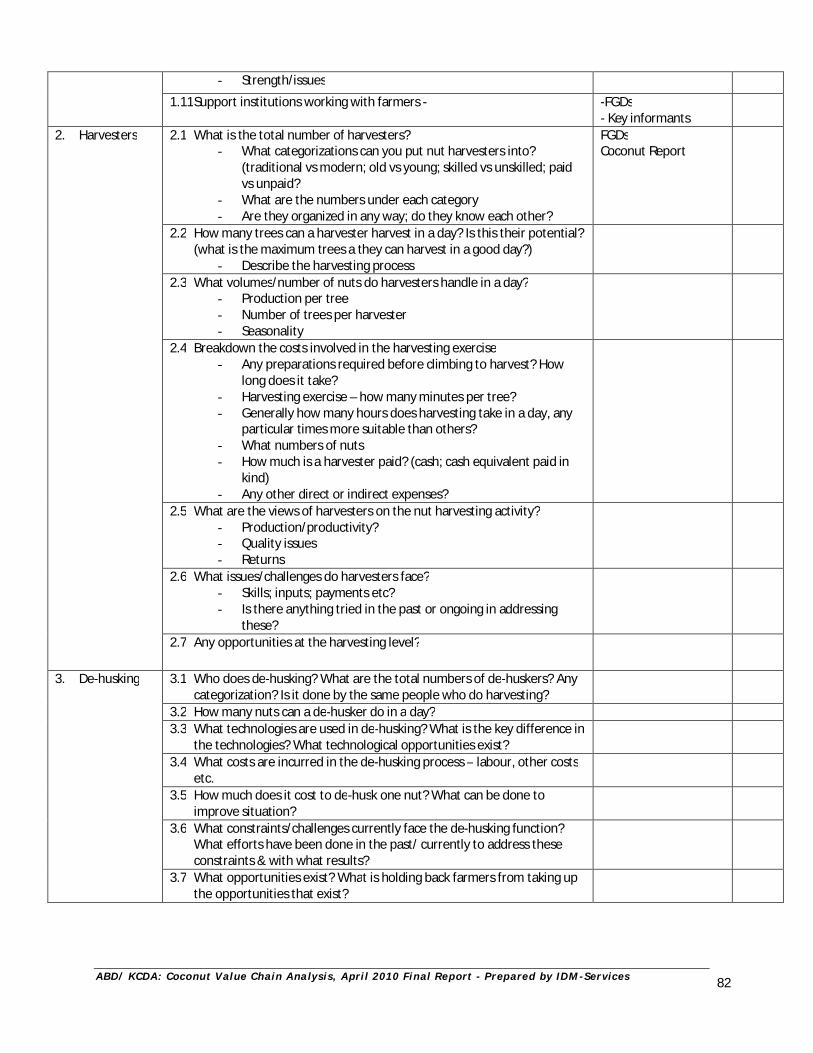
A B D / K C D A : C oc o nu t V al ue C h ai n A na l y s i s , A pr i l 2 0 1 0 F i n a l R e p or t - P r e p ar e d by I D M - Se r v i c e s
82
- Strength/issues
1.11 Support institutions working with farmers - -FGDs - Key informants
2. Harvesters 2.1 What is the total number of harvesters? - What categorizations can you put nut harvesters into?
(traditional vs modern; old vs young; skilled vs unskilled; paid vs unpaid?
- What are the numbers under each category - Are they organized in any way; do they know each other?
FGDs Coconut Report
2.2 How many trees can a harvester harvest in a day? Is this their potential? (what is the maximum trees a they can harvest in a good day?)
- Describe the harvesting process
2.3 What volumes/number of nuts do harvesters handle in a day? - Production per tree - Number of trees per harvester - Seasonality
2.4 Breakdown the costs involved in the harvesting exercise - Any preparations required before climbing to harvest? How
long does it take? - Harvesting exercise – how many minutes per tree? - Generally how many hours does harvesting take in a day, any
particular times more suitable than others? - What numbers of nuts - How much is a harvester paid? (cash; cash equivalent paid in
kind) - Any other direct or indirect expenses?
2.5 What are the views of harvesters on the nut harvesting activity? - Production/productivity? - Quality issues - Returns
2.6 What issues/challenges do harvesters face? - Skills; inputs; payments etc? - Is there anything tried in the past or ongoing in addressing
these?
2.7 Any opportunities at the harvesting level?
3. De-husking 3.1 Who does de-husking? What are the total numbers of de-huskers? Any categorization? Is it done by the same people who do harvesting?
3.2 How many nuts can a de-husker do in a day? 3.3 What technologies are used in de-husking? What is the key difference in
the technologies? What technological opportunities exist?
3.4 What costs are incurred in the de-husking process – labour, other costs etc.
3.5 How much does it cost to de-husk one nut? What can be done to improve situation?
3.6 What constraints/challenges currently face the de-husking function? What efforts have been done in the past/ currently to address these constraints & with what results?
3.7 What opportunities exist? What is holding back farmers from taking up the opportunities that exist?
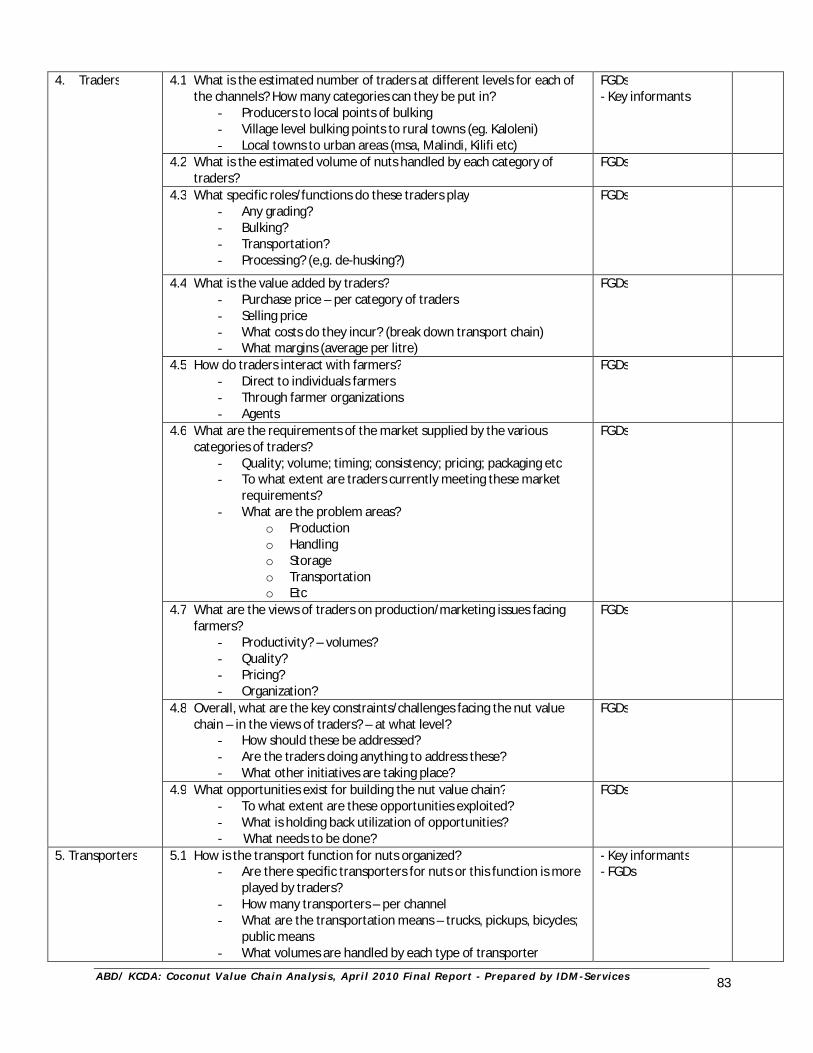
A B D / K C D A : C oc o nu t V al ue C h ai n A na l y s i s , A pr i l 2 0 1 0 F i n a l R e p or t - P r e p ar e d by I D M - Se r v i c e s
83
4. Traders 4.1 What is the estimated number of traders at different levels for each of the channels? How many categories can they be put in?
- Producers to local points of bulking - Village level bulking points to rural towns (eg. Kaloleni) - Local towns to urban areas (msa, Malindi, Kilifi etc)
FGDs - Key informants
4.2 What is the estimated volume of nuts handled by each category of traders?
FGDs
4.3 What specific roles/functions do these traders play - Any grading? - Bulking? - Transportation? - Processing? (e,g. de-husking?)
FGDs
4.4 What is the value added by traders? - Purchase price – per category of traders - Selling price - What costs do they incur? (break down transport chain) - What margins (average per litre)
FGDs
4.5 How do traders interact with farmers? - Direct to individuals farmers - Through farmer organizations - Agents
FGDs
4.6 What are the requirements of the market supplied by the various categories of traders?
- Quality; volume; timing; consistency; pricing; packaging etc - To what extent are traders currently meeting these market
requirements? - What are the problem areas?
o Production o Handling o Storage o Transportation o Etc
FGDs
4.7 What are the views of traders on production/marketing issues facing farmers?
- Productivity? – volumes? - Quality? - Pricing? - Organization?
FGDs
4.8 Overall, what are the key constraints/challenges facing the nut value chain – in the views of traders? – at what level?
- How should these be addressed? - Are the traders doing anything to address these? - What other initiatives are taking place?
FGDs
4.9 What opportunities exist for building the nut value chain? - To what extent are these opportunities exploited? - What is holding back utilization of opportunities? - What needs to be done?
FGDs
5. Transporters
5.1 How is the transport function for nuts organized? - Are there specific transporters for nuts or this function is more
played by traders? - How many transporters – per channel - What are the transportation means – trucks, pickups, bicycles;
public means - What volumes are handled by each type of transporter
- Key informants - FGDs
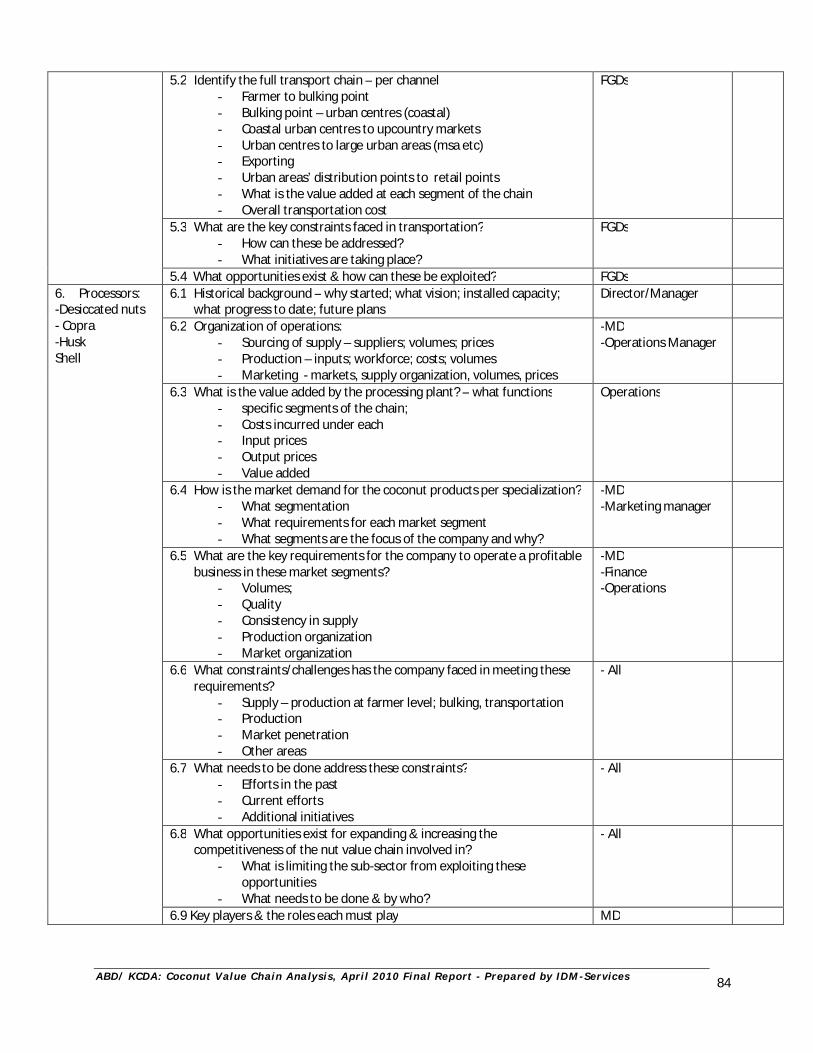
A B D / K C D A : C oc o nu t V al ue C h ai n A na l y s i s , A pr i l 2 0 1 0 F i n a l R e p or t - P r e p ar e d by I D M - Se r v i c e s
84
5.2 Identify the full transport chain – per channel - Farmer to bulking point - Bulking point – urban centres (coastal) - Coastal urban centres to upcountry markets - Urban centres to large urban areas (msa etc) - Exporting - Urban areas’ distribution points to retail points - What is the value added at each segment of the chain - Overall transportation cost
FGDs
5.3 What are the key constraints faced in transportation? - How can these be addressed? - What initiatives are taking place?
FGDs
5.4 What opportunities exist & how can these be exploited? FGDs 6. Processors: -Desiccated nuts - Copra -Husk Shell
6.1 Historical background – why started; what vision; installed capacity; what progress to date; future plans
Director/Manager
6.2 Organization of operations: - Sourcing of supply – suppliers; volumes; prices - Production – inputs; workforce; costs; volumes - Marketing - markets, supply organization, volumes, prices
-MD -Operations Manager
6.3 What is the value added by the processing plant? – what functions - specific segments of the chain; - Costs incurred under each - Input prices - Output prices - Value added
Operations
6.4 How is the market demand for the coconut products per specialization? - What segmentation - What requirements for each market segment - What segments are the focus of the company and why?
-MD -Marketing manager
6.5 What are the key requirements for the company to operate a profitable business in these market segments?
- Volumes; - Quality - Consistency in supply - Production organization - Market organization
-MD -Finance -Operations
6.6 What constraints/challenges has the company faced in meeting these requirements?
- Supply – production at farmer level; bulking, transportation - Production - Market penetration - Other areas
- All
6.7 What needs to be done address these constraints? - Efforts in the past - Current efforts - Additional initiatives
- All
6.8 What opportunities exist for expanding & increasing the competitiveness of the nut value chain involved in?
- What is limiting the sub-sector from exploiting these opportunities
- What needs to be done & by who?
- All
6.9 Key players & the roles each must play MD
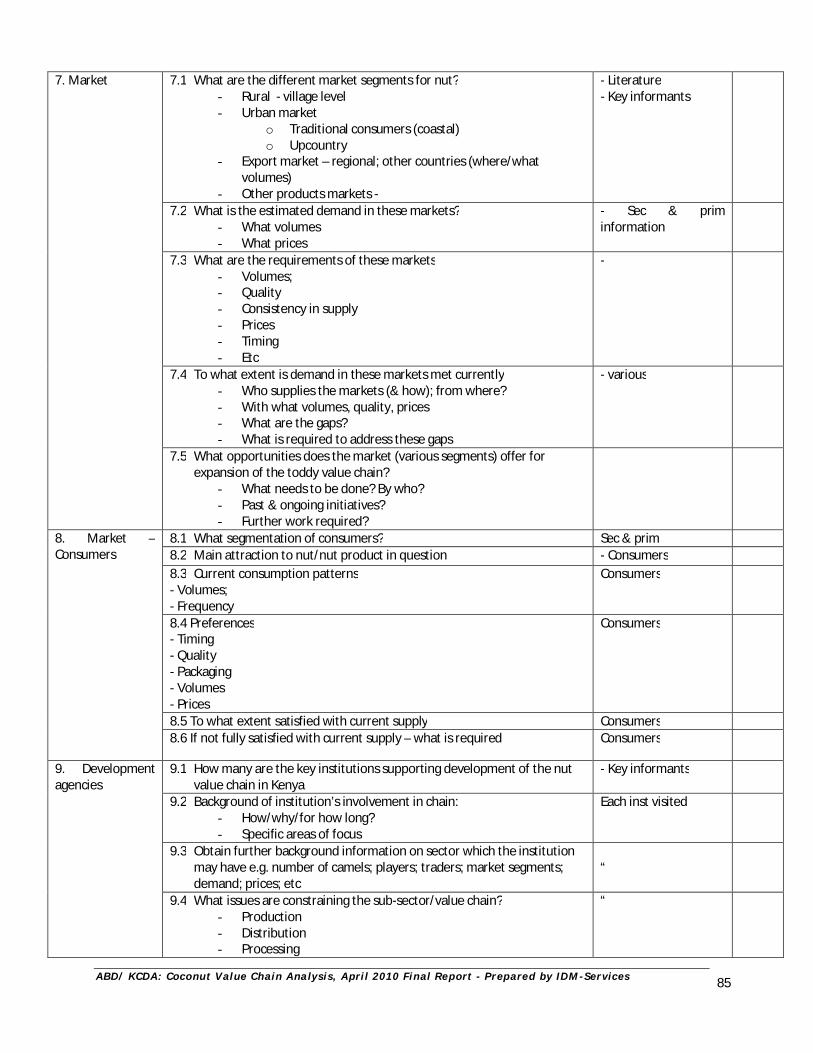
A B D / K C D A : C oc o nu t V al ue C h ai n A na l y s i s , A pr i l 2 0 1 0 F i n a l R e p or t - P r e p ar e d by I D M - Se r v i c e s
85
7. Market 7.1 What are the different market segments for nut? - Rural - village level - Urban market
o Traditional consumers (coastal) o Upcountry
- Export market – regional; other countries (where/what volumes)
- Other products markets -
- Literature - Key informants
7.2 What is the estimated demand in these markets? - What volumes - What prices
- Sec & prim information
7.3 What are the requirements of these markets - Volumes; - Quality - Consistency in supply - Prices - Timing - Etc
-
7.4 To what extent is demand in these markets met currently - Who supplies the markets (& how); from where? - With what volumes, quality, prices - What are the gaps? - What is required to address these gaps
- various
7.5 What opportunities does the market (various segments) offer for expansion of the toddy value chain?
- What needs to be done? By who? - Past & ongoing initiatives? - Further work required?
8. Market – Consumers
8.1 What segmentation of consumers? Sec & prim 8.2 Main attraction to nut/nut product in question - Consumers 8.3 Current consumption patterns - Volumes; - Frequency
Consumers
8.4 Preferences - Timing - Quality - Packaging - Volumes - Prices
Consumers
8.5 To what extent satisfied with current supply Consumers 8.6 If not fully satisfied with current supply – what is required Consumers
9. Development agencies
9.1 How many are the key institutions supporting development of the nut value chain in Kenya
- Key informants
9.2 Background of institution’s involvement in chain: - How/why/for how long? - Specific areas of focus
Each inst visited
9.3 Obtain further background information on sector which the institution may have e.g. number of camels; players; traders; market segments; demand; prices; etc
“
9.4 What issues are constraining the sub-sector/value chain? - Production - Distribution - Processing
“
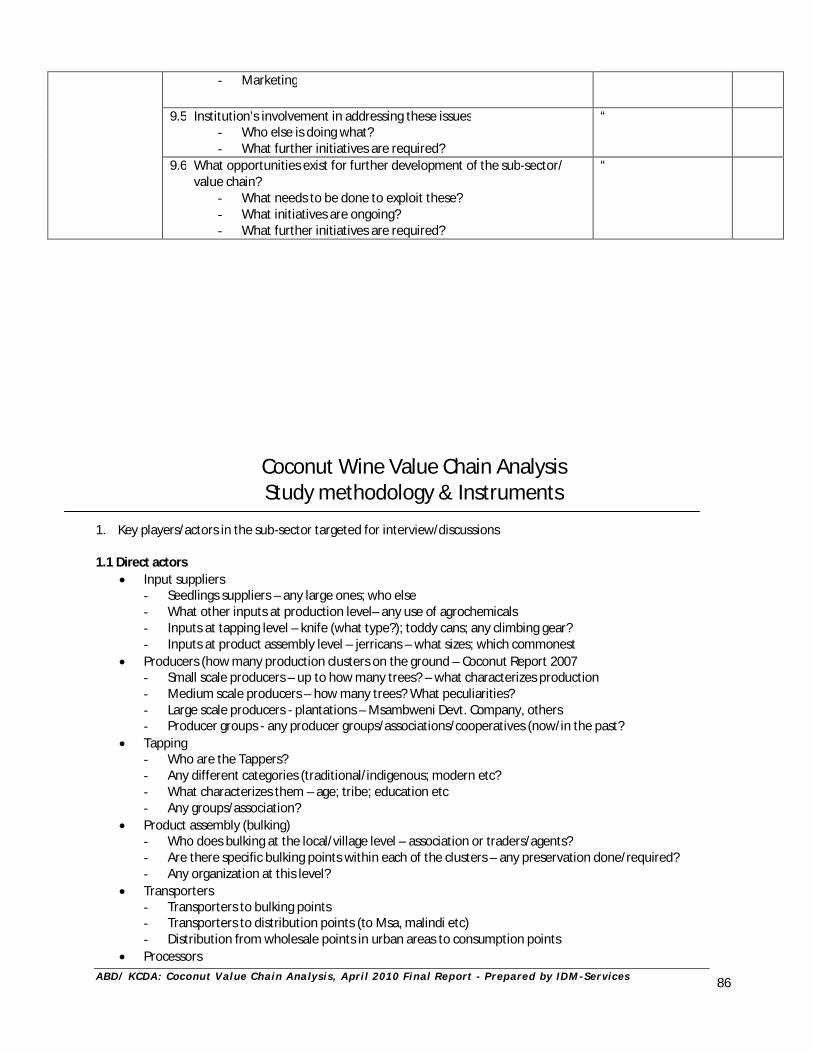
A B D / K C D A : C oc o nu t V al ue C h ai n A na l y s i s , A pr i l 2 0 1 0 F i n a l R e p or t - P r e p ar e d by I D M - Se r v i c e s
86
- Marketing
9.5 Institution’s involvement in addressing these issues - Who else is doing what? - What further initiatives are required?
“
9.6 What opportunities exist for further development of the sub-sector/ value chain?
- What needs to be done to exploit these? - What initiatives are ongoing? - What further initiatives are required?
“
Coconut Wine Value Chain Analysis Study methodology & Instruments
1. Key players/actors in the sub-sector targeted for interview/discussions 1.1 Direct actors
Input suppliers - Seedlings suppliers – any large ones; who else - What other inputs at production level– any use of agrochemicals - Inputs at tapping level – knife (what type?); toddy cans; any climbing gear? - Inputs at product assembly level – jerricans – what sizes; which commonest
Producers (how many production clusters on the ground – Coconut Report 2007 - Small scale producers – up to how many trees? – what characterizes production - Medium scale producers – how many trees? What peculiarities? - Large scale producers - plantations – Msambweni Devt. Company, others - Producer groups - any producer groups/associations/cooperatives (now/in the past?
Tapping - Who are the Tappers? - Any different categories (traditional/indigenous; modern etc? - What characterizes them – age; tribe; education etc - Any groups/association?
Product assembly (bulking) - Who does bulking at the local/village level – association or traders/agents? - Are there specific bulking points within each of the clusters – any preservation done/required? - Any organization at this level?
Transporters - Transporters to bulking points - Transporters to distribution points (to Msa, malindi etc) - Distribution from wholesale points in urban areas to consumption points
Processors
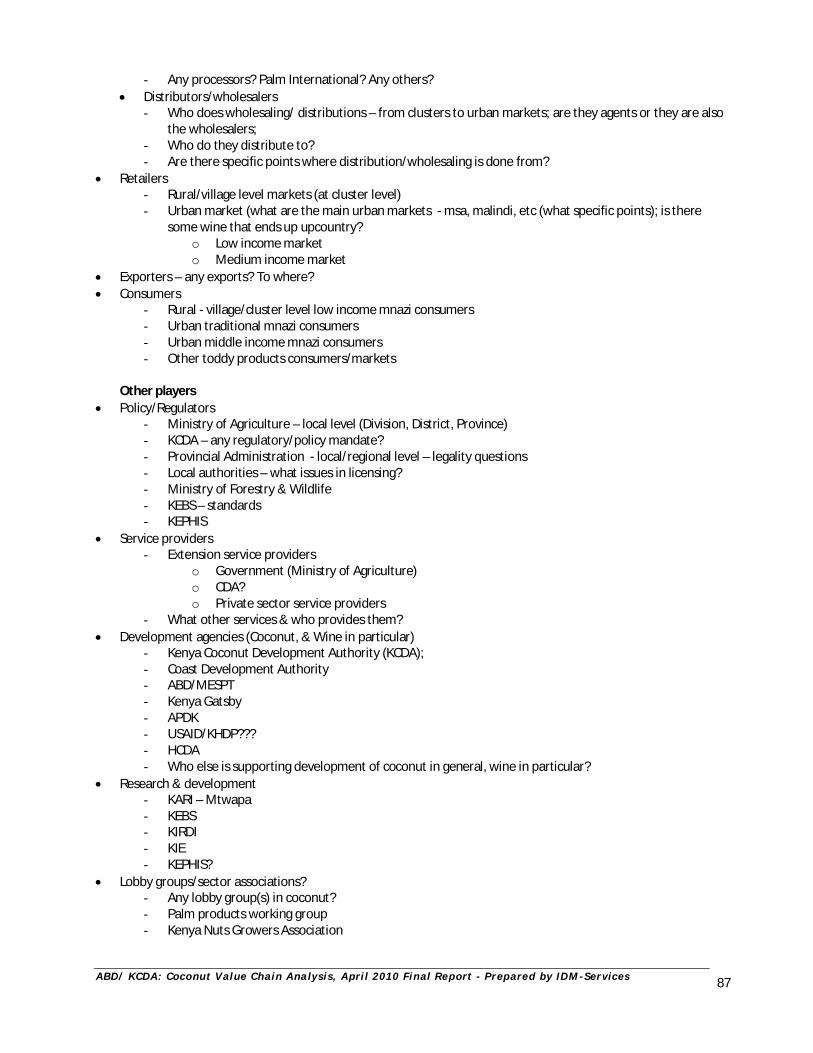
A B D / K C D A : C oc o nu t V al ue C h ai n A na l y s i s , A pr i l 2 0 1 0 F i n a l R e p or t - P r e p ar e d by I D M - Se r v i c e s
87
- Any processors? Palm International? Any others? Distributors/wholesalers
- Who does wholesaling/ distributions – from clusters to urban markets; are they agents or they are also the wholesalers;
- Who do they distribute to? - Are there specific points where distribution/wholesaling is done from?
Retailers - Rural/village level markets (at cluster level) - Urban market (what are the main urban markets - msa, malindi, etc (what specific points); is there
some wine that ends up upcountry? o Low income market o Medium income market
Exporters – any exports? To where? Consumers
- Rural - village/cluster level low income mnazi consumers - Urban traditional mnazi consumers - Urban middle income mnazi consumers - Other toddy products consumers/markets
Other players Policy/Regulators
- Ministry of Agriculture – local level (Division, District, Province) - KCDA – any regulatory/policy mandate? - Provincial Administration - local/regional level – legality questions - Local authorities – what issues in licensing? - Ministry of Forestry & Wildlife - KEBS – standards - KEPHIS
Service providers - Extension service providers
o Government (Ministry of Agriculture) o CDA? o Private sector service providers
- What other services & who provides them? Development agencies (Coconut, & Wine in particular)
- Kenya Coconut Development Authority (KCDA); - Coast Development Authority - ABD/MESPT - Kenya Gatsby - APDK - USAID/KHDP??? - HCDA - Who else is supporting development of coconut in general, wine in particular?
Research & development - KARI – Mtwapa - KEBS - KIRDI - KIE - KEPHIS?
Lobby groups/sector associations? - Any lobby group(s) in coconut? - Palm products working group - Kenya Nuts Growers Association
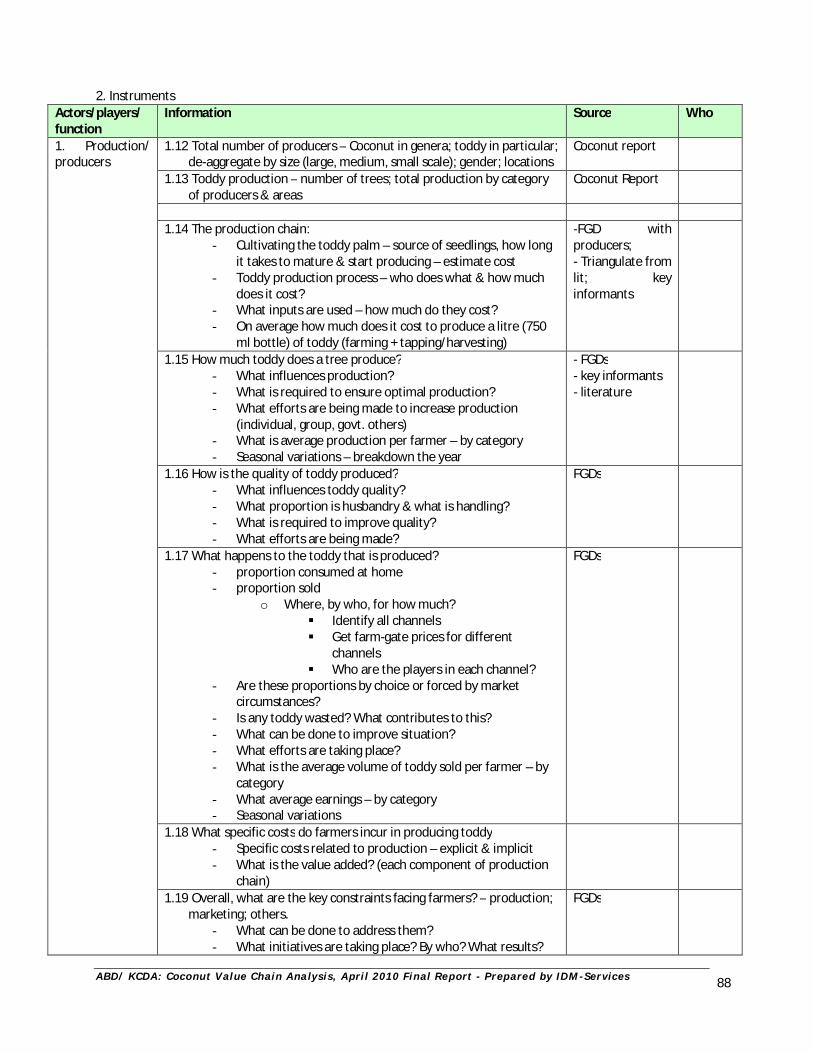
A B D / K C D A : C oc o nu t V al ue C h ai n A na l y s i s , A pr i l 2 0 1 0 F i n a l R e p or t - P r e p ar e d by I D M - Se r v i c e s
88
2. Instruments
Actors/players/ function
Information Source Who
1. Production/ producers
1.12 Total number of producers – Coconut in genera; toddy in particular; de-aggregate by size (large, medium, small scale); gender; locations
Coconut report
1.13 Toddy production – number of trees; total production by category of producers & areas
Coconut Report
1.14 The production chain:
- Cultivating the toddy palm – source of seedlings, how long it takes to mature & start producing – estimate cost
- Toddy production process – who does what & how much does it cost?
- What inputs are used – how much do they cost? - On average how much does it cost to produce a litre (750
ml bottle) of toddy (farming + tapping/harvesting)
-FGD with producers; - Triangulate from lit; key informants
1.15 How much toddy does a tree produce? - What influences production? - What is required to ensure optimal production? - What efforts are being made to increase production
(individual, group, govt. others) - What is average production per farmer – by category - Seasonal variations – breakdown the year
- FGDs - key informants - literature
1.16 How is the quality of toddy produced? - What influences toddy quality? - What proportion is husbandry & what is handling? - What is required to improve quality? - What efforts are being made?
FGDs
1.17 What happens to the toddy that is produced? - proportion consumed at home - proportion sold
o Where, by who, for how much? Identify all channels Get farm-gate prices for different
channels Who are the players in each channel?
- Are these proportions by choice or forced by market circumstances?
- Is any toddy wasted? What contributes to this? - What can be done to improve situation? - What efforts are taking place? - What is the average volume of toddy sold per farmer – by
category - What average earnings – by category - Seasonal variations
FGDs
1.18 What specific costs do farmers incur in producing toddy - Specific costs related to production – explicit & implicit - What is the value added? (each component of production
chain)
1.19 Overall, what are the key constraints facing farmers? – production; marketing; others.
- What can be done to address them? - What initiatives are taking place? By who? What results?
FGDs
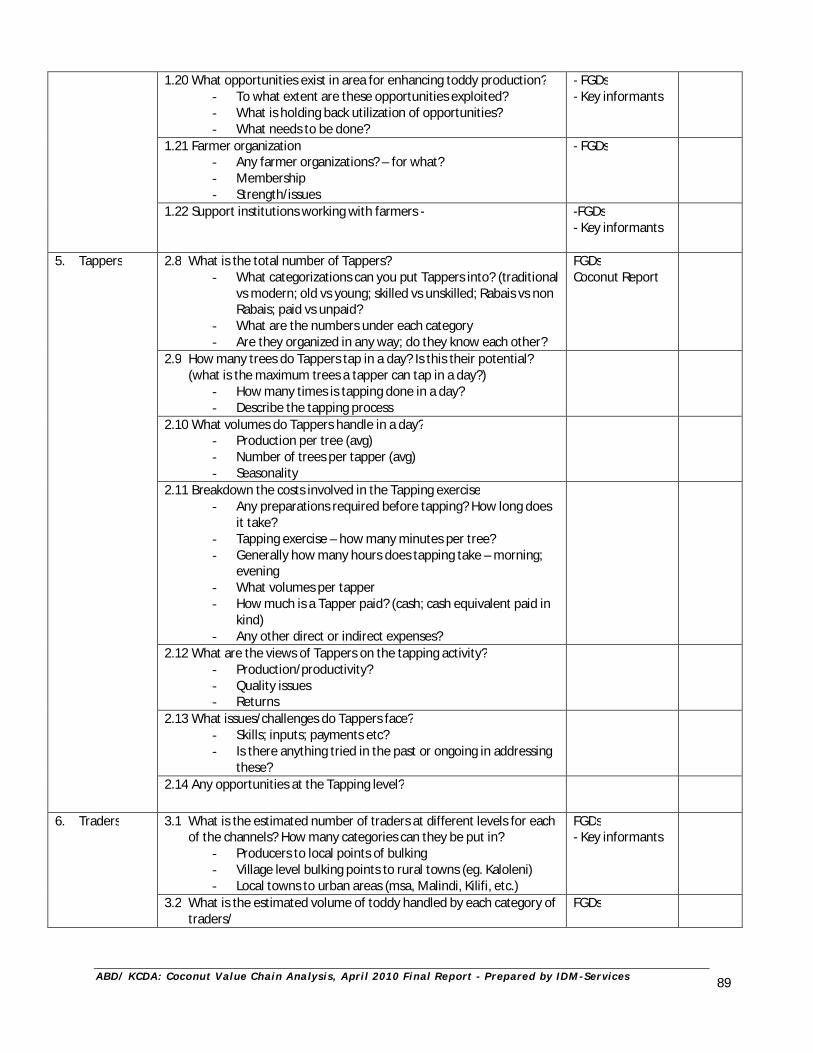
A B D / K C D A : C oc o nu t V al ue C h ai n A na l y s i s , A pr i l 2 0 1 0 F i n a l R e p or t - P r e p ar e d by I D M - Se r v i c e s
89
1.20 What opportunities exist in area for enhancing toddy production? - To what extent are these opportunities exploited? - What is holding back utilization of opportunities? - What needs to be done?
- FGDs - Key informants
1.21 Farmer organization - Any farmer organizations? – for what? - Membership - Strength/issues
- FGDs
1.22 Support institutions working with farmers - -FGDs - Key informants
5. Tappers 2.8 What is the total number of Tappers? - What categorizations can you put Tappers into? (traditional
vs modern; old vs young; skilled vs unskilled; Rabais vs non Rabais; paid vs unpaid?
- What are the numbers under each category - Are they organized in any way; do they know each other?
FGDs Coconut Report
2.9 How many trees do Tappers tap in a day? Is this their potential? (what is the maximum trees a tapper can tap in a day?)
- How many times is tapping done in a day? - Describe the tapping process
2.10 What volumes do Tappers handle in a day? - Production per tree (avg) - Number of trees per tapper (avg) - Seasonality
2.11 Breakdown the costs involved in the Tapping exercise - Any preparations required before tapping? How long does
it take? - Tapping exercise – how many minutes per tree? - Generally how many hours does tapping take – morning;
evening - What volumes per tapper - How much is a Tapper paid? (cash; cash equivalent paid in
kind) - Any other direct or indirect expenses?
2.12 What are the views of Tappers on the tapping activity? - Production/productivity? - Quality issues - Returns
2.13 What issues/challenges do Tappers face? - Skills; inputs; payments etc? - Is there anything tried in the past or ongoing in addressing
these?
2.14 Any opportunities at the Tapping level?
6. Traders 3.1 What is the estimated number of traders at different levels for each of the channels? How many categories can they be put in?
- Producers to local points of bulking - Village level bulking points to rural towns (eg. Kaloleni) - Local towns to urban areas (msa, Malindi, Kilifi, etc.)
FGDs - Key informants
3.2 What is the estimated volume of toddy handled by each category of traders/
FGDs
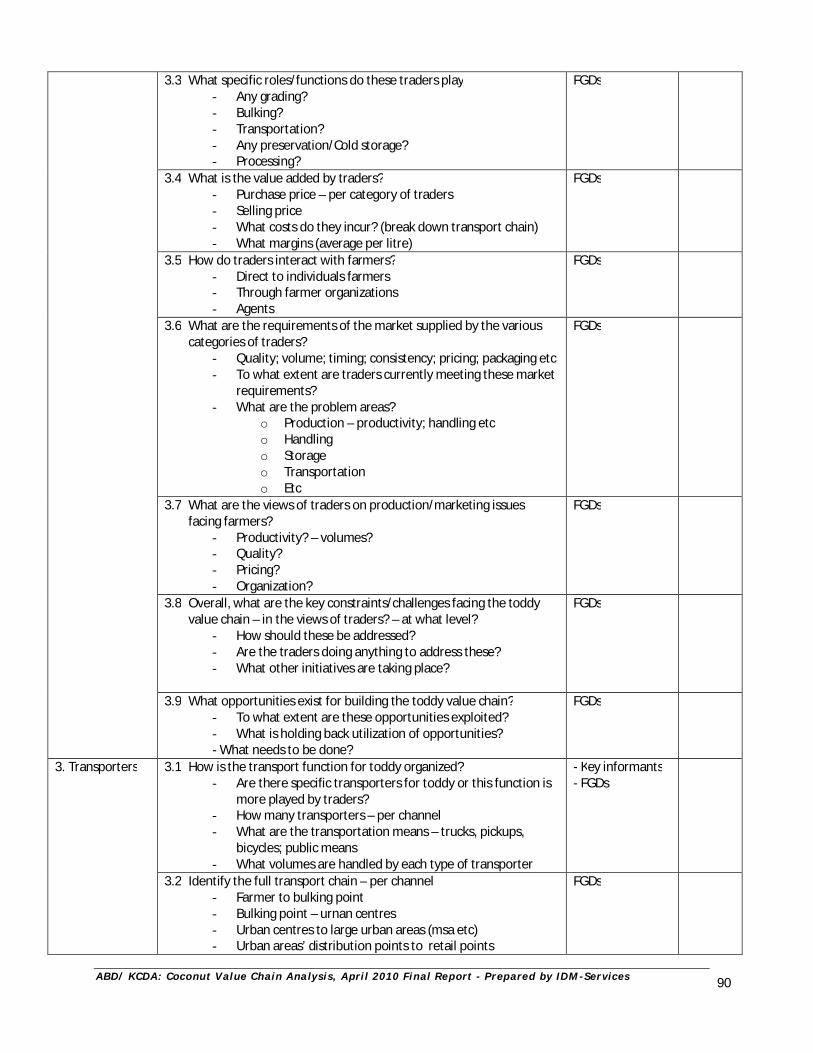
A B D / K C D A : C oc o nu t V al ue C h ai n A na l y s i s , A pr i l 2 0 1 0 F i n a l R e p or t - P r e p ar e d by I D M - Se r v i c e s
90
3.3 What specific roles/functions do these traders play - Any grading? - Bulking? - Transportation? - Any preservation/Cold storage? - Processing?
FGDs
3.4 What is the value added by traders? - Purchase price – per category of traders - Selling price - What costs do they incur? (break down transport chain) - What margins (average per litre)
FGDs
3.5 How do traders interact with farmers? - Direct to individuals farmers - Through farmer organizations - Agents
FGDs
3.6 What are the requirements of the market supplied by the various categories of traders?
- Quality; volume; timing; consistency; pricing; packaging etc - To what extent are traders currently meeting these market
requirements? - What are the problem areas?
o Production – productivity; handling etc o Handling o Storage o Transportation o Etc
FGDs
3.7 What are the views of traders on production/marketing issues facing farmers?
- Productivity? – volumes? - Quality? - Pricing? - Organization?
FGDs
3.8 Overall, what are the key constraints/challenges facing the toddy value chain – in the views of traders? – at what level?
- How should these be addressed? - Are the traders doing anything to address these? - What other initiatives are taking place?
FGDs
3.9 What opportunities exist for building the toddy value chain? - To what extent are these opportunities exploited? - What is holding back utilization of opportunities? - What needs to be done?
FGDs
3. Transporters
3.1 How is the transport function for toddy organized? - Are there specific transporters for toddy or this function is
more played by traders? - How many transporters – per channel - What are the transportation means – trucks, pickups,
bicycles; public means - What volumes are handled by each type of transporter
- Key informants - FGDs
3.2 Identify the full transport chain – per channel - Farmer to bulking point - Bulking point – urnan centres - Urban centres to large urban areas (msa etc) - Urban areas’ distribution points to retail points
FGDs
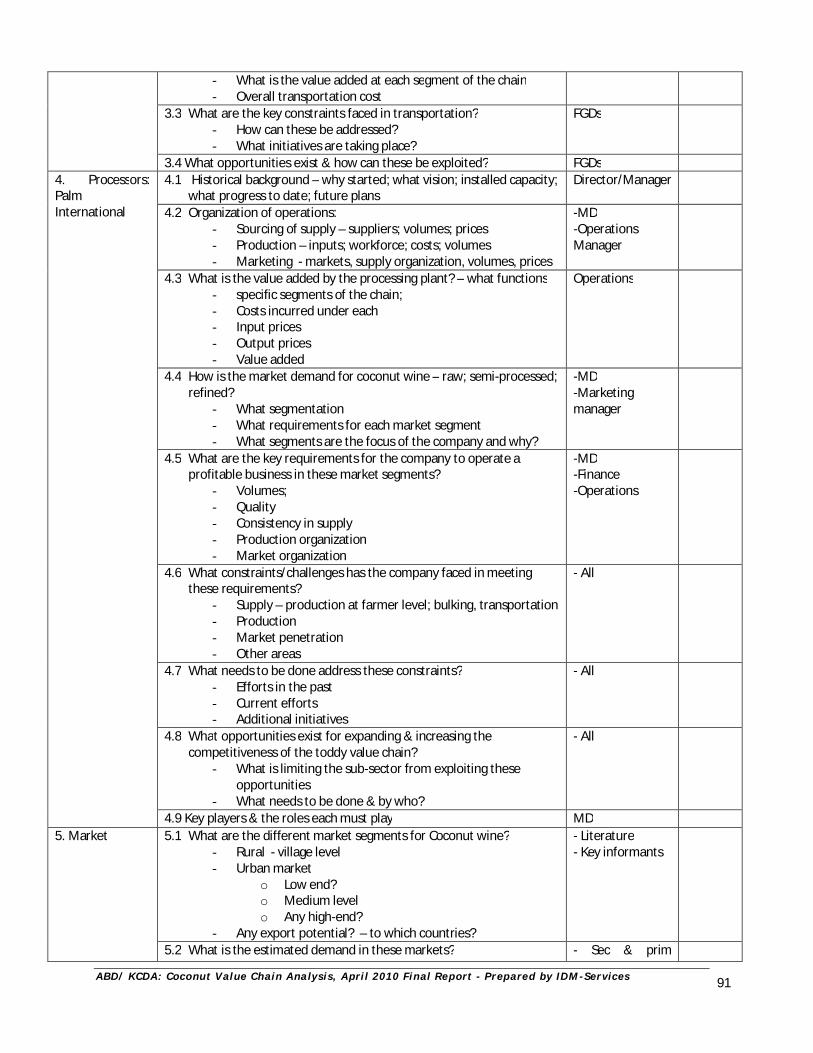
A B D / K C D A : C oc o nu t V al ue C h ai n A na l y s i s , A pr i l 2 0 1 0 F i n a l R e p or t - P r e p ar e d by I D M - Se r v i c e s
91
- What is the value added at each segment of the chain - Overall transportation cost
3.3 What are the key constraints faced in transportation? - How can these be addressed? - What initiatives are taking place?
FGDs
3.4 What opportunities exist & how can these be exploited? FGDs 4. Processors: Palm International
4.1 Historical background – why started; what vision; installed capacity; what progress to date; future plans
Director/Manager
4.2 Organization of operations: - Sourcing of supply – suppliers; volumes; prices - Production – inputs; workforce; costs; volumes - Marketing - markets, supply organization, volumes, prices
-MD -Operations Manager
4.3 What is the value added by the processing plant? – what functions - specific segments of the chain; - Costs incurred under each - Input prices - Output prices - Value added
Operations
4.4 How is the market demand for coconut wine – raw; semi-processed; refined?
- What segmentation - What requirements for each market segment - What segments are the focus of the company and why?
-MD -Marketing manager
4.5 What are the key requirements for the company to operate a profitable business in these market segments?
- Volumes; - Quality - Consistency in supply - Production organization - Market organization
-MD -Finance -Operations
4.6 What constraints/challenges has the company faced in meeting these requirements?
- Supply – production at farmer level; bulking, transportation - Production - Market penetration - Other areas
- All
4.7 What needs to be done address these constraints? - Efforts in the past - Current efforts - Additional initiatives
- All
4.8 What opportunities exist for expanding & increasing the competitiveness of the toddy value chain?
- What is limiting the sub-sector from exploiting these opportunities
- What needs to be done & by who?
- All
4.9 Key players & the roles each must play MD 5. Market 5.1 What are the different market segments for Coconut wine?
- Rural - village level - Urban market
o Low end? o Medium level o Any high-end?
- Any export potential? – to which countries?
- Literature - Key informants
5.2 What is the estimated demand in these markets? - Sec & prim
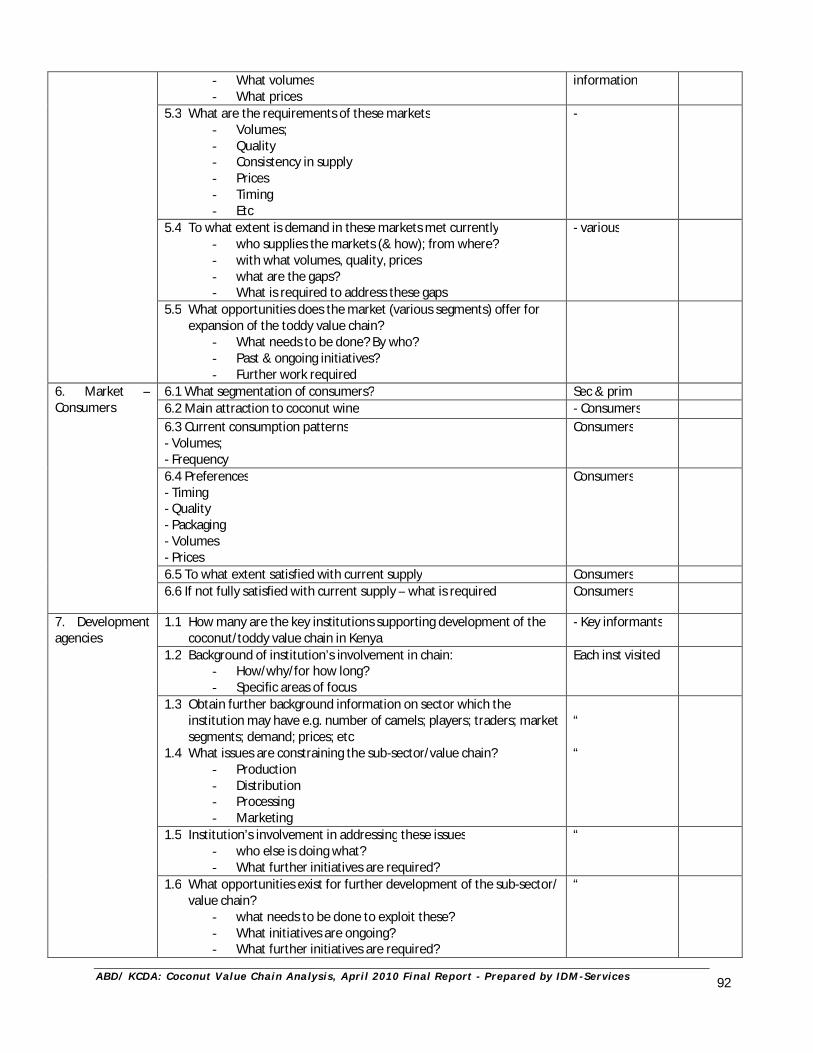
A B D / K C D A : C oc o nu t V al ue C h ai n A na l y s i s , A pr i l 2 0 1 0 F i n a l R e p or t - P r e p ar e d by I D M - Se r v i c e s
92
- What volumes - What prices
information
5.3 What are the requirements of these markets - Volumes; - Quality - Consistency in supply - Prices - Timing - Etc
-
5.4 To what extent is demand in these markets met currently - who supplies the markets (& how); from where? - with what volumes, quality, prices - what are the gaps? - What is required to address these gaps
- various
5.5 What opportunities does the market (various segments) offer for expansion of the toddy value chain?
- What needs to be done? By who? - Past & ongoing initiatives? - Further work required
6. Market – Consumers
6.1 What segmentation of consumers? Sec & prim 6.2 Main attraction to coconut wine - Consumers 6.3 Current consumption patterns - Volumes; - Frequency
Consumers
6.4 Preferences - Timing - Quality - Packaging - Volumes - Prices
Consumers
6.5 To what extent satisfied with current supply Consumers 6.6 If not fully satisfied with current supply – what is required Consumers
7. Development agencies
1.1 How many are the key institutions supporting development of the coconut/toddy value chain in Kenya
- Key informants
1.2 Background of institution’s involvement in chain: - How/why/for how long? - Specific areas of focus
Each inst visited
1.3 Obtain further background information on sector which the institution may have e.g. number of camels; players; traders; market segments; demand; prices; etc
1.4 What issues are constraining the sub-sector/value chain? - Production - Distribution - Processing - Marketing
“ “
1.5 Institution’s involvement in addressing these issues - who else is doing what? - What further initiatives are required?
“
1.6 What opportunities exist for further development of the sub-sector/ value chain?
- what needs to be done to exploit these? - What initiatives are ongoing? - What further initiatives are required?
“
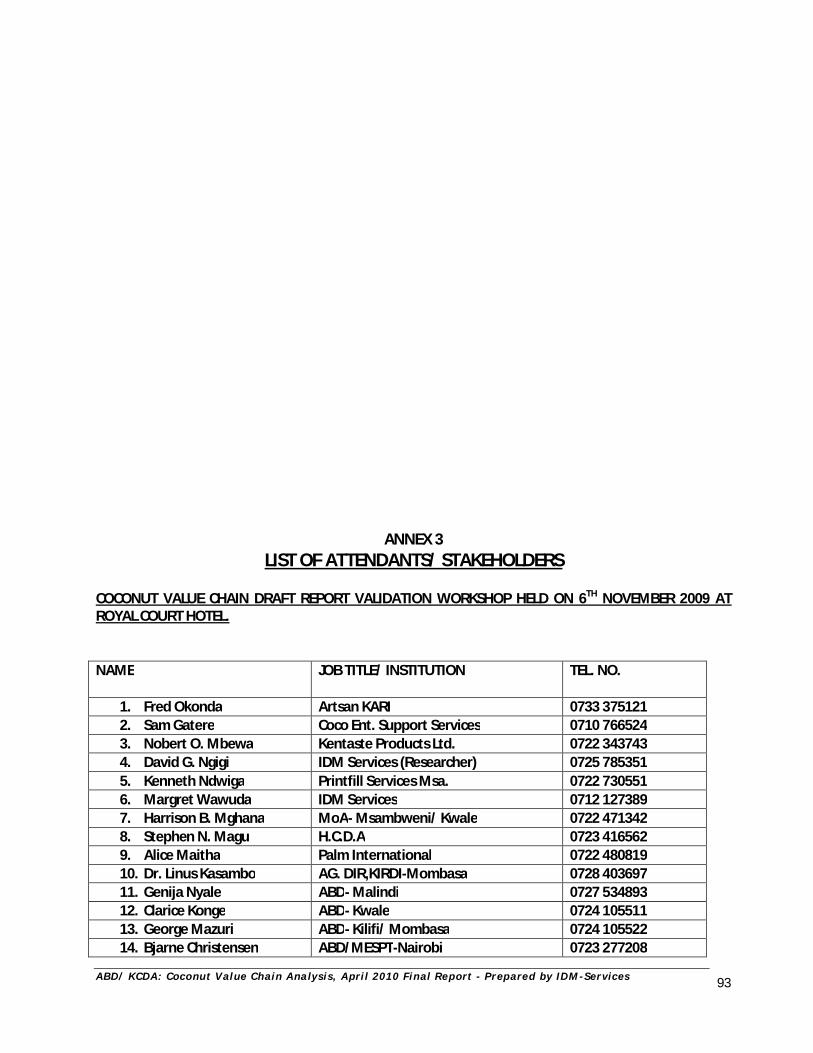
A B D / K C D A : C oc o nu t V al ue C h ai n A na l y s i s , A pr i l 2 0 1 0 F i n a l R e p or t - P r e p ar e d by I D M - Se r v i c e s
93
ANNEX 3 LIST OF ATTENDANTS/ STAKEHOLDERS
COCONUT VALUE CHAIN DRAFT REPORT VALIDATION WORKSHOP HELD ON 6TH NOVEMBER 2009 AT ROYAL COURT HOTEL. NAME JOB TITLE/ INSTITUTION TEL. NO.
1. Fred Okonda Artsan KARI 0733 375121 2. Sam Gatere Coco Ent. Support Services 0710 766524 3. Nobert O. Mbewa Kentaste Products Ltd. 0722 343743 4. David G. Ngigi IDM Services (Researcher) 0725 785351 5. Kenneth Ndwiga Printfill Services Msa. 0722 730551 6. Margret Wawuda IDM Services 0712 127389 7. Harrison B. Mghana MoA- Msambweni/ Kwale 0722 471342 8. Stephen N. Magu H.C.D.A 0723 416562 9. Alice Maitha Palm International 0722 480819 10. Dr. Linus Kasambo AG. DIR,KIRDI-Mombasa 0728 403697 11. Genija Nyale ABD- Malindi 0727 534893 12. Clarice Konge ABD- Kwale 0724 105511 13. George Mazuri ABD- Kilifi/ Mombasa 0724 105522 14. Bjarne Christensen ABD/MESPT-Nairobi 0723 277208
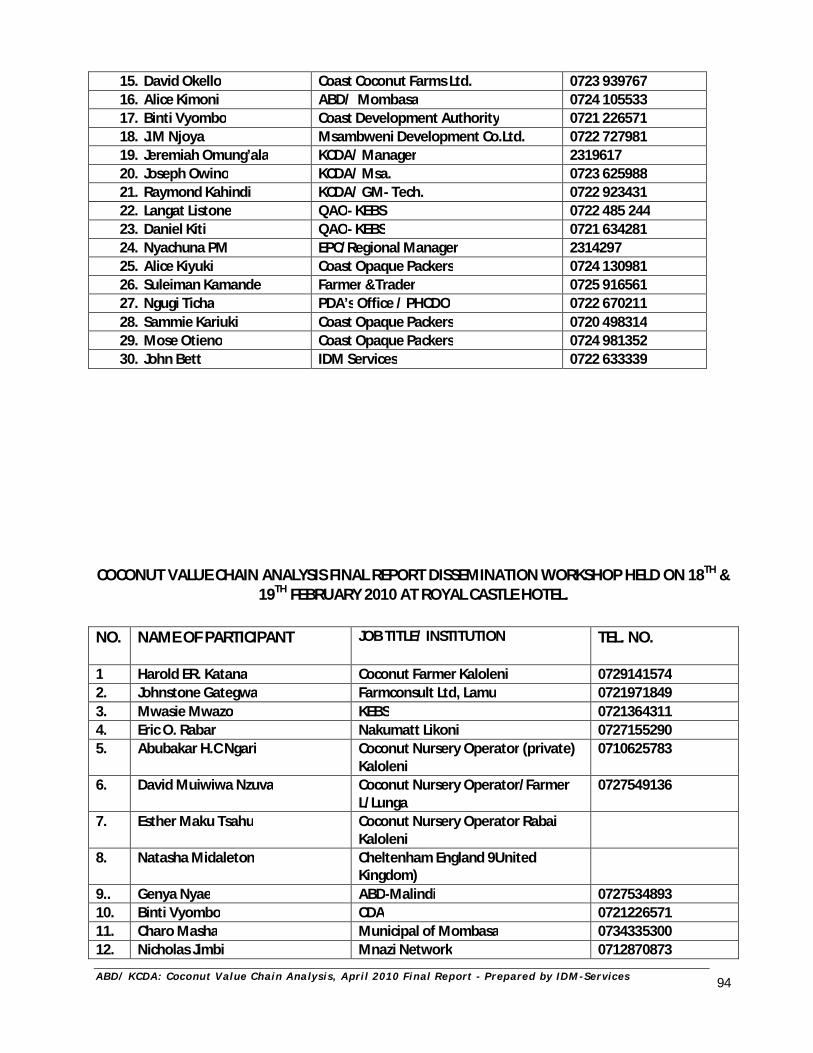
A B D / K C D A : C oc o nu t V al ue C h ai n A na l y s i s , A pr i l 2 0 1 0 F i n a l R e p or t - P r e p ar e d by I D M - Se r v i c e s
94
15. David Okello Coast Coconut Farms Ltd. 0723 939767 16. Alice Kimoni ABD/ Mombasa 0724 105533 17. Binti Vyombo Coast Development Authority 0721 226571 18. J.M Njoya Msambweni Development Co.Ltd. 0722 727981 19. Jeremiah Omung’ala KCDA/ Manager 2319617 20. Joseph Owino KCDA/ Msa. 0723 625988 21. Raymond Kahindi KCDA/ GM- Tech. 0722 923431 22. Langat Listone QAO- KEBS 0722 485 244 23. Daniel Kiti QAO- KEBS 0721 634281 24. Nyachuna PM EPC/Regional Manager 2314297 25. Alice Kiyuki Coast Opaque Packers 0724 130981 26. Suleiman Kamande Farmer &Trader 0725 916561 27. Ngugi Ticha PDA’s Office / PHCDO 0722 670211 28. Sammie Kariuki Coast Opaque Packers 0720 498314 29. Mose Otieno Coast Opaque Packers 0724 981352 30. John Bett IDM Services 0722 633339
COCONUT VALUE CHAIN ANALYSIS FINAL REPORT DISSEMINATION WORKSHOP HELD ON 18TH &
19TH FEBRUARY 2010 AT ROYAL CASTLE HOTEL. NO. NAME OF PARTICIPANT JOB TITLE/ INSTITUTION
TEL. NO.
1 Harold ER. Katana Coconut Farmer Kaloleni 0729141574 2. Johnstone Gategwa Farmconsult Ltd, Lamu 0721971849 3. Mwasie Mwazo KEBS 0721364311 4. Eric O. Rabar Nakumatt Likoni 0727155290 5. Abubakar H.C Ngari Coconut Nursery Operator (private)
Kaloleni 0710625783
6. David Muiwiwa Nzuva Coconut Nursery Operator/Farmer L/Lunga
0727549136
7. Esther Maku Tsahu Coconut Nursery Operator Rabai Kaloleni
8. Natasha Midaleton Cheltenham England 9United Kingdom)
9.. Genya Nyae ABD-Malindi 0727534893 10. Binti Vyombo CDA 0721226571 11. Charo Masha Municipal of Mombasa 0734335300 12. Nicholas Jimbi Mnazi Network 0712870873
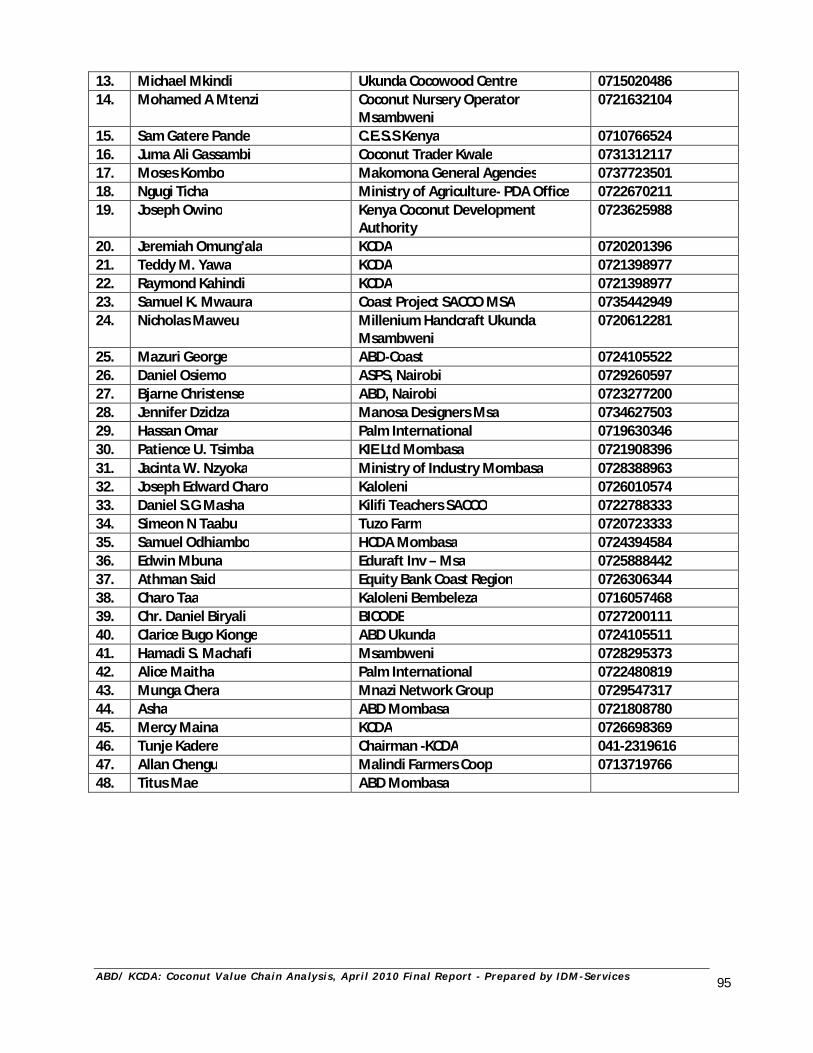
A B D / K C D A : C oc o nu t V al ue C h ai n A na l y s i s , A pr i l 2 0 1 0 F i n a l R e p or t - P r e p ar e d by I D M - Se r v i c e s
95
13. Michael Mkindi Ukunda Cocowood Centre 0715020486 14. Mohamed A Mtenzi Coconut Nursery Operator
Msambweni 0721632104
15. Sam Gatere Pande C.E.S.S Kenya 0710766524 16. Juma Ali Gassambi Coconut Trader Kwale 0731312117 17. Moses Kombo Makomona General Agencies 0737723501 18. Ngugi Ticha Ministry of Agriculture- PDA Office 0722670211 19. Joseph Owino Kenya Coconut Development
Authority 0723625988
20. Jeremiah Omung’ala KCDA 0720201396 21. Teddy M. Yawa KCDA 0721398977 22. Raymond Kahindi KCDA 0721398977 23. Samuel K. Mwaura Coast Project SACCO MSA 0735442949 24. Nicholas Maweu Millenium Handcraft Ukunda
Msambweni 0720612281
25. Mazuri George ABD-Coast 0724105522 26. Daniel Osiemo ASPS, Nairobi 0729260597 27. Bjarne Christense ABD, Nairobi 0723277200 28. Jennifer Dzidza Manosa Designers Msa 0734627503 29. Hassan Omar Palm International 0719630346 30. Patience U. Tsimba KIE Ltd Mombasa 0721908396 31. Jacinta W. Nzyoka Ministry of Industry Mombasa 0728388963 32. Joseph Edward Charo Kaloleni 0726010574 33. Daniel S.G Masha Kilifi Teachers SACCO 0722788333 34. Simeon N Taabu Tuzo Farm 0720723333 35. Samuel Odhiambo HCDA Mombasa 0724394584 36. Edwin Mbuna Eduraft Inv – Msa 0725888442 37. Athman Said Equity Bank Coast Region 0726306344 38. Charo Taa Kaloleni Bembeleza 0716057468 39. Chr. Daniel Biryali BICODE 0727200111 40. Clarice Bugo Kionge ABD Ukunda 0724105511 41. Hamadi S. Machafi Msambweni 0728295373 42. Alice Maitha Palm International 0722480819 43. Munga Chera Mnazi Network Group 0729547317 44. Asha ABD Mombasa 0721808780 45. Mercy Maina KCDA 0726698369 46. Tunje Kadere Chairman -KCDA 041-2319616 47. Allan Chengu Malindi Farmers Coop 0713719766 48. Titus Mae ABD Mombasa
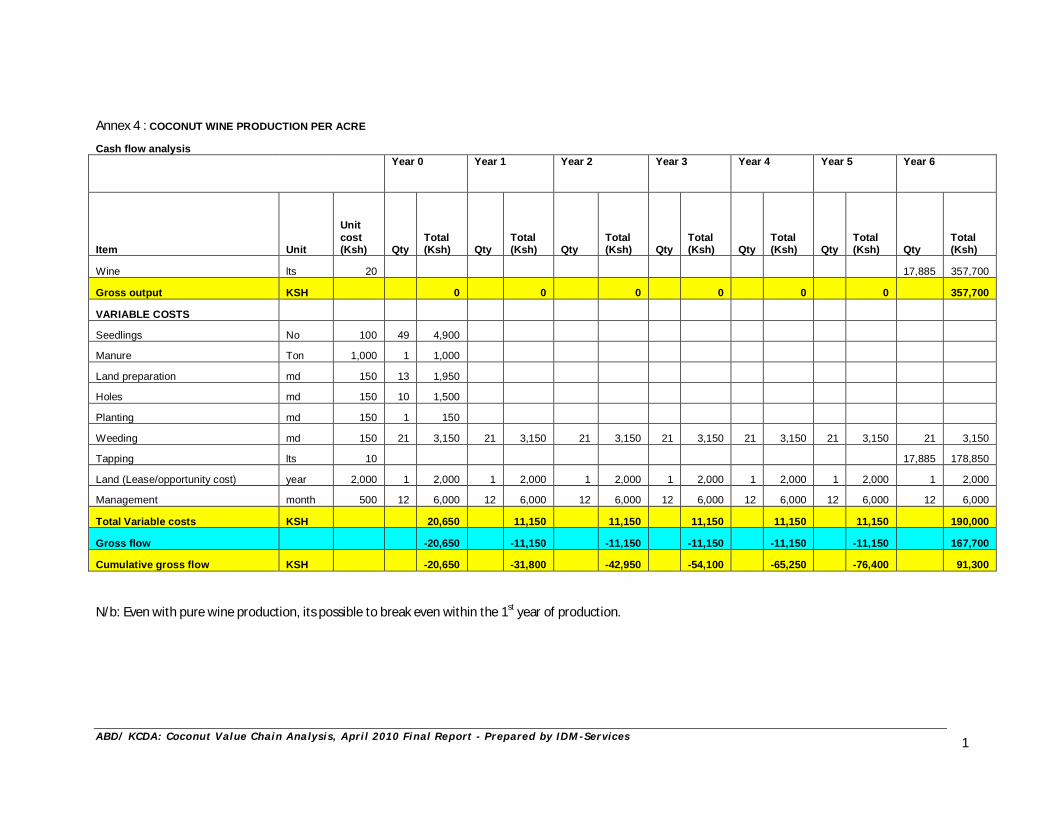
A B D / K C D A : C oc o nu t V al ue C h ai n A na l y s i s , A pr i l 2 0 1 0 F i n al R e p or t - P r ep ar e d by I D M - Se r v i c es
1
Annex 4 : COCONUT WINE PRODUCTION PER ACRE
Cash flow analysis
Year 0 Year 1 Year 2 Year 3 Year 4 Year 5 Year 6
Item Unit
Unit cost (Ksh) Qty
Total (Ksh) Qty
Total (Ksh) Qty
Total (Ksh) Qty
Total (Ksh) Qty
Total (Ksh) Qty
Total (Ksh) Qty
Total (Ksh)
Wine lts 20 17,885 357,700
Gross output KSH 0 0 0 0 0 0 357,700
VARIABLE COSTS
Seedlings No 100 49 4,900
Manure Ton 1,000 1 1,000
Land preparation md 150 13 1,950
Holes md 150 10 1,500
Planting md 150 1 150
Weeding md 150 21 3,150 21 3,150 21 3,150 21 3,150 21 3,150 21 3,150 21 3,150
Tapping lts 10 17,885 178,850
Land (Lease/opportunity cost) year 2,000 1 2,000 1 2,000 1 2,000 1 2,000 1 2,000 1 2,000 1 2,000
Management month 500 12 6,000 12 6,000 12 6,000 12 6,000 12 6,000 12 6,000 12 6,000
Total Variable costs KSH 20,650 11,150 11,150 11,150 11,150 11,150 190,000
Gross flow -20,650 -11,150 -11,150 -11,150 -11,150 -11,150 167,700
Cumulative gross flow KSH -20,650 -31,800 -42,950 -54,100 -65,250 -76,400 91,300 N/b: Even with pure wine production, its possible to break even within the 1st year of production.
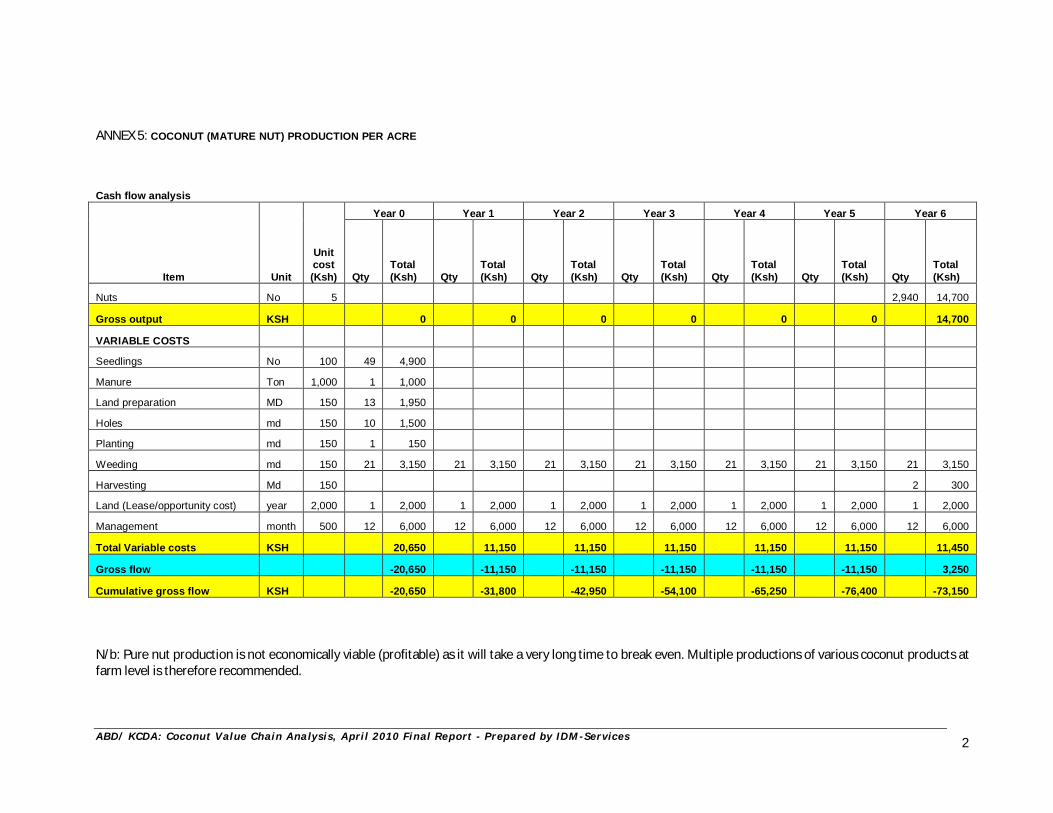
A B D / K C D A : C oc o nu t V al ue C h ai n A na l y s i s , A pr i l 2 0 1 0 F i n al R e p or t - P r ep ar e d by I D M - Se r v i c es
2
ANNEX 5: COCONUT (MATURE NUT) PRODUCTION PER ACRE
Cash flow analysis
Item Unit
Unit cost (Ksh)
Year 0 Year 1 Year 2 Year 3 Year 4 Year 5 Year 6
Qty Total (Ksh) Qty
Total (Ksh) Qty
Total (Ksh) Qty
Total (Ksh) Qty
Total (Ksh) Qty
Total (Ksh) Qty
Total (Ksh)
Nuts No 5 2,940 14,700
Gross output KSH 0 0 0 0 0 0 14,700
VARIABLE COSTS
Seedlings No 100 49 4,900
Manure Ton 1,000 1 1,000
Land preparation MD 150 13 1,950
Holes md 150 10 1,500
Planting md 150 1 150
Weeding md 150 21 3,150 21 3,150 21 3,150 21 3,150 21 3,150 21 3,150 21 3,150
Harvesting Md 150 2 300
Land (Lease/opportunity cost) year 2,000 1 2,000 1 2,000 1 2,000 1 2,000 1 2,000 1 2,000 1 2,000
Management month 500 12 6,000 12 6,000 12 6,000 12 6,000 12 6,000 12 6,000 12 6,000
Total Variable costs KSH 20,650 11,150 11,150 11,150 11,150 11,150 11,450
Gross flow -20,650 -11,150 -11,150 -11,150 -11,150 -11,150 3,250
Cumulative gross flow KSH -20,650 -31,800 -42,950 -54,100 -65,250 -76,400 -73,150 N/b: Pure nut production is not economically viable (profitable) as it will take a very long time to break even. Multiple productions of various coconut products at farm level is therefore recommended.
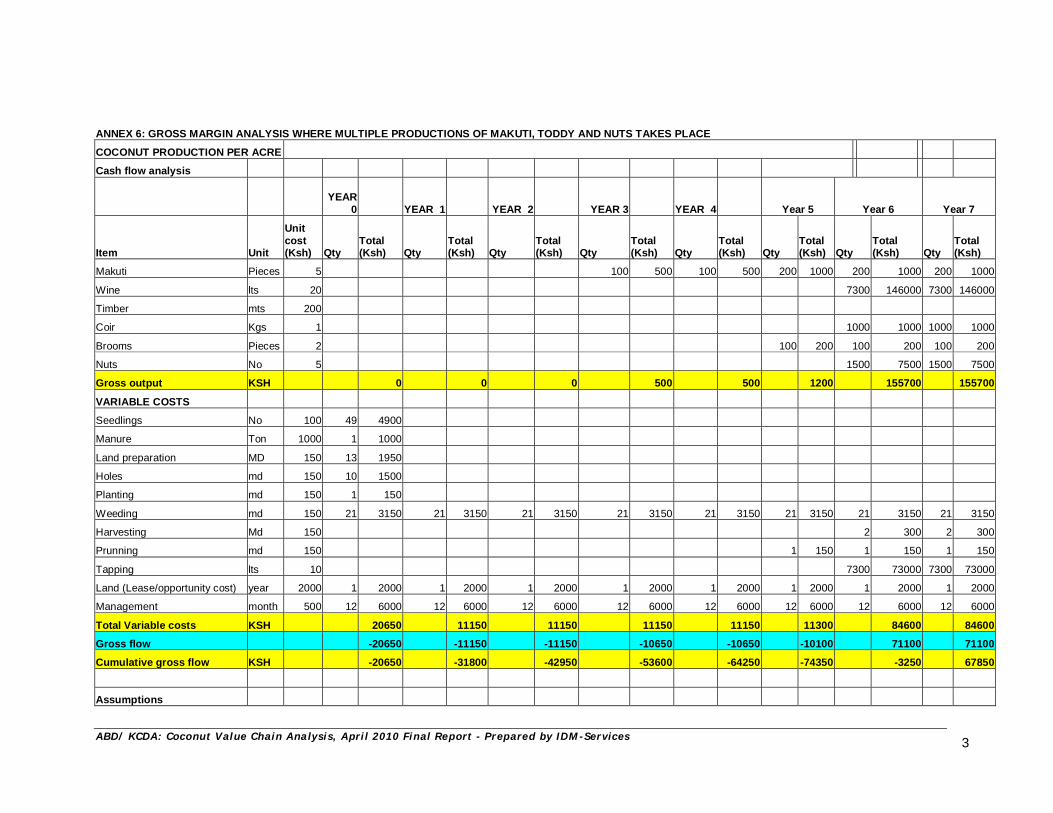
A B D / K C D A : C oc o nu t V al ue C h ai n A na l y s i s , A pr i l 2 0 1 0 F i n al R e p or t - P r ep ar e d by I D M - Se r v i c es
3
ANNEX 6: GROSS MARGIN ANALYSIS WHERE MULTIPLE PRODUCTIONS OF MAKUTI, TODDY AND NUTS TAKES PLACE COCONUT PRODUCTION PER ACRE
Cash flow analysis
YEAR
0
YEAR 1
YEAR 2
YEAR 3
YEAR 4 Year 5 Year 6 Year 7
Item Unit
Unit cost (Ksh) Qty
Total (Ksh) Qty
Total (Ksh) Qty
Total (Ksh) Qty
Total (Ksh) Qty
Total (Ksh) Qty
Total (Ksh) Qty
Total (Ksh) Qty
Total (Ksh)
Makuti Pieces 5 100 500 100 500 200 1000 200 1000 200 1000
Wine lts 20 7300 146000 7300 146000
Timber mts 200
Coir Kgs 1 1000 1000 1000 1000
Brooms Pieces 2 100 200 100 200 100 200
Nuts No 5 1500 7500 1500 7500
Gross output KSH 0 0 0 500 500 1200 155700 155700
VARIABLE COSTS
Seedlings No 100 49 4900
Manure Ton 1000 1 1000
Land preparation MD 150 13 1950
Holes md 150 10 1500
Planting md 150 1 150
Weeding md 150 21 3150 21 3150 21 3150 21 3150 21 3150 21 3150 21 3150 21 3150
Harvesting Md 150 2 300 2 300
Prunning md 150 1 150 1 150 1 150
Tapping lts 10 7300 73000 7300 73000
Land (Lease/opportunity cost) year 2000 1 2000 1 2000 1 2000 1 2000 1 2000 1 2000 1 2000 1 2000
Management month 500 12 6000 12 6000 12 6000 12 6000 12 6000 12 6000 12 6000 12 6000
Total Variable costs KSH 20650 11150 11150 11150 11150 11300 84600 84600
Gross flow -20650 -11150 -11150 -10650 -10650 -10100 71100 71100
Cumulative gross flow KSH -20650 -31800 -42950 -53600 -64250 -74350 -3250 67850
Assumptions
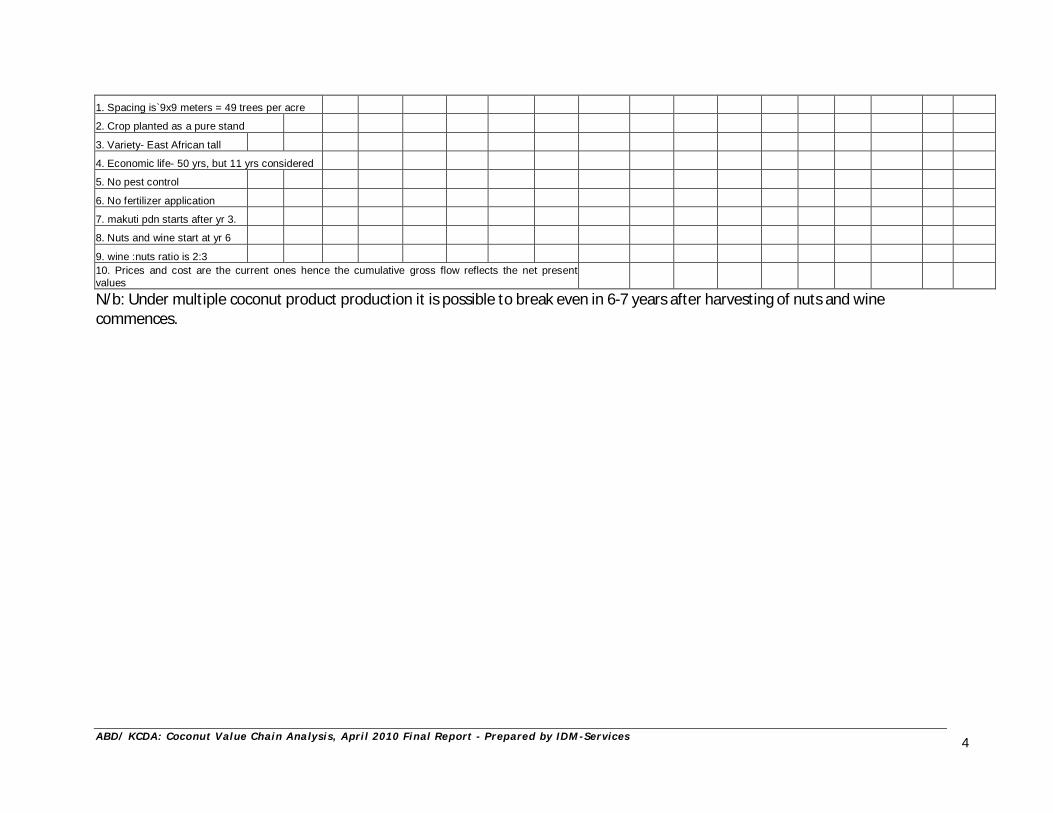
A B D / K C D A : C oc o nu t V al ue C h ai n A na l y s i s , A pr i l 2 0 1 0 F i n al R e p or t - P r ep ar e d by I D M - Se r v i c es
4
1. Spacing is`9x9 meters = 49 trees per acre
2. Crop planted as a pure stand
3. Variety- East African tall
4. Economic life- 50 yrs, but 11 yrs considered
5. No pest control
6. No fertilizer application
7. makuti pdn starts after yr 3.
8. Nuts and wine start at yr 6
9. wine :nuts ratio is 2:3 10. Prices and cost are the current ones hence the cumulative gross flow reflects the net present values
N/b: Under multiple coconut product production it is possible to break even in 6-7 years after harvesting of nuts and wine commences.
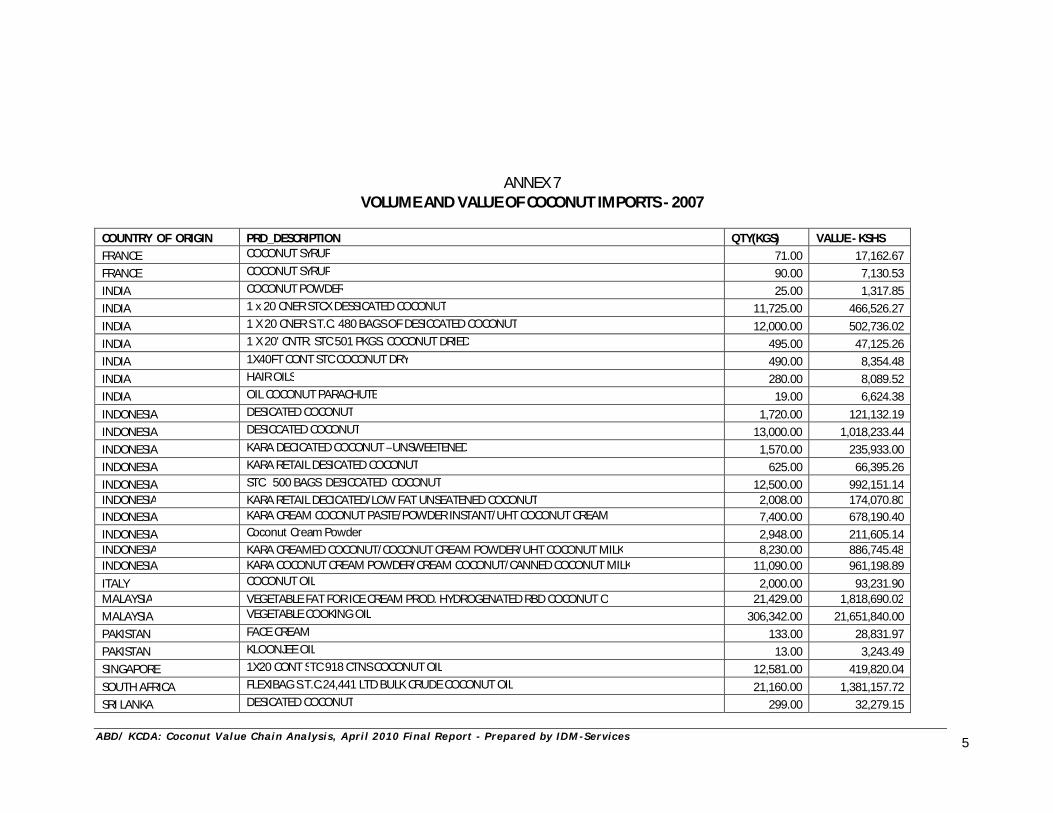
A B D / K C D A : C oc o nu t V al ue C h ai n A na l y s i s , A pr i l 2 0 1 0 F i n al R e p or t - P r ep ar e d by I D M - Se r v i c es
5
ANNEX 7 VOLUME AND VALUE OF COCONUT IMPORTS - 2007
COUNTRY OF ORIGIN PRD_DESCRIPTION QTY(KGS) VALUE - KSHS FRANCE COCONUT SYRUP 71.00 17,162.67 FRANCE COCONUT SYRUP 90.00 7,130.53 INDIA COCONUT POWDER 25.00 1,317.85 INDIA 1 x 20 CNER STCX DESSICATED COCONUT 11,725.00 466,526.27 INDIA 1 X 20 CNER S.T.C. 480 BAGS OF DESICCATED COCONUT 12,000.00 502,736.02 INDIA 1 X 20' CNTR. STC 501 PKGS. COCONUT DRIED 495.00 47,125.26 INDIA 1X40FT CONT STC COCONUT DRY 490.00 8,354.48 INDIA HAIR OILS 280.00 8,089.52 INDIA OIL COCONUT PARACHUTE 19.00 6,624.38 INDONESIA DESICATED COCONUT 1,720.00 121,132.19 INDONESIA DESICCATED COCONUT 13,000.00 1,018,233.44 INDONESIA KARA DECICATED COCONUT –UNSWEETENED 1,570.00 235,933.00 INDONESIA KARA RETAIL DESICATED COCONUT 625.00 66,395.26 INDONESIA STC 500 BAGS DESICCATED COCONUT 12,500.00 992,151.14 INDONESIA KARA RETAIL DECICATED/LOW FAT UNSEATENED COCONUT 2,008.00 174,070.80 INDONESIA KARA CREAM COCONUT PASTE/POWDER INSTANT/UHT COCONUT CREAM 7,400.00 678,190.40 INDONESIA Coconut Cream Powder 2,948.00 211,605.14 INDONESIA KARA CREAMED COCONUT/COCONUT CREAM POWDER/UHT COCONUT MILK 8,230.00 886,745.48 INDONESIA KARA COCONUT CREAM POWDER/CREAM COCONUT/CANNED COCONUT MILK 11,090.00 961,198.89 ITALY COCONUT OIL 2,000.00 93,231.90 MALAYSIA VEGETABLE FAT FOR ICE CREAM PROD. HYDROGENATED RBD COCONUT O 21,429.00 1,818,690.02 MALAYSIA VEGETABLE COOKING OIL 306,342.00 21,651,840.00 PAKISTAN FACE CREAM 133.00 28,831.97 PAKISTAN KLOONJEE OIL 13.00 3,243.49 SINGAPORE 1X20 CONT STC 918 CTNS COCONUT OIL 12,581.00 419,820.04 SOUTH AFRICA FLEXIBAG S.T.C.24,441 LTD BULK CRUDE COCONUT OIL 21,160.00 1,381,157.72 SRI LANKA DESICATED COCONUT 299.00 32,279.15
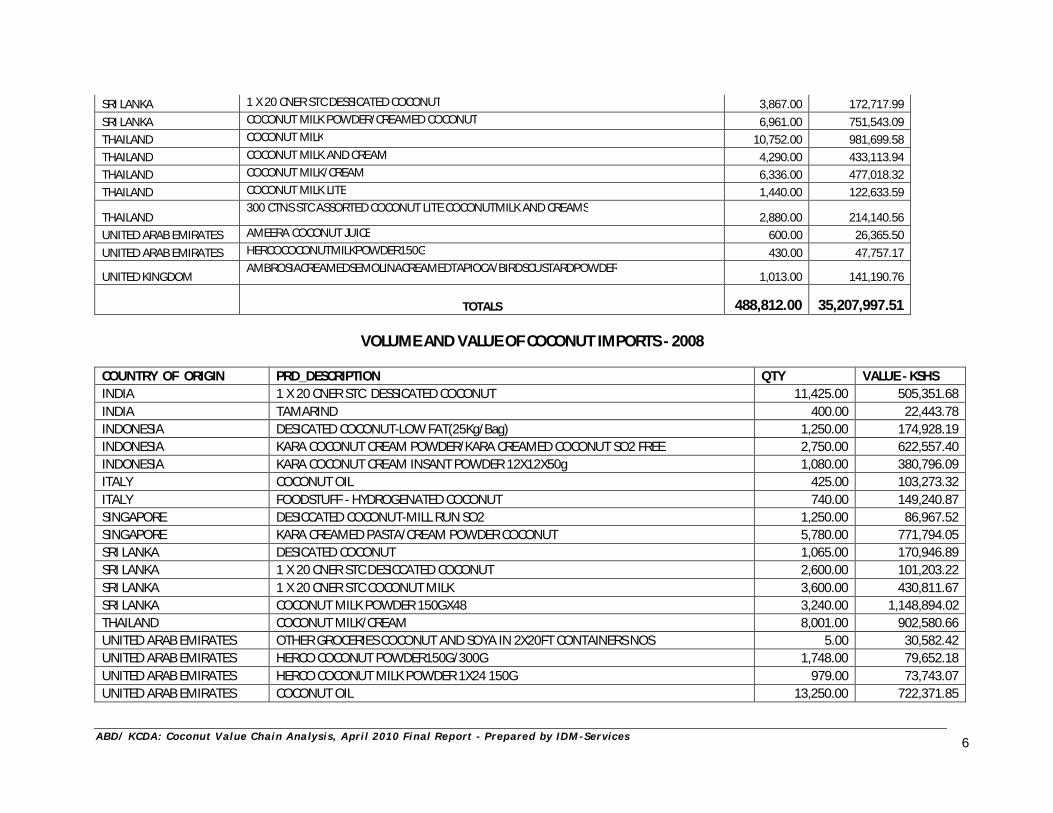
A B D / K C D A : C oc o nu t V al ue C h ai n A na l y s i s , A pr i l 2 0 1 0 F i n al R e p or t - P r ep ar e d by I D M - Se r v i c es
6
SRI LANKA 1 X 20 CNER STC DESSICATED COCONUT 3,867.00 172,717.99 SRI LANKA COCONUT MILK POWDER/CREAMED COCONUT 6,961.00 751,543.09 THAILAND COCONUT MILK 10,752.00 981,699.58 THAILAND COCONUT MILK AND CREAM 4,290.00 433,113.94 THAILAND COCONUT MILK/CREAM 6,336.00 477,018.32 THAILAND COCONUT MILK LITE 1,440.00 122,633.59
THAILAND 300 CTNS STC ASSORTED COCONUT LITE COCONUTMILK AND CREAMS
2,880.00 214,140.56 UNITED ARAB EMIRATES AMEERA COCONUT JUICE 600.00 26,365.50 UNITED ARAB EMIRATES HERCOCOCONUTMILKPOWDER150G 430.00 47,757.17
UNITED KINGDOM AMBROSIACREAMEDSEMOLINACREAMEDTAPIOCA/BIRDSCUSTARDPOWDER
1,013.00 141,190.76
TOTALS 488,812.00 35,207,997.51
VOLUME AND VALUE OF COCONUT IMPORTS - 2008 COUNTRY OF ORIGIN PRD_DESCRIPTION QTY VALUE - KSHS INDIA 1 X 20 CNER STC DESSICATED COCONUT 11,425.00 505,351.68 INDIA TAMARIND 400.00 22,443.78 INDONESIA DESICATED COCONUT-LOW FAT(25Kg/Bag) 1,250.00 174,928.19 INDONESIA KARA COCONUT CREAM POWDER/KARA CREAMED COCONUT SO2 FREE 2,750.00 622,557.40 INDONESIA KARA COCONUT CREAM INSANT POWDER 12X12X50g 1,080.00 380,796.09 ITALY COCONUT OIL 425.00 103,273.32 ITALY FOODSTUFF - HYDROGENATED COCONUT 740.00 149,240.87 SINGAPORE DESICCATED COCONUT-MILL RUN SO2 1,250.00 86,967.52 SINGAPORE KARA CREAMED PASTA/CREAM POWDER COCONUT 5,780.00 771,794.05 SRI LANKA DESICATED COCONUT 1,065.00 170,946.89 SRI LANKA 1 X 20 CNER STC DESICCATED COCONUT 2,600.00 101,203.22 SRI LANKA 1 X 20 CNER STC COCONUT MILK 3,600.00 430,811.67 SRI LANKA COCONUT MILK POWDER 150GX48 3,240.00 1,148,894.02 THAILAND COCONUT MILK/CREAM 8,001.00 902,580.66 UNITED ARAB EMIRATES OTHER GROCERIES COCONUT AND SOYA IN 2X20FT CONTAINERS NOS 5.00 30,582.42 UNITED ARAB EMIRATES HERCO COCONUT POWDER150G/300G 1,748.00 79,652.18 UNITED ARAB EMIRATES HERCO COCONUT MILK POWDER 1X24 150G 979.00 73,743.07 UNITED ARAB EMIRATES COCONUT OIL 13,250.00 722,371.85
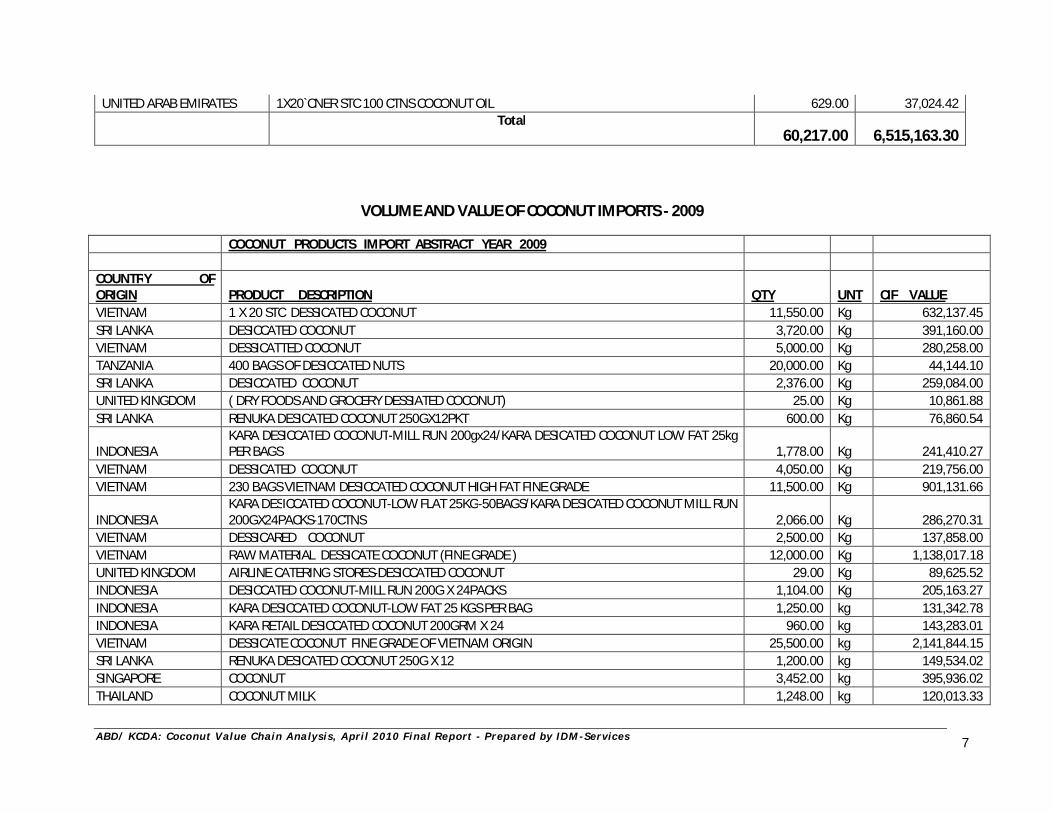
A B D / K C D A : C oc o nu t V al ue C h ai n A na l y s i s , A pr i l 2 0 1 0 F i n al R e p or t - P r ep ar e d by I D M - Se r v i c es
7
UNITED ARAB EMIRATES 1X20`CNER STC 100 CTNS COCONUT OIL 629.00 37,024.42
Total
60,217.00 6,515,163.30
VOLUME AND VALUE OF COCONUT IMPORTS - 2009 COCONUT PRODUCTS IMPORT ABSTRACT YEAR 2009 COUNTRY OF ORIGIN PRODUCT DESCRIPTION QTY UNT CIF VALUE VIETNAM 1 X 20 STC DESSICATED COCONUT 11,550.00 Kg 632,137.45 SRI LANKA DESICCATED COCONUT 3,720.00 Kg 391,160.00 VIETNAM DESSICATTED COCONUT 5,000.00 Kg 280,258.00 TANZANIA 400 BAGS OF DESICCATED NUTS 20,000.00 Kg 44,144.10 SRI LANKA DESICCATED COCONUT 2,376.00 Kg 259,084.00 UNITED KINGDOM ( DRY FOODS AND GROCERY DESSIATED COCONUT) 25.00 Kg 10,861.88 SRI LANKA RENUKA DESICATED COCONUT 250GX12PKT 600.00 Kg 76,860.54
INDONESIA KARA DESICCATED COCONUT-MILL RUN 200gx24/KARA DESICATED COCONUT LOW FAT 25kg PER BAGS 1,778.00 Kg 241,410.27
VIETNAM DESSICATED COCONUT 4,050.00 Kg 219,756.00 VIETNAM 230 BAGS VIETNAM DESICCATED COCONUT HIGH FAT FINE GRADE 11,500.00 Kg 901,131.66
INDONESIA KARA DESICCATED COCONUT-LOW FLAT 25KG-50BAGS/KARA DESICATED COCONUT MILL RUN 200GX24PACKS-170CTNS 2,066.00 Kg 286,270.31
VIETNAM DESSICARED COCONUT 2,500.00 Kg 137,858.00 VIETNAM RAW MATERIAL DESSICATE COCONUT (FINE GRADE ) 12,000.00 Kg 1,138,017.18 UNITED KINGDOM AIRLINE CATERING STORES-DESICCATED COCONUT 29.00 Kg 89,625.52 INDONESIA DESICCATED COCONUT-MILL RUN 200G X 24PACKS 1,104.00 Kg 205,163.27 INDONESIA KARA DESICCATED COCONUT-LOW FAT 25 KGS PER BAG 1,250.00 kg 131,342.78 INDONESIA KARA RETAIL DESICCATED COCONUT 200GRM X 24 960.00 kg 143,283.01 VIETNAM DESSICATE COCONUT FINE GRADE OF VIETNAM ORIGIN 25,500.00 kg 2,141,844.15 SRI LANKA RENUKA DESICATED COCONUT 250G X 12 1,200.00 kg 149,534.02 SINGAPORE COCONUT 3,452.00 kg 395,936.02 THAILAND COCONUT MILK 1,248.00 kg 120,013.33
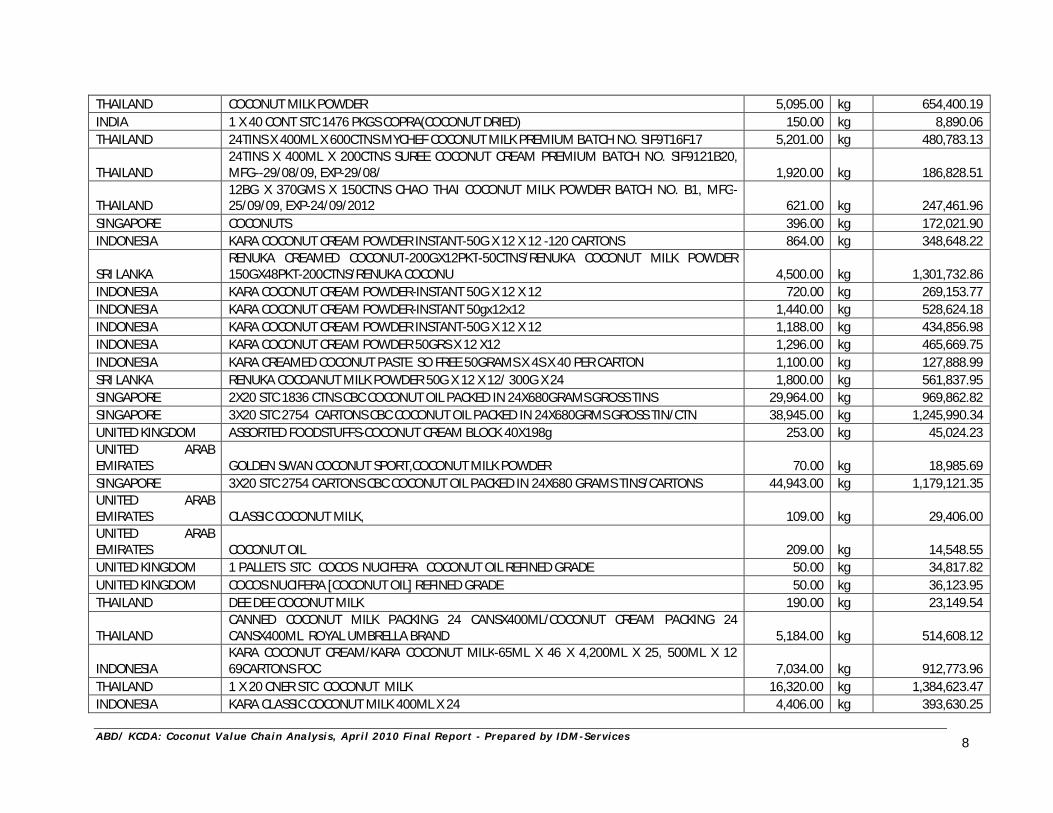
A B D / K C D A : C oc o nu t V al ue C h ai n A na l y s i s , A pr i l 2 0 1 0 F i n al R e p or t - P r ep ar e d by I D M - Se r v i c es
8
THAILAND COCONUT MILK POWDER 5,095.00 kg 654,400.19 INDIA 1 X 40 CONT STC 1476 PKGS COPRA(COCONUT DRIED) 150.00 kg 8,890.06 THAILAND 24TINS X 400ML X 600CTNS MYCHEF COCONUT MILK PREMIUM BATCH NO. SIF9T16F17 5,201.00 kg 480,783.13
THAILAND 24TINS X 400ML X 200CTNS SUREE COCONUT CREAM PREMIUM BATCH NO. SIF9121B20, MFG--29/08/09, EXP-29/08/ 1,920.00 kg 186,828.51
THAILAND 12BG X 370GMS X 150CTNS CHAO THAI COCONUT MILK POWDER BATCH NO. B1, MFG-25/09/09, EXP-24/09/2012 621.00 kg 247,461.96
SINGAPORE COCONUTS 396.00 kg 172,021.90 INDONESIA KARA COCONUT CREAM POWDER INSTANT-50G X 12 X 12 -120 CARTONS 864.00 kg 348,648.22
SRI LANKA RENUKA CREAMED COCONUT-200GX12PKT-50CTNS/RENUKA COCONUT MILK POWDER 150GX48PKT-200CTNS/RENUKA COCONU 4,500.00 kg 1,301,732.86
INDONESIA KARA COCONUT CREAM POWDER-INSTANT 50G X 12 X 12 720.00 kg 269,153.77 INDONESIA KARA COCONUT CREAM POWDER-INSTANT 50gx12x12 1,440.00 kg 528,624.18 INDONESIA KARA COCONUT CREAM POWDER INSTANT-50G X 12 X 12 1,188.00 kg 434,856.98 INDONESIA KARA COCONUT CREAM POWDER 50GRS X 12 X12 1,296.00 kg 465,669.75 INDONESIA KARA CREAMED COCONUT PASTE SO FREE 50GRAMS X 4S X 40 PER CARTON 1,100.00 kg 127,888.99 SRI LANKA RENUKA COCOANUT MILK POWDER 50G X 12 X 12/ 300G X 24 1,800.00 kg 561,837.95 SINGAPORE 2X20 STC 1836 CTNS CBC COCONUT OIL PACKED IN 24X680GRAMS GROSS TINS 29,964.00 kg 969,862.82 SINGAPORE 3X20 STC 2754 CARTONS CBC COCONUT OIL PACKED IN 24X680GRMS GROSS TIN/CTN 38,945.00 kg 1,245,990.34 UNITED KINGDOM ASSORTED FOODSTUFFS-COCONUT CREAM BLOCK 40X198g 253.00 kg 45,024.23 UNITED ARAB EMIRATES GOLDEN SWAN COCONUT SPORT,COCONUT MILK POWDER 70.00 kg 18,985.69 SINGAPORE 3X20 STC 2754 CARTONS CBC COCONUT OIL PACKED IN 24X680 GRAMS TINS/CARTONS 44,943.00 kg 1,179,121.35 UNITED ARAB EMIRATES CLASSIC COCONUT MILK, 109.00 kg 29,406.00 UNITED ARAB EMIRATES COCONUT OIL 209.00 kg 14,548.55 UNITED KINGDOM 1 PALLETS STC COCOS NUCIFERA COCONUT OIL REFINED GRADE 50.00 kg 34,817.82 UNITED KINGDOM COCOS NUCIFERA [COCONUT OIL] REFINED GRADE 50.00 kg 36,123.95 THAILAND DEE DEE COCONUT MILK 190.00 kg 23,149.54
THAILAND CANNED COCONUT MILK PACKING 24 CANSX400ML/COCONUT CREAM PACKING 24 CANSX400ML ROYAL UMBRELLA BRAND 5,184.00 kg 514,608.12
INDONESIA KARA COCONUT CREAM/KARA COCONUT MILK-65ML X 46 X 4,200ML X 25, 500ML X 12 69CARTONS FOC 7,034.00 kg 912,773.96
THAILAND 1 X 20 CNER STC COCONUT MILK 16,320.00 kg 1,384,623.47 INDONESIA KARA CLASSIC COCONUT MILK 400ML X 24 4,406.00 kg 393,630.25
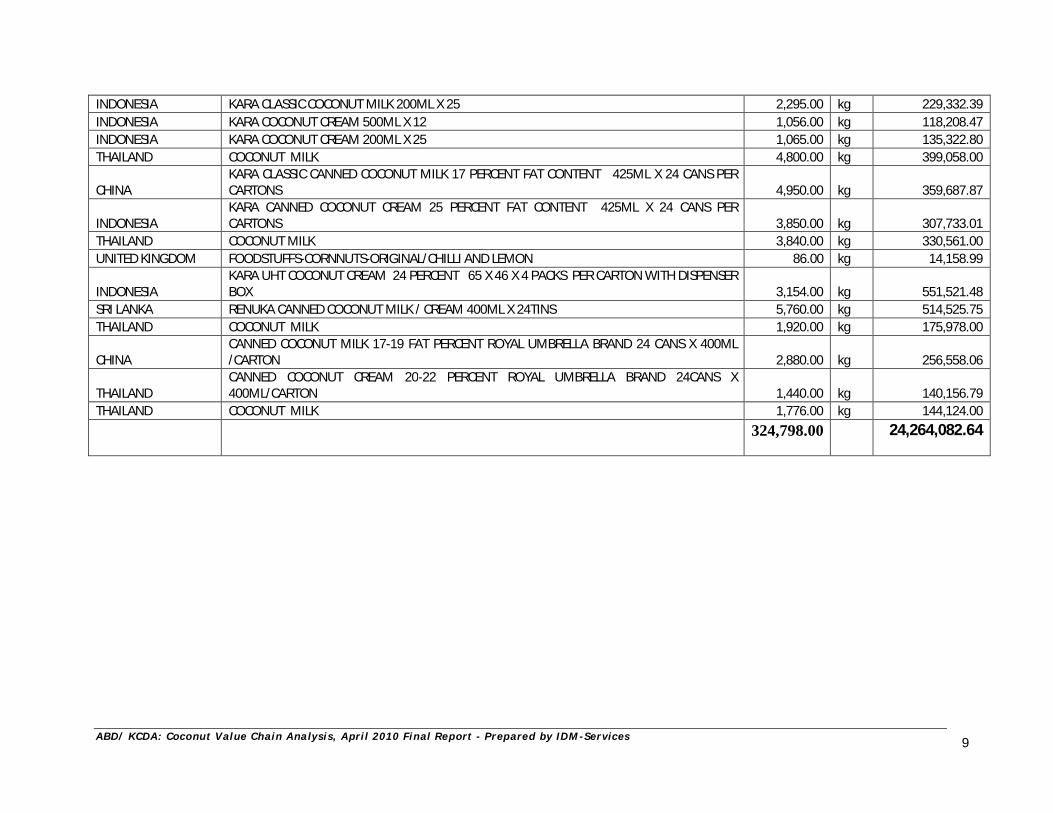
A B D / K C D A : C oc o nu t V al ue C h ai n A na l y s i s , A pr i l 2 0 1 0 F i n al R e p or t - P r ep ar e d by I D M - Se r v i c es
9
INDONESIA KARA CLASSIC COCONUT MILK 200ML X 25 2,295.00 kg 229,332.39 INDONESIA KARA COCONUT CREAM 500ML X 12 1,056.00 kg 118,208.47 INDONESIA KARA COCONUT CREAM 200ML X 25 1,065.00 kg 135,322.80 THAILAND COCONUT MILK 4,800.00 kg 399,058.00
CHINA KARA CLASSIC CANNED COCONUT MILK 17 PERCENT FAT CONTENT 425ML X 24 CANS PER CARTONS 4,950.00 kg 359,687.87
INDONESIA KARA CANNED COCONUT CREAM 25 PERCENT FAT CONTENT 425ML X 24 CANS PER CARTONS 3,850.00 kg 307,733.01
THAILAND COCONUT MILK 3,840.00 kg 330,561.00 UNITED KINGDOM FOODSTUFFS-CORNNUTS-ORIGINAL/CHILLI AND LEMON 86.00 kg 14,158.99
INDONESIA KARA UHT COCONUT CREAM 24 PERCENT 65 X 46 X 4 PACKS PER CARTON WITH DISPENSER BOX 3,154.00 kg 551,521.48
SRI LANKA RENUKA CANNED COCONUT MILK / CREAM 400ML X 24TINS 5,760.00 kg 514,525.75 THAILAND COCONUT MILK 1,920.00 kg 175,978.00
CHINA CANNED COCONUT MILK 17-19 FAT PERCENT ROYAL UMBRELLA BRAND 24 CANS X 400ML /CARTON 2,880.00 kg 256,558.06
THAILAND CANNED COCONUT CREAM 20-22 PERCENT ROYAL UMBRELLA BRAND 24CANS X 400ML/CARTON 1,440.00 kg 140,156.79
THAILAND COCONUT MILK 1,776.00 kg 144,124.00
324,798.00
24,264,082.64
A B D / K C D A : C oc o nu t V al ue C h ai n A na l y s i s , A pr i l 2 0 1 0 F i n a l R e p or t - P r e p ar e d by I D M - Se r v i c e s
1
ANNEX 8
STAKEHOLDERS’ COMMENTS DURING COCONUT VALUE CHAIN DISSEMINATION WORKSHOP HELD ON 18 – 19TH FEBRUARY 2010
During the coconut value chain dissemination workshop various stakeholders made comments in regard to the findings of the value chain analysis as presented to them. Comments made mainly touched on the following issues: Research Funding Mr. Pole from KARI acknowledged that substantial work is required to overcome production related challenges, especially in research for quality planting materials. Efforts should be made to encourage collaboration with development partners to provide R & D funds and reverse the current trend. Mr. Mbura asked whether coconut had the ability to produce bio fuel. Further research should be carried out to establish this where it’s possible. Increased nut export Stakeholders sought to know why nut export to Tanzania is on the rise, given that it occupies about 35% market share. They requested that the consultant should establish what the end use of the nuts is. In particular, David from Coast Coconut Farms Ltd, requested that information about who are the main importers of nuts in TZ be obtained as this would help in market prospecting for the SMEs. The consultant responded by saying statistics from KRA indicates that Tanzania is exporting desiccated coconut and coconut oil into the country. Joseph Owino (KCDA) also pointed that nuts from Kenya has higher quality nuts than Tanzania. On the other hand, some stakeholders said they used to export nuts to other countries 15 years ago but because of low nut production, resulting from ageing trees, the business was no longer lucrative. However, there was general concurrence against banning of nut exports as total ban will bring prices down tremendously. He pointed the case of cashew nut as an example. Awareness and dissemination to farmers Florence from CDA pointed that a lot has been done within the sub sector but wondered how much information is at the farmers’ disposal, to enable them to capitalize on inherent market opportunities. She suggested that mechanisms should be established to provide farmers with updated and relevant information on coconut farming. There is need to develop a coconut farming manual. Import products and their documentation It was suggested that information on major importers of coconut products, their volumes, sources and values, should be established. Import figures for 2009 should include imports for up to December (Bjarne). Various stakeholders contributing on this issue appreciated the good work presented in the report but requested that information about the amount of activated carbon and coco-peat being imported into the country annually should be captured. Stakeholders’ inclusion Export promotion council, while appreciating the good work that has been done, pointed out that it is important to include all the relevant stakeholders in efforts geared at improving the sub sector as each stakeholder carries out an important role. In particular, the roles of the Ministry of Trade, Industrialization,
A B D / K C D A : C oc o nu t V al ue C h ai n A na l y s i s , A pr i l 2 0 1 0 F i n a l R e p or t - P r e p ar e d by I D M - Se r v i c e s
2
the KenInvest, KEPHIS, etc. are key to the sub sector growth. He pointed out that the Ministry of Trade is currently building retail markets all over the country and the Coast region can benefit from construction of collection centres, where buyers and farmers meet on selected days for trade. This will greatly help to reduce exploitation by the middlemen. In addition, the Ministry of industrialization, through the stimulus programme, is constructing constituency industrial growth centres and a further Kes 1.5 million allocation for equipment purchase. SMEs, especially the community based ones, should capitalize on this as there is little EIA required. Planting materials Abubakar (farmer) pointed out that quality planting materials are the base of a solid coconut sub sector and efforts should be made to provide private nursery operators with quality planting seeds consistently. In this regard, KCDA indicated that private nursery operators training on seed selection, seedling management and application of chemicals, is ongoing. However, research should be done to establish whether better varieties exist that can grow even in upcountry. Ticha Ngugi of the PDAs office reiterated on this last issue and said that research has been done but the EAT variety still is the best variety in this region. For seed selection, KARI, MOA and KCDA, are carrying out mother plant identification for trees over 30 years where Nursery Operators can obtain seeds. Retailing of coconut products The Nakumatt representative pointed out that very few coconut products are being processed locally thereby forcing retail outlets to import in bulk. In addition, very few people know about coconut products and their health/nutritional benefits. There is need for awareness building and marketing of coconut products, especially in the upcountry markets. He urged local processors to diversify their product range and exploit the local market first. Production constraints Ticha Ngugi (MoA) pointed out that the relatively large number of old trees partly contribute to the low nut production per tree. Other issues that constrain initiatives to increase production include socio cultural factors and lack of private ownership of trees/land where one member of the family feels that if he/she puts efforts into increasing production, the rest of the family members will come and benefit. He informed the stakeholders that banning of imports or exports has adverse effects, hence they should embrace modern farming and processing technology and compete globally. Cottage industries and Value Addition The KIE representative lamented the low level of processing (5%) and attributed this to historical factors where Kenya was shaped to be predominantly a raw material producing country. He suggested that there is need for more SMEs to take up processing initiatives and their driving force need to be established, so that technology providers can rope them in. He mentioned that KIE is currently running an incubator programme where they are equipping SMEs with the necessary skills to venture into processing. He acknowledged that different SMEs have different needs and potential, and hence an incubation programme is modeled along individual SMEs as well as group concepts, so as to effectively address their needs. In addition, request was made to technology providers to disseminate replicable models for processing that SMEs can adopt. KCDA should also help potential SMEs to identify these technologies and ensure quality control to protect investors. On the other hand, Cll. Biryah of BICODE pointed out that they had identified a financier who is ready to help the community based processing plant make charcoal from coconut husks, shell (i.e. charcoal
A B D / K C D A : C oc o nu t V al ue C h ai n A na l y s i s , A pr i l 2 0 1 0 F i n a l R e p or t - P r e p ar e d by I D M - Se r v i c e s
3
bricattes). He however lamented that there is a shortage of nut supply due to exportation in TZ and requested that nut export be banned. He pointed out local cottage industries should be supported and allowed to compete locally amongst themselves as this was the only way they could improve their production. He was promptly advised on the negative economic gains associated with export banning. Commodity pricing Rose from Kebs requested that a detailed analysis of production costs and market prices for various products should be presented as this is the only way investors would know, which products provide higher returns. The amount of industrial oil being imported annually is high and ways through which coconut oil can substitute this, should be given due priority. Tapping business opportunities in the coconut sub sector Mr. Iqbal. Dadani, KARA product importer, drew on his his experience in the coconut product business where he pointed out the following issues;
i. Their company Portcross Ltd. imports products worth over Kes 400 million annually from India, Serilanka and the Far East.
ii. Coconut is a profitable business. iii. One must have a clear business idea and learn to see opportunities. iv. There is need for entrepreneurs to research and study wide on their areas of interest. v. Produce locally and readily accepted products.
vi. Carry out sensitization, promotion and advertise products. vii. Learn and improve on products development, packaging, branding, etc.
viii. Government support is crucial, especially in regulatory and infrastructure. Policy and regulation KCDA Managing Director pointed out that various efforts have been put in place, to ensure that sub sector potential is realized. During his closing remarks, he reassured the stakeholders that KCDA will not be a burden but a facilitator, to ensure sustainable growth in the coconut sub sector. He pointed out that the following initiatives have been undertaken by KCDA:
i. Quality standards (12) on coconut products are ready and will be published soon. ii. Code of Practice for the coconut industry is being developed and will be out in two weeks time. iii. Industry policy is in the mainstream. iv. 169,000 quality seedlings have already being sold to private nursery operator at a subsidized price of
Kes 30. v. 100,000 seedlings are ready for sale to farmers during the long rains.
vi. Sensitization on various regulatory and legal instruments is ongoing. vii. Formalities of registration of sector players have been put in place.
viii. KCDA’s willingness to support sub sector players. Mr. D. Osiemo, the ASPS National Coordinator, said that, in the past, there were too many legal obstacles that were not conducive for business development. As a result, the government has made efforts to streamline the legal environment that govern agriculture by reducing the number of regulations and legislations from 165 to just 5. This he said, is aimed at encouraging private sector to participate and compete favourably within the sector.
A B D / K C D A : C oc o nu t V al ue C h ai n A na l y s i s , A pr i l 2 0 1 0 F i n a l R e p or t - P r e p ar e d by I D M - Se r v i c e s
4
Role of financial institutions Financial institutions play an important role in the provision of the seed capital required by SMEs and producers to venture into the coconut business. These institutions were asked not to shy off from financing coconut sub sector initiatives as it has great potential and high returns. Individuals willing to obtain financial support were urged to develop comprehensive business plans and present them for financing. Equity bank promised to develop products to suit the coconut sub sector. Harassment and awareness creation on Mnazi trade There are serious concerns in regard to Mnazi trading, where Stakeholders complained of harassment from police, public administration and local authorities. There is need for KCDA and other relevant agencies to sensitize farmers and traders on regulations and instruments that legalize their trade. Players were however, asked to comply with the set regulations before they can complain of harassment. In addition, palm wine should be mainstreamed along other alcoholic drinks in the market. It is unfortunate that Mnazi is today regarded as a ‘lesser drink’ where Mangwe operators are only allowed to sell for a few hours, while bars and restaurants sell throughout the day. Product development in the wine chain As presented the wine chain has fewer products compared to the nut chain, and stakeholders sought to know whether there are more products from wine than those presented in the report (toddy, coconut sap, honey, vinegar, sugar). In other toddy producing countries, product development through blending, fortification, flavours, etc. have been introduced. A good example is the maribu drink, which fetches Kes 1,300 per litre in the local supermarkets. Efforts to extend shelf-life and elimination of bad oduor, will greatly help to market palm wine in the upcountry markets, where there is adequate demand and better returns. Application of salt Most stakeholders sought clarification on application of table salt as a way of boosting yields per tree as is the case in Far East countries. It was communicated by a MoA representative that foreign technology has to be tested before it is passed onto the farmers. However, trials will be conducted by KARI in conjunction with KCDA and results communicated by the Ministry of Agriculture. Nevertheless, where intercropping is done, salt should not be applied. Exhibition and promotion of coconut products In order to create awareness to all stakeholders, including potential investors, KCDA and other relevant organizations were requested to carry out exhibitions during the Mombasa International Show, Nairobi Trade Fairs, Field Visits and other market promotions in targeted towns. These exhibitions create avenues for communication and linkages. KCDA indicated that a schedule for field visits within the Coast Province is already in place.


