Embed Size (px)
Citation preview
USAID KENYA (APHIAPLUS WESTERN KENYA) PROGRESS REPORT FOR Q2 FY 2017
USAID KENYA
APHIAplus WESTERN KENYA QUARTERLY PROGRESS REPORT
AUGUST 2017 This publication was produced for review by the United States Agency for International Development. It was prepared by staff of PATH’s country program in Kenya.
USAID KENYA (APHIAPLUS WESTERN KENYA) PROGRESS REPORT FOR Q2 FY 2017
USAID KENYA
APHIAplus WESTERN KENYA FISCAL YEAR 2017
QUARTER 2 PROGRESS REPORT
APRIL 1 through JUNE 30, 2017
Award No: AID-623-A-11-00002
Prepared for
Dr. Maurice Maina
United States Agency for International Development Kenya
c/o American Embassy
United Nations Avenue, Gigiri
PO Box 629, Village Market
Nairobi 00621
Kenya
Prepared by
PATH’s Country Office in Kenya
ACS Plaza, 4th Floor
Lenana and Galana Road PO Box 76634
Nairobi 00100
Kenya
DISCLAIMER
The authors’ views expressed in this report do not necessarily reflect the views of the United
States Agency for International Development or the United States Government.
USAID KENYA (APHIAPLUS WESTERN KENYA) PROGRESS REPORT FOR Q2 FY 2017 ii
TABLE OF CONTENTS
LIST OF TABLES ...................................................................................................................................... III
LIST OF FIGURES ..................................................................................................................................... V
ACRONYMS AND ABBREVIATIONS ................................................................................................... VI
EXECUTIVE SUMMARY ..................................................................................................................... VIII
I. KEY ACHIEVEMENTS (QUALITATIVE IMPACT) ............................................................................ 1
Subpurpose 1. Increased and expanded quality HIV services ................................................................. 1
HIV testing and counseling services .................................................................................................. 1
Elimination of mother-to-child transmission of HIV (eMTCT) ....................................................... 12
HIV care and treatment .................................................................................................................... 24
TB-HIV co-infection services .......................................................................................................... 36
HIV prevention services ................................................................................................................... 42
Services for orphans and vulnerable children ................................................................................... 57
Subpurpose 2. Increased access to and utilization of malaria prevention and treatment services ......... 65
Malaria prevention and treatment services ....................................................................................... 65
Subpurpose 3. Strengthened and functional county health systems ...................................................... 67
Human resources for health services ................................................................................................ 67
Health care financing ........................................................................................................................ 67
Commodity security ......................................................................................................................... 68
Strategic monitoring and evaluation ................................................................................................. 69
II. ACTIVITY PROGRESS (QUANTITATIVE IMPACT) ...................................................................... 69
III. CONSTRAINTS AND OPPORTUNITIES .......................................................................................... 69
IV. PERFORMANCE MONITORING ...................................................................................................... 69
V. PROGRESS ON GENDER STRATEGY .............................................................................................. 74
VI. PROGRESS ON ENVIRONMENTAL MITIGATION AND MONITORING ................................... 74
VII. PROGRESS ON LINKS TO OTHER USAID PROGRAMS ............................................................. 75
VIII. PROGRESS ON LINKS WITH GOVERNMENT OF KENYA AGENCIES .................................. 76
IX. PROGRESS ON USAID FORWARD ................................................................................................. 79
X. SUSTAINABILITY AND EXIT STRATEGY ..................................................................................... 79
XI. GLOBAL DEVELOPMENT ALLIANCE (IF APPLICABLE) .......................................................... 80
XII. SUBSEQUENT QUARTER’S WORK PLAN ................................................................................... 80
XIII. FINANCIAL INFORMATION ......................................................................................................... 82
XIV. ACTIVITY ADMINISTRATION ..................................................................................................... 84
XV. INFORMATION FOR ANNUAL REPORTS ONLY ........................................................................ 84
XVI. GPS INFORMATION ....................................................................................................................... 84
XVII. SUCCESS STORIES ........................................................................................................................ 85
ANNEX A. SCHEDULE OF UPCOMING EVENTS ............................................................................... 90
ANNEX B. LIST OF DELIVERABLE PRODUCTS ................................................................................ 90
ANNEX C. ACTIVITY IMPLEMENTATION RESULTS TABLES ....................................................... 91
iii
LIST OF TABLES
Table 1. Overall project HIV testing and counseling performance, Y6Q4 to Y7Q2, compared with COP
2016 targets. 2
Table 2. County-level HIV testing and counseling and identification of HIV-positive individuals, Y6Q4 to
Y7Q2, compared with COP 2016 targets. 4
Table 3. County performance comparing positivity against achievement versus COP 2016 targets. 5
Table 4. County-level pediatric HIV testing and counseling and identification of HIV-positive individuals,
Y6Q4 to Y7Q2, compared with COP 2016 targets. 6
Table 5. Outcomes of the HIV positive yield from the referrals made to HTS from GMP, April
to June 2017 7
Table 6. Partner notification and family testing, April to June 2017. ........................................................... 8
Table 7. HIV testing services (HTS) modalities, Y6Q4 to Y7Q2................................................................. 8
Table 8. HTS performance by age and gender, Y6Q4 to Y7Q2. .................................................................. 9
Table 9. External quality assurance proficiency testing, round 16. ............................................................ 11
Table 10. Prevention of mother-to-child transmission of HIV (PMTCT) summary achievements,
October 2016 to June 2017, against COP 2016 .......................................................................................... 13
Table 11. Prevention of mother-to-child transmission of HIV (PMTCT) overall achievements,
April to June 2017 14
Table 12. Community PMTCT activities and their contribution (April-June 2017) .................................. 16
Table 13. Prevention of mother-to-child transmission (PMTCT) cohort analysis ...................................... 22
Table 14. Summary care and treatment achievements (Y6Q4 to Y7Q2).................................................... 25
Table 15. County antiretroviral therapy (ART) initiation against COP 2016 targets (Y7Q2). ................... 26
Table 16. Current antiretroviral therapy (ART) losses and retention during the April to June
2017 reporting period, by county. 28
Table 17. Current antiretroviral therapy (ART) achievement during Semi-Annual Program
Results (SAPR) and Y7Q2 period, by county. ............................................................................................ 29
Table 18. Pediatric antiretroviral therapy (ART) achievement, Y6Q4 to Y7Q2 period, by
county. 30
Table 19. Progress made in tracing of SAPR (Oct 2016 to Mar 2017) defaulters and those lost to
follow-up. 31
Table 20. Total number of CD4 done across the 32 project-supported nodal sites, Y7Q2. ........................ 32
Table 21. Viral load (VL) done and suppression in different age groups in Y7Q2. ................................... 32
Table 22. Differentiated drug delivery approaches at facility and community level, Y7Q2 ...................... 34
Table 23. Outcomes of adolescent services, Y7Q2..................................................................................... 35
Table 24. Key TB-HIV performance against COP 2016 target .................................................................. 37
Table 25. Tuberculosis (TB) screening among antiretroviral therapy (ART) clients, Y7Q2. .................... 40
Table 26. GeneXpert utilization rate per county, Y7Q1 to Y7Q2. ............................................................. 41
Table 27. Proportion of antiretroviral therapy (ART) patients who completed a standard course
of TB preventive therapy (isoniazid preventive therapy [IPT]) .................................................................. 41
iv
Table 28. Voluntary male medical circumcision (VMMC) performance by county, Y6Q4 to
Y7Q2. 43
Table 29. Fisher folk reached with HIV prevention services, October 2016 to June 2017. ....................... 45
Table 30. Fisher folk reached during splash inside out sessions and complete referrals provided,
April to June 2017 45
Table 31. Results of HIV testing of fisher folk in two counties, April to June 2017. ................................. 46
Table 32. Results of HIV testing of fisher folk in two counties, October 2016 to June 2017. ................... 46
Table 33. Post gender-based violence (GBV) care services, October 2016 to June 2017. ......................... 48
Table 34. Survivors of gender-based violence (GBV) reached with services, Y6Q4 to Y7Q2. ................. 49
Table 35. Enrollment status of adolescent girls and young women (AGYW), by county. ......................... 50
Table 36. Numbers of adolescent girls and young women receiving services. .......................................... 51
Table 37. Reasons for adolescent girls and young women (AGYW) to discontinue pre-exposure
prophylaxis. 53
Table 38. Number of adolescent girls and young women (AGYW) reached with education
subsidies. 56
Table 39. Orphans and vulnerable children (OVC) served per county in Y7Q2. ....................................... 58
Table 40. Trend in orphans and vulnerable children (OVC) served. .......................................................... 58
Table 41. HIV status of project supported orphans and vulnerable children. ............................................. 60
Table 42. Number of orphans and vulnerable children (OVC) accessing HIV testing services. ................ 60
Table 43. HRH establishment by county by end of Y7Q2 ......................................................................... 67
Table 44. Central and satellite ART commodity sites reporting rates, April to June 2017 ........................ 68
Table 45. Data quality audit comparisons for care and treatment, Y6Q4 to Y7Q2. ................................... 71
Table 46. Linkages between the Government of Kenya and the project. ................................................... 78
Table 47. Subsequent quarter’s work plan. ................................................................................................. 80
Table 48. Actual expenditure details 83
Table 49. Budget notes 83
Table 50. Schedule of upcoming events. .................................................................................................... 90
v
LIST OF FIGURES
Figure 1. HIV counseling and testing uptake by county, Y7Q2. ................................................................ 17
Figure 2. Maternal and infant prophylaxis uptake by county, Y7Q2. ......................................................... 18
Figure 3. Early infant diagnosis (EID) cascade, Y6Q4 to Y7Q2. ............................................................... 19
Figure 4. Linkage status of HIV positive infants, Y7Q2. ........................................................................... 20
Figure 5. Outcome of mother-to-child transmission of HIV (MTCT) audits, Y7Q2. ................................. 21
Figure 6. HIV-exposed infant (HEI) cohort analysis at 9 and 18 months. .................................................. 23
Figure 7. Viral suppression by age categories, in the nine project counties. .............................................. 33
Figure 8. TB/HIV cascade, Y6Q4 to Y7Q2. ............................................................................................... 39
Figure 9. Layering of services for adolescent girls and young women (AGYW) in three age
categories (10–14, 15–19, 20–24). 50
Figure 10. Orphans and vulnerable children (OVC) served, by type of service. ........................................ 59
Figure 11. Cash flow report and financial projections (pipeline burn-rate). ............................................... 82
vi
ACRONYMS AND ABBREVIATIONS
ACF active case finding
AGYW adolescent girls and young women
AIDS acquired immune deficiency syndrome
ANC antenatal care
APHIAplus AIDS, Population and Health Integrated Assistance Plus
ART antiretroviral therapy
ARV antiretroviral medication
CBO community-based organization
CCC comprehensive care clinic
CHMT County Health Management Team
CHV community health volunteer
CME continuing medical education
COP Country Operational Plan
CPT cotrimoxazole preventive therapy
DHIS district health information system
DQA data quality assessment
DREAMS Determined, Resilient, Empowered, AIDS-free, Mentored and Safe
DR-TB drug-resistant tuberculosis
DSD direct service delivery
EBI evidence-based intervention
EID early infant diagnosis
eMTCT elimination of mother-to-child transmission of HIV
FBO faith-based organization
FP family planning
GBV gender-based violence
GIS geographic information system
HCW health care worker
HEI HIV-exposed infant
HES household economic strengthening
HIV human immunodeficiency virus
HMIS health management information system
HTC HIV testing and counseling
HTS HIV testing services
ICF intensified case finding
IEC information, education, and communication
IPC infection prevention and control
IPT isoniazid preventive treatment
KEMSA Kenya Medical Supply Agency
LCHV lead community home visitor
LIP local implementing partner
M&E monitoring and evaluation
MCH maternal and child health
MIP malaria implementing partner
MOH Ministry of Health
vii
MTCT mother-to-child transmission of HIV
NACS nutrition assessment, counseling, and support
NASCOP National AIDS & STI Control Programme
NGO nongovernmental organization
NHIF National Health Insurance Fund
NHRL National HIV Reference Laboratory
OLMIS OVC longitudinal management information system
OPD outpatient department
OVC orphans and vulnerable children
PCR polymerase chain reaction
PE peer educator
PEP post-exposure prophylaxis
PEPFAR US President’s Emergency Plan for AIDS Relief
PHDP Positive Health, Dignity, and Prevention
PITC provider-initiated testing and counseling
PLHIV people living with HIV
PMTCT prevention of mother-to-child transmission of HIV
PPE personal protective equipment
PrEP pre-exposure prophylaxis
PSSG psychosocial support group
RH reproductive health
RLSN rider-led sample network
RRI Rapid Results Initiative
SAPR Semi-Annual Program Results
SCHMT Sub-County Health Management Team
SGBV sexual and gender-based violence
SIMS Site Improvement through Monitoring System
SMS short message service
STI sexually transmitted infection
TB tuberculosis
TB/HIV tuberculosis and HIV co-infection
TWG technical working group
USAID US Agency for International Development
VL viral load
VMMC voluntary medical male circumcision
VSLA voluntary savings and loan association
USAID KENYA (APHIAPLUS WESTERN KENYA) PROGRESS REPORT FOR Q2 FY 2017 viii
EXECUTIVE SUMMARY
The AIDS, Population and Health Integrated Assistance Plus Western Kenya Project is a US
Agency for International Development-funded project that is being implemented from January
2011 through December 2017 by a consortium led by PATH and including World Vision.
Since 2011, the project has:
Contributed to improvements in key health indicators.
Built the capacity of community-level structures to respond to the needs of people.
Strengthened linkages between health facilities and communities to facilitate access to HIV
care and treatment.
Enhanced health service quality by building the capacity of health care workers and
improving infrastructure of health facilities.
Helped empower communities and promote sustainability through support for local
community-based organizations.
In Year 7 Quarter 2 (Y7Q2, April through June 2017), the period under review, the project
continued to align its activities with US President’s Emergency Plan for AIDS Relief county
prioritization based on the HIV burden and Joint United Nations Programme on HIV/AIDS 90-
90-90 goals.1 In line with this and as outlined in the project’s Year 7 work plan, Homa Bay,
Kisumu, Migori, Busia, Kakamega, and Kisii were categorized as scale up to saturation counties;
Nyamira and Bungoma as aggressive scale-up counties; and Vihiga as a sustained county.
During the reporting quarter, the project supported HIV testing and counseling of 404,910
clients. This brings the total number of clients counseled and tested in the Y6Q4 to Y7Q2 period
(October 2016 through June 2017) to 1,240,811 against the Country Operational Plan 2016 (COP
2016) target of 929,003 (134% achievement). This performance exceeded the 75% threshold for
the quarter.2 The number of clients who tested HIV positive for the reporting period was 5,722,
bringing the total number of HIV-positive clients in Y6Q4 to Y7Q2 period to 16,279, against a
COP 2016 target of 30,734, a 53% achievement.
During the reporting quarter, 26,812 pregnant women were counseled and tested for HIV, of
whom 1,434 (5%) tested positive. Maternal prophylaxis was provided to 1,408 women (98% of
those who tested positive), and 1,395 infants (97%) received prophylaxis. Within the Y6Q4 to
Y7Q2 period, 90,899 women accessed testing services for the prevention of mother-to-child
transmission of HIV, against a COP 2016 target of 163,919 (55% achievement). Among these,
4,690 women (5%) were diagnosed HIV positive. Maternal prophylaxis uptake for the Y6Q4 to
Y7Q2 period was 97% and infant prophylaxis uptake was also 97%. For the Y6Q4 to Y7Q2
period, maternal prophylaxis performance translates to a 50% achievement against the COP 2016
target.
1 An ambitious UNAIDS treatment target to help end the AIDS epidemic. By 2020, 90% of all people living with HIV will know their HIV
status; 90% of all people with diagnosed HIV infection will receive sustained antiretroviral therapy; and 90% of all people receiving antiretroviral therapy will have viral suppression. 2 The 75% threshold is the expected performance for all indicators as of the end of the quarter. Indicators whose results were greater than 75%
against the COP 2016 target performed well, while indicators whose results were less than 75% against the COP 2016 target did not meet the expected target.
USAID KENYA (APHIAPLUS WESTERN KENYA) PROGRESS REPORT FOR Q2 FY 2017 ix
During the reporting quarter, 5,349 clients were initiated on antiretroviral therapy, bringing the
total to 15,659 clients within the Y6Q4 to Y7Q2 period, a 41% achievement against the COP
2016 target. At the end of the reporting period, 107,916 clients were active on treatment, against
the COP 2016 target of 120,374 (90% achievement).
Through HIV prevention services implemented during the reporting period, a total of 11,794
clients accessed voluntary medical male circumcision services during the period, bringing the
total number reached in the Y6Q4 to Y7Q2 period to 32,707, against a COP 2016 target of
44,618 (73% achievement). Behavioral interventions reached 2,926 fisher folk with evidence-
based interventions during the period under review, bringing the total for the Y6Q4 to Y7Q2
period to 8,927, against a target of 13,738 (65% achievement).
Within the reporting period, a total of 230,936 orphans and vulnerable children (OVC) were
served. Performance for the quarter translates to an achievement of 86% against the COP 2016
target of 268,818. A total of 183,613 OVC (younger than 18 years) were HIV negative, 7,586
were positive, and the status of 4,364 was unknown. All the 7,586 HIV-positive OVC were
linked to antiretroviral treatment programs across the project zone.
The project continued to implement the DREAMS initiative in 34 wards during the reporting
period (29 in Homa Bay and 5 in Kisumu East sub-county). The project enrolled 32,476
adolescent girls and young women (AGYW), 97% of the project target of 34,264; all have been
entered into the DREAMS database.
USAID KENYA (APHIAPLUS WESTERN KENYA) PROGRESS REPORT FOR Q2 FY 2017 1
I. KEY ACHIEVEMENTS (QUALITATIVE IMPACT)
Subpurpose 1. Increased and expanded quality HIV services
HIV testing and counseling services
The project continued to provide direct service delivery (DSD) support to all the 537 project-
supported sites. The areas of focus included capacity-building through mentorship of HIV testing
and counseling (HTC) providers on the use of family and partner testing registers, understanding
the new HIV testing services (HTS) algorithm, and the testing and retesting guidelines for
selected HTS providers. Reorientation of the HTS providers on the use of the master health
facility register for tracking the HIV-positive persons, use of the index client family members
line-listing forms, use of client locator forms, understanding the medical waste segregation job
aid, use of screening tools to establish eligibility for HIV testing, and understanding the referral
process of HIV-positive clients featured most during these sessions. Supportive supervision and
facility-level issues-based continuing medical education (CME) addressed site-specific issues in
selected sites.
The project increased the number of HTS service providers from 441 in the previous quarter to
519 and deployed these teams across 380 sites as a task-shifting strategy to enhance provider-
initiated testing and counseling (PITC) services; this translates to 71% site coverage, which is an
improvement from 60% coverage in the previous quarter. The remaining 29% of sites comprise
private clinics and dispensaries where focal persons were identified and empowered to offer
HTS. The project identified roving HTS service providers from the existing teams to provide
linkage support in private clinics that are not offering HIV treatment services.
The project also supported printing and distribution of job aids and standard operating
procedures to guide service providers in screening children, adolescents, and adults for eligibility
in testing; supported purchase of tents for sites that lacked adequate testing space; and supported
purchase of testing timers meant to uphold quality and ensure standardized timing of test results.
During the reporting quarter of April to June 2017, a total of 404,910 clients were counseled and
tested, of whom 5,722 were identified as HIV positive. Cumulatively in the three quarters of the
Country Operational Plan 2016 (COP 2016), a total of 1,240,811 clients were counseled and
tested against the target of 929,003, translating to 134% achievement. A total of 16,279 clients
among those counseled and tested were identified as HIV positive as at end of Y7Q2 period
against COP 2016 target of 30,734 (53% achievement).
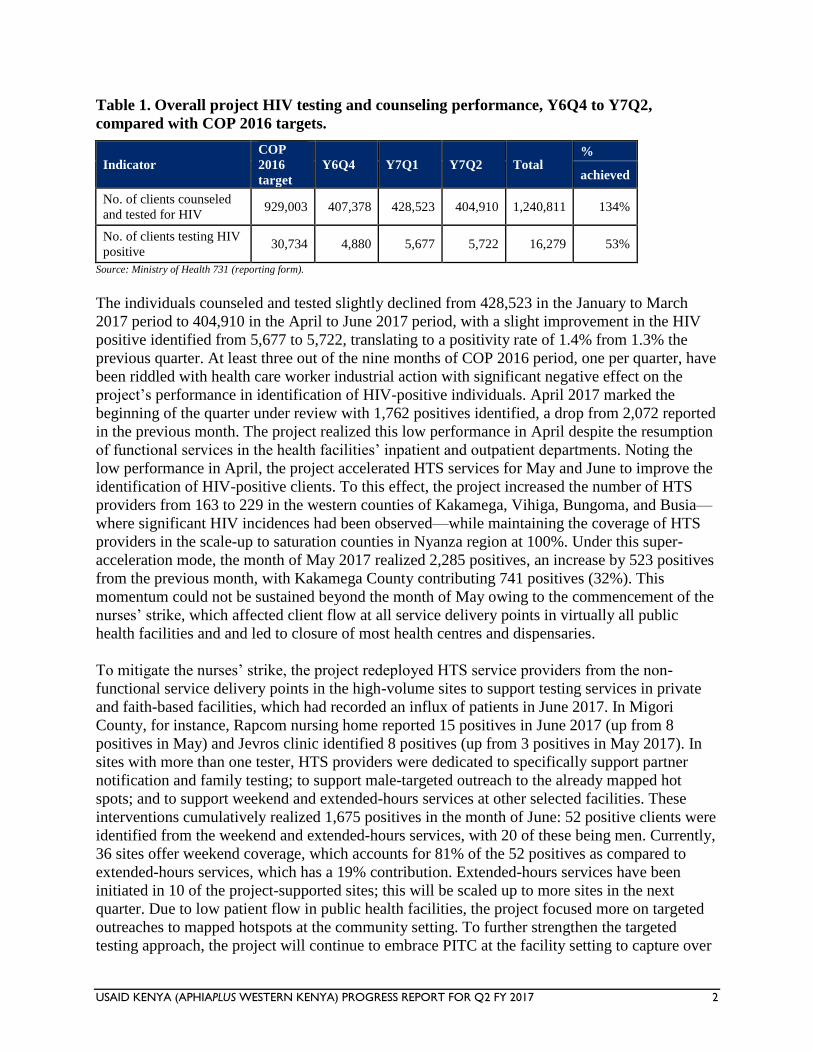
The project’s HTC performance for October 2016 through June 2017 period is shown in Table 1
below.
USAID KENYA (APHIAPLUS WESTERN KENYA) PROGRESS REPORT FOR Q2 FY 2017 2
Table 1. Overall project HIV testing and counseling performance, Y6Q4 to Y7Q2,
compared with COP 2016 targets.
Indicator
COP
2016
target
Y6Q4 Y7Q1 Y7Q2 Total %
achieved
No. of clients counseled
and tested for HIV 929,003 407,378 428,523 404,910 1,240,811 134%
No. of clients testing HIV
positive 30,734 4,880 5,677 5,722 16,279 53%
Source: Ministry of Health 731 (reporting form).
The individuals counseled and tested slightly declined from 428,523 in the January to March
2017 period to 404,910 in the April to June 2017 period, with a slight improvement in the HIV
positive identified from 5,677 to 5,722, translating to a positivity rate of 1.4% from 1.3% the
previous quarter. At least three out of the nine months of COP 2016 period, one per quarter, have
been riddled with health care worker industrial action with significant negative effect on the
project’s performance in identification of HIV-positive individuals. April 2017 marked the
beginning of the quarter under review with 1,762 positives identified, a drop from 2,072 reported
in the previous month. The project realized this low performance in April despite the resumption
of functional services in the health facilities’ inpatient and outpatient departments. Noting the
low performance in April, the project accelerated HTS services for May and June to improve the
identification of HIV-positive clients. To this effect, the project increased the number of HTS
providers from 163 to 229 in the western counties of Kakamega, Vihiga, Bungoma, and Busia—
where significant HIV incidences had been observed—while maintaining the coverage of HTS
providers in the scale-up to saturation counties in Nyanza region at 100%. Under this super-
acceleration mode, the month of May 2017 realized 2,285 positives, an increase by 523 positives
from the previous month, with Kakamega County contributing 741 positives (32%). This
momentum could not be sustained beyond the month of May owing to the commencement of the
nurses’ strike, which affected client flow at all service delivery points in virtually all public
health facilities and and led to closure of most health centres and dispensaries.
To mitigate the nurses’ strike, the project redeployed HTS service providers from the non-
functional service delivery points in the high-volume sites to support testing services in private
and faith-based facilities, which had recorded an influx of patients in June 2017. In Migori
County, for instance, Rapcom nursing home reported 15 positives in June 2017 (up from 8
positives in May) and Jevros clinic identified 8 positives (up from 3 positives in May 2017). In
sites with more than one tester, HTS providers were dedicated to specifically support partner
notification and family testing; to support male-targeted outreach to the already mapped hot
spots; and to support weekend and extended-hours services at other selected facilities. These
interventions cumulatively realized 1,675 positives in the month of June: 52 positive clients were
identified from the weekend and extended-hours services, with 20 of these being men. Currently,
36 sites offer weekend coverage, which accounts for 81% of the 52 positives as compared to
extended-hours services, which has a 19% contribution. Extended-hours services have been
initiated in 10 of the project-supported sites; this will be scaled up to more sites in the next
quarter. Due to low patient flow in public health facilities, the project focused more on targeted
outreaches to mapped hotspots at the community setting. To further strengthen the targeted
testing approach, the project will continue to embrace PITC at the facility setting to capture over
USAID KENYA (APHIAPLUS WESTERN KENYA) PROGRESS REPORT FOR Q2 FY 2017 3
50% of outpatient department (OPD) clients and 100% of inpatients with testing and will further
strengthen weekend coverage, offering extended-hours testing to progressively attain 50%
coverage of HTS sites. The project will continue with male-targeted outreach to mapped-out
hotspots within the supported sites catchment and finalize sexual partner notification and family
member testing in both the facility and community settings. The project will continue with the
snowballing approach to reach out to social networks of newly diagnosed positive clients.
The project is on track to achieve the counseling and testing targets in all six scale-up to
saturation counties—namely, Busia (86%), Kisumu (168%), Homa Bay (95%), Kakamega
(106%), Kisii (534%), and Migori (163%). All the other supported aggressive scale-up and
sustained counties equally met their counseling and testing targets against the expected target of
75%. The project will sustain this effort so as to achieve the counseling and testing COP 2016
targets, particularly in Busia and Homa Bay counties, which have not achieved their testing
target.
On the identification of HIV-positive individuals, only Busia (85%) and Kisii (331%) among the
six scale up to saturation counties met the expected targets. Migori (59%), Kisumu (54%), and
Kakamega (46%) were all below the 75% target. Homa Bay recorded a 26% achievement, up
from 17% the previous quarter. Homa Bay County registers an average of 157 positives monthly
with a positivity rate of below 1% in almost all strategies employed. In this reporting quarter, the
county reported 466 positives, down from 477 positives the previous quarter. The number of
individuals tested had a corresponding drop from 41,642 to 36,199, leading to a modest rise in
positivity rate from 1.2% to 1.3%, respectively. Partner notification and index contacts testing
yielded 54 positives among 6,832 contacts tested, while the male-targeted outreaches yielded 10
positives among a total of 962 tests conducted, translating to a positivity rate of 0.8% and 1%,
respectively.
Kisumu is the only county that demonstrated an upward trend this reporting quarter by
identifying 189 positives in April, 208 in May, and 227 in June 2017, with an improved
positivity rate from 1.3% in May to 1.7% in June. This was attributed to the acceleration of the
activities that target the use of nonstigmatizing platforms, in this case hypertension screening, to
offer HTS services in a county with multiple “location and find” opportunities as compared to
Homa Bay. A total of 21 diversified outreaches were conducted in June 2017, reaching out to
2,864 individuals, with 46 positives identified, a positivity rate of 1.6%. Index contacts testing
was biased toward sexual partners’ notification and testing since most of the enlisted children
below 15 years had been reached with HTC services. The index contacts testing realized a total
of 66 positives among 1,043 contacts tested, a 6.3% positivity rate. Migosi health center, one of
our high-volume project-supported sites, consistently offered daily extended-hours services
targeting men between 6 pm and 10 pm. This facility had a significant number of male clients
who were identified as HIV positive in this implementation period. Within 14 days of adding
extended-hours services, Migosi reached a total of 419 individuals with testing and identified 9
(7 males, 2 females) positives, a positivity rate of 2.1%. In June 2017, the site reported 35
positives up from 29 positives in May 2017. The project data for HIV incidences within Kisumu
further guided a mop-up around three key facilities in the densely populated rural urban slums,
namely Airport dispensary, Star Hospital, and K’owino. Airport reported 23 positives in June (up
from 20 in May), Star reported 21 positives in June (up from 10 in May), and K’owino reported
20 positives in June (up from 12 positives in May).
USAID KENYA (APHIAPLUS WESTERN KENYA) PROGRESS REPORT FOR Q2 FY 2017 4
Among the two aggressive scale-up counties, Bungoma (661%) met the set HIV-positive
identification target while Nyamira (31%) did not meet the target. Nyamira is a predominantly
low-HIV-prevalence county with a constant positivity rate of below 1%. To realize the positive
identification target in Nyamira, the project will continue support for focused testing among new
testers, priority populations, and family and partner testing particularly sexual partners and the
snowballing approach to achieve the APR 2017 targets for HIV-positive identification. Vihiga
(137%) met the expected HIV-positive targets. Table 2 summarizes the HTC achievements
against COP 2016 targets in the project counties.
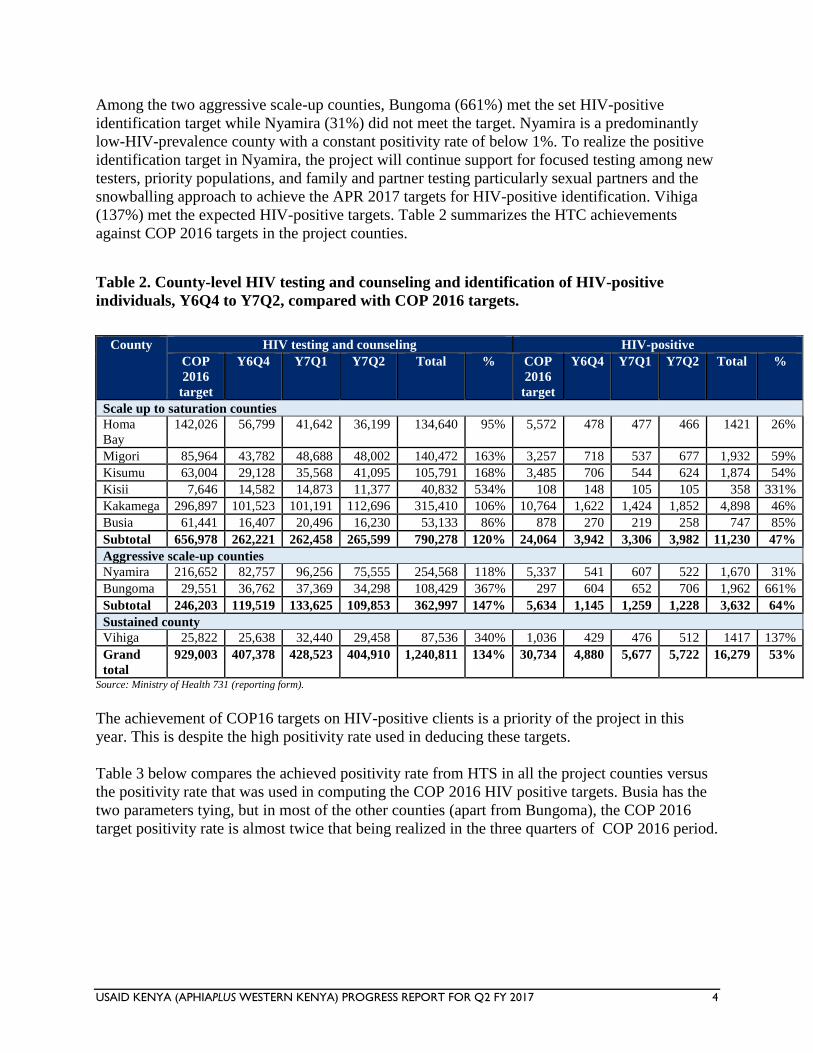
Table 2. County-level HIV testing and counseling and identification of HIV-positive
individuals, Y6Q4 to Y7Q2, compared with COP 2016 targets.
County HIV testing and counseling HIV-positive
COP
2016
target
Y6Q4 Y7Q1 Y7Q2 Total % COP
2016
target
Y6Q4 Y7Q1 Y7Q2 Total %
Scale up to saturation counties
Homa
Bay
142,026 56,799 41,642 36,199 134,640 95% 5,572 478 477 466 1421 26%
Migori 85,964 43,782 48,688 48,002 140,472 163% 3,257 718 537 677 1,932 59%
Kisumu 63,004 29,128 35,568 41,095 105,791 168% 3,485 706 544 624 1,874 54%
Kisii 7,646 14,582 14,873 11,377 40,832 534% 108 148 105 105 358 331%
Kakamega 296,897 101,523 101,191 112,696 315,410 106% 10,764 1,622 1,424 1,852 4,898 46%
Busia 61,441 16,407 20,496 16,230 53,133 86% 878 270 219 258 747 85%
Subtotal 656,978 262,221 262,458 265,599 790,278 120% 24,064 3,942 3,306 3,982 11,230 47%
Aggressive scale-up counties
Nyamira 216,652 82,757 96,256 75,555 254,568 118% 5,337 541 607 522 1,670 31%
Bungoma 29,551 36,762 37,369 34,298 108,429 367% 297 604 652 706 1,962 661%
Subtotal 246,203 119,519 133,625 109,853 362,997 147% 5,634 1,145 1,259 1,228 3,632 64%
Sustained county
Vihiga 25,822 25,638 32,440 29,458 87,536 340% 1,036 429 476 512 1417 137%
Grand
total
929,003 407,378 428,523 404,910 1,240,811 134% 30,734 4,880 5,677 5,722 16,279 53%
Source: Ministry of Health 731 (reporting form).
The achievement of COP16 targets on HIV-positive clients is a priority of the project in this
year. This is despite the high positivity rate used in deducing these targets.
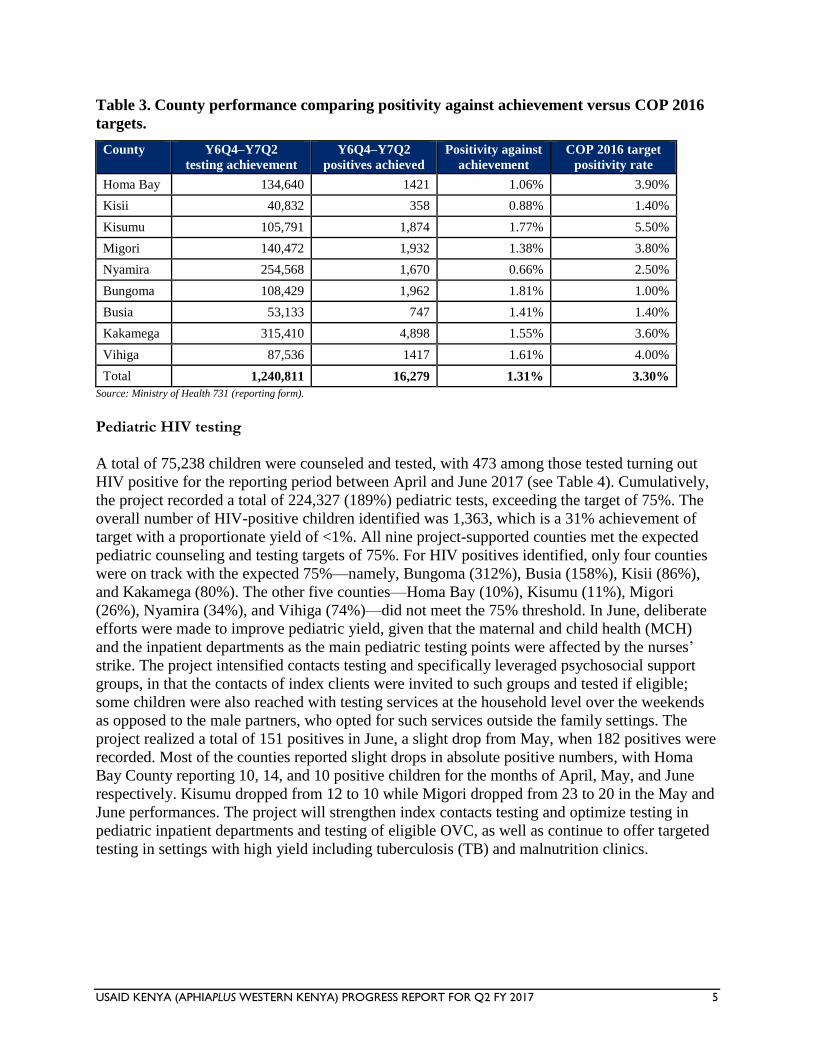
Table 3 below compares the achieved positivity rate from HTS in all the project counties versus
the positivity rate that was used in computing the COP 2016 HIV positive targets. Busia has the
two parameters tying, but in most of the other counties (apart from Bungoma), the COP 2016
target positivity rate is almost twice that being realized in the three quarters of COP 2016 period.
USAID KENYA (APHIAPLUS WESTERN KENYA) PROGRESS REPORT FOR Q2 FY 2017 5
Table 3. County performance comparing positivity against achievement versus COP 2016
targets.
County Y6Q4–Y7Q2
testing achievement
Y6Q4–Y7Q2
positives achieved
Positivity against
achievement
COP 2016 target
positivity rate
Homa Bay 134,640 1421 1.06% 3.90%
Kisii 40,832 358 0.88% 1.40%
Kisumu 105,791 1,874 1.77% 5.50%
Migori 140,472 1,932 1.38% 3.80%
Nyamira 254,568 1,670 0.66% 2.50%
Bungoma 108,429 1,962 1.81% 1.00%
Busia 53,133 747 1.41% 1.40%
Kakamega 315,410 4,898 1.55% 3.60%
Vihiga 87,536 1417 1.61% 4.00%
Total 1,240,811 16,279 1.31% 3.30%
Source: Ministry of Health 731 (reporting form).
Pediatric HIV testing
A total of 75,238 children were counseled and tested, with 473 among those tested turning out
HIV positive for the reporting period between April and June 2017 (see Table 4). Cumulatively,
the project recorded a total of 224,327 (189%) pediatric tests, exceeding the target of 75%. The
overall number of HIV-positive children identified was 1,363, which is a 31% achievement of
target with a proportionate yield of <1%. All nine project-supported counties met the expected
pediatric counseling and testing targets of 75%. For HIV positives identified, only four counties
were on track with the expected 75%—namely, Bungoma (312%), Busia (158%), Kisii (86%),
and Kakamega (80%). The other five counties—Homa Bay (10%), Kisumu (11%), Migori
(26%), Nyamira (34%), and Vihiga (74%)—did not meet the 75% threshold. In June, deliberate
efforts were made to improve pediatric yield, given that the maternal and child health (MCH)
and the inpatient departments as the main pediatric testing points were affected by the nurses’
strike. The project intensified contacts testing and specifically leveraged psychosocial support
groups, in that the contacts of index clients were invited to such groups and tested if eligible;
some children were also reached with testing services at the household level over the weekends
as opposed to the male partners, who opted for such services outside the family settings. The
project realized a total of 151 positives in June, a slight drop from May, when 182 positives were
recorded. Most of the counties reported slight drops in absolute positive numbers, with Homa
Bay County reporting 10, 14, and 10 positive children for the months of April, May, and June
respectively. Kisumu dropped from 12 to 10 while Migori dropped from 23 to 20 in the May and
June performances. The project will strengthen index contacts testing and optimize testing in
pediatric inpatient departments and testing of eligible OVC, as well as continue to offer targeted
testing in settings with high yield including tuberculosis (TB) and malnutrition clinics.
USAID KENYA (APHIAPLUS WESTERN KENYA) PROGRESS REPORT FOR Q2 FY 2017 6
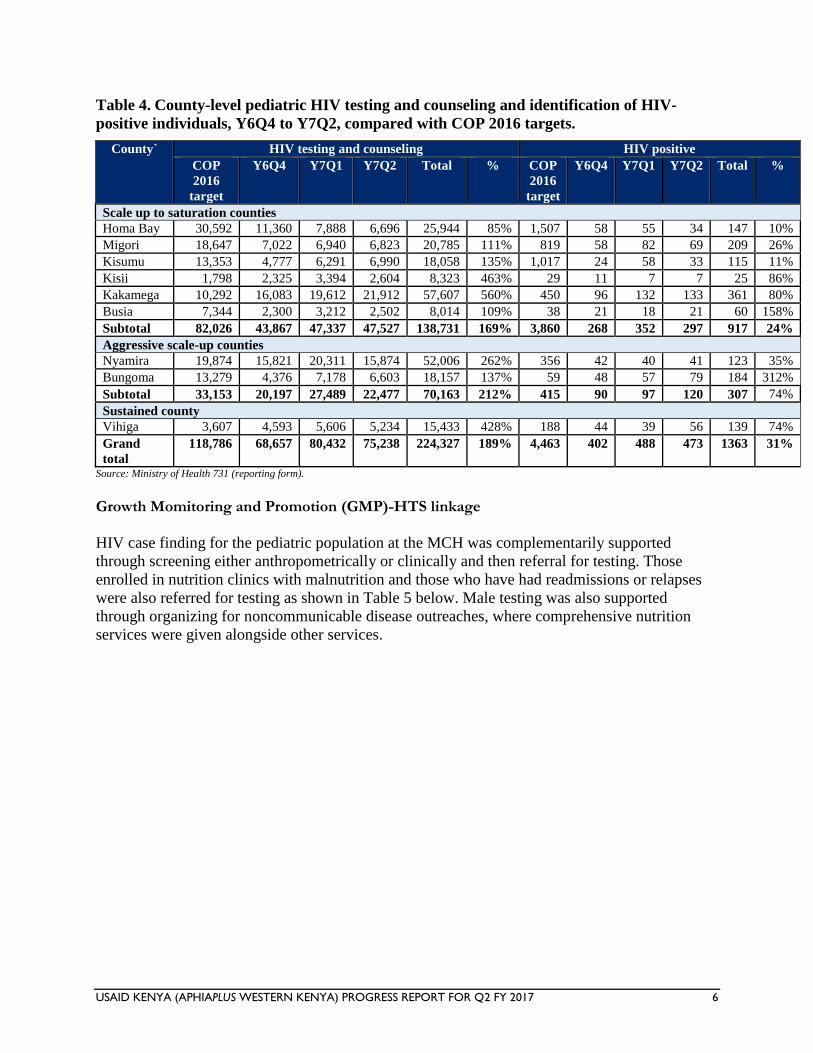
Table 4. County-level pediatric HIV testing and counseling and identification of HIV-
positive individuals, Y6Q4 to Y7Q2, compared with COP 2016 targets.
County` HIV testing and counseling HIV positive
COP
2016
target
Y6Q4 Y7Q1 Y7Q2 Total % COP
2016
target
Y6Q4 Y7Q1 Y7Q2 Total %
Scale up to saturation counties
Homa Bay 30,592 11,360 7,888 6,696 25,944 85% 1,507 58 55 34 147 10%
Migori 18,647 7,022 6,940 6,823 20,785 111% 819 58 82 69 209 26%
Kisumu 13,353 4,777 6,291 6,990 18,058 135% 1,017 24 58 33 115 11%
Kisii 1,798 2,325 3,394 2,604 8,323 463% 29 11 7 7 25 86%
Kakamega 10,292 16,083 19,612 21,912 57,607 560% 450 96 132 133 361 80%
Busia 7,344 2,300 3,212 2,502 8,014 109% 38 21 18 21 60 158%
Subtotal 82,026 43,867 47,337 47,527 138,731 169% 3,860 268 352 297 917 24%
Aggressive scale-up counties
Nyamira 19,874 15,821 20,311 15,874 52,006 262% 356 42 40 41 123 35%
Bungoma 13,279 4,376 7,178 6,603 18,157 137% 59 48 57 79 184 312%
Subtotal 33,153 20,197 27,489 22,477 70,163 212% 415 90 97 120 307 74%
Sustained county
Vihiga 3,607 4,593 5,606 5,234 15,433 428% 188 44 39 56 139 74%
Grand
total
118,786 68,657 80,432 75,238 224,327 189% 4,463 402 488 473 1363 31%
Source: Ministry of Health 731 (reporting form). Growth Momitoring and Promotion (GMP)-HTS linkage
HIV case finding for the pediatric population at the MCH was complementarily supported
through screening either anthropometrically or clinically and then referral for testing. Those
enrolled in nutrition clinics with malnutrition and those who have had readmissions or relapses
were also referred for testing as shown in Table 5 below. Male testing was also supported
through organizing for noncommunicable disease outreaches, where comprehensive nutrition
services were given alongside other services.
USAID KENYA (APHIAPLUS WESTERN KENYA) PROGRESS REPORT FOR Q2 FY 2017 7
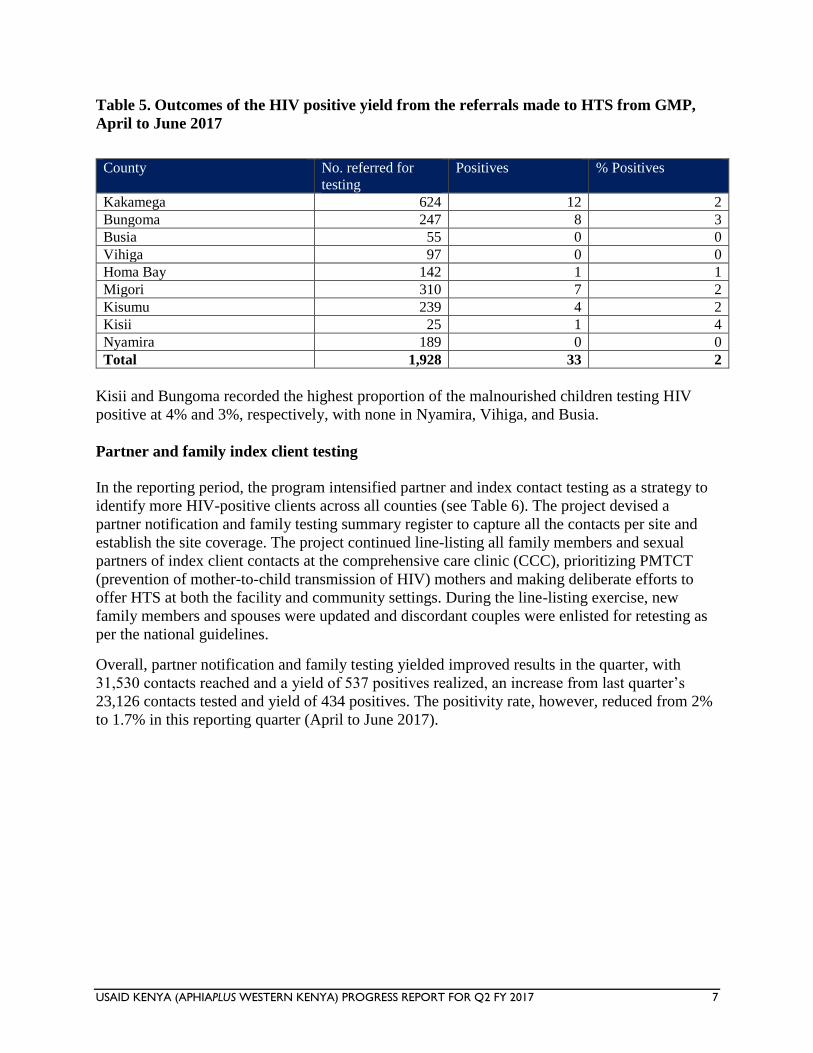
Table 5. Outcomes of the HIV positive yield from the referrals made to HTS from GMP,
April to June 2017
County No. referred for
testing
Positives % Positives
Kakamega 624 12 2
Bungoma 247 8 3
Busia 55 0 0
Vihiga 97 0 0
Homa Bay 142 1 1
Migori 310 7 2
Kisumu 239 4 2
Kisii 25 1 4
Nyamira 189 0 0
Total 1,928 33 2
Kisii and Bungoma recorded the highest proportion of the malnourished children testing HIV
positive at 4% and 3%, respectively, with none in Nyamira, Vihiga, and Busia.
Partner and family index client testing
In the reporting period, the program intensified partner and index contact testing as a strategy to
identify more HIV-positive clients across all counties (see Table 6). The project devised a
partner notification and family testing summary register to capture all the contacts per site and
establish the site coverage. The project continued line-listing all family members and sexual
partners of index client contacts at the comprehensive care clinic (CCC), prioritizing PMTCT
(prevention of mother-to-child transmission of HIV) mothers and making deliberate efforts to
offer HTS at both the facility and community settings. During the line-listing exercise, new
family members and spouses were updated and discordant couples were enlisted for retesting as
per the national guidelines.
Overall, partner notification and family testing yielded improved results in the quarter, with
31,530 contacts reached and a yield of 537 positives realized, an increase from last quarter’s
23,126 contacts tested and yield of 434 positives. The positivity rate, however, reduced from 2%
to 1.7% in this reporting quarter (April to June 2017).
USAID KENYA (APHIAPLUS WESTERN KENYA) PROGRESS REPORT FOR Q2 FY 2017 8
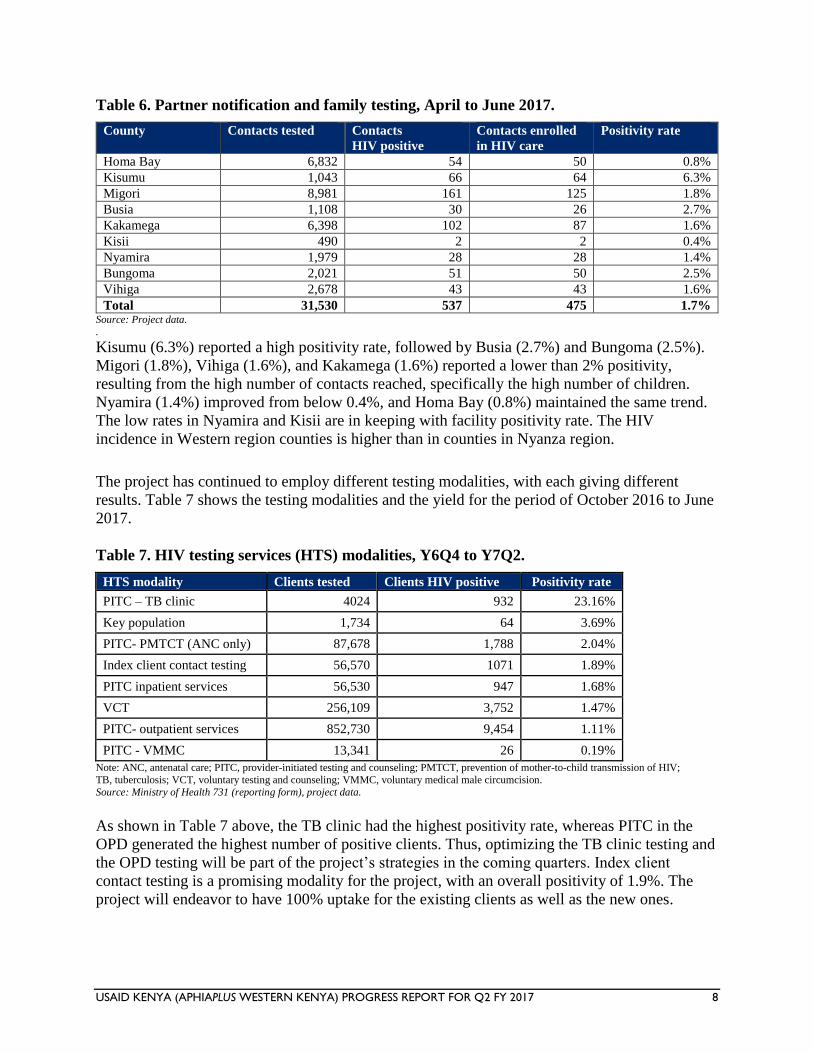
Table 6. Partner notification and family testing, April to June 2017.
County Contacts tested Contacts
HIV positive
Contacts enrolled
in HIV care
Positivity rate
Homa Bay 6,832 54 50 0.8%
Kisumu 1,043 66 64 6.3%
Migori 8,981 161 125 1.8%
Busia 1,108 30 26 2.7%
Kakamega 6,398 102 87 1.6%
Kisii 490 2 2 0.4%
Nyamira 1,979 28 28 1.4%
Bungoma 2,021 51 50 2.5%
Vihiga 2,678 43 43 1.6%
Total 31,530 537 475 1.7% Source: Project data.
.
Kisumu (6.3%) reported a high positivity rate, followed by Busia (2.7%) and Bungoma (2.5%).
Migori (1.8%), Vihiga (1.6%), and Kakamega (1.6%) reported a lower than 2% positivity,
resulting from the high number of contacts reached, specifically the high number of children.
Nyamira (1.4%) improved from below 0.4%, and Homa Bay (0.8%) maintained the same trend.
The low rates in Nyamira and Kisii are in keeping with facility positivity rate. The HIV
incidence in Western region counties is higher than in counties in Nyanza region.
The project has continued to employ different testing modalities, with each giving different
results. Table 7 shows the testing modalities and the yield for the period of October 2016 to June
2017.
Table 7. HIV testing services (HTS) modalities, Y6Q4 to Y7Q2.
HTS modality Clients tested Clients HIV positive Positivity rate
PITC – TB clinic 4024 932 23.16%
Key population 1,734 64 3.69%
PITC- PMTCT (ANC only) 87,678 1,788 2.04%
Index client contact testing 56,570 1071 1.89%
PITC inpatient services 56,530 947 1.68%
VCT 256,109 3,752 1.47%
PITC- outpatient services 852,730 9,454 1.11%
PITC - VMMC 13,341 26 0.19%
Note: ANC, antenatal care; PITC, provider-initiated testing and counseling; PMTCT, prevention of mother-to-child transmission of HIV;
TB, tuberculosis; VCT, voluntary testing and counseling; VMMC, voluntary medical male circumcision. Source: Ministry of Health 731 (reporting form), project data.
As shown in Table 7 above, the TB clinic had the highest positivity rate, whereas PITC in the
OPD generated the highest number of positive clients. Thus, optimizing the TB clinic testing and
the OPD testing will be part of the project’s strategies in the coming quarters. Index client
contact testing is a promising modality for the project, with an overall positivity of 1.9%. The
project will endeavor to have 100% uptake for the existing clients as well as the new ones.
USAID KENYA (APHIAPLUS WESTERN KENYA) PROGRESS REPORT FOR Q2 FY 2017 9
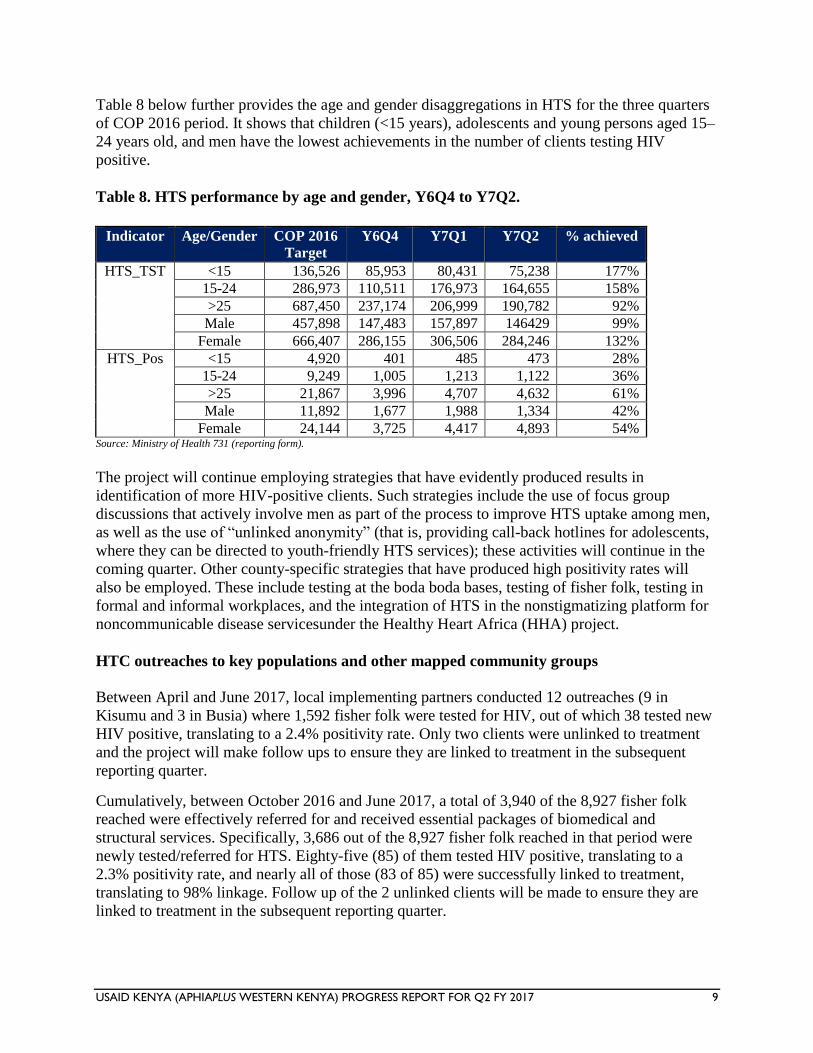
Table 8 below further provides the age and gender disaggregations in HTS for the three quarters
of COP 2016 period. It shows that children (<15 years), adolescents and young persons aged 15–
24 years old, and men have the lowest achievements in the number of clients testing HIV
positive.
Table 8. HTS performance by age and gender, Y6Q4 to Y7Q2.
Indicator Age/Gender COP 2016
Target
Y6Q4 Y7Q1 Y7Q2 % achieved
HTS_TST <15 136,526 85,953 80,431 75,238 177%
15-24 286,973 110,511 176,973 164,655 158%
>25 687,450 237,174 206,999 190,782 92%
Male 457,898 147,483 157,897 146429 99%
Female 666,407 286,155 306,506 284,246 132%
HTS_Pos <15 4,920 401 485 473 28%
15-24 9,249 1,005 1,213 1,122 36%
>25 21,867 3,996 4,707 4,632 61%
Male 11,892 1,677 1,988 1,334 42%
Female 24,144 3,725 4,417 4,893 54% Source: Ministry of Health 731 (reporting form).
The project will continue employing strategies that have evidently produced results in
identification of more HIV-positive clients. Such strategies include the use of focus group
discussions that actively involve men as part of the process to improve HTS uptake among men,
as well as the use of “unlinked anonymity” (that is, providing call-back hotlines for adolescents,
where they can be directed to youth-friendly HTS services); these activities will continue in the
coming quarter. Other county-specific strategies that have produced high positivity rates will
also be employed. These include testing at the boda boda bases, testing of fisher folk, testing in
formal and informal workplaces, and the integration of HTS in the nonstigmatizing platform for
noncommunicable disease servicesunder the Healthy Heart Africa (HHA) project.
HTC outreaches to key populations and other mapped community groups
Between April and June 2017, local implementing partners conducted 12 outreaches (9 in
Kisumu and 3 in Busia) where 1,592 fisher folk were tested for HIV, out of which 38 tested new
HIV positive, translating to a 2.4% positivity rate. Only two clients were unlinked to treatment
and the project will make follow ups to ensure they are linked to treatment in the subsequent
reporting quarter.
Cumulatively, between October 2016 and June 2017, a total of 3,940 of the 8,927 fisher folk
reached were effectively referred for and received essential packages of biomedical and
structural services. Specifically, 3,686 out of the 8,927 fisher folk reached in that period were
newly tested/referred for HTS. Eighty-five (85) of them tested HIV positive, translating to a
2.3% positivity rate, and nearly all of those (83 of 85) were successfully linked to treatment,
translating to 98% linkage. Follow up of the 2 unlinked clients will be made to ensure they are
linked to treatment in the subsequent reporting quarter.
USAID KENYA (APHIAPLUS WESTERN KENYA) PROGRESS REPORT FOR Q2 FY 2017 10
The project continued with the focus on the “location and population” strategy by mapping out
all hotspots to help target resources to areas with the greatest need. A total of 114 hotspots were
elicited across the project-supported sites. From these mapped hot spots, a total of 7,467
individuals (5,116 M, 2,351 F) were reached with testing services of which 136 (78 M, 58 F)
turned out HIV positive, a positivity rate of 1.8%. The hotspots reached comprised boda boda
sheds; brick, ballast, and gold mines; bars and pubs; tea factories; sugar cane cutters; and matatu
touts, among others. Focus group discussions (FGDs) conducted at the respective work places
were used as an entry point for most of the outreaches that targeted men. The uniformed police in
Oyugis, Homa Bay County, were among the formal work places that consented to HTS
following a consensus meeting with the base commander. The male-targeted FGDs also sought
to elicit some of the reasons why this subpopulation was reluctant to seek health care services.
The cited reasons included: long hospital queues, sitting alongside mothers and children, the
direct and indirect costs charged by the health facilities, lack of essential drugs in the facilities,
and the health care workers’ attitudes toward men. The majority therefore opted for over-the-
counter medicines and use of herbs, resorting to seeking health services as the last option.
Linkage to care and treatment services
Given the additional benefit of same-day enrollment into care, the project has strengthened the
adoption of a team approach that includes the involvement of peer educators (PEs) and
community health volunteers (CHVs) at the point of HIV diagnosis. The project has further
strengthened referral mechanisms through facility-level biweekly linkage meetings. Each HTC
provider is able to follow, over time, HIV-positive clients who are not enrolled, and this is
captured using a project-designed linkage template. All HIV-positive clients are escorted to the
CCC for enrollment into care by the HTS provider, a peer educator, or clinician. HIV-positive
clients are then captured in the Master Facility Linkage Register at the link facility, and the HIV-
Positive Client Referral Forms are signed by the receiving officer, including the locator form for
tracking purposes. The project has further supported each testing site with standard operating
procedures for referrals based on the HTS guidelines and index contacts line-listing forms for the
contacts of the newly diagnosed as part of the information captured upon diagnosis.
Quality assurance
The project continued to support County and Sub-County Health Management Teams (CHMTs
and SCHMTs) for quality assurance in HTC services through supportive supervision and
capacity-building interventions, including mentorship and individual observed sessions for HTC
providers. The project also provided onsite mentorships, focusing more on high-volume and
high-yield sites so as to ensure that HCWs upheld quality standards at all levels of service
provision.
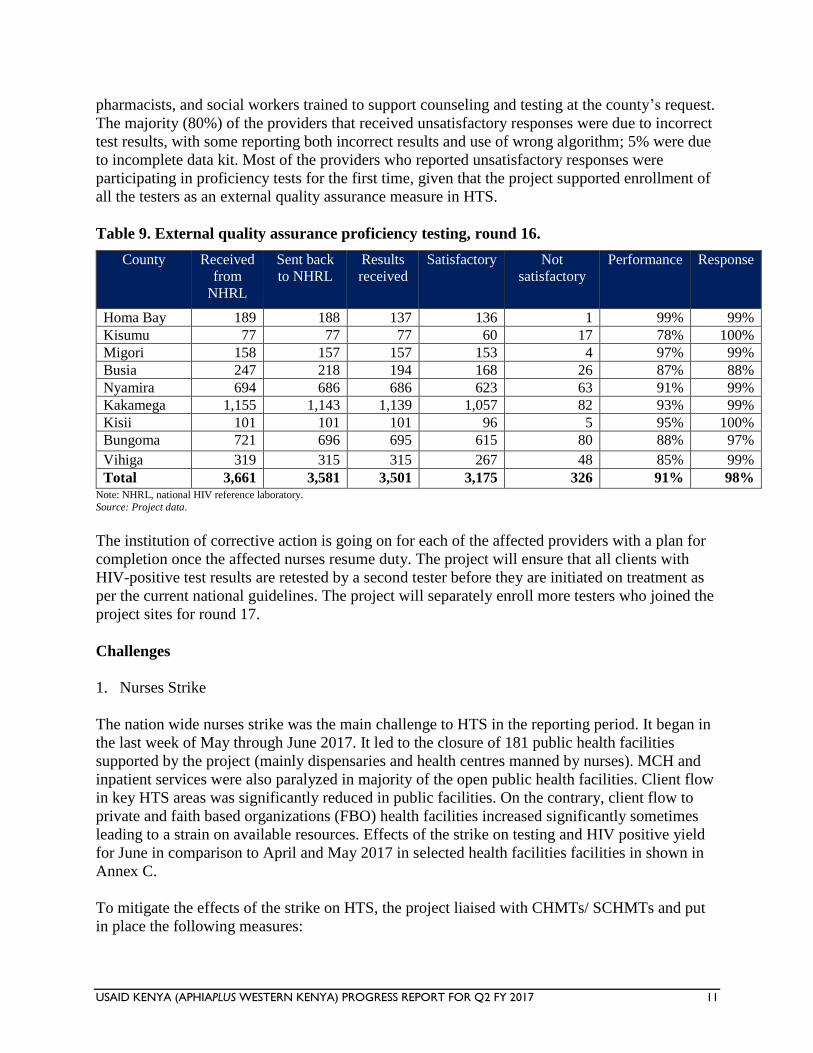
The project supported the distribution of 3,661 proficiency test panels for round 16 across the
nine supported counties (see Table 9). A total of 3,581 proficiency tests were processed and sent
back to the national HIV reference laboratory, a response rate of 98%. So far the project has
received 3,501 results, of which 3,175 (91%) are satisfactory and 326 (9%) are unsatisfactory.
Among the 326 HTC service providers with unsatisfactory responses, 202 (62%) were nurses
under the PMTCT program, 59 (18%) were laboratory technologists, 30 (9%) were clinical
officers, 26 (8%) were HTS counselors, and 9 (3%) were from a pool of nutritionists,
USAID KENYA (APHIAPLUS WESTERN KENYA) PROGRESS REPORT FOR Q2 FY 2017 11
pharmacists, and social workers trained to support counseling and testing at the county’s request.
The majority (80%) of the providers that received unsatisfactory responses were due to incorrect
test results, with some reporting both incorrect results and use of wrong algorithm; 5% were due
to incomplete data kit. Most of the providers who reported unsatisfactory responses were
participating in proficiency tests for the first time, given that the project supported enrollment of
all the testers as an external quality assurance measure in HTS.
Table 9. External quality assurance proficiency testing, round 16.
County Received
from
NHRL
Sent back
to NHRL
Results
received
Satisfactory Not
satisfactory
Performance Response
Homa Bay 189 188 137 136 1 99% 99%
Kisumu 77 77 77 60 17 78% 100%
Migori 158 157 157 153 4 97% 99%
Busia 247 218 194 168 26 87% 88%
Nyamira 694 686 686 623 63 91% 99%
Kakamega 1,155 1,143 1,139 1,057 82 93% 99%
Kisii 101 101 101 96 5 95% 100%
Bungoma 721 696 695 615 80 88% 97%
Vihiga 319 315 315 267 48 85% 99%
Total 3,661 3,581 3,501 3,175 326 91% 98% Note: NHRL, national HIV reference laboratory.
Source: Project data.
The institution of corrective action is going on for each of the affected providers with a plan for
completion once the affected nurses resume duty. The project will ensure that all clients with
HIV-positive test results are retested by a second tester before they are initiated on treatment as
per the current national guidelines. The project will separately enroll more testers who joined the
project sites for round 17.
Challenges
1. Nurses Strike
The nation wide nurses strike was the main challenge to HTS in the reporting period. It began in
the last week of May through June 2017. It led to the closure of 181 public health facilities
supported by the project (mainly dispensaries and health centres manned by nurses). MCH and
inpatient services were also paralyzed in majority of the open public health facilities. Client flow
in key HTS areas was significantly reduced in public facilities. On the contrary, client flow to
private and faith based organizations (FBO) health facilities increased significantly sometimes
leading to a strain on available resources. Effects of the strike on testing and HIV positive yield
for June in comparison to April and May 2017 in selected health facilities facilities in shown in
Annex C.
To mitigate the effects of the strike on HTS, the project liaised with CHMTs/ SCHMTs and put
in place the following measures:
USAID KENYA (APHIAPLUS WESTERN KENYA) PROGRESS REPORT FOR Q2 FY 2017 12
Re-deployment of project supported HTS providers from closed public facilities to
support privates /FBOs to address increased workload. The redeployment was reviewed
weekly and the providers moved to needy sites as appropriate.
Focus on community HTS strategies due to the low numbers of clients in public facilities.
The strategies included testing of partners and family members of index clients; and
outreaches to mapped hotspots based on project data e.g in the rural –urban slums in
Kisumu and shop to shop/ garage to garage testing in Isebania (Migori county)
Allocated a team to support extended and weekend coverage in sites that were
operational including private/FBO facilities.
Optimizing community HTS and Hypertension screening to reach out to Men in
Homabay and Kisumu counties (Healthy Heart Africa )
Deliberate efforts to reach out to formal workplaces including the uniformed police in
Rachuonyo and Busia
2. Delays in relaying back Round 16 Proficiency Testing results
This was mainly, in counties with multiple implementing partners. The National HIV
Reference Laboratory (NHRL) works through one identified implementing partner in each
county to collect the proficiency tests on behalf of others for processing and to collect hard
copies of the processed tests. A few samples for Round 16 had no diluents in the package as
witnessed in Round 15 and the pending corrective action for the nursing cadre that is still on
strike. The project will continue networking with other implementing partners through
identified focal persons so as to reduce the turnaround time.
Elimination of mother-to-child transmission of HIV (eMTCT)
During the reporting quarter, the project continued support for PMTCT services in 346 health
facilities (Nyanza 128; Western 218). The comprehensive support focused on improving
antenatal care (ANC) coverage, strengthening identification of HIV-infected women, providing
highly active antiretroviral therapy (ART) and infant prophylaxis, improving early infant
diagnosis services, and analyzing retention among maternal and HIV-exposed infant cohorts.
The project supported health care workers to carry out targeted ANC outreaches, pregnancy
mapping, and strengthened referrals from community levels. Site-level capacity-building was
done via supporting supervision and mentorship, monthly zonal eMTCT meetings, focused
onsite and offsite mentorships, CMEs, and on-the-job trainings to promote uptake of counseling
and testing among pregnant and breastfeeding women; orientations on commodity management
and rapid-test-kit forecasting and allocation meetings at county level; data documentation,
review, and reporting; and county stock-taking forums. The project also supported the county
level eMTCT technical working group (TWG)/business planning meetings. Human resource
support was also given to the private and faith-based organization (FBO) sites to enable them to
cope with the service need during the nurses’ strike that affected the Ministry of Health (MOH)
sites.
During the reporting quarter, 26,812 pregnant women had known HIV status at ANC only,
including 924 known positives. Of the pregnant women counseled and tested, 1,434 (5%) tested
HIV positive while 1,408 women (98% of those who tested positive) and 1,395 infants (97% of
USAID KENYA (APHIAPLUS WESTERN KENYA) PROGRESS REPORT FOR Q2 FY 2017 13
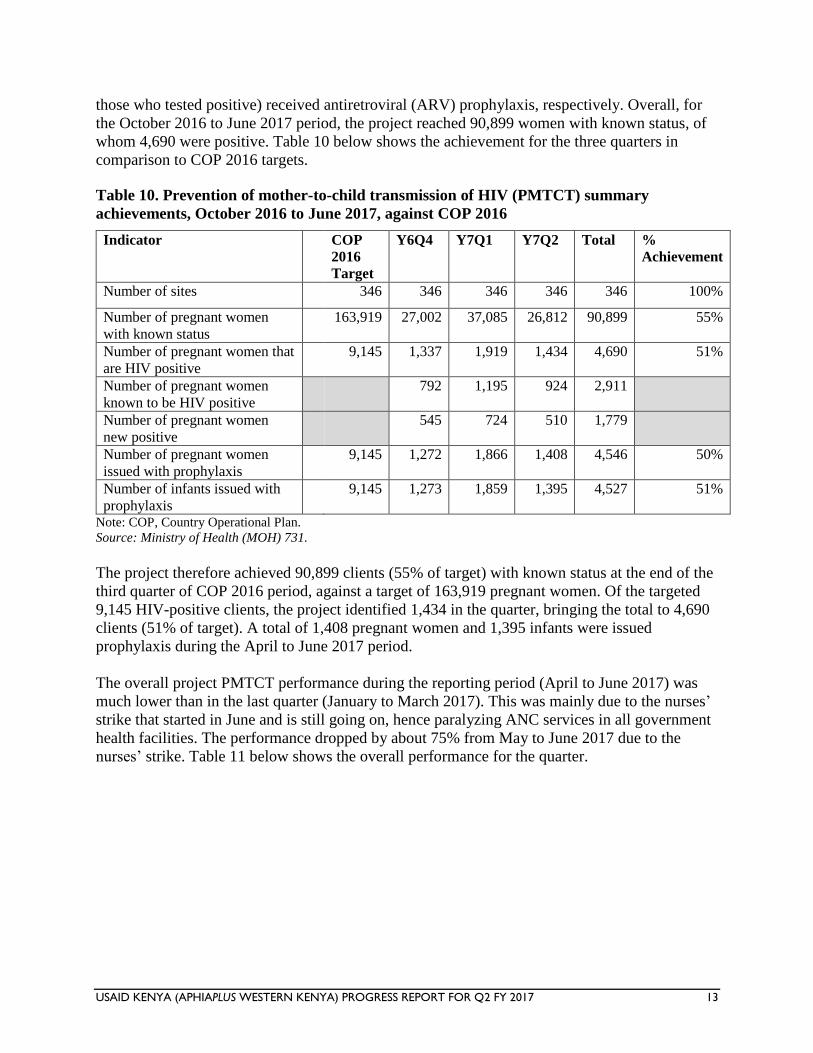
those who tested positive) received antiretroviral (ARV) prophylaxis, respectively. Overall, for
the October 2016 to June 2017 period, the project reached 90,899 women with known status, of
whom 4,690 were positive. Table 10 below shows the achievement for the three quarters in
comparison to COP 2016 targets.
Table 10. Prevention of mother-to-child transmission of HIV (PMTCT) summary
achievements, October 2016 to June 2017, against COP 2016
Indicator COP
2016
Target
Y6Q4 Y7Q1 Y7Q2 Total %
Achievement
Number of sites 346 346 346 346 346 100%
Number of pregnant women
with known status
163,919 27,002 37,085 26,812 90,899 55%
Number of pregnant women that
are HIV positive
9,145 1,337 1,919 1,434 4,690 51%
Number of pregnant women
known to be HIV positive
792 1,195 924 2,911
Number of pregnant women
new positive
545 724 510 1,779
Number of pregnant women
issued with prophylaxis
9,145 1,272 1,866 1,408 4,546 50%
Number of infants issued with
prophylaxis
9,145 1,273 1,859 1,395 4,527 51%
Note: COP, Country Operational Plan. Source: Ministry of Health (MOH) 731.
The project therefore achieved 90,899 clients (55% of target) with known status at the end of the
third quarter of COP 2016 period, against a target of 163,919 pregnant women. Of the targeted
9,145 HIV-positive clients, the project identified 1,434 in the quarter, bringing the total to 4,690
clients (51% of target). A total of 1,408 pregnant women and 1,395 infants were issued
prophylaxis during the April to June 2017 period.
The overall project PMTCT performance during the reporting period (April to June 2017) was
much lower than in the last quarter (January to March 2017). This was mainly due to the nurses’
strike that started in June and is still going on, hence paralyzing ANC services in all government
health facilities. The performance dropped by about 75% from May to June 2017 due to the
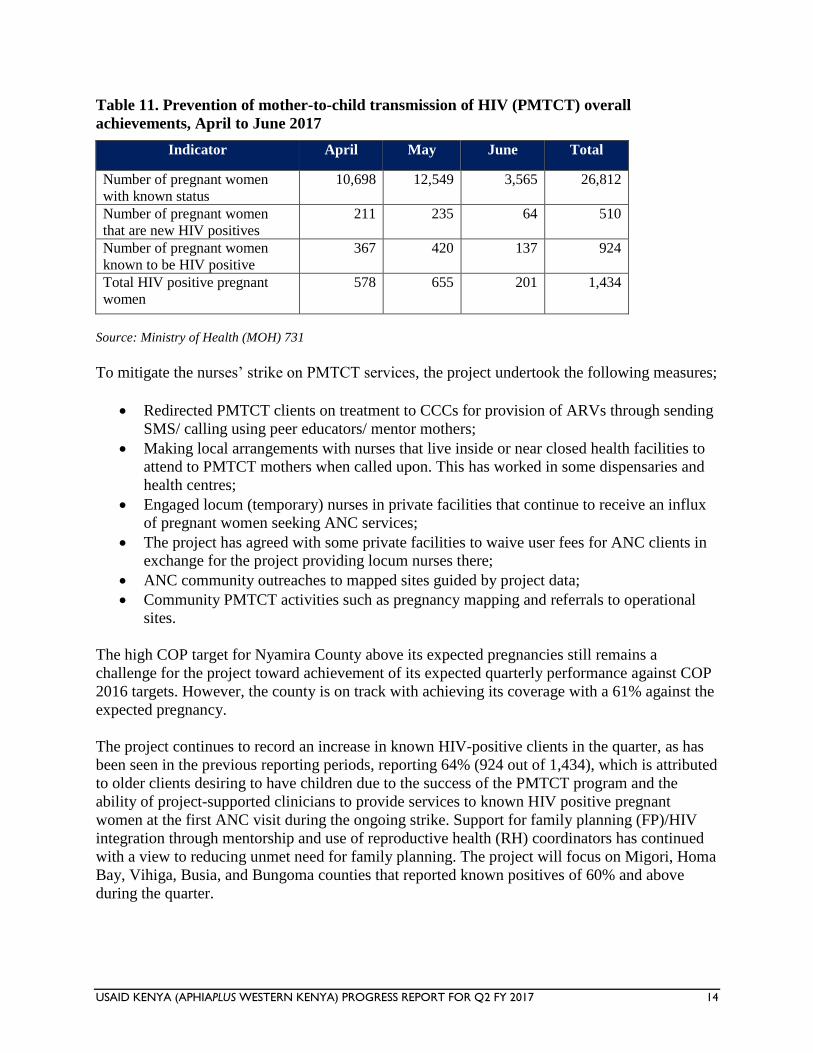
nurses’ strike. Table 11 below shows the overall performance for the quarter.
USAID KENYA (APHIAPLUS WESTERN KENYA) PROGRESS REPORT FOR Q2 FY 2017 14
Table 11. Prevention of mother-to-child transmission of HIV (PMTCT) overall
achievements, April to June 2017
Indicator April May June Total
Number of pregnant women
with known status
10,698 12,549 3,565 26,812
Number of pregnant women
that are new HIV positives
211 235 64 510
Number of pregnant women
known to be HIV positive
367 420 137 924
Total HIV positive pregnant
women
578 655 201 1,434
Source: Ministry of Health (MOH) 731
To mitigate the nurses’ strike on PMTCT services, the project undertook the following measures;
Redirected PMTCT clients on treatment to CCCs for provision of ARVs through sending
SMS/ calling using peer educators/ mentor mothers;
Making local arrangements with nurses that live inside or near closed health facilities to
attend to PMTCT mothers when called upon. This has worked in some dispensaries and
health centres;
Engaged locum (temporary) nurses in private facilities that continue to receive an influx
of pregnant women seeking ANC services;
The project has agreed with some private facilities to waive user fees for ANC clients in
exchange for the project providing locum nurses there;
ANC community outreaches to mapped sites guided by project data;
Community PMTCT activities such as pregnancy mapping and referrals to operational
sites.
The high COP target for Nyamira County above its expected pregnancies still remains a
challenge for the project toward achievement of its expected quarterly performance against COP
2016 targets. However, the county is on track with achieving its coverage with a 61% against the
expected pregnancy.
The project continues to record an increase in known HIV-positive clients in the quarter, as has
been seen in the previous reporting periods, reporting 64% (924 out of 1,434), which is attributed
to older clients desiring to have children due to the success of the PMTCT program and the
ability of project-supported clinicians to provide services to known HIV positive pregnant
women at the first ANC visit during the ongoing strike. Support for family planning (FP)/HIV
integration through mentorship and use of reproductive health (RH) coordinators has continued
with a view to reducing unmet need for family planning. The project will focus on Migori, Homa
Bay, Vihiga, Busia, and Bungoma counties that reported known positives of 60% and above
during the quarter.
USAID KENYA (APHIAPLUS WESTERN KENYA) PROGRESS REPORT FOR Q2 FY 2017 15
Performance of the known HIV-status indicator against the COP 2016 target at county level was
as follows: Busia 109%, Kisumu 91%, Homa Bay 79%, Kisii 65%, Kakamega 58%, Migori
57%, Vihiga 53%, Bungoma 52%, and Nyamira 33%. Busia, Kisumu, and Homa Bay counties
achieved above the expected performance of 75%, while the remaining counties are below 75%
and if the nurses strike continues, they may not achieve their targets. Nyamira County has the
lowest performance for known status (33% of the COP 2016 target) but the PMTCT coverage is
61% of target (8,362 out of 13,645). Nyamira County has a higher COP 2016 target as compared
to the expected pregnancies, and this could affect achieving the set targets. The project supported
human resource for health in the private and FBO health facilities across the counties and this
contributed to 940/3,582 (26%) ANC attendance during the month of June.
Improving coverage of PMTCT services through community interventions
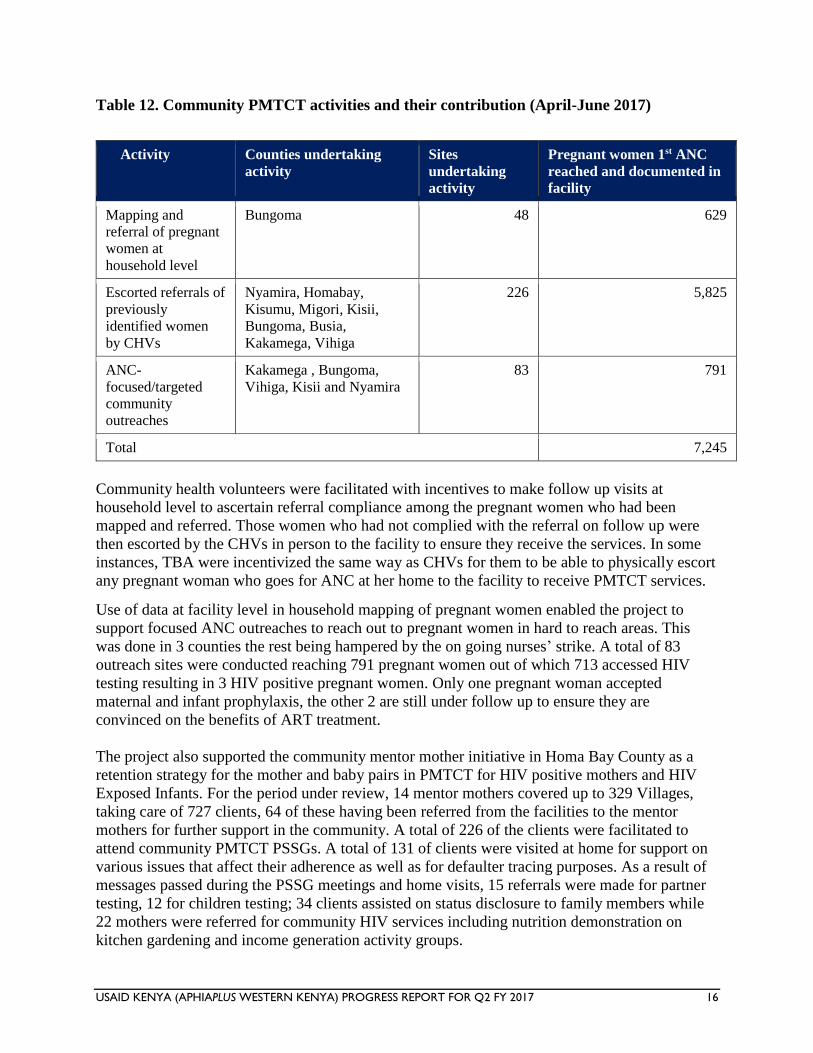
During the reporting period, the project supported several community PMTCT activities which
contributed to more women reached with testing in 1st ANC as illustrated in Table 12 below.
The project continued to utilize facility level data in making decisions on where to focus the
interventions so as to maximize on resources to achieve the set targets. Working with existing
community structures such as community health volunteers (CHVs), traditional birth attendants
(TBAs) and village elders, the facilities conducted household mapping to identify pregnant
women early in pregnancy, escorted referrals for those who delay starting ANC as well as
community targeted ANC outreaches to reach pregnant women from hard to reach areas.
Community Health Volunteers were facilitated to conduct household level mapping exercise in
Bungoma County in the month of June with the objective of identifying pregnant women in their
pregnancy to start attending ante natal care (ANC) clinic early, a precursor for receiving the
standard ANC package which includes PMTCT. The exercise was conducted in 48 project
supported PMTCT sites that have not met their ANC coverage targets and as a result 1,431
pregnant women were identified as having not started ANC and referrals were referred to link
health facilities. Out of this, 629 pregnant women were effectively referred and accessed
PMTCT services as shown in Table 12. Four pregnant women were identified as HIV positive
translating to a 1% HIV positivity rate and all the 4 were enrolled on treatment and received both
maternal and infant prohylaxis.
USAID KENYA (APHIAPLUS WESTERN KENYA) PROGRESS REPORT FOR Q2 FY 2017 16
Table 12. Community PMTCT activities and their contribution (April-June 2017)
Activity Counties undertaking
activity
Sites
undertaking
activity
Pregnant women 1st ANC
reached and documented in
facility
Mapping and
referral of pregnant
women at
household level
Bungoma 48 629
Escorted referrals of
previously
identified women
by CHVs
Nyamira, Homabay,
Kisumu, Migori, Kisii,
Bungoma, Busia,
Kakamega, Vihiga
226 5,825
ANC-
focused/targeted
community
outreaches
Kakamega , Bungoma,
Vihiga, Kisii and Nyamira
83 791
Total 7,245
Community health volunteers were facilitated with incentives to make follow up visits at
household level to ascertain referral compliance among the pregnant women who had been
mapped and referred. Those women who had not complied with the referral on follow up were
then escorted by the CHVs in person to the facility to ensure they receive the services. In some
instances, TBA were incentivized the same way as CHVs for them to be able to physically escort
any pregnant woman who goes for ANC at her home to the facility to receive PMTCT services.
Use of data at facility level in household mapping of pregnant women enabled the project to
support focused ANC outreaches to reach out to pregnant women in hard to reach areas. This
was done in 3 counties the rest being hampered by the on going nurses’ strike. A total of 83
outreach sites were conducted reaching 791 pregnant women out of which 713 accessed HIV
testing resulting in 3 HIV positive pregnant women. Only one pregnant woman accepted
maternal and infant prophylaxis, the other 2 are still under follow up to ensure they are
convinced on the benefits of ART treatment.
The project also supported the community mentor mother initiative in Homa Bay County as a
retention strategy for the mother and baby pairs in PMTCT for HIV positive mothers and HIV
Exposed Infants. For the period under review, 14 mentor mothers covered up to 329 Villages,
taking care of 727 clients, 64 of these having been referred from the facilities to the mentor
mothers for further support in the community. A total of 226 of the clients were facilitated to
attend community PMTCT PSSGs. A total of 131 of clients were visited at home for support on
various issues that affect their adherence as well as for defaulter tracing purposes. As a result of
messages passed during the PSSG meetings and home visits, 15 referrals were made for partner
testing, 12 for children testing; 34 clients assisted on status disclosure to family members while
22 mothers were referred for community HIV services including nutrition demonstration on
kitchen gardening and income generation activity groups.
USAID KENYA (APHIAPLUS WESTERN KENYA) PROGRESS REPORT FOR Q2 FY 2017 17
The project will continue with mapping of pregnant women and supported targeted ANC
outreaches to reach pregnant women in identified sites in all the counties. The project will work
with the sites that missed opportunities to reach these women with counseling and testing and
link those identified to health care as appropriate.
PMTCT cascade
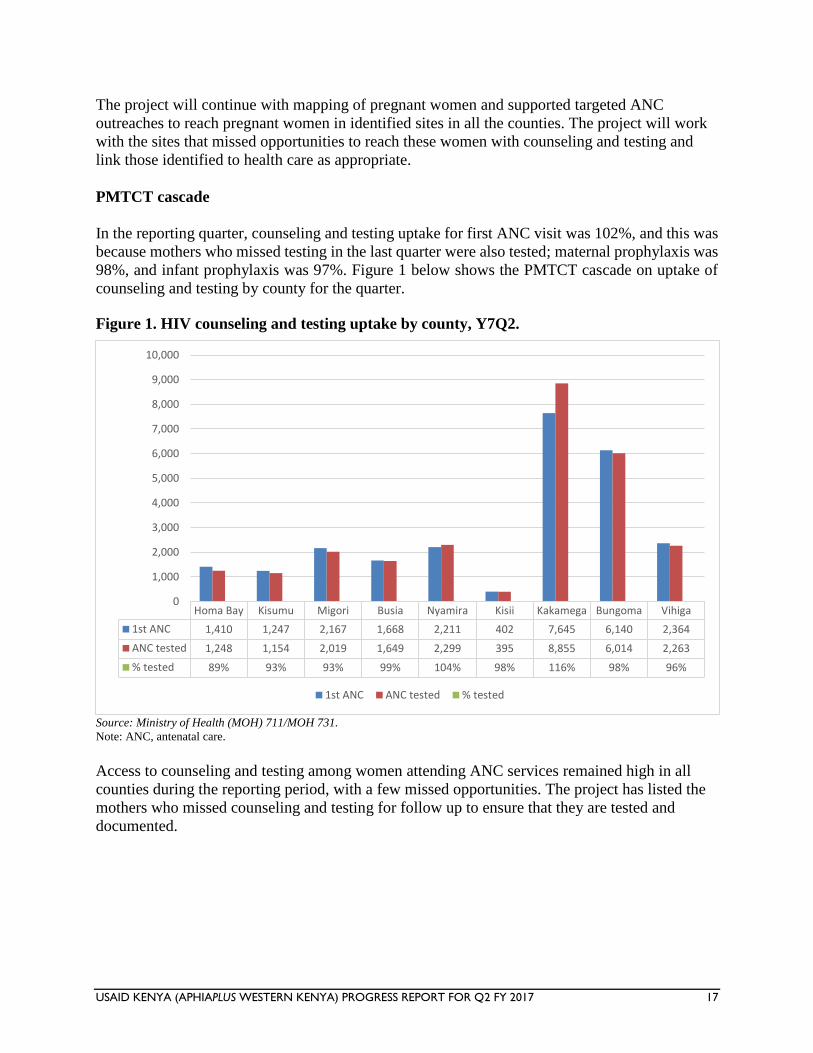
In the reporting quarter, counseling and testing uptake for first ANC visit was 102%, and this was
because mothers who missed testing in the last quarter were also tested; maternal prophylaxis was
98%, and infant prophylaxis was 97%. Figure 1 below shows the PMTCT cascade on uptake of
counseling and testing by county for the quarter.
Figure 1. HIV counseling and testing uptake by county, Y7Q2.
Source: Ministry of Health (MOH) 711/MOH 731.
Note: ANC, antenatal care.
Access to counseling and testing among women attending ANC services remained high in all
counties during the reporting period, with a few missed opportunities. The project has listed the
mothers who missed counseling and testing for follow up to ensure that they are tested and
documented.
Homa Bay Kisumu Migori Busia Nyamira Kisii Kakamega Bungoma Vihiga
1st ANC 1,410 1,247 2,167 1,668 2,211 402 7,645 6,140 2,364
ANC tested 1,248 1,154 2,019 1,649 2,299 395 8,855 6,014 2,263
% tested 89% 93% 93% 99% 104% 98% 116% 98% 96%
0
1,000
2,000
3,000
4,000
5,000
6,000
7,000
8,000
9,000
10,000
1st ANC ANC tested % tested
USAID KENYA (APHIAPLUS WESTERN KENYA) PROGRESS REPORT FOR Q2 FY 2017 18
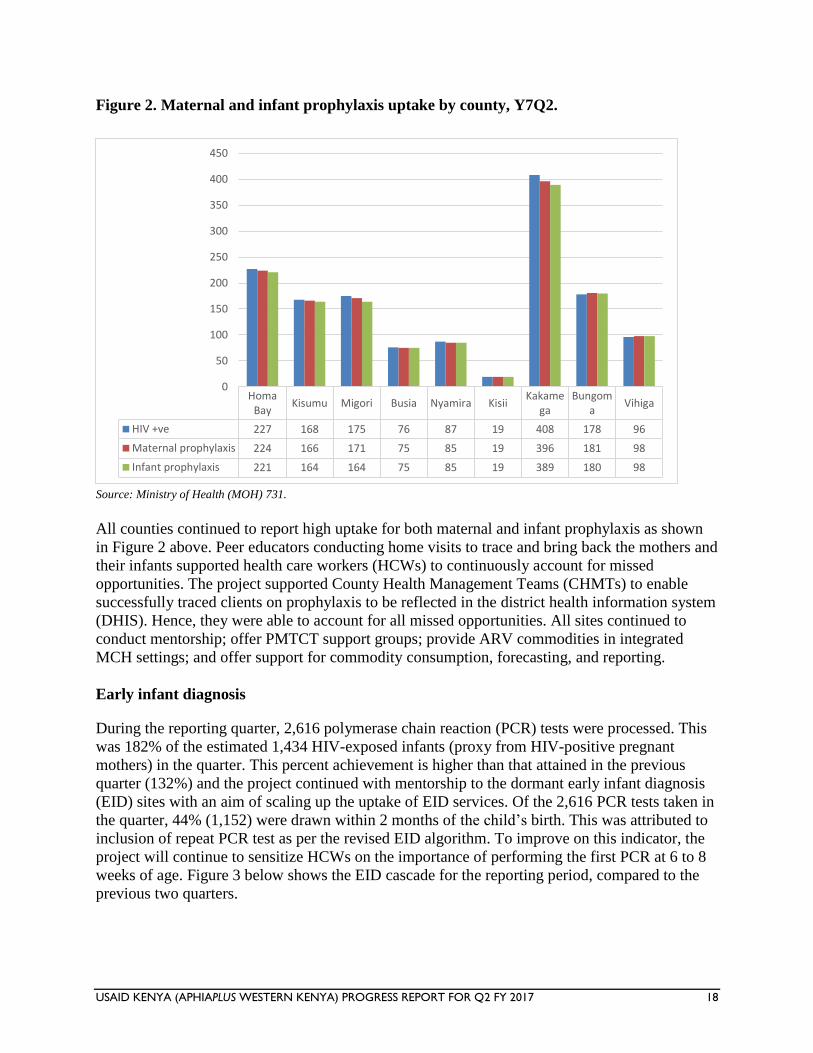
Figure 2. Maternal and infant prophylaxis uptake by county, Y7Q2.
Source: Ministry of Health (MOH) 731.
All counties continued to report high uptake for both maternal and infant prophylaxis as shown
in Figure 2 above. Peer educators conducting home visits to trace and bring back the mothers and
their infants supported health care workers (HCWs) to continuously account for missed
opportunities. The project supported County Health Management Teams (CHMTs) to enable
successfully traced clients on prophylaxis to be reflected in the district health information system
(DHIS). Hence, they were able to account for all missed opportunities. All sites continued to
conduct mentorship; offer PMTCT support groups; provide ARV commodities in integrated
MCH settings; and offer support for commodity consumption, forecasting, and reporting.
Early infant diagnosis
During the reporting quarter, 2,616 polymerase chain reaction (PCR) tests were processed. This
was 182% of the estimated 1,434 HIV-exposed infants (proxy from HIV-positive pregnant
mothers) in the quarter. This percent achievement is higher than that attained in the previous
quarter (132%) and the project continued with mentorship to the dormant early infant diagnosis
(EID) sites with an aim of scaling up the uptake of EID services. Of the 2,616 PCR tests taken in
the quarter, 44% (1,152) were drawn within 2 months of the child’s birth. This was attributed to
inclusion of repeat PCR test as per the revised EID algorithm. To improve on this indicator, the
project will continue to sensitize HCWs on the importance of performing the first PCR at 6 to 8
weeks of age. Figure 3 below shows the EID cascade for the reporting period, compared to the
previous two quarters.
HomaBay
Kisumu Migori Busia Nyamira KisiiKakame
gaBungom
aVihiga
HIV +ve 227 168 175 76 87 19 408 178 96
Maternal prophylaxis 224 166 171 75 85 19 396 181 98
Infant prophylaxis 221 164 164 75 85 19 389 180 98
0
50
100
150
200
250
300
350
400
450
USAID KENYA (APHIAPLUS WESTERN KENYA) PROGRESS REPORT FOR Q2 FY 2017 19
Figure 3. Early infant diagnosis (EID) cascade, Y6Q4 to Y7Q2.
Note: ART, antiretroviral treatment; DBS, dry blood spot.
Source: Early infant diagnosis (EID) database.
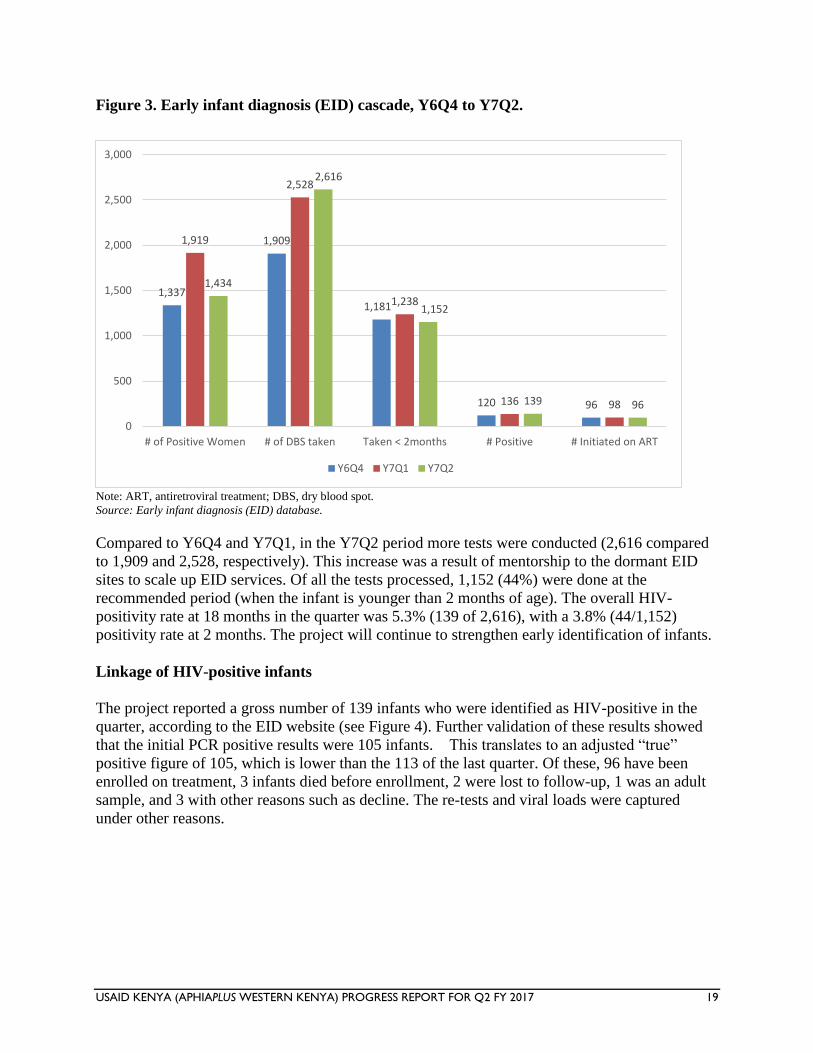
Compared to Y6Q4 and Y7Q1, in the Y7Q2 period more tests were conducted (2,616 compared
to 1,909 and 2,528, respectively). This increase was a result of mentorship to the dormant EID
sites to scale up EID services. Of all the tests processed, 1,152 (44%) were done at the
recommended period (when the infant is younger than 2 months of age). The overall HIV-
positivity rate at 18 months in the quarter was 5.3% (139 of 2,616), with a 3.8% (44/1,152)
positivity rate at 2 months. The project will continue to strengthen early identification of infants.
Linkage of HIV-positive infants
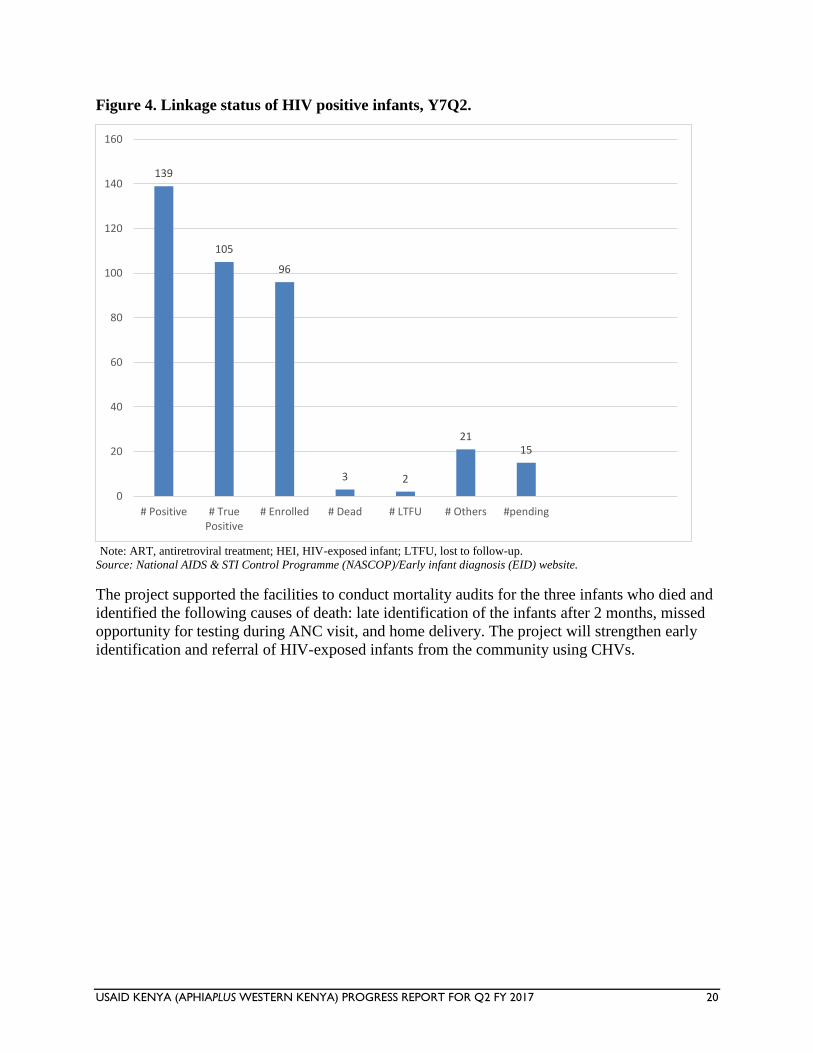
The project reported a gross number of 139 infants who were identified as HIV-positive in the
quarter, according to the EID website (see Figure 4). Further validation of these results showed
that the initial PCR positive results were 105 infants. This translates to an adjusted “true”
positive figure of 105, which is lower than the 113 of the last quarter. Of these, 96 have been
enrolled on treatment, 3 infants died before enrollment, 2 were lost to follow-up, 1 was an adult
sample, and 3 with other reasons such as decline. The re-tests and viral loads were captured
under other reasons.
1,337
1,909
1,181
120 96
1,919
2,528
1,238
136 98
1,434
2,616
1,152
139 96
0
500
1,000
1,500
2,000
2,500
3,000
# of Positive Women # of DBS taken Taken < 2months # Positive # Initiated on ART
Y6Q4 Y7Q1 Y7Q2
USAID KENYA (APHIAPLUS WESTERN KENYA) PROGRESS REPORT FOR Q2 FY 2017 20
Figure 4. Linkage status of HIV positive infants, Y7Q2.
Note: ART, antiretroviral treatment; HEI, HIV-exposed infant; LTFU, lost to follow-up.
Source: National AIDS & STI Control Programme (NASCOP)/Early infant diagnosis (EID) website.
The project supported the facilities to conduct mortality audits for the three infants who died and
identified the following causes of death: late identification of the infants after 2 months, missed
opportunity for testing during ANC visit, and home delivery. The project will strengthen early
identification and referral of HIV-exposed infants from the community using CHVs.
139
105
96
3 2
2115
0
20
40
60
80
100
120
140
160
# Positive # TruePositive
# Enrolled # Dead # LTFU # Others #pending
USAID KENYA (APHIAPLUS WESTERN KENYA) PROGRESS REPORT FOR Q2 FY 2017 21
Figure 5. Outcome of mother-to-child transmission of HIV (MTCT) audits, Y7Q2.
Note: #, number; ANC, antenatal care; HAART, highly active antiretroviral therapy; HEI, HIV-exposed infant; MAT, maternity;
OPD, outpatient department; PCR, polymerase chain reaction; PNC, postnatal care.
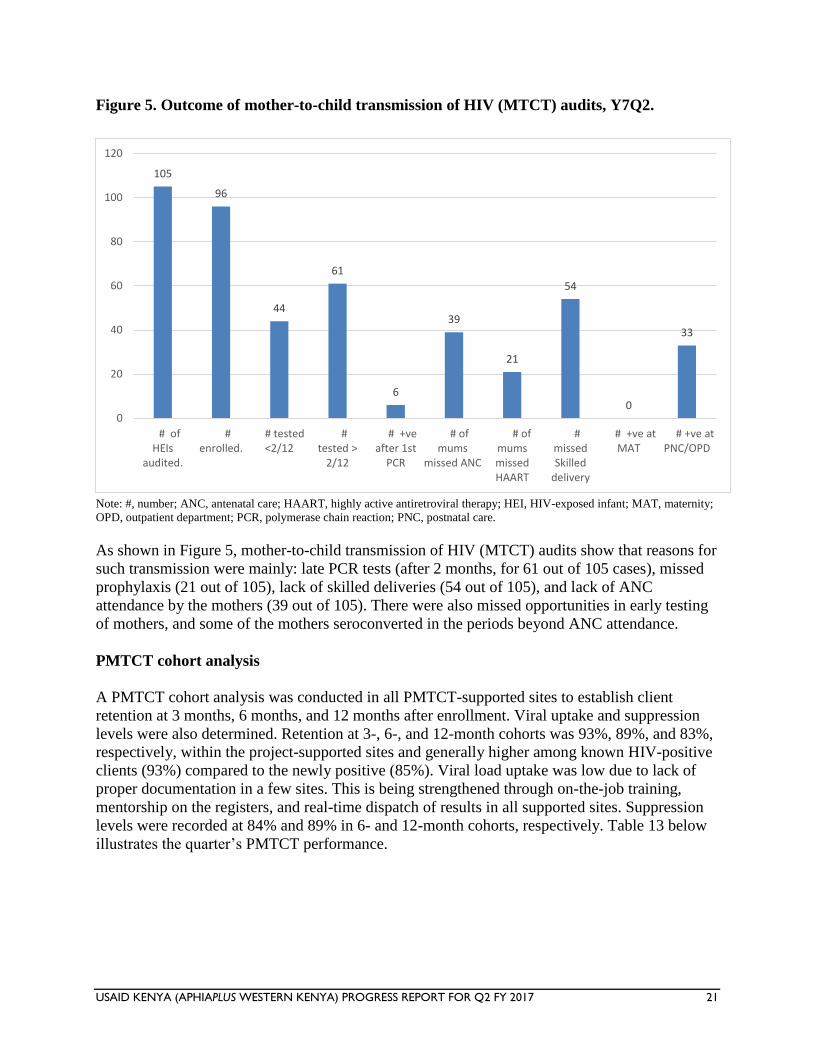
As shown in Figure 5, mother-to-child transmission of HIV (MTCT) audits show that reasons for
such transmission were mainly: late PCR tests (after 2 months, for 61 out of 105 cases), missed
prophylaxis (21 out of 105), lack of skilled deliveries (54 out of 105), and lack of ANC
attendance by the mothers (39 out of 105). There were also missed opportunities in early testing
of mothers, and some of the mothers seroconverted in the periods beyond ANC attendance.
PMTCT cohort analysis
A PMTCT cohort analysis was conducted in all PMTCT-supported sites to establish client
retention at 3 months, 6 months, and 12 months after enrollment. Viral uptake and suppression
levels were also determined. Retention at 3-, 6-, and 12-month cohorts was 93%, 89%, and 83%,
respectively, within the project-supported sites and generally higher among known HIV-positive
clients (93%) compared to the newly positive (85%). Viral load uptake was low due to lack of
proper documentation in a few sites. This is being strengthened through on-the-job training,
mentorship on the registers, and real-time dispatch of results in all supported sites. Suppression
levels were recorded at 84% and 89% in 6- and 12-month cohorts, respectively. Table 13 below
illustrates the quarter’s PMTCT performance.
105
96
44
61
6
39
21
54
0
33
0
20
40
60
80
100
120
# ofHEIs
audited.
#enrolled.
# tested<2/12
#tested >
2/12
# +veafter 1st
PCR
# ofmums
missed ANC
# ofmumsmissedHAART
#missedSkilled
delivery
# +ve atMAT
# +ve atPNC/OPD
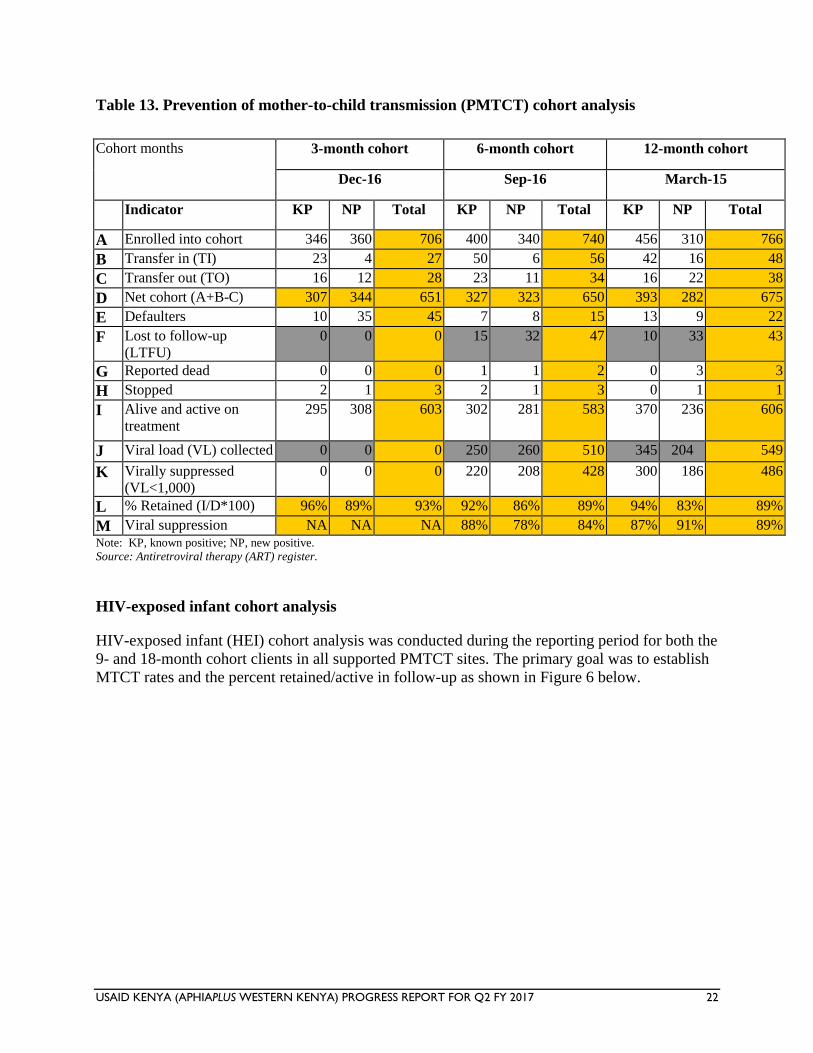
USAID KENYA (APHIAPLUS WESTERN KENYA) PROGRESS REPORT FOR Q2 FY 2017 22
Table 13. Prevention of mother-to-child transmission (PMTCT) cohort analysis
Cohort months 3-month cohort 6-month cohort 12-month cohort
Dec-16 Sep-16 March-15
Indicator KP NP Total KP NP Total KP NP Total
A Enrolled into cohort 346 360 706 400 340 740 456 310 766
B Transfer in (TI) 23 4 27 50 6 56 42 16 48
C Transfer out (TO) 16 12 28 23 11 34 16 22 38
D Net cohort (A+B-C) 307 344 651 327 323 650 393 282 675
E Defaulters 10 35 45 7 8 15 13 9 22
F Lost to follow-up
(LTFU)
0 0 0 15 32 47 10 33 43
G Reported dead 0 0 0 1 1 2 0 3 3
H Stopped 2 1 3 2 1 3 0 1 1
I Alive and active on
treatment
295 308 603 302 281 583 370 236 606
J Viral load (VL) collected 0 0 0 250 260 510 345 204 549
K Virally suppressed
(VL<1,000)
0 0 0 220 208 428 300 186 486
L % Retained (I/D*100) 96% 89% 93% 92% 86% 89% 94% 83% 89%
M Viral suppression NA NA NA 88% 78% 84% 87% 91% 89%
Note: KP, known positive; NP, new positive.
Source: Antiretroviral therapy (ART) register.
HIV-exposed infant cohort analysis
HIV-exposed infant (HEI) cohort analysis was conducted during the reporting period for both the
9- and 18-month cohort clients in all supported PMTCT sites. The primary goal was to establish
MTCT rates and the percent retained/active in follow-up as shown in Figure 6 below.
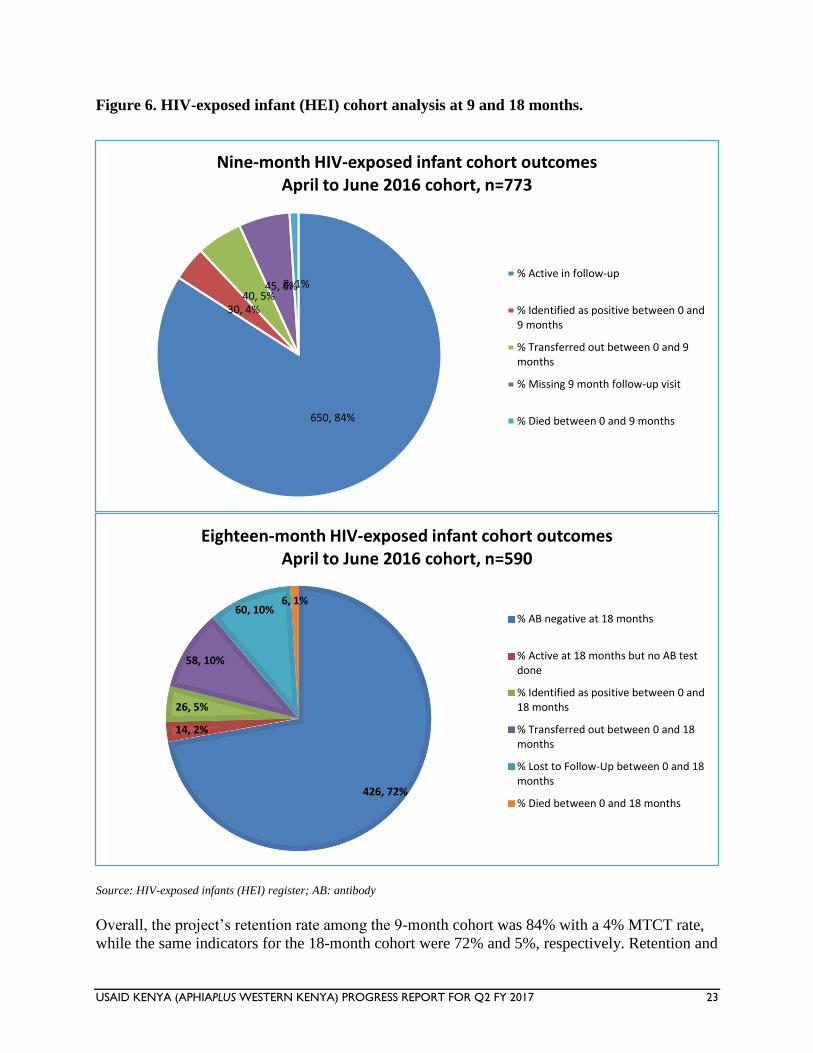
USAID KENYA (APHIAPLUS WESTERN KENYA) PROGRESS REPORT FOR Q2 FY 2017 23
Figure 6. HIV-exposed infant (HEI) cohort analysis at 9 and 18 months.
Source: HIV-exposed infants (HEI) register; AB: antibody
Overall, the project’s retention rate among the 9-month cohort was 84% with a 4% MTCT rate,
while the same indicators for the 18-month cohort were 72% and 5%, respectively. Retention and
650, 84%
30, 4%40, 5%
45, 6%8, 1%
Nine-month HIV-exposed infant cohort outcomes April to June 2016 cohort, n=773
% Active in follow-up
% Identified as positive between 0 and9 months
% Transferred out between 0 and 9months
% Missing 9 month follow-up visit
% Died between 0 and 9 months
426, 72%
14, 2%
26, 5%
58, 10%
60, 10%6, 1%
Eighteen-month HIV-exposed infant cohort outcomesApril to June 2016 cohort, n=590
% AB negative at 18 months
% Active at 18 months but no AB testdone
% Identified as positive between 0 and18 months
% Transferred out between 0 and 18months
% Lost to Follow-Up between 0 and 18months
% Died between 0 and 18 months
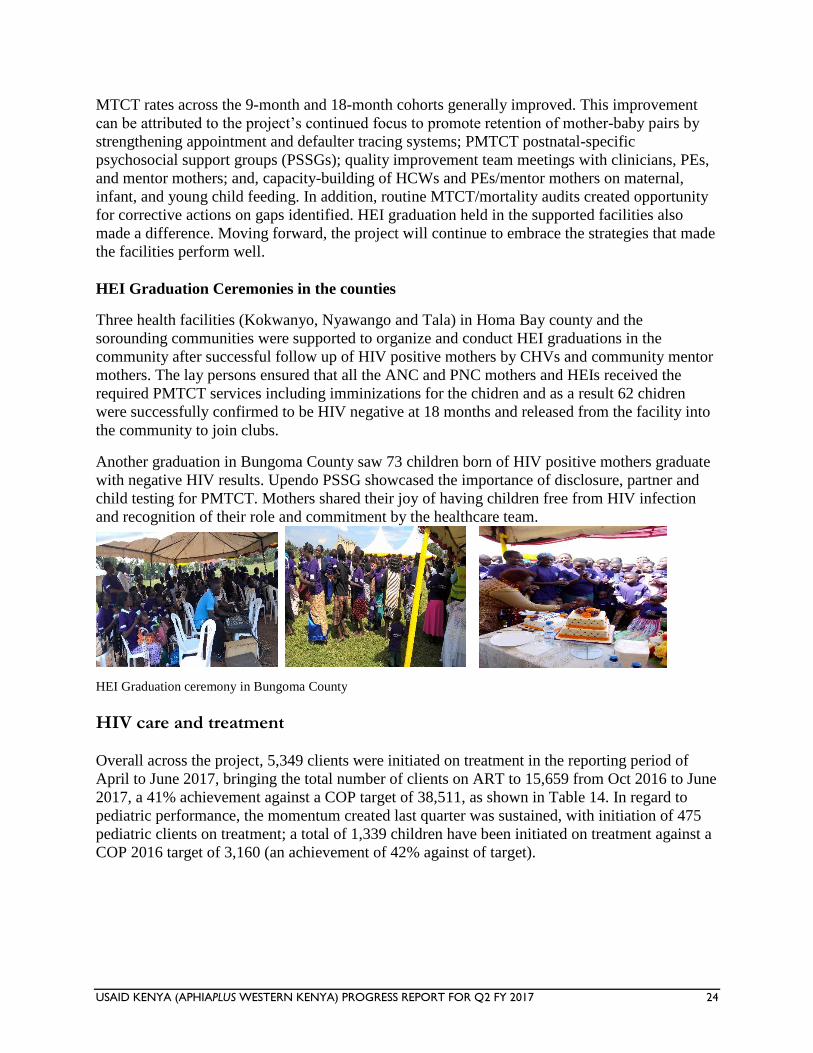
USAID KENYA (APHIAPLUS WESTERN KENYA) PROGRESS REPORT FOR Q2 FY 2017 24
MTCT rates across the 9-month and 18-month cohorts generally improved. This improvement
can be attributed to the project’s continued focus to promote retention of mother-baby pairs by
strengthening appointment and defaulter tracing systems; PMTCT postnatal-specific
psychosocial support groups (PSSGs); quality improvement team meetings with clinicians, PEs,
and mentor mothers; and, capacity-building of HCWs and PEs/mentor mothers on maternal,
infant, and young child feeding. In addition, routine MTCT/mortality audits created opportunity
for corrective actions on gaps identified. HEI graduation held in the supported facilities also
made a difference. Moving forward, the project will continue to embrace the strategies that made
the facilities perform well.
HEI Graduation Ceremonies in the counties
Three health facilities (Kokwanyo, Nyawango and Tala) in Homa Bay county and the
sorounding communities were supported to organize and conduct HEI graduations in the
community after successful follow up of HIV positive mothers by CHVs and community mentor
mothers. The lay persons ensured that all the ANC and PNC mothers and HEIs received the
required PMTCT services including imminizations for the chidren and as a result 62 chidren
were successfully confirmed to be HIV negative at 18 months and released from the facility into
the community to join clubs.
Another graduation in Bungoma County saw 73 children born of HIV positive mothers graduate
with negative HIV results. Upendo PSSG showcased the importance of disclosure, partner and
child testing for PMTCT. Mothers shared their joy of having children free from HIV infection
and recognition of their role and commitment by the healthcare team.
HEI Graduation ceremony in Bungoma County
HIV care and treatment
Overall across the project, 5,349 clients were initiated on treatment in the reporting period of
April to June 2017, bringing the total number of clients on ART to 15,659 from Oct 2016 to June
2017, a 41% achievement against a COP target of 38,511, as shown in Table 14. In regard to
pediatric performance, the momentum created last quarter was sustained, with initiation of 475
pediatric clients on treatment; a total of 1,339 children have been initiated on treatment against a
COP 2016 target of 3,160 (an achievement of 42% against of target).
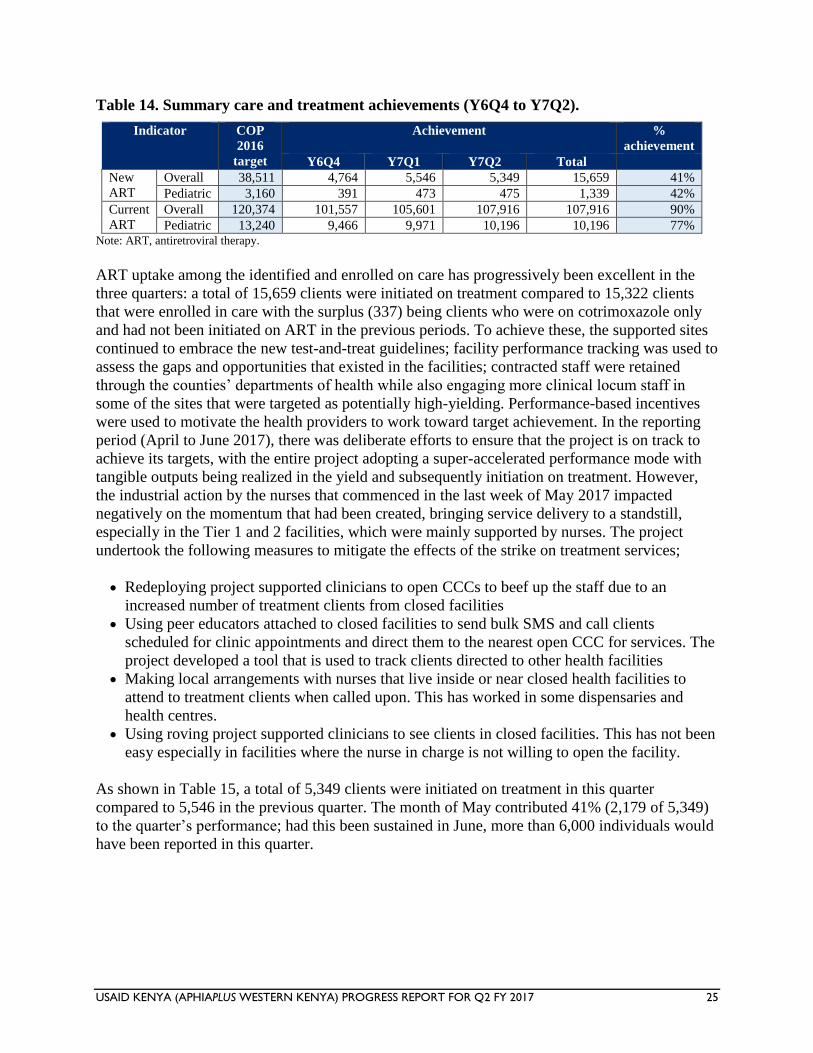
USAID KENYA (APHIAPLUS WESTERN KENYA) PROGRESS REPORT FOR Q2 FY 2017 25
Table 14. Summary care and treatment achievements (Y6Q4 to Y7Q2).
Indicator COP
2016
target
Achievement %
achievement
Y6Q4 Y7Q1 Y7Q2 Total
New
ART
Overall 38,511 4,764 5,546 5,349 15,659 41%
Pediatric 3,160 391 473 475 1,339 42%
Current
ART
Overall 120,374 101,557 105,601 107,916 107,916 90%
Pediatric 13,240 9,466 9,971 10,196 10,196 77% Note: ART, antiretroviral therapy.
ART uptake among the identified and enrolled on care has progressively been excellent in the
three quarters: a total of 15,659 clients were initiated on treatment compared to 15,322 clients
that were enrolled in care with the surplus (337) being clients who were on cotrimoxazole only
and had not been initiated on ART in the previous periods. To achieve these, the supported sites
continued to embrace the new test-and-treat guidelines; facility performance tracking was used to
assess the gaps and opportunities that existed in the facilities; contracted staff were retained
through the counties’ departments of health while also engaging more clinical locum staff in
some of the sites that were targeted as potentially high-yielding. Performance-based incentives
were used to motivate the health providers to work toward target achievement. In the reporting
period (April to June 2017), there was deliberate efforts to ensure that the project is on track to
achieve its targets, with the entire project adopting a super-accelerated performance mode with
tangible outputs being realized in the yield and subsequently initiation on treatment. However,
the industrial action by the nurses that commenced in the last week of May 2017 impacted
negatively on the momentum that had been created, bringing service delivery to a standstill,
especially in the Tier 1 and 2 facilities, which were mainly supported by nurses. The project
undertook the following measures to mitigate the effects of the strike on treatment services;
Redeploying project supported clinicians to open CCCs to beef up the staff due to an
increased number of treatment clients from closed facilities
Using peer educators attached to closed facilities to send bulk SMS and call clients
scheduled for clinic appointments and direct them to the nearest open CCC for services. The
project developed a tool that is used to track clients directed to other health facilities
Making local arrangements with nurses that live inside or near closed health facilities to
attend to treatment clients when called upon. This has worked in some dispensaries and
health centres.
Using roving project supported clinicians to see clients in closed facilities. This has not been
easy especially in facilities where the nurse in charge is not willing to open the facility.
As shown in Table 15, a total of 5,349 clients were initiated on treatment in this quarter
compared to 5,546 in the previous quarter. The month of May contributed 41% (2,179 of 5,349)
to the quarter’s performance; had this been sustained in June, more than 6,000 individuals would
have been reported in this quarter.
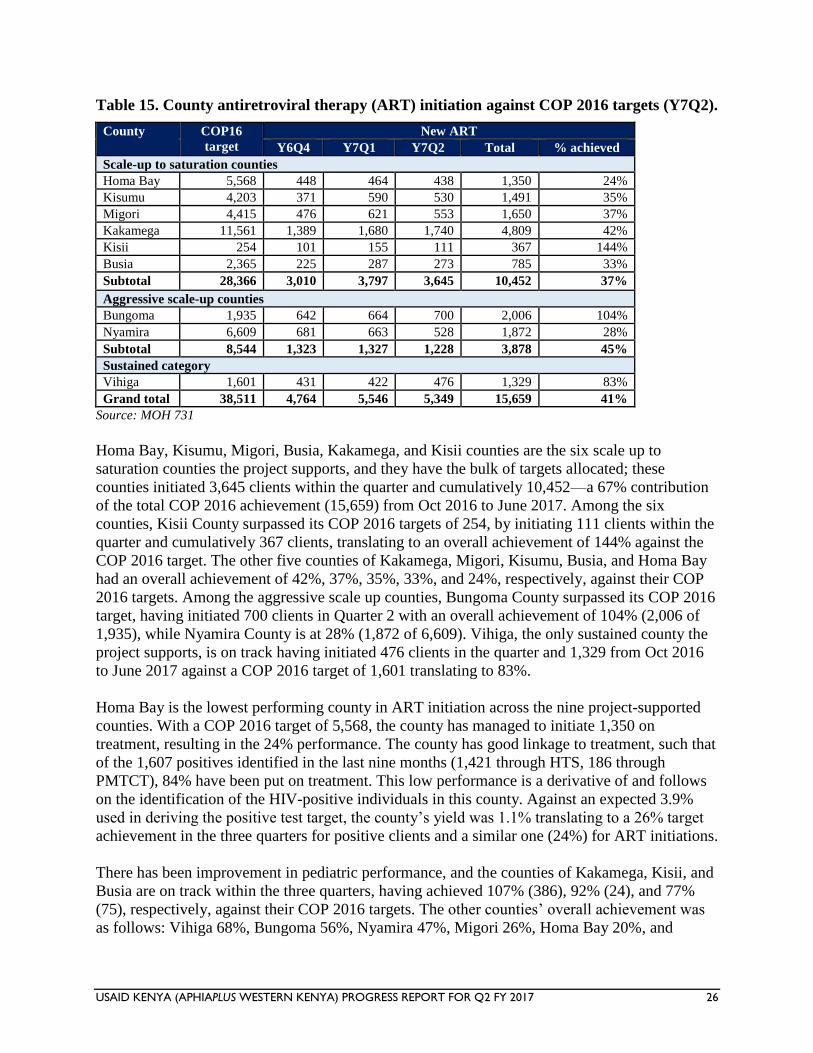
USAID KENYA (APHIAPLUS WESTERN KENYA) PROGRESS REPORT FOR Q2 FY 2017 26
Table 15. County antiretroviral therapy (ART) initiation against COP 2016 targets (Y7Q2).
County COP16
target
New ART
Y6Q4 Y7Q1 Y7Q2 Total % achieved
Scale-up to saturation counties
Homa Bay 5,568 448 464 438 1,350 24%
Kisumu 4,203 371 590 530 1,491 35%
Migori 4,415 476 621 553 1,650 37%
Kakamega 11,561 1,389 1,680 1,740 4,809 42%
Kisii 254 101 155 111 367 144%
Busia 2,365 225 287 273 785 33%
Subtotal 28,366 3,010 3,797 3,645 10,452 37%
Aggressive scale-up counties
Bungoma 1,935 642 664 700 2,006 104%
Nyamira 6,609 681 663 528 1,872 28%
Subtotal 8,544 1,323 1,327 1,228 3,878 45%
Sustained category
Vihiga 1,601 431 422 476 1,329 83%
Grand total 38,511 4,764 5,546 5,349 15,659 41%
Source: MOH 731
Homa Bay, Kisumu, Migori, Busia, Kakamega, and Kisii counties are the six scale up to
saturation counties the project supports, and they have the bulk of targets allocated; these
counties initiated 3,645 clients within the quarter and cumulatively 10,452—a 67% contribution
of the total COP 2016 achievement (15,659) from Oct 2016 to June 2017. Among the six
counties, Kisii County surpassed its COP 2016 targets of 254, by initiating 111 clients within the
quarter and cumulatively 367 clients, translating to an overall achievement of 144% against the
COP 2016 target. The other five counties of Kakamega, Migori, Kisumu, Busia, and Homa Bay
had an overall achievement of 42%, 37%, 35%, 33%, and 24%, respectively, against their COP
2016 targets. Among the aggressive scale up counties, Bungoma County surpassed its COP 2016
target, having initiated 700 clients in Quarter 2 with an overall achievement of 104% (2,006 of
1,935), while Nyamira County is at 28% (1,872 of 6,609). Vihiga, the only sustained county the
project supports, is on track having initiated 476 clients in the quarter and 1,329 from Oct 2016
to June 2017 against a COP 2016 target of 1,601 translating to 83%.
Homa Bay is the lowest performing county in ART initiation across the nine project-supported
counties. With a COP 2016 target of 5,568, the county has managed to initiate 1,350 on
treatment, resulting in the 24% performance. The county has good linkage to treatment, such that
of the 1,607 positives identified in the last nine months (1,421 through HTS, 186 through
PMTCT), 84% have been put on treatment. This low performance is a derivative of and follows
on the identification of the HIV-positive individuals in this county. Against an expected 3.9%
used in deriving the positive test target, the county’s yield was 1.1% translating to a 26% target
achievement in the three quarters for positive clients and a similar one (24%) for ART initiations.
There has been improvement in pediatric performance, and the counties of Kakamega, Kisii, and
Busia are on track within the three quarters, having achieved 107% (386), 92% (24), and 77%
(75), respectively, against their COP 2016 targets. The other counties’ overall achievement was
as follows: Vihiga 68%, Bungoma 56%, Nyamira 47%, Migori 26%, Homa Bay 20%, and
USAID KENYA (APHIAPLUS WESTERN KENYA) PROGRESS REPORT FOR Q2 FY 2017 27
Kisumu 19%. The project will continue to employ winning strategies to identify more children
and link them to care and treatment with focus in counties that are still lagging.
On the current ART indicator, during the reporting period, the project achieved 107,916 against a
COP 2016 target of 120,374, translating to 90% achievement. During the same period, the
performance against target among the males was 84% (33,042 of 39,046) and among females
was 92% (74,874 of 81,330).
During the reporting period (April to June 2017), the project started from a baseline of 105,601
(current ART in March 2017) and reported 5,349 new ART enrollments, giving an expected
current ART of 110,950 (see Table 16 below). Against this, a current ART of 107,916 was
realized in June 2017, indicating an overall net loss of 3,034. Overall achievement as at the
Y7Q2 reporting period beginning with a September 2016 baseline of 102,261, plus a total of
15,659 new ART clients who were initiated on ART in the last nine months, giving an expected
current ART of 117,920, against a reported figure of 107,916 at the end of the Y7Q2 period. This
translates to a 91% crude retention in the 9-month period (107,916 of 117,920).
During the reporting period (April to June 2017), the project lost an overall 3,034 current-ART
clients, of whom 42% were contributed in June (1,266 of 3,034); April and May reported 1,243
and 525 losses, respectively. The majority of the losses in June were defaulters who missed their
appointments in the month as a result of the nurses’ strike, which affected 51 facilities (Nyamira-
30, Bungoma-10, Kisii-7, Kakamega-2, and Migori-2) that are run by MOH nurses. These
facilities are low-volume sites, with a range of 50 to 300 clients active on ART. The project
made efforts to ensure that those affected received their refills from neighboring facilities as
transit clients and redirected some staff to support these sites during the ongoing strike.
The project undertook an audit of the 3,034 current-ART clients reported to have been lost
during the reporting period and sampled the facilities that reported a high margin of losses;
nearly half of the losses were contributed by defaulters (largely, clients who missed
appointments during the last week of the month during the reporting period and even when
traced back were captured in the subsequent month, thus missed to be captured in the daily
activity register of the reporting month). An example is in Rachuonyo District Hospital in Homa
Bay County; this hospital has a high volume of clients, with a current-ART cohort of 3,851. It
reports that an average of 15 clients miss appointments every day, which translates to nearly 105
clients who miss appointments during the last week of the month and thus are unlikely to be
captured in the daily activity register at the close of the month. The project to this effect has
sensitized the facility health workers to reduce and ultimately minimize appointments given to
clients toward the end of the month and ensure a rapid defaulter tracing mechanism is in place to
track defaulters as soon as they miss appointments.
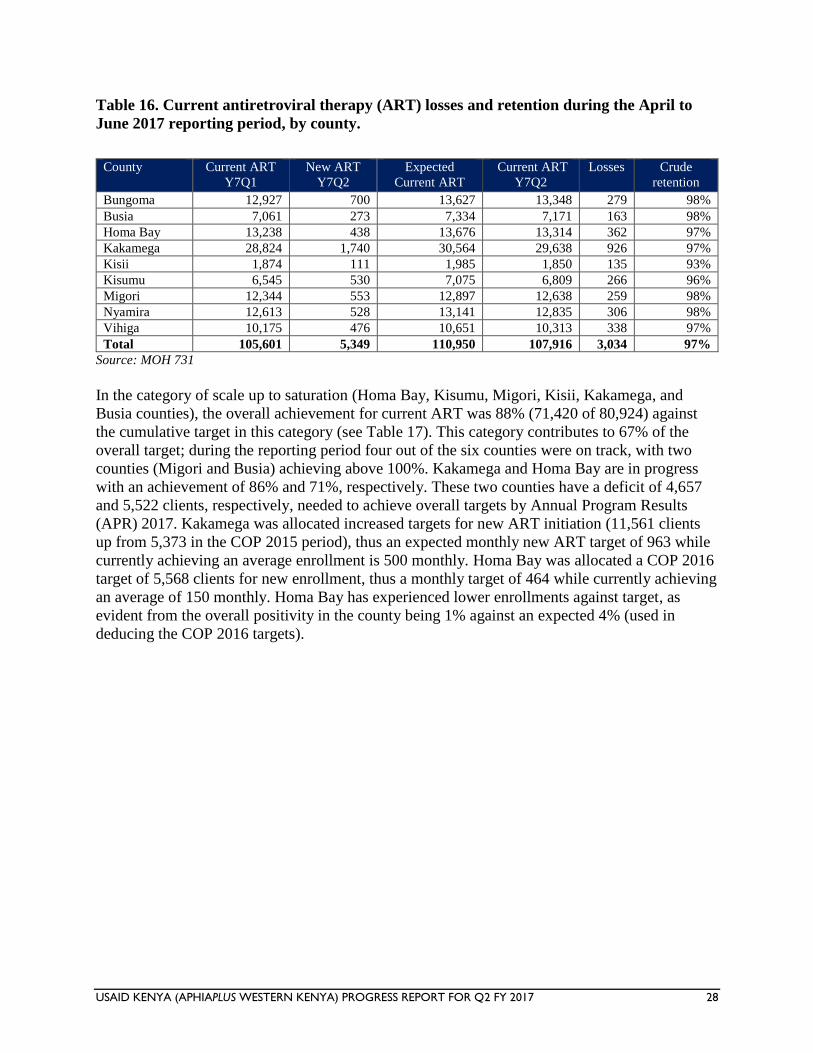
USAID KENYA (APHIAPLUS WESTERN KENYA) PROGRESS REPORT FOR Q2 FY 2017 28
Table 16. Current antiretroviral therapy (ART) losses and retention during the April to
June 2017 reporting period, by county.
County Current ART
Y7Q1
New ART
Y7Q2
Expected
Current ART
Current ART
Y7Q2
Losses Crude
retention
Bungoma 12,927 700 13,627 13,348 279 98%
Busia 7,061 273 7,334 7,171 163 98%
Homa Bay 13,238 438 13,676 13,314 362 97%
Kakamega 28,824 1,740 30,564 29,638 926 97%
Kisii 1,874 111 1,985 1,850 135 93%
Kisumu 6,545 530 7,075 6,809 266 96%
Migori 12,344 553 12,897 12,638 259 98%
Nyamira 12,613 528 13,141 12,835 306 98%
Vihiga 10,175 476 10,651 10,313 338 97%
Total 105,601 5,349 110,950 107,916 3,034 97%
Source: MOH 731
In the category of scale up to saturation (Homa Bay, Kisumu, Migori, Kisii, Kakamega, and
Busia counties), the overall achievement for current ART was 88% (71,420 of 80,924) against
the cumulative target in this category (see Table 17). This category contributes to 67% of the
overall target; during the reporting period four out of the six counties were on track, with two
counties (Migori and Busia) achieving above 100%. Kakamega and Homa Bay are in progress
with an achievement of 86% and 71%, respectively. These two counties have a deficit of 4,657
and 5,522 clients, respectively, needed to achieve overall targets by Annual Program Results
(APR) 2017. Kakamega was allocated increased targets for new ART initiation (11,561 clients
up from 5,373 in the COP 2015 period), thus an expected monthly new ART target of 963 while
currently achieving an average enrollment is 500 monthly. Homa Bay was allocated a COP 2016
target of 5,568 clients for new enrollment, thus a monthly target of 464 while currently achieving
an average of 150 monthly. Homa Bay has experienced lower enrollments against target, as
evident from the overall positivity in the county being 1% against an expected 4% (used in
deducing the COP 2016 targets).
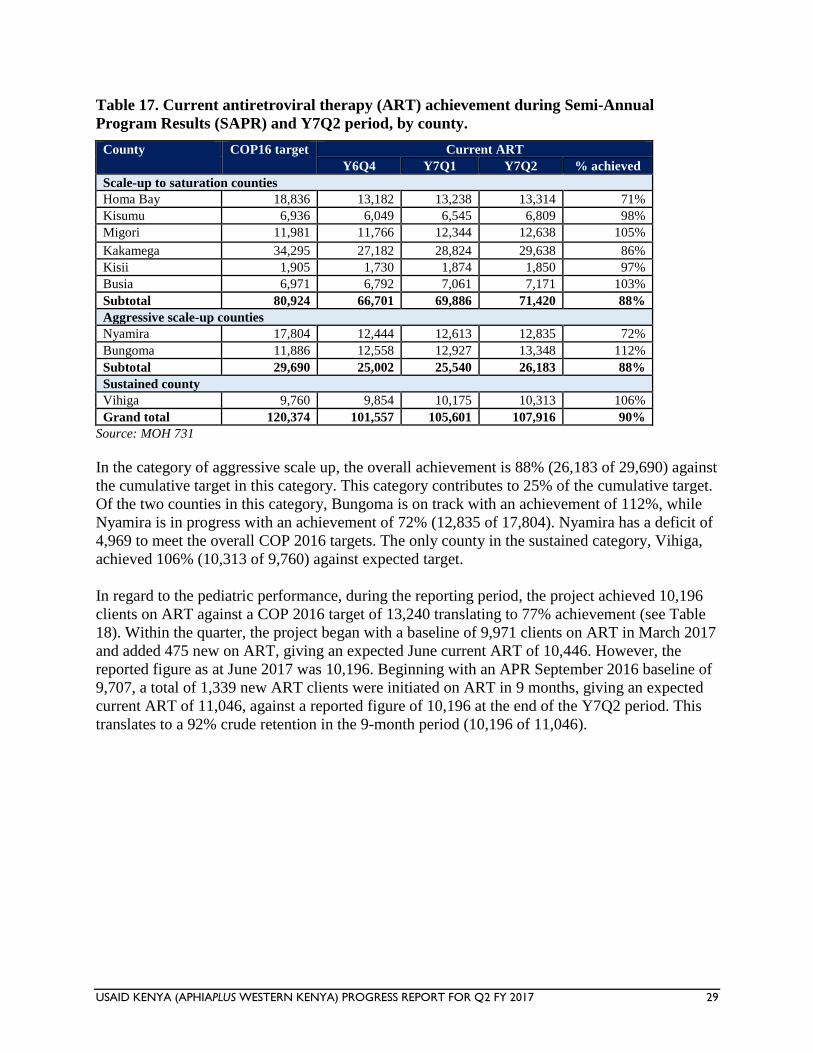
USAID KENYA (APHIAPLUS WESTERN KENYA) PROGRESS REPORT FOR Q2 FY 2017 29
Table 17. Current antiretroviral therapy (ART) achievement during Semi-Annual
Program Results (SAPR) and Y7Q2 period, by county.
County COP16 target Current ART
Y6Q4 Y7Q1 Y7Q2 % achieved
Scale-up to saturation counties
Homa Bay 18,836 13,182 13,238 13,314 71%
Kisumu 6,936 6,049 6,545 6,809 98%
Migori 11,981 11,766 12,344 12,638 105%
Kakamega 34,295 27,182 28,824 29,638 86%
Kisii 1,905 1,730 1,874 1,850 97%
Busia 6,971 6,792 7,061 7,171 103%
Subtotal 80,924 66,701 69,886 71,420 88%
Aggressive scale-up counties
Nyamira 17,804 12,444 12,613 12,835 72%
Bungoma 11,886 12,558 12,927 13,348 112%
Subtotal 29,690 25,002 25,540 26,183 88%
Sustained county
Vihiga 9,760 9,854 10,175 10,313 106%
Grand total 120,374 101,557 105,601 107,916 90%
Source: MOH 731
In the category of aggressive scale up, the overall achievement is 88% (26,183 of 29,690) against
the cumulative target in this category. This category contributes to 25% of the cumulative target.
Of the two counties in this category, Bungoma is on track with an achievement of 112%, while
Nyamira is in progress with an achievement of 72% (12,835 of 17,804). Nyamira has a deficit of
4,969 to meet the overall COP 2016 targets. The only county in the sustained category, Vihiga,
achieved 106% (10,313 of 9,760) against expected target.
In regard to the pediatric performance, during the reporting period, the project achieved 10,196
clients on ART against a COP 2016 target of 13,240 translating to 77% achievement (see Table
18). Within the quarter, the project began with a baseline of 9,971 clients on ART in March 2017
and added 475 new on ART, giving an expected June current ART of 10,446. However, the
reported figure as at June 2017 was 10,196. Beginning with an APR September 2016 baseline of
9,707, a total of 1,339 new ART clients were initiated on ART in 9 months, giving an expected
current ART of 11,046, against a reported figure of 10,196 at the end of the Y7Q2 period. This
translates to a 92% crude retention in the 9-month period (10,196 of 11,046).
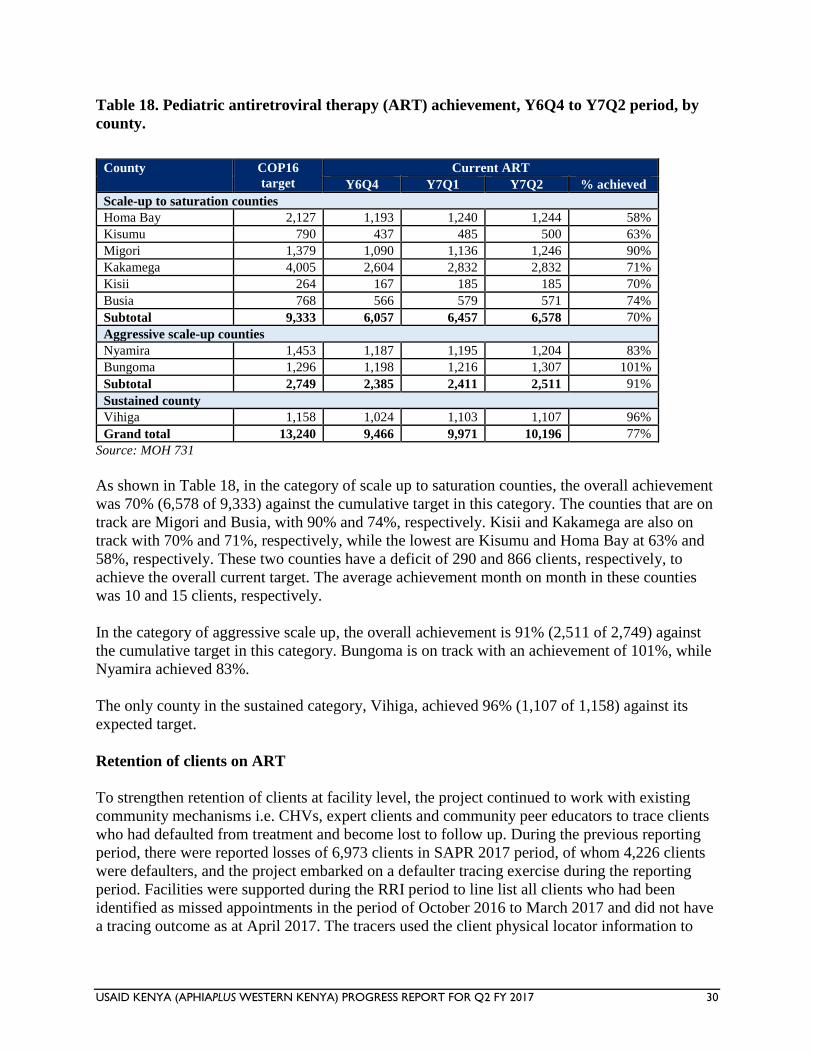
USAID KENYA (APHIAPLUS WESTERN KENYA) PROGRESS REPORT FOR Q2 FY 2017 30
Table 18. Pediatric antiretroviral therapy (ART) achievement, Y6Q4 to Y7Q2 period, by
county.
County COP16
target
Current ART
Y6Q4 Y7Q1 Y7Q2 % achieved
Scale-up to saturation counties
Homa Bay 2,127 1,193 1,240 1,244 58%
Kisumu 790 437 485 500 63%
Migori 1,379 1,090 1,136 1,246 90%
Kakamega 4,005 2,604 2,832 2,832 71%
Kisii 264 167 185 185 70%
Busia 768 566 579 571 74%
Subtotal 9,333 6,057 6,457 6,578 70%
Aggressive scale-up counties
Nyamira 1,453 1,187 1,195 1,204 83%
Bungoma 1,296 1,198 1,216 1,307 101%
Subtotal 2,749 2,385 2,411 2,511 91%
Sustained county
Vihiga 1,158 1,024 1,103 1,107 96%
Grand total 13,240 9,466 9,971 10,196 77%
Source: MOH 731
As shown in Table 18, in the category of scale up to saturation counties, the overall achievement
was 70% (6,578 of 9,333) against the cumulative target in this category. The counties that are on
track are Migori and Busia, with 90% and 74%, respectively. Kisii and Kakamega are also on
track with 70% and 71%, respectively, while the lowest are Kisumu and Homa Bay at 63% and
58%, respectively. These two counties have a deficit of 290 and 866 clients, respectively, to
achieve the overall current target. The average achievement month on month in these counties
was 10 and 15 clients, respectively.
In the category of aggressive scale up, the overall achievement is 91% (2,511 of 2,749) against
the cumulative target in this category. Bungoma is on track with an achievement of 101%, while
Nyamira achieved 83%.
The only county in the sustained category, Vihiga, achieved 96% (1,107 of 1,158) against its
expected target.
Retention of clients on ART
To strengthen retention of clients at facility level, the project continued to work with existing
community mechanisms i.e. CHVs, expert clients and community peer educators to trace clients
who had defaulted from treatment and become lost to follow up. During the previous reporting
period, there were reported losses of 6,973 clients in SAPR 2017 period, of whom 4,226 clients
were defaulters, and the project embarked on a defaulter tracing exercise during the reporting
period. Facilities were supported during the RRI period to line list all clients who had been
identified as missed appointments in the period of October 2016 to March 2017 and did not have
a tracing outcome as at April 2017. The tracers used the client physical locator information to
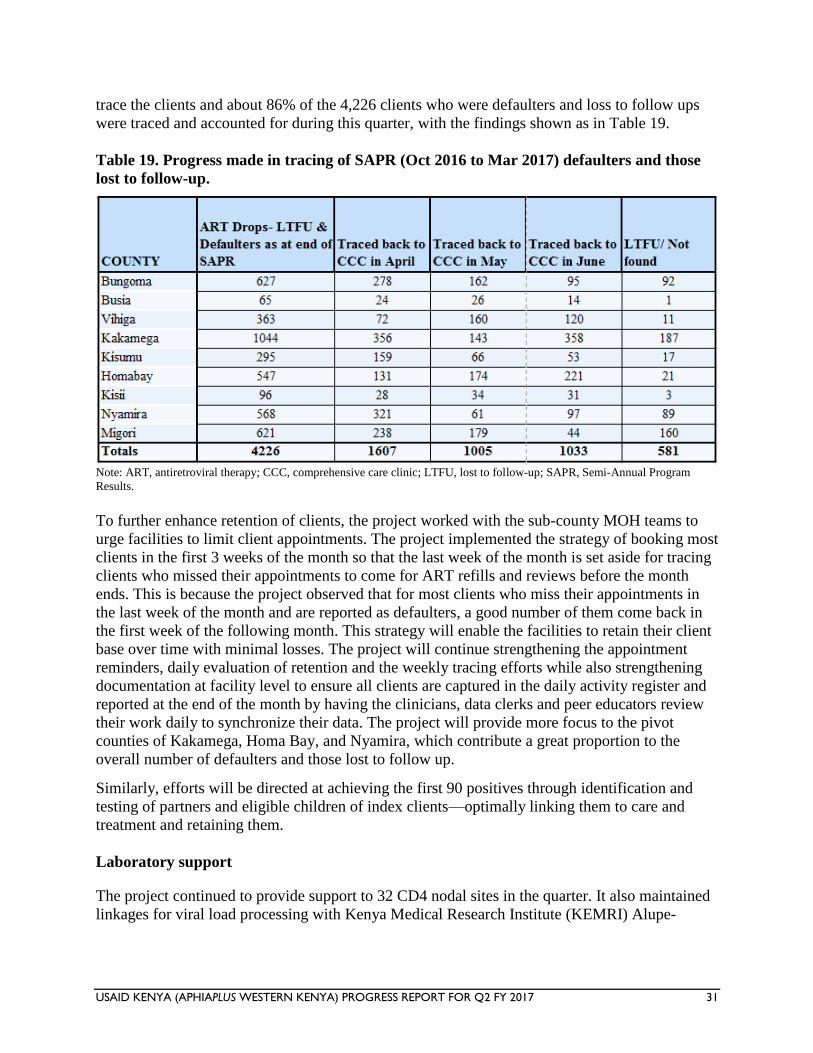
USAID KENYA (APHIAPLUS WESTERN KENYA) PROGRESS REPORT FOR Q2 FY 2017 31
trace the clients and about 86% of the 4,226 clients who were defaulters and loss to follow ups
were traced and accounted for during this quarter, with the findings shown as in Table 19.
Table 19. Progress made in tracing of SAPR (Oct 2016 to Mar 2017) defaulters and those
lost to follow-up.
Note: ART, antiretroviral therapy; CCC, comprehensive care clinic; LTFU, lost to follow-up; SAPR, Semi-Annual Program
Results.
To further enhance retention of clients, the project worked with the sub-county MOH teams to
urge facilities to limit client appointments. The project implemented the strategy of booking most
clients in the first 3 weeks of the month so that the last week of the month is set aside for tracing
clients who missed their appointments to come for ART refills and reviews before the month
ends. This is because the project observed that for most clients who miss their appointments in
the last week of the month and are reported as defaulters, a good number of them come back in
the first week of the following month. This strategy will enable the facilities to retain their client
base over time with minimal losses. The project will continue strengthening the appointment
reminders, daily evaluation of retention and the weekly tracing efforts while also strengthening
documentation at facility level to ensure all clients are captured in the daily activity register and
reported at the end of the month by having the clinicians, data clerks and peer educators review
their work daily to synchronize their data. The project will provide more focus to the pivot
counties of Kakamega, Homa Bay, and Nyamira, which contribute a great proportion to the
overall number of defaulters and those lost to follow up.
Similarly, efforts will be directed at achieving the first 90 positives through identification and
testing of partners and eligible children of index clients—optimally linking them to care and
treatment and retaining them.
Laboratory support
The project continued to provide support to 32 CD4 nodal sites in the quarter. It also maintained
linkages for viral load processing with Kenya Medical Research Institute (KEMRI) Alupe-
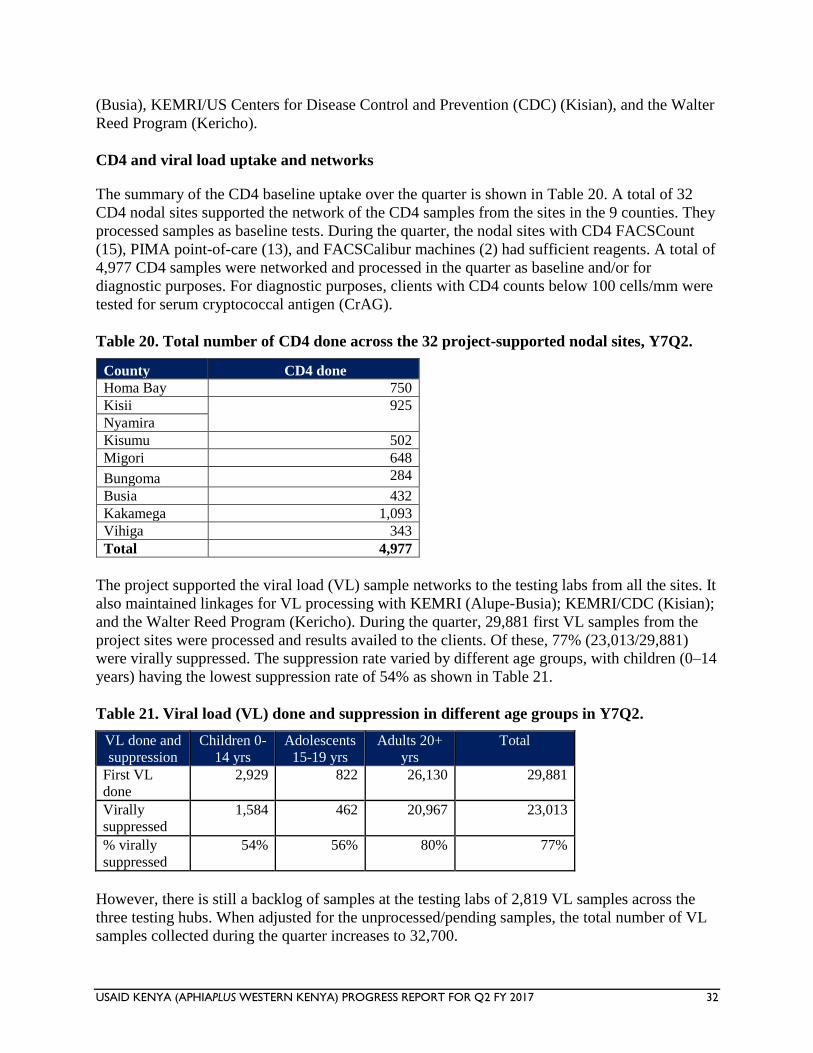
USAID KENYA (APHIAPLUS WESTERN KENYA) PROGRESS REPORT FOR Q2 FY 2017 32
(Busia), KEMRI/US Centers for Disease Control and Prevention (CDC) (Kisian), and the Walter
Reed Program (Kericho).
CD4 and viral load uptake and networks
The summary of the CD4 baseline uptake over the quarter is shown in Table 20. A total of 32
CD4 nodal sites supported the network of the CD4 samples from the sites in the 9 counties. They
processed samples as baseline tests. During the quarter, the nodal sites with CD4 FACSCount
(15), PIMA point-of-care (13), and FACSCalibur machines (2) had sufficient reagents. A total of
4,977 CD4 samples were networked and processed in the quarter as baseline and/or for
diagnostic purposes. For diagnostic purposes, clients with CD4 counts below 100 cells/mm were
tested for serum cryptococcal antigen (CrAG).
Table 20. Total number of CD4 done across the 32 project-supported nodal sites, Y7Q2.
County CD4 done
Homa Bay 750
Kisii 925
Nyamira
Kisumu 502
Migori 648
Bungoma 284
Busia 432
Kakamega 1,093
Vihiga 343
Total 4,977
The project supported the viral load (VL) sample networks to the testing labs from all the sites. It
also maintained linkages for VL processing with KEMRI (Alupe-Busia); KEMRI/CDC (Kisian);
and the Walter Reed Program (Kericho). During the quarter, 29,881 first VL samples from the
project sites were processed and results availed to the clients. Of these, 77% (23,013/29,881)
were virally suppressed. The suppression rate varied by different age groups, with children (0–14
years) having the lowest suppression rate of 54% as shown in Table 21.
Table 21. Viral load (VL) done and suppression in different age groups in Y7Q2.
VL done and
suppression
Children 0-
14 yrs
Adolescents
15-19 yrs
Adults 20+
yrs
Total
First VL
done
2,929 822 26,130 29,881
Virally
suppressed
1,584 462 20,967 23,013
% virally
suppressed
54% 56% 80% 77%
However, there is still a backlog of samples at the testing labs of 2,819 VL samples across the
three testing hubs. When adjusted for the unprocessed/pending samples, the total number of VL
samples collected during the quarter increases to 32,700.
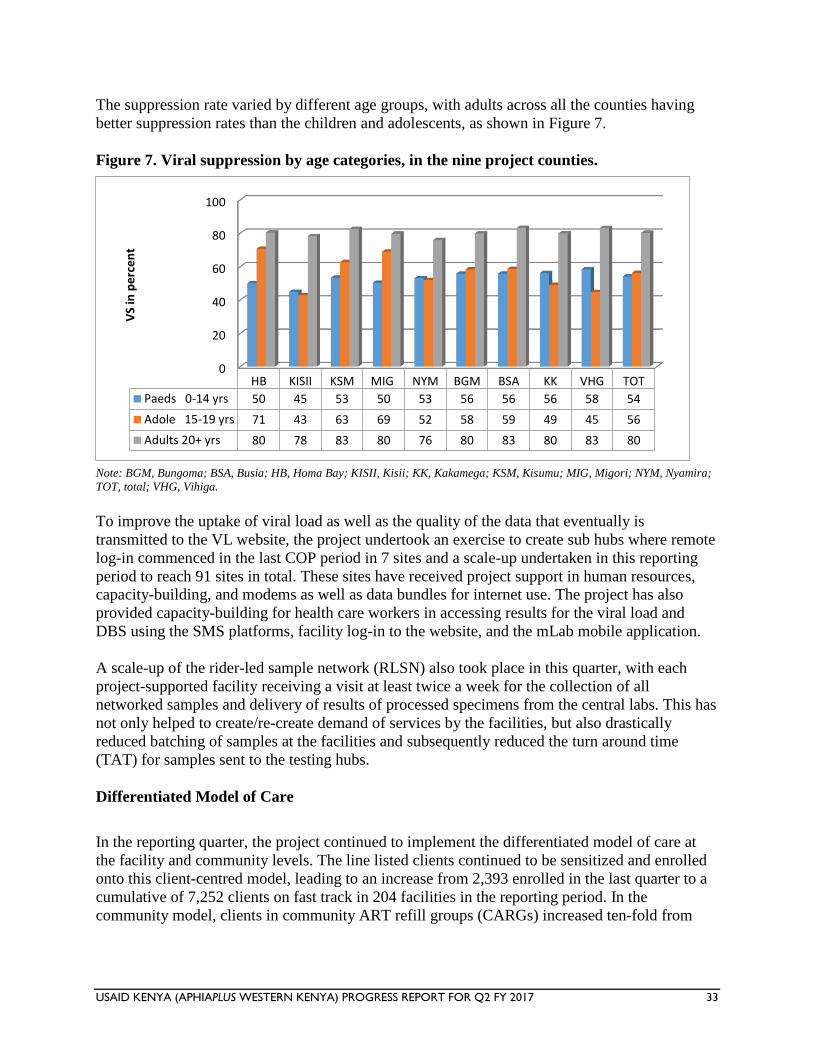
USAID KENYA (APHIAPLUS WESTERN KENYA) PROGRESS REPORT FOR Q2 FY 2017 33
The suppression rate varied by different age groups, with adults across all the counties having
better suppression rates than the children and adolescents, as shown in Figure 7.
Figure 7. Viral suppression by age categories, in the nine project counties.
Note: BGM, Bungoma; BSA, Busia; HB, Homa Bay; KISII, Kisii; KK, Kakamega; KSM, Kisumu; MIG, Migori; NYM, Nyamira;
TOT, total; VHG, Vihiga.
To improve the uptake of viral load as well as the quality of the data that eventually is
transmitted to the VL website, the project undertook an exercise to create sub hubs where remote
log-in commenced in the last COP period in 7 sites and a scale-up undertaken in this reporting
period to reach 91 sites in total. These sites have received project support in human resources,
capacity-building, and modems as well as data bundles for internet use. The project has also
provided capacity-building for health care workers in accessing results for the viral load and
DBS using the SMS platforms, facility log-in to the website, and the mLab mobile application.
A scale-up of the rider-led sample network (RLSN) also took place in this quarter, with each
project-supported facility receiving a visit at least twice a week for the collection of all
networked samples and delivery of results of processed specimens from the central labs. This has
not only helped to create/re-create demand of services by the facilities, but also drastically
reduced batching of samples at the facilities and subsequently reduced the turn around time
(TAT) for samples sent to the testing hubs.
Differentiated Model of Care
In the reporting quarter, the project continued to implement the differentiated model of care at
the facility and community levels. The line listed clients continued to be sensitized and enrolled
onto this client-centred model, leading to an increase from 2,393 enrolled in the last quarter to a
cumulative of 7,252 clients on fast track in 204 facilities in the reporting period. In the
community model, clients in community ART refill groups (CARGs) increased ten-fold from
0
20
40
60
80
100
HB KISII KSM MIG NYM BGM BSA KK VHG TOT
Paeds 0-14 yrs 50 45 53 50 53 56 56 56 58 54
Adole 15-19 yrs 71 43 63 69 52 58 59 49 45 56
Adults 20+ yrs 80 78 83 80 76 80 83 80 83 80
VS
in p
erc
en
t
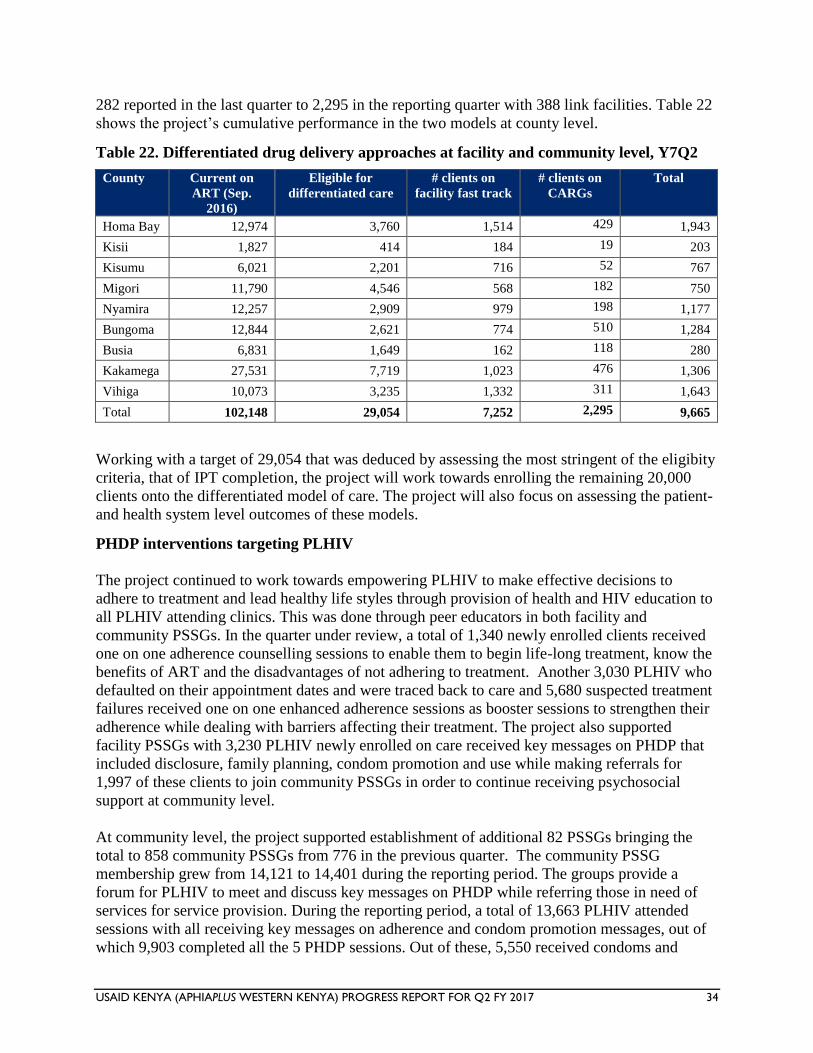
USAID KENYA (APHIAPLUS WESTERN KENYA) PROGRESS REPORT FOR Q2 FY 2017 34
282 reported in the last quarter to 2,295 in the reporting quarter with 388 link facilities. Table 22
shows the project’s cumulative performance in the two models at county level.
Table 22. Differentiated drug delivery approaches at facility and community level, Y7Q2
County Current on
ART (Sep.
2016)
Eligible for
differentiated care
# clients on
facility fast track
# clients on
CARGs
Total
Homa Bay 12,974 3,760 1,514 429 1,943
Kisii 1,827 414 184 19 203
Kisumu 6,021 2,201 716 52 767
Migori 11,790 4,546 568 182 750
Nyamira 12,257 2,909 979 198 1,177
Bungoma 12,844 2,621 774 510 1,284
Busia 6,831 1,649 162 118 280
Kakamega 27,531 7,719 1,023 476 1,306
Vihiga 10,073 3,235 1,332 311 1,643
Total 102,148 29,054 7,252 2,295 9,665
Working with a target of 29,054 that was deduced by assessing the most stringent of the eligibity
criteria, that of IPT completion, the project will work towards enrolling the remaining 20,000
clients onto the differentiated model of care. The project will also focus on assessing the patient-
and health system level outcomes of these models.
PHDP interventions targeting PLHIV
The project continued to work towards empowering PLHIV to make effective decisions to
adhere to treatment and lead healthy life styles through provision of health and HIV education to
all PLHIV attending clinics. This was done through peer educators in both facility and
community PSSGs. In the quarter under review, a total of 1,340 newly enrolled clients received
one on one adherence counselling sessions to enable them to begin life-long treatment, know the
benefits of ART and the disadvantages of not adhering to treatment. Another 3,030 PLHIV who
defaulted on their appointment dates and were traced back to care and 5,680 suspected treatment
failures received one on one enhanced adherence sessions as booster sessions to strengthen their
adherence while dealing with barriers affecting their treatment. The project also supported
facility PSSGs with 3,230 PLHIV newly enrolled on care received key messages on PHDP that
included disclosure, family planning, condom promotion and use while making referrals for
1,997 of these clients to join community PSSGs in order to continue receiving psychosocial
support at community level.
At community level, the project supported establishment of additional 82 PSSGs bringing the
total to 858 community PSSGs from 776 in the previous quarter. The community PSSG
membership grew from 14,121 to 14,401 during the reporting period. The groups provide a
forum for PLHIV to meet and discuss key messages on PHDP while referring those in need of
services for service provision. During the reporting period, a total of 13,663 PLHIV attended
sessions with all receiving key messages on adherence and condom promotion messages, out of
which 9,903 completed all the 5 PHDP sessions. Out of these, 5,550 received condoms and
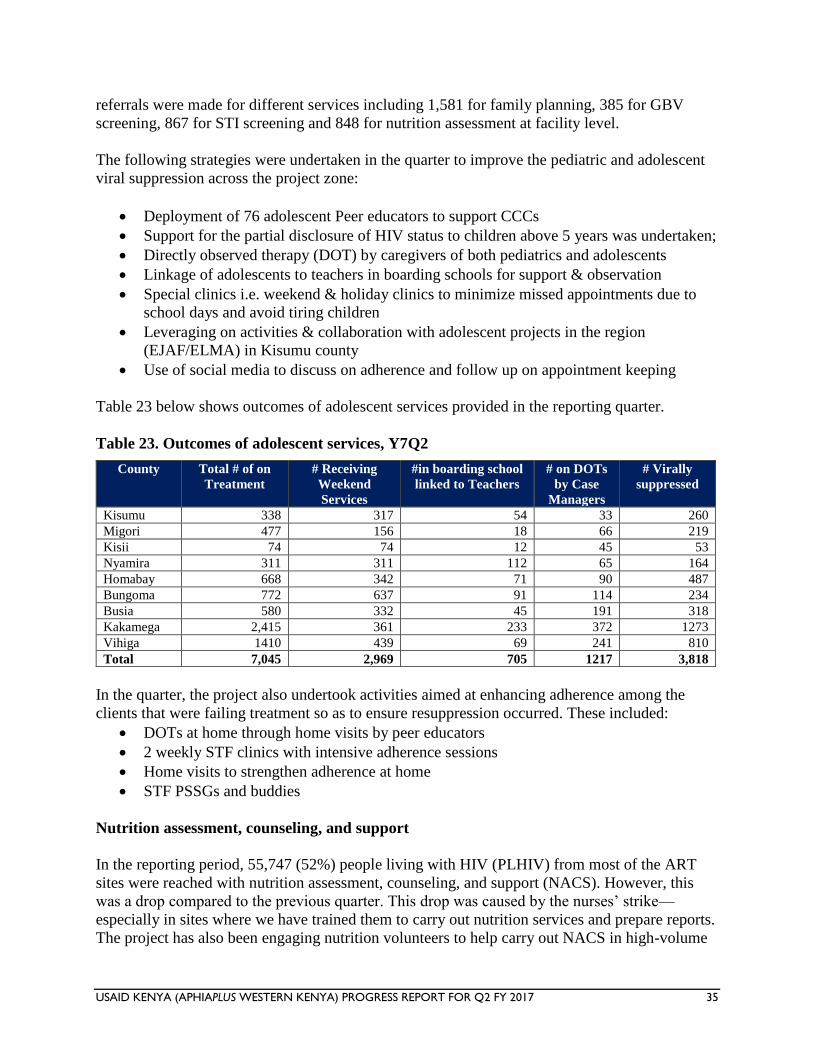
USAID KENYA (APHIAPLUS WESTERN KENYA) PROGRESS REPORT FOR Q2 FY 2017 35
referrals were made for different services including 1,581 for family planning, 385 for GBV
screening, 867 for STI screening and 848 for nutrition assessment at facility level.
The following strategies were undertaken in the quarter to improve the pediatric and adolescent
viral suppression across the project zone:
Deployment of 76 adolescent Peer educators to support CCCs
Support for the partial disclosure of HIV status to children above 5 years was undertaken;
Directly observed therapy (DOT) by caregivers of both pediatrics and adolescents
Linkage of adolescents to teachers in boarding schools for support & observation
Special clinics i.e. weekend & holiday clinics to minimize missed appointments due to
school days and avoid tiring children
Leveraging on activities & collaboration with adolescent projects in the region
(EJAF/ELMA) in Kisumu county
Use of social media to discuss on adherence and follow up on appointment keeping
Table 23 below shows outcomes of adolescent services provided in the reporting quarter.
Table 23. Outcomes of adolescent services, Y7Q2
County Total # of on
Treatment
# Receiving
Weekend
Services
#in boarding school
linked to Teachers
# on DOTs
by Case
Managers
# Virally
suppressed
Kisumu 338 317 54 33 260
Migori 477 156 18 66 219
Kisii 74 74 12 45 53
Nyamira 311 311 112 65 164
Homabay 668 342 71 90 487
Bungoma 772 637 91 114 234
Busia 580 332 45 191 318
Kakamega 2,415 361 233 372 1273
Vihiga 1410 439 69 241 810
Total 7,045 2,969 705 1217 3,818
In the quarter, the project also undertook activities aimed at enhancing adherence among the
clients that were failing treatment so as to ensure resuppression occurred. These included:
DOTs at home through home visits by peer educators
2 weekly STF clinics with intensive adherence sessions
Home visits to strengthen adherence at home
STF PSSGs and buddies
Nutrition assessment, counseling, and support
In the reporting period, 55,747 (52%) people living with HIV (PLHIV) from most of the ART
sites were reached with nutrition assessment, counseling, and support (NACS). However, this
was a drop compared to the previous quarter. This drop was caused by the nurses’ strike—
especially in sites where we have trained them to carry out nutrition services and prepare reports.
The project has also been engaging nutrition volunteers to help carry out NACS in high-volume
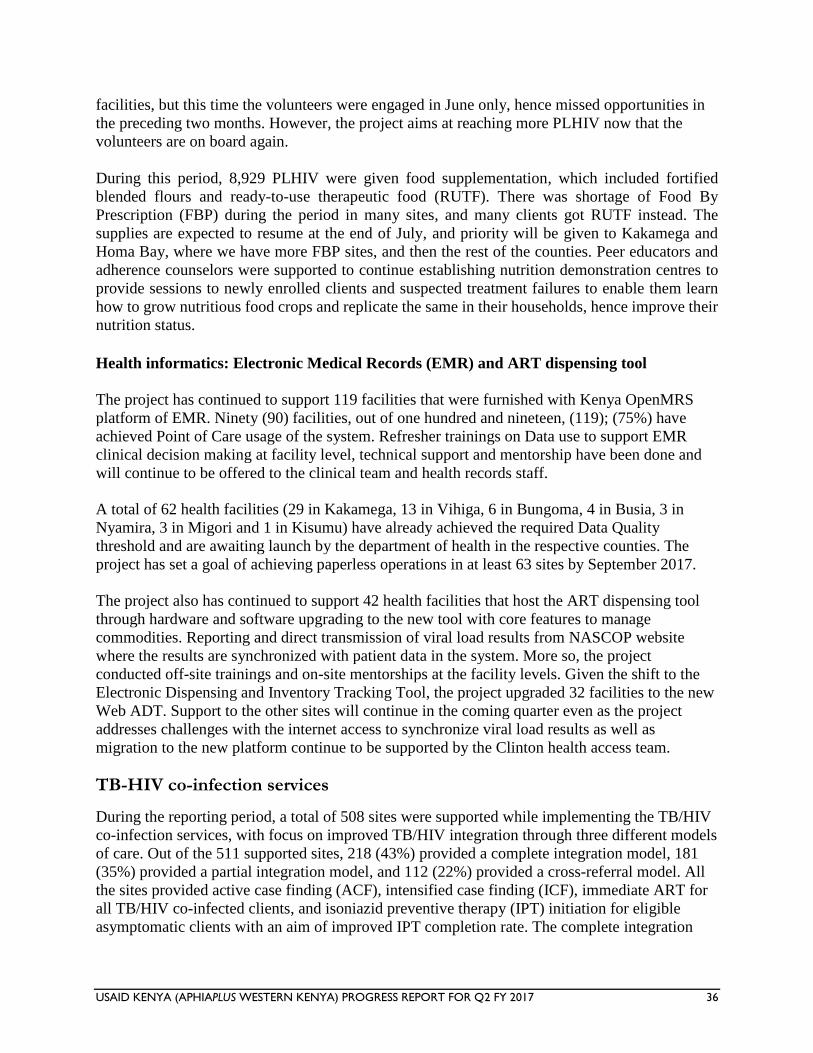
USAID KENYA (APHIAPLUS WESTERN KENYA) PROGRESS REPORT FOR Q2 FY 2017 36
facilities, but this time the volunteers were engaged in June only, hence missed opportunities in
the preceding two months. However, the project aims at reaching more PLHIV now that the
volunteers are on board again.
During this period, 8,929 PLHIV were given food supplementation, which included fortified
blended flours and ready-to-use therapeutic food (RUTF). There was shortage of Food By
Prescription (FBP) during the period in many sites, and many clients got RUTF instead. The
supplies are expected to resume at the end of July, and priority will be given to Kakamega and
Homa Bay, where we have more FBP sites, and then the rest of the counties. Peer educators and
adherence counselors were supported to continue establishing nutrition demonstration centres to
provide sessions to newly enrolled clients and suspected treatment failures to enable them learn
how to grow nutritious food crops and replicate the same in their households, hence improve their
nutrition status.
Health informatics: Electronic Medical Records (EMR) and ART dispensing tool
The project has continued to support 119 facilities that were furnished with Kenya OpenMRS
platform of EMR. Ninety (90) facilities, out of one hundred and nineteen, (119); (75%) have
achieved Point of Care usage of the system. Refresher trainings on Data use to support EMR
clinical decision making at facility level, technical support and mentorship have been done and
will continue to be offered to the clinical team and health records staff.
A total of 62 health facilities (29 in Kakamega, 13 in Vihiga, 6 in Bungoma, 4 in Busia, 3 in
Nyamira, 3 in Migori and 1 in Kisumu) have already achieved the required Data Quality
threshold and are awaiting launch by the department of health in the respective counties. The
project has set a goal of achieving paperless operations in at least 63 sites by September 2017.
The project also has continued to support 42 health facilities that host the ART dispensing tool
through hardware and software upgrading to the new tool with core features to manage
commodities. Reporting and direct transmission of viral load results from NASCOP website
where the results are synchronized with patient data in the system. More so, the project
conducted off-site trainings and on-site mentorships at the facility levels. Given the shift to the
Electronic Dispensing and Inventory Tracking Tool, the project upgraded 32 facilities to the new
Web ADT. Support to the other sites will continue in the coming quarter even as the project
addresses challenges with the internet access to synchronize viral load results as well as
migration to the new platform continue to be supported by the Clinton health access team.
TB-HIV co-infection services
During the reporting period, a total of 508 sites were supported while implementing the TB/HIV
co-infection services, with focus on improved TB/HIV integration through three different models
of care. Out of the 511 supported sites, 218 (43%) provided a complete integration model, 181
(35%) provided a partial integration model, and 112 (22%) provided a cross-referral model. All
the sites provided active case finding (ACF), intensified case finding (ICF), immediate ART for
all TB/HIV co-infected clients, and isoniazid preventive therapy (IPT) initiation for eligible
asymptomatic clients with an aim of improved IPT completion rate. The complete integration
USAID KENYA (APHIAPLUS WESTERN KENYA) PROGRESS REPORT FOR Q2 FY 2017 37
model was noted to be the best, in that patient management was good and the defaulter rate and
patient waiting time at the facility were noted to be low.
The project also supported provision of a minimum package of infection prevention and control
(IPC) to reduce TB transmission among health care workers and other patients. To improve on
the TB case finding and GeneXpert utilization, the project supported implementation of the
sample networking system through introduction of the RLSN approach, where one motorcycle
rider per sub-county (41 sub-counties and 41 riders) was engaged to transport samples (CD4,
GeneXpert, viral load, and EID) from peripheral sites to central sites with the diagnostic
equipment (CD4/GeneXpert samples) or for onward transmission to other labs (viral load
samples). Other activities during the reporting quarter included capacity-building initiatives, joint
supportive supervision, performance review meetings, and school health talks.
TB/HIV performance
As shown in Table 24 and Figure 8, in Y7Q2, 1,400 TB patients were registered in project-
supported sites, leading to a total of 3,363 TB registered patients in these sites. Of the total
registered patients, 3,249 (97%) were counseled and tested for HIV and 1,178 of these 3,249
(36%) were identified as TB/HIV co-infected; 1,165 of these 1,178 (99%) were initiated on
cotrimoxazole preventive therapy (CPT) and 1,120 of the 1,178 (95%) were put on ART.
Table 24. Key TB-HIV performance against COP 2016 target
TB/HIV performance indicators COP 2016
Targets
Y6Q4 Y7Q1 Y7Q2 Total
Number of TB cases registered 1,269 694 1,400 3,363
Number of TB patients who were
counseled, tested for HIV, and received
results
7,309 1,238 674 1,337 3,249
Proportion counseled and tested for HIV
and received results against COP 2016
target
44%
Number of HIV-infected TB patients 473 264 441 1,178
Proportion of TB-HIV co-infection 36%
Number of HIV-infected TB patients on
cotrimoxazole
469 258 438 1,165
Number of HIV-infected TB patients on
ARVs
2,564 454 246 420 1,120
Proportion of HIV-infected TB patients on
ARVs against COP 2016 target
44%
Number of HIV-positive clients screened
for TB
120,374 91,539 101,305 102,648 102,648
Proportion of PLHIV clients screened for
TB against COP 2016 target
(105%) 85%
Note: ARV, antiretroviral; COP, Country Operational Plan; PLHIV, people living with HIV; TB, tuberculosis.
Source: TIBU System data/MOH 711.
USAID KENYA (APHIAPLUS WESTERN KENYA) PROGRESS REPORT FOR Q2 FY 2017 38
Further analysis against the COP 2016 target of 7,309 clients indicated that 3,249 TB patients
were counseled and tested for HIV; this translates to 44% (3,249 of 7,309) project achievement
against the expected 75% at the end of the reporting period. Despite the increase of registered
patients by 706 patients as compared to Y7Q1 report, the overall low performance of 44% could
be attributed to the low number of registered TB patients in the Y7Q1 period coupled with the
health care workers’ strike.
To further improve and sustain the TB case finding and other key indicators, the project will
work closely with the facility and sub-county team members with a focus on improved case
finding. This will be achieved through utilization of the new RLSN system by ensuring that ACF
is conducted in all reporting sites and all identified patients are registered in the TB4 registers.
The project has recruited 324 ‘cough monitors’ who will be tasked in the ACF activities with
timely referrals; this cough monitors system will be a key deliverable in subsequent quarters.
ART initiation among TB/HIV co-infected clients
During the reporting period, 1,120 TB/HIV co-infected clients were initiated on ART, out of
1,178 co-infected clients, translating to a 95% ART uptake. When compared to the COP 2016
target, an achievement of 44% (1,120 of 2,564) was realized (see Table 24). The low COP target
performance (below the expected 75%) can be attributed mainly to the low case finding
witnessed in the Y7Q1 period. To further improve on ART uptake among co-infected TB
patients, the project has continued to focus on ACF through the cough monitors program,
mentioned above, to ensure that more clients are diagnosed earlier and started on treatment. The
project will also continue with dissemination of ART guidelines and capacity-building for health
providers and will support regular performance review meetings to ensure proper documentation
and reporting.
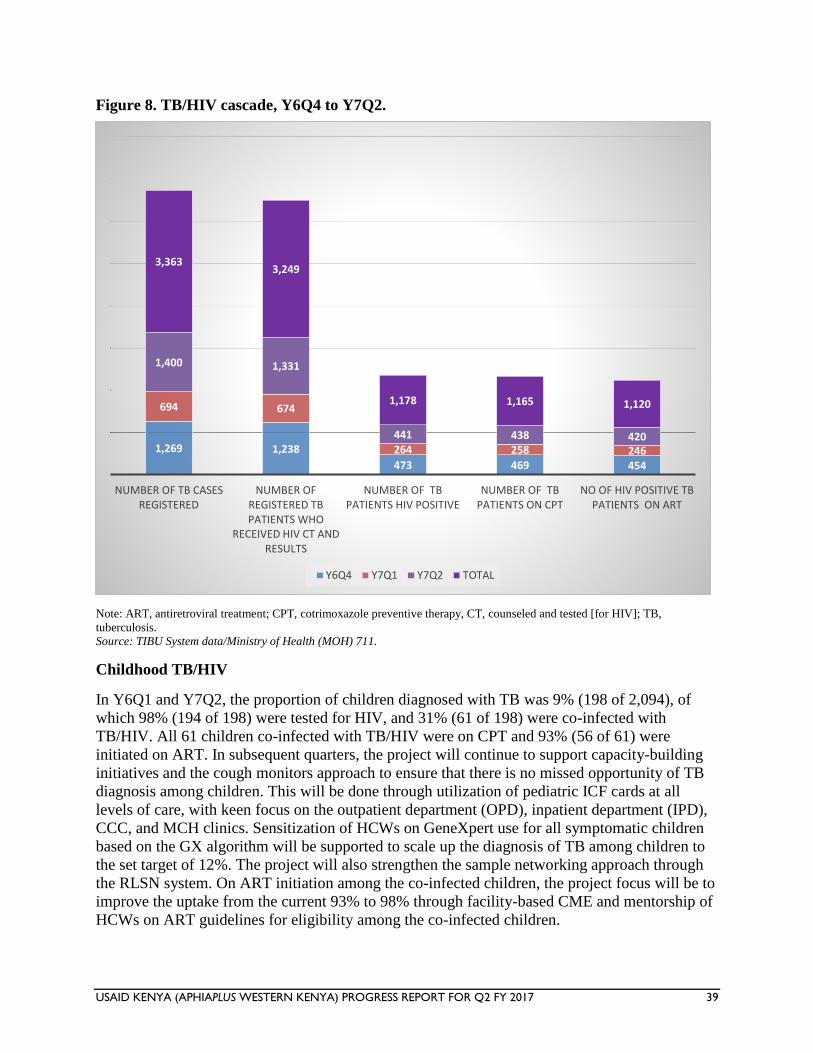
USAID KENYA (APHIAPLUS WESTERN KENYA) PROGRESS REPORT FOR Q2 FY 2017 39
Figure 8. TB/HIV cascade, Y6Q4 to Y7Q2.
Note: ART, antiretroviral treatment; CPT, cotrimoxazole preventive therapy, CT, counseled and tested [for HIV]; TB,
tuberculosis.
Source: TIBU System data/Ministry of Health (MOH) 711.
Childhood TB/HIV
In Y6Q1 and Y7Q2, the proportion of children diagnosed with TB was 9% (198 of 2,094), of
which 98% (194 of 198) were tested for HIV, and 31% (61 of 198) were co-infected with
TB/HIV. All 61 children co-infected with TB/HIV were on CPT and 93% (56 of 61) were
initiated on ART. In subsequent quarters, the project will continue to support capacity-building
initiatives and the cough monitors approach to ensure that there is no missed opportunity of TB
diagnosis among children. This will be done through utilization of pediatric ICF cards at all
levels of care, with keen focus on the outpatient department (OPD), inpatient department (IPD),
CCC, and MCH clinics. Sensitization of HCWs on GeneXpert use for all symptomatic children
based on the GX algorithm will be supported to scale up the diagnosis of TB among children to
the set target of 12%. The project will also strengthen the sample networking approach through
the RLSN system. On ART initiation among the co-infected children, the project focus will be to
improve the uptake from the current 93% to 98% through facility-based CME and mentorship of
HCWs on ART guidelines for eligibility among the co-infected children.
1,269 1,238
473 469 454
694 674
264 258 246
1,400 1,331
441 438 420
3,3633,249
1,178 1,165 1,120
NUMBER OF TB CASES REGISTERED
NUMBER OF REGISTERED TB PATIENTS WHO
RECEIVED HIV CT AND RESULTS
NUMBER OF TB PATIENTS HIV POSITIVE
NUMBER OF TB PATIENTS ON CPT
NO OF HIV POSITIVE TB PATIENTS ON ART
Y6Q4 Y7Q1 Y7Q2 TOTAL
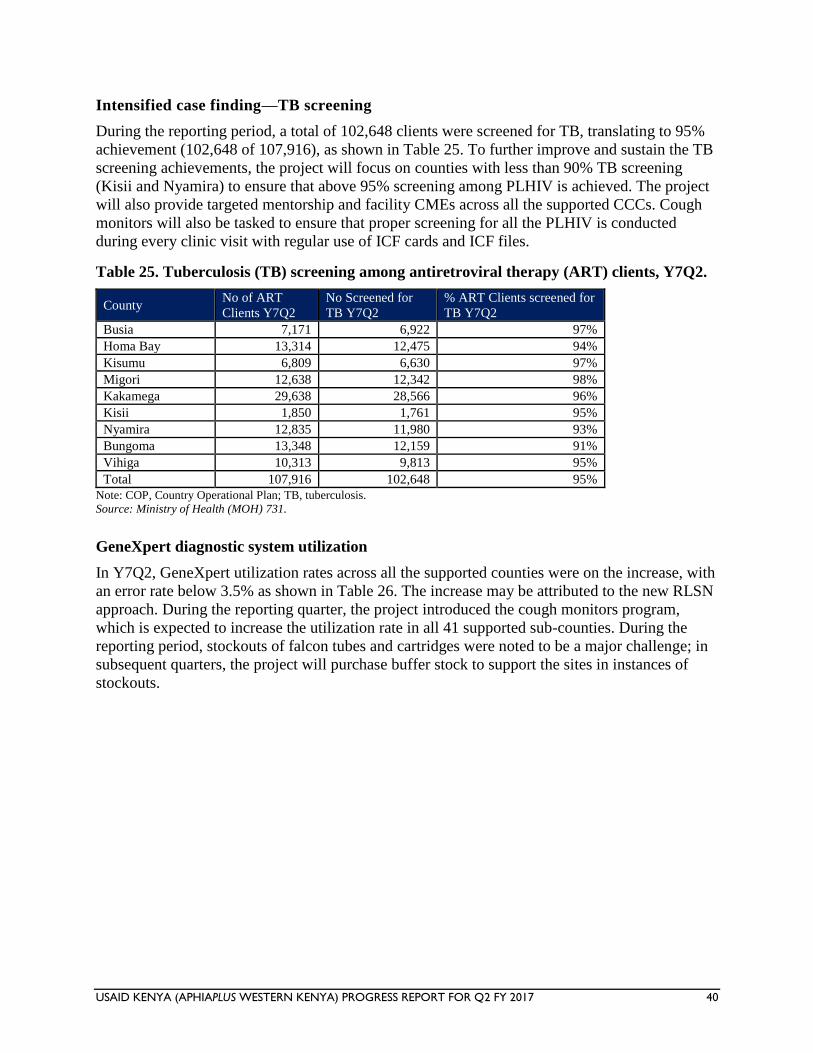
USAID KENYA (APHIAPLUS WESTERN KENYA) PROGRESS REPORT FOR Q2 FY 2017 40
Intensified case finding—TB screening
During the reporting period, a total of 102,648 clients were screened for TB, translating to 95%
achievement (102,648 of 107,916), as shown in Table 25. To further improve and sustain the TB
screening achievements, the project will focus on counties with less than 90% TB screening
(Kisii and Nyamira) to ensure that above 95% screening among PLHIV is achieved. The project
will also provide targeted mentorship and facility CMEs across all the supported CCCs. Cough
monitors will also be tasked to ensure that proper screening for all the PLHIV is conducted
during every clinic visit with regular use of ICF cards and ICF files.
Table 25. Tuberculosis (TB) screening among antiretroviral therapy (ART) clients, Y7Q2.
County No of ART
Clients Y7Q2
No Screened for
TB Y7Q2
% ART Clients screened for
TB Y7Q2
Busia 7,171 6,922 97%
Homa Bay 13,314 12,475 94%
Kisumu 6,809 6,630 97%
Migori 12,638 12,342 98%
Kakamega 29,638 28,566 96%
Kisii 1,850 1,761 95%
Nyamira 12,835 11,980 93%
Bungoma 13,348 12,159 91%
Vihiga 10,313 9,813 95%
Total 107,916 102,648 95%
Note: COP, Country Operational Plan; TB, tuberculosis.
Source: Ministry of Health (MOH) 731.
GeneXpert diagnostic system utilization
In Y7Q2, GeneXpert utilization rates across all the supported counties were on the increase, with
an error rate below 3.5% as shown in Table 26. The increase may be attributed to the new RLSN
approach. During the reporting quarter, the project introduced the cough monitors program,
which is expected to increase the utilization rate in all 41 supported sub-counties. During the
reporting period, stockouts of falcon tubes and cartridges were noted to be a major challenge; in
subsequent quarters, the project will purchase buffer stock to support the sites in instances of
stockouts.
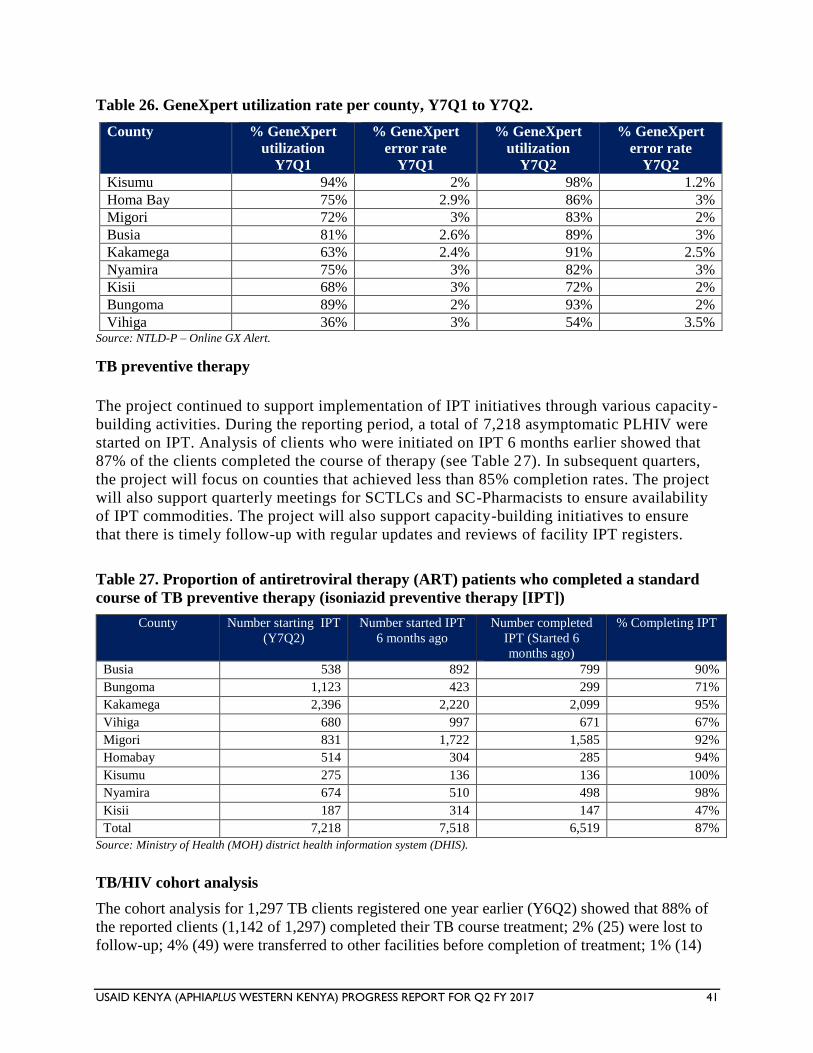
USAID KENYA (APHIAPLUS WESTERN KENYA) PROGRESS REPORT FOR Q2 FY 2017 41
Table 26. GeneXpert utilization rate per county, Y7Q1 to Y7Q2.
Source: NTLD-P – Online GX Alert.
TB preventive therapy
The project continued to support implementation of IPT initiatives through various capacity-
building activities. During the reporting period, a total of 7,218 asymptomatic PLHIV were
started on IPT. Analysis of clients who were initiated on IPT 6 months earlier showed that
87% of the clients completed the course of therapy (see Table 27). In subsequent quarters,
the project will focus on counties that achieved less than 85% completion rates. The project
will also support quarterly meetings for SCTLCs and SC-Pharmacists to ensure availability
of IPT commodities. The project will also support capacity-building initiatives to ensure
that there is timely follow-up with regular updates and reviews of facility IPT registers.
Table 27. Proportion of antiretroviral therapy (ART) patients who completed a standard
course of TB preventive therapy (isoniazid preventive therapy [IPT])
County Number starting IPT
(Y7Q2)
Number started IPT
6 months ago
Number completed
IPT (Started 6
months ago)
% Completing IPT
Busia 538 892 799 90%
Bungoma 1,123 423 299 71%
Kakamega 2,396 2,220 2,099 95%
Vihiga 680 997 671 67%
Migori 831 1,722 1,585 92%
Homabay 514 304 285 94%
Kisumu 275 136 136 100%
Nyamira 674 510 498 98%
Kisii 187 314 147 47%
Total 7,218 7,518 6,519 87%
Source: Ministry of Health (MOH) district health information system (DHIS).
TB/HIV cohort analysis
The cohort analysis for 1,297 TB clients registered one year earlier (Y6Q2) showed that 88% of
the reported clients (1,142 of 1,297) completed their TB course treatment; 2% (25) were lost to
follow-up; 4% (49) were transferred to other facilities before completion of treatment; 1% (14)
County % GeneXpert
utilization
Y7Q1
% GeneXpert
error rate
Y7Q1
% GeneXpert
utilization
Y7Q2
% GeneXpert
error rate
Y7Q2
Kisumu 94% 2% 98% 1.2%
Homa Bay 75% 2.9% 86% 3%
Migori 72% 3% 83% 2%
Busia 81% 2.6% 89% 3%
Kakamega 63% 2.4% 91% 2.5%
Nyamira 75% 3% 82% 3%
Kisii 68% 3% 72% 2%
Bungoma 89% 2% 93% 2%
Vihiga 36% 3% 54% 3.5%
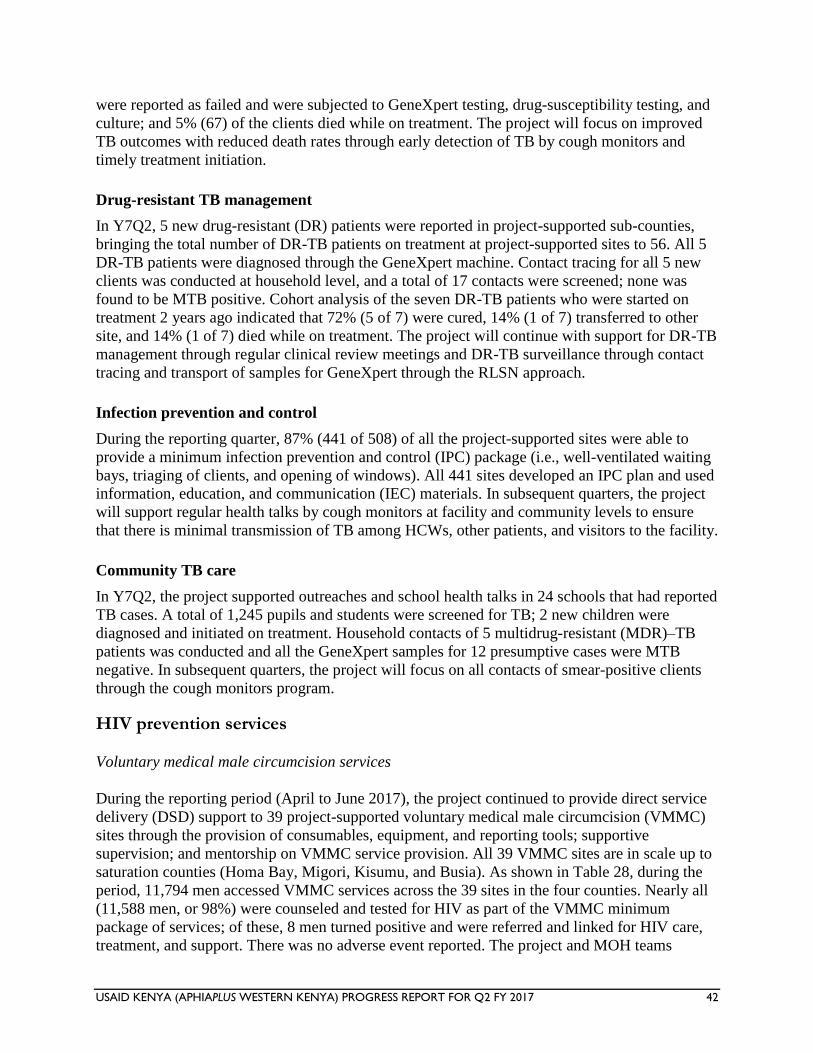
USAID KENYA (APHIAPLUS WESTERN KENYA) PROGRESS REPORT FOR Q2 FY 2017 42
were reported as failed and were subjected to GeneXpert testing, drug-susceptibility testing, and
culture; and 5% (67) of the clients died while on treatment. The project will focus on improved
TB outcomes with reduced death rates through early detection of TB by cough monitors and
timely treatment initiation.
Drug-resistant TB management
In Y7Q2, 5 new drug-resistant (DR) patients were reported in project-supported sub-counties,
bringing the total number of DR-TB patients on treatment at project-supported sites to 56. All 5
DR-TB patients were diagnosed through the GeneXpert machine. Contact tracing for all 5 new
clients was conducted at household level, and a total of 17 contacts were screened; none was
found to be MTB positive. Cohort analysis of the seven DR-TB patients who were started on
treatment 2 years ago indicated that 72% (5 of 7) were cured, 14% (1 of 7) transferred to other
site, and 14% (1 of 7) died while on treatment. The project will continue with support for DR-TB
management through regular clinical review meetings and DR-TB surveillance through contact
tracing and transport of samples for GeneXpert through the RLSN approach.
Infection prevention and control
During the reporting quarter, 87% (441 of 508) of all the project-supported sites were able to
provide a minimum infection prevention and control (IPC) package (i.e., well-ventilated waiting
bays, triaging of clients, and opening of windows). All 441 sites developed an IPC plan and used
information, education, and communication (IEC) materials. In subsequent quarters, the project
will support regular health talks by cough monitors at facility and community levels to ensure
that there is minimal transmission of TB among HCWs, other patients, and visitors to the facility.
Community TB care
In Y7Q2, the project supported outreaches and school health talks in 24 schools that had reported
TB cases. A total of 1,245 pupils and students were screened for TB; 2 new children were
diagnosed and initiated on treatment. Household contacts of 5 multidrug-resistant (MDR)–TB
patients was conducted and all the GeneXpert samples for 12 presumptive cases were MTB
negative. In subsequent quarters, the project will focus on all contacts of smear-positive clients
through the cough monitors program.
HIV prevention services
Voluntary medical male circumcision services
During the reporting period (April to June 2017), the project continued to provide direct service
delivery (DSD) support to 39 project-supported voluntary medical male circumcision (VMMC)
sites through the provision of consumables, equipment, and reporting tools; supportive
supervision; and mentorship on VMMC service provision. All 39 VMMC sites are in scale up to
saturation counties (Homa Bay, Migori, Kisumu, and Busia). As shown in Table 28, during the
period, 11,794 men accessed VMMC services across the 39 sites in the four counties. Nearly all
(11,588 men, or 98%) were counseled and tested for HIV as part of the VMMC minimum
package of services; of these, 8 men turned positive and were referred and linked for HIV care,
treatment, and support. There was no adverse event reported. The project and MOH teams
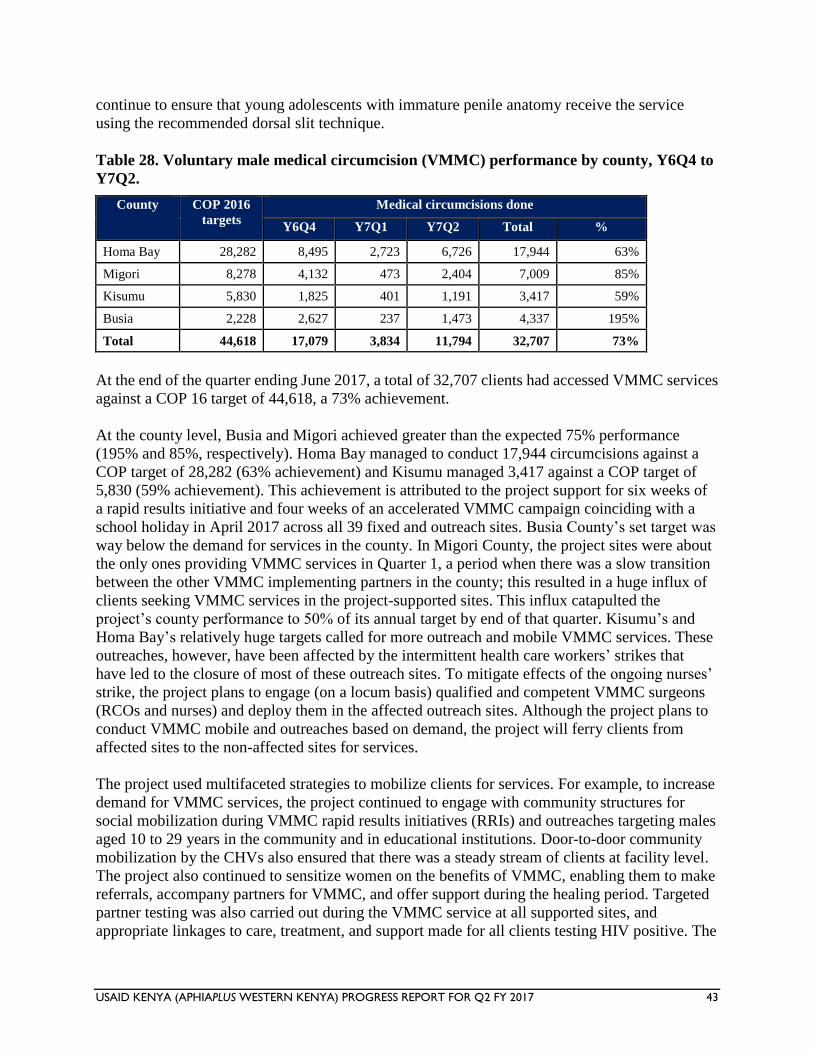
USAID KENYA (APHIAPLUS WESTERN KENYA) PROGRESS REPORT FOR Q2 FY 2017 43
continue to ensure that young adolescents with immature penile anatomy receive the service
using the recommended dorsal slit technique.
Table 28. Voluntary male medical circumcision (VMMC) performance by county, Y6Q4 to
Y7Q2.
County COP 2016
targets
Medical circumcisions done
Y6Q4 Y7Q1 Y7Q2 Total %
Homa Bay 28,282 8,495 2,723 6,726 17,944 63%
Migori 8,278 4,132 473 2,404 7,009 85%
Kisumu 5,830 1,825 401 1,191 3,417 59%
Busia 2,228 2,627 237 1,473 4,337 195%
Total 44,618 17,079 3,834 11,794 32,707 73%
At the end of the quarter ending June 2017, a total of 32,707 clients had accessed VMMC services
against a COP 16 target of 44,618, a 73% achievement.
At the county level, Busia and Migori achieved greater than the expected 75% performance
(195% and 85%, respectively). Homa Bay managed to conduct 17,944 circumcisions against a
COP target of 28,282 (63% achievement) and Kisumu managed 3,417 against a COP target of
5,830 (59% achievement). This achievement is attributed to the project support for six weeks of
a rapid results initiative and four weeks of an accelerated VMMC campaign coinciding with a
school holiday in April 2017 across all 39 fixed and outreach sites. Busia County’s set target was
way below the demand for services in the county. In Migori County, the project sites were about
the only ones providing VMMC services in Quarter 1, a period when there was a slow transition
between the other VMMC implementing partners in the county; this resulted in a huge influx of
clients seeking VMMC services in the project-supported sites. This influx catapulted the
project’s county performance to 50% of its annual target by end of that quarter. Kisumu’s and
Homa Bay’s relatively huge targets called for more outreach and mobile VMMC services. These
outreaches, however, have been affected by the intermittent health care workers’ strikes that
have led to the closure of most of these outreach sites. To mitigate effects of the ongoing nurses’
strike, the project plans to engage (on a locum basis) qualified and competent VMMC surgeons
(RCOs and nurses) and deploy them in the affected outreach sites. Although the project plans to
conduct VMMC mobile and outreaches based on demand, the project will ferry clients from
affected sites to the non-affected sites for services.
The project used multifaceted strategies to mobilize clients for services. For example, to increase
demand for VMMC services, the project continued to engage with community structures for
social mobilization during VMMC rapid results initiatives (RRIs) and outreaches targeting males
aged 10 to 29 years in the community and in educational institutions. Door-to-door community
mobilization by the CHVs also ensured that there was a steady stream of clients at facility level.
The project also continued to sensitize women on the benefits of VMMC, enabling them to make
referrals, accompany partners for VMMC, and offer support during the healing period. Targeted
partner testing was also carried out during the VMMC service at all supported sites, and
appropriate linkages to care, treatment, and support made for all clients testing HIV positive. The
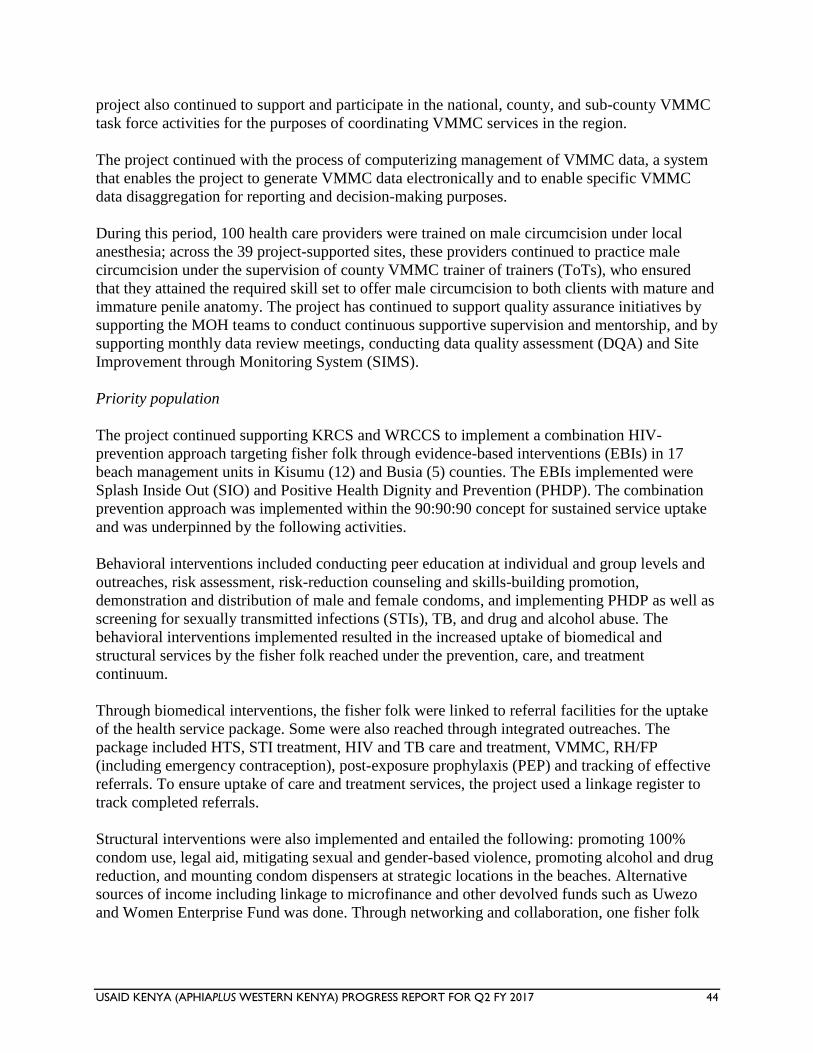
USAID KENYA (APHIAPLUS WESTERN KENYA) PROGRESS REPORT FOR Q2 FY 2017 44
project also continued to support and participate in the national, county, and sub-county VMMC
task force activities for the purposes of coordinating VMMC services in the region.
The project continued with the process of computerizing management of VMMC data, a system
that enables the project to generate VMMC data electronically and to enable specific VMMC
data disaggregation for reporting and decision-making purposes.
During this period, 100 health care providers were trained on male circumcision under local
anesthesia; across the 39 project-supported sites, these providers continued to practice male
circumcision under the supervision of county VMMC trainer of trainers (ToTs), who ensured
that they attained the required skill set to offer male circumcision to both clients with mature and
immature penile anatomy. The project has continued to support quality assurance initiatives by
supporting the MOH teams to conduct continuous supportive supervision and mentorship, and by
supporting monthly data review meetings, conducting data quality assessment (DQA) and Site
Improvement through Monitoring System (SIMS).
Priority population
The project continued supporting KRCS and WRCCS to implement a combination HIV-
prevention approach targeting fisher folk through evidence-based interventions (EBIs) in 17
beach management units in Kisumu (12) and Busia (5) counties. The EBIs implemented were
Splash Inside Out (SIO) and Positive Health Dignity and Prevention (PHDP). The combination
prevention approach was implemented within the 90:90:90 concept for sustained service uptake
and was underpinned by the following activities.
Behavioral interventions included conducting peer education at individual and group levels and
outreaches, risk assessment, risk-reduction counseling and skills-building promotion,
demonstration and distribution of male and female condoms, and implementing PHDP as well as
screening for sexually transmitted infections (STIs), TB, and drug and alcohol abuse. The
behavioral interventions implemented resulted in the increased uptake of biomedical and
structural services by the fisher folk reached under the prevention, care, and treatment
continuum.
Through biomedical interventions, the fisher folk were linked to referral facilities for the uptake
of the health service package. Some were also reached through integrated outreaches. The
package included HTS, STI treatment, HIV and TB care and treatment, VMMC, RH/FP
(including emergency contraception), post-exposure prophylaxis (PEP) and tracking of effective
referrals. To ensure uptake of care and treatment services, the project used a linkage register to
track completed referrals.
Structural interventions were also implemented and entailed the following: promoting 100%
condom use, legal aid, mitigating sexual and gender-based violence, promoting alcohol and drug
reduction, and mounting condom dispensers at strategic locations in the beaches. Alternative
sources of income including linkage to microfinance and other devolved funds such as Uwezo
and Women Enterprise Fund was done. Through networking and collaboration, one fisher folk
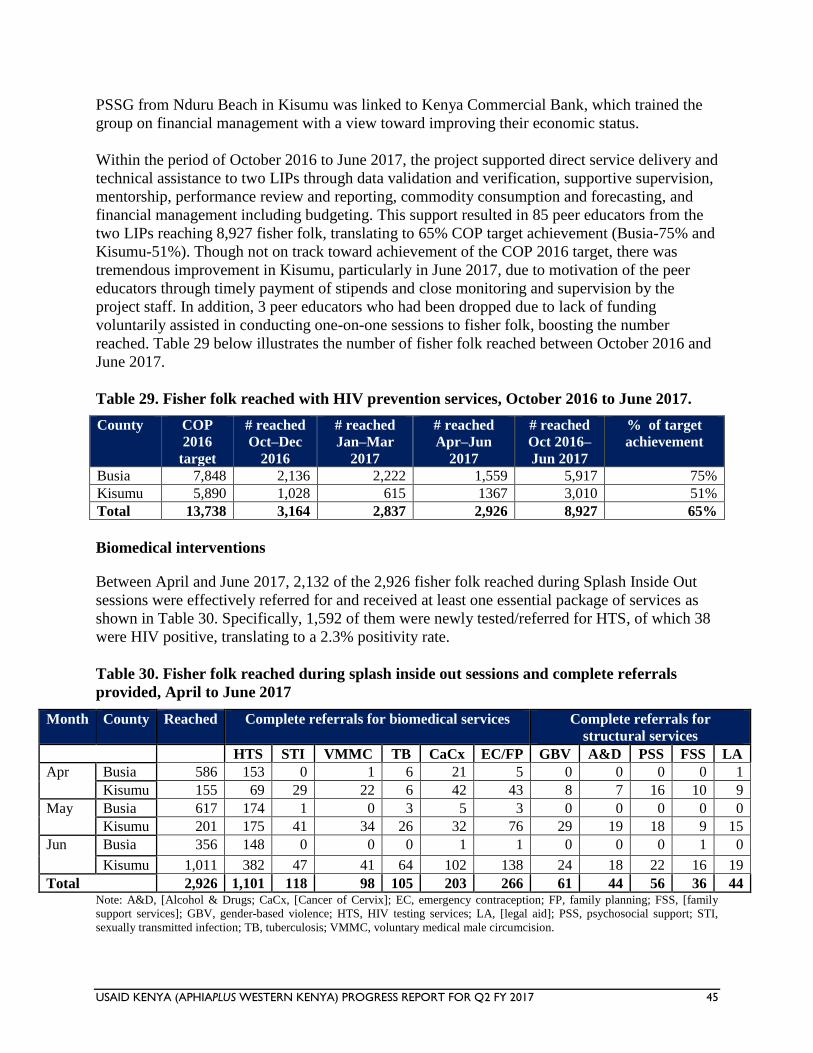
USAID KENYA (APHIAPLUS WESTERN KENYA) PROGRESS REPORT FOR Q2 FY 2017 45
PSSG from Nduru Beach in Kisumu was linked to Kenya Commercial Bank, which trained the
group on financial management with a view toward improving their economic status.
Within the period of October 2016 to June 2017, the project supported direct service delivery and
technical assistance to two LIPs through data validation and verification, supportive supervision,
mentorship, performance review and reporting, commodity consumption and forecasting, and
financial management including budgeting. This support resulted in 85 peer educators from the
two LIPs reaching 8,927 fisher folk, translating to 65% COP target achievement (Busia-75% and
Kisumu-51%). Though not on track toward achievement of the COP 2016 target, there was
tremendous improvement in Kisumu, particularly in June 2017, due to motivation of the peer
educators through timely payment of stipends and close monitoring and supervision by the
project staff. In addition, 3 peer educators who had been dropped due to lack of funding
voluntarily assisted in conducting one-on-one sessions to fisher folk, boosting the number
reached. Table 29 below illustrates the number of fisher folk reached between October 2016 and
June 2017.
Table 29. Fisher folk reached with HIV prevention services, October 2016 to June 2017.
County COP
2016
target
# reached
Oct–Dec
2016
# reached
Jan–Mar
2017
# reached
Apr–Jun
2017
# reached
Oct 2016–
Jun 2017
% of target
achievement
Busia 7,848 2,136 2,222 1,559 5,917 75%
Kisumu 5,890 1,028 615 1367 3,010 51%
Total 13,738 3,164 2,837 2,926 8,927 65%
Biomedical interventions
Between April and June 2017, 2,132 of the 2,926 fisher folk reached during Splash Inside Out
sessions were effectively referred for and received at least one essential package of services as
shown in Table 30. Specifically, 1,592 of them were newly tested/referred for HTS, of which 38
were HIV positive, translating to a 2.3% positivity rate.
Table 30. Fisher folk reached during splash inside out sessions and complete referrals
provided, April to June 2017
Month County Reached Complete referrals for biomedical services Complete referrals for
structural services HTS STI VMMC TB CaCx EC/FP GBV A&D PSS FSS LA
Apr Busia 586 153 0 1 6 21 5 0 0 0 0 1
Kisumu 155 69 29 22 6 42 43 8 7 16 10 9
May Busia 617 174 1 0 3 5 3 0 0 0 0 0
Kisumu 201 175 41 34 26 32 76 29 19 18 9 15
Jun Busia 356 148 0 0 0 1 1 0 0 0 1 0
Kisumu 1,011 382 47 41 64 102 138 24 18 22 16 19
Total 2,926 1,101 118 98 105 203 266 61 44 56 36 44 Note: A&D, [Alcohol & Drugs; CaCx, [Cancer of Cervix]; EC, emergency contraception; FP, family planning; FSS, [family
support services]; GBV, gender-based violence; HTS, HIV testing services; LA, [legal aid]; PSS, psychosocial support; STI,
sexually transmitted infection; TB, tuberculosis; VMMC, voluntary medical male circumcision.
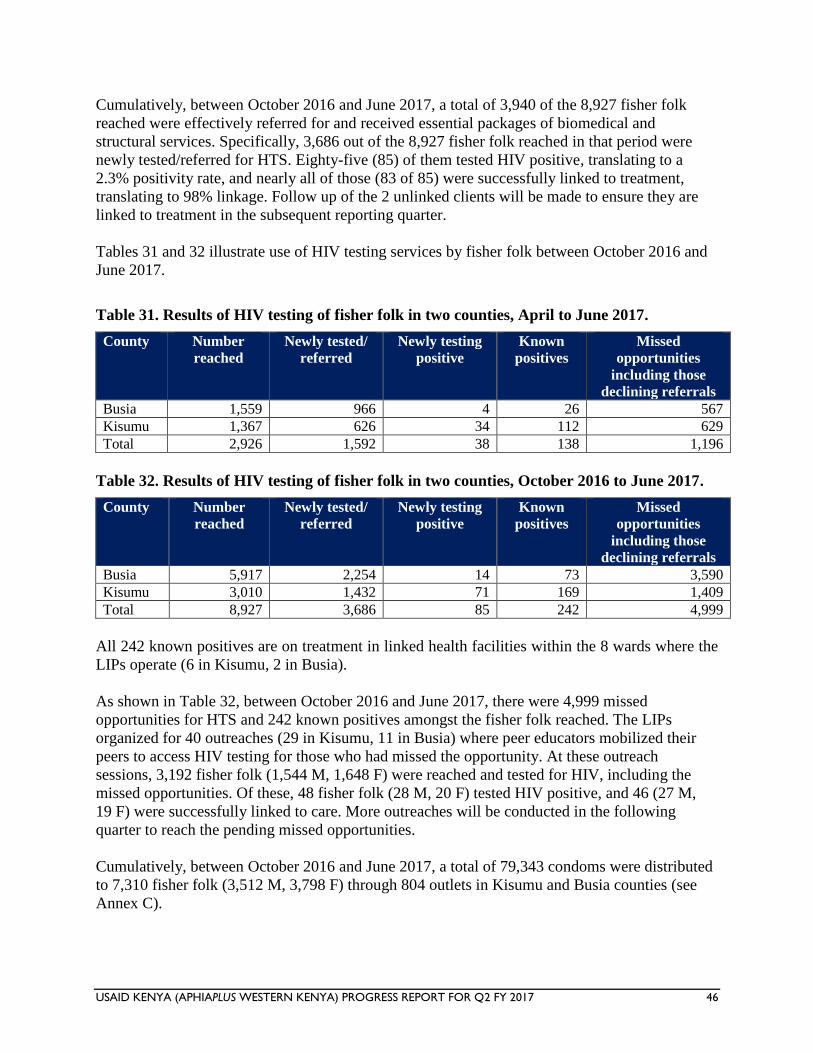
USAID KENYA (APHIAPLUS WESTERN KENYA) PROGRESS REPORT FOR Q2 FY 2017 46
Cumulatively, between October 2016 and June 2017, a total of 3,940 of the 8,927 fisher folk
reached were effectively referred for and received essential packages of biomedical and
structural services. Specifically, 3,686 out of the 8,927 fisher folk reached in that period were
newly tested/referred for HTS. Eighty-five (85) of them tested HIV positive, translating to a
2.3% positivity rate, and nearly all of those (83 of 85) were successfully linked to treatment,
translating to 98% linkage. Follow up of the 2 unlinked clients will be made to ensure they are
linked to treatment in the subsequent reporting quarter.
Tables 31 and 32 illustrate use of HIV testing services by fisher folk between October 2016 and
June 2017.
Table 31. Results of HIV testing of fisher folk in two counties, April to June 2017.
County Number
reached
Newly tested/
referred
Newly testing
positive
Known
positives
Missed
opportunities
including those
declining referrals
Busia 1,559 966 4 26 567
Kisumu 1,367 626 34 112 629
Total 2,926 1,592 38 138 1,196
Table 32. Results of HIV testing of fisher folk in two counties, October 2016 to June 2017.
County Number
reached
Newly tested/
referred
Newly testing
positive
Known
positives
Missed
opportunities
including those
declining referrals
Busia 5,917 2,254 14 73 3,590
Kisumu 3,010 1,432 71 169 1,409
Total 8,927 3,686 85 242 4,999
All 242 known positives are on treatment in linked health facilities within the 8 wards where the
LIPs operate (6 in Kisumu, 2 in Busia).
As shown in Table 32, between October 2016 and June 2017, there were 4,999 missed
opportunities for HTS and 242 known positives amongst the fisher folk reached. The LIPs
organized for 40 outreaches (29 in Kisumu, 11 in Busia) where peer educators mobilized their
peers to access HIV testing for those who had missed the opportunity. At these outreach
sessions, 3,192 fisher folk (1,544 M, 1,648 F) were reached and tested for HIV, including the
missed opportunities. Of these, 48 fisher folk (28 M, 20 F) tested HIV positive, and 46 (27 M,
19 F) were successfully linked to care. More outreaches will be conducted in the following
quarter to reach the pending missed opportunities.
Cumulatively, between October 2016 and June 2017, a total of 79,343 condoms were distributed
to 7,310 fisher folk (3,512 M, 3,798 F) through 804 outlets in Kisumu and Busia counties (see
Annex C).
USAID KENYA (APHIAPLUS WESTERN KENYA) PROGRESS REPORT FOR Q2 FY 2017 47
Structural Interventions
During the quarter, two legal aid clinics were done in collaboration with Children’s Legal Action
Network in Busia County, reaching 82 fisher folk (32 M, 50 F) with information on gender-
based violence (GBV) and property rights, among other concerns. Consequently, 8 people were
supported by a lawyer who participated in the clinic to handle cases of land, child protection, and
gender-based issues on a subsidized fee. On linkage to microfinance to fisher folk, 2 more
groups accessed devolved funds from Uwezo and Women Enterprise Fund, bringing to a total of
15 groups accessing devolved funds to expand and/or diversify individual businesses. The
groups also continued with table banking, which continued to improve the member’s economic
safety nets. In Kisumu County, one group from Nduru Beach was linked to financial institutions
such as Kenya Commercial Bank, which trained members on financial management, hence
building their capacity in record keeping and business diversification. The LIPs continued to
collaborate with other partners such as the Ministry of Health, Kenya Commercial Bank, and
microfinance institutions to provide services to the fisher folk.
The LIPs continued to collaborate with other partners such as the Ministry of Health, Kenya
Commercial Bank, and microfinance institutions to provide services to the fisher folk.
Gender mainstreaming and integration
The project continued to strengthen gender integration activities in service delivery to facilitate
access to and utilization of health care services by both men and women through community-
level norm change interventions and community- and facility-level GBV response services. The
key activities implemented in the reporting quarter were community-level education to empower
both male and female genders on gender-based violence (GBV) prevention and response,
orientation of police on gender to strengthen operations of gender desks in police stations and
GBV response, marking of the Day of the African Child, and protection and legal services to
GBV survivors. The project also continued supporting CMEs for HCWs to strengthen post
violence care service provision and reporting.
Addressing male norms and behaviors
The project continued to implement community-level activities to explore and reduce negative
gender norms that impact access to and use of services. In addition, these activities aimed at
preventing GBV and creating demand for clinical services. The activities carried out to address
norms change were orientation of local administration and police officers on gender and GBV
service provision, community-level dialogue sessions on gender and GBV, conducted gender
analysis using the gender marker method in Ntimaru (Migori County) to understand the
prevailing circumstances surrounding persistent physical gender violence recorded in the
community. The project also supported gender TWG monthly meetings to strengthen GBV
response, branding of the project-supported paralegals with t-shirts, and marking of the Day of
the African Child. Using the SASA! community mobilization approach
(http://raisingvoices.org/sasa/), 3,105 people were reached with norms and behavior changing
information and education in Y7Q2.
USAID KENYA (APHIAPLUS WESTERN KENYA) PROGRESS REPORT FOR Q2 FY 2017 48
Post gender-based violence (GBV) services
The project continued to support integrated post GBV care services both at the community and
facility levels leading to an achievement of 2,673 in Y7Q2 period and a total of 6,363 clients
reached by end of June 2017, an achievement of 92% against COP 2016 target of 6,889 (see
Table 33 below).
Table 33. Post gender-based violence (GBV) care services, October 2016 to June 2017.
COP 2016
targets
Y6Q4 Y7Q1 Y7Q2 Total
reached
% achievement
6,889 1,385 2,305 2,673 6,363 92%
Community-level GBV services
The project continued to conduct active GBV case identification through screening during
community outreaches and at the safe spaces. Targeted community-level sensitizations on GBV
were also held in Lurambi and Ikolomani (Kakamega County), Ntimaru and Kegonga (Migori
County), Ekerenyo (Nyamira County), and Rachuonyo (Homa Bay County), which had recorded
high cases of GBV.
In addition, the project supported gender TWGs to coordinate marking of the Day of the African
Child. In Kisumu, Bungoma, Kakamega, Nyamira, and Migori, the gender TWGs continued to
engage communities and administrations to understand the policy and legal contexts in relation
to violence against women and girls and how to collaborate with other actors in offering
response services. In Busia, Kisumu, Homa Bay, and Migori, the project continued to engage
women as essential partners in promoting voluntary male medical circumcision (VMMC) and
HIV testing among men, providing key messages on the benefits of VMMC and male-partner
testing to the females.
Facility-level post GBV services
During the reporting quarter, the project supported CMEs and supportive supervision for health
care workers to improve GBV screening, understanding and use of GBV reporting tools and
standard operating procedures, complete documentation of physical violence cases in the OPD
registers, and use of the black books to capture other forms of GBV (non-sexual) that receive
clinical services. The project-supported, facility-based peer educators and paralegals were
assisted to follow up clients to ensure that PEP medication is completed. To strengthen reporting
of non-sexual GBV, the project supported meetings involving data officers and health care
providers at the OPD to identify the existing gaps and how to improve on them. In Kisumu and
Nyamira counties, the project supported meetings between police officers and HCWs from two
major police stations and sub-county hospitals to facilitate collaboration and linkage for legal
redress of cases. As a result, a total of 352 survivors of sexual violence (350 F, 2 M) were
reached with services in Y7Q2, compared to 388 in Y7Q1, giving an achievement of 6,363 as at
end of June 2017 (92% against COP 2016 target) as shown in Table 34 below.
USAID KENYA (APHIAPLUS WESTERN KENYA) PROGRESS REPORT FOR Q2 FY 2017 49
Table 34. Survivors of gender-based violence (GBV) reached with services, Y6Q4 to Y7Q2.
County COP
2016
targets
Y6Q4 (GBV–
sexual and
other)
Y7Q1
(GBV–
sexual and
other)
Y7Q2
(GBV–
sexual)
Y7Q1
GBV–
other)
Total %
achievement
Bungoma 860 192 261 65 165 683 79%
Busia 803 136 89 30 87 342 43%
Homa Bay 690 106 156 5 129 396 57%
Kakamega 986 211 627 87 509 1,434 145%
Kisii 302 60 112 7 179 358 119%
Kisumu 677 146 122 12 245 525 78%
Migori 800 188 352 37 331 908 114%
Nyamira 788 227 403 10 458 1,098 139%
Vihiga 983 130 183 99 218 630 64%
Total 6,889 1,385 2,305 352 2,321 6,363 92%
A total of 256 survivors of sexual violence were tested for HIV, 213 received PEP, 114 received
STI treatment, and 52 were linked to legal, police, psychosocial, and protection services. In
Kakamega County, the project facilitated the rescue of 11 female survivors of sexual violence, 4
of them children. The project supported the survivors with daily dignity packs and food through
Dwele shelter home in Kakamega for a period of two weeks, after which they were re-integrated
with their families and caregivers. In Naitiri, Bungoma County, project-supported paralegals
facilitated the formation of a support group for GBV survivors to create a forum for experience
sharing and psychosocial support, while in Vihiga and Migori counties, 2 cases were transferred
to Eldoret and Kisumu, respectively, to protect the witnesses. A total of 26 cases proceeded to
court, 3 were concluded, and 23 are ongoing.
DREAMS interventions
In this reporting quarter, the project continued to implement the interventions in the two
Counties of Kisumu and Homa Bay. Focusing on the four categories of interventions in the
DREAMS initiative. A major focus was placed on ensuring that enrolled adolescent girls and
young women (AGYW) receive services. In the previous quarter, some AGYW were indicated
as having received zero services. The project therefore put efforts to find the AGYW and
determine the reasons for this. Additionally, the project, in view of the coming elections and in
anticipation of program disruptions, put in place mechanisms to accelerate achievements and
also to keep the AGYW safe.
AGYW enrollment into DREAMS
In the reporting quarter, significant progress was made in AGYW enrollment. Current enrollment
is at 32,476 AGYW against the project target of 34,264; this is a slight decrease from last
quarter’s enrollment level of 33,392. The decrease was attributed to a project-instituted measure
of de-enrolling 182 AGYW ages 10–14, 187 AGYW ages 15–19, and 557 AGYW ages 20–24 as
a result of over enrollment of these cohorts in Quarter 1, especially in Homa Bay County. Self-
requested exits, lost to follow up, request by the caregiver, and death also contributed to
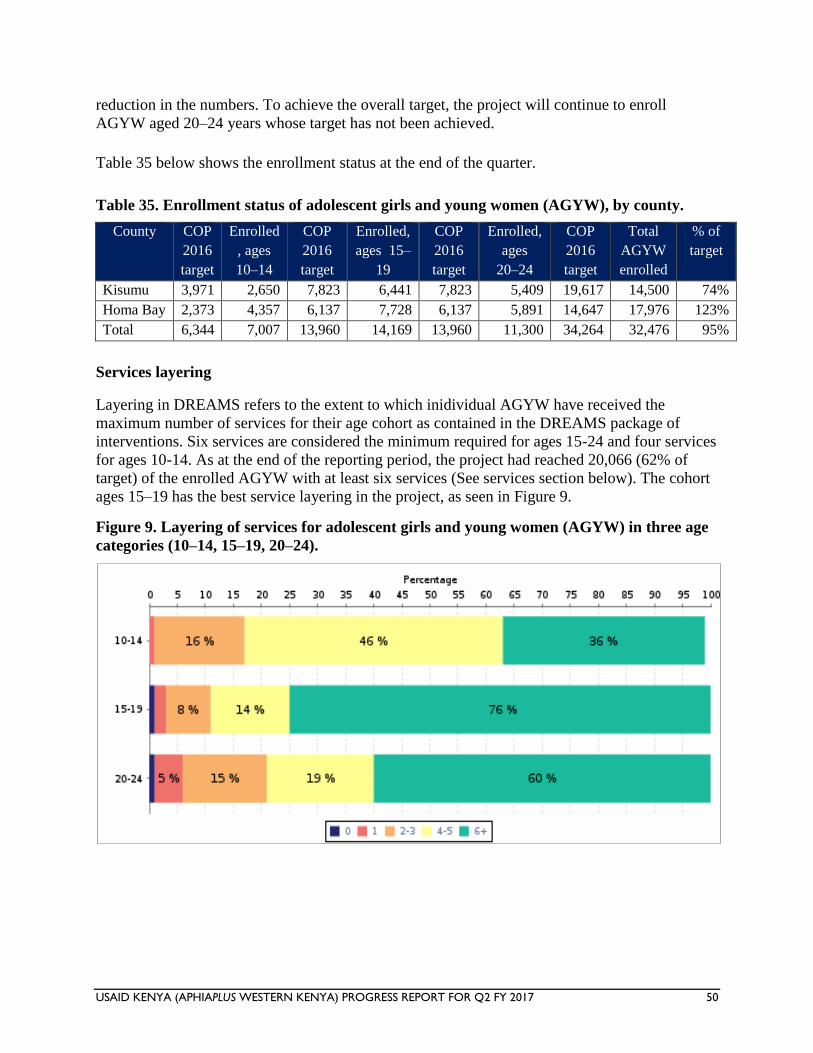
USAID KENYA (APHIAPLUS WESTERN KENYA) PROGRESS REPORT FOR Q2 FY 2017 50
reduction in the numbers. To achieve the overall target, the project will continue to enroll
AGYW aged 20–24 years whose target has not been achieved.
Table 35 below shows the enrollment status at the end of the quarter.
Table 35. Enrollment status of adolescent girls and young women (AGYW), by county.
County COP
2016
target
Enrolled
, ages
10–14
COP
2016
target
Enrolled,
ages 15–
19
COP
2016
target
Enrolled,
ages
20–24
COP
2016
target
Total
AGYW
enrolled
% of
target
Kisumu 3,971 2,650 7,823 6,441 7,823 5,409 19,617 14,500 74%
Homa Bay 2,373 4,357 6,137 7,728 6,137 5,891 14,647 17,976 123%
Total 6,344 7,007 13,960 14,169 13,960 11,300 34,264 32,476 95%
Services layering
Layering in DREAMS refers to the extent to which inidividual AGYW have received the
maximum number of services for their age cohort as contained in the DREAMS package of
interventions. Six services are considered the minimum required for ages 15-24 and four services
for ages 10-14. As at the end of the reporting period, the project had reached 20,066 (62% of
target) of the enrolled AGYW with at least six services (See services section below). The cohort
ages 15–19 has the best service layering in the project, as seen in Figure 9.
Figure 9. Layering of services for adolescent girls and young women (AGYW) in three age
categories (10–14, 15–19, 20–24).
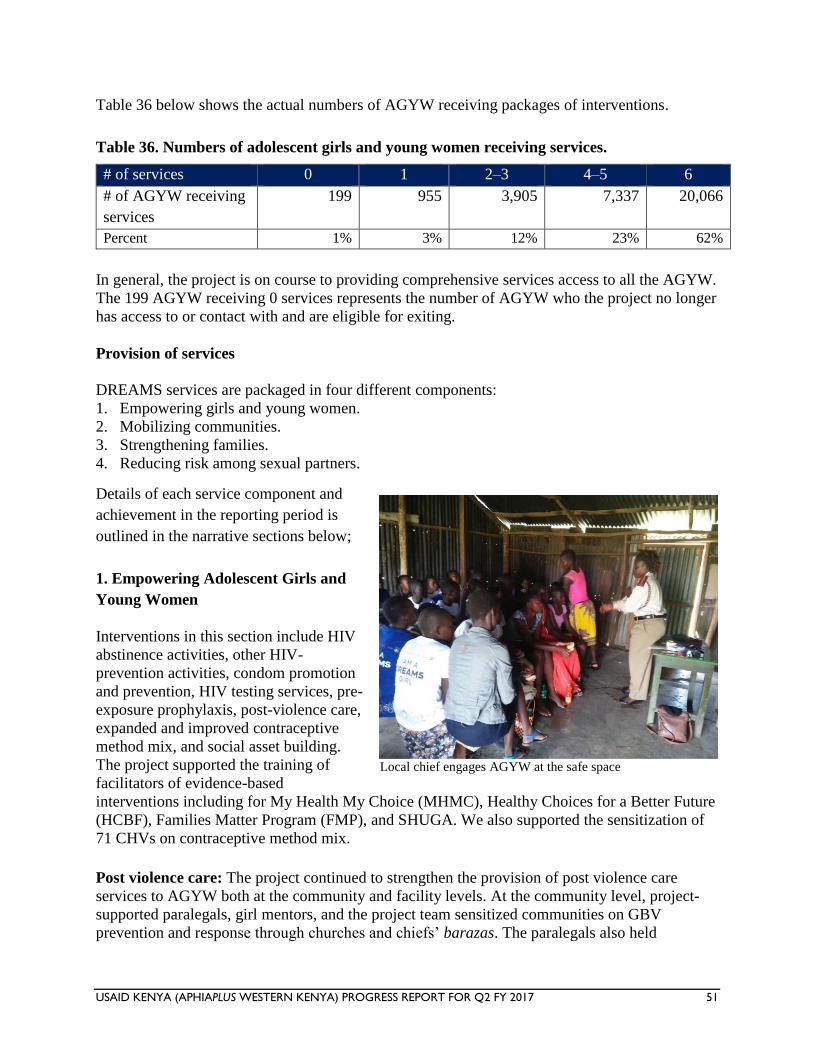
USAID KENYA (APHIAPLUS WESTERN KENYA) PROGRESS REPORT FOR Q2 FY 2017 51
Table 36 below shows the actual numbers of AGYW receiving packages of interventions.
Table 36. Numbers of adolescent girls and young women receiving services.
# of services 0 1 2–3 4–5 6
# of AGYW receiving
services
199
955
3,905
7,337
20,066
Percent 1% 3% 12% 23% 62%
In general, the project is on course to providing comprehensive services access to all the AGYW.
The 199 AGYW receiving 0 services represents the number of AGYW who the project no longer
has access to or contact with and are eligible for exiting.
Provision of services
DREAMS services are packaged in four different components:
1. Empowering girls and young women.
2. Mobilizing communities.
3. Strengthening families.
4. Reducing risk among sexual partners.
Details of each service component and
achievement in the reporting period is
outlined in the narrative sections below;
1. Empowering Adolescent Girls and
Young Women
Interventions in this section include HIV
abstinence activities, other HIV-
prevention activities, condom promotion
and prevention, HIV testing services, pre-
exposure prophylaxis, post-violence care,
expanded and improved contraceptive
method mix, and social asset building.
The project supported the training of
facilitators of evidence-based
interventions including for My Health My Choice (MHMC), Healthy Choices for a Better Future
(HCBF), Families Matter Program (FMP), and SHUGA. We also supported the sensitization of
71 CHVs on contraceptive method mix.
Post violence care: The project continued to strengthen the provision of post violence care
services to AGYW both at the community and facility levels. At the community level, project-
supported paralegals, girl mentors, and the project team sensitized communities on GBV
prevention and response through churches and chiefs’ barazas. The paralegals also held
Local chief engages AGYW at the safe space
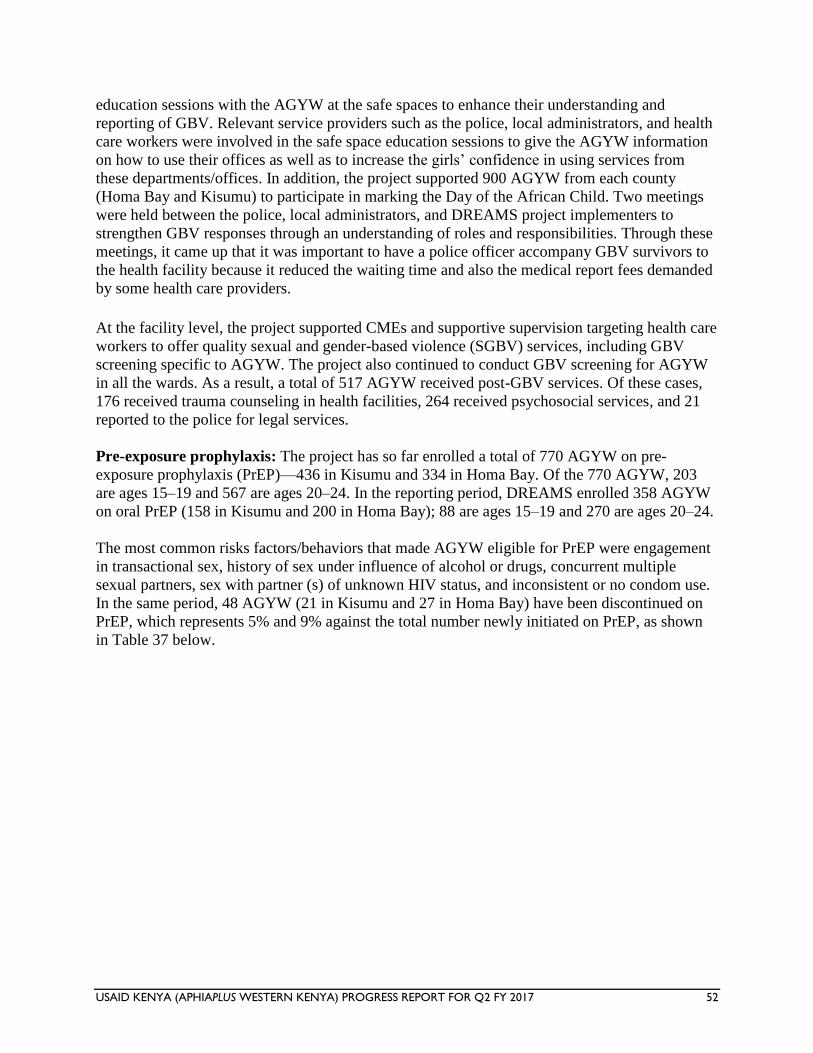
USAID KENYA (APHIAPLUS WESTERN KENYA) PROGRESS REPORT FOR Q2 FY 2017 52
education sessions with the AGYW at the safe spaces to enhance their understanding and
reporting of GBV. Relevant service providers such as the police, local administrators, and health
care workers were involved in the safe space education sessions to give the AGYW information
on how to use their offices as well as to increase the girls’ confidence in using services from
these departments/offices. In addition, the project supported 900 AGYW from each county
(Homa Bay and Kisumu) to participate in marking the Day of the African Child. Two meetings
were held between the police, local administrators, and DREAMS project implementers to
strengthen GBV responses through an understanding of roles and responsibilities. Through these
meetings, it came up that it was important to have a police officer accompany GBV survivors to
the health facility because it reduced the waiting time and also the medical report fees demanded
by some health care providers.
At the facility level, the project supported CMEs and supportive supervision targeting health care
workers to offer quality sexual and gender-based violence (SGBV) services, including GBV
screening specific to AGYW. The project also continued to conduct GBV screening for AGYW
in all the wards. As a result, a total of 517 AGYW received post-GBV services. Of these cases,
176 received trauma counseling in health facilities, 264 received psychosocial services, and 21
reported to the police for legal services.
Pre-exposure prophylaxis: The project has so far enrolled a total of 770 AGYW on pre-
exposure prophylaxis (PrEP)—436 in Kisumu and 334 in Homa Bay. Of the 770 AGYW, 203
are ages 15–19 and 567 are ages 20–24. In the reporting period, DREAMS enrolled 358 AGYW
on oral PrEP (158 in Kisumu and 200 in Homa Bay); 88 are ages 15–19 and 270 are ages 20–24.
The most common risks factors/behaviors that made AGYW eligible for PrEP were engagement
in transactional sex, history of sex under influence of alcohol or drugs, concurrent multiple
sexual partners, sex with partner (s) of unknown HIV status, and inconsistent or no condom use.
In the same period, 48 AGYW (21 in Kisumu and 27 in Homa Bay) have been discontinued on
PrEP, which represents 5% and 9% against the total number newly initiated on PrEP, as shown
in Table 37 below.
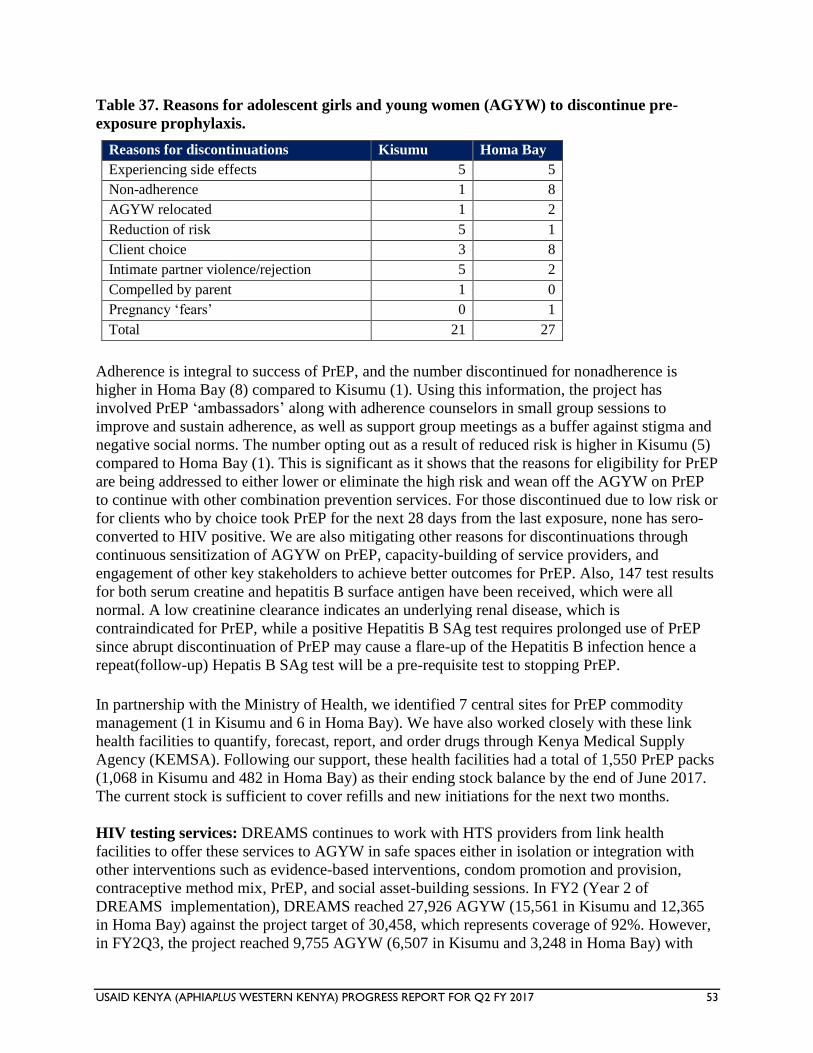
USAID KENYA (APHIAPLUS WESTERN KENYA) PROGRESS REPORT FOR Q2 FY 2017 53
Table 37. Reasons for adolescent girls and young women (AGYW) to discontinue pre-
exposure prophylaxis.
Reasons for discontinuations Kisumu Homa Bay
Experiencing side effects 5 5
Non-adherence 1 8
AGYW relocated 1 2
Reduction of risk 5 1
Client choice 3 8
Intimate partner violence/rejection 5 2
Compelled by parent 1 0
Pregnancy ‘fears’ 0 1
Total 21 27
Adherence is integral to success of PrEP, and the number discontinued for nonadherence is
higher in Homa Bay (8) compared to Kisumu (1). Using this information, the project has
involved PrEP ‘ambassadors’ along with adherence counselors in small group sessions to
improve and sustain adherence, as well as support group meetings as a buffer against stigma and
negative social norms. The number opting out as a result of reduced risk is higher in Kisumu (5)
compared to Homa Bay (1). This is significant as it shows that the reasons for eligibility for PrEP
are being addressed to either lower or eliminate the high risk and wean off the AGYW on PrEP
to continue with other combination prevention services. For those discontinued due to low risk or
for clients who by choice took PrEP for the next 28 days from the last exposure, none has sero-
converted to HIV positive. We are also mitigating other reasons for discontinuations through
continuous sensitization of AGYW on PrEP, capacity-building of service providers, and
engagement of other key stakeholders to achieve better outcomes for PrEP. Also, 147 test results
for both serum creatine and hepatitis B surface antigen have been received, which were all
normal. A low creatinine clearance indicates an underlying renal disease, which is
contraindicated for PrEP, while a positive Hepatitis B SAg test requires prolonged use of PrEP
since abrupt discontinuation of PrEP may cause a flare-up of the Hepatitis B infection hence a
repeat(follow-up) Hepatis B SAg test will be a pre-requisite test to stopping PrEP.
In partnership with the Ministry of Health, we identified 7 central sites for PrEP commodity
management (1 in Kisumu and 6 in Homa Bay). We have also worked closely with these link
health facilities to quantify, forecast, report, and order drugs through Kenya Medical Supply
Agency (KEMSA). Following our support, these health facilities had a total of 1,550 PrEP packs
(1,068 in Kisumu and 482 in Homa Bay) as their ending stock balance by the end of June 2017.
The current stock is sufficient to cover refills and new initiations for the next two months.
HIV testing services: DREAMS continues to work with HTS providers from link health
facilities to offer these services to AGYW in safe spaces either in isolation or integration with
other interventions such as evidence-based interventions, condom promotion and provision,
contraceptive method mix, PrEP, and social asset-building sessions. In FY2 (Year 2 of
DREAMS implementation), DREAMS reached 27,926 AGYW (15,561 in Kisumu and 12,365
in Homa Bay) against the project target of 30,458, which represents coverage of 92%. However,
in FY2Q3, the project reached 9,755 AGYW (6,507 in Kisumu and 3,248 in Homa Bay) with
USAID KENYA (APHIAPLUS WESTERN KENYA) PROGRESS REPORT FOR Q2 FY 2017 54
HTS; this includes 1,466 AGYW ages 10–14 years, 4,545 ages 15–19 years, and 3,744 ages 20–
24 years. Of those tested in this quarter, 49 AGYW (28 in Kisumu and 21 in Homa Bay) were
new HIV positives and a total of 16 enrolled into treatment with unique patient numbers. In
addition, the project is working closely with AGYW, mentors, HTS providers and other health
care workers to complete linkage to care and treatment.
Condom promotion and provision (CPP): The DREAMS project rides on several interventions
and opportunities to provide comprehensive condom education and access to AGYW. These
include EBIs, HTS, PrEP, STI screening, and condom promotion and distribution sessions only
at safe spaces. In FY2, the project facilitated 14,782 AGYW (8,052 in Kisumu and 6,730 in
Homa Bay) with condom promotion and provision. However, in FY2Q3, 8,453 AGYW (5,292 in
Kisumu and 3,161 in Homa Bay) were reached with the same services; this includes 126 AGYW
ages 10–14 years, 4,134 ages 15–19 years, and 4,193 ages 20–24 years. For those who opt to
take up contraceptives (ages 15–24 years), referrals are done to link health facilities for
individual counseling and provision of contraceptives. The project continues to help AGYW
appreciate the value of condoms in both HIV and STI prevention.
Contraceptive method mix (CMM): In FY2, 12,606 AGYW (7,633 in Kisumu and 4,973 in
Homa Bay) were reached with contraceptive method mix education. For FY2Q3, 7,881 AGYW
(4,547 in Kisumu and 3,334 in Homa Bay) have been reached with the same intervention; this
includes 138 ages 10–14 years, 3,817 ages 15–19 years, and 3,926 ages 20–24 years. The project
continues to work with sexual and reproductive health officers from MOH and other partners in
the same sector to provide individual counseling and contraceptives for AGYW ages 15–24
years who request them either at safe spaces or through referrals to link health facilities.
However, it has been observed that AGYW generally find safe spaces to be a friendlier venue in
which to interact with HCWs and receive contraceptives compared to health facilities.
2. Mobilizing Communities and Norms Change
This category of interventions seeks to educate girls and young women and men, as well as to
mobilize communities, and includes norms change and school-based HIV and violence
prevention.
The interventions aim to ensure that AGYW have access to community resources and persons,
and also that gender education is facilitated amongst the population to make girls live in a safe
and respectful environment.
Evidence-based interventions: The project continued to implement EBIs including My Health
My Choice (MHMC) and Healthy Choices for a Better Future (HCBF). SHUGA 2 was generally
implemented at the safe spaces. Working under the auspices of the Ministry of Education, the
project worked with schools to reach 3,451 AGYW in Kisumu and 13,178 in Homa Bay.
A total of 2,996 individuals were reached through SASA! for violence and HIV prevention.
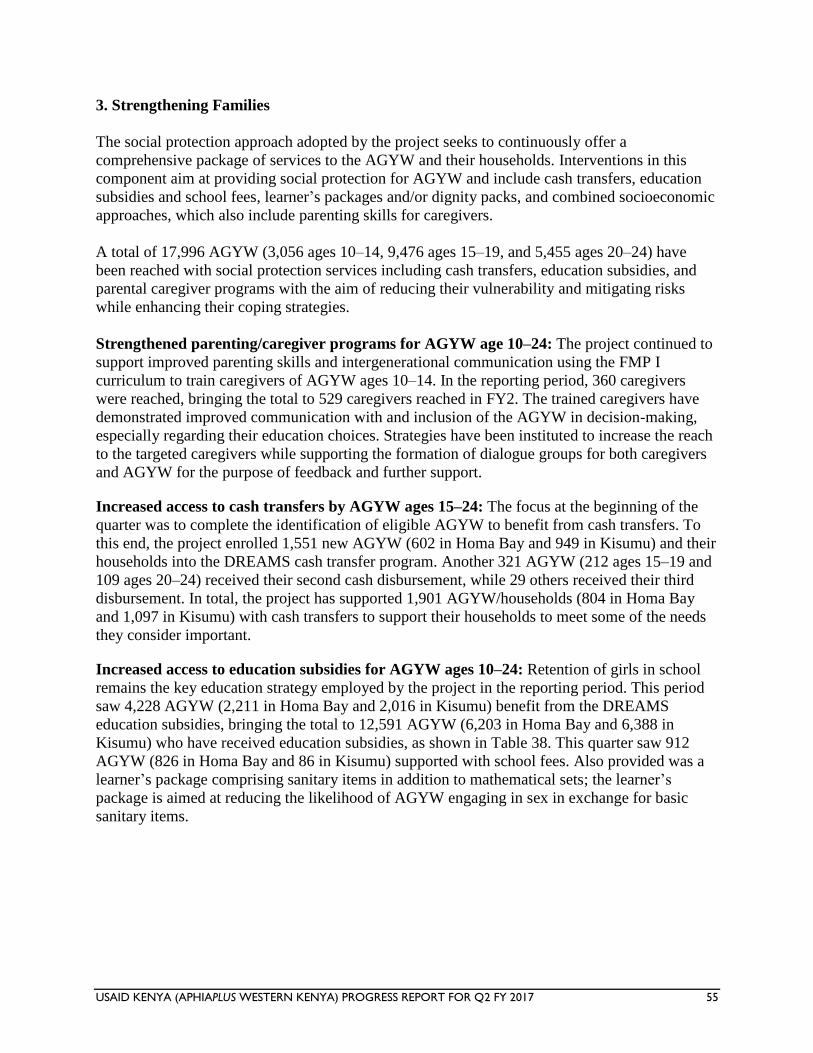
USAID KENYA (APHIAPLUS WESTERN KENYA) PROGRESS REPORT FOR Q2 FY 2017 55
3. Strengthening Families
The social protection approach adopted by the project seeks to continuously offer a
comprehensive package of services to the AGYW and their households. Interventions in this
component aim at providing social protection for AGYW and include cash transfers, education
subsidies and school fees, learner’s packages and/or dignity packs, and combined socioeconomic
approaches, which also include parenting skills for caregivers.
A total of 17,996 AGYW (3,056 ages 10–14, 9,476 ages 15–19, and 5,455 ages 20–24) have
been reached with social protection services including cash transfers, education subsidies, and
parental caregiver programs with the aim of reducing their vulnerability and mitigating risks
while enhancing their coping strategies.
Strengthened parenting/caregiver programs for AGYW age 10–24: The project continued to
support improved parenting skills and intergenerational communication using the FMP I
curriculum to train caregivers of AGYW ages 10–14. In the reporting period, 360 caregivers
were reached, bringing the total to 529 caregivers reached in FY2. The trained caregivers have
demonstrated improved communication with and inclusion of the AGYW in decision-making,
especially regarding their education choices. Strategies have been instituted to increase the reach
to the targeted caregivers while supporting the formation of dialogue groups for both caregivers
and AGYW for the purpose of feedback and further support.
Increased access to cash transfers by AGYW ages 15–24: The focus at the beginning of the
quarter was to complete the identification of eligible AGYW to benefit from cash transfers. To
this end, the project enrolled 1,551 new AGYW (602 in Homa Bay and 949 in Kisumu) and their
households into the DREAMS cash transfer program. Another 321 AGYW (212 ages 15–19 and
109 ages 20–24) received their second cash disbursement, while 29 others received their third
disbursement. In total, the project has supported 1,901 AGYW/households (804 in Homa Bay
and 1,097 in Kisumu) with cash transfers to support their households to meet some of the needs
they consider important.
Increased access to education subsidies for AGYW ages 10–24: Retention of girls in school
remains the key education strategy employed by the project in the reporting period. This period
saw 4,228 AGYW (2,211 in Homa Bay and 2,016 in Kisumu) benefit from the DREAMS
education subsidies, bringing the total to 12,591 AGYW (6,203 in Homa Bay and 6,388 in
Kisumu) who have received education subsidies, as shown in Table 38. This quarter saw 912
AGYW (826 in Homa Bay and 86 in Kisumu) supported with school fees. Also provided was a
learner’s package comprising sanitary items in addition to mathematical sets; the learner’s
package is aimed at reducing the likelihood of AGYW engaging in sex in exchange for basic
sanitary items.
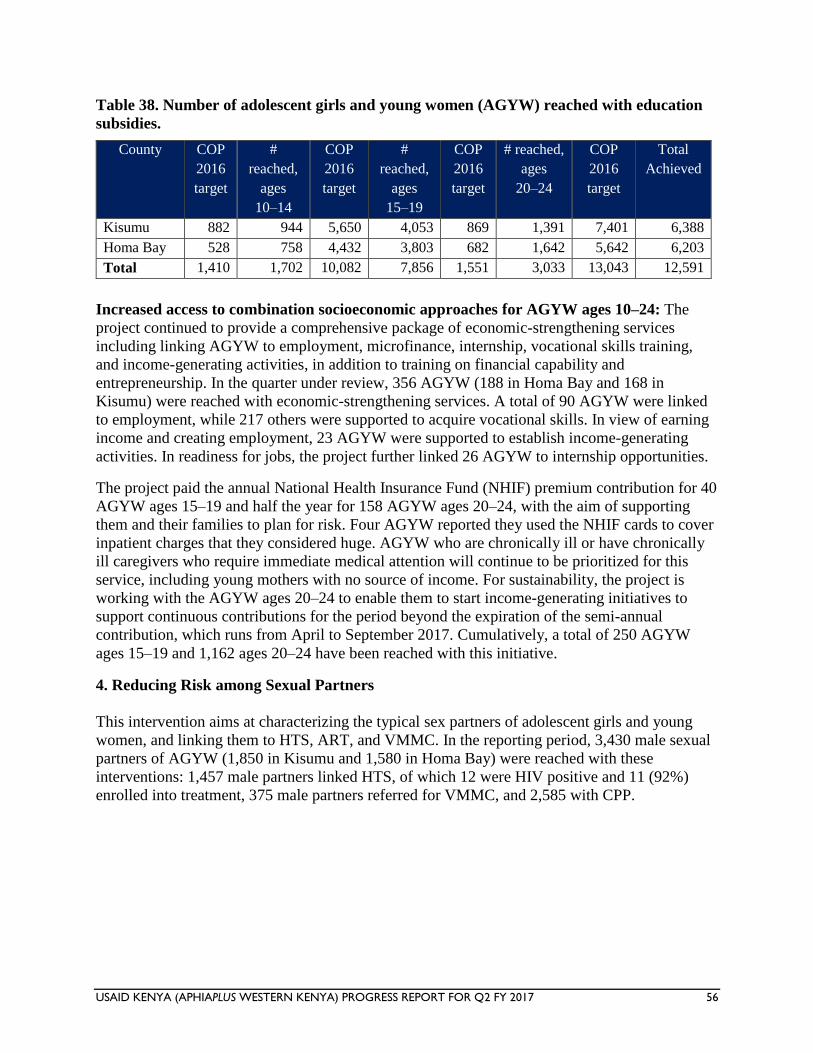
USAID KENYA (APHIAPLUS WESTERN KENYA) PROGRESS REPORT FOR Q2 FY 2017 56
Table 38. Number of adolescent girls and young women (AGYW) reached with education
subsidies.
County COP
2016
target
#
reached,
ages
10–14
COP
2016
target
#
reached,
ages
15–19
COP
2016
target
# reached,
ages
20–24
COP
2016
target
Total
Achieved
Kisumu 882 944 5,650 4,053 869 1,391 7,401 6,388
Homa Bay 528 758 4,432 3,803 682 1,642 5,642 6,203
Total 1,410 1,702 10,082 7,856 1,551 3,033 13,043 12,591
Increased access to combination socioeconomic approaches for AGYW ages 10–24: The
project continued to provide a comprehensive package of economic-strengthening services
including linking AGYW to employment, microfinance, internship, vocational skills training,
and income-generating activities, in addition to training on financial capability and
entrepreneurship. In the quarter under review, 356 AGYW (188 in Homa Bay and 168 in
Kisumu) were reached with economic-strengthening services. A total of 90 AGYW were linked
to employment, while 217 others were supported to acquire vocational skills. In view of earning
income and creating employment, 23 AGYW were supported to establish income-generating
activities. In readiness for jobs, the project further linked 26 AGYW to internship opportunities.
The project paid the annual National Health Insurance Fund (NHIF) premium contribution for 40
AGYW ages 15–19 and half the year for 158 AGYW ages 20–24, with the aim of supporting
them and their families to plan for risk. Four AGYW reported they used the NHIF cards to cover
inpatient charges that they considered huge. AGYW who are chronically ill or have chronically
ill caregivers who require immediate medical attention will continue to be prioritized for this
service, including young mothers with no source of income. For sustainability, the project is
working with the AGYW ages 20–24 to enable them to start income-generating initiatives to
support continuous contributions for the period beyond the expiration of the semi-annual
contribution, which runs from April to September 2017. Cumulatively, a total of 250 AGYW
ages 15–19 and 1,162 ages 20–24 have been reached with this initiative.
4. Reducing Risk among Sexual Partners
This intervention aims at characterizing the typical sex partners of adolescent girls and young
women, and linking them to HTS, ART, and VMMC. In the reporting period, 3,430 male sexual
partners of AGYW (1,850 in Kisumu and 1,580 in Homa Bay) were reached with these
interventions: 1,457 male partners linked HTS, of which 12 were HIV positive and 11 (92%)
enrolled into treatment, 375 male partners referred for VMMC, and 2,585 with CPP.
USAID KENYA (APHIAPLUS WESTERN KENYA) PROGRESS REPORT FOR Q2 FY 2017 57
Services for orphans and vulnerable children The project continued to implement activities at county, community, household, and child level
to support child outcomes. The areas of focus included HIV testing, counseling, and linkage;
nutrition; education; protection; psychosocial support; and household economic strengthening
(HES). The capacity of the 76 implementing community-based organizations (CBOs) was
strengthened for quality services and data management. At the county level, the project
continued to work with Department of Child Services to strengthen the social service system for
care of orphans and vulnerable children (OVC) within the 10 project counties and expanded the
project’s engagement with other line ministries to include the Ministry of Education and the
Ministry of Agriculture. The project conducted transition meetings with various partners
including the incoming OVC partner. A handing-over report with key project products including
OVC data was shared with them to facilitate smooth transition and continued service provision
for OVC.
1. Increased access to health and social services for OVC and their families
The project has a COP target of 268,818 OVC, against which 230,936 OVC (85.9%) were served
in the reporting period, as shown in Table 39. Prioritized services included HIV testing,
nutritional support for children under 5, food supplementation for malnourished OVC in all age
cohorts, protection, psychosocial support, shelter, care, and household economic strengthening.
Of the 8,187 OVC who left the program in this quarter, 3,833 graduated,3 4,226 were
transferred,4 and 128 exited without graduation.5 Migori, Kisumu and Homa Bay were at 66%,
87%, and 69% achievement of OVC served against COP 2016 target, respectively, and
enrollment plans to recruit additional OVC were shared with the incoming partner to improve on
the number of OVC served.
3 Children and caregivers are deemed to be stable and no longer in urgent need of externally supported services.
4 Children and families have transitioned to other forms of support programs other than PEPFAR-funded OVC programs (could include other
donor-funded programs). 5 Children lost to follow up, aged out without a graduation plan from PEPFAR OVC program, re-located, or died.
USAID KENYA (APHIAPLUS WESTERN KENYA) PROGRESS REPORT FOR Q2 FY 2017 58
Table 39. Orphans and vulnerable children (OVC) served per county in Y7Q2.
County COP 2016
target
Y7Q2 active
OVC
Graduated Transferred Exit without
graduation
OVC
served
% served (vs.
COP target)
Bungoma 20,761 20,758 506 709 16 21,989 105.9%
Busia 15,800 20,279 307 366 9 20,961 132.7%
Homa Bay 80,681 54,386 494 623 38 55,541 68.8%
Kakamega 32,742 32,165 945 1,132 24 34,266 104.7%
Kisii 5,270 4,704 48 32 1 4,785 90.8%
Kisumu 38,544 32,444 629 530 11 33,614 87.2%
Migori 40,780 26,050 419 263 14 26,746 65.6%
Nyamira 3,506 3,501 71 90 4 3,666 104.6%
Siaya 23,165 20,920 124 307 7 21,358 92.2%
Vihiga 7,569 7,542 290 174 4 8,010 105.8%
Overall 268,818 222,749 3,833 4,226 128 230,936 85.9%
Source: OVC longitudinal management information system (OLMIS) June 2017.
Table 40. Trend in orphans and vulnerable children (OVC) served.
OVC services Y6Q1 Y6Q2 Y6Q3 Y6Q4 Y7Q1 Y7Q2
Number of OVC active
within period
195,854 189,681 181,991 177,435 220,536 222,749
Number of OVC served 192,162 185,065 165,253 163,254 227,883 230,936
Percent served 98% 98% 91% 92%
Source: OVC longitudinal management information system (OLMIS) June 2017.
In the first two quarters of Year 7, the project notably served 100% of the OVC enrolled in the
program, as shown in Table 40 above. This was made possible as the project embraced case
management planning that extended caregiver involvement, contributions, and enabled effective
delivery of prioritized OVC needs.
Figure 10 shows the types of services provided to the OVC. Details of the specific services are
explained under the subsequent sections of the report.
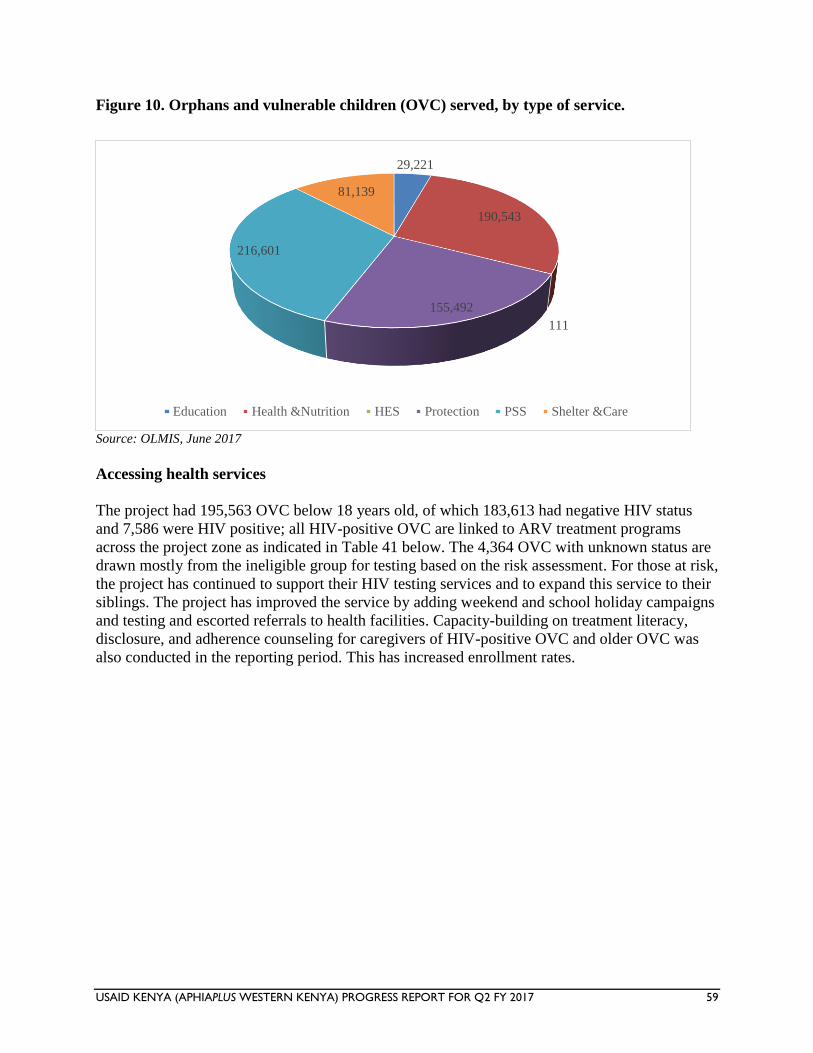
USAID KENYA (APHIAPLUS WESTERN KENYA) PROGRESS REPORT FOR Q2 FY 2017 59
Figure 10. Orphans and vulnerable children (OVC) served, by type of service.
Source: OLMIS, June 2017
Accessing health services
The project had 195,563 OVC below 18 years old, of which 183,613 had negative HIV status
and 7,586 were HIV positive; all HIV-positive OVC are linked to ARV treatment programs
across the project zone as indicated in Table 41 below. The 4,364 OVC with unknown status are
drawn mostly from the ineligible group for testing based on the risk assessment. For those at risk,
the project has continued to support their HIV testing services and to expand this service to their
siblings. The project has improved the service by adding weekend and school holiday campaigns
and testing and escorted referrals to health facilities. Capacity-building on treatment literacy,
disclosure, and adherence counseling for caregivers of HIV-positive OVC and older OVC was
also conducted in the reporting period. This has increased enrollment rates.
29,221
190,543
111
155,492
216,601
81,139
Education Health &Nutrition HES Protection PSS Shelter &Care
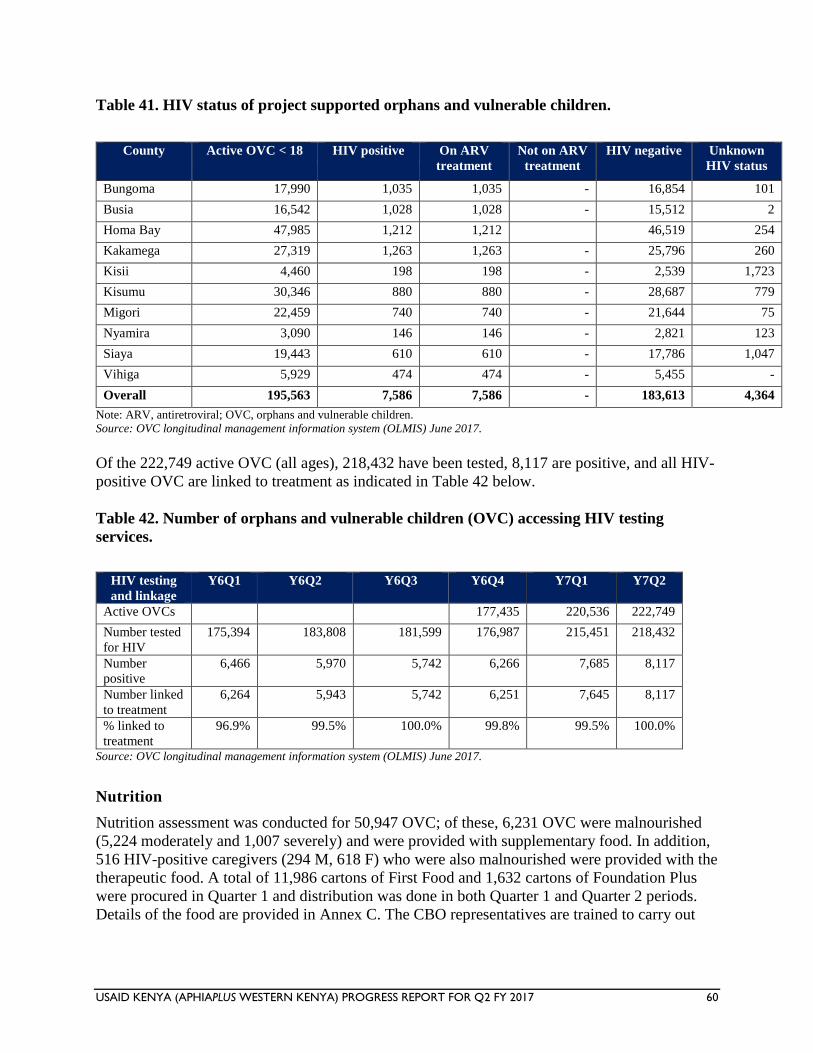
USAID KENYA (APHIAPLUS WESTERN KENYA) PROGRESS REPORT FOR Q2 FY 2017 60
Table 41. HIV status of project supported orphans and vulnerable children.
County Active OVC < 18 HIV positive On ARV
treatment
Not on ARV
treatment
HIV negative Unknown
HIV status
Bungoma 17,990 1,035 1,035 - 16,854 101
Busia 16,542 1,028 1,028 - 15,512 2
Homa Bay 47,985 1,212 1,212
46,519 254
Kakamega 27,319 1,263 1,263 - 25,796 260
Kisii 4,460 198 198 - 2,539 1,723
Kisumu 30,346 880 880 - 28,687 779
Migori 22,459 740 740 - 21,644 75
Nyamira 3,090 146 146 - 2,821 123
Siaya 19,443 610 610 - 17,786 1,047
Vihiga 5,929 474 474 - 5,455 -
Overall 195,563 7,586 7,586 - 183,613 4,364
Note: ARV, antiretroviral; OVC, orphans and vulnerable children.
Source: OVC longitudinal management information system (OLMIS) June 2017.
Of the 222,749 active OVC (all ages), 218,432 have been tested, 8,117 are positive, and all HIV-
positive OVC are linked to treatment as indicated in Table 42 below.
Table 42. Number of orphans and vulnerable children (OVC) accessing HIV testing
services.
HIV testing
and linkage
Y6Q1 Y6Q2 Y6Q3 Y6Q4 Y7Q1 Y7Q2
Active OVCs
177,435 220,536 222,749
Number tested
for HIV
175,394 183,808 181,599 176,987 215,451 218,432
Number
positive
6,466 5,970 5,742 6,266 7,685 8,117
Number linked
to treatment
6,264 5,943 5,742 6,251 7,645 8,117
% linked to
treatment
96.9% 99.5% 100.0% 99.8% 99.5% 100.0%
Source: OVC longitudinal management information system (OLMIS) June 2017.
Nutrition
Nutrition assessment was conducted for 50,947 OVC; of these, 6,231 OVC were malnourished
(5,224 moderately and 1,007 severely) and were provided with supplementary food. In addition,
516 HIV-positive caregivers (294 M, 618 F) who were also malnourished were provided with the
therapeutic food. A total of 11,986 cartons of First Food and 1,632 cartons of Foundation Plus
were procured in Quarter 1 and distribution was done in both Quarter 1 and Quarter 2 periods.
Details of the food are provided in Annex C. The CBO representatives are trained to carry out
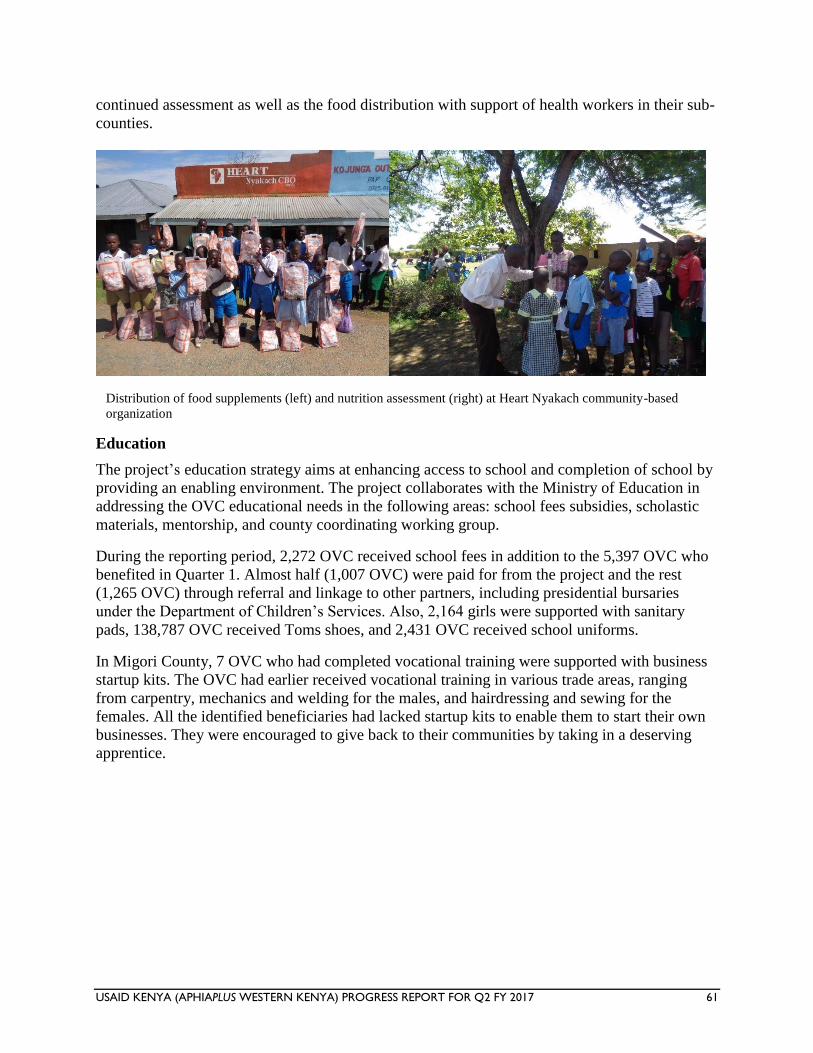
USAID KENYA (APHIAPLUS WESTERN KENYA) PROGRESS REPORT FOR Q2 FY 2017 61
continued assessment as well as the food distribution with support of health workers in their sub-
counties.
Education
The project’s education strategy aims at enhancing access to school and completion of school by
providing an enabling environment. The project collaborates with the Ministry of Education in
addressing the OVC educational needs in the following areas: school fees subsidies, scholastic
materials, mentorship, and county coordinating working group.
During the reporting period, 2,272 OVC received school fees in addition to the 5,397 OVC who
benefited in Quarter 1. Almost half (1,007 OVC) were paid for from the project and the rest
(1,265 OVC) through referral and linkage to other partners, including presidential bursaries
under the Department of Children’s Services. Also, 2,164 girls were supported with sanitary
pads, 138,787 OVC received Toms shoes, and 2,431 OVC received school uniforms.
In Migori County, 7 OVC who had completed vocational training were supported with business
startup kits. The OVC had earlier received vocational training in various trade areas, ranging
from carpentry, mechanics and welding for the males, and hairdressing and sewing for the
females. All the identified beneficiaries had lacked startup kits to enable them to start their own
businesses. They were encouraged to give back to their communities by taking in a deserving
apprentice.
Distribution of food supplements (left) and nutrition assessment (right) at Heart Nyakach community-based
organization
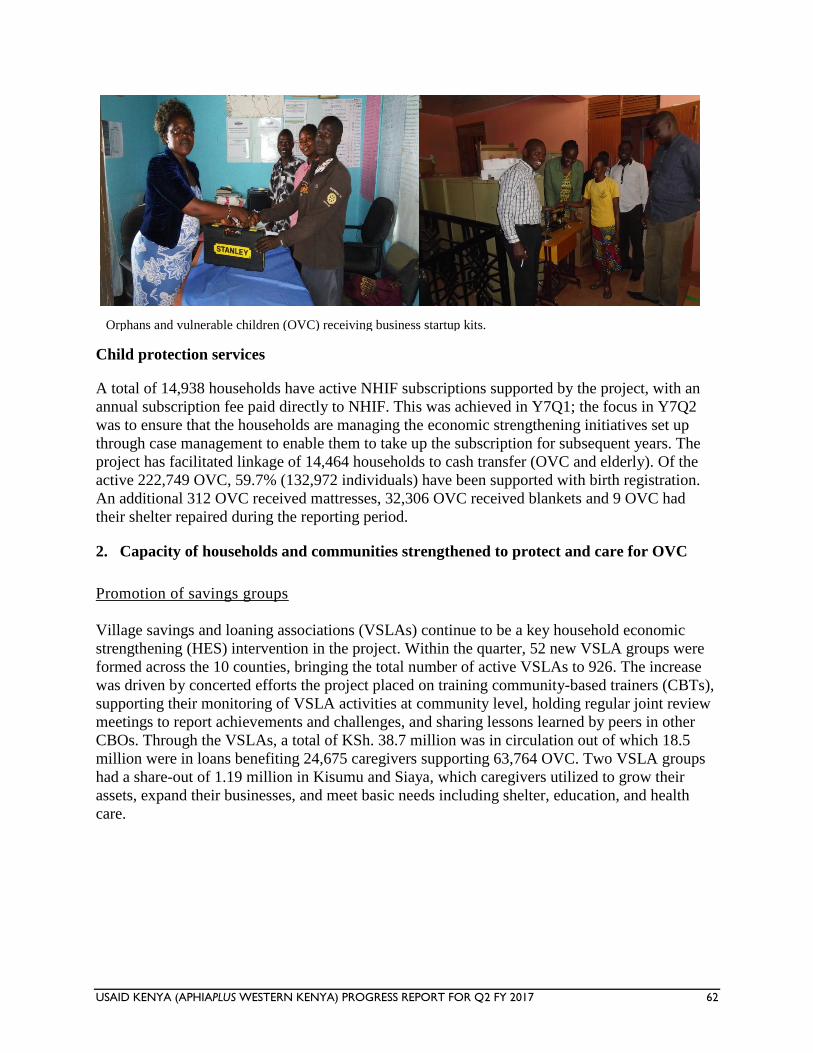
USAID KENYA (APHIAPLUS WESTERN KENYA) PROGRESS REPORT FOR Q2 FY 2017 62
Child protection services
A total of 14,938 households have active NHIF subscriptions supported by the project, with an
annual subscription fee paid directly to NHIF. This was achieved in Y7Q1; the focus in Y7Q2
was to ensure that the households are managing the economic strengthening initiatives set up
through case management to enable them to take up the subscription for subsequent years. The
project has facilitated linkage of 14,464 households to cash transfer (OVC and elderly). Of the
active 222,749 OVC, 59.7% (132,972 individuals) have been supported with birth registration.
An additional 312 OVC received mattresses, 32,306 OVC received blankets and 9 OVC had
their shelter repaired during the reporting period.
2. Capacity of households and communities strengthened to protect and care for OVC
Promotion of savings groups
Village savings and loaning associations (VSLAs) continue to be a key household economic
strengthening (HES) intervention in the project. Within the quarter, 52 new VSLA groups were
formed across the 10 counties, bringing the total number of active VSLAs to 926. The increase
was driven by concerted efforts the project placed on training community-based trainers (CBTs),
supporting their monitoring of VSLA activities at community level, holding regular joint review
meetings to report achievements and challenges, and sharing lessons learned by peers in other
CBOs. Through the VSLAs, a total of KSh. 38.7 million was in circulation out of which 18.5
million were in loans benefiting 24,675 caregivers supporting 63,764 OVC. Two VSLA groups
had a share-out of 1.19 million in Kisumu and Siaya, which caregivers utilized to grow their
assets, expand their businesses, and meet basic needs including shelter, education, and health
care.
Orphans and vulnerable children (OVC) receiving business startup kits.
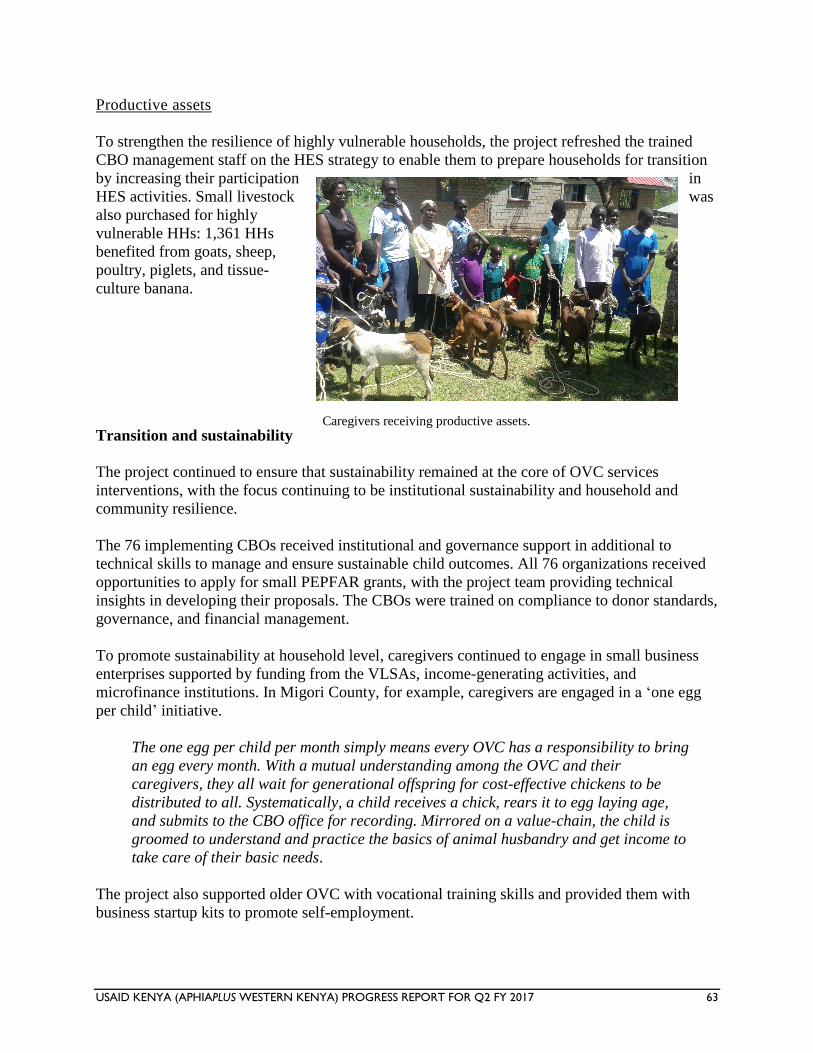
USAID KENYA (APHIAPLUS WESTERN KENYA) PROGRESS REPORT FOR Q2 FY 2017 63
Productive assets
To strengthen the resilience of highly vulnerable households, the project refreshed the trained
CBO management staff on the HES strategy to enable them to prepare households for transition
by increasing their participation in
HES activities. Small livestock was
also purchased for highly
vulnerable HHs: 1,361 HHs
benefited from goats, sheep,
poultry, piglets, and tissue-
culture banana.
Transition and sustainability
The project continued to ensure that sustainability remained at the core of OVC services
interventions, with the focus continuing to be institutional sustainability and household and
community resilience.
The 76 implementing CBOs received institutional and governance support in additional to
technical skills to manage and ensure sustainable child outcomes. All 76 organizations received
opportunities to apply for small PEPFAR grants, with the project team providing technical
insights in developing their proposals. The CBOs were trained on compliance to donor standards,
governance, and financial management.
To promote sustainability at household level, caregivers continued to engage in small business
enterprises supported by funding from the VLSAs, income-generating activities, and
microfinance institutions. In Migori County, for example, caregivers are engaged in a ‘one egg
per child’ initiative.
The one egg per child per month simply means every OVC has a responsibility to bring
an egg every month. With a mutual understanding among the OVC and their
caregivers, they all wait for generational offspring for cost-effective chickens to be
distributed to all. Systematically, a child receives a chick, rears it to egg laying age,
and submits to the CBO office for recording. Mirrored on a value-chain, the child is
groomed to understand and practice the basics of animal husbandry and get income to
take care of their basic needs.
The project also supported older OVC with vocational training skills and provided them with
business startup kits to promote self-employment.
Caregivers receiving productive assets.
USAID KENYA (APHIAPLUS WESTERN KENYA) PROGRESS REPORT FOR Q2 FY 2017 64
In addition, all the CBOs were introduced to the incoming partner and a transition plan was
shared with them for OVC needing program support to be sure that the support is continued.
A total of 1,234 households supporting 3,833 OVC transitioned from project support through
graduation.
Linkage to microfinance institutions
Within the quarter, 502 households were reported as linked to microfinance institutions (MFIs)
with a direct purpose of enabling them acquire capital to build their asset base for their business.
MFIs like One Acre Fund, Nuru, and Development in Gardening (DiG) have over the years
come in handy to train caregiver support groups on business skills, after which they offer group-
guaranteed loans to enable loanees start their own small businesses. The MFIs are instrumental
in monitoring and supporting the caregivers to make progress in their business ventures.
3. Strengthened child welfare and protection systems at county level, and improved
structures and services for effective responses in targeted counties
Partnership with the Department of Children Services, Ministry of Education, Civil Registrar,
and the Ministry of Agriculture continued in the quarter in support of birth registration, linkage
to cash transfer, and Constituency Development Fund bursaries for school fees across the
counties. Groups of 500 caregivers who received small livestock and those carrying out small-
scale farming have been linked to the Ministry of Agriculture, Livestock and Fisheries for
continued advice and technical support. The project continued to build social capital in the
community, which is critical for sustainability.
Strengthening use of OLMIS
To support data quality at the CBO level and continuous mentorship of CBOs on the use of the
OVC longitudinal management information system (OLMIS), 47 data clerks recruited in 2016
were supported to conduct quarterly data quality assessments to ensure consistency of data from
household level to the OLMIS. The data clerks also conducted continuous capacity-building to
OVC desk people, lead community home visitors, and community health volunteers in the 76
CBOs.
USAID KENYA (APHIAPLUS WESTERN KENYA) PROGRESS REPORT FOR Q2 FY 2017 65
Subpurpose 2. Increased access to and utilization of malaria prevention and treatment services
Malaria prevention and treatment services
Linkage and coordination
In Y7Q2, the project continued to arrange for joint partner planning meetings. Three malaria
implementing partner (MIP) linkage and coordination meetings were successfully held, bringing
together A+, PSK, URC, MEASURE Evaluation PIMA, MalariaCare, Kenya Civil Society
Strengthening Program (KCSSP), Palladium (Tupime Kaunti).
During this quarter, the main milestone for the linkage was the review of the supportive
supervision (SS) tool, and bringing the CMCCs on board for the review of activities and joint
planning aimed at strengthening advocacy for the malaria work supported by USAID in the
region.
In collaboration with the other MIPs in the area, activities planned by the project, such as
supportive supervision, SHFs, and TWG meetings, continued to be jointly attended by other
USAID MIPs at county and sub-county levels.
During the meetings, it has been noted that the joint approach has many advantages, including
cost cutting, show of partnership, and reduced waste of time and duplication of service.
Malaria supportive supervision
The project supported all 10 counties (6 in Nyanza, 4 in Western), reaching a total of 75 sub-
counties (41 N, 34 W) and 430 RHFs (221 N, 209 W). As a result of this support, 1,970 HCWs
(1,069 N, 901 W) were provided on-the-job training and/or mentorship in malaria case
management, based on identified gaps in knowledge and skills.
Based on the supportive supervision tool being reviewed, the findings still indicate challenges
including high malaria positivity rates; irregularity in artemether-lumefantrine dosage schedule;
inadequate advocacy, communication, and social mobilization (ACSM) materials in a number of
facilities; and inconsistent availability of the outpatient tally sheets (MOH 705A and B). This
was strengthened through mentorship and on-the-job training during the review. Other corrective
measures put in place included holding feedback sessions with all staff so that individuals were
assigned the responsibility of making desired changes. The role of data in decision-making at the
local level was emphasized, as well as the need for HCWs to tabulate summary data at facility
levels to indicate trends. These findings have remained a challenge to the malaria programme for
some time now. The nurses’ strike during the quarter worsened the situation, making this support
incomplete.
The project made an effort to distribute the IEC materials as well as the current malaria
guidelines to most of the facilities.
The HCWs were urged to continue monitoring malaria trends in their respective areas by
charting findings and periodically alerting the sub-county malaria control coordinators on the
levels reached.
USAID KENYA (APHIAPLUS WESTERN KENYA) PROGRESS REPORT FOR Q2 FY 2017 66
To address the challenges, the project in consultation with Tupime Kaunti will work to support
data review meetings. The focus will be on gaps identified during supportive supervision visits
and recommendations for strengthening clinical skills through practice as recommended by the
technical working groups and the national malaria guidelines.
Malaria stakeholder forums at county and sub-county level
The project continued to support county and sub-county malaria stakeholder forums in 9 counties
(5 in Nyanza, 4 in Western) reaching a total of 29 sub-counties (9 Nyanza, 20 Western). The
forum, comprising representatives from the national malaria control program, KEMSA, and
other MIPs to contribute toward improving malaria performance indicators in the region. During
the meetings, each MIP is usually given time to present the project role, activities undertaken,
areas of operation, and planned activities for the next quarter.
The issues, gaps, and challenges that were identified were discussed and recommendations made
on how to solve them locally first. The project continued to follow up and address the identified
gaps with the respective partners in each region.
These meetings were well attended with the participation of 1,033 (310 Nyanza, 723 Western)
people in the region. Action plans were drawn and roles and responsibilities were outlined and
reviewed in subsequent meetings.
Malaria technical working group meetings
Malaria TWG meetings were held in 38 sub-counties (20 in Nyanza, 18 in Western) with 416
members (114 N, 302 W). The gaps identified during the supportive supervsion and stakeholders
forum were followed up by the TWGs, supported by the project.
Among other issues, the respective TWGs recommended that data collecting tools be made
available and improved, that KEMSA should always be attending the SHF to handle the
commodity component, and that KCSSP should look into this.
Malaria performance data review meetings
Performance data review meetings should be taken up as a serious component of the deliverables
after the exit of PIMA by its successor; A+ will be following this keenly as one of the key
linkage areas.
During the data review meetings in Q1, concerns were raised, including inadequate tools for data
collection, inaccurate or incomplete data, commodity stockouts, inadequate advocacy,
communication, and social mobilization (ACSM) materials, and utilization of the same data
source, among others. As a result of the identfied gaps, discussions/proposals have been made
for Palladium and/or the successor to PIMA to take over the support for this important
component of malaria management.
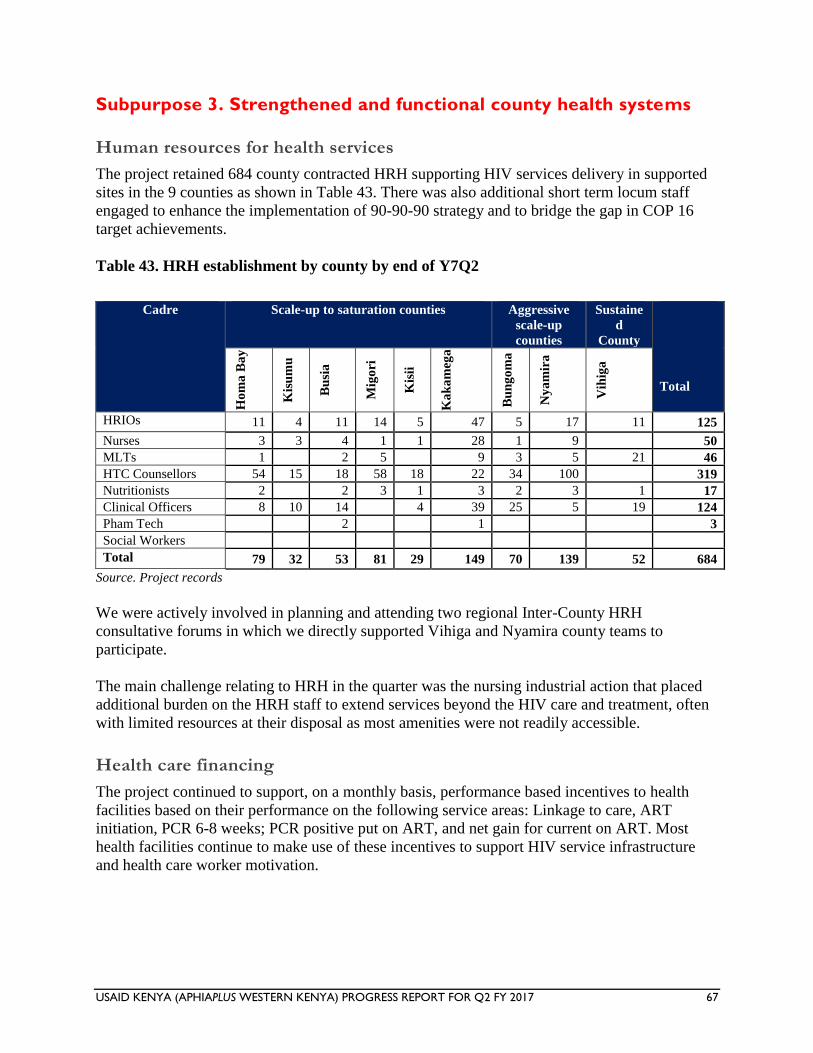
USAID KENYA (APHIAPLUS WESTERN KENYA) PROGRESS REPORT FOR Q2 FY 2017 67
Subpurpose 3. Strengthened and functional county health systems
Human resources for health services
The project retained 684 county contracted HRH supporting HIV services delivery in supported
sites in the 9 counties as shown in Table 43. There was also additional short term locum staff
engaged to enhance the implementation of 90-90-90 strategy and to bridge the gap in COP 16
target achievements.
Table 43. HRH establishment by county by end of Y7Q2
Cadre Scale-up to saturation counties Aggressive
scale-up
counties
Sustaine
d
County
Total
Ho
ma
Ba
y
Kis
um
u
Bu
sia
Mig
ori
Kis
ii
Ka
ka
meg
a
Bu
ng
om
a
Ny
am
ira
Vih
iga
HRIOs 11 4 11 14 5 47 5 17 11 125
Nurses 3 3 4 1 1 28 1 9 50
MLTs 1 2 5 9 3 5 21 46
HTC Counsellors 54 15 18 58 18 22 34 100 319
Nutritionists 2 2 3 1 3 2 3 1 17
Clinical Officers 8 10 14 4 39 25 5 19 124
Pham Tech 2 1 3
Social Workers
Total 79 32 53 81 29 149 70 139 52 684
Source. Project records
We were actively involved in planning and attending two regional Inter-County HRH
consultative forums in which we directly supported Vihiga and Nyamira county teams to
participate.
The main challenge relating to HRH in the quarter was the nursing industrial action that placed
additional burden on the HRH staff to extend services beyond the HIV care and treatment, often
with limited resources at their disposal as most amenities were not readily accessible.
Health care financing
The project continued to support, on a monthly basis, performance based incentives to health
facilities based on their performance on the following service areas: Linkage to care, ART
initiation, PCR 6-8 weeks; PCR positive put on ART, and net gain for current on ART. Most
health facilities continue to make use of these incentives to support HIV service infrastructure
and health care worker motivation.
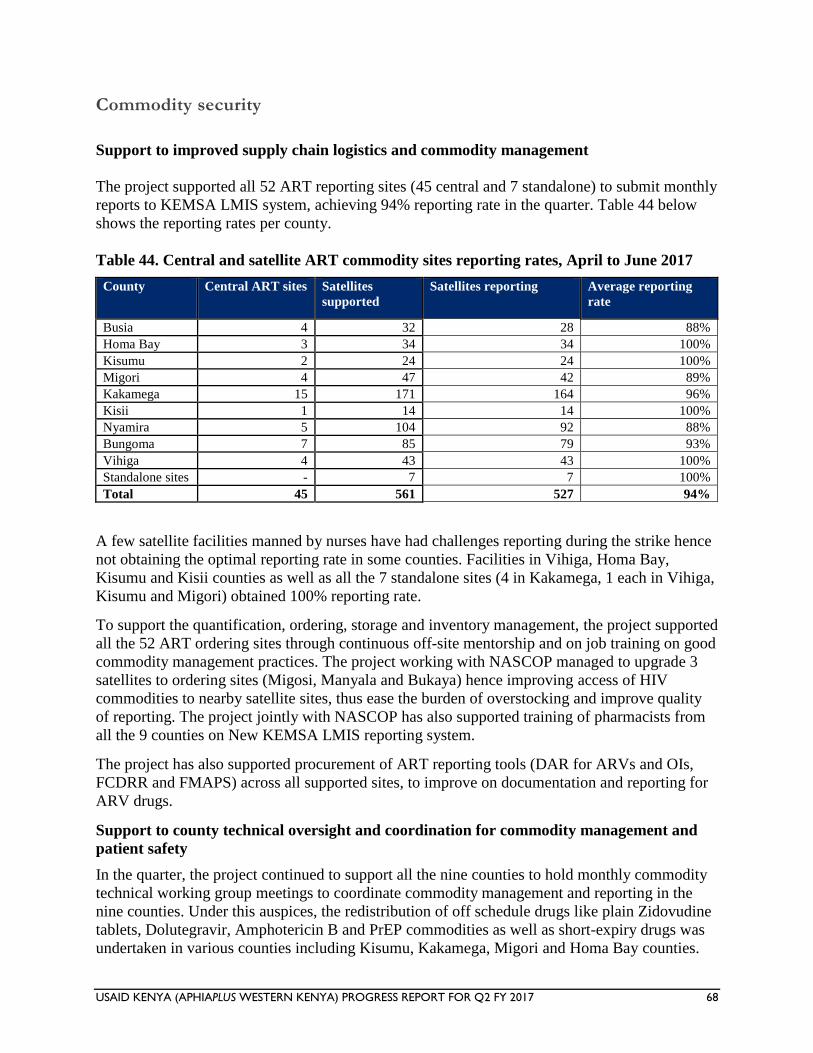
USAID KENYA (APHIAPLUS WESTERN KENYA) PROGRESS REPORT FOR Q2 FY 2017 68
Commodity security
Support to improved supply chain logistics and commodity management
The project supported all 52 ART reporting sites (45 central and 7 standalone) to submit monthly
reports to KEMSA LMIS system, achieving 94% reporting rate in the quarter. Table 44 below
shows the reporting rates per county.
Table 44. Central and satellite ART commodity sites reporting rates, April to June 2017
County Central ART sites Satellites
supported
Satellites reporting Average reporting
rate
Busia 4 32 28 88%
Homa Bay 3 34 34 100%
Kisumu 2 24 24 100%
Migori 4 47 42 89%
Kakamega 15 171 164 96%
Kisii 1 14 14 100%
Nyamira 5 104 92 88%
Bungoma 7 85 79 93%
Vihiga 4 43 43 100%
Standalone sites - 7 7 100%
Total 45 561 527 94%
A few satellite facilities manned by nurses have had challenges reporting during the strike hence
not obtaining the optimal reporting rate in some counties. Facilities in Vihiga, Homa Bay,
Kisumu and Kisii counties as well as all the 7 standalone sites (4 in Kakamega, 1 each in Vihiga,
Kisumu and Migori) obtained 100% reporting rate.
To support the quantification, ordering, storage and inventory management, the project supported
all the 52 ART ordering sites through continuous off-site mentorship and on job training on good
commodity management practices. The project working with NASCOP managed to upgrade 3
satellites to ordering sites (Migosi, Manyala and Bukaya) hence improving access of HIV
commodities to nearby satellite sites, thus ease the burden of overstocking and improve quality
of reporting. The project jointly with NASCOP has also supported training of pharmacists from
all the 9 counties on New KEMSA LMIS reporting system.
The project has also supported procurement of ART reporting tools (DAR for ARVs and OIs,
FCDRR and FMAPS) across all supported sites, to improve on documentation and reporting for
ARV drugs.
Support to county technical oversight and coordination for commodity management and
patient safety
In the quarter, the project continued to support all the nine counties to hold monthly commodity
technical working group meetings to coordinate commodity management and reporting in the
nine counties. Under this auspices, the redistribution of off schedule drugs like plain Zidovudine
tablets, Dolutegravir, Amphotericin B and PrEP commodities as well as short-expiry drugs was
undertaken in various counties including Kisumu, Kakamega, Migori and Homa Bay counties.
USAID KENYA (APHIAPLUS WESTERN KENYA) PROGRESS REPORT FOR Q2 FY 2017 69
The project provided support in carrying out of supportive supervisions at county and subcounty
levels to help in monitoring commodity management challenges at the health facilities. Identified
gaps were addressed through mentorship and on-job training, also aimed at strengthening
pharmacovigilance reporting among the healthcare workers.
The project continued to strengthen multi-disciplinary teams at facility levels to discuss
suspected treatment failures and continuous monitoring of adverse drug reactions in patients.
The project, working with CHAI conducted training on introduction of web-based ADT in all
reporting health facilities and supported the installation. The tool besides managing drug
inventory, patients’ records and dispensing, also has capability of generating current patients’
viral load from the NASCOP website.
Strategic monitoring and evaluation
During the reporting period, monitoring and evaluation (M&E) activities helped to strengthen
data management and reporting systems. M&E activities included mentorship to enhance the
capacities of project collaborators and MOH systems, including rollout of the revised HIV data
collection and reporting tools; data quality improvement; reporting at county, sub-county,
facility, and community levels; and strengthening of the OVC reporting process and use of the
OLMIS and DREAMS databases. The activities undertaken were in line with the M&E strategic
areas of implementation. Details on the strategic M&E activities are included in the performance
monitoring section.
II. ACTIVITY PROGRESS (QUANTITATIVE IMPACT)
Please refer to the performance data tables in the attachment.
III. CONSTRAINTS AND OPPORTUNITIES
The health care workers’ strike that continued into the reporting period affected service delivery
in project-supported health facilities and contributed to low performance in various indicators,
especially in the June 2017 period. The project will continue to take advantage of HRH staff
supported through the project to strengthen service delivery in health facilities.
IV. PERFORMANCE MONITORING
During the reporting period, the project continued to collaborate with the MOH at the county and
sub-county levels to provide support in addressing MOH reporting tools shortages in the nine
project-supported counties. The project supported photocopying and distribution of the blue
cards, daily activity registers, intensified case-finding cards, and appointment cards during the
reporting period. The support contributed to the availability of the reporting tools and to
improved updates of patient records and data quality at the facility level.
USAID KENYA (APHIAPLUS WESTERN KENYA) PROGRESS REPORT FOR Q2 FY 2017 70
Capacity-building of MOH systems, structures, and personnel on data collection and use
Strengthening health care worker capacity on reporting tools, indicators, and data use
The project continued to strengthen its support for onsite mentorship on health management
information system (HMIS) reporting tools across the nine supported counties. A total of 344
HCWs (40 in Vihiga, 12 in Kakamega, 12 in Homa Bay, 11 in Kisumu, 12 in Busia, 123 in
Bungoma, 103 in Nyamira, and 21 in Kisii) were mentored in the reporting period. This brings
the total to 1,550 HCWs mentored in the Y6Q4 through Y7Q2 period. The support targeted gaps
that were identified during SIMS visits, monthly data review meetings at project level, quarterly
data review meetings at the sub-county level, and routine DQA at site level. The focus was on
addressing reporting challenges in use of MOH 731, MOH 711, the daily activity register, the
ART register, the SGBV register, ANC register, and HEI cohort analysis.
Under the DREAMS initiative, the project continued to provide onsite mentorship on use of the
web-based system for all 34 supported administrative wards. The mentorship targeted mentors
and ward staff who engage with girls at the ward level on updating the service uptake forms.
Improving data quality
Facility data quality audit
In the reporting period, the project, in liaison with data clerks at the health facility level,
conducted DQAs in 121 project-supported high-volume health facilities during the months of
April to June 2017. The DQA built on previous similar audits that have been carried out by the
project since April 2014. These audits focus on comparison of data from source registers—
monthly reporting on MOH 731 and DHIS2 by facilities.
Generally, the results showed continued improvements in data consistency in the follow-up
period of April to June 2017 (see Table 45 below). These results were due to the project’s
continued onsite mentorship on the use of MOH 731 and to the support from data clerks assigned
to the high-volume health facilities. The project will continue to carry out DQAs to identify gaps
in data quality and to develop data quality improvement plans to address gaps.
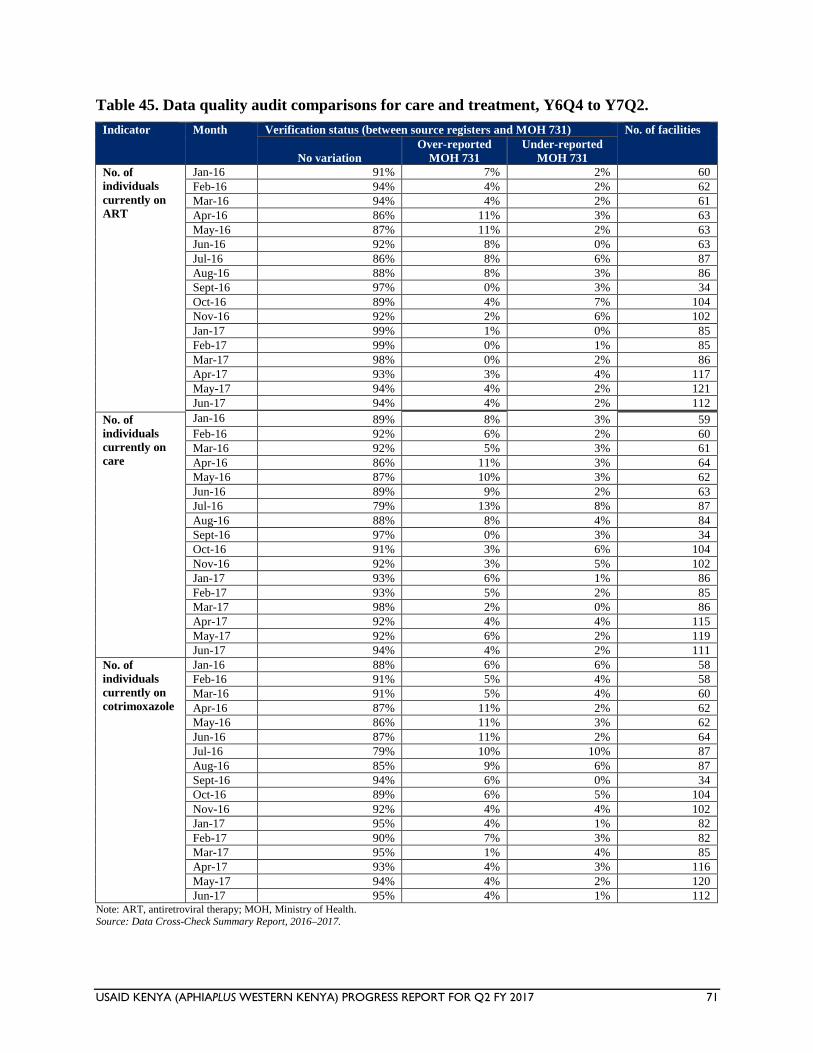
USAID KENYA (APHIAPLUS WESTERN KENYA) PROGRESS REPORT FOR Q2 FY 2017 71
Table 45. Data quality audit comparisons for care and treatment, Y6Q4 to Y7Q2.
Indicator Month Verification status (between source registers and MOH 731) No. of facilities
No variation
Over-reported
MOH 731
Under-reported
MOH 731
No. of
individuals
currently on
ART
Jan-16 91% 7% 2% 60
Feb-16 94% 4% 2% 62
Mar-16 94% 4% 2% 61
Apr-16 86% 11% 3% 63
May-16 87% 11% 2% 63
Jun-16 92% 8% 0% 63
Jul-16 86% 8% 6% 87
Aug-16 88% 8% 3% 86
Sept-16 97% 0% 3% 34
Oct-16 89% 4% 7% 104
Nov-16 92% 2% 6% 102
Jan-17 99% 1% 0% 85
Feb-17 99% 0% 1% 85
Mar-17 98% 0% 2% 86
Apr-17 93% 3% 4% 117
May-17 94% 4% 2% 121
Jun-17 94% 4% 2% 112
Jan-16 89% 3% 8% No. of
individuals
currently on
care
59
Feb-16 92% 6% 2% 60
Mar-16 92% 5% 3% 61
Apr-16 86% 11% 3% 64
May-16 87% 10% 3% 62
Jun-16 89% 9% 2% 63
Jul-16 79% 13% 8% 87
Aug-16 88% 8% 4% 84
Sept-16 97% 0% 3% 34
Oct-16 91% 3% 6% 104
Nov-16 92% 3% 5% 102
Jan-17 93% 6% 1% 86
Feb-17 93% 5% 2% 85
Mar-17 98% 2% 0% 86
Apr-17 92% 4% 4% 115
May-17 92% 6% 2% 119
Jun-17 94% 4% 2% 111
No. of
individuals
currently on
cotrimoxazole
Jan-16 88% 6% 6% 58
Feb-16 91% 5% 4% 58
Mar-16 91% 5% 4% 60
Apr-16 87% 11% 2% 62
May-16 86% 11% 3% 62
Jun-16 87% 11% 2% 64
Jul-16 79% 10% 10% 87
Aug-16 85% 9% 6% 87
Sept-16 94% 6% 0% 34
Oct-16 89% 6% 5% 104
Nov-16 92% 4% 4% 102
Jan-17 95% 4% 1% 82
Feb-17 90% 7% 3% 82
Mar-17 95% 1% 4% 85
Apr-17 93% 4% 3% 116
May-17 94% 4% 2% 120
Jun-17 95% 4% 1% 112 Note: ART, antiretroviral therapy; MOH, Ministry of Health. Source: Data Cross-Check Summary Report, 2016–2017.
USAID KENYA (APHIAPLUS WESTERN KENYA) PROGRESS REPORT FOR Q2 FY 2017 72
DREAMS data quality audit
Data verification and quality assessments were conducted during visits to the safe spaces. The
exercise included checking for availability of standard tools and consistency, accuracy, and
completeness of information documented on the DREAMS enrollment form, service uptake,
referrals tool, male sexual partners planning and monitoring tools, and EBI registers. Chart
abstraction was done during these visits to monitor quality of services offered to the AGYW and
layering of services for individual girls.
The DQA also assessed proper utilization of the tools and use of the DREAMS database to
generate project reports. Facility-based data verification was conducted for PMTCT DREAMS
indicators, with the support of Ministry of Health staff, along with mentorship of staff working in
PMTCT-supported sites on the tally sheets and summary tools that capture PMTCT data for the
DREAMS project. Onsite data verification was done for facilities visited and desk review to
ensure consistency of data in DHIS2. PrEP has been rolled out and records for AGYWs started
on PrEP are being reviewed to check on completeness of information. Monthly reports on PrEP
for each ward and commodity reports from facilities were submitted.
All 34 wards are supported by a data clerk, who weekly updated information in the DREAMS
system, with bimonthly data review meetings conducted by the M&E staff at the ward to review
performance. The M&E staff continued with management of the DREAMS database, generation
of monthly reports, and completion of the performance monitoring plan and project dashboards.
Review of monthly reports was done with the aim of identifying gaps in reporting and
understand the DREAMS reportable indicators by the implementers, frequency of reporting, and
data flow.
Quarterly data review meetings at the sub-county level
The project continued to support quarterly data review meetings in all project-supported sub-
counties. A total of 170 HCWs (29 in Vihiga, 57 in Homa Bay, 60 in Bungoma, and 22 in
Kakamega) were reached during the data review meetings. The project was not able to reach
HCWs in the other counties due to the HCWs’ strike that took place during the reporting period.
This brings the total to 964 HCWs reached in the Y6Q4 through Y7Q2 period. HCWs included
clinical and data management staff. During the meetings, facility-level data for HTC, care and
treatment, PMTCT, and VMMC were reviewed. Key gaps in performance and data quality,
including missed opportunities in service provision, were discussed and strategies formulated for
data quality improvement at the facility level.
The project continued to support 92 health records and information officers (8 in Migori, 5 in
Kisumu, 10 in Nyamira, 7 in Siaya, 5 in Homa Bay, 2 in Kisii, 13 in Bungoma, 7 in Busia, 25 in
Kakamega, and 10 in Vihiga) with monthly airtime to ensure timely, complete, and accurate
entry of health service delivery data into DHIS2.
Under DREAMS, the project supported ward-level data review meetings to ensure that source
documents are properly completed and service uptake forms completed. The project also
supported monthly review of reports at the county level to identify gaps in reporting and assess
performance of DREAMS reportable indicators against COP 2016 targets.
USAID KENYA (APHIAPLUS WESTERN KENYA) PROGRESS REPORT FOR Q2 FY 2017 73
Quarterly county M&E TWG meetings
To improve coordination of M&E activities in the counties, the project supported quarterly
county M&E TWG meetings. A total of 63 HCWs (16 in Busia, 17 in Nyamira, and 30 in
Migori) attended the county TWG meetings during the reporting period.
Bimonthly meetings to review DHIS2 data
During the reporting quarter, the project supported bimonthly meetings to review consistency of
data reported in DHIS2 against facility summary reports (MOH 731 and MOH 711A) and project
data. The indicators reviewed were for HTC, PMTCT, and care and treatment programs. A total
of 73 HCWs (30 in Bungoma, 38 in Nyamira, and 5 in Kisii) participated in the bimonthly
meetings, for a total of 162 HCWs reached through bimonthly meetings to review data
consistency in the Y6Q4 through Y7Q2 period. Through the process, data entry inconsistencies
in DHIS2 were identified and corrected by sub-county health records and information officers.
This contributed to improvement in the quality of data in DHIS2.
Strengthening the use of the OVC longitudinal management information system (OLMIS)
During the reporting period, the project continued to provide targeted onsite mentorship to CBO
staff on use of OLMIS, including the OVC reporting tools. The onsite mentorships were
provided based on identified CBO-specific issues. The 47 data clerks assigned to the 76 project-
supported CBOs provided support in the filing of OVC records and in entry and validation of
OVC data in OLMIS at the CBO level.
The project also provided system maintenance support to the CBOs, especially to CBOs that had
technical system challenges in computers that they use for data management and reporting
through the OLMIS. The project also handed over the OLMIS database to the incoming partner,
Catholics Relief Services (CRS), who will continue to implement the OVC program from July
2017 onward. The hand-over process went well, and the project has continued to provide
relevant information and data to CRS.
Strengthening use of the VMMC M&E system
The project continued to strengthen use of the VMMC M&E system. Twelve data clerks
assigned to Busia, Kisumu, Homa Bay, and Migori counties continued to support entry of
VMMC data into the M&E system at the site level.
Meaningful use of ICT infrastructure
To enhance meaningful use of ICT infrastructure for data management and reporting at facility,
sub-county, and county levels, the project, during the previous quarter, delivered a set of
computers, printers, uninterrupted power supply (UPS), Cisco routers, access points, and dongles
to ten supported sites and respective CHMT and SCHMT offices in four scale up to saturation
counties: Homa Bay, Kisumu, Migori, and Busia. During the reporting period, the project
installed the computers, printers, UPS, Cisco routers, access points, and dongles in the respective
sites. The project will monitor use of this information and communication technology (ICT)
infrastructure with an aim of establishing them as model ICT sites and centers of excellence in
USAID KENYA (APHIAPLUS WESTERN KENYA) PROGRESS REPORT FOR Q2 FY 2017 74
the provision of service delivery, data management, and use of electronic medical records at
points of care.
Use of the open data kit platform in weekly collection of data
The project rolled out use of the open data kit (ODK) tool for weekly collection of data on early
warning indicators for all nine supported counties. The ODK application enables offline data
entry through a pre-designed form in a mobile phone, then loaded to a central server database,
which is then downloaded and analyzed in any required format. A total of 122 data clerks/health
records and information officers and 184 clinical staff (a total of 306 HCWs) were trained on use
of the ODK tool.
Progress on Site Improvement through Monitoring System (SIMS)
During the reporting period, the project worked with International Business and Technical
Consultants Inc (IBTCI) to conduct SIMS in six CBOs—five in Homa Bay County and one in
Migori County. The areas of concern that require immediate action are included in Annex C.
V. PROGRESS ON GENDER STRATEGY
The project continued to respond to the existing gender inequality gaps through facility- and
community-level interventions. At the facility, the project supported capacity-building of HCWs
on SGBV reporting to improve through CMEs and on-the-job training. The project also
supported HCWs to conduct GBV screening exercises to help in identifying cases of SGBV. At
the community level, the project supported community-awareness creation activities to enhance
demand creation for GBV services as well as to address power relations and imbalances that
prevent people from seeking care and treatment services. The project supported orientations of
local administration and police officers on gender and GBV to strengthen their response services,
community-level dialogue sessions on GBV, gender analysis in Ntimaru (Migori County), and
monthly gender technical working group (GTWG) meetings to strengthen the coordination of
gender activities in all the counties. In addition, the project supported marking of the Day of the
African Child.
VI. PROGRESS ON ENVIRONMENTAL MITIGATION AND MONITORING
Improved disposal of health care waste formed the core of environmental mitigation activities
during this reporting period. This was complemented by training and mentorship through
integrated supportive supervision and technical advice to project supported facilities. A total of
11 health facilities in 7 counties (Kakamega, Bungoma, Busia, Vihiga, Siaya, Migori, and Homa
Bay) were visited during the quarter.
Medical waste incinerators recently renovated with support from the project were commissioned
and launched at Sio Port, Cheptais, and Lumakanda sub-county hospitals in Busia, Bungoma,
USAID KENYA (APHIAPLUS WESTERN KENYA) PROGRESS REPORT FOR Q2 FY 2017 75
and Kakamega counties, respectively. Renovation at Kabondo in Homa Bay and Awendo in
Migori was finalized and these are pending commissioning. All five incinerators are now fully
operational with adequate and secure holding space for waste. In additional, Ipali health center
was supported to revive and begin using the incinerator installed by the county government of
Vihiga. Incinerator operators at all the above facilities were trained on operation and
maintenance, record keeping, and health and safety measures. They were also equipped with
personal protective equipment (PPE), operating tools, and firefighting equipment. This was done
to optimize incineration so as to ensure proper destruction of biohazardous waste as well
minimize emissions. Use of PPE is expected to minimize occupational hazards such as exposure
to contaminated waste and risk of needlestick injuries. Next steps will involve support to these
facilities to treat and dispose of safety boxes from other health facilities within the respective
sub-counties that do not have incinerators.
Training and mentorship sessions were conducted in 11 health facilities for a total of 71 health
workers. Participants included members of the health management teams at county and facility
levels, health care service providers, and waste handling staff (casual workers). The following
facilities were supported: Sio Port, Cheptais, and Lumakanda sub-county hospital in Busia,
Bungoma, and Kakamega; Ipali health center in Vihiga; Kabondo sub-county hospital and
Othoro and Ober health centers in Homa Bay. Others were Awendo and Uriri sub-county
hospitals and Mariwa health center in Migori and Siaya county referral hospital. Training and
mentorship focused on refreshing best practices on waste handling, especially segregation
according to national guidelines, safe handling, storage, treatment, and disposal. Emphasis was
given to integration of waste management and infection prevention and control. Due to the
ongoing strike by nurses, it was not possible to roll out health care waste management trainings
as planned. Training for other cadres will continued as we wait for the nurses’ strike to be
resolved.
VII. PROGRESS ON LINKS TO OTHER USAID PROGRAMS
Applying Science to Strengthen and Improve Systems project
Collaboration with the Applying Science to Strengthen and Improve Systems (ASSIST) project
continued in this quarter, in line with the 2017 work plan activities that related to quality
improvement. The project continued and scaled up support in quality improvement by supporting
quality improvement team meetings in the region. County TWGs on quality improvement were
supported across the zone. Quality and work improvement team meetings were supported jointly
at the facility-management and departmental levels. In the high- and medium-volume facilities,
the projects supported coaching sessions, during which the periodic review was done of the
Standards of Care according to the Kenya HIV Quality Improvement Framework.
Kenya Agricultural Value Chains Enterprises project
APHIAplus Western Kenya partnered with the Kenya Agricultural Value Chains Enterprises
(KAVES) project and Agricultural Sector Development Support Programme (ASDSP) in
building the capacity of caregivers on value chains, focusing on horticulture, dairy, and poultry
farming.
USAID KENYA (APHIAPLUS WESTERN KENYA) PROGRESS REPORT FOR Q2 FY 2017 76
During the reporting period, a farmers’ field day exercise was conducted to promote dairy
farming, poultry, and maize value chains in Butere presided over by the Kakamega County
governor; 678 caregiver farmers from 14 CBOs in Kakamega and Vihiga counties participated.
One Acre Fund
APHIAplus Western Kenya partnered with One Acre Fund in supporting caregivers with farm
inputs and solar lamps on soft credit across the project area. During the reporting period, 245
caregivers from Khwisero Dorcas CBO, Bushesma CBO and Bushe CBO (trained and supported
with farm inputs in Q1) were monitored to ensure they achieve the highest yield to ensure they
are able to repay the loans provided for inputs and accrue profit from the sale of the extra yields
after storing the grains for home consumption.
During the reporting period, the project also partnered with other USAID-funded partners
Academic Model Providing Access to Healthcare (AMPATH), Centre for Health Solutions
(CHS) Kenya, Elizabeth Glaser Pediatric AIDS Foundation (EGPAF), and University of
Maryland in providing HIV testing and counseling and linkages to care and treatment.
MEASURE Evaluation PIMA
During the reporting period, the project continued work with the MEASURE Evaluation PIMA
team to address OLMIS-related issues and transition of OLMIS to the incoming OVC
implementing partner, Catholic Relief Services. The PIMA team also provided remote
backstopping support to the project, based on identified needs.
VIII. PROGRESS ON LINKS WITH GOVERNMENT OF KENYA AGENCIES
The project has strengthened partnerships with national and county government agencies on the
areas of food security, health, education, and protection for OVC. During the reporting quarter,
partnerships with county health departments enabled the project to continue supporting HIV
testing services for OVC and health access as shown in Table 46.
The project’s education strategy aims at enhancing access to school and completion by providing
an enabling environment. The project collaborates with the Ministry of Education in addressing
OVC educational needs in the following areas: school fees subsidies, scholastic materials,
mentorship, and county coordinating working groups. The project also collaborated with the
Ministry of Education to provide safe spaces in selected schools. The project also supported
quarterly gender TWG meetings in the two counties and supported two county governments to
develop gender strategic plans, among other activities.
During the reporting period, 2,272 OVC received school fees in addition to the 5,397 OVC who
benefited in Q1; of these, 1,007 were paid for from the project and 1,265 through referral and
linkage to other partners. In addition, area advisory councils at the local and county levels were
supported to strengthen child protection initiatives. OVC households were linked to the
USAID KENYA (APHIAPLUS WESTERN KENYA) PROGRESS REPORT FOR Q2 FY 2017 77
departments of children, civil registration, and vital statistics, as well as the National Health
Insurance Fund for the acquisition of cash transfers, birth registration certificates, and medical
insurance coverage.
During the reporting quarter, the project collaborated with the Ministry of Education to
strengthen OVC’s and AGYW’s access to, and retention in, schools. This was done through
school fees support and the promotion of adult education through consultative meetings and
supportive supervision.
To further strengthen the OVC households economically, households in different levels of
vulnerability (high, moderate, and low vulnerability) were linked to various forms of support.
During the period, 8,129 highly vulnerable OVC households were linked to respective county
governments’ cash transfer assistance programs to boost their economic resilience. This has
increased these households’ economic resilience level and helped them move out of highly
vulnerable status.
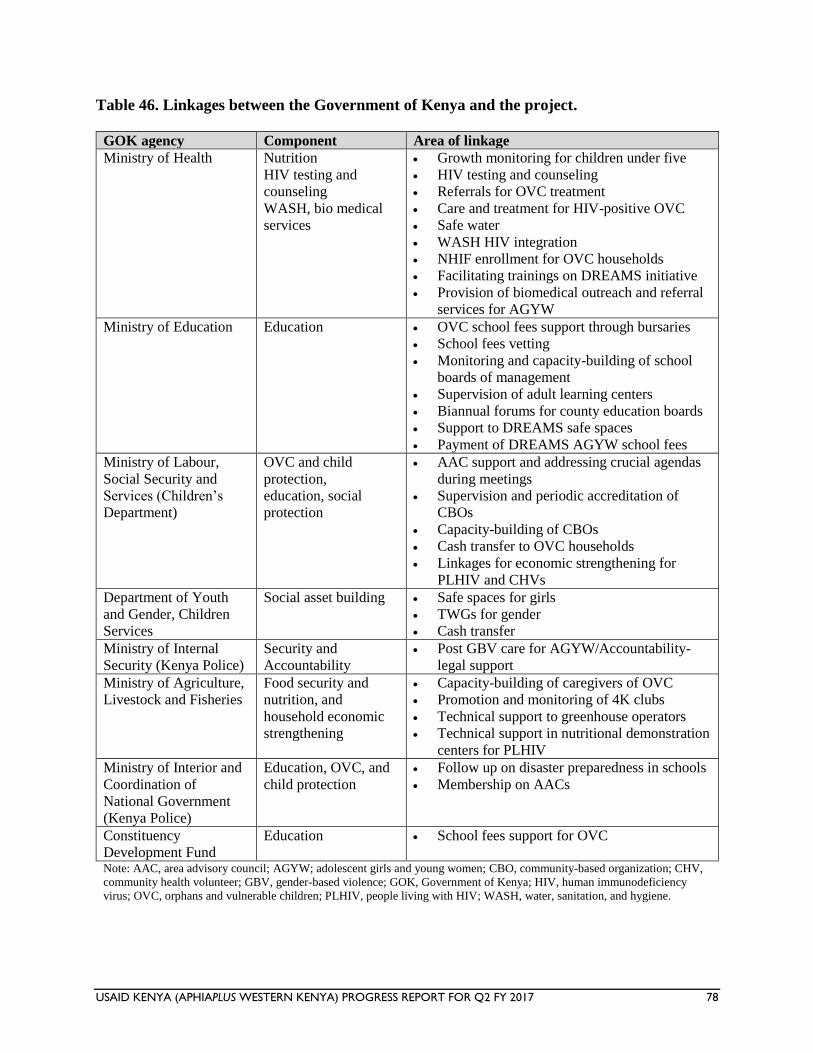
USAID KENYA (APHIAPLUS WESTERN KENYA) PROGRESS REPORT FOR Q2 FY 2017 78
Table 46. Linkages between the Government of Kenya and the project.
GOK agency Component Area of linkage
Ministry of Health Nutrition
HIV testing and
counseling
WASH, bio medical
services
Growth monitoring for children under five
HIV testing and counseling
Referrals for OVC treatment
Care and treatment for HIV-positive OVC
Safe water
WASH HIV integration
NHIF enrollment for OVC households
Facilitating trainings on DREAMS initiative
Provision of biomedical outreach and referral
services for AGYW
Ministry of Education Education OVC school fees support through bursaries
School fees vetting
Monitoring and capacity-building of school
boards of management
Supervision of adult learning centers
Biannual forums for county education boards
Support to DREAMS safe spaces
Payment of DREAMS AGYW school fees
Ministry of Labour,
Social Security and
Services (Children’s
Department)
OVC and child
protection,
education, social
protection
AAC support and addressing crucial agendas
during meetings
Supervision and periodic accreditation of
CBOs
Capacity-building of CBOs
Cash transfer to OVC households
Linkages for economic strengthening for
PLHIV and CHVs
Department of Youth
and Gender, Children
Services
Social asset building Safe spaces for girls
TWGs for gender
Cash transfer
Ministry of Internal
Security (Kenya Police)
Security and
Accountability
Post GBV care for AGYW/Accountability-
legal support
Ministry of Agriculture,
Livestock and Fisheries
Food security and
nutrition, and
household economic
strengthening
Capacity-building of caregivers of OVC
Promotion and monitoring of 4K clubs
Technical support to greenhouse operators
Technical support in nutritional demonstration
centers for PLHIV
Ministry of Interior and
Coordination of
National Government
(Kenya Police)
Education, OVC, and
child protection
Follow up on disaster preparedness in schools
Membership on AACs
Constituency
Development Fund
Education School fees support for OVC
Note: AAC, area advisory council; AGYW; adolescent girls and young women; CBO, community-based organization; CHV,
community health volunteer; GBV, gender-based violence; GOK, Government of Kenya; HIV, human immunodeficiency
virus; OVC, orphans and vulnerable children; PLHIV, people living with HIV; WASH, water, sanitation, and hygiene.
USAID KENYA (APHIAPLUS WESTERN KENYA) PROGRESS REPORT FOR Q2 FY 2017 79
IX. PROGRESS ON USAID FORWARD
The project continued to ensure that sustainability remained at the core of OVC services. The
focus was on institutional sustainability and household and community resilience. The project
continued to work with the 76 CBOs, building their institutional and technical capacity to
manage and ensure sustainable child outcomes. All 76 CBOs received opportunities to apply for
small PEPFAR grants, with the project team providing technical insights in developing their
proposals. The CBOs were trained on compliance to donor standards, governance, and financial
management.
The project continued to build the capacity of 15 CBOs that provide services to DREAMS
beneficiaries/AGYW through trainings, mentorship, and supportive supervision. The project
continued to work with 6 local implementing partners as a strategy of building local capacity to
implement interventions targeting AGYW. The support provided to the local implementing
partners was both financial and technical to enable them to deliver targeted interventions to girls
with high vulnerability. Project-trained mentors and facilitators regularly reach out to AGYW
with repeat prevention and risk-reduction messages, condom promotion, and referrals for
biomedical services including social protection services in the two counties of Homa Bay and
Kisumu.
X. SUSTAINABILITY AND EXIT STRATEGY
The project continued to ensure that sustainability remained at the core of OVC services. The
focus continues to be within three key areas: institutional sustainability, household and
community resilience, and environmentally sustainable production systems.
Institutional sustainability seeks to transition services and responsibility at the household and
CBO levels. At the CBO level, capacity-building through exchange visits, twinning of CSO,
quarterly review meetings, and supportive supervision was carried out, which has resulted in
strengthened networks, stronger linkages for resource mobilization, and enhanced governance
and management of these organizations. In Y7Q2, Village savings and loan associations
(VSLAs) continued to be a key household economic strengthening intervention in the project.
Community-based trainers (CBTs) trained by the project continued to promote village savings
and loan (VSL) methodology among the OVC caregivers. A total of 52 new VSLA groups were
trained during the reporting period, bringing the number of active VSLA groups to 926.
During the reporting period, KSh. 38.7 million was in circulation and 18.5 million in loans
benefiting 24,675 caregivers supporting 63,764 OVC. Two groups had a share-out of 1.19
million in Kisumu and Siaya, which caregivers utilized to grow their assets, expand their
businesses, and meet basic needs including shelter, education, and health care.
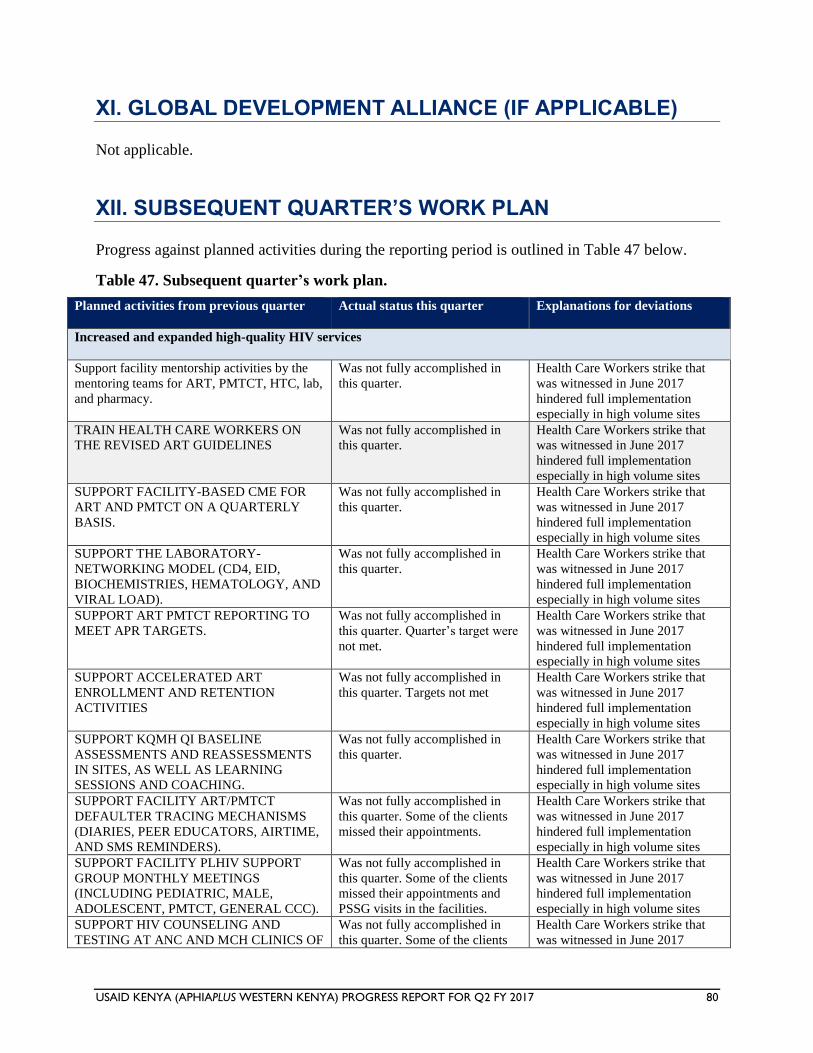
USAID KENYA (APHIAPLUS WESTERN KENYA) PROGRESS REPORT FOR Q2 FY 2017 80
XI. GLOBAL DEVELOPMENT ALLIANCE (IF APPLICABLE)
Not applicable.
XII. SUBSEQUENT QUARTER’S WORK PLAN
Progress against planned activities during the reporting period is outlined in Table 47 below.
Table 47. Subsequent quarter’s work plan.
Planned activities from previous quarter Actual status this quarter Explanations for deviations
Increased and expanded high-quality HIV services
Support facility mentorship activities by the
mentoring teams for ART, PMTCT, HTC, lab,
and pharmacy.
Was not fully accomplished in
this quarter.
Health Care Workers strike that
was witnessed in June 2017
hindered full implementation
especially in high volume sites
TRAIN HEALTH CARE WORKERS ON
THE REVISED ART GUIDELINES
Was not fully accomplished in
this quarter.
Health Care Workers strike that
was witnessed in June 2017
hindered full implementation
especially in high volume sites
SUPPORT FACILITY-BASED CME FOR
ART AND PMTCT ON A QUARTERLY
BASIS.
Was not fully accomplished in
this quarter.
Health Care Workers strike that
was witnessed in June 2017
hindered full implementation
especially in high volume sites
SUPPORT THE LABORATORY-
NETWORKING MODEL (CD4, EID,
BIOCHEMISTRIES, HEMATOLOGY, AND
VIRAL LOAD).
Was not fully accomplished in
this quarter.
Health Care Workers strike that
was witnessed in June 2017
hindered full implementation
especially in high volume sites
SUPPORT ART PMTCT REPORTING TO
MEET APR TARGETS.
Was not fully accomplished in
this quarter. Quarter’s target were
not met.
Health Care Workers strike that
was witnessed in June 2017
hindered full implementation
especially in high volume sites
SUPPORT ACCELERATED ART
ENROLLMENT AND RETENTION
ACTIVITIES
Was not fully accomplished in
this quarter. Targets not met
Health Care Workers strike that
was witnessed in June 2017
hindered full implementation
especially in high volume sites
SUPPORT KQMH QI BASELINE
ASSESSMENTS AND REASSESSMENTS
IN SITES, AS WELL AS LEARNING
SESSIONS AND COACHING.
Was not fully accomplished in
this quarter.
Health Care Workers strike that
was witnessed in June 2017
hindered full implementation
especially in high volume sites
SUPPORT FACILITY ART/PMTCT
DEFAULTER TRACING MECHANISMS
(DIARIES, PEER EDUCATORS, AIRTIME,
AND SMS REMINDERS).
Was not fully accomplished in
this quarter. Some of the clients
missed their appointments.
Health Care Workers strike that
was witnessed in June 2017
hindered full implementation
especially in high volume sites
SUPPORT FACILITY PLHIV SUPPORT
GROUP MONTHLY MEETINGS
(INCLUDING PEDIATRIC, MALE,
ADOLESCENT, PMTCT, GENERAL CCC).
Was not fully accomplished in
this quarter. Some of the clients
missed their appointments and
PSSG visits in the facilities.
Health Care Workers strike that
was witnessed in June 2017
hindered full implementation
especially in high volume sites
SUPPORT HIV COUNSELING AND
TESTING AT ANC AND MCH CLINICS OF
Was not fully accomplished in
this quarter. Some of the clients
Health Care Workers strike that
was witnessed in June 2017
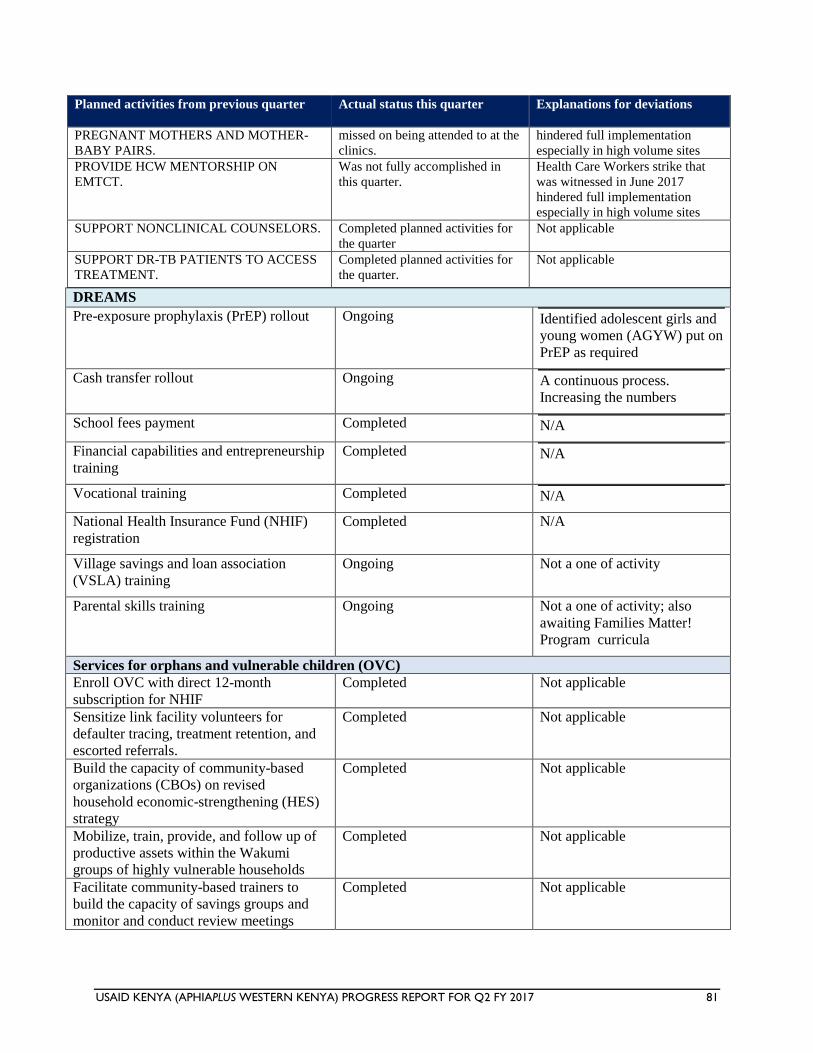
USAID KENYA (APHIAPLUS WESTERN KENYA) PROGRESS REPORT FOR Q2 FY 2017 81
Planned activities from previous quarter Actual status this quarter Explanations for deviations
PREGNANT MOTHERS AND MOTHER-
BABY PAIRS.
missed on being attended to at the
clinics.
hindered full implementation
especially in high volume sites
PROVIDE HCW MENTORSHIP ON
EMTCT.
Was not fully accomplished in
this quarter.
Health Care Workers strike that
was witnessed in June 2017
hindered full implementation
especially in high volume sites
SUPPORT NONCLINICAL COUNSELORS.
Completed planned activities for
the quarter
Not applicable
SUPPORT DR-TB PATIENTS TO ACCESS
TREATMENT.
Completed planned activities for
the quarter.
Not applicable
DREAMS
Pre-exposure prophylaxis (PrEP) rollout Ongoing Identified adolescent girls and
young women (AGYW) put on
PrEP as required
Cash transfer rollout Ongoing A continuous process.
Increasing the numbers
School fees payment Completed N/A
Financial capabilities and entrepreneurship
training
Completed N/A
Vocational training Completed N/A
National Health Insurance Fund (NHIF)
registration
Completed N/A
Village savings and loan association
(VSLA) training
Ongoing Not a one of activity
Parental skills training Ongoing Not a one of activity; also
awaiting Families Matter!
Program curricula
Services for orphans and vulnerable children (OVC)
Enroll OVC with direct 12-month
subscription for NHIF
Completed Not applicable
Sensitize link facility volunteers for
defaulter tracing, treatment retention, and
escorted referrals.
Completed Not applicable
Build the capacity of community-based
organizations (CBOs) on revised
household economic-strengthening (HES)
strategy
Completed Not applicable
Mobilize, train, provide, and follow up of
productive assets within the Wakumi
groups of highly vulnerable households
Completed Not applicable
Facilitate community-based trainers to
build the capacity of savings groups and
monitor and conduct review meetings
Completed Not applicable
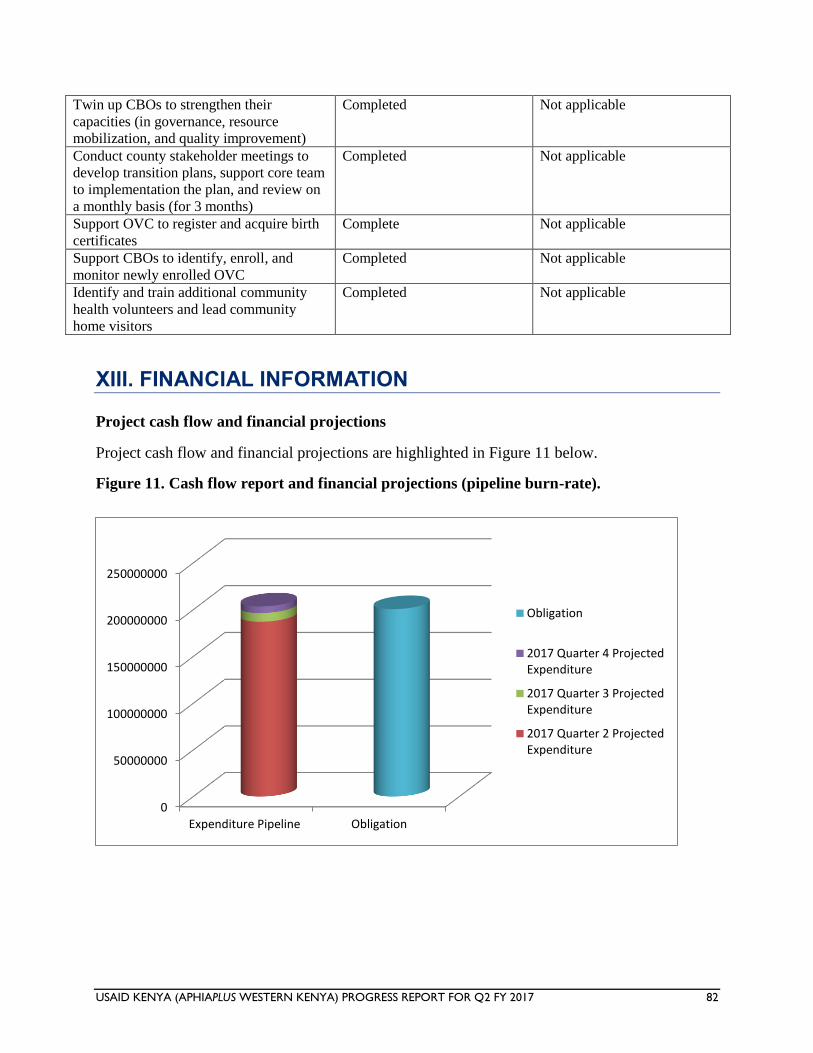
USAID KENYA (APHIAPLUS WESTERN KENYA) PROGRESS REPORT FOR Q2 FY 2017 82
Twin up CBOs to strengthen their
capacities (in governance, resource
mobilization, and quality improvement)
Completed Not applicable
Conduct county stakeholder meetings to
develop transition plans, support core team
to implementation the plan, and review on
a monthly basis (for 3 months)
Completed Not applicable
Support OVC to register and acquire birth
certificates
Complete Not applicable
Support CBOs to identify, enroll, and
monitor newly enrolled OVC
Completed Not applicable
Identify and train additional community
health volunteers and lead community
home visitors
Completed Not applicable
XIII. FINANCIAL INFORMATION
Project cash flow and financial projections
Project cash flow and financial projections are highlighted in Figure 11 below.
Figure 11. Cash flow report and financial projections (pipeline burn-rate).
0
50000000
100000000
150000000
200000000
250000000
Expenditure Pipeline Obligation
Obligation
2017 Quarter 4 ProjectedExpenditure
2017 Quarter 3 ProjectedExpenditure
2017 Quarter 2 ProjectedExpenditure
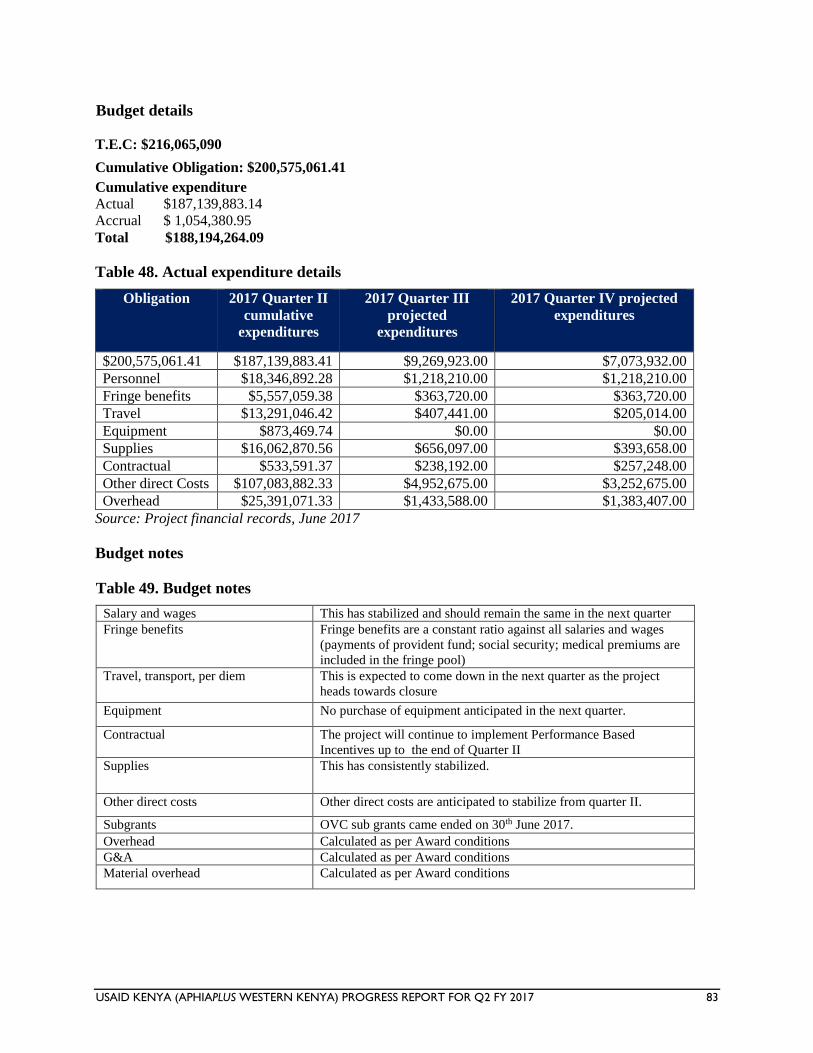
USAID KENYA (APHIAPLUS WESTERN KENYA) PROGRESS REPORT FOR Q2 FY 2017 83
Budget details
T.E.C: $216,065,090
Cumulative Obligation: $200,575,061.41
Cumulative expenditure
Actual $187,139,883.14
Accrual $ 1,054,380.95
Total $188,194,264.09
Table 48. Actual expenditure details
Obligation 2017 Quarter II
cumulative
expenditures
2017 Quarter III
projected
expenditures
2017 Quarter IV projected
expenditures
$200,575,061.41 $187,139,883.41 $9,269,923.00 $7,073,932.00
Personnel $18,346,892.28 $1,218,210.00 $1,218,210.00
Fringe benefits $5,557,059.38 $363,720.00 $363,720.00
Travel $13,291,046.42 $407,441.00 $205,014.00
Equipment $873,469.74 $0.00 $0.00
Supplies $16,062,870.56 $656,097.00 $393,658.00
Contractual $533,591.37 $238,192.00 $257,248.00
Other direct Costs $107,083,882.33 $4,952,675.00 $3,252,675.00
Overhead $25,391,071.33 $1,433,588.00 $1,383,407.00
Source: Project financial records, June 2017
Budget notes
Table 49. Budget notes
Salary and wages This has stabilized and should remain the same in the next quarter
Fringe benefits Fringe benefits are a constant ratio against all salaries and wages
(payments of provident fund; social security; medical premiums are
included in the fringe pool)
Travel, transport, per diem This is expected to come down in the next quarter as the project
heads towards closure
Equipment No purchase of equipment anticipated in the next quarter.
Contractual The project will continue to implement Performance Based
Incentives up to the end of Quarter II
Supplies This has consistently stabilized.
Other direct costs Other direct costs are anticipated to stabilize from quarter II.
Subgrants OVC sub grants came ended on 30th June 2017.
Overhead Calculated as per Award conditions
G&A Calculated as per Award conditions
Material overhead Calculated as per Award conditions
USAID KENYA (APHIAPLUS WESTERN KENYA) PROGRESS REPORT FOR Q2 FY 2017 84
New subaward details
None
XIV. ACTIVITY ADMINISTRATION
Personnel
There were no changes in the project key personnel within the reporting period.
Contract, award, or cooperative agreement modifications and amendments
The project received an incremental obligation of $ 14,320,407 on May 2, 2017. The OVC sub grants
ended on June 30, 2017.
XV. INFORMATION FOR ANNUAL REPORTS ONLY
N/A.
XVI. GPS INFORMATION
Please see the GPS information sheet in the attachment.
USAID KENYA (APHIAPLUS WESTERN KENYA) PROGRESS REPORT FOR Q2 FY 2017 85
XVII. SUCCESS STORIES
Success story 1 - DREAMS initiative Makes girls dream again
Doreen Auma is only 14 years old, but she is already a mother. In 2016, Doreen braved the
stigma often directed toward young girls who get pregnant while in school to continue with her
studies and attain a better life for herself and her siblings. She hopes to become a nurse and care
for young mothers like herself and children. Doreen is among more than 500 girls supported
under the Determined, Resilient, Empowered, AIDS-free, Mentored, and Safe (DREAMS)
initiative supported by the US President’s Emergency Plan for AIDS Relief targeting adolescent
girls and young women.
Doreen comes from a polygamous family in Homa Bay County where poverty and cultural
practices, including polygamy, continue to fuel the spread of HIV. Doreen’s problems started
when her father married a second wife and abandoned her mother, who is the first wife. Doreen’s
mother has to care for the five siblings by casual jobs just to make enough for the family,
sometimes having to take Doreen with her. As a result, in the struggle to make ends meet,
Doreen started either attending classes for only half a day or missing out completely to take up
casual work to earn a living.
The dire situation at home made Doreen suffer trauma, psychological issues, confusion, and
withdrawal from her peers, making her lose her self-esteem and self-confidence. She could not
concentrate in school and thought of running away to get married, just like her elder sister.
During this time, a man she met at a funeral vigil (locally referred to as disco matanga) took
advantage of her and impregnated her, forcing Doreen, who was in class seven, to drop out of
school completely. The man fled when he received the news, leaving the young girl to face
motherhood alone. This came with not only a lot of stigma and judgment from her neighbors but
also verbal abuse from her own father.
In June 2016, Doreen was enrolled in the DREAMS project after meeting all the eligibility
criteria requirements. She was attached to Otange ‘Safe Space, where she is receiving services.
She was immediately referred for biomedical services and linked to Otange dispensary, where
she was enrolled in antenatal care.
“Joining the DREAMS could not have come at a better time. I have learned and benefited a lot,”
Doreen says.
Doreen also underwent behavioral interventions such as Life Skills Education and My Health
My Choice, regular mentorship sessions, and SASA intervention. Another structural intervention
that Doreen received at the safe space was a learner’s package that contained sanitary towels,
toothpaste and toothbrush, and body lotion. She singles out the mentorship sessions, which she
says have empowered her to better deal with life.
“I have learned how to take care of myself. If I had joined the safe space earlier, I would not
have become pregnant because I would have known how to protect myself,” she said.
At Minyere Primary School, Doreen is an obedient, hard-working pupil. She is able to focus on
her studies because her mother has agreed to take care of her one-year-old baby boy while
Doreen is at school. In the evening, she breastfeeds her son and takes a few hours to do her
USAID KENYA (APHIAPLUS WESTERN KENYA) PROGRESS REPORT FOR Q2 FY 2017 86
homework and read for her exams. The DREAMS initiative has also provided her with a solar
lamp to aid her during her studies, and she was also enrolled in the cash transfer program of
4000/=, which her mother receives on her behalf as she takes care of her baby.
DREAMS aims to give adolescent girls and young women an opportunity to live Determined,
Resilient, Empowered, AIDS-free, Mentored, and Safe lives. The objective of DREAMS is to
reduce by 40% the HIV incidence among females between the ages of 10 and 24 in two years.
DREAMS in Kenya is implemented in Homa Bay, Siaya, Kisumu, and Nairobi counties, which
have an HIV prevalence of 26%, 24.8%, 19%, and 6%, respectively (KAIS, 2012).
Success story 2 - I am living testimony of the success of prevention of mother-to-child
transmission of HIV
Losing a child is, definitely, one of the most traumatic moments in a mother’s life. As if one was
not enough, Martha Kwamboka lost three in a row. She was devastated and even wondered if she
had been bewitched. Nearly ten years after she lost her third baby, Martha decided to turn the
pain into a passion to help HIV-positive mothers deliver HIV-free children. She is one of the
mentor mothers working with the AIDS, Population, and Health Integrated Assistance
(APHIAplus Western) project to support prevention of mother-to-child transmission (PMTCT)
of HIV in Bungoma County.
“I delivered my first child, a baby boy, in 2000 and I was very happy. The baby was fine but at
about four months he stopped growing and complications set in. He developed swellings around
the lymph nodes and died at six months,” said Martha, narrating her ordeal. Martha got pregnant
again in 2002 and gave birth to a baby boy who looked healthy; six months later he developed a
strange skin rash and died a few weeks later. The same thing occurred to her third-born child,
also a baby boy.
“I was so angry and disillusioned. I knew I had been bewitched or my marriage had been cursed,
so I left my husband. A few years later, I started getting sickly and came to the hospital
[Bungoma County Referral Hospital] where I was tested and told that I was HIV positive. I was
encouraged to join a support group where I started to learn a lot about how to live positively,”
she said.
It was in this support group of people living with HIV that Martha met her new husband in 2010.
Seven years on, Martha is an ecstatic mother to six-year-old Joy and two-year-old Joshua. Both
children went through the PMTCT process and graduated after being confirmed HIV free at 18
months.
“I was hesitant at first because I feared that what happened earlier would happen again. The
clinician, however, assured us through counseling that it was possible to have a healthy baby. We
had to ensure that we were adhering to our medication, [that we] maintained a low viral load, and
that we were healthy before we tried to have the baby. When my daughter was born, I named her
Joy after our support group name. I brought her in regularly for PMTCT and when at 18 months
she was tested negative for HIV, I became emboldened. The second child was easy,” she
explains.
USAID KENYA (APHIAPLUS WESTERN KENYA) PROGRESS REPORT FOR Q2 FY 2017 87
Martha’s husband, Emmanuel Nyumba, also went through similar tribulations and says PMTCT
has enabled him to experience the joy of being a father. He too was previously married and lost
three children and a wife before discovering that he was HIV positive.
“It is not easy to lose three children and a wife. In my Luo community there is something called
chira [loosely translated, this means a curse] and this is what we all thought was the reason
behind the death of my first three children. But when I fell sick in 2000, a test was taken and that
is when I discovered that my children were dying of HIV-related complications,” said
Emmanuel.
Martha says she is now content with her two children and wants to spend her time helping other
women deliver and raise HIV-negative children. She spends her day at the Bungoma County
Referral Hospital, where she is known as a mentor mother who helps counsel and encourage
women at the PMTCT clinic on the benefits of treatment adherence and its resultant impact of
healthy HIV-negative babies.
“Women lose hope once they test positive for HIV. Some women used to abort their babies out
of fear that they will give birth to HIV-positive children. Others even deliver but abandon their
newborns at the hospital because they do not want to take home an HIV-positive baby,” she said.
Martha is proud of the work that she and other mentor mothers are doing to reduce HIV
infections in the county. Bungoma has an HIV prevalence rate of 2.8%, with women and young
people of reproductive age being the most affected. The rollout of aggressive PMTCT programs
such as the mentor mother initiative have helped reduce the rate of mother-to-child transmission
from 5.2% in 2015 to the current 4%.
Success story 3 - Improving adherence through treatment buddies at Butere County
Hospital
Ask Livingstone Okune how he contracted HIV and he will point to his alcoholism. Alcoholism
and HIV would also have sent him to the grave if it were not for Christabel Bukachi, an
adherence counselor with the USAID-funded APHIAplus Western project. Christabel convinced
Livingstone to reduce his drinking and adhere to treatment.
Livingstone was in a group of 130 HIV-positive people on treatment who a year ago were not
responding to antiretroviral therapy, largely due to poor adherence to treatment. He is now
responding well to treatment and regained his health thanks to the treatment buddies initiative, an
aggressive Butere County Hospital program initiated to support patients with adherence
difficulties.
In February 2015, Livingstone was brought to the hospital very sick. His CD4 cell count, the
measure of the level of immunity in the body, was barely above 30. He was in dire straits: this
was well below 500, which is indicative of good health. He was counseled and immediately
enrolled on ARVs. Six months later, a viral load was taken to assess how he was responding to
treatment. His clinician was shocked to find that his viral load was more than 20,000 copies. A
second viral load test was conducted after another six months and it was more than 40,000.
When a third test was done in August 2016, it had shot to more than 200,000 copies! The
clinician concluded that Livingstone was not taking his medicine properly. Six months later and
USAID KENYA (APHIAPLUS WESTERN KENYA) PROGRESS REPORT FOR Q2 FY 2017 88
after close monitoring by his treatment buddy, his viral load dropped to low detectable levels,
and Livingstone looked and felt healthier.
The treatment buddies initiative involves assigning specific peer counselors to clients who are
struggling to adhere to treatment. The peer counselor befriends the client and in the process is
able to understand the unique challenges his/her client may face.
Christabel, who was assigned to handle Livingstone, says, “Livingstone was one of the most
difficult clients I have ever dealt with. . . . He would come here drunk, incoherent, and disorderly
and would shout at us.” This is contrary to how I found him at the Facility Comprehensive Care
Center on the day of this interview. Livingstone was sober, composed, and coherent.
“I was drinking too much and this was affecting my health. I would drink all day and when I got
home I would just sleep without taking any food or my medication,” he admitted.
The treatment buddies initiative was mooted at a meeting convened by Butere Sub-County AIDS
and Sexually Transmitted Infections Coordinator Christine Odhiambo. The initiative aimed to
address the low viral load suppression at the facility and support clients with adherence
challenges, especially the alcoholics.
“Poor adherence was clouding our efforts in other areas and we had to do something,” Odhiambo
said.
“Our linkage to treatment for clients testing [HIV] positive was above 80% but due to poor
adherence, the viral load suppression was low,” she added.
Butere County Hospital is the second largest health facility in Kakamega County providing care
nearly 1,500 people living with HIV (PLHIV) on antiretroviral therapy. Because of poor
adherence, the number of suspected treatment failures was rising and affecting suppression of the
viral load, a key target in the UNAIDS 90-90-90 HIV treatment strategy. The 90-90-90 treatment
strategy seeks to ensure that 90% of people living with HIV know their status, 90% of people
living with HIV are put on treatment, and 90% of PLHIV on treatment attain viral load
suppression. Following the implementation of the treatment buddies initiative and other
adherence support strategies, the number of patients not adhering to treatment dropped by almost
two-thirds, from 130 in April 2016 to just 48 in May 2017.
To deal with patients with alcoholic challenges like Livingstone, the hospital also started a
special alcoholics’ clinic where counselors would discuss their challenges. Other strategies
adopted by the peer counselors included reducing the intervals for clinic visits and involving the
alcoholics’ partners or close relatives for increased support. For Livingstone, it is a double win.
“No one had really spent time to educate me on the dangers of alcohol. Now I can plan my life
and support a family, something that I was not doing earlier,” he said.
Christabel, who has lived with HIV for more than 20 years, says, “I see no reason why someone
should die of HIV, especially now when treatment is widely available.”
USAID KENYA (APHIAPLUS WESTERN KENYA) PROGRESS REPORT FOR Q2 FY 2017 89
With initiatives like the treatment buddies at Butere County Hospital, people living with HIV
like Livingstone can enjoy the full benefits of antiretroviral therapy and contribute to ending new
infections.
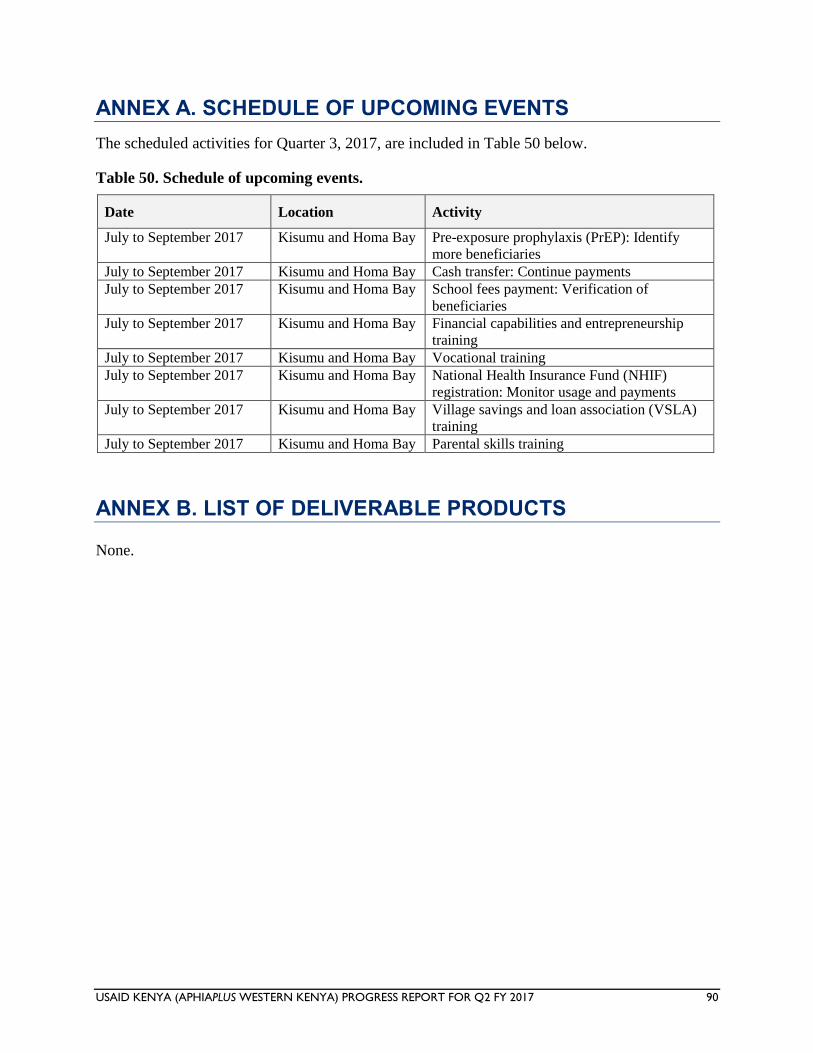
USAID KENYA (APHIAPLUS WESTERN KENYA) PROGRESS REPORT FOR Q2 FY 2017 90
ANNEX A. SCHEDULE OF UPCOMING EVENTS
The scheduled activities for Quarter 3, 2017, are included in Table 50 below.
Table 50. Schedule of upcoming events.
Date Location Activity
July to September 2017 Kisumu and Homa Bay Pre-exposure prophylaxis (PrEP): Identify
more beneficiaries
July to September 2017 Kisumu and Homa Bay Cash transfer: Continue payments
July to September 2017 Kisumu and Homa Bay School fees payment: Verification of
beneficiaries
July to September 2017 Kisumu and Homa Bay Financial capabilities and entrepreneurship
training
July to September 2017 Kisumu and Homa Bay Vocational training
July to September 2017 Kisumu and Homa Bay National Health Insurance Fund (NHIF)
registration: Monitor usage and payments
July to September 2017 Kisumu and Homa Bay Village savings and loan association (VSLA)
training
July to September 2017 Kisumu and Homa Bay Parental skills training
ANNEX B. LIST OF DELIVERABLE PRODUCTS
None.
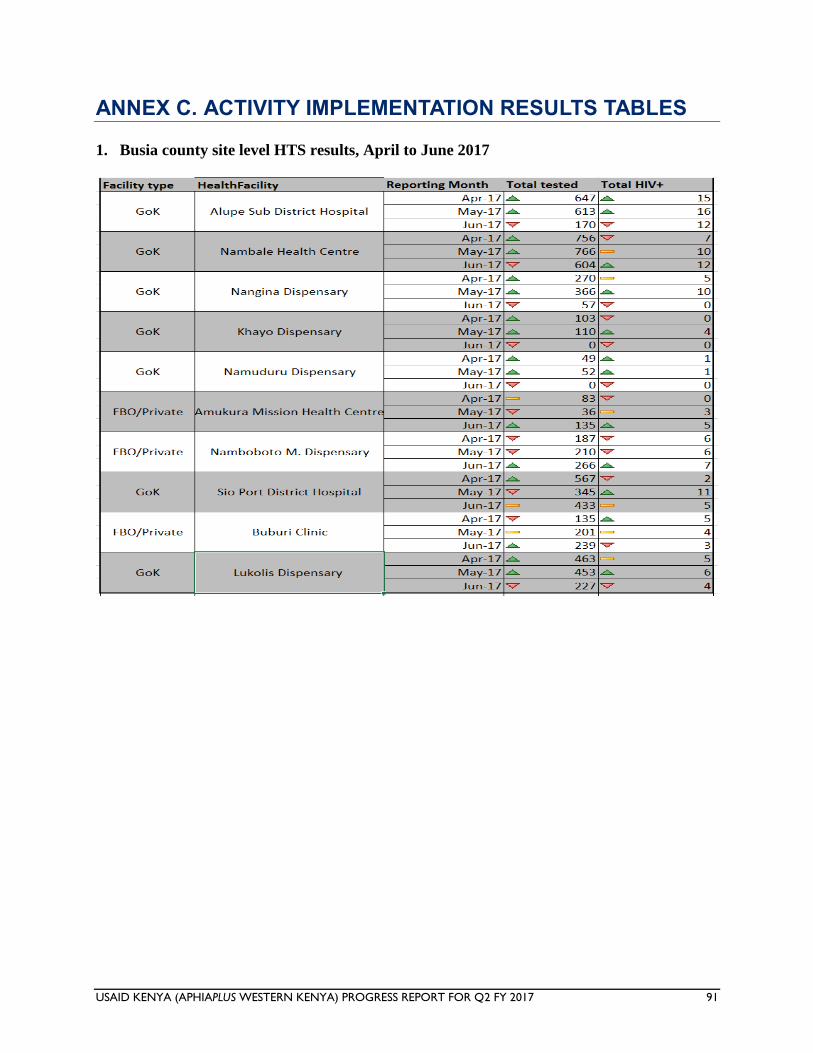
USAID KENYA (APHIAPLUS WESTERN KENYA) PROGRESS REPORT FOR Q2 FY 2017 91
ANNEX C. ACTIVITY IMPLEMENTATION RESULTS TABLES
1. Busia county site level HTS results, April to June 2017
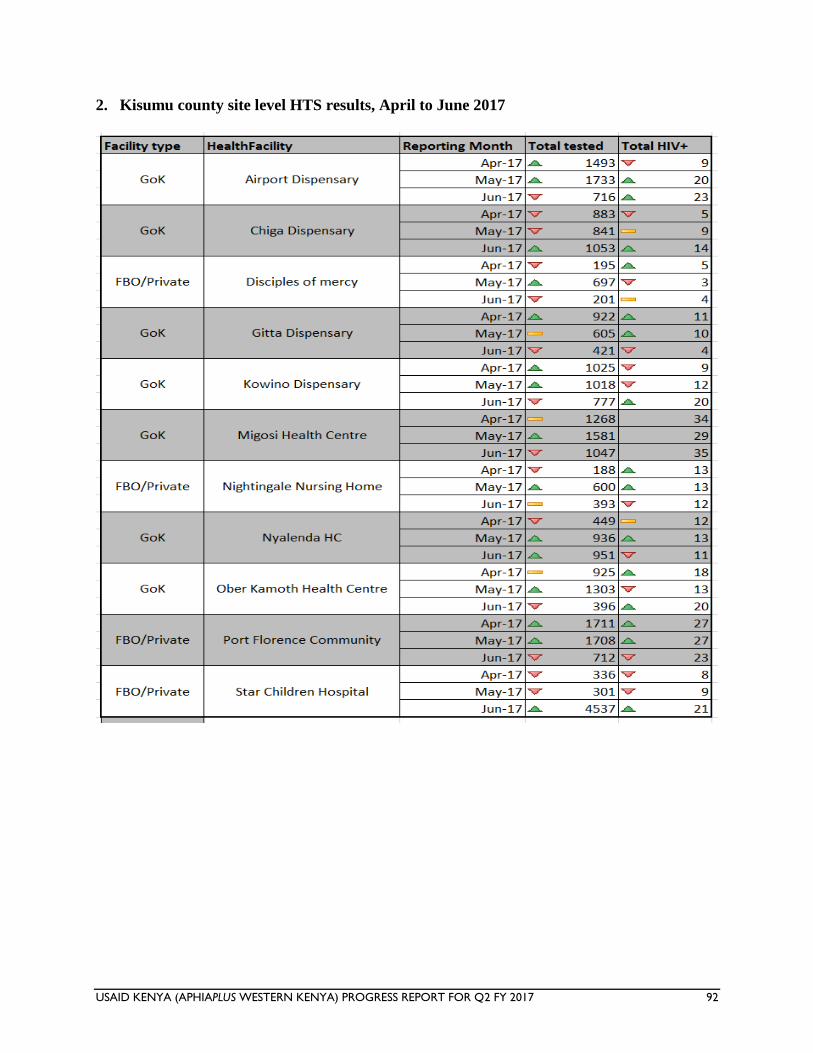
USAID KENYA (APHIAPLUS WESTERN KENYA) PROGRESS REPORT FOR Q2 FY 2017 92
2. Kisumu county site level HTS results, April to June 2017
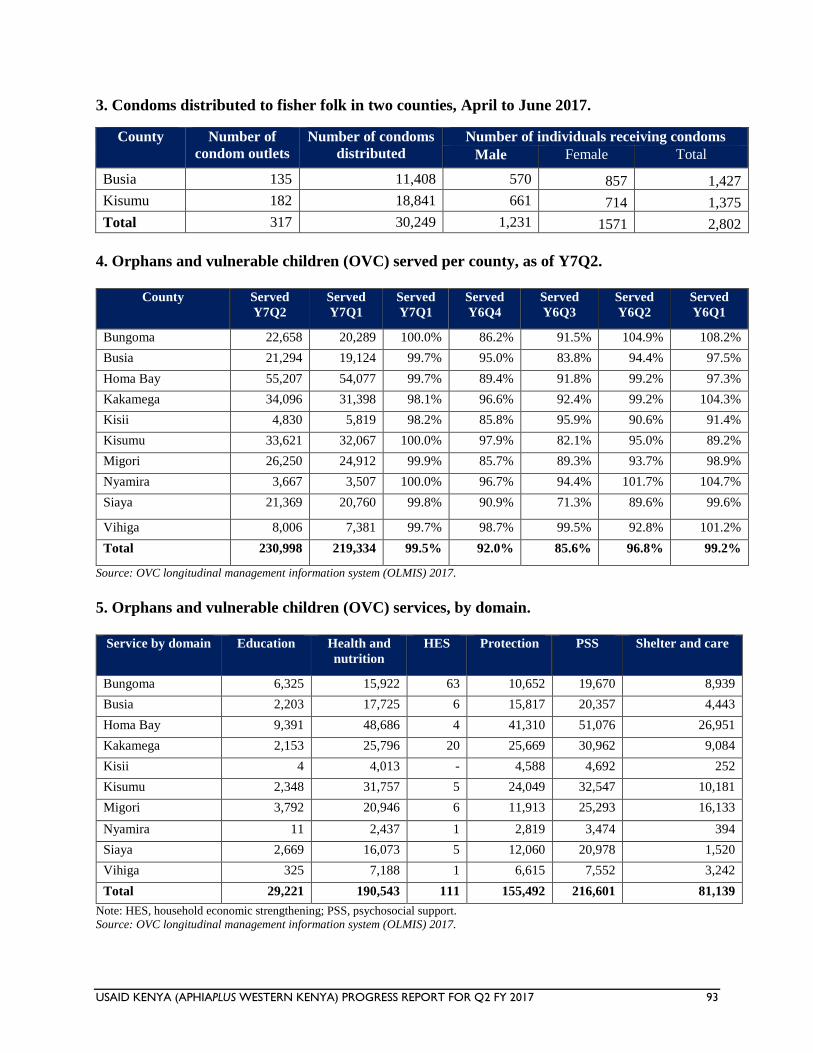
USAID KENYA (APHIAPLUS WESTERN KENYA) PROGRESS REPORT FOR Q2 FY 2017 93
3. Condoms distributed to fisher folk in two counties, April to June 2017.
County Number of
condom outlets
Number of condoms
distributed
Number of individuals receiving condoms
Male Female Total
Busia 135 11,408 570 857 1,427
Kisumu 182 18,841 661 714 1,375
Total 317 30,249 1,231 1571 2,802
4. Orphans and vulnerable children (OVC) served per county, as of Y7Q2.
County Served
Y7Q2
Served
Y7Q1
Served
Y7Q1
Served
Y6Q4
Served
Y6Q3
Served
Y6Q2
Served
Y6Q1
Bungoma 22,658 20,289 100.0% 86.2% 91.5% 104.9% 108.2%
Busia 21,294 19,124 99.7% 95.0% 83.8% 94.4% 97.5%
Homa Bay 55,207 54,077 99.7% 89.4% 91.8% 99.2% 97.3%
Kakamega 34,096 31,398 98.1% 96.6% 92.4% 99.2% 104.3%
Kisii 4,830 5,819 98.2% 85.8% 95.9% 90.6% 91.4%
Kisumu 33,621 32,067 100.0% 97.9% 82.1% 95.0% 89.2%
Migori 26,250 24,912 99.9% 85.7% 89.3% 93.7% 98.9%
Nyamira 3,667 3,507 100.0% 96.7% 94.4% 101.7% 104.7%
Siaya 21,369 20,760 99.8% 90.9% 71.3% 89.6% 99.6%
Vihiga 8,006 7,381 99.7% 98.7% 99.5% 92.8% 101.2%
Total 230,998 219,334 99.5% 92.0% 85.6% 96.8% 99.2%
Source: OVC longitudinal management information system (OLMIS) 2017.
5. Orphans and vulnerable children (OVC) services, by domain.
Service by domain Education Health and
nutrition
HES Protection PSS Shelter and care
Bungoma 6,325 15,922 63 10,652 19,670 8,939
Busia 2,203 17,725 6 15,817 20,357 4,443
Homa Bay 9,391 48,686 4 41,310 51,076 26,951
Kakamega 2,153 25,796 20 25,669 30,962 9,084
Kisii 4 4,013 - 4,588 4,692 252
Kisumu 2,348 31,757 5 24,049 32,547 10,181
Migori 3,792 20,946 6 11,913 25,293 16,133
Nyamira 11 2,437 1 2,819 3,474 394
Siaya 2,669 16,073 5 12,060 20,978 1,520
Vihiga 325 7,188 1 6,615 7,552 3,242
Total 29,221 190,543 111 155,492 216,601 81,139
Note: HES, household economic strengthening; PSS, psychosocial support.
Source: OVC longitudinal management information system (OLMIS) 2017.
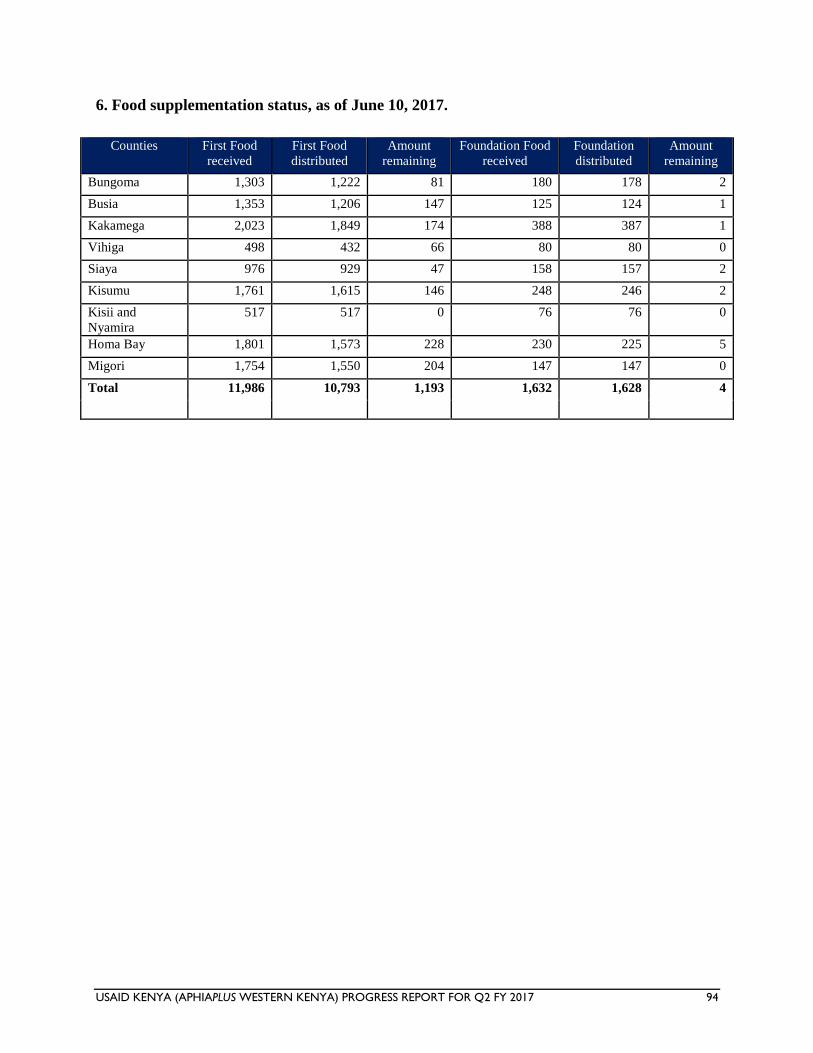
USAID KENYA (APHIAPLUS WESTERN KENYA) PROGRESS REPORT FOR Q2 FY 2017 94
6. Food supplementation status, as of June 10, 2017.
Counties First Food
received
First Food
distributed
Amount
remaining
Foundation Food
received
Foundation
distributed
Amount
remaining
Bungoma 1,303 1,222 81 180 178 2
Busia 1,353 1,206 147 125 124 1
Kakamega 2,023 1,849 174 388 387 1
Vihiga 498 432 66 80 80 0
Siaya 976 929 47 158 157 2
Kisumu 1,761 1,615 146 248 246 2
Kisii and
Nyamira
517 517 0 76 76 0
Homa Bay 1,801 1,573 228 230 225 5
Migori 1,754 1,550 204 147 147 0
Total 11,986 10,793 1,193 1,632 1,628 4
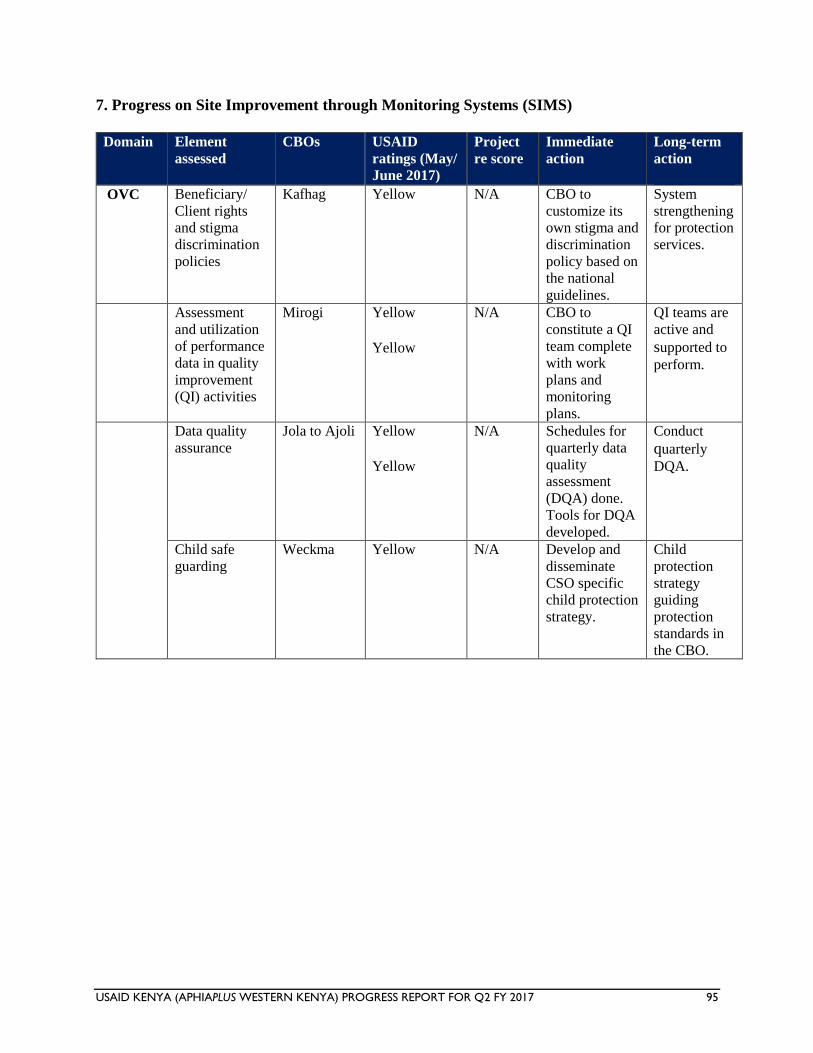
USAID KENYA (APHIAPLUS WESTERN KENYA) PROGRESS REPORT FOR Q2 FY 2017 95
7. Progress on Site Improvement through Monitoring Systems (SIMS)
Domain Element
assessed CBOs USAID
ratings (May/
June 2017)
Project
re score Immediate
action Long-term
action
OVC Beneficiary/ Client rights
and stigma
discrimination
policies
Kafhag Yellow N/A CBO to
customize its
own stigma and
discrimination
policy based on
the national
guidelines.
System
strengthening
for protection
services.
Assessment
and utilization
of performance
data in quality
improvement
(QI) activities
Mirogi Yellow Yellow
N/A CBO to
constitute a QI
team complete
with work
plans and
monitoring
plans.
QI teams are
active and
supported to
perform.
Data quality
assurance Jola to Ajoli Yellow
Yellow
N/A Schedules for
quarterly data
quality
assessment
(DQA) done.
Tools for DQA
developed.
Conduct
quarterly
DQA.
Child safe
guarding Weckma Yellow N/A Develop and
disseminate
CSO specific
child protection
strategy.
Child
protection
strategy
guiding
protection
standards in the CBO.
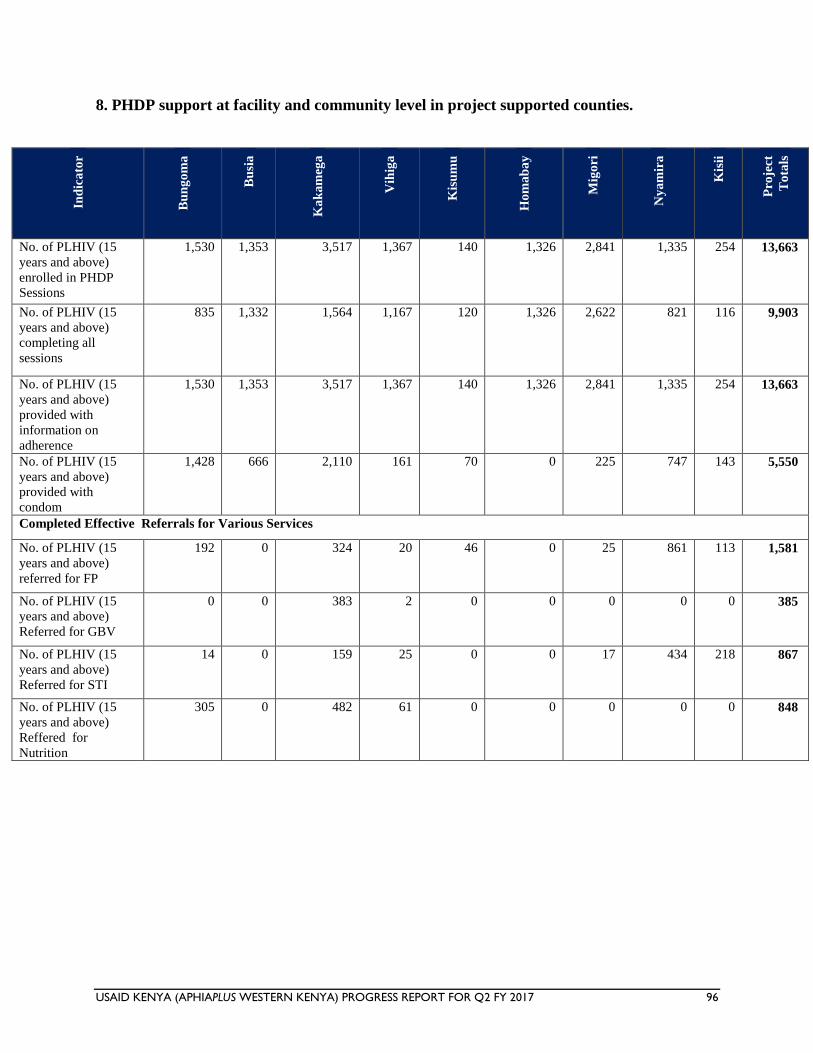
USAID KENYA (APHIAPLUS WESTERN KENYA) PROGRESS REPORT FOR Q2 FY 2017 96
8. PHDP support at facility and community level in project supported counties.
Ind
ica
tor
Bu
ng
om
a
Bu
sia
Ka
ka
meg
a
Vih
iga
Kis
um
u
Ho
ma
ba
y
Mig
ori
Ny
am
ira
Kis
ii
Pro
ject
To
tals
No. of PLHIV (15
years and above)
enrolled in PHDP
Sessions
1,530 1,353 3,517 1,367 140 1,326 2,841 1,335 254 13,663
No. of PLHIV (15
years and above)
completing all
sessions
835 1,332 1,564 1,167 120 1,326 2,622 821 116 9,903
No. of PLHIV (15
years and above)
provided with
information on
adherence
1,530 1,353 3,517 1,367 140 1,326 2,841 1,335 254 13,663
No. of PLHIV (15
years and above)
provided with
condom
1,428 666 2,110 161 70 0 225 747 143 5,550
Completed Effective Referrals for Various Services
No. of PLHIV (15
years and above)
referred for FP
192 0 324 20 46 0 25 861 113 1,581
No. of PLHIV (15
years and above)
Referred for GBV
0 0 383 2 0 0 0 0 0 385
No. of PLHIV (15
years and above)
Referred for STI
14 0 159 25 0 0 17 434 218 867
No. of PLHIV (15
years and above)
Reffered for
Nutrition
305 0 482 61 0 0 0 0 0 848


