Embed Size (px)
Citation preview

i n t e rn a t i o n a l j o u r n a l o f h y d r o g e n en e r g y 3 6 ( 2 0 1 1 ) 3 5 6 6e3 5 7 3
Avai lab le at www.sc iencedi rect .com
journa l homepage : www.e lsev ie r . com/ loca te /he
Co-electrospun Pd-coated porous carbon nanofibersfor hydrogen storage applications
Hongyeun Kim, Daehee Lee, Jooho Moon*
Department of Materials Science and Engineering, Yonsei University, Seoul 120-749, Republic of Korea
a r t i c l e i n f o
Article history:
Received 19 October 2010
Received in revised form
7 December 2010
Accepted 9 December 2010
Available online 7 January 2011
Keywords:
Carbon fiber
Electrospinning
Palladium coating
Nanoporous fibers
Hydrogen adsorption
* Corresponding author. Tel.: þ82 2 2123 285E-mail address: [email protected] (J. M
0360-3199/$ e see front matter Copyright ªdoi:10.1016/j.ijhydene.2010.12.041
a b s t r a c t
Electrospinning produces sub-micron sized continuous fibers from polymer solutions or
melt by electric force. Due to its versatility and cost-effectiveness, this method has been
recently adopted for the fabrication of one-dimensional materials. Here, we fabricated
polyacrylonitrile (PAN) polymer fibers from which uniform nanoporous carbon fibers with
diameters of 100e200 nm were obtained after carbonization at 800 �C in Ar þ H2O. Water
vapor was injected during carbonization to be utilized as a nanoscale pore former. Addi-
tionally, a direct coating method using palladium nanoparticles on the carbon fibers was
developed. Palladium salt solution was electrosprayed during the electrospinning of the
polymer fibers. X-ray photoelectron spectroscopy (XPS) and Raman spectroscopy were used
to confirm surface chemical composition and degree of carbonization. The specific surface
area of the palladium coated carbon fibers was 815.6 m2/g. Reversible hydrogen adsorption
capacity was determined to be 0.35 wt% at 298 K, 0.1 MPa.
Copyright ª 2010, Hydrogen Energy Publications, LLC. Published by Elsevier Ltd. All rights
reserved.
1. Introduction carbonmaterials. Bothsingle-wallCNTandmesoporouscarbon
Hydrogen is a promising energy alternative to fossil fuels be-
cause it is renewable and pollution-free. Among various tech-
nical issues, the identification of efficient hydrogen storage
mediaposesamajorhurdleto full-scaleexploitationofhydrogen
energy. Carbonmaterials such as carbonnanotubes [1], graphite
[2], and fullerene [3] have attracted significant interest due to
their overall safety, low mass density, and high reliability.
Among these, activated carbon and carbon fibers [4,5] provide
cost-effective storage media with reasonable storage capacity,
although more hydrogen can be absorbed on carbon nanotubes
(CNT).
Hydrogen adsorption on carbonmaterials occurs due toVan
der Waals interactions. The amount of adsorption is therefore
proportional to the surface area as well as pressure and
temperature. The effective surface area can be significantly
extended by introducing nanoscale pores on the surfaces of
5; fax: þ82 2 312 5375.oon).2010, Hydrogen Energy P
have extremely high surface areas of w1300 and w2000 m2/g,
respectively. These high surface area carbon materials are
usually synthesized by either vapor phase deposition or tem-
plating processes. However, their synthesis methods are
generally unsuitable for cost-effective mass production, which
prevents them from being utilized for hydrogen storage.
Electrospinning produces sub-micron sized continuous
fibers from a polymer solution or melt by electric force. Due to
its versatility and cost-effectiveness, this process has been
adopted to fabricate one-dimensional nanostructured mate-
rials. Recently, electrospun carbon fibers have been applied to
uses in fuel cells [6], supercapacitors [7], electrochemical
storage [8] and hydrogen storage media [9]. Porous carbon
fibers are capable of hydrogen storage as much as 2.5 wt% H2
at 300 K and 30 MPa [10].
The introduction of water vapor while carbonizing fibers
can assist with the formation of pores on the hydrophobic
ublications, LLC. Published by Elsevier Ltd. All rights reserved.

Fig. 1 e Schematic diagram of the co-electrospinning
process.
60
70
80
90
100
t L
os
s (%
)
0
5
He
at F
lo
w (
42oC100%
ring reaction of PAN
a
i n t e r n a t i o n a l j o u r n a l o f h y d r o g e n en e r g y 3 6 ( 2 0 1 1 ) 3 5 6 6e3 5 7 3 3567
carbon surface by removing surface carbon atoms. The pore
formation reaction occurs as follows:
C(s) þ 2H2O / CO2 (g) þ 2H2 (1)
C(s) þ H2O / CO (g) þ H2 (2)
Molina-Sabio et al. reported that nanoporous carbon con-
taining pores less than 1 nm in diameter can be synthesized by
steam activation at high temperature (w800 �C), although the
amount of surface oxygen increases slightly [11]. These slit
pores contribute to the increase in the active surface area and,
in turn, enhance the hydrogen storage. Furthermore, surface
modification with a metal catalyst can also boost hydrogen
adsorption, either by the spillover effect [12] or metal hydride
formation [13]. The hydrogenmolecules that are preferentially
absorbed on the metal catalyst particles are dissociated, fol-
lowed by migration of hydrogen atoms to remote surface
sites on the carbon materials. In particular, Pd nanorpar-
ticles loaded on carbon materials can chemically absorb
hydrogenby forminghydride (PdHx) [14]. Particle sizealsoplays
an important role in determining hydrogen solubility. In the
present study, we prepare Pd nanoparticle-coated high surface
area carbon nanofibers by a one-step co-electrospinning
method. Pd salt containing solution was electrosprayed while
polyacrylonitrile (PAN) fibers are drawn from the core. Water
vapor was introduced during carbonization at 800 �C to obtain
nanoporous carbon fibers and, at the same time, Pd salt
attached to the PAN was reduced to Pd nanoparticles during
cooling. We performed structural and chemical analyses to
identify PAN-derived nanoporous carbon fibers and compare
the H2 adsorption abilities of carbon fibers prepared under
different synthesis conditions.
0 100 200 300 400 500 600 700 800 900
30
40
50
Temperature (o
C)
We
ig
h
31.45%-10
-5 W/g
)
0 100 200 300 400 500 600 700 800 900
30
40
50
60
70
80
90
100
Temperature (o
C)
Weig
ht L
oss (%
)
42oC100%
ring reaction of PAN
50.72%
-10
-5
0
5
He
at F
lo
w (W
/g
)
b
Fig. 2 e TG-DSC graphs of (a) as-spun PAN fibers and (b) Pd
salt coated PAN fibers.
2. Experimental procedures
To prepare the precursor solution for electrospinning, poly-
acrylonitrile (PAN, Mw ¼ 150,000, Aldrich) was dissolved in
dimethylformamide (DMF, anhydrous, 99.8%, Aldrich) at
60 �C. The viscosity of the polymer solutionwas in the range of
1600e2000 mPa s as determined by a rheometer (AR-2000EX,
TA Instruments). The polymer solution was electrospun
through a stainless steel nozzle (inner diameter¼ 0.51mm) by
applying an electric field of 1 kV/cm using a high-voltage DC
power supply unit (Nanotech) at a distance of 15 cm between
the nozzle and the drum collector. The polymer solution was
supplied by a syringe pump (KD100, KD Scientific) at a flow
rate of 1.0 ml/h. As-electrospun polymer fibers were dried at
80 �C for 24 h, followed by stabilization at 250 �C for 4 h in air
and then carbonization occurred at 800 �C for 2 h in an argon
atmosphere. During carbonization, fibers were exposed to
water vapor carried by Ar gas bubbled through a water bath.
The amount of water vapor was adjusted by controlling bath
temperature (40 �C) and exposure time to water vapor during
carbonization, which was varied from 0 h to 2 h.
Palladium solution of 1 wt% was prepared by dissolving
palladium chloride (PdCl2, 99.999% Aldrich) in a DMF solution
and the resulting solution was vigorously stirred at 60 �C to
ensure a complete dissolution. A dual concentric-type nozzle
was used to produce palladium coated carbon fibers. The PAN
solution was supplied through the inner part of the nozzle
(core), while the palladium solution was sprayed through the
outer part of the nozzle (sheath) as shown in Fig. 1. The
palladium salt coated fibers were stabilized at 250 �C for 4 h in
air, followed by carbonization at 800 �C for 2 h under a water

i n t e rn a t i o n a l j o u r n a l o f h y d r o g e n en e r g y 3 6 ( 2 0 1 1 ) 3 5 6 6e3 5 7 33568
vapor atmosphere carried by highly purified Ar gas. The
palladium ions were reduced by 4% H2 balanced Ar gas at
250 �C for 2 h during cooling.
The thermal decomposition behavior of the electrospun
polymer fibers was determined by a thermal gravimetric-
differential scanning calorimeter (TG-DSC, Q600, TA Instru-
ments) in a nitrogen atmosphere. The morphologies of the
stabilized and carbonized fibersweremonitored by a scanning
electron microscope (SEM, HITACHI S-4300, Hitachi) and
a transmission electron microscope (TEM, JEM-2000EX, Jeol).
Fig. 3 e TEM and SEM (inset) images of PAN-derived
nanoporous carbon fibers: (a) water vapor untreated fibers,
(b) 1 h water vapor treated fibers, and (c) 2 h water vapor
treated fiber.
Surface chemical structures of the carbon fibers were
analyzed by X-ray photoelectric spectroscopy (XPS, ESCALAB
22i-XL, VG Scientific Ins.) and Raman spectroscopy (LabRam
HR High Resolution, Jobin-Yvon). Specific surface area was
measured using the Brunauer-Emmett-Teller (BET) nitrogen
method (ASAP 2020, Micromeritics Ins.) and hydrogen stor-
age capacity was compared by measuring the adsorption
isotherm using high-purity dry H2 (99.999%) at both 77 K and
298 K.
3. Results and discussion
Fig. 2a shows the thermal decomposition behavior of the
electrospun polymer fiber. An abrupt weight loss (36 wt%)
occurred accompanying an exothermic peak in the vicinity of
310e340 �C, followed by a gradual weight loss. The exothermic
reaction at 310e350 �C can be ascribed to cyclization reaction
10 100 1000
0.00
0.02
0.04
0.06
0.08
0.10
0.12
0.14
0.16
H-K method
Diffe
re
ntia
l P
ore
V
olu
me
cm
3
/g
·
Pore size distribution (Å)
a
BJH method
10 100 1000
0.00
0.02
0.04
0.06
0.08
0.10
0.12
0.14
0.16
BJH method
Diffe
ren
tia
l P
ore
V
olu
me
cm
3
/g
·Å
Pore size distribution (Å)
b
H-K method
Fig. 4 e Differential plot of the BET analysis of (a) 2 h water
vapor treated carbon fibers and (b) 2 h water vapor treated
palladium coated carbon fibers. Carbon fibers are
preheated at 250 �C for 4 h in a vacuum prior to the
measurement.

i n t e r n a t i o n a l j o u r n a l o f h y d r o g e n en e r g y 3 6 ( 2 0 1 1 ) 3 5 6 6e3 5 7 3 3569
of the nitrile groups [15]. Cyclization reactions cause the PAN
polymer to transform into a ladder-structured polymer by
polymer-analogue polymerization of the nitrile groups [16].
The stabilization process of the electrospun PAN fiber was
performed at 250 �C which was 50 �C lower than the temper-
ature involving a drastic weight loss based on the TG-DSC
result to maintain the fiber shape.
Electric field strength plays an important role in deter-
mining the morphologies of the electrospun PAN. At an elec-
tric field of 1.0 kV/cm, continuous and relatively uniform PAN
fibers with the diameter of 200e400 nm were produced as
confirmed by both SEM and TEM (data not shown). Under an
electric field strength condition of <0.6 kV/cm or >1.6 kV/cm,
on the other hand, we observed either bead formation or
larger-sized discontinuous fibers due to the instability of the
jet [17]. The fibers were shrunk to a diameter of 100e200 nm
after carbonization at 800 �C as shown in Fig. 3a. No other
noticeable morphological change or damage was observed.
Introduction of water vapor during carbonization did not alter
macroscopic fiber shape, but did produce nanoscale slit pores
on the carbon fiber surfaces (Fig. 3b). Extending water vapor
exposure time from 1 h to 2 h caused more pores to form, as
300 295 290 285 280 275
C=O (288.9V)
C-O (286.5eV)
Binding Energy (eV)
C-C (285eV)
a
b
300 295 290 285 280 275
Binding Energy (eV)
C=O (288.9V)
C-O (286.5eV)
C-C (285eV)
1200 800 400 0
Binding Energy (eV)
O 1s
N 1s
C 1s
1200 800 400 0
Pd 3d
O 1s
N 1s
Binding Energy (eV)
C 1s
Fig. 5 e XPS data of (a) 2 h water vapor treated carbon fibers
and (b) 2 h water vapor treated palladium coated carbon
fibers.
shown in Fig. 3c. An increased amount of adsorbed water
promotes pore formation on carbon surface as described in
Equations (1) and (2).
Water vapor exposure effectively expands the surface area
of the electrospun carbon fibers. The BET surface area for
carbon fibers not treated with water vapor was 15.1 � 6 m2/g,
whereas the surface area increased dramatically to 648.2 � 37
and 1120.8 � 27.2 m2/g as the water vapor exposure time
increased from 1 h to 2 h, respectively. This value is similar to
the theoretical value of single-wall CNT (1315 m2/g) [18]. Upon
further exposure to water vapor, the carbonized fibers were
completely burned out. Detailed pore structures of various
carbon fibers were analyzed by BET measurements. Fig. 4a
shows the pore size distribution for the carbon fibers treated
with water vapor for 2 h. Both Horvath-Kawazoe (HK) and
Barrett-Joyner-Halenda (BJH) analyses were utilized to reveal
the nanoporous (pore size 0.4e2.0 nm) and the mesoporous
(pore size 2e50 nm) characteristics. The differential pore
volume plot indicated that the water vapor treated carbon
nanofibers have a narrow pore size distribution. They con-
tained mainly sub-nm to 1 nm sized slit pores whose volume
fraction accounts for w90% of the total pore volume.
XPS analysis was performed under ultra high vacuum
(w1� 109 Torr) to study the surface chemistry of carbon fibers.
The wide scan spectrum indicated that water vapor treated
carbon fiber contained only oxygen, nitrogen, and carbon
(Fig. 5a). The C 1s spectrum can be deconvoluted into three
Gaussian distribution sub-peaks. The main peaks observed at
a binding energy of 285 eV in Fig. 5a can be attributed to carbon
single bond (CeC) [19]. The second peak at 286.5 eV originated
500 1000 1500 2000
D band
Binding Energy (eV)
a
G band
500 1000 1500 2000
b
Binding Energy (eV)
Fig. 6 e Raman spectroscopy results of (a) water vapor
untreated and (b) 2 h water vapor treated carbon fibers.

i n t e rn a t i o n a l j o u r n a l o f h y d r o g e n en e r g y 3 6 ( 2 0 1 1 ) 3 5 6 6e3 5 7 33570
from the carboneoxygen single bond (CeO), whereas the third
peak observed at 288.9 eV represented the oxygen defects
caused by C]O or O]CeO bonds. These surface oxygens
likely result from adsorption during the stabilization process
in air. The surface composition calculated by the peak area
ratio was approximately 80% carbonecarbon bonds and 20%
carboneoxygen bonds. Carboneoxygen bonds reduce molec-
ular hydrogen absorption capacity on carbon surfaces because
CeO, C]O or O]CeO bonds are too chemically stable to
adsorb hydrogen molecules [20]. It is possible to reduce the
oxygen content on the fibers by raising the carbonization
temperature above 900 �C, but the specific surface area and
the synthesis yield were significantly reduced.
Fig. 6 shows Raman spectra of electrospun carbon nano-
fibers prepared under different atmospheres. The presence of
water vapor did not alter the Raman spectra. The two Raman
spectra (500e2200 cm�1) for the samples carbonized in dry
argon (Fig. 6a) and moisturized argon (Fig. 6b) were almost
identical. The peak at 1580e1600 cm�1 is called G band which
canbe assigned to the sp2 bonds. The stronger peak intensity of
theGband indicatesahigherdegreeof graphitization.Thepeak
positionedat 1350e1360 cm�1 corresponds to theD bandwhich
originated from the disordered carbon (a mixture of the sp and
sp3 bondsor thebrokenbond) [21]. For the carbonmaterials, the
relative intensity raio (R), defined as ID/IG where ID and IGrepresent the maximum peak intensity for D and G bands,
respectively, is indicative of the surface defect density. As R
shrinks, the number of sp2 bonds increases. The R value for the
carbon fiber obtained by dry carbonization was 1.24, whereas
0 2 4
c
In
te
ns
ity
(A
rb
. U
nit)
k
C
N
OPd
Fig. 7 e SEM images and the corresponding EDX spectrum of pa
0.95 for the water vapor treated carbon fibers since the peak
intensity of the D band declined. Raman analysis revealed that
the water vapor treated carbon fibers contain less surface
defects compared to those prepared by dry carbonization. The
surface defect concentration was reduced as the surface
carbon atomswere eliminated by thewatermolecules, leaving
behind the micropores on the surfaces.
Palladium coated carbon fiber was fabricated by a single-
step co-electrospinning process as shown in Fig. 7. At the stage
of stabilization at 250 �C in air, nanosized palladium salt
particles were distributed around the fibers as confirmed by
SEM images and energy dispersive X-ray (EDX) analysis in
Fig. 7. The peaks of carbon, nitrogen, oxygen and palladium
were observed for air-stabilized polymer fibers. Chlorine is
invisible since its peaks overlap with those of palladium. The
thermal decomposition behavior of the Pd salt coated polymer
fibers was similar to the PAN fibers as shown in Fig. 2b. DMF
solvent that was entrapped in the polymer fiber evapora-
ted below 200 �C and total weight loss was reduced. After
carbonization in moisturized argon and successive reduction
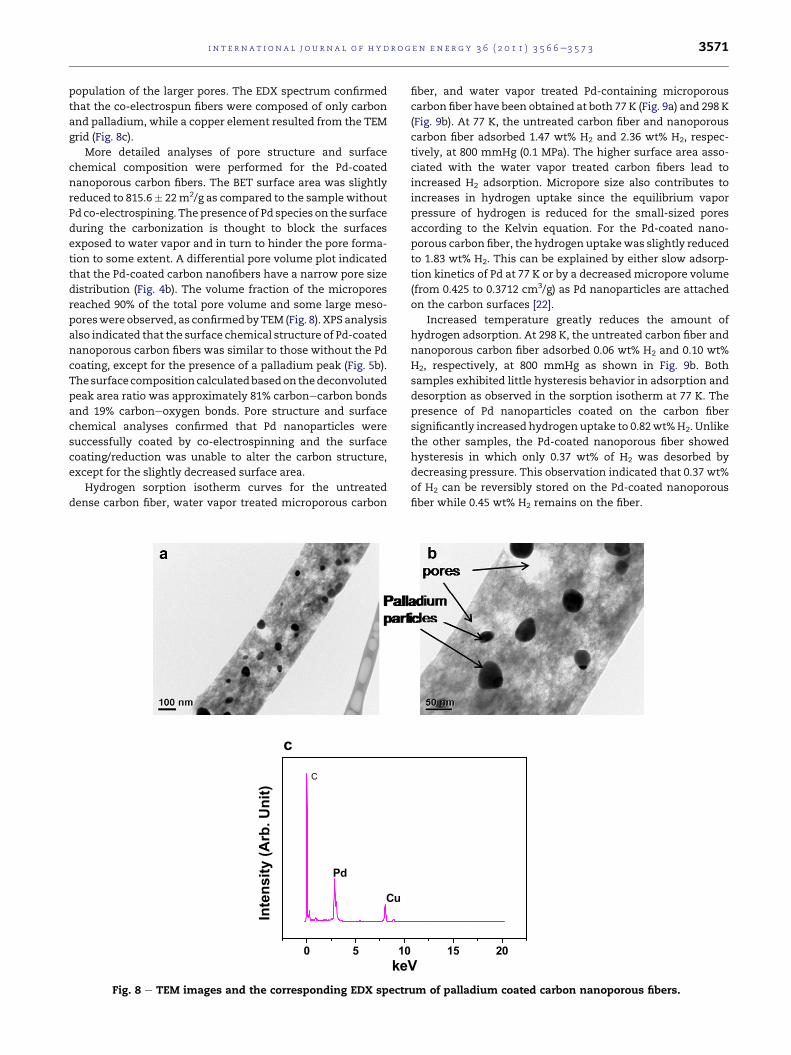
in a H2þAr atmosphere, Pd nanoparticles were uniformly
coated on the surface of the carbon nanoporous fibers as
shown in Fig. 8a and b. The TEM study revealed that Pd nano-
particles in a size range of 10e50 nm were attached on the
carbon surface. The macroscopic morphology of the nano-
fibers was unchanged during the co-spinning process. The
averagediameterof thefiberswere in the rangeof 100e200nm.
There was also no noticeable variation in the pore structure
of the co-electrospun carbon fibers except for the increased
6 8 10
eV
lladium salt coated PAN fibers after stabilization at 250 �C.
i n t e r n a t i o n a l j o u r n a l o f h y d r o g e n en e r g y 3 6 ( 2 0 1 1 ) 3 5 6 6e3 5 7 3 3571
population of the larger pores. The EDX spectrum confirmed
that the co-electrospun fibers were composed of only carbon
and palladium, while a copper element resulted from the TEM
grid (Fig. 8c).
More detailed analyses of pore structure and surface
chemical composition were performed for the Pd-coated
nanoporous carbon fibers. The BET surface area was slightly
reduced to 815.6� 22m2/g as compared to the sample without
Pd co-electrospining. Thepresenceof Pd species on the surface
during the carbonization is thought to block the surfaces
exposed to water vapor and in turn to hinder the pore forma-
tion to some extent. A differential pore volume plot indicated
that the Pd-coated carbon nanofibers have a narrow pore size
distribution (Fig. 4b). The volume fraction of the micropores
reached 90% of the total pore volume and some large meso-
poreswere observed, as confirmedbyTEM (Fig. 8). XPS analysis
also indicated that the surface chemical structure of Pd-coated
nanoporous carbon fibers was similar to those without the Pd
coating, except for the presence of a palladium peak (Fig. 5b).
Thesurfacecomposition calculatedbasedon thedeconvoluted
peak area ratio was approximately 81% carbonecarbon bonds
and 19% carboneoxygen bonds. Pore structure and surface
chemical analyses confirmed that Pd nanoparticles were
successfully coated by co-electrospinning and the surface
coating/reduction was unable to alter the carbon structure,
except for the slightly decreased surface area.
Hydrogen sorption isotherm curves for the untreated
dense carbon fiber, water vapor treated microporous carbon
0 5 10
c
ke
C
Pd
Cu
In
te
ns
ity
(A
rb
. U
nit)
Fig. 8 e TEM images and the corresponding EDX spectr
fiber, and water vapor treated Pd-containing microporous
carbon fiber have been obtained at both 77 K (Fig. 9a) and 298 K
(Fig. 9b). At 77 K, the untreated carbon fiber and nanoporous
carbon fiber adsorbed 1.47 wt% H2 and 2.36 wt% H2, respec-
tively, at 800 mmHg (0.1 MPa). The higher surface area asso-
ciated with the water vapor treated carbon fibers lead to
increased H2 adsorption. Micropore size also contributes to
increases in hydrogen uptake since the equilibrium vapor
pressure of hydrogen is reduced for the small-sized pores
according to the Kelvin equation. For the Pd-coated nano-
porous carbon fiber, the hydrogen uptakewas slightly reduced
to 1.83 wt% H2. This can be explained by either slow adsorp-
tion kinetics of Pd at 77 K or by a decreased micropore volume
(from 0.425 to 0.3712 cm3/g) as Pd nanoparticles are attached
on the carbon surfaces [22].
Increased temperature greatly reduces the amount of
hydrogen adsorption. At 298 K, the untreated carbon fiber and
nanoporous carbon fiber adsorbed 0.06 wt% H2 and 0.10 wt%
H2, respectively, at 800 mmHg as shown in Fig. 9b. Both
samples exhibited little hysteresis behavior in adsorption and
desorption as observed in the sorption isotherm at 77 K. The
presence of Pd nanoparticles coated on the carbon fiber
significantly increased hydrogen uptake to 0.82wt%H2. Unlike
the other samples, the Pd-coated nanoporous fiber showed
hysteresis in which only 0.37 wt% of H2 was desorbed by
decreasing pressure. This observation indicated that 0.37 wt%
of H2 can be reversibly stored on the Pd-coated nanoporous
fiber while 0.45 wt% H2 remains on the fiber.
15 20
V
um of palladium coated carbon nanoporous fibers.

0 200 400 600 800
0.0
0.5
1.0
1.5
2.0
2.5
3.0
Water vapor treated
Absolute pressure (mmHg)
Untreated
Water vapor treated with Pd coated
a
0 200 400 600 800
0.0
0.2
0.4
0.6
0.8 Water vapor treated with Pd coated Water vapor treated Untreated
Absolute pressure (mmHg)
b
Fig. 9 e Hydrogen adsorption capability determined by the
BETmethod at the temperatures of (a) 77 K and (b) 298 K for
various carbon fibers prepared at different conditions.
i n t e rn a t i o n a l j o u r n a l o f h y d r o g e n en e r g y 3 6 ( 2 0 1 1 ) 3 5 6 6e3 5 7 33572
A TG ananlysis of palladium salt-coated PAN fiber was
performed to determine the Pd loading amount. The Pd-coated
fibers were pyrolzed in air at 900 �C where all of the carbon
species were eliminated, leaving behind the oxidized Pd.
Assuming that the remaining phase was PdO, we determined
the Pd loading content to be 8.7 wt% based on multiple
measurements. At room temperature and 1 atm of H2, a palla-
diumhydridewith a stoichiometry of 0.6H/Pd can form,which
corresponds to a hydrogen capacity of 0.56 wt% of bulk Pd
[23]. Accounting for the Pd loading in our carbon fiber (8.7 wt%)
as determined by TG analysis, the amount of hydrogen
adsorption in the form of palladiumhydride is calculated to be
0.05 wt% H2. The hydrogen physisorbed on the Pd-coated fiber
is proportional to the active surface area of the carbon surface,
whichwas calculated to bew0.09wt%H2. Thus, the remaining
hydrogen adsorption (w0.23wt%H2 ) out of the total reversible
adsorption occurred via a spillover effect or hydrogen accu-
mulation on the interface between Pd particle-carbon surface.
Molecular hydrogen physisorbs on carbon fiber in the
absenceofPdparticles. In thepresenceofPdparticles, however,
the hydrogenmolecules were dissociated over Pd surfaces due
to the incompletely occupied d-orbitals. Some of the chem-
isorbed hydrogen atoms dissolved to form a hydride. Dissoci-
ated hydrogen atoms can also migrate to the carbon support
near the PdeC interface. Some of these hydrogen atoms
form stable bonds with surface defects near the PdeC inter-
face, leading to irreversible adsorption (0.45 wt% H2). Other
hydrogen atoms can be reversibly desorbed by migration back
to Pd particles as well as those stored in the form of palladium
hydride [24]. This hydrogen spillover accounts for thehydrogen
adsorption of 0.23 wt% H2.
4. Conclusions
We demonstrated the synthesis of Pd nanoparticle-coated
carbon nanoporous fibers by one-step co-electrospinning.
Palladium salt solution was electrosprayed while the poly-
acrylonitrile (PAN) polymer fibers were electrospun. Uniform
nanoporous carbon fibers with Pd nanoparticles of 10e50 nm
in diameter were obtained by carbonization at 800 �C in
Ar þ H2O and reduction at 250 �C in H2 þ Ar. Water vapor was
utilized as a nanoscale pore former by injecting it during the
carbonization at 800 �C. The resulting carbon fibers had a sub-
nano scale pore structure, possessing a high surface area of
815.6e1120.8 m2/g, as determined by TEM observation and
BET surface area analysis. Raman spectroscopy and XPS
analyses also confirmed that the Pd-loaded carbon fibers are
highly carbonized (R ¼ 0.95) and are composed of 80% CeC
bonds. Hydrogen adsorption capacity of the palladium coated
carbon nanofibers was 2.36 wt% H2 at 77 K and 0.82 wt% H2 at
298 K, 0.1 MPa. The hydrogen adsorption at 298 K can be
divided into reversible uptake (0.37 wt% H2) and irreversible
uptake (0.45 wt% H2). Irreversible adsorption occurs by stable
bonding formation of the dissociated hydrogen atoms with
surface defects near the PdeC interface.
Acknowledgement
This work was supported by DAPA and ADD in Korea. It was
also partially supported by the Second Stage of the Brain Korea
21 Project.
r e f e r e n c e s
[1] Liu C, Fan YY, Liu M, Cong HT, Cheng HM, Dresselhaus MS.Hydrogen storage in single-walled carbon nanotubes at roomtemperature. Science 1999;286:1127e9.
[2] Heine T, Zhechkov L, Seifert G. Hydrogen storage byphysisorption on nanostructured graphite platelets. PhysChem Chem Phys 2004;6:980e4.
[3] Zhao Y, Kim YH, Dillon AC, Heben MJ, Zhang SB. Hydrogenstorage in novel organometallic buckyballs. Phys Rev Lett2005;94:155504.
[4] de la Casa-Lillo MA, Lamari-Darkrim F, Cazorla-Amoros D,Linares-Solano A. Hydrogen storage in activated carbons andactivated carbon fibers. J Phys Chem B 2002;106:10930e4.
[5] Im JS, Park SJ, Kim TJ, Lee YS. Hydrogen storage evaluationbased on investigations of the catalytic properties of metal/metal oxides in electrospun carbon fibers. Int J HydrogenEnergy 2009;34:3382e8.
i n t e r n a t i o n a l j o u r n a l o f h y d r o g e n en e r g y 3 6 ( 2 0 1 1 ) 3 5 6 6e3 5 7 3 3573
[6] Li M, Zhao S, Han G, Yang B. Electrospinning-derivedcarbon fibrous mats improving the performance ofcommercial Pt/C for methanol oxidation. J Power Sourc 2009;191:351e6.
[7] Kim C, Yang KS. Electrochemical properties of carbonnanofiber web as an electrode for supercapacitor prepared byelectrospinning. Appl Phys Lett 2003;83:1216e8.
[8] Chen X, Zhang Y, Gao XP, Pan GL, Jiang XY, Qu JQ, et al.Electrochemical hydrogen storage of carbon nanotubes andcarbon nanofibers. Int J Hydrogen Energy 2004;29:743e8.
[9] Im JS, Park SJ, Kim TJ, Kim YH, Lee YS. The study ofcontrolling pore size on electrospun carbon nanofibersfor hydrogen adsorption. J Colloid Interface Sci 2008;318:42e9.
[10] Rzepka M, Lamp P, de la Casa-Lillo MA. Physisorption ofhydrogen on microporous carbon and carbon nanotubes.J Phys Chem B 1998;102:10894e8.
[11] Molina-Sabio M, Gonzalez MT, Rodriguez-Reinoso F,Sepulveda-Escribano A. Effect of steam and carbon dioxideactivation in the micropore size distribution of activatedcarbon. Carbon 1996;34:505e9.
[12] Zacharia R, Kim KY, Kibria AKMF, Nahm KS. Enhancement ofhydrogen storage capacity of carbon nanotubes via spill-overfrom vanadium and palladium nanoparticles. Chem PhysLett 2005;412:369e75.
[13] Takagi H, Hatori H, Yamada Y, Matsuo S, Shiraishi M.Hydrogen adsorption properties of activated carbons withmodified surfaces. J Alloy Comp 2004;385:257e63.
[14] Fukai Y. The metalehydrogen system: basic bulk properties.2nd ed. New York: Springer; 2005.
[15] Kim HS. Thermal behavior of polyacrylonitrile and poly(vinylpyrrolidone-graft-acrylonitrile) blend. J Polymer Sci BPolymer Phys 1996;34:1181e7.
[16] Fitzer E, Muller DJ. The influence of oxygen on the chemicalreactions during stabilization of pan as carbon fiberprecursor. Carbon 1975;13:63e9.
[17] HohmanMM,ShinM,RutledgeG, BrennerMP. Electrospinningand electrically forced jets. II. Applications. Phys Fluid 2001;13:2221e36.
[18] Peigney A, Laurent Ch, Flahaut E, Bacsa RR, Rousset A.Specific surface area of carbon nanotubes and bundles ofcarbon nanotubes. Carbon 2001;39:507e14.
[19] Deitzel JM, KosikW,McKnight SH, BeckTanNC,DeSimone JM,Crette S. Electrospinning of polymer nanofibers with specificsurface chemistry. Polymer 2002;43:1025e9.
[20] Lamari Darkrim F, Malbrunot P, Tartaglia GP. Review ofhydrogen storage by adsorption in carbon nanotubes. IntJ Hydrogen Energy 2002;27:193e202.
[21] WangY, SerranoS, Santiago-Aviles JJ. Ramancharacterizationof carbon nanofibers prepared using electrospinning.Synthetic Met 2003;138:423e7.
[22] Contescu CI, Brown CM, Liu L, Bhat VV, Gallego NC. Detectionof hydrogen spillover in palladium-modified activatedcarbon fibers during hydrogen adsorption. J Phys Chem C2009;113:5886e90.
[23] Mueller WM, Blackledge JP, Libowitz GG. Metal hydrides.New York: Academic Press; 1964.
[24] Lachawiec AJ, Qi JG, Yang RT. Hydrogen storage innanostructured carbons by spillover: bridge-buildingenhancement. Langmuir 2005;21:11418e24.


![[PD] Libros - Mapas Estrategicos](https://img.dokumen.tips/doc/110x75/6359494c341e5cd74a0a96c8/pd-libros-mapas-estrategicos.jpg)


