Embed Size (px)
Citation preview

APPENDIX B
Purpose and Need and Alternatives

TECHNICAL MEMORANDUM – Final
Forecast Technical Memorandum Charlotte Douglas International Airport Environmental Impact Statement
PREPARED FOR
FEDERAL AVIATION ADMINISTRATION
Mr. Tommy Dupree 2600 Thousand Oaks Boulevard Suite 2250 Memphis, Tennessee 38118 901.322.8182
PREPARED BY
VHB Engineering NC, P.C.
IN ASSOCIATION WITH InterVISTAS
4/18/2018

Record of Changes/Version History
Change/ Version Number Date of Change Sections Changed Description
Person Entering Change
1 11/10/2017 All Original Draft VHB/InterVISTAS
2 1/17/2018 1, Appendix Additional data added to tables VHB/InterVISTAS
3 03/27/2018 All Response to FAA Comments VHB/InterVISTAS
4 04/18/2018 None. Finalized. VHB
CLT EIS Forecast Technical Memorandum
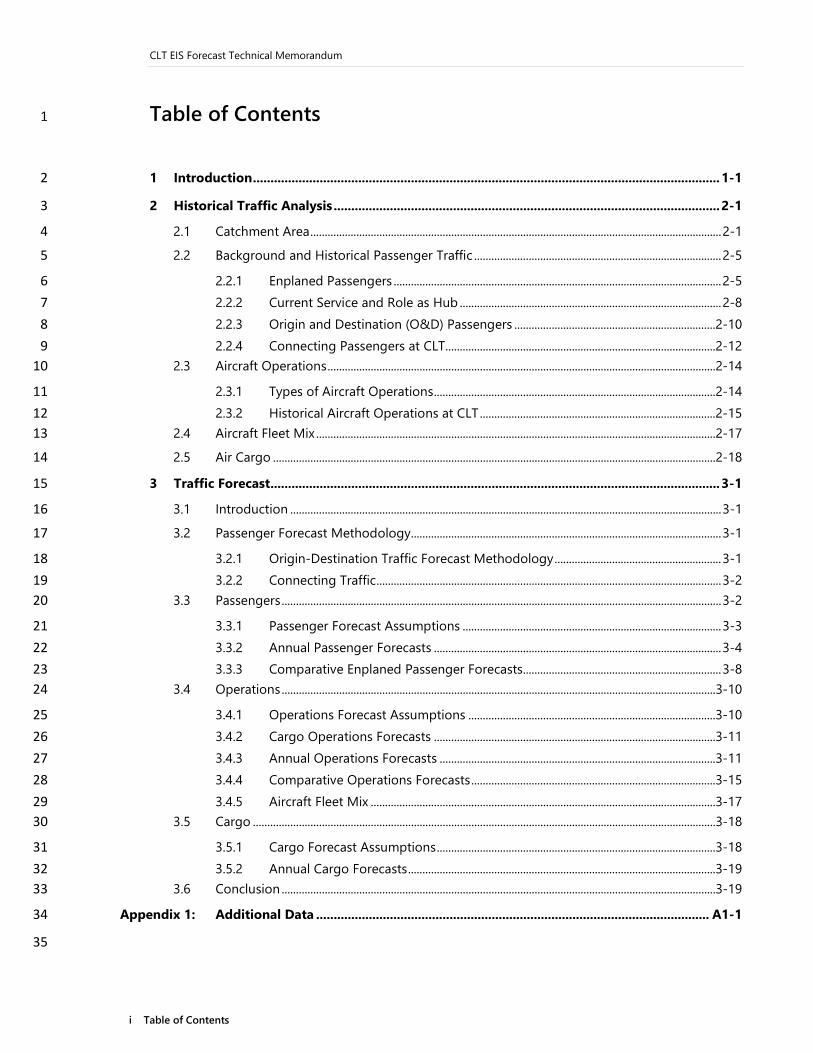
i Table of Contents
Table of Contents 1
1 Introduction ..................................................................................................................................... 1-1 2
2 Historical Traffic Analysis .............................................................................................................. 2-1 3
2.1 Catchment Area ............................................................................................................................................... 2-1 4
2.2 Background and Historical Passenger Traffic ...................................................................................... 2-5 5
2.2.1 Enplaned Passengers .................................................................................................................. 2-5 6 2.2.2 Current Service and Role as Hub ........................................................................................... 2-8 7 2.2.3 Origin and Destination (O&D) Passengers ......................................................................2-10 8 2.2.4 Connecting Passengers at CLT ..............................................................................................2-12 9
2.3 Aircraft Operations .......................................................................................................................................2-14 10
2.3.1 Types of Aircraft Operations ..................................................................................................2-14 11 2.3.2 Historical Aircraft Operations at CLT ..................................................................................2-15 12
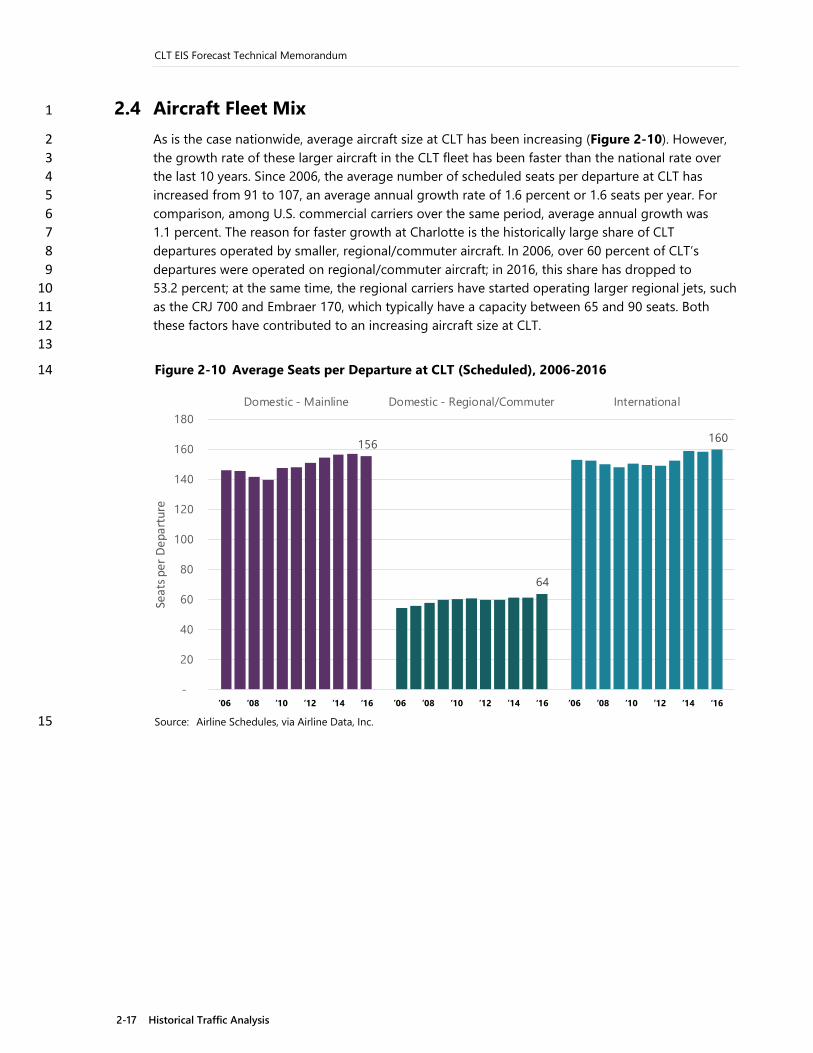
2.4 Aircraft Fleet Mix ...........................................................................................................................................2-17 13
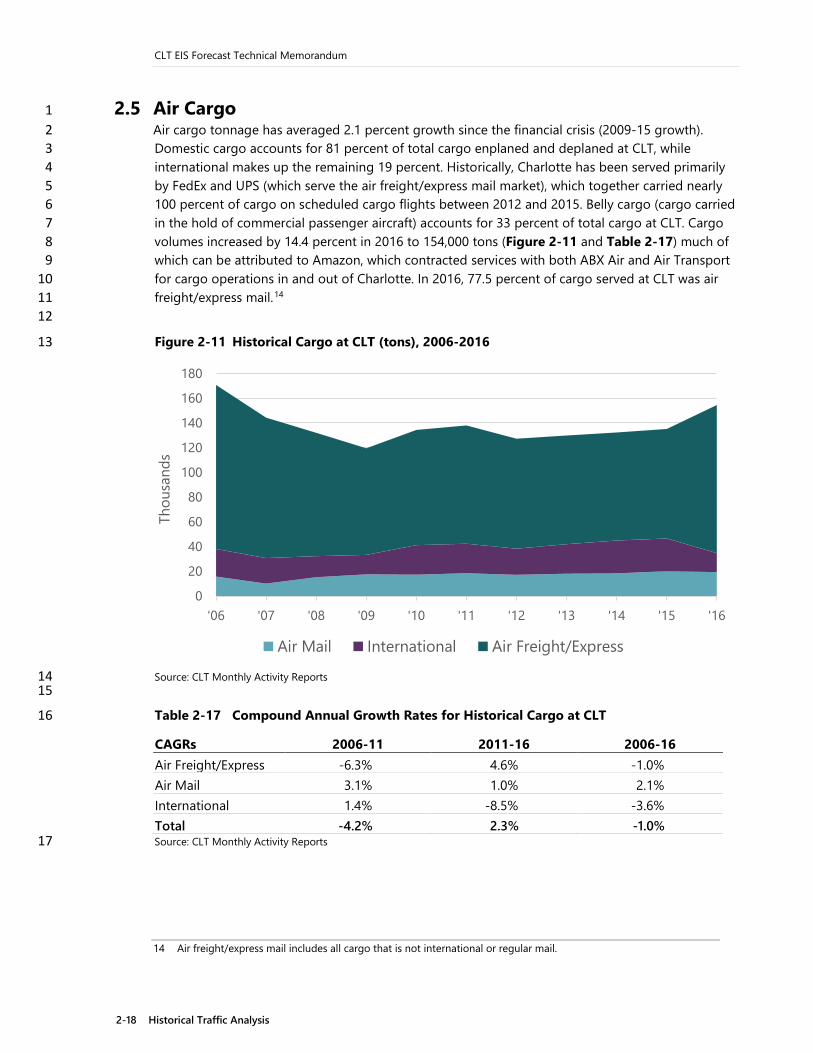
2.5 Air Cargo ..........................................................................................................................................................2-18 14
3 Traffic Forecast ................................................................................................................................ 3-1 15
3.1 Introduction ...................................................................................................................................................... 3-1 16
3.2 Passenger Forecast Methodology ............................................................................................................ 3-1 17
3.2.1 Origin-Destination Traffic Forecast Methodology .......................................................... 3-1 18 3.2.2 Connecting Traffic ........................................................................................................................ 3-2 19
3.3 Passengers ......................................................................................................................................................... 3-2 20
3.3.1 Passenger Forecast Assumptions .......................................................................................... 3-3 21 3.3.2 Annual Passenger Forecasts .................................................................................................... 3-4 22 3.3.3 Comparative Enplaned Passenger Forecasts..................................................................... 3-8 23
3.4 Operations .......................................................................................................................................................3-10 24
3.4.1 Operations Forecast Assumptions ......................................................................................3-10 25 3.4.2 Cargo Operations Forecasts ..................................................................................................3-11 26 3.4.3 Annual Operations Forecasts ................................................................................................3-11 27 3.4.4 Comparative Operations Forecasts .....................................................................................3-15 28 3.4.5 Aircraft Fleet Mix ........................................................................................................................3-17 29
3.5 Cargo .................................................................................................................................................................3-18 30
3.5.1 Cargo Forecast Assumptions .................................................................................................3-18 31 3.5.2 Annual Cargo Forecasts ...........................................................................................................3-19 32
3.6 Conclusion .......................................................................................................................................................3-19 33
Appendix 1: Additional Data ................................................................................................................ A1-1 34
35

CLT EIS Forecast Technical Memorandum
ii Table of Contents
List of Tables 1
Table No. Description Page 2
Table 1-1 Summary of Charlotte Douglas International Airport Forecast ........................................... 1-2 3 Table 2-1 Top 20 U.S. Cities Ranked by Population, CY 2016 ................................................................... 2-3 4 Table 2-2 Population Comparison, CY 2016 .................................................................................................... 2-3 5 Table 2-3 Select Historical and Forecast Populations (in thousands) .................................................... 2-4 6 Table 2-4 Select Historical and Projected Per Capita Income (in 2009 USD) ..................................... 2-4 7 Table 2-5 Compound Annual Growth Rates for Historical Enplaned Passengers at CLT ............... 2-6 8 Table 2-6 Enplaned Passengers at Top 30 U.S. Airports, CY 2016 .......................................................... 2-7 9 Table 2-7 Charlotte Passenger Traffic CY 2016 ............................................................................................... 2-8 10 Table 2-8 Overview of Capacity at American Airlines Hubs, CY 2016.................................................... 2-9 11 Table 2-9 Weekly Frequencies from CLT by Region, August 2017 ...................................................... 2-10 12 Table 2-10 Weekly Frequency from CLT by Aircraft Type, August 2017 .............................................. 2-10 13 Table 2-11 Compound Annual Growth Rates for Historical O&D Passengers at CLT .................... 2-11 14 Table 2-12 Top 10 O&D Destinations from CLT, CY 2016 ......................................................................... 2-11 15 Table 2-13 Compound Annual Growth Rates for Historical Connecting Passengers at CLT ....... 2-12 16 Table 2-14 Charlotte Domestic Connecting Flows, CY 2016 ..................................................................... 2-13 17 Table 2-15 Charlotte International Connecting Flows, CY 2016 .............................................................. 2-13 18 Table 2-16 Compound Annual Growth Rates for Historical Commercial Operations at CLT ...... 2-15 19 Table 2-17 Compound Annual Growth Rates for Historical Cargo at CLT .......................................... 2-18 20 Table 3-1 Passenger Forecast – Base Case ....................................................................................................... 3-5 21 Table 3-2 Passenger Forecast – High Case ....................................................................................................... 3-6 22 Table 3-3 Passenger Forecast – Low Case ........................................................................................................ 3-7 23 Table 3-4 Historical and Forecast Enplaned Passengers Compound Average Growth Rates – EIS, 24
TAF, and ACEP ........................................................................................................................................... 3-9 25 Table 3-5 Load Factor Assumptions ................................................................................................................. 3-11 26 Table 3-6 Operations Forecast – Base Case – Charlotte Douglas International Airport .............. 3-12 27 Table 3-7 Operations Forecast – High Case – Charlotte Douglas International Airport ............. 3-13 28 Table 3-8 Operations Forecast – Low Case – Charlotte Douglas International Airport ............... 3-14 29 Table 3-9 Historical and Forecast Operations– EIS, TAF and ACEP ..................................................... 3-17 30
31
32

CLT EIS Forecast Technical Memorandum
iii Table of Contents
List of Figures 1
Figure No. Description Page 2
Figure 2-1 CLT Catchment Area .............................................................................................................................. 2-2 3 Figure 2-2 Historical Enplaned Passengers at CLT, 2002-2016 .................................................................. 2-5 4 Figure 2-3 Airline Share of CLT Enplanements, CY 2016 .............................................................................. 2-8 5 Figure 2-4 American Airlines Hub Locations ..................................................................................................... 2-9 6 Figure 2-5 Historical O&D Passengers at CLT, 1996-2016........................................................................ 2-11 7 Figure 2-6 Historical Connecting Passengers at CLT, 2002-2016........................................................... 2-12 8 Figure 2-7 CLT Connecting Share of Total U.S. Traffic, 2006-2016 ........................................................ 2-14 9 Figure 2-8 Historical Commercial Operations at CLT, 2002-2016 .......................................................... 2-15 10 Figure 2-9 Operations by Category, 2012-2016............................................................................................ 2-16 11 Figure 2-10 Average Seats per Departure at CLT (Scheduled), 2006-2016 .......................................... 2-17 12 Figure 2-11 Historical Cargo at CLT (tons), 2006-2016 ................................................................................. 2-18 13 Figure 3-1 Enplanements Forecast – Base, High, Low Cases....................................................................... 3-8 14 Figure 3-2 Historical and Forecast Enplaned Passengers – EIS, TAF and ACEP ................................... 3-9 15 Figure 3-3 Operations Forecast – Base, High, Low Cases – Charlotte Douglas International Airport . 3-15 16 Figure 3-4 Historical and Forecast Aircraft Operations – EIS, TAF and ACEP .................................... 3-16 17 Figure 3-5 Historical and Forecast Cargo Tonnage – Base, High, Low Cases – 18
Charlotte Douglas International Airport ..................................................................................... 3-19 19
20

CLT EIS Forecast Technical Memorandum
iv Table of Contents
This page intentionally left blank. 1

CLT EIS Forecast Technical Memorandum
1-1 Introduction
1
Introduction 2
In accordance with FAA Order 1050.1F “Environmental Impacts: Policies and Procedures, an EIS 3 requires a Purpose and Need section. In order to demonstrate part of the need for capacity-related 4 components of the Project, a passenger and operations forecast (“EIS forecast”) has been 5 completed for Charlotte Douglas International Airport (“the Airport” or “CLT”). This technical 6 memorandum covers analysis of the historical traffic at CLT as well as the methodology and results 7 of the long-term traffic forecast. This long-term annual forecast was used as the basis of derivative 8 forecasts (busy day, peak hour, design day schedules), which served as inputs into the simulation 9 modeling. Summary forecast results are shown below in Table 1-1. The most recent calendar year 10 of data available as of the writing of this memorandum is 2016; therefore, 2016 was selected as the 11 base year for this EIS. 12
In addition to showing the results of the EIS forecast, this memorandum also compares the EIS 13 forecast to the Federal Aviation Administration’s (FAA) 2016 Terminal Area Forecast (TAF) and the 14 forecast completed by the Charlotte Aviation Department (the Department) in 2014 for the CLT 15 Master Plan (known as the Airport Capacity Enhancement Plan or ACEP).1 The service and outlook 16 for CLT is now updated to reflect changing conditions since completion of the ACEP. 17
1 The ACEP was released in February 2016; however, the latest full year of data shown in the report and used in the
forecast is 2013.

CLT EIS Forecast Technical Memorandum
1-2 Introduction
Table 1-1 Summary of Charlotte Douglas International Airport Forecast 1
Forecast Compound Annual Growth Rates Base
Year 2016
Base Year+1 2017
Build Year 2028
Build Year +5
2033
Base Year+1 2017
Build Year 2028
Build Year +5
2033
Passenger Enplanements
Air Carrier 15,640,736 15,850,803 19,824,450 21,720,151 1.3% 2.0% 2.0% Commuter 6,533,011 6,895,699 8,068,898 8,578,173 5.6% 1.8% 1.6% Total 22,173,747 22,746,502 27,893,348 30,298,324 2.6% 1.9% 1.9%
Aircraft Operations
Air Carrier 400,819 409,357 482,269 513,764 2.1% 1.6% 1.5% Air Taxi 117,378 118,994 129,351 133,460 1.4% 0.8% 0.8% Subtotal 518,197 528,351 611,620 647,224 2.0% 1.4% 1.3% General Aviation 24,869 24,935 25,487 25,742 0.3% 0.2% 0.2% Military 2,676 2,676 2,676 2,676 0.0% 0.0% 0.0% Total Operations 545,742 555,962 639,783 675,643 1.9% 1.3% 1.3% Peak Hour Operations 114 116 134 146 1.8% 1.4% 1.5%
Cargo/Mail
Enplaned and Deplaned Tons 154,477 169,152 235,242 261,000 9.5% 3.6% 3.1%
Operational Factors
Average Aircraft Size (seats) Air Carrier 144 144 148 150 0.0% 0.2% 0.2% Air Taxi 59 59 62 63 0.0% 0.4% 0.4% Average Enplaning Load Factor Air Carrier 83.6% 83.7% 84.3% 84.6% Air Taxi 80.2% 80.3% 81.4% 81.4% Source: FAA Operations Network (OPSNET); InterVISTAS analysis for forecast. 2 Note: This summary table shows is based on a Build Year of 2028. A similar version of this table reflecting Base Year + 5, 10 and 15 years is 3
shown in the Appendix. 4 Note: The forecast does not reallocate air taxi operations to air carrier as the seating capacity increases; therefore, the average aircraft size 5
(seats) for air taxi goes above 60 seats. 6

CLT EIS Forecast Technical Memorandum
2-1 Historical Traffic Analysis
1
Historical Traffic Analysis 2
This chapter presents background information on the Charlotte Douglas International Airport (“the 3 Airport” or “CLT”), the economics of the surrounding catchment area, historical traffic growth, the 4 relationship between local economics and airport traffic, as well as the Airport’s role as a hub in the 5 network of the dominant air carrier American Airlines. 6
2.1 Catchment Area 7
The Airport serves the 20-county Charlotte-Gastonia-Salisbury economic area, which includes 8 portions of both North Carolina and South Carolina (Figure 2-1).2 Included in this economic area is 9 the Charlotte-Concord Combined Statistical Area (CSA), which in turn covers the 10-county 10 Charlotte-Concord-Gastonia Metropolitan Statistical Area (MSA) and two micropolitan areas 11 (Albemarle and Shelby). The largest county, Mecklenburg County in North Carolina, includes the 12 City of Charlotte and the Airport itself. 13
2 City of Charlotte, Official Statement, Bond Series 2017 A-C, May 19, 2017.

CLT EIS Forecast Technical Memorandum
2-2 Historical Traffic Analysis
Figure 2-1 CLT Catchment Area 1
Source: County data from U.S. Census Bureau 2
CLT EIS Forecast Technical Memorandum
2-3 Historical Traffic Analysis
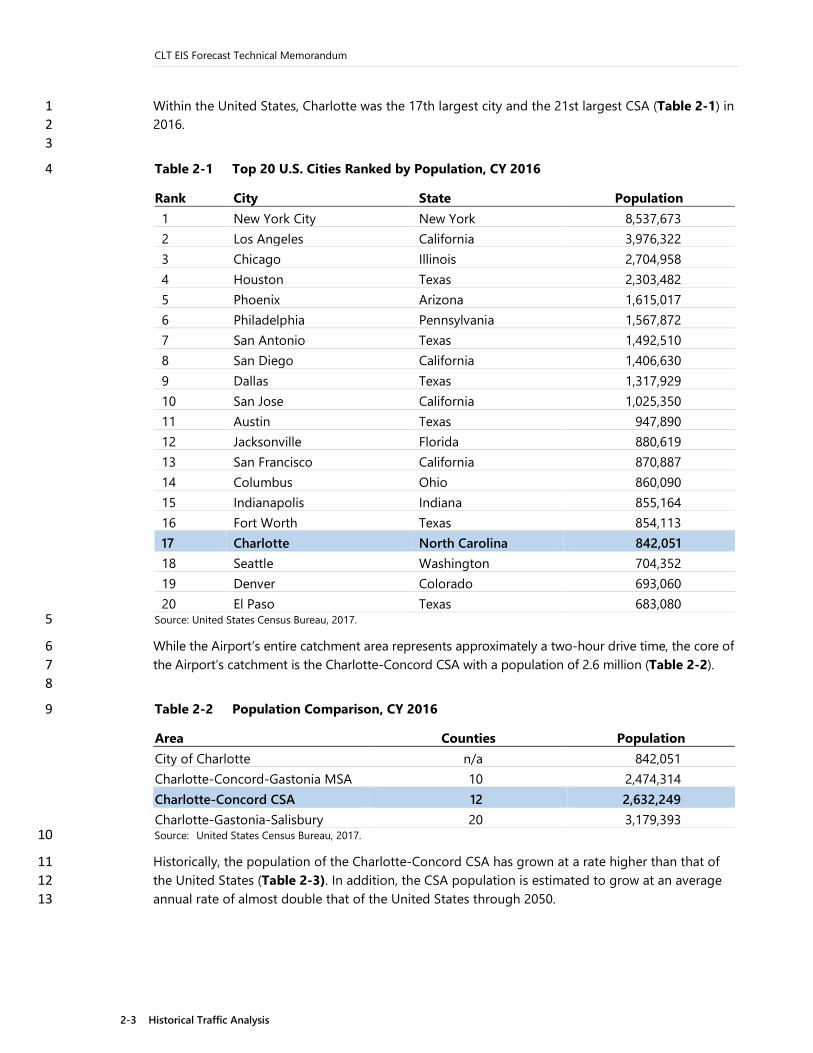
Within the United States, Charlotte was the 17th largest city and the 21st largest CSA (Table 2-1) in 1 2016. 2 3
Table 2-1 Top 20 U.S. Cities Ranked by Population, CY 2016 4
Rank City State Population 1 New York City New York 8,537,673 2 Los Angeles California 3,976,322 3 Chicago Illinois 2,704,958 4 Houston Texas 2,303,482 5 Phoenix Arizona 1,615,017 6 Philadelphia Pennsylvania 1,567,872 7 San Antonio Texas 1,492,510 8 San Diego California 1,406,630 9 Dallas Texas 1,317,929 10 San Jose California 1,025,350 11 Austin Texas 947,890 12 Jacksonville Florida 880,619 13 San Francisco California 870,887 14 Columbus Ohio 860,090 15 Indianapolis Indiana 855,164 16 Fort Worth Texas 854,113 17 Charlotte North Carolina 842,051 18 Seattle Washington 704,352 19 Denver Colorado 693,060 20 El Paso Texas 683,080
Source: United States Census Bureau, 2017. 5
While the Airport’s entire catchment area represents approximately a two-hour drive time, the core of 6 the Airport’s catchment is the Charlotte-Concord CSA with a population of 2.6 million (Table 2-2). 7 8
Table 2-2 Population Comparison, CY 2016 9
Area Counties Population City of Charlotte n/a 842,051 Charlotte-Concord-Gastonia MSA 10 2,474,314 Charlotte-Concord CSA 12 2,632,249 Charlotte-Gastonia-Salisbury 20 3,179,393 Source: United States Census Bureau, 2017. 10
Historically, the population of the Charlotte-Concord CSA has grown at a rate higher than that of 11 the United States (Table 2-3). In addition, the CSA population is estimated to grow at an average 12 annual rate of almost double that of the United States through 2050. 13
CLT EIS Forecast Technical Memorandum
2-4 Historical Traffic Analysis
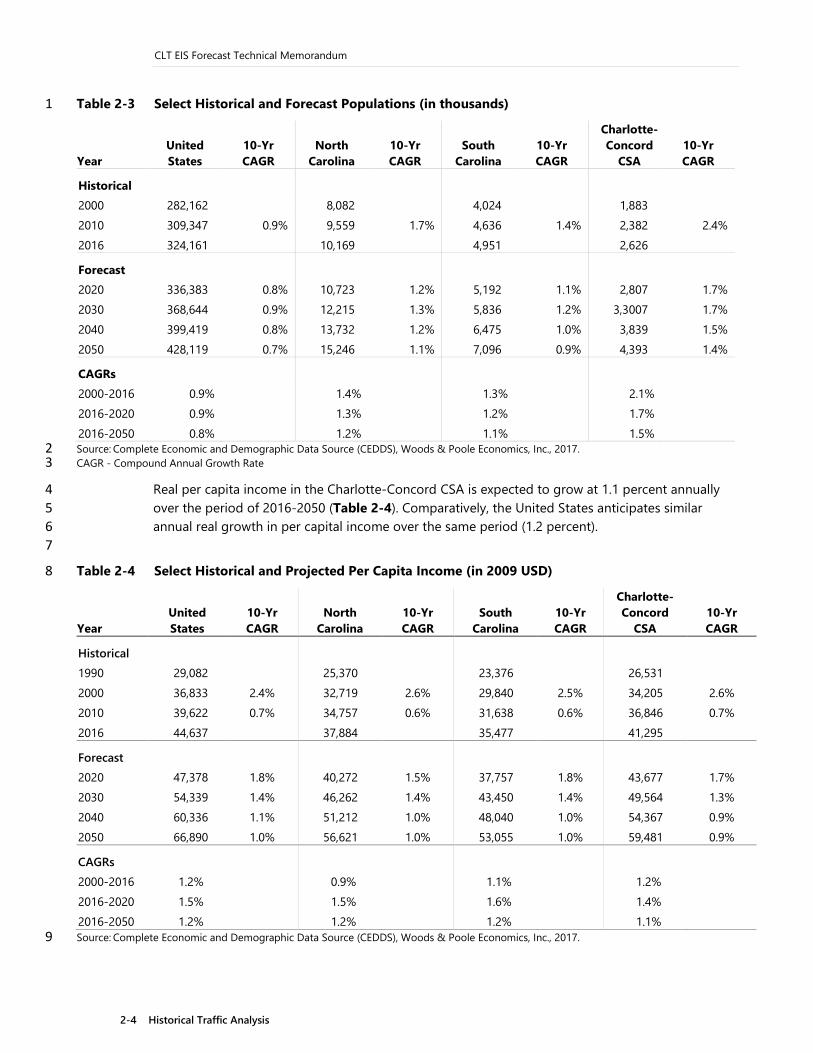
Table 2-3 Select Historical and Forecast Populations (in thousands) 1
Year United States
10-Yr CAGR
North Carolina
10-Yr CAGR
South Carolina
10-Yr CAGR
Charlotte-Concord
CSA 10-Yr CAGR
Historical
2000 282,162 8,082 4,024 1,883 2010 309,347 0.9% 9,559 1.7% 4,636 1.4% 2,382 2.4% 2016 324,161 10,169 4,951 2,626
Forecast
2020 336,383 0.8% 10,723 1.2% 5,192 1.1% 2,807 1.7% 2030 368,644 0.9% 12,215 1.3% 5,836 1.2% 3,3007 1.7% 2040 399,419 0.8% 13,732 1.2% 6,475 1.0% 3,839 1.5% 2050 428,119 0.7% 15,246 1.1% 7,096 0.9% 4,393 1.4%
CAGRs 2000-2016 0.9% 1.4% 1.3% 2.1% 2016-2020 0.9% 1.3% 1.2% 1.7% 2016-2050 0.8% 1.2% 1.1% 1.5% Source: Complete Economic and Demographic Data Source (CEDDS), Woods & Poole Economics, Inc., 2017. 2 CAGR - Compound Annual Growth Rate 3
Real per capita income in the Charlotte-Concord CSA is expected to grow at 1.1 percent annually 4 over the period of 2016-2050 (Table 2-4). Comparatively, the United States anticipates similar 5 annual real growth in per capital income over the same period (1.2 percent). 6 7
Table 2-4 Select Historical and Projected Per Capita Income (in 2009 USD) 8
Year United States
10-Yr CAGR
North Carolina
10-Yr CAGR
South Carolina
10-Yr CAGR
Charlotte-Concord
CSA 10-Yr CAGR
Historical 1990 29,082 25,370 23,376 26,531 2000 36,833 2.4% 32,719 2.6% 29,840 2.5% 34,205 2.6% 2010 39,622 0.7% 34,757 0.6% 31,638 0.6% 36,846 0.7% 2016 44,637 37,884 35,477 41,295
Forecast
2020 47,378 1.8% 40,272 1.5% 37,757 1.8% 43,677 1.7% 2030 54,339 1.4% 46,262 1.4% 43,450 1.4% 49,564 1.3% 2040 60,336 1.1% 51,212 1.0% 48,040 1.0% 54,367 0.9% 2050 66,890 1.0% 56,621 1.0% 53,055 1.0% 59,481 0.9%
CAGRs
2000-2016 1.2% 0.9% 1.1% 1.2% 2016-2020 1.5% 1.5% 1.6% 1.4% 2016-2050 1.2% 1.2% 1.2% 1.1% Source: Complete Economic and Demographic Data Source (CEDDS), Woods & Poole Economics, Inc., 2017. 9

CLT EIS Forecast Technical Memorandum
2-5 Historical Traffic Analysis
2.2 Background and Historical Passenger Traffic 1
One of the most important inputs into a traffic forecast is the historical traffic. This section shows 2 historical data for enplaned passengers (including both Origin and Destination (O&D) passengers 3 and connecting passengers) as well as discusses CLT’s role as a hub for American Airlines. 4
2.2.1 Enplaned Passengers 5
Since 2002, the Airport has grown 4.6 percent annually on average in terms of enplaned 6 passengers, reaching 22.2 million in 2016. During this period, average international growth 7 (8.1 percent) almost doubled that of domestic growth (4.4 percent). As shown in Figure 2-2 below, 8 enplanements only dipped by 0.6 percent in 2009 following the 2008-2009 economic crisis – 9 compared to a 7.2 percent drop in the United States as a whole.3 Traffic rebounded in 2010 with a 10 rate of 10.7 percent. In 2016, traffic declined by 1.1 percent, driven by a decrease in domestic 11 connecting passengers (O&D passengers increased). However, in the first half of 2017, enplaned 12 passenger traffic was three percent higher than the first six months of 2016; international enplaned 13 passengers are 20 percent higher than the same period in 2016. 14 15
Figure 2-2 Historical Enplaned Passengers at CLT, 2002-2016 16
Source: CLT Monthly Activity Reports 17
18
3 FAA Aerospace Forecast, FY 2011-2031
0
5
10
15
20
25
'02 '03 '04 '05 '06 '07 '08 '09 '10 '11 '12 '13 '14 '15 '16
Mill
ions
Domestic International
CLT EIS Forecast Technical Memorandum
2-6 Historical Traffic Analysis
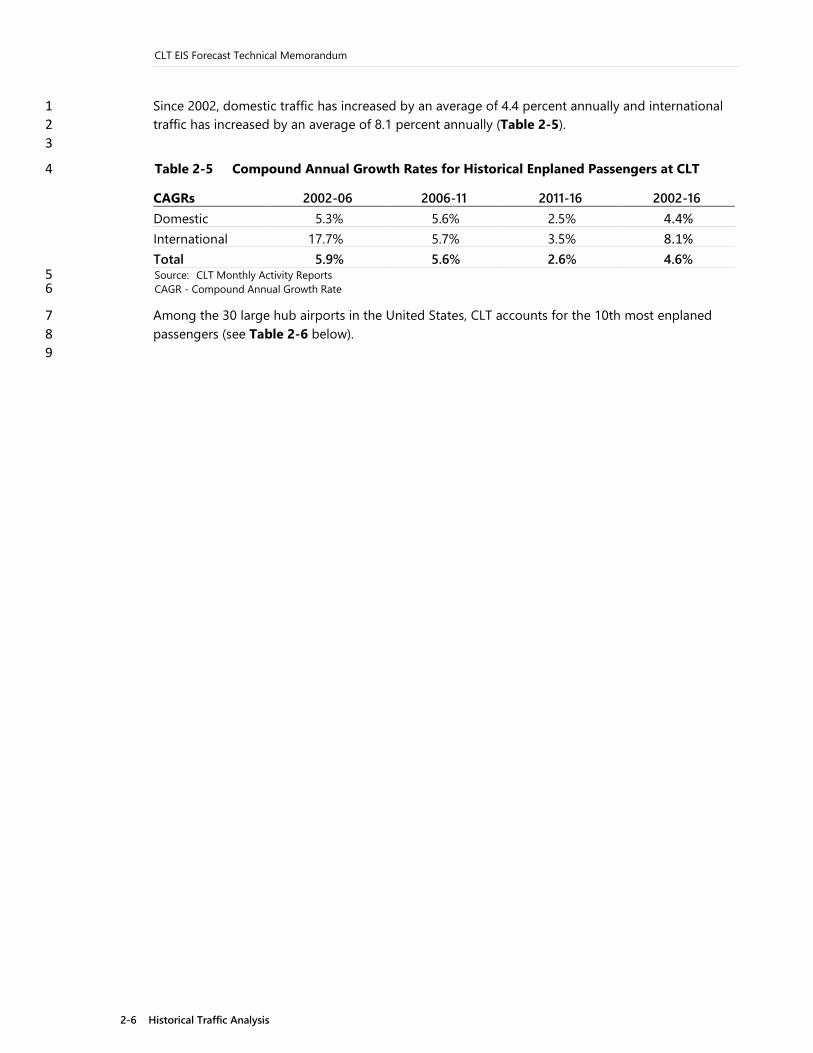
Since 2002, domestic traffic has increased by an average of 4.4 percent annually and international 1 traffic has increased by an average of 8.1 percent annually (Table 2-5). 2 3
Table 2-5 Compound Annual Growth Rates for Historical Enplaned Passengers at CLT 4
CAGRs 2002-06 2006-11 2011-16 2002-16 Domestic 5.3% 5.6% 2.5% 4.4% International 17.7% 5.7% 3.5% 8.1% Total 5.9% 5.6% 2.6% 4.6% Source: CLT Monthly Activity Reports 5 CAGR - Compound Annual Growth Rate 6
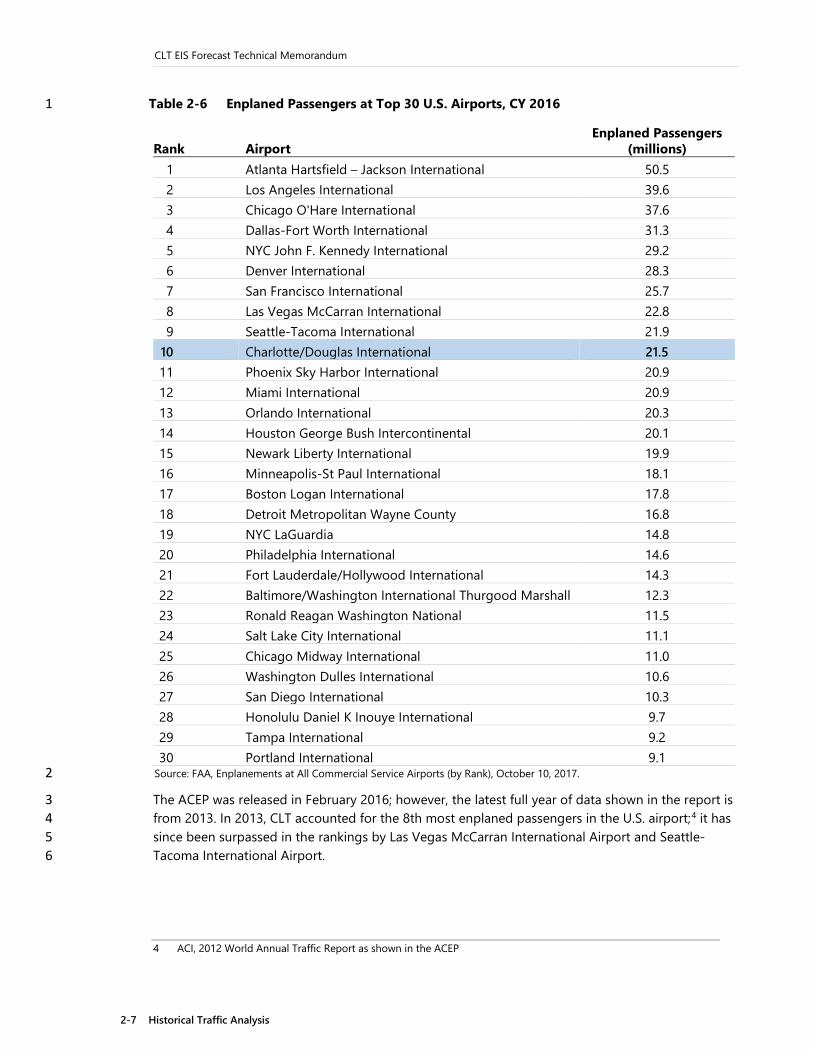
Among the 30 large hub airports in the United States, CLT accounts for the 10th most enplaned 7 passengers (see Table 2-6 below). 8 9
CLT EIS Forecast Technical Memorandum
2-7 Historical Traffic Analysis
Table 2-6 Enplaned Passengers at Top 30 U.S. Airports, CY 2016 1
Rank Airport Enplaned Passengers
(millions) 1 Atlanta Hartsfield – Jackson International 50.5 2 Los Angeles International 39.6 3 Chicago O'Hare International 37.6 4 Dallas-Fort Worth International 31.3 5 NYC John F. Kennedy International 29.2 6 Denver International 28.3 7 San Francisco International 25.7 8 Las Vegas McCarran International 22.8 9 Seattle-Tacoma International 21.9
10 Charlotte/Douglas International 21.5 11 Phoenix Sky Harbor International 20.9 12 Miami International 20.9 13 Orlando International 20.3 14 Houston George Bush Intercontinental 20.1 15 Newark Liberty International 19.9 16 Minneapolis-St Paul International 18.1 17 Boston Logan International 17.8 18 Detroit Metropolitan Wayne County 16.8 19 NYC LaGuardia 14.8 20 Philadelphia International 14.6 21 Fort Lauderdale/Hollywood International 14.3 22 Baltimore/Washington International Thurgood Marshall 12.3 23 Ronald Reagan Washington National 11.5 24 Salt Lake City International 11.1 25 Chicago Midway International 11.0 26 Washington Dulles International 10.6 27 San Diego International 10.3 28 Honolulu Daniel K Inouye International 9.7 29 Tampa International 9.2 30 Portland International 9.1
Source: FAA, Enplanements at All Commercial Service Airports (by Rank), October 10, 2017. 2
The ACEP was released in February 2016; however, the latest full year of data shown in the report is 3 from 2013. In 2013, CLT accounted for the 8th most enplaned passengers in the U.S. airport;4 it has 4 since been surpassed in the rankings by Las Vegas McCarran International Airport and Seattle-5 Tacoma International Airport. 6
4 ACI, 2012 World Annual Traffic Report as shown in the ACEP
CLT EIS Forecast Technical Memorandum
2-8 Historical Traffic Analysis
2.2.2 Current Service and Role as Hub 1
Passenger traffic at CLT comprises of O&D traffic (travel to and from Charlotte) and connecting 2 traffic (passengers making connections at CLT) as illustrated below. As can be seen in Table 2-7, 3 connecting traffic comprises 71 percent of passenger movements and consists mostly of domestic 4 connections. 5 6
Table 2-7 Charlotte Passenger Traffic CY 2016 7
Traffic Type Share Domestic O&D 25.6% International O&D 3.2% Domestic Connecting 67.5% International Connecting 3.7% Total 100.0% Source: U.S. DOT O&D and T100 data, via Flight Global’s Diio Mi database. 8
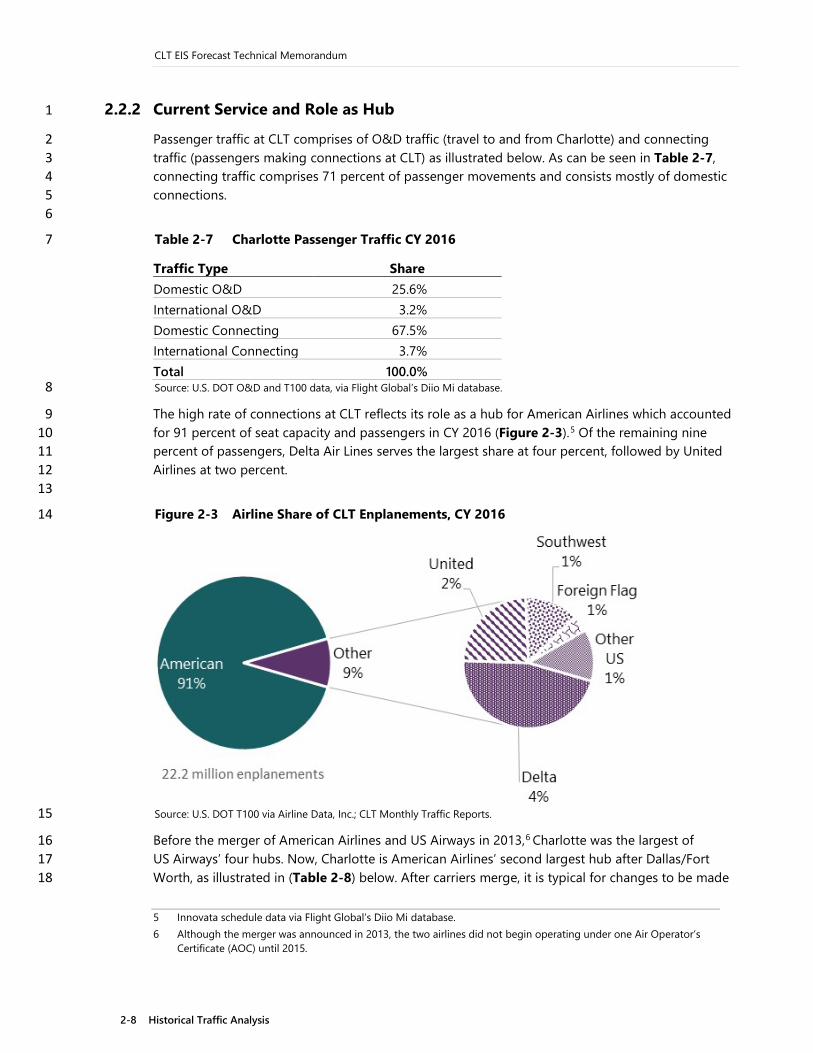
The high rate of connections at CLT reflects its role as a hub for American Airlines which accounted 9 for 91 percent of seat capacity and passengers in CY 2016 (Figure 2-3).5 Of the remaining nine 10 percent of passengers, Delta Air Lines serves the largest share at four percent, followed by United 11 Airlines at two percent. 12 13
Figure 2-3 Airline Share of CLT Enplanements, CY 2016 14
Source: U.S. DOT T100 via Airline Data, Inc.; CLT Monthly Traffic Reports. 15
Before the merger of American Airlines and US Airways in 2013,6 Charlotte was the largest of 16 US Airways’ four hubs. Now, Charlotte is American Airlines’ second largest hub after Dallas/Fort 17 Worth, as illustrated in (Table 2-8) below. After carriers merge, it is typical for changes to be made 18 5 Innovata schedule data via Flight Global’s Diio Mi database. 6 Although the merger was announced in 2013, the two airlines did not begin operating under one Air Operator’s
Certificate (AOC) until 2015.

CLT EIS Forecast Technical Memorandum
2-9 Historical Traffic Analysis
to the hub structure in order to optimize operations. As an example, the largest international 1 connect flow was the U.S. Northeast-Caribbean market. Some of this traffic has since shifted to 2 American Airlines’ largest Caribbean gateway, Miami (Figure 2-4). 3 4
Table 2-8 Overview of Capacity at American Airlines Hubs, CY 2016 5
Seat Rank Airport Markets Served Daily Departures Daily Seats 1 Dallas/Fort Worth 202 749 95,927 2 Charlotte 158 660 71,170 3 Chicago O’Hare 133 481 49,938 4 Miami 129 333 48,061 5 Philadelphia 114 379 37,549 6 Phoenix 86 253 33,557 7 Los Angeles 70 202 27,723 8 Washington DCA 72 239 20,654 9 New York JFK 46 93 13,225
Source: Airport Records, U.S. DOT, O&D Survey, via Flight Global’s Diio Mi database. 6
7
Figure 2-4 American Airlines Hub Locations 8
Source: Innovata schedule data via Flight Global’s Diio Mi database, August 2017. 9
Flights from CLT reach 169 destinations; 135 of those in the United States (Table 2-9). These 135 10 destinations account for 95 percent of weekly departing flights. International service connects 11 Charlotte to 34 airports with the 50 percent of those located in the Caribbean. American Airlines’ 12 focus at Charlotte is on domestic connections as it connects the United States to Latin American via 13 its hub at Miami; Europe via its hub at New York JFK; and Asia from Los Angeles. 14
ORD
LAXPHX
DFW
MIA
CLT
DCA
PHL
JFK

CLT EIS Forecast Technical Memorandum
2-10 Historical Traffic Analysis
Table 2-9 Weekly Frequencies from CLT by Region, August 2017 1
Region Weekly
Departures Weekly
Departing Seats Number of
Destinations Domestic 4,893 509,388 135 Europe 63 16,926 8 Caribbean 112 16,876 17 Mexico 30 5,048 4 Canada 46 2,984 2 Central America 7 882 3 Total 5,150 552,104 169 Source: Innovata Schedule Data via Flight Global’s Diio Mi database, August 2017. 2
As noted above, the air service offerings at CLT has changed since the ACEP. In 2013, international 3 flights accounted for 6.5 percent of total scheduled flights7 whereas in August 2017 they accounted 4 for 5 percent. Of these international flights, 65 percent were to Latin America in 2013;8 this share 5 has dropped to 57.8 percent in 2017. 6
Of the 5,150 weekly nonstop departures at CLT in August 2017, 67.8 percent are operated with 7 narrowbody equipment (Table 2-10). Ten routes are operated with widebody aircraft. 8 9
Table 2-10 Weekly Frequency from CLT by Aircraft Type, August 2017 10
Aircraft Group Weekly
Departures Weekly
Departing Seats Number of
Destinations Narrowbody 3,493 442,823 124 Regional Jet/Turboprop 1,584 89,985 90 Widebody 73 19,296 10 Total 5,150 552,104 N/A Source: Innovata Schedule Data via Flight Global’s Diio Mi database, August 2017 11
2.2.3 Origin and Destination (O&D) Passengers 12
While connections account for 71.2 percent of passengers at CLT, O&D passengers play an 13 increasing role at the Airport. Over the last 20 years, O&D passengers have increased by 4.7 percent 14 annually on average (Table 2-11), with slightly larger growth in the international segment (see 15 Figure 2-5). In 1996, international passengers accounted for 7.6 percent of total passengers; this 16 share has increased to 11.1 percent in 2016. In 2016, both international and domestic O&D 17 passengers grew, by 7.8 percent and 3.8 percent, respectively compared to 2015. 18
7 OAG schedules as shown in the ACEP 8 Ibid.

CLT EIS Forecast Technical Memorandum
2-11 Historical Traffic Analysis
Figure 2-5 Historical O&D Passengers at CLT, 1996-2016 1
Source: U.S. DOT O&D Survey via Flight Global’s Diio Mi database. 2
3
Table 2-11 Compound Annual Growth Rates for Historical O&D Passengers at CLT 4
CAGRs 1996-06 2006-16 1996-16 Domestic 5.7% 3.3% 4.5% International 9.5% 3.9% 6.7% Total 6.0% 3.3% 4.7% Source: U.S. DOT O&D Survey via Flight Global’s Diio Mi database. 5
New York City (as represented by JFK, LaGuardia and Newark airports) is the largest O&D 6 destination from CLT, followed by Chicago (O’Hare and Midway) (see Table 2-12). 7 8
Table 2-12 Top 10 O&D Destinations from CLT, CY 2016 9
Rank City O&D Passengers 1 New York City 1,514,506 2 Chicago 594,468 3 Boston 474,979 4 Dallas 422,592 5 Philadelphia 339,573 6 Orlando 281,049 7 Baltimore 274,187 8 Los Angeles 272,809 9 Washington D.C. 244,093
10 San Francisco 240,379 Source: U.S. DOT O&D Survey via Airline Data, Inc. 10 CAGR - Compound Annual Growth Rate 11 12
0
2
4
6
8
10
12
'96 '97 '98 '99 '00 '01 '02 '03 '04 '05 '06 '07 '08 '09 '10 '11 '12 '13 '14 '15 '16
Mill
ions
Domestic Intl

CLT EIS Forecast Technical Memorandum
2-12 Historical Traffic Analysis
2.2.4 Connecting Passengers at CLT 1
Since 2002, the number of connecting passengers at CLT has increased by 4.2 percent annually on 2 average (Figure 2-6 and Table 2-13), reaching 31.9 million passengers in 2016. International 3 connections, which include connections between domestic and international flights have increased 4 at a faster rate than domestic-to-domestic connections, likely due to the increase in the number of 5 international flights. 6
Connecting traffic is a function of air carrier hubbing and network decisions (primarily American 7 Airlines at CLT). While underlying demand can grow connecting traffic, it is American Airlines 8 decision to flow traffic through specific hubs that will ultimately affect traffic volumes at CLT. 9 10
Figure 2-6 Historical Connecting Passengers at CLT, 2002-2016 11
Source: U.S. DOT O&D Survey via Flight Global’s Diio Mi database 12 13
Table 2-13 Compound Annual Growth Rates for Historical Connecting Passengers at CLT 14
CAGRs 2002-06 2006-11 2011-16 2002-16 Domestic 2.9% 7.1% 1.7% 4.0% International 20.5% 6.6% 3.8% 9.3% Total 3.5% 7.1% 1.8% 4.2% Source: U.S. DOT O&D Survey via Flight Global’s Diio Mi database 15
Table 2-14 below shows the major domestic connecting flows (domestic-to-domestic) and Table 2-15 16 shows international connecting flows (domestic-to-international and international-to-international) at 17 CLT in 2016. The major domestic-domestic flows tend to be north-to-south in nature, particularly on the 18 eastern side of the country. CLT is geographically well-positioned to continue to handle these flows 19 within America Airlines’ network, compared with the Airline’s other major hubs. 20 21
0
5
10
15
20
25
30
35
'02 '03 '04 '05 '06 '07 '08 '09 '10 '11 '12 '13 '14 '15 '16
Mill
ions
Domestic Intl

CLT EIS Forecast Technical Memorandum
2-13 Historical Traffic Analysis
Table 2-14 Charlotte Domestic Connecting Flows, CY 2016 1
Domestic Connecting Flows Northeast-to-Southeast 16.7% Florida-to-Northeast 14.1% Northeast-to-Southwest 7.5% Florida-to-Southeast 6.9% Great Lakes-to-Southeast 6.8% Florida-to-Great Lakes 6.0% Northeast-to-Pacific 5.3% Southeast-to-Southwest 5.0% Other 31.7% Total 100.0% Source: U.S. DOT, O&D Database via Airline Data, Inc. 2
As shown in Table 2-15, for international, nearly two thirds of the flows are to the Caribbean and 3 Mexico, which overlaps with American Airlines’ Miami hub. Similarly, the flows to Europe overlap 4 with Dallas and American Airlines’ hubs in the Northeast. 5 6
Table 2-15 Charlotte International Connecting Flows, CY 2016 7
International Connecting Flows Domestic-to-Caribbean 50.8% Domestic-to-Europe 23.6% Domestic-to-Mexico 15.7% Domestic-to-Canada 5.3% Domestic-to-Other 2.9% International-to-International 1.7% Total 100.0% Source: U.S. DOT, O&D Database via Airline Data, Inc. 8
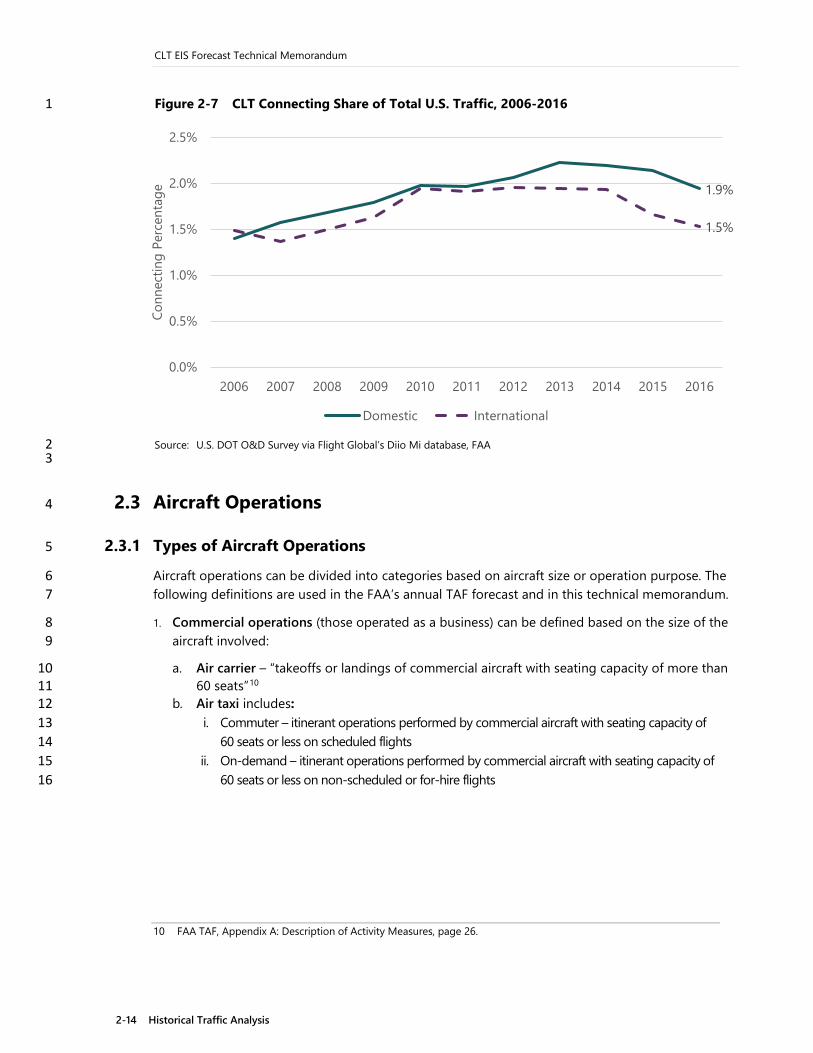
In 2016, domestic connecting traffic at CLT accounted for 1.9 percent of total U.S. domestic passenger 9 traffic, while international connecting traffic accounted for 1.5 percent of total U.S. international passenger 10 traffic (see Figure 2-7).9 Both the international and domestic connecting share of CLT compared to the 11 national aviation market have been declining since 2013. This decline is due to an industry-wide trend 12 towards more direct services as well as a consolidation of American Airlines’ connecting traffic at other 13 hubs such as Miami and Dallas. As discussed in the next chapter, this is a trend that is expected to 14 continue, and it serves as one of the inputs into the long-term passenger forecast prepared for this EIS. 15 16
17
9 “International” here includes U.S.-Transatlantic, U.S.-Latin American, and U.S.-Canadian markets
CLT EIS Forecast Technical Memorandum
2-14 Historical Traffic Analysis
Figure 2-7 CLT Connecting Share of Total U.S. Traffic, 2006-2016 1
Source: U.S. DOT O&D Survey via Flight Global’s Diio Mi database, FAA 2 3
2.3 Aircraft Operations 4
2.3.1 Types of Aircraft Operations 5
Aircraft operations can be divided into categories based on aircraft size or operation purpose. The 6 following definitions are used in the FAA’s annual TAF forecast and in this technical memorandum. 7
1. Commercial operations (those operated as a business) can be defined based on the size of the 8 aircraft involved: 9
a. Air carrier – “takeoffs or landings of commercial aircraft with seating capacity of more than 10 60 seats”10 11
b. Air taxi includes: 12 i. Commuter – itinerant operations performed by commercial aircraft with seating capacity of 13
60 seats or less on scheduled flights 14 ii. On-demand – itinerant operations performed by commercial aircraft with seating capacity of 15
60 seats or less on non-scheduled or for-hire flights 16
10 FAA TAF, Appendix A: Description of Activity Measures, page 26.
1.9%
1.5%
0.0%
0.5%
1.0%
1.5%
2.0%
2.5%
2006 2007 2008 2009 2010 2011 2012 2013 2014 2015 2016
Conn
ectin
g Pe
rcen
tage
Domestic International

CLT EIS Forecast Technical Memorandum
2-15 Historical Traffic Analysis
2. Non-commercial operations 1
a. General Aviation (GA) – “all civil aviation aircraft takeoffs and landings not classified as 2 commercial or military”11 3
b. Military – “takeoffs and landings by military aircraft”12 4
2.3.2 Historical Aircraft Operations at CLT 5
Overall commercial operations at CLT have increased by 1.7 percent on average annually since 6 2002, reaching 518,197 in 2016 (Figure 2-8). 7 8
Figure 2-8 Historical Commercial Operations at CLT, 2002-2016 9
Source: FAA OPSNET 10
This growth has been driven by increases in air carrier operations as air taxi operations have declined 11 over this period by 2.9 percent per annum on average (Table 2-16). The number of both international 12 and domestic air carrier operations have increased by 6.1 percent and 4.1 percent, respectively.13 13 14
Table 2-16 Compound Annual Growth Rates for Historical Commercial Operations at CLT 15
CAGRs 2002-06 2006-11 2011-16 2002-16 Air Carrier 2.6% 4.9% 4.0% 3.9% Air Taxi 4.9% -3.1% -8.6% -2.9% Total Commercial 3.6% 1.6% 0.2% 1.7% Source: CLT Monthly Activity Reports 16 CAGR - Compound Annual Growth Rates 17
11 FAA TAF, Appendix A: Description of Activity Measures, page 26. 12 Ibid. 13 U.S. DOT T100 via Airline Data, Inc.
0
50
100
150
200
250
300
350
400
450
'02 '03 '04 '05 '06 '07 '08 '09 '10 '11 '12 '13 '14 '15 '16
Thou
sand
s
Air Carrier Air Taxi
CLT EIS Forecast Technical Memorandum
2-16 Historical Traffic Analysis
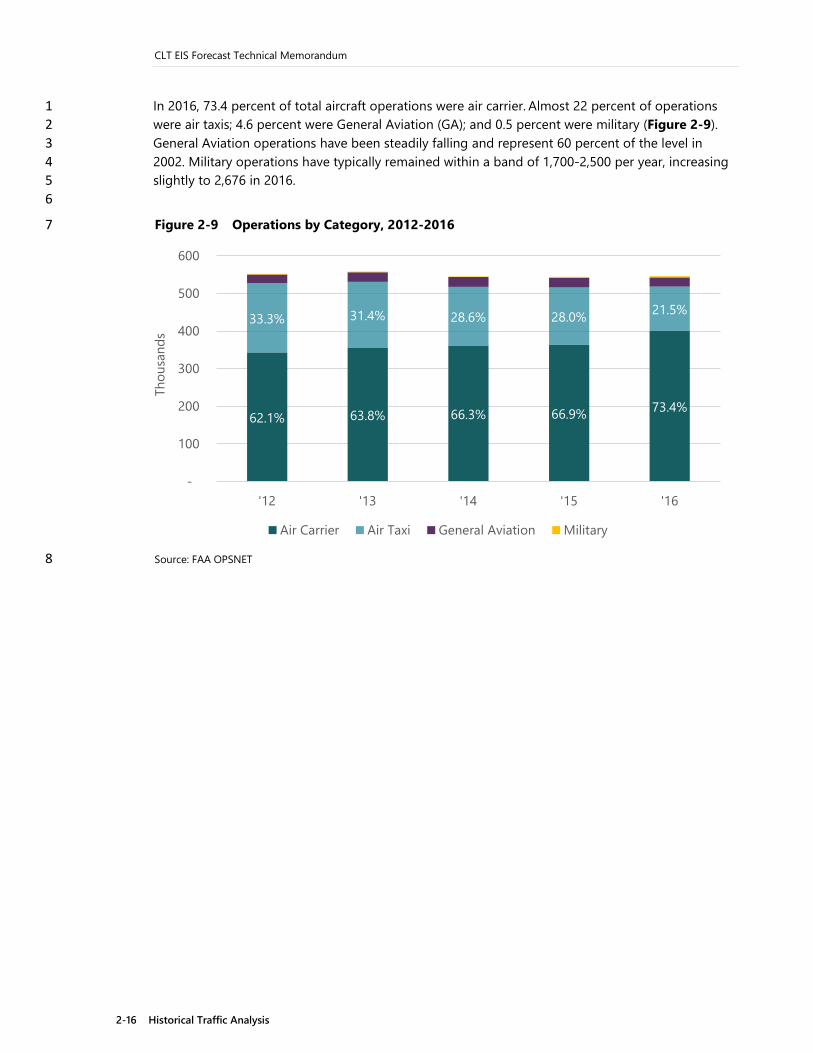
In 2016, 73.4 percent of total aircraft operations were air carrier. Almost 22 percent of operations 1 were air taxis; 4.6 percent were General Aviation (GA); and 0.5 percent were military (Figure 2-9). 2 General Aviation operations have been steadily falling and represent 60 percent of the level in 3 2002. Military operations have typically remained within a band of 1,700-2,500 per year, increasing 4 slightly to 2,676 in 2016. 5 6
Figure 2-9 Operations by Category, 2012-2016 7
Source: FAA OPSNET 8
62.1% 63.8% 66.3% 66.9% 73.4%
33.3% 31.4% 28.6% 28.0% 21.5%
-
100
200
300
400
500
600
'12 '13 '14 '15 '16
Thou
sand
s
Air Carrier Air Taxi General Aviation Military
CLT EIS Forecast Technical Memorandum
2-17 Historical Traffic Analysis
2.4 Aircraft Fleet Mix 1
As is the case nationwide, average aircraft size at CLT has been increasing (Figure 2-10). However, 2 the growth rate of these larger aircraft in the CLT fleet has been faster than the national rate over 3 the last 10 years. Since 2006, the average number of scheduled seats per departure at CLT has 4 increased from 91 to 107, an average annual growth rate of 1.6 percent or 1.6 seats per year. For 5 comparison, among U.S. commercial carriers over the same period, average annual growth was 6 1.1 percent. The reason for faster growth at Charlotte is the historically large share of CLT 7 departures operated by smaller, regional/commuter aircraft. In 2006, over 60 percent of CLT’s 8 departures were operated on regional/commuter aircraft; in 2016, this share has dropped to 9 53.2 percent; at the same time, the regional carriers have started operating larger regional jets, such 10 as the CRJ 700 and Embraer 170, which typically have a capacity between 65 and 90 seats. Both 11 these factors have contributed to an increasing aircraft size at CLT. 12 13
Figure 2-10 Average Seats per Departure at CLT (Scheduled), 2006-2016 14
Source: Airline Schedules, via Airline Data, Inc. 15
156
64
160
-
20
40
60
80
100
120
140
160
180Domestic - Mainline Domestic - Regional/Commuter International
Seat
s per
Dep
artu
re
’06 ’08 ’10 ’12 ’14 ‘16 ’06 ’08 ’10 ’12 ’14 ‘16 ’06 ’08 ’10 ’12 ’14 ‘16
CLT EIS Forecast Technical Memorandum
2-18 Historical Traffic Analysis
2.5 Air Cargo 1 Air cargo tonnage has averaged 2.1 percent growth since the financial crisis (2009-15 growth). 2 Domestic cargo accounts for 81 percent of total cargo enplaned and deplaned at CLT, while 3 international makes up the remaining 19 percent. Historically, Charlotte has been served primarily 4 by FedEx and UPS (which serve the air freight/express mail market), which together carried nearly 5 100 percent of cargo on scheduled cargo flights between 2012 and 2015. Belly cargo (cargo carried 6 in the hold of commercial passenger aircraft) accounts for 33 percent of total cargo at CLT. Cargo 7 volumes increased by 14.4 percent in 2016 to 154,000 tons (Figure 2-11 and Table 2-17) much of 8 which can be attributed to Amazon, which contracted services with both ABX Air and Air Transport 9 for cargo operations in and out of Charlotte. In 2016, 77.5 percent of cargo served at CLT was air 10 freight/express mail.14 11 12
Figure 2-11 Historical Cargo at CLT (tons), 2006-2016 13
Source: CLT Monthly Activity Reports 14 15
Table 2-17 Compound Annual Growth Rates for Historical Cargo at CLT 16
CAGRs 2006-11 2011-16 2006-16 Air Freight/Express -6.3% 4.6% -1.0% Air Mail 3.1% 1.0% 2.1% International 1.4% -8.5% -3.6% Total -4.2% 2.3% -1.0% Source: CLT Monthly Activity Reports 17
14 Air freight/express mail includes all cargo that is not international or regular mail.
0
20
40
60
80
100
120
140
160
180
'06 '07 '08 '09 '10 '11 '12 '13 '14 '15 '16
Thou
sand
s
Air Mail International Air Freight/Express
CLT EIS Forecast Technical Memorandum
3-1 Traffic Forecast
1
Traffic Forecast 2
3.1 Introduction 3
In the process of conducting this EIS, it is necessary to update the long-term traffic forecast for the 4 Charlotte Douglas International Airport (“the Airport” or “CLT”). This updated forecast will be used as 5 an input into several subsequent analyses completed for the Environmental Impact Statement (EIS) 6 including (among others): aircraft delay modeling, noise modeling, establishment of the design 7 aircraft type, and determination of the optimal runway length. This chapter first presents the 8 methodology and results for projecting passengers, operations and cargo. The most recent calendar 9 year of data available as of the writing of this memorandum is 2016; therefore, 2016 was selected as 10 the base year for this EIS forecast. The two benchmark years chosen for this study are 2028 (the “Build 11 Year,” when the Project is expected to open) and the Build Year plus five years (2033). Both the 12 passenger and operations forecasts are compared to both the Airport Capacity Enhancement Plan 13 (ACEP) and the FAA’s Terminal Area Forecast (TAF) to determine consistency. Where the EIS 14 forecast differs from either the ACEP or TAF forecasts, explanations are discussed. The forecasts 15 presented in this chapter for CLT have been submitted to the FAA’s Airport District Office (ADO) for 16 approval for use in the EIS study. 17
3.2 Passenger Forecast Methodology 18
This section presents the separate approaches used to forecast Origin and Destination (O&D) and 19 connecting traffic. 20
3.2.1 Origin-Destination Traffic Forecast Methodology 21
The long-term passenger forecasts prepared for this EIS are based on an econometric model for 22 domestic, Canada, the Caribbean (including Mexico and Central America), South America, trans-23 Atlantic, and trans-Pacific origin-destination passengers. Separate outbound (Charlotte residents) and 24 inbound (overseas residents) models were developed using data sourced from the U.S. DOT. Various 25 models were tested to explain traffic volumes in terms of: relevant GDP measures, population, air 26 fares and fuel prices. The most robust models, in terms of statistical fit (adjusted r-squared and 27 parameter t-statistics), were found to be those based on measures of real GDP (as well as dummy 28 variables in 2001 and 2002 to capture the impacts of the events of September 11, 2001). For the 29 domestic and outbound international models, Charlotte Combined Statistical Area (CSA) gross 30 domestic product (GDP) was found to be the most effective explanatory variable, while the real GDP 31 of the international regions were used for the inbound markets. The dependent variables used in the 32 econometric analysis were in natural log terms. The key results from the econometric analysis are 33 summarized in Appendix 1. 34

CLT EIS Forecast Technical Memorandum
3-2 Traffic Forecast
As the markets mature, the responsiveness of demand to economic growth is expected to decline. 1 To capture this, the GDP elasticities were gradually declined by 25 percent by 2035 - this of level 2 decline is based on expert judgement and reflects the expected maturing of the market. To 3 generate forecasts of O&D traffic, the parameters were applied to projections of real GDP sourced 4 from Woods & Poole15 for Charlotte GDP and the U.S. Department of Agriculture Economic 5 Research Service.16 6
3.2.2 Connecting Traffic 7
Connecting traffic at CLT is primarily a function of air carrier decisions (primarily American Airlines). 8 While underlying demand can grow connecting traffic, it is carriers’ decisions regarding flow traffic 9 through specific hubs that will ultimately affect traffic volumes. 10
Connecting traffic was modelled as a function of national demand for travel and CLT’s share of that 11 demand. In 2016, domestic connecting traffic at CLT accounted for 1.9 percent of total domestic 12 passenger traffic. The FAA forecasts that in the U.S., domestic traffic will increase by 1.7 percent per 13 annum up to 2035. It is assumed that CLT’s share of this traffic will decline by 10 percent over the 14 forecast period as new direct services reduce the need for connecting itineraries (CLT’s share will 15 decline to 1.7 percent). As noted in Section 2.2.4, CLT’s share of domestic connecting traffic has 16 been declining in recent years, and this trend is expected to continue. This trend of declining 17 connecting share was broadly confirmed by interviews with American Airlines. As a result, domestic 18 connecting traffic is forecast to increase by 1.2 percent per annum (forecast values are shown in the 19 Appendix). 20
The forecasts of international connecting traffic were based on the FAA forecasts of traffic to/from 21 Canada, Latin America and Trans-Atlantic. CLT’s share of these total traffic flows is assumed to 22 decline by 25 percent, due to the development of direct services and the increased concentration of 23 connecting flows at other hubs. As with domestic connecting traffic, CLT’s share of international 24 connecting traffic has been declining and this trend is expected to continue. This results in average 25 growth of 2.1 percent per annum over the forecast period (compared with 3.6 percent per annum 26 growth in total demand). Forecast connecting passenger values are shown in the Appendix. 27
3.3 Passengers 28
The EIS passenger forecast projects passengers by route group (domestic and international) as well 29 as type of passenger. The two types of passengers projected are O&D and connecting. 30
› O&D passengers at CLT are those beginning or ending their trip at CLT. An example of an O&D 31 passenger would be someone traveling between Charlotte and New York City. 32
› Connecting passengers at CLT are those changing planes in the Airport on their way to another 33 destination. An example of a connecting passenger would be someone flying from New York 34 City to Charlotte and then to Dallas. 35
15 Complete Economic and Demographic Data Source (CEDDS), Woods & Poole Economics, Inc., 2017. 16 U.S. Department of Agriculture Economic Research Service, https://www.ers.usda.gov/

CLT EIS Forecast Technical Memorandum
3-3 Traffic Forecast
3.3.1 Passenger Forecast Assumptions 1
The next three sections describe the different assumptions used to create the Base, High, and Low 2 forecasts. Although the Base Case is that used for the majority of EIS analyses, it is important to 3 have High and Low cases in order to test the range of possible outcomes. 4
3.3.1.1 Base Case 5
The following assumptions were made in creating the passenger forecast: 6
› The United States economy as well as Charlotte’s local economy will experience moderate and 7 steady growth between 2016 and 2035 in line with current forecasts; 8
› No large demand shock, such as terrorism or war, will significantly affect demand for air travel in 9 the U.S.; 10
› No significant change in airfares from Charlotte will dramatically affect demand for air travel; 11 › No large change in jet fuel prices will dramatically affect the airlines’ ability to serve Charlotte’s 12
from their respective bases; 13 › The U.S. air traffic control system will be able to absorb incremental capacity throughout the 14
forecast period; 15 › The airport’s facilities will not constrain demand; and, 16 › CLT's share of the U.S. industry domestic connects is forecast to decline from 1.9 percent to 1.7 17
percent while the share of international connections declines from 1.5 percent to 1.1 percent. 18 This is an industry trend that reflects greater passenger volumes flying on a nonstop itinerary to 19 reach their destination. Even though the CLT share of connecting passengers is declining, the 20 actual volume of connecting passengers will increase. 21
3.3.1.2 High Case 22
In order to test the outer limit of the passenger forecast, a High Case was created. The following 23 assumptions were made regarding the high forecast scenario for CLT: 24
› In an iterative process, O&D adjustments upward were made to the underlying independent 25 variables in the regression analysis, i.e., economic growth rates forecast by Woods & Poole17 26 and the U.S. Department of Agriculture Economic Research Service. The revised economic 27 growth rates will drive changes to O&D passengers. In the High Case, the GDP growth rate 28 increased by 0.1 percentage points. 29
› Connecting adjustments upward were made on the share of U.S. passenger growth that CLT 30 connecting traffic represents. In the High Case, connecting shares of 1.9 percent for domestic, 31 and 1.5 percent for international are held constant through the forecast period. 32
17 Complete Economic and Demographic Data Source (CEDDS), Woods & Poole Economics, Inc., 2017.

CLT EIS Forecast Technical Memorandum
3-4 Traffic Forecast
However, after review of the output, it was determined that a larger adjustment to the O&D 1 forecast was necessary to reflect a more meaningful change in the underlying conditions. The GDP 2 growth rate was then increased by +0.5 percentage points per annum throughout the forecast 3 period. No change was made to initial assumptions for the connecting passenger forecast. 4
3.3.1.3 Low Case 5
In order to test the lower limit of the passenger forecast, a Low Case was created. The following 6 assumptions were made regarding the Low Case for CLT: 7
› In the Low Case, the GDP growth rated was decreased by -0.1 percentage points per annum. 8 › Connecting shares were decreased from 1.9 percent to 1.6 percent for domestic, and 1.5 percent 9
to 1.0 percent for international over the forecast period. 10
Similar to the high forecast, the results of the low forecast scenario were further analyzed and it was 11 determined that an additional adjustment to the O&D passenger forecast was required. The GDP 12 growth rate was adjusted to reflect a -0.5 percentage point change per year throughout the 13 forecast period. 14
A high/low variance range of 20-25 percent was assumed when reviewing the outputs of the scenarios 15 above. 16
3.3.2 Annual Passenger Forecasts 17
For 2017, the number of enplaned/deplaned passengers is expected to increase 2.4 percent from 18 2016, which reflects anticipated seat capacity growth shown in the 2017 schedule data and the 19 year-to-date passenger figures as of April 2017. Based on the methodology and assumptions 20 described above, the average growth rate is forecast to average 2.4 percent per annum between 21 2016 and 2020 (figures below Table 3-1). In the longer run, between 2016 and 2035, total 22 enplanements will increase at 1.8 percent per annum. Yearly passengers at Charlotte will reach 23 approximately 62.6 million by 2035, compared to 44.4 million in 2016. The resulting passenger 24 forecasts are presented in Table 3-1, Table 3-2, and Table 3-3 below. 25

CLT EIS Forecast Technical Memorandum
3-5 Traffic Forecast
Table 3-1 Passenger Forecast – Base Case 1
Year Domestic O&D Int’l O&D Connecting Total 2005 6,762,157 899,855 20,544,040 28,206,052 2010 8,613,655 1,091,525 28,549,027 38,254,207 2011 8,752,758 1,193,081 29,097,869 39,043,708 2012 9,107,012 1,217,000 30,904,360 41,228,372 2013 9,513,203 1,266,955 32,676,733 43,456,891 2014 9,718,241 1,248,403 33,309,205 44,275,849 2015 10,353,573 1,343,355 33,173,903 44,870,831 2016 11,162,763 1,393,853 31,865,406 44,422,022 2017 11,547,629 1,491,064 32,454,311 45,493,004 2020 12,686,885 1,761,671 34,343,300 48,791,856 2025 14,615,653 2,285,876 36,120,282 53,021,811 2030 16,524,455 2,903,787 38,265,291 57,693,533 2035 18,378,400 3,621,209 40,604,915 62,604,524
Compound Annual Growth Rates (CAGRs) 2005 – 2010 5.0% 3.9% 6.8% 6.3% 2010 – 2015 3.7% 4.2% 3.0% 3.2% 2016 – 2020 3.3% 6.0% 1.9% 2.4% 2020 – 2025 2.9% 5.3% 1.0% 1.7% 2025 – 2030 2.5% 4.9% 1.2% 1.7% 2030 – 2035 2.1% 4.5% 1.2% 1.6% 2016 – 2035 2.7% 5.2% 1.3% 1.8% Source: Airport Statistics data for historical; U.S. DOT T100; InterVISTAS analysis for forecasts. 2 Note: Data is reflected in calendar years 3
4
CLT EIS Forecast Technical Memorandum
3-6 Traffic Forecast
Table 3-2 Passenger Forecast – High Case 1
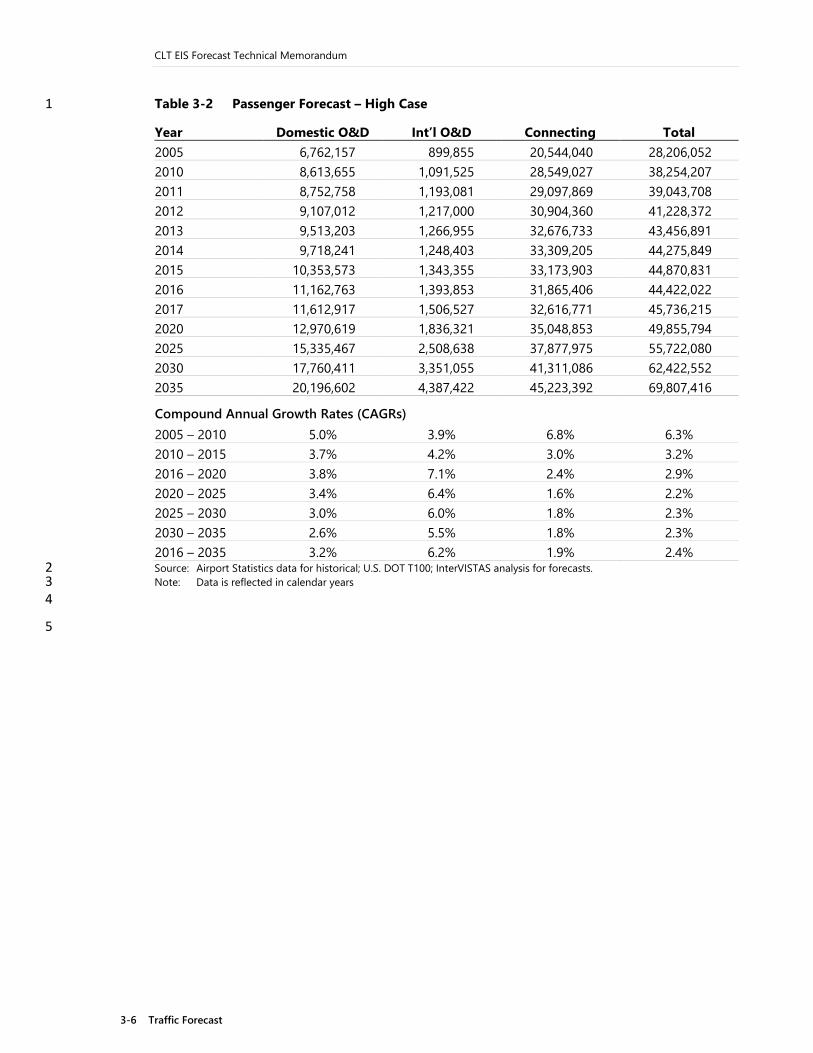
Year Domestic O&D Int’l O&D Connecting Total 2005 6,762,157 899,855 20,544,040 28,206,052 2010 8,613,655 1,091,525 28,549,027 38,254,207 2011 8,752,758 1,193,081 29,097,869 39,043,708 2012 9,107,012 1,217,000 30,904,360 41,228,372 2013 9,513,203 1,266,955 32,676,733 43,456,891 2014 9,718,241 1,248,403 33,309,205 44,275,849 2015 10,353,573 1,343,355 33,173,903 44,870,831 2016 11,162,763 1,393,853 31,865,406 44,422,022 2017 11,612,917 1,506,527 32,616,771 45,736,215 2020 12,970,619 1,836,321 35,048,853 49,855,794 2025 15,335,467 2,508,638 37,877,975 55,722,080 2030 17,760,411 3,351,055 41,311,086 62,422,552 2035 20,196,602 4,387,422 45,223,392 69,807,416
Compound Annual Growth Rates (CAGRs) 2005 – 2010 5.0% 3.9% 6.8% 6.3% 2010 – 2015 3.7% 4.2% 3.0% 3.2% 2016 – 2020 3.8% 7.1% 2.4% 2.9% 2020 – 2025 3.4% 6.4% 1.6% 2.2% 2025 – 2030 3.0% 6.0% 1.8% 2.3% 2030 – 2035 2.6% 5.5% 1.8% 2.3% 2016 – 2035 3.2% 6.2% 1.9% 2.4% Source: Airport Statistics data for historical; U.S. DOT T100; InterVISTAS analysis for forecasts. 2 Note: Data is reflected in calendar years 3 4
5

CLT EIS Forecast Technical Memorandum
3-7 Traffic Forecast
Table 3-3 Passenger Forecast – Low Case 1
Year Domestic O&D Int’l O&D Connecting Total 2005 6,762,157 899,855 20,544,040 28,206,052 2010 8,613,655 1,091,525 28,549,027 38,254,207 2011 8,752,758 1,193,081 29,097,869 39,043,708 2012 9,107,012 1,217,000 30,904,360 41,228,372 2013 9,513,203 1,266,955 32,676,733 43,456,891 2014 9,718,241 1,248,403 33,309,205 44,275,849 2015 10,353,573 1,343,355 33,173,903 44,870,831 2016 11,162,763 1,393,853 31,865,406 44,422,022 2017 11,482,340 1,475,601 32,319,802 45,277,743 2020 12,407,831 1,689,593 33,762,591 47,860,015 2025 13,926,024 2,082,707 34,695,996 50,704,728 2030 15,368,749 2,517,566 35,829,682 53,715,997 2035 16,715,958 2,993,229 36,958,319 56,667,506
Compound Annual Growth Rates (CAGRs) 2005 – 2010 5.0% 3.9% 6.8% 6.3% 2010 – 2015 3.7% 4.2% 3.0% 3.2% 2016 – 2020 2.7% 4.9% 1.5% 1.9% 2020 – 2025 2.3% 4.3% 0.5% 1.2% 2025 – 2030 2.0% 3.9% 0.6% 1.2% 2030 – 2035 1.7% 3.5% 0.6% 1.1% 2016 – 2035 2.1% 4.1% 0.8% 1.3% Source: Airport Statistics data for historical; U.S. DOT T100; InterVISTAS analysis for forecasts. 2 Note: Data is reflected in calendar years 3
The figure below (Figure 3-1) reflects the high and low growth scenarios compared to the base 4 case. Forecasted enplanements for the high case are 12 percent above the base case, reaching 5 33.8 million enplanements in 2035. As for the low scenario, enplanements are projected to be 6 28.3 million, nine percent below the base case scenario. The variance for the revised high/low 7 forecast is 23 percent. 8
9

CLT EIS Forecast Technical Memorandum
3-8 Traffic Forecast
Figure 3-1 Enplanements Forecast – Base, High, Low Cases 1
Source: CLT statistics data for historical; U.S. DOT T100; InterVISTAS analysis for forecasts. 2 3
3.3.3 Comparative Enplaned Passenger Forecasts 4
Forecasts that are part of an EIS are required to be approved by the FAA. The FAA “must ensure 5 that the forecast is based on reasonable planning assumptions, uses current data, and is developed 6 using appropriate forecast methods.”18 In addition, forecasts must be deemed to be consistent with 7 the FAA’s Terminal Area Forecast (TAF). The TAF is an annual forecast of passengers and aircraft 8 operations produced by the FAA for all existing airports in the National Plan of Integrated Airport 9 Systems19. The comparison shown below (Figure 3-2) shows the most recent version of the TAF, 10 which uses FY 2016 as the base year and provides forecasts for FY 2017-2045. In addition to its 11 baseline forecast, the TAF also shows optimistic and pessimistic scenarios. In order to be approved, 12 this EIS forecast must fall within a defined, acceptable range of the baseline TAF forecast: 13 ±10 percent in the five-year forecast period and ±15 percent in the 10-year forecast period. 14
As shown in the table below (Table 3-4), the EIS passenger forecast matches closely with the FAA 15 TAF for the future forecast years.20 The EIS forecast is 0.5 percent below the TAF base forecast by 16 2035, which is within the TAF consistency requirements required by the FAA. This forecast technical 17 memorandum is accompanied by a letter to the FAA requesting approval for its use in this EIS 18 process. 19
18 FAA, Approval of Local Forecasts, 2008, page 1. 19 CLT is a large hub airport. 20 The TAF forecast has been converted into calendar years for comparison purposes. Calendar year figures were
determined by assuming 75 percent of operations in the base fiscal year and 25 percent of operations in the following fiscal year (i.e., for CY 2016: 75 percent of FY 2016 and 25 percent of FY 2017).
0
5
10
15
20
25
30
35
40
'05'06'07'08'09'10'11'12'13'14'15'16'17'18'19'20'21'22'23'24'25'26'27'28'29'30'31'32'33'34'35
Mill
ions
High Case Base Case Low Case

CLT EIS Forecast Technical Memorandum
3-9 Traffic Forecast
Figure 3-2 Historical and Forecast Enplaned Passengers – EIS, TAF and ACEP 1
Source: Airport statistics data for historical; U.S. DOT T100 data; InterVISTAS analysis for forecasts. 2 FAA TAF: https://www.faa.gov/data_research/aviation/taf/ 3
CLT Master Plan Update: Phase 1, Airport Capacity Enhancement Plan 4 Note: The forecast in the ACEP ends in 2033 5 6
Table 3-4 Historical and Forecast Enplaned Passengers Compound Average Growth Rates – 7 EIS, TAF, and ACEP 8
Period EIS TAF ACEP 2010 – 2016 2.5% 3.1% 4.2% 2016 – 2020 2.4% 2.1% 3.5% 2020 – 2025 1.7% 2.0% 3.4% 2025 – 2030 1.7% 1.9% 3.3% 2030 – 2035 1.6% 1.8% 3.3% 2016 – 2035 1.8% 1.9% 3.5% Source: Airport statistics data for historical; U.S. DOT T100; InterVISTAS analysis for forecasts. 9
FAA TAF: https://www.faa.gov/data_research/aviation/taf/ 10 CLT Master Plan Update: Phase 1, Airport Capacity Enhancement Plan 11 Note: ACEP Growth Rates are for 2030-2033, and 2013-2033 12 Note: Comparison is made between the baseline EIS and TAF forecasts. 13 14
The graph (Figure 3-2) and table (Table 3-4) above, also show a comparison of the EIS forecast to 15 that in the ACEP. When compared to the enplanement forecast in the ACEP, both the EIS and TAF 16 forecasts are 29.3 percent and 29.2 percent below the ACEP in 2033, respectively. The ACEP forecast 17 used 2013 as a base year, while 2016 is the base year in the EIS forecast, and has overestimated 18 enplanements in 2016 by over 2 million passengers. 19
0
5
10
15
20
25
30
35
40
45
50
'05 '07 '09 '11 '13 '15 '17 '19 '21 '23 '25 '27 '29 '31 '33 '35
Mill
ions
FAA TAF:Low
FAA TAF:Base
FAA TAF:High
EIS ACEP

CLT EIS Forecast Technical Memorandum
3-10 Traffic Forecast
Since the ACEP forecast was completed, several of the assumptions used in the forecast have changed. 1
› At the time the ACEP forecast was created, the merger of American Airlines and US Airways had 2 only recently been announced. The ACEP forecast assumed that the merger “is not expected to 3 negatively affect passenger growth at CLT.”21 While the merger has not negatively affected 4 passenger traffic at CLT as of yet, American Airlines has altered the role of CLT in its network, 5 specifically in international routes. 6
› The ACEP assumed that “Growth in the Latin American economies will be the primary driver of 7 continued growth in international air travel at CLT.”22 While Charlotte maintained service to the 8 Caribbean, American Airlines shifted international service among its hub and withdrew its service from 9 Charlotte to Sao Paulo and Rio de Janeiro in Brazil, instead relying on its flights from Miami to connect 10 the U.S. to South America. In 2016, Charlotte had no flights to South America and American Airlines is 11 not expected to add any in the near future according to the carrier’s network planners. 12
› In addition, the ACEP report states that “Domestic enplanements at CLT increased 4.8 percent 13 annually between 1990 and 2013…This was primarily driven by domestic connections…”23 14 However, since the ACEP forecast was completed, domestic O&D passengers continued to 15 grow, while domestic connections have grown more slowly or even decline (-1.1 percent on 16 average per annum from 2013-2016). 17
› The ACEP “assumed that connecting domestic enplanements would account for 75.0 percent of 18 the total domestic enplanements throughout the forecast period.”24 Instead, the connecting 19 share of passengers has declined to 71.7 percent in 2016. 20
› The ACEP assumed continued high fuel prices; however, fuel prices have plummeted in recent 21 years, changing the economics of airline operations. 22
All of these factors/assumptions explain why the ACEP forecast is higher than that of the more 23 recent TAF and EIS forecasts. 24
3.4 Operations 25
This section presents the methodology and results for projected aircraft operations at CLT for the 26 2017-2035 period. 27
3.4.1 Operations Forecast Assumptions 28
Forecasts of annual commercial passenger aircraft operations are based on forecast passenger 29 traffic demand. Passenger aircraft landings depend on the average aircraft size and average load 30 factor (i.e., average passenger per flight), as represented by the formula below: 31
𝑷𝑷𝑷𝑷𝑷𝑷𝑷𝑷𝑷𝑷𝑷𝑷𝑷𝑷𝑷𝑷𝑷𝑷 𝑨𝑨𝑨𝑨𝑷𝑷𝑨𝑨𝑷𝑷𝑷𝑷𝑨𝑨𝑨𝑨 𝑶𝑶𝑶𝑶𝑷𝑷𝑷𝑷𝑷𝑷𝑨𝑨𝑨𝑨𝑶𝑶𝑷𝑷𝑷𝑷32 = (𝑃𝑃𝑃𝑃𝑃𝑃𝑃𝑃𝑃𝑃𝑃𝑃𝑃𝑃𝑃𝑃𝑃𝑃 𝐹𝐹𝐹𝐹𝑃𝑃𝑃𝑃𝐹𝐹𝑃𝑃𝑃𝑃𝐹𝐹𝑃𝑃)/(𝐴𝐴𝐴𝐴𝑃𝑃.𝐴𝐴𝐴𝐴𝑃𝑃𝐹𝐹𝑃𝑃𝑃𝑃𝐴𝐴𝐹𝐹 𝑆𝑆𝐴𝐴𝑆𝑆𝑃𝑃 𝑥𝑥 𝐴𝐴𝐴𝐴𝑃𝑃. 𝐿𝐿𝐹𝐹𝑃𝑃𝐿𝐿 𝐹𝐹𝑃𝑃𝐹𝐹𝐹𝐹𝐹𝐹𝑃𝑃) 33
where Avg. Aircraft Size x Avg. Load Factor = Avg. Passengers per Aircraft Movement 34
21 CLT Master Plan Update: Phase 1, Airport Capacity Enhancement Plan 22 Ibid. 23 Ibid. 24 Ibid.

CLT EIS Forecast Technical Memorandum
3-11 Traffic Forecast
Forecasts of average load factors were prepared (including marginal growth) and applied to the 1 passenger figures (Table 3-5). 2 3
Table 3-5 Load Factor Assumptions 4
Region 2016 2035 Commuter – Domestic 80.2% 81.4% Air Carrier – Domestic 84.0% 85.0% Air Carrier – Canada 77.4% 82.0% Air Carrier – Caribbean, Mexico, Central America 83.8% 85.0% Air Carrier – South America 80.0% 82.0% Air Carrier – Trans-Atlantic 75.1% 80.0% Air Carrier – Trans-Pacific 80.0% 85.0% Source: InterVISTAS assumptions. 5 6
Projections of passenger operations for Base, High and Low Cases were created by applying these 7 load factor assumptions and assumptions regarding aircraft size (discussed in Section 3.4.5 below). 8 Forecasts of annual general aviation and military operations were increased in line with the FAA TAF 9 forecast. 10
3.4.2 Cargo Operations Forecasts 11
In 2016, there were 2,696 air cargo operations at CLT, 0.5 percent of total aircraft operations. The 12 forecast of cargo aircraft operations was based on historical operations and forecast air cargo 13 tonnage. It was assumed that the proportion of air cargo that would be transported by cargo 14 aircraft (as opposed to passenger aircraft bellyhold), would remain at 2016 levels throughout the 15 forecast period. Furthermore, it was assumed that the tonnage per cargo aircraft would remain 16 constant over the forecast period. 17
3.4.3 Annual Operations Forecasts 18
The resulting base case operations forecasts are presented in Table 3-6 below. Air carrier aircraft 19 movements are forecast to increase by an average of 1.4 percent per annum, compared with 20 passenger growth of 1.8 percent per annum (the lower growth due to rising load factors and the 21 number of passengers per aircraft). Total operations for the base case forecasted are projected to 22 grow at an average annual rate of 1.2 percent. 23

CLT EIS Forecast Technical Memorandum
3-12 Traffic Forecast
Table 3-6 Operations Forecast – Base Case – Charlotte Douglas International Airport 1
Year Air Carrier Air Taxi GA Military Total 2010 331,110 171,836 24,414 1,741 529,101 2011 329,680 184,122 24,131 1,909 539,842 2012 343,121 183,870 23,400 1,702 552,093 2013 356,079 175,051 25,426 1,392 557,948 2014 361,273 156,188 26,321 1,396 545,178 2015 363,667 152,215 25,639 2,423 543,944 2016 400,819 117,378 24,869 2,676 545,742 2017 409,357 118,994 24,935 2,676 555,962 2020 431,503 122,231 25,083 2,676 581,494 2025 464,250 127,137 25,335 2,676 619,399 2030 494,758 130,959 25,588 2,676 653,981 2035 526,759 135,135 25,845 2,676 690,415
Compound Annual Growth Rates 2010 – 2015 1.9% -2.4% 1.0% 6.8% 0.6% 2016 – 2020 1.9% 1.0% 0.2% 0.0% 1.6% 2020 – 2025 1.5% 0.8% 0.2% 0.0% 1.3% 2025 – 2030 1.3% 0.6% 0.2% 0.0% 1.1% 2030 – 2035 1.3% 0.6% 0.2% 0.0% 1.1% 2016 – 2035 1.4% 0.7% 0.2% 0.0% 1.2% Source: Airport Statistics data for historical; U.S. DOT T100; InterVISTAS analysis for forecasts. 2 Note: Data is reflected in calendar years. 3 Note: The forecast does not reallocate air taxi operations to air carrier as the seating capacity increases; therefore, the 4
average aircraft size (seats) for air taxi goes above 60 seats. 5 6

CLT EIS Forecast Technical Memorandum
3-13 Traffic Forecast
Table 3-7 Operations Forecast – High Case – Charlotte Douglas International Airport 1
Year Air Carrier Air Taxi GA Military Total 2010 331,110 171,836 24,414 1,741 529,101 2011 329,680 184,122 24,131 1,909 539,842 2012 343,121 183,870 23,400 1,702 552,093 2013 356,079 175,051 25,426 1,392 557,948 2014 361,273 156,188 26,321 1,396 545,178 2015 363,667 152,215 25,639 2,423 543,944 2016 400,819 117,378 24,869 2,676 545,742 2017 411,504 119,523 24,935 2,676 558,638 2020 440,726 124,439 25,083 2,676 592,925 2025 483,014 129,731 25,335 2,676 640,757 2030 531,968 138,249 25,588 2,676 698,481 2035 585,654 147,635 25,845 2,676 761,810
Compound Annual Growth Rates 2010 – 2015 1.9% -2.4% 1.0% 6.8% 0.6% 2016 – 2020 2.4% 1.5% 0.2% 0.0% 2.1% 2020 – 2025 1.8% 0.8% 0.2% 0.0% 1.6% 2025 – 2030 1.9% 1.3% 0.2% 0.0% 1.7% 2030 – 2035 1.9% 1.3% 0.2% 0.0% 1.8% 2016 – 2035 2.0% 1.2% 0.2% 0.0% 1.8% Source: Airport Statistics data for historical; U.S. DOT T100; InterVISTAS analysis for forecasts. 2 Note: Data is reflected in calendar years 3 Note: The forecast does not reallocate air taxi operations to air carrier as the seating capacity increases; therefore, the 4
average aircraft size (seats) for air taxi goes above 60 seats. 5

CLT EIS Forecast Technical Memorandum
3-14 Traffic Forecast
Table 3-8 Operations Forecast – Low Case – Charlotte Douglas International Airport 1
Year Air Carrier Air Taxi GA Military Total 2010 331,110 171,836 24,414 1,741 529,101 2011 329,680 184,122 24,131 1,909 539,842 2012 343,121 183,870 23,400 1,702 552,093 2013 356,079 175,051 25,426 1,392 557,948 2014 361,273 156,188 26,321 1,396 545,178 2015 363,667 152,215 25,639 2,423 543,944 2016 400,819 117,378 24,869 2,676 545,742 2017 407,441 118,506 24,935 2,676 553,557 2020 423,357 120,210 25,083 2,676 571,326 2025 440,261 119,856 25,335 2,676 588,129 2030 459,150 121,963 25,588 2,676 609,377 2035 477,630 124,175 25,845 2,676 630,326
Compound Annual Growth Rates 2010 – 2015 1.9% -2.4% 1.0% 6.8% 0.6% 2016 – 2020 1.4% 0.6% 0.2% 0.0% 1.2% 2020 – 2025 0.8% -0.1% 0.2% 0.0% 0.6% 2025 – 2030 0.8% 0.3% 0.2% 0.0% 0.7% 2030 – 2035 0.8% 0.4% 0.2% 0.0% 0.7% 2016 – 2035 0.9% 0.3% 0.2% 0.0% 0.8% Source: Airport Statistics data for historical; U.S. DOT T100; InterVISTAS analysis for forecasts. 2 Note: Data is reflected in calendar years 3 Note: The forecast does not reallocate air taxi operations to air carrier as the seating capacity increases; therefore, the 4
average aircraft size (seats) for air taxi goes above 60 seats. 5
6 In the high growth scenario, total aircraft operations at Charlotte Douglas International will reach 7 over 761,800 operations, with an average annual growth rate of 1.8 percent through 2035 8 (Figure 3-3 and Table 3-7). While a period of low growth is projected to reach 630,300 operations 9 in 2035 with an average annual growth rate of 0.8 percent (Table 3-8). 10
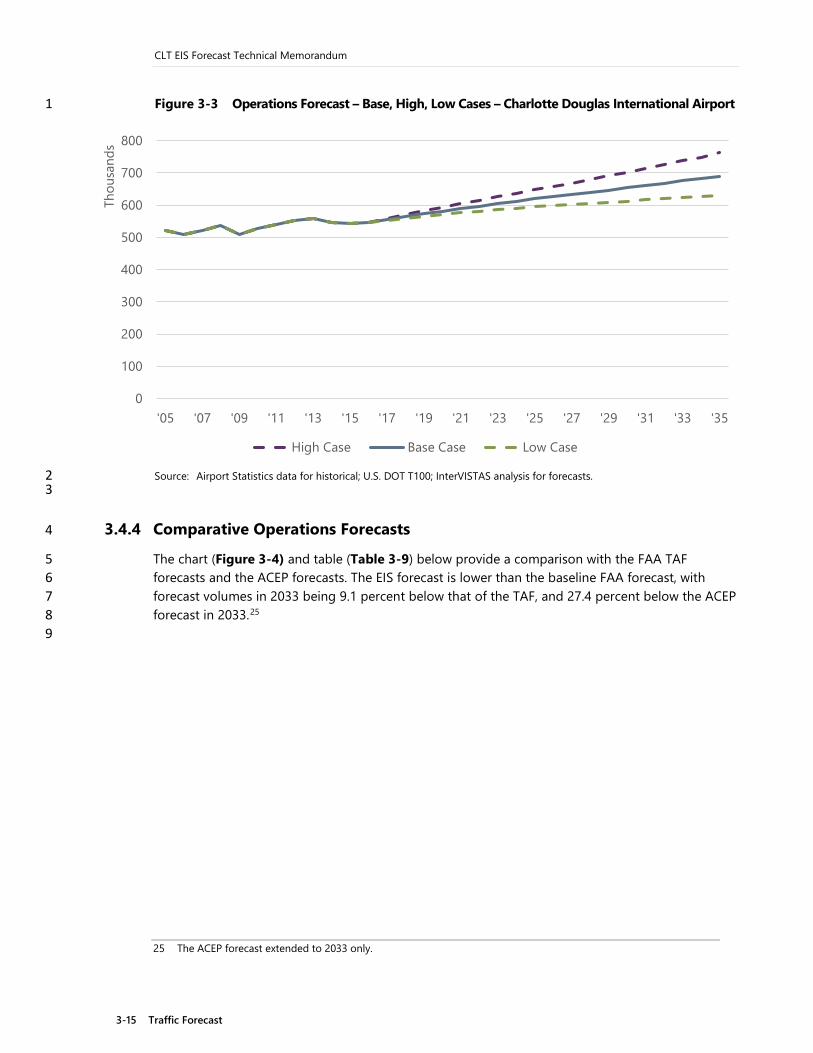
CLT EIS Forecast Technical Memorandum
3-15 Traffic Forecast
Figure 3-3 Operations Forecast – Base, High, Low Cases – Charlotte Douglas International Airport 1
Source: Airport Statistics data for historical; U.S. DOT T100; InterVISTAS analysis for forecasts. 2 3
3.4.4 Comparative Operations Forecasts 4
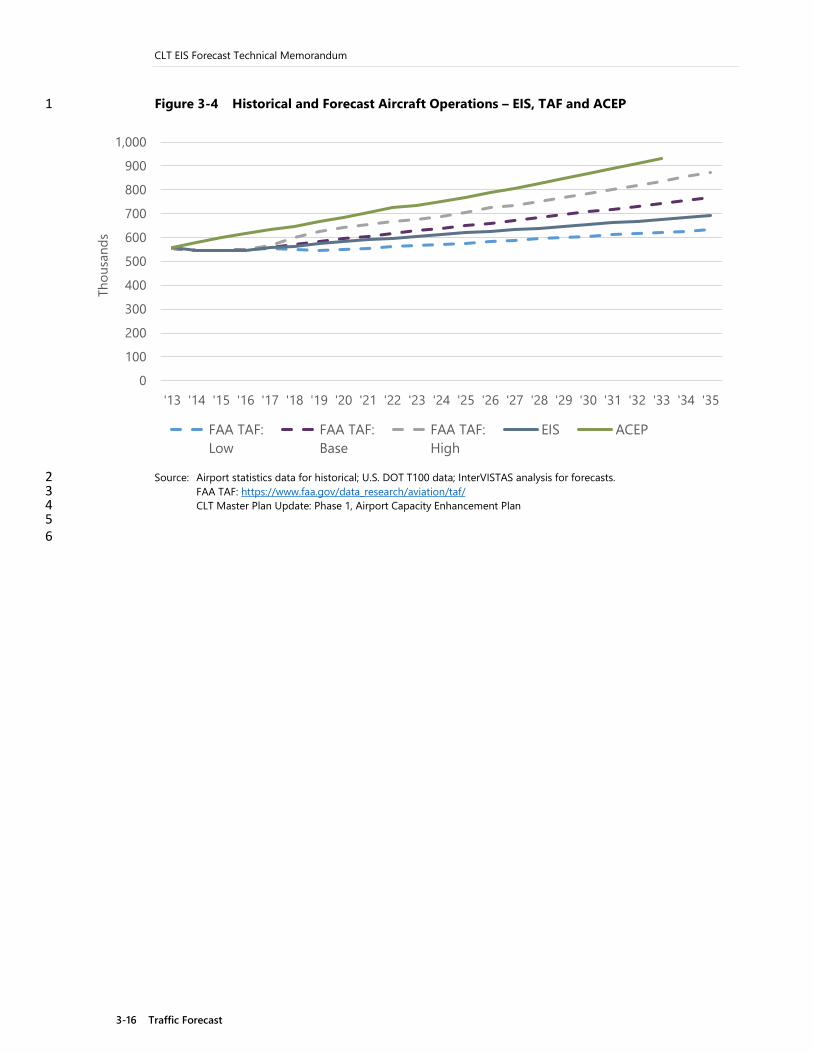
The chart (Figure 3-4) and table (Table 3-9) below provide a comparison with the FAA TAF 5 forecasts and the ACEP forecasts. The EIS forecast is lower than the baseline FAA forecast, with 6 forecast volumes in 2033 being 9.1 percent below that of the TAF, and 27.4 percent below the ACEP 7 forecast in 2033.25 8 9
25 The ACEP forecast extended to 2033 only.
0
100
200
300
400
500
600
700
800
'05 '07 '09 '11 '13 '15 '17 '19 '21 '23 '25 '27 '29 '31 '33 '35
Thou
sand
s
High Case Base Case Low Case
CLT EIS Forecast Technical Memorandum
3-16 Traffic Forecast
Figure 3-4 Historical and Forecast Aircraft Operations – EIS, TAF and ACEP 1
Source: Airport statistics data for historical; U.S. DOT T100 data; InterVISTAS analysis for forecasts. 2 FAA TAF: https://www.faa.gov/data_research/aviation/taf/ 3
CLT Master Plan Update: Phase 1, Airport Capacity Enhancement Plan 4 5
6
0
100
200
300
400
500
600
700
800
900
1,000
'13 '14 '15 '16 '17 '18 '19 '20 '21 '22 '23 '24 '25 '26 '27 '28 '29 '30 '31 '32 '33 '34 '35
Thou
sand
s
FAA TAF:Low
FAA TAF:Base
FAA TAF:High
EIS ACEP

CLT EIS Forecast Technical Memorandum
3-17 Traffic Forecast
Table 3-9 Historical and Forecast Operations– EIS, TAF and ACEP 1
Year EIS FAA TAF ACEP EIS vs.
TAF EIS vs. ACEP
Passenger Enplanements Base Year 2016 22,173,747 21,900,456 24,408,300 1.2% -9.2% Base Year + 1 2017 22,746,502 22,231,446 25,266,400 2.3% -10.0% Build Year 2028 27,893,348 27,735,137 36,449,000 0.6% -23.5% Build Year + 5 2033 30,298,324 30,353,627 42,865,500 -0.2% -29.3%
Commercial Operations Base Year 2016 518,197 521,304 579,260 -0.6% -10.5% Base Year + 1 2017 528,351 532,647 594,800 -0.8% -11.2% Build Year 2028 611,620 655,739 783,220 -6.7% -21.9% Build Year + 5 2033 647,224 714,678 886,260 -9.4% -27.0%
Total Operations Base Year 2016 545,742 548,653 616,400 -0.5% -11.5% Base Year + 1 2017 555,962 560,057 632,300 -0.7% -12.1% Build Year 2028 639,783 683,696 824,740 -6.4% -22.4% Build Year + 5 2033 675,643 742,889 930,080 -9.1% -27.4% Source: Airport statistics data for historical; U.S. DOT T100 data; InterVISTAS analysis for forecasts. 2
FAA TAF: https://www.faa.gov/data_research/aviation/taf/ 3 CLT Master Plan Update: Phase 1, Airport Capacity Enhancement Plan 4 Note: A version of this table with Base Year +5,10,15 years is shown in the Appendix. 5 Note: Comparison is made between the baseline EIS and TAF forecasts. 6
3.4.5 Aircraft Fleet Mix 7
One of the other major assumptions required to convert the passenger forecast into aircraft 8 operations is the average aircraft size, which includes assumptions regarding how the fleet of 9 aircraft using CLT will change in the future. Forecasts of average aircraft size were prepared and 10 applied, pointing to a trend of larger aircraft. In particular, the fleet orders of American Airlines 11 which include large orders for the Airbus A321neo (starting in 2019) and the Boeing B737Max8 12 (starting in 2021), were included. The addition of these aircraft are expected to increase the average 13 aircraft size at CLT (confirmed in interviews with American Airlines). 14
Average Aircraft Size (Seats per Departure) Assumptions: 15
› Commuter – commuter aircraft, including large and small regional jets, are assumed to increase 16 from 59 seats in 2016 to 62 seats in 2022 and 64 seats by 2035. This increase assumes network 17 carriers will continue retiring smaller regional jets and replace them with more efficient larger 18 regional jets. 19
› Domestic – seats per aircraft increase from 142 in 2016 to 145 in 2022 and 148 by 2035, as airlines 20 upgauge; e.g., moving some operations from A319 to A320, and from A320 to A321Neo, etc. 21
› Canada – seats per departure to Canada decreased following the 2008-2010 financial crisis. 22 However, seats per departure have stabilized since 2013. Average seats are forecast to increase 23 gradually from 62 seats in 2016 to 64 in 2022 and 67 in 2035. 24

CLT EIS Forecast Technical Memorandum
3-18 Traffic Forecast
› Caribbean, Mexico, South America – seats per departures has stayed relatively flat for this 1 region at 159 seats - assumed to be 162 seats by 2022 and 166 seats by 2035. 2
› South America – US Airways previously serviced Brazil from 2009-2015, with average seats per 3 departure of 204 in 2015. Service is assumed to resume by 2020, operating with 209 seats. 4
› Trans-Atlantic – seats per departures are projected to increase from 261 seats in 2016 to 265 in 2035. 5
› Trans-Pacific – does not currently have service, assumed this would remain the case through 2035 6
3.5 Cargo 7
This section presents the methodology and forecast results for cargo tonnage at CLT for the 2017-8 2035 period. 9
3.5.1 Cargo Forecast Assumptions 10
Cargo forecasts were prepared for Base, High and Low Cases, with differing assumptions for each 11 case. The cargo growth forecast is based on expert judgement. 12
3.5.1.1 Base Case 13
The continuation of activity is expected to spur growth in the short term, averaging 6 percent per 14 annum up to 2019. After that, cargo activity growth at the airport is expected to taper off in the 15 long term as Amazon plans to build a centralized air hub at Cincinnati/Northern Kentucky Airport 16 to support its growing fleet of Prime Air cargo planes. Cargo growth after 2020 is projected to 17 range from 2-3 percent per annum in line with historical levels. While the Department does not 18 currently have plans to expand its cargo facilities, the Department recently completed an expansion 19 of the cargo ramp, providing 12,000 square yards of additional space. Airport facilities are assumed 20 to accommodate future cargo activity levels. 21
The following assumptions were made concerning the cargo forecast at Charlotte: 22
› The U.S. economy as well as Charlotte’s local economy will experience moderate and steady 23 growth between 2016 and 2041; 24
› Rapid growth due to Amazon will slow by 2019; 25
› Key integrated carriers (e.g., FedEx, UPS, etc.) will maintain their services at Charlotte airport; 26
› Passenger air carriers would continue to provide cargo services through their belly capacity; 27 regional jets would provide limited cargo capacity 28
› Long-term (2020-2035) growth is forecast to average 2.4 percent per annum, close to the 29 average between 2011 and 2016 (2.3 percent per annum – see Section 2.5). 30
3.5.1.2 High Case 31
To reflect a high growth scenario, an adjustment of +0.5 percentage points was made to the annual 32 cargo growth rate. 33

CLT EIS Forecast Technical Memorandum
3-19 Traffic Forecast
3.5.1.3 Low Case 1
For the low growth scenario, it was assumed Amazon growth in the early part of the forecast is 2 curtailed, and an adjustment of -0.5 percentage points was made to the annual cargo growth rate. 3
3.5.2 Annual Cargo Forecasts 4
In the Base Case forecast, cargo tonnage is expected to grow an average of 3.0 percent per year 5 reaching 270,215 tons in 2035, compared to 154,477 tons in 2016 (Figure 3-5). In the High Case 6 forecast average annual growth increases to 3.5 percent per year, reaching 296,264 tons in 2035. 7 While in the Low Case, cargo is projected to reach 246,346 tons by 2035, with an average annual 8 growth rate of 2.5 percent. 9 10
Figure 3-5 Historical and Forecast Cargo Tonnage – Base, High, Low Cases – 11 Charlotte Douglas International Airport 12
Source: Airport Statistics data for historical; U.S. DOT T100; InterVISTAS analysis for forecasts. 13 14
3.6 Conclusion 15
The forecasts presented in this technical memorandum will be used as an input into several 16 subsequent analyses in the EIS. The Base Case forecast serves as the most likely future demand 17 scenario given no constraints on traffic growth at the Airport; the High and Low Cases serve as 18 indicators of how actual demand could vary above/below the Base Case depending on changes in 19 the economic environment or changes in strategic decisions made by American Airlines. The annual 20 forecasts for 2028 (Build Year) and 2033 (Build Year + 5) will be converted into Design Day 21 Schedules including details of individual flights. Such schedules are required to conduct the 22 capacity delay analysis and evaluate delays in airspace, runway usage, taxi-in/out times, and gate 23
0
50
100
150
200
250
300
350
'15 '17 '19 '21 '23 '25 '27 '29 '31 '33 '35
Thou
sand
s
High Case Base Case Low Case

CLT EIS Forecast Technical Memorandum
3-20 Traffic Forecast
usage. Simulation of a Design Day Schedule for 2016 (based on current OAG schedules) will 1 determine the presence and location of existing delays; the schedules for 2028 and 2033 will be 2 used as inputs to model future delays in the absence of the Project (No Action). 3

CLT EIS Forecast Technical Memorandum
A1-1 Appendix 1: Additional Data
Appendix 1: Additional Data 1
Domestic O&D Traffic Parameter Estimates (1998-2016) 2
Variable Parameter Estimate T-Statistic Constant -22.53 -5.92 Ln (Charlotte GDP) 1.19 10.10 Ln (2001 Dummy) -0.13 -1.41 Ln (2002 Dummy) -0.17 -1.83 Adjusted-R2 0.89 3
Canada O&D Traffic Parameter Estimates – Outbound (1998-2016) 4 Variable Parameter Estimate T-Statistic Constant -20.19 -5.09 Ln (Charlotte GDP) 0.97 7.91 Ln (2001 Dummy) -0.05 -0.48 Ln (2002 Dummy) 0.17 1.72 Adjusted-R2 0.79 5
Canada O&D Traffic Parameter Estimates – Inbound (1998-2016) 6 Variable Parameter Estimate T-Statistic Constant -43.24 -10.38 Ln (Canadian GDP) 1.93 13.00 Ln (2001 Dummy) -0.07 -0.92 Ln (2002 Dummy) 0.01 0.10 Adjusted-R2 0.91 7
Caribbean (including Mexico and the Caribbean) O&D Traffic Parameter Estimates – 8 Outbound (1998-2016) 9 Variable Parameter Estimate T-Statistic Constant -73.08 -12.37 Ln (Charlotte GDP) 2.64 14.48 Ln (2001 Dummy) -0.11 -0.78 Ln (2002 Dummy) -0.03 -0.23 Adjusted-R2 0.93 10
11
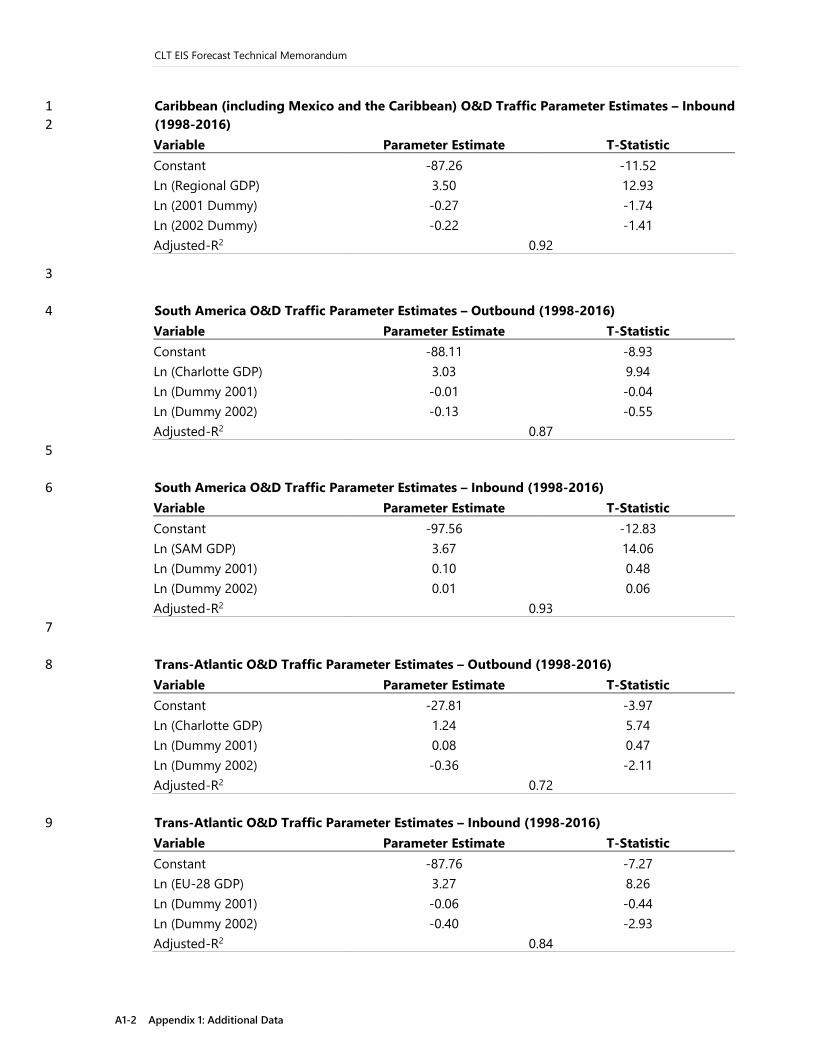
CLT EIS Forecast Technical Memorandum
A1-2 Appendix 1: Additional Data
Caribbean (including Mexico and the Caribbean) O&D Traffic Parameter Estimates – Inbound 1 (1998-2016) 2 Variable Parameter Estimate T-Statistic Constant -87.26 -11.52 Ln (Regional GDP) 3.50 12.93 Ln (2001 Dummy) -0.27 -1.74 Ln (2002 Dummy) -0.22 -1.41 Adjusted-R2 0.92
3
South America O&D Traffic Parameter Estimates – Outbound (1998-2016) 4 Variable Parameter Estimate T-Statistic Constant -88.11 -8.93 Ln (Charlotte GDP) 3.03 9.94 Ln (Dummy 2001) -0.01 -0.04 Ln (Dummy 2002) -0.13 -0.55 Adjusted-R2 0.87 5
South America O&D Traffic Parameter Estimates – Inbound (1998-2016) 6 Variable Parameter Estimate T-Statistic Constant -97.56 -12.83 Ln (SAM GDP) 3.67 14.06 Ln (Dummy 2001) 0.10 0.48 Ln (Dummy 2002) 0.01 0.06 Adjusted-R2 0.93 7
Trans-Atlantic O&D Traffic Parameter Estimates – Outbound (1998-2016) 8 Variable Parameter Estimate T-Statistic Constant -27.81 -3.97 Ln (Charlotte GDP) 1.24 5.74 Ln (Dummy 2001) 0.08 0.47 Ln (Dummy 2002) -0.36 -2.11 Adjusted-R2 0.72
Trans-Atlantic O&D Traffic Parameter Estimates – Inbound (1998-2016) 9 Variable Parameter Estimate T-Statistic Constant -87.76 -7.27 Ln (EU-28 GDP) 3.27 8.26 Ln (Dummy 2001) -0.06 -0.44 Ln (Dummy 2002) -0.40 -2.93 Adjusted-R2 0.84
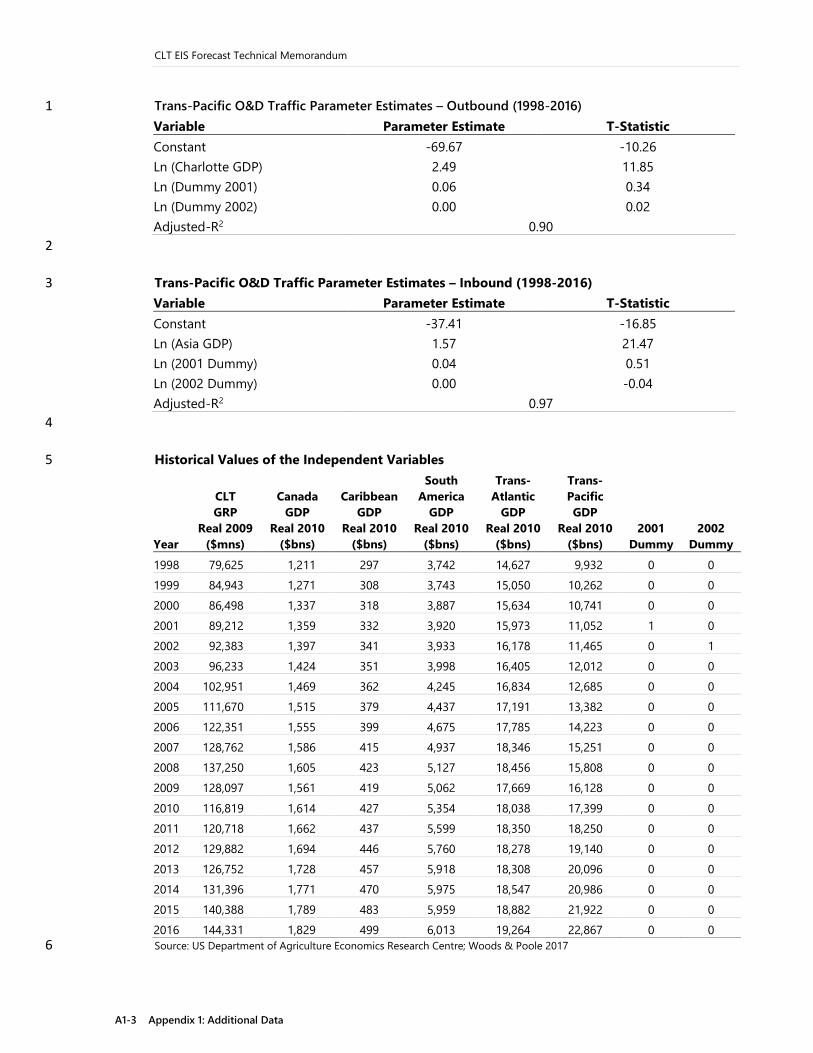
CLT EIS Forecast Technical Memorandum
A1-3 Appendix 1: Additional Data
Trans-Pacific O&D Traffic Parameter Estimates – Outbound (1998-2016) 1 Variable Parameter Estimate T-Statistic Constant -69.67 -10.26 Ln (Charlotte GDP) 2.49 11.85 Ln (Dummy 2001) 0.06 0.34 Ln (Dummy 2002) 0.00 0.02 Adjusted-R2 0.90 2
Trans-Pacific O&D Traffic Parameter Estimates – Inbound (1998-2016) 3 Variable Parameter Estimate T-Statistic Constant -37.41 -16.85 Ln (Asia GDP) 1.57 21.47 Ln (2001 Dummy) 0.04 0.51 Ln (2002 Dummy) 0.00 -0.04 Adjusted-R2 0.97 4
Historical Values of the Independent Variables 5
Year
CLT GRP
Real 2009 ($mns)
Canada GDP
Real 2010 ($bns)
Caribbean GDP
Real 2010 ($bns)
South America
GDP Real 2010
($bns)
Trans-Atlantic
GDP Real 2010
($bns)
Trans-Pacific GDP
Real 2010 ($bns)
2001 Dummy
2002 Dummy
1998 79,625 1,211 297 3,742 14,627 9,932 0 0 1999 84,943 1,271 308 3,743 15,050 10,262 0 0 2000 86,498 1,337 318 3,887 15,634 10,741 0 0 2001 89,212 1,359 332 3,920 15,973 11,052 1 0 2002 92,383 1,397 341 3,933 16,178 11,465 0 1 2003 96,233 1,424 351 3,998 16,405 12,012 0 0 2004 102,951 1,469 362 4,245 16,834 12,685 0 0 2005 111,670 1,515 379 4,437 17,191 13,382 0 0 2006 122,351 1,555 399 4,675 17,785 14,223 0 0 2007 128,762 1,586 415 4,937 18,346 15,251 0 0 2008 137,250 1,605 423 5,127 18,456 15,808 0 0 2009 128,097 1,561 419 5,062 17,669 16,128 0 0 2010 116,819 1,614 427 5,354 18,038 17,399 0 0 2011 120,718 1,662 437 5,599 18,350 18,250 0 0 2012 129,882 1,694 446 5,760 18,278 19,140 0 0 2013 126,752 1,728 457 5,918 18,308 20,096 0 0 2014 131,396 1,771 470 5,975 18,547 20,986 0 0 2015 140,388 1,789 483 5,959 18,882 21,922 0 0 2016 144,331 1,829 499 6,013 19,264 22,867 0 0 Source: US Department of Agriculture Economics Research Centre; Woods & Poole 2017 6
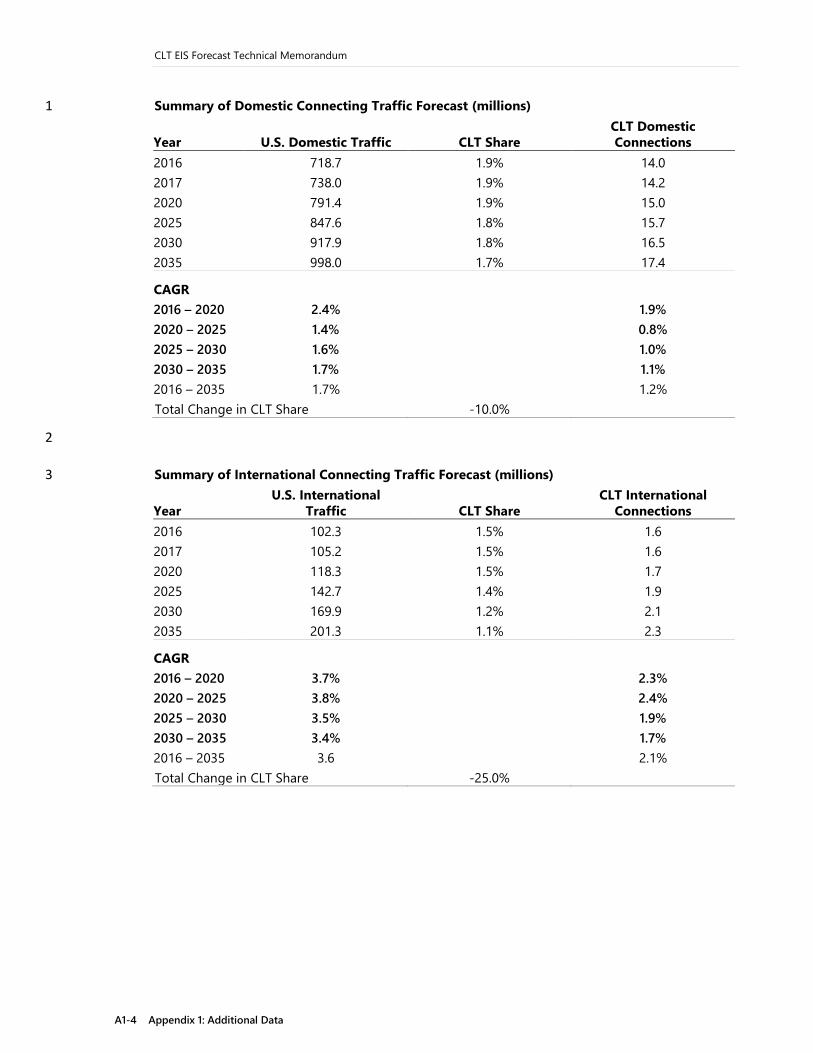
CLT EIS Forecast Technical Memorandum
A1-4 Appendix 1: Additional Data
Summary of Domestic Connecting Traffic Forecast (millions) 1
Year U.S. Domestic Traffic CLT Share CLT Domestic Connections
2016 718.7 1.9% 14.0 2017 738.0 1.9% 14.2 2020 791.4 1.9% 15.0 2025 847.6 1.8% 15.7 2030 917.9 1.8% 16.5 2035 998.0 1.7% 17.4
CAGR 2016 – 2020 2.4% 1.9% 2020 – 2025 1.4% 0.8% 2025 – 2030 1.6% 1.0% 2030 – 2035 1.7% 1.1% 2016 – 2035 1.7% 1.2% Total Change in CLT Share -10.0%
2
Summary of International Connecting Traffic Forecast (millions) 3
Year U.S. International
Traffic CLT Share CLT International
Connections 2016 102.3 1.5% 1.6 2017 105.2 1.5% 1.6 2020 118.3 1.5% 1.7 2025 142.7 1.4% 1.9 2030 169.9 1.2% 2.1 2035 201.3 1.1% 2.3
CAGR 2016 – 2020 3.7% 2.3% 2020 – 2025 3.8% 2.4% 2025 – 2030 3.5% 1.9% 2030 – 2035 3.4% 1.7% 2016 – 2035 3.6 2.1% Total Change in CLT Share -25.0%

CLT EIS Forecast Technical Memorandum
A1-5 Appendix 1: Additional Data
Summary of Charlotte Douglas International Airport Forecast – FAA Template 1 Forecast Compound Annual Growth Rates
Base Year 2016
Base Year+1 2017
Base Year+5
2021
Base Year+10
2026
Base Year+15
2031
Base Year+1 2017
Base Year+5
2021
Base Year+10
2026
Base Year+15
2031
Passenger Enplanements Air Carrier 15,640,736 15,850,803 17,411,598 19,089,474 20,951,150 1.3% 2.2% 2.0% 2.0%
Commuter 6,533,011 6,895,699 7,398,772 7,864,182 8,374,605 5.6% 2.5% 1.9% 1.7%
Total 22,173,747 22,746,502 24,810,370 26,953,656 29,325,755 2.6% 2.3% 2.0% 1.9%
Aircraft Operations Air Carrier 400,819 409,357 438,230 469,999 501,066 2.1% 1.8% 1.6% 1.5%
Air Taxi 117,378 118,994 123,291 127,823 131,798 1.4% 1.0% 0.9% 0.8%
Subtotal 518,197 528,351 561,520 597,822 632,864 2.0% 1.6% 1.4% 1.3%
General Aviation 24,869 24,935 25,134 25,386 25,639 0.3% 0.2% 0.2% 0.2%
Military 2,676 2,676 2,676 2,676 2,676 0.0% 0.0% 0.0% 0.0%
Total Operations 545,742 555,962 589,330 625,884 661,180 1.9% 1.5% 1.4% 1.3%
Peak Hour Operations 114 116 * * * 1.8%
Cargo/Mail
Enplaned and Deplaned Tons
154,477 169,152 195,221 224,125 251,111 9.5% 4.8% 3.8% 3.3%
Operational Factors
Average Aircraft Size (seats)
Air Carrier 144 144 146 147 149 0.0% 0.3% 0.2% 0.2%
Air Taxi 59 59 61 62 63 0.0% 0.7% 0.5% 0.4%
Average Enplaning Load Factor
Air Carrier 83.6% 83.7% 83.9% 84.2% 84.5%
Air Taxi 80.2% 80.3% 80.7% 81.2% 81.4% Source: Airport Statistics data for 2016; InterVISTAS analysis for forecast 2 * Forecast peak hour was only estimated for 2028 (Build Year) and 2033 (Build Year +5). See Table 1-1. 3
4

CLT EIS Forecast Technical Memorandum
A1-6 Appendix 1: Additional Data
Comparison of EIS and TAF Forecasts – FAA Template 1 Year EIS FAA TAF EIS vs TAF
Passenger Enplanements Base Year 2016 22,173,747 21,900,456 1.2% Base Year + 1 2017 22,746,502 22,231,446 2.3% Base Year + 5 2021 24,810,370 24,283,346 2.2% Base Year + 10 2026 26,953,656 26,714,161 0.9% Base Year + 15 2031 29,325,755 29,301,711 0.1%
Commercial Operations Base Year 2016 518,197 521,304 -0.6% Base Year + 1 2017 528,351 532,647 -0.8% Base Year + 5 2021 561,520 578,313 -2.9% Base Year + 10 2026 597,822 632,765 -5.5% Base Year + 15 2031 632,864 691,018 -8.4%
Total Operations Base Year 2016 545,742 548,653 -0.5% Base Year + 1 2017 555,962 560,057 -0.7% Base Year + 5 2021 589,330 605,921 -2.7% Base Year + 10 2026 625,884 660,623 -5.3% Base Year + 15 2031 661,180 719,127 -8.1%
Source: Airport statistics data for historical; U.S. DOT T100 data; InterVISTAS analysis for forecasts. 2 FAA TAF: https://www.faa.gov/data_research/aviation/taf/ 3
Note: TAF has been converted to Calendar Years for comparison. 4 5

TECHNICAL MEMORANDUM - FINAL
Capacity/Delay Analysis and Airfield Modeling Technical Memorandum Charlotte Douglas International Airport Environmental Impact Statement
PREPARED FOR
FEDERAL AVIATION ADMINISTRATION
Mr. Tommy Dupree Memphis Airport District Office
PREPARED BY
VHB Engineering NC, P.C.
IN ASSOCIATION WITH
TransSolutions 7/16/2018
CLT EIS Capacity/Delay Analysis and Airfield Modeling Technical Memorandum
i Table of Contents
Table of Contents 1
1 Summary of Findings ................................................................................................................ 1-1 2
1.1 Introduction ................................................................................................................................................... 1-1 3
1.2 Peak Hour Throughput and Hourly Capacity ................................................................................... 1-2 4
1.3 Average Aircraft Taxi Times and Airspace/Ground Delays ......................................................... 1-4 5
1.4 Average Arrival Gate and Ramp Delays ............................................................................................. 1-5 6
1.5 Average Delay per Operation ................................................................................................................. 1-7 7
1.6 Comparison to ACEP .................................................................................................................................. 1-7 8
2 Approach/Methodology ........................................................................................................... 2-1 9
2.1 Objective ......................................................................................................................................................... 2-1 10
2.2 Approach ........................................................................................................................................................ 2-1 11
2.3 Runway Flow Usage ................................................................................................................................... 2-2 12
2.4 Additional Runway Usage Assumptions ............................................................................................ 2-7 13
2.4.1 Long-Haul Aircraft Operations ............................................................................................ 2-7 14
2.4.2 General Aviation and Military Operations ...................................................................... 2-8 15
2.4.3 Cargo Operations ..................................................................................................................... 2-8 16
2.4.4 Noise Abatement Procedures ............................................................................................. 2-8 17
2.5 Terminal Radar Approach Control (TRACON) Airspace ............................................................... 2-8 18
2.5.1 Metroplex Airspace .................................................................................................................. 2-8 19
2.5.2 Airspace Separations ............................................................................................................. 2-12 20
2.5.3 Enroute Assignments and Metering ............................................................................... 2-14 21

CLT EIS Capacity/Delay Analysis and Airfield Modeling Technical Memorandum
ii Table of Contents
2.6 Runway Separations and Dependencies .......................................................................................... 2-15 1
2.7 Aircraft Final Approach Speed ............................................................................................................. 2-18 2
2.8 Aircraft Take-Off and Landing Roll .................................................................................................... 2-18 3
2.9 Ramp Areas ................................................................................................................................................. 2-21 4
2.10 Ramp Entry and Exit ................................................................................................................................. 2-22 5
2.11 Airline Gate Assignment ......................................................................................................................... 2-23 6
2.12 Aircraft Taxi Speeds .................................................................................................................................. 2-24 7
2.13 Aircraft Pushback Times ......................................................................................................................... 2-26 8
2.14 Taxiflows ....................................................................................................................................................... 2-28 9
2.15 Flight Dependability ................................................................................................................................. 2-28 10
2.16 Model Calibration ..................................................................................................................................... 2-29 11
2.16.1 VMC Calibration ...................................................................................................................... 2-30 12
2.16.2 IMC Calibration ....................................................................................................................... 2-32 13
3 Simulation Findings .................................................................................................................. 3-1 14
3.1 Introduction ................................................................................................................................................... 3-1 15
3.2 Existing Conditions and Future No-Action Modeling Analysis ................................................. 3-2 16
3.2.1 South Flow Instrument Meteorological Conditions (IMC) ....................................... 3-4 17
3.2.2 North Flow VMC ....................................................................................................................... 3-6 18
3.2.3 North Flow IMC ......................................................................................................................... 3-8 19
3.3 Hourly Airport Capacity (Peak Hour Throughput) ....................................................................... 3-10 20
3.4 Arrival Gate and Ramp Delays ............................................................................................................. 3-12 21
3.5 Summary of Simulated Results ............................................................................................................ 3-13 22
4 Conclusions ................................................................................................................................ 4-1 23
24

CLT EIS Capacity/Delay Analysis and Airfield Modeling Technical Memorandum
iii Table of Contents
List of Tables 1
Table No. Description Page 2
Table 1-1 Airport Peak Hour Throughput and Capacity .......................................................................... 1-4 3 Table 1-2 Average Airspace Delay and Taxi Times (in minutes) ........................................................... 1-5 4 Table 1-3 Arrival Aircraft Waiting for Available Gates .............................................................................. 1-6 5 Table 1-4 Annualized Average Delay .............................................................................................................. 1-7 6 Table 1-5 Annualized Average Delay – Comparison to ACEP ............................................................... 1-8 7 Table 2-1 Current Runway Usage ..................................................................................................................... 2-4 8 Table 2-2 FAA RECAT Specifications (NM) .................................................................................................. 2-13 9 Table 2-3 Runway Departure Separations (in seconds) ......................................................................... 2-13 10 Table 2-4 Arrival and Departure Route Assignment Examples ........................................................... 2-14 11 Table 2-5 Aerobahn® Runway Separation Observations ..................................................................... 2-17 12 Table 2-6 FAA Aircraft Characteristics .......................................................................................................... 2-18 13 Table 2-7 Take-Off Roll Distances .................................................................................................................. 2-19 14 Table 2-8 Runway Exit Usage by Aircraft Type .......................................................................................... 2-20 15 Table 2-9 Ramp Entry and Exit Point Usage ............................................................................................... 2-23 16 Table 2-10 ACEP Taxi Speeds ............................................................................................................................. 2-25 17 Table 2-11 2017 Taxi Speeds .............................................................................................................................. 2-25 18 Table 2-12 Average Pushback Time ................................................................................................................. 2-27 19 Table 2-13 Hourly Runway Throughput Calibration in VMC .................................................................. 2-30 20 Table 2-14 VMC Hourly Throughput Calibration by Operation Type ................................................. 2-31 21 Table 2-15 VMC Hourly Throughput Calibration – Total Operations ................................................. 2-31 22 Table 2-16 2017 Average Taxi Times ............................................................................................................... 2-31 23 Table 2-17 Hourly Runway Throughput Calibration in IMC ................................................................... 2-32 24 Table 2-18 IMC Hourly Throughput Calibration by Operation Type .................................................. 2-33 25 Table 2-19 IMC Hourly Throughput Calibration – Total Operations ................................................... 2-33 26 Table 3-1 South Flow VMC Average Delay and Taxi Times (in minutes) .......................................... 3-2 27 Table 3-2 South Flow IMC Average Delay and Taxi Times (in minutes) ............................................ 3-4 28 Table 3-3 North Flow VMC Average Delay and Taxi Times (in minutes) .......................................... 3-6 29 Table 3-4 North Flow IMC Average Delays and Taxi Times (in minutes) .......................................... 3-8 30 Table 3-5 Airport Peak Hour Throughput ................................................................................................... 3-10 31 Table 3-6 Arrival Aircraft Waiting on Ramp for an Available Gate .................................................... 3-12 32 Table 3-7 Annual Use of Runway Configurations .................................................................................... 3-13 33
34
CLT EIS Capacity/Delay Analysis and Airfield Modeling Technical Memorandum
v Table of Contents
List of Figures 1
Figure No. Description Page 2
Figure 1-1 Hourly Departures and Arrival Demand (2016, 2028 and 2033) ........................................1-3 3 Figure 2-1 CLT Airfield and Runways ..................................................................................................................2-3 4 Figure 2-2 Historical Runway Usage at CLT .....................................................................................................2-6 5 Figure 2-3 Arrival and Departure Runway Configurations .........................................................................2-7 6 Figure 2-4 Metroplex Airspace ........................................................................................................................... 2-10 7 Figure 2-5 Simulated Airspace for South-flow ............................................................................................. 2-11 8 Figure 2-6 Simulated Airspace for North-flow ............................................................................................. 2-12 9 Figure 2-5 Aircraft Ramps ..................................................................................................................................... 2-21 10 Figure 2-6 Ramp Entry and Exit Points ............................................................................................................ 2-22 11 Figure 2-7 CLT Terminal Concourse Location, Number of Gates, and Airline Assignments ...... 2-24 12 Figure 2-8 Different Taxi Speeds in the Airfield ........................................................................................... 2-26 13 Figure 2-9 2017 Observed Pushback Times .................................................................................................. 2-27 14 Figure 2-10 North and South Taxi Flows – Integrated ACEP and 2017 Observations .................... 2-28 15 Figure 2-11 Earliness/Lateness Distributions................................................................................................... 2-29 16 Figure 3-1 South Flow VMC Hourly Average Taxi Times ............................................................................3-3 17 Figure 3-2 South Flow IMC Quarter-Hour Average Taxi Times ................................................................3-5 18 Figure 3-3 North Flow VMC Hourly Average Taxi Times ............................................................................3-7 19 Figure 3-4 North Flow IMC Hourly Average Taxi Times ..............................................................................3-9 20 Figure 3-5 Rolling Hour Flight Schedule ........................................................................................................ 3-11 21 Figure 3-6 Average Taxi Times ........................................................................................................................... 3-14 22 Figure 3-7 Average Airspace Delays ................................................................................................................. 3-15 23 Figure 3-8 Average Delay per Operation (in minutes) .............................................................................. 3-16 24 Figure 3-9 Annualized Average Airspace and Ground Delays ............................................................... 3-16 25 Figure 3-10 Annualized Average Delay per Operation (in minutes) ...................................................... 3-17 26 27 28
CLT EIS Capacity/Delay Analysis and Airfield Modeling Technical Memorandum
1-1 Summary of Findings
1 1
Summary of Findings 2
1.1 Introduction 3
A comprehensive development program (Airport Capital Enhancement Plan, or ACEP) was initiated 4 by the City of Charlotte, North Carolina (Aviation Department or the “Department”) to address the 5 existing and anticipated demand at Charlotte Douglas International Airport (CLT). A Consultant 6 Team is evaluating the existing planning data and preparing an Environmental Impact Statement 7 (EIS) at the direction of the Federal Aviation Administration (FAA), to satisfy requirements of the 8 National Environmental Policy Act of 1969 (NEPA). TransSolutions, LLC performed the airfield 9 capacity/delay analysis for the Existing Conditions (2016) based on the current airfield and aviation 10 demand in 2016, and a future No-Action alternative based on the current airfield, improvements 11 currently under construction, and forecast demand levels representing 2028 and 2033. 12
The airfield capacity/delay analysis was performed using ATAC Corporation’s SIMMOD Plus!® 13 version 8.1 software, based on the FAA’s Airfield and Airspace Simulation Model, SIMMOD. 14 Simulations were run for the four predominant operational configurations: South Flow Visual 15 Meteorological Conditions (VMC), South Flow Instrument Meteorological Conditions (IMC), North 16 Flow VMC, and North Flow IMC. As part of the EIS effort, the Consultant Team updated the 17 operations and passenger forecasts that were originally documented in the ACEP in early 2016 to 18 reflect the merger of American Airlines and US Airways, as well as current trends. The Existing 19 Conditions traffic demand level (2016) was analyzed along with the two updated forecast demand 20 levels representing 2028 and 2033, years which reflect the construction phasing of the proposed 21 airport improvements that are the subject of the EIS. 22
This summary provides findings of the following: 23
› Peak hour throughput and hourly capacity 24
› Average aircraft taxi times and arrival airspace delay 25
› Average delay per operation 26
› Average arrival gate and ramp delays 27
› Comparison to the ACEP 28
A description of the modeling methodology is presented in Section 2 and was previously reviewed 29 by the FAA and the Department. Detailed modeling results of each simulation scenario are 30

CLT EIS Capacity/Delay Analysis and Airfield Modeling Technical Memorandum
1-2 Summary of Findings
presented in Section 3 of this Technical Memorandum. Section 4 provides a brief discussion of the 1 conclusions reached based on the modeling results. 2
1.2 Peak Hour Throughput and Hourly Capacity 3
Due to CLT’s role as a major hub operation for American Airlines, peak hour demand and capacity 4 are key determinants of the airport system’s (airfield, terminal and landside components) ability to 5 operate efficiently, including maintaining proper schedule integrity. American Airlines’ hub 6 operation currently each day serves a total of 18 “banks”1, or periods of time during the day when 7 there is heavy aircraft arrival activity coming into CLT (the hub) followed by periods of heavy 8 departure activity leaving CLT. As shown in Figure 1-1, the banks consist of nine departure banks 9 and nine arrival banks. 10 11
1 Airport Capacity Enhancement Plan, Landrum & Brown, February 2016, Page 1-1
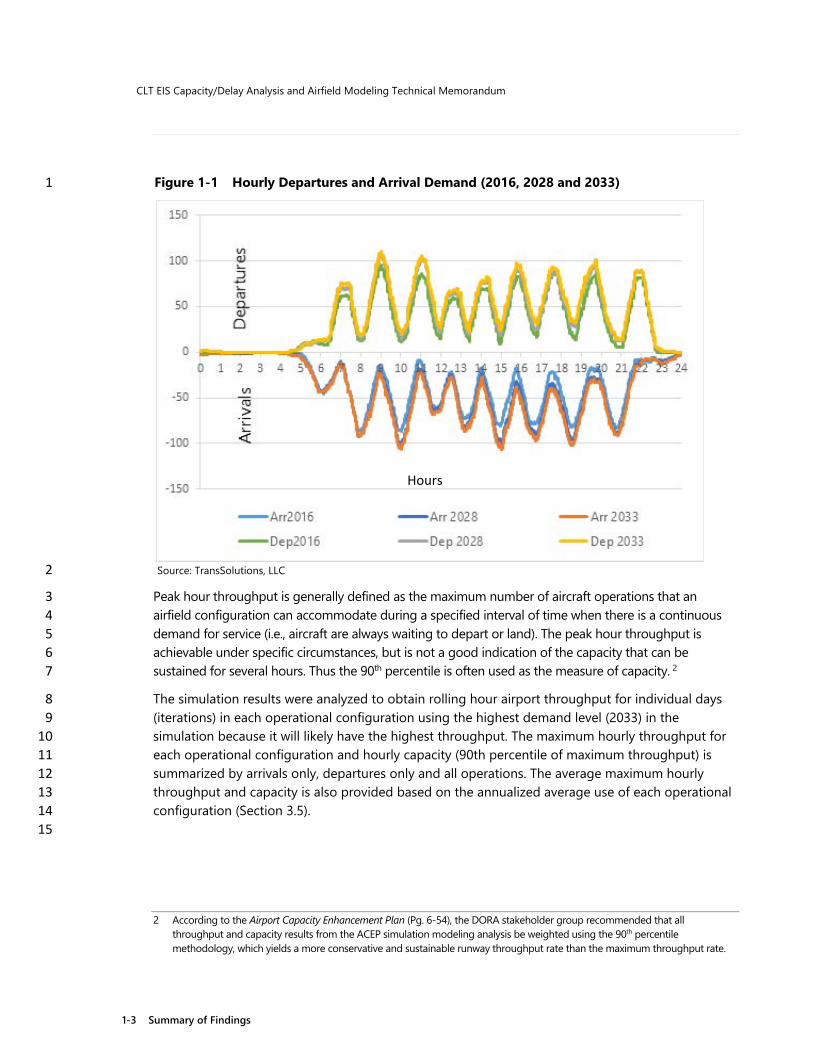
CLT EIS Capacity/Delay Analysis and Airfield Modeling Technical Memorandum
1-3 Summary of Findings
Figure 1-1 Hourly Departures and Arrival Demand (2016, 2028 and 2033) 1
Source: TransSolutions, LLC 2
Peak hour throughput is generally defined as the maximum number of aircraft operations that an 3 airfield configuration can accommodate during a specified interval of time when there is a continuous 4 demand for service (i.e., aircraft are always waiting to depart or land). The peak hour throughput is 5 achievable under specific circumstances, but is not a good indication of the capacity that can be 6 sustained for several hours. Thus the 90th percentile is often used as the measure of capacity. 2 7
The simulation results were analyzed to obtain rolling hour airport throughput for individual days 8 (iterations) in each operational configuration using the highest demand level (2033) in the 9 simulation because it will likely have the highest throughput. The maximum hourly throughput for 10 each operational configuration and hourly capacity (90th percentile of maximum throughput) is 11 summarized by arrivals only, departures only and all operations. The average maximum hourly 12 throughput and capacity is also provided based on the annualized average use of each operational 13 configuration (Section 3.5). 14 15
2 According to the Airport Capacity Enhancement Plan (Pg. 6-54), the DORA stakeholder group recommended that all
throughput and capacity results from the ACEP simulation modeling analysis be weighted using the 90th percentile methodology, which yields a more conservative and sustainable runway throughput rate than the maximum throughput rate.
Hours
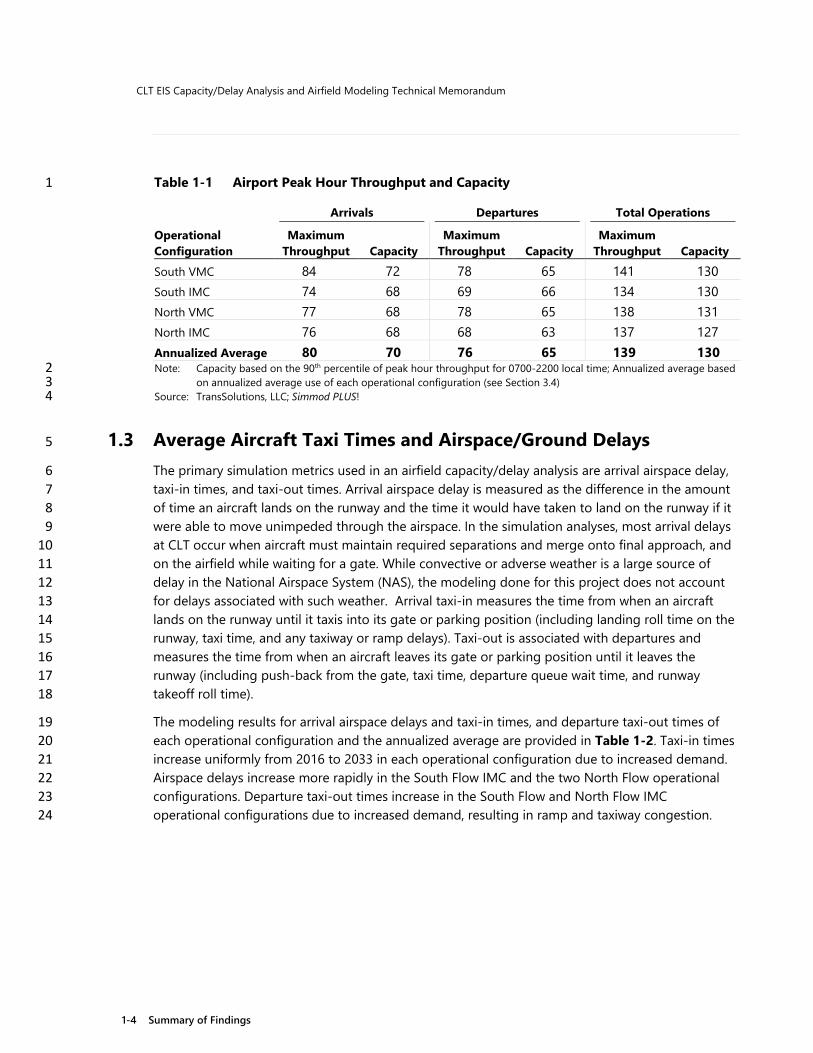
CLT EIS Capacity/Delay Analysis and Airfield Modeling Technical Memorandum
1-4 Summary of Findings
Table 1-1 Airport Peak Hour Throughput and Capacity 1
Operational Configuration
Arrivals Departures Total Operations
Maximum Throughput Capacity
Maximum Throughput Capacity
Maximum Throughput Capacity
South VMC 84 72 78 65 141 130 South IMC 74 68 69 66 134 130 North VMC 77 68 78 65 138 131 North IMC 76 68 68 63 137 127 Annualized Average 80 70 76 65 139 130 Note: Capacity based on the 90th percentile of peak hour throughput for 0700-2200 local time; Annualized average based 2
on annualized average use of each operational configuration (see Section 3.4) 3 Source: TransSolutions, LLC; Simmod PLUS! 4
1.3 Average Aircraft Taxi Times and Airspace/Ground Delays 5
The primary simulation metrics used in an airfield capacity/delay analysis are arrival airspace delay, 6 taxi-in times, and taxi-out times. Arrival airspace delay is measured as the difference in the amount 7 of time an aircraft lands on the runway and the time it would have taken to land on the runway if it 8 were able to move unimpeded through the airspace. In the simulation analyses, most arrival delays 9 at CLT occur when aircraft must maintain required separations and merge onto final approach, and 10 on the airfield while waiting for a gate. While convective or adverse weather is a large source of 11 delay in the National Airspace System (NAS), the modeling done for this project does not account 12 for delays associated with such weather. Arrival taxi-in measures the time from when an aircraft 13 lands on the runway until it taxis into its gate or parking position (including landing roll time on the 14 runway, taxi time, and any taxiway or ramp delays). Taxi-out is associated with departures and 15 measures the time from when an aircraft leaves its gate or parking position until it leaves the 16 runway (including push-back from the gate, taxi time, departure queue wait time, and runway 17 takeoff roll time). 18
The modeling results for arrival airspace delays and taxi-in times, and departure taxi-out times of 19 each operational configuration and the annualized average are provided in Table 1-2. Taxi-in times 20 increase uniformly from 2016 to 2033 in each operational configuration due to increased demand. 21 Airspace delays increase more rapidly in the South Flow IMC and the two North Flow operational 22 configurations. Departure taxi-out times increase in the South Flow and North Flow IMC 23 operational configurations due to increased demand, resulting in ramp and taxiway congestion. 24
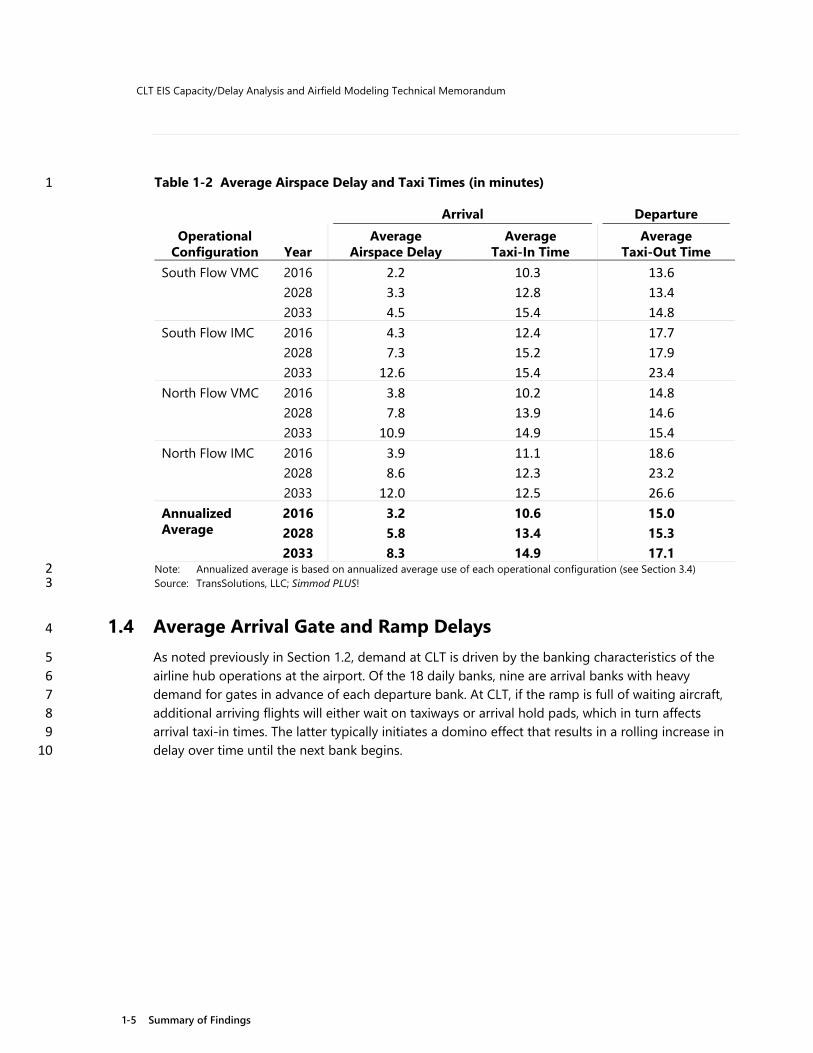
CLT EIS Capacity/Delay Analysis and Airfield Modeling Technical Memorandum
1-5 Summary of Findings
Table 1-2 Average Airspace Delay and Taxi Times (in minutes) 1
Operational Configuration Year
Arrival Departure Average
Airspace Delay Average
Taxi-In Time Average
Taxi-Out Time South Flow VMC 2016 2.2 10.3 13.6
2028 3.3 12.8 13.4 2033 4.5 15.4 14.8
South Flow IMC 2016 4.3 12.4 17.7 2028 7.3 15.2 17.9 2033 12.6 15.4 23.4
North Flow VMC 2016 3.8 10.2 14.8 2028 7.8 13.9 14.6 2033 10.9 14.9 15.4
North Flow IMC 2016 3.9 11.1 18.6 2028 8.6 12.3 23.2 2033 12.0 12.5 26.6
Annualized Average
2016 3.2 10.6 15.0 2028 5.8 13.4 15.3 2033 8.3 14.9 17.1
Note: Annualized average is based on annualized average use of each operational configuration (see Section 3.4) 2 Source: TransSolutions, LLC; Simmod PLUS! 3
1.4 Average Arrival Gate and Ramp Delays 4
As noted previously in Section 1.2, demand at CLT is driven by the banking characteristics of the 5 airline hub operations at the airport. Of the 18 daily banks, nine are arrival banks with heavy 6 demand for gates in advance of each departure bank. At CLT, if the ramp is full of waiting aircraft, 7 additional arriving flights will either wait on taxiways or arrival hold pads, which in turn affects 8 arrival taxi-in times. The latter typically initiates a domino effect that results in a rolling increase in 9 delay over time until the next bank begins. 10
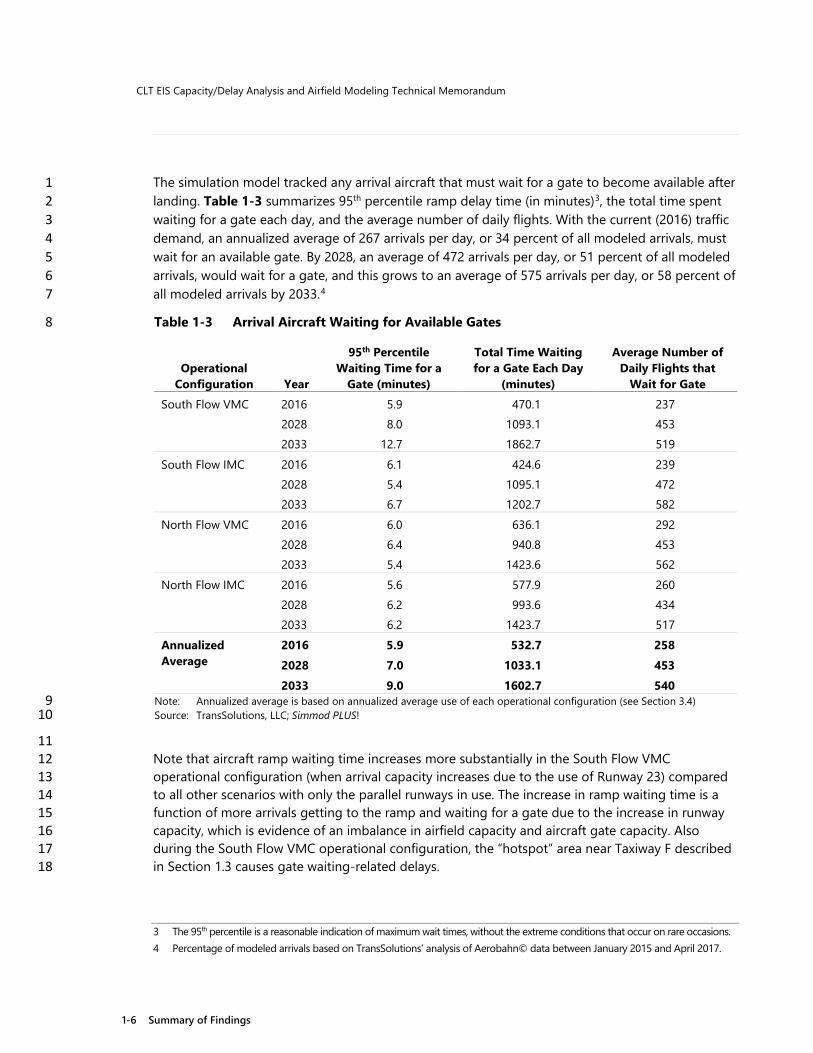
CLT EIS Capacity/Delay Analysis and Airfield Modeling Technical Memorandum
1-6 Summary of Findings
The simulation model tracked any arrival aircraft that must wait for a gate to become available after 1 landing. Table 1-3 summarizes 95th percentile ramp delay time (in minutes)3, the total time spent 2 waiting for a gate each day, and the average number of daily flights. With the current (2016) traffic 3 demand, an annualized average of 267 arrivals per day, or 34 percent of all modeled arrivals, must 4 wait for an available gate. By 2028, an average of 472 arrivals per day, or 51 percent of all modeled 5 arrivals, would wait for a gate, and this grows to an average of 575 arrivals per day, or 58 percent of 6 all modeled arrivals by 2033.4 7
Table 1-3 Arrival Aircraft Waiting for Available Gates 8
Operational Configuration Year
95th Percentile Waiting Time for a
Gate (minutes)
Total Time Waiting for a Gate Each Day
(minutes)
Average Number of Daily Flights that
Wait for Gate South Flow VMC 2016 5.9 470.1 237
2028 8.0 1093.1 453 2033 12.7 1862.7 519
South Flow IMC 2016 6.1 424.6 239 2028 5.4 1095.1 472 2033 6.7 1202.7 582
North Flow VMC 2016 6.0 636.1 292 2028 6.4 940.8 453 2033 5.4 1423.6 562
North Flow IMC 2016 5.6 577.9 260 2028 6.2 993.6 434 2033 6.2 1423.7 517
Annualized Average
2016 5.9 532.7 258 2028 7.0 1033.1 453 2033 9.0 1602.7 540
Note: Annualized average is based on annualized average use of each operational configuration (see Section 3.4) 9 Source: TransSolutions, LLC; Simmod PLUS! 10
11 Note that aircraft ramp waiting time increases more substantially in the South Flow VMC 12 operational configuration (when arrival capacity increases due to the use of Runway 23) compared 13 to all other scenarios with only the parallel runways in use. The increase in ramp waiting time is a 14 function of more arrivals getting to the ramp and waiting for a gate due to the increase in runway 15 capacity, which is evidence of an imbalance in airfield capacity and aircraft gate capacity. Also 16 during the South Flow VMC operational configuration, the “hotspot” area near Taxiway F described 17 in Section 1.3 causes gate waiting-related delays. 18
3 The 95th percentile is a reasonable indication of maximum wait times, without the extreme conditions that occur on rare occasions. 4 Percentage of modeled arrivals based on TransSolutions’ analysis of Aerobahn© data between January 2015 and April 2017.
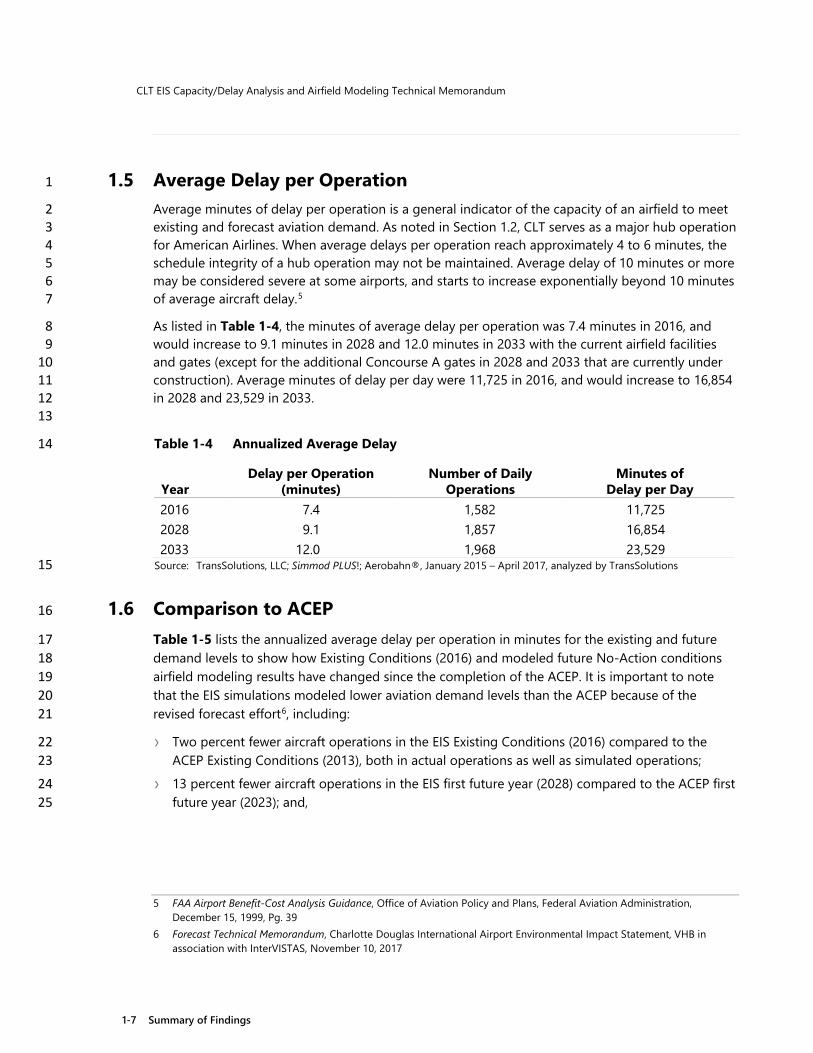
CLT EIS Capacity/Delay Analysis and Airfield Modeling Technical Memorandum
1-7 Summary of Findings
1.5 Average Delay per Operation 1
Average minutes of delay per operation is a general indicator of the capacity of an airfield to meet 2 existing and forecast aviation demand. As noted in Section 1.2, CLT serves as a major hub operation 3 for American Airlines. When average delays per operation reach approximately 4 to 6 minutes, the 4 schedule integrity of a hub operation may not be maintained. Average delay of 10 minutes or more 5 may be considered severe at some airports, and starts to increase exponentially beyond 10 minutes 6 of average aircraft delay.5 7
As listed in Table 1-4, the minutes of average delay per operation was 7.4 minutes in 2016, and 8 would increase to 9.1 minutes in 2028 and 12.0 minutes in 2033 with the current airfield facilities 9 and gates (except for the additional Concourse A gates in 2028 and 2033 that are currently under 10 construction). Average minutes of delay per day were 11,725 in 2016, and would increase to 16,854 11 in 2028 and 23,529 in 2033. 12 13
Table 1-4 Annualized Average Delay 14
Year Delay per Operation
(minutes) Number of Daily
Operations Minutes of
Delay per Day 2016 7.4 1,582 11,725 2028 9.1 1,857 16,854 2033 12.0 1,968 23,529
Source: TransSolutions, LLC; Simmod PLUS!; Aerobahn®, January 2015 – April 2017, analyzed by TransSolutions 15
1.6 Comparison to ACEP 16
Table 1-5 lists the annualized average delay per operation in minutes for the existing and future 17 demand levels to show how Existing Conditions (2016) and modeled future No-Action conditions 18 airfield modeling results have changed since the completion of the ACEP. It is important to note 19 that the EIS simulations modeled lower aviation demand levels than the ACEP because of the 20 revised forecast effort6, including: 21
› Two percent fewer aircraft operations in the EIS Existing Conditions (2016) compared to the 22 ACEP Existing Conditions (2013), both in actual operations as well as simulated operations; 23
› 13 percent fewer aircraft operations in the EIS first future year (2028) compared to the ACEP first 24 future year (2023); and, 25
5 FAA Airport Benefit-Cost Analysis Guidance, Office of Aviation Policy and Plans, Federal Aviation Administration,
December 15, 1999, Pg. 39 6 Forecast Technical Memorandum, Charlotte Douglas International Airport Environmental Impact Statement, VHB in
association with InterVISTAS, November 10, 2017

CLT EIS Capacity/Delay Analysis and Airfield Modeling Technical Memorandum
1-8 Summary of Findings
› 27 percent fewer aircraft operations in the EIS second future year (2033) compared to the ACEP 1 second future year the second future year (2033), and 7.5 percent fewer aircraft operations 2 compared to the ACEP first future year (2023). 3
As average delay levels per operation approach 10 minutes, increases in demand will increase delay 4 exponentially. Therefore, the modeled ACEP delay results are much greater than the percentage 5 differences in operations when compared to the EIS modeled delay results. 6
It is also important to note that the ACEP modeling analysis was conducted using an 7 “unconstrained” level of aviation activity. Average delay per operation of 20 minutes represents the 8 highest level of average delay realized in actual practice, even at highly congested airports. At that 9 level growth in operations would be constrained. Therefore, differences between the ACEP and EIS 10 delay modeling results would be much less in reality due to constrained operations because delay 11 would not exceed 20 minutes. 12
Table 1-5 Annualized Average Delay – Comparison to ACEP 13
Year
ACEP EIS Number of
Daily Operations
Delay per Operation (minutes)
Number of Daily
Operations
Delay per Operation (minutes)
Existing (ACEP: 2013; EIS: 2016)
1,610
8-9
1,582
7.4
Future Year 1 (ACEP: 2023; EIS: 2028)
2,127
21-23
1,857
9.1
Future Year 2 (ACEP and EIS: 2033)
2,679
118-143
1,968
12.0
Sources: ACEP: Landrum & Brown, Exhibit 3-40; EIS: TransSolutions, LLC; Simmod PLUS! 14
15 In addition to the differences in forecasts of operations, the EIS analysis considered the following 16 items: 17
› Full implementation of FAA’s Charlotte Metroplex Project7 (see Section 2.5) to improve airspace 18 efficiency 19
7 A Metroplex is a geographic airspace area covering several airports, serving major metropolitan areas and a diversity of
aviation stakeholders. FAA is focusing on airspace optimization at the Metroplex level, which provides solutions on a

CLT EIS Capacity/Delay Analysis and Airfield Modeling Technical Memorandum
1-9 Summary of Findings
› Inclusion of the Concourse A Improvement Project that is currently under construction, resulting 1 in eight more gates in the EIS future No-Action than modeled in the ACEP analysis 2
› Observed8 or actual data for the following modeling inputs: 3
• Varied final aircraft approach speeds based on weight category (Section 2.8) 4
• Take-off and landing roll distances (Section 2.9) 5
• Aircraft taxi speeds (Section 2.13) 6
• Aircraft push-back times9 (Section 2.14) 7
• Flight dependability10 (Section 2.16) 8
› Assumption that, by Future Year 1, a system/technology will be implemented to eliminate miles-9 in-trail (MIT) restrictions to/from CLT airspace. 10
11
regional scale, rather than focusing on a single airport or set of procedures. The overall goal of FAA’s NextGen Metroplex program is to improve the operational efficiency of the airspace serving large airports.
8 On-site observations at CLT Air Traffic Control Tower (ATCT) and interviews with the Air Traffic Manager, including subsequent TRACON personnel, conducted June 14-15, 2017.
9 Push-back is the time from when an aircraft leaves the gate to the time when the aircraft starts using its own power. 10 Flight dependability is the probability that a flight arrives or departs earlier or later than scheduled.

CLT EIS Capacity/Delay Analysis and Airfield Modeling Technical Memorandum
1-10 Summary of Findings
This page intentionally left blank. 1
2

CLT EIS Capacity/Delay Analysis and Airfield Modeling Technical Memorandum
2-1 Approach/Methodology
2 1
Approach/Methodology 2
This section represents the approach and methodology used for the capacity/delay analysis. The 3 operating assumptions are presented as well as the SIMMOD model calibration. 4
2.1 Objective 5
The objective of this analysis is to conduct an airfield capacity-delay analysis to establish an Existing 6 Conditions and future No-Action Baseline at Charlotte Douglas International Airport (CLT) for 7 current and future conditions, respectively. The delay analysis includes delays associated with 8 runway use, airfield, airspace and terminal gates. This analysis does not consider any potential 9 airfield or terminal gate improvements (aside from any that are already under construction) to 10 enhance capacity and/or reduce delay. 11
2.2 Approach 12
ATAC Corporation’s SIMMOD Plus!® version 8.1 was used to model the airspace/airfield operations 13 for this analysis. The baseline in this study includes three demand levels – 2016 (Existing 14 Conditions), 2028 and 2033 (future No-Action). For each of the three demand levels, there were two 15 operational flows (South and North) and two weather conditions (Visual Meteorological Conditions 16 [VMC] and Instrument Meteorological Conditions [IMC]) modeled. This analysis quantifies how the 17 airport performs operationally under current and forecast traffic demand levels. 18
Information and assumptions that were used in the SIMMOD models were compiled from previous 19 analyses and updated requirements including the following. 20
› Airport Capacity Enhancement Plan (ACEP) Final Report (February 2016)11 prepared by Landrum 21 & Brown, specifically the following elements: 22
• Airside demand/capacity operating assumptions. 23
• ACEP Simmod input files. 24
› Aerobahn®12 data provided by CLT for January 2015 through April 2017. 25
11 Relevant sections of the ACEP “Chapter 3 Airside Demand/Capacity” include the Existing Airport Operating Assumptions. 12 Aerobahn is a product by Saab Sensis Corporation for tracking aircraft movement. The data captured for each individual
flight includes airline, flight number, aircraft type, runway, gate and time-stamps for runway use, gate arrival and gate departure.

CLT EIS Capacity/Delay Analysis and Airfield Modeling Technical Memorandum
2-2 Approach/Methodology
› On-site observations at CLT Air Traffic Control Tower (ATCT) and interviews with the Air Traffic 1 Manager, Traffic Management Coordinators, and subsequent Terminal Radar Approach Control 2 (TRACON) personnel, conducted June 14-15, 2017. 3
› Teleconference interview conducted with American Airlines CLT Ramp Tower Operations 4 Manager and personnel on January 29th, 2018. 5
› Documents provided by CLT ATCT, such as noise abatement procedures, CLT-specific orders, 6 ramp hand-off spot locations, etc. 7
› Documents provided by the City of Charlotte, Airport Department (the Department) including 8 Letters of Agreement, terminal gate layouts, CLT Metroplex plans, and FAA Notices to Airmen 9 (NOTAM) records. 10
All data, performance goals, runway use configurations, and descriptions of the runway planning 11 are summarized in this chapter. 12
2.3 Runway Flow Usage 13
The CLT airfield consists of three parallel runways in the north/south direction (18-36) and a single 14 crosswind runway (5-23), as depicted in Figure 2-1. 15
Operational flows at CLT are split between North Flow and South Flow operations depending on 16 prevailing wind conditions. The runway usage configurations during different flows are described 17 below. 18
North Flow: 19
› Primary arrival Runways: 36L and 36R. 20
› Primary departure Runways: 36C and 36R. 21
› Runway 5-23 is typically used as a taxiway. 22
South Flow: 23
› Primary arrival Runways: 18R and 23. 24
› Primary departure Runways: 18C and 18L. 25
› In IMC, Runway 23 is not used. 26 27

CLT EIS Capacity/Delay Analysis and Airfield Modeling Technical Memorandum
2-3 Approach/Methodology
Figure 2-1 CLT Airfield and Runways 1
Source: Charlotte Douglas International Airport 2 3

CLT EIS Capacity/Delay Analysis and Airfield Modeling Technical Memorandum
2-4 Approach/Methodology
Table 2-1 summarizes runway use by operational flows with the primary arrival/departure runways 1 highlighted. These percentages were used in the Existing Conditions and future No-Action baseline 2 scenarios. 3 4
Table 2-1 Current Runway Usage 5
Flow Runway Arrivals Departures Overall
North
5 0.5% 0.9% 0.7% 36C 11.9% 57.7% 34.1% 36L 51.9% 0.5% 26.9% 36R 35.7% 40.9% 38.2%
South
23 28.2% 0.6% 14.5% 18C 11.9% 46.6% 29.1% 18L 9.6% 52.6% 30.9% 18R 50.3% 0.2% 25.5%
Source: Aerobahn®, January 2015 – April 2017, analyzed by TransSolutions.13 6
7 Figure 2-2 illustrates the runway usage at CLT since January 2015, including all 24 hours of each 8 day. Note that in North Flow: 9
› The percentage of arrivals on Runway 36L has been steadily increasing as the other runways 10 have reached capacity. 11
› The percentage of arrivals on Runway 36C has been steadily decreasing as more arrivals land on 12 Runway 36L. 13
› Usage of specific departure runways has remained fairly consistent. 14
And in South Flow: 15
› The percentage of arrivals on Runway 18R has been steadily increasing. 16
› The percentage of arrivals on Runway 23 has been steadily decreasing. This is likely due to: 17
• Runway 23 arrivals constrain Runway 18C departures with the current Converging Runway 18 Operations (CRO) and Arrival Departure Window (ADW) procedural change that took effect 19 in early 2015. 20
• Runway 23 arrivals exit into the commercial ramp area causing additional congestion to the 21 traffic already in that area. 22
During peak departure times, more departure capacity is needed than can be achieved during 23 CRO conditions, whereas the airport then switches to an all parallel runway configuration to 24
13 Data was analyzed for all hours (24), including noise abatement periods (2300-0700 local time).

CLT EIS Capacity/Delay Analysis and Airfield Modeling Technical Memorandum
2-5 Approach/Methodology
achieve more efficiency. The Runway 23 arrivals are then assigned to other runways so that 1 departures can be better accommodated on Runway 18C. 2
3

CLT EIS Capacity/Delay Analysis and Airfield Modeling Technical Memorandum
2-6 Approach/Methodology
Figure 2-2 Historical Runway Usage at CLT 1
2
North Flow – Arrival North Flow – Departure
South Flow – Arrival South Flow – Departure
Source: Aerobahn®, January 2015 – April 2017, analyzed by TransSolutions 3
4 Note that a rehabilitation project of Taxiway C occurred in fall 2016, which closed Runway 5-23 for 5 most of August, September, October and half of November. Periodic runway closures occurred 6 throughout the winter. Runway 5-23 was closed all of March 2017 for boring work in the Runway 7 Safety Area (RSA). When the crosswind Runway 23 is not used, arrivals that would typically land on 8 Runway 23 instead land on Runway 18L. At the same time, there is a reduced use of Runway 18L for 9 departures and an increased use of Runway 18C by departures. 10
Figure 2-3 illustrates the arrival and departure runway configurations for North Flow and South 11 Flow. 12
13

CLT EIS Capacity/Delay Analysis and Airfield Modeling Technical Memorandum
2-7 Approach/Methodology
Figure 2-3 Arrival and Departure Runway Configurations 1
North Flow VMC/IMC Runway Configuration South Flow VMC/IMC Source: ACEP Final Report, Exhibits 3-2 and 3-3, February 2016 2
2.4 Additional Runway Usage Assumptions 3
The following section outlines the additional runway use assumptions that were used in the 4 modeling effort. 5
2.4.1 Long-Haul Aircraft Operations 6
Runway use is mostly assigned by the direction of flight. Using this approach, some heavy and 7 long-haul departures to the West Coast require Runway 18C-36C. More specifically: 8
› In North Flow, aircraft will depart Runway 36C with no arrivals on Runway 36C until the arrival 9 peaks require that Runway 36C also be used for arrival traffic. 10
› In South Flow, aircraft will depart Runway 18C and arrive Runway 18L or 23 until the traffic peaks 11 require that Runway 23 arrivals be re-assigned so that Runway 18L is used for arrival traffic with 12 three parallel arrival runways. 13
D
D
A A A
Arrival Departure
A A A
A
D D
Arrival Departure

CLT EIS Capacity/Delay Analysis and Airfield Modeling Technical Memorandum
2-8 Approach/Methodology
2.4.2 General Aviation and Military Operations 1
In most circumstances, General Aviation (GA) and military flights primarily land/depart on Runway 2 18L-36R due to the proximity of their assigned ramps to this runway. In addition, Runway 23 is 3 frequently utilized in South Flow conditions by GA and military arrivals.14 4
2.4.3 Cargo Operations 5
In general, more than 50 percent of cargo flights operate on Runway 18C–36C due to its longer 6 length compared to other runways. Another 25 percent of cargo traffic operates on Runway 18L–7 36R due to its proximity to the cargo ramps/facilities.15 8
2.4.4 Noise Abatement Procedures 9
Noise abatement procedures are included in the simulation model, based on the FAA Order CLT 10 ATCT 1050.1j, effective December 1, 2013. Noise abatement procedures are in effect from 2300 – 11 0700, local time. During this time, Runway 5-23 is preferred. 12
For noise abatement, jet and large four-engine props aircraft are assigned the following headings 13 until two (2) Nautical Miles (NM) from the departure end of the following runways. 14
› Runway 18L, 18C, 23 and 5: runway heading. 15
› Runway 36R: 025 degrees. 16
› Runway 36C: 330 degrees. 17
› Runway 36L: 315 degrees. 18
› Runway 18R: 200 degrees. 19
2.5 Terminal Radar Approach Control (TRACON) Airspace 20
The air traffic control area managing arrivals to and departures from CLT is the TRACON. Simulation 21 functions that direct the movement of aircraft through the airspace are described in this section. 22
2.5.1 Metroplex Airspace 23
A Metroplex is a geographic airspace area covering several airports, serving major metropolitan 24 areas and a diversity of aviation stakeholders. Currently, the FAA is focusing on airspace 25 optimization at the Metroplex level, which provides solutions on a regional scale, rather than 26 focusing on a single airport or set of procedures. The overall goal of FAA’s NextGen Metroplex 27
14 TransSolutions analysis of Aerobahn® data 15 TransSolutions analysis of Aerobahn® data
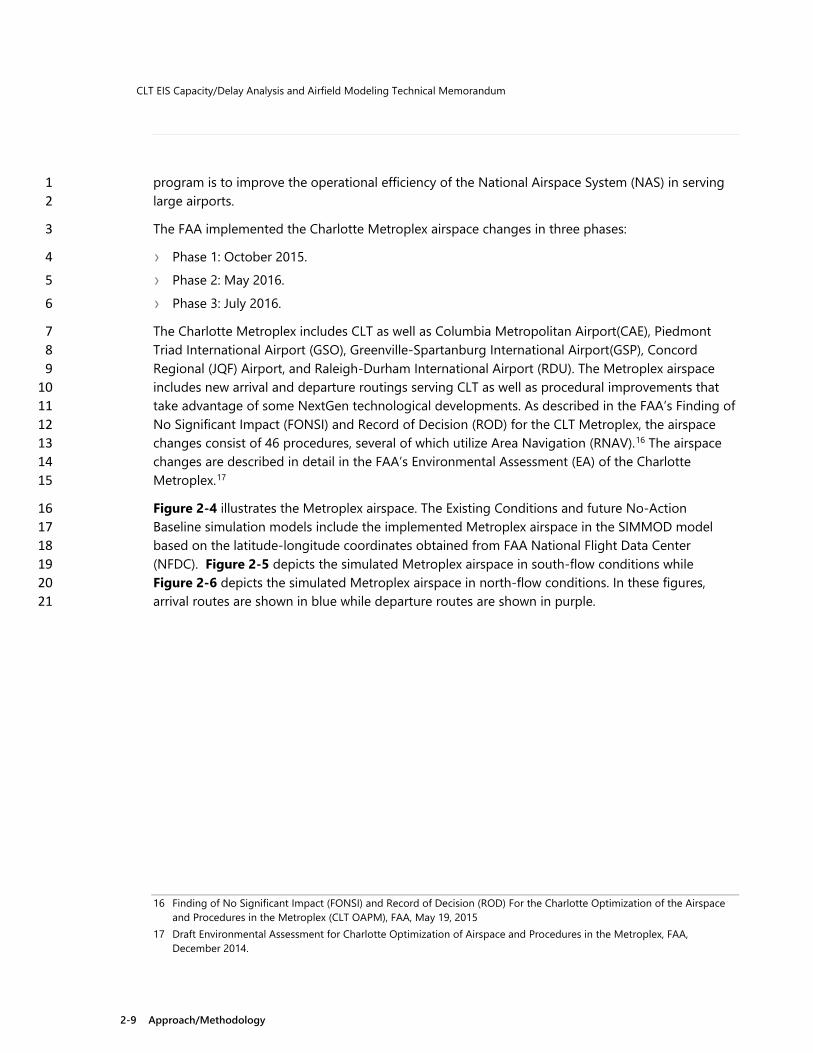
CLT EIS Capacity/Delay Analysis and Airfield Modeling Technical Memorandum
2-9 Approach/Methodology
program is to improve the operational efficiency of the National Airspace System (NAS) in serving 1 large airports. 2
The FAA implemented the Charlotte Metroplex airspace changes in three phases: 3
› Phase 1: October 2015. 4
› Phase 2: May 2016. 5
› Phase 3: July 2016. 6
The Charlotte Metroplex includes CLT as well as Columbia Metropolitan Airport(CAE), Piedmont 7 Triad International Airport (GSO), Greenville-Spartanburg International Airport(GSP), Concord 8 Regional (JQF) Airport, and Raleigh-Durham International Airport (RDU). The Metroplex airspace 9 includes new arrival and departure routings serving CLT as well as procedural improvements that 10 take advantage of some NextGen technological developments. As described in the FAA’s Finding of 11 No Significant Impact (FONSI) and Record of Decision (ROD) for the CLT Metroplex, the airspace 12 changes consist of 46 procedures, several of which utilize Area Navigation (RNAV).16 The airspace 13 changes are described in detail in the FAA’s Environmental Assessment (EA) of the Charlotte 14 Metroplex.17 15
Figure 2-4 illustrates the Metroplex airspace. The Existing Conditions and future No-Action 16 Baseline simulation models include the implemented Metroplex airspace in the SIMMOD model 17 based on the latitude-longitude coordinates obtained from FAA National Flight Data Center 18 (NFDC). Figure 2-5 depicts the simulated Metroplex airspace in south-flow conditions while 19 Figure 2-6 depicts the simulated Metroplex airspace in north-flow conditions. In these figures, 20 arrival routes are shown in blue while departure routes are shown in purple. 21
16 Finding of No Significant Impact (FONSI) and Record of Decision (ROD) For the Charlotte Optimization of the Airspace
and Procedures in the Metroplex (CLT OAPM), FAA, May 19, 2015 17 Draft Environmental Assessment for Charlotte Optimization of Airspace and Procedures in the Metroplex, FAA,
December 2014.

CLT EIS Capacity/Delay Analysis and Airfield Modeling Technical Memorandum
2-10 Approach/Methodology
Figure 2-4 Metroplex Airspace 1
Source: FAA, CLT Airport Traffic Control Tower 2 3

CLT EIS Capacity/Delay Analysis and Airfield Modeling Technical Memorandum
2-11 Approach/Methodology
Figure 2-5 Simulated Airspace for South-flow 1
Source: TransSolutions SIMMOD model 2 3

CLT EIS Capacity/Delay Analysis and Airfield Modeling Technical Memorandum
2-12 Approach/Methodology
Figure 2-6 Simulated Airspace for North-flow 1
Source: TransSolutions SIMMOD model 2
2.5.2 Airspace Separations 3
The airspace modeled in the future No-Action baseline scenarios encompasses the CLT Terminal 4 Radar Control Facility (TRACON), which extends a maximum of 30 nautical miles from CLT. Aircraft 5 separations in the SIMMOD model were maintained in the airspace based on the following: 6
› Wake turbulence separation. 7 › Route separation. 8 › Departure separation. 9
The simulation models calculated the required separation for each of these and then applied the 10 maximum separation between two aircraft. Each of these separations is described below. 11
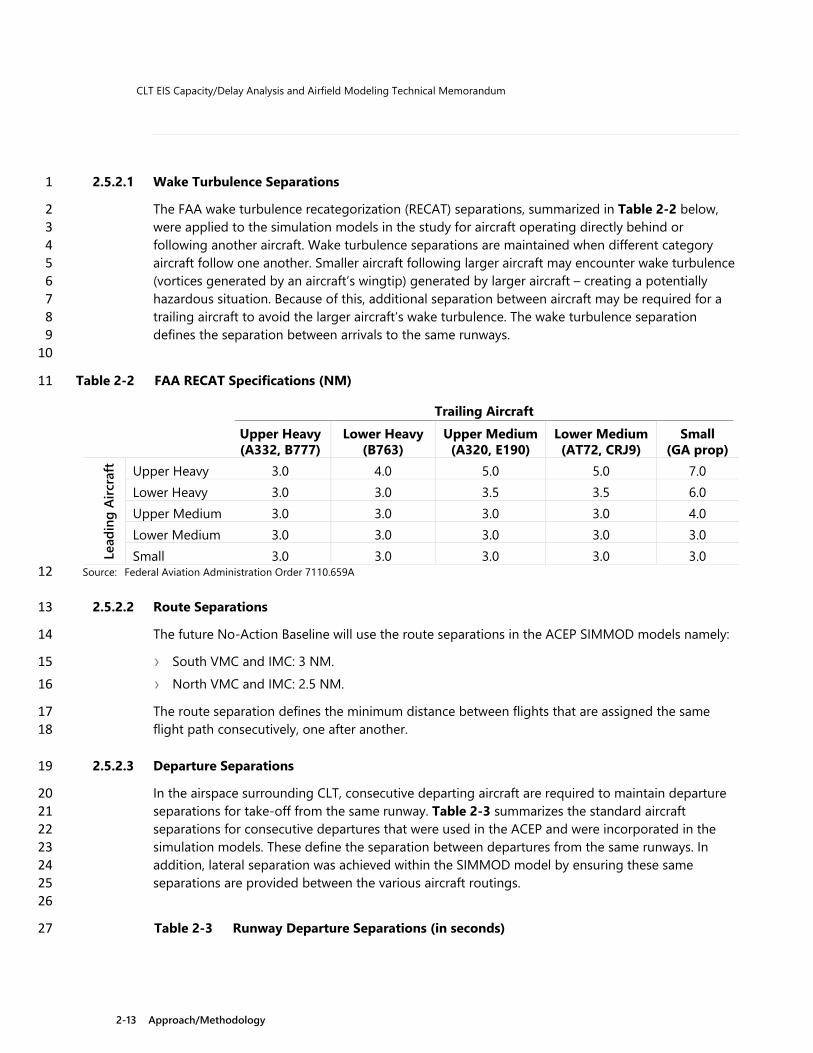
CLT EIS Capacity/Delay Analysis and Airfield Modeling Technical Memorandum
2-13 Approach/Methodology
2.5.2.1 Wake Turbulence Separations 1
The FAA wake turbulence recategorization (RECAT) separations, summarized in Table 2-2 below, 2 were applied to the simulation models in the study for aircraft operating directly behind or 3 following another aircraft. Wake turbulence separations are maintained when different category 4 aircraft follow one another. Smaller aircraft following larger aircraft may encounter wake turbulence 5 (vortices generated by an aircraft’s wingtip) generated by larger aircraft – creating a potentially 6 hazardous situation. Because of this, additional separation between aircraft may be required for a 7 trailing aircraft to avoid the larger aircraft’s wake turbulence. The wake turbulence separation 8 defines the separation between arrivals to the same runways. 9 10
Table 2-2 FAA RECAT Specifications (NM) 11
Trailing Aircraft
Upper Heavy (A332, B777)
Lower Heavy (B763)
Upper Medium (A320, E190)
Lower Medium (AT72, CRJ9)
Small (GA prop)
Lead
ing
Airc
raft
Upper Heavy 3.0 4.0 5.0 5.0 7.0 Lower Heavy 3.0 3.0 3.5 3.5 6.0 Upper Medium 3.0 3.0 3.0 3.0 4.0 Lower Medium 3.0 3.0 3.0 3.0 3.0 Small 3.0 3.0 3.0 3.0 3.0
Source: Federal Aviation Administration Order 7110.659A 12
2.5.2.2 Route Separations 13
The future No-Action Baseline will use the route separations in the ACEP SIMMOD models namely: 14
› South VMC and IMC: 3 NM. 15 › North VMC and IMC: 2.5 NM. 16
The route separation defines the minimum distance between flights that are assigned the same 17 flight path consecutively, one after another. 18
2.5.2.3 Departure Separations 19
In the airspace surrounding CLT, consecutive departing aircraft are required to maintain departure 20 separations for take-off from the same runway. Table 2-3 summarizes the standard aircraft 21 separations for consecutive departures that were used in the ACEP and were incorporated in the 22 simulation models. These define the separation between departures from the same runways. In 23 addition, lateral separation was achieved within the SIMMOD model by ensuring these same 24 separations are provided between the various aircraft routings. 25 26
Table 2-3 Runway Departure Separations (in seconds) 27

CLT EIS Capacity/Delay Analysis and Airfield Modeling Technical Memorandum
2-14 Approach/Methodology
Trail Aircraft Lead Aircraft Category
Heavy B757 Large Small Heavy 90 120 120 120 B757 90 90 90 120 Large 160/72 160/72 160/72 160/72 Small 160/72 160/72 160/72 160/72 * VMC/IMC in-trail separations 1 Source: ACEP Final Report, Table 3-4, February 2016 2
To replicate variability in actual air traffic operations, the SIMMOD models will incorporate 3 separation multipliers (both arrivals and departures) which vary the distance between aircraft on the 4 same route. In VMC, the multipliers range from 0.55 to 1.55, which adjust a 3.0 nautical mile (nmi) 5 separation to vary between 1.65 nmi to 4.65 nmi, with an average separation of 3.24 nmi. In IMC, 6 the lowest multiplier is 0.978, which may reduce the 3.0 nmi separation to 2.93 nmi separation. 7
2.5.3 Enroute Assignments and Metering 8
Flights are assigned to specific arrival routes based on their originating airport, and are assigned 9 specific departure routes based on their destination airport. A few representative airports along 10 with the assigned arrival and departure route are provided in Table 2-4. 11 12
Table 2-4 Arrival and Departure Route Assignment Examples 13
City/Airport Direction Arrival Route Departure Route
Albany, NY (ALB) NE CHSLY KILNS, BARMY Atlanta, GA (ATL) WSW FILPZ BOBZY Augusta, GA (AGS) SSW BANKR BEAVY Boston, MA (BOS) E MILLET BARMY Buffalo, NY (BUF) NNE CHSLY KILNS, KRITR Canton/Akron, OH (CAK) N CHSLY JOJJO, WEAZL, KRITR Charleston, SC (CHS) SSE STOCR KWEEN Columbus, OH (CMH) NNW PARQR WEAZL Dallas/Fort Worth (DFW) W FILPZ ESTRR, BOBZY Des Moines, IA (DSM) WNW FILPZ BOBZY Frankfurt, Germany (FRA) ENE CHSLY BARMY Houston (IAH) W FILPZ ESTRR, BOBZY Indianapolis, IN (IND) NW PARQR JOJJO Los Angeles, CA (LAX) W FILPZ ESTRR, BOBZY Miami, FL (MIA) S STOCR, BANKR KWEEN, ICONS, BEAVY

CLT EIS Capacity/Delay Analysis and Airfield Modeling Technical Memorandum
2-15 Approach/Methodology
Myrtle Beach, SC (MYR) SE MILLET LILLS Mexico City, Mexico (MEX) SW JONZE BEAVY Nashville, TX (BNA) W FILPZ ESTRR, BOBZY New York (JFK/LGA) E MILLET BARMY Philadelphia, PA (PHL) E MILLET BARMY Washington, DC (DCA) E MILLET BARMY Wilmington, NC (ILM) ESE MILLET LILLS Source: Aerobahn, analyzed by TransSolutions 1
While flights can get to any route from any runway, typically arrivals at CLT from the west land on 2 Runway 18R-36L, and flights from the east land on Runway 18L-36R or Runway 23. Departures to 3 the west typically depart Runway 18C-36C while departures to the east typically depart Runway 4 18L-36R. Some logical adjustments were made in the SIMMOD model to the directional 5 assignments in order to coincide with the runway usage noted in Table 2-1. 6
In 2017, CLT began testing the Airspace Technology Demonstration 2 (ATD-2) specifically for 7 departures to the enroute airspace of Washington Air Route Traffic Control Center (ARTCC), or 8 Washington Center. Previously, departures to the northeast over the BARMY and KILNS fixes often 9 had a miles-in-trail (MIT) restriction to handoff from the CLT airspace to Washington Center. With 10 ATD-2, the flights going into Washington Center are assigned a take-off time prior to pushing-back 11 from the gate, thus metering the departures into the airspace. Operating with ATD-2 has eliminated 12 the MIT restrictions except in the event of convective weather. Based on feedback from the FAA 13 ATC staff at CLT, it was assumed that ATD-2 or a system/technology providing a similar capability 14 will remain in place at CLT, hence, the baseline simulations for future years did not include MIT 15 separations. Note however that the 2016 baseline simulation assumed a 15-nmi in-trail restriction 16 to routes departing CLT airspace into the Washington Center. 17
2.6 Runway Separations and Dependencies 18
Due to the crossing runway configurations at CLT, certain operations are subject to Converging 19 Runway Operations (CRO) procedures in South Flow as described below. 20
› Converging Runway Operations (CRO) Arrival Departure Window (ADW) on Runway 23. 21
• When arrivals to Runway 23 are within 1.8 NM of landing, departures are blocked from 22 Runway 18C until the arrival aircraft is 0.2 NM beyond the Runway 23 threshold (i.e., after 23 the arriving aircraft crosses over Taxiway D). 24
• This configuration operates with 3.0 NM between arrivals to get a Runway 18C departure 25 between each pair of arrivals. 26
› When arrivals to Runway 23 are within 2.0 NM of landing, departures are blocked from 27 Runway18L until the arrival aircraft crosses Runway 18L. 28
CLT EIS Capacity/Delay Analysis and Airfield Modeling Technical Memorandum
2-16 Approach/Methodology
Due to the runway separation, operations on the parallel runways are independent in both VMC 1 and IMC. 2
› South Flow VMC/IMC: Runways 18R, 18C, and 18L are independent. 3
› North Flow VMC/IMC: Runways 36L, 36C, and 36R are independent. 4
Table 2-5 shows the time between consecutive operations on the same runway observed from the 5 Aerobahn® data from January 2015 to April 2017. Note that this analysis included consecutive 6 operations less than 2.5 minutes, since operations with separations greater than that are likely not 7 during a high demand period. This data provided the basis for the simulation model runway 8 procedures. 9
10

CLT EIS Capacity/Delay Analysis and Airfield Modeling Technical Memorandum
2-17 Approach/Methodology
Table 2-5 Aerobahn® Runway Separation Observations 1
Operations Flow Runway 5th Percentile
(min) Avg (min)
Arrival - Arrival
North
36L 1.1 1.5 36C 1.3 1.8 36R 1.3 1.9 Overall 1.1 1.6
South
23 1.2 1.7 18L 1.4 1.9 18C 1.3 1.9 18R 1.1 1.5 Overall 1.1 1.6
Departure - Departure
North
36L 0.7 1.3 36C 0.7 1.3 36R 0.7 1.5 Overall 0.7 1.4
South
18L 0.6 1.3 18C 0.8 1.4 18R 0.7 1.4 Overall 0.6 1.4
Arrival - Departure
North 36C 0.4 0.8 36R 0.3 0.5 Overall 0.3 0.6
South 18C 0.4 0.8 18L 0.5 0.8 Overall 0.4 0.8
Departure - Arrival
North 36C 1.4 1.9 36R 1.3 1.7 Overall 1.3 1.7
South 18C 1.5 1.9 18L 1.1 1.6 Overall 1.1 1.7
Source: Aerobahn®, January 2015 – April 2017, analyzed by TransSolutions 2
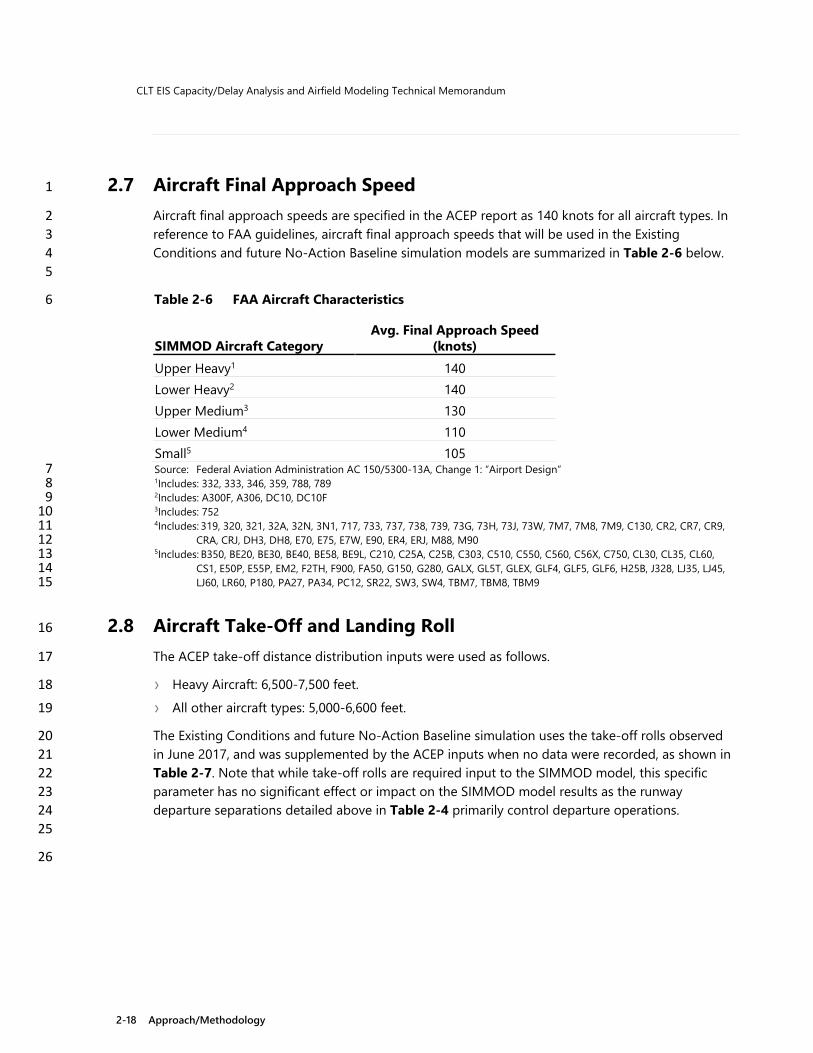
CLT EIS Capacity/Delay Analysis and Airfield Modeling Technical Memorandum
2-18 Approach/Methodology
2.7 Aircraft Final Approach Speed 1
Aircraft final approach speeds are specified in the ACEP report as 140 knots for all aircraft types. In 2 reference to FAA guidelines, aircraft final approach speeds that will be used in the Existing 3 Conditions and future No-Action Baseline simulation models are summarized in Table 2-6 below. 4 5
Table 2-6 FAA Aircraft Characteristics 6
SIMMOD Aircraft Category Avg. Final Approach Speed
(knots) Upper Heavy1 140 Lower Heavy2 140 Upper Medium3 130 Lower Medium4 110 Small5 105 Source: Federal Aviation Administration AC 150/5300-13A, Change 1: “Airport Design” 7 1Includes: 332, 333, 346, 359, 788, 789 8 2Includes: A300F, A306, DC10, DC10F 9 3Includes: 752 10 4Includes: 319, 320, 321, 32A, 32N, 3N1, 717, 733, 737, 738, 739, 73G, 73H, 73J, 73W, 7M7, 7M8, 7M9, C130, CR2, CR7, CR9, 11
CRA, CRJ, DH3, DH8, E70, E75, E7W, E90, ER4, ERJ, M88, M90 12 5Includes: B350, BE20, BE30, BE40, BE58, BE9L, C210, C25A, C25B, C303, C510, C550, C560, C56X, C750, CL30, CL35, CL60, 13
CS1, E50P, E55P, EM2, F2TH, F900, FA50, G150, G280, GALX, GL5T, GLEX, GLF4, GLF5, GLF6, H25B, J328, LJ35, LJ45, 14 LJ60, LR60, P180, PA27, PA34, PC12, SR22, SW3, SW4, TBM7, TBM8, TBM9 15
2.8 Aircraft Take-Off and Landing Roll 16
The ACEP take-off distance distribution inputs were used as follows. 17
› Heavy Aircraft: 6,500-7,500 feet. 18
› All other aircraft types: 5,000-6,600 feet. 19
The Existing Conditions and future No-Action Baseline simulation uses the take-off rolls observed 20 in June 2017, and was supplemented by the ACEP inputs when no data were recorded, as shown in 21 Table 2-7. Note that while take-off rolls are required input to the SIMMOD model, this specific 22 parameter has no significant effect or impact on the SIMMOD model results as the runway 23 departure separations detailed above in Table 2-4 primarily control departure operations. 24 25
26

CLT EIS Capacity/Delay Analysis and Airfield Modeling Technical Memorandum
2-19 Approach/Methodology
Table 2-7 Take-Off Roll Distances 1
Type Avg. Distance (ft.) Turboprop 3,385 Regional Jets 5,350 Narrow Body 6,640 Source: Data collected at CLT, 77 observations recorded June 14-15, 2017. 2 3
The Existing Conditions and future No-Action Baseline simulation model landing rolls used runway 4 exit percentages obtained from Aerobahn® data. Note that the analysis of the Aerobahn® data 5 shows a difference in runway exit location designations after January 2016, and the details of the 6 previous data labels are not available. Thus, Table 2-8 summarizes the runway exit percentages 7 analyzed from Aerobahn® for February 2016 – April 2017, which were used in this study. 8 9
10
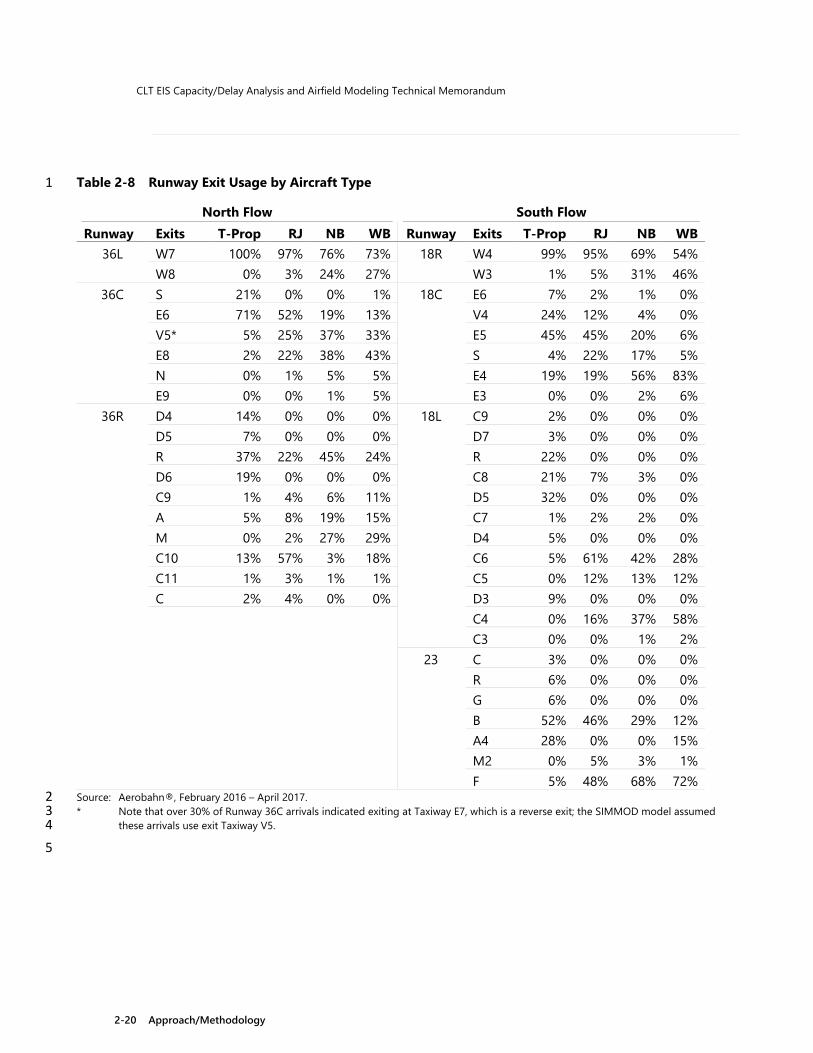
CLT EIS Capacity/Delay Analysis and Airfield Modeling Technical Memorandum
2-20 Approach/Methodology
Table 2-8 Runway Exit Usage by Aircraft Type 1
North Flow South Flow Runway Exits T-Prop RJ NB WB Runway Exits T-Prop RJ NB WB
36L W7 100% 97% 76% 73% 18R W4 99% 95% 69% 54%
W8 0% 3% 24% 27% W3 1% 5% 31% 46% 36C S 21% 0% 0% 1% 18C E6 7% 2% 1% 0%
E6 71% 52% 19% 13% V4 24% 12% 4% 0%
V5* 5% 25% 37% 33% E5 45% 45% 20% 6%
E8 2% 22% 38% 43% S 4% 22% 17% 5%
N 0% 1% 5% 5% E4 19% 19% 56% 83%
E9 0% 0% 1% 5% E3 0% 0% 2% 6% 36R D4 14% 0% 0% 0% 18L C9 2% 0% 0% 0%
D5 7% 0% 0% 0% D7 3% 0% 0% 0%
R 37% 22% 45% 24% R 22% 0% 0% 0%
D6 19% 0% 0% 0% C8 21% 7% 3% 0%
C9 1% 4% 6% 11% D5 32% 0% 0% 0%
A 5% 8% 19% 15% C7 1% 2% 2% 0%
M 0% 2% 27% 29% D4 5% 0% 0% 0%
C10 13% 57% 3% 18% C6 5% 61% 42% 28%
C11 1% 3% 1% 1% C5 0% 12% 13% 12%
C 2% 4% 0% 0% D3 9% 0% 0% 0%
C4 0% 16% 37% 58%
C3 0% 0% 1% 2%
23 C 3% 0% 0% 0%
R 6% 0% 0% 0%
G 6% 0% 0% 0%
B 52% 46% 29% 12%
A4 28% 0% 0% 15%
M2 0% 5% 3% 1%
F 5% 48% 68% 72% Source: Aerobahn®, February 2016 – April 2017. 2 * Note that over 30% of Runway 36C arrivals indicated exiting at Taxiway E7, which is a reverse exit; the SIMMOD model assumed 3
these arrivals use exit Taxiway V5. 4 5
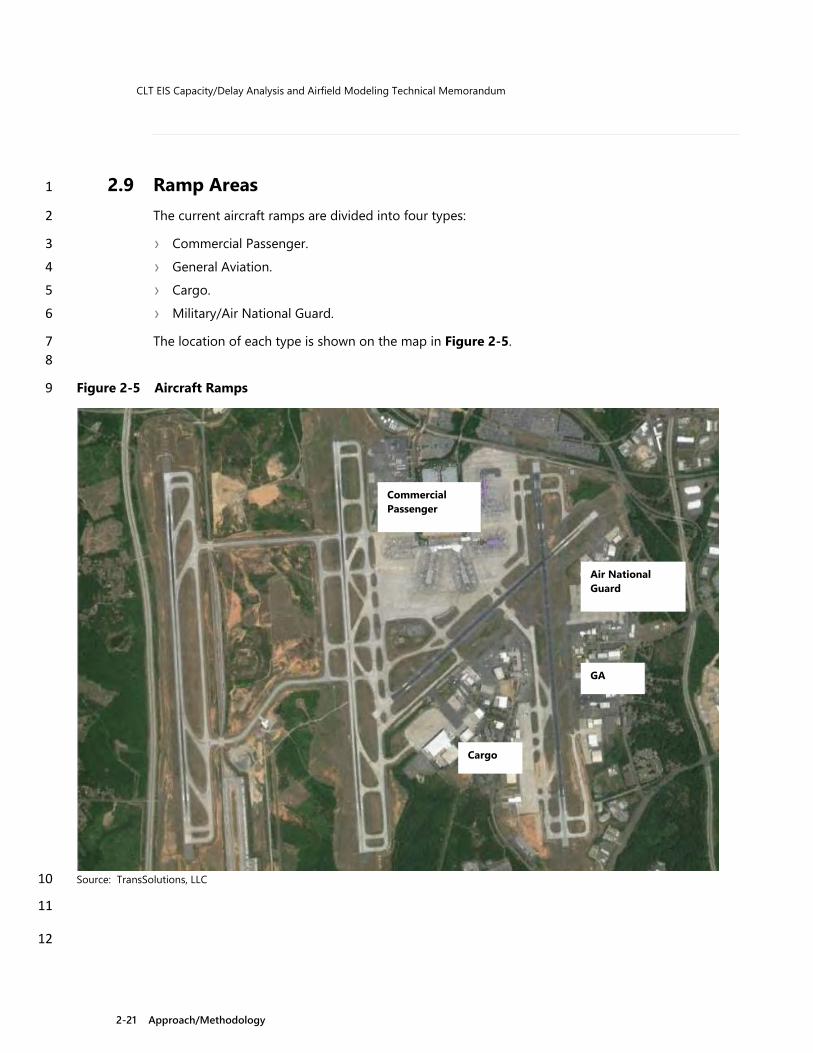
CLT EIS Capacity/Delay Analysis and Airfield Modeling Technical Memorandum
2-21 Approach/Methodology
2.9 Ramp Areas 1
The current aircraft ramps are divided into four types: 2
› Commercial Passenger. 3
› General Aviation. 4
› Cargo. 5
› Military/Air National Guard. 6
The location of each type is shown on the map in Figure 2-5. 7 8
Figure 2-5 Aircraft Ramps 9
Source: TransSolutions, LLC 10
11
12
Commercial Passenger
Cargo
Air National Guard
GA

CLT EIS Capacity/Delay Analysis and Airfield Modeling Technical Memorandum
2-22 Approach/Methodology
2.10 Ramp Entry and Exit 1
Figure 2-6 illustrates aircraft entry and exit points at the ramp. 2 3
Figure 2-6 Ramp Entry and Exit Points 4
Source: CLT Air Traffic Control, 2017 5
6 Aerobahn® data were analyzed to determine the usage of each entry and exit point at the ramp. 7 The data also indicated a change in operations or airfield configuration after January 2016 where 8 certain entry and exit points were no longer used or available. Table 2-9 summarizes the ramp 9 entry and exit points for the operations from February 2016 to April 2017. 10
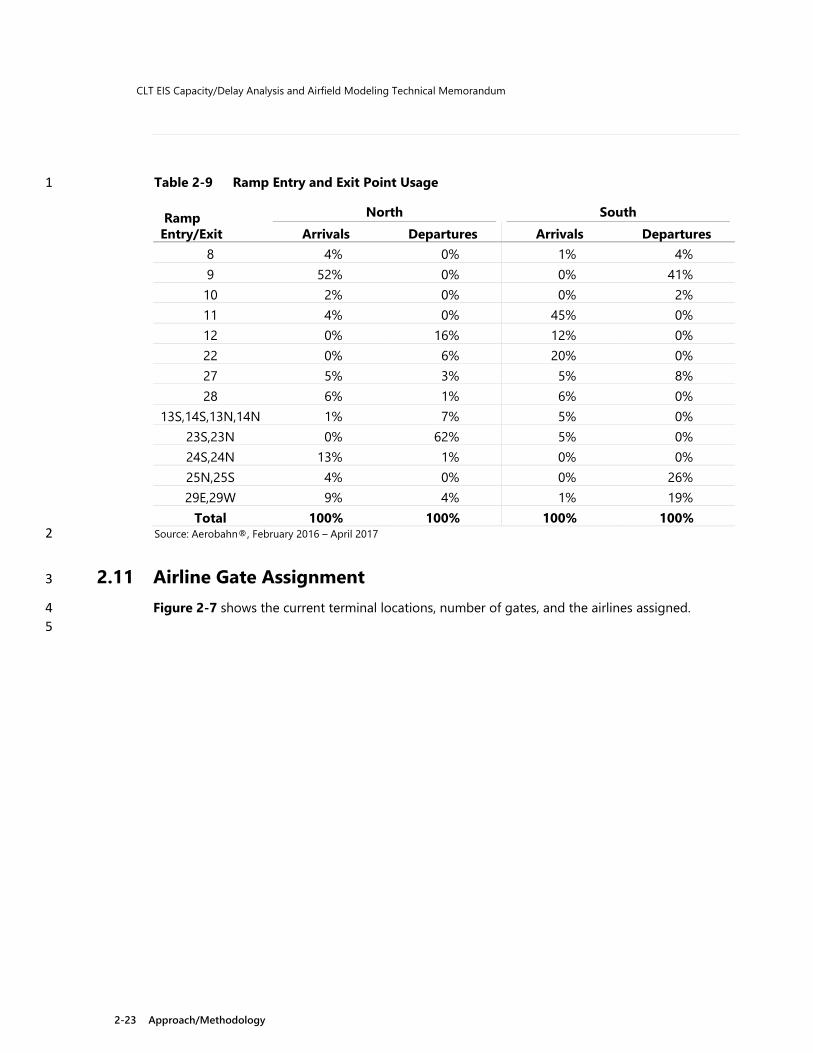
CLT EIS Capacity/Delay Analysis and Airfield Modeling Technical Memorandum
2-23 Approach/Methodology
Table 2-9 Ramp Entry and Exit Point Usage 1
Ramp Entry/Exit
North South Arrivals Departures Arrivals Departures
8 4% 0% 1% 4% 9 52% 0% 0% 41% 10 2% 0% 0% 2% 11 4% 0% 45% 0% 12 0% 16% 12% 0% 22 0% 6% 20% 0% 27 5% 3% 5% 8% 28 6% 1% 6% 0%
13S,14S,13N,14N 1% 7% 5% 0% 23S,23N 0% 62% 5% 0% 24S,24N 13% 1% 0% 0% 25N,25S 4% 0% 0% 26% 29E,29W 9% 4% 1% 19%
Total 100% 100% 100% 100% Source: Aerobahn®, February 2016 – April 2017 2
2.11 Airline Gate Assignment 3
Figure 2-7 shows the current terminal locations, number of gates, and the airlines assigned. 4 5
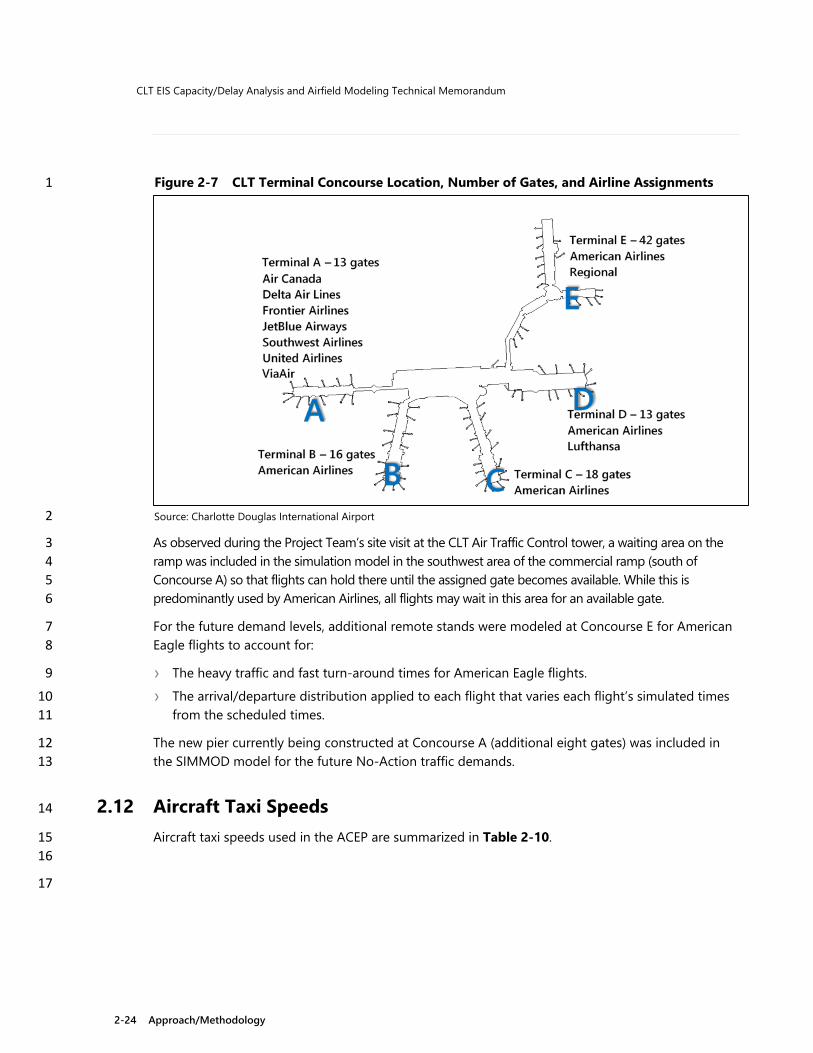
CLT EIS Capacity/Delay Analysis and Airfield Modeling Technical Memorandum
2-24 Approach/Methodology
Figure 2-7 CLT Terminal Concourse Location, Number of Gates, and Airline Assignments 1
Source: Charlotte Douglas International Airport 2
As observed during the Project Team’s site visit at the CLT Air Traffic Control tower, a waiting area on the 3 ramp was included in the simulation model in the southwest area of the commercial ramp (south of 4 Concourse A) so that flights can hold there until the assigned gate becomes available. While this is 5 predominantly used by American Airlines, all flights may wait in this area for an available gate. 6
For the future demand levels, additional remote stands were modeled at Concourse E for American 7 Eagle flights to account for: 8
› The heavy traffic and fast turn-around times for American Eagle flights. 9
› The arrival/departure distribution applied to each flight that varies each flight’s simulated times 10 from the scheduled times. 11
The new pier currently being constructed at Concourse A (additional eight gates) was included in 12 the SIMMOD model for the future No-Action traffic demands. 13
2.12 Aircraft Taxi Speeds 14
Aircraft taxi speeds used in the ACEP are summarized in Table 2-10. 15 16
17

CLT EIS Capacity/Delay Analysis and Airfield Modeling Technical Memorandum
2-25 Approach/Methodology
Table 2-10 ACEP Taxi Speeds 1
Area of Airfield Speed (knots) Outer Perimeter Taxiways (Arrivals) 25 knots Runway Crossings 10 knots Ramp Area Taxiways 12 knots Ramp Area Taxilanes 10 knots Gate Power-In 5 knots Source: ACEP Final Report, Table 3-6, February 2016 2
3 The Existing Conditions and future No-Action Baseline used a combination of the ACEP and the on-4 site observations of taxi speeds collected at CLT on June 14-15, 2017, as shown in Table 2-11 and 5 illustrated in Figure 2-8. 6 7
Table 2-11 2017 Taxi Speeds 8
Area of Airfield Speed (knots) Runways 70 Rapid Exit Taxiways (Angled Exits) 32 Perpendicular Runway Exits 15 Taxiways N and S (between Runways 18C-36C and 18R-36L) 20 Taxiways 15 Ramp Areas 10 Runway Crossings 18 Source: Data collected at CLT, 381 observations recorded, June 14-15, 2017 9
10
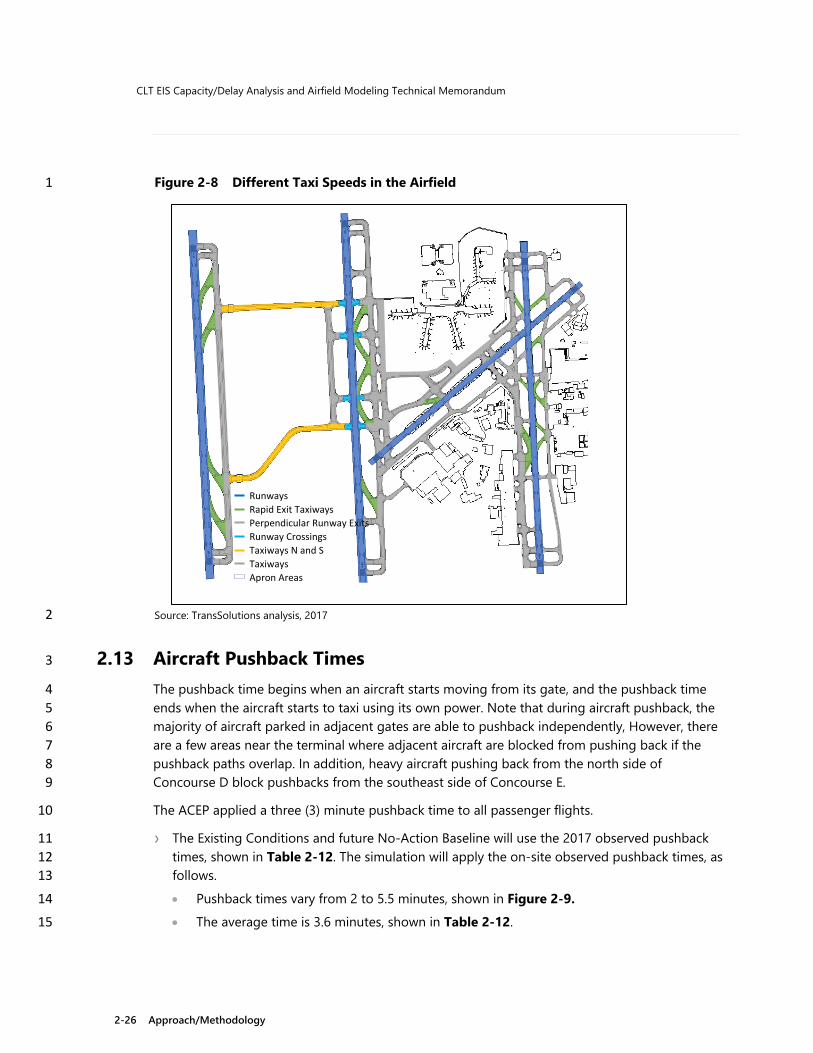
CLT EIS Capacity/Delay Analysis and Airfield Modeling Technical Memorandum
2-26 Approach/Methodology
Figure 2-8 Different Taxi Speeds in the Airfield 1
Source: TransSolutions analysis, 2017 2
2.13 Aircraft Pushback Times 3
The pushback time begins when an aircraft starts moving from its gate, and the pushback time 4 ends when the aircraft starts to taxi using its own power. Note that during aircraft pushback, the 5 majority of aircraft parked in adjacent gates are able to pushback independently, However, there 6 are a few areas near the terminal where adjacent aircraft are blocked from pushing back if the 7 pushback paths overlap. In addition, heavy aircraft pushing back from the north side of 8 Concourse D block pushbacks from the southeast side of Concourse E. 9
The ACEP applied a three (3) minute pushback time to all passenger flights. 10
› The Existing Conditions and future No-Action Baseline will use the 2017 observed pushback 11 times, shown in Table 2-12. The simulation will apply the on-site observed pushback times, as 12 follows. 13
• Pushback times vary from 2 to 5.5 minutes, shown in Figure 2-9. 14
• The average time is 3.6 minutes, shown in Table 2-12. 15
Runways Rapid Exit Taxiways Perpendicular Runway Exits Runway Crossings Taxiways N and S Taxiways Apron Areas

CLT EIS Capacity/Delay Analysis and Airfield Modeling Technical Memorandum
2-27 Approach/Methodology
• The same pushback distribution will be used for all commercial passenger aircraft types as 1 they are not significantly different across different aircraft types. 2 3
Table 2-12 Average Pushback Time 4
Type Avg. Times (min) T-Prop 3.2 RJ 3.8 NB 3.6 Total 3.6 Source: Data collected at CLT, 60 observations recorded, June 14-15, 2017 5
6
Figure 2-9 2017 Observed Pushback Times 7
Source: Data collected at CLT, June 14-15, 2017 8 9

CLT EIS Capacity/Delay Analysis and Airfield Modeling Technical Memorandum
2-28 Approach/Methodology
2.14 Taxiflows 1
The Existing Conditions and future No-Action Baseline used both the ACEP and 2017 observed taxi-2 flows, illustrated in Figure 2-10. 3 4
Figure 2-10 North and South Taxi Flows – Integrated ACEP and 2017 Observations 5
North Flow South Flow Source: TransSolutions analysis of ACEP and observations 6
2.15 Flight Dependability 7
The probability that a flight arrives/departs earlier or later than scheduled is applied in the 8 SIMMOD model to create a realistic arrival and departure profile. Negative values indicate flights 9 that arrive or depart prior to their scheduled time, while positive values indicate flights that arrive or 10 depart after their scheduled time. 11
Flight dependability varied for both arrivals and departures by 30 minutes (60 minutes in North IMC 12 configuration) in the ACEP. The Existing Conditions and future No-Action Baseline used the data 13 analyzed from Aerobahn®, shown in Figure 2-11, since this provided more detailed information. 14
D
D
A A A
Arrival Departure
A A A
A
D D
Arrival Departure
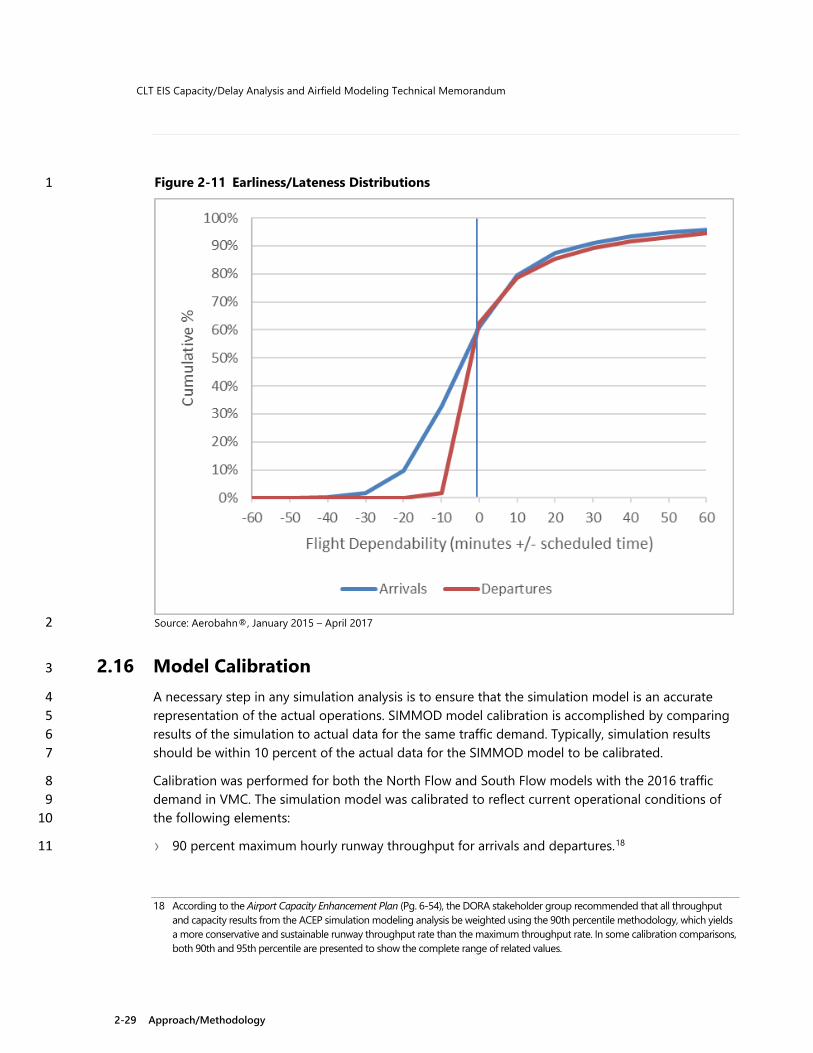
CLT EIS Capacity/Delay Analysis and Airfield Modeling Technical Memorandum
2-29 Approach/Methodology
Figure 2-11 Earliness/Lateness Distributions 1
Source: Aerobahn®, January 2015 – April 2017 2
2.16 Model Calibration 3
A necessary step in any simulation analysis is to ensure that the simulation model is an accurate 4 representation of the actual operations. SIMMOD model calibration is accomplished by comparing 5 results of the simulation to actual data for the same traffic demand. Typically, simulation results 6 should be within 10 percent of the actual data for the SIMMOD model to be calibrated. 7
Calibration was performed for both the North Flow and South Flow models with the 2016 traffic 8 demand in VMC. The simulation model was calibrated to reflect current operational conditions of 9 the following elements: 10
› 90 percent maximum hourly runway throughput for arrivals and departures.18 11
18 According to the Airport Capacity Enhancement Plan (Pg. 6-54), the DORA stakeholder group recommended that all throughput
and capacity results from the ACEP simulation modeling analysis be weighted using the 90th percentile methodology, which yields a more conservative and sustainable runway throughput rate than the maximum throughput rate. In some calibration comparisons, both 90th and 95th percentile are presented to show the complete range of related values.
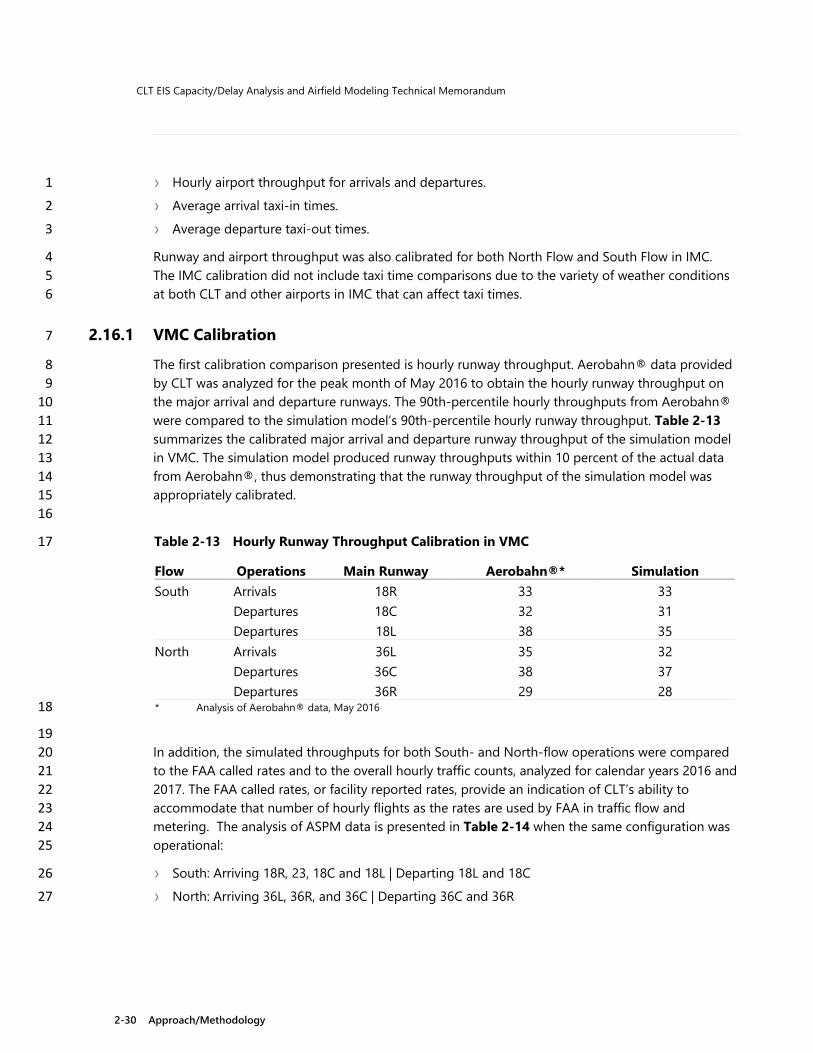
CLT EIS Capacity/Delay Analysis and Airfield Modeling Technical Memorandum
2-30 Approach/Methodology
› Hourly airport throughput for arrivals and departures. 1
› Average arrival taxi-in times. 2
› Average departure taxi-out times. 3
Runway and airport throughput was also calibrated for both North Flow and South Flow in IMC. 4 The IMC calibration did not include taxi time comparisons due to the variety of weather conditions 5 at both CLT and other airports in IMC that can affect taxi times. 6
2.16.1 VMC Calibration 7
The first calibration comparison presented is hourly runway throughput. Aerobahn® data provided 8 by CLT was analyzed for the peak month of May 2016 to obtain the hourly runway throughput on 9 the major arrival and departure runways. The 90th-percentile hourly throughputs from Aerobahn® 10 were compared to the simulation model’s 90th-percentile hourly runway throughput. Table 2-13 11 summarizes the calibrated major arrival and departure runway throughput of the simulation model 12 in VMC. The simulation model produced runway throughputs within 10 percent of the actual data 13 from Aerobahn®, thus demonstrating that the runway throughput of the simulation model was 14 appropriately calibrated. 15 16
Table 2-13 Hourly Runway Throughput Calibration in VMC 17
Flow Operations Main Runway Aerobahn®* Simulation South Arrivals 18R 33 33 Departures 18C 32 31 Departures 18L 38 35 North Arrivals 36L 35 32 Departures 36C 38 37 Departures 36R 29 28 * Analysis of Aerobahn® data, May 2016 18
19 In addition, the simulated throughputs for both South- and North-flow operations were compared 20 to the FAA called rates and to the overall hourly traffic counts, analyzed for calendar years 2016 and 21 2017. The FAA called rates, or facility reported rates, provide an indication of CLT’s ability to 22 accommodate that number of hourly flights as the rates are used by FAA in traffic flow and 23 metering. The analysis of ASPM data is presented in Table 2-14 when the same configuration was 24 operational: 25
› South: Arriving 18R, 23, 18C and 18L | Departing 18L and 18C 26
› North: Arriving 36L, 36R, and 36C | Departing 36C and 36R 27

CLT EIS Capacity/Delay Analysis and Airfield Modeling Technical Memorandum
2-31 Approach/Methodology
Note: a variety of called rate values were found in ASPM for a particular runway configuration. The 1 most frequent called rate for each configuration is included in the table. For comparison purposes, 2 the ACEP throughputs are also provided. 3
Table 2-14 VMC Hourly Throughput Calibration by Operation Type 4
ASPM1 Simulation2 ACEP3
Flow Operations Called Rate*
Maximum Operations*
95th% Operations*
Maximum Operations
95th% Operations Peak Hour
South Arrivals 92 78 66 77 69 71 Departures 82 81 70 78 66 73 North Arrivals 92 79 67 73 66 72 Departures 69 82 71 78 67 73
1 Analysis of ASPM data, 2016-2017 5 2 Simulation single day of 2016 6 3 ACEP Table 3-11 on page 3-34 7
8 The FAA’s acceptance or called arrival rates are much higher than actual hourly counts. The hourly 9 throughput of the simulated single day is very similar to the ASPM hourly counts, especially for the 10 95th percentiles. 11
Overall, the simulated hourly airport throughput for arrivals and departures together is presented in 12 Table 2-15 for the 90th percentile. 13 14
Table 2-15 VMC Hourly Throughput Calibration – Total Operations 15
ASPM Simulation 90th % 90th %
121 121 121 118
Note: Analysis of ASPM data, 2016-2017 16 17
Another primary calibration comparison in VMC is taxi-in and taxi-out times. While the simulation 18 model produces unimpeded travel times, taxi delays and departure queue delays, the only 19 operational statistic for comparison is the overall taxi times, which include all delays encountered 20 taxiing between the gate and the runway. For CLT, the taxi times compare favorably, within ten 21 percent of the actual taxi times from Aerobahn®. Table 2-16 summarizes the comparison of the 22 calibrated taxi times of the simulation model in VMC. 23 24
Table 2-16 2017 Average Taxi Times 25

CLT EIS Capacity/Delay Analysis and Airfield Modeling Technical Memorandum
2-32 Approach/Methodology
Flow Operation Aerobahn®1
(min) Simulation (min) South Arrival 11.0 10.3
Departure 12.5 13.6 North Arrival 10.5 10.2
Departure 13.7 14.8 1 Analysis of Aerobahn® data, May 2016 1
2.16.2 IMC Calibration 2
The IMC calibration includes both hourly runway throughput and overall hourly airport throughput. 3 The runway throughput is obtained from Aerobahn® for the January - August 2016 to obtain the 4 hourly runway throughput on the major arrival and departure runways: arrivals on Runway 18R-36L, 5 and departures on Runways 18C-36C and 18L-36R. Note that additional months were analyzed to 6 obtain adequate amount of IMC hours for comparing to the simulation. The 90th-percentile hourly 7 throughputs from Aerobahn® were compared to the simulation model’s 90th-percentile hourly 8 runway throughput in Table 2-17. 9 10
Table 2-17 Hourly Runway Throughput Calibration in IMC 11
Flow Operations Main Runway Aerobahn®1 Simulation South Arrivals 18R 34 35 Departures 18C 28 29 Departures 18L 32 34 North Arrivals 36L 35 32 Departures 36C 35 35 Departures 36R 27 26 1 Analysis of Aerobahn® data, January - August 2016 12
13 The simulated throughputs for both South Flow and North Flow operations IMC were compared to 14 the FAA called rates and to the overall hourly traffic counts, analyzed for calendar years 2016 and 15 2017. Analysis is presented in Table 2-18 of ASPM data when the same configuration was 16 operational as is being simulated: 17
› South: Arriving 18R, 18C and 18L | Departing 18L and 18C 18
› North: Arriving 36L, 36R, and 36C | Departing 36C and 36R 19
While several called rate values are found in ASPM for a particular runway configuration, the most 20 frequent called rate for each configuration is presented below. In addition to maximum counts, the 21 95th percentile is also provided for 0700 – 2200 local time. For comparison purposes, the ACEP 22 throughputs are also provided. The hourly throughput of the simulated single day is very similar to 23

CLT EIS Capacity/Delay Analysis and Airfield Modeling Technical Memorandum
2-33 Approach/Methodology
the ASPM hourly counts, especially for the 95th percentiles. 1 2
Table 2-18 IMC Hourly Throughput Calibration by Operation Type 3
ASPM1 Simulation2 ACEP3
Flow Operations Called Rate*
Maximum Operations*
95th% Operations*
Maximum Operations
95th% Operations
Peak Hour
South Arrivals 75 77 68 74 66 65 Departures 65 74 64 68 62 68 North Arrivals 75 76 68 73 66 65 Departures 65 79 66 68 61 65 1 Analysis of ASPM data, 2016-2017 4 2 Simulation single day of 2016 5 3 ACEP Table 3-11 on page 3-34 6
7 The simulated hourly airport throughput for arrivals and departures combined is presented in 8 Table 2-19 for the 90th percentile. 9 10
Table 2-19 IMC Hourly Throughput Calibration – Total Operations 11
Flow ASPM Simulation 90th % 90th %
South 112 114 North 114 116 Note: Analysis of ASPM data, 2016-2017 12
13 All simulation outputs compared for the 2016 calibration are within 10 to 11 percent of the actual 14 data analyzed from FAA ASPM and Aerobahn for all four runway configurations: South Flow VMC, 15 North Flow VMC, South Flow IMC and North Flow IMC. 16
17

CLT EIS Capacity/Delay Analysis and Airfield Modeling Technical Memorandum
3-1 Simulation Findings
3 1
Simulation Findings 2
3.1 Introduction 3
This section documents the findings of the airfield capacity/delay analysis for the Existing 4 Conditions and future No-Action alternatives. This is followed by analysis of the simulation results 5 for the current and anticipated demand for the Environmental Impact Statement (EIS) requirement 6 for current and future conditions. The analysis years considered are the 2016 baseline year (Existing 7 Conditions) for which a full year of data is available, 2028 when the project elements will be in 8 place, and 2033, which is five years after the full implementation of the Project. This simulation 9 estimates what the future would be like, without the proposed projects, and will ultimately serve as 10 a comparison to the proposed project alternatives. 11
The primary simulation metrics used in an airfield capacity/delay analysis are the following. 12
› Airfield/Runway throughput: Hourly throughput reports the maximum number of arrivals and 13 departures that use the runways in a given hour. Sustainable hourly capacity is the 90th 14 percentile of the maximum hourly throughputs. 15
› Arrival airspace delay: Delay is measured as the difference in the amount of time an aircraft 16 actually lands on the runway and the time it would have taken to land on the runway if it were 17 able to move unimpeded through the airspace. The majority of the arrival delay occurs when 18 aircraft must maintain separations and merge onto final approach. 19
› Taxi times: 20
• Arrival taxi-in time (“on-to-in”) – Taxi-in time measures the time from when the aircraft 21 lands on the runway until it taxies into its gate or ramp. It includes runway landing roll time, 22 airfield taxi time, and any taxiway or ramp delays. 23
• Departure taxi-out time (“out-to-off”) – Taxi-out time measures the time from when the 24 aircraft departs its gate or ramp until it leaves the runway. It includes the time for push-back 25 from the gate, airfield taxi time, departure queue wait time, and runway takeoff roll time. 26
› Airfield delays: Taxi delay is measured as the difference between the time an aircraft taxis 27 between the runway and gate compared to the time it would have taken if it were able to move 28 unimpeded on its airfield taxiing path. Departure ground delay includes the time in departure 29 queue awaiting clearance to take-off. (Note that this airfield delay measure is included in the 30 taxi times above.) 31
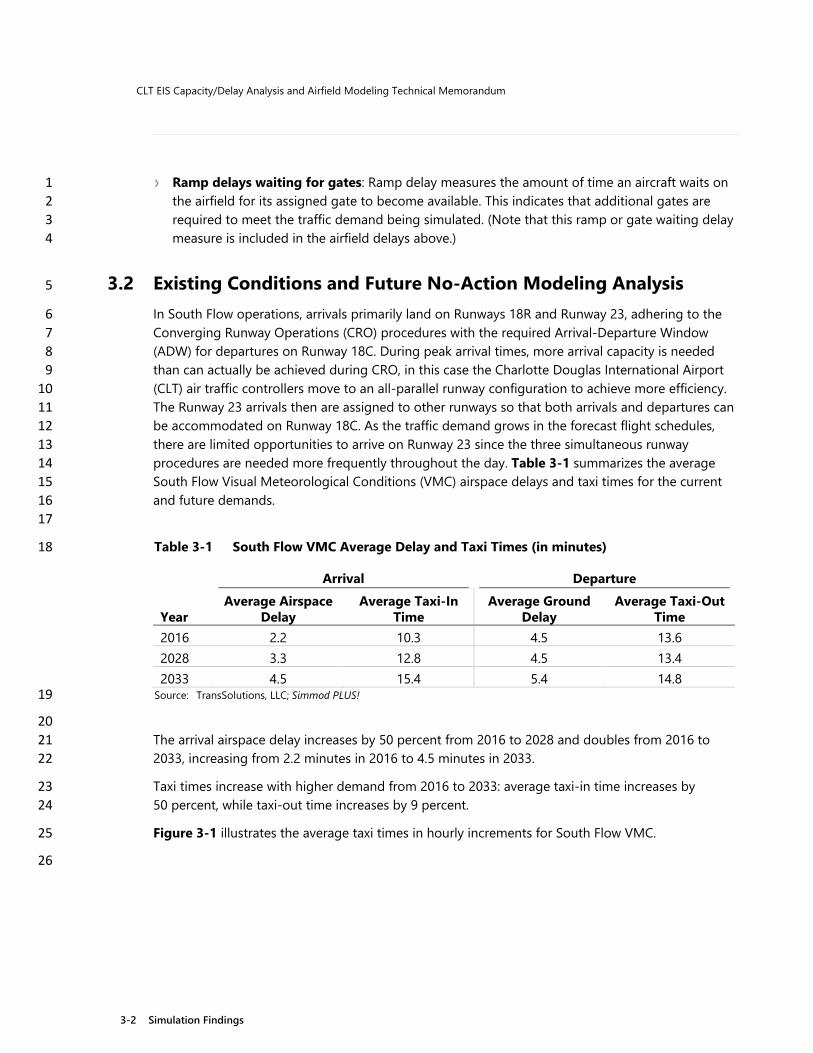
CLT EIS Capacity/Delay Analysis and Airfield Modeling Technical Memorandum
3-2 Simulation Findings
› Ramp delays waiting for gates: Ramp delay measures the amount of time an aircraft waits on 1 the airfield for its assigned gate to become available. This indicates that additional gates are 2 required to meet the traffic demand being simulated. (Note that this ramp or gate waiting delay 3 measure is included in the airfield delays above.) 4
3.2 Existing Conditions and Future No-Action Modeling Analysis 5
In South Flow operations, arrivals primarily land on Runways 18R and Runway 23, adhering to the 6 Converging Runway Operations (CRO) procedures with the required Arrival-Departure Window 7 (ADW) for departures on Runway 18C. During peak arrival times, more arrival capacity is needed 8 than can actually be achieved during CRO, in this case the Charlotte Douglas International Airport 9 (CLT) air traffic controllers move to an all-parallel runway configuration to achieve more efficiency. 10 The Runway 23 arrivals then are assigned to other runways so that both arrivals and departures can 11 be accommodated on Runway 18C. As the traffic demand grows in the forecast flight schedules, 12 there are limited opportunities to arrive on Runway 23 since the three simultaneous runway 13 procedures are needed more frequently throughout the day. Table 3-1 summarizes the average 14 South Flow Visual Meteorological Conditions (VMC) airspace delays and taxi times for the current 15 and future demands. 16 17
Table 3-1 South Flow VMC Average Delay and Taxi Times (in minutes) 18
Year
Arrival Departure Average Airspace
Delay Average Taxi-In
Time Average Ground
Delay Average Taxi-Out
Time 2016 2.2 10.3 4.5 13.6 2028 3.3 12.8 4.5 13.4 2033 4.5 15.4 5.4 14.8
Source: TransSolutions, LLC; Simmod PLUS! 19
20 The arrival airspace delay increases by 50 percent from 2016 to 2028 and doubles from 2016 to 21 2033, increasing from 2.2 minutes in 2016 to 4.5 minutes in 2033. 22
Taxi times increase with higher demand from 2016 to 2033: average taxi-in time increases by 23 50 percent, while taxi-out time increases by 9 percent. 24
Figure 3-1 illustrates the average taxi times in hourly increments for South Flow VMC. 25
26

CLT EIS Capacity/Delay Analysis and Airfield Modeling Technical Memorandum
3-3 Simulation Findings
Figure 3-1 South Flow VMC Hourly Average Taxi Times 1
Taxi-In
Taxi-Out
Source: TransSolutions, LLC; Simmod PLUS! 2 3

CLT EIS Capacity/Delay Analysis and Airfield Modeling Technical Memorandum
3-4 Simulation Findings
3.2.1 South Flow Instrument Meteorological Conditions (IMC) 1
During Instrument Meteorological Conditions (IMC) operations, Runway 23 is not used in South 2 Flow. Table 3-2 summarizes the average South Flow IMC airspace delays and taxi times for the 3 current and future demands. 4 5
Table 3-2 South Flow IMC Average Delay and Taxi Times (in minutes) 6
Year
Arrival Departure Average Airspace
Delay Average Taxi-In
Time Average Ground
Delay Average Taxi-Out
Time 2016 4.3 12.4 8.3 17.7 2028 7.3 15.2 8.6 17.9 2033 12.6 15.4 13.1 23.4
Source: TransSolutions, LLC; Simmod PLUS! 7
8 Arrival airspace delay is nearly three times higher in 2033 than in 2016. Average taxi-in time 9 increases by 24 percent and average taxi-out time increases by nearly 32 percent from 2016 to 10 2033. The average departure ground delays increase 4 percent from 2016 to 2028, and another 52 11 percent from 2028 to 2033. 12
Figure 3-2 illustrates the average taxi times in hourly increments for South Flow IMC. 13
14
15
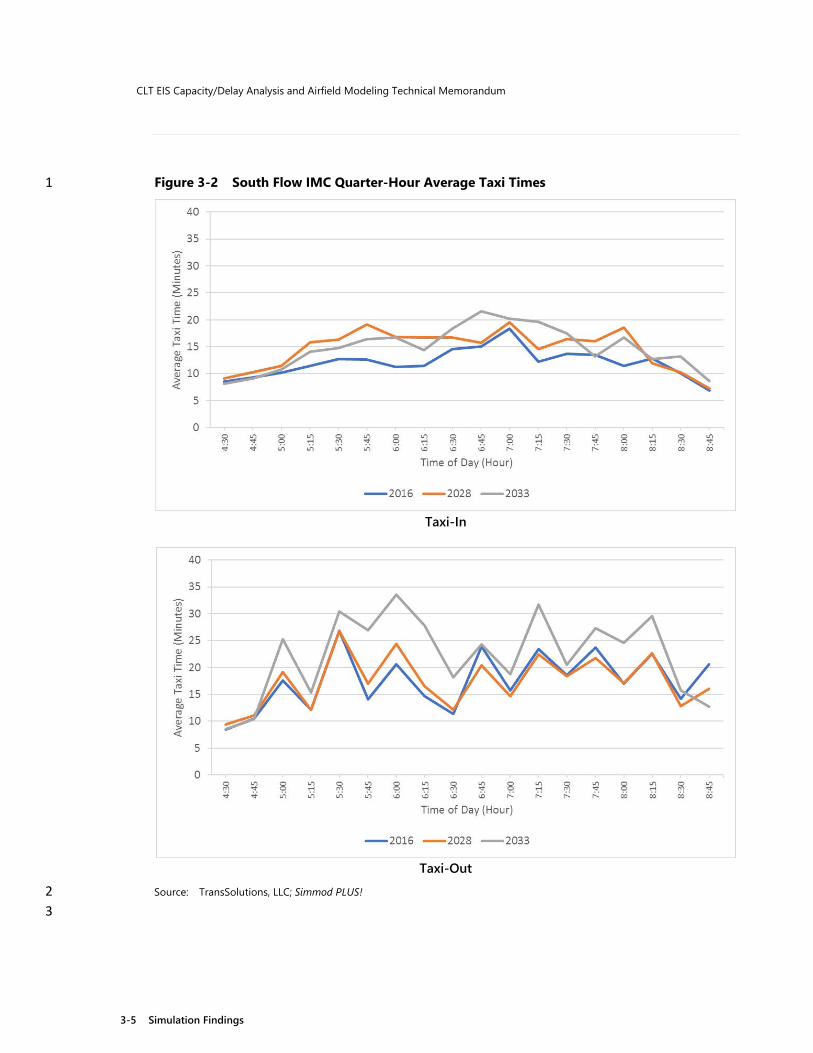
CLT EIS Capacity/Delay Analysis and Airfield Modeling Technical Memorandum
3-5 Simulation Findings
Figure 3-2 South Flow IMC Quarter-Hour Average Taxi Times 1
Taxi-In
Taxi-Out Source: TransSolutions, LLC; Simmod PLUS! 2
3

CLT EIS Capacity/Delay Analysis and Airfield Modeling Technical Memorandum
3-6 Simulation Findings
3.2.2 North Flow VMC 1
In North Flow operations, the arrivals and departures use only the parallel runways so that Runway 2 5 is used as a taxiway. Often, departure aircraft taxi from their gates to Runway 36C on Runway 5. 3 Table 3-3 summarizes the average North Flow VMC average air delay and taxi times for the current 4 and future demands. 5 6
Table 3-3 North Flow VMC Average Delay and Taxi Times (in minutes) 7
Year
Arrival Departure Average
Airspace Delay Average
Taxi-In Time Average
Ground Delay Average
Taxi-Out Time 2016 3.8 10.2 4.4 14.8 2028 7.8 13.9 4.1 14.6 2033 10.9 14.9 4.8 15.4 Source: TransSolutions, LLC; Simmod PLUS! 8
9 In general, taxi-in times are similar to South Flow but taxi-out times are longer because the 10 departure runway ends are further from the terminals. In North Flow VMC: 11
› Average airspace delays nearly double from 2016 to 2028 and nearly triple from 2016 to 2033. 12
› Average taxi-in time increases by 46 percent from 2016 to 2033. 13
› Average taxi-out time increases by 4 percent from 2016 to 2033. 14
› Average departure ground delays decreased by 7 percent from 2016 to 2028 as next generation 15 (FAA NextGen) equipment is assumed to be in place by 2028, reducing the required departure 16 separations. However, average departure ground delays increased by 17 percent from 2028 to 17 2033 due to the increase in traffic demand. 18
Figure 3-3 illustrates the average taxi times in hourly increments for North Flow VMC. 19
20
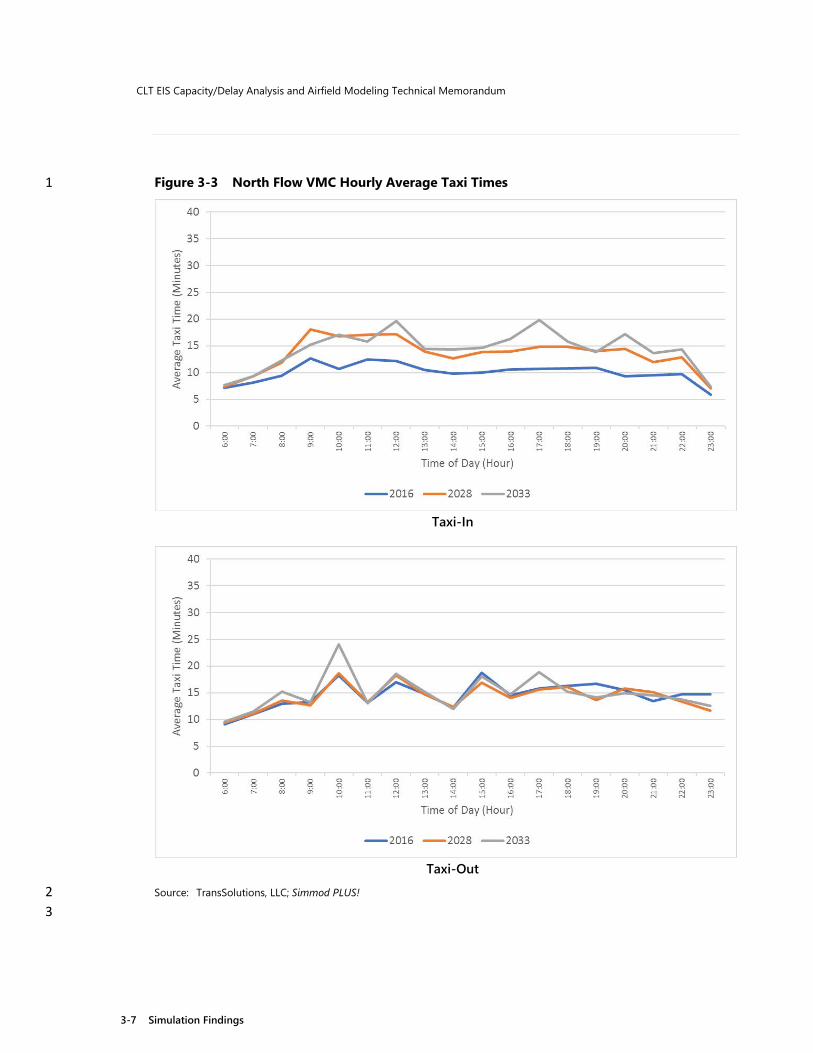
CLT EIS Capacity/Delay Analysis and Airfield Modeling Technical Memorandum
3-7 Simulation Findings
Figure 3-3 North Flow VMC Hourly Average Taxi Times 1
Taxi-In
Taxi-Out Source: TransSolutions, LLC; Simmod PLUS! 2
3
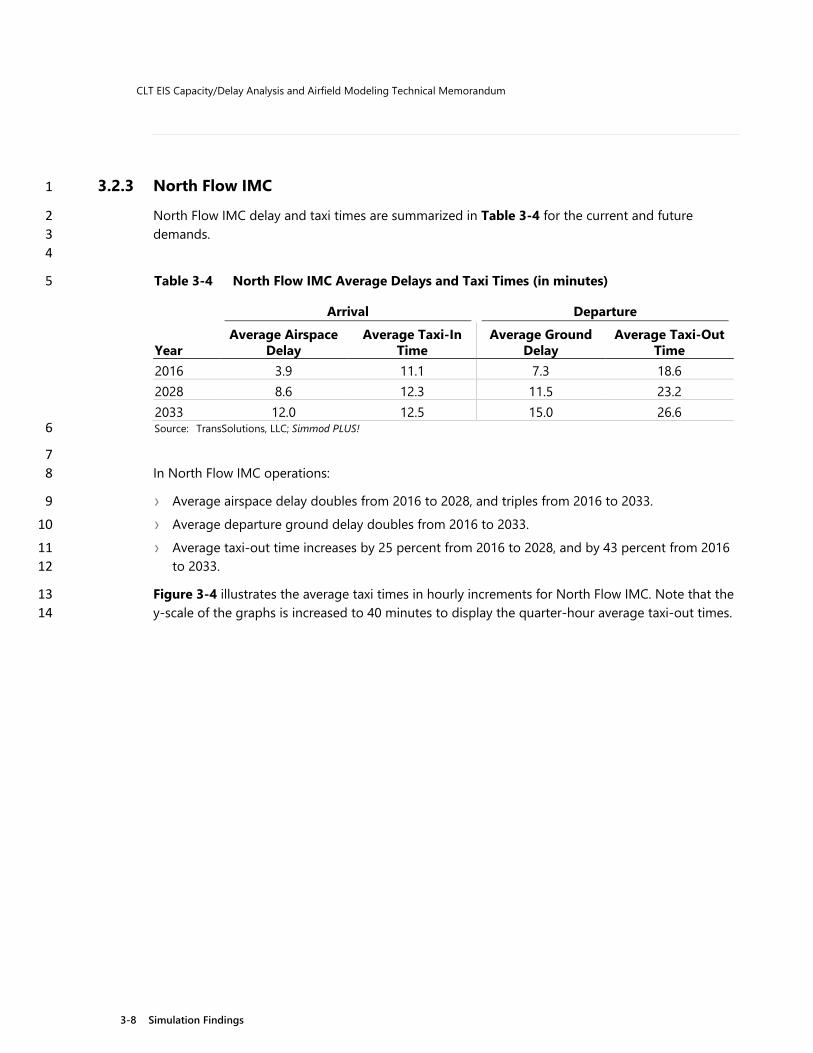
CLT EIS Capacity/Delay Analysis and Airfield Modeling Technical Memorandum
3-8 Simulation Findings
3.2.3 North Flow IMC 1
North Flow IMC delay and taxi times are summarized in Table 3-4 for the current and future 2 demands. 3 4
Table 3-4 North Flow IMC Average Delays and Taxi Times (in minutes) 5
Arrival Departure
Year Average Airspace
Delay Average Taxi-In
Time Average Ground
Delay Average Taxi-Out
Time 2016 3.9 11.1 7.3 18.6 2028 8.6 12.3 11.5 23.2 2033 12.0 12.5 15.0 26.6 Source: TransSolutions, LLC; Simmod PLUS! 6
7 In North Flow IMC operations: 8
› Average airspace delay doubles from 2016 to 2028, and triples from 2016 to 2033. 9
› Average departure ground delay doubles from 2016 to 2033. 10
› Average taxi-out time increases by 25 percent from 2016 to 2028, and by 43 percent from 2016 11 to 2033. 12
Figure 3-4 illustrates the average taxi times in hourly increments for North Flow IMC. Note that the 13 y-scale of the graphs is increased to 40 minutes to display the quarter-hour average taxi-out times. 14
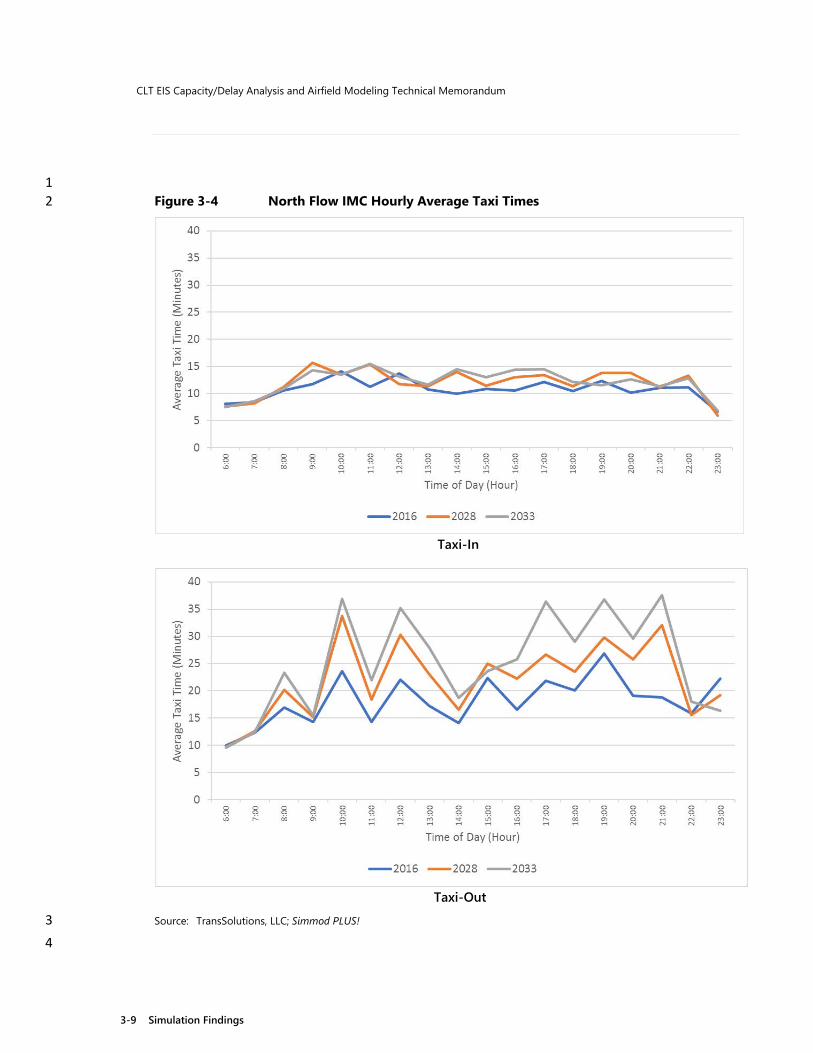
CLT EIS Capacity/Delay Analysis and Airfield Modeling Technical Memorandum
3-9 Simulation Findings
1 Figure 3-4 North Flow IMC Hourly Average Taxi Times 2
Taxi-In
Taxi-Out Source: TransSolutions, LLC; Simmod PLUS! 3
4

CLT EIS Capacity/Delay Analysis and Airfield Modeling Technical Memorandum
3-10 Simulation Findings
3.3 Hourly Airport Capacity (Peak Hour Throughput) 1
The simulation results were analyzed to obtain rolling hour airport throughput for individual days 2 (iterations) in each wind/weather configuration. This analysis used the highest demand level (2033) 3 in the simulation since it will likely have the highest throughput. The maximum hourly throughput is 4 achievable under specific circumstances, but is not a good indication of the capacity that can be 5 sustained for several hours. Thus the 90th percentile is often used as the measure of capacity. In 6 Table 3-5, the hourly throughput for each wind/weather configuration is summarized by arrivals 7 only, departures only and all operations, with 90th percentile calculated for 7:00 AM to 10:00 PM 8 local time. 9 10
Table 3-5 Airport Peak Hour Throughput 11
Flow / Weather
Arrivals Departures Total Operations Maximum Capacity Maximum Capacity Maximum Capacity
South VMC 84 72 78 65 141 130 South IMC 74 68 69 66 134 130 North VMC 77 68 78 65 138 131 North IMC 76 68 68 63 137 127 Source: TransSolutions, LLC; Simmod PLUS! 12
13
› In VMC, the simulated overall capacity is approximately 130 operations, with 130 operations in 14 South Flow and 131 in North Flow. 15
› In IMC, the simulated overall capacity is 126-130 operations. 16
These hourly capacity estimates are depicted with the rolling-hour flight schedule in Figure 3-5 17 below. Both arrival and departure capacity is already exceeded during peak departure times; by 18 2033, the capacity will be exceeded during most of the airline banks. 19

CLT EIS Capacity/Delay Analysis and Airfield Modeling Technical Memorandum
3-11 Simulation Findings
Figure 3-5 Rolling Hour Flight Schedule 1
Source: TransSolutions, LLC 2
3
4
Hours

CLT EIS Capacity/Delay Analysis and Airfield Modeling Technical Memorandum
3-12 Simulation Findings
3.4 Arrival Gate and Ramp Delays 1
The simulations in this analysis were run with the gate expansions currently under construction 2 incorporated, including an additional pier at Concourse A and a few more parking positions for 3 American Eagle. With all the domestic non-American flights parking at Concourse A, these airlines 4 were allowed to park at any Concourse A gate. 5
While the simulations ran without any additional gates, more aircraft wait for an available gate as 6 the traffic demand increases from 2016 through 2033. Table 3-6 summarizes the number of flights 7 and amount of time spent waiting for an open gate after landing for each simulated scenario. 8
Table 3-6 Arrival Aircraft Waiting on Ramp for an Available Gate 9
Operational Configuration Year
95th Percentile Waiting Time for a
Gate (minutes)
Total Time Waiting for a Gate Each Day
(minutes)
Average Number of Daily Flights
that Wait for Gate South Flow VMC
2016 5.9 470.1 327 2028 8.0 1093.1 453 2033 12.7 1862.7 519
South Flow IMC
2016 6.1 424.6 239 2028 5.4 1095.1 472 2033 6.7 1202.7 582
North Flow VMC
2016 6.0 636.1 292 2028 6.4 940.8 453 2033 5.4 1423.6 562
North Flow IMC
2016 5.6 577.9 260 2028 6.2 993.6 434 2033 6.2 1423.7 517
Source: TransSolutions, LLC; Simmod PLUS! 10
11 Note that with aircraft arriving on Runway 23 in South Flow, the gate waiting time increases 12 significantly, compared to all other scenarios with only the parallel runways in use. The arrival 13 runway throughput is higher when Runway 23 is used so that more arrivals get to the ramp and 14 must wait for a gate. 15
With the current number of gates, there is not enough ramp space for the arrival flights to wait for 16 an open gate. If the ramp is full of aircraft waiting for a gate, additional arriving flights will wait on 17 the taxiways and may back-up to the runways, indicating that ramp capacity is being exceeded. 18
19

CLT EIS Capacity/Delay Analysis and Airfield Modeling Technical Memorandum
3-13 Simulation Findings
3.5 Summary of Simulated Results 1
The results from all simulation scenarios are analyzed together to provide a summary of the overall 2 CLT operations. Figure 3-6 illustrates the average taxi times for all operational scenarios. While 3 taxi-in times increase rather steadily from 2016 to 2033, the most notable increase occurs from 4 2028 to 2033 in south VMC. In general, taxi-out times increase faster from 2028 to 2033 compared 5 with the increase from 2016 to 2028. 6
Annualized average times are calculated to succinctly analyze the delays and taxi times for each 7 demand level. The FAA Aviation System Performance Metrics (ASPM) data was analyzed for 14 8 years, 2003 through 2017. The data excludes the hours when only the crosswind Runway 5-23 is 9 used, North Flow is used for 44 percent of the operations and South Flow for 56 percent of the 10 operations. IMC is used during approximately 21 percent of the operations, almost equally split 11 between North and South Flow. Table 3-7 summarizes the percentage of the operations, 2003 12 through 2017, that occurred in each particular configuration (excluding the time when only the 13 crosswind Runway 5-23 is used). 14 15
Table 3-7 Annual Use of Runway Configurations 16
Flow Weather Percent of
Operations19 North IMC 10.7% VMC 33.3% South IMC 10.4% VMC 45.7%
Source: ASPM, analyzed by TransSolutions 17
18
19
19 Note that ACEP included configuration use for 2013 only, resulting in slightly different percentage use.
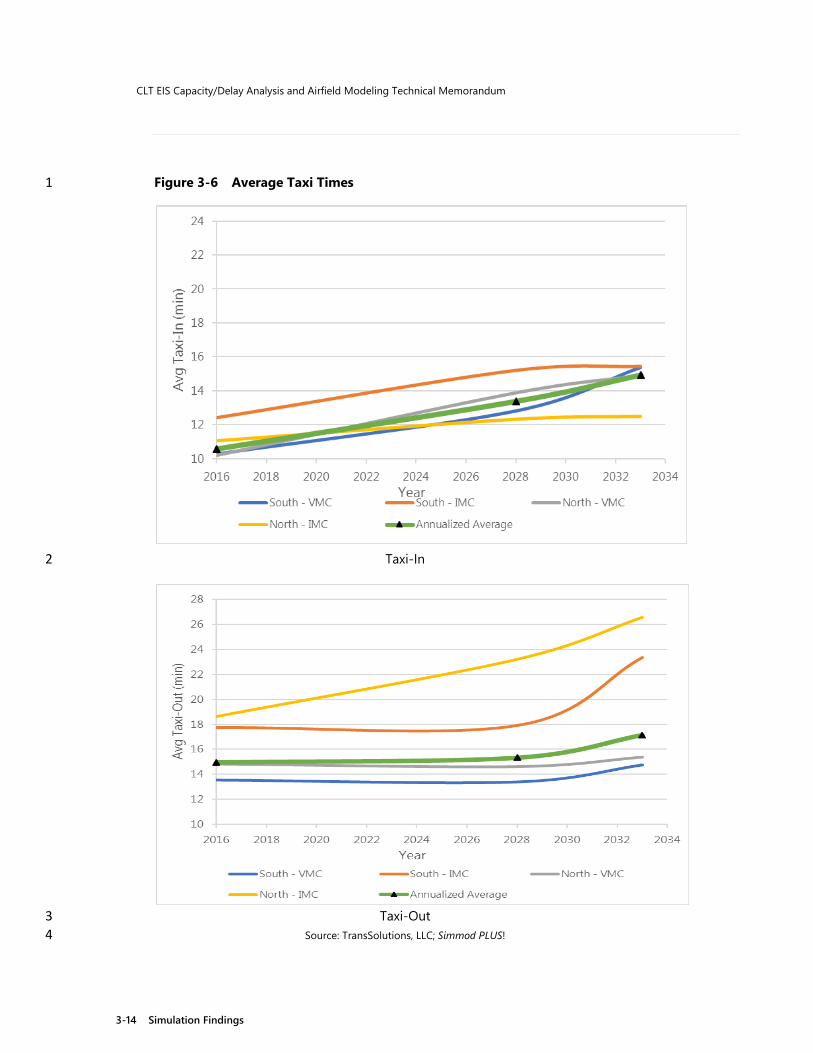
CLT EIS Capacity/Delay Analysis and Airfield Modeling Technical Memorandum
3-14 Simulation Findings
Figure 3-6 Average Taxi Times 1
Taxi-In 2
Taxi-Out 3 Source: TransSolutions, LLC; Simmod PLUS! 4
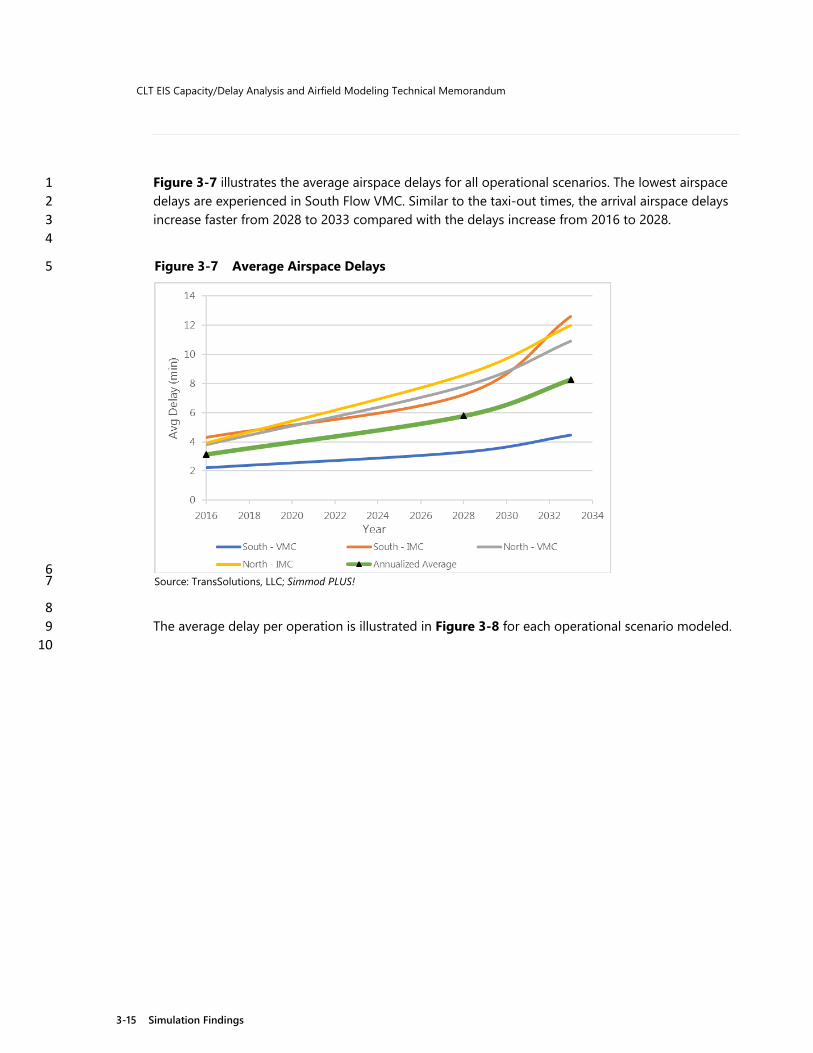
CLT EIS Capacity/Delay Analysis and Airfield Modeling Technical Memorandum
3-15 Simulation Findings
Figure 3-7 illustrates the average airspace delays for all operational scenarios. The lowest airspace 1 delays are experienced in South Flow VMC. Similar to the taxi-out times, the arrival airspace delays 2 increase faster from 2028 to 2033 compared with the delays increase from 2016 to 2028. 3 4
Figure 3-7 Average Airspace Delays 5
6 Source: TransSolutions, LLC; Simmod PLUS! 7
8 The average delay per operation is illustrated in Figure 3-8 for each operational scenario modeled. 9 10
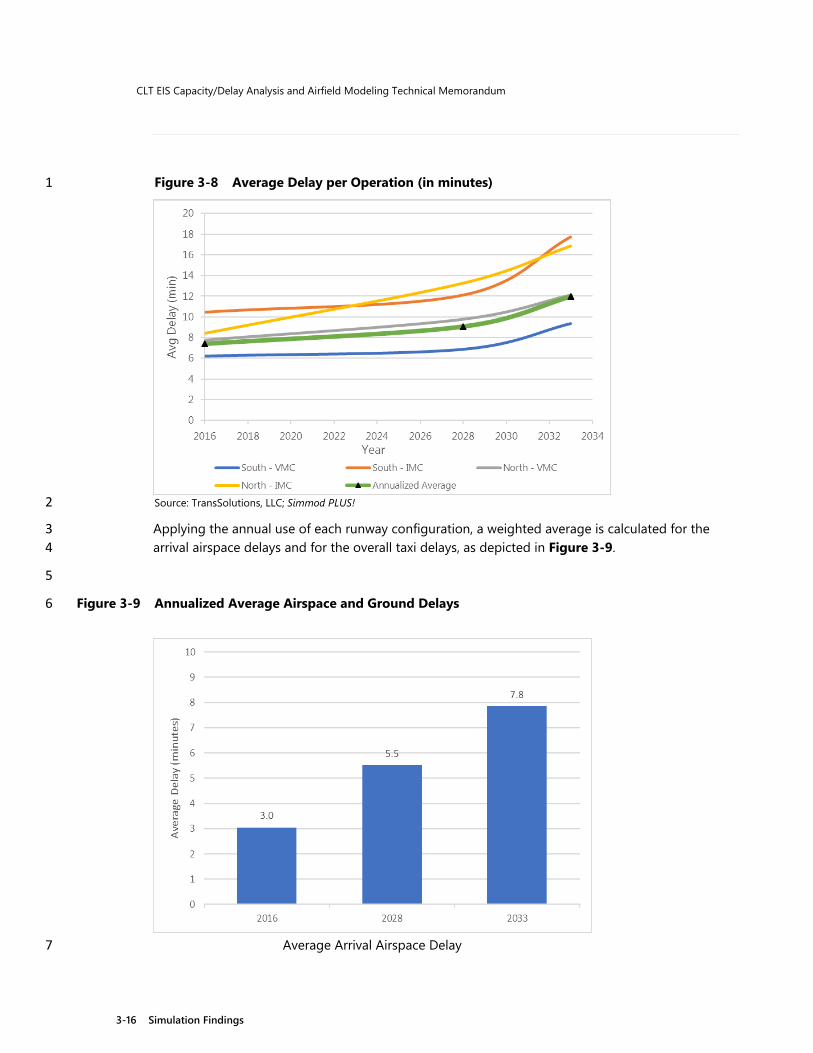
CLT EIS Capacity/Delay Analysis and Airfield Modeling Technical Memorandum
3-16 Simulation Findings
Figure 3-8 Average Delay per Operation (in minutes) 1
Source: TransSolutions, LLC; Simmod PLUS! 2
Applying the annual use of each runway configuration, a weighted average is calculated for the 3 arrival airspace delays and for the overall taxi delays, as depicted in Figure 3-9. 4
5
Figure 3-9 Annualized Average Airspace and Ground Delays 6
Average Arrival Airspace Delay 7

CLT EIS Capacity/Delay Analysis and Airfield Modeling Technical Memorandum
3-17 Simulation Findings
1
Average Taxi Delays 2
Source: TransSolutions, LLC; Simmod PLUS! 3 4
The annualized average delays per operation, depicted in Figure 3-10, increase over 60 percent 5 from 2016 to 2033. 6 7
Figure 3-10 Annualized Average Delay per Operation (in minutes) 8
9 Source: TransSolutions, LLC; Simmod PLUS! 10

CLT EIS Capacity/Delay Analysis and Airfield Modeling Technical Memorandum
3-18 Simulation Findings
These average delays per operation result in the following daily total delays for the average day 1 peak month: 2
› 2016 – 1,582 operations with a total of 11,725 minutes of delay per day. 3
› 2028 – 1,857 operations with a total of 16,854 minutes of delay per day. 4
› 2033 – 1,968 operations with a total of 23,529 minutes of delay per day. 5
6

CLT EIS Capacity/Delay Analysis and Airfield Modeling Technical Memorandum
4-1 Conclusions
4 1
Conclusions 2
Based on the Existing Conditions and future No-Action simulation analyses and findings detailed in 3 this Technical Memorandum, the following conclusions can be made: 4
› Hourly capacity of the airfield system is regularly exceeded by the arrival and departure demand 5 of the airline hub banking periods. 6
› During Visual Meteorological Conditions (VMC), taxi-in times (including ramp delays due to 7 aircraft waiting for a gate) increase more rapidly than in Instrument Meteorological Conditions 8 (IMC), since arrival runway operations exceed gate/ramp capacity, which in turn cause more 9 ramp congestion. 10
› Imbalance of arrival runway capacity and aircraft gate capacity, particularly during the 11 predominant operational configuration of the airport (South flow VMC), results in high taxi-in 12 delays (due to aircraft waiting on the ramp for a gate). 13
Based on the modeling results and other information, the Consultant Team will develop a Purpose 14 & Need Technical Report. The Technical Report will compare the capacity (annual and hourly) of 15 the airfield system at Charlotte Douglas International Airport (CLT) with existing and forecast 16 demand, and will also describe the delay analysis results in the context of the National 17 Environmental Policy Act (NEPA) requirements for Purpose & Need. 18
FINAL
Gating Analysis Charlotte Douglas International Airport
Environmental Impact Statement
PREPARED FOR
FEDERAL AVIATION ADMINISTRATION
Mr. Tommy Dupree
2600 Thousand Oaks Boulevard
Suite 2250
Memphis, Tennessee 38118
901.322.8182
PREPARED BY
VHB Engineering NC, P.C.
IN ASSOCIATION WITH
TransSolutions, LLC
5/8/2019

Record of Changes/Version History
Change/
Version Number Date of Change Sections Changed Description
Person
Entering Change
1 10/17/2018 All Draft #1 VHB,
TransSolutions
2 4/30/2019 All Draft #2 TransSolutions
3 5/8/2019 All Final VHB,
TransSolutions

Gating Analysis Approach and Assumptions – Final
i Table of Contents
Table of Contents 1
1 Gating Analysis Approach and Assumptions ........................................................................... 1-1 2
1.1 Approach ............................................................................................................................................................ 1-1 3
1.2 Flight Demand ................................................................................................................................................. 1-2 4
1.3 Assumptions ..................................................................................................................................................... 1-3 5
1.4 Gating Scenarios ............................................................................................................................................. 1-4 6
2 Gating Analysis ............................................................................................................................ 2-1 7
2.1 Gating Solutions .............................................................................................................................................. 2-1 8
2.2 Gate Assignment – Gateboards ................................................................................................................ 2-2 9
2.3 Conclusion ......................................................................................................................................................... 2-3 10
11
Appendices 12
Appendix A: Gateboard Scenarios .................................................................................................................................. 2-1 13 14
15
16
17
Gating Analysis Approach and Assumptions – Final
ii Table of Contents
List of Tables 1
Table No. Description Page 2
Table 1-1 Current and Projected Daily Commercial Passenger Operations ............................... 1-2 3
Table 1-2 Current and Projected ADPM Commercial Passenger Fleet Mix 4
(Daily Operations Count) ............................................................................................................ 1-2 5
Table 1-3 Gate Occupancy Times (in minutes) ....................................................................................... 1-4 6
Table 1-4 Gating Scenarios ............................................................................................................................. 1-5 7
Table 2-1 Gating Solution Summaries ....................................................................................................... 2-1 8
Table 2-2 Operations Per Gate ...................................................................................................................... 2-2 9
Table 2-3 Total Position Requirements ..................................................................................................... 2-2 10
11
12
List of Figures 13
Figure No. Description Page 14
Figure 1-1 Sample of GatePlan Gateboard ................................................................................................ 1-3 15
Figure 1-2 Rolling 60-Minute Commercial Passenger Flight Profile ............................................. 1-33 16
17

Gating Analysis Approach and Assumptions – Final
1-1 Gating Analysis Approach and Assumptions
1
Gating Analysis Approach and Assumptions 2
The objectives of this study were to quantify the gate requirements for the CLT EIS flight schedule 3
forecasts for 2016, 2028 and 2033 and to verify if the number of gates identified in the Airport 4
Capital Enhancement Program (ACEP) is still valid. This memo documents the assumptions and 5
approach used in the gating analysis. 6
1.1 Approach 7
8
9
10
11
12
13
14
15
16
17
18
TransSolutions utilized a gating tool, GatePlan® for this study. Gate characteristics such as aircraft
size constraints, assigned airlines, and flight origin (domestic and international) were considered
and implemented into the tool. Each flight was gated, adhering to the parameters built into
GatePlan®, producing a gateboard similar to that shown in Figure 1-1, with gates from top to
bottom and the time or hours from left to right. As flights are assigned to gates, they appear in the
gateboard, displaying the flight arrival time and departure time.
Parameters used included gate buffer times between flights, minimum gate occupancy times based
on domestic versus international flights, splitting flights that have 3 hours or more of ground time
to free up contact gates and use hardstand positions. These are described in more detail in the
sections below.
Figure 1-1 Sample of GatePlan Gateboard 19
20
Gateboard
Gat
es
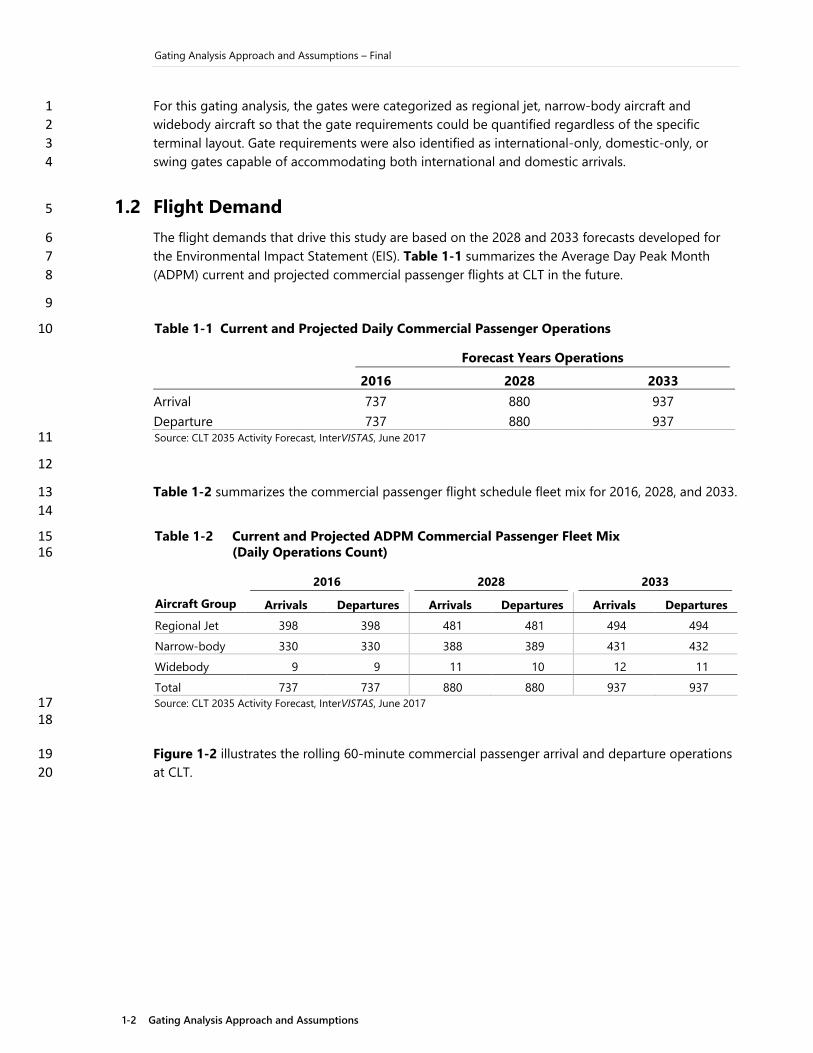
Gating Analysis Approach and Assumptions – Final
1-2 Gating Analysis Approach and Assumptions
For this gating analysis, the gates were categorized as regional jet, narrow-body aircraft and 1
widebody aircraft so that the gate requirements could be quantified regardless of the specific 2
terminal layout. Gate requirements were also identified as international-only, domestic-only, or 3
swing gates capable of accommodating both international and domestic arrivals. 4
1.2 Flight Demand 5
The flight demands that drive this study are based on the 2028 and 2033 forecasts developed for 6
the Environmental Impact Statement (EIS). Table 1-1 summarizes the Average Day Peak Month 7
(ADPM) current and projected commercial passenger flights at CLT in the future. 8
9
Table 1-1 Current and Projected Daily Commercial Passenger Operations 10
Forecast Years Operations
2016 2028 2033
Arrival 737 880 937
Departure 737 880 937 Source: CLT 2035 Activity Forecast, InterVISTAS, June 2017 11
12
Table 1-2 summarizes the commercial passenger flight schedule fleet mix for 2016, 2028, and 2033. 13
14
Table 1-2 Current and Projected ADPM Commercial Passenger Fleet Mix 15 (Daily Operations Count) 16
Aircraft Group
2016 2028 2033
Arrivals Departures Arrivals Departures Arrivals Departures
Regional Jet 398 398 481 481 494 494
Narrow-body 330 330 388 389 431 432
Widebody 9 9 11 10 12 11
Total 737 737 880 880 937 937
Source: CLT 2035 Activity Forecast, InterVISTAS, June 2017 17 18
Figure 1-2 illustrates the rolling 60-minute commercial passenger arrival and departure operations 19
at CLT. 20

Gating Analysis Approach and Assumptions – Final
1-3 Gating Analysis Approach and Assumptions
Figure 1-2 Rolling 60-Minute Commercial Passenger Flight Profile 1
Source: TransSolutions analysis of EIS forecasts CLT EIS Study, 2018 2
3
The majority of the flights in the design day flight schedules were routed, meaning that the arriving 4
and departing flights were paired, or matched. For flights with less than three hours’ ground time, 5
the average ground time was 62 minutes (58 minutes for regional and 68 minutes for mainline 6
operations). Approximately 15-percent of the flights have a ground time longer than 3 hours. 7
1.3 Assumptions 8
To quantify the number of gates required to accommodate the flight schedules, the analysis 9
assumed there are no adjacency constraints between nearby gates. 10
International flights must be programmed to arrive at an international-capable gate, while 11
international departure flights may depart from any gate. Note that arrivals from airports with 12
United States (U.S.) preclearance facilities do not require an international gate. In the CLT flight 13
schedules, there are flights from the preclear airports of Aruba (AUA), Bermuda (BDA), Dublin 14
(DUB), and Montreal (YUL). 15
For domestic flights, a minimum of 15 minutes “buffer” time was used so that at least 15 minutes 16
was planned between the departure from a gate and the subsequent arrival to the gate. For 17
international flights, American Airlines Operations at CLT identified that the “buffer” time used 18
should be at least 20 minutes (email received from Rodney Frascht, April 3, 2019). 19

Gating Analysis Approach and Assumptions – Final
1-4 Gating Analysis Approach and Assumptions
To maximize utilization of each gate, flights with longer than three (3) hours of ground time were 1
assumed to be towed to a hardstand as necessary. For the flights that were not matched, or those 2
that were towed to/from a hardstand, the gate occupancy times in Table 1-3 were used. These 3
times were confirmed with American Airlines Operations personnel at CLT.1 4
5
Table 1-3 Gate Occupancy Times (in minutes) 6
Aircraft Type
Domestic Flights International Flights
Originating/
Pull
Terminating/
Push
Originating/
Pull
Terminating/
Push
Regional Jet 50 35 55 50
Narrowbody 65 40 85 55
Widebody 70 50 130 75
Source: American Airlines Operations, CLT. 7
1.4 Gating Scenarios 8
Gate requirements were quantified for both 2028 and 2033 schedules for two gate assignment 9
policy scenarios as described below. A scenario (Scenario 1: All Gates Shared), where all gates 10
would be shared (common use) for all carriers, was identified but not analyzed as it was not 11
considered to be a realistic planning option. 12
Predominant carrier – domestic and international. In this scenario (Scenario 2: AA Gates 13
Dedicated; OA Gates Shared), each gate was used by the primary carrier American Airlines (AA) or 14
by other airlines (OA). Results estimated the number of gates for these 12 categories: 15
› AA Widebody international16
› AA Widebody domestic17
› AA Narrowbody international18
› AA Narrowbody domestic19
› AA Regional international20
› AA Regional domestic21
› AA Widebody international22
› OA Widebody international23
› OA Widebody domestic24
› OA Narrowbody international25
› OA Narrowbody domestic26
› OA Regional international27
› OA Regional domestic28
If the international gates could be used for domestic flights at other times of day such that the overall 29
domestic gate requirement is reduced, the international gates were designated as swing gates. 30
1 Email received from Rodney Frascht, FAA, April 4, 2019.

Gating Analysis Approach and Assumptions – Final
1-5 Gating Analysis Approach and Assumptions
1
Dedicated airline gates – domestic and international. In this scenario (Scenario 3: All Gates 2
Dedicated), each gate was dedicated for an individual airline; no sharing of gates by multiple 3
airlines was allowed. The results show the number of gates for the same categories as above, but 4
the “OA” gates were split for each airline forecasted to operate at CLT. As in the above scenarios, 5
international gates were designated as swing gates if it reduced the overall gate requirements. 6
Table 1-4 summarizes the gating scenarios considered in this study. 7
Table 1-4 Gating Scenarios 8
Scenario
Dedicated
Gates by
Airline
Domestic/
International
Aircraft Type
(NB, WB, Reg) Demand Year
Scenario 2: AA Gates Dedicated; OA
Gates Shared (Predominant carrier
– domestic or international
operations)
Only for AA ✓ ✓ 2028
2033
Scenario 3: All Gates Dedicated
(Dedicated airlines – domestic or
international operations)
✓ ✓ ✓ 2028
2033
NB: Narrowbody 9 WB: Widebody 10 Reg: Regional 11
12
The total number of contact gates and hardstands required to accommodate the ADPM flight 13
schedules are reported in Chapter 2. The requirements ensure that all flights are gated, with the 14
most efficient gate assignments, in other words using the fewest number of gates such that all 15
flights are assigned to a gate. All gates used at any point in the day are counted in the totals. The 16
requirements are reported by aircraft type and by airline (if relevant), along with number of 17
operations or turns per gate per day for each of the two different scenarios. 18
19
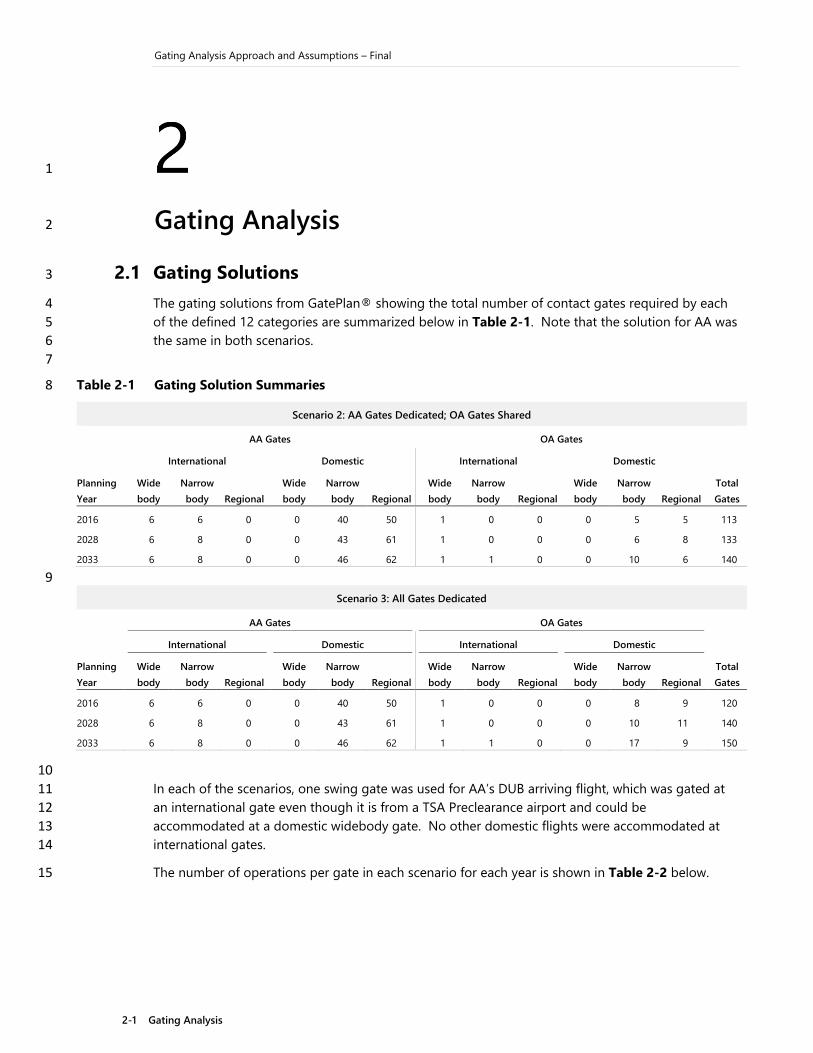
Gating Analysis Approach and Assumptions – Final
2-1 Gating Analysis
1
Gating Analysis 2
2.1 Gating Solutions 3
The gating solutions from GatePlan® showing the total number of contact gates required by each 4
of the defined 12 categories are summarized below in Table 2-1. Note that the solution for AA was 5
the same in both scenarios. 6
7
Table 2-1 Gating Solution Summaries 8
Scenario 2: AA Gates Dedicated; OA Gates Shared
Planning
Year
AA Gates OA Gates
Total
Gates
International Domestic International Domestic
Wide
body
Narrow
body Regional
Wide
body
Narrow
body Regional
Wide
body
Narrow
body Regional
Wide
body
Narrow
body Regional
2016 6 6 0 0 40 50 1 0 0 0 5 5 113
2028 6 8 0 0 43 61 1 0 0 0 6 8 133
2033 6 8 0 0 46 62 1 1 0 0 10 6 140
9
Scenario 3: All Gates Dedicated
Planning
Year
AA Gates OA Gates
Total
Gates
International Domestic International Domestic
Wide
body
Narrow
body Regional
Wide
body
Narrow
body Regional
Wide
body
Narrow
body Regional
Wide
body
Narrow
body Regional
2016 6 6 0 0 40 50 1 0 0 0 8 9 120
2028 6 8 0 0 43 61 1 0 0 0 10 11 140
2033 6 8 0 0 46 62 1 1 0 0 17 9 150
10
In each of the scenarios, one swing gate was used for AA’s DUB arriving flight, which was gated at 11
an international gate even though it is from a TSA Preclearance airport and could be 12
accommodated at a domestic widebody gate. No other domestic flights were accommodated at 13
international gates. 14
The number of operations per gate in each scenario for each year is shown in Table 2-2 below. 15

Gating Analysis Approach and Assumptions – Final
2-2 Gating Analysis
Table 2-2 Operations Per Gate 1
Number of Operations Per Gate
Planning Year
Scenario 2:
AA Gates Dedicated;
OA Gates Shared
Scenario3:
All Gates Dedicated
Difference
Between Scenarios
2016 7.13 6.69 0.44
2028 7.27 6.96 0.31
2033 7.32 6.85 0.47
As part of the gating analysis approach, some flights that were on the ground for more than three 2
(3) hours were designated to be towed to a hardstand position. Additionally, for any gates that had 3
multiple terminating flights, the earlier arriving terminating flights were accounted for at hardstand 4
positions. Similarly, for any gates that had multiple originating flights, the later departing flights 5
were accounted for at hardstand positions. A summary of the total number of hardstand positions 6
needed for these two scenarios is summarized in Table 2-3. 7
8
Table 2-3 Total Position Requirements 9
Total Positions Required
Planning
Year
Scenario 2:
AA Gates Dedicated; OA Gates Shared
Scenario 3:
All Gates Dedicated
Contact
Gates
Hardstand
Positions
Total
Positions
Contact
Gates
Hardstand
Positions
Total
Positions
2016 113 33 146 120 32 152
2028 133 36 169 140 35 175
2033 140 32 172 150 29 179
Note: Each hardstand positions were assumed to be able to accommodate any size aircraft. 10
The number of hardstand positions changes as the number of contact gates change due to a 11
change in the fleet mix which alters the aircraft remaining overnight that can be accommodated at 12
contact gates rather than at hardstands. Additionally, under the All Gates Dedicated scenario, fewer 13
flights with ground times of more than 3 hours need to be split and moved to hardstand positions. 14
2.2 Gate Assignment – Gateboards 15
The gateboards showing the gate assignments for each scenario are included in Appendix A. 16
The following bullets provide information needed to interpret that gateboards, 17
› The gate names on the far left are for labeling purposes only and do not identify any actual current or 18
future gates. The yellow gates represent domestic gates and the blue gates represent international gates. 19
› The gate assignments are separated by solid black lines; each grouping represents one of the following. 20
• AADO – AA Domestic 21
• AAIN – AA International 22
• OADO – OA Domestic 23
Gating Analysis Approach and Assumptions – Final
2-3 Gating Analysis
• OAIN – OA International 1
• HS - Hardstands 2
› For the individual flight pucks, the following color scheme applies. 3
• Blue – Regional Jets + Turbo props 4
• Green – Narrow body 5
• Orange – Widebody 6
2.3 Conclusion 7
The gating analysis shows that the number of contact gates and total positions required 8
consistently grows as both the schedule grows and as the more restrictive requirements are applied 9
in the All Gates Dedicated scenario. 10
For the 2033 schedule, in the All Gates Dedicated scenario, 150 contact gates are required as well 11
as an additional 29 hardstand positions for a total of 179 positions. 12
The number of operations per gate is notably higher in the scenarios that allows sharing between 13
airlines with between 0.3 and 0.5 more operations per gate per day in the less restrictive scenarios. 14
15
Gating Analysis Approach and Assumptions – Final
Appendix A: Gateboard Scenarios
Appendix A: Gateboard Scenarios 1
2

CLT 2016 Gating Scenario 2 1

00:00 01:00 02:00 03:00 04:00 05:00 06:00 07:00 08:00 09:00 10:00 11:00 12:00 13:00 14:00 15:00 16:00 17:00 18:00 19:00 20:00 21:00 22:00 23:00
396
450
475
560
624
710
726
790
808
890
905
959
1119
1220
508
590
798
865
1015
1065
1264
1325
500
575
612
685*
722
792
810
870
1142
1225
1276
1330
1349
TERM
620
690*
750
810*
832
890
925
985
1134
1205
1229
1279
1310
1365
508
413
611
663
724
800
903
984
1004
1065
1082
1135
1152
1220
1286
1796
370
658
501
560
632
715
815
2080
927
725
1017
1100
1286
1346
375
470
521
580
600
700*
723
782
803
875
925
637
1040
1120
1135
1200
1281
1340
369
460
493
PUSH
638
690
717
780
1125
643
1223
1330
374
465
481
585
619
705
726
789
817
885
900
975
1240
472
386
475
500
680
605
690*
825
885
900
559
1006
1908
1145
844
1252
1335 TERM
362
408
482
565*
635
715
734
1878
832
895
924
995
1017
1090
1262
1340
364
450
502
580
632
710*
747
804
920
984
1014
1085
1129
1205
1264
557
370
1993
514
590
629
521
724
781
830
890
935
705
1020
1090
1276
1345
490
565*
611
685*
725
785
801
860
908
970
1020
1090
1135
2075
1263
1329
404
479
511
575
631
705
810
865
909
970
991
1060
1154
1229
1273
1339
490
565*
613
685
718
774
811
866
905
960
1036
1105
1154
1975
1269
1330
490
564
613
2053
731
100
916
1453
1091
1150
1175
1240
1270
TERM
491
559
618
685
743
806
825
880
905
985
1033
678
1160
1220
1280
1334
397
TERM
523
585
626
690
729
784
807
875
999
1050
1147
1205
1272
1330
637
700
739
1950
840
2249
930
1000
1021
TERM
1139
1195
1278
1335
412
480
509
555
601
TERM
748
800
819
880
1041
TERM
1185
TERM
1273
1384
377
470
526
569
712
765
811
870
902
990
1160
TERM
1287
1277
745
795
817
870
903
990
1031
1105
1132
TERM
1236
1608
406
470
510
148
603
TERM
831
895
1185
1233
1264
1336
422
479
496
2529
608
TERM
743
792
836
895
915
980
1035
1105
1257
1345
394
450
488
550
642
330
737
785
842
895
913
975
1033
1100
1149
1390
1238
1360
527
595
633
710
806
855
944
1005
1021
1085
1156
2483
1239
1355
407
465
501
580
602
1458
920
979
1027
1090
1115
1170
1275
1340
492
565*
644
700
808
TERM
914
969
1084
1200
1299
TERM
374
455
495
570*
614
690
937
990
1024
1085
1145
TERM
1258
1335
432
480
497
570
619
695
908
959
1010
1070
1282
1360
402
455
523
595
628
PUSH
1147
TERM
488
559
639
715
939
990
1014
1074
1150
1200
1255
1330
1420
TERM
524
590
633
699
719
2054
1019
1074
1124
1194
1255
1324
1350
TERM
508
570
610
675
941
984
1036
1733
1165
1230
1285
TERM
518
580
627
690
935
TERM
1024
1095
1154
1215
1289
1355
515
575
639
700
1151
1206
1272
TERM
484
1839
614
674
910
989
1155
1210
1280
1345
510
564
620
680
1147
1200
1270
1331
531
585
623
680
1164
1215
1300
1360
*1010
1073
*1094
1189
*893
970
*1000
1075
*1120
1185
BWI
6:36
JFK
7:30
AA 320
EWR
7:55
PBI
9:20
AA 320
MSY
10:24
STT
11:50
AA 320
TPA
12:06
BOS
13:10
AA 321
TPA
13:28
MSP
14:50
AA 320
FLL
15:05
ATL
15:59
AA 320
BWI
18:39
FLL
20:20
AA 320
BOS
8:28
FLL
9:50
AA 320ORIG
679
CLTSC4
10:34
IAH
11:19
PHL
13:18
PBI
14:25
AA 320
RSW
16:55
BWI
17:45
AA 320
MSP
21:04
PVD
22:05
AA 320
ORIG
450
CLTSC4
6:45
DFW
7:30
BWI
8:20
TPA
9:35
AA 320
ATL
10:12
GCM
11:25
AA 320
ATL
12:02
LGA
13:12
AA 320
BWI
13:30
FLL
14:30
AA 320
ATL
19:02
SAT
20:25
AA 320
ATL
21:16
IAH
22:10
AA 320
ORIG
554
CLTSC4
8:29
MSY
9:14
BWI
10:20
AUA
11:30
AA 320
JFK
12:30
CUN
13:30
AA 320
PBI
13:52
BWI
14:50
AA 320
MSP
15:25
RSW
16:25
AA 3201035
1070
IAH
17:15
ATL
17:50
PBI
18:54
PHL
20:05
AA 320
STT
20:29
ATL
21:19
AA 320
PHX
21:50
RDU
22:45
AA 321
RSW
8:28
ATL
9:35
AA 320
SYR
10:11
MSY
11:03
AA 319
BOS
12:04
MIA
13:20
AA 321
SFO
15:03
TPA
16:24
AA 321
LGA
16:44
PHX
17:45
AA 321
LGA
18:02
MSY
18:55
AA 320
FLL
19:12
BWI
20:20
AA 320
LAS
21:26
PHL
22:25
AA 321
LAS
6:10
LAS
8:00
AA 321
ATL
8:21
MSP
9:20
AA 320
DCA
10:32
RSW
11:55
AA 320
MIA
13:35
ORD
14:50
AA 321
TPA
15:27
LAX
16:40
AA 321
PIT
16:57
SMF
18:20
AA 321
SEA
21:26
RSW
22:26
AA 321
SEA
6:15
SAN
7:50
AA 321
TPA
8:41
BWI
9:40
AA 320
LGA
10:00
PLS
11:40
AA 321
DEN
12:03
TPA
13:02
AA 321
ORD
13:23
PHX
14:35
AA 321
MCO
15:25
LAS
16:45
AA 321
TPA
17:20
LGA
18:40
AA 321
RDU
18:55
RSW
20:00
AA 320
FLL
21:21
LAX
22:20
AA 321
PHX
6:09
MCO
7:40
AA 321ORIG
595
CLTSC4
9:10
LGA
9:55
RDU
10:38
IND
11:30
AA 319
ORD
11:57
PHX
13:00
AA 321PULL
565
CLTSC4
17:45
DFW
18:30
ORD
18:45
LAS
20:05
AA 321
SJU
20:23
DFW
22:10
AA 321
PDX
6:14
TPA
7:45
AA 321
SFO
8:01
LAX
9:45
AA 321
BOS
10:19
MIA
11:45
AA 321
PHX
12:06
PIT
13:09
AA 321
LGA
13:37
MCO
14:45
AA 321
LGA
15:00
PHX
16:15
AA 321
PHL
20:40
PHX
22:15
AA 321
ORIG
360
CLTSC4
5:15
DFW
6:00
LAX
6:26
ORD
7:55
AA 321
ORD
8:20
PHX
9:40
AA 321
PHL
10:05
MBJ
11:30
AA 321
MCO
13:45
PHL
14:45
AA 321
LAX
15:00
PHL
16:05
AA 321
SFO
16:46
ORD
18:00
AA 321
PHL
19:05
DFW
20:27
AA 321
TPA
20:52
BOS
22:15
AA 321
SMF
6:02
PHX
7:30
AA 321
RDU
8:02
MBJ
9:25
AA 321
IAH
10:35
FLL
11:55
AA 321
MIA
12:14
DFW
13:15
AA 321
DFW
13:52
JFK
14:55
AA 321
DEN
15:24
PIT
16:35
AA 321
ATL
16:57
LAS
18:10
AA 321
JFK
21:02
DTW
22:20
AA 321
SAN
6:04
SFO
7:30
AA 321
FLL
8:22
SEA
9:40
AA 321
PVD
10:32
PUJ
11:50
AA 321
DFW
12:27
ATL
13:24
AA 321
DFW
15:20
FLL
16:24
AA 321
MIA
16:54
SFO
18:05
AA 321
SAN
18:49
ORD
20:05
AA 321
LGA
21:04
SFO
22:20
AA 321
SLC
6:10
LAX
7:35
AA 321
DFW
8:34
SJU
9:50
AA 321
MIA
10:29
DEN
11:45
AA 321
MCO
12:04
MCO
13:01
AA 321
LAX
13:50
TPA
14:50
AA 321
PHX
15:35
SFO
16:40
AA 321
BOS
17:00
PDX
18:10
AA 321
PHX
21:16
DEN
22:25
AA 321
LAS
8:10
PUJ
9:25
AA 321
DTW
10:11
CUN
11:25
AA 321
PIT
12:05
CLE
13:05
AA 319
DEN
13:21
MIA
14:20
AA 321
LAS
15:08
BOS
16:10
AA 321
FLL
17:00
SEA
18:10
AA 321
LAS
18:55
MSP
20:10
AA 321
MCO
21:03
BDL
22:09
AA 321
MCO
6:44
LGA
7:59
AA 321
PBI
8:31
DEN
9:35
AA 321
BDL
10:31
SJU
11:45
AA 321
BOS
13:30
DFW
14:25
AA 321
BOS
15:09
DFW
16:10
AA 321
DFW
16:31
DFW
17:40
AA 321
SFO
19:14
BOS
20:29
AA 321
SFO
21:13
MCO
22:19
AA 321
ORIG
420
CLTSC4
6:15
MIA
7:00
PHL
8:10
CUN
9:25
AA 321
RSW
10:13
PHX
11:25
AA 321
BNA
11:58
AUS
12:54
AA 319
PHX
13:31
LGA
14:26
AA 321
ORD
15:05
MCO
16:00
AA 321
MCO
17:16
DEN
18:25
AA 321
PHX
19:14
LAX
20:20
AA 321
LAX
21:09
FLL
22:10
AA 321
MCO
8:10
SFO
9:24
AA 321
MCO
10:13
TPA
11:20
AA 321
IAH
12:11
JFK
13:19
AA 73H
MIA
15:16
ORD
16:25
AA 73H
DFW
18:11
DFW
19:10
AA 321
DFW
19:35
LGA
20:40
AA 321
PHX
8:11
MCO
9:19
AA 321
TPA
10:18
ORD
11:25
AA 321
EWR
12:23
EWR
13:26
AA 73H
DTW
13:45
STL
14:40
AA 319
EWR
15:05
MIA
16:25
AA 73H
PHX
17:13
LAX
18:16
AA 321
LGA
19:20
DEN
20:20
AA 321
PVD
21:20
DCA
22:14
AA 319
LAX
8:43
BOS
9:45
AA 321
MSP
10:26
BOS
11:30
AA 321
BDL
12:09
RDU
13:04
AA 319
MCI
13:27
MSY
14:35
AA 319ORIG
970
CLTSC4
15:25
LGA
16:10
ORD
16:39
PHL
17:30
AA 321
TPA
19:07
SLC
20:05
AA 321
DFW
21:12
MSP
22:10
AA 321
ORIG
575
CLTSC4
8:50
ORD
9:35
DFW
10:37
LGA
11:40
AA 321
FLL
12:19
DCA
13:15
AA 319
JFK
14:00
EWR
15:15
AA 73H
IND
15:30
DCA
16:40
AA 319
MCO
18:59
PHX
19:55
AA 321
DEN
21:18
TPA
22:15
AA 321
ATL
6:52
ATL
8:00
AA 320
ORF
8:29
ORF
9:15
AA 319
PVD
12:28
IAH
13:20
AA 319
MEM
13:39
SAT
14:40
AA 319
MIA
21:13
EWR
22:15
AA 73H
RDU
6:17
MCI
7:50
AA 319
MSP
8:46
DFW
9:29
AA 321ORIG
680
CLTSC4
10:35
LAS
11:20
DCA
11:52
RIC
12:45
AA 319
PIT
13:31
BDL
14:30
AA 319
BDL
15:02
DTW
16:30
AA 319
ORD
21:27
MIA
22:30
AA 73H
ORIG
680
CLTSC4
10:35
MCO
11:20
CHS
12:25
JAX
13:15
AA 319
CLE
13:37
RDU
14:30
AA 319
RSW
15:03
PVD
16:30
AA 319
IND
17:11
STL
18:25
AA 319
EWR
20:36
JFK
22:10
AA 73H
TPA
6:46
RDU
7:50
AA 319
JFK
8:30
MIA
9:30
AA 73HORIG
730
CLTSC4
11:25
EWR
12:10
MSY
13:51
PIT
14:55
AA 319
BOS
19:45
STL
20:33
AA 319
SYR
21:04
ROC
22:16
AA 319
DCA
7:02
PIT
7:59
AA 319
EWR
8:16
JFK
9:06
AA 73H
ORF
12:23
IND
13:12
AA 319
RDU
13:56
IAH
14:55
AA 319
BWI
15:15
BDL
16:20
AA 319
AUS
17:15
BDL
18:25
AA 319ORIG
1229
CLTSC4
19:44
PVD
20:29
RDU
20:57
CLE
22:25
AA 319
RIC
6:34
BDL
7:30
AA 319
DTW
8:08
BUF
9:10
AA 319
JFK
10:42
DFW
11:35
AA 73H
LGA
12:17
ORD
13:05
AA 319
CHS
14:02
DCA
14:55
AA 319
DCA
15:13
MCI
16:15
AA 319
MCI
17:13
MIA
18:20
AA 319
JFK
19:09
EWR
20:10
AA 73H
BWI
20:38
RIC
22:40
AA 319
MIA
8:47
EWR
9:55
AA 73H
MDT
10:33
JAX
11:50
AA 319
BUF
13:26
BOS
14:15
AA 319
RDU
15:44
BWI
16:45
AA 319
ALB
17:01
DTW
18:05
AA 319
EWR
19:16
IAH
20:10
AA 73H
PIT
20:39
ORD
22:35
AA 319
EWR
6:47
EWR
7:45
AA 73H
BDL
8:21
CLE
9:40
AA 319
EWR
10:02
EWR
11:05
AA 73H
JAX
15:20
SYR
16:19
AA 319
BWI
17:07
RDU
18:10
AA 319
SJU
18:35
SFO
19:30
AA 321
PBI
21:15
SYR
22:20
AA 319
PVD
8:12
SXM
9:25
AA 320
LGA
10:44
BNA
11:40
AA 319
BNA
15:14
RIC
16:09
AA 319
ORD
18:04
ILM
20:00
AA 319
SFO
6:14
DEN
7:35
AA 321
RIC
8:15
MEX
9:30
AA 319
BUF
10:14
NAS
11:30
AA 319
PHL
15:37
PBI
16:30
AA 319
RDU
17:04
PWM
18:05
AA 319
BUF
20:58
ALB
22:15
AA 319
BOS
7:12
BNA
8:00
AA 319
JAX
8:17
DCA
9:30
AA 319
JAX
10:19
BWI
11:35
AA 319
ATL
15:08
JAX
15:59
AA 319
JAX
16:50
DCA
17:50
AA 319ORIG
1200
CLTSC4
19:15
JFK
20:00
ALB
21:22
ATL
22:40
AA 319
PIT
6:42
PVD
7:35
AA 319
MEM
8:43
RSW
9:55
AA 319PULL
1793
CLTSC4
21:40
PIT
22:25
ORIG
365
CLTSC4
5:20
LGA
6:05
BUF
8:08
DTW
9:19
AA 319
AUS
10:39
ALB
11:55
AA 319
DTW
15:39
MSY
16:30
AA 319
DCA
16:54
IAH
17:54
AA 319
STL
19:10
MEM
20:00
AA 319
RIC
20:55
AUS
22:10
AA 319
ORIG
395
CLTSC4
5:50
PHL
6:35
IND
8:44
BDL
9:50
AA 319
PWM
10:33
ATL
11:39
AA 319
PHL
11:59
PHL
13:00
AA E90
CLE
16:59
RIC
17:54
AA 319
PIT
18:44
PIT
19:54
AA 319
DTW
20:55
LGA
22:04
AA 319
ORIG
450
CLTSC4
6:45
PHL
7:30
DCA
8:28
CHS
9:30
AA 319
PBI
10:10
PHL
11:15
AA 319
RIC
15:41
ALB
16:24
AA 319
PHL
17:16
MCO
18:20
AA 752
IAH
19:25
RIC
20:30
AA 319
ORIG
450
CLTSC4
6:45
DCA
7:30
IAH
8:38
NAS
9:40
AA 319
STL
10:27
DCA
11:30
AA 319
NAS
17:04
PIT
18:15
AA 319
MSY
19:14
JAX
20:15
AA 319
DCA
21:29
JAX
22:35
AA 319
ORIG
455
CLTSC4
6:50
FLL
7:35
PIT
8:35
IAH
9:35
AA 319
SAT
10:39
MCI
11:40
AA 319930
966
MSY
15:30
BNA
16:06
AA 319
RIC
19:11
TPA
20:06
AA 319
ILM
8:04
PHL
9:00
AA 319
ROC
10:14
CHS
11:14
AA 319ORIG
799
CLTSC4
12:34
BWI
13:19
NAS
15:10
BUF
16:29
AA 319
JAX
19:15
RDU
20:10
AA 319
MSY
21:20
BUF
22:25
AA 319
CLE
8:30
MEM
9:24
AA 319
PIT
10:20
DTW
11:20
AA 319ORIG
875
CLTSC4
13:50
ROC
14:35
BDL
19:07
MCI
20:00
AA 319
IAH
21:10
PBI
22:11
AA 319
ORIG
470
CLTSC4
7:05
BOS
7:50
STL
8:51
PIT
9:45
AA 319
ALB
10:23
RDU
11:20
AA 319
BNA
19:24
BUF
20:15
AA 319
MCI
21:40
ORF
22:40
AA 319
ORIG
465*
CLTSC4
6:55
MBJ
7:45
MBJ
16:50
TPA
17:53
AA 321
GCM
18:14
BNA
19:49
AA 320*1229
TERM
CUN
20:29
CLTSC4
21:14
ORIG
475*
CLTSC4
7:05
PUJ
7:55
MBJ
14:53
RDU
16:10
AA 320
CUN
16:40
BOS
17:55
AA 321
SXM
18:40
DCA
19:45
AA 320*1216
TERM
PUJ
20:16
CLTSC4
21:01
AADO
A21
A22
A23
A24
A25
A26
A27
A28
A29
A1
A3
A5
A7
A9
A11
A13
A12
A10
A8
A6
A4
A2
B1
B3
B5
B7
B9
B11
B13
B15
B16
B14
B12
B10
B8
B6
B4
B2
C2
C4
C6
C8
C10
C12
C14
C16
AAIN
I1
I2
Date:04/11/2019 Time:13:00CLT 2016-Scenario 2
Page # 1 of 4
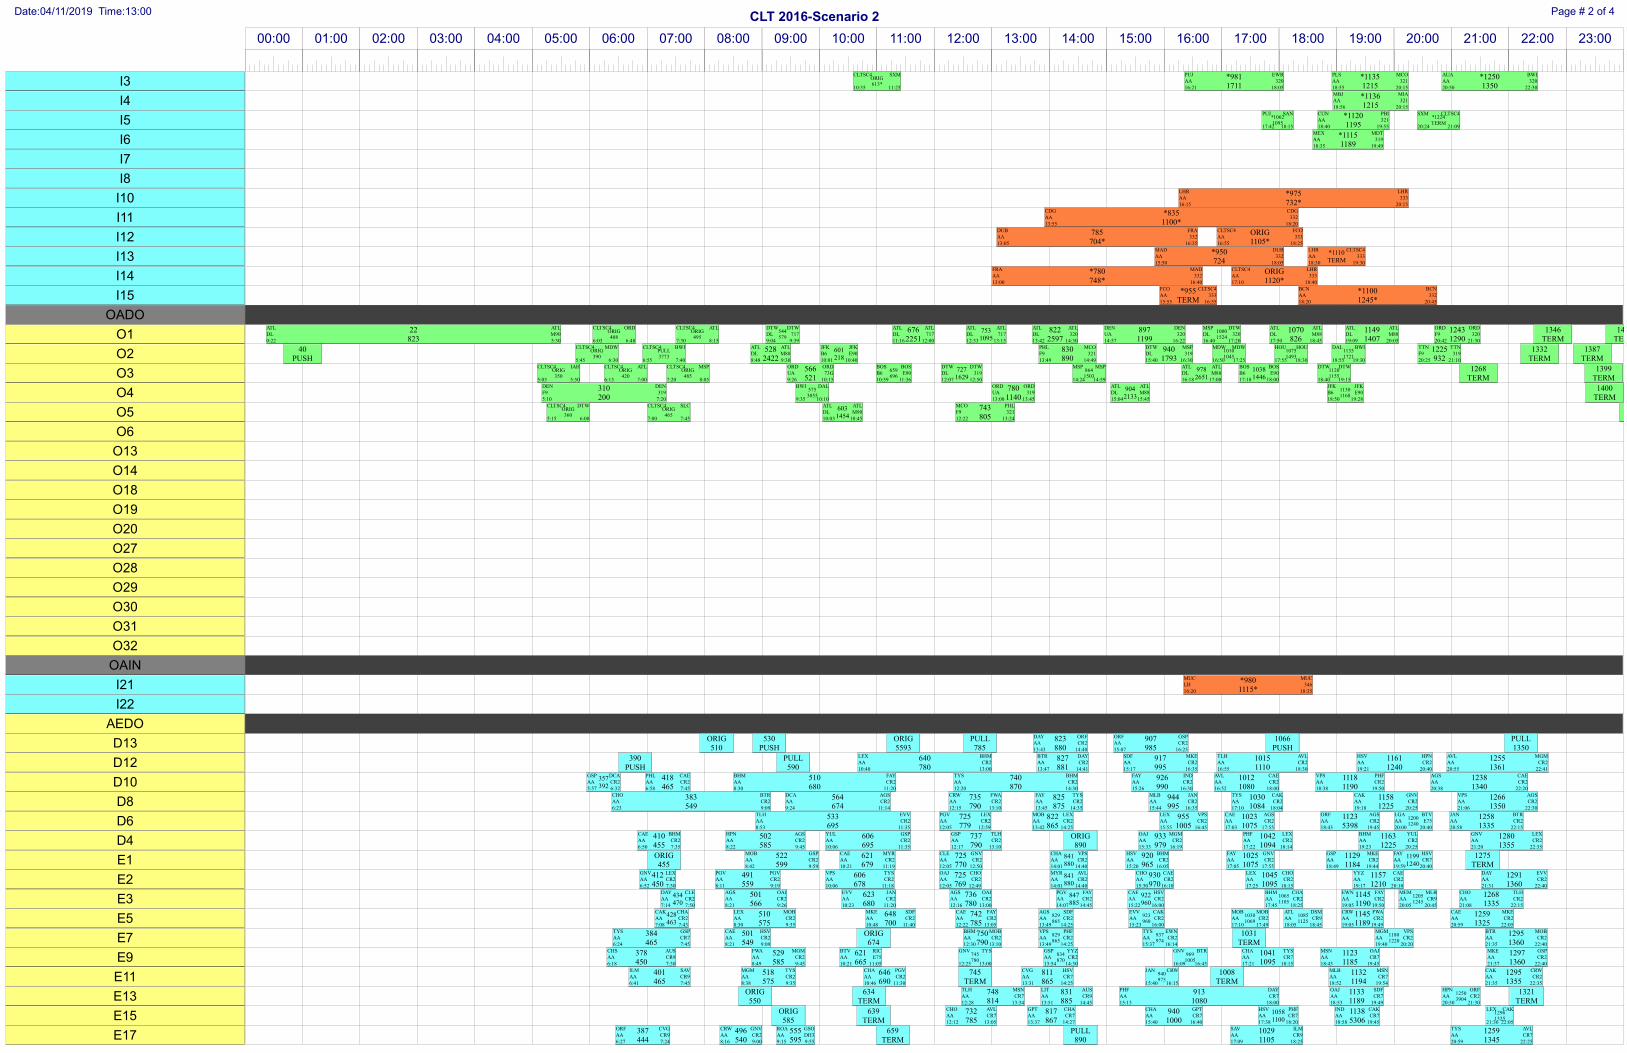
00:00 01:00 02:00 03:00 04:00 05:00 06:00 07:00 08:00 09:00 10:00 11:00 12:00 13:00 14:00 15:00 16:00 17:00 18:00 19:00 20:00 21:00 22:00 23:00
*975
732*
*835
1100*
785
704*
ORIG
1105*
*950
724
*780
748*
ORIG
1120*
*955
TERM
*1100
1245*
*980
1115*
*1110
TERM
LHR
16:15
LHR
20:15
AA 333
CDG
13:55
CDG
18:20
AA 332
DUB
13:05
FRA
16:35
AA 332
CLTSC4
16:55
FCO
18:25
AA 333
MAD
15:50
DUB
18:05
AA 332
LHR
18:30
CLTSC4
19:30
AA 333
FRA
13:00
MAD
16:40
AA 332
CLTSC4
17:10
LHR
18:40
AA 333
FCO
15:55
CLTSC4
16:55
AA 333
BCN
18:20
BCN
20:45
AA 332
MUC
16:20
MUC
18:35
LH 346
*981
1711
*1135
1215
*1250
1350
*1136
1215
*1120
1195
*1115
1189
22
823
676
2251
822
2597
897
1199
1070
826
1149
1407
1243
1290
1346
TERM
1421
TERM
40
PUSH
528
2422
830
890
940
1793
1225
932
1332
TERM
1387
TERM
566
521
1268
TERM
1399
TERM
310
200
780
1140
1400
TERM
743
805 TERM
ORIG
510
530
PUSH
ORIG
5593
PULL
785
823
880
907
985
1066
PUSH
PULL
1350
390
PUSH
PULL
590
640
780
827
881
917
995
1015
1110
1161
1240
1255
1361
418
465
510
680
740
870
926
990
1012
1080
1118
1190
1238
1340
383
549
564
674
735
790
825
875
944
995
1030
1084
1158
1225
1266
1350
533
695
725
779
822
865
955
1005
1023
1075
1123
5398
1258
1335
410
455
502
585
606
695
737
790
ORIG
890
933
979
1042
1094
1163
1225
1280
1355
ORIG
455
522
599
621
679
725
770
920
965
1025
1075
1129
1184
1275
TERM
412
450
491
559
606
678
725
769
930
970
1045
1095
1157
1210
1291
1360
501
566
623
680
736
780
1145
1190
1268
1335
510
575
648
700
742
785
1145
1189
1259
1325
384
465
501
549
ORIG
674
750
790
1031
TERM
1295
1360
378
450
529
585
621
665
1041
1095
1123
1185
1297
1360
401
465
518
575
646
690
745
TERM
811
865
1008
TERM
1132
1194
1295
1355
ORIG
550
634
TERM
748
814
831
885
913
1080
1133
1189
1321
TERM
ORIG
585
639
TERM
732
785
817
867
940
1000
1138
5306
387
444
496
540
555
595
659
TERM
PULL
890
1029
1105
1259
1345
753
1095
601
218
727
1629
978
2651
1038
1446
904
2133
603
1454
357
392
841
880
1199
1240
841
880
434
470
847
885
922
960
428
463
1058
1100
ORIG
613*
CLTSC4
10:35
SXM
11:25
PUJ
16:21
EWR
18:05
AA 320
PLS
18:55
MCO
20:15
AA 321
AUA
20:50
BWI
22:30
AA 320
MBJ
18:56
MIA
20:15
AA 321
*1062
1095
PUJ
17:42
SAN
18:15
CUN
18:40
PBI
19:55
AA 321*1224
TERM
SXM
20:24
CLTSC4
21:09
MEX
18:35
MDT
19:49
AA 319
ATL
0:22
ATL
5:30
DL M90ORIG
408
CLTSC4
6:03
ORD
6:48
ORIG
495
CLTSC4
7:30
ATL
8:15
544
579
DTW
9:04
DTW
9:39
DL 717
ATL
11:16
ATL
12:00
DL 717
ATL
12:33
ATL
13:15
DL 717
ATL
13:42
ATL
14:30
DL 320
DEN
14:57
DEN
16:22
UA 3201000
1524
MSP
16:40
DTW
17:20
DL 320
ATL
17:50
ATL
18:45
DL M88
ATL
19:09
ATL
20:05
DL M88
ORD
20:42
ORD
21:30
F9 320
ORIG
390
CLTSC4
5:45
MDW
6:30
PULL
3773
CLTSC4
6:55
BWI
7:40
ATL
8:48
ATL
9:30
DL M88
JFK
10:01
JFK
10:40
B6 E90
PHL
13:49
MCO
14:49
F9 321
DTW
15:40
MSP
16:30
DL 3191010
1045
MDW
16:50
MDW
17:25
1075
1493
HOU
17:55
HOU
18:30
1135
1721
DAL
18:55
BWI
19:30
TTN
20:25
TTN
21:10
F9 319
ORIG
350
CLTSC4
5:05
IAH
5:50
ORIG
420
CLTSC4
6:15
ATL
7:00
ORIG
485
CLTSC4
7:20
MSP
8:05
ORD
9:26
ORD
10:15
UA 73G659
696
BOS
10:59
BOS
11:36
B6 E90
DTW
12:07
DTW
12:50
DL 319864
1503
MSP
14:24
MSP
14:59
ATL
16:18
ATL
17:00
DL M88
BOS
17:18
BOS
18:00
B6 E901120
1155
DTW
18:40
DTW
19:15
DEN
5:10
DEN
7:20
F9 319575
3055
BWI
9:35
DAL
10:10
ORD
13:00
ORD
13:45
UA 319
ATL
15:04
ATL
15:45
DL M881130
1168
JFK
18:50
JFK
19:28
B6 E90
ORIG
360
CLTSC4
5:15
DTW
6:00
ORIG
465
CLTSC4
7:00
SLC
7:45
ATL
10:03
ATL
10:45
DL M90
MCO
12:22
PHL
13:24
F9 321
DAY
13:43
ORF
14:40
AA CR2
ORF
15:07
GSP
16:25
AA CR2
LEX
10:40
BHM
13:00
AA CR2
BTR
13:47
DAY
14:41
AA CR2
SDF
15:17
MKE
16:35
AA CR2
TLH
16:55
AVL
18:30
AA CR2
HSV
19:21
HPN
20:40
AA CR2
AVL
20:55
MGM
22:41
AA CR2
GSP
5:57
DCA
6:32
AA CR2
PHL
6:58
CAE
7:45
AA CR2
BHM
8:30
FAY
11:20
AA CR2
TYS
12:20
BHM
14:30
AA CR2
FAY
15:26
IND
16:30
AA CR2
AVL
16:52
CAE
18:00
AA CR2
VPS
18:38
PHF
19:50
AA CR2
AGS
20:38
CAE
22:20
AA CR2
CHO
6:23
BTR
9:09
AA CR2
DCA
9:24
AGS
11:14
AA CR2
CRW
12:15
FWA
13:10
AA CR2
FAY
13:45
TYS
14:35
AA CR2
MLB
15:44
JAN
16:35
AA CR2
TYS
17:10
CAK
18:04
AA CR2
CAK
19:18
GNV
20:25
AA CR2
VPS
21:06
AGS
22:30
AA CR2
TLH
8:53
EVV
11:35
AA CR2
PGV
12:05
LEX
12:59
AA CR2
MOB
13:42
LEX
14:25
AA CR2
LEX
15:55
VPS
16:45
AA CR2
CAE
17:03
AGS
17:55
AA CR2
ORF
18:43
AGS
19:45
AA CR21200
1240
LGA
20:00
BTV
20:40
AA E75
JAN
20:58
BTR
22:15
AA CR2
CAE
6:50
BHM
7:35
AA CR2
HPN
8:22
AGS
9:45
AA CR2
YUL
10:06
GSP
11:35
AA CR2
GSP
12:17
TLH
13:10
AA CR2
OAJ
15:33
MGM
16:19
AA CR2
PHF
17:22
LEX
18:14
AA CR2
BHM
19:23
YUL
20:25
AA CR2
GNV
21:20
LEX
22:35
AA CR2
MOB
8:42
GSP
9:59
AA CR2
CAE
10:21
MYR
11:19
AA CR2
CLE
12:05
GNV
12:50
AA CR2
CHA
14:01
VPS
14:40
AA CR2
HSV
15:20
BHM
16:05
AA CR2
FAY
17:05
GNV
17:55
AA CR2
GSP
18:49
MKE
19:44
AA CR2
FAY
19:59
HSV
20:40
AA CR7
GNV
6:52
LEX
7:30
AA CR2
PGV
8:11
PGV
9:19
AA CR2
VPS
10:06
TYS
11:18
AA CR2
OAJ
12:05
CHO
12:49
AA CR2
MYR
14:01
AVL
14:40
AA CR2
CHO
15:30
CAE
16:10
AA CR2
LEX
17:25
CHO
18:15
AA CR2
YYZ
19:17
CAE
20:10
AA CR2
DAY
21:31
EVV
22:40
AA CR2
DAY
7:14
CLE
7:50
AA CR2
AGS
8:21
OAJ
9:26
AA CR2
EVV
10:23
JAN
11:20
AA CR2
AGS
12:16
OAJ
13:00
AA CR2
PGV
14:07
FAY
14:45
AA CR2
CAE
15:22
HSV
16:00
AA CR21065
1105
BHM
17:45
CHA
18:25
AA CR2
EWN
19:05
FAY
19:50
AA CR21205
1245
MEM
20:05
MLB
20:45
AA CR9
CHO
21:08
TLH
22:15
AA CR2
CAK
7:08
CHA
7:43
AA CR2
LEX
8:30
MOB
9:35
AA CR2
MKE
10:48
SDF
11:40
AA CR2
CAE
12:22
FAY
13:05
AA CR2829
865
AGS
13:49
SDF
14:25
AA CR2923
960
EVV
15:23
CAK
16:00
AA CR21030
1069
MOB
17:10
MOB
17:49
AA CR21085
1125
ATL
18:05
DSM
18:45
AA CR9
CRW
19:05
FWA
19:49
AA CR2
CAE
20:59
MKE
22:05
AA CR2
TYS
6:24
GSP
7:45
AA CR7
CAE
8:21
HSV
9:09
AA CR2
BHM
12:30
MOB
13:10
AA CR2829
865
VPS
13:49
PHF
14:25
AA CR2937
974
TYS
15:37
EWN
16:14
AA CR21180
1220
MGM
19:40
VPS
20:20
AA CR2
BTR
21:35
MOB
22:40
AA CR2
CHS
6:18
AUS
7:30
AA CR9
FWA
8:49
MGM
9:45
AA CR2
BTV
10:21
RIC
11:05
AA E75745
780
GNV
12:25
TYS
13:00
834
870
GSP
13:54
YYZ
14:30
AA CR2969
1005
GNV
16:09
BTR
16:45
CHA
17:21
TYS
18:15
AA CR7
MSN
18:43
OAJ
19:45
AA CR7
MKE
21:37
GSP
22:40
AA CR2
ILM
6:41
SAV
7:45
AA CR9
MGM
8:38
TYS
9:35
AA CR2
CHA
10:46
PGV
11:30
AA CR2
CVG
13:31
HSV
14:25
AA CR7940
975
JAN
15:40
CRW
16:15
MLB
18:52
MSN
19:54
AA CR7
CAK
21:35
CRW
22:35
AA CR2
TLH
12:28
MSN
13:34
AA CR7
LIT
13:51
AUS
14:45
AA CR9
PHF
15:13
DAY
18:00
AA CR7
OAJ
18:53
SDF
19:49
AA CR71250
3904
HPN
20:50
ORF
21:30
AA CR2
CHO
12:12
AVL
13:05
AA CR7
GPT
13:37
CHA
14:27
AA CR7
CHA
15:40
GPT
16:40
AA CR7
HSV
17:38
PHF
18:20
AA CR7
IND
18:58
CAK
19:45
AA CR71296
1325
LEX
21:36
CAK
22:05
ORF
6:27
CVG
7:24
AA CR9
CRW
8:16
GNV
9:00
AA CR2
ROA
9:15
GSO
9:55
AA DH3
SAV
17:09
ILM
18:25
AA CR9
TYS
20:59
AVL
22:25
AA CR7
I3
I4
I5
I6
I7
I8
I10
I11
I12
I13
I14
I15
OADO
O1
O2
O3
O4
O5
O6
O13
O14
O18
O19
O20
O27
O28
O29
O30
O31
O32
OAIN
I21
I22
AEDO
D13
D12
D10
D8
D6
D4
E1
E2
E3
E5
E7
E9
E11
E13
E15
E17
Date:04/11/2019 Time:13:00CLT 2016-Scenario 2
Page # 2 of 4

00:00 01:00 02:00 03:00 04:00 05:00 06:00 07:00 08:00 09:00 10:00 11:00 12:00 13:00 14:00 15:00 16:00 17:00 18:00 19:00 20:00 21:00 22:00 23:00
404
460
520
560
609
650
730
780
798
TERM
929
974
1026
1100
1270
1334
412
460
490
560
645
705
739
795
831
TERM
924
990
1042
1110
1286
1350
ORIG
440
517
PUSH
646
693
921
969
PULL
1065
1120
1185
1300
TERM
382
460
493
560
646
705
827
873
ORIG
970
1036
1100
1130
1184
1199
1365
395
460
501
559
749
800
842
TERM
943
1004
1034
1085
1166
1230
1245
1350
424
470
512
5384
630
715
730
779
812
875
914
974
1013
1070
1140
1200
1263
1355
513
570
638
779
820
880
902
959
1018
1070
1130
1185
1270
TERM
ORIG
449
484
540
613
695
730
774
808
865
907
959
1039
1090
1141
1195
1265
TERM
399
455
502
555
620
695
735
779
813
864
914
965
1011
1060
1080
1125
1176
1230
1285
1360
389
PUSH
488
550
610
PUSH
PULL
700
727
770
817
867
910
960
1028
1075
1129
1180
1269
1340
396
565
621
685
738
781
825
875
935
985
1024
1070
1159
1210
1255
1325
ORIG
455
489
570
641
705
749
792
845
895
915
964
1039
1085
1140
1190
1265
1335
ORIG
460
516
590
642
705
738
779
836
885
925
974
1030
1074
1156
1205
1260
1350
ORIG
465
523
595
618
680
836
885
930
979
1066
1110
1166
1215
1293
1360
526
590
619
680
836
885
936
985
1143
1190
1260
1350
529
590
639
700
841
890
933
980
1144
1190
1292
1355
398
475
496
554
649
710
747
804
832
880
914
960
1161
1205
1294
1355
411
465
527
585
650
710
727
770
859
915
935
980
1299
1355
ORIG
559
654
710
732
785
820
865
ORIG
995
1036
1110
1288
1360
391
450
498
549
610
662
830
870
942
TERM
1050
1105
1155
1230
1281
1329
529
580
628
680
743
790
830
875
906
970
1044
1095
1139
1210
406
470
515
564
630
680
819
859
938
990
1038
1085
1122
1189
1282
1350
389
450
480
685
935
984
1150
1215
496
540
559
599
627
676
805
845
920
965
1123
1184
1289
1340
525
5089
622
670
933
976
1149
1209
1278
1355
518
560
607
674
1016
1070
1140
1190
1259
1325
531
580
822
885
940
959
1019
1070
1180
1230
517
TERM
842
895
930
987
1028
1079
1130
1185
1284
1350
492
580
631
TERM
1051
1095
416
460
495
575
ORIG
1184
1253
4925
512
560
645
695
1011
1070
1135
TERM
1275
1340
ORIG
530
ORIG
710
1282
1355
523
564
645
TERM
1274
1330
516
567
670
715
ORIG
1325
ORIG
360
ORIG
515
794
3642
1271
TERM
1410
TERM
ORIG
369
ORIG
420
515
3840
720
1025
1050
1075
1379
TERM
ORIG
425
674
5069
906
5099
1032
5135
1281
TERM
1379
TERM
ORIG
460
1034
6285 TERM
555
590
732
770
743
781
1032
1075
1146
1189
1168
1210
1299
1340
941
979
647
685
1299
1340
550
585
1158
6227
IAD
6:44
CHS
7:40
AA CR9
FAY
8:40
CRW
9:20
AA CR2
SGF
10:09
SGF
10:50
AA ER4665
700
SDF
11:05
MLB
11:40
JAX
12:10
DTW
13:00
AA CR9
AVL
15:29
OAJ
16:14
AA CR7
OMA
17:06
SAV
18:20
AA CR91156
5221
LEX
19:16
TYS
19:56
AA CR7
GPT
21:10
SRQ
22:14
AA CR7
GSO
6:52
RIC
7:40
AA CR9
PHF
8:10
GPT
9:20
AA CR7
MSN
10:45
PHF
11:45
AA CR7
RDU
12:19
CAK
13:15
AA CR9
PIT
15:24
LIT
16:30
AA CR9
DTW
17:22
GSO
18:30
AA CR9
PHF
21:26
PHF
22:30
AA CR7
OAJ
10:46
FLO
11:33
AA DH3
CMH
15:21
ILM
16:09
AA E75
SAT
18:40
CVG
19:45
AA CR9
LYH
6:22
OAJ
7:40
AA DH3
OAJ
8:13
CVG
9:20
AA CR7
IND
10:46
CMH
11:45
AA E75
JAN
13:47
HPN
14:33
AA CR7
SYR
17:16
CHS
18:20
AA CR9
MEM
18:50
CHS
19:44
AA CR9
GSP
19:59
GSO
22:45
AA CR9
EWN
6:35
FAY
7:40
AA DH3
AVL
8:21
CHO
9:19
AA CR7621
655
ROA
10:21
HHH
10:55
IAD
12:29
BNA
13:20
AA CR9
STL
15:43
PNS
16:44
AA CR9
ILM
17:14
ORF
18:05
AA CR9
IAD
19:26
MSY
20:30
AA CR9
GSO
20:45
SAV
22:30
AA CR9
ROA
7:04
GSO
7:50
AA DH3
SDF
8:32
HPN
9:30
AA CR7
GSO
10:30
EWN
11:55
AA DH3
STL
12:10
SAV
12:59
AA CR9
JAX
13:32
ILM
14:35
AA CR9
DAY
15:14
SAV
16:14
AA CR9
CAK
16:53
GSP
17:50
AA CR9
SAV
19:00
ORF
20:00
AA CR9
ILM
21:03
CHS
22:35
AA CR9
HSV
8:33
JAN
9:30
AA CR7
SAV
10:38
ILM
12:59
AA CR9
DAB
13:40
MEM
14:40
AA CR9
MHT
15:02
TLH
15:59
AA CR9
DSM
16:58
CLE
17:50
AA CR9
PNS
18:50
GRR
19:45
AA CR9
SRQ
8:04
TLH
9:00
AA CR7
SBY
9:15
AVL
9:50
AA DH3
BHM
10:13
BHM
11:35
AA CR9
FAY
12:10
CHS
12:54
AA CR9
CAK
13:28
IAD
14:25
AA CR9
MDT
15:07
CMH
15:59
AA CR9
RIC
17:19
BNA
18:10
AA CR9
TYS
19:01
SAV
19:55
AA CR9
TRI
6:39
HHH
7:35
AA DH8
TYS
8:22
LIT
9:15
AA CR9
TUL
10:20
DAY
11:35
AA CR9
MYR
12:15
MYR
12:59
AA CR9
GSO
13:33
CMH
14:24
AA CR9
OKC
15:14
SDF
16:05
AA CR9
PVD
16:51
SRQ
17:40
AA CR9
DAB
18:00
OKC
18:45
AA CR9
DAB
19:36
CLE
20:30
AA CR9
SDF
21:25
MYR
22:40
AA CR9
MDT
8:08
CMH
9:10
AA E75
MEM
12:07
SYR
12:50
AA CR9
SRQ
13:37
SAV
14:27
AA CR9
BHM
15:10
IAD
16:00
AA CR9
TUL
17:08
IAD
17:55
AA CR9
GSO
18:49
DAY
19:40
AA CR9
ORF
21:09
CHA
22:20
AA CR9
SAV
6:36
GRR
9:25
AA CR9
CLE
10:21
MDT
11:25
AA CR9
HTS
12:18
AGS
13:01
AA DH3
AUS
13:45
CHS
14:35
AA CR9
ILM
15:35
GSO
16:25
AA CR9
XNA
17:04
CVG
17:50
AA CR9
TLH
19:19
GSO
20:10
AA CR9
PNS
20:55
DAY
22:05
AA CR9
CHS
8:09
MYR
9:30
AA CR9
OMA
10:41
PIT
11:45
AA CR9
EWN
12:29
GSP
13:12
AA DH3
GRR
14:05
ATL
14:55
AA CR9
IAD
15:15
DAB
16:04
AA CR9
MYR
17:19
BHM
18:05
AA CR9
MYR
19:00
PNS
19:50
AA CR9
AUS
21:05
IAD
22:15
AA CR9
GSO
8:36
JAX
9:50
AA CR9
OKC
10:42
IAD
11:45
AA CR9
GSO
12:18
TRI
12:59
AA DH3
PNS
13:56
DTW
14:45
AA CR9
CLE
15:25
CVG
16:14
AA CR9
PWM
17:10
SDF
17:54
AA CR9
CMH
19:16
MHT
20:05
AA CR9
CHS
21:00
XNA
22:30
AA CR9
IAD
8:43
IND
9:55
AA CR9
AVP
10:18
AVP
11:20
AA CR9
AVL
12:12
LYH
12:50
AA DH3
ORF
13:56
MYR
14:45
AA CR9
CHS
15:30
TYS
16:19
AA CR91005
1045
BNA
16:45
LGA
17:25
AA CR9
IAD
17:46
TUL
18:30
AA CR9
CVG
19:26
ABE
20:15
AA CR9
XNA
21:33
BNA
22:40
AA CR9
MSY
8:46
SDF
9:50
AA CR9
DSM
10:19
GSO
11:20
AA CR9
TRI
12:23
ROA
13:01
AA DH3
MKE
13:56
ABE
14:45
AA CR9
AVP
15:36
XNA
16:25
AA CR9
CHS
17:12
MDT
17:55
AA CR9
CHS
19:03
SRQ
19:50
AA CR9
ROA
21:00
LYH
22:30
AA DH3
416
450
HHH
6:56
ROA
7:30
AA DH8
BNA
8:49
DAB
9:50
AA CR9
ABE
10:39
CVG
11:40
AA CR9752
786
LYH
12:32
FLO
13:06
IND
14:01
PNS
14:50
AA CR9
MYR
15:33
CHS
16:20
AA CR91061
1100
CMH
17:41
MYR
18:20
AA CR9
DTW
19:04
GSP
19:50
AA CR9
BHM
21:32
MEM
22:35
AA CR9
CMH
6:38
IND
7:55
AA E75
SAV
8:16
MKE
9:14
AA CR9
CVG
10:49
XNA
11:50
AA CR9
CMH
12:27
MCI
13:24
AA E75
ILM
13:52
MKE
14:40
AA CR9
CVG
15:14
MEM
16:00
AA CR9
MKE
19:21
IAD
20:05
AA CR9
BNA
21:34
ILM
22:35
AA CR9
IND
6:51
DTW
7:45
AA E75
MLB
8:47
PNS
9:45
AA CR9
CMH
10:50
PWM
11:50
AA CR9
SAV
12:07
CHA
12:50
AA CR7
YYZ
14:19
LGA
15:15
AA E75
MEM
15:35
MYR
16:20
AA CR9
ABE
19:06
OMA
19:49
AA CR9
CLE
21:39
LIT
22:35
AA CR9
DAY
10:54
PVD
11:50
AA CR9
IND
12:12
GSO
13:05
AA E75
SDF
13:40
DAB
14:25
AA CR9
ROA
17:16
LYH
18:30
AA DH3
SDF
19:28
DAB
20:10
AA CR9
CHA
21:28
PGV
22:40
AA CR2
AGS
6:31
SDF
7:30
AA CR2
GSP
8:18
IAD
9:09
AA CR9
SRQ
10:10
ORF
11:02
AA CR9
SAV
13:50
RIC
14:30
AA CR9
CRW
17:30
OAJ
18:25
AA DH3
PGV
19:15
EWN
20:30
AA DH3
IAD
21:21
TYS
22:09
AA CR9
GRR
8:49
RDU
9:40
AA CR9
XNA
10:28
OMA
11:20
AA CR9
DTW
12:23
MDT
13:10
AA E75
ROA
13:50
ROA
14:35
AA DH3
EWN
15:06
LYH
16:10
AA DH3
EWN
17:24
ROA
18:15
AA DH3
LYH
18:59
LYH
20:10
AA DH3
SRQ
21:39
SDF
22:20
AA CR9
SDF
6:46
MEM
7:50
AA CR9
DAB
8:35
SRQ
9:24
AA CR9
MHT
10:30
STL
11:20
AA CR9
SBY
13:39
CRW
14:19
AA DH3
TRI
15:38
TRI
16:30
AA DH3
HTS
17:18
HHH
18:05
AA DH8
AVL
18:42
CHO
19:49
AA DH3
CVG
21:22
BHM
22:30
AA CR9
CHA
6:29
IAD
7:30
AA CR9
HTS
8:00
AVL
11:25
AA DH8828
865
FLO
13:48
EWN
14:25
AA DH3
LYH
15:35
AVL
16:24
AA DH3
CHO
19:10
TRI
20:15
AA DH31293
1329
JAX
21:33
CMH
22:09
TRI
8:16
HTS
9:00
AA DH3
YYZ
9:19
BNA
9:59
AA E75
CHS
10:27
ILM
11:16
AA CR9
CRW
13:25
HTS
14:05
AA DH8
FLO
15:20
ROA
16:05
AA DH31021
1055
CHO
17:01
FLO
17:35
ROA
18:43
ROA
19:44
AA DH3
MDT
21:29
AVP
22:20
AA CR9
LIT
8:45
MHT
9:30
AA CR9
MYR
10:22
SAV
11:10
AA CR9822
859
AVL
13:42
CHO
14:19
AA DH8
GSP
15:33
PGV
16:16
AA DH3
AGS
19:09
FLO
20:09
AA DH3
LIT
21:18
JAN
22:35
AA CR9
PNS
8:38
OKC
9:20
AA CR9
FAY
10:07
ROA
11:14
AA DH3836
870
HHH
13:56
HHH
14:30
ROA
15:41
AGS
16:19
AA DH3
MDT
16:56
IND
17:50
AA E75
TRI
19:00
SBY
19:50
AA DH3
MYR
20:59
CVG
22:05
AA CR9
DAY
8:51
FAY
9:40
AA CR9
ORF
10:47
MEM
11:25
AA CR9
BNA
13:42
GSO
14:45
AA E75
GSO
16:59
CMH
17:50
AA E75
FLO
19:40
HTS
20:30
AA DH8
IND
21:39
MDT
22:20
AA E75
643
680
MEM
10:43
DSM
11:20
AA CR9
RIC
14:02
OMA
14:55
AA E75
GSO
15:30
YYZ
16:27
AA E75
MSY
17:08
JAX
17:59
AA E75
ILM
18:50
IND
19:45
AA E75
OAJ
21:24
EWN
22:30
AA DH3
LYH
8:12
TRI
9:40
AA DH3
HHH
17:31
TRI
18:15
AA DH81286
1325
LYH
21:26
ROA
22:05
AA DH3
CVG
6:56
MYR
7:40
AA CR9
CHO
8:15
LYH
9:35
AA DH3647
679
HHH
10:47
CRW
11:19
TRI
20:53
TRI
22:25
AA DH8
EWN
8:32
SBY
9:20
AA DH3
RIC
10:45
CLE
11:35
AA CR9
SGF
16:51
SGF
17:50
AA ER4
HHH
21:15
HHH
22:20
AA DH8
CVG
9:10
CAK
9:45
AA CR9
YYZ
21:22
MSY
22:35
AA E75
FLO
8:43
EWN
9:24
AA DH3
CMH
21:14
YYZ
22:10
AA E75
CMH
8:36
YYZ
9:27
AA E75
IAD
11:10
SAT
11:55
AA CR9
582
6150
IAD
9:42
IAD
10:22
UA CR7666
696
CVG
11:06
CVG
11:36
LGA
13:14
LGA
14:00
DL CR9864
3315
EWR
14:24
IAH
15:02
UA E701006
4843
ORD
16:46
ORD
17:21
1069
7349
YYZ
17:49
YYZ
18:20
LGA
19:18
LGA
20:00
DL CR7
LGA
8:35
LGA
9:15
DL CR9
BKW
12:00
BKW
17:05
VC EM21135
6160
IAD
18:55
IAD
19:30
514
3648
EWR
8:34
EWR
9:09
597
3399
LGA
9:57
LGA
10:30
LGA
11:14
LGA
12:00
DL CR7849
6120
IAH
14:09
IAD
14:44
LGA
15:06
LGA
16:00
DL CR7
LGA
17:12
LGA
18:00
DL CR7
515
545
BKW
8:35
BKW
9:05
632
667
MSP
10:32
MSP
11:07
712
3311
EWR
11:52
EWR
12:27
IAH
17:14
IAH
18:05
UA E7W
E19
E18
E16
E14
E12
E10
E21
E23
E25
E27
E29
E31
E33
E35
E38
E36
E34
E32
E30
E28
E26
E24
E22
E20
E8
E6
E4
F1
F2
F3
F4
F5
F6
F7
F8
F9
F10
F11
F12
F13
F14
F15
F16
F17
F18
F19
O7
O8
O9
O10
Date:04/11/2019 Time:13:00CLT 2016-Scenario 2
Page # 3 of 4

00:00 01:00 02:00 03:00 04:00 05:00 06:00 07:00 08:00 09:00 10:00 11:00 12:00 13:00 14:00 15:00 16:00 17:00 18:00 19:00 20:00 21:00 22:00 23:00
O379
O380*
O377
O378*
*T461
T462
CLT
0:00
LHR
17:10
AA 333
CLT
0:00
FCO
16:55
AA 333
FCO
16:55
CLT
23:59
AA 333
ORIG
445
1281
TERM
T447
T448
T457
T458
O375
O376
O373
O374
T453
T454
O359
O360
T459
T460
O391
O392
PSH
1793
T465
T466
O361
O362
T439
T440
O381
O382
T435
T436
O369
O370
T445
T446
O389
O390
T449
T450
O383
O384
T451
T452
O363
O364
T437
T438
O367
O368
T441
T442
O365
O366
T443
T444
O387
O388
PSH
565
T455
T456
O371
O372
T467
T468
O385
O386
PSH
785
PSH
1350
T463
T464
PSH
3773
T479
T480
O401
O402
T481
T482
O409
O410
T483
T484
O395
O396
PSH
590
T475
T476
O399
O400
T473
T474
O397
O398
T485
T486
PSH
700
T487
T488
O403
O404
T477
T478
O393
O394
PSH
890
T489
T490
PSH
1065
T469
T470
T495
T496
T497
T498
O405
O406
T493
T494
O411
O412
T471
T472
T501
T502
O407
O408
T499
T500
639
7347
YYZ
10:39
YYZ
11:10
1040
1076
EWR
17:20
EWR
17:56
DCA
19:32
CLT
23:59
AA 319
ROC
19:47
CLT
23:59
AA 319
CLT
0:00
ROC
13:50
AA 319
CLT
0:00
BWI
12:34
AA 319
DCA
14:08
CLT
23:59
AA 319
CLT
0:00
IAH
10:34
AA 320
IAH
16:15
CLT
23:59
AA 319
CLT
0:00
SLC
7:00
DL 320
MCI
11:08
CLT
21:40
AA 319
ORD
22:52
CLT
23:59
UA 73G
CLT
0:00
LGA
9:10
AA 321
BNA
10:41
CLT
23:59
AA 320
CLT
0:00
ORD
6:03
UA 73G
DEN
7:17
CLT
23:59
AA 321
CLT
0:00
PVD
19:44
AA 321
MIA
20:00
CLT
23:59
AA 321
CLT
0:00
MSP
7:20
DL 717
FLL
10:43
CLT
23:59
AA 321
CLT
0:00
ATL
7:30
DL 738
ORD
10:48
CLT
23:59
AA 321
CLT
0:00
LGA
15:25
AA 321
EWR
17:41
CLT
23:59
AA 321
CLT
0:00
EWR
11:25
AA 321
DEN
18:01
CLT
23:59
AA 321
CLT
0:00
LAS
10:35
AA 321
LAX
20:25
CLT
23:59
AA 321
CLT
0:00
ATL
6:15
DL 73H
LGA
8:53
CLT
17:45
AA 321
DFW
19:45
CLT
23:59
AA 73H
CLT
0:00
JFK
19:15
AA 73H
ATL
21:48
CLT
23:59
DL 73H
CLT
0:00
MDW
5:45
WN 73W
MKE
9:25
CLT
12:30
AA CR2
SDF
18:21
CLT
21:55
AA CR2
ATL
23:06
CLT
23:59
DL 73H
MDW
1:20
CLT
6:55
WN 73W
BTR
11:09
CLT
23:59
AA CR2
CLT
0:00
CHA
10:39
AA CR2
PHF
11:14
CLT
23:59
AA CR2
CLT
0:00
HSV
11:15
AA CR2
BHM
11:34
CLT
23:59
AA CR2
CLT
0:00
LGA
6:25
DL CR9
PHF
7:05
CLT
9:15
AA CR2
HSV
13:00
CLT
23:59
AA CR2
CLT
0:00
IND
14:15
AA CR2
FWA
17:46
CLT
23:59
AA CR2
CLT
0:00
FPO
11:10
AA CR7
MGM
13:53
CLT
23:59
AA CR2
MYR
7:04
CLT
11:05
AA CR9
TYS
14:26
CLT
23:59
AA CR2
CLT
0:00
LEX
15:35
AA CR7
FPO
17:23
CLT
23:59
AA CR7
CLT
0:00
DEN
8:00
UA E7W
GSP
10:45
CLT
14:15
AA CR7
HPN
14:37
CLT
23:59
AA CR7
CAK
9:12
CLT
17:10
AA CR7
LGA
21:46
CLT
23:59
DL CR9
JAN
9:12
CLT
23:59
AA CR9
ILM
11:06
CLT
23:59
AA CR9
CLT
0:00
STL
16:00
AA CR9
SAV
16:17
CLT
23:59
AA CR9
CLT
0:00
IND
21:30
AA E75
CVG
21:56
CLT
23:59
DL CRJ
FLO
11:20
CLT
23:59
AA DH8
CLT
0:00
CMH
19:09
AA E75
MCI
19:30
CLT
23:59
AA E75
O11
O12
O15
O23
O24
O25
O26
HS
R01
R02
R03
R04
R05
R06
R07
R08
R09
R10
R11
R12
R13
R14
R15
R16
R17
R18
R19
R20
R21
R22
R23
R24
R25
R26
R27
R28
R29
R30
R31
R32
R33
R34
R35
Date:04/11/2019 Time:13:00CLT 2016-Scenario 2
Page # 4 of 4
CLT 2016 Gating Scenario 3 1
00:00 01:00 02:00 03:00 04:00 05:00 06:00 07:00 08:00 09:00 10:00 11:00 12:00 13:00 14:00 15:00 16:00 17:00 18:00 19:00 20:00 21:00 22:00 23:00
396
450
475
560
624
710
726
790
808
890
905
959
1119
1220
1300
1360
508
590
632
715
798
865
1015
1065
1264
1325
500
575
612
685*
722
792
810
870
1036
1733
1142
1225
1276
1330
1349
TERM
620
690*
750
810*
832
890
925
985
1134
1205
1229
1279
1310
1365
508
413
611
663
724
800
903
984
1004
1065
1082
1135
1152
1220
1286
1796
370
658
501
560
717
780
815
2080
927
725
1017
1100
1154
1215
1286
1346
375
470
492
565*
600
700*
723
782
803
875
925
637
1040
1120
1135
1200
1281
1340
369
460
493
PUSH
638
690
1125
643
1223
1330
374
465
481
585
619
705
726
789
817
885
900
975
1151
1206
1240
472
386
475
500
680
605
690*
825
885
900
559
1006
1908
1145
844
1252
1335 TERM
362
408
482
565*
635
715
734
1878
832
895
924
995
1017
1090
1155
1210
1262
1340
364
450
502
580
632
710*
747
804
920
984
1014
1085
1129
1205
1264
557
370
1993
514
590
629
521
724
781
830
890
935
705
1020
1090
1147
1200
1276
1345
490
565*
611
685*
725
785
801
860
908
970
1020
1090
1135
2075
1263
1329
404
479
511
575
631
705
810
865
909
970
991
1060
1154
1229
1273
1339
490
565*
613
685
718
774
811
866
905
960
1036
1105
1154
1975
1269
1330
377
470
490
564
613
2053
731
100
916
1453
1091
1150
1175
1240
1270
TERM
491
559
618
685
743
806
825
880
905
985
1033
678
1160
1220
1280
1334
397
TERM
523
585
626
690
729
784
807
875
999
1050
1147
1205
1272
1330
637
700
739
1950
840
2249
930
1000
1021
TERM
1139
1195
1278
1335
412
480
509
555
601
TERM
748
800
819
880
1041
TERM
1115
1170
1185
TERM
1273
1384
526
569
712
765
811
870
902
990
1160
TERM
1287
1277
745
795
817
870
903
990
1031
1105
1132
TERM
1236
1608
406
470
510
148
603
TERM
831
895
1185
1233
1264
1336
422
479
496
2529
608
TERM
743
792
836
895
915
980
1035
1105
1257
1345
394
450
488
550
642
330
737
785
842
895
913
975
1033
1100
1149
1390
1238
1360
527
595
633
710
806
855
944
1005
1021
1085
1156
2483
1239
1355
407
465
501
580
602
1458
920
979
1027
1090
1164
1215
1275
1340
521
580
644
700
808
TERM
914
969
1084
1200
1299
TERM
374
455
495
570*
614
690
719
2054
937
990
1024
1085
1145
TERM
1258
1335
432
480
497
570
619
695
908
959
1010
1070
1282
1360
402
455
523
595
628
1793
488
559
639
715
939
990
1014
1074
1150
1200
1255
1330
1420
TERM
524
590
633
699
1019
1074
1124
1194
1255
1324
1350
TERM
508
570
610
675
941
984
1165
1230
1285
TERM
518
580
627
690
910
989
1024
1095
1289
1355
515
575
639
700
1272
TERM
484
1839
614
674
1280
1345
510
564
620
680
935
TERM
1270
1331
531
585
623
680
1147
TERM
*1010
1073
*1094
1189
*893
970
*1000
1075
*1120
1185
*1250
1350
BWI
06:36
JFK
07:30
AA 320
EWR
07:55
PBI
09:20
AA 320
MSY
10:24
STT
11:50
AA 320
TPA
12:06
BOS
13:10
AA 321
TPA
13:28
MSP
14:50
AA 320
FLL
15:05
ATL
15:59
AA 320
BWI
18:39
FLL
20:20
AA 320
MCI
21:40
ORF
22:40
AA 319
BOS
08:28
FLL
09:50
AA 320
DCA
10:32
RSW
11:55
AA 320
PHL
13:18
PBI
14:25
AA 320
RSW
16:55
BWI
17:45
AA 320
MSP
21:04
PVD
22:05
AA 320
ORIG
450
CLTSC4
06:45
DFW
07:30
BWI
08:20
TPA
09:35
AA 320
ATL
10:12
GCM
11:25
AA 320
ATL
12:02
LGA
13:12
AA 320
BWI
13:30
FLL
14:30
AA 320
PHL
17:16
MCO
18:20
AA 752
ATL
19:02
SAT
20:25
AA 320
ATL
21:16
IAH
22:10
AA 320
ORIG
554
CLTSC4
08:29
MSY
09:14
BWI
10:20
AUA
11:30
AA 320
JFK
12:30
CUN
13:30
AA 320
PBI
13:52
BWI
14:50
AA 320
MSP
15:25
RSW
16:25
AA 3201035
1070
IAH
17:15
ATL
17:50
PBI
18:54
PHL
20:05
AA 320
STT
20:29
ATL
21:19
AA 320
PHX
21:50
RDU
22:45
AA 321
RSW
08:28
ATL
09:35
AA 320
SYR
10:11
MSY
11:03
AA 319
BOS
12:04
MIA
13:20
AA 321
SFO
15:03
TPA
16:24
AA 321
LGA
16:44
PHX
17:45
AA 321
LGA
18:02
MSY
18:55
AA 320
FLL
19:12
BWI
20:20
AA 320
LAS
21:26
PHL
22:25
AA 321
LAS
06:10
LAS
08:00
AA 321
ATL
08:21
MSP
09:20
AA 320ORIG
679
CLTSC4
10:34
IAH
11:19
ORD
11:57
PHX
13:00
AA 321
MIA
13:35
ORD
14:50
AA 321
TPA
15:27
LAX
16:40
AA 321
PIT
16:57
SMF
18:20
AA 321
MSY
19:14
JAX
20:15
AA 319
SEA
21:26
RSW
22:26
AA 321
SEA
06:15
SAN
07:50
AA 321
PVD
08:12
SXM
09:25
AA 320
LGA
10:00
PLS
11:40
AA 321
DEN
12:03
TPA
13:02
AA 321
ORD
13:23
PHX
14:35
AA 321
MCO
15:25
LAS
16:45
AA 321
TPA
17:20
LGA
18:40
AA 321
RDU
18:55
RSW
20:00
AA 320
FLL
21:21
LAX
22:20
AA 321
PHX
06:09
MCO
07:40
AA 321ORIG
595
CLTSC4
09:10
LGA
09:55
RDU
10:38
IND
11:30
AA 319PULL
565
CLTSC4
17:45
DFW
18:30
ORD
18:45
LAS
20:05
AA 321
SJU
20:23
DFW
22:10
AA 321
PDX
06:14
TPA
07:45
AA 321
SFO
08:01
LAX
09:45
AA 321
BOS
10:19
MIA
11:45
AA 321
PHX
12:06
PIT
13:09
AA 321
LGA
13:37
MCO
14:45
AA 321
LGA
15:00
PHX
16:15
AA 321
RIC
19:11
TPA
20:06
AA 319
PHL
20:40
PHX
22:15
AA 321
ORIG
360
CLTSC4
05:15
DFW
06:00
LAX
06:26
ORD
07:55
AA 321
ORD
08:20
PHX
09:40
AA 321
PHL
10:05
MBJ
11:30
AA 321
MCO
13:45
PHL
14:45
AA 321
LAX
15:00
PHL
16:05
AA 321
SFO
16:46
ORD
18:00
AA 321
PHL
19:05
DFW
20:27
AA 321
TPA
20:52
BOS
22:15
AA 321
SMF
06:02
PHX
07:30
AA 321
RDU
08:02
MBJ
09:25
AA 321
IAH
10:35
FLL
11:55
AA 321
MIA
12:14
DFW
13:15
AA 321
DFW
13:52
JFK
14:55
AA 321
DEN
15:24
PIT
16:35
AA 321
ATL
16:57
LAS
18:10
AA 321
JAX
19:15
RDU
20:10
AA 319
JFK
21:02
DTW
22:20
AA 321
SAN
06:04
SFO
07:30
AA 321
FLL
08:22
SEA
09:40
AA 321
PVD
10:32
PUJ
11:50
AA 321
DFW
12:27
ATL
13:24
AA 321
DFW
15:20
FLL
16:24
AA 321
MIA
16:54
SFO
18:05
AA 321
SAN
18:49
ORD
20:05
AA 321
LGA
21:04
SFO
22:20
AA 321
SLC
06:10
LAX
07:35
AA 321
DFW
08:34
SJU
09:50
AA 321
MIA
10:29
DEN
11:45
AA 321
MCO
12:04
MCO
13:01
AA 321
LAX
13:50
TPA
14:50
AA 321
PHX
15:35
SFO
16:40
AA 321
BOS
17:00
PDX
18:10
AA 321
BDL
19:07
MCI
20:00
AA 319
PHX
21:16
DEN
22:25
AA 321
LAS
08:10
PUJ
09:25
AA 321
DTW
10:11
CUN
11:25
AA 321
PIT
12:05
CLE
13:05
AA 319
DEN
13:21
MIA
14:20
AA 321
LAS
15:08
BOS
16:10
AA 321
FLL
17:00
SEA
18:10
AA 321
LAS
18:55
MSP
20:10
AA 321
MCO
21:03
BDL
22:09
AA 321
MCO
06:44
LGA
07:59
AA 321
PBI
08:31
DEN
09:35
AA 321
BDL
10:31
SJU
11:45
AA 321
BOS
13:30
DFW
14:25
AA 321
BOS
15:09
DFW
16:10
AA 321
DFW
16:31
DFW
17:40
AA 321
SFO
19:14
BOS
20:29
AA 321
SFO
21:13
MCO
22:19
AA 321
ORIG
420
CLTSC4
06:15
MIA
07:00
PHL
08:10
CUN
09:25
AA 321
RSW
10:13
PHX
11:25
AA 321
BNA
11:58
AUS
12:54
AA 319
PHX
13:31
LGA
14:26
AA 321
ORD
15:05
MCO
16:00
AA 321
MCO
17:16
DEN
18:25
AA 321
PHX
19:14
LAX
20:20
AA 321
LAX
21:09
FLL
22:10
AA 321
RDU
06:17
MCI
07:50
AA 319
MCO
08:10
SFO
09:24
AA 321
MCO
10:13
TPA
11:20
AA 321
IAH
12:11
JFK
13:19
AA 73H
MIA
15:16
ORD
16:25
AA 73H
DFW
18:11
DFW
19:10
AA 321
DFW
19:35
LGA
20:40
AA 321
PHX
08:11
MCO
09:19
AA 321
TPA
10:18
ORD
11:25
AA 321
EWR
12:23
EWR
13:26
AA 73H
DTW
13:45
STL
14:40
AA 319
EWR
15:05
MIA
16:25
AA 73H
PHX
17:13
LAX
18:16
AA 321
LGA
19:20
DEN
20:20
AA 321
PVD
21:20
DCA
22:14
AA 319
LAX
08:43
BOS
09:45
AA 321
MSP
10:26
BOS
11:30
AA 321
BDL
12:09
RDU
13:04
AA 319
MCI
13:27
MSY
14:35
AA 319ORIG
970
CLTSC4
15:25
LGA
16:10
ORD
16:39
PHL
17:30
AA 321
TPA
19:07
SLC
20:05
AA 321
DFW
21:12
MSP
22:10
AA 321
ORIG
575
CLTSC4
08:50
ORD
09:35
DFW
10:37
LGA
11:40
AA 321
FLL
12:19
DCA
13:15
AA 319
JFK
14:00
EWR
15:15
AA 73H
IND
15:30
DCA
16:40
AA 319
MCO
18:59
PHX
19:55
AA 321
DEN
21:18
TPA
22:15
AA 321
ATL
06:52
ATL
08:00
AA 320
ORF
08:29
ORF
09:15
AA 319
PVD
12:28
IAH
13:20
AA 319
MEM
13:39
SAT
14:40
AA 319
SJU
18:35
SFO
19:30
AA 321
MIA
21:13
EWR
22:15
AA 73H
MSP
08:46
DFW
09:29
AA 321ORIG
680
CLTSC4
10:35
LAS
11:20
DCA
11:52
RIC
12:45
AA 319
PIT
13:31
BDL
14:30
AA 319
BDL
15:02
DTW
16:30
AA 319
ORD
21:27
MIA
22:30
AA 73H
ORIG
680
CLTSC4
10:35
MCO
11:20
CHS
12:25
JAX
13:15
AA 319
CLE
13:37
RDU
14:30
AA 319
RSW
15:03
PVD
16:30
AA 319
IND
17:11
STL
18:25
AA 319
EWR
20:36
JFK
22:10
AA 73H
TPA
06:46
RDU
07:50
AA 319
JFK
08:30
MIA
09:30
AA 73HORIG
730
CLTSC4
11:25
EWR
12:10
MSY
13:51
PIT
14:55
AA 319
BOS
19:45
STL
20:33
AA 319
SYR
21:04
ROC
22:16
AA 319
DCA
07:02
PIT
07:59
AA 319
EWR
08:16
JFK
09:06
AA 73H
ORF
12:23
IND
13:12
AA 319
RDU
13:56
IAH
14:55
AA 319
BWI
15:15
BDL
16:20
AA 319
AUS
17:15
BDL
18:25
AA 319ORIG
1229
CLTSC4
19:44
PVD
20:29
RDU
20:57
CLE
22:25
AA 319
RIC
06:34
BDL
07:30
AA 319
DTW
08:08
BUF
09:10
AA 319
JFK
10:42
DFW
11:35
AA 73H
LGA
12:17
ORD
13:05
AA 319
CHS
14:02
DCA
14:55
AA 319
DCA
15:13
MCI
16:15
AA 319
MCI
17:13
MIA
18:20
AA 319
JFK
19:09
EWR
20:10
AA 73H
BWI
20:38
RIC
22:40
AA 319
MIA
08:47
EWR
09:55
AA 73H
MDT
10:33
JAX
11:50
AA 319
BUF
13:26
BOS
14:15
AA 319
RDU
15:44
BWI
16:45
AA 319
ALB
17:01
DTW
18:05
AA 319
EWR
19:16
IAH
20:10
AA 73H
PIT
20:39
ORD
22:35
AA 319
EWR
06:47
EWR
07:45
AA 73H
BDL
08:21
CLE
09:40
AA 319
EWR
10:02
EWR
11:05
AA 73HORIG
799
CLTSC4
12:34
BWI
13:19
ORIG
875
CLTSC4
13:50
ROC
14:35
JAX
15:20
SYR
16:19
AA 319
BWI
17:07
RDU
18:10
AA 319
BNA
19:24
BUF
20:15
AA 319
PBI
21:15
SYR
22:20
AA 319
TPA
08:41
BWI
09:40
AA 320
LGA
10:44
BNA
11:40
AA 319
BNA
15:14
RIC
16:09
AA 319
ORD
18:04
ILM
20:00
AA 319
SFO
06:14
DEN
07:35
AA 321
RIC
08:15
MEX
09:30
AA 319
BUF
10:14
NAS
11:30
AA 319
PHL
11:59
PHL
13:00
AA E90
PHL
15:37
PBI
16:30
AA 319
RDU
17:04
PWM
18:05
AA 319
BUF
20:58
ALB
22:15
AA 319
ORIG
395
CLTSC4
05:50
PHL
06:35
BOS
07:12
BNA
08:00
AA 319
JAX
08:17
DCA
09:30
AA 319
JAX
10:19
BWI
11:35
AA 319
ATL
15:08
JAX
15:59
AA 319
JAX
16:50
DCA
17:50
AA 319ORIG
1200
CLTSC4
19:15
JFK
20:00
ALB
21:22
ATL
22:40
AA 319
PIT
06:42
PVD
07:35
AA 319
MEM
08:43
RSW
09:55
AA 319
MCI
10:28
PIT
22:25
AA 319
ORIG
365
CLTSC4
05:20
LGA
06:05
BUF
08:08
DTW
09:19
AA 319
AUS
10:39
ALB
11:55
AA 319
DTW
15:39
MSY
16:30
AA 319
DCA
16:54
IAH
17:54
AA 319
STL
19:10
MEM
20:00
AA 319
RIC
20:55
AUS
22:10
AA 319
ORIG
470
CLTSC4
07:05
BOS
07:50
IND
08:44
BDL
09:50
AA 319
PWM
10:33
ATL
11:39
AA 319930
966
MSY
15:30
BNA
16:06
AA 319
CLE
16:59
RIC
17:54
AA 319
PIT
18:44
PIT
19:54
AA 319
DTW
20:55
LGA
22:04
AA 319
ORIG
450
CLTSC4
06:45
PHL
07:30
DCA
08:28
CHS
09:30
AA 319
PBI
10:10
PHL
11:15
AA 319
RIC
15:41
ALB
16:24
AA 319
IAH
19:25
RIC
20:30
AA 319
ORIG
450
CLTSC4
06:45
DCA
07:30
IAH
08:38
NAS
09:40
AA 319
STL
10:27
DCA
11:30
AA 319
NAS
15:10
BUF
16:29
AA 319
NAS
17:04
PIT
18:15
AA 319
DCA
21:29
JAX
22:35
AA 319
ORIG
455
CLTSC4
06:50
FLL
07:35
PIT
08:35
IAH
09:35
AA 319
SAT
10:39
MCI
11:40
AA 319
ILM
08:04
PHL
09:00
AA 319
ROC
10:14
CHS
11:14
AA 319
MSY
21:20
BUF
22:25
AA 319
CLE
08:30
MEM
09:24
AA 319
PIT
10:20
DTW
11:20
AA 319
IAH
21:10
PBI
22:11
AA 319
STL
08:51
PIT
09:45
AA 319
ALB
10:23
RDU
11:20
AA 319
ORIG
465*
CLTSC4
06:55
MBJ
07:45
MBJ
16:50
TPA
17:53
AA 321
GCM
18:14
BNA
19:49
AA 320*1229
TERM
CUN
20:29
CLTSC4
21:14
ORIG
475*
CLTSC4
07:05
PUJ
07:55
MBJ
14:53
RDU
16:10
AA 320
CUN
16:40
BOS
17:55
AA 321
SXM
18:40
DCA
19:45
AA 320
AUA
20:50
BWI
22:30
AA 320
AADO
A21
A22
A23
A24
A25
A26
A27
A28
A29
A1
A3
A5
A7
A9
A11
A13
A12
A10
A8
A6
A4
A2
B1
B3
B5
B7
B9
B11
B13
B15
B16
B14
B12
B10
B8
B6
B4
B2
C2
C4
C6
C8
C10
C12
C14
C16
AAIN
I1
I2
Date:04/11/2019 Time:12:51CLT 2016-Scenario 3
Page # 1 of 4
00:00 01:00 02:00 03:00 04:00 05:00 06:00 07:00 08:00 09:00 10:00 11:00 12:00 13:00 14:00 15:00 16:00 17:00 18:00 19:00 20:00 21:00 22:00 23:00
*975
732*
*835
1100*
785
704*
ORIG
1105*
*950
724
*780
748*
ORIG
1120*
*955
TERM
*1100
1245*
*980
1115*
*1110
TERM
LHR
16:15
LHR
20:15
AA 333
CDG
13:55
CDG
18:20
AA 332
DUB
13:05
FRA
16:35
AA 332
CLTSC4
16:55
FCO
18:25
AA 333
MAD
15:50
DUB
18:05
AA 332
LHR
18:30
CLTSC4
19:30
AA 333
FRA
13:00
MAD
16:40
AA 332
CLTSC4
17:10
LHR
18:40
AA 333
FCO
15:55
CLTSC4
16:55
AA 333
BCN
18:20
BCN
20:45
AA 332
MUC
16:20
MUC
18:35
LH 346
*981
1711
*1135
1215
*1136
1215
*1120
1195
*1115
1189
22
823
676
2251
822
2597
1070
826
1149
1407
1268
TERM
1346
TERM
1421
TERM
940
1793
1387
TERM
1400
TERM
566
521
780
1140
897
1199
1399
TERM
1332
TERM
40
PUSH TERM
310
200
743
1688
830
1029
1243
1207
1225
932
ORIG
510
530
PUSH
659
TERM
PULL
785
823
880
907
985
1066
1350
390
590
640
780
827
881
917
995
1015
1110
1161
1240
1255
1361
418
465
510
680
740
870
926
990
1012
1080
1118
1190
1238
1340
383
549
564
674
735
790
825
875
944
995
1030
1084
1158
1225
1266
1350
533
695
725
779
822
865
955
1005
1023
1075
1123
5398
1258
1335
410
455
502
585
606
695
737
790
ORIG
890
933
979
1042
1094
1163
1225
1280
1355
ORIG
455
522
599
621
679
725
770
920
965
1025
1075
1129
1184
1275
TERM
491
559
606
678
725
769
930
970
1045
1095
1157
1210
1291
1360
501
566
623
680
736
780
1145
1190
1268
1335
510
575
648
700
742
785
1145
1189
1259
1325
384
465
518
575
ORIG
674
750
790
1031
TERM
1295
1360
378
450
529
585
621
665
1041
1095
1123
1185
1297
1360
401
465
501
549
646
690
745
TERM
811
865
1008
TERM
1132
1194
1295
1355
ORIG
550
634
TERM
748
814
831
885
913
1080
1133
1189
1265
TERM
ORIG
585
639
TERM
732
785
817
867
940
1000
1138
5306
387
444
496
540
555
595
610
PUSH
ORIG
5593
PULL
890
1029
1105
1259
1345
753
1095
904
2133
528
2422
727
1629
603
1454
978
2651
601
218
1038
1446
841
880
1199
1240
412
450
841
880
847
885
922
960
1058
1100
ORIG
613*
CLTSC4
10:35
SXM
11:25
PUJ
16:21
EWR
18:05
AA 320
PLS
18:55
MCO
20:15
AA 321
MBJ
18:56
MIA
20:15
AA 321
*1062
1095
PUJ
17:42
SAN
18:15
CUN
18:40
PBI
19:55
AA 321*1224
TERM
SXM
20:24
CLTSC4
21:09
MEX
18:35
MDT
19:49
AA 319*1216
TERM
PUJ
20:16
CLTSC4
21:01
ATL
00:22
ATL
05:30
DL M90ORIG
420
CLTSC4
06:15
ATL
07:00
ORIG
485
CLTSC4
07:20
MSP
08:05
544
579
DTW
09:04
DTW
09:39
ATL
11:16
ATL
12:00
DL 717
ATL
12:33
ATL
13:15
DL 717
ATL
13:42
ATL
14:30
DL 320
ATL
15:04
ATL
15:45
DL M881000
1524
MSP
16:40
DTW
17:20
DL 320
ATL
17:50
ATL
18:45
DL M88
ATL
19:09
ATL
20:05
DL M88
ORIG
360
CLTSC4
05:15
DTW
06:00
ORIG
465
CLTSC4
07:00
SLC
07:45
ATL
08:48
ATL
09:30
DL M88
DTW
12:07
DTW
12:50
DL 319864
1503
MSP
14:24
MSP
14:59
DTW
15:40
MSP
16:30
DL 319
ORIG
495
CLTSC4
07:30
ATL
08:15
ATL
10:03
ATL
10:45
DL M90
ATL
16:18
ATL
17:00
DL M881120
1155
DTW
18:40
DTW
19:15
ORIG
350
CLTSC4
05:05
IAH
05:50
ORD
09:26
ORD
10:15
UA 73G
ORD
13:00
ORD
13:45
UA 319
DEN
14:57
DEN
16:22
UA 320
ORIG
408
CLTSC4
06:03
ORD
06:48
ORIG
390
CLTSC4
05:45
MDW
06:30
PULL
3773
CLTSC4
06:55
BWI
07:40
575
3055
BWI
09:35
DAL
10:10
1010
1045
MDW
16:50
MDW
17:25
1075
1493
HOU
17:55
HOU
18:30
1135
1721
DAL
18:55
BWI
19:30
JFK
10:01
JFK
10:40
B6 E90659
696
BOS
10:59
BOS
11:36
B6 E90
BOS
17:18
BOS
18:00
B6 E901130
1168
JFK
18:50
JFK
19:28
B6 E90
DEN
05:10
DEN
07:20
F9 319
MCO
12:22
PHL
13:24
F9 321
PHL
13:49
MCO
14:49
F9 321
ORD
20:42
ORD
21:30
F9 320
TTN
20:25
TTN
21:10
F9 319
DAY
13:43
ORF
14:40
AA CR2
ORF
15:07
GSP
16:25
AA CR2
SDF
17:46
CHO
22:30
AA CR2
PHF
06:30
VPS
09:50
AA CR2
LEX
10:40
BHM
13:00
AA CR2
BTR
13:47
DAY
14:41
AA CR2
SDF
15:17
MKE
16:35
AA CR2
TLH
16:55
AVL
18:30
AA CR2
HSV
19:21
HPN
20:40
AA CR2
AVL
20:55
MGM
22:41
AA CR2
357
392
GSP
05:57
DCA
06:32
PHL
06:58
CAE
07:45
AA CR2
BHM
08:30
FAY
11:20
AA CR2
TYS
12:20
BHM
14:30
AA CR2
FAY
15:26
IND
16:30
AA CR2
AVL
16:52
CAE
18:00
AA CR2
VPS
18:38
PHF
19:50
AA CR2
AGS
20:38
CAE
22:20
AA CR2
CHO
06:23
BTR
09:09
AA CR2
DCA
09:24
AGS
11:14
AA CR2
CRW
12:15
FWA
13:10
AA CR2
FAY
13:45
TYS
14:35
AA CR2
MLB
15:44
JAN
16:35
AA CR2
TYS
17:10
CAK
18:04
AA CR2
CAK
19:18
GNV
20:25
AA CR2
VPS
21:06
AGS
22:30
AA CR2
TLH
08:53
EVV
11:35
AA CR2
PGV
12:05
LEX
12:59
AA CR2
MOB
13:42
LEX
14:25
AA CR2
LEX
15:55
VPS
16:45
AA CR2
CAE
17:03
AGS
17:55
AA CR2
ORF
18:43
AGS
19:45
AA CR21200
1240
LGA
20:00
BTV
20:40
AA E75
JAN
20:58
BTR
22:15
AA CR2
CAE
06:50
BHM
07:35
AA CR2
HPN
08:22
AGS
09:45
AA CR2
YUL
10:06
GSP
11:35
AA CR2
GSP
12:17
TLH
13:10
AA CR2
OAJ
15:33
MGM
16:19
AA CR2
PHF
17:22
LEX
18:14
AA CR2
BHM
19:23
YUL
20:25
AA CR2
GNV
21:20
LEX
22:35
AA CR2
MOB
08:42
GSP
09:59
AA CR2
CAE
10:21
MYR
11:19
AA CR2
CLE
12:05
GNV
12:50
AA CR2
CHA
14:01
VPS
14:40
AA CR2
HSV
15:20
BHM
16:05
AA CR2
FAY
17:05
GNV
17:55
AA CR2
GSP
18:49
MKE
19:44
AA CR2
FAY
19:59
HSV
20:40
AA CR7
GNV
06:52
LEX
07:30
AA CR2
PGV
08:11
PGV
09:19
AA CR2
VPS
10:06
TYS
11:18
AA CR2
OAJ
12:05
CHO
12:49
AA CR2
MYR
14:01
AVL
14:40
AA CR2
CHO
15:30
CAE
16:10
AA CR2
LEX
17:25
CHO
18:15
AA CR2
YYZ
19:17
CAE
20:10
AA CR2
DAY
21:31
EVV
22:40
AA CR2
434
470
DAY
07:14
CLE
07:50
AA CR2
AGS
08:21
OAJ
09:26
AA CR2
EVV
10:23
JAN
11:20
AA CR2
AGS
12:16
OAJ
13:00
AA CR2
PGV
14:07
FAY
14:45
AA CR2
CAE
15:22
HSV
16:00
AA CR21065
1105
BHM
17:45
CHA
18:25
AA CR2
EWN
19:05
FAY
19:50
AA CR21205
1245
MEM
20:05
MLB
20:45
AA CR9
CHO
21:08
TLH
22:15
AA CR2
428
463
CAK
07:08
CHA
07:43
LEX
08:30
MOB
09:35
AA CR2
MKE
10:48
SDF
11:40
AA CR2
CAE
12:22
FAY
13:05
AA CR2829
865
AGS
13:49
SDF
14:25
AA CR2923
960
EVV
15:23
CAK
16:00
AA CR21030
1069
MOB
17:10
MOB
17:49
AA CR21085
1125
ATL
18:05
DSM
18:45
AA CR9
CRW
19:05
FWA
19:49
AA CR2
CAE
20:59
MKE
22:05
AA CR2
TYS
06:24
GSP
07:45
AA CR7
MGM
08:38
TYS
09:35
AA CR2
BHM
12:30
MOB
13:10
AA CR2829
865
VPS
13:49
PHF
14:25
AA CR2937
974
TYS
15:37
EWN
16:14
AA CR21180
1220
MGM
19:40
VPS
20:20
AA CR2
BTR
21:35
MOB
22:40
AA CR2
CHS
06:18
AUS
07:30
AA CR9
FWA
08:49
MGM
09:45
AA CR2
BTV
10:21
RIC
11:05
AA E75745
780
GNV
12:25
TYS
13:00
834
870
GSP
13:54
YYZ
14:30
AA CR2969
1005
GNV
16:09
BTR
16:45
CHA
17:21
TYS
18:15
AA CR7
MSN
18:43
OAJ
19:45
AA CR7
MKE
21:37
GSP
22:40
AA CR2
ILM
06:41
SAV
07:45
AA CR9
CAE
08:21
HSV
09:09
AA CR2
CHA
10:46
PGV
11:30
AA CR2
CVG
13:31
HSV
14:25
AA CR7940
975
JAN
15:40
CRW
16:15
MLB
18:52
MSN
19:54
AA CR7
CAK
21:35
CRW
22:35
AA CR2
TLH
12:28
MSN
13:34
AA CR7
LIT
13:51
AUS
14:45
AA CR9
PHF
15:13
DAY
18:00
AA CR7
OAJ
18:53
SDF
19:49
AA CR7
CHO
12:12
AVL
13:05
AA CR7
GPT
13:37
CHA
14:27
AA CR7
CHA
15:40
GPT
16:40
AA CR7
HSV
17:38
PHF
18:20
AA CR7
IND
18:58
CAK
19:45
AA CR71296
1325
LEX
21:36
CAK
22:05
ORF
06:27
CVG
07:24
AA CR9
CRW
08:16
GNV
09:00
AA CR2
ROA
09:15
GSO
09:55
AA DH3
SAV
17:09
ILM
18:25
AA CR9
TYS
20:59
AVL
22:25
AA CR7
I3
I4
I5
I6
I7
I8
I10
I11
I12
I13
I14
I15
OADO
O1
O2
O3
O4
O5
O6
O13
O14
O18
O19
O20
O27
O28
O29
O30
O31
O32
OAIN
I21
I22
AEDO
D13
D12
D10
D8
D6
D4
E1
E2
E3
E5
E7
E9
E11
E13
E15
E17
Date:04/11/2019 Time:12:51CLT 2016-Scenario 3
Page # 2 of 4
00:00 01:00 02:00 03:00 04:00 05:00 06:00 07:00 08:00 09:00 10:00 11:00 12:00 13:00 14:00 15:00 16:00 17:00 18:00 19:00 20:00 21:00 22:00 23:00
404
460
520
560
609
650
730
780
798
TERM
929
974
1026
1100
1270
1334
412
460
490
560
645
705
739
795
831
TERM
924
990
1042
1110
1286
1350
ORIG
440
517
PUSH
646
693
921
969
PULL
1065
1120
1185
1300
TERM
382
460
493
560
646
705
827
873
ORIG
970
1036
1100
1130
1184
1199
1365
395
460
501
559
749
800
842
TERM
943
1004
1034
1085
1166
1230
1245
1350
424
470
512
5384
630
715
730
779
812
875
914
974
1013
1070
1140
1200
1263
1355
513
570
638
779
820
880
902
959
1018
1070
1130
1185
1270
TERM
ORIG
449
484
540
613
695
730
774
808
865
907
959
1039
1090
1141
1195
1321
TERM
399
455
502
555
620
695
735
779
813
864
914
965
1011
1060
1080
1125
1176
1230
1285
1360
389
PUSH
488
550
PULL
700
727
770
817
867
910
960
1028
1075
1129
1180
1269
1340
396
565
621
685
738
781
825
875
935
985
1024
1070
1159
1210
1255
1325
ORIG
455
489
570
641
705
749
792
845
895
915
964
1039
1085
1140
1190
1265
1335
ORIG
460
516
590
642
705
738
779
836
885
925
974
1030
1074
1156
1205
1260
1350
ORIG
465
523
595
618
680
836
885
930
979
1066
1110
1166
1215
1293
1360
526
590
619
680
836
885
936
985
1143
1190
1260
1350
529
590
639
700
841
890
933
980
1144
1190
1292
1355
398
475
496
554
649
710
747
804
832
880
914
960
1161
1205
1294
1355
411
465
527
585
650
710
727
770
859
915
935
980
1299
1355
ORIG
559
654
710
732
785
820
865
ORIG
995
1036
1110
1288
1360
391
450
498
549
610
662
830
870
942
TERM
1050
1105
1155
1230
1281
1329
529
580
628
680
743
790
830
875
906
970
1044
1095
1139
1210
406
470
515
564
630
680
819
859
938
990
1038
1085
1122
1189
1282
1350
389
450
480
685
935
984
1150
1215
ORIG
530
627
676
805
845
920
965
1123
1184
1289
1340
525
5089
622
670
933
976
1149
1209
1278
1355
518
560
607
674
1016
1070
1140
1190
1259
1325
531
580
822
885
940
959
1019
1070
1180
1230
517
TERM
842
895
930
987
1028
1079
1130
1185
1284
1350
492
580
631
TERM
1051
1095
416
460
495
575
ORIG
1184
1253
4925
512
560
645
695
1011
1070
1135
TERM
1275
1340
496
540
559
599
ORIG
710
1282
1355
523
564
645
TERM
1274
1330
516
567
670
715
ORIG
1325
ORIG
360
ORIG
445
1410
TERM
ORIG
369
ORIG
460
1379
TERM
ORIG
515
1034
6285
1281
TERM
1379
TERM TERM
ORIG
425
794
3642
906
5099
1050
1075
1281
TERM
732
770
743
781
1032
1075
1146
1189
1168
1210
1299
1340
941
979
647
685
1299
1340
1158
6227
IAD
06:44
CHS
07:40
AA CR9
FAY
08:40
CRW
09:20
AA CR2
SGF
10:09
SGF
10:50
AA ER4665
700
SDF
11:05
MLB
11:40
JAX
12:10
DTW
13:00
AA CR9
AVL
15:29
OAJ
16:14
AA CR7
OMA
17:06
SAV
18:20
AA CR91156
5221
LEX
19:16
TYS
19:56
AA CR7
GPT
21:10
SRQ
22:14
AA CR7
GSO
06:52
RIC
07:40
AA CR9
PHF
08:10
GPT
09:20
AA CR7
MSN
10:45
PHF
11:45
AA CR7
RDU
12:19
CAK
13:15
AA CR9
PIT
15:24
LIT
16:30
AA CR9
DTW
17:22
GSO
18:30
AA CR9
PHF
21:26
PHF
22:30
AA CR7
OAJ
10:46
FLO
11:33
AA DH3
CMH
15:21
ILM
16:09
AA E75
SAT
18:40
CVG
19:45
AA CR9
LYH
06:22
OAJ
07:40
AA DH3
OAJ
08:13
CVG
09:20
AA CR7
IND
10:46
CMH
11:45
AA E75
JAN
13:47
HPN
14:33
AA CR7
SYR
17:16
CHS
18:20
AA CR9
MEM
18:50
CHS
19:44
AA CR9
GSP
19:59
GSO
22:45
AA CR9
EWN
06:35
FAY
07:40
AA DH3
AVL
08:21
CHO
09:19
AA CR7621
655
ROA
10:21
HHH
10:55
IAD
12:29
BNA
13:20
AA CR9
STL
15:43
PNS
16:44
AA CR9
ILM
17:14
ORF
18:05
AA CR9
IAD
19:26
MSY
20:30
AA CR9
GSO
20:45
SAV
22:30
AA CR9
ROA
07:04
GSO
07:50
AA DH3
SDF
08:32
HPN
09:30
AA CR7
GSO
10:30
EWN
11:55
AA DH3
STL
12:10
SAV
12:59
AA CR9
JAX
13:32
ILM
14:35
AA CR9
DAY
15:14
SAV
16:14
AA CR9
CAK
16:53
GSP
17:50
AA CR9
SAV
19:00
ORF
20:00
AA CR9
ILM
21:03
CHS
22:35
AA CR9
HSV
08:33
JAN
09:30
AA CR7
SAV
10:38
ILM
12:59
AA CR9
DAB
13:40
MEM
14:40
AA CR9
MHT
15:02
TLH
15:59
AA CR9
DSM
16:58
CLE
17:50
AA CR9
PNS
18:50
GRR
19:45
AA CR9
SRQ
08:04
TLH
09:00
AA CR7555
590
SBY
09:15
AVL
09:50
BHM
10:13
BHM
11:35
AA CR9
FAY
12:10
CHS
12:54
AA CR9
CAK
13:28
IAD
14:25
AA CR9
MDT
15:07
CMH
15:59
AA CR9
RIC
17:19
BNA
18:10
AA CR9
TYS
19:01
SAV
19:55
AA CR91250
3904
HPN
20:50
ORF
21:30
AA CR2
TRI
06:39
HHH
07:35
AA DH8
TYS
08:22
LIT
09:15
AA CR9
TUL
10:20
DAY
11:35
AA CR9
MYR
12:15
MYR
12:59
AA CR9
GSO
13:33
CMH
14:24
AA CR9
OKC
15:14
SDF
16:05
AA CR9
PVD
16:51
SRQ
17:40
AA CR9
DAB
18:00
OKC
18:45
AA CR9
DAB
19:36
CLE
20:30
AA CR9
SDF
21:25
MYR
22:40
AA CR9
MDT
08:08
CMH
09:10
AA E75
MEM
12:07
SYR
12:50
AA CR9
SRQ
13:37
SAV
14:27
AA CR9
BHM
15:10
IAD
16:00
AA CR9
TUL
17:08
IAD
17:55
AA CR9
GSO
18:49
DAY
19:40
AA CR9
ORF
21:09
CHA
22:20
AA CR9
SAV
06:36
GRR
09:25
AA CR9
CLE
10:21
MDT
11:25
AA CR9
HTS
12:18
AGS
13:01
AA DH3
AUS
13:45
CHS
14:35
AA CR9
ILM
15:35
GSO
16:25
AA CR9
XNA
17:04
CVG
17:50
AA CR9
TLH
19:19
GSO
20:10
AA CR9
PNS
20:55
DAY
22:05
AA CR9
CHS
08:09
MYR
09:30
AA CR9
OMA
10:41
PIT
11:45
AA CR9
EWN
12:29
GSP
13:12
AA DH3
GRR
14:05
ATL
14:55
AA CR9
IAD
15:15
DAB
16:04
AA CR9
MYR
17:19
BHM
18:05
AA CR9
MYR
19:00
PNS
19:50
AA CR9
AUS
21:05
IAD
22:15
AA CR9
GSO
08:36
JAX
09:50
AA CR9
OKC
10:42
IAD
11:45
AA CR9
GSO
12:18
TRI
12:59
AA DH3
PNS
13:56
DTW
14:45
AA CR9
CLE
15:25
CVG
16:14
AA CR9
PWM
17:10
SDF
17:54
AA CR9
CMH
19:16
MHT
20:05
AA CR9
CHS
21:00
XNA
22:30
AA CR9
IAD
08:43
IND
09:55
AA CR9
AVP
10:18
AVP
11:20
AA CR9
AVL
12:12
LYH
12:50
AA DH3
ORF
13:56
MYR
14:45
AA CR9
CHS
15:30
TYS
16:19
AA CR91005
1045
BNA
16:45
LGA
17:25
AA CR9
IAD
17:46
TUL
18:30
AA CR9
CVG
19:26
ABE
20:15
AA CR9
XNA
21:33
BNA
22:40
AA CR9
MSY
08:46
SDF
09:50
AA CR9
DSM
10:19
GSO
11:20
AA CR9
TRI
12:23
ROA
13:01
AA DH3
MKE
13:56
ABE
14:45
AA CR9
AVP
15:36
XNA
16:25
AA CR9
CHS
17:12
MDT
17:55
AA CR9
CHS
19:03
SRQ
19:50
AA CR9
ROA
21:00
LYH
22:30
AA DH3
416
450
HHH
06:56
ROA
07:30
BNA
08:49
DAB
09:50
AA CR9
ABE
10:39
CVG
11:40
AA CR9752
786
LYH
12:32
FLO
13:06
IND
14:01
PNS
14:50
AA CR9
MYR
15:33
CHS
16:20
AA CR91061
1100
CMH
17:41
MYR
18:20
AA CR9
DTW
19:04
GSP
19:50
AA CR9
BHM
21:32
MEM
22:35
AA CR9
CMH
06:38
IND
07:55
AA E75
SAV
08:16
MKE
09:14
AA CR9
CVG
10:49
XNA
11:50
AA CR9
CMH
12:27
MCI
13:24
AA E75
ILM
13:52
MKE
14:40
AA CR9
CVG
15:14
MEM
16:00
AA CR9
MKE
19:21
IAD
20:05
AA CR9
BNA
21:34
ILM
22:35
AA CR9
IND
06:51
DTW
07:45
AA E75
MLB
08:47
PNS
09:45
AA CR9
CMH
10:50
PWM
11:50
AA CR9
SAV
12:07
CHA
12:50
AA CR7
YYZ
14:19
LGA
15:15
AA E75
MEM
15:35
MYR
16:20
AA CR9
ABE
19:06
OMA
19:49
AA CR9
CLE
21:39
LIT
22:35
AA CR9
DAY
10:54
PVD
11:50
AA CR9
IND
12:12
GSO
13:05
AA E75
SDF
13:40
DAB
14:25
AA CR9
ROA
17:16
LYH
18:30
AA DH3
SDF
19:28
DAB
20:10
AA CR9
CHA
21:28
PGV
22:40
AA CR2
AGS
06:31
SDF
07:30
AA CR2
GSP
08:18
IAD
09:09
AA CR9
SRQ
10:10
ORF
11:02
AA CR9
SAV
13:50
RIC
14:30
AA CR9
CRW
17:30
OAJ
18:25
AA DH3
PGV
19:15
EWN
20:30
AA DH3
IAD
21:21
TYS
22:09
AA CR9
GRR
08:49
RDU
09:40
AA CR9
XNA
10:28
OMA
11:20
AA CR9
DTW
12:23
MDT
13:10
AA E75
ROA
13:50
ROA
14:35
AA DH3
EWN
15:06
LYH
16:10
AA DH3
EWN
17:24
ROA
18:15
AA DH3
LYH
18:59
LYH
20:10
AA DH3
SRQ
21:39
SDF
22:20
AA CR9
SDF
06:46
MEM
07:50
AA CR9
DAB
08:35
SRQ
09:24
AA CR9
MHT
10:30
STL
11:20
AA CR9
SBY
13:39
CRW
14:19
AA DH3
TRI
15:38
TRI
16:30
AA DH3
HTS
17:18
HHH
18:05
AA DH8
AVL
18:42
CHO
19:49
AA DH3
CVG
21:22
BHM
22:30
AA CR9
CHA
06:29
IAD
07:30
AA CR9
HTS
08:00
AVL
11:25
AA DH8828
865
FLO
13:48
EWN
14:25
AA DH3
LYH
15:35
AVL
16:24
AA DH3
CHO
19:10
TRI
20:15
AA DH31293
1329
JAX
21:33
CMH
22:09
550
585
CVG
09:10
CAK
09:45
CHS
10:27
ILM
11:16
AA CR9
CRW
13:25
HTS
14:05
AA DH8
FLO
15:20
ROA
16:05
AA DH31021
1055
CHO
17:01
FLO
17:35
ROA
18:43
ROA
19:44
AA DH3
MDT
21:29
AVP
22:20
AA CR9
LIT
08:45
MHT
09:30
AA CR9
MYR
10:22
SAV
11:10
AA CR9822
859
AVL
13:42
CHO
14:19
AA DH8
GSP
15:33
PGV
16:16
AA DH3
AGS
19:09
FLO
20:09
AA DH3
LIT
21:18
JAN
22:35
AA CR9
PNS
08:38
OKC
09:20
AA CR9
FAY
10:07
ROA
11:14
AA DH3836
870
HHH
13:56
HHH
14:30
ROA
15:41
AGS
16:19
AA DH3
MDT
16:56
IND
17:50
AA E75
TRI
19:00
SBY
19:50
AA DH3
MYR
20:59
CVG
22:05
AA CR9
DAY
08:51
FAY
09:40
AA CR9
ORF
10:47
MEM
11:25
AA CR9
BNA
13:42
GSO
14:45
AA E75
GSO
16:59
CMH
17:50
AA E75
FLO
19:40
HTS
20:30
AA DH8
IND
21:39
MDT
22:20
AA E75
643
680
MEM
10:43
DSM
11:20
AA CR9
RIC
14:02
OMA
14:55
AA E75
GSO
15:30
YYZ
16:27
AA E75
MSY
17:08
JAX
17:59
AA E75
ILM
18:50
IND
19:45
AA E75
OAJ
21:24
EWN
22:30
AA DH3
LYH
08:12
TRI
09:40
AA DH3
HHH
17:31
TRI
18:15
AA DH81286
1325
LYH
21:26
ROA
22:05
AA DH3
CVG
06:56
MYR
07:40
AA CR9
CHO
08:15
LYH
09:35
AA DH3647
679
HHH
10:47
CRW
11:19
TRI
20:53
TRI
22:25
AA DH8
EWN
08:32
SBY
09:20
AA DH3
RIC
10:45
CLE
11:35
AA CR9
SGF
16:51
SGF
17:50
AA ER4
HHH
21:15
HHH
22:20
AA DH8
TRI
08:16
HTS
09:00
AA DH3
YYZ
09:19
BNA
09:59
AA E75
YYZ
21:22
MSY
22:35
AA E75
FLO
08:43
EWN
09:24
AA DH3
CMH
21:14
YYZ
22:10
AA E75
CMH
08:36
YYZ
09:27
AA E75
IAD
11:10
SAT
11:55
AA CR9
582
6150
IAD
09:42
IAD
10:22
UA CR7712
3311
EWR
11:52
EWR
12:27
864
3315
EWR
14:24
IAH
15:02
UA E701006
4843
ORD
16:46
ORD
17:21
1135
6160
IAD
18:55
IAD
19:30
514
3648
EWR
08:34
EWR
09:09
849
6120
IAH
14:09
IAD
14:44
1040
1076
EWR
17:20
EWR
17:56
IAH
17:14
IAH
18:05
UA E7W
515
3840
LGA
08:35
LGA
09:15
DL CR9632
667
MSP
10:32
MSP
11:07
LGA
13:14
LGA
14:00
DL CR9
LGA
15:06
LGA
16:00
DL CR7
LGA
19:18
LGA
20:00
DL CR7
E19
E18
E16
E14
E12
E10
E21
E23
E25
E27
E29
E31
E33
E35
E38
E36
E34
E32
E30
E28
E26
E24
E22
E20
E8
E6
E4
F1
F2
F3
F4
F5
F6
F7
F8
F9
F10
F11
F12
F13
F14
F15
F16
F17
F18
F19
O7
O8
O9
O10
Date:04/11/2019 Time:12:51CLT 2016-Scenario 3
Page # 3 of 4

00:00 01:00 02:00 03:00 04:00 05:00 06:00 07:00 08:00 09:00 10:00 11:00 12:00 13:00 14:00 15:00 16:00 17:00 18:00 19:00 20:00 21:00 22:00 23:00
ORIG
420
674
5069
1032
5135
1271
TERM
720
1025
O311
O312
T379
T380
O323
O324
T371
T372
O333
O334
T393
T394
O319
O320
T373
T374
O321
O322
T411
T412
O341
O342
PSH
565
T403
T404
O335
O336
PSH
785
T369
T370
O331
O332
PSH
1065
T381
T382
O315
O316
T385
T386
O325
O326
T387
T388
O339
O340
PSH
890
T375
T376
O313
O314
T389
T390
O317
O318
T377
T378
O343
O344
T391
T392
T395
T396
O327
O328
PSH
700
T397
T398
O329
O330
T407
T408
PSH
3773
T401
T402
T405
T406
O337
O338
T409
T410
O345
O346
T431
T432
O347
O348
T417
T418
O349
O350
T415
T416
O351
O352
T429
T430
O355
O356
T423
T424
O353
O354
T419
T420
T425
T426
T421
T422
T413
T414
T427
T428
T399
T400
T383
T384
597
3399
LGA
09:57
LGA
10:30
LGA
11:14
LGA
12:00
DL CR7
LGA
17:12
LGA
18:00
DL CR7
666
696
CVG
11:06
CVG
11:36
515
545
BKW
08:35
BKW
09:05
BKW
12:00
BKW
17:05
VC EM2
639
7347
YYZ
10:39
YYZ
11:10
1069
7349
YYZ
17:49
YYZ
18:20
CLT
00:00
RIC
19:45
AA 319
PIT
21:19
CLT
23:59
AA 319
CLT
00:00
MDT
19:04
AA 319
PIT
19:24
CLT
23:59
AA 319
CLT
00:00
DEN
07:50
UA 319
JAX
10:59
CLT
23:59
AA 319
CLT
00:00
BDL
15:35
AA 319
ELP
21:35
CLT
23:59
AA 319
CLT
00:00
IAH
14:10
AA 319
CLT
00:00
SEA
06:50
DL 319
LGA
08:53
CLT
17:45
AA 321
FLL
22:40
CLT
23:59
NK 320
CLT
00:00
IAH
05:05
UA 319
MKE
09:25
CLT
12:30
AA CR2
TPA
14:08
CLT
23:59
AA 321
CLT
00:00
IAH
06:45
NK 320
CAK
09:12
CLT
17:10
AA CR7
PHL
19:45
CLT
23:59
AA 321
CLT
00:00
PBI
18:28
AA 321
TPA
19:47
CLT
23:59
AA 321
CLT
00:00
PBI
13:40
AA 321
PHX
19:54
CLT
23:59
AA 321
CLT
00:00
MSP
07:20
DL 717
GSP
10:45
CLT
14:15
AA CR7
PVD
20:10
CLT
23:59
AA 321
CLT
00:00
MSP
18:29
AA 738
LAX
20:40
CLT
23:59
AA 321
CLT
00:00
RDU
17:25
AA 738
STT
21:09
CLT
23:59
AA 321
CLT
00:00
ATL
07:30
DL 738
JFK
13:10
CLT
23:59
AA 738
ATL
01:02
CLT
23:59
DL 739
CLT
00:00
HOU
04:40
WN 73H
MYR
07:04
CLT
11:05
AA CR9
ORD
22:47
CLT
23:59
UA 73G
CLT
00:00
MDW
05:45
WN 73W
ATL
23:06
CLT
23:59
DL 73H
MDW
01:20
CLT
06:55
WN 73W
LGA
21:51
CLT
23:59
DL CS1
JFK
22:51
CLT
23:59
DL CS1
CLT
00:00
JFK
06:08
DL CS1
BOS
22:50
CLT
23:59
B6 E90
CLT
00:00
FLL
07:15
B6 E90
HSV
15:55
CLT
23:59
AE CR7
CLT
00:00
HSV
15:25
AE CR2
OKC
17:39
CLT
23:59
AE CR9
CLT
00:00
TRI
17:40
AE CR7
BTV
19:12
CLT
23:59
AE CR9
CLT
00:00
TYS
17:40
AE CR7
CLE
19:18
CLT
23:59
AE CR9
CLT
00:00
XNA
09:20
AE CR9
CHS
17:47
CLT
23:59
AE CR9
CLT
00:00
YUL
10:01
AE E75
MHT
19:53
CLT
23:59
AE CR9
GRR
20:25
CLT
23:59
AE CR9
GRB
20:27
CLT
23:59
AE CR9
BDA
19:20
CLT
23:59
AE E75
YUL
19:36
CLT
23:59
AE E75
MDW
01:20
CLT
23:59
WN 73W
ORD
18:44
CLT
23:59
AA 738
O11
O12
O15
O23
O24
O25
O26
HS
R01
R02
R03
R04
R05
R06
R07
R08
R09
R10
R11
R12
R13
R14
R15
R16
R17
R18
R19
R20
R21
R22
R23
R24
R25
R26
R27
R28
R29
R30
R31
R32
R33
R34
R35
Date:04/11/2019 Time:12:51CLT 2016-Scenario 3
Page # 4 of 4

CLT 2028 Gating Scenario 2 1

00:00 01:00 02:00 03:00 04:00 05:00 06:00 07:00 08:00 09:00 10:00 11:00 12:00 13:00 14:00 15:00 16:00 17:00 18:00 19:00 20:00 21:00 22:00 23:00
865*821
876*2044
823
65
732
1885
1897
1998
1828
TERM
1770 8331789
1855
1915
2038
1976
TERM1717
2005
TERM
1709876
821*
445
580637
1598
24831922
148 1909695
1810436 1809
1768
1747
753
2039
550
TERM
1839 6291154
1583494
720
830
1853
660
1945
733
2035
TERM
5330
5089
1729
1967*893
1051
PUSH
560
6162070
680 879* 628 20801889
1798
277
TERM
783
TERM
19121977
1936581
294
1673793
1971
TERM
1944
1946
1735
826*1842 1760
1745
1843
1836
1841557
1866 1837 1878 891704
20502028 416
499
1865
1772 1961 19701810
2055
724
559
1908
1799
1798
8441857
835 858 1808 2059 1992 673 19211724
TERM1788
883* 5211725
691
2091
1972
1899
705
786
678747 1812
TERM
1925826
1735873 2063
2107
443
730
17401820 1863
885* 2066 2068 1719487
451
1998
1897
925
1109
382
100
1458
1917
748
1999
622
7312075 1704
19101964
1849
2055
6951775 470
760
19961873
696
1813461 679
1882
2054
1855
TERM
428
1791
609
17871769
892
472
898
2057
790
2053
1615
14472046
1787
609
616
17831796
431
428445 1862
1907
2541715 651
633
541
2039
890
579
6621982 752 1973 1860
1999
1899
1811
5651920 1774
1930
4871960 1937 2078 2045 504
767
466
662
19751737
661
1872
413
7132064 653 1827
1130
184
1799
19081871
334
TERM1277
19801955
1905
1967
17291914
2530
2249
819
972
799
1733
1861
2043
1364 14961376
1404657 379 703 2038
2011
1797
2448
1453
746
463
1245
1608
2042829
19412065
1633
296
836
6191384
476
840*
1451
1458
1849
19501700
539
7251711
766
TERM
1805
745
1942 330 2077 7562032
18211701
844
TERM1940
17321751
97
1924
TERM
1446
652
2069
2084
1843
18642067
2084
TERM1893
2020
20911780 1831
887
TERM
1974
12422648
864
2035
2014
408
1978
8521923 1934 1653 2052
78
881
18171941
829*1753 2002 859
101
13901952
423
1965*1988 1938 1962 765 861
5563
TERM
2062 1722 17301267
751
1756
17532036
584
1701854
1654 18531864
17451750 1870
1903 1677 1814 2047 1752744
18611987
624
6581756 1847 1840 1979 1981
1904 17951707
613*
2017
PUSH
1886
2032
422
524
808
TERM
852
1978
1797
1977
422
1540
1954
TERM1793
2531
2529
784
993850 1802
1065
PUSH
605
1029*1785
469 1784 18681692
TERM
451
TERM
973
TERM
713
413
1840
1434*853
1891
736
2043
TERM
*869
749
*827
1919
*368
1826
*843
2056
*884
1806
*880
1851
1829
721
281
1870
*860
1615*
ORIG
2451
CLTSC4
5:15
DFW
6:00
PVD
8:12
SXM
9:25
AA 320
BNA
10:01
AUA
11:30
AA 320
BOS
12:04
MIA
13:20
AA 321
SAN
14:51
LAS
15:49
AA 321
MSY
19:14
BUF
20:15
AA 319
MSP
21:04
BWI
22:30
AA 320
ORIG
2060
CLTSC4
5:20
LGA
6:05
ORF
8:29
ORF
9:15
AA 319
MSY
10:24
STT
11:50
AA 320
PHL
13:18
MSP
14:50
AA 321
BWI
17:07
PVD
18:15
AA 320
LAX
21:09
FLL
22:10
AA 321
ORIG
2010
CLTSC4
5:50
PHL
6:35
BOS
8:28
FLL
9:50
AA 321
BWI
10:20
GCM
11:25
AA 320
RSW
12:00
DEN
14:20
AA 321
MCO
15:25
LAS
16:45
AA 321ORIG
1915
CLTSC4
17:25
RDU
18:10
EWR
19:16
IAH
20:10
AA 738
DCA
21:29
RIC
22:40
AA 319
ORIG
1877
CLTSC4
6:15
MIA
7:00
JFK
8:30
MIA
9:30
AA 738
SYR
10:11
MSY
11:03
AA 319
ORD
13:23
TPA
14:50
AA 321
LGA
16:44
PHX
17:45
AA 321
LGA
18:02
MSY
18:55
AA 320
STL
19:10
PIT
19:54
AA 319
SJU
20:23
MSP
22:10
AA 321
ORIG
1956
CLTSC4
6:45
PHL
7:30
ILM
8:04
PHL
9:00
AA 319ORIG
1964
CLTSC4
10:55
MCI
11:40
TPA
12:06
BOS
13:10
AA 321
SMF
13:28
SAN
14:45
AA 321
LGA
15:00
PHX
16:15
AA 321
DFW
16:31
PHL
17:30
AA 321
PDX
17:58
SJC
19:09
AA 320
BNA
19:24
SAT
20:25
AA 319
ORIG
868
CLTSC4
6:45
ROC
7:30
MSY
8:46
MHT
9:30
AA 319
ORD
10:08
PUJ
11:50
AA 321
LGA
12:17
ORD
13:05
AA 738PULL
275
CLTSC4
18:25
PVD
19:10
DFW
19:35
DEN
20:20
AA 321
ALB
21:22
CLE
22:25
AA 319
ORIG
928
CLTSC4
6:45
RSW
7:30
ORD
8:20
PHX
9:40
AA 321
LGA
10:00
PLS
11:40
AA 321
ORD
11:57
PHX
13:00
AA 321
MIA
13:35
ORD
14:50
AA 321
BWI
15:15
PHL
20:05
AA 321
ORIG
1727
CLTSC4
6:45
SAT
7:30
FLL
8:22
SEA
9:40
AA 321
RDU
10:38
EWR
12:10
AA 321
LGA
13:37
MCO
14:45
AA 321
PBI
16:00
EWR
19:11
AA 321
BOS
19:45
STL
20:33
AA 319
ORIG
1993
CLTSC4
6:50
LAX
7:35
SFO
8:01
ORD
9:35
AA 321
FLL
10:03
MBJ
11:30
AA 321
PHX
12:06
PIT
13:09
AA 321
BWI
13:30
FLL
14:30
AA 321
IAH
15:35
ALB
16:24
AA 319
MSP
17:40
FLL
19:12
AA 321ORIG
2006
CLTSC4
19:45
RIC
20:30
LGA
21:04
SFO
22:20
AA 321
ORIG
525
CLTSC4
6:50
FLL
7:35
EWR
7:55
PBI
9:20
AA 321
DCA
10:32
RSW
11:55
AA 321
MIA
12:14
DFW
13:15
AA 321
BOS
13:30
DFW
14:25
AA 321
SFO
15:03
LGA
16:10
AA 321
CLE
16:59
RIC
17:54
AA 319
BWI
18:39
FLL
20:20
AA 321
PHX
21:16
DEN
22:25
AA 321
ORIG
1725
CLTSC4
6:55
MCO
7:40
LGA
8:13
DFW
9:29
AA 321
IAH
10:35
FLL
11:55
AA 321
FLL
12:19
BWI
13:19
AA 321
LAX
13:50
PHL
14:45
AA 321
LAX
15:00
PHL
16:05
AA 321
SFO
16:46
SFO
18:05
AA 321
PBI
18:54
DFW
20:27
AA 321
SFO
21:13
MCO
22:19
AA 321
ORIG
1906
CLTSC4
7:05
MCI
7:50
DFW
8:34
SJU
9:50
AA 321
BUF
10:14
NAS
11:30
AA 321
DEN
12:03
TPA
13:02
AA 321
DEN
13:21
MIA
14:20
AA 321
RSW
15:03
PVD
16:30
AA 319
DCA
16:54
IAH
17:54
AA 319
ROC
19:07
JAX
20:15
AA 319
BOS
21:39
ORD
22:35
AA 321
ORIG
2011
CLTSC4
7:05
RDU
7:50
PHL
8:10
CUN
9:25
AA 321
MIA
10:29
DEN
11:45
AA 321
MCO
12:04
MCO
13:01
AA 321
DFW
13:52
JFK
14:55
AA 321
PHX
15:35
SFO
16:40
AA 321
ATL
16:57
LAX
18:16
AA 321
ORD
18:45
MCO
20:15
AA 321
DFW
21:12
BOS
22:15
AA 321
ORIG
1916
CLTSC4
7:10
ORD
7:55
BWI
8:20
TPA
9:35
AA 321
PHL
10:05
LAS
11:20
AA 321
DFW
12:27
ATL
13:24
AA 321
PBI
13:52
BWI
14:50
AA 321
SEA
15:16
SEA
16:20
AA 321
TPA
17:20
LGA
18:40
AA 321
ATL
19:02
RSW
20:00
AA 321
SEA
21:26
RSW
22:26
AA 321
ORIG
1957
CLTSC4
8:29
MSY
9:14
DTW
10:11
CUN
11:25
AA 321
ATL
12:02
LGA
13:12
AA 738
PHX
13:31
LGA
14:26
AA 321
DFW
15:20
FLL
16:24
AA 321
SAN
18:49
SLC
20:05
AA 321
ATL
21:16
ATL
22:40
AA 738
DTW
9:06
FNT
9:52
AA 319ORIG
1924
CLTSC4
10:50
BWI
11:35
IAH
12:11
JFK
13:19
AA 738
LAS
13:58
SMF
14:50
AA 321
LAS
15:08
BOS
16:10
AA 321
ORD
16:39
TPA
17:53
AA 321
LAS
18:55
MSP
20:10
AA 321
MCO
21:03
BDL
22:09
AA 321
MSP
8:46
LGA
9:55
AA 321
AUS
10:39
JAX
13:15
AA 319
MCO
13:45
PHX
14:35
AA 321
BOS
15:09
DFW
16:10
AA 321
EWR
17:01
SAN
18:15
AA 321
MIA
19:20
PVD
20:29
AA 321
DEN
21:18
TPA
22:15
AA 321
LAX
6:26
TPA
7:45
AA 321
MCO
8:10
SFO
9:24
AA 321
RSW
10:13
PHX
11:25
AA 321
PHL
11:59
PHL
13:00
AA 319
DEN
15:24
TPA
16:24
AA 321
FLL
17:00
PDX
18:10
AA 321
RIC
19:11
MCI
20:00
AA 319
PHL
20:40
PHX
22:15
AA 321
SFO
6:14
LAX
9:45
AA 321
MCO
10:13
TPA
11:20
AA 321
EWR
12:23
EWR
13:26
AA 738
MSP
15:25
RSW
16:25
AA 321
BOS
17:00
SEA
18:10
AA 321
LGA
19:20
BOS
20:29
AA 321
LAS
21:26
PHL
22:25
AA 321
LAS
6:10
DEN
7:35
AA 321
PBI
8:31
DEN
9:35
AA 321
TPA
10:18
ORD
11:25
AA 321
ROC
12:19
ELP
13:45
AA 319
BDL
15:02
BNA
16:06
AA 319
MCO
17:16
DEN
18:25
AA 321
SEA
19:12
SEA
20:20
AA 321
TPA
20:52
DFW
22:10
AA 321
SAN
6:04
SFO
7:30
AA 321
LAX
8:43
BOS
9:45
AA 321
BDL
10:31
SJU
11:45
AA 321
ORF
12:23
IND
13:12
AA 319
MCI
13:27
ROC
14:35
AA 319
ORD
15:05
MCO
16:00
AA 321
DEN
17:21
DFW
18:30
AA 321
FLL
19:12
BWI
20:20
AA 321
JFK
21:02
DTW
22:20
AA 321
PDX
6:14
SAN
7:50
AA 321
TPA
8:41
BWI
9:40
AA 321
MSP
10:26
BOS
11:30
AA 321
PIT
12:05
CLE
13:05
AA 319
DCA
13:28
MSY
14:35
AA 319
FLL
15:05
ATL
15:59
AA 321
PHX
17:13
SMF
18:20
AA 321
SFO
19:14
LAX
20:20
AA 321
FLL
21:21
LAX
22:20
AA 321
SJC
6:00
PDX
7:05
AA 320
RSW
8:28
MSP
9:20
AA 321
DFW
10:37
LGA
11:40
AA 321
BNA
11:58
AUS
12:54
AA 319
MEM
13:39
SAT
14:40
AA 319
SRQ
15:20
DEN
16:10
AA 321
MIA
16:54
ORD
18:00
AA 321
BDL
19:07
TPA
20:06
AA 321
ORD
21:27
MIA
22:30
AA 738
DEN
6:37
BOS
7:50
AA 321
LAS
8:10
MCO
9:19
AA 321
BOS
10:19
MCO
11:20
AA 321
BDL
12:09
RDU
13:04
AA 319
JFK
14:00
EWR
15:15
AA 738
LAX
16:00
SJU
16:50
AA 321
PHL
17:16
MCO
18:20
AA 321
JAX
19:15
PBI
22:11
AA 319
EWR
6:47
EWR
7:45
AA 738
MIA
8:47
EWR
9:55
AA 738
SJU
10:50
SRQ
11:40
AA 321
PVD
12:28
IAH
13:20
AA 319
EWR
15:05
MIA
16:25
AA 738
RSW
16:55
BWI
17:45
AA 321ORIG
1720
CLTSC4
19:04
MDT
19:49
RDU
20:57
PVD
22:05
AA 738
TPA
6:46
RDU
11:20
AA 321
MIA
15:16
ORD
16:25
AA 738
PIT
16:57
DFW
17:40
AA 321
MCO
18:59
PHX
19:55
AA 321
EWR
20:36
JFK
22:10
AA 738
BWI
6:36
JFK
7:30
AA 738
BUF
8:08
DTW
9:19
AA 319
ATL
10:12
IAH
11:19
AA 738
SAT
13:48
FNT
15:11
AA 319
SJU
18:35
SFO
19:30
AA 321
MIA
21:13
EWR
22:15
AA 738
SMF
6:02
MBJ
9:25
AA 321
EWR
10:02
EWR
11:05
AA 738
CHS
12:25
DCA
13:15
AA 319
PIT
13:31
BDL
14:30
AA 319
TPA
15:27
LAX
16:40
AA 321
IAH
17:15
EWR
18:05
AA 738ORIG
1530
CLTSC4
18:28
PBI
19:13
RSW
21:10
IAH
22:10
AA 321
DTW
8:08
BUF
9:10
AA 319
JFK
10:42
DFW
11:35
AA 738
DCA
11:52
RIC
12:45
AA 319
DTW
13:45
STL
14:40
AA 319
ATL
15:08
DTW
16:30
AA 319
MCI
17:13
MIA
18:20
AA 738
BUF
20:58
ALB
22:15
AA 319
RDU
6:17
DCA
7:30
AA 319
FNT
8:03
SLC
9:30
AA 319
DEN
11:15
LAX
13:00
AA 321
RDU
13:56
PIT
14:55
AA 319
IND
15:30
DCA
16:40
AA 319
RDU
17:04
DTW
18:05
AA 319
RIC
20:55
AUS
22:10
AA 319
PHX
6:09
DFW
7:30
AA 321
BDL
8:21
CLE
9:40
AA 319
PVD
10:32
MIA
11:45
AA 321
FNT
14:30
BUF
18:00
AA 319
DFW
19:05
JFK
20:00
AA 738
BWI
20:38
JAX
22:35
AA 319
SLC
6:10
PHX
7:30
AA 321
PIT
8:35
NAS
9:40
AA 319
STL
10:27
DTW
11:20
AA 319
CLE
13:37
RDU
14:30
AA 319
DCA
15:13
MCI
16:15
AA 319
ALB
17:01
PWM
18:05
AA 319
SLC
18:40
STL
22:00
AA 319
BOS
7:12
BNA
8:00
AA 319
RIC
8:15
MEX
9:30
AA 319
MDT
10:33
JAX
11:50
AA 319
BUF
13:26
BOS
14:15
AA 319
NAS
17:04
PIT
18:15
AA 319
JFK
19:09
EWR
20:10
AA 738
BDL
21:12
BUF
22:25
AA 319
PHX
8:11
PUJ
9:25
AA 321
LGA
10:44
ALB
11:55
AA 319
CHS
14:02
DCA
14:55
AA 319
RDU
15:44
BWI
16:45
AA 319
IND
17:11
STL
18:25
AA 319
RDU
18:55
ATL
21:19
AA 738
MCO
6:44
LGA
7:59
AA 321
JAX
8:17
DCA
9:30
AA 319
PIT
10:20
DCA
11:30
AA 319
MCI
11:45
BUF
12:30
AA 319
ALB
12:50
ALB
13:50
AA 319
JAX
15:20
SYR
16:19
AA 319
BUF
18:00
MCI
21:30
AA 319
PHX
21:50
RDU
22:45
AA 321
RIC
6:34
BDL
7:30
AA 319
MEM
8:43
RSW
9:55
AA 319
ELP
11:07
ELP
11:50
AA 319ORIG
2069
CLTSC4
14:10
IAH
14:55
RIC
15:41
PIT
16:35
AA 319
JAX
16:50
DCA
17:50
AA 319ORIG
1317
CLTSC4
18:29
MSP
19:14
ORIG
1954
CLTSC4
19:55
LGA
20:40
SAT
21:25
ROC
22:16
AA 319
PIT
6:42
PVD
7:35
AA 319
STL
8:51
PIT
9:45
AA 319
PWM
10:33
ATL
11:39
AA 319
PHL
15:37
PBI
16:30
AA 319
DFW
18:11
DFW
19:10
AA 321
IAH
19:25
RDU
20:10
AA 319
SYR
21:04
DCA
22:14
AA 319
SEA
6:15
LAS
8:00
AA 321
IND
8:44
BDL
9:50
AA 319
PBI
10:10
PHL
11:15
AA 3191821
1886
MSY
15:30
RIC
16:09
AA 319
AUS
17:15
BDL
18:25
AA 319
DCA
18:52
ILM
20:00
AA 319
DTW
20:55
LGA
22:04
AA 319
DCA
7:02
PIT
7:59
AA 319
DCA
8:28
CHS
9:30
AA 319
ALB
10:23
SXM
11:25
AA 319
BNA
15:14
JAX
15:59
AA 319
BUF
16:20
FSD
19:54
AA 319PULL
1971
CLTSC4
21:35
SYR
22:20
IAH
8:38
IAH
9:35
AA 319
MCI
10:28
IND
11:30
AA 319ORIG
1789
CLTSC4
13:40
PBI
14:25
MCI
15:35
ELP
19:15
AA 319
MSY
21:20
PIT
22:25
AA 319
EWR
8:16
JFK
9:06
AA 738
FSD
9:23
MCI
10:15
AA 319
SAT
10:39
BNA
11:40
AA 319
DTW
15:39
MSY
16:30
AA 319
NAS
18:54
PLS
20:00
AA 319PULL
1002
CLTSC4
20:32
FNT
21:17
MCI
21:40
ORF
22:40
AA 319
ATL
6:52
ATL
8:00
AA 321
CLE
8:30
MEM
9:24
AA 319
ROC
10:14
CHS
11:14
AA 319ORIG
1889
CLTSC4
15:35
BDL
16:20
ATL
8:21
ATL
9:35
AA 321
BDA
10:51
MEX
12:00
AA 319
NAS
15:10
BUF
16:29
AA 321
ELP
16:55
DTW
20:00
AA 319
ORIG
887*
CLTSC4
12:40
CUN
13:30
MBJ
16:50
LAS
18:10
AA 321
MBJ
18:56
MIA
20:15
AA 321*1850
TERM
SJO
21:55
CLTSC4
22:40
ORIG
1963*
CLTSC4
7:05
PUJ
7:55
GCM
9:00
HAV
9:45
AA 319
PAP
11:00
NAS
13:15
AA 319
MBJ
14:53
RDU
16:10
AA 321
CUN
16:40
BOS
17:55
AA 321
PLS
18:55
ORD
20:05
AA 321*877
TERM
AUA
20:50
CLTSC4
21:35
AADO
A21
A22
A23
A24
A25
A26
A27
A28
A29
A1
A3
A5
A7
A9
A11
A13
A12
A10
A8
A6
A4
A2
B1
B3
B5
B7
B9
B11
B13
B15
B16
B14
B12
B10
B8
B6
B4
B2
C2
C4
C6
C8
C10
C12
C14
C16
AAIN
I1
I2
Date:04/11/2019 Time:12:58CLT 2028-Scenario 2
Page # 1 of 4
00:00 01:00 02:00 03:00 04:00 05:00 06:00 07:00 08:00 09:00 10:00 11:00 12:00 13:00 14:00 15:00 16:00 17:00 18:00 19:00 20:00 21:00 22:00 23:00
*705
PUSH
*731
730*
PULL
1568*
*721
TERM
*721
748*
*745
744*
*749
724
*733
732*
*787
704*
PULL
720*
725
786*
*428
429*
*1062
PUSH
GRU
7:50
CLTSC4
8:50
AA 332
FRA
13:00
CLTSC4
14:00
AA 789
LHR
16:15
LHR
18:40
AA 789
CLTSC4
19:00
GRU
20:30
AA 332
FCO
15:55
CLTSC4
16:55
AA 789
FCO
15:55
MAD
16:40
AA 789
BCN
18:20
BCN
20:45
AA 332
MAD
15:50
DUB
18:05
AA 332
LHR
18:30
LHR
20:15
AA 789
CDG
13:55
FRA
16:35
AA 332
CLTSC4
16:55
FCO
18:25
AA 789
DUB
13:05
CDG
18:20
AA 332
MUC
16:20
MUC
18:35
LH 359
*842
1040*
*1963
787
*886
2061
*866
1867
*1844
1853*
*1074
1028
*639
1865*
*854
1647*
*1966
643
*1283
1087*
*822
856
*1342
874*
*1839
982*
*828
1768
1078
TERM
8021
8016
2808
TERM
9
TERM
201
200
354
353
5136
6841689
5812
TERM TERM
1441
TERM2422 826 1407
1076
TERM
1989
TERM
1028 22518017
TERM
522
TERM
1704
1969
8025
80202597
603
1793
876
TERM
425
521
1484
1140
1711
1199
1176
1698
933
932
1286
TERM
1974
TERM
5190
5557
5234
5187
5241
5132
5176
5314
5441
5154
3831
4076
5486
5172
5326
5124
5293
5440
5093
5323
5032
5366
5119
5256
5156
5118
5273
5297
5277
5032
5237
5164
5095
5096
5063
5259
5148
5405
5264
5298
5235
5509
5314
5222
4011
37755227
5058
PUSH
5175
5384
PULL
5343
ORIG
3973
5052
5264
5222
5304
5279
PUSH
5292
PUSH
PULL
5117
5320
5226
5135
5156
4769
4895
5186
TERM
5347
5142
5231
5104
5366
5096
4786
4755
5099
TERM
5006
PUSH
5263
5335
5157
5179
3773
38654522
PULL
5468
5037
5100
ORIG
5452
4538
4675
5294
5119
3798
3959
4892
4925
4738
4889
4935
TERM
5122
5364
5396
5135
5327
5204
5508
5233
5257
5407
4921
4826
5337
5514
4751
4804
5110
5459
5526
5166
4829
4798
3865
4023
3775
4056
5296
5093
5390
5002
5297
5512
5463
5453
5138
5200
4749
4931
4842
4835
4931
4922
4867
4942
4852
4820
5506
5514
5466
5319
4773
4779
5218
5202
3973
3915
4807
4799
5150
5251
5546
5364
5263
5123
5582
5083
5456
5429
5437
53064943
4669
4538
5111
5514
5384
5302
5364
5283
5431
TERM
5209
5398
5074
5038
5246
5295
4886
4831
5320
5423
4904
4829
5132
5257
4939
48075230
5083
5393
219
218
1454 1629602
2651
1095 2133
1445
1446
5120
5052
5185
5582
4866
4805
ORIG
804*
CLTSC4
6:55
CUN
7:45
PLS
10:00
KIN
12:00
AA 319
PUJ
16:21
ATL
17:50
AA 738
CUN
18:40
PBI
19:55
AA 321*1968
TERM
PUJ
20:16
CLTSC4
21:01
ORIG
843*
CLTSC4
6:55
MBJ
7:45
SXM
18:40
BNA
19:49
AA 320*888
TERM
CUN
20:29
CLTSC4
21:14
MEX
11:00
SDQ
12:00
AA 319
HAV
16:05
BDA
17:30
AA 319
SDQ
18:00
GCM
19:30
AA 319*613
TERM
SXM
20:24
CLTSC4
21:09
KIN
9:55
PAP
10:50
AA 319
PUJ
17:42
LAS
20:05
AA 321
CUN
10:50
SJO
11:55
AA 321
GCM
18:14
DCA
19:44
AA 320
UVF
20:15
SDQ
22:00
AA 321
SDQ
8:00
UVF
9:45
AA 321
MEX
18:35
MEM
20:00
AA 319
ORIG
643
CLTSC4
4:40
HOU
5:25
ORIG
1010
CLTSC4
5:45
MDW
6:30
ORIG
3773
CLTSC4
6:55
BWI
7:40
3055
BWI
9:35
DAL
10:10
1245
1246
BOS
10:59
BOS
11:36
BOS
16:00
BOS
17:00
B6 E901747
1493
HOU
17:55
HOU
18:30
1721
DAL
18:55
BWI
19:30
DEN
5:10
DEN
7:20
F9 319ORIG
5290
CLTSC4
7:50
DEN
8:35
JFK
10:01
JFK
10:40
B6 E90
ISP
11:20
ISP
12:05
F9 319
BNA
14:00
BNA
14:45
WN 738
PHL
15:21
MCO
16:09
F9 320853
1748
MDW
16:50
MDW
17:25
ORIG
1191
CLTSC4
5:05
IAH
5:50
ORIG
521
CLTSC4
7:00
SLC
7:45
ATL
8:48
ATL
9:30
DL 73H
ATL
10:03
ATL
10:45
DL M90
DTW
12:07
DTW
12:50
DL 319 1503
MSP
14:24
MSP
14:59
ATL
16:18
ATL
17:00
DL 73H
ATL
17:50
ATL
18:45
DL 73H
ATL
19:09
ATL
20:05
DL 73H
ORIG
1366
CLTSC4
5:15
DTW
6:00
ORIG
2488
CLTSC4
6:15
ATL
7:00
ORIG
2266
CLTSC4
7:20
MSP
8:05
2292
DTW
9:04
DTW
9:39
MCO
10:11
PHL
10:59
F9 320
ATL
11:16
ATL
12:00
DL 717
ATL
12:33
ATL
13:15
DL 717
ATL
15:04
ATL
15:45
DL 73H1322
1524
MSP
16:40
DTW
17:20
DL 320 1057
DTW
18:40
DTW
19:15
ORIG
823
CLTSC4
4:45
ATL
5:30
ORIG
1712
CLTSC4
6:03
ORD
6:48
SFO
7:21
SFO
8:20
UA 739
BOS
9:24
BOS
10:51
B6 E90
ATL
13:42
ATL
14:30
DL 320
DTW
15:40
MSP
16:30
DL 319
BOS
17:18
BOS
18:00
B6 E901119
1118
JFK
18:50
JFK
19:28
B6 E90
ORIG
8022
CLTSC4
5:33
BOS
6:18
ORIG
1591
CLTSC4
7:30
ATL
8:15
ORD
9:26
ORD
10:15
UA 73G
ORD
13:00
ORD
13:45
UA 319
DEN
15:10
DEN
16:22
UA 320
SFO
17:31
SFO
18:30
UA 739
TTN
20:25
TTN
21:10
F9 320
PHF
6:30
PHF
7:35
AE CR2
PGV
8:11
PGV
9:19
AE CR2
EVV
10:23
MLB
11:40
AE CR2
OAJ
12:05
OAJ
13:00
AE CR2
MGM
13:18
SDF
14:25
AE CR2
FAY
15:26
IND
16:30
AE CR2
FAY
17:05
GNV
20:25
AE CR2
AVL
20:55
CAK
22:05
AE CR25491
5292
MGM
22:27
AEX
22:59
MGM
8:38
MGM
9:45
AE CR2
SDF
11:05
IND
14:50
AE CR7
EVV
15:23
EWN
16:14
AE CR2
TYS
17:10
FAY
19:50
AE CR25461
5049
HTS
20:15
CRW
20:50
DAY
21:31
PGV
22:40
AE CR2
5228
5039
GNV
6:52
LEX
7:30
AE CR2
FAY
8:40
TYS
9:35
AE CR2
CHA
10:46
EVV
11:35
AE CR2
CRW
12:15
BHM
13:00
AE CR2
DAY
13:43
PHF
14:25
AE CR2
GPT
15:05
CID
15:50
AE CR7
GNV
16:09
CAK
18:04
AE CR2
CRW
19:05
FWA
19:49
AE CR25265
5141
MEM
20:05
MLB
20:45
AE CR9
LEX
21:36
MGM
22:41
AE CR2
5355
5277
CAK
7:08
CHA
7:43
GSP
8:18
IAD
9:09
AE CR95039
5463
LEX
10:40
FAY
11:20
AE CR23906
3960
HSV
12:25
CAE
13:05
AE CR23777
4011
MYR
14:01
AVL
14:40
AE CR2
OAJ
15:33
MGM
16:19
AE CR2
AVL
16:52
CAE
18:00
AE CR2
CHS
19:03
SRQ
19:50
AE CR95211
5276
TLH
21:15
LFT
21:46
MLB
8:47
HPN
9:30
AE CR75142
5218
BHM
12:30
TLH
13:10
AE CR25117
5486
PGV
14:07
FAY
14:45
AE CR2
PHF
17:22
LEX
18:14
AE CR25514
5254
SHV
18:30
TLH
19:05
MGM
19:40
MOB
22:40
AE CR7
5371
5305
GNV
12:25
TYS
13:00
GPT
13:37
OAJ
16:14
AE CR7
FWA
17:11
DAY
18:00
AE CR2
AVL
18:42
TRI
20:15
AE CR7
CRW
8:16
BHM
9:10
AE CR2
MSN
10:45
HPN
14:33
AE CR7
MGM
14:57
LFT
16:20
AE CR75311
5186
BHM
17:45
CHA
18:25
AE CR2
TRI
19:00
EWN
20:30
AE CR7
CRW
6:45
LFT
9:36
AE CR7
VPS
10:06
CHA
11:14
AE E755514
5255
RAP
11:40
DAB
12:20
AE CR9
ORF
15:07
BHM
16:05
AE E75
GSO
16:59
IND
17:50
AE E75
TYS
20:59
AVL
22:25
AE CR7
5557
5294
PHF
10:39
TYS
11:18
AE CR2
CMH
12:27
MCI
13:24
AE E75
TYS
13:51
TYS
14:35
AE CR2
SDF
15:17
MKE
16:35
AE CR7
HHH
17:31
TRI
22:25
AE CR7
LYH
6:22
OAJ
7:40
AE CR7
DAY
8:51
PHF
11:45
AE CR7
AGS
12:16
FWA
13:10
AE CR7
CAE
14:03
EVV
16:00
AE CR7
CHA
17:21
OAJ
19:45
AE CR75411
5523
LFT
20:00
SHV
20:40
AE CR7
JAN
20:58
BTR
22:15
AE CR7
EWN
6:35
GSO
7:50
AE CR7
LEX
8:30
JAN
11:20
AE CR7
AVL
12:12
LYH
13:03
AE CR7
LFT
13:50
GNV
15:15
AE CR7
HPN
15:44
HPN
17:00
AE CR7
ROA
17:16
LYH
18:30
AE CR7
BHM
19:23
HPN
20:40
AE CR7
CAE
20:59
MKE
22:05
AE CR7
AGS
6:31
SDF
7:30
AE CR7
LFT
8:42
CAE
11:19
AE CR7
TYS
12:20
MOB
13:10
AE CR7
FAY
13:45
VPS
14:40
AE CR75569
5196
XNA
14:55
ICT
15:32
VPS
15:50
HTS
17:00
AE CR7
CRW
17:30
OAJ
18:25
AE CR7
ROA
18:43
SBY
19:50
AE CR7
OAJ
21:24
LYH
22:30
AE CR7
TRI
6:39
HHH
7:35
AE CR7
TRI
8:16
LYH
9:35
AE CR7
MOB
10:45
SHV
13:15
AE CR7
CVG
13:31
HSV
14:25
AE CR7
EWN
15:06
LYH
16:10
AE CR7
TLH
16:55
GNV
17:55
AE CR75500
5505
BTR
18:30
HSV
19:05
HSV
19:21
YUL
20:25
AE CR7
ROA
21:00
ROA
22:05
AE CR7
4776
4934
ROA
7:04
FAY
7:40
AE CR7
HPN
8:22
MOB
9:35
AE CR7
SHV
10:44
BTR
13:00
AE CR7
AGS
13:49
DAY
14:41
AE CR7
CHA
15:40
GPT
16:40
AE CR7
CID
17:04
CID
18:04
AE CR7
MSN
18:43
CAK
19:45
AE CR74460
4582
LGA
20:00
BTV
20:40
AE E75
HHH
21:15
HHH
22:20
AE CR7
4915
4763
HHH
6:56
ROA
7:30
MDT
8:08
CMH
9:10
AE E75
MLI
9:40
GRR
11:30
AE CR9
SAV
12:07
CHA
12:50
AE CR75375
5144
AEX
13:14
AEX
13:46
HPN
14:02
MLB
14:50
AE CR7
PHF
15:13
LEX
16:10
AE CR7
ORF
18:43
AGS
19:45
AE CR7
BTR
21:35
EVV
22:40
AE CR7
CHS
6:18
SAV
7:45
AE CR9
LYH
8:12
SBY
9:20
AE CR7
CID
10:18
CID
11:45
AE CR7
HTS
12:18
AGS
13:01
AE CR7
FLO
13:48
ROA
14:35
AE CR7
MLB
15:44
JAN
16:35
AE CR7
EWN
17:24
ROA
18:15
AE CR7
MLB
18:52
MSN
19:54
AE CR7
GPT
21:10
SRQ
22:14
AE CR7
I3
I4
I5
I6
I7
I8
I10
I11
I12
I13
I14
I15
OADO
O1
O2
O3
O4
O5
O6
O13
O14
O18
O19
O20
O27
O28
O29
O30
O31
O32
OAIN
I21
I22
AEDO
D13
D12
D10
D8
D6
D4
E1
E2
E3
E5
E7
E9
E11
E13
E15
E17
Date:04/11/2019 Time:12:58CLT 2028-Scenario 2
Page # 2 of 4

00:00 01:00 02:00 03:00 04:00 05:00 06:00 07:00 08:00 09:00 10:00 11:00 12:00 13:00 14:00 15:00 16:00 17:00 18:00 19:00 20:00 21:00 22:00 23:00
5357
5309
4884
4841
4934
4904
4759
4813
5036
5143
4798
4744
5452
5389
5113
5466
4889
4773
4765
4769
5077
5105
4907
4870
5180
5556
50265278
5396
5349
5431
ORIG
4809
5513
5147
5431
5207
5066
5112
5460
5268
5365
5152
4826
4879
4862
4842
ORIG
5037
3833
3889
5060
5520
ORIG
5129
5315
5258
4869
4780
5476
5235
5256
TERM
5342
5073
5390
5091
5183
5220
5091
5437
4779
4885
5202
5287
5399
5373
3850
3814
3896
3798
5415
5288
ORIG
4796
4777
4767
5232
5060
5468
5462
5152
5086
3899
3908
5242
5071
3908
3777
5107
5189
5226
5477
4544
4542
5439
5225
5373
5210
5458
5087
5214
5336
4661
4531
5329
5185
5290
5436
5073
5345
5245
5212
3909
TERM
5055
5276
5449
5114
ORIG
5573
5509
5243
5372
5494
4933
TERM
5253
5421
5530
5491
5090
TERM
3967
3819
3826
3906
5252
5285
5166
5229
4675
4624
4556
4495
ORIG
5261
5253
5266
5247
5315
3190
TERM
5378
5036
5552
5177
ORIG
5547
5316
5164
4542
4510
5139
5151
5043
5236
5077
TERM
5341
51165054
5187
5048
5433
51815072
3957
4001
5259
5438
ORIG
5082
5346
5237
4484
4457
5171
5395
5533
5192
5460
5053
3834
3968
4001
3795
ORIG
5290
5117
5502
5487
5084
5092
PUSH
4457
4674
5078
5552
5502
52324476
5165
5457
5128
5504
5289
5053
5223
5349
5267
5514
5335
5238
ORIG
5252
4876
4866
5177
5037
5033
5098
5200
5456
5301
5299
ORIG
5531
5204
5033
5282
5063
5386
5244
4510
46625420
5069
TERM
ORIG
5432
5130
5267
5415
5575
4470
4537
5081
5313
5370
5094
5398
5040
5121
5374
ORIG
5079
5207
5289
5356
5474
5267
5140
5592
5004
5210
5335
5094
5109
ORIG
4850
ORIG
5632
5042
5193
5255
5434
5086
5180
5435
51695138
5096
5061
5194
5568
5102
5322
PULL
5172
5317
5031
5053
5066
5276
5553
5495
5255
5162
5166
5568
5301
5084
5088
5034
50705056
5281
5211
5431
5260
5350
5178
5436
51705131
5212
5303
5236
5161
5417
5245
5474
5034
4537
4498
5288
5049
5494
5318
5088
5334
5158
53305080
5266
50695377 5144
5161
5333
5343
54875510 5064 5249
5189
5155
5331
5250
ORIG
5136
5160
5370
5116
5300
5243
5331
5418
5101
5455
5099
53545344
5033
5129
5270
5178
5502
5285
5455
5170
5103
5286
5451
4547
4546
5134
5058
5183
5223
5154
53264572
4554
4579
5504
51155043
5321
55635047
5065
5349
5534
5415
5061
5522
4695
4556
5345
54185286
5366
TERM
5049
TERM
5352
5139
5309
53505035 5125
5098
5127
5182
TERM
ORIG
5371
5467
5593
4546
4566
5322
5236
5087
5121
5169
5307
5451
5200
5327
5533
3819
3909
5115
5265
5361
TERM
5325
5317
5082
5055
5058
5208
5193
5281
5546
TERM
5382
TERM
PULL
5503
ORIG
5071
5153
5074
5313
5182
5300
5219
ORIG
5509
5268
5458
5031
5271
5163
TERM
5076
TERM
5213
5183
5389
5051
ORIG
3190
5307
TERM
5337
TERM
ORIG
5294
4649
4618
5305
5065
5181
TERM5385
4498
4636
ORIG
5247
3960
3833
5543
5265
5814
TERM
5383
5320
3916
3989
5587
5553
4796
TERM
ORIG
6238
ORIG
6113
3888
3642
3642
3356
6234
TERM
2010
TERM
ORIG
4845
5508
5135
6302
TERM
ORIG
3612
3930
3840
5096
5099 TERM
ORIG
3312
ORIG
3844
ORIG
2120
2030
2140
ORIG
4554
4781
TERM
5067
5153
5251
5078
4903
4765
5225
5311
4804
4786
5064
5376
4790
4903
5319
5361
3959
4010
4464
4684
4662
4506
4914
4936
5184
3814
3831
5294
5525
5191
5035
5105
5224
4618
4695
5140
5248
3706
3213
5070
5214
5196
5081
6224
6227
MYR
6:29
CHS
7:40
AE CR9
EWN
8:32
TRI
9:40
AE CR7
FAY
10:07
FLO
11:33
AE CR7
GSP
12:17
LEX
12:59
AE CR7
MOB
13:42
LEX
14:25
AE CR75572
5567
PWM
15:10
GRR
15:50
AE CR9
HTS
17:18
HHH
18:05
AE CR7
CAK
19:18
VPS
20:20
AE CR7
LYH
21:26
EWN
22:30
AE CR7
SAV
6:36
MYR
7:40
AE CR9
OAJ
8:13
CVG
9:20
AE CR7
OAJ
10:46
EWN
11:55
AE CR7
GSO
12:18
TRI
12:59
AE CR7
BTR
13:47
BHM
14:30
AE CR7
TRI
15:38
AVL
16:24
AE CR7
FPO
16:48
FAY
17:45
AE CR7
AGS
19:09
FLO
20:09
AE CR7
MDT
21:29
PHF
22:30
AE CR7
GSO
6:52
MEM
7:50
AE CR9
MOB
8:42
AGS
9:45
AE CR7
PIA
10:26
PIA
11:19
AE CR74820
4933
LYH
12:32
GSP
13:12
AE CR74831
4749
SBY
13:39
CRW
14:19
AE CR7
LIT
16:20
GRB
19:57
AE CR9
MLB
20:30
MOB
21:30
AE CR7
LGA
22:01
GSO
22:45
AE CR9
ORF
6:27
CVG
7:24
AE CR9
AVL
8:21
CHO
9:19
AE CR7
GSO
10:30
ROA
11:14
AE CR74841
4926
TRI
12:23
ROA
13:01
AE CR74824
4759
CRW
13:25
HTS
14:05
AE CR75204
5272
MSN
14:25
CAK
15:05
AE CR7
FLO
15:20
ROA
16:05
AE CR7
GSP
18:49
MKE
19:44
AE CR7
MOB
21:40
LEX
22:35
AE CR7
5507
5263
BTR
10:34
AGS
11:14
AE CR74936
4862
EWN
12:29
FLO
13:06
5071
5508
JAN
13:47
CHA
14:27
AE CR7
LYH
15:47
TRI
16:30
AE CR7
LFT
16:58
MLB
17:40
AE CR7
DAB
18:00
OKC
18:45
AE CR9
PGV
19:15
LYH
20:10
AE CR7
FWA
20:30
LEX
21:30
AE CR7
SDF
6:46
STL
7:40
AE CR9
SRQ
8:04
TLH
9:00
AE CR7
ROA
9:15
GSO
9:55
AE CR7
LIT
11:00
EYW
11:45
AE CR9
TLH
12:28
MSN
13:34
AE CR95179
5110
CHA
14:01
ORF
14:40
AE CR75048
5239
CHO
15:30
CAE
16:10
AE CR7
HSV
17:38
PHF
18:20
AE CR7
LYH
18:59
CHO
19:49
AE CR7
GNV
21:20
CHO
22:30
AE E75
IAD
6:44
IAD
7:30
AE CR9
MKE
8:50
CAE
9:45
AE CR7
MKE
10:48
SDF
11:40
AE CR7
RDU
12:19
BNA
13:20
AE CR94800
4743
AVL
13:42
CHO
14:19
4926
4907
ROA
15:41
AGS
16:19
AE CR7
FLO
19:40
HTS
20:30
AE CR7
MKE
21:37
CAE
22:20
AE CR7
5328
5282
DAY
7:14
CLE
7:50
AE CR2
GPT
8:51
MSN
9:45
AE CR7
CAK
10:50
GPT
11:40
AE CR7
CHO
12:12
AVL
13:05
AE CR94879
4939
ROA
13:50
EWN
14:25
5186
5310
PIA
15:43
AEX
16:20
5060
5324
AEX
17:05
FWA
17:45
AE CR75283
5221
LEX
19:16
TYS
19:56
AE CR73945
3904
HPN
20:50
ORF
21:30
AE CR7
PHL
6:58
CAE
7:45
AE E75
CAK
8:37
JAN
9:30
AE CR7
CAE
10:21
MYR
11:19
AE E75
ILM
12:13
AVP
13:04
AE CR94844
4892
HHH
13:56
HHH
14:30
4805
4869
AGS
15:40
PGV
16:16
5512
5060
MOB
17:10
MOB
17:49
AE CR7
OAJ
18:53
SDF
19:49
AE CR75050
5041
HSV
21:06
PIA
21:45
AE CR7
CMH
6:38
DTW
7:45
AE E75
AGS
8:21
BTR
9:09
AE CR7 5260
DCA
9:24
GSP
9:59
4763
4844
ROA
10:21
HHH
10:55
IAD
11:10
SAT
11:55
AE CR9
JAX
12:10
CMH
14:24
AE CR95514
5148
JAN
15:40
CRW
16:15
4918
4777
CHO
17:01
FLO
17:35
4809
4810
CHO
19:10
ROA
19:44
GSP
19:59
BNA
22:40
AE CR9
IND
6:51
IND
7:55
AE E75
HSV
8:33
SAV
9:19
AE CR7
RIC
10:45
CLE
11:35
AE CR9
STL
12:10
ILM
12:59
AE CR9
CAK
13:28
PNS
14:50
AE CR9
DSM
16:58
DSM
18:45
AE CR95252
5024
GNV
19:18
BTR
19:50
MYR
20:59
CHS
22:35
AE CR9
YYZ
9:19
BNA
9:59
AE E754942
4816
HHH
10:47
CRW
11:19
IAD
12:29
CAK
13:15
AE CR9
GSO
13:33
MEM
14:40
AE CR9
EYW
16:56
MLI
20:22
AE CR9
CID
20:40
GPT
21:30
AE CR7
CAE
6:50
BHM
7:35
AE E75
CAE
8:21
HSV
9:09
AE E75
ORF
10:47
ILM
14:35
AE CR9
CVG
15:14
CHS
16:20
AE CR9
MSY
17:08
CMH
17:50
AE E75
MCI
18:55
CMH
19:44
AE E75
OMA
21:05
IND
22:05
AE E75
FLO
8:43
EWN
9:24
AE CR7
OMA
10:41
SAV
12:59
AE CR9
JAX
13:32
DAB
14:25
AE CR9
DSM
16:45
SAT
20:00
AE CR9
CHO
21:08
CRW
22:35
AE CR7
ICT
9:03
CMH
10:30
AE CR94850
4800
FLO
10:45
AVL
11:25
AE CR7
DTW
12:23
MDT
13:10
AE E75
SRQ
13:37
SAV
14:27
AE CR9
GRR
15:50
BHM
19:30
AE CR9
CVG
6:56
OKC
9:20
AE CR9
TUL
10:50
TUL
11:40
AE CR9
PGV
12:05
CHO
12:49
AE E75
AUS
13:45
CHS
14:35
AE CR9
MHT
15:02
TLH
15:59
AE CR9
CAE
17:03
AGS
17:55
AE E75
CAK
21:35
AGS
22:30
AE CR2
BHM
8:30
CRW
9:20
AE CR2
IND
10:46
CMH
11:45
AE E75
AUS
12:05
LIT
12:50
AE CR95167
5314
TVC
13:10
BTV
13:44
GRR
14:05
ATL
14:55
AE CR9
DAB
15:30
LIT
19:00
AE CR9
YYZ
19:17
CAE
20:10
AE E75
AGS
20:38
GSP
22:40
AE CR7
AEX
8:49
VPS
11:50
AE CR9
FAY
12:10
CHS
12:54
AE CR9
CMH
15:21
ILM
16:09
AE E75
LEX
17:25
CHO
18:15
AE E75
IAD
19:26
MSY
20:30
AE CR9
IND
21:39
MSY
22:35
AE E75
CHA
6:29
JAX
8:50
AE CR9
CVG
9:10
OMA
11:20
AE CR9
MYR
12:15
MYR
12:59
AE CR9
SYR
14:30
CLE
15:20
AE CR9
MLI
15:39
RAP
19:03
AE CR9
DAB
19:36
CHA
22:20
AE CR9
CHO
8:15
HTS
9:00
AE CR7
SGF
9:15
TVC
11:24
AE CR9
MEM
12:07
SYR
12:50
AE CR9
LIT
13:51
MKE
14:40
AE CR9
AUS
15:30
SGF
18:50
AE CR9
AUS
21:05
MEM
22:35
AE CR9
BHM
9:15
OKC
11:20
AE CR9
CLE
12:05
GNV
12:50
AE CR2
ILM
13:52
CVG
16:14
AE CR9
MDT
16:56
JAX
17:59
AE E75
TLH
19:19
GSO
20:10
AE CR9
SAV
8:16
MKE
9:14
AE CR9
LNK
9:33
PNS
11:25
AE CR9
IND
12:12
GSO
13:05
AE E75
ORF
13:56
MYR
14:45
AE CR9
STL
15:43
PNS
16:44
AE CR9
CVG
17:00
ICT
20:06
AE CR9
GSO
20:45
DAY
22:05
AE CR9
CHS
8:09
MYR
9:30
AE CR9
BHM
10:13
PVD
11:50
AE CR9
CAE
12:22
FAY
13:05
AE E75
MKE
13:56
ABE
14:45
AE CR9
PNS
15:22
AUS
18:25
AE CR9
SAT
18:40
CLE
20:30
AE CR9
PNS
20:55
CVG
22:05
AE CR9
AVP
8:47
ILM
9:25
AE CR9
DAY
10:54
XNA
11:50
AE CR9
PNS
13:56
DTW
14:45
AE CR9
AVL
15:29
MDT
17:55
AE CR9
DTW
19:04
ABE
20:15
AE CR9
CHS
21:00
TYS
22:09
AE CR9
ILM
6:41
CMH
7:29
AE CR9
JAN
8:37
IND
9:55
AE CR9
SRQ
10:10
AVP
11:20
AE CR9
DAB
13:40
IAD
14:25
AE CR9
MYR
15:33
LGA
17:25
AE CR9
ATL
18:05
GRR
19:45
AE CR94636
4554
JAX
21:33
YYZ
22:10
SDF
8:32
PNS
9:45
AE CR9
MHT
10:30
CVG
11:40
AE CR9
IND
14:01
AUS
14:45
AE CR9
CHS
15:30
LIT
16:30
AE CR9
PWM
17:10
ILM
18:25
AE CR9
SAV
19:00
ORF
20:00
AE CR9
CVG
21:22
BHM
22:30
AE CR9
MYR
8:47
SYR
10:00
AE CR9
XNA
10:28
BHM
11:35
AE CR9
ABE
13:44
CVG
14:25
AE CR9
CLE
15:25
MYR
16:20
AE CR9
OMA
17:06
SAV
18:20
AE CR9
PNS
18:50
CVG
19:45
AE CR9
XNA
21:33
MYR
22:40
AE CR9
GSO
8:36
CAK
9:45
AE CR9
MEM
10:43
PWM
11:50
AE CR95051
5372
SAV
13:50
RIC
14:30
AE CR9
GSO
15:30
YYZ
16:27
AE E75
BNA
16:45
SDF
17:54
AE CR9
MEM
18:50
CHS
19:44
AE CR9
FAY
19:59
HSV
20:40
AE CR7
LIT
21:18
SDF
22:20
AE CR9
LIT
8:45
SDF
9:50
AE CR9
CLE
10:21
MDT
11:25
AE CR95504
5527
OKC
13:18
MYR
13:57
AE CR95531
5286
GRB
14:22
ABE
14:59
SAV
15:42
STL
16:35
AE CR9
SYR
17:16
CHS
18:20
AE CR9
TYS
19:01
SAV
19:55
AE CR9
SRQ
21:39
JAN
22:35
AE CR9
3802
GSP
5:57
DCA
6:32
PNS
8:38
FAY
9:40
AE CR9
OKC
10:42
IAD
11:45
AE CR95046
5265
SAT
13:48
MLI
14:26
AE CR9
MDT
15:07
CMH
15:59
AE CR9
DTW
17:22
MYR
18:20
AE CR9
IND
18:58
GSP
19:50
AE CR9
CLE
21:39
ILM
22:35
AE CR9
AVP
10:18
STL
11:20
AE CR95103
5565
ICT
14:07
MHT
14:45
AE CR9
OKC
15:14
SDF
16:05
AE CR9
CAK
16:53
CLE
17:50
AE CR9
GSO
18:49
DAY
19:40
AE CR9
ORF
21:09
AVP
22:20
AE CR9
TYS
6:24
GSP
7:45
AE CR7
TYS
8:22
LIT
9:15
AE CR9
DSM
10:19
ILM
11:16
AE CR95414
5542
CMH
14:00
TUL
14:35
BHM
15:10
IAD
16:00
AE CR9
ILM
17:14
ORF
18:05
AE CR9
MYR
19:00
PNS
19:50
AE CR9
IAD
21:21
SAV
22:30
AE CR9
CMH
8:36
YYZ
9:27
AE E75
ABE
10:39
MEM
11:25
AE CR9
VPS
13:49
CAK
16:00
AE E75
SDF
17:46
AVL
18:30
AE CR7
ILM
18:50
IND
19:45
AE E75
CMH
21:14
CMH
22:09
AE E75
5406
5176
FWA
8:49
OAJ
9:26
AE CR2
SAV
10:38
DAY
11:35
AE CR9
PIT
15:24
SAV
16:14
AE CR9
RIC
17:19
BNA
18:10
AE CR9
CMH
19:16
MHT
20:05
AE CR9
VPS
21:06
TLH
22:15
AE E75
GRR
8:49
RDU
9:40
AE CR9
CMH
10:50
PIT
11:45
AE CR9
BNA
13:42
OMA
14:55
AE E75
ILM
15:35
GSO
16:25
AE CR9
IAD
17:05
IAD
17:55
AE CR9
DAB
8:35
SRQ
9:24
AE CR9
CHS
10:27
GSO
11:20
AE CR9
RIC
14:02
GSO
14:45
AE E75
IAD
15:15
DAB
16:04
AE CR9
PVD
16:51
SRQ
17:40
AE CR9
MKE
19:21
IAD
20:05
AE CR9
4770
4751
SBY
9:15
AVL
9:50
AE CR7
GSP
10:10
FPO
11:45
AE CR7
YYZ
14:19
LGA
15:15
AE E75
AVP
15:36
XNA
16:25
AE CR9
CMH
17:41
GSO
18:30
AE CR9
CVG
19:26
DAB
20:10
AE CR9
ILM
21:03
LIT
22:35
AE CR9
IAD
8:43
GRR
9:25
AE CR9
BHM
10:59
HSV
11:50
AE CR23989
3834
GSP
13:54
YYZ
14:30
DAY
15:14
MEM
16:00
AE CR9
ABE
19:06
OMA
19:49
AE CR9
BNA
8:49
DAB
9:50
AE CR9
ILM
10:31
DSM
11:20
AE CR9
MEM
15:35
TYS
16:19
AE CR9
XNA
17:04
CVG
17:50
AE CR9
SGF
10:09
SGF
10:50
AE E75
LEX
15:55
BTR
16:45
AE CR7
MYR
17:19
BHM
18:05
AE CR9
SDF
19:28
XNA
22:30
AE CR9
CVG
10:49
DTW
13:00
AE CR95431
5165
OMA
15:20
DSM
16:00
AE CR9
IAD
17:46
TUL
18:30
AE CR9
TLH
8:53
VPS
9:50
AE CR7
MYR
10:22
SAV
11:10
AE CR9
SAV
17:09
GSP
17:50
AE CR9
BTV
10:21
RIC
11:05
AE E75
TYS
15:37
VPS
16:45
AE E75
VPS
18:38
PHF
19:50
AE E75
YYZ
21:22
MDT
22:20
AE E75
TUL
10:20
ORF
11:02
AE CR9
CAE
15:22
GSP
16:25
AE E75
YOW
17:06
YOW
18:10
AE E75
PHF
8:10
GPT
9:20
AE CR7
YUL
10:06
GSP
11:35
AE CR7
SAT
16:00
LNK
19:45
AE CR9
3697
3648
EWR
8:34
EWR
9:09
6150
IAD
9:42
IAD
10:22
UA CR77346
7347
YYZ
10:39
YYZ
11:10
LGA
13:14
LGA
14:00
DL CR9
EWR
14:33
EWR
15:30
UA E7W4823
4843
ORD
16:46
ORD
17:21
7348
7349
YYZ
17:49
YYZ
18:20
6160
IAD
18:55
IAD
19:30
3367
3311
EWR
11:52
EWR
12:27
3314
3315
EWR
14:24
IAH
15:02
UA E70
LGA
17:12
LGA
18:00
DL CR9
LGA
19:18
LGA
20:00
DL CR9
LGA
8:35
LGA
9:15
DL CR93337
3399
LGA
9:57
LGA
10:30
6165
6310
IAH
11:04
IAH
11:41
6115
6120
IAH
14:09
IAD
14:44
LGA
15:06
LGA
16:00
DL CR93401
3343
EWR
17:20
EWR
17:56
3966
MSP
10:32
MSP
11:07
BKW
12:00
BKW
17:05
VC EM2
E19
E18
E16
E14
E12
E10
E21
E23
E25
E27
E29
E31
E33
E35
E38
E36
E34
E32
E30
E28
E26
E24
E22
E20
E8
E6
E4
F1
F2
F3
F4
F5
F6
F7
F8
F9
F10
F11
F12
F13
F14
F15
F16
F17
F18
F19
O7
O8
O9
O10
Date:04/11/2019 Time:12:58CLT 2028-Scenario 2
Page # 3 of 4

00:00 01:00 02:00 03:00 04:00 05:00 06:00 07:00 08:00 09:00 10:00 11:00 12:00 13:00 14:00 15:00 16:00 17:00 18:00 19:00 20:00 21:00 22:00 23:00
*PSH
1568
*PSH
720
GRU
8:50
CLT
19:00
AA 332
FRA
14:00
CLT
16:55
AA 789
ORIG
4663
6245
6285
3812
TERM
ORIG
3357
8010
1180
8011
1181
4128
TERM
4845
TERM
4554
TERM
5060
5069
3395
TERM
O129
O130
T117
T118
O131
O132
PSH
5343
PSH
1002
T109
T110
O133
O134
PSH
5172
PSH
1971
T133
T134
O139
O140
PSH
5117
PSH
275
T105
T106
PSH
5468
T103
T104
O103
O104
PSH
5503
T141
T142
O105
O106
T111
T112
O109
O110
T113
T114
O121
O122
T127
T128
O113
O114
T101
T102
O137
O138
T115
T116
O107
O108
T107
T108
O101
O102
T123
T124
O117
O118
T121
T122
O111
O112
T125
T126
O119
O120
T137
T138
O115
O116
T139
T140
O141
O142
T119
T120
T129
T130
O135
O136
T157
T158
O123
O124
T147
T148
T131
T132
O127
O128
T145
T146
O125
O126
T151
T152
T135
T136
O153
O154
T153
T154
O157
O158
T159
T160
O159
O160
T165
T166
O151
O152
T149
T150
O155
O156
T167
T168
O145
O146
T163
T164
O147
O148
T161
T162
O163
O164
T155
T156
O161
O162
O143
O144
T143
T144
O149
O150
4189
3433
4093
4058
JFK
10:38
JFK
11:15
IAH
17:14
IAH
18:05
UA E7W
LWB
10:16
LWB
11:01
VC ER4
LWB
16:54
LWB
18:06
VC ER4
LGA
11:14
LGA
12:00
DL CR9
JFK
17:19
JFK
18:00
DL CR9
CLT
0:00
DEN
7:50
UA 319
PIT
19:24
CLT
23:59
AA 319
CLT
0:00
IAH
5:05
UA 319
LEX
8:05
CLT
9:55
AE CR7
STL
18:17
CLT
20:32
AA 319
FNT
21:03
CLT
23:59
AA 319
CLT
0:00
SLC
7:00
DL 320
BTR
9:55
CLT
11:50
AE CR9
MSY
14:31
CLT
21:35
AA 319
CLT
0:00
ORD
6:03
UA 73G
CHO
6:58
CLT
10:55
AE E75
FLL
14:00
CLT
18:25
AA 321
PIT
21:19
CLT
23:59
AA 319
EVV
3:10
CLT
19:55
AE CR7
ELP
21:35
CLT
23:59
AA 319
CLT
0:00
MCI
10:55
AA 319
SDF
14:15
CLT
21:40
AE CR9
ORD
22:47
CLT
23:59
UA 73G
CLT
0:00
RIC
19:45
AA 319
PVD
20:10
CLT
23:59
AA 321
CLT
0:00
MDT
19:04
AA 319
PHL
19:45
CLT
23:59
AA 321
CLT
0:00
BDL
15:35
AA 319
TPA
19:47
CLT
23:59
AA 321
CLT
0:00
IAH
14:10
AA 319
PHX
19:54
CLT
23:59
AA 321
CLT
0:00
MSP
7:20
DL 717
JAX
10:59
CLT
23:59
AA 319
CLT
0:00
BWI
10:50
AA 319
TPA
14:08
CLT
23:59
AA 321
CLT
0:00
RDU
17:25
AA 320
LAX
20:40
CLT
23:59
AA 321
CLT
0:00
LGA
19:55
AA 321
STT
21:09
CLT
23:59
AA 321
CLT
0:00
PBI
18:28
AA 321
ORD
18:44
CLT
23:59
AA 738
CLT
0:00
PBI
13:40
AA 321
ATL
23:06
CLT
23:59
DL 73H
CLT
0:00
MSP
18:29
AA 738
BOS
22:50
CLT
23:59
B6 E90
CLT
0:00
ATL
7:30
DL 738
JFK
13:10
CLT
23:59
AA 738
HOU
0:40
CLT
23:59
WN 73H
CLT
0:00
ATL
6:15
DL 73H
EWN
19:40
CLT
23:59
AE CR2
CLT
0:00
HOU
4:40
WN 73H
HTS
8:35
CLT
23:59
AE CR7
MDW
1:20
CLT
23:59
WN 73W
CLT
0:00
BWI
6:55
WN 73W
CVG
11:41
CLT
23:59
DL CR7
CLT
0:00
MDW
5:45
WN 73W
HSV
15:55
CLT
23:59
AE CR7
ATL
1:02
CLT
23:59
DL M90
CLT
0:00
HSV
15:25
AE CR2
GSP
16:08
CLT
23:59
AE CR7
CLT
0:00
TYS
17:40
AE CR7
BTV
19:12
CLT
23:59
AE CR9
CLT
0:00
TRI
17:40
AE CR7
CLE
19:18
CLT
23:59
AE CR9
CLT
0:00
CVG
17:20
DL CR7
OKC
17:39
CLT
23:59
AE CR9
CLT
0:00
CHO
15:24
AE CR7
CHS
17:47
CLT
23:59
AE CR9
CLT
0:00
CVG
11:01
DL CR7
MHT
19:53
CLT
23:59
AE CR9
CLT
0:00
LGA
6:25
DL CR9
TUL
20:25
CLT
23:59
AE CR9
CLT
0:00
SGF
15:49
AE E75
SGF
16:30
CLT
23:59
AE E75
CLT
0:00
YUL
10:01
AE E75
CLT
0:00
IAH
7:05
UA E7W
BKW
9:10
CLT
23:59
VC EM2
CLT
0:00
BKW
8:30
VC EM2
O11
O12
O15
O23
O24
O25
O26
HS
R01
R02
R03
R04
R05
R06
R07
R08
R09
R10
R11
R12
R13
R14
R15
R16
R17
R18
R19
R20
R21
R22
R23
R24
R25
R26
R27
R28
R29
R30
R31
R32
R33
R34
R35
R36
R37
R38
Date:04/11/2019 Time:12:58CLT 2028-Scenario 2
Page # 4 of 4

CLT 2028 Gating Scenario 3 1
00:00 01:00 02:00 03:00 04:00 05:00 06:00 07:00 08:00 09:00 10:00 11:00 12:00 13:00 14:00 15:00 16:00 17:00 18:00 19:00 20:00 21:00 22:00 23:00
865*821
876*2044 1979
1897
1998
1828
TERM
1770 8331789
1855
1915
2038
78
PUSH1717
2005
TERM
1709876
821*
445
580637
1598
2483
808
TERM1922
1909695
1810436 1809
1768
1747
753
2039
550
TERM
925
1109629
1154
1583494
720
830
1853
660
1945
733
2035
TERM
5330
5089
1729
1967*893
1051
PUSH
823
65
1891
PUSH
560
616
1724
TERM
973
TERM
680 879* 628 20801836
1841
766
TERM
277
TERM
783
TERM
19121977
1936581
294
1673793
1971
TERM
1944
1946
1735
826*1842 1760
1889
1798557
1866 1837 1878 891704
20502028 416
499
1865
1772 1961 19701810
2055
724
559
1908
1799
1798
8441857
835 858 1808 2059 1992 6732084
TERM1788
883* 5211725
691
2091
1972
1899
705
786
678747 1812
TERM
1925826
1735873 2063
2107
443
730
17401820 1863
885* 2066 2068 1719487
451
1998
1897
1677382
100
1458
1917
748
1999
622
7312075 1704
2055
6951775 470
760
19961873
696
1813461 679
1882
2054
1855
TERM
428
1791
609
17871769
892
472
898
PUSH1910
790
2053
1615
14472046
1787
609
616
17831796
431
428445 1862
1907
2541715 651
633
541
2039
890
579
6621982 752 1973 1860
1999
1899
1811
5651920 1774
1930
4871960 1937 2078 2045 504
767
466
662
19751737
661
1872
413
7132064 653 1827
1130
184
1799
19081871
334
TERM1277
19801955
1905
1967
17291914
2530
2249
819
972
799
1733
1861
2043
1364 14961376
1404657 379 703 2038
2011
PUSH148
1964
1849
2448
1453
746
463
1245
1608
20422531
25292065
1633
2961711
836
6191384
476
PUSH
713
413
1451
1458
1849
19501700
539
725
1065
1002
1942 330 2077 7562032
18211701
844
TERM1940
17321751
97
1924
TERM
1446
652
2069
2084
1843
18642067
451
TERM1893
2020
20911780 1831
887
TERM
1974
PUSH
1745
18432648
864
2035
2014
408
1978
8521923 1934 1653 2052 1921
2043
TERM
18171941
829*1753 2002 853 859
101
13901952
423
1965*1988 1938 1962 765 861
5563
TERM
2062 1722 17301267
751
1756
17532036
1692
TERM
732
18852070
1654 18531864
17451750 1870
1903829
19411814 2047 1752
744
18611987
624
6581756 1847
584
PUSH1981
1904 17951707
613*
2017
PUSH
1886
20321840
605
1029*
1805
745
852
1978
1797
1977
422
1540
1954
TERM1793
1839784
993850 1802
1976
TERM1785
469 1784 1868422
5241854
1840
1434*
*869
749
*827
1919
*368
1826
*843
2056
*884
1806
*880
1851
1829
721
281
1870
*860
1615*
ORIG
2451
CLTSC4
5:15
DFW
6:00
PVD
8:12
SXM
9:25
AA 320
BNA
10:01
AUA
11:30
AA 320
BOS
12:04
MIA
13:20
AA 321
DCA
18:52
ILM
20:00
AA 319
MSP
21:04
BWI
22:30
AA 320
ORIG
2060
CLTSC4
5:20
LGA
6:05
ORF
8:29
ORF
9:15
AA 319
MSY
10:24
STT
11:50
AA 320
PHL
13:18
MSP
14:50
AA 321
BWI
17:07
PVD
18:15
AA 320
LAX
21:09
FLL
22:10
AA 321
ORIG
2010
CLTSC4
5:50
PHL
6:35
BOS
8:28
FLL
9:50
AA 321
BWI
10:20
GCM
11:25
AA 320
RSW
12:00
DEN
14:20
AA 321
MCO
15:25
LAS
16:45
AA 321ORIG
1915
CLTSC4
17:25
RDU
18:10
EWR
19:16
IAH
20:10
AA 738
DCA
21:29
RIC
22:40
AA 319
ORIG
1877
CLTSC4
6:15
MIA
7:00
PULL
2057
CLTSC4
9:00
LAX
9:45
SYR
10:11
MSY
11:03
AA 319
ORD
13:23
TPA
14:50
AA 321
LGA
16:44
PHX
17:45
AA 321
LGA
18:02
MSY
18:55
AA 320
STL
19:10
PIT
19:54
AA 319
SJU
20:23
MSP
22:10
AA 321
ORIG
1956
CLTSC4
6:45
PHL
7:30
DTW
9:06
FNT
9:52
AA 319PULL
1797
CLTSC4
10:35
RDU
11:20
TPA
12:06
BOS
13:10
AA 321
SMF
13:28
SAN
14:45
AA 321
LGA
15:00
PHX
16:15
AA 321
DFW
16:31
PHL
17:30
AA 321
PDX
17:58
SJC
19:09
AA 320
BNA
19:24
SAT
20:25
AA 319
ORIG
868
CLTSC4
6:45
ROC
7:30
MSY
8:46
MHT
9:30
AA 319
ORD
10:08
PUJ
11:50
AA 321
LGA
12:17
ORD
13:05
AA 738
SAN
14:51
LAS
15:49
AA 321PULL
275
CLTSC4
18:25
PVD
19:10
DFW
19:35
DEN
20:20
AA 321
ORIG
928
CLTSC4
6:45
RSW
7:30
ORD
8:20
PHX
9:40
AA 321
LGA
10:00
PLS
11:40
AA 321
ORD
11:57
PHX
13:00
AA 321
MIA
13:35
ORD
14:50
AA 321
MSP
17:40
FLL
19:12
AA 321
ORIG
1727
CLTSC4
6:45
SAT
7:30
FLL
8:22
SEA
9:40
AA 321
RDU
10:38
EWR
12:10
AA 321
LGA
13:37
MCO
14:45
AA 321
PBI
16:00
EWR
19:11
AA 321
BOS
19:45
STL
20:33
AA 319
ORIG
1993
CLTSC4
6:50
LAX
7:35
SFO
8:01
ORD
9:35
AA 321
FLL
10:03
MBJ
11:30
AA 321
PHX
12:06
PIT
13:09
AA 321
BWI
13:30
FLL
14:30
AA 321
BWI
15:15
PHL
20:05
AA 321
LGA
21:04
SFO
22:20
AA 321
ORIG
525
CLTSC4
6:50
FLL
7:35
EWR
7:55
PBI
9:20
AA 321
DCA
10:32
RSW
11:55
AA 321
MIA
12:14
DFW
13:15
AA 321
BOS
13:30
DFW
14:25
AA 321
SFO
15:03
LGA
16:10
AA 321
CLE
16:59
RIC
17:54
AA 319
BWI
18:39
FLL
20:20
AA 321
PHX
21:16
DEN
22:25
AA 321
ORIG
1725
CLTSC4
6:55
MCO
7:40
LGA
8:13
DFW
9:29
AA 321
IAH
10:35
FLL
11:55
AA 321
FLL
12:19
BWI
13:19
AA 321
LAX
13:50
PHL
14:45
AA 321
LAX
15:00
PHL
16:05
AA 321
SFO
16:46
SFO
18:05
AA 321
PBI
18:54
DFW
20:27
AA 321
SFO
21:13
MCO
22:19
AA 321
ORIG
1906
CLTSC4
7:05
MCI
7:50
DFW
8:34
SJU
9:50
AA 321
BUF
10:14
NAS
11:30
AA 321
DEN
12:03
TPA
13:02
AA 321
DEN
13:21
MIA
14:20
AA 321
RSW
15:03
PVD
16:30
AA 319
DCA
16:54
IAH
17:54
AA 319ORIG
2006
CLTSC4
19:45
RIC
20:30
BOS
21:39
ORD
22:35
AA 321
ORIG
2011
CLTSC4
7:05
RDU
7:50
PHL
8:10
CUN
9:25
AA 321
MIA
10:29
DEN
11:45
AA 321
MCO
12:04
MCO
13:01
AA 321
DFW
13:52
JFK
14:55
AA 321
PHX
15:35
SFO
16:40
AA 321
ATL
16:57
LAX
18:16
AA 321
ORD
18:45
MCO
20:15
AA 321
DFW
21:12
BOS
22:15
AA 321
ORIG
1916
CLTSC4
7:10
ORD
7:55
BWI
8:20
TPA
9:35
AA 321
PHL
10:05
LAS
11:20
AA 321
DFW
12:27
ATL
13:24
AA 321
PBI
13:52
BWI
14:50
AA 321
SEA
15:16
SEA
16:20
AA 321
TPA
17:20
LGA
18:40
AA 321
ATL
19:02
RSW
20:00
AA 321
SEA
21:26
RSW
22:26
AA 321
ORIG
1957
CLTSC4
8:29
MSY
9:14
DTW
10:11
CUN
11:25
AA 321
ATL
12:02
LGA
13:12
AA 738
PHX
13:31
LGA
14:26
AA 321
DFW
15:20
FLL
16:24
AA 321
SAN
18:49
SLC
20:05
AA 321
ATL
21:16
ATL
22:40
AA 738
STL
8:51
PIT
9:45
AA 319ORIG
1924
CLTSC4
10:50
BWI
11:35
IAH
12:11
JFK
13:19
AA 738
LAS
13:58
SMF
14:50
AA 321
LAS
15:08
BOS
16:10
AA 321
ORD
16:39
TPA
17:53
AA 321
LAS
18:55
MSP
20:10
AA 321
MCO
21:03
BDL
22:09
AA 321
ORIG
1964
CLTSC4
10:55
MCI
11:40
MCO
13:45
PHX
14:35
AA 321
BOS
15:09
DFW
16:10
AA 321
EWR
17:01
SAN
18:15
AA 321
MIA
19:20
PVD
20:29
AA 321
DEN
21:18
TPA
22:15
AA 321
LAX
6:26
TPA
7:45
AA 321
MCO
8:10
SFO
9:24
AA 321
RSW
10:13
PHX
11:25
AA 321
PHL
11:59
PHL
13:00
AA 319
DEN
15:24
TPA
16:24
AA 321
FLL
17:00
PDX
18:10
AA 321
RIC
19:11
MCI
20:00
AA 319
PHL
20:40
PHX
22:15
AA 321
MSP
8:46
LGA
9:55
AA 321
MCO
10:13
TPA
11:20
AA 321
EWR
12:23
EWR
13:26
AA 738
MSP
15:25
RSW
16:25
AA 321
BOS
17:00
SEA
18:10
AA 321
LGA
19:20
BOS
20:29
AA 321
LAS
21:26
PHL
22:25
AA 321
LAS
6:10
DEN
7:35
AA 321
PBI
8:31
DEN
9:35
AA 321
TPA
10:18
ORD
11:25
AA 321
ROC
12:19
ELP
13:45
AA 319
BDL
15:02
BNA
16:06
AA 319
MCO
17:16
DEN
18:25
AA 321
SEA
19:12
SEA
20:20
AA 321
TPA
20:52
DFW
22:10
AA 321
SAN
6:04
SFO
7:30
AA 321
LAX
8:43
BOS
9:45
AA 321
BDL
10:31
SJU
11:45
AA 321
ORF
12:23
IND
13:12
AA 319
MCI
13:27
ROC
14:35
AA 319
ORD
15:05
MCO
16:00
AA 321
DEN
17:21
DFW
18:30
AA 321
FLL
19:12
BWI
20:20
AA 321
JFK
21:02
DTW
22:20
AA 321
PDX
6:14
SAN
7:50
AA 321
TPA
8:41
BWI
9:40
AA 321
MSP
10:26
BOS
11:30
AA 321
PIT
12:05
CLE
13:05
AA 319
DCA
13:28
MSY
14:35
AA 319
FLL
15:05
ATL
15:59
AA 321
PHX
17:13
SMF
18:20
AA 321
SFO
19:14
LAX
20:20
AA 321
FLL
21:21
LAX
22:20
AA 321
SJC
6:00
PDX
7:05
AA 320
RSW
8:28
MSP
9:20
AA 321
DFW
10:37
LGA
11:40
AA 321
BNA
11:58
AUS
12:54
AA 319
MEM
13:39
SAT
14:40
AA 319
SRQ
15:20
DEN
16:10
AA 321
MIA
16:54
ORD
18:00
AA 321
BDL
19:07
TPA
20:06
AA 321
ORD
21:27
MIA
22:30
AA 738
DEN
6:37
BOS
7:50
AA 321
LAS
8:10
MCO
9:19
AA 321
BOS
10:19
MCO
11:20
AA 321
BDL
12:09
RDU
13:04
AA 319
JFK
14:00
EWR
15:15
AA 738
LAX
16:00
SJU
16:50
AA 321
PHL
17:16
MCO
18:20
AA 321
JAX
19:15
PBI
22:11
AA 319
EWR
6:47
EWR
7:45
AA 738
MIA
8:47
EWR
9:55
AA 738
SJU
10:50
SRQ
11:40
AA 321
PVD
12:28
IAH
13:20
AA 319
EWR
15:05
MIA
16:25
AA 738
RSW
16:55
BWI
17:45
AA 321ORIG
1720
CLTSC4
19:04
MDT
19:49
RDU
20:57
PVD
22:05
AA 738
JFK
8:30
MIA
9:30
AA 738
AUS
10:39
JAX
13:15
AA 319
MIA
15:16
ORD
16:25
AA 738
PIT
16:57
DFW
17:40
AA 321
MCO
18:59
PHX
19:55
AA 321
EWR
20:36
JFK
22:10
AA 738
BWI
6:36
JFK
7:30
AA 738
EWR
8:16
JFK
9:06
AA 738
ATL
10:12
IAH
11:19
AA 738
SAT
13:48
FNT
15:11
AA 319
IAH
17:15
EWR
18:05
AA 738
SJU
18:35
SFO
19:30
AA 321
MIA
21:13
EWR
22:15
AA 738
ATL
8:21
ATL
9:35
AA 321
EWR
10:02
EWR
11:05
AA 738
CHS
12:25
DCA
13:15
AA 319
PIT
13:31
BDL
14:30
AA 319
TPA
15:27
LAX
16:40
AA 321
STL
17:37
FNT
21:17
AA 319PULL
1971
CLTSC4
21:35
SYR
22:20
DTW
8:08
BUF
9:10
AA 319
JFK
10:42
DFW
11:35
AA 738
DCA
11:52
RIC
12:45
AA 319
DTW
13:45
STL
14:40
AA 319
ATL
15:08
DTW
16:30
AA 319
MCI
17:13
MIA
18:20
AA 738
BUF
20:58
ALB
22:15
AA 319
RDU
6:17
DCA
7:30
AA 319
FNT
8:03
SLC
9:30
AA 319
DEN
11:15
LAX
13:00
AA 321
RDU
13:56
PIT
14:55
AA 319
IND
15:30
DCA
16:40
AA 319
RDU
17:04
DTW
18:05
AA 319
RIC
20:55
AUS
22:10
AA 319
PHX
6:09
DFW
7:30
AA 321
BDL
8:21
CLE
9:40
AA 319
PVD
10:32
MIA
11:45
AA 321
IAH
15:35
ALB
16:24
AA 319PULL
1242
CLTSC4
17:15
BUF
18:00
DFW
19:05
JFK
20:00
AA 738
BWI
20:38
JAX
22:35
AA 319
SLC
6:10
PHX
7:30
AA 321
PIT
8:35
NAS
9:40
AA 319
STL
10:27
DTW
11:20
AA 319
CLE
13:37
RDU
14:30
AA 319
DCA
15:13
MCI
16:15
AA 319
ALB
17:01
PWM
18:05
AA 319
ROC
19:07
JAX
20:15
AA 319
BOS
7:12
BNA
8:00
AA 319
RIC
8:15
MEX
9:30
AA 319
MDT
10:33
JAX
11:50
AA 319
BUF
13:26
BOS
14:15
AA 319
NAS
15:10
BUF
16:29
AA 321
NAS
17:04
PIT
18:15
AA 319
JFK
19:09
EWR
20:10
AA 738
BDL
21:12
BUF
22:25
AA 319
PHX
8:11
PUJ
9:25
AA 321
LGA
10:44
ALB
11:55
AA 319
CHS
14:02
DCA
14:55
AA 319
RDU
15:44
BWI
16:45
AA 319
IND
17:11
STL
18:25
AA 319
RDU
18:55
ATL
21:19
AA 738
MCO
6:44
LGA
7:59
AA 321
JAX
8:17
DCA
9:30
AA 319
PIT
10:20
DCA
11:30
AA 319
MCI
11:45
BUF
12:30
AA 319
ALB
12:50
ALB
13:50
AA 319
JAX
15:20
SYR
16:19
AA 319
MSY
19:14
BUF
20:15
AA 319
ALB
21:22
CLE
22:25
AA 319
RIC
6:34
BDL
7:30
AA 319
MEM
8:43
RSW
9:55
AA 319
ELP
11:07
ELP
11:50
AA 319ORIG
2069
CLTSC4
14:10
IAH
14:55
RIC
15:41
PIT
16:35
AA 319
JAX
16:50
DCA
17:50
AA 319ORIG
1317
CLTSC4
18:29
MSP
19:14
ORIG
1954
CLTSC4
19:55
LGA
20:40
SAT
21:25
ROC
22:16
AA 319
PIT
6:42
PVD
7:35
AA 319
BUF
8:08
DTW
9:19
AA 319
PWM
10:33
ATL
11:39
AA 319
PHL
15:37
PBI
16:30
AA 319
DFW
18:11
DFW
19:10
AA 321
IAH
19:25
RDU
20:10
AA 319
SYR
21:04
DCA
22:14
AA 319
SEA
6:15
LAS
8:00
AA 321
IND
8:44
BDL
9:50
AA 319
PBI
10:10
PHL
11:15
AA 3191821
1886
MSY
15:30
RIC
16:09
AA 319PULL
736
CLTSC4
19:15
DTW
20:00
DTW
20:55
LGA
22:04
AA 319
DCA
7:02
PIT
7:59
AA 319
DCA
8:28
CHS
9:30
AA 319
ALB
10:23
SXM
11:25
AA 319
BNA
15:14
JAX
15:59
AA 319
AUS
17:15
BDL
18:25
AA 319
NAS
18:54
PLS
20:00
AA 319
RSW
21:10
IAH
22:10
AA 321
IAH
8:38
IAH
9:35
AA 319
MCI
10:28
IND
11:30
AA 319ORIG
1789
CLTSC4
13:40
PBI
14:25
MCI
15:35
ELP
19:15
AA 319
MSY
21:20
PIT
22:25
AA 319
ILM
8:04
PHL
9:00
AA 319
FSD
9:23
MCI
10:15
AA 319
SAT
10:39
BNA
11:40
AA 319
DTW
15:39
MSY
16:30
AA 319
MCI
21:40
ORF
22:40
AA 319
ATL
6:52
ATL
8:00
AA 321
CLE
8:30
MEM
9:24
AA 319
ROC
10:14
CHS
11:14
AA 319
BUF
16:20
FSD
19:54
AA 319PULL
170
CLTSC4
20:45
MCI
21:30
PHX
21:50
RDU
22:45
AA 321
BDA
10:51
MEX
12:00
AA 319ORIG
1889
CLTSC4
15:35
BDL
16:20
ORIG
1530
CLTSC4
18:28
PBI
19:13
PULL
881
CLTSC4
21:15
STL
22:00
ORIG
887*
CLTSC4
12:40
CUN
13:30
MBJ
16:50
LAS
18:10
AA 321
MBJ
18:56
MIA
20:15
AA 321*1850
TERM
SJO
21:55
CLTSC4
22:40
ORIG
1963*
CLTSC4
7:05
PUJ
7:55
GCM
9:00
HAV
9:45
AA 319
PAP
11:00
NAS
13:15
AA 319
MBJ
14:53
RDU
16:10
AA 321
CUN
16:40
BOS
17:55
AA 321
PLS
18:55
ORD
20:05
AA 321
AADO
A21
A22
A23
A24
A25
A26
A27
A28
A29
A1
A3
A5
A7
A9
A11
A13
A12
A10
A8
A6
A4
A2
B1
B3
B5
B7
B9
B11
B13
B15
B16
B14
B12
B10
B8
B6
B4
B2
C2
C4
C6
C8
C10
C12
C14
C16
AAIN
I1
I2
Date:04/11/2019 Time:12:46CLT 2028-Scenario 3
Page # 1 of 4
00:00 01:00 02:00 03:00 04:00 05:00 06:00 07:00 08:00 09:00 10:00 11:00 12:00 13:00 14:00 15:00 16:00 17:00 18:00 19:00 20:00 21:00 22:00 23:00
*705
PUSH
*731
730*
*721
TERM
*745
744*
*721
748*
PULL
1568*
*749
724
*733
732*
*787
704*
PULL
720*
725
786*
*428
429*
*1062
PUSH
GRU
7:50
CLTSC4
8:50
AA 332
FRA
13:00
CLTSC4
14:00
AA 789
LHR
16:15
LHR
18:40
AA 789
FCO
15:55
CLTSC4
16:55
AA 789
BCN
18:20
BCN
20:45
AA 332
FCO
15:55
MAD
16:40
AA 789
CLTSC4
19:00
GRU
20:30
AA 332
MAD
15:50
DUB
18:05
AA 332
LHR
18:30
LHR
20:15
AA 789
CDG
13:55
FRA
16:35
AA 332
CLTSC4
16:55
FCO
18:25
AA 789
DUB
13:05
CDG
18:20
AA 332
MUC
16:20
MUC
18:35
LH 359
*842
1040*
*1963
787
*886
2061
*1839
982*
*1283
1087*
*1074
1028
*866
1867
*1844
1853*
*639
1865*
*1342
874*
*854
1647*
*1966
643
*822
856
*828
1768
1078
TERM
5136
684 TERM
9
TERM
1441
TERM2422 826 1407
2808
TERM
1076
TERM
1989
TERM
2251522
TERM
2597603
1793
876
TERM
1704
1969
425
521
1484
1140
1711
1199
1176
1698
1286
TERM
1974
TERM
8025
8020
8021
8016
8017
TERM
5812
TERM
201
2001028
354
3531689
933
932
5190
5557
5234
5187
5241
5132
5176
5314
5441
5154
3831
4076
5486
5172
5202
5287
5293
5440
5093
5323
5032
5366
5119
5256
5156
5118
5273
5297
5277
5032
5237
5164
5095
5096
5063
5259
5148
5405
5264
5298
5347
5142
5314
5222
4011
37755227
4796
TERM
3826
3906
ORIG
3973
5052
5264
5222
PUSH
PULL
5304
5467
5593
5320
5226
5135
5156
4769
4895
5058
PUSH
5327
5533
PULL
5343
5231
5104
5366
5096
5186
TERM
5006
PUSH
5263
5335
5157
5179
5294
5119
3773
3865
5087
5121
PULL
5468
5037
5100
5279
PUSH
5175
5384
4538
4675
3798
3959
4892
PUSH
4786
4755
5049
TERM
4738
4889
4935
TERM
5122
5364
5396
5135
5327
5204
5508
5233
5257
5407
4921
4826
5337
5514
4751
4804
5110
5459
5526
5166
4829
4798
3865
4023
3775
4056
5296
5093
5390
5002
5297
5512
5463
5453
5138
5200
4749
4931
4842
4835
4931
4922
4867
4942
4852
4820
5506
5514
5466
5319
4773
4779
5218
5202
3973
3915
4807
4799
5150
5251
5546
5364
5263
5123
5582
5083
5456
5429
5437
53064943
5235
5509
ORIG
5632
5183
5220
5384
5302
5364
5283
5209
5398
5074
5038
5246
5295
4886
4831
5320
5423
4904
4829
5132
5257
4939
48075230
5083
5393
1454 1629602
2651
1095 2133
219
218
1445
1446
3706
3213
5120
5052
5185
5582
4866
4805
ORIG
804*
CLTSC4
6:55
CUN
7:45
PLS
10:00
KIN
12:00
AA 319
PUJ
16:21
ATL
17:50
AA 738
CUN
18:40
PBI
19:55
AA 321*1968
TERM
PUJ
20:16
CLTSC4
21:01
SDQ
8:00
UVF
9:45
AA 321
CUN
10:50
SJO
11:55
AA 321
HAV
16:05
BDA
17:30
AA 319
SXM
18:40
BNA
19:49
AA 320*888
TERM
CUN
20:29
CLTSC4
21:14
ORIG
843*
CLTSC4
6:55
MBJ
7:45
MEX
11:00
SDQ
12:00
AA 319
SDQ
18:00
GCM
19:30
AA 319
UVF
20:15
SDQ
22:00
AA 321
PULL
840*
CLTSC4
8:35
MBJ
9:25
KIN
9:55
PAP
10:50
AA 319
PUJ
17:42
LAS
20:05
AA 321*877
TERM
AUA
20:50
CLTSC4
21:35
GCM
18:14
DCA
19:44
AA 320*613
TERM
SXM
20:24
CLTSC4
21:09
MEX
18:35
MEM
20:00
AA 319
ORIG
643
CLTSC4
4:40
HOU
5:25
ORIG
1010
CLTSC4
5:45
MDW
6:30
ORIG
3773
CLTSC4
6:55
BWI
7:40
3055
BWI
9:35
DAL
10:10
BNA
14:00
BNA
14:45
WN 738853
1748
MDW
16:50
MDW
17:25
1747
1493
HOU
17:55
HOU
18:30
1721
DAL
18:55
BWI
19:30
ORIG
823
CLTSC4
4:45
ATL
5:30
ORIG
521
CLTSC4
7:00
SLC
7:45
ATL
8:48
ATL
9:30
DL 73H
ATL
10:03
ATL
10:45
DL M90
DTW
12:07
DTW
12:50
DL 319 1503
MSP
14:24
MSP
14:59
ATL
16:18
ATL
17:00
DL 73H
ATL
17:50
ATL
18:45
DL 73H
ATL
19:09
ATL
20:05
DL 73H
ORIG
1366
CLTSC4
5:15
DTW
6:00
ORIG
2266
CLTSC4
7:20
MSP
8:05
2292
DTW
9:04
DTW
9:39
ATL
11:16
ATL
12:00
DL 717
ATL
12:33
ATL
13:15
DL 717
ATL
15:04
ATL
15:45
DL 73H1322
1524
MSP
16:40
DTW
17:20
DL 320 1057
DTW
18:40
DTW
19:15
ORIG
2488
CLTSC4
6:15
ATL
7:00
ORIG
1591
CLTSC4
7:30
ATL
8:15
ATL
13:42
ATL
14:30
DL 320
DTW
15:40
MSP
16:30
DL 319
ORIG
1191
CLTSC4
5:05
IAH
5:50
SFO
7:21
SFO
8:20
UA 739
ORD
9:26
ORD
10:15
UA 73G
ORD
13:00
ORD
13:45
UA 319
DEN
15:10
DEN
16:22
UA 320
SFO
17:31
SFO
18:30
UA 739
BOS
9:24
BOS
10:51
B6 E90
ORIG
8022
CLTSC4
5:33
BOS
6:18
JFK
10:01
JFK
10:40
B6 E901245
1246
BOS
10:59
BOS
11:36
BOS
16:00
BOS
17:00
B6 E90
BOS
17:18
BOS
18:00
B6 E901119
1118
JFK
18:50
JFK
19:28
B6 E90
ORIG
1712
CLTSC4
6:03
ORD
6:48
ORIG
5290
CLTSC4
7:50
DEN
8:35
DEN
5:10
DEN
7:20
F9 319
MCO
10:11
PHL
10:59
F9 320
ISP
11:20
ISP
12:05
F9 319
PHL
15:21
MCO
16:09
F9 320
TTN
20:25
TTN
21:10
F9 320
PHF
6:30
PHF
7:35
AE CR2
PGV
8:11
PGV
9:19
AE CR2
EVV
10:23
MLB
11:40
AE CR2
OAJ
12:05
OAJ
13:00
AE CR2
MGM
13:18
SDF
14:25
AE CR2
FAY
15:26
IND
16:30
AE CR2
FAY
17:05
GNV
20:25
AE CR2
GNV
21:20
CHO
22:30
AE E75
MGM
8:38
MGM
9:45
AE CR2
SGF
10:09
SGF
10:50
AE E75
SDF
11:05
IND
14:50
AE CR7
EVV
15:23
EWN
16:14
AE CR2
TYS
17:10
FAY
19:50
AE CR25461
5049
HTS
20:15
CRW
20:50
DAY
21:31
PGV
22:40
AE CR2
5228
5039
GNV
6:52
LEX
7:30
AE CR2
FAY
8:40
TYS
9:35
AE CR2
CHA
10:46
EVV
11:35
AE CR2
CRW
12:15
BHM
13:00
AE CR2
DAY
13:43
PHF
14:25
AE CR2
GPT
15:05
CID
15:50
AE CR7
GNV
16:09
CAK
18:04
AE CR2
CRW
19:05
FWA
19:49
AE CR25265
5141
MEM
20:05
MLB
20:45
AE CR9
LEX
21:36
MGM
22:41
AE CR2
5355
5277
CAK
7:08
CHA
7:43
CRW
8:16
BHM
9:10
AE CR25039
5463
LEX
10:40
FAY
11:20
AE CR23906
3960
HSV
12:25
CAE
13:05
AE CR23777
4011
MYR
14:01
AVL
14:40
AE CR2
OAJ
15:33
MGM
16:19
AE CR2
AVL
16:52
CAE
18:00
AE CR2
CHS
19:03
SRQ
19:50
AE CR9
CAE
8:21
HSV
9:09
AE E755507
5263
BTR
10:34
AGS
11:14
AE CR75142
5218
BHM
12:30
TLH
13:10
AE CR25117
5486
PGV
14:07
FAY
14:45
AE CR2
PHF
17:22
LEX
18:14
AE CR25514
5254
SHV
18:30
TLH
19:05
5211
5276
TLH
21:15
LFT
21:46
5406
5176
FWA
8:49
OAJ
9:26
AE CR2
GSP
10:10
FPO
11:45
AE CR75371
5305
GNV
12:25
TYS
13:00
GPT
13:37
OAJ
16:14
AE CR7
FWA
17:11
DAY
18:00
AE CR2
AVL
18:42
TRI
20:15
AE CR73945
3904
HPN
20:50
ORF
21:30
AE CR7
IAD
8:43
GRR
9:25
AE CR9
MSN
10:45
HPN
14:33
AE CR7
MGM
14:57
LFT
16:20
AE CR75311
5186
BHM
17:45
CHA
18:25
AE CR2
CRW
6:45
LFT
9:36
AE CR7
VPS
10:06
CHA
11:14
AE E755514
5255
RAP
11:40
DAB
12:20
AE CR9
TYS
13:51
TYS
14:35
AE CR2
ORF
15:07
BHM
16:05
AE E75
CMH
17:41
GSO
18:30
AE CR9
TYS
20:59
AVL
22:25
AE CR7
MLB
8:47
HPN
9:30
AE CR75557
5294
PHF
10:39
TYS
11:18
AE CR2
CMH
12:27
MCI
13:24
AE E75
SDF
15:17
MKE
16:35
AE CR7
TRI
19:00
EWN
20:30
AE CR7
LYH
6:22
OAJ
7:40
AE CR7
DAY
8:51
PHF
11:45
AE CR7
AGS
12:16
FWA
13:10
AE CR7
CAE
14:03
EVV
16:00
AE CR7
CHA
17:21
OAJ
19:45
AE CR75411
5523
LFT
20:00
SHV
20:40
AE CR7
JAN
20:58
BTR
22:15
AE CR7
EWN
6:35
GSO
7:50
AE CR7
LEX
8:30
JAN
11:20
AE CR7
AVL
12:12
LYH
13:03
AE CR7
LFT
13:50
GNV
15:15
AE CR7
HPN
15:44
HPN
17:00
AE CR7
ROA
17:16
LYH
18:30
AE CR7
BHM
19:23
HPN
20:40
AE CR7
CAE
20:59
MKE
22:05
AE CR7
AGS
6:31
SDF
7:30
AE CR7
LFT
8:42
CAE
11:19
AE CR7
TYS
12:20
MOB
13:10
AE CR7
FAY
13:45
VPS
14:40
AE CR75569
5196
XNA
14:55
ICT
15:32
VPS
15:50
HTS
17:00
AE CR7
CRW
17:30
OAJ
18:25
AE CR7
ROA
18:43
SBY
19:50
AE CR7
OAJ
21:24
LYH
22:30
AE CR7
TRI
6:39
HHH
7:35
AE CR7
TRI
8:16
LYH
9:35
AE CR7
MOB
10:45
SHV
13:15
AE CR7
CVG
13:31
HSV
14:25
AE CR7
EWN
15:06
LYH
16:10
AE CR7
TLH
16:55
GNV
17:55
AE CR75500
5505
BTR
18:30
HSV
19:05
HSV
19:21
YUL
20:25
AE CR7
ROA
21:00
ROA
22:05
AE CR7
4776
4934
ROA
7:04
FAY
7:40
AE CR7
HPN
8:22
MOB
9:35
AE CR7
SHV
10:44
BTR
13:00
AE CR7
AGS
13:49
DAY
14:41
AE CR7
CHA
15:40
GPT
16:40
AE CR7
CID
17:04
CID
18:04
AE CR7
MSN
18:43
CAK
19:45
AE CR74460
4582
LGA
20:00
BTV
20:40
AE E75
HHH
21:15
HHH
22:20
AE CR7
4915
4763
HHH
6:56
ROA
7:30
GSP
8:18
IAD
9:09
AE CR9
LIT
11:00
EYW
11:45
AE CR9
SAV
12:07
CHA
12:50
AE CR75375
5144
AEX
13:14
AEX
13:46
HPN
14:02
MLB
14:50
AE CR7
PHF
15:13
LEX
16:10
AE CR7
ORF
18:43
AGS
19:45
AE CR7
BTR
21:35
EVV
22:40
AE CR7
CHS
6:18
SAV
7:45
AE CR9
LYH
8:12
SBY
9:20
AE CR7
CID
10:18
CID
11:45
AE CR7
HTS
12:18
AGS
13:01
AE CR7
FLO
13:48
ROA
14:35
AE CR7
MLB
15:44
JAN
16:35
AE CR7
EWN
17:24
ROA
18:15
AE CR7
MLB
18:52
MSN
19:54
AE CR7
GPT
21:10
SRQ
22:14
AE CR7
I3
I4
I5
I6
I7
I8
I10
I11
I12
I13
I14
I15
OADO
O1
O2
O3
O4
O5
O6
O13
O14
O18
O19
O20
O27
O28
O29
O30
O31
O32
OAIN
I21
I22
AEDO
D13
D12
D10
D8
D6
D4
E1
E2
E3
E5
E7
E9
E11
E13
E15
E17
Date:04/11/2019 Time:12:46CLT 2028-Scenario 3
Page # 2 of 4
00:00 01:00 02:00 03:00 04:00 05:00 06:00 07:00 08:00 09:00 10:00 11:00 12:00 13:00 14:00 15:00 16:00 17:00 18:00 19:00 20:00 21:00 22:00 23:00
5357
5309
4884
4841
4934
4904
4759
4813
5036
5143
4798
4744
5452
5389
5113
5466
4889
4773
4765
4769
5431
TERM
4907
4870
5180
5556
50265278
5396
5349
5431
ORIG
4809
5154
5326
5226
5477
5431
5207
5066
5112
5460
5268
5365
5152
4826
4879
4862
4842
ORIG
5037
3833
3889
5060
5520
5096
5061
4669
4538
5111
5514
5315
5258
4869
4780
5476
5235
5256
TERM
5342
5073
5390
5091
PULL
5117
5091
5437
4779
4885
5399
5373
3850
3814
3896
3798
5415
5288
ORIG
4796
4777
4767
5232
5060
5468
5462
5152
5086
4556
4495
3899
3908
5242
5071
3908
3777
5107
5189
5326
5124
4544
4542
5439
5225
5373
5210
5458
5087
5214
5336
4661
4531
5329
5185
5290
5436
5073
5345
5245
5212
3909
TERM
5055
5276
5449
5114
ORIG
5573
5292
5172
5372
5494
4933
TERM
5253
5421
5090
TERM
3967
3819
4876
4866
5252
5285
5166
5229
4675
4624
5099
TERM
5253
5266
5247
5315
3190
TERM
5378
5036
5552
5177
5316
5164
4542
4510
5139
5151
5043
5236
5077
TERM
5259
5438
5341
51165054
5187
5048
5433
51815072
5513
5147
5530
5491
5346
5237
4484
4457
5171
5395
5533
5192
5460
5053
3834
3968
4001
3795
5117
5502
5487
5084
5092
PUSH
4457
4674
5078
5552
5502
5232
PULL
5503
5165
5457
5128
5504
5289
5053
5223
5349
5267
5514
5335
5238
5177
5037
5033
5098
5200
54565420
5301
5299
ORIG
5531
5204
5033
5282
5063
5386
5244
4510
4662
5069
TERM
5130
5267
5415
5575
5509
5243
5081
5313
5370
5094
5398
5040
5121
5374
5207
5289
5356
5474
5267
5140
5592
PUSH
PULL
5004
5210
5335
5094
5109
5042
5193
5255
5434
5086
5180
5435
51695138
5194
5568
5102
5322
4470
4537
5317
5031
5053
5066
5276
5553
5495
5255
5162
5166
5568
5301
5084
5088
5034
50705056
5281
5211
ORIG
5261
5431
5260
5350
5178
5436
51705131
5212
5303
5236
5161
ORIG
5079
5417
5245
5474
5034
4537
4498
5288
5049
5494
5318
5088
5334
ORIG
5432
5158
53305080
5266
50695377 5144
5161
5333
5343
54875510 5064 5249
5189
5155
5331
5250
ORIG
5136
5160
5370
5116
5300
5243
5331
5418
5101
5455
5099
53545344
5033
5129
5270
5178
5502
5285
5455
5170
5103
5286
5451
ORIG
5252
4547
4546
5134
5058
5183
52234522 4572
4554
4579
ORIG
5290
5383
5320
5504
51155043
5321
55635047
5065
5349
ORIG
5082
5534
5415
5061
5522
4695
4556
5345
54185286
5366
TERM
ORIG
5547
5352
5139
5309
53505035 5125
5098
5127
5182
TERM
ORIG
5371
3916
3989
4546
4566
5322
5236
3957
4001
5169
5307
5451
5200
ORIG
5452
5115
5265
5031
5271
5361
TERM
ORIG
4850
5325
5317
5082
5055
5058
5208
5193
5281
5546
TERM
5382
TERM
ORIG
5071
3819
3909
5153
5074
5313
5182
5300
5219
ORIG
5509
5268
5458
5077
5105
5163
TERM
PULL
4925
5213
5183
5389
5051
ORIG
3190
5814
TERM
5337
TERM
ORIG
5294
4649
4618
5305
5065
5181
TERM5385 4476
ORIG
5247
3960
3833
5543
5265
5307
TERM
4498
4636
ORIG
5129
5587
5553
5076
TERM
ORIG
6238
ORIG
3357
3642
3356
6234
TERM
ORIG
3312
3395
TERM TERM
ORIG
6113
6245
6285
6302
TERM
ORIG
3612
5060
5069
3888
3642
5096
5099
ORIG
4554
3812
TERM
5067
5153
5251
5078
4903
4765
5225
5311
4804
4786
5064
5376
4790
4903
5319
5361
3959
4010
5105
5224
4464
4684
4662
4506
4914
4936
5184
3814
3831
5294
5525
5191
5035
4618
4695
5140
5248
5070
5214
5196
5081
6224
6227
MYR
6:29
CHS
7:40
AE CR9
EWN
8:32
TRI
9:40
AE CR7
FAY
10:07
FLO
11:33
AE CR7
GSP
12:17
LEX
12:59
AE CR7
MOB
13:42
LEX
14:25
AE CR75572
5567
PWM
15:10
GRR
15:50
AE CR9
HTS
17:18
HHH
18:05
AE CR7
CAK
19:18
VPS
20:20
AE CR7
LYH
21:26
EWN
22:30
AE CR7
SAV
6:36
MYR
7:40
AE CR9
OAJ
8:13
CVG
9:20
AE CR7
OAJ
10:46
EWN
11:55
AE CR7
GSO
12:18
TRI
12:59
AE CR7
BTR
13:47
BHM
14:30
AE CR7
TRI
15:38
AVL
16:24
AE CR7
AGS
19:09
FLO
20:09
AE CR7
MDT
21:29
PHF
22:30
AE CR7
GSO
6:52
MEM
7:50
AE CR9
MOB
8:42
AGS
9:45
AE CR7
PIA
10:26
PIA
11:19
AE CR74820
4933
LYH
12:32
GSP
13:12
AE CR74831
4749
SBY
13:39
CRW
14:19
AE CR7
SDF
17:46
AVL
18:30
AE CR7
OAJ
18:53
SDF
19:49
AE CR7
MLB
20:30
MOB
21:30
AE CR7
LGA
22:01
GSO
22:45
AE CR9
ORF
6:27
CVG
7:24
AE CR9
AVL
8:21
CHO
9:19
AE CR7
GSO
10:30
ROA
11:14
AE CR74841
4926
TRI
12:23
ROA
13:01
AE CR74824
4759
CRW
13:25
HTS
14:05
AE CR75204
5272
MSN
14:25
CAK
15:05
AE CR7
FLO
15:20
ROA
16:05
AE CR7
GSP
18:49
MKE
19:44
AE CR7
MOB
21:40
LEX
22:35
AE CR7
ILM
6:41
CMH
7:29
AE CR9
MDT
8:08
CMH
9:10
AE E75
MLI
9:40
GRR
11:30
AE CR94936
4862
EWN
12:29
FLO
13:06
5071
5508
JAN
13:47
CHA
14:27
AE CR7
LYH
15:47
TRI
16:30
AE CR7
LFT
16:58
MLB
17:40
AE CR7
DAB
18:00
OKC
18:45
AE CR9
PGV
19:15
LYH
20:10
AE CR7
FWA
20:30
LEX
21:30
AE CR7
SDF
6:46
STL
7:40
AE CR9
SRQ
8:04
TLH
9:00
AE CR7
ROA
9:15
GSO
9:55
AE CR7
TLH
12:28
MSN
13:34
AE CR95179
5110
CHA
14:01
ORF
14:40
AE CR75048
5239
CHO
15:30
CAE
16:10
AE CR7
HSV
17:38
PHF
18:20
AE CR7
LYH
18:59
CHO
19:49
AE CR75050
5041
HSV
21:06
PIA
21:45
AE CR7
IAD
6:44
IAD
7:30
AE CR9
MKE
8:50
CAE
9:45
AE CR7
MKE
10:48
SDF
11:40
AE CR7
RDU
12:19
BNA
13:20
AE CR94800
4743
AVL
13:42
CHO
14:19
4926
4907
ROA
15:41
AGS
16:19
AE CR7
FLO
19:40
HTS
20:30
AE CR7
MKE
21:37
CAE
22:20
AE CR7
5328
5282
DAY
7:14
CLE
7:50
AE CR2
GPT
8:51
MSN
9:45
AE CR7
CAK
10:50
GPT
11:40
AE CR7
CHO
12:12
AVL
13:05
AE CR94879
4939
ROA
13:50
EWN
14:25
5186
5310
PIA
15:43
AEX
16:20
5060
5324
AEX
17:05
FWA
17:45
AE CR75283
5221
LEX
19:16
TYS
19:56
AE CR7
OMA
21:05
IND
22:05
AE E75
PHL
6:58
CAE
7:45
AE E75
CAK
8:37
JAN
9:30
AE CR7
CAE
10:21
MYR
11:19
AE E75
ILM
12:13
AVP
13:04
AE CR94844
4892
HHH
13:56
HHH
14:30
4805
4869
AGS
15:40
PGV
16:16
5512
5060
MOB
17:10
MOB
17:49
AE CR7
FAY
19:59
HSV
20:40
AE CR7
AVL
20:55
CAK
22:05
AE CR25491
5292
MGM
22:27
AEX
22:59
CMH
6:38
DTW
7:45
AE E75
AGS
8:21
BTR
9:09
AE CR7 5260
DCA
9:24
GSP
9:59
4763
4844
ROA
10:21
HHH
10:55
IAD
11:10
SAT
11:55
AE CR9
JAX
12:10
CMH
14:24
AE CR95514
5148
JAN
15:40
CRW
16:15
4918
4777
CHO
17:01
FLO
17:35
4809
4810
CHO
19:10
ROA
19:44
GSP
19:59
BNA
22:40
AE CR9
IND
6:51
IND
7:55
AE E75
HSV
8:33
SAV
9:19
AE CR7
RIC
10:45
CLE
11:35
AE CR9
STL
12:10
ILM
12:59
AE CR9
CAK
13:28
PNS
14:50
AE CR9
DSM
16:58
DSM
18:45
AE CR95252
5024
GNV
19:18
BTR
19:50
MYR
20:59
CHS
22:35
AE CR9
BTR
9:20
LFT
12:25
AE CR9
GSO
13:33
MEM
14:40
AE CR9
EYW
16:56
MLI
20:22
AE CR9
CAE
6:50
BHM
7:35
AE E75
CHO
8:15
HTS
9:00
AE CR7
YYZ
9:19
BNA
9:59
AE E75
ORF
10:47
ILM
14:35
AE CR9
CVG
15:14
CHS
16:20
AE CR9
MSY
17:08
CMH
17:50
AE E75
MCI
18:55
CMH
19:44
AE E75
FLO
8:43
EWN
9:24
AE CR7
OMA
10:41
SAV
12:59
AE CR9
JAX
13:32
DAB
14:25
AE CR9
DSM
16:45
SAT
20:00
AE CR9
CHO
21:08
CRW
22:35
AE CR7
ICT
9:03
CMH
10:30
AE CR94850
4800
FLO
10:45
AVL
11:25
AE CR7
DTW
12:23
MDT
13:10
AE E75
SRQ
13:37
SAV
14:27
AE CR9
GRR
15:50
BHM
19:30
AE CR9
CAK
21:35
AGS
22:30
AE CR2
CVG
6:56
OKC
9:20
AE CR9
TUL
10:50
TUL
11:40
AE CR9
PGV
12:05
CHO
12:49
AE E75
AUS
13:45
CHS
14:35
AE CR9
MHT
15:02
TLH
15:59
AE CR9
LIT
16:20
GRB
19:57
AE CR9
CID
20:40
GPT
21:30
AE CR7
BHM
8:30
CRW
9:20
AE CR2
IND
10:46
CMH
11:45
AE E75
AUS
12:05
LIT
12:50
AE CR95167
5314
TVC
13:10
BTV
13:44
GRR
14:05
ATL
14:55
AE CR9
DAB
15:30
LIT
19:00
AE CR9
YYZ
19:17
CAE
20:10
AE E75
AGS
20:38
GSP
22:40
AE CR7
AEX
8:49
VPS
11:50
AE CR9
FAY
12:10
CHS
12:54
AE CR9
CMH
15:21
ILM
16:09
AE E75
LEX
17:25
CHO
18:15
AE E75
IAD
19:26
MSY
20:30
AE CR9
CHA
6:29
JAX
8:50
AE CR9
CVG
9:10
OMA
11:20
AE CR9
MYR
12:15
MYR
12:59
AE CR9
SYR
14:30
CLE
15:20
AE CR9
MLI
15:39
RAP
19:03
AE CR9
DAB
19:36
CHA
22:20
AE CR9
SGF
9:15
TVC
11:24
AE CR9
MEM
12:07
SYR
12:50
AE CR9
LIT
13:51
MKE
14:40
AE CR9
AUS
15:30
SGF
18:50
AE CR9
TLH
19:19
GSO
20:10
AE CR9
AUS
21:05
MEM
22:35
AE CR9
BHM
9:15
OKC
11:20
AE CR9
CLE
12:05
GNV
12:50
AE CR2
ILM
13:52
CVG
16:14
AE CR9
MDT
16:56
JAX
17:59
AE E75
SAV
8:16
MKE
9:14
AE CR9
LNK
9:33
PNS
11:25
AE CR9
IAD
12:29
CAK
13:15
AE CR9
ORF
13:56
MYR
14:45
AE CR9
STL
15:43
PNS
16:44
AE CR9
CVG
17:00
ICT
20:06
AE CR9
GSO
20:45
DAY
22:05
AE CR9
CHS
8:09
MYR
9:30
AE CR9
BHM
10:13
PVD
11:50
AE CR9
CAE
12:22
FAY
13:05
AE E75
MKE
13:56
ABE
14:45
AE CR9
SAT
18:40
CLE
20:30
AE CR9
PNS
20:55
CVG
22:05
AE CR9
AVP
8:47
ILM
9:25
AE CR9
DAY
10:54
XNA
11:50
AE CR9
PNS
13:56
DTW
14:45
AE CR9
AVL
15:29
MDT
17:55
AE CR9
DTW
19:04
ABE
20:15
AE CR9
CHS
21:00
TYS
22:09
AE CR9
JAN
8:37
IND
9:55
AE CR9
SRQ
10:10
AVP
11:20
AE CR9
IND
12:12
GSO
13:05
AE E75
DAB
13:40
IAD
14:25
AE CR9
MYR
15:33
LGA
17:25
AE CR9
ATL
18:05
GRR
19:45
AE CR94636
4554
JAX
21:33
YYZ
22:10
SDF
8:32
PNS
9:45
AE CR9
MHT
10:30
CVG
11:40
AE CR9
IND
14:01
AUS
14:45
AE CR9
CHS
15:30
LIT
16:30
AE CR9
PWM
17:10
ILM
18:25
AE CR9
SAV
19:00
ORF
20:00
AE CR9
CVG
21:22
BHM
22:30
AE CR9
MYR
8:47
SYR
10:00
AE CR9
XNA
10:28
BHM
11:35
AE CR9
ABE
13:44
CVG
14:25
AE CR9
CLE
15:25
MYR
16:20
AE CR9
OMA
17:06
SAV
18:20
AE CR9
PNS
18:50
CVG
19:45
AE CR9
XNA
21:33
MYR
22:40
AE CR9
GSO
8:36
CAK
9:45
AE CR9
MEM
10:43
PWM
11:50
AE CR95051
5372
SAV
13:50
RIC
14:30
AE CR9
GSO
15:30
YYZ
16:27
AE E75
BNA
16:45
SDF
17:54
AE CR9
MEM
18:50
CHS
19:44
AE CR9
LIT
21:18
SDF
22:20
AE CR9
LIT
8:45
SDF
9:50
AE CR9
CLE
10:21
MDT
11:25
AE CR95504
5527
OKC
13:18
MYR
13:57
AE CR95531
5286
GRB
14:22
ABE
14:59
SAV
15:42
STL
16:35
AE CR9
SYR
17:16
CHS
18:20
AE CR9
TYS
19:01
SAV
19:55
AE CR9
SRQ
21:39
JAN
22:35
AE CR9
3802
GSP
5:57
DCA
6:32
PNS
8:38
FAY
9:40
AE CR9
OKC
10:42
IAD
11:45
AE CR95046
5265
SAT
13:48
MLI
14:26
AE CR9
MDT
15:07
CMH
15:59
AE CR9
DTW
17:22
MYR
18:20
AE CR9
IND
18:58
GSP
19:50
AE CR9
CLE
21:39
ILM
22:35
AE CR9
AVP
10:18
STL
11:20
AE CR95103
5565
ICT
14:07
MHT
14:45
AE CR9
OKC
15:14
SDF
16:05
AE CR9
CAK
16:53
CLE
17:50
AE CR9
GSO
18:49
DAY
19:40
AE CR9
ORF
21:09
AVP
22:20
AE CR9
TYS
6:24
GSP
7:45
AE CR7
TYS
8:22
LIT
9:15
AE CR9
DSM
10:19
ILM
11:16
AE CR95414
5542
CMH
14:00
TUL
14:35
BHM
15:10
IAD
16:00
AE CR9
ILM
17:14
ORF
18:05
AE CR9
MYR
19:00
PNS
19:50
AE CR9
IAD
21:21
SAV
22:30
AE CR9
CMH
8:36
YYZ
9:27
AE E75
ABE
10:39
MEM
11:25
AE CR9
VPS
13:49
CAK
16:00
AE E75
GSO
16:59
IND
17:50
AE E75
ILM
18:50
IND
19:45
AE E75
CMH
21:14
CMH
22:09
AE E75
PHF
8:10
GPT
9:20
AE CR7
SAV
10:38
DAY
11:35
AE CR9
PIT
15:24
SAV
16:14
AE CR9
RIC
17:19
BNA
18:10
AE CR9
CMH
19:16
MHT
20:05
AE CR9
VPS
21:06
TLH
22:15
AE E75
GRR
8:49
RDU
9:40
AE CR9
CMH
10:50
PIT
11:45
AE CR9
BNA
13:42
OMA
14:55
AE E75
ILM
15:35
GSO
16:25
AE CR9
IAD
17:05
IAD
17:55
AE CR9
DAB
8:35
SRQ
9:24
AE CR9
CHS
10:27
GSO
11:20
AE CR9
RIC
14:02
GSO
14:45
AE E75
IAD
15:15
DAB
16:04
AE CR9
PVD
16:51
SRQ
17:40
AE CR9
MKE
19:21
IAD
20:05
AE CR9
4770
4751
SBY
9:15
AVL
9:50
AE CR7
YUL
10:06
GSP
11:35
AE CR7
YYZ
14:19
LGA
15:15
AE E75
AVP
15:36
XNA
16:25
AE CR9
CAE
17:03
AGS
17:55
AE E75
CVG
19:26
DAB
20:10
AE CR9
ILM
21:03
LIT
22:35
AE CR9
4942
4816
HHH
10:47
CRW
11:19
3989
3834
GSP
13:54
YYZ
14:30
DAY
15:14
MEM
16:00
AE CR9
IAD
17:46
TUL
18:30
AE CR9
ABE
19:06
OMA
19:49
AE CR9
BNA
8:49
DAB
9:50
AE CR9
ILM
10:31
DSM
11:20
AE CR9
MEM
15:35
TYS
16:19
AE CR9
XNA
17:04
CVG
17:50
AE CR9
BHM
10:59
HSV
11:50
AE CR2
LEX
15:55
BTR
16:45
AE CR7
MYR
17:19
BHM
18:05
AE CR9
SDF
19:28
XNA
22:30
AE CR9
CVG
10:49
DTW
13:00
AE CR95431
5165
OMA
15:20
DSM
16:00
AE CR9
FPO
16:48
FAY
17:45
AE CR7
TLH
8:53
VPS
9:50
AE CR7
MYR
10:22
SAV
11:10
AE CR9
SAV
17:09
GSP
17:50
AE CR9
BTV
10:21
RIC
11:05
AE E75
TYS
15:37
VPS
16:45
AE E75
VPS
18:38
PHF
19:50
AE E75
IND
21:39
MSY
22:35
AE E75
TUL
10:20
ORF
11:02
AE CR9
CAE
15:22
GSP
16:25
AE E75
YOW
17:06
YOW
18:10
AE E75
YYZ
21:22
MDT
22:20
AE E75
SAT
16:00
LNK
19:45
AE CR9
3697
3648
EWR
8:34
EWR
9:09
6150
IAD
9:42
IAD
10:22
UA CR76165
6310
IAH
11:04
IAH
11:41
EWR
14:33
EWR
15:30
UA E7W4823
4843
ORD
16:46
ORD
17:21
6160
IAD
18:55
IAD
19:30
3367
3311
EWR
11:52
EWR
12:27
3314
3315
EWR
14:24
IAH
15:02
UA E703401
3343
EWR
17:20
EWR
17:56
6115
6120
IAH
14:09
IAD
14:44
IAH
17:14
IAH
18:05
UA E7W
LGA
11:14
LGA
12:00
DL CR9
LGA
13:14
LGA
14:00
DL CR9
LGA
15:06
LGA
16:00
DL CR9
LGA
19:18
LGA
20:00
DL CR9
E19
E18
E16
E14
E12
E10
E21
E23
E25
E27
E29
E31
E33
E35
E38
E36
E34
E32
E30
E28
E26
E24
E22
E20
E8
E6
E4
F1
F2
F3
F4
F5
F6
F7
F8
F9
F10
F11
F12
F13
F14
F15
F16
F17
F18
F19
O7
O8
O9
O10
Date:04/11/2019 Time:12:46CLT 2028-Scenario 3
Page # 3 of 4
00:00 01:00 02:00 03:00 04:00 05:00 06:00 07:00 08:00 09:00 10:00 11:00 12:00 13:00 14:00 15:00 16:00 17:00 18:00 19:00 20:00 21:00 22:00 23:00
*PSH
1568
*T199
T200
*PSH
720
GRU
8:50
CLT
19:00
AA 332
FCO
16:55
CLT
23:59
AA 789
FRA
14:00
CLT
16:55
AA 789
ORIG
3844
5508
5135
4128
TERM
ORIG
4663
4554
TERM
4781
TERM
ORIG
4845
3930
3840
4845
TERM
ORIG
2120
8010
1180
8011
1181
2010
TERM
2030
2140
O201
O202
T179
T180
O183
O184
O171
O172
PSH
170
T183
T184
O169
O170
T173
T174
O173
O174
PSH
881
T177
T178
O195
O196
PSH
1797
T187
T188
O175
O176
PSH
1971
T209
T210
O181
O182
PSH
1242
PSH
736
T185
T186
O167
O168
T189
T190
O179
O180
T175
T176
O185
O186
T197
T198
O187
O188
PSH
2057
T181
T182
T201
T202
O197
O198
PSH
5343
T171
T172
O177
O178
T193
T194
O199
O200
T191
T192
O191
O192
T205
T206
O189
O190
PSH
5117
PSH
5004
PSH
4925
T207
T208
O193
O194
T219
T220
T203
T204
O207
O208
T225
T226
O213
O214
T213
T214
O215
O216
PSH
5304
T211
T212
O205
O206
T221
T222
PSH
5468
T229
T230
O211
O212
T237
T238
O217
O218
T231
T232
O209
O210
T239
T240
O203
O204
PSH
275
T233
T234
PSH
840
PSH
5503
T223
T224
T227
T228
T235
T236
T215
T216
T195
T196
4189
3433
4093
4058
JFK
10:38
JFK
11:15
LGA
17:12
LGA
18:00
DL CR9
3966
MSP
10:32
MSP
11:07
JFK
17:19
JFK
18:00
DL CR9
LGA
8:35
LGA
9:15
DL CR93337
3399
LGA
9:57
LGA
10:30
LWB
10:16
LWB
11:01
VC ER4
LWB
16:54
LWB
18:06
VC ER4
BKW
12:00
BKW
17:05
VC EM2
7346
7347
YYZ
10:39
YYZ
11:10
7348
7349
YYZ
17:49
YYZ
18:20
CLT
0:00
DEN
7:50
UA 319
PIT
19:24
CLT
23:59
AA 319
CLT
0:00
BDL
15:35
AA 319
CLT
0:00
BWI
10:50
AA 319
BUF
18:40
CLT
20:45
AA 319
FNT
21:03
CLT
23:59
AA 319
CLT
0:00
RIC
19:45
AA 319
PIT
21:19
CLT
23:59
AA 319
CLT
0:00
MDT
19:04
AA 319
SLC
19:20
CLT
21:15
AA 319
ELP
21:35
CLT
23:59
AA 319
CLT
0:00
SLC
7:00
DL 320
TPA
7:26
CLT
10:35
AA 321
JAX
10:59
CLT
23:59
AA 319
CLT
0:00
IAH
14:10
AA 319
MSY
14:31
CLT
21:35
AA 319
ORD
22:47
CLT
23:59
UA 73G
CLT
0:00
PBI
13:40
AA 321
FNT
15:10
CLT
17:15
AA 319
ELP
17:35
CLT
19:15
AA 319
PHL
19:45
CLT
23:59
AA 321
CLT
0:00
RDU
17:25
AA 320
TPA
19:47
CLT
23:59
AA 321
CLT
0:00
LGA
19:55
AA 321
PVD
20:10
CLT
23:59
AA 321
CLT
0:00
PBI
18:28
AA 321
PHX
19:54
CLT
23:59
AA 321
CLT
0:00
HOU
4:40
WN 73H
SFO
6:54
CLT
9:00
AA 321
TPA
14:08
CLT
23:59
AA 321
HOU
0:40
CLT
23:59
WN 73H
CLT
0:00
MSP
7:20
DL 717
LEX
8:05
CLT
9:55
AE CR7
STT
21:09
CLT
23:59
AA 321
CLT
0:00
MSP
18:29
AA 738
ORD
18:44
CLT
23:59
AA 738
CLT
0:00
ATL
7:30
DL 738
JFK
13:10
CLT
23:59
AA 738
CLT
0:00
BWI
6:55
WN 73W
ATL
21:48
CLT
23:59
DL 73H
CLT
0:00
MDW
5:45
WN 73W
CHO
6:58
CLT
10:55
AE E75
PNS
15:57
CLT
17:50
AE CR9
HHH
18:06
CLT
21:50
AE CR7
ATL
23:06
CLT
23:59
DL 73H
CLT
0:00
ATL
4:45
DL M90
HTS
8:35
CLT
23:59
AE CR7
ATL
1:02
CLT
23:59
DL M90
CLT
0:00
HSV
15:25
AE CR2
GSP
16:08
CLT
23:59
AE CR7
CLT
0:00
TYS
17:40
AE CR7
CVG
18:05
CLT
23:59
DL CR7
CLT
0:00
TRI
17:40
AE CR7
MGM
20:15
CLT
22:05
AE CR7
CLT
0:00
CVG
17:20
DL CR7
OKC
17:39
CLT
23:59
AE CR9
EVV
3:10
CLT
19:55
AE CR7
GRR
20:25
CLT
23:59
AE CR9
CLT
0:00
CHO
15:24
AE CR7
CHS
17:47
CLT
23:59
AE CR9
CLT
0:00
SGF
15:49
AE E75
BTV
19:12
CLT
23:59
AE CR9
CLT
0:00
YUL
10:01
AE E75
CLE
19:18
CLT
23:59
AE CR9
CLT
0:00
EWR
6:50
UA E7W
FLL
14:00
CLT
18:25
AA 321
MHT
19:53
CLT
23:59
AE CR9
SMF
6:42
CLT
8:40
AA 321
SDF
14:15
CLT
21:40
AE CR9
HSV
15:55
CLT
23:59
AE CR7
SGF
16:30
CLT
23:59
AE E75
YUL
19:36
CLT
23:59
AE E75
BKW
9:10
CLT
23:59
VC EM2
LAX
20:40
CLT
23:59
AA 321
O11
O12
O15
O23
O24
O25
O26
HS
R01
R02
R03
R04
R05
R06
R07
R08
R09
R10
R11
R12
R13
R14
R15
R16
R17
R18
R19
R20
R21
R22
R23
R24
R25
R26
R27
R28
R29
R30
R31
R32
R33
R34
R35
R36
Date:04/11/2019 Time:12:46CLT 2028-Scenario 3
Page # 4 of 4

CLT 2033 Gating Scenario 2 1

00:00 01:00 02:00 03:00 04:00 05:00 06:00 07:00 08:00 09:00 10:00 11:00 12:00 13:00 14:00 15:00 16:00 17:00 18:00 19:00 20:00 21:00 22:00 23:00
2011
1797628
1051
2751873
TERM
898
2057879*
445
580
1889
1798
892
472
476
840*1909
1789
1855
294
1673
1245
1608
624
6581709
1729
1967*629
1855
TERM703
852
843
2039
890
579
662
925
1109
1977
1936
695
1810637 470 416 1774
6801735
826*1842
1154
1583
720
830
1798
844557
431
428
1944
19461837 1878 1760
1836
1841
499
1865
2020
20911866 1961 1970 2080
2107
443
1908
1799747 1704
2014
4081912 858 2044 581 494
730
1740
1768
17471857
696
18131772 521 1808
2091
1972
539
725
786
678
487
4511812
2062 835826
1735
1725
6912059
704
2050
2084
TERM1717
1364 883* 885* 8731810
2055
724
559
622
731
836
619793
277
TERM
973
TERM
469 1925 752 20631899
705
1787
6091769 1863
1980 461 1831 891 1719609
17871820 1737
423
1965*679 2066 2068
748
1999651
616
17831940
713
413
790
2053
382
100
1458
19171775
1811
5651920
1805
745
550
TERM
1955
19051862
1615
1447
2055
695
428
1791
767
466
633
541
5069
TERM
1910 833 893 20461799
1908
662
1975
783
TERM
445 19371907
254
823
65
799
17331871 1277
1982 20641882
20541827
1999
1899436 1752
744
1861
1897
1998
19601967
17292078 504
766
TERM
808
TERM1922
413
713
1451
1458
1130
184
746
463
2043
TERM
17841376
1404653
819
9721701 2075
1998
1897
1904 1722821
876*1973 1860 379
1724
TERM
5563
TERM
661
18721496 2065 1914
2530
2249
1843
1864
844
TERM1796
2042 148 19231756
1753
1767
278
1692
TERM
451
TERM1981
17322531
2529850 2045 1840
1976
TERM
753
2039
5330
5089330 2077 1700
2448
1453
125
1577
5276
5553
1954
TERM1384
1942887
TERM
1633
296
1577
18711711 861 1785
1828
TERM
17801964
1849
2069
20841962
5321
5563
786
585
628
TERM
1654 18535373
5210756
1886
2032
1853
660
1945
7331952
1930
4871677 1753 657 1934 1992 673
101
1390
864
2035
1903 1839784
9931988
1849
1950
2032
18211809
732
1885
1971
TERM
1751
971730
1267
7512002 1715 1750 2648
2035
TERM
18171941
829*
1924
TERM
2754
2845
1974
1242
1598
24831893
829
19411814 1938 2052
1861
2043
1756 1847 1653 7655210
53351987
1978
8525510
5370
50942028 1793
1707
613*
2017
PUSH1802
1915
20381979
334
TERM
17951797
1977
422
1540
560
6162070
852
19781868
1745
1843
1065
PUSH
760
19961788
1770876
821*853 859
605
1029*1870
865*1840
1434*2047
584
PUSH1921 1854
1446
6522036 2067
78
881
2005
TERM
1864
1745
1891
7362038
422
524
*1839
982*
*1844
1853*
*1074
1028
*828
1768
*1283
1087*
*1963
787
*822
856
*1968
1954
1829
721
281
1870
*860
1615*
ORIG
2451
CLTSC4
5:15
DFW
6:00
TPA
6:46
RDU
11:20
AA 321
ORD
11:57
PHX
13:00
AA 321
FLL
13:20
PVD
19:10
AA 321ORIG
2006
CLTSC4
19:45
RIC
20:30
DEN
21:18
TPA
22:15
AA 321
SFO
6:14
LAX
9:45
AA 321
LGA
10:00
PLS
11:40
AA 321
RSW
12:00
DEN
14:20
AA 321
BWI
15:15
PHL
20:05
AA 321
PHL
20:40
PHX
22:15
AA 321
SMF
6:02
MBJ
9:25
AA 321
SYR
10:11
MSY
11:03
AA 319
PHL
13:18
MSP
14:50
AA 321
PBI
16:00
EWR
19:11
AA 321
EWR
20:36
JFK
22:10
AA 738
SEA
6:15
LAS
8:00
AA 321
BOS
8:28
FLL
9:50
AA 321
ORD
10:08
PUJ
11:50
AA 321
TPA
12:06
BOS
13:10
AA 321
RSW
16:55
BWI
17:45
AA 321
TUS
19:10
TUS
20:10
AA 319
TPA
20:52
DFW
22:10
AA 321
SAN
6:04
SFO
7:30
AA 321
DTW
9:06
FNT
9:52
AA 319
RDU
10:38
EWR
12:10
AA 321
ORD
13:23
TPA
14:50
AA 321
MCO
15:25
LAS
16:45
AA 321
EWR
17:01
SAN
18:15
AA 321
BWI
18:39
FLL
20:20
AA 321
JFK
21:02
DTW
22:20
AA 321
ORIG
1956
CLTSC4
6:45
PHL
7:30
ORD
8:20
PHX
9:40
AA 321
FLL
10:03
MBJ
11:30
AA 321
PHX
12:06
PIT
13:09
AA 321
SMF
13:28
SAN
14:45
AA 321
DFW
16:31
PHL
17:30
AA 321
PBI
18:54
DFW
20:27
AA 321
LGA
21:04
SFO
22:20
AA 321
LAS
6:10
DEN
7:35
AA 321
SFO
8:01
ORD
9:35
AA 321
DCA
10:32
RSW
11:55
AA 321
MIA
12:14
DFW
13:15
AA 321
BWI
13:30
FLL
14:30
AA 321
MSP
17:40
FLL
19:12
AA 321
PHX
21:16
DEN
22:25
AA 321
PHX
6:09
DFW
7:30
AA 321
EWR
7:55
PBI
9:20
AA 321
IAH
10:35
FLL
11:55
AA 321
FLL
12:19
BWI
13:19
AA 321
MIA
13:35
ORD
14:50
AA 321
SEA
15:16
SEA
16:20
AA 321
SFO
16:46
SFO
18:05
AA 321
ORD
18:45
MCO
20:15
AA 321
MCO
21:03
BDL
22:09
AA 321
SLC
6:10
PHX
7:30
AA 321
FLL
8:22
SEA
9:40
AA 321
BUF
10:14
NAS
11:30
AA 321
BOS
12:04
MIA
13:20
AA 321
LGA
13:37
MCO
14:45
AA 321
LGA
15:00
PHX
16:15
AA 321
TPA
17:20
LGA
18:40
AA 321
STL
19:10
PIT
19:54
AA 319
SFO
21:13
MCO
22:19
AA 321
LAX
6:26
TPA
7:45
AA 321
LGA
8:13
DFW
9:29
AA 321
MIA
10:29
DEN
11:45
AA 321
DEN
12:03
TPA
13:02
AA 321
DFW
13:52
JFK
14:55
AA 321
TPA
15:27
LAX
16:40
AA 321
ATL
16:57
LAX
18:16
AA 321
SAN
18:49
SLC
20:05
AA 321
DFW
21:12
BOS
22:15
AA 321
MCO
6:44
LGA
7:59
AA 321
DFW
8:34
SJU
9:50
AA 321
PHL
10:05
LAS
11:20
AA 321
MCO
12:04
MCO
13:01
AA 321
DEN
13:21
MIA
14:20
AA 321
SFO
15:03
LGA
16:10
AA 321
LAX
21:09
FLL
22:10
AA 321
ORIG
2060
CLTSC4
5:20
LGA
6:05
EWR
6:47
EWR
7:45
AA 738
PHL
8:10
CUN
9:25
AA 321
DTW
10:11
CUN
11:25
AA 321
DFW
12:27
ATL
13:24
AA 321
LAX
13:50
PHL
14:45
AA 321
LAX
15:00
PHL
16:05
AA 321
ORD
16:39
TPA
17:53
AA 321
SJU
18:35
SFO
19:30
AA 321
BOS
19:45
STL
20:33
AA 319
ATL
6:52
ATL
8:00
AA 321
BWI
8:20
TPA
9:35
AA 321
BDL
10:31
SJU
11:45
AA 321
PBI
13:52
BWI
14:50
AA 321
PHX
15:35
SFO
16:40
AA 321
BOS
17:00
SEA
18:10
AA 321
RIC
19:11
MCI
20:00
AA 319
SEA
21:26
RSW
22:26
AA 321
ORIG
823
CLTSC4
4:45
ATL
5:30
DEN
6:37
BOS
7:50
AA 321
MCO
8:10
SFO
9:24
AA 321
PVD
10:32
MIA
11:45
AA 321
BOS
13:30
DFW
14:25
AA 321
DFW
15:20
FLL
16:24
AA 321
FLL
17:00
PDX
18:10
AA 321
ATL
19:02
RSW
20:00
AA 321
FLL
21:21
LAX
22:20
AA 321
ORIG
928
CLTSC4
6:45
RSW
7:30
PHX
8:11
PUJ
9:25
AA 321
RSW
10:13
PHX
11:25
AA 321
ATL
12:02
LGA
13:12
AA 738
PHX
13:31
LGA
14:26
AA 321
LAS
15:08
BOS
16:10
AA 321
MCO
17:16
DEN
18:25
AA 321
LGA
19:20
BOS
20:29
AA 321
BUF
20:58
ALB
22:15
AA 319
ORIG
1877
CLTSC4
6:15
MIA
7:00
ATL
8:21
ATL
9:35
AA 321
MCO
10:13
TPA
11:20
AA 321
IAH
12:11
JFK
13:19
AA 738
LAS
13:58
SMF
14:50
AA 321
BOS
15:09
DFW
16:10
AA 321
DEN
17:21
DFW
18:30
AA 321
FLL
19:12
BWI
20:20
AA 321
RSW
21:10
IAH
22:10
AA 321
ORIG
1727
CLTSC4
6:45
SAT
7:30
LAS
8:10
MCO
9:19
AA 321
TPA
10:18
ORD
11:25
AA 321
EWR
12:23
EWR
13:26
AA 738
MCO
13:45
PHX
14:35
AA 321
DEN
15:24
TPA
16:24
AA 321
PHX
17:13
SMF
18:20
AA 321
SEA
19:12
SEA
20:20
AA 321
ORIG
1725
CLTSC4
6:55
MCO
7:40
MSP
8:46
LGA
9:55
AA 321
MSY
10:24
STT
11:50
AA 320
LGA
12:17
ORD
13:05
AA 738
MSP
15:25
RSW
16:25
AA 321
MIA
16:54
ORD
18:00
AA 321
SFO
19:14
LAX
20:20
AA 321
ORIG
1963*
CLTSC4
7:05
PUJ
7:55
PBI
8:31
DEN
9:35
AA 321
MSP
10:26
BOS
11:30
AA 321
ROC
12:19
ELP
13:45
AA 319
SAN
14:51
LAS
15:49
AA 321
PHL
17:16
MCO
18:20
AA 321
BDL
19:07
TPA
20:06
AA 321
ORD
21:27
MIA
22:30
AA 738
ORIG
1906
CLTSC4
7:05
MCI
7:50
LAX
8:43
BOS
9:45
AA 321
DFW
10:37
LGA
11:40
AA 321
PHL
11:59
PHL
13:00
AA 319
MEM
13:39
SAT
14:40
AA 738
ORD
15:05
MCO
16:00
AA 321
LGA
16:44
PHX
17:45
AA 321
DFW
18:11
DFW
19:10
AA 321
IAH
19:25
RDU
20:10
AA 319
MSP
21:04
BWI
22:30
AA 320
ORIG
1916
CLTSC4
7:10
ORD
7:55
TPA
8:41
BWI
9:40
AA 321
BOS
10:19
MCO
11:20
AA 321
PIT
12:05
CLE
13:05
AA 319
FLL
15:05
ATL
15:59
AA 321ORIG
1317
CLTSC4
18:29
MSP
19:14
DCA
21:29
RIC
22:40
AA 319
ORIG
3773
CLTSC4
6:55
BWI
7:40
RSW
8:28
MSP
9:20
AA 321
EWR
10:02
EWR
11:05
AA 738
SRQ
15:20
DEN
16:10
AA 321
MCO
18:59
PHX
19:55
AA 321
ORIG
525
CLTSC4
6:50
FLL
7:35
CLE
8:30
MEM
9:24
AA 319
SJU
10:50
SRQ
11:40
AA 321
BNA
11:58
AUS
12:54
AA 319
LAX
16:00
SJU
16:50
AA 321
MCI
17:13
MIA
18:20
AA 738
LAS
18:55
MSP
20:10
AA 321
ATL
21:16
ATL
22:40
AA 738
ORIG
2010
CLTSC4
5:50
PHL
6:35
DCA
7:02
PIT
7:59
AA 319
JAX
8:17
DCA
9:30
AA 738
BNA
10:01
AUA
11:30
AA 320
ORF
12:23
IND
13:12
AA 319
MCI
13:27
ROC
14:35
AA 319
EWR
15:05
MIA
16:25
AA 738
PIT
16:57
DFW
17:40
AA 321ORIG
1530
CLTSC4
18:28
PBI
19:13
SJC
6:00
PDX
7:05
AA 738
MIA
8:47
EWR
9:55
AA 738
ATL
10:12
IAH
11:19
AA 738
BDL
12:09
RDU
13:04
AA 319
JFK
14:00
EWR
15:15
AA 738
IND
15:30
DCA
16:40
AA 319ORIG
1915
CLTSC4
17:25
RDU
18:10
LAS
21:26
PHL
22:25
AA 321
BWI
6:36
JFK
7:30
AA 738
JFK
8:30
MIA
9:30
AA 738
STL
10:27
DTW
11:20
AA 319
ALB
12:50
ALB
13:50
AA 319
SNA
14:10
LAS
15:00
AA 7381821
1886
MSY
15:30
RIC
16:09
AA 319
DTW
20:55
LGA
22:04
AA 738
RDU
6:17
DCA
7:30
AA 319
EWR
8:16
JFK
9:06
AA 738
SAT
10:39
BNA
11:40
AA 738
DCA
13:28
MSY
14:35
AA 319
AUS
17:15
BDL
18:25
AA 319
SJU
20:23
MSP
22:10
AA 321
ORIG
1993
CLTSC4
6:50
LAX
7:35
MSY
8:46
MHT
9:30
AA 319
JFK
10:42
DFW
11:35
AA 738
DCA
11:52
RIC
12:45
AA 319
PIT
13:31
BDL
14:30
AA 319
MIA
15:16
ORD
16:25
AA 738
LAS
16:45
JFK
17:45
AA 738
ATL
18:05
GRR
19:45
AA 319
MIA
21:13
EWR
22:15
AA 738
ORIG
2011
CLTSC4
7:05
RDU
7:50
DTW
8:08
BUF
9:10
AA 319
ELP
11:07
ELP
11:50
AA 319
SAT
13:48
FNT
15:11
AA 319
JFK
16:00
SNA
16:45
AA 738
IAH
17:15
EWR
18:05
AA 738
RDU
18:55
ATL
21:19
AA 738
MCI
21:40
ORF
22:40
AA 319
ORIG
827
CLTSC4
7:20
SJC
8:05
BDL
8:21
CLE
9:40
AA 319
AUS
10:39
JAX
13:15
AA 319
RDU
13:56
PIT
14:55
AA 319
RDU
15:44
BWI
16:45
AA 319
RIC
17:19
BNA
18:10
AA 319
SJC
18:35
ABQ
20:05
AA 738
RIC
6:34
BDL
7:30
AA 319
MEM
8:43
RSW
9:55
AA 319
IAD
11:10
SAT
11:55
AA 319
DTW
13:45
STL
14:40
AA 319
BNA
15:14
JAX
15:59
AA 319
PDX
17:58
SJC
19:09
AA 738
BNA
19:24
SAT
20:25
AA 738
BDL
21:12
BUF
22:25
AA 738
PDX
6:14
SAN
7:50
AA 321
STL
8:51
PIT
9:45
AA 319
MDT
10:33
JAX
11:50
AA 319
PVD
12:28
IAH
13:20
AA 319
CLE
13:37
RDU
14:30
AA 319
RSW
15:03
PVD
16:30
AA 319
DCA
16:54
IAH
17:54
AA 319
JFK
19:09
EWR
20:10
AA 738
BWI
20:38
JAX
22:35
AA 319
PIT
6:42
PVD
7:35
AA 319
ILM
8:04
PHL
9:00
AA 319
FSD
9:23
MCI
10:15
AA 319
LGA
10:44
ALB
11:55
AA 319
CHS
12:25
DCA
13:15
AA 319
ATL
15:08
DTW
16:30
AA 319
LGA
18:02
MSY
18:55
AA 320
MSY
19:14
BUF
20:15
AA 738
ORIG
868
CLTSC4
6:45
ROC
7:30
FNT
8:03
SLC
9:30
AA 319
PIT
10:20
DCA
11:30
AA 319
MCI
11:45
BUF
12:30
AA 319
BUF
13:26
BOS
14:15
AA 319
BDL
15:02
BNA
16:06
AA 319
JAX
16:50
DCA
17:50
AA 319
DFW
19:05
JFK
20:00
AA 738
BOS
7:12
BNA
8:00
AA 319
RIC
8:15
MEX
9:30
AA 319
PBI
11:15
PBI
12:15
AA 321
FNT
14:30
BUF
18:00
AA 319
EWR
19:16
IAH
20:10
AA 738
RIC
20:55
AUS
22:10
AA 319
BUF
8:08
DTW
9:19
AA 319
PWM
10:33
ATL
11:39
AA 319
CHS
14:02
DCA
14:55
AA 319ORIG
1889
CLTSC4
15:35
BDL
16:20
ALB
17:01
PWM
18:05
AA 319
JAX
19:15
PBI
22:11
AA 319
IND
8:44
BDL
9:50
AA 319
PBI
10:10
PHL
11:15
AA 319ORIG
2069
CLTSC4
14:10
IAH
14:55
DCA
15:13
MCI
16:15
AA 319
IND
17:11
STL
18:25
AA 319
SAT
18:40
CLE
20:30
AA 319
SYR
21:04
DCA
22:14
AA 319
PIT
8:35
NAS
9:40
AA 319
OKC
10:42
IAD
11:45
AA 319
STL
15:43
PNS
16:44
AA 319
CLE
16:59
RIC
17:54
AA 319ORIG
1720
CLTSC4
19:04
MDT
19:49
MSY
21:20
PIT
22:25
AA 319
ORIG
1957
CLTSC4
8:29
MSY
9:14
ALB
10:23
SXM
11:25
AA 319
DTW
15:39
MSY
16:30
AA 319
BWI
17:07
PVD
18:15
AA 320
DCA
18:52
ILM
20:00
AA 319
DCA
8:28
CHS
9:30
AA 319
MCI
10:28
IND
11:30
AA 319
MCI
15:35
ELP
19:15
AA 319
DFW
19:35
DEN
20:20
AA 321
ALB
21:22
CLE
22:25
AA 319
IAH
8:38
IAH
9:35
AA 319
ROC
10:14
CHS
11:14
AA 319
IAH
15:35
ALB
16:24
AA 319
MIA
19:20
PVD
20:29
AA 321
BOS
21:39
ORD
22:35
AA 321
ORF
8:29
ORF
9:15
AA 319
BWI
10:20
GCM
11:25
AA 320
NAS
15:10
BUF
16:29
AA 321
NAS
17:04
PIT
18:15
AA 319
NAS
18:54
PLS
20:00
AA 319
SAT
21:25
ROC
22:16
AA 319
PVD
8:12
SXM
9:25
AA 320
BDA
10:51
MEX
12:00
AA 319ORIG
1789
CLTSC4
13:40
PBI
14:25
PHL
15:37
PBI
16:30
AA 319
ROC
19:07
JAX
20:15
AA 319PULL
170
CLTSC4
20:45
MCI
21:30
PHX
21:50
RDU
22:45
AA 321
ORIG
5247
CLTSC4
9:05
JAX
9:50
DEN
11:15
LAX
13:00
AA 321
JAX
15:20
SYR
16:19
AA 319
RDU
17:04
DTW
18:05
AA 319
SLC
18:40
STL
22:00
AA 319
ORIG
1964
CLTSC4
10:55
MCI
11:40
RIC
15:41
PIT
16:35
AA 319
ELP
16:55
DTW
20:00
AA 319
RDU
20:57
PVD
22:05
AA 738
ORIG
1924
CLTSC4
10:50
BWI
11:35
BUF
16:20
FSD
19:54
AA 319PULL
1002
CLTSC4
20:32
FNT
21:17
PULL
1971
CLTSC4
21:35
SYR
22:20
SDQ
8:00
UVF
9:45
AA 321
MEX
11:00
SDQ
12:00
AA 319
HAV
16:05
BDA
17:30
AA 319
MEX
18:35
MEM
20:00
AA 319*877
TERM
AUA
20:50
CLTSC4
21:35
ORIG
843*
CLTSC4
6:55
MBJ
7:45
GCM
9:00
HAV
9:45
AA 319
CUN
10:50
SJO
11:55
AA 321
PUJ
16:21
ATL
17:50
AA 738
GCM
18:14
DCA
19:44
AA 320*1850
TERM
SJO
21:55
CLTSC4
22:40
AADO
A21
A22
A23
A24
A25
A26
A27
A28
A29
A1
A3
A5
A7
A9
A11
A13
A12
A10
A8
A6
A4
A2
B1
B3
B5
B7
B9
B11
B13
B15
B16
B14
B12
B10
B8
B6
B4
B2
C2
C4
C6
C8
C10
C12
C14
C16
AAIN
I1
I2
Date:04/11/2019 Time:12:56CLT 2033-Scenario 2
Page # 1 of 4

00:00 01:00 02:00 03:00 04:00 05:00 06:00 07:00 08:00 09:00 10:00 11:00 12:00 13:00 14:00 15:00 16:00 17:00 18:00 19:00 20:00 21:00 22:00 23:00
*705
PUSH
*721
748*
*745
744*
*749
724
*733
732*
*721
TERM
*787
704*
PULL
720*
*731
730*
725
786*
PULL
1568*
*428
429*
*7751
7752*
*1062
PUSH
FRA
13:00
CLTSC4
14:00
AA 789
FCO
15:55
MAD
16:40
AA 789
BCN
18:20
BCN
20:45
AA 332
MAD
15:50
DUB
18:05
AA 332
LHR
18:30
LHR
20:15
AA 789
GRU
7:50
CLTSC4
8:50
AA 332
FCO
15:55
CLTSC4
16:55
AA 789
CDG
13:55
FRA
16:35
AA 332
CLTSC4
16:55
FCO
18:25
AA 789
LHR
16:15
LHR
18:40
AA 789
DUB
13:05
CDG
18:20
AA 332
CLTSC4
19:00
GRU
20:30
AA 332
MUC
16:20
MUC
18:35
LH 359
LGW
21:05
LGW
23:05
DY 788
*672
617*
*866
1867
*368
1826
*843
2056
*869
749
*827
1919
*842
1040*
*644
2456*
*1966
643
*854
1647*
*1542
625*
*2364
2541*
*639
1865*
*1342
874*
*884
1806
*886
2061
*880
1851
1441
TERM
5136
684
525
526
1286
TERM
738
TERM
9
TERM
3930
3840
5060
5069
3812
TERM
876
TERM
165
8642422 2251
135
386
357
TERM
614
TERM
354
353
5096
50991407
933
932
4128
TERM
1989
TERM
1704
1969
1711
1199
5508
5135
1076
TERM
1078
TERM
425
5211689
344
541
8017
TERM
1974
TERM
8025
8020
8101
8102
8021
8016
8103
TERM
625
626
1484
1140
603
1793
2465
3113
486
489
522
TERM
3888
3642
1176
1698
5812
TERM TERM
201
2001028 2597 826
2808
TERM
*201
202*
5190
5557
5337
5514
5176
5314
5441
5154
3831
4076
5119
5256
5156
5118
5293
5440
3819
3909
5282
5063
5294
5119
5095
5096
5063
5259
5264
5298
5273
5297
5277
5032
5237
5164
5032
5366
5052
5264
5366
TERM
4738
4889
5314
5222
5135
5156
4769
4895
4001
3795
4852
4820
5463
5453
ORIG
3973
4786
4755
5552
5177
53545122
5364
5320
5226
5486
5172
5037
5100
5263
5335
5506
5514
5327
5204
5513
PUSH
5031
5271
PULL
5147
5257
5407
4921
4826
5234
5187
5603
5023
5110
5459
5526
5166
4829
4798
3973
3915
5326
5124
5058
PUSH
5344
5033
PULL
5343
5183
5220
4751
4804
5466
5319
5366
5096
4011
3775
2344
TERM
4867
4942
5150
5251
5546
5364
5263
5123
3798
3959
5218
5202
5209
5398
4931
4922
5383
5320
5467
5593
5297
5512
5384
5302
5138
5200
4749
4931
5437
5306
4807
4799
4886
4831
3908
3777
4904
4829
4773
4779
5456
54295230 4943
5213
5183
5320
5423
5582
5083
4939
4807
5036
5143
5074
5038
5246
5295
4884
4841
4934
4904
5364
5283
5077
5105
5315
5258
4907
4870
5083
5393
5278
5396
4889
4773
5132
5257
4759
4813
5226
5477
4798
4744
5357
5309
5113
5466
5349
5431
5153
5074
ORIG
4796
3833
3889
5180
5556
219
2182133
16296224
6227
10954189
3433
1445
1446
1454602
2651
5120
5052
3706
3213
5185
5582
4866
4805
5067
5153
4903
4765
5251
5078
5225
5311
5105
5224
ORIG
887*
CLTSC4
12:40
CUN
13:30
SJO
14:35
AUA
16:05
AA 321
SXM
18:40
BNA
19:49
AA 320*613
TERM
SXM
20:24
CLTSC4
21:09
PAP
11:00
NAS
13:15
AA 319
MBJ
14:53
RDU
16:10
AA 321
MBJ
16:50
LAS
18:10
AA 321
MBJ
18:56
MIA
20:15
AA 321
ORIG
804*
CLTSC4
6:55
CUN
7:45
PLS
10:00
KIN
12:00
AA 319
KIN
15:40
KIN
16:40
AA 319
PUJ
17:42
LAS
20:05
AA 321*888
TERM
CUN
20:29
CLTSC4
21:14
KIN
9:55
PAP
10:50
AA 319
AUA
13:30
SJO
15:40
AA 738
PAP
16:15
PAP
17:15
AA 738
SDQ
18:00
GCM
19:30
AA 319
UVF
20:15
SDQ
22:00
AA 321
CUN
16:40
BOS
17:55
AA 321
CUN
18:40
PBI
19:55
AA 321
PLS
18:55
ORD
20:05
AA 321
ORIG
643
CLTSC4
4:40
HOU
5:25
ORIG
1010
CLTSC4
5:45
MDW
6:30
ORIG
516
CLTSC4
6:45
IAH
7:30
ORIG
5290
CLTSC4
7:50
DEN
8:35
4093
4058
JFK
10:38
JFK
11:15
BNA
14:00
BNA
14:45
WN 738
SEA
16:30
SEA
17:30
AS 7371747
1493
HOU
17:55
HOU
18:30
ORIG
1191
CLTSC4
5:05
IAH
5:50
ORIG
3612
CLTSC4
6:08
JFK
6:53
ORIG
2266
CLTSC4
7:20
MSP
8:05
LGA
8:35
LGA
9:15
DL CS1
LGA
11:14
LGA
12:00
DL CS1 1503
MSP
14:24
MSP
14:59
1322
1524
MSP
16:40
DTW
17:20
DL 320 1057
DTW
18:40
DTW
19:15
ORIG
612
CLTSC4
5:15
ATL
6:00
LAS
6:45
MCO
8:00
NK 320
ATL
8:48
ATL
9:30
DL 73H
JFK
10:01
JFK
10:40
B6 E90
ATL
11:16
ATL
12:00
DL 717
ATL
15:04
ATL
15:45
DL 73H
IAH
16:45
FLL
17:30
NK 320 1721
DAL
18:55
BWI
19:30
ORIG
1366
CLTSC4
5:15
DTW
6:00
ORIG
681
CLTSC4
6:50
SEA
7:35
2292
DTW
9:04
DTW
9:39
ISP
11:20
ISP
12:05
F9 319
LGA
15:06
LGA
16:00
DL CS1853
1748
MDW
16:50
MDW
17:25
ATL
19:09
ATL
20:05
DL 73H
TTN
20:25
TTN
21:10
F9 321
ORIG
1712
CLTSC4
5:58
ORD
6:48
SFO
7:21
SFO
8:20
UA 739 1685
MCO
9:20
DEN
10:00
WN 738
DTW
12:07
DTW
12:50
DL 319
DEN
15:10
DEN
16:22
UA 739
LGA
17:12
LGA
18:00
DL CS1
LGA
19:18
LGA
20:00
DL CS1
ORIG
3844
CLTSC4
6:15
LGA
7:00
ORIG
1591
CLTSC4
7:30
ATL
8:15
ORD
9:26
ORD
10:15
UA 73G1245
1246
BOS
10:59
BOS
11:36
ATL
12:33
ATL
13:15
DL 717
PHL
15:21
MCO
16:09
F9 320
JFK
17:19
JFK
18:00
DL CS11119
1118
JFK
18:50
JFK
19:28
B6 E90
MCO
20:00
LAS
20:50
NK 320
ORIG
8022
CLTSC4
5:33
BOS
6:18
ORIG
8104
CLTSC4
7:15
FLL
8:00
BOS
9:24
BOS
10:51
B6 E90
FLL
11:30
FLL
12:30
B6 E90
BOS
16:00
BOS
17:00
B6 E90
BOS
17:18
BOS
18:00
B6 E90
ORIG
2488
CLTSC4
6:15
ATL
7:00
PDX
7:15
PDX
9:00
AS 73H 3055
BWI
9:35
DAL
10:10
ORD
13:00
ORD
13:45
UA 319
DTW
15:40
MSP
16:30
DL 319
BNA
17:20
BNA
18:10
WN 73W
CLE
20:20
CLE
21:20
F9 320
ORIG
521
CLTSC4
7:00
SLC
7:45
ATL
10:03
ATL
10:45
DL 739
LGA
13:14
LGA
14:00
DL CS1
ATL
16:18
ATL
17:00
DL 73H
SFO
17:31
SFO
18:30
UA 739
DEN
5:10
DEN
7:20
F9 319
MCO
10:11
PHL
10:59
F9 320
ATL
13:42
ATL
14:30
DL 320 1362
DEN
16:20
MCO
17:00
WN 738
ATL
17:50
ATL
18:45
DL 73H
KEF
17:40
KEF
18:40
WW 321
PHF
6:30
PHF
7:35
AE CR2
LEX
8:30
JAN
11:20
AE CR7
OAJ
12:05
OAJ
13:00
AE CR2
MGM
13:18
SDF
14:25
AE CR2
FAY
15:26
IND
16:30
AE CR2
TYS
17:10
FAY
19:50
AE CR25461
5049
HTS
20:15
CRW
20:50
DAY
21:31
PGV
22:40
AE CR2
MGM
8:38
MGM
9:45
AE CR2
BHM
10:59
HSV
11:50
AE CR2
CLE
12:05
GNV
12:50
AE CR2
TYS
13:51
TYS
14:35
AE CR2
GPT
15:05
CID
15:50
AE CR7
GNV
16:09
CAK
18:04
AE CR25514
5254
SHV
18:30
TLH
19:05
LEX
21:36
MGM
22:41
AE CR2
3802
GSP
5:57
DCA
6:32
5228
5039
GNV
6:52
LEX
7:30
AE CR2
FAY
8:40
TYS
9:35
AE CR2
CHA
10:46
EVV
11:35
AE CR2
CRW
12:15
BHM
13:00
AE CR2
DAY
13:43
PHF
14:25
AE CR2
EVV
15:23
EWN
16:14
AE CR2
PHF
17:22
LEX
18:14
AE CR2
LYH
6:22
OAJ
7:40
AE CR75406
5176
FWA
8:49
OAJ
9:26
AE CR25039
5463
LEX
10:40
FAY
11:20
AE CR23906
3960
HSV
12:25
CAE
13:05
AE CR25117
5486
PGV
14:07
FAY
14:45
AE CR2
OAJ
15:33
MGM
16:19
AE CR2
FWA
17:11
DAY
18:00
AE CR2
AVL
18:42
TRI
20:15
AE CR7
AGS
20:38
GSP
22:40
AE CR7
5355
5277
CAK
7:08
CHA
7:43
TRI
8:16
LYH
9:35
AE CR75557
5294
PHF
10:39
TYS
11:18
AE CR25142
5218
BHM
12:30
TLH
13:10
AE CR2
FAY
13:45
VPS
14:40
AE CR75311
5186
BHM
17:45
CHA
18:25
AE CR2
TRI
19:00
EWN
20:30
AE CR7
CHO
21:08
CRW
22:35
AE CR7
TYS
6:24
GSP
7:45
AE CR74935
4850
HTS
8:00
FLO
8:30
DAY
8:51
PHF
11:45
AE CR75371
5305
GNV
12:25
TYS
13:00
GPT
13:37
OAJ
16:14
AE CR7
FAY
17:05
GNV
20:25
AE CR2
TYS
20:59
AVL
22:25
AE CR7
CRW
6:45
LFT
9:36
AE CR7
MOB
10:45
SHV
13:15
AE CR7
CAE
14:03
EVV
16:00
AE CR7
IAD
17:46
TUL
18:30
AE CR9
JAN
20:58
BTR
22:15
AE CR7
EWN
6:35
GSO
7:50
AE CR7
PGV
8:11
PGV
9:19
AE CR2
SGF
10:09
SGF
10:50
AE E75
DAB
11:05
RAP
12:10
AE CR9
LFT
13:50
GNV
15:15
AE CR7
HPN
15:44
HPN
17:00
AE CR7
ROA
17:16
LYH
18:30
AE CR7
HSV
19:21
YUL
20:25
AE CR7
AVL
20:55
CAK
22:05
AE CR75491
5292
MGM
22:27
AEX
22:59
TYS
8:22
LIT
9:15
AE CR9
LIT
11:00
EYW
11:45
AE CR9
AVL
12:12
LYH
13:03
AE CR7
CVG
13:31
HSV
14:25
AE CR7
MGM
14:57
LFT
16:20
AE CR7
AVL
16:52
CAE
18:00
AE CR75411
5523
LFT
20:00
SHV
20:40
AE CR7
TRI
6:39
HHH
7:35
AE CR7
HPN
8:22
MOB
9:35
AE CR7
SHV
10:44
BTR
13:00
AE CR7
AGS
13:49
DAY
14:41
AE CR7
SDF
15:17
MKE
16:35
AE CR7
TLH
16:55
GNV
17:55
AE CR7
ORF
18:43
AGS
19:45
AE CR75265
5141
MEM
20:05
MLB
20:45
AE CR9
OAJ
21:24
LYH
22:30
AE CR7
4776
4934
ROA
7:04
FAY
7:40
AE CR7
PHF
8:10
GPT
9:20
AE CR7
GSP
10:10
FPO
11:45
AE CR7
TYS
12:20
MOB
13:10
AE CR7
HPN
14:02
MLB
14:50
AE CR7
VPS
15:50
HTS
17:00
AE CR7
CRW
17:30
OAJ
18:25
AE CR7
MSN
18:43
CAK
19:45
AE CR74460
4582
LGA
20:00
BTV
20:40
AE E75
ROA
21:00
ROA
22:05
AE CR7
5328
5282
DAY
7:14
CLE
7:50
AE CR2
LYH
8:12
SBY
9:20
AE CR7
CAE
10:21
MYR
11:19
AE E75
SAV
12:07
CHA
12:50
AE CR7
FLO
13:48
ROA
14:35
AE CR7
EWN
15:06
LYH
16:10
AE CR7
CID
17:04
CID
18:04
AE CR7
MLB
18:52
MSN
19:54
AE CR7
HHH
21:15
HHH
22:20
AE CR7
4915
4763
HHH
6:56
ROA
7:30
TLH
8:53
VPS
9:50
AE CR7
CID
10:18
CID
11:45
AE CR7
HTS
12:18
AGS
13:01
AE CR74800
4743
AVL
13:42
CHO
14:19
CHA
15:40
GPT
16:40
AE CR7
EWN
17:24
ROA
18:15
AE CR7
CAK
19:18
VPS
20:20
AE CR7
BTR
21:35
EVV
22:40
AE CR7
CHS
6:18
SAV
7:45
AE CR9
EWN
8:32
TRI
9:40
AE CR7
FAY
10:07
FLO
11:33
AE CR7
GSP
12:17
LEX
12:59
AE CR75375
5144
AEX
13:14
AEX
13:46
PHF
15:13
LEX
16:10
AE CR7
FPO
16:48
FAY
17:45
AE CR7
DAB
18:00
OKC
18:45
AE CR9
AGS
19:09
FLO
20:09
AE CR7
GPT
21:10
SRQ
22:14
AE CR7
MOB
8:42
AGS
9:45
AE CR7
OAJ
10:46
EWN
11:55
AE CR7
GSO
12:18
TRI
12:59
AE CR7
MOB
13:42
LEX
14:25
AE CR7
MLB
15:44
JAN
16:35
AE CR7
HTS
17:18
HHH
18:05
AE CR7
OAJ
18:53
SDF
19:49
AE CR7
LYH
21:26
EWN
22:30
AE CR7
MYR
6:29
CHS
7:40
AE CR9
OAJ
8:13
CVG
9:20
AE CR7
PIA
10:26
PIA
11:19
AE CR74820
4933
LYH
12:32
GSP
13:12
AE CR7
BTR
13:47
BHM
14:30
AE CR75569
5196
XNA
14:55
ICT
15:32
LEX
15:55
BTR
16:45
AE CR7
GSP
18:49
MKE
19:44
AE CR7
FAY
19:59
HSV
20:40
AE CR7
MDT
21:29
PHF
22:30
AE CR7
I3
I4
I5
I6
I7
I8
I10
I11
I12
I13
I14
I15
OADO
O1
O2
O3
O4
O5
O6
O13
O14
O18
O19
O20
O27
O28
O29
O30
O31
O32
OAIN
I21
I22
AEDO
D13
D12
D10
D8
D6
D4
E1
E2
E3
E5
E7
E9
E11
E13
E15
E17
Date:04/11/2019 Time:12:56CLT 2033-Scenario 2
Page # 2 of 4

00:00 01:00 02:00 03:00 04:00 05:00 06:00 07:00 08:00 09:00 10:00 11:00 12:00 13:00 14:00 15:00 16:00 17:00 18:00 19:00 20:00 21:00 22:00 23:00
5452
5389
5365
5152
3896
3798
4765
4769
ORIG
5037
4869
4780
5431
5207
5296
5093
5235
5509
5468
5462
4862
4842
5378
5036
5476
5235
50265347
5142
4484
4457
5415
5288
4777
4767
5060
5520
5460
5268
5439
5225
5091
5437
5066
5112
5342
5073
5232
5060
5674
5036
3834
3968
5259
5438
5096
5061
5242
5071
5231
5104
5222
5304
5399
5373
5346
5237
ORIG
5632
5093
5323
4892
4925
4544
4542
3850
3814
4826
4879
5073
5345
3773
38655138
3899
3908
5329
5185
5458
5087
5508
5233
ORIG
5294
4649
4618
5388
5158
4933
4809
5055
5276
5440
5880
3775
4056
3967
3819
4876
4866
5253
5266
5245
5212
5086
5180
5502
5232
5361
TERM
ORIG
5432
5175
5384
5268
5458
5386
5244
5034
50705056
5049
TERM
5111
5514
5509
5243
5372
5494
5053
5066
5216
5480
5335
5238
5341
5116
5356
5474
5171
5395
5357
5227
5166
52295131
5494
5318
5214
5336
5165
5457
5128
5504
PULL
5172
5247
5315
5084
5088
5288
5049
5212
5303
5449
5114
5390
5091
5177
5037
5487
5084
5139
51515072 5377 5144
5451
5200
5204
5033
5289
5053
5433
5181
5436
51705249
5189
5155
5301
5299
5130
5267
5415
5575
5533
5192
5266
5069
5243
5331
5418
5101
5121
5374
4661
4531
5327
5533
5157
5179
5565
5327
5033
50985064
5291
52715420
5455
5099
5207
5289
5102
5322
5267
5140
5116
5300
5285
5455
5170
5103
5094
5109
5194
5568
5162
5166
5187
5048
5223
5349
5345
54185286 5047
4796
TERM
5495
5255
5350
5178
5107
5189
5255
5434
5178
55025125 5227
5286
5451
5431
5260
5474
5034
4932
4731
5081
53135043
5087
5121
5169
5307
5281
5211
5417
52455080
4538
4675
5317
50315035
5193
5281
5236
5161
5158
5330
5160
5370
4542
4510
5322
5236
5313
5182
5435
5169
5088
5334
5343
5487
5129
5270
5645
5983
5568
5301
5115
5265
5154
5326
4779
4885
5161
5333
5325
5317
5504
5115
4470
4537
5084
5100
4510
4662
3865
4023
5331
5250
5316
5164
5042
5193
5058
5208
5546
TERM
PULL
5503
ORIG
5531
5292
PUSH
5061
5522
5396
5135
5398
5040
5534
5415
5309
5350
5152
5086
5815
53794572
5202
5287
5352
5139
3916
3989
5092
PUSH
5592
5004
5065
5349
ORIG
53715054
5460
5053
5300
5219
4547
4546
5241
5132
4695
4556
4457
4674
5431
TERM
5315
5732
4554
4579
ORIG
5547
3826
3906
5082
5055
5200
5456
5163
TERM
5186
TERM
ORIG
5129
5389
5051
5267
5514
5098
5127
5256
TERM
ORIG
5071
5134
5058
5043
5236
PULL
5421
5182
TERM
ORIG
5261
5390
5002
5587
5553
ORIG
5082
4669
4538
5586
5328
5851
5321
5078
5552
4675
4624
5099
TERM
5279
PUSH
ORIG
5452
PULL
5117
5183
5223
5253
PUSH5385
5530
5491
5090
TERM
ORIG
5079
5864
5378
4867
4837
3957
4001
4687
4685
5337
TERM
ORIG
5573
4627
4373
5305
5065
5181
TERM
5148
5405
ORIG
5252
5579
5331
PULL
5502
3960
38334522
5126
5321
5077
TERM
4556
4495
ORIG
5290
5117
PUSH
5290
5436
5485
5926
4327
4378
5684
5783
5814
TERM4476
ORIG
5136
5252
5285
4537
4498
4842
4835
5076
TERM
ORIG
5509
4839
4781
4546
4566
5543
5265
5307
TERM
5382
TERM
3909
TERM
4498
4636
ORIG
6238
3642
3356
3368
3365
6302
TERM
ORIG
3312
8011
1181 TERM
6245
6285
ORIG
4663
2030
2140
4781
TERM
4804
4786
5064
5376
5319
5361
4914
4936
5184
5191
5035
3814
3831
5070
5214
3959
4010
5140
5248
4790
4903
4618
4695
5196
5081
4464
4684
5294
5525
4662
4506
SAV
6:36
MYR
7:40
AE CR9
AVL
8:21
CHO
9:19
AE CR7
MKE
10:48
SDF
11:40
AE CR74841
4926
TRI
12:23
ROA
13:01
AE CR74824
4759
CRW
13:25
HTS
14:05
AE CR75204
5272
MSN
14:25
CAK
15:05
AE CR7
TRI
15:38
AVL
16:24
AE CR7
PGV
19:15
LYH
20:10
AE CR7
MLB
20:30
MOB
21:30
AE CR7
AGS
6:31
SDF
7:30
AE CR7
GSP
8:18
IAD
9:09
AE CR9 5260
DCA
9:24
GSP
9:59
CAK
10:50
GPT
11:40
AE CR74936
4862
EWN
12:29
FLO
13:06
4831
4749
SBY
13:39
CRW
14:19
AE CR7
FLO
15:20
ROA
16:05
AE CR7
DSM
16:45
SAT
20:00
AE CR9
FWA
20:30
LEX
21:30
AE CR7
GSO
6:52
MEM
7:50
AE CR9
CRW
8:16
BHM
9:10
AE CR7
IND
10:46
CMH
11:45
AE E75
RDU
12:19
BNA
13:20
AE CR94879
4939
ROA
13:50
EWN
14:25
LYH
15:47
TRI
16:30
AE CR7
LFT
16:58
MLB
17:40
AE CR7
FLO
19:40
HTS
20:30
AE CR7
MOB
21:40
LEX
22:35
AE CR7
ORF
6:27
CVG
7:24
AE CR9
AGS
8:21
BTR
9:09
AE CR75507
5263
BTR
10:34
AGS
11:14
AE CR7
TLH
12:28
MSN
13:34
AE CR93777
4011
MYR
14:01
AVL
14:40
AE CR75048
5239
CHO
15:30
CAE
16:10
AE CR7
HSV
17:38
PHF
18:20
AE CR75283
5221
LEX
19:16
TYS
19:56
AE CR75211
5276
TLH
21:15
LFT
21:46
LGA
22:01
GSO
22:45
AE CR9
SDF
6:46
STL
7:40
AE CR9
GPT
8:51
MSN
9:45
AE CR74850
4800
FLO
10:45
AVL
11:25
AE CR7
GRB
12:20
PNS
13:15
AE CR95179
5110
CHA
14:01
ORF
14:40
AE CR74926
4907
ROA
15:41
AGS
16:19
AE CR75060
5324
AEX
17:05
FWA
17:45
AE CR7
YYZ
19:17
CAE
20:10
AE E75
CAK
21:35
AGS
22:30
AE CR2
ILM
6:41
CMH
7:29
AE CR9
CAK
8:37
JAN
9:30
AE CR7
MSN
10:45
HPN
14:33
AE CR75186
5310
PIA
15:43
AEX
16:20
5512
5060
MOB
17:10
MOB
17:49
AE CR7
MGM
19:40
MOB
22:40
AE CR7
IAD
6:44
IAD
7:30
AE CR9
BHM
8:30
CRW
9:20
AE CR7
SDF
11:05
IND
14:50
AE CR74805
4869
AGS
15:40
PGV
16:16
HHH
17:31
TRI
22:25
AE CR7
CMH
6:38
DTW
7:45
AE E75
MKE
8:50
CAE
9:45
AE CR7
GSO
10:30
ROA
11:14
AE CR7
STL
12:10
ILM
12:59
AE CR94844
4892
HHH
13:56
HHH
14:30
ORF
15:07
BHM
16:05
AE E754918
4777
CHO
17:01
FLO
17:35
5252
5024
GNV
19:18
BTR
19:50
CHS
21:00
TYS
22:09
AE CR9
PHL
6:58
CAE
7:45
AE E75
HSV
8:33
SAV
9:19
AE CR74942
4816
HHH
10:47
CRW
11:19
JAX
12:10
CMH
14:24
AE CR95514
5148
JAN
15:40
CRW
16:15
CHA
17:21
OAJ
19:45
AE CR73945
3904
HPN
20:50
ORF
21:30
AE CR7
BTV
10:21
RIC
11:05
AE E75
XNA
12:30
TVC
14:05
AE CR95531
5286
GRB
14:22
ABE
14:59
DSM
16:58
DSM
18:45
AE CR9
LIT
19:30
TUL
20:40
AE CR9
CAE
20:59
MKE
22:05
AE CR7
CAE
6:50
BHM
7:35
AE E75
CHO
8:15
HTS
9:00
AE CR74770
4751
SBY
9:15
AVL
9:50
AE CR7
OMA
10:41
SAV
12:59
AE CR9
CAK
13:28
PNS
14:50
AE CR9
AVL
15:29
MDT
17:55
AE CR95500
5505
BTR
18:30
HSV
19:05
IAD
19:26
MSY
20:30
AE CR9
MLB
8:47
HPN
9:30
AE CR7
CVG
10:49
DTW
13:00
AE CR9
ILM
13:52
CVG
16:14
AE CR9
PWM
17:10
ILM
18:25
AE CR9
SAV
19:00
ORF
20:00
AE CR9
FLO
8:43
EWN
9:24
AE CR7
MLI
9:40
GRR
11:30
AE CR9
IAD
12:29
CAK
13:15
AE CR9
GSO
13:33
MEM
14:40
AE CR9
MYR
15:33
LGA
17:25
AE CR9
TVC
17:40
DAB
18:50
AE CR9
DAB
19:36
CHA
22:20
AE CR9
CVG
6:56
OKC
9:20
AE CR9
BHM
10:13
PVD
11:50
AE CR9
AUS
12:05
LIT
12:50
AE CR95167
5314
TVC
13:10
BTV
13:44
TUL
14:00
GRB
14:55
AE CR9
CVG
15:14
CHS
16:20
AE CR9
OMA
17:06
SAV
18:20
AE CR9
MEM
18:50
CHS
19:44
AE CR9
GSP
19:59
BNA
22:40
AE CR9
CHA
6:29
JAX
8:50
AE CR9
CVG
9:10
OMA
11:20
AE CR9
JAX
13:32
DAB
14:25
AE CR9
CHS
15:30
LIT
16:30
AE CR9
BNA
16:45
SDF
17:54
AE CR9
PNS
18:50
CVG
19:45
AE CR9
MYR
20:59
CHS
22:35
AE CR9
SRQ
8:04
TLH
9:00
AE CR7
SGF
9:15
TVC
11:24
AE CR9
FAY
12:10
CHS
12:54
AE CR9
SRQ
13:37
SAV
14:27
AE CR9
MHT
15:02
TLH
15:59
AE CR9
SYR
17:16
CHS
18:20
AE CR9
TYS
19:01
SAV
19:55
AE CR9
ILM
21:03
LIT
22:35
AE CR9
ORIG
682
CLTSC4
8:15
BDA
9:00
BHM
9:15
OKC
11:20
AE CR9
MYR
12:15
MYR
12:59
AE CR9
AUS
13:45
CHS
14:35
AE CR9
CLE
15:25
MYR
16:20
AE CR9
DTW
17:22
MYR
18:20
AE CR9
IND
18:58
GSP
19:50
AE CR9
AUS
21:05
MEM
22:35
AE CR9
SAV
8:16
MKE
9:14
AE CR9
LNK
9:33
PNS
11:25
AE CR9
MEM
12:07
SYR
12:50
AE CR9
GRR
14:05
ATL
14:55
AE CR9
SAV
15:42
STL
16:35
AE CR9
CAK
16:53
CLE
17:50
AE CR9
GSO
18:49
DAY
19:40
AE CR9
GSO
20:45
DAY
22:05
AE CR9
IND
6:51
IND
7:55
AE E75
IAD
8:43
GRR
9:25
AE CR9
VPS
10:06
CHA
11:14
AE E75
MSN
12:25
SBY
13:30
AE E75
LIT
13:51
MKE
14:40
AE CR9
MDT
15:07
CMH
15:59
AE CR9
PNS
17:35
EYW
18:30
AE CR9
TLH
19:19
GSO
20:10
AE CR9
ORF
21:09
AVP
22:20
AE CR9
CHS
8:09
MYR
9:30
AE CR9
SRQ
10:10
AVP
11:20
AE CR95514
5255
RAP
11:40
DAB
12:20
AE CR9
MKE
13:56
ABE
14:45
AE CR9
OKC
15:14
SDF
16:05
AE CR9
ILM
17:14
ORF
18:05
AE CR9
MYR
19:00
PNS
19:50
AE CR9
PNS
20:55
CVG
22:05
AE CR9
JAN
8:37
IND
9:55
AE CR9
MHT
10:30
CVG
11:40
AE CR9
PGV
12:05
CHO
12:49
AE E755504
5527
OKC
13:18
MYR
13:57
AE CR9
SYR
14:30
CLE
15:20
AE CR9
ILM
15:35
GSO
16:25
AE CR9
IAD
17:05
IAD
17:55
AE CR9
CMH
19:16
MHT
20:05
AE CR9
SDF
8:32
PNS
9:45
AE CR9
XNA
10:28
BHM
11:35
AE CR9
ILM
12:13
AVP
13:04
AE CR9
PNS
13:56
DTW
14:45
AE CR9
BHM
15:10
IAD
16:00
AE CR9
PVD
16:51
SRQ
17:40
AE CR9
CHS
19:03
SRQ
19:50
AE CR9
IAD
21:21
SAV
22:30
AE CR9
MYR
8:47
SYR
10:00
AE CR9
MEM
10:43
PWM
11:50
AE CR9
MDT
12:30
BMI
13:30
AE E75
ORF
13:56
MYR
14:45
AE CR9
PIT
15:24
SAV
16:14
AE CR9
CMH
17:41
GSO
18:30
AE CR9
CVG
19:26
DAB
20:10
AE CR9
CVG
21:22
BHM
22:30
AE CR9
GSO
8:36
CAK
9:45
AE CR9
CLE
10:21
MDT
11:25
AE CR9
CMH
12:27
MCI
13:24
AE E75
DAB
13:40
IAD
14:25
AE CR9
IAD
15:15
DAB
16:04
AE CR9
XNA
17:04
CVG
17:50
AE CR94809
4810
CHO
19:10
ROA
19:44
XNA
21:33
MYR
22:40
AE CR9
LIT
8:45
SDF
9:50
AE CR9
AVP
10:18
STL
11:20
AE CR9
DTW
12:23
MDT
13:10
AE E75
AVP
15:36
XNA
16:25
AE CR9
MYR
17:19
BHM
18:05
AE CR9
DTW
19:04
ABE
20:15
AE CR9
LIT
21:18
SDF
22:20
AE CR9
PNS
8:38
FAY
9:40
AE CR9
DSM
10:19
ILM
11:16
AE CR9
FWA
11:40
MKE
12:25
AE E75
IND
14:01
AUS
14:45
AE CR9
DAY
15:14
MEM
16:00
AE CR9
SDF
17:46
AVL
18:30
AE CR7
LYH
18:59
CHO
19:49
AE CR7
SRQ
21:39
JAN
22:35
AE CR9
BNA
8:49
DAB
9:50
AE CR9
SAV
10:38
DAY
11:35
AE CR9
IND
12:12
GSO
13:05
AE E75
ABE
13:44
CVG
14:25
AE CR9
LNK
15:05
LIT
15:50
AE CR9
MDT
16:56
JAX
17:59
AE E75
BHM
19:23
HPN
20:40
AE CR7
CLE
21:39
ILM
22:35
AE CR9
ICT
9:03
CMH
10:30
AE CR9
DAY
10:54
XNA
11:50
AE CR9
CAE
12:22
FAY
13:05
AE E755051
5372
SAV
13:50
RIC
14:30
AE CR9
MEM
15:35
TYS
16:19
AE CR9
SAV
17:09
GSP
17:50
AE CR95006
5468
EVV
19:50
MGM
20:30
AE CR7
CMH
10:50
PIT
11:45
AE CR9
AGS
12:16
FWA
13:10
AE CR75046
5265
SAT
13:48
MLI
14:26
AE CR95572
5567
PWM
15:10
GRR
15:50
AE CR9
CVG
17:00
ICT
20:06
AE CR9
MKE
21:37
CAE
22:20
AE CR7
GRR
8:49
RDU
9:40
AE CR9
CHS
10:27
GSO
11:20
AE CR9
CHO
12:12
AVL
13:05
AE CR95103
5565
ICT
14:07
MHT
14:45
AE CR95431
5165
OMA
15:20
DSM
16:00
AE CR9
SHV
16:40
SHV
17:35
AE E75
ILM
18:50
IND
19:45
AE E75
GNV
21:20
CHO
22:30
AE E75
DAB
8:35
SRQ
9:24
AE CR9
YUL
10:06
GSP
11:35
AE CR7
PNS
15:22
AUS
18:25
AE CR9
ABE
19:06
OMA
19:49
AE CR9
VPS
21:06
TLH
22:15
AE E75
ROA
9:15
GSO
9:55
AE CR7
TUL
10:50
TUL
11:40
AE CR95414
5542
CMH
14:00
TUL
14:35
DAB
15:30
LIT
19:00
AE CR9
SDF
19:28
XNA
22:30
AE CR9
CMH
8:36
YYZ
9:27
AE E75
EVV
10:23
MLB
11:40
AE CR2
BNA
13:42
OMA
14:55
AE E75
CMH
15:21
ILM
16:09
AE E75
JAN
18:55
LAN
20:10
AE E75
CMH
21:14
CMH
22:09
AE E75
CAE
8:21
HSV
9:09
AE E75
ILM
10:31
DSM
11:20
AE CR9
AUS
15:30
SGF
18:50
AE CR9
MYR
10:22
SAV
11:10
AE CR9
RIC
14:02
GSO
14:45
AE E75
MLI
15:39
RAP
19:03
AE CR9
MKE
19:21
IAD
20:05
AE CR9
ABE
10:39
MEM
11:25
AE CR95767
5326
SHV
13:15
JAN
13:55
AE E75
GRR
15:50
BHM
19:30
AE CR9
LFT
8:42
CAE
11:19
AE CR73989
3834
GSP
13:54
YYZ
14:30
SAT
16:00
LNK
19:45
AE CR95050
5041
HSV
21:06
PIA
21:45
AE CR7
MDT
8:08
CMH
9:10
AE E75
SBN
10:05
SHV
10:55
AE E75
SBY
16:00
MSN
16:45
AE E75
LEX
17:25
CHO
18:15
AE E75
MCI
18:55
CMH
19:44
AE E75
VPS
13:49
CAK
16:00
AE E75
VPS
18:38
PHF
19:50
AE E75
CID
20:40
GPT
21:30
AE CR7
LAN
9:20
SBN
10:05
AE E75
TUL
10:20
ORF
11:02
AE CR95071
5508
JAN
13:47
CHA
14:27
AE CR7
BMI
15:25
BTV
16:40
AE E75
CAE
17:03
AGS
17:55
AE E75
BMI
18:30
ECP
19:20
AE E754636
4554
JAX
21:33
YYZ
22:10
YYZ
9:19
BNA
9:59
AE E754763
4844
ROA
10:21
HHH
10:55
ECP
14:25
MDT
15:20
AE E75
TYS
15:37
VPS
16:45
AE E75
CRW
19:05
FWA
19:49
AE E75
AVP
8:47
ILM
9:25
AE CR9
EYW
10:10
LNK
10:55
AE CR9
CAE
15:22
GSP
16:25
AE E75
GSO
16:59
IND
17:50
AE E75
RAP
18:10
XNA
19:00
AE CR9
OMA
21:05
IND
22:05
AE E75
RIC
10:45
CLE
11:35
AE CR9
SBN
14:30
FWA
15:15
AE E75
BTV
15:30
BMI
16:30
AE E75
MKE
17:35
SBN
18:20
AE E75
IND
21:39
MSY
22:35
AE E75
ORF
10:47
ILM
14:35
AE CR9
GSO
15:30
YYZ
16:27
AE E75
MSY
17:08
CMH
17:50
AE E75
ROA
18:43
SBY
19:50
AE CR7
ECP
10:10
ECP
11:05
AE E75
YYZ
14:19
LGA
15:15
AE E75 3190
SGF
15:55
SGF
16:24
YOW
17:06
YOW
18:10
AE E75
YYZ
21:22
MDT
22:20
AE E75
4845
CVG
11:06
CVG
11:36
EWR
14:33
EWR
15:30
UA E7W4823
4843
ORD
16:46
ORD
17:21
7348
7349
YYZ
17:49
YYZ
18:20
EWR
18:45
EWR
19:30
UA E7W
6150
IAD
9:42
IAD
10:22
UA CR77346
7347
YYZ
10:39
YYZ
11:10
3367
3311
EWR
11:52
EWR
12:27
LWB
16:54
LWB
18:06
VC ER4
3337
3399
LGA
9:57
LGA
10:30
6165
6310
IAH
11:04
IAH
11:41
7350
7351
YUL
15:05
YUL
15:40
IAH
17:14
IAH
18:05
UA E7W
3966
MSP
10:32
MSP
11:07
BKW
12:00
BKW
17:05
VC EM2
E19
E18
E16
E14
E12
E10
E21
E23
E25
E27
E29
E31
E33
E35
E38
E36
E34
E32
E30
E28
E26
E24
E22
E20
E8
E6
E4
F1
F2
F3
F4
F5
F6
F7
F8
F9
F10
F11
F12
F13
F14
F15
F16
F17
F18
F19
O7
O8
O9
O10
Date:04/11/2019 Time:12:56CLT 2033-Scenario 2
Page # 3 of 4

00:00 01:00 02:00 03:00 04:00 05:00 06:00 07:00 08:00 09:00 10:00 11:00 12:00 13:00 14:00 15:00 16:00 17:00 18:00 19:00 20:00 21:00 22:00 23:00
*PSH
1568
*PSH
720
GRU
8:50
CLT
19:00
AA 332
FRA
14:00
CLT
16:55
AA 789
4554
ORIG
3357
8010
1180
3395
TERM
ORIG
6113
5168
5465
6234
TERM
O285
O286
T305
T306
O293
O294
PSH
5343
PSH
1002
T313
T314
O263
O264
T307
T308
O275
O276
T345
T346
O271
O272
PSH
170
T337
T338
O273
O274
PSH
1971
T331
T332
O287
O288
T327
T328
O283
O284
PSH
5172
T303
T304
O267
O268
T315
T316
O277
O278
PSH
5147
T319
T320
O291
O292
PSH
5502
T321
T322
O265
O266
T309
T310
O269
O270
T323
T324
O295
O296
PSH
5421
T311
T312
O279
O280
PSH
5117
T325
T326
O281
O282
T317
T318
T329
T330
O289
O290
PSH
5503
T341
T342
T333
T334
O297
O298
T335
T336
O299
O300
T339
T340
O301
O302
T343
T344
O303
O304
T349
T350
O307
O308
T365
T366
O305
O306
T351
T352
T357
T358
T363
T364
T353
T354
T359
T360
T355
T356
T347
T348
T361
T362
3697
3648
EWR
8:34
EWR
9:09
LWB
10:16
LWB
11:01
VC ER46115
6120
IAH
14:09
IAD
14:44
3401
3343
EWR
17:20
EWR
17:56
6160
IAD
18:55
IAD
19:30
2010
2120
BKW
8:35
BKW
9:05
BOS
10:30
BOS
11:15
DL CR93314
3315
EWR
14:24
IAH
15:02
UA E70
CLT
0:00
DEN
7:50
UA 319
PIT
19:24
CLT
23:59
AA 319
CLT
0:00
SEA
6:50
DL 319
LEX
8:05
CLT
9:55
AE CR7
STL
18:17
CLT
20:32
AA 319
PIT
21:19
CLT
23:59
AA 319
CLT
0:00
RIC
19:45
AA 319
ELP
21:35
CLT
23:59
AA 319
CLT
0:00
MDT
19:04
AA 319
CLT
0:00
BDL
15:35
AA 319
BUF
18:40
CLT
20:45
AA 319
FLL
22:40
CLT
23:59
NK 320
CLT
0:00
IAH
14:10
AA 319
MSY
14:31
CLT
21:35
AA 319
ORD
22:47
CLT
23:59
UA 73G
CLT
0:00
IAH
5:05
UA 319
JAX
10:59
CLT
23:59
AA 319
CLT
0:00
IAH
6:45
NK 320
BTR
9:55
CLT
11:50
AE CR9
TPA
14:08
CLT
23:59
AA 321
CLT
0:00
PBI
18:28
AA 321
PHL
19:45
CLT
23:59
AA 321
CLT
0:00
PBI
13:40
AA 321
LIT
16:55
CLT
19:22
AE CR9
TPA
19:47
CLT
23:59
AA 321
CLT
0:00
MSP
7:20
DL 717
AEX
9:24
CLT
11:15
AE CR9
PHX
19:54
CLT
23:59
AA 321
CLT
0:00
MSP
18:29
AA 738
PVD
20:10
CLT
23:59
AA 321
CLT
0:00
RDU
17:25
AA 738
LAX
20:40
CLT
23:59
AA 321
CLT
0:00
ATL
7:30
DL 738
EYW
17:31
CLT
19:47
AE CR9
STT
21:09
CLT
23:59
AA 321
CLT
0:00
HOU
4:40
WN 73H
CHO
6:58
CLT
10:55
AE E75
JFK
13:10
CLT
23:59
AA 738
CLT
0:00
MDW
5:45
WN 73W
ORD
18:44
CLT
23:59
AA 738
ATL
1:02
CLT
23:59
DL 739
CLT
0:00
JFK
6:08
DL CS1
SDF
14:15
CLT
21:40
AE CR9
ATL
23:06
CLT
23:59
DL 73H
MDW
1:20
CLT
23:59
WN 73W
CLT
0:00
FLL
7:15
B6 E90
LGA
21:51
CLT
23:59
DL CS1
CLT
0:00
HSV
15:25
AE CR2
JFK
22:51
CLT
23:59
DL CS1
CLT
0:00
TRI
17:40
AE CR7
BOS
22:50
CLT
23:59
B6 E90
CLT
0:00
TYS
17:40
AE CR7
BTV
19:12
CLT
23:59
AE CR9
CLT
0:00
XNA
9:20
AE CR9
HSV
15:55
CLT
23:59
AE CR7
CLT
0:00
YUL
10:01
AE E75
OKC
17:39
CLT
23:59
AE CR9
CHS
17:47
CLT
23:59
AE CR9
CLE
19:18
CLT
23:59
AE CR9
MHT
19:53
CLT
23:59
AE CR9
GRR
20:25
CLT
23:59
AE CR9
GRB
20:27
CLT
23:59
AE CR9
BDA
19:20
CLT
23:59
AE E75
YUL
19:36
CLT
23:59
AE E75
O11
O12
O15
O23
O24
O25
O26
HS
R01
R02
R03
R04
R05
R06
R07
R08
R09
R10
R11
R12
R13
R14
R15
R16
R17
R18
R19
R20
R21
R22
R23
R24
R25
R26
R27
R28
R29
R30
R31
R32
R33
R34
R35
Date:04/11/2019 Time:12:56CLT 2033-Scenario 2
Page # 4 of 4
CLT 2033 Gating Scenario 3 1
2
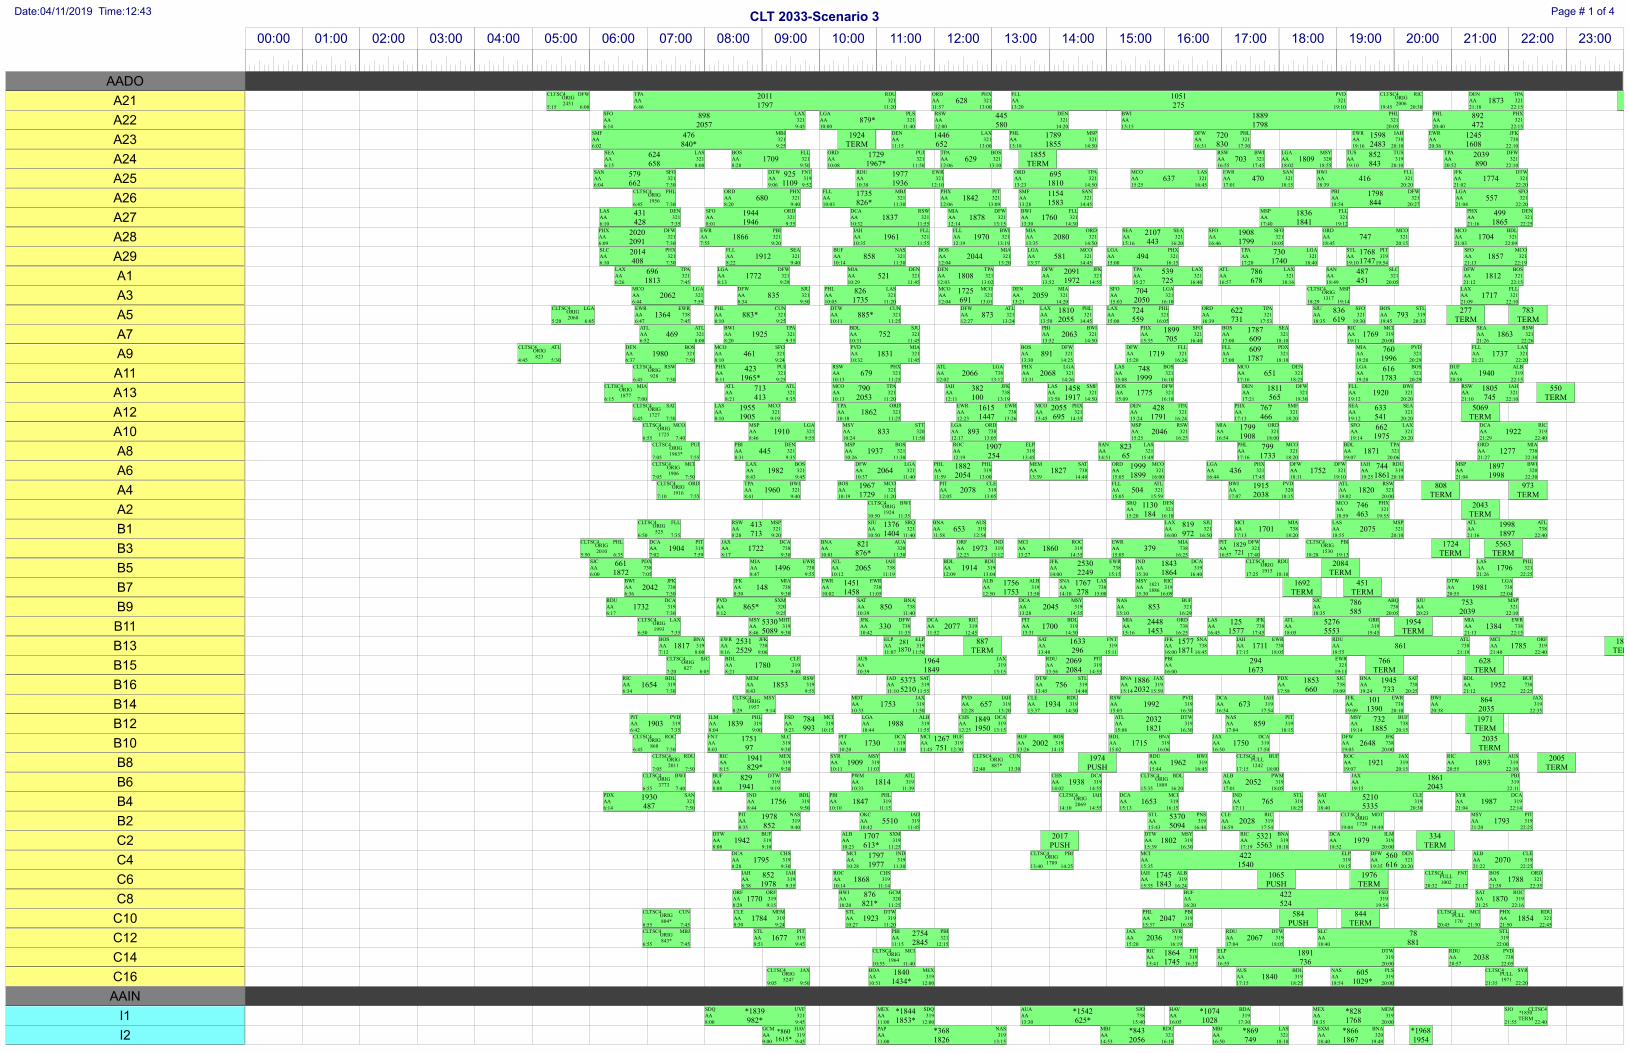
00:00 01:00 02:00 03:00 04:00 05:00 06:00 07:00 08:00 09:00 10:00 11:00 12:00 13:00 14:00 15:00 16:00 17:00 18:00 19:00 20:00 21:00 22:00 23:00
2011
1797628
1051
2751873
TERM
898
2057879*
445
580
1889
1798
892
472
476
840*
1924
TERM
1446
652
1789
1855
720
830
1598
2483
1245
1608
624
6581709
1729
1967*629
1855
TERM703 1809
852
843
2039
890
579
662
925
1109
1977
1936
695
1810637 470 416 1774
6801735
826*1842
1154
1583
1798
844557
431
428
1944
19461837 1878 1760
1836
1841
499
1865
2020
20911866 1961 1970 2080
2107
443
1908
1799747 1704
2014
4081912 858 2044 581 494
730
1740
1768
17471857
696
18131772 521 1808
2091
1972
539
725
786
678
487
4511812
2062 835826
1735
1725
6912059
704
20501717
1364 883* 885* 8731810
2055
724
559
622
731
836
619793
277
TERM
783
TERM
469 1925 752 20631899
705
1787
6091769 1863
1980 461 1831 891 1719609
1787
760
19961737
423
1965*679 2066 2068
748
1999651
616
17831940
713
413
790
2053
382
100
1458
19171775
1811
5651920
1805
745
550
TERM
1955
19051862
1615
1447
2055
695
428
1791
767
466
633
541
5069
TERM
1910 833 893 20461799
1908
662
19751922
445 19371907
254
823
65
799
17331871 1277
1982 20641882
20541827
1999
1899436 1752
744
1861
1897
1998
19601967
17292078 504
1915
20381820
808
TERM
973
TERM
1130
184
746
463
2043
TERM
413
713
1376
1404653
819
9721701 2075
1998
1897
1904 1722821
876*1973 1860 379
1724
TERM
5563
TERM
661
18721496 2065 1914
2530
2249
1843
1864
2084
TERM1796
2042 1481451
1458
1756
1753
1767
278
1692
TERM
451
TERM1981
1732 865* 850 2045 853786
585
753
2039
5330
5089330 2077 1700
2448
1453
125
1577
5276
5553
1954
TERM1384
18172531
2529
887
TERM
1633
296
1577
18711711 861 1785
1828
TERM
17801964
1849
2069
2084
294
1673
766
TERM
628
TERM
1654 18535373
5210756
1886
2032
1853
660
1945
7331952
1753 657 1934 1992 673101
1390
864
2035
1903 1839784
9931988
1849
1950
2032
1821859
732
1885
1971
TERM
1751
971730
1267
7512002 1715 1750 2648
2035
TERM
1941
829*1909
1974
PUSH1962 1921 1893
2005
TERM
829
19411814 1938 2052
1861
2043
1930
4871756 1847 1653 765
5210
53351987
1978
8525510
5370
50942028 1793
19421707
613*
2017
PUSH1802
5321
55631979
334
TERM
17951797
1977
422
1540
560
6162070
852
19781868
1745
1843
1065
PUSH
1976
TERM1788
1770876
821*
422
5241870
1784 1923 2047584
PUSH
844
TERM1854
16772754
28452036 2067
78
881
1864
1745
1891
7362038
1840
1434*1840
605
1029*
*1839
982*
*1844
1853*
*1542
625*
*1074
1028
*828
1768
*368
1826
*843
2056
*869
749
*866
1867
*1968
1954
1829
721
281
1870
*860
1615*
ORIG
2451
CLTSC4
5:15
DFW
6:00
TPA
6:46
RDU
11:20
AA 321
ORD
11:57
PHX
13:00
AA 321
FLL
13:20
PVD
19:10
AA 321ORIG
2006
CLTSC4
19:45
RIC
20:30
DEN
21:18
TPA
22:15
AA 321
SFO
6:14
LAX
9:45
AA 321
LGA
10:00
PLS
11:40
AA 321
RSW
12:00
DEN
14:20
AA 321
BWI
15:15
PHL
20:05
AA 321
PHL
20:40
PHX
22:15
AA 321
SMF
6:02
MBJ
9:25
AA 321
DEN
11:15
LAX
13:00
AA 321
PHL
13:18
MSP
14:50
AA 321
DFW
16:31
PHL
17:30
AA 321
EWR
19:16
IAH
20:10
AA 738
EWR
20:36
JFK
22:10
AA 738
SEA
6:15
LAS
8:00
AA 321
BOS
8:28
FLL
9:50
AA 321
ORD
10:08
PUJ
11:50
AA 321
TPA
12:06
BOS
13:10
AA 321
RSW
16:55
BWI
17:45
AA 321
LGA
18:02
MSY
18:55
AA 320
TUS
19:10
TUS
20:10
AA 319
TPA
20:52
DFW
22:10
AA 321
SAN
6:04
SFO
7:30
AA 321
DTW
9:06
FNT
9:52
AA 319
RDU
10:38
EWR
12:10
AA 321
ORD
13:23
TPA
14:50
AA 321
MCO
15:25
LAS
16:45
AA 321
EWR
17:01
SAN
18:15
AA 321
BWI
18:39
FLL
20:20
AA 321
JFK
21:02
DTW
22:20
AA 321
ORIG
1956
CLTSC4
6:45
PHL
7:30
ORD
8:20
PHX
9:40
AA 321
FLL
10:03
MBJ
11:30
AA 321
PHX
12:06
PIT
13:09
AA 321
SMF
13:28
SAN
14:45
AA 321
PBI
18:54
DFW
20:27
AA 321
LGA
21:04
SFO
22:20
AA 321
LAS
6:10
DEN
7:35
AA 321
SFO
8:01
ORD
9:35
AA 321
DCA
10:32
RSW
11:55
AA 321
MIA
12:14
DFW
13:15
AA 321
BWI
13:30
FLL
14:30
AA 321
MSP
17:40
FLL
19:12
AA 321
PHX
21:16
DEN
22:25
AA 321
PHX
6:09
DFW
7:30
AA 321
EWR
7:55
PBI
9:20
AA 321
IAH
10:35
FLL
11:55
AA 321
FLL
12:19
BWI
13:19
AA 321
MIA
13:35
ORD
14:50
AA 321
SEA
15:16
SEA
16:20
AA 321
SFO
16:46
SFO
18:05
AA 321
ORD
18:45
MCO
20:15
AA 321
MCO
21:03
BDL
22:09
AA 321
SLC
6:10
PHX
7:30
AA 321
FLL
8:22
SEA
9:40
AA 321
BUF
10:14
NAS
11:30
AA 321
BOS
12:04
MIA
13:20
AA 321
LGA
13:37
MCO
14:45
AA 321
LGA
15:00
PHX
16:15
AA 321
TPA
17:20
LGA
18:40
AA 321
STL
19:10
PIT
19:54
AA 319
SFO
21:13
MCO
22:19
AA 321
LAX
6:26
TPA
7:45
AA 321
LGA
8:13
DFW
9:29
AA 321
MIA
10:29
DEN
11:45
AA 321
DEN
12:03
TPA
13:02
AA 321
DFW
13:52
JFK
14:55
AA 321
TPA
15:27
LAX
16:40
AA 321
ATL
16:57
LAX
18:16
AA 321
SAN
18:49
SLC
20:05
AA 321
DFW
21:12
BOS
22:15
AA 321
MCO
6:44
LGA
7:59
AA 321
DFW
8:34
SJU
9:50
AA 321
PHL
10:05
LAS
11:20
AA 321
MCO
12:04
MCO
13:01
AA 321
DEN
13:21
MIA
14:20
AA 321
SFO
15:03
LGA
16:10
AA 321ORIG
1317
CLTSC4
18:29
MSP
19:14
LAX
21:09
FLL
22:10
AA 321
ORIG
2060
CLTSC4
5:20
LGA
6:05
EWR
6:47
EWR
7:45
AA 738
PHL
8:10
CUN
9:25
AA 321
DTW
10:11
CUN
11:25
AA 321
DFW
12:27
ATL
13:24
AA 321
LAX
13:50
PHL
14:45
AA 321
LAX
15:00
PHL
16:05
AA 321
ORD
16:39
TPA
17:53
AA 321
SJU
18:35
SFO
19:30
AA 321
BOS
19:45
STL
20:33
AA 319
ATL
6:52
ATL
8:00
AA 321
BWI
8:20
TPA
9:35
AA 321
BDL
10:31
SJU
11:45
AA 321
PBI
13:52
BWI
14:50
AA 321
PHX
15:35
SFO
16:40
AA 321
BOS
17:00
SEA
18:10
AA 321
RIC
19:11
MCI
20:00
AA 319
SEA
21:26
RSW
22:26
AA 321
ORIG
823
CLTSC4
4:45
ATL
5:30
DEN
6:37
BOS
7:50
AA 321
MCO
8:10
SFO
9:24
AA 321
PVD
10:32
MIA
11:45
AA 321
BOS
13:30
DFW
14:25
AA 321
DFW
15:20
FLL
16:24
AA 321
FLL
17:00
PDX
18:10
AA 321
MIA
19:20
PVD
20:29
AA 321
FLL
21:21
LAX
22:20
AA 321
ORIG
928
CLTSC4
6:45
RSW
7:30
PHX
8:11
PUJ
9:25
AA 321
RSW
10:13
PHX
11:25
AA 321
ATL
12:02
LGA
13:12
AA 738
PHX
13:31
LGA
14:26
AA 321
LAS
15:08
BOS
16:10
AA 321
MCO
17:16
DEN
18:25
AA 321
LGA
19:20
BOS
20:29
AA 321
BUF
20:58
ALB
22:15
AA 319
ORIG
1877
CLTSC4
6:15
MIA
7:00
ATL
8:21
ATL
9:35
AA 321
MCO
10:13
TPA
11:20
AA 321
IAH
12:11
JFK
13:19
AA 738
LAS
13:58
SMF
14:50
AA 321
BOS
15:09
DFW
16:10
AA 321
DEN
17:21
DFW
18:30
AA 321
FLL
19:12
BWI
20:20
AA 321
RSW
21:10
IAH
22:10
AA 321
ORIG
1727
CLTSC4
6:45
SAT
7:30
LAS
8:10
MCO
9:19
AA 321
TPA
10:18
ORD
11:25
AA 321
EWR
12:23
EWR
13:26
AA 738
MCO
13:45
PHX
14:35
AA 321
DEN
15:24
TPA
16:24
AA 321
PHX
17:13
SMF
18:20
AA 321
SEA
19:12
SEA
20:20
AA 321
ORIG
1725
CLTSC4
6:55
MCO
7:40
MSP
8:46
LGA
9:55
AA 321
MSY
10:24
STT
11:50
AA 320
LGA
12:17
ORD
13:05
AA 738
MSP
15:25
RSW
16:25
AA 321
MIA
16:54
ORD
18:00
AA 321
SFO
19:14
LAX
20:20
AA 321
DCA
21:29
RIC
22:40
AA 319
ORIG
1963*
CLTSC4
7:05
PUJ
7:55
PBI
8:31
DEN
9:35
AA 321
MSP
10:26
BOS
11:30
AA 321
ROC
12:19
ELP
13:45
AA 319
SAN
14:51
LAS
15:49
AA 321
PHL
17:16
MCO
18:20
AA 321
BDL
19:07
TPA
20:06
AA 321
ORD
21:27
MIA
22:30
AA 738
ORIG
1906
CLTSC4
7:05
MCI
7:50
LAX
8:43
BOS
9:45
AA 321
DFW
10:37
LGA
11:40
AA 321
PHL
11:59
PHL
13:00
AA 319
MEM
13:39
SAT
14:40
AA 738
ORD
15:05
MCO
16:00
AA 321
LGA
16:44
PHX
17:45
AA 321
DFW
18:11
DFW
19:10
AA 321
IAH
19:25
RDU
20:10
AA 319
MSP
21:04
BWI
22:30
AA 320
ORIG
1916
CLTSC4
7:10
ORD
7:55
TPA
8:41
BWI
9:40
AA 321
BOS
10:19
MCO
11:20
AA 321
PIT
12:05
CLE
13:05
AA 319
FLL
15:05
ATL
15:59
AA 321
BWI
17:07
PVD
18:15
AA 320
ATL
19:02
RSW
20:00
AA 321
ORIG
1924
CLTSC4
10:50
BWI
11:35
SRQ
15:20
DEN
16:10
AA 321
MCO
18:59
PHX
19:55
AA 321
ORIG
525
CLTSC4
6:50
FLL
7:35
RSW
8:28
MSP
9:20
AA 321
SJU
10:50
SRQ
11:40
AA 321
BNA
11:58
AUS
12:54
AA 319
LAX
16:00
SJU
16:50
AA 321
MCI
17:13
MIA
18:20
AA 738
LAS
18:55
MSP
20:10
AA 321
ATL
21:16
ATL
22:40
AA 738
ORIG
2010
CLTSC4
5:50
PHL
6:35
DCA
7:02
PIT
7:59
AA 319
JAX
8:17
DCA
9:30
AA 738
BNA
10:01
AUA
11:30
AA 320
ORF
12:23
IND
13:12
AA 319
MCI
13:27
ROC
14:35
AA 319
EWR
15:05
MIA
16:25
AA 738
PIT
16:57
DFW
17:40
AA 321ORIG
1530
CLTSC4
18:28
PBI
19:13
SJC
6:00
PDX
7:05
AA 738
MIA
8:47
EWR
9:55
AA 738
ATL
10:12
IAH
11:19
AA 738
BDL
12:09
RDU
13:04
AA 319
JFK
14:00
EWR
15:15
AA 738
IND
15:30
DCA
16:40
AA 319ORIG
1915
CLTSC4
17:25
RDU
18:10
LAS
21:26
PHL
22:25
AA 321
BWI
6:36
JFK
7:30
AA 738
JFK
8:30
MIA
9:30
AA 738
EWR
10:02
EWR
11:05
AA 738
ALB
12:50
ALB
13:50
AA 319
SNA
14:10
LAS
15:00
AA 7381821
1886
MSY
15:30
RIC
16:09
AA 319
DTW
20:55
LGA
22:04
AA 738
RDU
6:17
DCA
7:30
AA 319
PVD
8:12
SXM
9:25
AA 320
SAT
10:39
BNA
11:40
AA 738
DCA
13:28
MSY
14:35
AA 319
NAS
15:10
BUF
16:29
AA 321
SJC
18:35
ABQ
20:05
AA 738
SJU
20:23
MSP
22:10
AA 321
ORIG
1993
CLTSC4
6:50
LAX
7:35
MSY
8:46
MHT
9:30
AA 319
JFK
10:42
DFW
11:35
AA 738
DCA
11:52
RIC
12:45
AA 319
PIT
13:31
BDL
14:30
AA 319
MIA
15:16
ORD
16:25
AA 738
LAS
16:45
JFK
17:45
AA 738
ATL
18:05
GRR
19:45
AA 319
MIA
21:13
EWR
22:15
AA 738
BOS
7:12
BNA
8:00
AA 319
EWR
8:16
JFK
9:06
AA 738
ELP
11:07
ELP
11:50
AA 319
SAT
13:48
FNT
15:11
AA 319
JFK
16:00
SNA
16:45
AA 738
IAH
17:15
EWR
18:05
AA 738
RDU
18:55
ATL
21:19
AA 738
MCI
21:40
ORF
22:40
AA 319
ORIG
827
CLTSC4
7:20
SJC
8:05
BDL
8:21
CLE
9:40
AA 319
AUS
10:39
JAX
13:15
AA 319
RDU
13:56
PIT
14:55
AA 319
PBI
16:00
EWR
19:11
AA 321
RIC
6:34
BDL
7:30
AA 319
MEM
8:43
RSW
9:55
AA 319
IAD
11:10
SAT
11:55
AA 319
DTW
13:45
STL
14:40
AA 319
BNA
15:14
JAX
15:59
AA 319
PDX
17:58
SJC
19:09
AA 738
BNA
19:24
SAT
20:25
AA 738
BDL
21:12
BUF
22:25
AA 738
ORIG
1957
CLTSC4
8:29
MSY
9:14
MDT
10:33
JAX
11:50
AA 319
PVD
12:28
IAH
13:20
AA 319
CLE
13:37
RDU
14:30
AA 319
RSW
15:03
PVD
16:30
AA 319
DCA
16:54
IAH
17:54
AA 319
JFK
19:09
EWR
20:10
AA 738
BWI
20:38
JAX
22:35
AA 319
PIT
6:42
PVD
7:35
AA 319
ILM
8:04
PHL
9:00
AA 319
FSD
9:23
MCI
10:15
AA 319
LGA
10:44
ALB
11:55
AA 319
CHS
12:25
DCA
13:15
AA 319
ATL
15:08
DTW
16:30
AA 319
NAS
17:04
PIT
18:15
AA 319
MSY
19:14
BUF
20:15
AA 738
ORIG
868
CLTSC4
6:45
ROC
7:30
FNT
8:03
SLC
9:30
AA 319
PIT
10:20
DCA
11:30
AA 319
MCI
11:45
BUF
12:30
AA 319
BUF
13:26
BOS
14:15
AA 319
BDL
15:02
BNA
16:06
AA 319
JAX
16:50
DCA
17:50
AA 319
DFW
19:05
JFK
20:00
AA 738
ORIG
2011
CLTSC4
7:05
RDU
7:50
RIC
8:15
MEX
9:30
AA 319
SYR
10:11
MSY
11:03
AA 319ORIG
887*
CLTSC4
12:40
CUN
13:30
RDU
15:44
BWI
16:45
AA 319PULL
1242
CLTSC4
17:15
BUF
18:00
ROC
19:07
JAX
20:15
AA 319
RIC
20:55
AUS
22:10
AA 319
ORIG
3773
CLTSC4
6:55
BWI
7:40
BUF
8:08
DTW
9:19
AA 319
PWM
10:33
ATL
11:39
AA 319
CHS
14:02
DCA
14:55
AA 319ORIG
1889
CLTSC4
15:35
BDL
16:20
ALB
17:01
PWM
18:05
AA 319
JAX
19:15
PBI
22:11
AA 319
PDX
6:14
SAN
7:50
AA 321
IND
8:44
BDL
9:50
AA 319
PBI
10:10
PHL
11:15
AA 319ORIG
2069
CLTSC4
14:10
IAH
14:55
DCA
15:13
MCI
16:15
AA 319
IND
17:11
STL
18:25
AA 319
SAT
18:40
CLE
20:30
AA 319
SYR
21:04
DCA
22:14
AA 319
PIT
8:35
NAS
9:40
AA 319
OKC
10:42
IAD
11:45
AA 319
STL
15:43
PNS
16:44
AA 319
CLE
16:59
RIC
17:54
AA 319ORIG
1720
CLTSC4
19:04
MDT
19:49
MSY
21:20
PIT
22:25
AA 319
DTW
8:08
BUF
9:10
AA 319
ALB
10:23
SXM
11:25
AA 319
DTW
15:39
MSY
16:30
AA 319
RIC
17:19
BNA
18:10
AA 319
DCA
18:52
ILM
20:00
AA 319
DCA
8:28
CHS
9:30
AA 319
MCI
10:28
IND
11:30
AA 319ORIG
1789
CLTSC4
13:40
PBI
14:25
MCI
15:35
ELP
19:15
AA 319
DFW
19:35
DEN
20:20
AA 321
ALB
21:22
CLE
22:25
AA 319
IAH
8:38
IAH
9:35
AA 319
ROC
10:14
CHS
11:14
AA 319
IAH
15:35
ALB
16:24
AA 319PULL
1002
CLTSC4
20:32
FNT
21:17
BOS
21:39
ORD
22:35
AA 321
ORF
8:29
ORF
9:15
AA 319
BWI
10:20
GCM
11:25
AA 320
BUF
16:20
FSD
19:54
AA 319
SAT
21:25
ROC
22:16
AA 319
ORIG
804*
CLTSC4
6:55
CUN
7:45
CLE
8:30
MEM
9:24
AA 319
STL
10:27
DTW
11:20
AA 319
PHL
15:37
PBI
16:30
AA 319PULL
170
CLTSC4
20:45
MCI
21:30
PHX
21:50
RDU
22:45
AA 321
ORIG
843*
CLTSC4
6:55
MBJ
7:45
STL
8:51
PIT
9:45
AA 319
PBI
11:15
PBI
12:15
AA 321
JAX
15:20
SYR
16:19
AA 319
RDU
17:04
DTW
18:05
AA 319
SLC
18:40
STL
22:00
AA 319
ORIG
1964
CLTSC4
10:55
MCI
11:40
RIC
15:41
PIT
16:35
AA 319
ELP
16:55
DTW
20:00
AA 319
RDU
20:57
PVD
22:05
AA 738
ORIG
5247
CLTSC4
9:05
JAX
9:50
BDA
10:51
MEX
12:00
AA 319
AUS
17:15
BDL
18:25
AA 319
NAS
18:54
PLS
20:00
AA 319PULL
1971
CLTSC4
21:35
SYR
22:20
SDQ
8:00
UVF
9:45
AA 321
MEX
11:00
SDQ
12:00
AA 319
AUA
13:30
SJO
15:40
AA 738
HAV
16:05
BDA
17:30
AA 319
MEX
18:35
MEM
20:00
AA 319*1850
TERM
SJO
21:55
CLTSC4
22:40
GCM
9:00
HAV
9:45
AA 319
PAP
11:00
NAS
13:15
AA 319
MBJ
14:53
RDU
16:10
AA 321
MBJ
16:50
LAS
18:10
AA 321
SXM
18:40
BNA
19:49
AA 320
AADO
A21
A22
A23
A24
A25
A26
A27
A28
A29
A1
A3
A5
A7
A9
A11
A13
A12
A10
A8
A6
A4
A2
B1
B3
B5
B7
B9
B11
B13
B15
B16
B14
B12
B10
B8
B6
B4
B2
C2
C4
C6
C8
C10
C12
C14
C16
AAIN
I1
I2
Date:04/11/2019 Time:12:43CLT 2033-Scenario 3
Page # 1 of 4

00:00 01:00 02:00 03:00 04:00 05:00 06:00 07:00 08:00 09:00 10:00 11:00 12:00 13:00 14:00 15:00 16:00 17:00 18:00 19:00 20:00 21:00 22:00 23:00
*705
PUSH
*731
730*
*721
748*
*749
724
*733
732*
*721
TERM
*745
744*
*787
704*
PULL
720*
PULL
1568*
725
786*
*428
429*
*7751
7752*
*1062
PUSH
GRU
7:50
CLTSC4
8:50
AA 332
FRA
13:00
CLTSC4
14:00
AA 789
LHR
16:15
LHR
18:40
AA 789
FCO
15:55
MAD
16:40
AA 789
MAD
15:50
DUB
18:05
AA 332
LHR
18:30
LHR
20:15
AA 789
FCO
15:55
CLTSC4
16:55
AA 789
BCN
18:20
BCN
20:45
AA 332
CDG
13:55
FRA
16:35
AA 332
CLTSC4
16:55
FCO
18:25
AA 789
CLTSC4
19:00
GRU
20:30
AA 332
DUB
13:05
CDG
18:20
AA 332
MUC
16:20
MUC
18:35
LH 359
LGW
21:05
LGW
23:05
DY 788
*854
1647*
*672
617*
*822
856
*842
1040*
*1963
787
*827
1919
*644
2456*
*1966
643
*1283
1087*
*2364
2541*
*639
1865*
*1342
874*
*884
1806
*886
2061
*880
1851
1441
TERM
603
1793
5508
5135
522
TERM
3930
3840
5060
5069
3812
TERM
876
TERM
2422 22513888
3642826
1076
TERM
25975096
50991407
4128
TERM
1989
TERM
2808
TERM
738
TERM
1704
1969
425
521
1484
1140
1711
1199
1176
1698
1286
TERM
1974
TERM
8025
8020
8101
8102
8021
8016
8017
TERM
8103
TERM
5812
TERM
9
TERM TERM
5136
684
614
TERM
2465
3113
1078
TERM
201
2001028
354
3531689
486
489
933
932
165
864
135
386
344
541
357
TERM
625
626
525
526
*201
202*
5190
5557
5337
5514
5176
5314
5441
5154
3831
4076
5119
5256
5156
5118
4738
4889
5293
5440
3819
3909
5282
5063
5294
5119
5095
5096
5063
5259
PULL
5172
5264
5298
5273
5297
5277
5032
5237
5164
5032
5366
5052
5264
5366
TERM
5259
5438
5204
5033
5314
5222
5077
5105
4769
4895
4001
3795
4852
4820
5463
5453
ORIG
3973
4786
4755
5552
5177
53545122
5364
5320
5226
5486
PUSH
5126
5321
3865
4023
5037
5100
5263
5335
5506
5514
5327
5204
5513
PUSH
5508
5233
5257
5407
4921
4826
5234
5187
5603
5023
5110
5459
5526
5166
4829
4798
3973
3915
5326
5124
5316
5164
5183
5220
4751
4804
5466
5319
5366
5096
4011
3775
4842
4835
4867
4942
5150
5251
5546
5364
5263
5123
3798
3959
5218
5202
5209
5398
4931
4922
5383
5320
5467
5593
5297
5512
5384
5302
5138
5200
4749
4931
5437
5306
4807
4799
4886
4831
3908
3777
4904
4829
4773
4779
5456
54295230 4943
5213
5183
5320
5423
5582
5083
4939
4807
5036
5143
5074
5038
5246
5295
4884
4841
4934
4904
5364
5283
5315
5258
4907
4870
5083
5393
5279
PUSH
5278
5396
PULL
5117
5132
5257
4759
4813
5226
5477
4798
4744
5357
5309
5113
5466
5349
5431
5153
5074
ORIG
4796
3833
3889
5180
5556
16296224
6227
1454 1095
2133602
2651
4189
3433
1445
1446
219
218
5120
5052
5105
5224
3706
3213
5185
5582
4866
4805
5067
5153
4903
4765
5251
5078
5225
5311
KIN
9:55
PAP
10:50
AA 319
SJO
14:35
AUA
16:05
AA 321
GCM
18:14
DCA
19:44
AA 320*888
TERM
CUN
20:29
CLTSC4
21:14
PLS
10:00
KIN
12:00
AA 319
PUJ
16:21
ATL
17:50
AA 738
MBJ
18:56
MIA
20:15
AA 321*877
TERM
AUA
20:50
CLTSC4
21:35
KIN
15:40
KIN
16:40
AA 319
PUJ
17:42
LAS
20:05
AA 321
CUN
10:50
SJO
11:55
AA 321
PAP
16:15
PAP
17:15
AA 738
SDQ
18:00
GCM
19:30
AA 319
UVF
20:15
SDQ
22:00
AA 321
CUN
16:40
BOS
17:55
AA 321
CUN
18:40
PBI
19:55
AA 321*613
TERM
SXM
20:24
CLTSC4
21:09
PLS
18:55
ORD
20:05
AA 321
ORIG
1366
CLTSC4
5:15
DTW
6:00
ORIG
2488
CLTSC4
6:15
ATL
7:00
ORIG
2266
CLTSC4
7:20
MSP
8:05
4093
4058
JFK
10:38
JFK
11:15
DTW
12:07
DTW
12:50
DL 319
DTW
15:40
MSP
16:30
DL 319
LGA
17:12
LGA
18:00
DL CS1
LGA
19:18
LGA
20:00
DL CS1
ORIG
3612
CLTSC4
6:08
JFK
6:53
LGA
8:35
LGA
9:15
DL CS1
ATL
10:03
ATL
10:45
DL 739
LGA
11:14
LGA
12:00
DL CS1
ATL
12:33
ATL
13:15
DL 717 1503
MSP
14:24
MSP
14:59
1322
1524
MSP
16:40
DTW
17:20
DL 320 1057
DTW
18:40
DTW
19:15
ORIG
3844
CLTSC4
6:15
LGA
7:00
ORIG
1591
CLTSC4
7:30
ATL
8:15
ATL
8:48
ATL
9:30
DL 73H
ATL
11:16
ATL
12:00
DL 717
LGA
13:14
LGA
14:00
DL CS1
ATL
15:04
ATL
15:45
DL 73H
ATL
16:18
ATL
17:00
DL 73H
ATL
17:50
ATL
18:45
DL 73H
ORIG
521
CLTSC4
7:00
SLC
7:45
2292
DTW
9:04
DTW
9:39
ATL
13:42
ATL
14:30
DL 320
LGA
15:06
LGA
16:00
DL CS1
JFK
17:19
JFK
18:00
DL CS1
ATL
19:09
ATL
20:05
DL 73H
ORIG
681
CLTSC4
6:50
SEA
7:35
ORIG
1191
CLTSC4
5:05
IAH
5:50
SFO
7:21
SFO
8:20
UA 739
ORD
9:26
ORD
10:15
UA 73G
ORD
13:00
ORD
13:45
UA 319
DEN
15:10
DEN
16:22
UA 739
SFO
17:31
SFO
18:30
UA 739
ORIG
8022
CLTSC4
5:33
BOS
6:18
BOS
9:24
BOS
10:51
B6 E90
FLL
11:30
FLL
12:30
B6 E90
BOS
16:00
BOS
17:00
B6 E90
BOS
17:18
BOS
18:00
B6 E901119
1118
JFK
18:50
JFK
19:28
B6 E90
ORIG
8104
CLTSC4
7:15
FLL
8:00
JFK
10:01
JFK
10:40
B6 E901245
1246
BOS
10:59
BOS
11:36
ORIG
1712
CLTSC4
5:58
ORD
6:48
ORIG
5290
CLTSC4
7:50
DEN
8:35
ORIG
643
CLTSC4
4:40
HOU
5:25
3055
BWI
9:35
DAL
10:10
853
1748
MDW
16:50
MDW
17:25
ORIG
612
CLTSC4
5:15
ATL
6:00
1685
MCO
9:20
DEN
10:00
WN 738
BNA
14:00
BNA
14:45
WN 738 1362
DEN
16:20
MCO
17:00
WN 7381747
1493
HOU
17:55
HOU
18:30
1721
DAL
18:55
BWI
19:30
ORIG
1010
CLTSC4
5:45
MDW
6:30
BNA
17:20
BNA
18:10
WN 73W
DEN
5:10
DEN
7:20
F9 319
MCO
10:11
PHL
10:59
F9 320
ISP
11:20
ISP
12:05
F9 319
PHL
15:21
MCO
16:09
F9 320
CLE
20:20
CLE
21:20
F9 320
TTN
20:25
TTN
21:10
F9 321
LAS
6:45
MCO
8:00
NK 320
IAH
16:45
FLL
17:30
NK 320
MCO
20:00
LAS
20:50
NK 320
ORIG
516
CLTSC4
6:45
IAH
7:30
PDX
7:15
PDX
9:00
AS 73H
SEA
16:30
SEA
17:30
AS 737
KEF
17:40
KEF
18:40
WW 321
PHF
6:30
PHF
7:35
AE CR2
LEX
8:30
JAN
11:20
AE CR7
OAJ
12:05
OAJ
13:00
AE CR2
MGM
13:18
SDF
14:25
AE CR2
FAY
15:26
IND
16:30
AE CR2
TYS
17:10
FAY
19:50
AE CR25461
5049
HTS
20:15
CRW
20:50
DAY
21:31
PGV
22:40
AE CR2
LYH
6:22
OAJ
7:40
AE CR7
MGM
8:38
MGM
9:45
AE CR2
BHM
10:59
HSV
11:50
AE CR2
CLE
12:05
GNV
12:50
AE CR2
TYS
13:51
TYS
14:35
AE CR2
GPT
15:05
CID
15:50
AE CR7
GNV
16:09
CAK
18:04
AE CR25514
5254
SHV
18:30
TLH
19:05
LEX
21:36
MGM
22:41
AE CR2
3802
GSP
5:57
DCA
6:32
5228
5039
GNV
6:52
LEX
7:30
AE CR2
FAY
8:40
TYS
9:35
AE CR2
CHA
10:46
EVV
11:35
AE CR2
CRW
12:15
BHM
13:00
AE CR2
DAY
13:43
PHF
14:25
AE CR2
EVV
15:23
EWN
16:14
AE CR2
PHF
17:22
LEX
18:14
AE CR2
FAY
19:59
HSV
20:40
AE CR7
CAK
21:35
AGS
22:30
AE CR2
ORIG
682
CLTSC4
8:15
BDA
9:00
BHM
9:15
OKC
11:20
AE CR93906
3960
HSV
12:25
CAE
13:05
AE CR25117
5486
PGV
14:07
FAY
14:45
AE CR2
OAJ
15:33
MGM
16:19
AE CR2
FPO
16:48
FAY
17:45
AE CR7
AVL
18:42
TRI
20:15
AE CR7
AGS
20:38
GSP
22:40
AE CR7
5355
5277
CAK
7:08
CHA
7:43
TRI
8:16
LYH
9:35
AE CR75557
5294
PHF
10:39
TYS
11:18
AE CR25142
5218
BHM
12:30
TLH
13:10
AE CR2
FAY
13:45
VPS
14:40
AE CR75311
5186
BHM
17:45
CHA
18:25
AE CR2
TRI
19:00
EWN
20:30
AE CR7
CHO
21:08
CRW
22:35
AE CR7
TYS
6:24
GSP
7:45
AE CR74935
4850
HTS
8:00
FLO
8:30
DAY
8:51
PHF
11:45
AE CR75371
5305
GNV
12:25
TYS
13:00
GPT
13:37
OAJ
16:14
AE CR7
RAP
18:10
XNA
19:00
AE CR9
BHM
19:23
HPN
20:40
AE CR7
TYS
20:59
AVL
22:25
AE CR7
CRW
6:45
LFT
9:36
AE CR7
MOB
10:45
SHV
13:15
AE CR7
CAE
14:03
EVV
16:00
AE CR7
CHA
17:21
OAJ
19:45
AE CR75411
5523
LFT
20:00
SHV
20:40
AE CR7
JAN
20:58
BTR
22:15
AE CR7
EWN
6:35
GSO
7:50
AE CR7
PGV
8:11
PGV
9:19
AE CR2
SGF
10:09
SGF
10:50
AE E75
DAB
11:05
RAP
12:10
AE CR9
LFT
13:50
GNV
15:15
AE CR7
HPN
15:44
HPN
17:00
AE CR7
ROA
17:16
LYH
18:30
AE CR7
HSV
19:21
YUL
20:25
AE CR7
AVL
20:55
CAK
22:05
AE CR75491
5292
MGM
22:27
AEX
22:59
ICT
9:03
CMH
10:30
AE CR9
LIT
11:00
EYW
11:45
AE CR9
AVL
12:12
LYH
13:03
AE CR7
CVG
13:31
HSV
14:25
AE CR7
MGM
14:57
LFT
16:20
AE CR7
AVL
16:52
CAE
18:00
AE CR7
ROA
18:43
SBY
19:50
AE CR74636
4554
JAX
21:33
YYZ
22:10
TRI
6:39
HHH
7:35
AE CR7
HPN
8:22
MOB
9:35
AE CR7
SHV
10:44
BTR
13:00
AE CR7
AGS
13:49
DAY
14:41
AE CR7
SDF
15:17
MKE
16:35
AE CR7
TLH
16:55
GNV
17:55
AE CR7
ORF
18:43
AGS
19:45
AE CR75265
5141
MEM
20:05
MLB
20:45
AE CR9
OAJ
21:24
LYH
22:30
AE CR7
4776
4934
ROA
7:04
FAY
7:40
AE CR7
PHF
8:10
GPT
9:20
AE CR7
GSP
10:10
FPO
11:45
AE CR7
TYS
12:20
MOB
13:10
AE CR7
HPN
14:02
MLB
14:50
AE CR7
VPS
15:50
HTS
17:00
AE CR7
CRW
17:30
OAJ
18:25
AE CR7
MSN
18:43
CAK
19:45
AE CR74460
4582
LGA
20:00
BTV
20:40
AE E75
ROA
21:00
ROA
22:05
AE CR7
5328
5282
DAY
7:14
CLE
7:50
AE CR2
LYH
8:12
SBY
9:20
AE CR7
CAE
10:21
MYR
11:19
AE E75
SAV
12:07
CHA
12:50
AE CR7
FLO
13:48
ROA
14:35
AE CR7
EWN
15:06
LYH
16:10
AE CR7
CID
17:04
CID
18:04
AE CR7
MLB
18:52
MSN
19:54
AE CR7
HHH
21:15
HHH
22:20
AE CR7
4915
4763
HHH
6:56
ROA
7:30
TLH
8:53
VPS
9:50
AE CR7
CID
10:18
CID
11:45
AE CR7
HTS
12:18
AGS
13:01
AE CR7
CHA
15:40
GPT
16:40
AE CR7
EWN
17:24
ROA
18:15
AE CR7
CAK
19:18
VPS
20:20
AE CR7
BTR
21:35
EVV
22:40
AE CR7
CHS
6:18
SAV
7:45
AE CR9
EWN
8:32
TRI
9:40
AE CR7
FAY
10:07
FLO
11:33
AE CR7
GSP
12:17
LEX
12:59
AE CR75375
5144
AEX
13:14
AEX
13:46
PHF
15:13
LEX
16:10
AE CR7
DAB
18:00
OKC
18:45
AE CR9
AGS
19:09
FLO
20:09
AE CR7
GPT
21:10
SRQ
22:14
AE CR7
MOB
8:42
AGS
9:45
AE CR7
GSO
12:18
TRI
12:59
AE CR7
MOB
13:42
LEX
14:25
AE CR7
MLB
15:44
JAN
16:35
AE CR7
HTS
17:18
HHH
18:05
AE CR7
OAJ
18:53
SDF
19:49
AE CR7
LYH
21:26
EWN
22:30
AE CR7
MYR
6:29
CHS
7:40
AE CR9
OAJ
8:13
CVG
9:20
AE CR7
PIA
10:26
PIA
11:19
AE CR74820
4933
LYH
12:32
GSP
13:12
AE CR7
BTR
13:47
BHM
14:30
AE CR75569
5196
XNA
14:55
ICT
15:32
LEX
15:55
BTR
16:45
AE CR7
GSP
18:49
MKE
19:44
AE CR7
MDT
21:29
PHF
22:30
AE CR7
I3
I4
I5
I6
I7
I8
I10
I11
I12
I13
I14
I15
OADO
O1
O2
O3
O4
O5
O6
O13
O14
O18
O19
O20
O27
O28
O29
O30
O31
O32
OAIN
I21
I22
AEDO
D13
D12
D10
D8
D6
D4
E1
E2
E3
E5
E7
E9
E11
E13
E15
E17
Date:04/11/2019 Time:12:43CLT 2033-Scenario 3
Page # 2 of 4

00:00 01:00 02:00 03:00 04:00 05:00 06:00 07:00 08:00 09:00 10:00 11:00 12:00 13:00 14:00 15:00 16:00 17:00 18:00 19:00 20:00 21:00 22:00 23:00
4554
5452
5389
5365
5152
3896
3798
4765
4769
ORIG
5037
4869
4780
5431
5207
5296
5093
5235
5509
5468
5462
4862
4842
5154
5326
4779
4885
5476
5235
50265347
5142
4484
4457
5415
5288
4777
4767
5186
TERM
5460
5268
5439
5225
5091
5437
5530
5491
5066
5112
5342
5073
5232
5060
5674
5036
5148
5405
5090
TERM
5096
5061
5242
5071
5231
5104
5222
PUSH
PULL
5304
5399
5373
5346
5237
ORIG
5632
5093
5323
4892
4925
4544
4542
3850
3814
4826
4879
5073
5345
3909
TERM
PULL
55145138
3899
3908
5329
5185
5458
5087
5435
51694476
ORIG
5294
4649
4618
5388
5158
4933
4809
5055
5276
5440
5880
3775
4056
3967
3819
4876
4866
5253
5266
5245
5212
5086
5180
5502
5232
5361
TERM
ORIG
5432
5175
5384
5268
5458
5386
5244
5034
50705056
5049
TERM
5111
5514
5509
5243
5372
5494
5053
5066
5216
5480
5335
5238
5341
5116
5356
5474
5171
5395
5357
5227
5166
52295131
5494
5318
5214
5336
5165
5457
5128
5504
PULL
5172
5247
5315
5084
5088
5288
5049
5212
5303
5449
5114
5390
5091
5177
5037
5487
5084
5139
51515072 5377 5144
5451
5200
5534
5415
5289
5053
5433
5181
5436
51705249
5189
5155
5301
5299
5130
5267
5415
5575
5533
5192
5266
5069
5243
5331
5418
5101
5121
5374
4661
4531
5327
5533
5157
5179
5565
5327
5033
50985064
5291
52715420
5455
5099
5207
5289
5102
5322
5267
5140
5116
5300
5285
5455
5170
5103
5094
5109
5194
5568
5162
5166
5187
5048
5223
5349
5345
54185286 5047
5281
5211
5495
5255
5350
5178
5255
5434
5178
55025125 5227
5286
5451
5431
5260
5474
5034
4932
4731
5081
53135043
5087
5121
PULL
5236
5382
TERM
5417
52455080
4538
4675
5317
50315035
5193
5281
5236
5161
5158
5330
5160
5370
4542
4510
5322
5236
5313
5182
PULL
5147
5076
TERM
5088
5334
5343
5487
5129
5270
5645
5983
5568
5301
5115
5265
5031
52714572
5161
5333
5325
5317
5504
5115
4470
4537
5587
5553
5331
5250
5058
5343
5042
5193
5058
5208
5546
TERM
PULL
5503
ORIG
5531
5292
PUSH
5061
5522
5152
5086
5398
5040
4556
4495
5344
5033
5309
5350
5107
5189
5815
53795385
5202
5287
5352
5139
5290
5436
5396
5135
5092
PUSH
5592
5004
5065
5349
ORIG
53715054
5460
5053
5300
5219
4547
4546
5241
5132
4695
4556
4457
4674
5135
5156
5315
5732
4554
4579
ORIG
5079
3826
3906
5082
5055
5200
5456
5169
5307
5182
TERM
ORIG
5129
5389
5051
5267
PUSH
5378
5036
5256
TERM
ORIG
5071
5134
5058
5485
5926
5043
PUSH
5431
TERM
5163
TERM
4498
4636
ORIG
5547
5390
5002
5084
5100
4510
4662
5098
5127
ORIG
5082
4669
4538
5586
5328
PULL
5502
3773
3865
5078
5552
4675
4624
5099
TERM
ORIG
5452
5183
5223
5253
5421
ORIG
5573
5864
5378
4867
4837
3957
4001
4687
4685
5337
TERM
5060
5520
ORIG
5261
4889
4773
4627
4373
5305
5065
5181
TERM
3834
3968
4796
TERM
ORIG
5252
5579
5331
3960
38334522
5077
TERM
ORIG
5290
5117
PUSH
5252
5285
4327
4378
5684
5783
5814
TERM
ORIG
5136
3916
3989
4537
4498
2344
TERM
ORIG
5509
4839
4781
4546
4566
5543
5265
5307
TERM
5851
5321
ORIG
6238
ORIG
3357
3368
3365
3395
TERM TERM
ORIG
3312
6245
6285
6234
TERM
ORIG
6113
3642
3356
6302
TERM
ORIG
4663
5168
5465
4781
TERM
4804
4786
5064
5376
5319
5361
4914
4936
5184
5191
5035
3814
3831
5070
5214
5140
5248
4790
4903
4618
4695
3959
4010
5196
5081
4464
4684
5294
5525
4662
4506
SAV
6:36
MYR
7:40
AE CR9
AVL
8:21
CHO
9:19
AE CR7
MKE
10:48
SDF
11:40
AE CR74841
4926
TRI
12:23
ROA
13:01
AE CR74824
4759
CRW
13:25
HTS
14:05
AE CR75204
5272
MSN
14:25
CAK
15:05
AE CR7
TRI
15:38
AVL
16:24
AE CR7
PGV
19:15
LYH
20:10
AE CR7
MLB
20:30
MOB
21:30
AE CR7
AGS
6:31
SDF
7:30
AE CR7
GSP
8:18
IAD
9:09
AE CR9 5260
DCA
9:24
GSP
9:59
CAK
10:50
GPT
11:40
AE CR74936
4862
EWN
12:29
FLO
13:06
4831
4749
SBY
13:39
CRW
14:19
AE CR7
FLO
15:20
ROA
16:05
AE CR7
SDF
17:46
AVL
18:30
AE CR7
LYH
18:59
CHO
19:49
AE CR7
FWA
20:30
LEX
21:30
AE CR7
GSO
6:52
MEM
7:50
AE CR9
CRW
8:16
BHM
9:10
AE CR7
IND
10:46
CMH
11:45
AE E75
RDU
12:19
BNA
13:20
AE CR94879
4939
ROA
13:50
EWN
14:25
LYH
15:47
TRI
16:30
AE CR7
LFT
16:58
MLB
17:40
AE CR7
FLO
19:40
HTS
20:30
AE CR7
ORF
6:27
CVG
7:24
AE CR9
AGS
8:21
BTR
9:09
AE CR75507
5263
BTR
10:34
AGS
11:14
AE CR7
TLH
12:28
MSN
13:34
AE CR93777
4011
MYR
14:01
AVL
14:40
AE CR75048
5239
CHO
15:30
CAE
16:10
AE CR7
HSV
17:38
PHF
18:20
AE CR75283
5221
LEX
19:16
TYS
19:56
AE CR7
CID
20:40
GPT
21:30
AE CR7
LGA
22:01
GSO
22:45
AE CR9
SDF
6:46
STL
7:40
AE CR9
GPT
8:51
MSN
9:45
AE CR74850
4800
FLO
10:45
AVL
11:25
AE CR7
GRB
12:20
PNS
13:15
AE CR95179
5110
CHA
14:01
ORF
14:40
AE CR74926
4907
ROA
15:41
AGS
16:19
AE CR75060
5324
AEX
17:05
FWA
17:45
AE CR7
CRW
19:05
FWA
19:49
AE E753945
3904
HPN
20:50
ORF
21:30
AE CR7
ILM
6:41
CMH
7:29
AE CR9
CAK
8:37
JAN
9:30
AE CR7
MSN
10:45
HPN
14:33
AE CR75186
5310
PIA
15:43
AEX
16:20
5512
5060
MOB
17:10
MOB
17:49
AE CR75211
5276
TLH
21:15
LFT
21:46
IAD
6:44
IAD
7:30
AE CR9
BHM
8:30
CRW
9:20
AE CR7
SDF
11:05
IND
14:50
AE CR74805
4869
AGS
15:40
PGV
16:16
HHH
17:31
TRI
22:25
AE CR7
CMH
6:38
DTW
7:45
AE E75
MKE
8:50
CAE
9:45
AE CR7
GSO
10:30
ROA
11:14
AE CR7
STL
12:10
ILM
12:59
AE CR94844
4892
HHH
13:56
HHH
14:30
4918
4777
CHO
17:01
FLO
17:35
5252
5024
GNV
19:18
BTR
19:50
CHS
21:00
TYS
22:09
AE CR9
PHL
6:58
CAE
7:45
AE E75
HSV
8:33
SAV
9:19
AE CR74942
4816
HHH
10:47
CRW
11:19
JAX
12:10
CMH
14:24
AE CR95514
5148
JAN
15:40
CRW
16:15
DTW
19:04
ABE
20:15
AE CR9
IND
21:39
MSY
22:35
AE E75
BTV
10:21
RIC
11:05
AE E75
XNA
12:30
TVC
14:05
AE CR95531
5286
GRB
14:22
ABE
14:59
DSM
16:58
DSM
18:45
AE CR9
LIT
19:30
TUL
20:40
AE CR9
CAE
20:59
MKE
22:05
AE CR7
CAE
6:50
BHM
7:35
AE E75
CHO
8:15
HTS
9:00
AE CR74770
4751
SBY
9:15
AVL
9:50
AE CR7
OMA
10:41
SAV
12:59
AE CR9
CAK
13:28
PNS
14:50
AE CR9
AVL
15:29
MDT
17:55
AE CR95500
5505
BTR
18:30
HSV
19:05
IAD
19:26
MSY
20:30
AE CR9
MLB
8:47
HPN
9:30
AE CR7
CVG
10:49
DTW
13:00
AE CR9
ILM
13:52
CVG
16:14
AE CR9
PWM
17:10
ILM
18:25
AE CR9
SAV
19:00
ORF
20:00
AE CR9
FLO
8:43
EWN
9:24
AE CR7
MLI
9:40
GRR
11:30
AE CR9
IAD
12:29
CAK
13:15
AE CR9
GSO
13:33
MEM
14:40
AE CR9
MYR
15:33
LGA
17:25
AE CR9
TVC
17:40
DAB
18:50
AE CR9
DAB
19:36
CHA
22:20
AE CR9
CVG
6:56
OKC
9:20
AE CR9
BHM
10:13
PVD
11:50
AE CR9
AUS
12:05
LIT
12:50
AE CR95167
5314
TVC
13:10
BTV
13:44
TUL
14:00
GRB
14:55
AE CR9
CVG
15:14
CHS
16:20
AE CR9
OMA
17:06
SAV
18:20
AE CR9
MEM
18:50
CHS
19:44
AE CR9
GSP
19:59
BNA
22:40
AE CR9
CHA
6:29
JAX
8:50
AE CR9
CVG
9:10
OMA
11:20
AE CR9
JAX
13:32
DAB
14:25
AE CR9
CHS
15:30
LIT
16:30
AE CR9
BNA
16:45
SDF
17:54
AE CR9
PNS
18:50
CVG
19:45
AE CR9
MYR
20:59
CHS
22:35
AE CR9
SRQ
8:04
TLH
9:00
AE CR7
SGF
9:15
TVC
11:24
AE CR9
FAY
12:10
CHS
12:54
AE CR9
SRQ
13:37
SAV
14:27
AE CR9
MHT
15:02
TLH
15:59
AE CR9
SYR
17:16
CHS
18:20
AE CR9
TYS
19:01
SAV
19:55
AE CR9
ILM
21:03
LIT
22:35
AE CR9
GRR
8:49
RDU
9:40
AE CR95039
5463
LEX
10:40
FAY
11:20
AE CR2
MYR
12:15
MYR
12:59
AE CR9
AUS
13:45
CHS
14:35
AE CR9
CLE
15:25
MYR
16:20
AE CR9
DTW
17:22
MYR
18:20
AE CR9
IND
18:58
GSP
19:50
AE CR9
AUS
21:05
MEM
22:35
AE CR9
SAV
8:16
MKE
9:14
AE CR9
LNK
9:33
PNS
11:25
AE CR9
MEM
12:07
SYR
12:50
AE CR9
GRR
14:05
ATL
14:55
AE CR9
SAV
15:42
STL
16:35
AE CR9
CAK
16:53
CLE
17:50
AE CR9
GSO
18:49
DAY
19:40
AE CR9
GSO
20:45
DAY
22:05
AE CR9
IND
6:51
IND
7:55
AE E75
IAD
8:43
GRR
9:25
AE CR9
VPS
10:06
CHA
11:14
AE E75
MSN
12:25
SBY
13:30
AE E75
LIT
13:51
MKE
14:40
AE CR9
MDT
15:07
CMH
15:59
AE CR9
PNS
17:35
EYW
18:30
AE CR9
TLH
19:19
GSO
20:10
AE CR9
ORF
21:09
AVP
22:20
AE CR9
CHS
8:09
MYR
9:30
AE CR9
SRQ
10:10
AVP
11:20
AE CR95514
5255
RAP
11:40
DAB
12:20
AE CR9
MKE
13:56
ABE
14:45
AE CR9
OKC
15:14
SDF
16:05
AE CR9
ILM
17:14
ORF
18:05
AE CR9
MYR
19:00
PNS
19:50
AE CR9
PNS
20:55
CVG
22:05
AE CR9
JAN
8:37
IND
9:55
AE CR9
MHT
10:30
CVG
11:40
AE CR9
PGV
12:05
CHO
12:49
AE E755504
5527
OKC
13:18
MYR
13:57
AE CR9
SYR
14:30
CLE
15:20
AE CR9
ILM
15:35
GSO
16:25
AE CR9
IAD
17:05
IAD
17:55
AE CR9
CMH
19:16
MHT
20:05
AE CR9
CVG
21:22
BHM
22:30
AE CR9
SDF
8:32
PNS
9:45
AE CR9
XNA
10:28
BHM
11:35
AE CR9
PNS
13:56
DTW
14:45
AE CR9
BHM
15:10
IAD
16:00
AE CR9
PVD
16:51
SRQ
17:40
AE CR9
CHS
19:03
SRQ
19:50
AE CR9
IAD
21:21
SAV
22:30
AE CR9
MYR
8:47
SYR
10:00
AE CR9
MEM
10:43
PWM
11:50
AE CR9
MDT
12:30
BMI
13:30
AE E75
ORF
13:56
MYR
14:45
AE CR9
PIT
15:24
SAV
16:14
AE CR9
CMH
17:41
GSO
18:30
AE CR9
GSO
8:36
CAK
9:45
AE CR9
CLE
10:21
MDT
11:25
AE CR9
CMH
12:27
MCI
13:24
AE E75
DAB
13:40
IAD
14:25
AE CR9
IAD
15:15
DAB
16:04
AE CR9
XNA
17:04
CVG
17:50
AE CR94809
4810
CHO
19:10
ROA
19:44
XNA
21:33
MYR
22:40
AE CR9
LIT
8:45
SDF
9:50
AE CR9
AVP
10:18
STL
11:20
AE CR9
DTW
12:23
MDT
13:10
AE E75
AVP
15:36
XNA
16:25
AE CR9
MYR
17:19
BHM
18:05
AE CR9
LIT
21:18
SDF
22:20
AE CR9
PNS
8:38
FAY
9:40
AE CR9
DSM
10:19
ILM
11:16
AE CR9
FWA
11:40
MKE
12:25
AE E75
IND
14:01
AUS
14:45
AE CR9
DAY
15:14
MEM
16:00
AE CR9
IAD
17:46
TUL
18:30
AE CR9
ILM
18:50
IND
19:45
AE E75
SRQ
21:39
JAN
22:35
AE CR9
BNA
8:49
DAB
9:50
AE CR9
SAV
10:38
DAY
11:35
AE CR9
IND
12:12
GSO
13:05
AE E75
ABE
13:44
CVG
14:25
AE CR9
SAT
16:00
LNK
19:45
AE CR9
CLE
21:39
ILM
22:35
AE CR9
LEX
7:30
MGM
10:30
AE CR7
DAY
10:54
XNA
11:50
AE CR9
CAE
12:22
FAY
13:05
AE E755051
5372
SAV
13:50
RIC
14:30
AE CR9
MEM
15:35
TYS
16:19
AE CR9
SAV
17:09
GSP
17:50
AE CR95006
5468
EVV
19:50
MGM
20:30
AE CR7
CMH
10:50
PIT
11:45
AE CR9
CHO
12:12
AVL
13:05
AE CR95046
5265
SAT
13:48
MLI
14:26
AE CR95572
5567
PWM
15:10
GRR
15:50
AE CR9
CVG
17:00
ICT
20:06
AE CR9
OMA
21:05
IND
22:05
AE E75
TYS
8:22
LIT
9:15
AE CR9
CHS
10:27
GSO
11:20
AE CR9
ILM
12:13
AVP
13:04
AE CR95103
5565
ICT
14:07
MHT
14:45
AE CR95431
5165
OMA
15:20
DSM
16:00
AE CR9
SHV
16:40
SHV
17:35
AE E75
VPS
18:38
PHF
19:50
AE E75
GNV
21:20
CHO
22:30
AE E75
DAB
8:35
SRQ
9:24
AE CR9
RIC
10:45
CLE
11:35
AE CR9
AGS
12:16
FWA
13:10
AE CR7
PNS
15:22
AUS
18:25
AE CR9
ABE
19:06
OMA
19:49
AE CR9
VPS
21:06
TLH
22:15
AE E75
ROA
9:15
GSO
9:55
AE CR7
TUL
10:50
TUL
11:40
AE CR95414
5542
CMH
14:00
TUL
14:35
DAB
15:30
LIT
19:00
AE CR9
SDF
19:28
XNA
22:30
AE CR9
CMH
8:36
YYZ
9:27
AE E75
EVV
10:23
MLB
11:40
AE CR2
BNA
13:42
OMA
14:55
AE E75
CMH
15:21
ILM
16:09
AE E75
FWA
17:11
DAY
18:00
AE CR2
JAN
18:55
LAN
20:10
AE E75
CMH
21:14
CMH
22:09
AE E75
CAE
8:21
HSV
9:09
AE E75
ILM
10:31
DSM
11:20
AE CR94800
4743
AVL
13:42
CHO
14:19
AUS
15:30
SGF
18:50
AE CR9
CVG
19:26
DAB
20:10
AE CR9
MYR
10:22
SAV
11:10
AE CR9
RIC
14:02
GSO
14:45
AE E75
DSM
16:45
SAT
20:00
AE CR9
ABE
10:39
MEM
11:25
AE CR95767
5326
SHV
13:15
JAN
13:55
AE E75
SBN
14:30
FWA
15:15
AE E75
YYZ
21:22
MDT
22:20
AE E75
LFT
8:42
CAE
11:19
AE CR73989
3834
GSP
13:54
YYZ
14:30
LNK
15:05
LIT
15:50
AE CR9
MDT
16:56
JAX
17:59
AE E75
MKE
19:21
IAD
20:05
AE CR95050
5041
HSV
21:06
PIA
21:45
AE CR7
MDT
8:08
CMH
9:10
AE E75
SBN
10:05
SHV
10:55
AE E75
ORF
15:07
BHM
16:05
AE E75
LEX
17:25
CHO
18:15
AE E75
MCI
18:55
CMH
19:44
AE E75
4763
4844
ROA
10:21
HHH
10:55
VPS
13:49
CAK
16:00
AE E75
EYW
16:56
MLI
20:22
AE CR9
MKE
21:37
CAE
22:20
AE CR7
LAN
9:20
SBN
10:05
AE E75
TUL
10:20
ORF
11:02
AE CR95071
5508
JAN
13:47
CHA
14:27
AE CR7
BMI
15:25
BTV
16:40
AE E75
CAE
17:03
AGS
17:55
AE E75
BMI
18:30
ECP
19:20
AE E75
MOB
21:40
LEX
22:35
AE CR7
YYZ
9:19
BNA
9:59
AE E75
OAJ
10:46
EWN
11:55
AE CR7
ECP
14:25
MDT
15:20
AE E75
TYS
15:37
VPS
16:45
AE E75
YYZ
19:17
CAE
20:10
AE E75
AVP
8:47
ILM
9:25
AE CR9
EYW
10:10
LNK
10:55
AE CR9
CAE
15:22
GSP
16:25
AE E75
GSO
16:59
IND
17:50
AE E75
ORF
10:47
ILM
14:35
AE CR9
BTV
15:30
BMI
16:30
AE E75
MKE
17:35
SBN
18:20
AE E75
YUL
10:06
GSP
11:35
AE CR7
GSO
15:30
YYZ
16:27
AE E75
MSY
17:08
CMH
17:50
AE E75
ECP
10:10
ECP
11:05
AE E75
YYZ
14:19
LGA
15:15
AE E75 3190
SGF
15:55
SGF
16:24
YOW
17:06
YOW
18:10
AE E75
5406
5176
FWA
8:49
OAJ
9:26
AE CR2
SBY
16:00
MSN
16:45
AE E75
3697
3648
EWR
8:34
EWR
9:09
6150
IAD
9:42
IAD
10:22
UA CR76165
6310
IAH
11:04
IAH
11:41
6115
6120
IAH
14:09
IAD
14:44
4823
4843
ORD
16:46
ORD
17:21
EWR
18:45
EWR
19:30
UA E7W
3367
3311
EWR
11:52
EWR
12:27
3314
3315
EWR
14:24
IAH
15:02
UA E70
IAH
17:14
IAH
18:05
UA E7W 6160
IAD
18:55
IAD
19:30
EWR
14:33
EWR
15:30
UA E7W3401
3343
EWR
17:20
EWR
17:56
BOS
10:30
BOS
11:15
DL CR9
E19
E18
E16
E14
E12
E10
E21
E23
E25
E27
E29
E31
E33
E35
E38
E36
E34
E32
E30
E28
E26
E24
E22
E20
E8
E6
E4
F1
F2
F3
F4
F5
F6
F7
F8
F9
F10
F11
F12
F13
F14
F15
F16
F17
F18
F19
O7
O8
O9
O10
Date:04/11/2019 Time:12:43CLT 2033-Scenario 3
Page # 3 of 4

00:00 01:00 02:00 03:00 04:00 05:00 06:00 07:00 08:00 09:00 10:00 11:00 12:00 13:00 14:00 15:00 16:00 17:00 18:00 19:00 20:00 21:00 22:00 23:00
*PSH
1568
*T269
T270
*PSH
720
GRU
8:50
CLT
19:00
AA 332
FCO
16:55
CLT
23:59
AA 789
FRA
14:00
CLT
16:55
AA 789
8010
1180
2030
2140
8011
1181
O247
O248
T253
T254
O231
O232
O239
O240
PSH
5172
PSH
1002
T251
T252
O221
O222
T247
T248
O235
O236
T267
T268
O243
O244
T243
T244
O233
O234
PSH
1971
T279
T280
O237
O238
PSH
1242
PSH
170
T249
T250
O225
O226
T257
T258
O229
O230*
T245
T246
O223
O224
T265
T266
O227
O228
PSH
5172
T263
T264
O245
O246
PSH
5502
PSH
5236
T259
T260
T271
T272
O241
O242
PSH
5117
PSH
5514
T255
T256
O249
O250
PSH
5147
T277
T278
T281
T282
O253
O254
PSH
5304
T275
T276
O255
O256
T285
T286
O257
O258
T291
T292
O259
O260
T287
T288
O251
O252
T293
T294
T299
T300
T295
T296
T297
T298
PSH
5503
T283
T284
T289
T290
T261
T262
T273
T274
3966
MSP
10:32
MSP
11:07
3337
3399
LGA
9:57
LGA
10:30
4845
CVG
11:06
CVG
11:36
2010
2120
BKW
8:35
BKW
9:05
LWB
10:16
LWB
11:01
VC ER4
BKW
12:00
BKW
17:05
VC EM2
LWB
16:54
LWB
18:06
VC ER4
7346
7347
YYZ
10:39
YYZ
11:10
7350
7351
YUL
15:05
YUL
15:40
7348
7349
YYZ
17:49
YYZ
18:20
CLT
0:00
DEN
7:50
UA 319
PIT
19:24
CLT
23:59
AA 319
CLT
0:00
BDL
15:35
AA 319
CLT
0:00
DTW
5:15
DL 319
BTR
9:55
CLT
11:50
AE CR9
STL
18:17
CLT
20:32
AA 319
PIT
21:19
CLT
23:59
AA 319
CLT
0:00
RIC
19:45
AA 319
ELP
21:35
CLT
23:59
AA 319
CLT
0:00
MDT
19:04
AA 319
PHL
19:45
CLT
23:59
AA 321
CLT
0:00
MSP
7:20
DL 717
JAX
10:59
CLT
23:59
AA 319
CLT
0:00
IAH
14:10
AA 319
MSY
14:31
CLT
21:35
AA 319
ORD
22:47
CLT
23:59
UA 73G
CLT
0:00
PBI
13:40
AA 321
FNT
15:10
CLT
17:15
AA 319
BUF
18:40
CLT
20:45
AA 319
STT
21:09
CLT
23:59
AA 321
CLT
0:00
PBI
18:28
AA 321
TPA
19:47
CLT
23:59
AA 321
CLT
0:00
CUN
12:40
AA 321
TPA
14:08
CLT
23:59
AA 321
CLT
0:00
MSP
18:29
AA 738
PHX
19:54
CLT
23:59
AA 321
CLT
0:00
RDU
17:25
AA 738
FAY
17:40
CLT
19:50
AE CR2
PVD
20:10
CLT
23:59
AA 321
CLT
0:00
ATL
7:30
DL 738
AEX
9:24
CLT
11:15
AE CR9
GRR
16:25
CLT
18:55
AE CR9
LAX
20:40
CLT
23:59
AA 321
ATL
1:02
CLT
23:59
DL 739
CLT
0:00
ATL
6:15
DL 73H
CHO
6:58
CLT
10:55
AE E75
MLI
16:14
CLT
18:28
AE CR9
ORD
18:44
CLT
23:59
AA 738
CLT
0:00
HOU
4:40
WN 73H
LIT
16:55
CLT
19:22
AE CR9
ATL
21:48
CLT
23:59
DL 73H
MDW
1:20
CLT
23:59
WN 73W
CLT
0:00
HSV
15:25
AE CR2
MGM
20:15
CLT
22:05
AE CR7
JFK
22:51
CLT
23:59
DL CS1
CLT
0:00
TRI
17:40
AE CR7
EWN
19:40
CLT
23:59
AE CR2
CLT
0:00
TYS
17:40
AE CR7
BTV
19:12
CLT
23:59
AE CR9
CLT
0:00
YUL
10:01
AE E75
HSV
15:55
CLT
23:59
AE CR7
CLT
0:00
EWR
6:50
UA E7W
OKC
17:39
CLT
23:59
AE CR9
CHS
17:47
CLT
23:59
AE CR9
MHT
19:53
CLT
23:59
AE CR9
GRB
20:27
CLT
23:59
AE CR9
SDF
14:15
CLT
21:40
AE CR9
ICT
20:48
CLT
23:59
AE CR9
JFK
13:10
CLT
23:59
AA 738
LGA
21:51
CLT
23:59
DL CS1
O11
O12
O15
O23
O24
O25
O26
HS
R01
R02
R03
R04
R05
R06
R07
R08
R09
R10
R11
R12
R13
R14
R15
R16
R17
R18
R19
R20
R21
R22
R23
R24
R25
R26
R27
R28
R29
R30
Date:04/11/2019 Time:12:43CLT 2033-Scenario 3
Page # 4 of 4

DORA (Direction, Oversight, Review & Agree) Coordination
Meeting #1 Materials Meeting #2 Materials Meeting #3 Materials Meeting #4 Materials

1
CLT DORA (Direction, Oversight, Review & Agree) Meeting #1
March 25, 2020

2
– Introductions
– Meeting Objectives
– DORA Process
– EA Process Overview
– Review of Calibration
– 2019 Baseline & Future No Action Airfield Modeling Assumptions
– Next Steps
Agenda

3
Meeting Objectives

4
– To present an overview of the DORA process
– To present an overview of the Environmental Assessment (EA) process
– To present the 2019 Baseline and Future No Action modeling assumptions
– To present the next steps in the overall project
Meeting Objectives

5
DORA Process

Federal AviationAdministrationCharlotte Douglas International
Airport EADORA Process Overview
Prepared for: CLT EA DORA Meeting #1
By: Kent Duffy
Date: March 2020

7
Federal AviationAdministration
What is DORA?• DORA =
Direction, Oversight, Review and Agree• Obtaining and understanding controller input on operational issues and
viability of proposed alternatives is a key to airport capacity development
• DORA has been applied successfully to other large-scale airport and airspace modernization efforts (e.g., O’Hare Modernization Program)

8
Federal AviationAdministration
Objectives: Why are we here?• Ensure collaboration w/ATO on simulation activities as needed to complete EA
– Obtain input development of the simulation model
– Revise and refine simulation model, rather than develop new alternatives
• Build from successful process used during planning phase– Update with recent changes: forecast trends, CRO, metroplex, heading usage, Atlantic coast
routes, etc.
– Validate operating assumptions used in the simulation model
• Airspace flows and procedures, Runway usage and balancing, Aircraft separation and buffers, Taxi-flows and ground movement, etc.
– Review and validate airspace’s ability to accommodate new runway throughput
• Collaboration ensures the simulation results can be used in the EA analyses with confidence

9
Federal AviationAdministration
Planning Phase DORA Letter

10
Federal AviationAdministration
Desired Result: 2nd DORA Letter
• FAA Letter signed by ATO and ARP
• Explains process and summarizes meetings
• Identifies further analyses required in subsequent phases (e.g., design/ implementation), as needed
• Desired findings:
– Modeling approach is reasonable
– Modeling assumptions accurately reflects operational perspectives
– Subsequent capacity, throughput and delay results are reasonablerepresentations of the proposed airfield and airspace designs
Active ATC participation

11
Federal AviationAdministration
DORA Process Relationship to Modeling
2016 Calibration
No Action Model
Alternative(s) Model
DORA Mtg #1 of EISProject overview ProcessReview Input Data
DORA Mtg #1 of EAPresent no action input data
DORA Mtg #2Present and review simulationof no actionPresent Alternative(s) input data
DORA Mtg #3Present final results
~ July 11, 2017 (EIS)
~Today
~TBD
~TBD

12
EA Process Overview
13
– The CLT Environmental Impact Statement (EIS) that the Federal Aviation Administration (FAA) began was cancelled on February 27, 2019.
– The FAA cancelled the EIS because a runway length analysis determined only a 10,000 foot runway is required to meet the purpose and need.
– The FAA determined that this was a sufficient change to warrant cancellation of the EIS and conversion to an Environmental Assessment (EA).
– The City of Charlotte (Airport Sponsor) is responsible for preparing the EA.
– FAA is still the lead agency.
– Similar to the EIS, the EA will evaluate the potential direct, indirect, and cumulative environmental impacts that may result from the Proposed Action.
EA Process Overview - Background

14
– 4th Parallel Runway (10,000 feet long)– North and South End Around Taxiways
– Extensions of Concourse B and C– Decommissioning Runway 5/23– Crossfield Corridor– Dual Taxilanes Around Ramp
– Requires the removal of gates off the end of Concourse D and E
EA Process Overview – Proposed ActionProposed Action Airfield

15
EA Process Overview
1 Conversion of EIS to EA
2 Confirm Purpose and Need
3 Develop Alternatives
4 Study Affected Environment
5 Analyze Environmental Impact
6 Identify Mitigation
7 Publish Draft EA
8 Public Review Period
9 Hold Public Hearings
10 Publish Final EA
11 FAA Issues the Federal Decision
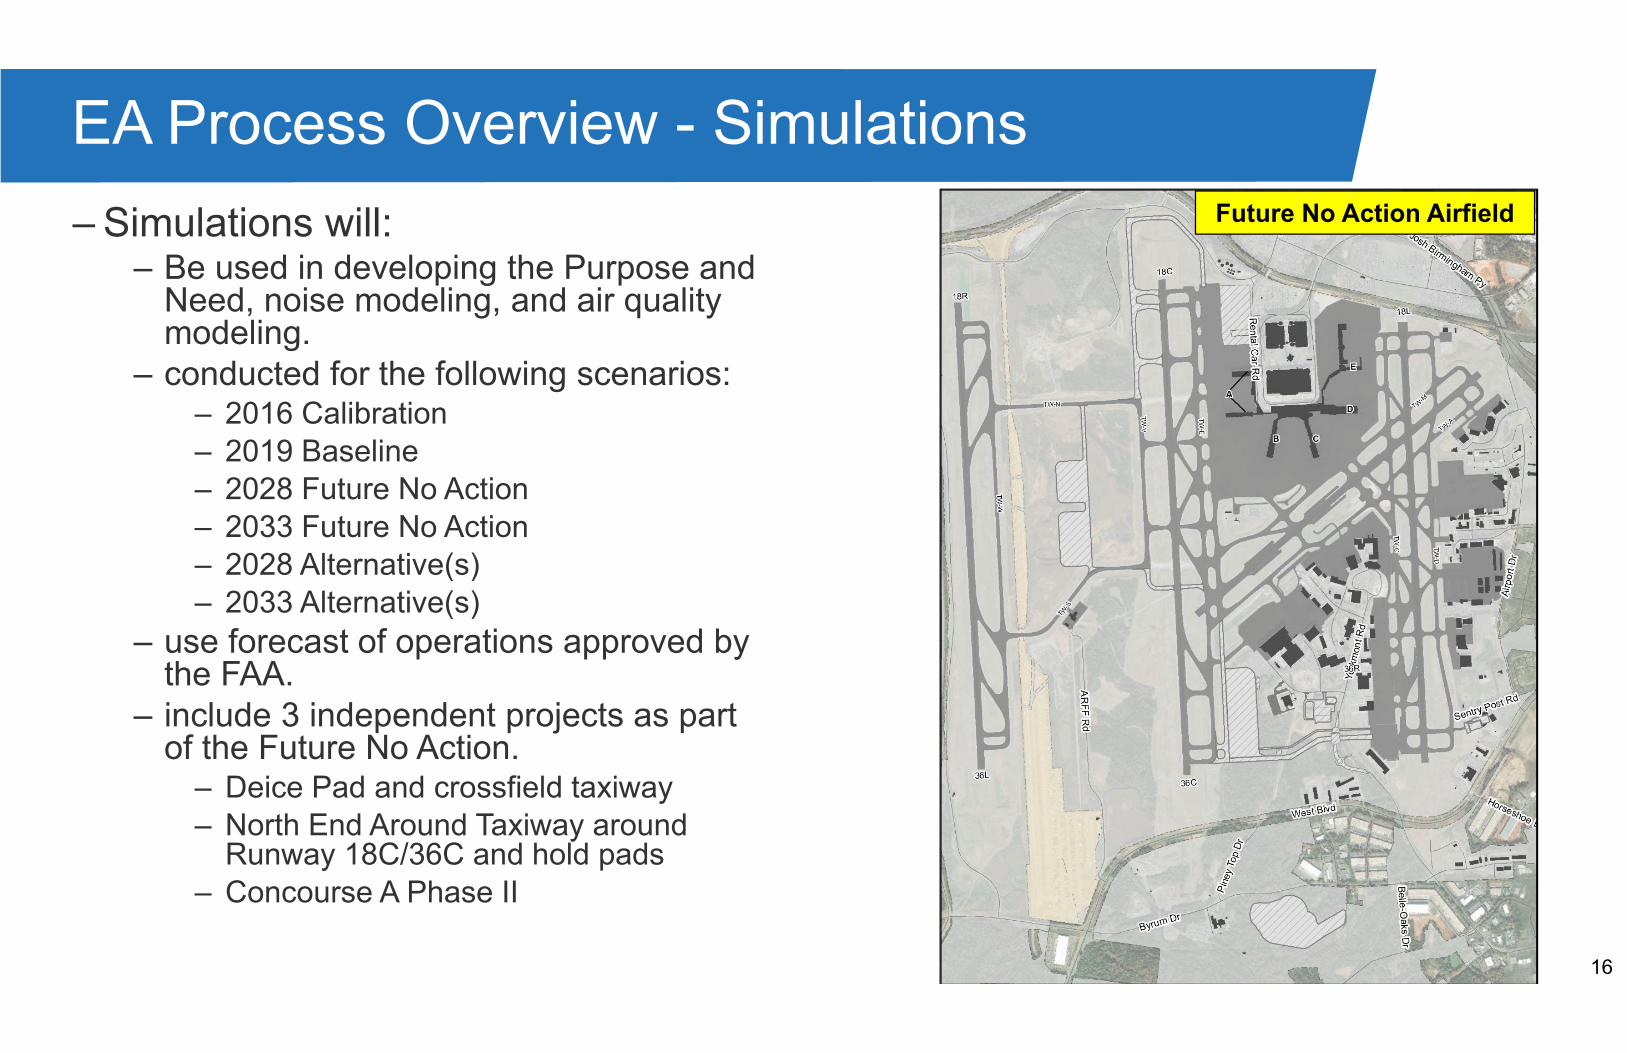
16
– Simulations will:– Be used in developing the Purpose and
Need, noise modeling, and air quality modeling.
– conducted for the following scenarios:– 2016 Calibration– 2019 Baseline– 2028 Future No Action– 2033 Future No Action– 2028 Alternative(s)– 2033 Alternative(s)
– use forecast of operations approved by the FAA.
– include 3 independent projects as part of the Future No Action.
– Deice Pad and crossfield taxiway– North End Around Taxiway around
Runway 18C/36C and hold pads– Concourse A Phase II
EA Process Overview - SimulationsFuture No Action Airfield
17
Review of Calibration

18
– As part of the EIS, the SIMMOD simulation model was calibrated for the 2016 existing conditions
– The calibrated model was approved by the FAA and shared in the EIS DORA meetings
– For purposes of the EA, the simulation model has been changed to the AirTOp simulation model and the previously approved 2016 calibration has been validated with AirTOp
– The AirTOp models produces results which are consistent with the previous calibration assessment
– The following slides summarize the results of the AirTOp calibration
Review of Calibration Findings

19
– Throughput rates are calibrated to 2016-2017 FAA ASPM or Aerobahn data and compared to the previous EIS calibration effort
– While the maximum throughput is achievable under certain circumstances, it is not a good indication of capacity. Therefore, the 90th percentile hourly rates is used as a measure of capacity per previous DORA stakeholder group recommendations
Rolling Hour Operation Throughput

20
– Simulated hourly throughput are within 10 percent of ASPM and EIS simulation effort
Total Operations Throughput
* Source: Capacity/Delay Analysis and Airfield Modeling Technical Memorandum, CLT EISASPM data, 2016-2017
Airport Throughput
ASPM – 90th* EIS – 90th* AirTOp – 90th
North VMC 121 118 117
North IMC 114 116 114
South VMC 121 121 117
South IMC 112 116 115

21
– Simulated hourly arrival and departure throughput match closely with ASPM and results of EIS simulation effort
– The FAA’s Capacity Airport Arrival Rates or called arrival rates in VMC are much higher than actual hourly counts
Arrival and Departure Throughput
Arrival and Departure Throughput
Operation ASPM - Called Rate* ASPM - Max* ASPM - 90th EIS - Max* AirTOp - Max AirTOp - 90th
North VMCArr 92 79 63 73 76 67
Dep 69 82 67 78 82 63
North IMCArr 75 76 64 73 72 64
Dep 65 79 62 68 78 59
South VMCArr 92 78 63 77 77 68
Dep 82 81 66 78 83 64
South IMCArr 75 77 64 74 77 66
Dep 65 74 58 68 79 61
* Source: Capacity/Delay Analysis and Airfield Modeling Technical Memorandum, CLT EISASPM data, 2016-2017A variety of called rates were found in ASPM for a particular runway configuration, the most frequent called rate for each configuration is included in the table90th percentile data was not provided in the EIS calibration report

22
South VMC Heat Map
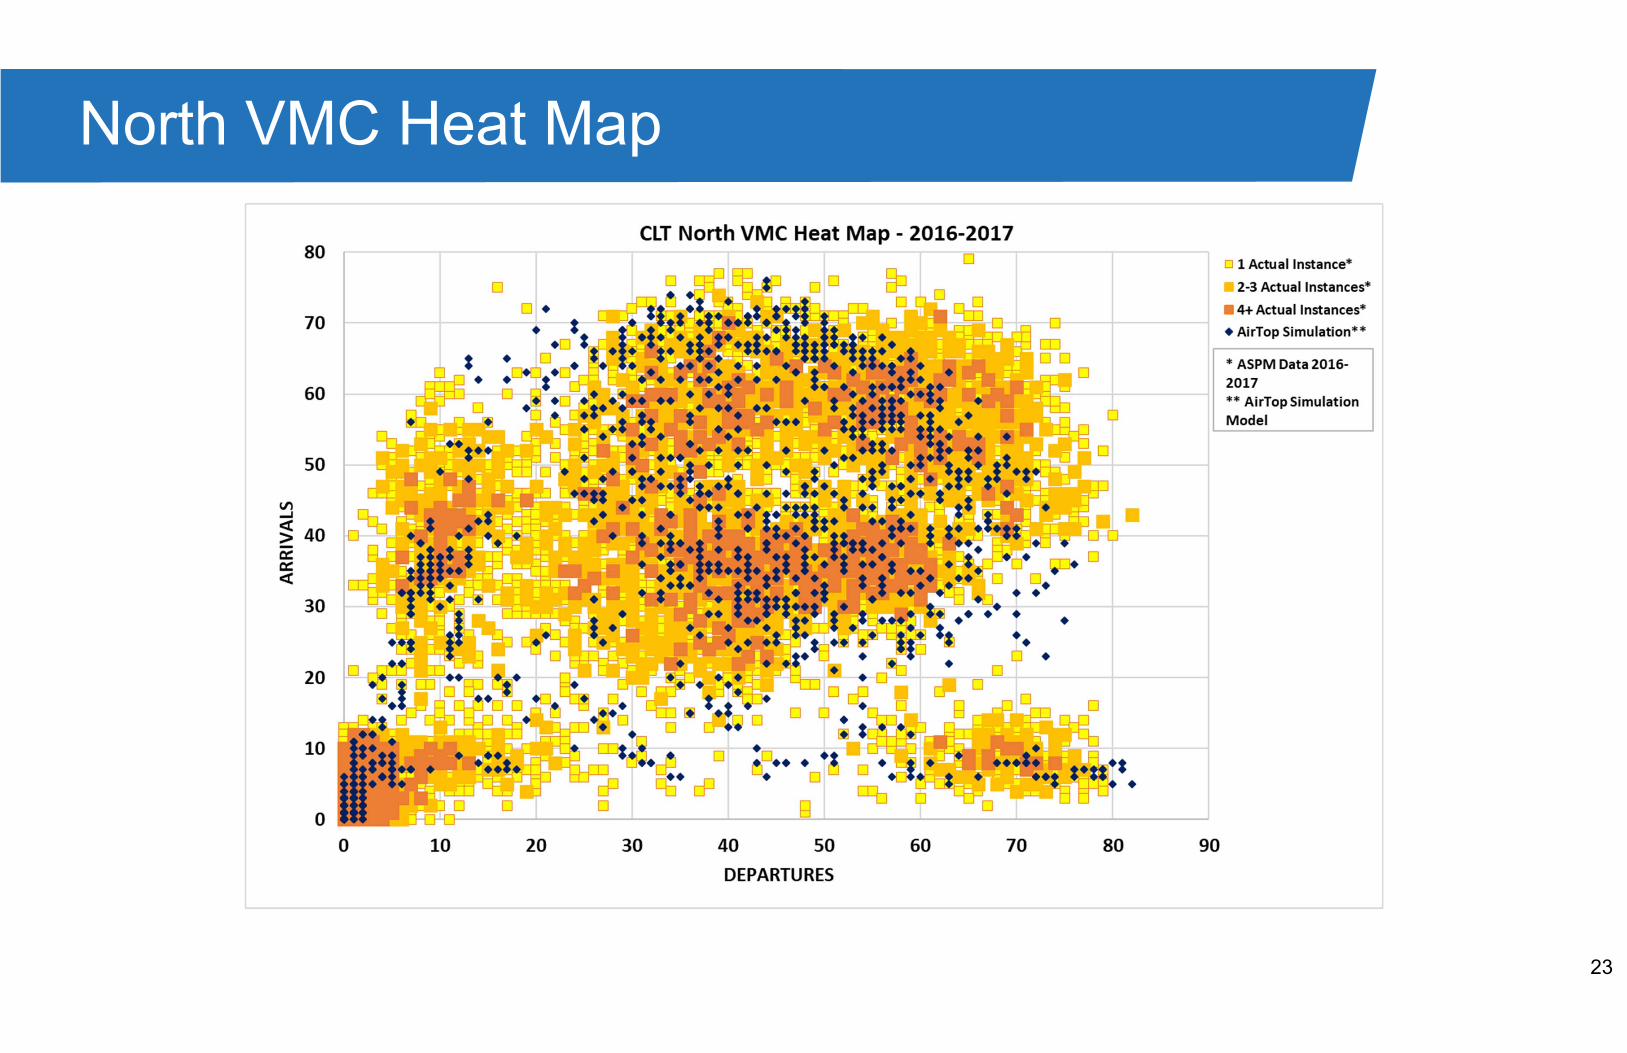
23
North VMC Heat Map
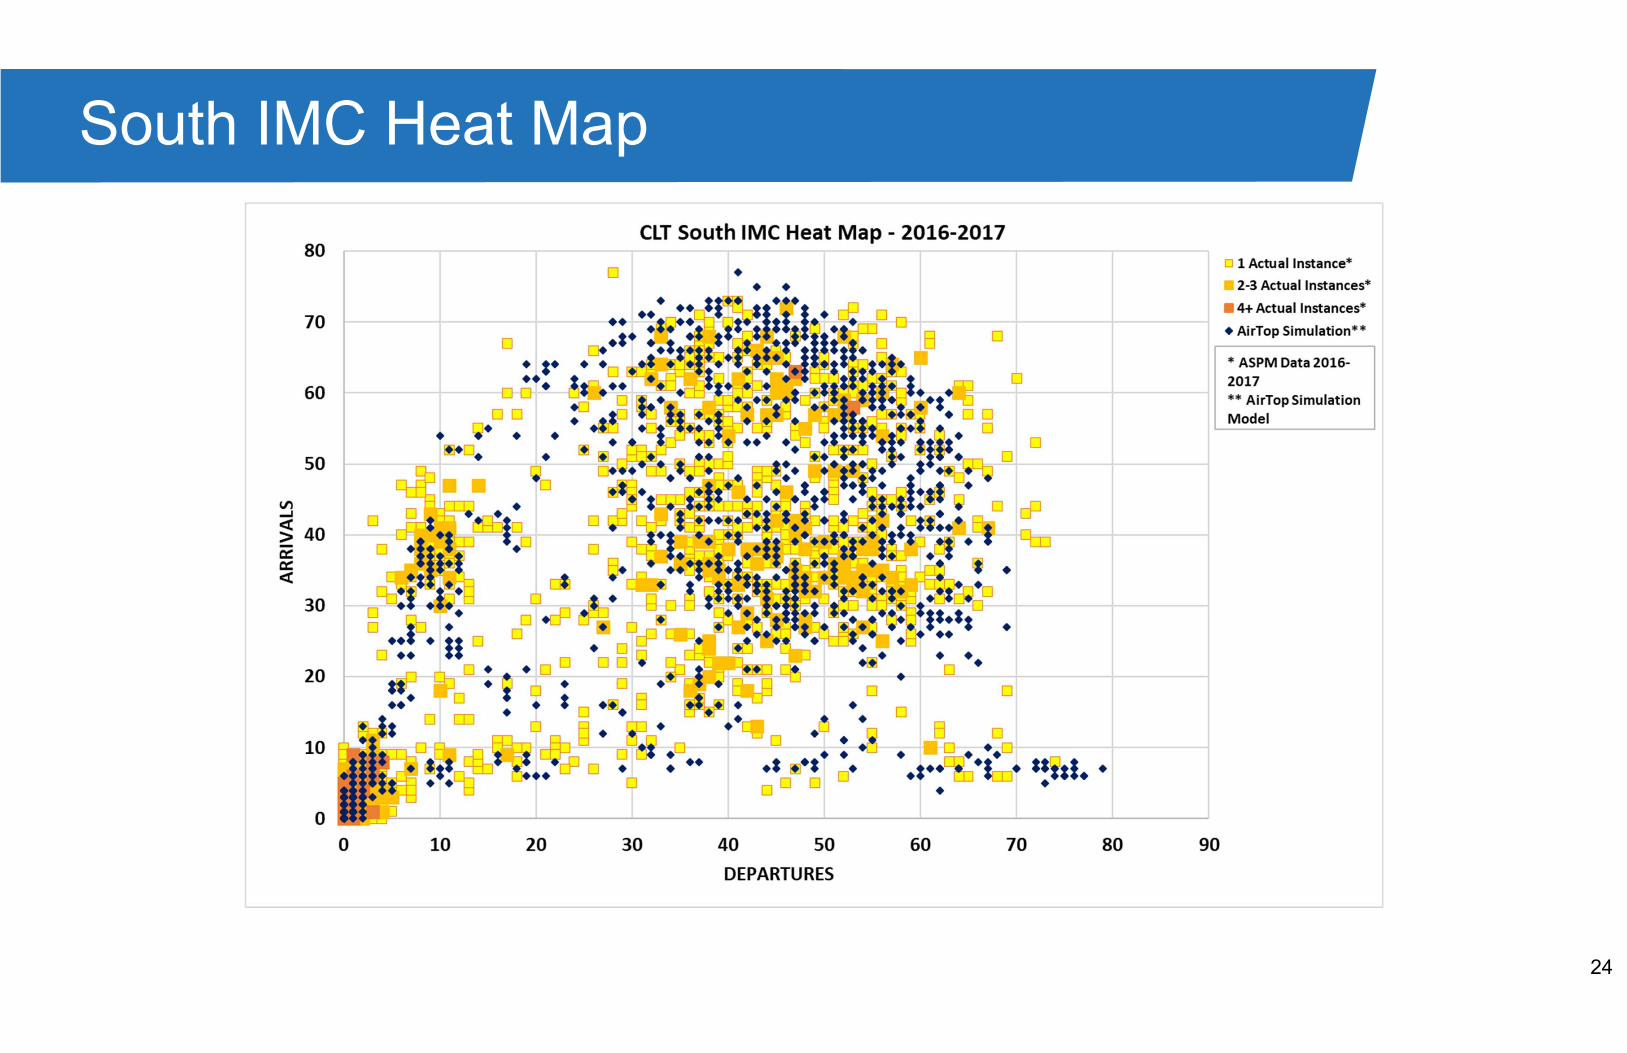
24
South IMC Heat Map
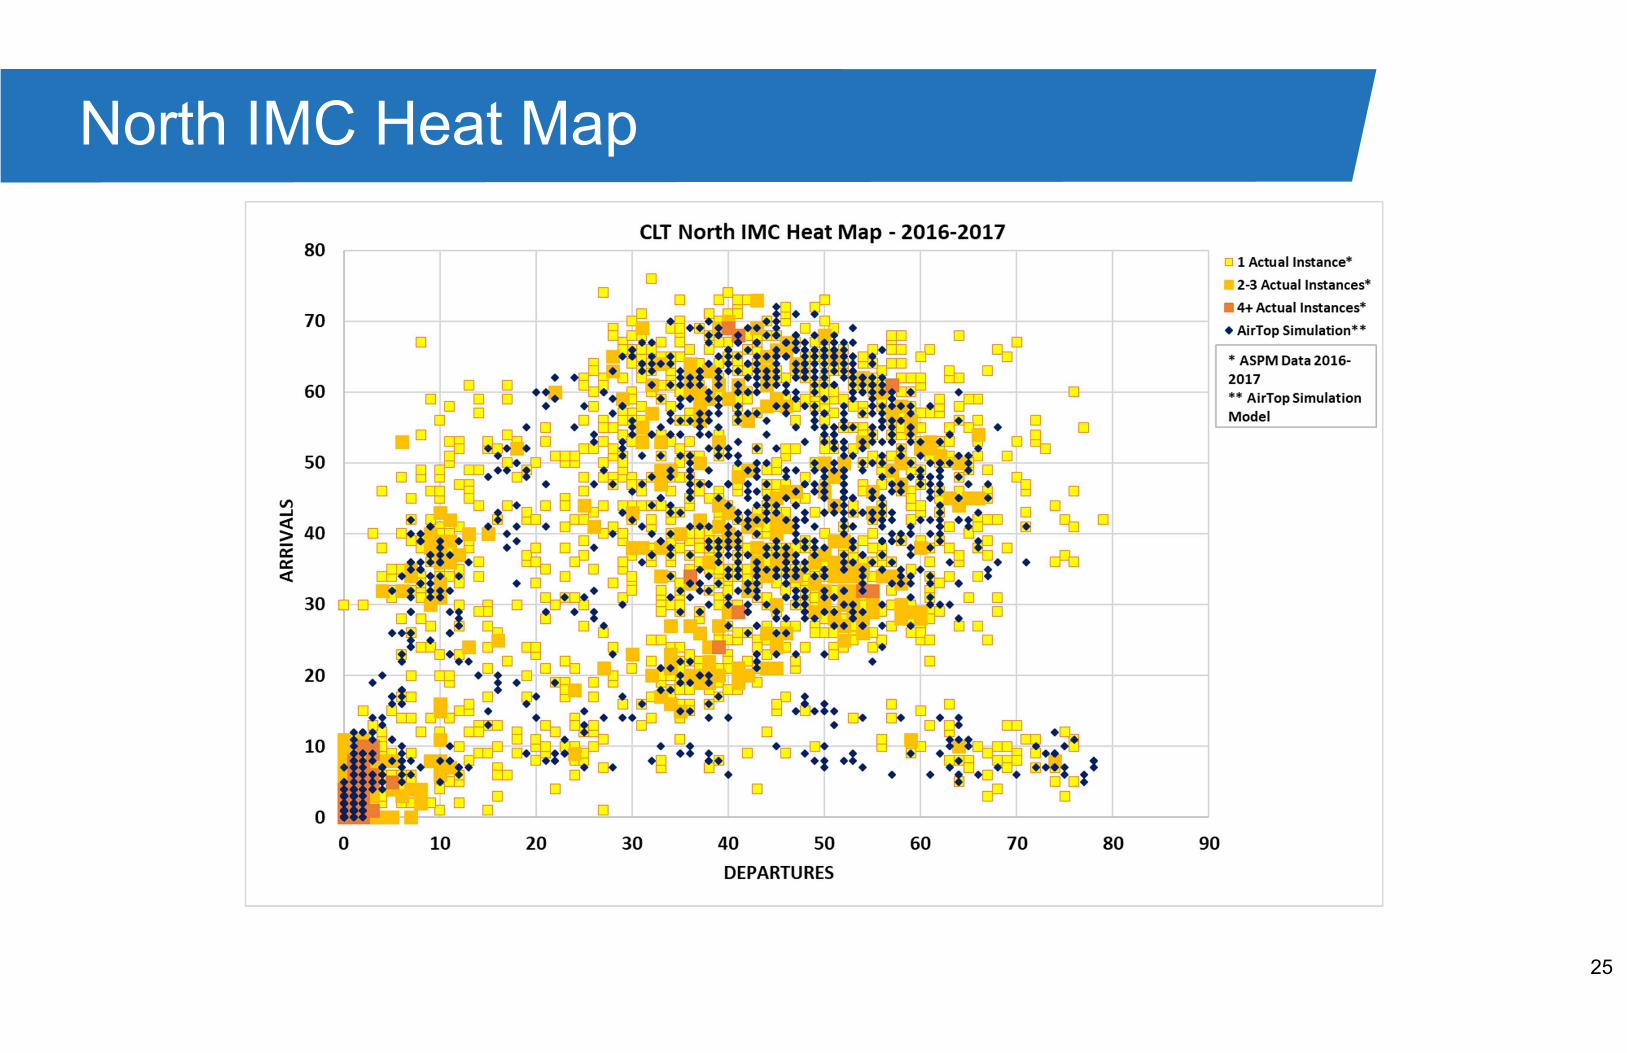
25
North IMC Heat Map

26
– A key metric in the calibration analysis are aircraft ground taxi times
– The FAA ASPM database was queried for data from 2016 regarding total taxi in (arrivals) and taxi out (departures) times
– AirTOp ground speeds are adjusted to ensure that the model produces taxi times which are within an acceptable range of actual data
Aircraft Taxi Time Analysis
2016 Average Total Taxi Times from FAA ASPM Database (minute)
Arrival Taxi In Time Departure Taxi Out Time
North Flow ASPM 11.0 20.3
North VMC Simulation 11.9 20.2
South Flow ASPM 12.4 19.5
South VMC Simulation 11.6 17.6

27
Calibration Simulation Modeling Results
Baseline Simulation Model Results Summary (minute)
North VMC North IMC South VMC South IMC AnnualizationAvg arrival taxi time 11.9 13.1 11.6 12.2 11.9
Avg departure taxi time 20.2 22.3 17.6 20.6 19.4Avg arrival air delay 6.1 7.5 5.1 5.6 5.8
Avg arrival delay 11.3 13.8 9.6 10.8 10.9Avg departure taxi delay 7.0 9.1 6.8 9.5 7.3
Avg departure delay 8.8 11.3 8.9 11.5 9.2Avg delay 10.1 12.5 9.2 11.2 10.1
Use of Runway Configurations in 2016* 44.8% 9.9% 38.8% 6.5%
– Taxi time and delay metrics are presented for each runway configuration
– Annualization is calculated by averaging the metrics using the runway configuration use percentage
* Based on ASPM configurations and called rates

28
– Significant increase in percent of north flow operations and decrease in south flow operations over the past few years
Runway Configuration Changes
0%
10%
20%
30%
40%
50%
60%
70%
2012 2013 2014 2015 2016 2017 2018 2019
Per
cent
of O
pera
tions
Year
Annual Use of Runway Configurations (2012-2019)
North IMC
North VMCSouth VMC
South IMC
Based on ASPM configurations and called rates
29
2019 Baseline and Future No Action Airfield Modeling Assumptions

30
– The use of Runway 5/23 has changed since the 2016 calibration
– In this section of the presentation, we review the assumptions of how the airfield is operating today
– These assumptions will be applied to the following simulation scenarios:– 2019 Baseline– 2028 Future No Action– 2033 Future No Action
2019 Baseline and Future No Action Modeling Scenarios
31
– Baseline Modeling Experiments– 2019 South VMC– 2019 South IMC
– Future No Action Modeling Experiments– 2028 South VMC – 2028 South IMC– 2028 North VMC – 2028 North IMC– 2033 South VMC – 2033 South IMC– 2033 North VMC – 2033 North IMC
2019 Baseline and Future No Action Summary of Experiments

32
Airfield Layouts for Simulation2019 Baseline Airfield Layout 2028/2033 Future No Action Airfield Layout
½ North EAT
West Hold Pad
South Cross Field
Taxiway& Deice Pad
Concourse A Phase II Pier
Dual Taxilanes
Notes: The 2019 baseline airfield layout will include the new aircraft holdpad/deicing pad located north of the new Concourse A Phase 1 expansion
Deicing/Hold Pad
18R
18C
18L
36C 36R
18R
18C
18L
36C 36R36L 36L
23
05
23
05
Concourse A Phase I Pier
Twy SRemoval
Twy NRemoval

33
Simulation Flight Schedules
– Total Daily Operations– 2016: 1,563– 2019: 1,626*– 2028: 1,860– 2033: 1,978
*2019 schedule currently in development
120
100
80
60
40
20
-
20
40
60
80
100
120
0 1 2 3 4 5 6 7 8 9 10 11 12 13 14 15 16 17 18 19 20 21 22 23
Dep
artu
res
A
rriv
als
Local Time (Hour)
Rolling Hour Arrival and Departure Demand
2016
2028
2033

34
– Airfield Operating Assumptions– Terminal/Concourse Layouts– Airfield Deicing/Hold Pad Usage– Runway Operating Configurations– Aircraft Taxi Flows– Aircraft Ground Speeds
– Airspace Operating Assumptions– Airspace Route Structure– Intrail Separations (Wake RECAT)– Airspace Route Structure
Review of 2019 Baseline and Future No Action Modeling Assumptions
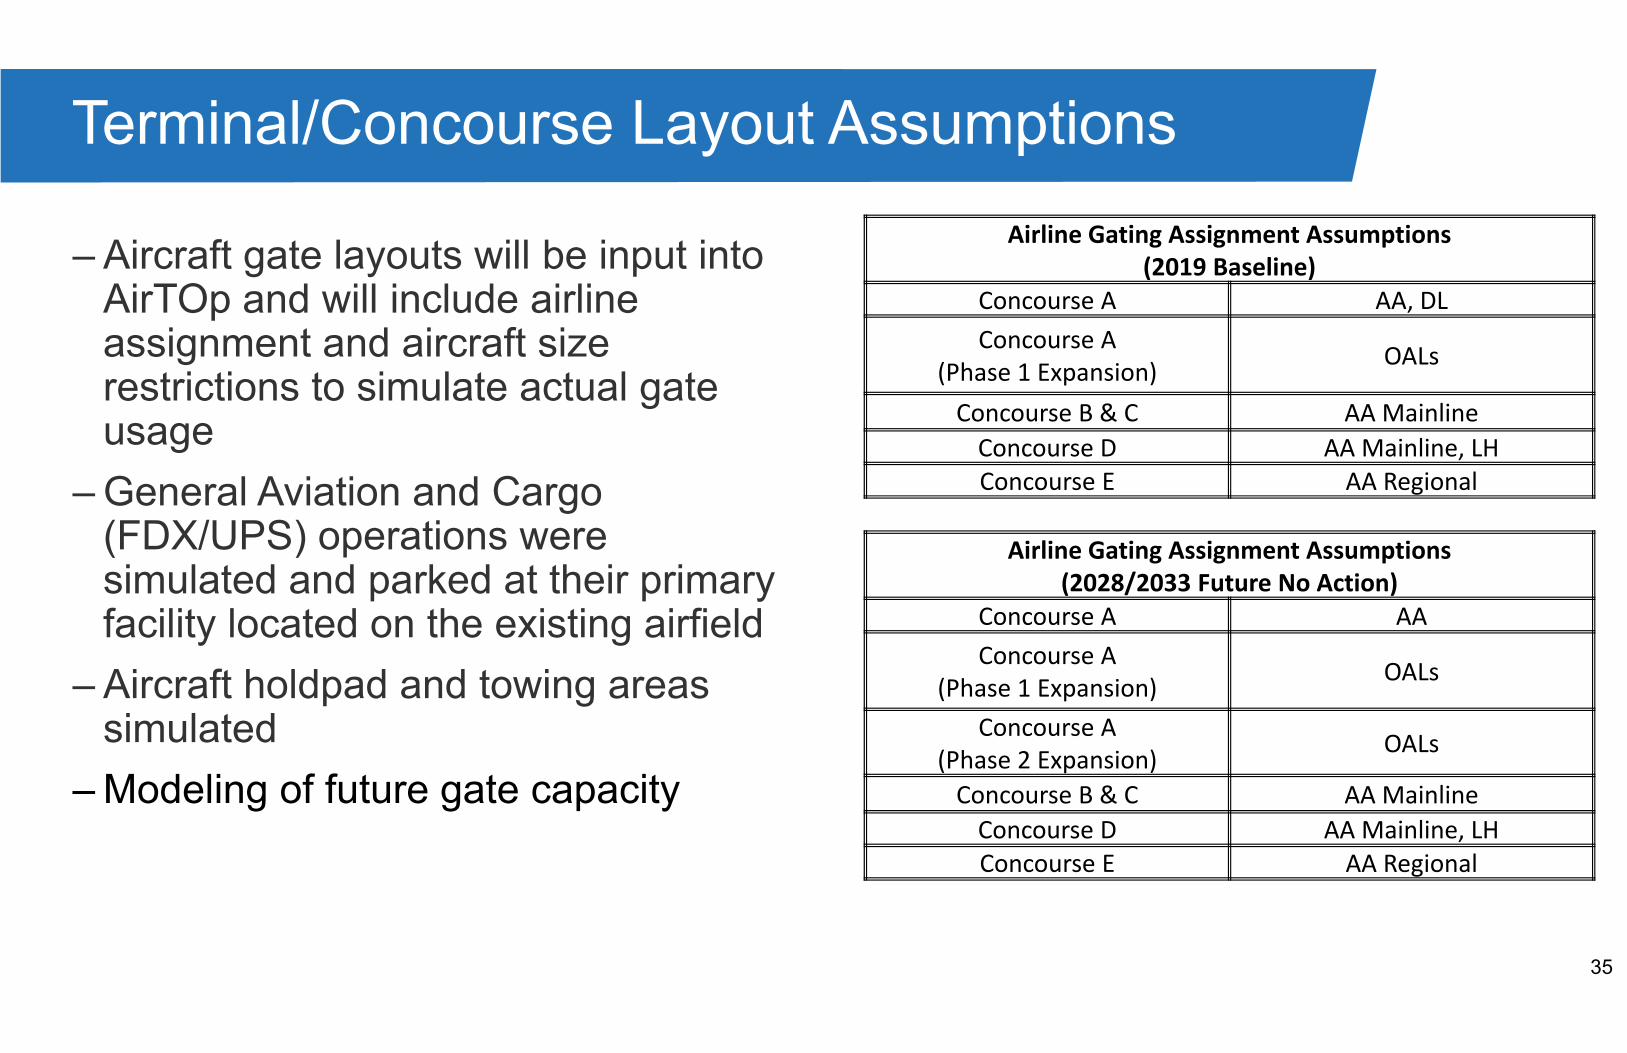
35
– Aircraft gate layouts will be input into AirTOp and will include airline assignment and aircraft size restrictions to simulate actual gate usage
– General Aviation and Cargo (FDX/UPS) operations were simulated and parked at their primary facility located on the existing airfield
– Aircraft holdpad and towing areas simulated
– Modeling of future gate capacity
Terminal/Concourse Layout Assumptions
Airline Gating Assignment Assumptions (2019 Baseline)
Concourse A AA, DLConcourse A
(Phase 1 Expansion) OALs
Concourse B & C AA MainlineConcourse D AA Mainline, LHConcourse E AA Regional
Airline Gating Assignment Assumptions (2028/2033 Future No Action)
Concourse A AAConcourse A
(Phase 1 Expansion) OALs
Concourse A (Phase 2 Expansion) OALs
Concourse B & C AA MainlineConcourse D AA Mainline, LHConcourse E AA Regional
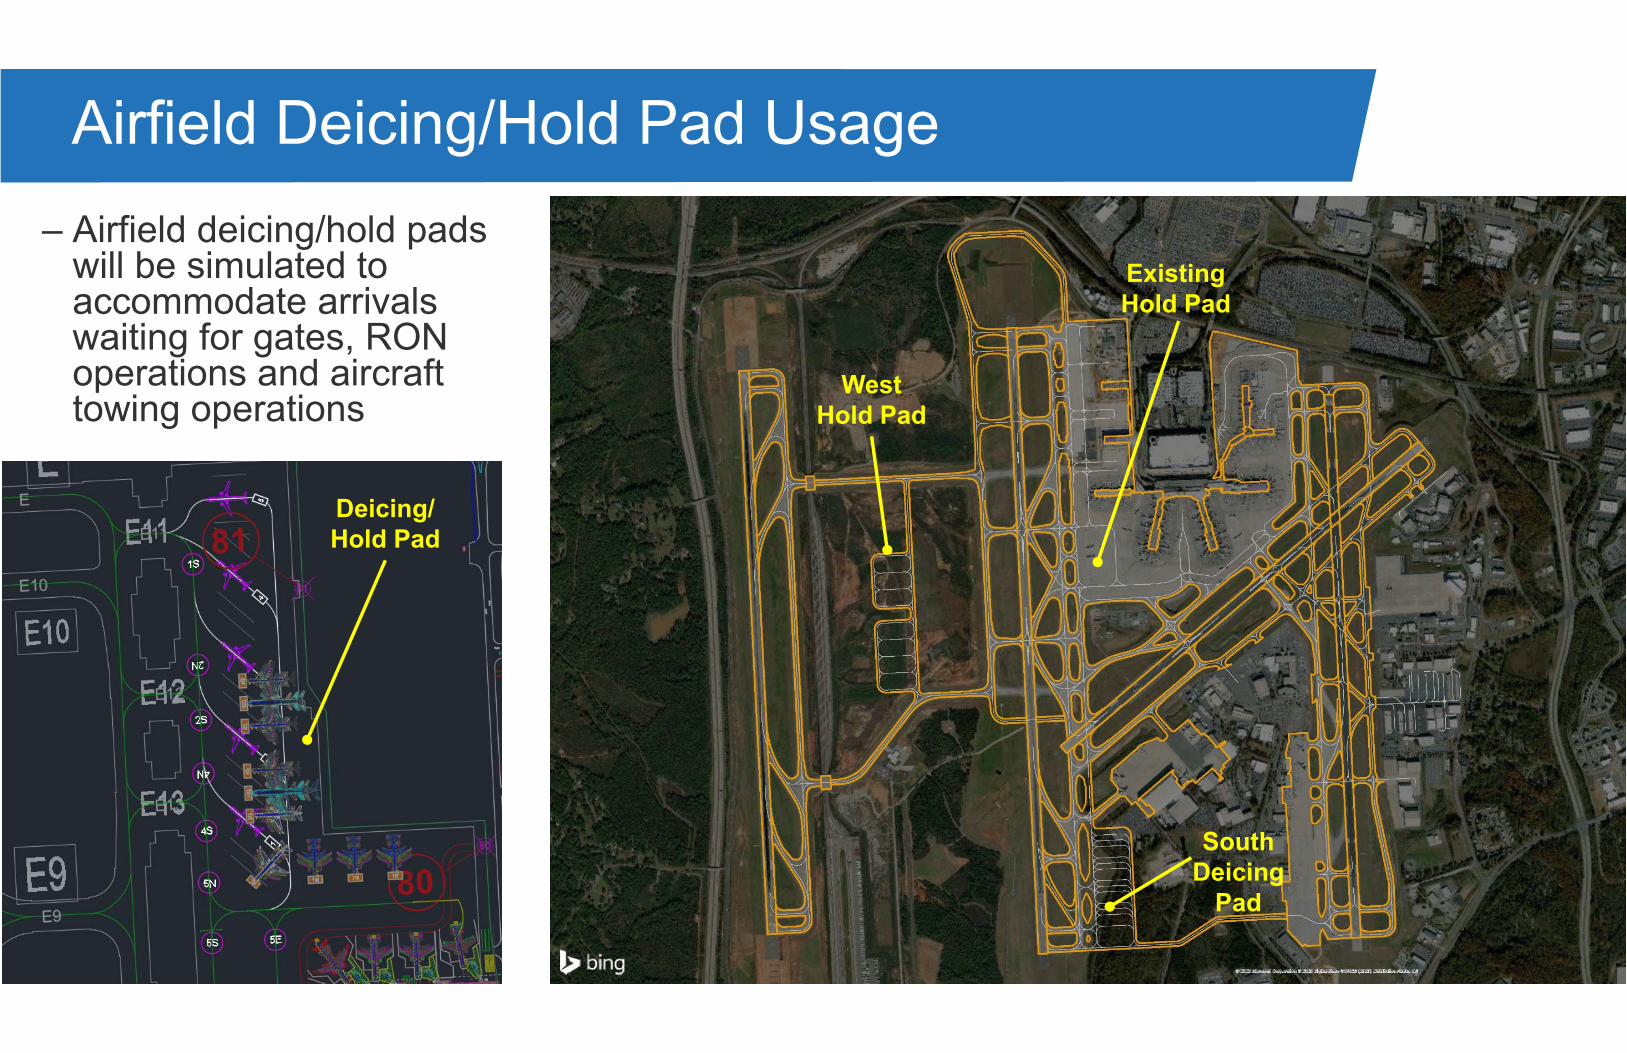
36
Airfield Deicing/Hold Pad Usage
West Hold Pad
South Deicing
Pad
Existing Hold Pad
Deicing/Hold Pad
– Airfield deicing/hold pads will be simulated to accommodate arrivals waiting for gates, RON operations and aircraft towing operations
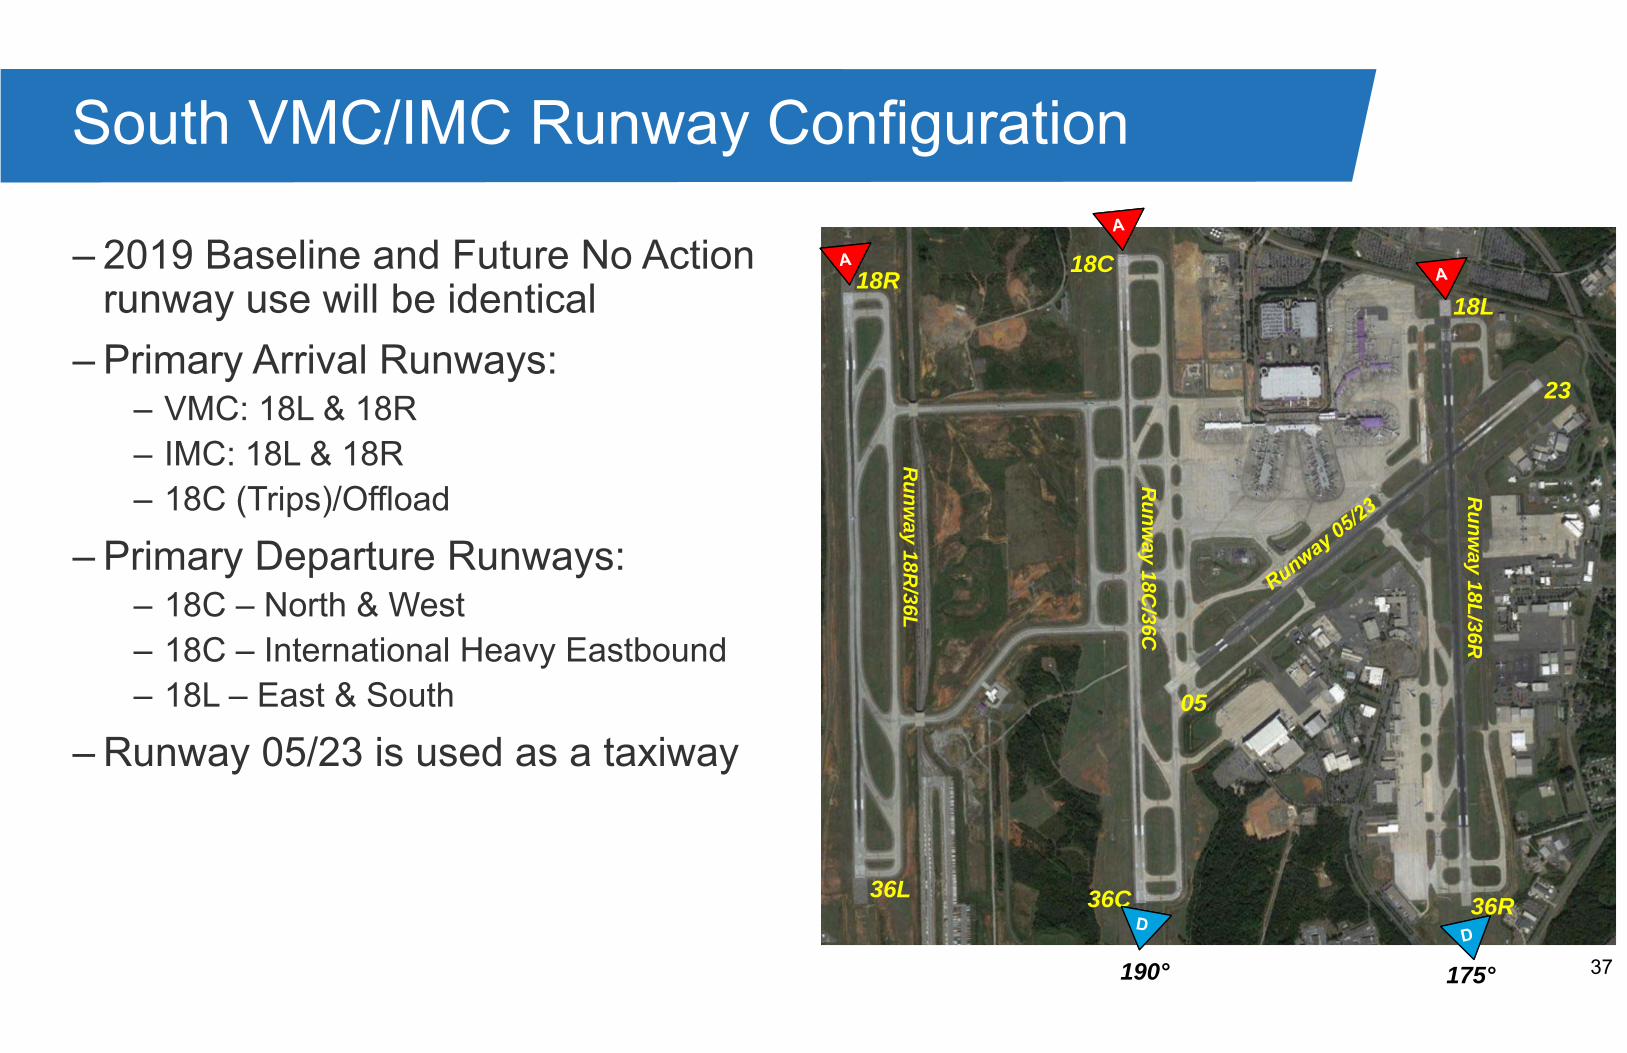
37
– 2019 Baseline and Future No Action runway use will be identical
– Primary Arrival Runways:– VMC: 18L & 18R– IMC: 18L & 18R– 18C (Trips)/Offload
– Primary Departure Runways:– 18C – North & West– 18C – International Heavy Eastbound– 18L – East & South
– Runway 05/23 is used as a taxiway
South VMC/IMC Runway Configuration
18R
36L 36C 36R
18C
18L
Runw
ay 18R/36L
Runw
ay 18C/36C
Runw
ay 18L/36R
05
23
190° 175°
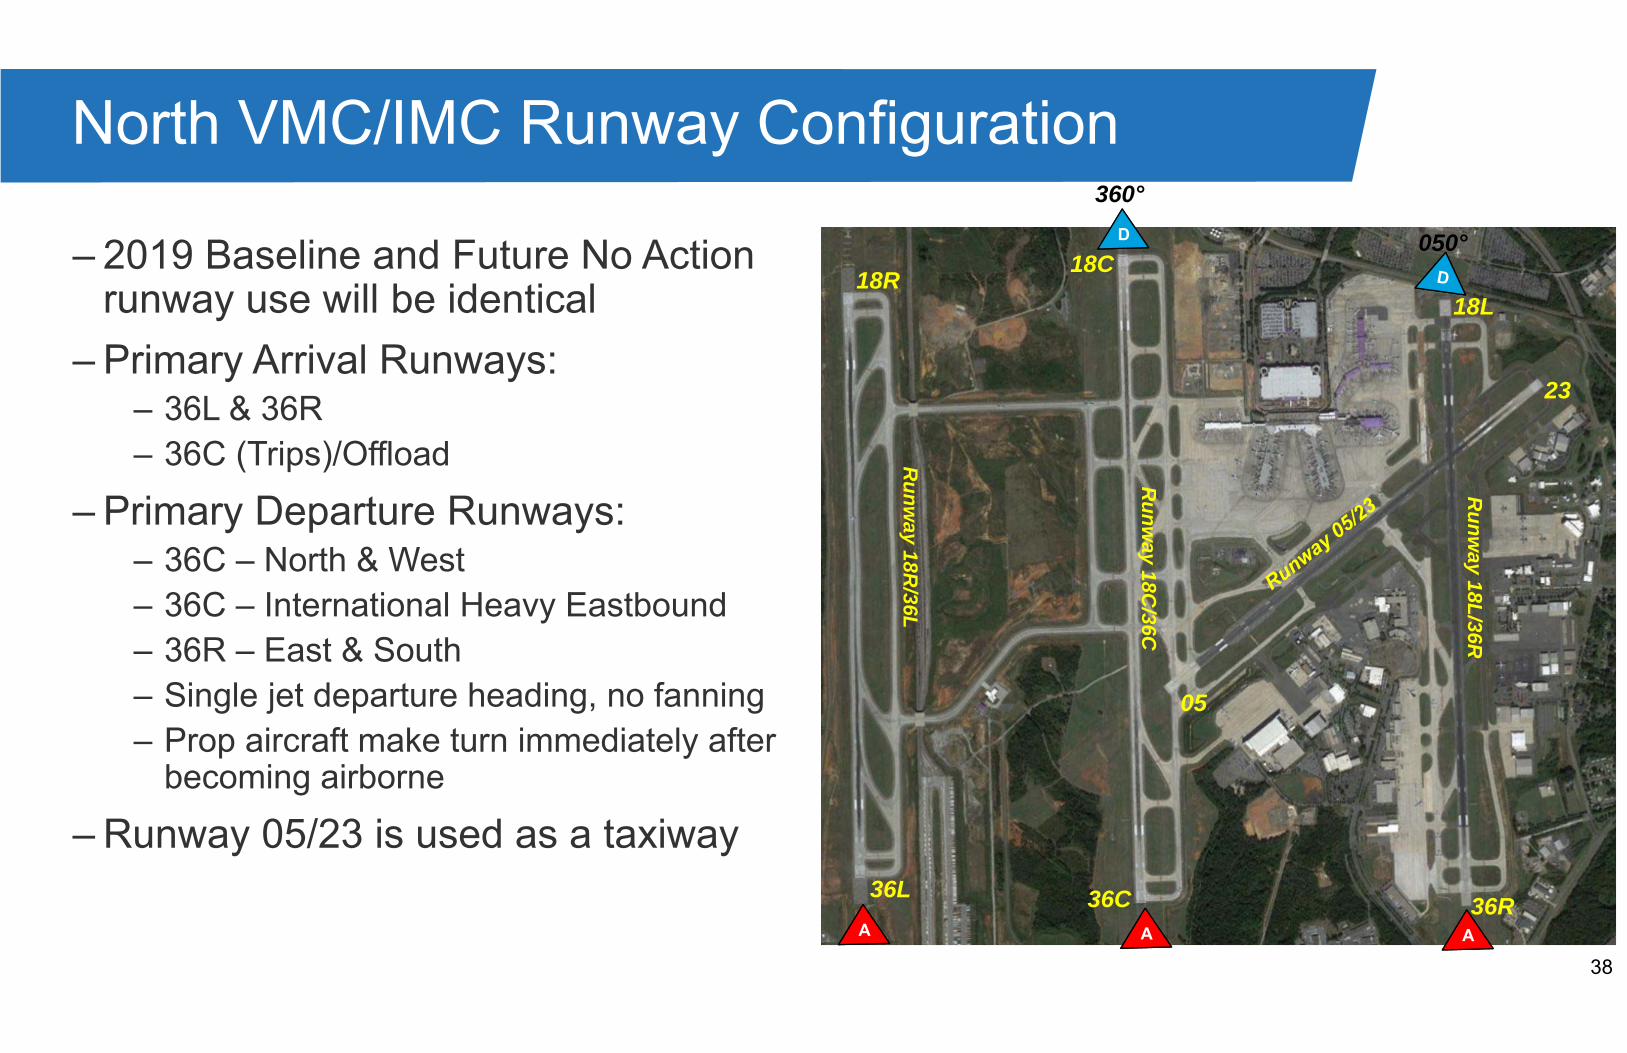
38
– 2019 Baseline and Future No Action runway use will be identical
– Primary Arrival Runways:– 36L & 36R– 36C (Trips)/Offload
– Primary Departure Runways:– 36C – North & West– 36C – International Heavy Eastbound– 36R – East & South– Single jet departure heading, no fanning– Prop aircraft make turn immediately after
becoming airborne
– Runway 05/23 is used as a taxiway
North VMC/IMC Runway Configuration
18R
36L 36C 36R
18C
18L
Runw
ay 18R/36L
Runw
ay 18C/36C
Runw
ay 18L/36R
05
23
360°
050°

39
South Flow Aircraft Taxi Flows
18R18C
18L
36C 36R
Arrivals
Departures
Mixed
2019 Baseline Airfield Layout 2028/2033 Future No Action Airfield Layout
18R18C
18L
36C 36R

40
North Flow Aircraft Taxi Flows
36L
18C
18L
36C 36R
Arrivals
Departures
Mixed
2019 Baseline Airfield Layout
36L
18C
18L
36C 36R
2028/2033 Future No Action Airfield Layout

41
High Speed Exits 32 knots
Outer Perimeter Taxiways 20 knots
Runway Crossings 18 knots
Taxiways 15 knots
Ramp Area Taxilanes 12 knots
Ramp Area Taxilanes 10 knots
Airfield Ground Speed Assumptions – Baseline
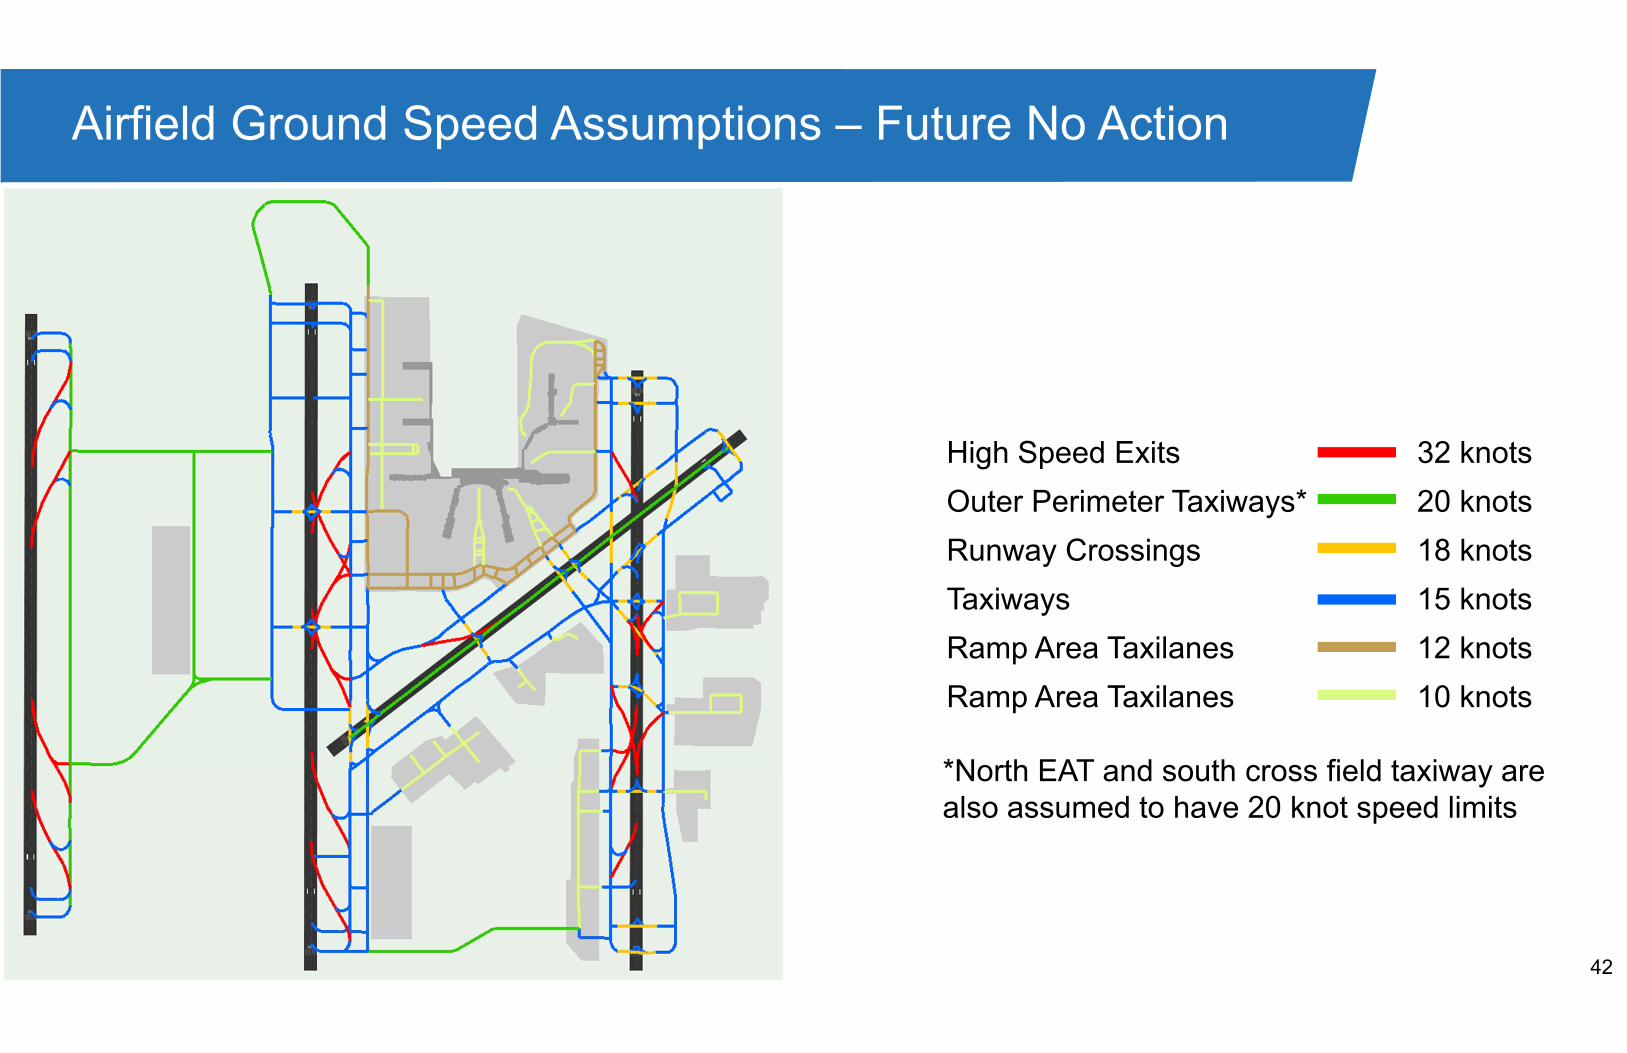
42
Airfield Ground Speed Assumptions – Future No Action
High Speed Exits 32 knots
Outer Perimeter Taxiways* 20 knots
Runway Crossings 18 knots
Taxiways 15 knots
Ramp Area Taxilanes 12 knots
Ramp Area Taxilanes 10 knots
*North EAT and south cross field taxiway arealso assumed to have 20 knot speed limits
43
Airspace Operating Assumptions
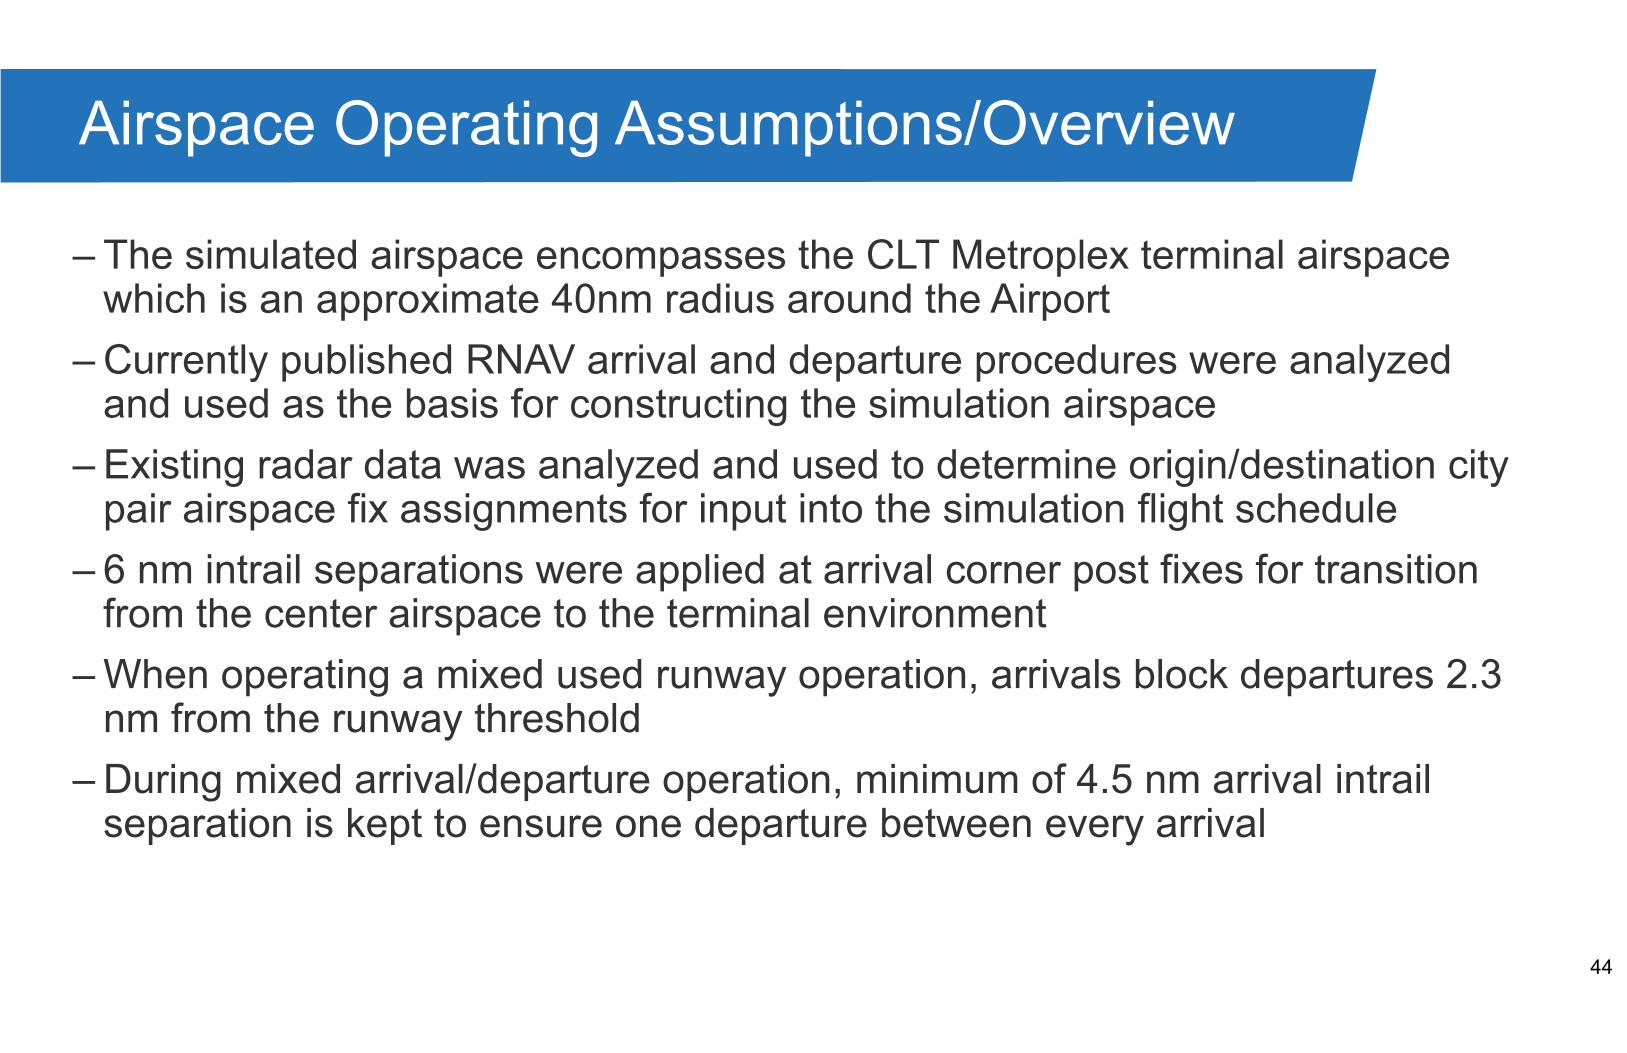
44
Airspace Operating Assumptions/Overview
– The simulated airspace encompasses the CLT Metroplex terminal airspace which is an approximate 40nm radius around the Airport
– Currently published RNAV arrival and departure procedures were analyzed and used as the basis for constructing the simulation airspace
– Existing radar data was analyzed and used to determine origin/destination city pair airspace fix assignments for input into the simulation flight schedule
– 6 nm intrail separations were applied at arrival corner post fixes for transition from the center airspace to the terminal environment
– When operating a mixed used runway operation, arrivals block departures 2.3 nm from the runway threshold
– During mixed arrival/departure operation, minimum of 4.5 nm arrival intrail separation is kept to ensure one departure between every arrival

45
Intrail Separation Minimums – Wake RECAT
– Simulation of FAA Wake RECAT separation criteria will be applied to the Baseline and Future No Action scenarios
– Previous simulation modeling and intrail separation analyses indicate minimum arrival separations on final approach range between 3.3nm (VMC) and 3.8nm (IMC)
Source: JO 7110.126A - Consolidated Wake Turbulence (CWT) Separation StandardsEffective Date: September 28, 2019

46
South Flow Arrival Airspace
BANKR
JONZE
FLIPZ
STOCR
CHSLY
MLLET
PARQR
18R
18L or 23
18C
BTSEY(prop)
RASLN(prop)
CLT
Note: Arrivals can be offloaded to other runways during busy periods

47
North Flow Arrival Airspace
JONZEBANKR
MLLET
STOCR
FLIPZ
CHSLY
PARQR36L
36R
36C
RASLN (prop)
BTSEY(prop)
CLT
Note: Arrivals can be offloaded to other runways during busy periods
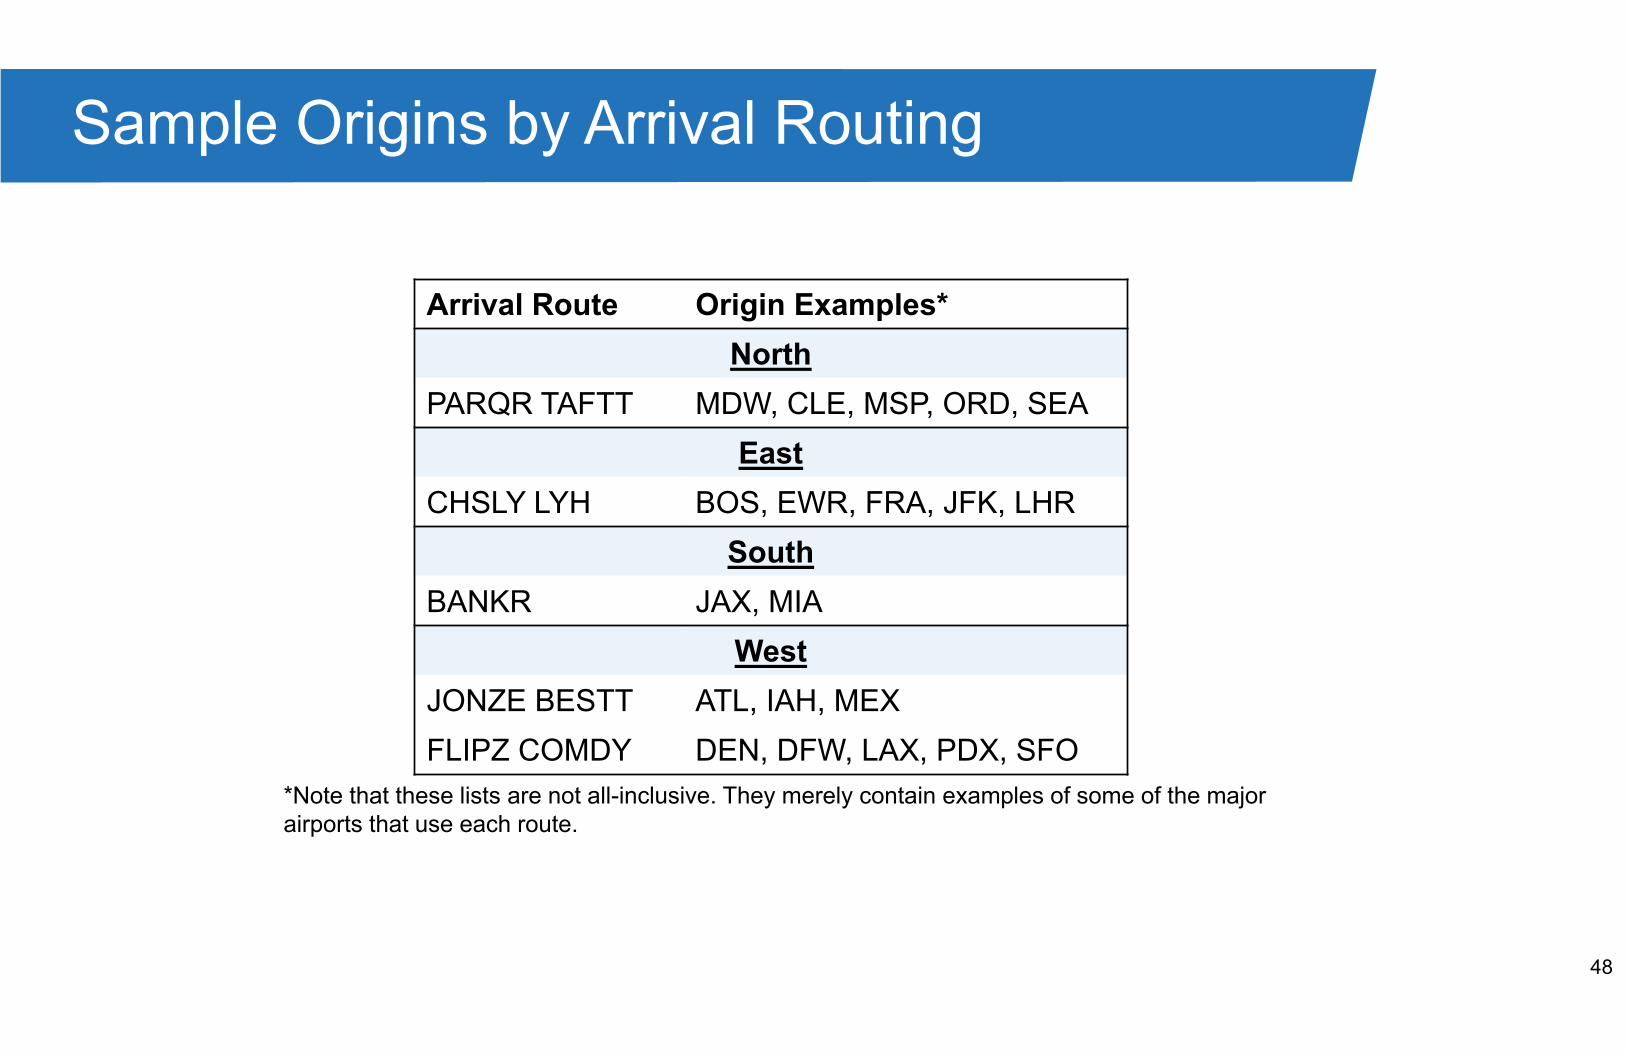
48
Sample Origins by Arrival Routing
Arrival Route Origin Examples*
North
PARQR TAFTT MDW, CLE, MSP, ORD, SEA
East
CHSLY LYH BOS, EWR, FRA, JFK, LHR
South
BANKR JAX, MIA
West
JONZE BESTT ATL, IAH, MEX
FLIPZ COMDY DEN, DFW, LAX, PDX, SFO
*Note that these lists are not all-inclusive. They merely contain examples of some of the majorairports that use each route.

49
South Flow Departure Airspace
JOJJO
BOBZY
BEAVY
ESTRR
KWEEN
WEAZL
ICONS
KRITR
KILNS
BARMY
LILLS
18L
18C
KNIGHTSANDYS (prop)
KNIGHTSPEKNN(prop)
KNIGHTSHAMLN(prop)
KNIGHTSFLYNN (prop)
Note: KRITR departures can be offloaded to 18L during busy periods
CLT
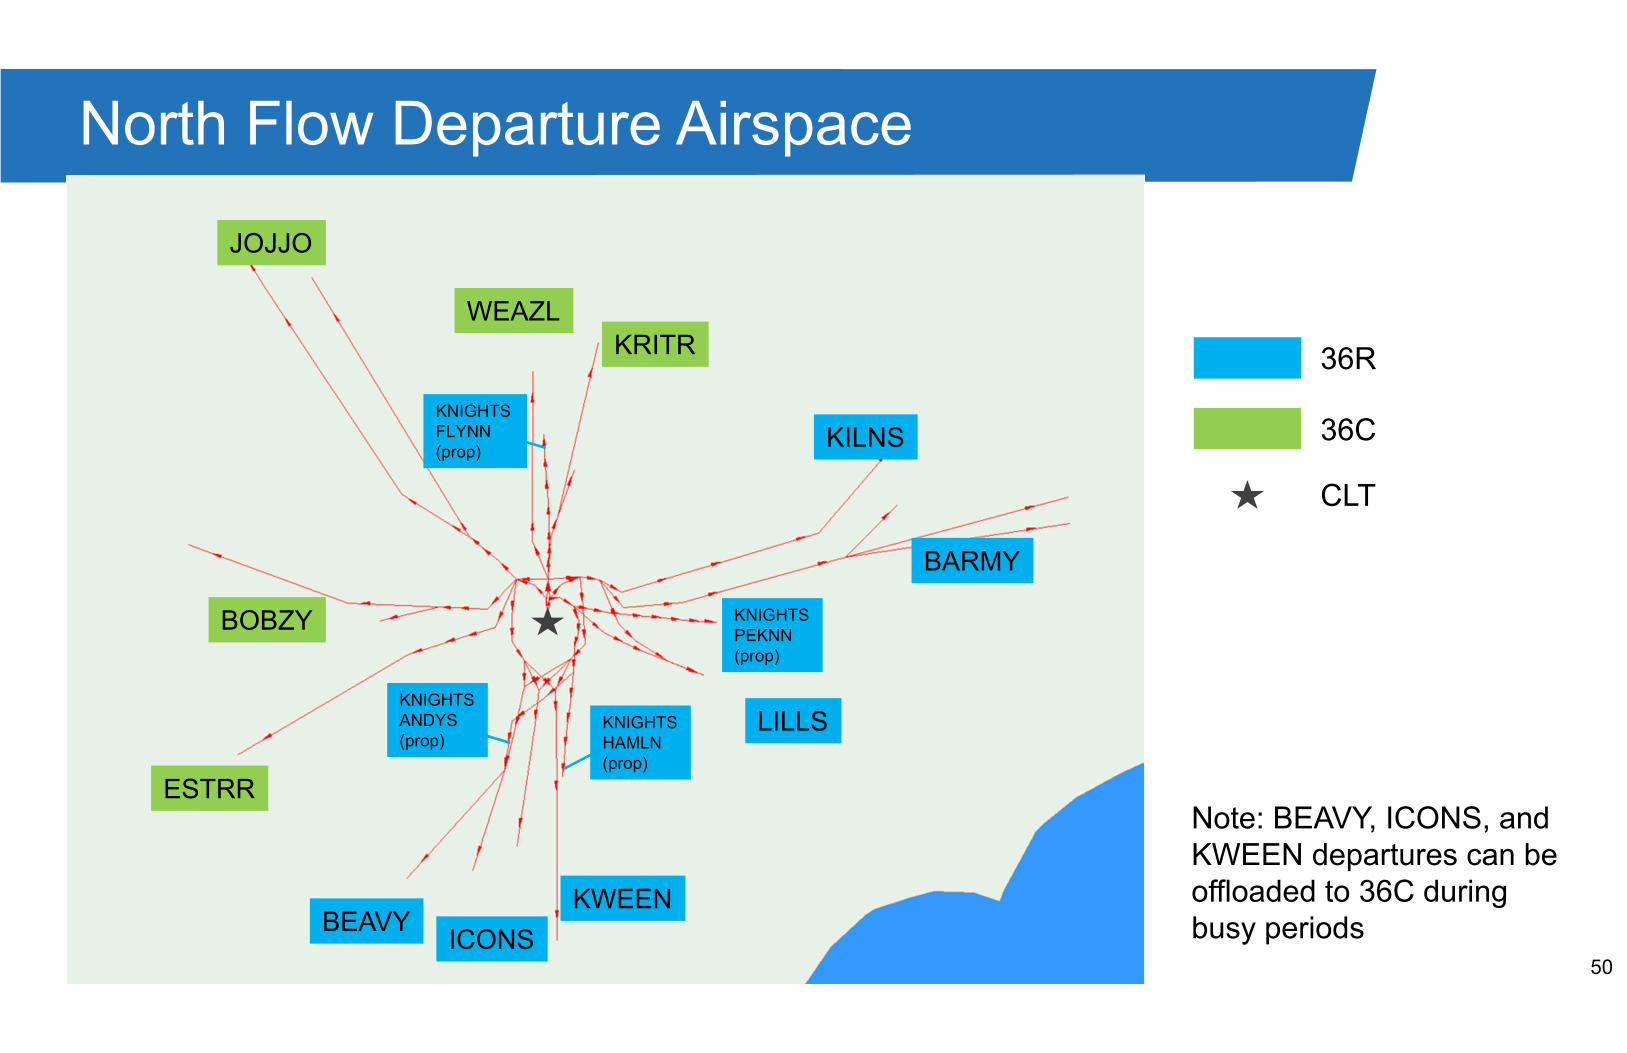
50
North Flow Departure Airspace
BOBZY
ESTRR
BEAVYICONS
KWEEN
JOJJO
WEAZLKRITR
KILNS
BARMY
LILLS
36R
36C
KNIGHTSPEKNN(prop)
KNIGHTSHAMLN(prop)
KNIGHTSANDYS (prop)
KNIGHTSFLYNN (prop)
Note: BEAVY, ICONS, and KWEEN departures can be offloaded to 36C during busy periods
CLT
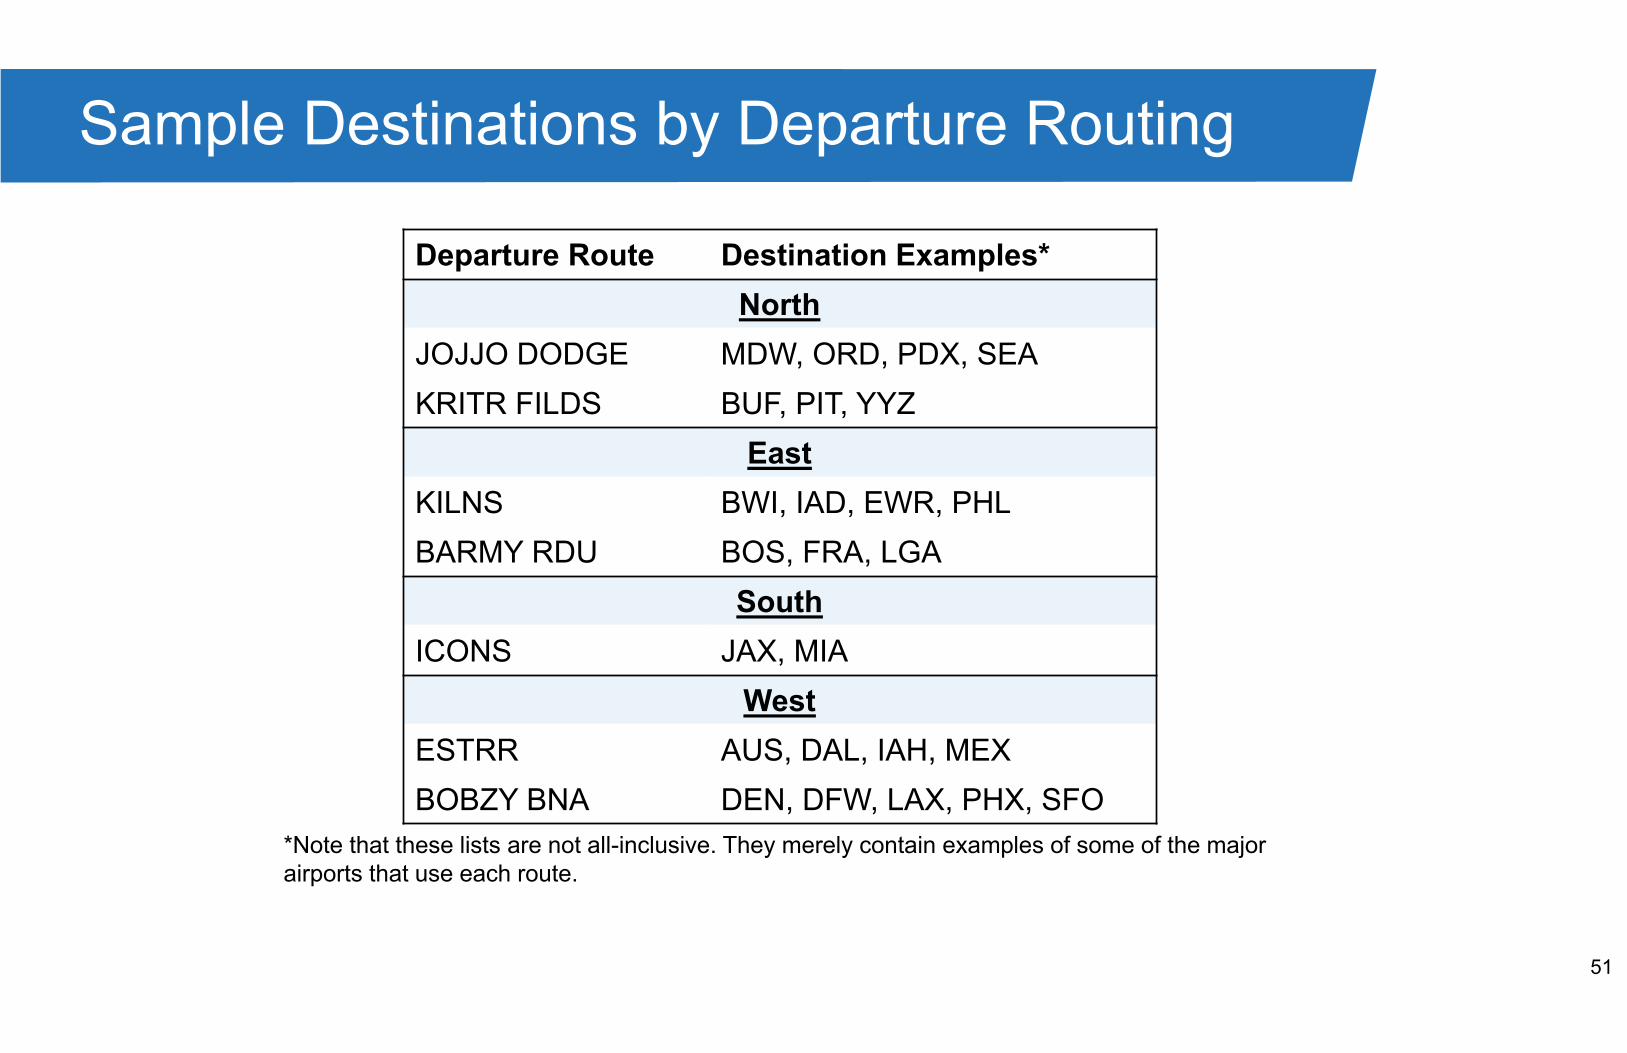
51
Sample Destinations by Departure Routing
Departure Route Destination Examples*
North
JOJJO DODGE MDW, ORD, PDX, SEA
KRITR FILDS BUF, PIT, YYZ
East
KILNS BWI, IAD, EWR, PHL
BARMY RDU BOS, FRA, LGA
South
ICONS JAX, MIA
West
ESTRR AUS, DAL, IAH, MEX
BOBZY BNA DEN, DFW, LAX, PHX, SFO
*Note that these lists are not all-inclusive. They merely contain examples of some of the majorairports that use each route.

52
– Provide comments to EA Team by March 31, 2020– Send comments to [email protected]
– Incorporate comments from DORA Team
– Conduct 2019 Baseline & 2028 & 2033 Future No Action simulations
– Conduct alternatives evaluation
– DORA Meeting #2 – present results of the 2019 Baseline & Future No Action simulations
– Tentative 3rd week of April (week of the 20th)
– Continue preparation of the Draft EA
Next Steps

1
CLT DORA (Direction, Oversight, Review & Agree) Meeting #2
June 11, 2020

2
– Introductions
– Meeting Objectives
– DORA Process
– EA Process Overview
– No Action Modeling Simulation Overview– Airfield Operating Assumptions
– Airspace Operating Assumptions
– Proposed Action Modeling Assumptions– Airfield Operating Assumptions
– Airspace Operating Assumptions
– Next Steps
Agenda

3
Meeting Objectives

4
– To present and review Future No Action modeling assumptions and simulation modeling results
– To present the Proposed Action airfield modeling assumptions
– To present the next steps in the overall project
Meeting Objectives

5
DORA Process
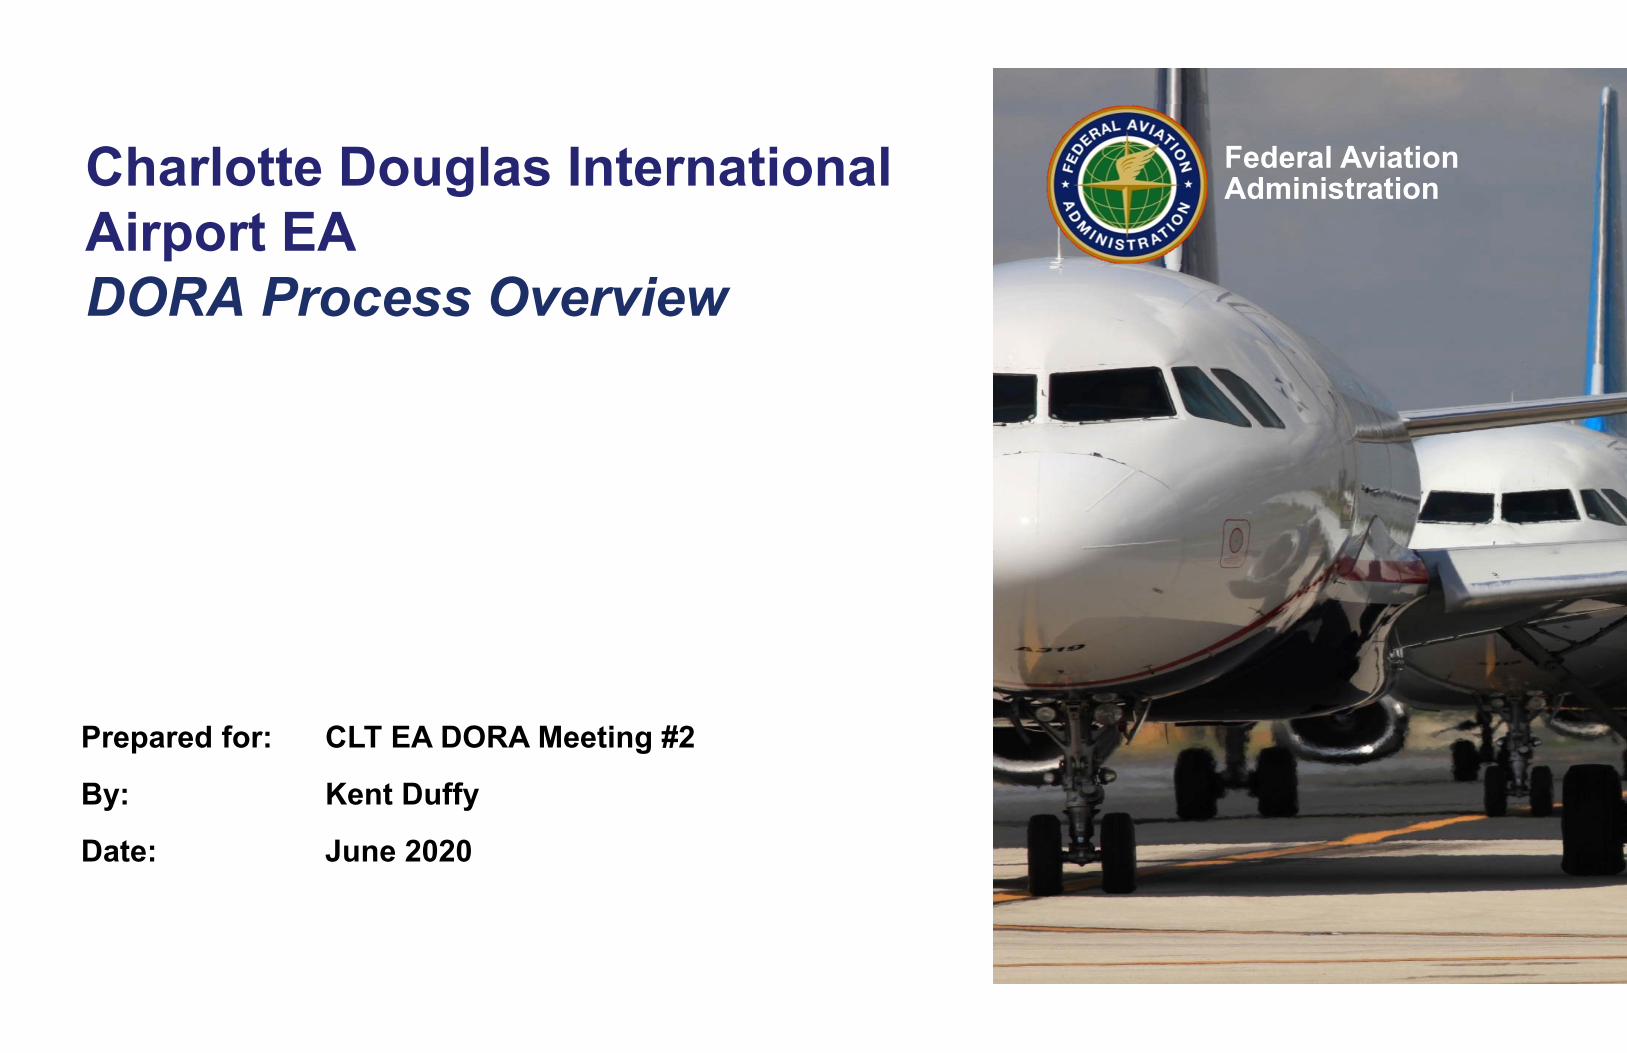
Federal AviationAdministrationCharlotte Douglas International
Airport EA
DORA Process Overview
Prepared for: CLT EA DORA Meeting #2
By: Kent Duffy
Date: June 2020

7
Federal AviationAdministration
What is DORA?
• DORA =
Direction, Oversight, Review and Agree• Obtaining and understanding controller input on operational issues and
viability of proposed alternatives is a key to airport capacity development
• DORA has been applied successfully to other large-scale airport and
airspace modernization efforts (e.g., O’Hare Modernization Program)

8
Federal AviationAdministration
Objectives: Why are we here?• Ensure collaboration w/ATO on simulation activities as needed to complete EA
– Obtain input development of the simulation model
– Revise and refine simulation model, rather than develop new alternatives
• Build from successful process used during planning phase
– Update with recent changes: forecast trends, CRO, metroplex, heading usage, Atlantic coast
routes, etc.
– Validate operating assumptions used in the simulation model
• Airspace flows and procedures, Runway usage and balancing, Aircraft separation and buffers, Taxi-
flows and ground movement, etc.
– Review and validate airspace’s ability to accommodate new runway throughput
• Collaboration ensures the simulation results can be used in the EA analyses with confidence

9
Federal AviationAdministration
Planning Phase DORA Letter
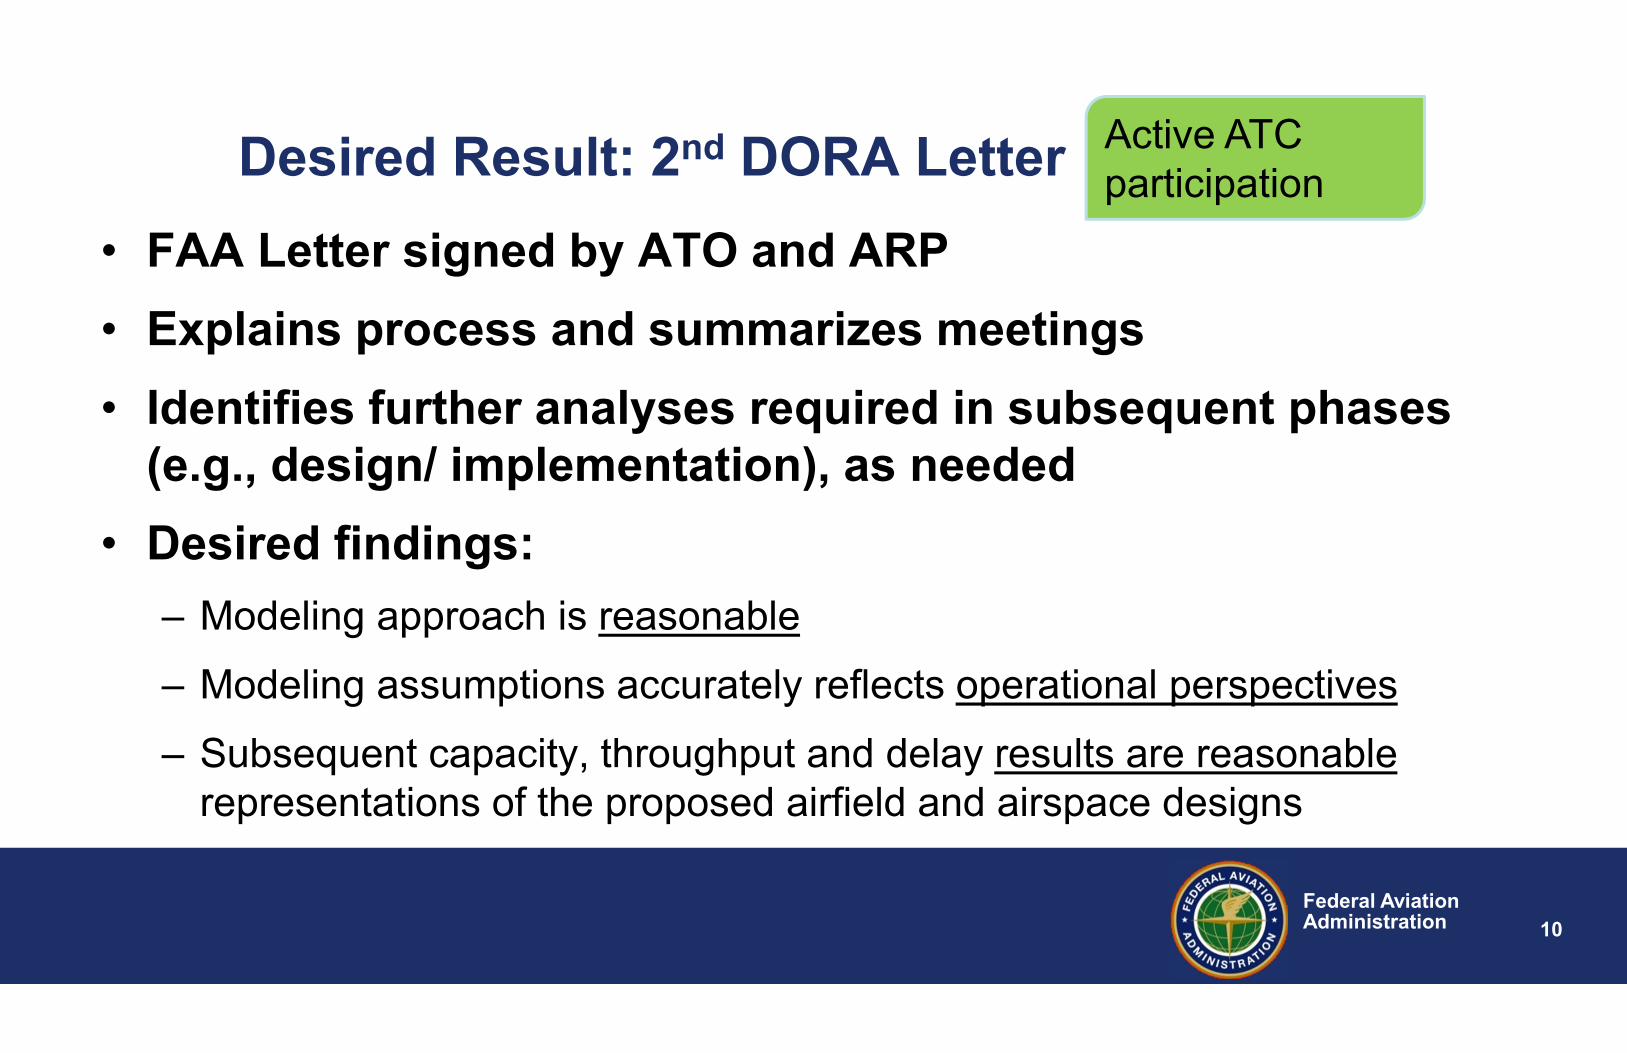
10
Federal AviationAdministration
Desired Result: 2nd DORA Letter
• FAA Letter signed by ATO and ARP
• Explains process and summarizes meetings
• Identifies further analyses required in subsequent phases
(e.g., design/ implementation), as needed
• Desired findings:
– Modeling approach is reasonable
– Modeling assumptions accurately reflects operational perspectives
– Subsequent capacity, throughput and delay results are reasonable
representations of the proposed airfield and airspace designs
Active ATC
participation
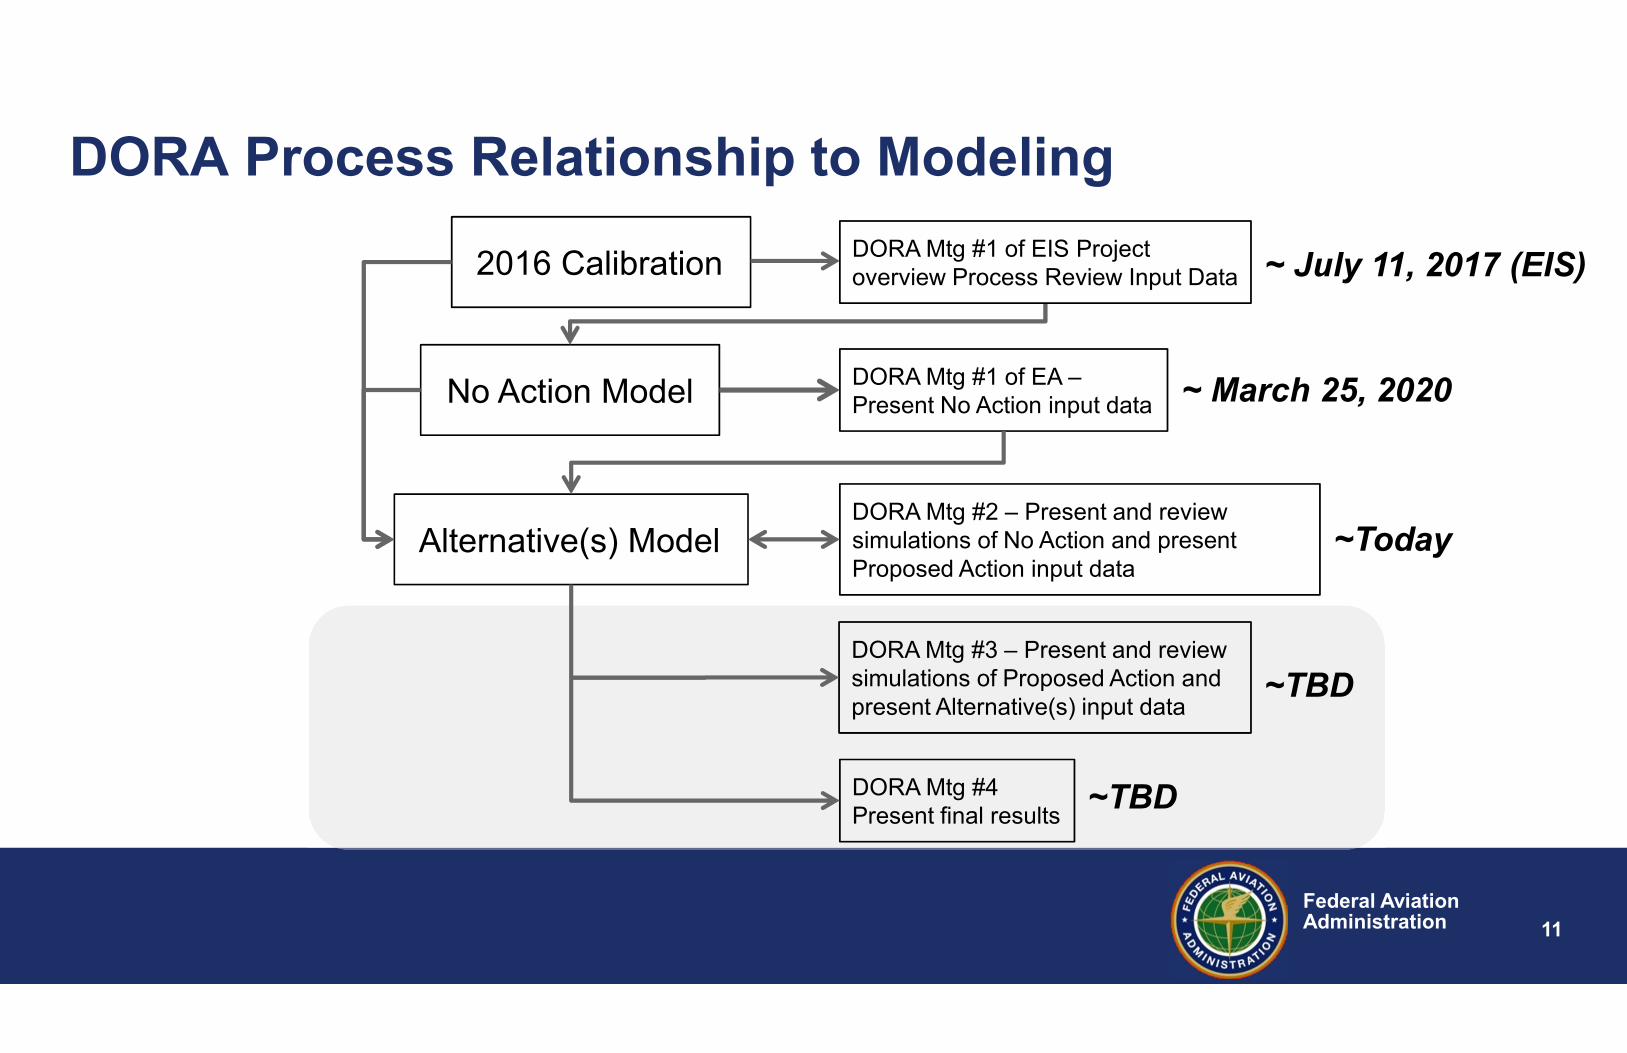
11
Federal AviationAdministration
DORA Process Relationship to Modeling
2016 Calibration
No Action Model
Alternative(s) Model
DORA Mtg #1 of EA –
Present No Action input data
DORA Mtg #2 – Present and review
simulations of No Action and present
Proposed Action input data
DORA Mtg #4
Present final results
~ July 11, 2017 (EIS)
~ March 25, 2020
~Today
~TBD
DORA Mtg #1 of EIS Project
overview Process Review Input Data
DORA Mtg #3 – Present and review
simulations of Proposed Action and
present Alternative(s) input data~TBD
12
EA Process Overview

13
– The CLT Environmental Impact Statement (EIS) that the Federal Aviation Administration (FAA) began was cancelled on February 27, 2019.
– The FAA cancelled the EIS because a runway length analysis determined only a 10,000 foot runway is required to meet the purpose and need.
– The FAA determined that this was a sufficient change to warrant cancellation of the EIS and conversion to an Environmental Assessment (EA).
– The City of Charlotte (Airport Sponsor) is responsible for preparing the EA.
– FAA is still the lead agency.
– Similar to the EIS, the EA will evaluate the potential direct, indirect, and cumulative environmental impacts that may result from the Proposed Action.
EA Process Overview - Background

14
– 4th Parallel Runway (10,000 feet long)– North and South End Around Taxiways
– Extensions of Concourse B and C– Decommissioning Runway 5/23
– Crossfield Corridor
– Dual Taxilanes Around Ramp
– Requires the removal of gates off the end of Concourse D and E
EA Process Overview – Proposed Action
Proposed Action Airfield

15
EA Process Overview
1 Conversion of EIS to EA
2 Confirm Purpose and Need
3 Develop Alternatives
4 Study Affected Environment
5 Analyze Environmental Impact
6 Identify Mitigation
7 Publish Draft EA
8 Public Review Period
9 Hold Public Hearings
10 Publish Final EA
11FAA Issues the Federal
Decision
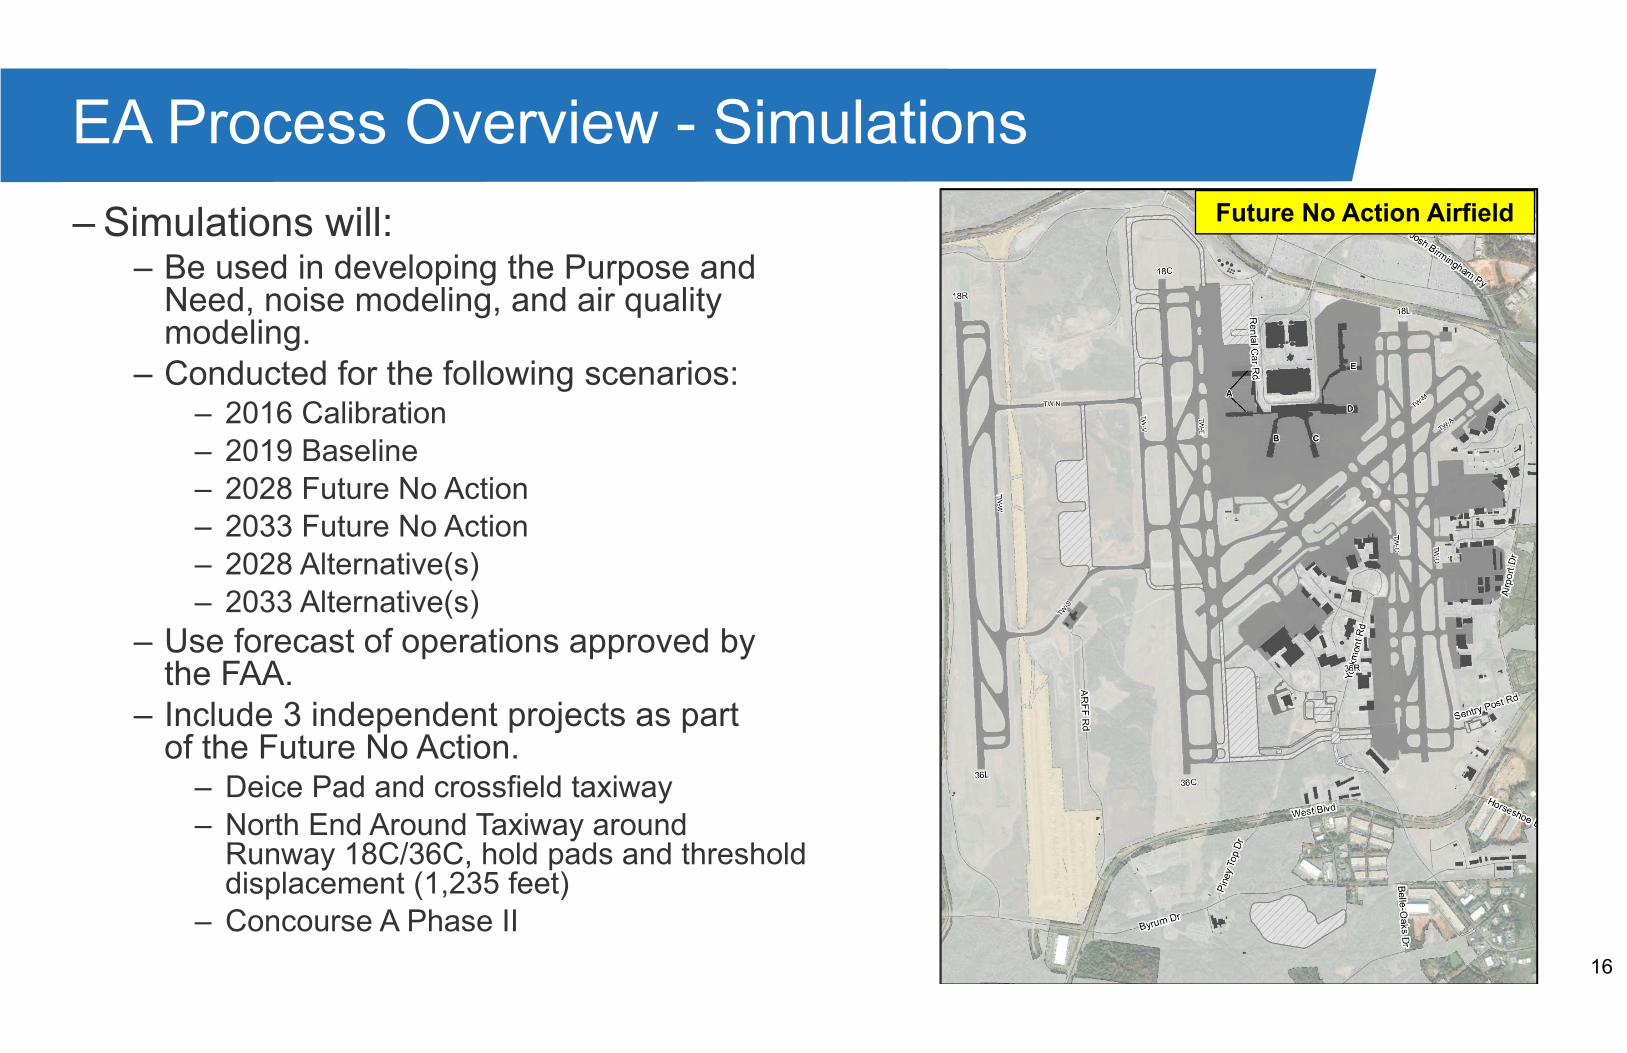
16
– Simulations will:– Be used in developing the Purpose and
Need, noise modeling, and air quality modeling.
– Conducted for the following scenarios:– 2016 Calibration
– 2019 Baseline
– 2028 Future No Action
– 2033 Future No Action
– 2028 Alternative(s)
– 2033 Alternative(s)
– Use forecast of operations approved by the FAA.
– Include 3 independent projects as part of the Future No Action.
– Deice Pad and crossfield taxiway
– North End Around Taxiway around Runway 18C/36C, hold pads and threshold displacement (1,235 feet)
– Concourse A Phase II
EA Process Overview - Simulations
Future No Action Airfield

17
No Action Modeling Simulation Overview

18
– The following items were identified for further discussion by Scott O’Halloran with FAA Local Air Traffic and have been addressed:
– The use of the new west hold pads may be limited as most aircraft without a gate would have taxied past those positions by the time they are notified they need to hold.
– The use of Taxiway B and west on Runway 05/23 was identified as a route that doesn’t happen or is not common within the existing airfield.
– Safety issues regarding the Future No Action taxi flows in South Flow (i.e. the use of Taxiway B and Runway 05/23, the amount of flow on the ramp, and one-way flow on Taxiway E).
Follow Up Comments Addressed From DORA #1

19
No Action Airfield Layout for Simulation
– South Flow Experiments
– 2028 South VMC
– 2028 South IMC
– 2033 South VMC
– 2033 South IMC
– North Flow Experiments
– 2028 North VMC
– 2028 North IMC
– 2033 North VMC
– 2033 North IMC

20
Simulation Flight Schedules
– Total Daily Operations
– 2016: 1,563
– 2028: 1,860
– 2033: 1,978
120
100
80
60
40
20
-
20
40
60
80
100
120
0 1 2 3 4 5 6 7 8 9 10 11 12 13 14 15 16 17 18 19 20 21 22 23
De
pa
rtu
res
Arr
iva
ls
Local Time (Hour)
Rolling Hour Arrival and Departure Demand
2016
2028
2033

21
– Aircraft gate layouts will be input into AirTOp and will include airline assignment and aircraft size restrictions to simulate actual gate usage
– General Aviation and Cargo (FDX/UPS) operations were simulated and parked at their primary facility located on the existing airfield
– Aircraft holdpad and towing areas simulated
– Modeling of future gate capacity
Terminal/Concourse Layout Assumptions
Airline Gating Assignment Assumptions
(2028/2033 Future No Action)
Concourse A AA
Concourse A
(Phase 1 Expansion)OALs
Concourse A
(Phase 2 Expansion)OALs
Concourse B & C AA Mainline
Concourse D AA Mainline, LH
Concourse E AA Regional

22
– Primary Arrival Runways:– Runways 36L & 36R
– Runway 36C (Trips)/Offload
– Primary Departure Runways:– Runway 36C – North & West
– Runway 36C – International Heavy Eastbound
– Runway 36R – East & South
– Single jet departure heading, no fanning
– Prop aircraft make turn immediately after becoming airborne
– Runway 05/23 is used as a taxiway
North VMC/IMC Runway Configuration
18R
36L 36C36R
18C
18L
Ru
nw
ay 1
8R
/36L
Ru
nw
ay 1
8C
/36C
Ru
nw
ay 1
8L
/36R
05
23
360°
050°
Configuration 36L, 36C, 36R 36C, 36R
AAR ADR
VMC 87 69
IMC 80 69

23
– Primary Arrival Runways:– Runways 18L & 18R
– Runway 18C (Trips)/Offload
– Primary Departure Runways:– Runway 18C – North & West
– Runway 18C – International Heavy Eastbound
– Runway 18L – East & South
– Runway 05/23 is used as a taxiway
South VMC/IMC Runway Configuration
190° 175°
18R
36L 36C 36R
18C
18L
Ru
nw
ay 1
8C
/36C
Ru
nw
ay 1
8L
/36R
05
23
Ru
nw
ay 1
8R
/36L
Configuration 18L, 18C, 18R 18C, 18L
AAR ADR
VMC 87 69
IMC 80 69

24
North Flow Aircraft Taxi Flow Animation
Animation
36L
18C
18L
36C 36R
2028/2033 Future No Action Airfield Layout
VMC
Only
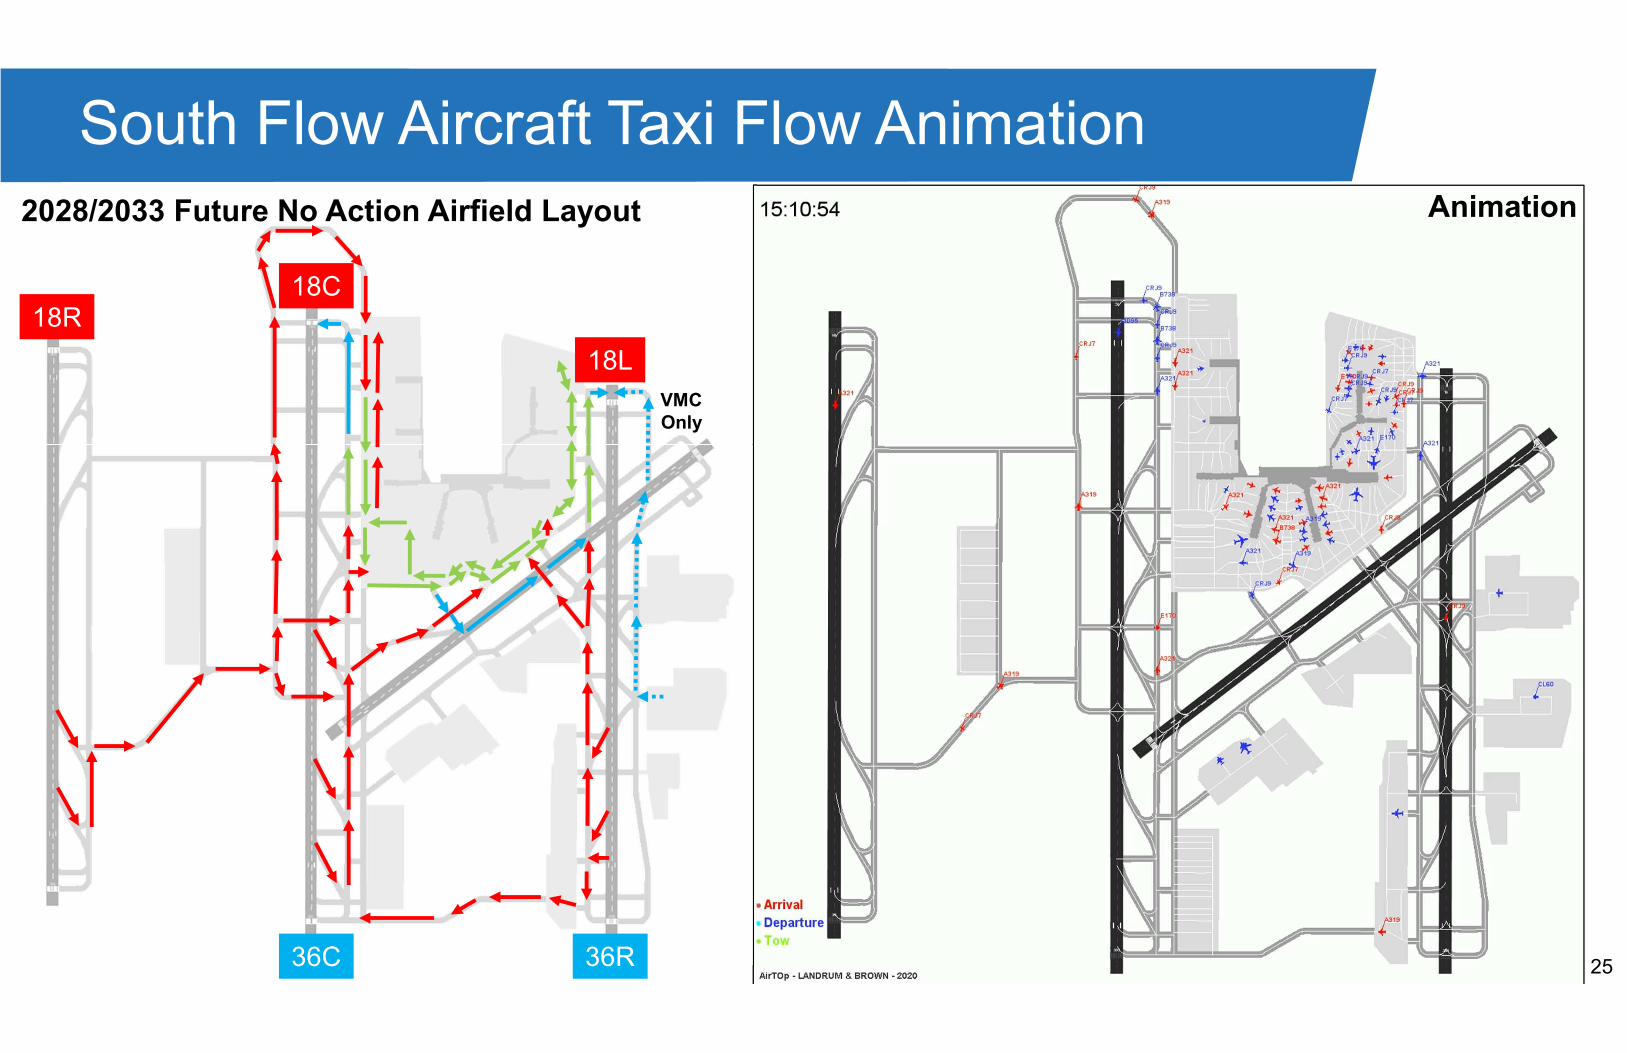
25
South Flow Aircraft Taxi Flow Animation
Animation
18R18C
18L
36C 36R
2028/2033 Future No Action Airfield Layout
VMC
Only

26
Airfield Ground Speed Assumptions – Future No Action
High Speed Exits 32 knots
Outer Perimeter Taxiways* 20 knots
Runway Crossings 18 knots
Taxiways 15 knots
Ramp Area Taxilanes 12 knots
Ramp Area Taxilanes 10 knots
*North EAT and south cross field taxiway are
also assumed to have 20 knot speed limits

27
No Action Airspace Operating Assumptions

28
Airspace Operating Assumptions/Overview
– Simulated airspace is the CLT Metroplex airspace that was modeled in the simulation calibration modeling analysis
– Existing radar data was analyzed and used to determine origin/destination city pair airspace fix assignments for input into the simulation flight schedule
– 6 nm intrail separations were applied at arrival corner post fixes for transition from the center airspace to the terminal environment
– When operating a mixed used runway operation, arrivals block departures 2.3 nm from the runway threshold
– During mixed arrival/departure operation, minimum of 4.5 nm arrival intrail separation is kept to ensure one departure between every arrival

29
Intrail Separation Minimums – Wake RECAT
– Simulation of FAA Wake RECAT separation criteria will be applied to the Baseline and Future No Action scenarios
– Previous simulation modeling and intrail separation analyses indicate minimum arrival separations on final approach range between 3.3nm (VMC) and 3.8nm (IMC)
Source: JO 7110.126A - Consolidated Wake Turbulence (CWT) Separation Standards
Effective Date: September 28, 2019

30
Sample Airport Route/City Pairs
Arrival Route Origin Examples*
North
PARQR TAFTT MDW, CLE, MSP, ORD, SEA
East
CHSLY LYH BOS, EWR, FRA, JFK, LHR
South
BANKR JAX, MIA
West
JONZE BESTT ATL, IAH, MEX
FLIPZ COMDY DEN, DFW, LAX, PDX, SFO
*Note that these lists are not all-inclusive. They merely contain
examples of some of the major
airports that use each route.
Departure Route Destination Examples*
North
JOJJO DODGE MDW, ORD, PDX, SEA
KRITR FILDS BUF, PIT, YYZ
East
KILNS BWI, IAD, EWR, PHL
BARMY RDU BOS, FRA, LGA
South
ICONS JAX, MIA
West
ESTRR AUS, DAL, IAH, MEX
BOBZY BNA DEN, DFW, LAX, PHX, SFO

31
North Flow Arrival Airspace
JONZEBANKR
MLLET
STOCR
FLIPZ
CHSLY
PARQRRunway 36L
Runway 36R
Runway 36C
RASLN
(prop)
BTSEY
(prop)
Note: Arrivals can be
offloaded to other runways
during busy periods
CLT

32
North Flow Departure Airspace
BOBZY
ESTRR
BEAVYICONS
KWEEN
JOJJO
WEAZL
KRITR
KILNS
BARMY
LILLS
Runway 36R
Runway 36C
KNIGHTS
PEKNN
(prop)
KNIGHTS
HAMLN
(prop)
KNIGHTS
ANDYS
(prop)
KNIGHTS
FLYNN
(prop)
Note: BEAVY and ICONS
departures can be offloaded
to 36C during busy periods
CLT
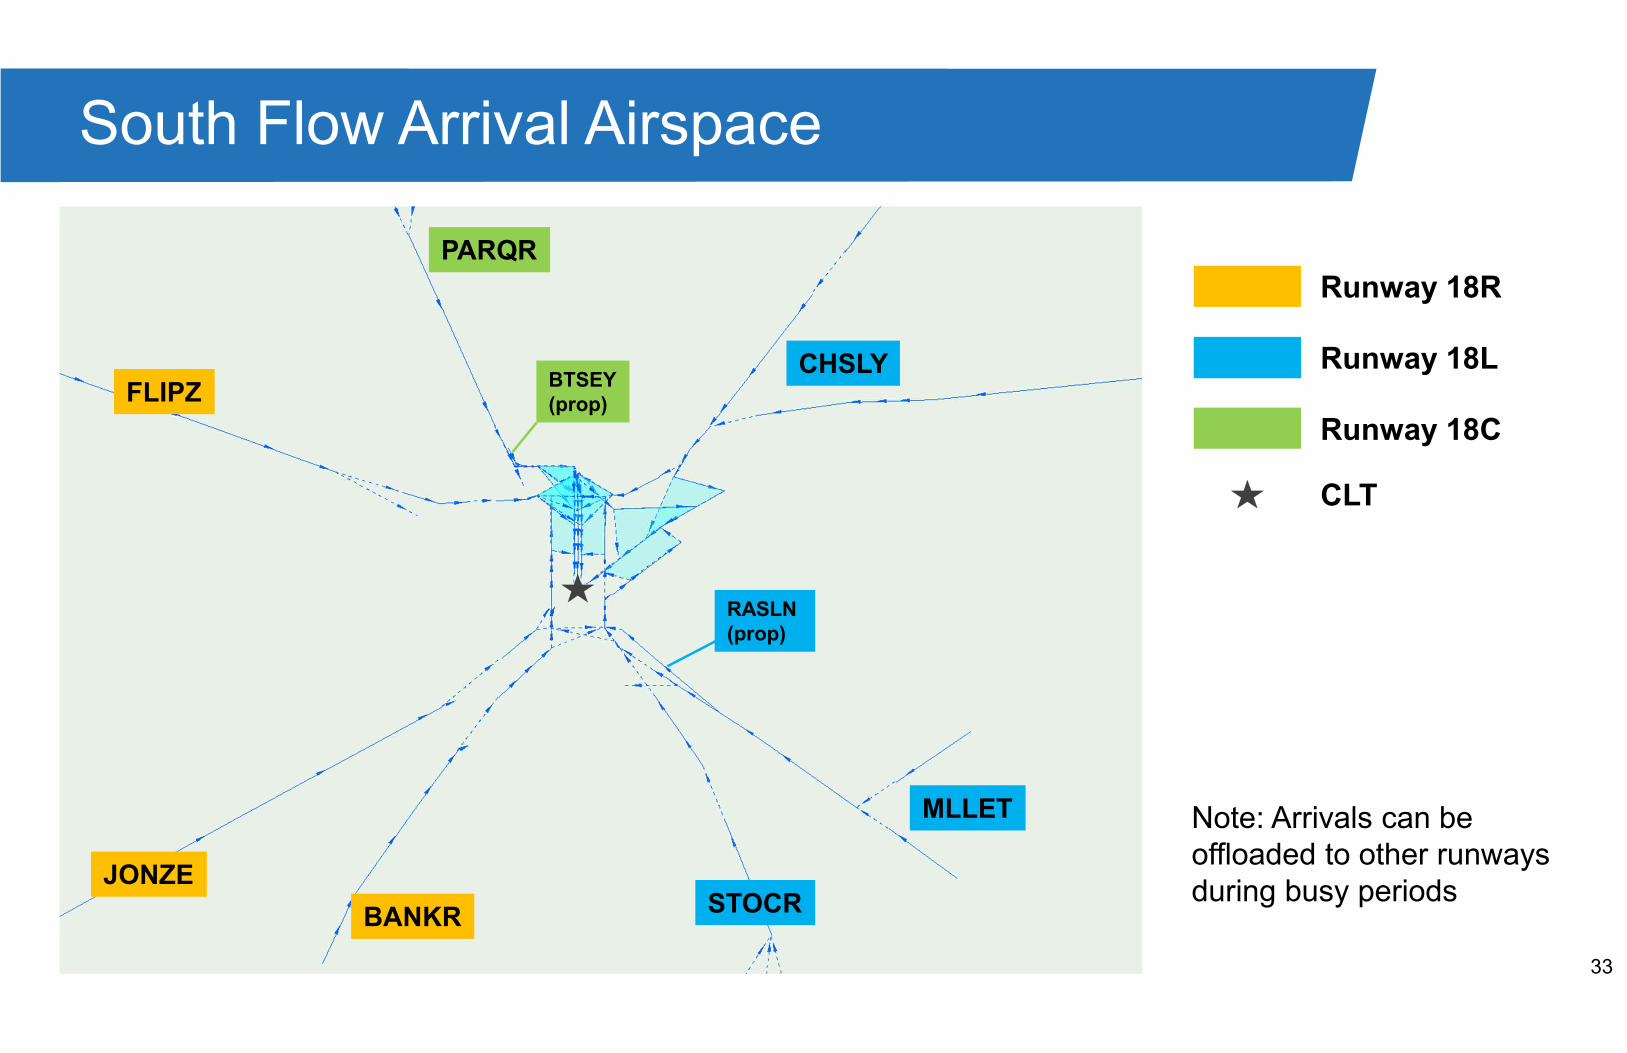
33
South Flow Arrival Airspace
BANKR
JONZE
FLIPZ
STOCR
CHSLY
MLLET
PARQR
Runway 18R
Runway 18L
Runway 18C
BTSEY
(prop)
RASLN
(prop)
Note: Arrivals can be
offloaded to other runways
during busy periods
CLT
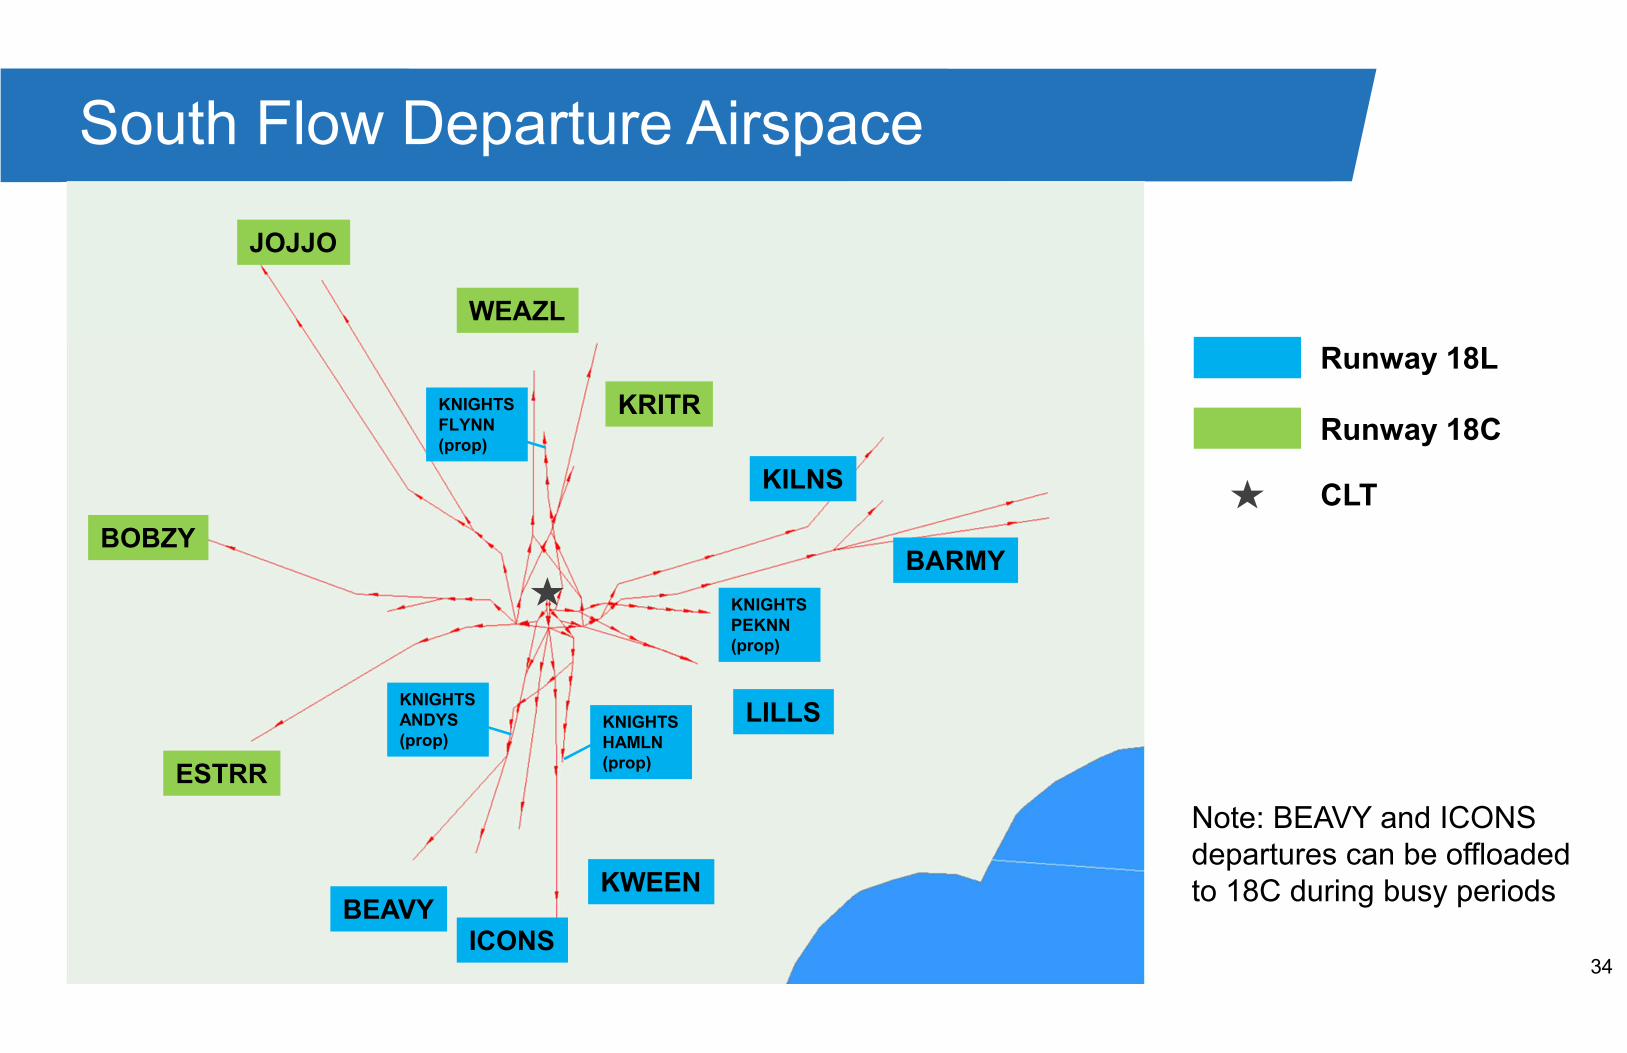
34
South Flow Departure Airspace
JOJJO
BOBZY
BEAVY
ESTRR
KWEEN
WEAZL
ICONS
KRITR
KILNS
BARMY
LILLS
Runway 18L
Runway 18C
KNIGHTS
ANDYS
(prop)
KNIGHTS
PEKNN
(prop)
KNIGHTS
HAMLN
(prop)
KNIGHTS
FLYNN
(prop)
CLT
Note: BEAVY and ICONS
departures can be offloaded
to 18C during busy periods

35
No Action Simulation Modeling Results

36
– A key metric in the simulation analysis is an assessment of the peak hour and total airport throughput achieved in each scenario simulated
– While the maximum throughput is achievable under certain circumstances, it is not a good indication of capacity. Therefore, the 90th percentile hourly rates is used as a measure of capacity per previous DORA stakeholder group recommendations
No Action Simulated Airport Throughput
90th Percentile Simulated Throughput
2016
(1,563 ops.)
2028
(1,860 ops.)
2033
(1,978 ops.)
Peak Hour (Arr. & Deps.) 117 130 133
Peak Hour Arrival 67 71 73
Peak Hour Departure 63 69 70
Maximum Simulated Throughput
2016 2028 2033
Peak Hour (Arr. & Deps.) 127 140 140
Peak Hour Arrival 76 78 79
Peak Hour Departure 82 85 86
Annualized Call Rates*
AAR 86
ADR 69
* Annualized based on the most frequent called rate
for each ASPM configurations and configuration
use percentage for 2019

37
No Action Weighted Aircraft Throughput
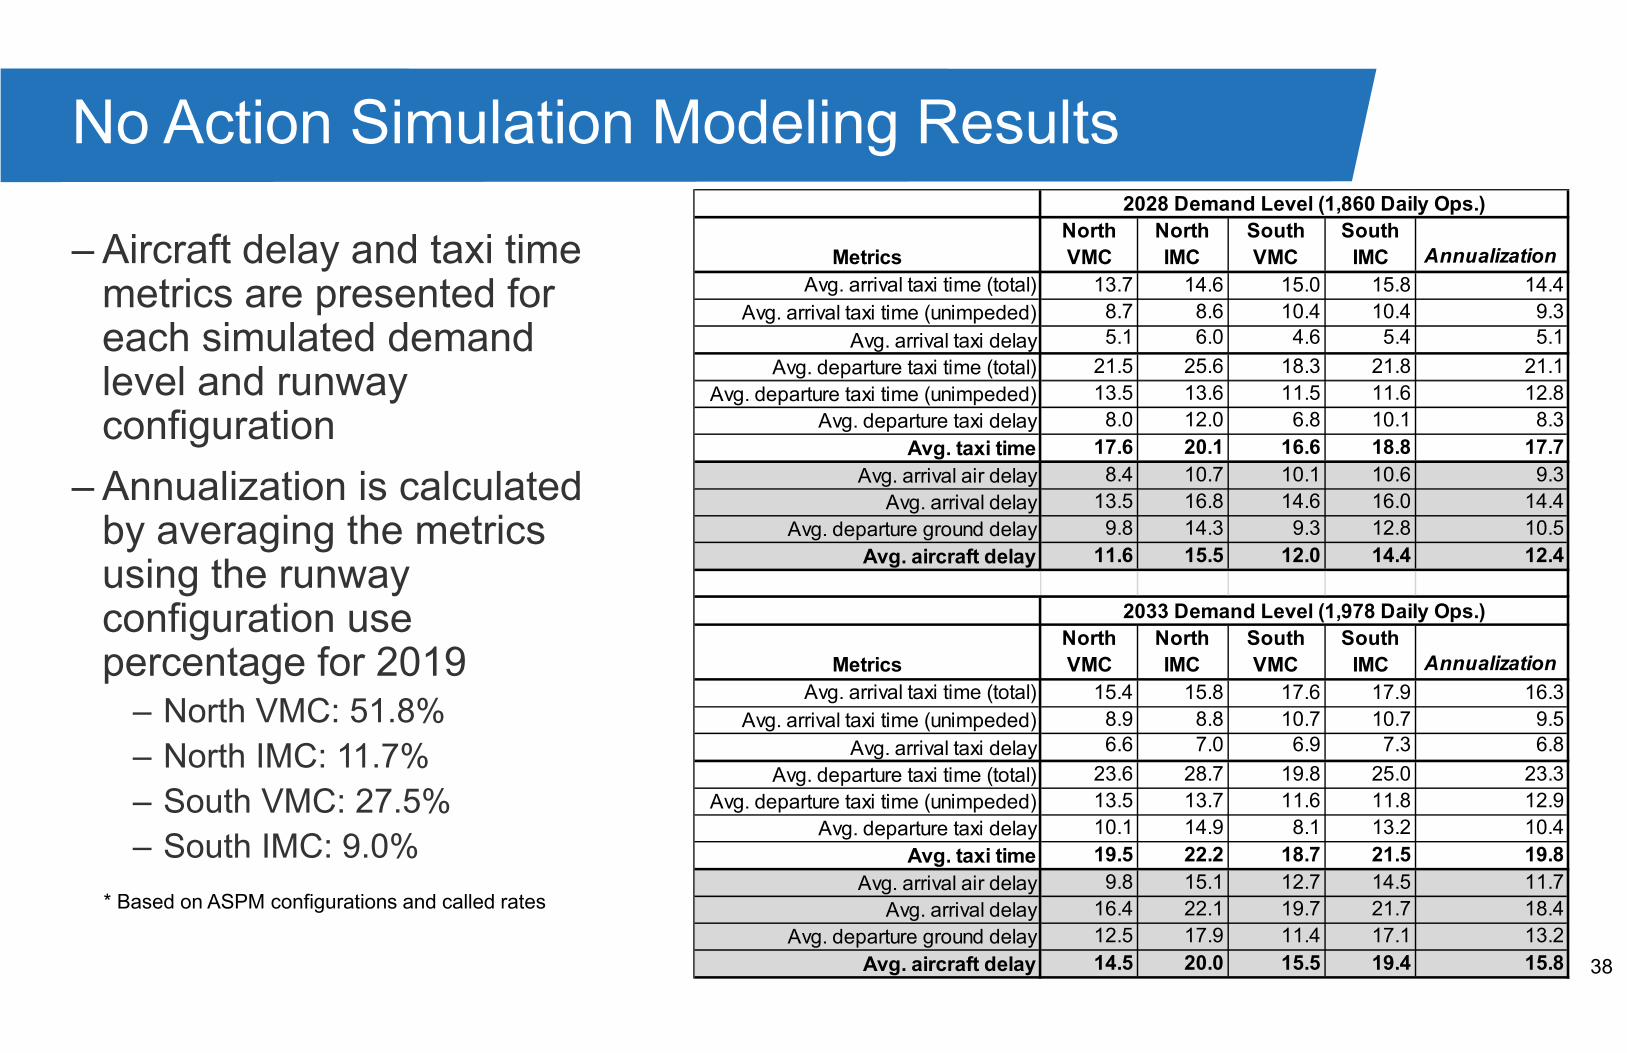
38
No Action Simulation Modeling Results
– Aircraft delay and taxi time metrics are presented for each simulated demand level and runway configuration
– Annualization is calculated by averaging the metrics using the runway configuration use percentage for 2019
– North VMC: 51.8%
– North IMC: 11.7%
– South VMC: 27.5%
– South IMC: 9.0%
* Based on ASPM configurations and called rates
Metrics
North
VMC
North
IMC
South
VMC
South
IMC Annualization
Avg. arrival taxi time (total) 13.7 14.6 15.0 15.8 14.4
Avg. arrival taxi time (unimpeded) 8.7 8.6 10.4 10.4 9.3
Avg. arrival taxi delay 5.1 6.0 4.6 5.4 5.1
Avg. departure taxi time (total) 21.5 25.6 18.3 21.8 21.1
Avg. departure taxi time (unimpeded) 13.5 13.6 11.5 11.6 12.8
Avg. departure taxi delay 8.0 12.0 6.8 10.1 8.3
Avg. taxi time 17.6 20.1 16.6 18.8 17.7
Avg. arrival air delay 8.4 10.7 10.1 10.6 9.3
Avg. arrival delay 13.5 16.8 14.6 16.0 14.4
Avg. departure ground delay 9.8 14.3 9.3 12.8 10.5
Avg. aircraft delay 11.6 15.5 12.0 14.4 12.4
Metrics
North
VMC
North
IMC
South
VMC
South
IMC Annualization
Avg. arrival taxi time (total) 15.4 15.8 17.6 17.9 16.3
Avg. arrival taxi time (unimpeded) 8.9 8.8 10.7 10.7 9.5
Avg. arrival taxi delay 6.6 7.0 6.9 7.3 6.8
Avg. departure taxi time (total) 23.6 28.7 19.8 25.0 23.3
Avg. departure taxi time (unimpeded) 13.5 13.7 11.6 11.8 12.9
Avg. departure taxi delay 10.1 14.9 8.1 13.2 10.4
Avg. taxi time 19.5 22.2 18.7 21.5 19.8
Avg. arrival air delay 9.8 15.1 12.7 14.5 11.7
Avg. arrival delay 16.4 22.1 19.7 21.7 18.4
Avg. departure ground delay 12.5 17.9 11.4 17.1 13.2
Avg. aircraft delay 14.5 20.0 15.5 19.4 15.8
2033 Demand Level (1,978 Daily Ops.)
2028 Demand Level (1,860 Daily Ops.)
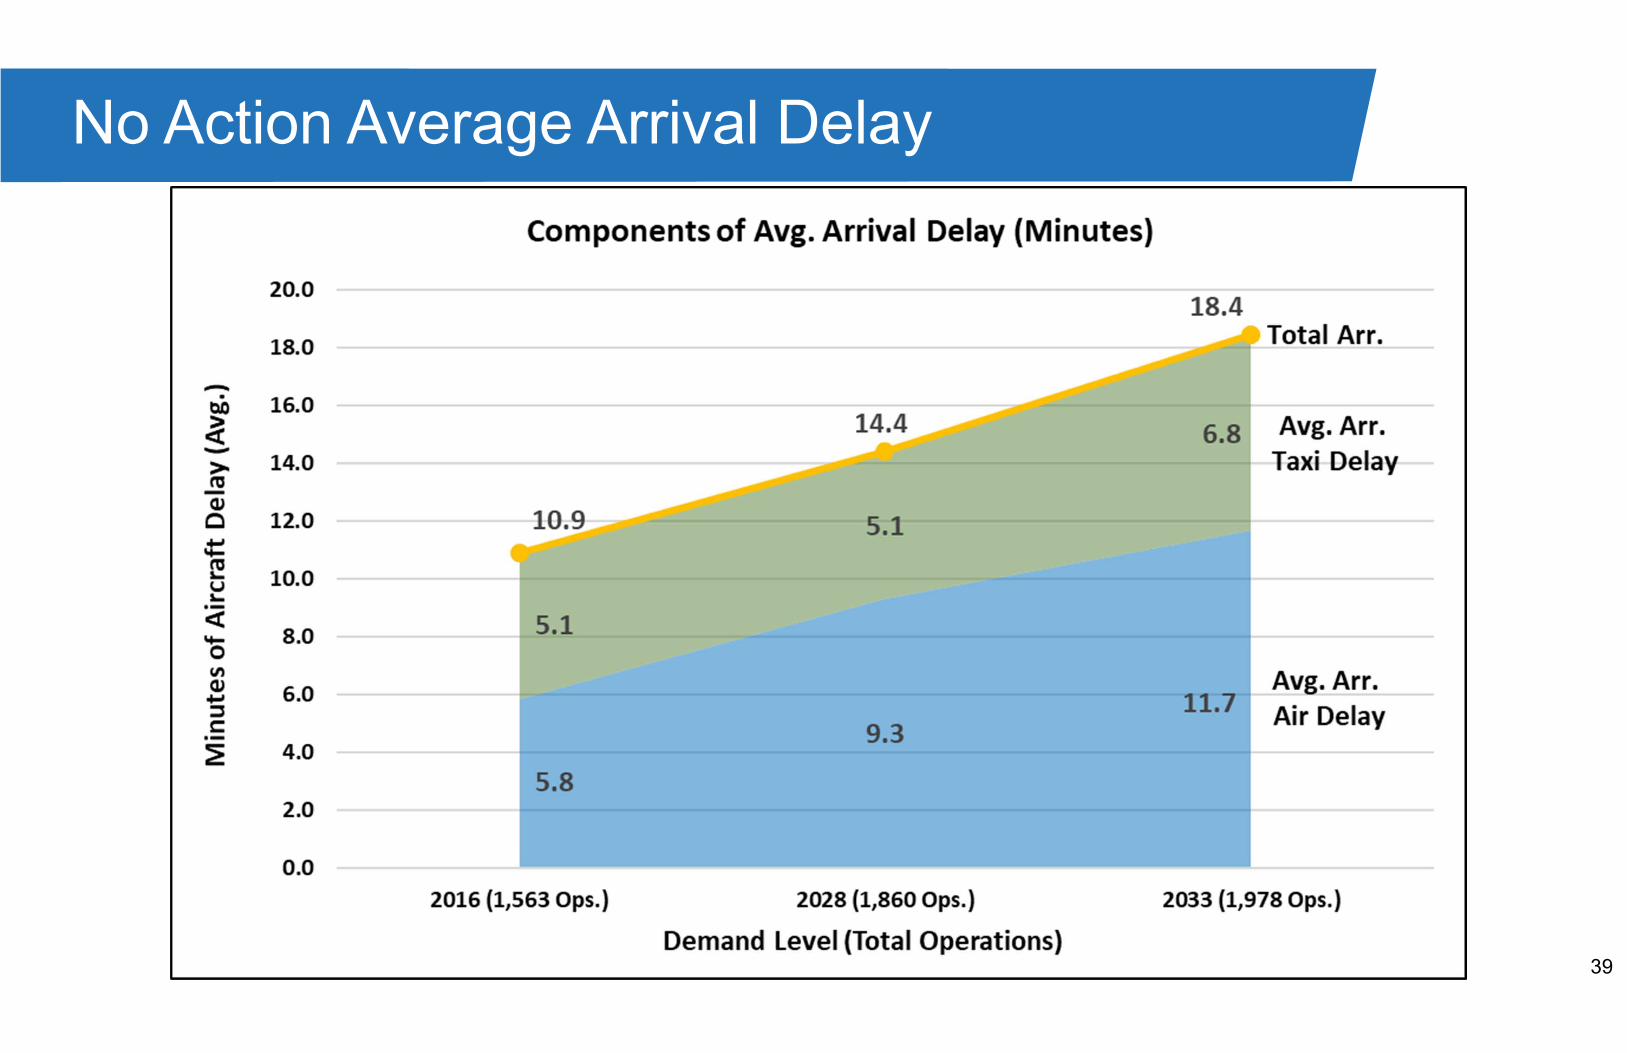
39
No Action Average Arrival Delay
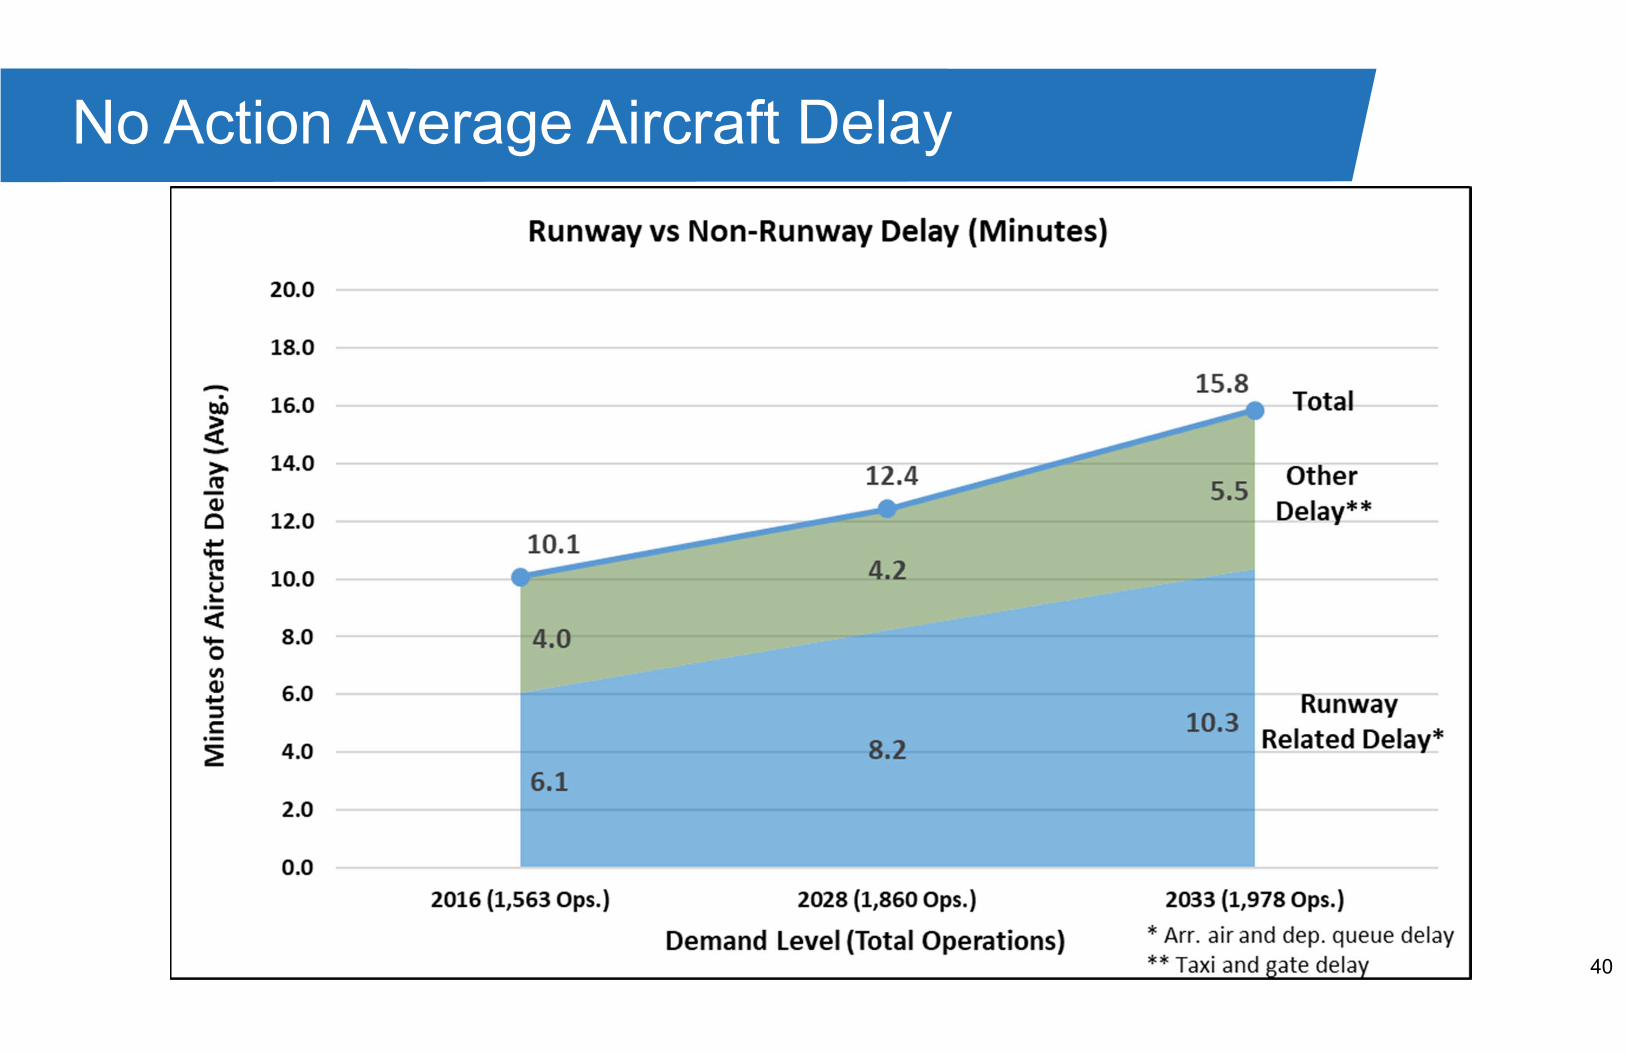
40
No Action Average Aircraft Delay

41
No Action Average Departure Delay

42
No Action Average Aircraft Delay

43
No Action Average Aircraft Taxi Times
44
Proposed Action
Modeling Assumptions

45
Ru
nw
ay 1
8C
/36C
Ru
nw
ay 1
8L
/36R
Ru
nw
ay 1
8R
/36L
Ru
nw
ay 1
9/0
1
Proposed Action Airfield Layout
18R
36C 36R
18C
18L
36L
01
19
Full
North
EAT
Concourse
B & C
Expansion
Full
South
EAT
Dual
Taxilanes
Additional
Taxiway/Taxilane
Infrastructure
– Proposed Action Airfield includes all facilities in the No Action airfield as well as new facilities including:
– Proposed Runway 01/19
– Full End-Around Taxiway (EAT)
– Removal of existing Runway 05/23
– Additional aircraft gates
– Additional taxilanes/taxiways
– EAT usage assumes that arrivals over-the-top of departures is not permitted
– The 2028 and 2033 demand levels will be simulated for the four airport operating configurations
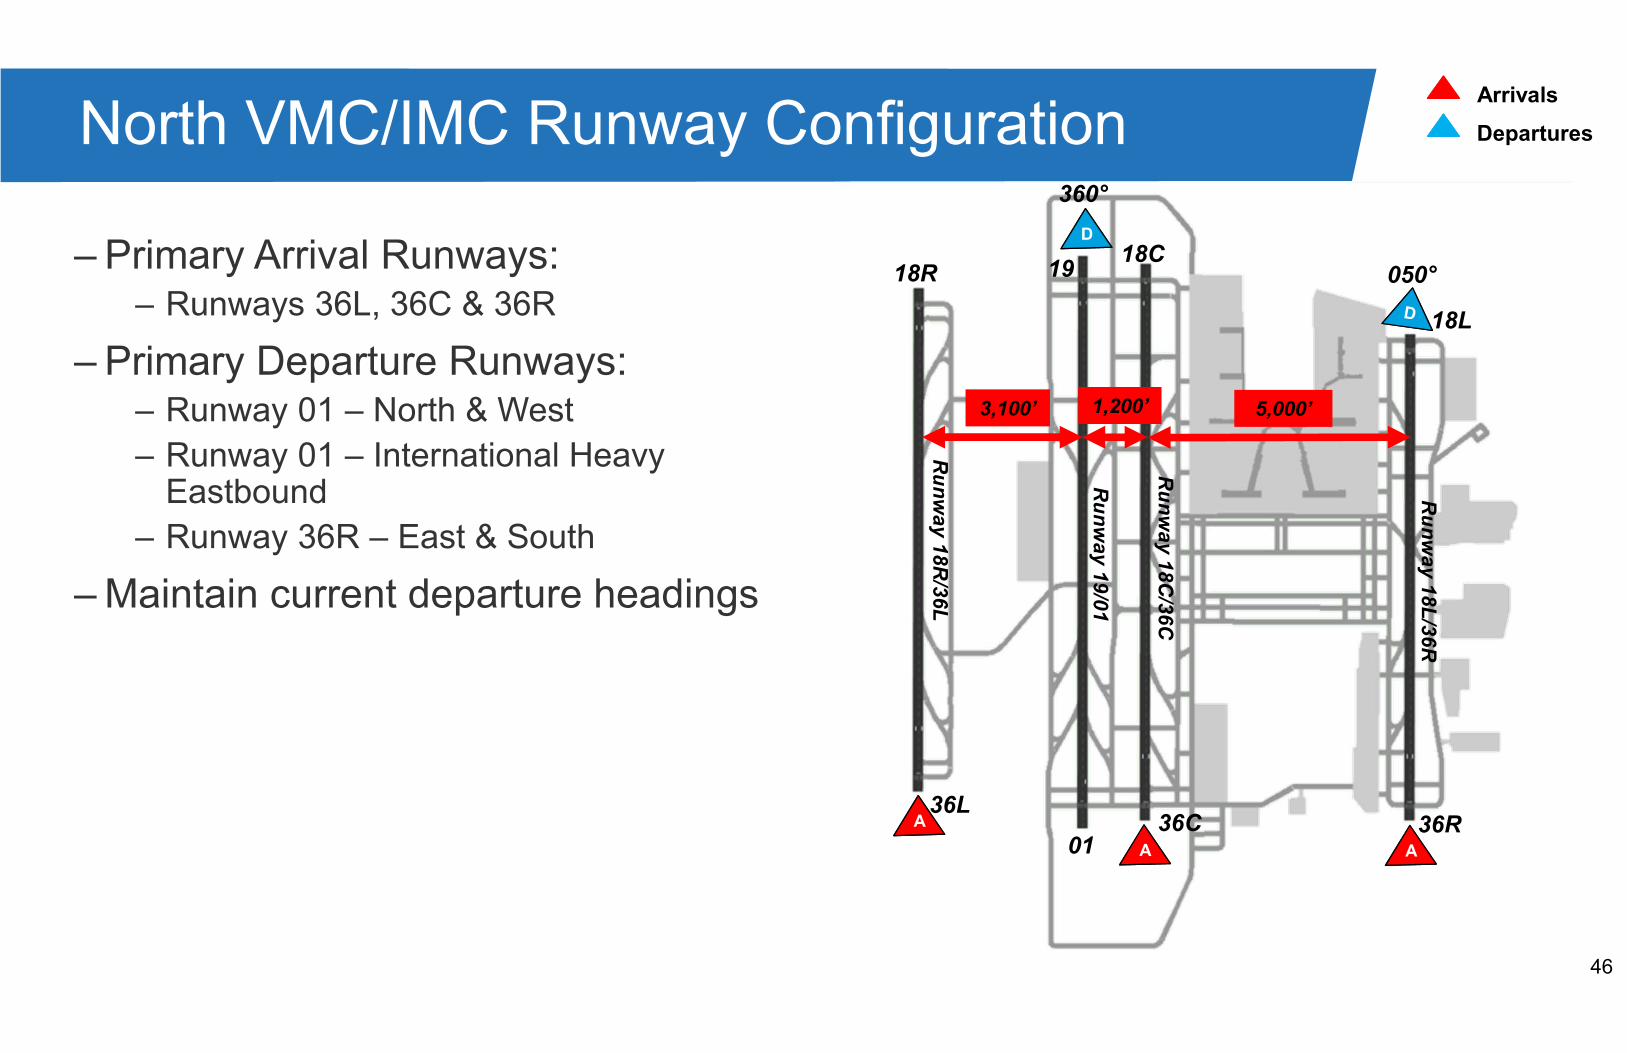
46
– Primary Arrival Runways:– Runways 36L, 36C & 36R
– Primary Departure Runways:– Runway 01 – North & West
– Runway 01 – International Heavy Eastbound
– Runway 36R – East & South
– Maintain current departure headings
North VMC/IMC Runway ConfigurationArrivals
Departures
18R
36C 36R
18C
18L
Ru
nw
ay 1
8C
/36C
Ru
nw
ay 1
8L
/36R
Ru
nw
ay 1
8R
/36L
Ru
nw
ay 1
9/0
1
36L
01
360°
050°19
3,100’ 1,200’ 5,000’

47
South VMC/IMC Runway ConfigurationArrivals
Departures
190°
175°
18R
36L36C
36R
18C
18L
Ru
nw
ay 1
8C
/36C
Ru
nw
ay 1
8L
/36R
Ru
nw
ay 1
8R
/36L
Ru
nw
ay 1
9/0
1
19– Primary Arrival Runways:– Runways 18L, 18C & 18R
– Primary Departure Runways:– Runway 19 – North & West
– Runway 19 – International Heavy Eastbound
– Runway 18L – East & South
– Maintain current departure headings
3,100’ 1,200’ 5,000’
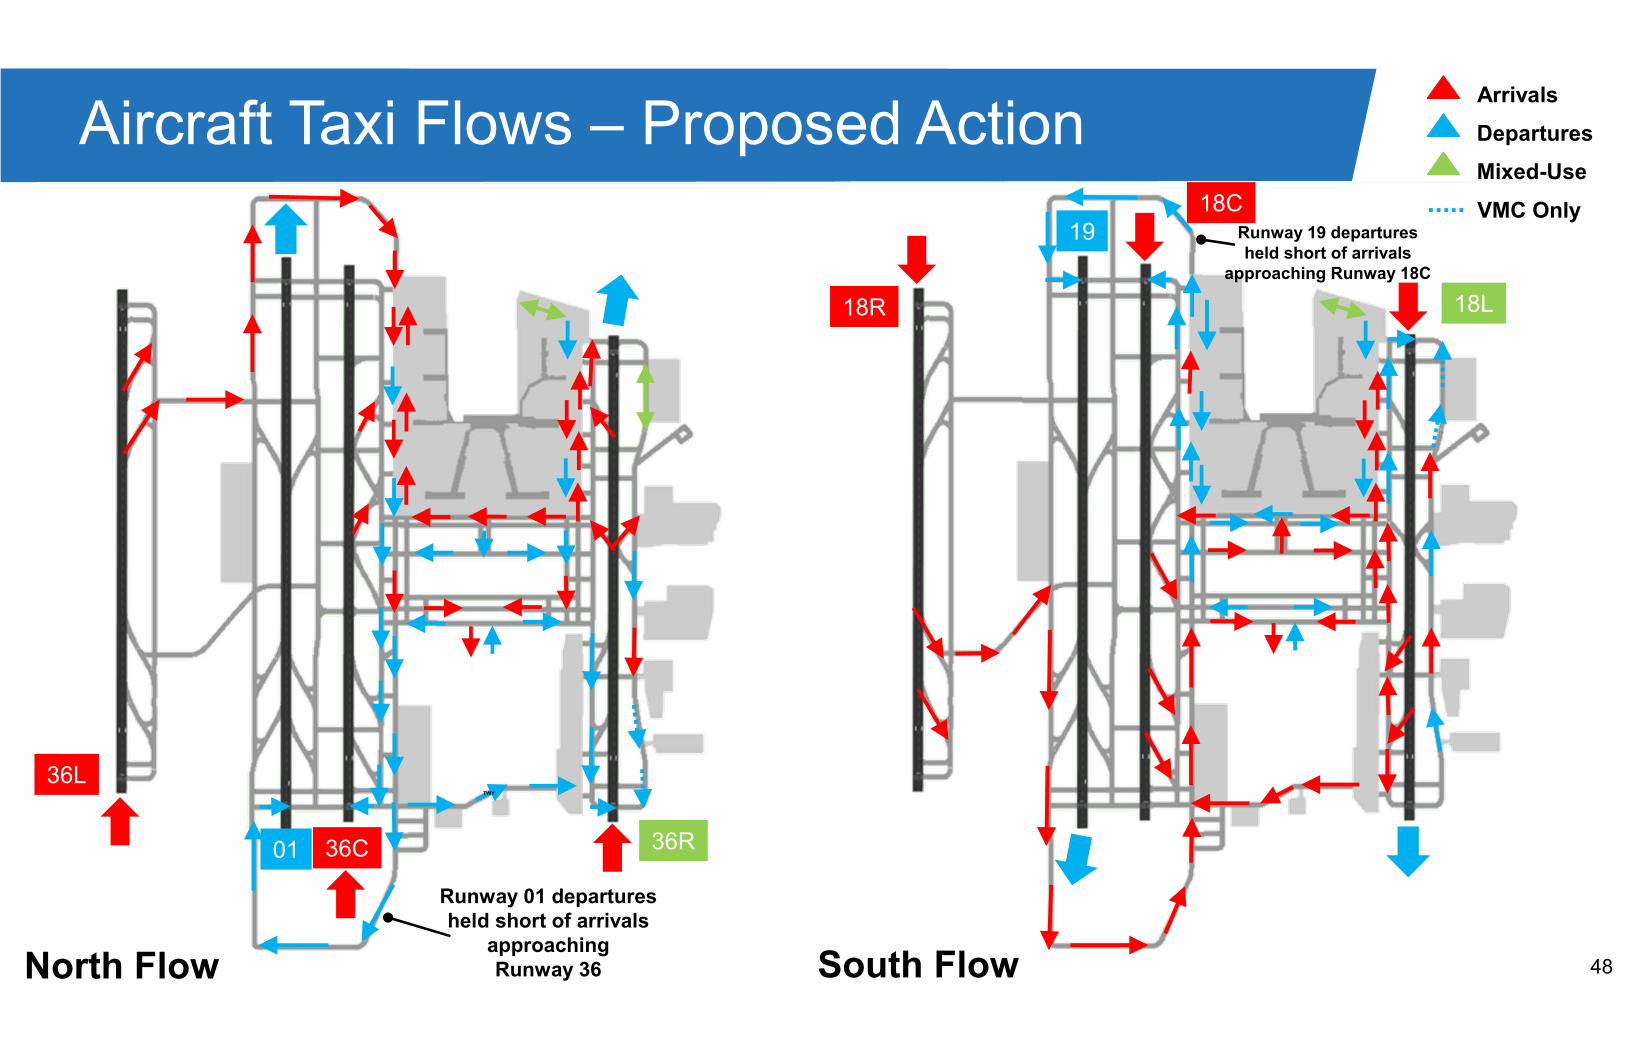
48
Aircraft Taxi Flows – Proposed ActionArrivals
Departures
Mixed-Use
North Flow
36C 36R
36L
South Flow
18R
18C
18L
19
01
Runway 01 departures
held short of arrivals
approaching
Runway 36
Runway 19 departures
held short of arrivals
approaching Runway 18C
VMC Only
TWY
49
Proposed Action Airspace
Modeling Assumptions

50
Intrail Separation Minimums – Wake RECAT
– Simulation of FAA Wake RECAT separation criteria will be applied to the Baseline and Future No Action scenarios
– Previous simulation modeling and intrail separation analyses indicate minimum arrival separations on final approach range between 3.3nm (VMC) and 3.8nm (IMC)
Source: JO 7110.126A - Consolidated Wake Turbulence (CWT) Separation Standards
Effective Date: September 28, 2019
51
Sample Airport Route/City Pairs
Arrival Route Origin Examples*
North
PARQR TAFTT MDW, CLE, MSP, ORD, SEA
East
CHSLY LYH BOS, EWR, FRA, JFK, LHR
South
BANKR JAX, MIA
West
JONZE BESTT ATL, IAH, MEX
FLIPZ COMDY DEN, DFW, LAX, PDX, SFO
*Note that these lists are not all-inclusive. They merely contain
examples of some of the major
airports that use each route.
Departure Route Destination Examples*
North
JOJJO DODGE MDW, ORD, PDX, SEA
KRITR FILDS BUF, PIT, YYZ
East
KILNS BWI, IAD, EWR, PHL
BARMY RDU BOS, FRA, LGA
South
ICONS JAX, MIA
West
ESTRR AUS, DAL, IAH, MEX
BOBZY BNA DEN, DFW, LAX, PHX, SFO
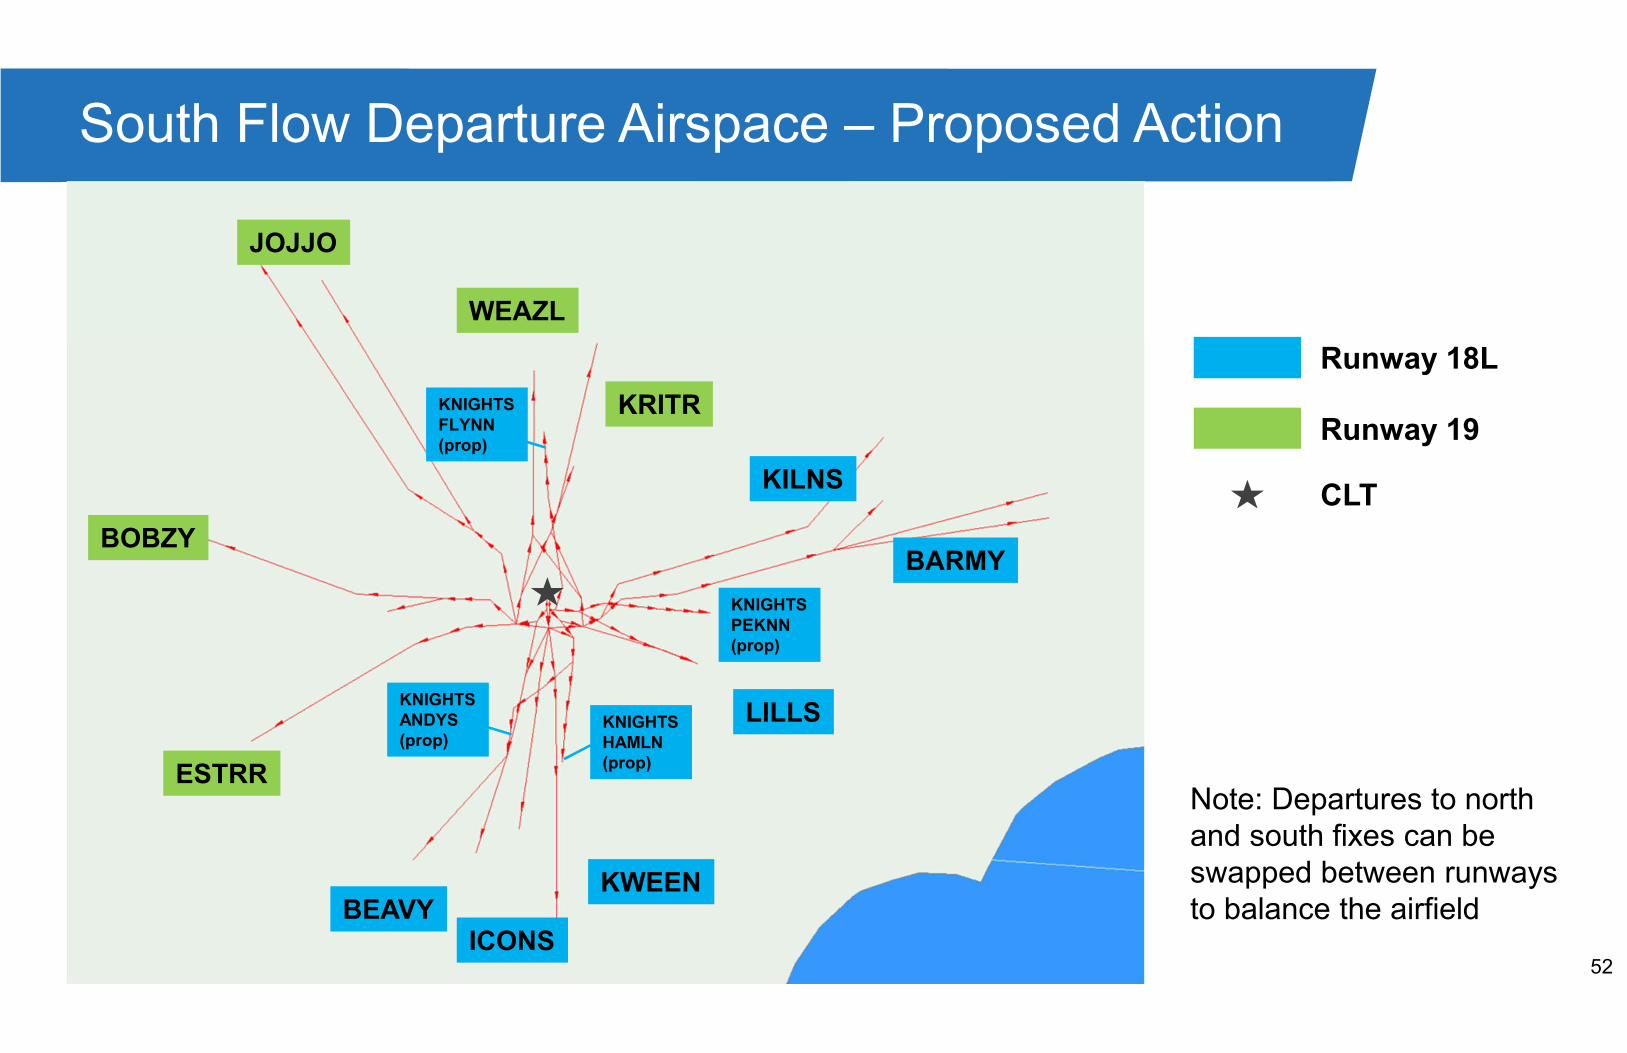
52
South Flow Departure Airspace – Proposed Action
JOJJO
BOBZY
BEAVY
ESTRR
KWEEN
WEAZL
ICONS
KRITR
KILNS
BARMY
LILLS
Runway 18L
Runway 19
KNIGHTS
ANDYS
(prop)
KNIGHTS
PEKNN
(prop)
KNIGHTS
HAMLN
(prop)
KNIGHTS
FLYNN
(prop)
Note: Departures to north
and south fixes can be
swapped between runways
to balance the airfield
CLT

53
North Flow Departure Airspace – Proposed Action
BOBZY
ESTRR
BEAVYICONS
KWEEN
JOJJO
WEAZL
KRITR
KILNS
BARMY
LILLS
Runway 36R
Runway 01
KNIGHTS
PEKNN
(prop)
KNIGHTS
HAMLN
(prop)
KNIGHTS
ANDYS
(prop)
KNIGHTS
FLYNN
(prop)
CLT
Note: Departures to north
and south fixes can be
swapped between runways
to balance the airfield

54
South Flow Arrival Airspace – Proposed Action
BANKR
JONZE
FLIPZ
STOCR
CHSLY
MLLET
PARQRRunway 18R
Runway 18L
Runway 18CBTSEY
(prop)
RASLN
(prop)
Note: Arrivals can be
offloaded to other runways
during busy periods
CLT

55
North Flow Arrival Airspace – Proposed Action
JONZEBANKR
MLLET
STOCR
FLIPZ
CHSLY
PARQRRunway 36L
Runway 36R
Runway 36C
RASLN
(prop)
BTSEY
(prop)
Note: Arrivals can be
offloaded to other runways
during busy periods
CLT

56
– Provide comments to EA Team by June 18th, 2020– Send comments to [email protected]
– Incorporate comments from DORA Team
– Conduct the Proposed Action modeling analysis
– Conduct alternatives evaluation
– DORA Meeting #3 – present results of the Proposed Action and Alternatives modeling analysis (tentative mid-July 2020)
– Continue preparation of the Draft EA
Next Steps
1
CLT DORA (Direction, Oversight, Review & Agree) Meeting #3
November 6, 2020
2
– Role Call
– Meeting Objectives
– DORA Process
– EA Process Overview
– Proposed Action Modeling Results
– Alternatives Modeling Assumptions– Alternatives Development and Screening– Alternatives Airspace Assumptions– Alternatives Taxi Flow Assumptions
– Next Steps
Agenda

3
Meeting Objectives
4
– To present the Proposed Action simulation modeling results
– To present the alternatives modeling assumptions
– To present the next steps in the overall project
Meeting Objectives
5
DORA Process

Federal AviationAdministrationCharlotte Douglas International
Airport EADORA Process Overview
Prepared for: CLT EA DORA Meeting #3
By: Kent Duffy
Date: November 6, 2020

7
Federal AviationAdministration
What is DORA?• DORA =
Direction, Oversight, Review and Agree• Obtaining and understanding controller input on operational issues and
viability of proposed alternatives is a key to airport capacity development
• DORA has been applied successfully to other large-scale airport and airspace modernization efforts (e.g., O’Hare Modernization Program)

8
Federal AviationAdministration
Objectives: Why are we here?• Ensure collaboration w/ATO on simulation activities as needed to complete EA
– Obtain input development of the simulation model
– Revise and refine simulation model, rather than develop new alternatives
• Build from successful process used during planning phase– Update with recent changes: forecast trends, CRO, metroplex, heading usage, Atlantic coast
routes, etc.
– Validate operating assumptions used in the simulation model
• Airspace flows and procedures, Runway usage and balancing, Aircraft separation and buffers, Taxi-flows and ground movement, etc.
– Review and validate airspace’s ability to accommodate new runway throughput
• Collaboration ensures the simulation results can be used in the EA analyses with confidence

9
Federal AviationAdministration
Planning Phase DORA Letter

10
Federal AviationAdministration
Desired Result: 2nd DORA Letter
• FAA Letter signed by ATO and ARP
• Explains process and summarizes meetings
• Identifies further analyses required in subsequent phases (e.g., design/ implementation), as needed
• Desired findings:
– Modeling approach is reasonable
– Modeling assumptions accurately reflects operational perspectives
– Subsequent capacity, throughput and delay results are reasonablerepresentations of the proposed airfield and airspace designs
Active ATC participation

11
Federal AviationAdministration
DORA Process Relationship to Modeling
2016 Calibration
No Action Model
Alternative(s) Model
DORA Mtg #1 of EA –Present No Action input data
DORA Mtg #2 – Present and review simulations of No Action and present Proposed Action input data
DORA Mtg #4Present final results
~ July 11, 2017 (EIS)
~ March 25, 2020
~June 11, 2020
~TBD
DORA Mtg #1 of EIS Project overview Process Review Input Data
DORA Mtg #3 – Present and review simulations of Proposed Action and present Alternative(s) input data
~ Today

12
EA Process Overview
13
– The CLT Environmental Impact Statement (EIS) that the Federal Aviation Administration (FAA) began was cancelled on February 27, 2019.
– The FAA cancelled the EIS because a runway length analysis determined only a 10,000 foot runway is required to meet the purpose and need.
– The FAA determined that this was a sufficient change to warrant cancellation of the EIS and conversion to an Environmental Assessment (EA).
– The City of Charlotte (Airport Sponsor) is responsible for preparing the EA.
– FAA is still the lead agency.
– Similar to the EIS, the EA will evaluate the potential direct, indirect, and cumulative environmental impacts that may result from the Proposed Action.
EA Process Overview - Background

14
– 4th Parallel Runway (10,000 feet long)– North and South End Around Taxiways
– Extensions of Concourse B and C– Decommissioning Runway 5/23
– Dual Taxilanes Around Ramp– Requires the removal of gates off the end of
Concourse D and E
– Crossfield Corridors
EA Process Overview – Proposed ActionProposed Action Airfield

15
– Simulations will:– Be used in developing the Purpose and
Need, noise modeling, and air quality modeling.
– Conducted for the following scenarios:– 2016 Calibration - Complete– 2019 Baseline - Complete– 2028 Future No Action - Complete– 2033 Future No Action - Complete– 2028 Alternative(s) - Underway– 2033 Alternative(s) - Underway
– Use forecast of operations approved by the FAA.
– Include 3 independent projects as part of the Future No Action.
– Deice Pad and crossfield taxiway– North End Around Taxiway around
Runway 18C/36C, hold pads and threshold displacement (1,235 feet)
– Concourse A Phase II
EA Process Overview - SimulationsFuture No Action Airfield
16
Proposed Action Simulation Modeling Results

17
– Aircraft taxiing on the North and South EATs require large arrival gaps on Runway 18C/36C approach
– 8nm gap for NEAT – 9nm gap for SEAT
– Arrival gap requirement may hinder efficient operations – Reduced arrival capacity on Runway 18C/36C – Increased ground holding times for aircraft holding short of the EAT as arrivals over-the-
top of taxiing aircraft is not currently permitted
– Therefore, two EAT scenarios were evaluated– Scenario 1: All operations use EATs (no runway crossings)– Scenario 2: Departures use Taxiway V and arrivals use EATs
Proposed Action EAT Usage Assumption
Proposed Action Scenario Advantages Disadvantages
Scenario 1 • Avoid runway crossings• Long departure taxi distance• Departures on EAT hold short of approach• Gap needed in arrival stream
Scenario 2 • Short departure taxi distance• Runway crossings • Queue for crossing extends into apron area during peak
in south flow
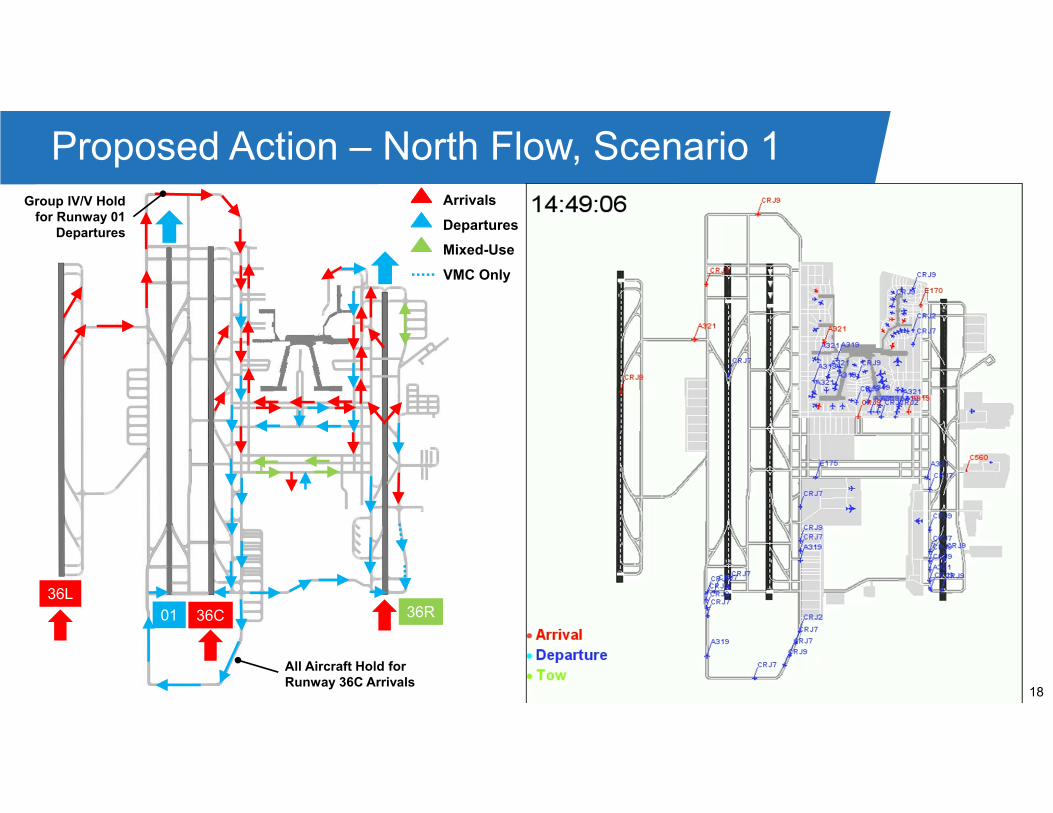
18
Proposed Action – North Flow, Scenario 1
36C 36R36L
01
Arrivals
Departures
Mixed-Use
VMC Only
Group IV/V Holdfor Runway 01
Departures
All Aircraft Hold forRunway 36C Arrivals

19
Proposed Action – South Flow, Scenario 1
Arrivals
Departures
Mixed-Use
VMC Only
18R
18C
18L
19All Aircraft Hold for Runway 18C Arrivals
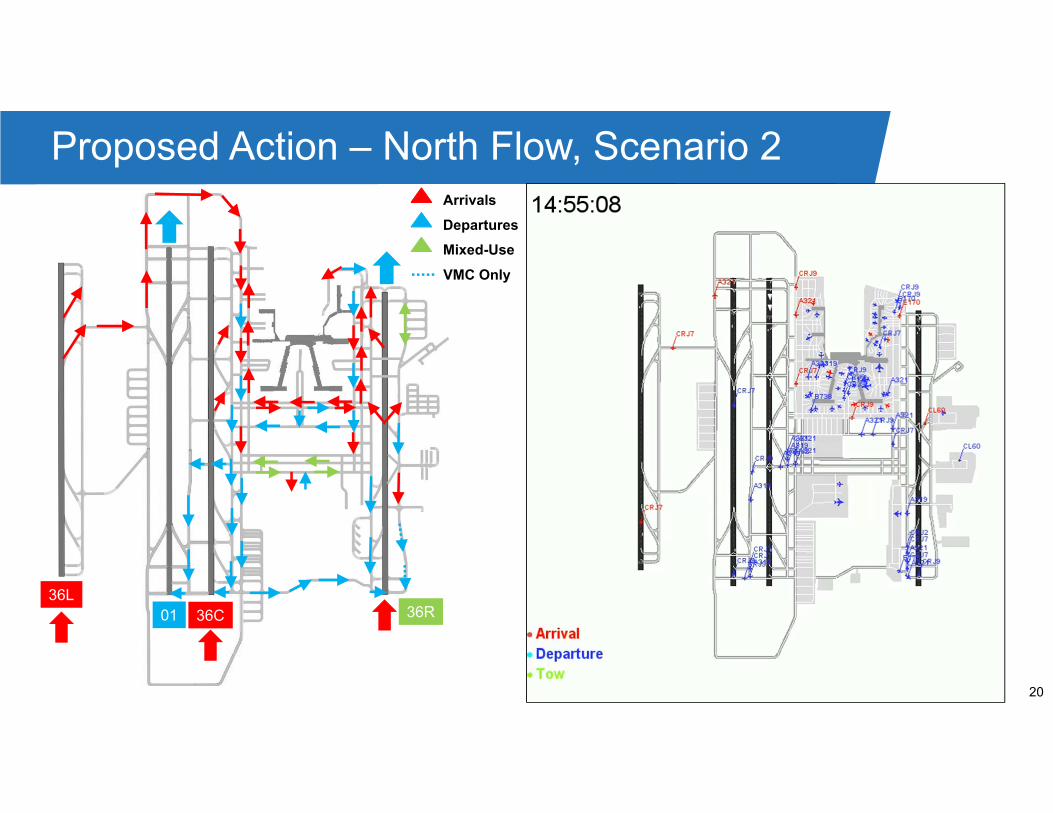
20
Proposed Action – North Flow, Scenario 2Arrivals
Departures
Mixed-Use
VMC Only
36C 36R36L
01

21
Proposed Action – South Flow, Scenario 2
Arrivals
Departures
Mixed-Use
VMC Only
18R18L
18C
19

22
Proposed Action Weighted Aircraft Throughput
Prop. Act. Scenario 1: All operations use EATs (no runway crossings)Prop. Act. Scenario 2: Departures use Taxiway V and arrivals use EATs

23
Proposed Action Total Time Including Delay
Prop. Act. Scenario 1: All operations use EATs (no runway crossings)Prop. Act. Scenario 2: Departures use Taxiway V and arrivals use EATs
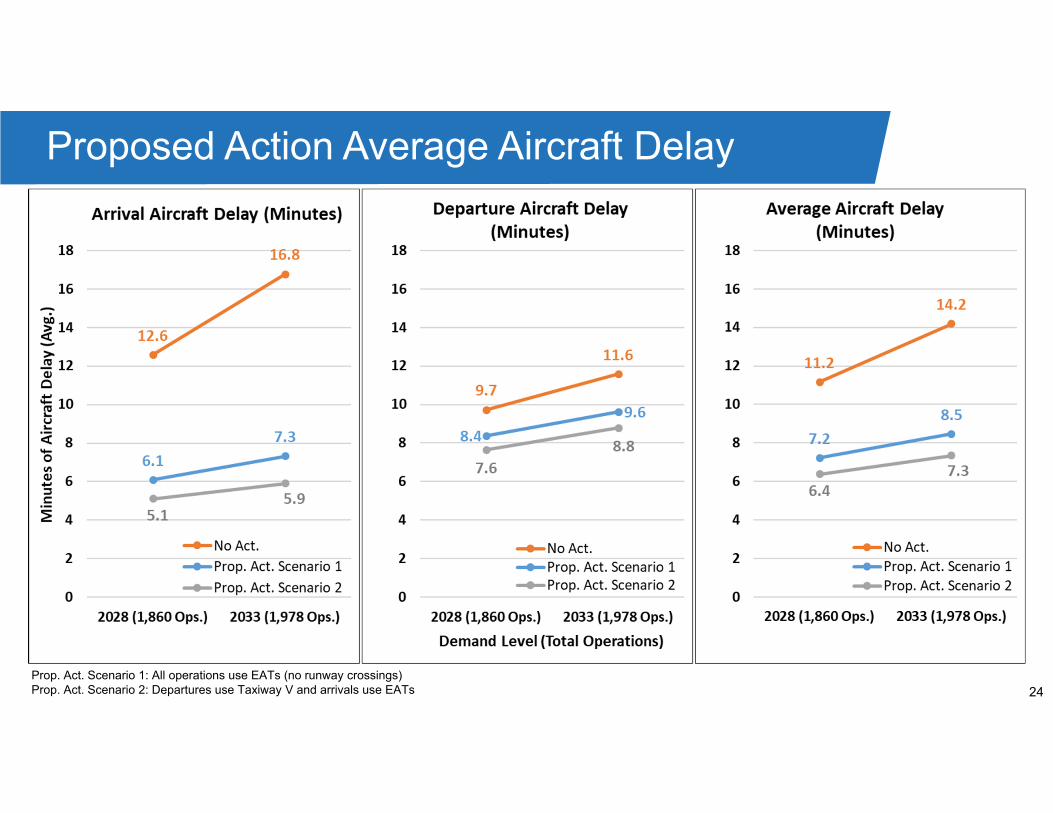
24
Proposed Action Average Aircraft Delay
Prop. Act. Scenario 1: All operations use EATs (no runway crossings)Prop. Act. Scenario 2: Departures use Taxiway V and arrivals use EATs
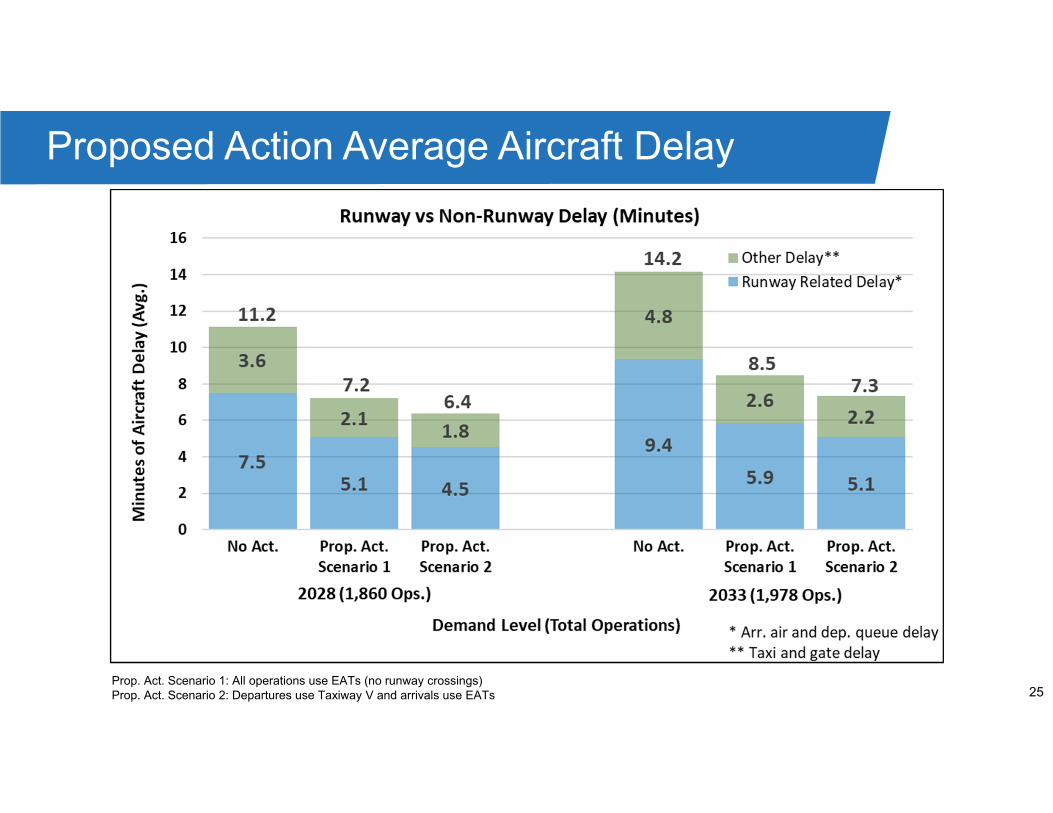
25
Proposed Action Average Aircraft Delay
Prop. Act. Scenario 1: All operations use EATs (no runway crossings)Prop. Act. Scenario 2: Departures use Taxiway V and arrivals use EATs

26
Alternatives Development and Screening
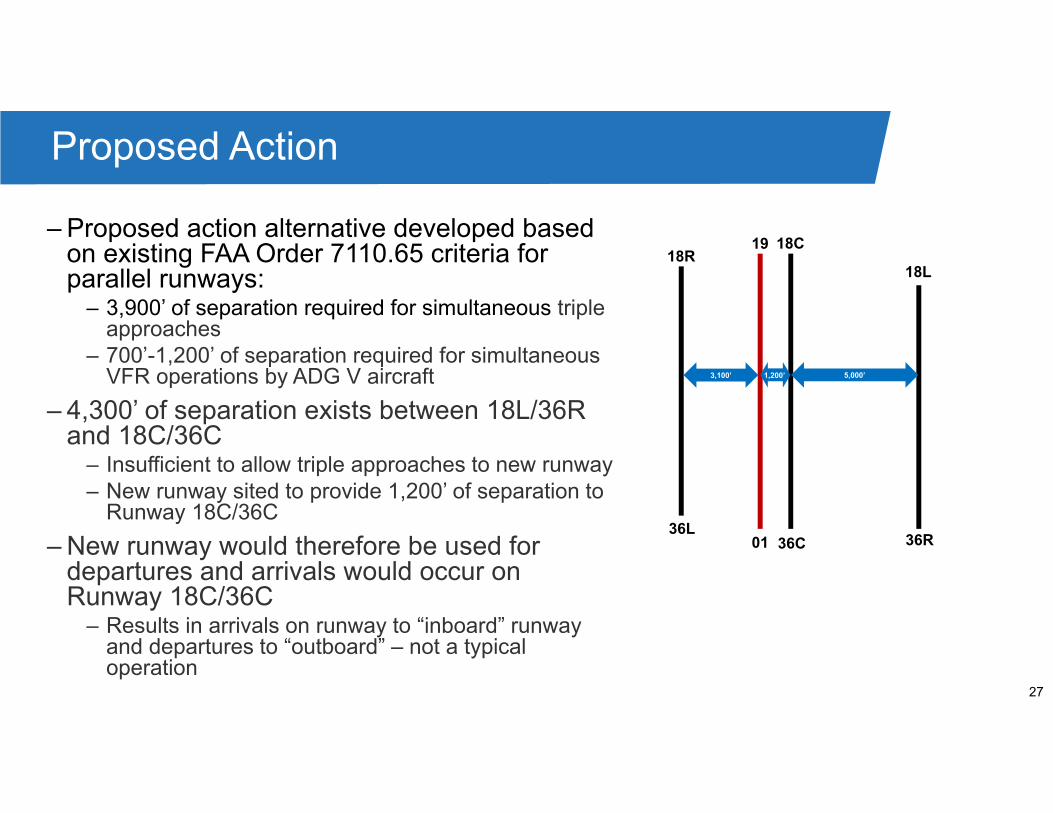
27
– Proposed action alternative developed based on existing FAA Order 7110.65 criteria for parallel runways:
– 3,900’ of separation required for simultaneous triple approaches
– 700’-1,200’ of separation required for simultaneous VFR operations by ADG V aircraft
– 4,300’ of separation exists between 18L/36R and 18C/36C
– Insufficient to allow triple approaches to new runway– New runway sited to provide 1,200’ of separation to
Runway 18C/36C
– New runway would therefore be used for departures and arrivals would occur on Runway 18C/36C
– Results in arrivals on runway to “inboard” runway and departures to “outboard” – not a typical operation
Proposed Action
3,100’ 1,200’
36R01 36C36L
18R19 18C
18L
5,000’
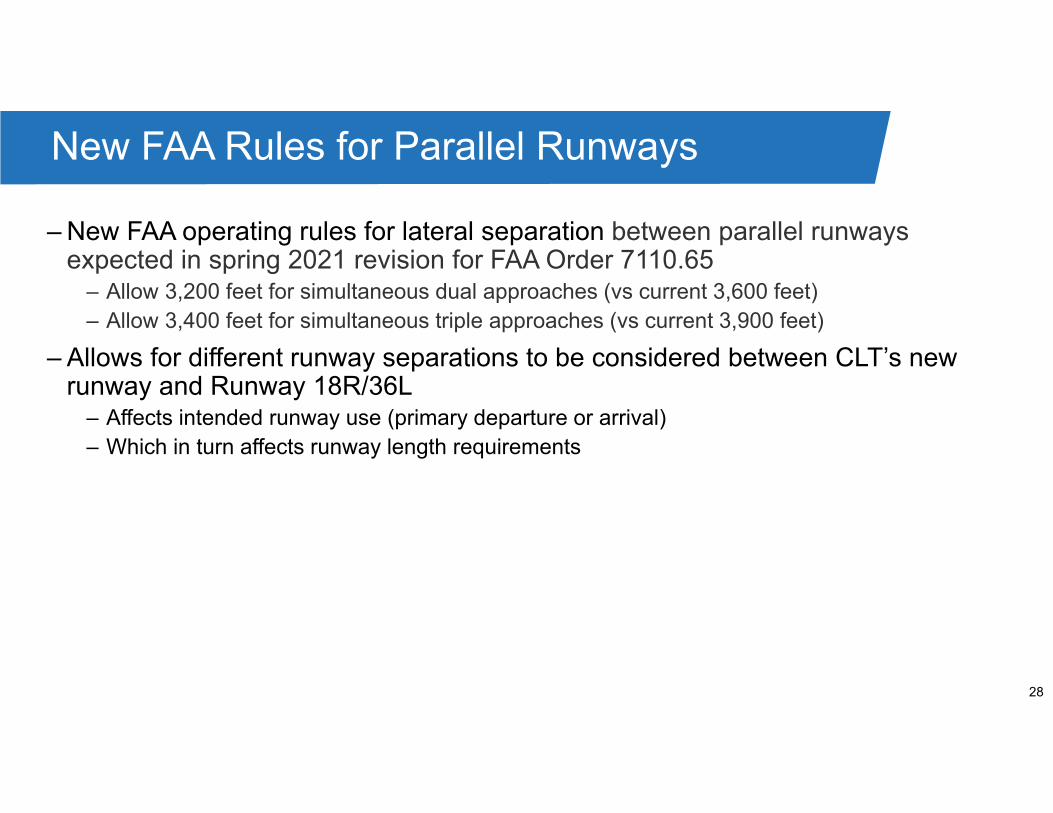
28
– New FAA operating rules for lateral separation between parallel runways expected in spring 2021 revision for FAA Order 7110.65
– Allow 3,200 feet for simultaneous dual approaches (vs current 3,600 feet)– Allow 3,400 feet for simultaneous triple approaches (vs current 3,900 feet)
– Allows for different runway separations to be considered between CLT’s new runway and Runway 18R/36L
– Affects intended runway use (primary departure or arrival)– Which in turn affects runway length requirements
New FAA Rules for Parallel Runways
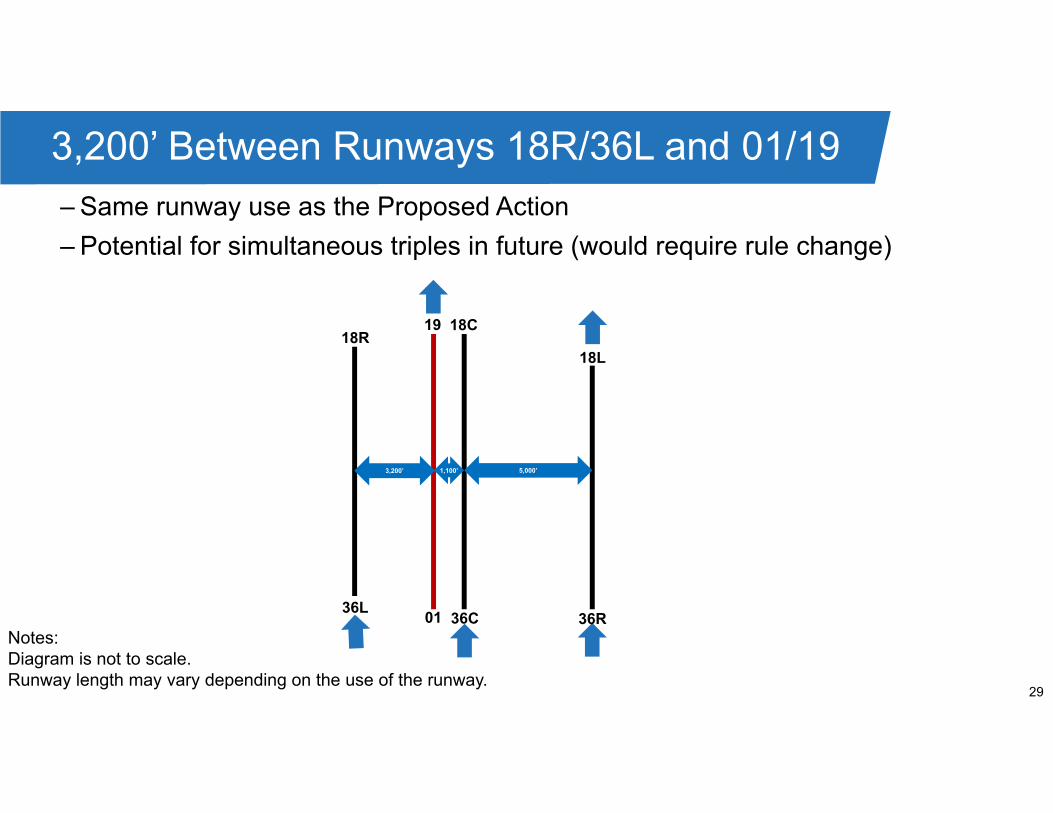
29
– Same runway use as the Proposed Action
– Potential for simultaneous triples in future (would require rule change)
3,200’ Between Runways 18R/36L and 01/19
3,200’ 5,000’1,100’
18R19 18C
18L
36R01 36C36L
Notes: Diagram is not to scale.Runway length may vary depending on the use of the runway.

30
– Allows simultaneous triple approaches to new runway
3,400’ Between Runways 18R/36L and 01/19
3,400’ 5,000’900’
Notes: Diagram is not to scale.Runway length may vary depending on the use of the runway.
18R19 18C
18L
36R01 36C36L

31
– Runway length will vary depending on how the runway is being used
– Conducted a runway length requirements analysis based on– CLT future fleet– FAA guidelines– Airline input
– Length requirements: – Departures: 10,000 feet– Arrivals: 7,300 feet
– Lengths can be longer if required for other operational reasons
Runway Length Requirements

32
Alternatives with Alternative Runway Separations
Note: Diagrams are not to scale.
Alternative 1(Proposed Action)
3,200’ 5,000’1,200’3,100’ 5,000’
10,0
00’
18R19 18C
18L
36L36R36C01
Alternative 2
3,200’ 5,000’1,100’3,200’ 5,000’
10,0
00’
18R19 18C
18L
36L36R36C01
Alternative 3
3,200’ 5,000’900’3,400’ 5,000’
8,90
0’
18R
19
18C
18L
36L36R36C01
Alternative 4
5,000’ 2,850’5,000’
7,30
0’
18R
19
18C
18L
36L36R36C 01
4,300’
3,100’ separation to 18R/36L10,000’ departure runway
3,200’ separation to 18R/36L10,000’ departure runway
3,400’ separation to 18R/36L8,900’ arrival runway
2,850’ separation to 18L/36R7,300’ arrival runway
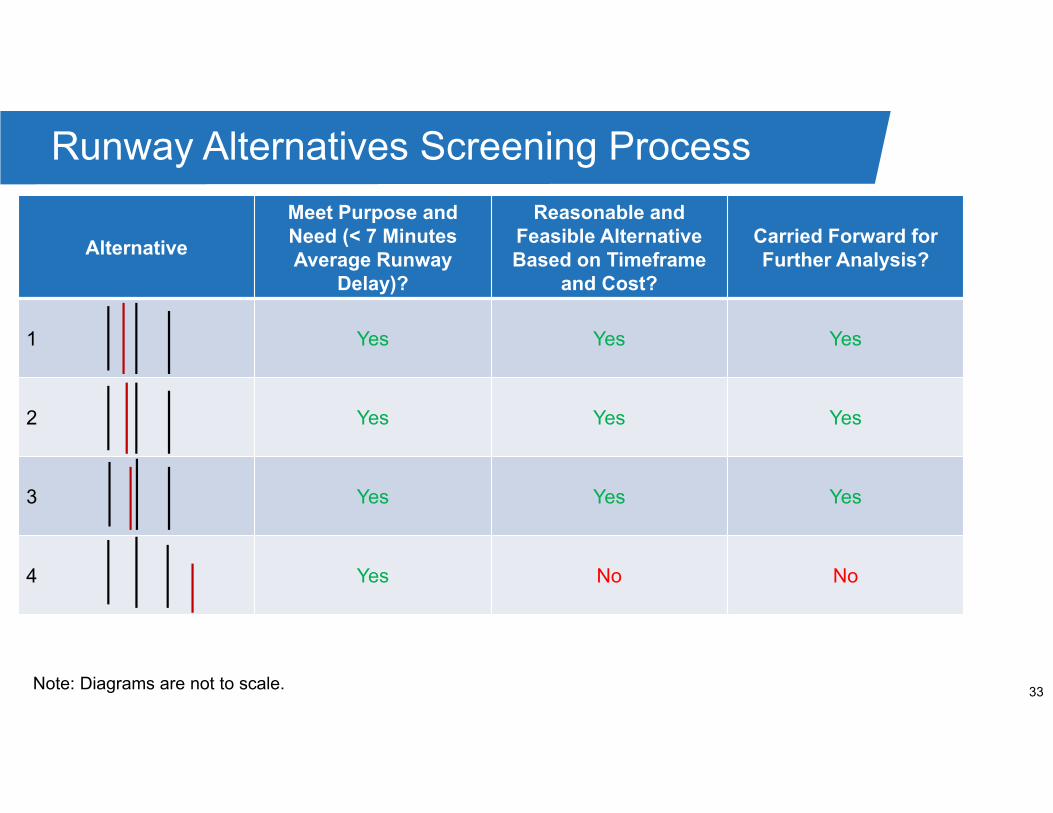
33
Alternative
Meet Purpose and Need (< 7 Minutes Average Runway
Delay)?
Reasonable and Feasible Alternative Based on Timeframe
and Cost?
Carried Forward for Further Analysis?
1 Yes Yes Yes
2 Yes Yes Yes
3 Yes Yes Yes
4 Yes No No
Runway Alternatives Screening Process
Note: Diagrams are not to scale.

34
Alternatives Airspace Assumptions
35
– Alternatives will use same assumptions as Proposed Action:– Apply FAA Wake RECAT separation criteria – Minimum arrival separations on final approach – 2.5 nautical miles (VMC) and 3.8
nautical miles (IMC) – Allocation of city pairs to airport routes – Allocation of fixes to runways– Straight out departure headings
Alternatives Airspace Assumptions

36
Alternative 1 (Proposed Action) – North Flow 10,000’ Runway / 3,100’ Separation to 18R/36L
– Proposed Action
– 3,100 feet of separation between new midfield runway and Runway 18R/36L
– Arrivals:– Runways: 36L, 36C, 36R– Simultaneous triple independent approaches
permissible in all weather conditions
– Departures:– Runways 01 and 36R– 10,000-foot long Runway 01/19
– Runway capacity: – Simultaneous triple approaches
36R01 36C36L
Projects In Design/Under Construction
Source: L&B, 2020
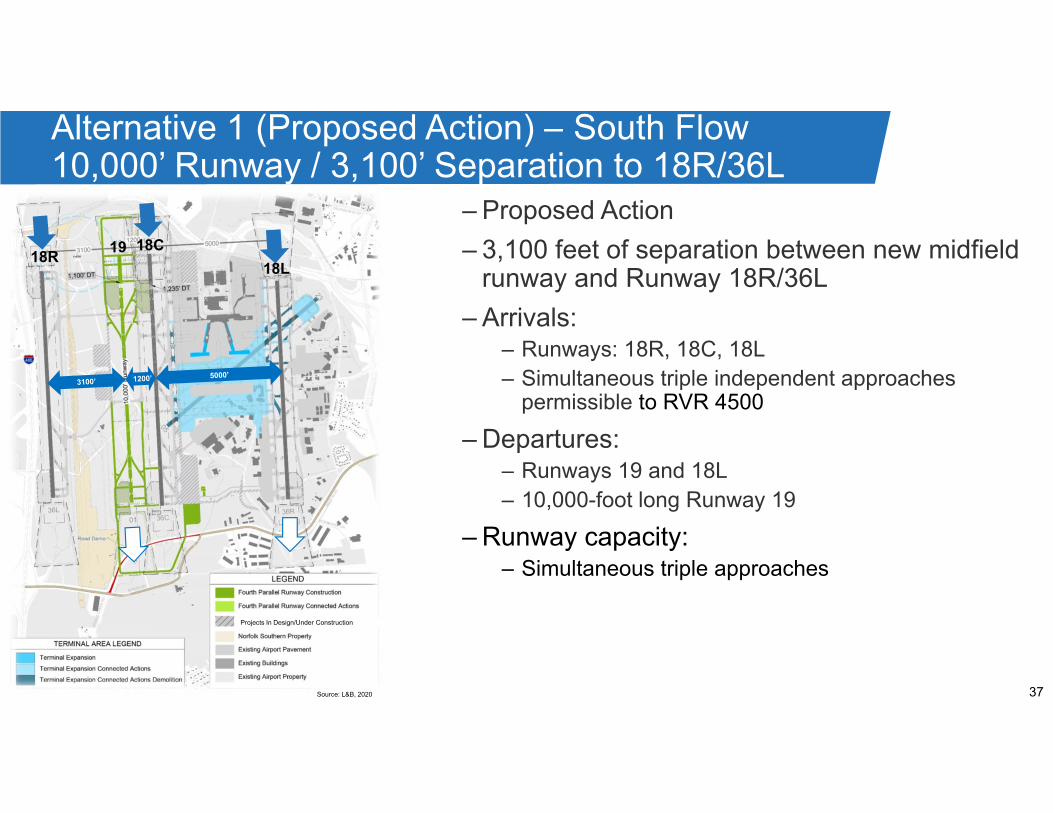
37
Alternative 1 (Proposed Action) – South Flow 10,000’ Runway / 3,100’ Separation to 18R/36L
– Proposed Action
– 3,100 feet of separation between new midfield runway and Runway 18R/36L
– Arrivals:– Runways: 18R, 18C, 18L– Simultaneous triple independent approaches
permissible to RVR 4500
– Departures:– Runways 19 and 18L– 10,000-foot long Runway 19
– Runway capacity:– Simultaneous triple approaches
18R19 18C
18L
Projects In Design/Under Construction
Source: L&B, 2020
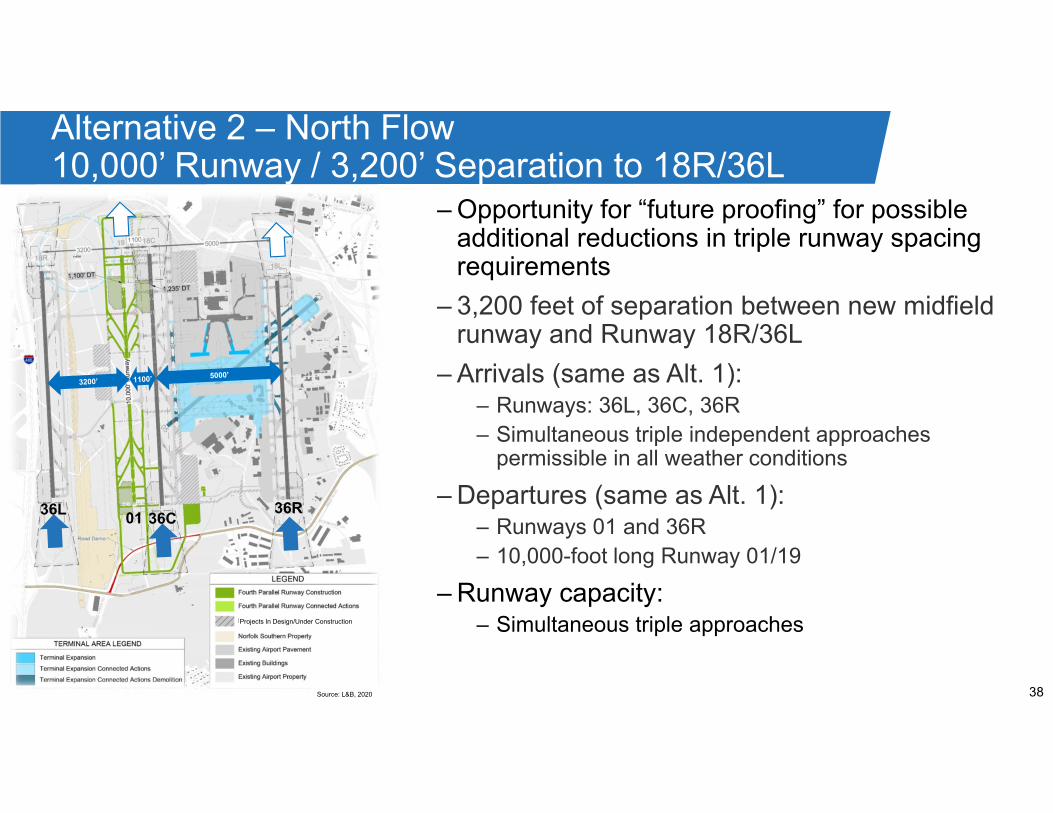
38
Alternative 2 – North Flow10,000’ Runway / 3,200’ Separation to 18R/36L
– Opportunity for “future proofing” for possible additional reductions in triple runway spacing requirements
– 3,200 feet of separation between new midfield runway and Runway 18R/36L
– Arrivals (same as Alt. 1):– Runways: 36L, 36C, 36R– Simultaneous triple independent approaches
permissible in all weather conditions
– Departures (same as Alt. 1):– Runways 01 and 36R– 10,000-foot long Runway 01/19
– Runway capacity: – Simultaneous triple approaches
36R01 36C
36L
Projects In Design/Under Construction
Source: L&B, 2020
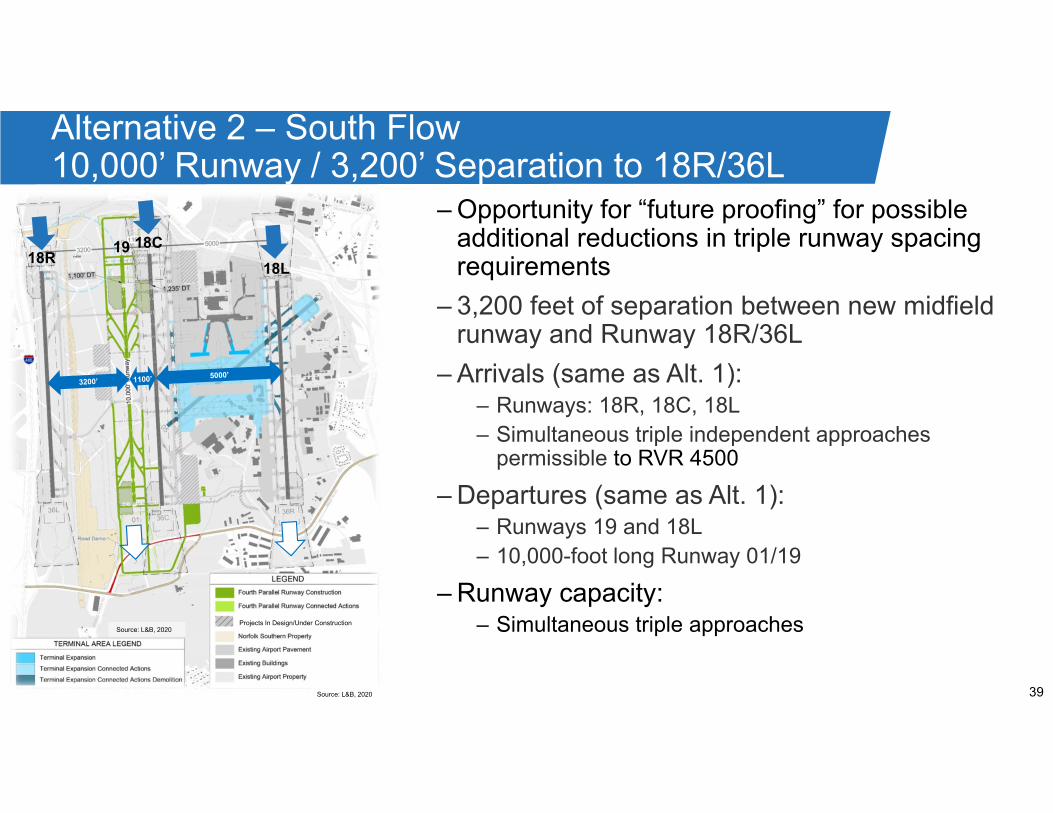
39
Alternative 2 – South Flow10,000’ Runway / 3,200’ Separation to 18R/36L
– Opportunity for “future proofing” for possible additional reductions in triple runway spacing requirements
– 3,200 feet of separation between new midfield runway and Runway 18R/36L
– Arrivals (same as Alt. 1):– Runways: 18R, 18C, 18L– Simultaneous triple independent approaches
permissible to RVR 4500
– Departures (same as Alt. 1):– Runways 19 and 18L– 10,000-foot long Runway 01/19
– Runway capacity: – Simultaneous triple approaches
18R19 18C
18L
Projects In Design/Under ConstructionSource: L&B, 2020
Source: L&B, 2020
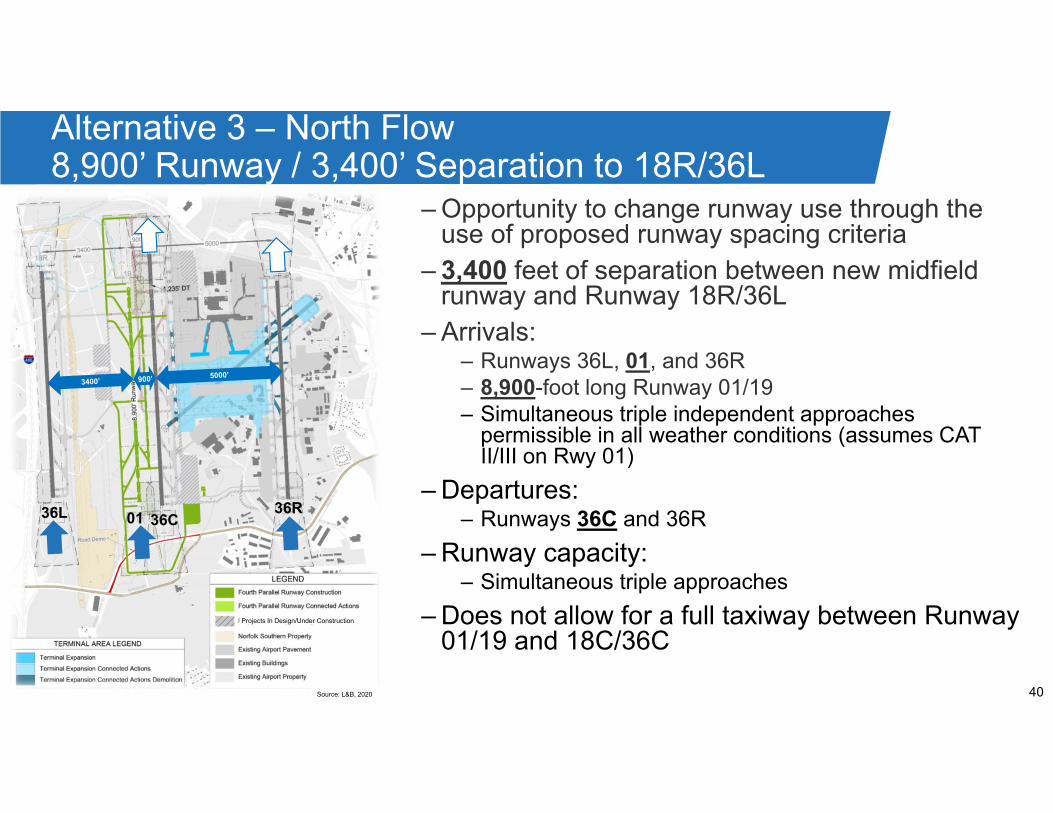
40
Alternative 3 – North Flow8,900’ Runway / 3,400’ Separation to 18R/36L
– Opportunity to change runway use through the use of proposed runway spacing criteria
– 3,400 feet of separation between new midfield runway and Runway 18R/36L
– Arrivals:– Runways 36L, 01, and 36R– 8,900-foot long Runway 01/19– Simultaneous triple independent approaches
permissible in all weather conditions (assumes CAT II/III on Rwy 01)
– Departures:– Runways 36C and 36R
– Runway capacity: – Simultaneous triple approaches
– Does not allow for a full taxiway between Runway 01/19 and 18C/36C
36R01 36C36L
Projects In Design/Under Construction
Source: L&B, 2020

41
Alternative 3 – South Flow8,900’ Runway / 3,400’ Separation to 18R/36L
– Opportunity to change runway use through the use of proposed runway spacing criteria
– 3,400 feet of separation between new midfield runway and Runway 18R/36L
– Arrivals:– Runways 18R, 19, and 18L– 8,900-foot long Runway 01/19. – Simultaneous triple independent approaches
permissible (assumes CAT II/III on Rwy 19) to RVR 4500
– Departures:– Runways 18C and 18L
– Runway capacity: – Simultaneous triple approaches
– Does not allow for a full taxiway between Runway 01/19 and 18C/36C
18R
19
18C
18L
Projects In Design/Under Construction
Source: L&B, 2020
42
Alternatives Taxi Flow Assumptions

43
– Taxi flows for the Proposed Action (Alternative 1) were presented earlier
– Taxi flows for Alternative 2 will be identical to the Proposed Action with one exception
– Taxiway V cannot be used by ADG V aircraft when visibility is less than a half mile due to the 1,100-foot separation between Runways 01/19 and 18C/36C
Aircraft Taxi Flows – Alternatives 1 and 2

44
Aircraft Taxi Flows – Alternative 3Arrivals
Departures
Mixed-Use
North Flow
36C 36R
36L
South Flow
18R
18C
18L
19
01
VMC Only
Taxiway limited to ADG IV or smaller
when visibility <1/2 mile
Taxiway limited to ADG IV or smaller
when visibility <1/2 mile

45
Next Steps
46
– Provide comments to EA Team by November 20, 2020– Send comments to [email protected]
– Incorporate comments from DORA Team
– Conduct alternatives modeling analysis
– DORA Meeting #4
– Continue preparation of the Draft EA
Next Steps

1
CLT DORA (Direction, Oversight, Review & Agree) Meeting #4
January 27, 2021
2
– Role Call
– Meeting Objectives
– DORA Process
– EA Process Overview
– Present Alternatives Modeling Results
– Next Steps
Agenda

3
DORA Process
Federal AviationAdministrationCharlotte Douglas International
Airport EADORA Process Overview
Prepared for: CLT EA DORA Meeting #4
By: Kent Duffy
Date: January 27, 2021

5
Federal AviationAdministration
What is DORA?• DORA =
Direction, Oversight, Review and Agree• Obtaining and understanding controller input on operational issues and
viability of proposed alternatives is a key to airport capacity development
• DORA has been applied successfully to other large-scale airport and airspace modernization efforts (e.g., O’Hare Modernization Program)
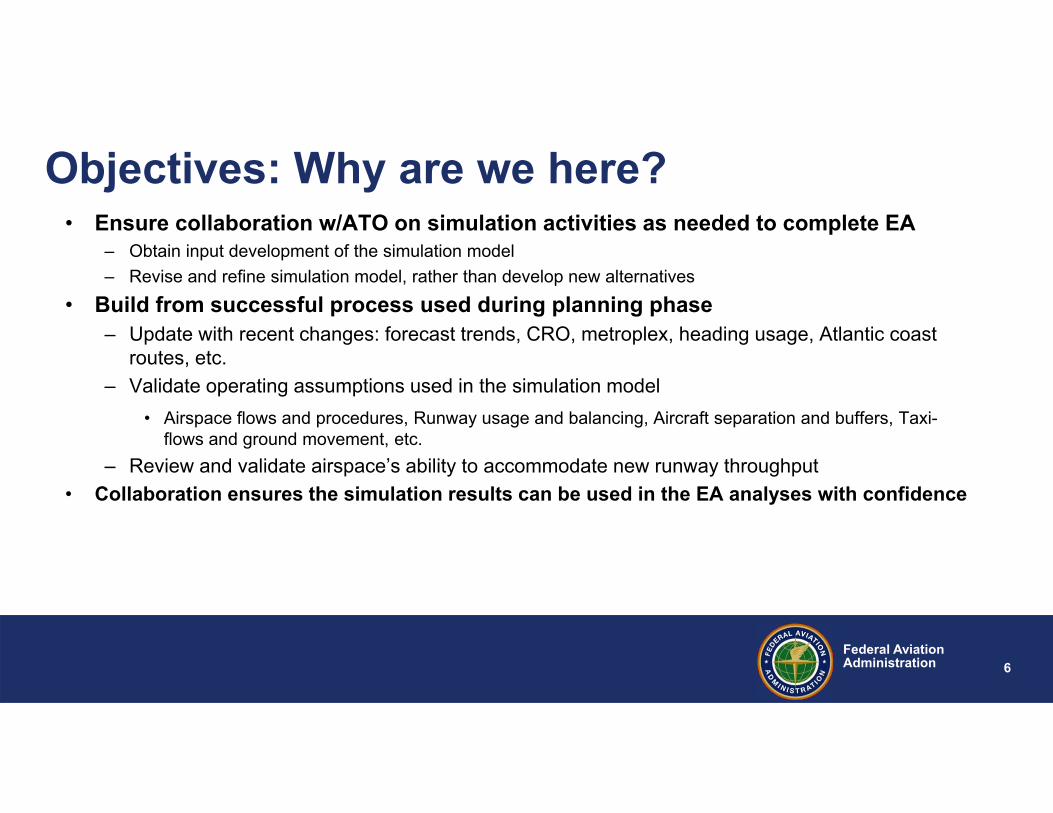
6
Federal AviationAdministration
Objectives: Why are we here?• Ensure collaboration w/ATO on simulation activities as needed to complete EA
– Obtain input development of the simulation model
– Revise and refine simulation model, rather than develop new alternatives
• Build from successful process used during planning phase– Update with recent changes: forecast trends, CRO, metroplex, heading usage, Atlantic coast
routes, etc.
– Validate operating assumptions used in the simulation model
• Airspace flows and procedures, Runway usage and balancing, Aircraft separation and buffers, Taxi-flows and ground movement, etc.
– Review and validate airspace’s ability to accommodate new runway throughput
• Collaboration ensures the simulation results can be used in the EA analyses with confidence

7
Federal AviationAdministration
Planning Phase DORA Letter

8
Federal AviationAdministration
Desired Result: 2nd DORA Letter
• FAA Letter signed by ATO and ARP
• Explains process and summarizes meetings
• Identifies further analyses required in subsequent phases (e.g., design/ implementation), as needed
• Desired findings:
– Modeling approach is reasonable
– Modeling assumptions accurately reflects operational perspectives
– Subsequent capacity, throughput and delay results are reasonablerepresentations of the proposed airfield and airspace designs
Active ATC participation

9
Federal AviationAdministration
DORA Process Relationship to Modeling
2016 Calibration
No Action Model
Alternative(s) Model
DORA Mtg #1 of EA –Present No Action input data
DORA Mtg #2 – Present and review simulations of No Action and present Proposed Action input data
DORA Mtg #4Present final results
~ July 11, 2017 (EIS)
~ March 25, 2020
~June 11, 2020
DORA Mtg #1 of EIS Project overview Process Review Input Data
DORA Mtg #3 – Present and review simulations of Proposed Action and present Alternative(s) input data
~ Today
~November 6, 2020

10
EA Process Overview

11
– The CLT Environmental Impact Statement (EIS) that the Federal Aviation Administration (FAA) began was cancelled on February 27, 2019.
– The FAA cancelled the EIS because a runway length analysis determined only a 10,000 foot runway is required to meet the purpose and need.
– The FAA determined that this was a sufficient change to warrant cancellation of the EIS and conversion to an Environmental Assessment (EA).
– The City of Charlotte (Airport Sponsor) is responsible for preparing the EA.
– FAA is still the lead agency.
– Similar to the EIS, the EA will evaluate the potential direct, indirect, and cumulative environmental impacts that may result from the Proposed Action.
EA Process Overview - Background
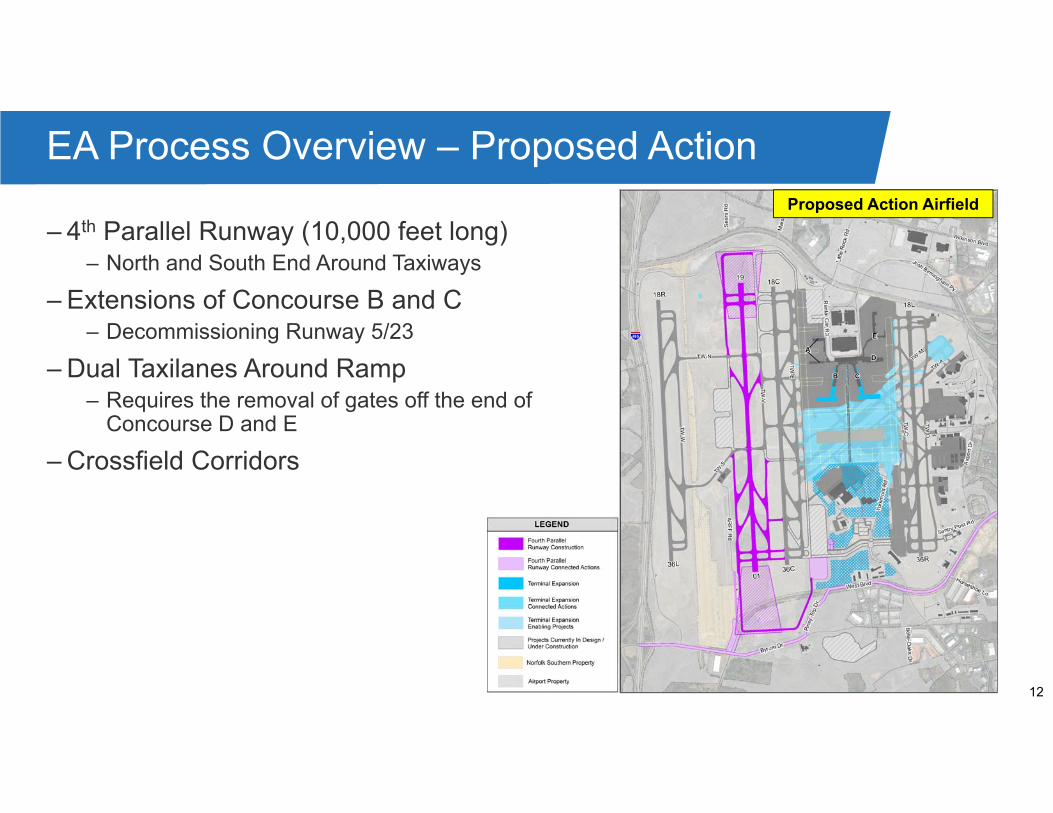
12
– 4th Parallel Runway (10,000 feet long)– North and South End Around Taxiways
– Extensions of Concourse B and C– Decommissioning Runway 5/23
– Dual Taxilanes Around Ramp– Requires the removal of gates off the end of
Concourse D and E
– Crossfield Corridors
EA Process Overview – Proposed ActionProposed Action Airfield

13
– Simulations will:– Be used in developing the Purpose and
Need, noise modeling, and air quality modeling.
– Conducted for the following scenarios:– 2016 Calibration - Complete– 2019 Baseline - Complete– 2028 Future No Action - Complete– 2033 Future No Action - Complete– 2028 Alternative(s) - Complete– 2033 Alternative(s) - Complete
– Use forecast of operations approved by the FAA.
– Include 3 independent projects as part of the Future No Action.
– Deice Pad and crossfield taxiway– North End Around Taxiway around
Runway 18C/36C, hold pads and threshold displacement (1,235 feet)
– Concourse A Phase II
EA Process Overview - SimulationsFuture No Action Airfield

14
Alternatives Simulation Modeling Results

15
Alternatives Overview
Note: Diagrams are not to scale.
Alternative 1(Proposed Action)
3,200’ 5,000’1,200’3,100’ 5,000’
10,0
00’
18R19 18C
18L
36L36R36C01
Alternative 2
3,200’ 5,000’1,100’3,200’ 5,000’
10,0
00’
18R19 18C
18L
36L36R36C01
Alternative 3
3,200’ 5,000’900’3,400’ 5,000’
8,90
0’
18R
19
18C
18L
36L36R36C01
3,100’ separation to 18R/36L10,000’ departure runway
3,200’ separation to 18R/36L10,000’ departure runway
3,400’ separation to 18R/36L8,900’ arrival runway
Alternative 2 simulation results are assumed to be same as Alternative 1, with only slight taxi time differences

16
Comparison of Alternatives
AlternativeFuture
FlexibilityTaxiway V Capability
Navigational Aid Placement
Runway Use
Crossings of Rwy 18C/36C
1 Proposed
Action
NoFull length; unrestricted
Standard placement
Arrivals on inboard runway
More than Alternative 3
2
Potential for Rwy 01/19 to be part of simultaneous triples if rules
changed in future
Full length; minor restrictions
Standard placement
Arrivals on inboard runway
More than Alternative 3
3 n/aPartial taxiway;
minor restrictions
Co-located glideslopes (Rwy
18C/19 and 36C/01)
Arrivals on outboard runway
Fewer than Alternatives
1 & 2
10,0
00’
18R 19 18C
18L
36L36R36C01
3,100’
10,0
00’
18R 19 18C
18L
36L36R36C01
3,200’
8,90
0’
18R
19
18C
18L
36L36R36C01
3,400’

17
– Added runway crossing points to let two departing aircraft cross Runway 18C/36C simultaneously
– Reduces Runway 01/19 departure delay– Allow more arrivals on Runway 18C/36C
– Rebalanced runway usage to optimize delay and throughput
– Offload arrivals from Runway 18L/36R to Runway 18C/36C – Balance departures between Runway 01/19 and Runway
18L/36R
Alternative 1 (Proposed Action) Refinement18C19
36C01
South Flow
North Flow

18
Alternative 1 (Proposed Action)/Alternative 2
Note: Diagram is not to scale.
– Alternatives 1 and 2– Same runway use and procedures– Same performance with the exception of slight differences in
taxi times
– Closely spaced parallel runways:– Runways are dependent in IMC– Arrivals block departures 2 miles out 3,100’ 1,200’
36R01 36C36L
18R19 18C
18L
5,000’
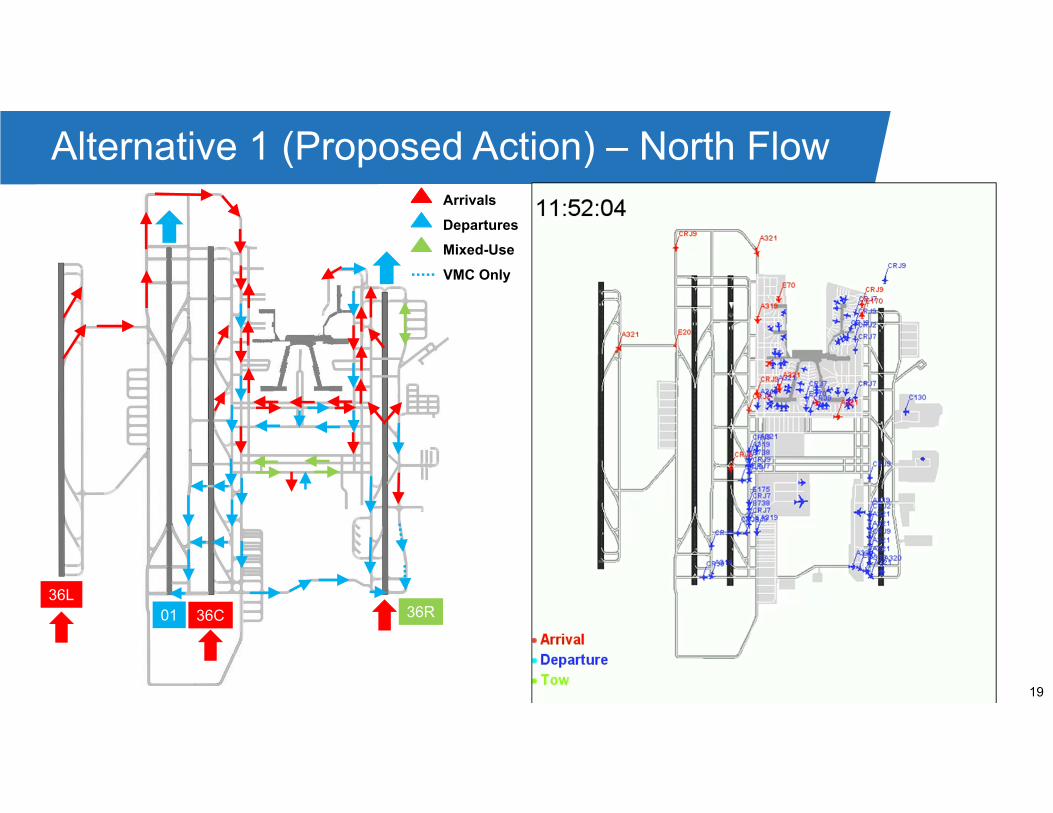
19
Alternative 1 (Proposed Action) – North FlowArrivals
Departures
Mixed-Use
VMC Only
36C 36R36L
01

20
Alternative 1 (Proposed Action) – South Flow
Arrivals
Departures
Mixed-Use
VMC Only
18R18L
18C
19

21
– Assumes that new FAA rules for parallel runways allow simultaneous triple approaches to new runway
– Alternative 3 will use same the airspace assumptions and procedures as Alternative 1 (Proposed Action)
Alternative 3
3,400’ 5,000’900’
18R19
18C
18L
36R01 36C36L
Note: Diagram is not to scale.
8,90
0’

22
Alternative 3 – North FlowArrivals
Departures
Mixed-Use
36C 36R
36L
01
VMC Only
Taxiway limited to ADG IV or smaller
when visibility <1/2 mile

23
Alternative 3 – South Flow
Arrivals
Departures
Mixed-Use
18R
18C
18L
19
VMC Only
Taxiway limited to ADG IV or smaller
when visibility <1/2 mile
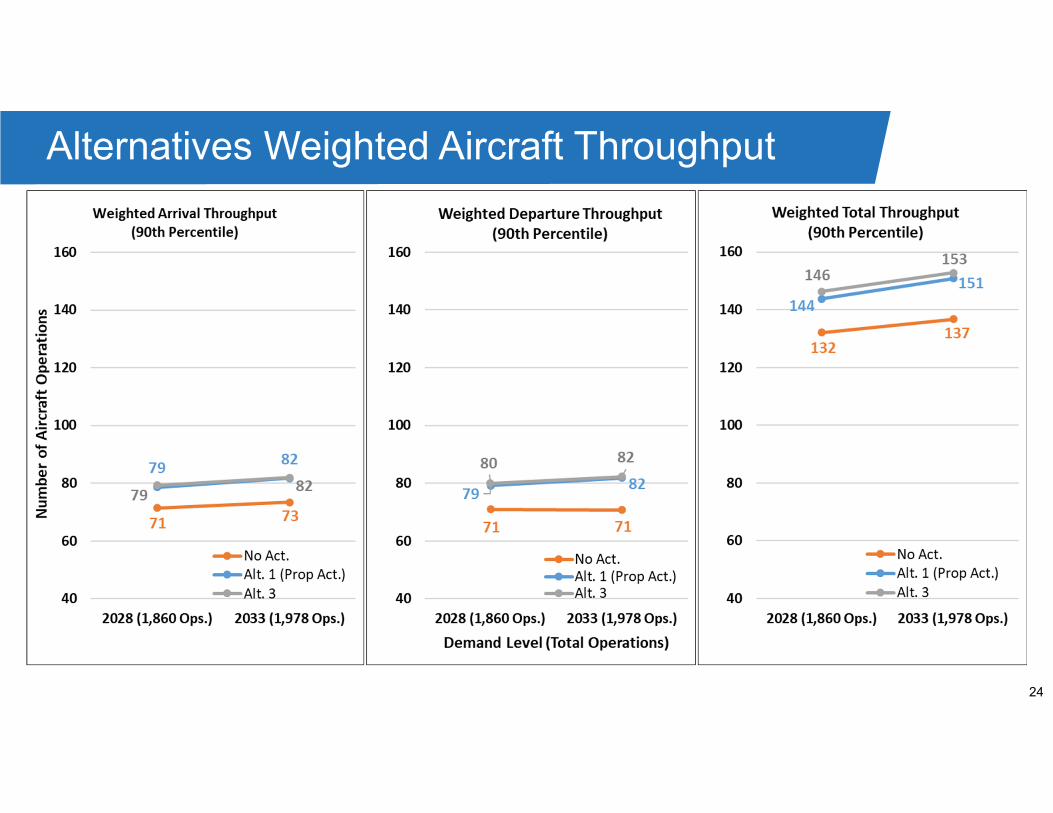
24
Alternatives Weighted Aircraft Throughput
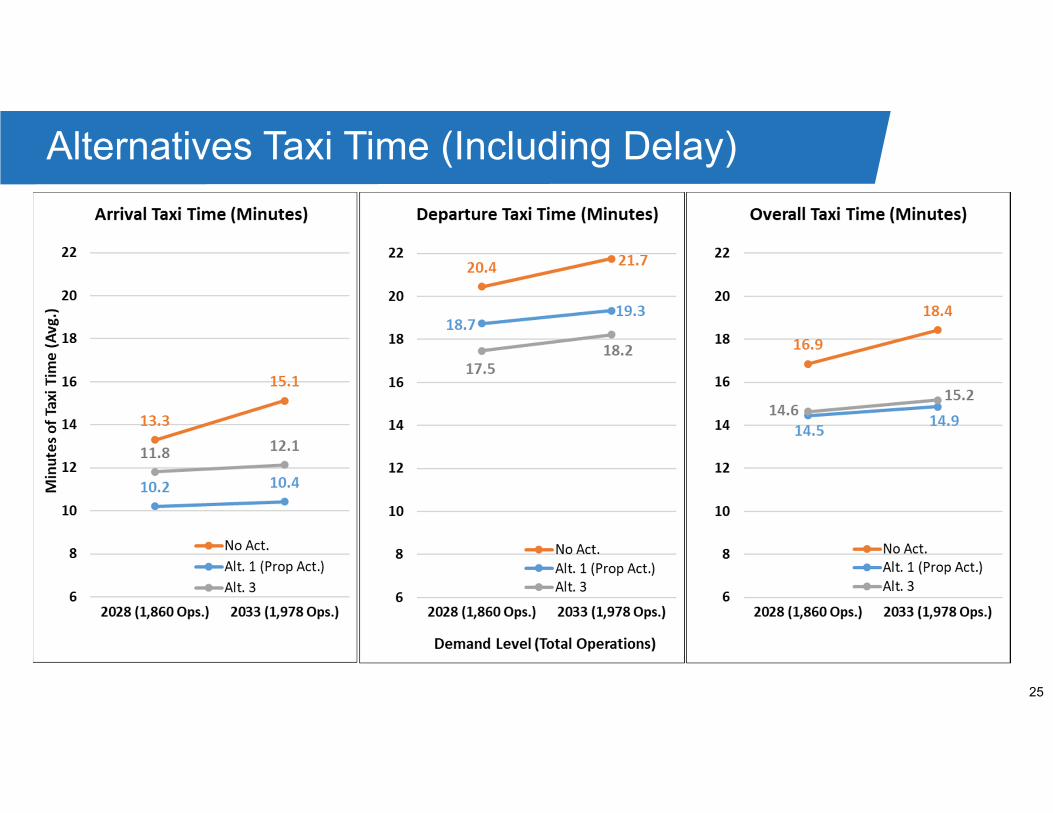
25
Alternatives Taxi Time (Including Delay)

26
Alternatives Average Aircraft Delay
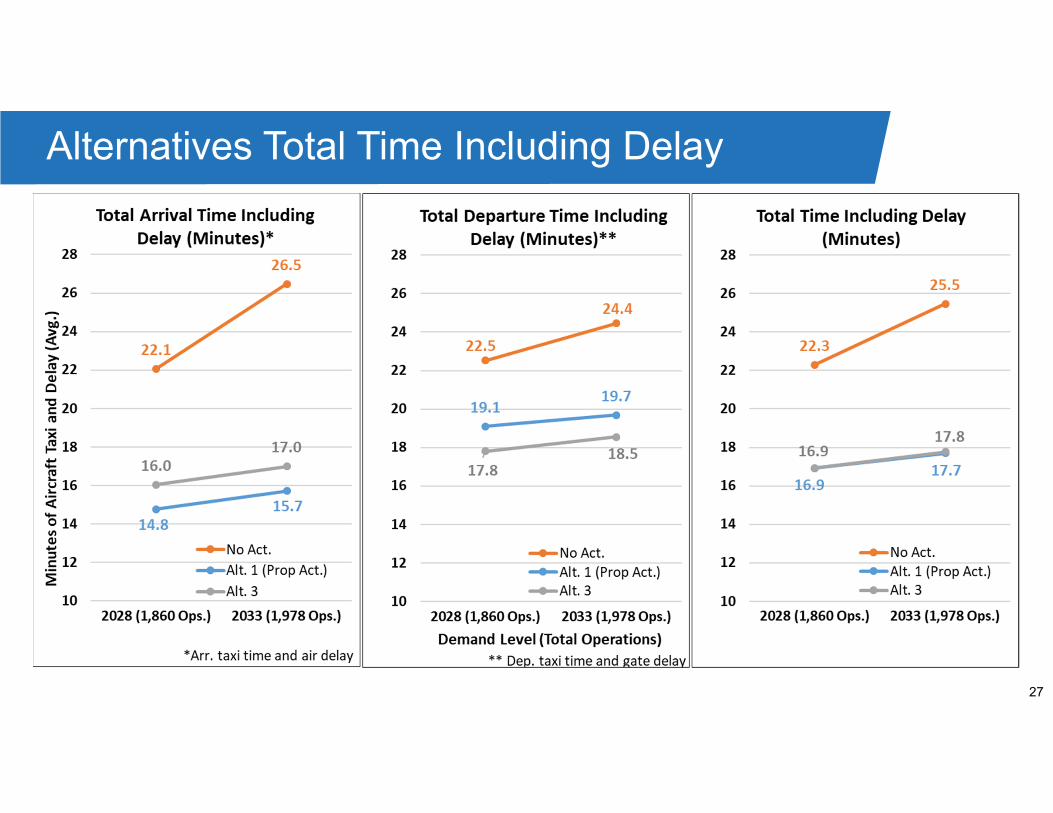
27
Alternatives Total Time Including Delay

28
Alternatives Average Aircraft Delay

29
Next Steps
30
– Send questions to [email protected]
– Complete DORA compliance letter
– Continue preparation of the Draft EA
Next Steps
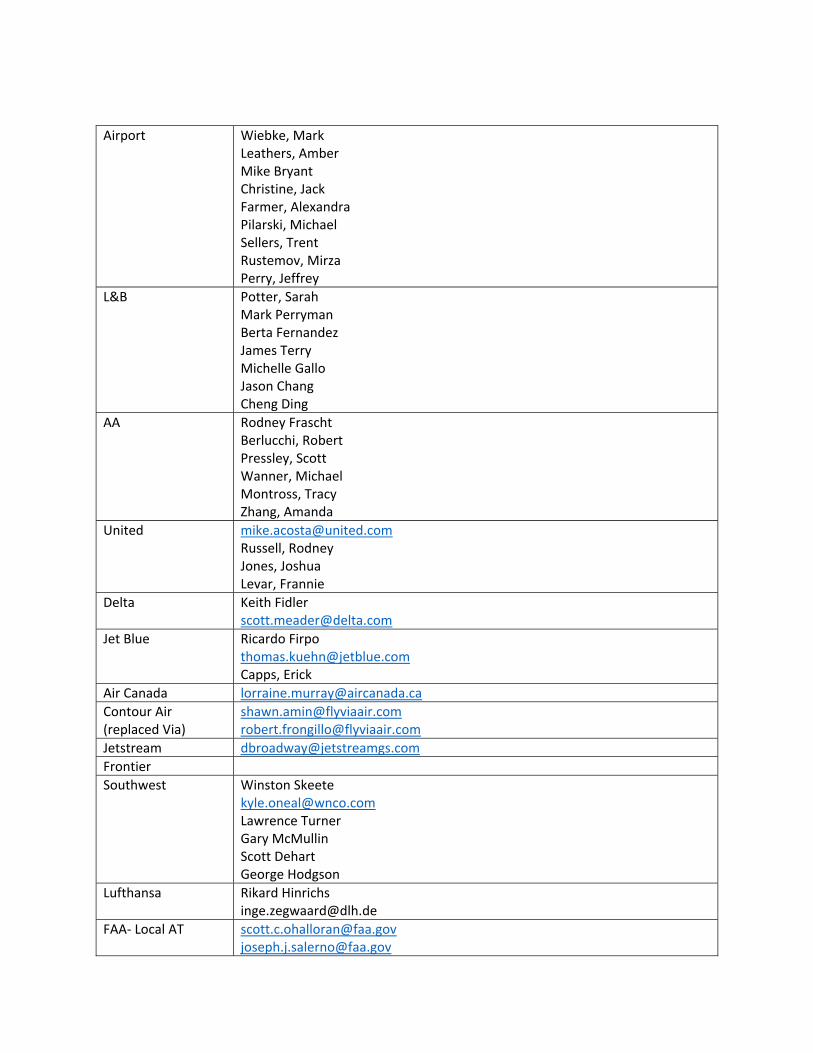
Airport Wiebke, Mark Leathers, Amber Mike Bryant Christine, Jack Farmer, Alexandra Pilarski, Michael Sellers, Trent Rustemov, Mirza Perry, Jeffrey
L&B Potter, Sarah Mark Perryman Berta Fernandez James Terry Michelle Gallo Jason Chang Cheng Ding
AA Rodney Frascht Berlucchi, Robert Pressley, Scott Wanner, Michael Montross, Tracy Zhang, Amanda
United [email protected] Russell, Rodney Jones, Joshua Levar, Frannie
Delta Keith Fidler [email protected]
Jet Blue Ricardo Firpo [email protected] Capps, Erick
Air Canada [email protected] Contour Air (replaced Via)
[email protected] [email protected]
Jetstream [email protected] Frontier Southwest Winston Skeete
[email protected] Lawrence Turner Gary McMullin Scott Dehart George Hodgson
Lufthansa Rikard Hinrichs [email protected]
FAA‐ Local AT [email protected] [email protected]
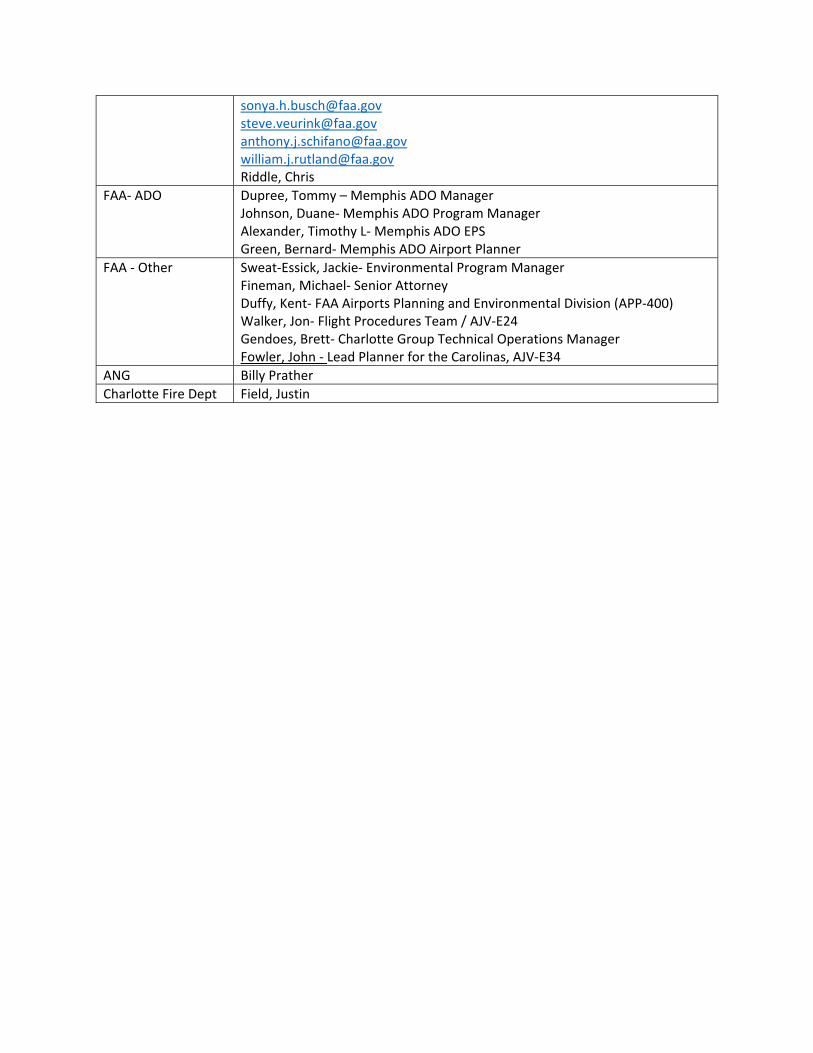
[email protected] [email protected] [email protected] [email protected] Riddle, Chris
FAA‐ ADO Dupree, Tommy – Memphis ADO Manager Johnson, Duane‐ Memphis ADO Program Manager Alexander, Timothy L‐ Memphis ADO EPS Green, Bernard‐ Memphis ADO Airport Planner
FAA ‐ Other Sweat‐Essick, Jackie‐ Environmental Program Manager Fineman, Michael‐ Senior Attorney Duffy, Kent‐ FAA Airports Planning and Environmental Division (APP‐400) Walker, Jon‐ Flight Procedures Team / AJV‐E24 Gendoes, Brett‐ Charlotte Group Technical Operations Manager Fowler, John ‐ Lead Planner for the Carolinas, AJV‐E34
ANG Billy Prather Charlotte Fire Dept Field, Justin
Environmental Assessment April 2021
Landrum & Brown | i
Proposed Capacity Enhancements at Charlotte Douglas International Airport National Environmental Policy Act Environmental Assessment AirTOp Simulation Report
April 2021
PREPARED FOR
Charlotte Douglas International Airport

Environmental Assessment AirTOp Simulation Report April 2021
ii | Landrum & Brown
Contents Page
1 Introduction 1 1.1 Direction, Oversight, Review, and Agreement (DORA) Process 1
2 Design Day Flight Schedules 2 2.1 Flight Dependability 4
3 2016 Airport Operating Assumptions 4 3.1 Airfield and Aircraft Apron Layouts 4 3.2 Airfield Hold Pad Usage 7 3.3 Runway Operating Configurations 7
3.3.1 North Flow VMC and IMC Operating Configurations 8 3.3.2 South Flow VMC and IMC Operating Configurations 9
3.4 Airfield Ground Speeds 10 3.5 Airfield Taxi Flows 11 3.6 Aircraft Separations 11 3.7 Airspace Structure 12
3.7.1 Arrival Airspace 13 3.7.2 Departure Airspace 14 3.7.3 Converging Runway Operation (CRO) with Arrival Departure Window
(ADW) 16 4 Simulation Model Calibration 17
4.1 Throughput Rates 17 4.2 Aircraft Taxi Times 22 4.3 Calibration Summary 22
5 2019 Baseline Operating Assumptions 23 5.1 Airfield and Aircraft Apron Layouts 23 5.2 Hold Pad Usage 24 5.3 Runway Operating Configurations 25 5.4 Airfield Ground Speeds 26 5.5 Airfield Taxi Flows 26 5.6 Airspace Assumptions 27
6 2019 Baseline Modeling Results 27 6.1 Throughput Rates 27 6.2 Aircraft Taxi Times 30 6.3 Baseline Summary 30
7 No Action Operating Assumptions 30 7.1 Airfield and Aircraft Apron Layouts 32 7.2 Hold Pad Usage 32 7.3 Runway Operating Configurations 33 7.4 Airfield Ground Speeds 33 7.5 Airfield Taxi Flows 34 7.6 Airspace Assumptions 34
8 No Action Modeling Results 36 8.1 Throughput Rates 37 8.2 Aircraft Taxi Times and Delay 38

AirTOp Simulation Report Environmental Assessment April 2021
Landrum & Brown | iii
9 Airfield Alternatives Operating Assumptions 41 9.1 Airfield and Aircraft Apron Layouts 42 9.2 Runway Operating Configurations 44 9.3 Airfield Ground Speeds 45 9.4 Airfield Taxi Flows 47 9.5 Airspace Assumptions 48
10 Airfield Alternatives Modeling Results 51 10.1 Throughput Rates 51 10.2 Aircraft Taxi Times and Delay 52
11 Conclusions 55

Environmental Assessment AirTOp Simulation Report April 2021
iv | Landrum & Brown
List of Tables Page
Table 2-1, Total Daily Operations 2 Table 2-2, Fleet Mix by Flight Type 3 Table 2-3, Fleet Mix by Design Group 3 Table 3-1, 2016 Airline Gating Assignment Assumptions 5 Table 3-2, Simulated Arrival In-trail Separations 12 Table 3-3, Simulated Departure In-trail Separations 12 Table 3-4, Sample Origins by Arrival Routing 13 Table 3-5, Sample Destinations by Departure Routing 14 Table 4-1, Calibration Total Operations Throughput Comparison 17 Table 4-2, Calibration Arrival and Departure Throughput Comparison 18 Table 4-3, Calibration Runway Throughput Comparison 18 Table 4-4, Calibration Taxi Time Comparison 22 Table 4-5, Calibration Results Summary 22 Table 5-1, 2019 Baseline Airline Gating Assignment Assumptions 24 Table 6-1, 2019 Baseline Total Operations Throughput Comparison 28 Table 6-2, 2019 Baseline Arrival and Departure Throughput Comparison 28 Table 6-3, 2019 Baseline Runway Throughput Comparison 28 Table 6-4, 2019 Baseline Taxi Time Comparison 30 Table 7-1, No Action Airline Gating Assignment Assumptions 32 Table 7-2, CWT Categories 35 Table 7-3, CWT Arrival In-trail Separations 35 Table 7-4, CWT Departure In-trail Separations 36 Table 7-5, Fleet Mix by CWT Category 36 Table 8-1, No Action Aircraft Throughput by Flow 38 Table 9-1, Alternatives Airline Gating Assignment Assumptions 43 Table 10-1, Alternative 1 Aircraft Throughput by Flow 52 Table 10-2, Alternative 3 Aircraft Throughput by Flow 52
List of Exhibits Page
Exhibit 2-1, Rolling Hour Arrival and Departure Profiles 3 Exhibit 2-2, Flight Earliness/Lateness Distributions 4 Exhibit 3-1, 2016 CLT Airfield 5 Exhibit 3-2, 2016 CLT Aircraft Parking Aprons 6 Exhibit 3-3, 2016 Airfield Hold Pad 7 Exhibit 3-4, 2016 North Flow VMC/IMC Runway Configuration 8 Exhibit 3-5, 2016 South Flow VMC/IMC Runway Configuration 9 Exhibit 3-6, 2016 Airfield Ground Speed Assumptions 10 Exhibit 3-7, 2016 Taxi Routes 11 Exhibit 3-8, 2016 North Flow Simulation Arrival Route Structure 13 Exhibit 3-9, 2016 South Flow Simulation Arrival Route Structure 14 Exhibit 3-10, 2016 North Flow Simulation Departure Route Structure 15 Exhibit 3-11, 2016 South Flow Simulation Departure Route Structure 15 Exhibit 3-12, Converging Runway Operation with ADW 16

AirTOp Simulation Report Environmental Assessment April 2021
Landrum & Brown | v
Exhibit 4-1, Heat Map Example 19 Exhibit 4-2, Calibration North Flow VMC Throughput Heat Map – Actual Data 20 Exhibit 4-3, Calibration South Flow VMC Throughput Heat Map – Actual Data 20 Exhibit 4-4, Calibration North Flow IMC Throughput Heat Map – Actual Data 21 Exhibit 4-5, Calibration South Flow IMC Throughput Heat Map – Actual Data 21 Exhibit 5-1, 2019 Baseline Airfield Layout 23 Exhibit 5-2, 2019 Baseline Deicing/Hold Pads 24 Exhibit 5-3, 2019 Baseline South Flow VMC/IMC Runway Configuration 25 Exhibit 5-4, 2019 Baseline Airfield Ground Speed Assumptions 26 Exhibit 5-5, 2019 Baseline Taxi Routes 27 Exhibit 6-1, 2019 Baseline South Flow VMC Throughput Heat Map – Actual Data 29 Exhibit 6-2, 2019 Baseline South Flow IMC Throughput Heat Map – Actual Data 29 Exhibit 7-1, 2028/2033 Future No Action Airfield Layout 31 Exhibit 7-2, No Action Deicing/Hold Pads 32 Exhibit 7-3, No Action Airfield Ground Speed Assumptions 33 Exhibit 7-4, No Action Taxi Routes 34 Exhibit 8-1, Annual Use of Airport Configurations 37 Exhibit 8-2, No Action Weighted Aircraft Throughput 38 Exhibit 8-3, No Action Weighted Average Taxi Times 39 Exhibit 8-4, No Action Weighted Average Delay 39 Exhibit 8-5, No Action Total Time Including Delay 40 Exhibit 8-6, No Action Runway vs Non-Runway Delay 40 Exhibit 9-1, Alternatives Overview 41 Exhibit 9-2, Alternative 1 Airfield Layout 42 Exhibit 9-3, Alternative 3 Airfield Layout 43 Exhibit 9-4, Alternative 1 VMC/IMC Runway Configuration 44 Exhibit 9-5, Alternative 3 VMC/IMC Runway Configuration 45 Exhibit 9-6, Alternative 1 Airfield Ground Speed Assumptions 46 Exhibit 9-7, Alternative 3 Airfield Ground Speed Assumptions 46 Exhibit 9-8, Alternative 1 Taxi Routes 47 Exhibit 9-9, Alternative 3 Taxi Routes 48 Exhibit 9-10, Alternative 1 North Flow Arrival Route Structure 49 Exhibit 9-11, Alternative 1 South Flow Arrival Route Structure 49 Exhibit 9-12, Alternative 1 North Flow Departure Route Structure 50 Exhibit 9-13, Alternative 1 South Flow Departure Route Structure 50 Exhibit 10-1, Throughput Rates from the No Action and Alternatives Simulations 51 Exhibit 10-2, No Action and Alternatives Weighted Average Taxi Times 53 Exhibit 10-3, No Action and Alternatives Weighted Average Delay 53 Exhibit 10-4, No Action and Alternatives Total Time Including Delay 54 Exhibit 10-5, No Action and Alternatives Runway vs Non-Runway Delay 55
AirTOp Simulation Report Environmental Assessment April 2021
Landrum & Brown | 1
1 Introduction Charlotte Douglas International Airport (CLT or Airport) is the sixth busiest airport in the US in terms of aircraft operations and the tenth busiest in terms of passenger enplanements,1 making it an integral part of the National Airspace System (NAS). CLT is the second busiest hub operation for American Airlines. In 2016, the airline connected approximately 58,000 passengers per day through CLT on a normal day; 67,000 passengers on a typical busy day, and even more during peak travel days.2 Given this level of connecting passengers, American Airlines (AA) personnel have indicated that schedule reliability is critical to maintaining minimum connection times for passengers that range from 25 to 35 minutes.
The City of Charlotte (Sponsor) completed an Airport Capacity Enhancement Program (ACEP) and Master Plan Update in February 2016. The ACEP utilized a comprehensive approach to understand the demand for and capacity of runways, taxiways, aircraft gates, ramp, and passenger processing facilities. The ACEP identified a number of deficiencies that exist at CLT. These included insufficient runway capacity, gate capacity, and ramp space to accommodate the existing and future demand. The Sponsor is now undertaking an Environmental Assessment (EA) that analyzes proposed solutions for those deficiencies.
As part of the EA, a simulation modeling analysis has been conducted to simulate the existing and future airfield and airspace improvements at the Airport. The simulation was conducted using the Air Traffic Optimization (AirTOp) model, a rule-based, fast-time simulation tool. AirTOp computes aircraft travel times and delay statistics which are used as evaluation metrics to determine differences between various simulated alternatives.
The simulation modeling began with an analysis of CLT for the base year of 2016. The EA has a base year of 2016 because this was the latest calendar year with a full year of available data when the National Environmental Policy Act (NEPA) process began.
The simulation analysis involved the following steps and is described in the sections that follow:
Develop design day flight schedules
Define 2016 existing conditions and modeling assumptions
Calibrate model to actual 2016 results
Model 2019 Baseline experiments
Model No Action experiments
Model Airfield Alternatives experiments
1.1 Direction, Oversight, Review, and Agreement (DORA) Process
The EA utilized the DORA process to obtain the necessary operational input from stakeholders and the Federal Aviation Administration (FAA). The DORA Work Group was comprised of representatives from the FAA, CLT Airport, airlines, and consultants. The meetings provided FAA controller input on air traffic control operations and the viability of proposed alternatives, which were crucial components of analyzing and screening the airfield alternatives. The airlines, as users of the airport’s infrastructure, were active in providing their operational perspectives, including linkages to network hub operations
1 2017 Airports Council International-North America Traffic Report 2 Purpose and Need Working Paper, Charlotte Douglas International Airport, Environmental Impact Statement, prepared by
VHB Engineering NC, P.C. in association with Parish and Partners, Inc. and TransSolutions, July 31, 2018.

Environmental Assessment AirTOp Simulation Report April 2021
2 | Landrum & Brown
and ramp control. FAA provided their perspective and expectations regarding data and simulation analysis, as well as unique knowledge about the efficacy of ways to enhance operational efficiency. Four meetings during the EA were conducted with the stakeholder group, which builds on prior DORA coordination conducted during the Environmental Impact Statement (EIS) and ACEP.
This process has ensured that the appropriate operational expertise and experience has informed the design, analysis and decision-making for the CLT EA effort.
2 Design Day Flight Schedules The first step in building the simulation models was to select the design day flight schedule. The schedule for the calibration year of 2016 and future years of 2028 and 2033 were developed by VHB and InterVISTAS as part of the CLT EIS.3 Subsequent to the creation of those schedules, Runway 23 ceased being a primary arrival runway during South Flow operations. To ensure that the models accurately reflect airport operations without the use of Runway 23, a 2019 Baseline demand level was added to the simulation study.
The schedule for the Baseline year of 2019 was developed by Landrum & Brown using the Average Busy Weekday, Peak Month methodology. This methodology was used in the previous ACEP study. Weekends were excluded from the selection process due to the low number of operations compared to weekdays. The selected design day would also have to meet the following criteria:
South flow runway configuration (all day)
Visual Meteorological Conditions weather conditions (all day)
No runway closures or other anomalies in the normal daily operation
Based on the FAA Aviation System Performance Metrics (ASPM) database, October was the peak month of operations for 2019. However, no suitable day in October met all of the selection criteria. May was the second busiest month for 2019. Applying the criteria above, May 30, 2019, with 1,628 daily operations was the nearest demand level to the average busy weekday for May (1,638 daily ops) so May 30, 2019 was chosen as the 2019 design day.
The operation levels of the four demand schedules are compared in Table 2-1.
Table 2-1, Total Daily Operations
YEAR DAILY OPERATIONS 2016 1,563 2019 1,628 2028 1,860 2033 1,978
Source: Landrum & Brown analysis, 2021
The rolling hour arrival and departure demand for each schedule is shown on Exhibit 2-1. CLT has a typical hub airline schedule, with distinct arrival and departure banks throughout the day. The 2016 schedule exceeds 80 arrivals in five hours of the day and is at or above 80 departures in six hours of the day. The peak arrival period at the Airport occurs in the 10:00 a.m. hour. From 2016 to 2033, peak hour arrival demand increases from 88 to 104 operations. The peak departure period at the Airport occurs in the 09:00 a.m. hour. From 2016 to 2033, demand increases from 93 to 110 operations in the peak departure period.
3 Forecast Technical Memorandum, Charlotte Douglas International Airport Environmental Impact Statement, VHB in
association with InterVISTAS, November 10, 2017

AirTOp Simulation Report Environmental Assessment April 2021
Landrum & Brown | 3
Exhibit 2-1, Rolling Hour Arrival and Departure Profiles
Source: Landrum & Brown analysis, 2020
Table 2-2 and Table 2-3 provides a summary of the aircraft fleet mix by flight type and FAA Airplane Design Group (ADG). The tables summarize the number of aircraft by group and as a percentage of total operations.
Table 2-2, Fleet Mix by Flight Type
Flight Type
2016 2019 2028 2033 Number of Ops
% of Total Ops
Number of Ops
% of Total Ops
Number of Ops
% of Total Ops
Number of Ops
% of Total Ops
Passenger 1470 94% 1506 93% 1760 95% 1874 95% General Aviation
81 5% 108 7% 84 5% 86 4%
Cargo 10 1% 14 1% 14 1% 16 1% Military 2 0% 0 0% 2 0% 2 0% Total 1563 100% 1628 100% 1860 100% 1978 100%
Source: Landrum & Brown analysis, 2020
Table 2-3, Fleet Mix by Design Group
FAA ADG 2016 2019 2028 2033
Number of Ops
% of Total Ops
Number of Ops
% of Total Ops
Number of Ops
% of Total Ops
Number of Ops
% of Total Ops
I 19 1% 16 1% 20 1% 21 1% II 372 24% 474 29% 494 27% 495 25% III 1139 73% 1102 68% 1309 70% 1421 72% IV 14 1% 16 1% 16 1% 18 1% V 19 1% 20 1% 21 1% 23 1% Total 1563 100% 1628 100% 1860 100% 1978 100%
Source: Landrum & Brown analysis, 2020

Environmental Assessment AirTOp Simulation Report April 2021
4 | Landrum & Brown
2.1 Flight Dependability
A probability distribution is applied to flight times in the simulation models to mimic variation in flight arrival/departure times. Flights that arrive or depart early are indicated by negative values, while flights that arrive or depart late are indicated by positive values.
The distributions, shown in Exhibit 2-2, are based on data analyzed from Aerobahn.4 Arrivals tend to have more variability than departures and are more likely to be early.
Exhibit 2-2, Flight Earliness/Lateness Distributions
Source: Aerobahn May 2016- Apr 2017, Landrum & Brown analysis, 2020
3 2016 Airport Operating Assumptions The first objective of this simulation analysis was to develop an AirTOp simulation model that is an appropriate representation of the actual operations at CLT. Once it has been confirmed that the simulation model reflects existing operating conditions, the model can be adjusted using various control parameters and demand levels to evaluate changes in the operation. This chapter describes the assumptions that were used to develop and calibrate the AirTOp models.
3.1 Airfield and Aircraft Apron Layouts
CLT has three parallel runways oriented in the 18/36 direction and one crosswind runway oriented in the 5/23 direction. Exhibit 3-1 depicts the airfield as it existed in 2016. The 2016 apron areas for the passenger airlines, cargo carriers (FedEx and UPS), general aviation, and military aircraft are shown on Exhibit 3-2. The passenger airlines park at Concourses A through E, which are located on the north side of the Airport between Runway 18C/36C and Runway 18L/36R. The passenger airline gating assignments are shown in Table 3-1. The table also summarizes the number of gates in each concourse. The count is based on the number of regional and narrowbody gates. For Multiple Apron Ramp System (MARS) gates, which accommodate one widebody or two narrowbody aircraft, only the narrowbody gates are counted to avoid double counting. The cargo facilities are located to the south of the passenger terminal and Runway 5/23. The general aviation and Air National Guard aprons are located to the east of Runway 18L/36R.
4 Aerobahn® tracks and reports aircraft ground movements to provide a comprehensive view of airport surface operations.
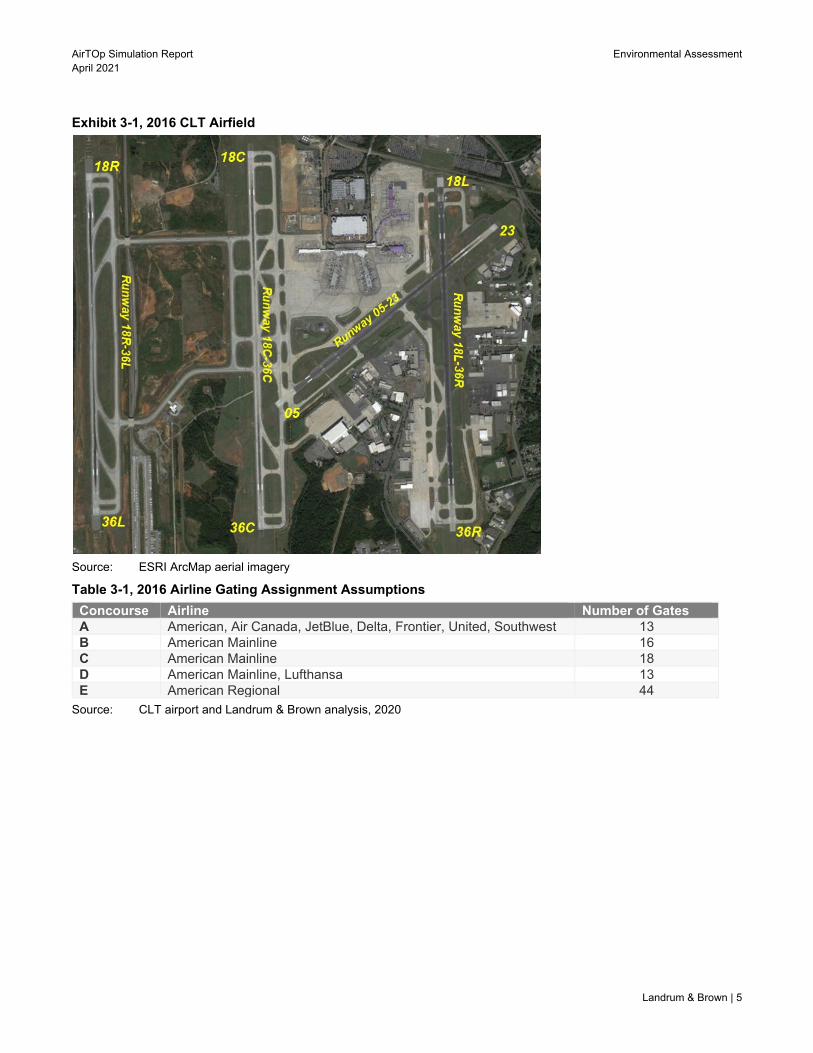
AirTOp Simulation Report Environmental Assessment April 2021
Landrum & Brown | 5
Exhibit 3-1, 2016 CLT Airfield
Source: ESRI ArcMap aerial imagery
Table 3-1, 2016 Airline Gating Assignment Assumptions
Concourse Airline Number of Gates A American, Air Canada, JetBlue, Delta, Frontier, United, Southwest 13 B American Mainline 16 C American Mainline 18 D American Mainline, Lufthansa 13 E American Regional 44
Source: CLT airport and Landrum & Brown analysis, 2020

Environmental Assessment AirTOp Simulation Report April 2021
6 | Landrum & Brown
Exhibit 3-2, 2016 CLT Aircraft Parking Aprons
Source: ESRI ArcMap aerial imagery

AirTOp Simulation Report Environmental Assessment April 2021
Landrum & Brown | 7
3.2 Airfield Hold Pad Usage
CLT has one hold pad that is used to accommodate arrivals waiting for an available gate, remain overnight (RON) operations, towed aircraft, and departures waiting for a spot in the queue. This hold pad is located south of Concourse A and west of Concourse B as shown on Exhibit 3-3.
Exhibit 3-3, 2016 Airfield Hold Pad
Source: ESRI ArcMap aerial imagery
3.3 Runway Operating Configurations
Runway use at an airport is typically dictated by the origin/destination city, wind direction, and weather conditions. Runway use changes as demand for flights arriving from specific standard terminal arrival routes (STAR) or departing to standard instrument departure (SID) routes changes. The four primary (most often used) runway operating configurations at CLT were modeled for the EA:
North Flow Visual Meteorological Conditions (VMC)
North Flow Instrument Meteorological Conditions (IMC)
South Flow VMC
South Flow IMC

Environmental Assessment AirTOp Simulation Report April 2021
8 | Landrum & Brown
3.3.1 North Flow VMC and IMC Operating Configurations
The basic runway usage in a North Flow configuration (VMC and IMC) consists of arrivals on Runways 36L and 36R. Runway 36C is used in conjunction with Runways 36L and 36R to provide triple parallel approach capability during periods of high arrival demand. The primary departure runways are Runways 36C and 36R in both VMC and IMC. The allocation of departing aircraft to these runways is based on the destination of the flight. Runway 36C is used by aircraft departing to northbound and westbound destinations. Runway 36C is also used by international heavy aircraft heading east. Runway 36R is used by southbound and eastbound departures. Exhibit 3-4 depicts the North Flow runway usage. There is a single jet departure heading in North Flow (no fanning permitted). However, prop aircraft can turn immediately after becoming airborne.
Exhibit 3-4, 2016 North Flow VMC/IMC Runway Configuration
Source: ESRI ArcMap aerial imagery; Landrum & Brown, 2020

AirTOp Simulation Report Environmental Assessment April 2021
Landrum & Brown | 9
3.3.2 South Flow VMC and IMC Operating Configurations
The basic runway usage in a South Flow VMC configuration consists of arrivals on Runways 23 and 18R, with Runway 18L used in lieu of Runway 23 during peak departure times5. In IMC, Runways 18L and 18R are used for arrivals; Runway 23 is used as a taxiway, not a runway in South Flow IMC. Runway 18C is used in conjunction with Runways 18L and 18R to provide triple parallel approach capability during periods of high arrival demand. The primary departure runways are Runways 18C and 18L in both VMC and IMC. The allocation of departing aircraft to these runways is based on the destination of the flight. Runway 18C is used by aircraft departing to northbound and westbound destinations. Runway 18C is also used by international heavy aircraft heading east. Runway 18L is used by southbound and eastbound departures. Exhibit 3-5 depicts the South Flow runway usage.
Exhibit 3-5, 2016 South Flow VMC/IMC Runway Configuration
Source: ESRI ArcMap aerial imagery; Landrum & Brown, 2020
5 This was the standard arrival configuration in 2016. Since that time, Runway 23 is no longer a primary arrival runway.

Environmental Assessment AirTOp Simulation Report April 2021
10 | Landrum & Brown
3.4 Airfield Ground Speeds
For accurate simulation, the aircraft taxi speeds within the AirTOp model should replicate the actual taxi speeds at the Airport. Exhibit 3-6 shows the average taxi speeds used in the model.
Exhibit 3-6, 2016 Airfield Ground Speed Assumptions
High Speed Exits 32 knots Outer Perimeter Taxiways 20 knots Runway Crossings 18 knots Taxiways 15 knots Ramp Area Taxiways 12 knots Ramp Area Taxilanes 10 knots
Source: ACEP, EIS, and Landrum & Brown analysis, 2020
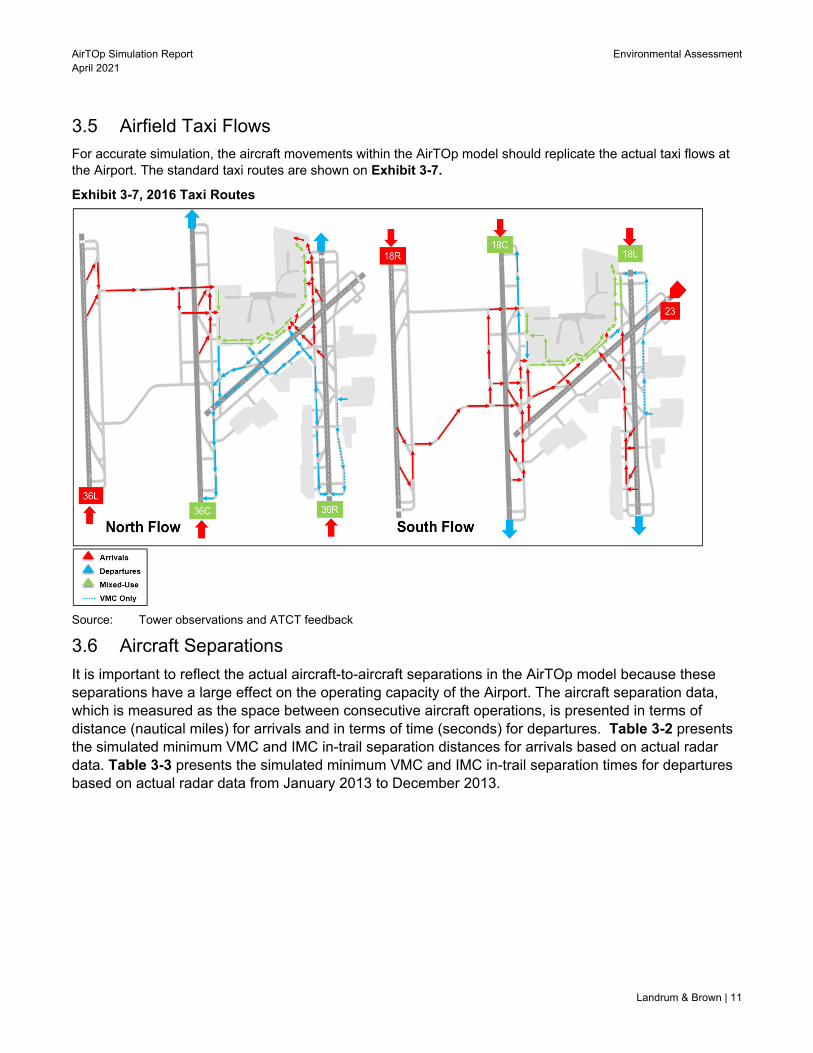
AirTOp Simulation Report Environmental Assessment April 2021
Landrum & Brown | 11
3.5 Airfield Taxi Flows
For accurate simulation, the aircraft movements within the AirTOp model should replicate the actual taxi flows at the Airport. The standard taxi routes are shown on Exhibit 3-7.
Exhibit 3-7, 2016 Taxi Routes
Source: Tower observations and ATCT feedback
3.6 Aircraft Separations
It is important to reflect the actual aircraft-to-aircraft separations in the AirTOp model because these separations have a large effect on the operating capacity of the Airport. The aircraft separation data, which is measured as the space between consecutive aircraft operations, is presented in terms of distance (nautical miles) for arrivals and in terms of time (seconds) for departures. Table 3-2 presents the simulated minimum VMC and IMC in-trail separation distances for arrivals based on actual radar data. Table 3-3 presents the simulated minimum VMC and IMC in-trail separation times for departures based on actual radar data from January 2013 to December 2013.
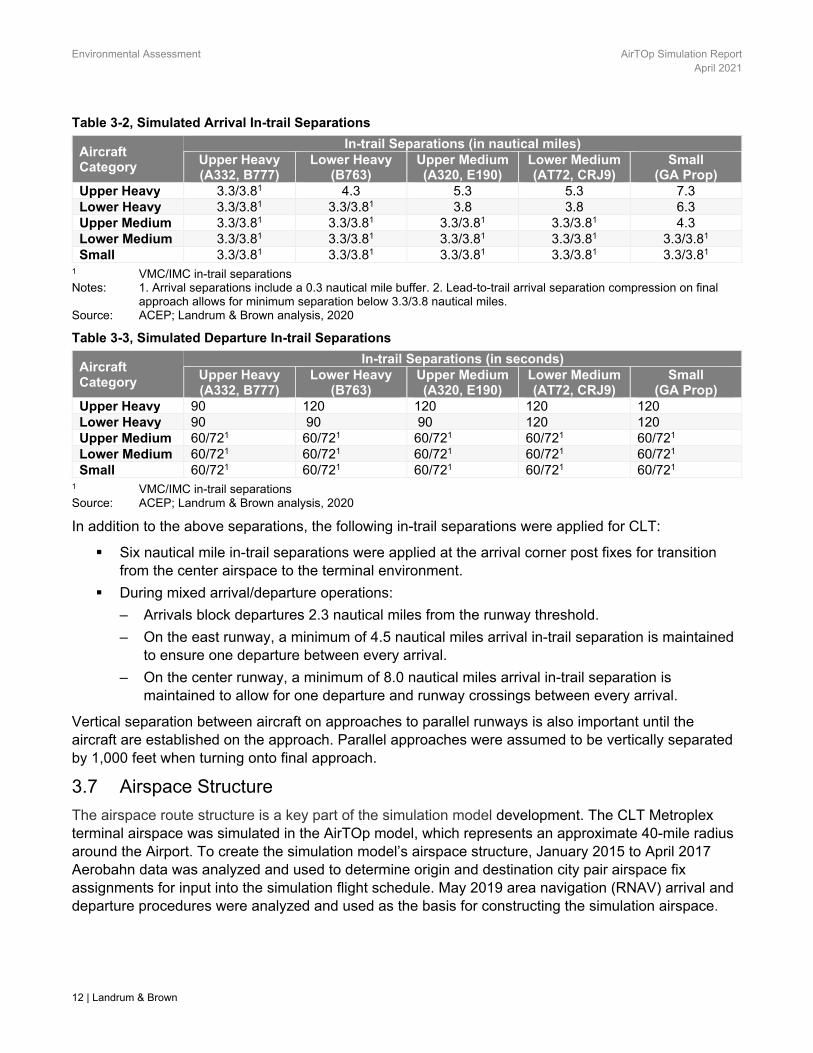
Environmental Assessment AirTOp Simulation Report April 2021
12 | Landrum & Brown
Table 3-2, Simulated Arrival In-trail Separations
Aircraft Category
In-trail Separations (in nautical miles) Upper Heavy (A332, B777)
Lower Heavy (B763)
Upper Medium (A320, E190)
Lower Medium (AT72, CRJ9)
Small (GA Prop)
Upper Heavy 3.3/3.81 4.3 5.3 5.3 7.3 Lower Heavy 3.3/3.81 3.3/3.81 3.8 3.8 6.3 Upper Medium 3.3/3.81 3.3/3.81 3.3/3.81 3.3/3.81 4.3 Lower Medium 3.3/3.81 3.3/3.81 3.3/3.81 3.3/3.81 3.3/3.81 Small 3.3/3.81 3.3/3.81 3.3/3.81 3.3/3.81 3.3/3.81
1 VMC/IMC in-trail separations Notes: 1. Arrival separations include a 0.3 nautical mile buffer. 2. Lead-to-trail arrival separation compression on final
approach allows for minimum separation below 3.3/3.8 nautical miles. Source: ACEP; Landrum & Brown analysis, 2020
Table 3-3, Simulated Departure In-trail Separations
Aircraft Category
In-trail Separations (in seconds) Upper Heavy (A332, B777)
Lower Heavy (B763)
Upper Medium (A320, E190)
Lower Medium (AT72, CRJ9)
Small (GA Prop)
Upper Heavy 90 120 120 120 120 Lower Heavy 90 90 90 120 120 Upper Medium 60/721 60/721 60/721 60/721 60/721 Lower Medium 60/721 60/721 60/721 60/721 60/721 Small 60/721 60/721 60/721 60/721 60/721
1 VMC/IMC in-trail separations Source: ACEP; Landrum & Brown analysis, 2020
In addition to the above separations, the following in-trail separations were applied for CLT:
Six nautical mile in-trail separations were applied at the arrival corner post fixes for transition from the center airspace to the terminal environment.
During mixed arrival/departure operations:
– Arrivals block departures 2.3 nautical miles from the runway threshold.
– On the east runway, a minimum of 4.5 nautical miles arrival in-trail separation is maintained to ensure one departure between every arrival.
– On the center runway, a minimum of 8.0 nautical miles arrival in-trail separation is maintained to allow for one departure and runway crossings between every arrival.
Vertical separation between aircraft on approaches to parallel runways is also important until the aircraft are established on the approach. Parallel approaches were assumed to be vertically separated by 1,000 feet when turning onto final approach.
3.7 Airspace Structure
The airspace route structure is a key part of the simulation model development. The CLT Metroplex terminal airspace was simulated in the AirTOp model, which represents an approximate 40-mile radius around the Airport. To create the simulation model’s airspace structure, January 2015 to April 2017 Aerobahn data was analyzed and used to determine origin and destination city pair airspace fix assignments for input into the simulation flight schedule. May 2019 area navigation (RNAV) arrival and departure procedures were analyzed and used as the basis for constructing the simulation airspace.

AirTOp Simulation Report Environmental Assessment April 2021
Landrum & Brown | 13
3.7.1 Arrival Airspace
Table 3-4 provides a summary of the arrival routes and sample origin airports they serve.
Table 3-4, Sample Origins by Arrival Routing
Arrival Route Origin Direction Origin Examples PARQR North Midway and O’Hare (Chicago), Cleveland, Minneapolis, Seattle CHSLY East Boston, Newark, New York City, Frankfurt, London Heathrow MLLET East Coastal Carolina Regional, Ellis (Jacksonville NC), Florence SC STOCR South Palm Beach, Southwest Florida, Fort Lauderdale BANKR South Jacksonville, Miami JONZE West Atlanta, Houston, Mexico City FLIPZ West Denver, Dallas, Los Angeles, Phoenix, San Francisco
Note: Origin examples listing is not all-inclusive. Source: EIS and Landrum & Brown analysis, 2020
Exhibit 3-8 and Exhibit 3-9 depict the arrival route structure for both North and South Flows. The exhibit shows the primary allocation of the arrival routes to an arrival runway. The routes that primarily feed Runway 18R/36L are shown in orange, Runway 18L/36R and Runway 23 routes are shown in blue, and the Runway 18C/36C routes are shown in green. While the primary route-runway allocations are depicted on the exhibit, arrivals were offloaded to a different runway than is shown as needed based on demand. For example, triple simultaneous approaches were simulated during various peak arrival pushes throughout the day. During these times, Runway 18C/36C served as the mixed-use offload runway.
Exhibit 3-8, 2016 North Flow Simulation Arrival Route Structure
Note: Arrivals can be offloaded to runways other than those shown on exhibit during busy periods. Source: FAA terminal procedures
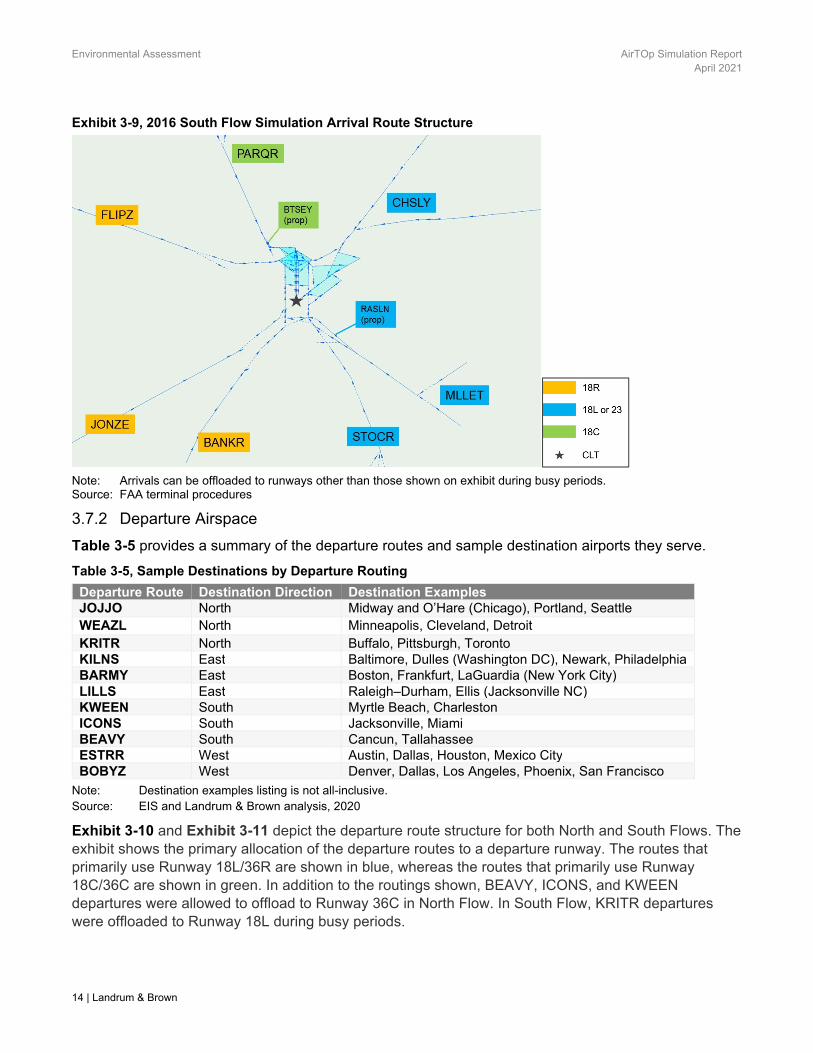
Environmental Assessment AirTOp Simulation Report April 2021
14 | Landrum & Brown
Exhibit 3-9, 2016 South Flow Simulation Arrival Route Structure
Note: Arrivals can be offloaded to runways other than those shown on exhibit during busy periods. Source: FAA terminal procedures
3.7.2 Departure Airspace
Table 3-5 provides a summary of the departure routes and sample destination airports they serve.
Table 3-5, Sample Destinations by Departure Routing
Departure Route Destination Direction Destination Examples JOJJO North Midway and O’Hare (Chicago), Portland, Seattle WEAZL North Minneapolis, Cleveland, Detroit KRITR North Buffalo, Pittsburgh, Toronto KILNS East Baltimore, Dulles (Washington DC), Newark, Philadelphia BARMY East Boston, Frankfurt, LaGuardia (New York City) LILLS East Raleigh–Durham, Ellis (Jacksonville NC) KWEEN South Myrtle Beach, Charleston ICONS South Jacksonville, Miami BEAVY South Cancun, Tallahassee ESTRR West Austin, Dallas, Houston, Mexico City BOBYZ West Denver, Dallas, Los Angeles, Phoenix, San Francisco
Note: Destination examples listing is not all-inclusive. Source: EIS and Landrum & Brown analysis, 2020
Exhibit 3-10 and Exhibit 3-11 depict the departure route structure for both North and South Flows. The exhibit shows the primary allocation of the departure routes to a departure runway. The routes that primarily use Runway 18L/36R are shown in blue, whereas the routes that primarily use Runway 18C/36C are shown in green. In addition to the routings shown, BEAVY, ICONS, and KWEEN departures were allowed to offload to Runway 36C in North Flow. In South Flow, KRITR departures were offloaded to Runway 18L during busy periods.

AirTOp Simulation Report Environmental Assessment April 2021
Landrum & Brown | 15
Exhibit 3-10, 2016 North Flow Simulation Departure Route Structure
Note: BEAVY, ICONS, and KWEEN departures can be offloaded to Runway 36C during busy periods. Source: FAA terminal procedures
Exhibit 3-11, 2016 South Flow Simulation Departure Route Structure
Note: KRITR departures can be offloaded to Runway 18L during busy periods. Source: FAA terminal procedures

Environmental Assessment AirTOp Simulation Report April 2021
16 | Landrum & Brown
3.7.3 Converging Runway Operation (CRO) with Arrival Departure Window (ADW)
Runway 5/23 intersects Runway 18L/36R and its flight paths intersect with Runway 18C/36C and Runway 18R/36L. As a result, operations on these runways must be coordinated when Runway 23 is being used for arrivals, as shown on Exhibit 3-12. This coordination involves:
Arrivals on Runway 23 block departures on Runway 18C/36C and Runway 18L/36R when the arrival is 2.3 nautical miles or less from the Runway 23 threshold.
Runway 18L departure cannot take off until Runway 23 arrival crosses the Runway 18L/36R intersection.
Runway 18C cannot take off until Runway 23 arrival crosses Taxiway D.
Exhibit 3-12, Converging Runway Operation with ADW
Source: Landrum & Brown, 2020
18R
36L
18C
36C
18L
36R
05
23
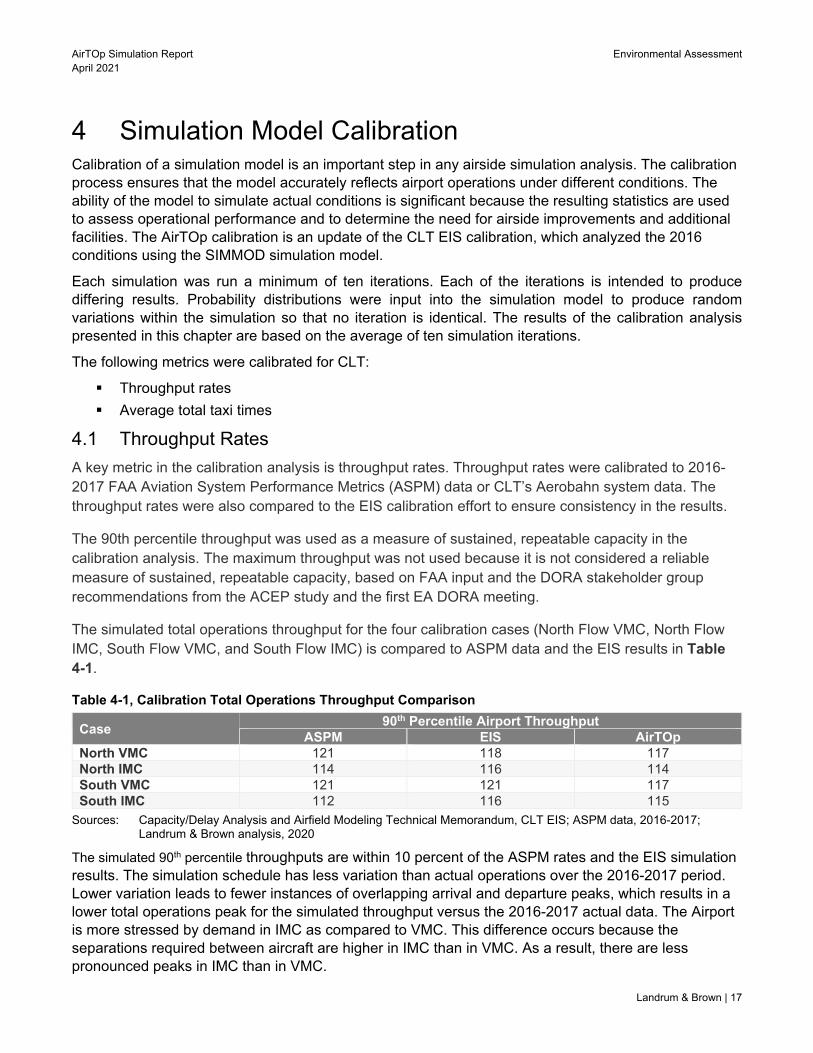
AirTOp Simulation Report Environmental Assessment April 2021
Landrum & Brown | 17
4 Simulation Model Calibration Calibration of a simulation model is an important step in any airside simulation analysis. The calibration process ensures that the model accurately reflects airport operations under different conditions. The ability of the model to simulate actual conditions is significant because the resulting statistics are used to assess operational performance and to determine the need for airside improvements and additional facilities. The AirTOp calibration is an update of the CLT EIS calibration, which analyzed the 2016 conditions using the SIMMOD simulation model.
Each simulation was run a minimum of ten iterations. Each of the iterations is intended to produce differing results. Probability distributions were input into the simulation model to produce random variations within the simulation so that no iteration is identical. The results of the calibration analysis presented in this chapter are based on the average of ten simulation iterations.
The following metrics were calibrated for CLT:
Throughput rates
Average total taxi times
4.1 Throughput Rates
A key metric in the calibration analysis is throughput rates. Throughput rates were calibrated to 2016-2017 FAA Aviation System Performance Metrics (ASPM) data or CLT’s Aerobahn system data. The throughput rates were also compared to the EIS calibration effort to ensure consistency in the results.
The 90th percentile throughput was used as a measure of sustained, repeatable capacity in the calibration analysis. The maximum throughput was not used because it is not considered a reliable measure of sustained, repeatable capacity, based on FAA input and the DORA stakeholder group recommendations from the ACEP study and the first EA DORA meeting.
The simulated total operations throughput for the four calibration cases (North Flow VMC, North Flow IMC, South Flow VMC, and South Flow IMC) is compared to ASPM data and the EIS results in Table 4-1.
Table 4-1, Calibration Total Operations Throughput Comparison
Case 90th Percentile Airport Throughput
ASPM EIS AirTOp North VMC 121 118 117 North IMC 114 116 114 South VMC 121 121 117 South IMC 112 116 115
Sources: Capacity/Delay Analysis and Airfield Modeling Technical Memorandum, CLT EIS; ASPM data, 2016-2017; Landrum & Brown analysis, 2020
The simulated 90th percentile throughputs are within 10 percent of the ASPM rates and the EIS simulation results. The simulation schedule has less variation than actual operations over the 2016-2017 period. Lower variation leads to fewer instances of overlapping arrival and departure peaks, which results in a lower total operations peak for the simulated throughput versus the 2016-2017 actual data. The Airport is more stressed by demand in IMC as compared to VMC. This difference occurs because the separations required between aircraft are higher in IMC than in VMC. As a result, there are less pronounced peaks in IMC than in VMC.

Environmental Assessment AirTOp Simulation Report April 2021
18 | Landrum & Brown
The simulated arrival and departure throughputs are compared to the ASPM data and the EIS results for the maximum rates and the 90th percentile rates in Table 4-2. The simulated arrival and departure hourly throughputs match closely with ASPM and the EIS simulation results. The FAA’s Capacity Airport Rates (called rates) are also shown; the arrival called rates are much higher than actual hourly counts, so they are not considered a reliable indication of actual throughput.
Table 4-2, Calibration Arrival and Departure Throughput Comparison
Case Type of Operation
Arrival and Departure Throughput ASPM Called Rate1
ASPM Max
ASPM 90th
EIS Max2
AirTOp Max
AirTOp 90th
North VMC Arrival 92 79 63 73 76 67 Departure 69 82 67 78 82 63
North IMC Arrival 75 76 64 73 72 64 Departure 65 79 62 68 78 59
South VMC
Arrival 92 78 63 77 77 68 Departure 82 81 66 78 83 64
South IMC Arrival 75 77 64 74 77 66 Departure 65 74 58 68 79 61
1 A variety of called rates were found in ASPM for each particular runway configuration; the most frequent called rate is shown in the table.
2 The EIS did not include 90th percentile data for arrival and departure throughput. Source: Capacity/Delay Analysis and Airfield Modeling Technical Memorandum, CLT EIS; ASPM data, 2016-2017;
Landrum & Brown analysis, 2020
The hourly throughput rate for the main operation on each runway was compared to the actual runway throughput. The simulated runway throughputs are shown with the Aerobahn data and the EIS results for the 90th percentile rates in Table 4-3. The simulated runway throughputs match closely with Aerobahn and the EIS simulation results.
Table 4-3, Calibration Runway Throughput Comparison Operation Runway Aerobahn – 90th EIS - 90th AirTOp – 90th
North VMC Arrival 36L 35 32 34 Departure 36C 38 37 39 Departure 36R 29 28 27
North IMC Arrival 36L 35 32 32 Departure 36C 35 35 36 Departure 36R 27 26 26
South VMC Arrival 18R 33 33 33 Departure 18C 32 31 32 Departure 18L 38 35 37
South IMC Arrival 18R 34 35 33 Departure 18C 28 29 31 Departure 18L 32 34 32
Source: Capacity/Delay Analysis and Airfield Modeling Technical Memorandum, CLT EIS; Aerobahn data, May 2016 for VMC, Jan-Aug 2016 for IMC; Landrum & Brown analysis, 2020

AirTOp Simulation Report Environmental Assessment April 2021
Landrum & Brown | 19
Simulated throughputs can also be compared to actual rates using a heat map. A heat map plots the number of hourly arrivals against the number of hourly departures. The frequency of occurrence of a particular arrival-departure rate in the data sample defines the color (heat) of the data point. This technique enables the visual differentiation of commonly occurring throughput rates from outlier throughput rates. Exhibit 4-1 shows how heat maps work.
Exhibit 4-1, Heat Map Example
Source: Landrum & Brown analysis, 2020

Environmental Assessment AirTOp Simulation Report April 2021
20 | Landrum & Brown
Exhibit 4-2 and Exhibit 4-3 present the throughput rate heat map based on 2016-2017 ASPM data for the North Flow VMC and South Flow VMC operation respectively. In both flows, the simulated throughputs correlate well to the actual data.
Exhibit 4-2, Calibration North Flow VMC Throughput Heat Map – Actual Data
Source: ASPM data, 2016-2017; Landrum & Brown analysis, 2020
Exhibit 4-3, Calibration South Flow VMC Throughput Heat Map – Actual Data
Source: ASPM data, 2016-2017; Landrum & Brown analysis, 2020

AirTOp Simulation Report Environmental Assessment April 2021
Landrum & Brown | 21
Exhibit 4-4 and Exhibit 4-5 present the throughput rate heat map based on 2016-2017 ASPM data for the North Flow VMC and South Flow IMC operation respectively. In both flows, the simulated throughputs correlate well to the actual data.
Exhibit 4-4, Calibration North Flow IMC Throughput Heat Map – Actual Data
Source: ASPM data, 2016-2017; Landrum & Brown analysis, 2020
Exhibit 4-5, Calibration South Flow IMC Throughput Heat Map – Actual Data
Source: ASPM data, 2016-2017; Landrum & Brown analysis, 2020
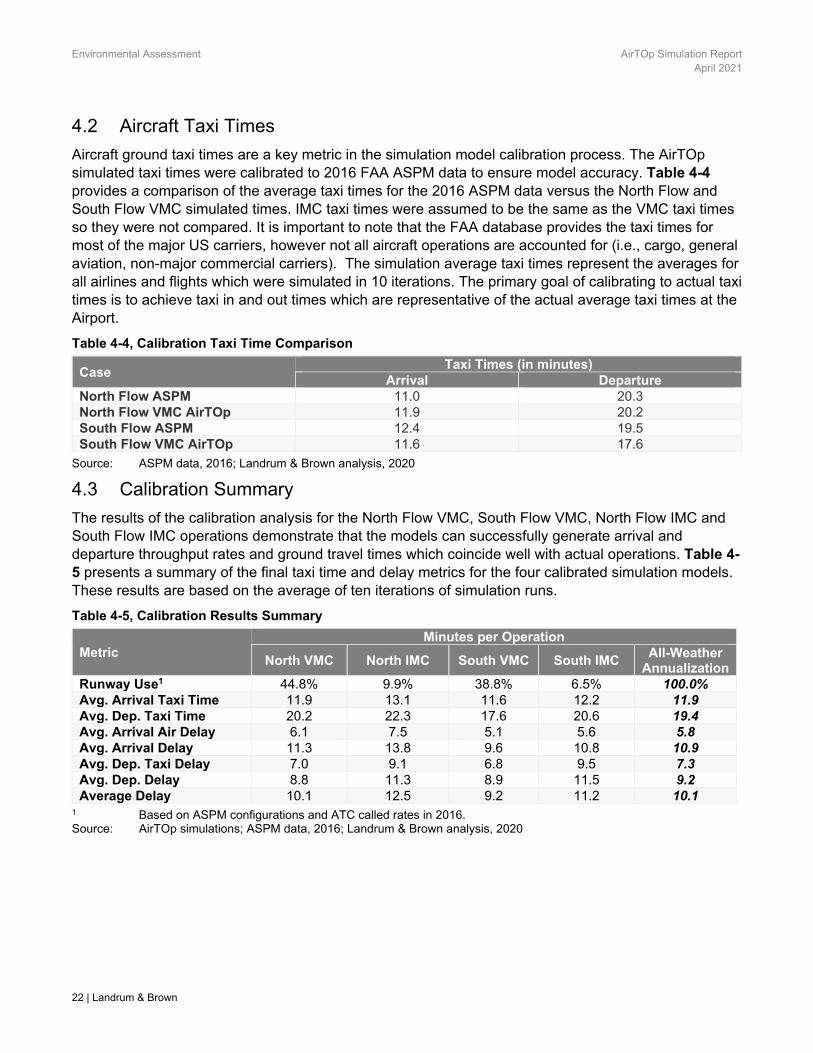
Environmental Assessment AirTOp Simulation Report April 2021
22 | Landrum & Brown
4.2 Aircraft Taxi Times
Aircraft ground taxi times are a key metric in the simulation model calibration process. The AirTOp simulated taxi times were calibrated to 2016 FAA ASPM data to ensure model accuracy. Table 4-4 provides a comparison of the average taxi times for the 2016 ASPM data versus the North Flow and South Flow VMC simulated times. IMC taxi times were assumed to be the same as the VMC taxi times so they were not compared. It is important to note that the FAA database provides the taxi times for most of the major US carriers, however not all aircraft operations are accounted for (i.e., cargo, general aviation, non-major commercial carriers). The simulation average taxi times represent the averages for all airlines and flights which were simulated in 10 iterations. The primary goal of calibrating to actual taxi times is to achieve taxi in and out times which are representative of the actual average taxi times at the Airport.
Table 4-4, Calibration Taxi Time Comparison
Case Taxi Times (in minutes)
Arrival Departure North Flow ASPM 11.0 20.3 North Flow VMC AirTOp 11.9 20.2 South Flow ASPM 12.4 19.5 South Flow VMC AirTOp 11.6 17.6
Source: ASPM data, 2016; Landrum & Brown analysis, 2020
4.3 Calibration Summary
The results of the calibration analysis for the North Flow VMC, South Flow VMC, North Flow IMC and South Flow IMC operations demonstrate that the models can successfully generate arrival and departure throughput rates and ground travel times which coincide well with actual operations. Table 4-5 presents a summary of the final taxi time and delay metrics for the four calibrated simulation models. These results are based on the average of ten iterations of simulation runs.
Table 4-5, Calibration Results Summary
Metric Minutes per Operation
North VMC North IMC South VMC South IMC All-Weather
Annualization Runway Use1 44.8% 9.9% 38.8% 6.5% 100.0% Avg. Arrival Taxi Time 11.9 13.1 11.6 12.2 11.9 Avg. Dep. Taxi Time 20.2 22.3 17.6 20.6 19.4 Avg. Arrival Air Delay 6.1 7.5 5.1 5.6 5.8 Avg. Arrival Delay 11.3 13.8 9.6 10.8 10.9 Avg. Dep. Taxi Delay 7.0 9.1 6.8 9.5 7.3 Avg. Dep. Delay 8.8 11.3 8.9 11.5 9.2 Average Delay 10.1 12.5 9.2 11.2 10.1
1 Based on ASPM configurations and ATC called rates in 2016. Source: AirTOp simulations; ASPM data, 2016; Landrum & Brown analysis, 2020

AirTOp Simulation Report Environmental Assessment April 2021
Landrum & Brown | 23
5 2019 Baseline Operating Assumptions Since the 2016 calibration, Runway 23 is no longer a primary arrival runway, therefore subsequent South Flow models were revised to reflect the new runway usage. To ensure that the models accurately reflect airport operations under the updated conditions, the 2019 Baseline simulation results were used to validate the models. North Flow models were not modeled for 2019 because runway usage remained the same as 2016.
The Baseline condition represents existing airside conditions (airfield, airspace, and terminal) in 2019 as shown on Exhibit 5-1. The primary differences between the 2016 calibrated condition and the 2019 condition are the addition of (1) the Concourse A Phase 1 Pier and (2) a deicing/hold pad to the north of the new pier. The 2019 Baseline condition was simulated with the 2019 flight schedule.
Exhibit 5-1, 2019 Baseline Airfield Layout
Source: 2020 Bing Maps imagery; Landrum & Brown, 2020
For purposes of the EA, the following 2019 Baseline modeling experiments were run:
2019 South Flow VMC
2019 South Flow IMC
5.1 Airfield and Aircraft Apron Layouts
The apron areas for the cargo carriers, general aviation, and military aircraft remain the same as in 2016. The 2019 Baseline includes the addition of the new Concourse A Phase I Pier as compared to the 2016 condition. In addition, airline usage of gates has changed since 2016. In 2019, American and Delta occupied the original Concourse A pier, while OALs moved to the Concourse A Phase I Extension Pier. The updated passenger airline gating assignments are shown in Table 5-1. The table also summarizes the number of gates in each concourse.

Environmental Assessment AirTOp Simulation Report April 2021
24 | Landrum & Brown
Table 5-1, 2019 Baseline Airline Gating Assignment Assumptions
Concourse Airline Assignments Number of Gates A American, Delta 13 A Phase I Pier Other Airlines (OALs) 9 B American Mainline 16 C American Mainline 18 D American Mainline, Lufthansa 13 E American Regional 44
Source: CLT airport and Landrum & Brown analysis, 2020
5.2 Hold Pad Usage
As with the 2016 condition, airfield deicing/hold pads were used to accommodate arrivals waiting for an available gate, RON operations, towed aircraft, and departures waiting for a spot in the queue. In the Baseline condition, the new deicing/hold pad located at the Runway 18C end can be used in addition to the existing hold pad between Concourses B and C, as shown on Exhibit 5-2.
Exhibit 5-2, 2019 Baseline Deicing/Hold Pads
Source: 2020 Bing Maps imagery; Landrum & Brown, 2020

AirTOp Simulation Report Environmental Assessment April 2021
Landrum & Brown | 25
5.3 Runway Operating Configurations
In South Flow, Runway 23 is no longer used for arrivals in the 2019 Baseline; Runway 5/23 is used as a taxiway instead. The basic runway usage in a South Flow configuration therefore consists of arrivals on Runways 18L and 18R, Runway 18C is used in conjunction with Runways 18L and 18R to provide triple parallel approach capability during periods of high arrival demand. The primary departure runways are Runways 18C and 18L in both VMC and IMC. The allocation of departing aircraft to these runways is based on the destination of the flight. Runway 18C is used by aircraft departing to northbound and westbound destinations. Runway 18C is also used by international heavy aircraft heading east. Runway 18L is used by southbound and eastbound departures. Exhibit 5-3 depicts the South Flow runway usage.
Exhibit 5-3, 2019 Baseline South Flow VMC/IMC Runway Configuration
Source: 2020 Bing Maps imagery; Landrum & Brown, 2020

Environmental Assessment AirTOp Simulation Report April 2021
26 | Landrum & Brown
5.4 Airfield Ground Speeds
The overall ground speed assumptions remain the same as in 2016. Exhibit 5-4 shows the 2019 Baseline speeds with the Concourse A pier expansion and deicing/hold pad included.
Exhibit 5-4, 2019 Baseline Airfield Ground Speed Assumptions
High Speed Exits 32 knots Outer Perimeter Taxiways 20 knots Runway Crossings 18 knots Taxiways 15 knots Ramp Area Taxiways 12 knots Ramp Area Taxilanes 10 knots
Source: ACEP, EIS, and Landrum & Brown analysis, 2020
5.5 Airfield Taxi Flows
Exhibit 5-5 shows the South Flow taxi routes with the Baseline improvements. Runway 23 is used as a taxiway.

AirTOp Simulation Report Environmental Assessment April 2021
Landrum & Brown | 27
Exhibit 5-5, 2019 Baseline Taxi Routes
Source: Tower observations and ATCT feedback
5.6 Airspace Assumptions
The 2019 Baseline conditions were modeled with the same aircraft separation and airspace structure assumptions as were used for the 2016 modeling and calibration effort.
6 2019 Baseline Modeling Results The results of the 2019 Baseline simulation models are presented in this chapter. The following metrics were validated for the South VMC and IMC models:
Throughput rates
Average total taxi times
6.1 Throughput Rates
A key metric in the calibration analysis is throughput rates. Throughput rates were calibrated to 2019 FAA ASPM data or CLT’s Aerobahn system data. The simulated total operations throughput is compared to ASPM data in Table 6-1. The simulated 90th percentile throughputs are within 10 percent of the ASPM rates.
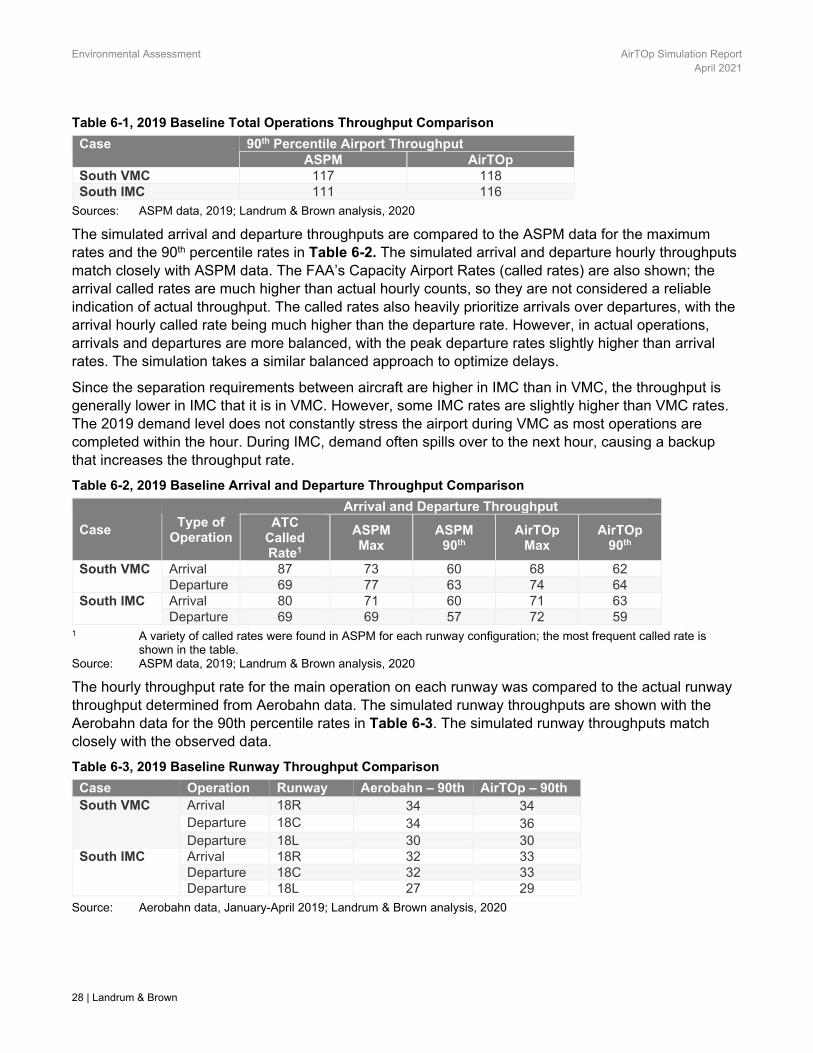
Environmental Assessment AirTOp Simulation Report April 2021
28 | Landrum & Brown
Table 6-1, 2019 Baseline Total Operations Throughput Comparison
Case 90th Percentile Airport Throughput ASPM AirTOp
South VMC 117 118 South IMC 111 116
Sources: ASPM data, 2019; Landrum & Brown analysis, 2020
The simulated arrival and departure throughputs are compared to the ASPM data for the maximum rates and the 90th percentile rates in Table 6-2. The simulated arrival and departure hourly throughputs match closely with ASPM data. The FAA’s Capacity Airport Rates (called rates) are also shown; the arrival called rates are much higher than actual hourly counts, so they are not considered a reliable indication of actual throughput. The called rates also heavily prioritize arrivals over departures, with the arrival hourly called rate being much higher than the departure rate. However, in actual operations, arrivals and departures are more balanced, with the peak departure rates slightly higher than arrival rates. The simulation takes a similar balanced approach to optimize delays.
Since the separation requirements between aircraft are higher in IMC than in VMC, the throughput is generally lower in IMC that it is in VMC. However, some IMC rates are slightly higher than VMC rates. The 2019 demand level does not constantly stress the airport during VMC as most operations are completed within the hour. During IMC, demand often spills over to the next hour, causing a backup that increases the throughput rate.
Table 6-2, 2019 Baseline Arrival and Departure Throughput Comparison
Case Type of
Operation
Arrival and Departure Throughput ATC
Called Rate1
ASPM Max
ASPM 90th
AirTOp Max
AirTOp 90th
South VMC Arrival 87 73 60 68 62 Departure 69 77 63 74 64
South IMC Arrival 80 71 60 71 63 Departure 69 69 57 72 59
1 A variety of called rates were found in ASPM for each runway configuration; the most frequent called rate is shown in the table.
Source: ASPM data, 2019; Landrum & Brown analysis, 2020
The hourly throughput rate for the main operation on each runway was compared to the actual runway throughput determined from Aerobahn data. The simulated runway throughputs are shown with the Aerobahn data for the 90th percentile rates in Table 6-3. The simulated runway throughputs match closely with the observed data.
Table 6-3, 2019 Baseline Runway Throughput Comparison
Case Operation Runway Aerobahn – 90th AirTOp – 90th South VMC Arrival 18R 34 34
Departure 18C 34 36 Departure 18L 30 30
South IMC Arrival 18R 32 33 Departure 18C 32 33 Departure 18L 27 29
Source: Aerobahn data, January-April 2019; Landrum & Brown analysis, 2020

AirTOp Simulation Report Environmental Assessment April 2021
Landrum & Brown | 29
Simulated throughputs can also be compared to actual rates using a heat map. Exhibit 6-1 and Exhibit 6-2 present the throughput rate heat map based on 2019 ASPM data for the South Flow VMC and South Flow IMC operation respectively. In both flows, the simulated throughputs correlate well to the actual data.
Exhibit 6-1, 2019 Baseline South Flow VMC Throughput Heat Map – Actual Data
Source: ASPM data, 2019; Landrum & Brown analysis, 2020
Exhibit 6-2, 2019 Baseline South Flow IMC Throughput Heat Map – Actual Data
Source: ASPM data, 2019; Landrum & Brown analysis, 2020
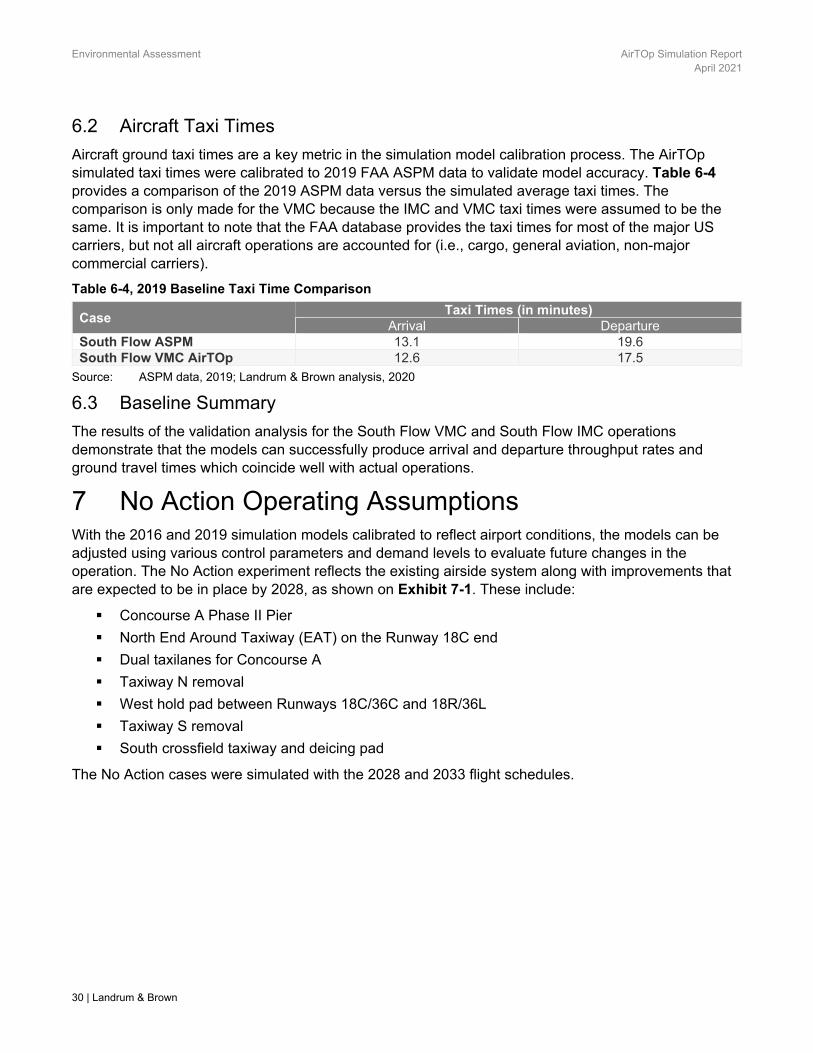
Environmental Assessment AirTOp Simulation Report April 2021
30 | Landrum & Brown
6.2 Aircraft Taxi Times
Aircraft ground taxi times are a key metric in the simulation model calibration process. The AirTOp simulated taxi times were calibrated to 2019 FAA ASPM data to validate model accuracy. Table 6-4 provides a comparison of the 2019 ASPM data versus the simulated average taxi times. The comparison is only made for the VMC because the IMC and VMC taxi times were assumed to be the same. It is important to note that the FAA database provides the taxi times for most of the major US carriers, but not all aircraft operations are accounted for (i.e., cargo, general aviation, non-major commercial carriers).
Table 6-4, 2019 Baseline Taxi Time Comparison
Case Taxi Times (in minutes)
Arrival Departure South Flow ASPM 13.1 19.6 South Flow VMC AirTOp 12.6 17.5
Source: ASPM data, 2019; Landrum & Brown analysis, 2020
6.3 Baseline Summary
The results of the validation analysis for the South Flow VMC and South Flow IMC operations demonstrate that the models can successfully produce arrival and departure throughput rates and ground travel times which coincide well with actual operations.
7 No Action Operating Assumptions With the 2016 and 2019 simulation models calibrated to reflect airport conditions, the models can be adjusted using various control parameters and demand levels to evaluate future changes in the operation. The No Action experiment reflects the existing airside system along with improvements that are expected to be in place by 2028, as shown on Exhibit 7-1. These include:
Concourse A Phase II Pier
North End Around Taxiway (EAT) on the Runway 18C end
Dual taxilanes for Concourse A
Taxiway N removal
West hold pad between Runways 18C/36C and 18R/36L
Taxiway S removal
South crossfield taxiway and deicing pad
The No Action cases were simulated with the 2028 and 2033 flight schedules.

AirTOp Simulation Report Environmental Assessment April 2021
Landrum & Brown | 31
Exhibit 7-1, 2028/2033 Future No Action Airfield Layout
Source: CLT airport and Landrum & Brown, 2020
For purposes of the EA, the following No Action modeling experiments were run:
2028 North Flow VMC 2028 North Flow IMC 2028 South Flow VMC 2028 South Flow IMC
2033 North Flow VMC 2033 North Flow IMC 2033 South Flow VMC 2033 South Flow IMC

Environmental Assessment AirTOp Simulation Report April 2021
32 | Landrum & Brown
7.1 Airfield and Aircraft Apron Layouts
The apron areas for the cargo carriers, general aviation, and military aircraft remain the same as in 2016 and 2019. The No Action conditions include the addition of Concourse A Phase II Pier as compared to the 2019 condition. The updated passenger airline gating assignments are shown in Table 7-1. The table also summarizes the number of gates in each concourse.
Table 7-1, No Action Airline Gating Assignment Assumptions
Concourse No Action Airline Assignments Number of Gates A American 9 A Phase I Pier Other Airlines (OALs) 9 A Phase II Pier Other Airlines (OALs) 10 B American Mainline 16 C American Mainline 18 D American Mainline, Lufthansa 13 E American Regional 44
Source: CLT airport and Landrum & Brown analysis, 2020
7.2 Hold Pad Usage
Airfield deicing/hold pads were used to accommodate arrivals waiting for an available gate, RON operations, and towed aircraft. In the No Action condition, the South Deicing Pad and West Hold Pad can be used in addition to the existing hold pad between Concourses B and C (see Exhibit 7-2).
Exhibit 7-2, No Action Deicing/Hold Pads
Source: CLT airport and Landrum & Brown, 2020

AirTOp Simulation Report Environmental Assessment April 2021
Landrum & Brown | 33
7.3 Runway Operating Configurations
For North Flow, the No Action experiments were modeled with the same runway operating configurations as the 2016 Calibration modeling effort. For South Flow, the No Action experiments were modeled with the same runway operating configurations as the 2019 Baseline modeling effort.
7.4 Airfield Ground Speeds
The overall ground speed assumptions remain the same as in 2016 and 2019. Exhibit 7-3, No Action Airfield Ground Speed Assumptions, shows the 2028 and 2033 No Action speeds with the No Action additions, such as the Concourse A pier and the North EAT, included.
Exhibit 7-3, No Action Airfield Ground Speed Assumptions
High Speed Exits 32 knots Outer Perimeter Taxiways 20 knots Runway Crossings 18 knots Taxiways 15 knots Ramp Area Taxiways 12 knots Ramp Area Taxilanes 10 knots
Source: ACEP, EIS, and Landrum & Brown analysis, 2020

Environmental Assessment AirTOp Simulation Report April 2021
34 | Landrum & Brown
7.5 Airfield Taxi Flows
Exhibit 7-4 shows the taxi routes in the No Action with additional projects implemented. Both North Flow and South Flow reflect the use of the new North EAT and the new dual taxilanes along Concourse A. In addition, in South Flow, Runway 23 is not used for arrivals as it was in 2016; instead Runway 5/23 is used as a taxiway.
Exhibit 7-4, No Action Taxi Routes
Source: Tower observations and ATCT feedback
7.6 Airspace Assumptions
Based on discussion with the FAA during the DORA process,6 the No Action and alternative simulations assumed a final approach in-trail separation of 2.5 nautical miles due to average runway occupancy time of less than 50 seconds. This separation allows arrivals to fully utilize runway capacity at higher demand levels.
With the implementation of the NASA Airspace Technology Demonstration 2 (ATD-2) system, a predecessor to the FAA Terminal Flight Data Manager (TFDM), the miles-in-trail (MIT) constraints that would have otherwise been added for northern destinations from CLT are no longer necessary. Prior to ATD-2, it was normal practice for MIT restrictions to be implemented, even during VMC, due to overhead enroute congestion. With ATD-2, flights going to the north are assigned a takeoff time prior to pushback from the gate to meter the departures into the airspace. Further improved enroute flows are anticipated with the Atlantic Coast Reroute Project.
6 DORA #3 follow up meeting with FAA, July 8, 2020
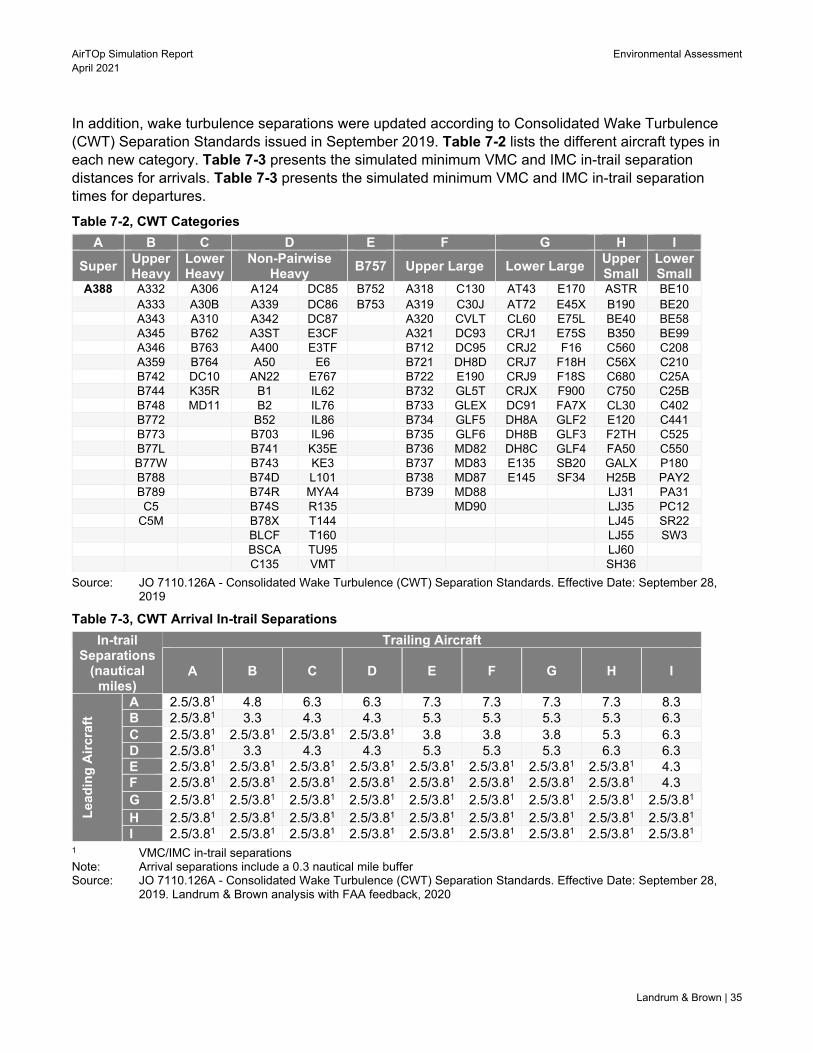
AirTOp Simulation Report Environmental Assessment April 2021
Landrum & Brown | 35
In addition, wake turbulence separations were updated according to Consolidated Wake Turbulence (CWT) Separation Standards issued in September 2019. Table 7-2 lists the different aircraft types in each new category. Table 7-3 presents the simulated minimum VMC and IMC in-trail separation distances for arrivals. Table 7-3 presents the simulated minimum VMC and IMC in-trail separation times for departures.
Table 7-2, CWT Categories
A B C D E F G H I
Super Upper Heavy
Lower Heavy
Non-Pairwise Heavy
B757 Upper Large Lower Large Upper Small
Lower Small
A388 A332 A306 A124 DC85 B752 A318 C130 AT43 E170 ASTR BE10 A333 A30B A339 DC86 B753 A319 C30J AT72 E45X B190 BE20 A343 A310 A342 DC87
A320 CVLT CL60 E75L BE40 BE58
A345 B762 A3ST E3CF
A321 DC93 CRJ1 E75S B350 BE99 A346 B763 A400 E3TF
B712 DC95 CRJ2 F16 C560 C208
A359 B764 A50 E6
B721 DH8D CRJ7 F18H C56X C210 B742 DC10 AN22 E767
B722 E190 CRJ9 F18S C680 C25A
B744 K35R B1 IL62
B732 GL5T CRJX F900 C750 C25B B748 MD11 B2 IL76
B733 GLEX DC91 FA7X CL30 C402
B772
B52 IL86
B734 GLF5 DH8A GLF2 E120 C441 B773
B703 IL96
B735 GLF6 DH8B GLF3 F2TH C525
B77L
B741 K35E
B736 MD82 DH8C GLF4 FA50 C550 B77W
B743 KE3
B737 MD83 E135 SB20 GALX P180
B788
B74D L101
B738 MD87 E145 SF34 H25B PAY2 B789
B74R MYA4
B739 MD88
LJ31 PA31
C5
B74S R135
MD90
LJ35 PC12 C5M
B78X T144
LJ45 SR22
BLCF T160
LJ55 SW3
BSCA TU95
LJ60
C135 VMT
SH36
Source: JO 7110.126A - Consolidated Wake Turbulence (CWT) Separation Standards. Effective Date: September 28, 2019
Table 7-3, CWT Arrival In-trail Separations
In-trail Separations
(nautical miles)
Trailing Aircraft
A B C D E F G H I
Lea
din
g A
ircr
aft
A 2.5/3.81 4.8 6.3 6.3 7.3 7.3 7.3 7.3 8.3 B 2.5/3.81 3.3 4.3 4.3 5.3 5.3 5.3 5.3 6.3 C 2.5/3.81 2.5/3.81 2.5/3.81 2.5/3.81 3.8 3.8 3.8 5.3 6.3 D 2.5/3.81 3.3 4.3 4.3 5.3 5.3 5.3 6.3 6.3 E 2.5/3.81 2.5/3.81 2.5/3.81 2.5/3.81 2.5/3.81 2.5/3.81 2.5/3.81 2.5/3.81 4.3 F 2.5/3.81 2.5/3.81 2.5/3.81 2.5/3.81 2.5/3.81 2.5/3.81 2.5/3.81 2.5/3.81 4.3 G 2.5/3.81 2.5/3.81 2.5/3.81 2.5/3.81 2.5/3.81 2.5/3.81 2.5/3.81 2.5/3.81 2.5/3.81 H 2.5/3.81 2.5/3.81 2.5/3.81 2.5/3.81 2.5/3.81 2.5/3.81 2.5/3.81 2.5/3.81 2.5/3.81 I 2.5/3.81 2.5/3.81 2.5/3.81 2.5/3.81 2.5/3.81 2.5/3.81 2.5/3.81 2.5/3.81 2.5/3.81
1 VMC/IMC in-trail separations Note: Arrival separations include a 0.3 nautical mile buffer Source: JO 7110.126A - Consolidated Wake Turbulence (CWT) Separation Standards. Effective Date: September 28,
2019. Landrum & Brown analysis with FAA feedback, 2020
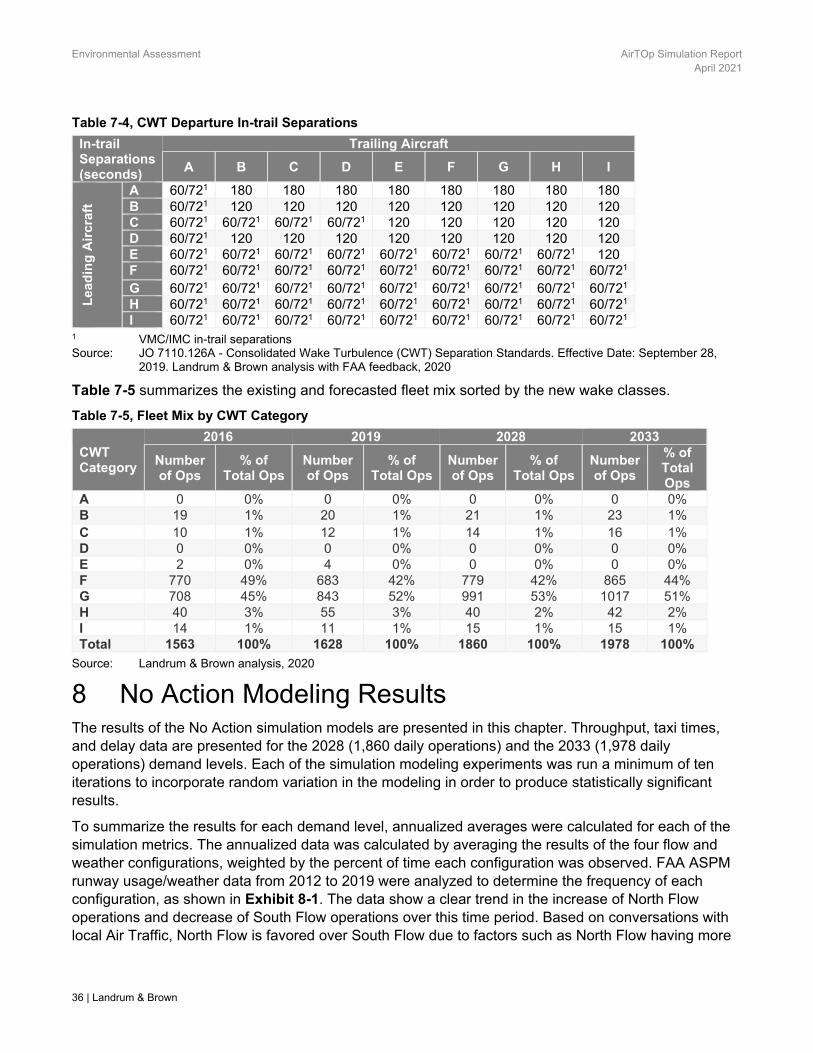
Environmental Assessment AirTOp Simulation Report April 2021
36 | Landrum & Brown
Table 7-4, CWT Departure In-trail Separations
In-trail Separations (seconds)
Trailing Aircraft
A B C D E F G H I
Lea
din
g A
ircr
aft
A 60/721 180 180 180 180 180 180 180 180 B 60/721 120 120 120 120 120 120 120 120 C 60/721 60/721 60/721 60/721 120 120 120 120 120 D 60/721 120 120 120 120 120 120 120 120 E 60/721 60/721 60/721 60/721 60/721 60/721 60/721 60/721 120 F 60/721 60/721 60/721 60/721 60/721 60/721 60/721 60/721 60/721 G 60/721 60/721 60/721 60/721 60/721 60/721 60/721 60/721 60/721 H 60/721 60/721 60/721 60/721 60/721 60/721 60/721 60/721 60/721 I 60/721 60/721 60/721 60/721 60/721 60/721 60/721 60/721 60/721
1 VMC/IMC in-trail separations Source: JO 7110.126A - Consolidated Wake Turbulence (CWT) Separation Standards. Effective Date: September 28,
2019. Landrum & Brown analysis with FAA feedback, 2020
Table 7-5 summarizes the existing and forecasted fleet mix sorted by the new wake classes.
Table 7-5, Fleet Mix by CWT Category
CWT Category
2016 2019 2028 2033
Number of Ops
% of Total Ops
Number of Ops
% of Total Ops
Number of Ops
% of Total Ops
Number of Ops
% of Total Ops
A 0 0% 0 0% 0 0% 0 0% B 19 1% 20 1% 21 1% 23 1% C 10 1% 12 1% 14 1% 16 1% D 0 0% 0 0% 0 0% 0 0% E 2 0% 4 0% 0 0% 0 0% F 770 49% 683 42% 779 42% 865 44% G 708 45% 843 52% 991 53% 1017 51% H 40 3% 55 3% 40 2% 42 2% I 14 1% 11 1% 15 1% 15 1% Total 1563 100% 1628 100% 1860 100% 1978 100%
Source: Landrum & Brown analysis, 2020
8 No Action Modeling Results The results of the No Action simulation models are presented in this chapter. Throughput, taxi times, and delay data are presented for the 2028 (1,860 daily operations) and the 2033 (1,978 daily operations) demand levels. Each of the simulation modeling experiments was run a minimum of ten iterations to incorporate random variation in the modeling in order to produce statistically significant results.
To summarize the results for each demand level, annualized averages were calculated for each of the simulation metrics. The annualized data was calculated by averaging the results of the four flow and weather configurations, weighted by the percent of time each configuration was observed. FAA ASPM runway usage/weather data from 2012 to 2019 were analyzed to determine the frequency of each configuration, as shown in Exhibit 8-1. The data show a clear trend in the increase of North Flow operations and decrease of South Flow operations over this time period. Based on conversations with local Air Traffic, North Flow is favored over South Flow due to factors such as North Flow having more

AirTOp Simulation Report Environmental Assessment April 2021
Landrum & Brown | 37
departure queue space. An average of 2012 to 2019 configuration shares would likely undercount North Flow percentages at future demand levels, therefore the 2028 and 2033 simulation results were weighted solely on the 2019 shares.
Exhibit 8-1, Annual Use of Airport Configurations
Source: ASPM data, 2012-2019
8.1 Throughput Rates
In order to evaluate the No Action airfield’s ability to manage the increase in demand, rolling hour throughput rates were calculated from the simulations. As recommended by the DORA stakeholder group, the 90th percentile throughput is used in this analysis rather than the maximum throughput. The 90th percentile methodology presents an achievable runway throughput rate, while the maximum hourly rate may not be sustainable7 on a recurring basis.
Exhibit 8-2 shows the 90th percentile hourly throughput rate for arrivals, departures, and overall airport operations. The 2016 calibration throughput rates are included for reference. The 2016 rates are annualized based on the shares of 2016 runway configurations, while the 2028 and 2033 rates are annualized based on the 2019 runway configurations. At the higher No Action demand levels, airfield improvements such as the addition of the North EAT and the compression of arrival separations to 2.5nm allow for the increase in throughput as compared to the 2016 Calibration.
7 Although the focus of the analysis was on the 90th percentile sustained throughput rate, the maximum 15-minute
simulation throughput was verified with and matches the Airport Capacity Profile modeled rates for CLT.
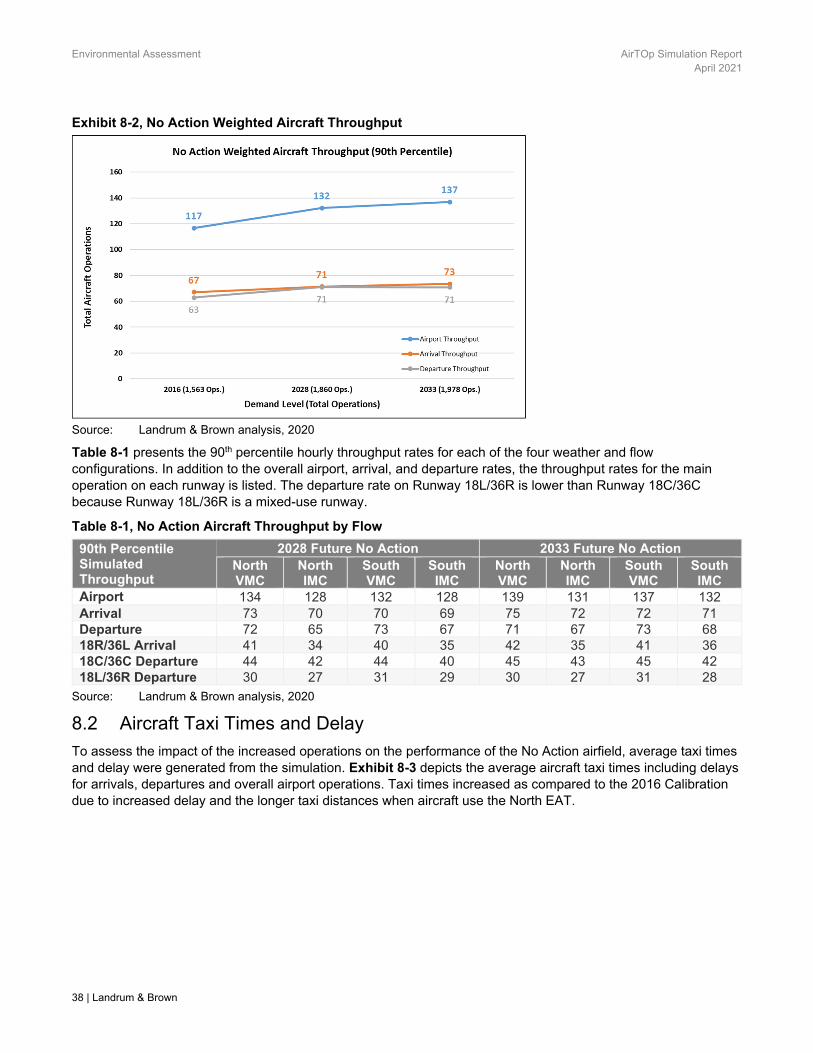
Environmental Assessment AirTOp Simulation Report April 2021
38 | Landrum & Brown
Exhibit 8-2, No Action Weighted Aircraft Throughput
Source: Landrum & Brown analysis, 2020
Table 8-1 presents the 90th percentile hourly throughput rates for each of the four weather and flow configurations. In addition to the overall airport, arrival, and departure rates, the throughput rates for the main operation on each runway is listed. The departure rate on Runway 18L/36R is lower than Runway 18C/36C because Runway 18L/36R is a mixed-use runway.
Table 8-1, No Action Aircraft Throughput by Flow
90th Percentile Simulated Throughput
2028 Future No Action 2033 Future No Action North VMC
North IMC
South VMC
South IMC
North VMC
North IMC
South VMC
South IMC
Airport 134 128 132 128 139 131 137 132 Arrival 73 70 70 69 75 72 72 71 Departure 72 65 73 67 71 67 73 68 18R/36L Arrival 41 34 40 35 42 35 41 36 18C/36C Departure 44 42 44 40 45 43 45 42 18L/36R Departure 30 27 31 29 30 27 31 28
Source: Landrum & Brown analysis, 2020
8.2 Aircraft Taxi Times and Delay
To assess the impact of the increased operations on the performance of the No Action airfield, average taxi times and delay were generated from the simulation. Exhibit 8-3 depicts the average aircraft taxi times including delays for arrivals, departures and overall airport operations. Taxi times increased as compared to the 2016 Calibration due to increased delay and the longer taxi distances when aircraft use the North EAT.
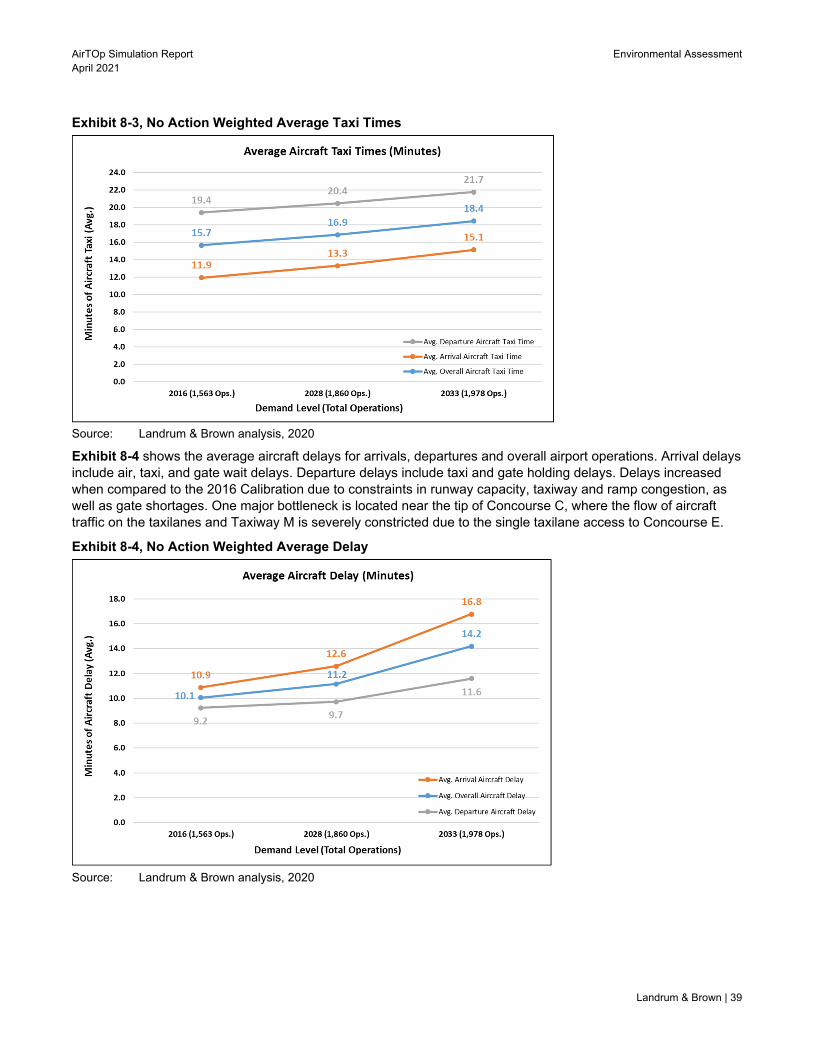
AirTOp Simulation Report Environmental Assessment April 2021
Landrum & Brown | 39
Exhibit 8-3, No Action Weighted Average Taxi Times
Source: Landrum & Brown analysis, 2020
Exhibit 8-4 shows the average aircraft delays for arrivals, departures and overall airport operations. Arrival delays include air, taxi, and gate wait delays. Departure delays include taxi and gate holding delays. Delays increased when compared to the 2016 Calibration due to constraints in runway capacity, taxiway and ramp congestion, as well as gate shortages. One major bottleneck is located near the tip of Concourse C, where the flow of aircraft traffic on the taxilanes and Taxiway M is severely constricted due to the single taxilane access to Concourse E.
Exhibit 8-4, No Action Weighted Average Delay
Source: Landrum & Brown analysis, 2020

Environmental Assessment AirTOp Simulation Report April 2021
40 | Landrum & Brown
Exhibit 8-5 shows the total aircraft times including delays for arrivals, departures and overall airport operations. Arrival total times include air delays, taxi times, taxi delays, and gate wait delays. Departure total times include gate holding delays, taxi times, and taxi delays. The total time provides a more well-rounded measure of airport performance than taxi times and delay could separately.
Exhibit 8-5, No Action Total Time Including Delay
Source: Landrum & Brown analysis, 2020
Exhibit 8-6 presents the delay that can be attributed to the runway versus non-runway delays. Runway related delays include arrival air delays and departure queue delays. Non-runway delays include taxi and gate delays. Arrivals and departures both experience high amounts of delay largely due to the constraint of the runway system. Taxiway and ramp congestion as well as gate shortage generate additional delays. The average runway delay of 7.5 at the 2028 demand level and 9.4 minutes at the 2033 demand level exceeds the threshold for the acceptable level of runway delay (seven minutes).
Exhibit 8-6, No Action Runway vs Non-Runway Delay
Source: Landrum & Brown analysis, 2020
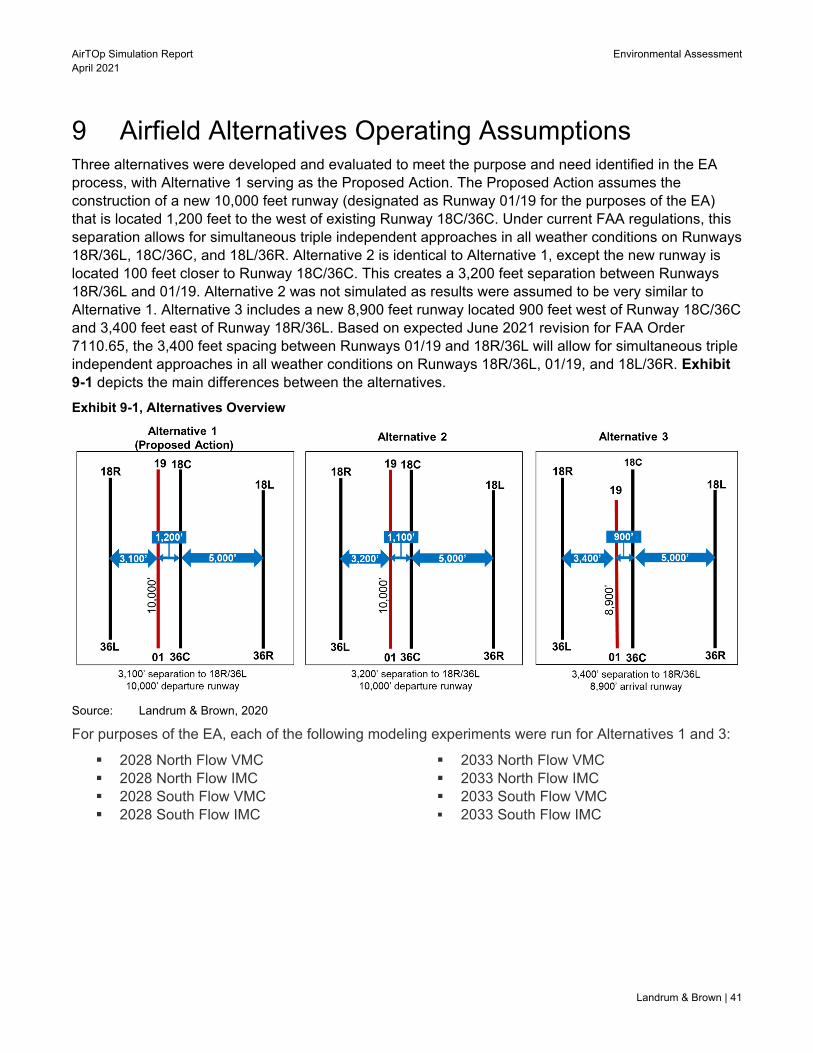
AirTOp Simulation Report Environmental Assessment April 2021
Landrum & Brown | 41
9 Airfield Alternatives Operating Assumptions Three alternatives were developed and evaluated to meet the purpose and need identified in the EA process, with Alternative 1 serving as the Proposed Action. The Proposed Action assumes the construction of a new 10,000 feet runway (designated as Runway 01/19 for the purposes of the EA) that is located 1,200 feet to the west of existing Runway 18C/36C. Under current FAA regulations, this separation allows for simultaneous triple independent approaches in all weather conditions on Runways 18R/36L, 18C/36C, and 18L/36R. Alternative 2 is identical to Alternative 1, except the new runway is located 100 feet closer to Runway 18C/36C. This creates a 3,200 feet separation between Runways 18R/36L and 01/19. Alternative 2 was not simulated as results were assumed to be very similar to Alternative 1. Alternative 3 includes a new 8,900 feet runway located 900 feet west of Runway 18C/36C and 3,400 feet east of Runway 18R/36L. Based on expected June 2021 revision for FAA Order 7110.65, the 3,400 feet spacing between Runways 01/19 and 18R/36L will allow for simultaneous triple independent approaches in all weather conditions on Runways 18R/36L, 01/19, and 18L/36R. Exhibit 9-1 depicts the main differences between the alternatives.
Exhibit 9-1, Alternatives Overview
Source: Landrum & Brown, 2020
For purposes of the EA, each of the following modeling experiments were run for Alternatives 1 and 3:
2028 North Flow VMC 2028 North Flow IMC 2028 South Flow VMC 2028 South Flow IMC
2033 North Flow VMC 2033 North Flow IMC 2033 South Flow VMC 2033 South Flow IMC

Environmental Assessment AirTOp Simulation Report April 2021
42 | Landrum & Brown
9.1 Airfield and Aircraft Apron Layouts
The alternatives’ airfields and apron areas contain numerous improvements to support future demand levels. These include full North and South EATs, additional crossfield taxiways, extensions of Concourses B and C, and complete dual taxilanes around the terminals. This infrastructure, highlighted in Exhibit 9-2 and Exhibit 9-3 complements the new runway by allowing for efficient taxi flows between gates and runways and removing bottlenecks around the ramp area. Alternative 3 includes the same infrastructure improvements as Alternative 1 but has a shorter runway and does not have a full-length Taxiway V. The runway is shorter in Alternative 3 because it would be used primarily as an arrival runway so does not require the 10,000-foot length. Taxiway V cannot extend the full length of the runway due to the location of the Runway 18C/36C glideslopes.
Exhibit 9-2, Alternative 1 Airfield Layout
Source: CLT airport and Landrum & Brown, 2020
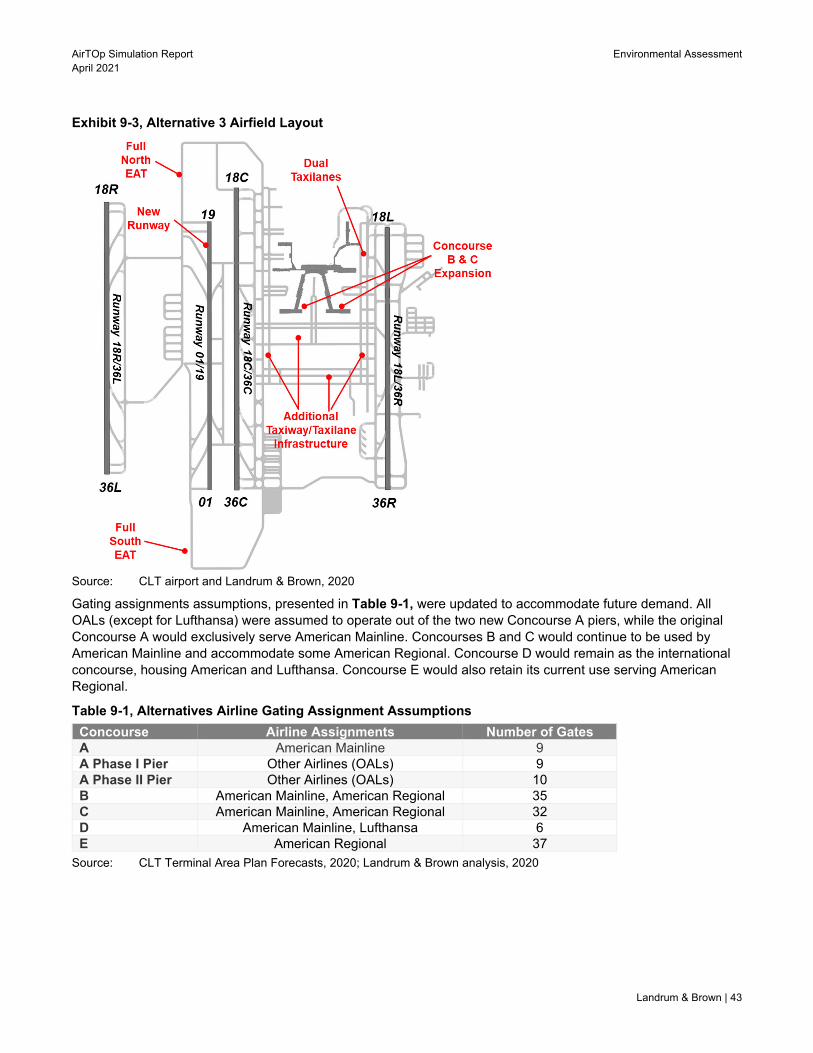
AirTOp Simulation Report Environmental Assessment April 2021
Landrum & Brown | 43
Exhibit 9-3, Alternative 3 Airfield Layout
Source: CLT airport and Landrum & Brown, 2020
Gating assignments assumptions, presented in Table 9-1, were updated to accommodate future demand. All OALs (except for Lufthansa) were assumed to operate out of the two new Concourse A piers, while the original Concourse A would exclusively serve American Mainline. Concourses B and C would continue to be used by American Mainline and accommodate some American Regional. Concourse D would remain as the international concourse, housing American and Lufthansa. Concourse E would also retain its current use serving American Regional.
Table 9-1, Alternatives Airline Gating Assignment Assumptions
Concourse Airline Assignments Number of Gates A American Mainline 9 A Phase I Pier Other Airlines (OALs) 9 A Phase II Pier Other Airlines (OALs) 10 B American Mainline, American Regional 35 C American Mainline, American Regional 32 D American Mainline, Lufthansa 6 E American Regional 37
Source: CLT Terminal Area Plan Forecasts, 2020; Landrum & Brown analysis, 2020

Environmental Assessment AirTOp Simulation Report April 2021
44 | Landrum & Brown
9.2 Runway Operating Configurations
The addition of the fourth runway allows for greater flexibility in runway operating configurations. For the purposes of this study, one main set of runway configuration was assumed and simulated for each alternative. Other runway configurations and procedures can be developed based on the needs of future airport operations.
In Alternative 1, the new runway does not have sufficient spacing between it and either of its two adjacent runways to allow for triple simultaneous independent straight-in approaches, so it is intended to be used primarily by departures. Therefore, Runways 18R/36L, 18C/36C, and 18L/36R would be used for arrivals to provide simultaneous triple independent approaches capability. Runways 01/19 and 18L/36R would be used for departures. During off-peak periods when arrival demand is sparse, Runway 18C/36C could be used for departures.
In Alternative 3, the new runway has sufficient spacing between it and Runways 18R/36L and 18L/36R to allow for triple simultaneous independent straight-in approaches, so it intended to be used primarily by arrivals. Therefore, Runways 18R/36L, 01/19, and 18L/36R would be used for arrivals to provide simultaneous triple independent approaches capability. Runways 18C/36C and 18L/36R would be used for departures.
The runway usage for each Alternative is depicted on Exhibit 9-4 and Exhibit 9-5.
Exhibit 9-4, Alternative 1 VMC/IMC Runway Configuration
North Flow South Flow
Source: Landrum & Brown, 2020
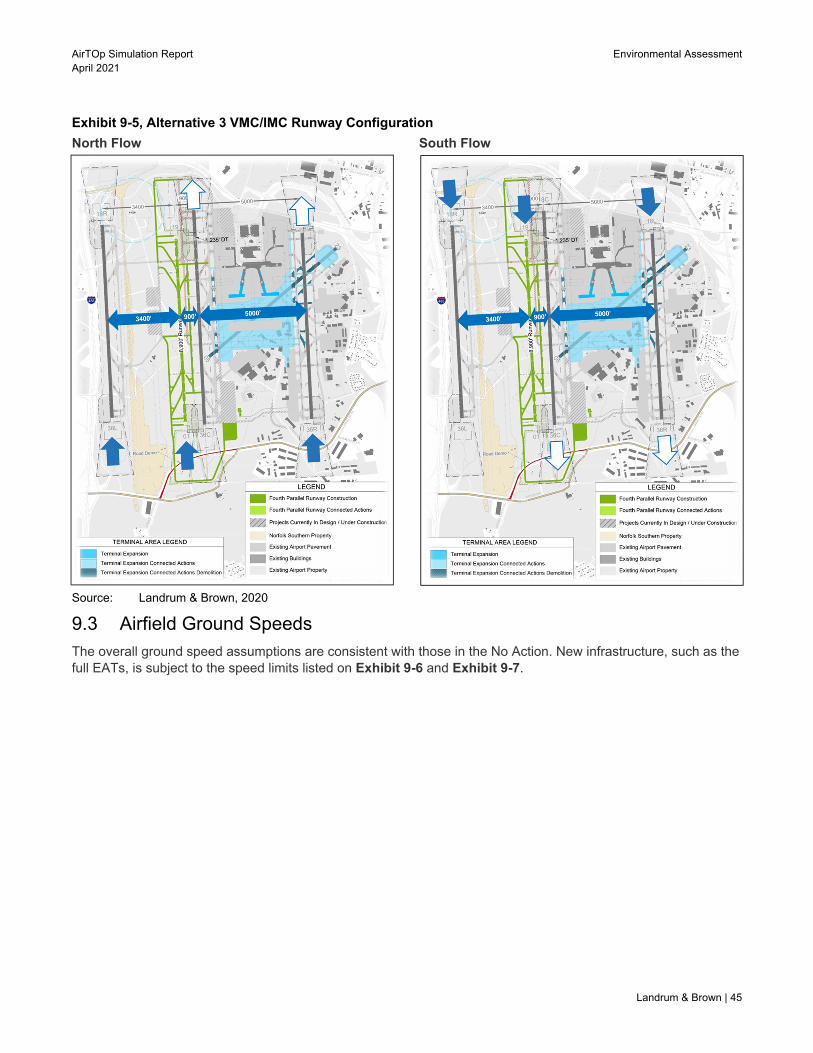
AirTOp Simulation Report Environmental Assessment April 2021
Landrum & Brown | 45
Exhibit 9-5, Alternative 3 VMC/IMC Runway Configuration
North Flow South Flow
Source: Landrum & Brown, 2020
9.3 Airfield Ground Speeds
The overall ground speed assumptions are consistent with those in the No Action. New infrastructure, such as the full EATs, is subject to the speed limits listed on Exhibit 9-6 and Exhibit 9-7.

Environmental Assessment AirTOp Simulation Report April 2021
46 | Landrum & Brown
Exhibit 9-6, Alternative 1 Airfield Ground Speed Assumptions
Source: ACEP, EIS, and Landrum & Brown analysis, 2020
Exhibit 9-7, Alternative 3 Airfield Ground Speed Assumptions
Source: ACEP, EIS, and Landrum & Brown analysis, 2020
High Speed Exits 32 knots Outer Perimeter Taxiways 20 knots Runway Crossings 18 knots Taxiways 15 knots Ramp Area Taxiways 12 knots Ramp Area Taxilanes 10 knots
High Speed Exits 32 knots Outer Perimeter Taxiways 20 knots Runway Crossings 18 knots Taxiways 15 knots Ramp Area Taxiways 12 knots Ramp Area Taxilanes 10 knots

AirTOp Simulation Report Environmental Assessment April 2021
Landrum & Brown | 47
9.4 Airfield Taxi Flows
As depicted in Exhibit 9-8 and Exhibit 9-9, both alternatives take advantage of the new crossfield taxiways to move traffic between the east and west sides of the airfield without interfering with ramp area movements. Traffic on the dual taxilanes abutting the ramp area would be unidirectional to avoid head-on conflicts. In Alternative 1, Runway 01/19 departures would cross Runway 18C/36C to access the departure queue on Taxiway V. Two locations are used in both flows to allow for two simultaneous crossings of Runway 18C/36C between each pair of arrivals. The locations were selected to avoid the high energy zone in the middle third of the runway and the glide slope critical areas. The departures would not use the EAT to reach Runway 01/19 to avoid taxiing under approaching aircraft, which is not allowed unrestricted. In Alternative 3, Runway 01/19 arrivals would exit east for a shorter taxi when there are no Runway 18C/36C departures. Otherwise, they exit west and taxi around one of the EATs to avoid interrupting the departure stream.
Exhibit 9-8, Alternative 1 Taxi Routes
Source: Landrum & Brown analysis and ATCT feedback, 2020

Environmental Assessment AirTOp Simulation Report April 2021
48 | Landrum & Brown
Exhibit 9-9, Alternative 3 Taxi Routes
Source: Landrum & Brown analysis and ATCT feedback, 2020
9.5 Airspace Assumptions
Exhibit 9-10 and Exhibit 9-11 show the arrival fix assignments for each arrival runway. Arrival traffic can be swapped between runways to balance runway loads. Alternative 3 was assumed to have the same airspace assumptions, with Runway 18C/36C replaced by Runway 01/19.
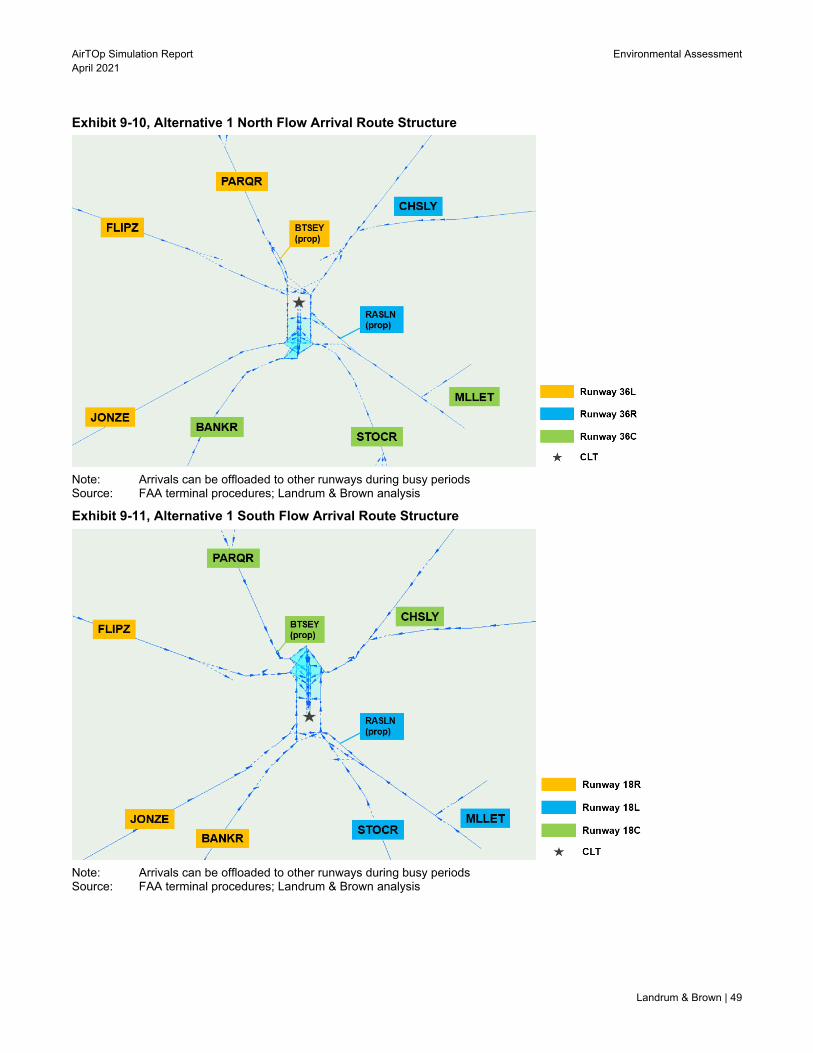
AirTOp Simulation Report Environmental Assessment April 2021
Landrum & Brown | 49
Exhibit 9-10, Alternative 1 North Flow Arrival Route Structure
Note: Arrivals can be offloaded to other runways during busy periods Source: FAA terminal procedures; Landrum & Brown analysis
Exhibit 9-11, Alternative 1 South Flow Arrival Route Structure
Note: Arrivals can be offloaded to other runways during busy periods Source: FAA terminal procedures; Landrum & Brown analysis

Environmental Assessment AirTOp Simulation Report April 2021
50 | Landrum & Brown
Exhibit 9-12 and Exhibit 9-13 present the primary fix allocation for each departure runway. Departures to the north (JOJJO, WEAZL, KRITR) and south (BEAVY, ICONS, KWEEN) fixes can be switched between runways to balance the runway queues during departure pushes. Alternative 3 was assumed to have the same fix assignments, with Runway 01/19 replaced by Runway 18C/36C.
Exhibit 9-12, Alternative 1 North Flow Departure Route Structure
Note: Departures to north and south fixes can be swapped between runways to balance the airfield Source: FAA terminal procedures; Landrum & Brown analysis, 2020
Exhibit 9-13, Alternative 1 South Flow Departure Route Structure
Note: Departures to north and south fixes can be swapped between runways to balance the airfield Source: FAA terminal procedures; Landrum & Brown analysis, 2020

AirTOp Simulation Report Environmental Assessment April 2021
Landrum & Brown | 51
10 Airfield Alternatives Modeling Results To provide a comparison against the No Action simulation results, the same metrics of throughput, taxi times, and delay were generated for the Alternative 1 and Alternative 3 simulation models. Alternative 2 was not modeled as it was expected to produce very similar results to Alternative 1. The same annualization percentages used to generate the No Action results were used for the alternatives.
10.1 Throughput Rates
The 90th percentile hourly throughput rates are displayed in Exhibit 10-1. The left chart presents the arrival rates, the middle chart the departure rates, and the right chart the overall airport rates. Each chart shows the No Action, Alternative 1, and Alternative 3 throughput rates for both the 2028 and 2033 demand levels. Alternatives 1 and 3 produce very similar throughputs and both outperform the No Action. This is the expected result as the alternatives add a runway and therefore allow the two center runways to operate as dedicated arrival/departure runways.
Exhibit 10-1, Throughput Rates from the No Action and Alternatives Simulations
Source: Landrum & Brown analysis, 2021
The 90th percentile throughput numbers presented do not necessarily represent total airport capacity because the modeled throughput rates are also a function of the flight schedule demand. While the additional runway and updated operating procedures allow for higher hourly rates, the schedule profile does not push the airport to capacity for extended periods at a time. Higher throughput may be achievable with a higher demand level or different demand profiles.
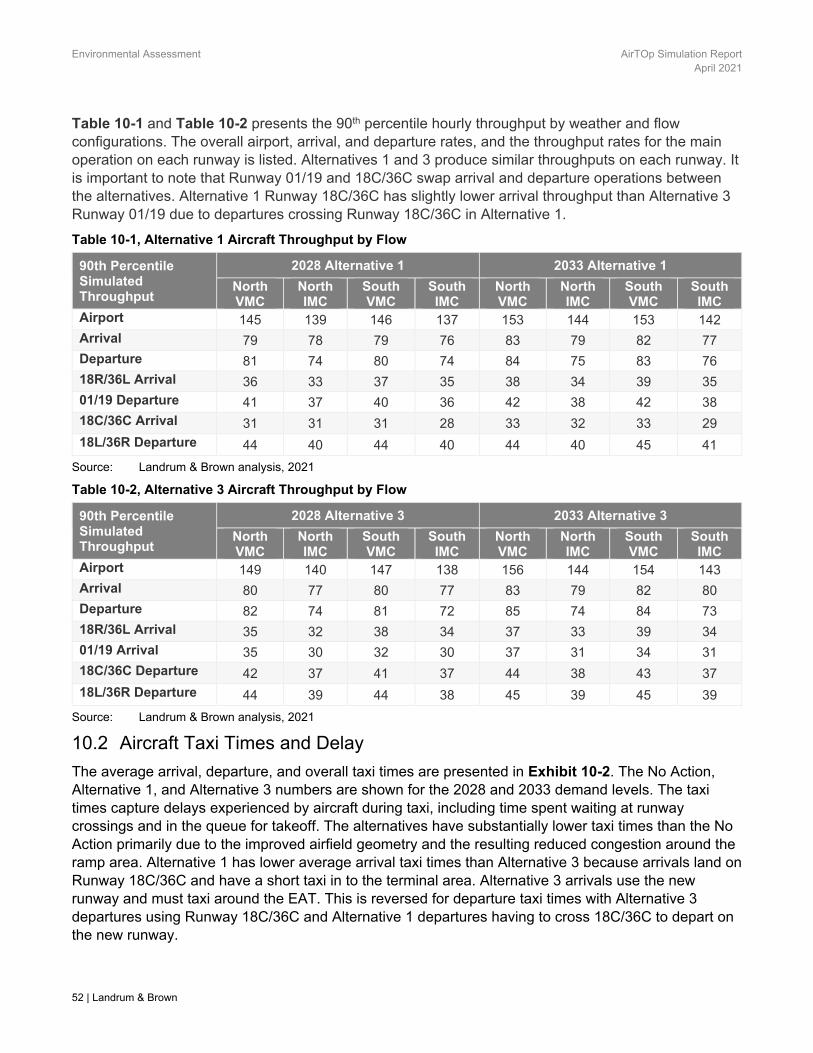
Environmental Assessment AirTOp Simulation Report April 2021
52 | Landrum & Brown
Table 10-1 and Table 10-2 presents the 90th percentile hourly throughput by weather and flow configurations. The overall airport, arrival, and departure rates, and the throughput rates for the main operation on each runway is listed. Alternatives 1 and 3 produce similar throughputs on each runway. It is important to note that Runway 01/19 and 18C/36C swap arrival and departure operations between the alternatives. Alternative 1 Runway 18C/36C has slightly lower arrival throughput than Alternative 3 Runway 01/19 due to departures crossing Runway 18C/36C in Alternative 1.
Table 10-1, Alternative 1 Aircraft Throughput by Flow
90th Percentile Simulated Throughput
2028 Alternative 1 2033 Alternative 1
North VMC
North IMC
South VMC
South IMC
North VMC
North IMC
South VMC
South IMC
Airport 145 139 146 137 153 144 153 142 Arrival 79 78 79 76 83 79 82 77 Departure 81 74 80 74 84 75 83 76 18R/36L Arrival 36 33 37 35 38 34 39 35 01/19 Departure 41 37 40 36 42 38 42 38 18C/36C Arrival 31 31 31 28 33 32 33 29
18L/36R Departure 44 40 44 40 44 40 45 41
Source: Landrum & Brown analysis, 2021
Table 10-2, Alternative 3 Aircraft Throughput by Flow
90th Percentile Simulated Throughput
2028 Alternative 3 2033 Alternative 3
North VMC
North IMC
South VMC
South IMC
North VMC
North IMC
South VMC
South IMC
Airport 149 140 147 138 156 144 154 143 Arrival 80 77 80 77 83 79 82 80 Departure 82 74 81 72 85 74 84 73 18R/36L Arrival 35 32 38 34 37 33 39 34 01/19 Arrival 35 30 32 30 37 31 34 31 18C/36C Departure 42 37 41 37 44 38 43 37
18L/36R Departure 44 39 44 38 45 39 45 39
Source: Landrum & Brown analysis, 2021
10.2 Aircraft Taxi Times and Delay
The average arrival, departure, and overall taxi times are presented in Exhibit 10-2. The No Action, Alternative 1, and Alternative 3 numbers are shown for the 2028 and 2033 demand levels. The taxi times capture delays experienced by aircraft during taxi, including time spent waiting at runway crossings and in the queue for takeoff. The alternatives have substantially lower taxi times than the No Action primarily due to the improved airfield geometry and the resulting reduced congestion around the ramp area. Alternative 1 has lower average arrival taxi times than Alternative 3 because arrivals land on Runway 18C/36C and have a short taxi in to the terminal area. Alternative 3 arrivals use the new runway and must taxi around the EAT. This is reversed for departure taxi times with Alternative 3 departures using Runway 18C/36C and Alternative 1 departures having to cross 18C/36C to depart on the new runway.

AirTOp Simulation Report Environmental Assessment April 2021
Landrum & Brown | 53
Exhibit 10-2, No Action and Alternatives Weighted Average Taxi Times
Source: Landrum & Brown analysis, 2021
The average arrival, departure, and overall aircraft delays are shown in Exhibit 10-3. Both arrival and departure delays are slightly higher in Alternative 1 than Alternative 3 due to Runway 01/19 departures needing to cross Runway 18C/36C to reach the departure queue on Taxiway V. The departures experience delay at the runway crossing, and arrivals experience air delay due to increased arrival separations on Runway 18C/36C.
Exhibit 10-3, No Action and Alternatives Weighted Average Delay
Source: Landrum & Brown analysis, 2021

Environmental Assessment AirTOp Simulation Report April 2021
54 | Landrum & Brown
To provide a holistic measure of the alternatives, both taxi time and delay must be considered. Exhibit 10-4 captures the total delay that aircraft experience by adding arrival air delay and departure gate holding delay to arrival and departure taxi times respectively. Both alternatives benefit from the additional runway, improved taxiway and ramp layout, and concourse extensions. These improvements result in lower air and ground delays than the No Action experiment. This difference is especially noticeable at the 2033 demand level, with the alternatives able to handle the increased traffic demand much more effectively than the No Action (note the steeper slope of the No Action lines compared to the alternatives lines). The overall airport performance for Alternatives 1 and 3 is very similar. The difference in arrivals and departures between Alternative 1 and Alternative 3 is due to the usage of Runway 18C/36C and 01/19. In Alternative 1, arrivals benefit from a short taxi in from Runway 18C/36C and departures must cross Runway 18C/36C to reach the new runway. In Alternative 3, departures use Runway 18C/36C, while arrivals use the new runway and must taxi around one of the EATs to reach the ramp area in periods of high demand.
Exhibit 10-4, No Action and Alternatives Total Time Including Delay
Source: Landrum & Brown analysis, 2021
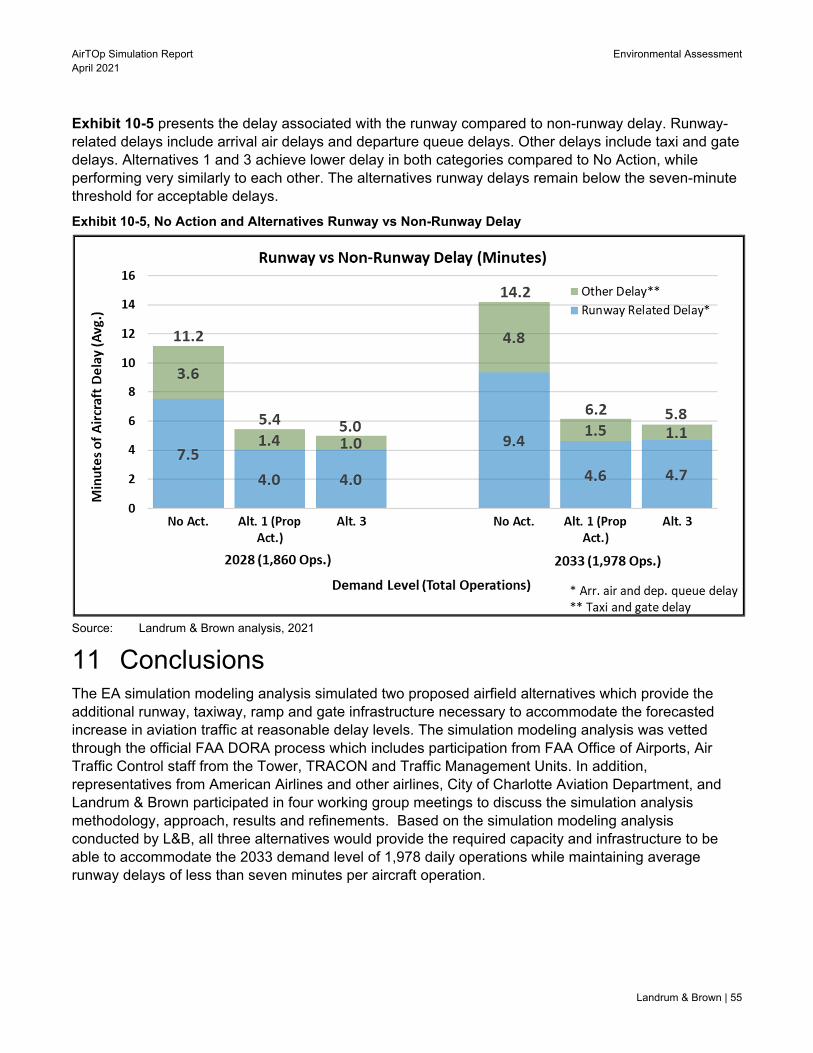
AirTOp Simulation Report Environmental Assessment April 2021
Landrum & Brown | 55
Exhibit 10-5 presents the delay associated with the runway compared to non-runway delay. Runway-related delays include arrival air delays and departure queue delays. Other delays include taxi and gate delays. Alternatives 1 and 3 achieve lower delay in both categories compared to No Action, while performing very similarly to each other. The alternatives runway delays remain below the seven-minute threshold for acceptable delays.
Exhibit 10-5, No Action and Alternatives Runway vs Non-Runway Delay
Source: Landrum & Brown analysis, 2021
11 Conclusions The EA simulation modeling analysis simulated two proposed airfield alternatives which provide the additional runway, taxiway, ramp and gate infrastructure necessary to accommodate the forecasted increase in aviation traffic at reasonable delay levels. The simulation modeling analysis was vetted through the official FAA DORA process which includes participation from FAA Office of Airports, Air Traffic Control staff from the Tower, TRACON and Traffic Management Units. In addition, representatives from American Airlines and other airlines, City of Charlotte Aviation Department, and Landrum & Brown participated in four working group meetings to discuss the simulation analysis methodology, approach, results and refinements. Based on the simulation modeling analysis conducted by L&B, all three alternatives would provide the required capacity and infrastructure to be able to accommodate the 2033 demand level of 1,978 daily operations while maintaining average runway delays of less than seven minutes per aircraft operation.
Proposed Capacity Enhancements at Charlotte Douglas International Airport National Environmental Policy Act Environmental Assessment Alternatives Analysis
April 2021
PREPARED FOR
Charlotte Douglas International Airport
Alternatives Analysis Environmental Assessment April 2021
Landrum & Brown | i
Contents Page
1 Introduction 1 2 Runway Separation 1 3 Runway Length Requirements 4
3.1 Runway Length Methodology 4 3.1.1 Aircraft Fleet 4 3.1.2 Density Altitude 4 3.1.3 Runway Contamination 5 3.1.4 Flap Settings 5
3.2 Takeoff Runway Length Requirements 5 3.3 Arrival Runway Length Requirements 7
4 Taxiway Geometry 8 5 Runway Exit Geometry 8
5.1 Assumptions 9 5.2 Runway Exit Analysis Results 11
6 Development of Alternatives 12 6.1 Alternative 1 (Proposed Action) 13 6.2 Alternative 2 17 6.3 Alternative 3 17
7 Alternatives Comparison 18 7.1 End Around Taxiway (EAT) Holding 18
7.1.1 South EAT Holding Requirements 18 7.1.2 North EAT Holding Requirements 19
7.2 Runway Use and Runway Crossings 19 7.2.1 Alternatives 1 and 2 19 7.2.2 Alternative 3 21
7.3 Taxiway V Capability 21 7.4 Navigational Aid Placement 23 7.5 Future Flexibility 23 7.6 Conclusions 23
List of Tables Page
Table 2-1, Lateral Runway Separation Requirements 1 Table 2-2, Current and Expected Runway Separation Requirements 1 Table 3-1, 2033 Aircraft Fleet for Runway Length Analysis 5 Table 3-2, 2033 Runway 18L/36R Payload-Range Analysis 6 Table 3-3, 2033 Departures That Cannot Takeoff From Runway 18L/36R At Full Payload 7 Table 4-1, Runway To Taxiway Lateral Separation Requirements 8 Table 5-1, REDIM Aircraft Fleet Mix 9 Table 5-2, Airport Specific Inputs 11 Table 5-3, REDIM Results For 10,000-Foot Long Runway With Four Exits 11 Table 5-4, REDIM Results For 10,000-Foot Long Runway With Five Exits 11 Table 5-5, REDIM Results For 8,900-Foot Long Runway 12 Table 5-6, REDIM Results For 7,300-Foot Long Runway 12 Table 7-1, Alternatives Screening Summary 24

Environmental Assessment Alternatives Analysis April 2021
ii | Landrum & Brown
List of Exhibits Page
Exhibit 2-1, Proposed Action Runways 2 Exhibit 2-2, Potential Separation Scenario 1 3 Exhibit 2-3, Potential Separation Scenario 2 3 Exhibit 3-1, 2033 Landing Runway Length Requirements 7 Exhibit 6-1, Midfield Runway Alternatives Summary 13 Exhibit 6-2, Alternative 1 14 Exhibit 6-3, Alternative 2 15 Exhibit 6-4, Alternative 3 16 Exhibit 6-5, Runway Use Examples 19 Exhibit 6-6, Alternative 1 Primary Taxi Flows – North Flow/South Flow 21 Exhibit 6-7, Alternative 3 Primary Taxi Flows – North Flow/South Flow 22
Alternatives Analysis Environmental Assessment April 2021
Landrum & Brown | 1
1 Introduction This appendix discusses the development and evaluation of runway alternatives for the Charlotte Douglas International Airport (CLT) Environmental Assessment (EA) for the Capacity Enhancement Projects. This appendix only describes the airfield alternatives that were developed in response to the upcoming changes to FAA rules regarding parallel runway separation. Each of the alternatives includes a new runway which is referred to as Runway 01/19 for purposes of the analysis in this EA. If the new runway is implemented in the future, the proper nomenclature will be determined at that time.
2 Runway Separation The separation provided between parallel runways is the primary factor that determines the air traffic procedures that must be followed, which in turn determines the capacity of the runways. The current Federal Aviation Administration (FAA) runway separation requirements that are relevant to the CLT analysis are shown in Table 2-1.
TABLE 2-1, LATERAL RUNWAY SEPARATION REQUIREMENTS
Type of Operation Lateral Runway Separation
(in feet) Simultaneous VFR Operations – Standard 700 feet Simultaneous VFR Operations – Recommended for ADG V and VI Runways
1,200 feet
Simultaneous IFR Approaches and Departures 2,500 feet1 Simultaneous IFR Departures 2,500 feet1 Dual Simultaneous Independent IFR Approaches 3,600 feet2 Triple Simultaneous Independent IFR Approaches 3,900 feet2
1 When thresholds are not staggered. 2 Assumes straight-in approaches. Note: VFR = Visual Flight Rules; IFR = Instrument Flight Rules; ADG = Airplane Design Group Source: FAA Order 7110.65Y, Air Traffic Control
The FAA notified CLT in April of 2020 of an upcoming modification to the lateral runway separation requirements for the dual and triple simultaneous independent approaches shown in the table. A comparison of the current and expected lateral runway separation requirements is shown in Table 2-2.
TABLE 2-2, CURRENT AND EXPECTED RUNWAY SEPARATION REQUIREMENTS
Type of Approach Current Runway Separation
Requirement Expected Runway
Separation Requirement Dual Simultaneous Independent 3,600 feet 3,200 feet Triple Simultaneous Independent 3,900 feet 3,400 feet
Note: Assumes straight-in approaches. Source: FAA Order 7110.65Y, Air Traffic Control; FAA Headquarters office
This rule change is relevant at CLT because the new runway location and intended runway use in the Proposed Action Alternative were chosen based on the current runway separation requirements in FAA Order 7110.65, Air Traffic Control. As shown on Exhibit 2-1, the Proposed Action includes a new “midfield” runway located on the west side of the airfield between Runways 18R/36L and 18C/36C, which are separated by 4,300 feet. Based on the current FAA separation requirements, it is not possible to meet the separation requirement for simultaneous Visual Flight Rules (VFR) operations between Runways 01/19 and 18C/36C (700 to 1,200 feet) while also meeting the 3,900-foot separation requirement for triple approaches between Runway 01/19 and 18R/36L. Therefore, the new runway in the Proposed Action alternative was sited so that it provides 1,200 feet of separation to Runway 18C/36C (the recommended separation for ADG V and VI aircraft), leaving 3,100 feet between it and Runway 18R/36L. Because Runway 01/19 does not have the necessary separation between it and the other runways to allow for triple simultaneous independent straight-in approaches, the new runway in the

Environmental Assessment Alternatives Analysis April 2021
2 | Landrum & Brown
Proposed Action Alternative is intended primarily for departure use, with Runway 18C/36C intended primarily for arrival use.1
EXHIBIT 2-1, PROPOSED ACTION RUNWAYS
Source: Landrum & Brown, 2020
The expected reduction in separation requirements for triple simultaneous independent straight-in approaches, results in two possible alternative locations for the new runway in the midfield. The first is placement of Runway 01/19 so that it provides 3,400 of separation to Runway 18R/36L and 900 feet of separation to Runway 18C/36C (see Exhibit 2-2). The 3,400-foot separation to Runway 18R/36L would allow triple simultaneous independent straight-in approaches to Runways 18R/36L, 01/19, and 18L/36R. Another possible location for Runway 01/19 is to place Runway 01/19 with 3,200 of separation to Runway 18R/36L and 1,100 feet of separation to Runway 18C/36C (see Exhibit 2-3). This option would not allow triple simultaneous independent straight-in approaches to Runways 18R/36L, 01/19, and 18L/36R but would provide operational flexibility2 and position CLT to take advantage of any potential future reductions in runway separation requirements.3 Both of these runway separation options meet standards for the separation between Runway 01/19 and Runway 18R/36L but do not provide the recommended separation of 1,200 feet between Runway 01/19 and Runway 18C/36C. The 3,200-foot and 3,400-foot runway separations will be evaluated in the alternatives analysis.
1 Although Runway 01/19 is primarily intended for departure use and Runway 18C/36C is primarily intended for arrival use,
no restrictions on runway use are proposed or assumed. It is important that air traffic controllers have the flexibility to use these two runways for both arrivals and departures to maximize capacity and operational flexibility. For example, during off-peak periods, air traffic controllers may choose to land on Runways 18R/36L and 18L/36R while departing Runways 01/19 and 18C/36C. Air traffic controllers could also choose to land on Runway 01/19 and depart Runway 18C/36C during visual weather conditions.
2 The 3,200-foot separation between the new runway and Runway 18R/36L would allow these runways to be used by arrivals, with departures on the two eastern most runways, during off-peak periods when triple approaches are not required. The operational benefit of this runway use configuration is the segregation of arrival and departure traffic.
3 Because dual simultaneous independent approaches would be permitted to Runways 18R/36L and Runway 01/19 if the runways were 3,200 feet apart and because the separation between Runway 01/19 and Runway 18L/36R far exceeds the requirement of 3,400 feet for triple simultaneous independent approaches, it may be possible to obtain a waiver from FAA to operate triple simultaneous independent approaches at CLT in the future. Such an operation would require further study and is not assumed for this EA.
3,100’
1,200’
5,000’ 1,200’
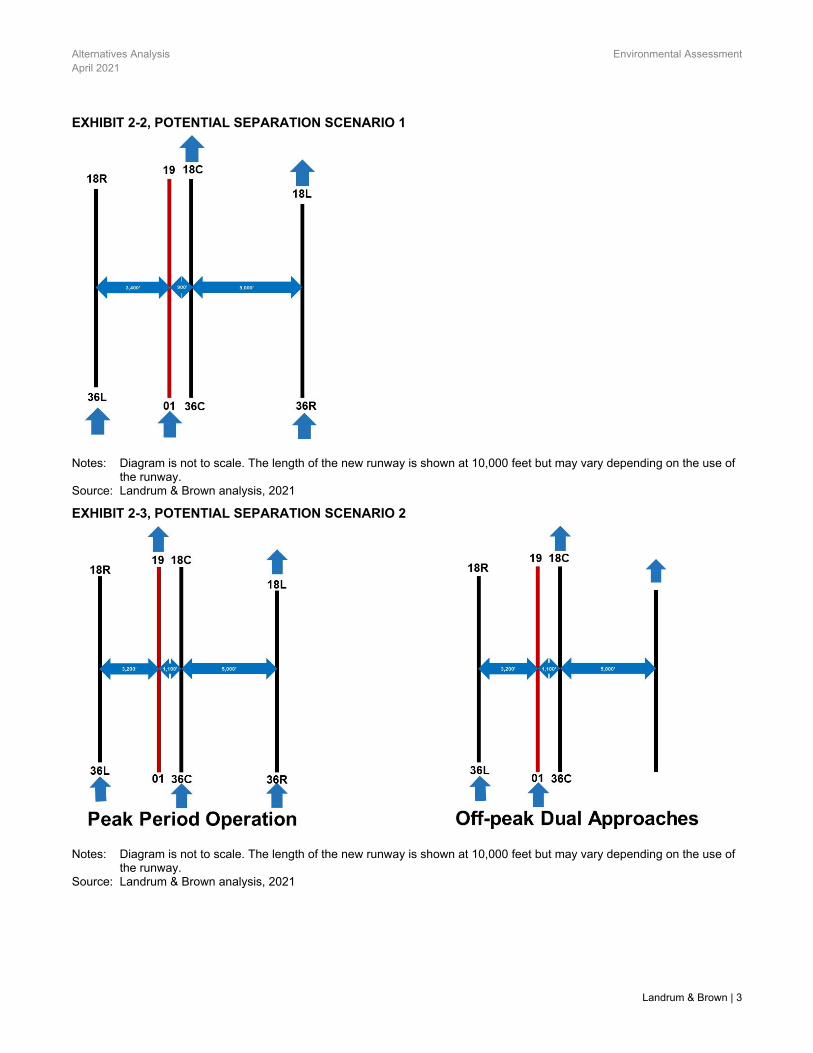
Alternatives Analysis Environmental Assessment April 2021
Landrum & Brown | 3
EXHIBIT 2-2, POTENTIAL SEPARATION SCENARIO 1
Notes: Diagram is not to scale. The length of the new runway is shown at 10,000 feet but may vary depending on the use of the runway.
Source: Landrum & Brown analysis, 2021
EXHIBIT 2-3, POTENTIAL SEPARATION SCENARIO 2
Notes: Diagram is not to scale. The length of the new runway is shown at 10,000 feet but may vary depending on the use of
the runway. Source: Landrum & Brown analysis, 2021
Environmental Assessment Alternatives Analysis April 2021
4 | Landrum & Brown
3 Runway Length Requirements This section describes the takeoff and landing runway length requirements for CLT.
3.1 Runway Length Methodology
Landing and takeoff requirements were calculated following the recommended guidance in FAA Advisory Circular (AC) 150/5325-4B, Runway Length Requirements for Airport Design. As such, the aircraft manufacturers’ airport planning manuals from Airbus, Boeing, and Gulfstream were utilized in conjunction with the 2033 forecast fleet mix to calculate runway length requirements. Runway length requirements are a function of the following factors:
Aircraft Fleet
Density Altitude
Runway Contamination (landings only)
Flap Settings (landings only)
3.1.1 Aircraft Fleet
The CLT 2033 fleet mix was reviewed to determine the most critical aircraft for runway length requirements. Thirteen aircraft were selected for the analysis. All of the analyzed aircraft meet the critical aircraft threshold of maintaining at least 500 operations annually in the 2033 forecast. Landing runway length requirements for these aircraft were assessed at maximum landing weight (MLW). Takeoff requirements were calculated for the furthest destination for each aircraft, assuming 100 percent payload. Each aircraft used in this analysis is depicted in Table 3-1.
3.1.2 Density Altitude
Density altitude is pressure altitude corrected for non-standard temperature. It affects an aircraft’s performance including how fast it can accelerate, how quickly it can obtain lift, and how fast it can climb. As an airport’s elevation and/or temperature increase, air density decreases, which results in decreased aircraft performance and longer runway length requirements.4
Airfield elevation is the first component to density altitude. It is used as an input factor on the landing and takeoff charts in the aircraft manufacturers’ airport planning manuals to determine accurate takeoff and landing requirements. The elevation at CLT is 747.9 feet above Mean Sea Level (MSL).5
4 https://www.aopa.org/training-and-safety/active-pilots/safety-and-technique/weather/density-altitude#WIDA 5 FAA Airport Data and Information Portal (ADIP) 2020

Alternatives Analysis Environmental Assessment April 2021
Landrum & Brown | 5
TABLE 3-1, 2033 AIRCRAFT FLEET FOR RUNWAY LENGTH ANALYSIS
Aircraft Operator Critical Destination
(distance in NM from CLT) 2033 Annual Operations
Airbus A300-600F FedEx, UPS MEM (444) 4092 Airbus A321 American SFO (1,995) 96,503 Airbus A321NEO American KEF (2,711) 21,142 Airbus A330-200 American GRU (4,018) 3,410 Boeing B717-200 Delta MSP (808) 4,092 Boeing B737-800 Delta, Southwest PDX (1,983) 6,138 Boeing B737MAX8 American, Southwest PDX (1,983) 37,169 Boeing B737MAX9 United SFO (1,995) 2,046 Boeing B787-900 American FCO (4,182) 3,069 Bombardier CRJ900 American, Delta n/a1 133,672 Embraer 145 American n/a1 1,364 Gulfstream G500/600 General Aviation n/a1 682 McDonnel Douglas DC10 FedEx MEM (444) 1,364
1 Aircraft not assessed for takeoffs. Source: 2033 design day flight schedule
The second component to density altitude is temperature. The effect of temperature on density altitude is greater with takeoffs than landings. As a result, the FAA requires temperature adjustments for takeoffs, but not landings, according to FAA AC 150/5325-4B, Runway Length Requirements for Airport Design. The aircraft manufacturers’ manuals contain charts to calculate takeoff runway length requirements based on temperature. Takeoff length requirements may be calculated based on a "standard day" (defined as 59 degrees Fahrenheit) or a "hot day." The hot day charts in the aircraft manufacturers’ manuals vary the conditions of the hot day depending on the aircraft type. The determination of which temperature chart to use depends upon the average or typical weather conditions for a particular region or airport. FAA guidance prescribes the use of an airport’s mean-max temperature for use in runway length calculations. The mean-max temperature is defined as the average daily maximum temperature of the hottest month. The mean daily maximum temperature at CLT is approximately 87 degrees Fahrenheit,6 making the hot day charts most appropriate for use in the CLT takeoff analysis.
3.1.3 Runway Contamination
Landing length requirements should be calculated for wet (contaminated) runways when following FAA AC 150/5325-4B, Runway Length Requirements for Airport Design. Contaminated runway conditions require longer runways for landing than dry conditions, due to the additional distance needed to decelerate on wet pavement. For those aircraft where the aircraft performance manuals do not specifically show a wet landing length curve, the dry landing length was increased by 15% as specified in the runway length AC. Takeoff runway length requirements do not factor in runway contamination per FAA guidance.
3.1.4 Flap Settings
Flaps are used on landings to produce a slower stall speed (so the pilot can land slower) and more drag (which allows the pilot to fly at a steeper descent angle to the runway). Maximum flap settings allow a pilot to maximize the lift and drag that the aircraft wings produce. All landing analysis was conducted using the highest landing flap settings available. Flap settings are not used in determining takeoff requirements.
3.2 Takeoff Runway Length Requirements
The Runway Length Analysis: Proposed Runway 1-19 Technical Memorandum, April 15, 2019, found that 10,000 feet of runway length is required at CLT to serve departures by the critical aircraft. This analysis was based on
6 National Centers for Environmental Information, 1981-2010 Station Normals of Temperature, Precipitation, and Heating and
Cooling Degree Days.
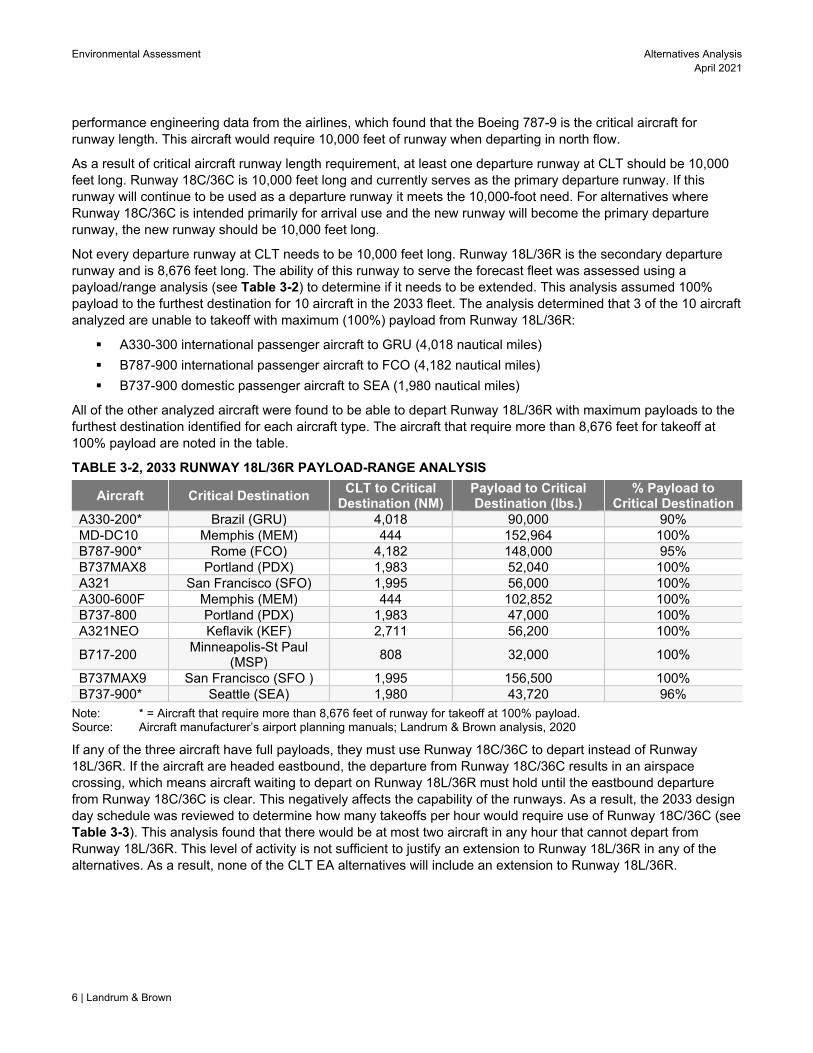
Environmental Assessment Alternatives Analysis April 2021
6 | Landrum & Brown
performance engineering data from the airlines, which found that the Boeing 787-9 is the critical aircraft for runway length. This aircraft would require 10,000 feet of runway when departing in north flow.
As a result of critical aircraft runway length requirement, at least one departure runway at CLT should be 10,000 feet long. Runway 18C/36C is 10,000 feet long and currently serves as the primary departure runway. If this runway will continue to be used as a departure runway it meets the 10,000-foot need. For alternatives where Runway 18C/36C is intended primarily for arrival use and the new runway will become the primary departure runway, the new runway should be 10,000 feet long.
Not every departure runway at CLT needs to be 10,000 feet long. Runway 18L/36R is the secondary departure runway and is 8,676 feet long. The ability of this runway to serve the forecast fleet was assessed using a payload/range analysis (see Table 3-2) to determine if it needs to be extended. This analysis assumed 100% payload to the furthest destination for 10 aircraft in the 2033 fleet. The analysis determined that 3 of the 10 aircraft analyzed are unable to takeoff with maximum (100%) payload from Runway 18L/36R:
A330-300 international passenger aircraft to GRU (4,018 nautical miles)
B787-900 international passenger aircraft to FCO (4,182 nautical miles)
B737-900 domestic passenger aircraft to SEA (1,980 nautical miles)
All of the other analyzed aircraft were found to be able to depart Runway 18L/36R with maximum payloads to the furthest destination identified for each aircraft type. The aircraft that require more than 8,676 feet for takeoff at 100% payload are noted in the table.
TABLE 3-2, 2033 RUNWAY 18L/36R PAYLOAD-RANGE ANALYSIS
Aircraft Critical Destination CLT to Critical
Destination (NM) Payload to Critical Destination (lbs.)
% Payload to Critical Destination
A330-200* Brazil (GRU) 4,018 90,000 90% MD-DC10 Memphis (MEM) 444 152,964 100% B787-900* Rome (FCO) 4,182 148,000 95% B737MAX8 Portland (PDX) 1,983 52,040 100% A321 San Francisco (SFO) 1,995 56,000 100% A300-600F Memphis (MEM) 444 102,852 100% B737-800 Portland (PDX) 1,983 47,000 100% A321NEO Keflavik (KEF) 2,711 56,200 100%
B717-200 Minneapolis-St Paul
(MSP) 808 32,000 100%
B737MAX9 San Francisco (SFO ) 1,995 156,500 100% B737-900* Seattle (SEA) 1,980 43,720 96%
Note: * = Aircraft that require more than 8,676 feet of runway for takeoff at 100% payload. Source: Aircraft manufacturer’s airport planning manuals; Landrum & Brown analysis, 2020
If any of the three aircraft have full payloads, they must use Runway 18C/36C to depart instead of Runway 18L/36R. If the aircraft are headed eastbound, the departure from Runway 18C/36C results in an airspace crossing, which means aircraft waiting to depart on Runway 18L/36R must hold until the eastbound departure from Runway 18C/36C is clear. This negatively affects the capability of the runways. As a result, the 2033 design day schedule was reviewed to determine how many takeoffs per hour would require use of Runway 18C/36C (see Table 3-3). This analysis found that there would be at most two aircraft in any hour that cannot depart from Runway 18L/36R. This level of activity is not sufficient to justify an extension to Runway 18L/36R in any of the alternatives. As a result, none of the CLT EA alternatives will include an extension to Runway 18L/36R.

Alternatives Analysis Environmental Assessment April 2021
Landrum & Brown | 7
TABLE 3-3, 2033 DEPARTURES THAT CANNOT TAKEOFF FROM RUNWAY 18L/36R AT FULL PAYLOAD
Aircraft Destination Daily Departures Hours of Operation
A330-200
Frankfurt (FRA) 1 16:00 Paris (CDG) 1 18:00 Brazil (GRU) 1 20:00
Barcelona (BCN) 1 20:00 B787-900 Rome (FCO) 1 18:00 B737-900 Seattle (SEA) 1 17:00
Source: 2033 design day flight schedule; Landrum & Brown analysis, 2020
3.3 Arrival Runway Length Requirements
Given the FAA’s expected rule change for runway separations, it may be possible for CLT’s new runway to be a primary arrival runway in some of the EA alternatives. As a result, arrival runway length requirements were determined using the procedures outlined in FAA Advisory Circular (AC) 150/5325-4B, Runway Length Requirements for Airport Design. The results of these calculations can differ from the more detailed performance engineering analysis that aircraft operators and airlines are capable of performing. As a result, the airlines at CLT were consulted to validate the runway length conclusions.
The landing length requirements are depicted on Exhibit 3-1. The requirements shown for most of the aircraft reflect the results of the aircraft manufacturers’ charts. American Airlines provided requirements for the B878-900, B737-800, A321, and B737MAX8; the requirements provided by American are shown instead of the chart results for these aircraft. The B787-900, B737-800, and Gulfstream 500/600 require the most landing length at 7,300 feet. These aircraft combined are forecast to make up 9,889 annual operations in 2033. Therefore, any alternative that considers arrival use for the new runway will include a 7,300-foot long runway, unless there are operational reasons that require a longer length.
EXHIBIT 3-1, 2033 LANDING RUNWAY LENGTH REQUIREMENTS
Notes: Landing lengths based on wet (contaminated) runway conditions at MLW. Source: Aircraft manufacturer’s airport planning manuals; Landrum & Brown analysis, 2020
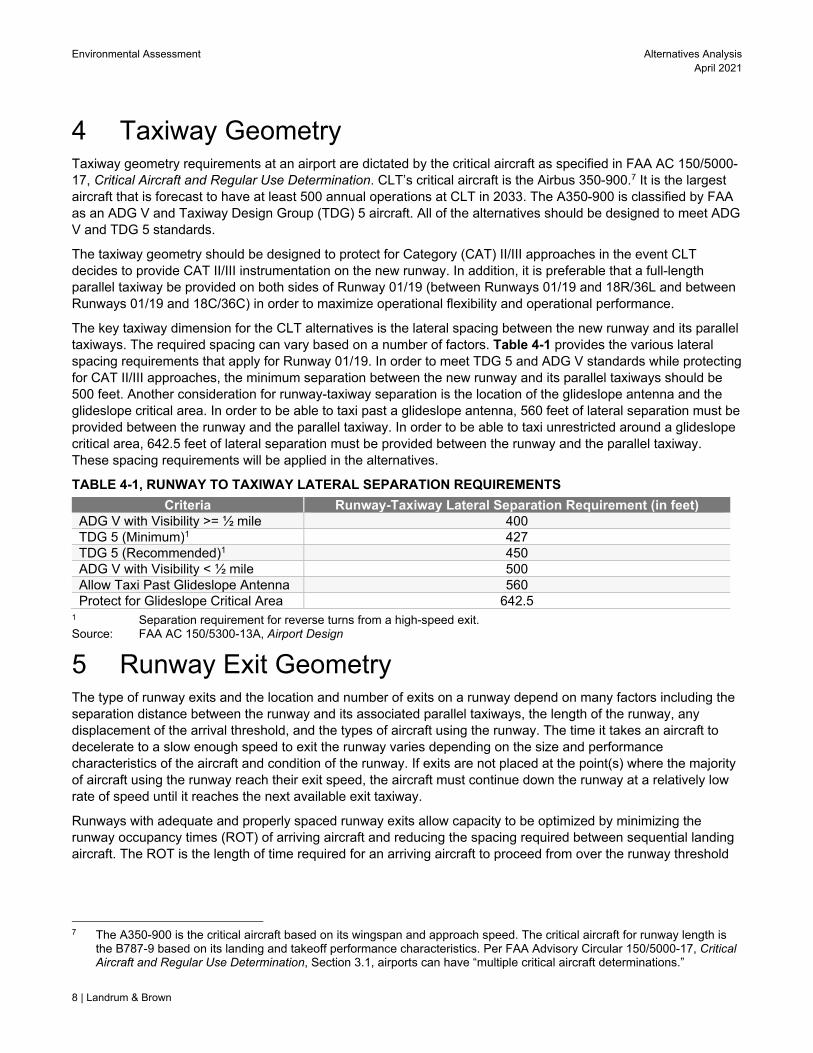
Environmental Assessment Alternatives Analysis April 2021
8 | Landrum & Brown
4 Taxiway Geometry Taxiway geometry requirements at an airport are dictated by the critical aircraft as specified in FAA AC 150/5000-17, Critical Aircraft and Regular Use Determination. CLT’s critical aircraft is the Airbus 350-900.7 It is the largest aircraft that is forecast to have at least 500 annual operations at CLT in 2033. The A350-900 is classified by FAA as an ADG V and Taxiway Design Group (TDG) 5 aircraft. All of the alternatives should be designed to meet ADG V and TDG 5 standards.
The taxiway geometry should be designed to protect for Category (CAT) II/III approaches in the event CLT decides to provide CAT II/III instrumentation on the new runway. In addition, it is preferable that a full-length parallel taxiway be provided on both sides of Runway 01/19 (between Runways 01/19 and 18R/36L and between Runways 01/19 and 18C/36C) in order to maximize operational flexibility and operational performance.
The key taxiway dimension for the CLT alternatives is the lateral spacing between the new runway and its parallel taxiways. The required spacing can vary based on a number of factors. Table 4-1 provides the various lateral spacing requirements that apply for Runway 01/19. In order to meet TDG 5 and ADG V standards while protecting for CAT II/III approaches, the minimum separation between the new runway and its parallel taxiways should be 500 feet. Another consideration for runway-taxiway separation is the location of the glideslope antenna and the glideslope critical area. In order to be able to taxi past a glideslope antenna, 560 feet of lateral separation must be provided between the runway and the parallel taxiway. In order to be able to taxi unrestricted around a glideslope critical area, 642.5 feet of lateral separation must be provided between the runway and the parallel taxiway. These spacing requirements will be applied in the alternatives.
TABLE 4-1, RUNWAY TO TAXIWAY LATERAL SEPARATION REQUIREMENTS
Criteria Runway-Taxiway Lateral Separation Requirement (in feet) ADG V with Visibility >= ½ mile 400 TDG 5 (Minimum)1 427 TDG 5 (Recommended)1 450 ADG V with Visibility < ½ mile 500 Allow Taxi Past Glideslope Antenna 560 Protect for Glideslope Critical Area 642.5
1 Separation requirement for reverse turns from a high-speed exit. Source: FAA AC 150/5300-13A, Airport Design
5 Runway Exit Geometry The type of runway exits and the location and number of exits on a runway depend on many factors including the separation distance between the runway and its associated parallel taxiways, the length of the runway, any displacement of the arrival threshold, and the types of aircraft using the runway. The time it takes an aircraft to decelerate to a slow enough speed to exit the runway varies depending on the size and performance characteristics of the aircraft and condition of the runway. If exits are not placed at the point(s) where the majority of aircraft using the runway reach their exit speed, the aircraft must continue down the runway at a relatively low rate of speed until it reaches the next available exit taxiway.
Runways with adequate and properly spaced runway exits allow capacity to be optimized by minimizing the runway occupancy times (ROT) of arriving aircraft and reducing the spacing required between sequential landing aircraft. The ROT is the length of time required for an arriving aircraft to proceed from over the runway threshold
7 The A350-900 is the critical aircraft based on its wingspan and approach speed. The critical aircraft for runway length is
the B787-9 based on its landing and takeoff performance characteristics. Per FAA Advisory Circular 150/5000-17, Critical Aircraft and Regular Use Determination, Section 3.1, airports can have “multiple critical aircraft determinations.”

Alternatives Analysis Environmental Assessment April 2021
Landrum & Brown | 9
to a point clear of the runway. An average ROT of 50 seconds or less is considered high efficiency.8 The number, type, and location of runway exits influences the ROT for each runway.
A runway exit analysis was conducted for CLT to identify the best placement of runway exits on Runway 01/19 in the alternatives. The analysis was completed for the 2028 and 2033 fleet mixes. The new Version 3 release of the FAA’s Runway Exit Design Interactive Model (REDIM) was used in this analysis. This new version of REDIM uses real aircraft landing data from 30 major U.S. airports to determine typical landing patterns by aircraft type based on runway length. As a result, the ROT results from REDIM V3 are influenced by factors outside of aircraft performance such as the availability of properly placed exits and terminal/parking locations at the analyzed airports. Because this model is new, additional study will be needed to determine the most appropriate number and location of runway exits for the new runway prior to its construction.
5.1 Assumptions
REDIM uses a mix of airport specific fixed and variable inputs to perform its analysis. The main inputs include the following:
Fleet Mix
Airport Temperature
Airport Elevation
Surface Conditions
Table 5-1 summarizes the 2028 and 2033 forecast fleet mix for CLT.
TABLE 5-1, REDIM AIRCRAFT FLEET MIX
Fleet Mix 2028 % of Fleet 2033 % of Fleet 319 (A319) 14.6% 14.0% 320 (A320) 2.1% 1.7% 321 (A321) 15.2% 14.3% 32N (A320neo) 0.0% 0.3% 332 (A330-200) 0.5% 0.5% 333 (A330-300) 0.0% 0.0% 359 (A350-900) 0.1% 0.1% A321 Neo 2.9% 3.1% 717 (B717-200) 0.6% 0.6% 733 (B737-300) 0.0% 0.0% 738 (B737-800 Passenger) 0.9% 1.0% 739 (B737-900 Passenger) 0.0% 0.3% 73G (B737-700 Passenger) 0.6% 0.7% 752 (B757-200 Passenger) 0.0% 0.0% Boeing 787-8 0.0% 0.1% Boeing 787-9 0.5% 0.5% 7M7 (B737-Max 7 Passenger) 0.1% 0.1% 7M8 (B737-Max 8 Passenger) 3.6% 5.5% 7M9 (B737-Max 9 Passenger) 0.2% 0.3% A300 0.6% 0.6% Beech 350 Super King 0.1% 0.1% Beech 200 Super King 0.4% 0.4% Beechcraft Baron 0.1% 0.1% Beech 90 King Air 0.1% 0.1% Lockheed C-130 0.1% 0.1% Cessna 525A 0.1% 0.1%
8 An average 50-second ROT on a runway allows air traffic controllers to authorize 2.5-nautical mile separation between
aircraft on final approach within 10 nautical miles of the landing runway. FAA Order 7110.65, Air Traffic Control.

Environmental Assessment Alternatives Analysis April 2021
10 | Landrum & Brown
Fleet Mix 2028 % of Fleet 2033 % of Fleet Cessna 525B 0.1% 0.1% Cessna T303 Crussader 0.1% 0.1% Cessna 550 0.2% 0.2% Cessna Citation V 0.3% 0.3% Cessna Citation Excel 0.4% 0.4% Cessna Citation X 0.2% 0.2% Bombardier Challenger 300 0.2% 0.2% Bombardier Challenger 350 0.1% 0.1% Bombardier Challenger 600 0.1% 0.1% CR2 (CRJ-200) 4.6% 3.7% CR7 (CRJ-700) 17.9% 17.3% CR9 (CRJ-900) 21.7% 19.8% CR7 (CRJ-700) 0.2% 0.3% CRJ (CRJ) 0.0% 0.0% Airbus 220-100 0.0% 1.0% McDonnell Douglas DC-10 0.1% 0.2% DH3 (DHC-8-300) 0.0% 0.0% DH8 (DHC-8) 0.0% 0.0% Embraer Phenom 300 0.4% 0.4% E70 (E-170) 0.5% 0.5% E75 (E-175) 5.5% 7.0% E7W (E-175 Enhanced Winglets) 0.9% 0.9% E90 (E-190) 0.8% 0.9% EM2 (EMB-120 Brasilia) 0.2% 0.2% ER4 (ERJ-145) 0.2% 0.2% Dassault Falcon 2000 0.4% 0.4% Dassault Falcon 900 0.1% 0.1% DASSAULT Falcon 50 0.1% 0.1% FRJ (328Jet) 0.1% 0.1% Gulfstream G100 0.1% 0.1% Gulfstream G280 0.1% 0.1% Gulfstream G200 0.1% 0.1% Bombardier Global Express 0.2% 0.2% Gulfstream 5 0.1% 0.1% Gulfstream 6 0.1% 0.1% Hawker 800 0.1% 0.1% Learjet 45 0.2% 0.2% Learjet 60 0.1% 0.1% M88 (MD-88) 0.0% 0.0% M90 (MD-90) 0.2% 0.0% Cirrus SR22 0.1% 0.1% Socata TBM-800 0.1% 0.1% Socata TBM-900 0.1% 0.1%
Source: 2028 and 2033 design day flight schedules.
Table 5-2 presents the airport specific assumptions that affect the REDIM output. Higher airport elevation results in higher ground speeds, leading to longer landing distances. Similarly, higher airport temperature leads to lower air density and decreased aircraft performance, resulting in increased ROT. Surface conditions affect the landing performance of aircraft. A wet runway results in increased rolling distances and higher ROT times than dry runway conditions.
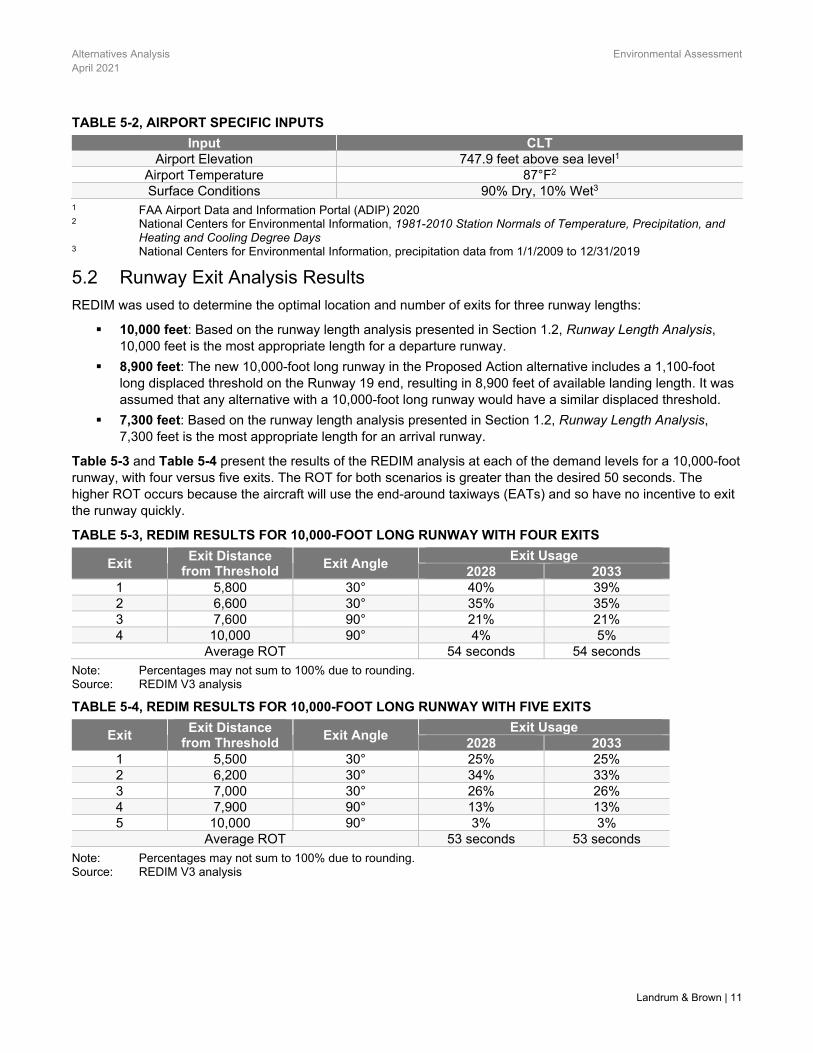
Alternatives Analysis Environmental Assessment April 2021
Landrum & Brown | 11
TABLE 5-2, AIRPORT SPECIFIC INPUTS
Input CLT Airport Elevation 747.9 feet above sea level1
Airport Temperature 87°F2 Surface Conditions 90% Dry, 10% Wet3
1 FAA Airport Data and Information Portal (ADIP) 2020 2 National Centers for Environmental Information, 1981-2010 Station Normals of Temperature, Precipitation, and
Heating and Cooling Degree Days 3 National Centers for Environmental Information, precipitation data from 1/1/2009 to 12/31/2019
5.2 Runway Exit Analysis Results
REDIM was used to determine the optimal location and number of exits for three runway lengths:
10,000 feet: Based on the runway length analysis presented in Section 1.2, Runway Length Analysis, 10,000 feet is the most appropriate length for a departure runway.
8,900 feet: The new 10,000-foot long runway in the Proposed Action alternative includes a 1,100-foot long displaced threshold on the Runway 19 end, resulting in 8,900 feet of available landing length. It was assumed that any alternative with a 10,000-foot long runway would have a similar displaced threshold.
7,300 feet: Based on the runway length analysis presented in Section 1.2, Runway Length Analysis, 7,300 feet is the most appropriate length for an arrival runway.
Table 5-3 and Table 5-4 present the results of the REDIM analysis at each of the demand levels for a 10,000-foot runway, with four versus five exits. The ROT for both scenarios is greater than the desired 50 seconds. The higher ROT occurs because the aircraft will use the end-around taxiways (EATs) and so have no incentive to exit the runway quickly.
TABLE 5-3, REDIM RESULTS FOR 10,000-FOOT LONG RUNWAY WITH FOUR EXITS
Exit Exit Distance
from Threshold Exit Angle
Exit Usage 2028 2033
1 5,800 30° 40% 39% 2 6,600 30° 35% 35% 3 7,600 90° 21% 21% 4 10,000 90° 4% 5%
Average ROT 54 seconds 54 seconds
Note: Percentages may not sum to 100% due to rounding. Source: REDIM V3 analysis
TABLE 5-4, REDIM RESULTS FOR 10,000-FOOT LONG RUNWAY WITH FIVE EXITS
Exit Exit Distance
from Threshold Exit Angle
Exit Usage 2028 2033
1 5,500 30° 25% 25% 2 6,200 30° 34% 33% 3 7,000 30° 26% 26% 4 7,900 90° 13% 13% 5 10,000 90° 3% 3%
Average ROT 53 seconds 53 seconds
Note: Percentages may not sum to 100% due to rounding. Source: REDIM V3 analysis
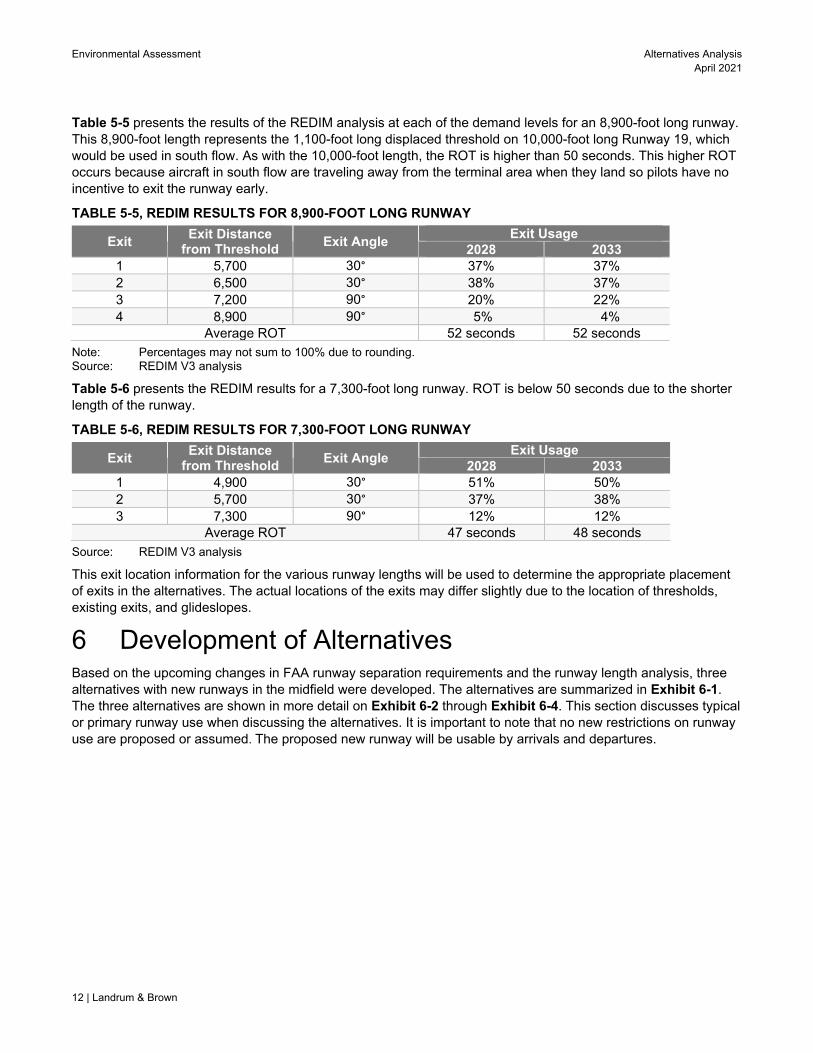
Environmental Assessment Alternatives Analysis April 2021
12 | Landrum & Brown
Table 5-5 presents the results of the REDIM analysis at each of the demand levels for an 8,900-foot long runway. This 8,900-foot length represents the 1,100-foot long displaced threshold on 10,000-foot long Runway 19, which would be used in south flow. As with the 10,000-foot length, the ROT is higher than 50 seconds. This higher ROT occurs because aircraft in south flow are traveling away from the terminal area when they land so pilots have no incentive to exit the runway early.
TABLE 5-5, REDIM RESULTS FOR 8,900-FOOT LONG RUNWAY
Exit Exit Distance
from Threshold Exit Angle
Exit Usage 2028 2033
1 5,700 30° 37% 37% 2 6,500 30° 38% 37% 3 7,200 90° 20% 22% 4 8,900 90° 5% 4%
Average ROT 52 seconds 52 seconds
Note: Percentages may not sum to 100% due to rounding. Source: REDIM V3 analysis
Table 5-6 presents the REDIM results for a 7,300-foot long runway. ROT is below 50 seconds due to the shorter length of the runway.
TABLE 5-6, REDIM RESULTS FOR 7,300-FOOT LONG RUNWAY
Exit Exit Distance
from Threshold Exit Angle
Exit Usage 2028 2033
1 4,900 30° 51% 50% 2 5,700 30° 37% 38% 3 7,300 90° 12% 12%
Average ROT 47 seconds 48 seconds
Source: REDIM V3 analysis
This exit location information for the various runway lengths will be used to determine the appropriate placement of exits in the alternatives. The actual locations of the exits may differ slightly due to the location of thresholds, existing exits, and glideslopes.
6 Development of Alternatives Based on the upcoming changes in FAA runway separation requirements and the runway length analysis, three alternatives with new runways in the midfield were developed. The alternatives are summarized in Exhibit 6-1. The three alternatives are shown in more detail on Exhibit 6-2 through Exhibit 6-4. This section discusses typical or primary runway use when discussing the alternatives. It is important to note that no new restrictions on runway use are proposed or assumed. The proposed new runway will be usable by arrivals and departures.

Alternatives Analysis Environmental Assessment April 2021
Landrum & Brown | 13
EXHIBIT 6-1, MIDFIELD RUNWAY ALTERNATIVES SUMMARY
Alternative Separation to
West Rwy (in feet)
Separation to East Rwy (in feet)
Primary Use of New Runway
Length (in feet)
11 3,100 1,200 Departure 10,000 2 3,200 1,100 Departure 10,000 3 3,400 900 Arrival 8,900
1 Proposed Action Source: Landrum & Brown analysis, 2020
6.1 Alternative 1 (Proposed Action)
Alternative 1 is the Proposed Action. It includes a 10,000-foot long midfield runway with 3,100 feet of separation to Runway 18R/36L and 1,200 feet of separation to Runway 18C/36C. The new runway does not have sufficient spacing between it and either of its two adjacent runways to allow for triple simultaneous independent straight-in approaches, so it is intended to be used primarily by departures. As a result of this intended use, the new runway is 10,000 feet long in this alternative. Runways 18R/36L, 18C/36C, and 18L/36R are anticipated to be used for arrivals, providing triple simultaneous independent approach capability. Runways 01/19 and 18L/36R would be used for departures.
Runway 01/19 is intended for departure use so it is not necessary to optimize ROT in this alternative. As a result, two high-speed exits are provided in north flow and one is provided in south flow. The locations of the exits differ from that shown in Section 5, Runway Exit Geometry, due to the location of other taxiways and navigational aids.
Alternative 1 includes the construction of a partial north EAT (NEAT), and a full south EAT (SEAT). The alternative also includes the construction of a west parallel taxiway and the extension of Taxiway V (the taxiway between the new runway and Runway 18C/36C) to the Runway 01 threshold. There is 1,200 feet of separation between Runways 01/19 and 18C/36C, so Taxiway V has sufficient spacing to both runways to allow unrestricted taxiing during all weather conditions.
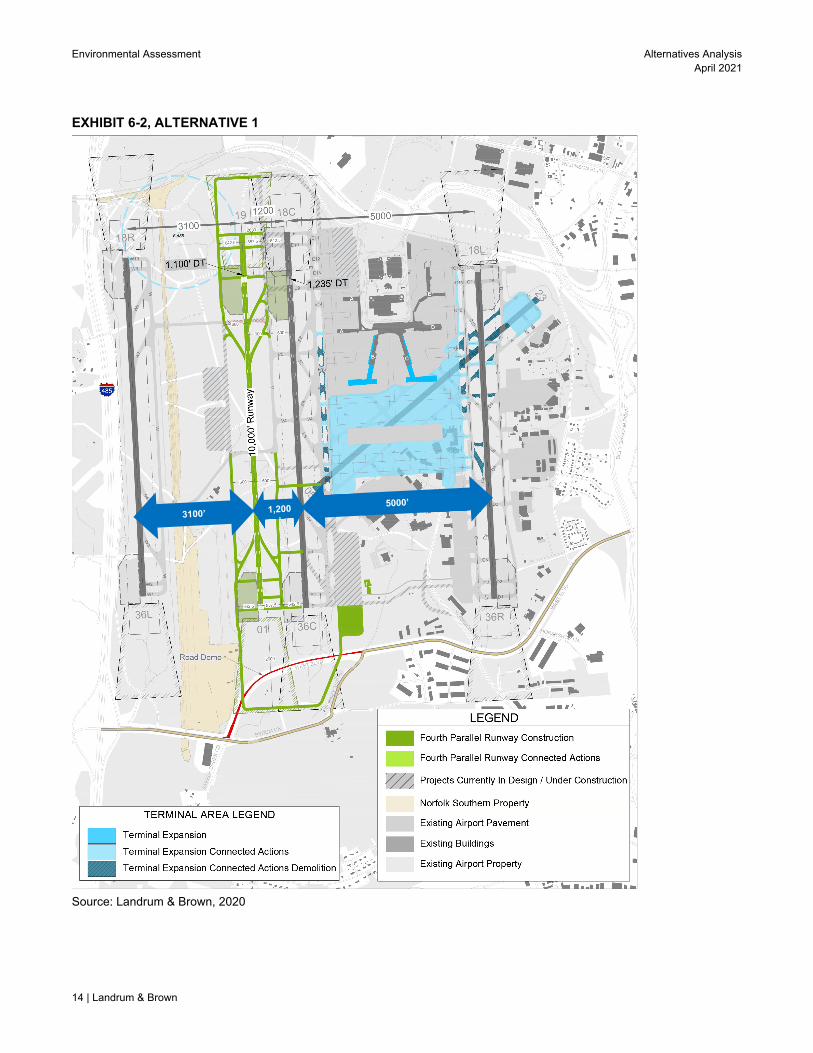
Environmental Assessment Alternatives Analysis April 2021
14 | Landrum & Brown
EXHIBIT 6-2, ALTERNATIVE 1
Source: Landrum & Brown, 2020

Alternatives Analysis Environmental Assessment April 2021
Landrum & Brown | 15
EXHIBIT 6-3, ALTERNATIVE 2
Source: Landrum & Brown, 2020

Environmental Assessment Alternatives Analysis April 2021
16 | Landrum & Brown
EXHIBIT 6-4, ALTERNATIVE 3
Source: Landrum & Brown, 2020
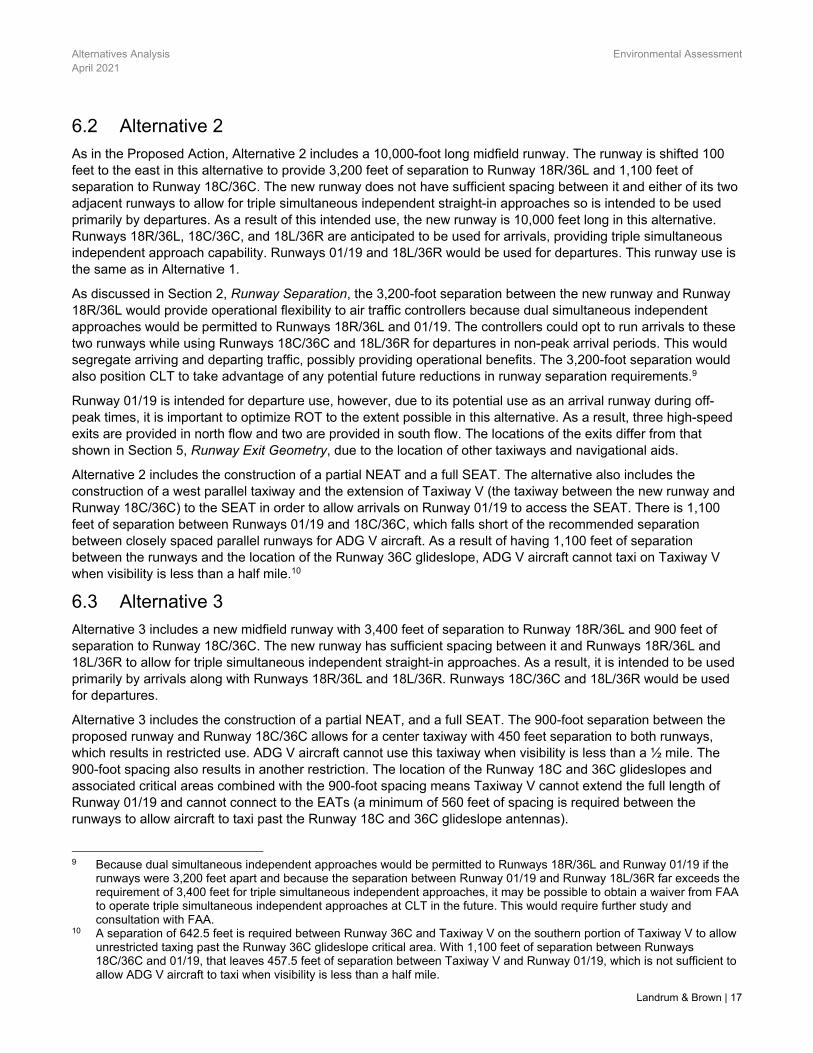
Alternatives Analysis Environmental Assessment April 2021
Landrum & Brown | 17
6.2 Alternative 2
As in the Proposed Action, Alternative 2 includes a 10,000-foot long midfield runway. The runway is shifted 100 feet to the east in this alternative to provide 3,200 feet of separation to Runway 18R/36L and 1,100 feet of separation to Runway 18C/36C. The new runway does not have sufficient spacing between it and either of its two adjacent runways to allow for triple simultaneous independent straight-in approaches so is intended to be used primarily by departures. As a result of this intended use, the new runway is 10,000 feet long in this alternative. Runways 18R/36L, 18C/36C, and 18L/36R are anticipated to be used for arrivals, providing triple simultaneous independent approach capability. Runways 01/19 and 18L/36R would be used for departures. This runway use is the same as in Alternative 1.
As discussed in Section 2, Runway Separation, the 3,200-foot separation between the new runway and Runway 18R/36L would provide operational flexibility to air traffic controllers because dual simultaneous independent approaches would be permitted to Runways 18R/36L and 01/19. The controllers could opt to run arrivals to these two runways while using Runways 18C/36C and 18L/36R for departures in non-peak arrival periods. This would segregate arriving and departing traffic, possibly providing operational benefits. The 3,200-foot separation would also position CLT to take advantage of any potential future reductions in runway separation requirements.9
Runway 01/19 is intended for departure use, however, due to its potential use as an arrival runway during off-peak times, it is important to optimize ROT to the extent possible in this alternative. As a result, three high-speed exits are provided in north flow and two are provided in south flow. The locations of the exits differ from that shown in Section 5, Runway Exit Geometry, due to the location of other taxiways and navigational aids.
Alternative 2 includes the construction of a partial NEAT and a full SEAT. The alternative also includes the construction of a west parallel taxiway and the extension of Taxiway V (the taxiway between the new runway and Runway 18C/36C) to the SEAT in order to allow arrivals on Runway 01/19 to access the SEAT. There is 1,100 feet of separation between Runways 01/19 and 18C/36C, which falls short of the recommended separation between closely spaced parallel runways for ADG V aircraft. As a result of having 1,100 feet of separation between the runways and the location of the Runway 36C glideslope, ADG V aircraft cannot taxi on Taxiway V when visibility is less than a half mile.10
6.3 Alternative 3
Alternative 3 includes a new midfield runway with 3,400 feet of separation to Runway 18R/36L and 900 feet of separation to Runway 18C/36C. The new runway has sufficient spacing between it and Runways 18R/36L and 18L/36R to allow for triple simultaneous independent straight-in approaches. As a result, it is intended to be used primarily by arrivals along with Runways 18R/36L and 18L/36R. Runways 18C/36C and 18L/36R would be used for departures.
Alternative 3 includes the construction of a partial NEAT, and a full SEAT. The 900-foot separation between the proposed runway and Runway 18C/36C allows for a center taxiway with 450 feet separation to both runways, which results in restricted use. ADG V aircraft cannot use this taxiway when visibility is less than a ½ mile. The 900-foot spacing also results in another restriction. The location of the Runway 18C and 36C glideslopes and associated critical areas combined with the 900-foot spacing means Taxiway V cannot extend the full length of Runway 01/19 and cannot connect to the EATs (a minimum of 560 feet of spacing is required between the runways to allow aircraft to taxi past the Runway 18C and 36C glideslope antennas).
9 Because dual simultaneous independent approaches would be permitted to Runways 18R/36L and Runway 01/19 if the
runways were 3,200 feet apart and because the separation between Runway 01/19 and Runway 18L/36R far exceeds the requirement of 3,400 feet for triple simultaneous independent approaches, it may be possible to obtain a waiver from FAA to operate triple simultaneous independent approaches at CLT in the future. This would require further study and consultation with FAA.
10 A separation of 642.5 feet is required between Runway 36C and Taxiway V on the southern portion of Taxiway V to allow unrestricted taxing past the Runway 36C glideslope critical area. With 1,100 feet of separation between Runways 18C/36C and 01/19, that leaves 457.5 feet of separation between Taxiway V and Runway 01/19, which is not sufficient to allow ADG V aircraft to taxi when visibility is less than a half mile.

Environmental Assessment Alternatives Analysis April 2021
18 | Landrum & Brown
It is important that aircraft have the ability to exit Runway 01/19 to both the east and the west. Aircraft exiting to the west can use the EATs to reach the terminal area, avoiding runway crossings. In addition, ADG V aircraft, which cannot use Taxiway V when visibility is less than a half mile, need to be able to exit to the west. According to the runway exit analysis, two high-speed exits are required in order to achieve runway occupancy times of less than 50 seconds. If the two glideslopes for Runway 01/19 were placed on the west side of Runway 01/19 (most typical location), their critical areas would conflict with the optimal location of the runway exits. Because the parallel taxiway to the east of Runway 01/19 has restricted use due to the separation between the proposed runway and Runway 18C/36C, the glideslopes were placed on the east side of Runway 01/19. This placement of the glideslopes allows two high-speed exits to be placed on the west side of the runway in both directions.
The ability to exit to the east Runway 01/19 is needed because it provides a shorter path to the terminal. If the new runway were 7,300 feet long, Taxiway V could only extend from Taxiway E3 to Taxiway V4 due to the location of the Runways 18C, 19, 01, and 36 glideslopes as well as the location of Runway 36C high-speed exits. This distance is 3,500 feet which is not sufficient to allow most aircraft in the CLT fleet to exit to the east. In order for the center taxiway to be long enough to provide the capability for all arrivals to exit east, the runway needs to be longer. A length of 8,900 feet provides 7,303 feet of usable runway length for south flow arrivals exiting east and 7,418 feet of usable runway length for north flow arrivals exiting east. Thus, Runway 01/19 is 8,900 feet long in Alternative 3. It has one high-speed exit in both directions to the east of Runway 01/19.
The location of the runway and exit taxiways requires that a portion of Taxiway N, a portion of the newly constructed Taxiway V, and Taxiway E8 (a high-speed exit for Runway 36C) be removed. The removal of a Runway 36C high-speed taxiway is not expected to cause an increase in ROT for Runway 36C.
7 Alternatives Comparison There are several key differentiators between the three alternatives: (1) EAT holding requirements, (2) runway use and runway crossings, (3) Taxiway V capability, (4) navigational aid placement, and (5) the ability to provide future flexibility. The alternatives were screened with regards to these factors to identify any fatal flaws.
The alternatives will all result in differing costs, implementation time frames, and operational performance. These factors will be assessed as part of the EA alternatives analysis to determine which ones should be carried forward for detailed environmental analysis.
7.1 End Around Taxiway (EAT) Holding
An EAT is a taxiway that crosses the extended centerline of a runway, on which aircraft do not require clearance from air traffic control (ATC) to cross. EATs can improve efficiency and reduce runway crossings. All three alternatives have full EATs around Runways 19 and 18C on the north end and around Runways 01 and 36C on the south end. These EATs were designed based on the following guidance in FAA AC 150/5300-13A, Airport Design:
The centerline of an EAT must be at least 1,500 feet from the stop end of the runway for a minimum of 500 feet on each side of the extended runway centerline.
The minimum dimensions are typically increased in order to prevent aircraft tails from being a penetration to the 40:1 departure surface or any other relevant surfaces.
EATs can be placed at a lower elevation than the stop end of the runway to reduce the distance between the runway end and the EAT that is perpendicular to the extended runway centerline.
It is not currently possible for aircraft to taxi unrestricted on the EAT in the approach surface of an incoming arrival.
7.1.1 South EAT Holding Requirements
The perpendicular portion of the SEAT is located 2,600 feet from the stop end of Runways 01 and 36C in all three alternatives. This distance allows unrestricted flow on the EATs under departing aircraft because all tail heights for the CLT fleet can clear the 40:1 departure surface.
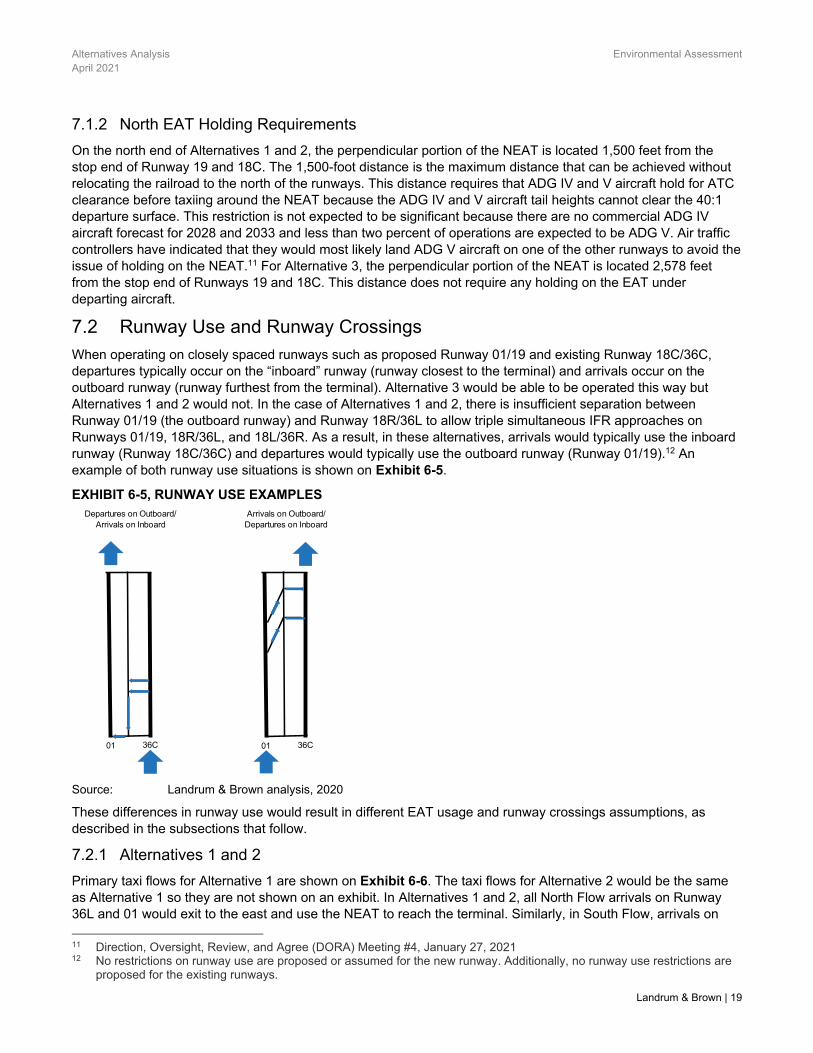
Alternatives Analysis Environmental Assessment April 2021
Landrum & Brown | 19
7.1.2 North EAT Holding Requirements
On the north end of Alternatives 1 and 2, the perpendicular portion of the NEAT is located 1,500 feet from the stop end of Runway 19 and 18C. The 1,500-foot distance is the maximum distance that can be achieved without relocating the railroad to the north of the runways. This distance requires that ADG IV and V aircraft hold for ATC clearance before taxiing around the NEAT because the ADG IV and V aircraft tail heights cannot clear the 40:1 departure surface. This restriction is not expected to be significant because there are no commercial ADG IV aircraft forecast for 2028 and 2033 and less than two percent of operations are expected to be ADG V. Air traffic controllers have indicated that they would most likely land ADG V aircraft on one of the other runways to avoid the issue of holding on the NEAT.11 For Alternative 3, the perpendicular portion of the NEAT is located 2,578 feet from the stop end of Runways 19 and 18C. This distance does not require any holding on the EAT under departing aircraft.
7.2 Runway Use and Runway Crossings
When operating on closely spaced runways such as proposed Runway 01/19 and existing Runway 18C/36C, departures typically occur on the “inboard” runway (runway closest to the terminal) and arrivals occur on the outboard runway (runway furthest from the terminal). Alternative 3 would be able to be operated this way but Alternatives 1 and 2 would not. In the case of Alternatives 1 and 2, there is insufficient separation between Runway 01/19 (the outboard runway) and Runway 18R/36L to allow triple simultaneous IFR approaches on Runways 01/19, 18R/36L, and 18L/36R. As a result, in these alternatives, arrivals would typically use the inboard runway (Runway 18C/36C) and departures would typically use the outboard runway (Runway 01/19).12 An example of both runway use situations is shown on Exhibit 6-5.
EXHIBIT 6-5, RUNWAY USE EXAMPLES
Source: Landrum & Brown analysis, 2020 These differences in runway use would result in different EAT usage and runway crossings assumptions, as described in the subsections that follow.
7.2.1 Alternatives 1 and 2
Primary taxi flows for Alternative 1 are shown on Exhibit 6-6. The taxi flows for Alternative 2 would be the same as Alternative 1 so they are not shown on an exhibit. In Alternatives 1 and 2, all North Flow arrivals on Runway 36L and 01 would exit to the east and use the NEAT to reach the terminal. Similarly, in South Flow, arrivals on
11 Direction, Oversight, Review, and Agree (DORA) Meeting #4, January 27, 2021 12 No restrictions on runway use are proposed or assumed for the new runway. Additionally, no runway use restrictions are
proposed for the existing runways.
Departures on Outboard/ Arrivals on Inboard
Arrivals on Outboard/ Departures on Inboard
01 36C 01 36C
Environmental Assessment Alternatives Analysis April 2021
20 | Landrum & Brown
18R and 19 would exit to the east and use the SEAT to access the terminal. No arrivals would be required to cross a runway to reach the terminal area in these alternatives.
Departing aircraft bound for Runway 01 in North Flow or Runway 19 in South Flow would cross Runway 18C/36C at two locations to reach the departure queue. These departing aircraft were assumed to cross Runway 18C/36C instead of using the EATs for several reasons:
FAA air traffic officials indicated they would rather cross Runway 18C/36C than taxi on the EATs due to the amount of time it would take for aircraft to taxi through the approach surface.13
Participants at the Safety Assessment Workshop (October 16, 2020) identified a hazard with a high potential risk related to holding on the EATs for the approach surface of Runway 18C/36C.
Large gaps in the arrival stream (eight to nine nautical miles) would be required in order to allow aircraft on the EATs to taxi through the approach surfaces of Runway 18C/36C. These gaps would result in reduced capacity on Runway 18/36C. If the gaps are not provided, taxiing aircraft would have long ground delays while waiting for a natural gap in the arrival sequence. Crossing the runway was found to take less time and result in a more efficient operation than taxiing on the EATs.
Based on these factors, crossing the runway was identified as preferable over taxiing through the approach surfaces on the EATs.
There would be more runway crossings with Alternatives 1 and 2 versus Alternative 3 because all Runway 01/19 departures would be required to cross a runway to reach their departure queue in Alternatives 1 and 2. Runway 01/19 departures would have to cross an arrival runway (Runway 18C/36C) to access the Runway 01/19 departure queue. This type of operation creates a more complex situation for air traffic controllers to manage than when arrivals are on the outboard runway and departures are on the inboard runway. In general, it is more complicated to cross an arrival runway than a departure runway for two reasons:
Arrivals restrict the runway from use by crossing aircraft for a longer period of time than departures. Arrivals that are less than two miles out “own” the runway until they land and pass the runway crossing point, whereas departures only “own” the runway from the point of takeoff clearance until they pass the runway crossing point.
Crossing an arrival runway provides less flexibility to manage the flow of aircraft on the ground. Arrivals cannot be told to hold in the air for a runway crossing. If separation cannot be assured between arrivals due to a slow runway crossing or other reason, the controller must send the arriving aircraft around for a missed approach to avoid an operational error. On the other hand, departures on the ground can be told to hold for runway crossings, providing flexibility to reduce taxiway congestion.
13 Feedback received at DORA Meeting #2 (June 11, 2020).
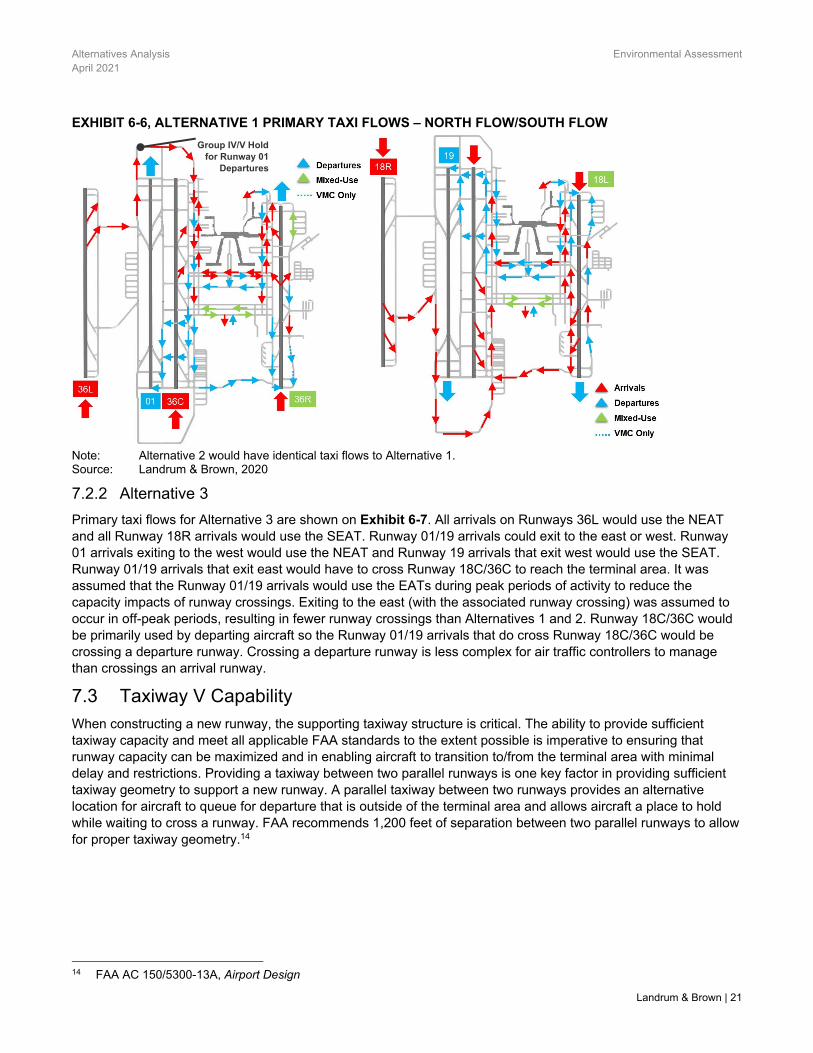
Alternatives Analysis Environmental Assessment April 2021
Landrum & Brown | 21
EXHIBIT 6-6, ALTERNATIVE 1 PRIMARY TAXI FLOWS – NORTH FLOW/SOUTH FLOW
Note: Alternative 2 would have identical taxi flows to Alternative 1. Source: Landrum & Brown, 2020
7.2.2 Alternative 3
Primary taxi flows for Alternative 3 are shown on Exhibit 6-7. All arrivals on Runways 36L would use the NEAT and all Runway 18R arrivals would use the SEAT. Runway 01/19 arrivals could exit to the east or west. Runway 01 arrivals exiting to the west would use the NEAT and Runway 19 arrivals that exit west would use the SEAT. Runway 01/19 arrivals that exit east would have to cross Runway 18C/36C to reach the terminal area. It was assumed that the Runway 01/19 arrivals would use the EATs during peak periods of activity to reduce the capacity impacts of runway crossings. Exiting to the east (with the associated runway crossing) was assumed to occur in off-peak periods, resulting in fewer runway crossings than Alternatives 1 and 2. Runway 18C/36C would be primarily used by departing aircraft so the Runway 01/19 arrivals that do cross Runway 18C/36C would be crossing a departure runway. Crossing a departure runway is less complex for air traffic controllers to manage than crossings an arrival runway.
7.3 Taxiway V Capability
When constructing a new runway, the supporting taxiway structure is critical. The ability to provide sufficient taxiway capacity and meet all applicable FAA standards to the extent possible is imperative to ensuring that runway capacity can be maximized and in enabling aircraft to transition to/from the terminal area with minimal delay and restrictions. Providing a taxiway between two parallel runways is one key factor in providing sufficient taxiway geometry to support a new runway. A parallel taxiway between two runways provides an alternative location for aircraft to queue for departure that is outside of the terminal area and allows aircraft a place to hold while waiting to cross a runway. FAA recommends 1,200 feet of separation between two parallel runways to allow for proper taxiway geometry.14
14 FAA AC 150/5300-13A, Airport Design
Group IV/V Hold for Runway 01
Departures

Environmental Assessment Alternatives Analysis April 2021
22 | Landrum & Brown
All of the CLT alternatives meet all applicable FAA requirements for taxiway design and provide a full parallel taxiway to the west of Runway 01/19. They differ in the capability of the taxiway between Runways 01/19 and 18C/36C. Alternative 1 is the only alternative that provides a full parallel taxiway between the runways, meets FAA recommendations, and is capable of accommodating ADG V aircraft in all weather conditions.
Alternative 2 provides a full parallel taxiway between the runways but ADG V aircraft cannot taxi on it when visibility is less than a half mile because the separation between Runways 18C/36C and 01/19 is 1,100 feet. ADG V aircraft would have to exit Runway 01/19 to the west during these low visibility conditions, resulting in a longer taxi times and less flexibility for air traffic controllers. This restriction is not expected to be significant because less than two percent of operations are expected to be ADG V and the referenced low visibility conditions occur less than one percent of the time.
Alternative 3 has 900 feet of separation between Runways 01/19 and 18C/36C. Similar to Alternative 2, this separation does not allow ADG V aircraft to taxi on Taxiway V when visibility is less than a half mile. ADG V aircraft would have to exit Runway 01/19 to the west during these low visibility conditions, resulting in a longer taxi times and less flexibility for air traffic controllers. As with Alternative 2, this restriction is not expected to be significant. In addition, a full taxiway cannot be provided between Runways 01/19 and 18C/36C due to the location of the Runway 18C/36C glideslopes. The lack of a full length taxiway means that the EAT would not be accessible to aircraft that exit Runway 01/19 to the east. It also means there would be less flexibility for controllers because there would be less space for aircraft to queue for departure and fewer places for aircraft to hold while waiting to cross Runway 18C/36C.
EXHIBIT 6-7, ALTERNATIVE 3 PRIMARY TAXI FLOWS – NORTH FLOW/SOUTH FLOW
Source: Landrum & Brown, 2020
Alternatives Analysis Environmental Assessment April 2021
Landrum & Brown | 23
7.4 Navigational Aid Placement
Glideslopes are located on the sides of runways near the runway ends. They have critical areas that need to be kept free of aircraft when the glideslope is in use. As a result, glideslope placement must be carefully considered so that there are no implications to taxiing aircraft.
For Alternatives 1 and 2, the Runway 01/19 glideslopes were placed on the west side of the runway. There is sufficient separation between the runway and the west parallel taxiway to allow aircraft to taxi unrestricted adjacent to the glideslope critical area. The glideslope and its critical area do not cause restrictions on taxiing aircraft.
Alternative 3 would require that the Runway 01/19 glideslopes be placed between Runways 01/19 and 18C/36C in order to allow for high-speed exits on the west side of the runway. This placement results in the Runway 01 glideslope being co-located with the Runway 36C glideslope. While it is possible to co-locate the glideslopes, there may be issues with the glideslopes and the terminal instrument procedures (TERPS) surfaces – this requires further study. If this glideslope siting is ultimately not possible, the glideslope would have to be placed on the west side of the runway. If the Runway 01 glideslope is located on the west side of the runway, the second high-speed exits in both directions would be in the glideslope critical area which may not be permitted due to signal reflectivity issues. Not having the second high-speed exit in both directions could increase runway occupancy times and ultimately reduce the capacity of the runway.
7.5 Future Flexibility
Alternative 2 provides 3,200 feet of separation between Runways 01/19 and 18C/36C, which meets the minimum requirement for dual simultaneous independent approaches under the FAA’s upcoming rule change. The separation between Runways 01/19 and 18L/36R in this alternative is 6,100 feet, which is far in excess of the 3,400 feet of separation that will be needed for triple simultaneous independent approaches under the new FAA requirements. The capability to run duals to Runways 18R/36L and 01/19 combined with the excess separation between Runways 01/19 and 18L/36R may make it possible to get approval to run triples to Runway 01/19 in the future. If so, Alternative 2 would be operated with arrivals on Runways 18R/36L, 01/19, and 18L/36R. With regards to the set of closely spaced parallel runways (01/19 and 18C/36C), arrivals would occur on the outboard runway, with departures on the inboard runway. This is a more typical runway use which would result in fewer runway crossings and reduce crossings of an arrival runway. As a result, Alternative 2 could provide future flexibility that may not be available with Alternative 1. It is important to note that this runway use has not been approved and is not assumed as part of this EA. The ability to run triples with 3,200 feet of separation would require future study and consultation with the FAA.
The future flexibility concept is not necessary with Alternative 3 because its 3,400-foot separation takes advantage of the upcoming FAA rule change for triple approaches. No additional flexibility would be needed.
7.6 Conclusions
The results of the alternatives screening are summarized in Table 7-1. Alternative 1 would have a fully capable taxiway system with no aircraft size restrictions and the glideslope siting is standard. However, this alternative would have more runway crossings than Alternative 3, would require crossings of an arrival runway, would require holding by ADG IV and V aircraft on the NEAT, and would not provide future flexibility with regards to triple approaches to the new runway.

Environmental Assessment Alternatives Analysis April 2021
24 | Landrum & Brown
TABLE 7-1, ALTERNATIVES SCREENING SUMMARY
Alternative Pro/Con EAT Holding Runway
Crossings Taxiway V Capability
Navigational Aid Placement
Future Flexibility
11
Con
ADG IV and V aircraft
required to hold on NEAT;
Rwy 01/19 departures
cross inboard arrival runway
n/a n/a No
Pro no holding on
SEAT n/a
Full length, unrestricted Taxiway V
Standard placement
n/a
2 Con
ADG IV and V aircraft
required to hold on NEAT;
Rwy 01/19 departures
cross inboard arrival runway
ADG V cannot use Taxiway V
when visibility is less than a half
mile
n/a Yes
Pro no holding on
SEAT
Full length Taxiway V
Standard placement
n/a
3
Con n/a n/a
Partial Taxiway V; ADG V cannot
use Taxiway V when visibility is less than a half
mile
Requires 18C/19 and
36C/01 glideslopes to be co-located
which may have TERPS issues
n/a
Pro No holding on
NEAT or SEAT
some Rwy 01/19 arrivals cross inboard
departure runway
n/a n/a n/a
Note: 1 Proposed Action Source: Landrum & Brown analysis, 2021
Alternative 2 would provide a full length Taxiway V, the glideslope siting is standard, and it would provide future flexibility with regards to triple approaches to the new runway. However, this alternative would have an aircraft size restriction on Taxiway V, more runway crossings than Alternative 3, require crossings of an arrival runway, and require holding by ADG IV and V aircraft on the NEAT.
Alternative 3 would not require holding for arriving aircraft on the EATs, would have the least complex runway use, and would have fewer runway crossings than Alternatives 1 and 2. However, it would have the least amount of capability on Taxiway V and would require co-location of glideslopes.
Each of these alternatives has its pros and cons but no fatal flaws. It is therefore recommended that all three alternatives be carried forward into the EA for airfield simulation analysis to determine the best performing alternative from an operational perspective.


