Embed Size (px)
Citation preview
CLH REPORT FOR ACETOCHLOR
1
CLH report
Proposal for Harmonised Classification and Labelling
Based on Regulation (EC) No 1272/2008 (CLP Regulation),
Annex VI, Part 2
Substance Name: Acetochlor
EC Number: 251-899-3
CAS Number: 34256-82-1
Index Number: 616-037-00-6
Contact details for dossier submitter: Spanish Competent Authority
Ministerio de Sanidad, Servicios Sociales e Igualdad. Dirección General de Salud Pública, Calidad e Innovación. Subdirección General de Sanidad Ambiental y Salud Laboral. Área de Productos Fitosanitarios. [email protected]
Version number: 2 Date: September 2013
CLH REPORT FOR ACETOCHLOR
2
CONTENTS
Part A 1 PROPOSAL FOR HARMONISED CLASSIFICATION AND LABELLIN G ................................................. 5
1.1 SUBSTANCE ........................................................................................................................................................... 5
1.2 HARMONISED CLASSIFICATION AND LABELLING PROPOSAL .................................................................................. 5
1.3 PROPOSED HARMONISED CLASSIFICATION AND LABELLING BASED ON CLP REGULATION AND/OR DSD CRITERIA ................................................................................................................................................................ 7
2 BACKGROUND TO THE CLH PROPOSAL ................................................................................................... 10
2.1 HISTORY OF THE PREVIOUS CLASSIFICATION AND LABELLING ............................................................................ 10 2.2 SHORT SUMMARY OF THE SCIENTIFIC JUSTIFICATION FOR THE CLH PROPOSAL .................................................. 11
2.3 CURRENT HARMONISED CLASSIFICATION AND LABELLING .................................................................................. 11
2.3.1 Current classification and labelling in Annex VI, Table 3.1 in the CLP Regulation ................................ 11 2.3.2 Current classification and labelling in Annex VI, Table 3.2 in the CLP Regulation ................................ 11
2.4 CURRENT SELF-CLASSIFICATION AND LABELLING ............................................................................................... 12
3 JUSTIFICATION THAT ACTION IS NEEDED AT COMMUNITY LE VEL .............................................. 12
Part B 1 IDENTITY OF THE SUBSTANCE .................................................................................................................... 13
1.1 NAME AND OTHER IDENTIFIERS OF THE SUBSTANCE ............................................................................................ 13
1.2 COMPOSITION OF THE SUBSTANCE ...................................................................................................................... 14 1.2.1 Composition of test material ..................................................................................................................... 14
1.3 PHYSICO-CHEMICAL PROPERTIES ........................................................................................................................ 15
2 MANUFACTURE AND USES ............................................................................................................................ 16
3 CLASSIFICATION FOR PHYSICO-CHEMICAL PROPERTIES .... ............................................................ 16
4 HUMAN HEALTH HAZARD ASSESMENT .................................................................................................... 16
4.1 TOXICOKINETICS (ABSORPTION, METABOLISM, DISTRIBUTION AND ELIMINATION ) ............................................. 16
4.1.1 Non-human information ............................................................................................................................ 16
4.1.2 Human information ................................................................................................................................... 29
4.1.3 Summary and discussion on toxicokinetic................................................................................................. 30
4.2 ACUTE TOXICITY ................................................................................................................................................. 30
4.2.1 Non-human information ............................................................................................................................ 33
4.2.1.1 Acute toxicity: oral ................................................................................................................................................ 33 4.2.1.2 Acute toxicity: inhalation ....................................................................................................................................... 33 4.2.1.3 Acute toxicity: dermal ............................................................................................................................................ 33 4.2.1.4 Acute toxicity: other routes .................................................................................................................................... 33
4.2.2 Human information ................................................................................................................................... 34
4.2.3 Summary and discussion of acute toxicity ................................................................................................ 34
4.2.4 Comparison with criteria .......................................................................................................................... 34
4.2.5 Conclusions on classification and labelling ............................................................................................. 34
4.3 SPECIFIC TARGET ORGAN TOXICITY — SINGLE EXPOSURE (STOT SE) ................................................................ 34 4.4 IRRITATION ..................................................................................................................................................... 35
4.4.1 Skin Irritation ............................................................................................................................................ 35 4.4.1.1 Non-human information ......................................................................................................................................... 36 4.4.1.2 Human information ................................................................................................................................................ 36 4.4.1.3 Summary and discussion of skin irritation ............................................................................................................. 36
4.4.1.4 Comparison with criteria ........................................................................................................................................ 37 4.4.1.5 Conclusions on classification and labelling ........................................................................................................... 37
4.4.2 Eye Irritation............................................................................................................................................. 38 4.4.2.1 Non-human information ......................................................................................................................................... 38
CLH REPORT FOR ACETOCHLOR
3
4.4.2.2 Human information ................................................................................................................................................ 38 4.4.2.3 Summary and discussion of eye irritation .............................................................................................................. 38
4.4.2.4 Comparison with criteria ........................................................................................................................................ 39 4.4.2.5 Conclusions on classification and labelling ........................................................................................................... 39
4.4.3 Respiratory tract irritation ....................................................................................................................... 39
4.4.3.1 Non-human information ......................................................................................................................................... 39 4.4.3.2 Human information ................................................................................................................................................ 39 4.4.3.3 Summary and discussion of respiratory tract irritation .......................................................................................... 39
4.4.3.4 Comparison with criteria ........................................................................................................................................ 39 4.4.3.5 Conclusions on classification and labelling ........................................................................................................... 40
4.5 CORROSIVITY ...................................................................................................................................................... 40
4.6 SKIN SENSITISATION ............................................................................................................................................ 40
4.6.1 Skin sensitisation ....................................................................................................................................... 40 4.6.1.1 Non-human information ......................................................................................................................................... 41 4.6.1.2 Human information ........................................................................................................................................... 41 4.6.1.3 Summary and discussion of skin sensitisation .................................................................................................. 41
4.6.1.4 Comparison with criteria .................................................................................................................................. 41 4.6.1.5 Conclusions on classification and labelling ...................................................................................................... 42
4.6.2 Respiratory Sensitisation .......................................................................................................................... 42
4.7 REPEATED DOSE TOXICITY .................................................................................................................................. 42
4.7.1 Non-human information ............................................................................................................................ 42
4.7.1.1 Repeated dose toxicity: oral .............................................................................................................................. 42 4.7.1.1.1 Short-term oral toxicity studies ................................................................................................................... 42
4.7.1.2 Repeated dose toxicity: inhalation ......................................................................................................................... 51 4.7.1.3 Repeated dose toxicity: dermal .............................................................................................................................. 51 4.7.1.4 Repeated dose toxicity: other routes ................................................................................................................. 53
4.7.1.5 Human information ........................................................................................................................................... 53 4.7.1.6 Other relevant information................................................................................................................................ 53 4.7.1.7 Summary and discussion of repeated dose toxicity (short-term and long-term toxicity studies) ...................... 53 4.7.1.8 Summary and discussion of repeated dose toxicity findings relevant for classification according to DSD ...... 54 4.7.1.9 Comparison with criteria of repeated dose toxicity findings relevant for classification according to DSD ...... 57 4.7.1.10 Conclusions on classification and labelling of repeated dose toxicity findings relevant for classification according to DSD. ................................................................................................................................................................. 58
4.8 SPECIFIC TARGET ORGAN TOXICITY (CLP REGULATION) –REPEATED EXPOSURE (STOT RE) ....................... 58 4.8.1 Summary and discussion of repeated dose toxicity findings relevant for classification as STOT RE according to CLP .................................................................................................................................................... 58 4.8.2 Comparison with criteria of repeated dose toxicity findings relevant for classification as STOT RE ...... 62 4.8.3 Conclusions on classification and labelling of repeated dose toxicity findings relevant for classification as STOT RE ............................................................................................................................................................. 64
4.9 GERM CELL MUTAGENICITY (MUTAGENICITY) ................................................................................................... 65
4.9.1 Non human information ............................................................................................................................ 65
4.9.1.1 In vitro data ............................................................................................................................................................ 71 4.9.1.1.1 Bacterial gene mutation ............................................................................................................................... 71
4.9.1.1.2 Mammalian Gene Mutation ......................................................................................................................... 76
4.9.1.1.3 Mammalian chromosome aberration ........................................................................................................... 81
4.9.1.1.4 DNA damage ............................................................................................................................................... 84 4.9.1.2 In vivo data ............................................................................................................................................................ 85
4.9.1.2.1 Chromosome aberration in mammalian somatic cells ................................................................................. 85 4.9.1.2.2 DNA effects in mammalian somatic cells ................................................................................................... 89
4.9.1.2.3 In vivo genotoxicity studies in mammalian germ cells ................................................................................ 98 4.9.2 Human information ................................................................................................................................. 107
4.9.3 Other relevant information ..................................................................................................................... 107
4.9.4 Summary and discussion of mutagenicity ............................................................................................... 107
4.9.5 Comparison with criteria ........................................................................................................................ 107
4.9.6 Conclusions on classification and labelling ........................................................................................... 108
4.10 CARCINOGENICITY ....................................................................................................................................... 109
4.10.1 Non-human information ..................................................................................................................... 109
4.10.1.1 Carcinogenicity: oral ...................................................................................................................................... 109 4.10.1.1.1 Oral carcinogenesis in rat .......................................................................................................................... 109
4.10.1.1.2 Oral Carcinogenesis in mice ...................................................................................................................... 122
4.10.2 Human information ............................................................................................................................ 128
4.10.3 Other relevant information ................................................................................................................ 128
4.10.4 Summary and discussion of carcinogenicity ...................................................................................... 131 4.10.4.1 Summary and discussion of carcinogenicity. Carcinogenesis in rats .............................................................. 131
CLH REPORT FOR ACETOCHLOR
4
4.10.4.2 Summary and discussion of carcinogenicity. Carcinogenesis in mice ............................................................ 145 4.10.5 Comparison with criteria ................................................................................................................... 152
4.10.6 Conclusions on Classification and Labelling ..................................................................................... 153
4.11 TOXICITY FOR REPRODUCTION ..................................................................................................................... 154 4.11.1 Effects on fertility ............................................................................................................................... 165
4.11.1.1 Non-human information ................................................................................................................................. 165
4.11.1.2 Human information ......................................................................................................................................... 167 4.11.2 Developmental toxicity ....................................................................................................................... 167
4.11.2.1 Non-human information ................................................................................................................................. 167
4.11.2.1 Human information ......................................................................................................................................... 168 4.11.3 Other relevant information ................................................................................................................ 168
4.11.4 Summary and discussion of reproductive toxicity .............................................................................. 168 4.11.5 Comparison with criteria ................................................................................................................... 169
4.11.6 Conclusions on classification and labelling ....................................................................................... 171
4.12 OTHER EFFECTS ............................................................................................................................................ 172
4.12.1 Non-human information ..................................................................................................................... 172
4.12.1.1 Neurotoxicity .................................................................................................................................................. 172 4.12.1.2 Immunotoxicity .............................................................................................................................................. 173 4.12.1.3 Specific investigations: other studies .............................................................................................................. 174
4.12.1.4 Human information ......................................................................................................................................... 174 4.12.2 Summary and discussion .................................................................................................................... 174
4.12.3 Comparison with criteria ................................................................................................................... 174
4.12.4 Conclusions on classification and labelling ....................................................................................... 174
5 ENVIRONMENTAL HAZARD ASSESSMENT ............................................................................................. 175
5.1 DEGRADATION .................................................................................................................................................. 175
5.1.1 Stability ................................................................................................................................................... 175 5.1.2 Biodegradation ....................................................................................................................................... 177
5.1.2.1 Biodegradation estimation ................................................................................................................................... 177 5.1.2.2 Screening tests ..................................................................................................................................................... 183 5.1.2.3 Simulation tests .................................................................................................................................................... 184
5.1.3 Summary and discussion of degradation ................................................................................................ 184
5.2 ENVIRONMENTAL DISTRIBUTION ....................................................................................................................... 184 5.2.1 Adsorption/Desorption ............................................................................................................................ 184
5.2.2 Volatilisation ........................................................................................................................................... 186 5.2.3 Distribution modelling ............................................................................................................................ 186
5.3 AQUATIC BIOACCUMULATION .......................................................................................................................... 186 5.3.1 Aquatic bioaccumulation ........................................................................................................................ 186
5.3.1.1 Bioaccumulation estimation ................................................................................................................................. 188 5.3.1.2 Measured bioaccumulation data ........................................................................................................................... 188
5.3.2 Summary and discussion of aquatic bioaccumulation ............................................................................ 188 5.4 AQUATIC TOXICITY ........................................................................................................................................... 189
5.4.1 Fish ......................................................................................................................................................... 190 5.4.1.1 Short-term toxicity to fish .................................................................................................................................... 190 5.4.1.2 Long-term toxicity to fish .................................................................................................................................... 194
5.4.2 Aquatic invertebrates .............................................................................................................................. 197
5.4.2.1 Short-term toxicity to aquatic invertebrates ......................................................................................................... 197
5.4.2.2 Long-term toxicity to aquatic invertebrates ......................................................................................................... 200
5.4.3 Algae and aquatic plants ........................................................................................................................ 201
5.4.4 Other aquatic organisms (including sediment) ....................................................................................... 213
5.4.5 Summary and discussion of aquatic toxicity ........................................................................................... 214
5.5 COMPARISON WITH CRITERIA FOR ENVIRONMENTAL HAZARDS (SECTIONS 5.1 – 5.4) ........................................ 215
5.6 CONCLUSIONS ON CLASSIFICATION AND LABELLING FOR ENVIRONMENTAL HAZARDS (SECTIONS 5.1 5.4) ........ 216
6 OTHER INFORMATION .................................................................................................................................. 217
7 REFERENCES .................................................................................................................................................... 218
7.1 PHYSICAL AND CHEMICAL PROPERTIES ............................................................................................................. 220 7.2 TOXICOLOGY AND METABOLISM ....................................................................................................................... 222 7.3 ENVIRONMENT .................................................................................................................................................. 240
8 ANNEXES ............................................................................................................................................................ 243
8.1 ANNEX SUMMARY RECORDS ECBI/52/97 AND ECBI/28/97: ............................................................................ 243
CLH REPORT FOR ACETOCHLOR
5
Part A
1 PROPOSAL FOR HARMONISED CLASSIFICATION AND LABELLIN G
1.1 Substance
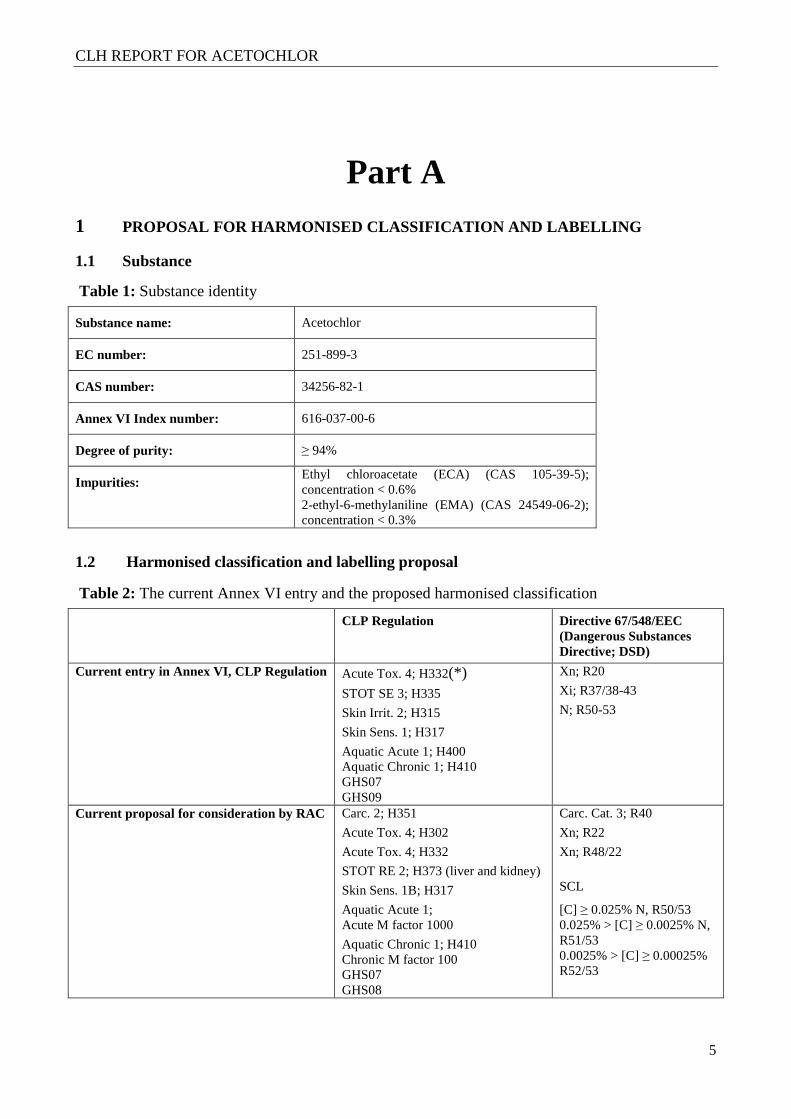
Table 1: Substance identity
Substance name: Acetochlor
EC number: 251-899-3
CAS number: 34256-82-1
Annex VI Index number: 616-037-00-6
Degree of purity: ≥ 94%
Impurities: Ethyl chloroacetate (ECA) (CAS 105-39-5); concentration < 0.6% 2-ethyl-6-methylaniline (EMA) (CAS 24549-06-2); concentration < 0.3%
1.2 Harmonised classification and labelling proposal
Table 2: The current Annex VI entry and the proposed harmonised classification
CLP Regulation Directive 67/548/EEC (Dangerous Substances Directive; DSD)
Current entry in Annex VI, CLP Regulation Acute Tox. 4; H332(*)
STOT SE 3; H335
Skin Irrit. 2; H315
Skin Sens. 1; H317
Aquatic Acute 1; H400 Aquatic Chronic 1; H410 GHS07 GHS09
Xn; R20
Xi; R37/38-43
N; R50-53
Current proposal for consideration by RAC Carc. 2; H351
Acute Tox. 4; H302
Acute Tox. 4; H332
STOT RE 2; H373 (liver and kidney)
Skin Sens. 1B; H317
Aquatic Acute 1; Acute M factor 1000
Aquatic Chronic 1; H410 Chronic M factor 100 GHS07 GHS08
Carc. Cat. 3; R40
Xn; R22
Xn; R48/22
SCL
[C] ≥ 0.025% N, R50/53 0.025% > [C] ≥ 0.0025% N, R51/53 0.0025% > [C] ≥ 0.00025% R52/53
CLH REPORT FOR ACETOCHLOR
6
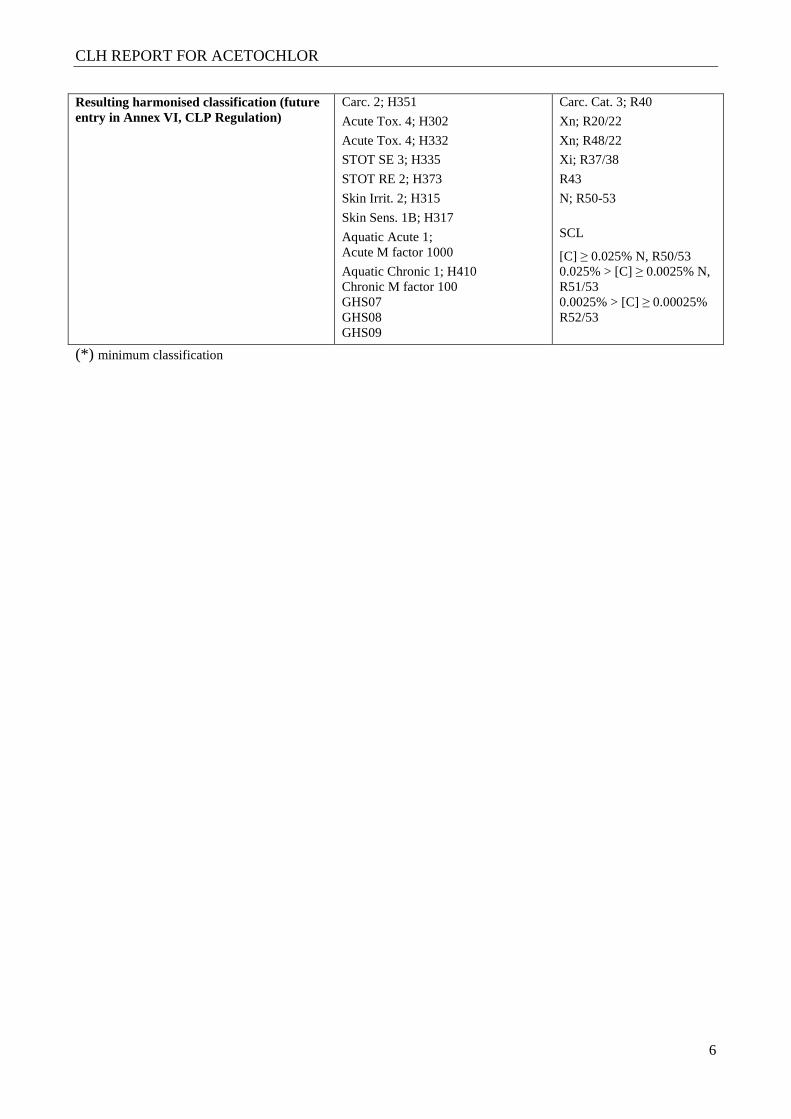
Resulting harmonised classification (future entry in Annex VI, CLP Regulation)
Carc. 2; H351
Acute Tox. 4; H302
Acute Tox. 4; H332
STOT SE 3; H335
STOT RE 2; H373
Skin Irrit. 2; H315
Skin Sens. 1B; H317
Aquatic Acute 1; Acute M factor 1000
Aquatic Chronic 1; H410 Chronic M factor 100 GHS07 GHS08 GHS09
Carc. Cat. 3; R40
Xn; R20/22
Xn; R48/22
Xi; R37/38
R43
N; R50-53
SCL
[C] ≥ 0.025% N, R50/53 0.025% > [C] ≥ 0.0025% N, R51/53 0.0025% > [C] ≥ 0.00025% R52/53
(*) minimum classification
CLH REPORT FOR ACETOCHLOR
7
1.3 Proposed harmonised classification and labelling based on CLP Regulation and/or DSD criteria
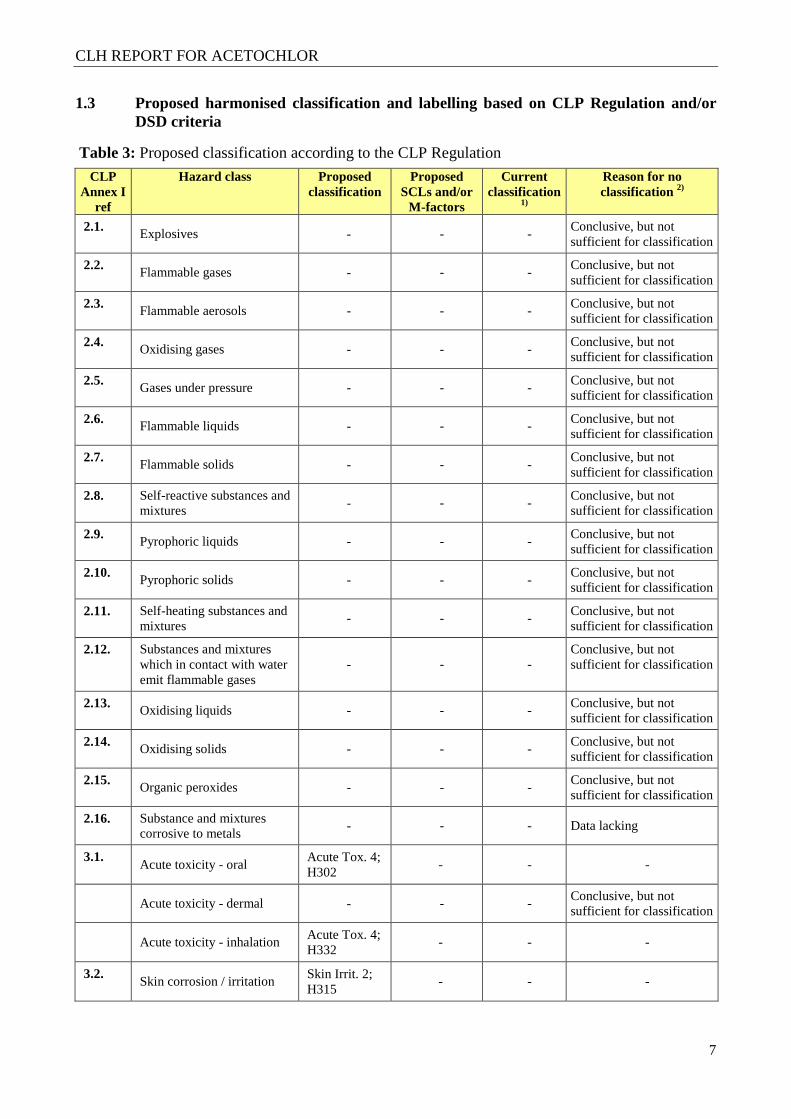
Table 3: Proposed classification according to the CLP Regulation
CLP Annex I
ref
Hazard class Proposed classification
Proposed SCLs and/or
M-factors
Current classification
1)
Reason for no classification 2)
2.1. Explosives - - - Conclusive, but not sufficient for classification
2.2. Flammable gases - - - Conclusive, but not sufficient for classification
2.3. Flammable aerosols - - - Conclusive, but not sufficient for classification
2.4. Oxidising gases - - - Conclusive, but not sufficient for classification
2.5. Gases under pressure - - - Conclusive, but not sufficient for classification
2.6. Flammable liquids - - - Conclusive, but not sufficient for classification
2.7. Flammable solids - - - Conclusive, but not sufficient for classification
2.8. Self-reactive substances and mixtures
- - - Conclusive, but not sufficient for classification
2.9. Pyrophoric liquids - - - Conclusive, but not sufficient for classification
2.10. Pyrophoric solids - - - Conclusive, but not sufficient for classification
2.11. Self-heating substances and mixtures
- - - Conclusive, but not sufficient for classification
2.12. Substances and mixtures which in contact with water emit flammable gases
- - - Conclusive, but not sufficient for classification
2.13. Oxidising liquids - - - Conclusive, but not sufficient for classification
2.14. Oxidising solids - - - Conclusive, but not sufficient for classification
2.15. Organic peroxides - - - Conclusive, but not sufficient for classification
2.16. Substance and mixtures corrosive to metals
- - - Data lacking
3.1. Acute toxicity - oral
Acute Tox. 4; H302
- - -
Acute toxicity - dermal - - - Conclusive, but not sufficient for classification
Acute toxicity - inhalation
Acute Tox. 4; H332
- - -
3.2. Skin corrosion / irritation
Skin Irrit. 2; H315
- - -
CLH REPORT FOR ACETOCHLOR
8
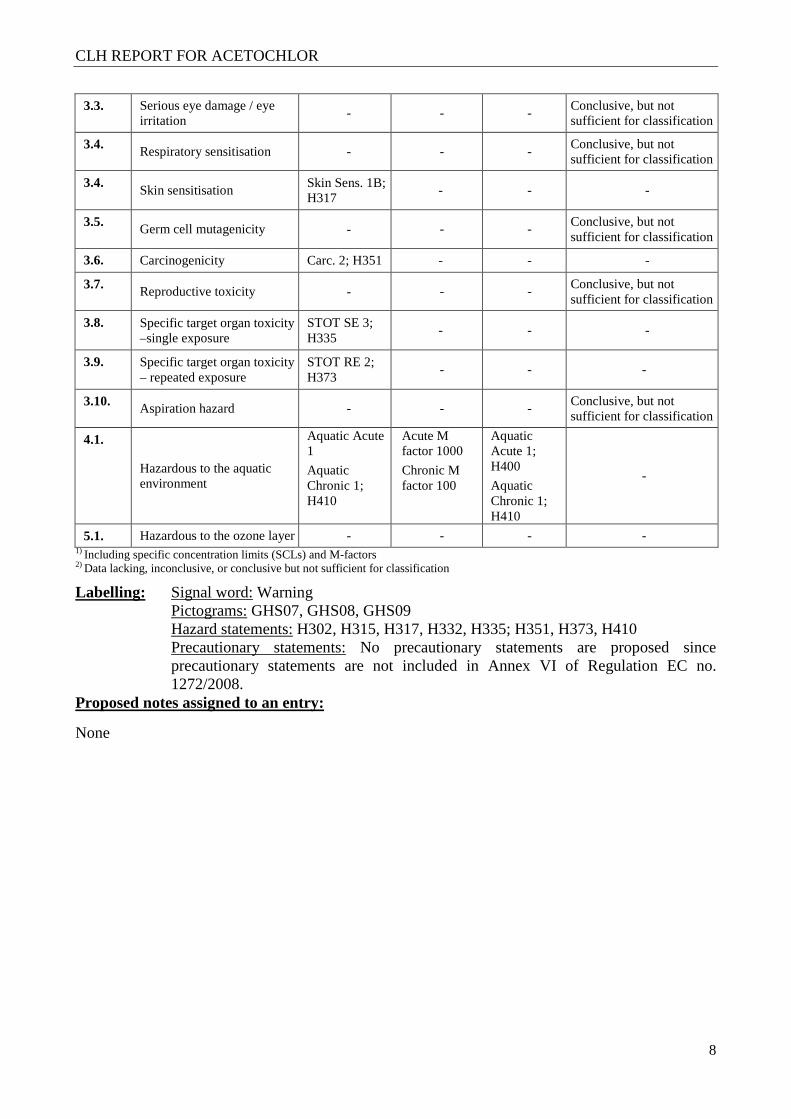
3.3. Serious eye damage / eye irritation
- - - Conclusive, but not sufficient for classification
3.4. Respiratory sensitisation - - - Conclusive, but not sufficient for classification
3.4. Skin sensitisation
Skin Sens. 1B; H317
- - -
3.5. Germ cell mutagenicity - - - Conclusive, but not sufficient for classification
3.6. Carcinogenicity Carc. 2; H351 - - -
3.7. Reproductive toxicity - - - Conclusive, but not sufficient for classification
3.8. Specific target organ toxicity –single exposure
STOT SE 3; H335
- - -
3.9. Specific target organ toxicity – repeated exposure
STOT RE 2; H373
- - -
3.10. Aspiration hazard - - - Conclusive, but not sufficient for classification
4.1.
Hazardous to the aquatic environment
Aquatic Acute 1
Aquatic Chronic 1; H410
Acute M factor 1000
Chronic M factor 100
Aquatic Acute 1; H400
Aquatic Chronic 1; H410
-
5.1. Hazardous to the ozone layer - - - - 1) Including specific concentration limits (SCLs) and M-factors 2) Data lacking, inconclusive, or conclusive but not sufficient for classification
Labelling: Signal word: Warning Pictograms: GHS07, GHS08, GHS09
Hazard statements: H302, H315, H317, H332, H335; H351, H373, H410 Precautionary statements: No precautionary statements are proposed since precautionary statements are not included in Annex VI of Regulation EC no. 1272/2008.
Proposed notes assigned to an entry:
None
CLH REPORT FOR ACETOCHLOR
9
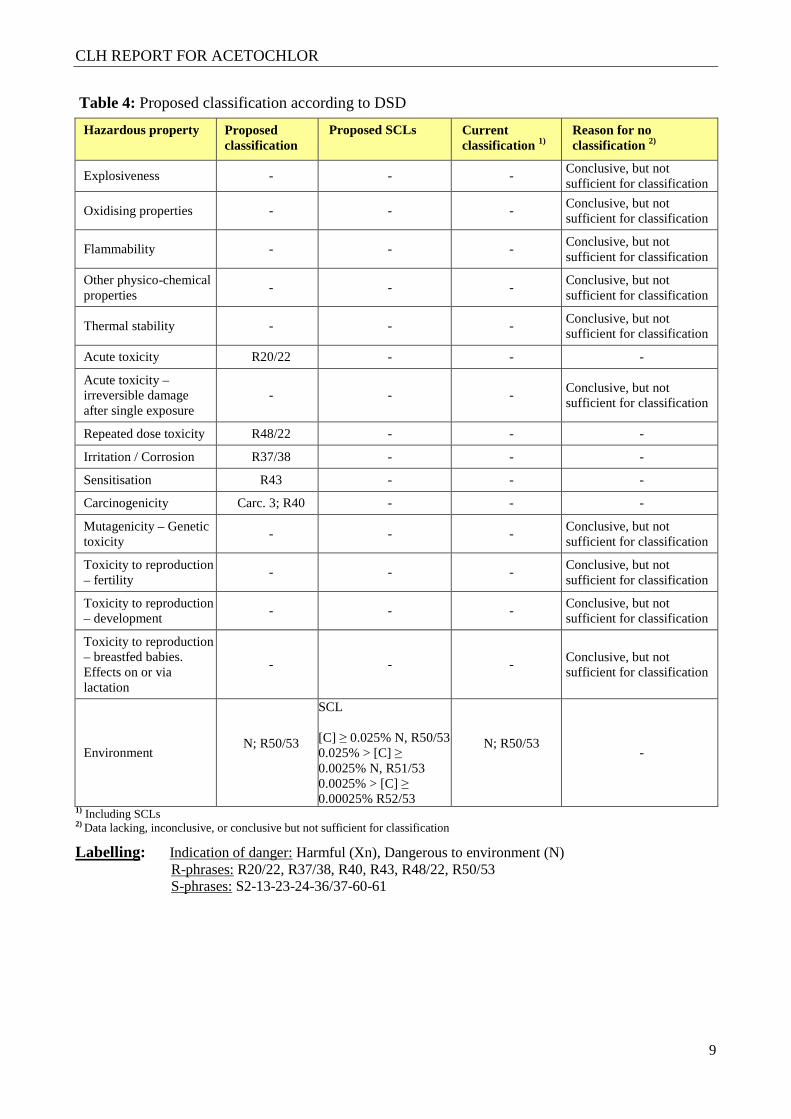
Table 4: Proposed classification according to DSD
Hazardous property
Proposed classification
Proposed SCLs Current classification 1)
Reason for no classification 2)
Explosiveness - - - Conclusive, but not sufficient for classification
Oxidising properties - - - Conclusive, but not sufficient for classification
Flammability - - - Conclusive, but not sufficient for classification
Other physico-chemical properties
- - - Conclusive, but not sufficient for classification
Thermal stability - - - Conclusive, but not sufficient for classification
Acute toxicity R20/22 - - -
Acute toxicity – irreversible damage after single exposure
- - - Conclusive, but not sufficient for classification
Repeated dose toxicity R48/22 - - -
Irritation / Corrosion R37/38 - - -
Sensitisation R43 - - -
Carcinogenicity Carc. 3; R40 - - -
Mutagenicity – Genetic toxicity
- - - Conclusive, but not sufficient for classification
Toxicity to reproduction – fertility
- - - Conclusive, but not sufficient for classification
Toxicity to reproduction – development
- - - Conclusive, but not sufficient for classification
Toxicity to reproduction – breastfed babies. Effects on or via lactation
- - - Conclusive, but not sufficient for classification
Environment N; R50/53
SCL [C] ≥ 0.025% N, R50/53 0.025% > [C] ≥ 0.0025% N, R51/53 0.0025% > [C] ≥ 0.00025% R52/53
N; R50/53
-
1) Including SCLs 2) Data lacking, inconclusive, or conclusive but not sufficient for classification
Labelling: Indication of danger: Harmful (Xn), Dangerous to environment (N) R-phrases: R20/22, R37/38, R40, R43, R48/22, R50/53 S-phrases: S2-13-23-24-36/37-60-61
CLH REPORT FOR ACETOCHLOR
10
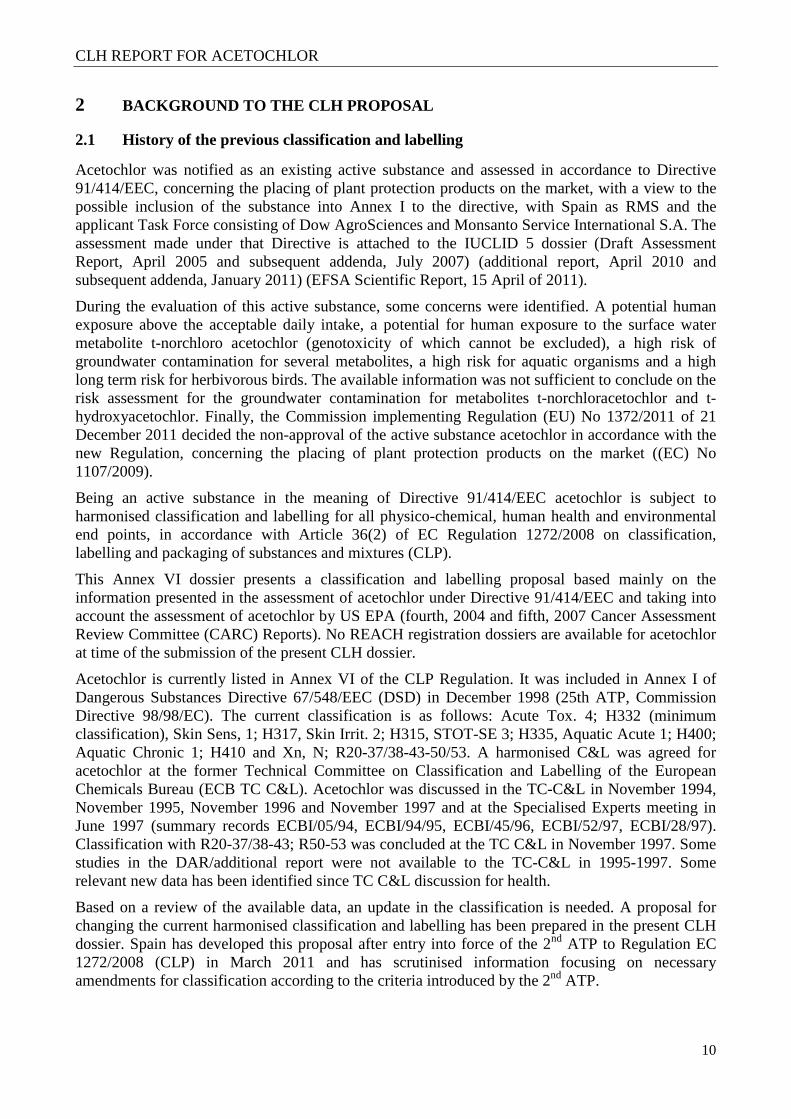
2 BACKGROUND TO THE CLH PROPOSAL
2.1 History of the previous classification and labelling
Acetochlor was notified as an existing active substance and assessed in accordance to Directive 91/414/EEC, concerning the placing of plant protection products on the market, with a view to the possible inclusion of the substance into Annex I to the directive, with Spain as RMS and the applicant Task Force consisting of Dow AgroSciences and Monsanto Service International S.A. The assessment made under that Directive is attached to the IUCLID 5 dossier (Draft Assessment Report, April 2005 and subsequent addenda, July 2007) (additional report, April 2010 and subsequent addenda, January 2011) (EFSA Scientific Report, 15 April of 2011).
During the evaluation of this active substance, some concerns were identified. A potential human exposure above the acceptable daily intake, a potential for human exposure to the surface water metabolite t-norchloro acetochlor (genotoxicity of which cannot be excluded), a high risk of groundwater contamination for several metabolites, a high risk for aquatic organisms and a high long term risk for herbivorous birds. The available information was not sufficient to conclude on the risk assessment for the groundwater contamination for metabolites t-norchloracetochlor and t-hydroxyacetochlor. Finally, the Commission implementing Regulation (EU) No 1372/2011 of 21 December 2011 decided the non-approval of the active substance acetochlor in accordance with the new Regulation, concerning the placing of plant protection products on the market ((EC) No 1107/2009).
Being an active substance in the meaning of Directive 91/414/EEC acetochlor is subject to harmonised classification and labelling for all physico-chemical, human health and environmental end points, in accordance with Article 36(2) of EC Regulation 1272/2008 on classification, labelling and packaging of substances and mixtures (CLP).
This Annex VI dossier presents a classification and labelling proposal based mainly on the information presented in the assessment of acetochlor under Directive 91/414/EEC and taking into account the assessment of acetochlor by US EPA (fourth, 2004 and fifth, 2007 Cancer Assessment Review Committee (CARC) Reports). No REACH registration dossiers are available for acetochlor at time of the submission of the present CLH dossier.
Acetochlor is currently listed in Annex VI of the CLP Regulation. It was included in Annex I of Dangerous Substances Directive 67/548/EEC (DSD) in December 1998 (25th ATP, Commission Directive 98/98/EC). The current classification is as follows: Acute Tox. 4; H332 (minimum classification), Skin Sens, 1; H317, Skin Irrit. 2; H315, STOT-SE 3; H335, Aquatic Acute 1; H400; Aquatic Chronic 1; H410 and Xn, N; R20-37/38-43-50/53. A harmonised C&L was agreed for acetochlor at the former Technical Committee on Classification and Labelling of the European Chemicals Bureau (ECB TC C&L). Acetochlor was discussed in the TC-C&L in November 1994, November 1995, November 1996 and November 1997 and at the Specialised Experts meeting in June 1997 (summary records ECBI/05/94, ECBI/94/95, ECBI/45/96, ECBI/52/97, ECBI/28/97). Classification with R20-37/38-43; R50-53 was concluded at the TC C&L in November 1997. Some studies in the DAR/additional report were not available to the TC-C&L in 1995-1997. Some relevant new data has been identified since TC C&L discussion for health.
Based on a review of the available data, an update in the classification is needed. A proposal for changing the current harmonised classification and labelling has been prepared in the present CLH dossier. Spain has developed this proposal after entry into force of the 2nd ATP to Regulation EC 1272/2008 (CLP) in March 2011 and has scrutinised information focusing on necessary amendments for classification according to the criteria introduced by the 2nd ATP.
CLH REPORT FOR ACETOCHLOR
11
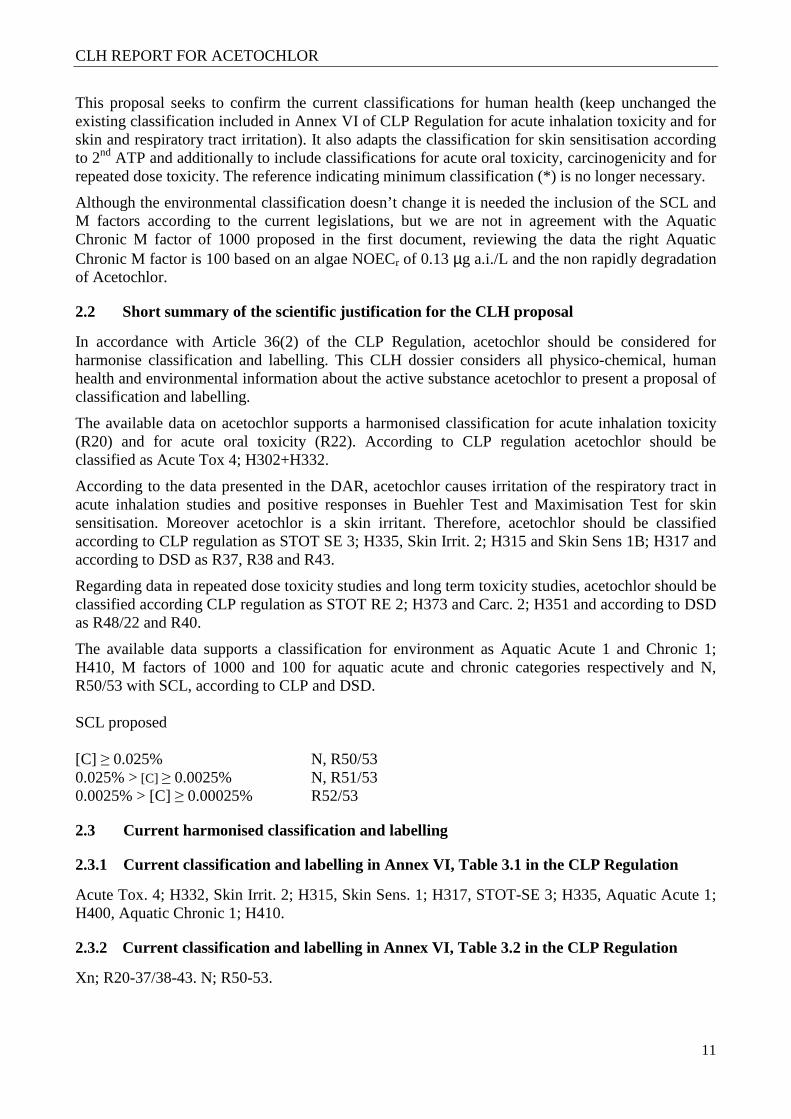
This proposal seeks to confirm the current classifications for human health (keep unchanged the existing classification included in Annex VI of CLP Regulation for acute inhalation toxicity and for skin and respiratory tract irritation). It also adapts the classification for skin sensitisation according to 2nd ATP and additionally to include classifications for acute oral toxicity, carcinogenicity and for repeated dose toxicity. The reference indicating minimum classification (*) is no longer necessary.
Although the environmental classification doesn’t change it is needed the inclusion of the SCL and M factors according to the current legislations, but we are not in agreement with the Aquatic Chronic M factor of 1000 proposed in the first document, reviewing the data the right Aquatic Chronic M factor is 100 based on an algae NOECr of 0.13 µg a.i./L and the non rapidly degradation of Acetochlor.
2.2 Short summary of the scientific justification for the CLH proposal
In accordance with Article 36(2) of the CLP Regulation, acetochlor should be considered for harmonise classification and labelling. This CLH dossier considers all physico-chemical, human health and environmental information about the active substance acetochlor to present a proposal of classification and labelling.
The available data on acetochlor supports a harmonised classification for acute inhalation toxicity (R20) and for acute oral toxicity (R22). According to CLP regulation acetochlor should be classified as Acute Tox 4; H302+H332.
According to the data presented in the DAR, acetochlor causes irritation of the respiratory tract in acute inhalation studies and positive responses in Buehler Test and Maximisation Test for skin sensitisation. Moreover acetochlor is a skin irritant. Therefore, acetochlor should be classified according to CLP regulation as STOT SE 3; H335, Skin Irrit. 2; H315 and Skin Sens 1B; H317 and according to DSD as R37, R38 and R43.
Regarding data in repeated dose toxicity studies and long term toxicity studies, acetochlor should be classified according CLP regulation as STOT RE 2; H373 and Carc. 2; H351 and according to DSD as R48/22 and R40.
The available data supports a classification for environment as Aquatic Acute 1 and Chronic 1; H410, M factors of 1000 and 100 for aquatic acute and chronic categories respectively and N, R50/53 with SCL, according to CLP and DSD. SCL proposed [C] ≥ 0.025% N, R50/53 0.025% > [C] ≥ 0.0025% N, R51/53 0.0025% > [C] ≥ 0.00025% R52/53
2.3 Current harmonised classification and labelling
2.3.1 Current classification and labelling in Annex VI, Table 3.1 in the CLP Regulation
Acute Tox. 4; H332, Skin Irrit. 2; H315, Skin Sens. 1; H317, STOT-SE 3; H335, Aquatic Acute 1; H400, Aquatic Chronic 1; H410.
2.3.2 Current classification and labelling in Annex VI, Table 3.2 in the CLP Regulation
Xn; R20-37/38-43. N; R50-53.
CLH REPORT FOR ACETOCHLOR
12
2.4 Current self-classification and labelling
Not applicable.
3 JUSTIFICATION THAT ACTION IS NEEDED AT COMMUNITY LE VEL
No need for justification for pesticides.
CLH REPORT FOR ACETOCHLOR
13
Part B
SCIENTIFIC EVALUATION OF THE DATA
1 IDENTITY OF THE SUBSTANCE
1.1 Name and other identifiers of the substance
Table 5: Substance identity
EC number: 251-899-3 (EINECS)
EC name: 2-chloro-N-(ethoxymethyl)-N-(2-ethyl-6-methylphenyl)acetamide
CAS number (EC inventory): 34256-82-1
CAS number:
CAS name: Acetamide, 2-chloro-N-(ethoxyemthyl)-N-(2-ethyl-6-methylphenyl)-
IUPAC name: 2-chloro-N-(ethoxymethyl)-N-(2-ethyl-6-methylphenyl)acetamide
CLP Annex VI Index number: 616-037-00-6
Molecular formula: C14H20ClNO2
Molecular weight range: 269.77
CLH REPORT FOR ACETOCHLOR
14
COCH2Cl
CH2OC2H5
CH3
C2H5
N
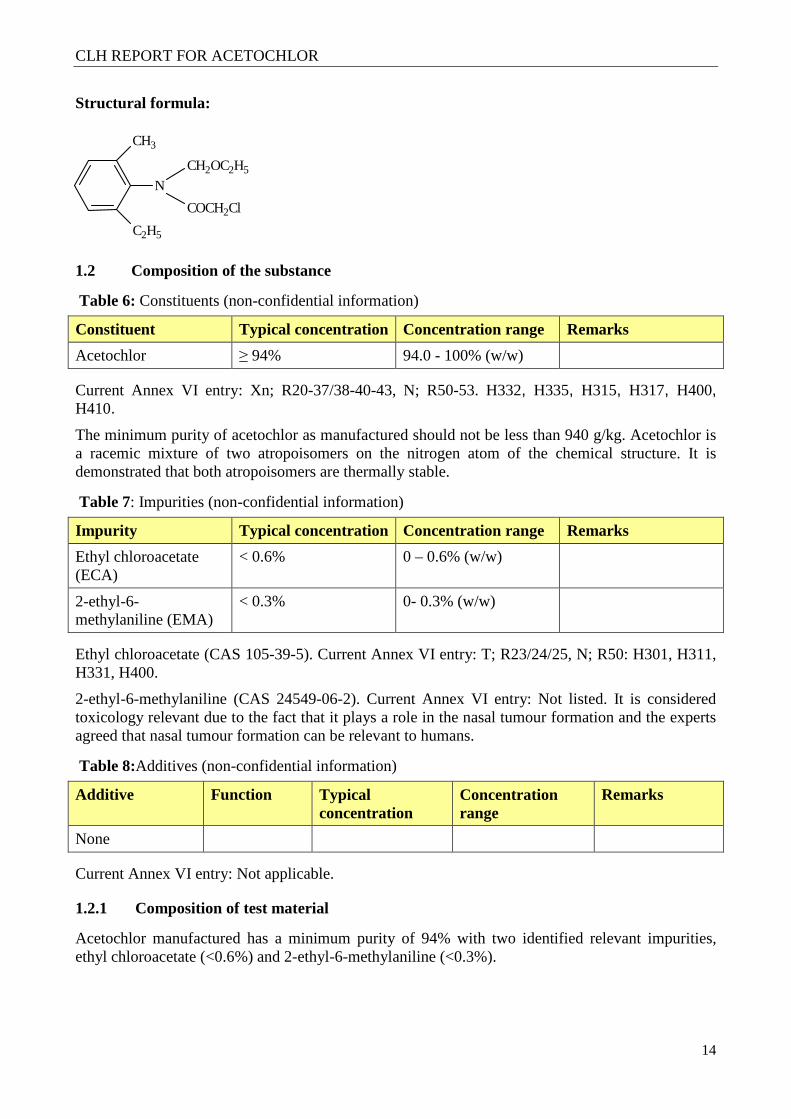
Structural formula:
1.2 Composition of the substance
Table 6: Constituents (non-confidential information)
Constituent Typical concentration Concentration range Remarks
Acetochlor ≥ 94% 94.0 - 100% (w/w)
Current Annex VI entry: Xn; R20-37/38-40-43, N; R50-53. H332, H335, H315, H317, H400, H410.
The minimum purity of acetochlor as manufactured should not be less than 940 g/kg. Acetochlor is a racemic mixture of two atropoisomers on the nitrogen atom of the chemical structure. It is demonstrated that both atropoisomers are thermally stable.
Table 7: Impurities (non-confidential information)
Impurity Typical concentration Concentration range Remarks
Ethyl chloroacetate (ECA)
< 0.6% 0 – 0.6% (w/w)
2-ethyl-6-methylaniline (EMA)
< 0.3% 0- 0.3% (w/w)
Ethyl chloroacetate (CAS 105-39-5). Current Annex VI entry: T; R23/24/25, N; R50: H301, H311, H331, H400.
2-ethyl-6-methylaniline (CAS 24549-06-2). Current Annex VI entry: Not listed. It is considered toxicology relevant due to the fact that it plays a role in the nasal tumour formation and the experts agreed that nasal tumour formation can be relevant to humans.
Table 8:Additives (non-confidential information)
Additive Function Typical concentration
Concentration range
Remarks
None
Current Annex VI entry: Not applicable.
1.2.1 Composition of test material
Acetochlor manufactured has a minimum purity of 94% with two identified relevant impurities, ethyl chloroacetate (<0.6%) and 2-ethyl-6-methylaniline (<0.3%).
CLH REPORT FOR ACETOCHLOR
15
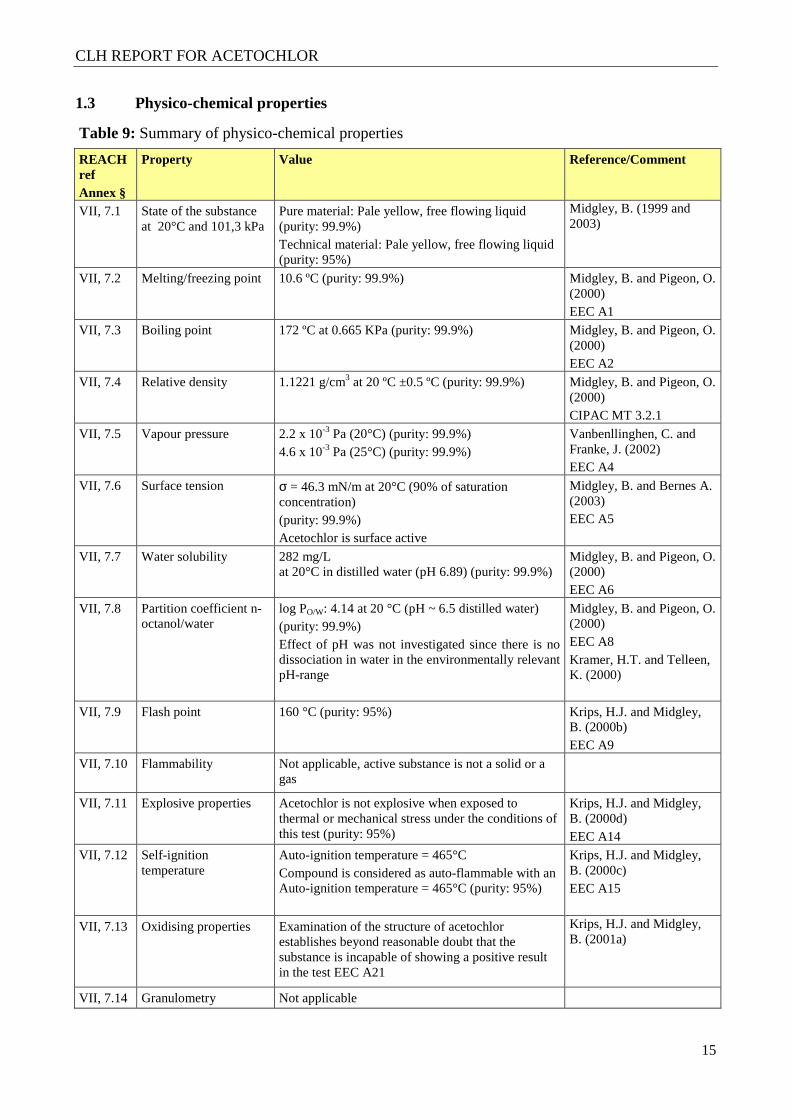
1.3 Physico-chemical properties
Table 9: Summary of physico-chemical properties
REACH ref Annex §
Property Value Reference/Comment
VII, 7.1 State of the substance at 20°C and 101,3 kPa
Pure material: Pale yellow, free flowing liquid (purity: 99.9%) Technical material: Pale yellow, free flowing liquid (purity: 95%)
Midgley, B. (1999 and 2003)
VII, 7.2 Melting/freezing point 10.6 ºC (purity: 99.9%) Midgley, B. and Pigeon, O. (2000) EEC A1
VII, 7.3 Boiling point 172 ºC at 0.665 KPa (purity: 99.9%) Midgley, B. and Pigeon, O. (2000) EEC A2
VII, 7.4 Relative density 1.1221 g/cm3 at 20 ºC ±0.5 ºC (purity: 99.9%) Midgley, B. and Pigeon, O. (2000) CIPAC MT 3.2.1
VII, 7.5 Vapour pressure 2.2 x 10⁻³ Pa (20°C) (purity: 99.9%) 4.6 x 10⁻³ Pa (25°C) (purity: 99.9%)
Vanbenllinghen, C. and Franke, J. (2002) EEC A4
VII, 7.6 Surface tension σ = 46.3 mN/m at 20°C (90% of saturation concentration) (purity: 99.9%) Acetochlor is surface active
Midgley, B. and Bernes A. (2003) EEC A5
VII, 7.7 Water solubility 282 mg/L at 20°C in distilled water (pH 6.89) (purity: 99.9%)
Midgley, B. and Pigeon, O. (2000) EEC A6
VII, 7.8 Partition coefficient n-octanol/water
log PO/W: 4.14 at 20 °C (pH ~ 6.5 distilled water) (purity: 99.9%) Effect of pH was not investigated since there is no dissociation in water in the environmentally relevant pH-range
Midgley, B. and Pigeon, O. (2000) EEC A8 Kramer, H.T. and Telleen, K. (2000)
VII, 7.9 Flash point 160 °C (purity: 95%) Krips, H.J. and Midgley, B. (2000b) EEC A9
VII, 7.10 Flammability Not applicable, active substance is not a solid or a gas
VII, 7.11 Explosive properties Acetochlor is not explosive when exposed to thermal or mechanical stress under the conditions of this test (purity: 95%)
Krips, H.J. and Midgley, B. (2000d) EEC A14
VII, 7.12 Self-ignition temperature
Auto-ignition temperature = 465°C Compound is considered as auto-flammable with an Auto-ignition temperature = 465°C (purity: 95%)
Krips, H.J. and Midgley, B. (2000c) EEC A15
VII, 7.13 Oxidising properties Examination of the structure of acetochlor establishes beyond reasonable doubt that the substance is incapable of showing a positive result in the test EEC A21
Krips, H.J. and Midgley, B. (2001a)
VII, 7.14 Granulometry Not applicable
CLH REPORT FOR ACETOCHLOR
16
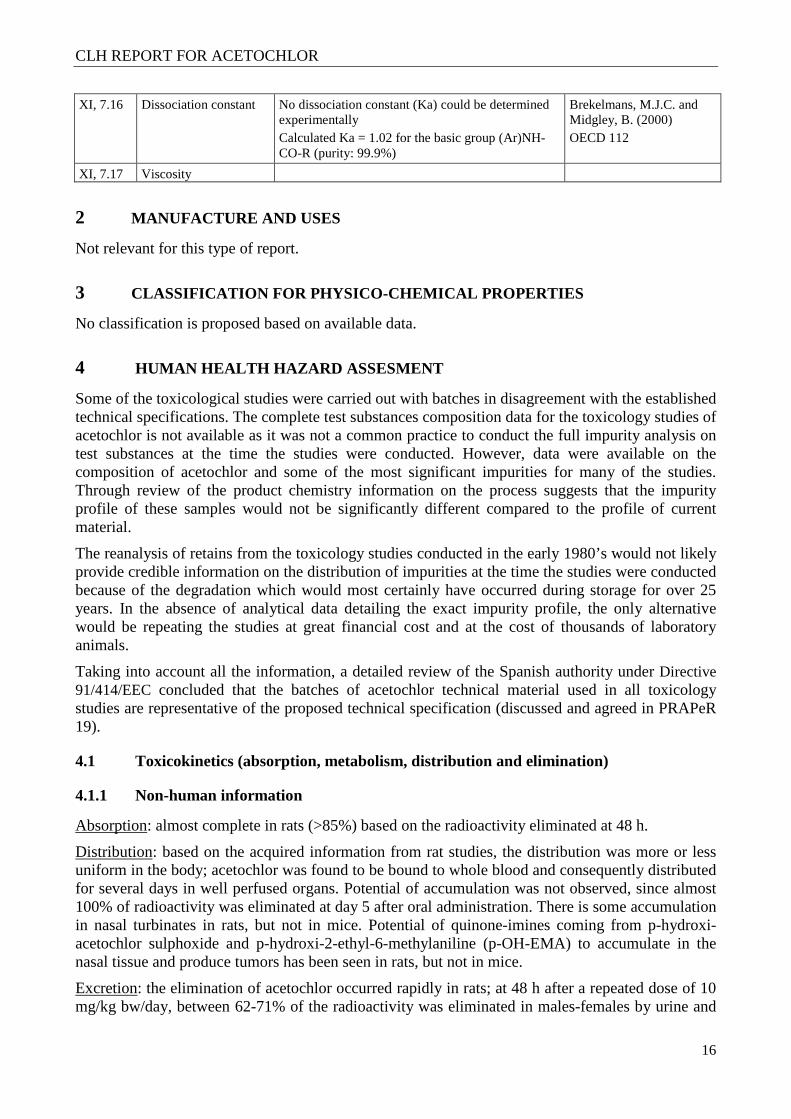
XI, 7.16 Dissociation constant No dissociation constant (Ka) could be determined experimentally Calculated Ka = 1.02 for the basic group (Ar)NH-CO-R (purity: 99.9%)
Brekelmans, M.J.C. and Midgley, B. (2000) OECD 112
XI, 7.17 Viscosity
2 MANUFACTURE AND USES
Not relevant for this type of report.
3 CLASSIFICATION FOR PHYSICO-CHEMICAL PROPERTIES
No classification is proposed based on available data.
4 HUMAN HEALTH HAZARD ASSESMENT
Some of the toxicological studies were carried out with batches in disagreement with the established technical specifications. The complete test substances composition data for the toxicology studies of acetochlor is not available as it was not a common practice to conduct the full impurity analysis on test substances at the time the studies were conducted. However, data were available on the composition of acetochlor and some of the most significant impurities for many of the studies. Through review of the product chemistry information on the process suggests that the impurity profile of these samples would not be significantly different compared to the profile of current material.
The reanalysis of retains from the toxicology studies conducted in the early 1980’s would not likely provide credible information on the distribution of impurities at the time the studies were conducted because of the degradation which would most certainly have occurred during storage for over 25 years. In the absence of analytical data detailing the exact impurity profile, the only alternative would be repeating the studies at great financial cost and at the cost of thousands of laboratory animals.
Taking into account all the information, a detailed review of the Spanish authority under Directive 91/414/EEC concluded that the batches of acetochlor technical material used in all toxicology studies are representative of the proposed technical specification (discussed and agreed in PRAPeR 19).
4.1 Toxicokinetics (absorption, metabolism, distribution and elimination)
4.1.1 Non-human information
Absorption: almost complete in rats (>85%) based on the radioactivity eliminated at 48 h.
Distribution: based on the acquired information from rat studies, the distribution was more or less uniform in the body; acetochlor was found to be bound to whole blood and consequently distributed for several days in well perfused organs. Potential of accumulation was not observed, since almost 100% of radioactivity was eliminated at day 5 after oral administration. There is some accumulation in nasal turbinates in rats, but not in mice. Potential of quinone-imines coming from p-hydroxi-acetochlor sulphoxide and p-hydroxi-2-ethyl-6-methylaniline (p-OH-EMA) to accumulate in the nasal tissue and produce tumors has been seen in rats, but not in mice.
Excretion: the elimination of acetochlor occurred rapidly in rats; at 48 h after a repeated dose of 10 mg/kg bw/day, between 62-71% of the radioactivity was eliminated in males-females by urine and
CLH REPORT FOR ACETOCHLOR
17
24-15% of the radioactivity was found in faeces in males-females. These results showed a slight different pattern of excretion between sexes. However, the effect of acute doses 10 and 200 mg/kg bw did not affect the excretion patterns.
An experiment with bile-cannulated rats showed that the biliary route was the most important in this specie. After dosing with 10 mg/kg bw, 85% of the dose was eliminated through bile at 48 h and about 8% and 4% of the dose was excreted by urine and faeces, respectively. This finding involved excretion through bile followed by intestine absorption (enterohepatic recirculation with further elimination by urine and faeces). Moreover, the toxicokinetic profile showed a second blood elevation of radioactivity due to acetochlor; mean peak plasma concentration reached at 7 hours declining rapidly and later stabilized between 72-168 hours.
In monkey, after an intravenous administration of 0.05-0.005 mg/kg bw the primary route of elimination of acetochlor was through the urine. An average of 77.2% of the total administered dose for all six monkeys used in the study was recovered in urine.
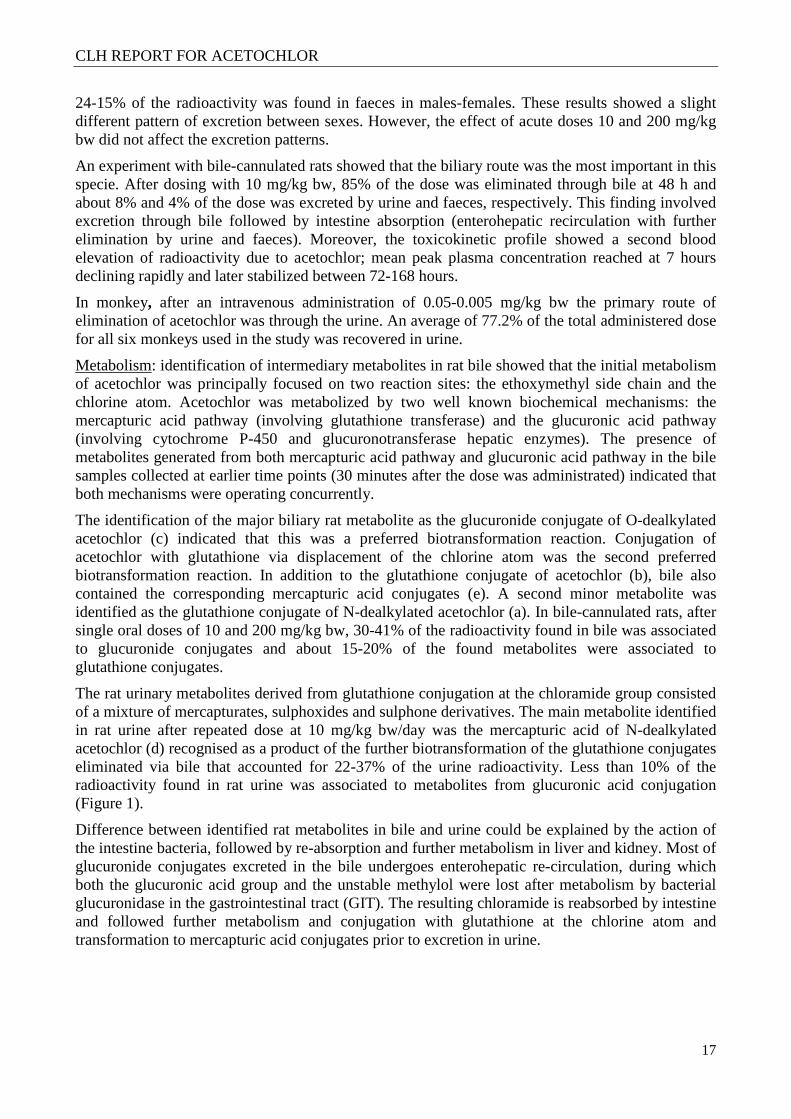
Metabolism: identification of intermediary metabolites in rat bile showed that the initial metabolism of acetochlor was principally focused on two reaction sites: the ethoxymethyl side chain and the chlorine atom. Acetochlor was metabolized by two well known biochemical mechanisms: the mercapturic acid pathway (involving glutathione transferase) and the glucuronic acid pathway (involving cytochrome P-450 and glucuronotransferase hepatic enzymes). The presence of metabolites generated from both mercapturic acid pathway and glucuronic acid pathway in the bile samples collected at earlier time points (30 minutes after the dose was administrated) indicated that both mechanisms were operating concurrently.
The identification of the major biliary rat metabolite as the glucuronide conjugate of O-dealkylated acetochlor (c) indicated that this was a preferred biotransformation reaction. Conjugation of acetochlor with glutathione via displacement of the chlorine atom was the second preferred biotransformation reaction. In addition to the glutathione conjugate of acetochlor (b), bile also contained the corresponding mercapturic acid conjugates (e). A second minor metabolite was identified as the glutathione conjugate of N-dealkylated acetochlor (a). In bile-cannulated rats, after single oral doses of 10 and 200 mg/kg bw, 30-41% of the radioactivity found in bile was associated to glucuronide conjugates and about 15-20% of the found metabolites were associated to glutathione conjugates.
The rat urinary metabolites derived from glutathione conjugation at the chloramide group consisted of a mixture of mercapturates, sulphoxides and sulphone derivatives. The main metabolite identified in rat urine after repeated dose at 10 mg/kg bw/day was the mercapturic acid of N-dealkylated acetochlor (d) recognised as a product of the further biotransformation of the glutathione conjugates eliminated via bile that accounted for 22-37% of the urine radioactivity. Less than 10% of the radioactivity found in rat urine was associated to metabolites from glucuronic acid conjugation (Figure 1).
Difference between identified rat metabolites in bile and urine could be explained by the action of the intestine bacteria, followed by re-absorption and further metabolism in liver and kidney. Most of glucuronide conjugates excreted in the bile undergoes enterohepatic re-circulation, during which both the glucuronic acid group and the unstable methylol were lost after metabolism by bacterial glucuronidase in the gastrointestinal tract (GIT). The resulting chloramide is reabsorbed by intestine and followed further metabolism and conjugation with glutathione at the chlorine atom and transformation to mercapturic acid conjugates prior to excretion in urine.
CLH REPORT FOR ACETOCHLOR
18
Figure 1: Major metabolic pathways of acetochlor in the rat
Consequently, the proposed metabolic pathway in rat involved a mayor glucuronidation as O-dealkylated conjugate (c) and a second preferred route via the conjugation of acetochlor with glutathione (b), giving the corresponding mercapturid acid (e). Another glutathione conjugate (a) was identified in bile, obtained partly from (b) and to some extend from metabolite (c), that once excreted in bile, is hydrolysed (N-dealkylated acetochlor) and reabsorbed to further conjugation with glutathione. The metabolic product (d) found in urine was the mercapturic acid of N-dealkylated acetochlor, recognized as a product of the further biotransformation of the two glutathione conjugates from the eliminated via bile and subsequent re-absorption.
N
O
Cl O
GIT
N
O Cl
OH
N
O
Cl OGlu
NH
O
Cl
NH
O
SG
N
O SG
O
N
O
SCys-NAc
O
Liver
NH
O
SCys-NAc
N
O Cl
N
O Cl
OH NH
O
S
GIT
N
O
S
O
N 2HO
Nasal tissue
N
O S
O
HO
NH
O
S
O
O NO
8
8
51
54
40
44
36
46
10
71
65
NH
O S O
Liver
NH
O
S O
ONH
O S
52
(a) (b)
(e) (d) (c)
(g) (f) (h)
(i) (j)
CLH REPORT FOR ACETOCHLOR
19
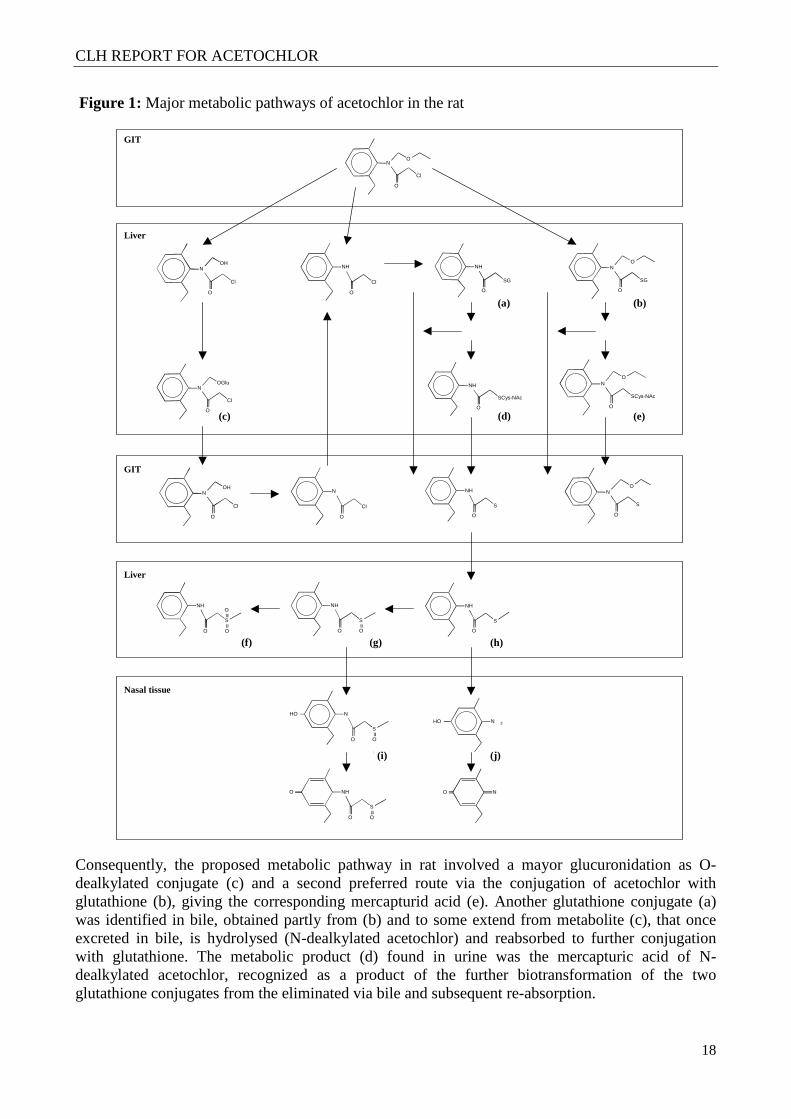
The glutathione conjugates and the metabolites of the mercapturic acid pathway that are excreted in the bile (a), (b), (d) and (e) are a substrate for b-lyases of the microbial flora in the gastrointestinal tract. Cleavage of the C-S-bond by these enzymes produces thiols that can either condense to form thio or dithio ethers or to be re-absorbed from the gastrointestinal tract. Following absorption the thiols are methylated and S-oxidised in the liver to form sec-amide methyl sulfide (h), sec-amide methyl sulphoxide (g) and sec-amide methyl sulfone (f). These can be further metabolised through anilide side chain hydroxylation and p-anilide hydroxylation to (i), which is a precursor of the sulfoxide quinone-imine, a metabolite thought to be responsible for the nasal tumour seen in rats.
Hydrolysis of the amide bond by amidases in the liver and the olfactory tissue leads to the formation of ethyl methyl aniline (EMA) and, following p-hydroxylation of the aniline ring, to p-OH EMA (j) that can evolve to the 3-ethyl-5-methyl-benzoquinoneimine (EMIQ). The formation of EMIQ in rat nasal tissue could also contribute to the induction of nasal tumour in rats.
Figure 2: Major metabolic pathways in the mouse
Metabolism data obtained in monkey demonstrated that the glutathione conjugation pathway leading to the formation of mercapturic acid conjugates is by far the predominant route of metabolism of acetochlor. Analysis of monkey urine after an intravenous administration of 0.05-0.005 mg/kg bw indicated that the major metabolite formed in the monkey was characterized as the acetochlor tert-mercapturic acid conjugate (e) which constituted 25.39-27.26 % of the radioactivity respectively. The difference in metabolic profiles and urinary excretion rates between rat and monkey was though to be primarily due to the different molecular weights required for liver metabolites to be excreted via bile between species. Intermediate molecular weight metabolites (300-500 g/mol) are good candidates for biliary excretion in rodents, but not in primates because of the different molecular weight thresholds required for biliary excretion between both species.
N
O
Cl
O
N
O
Cl
OH
N
O
Cl
OGlu
N
O
Cl
OGlu
GIT
Liver
Urine
52
52
(c)
(c)
CLH REPORT FOR ACETOCHLOR
20
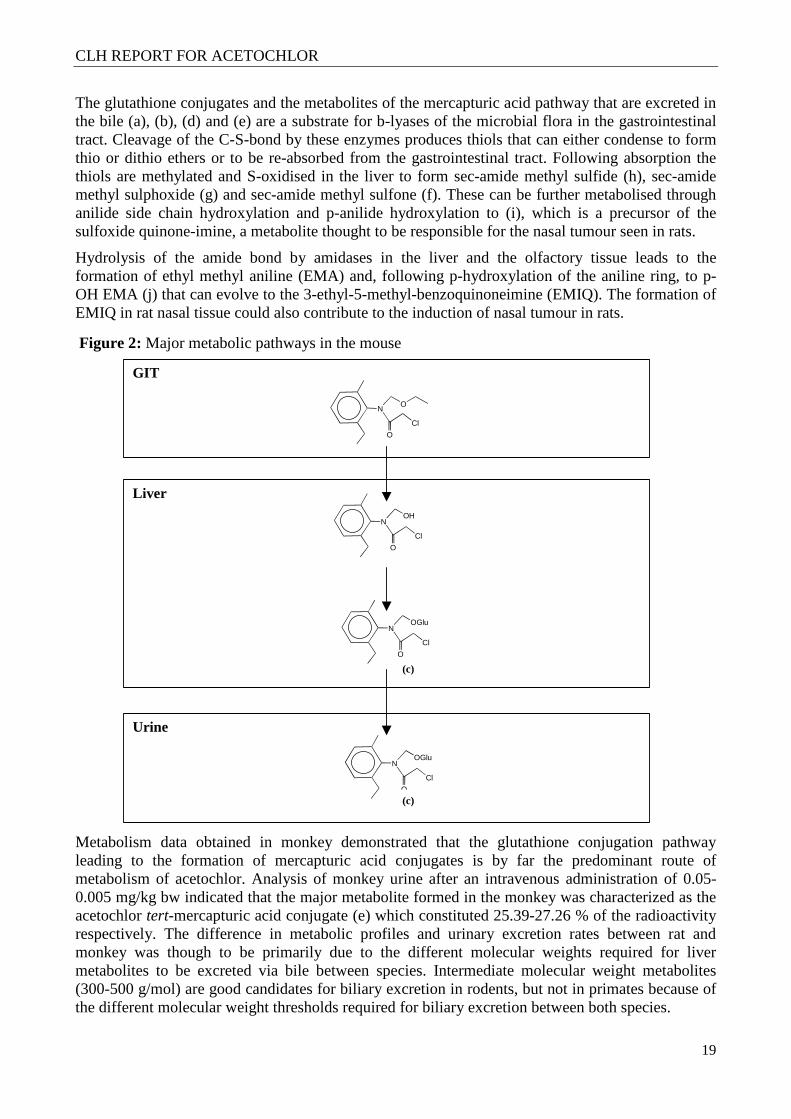
The metabolism of acetochlor differed between rat and mouse. Acetochlor was more extensively degraded to potential reactive metabolites in the rat than in the mouse, where acetochlor was rapidly metabolized in a cleared limited number of simple metabolic transformations. In rats acetochlor metabolites eliminated in urine derived from glutathione conjugation while the mouse eliminated glucuronide conjugates in urine Figure 2. Enterohepatic circulation was not observed and glutathione conjugation was not a major route of metabolism in the mouse. Main glucuronide conjugation in mice metabolism explains the absence of acetochlor sulfoxide in mouse plasma. The lack of this quinone-imine precursor could explain the little or none potential of accumulation of acetochlor metabolites derived from this acetochlor sulfoxide in the nasal tissue of mice that has been seen in rats and even related to tumors occurrence.
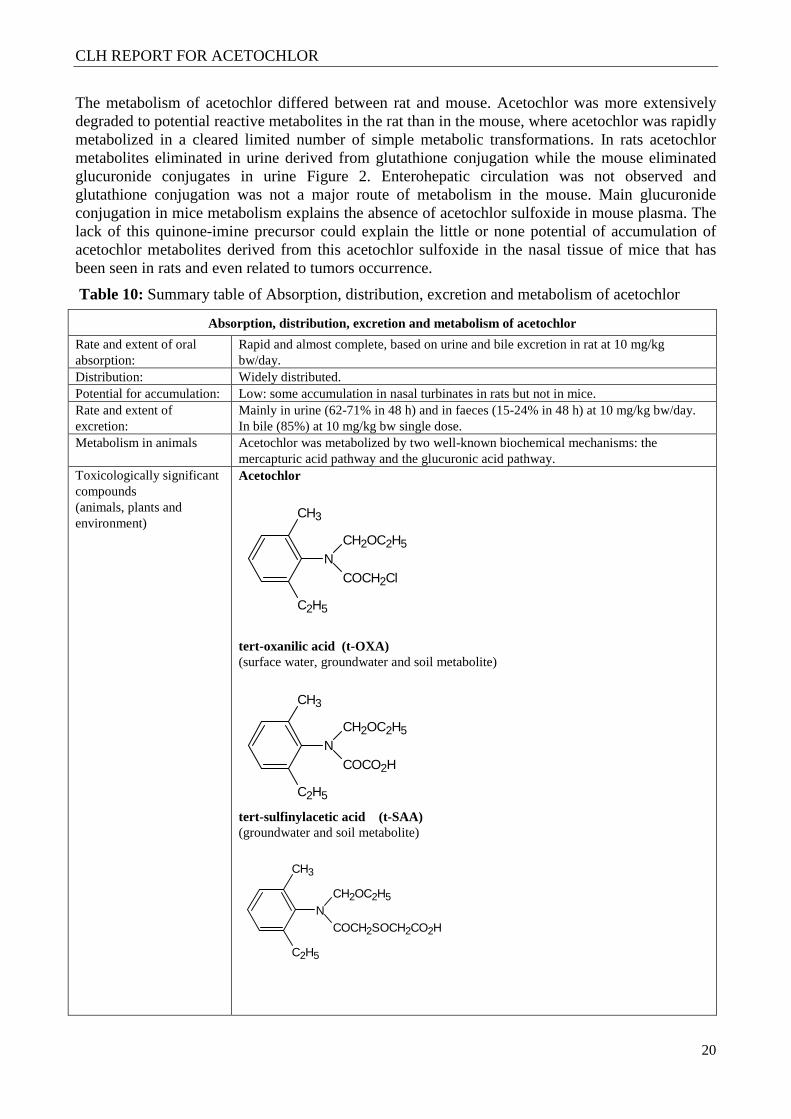
Table 10: Summary table of Absorption, distribution, excretion and metabolism of acetochlor
Absorption, distribution, excretion and metabolism of acetochlor
Rate and extent of oral absorption:
Rapid and almost complete, based on urine and bile excretion in rat at 10 mg/kg bw/day.
Distribution: Widely distributed. Potential for accumulation: Low: some accumulation in nasal turbinates in rats but not in mice. Rate and extent of excretion:
Mainly in urine (62-71% in 48 h) and in faeces (15-24% in 48 h) at 10 mg/kg bw/day. In bile (85%) at 10 mg/kg bw single dose.
Metabolism in animals Acetochlor was metabolized by two well-known biochemical mechanisms: the mercapturic acid pathway and the glucuronic acid pathway.
Toxicologically significant compounds (animals, plants and environment)
Acetochlor
N
CH3
COCH2Cl
CH2OC2H5
C2H5
tert-oxanilic acid (t-OXA) (surface water, groundwater and soil metabolite)
N
CH3
COCO2H
CH2OC2H5
C2H5
tert-sulfinylacetic acid (t-SAA) (groundwater and soil metabolite)
N
CH3
COCH2SOCH2CO2H
CH2OC2H5
C2H5
CLH REPORT FOR ACETOCHLOR
21
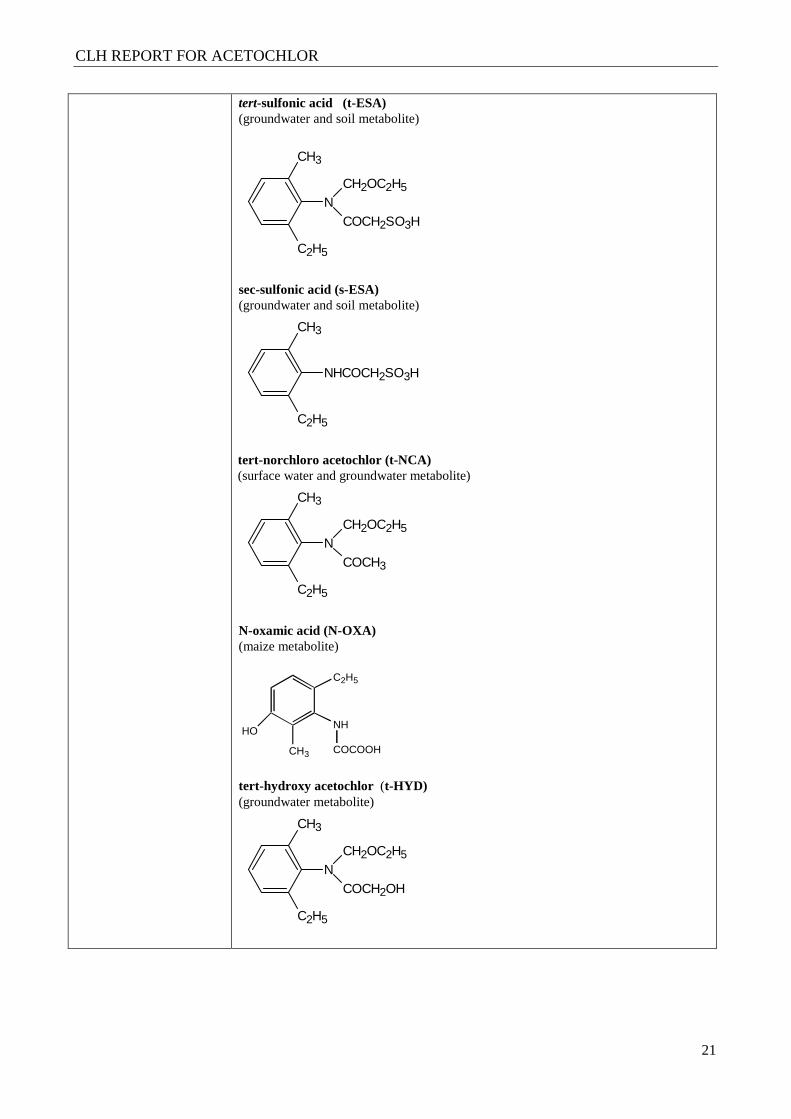
tert-sulfonic acid (t-ESA) (groundwater and soil metabolite)
N
CH3
COCH2SO3H
CH2OC2H5
C2H5
sec-sulfonic acid (s-ESA) (groundwater and soil metabolite)
CH3
NHCOCH2SO3H
C2H5
tert-norchloro acetochlor (t-NCA) (surface water and groundwater metabolite)
N
CH3
COCH3
CH2OC2H5
C2H5
N-oxamic acid (N-OXA) (maize metabolite)
CH3
HONH
C2H5
COCOOH
tert-hydroxy acetochlor (t-HYD) (groundwater metabolite)
CH3
NCH2OC2H5
COCH2OH
C2H5
CLH REPORT FOR ACETOCHLOR
22
Acetochlor metabolites
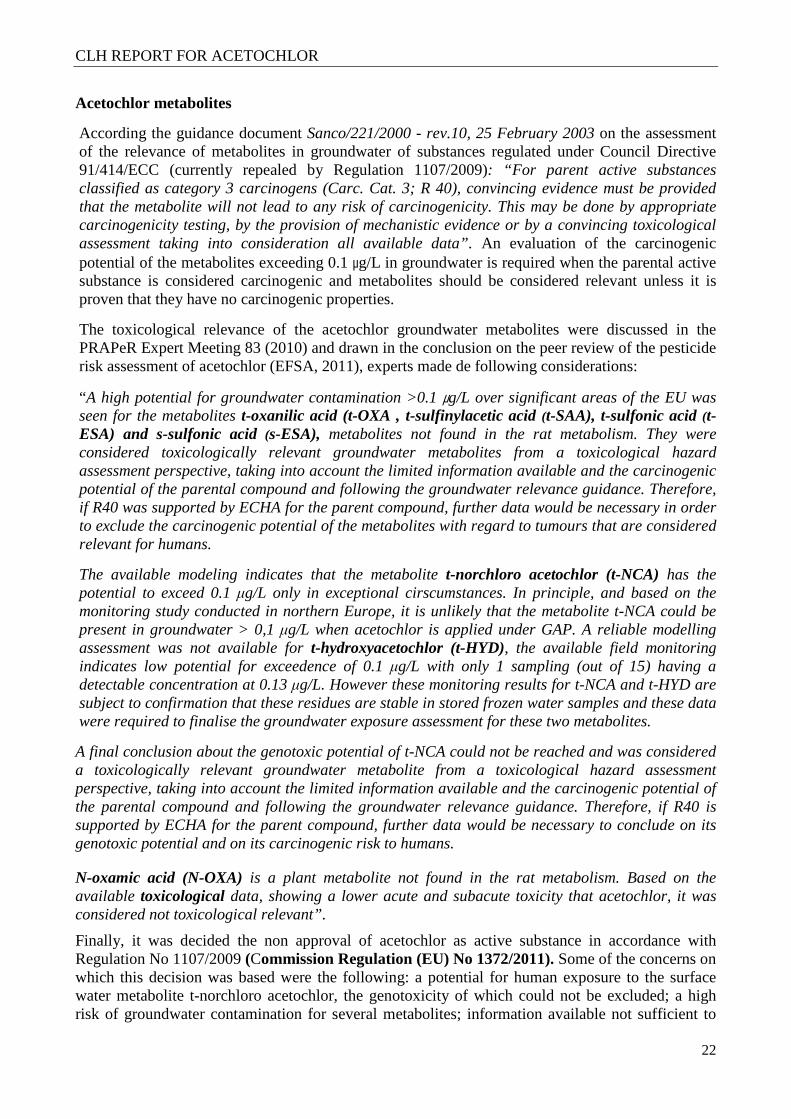
According the guidance document Sanco/221/2000 - rev.10, 25 February 2003 on the assessment of the relevance of metabolites in groundwater of substances regulated under Council Directive 91/414/ECC (currently repealed by Regulation 1107/2009): “For parent active substances classified as category 3 carcinogens (Carc. Cat. 3; R 40), convincing evidence must be provided that the metabolite will not lead to any risk of carcinogenicity. This may be done by appropriate carcinogenicity testing, by the provision of mechanistic evidence or by a convincing toxicological assessment taking into consideration all available data”. An evaluation of the carcinogenic potential of the metabolites exceeding 0.1 µg/L in groundwater is required when the parental active substance is considered carcinogenic and metabolites should be considered relevant unless it is proven that they have no carcinogenic properties.
The toxicological relevance of the acetochlor groundwater metabolites were discussed in the PRAPeR Expert Meeting 83 (2010) and drawn in the conclusion on the peer review of the pesticide risk assessment of acetochlor (EFSA, 2011), experts made de following considerations:
“A high potential for groundwater contamination >0.1 µg/L over significant areas of the EU was seen for the metabolites t-oxanilic acid (t-OXA , t-sulfinylacetic acid (t-SAA), t-sulfonic acid (t-ESA) and s-sulfonic acid (s-ESA), metabolites not found in the rat metabolism. They were considered toxicologically relevant groundwater metabolites from a toxicological hazard assessment perspective, taking into account the limited information available and the carcinogenic potential of the parental compound and following the groundwater relevance guidance. Therefore, if R40 was supported by ECHA for the parent compound, further data would be necessary in order to exclude the carcinogenic potential of the metabolites with regard to tumours that are considered relevant for humans.
The available modeling indicates that the metabolite t-norchloro acetochlor (t-NCA) has the potential to exceed 0.1 µg/L only in exceptional cirscumstances. In principle, and based on the monitoring study conducted in northern Europe, it is unlikely that the metabolite t-NCA could be present in groundwater > 0,1 µg/L when acetochlor is applied under GAP. A reliable modelling assessment was not available for t-hydroxyacetochlor (t-HYD), the available field monitoring indicates low potential for exceedence of 0.1 µg/L with only 1 sampling (out of 15) having a detectable concentration at 0.13 µg/L. However these monitoring results for t-NCA and t-HYD are subject to confirmation that these residues are stable in stored frozen water samples and these data were required to finalise the groundwater exposure assessment for these two metabolites.
A final conclusion about the genotoxic potential of t-NCA could not be reached and was considered a toxicologically relevant groundwater metabolite from a toxicological hazard assessment perspective, taking into account the limited information available and the carcinogenic potential of the parental compound and following the groundwater relevance guidance. Therefore, if R40 is supported by ECHA for the parent compound, further data would be necessary to conclude on its genotoxic potential and on its carcinogenic risk to humans.
N-oxamic acid (N-OXA) is a plant metabolite not found in the rat metabolism. Based on the available toxicological data, showing a lower acute and subacute toxicity that acetochlor, it was considered not toxicological relevant”.
Finally, it was decided the non approval of acetochlor as active substance in accordance with Regulation No 1107/2009 (Commission Regulation (EU) No 1372/2011). Some of the concerns on which this decision was based were the following: a potential for human exposure to the surface water metabolite t-norchloro acetochlor, the genotoxicity of which could not be excluded; a high risk of groundwater contamination for several metabolites; information available not sufficient to
CLH REPORT FOR ACETOCHLOR
23
conclude on the risk assessment for the groundwater contamination for metabolites t-norchloracetochlor and t-hydroxyacetochlor.
Given that the substance has not been included in the Community list, it is not expected to find metabolites in groundwater. However, in view of a possible classification by RAC of the active substance acetochlor regarding carcinogenicity, the MSCA makes the following considerations about the carcinogenic potential of the acetochlor metabolites of higher concern, taking into account the results of the toxicology studies conducted:
Position documents addressing the potential for carcinogenicity of the acetochlor metabolites in groundwater were submitted and summarized in DAR addenda I (July 2006) and II (January 2007). Additional studies were conducted to address the potential carcinogenicity of the t-OXA and t-ESA metabolites in mice (Hansen, 2009a and 2009b), and were included in Addendum V (April 2010).
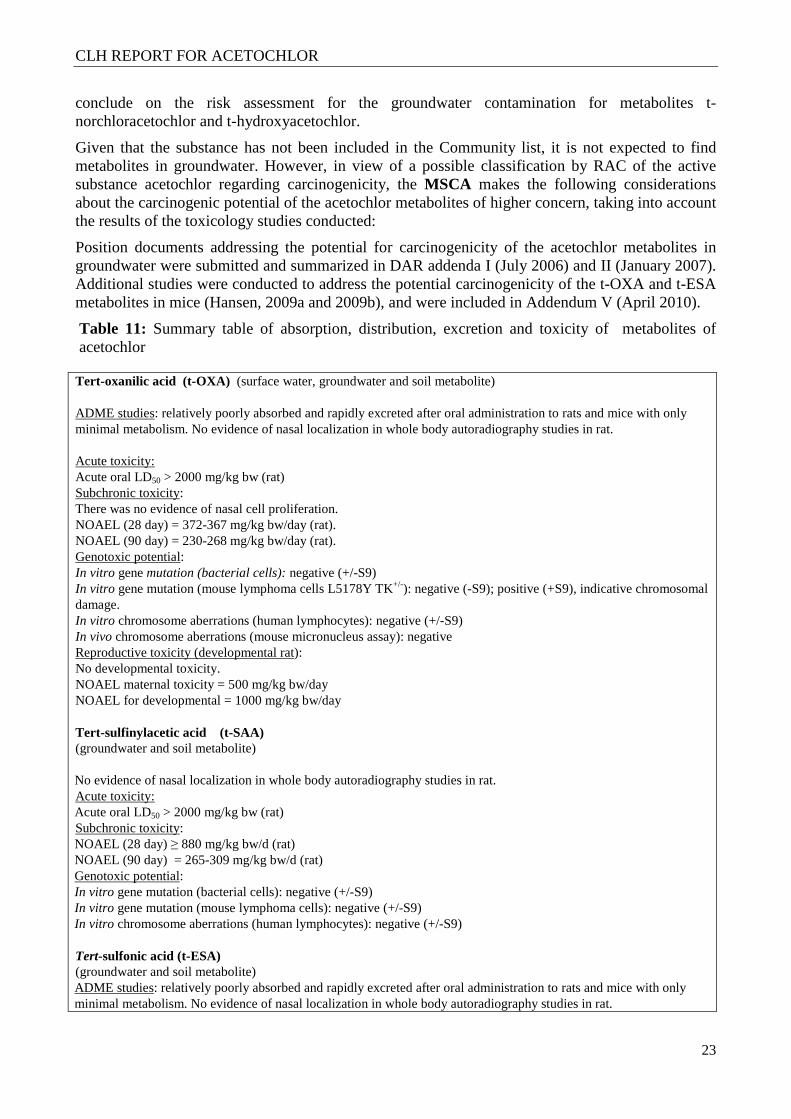
Table 11: Summary table of absorption, distribution, excretion and toxicity of metabolites of acetochlor
Tert-oxanilic acid (t-OXA) (surface water, groundwater and soil metabolite) ADME studies: relatively poorly absorbed and rapidly excreted after oral administration to rats and mice with only minimal metabolism. No evidence of nasal localization in whole body autoradiography studies in rat.
Acute toxicity: Acute oral LD50 > 2000 mg/kg bw (rat) Subchronic toxicity: There was no evidence of nasal cell proliferation. NOAEL (28 day) = 372-367 mg/kg bw/day (rat). NOAEL (90 day) = 230-268 mg/kg bw/day (rat). Genotoxic potential: In vitro gene mutation (bacterial cells): negative (+/-S9) In vitro gene mutation (mouse lymphoma cells L5178Y TK+/-): negative (-S9); positive (+S9), indicative chromosomal damage. In vitro chromosome aberrations (human lymphocytes): negative (+/-S9) In vivo chromosome aberrations (mouse micronucleus assay): negative Reproductive toxicity (developmental rat): No developmental toxicity. NOAEL maternal toxicity = 500 mg/kg bw/day NOAEL for developmental = 1000 mg/kg bw/day
Tert-sulfinylacetic acid (t-SAA) (groundwater and soil metabolite) No evidence of nasal localization in whole body autoradiography studies in rat. Acute toxicity: Acute oral LD50 > 2000 mg/kg bw (rat) Subchronic toxicity: NOAEL (28 day) ≥ 880 mg/kg bw/d (rat) NOAEL (90 day) = 265-309 mg/kg bw/d (rat) Genotoxic potential: In vitro gene mutation (bacterial cells): negative (+/-S9) In vitro gene mutation (mouse lymphoma cells): negative (+/-S9) In vitro chromosome aberrations (human lymphocytes): negative (+/-S9) Tert-sulfonic acid (t-ESA) (groundwater and soil metabolite) ADME studies: relatively poorly absorbed and rapidly excreted after oral administration to rats and mice with only minimal metabolism. No evidence of nasal localization in whole body autoradiography studies in rat.
CLH REPORT FOR ACETOCHLOR
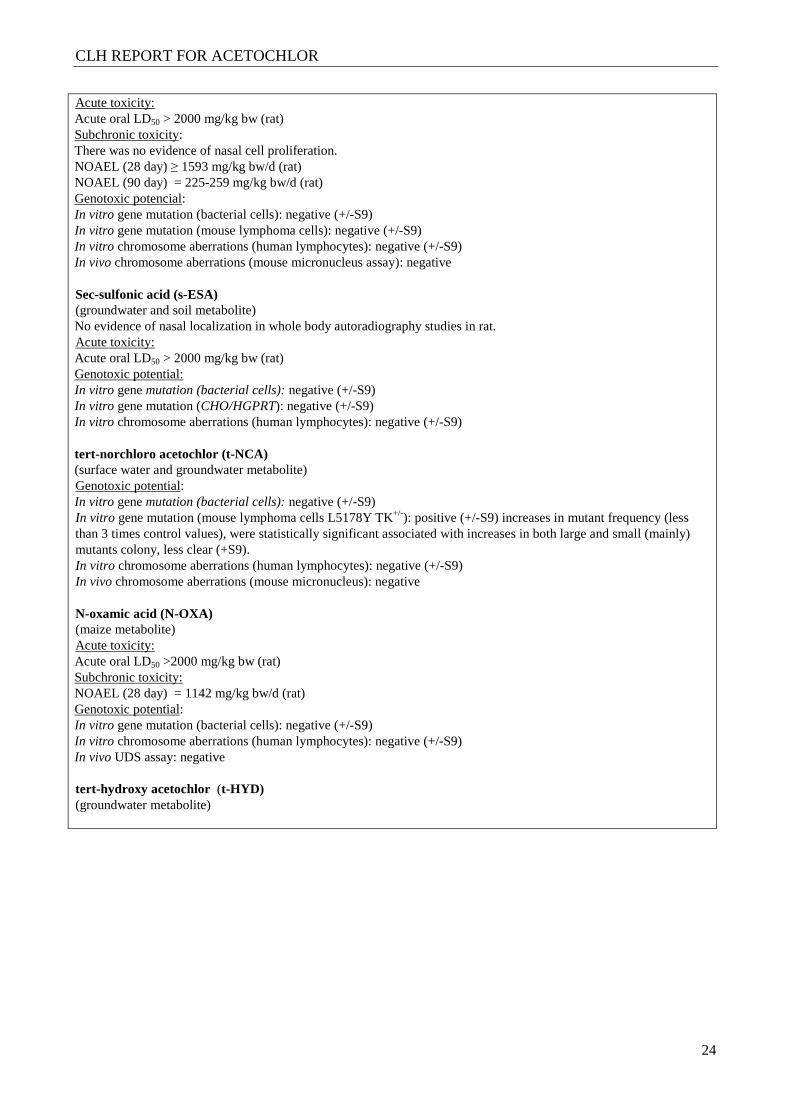
24
Acute toxicity: Acute oral LD50 > 2000 mg/kg bw (rat) Subchronic toxicity: There was no evidence of nasal cell proliferation. NOAEL (28 day) ≥ 1593 mg/kg bw/d (rat) NOAEL (90 day) = 225-259 mg/kg bw/d (rat) Genotoxic potencial: In vitro gene mutation (bacterial cells): negative (+/-S9) In vitro gene mutation (mouse lymphoma cells): negative (+/-S9) In vitro chromosome aberrations (human lymphocytes): negative (+/-S9) In vivo chromosome aberrations (mouse micronucleus assay): negative Sec-sulfonic acid (s-ESA) (groundwater and soil metabolite) No evidence of nasal localization in whole body autoradiography studies in rat. Acute toxicity: Acute oral LD50 > 2000 mg/kg bw (rat) Genotoxic potential: In vitro gene mutation (bacterial cells): negative (+/-S9) In vitro gene mutation (CHO/HGPRT): negative (+/-S9) In vitro chromosome aberrations (human lymphocytes): negative (+/-S9) tert-norchloro acetochlor (t-NCA) (surface water and groundwater metabolite) Genotoxic potential: In vitro gene mutation (bacterial cells): negative (+/-S9) In vitro gene mutation (mouse lymphoma cells L5178Y TK+/-): positive (+/-S9) increases in mutant frequency (less than 3 times control values), were statistically significant associated with increases in both large and small (mainly) mutants colony, less clear (+S9). In vitro chromosome aberrations (human lymphocytes): negative (+/-S9) In vivo chromosome aberrations (mouse micronucleus): negative N-oxamic acid (N-OXA) (maize metabolite) Acute toxicity: Acute oral LD50 >2000 mg/kg bw (rat) Subchronic toxicity: NOAEL (28 day) = 1142 mg/kg bw/d (rat) Genotoxic potential: In vitro gene mutation (bacterial cells): negative (+/-S9) In vitro chromosome aberrations (human lymphocytes): negative (+/-S9) In vivo UDS assay: negative tert-hydroxy acetochlor (t-HYD) (groundwater metabolite)
CLH REPORT FOR ACETOCHLOR
25
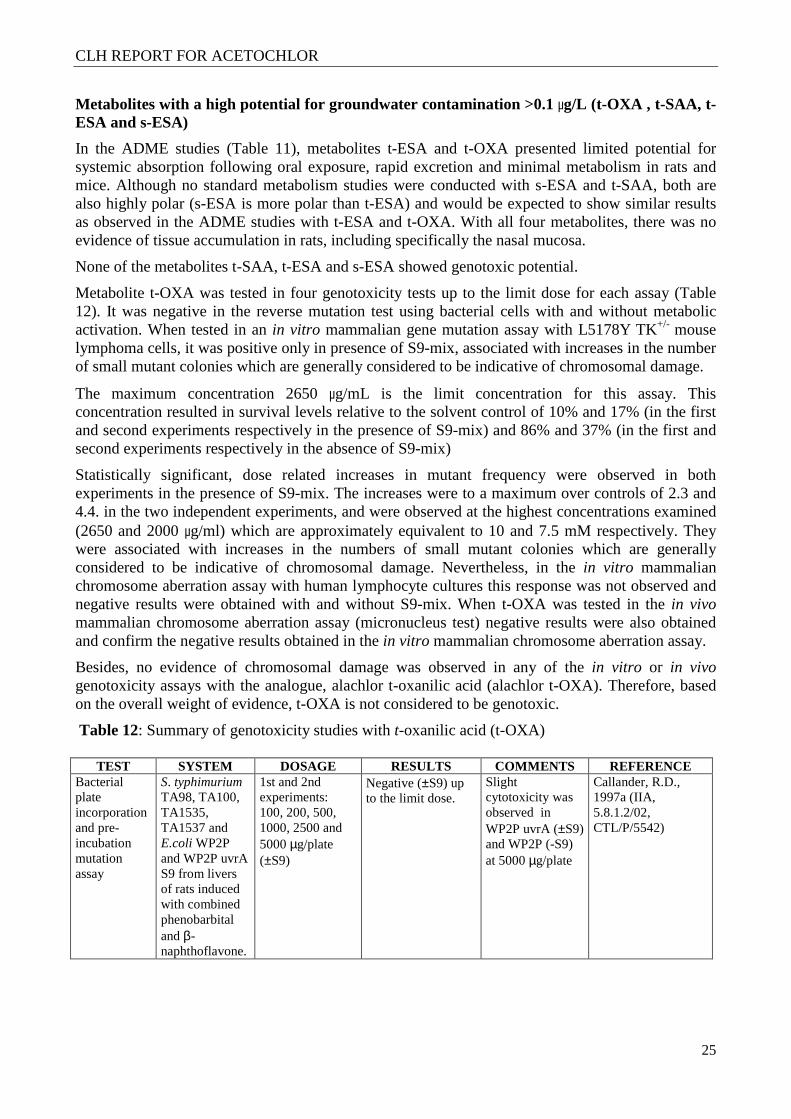
Metabolites with a high potential for groundwater contamination >0.1 µg/L (t-OXA , t-SAA, t-ESA and s-ESA)
In the ADME studies (Table 11), metabolites t-ESA and t-OXA presented limited potential for systemic absorption following oral exposure, rapid excretion and minimal metabolism in rats and mice. Although no standard metabolism studies were conducted with s-ESA and t-SAA, both are also highly polar (s-ESA is more polar than t-ESA) and would be expected to show similar results as observed in the ADME studies with t-ESA and t-OXA. With all four metabolites, there was no evidence of tissue accumulation in rats, including specifically the nasal mucosa.
None of the metabolites t-SAA, t-ESA and s-ESA showed genotoxic potential.
Metabolite t-OXA was tested in four genotoxicity tests up to the limit dose for each assay (Table 12). It was negative in the reverse mutation test using bacterial cells with and without metabolic activation. When tested in an in vitro mammalian gene mutation assay with L5178Y TK+/- mouse lymphoma cells, it was positive only in presence of S9-mix, associated with increases in the number of small mutant colonies which are generally considered to be indicative of chromosomal damage.
The maximum concentration 2650 µg/mL is the limit concentration for this assay. This concentration resulted in survival levels relative to the solvent control of 10% and 17% (in the first and second experiments respectively in the presence of S9-mix) and 86% and 37% (in the first and second experiments respectively in the absence of S9-mix)
Statistically significant, dose related increases in mutant frequency were observed in both experiments in the presence of S9-mix. The increases were to a maximum over controls of 2.3 and 4.4. in the two independent experiments, and were observed at the highest concentrations examined (2650 and 2000 µg/ml) which are approximately equivalent to 10 and 7.5 mM respectively. They were associated with increases in the numbers of small mutant colonies which are generally considered to be indicative of chromosomal damage. Nevertheless, in the in vitro mammalian chromosome aberration assay with human lymphocyte cultures this response was not observed and negative results were obtained with and without S9-mix. When t-OXA was tested in the in vivo mammalian chromosome aberration assay (micronucleus test) negative results were also obtained and confirm the negative results obtained in the in vitro mammalian chromosome aberration assay.
Besides, no evidence of chromosomal damage was observed in any of the in vitro or in vivo genotoxicity assays with the analogue, alachlor t-oxanilic acid (alachlor t-OXA). Therefore, based on the overall weight of evidence, t-OXA is not considered to be genotoxic.
Table 12: Summary of genotoxicity studies with t-oxanilic acid (t-OXA)
TEST SYSTEM DOSAGE RESULTS COMMENTS REFERENCE Bacterial plate incorporation and pre-incubation mutation assay
S. typhimurium TA98, TA100, TA1535, TA1537 and E.coli WP2P and WP2P uvrA S9 from livers of rats induced with combined phenobarbital and β-naphthoflavone.
1st and 2nd experiments: 100, 200, 500, 1000, 2500 and 5000 µg/plate (±S9)
Negative (±S9) up to the limit dose.
Slight cytotoxicity was observed in WP2P uvrA (±S9) and WP2P (-S9) at 5000 µg/plate
Callander, R.D., 1997a (IIA, 5.8.1.2/02, CTL/P/5542)
CLH REPORT FOR ACETOCHLOR
26
Metabolites t-OXA, t-SAA, t-ESA were less toxic than parent acetochlor in subchronic rat feeding studies. There was no evidence of nasal epithelium cell proliferation in rats with either t-ESA or t-OXA (additional groups were included in 90 day studies with these metabolites for the measurement to nasal cell proliferation). No significant increases in serum TSH levels, thyroid weights or thyroid pathology were seen with t-ESA or t-OXA in 90 day studies. With t-SAA a slight increase in relative thyroid weight was noted in males in the 90 day study at 966 mg/kg bw/day, however, this was not correlated with thyroid histopathology. No subchronic toxicity studies were conducted with the s-ESA metabolite, but this metabolite is more polar that t-ESA metabolite and it would be expected to be even less toxic. Furthermore, s-ESA was detected as a minor metabolite in ADME studies with t-ESA (accounted for 3.2% - 5.2% of the administered dose in rats, primarily in the urine and accounted for 2.0%-2.5% of the administered dose in urine of mice).
These metabolites are highly polar, poorly absorbed, rapidly excreted, minimally metabolised. Based on the acute and short term toxicity results in rats, the metabolites are of lower toxicity than the parent. Besides, the metabolites do not bind to nasal epithelium (they lack the capacity to form an electrofilic species as quinoneimine and CH2CL- precursor) and there was no evidence of nasal epithelium cell proliferation in rats. All of them lack the reactive electrophilic chlorine present in the parent molecule and none of them are genotoxic. The lack of a reactive chlorine along with the very limited metabolism, indicates that the four metabolites would be unlikely to deplete cells of protective nucleophiles such as GSH, be metabolized to reactive DABQIs, form adducts with cellular macromolecules, or produce oxidative damage. Therefore, there was no evidence of the key precursor events that are responsible for the formation of the rat nasal olfactory.
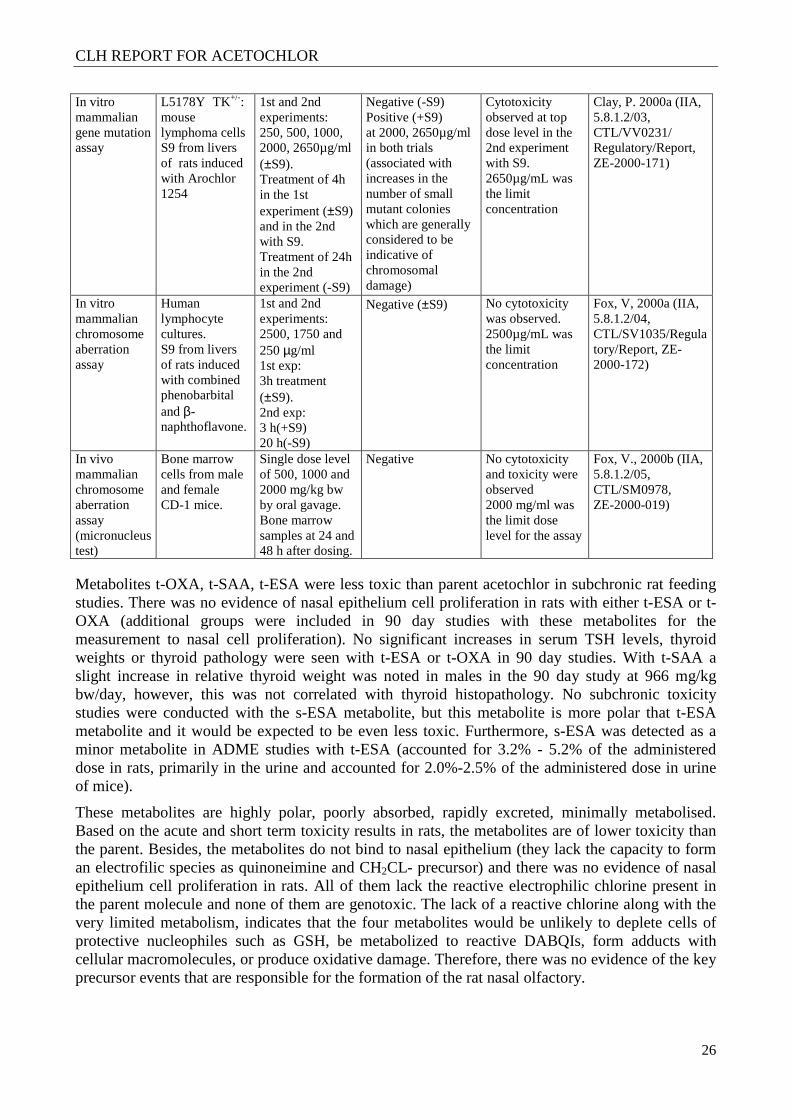
In vitro mammalian gene mutation assay
L5178Y TK+/-: mouse lymphoma cells S9 from livers of rats induced with Arochlor 1254
1st and 2nd experiments: 250, 500, 1000, 2000, 2650µg/ml (±S9). Treatment of 4h in the 1st experiment (±S9) and in the 2nd with S9. Treatment of 24h in the 2nd experiment (-S9)
Negative (-S9) Positive (+S9) at 2000, 2650µg/ml in both trials (associated with increases in the number of small mutant colonies which are generally considered to be indicative of chromosomal damage)
Cytotoxicity observed at top dose level in the 2nd experiment with S9. 2650µg/mL was the limit concentration
Clay, P. 2000a (IIA, 5.8.1.2/03, CTL/VV0231/ Regulatory/Report, ZE-2000-171)
In vitro mammalian chromosome aberration assay
Human lymphocyte cultures. S9 from livers of rats induced with combined phenobarbital and β-naphthoflavone.
1st and 2nd experiments: 2500, 1750 and 250 µg/ml 1st exp: 3h treatment (±S9). 2nd exp: 3 h(+S9) 20 h(-S9)
Negative (±S9) No cytotoxicity was observed. 2500µg/mL was the limit concentration
Fox, V, 2000a (IIA, 5.8.1.2/04, CTL/SV1035/Regulatory/Report, ZE-2000-172)
In vivo mammalian chromosome aberration assay (micronucleus test)
Bone marrow cells from male and female CD-1 mice.
Single dose level of 500, 1000 and 2000 mg/kg bw by oral gavage. Bone marrow samples at 24 and 48 h after dosing.
Negative No cytotoxicity and toxicity were observed 2000 mg/ml was the limit dose level for the assay
Fox, V., 2000b (IIA, 5.8.1.2/05, CTL/SM0978, ZE-2000-019)
CLH REPORT FOR ACETOCHLOR
27
Concerning other relevant tumors (lung tumours and histiocytic sarcoma in mice) the metabolites have the structural and metabolic characteristics, described above, that preclude them from being activated into carcinogens or to generate precursor carcinogens (they are very polar compounds with limited oral absorption and biotransformation, they are devoid of an electrophilic active chlorine that would consume protective nucleophiles and their inability to form quinoneimines and to form adducts with macromolecules and oxidative damage). Besides, the evidence of carcinogenic potential for lung tumours and histiocytic sarcoma in mice is weak.
In contrast, parent acetochlor is well absorbed in rats after oral administration, and undergoes extensive enterohepatic circulation and metabolism. This leads to formation of large quantities of sulphur-containing products (primarily s-methylsulfoxide) which are further metabolized to a reactive DABQI, which is likely to form adducts with macromolecules and is the key event leading to a dose related-increase in cell proliferation in the nasal olfactory epithelium and to the development of rat nasal tumours.
The toxicology profiles for the t-ESA, t-OXA, t-SAA and s-ESA metabolites of acetochlor are substantially different than that of parent acetochlor. Therefore, the weight of evidence indicates that the four environmental metabolites of acetochlor don´t seem to pose a carcinogenic risk to humans. Conducting chronic studies to provide further evidence of lack of carcinogenic potential would require intensive resources and animal use and it wouldn’t be justified. The US EPA concluded that the t-ESA and t-OXA degradates “had distinct, different, toxicological profiles from the parent” and that they “have the general structural and metabolic characteristics that preclude them from being activated into carcinogens or to generate precursors to carcinogens.” EPA concluded that these degradates “are not likely to be carcinogenic” (US EPA 2004b and 2006b). Metabolites with potential to exceed 0.1 µg/L only in exceptional cirscumstances (t-NCA)
Regarding the metabolite t-norchloro acetochlor t-NCA, short-term studies with this metabolite were not performed. It was tested in four genotoxicity studies (Table 13). It was not mutagenic for the following strains of bacterial cells: Salmonella typhimurium (TA1535, TA1537, TA98 and TA100) and Escherichia coli (WP2P and WP2P uvrA) in both the presence and absence of S9-mix. Although a number of increases were observed which showed some statistical significance, these were not dose-related, nor reproducible in at least one further experiment (two experiments in the case of TA1535 with S9-mix) and were within historical control ranges. These results indicate a lack of mutagenicity in the strain TA1535. Besides, negative results were seen with the strain TA100, which detects the same type of mutations than the strain TA1535.
When it was tested in an in vitro mammalian cell mutation assay in L5178Y TK+/- mouse lymphoma cells, t-NCA was mutagenic in both the presence and absence of S9-mix. The maximum concentration for testing was 500 µg/ml (+ S9-mix), but it resulted in excessive levels of toxicity, and the maximum concentration evaluated for mutant frequency was 400 µg/ml in the first experiment and 450 µg/ml in the second experiment. The maximum concentrations gave survival levels relative to the solvent control of 44% (with S9-mix) and 36% (without S9-mix) in the first experiment, and 19% (with S9-mix) and 36% (without S9-mix) in the second experiment. The increases in mutant frequency, although small (less than 3 times control values), were statistically significant, showed a general dose relationship, were reproducible and were associated with increases in both large and small mutant colony numbers. In the presence of S9-mix, the dose relationship was less clear than in the absence of S9-mix and the maximum increase was within the historical control range of values.
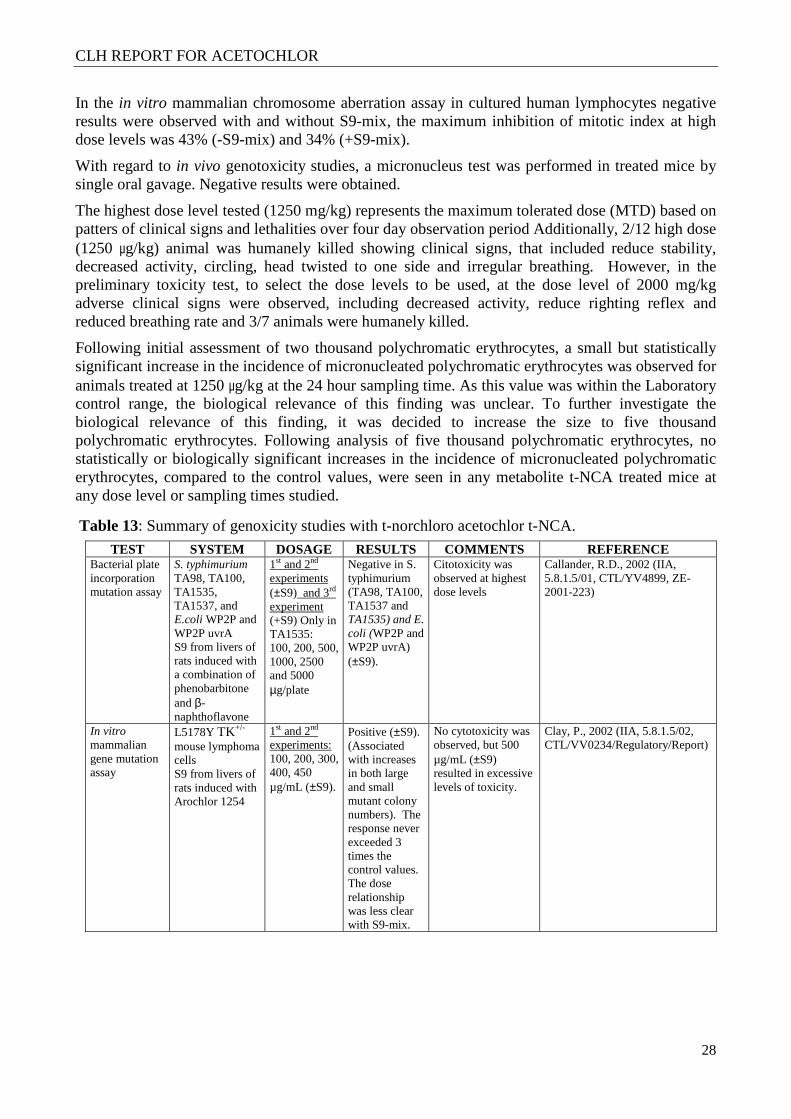
CLH REPORT FOR ACETOCHLOR
28
In the in vitro mammalian chromosome aberration assay in cultured human lymphocytes negative results were observed with and without S9-mix, the maximum inhibition of mitotic index at high dose levels was 43% (-S9-mix) and 34% (+S9-mix).
With regard to in vivo genotoxicity studies, a micronucleus test was performed in treated mice by single oral gavage. Negative results were obtained.
The highest dose level tested (1250 mg/kg) represents the maximum tolerated dose (MTD) based on patters of clinical signs and lethalities over four day observation period Additionally, 2/12 high dose (1250 µg/kg) animal was humanely killed showing clinical signs, that included reduce stability, decreased activity, circling, head twisted to one side and irregular breathing. However, in the preliminary toxicity test, to select the dose levels to be used, at the dose level of 2000 mg/kg adverse clinical signs were observed, including decreased activity, reduce righting reflex and reduced breathing rate and 3/7 animals were humanely killed.
Following initial assessment of two thousand polychromatic erythrocytes, a small but statistically significant increase in the incidence of micronucleated polychromatic erythrocytes was observed for animals treated at 1250 µg/kg at the 24 hour sampling time. As this value was within the Laboratory control range, the biological relevance of this finding was unclear. To further investigate the biological relevance of this finding, it was decided to increase the size to five thousand polychromatic erythrocytes. Following analysis of five thousand polychromatic erythrocytes, no statistically or biologically significant increases in the incidence of micronucleated polychromatic erythrocytes, compared to the control values, were seen in any metabolite t-NCA treated mice at any dose level or sampling times studied.
Table 13: Summary of genoxicity studies with t-norchloro acetochlor t-NCA.
TEST SYSTEM DOSAGE RESULTS COMMENTS REFERENCE Bacterial plate incorporation mutation assay
S. typhimurium TA98, TA100, TA1535, TA1537, and E.coli WP2P and WP2P uvrA S9 from livers of rats induced with a combination of phenobarbitone and β-naphthoflavone
1st and 2nd experiments (±S9) and 3rd experiment (+S9) Only in TA1535: 100, 200, 500, 1000, 2500 and 5000 µg/plate
Negative in S. typhimurium (TA98, TA100, TA1537 and TA1535) and E. coli (WP2P and WP2P uvrA) (±S9).
Citotoxicity was observed at highest dose levels
Callander, R.D., 2002 (IIA, 5.8.1.5/01, CTL/YV4899, ZE-2001-223)
In vitro mammalian gene mutation assay
L5178Y TK+/-
mouse lymphoma cells S9 from livers of rats induced with Arochlor 1254
1st and 2nd experiments: 100, 200, 300, 400, 450 µg/mL (±S9).
Positive (±S9). (Associated with increases in both large and small mutant colony numbers). The response never exceeded 3 times the control values. The dose relationship was less clear with S9-mix.
No cytotoxicity was observed, but 500 µg/mL (±S9) resulted in excessive levels of toxicity.
Clay, P., 2002 (IIA, 5.8.1.5/02, CTL/VV0234/Regulatory/Report)
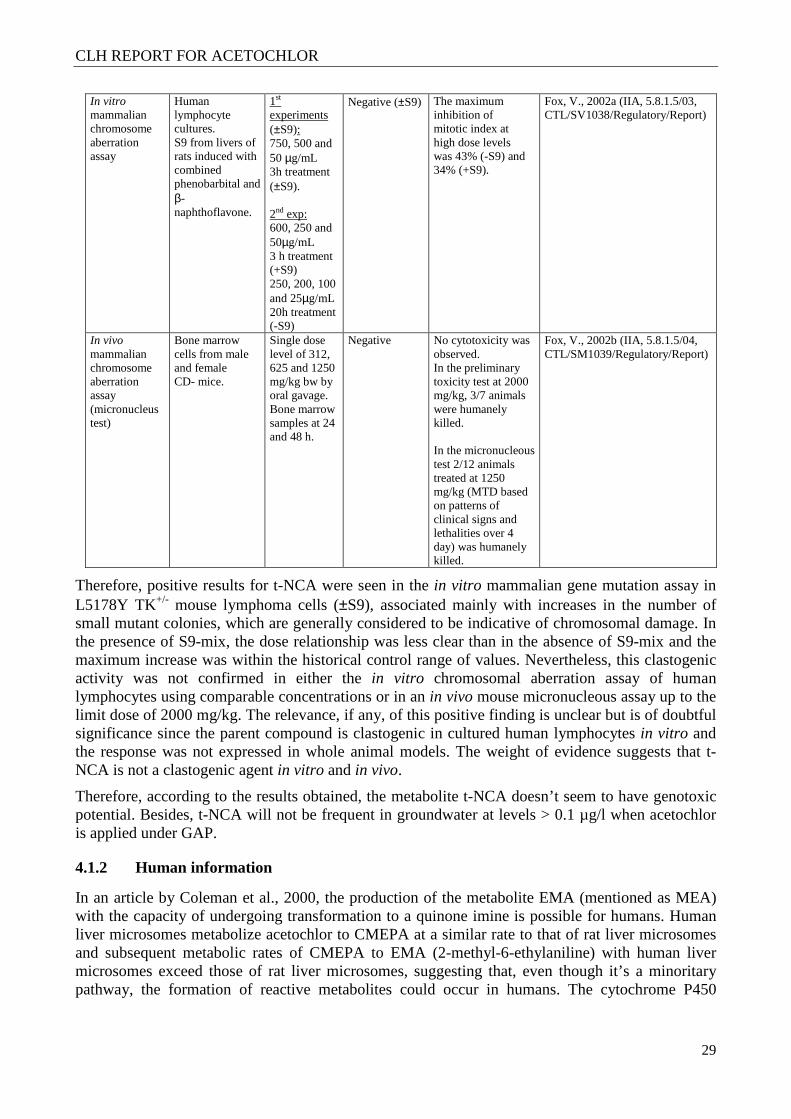
CLH REPORT FOR ACETOCHLOR
29
In vitro mammalian chromosome aberration assay
Human lymphocyte cultures. S9 from livers of rats induced with combined phenobarbital and β-naphthoflavone.
1st experiments (±S9): 750, 500 and 50 µg/mL 3h treatment (±S9). 2nd exp: 600, 250 and 50µg/mL 3 h treatment (+S9) 250, 200, 100 and 25µg/mL 20h treatment (-S9)
Negative (±S9) The maximum inhibition of mitotic index at high dose levels was 43% (-S9) and 34% (+S9).
Fox, V., 2002a (IIA, 5.8.1.5/03, CTL/SV1038/Regulatory/Report)
In vivo mammalian chromosome aberration assay (micronucleus test)
Bone marrow cells from male and female CD- mice.
Single dose level of 312, 625 and 1250 mg/kg bw by oral gavage. Bone marrow samples at 24 and 48 h.
Negative No cytotoxicity was observed. In the preliminary toxicity test at 2000 mg/kg, 3/7 animals were humanely killed. In the micronucleous test 2/12 animals treated at 1250 mg/kg (MTD based on patterns of clinical signs and lethalities over 4 day) was humanely killed.
Fox, V., 2002b (IIA, 5.8.1.5/04, CTL/SM1039/Regulatory/Report)
Therefore, positive results for t-NCA were seen in the in vitro mammalian gene mutation assay in L5178Y TK+/- mouse lymphoma cells (±S9), associated mainly with increases in the number of small mutant colonies, which are generally considered to be indicative of chromosomal damage. In the presence of S9-mix, the dose relationship was less clear than in the absence of S9-mix and the maximum increase was within the historical control range of values. Nevertheless, this clastogenic activity was not confirmed in either the in vitro chromosomal aberration assay of human lymphocytes using comparable concentrations or in an in vivo mouse micronucleous assay up to the limit dose of 2000 mg/kg. The relevance, if any, of this positive finding is unclear but is of doubtful significance since the parent compound is clastogenic in cultured human lymphocytes in vitro and the response was not expressed in whole animal models. The weight of evidence suggests that t-NCA is not a clastogenic agent in vitro and in vivo.
Therefore, according to the results obtained, the metabolite t-NCA doesn’t seem to have genotoxic potential. Besides, t-NCA will not be frequent in groundwater at levels > 0.1 µg/l when acetochlor is applied under GAP.
4.1.2 Human information
In an article by Coleman et al., 2000, the production of the metabolite EMA (mentioned as MEA) with the capacity of undergoing transformation to a quinone imine is possible for humans. Human liver microsomes metabolize acetochlor to CMEPA at a similar rate to that of rat liver microsomes and subsequent metabolic rates of CMEPA to EMA (2-methyl-6-ethylaniline) with human liver microsomes exceed those of rat liver microsomes, suggesting that, even though it’s a minoritary pathway, the formation of reactive metabolites could occur in humans. The cytochrome P450
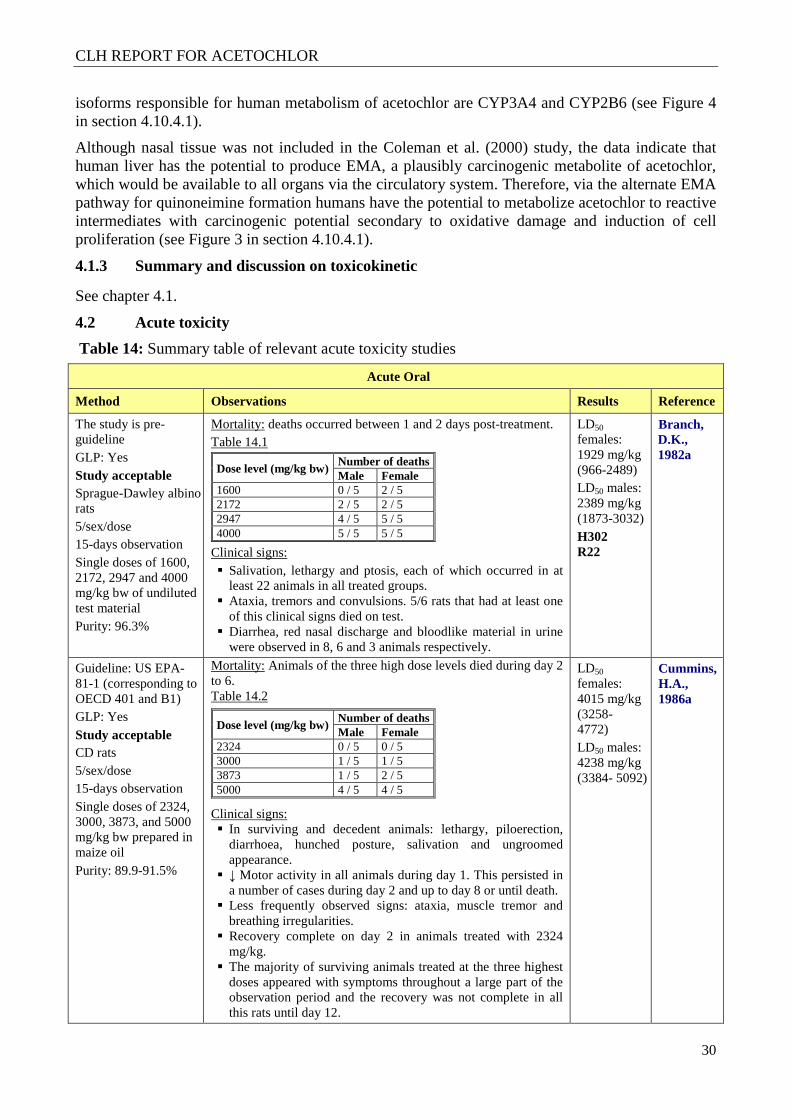
CLH REPORT FOR ACETOCHLOR
30
isoforms responsible for human metabolism of acetochlor are CYP3A4 and CYP2B6 (see Figure 4 in section 4.10.4.1).
Although nasal tissue was not included in the Coleman et al. (2000) study, the data indicate that human liver has the potential to produce EMA, a plausibly carcinogenic metabolite of acetochlor, which would be available to all organs via the circulatory system. Therefore, via the alternate EMA pathway for quinoneimine formation humans have the potential to metabolize acetochlor to reactive intermediates with carcinogenic potential secondary to oxidative damage and induction of cell proliferation (see Figure 3 in section 4.10.4.1).
4.1.3 Summary and discussion on toxicokinetic
See chapter 4.1.
4.2 Acute toxicity
Table 14: Summary table of relevant acute toxicity studies
Acute Oral
Method Observations Results Reference
The study is pre-guideline GLP: Yes Study acceptable Sprague-Dawley albino rats 5/sex/dose 15-days observation Single doses of 1600, 2172, 2947 and 4000 mg/kg bw of undiluted test material Purity: 96.3%
Mortality: deaths occurred between 1 and 2 days post-treatment. Table 14.1
Dose level (mg/kg bw) Number of deaths Male Female
1600 0 / 5 2 / 5 2172 2 / 5 2 / 5 2947 4 / 5 5 / 5 4000 5 / 5 5 / 5
Clinical signs: � Salivation, lethargy and ptosis, each of which occurred in at
least 22 animals in all treated groups. � Ataxia, tremors and convulsions. 5/6 rats that had at least one
of this clinical signs died on test. � Diarrhea, red nasal discharge and bloodlike material in urine
were observed in 8, 6 and 3 animals respectively.
LD50 females: 1929 mg/kg (966-2489) LD50 males: 2389 mg/kg (1873-3032) H302 R22
Branch, D.K., 1982a
Guideline: US EPA-81-1 (corresponding to OECD 401 and B1) GLP: Yes Study acceptable CD rats 5/sex/dose 15-days observation Single doses of 2324, 3000, 3873, and 5000 mg/kg bw prepared in maize oil Purity: 89.9-91.5%
Mortality: Animals of the three high dose levels died during day 2 to 6. Table 14.2
Clinical signs: � In surviving and decedent animals: lethargy, piloerection,
diarrhoea, hunched posture, salivation and ungroomed appearance.
� ↓ Motor activity in all animals during day 1. This persisted in a number of cases during day 2 and up to day 8 or until death.
� Less frequently observed signs: ataxia, muscle tremor and breathing irregularities.
� Recovery complete on day 2 in animals treated with 2324 mg/kg.
� The majority of surviving animals treated at the three highest doses appeared with symptoms throughout a large part of the observation period and the recovery was not complete in all this rats until day 12.
Dose level (mg/kg bw) Number of deaths Male Female
2324 0 / 5 0 / 5 3000 1 / 5 1 / 5 3873 1 / 5 2 / 5 5000 4 / 5 4 / 5
LD50 females: 4015 mg/kg (3258- 4772) LD50 males: 4238 mg/kg (3384- 5092)
Cummins, H.A., 1986a
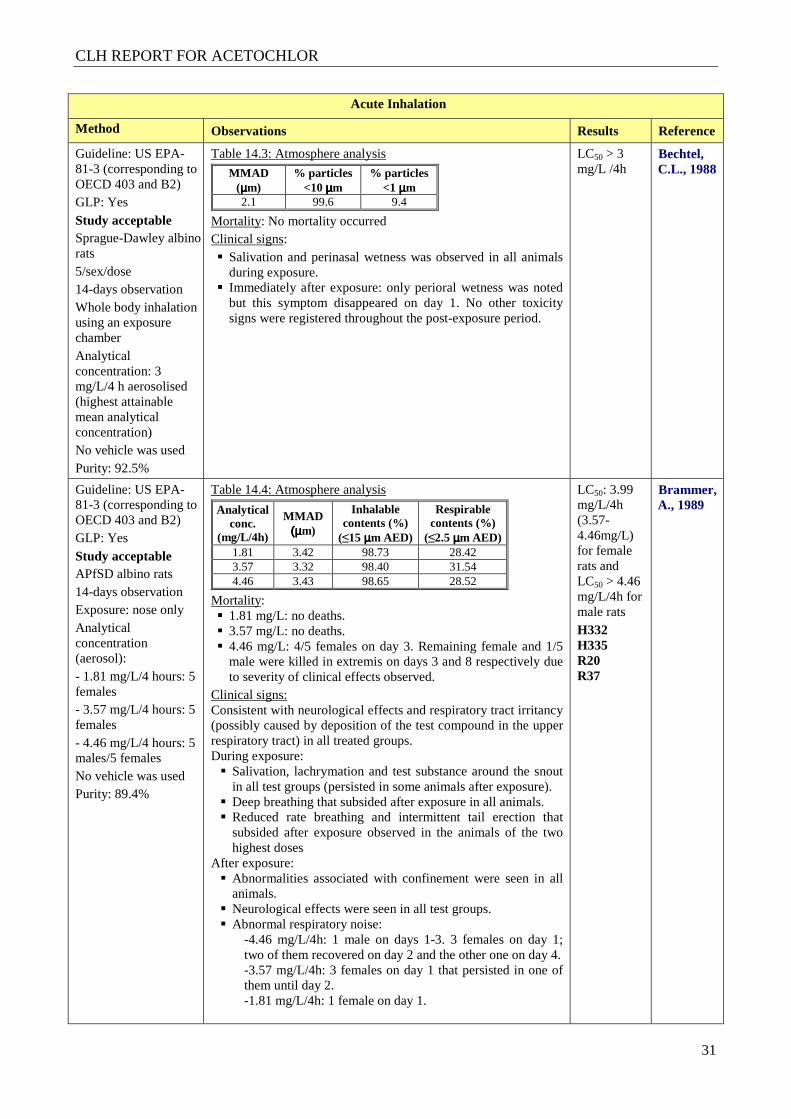
CLH REPORT FOR ACETOCHLOR
31
Acute Inhalation
Method Observations Results Reference
Guideline: US EPA-81-3 (corresponding to OECD 403 and B2) GLP: Yes Study acceptable Sprague-Dawley albino rats 5/sex/dose 14-days observation Whole body inhalation using an exposure chamber Analytical concentration: 3 mg/L/4 h aerosolised (highest attainable mean analytical concentration) No vehicle was used Purity: 92.5%
Table 14.3: Atmosphere analysis
MMAD (µµµµm)
% particles <10 µµµµm
% particles <1 µµµµm
2.1 99.6 9.4
Mortality: No mortality occurred Clinical signs: � Salivation and perinasal wetness was observed in all animals
during exposure. � Immediately after exposure: only perioral wetness was noted
but this symptom disappeared on day 1. No other toxicity signs were registered throughout the post-exposure period.
LC50 > 3 mg/L /4h
Bechtel, C.L., 1988
Guideline: US EPA-81-3 (corresponding to OECD 403 and B2) GLP: Yes Study acceptable APfSD albino rats 14-days observation Exposure: nose only Analytical concentration (aerosol): - 1.81 mg/L/4 hours: 5 females - 3.57 mg/L/4 hours: 5 females - 4.46 mg/L/4 hours: 5 males/5 females No vehicle was used Purity: 89.4%
Table 14.4: Atmosphere analysis
Analytical conc.
(mg/L/4h)
MMAD (µ(µ(µ(µm)
Inhalable contents (%)
(≤15 µµµµm AED)
Respirable contents (%)
(≤2.5 µµµµm AED) 1.81 3.42 98.73 28.42 3.57 3.32 98.40 31.54 4.46 3.43 98.65 28.52
Mortality: � 1.81 mg/L: no deaths. � 3.57 mg/L: no deaths. � 4.46 mg/L: 4/5 females on day 3. Remaining female and 1/5
male were killed in extremis on days 3 and 8 respectively due to severity of clinical effects observed.
Clinical signs: Consistent with neurological effects and respiratory tract irritancy (possibly caused by deposition of the test compound in the upper respiratory tract) in all treated groups. During exposure: � Salivation, lachrymation and test substance around the snout
in all test groups (persisted in some animals after exposure). � Deep breathing that subsided after exposure in all animals. � Reduced rate breathing and intermittent tail erection that
subsided after exposure observed in the animals of the two highest doses
After exposure: � Abnormalities associated with confinement were seen in all
animals. � Neurological effects were seen in all test groups. � Abnormal respiratory noise:
-4.46 mg/L/4h: 1 male on days 1-3. 3 females on day 1; two of them recovered on day 2 and the other one on day 4. -3.57 mg/L/4h: 3 females on day 1 that persisted in one of them until day 2. -1.81 mg/L/4h: 1 female on day 1.
LC50: 3.99 mg/L/4h (3.57- 4.46mg/L) for female rats and LC50 > 4.46 mg/L/4h for male rats H332 H335 R20 R37
Brammer, A., 1989
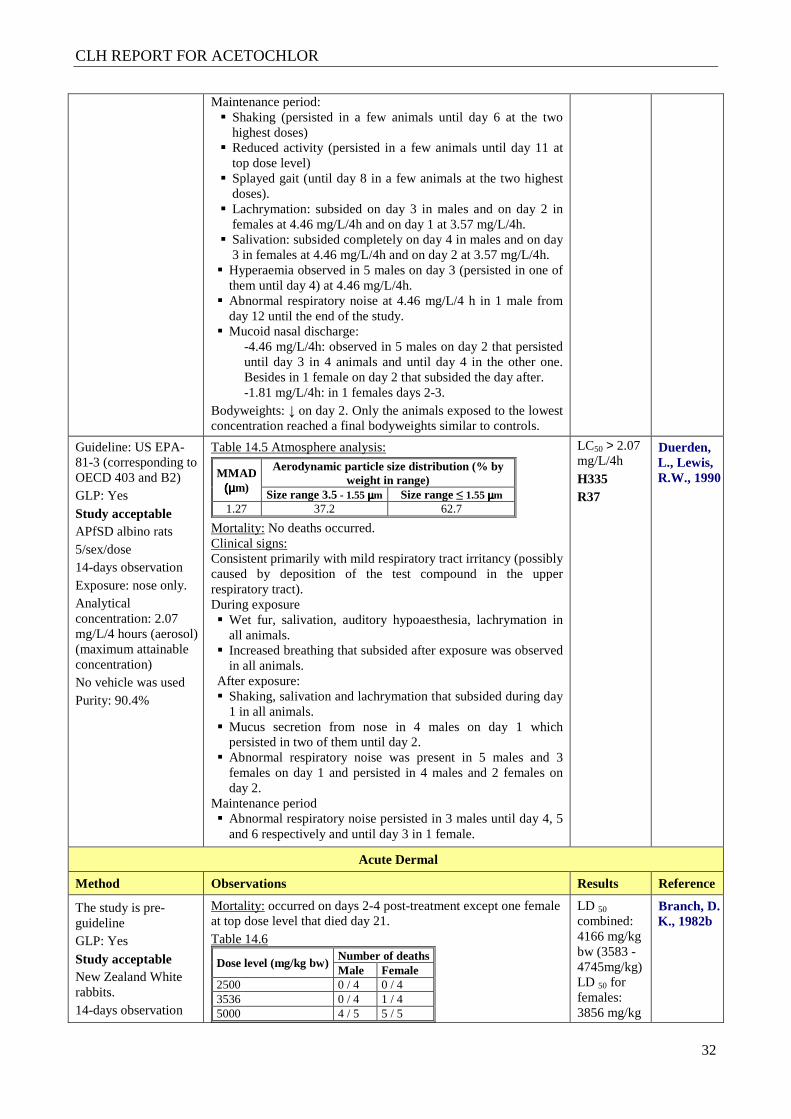
CLH REPORT FOR ACETOCHLOR
32
Maintenance period: � Shaking (persisted in a few animals until day 6 at the two
highest doses) � Reduced activity (persisted in a few animals until day 11 at
top dose level) � Splayed gait (until day 8 in a few animals at the two highest
doses). � Lachrymation: subsided on day 3 in males and on day 2 in
females at 4.46 mg/L/4h and on day 1 at 3.57 mg/L/4h. � Salivation: subsided completely on day 4 in males and on day
3 in females at 4.46 mg/L/4h and on day 2 at 3.57 mg/L/4h. � Hyperaemia observed in 5 males on day 3 (persisted in one of
them until day 4) at 4.46 mg/L/4h. � Abnormal respiratory noise at 4.46 mg/L/4 h in 1 male from
day 12 until the end of the study. � Mucoid nasal discharge:
-4.46 mg/L/4h: observed in 5 males on day 2 that persisted until day 3 in 4 animals and until day 4 in the other one. Besides in 1 female on day 2 that subsided the day after. -1.81 mg/L/4h: in 1 females days 2-3.
Bodyweights: ↓ on day 2. Only the animals exposed to the lowest concentration reached a final bodyweights similar to controls.
Guideline: US EPA-81-3 (corresponding to OECD 403 and B2) GLP: Yes Study acceptable APfSD albino rats 5/sex/dose 14-days observation Exposure: nose only. Analytical concentration: 2.07 mg/L/4 hours (aerosol) (maximum attainable concentration) No vehicle was used Purity: 90.4%
Table 14.5 Atmosphere analysis:
MMAD (µ(µ(µ(µm)
Aerodynamic particle size distribution (% by weight in range)
Size range 3.5 - 1.55 µµµµm Size range ≤ 1.55 µ µ µ µm 1.27 37.2 62.7
Mortality: No deaths occurred. Clinical signs: Consistent primarily with mild respiratory tract irritancy (possibly caused by deposition of the test compound in the upper respiratory tract). During exposure � Wet fur, salivation, auditory hypoaesthesia, lachrymation in
all animals. � Increased breathing that subsided after exposure was observed
in all animals. After exposure: � Shaking, salivation and lachrymation that subsided during day
1 in all animals. � Mucus secretion from nose in 4 males on day 1 which
persisted in two of them until day 2. � Abnormal respiratory noise was present in 5 males and 3
females on day 1 and persisted in 4 males and 2 females on day 2.
Maintenance period � Abnormal respiratory noise persisted in 3 males until day 4, 5
and 6 respectively and until day 3 in 1 female.
LC50 > 2.07 mg/L/4h H335 R37
Duerden, L., Lewis, R.W., 1990
Acute Dermal
Method Observations Results Reference
The study is pre-guideline GLP: Yes Study acceptable New Zealand White rabbits. 14-days observation
Mortality: occurred on days 2-4 post-treatment except one female at top dose level that died day 21. Table 14.6
Dose level (mg/kg bw) Number of deaths Male Female
2500 0 / 4 0 / 4 3536 0 / 4 1 / 4 5000 4 / 5 5 / 5
LD 50 combined: 4166 mg/kg bw (3583 - 4745mg/kg) LD 50 for females: 3856 mg/kg
Branch, D. K., 1982b
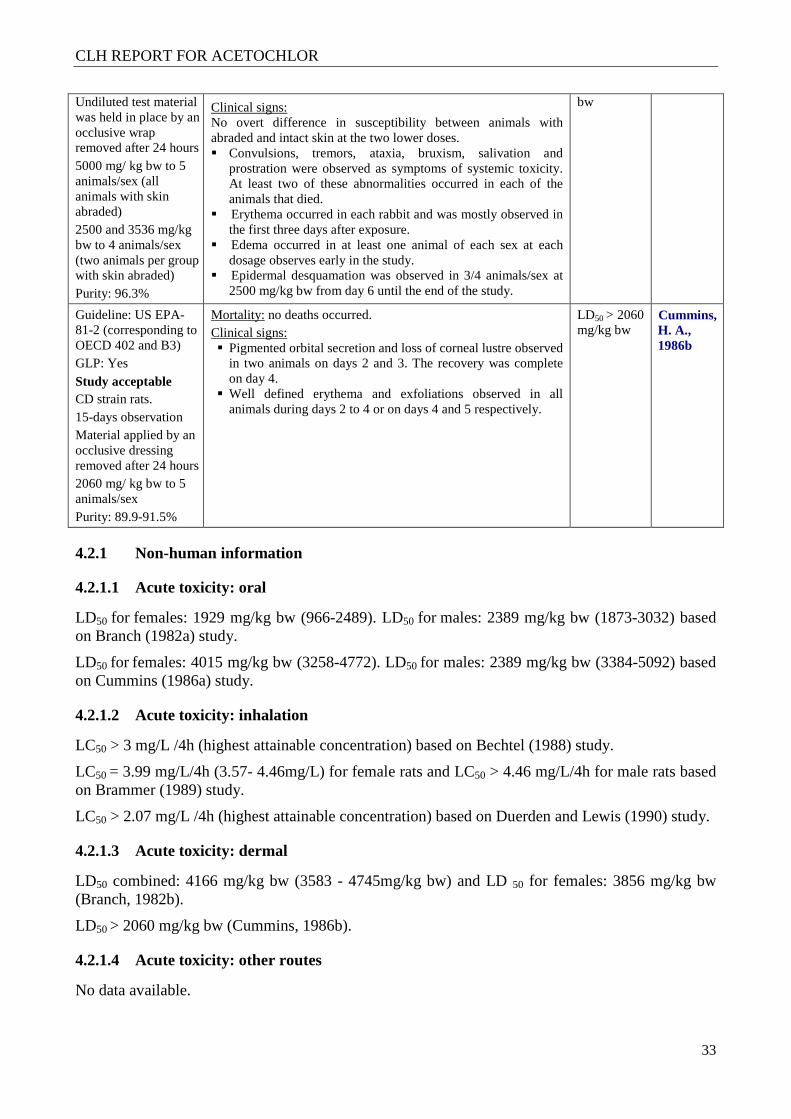
CLH REPORT FOR ACETOCHLOR
33
Undiluted test material was held in place by an occlusive wrap removed after 24 hours 5000 mg/ kg bw to 5 animals/sex (all animals with skin abraded) 2500 and 3536 mg/kg bw to 4 animals/sex (two animals per group with skin abraded) Purity: 96.3%
Clinical signs: No overt difference in susceptibility between animals with abraded and intact skin at the two lower doses. � Convulsions, tremors, ataxia, bruxism, salivation and
prostration were observed as symptoms of systemic toxicity. At least two of these abnormalities occurred in each of the animals that died.
� Erythema occurred in each rabbit and was mostly observed in the first three days after exposure.
� Edema occurred in at least one animal of each sex at each dosage observes early in the study.
� Epidermal desquamation was observed in 3/4 animals/sex at 2500 mg/kg bw from day 6 until the end of the study.
bw
Guideline: US EPA-81-2 (corresponding to OECD 402 and B3) GLP: Yes Study acceptable CD strain rats. 15-days observation Material applied by an occlusive dressing removed after 24 hours 2060 mg/ kg bw to 5 animals/sex Purity: 89.9-91.5%
Mortality: no deaths occurred. Clinical signs: � Pigmented orbital secretion and loss of corneal lustre observed
in two animals on days 2 and 3. The recovery was complete on day 4.
� Well defined erythema and exfoliations observed in all animals during days 2 to 4 or on days 4 and 5 respectively.
LD50 > 2060 mg/kg bw
Cummins, H. A., 1986b
4.2.1 Non-human information
4.2.1.1 Acute toxicity: oral
LD50 for females: 1929 mg/kg bw (966-2489). LD50 for males: 2389 mg/kg bw (1873-3032) based on Branch (1982a) study.
LD50 for females: 4015 mg/kg bw (3258-4772). LD50 for males: 2389 mg/kg bw (3384-5092) based on Cummins (1986a) study.
4.2.1.2 Acute toxicity: inhalation
LC50 > 3 mg/L /4h (highest attainable concentration) based on Bechtel (1988) study.
LC50 = 3.99 mg/L/4h (3.57- 4.46mg/L) for female rats and LC50 > 4.46 mg/L/4h for male rats based on Brammer (1989) study.
LC50 > 2.07 mg/L /4h (highest attainable concentration) based on Duerden and Lewis (1990) study.
4.2.1.3 Acute toxicity: dermal
LD50 combined: 4166 mg/kg bw (3583 - 4745mg/kg bw) and LD 50 for females: 3856 mg/kg bw (Branch, 1982b).
LD50 > 2060 mg/kg bw (Cummins, 1986b).
4.2.1.4 Acute toxicity: other routes
No data available.
CLH REPORT FOR ACETOCHLOR
34
4.2.2 Human information
No data available.
4.2.3 Summary and discussion of acute toxicity
See section 4.2.4.
4.2.4 Comparison with criteria
It was concluded at the TC C&L in November 1997 not to classify acetochlor for acute oral toxicity. However, based on the lowest reported acute oral LD50 value of 1929 mg/kg (966-2489 mg/kg) in female Sprague-Dawley albino rats, acetochlor should be classified as Xn; R22 (Harmful if swallowed), according to DSD criteria (oral LD50 guidance values from 200 to 2000 mg/kg bw) and as Acute Tox. 4 - H302 (Harmful if swallowed), according to CLP (oral LD50 guidance values for this category from 300 to 2000 mg/kg bw). Therefore the existing Annex VI entry should be changed accordingly.
The existing classification of acetochlor with R20 seems appropriate as the acute inhalation LC50 was 3.99 mg/L/4h (3.57- 4.46 mg/L) for female and greater than 4.46 mg/L/4h for male APfSD rats. Therefore, acetochlor should be classified as R20 (Harmful by inhalation) according to DSD criteria (LC50 guidance values from 1.0 to 5.0 mg/l for particulates/aerosol), and as Acute Tox. 4 - H332 (Harmful if inhaled) according to CLP (LC50 guidance values for this category from 1.0 to 5.0 mg/l for dust/mist).
At the TC C&L it was agreed not to classify acetochlor for acute dermal toxicity. LD50 values for dermal toxicity were above the threshold value of 2000 mg/kg bw for triggering classification and labelling in both DSD and CLP. Accordingly no acute classification is proposed for the dermal route.
4.2.5 Conclusions on classification and labelling
4.3 Specific target organ toxicity — single exposure (STOT SE)
The available data indicate that acetochlor does not need to be classified for specific target organ toxicity, with the exemption of respiratory tract irritation (see 4.4.3).
DSD: Xn; R20/22. CLP: Acute Tox. 4 - H302; Acute Tox. 4 - H332
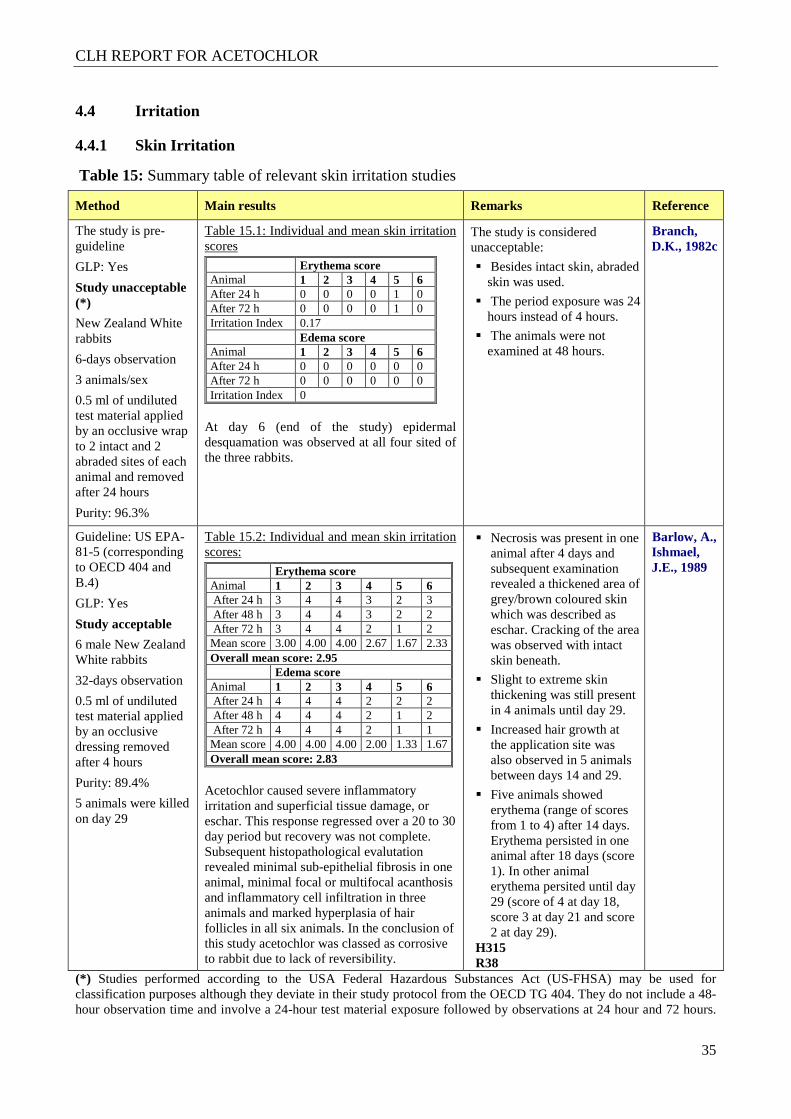
CLH REPORT FOR ACETOCHLOR
35
4.4 Irritation
4.4.1 Skin Irritation
Table 15: Summary table of relevant skin irritation studies
Method Main results Remarks Reference
The study is pre-guideline
GLP: Yes
Study unacceptable (*)
New Zealand White rabbits
6-days observation
3 animals/sex
0.5 ml of undiluted test material applied by an occlusive wrap to 2 intact and 2 abraded sites of each animal and removed after 24 hours
Purity: 96.3%
Table 15.1: Individual and mean skin irritation scores
Erythema score Animal 1 2 3 4 5 6 After 24 h 0 0 0 0 1 0 After 72 h 0 0 0 0 1 0 Irritation Index 0.17 Edema score Animal 1 2 3 4 5 6 After 24 h 0 0 0 0 0 0 After 72 h 0 0 0 0 0 0 Irritation Index 0
At day 6 (end of the study) epidermal desquamation was observed at all four sited of the three rabbits.
The study is considered unacceptable:
� Besides intact skin, abraded skin was used.
� The period exposure was 24 hours instead of 4 hours.
� The animals were not examined at 48 hours.
Branch, D.K., 1982c
Guideline: US EPA-81-5 (corresponding to OECD 404 and B.4)
GLP: Yes
Study acceptable
6 male New Zealand White rabbits
32-days observation
0.5 ml of undiluted test material applied by an occlusive dressing removed after 4 hours
Purity: 89.4%
5 animals were killed on day 29
Table 15.2: Individual and mean skin irritation scores:
Erythema score Animal 1 2 3 4 5 6 After 24 h 3 4 4 3 2 3 After 48 h 3 4 4 3 2 2 After 72 h 3 4 4 2 1 2 Mean score 3.00 4.00 4.00 2.67 1.67 2.33 Overall mean score: 2.95 Edema score Animal 1 2 3 4 5 6 After 24 h 4 4 4 2 2 2 After 48 h 4 4 4 2 1 2 After 72 h 4 4 4 2 1 1 Mean score 4.00 4.00 4.00 2.00 1.33 1.67 Overall mean score: 2.83
Acetochlor caused severe inflammatory irritation and superficial tissue damage, or eschar. This response regressed over a 20 to 30 day period but recovery was not complete. Subsequent histopathological evalutation revealed minimal sub-epithelial fibrosis in one animal, minimal focal or multifocal acanthosis and inflammatory cell infiltration in three animals and marked hyperplasia of hair follicles in all six animals. In the conclusion of this study acetochlor was classed as corrosive to rabbit due to lack of reversibility.
� Necrosis was present in one animal after 4 days and subsequent examination revealed a thickened area of grey/brown coloured skin which was described as eschar. Cracking of the area was observed with intact skin beneath.
� Slight to extreme skin thickening was still present in 4 animals until day 29.
� Increased hair growth at the application site was also observed in 5 animals between days 14 and 29.
� Five animals showed erythema (range of scores from 1 to 4) after 14 days. Erythema persisted in one animal after 18 days (score 1). In other animal erythema persited until day 29 (score of 4 at day 18, score 3 at day 21 and score 2 at day 29).
H315 R38
Barlow, A., Ishmael, J.E., 1989
(*) Studies performed according to the USA Federal Hazardous Substances Act (US-FHSA) may be used for classification purposes although they deviate in their study protocol from the OECD TG 404. They do not include a 48-hour observation time and involve a 24-hour test material exposure followed by observations at 24 hour and 72 hours.
CLH REPORT FOR ACETOCHLOR
36
Moreover, the test material is patched both on abraded and on intact skin of six rabbits. Studies usually are terminated after 72 hours. In case of pronounced responses at the 72 hours time point an expert judgement is needed as to whether the data is appropriate for classification (Guidance on the Application of Regulation (EC) No 1272/2008).
4.4.1.1 Non-human information
See table above.
4.4.1.2 Human information
No data available.
4.4.1.3 Summary and discussion of skin irritation
In Barlow and Ishmael (1989) skin irritation study in rabbits, the overall mean score following grading at 24, 48 and 72 hours were 2.95 for erythema and 2.83 for edema. Well defined erythema (score of 2) persisted in one animal until day 29. Additional observations included desquamation, thickening and hardening of the skin. Slight to extreme skin thickening was still present in 4 animals at the end of the study. Increased hair growth at the application site was also observed in 5 animals between days 14 and 29. Necrosis was present in one animal after 4 days and subsequent examination revealed a thickened area of grey/brown coloured skin which was described as eschar. Cracking of the area was observed with intact skin beneath. Histopathological examination revealed minimal sub-epithelial fibrosis in one animal, minimal focal or multifocal acanthosis and inflammatory cell infiltration in three animals and marked hyperplasia of hair follicles in all six animals.
In Branch (1982c) skin irritation study in rabbits, epidermal desquamation was observed at day 6 (end of the study) in three animals.
In Branch (1982b) acute dermal toxicity study in rats epidermal desquamation was observed in 3/4 animals/sex at 2500 mg/kg bw from day 6 until the end of the study.
In Cummins (1986b) acute dermal toxicity in rats well defined erythema and exfoliations were observed at 2060 mg/ kg bw in all rats during days 2 to 4 or on days 4 and 5 respectively.
In Johnson, (1981) 21 days dermal repeated dose toxicity study in rabbits (see data in section 4.7.1.3), signs of dermal irritation were found at all used doses: 100, 400 and 1200 mg/kg bw/day. Erythema and edema (score>2), atonia, desquamation, coriaceusness, fissuring, eschar and exfoliation persisted until day 14 in animals with not abraded skin. Histopatologic evidence of dermal irritation was also noted in all treatment groups of animals with not abraded skin: inflammatory cells in dermis (at 100 mg/kg bw/day), microabcess formation and necrosis of the epidermis junction (at 400 and 1200 mg/kg bw/day), ulcer and epidemolysis (at 1200 mg/kg bw/day), hyperkeratosis and acanthosis (at all dose levels).
In Leah (1989) 21 days dermal repeated dose toxicity study in rats (see data in section 4.7.1.3) irritation signs were observed in the preliminary study. Dermal applications with the undiluted test material caused severe signs of erythema and edema in all rats at 1000 and 500 mg/kg bw/day. At 1000 mg/kg bw/day treatment was discontinued in two males after two days due to observed necrosis in both animals. At 500 mg/kg bw/day treatment was discontinued after three days due to severity of the irritation. At 100 mg/kg bw/day moderate to severe irritation and desquamation in two males were observed. Dermal applications with the test material diluted in olive oil caused severe signs of erythema and edema at 1000 and 500 mg/kg bw/day. Moderate to severe irritation was observed at 100 and 10 mg/kg bw/day. Desquamation was observed in some animals at all doses (1, 10, 100, 500 and 1000 mg/kg bw/day).
CLH REPORT FOR ACETOCHLOR
37
4.4.1.4 Comparison with criteria
According to the classification criteria (3.2.2.7.1, Annex I CLP): “Using the results of animal testing the criterions for the skin irritant category are: (1) Mean value of ≥ 2,3 - ≤ 4,0 for erythema/eschar or for oedema in at least 2 of 3 tested animals from gradings at 24, 48 and 72 hours after patch removal or, if reactions are delayed, from grades on 3 consecutive days after the onset of skin reactions; or (2) Inflammation that persists to the end of the observation period normally 14 days in at least 2 animals, particularly taking into account alopecia (limited area), hyperkeratosis, hyperplasia, and scaling; or (3) In some cases where there is pronounced variability of response among animals, with very definite positive effects related to chemical exposure in a single animal but less than the criteria above.
According to the classification criteria (3.2.2.6.1, Annex I CLP): “On the basis of the results of animal testing, a corrosive substance is a substance that produces destruction of skin tissue, namely, visible necrosis through the epidermis and into the dermis, in at least 1 tested animal after exposure up to a 4 hour duration. Corrosive reactions are typified by ulcers, bleeding, bloody scabs and, by the end of observation at 14 days, by discoloration due to blanching of the skin, complete areas of alopecia and scars. Histopathology shall be considered to discern questionable lesions”.
In Barlow and Ishmael (1989) skin irritation study, necrosis was present in one animal after 4 days. There are doubts concerning the interpretation of this effect as no information related to the nature or extent of the necrosis reported is available. Subsequent examination revealed a thickened area of grey/brown coloured skin which was described as eschar. Cracking of the area was observed with intact skin beneath. Other significant dermal effects were still present at the end of the study; however, they don’t fully fit the corrosion criteria in 3.2.2.6.1, Annex I CLP.
Although corrosive reactions have been observed in Barlow and Ishmael (1989) skin irritation study and in the 21 days dermal studies, the global evaluation of the data leads us to believe that acetochlor is not a corrosive substance, given the lack of any corrosive reaction in other relevant studies (acute dermal studies, skin sensitisation studies or eye irritation studies). However, data are complex and some kind of borderline. Considering the totality of information, the overall weight of evidence does not appear sufficient for classified acetochlor for skin corrosion. It rests with RAC to decide a final conclusion regarding this issue.
The existing classification with R38 agreed at the TC C&L in November 1997 (see section 8 Annexes) seems appropriate to the MSCA. In Barlow and Ishmael (1989) skin irritation study, the overall mean index score was greater than 2.3 (CLP) or 2 (DSD) for erythema and for edema, and inflammation persisted until day 29 in at least two animals. Considering the results obtained in this study, acetochlor should be considered as an irritant to skin according to both CLP and DSD classification systems. Consequently, acetochlor should be classified as Xi; R38 (irritating to skin) according to DSD and as Skin Irrit. 2 - H315 (causes skin irritation), according to CLP Regulation.
4.4.1.5 Conclusions on classification and labelling
DSD: Xi; R38. CLP: Skin Irrit. 2 - H315.
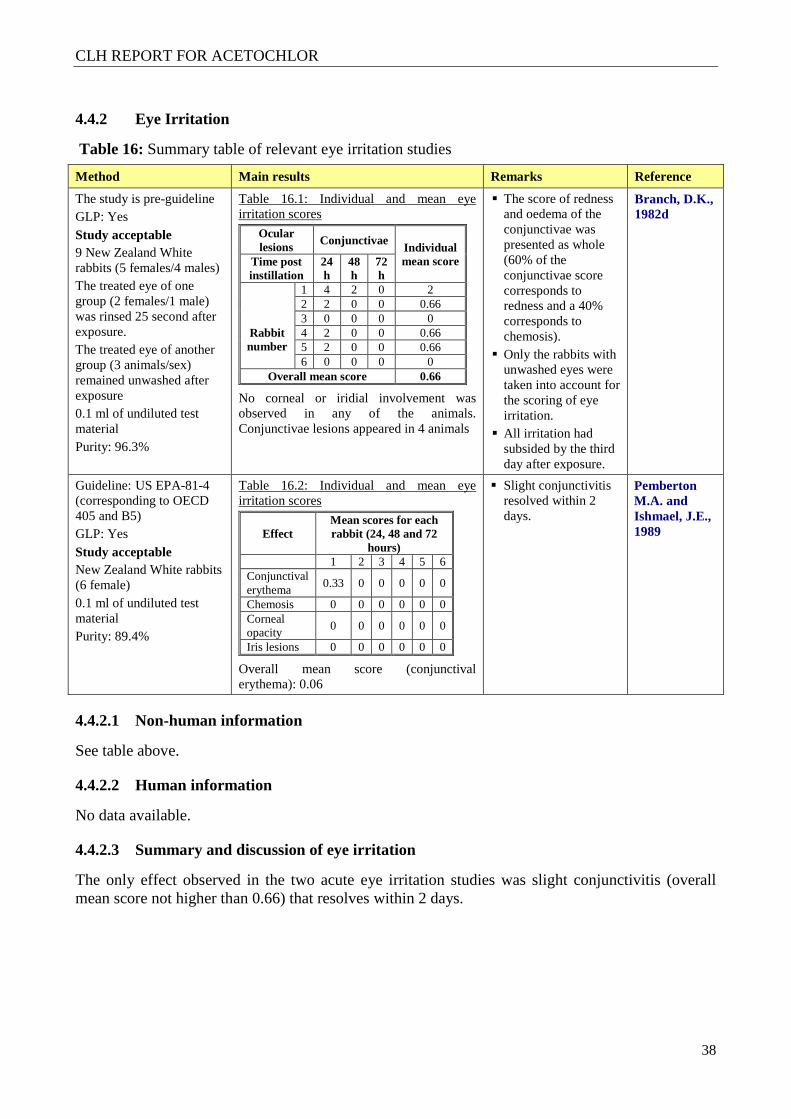
CLH REPORT FOR ACETOCHLOR
38
4.4.2 Eye Irritation
Table 16: Summary table of relevant eye irritation studies
Method Main results Remarks Reference
The study is pre-guideline GLP: Yes Study acceptable 9 New Zealand White rabbits (5 females/4 males) The treated eye of one group (2 females/1 male) was rinsed 25 second after exposure. The treated eye of another group (3 animals/sex) remained unwashed after exposure 0.1 ml of undiluted test material Purity: 96.3%
Table 16.1: Individual and mean eye irritation scores
Ocular lesions Conjunctivae
Individual mean score Time post
instillation 24 h
48 h
72 h
Rabbit number
1 4 2 0 2 2 2 0 0 0.66 3 0 0 0 0 4 2 0 0 0.66 5 2 0 0 0.66 6 0 0 0 0
Overall mean score 0.66
No corneal or iridial involvement was observed in any of the animals. Conjunctivae lesions appeared in 4 animals
� The score of redness and oedema of the conjunctivae was presented as whole (60% of the conjunctivae score corresponds to redness and a 40% corresponds to chemosis).
� Only the rabbits with unwashed eyes were taken into account for the scoring of eye irritation.
� All irritation had subsided by the third day after exposure.
Branch, D.K., 1982d
Guideline: US EPA-81-4 (corresponding to OECD 405 and B5) GLP: Yes Study acceptable New Zealand White rabbits (6 female) 0.1 ml of undiluted test material Purity: 89.4%
Table 16.2: Individual and mean eye irritation scores
Effect Mean scores for each rabbit (24, 48 and 72
hours) 1 2 3 4 5 6 Conjunctival erythema
0.33 0 0 0 0 0
Chemosis 0 0 0 0 0 0 Corneal opacity
0 0 0 0 0 0
Iris lesions 0 0 0 0 0 0
Overall mean score (conjunctival erythema): 0.06
� Slight conjunctivitis resolved within 2 days.
Pemberton M.A. and Ishmael, J.E., 1989
4.4.2.1 Non-human information
See table above.
4.4.2.2 Human information
No data available.
4.4.2.3 Summary and discussion of eye irritation
The only effect observed in the two acute eye irritation studies was slight conjunctivitis (overall mean score not higher than 0.66) that resolves within 2 days.
CLH REPORT FOR ACETOCHLOR
39
4.4.2.4 Comparison with criteria
The individual and group mean eye irritation scores do not meet the criteria for classification as irritating to the eyes according to CLP, (corneal opacity or iritis score ≥ 1 or conjunctival redness or edema score ≥ 2) and which fully reverses within the observation period of 21 days).
The criteria for classification according to DSD are slightly higher for corneal opacity (score equal to or higher than 2) and for conjunctival redness (score equal to or higher than 2.5), consequently, acetochlor does not fulfil either the DSD criteria for eye irritation. At the TC C&L it was also agreed not to classify acetochlor for eye irritation.
4.4.2.5 Conclusions on classification and labelling
4.4.3 Respiratory tract irritation
4.4.3.1 Non-human information
See acute inhalation studies in Table 14.
4.4.3.2 Human information
No data available.
4.4.3.3 Summary and discussion of respiratory tract irritation
Irritation of the respiratory tract was observed in two acute inhalation toxicity studies:
In Brammer (1989) acute inhalation study, salivation and lachrymation were observed in all test groups. Deep breathing and reduced rate breathing was seen during exposure. Abnormal respiratory noise was present in some animals after exposure and during the maintenance period in all test groups. At 4.46 mg/L/4h abnormal respiratory noise did not completely subside until day 4 in females and until day 3 in most males, but one male was affected from day 12 until the end of the study. At 3.57 mg/L/4h abnormal respiratory noise was observed in 3 females on day 1 that persisted until day 2 in one of them and at 1.81 mg/L/4h this effect subsided on day 1 in the only female affected. Mucoid nasal discharge was observed at 4.46 mg/L/4h in 5 males and 1 female and persisted until day 4 and 2 respectively. Hyperaemia was observed in 5 males on day 3 (persisted in one of them until day 4) at 4.46 mg/L/4h.
In Duerden and Lewis (1990) acute inhalation study after exposure at an atmospheric maximum attainable concentration of 2.07 mg/L salivation and lachrymation were observed during the first day of the study. Besides, mucus secretion from nose was seen in 4 males on day 1 and persisted in two of them until day 2. Abnormal respiratory noise was also seen in 5 males and 3 females on day 1 and it did not subside completely until days 6 and 3 in males and females, respectively.
4.4.3.4 Comparison with criteria
Substances could be classified as irritating to the respiration tract (R37) under DSD based on positive results from appropriate animal tests. Positive results from appropriate animal tests may include data obtained in a general toxicity test, including histopathological data from the respiratory
DSD: Not classified based on available data. CLP: Not classified based on available data.
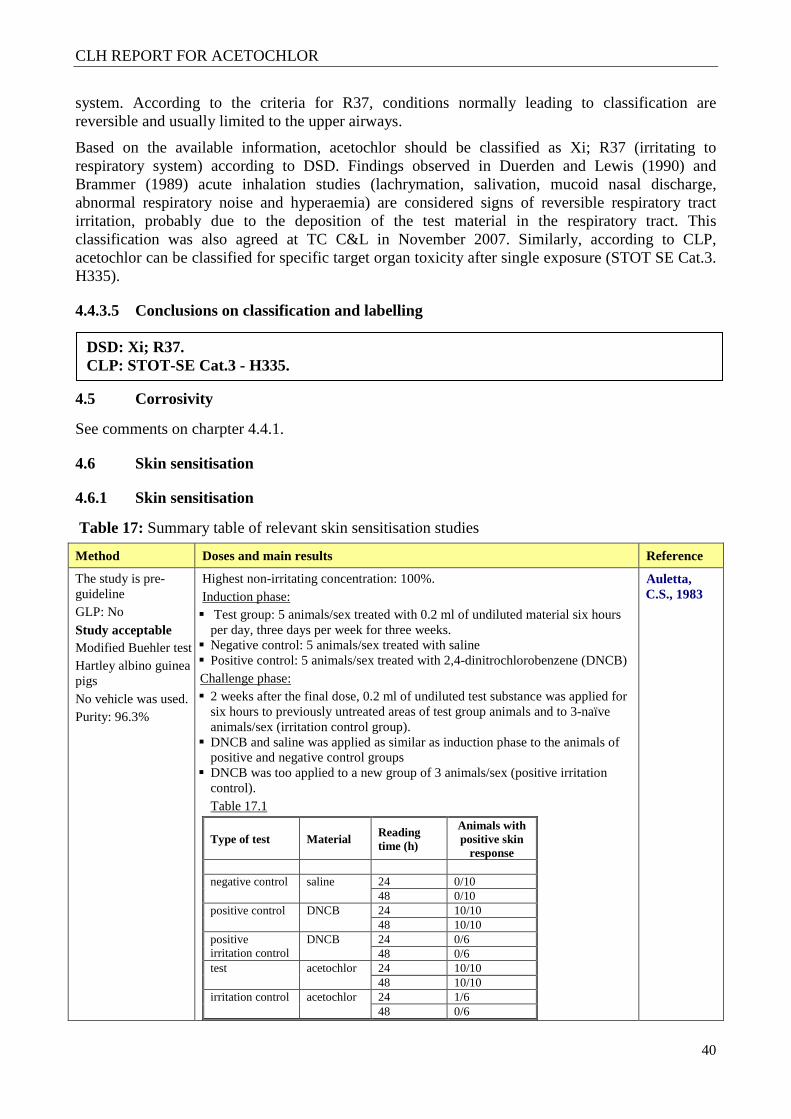
CLH REPORT FOR ACETOCHLOR
40
system. According to the criteria for R37, conditions normally leading to classification are reversible and usually limited to the upper airways.
Based on the available information, acetochlor should be classified as Xi; R37 (irritating to respiratory system) according to DSD. Findings observed in Duerden and Lewis (1990) and Brammer (1989) acute inhalation studies (lachrymation, salivation, mucoid nasal discharge, abnormal respiratory noise and hyperaemia) are considered signs of reversible respiratory tract irritation, probably due to the deposition of the test material in the respiratory tract. This classification was also agreed at TC C&L in November 2007. Similarly, according to CLP, acetochlor can be classified for specific target organ toxicity after single exposure (STOT SE Cat.3. H335).
4.4.3.5 Conclusions on classification and labelling
4.5 Corrosivity
See comments on charpter 4.4.1.
4.6 Skin sensitisation
4.6.1 Skin sensitisation
Table 17: Summary table of relevant skin sensitisation studies
Method Doses and main results Reference
The study is pre-guideline GLP: No Study acceptable Modified Buehler test Hartley albino guinea pigs No vehicle was used. Purity: 96.3%
Highest non-irritating concentration: 100%. Induction phase: � Test group: 5 animals/sex treated with 0.2 ml of undiluted material six hours
per day, three days per week for three weeks. � Negative control: 5 animals/sex treated with saline � Positive control: 5 animals/sex treated with 2,4-dinitrochlorobenzene (DNCB) Challenge phase: � 2 weeks after the final dose, 0.2 ml of undiluted test substance was applied for
six hours to previously untreated areas of test group animals and to 3-naïve animals/sex (irritation control group).
� DNCB and saline was applied as similar as induction phase to the animals of positive and negative control groups
� DNCB was too applied to a new group of 3 animals/sex (positive irritation control). Table 17.1
Type of test Material Reading time (h)
Animals with positive skin
response negative control saline 24 0/10
48 0/10 positive control DNCB 24 10/10
48 10/10 positive irritation control
DNCB 24 0/6 48 0/6
test acetochlor 24 10/10 48 10/10
irritation control acetochlor 24 1/6 48 0/6
Auletta, C.S., 1983
DSD: Xi; R37. CLP: STOT-SE Cat.3 - H335.
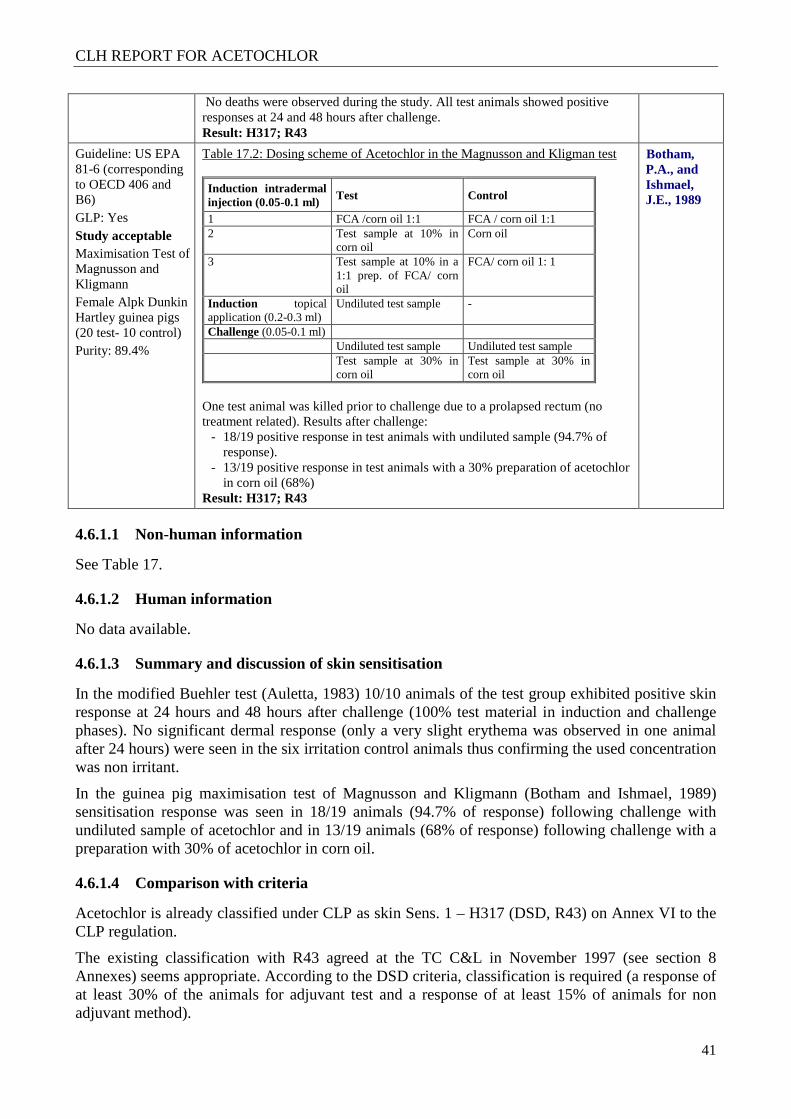
CLH REPORT FOR ACETOCHLOR
41
No deaths were observed during the study. All test animals showed positive responses at 24 and 48 hours after challenge. Result: H317; R43
Guideline: US EPA 81-6 (corresponding to OECD 406 and B6) GLP: Yes Study acceptable Maximisation Test of Magnusson and Kligmann Female Alpk Dunkin Hartley guinea pigs (20 test- 10 control) Purity: 89.4%
Table 17.2: Dosing scheme of Acetochlor in the Magnusson and Kligman test
Induction intradermal injection (0.05-0.1 ml) Test Control
1 FCA /corn oil 1:1 FCA / corn oil 1:1 2 Test sample at 10% in
corn oil Corn oil
3 Test sample at 10% in a 1:1 prep. of FCA/ corn oil
FCA/ corn oil 1: 1
Induction topical application (0.2-0.3 ml)
Undiluted test sample -
Challenge (0.05-0.1 ml) Undiluted test sample Undiluted test sample Test sample at 30% in
corn oil Test sample at 30% in corn oil
One test animal was killed prior to challenge due to a prolapsed rectum (no treatment related). Results after challenge:
- 18/19 positive response in test animals with undiluted sample (94.7% of response).
- 13/19 positive response in test animals with a 30% preparation of acetochlor in corn oil (68%)
Result: H317; R43
Botham, P.A., and Ishmael, J.E., 1989
4.6.1.1 Non-human information
See Table 17.
4.6.1.2 Human information
No data available.
4.6.1.3 Summary and discussion of skin sensitisation
In the modified Buehler test (Auletta, 1983) 10/10 animals of the test group exhibited positive skin response at 24 hours and 48 hours after challenge (100% test material in induction and challenge phases). No significant dermal response (only a very slight erythema was observed in one animal after 24 hours) were seen in the six irritation control animals thus confirming the used concentration was non irritant.
In the guinea pig maximisation test of Magnusson and Kligmann (Botham and Ishmael, 1989) sensitisation response was seen in 18/19 animals (94.7% of response) following challenge with undiluted sample of acetochlor and in 13/19 animals (68% of response) following challenge with a preparation with 30% of acetochlor in corn oil.
4.6.1.4 Comparison with criteria
Acetochlor is already classified under CLP as skin Sens. 1 – H317 (DSD, R43) on Annex VI to the CLP regulation.
The existing classification with R43 agreed at the TC C&L in November 1997 (see section 8 Annexes) seems appropriate. According to the DSD criteria, classification is required (a response of at least 30% of the animals for adjuvant test and a response of at least 15% of animals for non adjuvant method).
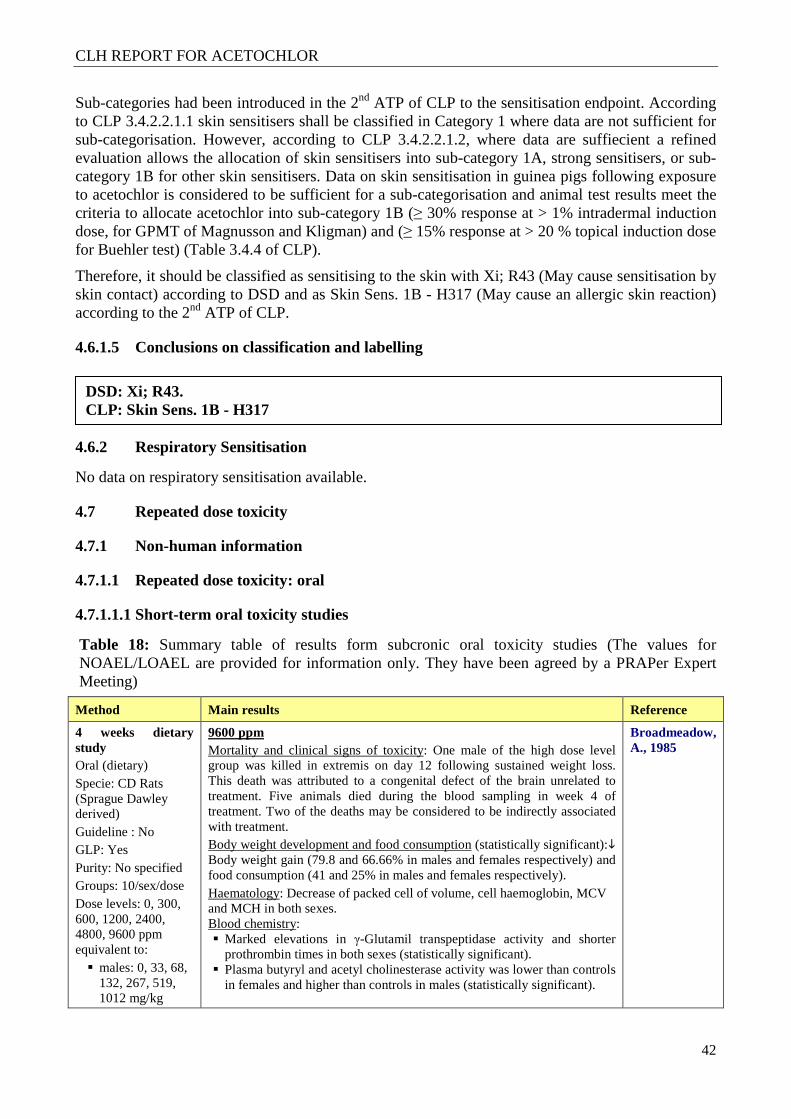
CLH REPORT FOR ACETOCHLOR
42
Sub-categories had been introduced in the 2nd ATP of CLP to the sensitisation endpoint. According to CLP 3.4.2.2.1.1 skin sensitisers shall be classified in Category 1 where data are not sufficient for sub-categorisation. However, according to CLP 3.4.2.2.1.2, where data are suffiecient a refined evaluation allows the allocation of skin sensitisers into sub-category 1A, strong sensitisers, or sub-category 1B for other skin sensitisers. Data on skin sensitisation in guinea pigs following exposure to acetochlor is considered to be sufficient for a sub-categorisation and animal test results meet the criteria to allocate acetochlor into sub-category 1B (≥ 30% response at > 1% intradermal induction dose, for GPMT of Magnusson and Kligman) and (≥ 15% response at > 20 % topical induction dose for Buehler test) (Table 3.4.4 of CLP).
Therefore, it should be classified as sensitising to the skin with Xi; R43 (May cause sensitisation by skin contact) according to DSD and as Skin Sens. 1B - H317 (May cause an allergic skin reaction) according to the 2nd ATP of CLP.
4.6.1.5 Conclusions on classification and labelling
4.6.2 Respiratory Sensitisation
No data on respiratory sensitisation available.
4.7 Repeated dose toxicity
4.7.1 Non-human information
4.7.1.1 Repeated dose toxicity: oral
4.7.1.1.1 Short-term oral toxicity studies
Table 18: Summary table of results form subcronic oral toxicity studies (The values for NOAEL/LOAEL are provided for information only. They have been agreed by a PRAPer Expert Meeting)
Method Main results Reference
4 weeks dietary study Oral (dietary) Specie: CD Rats (Sprague Dawley derived) Guideline : No GLP: Yes Purity: No specified Groups: 10/sex/dose Dose levels: 0, 300, 600, 1200, 2400, 4800, 9600 ppm equivalent to: � males: 0, 33, 68,
132, 267, 519, 1012 mg/kg
9600 ppm Mortality and clinical signs of toxicity: One male of the high dose level group was killed in extremis on day 12 following sustained weight loss. This death was attributed to a congenital defect of the brain unrelated to treatment. Five animals died during the blood sampling in week 4 of treatment. Two of the deaths may be considered to be indirectly associated with treatment. Body weight development and food consumption (statistically significant):� Body weight gain (79.8 and 66.66% in males and females respectively) and food consumption (41 and 25% in males and females respectively). Haematology: Decrease of packed cell of volume, cell haemoglobin, MCV and MCH in both sexes. Blood chemistry: � Marked elevations in γ-Glutamil transpeptidase activity and shorter
prothrombin times in both sexes (statistically significant). � Plasma butyryl and acetyl cholinesterase activity was lower than controls
in females and higher than controls in males (statistically significant).
Broadmeadow, A., 1985
DSD: Xi; R43. CLP: Skin Sens. 1B - H317
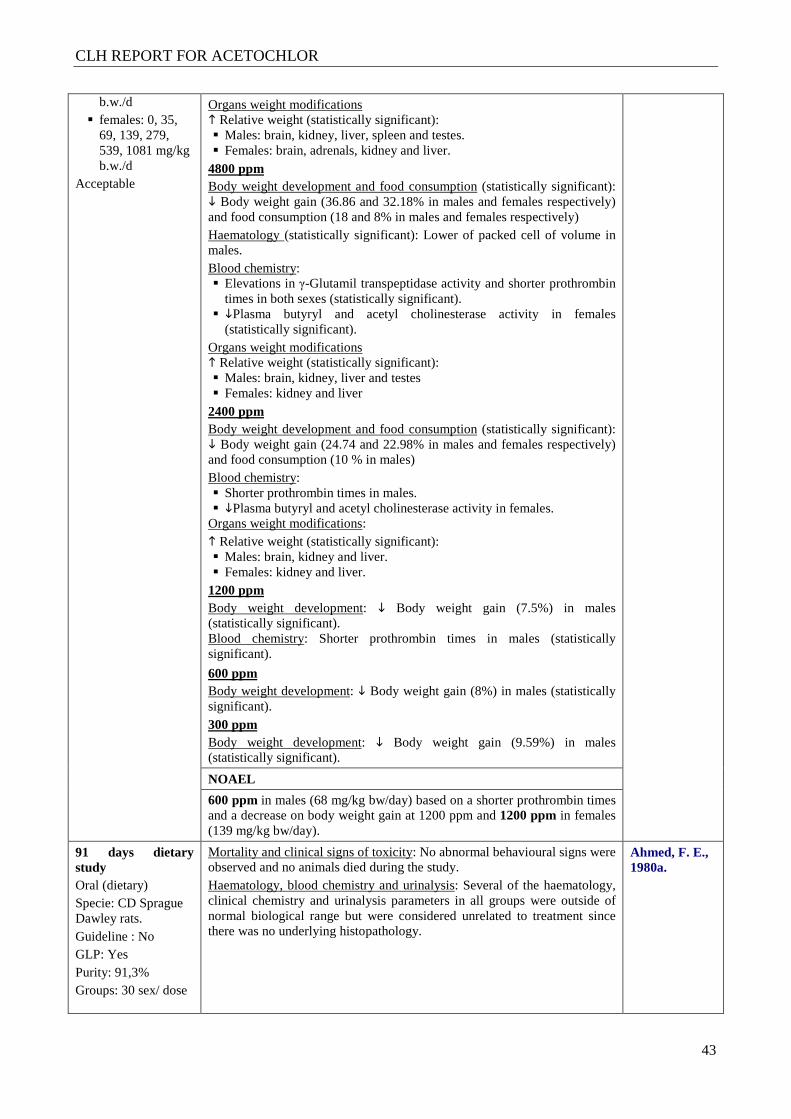
CLH REPORT FOR ACETOCHLOR
43
b.w./d � females: 0, 35,
69, 139, 279, 539, 1081 mg/kg b.w./d
Acceptable
Organs weight modifications � Relative weight (statistically significant): � Males: brain, kidney, liver, spleen and testes. � Females: brain, adrenals, kidney and liver.
4800 ppm Body weight development and food consumption (statistically significant): � Body weight gain (36.86 and 32.18% in males and females respectively) and food consumption (18 and 8% in males and females respectively) Haematology (statistically significant): Lower of packed cell of volume in males. Blood chemistry: � Elevations in γ-Glutamil transpeptidase activity and shorter prothrombin
times in both sexes (statistically significant). � �Plasma butyryl and acetyl cholinesterase activity in females
(statistically significant). Organs weight modifications � Relative weight (statistically significant): � Males: brain, kidney, liver and testes � Females: kidney and liver
2400 ppm Body weight development and food consumption (statistically significant): � Body weight gain (24.74 and 22.98% in males and females respectively) and food consumption (10 % in males) Blood chemistry: � Shorter prothrombin times in males. � �Plasma butyryl and acetyl cholinesterase activity in females.
Organs weight modifications: � Relative weight (statistically significant): � Males: brain, kidney and liver. � Females: kidney and liver.
1200 ppm Body weight development: � Body weight gain (7.5%) in males (statistically significant). Blood chemistry: Shorter prothrombin times in males (statistically significant).
600 ppm Body weight development: � Body weight gain (8%) in males (statistically significant). 300 ppm Body weight development: � Body weight gain (9.59%) in males (statistically significant).
NOAEL
600 ppm in males (68 mg/kg bw/day) based on a shorter prothrombin times and a decrease on body weight gain at 1200 ppm and 1200 ppm in females (139 mg/kg bw/day).
91 days dietary study Oral (dietary) Specie: CD Sprague Dawley rats. Guideline : No GLP: Yes Purity: 91,3% Groups: 30 sex/ dose
Mortality and clinical signs of toxicity: No abnormal behavioural signs were observed and no animals died during the study. Haematology, blood chemistry and urinalysis: Several of the haematology, clinical chemistry and urinalysis parameters in all groups were outside of normal biological range but were considered unrelated to treatment since there was no underlying histopathology.
Ahmed, F. E., 1980a.
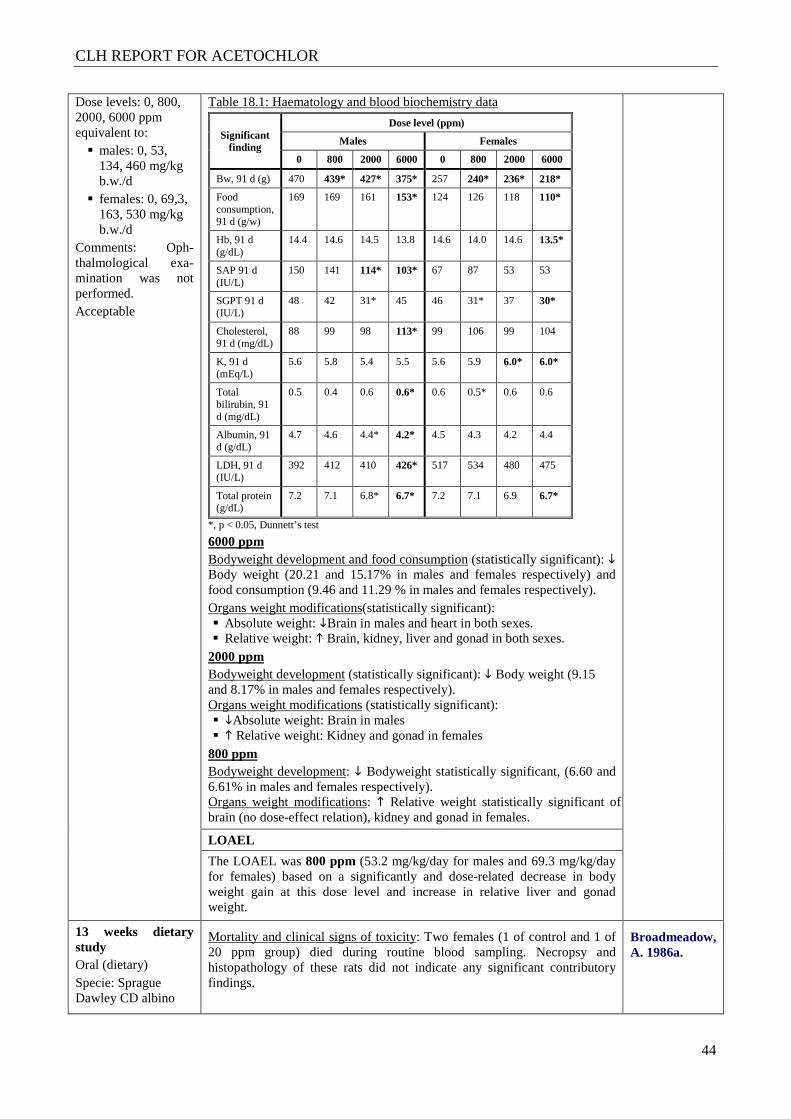
CLH REPORT FOR ACETOCHLOR
44
Dose levels: 0, 800, 2000, 6000 ppm equivalent to: � males: 0, 53,
134, 460 mg/kg b.w./d
� females: 0, 69,3, 163, 530 mg/kg b.w./d
Comments: Oph-thalmological exa-mination was not performed. Acceptable
Table 18.1: Haematology and blood biochemistry data
Significant finding
Dose level (ppm)
Males Females
0 800 2000 6000 0 800 2000 6000
Bw, 91 d (g) 470 439* 427* 375* 257 240* 236* 218*
Food consumption, 91 d (g/w)
169 169 161 153* 124 126 118 110*
Hb, 91 d (g/dL)
14.4 14.6 14.5 13.8 14.6 14.0 14.6 13.5*
SAP 91 d (IU/L)
150 141 114* 103* 67 87 53 53
SGPT 91 d (IU/L)
48 42 31* 45 46 31* 37 30*
Cholesterol, 91 d (mg/dL)
88 99 98 113* 99 106 99 104
K, 91 d (mEq/L)
5.6 5.8 5.4 5.5 5.6 5.9 6.0* 6.0*
Total bilirubin, 91 d (mg/dL)
0.5 0.4 0.6 0.6* 0.6 0.5* 0.6 0.6
Albumin, 91 d (g/dL)
4.7 4.6 4.4* 4.2* 4.5 4.3 4.2 4.4
LDH, 91 d (IU/L)
392 412 410 426* 517 534 480 475
Total protein (g/dL)
7.2 7.1 6.8* 6.7* 7.2 7.1 6.9 6.7*
*, p < 0.05, Dunnett’s test
6000 ppm Bodyweight development and food consumption (statistically significant): � Body weight (20.21 and 15.17% in males and females respectively) and food consumption (9.46 and 11.29 % in males and females respectively). Organs weight modifications(statistically significant): � Absolute weight: �Brain in males and heart in both sexes. � Relative weight: � Brain, kidney, liver and gonad in both sexes.
2000 ppm Bodyweight development (statistically significant): � Body weight (9.15 and 8.17% in males and females respectively). Organs weight modifications (statistically significant): � �Absolute weight: Brain in males � � Relative weight: Kidney and gonad in females
800 ppm Bodyweight development: � Bodyweight statistically significant, (6.60 and 6.61% in males and females respectively). Organs weight modifications: � Relative weight statistically significant of brain (no dose-effect relation), kidney and gonad in females.
LOAEL
The LOAEL was 800 ppm (53.2 mg/kg/day for males and 69.3 mg/kg/day for females) based on a significantly and dose-related decrease in body weight gain at this dose level and increase in relative liver and gonad weight.
13 weeks dietary study Oral (dietary) Specie: Sprague Dawley CD albino
Mortality and clinical signs of toxicity: Two females (1 of control and 1 of 20 ppm group) died during routine blood sampling. Necropsy and histopathology of these rats did not indicate any significant contributory findings.
Broadmeadow, A. 1986a.
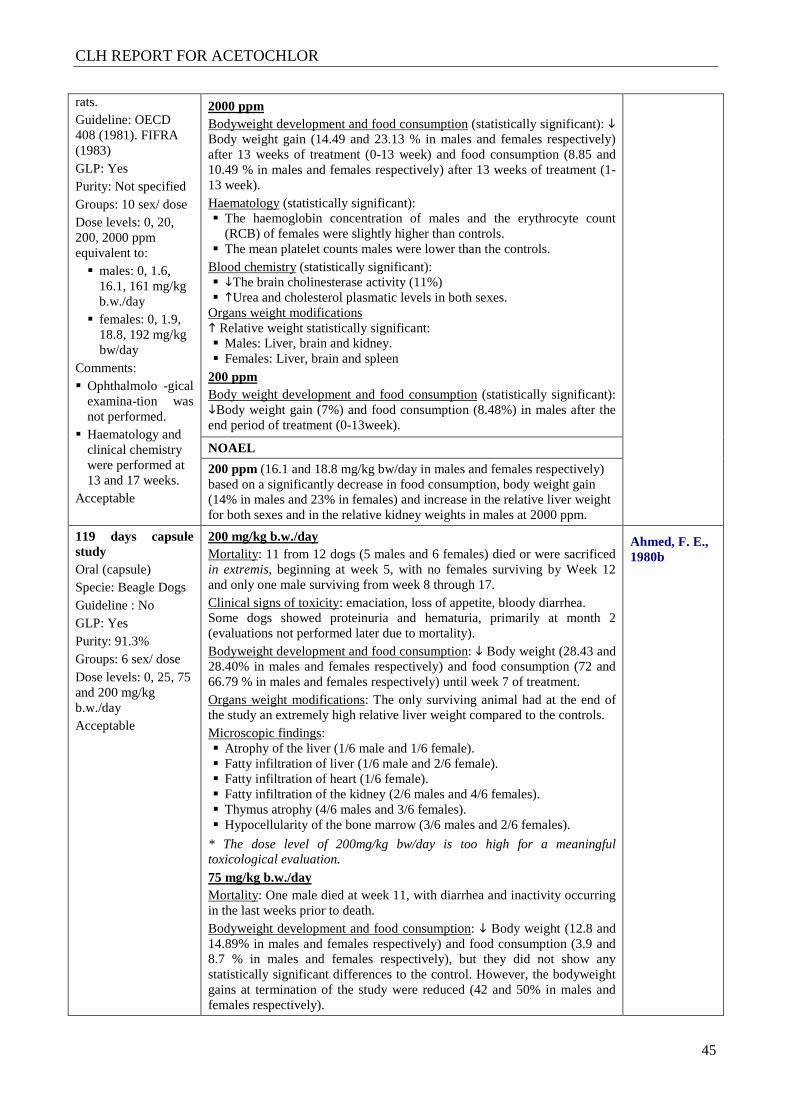
CLH REPORT FOR ACETOCHLOR
45
rats. Guideline: OECD 408 (1981). FIFRA (1983) GLP: Yes Purity: Not specified Groups: 10 sex/ dose Dose levels: 0, 20, 200, 2000 ppm equivalent to: � males: 0, 1.6,
16.1, 161 mg/kg b.w./day
� females: 0, 1.9, 18.8, 192 mg/kg bw/day
Comments: � Ophthalmolo -gical
examina-tion was not performed.
� Haematology and clinical chemistry were performed at 13 and 17 weeks.
Acceptable
2000 ppm Bodyweight development and food consumption (statistically significant): � Body weight gain (14.49 and 23.13 % in males and females respectively) after 13 weeks of treatment (0-13 week) and food consumption (8.85 and 10.49 % in males and females respectively) after 13 weeks of treatment (1-13 week). Haematology (statistically significant): � The haemoglobin concentration of males and the erythrocyte count
(RCB) of females were slightly higher than controls. � The mean platelet counts males were lower than the controls.
Blood chemistry (statistically significant): � �The brain cholinesterase activity (11%) � �Urea and cholesterol plasmatic levels in both sexes.
Organs weight modifications � Relative weight statistically significant: � Males: Liver, brain and kidney. � Females: Liver, brain and spleen
200 ppm Body weight development and food consumption (statistically significant): �Body weight gain (7%) and food consumption (8.48%) in males after the end period of treatment (0-13week).
NOAEL
200 ppm (16.1 and 18.8 mg/kg bw/day in males and females respectively) based on a significantly decrease in food consumption, body weight gain (14% in males and 23% in females) and increase in the relative liver weight for both sexes and in the relative kidney weights in males at 2000 ppm.
119 days capsule study Oral (capsule) Specie: Beagle Dogs Guideline : No GLP: Yes Purity: 91.3% Groups: 6 sex/ dose Dose levels: 0, 25, 75 and 200 mg/kg b.w./day Acceptable
200 mg/kg b.w./day Mortality: 11 from 12 dogs (5 males and 6 females) died or were sacrificed in extremis, beginning at week 5, with no females surviving by Week 12 and only one male surviving from week 8 through 17. Clinical signs of toxicity: emaciation, loss of appetite, bloody diarrhea. Some dogs showed proteinuria and hematuria, primarily at month 2 (evaluations not performed later due to mortality). Bodyweight development and food consumption: � Body weight (28.43 and 28.40% in males and females respectively) and food consumption (72 and 66.79 % in males and females respectively) until week 7 of treatment. Organs weight modifications: The only surviving animal had at the end of the study an extremely high relative liver weight compared to the controls. Microscopic findings: � Atrophy of the liver (1/6 male and 1/6 female). � Fatty infiltration of liver (1/6 male and 2/6 female). � Fatty infiltration of heart (1/6 female). � Fatty infiltration of the kidney (2/6 males and 4/6 females). � Thymus atrophy (4/6 males and 3/6 females). � Hypocellularity of the bone marrow (3/6 males and 2/6 females).
* The dose level of 200mg/kg bw/day is too high for a meaningful toxicological evaluation.
75 mg/kg b.w./day Mortality: One male died at week 11, with diarrhea and inactivity occurring in the last weeks prior to death. Bodyweight development and food consumption: � Body weight (12.8 and 14.89% in males and females respectively) and food consumption (3.9 and 8.7 % in males and females respectively), but they did not show any statistically significant differences to the control. However, the bodyweight gains at termination of the study were reduced (42 and 50% in males and females respectively).
Ahmed, F. E., 1980b
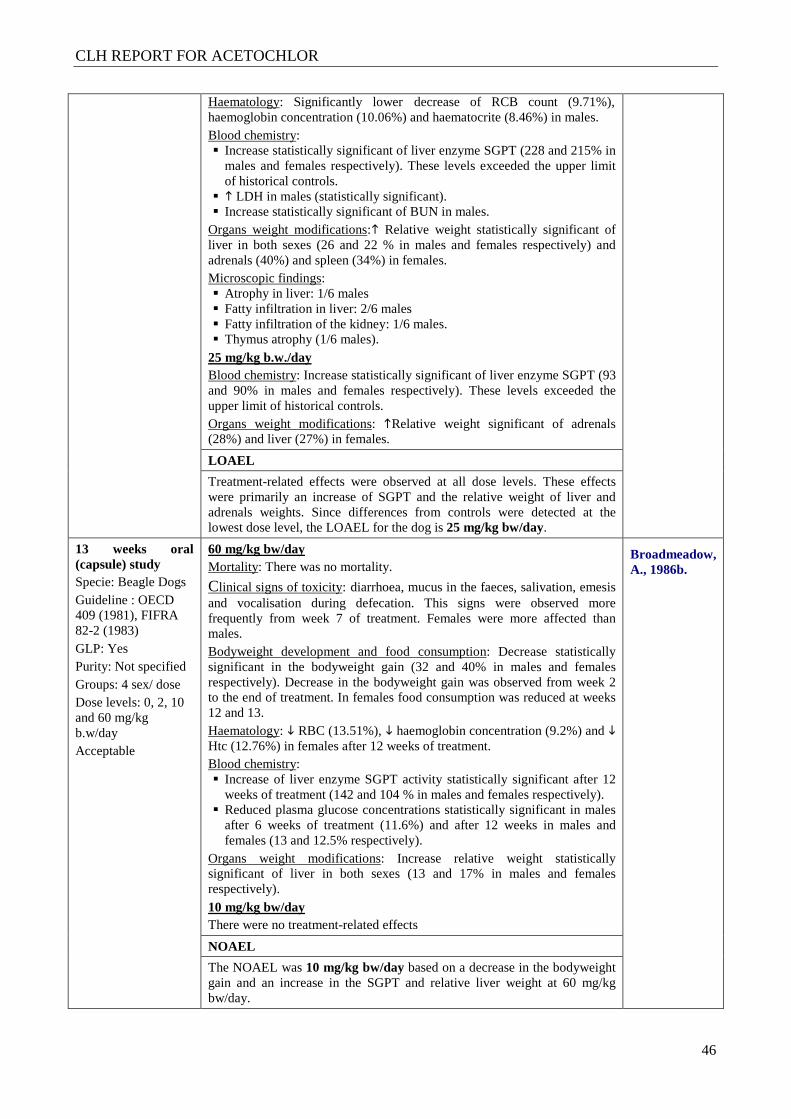
CLH REPORT FOR ACETOCHLOR
46
Haematology: Significantly lower decrease of RCB count (9.71%), haemoglobin concentration (10.06%) and haematocrite (8.46%) in males. Blood chemistry: � Increase statistically significant of liver enzyme SGPT (228 and 215% in
males and females respectively). These levels exceeded the upper limit of historical controls.
� � LDH in males (statistically significant). � Increase statistically significant of BUN in males.
Organs weight modifications:� Relative weight statistically significant of liver in both sexes (26 and 22 % in males and females respectively) and adrenals (40%) and spleen (34%) in females. Microscopic findings: � Atrophy in liver: 1/6 males � Fatty infiltration in liver: 2/6 males � Fatty infiltration of the kidney: 1/6 males. � Thymus atrophy (1/6 males).
25 mg/kg b.w./day Blood chemistry: Increase statistically significant of liver enzyme SGPT (93 and 90% in males and females respectively). These levels exceeded the upper limit of historical controls. Organs weight modifications: �Relative weight significant of adrenals (28%) and liver (27%) in females.
LOAEL
Treatment-related effects were observed at all dose levels. These effects were primarily an increase of SGPT and the relative weight of liver and adrenals weights. Since differences from controls were detected at the lowest dose level, the LOAEL for the dog is 25 mg/kg bw/day.
13 weeks oral (capsule) study Specie: Beagle Dogs Guideline : OECD 409 (1981), FIFRA 82-2 (1983) GLP: Yes Purity: Not specified Groups: 4 sex/ dose Dose levels: 0, 2, 10 and 60 mg/kg b.w/day Acceptable
60 mg/kg bw/day Mortality: There was no mortality.
Clinical signs of toxicity: diarrhoea, mucus in the faeces, salivation, emesis and vocalisation during defecation. This signs were observed more frequently from week 7 of treatment. Females were more affected than males. Bodyweight development and food consumption: Decrease statistically significant in the bodyweight gain (32 and 40% in males and females respectively). Decrease in the bodyweight gain was observed from week 2 to the end of treatment. In females food consumption was reduced at weeks 12 and 13. Haematology: � RBC (13.51%), � haemoglobin concentration (9.2%) and � Htc (12.76%) in females after 12 weeks of treatment. Blood chemistry: � Increase of liver enzyme SGPT activity statistically significant after 12
weeks of treatment (142 and 104 % in males and females respectively). � Reduced plasma glucose concentrations statistically significant in males
after 6 weeks of treatment (11.6%) and after 12 weeks in males and females (13 and 12.5% respectively).
Organs weight modifications: Increase relative weight statistically significant of liver in both sexes (13 and 17% in males and females respectively). 10 mg/kg bw/day There were no treatment-related effects
Broadmeadow, A., 1986b.
NOAEL
The NOAEL was 10 mg/kg bw/day based on a decrease in the bodyweight gain and an increase in the SGPT and relative liver weight at 60 mg/kg bw/day.
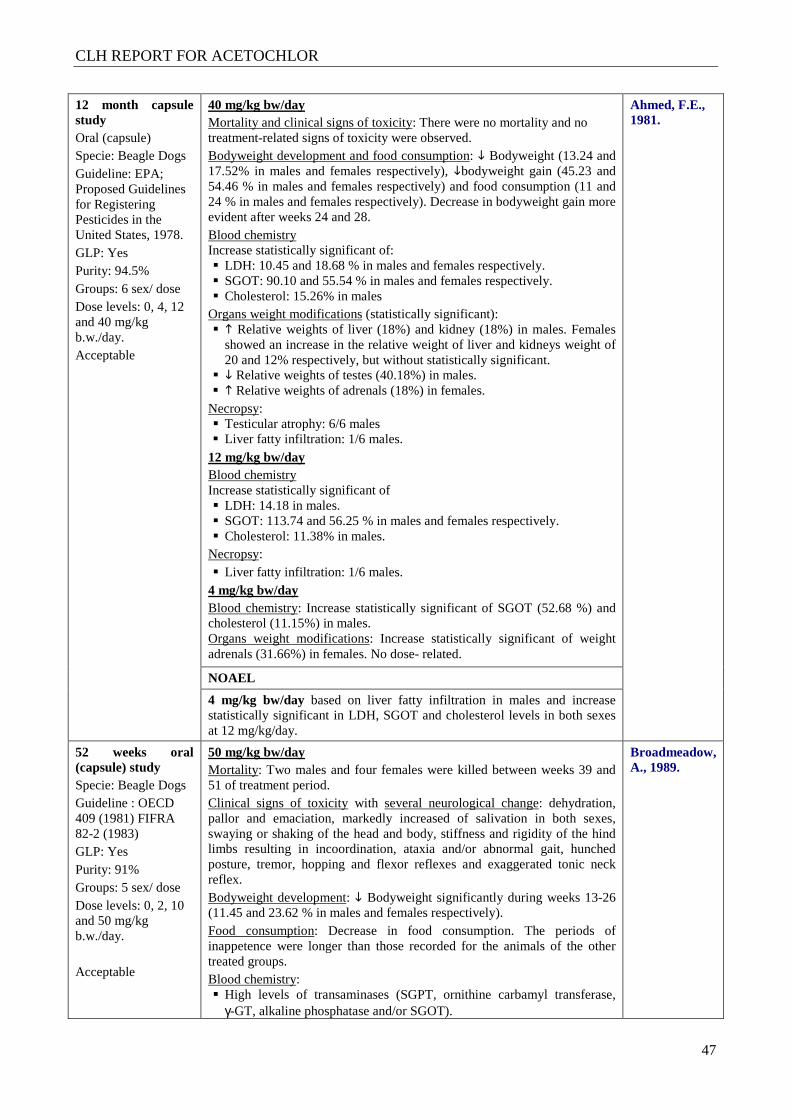
CLH REPORT FOR ACETOCHLOR
47
12 month capsule study Oral (capsule) Specie: Beagle Dogs Guideline: EPA; Proposed Guidelines for Registering Pesticides in the United States, 1978. GLP: Yes Purity: 94.5% Groups: 6 sex/ dose Dose levels: 0, 4, 12 and 40 mg/kg b.w./day. Acceptable
40 mg/kg bw/day Mortality and clinical signs of toxicity: There were no mortality and no treatment-related signs of toxicity were observed. Bodyweight development and food consumption: � Bodyweight (13.24 and 17.52% in males and females respectively), �bodyweight gain (45.23 and 54.46 % in males and females respectively) and food consumption (11 and 24 % in males and females respectively). Decrease in bodyweight gain more evident after weeks 24 and 28. Blood chemistry Increase statistically significant of: � LDH: 10.45 and 18.68 % in males and females respectively. � SGOT: 90.10 and 55.54 % in males and females respectively. � Cholesterol: 15.26% in males
Organs weight modifications (statistically significant): � � Relative weights of liver (18%) and kidney (18%) in males. Females
showed an increase in the relative weight of liver and kidneys weight of 20 and 12% respectively, but without statistically significant.
� � Relative weights of testes (40.18%) in males. � � Relative weights of adrenals (18%) in females.
Necropsy: � Testicular atrophy: 6/6 males � Liver fatty infiltration: 1/6 males.
12 mg/kg bw/day Blood chemistry Increase statistically significant of � LDH: 14.18 in males. � SGOT: 113.74 and 56.25 % in males and females respectively. � Cholesterol: 11.38% in males.
Necropsy: � Liver fatty infiltration: 1/6 males.
4 mg/kg bw/day Blood chemistry: Increase statistically significant of SGOT (52.68 %) and cholesterol (11.15%) in males. Organs weight modifications: Increase statistically significant of weight adrenals (31.66%) in females. No dose- related.
Ahmed, F.E., 1981.
NOAEL
4 mg/kg bw/day based on liver fatty infiltration in males and increase statistically significant in LDH, SGOT and cholesterol levels in both sexes at 12 mg/kg/day.
52 weeks oral (capsule) study Specie: Beagle Dogs Guideline : OECD 409 (1981) FIFRA 82-2 (1983) GLP: Yes Purity: 91% Groups: 5 sex/ dose Dose levels: 0, 2, 10 and 50 mg/kg b.w./day. Acceptable
50 mg/kg bw/day Mortality: Two males and four females were killed between weeks 39 and 51 of treatment period. Clinical signs of toxicity with several neurological change: dehydration, pallor and emaciation, markedly increased of salivation in both sexes, swaying or shaking of the head and body, stiffness and rigidity of the hind limbs resulting in incoordination, ataxia and/or abnormal gait, hunched posture, tremor, hopping and flexor reflexes and exaggerated tonic neck reflex. Bodyweight development: � Bodyweight significantly during weeks 13-26 (11.45 and 23.62 % in males and females respectively). Food consumption: Decrease in food consumption. The periods of inappetence were longer than those recorded for the animals of the other treated groups. Blood chemistry: � High levels of transaminases (SGPT, ornithine carbamyl transferase,
γ-GT, alkaline phosphatase and/or SGOT).
Broadmeadow, A., 1989.
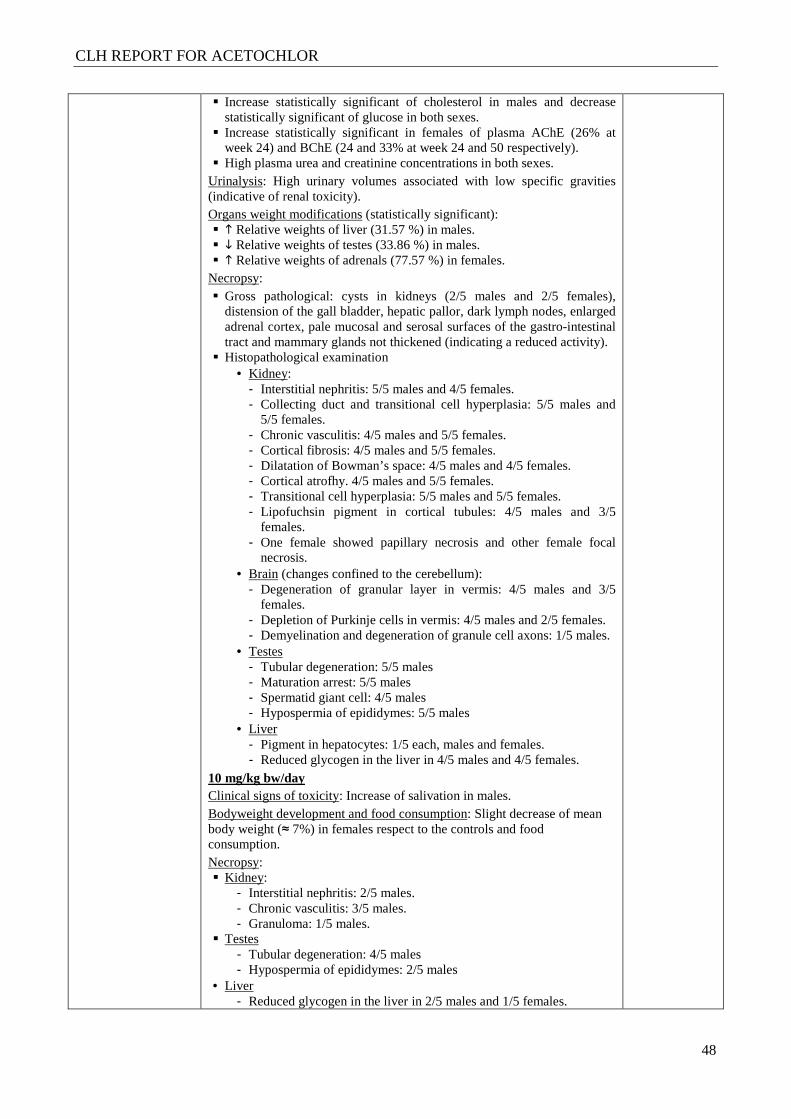
CLH REPORT FOR ACETOCHLOR
48
� Increase statistically significant of cholesterol in males and decrease statistically significant of glucose in both sexes.
� Increase statistically significant in females of plasma AChE (26% at week 24) and BChE (24 and 33% at week 24 and 50 respectively).
� High plasma urea and creatinine concentrations in both sexes. Urinalysis: High urinary volumes associated with low specific gravities (indicative of renal toxicity). Organs weight modifications (statistically significant): � � Relative weights of liver (31.57 %) in males. � � Relative weights of testes (33.86 %) in males. � � Relative weights of adrenals (77.57 %) in females.
Necropsy: � Gross pathological: cysts in kidneys (2/5 males and 2/5 females),
distension of the gall bladder, hepatic pallor, dark lymph nodes, enlarged adrenal cortex, pale mucosal and serosal surfaces of the gastro-intestinal tract and mammary glands not thickened (indicating a reduced activity).
� Histopathological examination • Kidney:
- Interstitial nephritis: 5/5 males and 4/5 females. - Collecting duct and transitional cell hyperplasia: 5/5 males and
5/5 females. - Chronic vasculitis: 4/5 males and 5/5 females. - Cortical fibrosis: 4/5 males and 5/5 females. - Dilatation of Bowman’s space: 4/5 males and 4/5 females. - Cortical atrofhy. 4/5 males and 5/5 females. - Transitional cell hyperplasia: 5/5 males and 5/5 females. - Lipofuchsin pigment in cortical tubules: 4/5 males and 3/5
females. - One female showed papillary necrosis and other female focal
necrosis. • Brain (changes confined to the cerebellum):
- Degeneration of granular layer in vermis: 4/5 males and 3/5 females.
- Depletion of Purkinje cells in vermis: 4/5 males and 2/5 females. - Demyelination and degeneration of granule cell axons: 1/5 males.
• Testes - Tubular degeneration: 5/5 males - Maturation arrest: 5/5 males - Spermatid giant cell: 4/5 males - Hypospermia of epididymes: 5/5 males
• Liver - Pigment in hepatocytes: 1/5 each, males and females. - Reduced glycogen in the liver in 4/5 males and 4/5 females.
10 mg/kg bw/day Clinical signs of toxicity: Increase of salivation in males. Bodyweight development and food consumption: Slight decrease of mean body weight (≈ 7%) in females respect to the controls and food consumption. Necropsy: � Kidney:
- Interstitial nephritis: 2/5 males. - Chronic vasculitis: 3/5 males. - Granuloma: 1/5 males.
� Testes - Tubular degeneration: 4/5 males - Hypospermia of epididymes: 2/5 males
• Liver - Reduced glycogen in the liver in 2/5 males and 1/5 females.
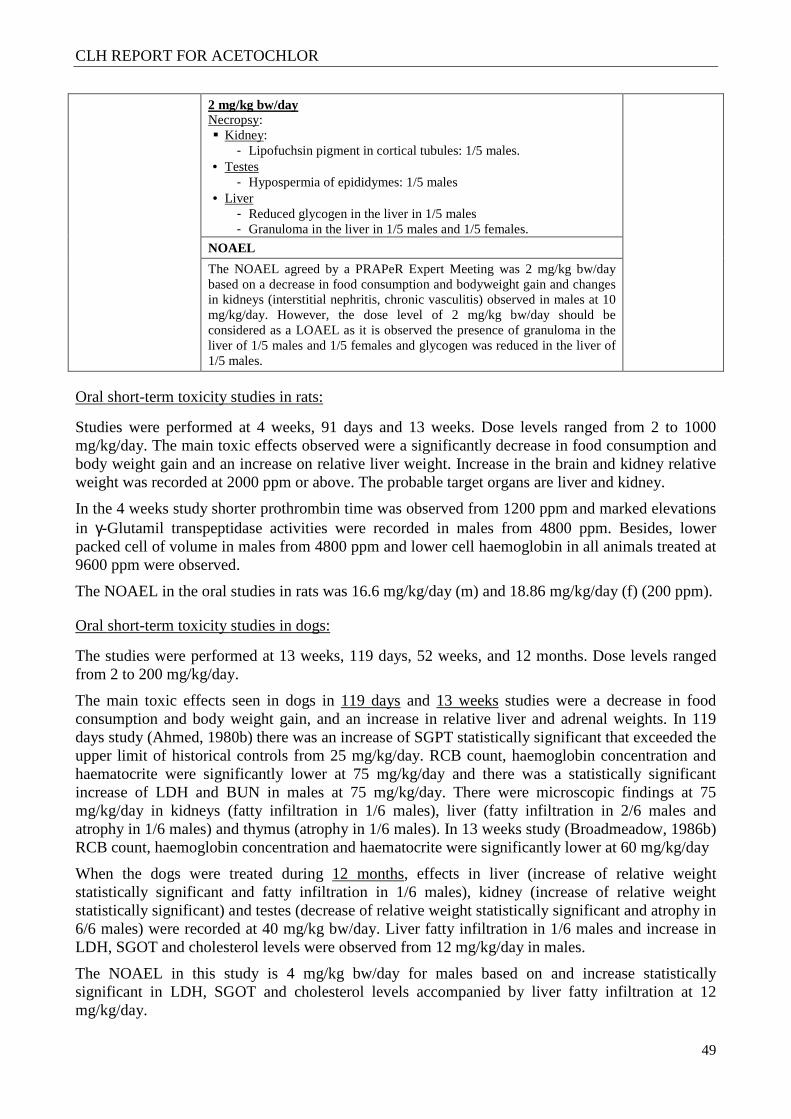
CLH REPORT FOR ACETOCHLOR
49
2 mg/kg bw/day Necropsy: � Kidney:
- Lipofuchsin pigment in cortical tubules: 1/5 males. • Testes
- Hypospermia of epididymes: 1/5 males • Liver
- Reduced glycogen in the liver in 1/5 males - Granuloma in the liver in 1/5 males and 1/5 females.
NOAEL
The NOAEL agreed by a PRAPeR Expert Meeting was 2 mg/kg bw/day based on a decrease in food consumption and bodyweight gain and changes in kidneys (interstitial nephritis, chronic vasculitis) observed in males at 10 mg/kg/day. However, the dose level of 2 mg/kg bw/day should be considered as a LOAEL as it is observed the presence of granuloma in the liver of 1/5 males and 1/5 females and glycogen was reduced in the liver of 1/5 males.
Oral short-term toxicity studies in rats:
Studies were performed at 4 weeks, 91 days and 13 weeks. Dose levels ranged from 2 to 1000 mg/kg/day. The main toxic effects observed were a significantly decrease in food consumption and body weight gain and an increase on relative liver weight. Increase in the brain and kidney relative weight was recorded at 2000 ppm or above. The probable target organs are liver and kidney.
In the 4 weeks study shorter prothrombin time was observed from 1200 ppm and marked elevations in γ-Glutamil transpeptidase activities were recorded in males from 4800 ppm. Besides, lower packed cell of volume in males from 4800 ppm and lower cell haemoglobin in all animals treated at 9600 ppm were observed.
The NOAEL in the oral studies in rats was 16.6 mg/kg/day (m) and 18.86 mg/kg/day (f) (200 ppm).
Oral short-term toxicity studies in dogs:
The studies were performed at 13 weeks, 119 days, 52 weeks, and 12 months. Dose levels ranged from 2 to 200 mg/kg/day.
The main toxic effects seen in dogs in 119 days and 13 weeks studies were a decrease in food consumption and body weight gain, and an increase in relative liver and adrenal weights. In 119 days study (Ahmed, 1980b) there was an increase of SGPT statistically significant that exceeded the upper limit of historical controls from 25 mg/kg/day. RCB count, haemoglobin concentration and haematocrite were significantly lower at 75 mg/kg/day and there was a statistically significant increase of LDH and BUN in males at 75 mg/kg/day. There were microscopic findings at 75 mg/kg/day in kidneys (fatty infiltration in 1/6 males), liver (fatty infiltration in 2/6 males and atrophy in 1/6 males) and thymus (atrophy in 1/6 males). In 13 weeks study (Broadmeadow, 1986b) RCB count, haemoglobin concentration and haematocrite were significantly lower at 60 mg/kg/day
When the dogs were treated during 12 months, effects in liver (increase of relative weight statistically significant and fatty infiltration in 1/6 males), kidney (increase of relative weight statistically significant) and testes (decrease of relative weight statistically significant and atrophy in 6/6 males) were recorded at 40 mg/kg bw/day. Liver fatty infiltration in 1/6 males and increase in LDH, SGOT and cholesterol levels were observed from 12 mg/kg/day in males.
The NOAEL in this study is 4 mg/kg bw/day for males based on and increase statistically significant in LDH, SGOT and cholesterol levels accompanied by liver fatty infiltration at 12 mg/kg/day.
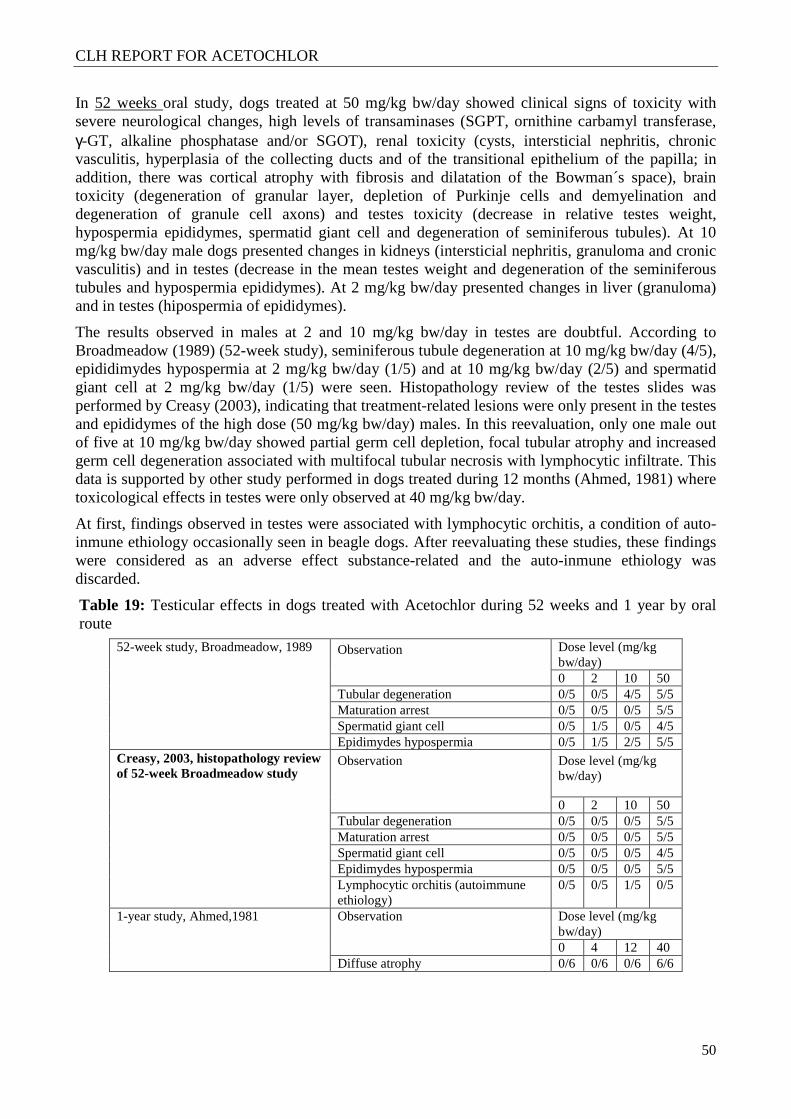
CLH REPORT FOR ACETOCHLOR
50
In 52 weeks oral study, dogs treated at 50 mg/kg bw/day showed clinical signs of toxicity with severe neurological changes, high levels of transaminases (SGPT, ornithine carbamyl transferase, γ-GT, alkaline phosphatase and/or SGOT), renal toxicity (cysts, intersticial nephritis, chronic vasculitis, hyperplasia of the collecting ducts and of the transitional epithelium of the papilla; in addition, there was cortical atrophy with fibrosis and dilatation of the Bowman´s space), brain toxicity (degeneration of granular layer, depletion of Purkinje cells and demyelination and degeneration of granule cell axons) and testes toxicity (decrease in relative testes weight, hypospermia epididymes, spermatid giant cell and degeneration of seminiferous tubules). At 10 mg/kg bw/day male dogs presented changes in kidneys (intersticial nephritis, granuloma and cronic vasculitis) and in testes (decrease in the mean testes weight and degeneration of the seminiferous tubules and hypospermia epididymes). At 2 mg/kg bw/day presented changes in liver (granuloma) and in testes (hipospermia of epididymes).
The results observed in males at 2 and 10 mg/kg bw/day in testes are doubtful. According to Broadmeadow (1989) (52-week study), seminiferous tubule degeneration at 10 mg/kg bw/day (4/5), epididimydes hypospermia at 2 mg/kg bw/day (1/5) and at 10 mg/kg bw/day (2/5) and spermatid giant cell at 2 mg/kg bw/day (1/5) were seen. Histopathology review of the testes slides was performed by Creasy (2003), indicating that treatment-related lesions were only present in the testes and epididymes of the high dose (50 mg/kg bw/day) males. In this reevaluation, only one male out of five at 10 mg/kg bw/day showed partial germ cell depletion, focal tubular atrophy and increased germ cell degeneration associated with multifocal tubular necrosis with lymphocytic infiltrate. This data is supported by other study performed in dogs treated during 12 months (Ahmed, 1981) where toxicological effects in testes were only observed at 40 mg/kg bw/day.
At first, findings observed in testes were associated with lymphocytic orchitis, a condition of auto-inmune ethiology occasionally seen in beagle dogs. After reevaluating these studies, these findings were considered as an adverse effect substance-related and the auto-inmune ethiology was discarded.
Table 19: Testicular effects in dogs treated with Acetochlor during 52 weeks and 1 year by oral route
52-week study, Broadmeadow, 1989 Observation Dose level (mg/kg bw/day) 0 2 10 50
Tubular degeneration 0/5 0/5 4/5 5/5 Maturation arrest 0/5 0/5 0/5 5/5 Spermatid giant cell 0/5 1/5 0/5 4/5 Epidimydes hypospermia 0/5 1/5 2/5 5/5
Creasy, 2003, histopathology review of 52-week Broadmeadow study
Observation Dose level (mg/kg bw/day)
0 2 10 50 Tubular degeneration 0/5 0/5 0/5 5/5 Maturation arrest 0/5 0/5 0/5 5/5 Spermatid giant cell 0/5 0/5 0/5 4/5 Epidimydes hypospermia 0/5 0/5 0/5 5/5 Lymphocytic orchitis (autoimmune ethiology)
0/5 0/5 1/5 0/5
1-year study, Ahmed,1981 Observation Dose level (mg/kg bw/day) 0 4 12 40
Diffuse atrophy 0/6 0/6 0/6 6/6
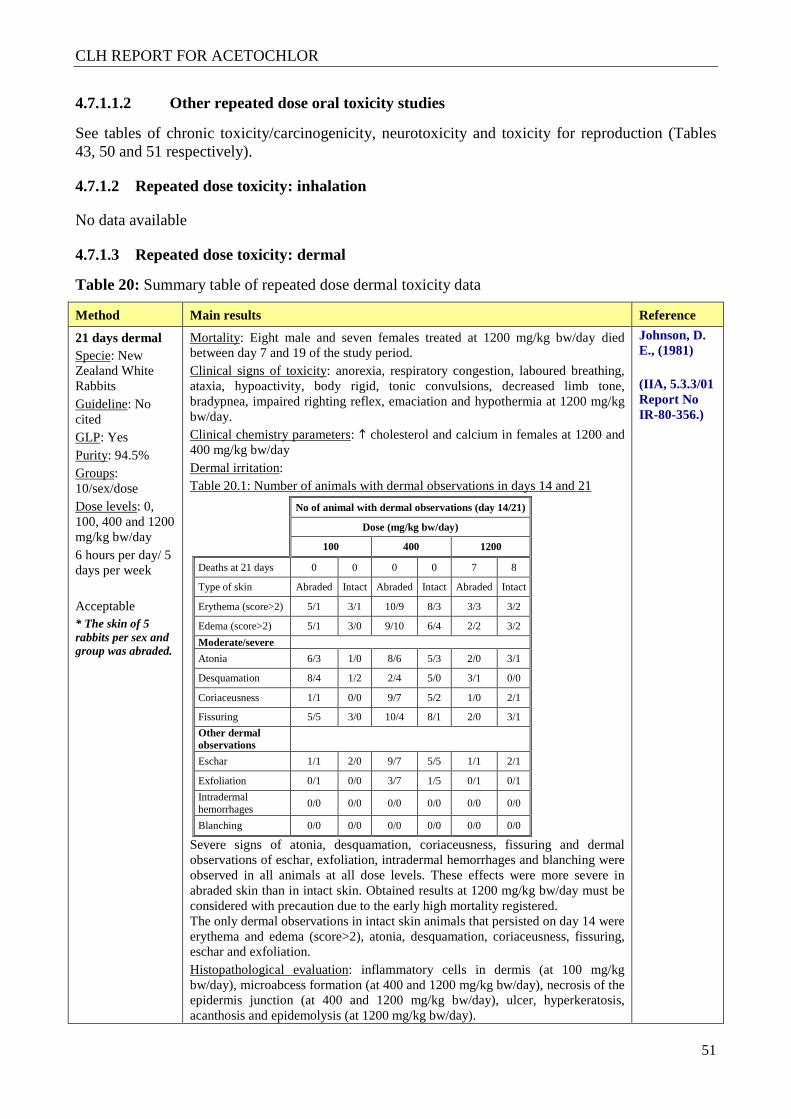
CLH REPORT FOR ACETOCHLOR
51
4.7.1.1.2 Other repeated dose oral toxicity studies
See tables of chronic toxicity/carcinogenicity, neurotoxicity and toxicity for reproduction (Tables 43, 50 and 51 respectively).
4.7.1.2 Repeated dose toxicity: inhalation
No data available
4.7.1.3 Repeated dose toxicity: dermal
Table 20: Summary table of repeated dose dermal toxicity data
Method Main results Reference
21 days dermal Specie: New Zealand White Rabbits Guideline: No cited GLP: Yes Purity: 94.5% Groups: 10/sex/dose Dose levels: 0, 100, 400 and 1200 mg/kg bw/day 6 hours per day/ 5 days per week Acceptable * The skin of 5 rabbits per sex and group was abraded.
Mortality: Eight male and seven females treated at 1200 mg/kg bw/day died between day 7 and 19 of the study period. Clinical signs of toxicity: anorexia, respiratory congestion, laboured breathing, ataxia, hypoactivity, body rigid, tonic convulsions, decreased limb tone, bradypnea, impaired righting reflex, emaciation and hypothermia at 1200 mg/kg bw/day. Clinical chemistry parameters: � cholesterol and calcium in females at 1200 and 400 mg/kg bw/day Dermal irritation: Table 20.1: Number of animals with dermal observations in days 14 and 21
No of animal with dermal observations (day 14/21)
Dose (mg/kg bw/day)
100 400 1200
Deaths at 21 days 0 0 0 0 7 8
Type of skin Abraded Intact Abraded Intact Abraded Intact
Erythema (score>2) 5/1 3/1 10/9 8/3 3/3 3/2
Edema (score>2) 5/1 3/0 9/10 6/4 2/2 3/2
Moderate/severe
Atonia 6/3 1/0 8/6 5/3 2/0 3/1
Desquamation 8/4 1/2 2/4 5/0 3/1 0/0
Coriaceusness 1/1 0/0 9/7 5/2 1/0 2/1
Fissuring 5/5 3/0 10/4 8/1 2/0 3/1
Other dermal observations
Eschar 1/1 2/0 9/7 5/5 1/1 2/1
Exfoliation 0/1 0/0 3/7 1/5 0/1 0/1
Intradermal hemorrhages
0/0 0/0 0/0 0/0 0/0 0/0
Blanching 0/0 0/0 0/0 0/0 0/0 0/0
Severe signs of atonia, desquamation, coriaceusness, fissuring and dermal observations of eschar, exfoliation, intradermal hemorrhages and blanching were observed in all animals at all dose levels. These effects were more severe in abraded skin than in intact skin. Obtained results at 1200 mg/kg bw/day must be considered with precaution due to the early high mortality registered. The only dermal observations in intact skin animals that persisted on day 14 were erythema and edema (score>2), atonia, desquamation, coriaceusness, fissuring, eschar and exfoliation. Histopathological evaluation: inflammatory cells in dermis (at 100 mg/kg bw/day), microabcess formation (at 400 and 1200 mg/kg bw/day), necrosis of the epidermis junction (at 400 and 1200 mg/kg bw/day), ulcer, hyperkeratosis, acanthosis and epidemolysis (at 1200 mg/kg bw/day).
Johnson, D. E., (1981) (IIA, 5.3.3/01 Report No IR-80-356.)
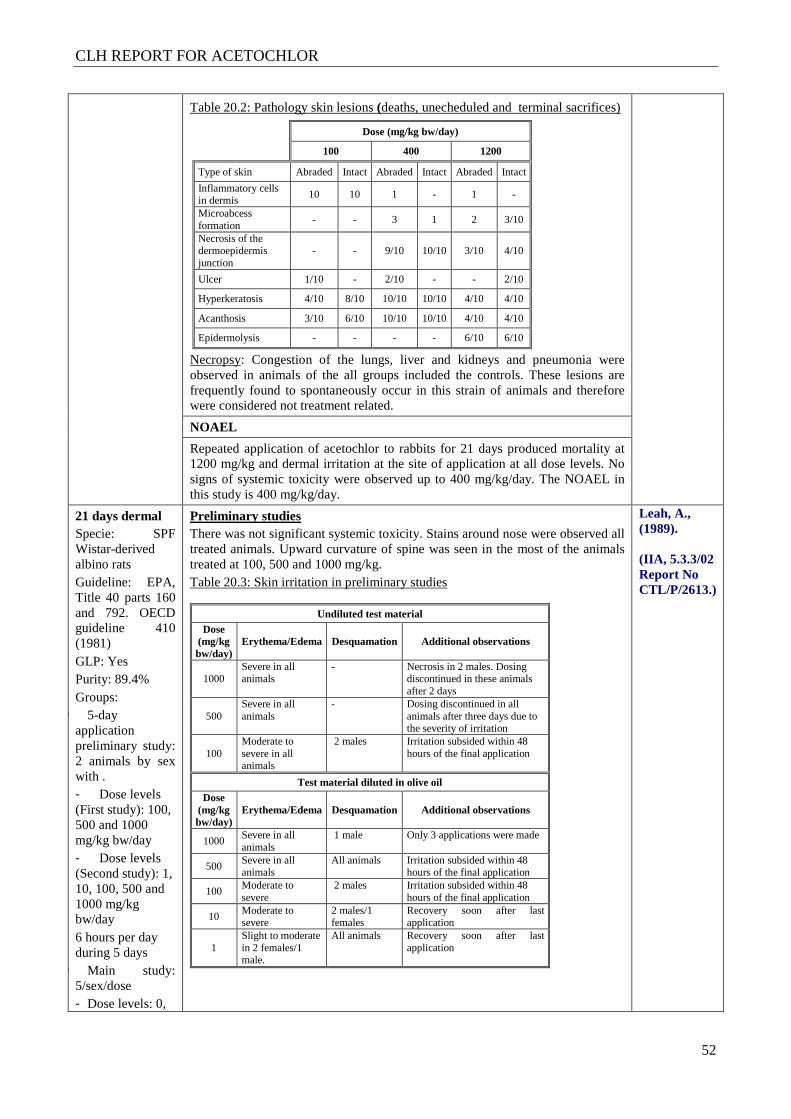
CLH REPORT FOR ACETOCHLOR
52
Table 20.2: Pathology skin lesions (deaths, unecheduled and terminal sacrifices)
Dose (mg/kg bw/day)
100 400 1200
Type of skin Abraded Intact Abraded Intact Abraded Intact
Inflammatory cells in dermis
10 10 1 - 1 -
Microabcess formation
- - 3 1 2 3/10
Necrosis of the dermoepidermis junction
- - 9/10 10/10 3/10 4/10
Ulcer 1/10 - 2/10 - - 2/10
Hyperkeratosis 4/10 8/10 10/10 10/10 4/10 4/10
Acanthosis 3/10 6/10 10/10 10/10 4/10 4/10
Epidermolysis - - - - 6/10 6/10
Necropsy: Congestion of the lungs, liver and kidneys and pneumonia were observed in animals of the all groups included the controls. These lesions are frequently found to spontaneously occur in this strain of animals and therefore were considered not treatment related.
NOAEL
Repeated application of acetochlor to rabbits for 21 days produced mortality at 1200 mg/kg and dermal irritation at the site of application at all dose levels. No signs of systemic toxicity were observed up to 400 mg/kg/day. The NOAEL in this study is 400 mg/kg/day.
21 days dermal Specie: SPF Wistar-derived albino rats Guideline: EPA, Title 40 parts 160 and 792. OECD guideline 410 (1981) GLP: Yes Purity: 89.4% Groups:
� 5-day application preliminary study: 2 animals by sex with . - Dose levels (First study): 100, 500 and 1000 mg/kg bw/day - Dose levels (Second study): 1, 10, 100, 500 and 1000 mg/kg bw/day 6 hours per day during 5 days
� Main study: 5/sex/dose - Dose levels: 0,
Preliminary studies There was not significant systemic toxicity. Stains around nose were observed all treated animals. Upward curvature of spine was seen in the most of the animals treated at 100, 500 and 1000 mg/kg. Table 20.3: Skin irritation in preliminary studies
Undiluted test material Dose
(mg/kg bw/day)
Erythema/Edema Desquamation Additional observations
1000 Severe in all animals
- Necrosis in 2 males. Dosing discontinued in these animals after 2 days
500 Severe in all animals
- Dosing discontinued in all animals after three days due to the severity of irritation
100 Moderate to severe in all animals
2 males Irritation subsided within 48 hours of the final application
Test material diluted in olive oil Dose
(mg/kg bw/day)
Erythema/Edema Desquamation Additional observations
1000 Severe in all animals
1 male Only 3 applications were made
500 Severe in all animals
All animals Irritation subsided within 48 hours of the final application
100 Moderate to severe
2 males Irritation subsided within 48 hours of the final application
10 Moderate to severe
2 males/1 females
Recovery soon after last application
1 Slight to moderate in 2 females/1 male.
All animals Recovery soon after last application
Leah, A., (1989). (IIA, 5.3.3/02 Report No CTL/P/2613.)
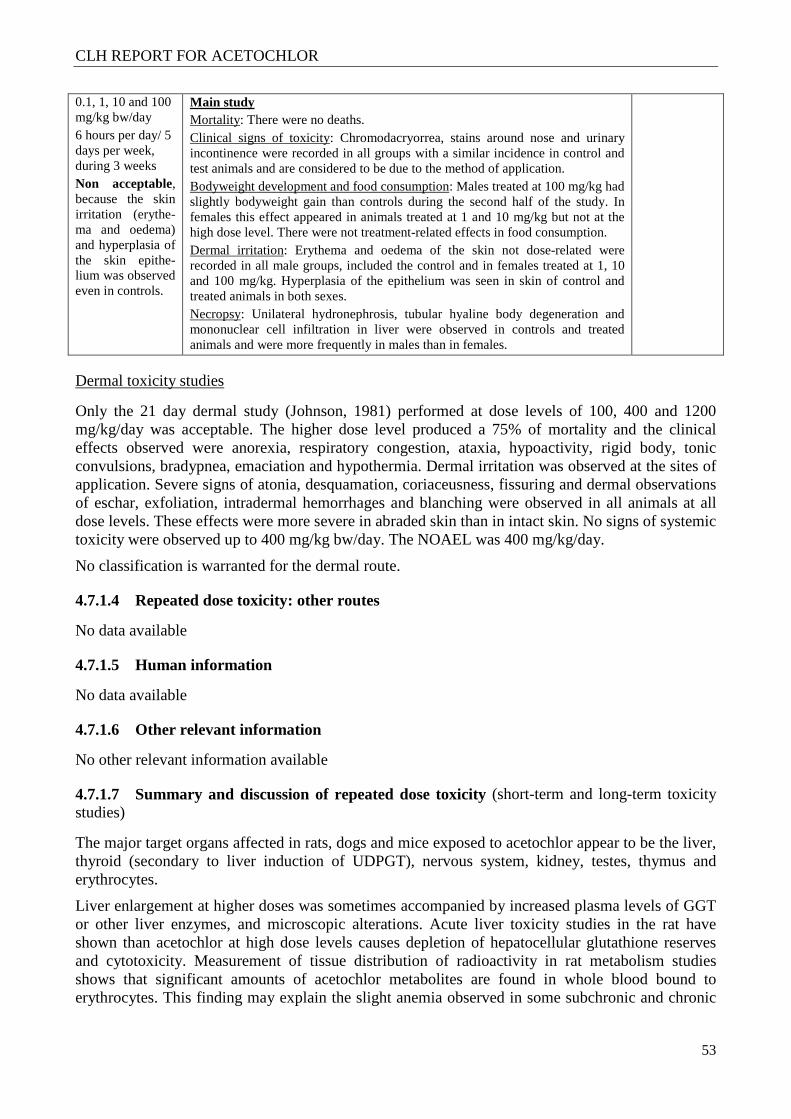
CLH REPORT FOR ACETOCHLOR
53
0.1, 1, 10 and 100 mg/kg bw/day 6 hours per day/ 5 days per week, during 3 weeks Non acceptable, because the skin irritation (erythe-ma and oedema) and hyperplasia of the skin epithe-lium was observed even in controls.
Main study Mortality: There were no deaths. Clinical signs of toxicity: Chromodacryorrea, stains around nose and urinary incontinence were recorded in all groups with a similar incidence in control and test animals and are considered to be due to the method of application. Bodyweight development and food consumption: Males treated at 100 mg/kg had slightly bodyweight gain than controls during the second half of the study. In females this effect appeared in animals treated at 1 and 10 mg/kg but not at the high dose level. There were not treatment-related effects in food consumption. Dermal irritation: Erythema and oedema of the skin not dose-related were recorded in all male groups, included the control and in females treated at 1, 10 and 100 mg/kg. Hyperplasia of the epithelium was seen in skin of control and treated animals in both sexes. Necropsy: Unilateral hydronephrosis, tubular hyaline body degeneration and mononuclear cell infiltration in liver were observed in controls and treated animals and were more frequently in males than in females.
Dermal toxicity studies
Only the 21 day dermal study (Johnson, 1981) performed at dose levels of 100, 400 and 1200 mg/kg/day was acceptable. The higher dose level produced a 75% of mortality and the clinical effects observed were anorexia, respiratory congestion, ataxia, hypoactivity, rigid body, tonic convulsions, bradypnea, emaciation and hypothermia. Dermal irritation was observed at the sites of application. Severe signs of atonia, desquamation, coriaceusness, fissuring and dermal observations of eschar, exfoliation, intradermal hemorrhages and blanching were observed in all animals at all dose levels. These effects were more severe in abraded skin than in intact skin. No signs of systemic toxicity were observed up to 400 mg/kg bw/day. The NOAEL was 400 mg/kg/day.
No classification is warranted for the dermal route.
4.7.1.4 Repeated dose toxicity: other routes
No data available
4.7.1.5 Human information
No data available
4.7.1.6 Other relevant information
No other relevant information available
4.7.1.7 Summary and discussion of repeated dose toxicity (short-term and long-term toxicity studies)
The major target organs affected in rats, dogs and mice exposed to acetochlor appear to be the liver, thyroid (secondary to liver induction of UDPGT), nervous system, kidney, testes, thymus and erythrocytes.
Liver enlargement at higher doses was sometimes accompanied by increased plasma levels of GGT or other liver enzymes, and microscopic alterations. Acute liver toxicity studies in the rat have shown than acetochlor at high dose levels causes depletion of hepatocellular glutathione reserves and cytotoxicity. Measurement of tissue distribution of radioactivity in rat metabolism studies shows that significant amounts of acetochlor metabolites are found in whole blood bound to erythrocytes. This finding may explain the slight anemia observed in some subchronic and chronic
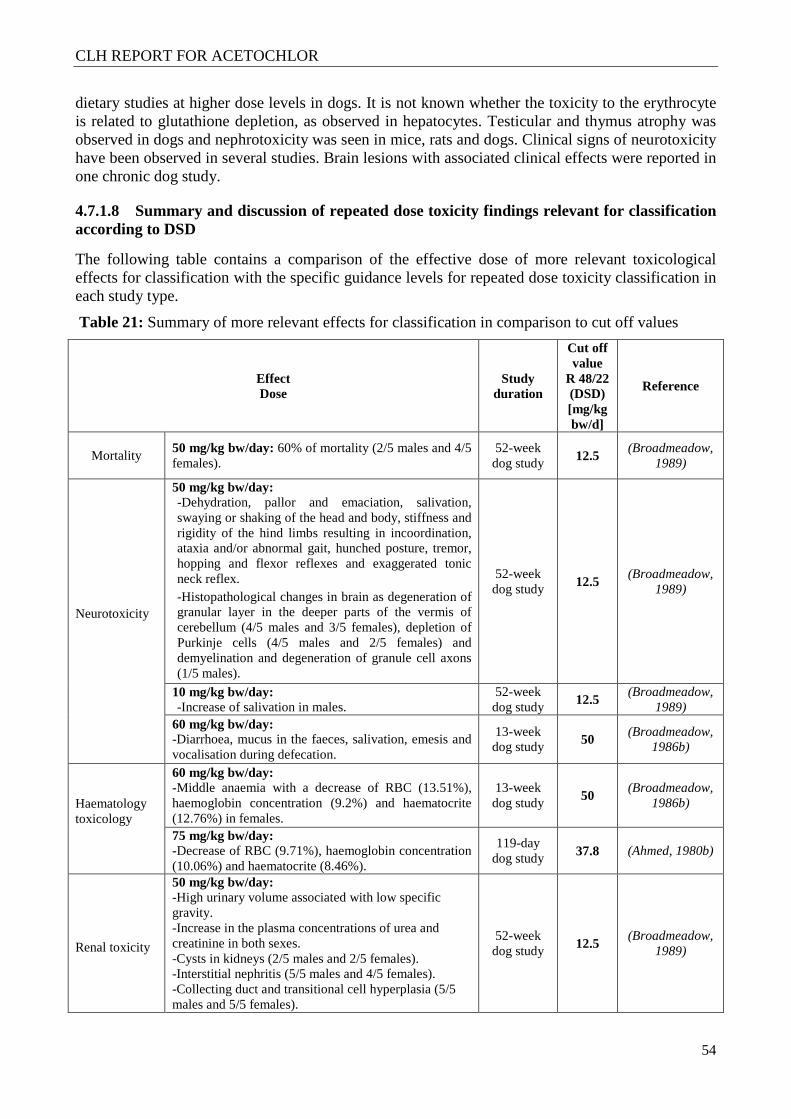
CLH REPORT FOR ACETOCHLOR
54
dietary studies at higher dose levels in dogs. It is not known whether the toxicity to the erythrocyte is related to glutathione depletion, as observed in hepatocytes. Testicular and thymus atrophy was observed in dogs and nephrotoxicity was seen in mice, rats and dogs. Clinical signs of neurotoxicity have been observed in several studies. Brain lesions with associated clinical effects were reported in one chronic dog study.
4.7.1.8 Summary and discussion of repeated dose toxicity findings relevant for classification according to DSD
The following table contains a comparison of the effective dose of more relevant toxicological effects for classification with the specific guidance levels for repeated dose toxicity classification in each study type.
Table 21: Summary of more relevant effects for classification in comparison to cut off values
Effect Dose
Study duration
Cut off value
R 48/22 (DSD) [mg/kg bw/d]
Reference
Mortality 50 mg/kg bw/day: 60% of mortality (2/5 males and 4/5 females).
52-week dog study 12.5
(Broadmeadow, 1989)
Neurotoxicity
50 mg/kg bw/day: -Dehydration, pallor and emaciation, salivation, swaying or shaking of the head and body, stiffness and rigidity of the hind limbs resulting in incoordination, ataxia and/or abnormal gait, hunched posture, tremor, hopping and flexor reflexes and exaggerated tonic neck reflex. -Histopathological changes in brain as degeneration of granular layer in the deeper parts of the vermis of cerebellum (4/5 males and 3/5 females), depletion of Purkinje cells (4/5 males and 2/5 females) and demyelination and degeneration of granule cell axons (1/5 males).
52-week dog study 12.5
(Broadmeadow, 1989)
10 mg/kg bw/day: -Increase of salivation in males.
52-week dog study 12.5
(Broadmeadow, 1989)
60 mg/kg bw/day: -Diarrhoea, mucus in the faeces, salivation, emesis and vocalisation during defecation.
13-week dog study 50
(Broadmeadow, 1986b)
Haematology toxicology
60 mg/kg bw/day: -Middle anaemia with a decrease of RBC (13.51%), haemoglobin concentration (9.2%) and haematocrite (12.76%) in females.
13-week dog study 50
(Broadmeadow, 1986b)
75 mg/kg bw/day: -Decrease of RBC (9.71%), haemoglobin concentration (10.06%) and haematocrite (8.46%).
119-day dog study 37.8 (Ahmed, 1980b)
Renal toxicity
50 mg/kg bw/day: -High urinary volume associated with low specific gravity. -Increase in the plasma concentrations of urea and creatinine in both sexes. -Cysts in kidneys (2/5 males and 2/5 females). -Interstitial nephritis (5/5 males and 4/5 females). -Collecting duct and transitional cell hyperplasia (5/5 males and 5/5 females).
52-week dog study 12.5
(Broadmeadow, 1989)
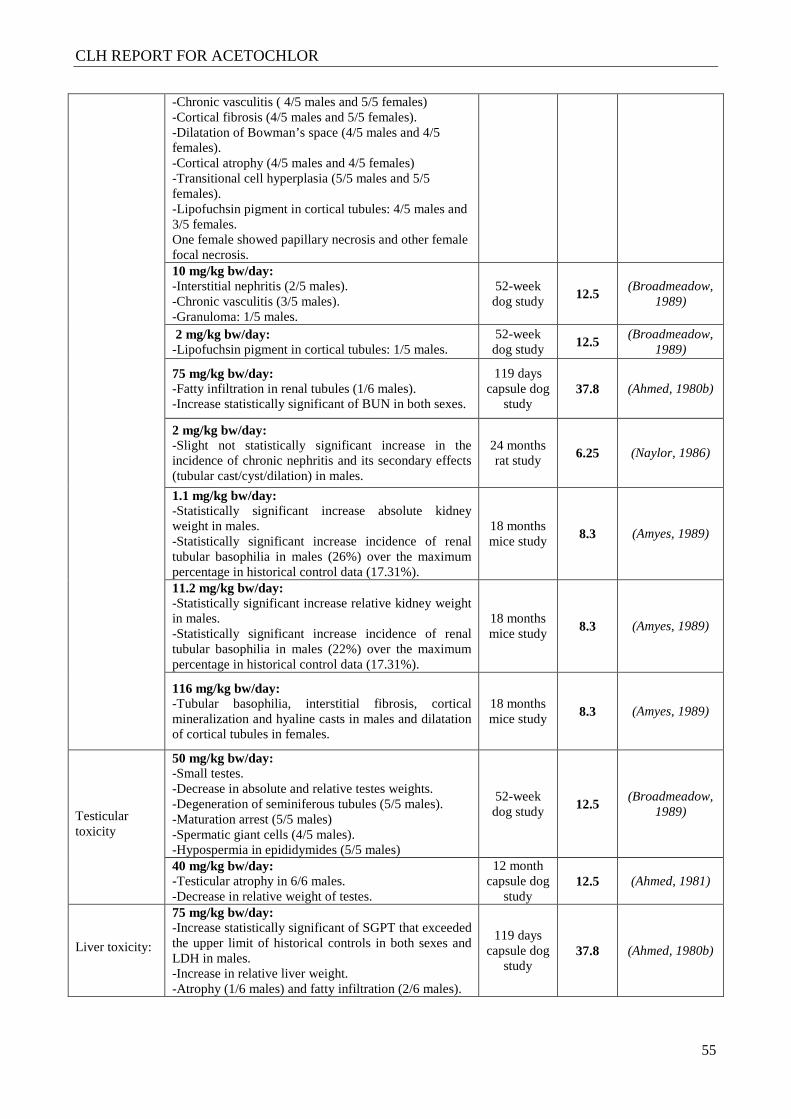
CLH REPORT FOR ACETOCHLOR
55
-Chronic vasculitis ( 4/5 males and 5/5 females) -Cortical fibrosis (4/5 males and 5/5 females). -Dilatation of Bowman’s space (4/5 males and 4/5 females). -Cortical atrophy (4/5 males and 4/5 females) -Transitional cell hyperplasia (5/5 males and 5/5 females). -Lipofuchsin pigment in cortical tubules: 4/5 males and 3/5 females. One female showed papillary necrosis and other female focal necrosis. 10 mg/kg bw/day: -Interstitial nephritis (2/5 males). -Chronic vasculitis (3/5 males). -Granuloma: 1/5 males.
52-week dog study 12.5
(Broadmeadow, 1989)
2 mg/kg bw/day: -Lipofuchsin pigment in cortical tubules: 1/5 males.
52-week dog study 12.5
(Broadmeadow, 1989)
75 mg/kg bw/day: -Fatty infiltration in renal tubules (1/6 males). -Increase statistically significant of BUN in both sexes.
119 days capsule dog
study 37.8 (Ahmed, 1980b)
2 mg/kg bw/day: -Slight not statistically significant increase in the incidence of chronic nephritis and its secondary effects (tubular cast/cyst/dilation) in males.
24 months rat study 6.25 (Naylor, 1986)
1.1 mg/kg bw/day: -Statistically significant increase absolute kidney weight in males. -Statistically significant increase incidence of renal tubular basophilia in males (26%) over the maximum percentage in historical control data (17.31%).
18 months mice study 8.3 (Amyes, 1989)
11.2 mg/kg bw/day: -Statistically significant increase relative kidney weight in males. -Statistically significant increase incidence of renal tubular basophilia in males (22%) over the maximum percentage in historical control data (17.31%).
18 months mice study 8.3 (Amyes, 1989)
116 mg/kg bw/day: -Tubular basophilia, interstitial fibrosis, cortical mineralization and hyaline casts in males and dilatation of cortical tubules in females.
18 months mice study 8.3 (Amyes, 1989)
Testicular toxicity
50 mg/kg bw/day: -Small testes. -Decrease in absolute and relative testes weights. -Degeneration of seminiferous tubules (5/5 males). -Maturation arrest (5/5 males) -Spermatic giant cells (4/5 males). -Hypospermia in epididymides (5/5 males)
52-week dog study 12.5
(Broadmeadow, 1989)
40 mg/kg bw/day: -Testicular atrophy in 6/6 males. -Decrease in relative weight of testes.
12 month capsule dog
study 12.5 (Ahmed, 1981)
Liver toxicity:
75 mg/kg bw/day: -Increase statistically significant of SGPT that exceeded the upper limit of historical controls in both sexes and LDH in males. -Increase in relative liver weight. -Atrophy (1/6 males) and fatty infiltration (2/6 males).
119 days capsule dog
study 37.8 (Ahmed, 1980b)
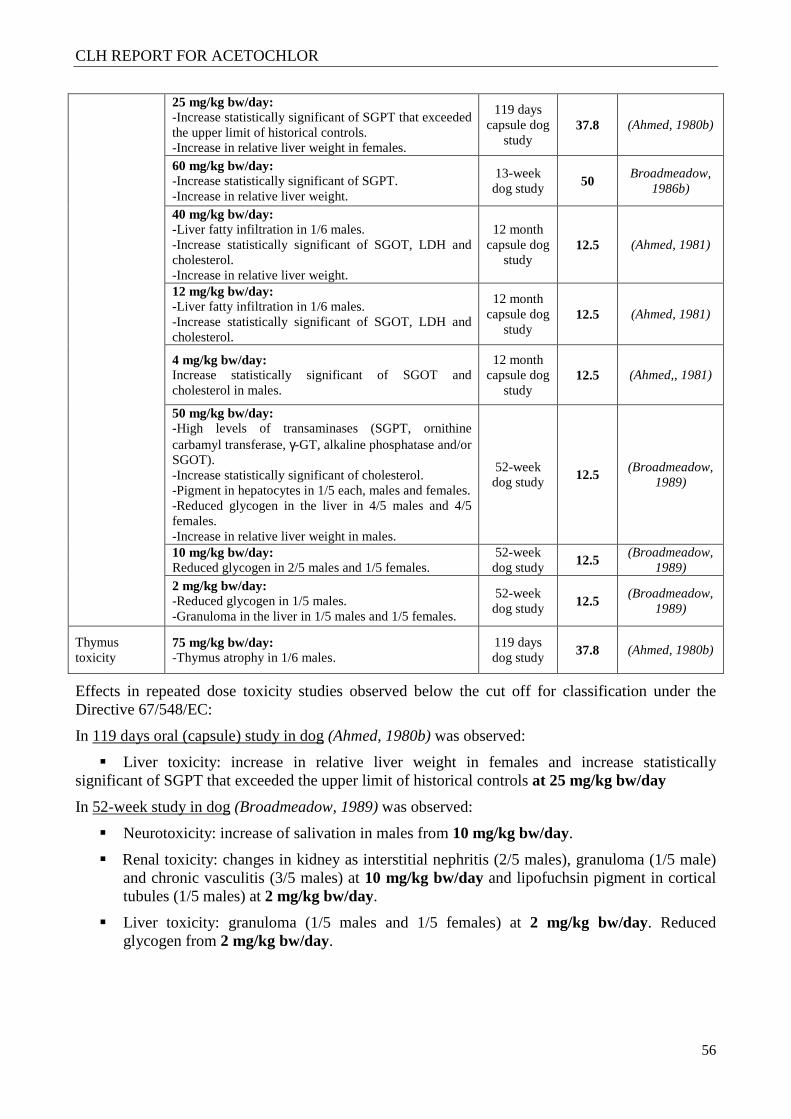
CLH REPORT FOR ACETOCHLOR
56
25 mg/kg bw/day: -Increase statistically significant of SGPT that exceeded the upper limit of historical controls. -Increase in relative liver weight in females.
119 days capsule dog
study 37.8 (Ahmed, 1980b)
60 mg/kg bw/day: -Increase statistically significant of SGPT. -Increase in relative liver weight.
13-week dog study 50
Broadmeadow, 1986b)
40 mg/kg bw/day: -Liver fatty infiltration in 1/6 males. -Increase statistically significant of SGOT, LDH and cholesterol. -Increase in relative liver weight.
12 month capsule dog
study 12.5 (Ahmed, 1981)
12 mg/kg bw/day: -Liver fatty infiltration in 1/6 males. -Increase statistically significant of SGOT, LDH and cholesterol.
12 month capsule dog
study 12.5 (Ahmed, 1981)
4 mg/kg bw/day: Increase statistically significant of SGOT and cholesterol in males.
12 month capsule dog
study 12.5 (Ahmed,, 1981)
50 mg/kg bw/day: -High levels of transaminases (SGPT, ornithine carbamyl transferase, γ-GT, alkaline phosphatase and/or SGOT). -Increase statistically significant of cholesterol. -Pigment in hepatocytes in 1/5 each, males and females. -Reduced glycogen in the liver in 4/5 males and 4/5 females. -Increase in relative liver weight in males.
52-week dog study 12.5
(Broadmeadow, 1989)
10 mg/kg bw/day: Reduced glycogen in 2/5 males and 1/5 females.
52-week dog study 12.5
(Broadmeadow, 1989)
2 mg/kg bw/day: -Reduced glycogen in 1/5 males. -Granuloma in the liver in 1/5 males and 1/5 females.
52-week dog study 12.5
(Broadmeadow, 1989)
Thymus toxicity
75 mg/kg bw/day: -Thymus atrophy in 1/6 males.
119 days dog study 37.8 (Ahmed, 1980b)
Effects in repeated dose toxicity studies observed below the cut off for classification under the Directive 67/548/EC:
In 119 days oral (capsule) study in dog (Ahmed, 1980b) was observed:
� Liver toxicity: increase in relative liver weight in females and increase statistically significant of SGPT that exceeded the upper limit of historical controls at 25 mg/kg bw/day
In 52-week study in dog (Broadmeadow, 1989) was observed:
� Neurotoxicity: increase of salivation in males from 10 mg/kg bw/day.
� Renal toxicity: changes in kidney as interstitial nephritis (2/5 males), granuloma (1/5 male) and chronic vasculitis (3/5 males) at 10 mg/kg bw/day and lipofuchsin pigment in cortical tubules (1/5 males) at 2 mg/kg bw/day.
� Liver toxicity: granuloma (1/5 males and 1/5 females) at 2 mg/kg bw/day. Reduced glycogen from 2 mg/kg bw/day.
CLH REPORT FOR ACETOCHLOR
57
In 12 month oral (capsule) study in dog (Ahmed, 1981) was observed:
� Liver toxicity: fatty infiltration in 1/6 males and statistically significant increase of SGOT, LDH, and cholesterol at 12 mg/kg bw/day and statistically significant increase of SGOT and cholesterol at 4 mg/kg bw/day in males.
In 18 months mice study (Amyes, 1989) was observed:
� Renal toxicity: statistically significant increased absolute kidney weight in males and statistically significant increased incidence of renal tubular basophilia in males from 1.1 mg/kg bw/day.
In 24 months rat study (Naylor, 1986) was observed:
� Renal toxicity: slight increase not statistically significant in the incidence of chronic nephritis and its secondary effects (tubular cast/cyst/dilation) in males at 2 mg/kg bw/day.
4.7.1.9 Comparison with criteria of repeated dose toxicity findings relevant for classification according to DSD
Rat is the species on which the oral cut-off values for repeated exposure according to Directive 67/548/EC are based on. Haber´s rule is used to adjust the standard guidance values, which are for studies of 90-day duration, for studies of longer or shorter durations. The cut-off values for classification as Xn R48/22 are then the following: ≤ 150 mg/kg bw/day from subacute studies on rat (28 days), ≤ 50 mg/kg bw/day from subchronic studies on rat (90 days), ≤ 12.5 mg/kg bw/day from one year studies and ≤ 6.25 mg/kg bw/day from two year studies. For the time being, there is no agreed EU position on how to apply the guidance values for classification of tested species other than rats. The current practice of RAC is to apply the guidance values for rats to other species as well (RAC has applied this approach in several opinons as in the case of bifenthrin, cymoxanil or fenpyrazamine).
A substance is classified with R48 under Directive 67/548/EEC when it has produced or has been shown to have the potential to produce serious damage (clear functional disturbance or morphological change which has toxicological significance), following repeated exposure by the oral, dermal or inhalation routes. It is particularly important when changes are irreversible. This can be on the basis of human data or evidence from studies in animals that cause such adverse effects at or below guidance values.
After repeated exposure, effects on kidney and liver were observed below the cut-off values for classification under DSD criteria.
In the 12-month dog study (Ahmed, 1981), liver fatty infiltration was observed in one male from 12 mg/kg bw/d (cut-off value of 12.5 mg/kg bw/d for R48/22) accompanied by changes in biochemistry such as significant increase of SGOT, LDH and cholesterol. Besides, in a 52-week dog study (Broadmeadow, 1989), granuloma was observed in one female and one male at the lowest dose level of 2 mg/kg bw/d (cut-off value of 12.5 mg/kg bw/d for R48/22). However, this lesion was not seen at higher dose levels and thus its relevance is unclear.
Relevant effects on kidney were also seen after acetochlor treatment. In the 52-week dog study (Broadmeadow, 1989), interstitial nephritis affecting the interstititum of the kidneys surrounding the tubules was observed in two males at 10 mg/kg bw/d and in five males and four females at 50 mg/kg bw/d (cut-off value of 12.5 mg/kg bw/d). Chronic vasculitis was seen in three males at 10 mg/kg bw/d and in four males and five females at 50 mg/kg bw/d. Granuloma was also observed in one male at 10 mg/kg bw/d. However, the significance of this lesion is unclear since it did not occur at higher dose levels. In the 24-months rat study (Naylor, 1986), slight increase not statistically significant in the incidence of chronic nephritis and its secondary effects (tubular cast/cyst/dilation)
CLH REPORT FOR ACETOCHLOR
58
was observed in males at 2 mg/kg bw/day (cut-off value of 6.25 mg/kg bw/d). In the 18-month mice study (Amyes, 1989), tubular basophilia was observed in males at doses from 1.1 mg/kg bw/d above the range of historical controls and below the guidance value for oral R48/22 (8.3 mg/kg bw/d). This is a relatively frequent spontaneous finding in young male rats associated with renal tubule regeneration occurred after injury to normal tubule epithelium. It has been tabulated as a natural renal lesion in CD-1 mice. However, it can also be induced by nephrotoxic agents. It has to be pointed out that the EFSA, on its Conclusion on the Pesticide Peer Review on Acetochlor (2011), argumented that the occurrence of tubular basophilia at the low dose, above historical control data and accompanied by an increased kidney weight, was considered as a first step of nephrotoxicity.
4.7.1.10 Conclusions on classification and labelling of repeated dose toxicity findings relevant for classification according to DSD.
Acetochlor is currently included in Annex VI of the CLP regulation and it is not classify with respect to repeated dose toxicity (concluded at the TC C&L meeting of November 1997). EFSA in Scientific Report (2011) proposed to classify acetochlor as (DSD) Xn; R 48/22 “Harmful: danger of serious damage to health by prolonged exposure if swallowed”, based on effects observed at 50 mg/kg bw/day in the 52-week dog study (mortalities, severe histopathological changes in the cerebellum, kidneys and testes). However, these effects are above the cut-off level for classification under the DSD regulation of 12.5 mg/kg bw/day in 1 year studies.
Severe effects on kidney (interstitial nephritis, chronic vasculitis and tubular basophilia) and liver (fatty infiltration) were observed after repeated exposure below the cut-off levels for classification as R48/22. These lesions are regarded as an evidence of clear functional disturbance and morphological changes in these organs and thus considered toxicologically relevant. Therefore, the overall weight of evidence appears to be sufficient for classifying acetochlor as for repeated toxicity according to DSD criteria as R48/22.
4.8 Specific target organ toxicity (CLP Regulation) –Repeated exposure (STOT RE)
4.8.1 Summary and discussion of repeated dose toxicity findings relevant for classification as STOT RE according to CLP
The following table contains a comparison of the effective dose of more relevant toxicological effects for classification with the specific guidance levels for specific target organ toxicity classification in each study type.
DSD: R48/22
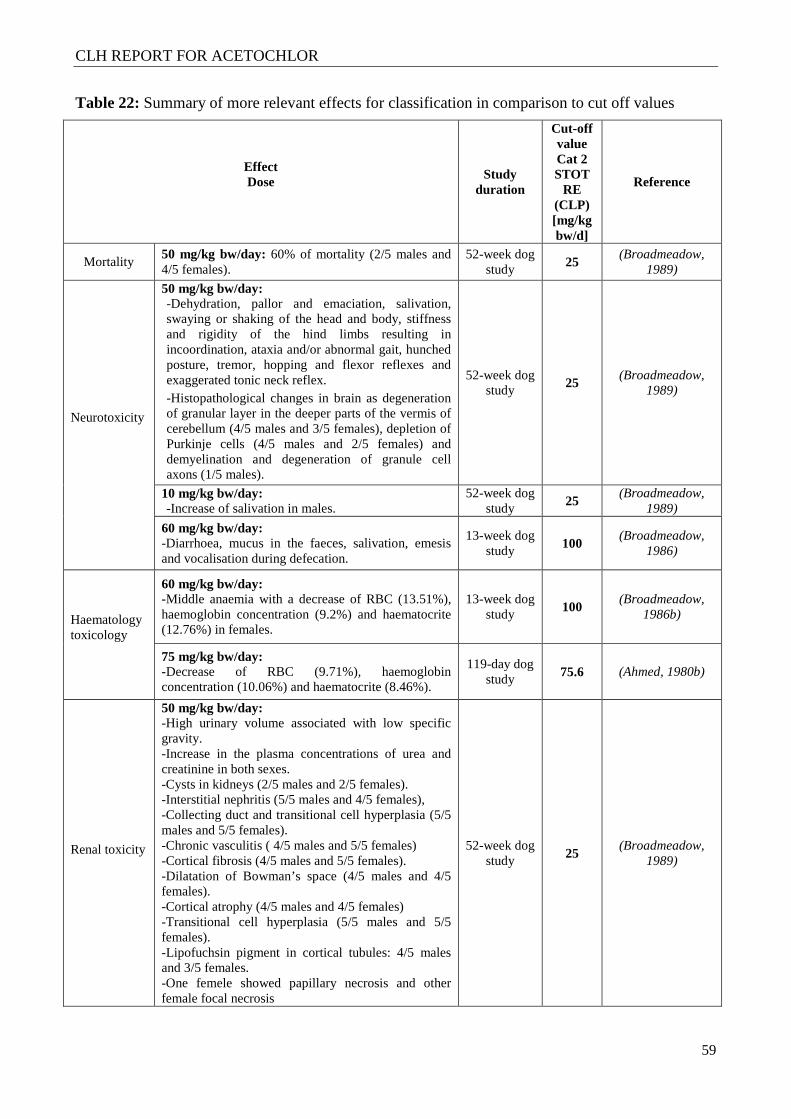
CLH REPORT FOR ACETOCHLOR
59
Table 22: Summary of more relevant effects for classification in comparison to cut off values
Effect Dose
Study duration
Cut-off value Cat 2 STOT
RE (CLP) [mg/kg bw/d]
Reference
Mortality 50 mg/kg bw/day: 60% of mortality (2/5 males and 4/5 females).
52-week dog study 25
(Broadmeadow, 1989)
Neurotoxicity
50 mg/kg bw/day: -Dehydration, pallor and emaciation, salivation, swaying or shaking of the head and body, stiffness and rigidity of the hind limbs resulting in incoordination, ataxia and/or abnormal gait, hunched posture, tremor, hopping and flexor reflexes and exaggerated tonic neck reflex. -Histopathological changes in brain as degeneration of granular layer in the deeper parts of the vermis of cerebellum (4/5 males and 3/5 females), depletion of Purkinje cells (4/5 males and 2/5 females) and demyelination and degeneration of granule cell axons (1/5 males).
52-week dog study 25
(Broadmeadow, 1989)
10 mg/kg bw/day: -Increase of salivation in males.
52-week dog study 25
(Broadmeadow, 1989)
60 mg/kg bw/day: -Diarrhoea, mucus in the faeces, salivation, emesis and vocalisation during defecation.
13-week dog study 100
(Broadmeadow, 1986)
Haematology toxicology
60 mg/kg bw/day: -Middle anaemia with a decrease of RBC (13.51%), haemoglobin concentration (9.2%) and haematocrite (12.76%) in females.
13-week dog study 100
(Broadmeadow, 1986b)
75 mg/kg bw/day: -Decrease of RBC (9.71%), haemoglobin concentration (10.06%) and haematocrite (8.46%).
119-day dog study 75.6 (Ahmed, 1980b)
Renal toxicity
50 mg/kg bw/day: -High urinary volume associated with low specific gravity. -Increase in the plasma concentrations of urea and creatinine in both sexes. -Cysts in kidneys (2/5 males and 2/5 females). -Interstitial nephritis (5/5 males and 4/5 females), -Collecting duct and transitional cell hyperplasia (5/5 males and 5/5 females). -Chronic vasculitis ( 4/5 males and 5/5 females) -Cortical fibrosis (4/5 males and 5/5 females). -Dilatation of Bowman’s space (4/5 males and 4/5 females). -Cortical atrophy (4/5 males and 4/5 females) -Transitional cell hyperplasia (5/5 males and 5/5 females). -Lipofuchsin pigment in cortical tubules: 4/5 males and 3/5 females. -One femele showed papillary necrosis and other female focal necrosis
52-week dog study 25
(Broadmeadow, 1989)
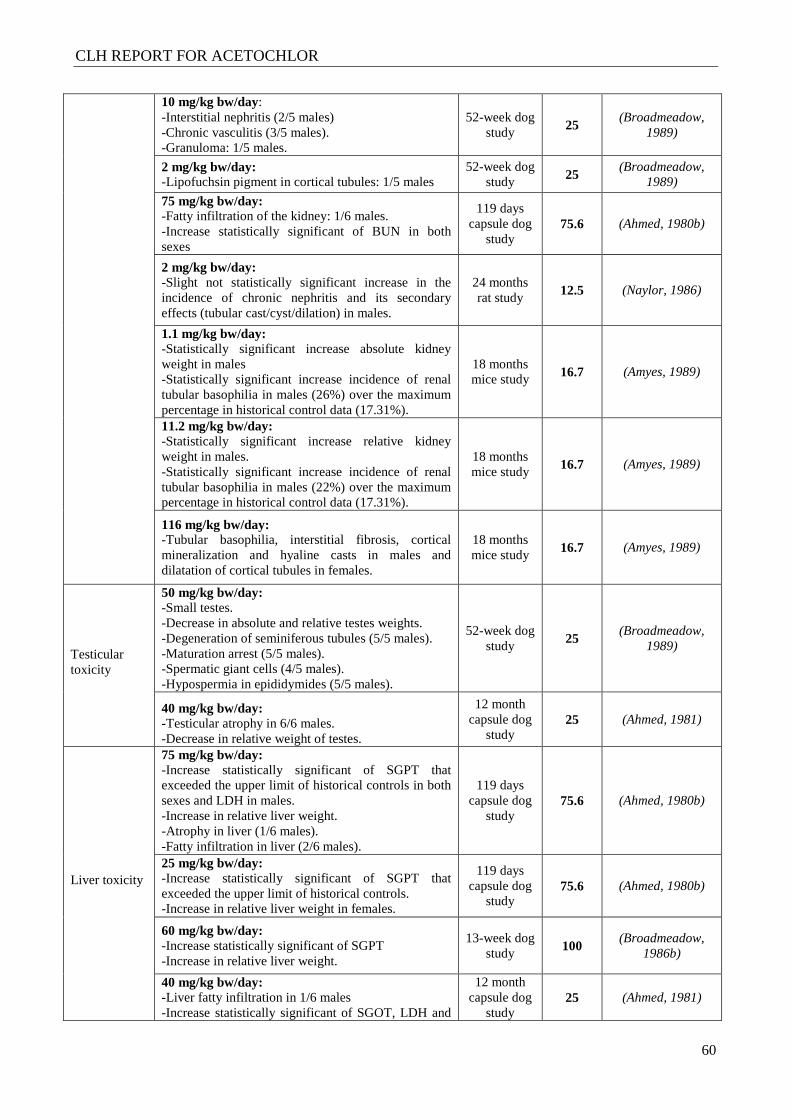
CLH REPORT FOR ACETOCHLOR
60
10 mg/kg bw/day: -Interstitial nephritis (2/5 males) -Chronic vasculitis (3/5 males). -Granuloma: 1/5 males.
52-week dog study 25
(Broadmeadow, 1989)
2 mg/kg bw/day: -Lipofuchsin pigment in cortical tubules: 1/5 males
52-week dog study 25
(Broadmeadow, 1989)
75 mg/kg bw/day: -Fatty infiltration of the kidney: 1/6 males. -Increase statistically significant of BUN in both sexes
119 days capsule dog
study 75.6 (Ahmed, 1980b)
2 mg/kg bw/day: -Slight not statistically significant increase in the incidence of chronic nephritis and its secondary effects (tubular cast/cyst/dilation) in males.
24 months rat study 12.5 (Naylor, 1986)
1.1 mg/kg bw/day: -Statistically significant increase absolute kidney weight in males -Statistically significant increase incidence of renal tubular basophilia in males (26%) over the maximum percentage in historical control data (17.31%).
18 months mice study 16.7 (Amyes, 1989)
11.2 mg/kg bw/day: -Statistically significant increase relative kidney weight in males. -Statistically significant increase incidence of renal tubular basophilia in males (22%) over the maximum percentage in historical control data (17.31%).
18 months mice study 16.7 (Amyes, 1989)
116 mg/kg bw/day: -Tubular basophilia, interstitial fibrosis, cortical mineralization and hyaline casts in males and dilatation of cortical tubules in females.
18 months mice study 16.7 (Amyes, 1989)
Testicular toxicity
50 mg/kg bw/day: -Small testes. -Decrease in absolute and relative testes weights. -Degeneration of seminiferous tubules (5/5 males). -Maturation arrest (5/5 males). -Spermatic giant cells (4/5 males). -Hypospermia in epididymides (5/5 males).
52-week dog study 25
(Broadmeadow, 1989)
40 mg/kg bw/day: -Testicular atrophy in 6/6 males. -Decrease in relative weight of testes.
12 month capsule dog
study 25 (Ahmed, 1981)
Liver toxicity
75 mg/kg bw/day: -Increase statistically significant of SGPT that exceeded the upper limit of historical controls in both sexes and LDH in males. -Increase in relative liver weight. -Atrophy in liver (1/6 males). -Fatty infiltration in liver (2/6 males).
119 days capsule dog
study 75.6 (Ahmed, 1980b)
25 mg/kg bw/day: -Increase statistically significant of SGPT that exceeded the upper limit of historical controls. -Increase in relative liver weight in females.
119 days capsule dog
study 75.6 (Ahmed, 1980b)
60 mg/kg bw/day: -Increase statistically significant of SGPT -Increase in relative liver weight.
13-week dog study 100
(Broadmeadow, 1986b)
40 mg/kg bw/day: -Liver fatty infiltration in 1/6 males -Increase statistically significant of SGOT, LDH and
12 month capsule dog
study 25 (Ahmed, 1981)
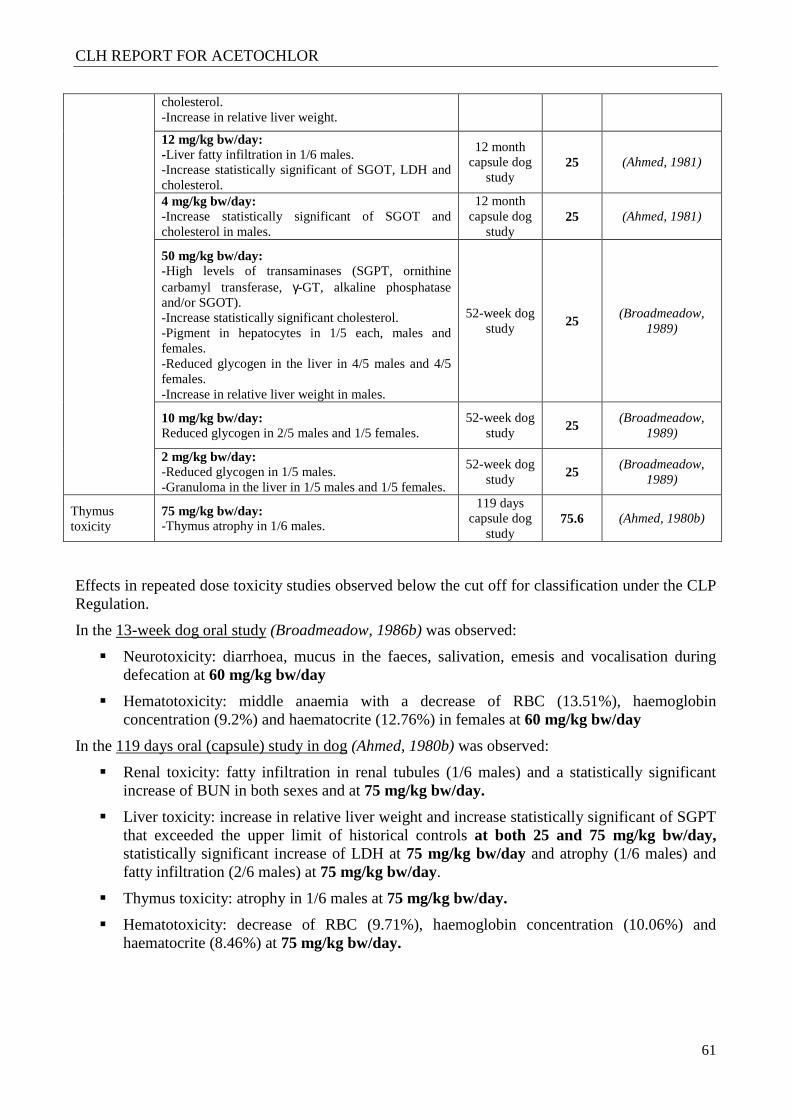
CLH REPORT FOR ACETOCHLOR
61
cholesterol. -Increase in relative liver weight.
12 mg/kg bw/day: -Liver fatty infiltration in 1/6 males. -Increase statistically significant of SGOT, LDH and cholesterol.
12 month capsule dog
study 25 (Ahmed, 1981)
4 mg/kg bw/day: -Increase statistically significant of SGOT and cholesterol in males.
12 month capsule dog
study 25 (Ahmed, 1981)
50 mg/kg bw/day: -High levels of transaminases (SGPT, ornithine carbamyl transferase, γ-GT, alkaline phosphatase and/or SGOT). -Increase statistically significant cholesterol. -Pigment in hepatocytes in 1/5 each, males and females. -Reduced glycogen in the liver in 4/5 males and 4/5 females. -Increase in relative liver weight in males.
52-week dog study 25
(Broadmeadow, 1989)
10 mg/kg bw/day: Reduced glycogen in 2/5 males and 1/5 females.
52-week dog study 25
(Broadmeadow, 1989)
2 mg/kg bw/day: -Reduced glycogen in 1/5 males. -Granuloma in the liver in 1/5 males and 1/5 females.
52-week dog study 25
(Broadmeadow, 1989)
Thymus toxicity
75 mg/kg bw/day: -Thymus atrophy in 1/6 males.
119 days capsule dog
study 75.6 (Ahmed, 1980b)
Effects in repeated dose toxicity studies observed below the cut off for classification under the CLP Regulation.
In the 13-week dog oral study (Broadmeadow, 1986b) was observed:
� Neurotoxicity: diarrhoea, mucus in the faeces, salivation, emesis and vocalisation during defecation at 60 mg/kg bw/day
� Hematotoxicity: middle anaemia with a decrease of RBC (13.51%), haemoglobin concentration (9.2%) and haematocrite (12.76%) in females at 60 mg/kg bw/day
In the 119 days oral (capsule) study in dog (Ahmed, 1980b) was observed:
� Renal toxicity: fatty infiltration in renal tubules (1/6 males) and a statistically significant increase of BUN in both sexes and at 75 mg/kg bw/day.
� Liver toxicity: increase in relative liver weight and increase statistically significant of SGPT that exceeded the upper limit of historical controls at both 25 and 75 mg/kg bw/day, statistically significant increase of LDH at 75 mg/kg bw/day and atrophy (1/6 males) and fatty infiltration (2/6 males) at 75 mg/kg bw/day.
� Thymus toxicity: atrophy in 1/6 males at 75 mg/kg bw/day.
� Hematotoxicity: decrease of RBC (9.71%), haemoglobin concentration (10.06%) and haematocrite (8.46%) at 75 mg/kg bw/day.
CLH REPORT FOR ACETOCHLOR
62
In the 52-week study in dog (Broadmeadow, 1989) was observed:
� Neurotoxicity: increase of salivation in males at 10 mg/kg bw/day
• Renal toxicity: changes in kidney as interstitial nephritis (2/5 males), granuloma (1/5 male) and chronic vasculitis (3/5 males) at 10 mg/kg bw/day and lipofuchsin pigment in cortical tubules (1/5 males) at 2 mg/kg bw/day.
� Liver toxicity: granuloma (1/5 males and 1/5 females) at 2 mg/kg bw/day. Reduced glycogen from 2 mg/kg bw/day.
In the 12 month oral (capsule) study in dog (Ahmed, 1981) was observed:
� Liver toxicity: fatty infiltration in 1/6 males and statistically significant increase of SGOT, LDH, and cholesterol at 12 mg/kg bw/day and statistically significant increase of SGOT and cholesterol at 4 mg/kg bw/day in males.
In the 13-week study in dog (Broadmeadow, 1986b) was observed:
� Liver toxicity: Increase in relative liver weight and statistically significant increase of SGPT at 60 mg/kg bw/day.
In the 18 months mice study (Amyes, 1989) was observed:
� Renal toxicity: statistically significant increased absolute kidney weight in males and statistically significant increased incidence of renal tubular basophilia in males from 1.1 mg/kg bw/day and statistically significant increased relative kidney weight in males from 11.2 mg/kg bw/day.
In the 24 months rat study (Naylor, 1986) was observed:
� Renal toxicity: slight increase not statistically significant in the incidence of chronic nephritis and its secondary effects (tubular cast/cyst/dilation) in males from 2 mg/kg bw/day.
4.8.2 Comparison with criteria of repeated dose toxicity findings relevant for classification as STOT RE
Rat is the species on which the oral cut-off values for repeated exposure according to Regulation 1272/2008 are based on. Haber´s rule is used to adjust the standard guidance values, which are for studies of 90-day duration, for studies of longer or shorter durations. The guidance cut-off values for a classification for STOT RE in category 2 under CLP are: ≤ 300 mg/kg bw/day from subacute studies on rat (28 days), ≤ 100 mg/kg bw/day from subchronic studies on rat (90 days), ≤ 25 mg/kg bw/day from one year studies and ≤ 12.5 mg/kg bw/day from two year studies. For the time being, there is no agreed EU position on how to apply the guidance values for classification of tested species other than rats. The current practice of RAC is to apply the guidance values for rats to other species as well (RAC has applied this approach in several opinons as in the case of bifenthrin, cymoxanil or fenpyrazamine).
A substance is classified with STOT RE under CLP when it has produced or has been shown to have the potential to produce significant toxicity in humans or be harmful to human health following repeated exposure by the oral, dermal or inhalation routes. This can be on the basis of human data or evidence from studies in animals that cause such effects at or below given guidance values. All significant health effects that can impair function, both reversible and irreversible, immediate and/or delayed are included under this classification.
Significant effects have been observed after acetochlor exposition in repeated dose toxicity studies below the guidance values for oral STOT RE 2. The MSCA regards liver and kidney the target organs. In the following paragraphs are compiled the consistent findings supporting this proposal.
CLH REPORT FOR ACETOCHLOR
63
Morphological changes resulting in functional disturbance of liver at dose levels below the cut-off values for classification for STOT RE 2 were observed in dog studies. In the 119-day dog study (Ahmed, 1980b), liver fatty infiltration occurred in two males at 75 mg/kg bw/d (cut-off value of 75.6 mg/kg bw/d for oral STOT RE 2). It was accompanied by significant increase of SGPT and LDH levels. Atrophy in the liver also occurred in one male at this dose level. Furthermore, in a 12-month dog study (Ahmed, 1981), liver fatty infiltration was also observed in one male at 12 and 40 mg/kg bw/d (cut-off value of 25 mg/kg bw/d for oral STOT RE 2) accompanied by changes in biochemistry such as significant increase of SGOT, LDH and cholesterol. In a 52-week dog study (Broadmeadow, 1989), granuloma was observed in the liver of one male and one female at 2 mg/kg bw/d (cut-off value of 25 mg/kg bw/d for oral STOT RE 2). However, in the absence of such findings at higher dose levels the significance of this lesion is unclear.
Relevant effects regarded as evidence of nephrotoxicity at dose levels below the cut-off value for classification as STOT RE 2 have been observed after acetochlor treatment in dog, rat and mice studies.
In the 52-week dog study (Broadmeadow, 1989), interstitial nephritis affecting the interstititum of the kidneys surrounding the tubules was observed observed in two males at 10 mg/kg bw/d and in five males and four females at 50 mg/kg bw/d (cut-off value of 25 mg/kg bw/d for STOT RE 2). Chronic vasculitis was seen in three males at 10 mg/kg bw/d and in four males and five females at 50 mg/kg bw/d. Granuloma in one male was observed at 10 mg/kg bw/d but not at other dose levels and thus the relevance of this finding remains unclear.
In the 119-day dog study (Ahmed, 1980b), fatty infiltration in renal tubules occurred in one male at 75 mg/kg bw/d (cut-off value of 75.6 mg/kg bw/d for oral STOT RE 2).
In the 24-months rat study (Naylor, 1986), slight increase not statistically significant in the incidence of chronic nephritis and its secondary effects (tubular cast/cyst/dilation) was observed in males at 2 mg/kg bw/day (cut-off value of 12.5 mg/kg bw/d).
In the 18-month mice study (Amyes, 1989), tubular basophilia was observed in males at doses of 1.1 and 11.2 mg/kg bw/d with an incidence above the range of historical controls and below the guidance value for oral STOT RE 2 (16.7 mg/kg bw/d). Tubular basophilia is associated with renal tubule regeneration occurred after injury to normal tubule epithelium. This lesion is a relatively frequent spontaneous finding in male young rats and it has been tabulated as a natural renal lesion in CD-1 mice. However, it can also be induced by nephrotoxic chemicals. The EFSA, on its Conclusion on the Pesticide Peer Review on Acetochlor (2011), argumented that the occurrence of tubular basophilia at the low dose, above historical control data and accompanied by an increased kidney weight, was considered as a first step of nephrotoxicity.
According to CLP Regulation (section 3.9.2.7.3 of Annex I) morphological changes that are potentially reversible but provide clear evidence of marked organ dysfunction (e.g., severe fatty change in the liver) and multi-focal or diffuse necrosis, fibrosis or granuloma formation in vital organs with regenerative capacity shall be taken into consideration in the classification process. Significant organ damage noted at necropsy and/or subsequently seen or confirmed at microscopic examination is also considered relevant for classification for STOT RE 2.
The MSCA is of the opinion that effects on liver (mainly fatty infiltration) and kidney (interstitial nephritis, chronic vasculitis, fatty infiltration and tubular basophilia) are deemed toxicologically relevant since they indicate functional disturbance in these organs. Therefore, classification for oral STOT RE 2 is required and liver and kidney are considered as target organs.
CLH REPORT FOR ACETOCHLOR
64
4.8.3 Conclusions on classification and labelling of repeated dose toxicity findings relevant for classification as STOT RE
Based on available data, the overall weight of evidence appears sufficient for classified acetochlor for Specific Target Organ Toxicity. Comparison of repeated dose toxicity data with CLP guidance levels indicates that effective doses for toxicological effects fulfil the CLP criteria for STOT RE 2 (kidney and liver), H373.
Acetochlor is currently included in Annex VI of the CLP regulation and it is not classify with respect to Specific Target Organ Toxicity. Therefore the existing Annex VI entry should be changed accordingly.
CLP: STOT RE 2 (H373): May cause damage to kidney and liver through prolonged or repeated oral exposure.
CLH REPORT FOR ACETOCHLOR
65
4.9 Germ cell mutagenicity (Mutagenicity)
4.9.1 Non human information
Acetochlor has been tested in a wide variety of genetic toxicology assay systems. These include studies sponsored by Monsanto and Dow Agrowsciences. These studies include in vitro and in vivo genotoxicity testing. In vitro studies consisted of bacterial gene mutation, and gene mutation, chromosome aberration and DNA effects in mammalian cells. In vivo studies included somatic and germ cell genotoxicity testing. In somatic cells studies consisted of chromosome aberration and DNA effects. In germ cells the studies was the dominant lethal assay. These studies are summarised in Table 20, Table 21 and Table 22.
Four bacterial mutagenicity studies were presented. Analytical Acetochlor (99.6% purity) and technical Acetochlor (from 89.9% to 94.4 % purity) were tested in the Salmonella/microsome assay. The oldest study (Kulik and Ross, 1978) was not considered acceptable due mainly to the highest concentration tested because it is too low, does not cause any toxicity and therefore is not suitable. Technical Acetochlor (89.9% purity, batch A) was observed to induce small increases in revertant colonies in TA1538 in the presence of S9 mix from rats treated with Araclor 1254 (Callander and Priestley, 1989). The numerical increases in revertant colony numbers over control values observed were small and not seen with analytical Acetochlor (99.6% purity, batch B) in a repeat study (Callander, 1992). Marginal increases over controls observed with technical Acetochlor (batch A) in this repeat study were of limited reproducibility. Further evaluation of batches A and B, together with an additional sample of technical Acetochlor (94.4% purity, batch C) was undertaken in the last study, including (for batch C) the use of S9 from rats treated with either Araclor 1254 or phenobarbital/β-naphthoflavone as enzyme inducers (Callander, 1998). These data showed no reproducible increases in revertant colonies in TA1538. Considering the data from the last study, and also in conjunction with the data from the previous two studies on Acetochlor, it is concluded that Acetochlor (technical or analytical) is not mutagenic to Salmonella. However, as these studies were conducted before the update of the TG 471 in 1997, they did not include strains capable of detecting certain oxidising mutagens, crosslinking agents and hydrazines. Then, the non-inclusion of TA102 would create uncertainty about the reached conclusion on mutagenicity of Acetochlor for Salmonella.
Three in vitro mammalian gene mutation studies were presented. Technical Acetochlor (96.3% and 91.4% purity) was tested with and without S9 from livers of Arochlor 1254-induced rats in two independent studies using Chinese hamster ovary cells (CHO-K1-BH4). Positive results were obtained in the 1st study for Acetochlor (96.3% purity) at the highest concentrations tested, 125 and 150 µg/mL (-S9) and 125 µg/mL (+S9). In the 2nd study Acetochlor (91.4% purity) was not mutagenic (±S9). Nevertheless, the concentrations which induce a mutagenic response in the 1st study were not tested in the 2nd. Acetochlor (unspecified purity) was also tested with and without S9 from livers of Arochlor 1254-induced rats in one study using L5178Y mouse lymphoma cells. Positive results were obtained with S9. Considering all data together, it can be concluded that Acetochlor induces gene mutation in mammalian cells.
Two in vitro mammalian chromosome aberration studies were presented. In the 1st study, Acetochlor (89.4% purity) was clastogenic (±S9) in whole blood cultures. In the 2nd study, Acetochlor (99.6% purity), n-butyl acetochlor and des-chloro acetochlor were tested in whole blood cultures (±S9), and p-(chloroacetyl)acetanilide, 2-chloroacetophenone and Acetochlor (94.4% purity) in both isolated lymphocytes and whole blood cultures (-S9). Acetochlor (99.6% purity) and n-butyl acetochlor were clastogenic (±S9) but not des-chloro acetochlor in whole blood cultures. Acetochlor (94.4% purity), p-(chloroacetyl)acetanilide and 2-chloroacetophenone were clastogenic, both in isolated lymphocytes and in whole blood cultures, and more toxic to the isolated cells,
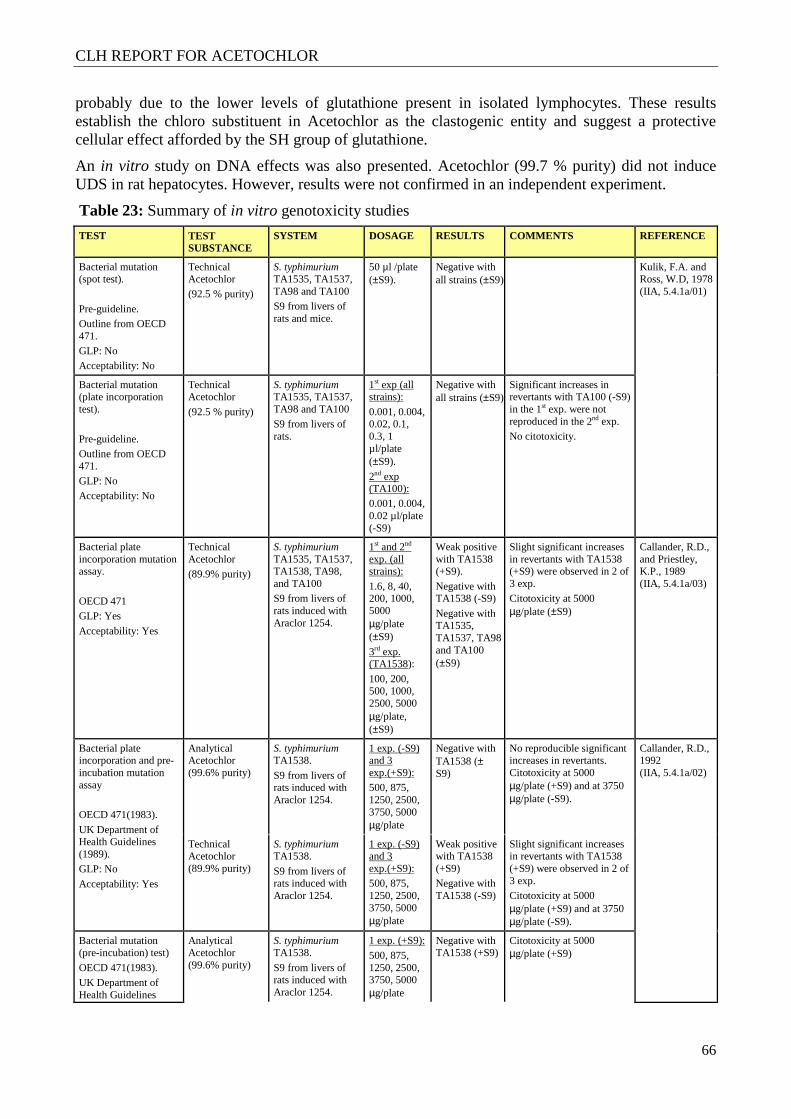
CLH REPORT FOR ACETOCHLOR
66
probably due to the lower levels of glutathione present in isolated lymphocytes. These results establish the chloro substituent in Acetochlor as the clastogenic entity and suggest a protective cellular effect afforded by the SH group of glutathione.
An in vitro study on DNA effects was also presented. Acetochlor (99.7 % purity) did not induce UDS in rat hepatocytes. However, results were not confirmed in an independent experiment.
Table 23: Summary of in vitro genotoxicity studies
TEST TEST SUBSTANCE
SYSTEM DOSAGE RESULTS COMMENTS REFERENCE
Bacterial mutation (spot test).
Pre-guideline. Outline from OECD 471. GLP: No Acceptability: No
Technical Acetochlor (92.5 % purity)
S. typhimurium TA1535, TA1537, TA98 and TA100 S9 from livers of rats and mice.
50 µl /plate (±S9).
Negative with all strains (±S9)
Kulik, F.A. and Ross, W.D, 1978 (IIA, 5.4.1a/01)
Bacterial mutation (plate incorporation test).
Pre-guideline. Outline from OECD 471. GLP: No Acceptability: No
Technical Acetochlor
(92.5 % purity)
S. typhimurium TA1535, TA1537, TA98 and TA100 S9 from livers of rats.
1st exp (all strains):
0.001, 0.004, 0.02, 0.1, 0.3, 1 µl/plate (±S9).
2nd exp (TA100): 0.001, 0.004, 0.02 µl/plate (-S9)
Negative with all strains (±S9)
Significant increases in revertants with TA100 (-S9) in the 1st exp. were not reproduced in the 2nd exp. No citotoxicity.
Bacterial plate incorporation mutation assay.
OECD 471 GLP: Yes
Acceptability: Yes
Technical Acetochlor (89.9% purity)
S. typhimurium TA1535, TA1537, TA1538, TA98, and TA100 S9 from livers of rats induced with Araclor 1254.
1st and 2nd exp. (all strains):
1.6, 8, 40, 200, 1000, 5000 µg/plate (±S9)
3rd exp. (TA1538):
100, 200, 500, 1000, 2500, 5000 µg/plate, (±S9)
Weak positive with TA1538 (+S9).
Negative with TA1538 (-S9)
Negative with TA1535, TA1537, TA98 and TA100 (±S9)
Slight significant increases in revertants with TA1538 (+S9) were observed in 2 of 3 exp. Citotoxicity at 5000 µg/plate (±S9)
Callander, R.D., and Priestley, K.P., 1989 (IIA, 5.4.1a/03)
Bacterial plate incorporation and pre-incubation mutation assay OECD 471(1983).
UK Department of Health Guidelines (1989). GLP: No
Acceptability: Yes
Analytical Acetochlor (99.6% purity)
S. typhimurium TA1538.
S9 from livers of rats induced with Araclor 1254.
1 exp. (-S9) and 3 exp.(+S9): 500, 875, 1250, 2500, 3750, 5000 µg/plate
Negative with TA1538 (± S9)
No reproducible significant increases in revertants. Citotoxicity at 5000 µg/plate (+S9) and at 3750 µg/plate (-S9).
Callander, R.D., 1992 (IIA, 5.4.1a/02)
Technical Acetochlor (89.9% purity)
S. typhimurium TA1538.
S9 from livers of rats induced with Araclor 1254.
1 exp. (-S9) and 3 exp.(+S9): 500, 875, 1250, 2500, 3750, 5000 µg/plate
Weak positive with TA1538 (+S9) Negative with TA1538 (-S9)
Slight significant increases in revertants with TA1538 (+S9) were observed in 2 of 3 exp. Citotoxicity at 5000 µg/plate (+S9) and at 3750 µg/plate (-S9).
Bacterial mutation (pre-incubation) test)
OECD 471(1983). UK Department of Health Guidelines
Analytical Acetochlor (99.6% purity)
S. typhimurium TA1538.
S9 from livers of rats induced with Araclor 1254.
1 exp. (+S9):
500, 875, 1250, 2500, 3750, 5000 µg/plate
Negative with TA1538 (+S9)
Citotoxicity at 5000 µg/plate (+S9)
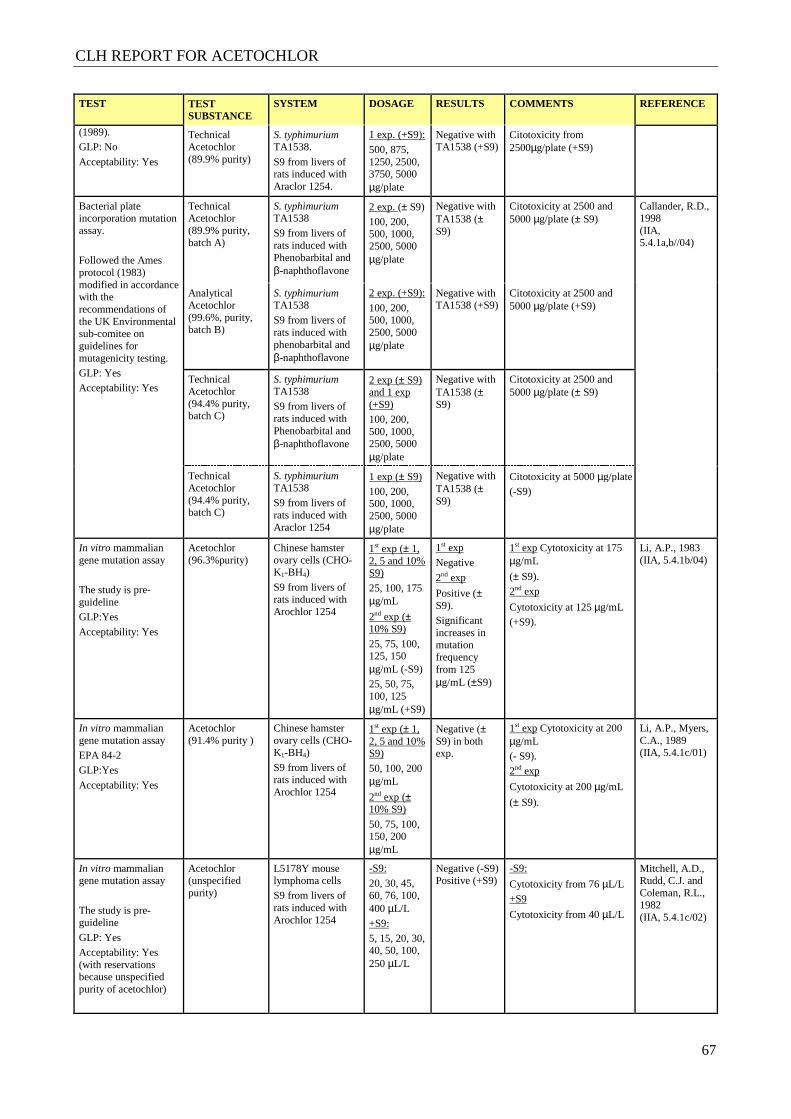
CLH REPORT FOR ACETOCHLOR
67
TEST TEST SUBSTANCE
SYSTEM DOSAGE RESULTS COMMENTS REFERENCE
(1989). GLP: No
Acceptability: Yes
Technical Acetochlor (89.9% purity)
S. typhimurium TA1538.
S9 from livers of rats induced with Araclor 1254.
1 exp. (+S9):
500, 875, 1250, 2500, 3750, 5000 µg/plate
Negative with TA1538 (+S9)
Citotoxicity from 2500µg/plate (+S9)
Bacterial plate incorporation mutation assay. Followed the Ames protocol (1983) modified in accordance with the recommendations of the UK Environmental sub-comitee on guidelines for mutagenicity testing. GLP: Yes Acceptability: Yes
Technical Acetochlor (89.9% purity, batch A)
S. typhimurium TA1538 S9 from livers of rats induced with Phenobarbital and β-naphthoflavone
2 exp. (± S9) 100, 200, 500, 1000, 2500, 5000 µg/plate
Negative with TA1538 (± S9)
Citotoxicity at 2500 and 5000 µg/plate (± S9)
Callander, R.D., 1998 (IIA, 5.4.1a,b//04)
Analytical Acetochlor (99.6%, purity, batch B)
S. typhimurium TA1538 S9 from livers of rats induced with phenobarbital and β-naphthoflavone
2 exp. (+S9):
100, 200, 500, 1000, 2500, 5000 µg/plate
Negative with TA1538 (+S9)
Citotoxicity at 2500 and 5000 µg/plate (+S9)
Technical Acetochlor (94.4% purity, batch C)
S. typhimurium TA1538 S9 from livers of rats induced with Phenobarbital and β-naphthoflavone
2 exp (± S9) and 1 exp (+S9) 100, 200, 500, 1000, 2500, 5000 µg/plate
Negative with TA1538 (± S9)
Citotoxicity at 2500 and 5000 µg/plate (± S9)
Technical Acetochlor (94.4% purity, batch C)
S. typhimurium TA1538 S9 from livers of rats induced with Araclor 1254
1 exp (± S9) 100, 200, 500, 1000, 2500, 5000 µg/plate
Negative with TA1538 (± S9)
Citotoxicity at 5000 µg/plate (-S9)
In vitro mammalian gene mutation assay The study is pre-guideline GLP:Yes
Acceptability: Yes
Acetochlor (96.3%purity)
Chinese hamster ovary cells (CHO-K1-BH4)
S9 from livers of rats induced with Arochlor 1254
1st exp (± 1, 2, 5 and 10% S9)
25, 100, 175 µg/mL
2nd exp (± 10% S9)
25, 75, 100, 125, 150 µg/mL (-S9) 25, 50, 75, 100, 125 µg/mL (+S9)
1st exp
Negative
2nd exp
Positive (± S9). Significant increases in mutation frequency from 125 µg/mL (±S9)
1st exp Cytotoxicity at 175 µg/mL
(± S9). 2nd exp
Cytotoxicity at 125 µg/mL (+S9).
Li, A.P., 1983 (IIA, 5.4.1b/04)
In vitro mammalian gene mutation assay EPA 84-2 GLP:Yes
Acceptability: Yes
Acetochlor (91.4% purity )
Chinese hamster ovary cells (CHO-K1-BH4)
S9 from livers of rats induced with Arochlor 1254
1st exp (± 1, 2, 5 and 10% S9)
50, 100, 200 µg/mL
2nd exp (± 10% S9)
50, 75, 100, 150, 200 µg/mL
Negative (± S9) in both exp.
1st exp Cytotoxicity at 200 µg/mL (- S9). 2nd exp
Cytotoxicity at 200 µg/mL
(± S9).
Li, A.P., Myers, C.A., 1989 (IIA, 5.4.1c/01)
In vitro mammalian gene mutation assay
The study is pre-guideline
GLP: Yes Acceptability: Yes (with reservations because unspecified purity of acetochlor)
Acetochlor (unspecified purity)
L5178Y mouse lymphoma cells S9 from livers of rats induced with Arochlor 1254
-S9:
20, 30, 45, 60, 76, 100, 400 µL/L +S9:
5, 15, 20, 30, 40, 50, 100, 250 µL/L
Negative (-S9) Positive (+S9)
-S9:
Cytotoxicity from 76 µL/L +S9
Cytotoxicity from 40 µL/L
Mitchell, A.D., Rudd, C.J. and Coleman, R.L., 1982 (IIA, 5.4.1c/02)
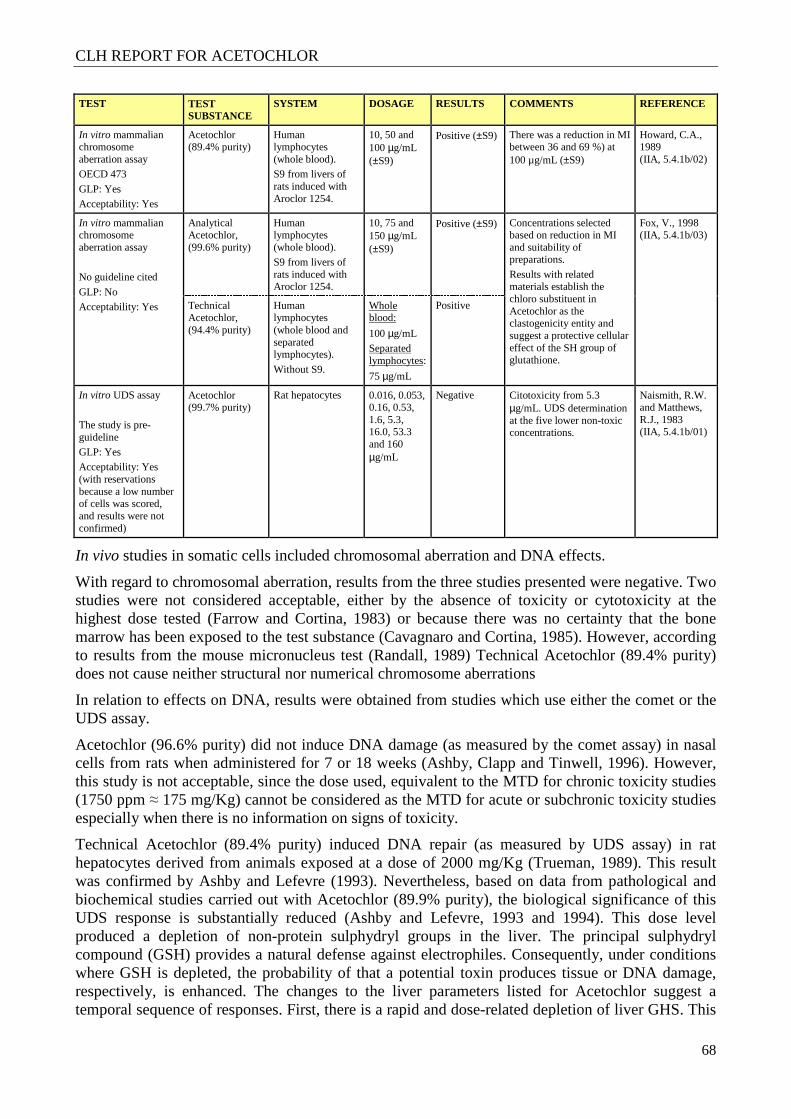
CLH REPORT FOR ACETOCHLOR
68
TEST TEST SUBSTANCE
SYSTEM DOSAGE RESULTS COMMENTS REFERENCE
In vitro mammalian chromosome aberration assay OECD 473
GLP: Yes Acceptability: Yes
Acetochlor (89.4% purity)
Human lymphocytes (whole blood). S9 from livers of rats induced with Aroclor 1254.
10, 50 and 100 µg/mL (±S9)
Positive (±S9) There was a reduction in MI between 36 and 69 %) at 100 µg/mL (±S9)
Howard, C.A., 1989 (IIA, 5.4.1b/02)
In vitro mammalian chromosome aberration assay No guideline cited
GLP: No Acceptability: Yes
Analytical Acetochlor, (99.6% purity)
Human lymphocytes (whole blood). S9 from livers of rats induced with Aroclor 1254.
10, 75 and 150 µg/mL (±S9)
Positive (±S9) Concentrations selected based on reduction in MI and suitability of preparations.
Results with related materials establish the chloro substituent in Acetochlor as the clastogenicity entity and suggest a protective cellular effect of the SH group of glutathione.
Fox, V., 1998 (IIA, 5.4.1b/03)
Technical Acetochlor, (94.4% purity)
Human lymphocytes (whole blood and separated lymphocytes).
Without S9.
Whole blood:
100 µg/mL Separated lymphocytes:
75 µg/mL
Positive
In vitro UDS assay
The study is pre-guideline GLP: Yes Acceptability: Yes (with reservations because a low number of cells was scored, and results were not confirmed)
Acetochlor (99.7% purity)
Rat hepatocytes 0.016, 0.053, 0.16, 0.53, 1.6, 5.3, 16.0, 53.3 and 160 µg/mL
Negative Citotoxicity from 5.3 µg/mL. UDS determination at the five lower non-toxic concentrations.
Naismith, R.W. and Matthews, R.J., 1983 (IIA, 5.4.1b/01)
In vivo studies in somatic cells included chromosomal aberration and DNA effects.
With regard to chromosomal aberration, results from the three studies presented were negative. Two studies were not considered acceptable, either by the absence of toxicity or cytotoxicity at the highest dose tested (Farrow and Cortina, 1983) or because there was no certainty that the bone marrow has been exposed to the test substance (Cavagnaro and Cortina, 1985). However, according to results from the mouse micronucleus test (Randall, 1989) Technical Acetochlor (89.4% purity) does not cause neither structural nor numerical chromosome aberrations
In relation to effects on DNA, results were obtained from studies which use either the comet or the UDS assay.
Acetochlor (96.6% purity) did not induce DNA damage (as measured by the comet assay) in nasal cells from rats when administered for 7 or 18 weeks (Ashby, Clapp and Tinwell, 1996). However, this study is not acceptable, since the dose used, equivalent to the MTD for chronic toxicity studies (1750 ppm ≈ 175 mg/Kg) cannot be considered as the MTD for acute or subchronic toxicity studies especially when there is no information on signs of toxicity.
Technical Acetochlor (89.4% purity) induced DNA repair (as measured by UDS assay) in rat hepatocytes derived from animals exposed at a dose of 2000 mg/Kg (Trueman, 1989). This result was confirmed by Ashby and Lefevre (1993). Nevertheless, based on data from pathological and biochemical studies carried out with Acetochlor (89.9% purity), the biological significance of this UDS response is substantially reduced (Ashby and Lefevre, 1993 and 1994). This dose level produced a depletion of non-protein sulphydryl groups in the liver. The principal sulphydryl compound (GSH) provides a natural defense against electrophiles. Consequently, under conditions where GSH is depleted, the probability of that a potential toxin produces tissue or DNA damage, respectively, is enhanced. The changes to the liver parameters listed for Acetochlor suggest a temporal sequence of responses. First, there is a rapid and dose-related depletion of liver GHS. This
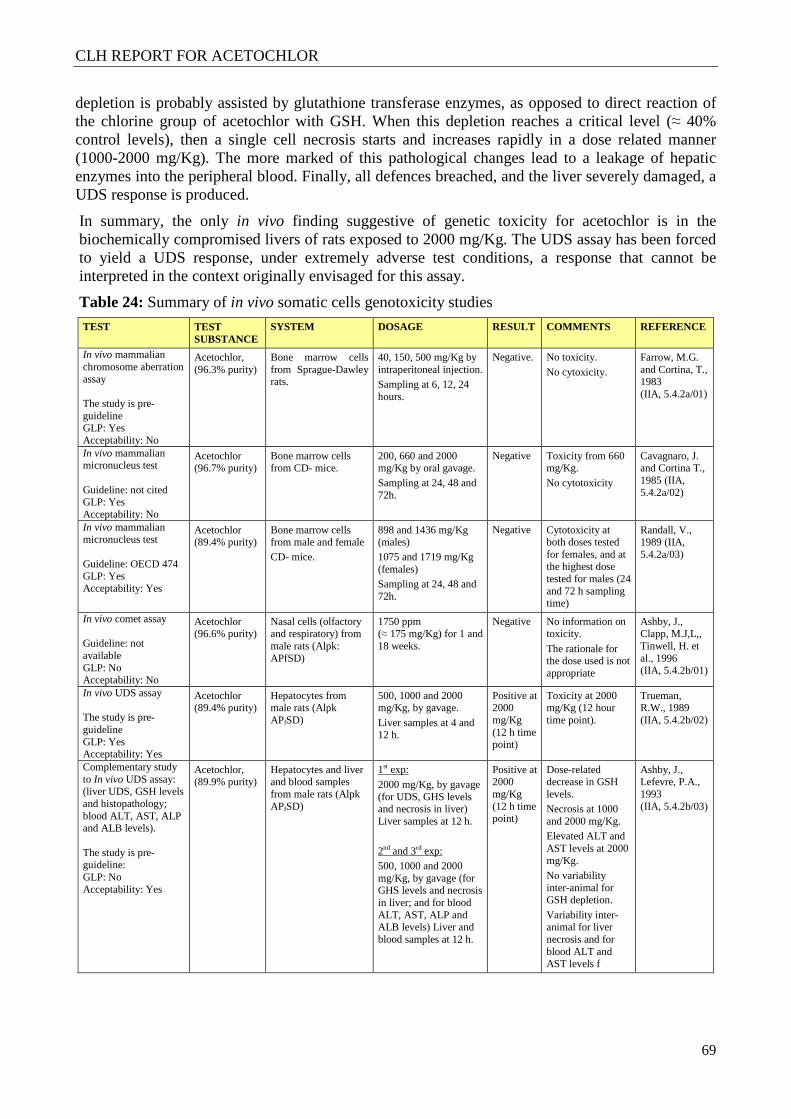
CLH REPORT FOR ACETOCHLOR
69
depletion is probably assisted by glutathione transferase enzymes, as opposed to direct reaction of the chlorine group of acetochlor with GSH. When this depletion reaches a critical level (≈ 40% control levels), then a single cell necrosis starts and increases rapidly in a dose related manner (1000-2000 mg/Kg). The more marked of this pathological changes lead to a leakage of hepatic enzymes into the peripheral blood. Finally, all defences breached, and the liver severely damaged, a UDS response is produced.
In summary, the only in vivo finding suggestive of genetic toxicity for acetochlor is in the biochemically compromised livers of rats exposed to 2000 mg/Kg. The UDS assay has been forced to yield a UDS response, under extremely adverse test conditions, a response that cannot be interpreted in the context originally envisaged for this assay.
Table 24: Summary of in vivo somatic cells genotoxicity studies
TEST TEST SUBSTANCE
SYSTEM DOSAGE RESULT COMMENTS REFERENCE
In vivo mammalian chromosome aberration assay The study is pre-guideline GLP: Yes Acceptability: No
Acetochlor, (96.3% purity)
Bone marrow cells from Sprague-Dawley rats.
40, 150, 500 mg/Kg by intraperitoneal injection. Sampling at 6, 12, 24 hours.
Negative. No toxicity.
No cytoxicity. Farrow, M.G. and Cortina, T., 1983 (IIA, 5.4.2a/01)
In vivo mammalian micronucleus test Guideline: not cited GLP: Yes Acceptability: No
Acetochlor (96.7% purity)
Bone marrow cells from CD- mice.
200, 660 and 2000 mg/Kg by oral gavage. Sampling at 24, 48 and 72h.
Negative Toxicity from 660 mg/Kg. No cytotoxicity
Cavagnaro, J. and Cortina T., 1985 (IIA, 5.4.2a/02)
In vivo mammalian micronucleus test Guideline: OECD 474 GLP: Yes Acceptability: Yes
Acetochlor (89.4% purity)
Bone marrow cells from male and female CD- mice.
898 and 1436 mg/Kg (males) 1075 and 1719 mg/Kg (females) Sampling at 24, 48 and 72h.
Negative Cytotoxicity at both doses tested for females, and at the highest dose tested for males (24 and 72 h sampling time)
Randall, V., 1989 (IIA, 5.4.2a/03)
In vivo comet assay Guideline: not available GLP: No Acceptability: No
Acetochlor (96.6% purity)
Nasal cells (olfactory and respiratory) from male rats (Alpk: APfSD)
1750 ppm (≈ 175 mg/Kg) for 1 and 18 weeks.
Negative No information on toxicity.
The rationale for the dose used is not appropriate
Ashby, J., Clapp, M.J,L,, Tinwell, H. et al., 1996 (IIA, 5.4.2b/01)
In vivo UDS assay The study is pre-guideline GLP: Yes Acceptability: Yes
Acetochlor (89.4% purity)
Hepatocytes from male rats (Alpk APfSD)
500, 1000 and 2000 mg/Kg, by gavage.
Liver samples at 4 and 12 h.
Positive at 2000 mg/Kg (12 h time point)
Toxicity at 2000 mg/Kg (12 hour time point).
Trueman, R.W., 1989 (IIA, 5.4.2b/02)
Complementary study to In vivo UDS assay: (liver UDS, GSH levels and histopathology; blood ALT, AST, ALP and ALB levels). The study is pre-guideline: GLP: No Acceptability: Yes
Acetochlor, (89.9% purity)
Hepatocytes and liver and blood samples from male rats (Alpk APfSD)
1st exp:
2000 mg/Kg, by gavage (for UDS, GHS levels and necrosis in liver) Liver samples at 12 h.
2nd and 3rd exp: 500, 1000 and 2000 mg/Kg, by gavage (for GHS levels and necrosis in liver; and for blood ALT, AST, ALP and ALB levels) Liver and blood samples at 12 h.
Positive at 2000 mg/Kg (12 h time point)
Dose-related decrease in GSH levels. Necrosis at 1000 and 2000 mg/Kg. Elevated ALT and AST levels at 2000 mg/Kg. No variability inter-animal for GSH depletion.
Variability inter- animal for liver necrosis and for blood ALT and AST levels f
Ashby, J., Lefevre, P.A., 1993 (IIA, 5.4.2b/03)
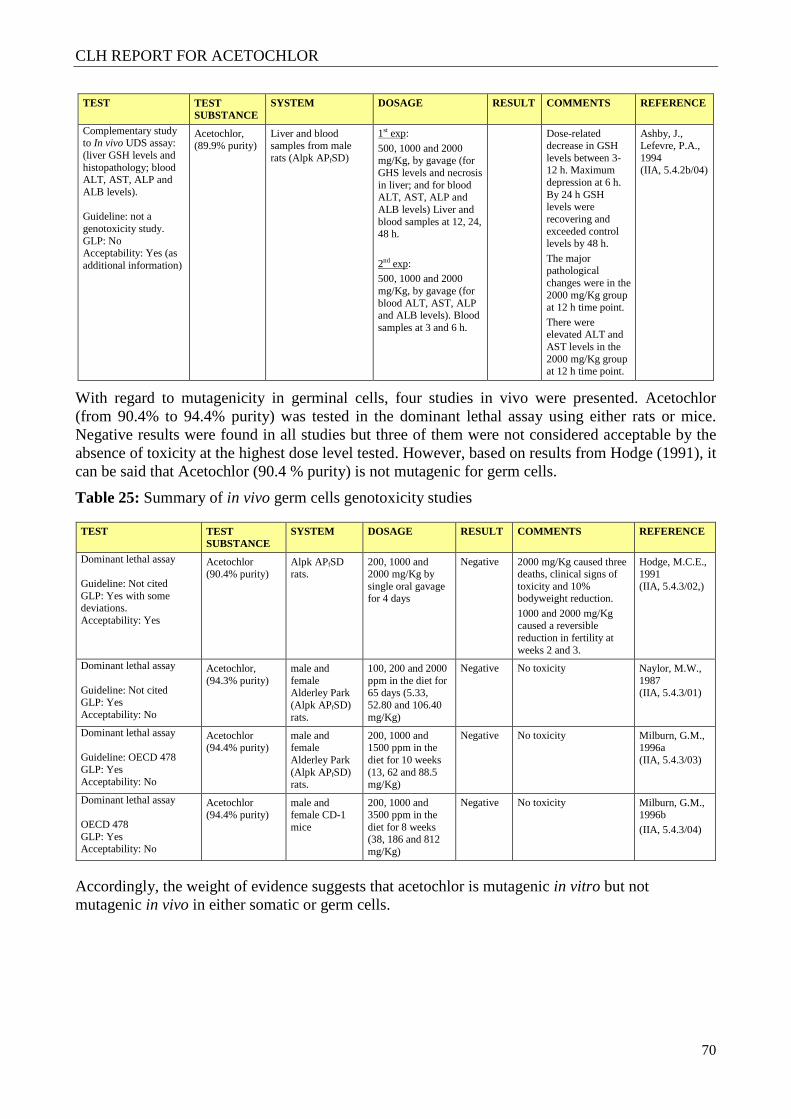
CLH REPORT FOR ACETOCHLOR
70
TEST TEST SUBSTANCE
SYSTEM DOSAGE RESULT COMMENTS REFERENCE
Complementary study to In vivo UDS assay: (liver GSH levels and histopathology; blood ALT, AST, ALP and ALB levels). Guideline: not a genotoxicity study. GLP: No Acceptability: Yes (as additional information)
Acetochlor, (89.9% purity)
Liver and blood samples from male rats (Alpk APfSD)
1st exp:
500, 1000 and 2000 mg/Kg, by gavage (for GHS levels and necrosis in liver; and for blood ALT, AST, ALP and ALB levels) Liver and blood samples at 12, 24, 48 h.
2nd exp: 500, 1000 and 2000 mg/Kg, by gavage (for blood ALT, AST, ALP and ALB levels). Blood samples at 3 and 6 h.
Dose-related decrease in GSH levels between 3-12 h. Maximum depression at 6 h. By 24 h GSH levels were recovering and exceeded control levels by 48 h.
The major pathological changes were in the 2000 mg/Kg group at 12 h time point.
There were elevated ALT and AST levels in the 2000 mg/Kg group at 12 h time point.
Ashby, J., Lefevre, P.A., 1994 (IIA, 5.4.2b/04)
With regard to mutagenicity in germinal cells, four studies in vivo were presented. Acetochlor (from 90.4% to 94.4% purity) was tested in the dominant lethal assay using either rats or mice. Negative results were found in all studies but three of them were not considered acceptable by the absence of toxicity at the highest dose level tested. However, based on results from Hodge (1991), it can be said that Acetochlor (90.4 % purity) is not mutagenic for germ cells.
Table 25: Summary of in vivo germ cells genotoxicity studies
TEST TEST SUBSTANCE
SYSTEM DOSAGE RESULT COMMENTS REFERENCE
Dominant lethal assay Guideline: Not cited GLP: Yes with some deviations. Acceptability: Yes
Acetochlor (90.4% purity)
Alpk APfSD rats.
200, 1000 and 2000 mg/Kg by single oral gavage for 4 days
Negative 2000 mg/Kg caused three deaths, clinical signs of toxicity and 10% bodyweight reduction.
1000 and 2000 mg/Kg caused a reversible reduction in fertility at weeks 2 and 3.
Hodge, M.C.E., 1991 (IIA, 5.4.3/02,)
Dominant lethal assay Guideline: Not cited GLP: Yes Acceptability: No
Acetochlor, (94.3% purity)
male and female Alderley Park (Alpk APfSD) rats.
100, 200 and 2000 ppm in the diet for 65 days (5.33, 52.80 and 106.40 mg/Kg)
Negative No toxicity Naylor, M.W., 1987 (IIA, 5.4.3/01)
Dominant lethal assay Guideline: OECD 478 GLP: Yes Acceptability: No
Acetochlor (94.4% purity)
male and female Alderley Park (Alpk APfSD) rats.
200, 1000 and 1500 ppm in the diet for 10 weeks (13, 62 and 88.5 mg/Kg)
Negative No toxicity Milburn, G.M., 1996a (IIA, 5.4.3/03)
Dominant lethal assay OECD 478 GLP: Yes Acceptability: No
Acetochlor (94.4% purity)
male and female CD-1 mice
200, 1000 and 3500 ppm in the diet for 8 weeks (38, 186 and 812 mg/Kg)
Negative No toxicity Milburn, G.M., 1996b (IIA, 5.4.3/04)
Accordingly, the weight of evidence suggests that acetochlor is mutagenic in vitro but not mutagenic in vivo in either somatic or germ cells.
CLH REPORT FOR ACETOCHLOR
71
4.9.1.1 In vitro data
4.9.1.1.1 Bacterial gene mutation
Salmonella mutagenicity assay of CP-55097, DA-78-186
Kulik, F.A. and Ross, W.D, 1978 (IIA, 5.4.1a/01).
Date of experimental work: 28 July 1978 to 16 October 1978. Date of report: 5 December 1978.
Objective: To determine whether any significant mutagenic activity of the test material could be detected towards Salmonella strains either in the presence or absence of a mammalian metabolic activation system.
Guidelines: No available. This study is pre-guideline. It was carried out as described by Ames, B. et al.(1975), Mutation Research, 31, 347-364.
Deviations from OECD TG 471 (1984): No information on the number of cells per ml in cultures. The S9 was obtained from the livers of rodents, but the report does not specify the species of rat or mouse, or the inducing agent, or the concentration that was used in the study. No positive control included for TA1537 without S9. The upper limit of 1 µl/plate was used in the initial mutagenicity assay in spite of not being toxic in the toxicity test and lower than 5 µl/plate, the upper limit recommended for non-toxic liquids. No confirmatory assay was performed except for TA 100 strain in the absence of S9.
GLP: No.
The study is not acceptable because the highest concentration tested is not considered appropriate, and important information is missing.
Material and methods together with findings
The test substance was Acetochlor, lot # Ba2-UOL-3/8/78 F.G.B., with purity of 92.5%. The compound was tested in the presence and absence of a mammalian metabolic activation system in both plate incorporation and spot tests. Four S. typhimurium strains (TA1535, TA1537, TA98, and TA100) were used. S9 from mouse and rat (Litton Lot #78 rat and Lot#14&15 mouse) was used in the spot test, and S9 from rat in the plate incorporation assays (Litton Lot #78 in the toxicity test, Lot #105 in the initial mutagenicity test, and not specified lot in the confirmatory test). Negative (untreated) and solvent control (ethanol) as well as appropriate positive controls without S9 (2-nitrofluorene for TA98 and TA100, and sodium nitrite for TA1535) and with S9 (2-aminoanthracene for TA98, TA100, TA1535, and TA1537) were used concurrently in the plate incorporation mutagenicity assays.
The test substance is considered positive if, three treatments show a response that is significantly different from the solvent controls at p< 0.01 (t-test) and a dose-response effect is demonstrated. The condition of the background bacterial lawn was evaluated for indications of cytotoxicity. Cytotoxicity is evidenced by a reduction in the number of revertans per plate and/or thinning or disappearance of the bacterial background lawn.
A toxicity test was conducted using tester strain TA100 in both the presence and absence of rat S9 (one plate per dose level). Acetochlor was tested at 0.1, 0.3, 1, 10, 30 and 100 µl/plate. Cytotoxity was observed at 10 µl/plate and above in both the presence and absence of S9 as evidenced by either low number of revertans (+ S9) or sparse lawn (- S9).
In the spot test, the compound was assayed at a concentration of 50 µl/plate with and without mouse and rat microsomal preparations using the four tester strains TA98, TA100, TA1535, and TA1537. In no case did a positive response.
CLH REPORT FOR ACETOCHLOR
72
In the initial mutagenicity assay, dose levels of 0.001, 0.004, 0.02, 0.1, 0.3 and 1 µl/plate were tested (three plates per dose level). No cytotoxicity was observed. Significant increases at dose levels of 0.001, 0.004 and 0.02 µl/plate in tester strain TA100 without S9 were observed, although without a clear dose response relationship. No other significant increases in the number of revertans per plate were observed. Positive controls gave a satisfactory response.
In order to confirm the significant increases observed in the first assay in TA100 without S9, a second assay was performed. Dose levels of 0.001, 0.004 and 0.02 µl/plate were tested. No cytotoxicity was observed. No significant increases in the number of revertans per plate were observed. The positive control gave a satisfactory response.
Conclusion
Acetochlor was not mutagenic for any of the tester strain used, under the conditions of this study.
Acetochlor: An evaluation in the Salmonella mutation assay
Callander, R.D. and Priestley, K.P., 1989 (IIA, 5.4.1a/03)
Date of experimental work: 25 October 1988 to 10 November 1988.
Date of report: 19 July 1989.
Objective: To evaluate the mutagenic potential of Acetochlor in bacterial test systems using strains of Salmonella typhimurium.
Guidelines: OECD TG 471 (1983).
Deviations from OECD TG 471 (1983): No information on the number of cells per ml in cultures.
GLP: Yes, except that the stability and concentration of the test substance in the vehicle used were not determined by analysis.
The study is considered acceptable.
Material and methods together with findings
The test substance was Acetochlor (technical material) with purity 89.9%, batch no B2993/15. The assay was conducted by means the plate incorporation method. Five S. typhimurium strains (TA98, TA100, TA1535, TA1537 and TA1538) were used. S9 was derived from livers of male Alderly Park (Alpk:ApfSD) albino rats induced with Araclor 1254. Negative (untreated) and solvent control (DMSO) as well as appropriate positive controls such as Acridine mutagen (ICR191) for TA1537, Daunomycin HCl (DR) for TA98, 4-Nitro-o-phenylene diamine (4NPD) for TA1538, and N-Methyl-N’-nitro-N-nitrosoguanidine (MNNG) for both TA1535 and TA100, without S9, as well as 2-aminoanthracene for all strains, with S9, were used concurrently.
A positive response in an individual experiment is achieved when one or both of the following criteria are met: a) a statistically significant dose-related increase in the mean number of revertant colonies is obtained; b) a two fold or greater increase in the mean number of revertants colonies (over that observed for the concurrent solvent control plates) which is statistically significant, is observed at at least one dose level. A test compound is considered mutagenic when the observed effect for the strain/S9 combination is consistently reproducible. The assessment of statistical significance was carried out using a one-tailed Student´s t-test. Values of p<0.01 are treated as significant, wich values of 0.01<p<0.05 being indicative of a possible effect. The condition of the background bacterial lawn was evaluated for indications of cytotoxicity. Cytotoxicity is evidenced by a reduction in the number of revertans per plate and/or thinning or disappearance of the bacterial background lawn.
CLH REPORT FOR ACETOCHLOR
73
Acetochlor was initially assayed twice at dose levels of 1.6, 8, 40, 200, 1000 and 5000 µg/plate in all strains, both in the presence and absence of S9.
In the 1st experiment, a two fold increase in the mean number of revertants colonies (over that observed for the solvent control) which is statistically significant was only achieved for TA1538 (-S9) at 1000 µg/plate (3.2 fold increase) and for TA98 (+S9) at 200 µg/plate (1.6 fold increase).
In the 2nd experiment, a two fold increase in the mean number of revertants colonies (over that observed for the solvent control) which is statistically significant was only achieved for TA1538 (+S9) at 1000 µg/plate (1.7 fold increase) and for TA98 (-S9) at 200 µg/plate (1.6 fold increase).
In view of the effects observed in strain TA1538 in the 1st experiment (-S9) and in the 2nd experiment (+S9), the compound was retested with this strain (±S9) in a third experiment, at dose levels of 100, 200, 500, 1000, 2500 and 5000 µg/plate. A two fold increase in the mean number of revertants colonies (over that observed for the solvent control) which is statistically significant was achieved for TA1538 (+S9) at 1000 µg/plate (1.9 fold increase) and at 2500 µg/plate (1.6 fold increase).
The positive response observed for TA1538 in the 1st experiment at 1000 µg/plate (-S9) was not reproduced in the 2nd or 3rd experiments, and the effects were therefore not considered to be due to compound-induced mutation.
The positive response observed for TA1538 in the 2nd experiment at 1000 µg/plate (+S9) was reproduced in the 3rd experiment, although these effects showed only limited dose relationships in each case.
In all three experiments, cytotoxicity was observed in each strain (±S9) at the top concentration tested (5000 µg/plate). Positive controls for each experiment gave a satisfactory response.
Conclusion
Acetochlor (technical material) gave a weak but positive mutagenic response with TA1538 in the presence of S9, under the conditions of this study.
Acetochlor (analytical standard) - An evaluation of mutagenic potential using S. typhimurium
Callander, R.D., 1992 (IIA, 5.4.1a/02)
Date of experimental work: 19 July 1991 to 07 October 1991. Date of report: 16 July 1992.
Objective: To evaluate the mutagenic potential of Acetochlor in the strain of Salmonella typhimurium TA1538.
Guidelines: Experimental procedures followed the protocols in accordance with the methods outlined in OECD TG 471 (1983), and in the UK Department of Health Guidelines (1989).
Deviations from OECD TG 471 (1983): Only one tester strain of Salmonella typhimurium (TA1538) was used. No information on the number of cells per ml in cultures. Negative results obtained in the first mutagenicity assay in the absence of S9 were not confirmed.
GLP: No.
The study is considered acceptable.
Material and methods together with findings
The test substances were Acetochlor (analytical standard) with purity 99.6%, batch ref: ASW-995-C, and Acetochlor (technical material) with purity 89.9%, batch ref: B2993/15. The assay was conducted by means the plate incorporation and pre-incubation methods. One S. typhimurium
CLH REPORT FOR ACETOCHLOR
74
strain (TA1538) was used. S9 was derived from livers of male Charles River CD [Crl:CD(SD)BR] albino rats induced with Araclor 1254. The solvent control (DMSO) and appropriate positive controls such as 4-nitro-o-phenylene diamine, in the absence of S9, and 2-aminoanthracene, in the presence of S9, were used concurrently.
A positive response in an individual experiment is achieved when one or both of the following criteria are met: a) a statistically significant dose-related increase in the mean number of revertant colonies is obtained; b) a two fold or greater increase in the mean number of revertants colonies (over that observed for the concurrent solvent control plates) which is statistically significant, is observed at at least one dose level. A test compound is considered mutagenic when the observed effect for the strain/S9 combination is consistently reproducible. The assessment of statistical significance was carried out using a one-tailed Student´s t-test. Values of p<0.01 are treated as significant, wich values of 0.01<p<0.05 being indicative of a possible effect. The condition of the background bacterial lawn was evaluated for indications of cytotoxicity. Cytotoxicity is evidenced by a reduction in the number of revertans per plate and/or thinning or disappearance of the bacterial background lawn.
The samples of Acetochlor (analytical standard and technical material) were initially tested using the plate incorporation method at dose levels of 500, 875, 1250, 2500, 3750, and 5000 µg/plate, in both the presence and absence of S9 mix. The compounds were subsequently retested (+S9 only) at the same concentrations. This 2nd assay was conducted using the pre-incubation method. The two samples were subsequently tested on two further ocassions (+S9 only) using the plate incorporation method, again at the same concentrations.
In four separate assays, Acetochlor (analytical standard) did not induce any significant, reproducible increases in the observed number of revertant colonies in strain TA1538 in the presence of S9, nor were any increases observed in the experiment conducted without S9.
In concurrent experiments, the sample of technical Acetochlor induced slight but significant and reproducible increases in the observed number of revertant colonies in strain TA1538 in the presence of S9. Therefore, the positive response observed at 1250 µg/plate (+S9) in the 1st experiment (1.5 fold increase) was reproduced in the 4th experiment (1.7 fold increase). However, there was not a positive response in the experiment conducted in the absence of S9.
In the plate incorporation assays, cytotoxicity was observed at 5000 µg/plate (+S9) and at 3750 µg/plate (-S9) for both analytical and technical Acetochlor. In the pre-incubation assays (+S9), cytotoxicity was observed at 5000 µg/plate for analytical standard and from 2500 µg/plate for technical material. Positive controls for each experiment gave a satisfactory response.
Conclusion
Under the conditions of this study, Acetochlor (analytical standard) was non mutagenic for tester strain TA1538 in both the presence and absence of S9. Technical Acetochlor showed a weak effect in the presence of S9 under the same conditions.
Acetochlor-An evaluation in the Salmonella/microsome assay
Callander, R.D., 1998 (IIA, 5.4.1a/04)
Date of experimental work: 17 September 1994 to 13 January 1995.
Date of report: 29 July 1998.
Objective: To evaluate the mutagenic potential of various batches of Acetochlor in the strain of Salmonella typhimurium TA1538.
CLH REPORT FOR ACETOCHLOR
75
Guidelines: The procedure followed the Ames protocol (Maron and Ames, 1983) modified in accordance with the recommendations of the UK Environmental Mutagen Society sub-committe on guidelines for mutagenicity testing (Gatehouse et al., 1990)
Deviations from OECD TG 471 (1983): Only one tester strain of Salmonella typhimurium (TA1538) was used. No information on the number of cells per ml in cultures.
GLP: Yes.
The study is considered acceptable
Material and methods together with findings
Three batches of Acetochlor were tested:
-Acethochlor (technical material), batch ref: P2, purity of 89.9%. In the report its name is batch A.
-Acetochlor (analytical standard) batch ref: ASW-995-C, purity of 99.6%. In the report its name is batch B.
-Acetochlor (technical material), batch ref: 13856-46-1, purity of 94.4%. In the report its name is batch C.
The assay was conducted by means the plate incorporation method. One S. typhimurium strain (TA1538) was used. S9 was derived from livers of male Sprague Dawley rats induced either with Araclor 1254 (in batch C) or with a Phenobarbital/β-naphthoflavone combination (in batches A, B and C). The solvent control (DMSO) and appropriate positive controls such as as 4-nitro-o-phenylene diamine, in the absence of S9, and 2-aminoanthracene, in the presence of S9, were used concurrently
A positive response in an individual experiment is achieved when one or both of the following criteria are met: a) a statistically significant dose-related increase in the mean number of revertant colonies is obtained; b) a two fold or greater increase in the mean number of revertants colonies (over that observed for the concurrent solvent control plates) which is statistically significant, is observed at one or more concentrations. A test compound is considered mutagenic when the observed effect for the strain/S9 combination is consistently reproducible. The assessment of statistical significance was carried out using a one-tailed Student´s t-test. Values of p<0.01 are treated as significant, wich values of 0.01<p<0.05 being indicative of a possible effect. The condition of the background bacterial lawn was evaluated for indications of cytotoxicity. Cytotoxicity is evidenced by a reduction in the number of revertans per plate and/or thinning or disappearance of the bacterial background lawn.
Each sample of Acetochlor was initially assayed twice at 100, 200, 500, 1000, 2500 and 5000 µg/plate in the presence of S9 mix prepared from Phenobarbital/β-naphthoflavone-induced rats. Batches A and C were also assayed in the absence of S9 mix. Acetochlor batch C was subsequently retested at the same concentrations, in both the absence and presence of S9 prepared from Arochlor 1254- induced rats.
In two separate experiments, all three test samples did not induce any significant, reproducible increases in the observed number of revertant colonies in the presence of Phenobarbital/β-naphthoflavone-induced S9 mix, nor did batches A and C in the absence of S9 mix. In a 3rd experiment, Acetochlor batch C gave negative results in the absence of S9 mix and with both Phenobarbital/β-naphthoflavone-induced and Arochlor 1254-induced S9 mixes.
In all experiments, cytotoxicity was observed at the top concentrations tested (2500 or 5000 µg/plate). Positive controls for each experiment gave a satisfactory response.
CLH REPORT FOR ACETOCHLOR
76
Conclusion
Under conditions of this study, Acetochlor as technical or analytical grade material is not mutagenic to S. typhimurium strain TA1538 in either the presence or absence of S9.presence or absence of S9.
4.9.1.1.2 Mammalian Gene Mutation
CHO/HGPRT gene mutation assay with MON 097
Li, A.P., 1983 (IIA, 5.4.1b/04)
Date of experimental work: 22 February 1983 to 3 May 1983. Date of report: 9 June 1983.
Objective: To assess the potential of Acetochlor to induce gene mutations at the hypoxanthine guanine phosphoribosyl transferase (HGPRT) locus in cultured Chinese hamster ovary (CHO) cells.
Guidelines: No available. This study is pre-guideline. It was carried out as described by Hsie, A.W. et al. (1979), Mutation Research, 86, 193-224.
Deviations from OECD 476 (1984): None.
GLP: Yes.
The study is considered acceptable.
Material and methods together with findings
The test substance was Acetochlor (MON 097), sample no. T830020, with purity of 96.3%. The study was conducted using a Chinese hamster ovary cell line designated CHO-K1-BH4. Arochlor l254-induced rat liver homogenate (S9) commercialy purchased from Litton Bionetics was used as an exogenous activation system. The solvent control (ethanol) and appropriate positive controls, ethylmethane sulfonate (-S9) and benzo(a)pyrene (+S9), were used concurrently. The assay for the induction of 6-thioguanine (6-TG) resistant mutants was performed.
The toxicity of Acetochlor to CHO cells with and without metabolic activation was determined in range-finding studies prior to the selection of the concentrations for the mutagenicity assays. Proliferating cells were exposed to the test substance both with and without metabolic activation for 3 hours. At the end of exposure period cells are washed and cultured to determine survival. Three samples of 200 cells were plated for determination of cloning efficiency (CE). Plates were incubated for 7-9 days. The colonies developed were counted. Citotoxicity was determined by measuring the cloning efficiency (CE) and expressed as relative survival.
In the mutation induction assays, cells were exposed to test or control compounds for 3 h in the presence or absence of S9. After the exposure period, cells were washed and cultured to determine survival and to allow for expression of the mutant phenotype. At the end of a 7-9 day expression period, a number of 106 cells per sample were plated (5 plates, 2x10⁵ cells per plate) in medium containing 6-thioguanine for mutant selection, and a number of 200 cells per sample in triplicate were plated in medium without 6-thioguanine for the determination of cloning efficiency. Plates were incubated for 8-12 days. Colonies developed were counted. The mutant frequency was calculated dividing the total number of mutant colonies by the total number of cells plated, and corrected by the cloning efficiency. It was expressed as mutants per 106 clonable cells.
Statistical analysis of data was based on methods published by Snee and Irr (1981). The analysis consisted of transformation of the data followed by an analysis of variance for linear trend and a pair-wise comparison of control and treated mutant frequencies by a modified Student´s t-test.
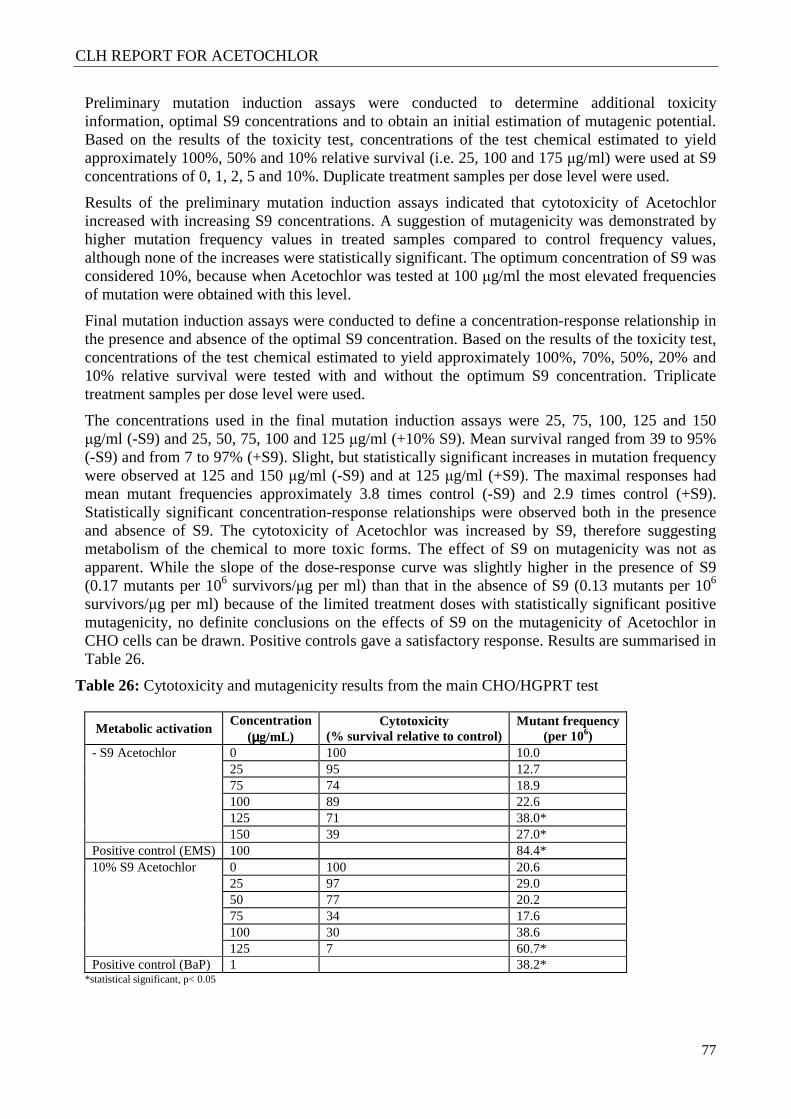
CLH REPORT FOR ACETOCHLOR
77
Preliminary mutation induction assays were conducted to determine additional toxicity information, optimal S9 concentrations and to obtain an initial estimation of mutagenic potential. Based on the results of the toxicity test, concentrations of the test chemical estimated to yield approximately 100%, 50% and 10% relative survival (i.e. 25, 100 and 175 µg/ml) were used at S9 concentrations of 0, 1, 2, 5 and 10%. Duplicate treatment samples per dose level were used.
Results of the preliminary mutation induction assays indicated that cytotoxicity of Acetochlor increased with increasing S9 concentrations. A suggestion of mutagenicity was demonstrated by higher mutation frequency values in treated samples compared to control frequency values, although none of the increases were statistically significant. The optimum concentration of S9 was considered 10%, because when Acetochlor was tested at 100 µg/ml the most elevated frequencies of mutation were obtained with this level.
Final mutation induction assays were conducted to define a concentration-response relationship in the presence and absence of the optimal S9 concentration. Based on the results of the toxicity test, concentrations of the test chemical estimated to yield approximately 100%, 70%, 50%, 20% and 10% relative survival were tested with and without the optimum S9 concentration. Triplicate treatment samples per dose level were used.
The concentrations used in the final mutation induction assays were 25, 75, 100, 125 and 150 µg/ml (-S9) and 25, 50, 75, 100 and 125 µg/ml (+10% S9). Mean survival ranged from 39 to 95% (-S9) and from 7 to 97% (+S9). Slight, but statistically significant increases in mutation frequency were observed at 125 and 150 µg/ml (-S9) and at 125 µg/ml (+S9). The maximal responses had mean mutant frequencies approximately 3.8 times control (-S9) and 2.9 times control (+S9). Statistically significant concentration-response relationships were observed both in the presence and absence of S9. The cytotoxicity of Acetochlor was increased by S9, therefore suggesting metabolism of the chemical to more toxic forms. The effect of S9 on mutagenicity was not as apparent. While the slope of the dose-response curve was slightly higher in the presence of S9 (0.17 mutants per 106 survivors/µg per ml) than that in the absence of S9 (0.13 mutants per 106 survivors/µg per ml) because of the limited treatment doses with statistically significant positive mutagenicity, no definite conclusions on the effects of S9 on the mutagenicity of Acetochlor in CHO cells can be drawn. Positive controls gave a satisfactory response. Results are summarised in Table 26.
Table 26: Cytotoxicity and mutagenicity results from the main CHO/HGPRT test
Metabolic activation Concentration
(µµµµg/mL) Cytotoxicity
(% survival relative to control) Mutant frequency
(per 106) - S9 Acetochlor 0 100 10.0 25 95 12.7 75 74 18.9 100 89 22.6 125 71 38.0* 150 39 27.0* Positive control (EMS) 100 84.4* 10% S9 Acetochlor 0 100 20.6 25 97 29.0 50 77 20.2 75 34 17.6 100 30 38.6 125 7 60.7* Positive control (BaP) 1 38.2*
*statistical significant, p< 0.05
CLH REPORT FOR ACETOCHLOR
78
Conclusion
Under the conditions of this study, Acetochlor induced gene mutations at the HGPRT-locus in CHO cells in the presence and absence of metabolic activation.
CHO/HGPRT gene mutation assay with MON 097
Li, A.P. and Myers, C.A., 1989 (IIA, 5.4.1c/01)
Date of experimental work: 28 September 1988 to 31 January 1989. Date of report: 6 September 1989.
Objective: To assess the potential of Acetochlor to induce gene mutations at the hypoxanthine guanine phosphoribosyl transferase (HGPRT) locus in cultured Chinese hamster ovary (CHO) cells.
Guidelines: Cited EPA guideline 84-2 (A).
Deviations from OECD 476 (1984): None.
GLP: Yes, except that the stability and concentration of the test substance in the carrier used were not determined by analysis.
The study is considered acceptable.
Material and methods together with findings
The test substance was Acetochlor (MON 097), sample no. T880095, with purity of 91.4%. The study was conducted using a Chinese hamster ovary cell line designated CHO-K1-BH4. Aroclor 1254-induced rat liver homogenate (S9), commercially purchased from Organon Teknika Corp., was used as an exogenous activation system. The solvent control (ethanol) and appropriate positive controls [ethylmethane sulfonate without S9, benzo(a)pyrene and dimethylnitrosamine (DMN) with S9] were used concurrently. The assay for the induction of 6-thioguanine (6-TG) resistant mutants was performed.
An initial experiment was performed to test the cytotoxicity of the test chemical. Proliferating cells were exposed to Acetochlor (25, 50, 75, 100, 125, 150, 175 and 200 µg/ml) both with and without metabolic activation for 3 hours. S9 concentrations of 1, 2, 5 and 10% were used. At the end of exposure period cells are washed and cultured to determine survival. Three samples of 200 cells per dose level were plated for determination of cloning efficiency (CE). Plates were incubated for 6-9 days. The colonies developed were counted. Citotoxicity was determined by measuring the cloning efficiency (CE) and expressed as relative survival. The concentrations that induced significant cytotoxicity (10-20% relative survival) were 150 µg/ml, 150 µg/ml, 175 µg/ml, 200 µg/ml, and 175 µg/ml without S9 and with 1%, 2%, 5% and 10% S9, respectively.
In the mutation induction assays, CHO cells were exposed to test or control compounds for 3 h in the presence or absence of S9. After the exposure period, cells were washed and cultured to determine survival and to allow for expression of the mutant phenotype. At the end of a 7-9 day expression period, a number of 106 cells per sample were plated (5 plates, 2x10⁵ cells per plate) in medium containing 6-thioguanine for mutant selection, and a number of 200 cells per sample in triplicate were plated in medium without 6-thioguanine for the determination of cloning efficiency. Plates were incubated for 6-10 days. Colonies developed were counted. The mutant frequency was calculated dividing the total number of mutant colonies by the total number of cells plated, and corrected by the cloning efficiency. It was expressed as mutants per 106 clonable cells.
Statistical analysis of data was based on methods published by Snee and Irr (1981). The analysis consisted of transformation of the data followed by an analysis of variance for linear trend and a pair-wise comparison of control and treated mutant frequencies by a modified Student´s t-test.
CLH REPORT FOR ACETOCHLOR
79
An initial mutagenicity experiment was conducted to yield an initial estimation of mutagenicity and the possible optimum S9 concentration for mutagenicity. Acetochlor was tested at 50, 100 and 200 µg/ml in a range of S9 concentrations (1%, 2%, 5% and 10%). Duplicate treatment samples per dose level were used. The concentration that induced significant cytotoxicity (10-20% relative survival) was 200 µg/ml (-S9). No statistically significant increases in mutant frequency or dose-response were observed. The optimum concentration of S9 was considered 10%, because when Acetochlor was tested at 100 µg/ml the most elevated frequencies of mutation were obtained with this level.
In the confirmatory experiment, Acetochlor was tested at 50, 75, 100, 150 and 200 µg/ml in the absence and presence of 10% S9 activation. Triplicate treatment samples per dose level were used. The concentration that induced significant cytotoxicity (10-20% relative survival) was 200 µg/ml (± S9). No statistically significant increases in mutant frequency or dose response were observed. Positive and solvent control gave a satisfactory response.
Conclusion
Acetochlor did not induce gene mutations at the HGPRT-locus in CHO cells in the presence and absence of metabolic activation, under the conditions of this study.
An evaluation of mutagenic potential of MON 097 employing the L5178Y TK+/- mouse lymphoma assay
Mitchell, A.D., Rudd C.J. and Coleman, R.L., 1982 (IIA, 5.4.1c/02)
Date of experimental work: 21 July 1981 to 16 December 1981. Date of report: August 1982.
Objective: To assess the potential of Acetochlor to induce gene mutations at the thymidine kinase locus in L5178Y mouse lymphoma cells.
Guidelines: No available. This study is pre-guideline. The experimental procedure was adapted from one described by Clive and associates (1971-79).
Deviations from OECD 476 (1984): None.
GLP: Yes.
The study is considered acceptable with reservations due to purity was not reported.
Material and methods together with findings
The test substance was Acetochlor (MON 097), lot no Nbp 1924845. The study was conducted using mouse lymphoma cell line designated L5178Y. S9 was derived from livers of male Fischer 344 rats induced with Arochlor 1254. The solvent control (DMSO) and appropriate positive controls, ethylmethanesulfonate (without S9) and 3 Methylcholantrene (with S9) were used concurrently. The assay for the induction of trifluorothymidine (TFT) resistant mutants was performed.
Preliminary experiments were conducted with Acetochlor to determine its cytotoxicity and the concentration range to use in the mutagenesis assays. Acetochlor was tested, in singlets, at 18 concentrations (1, 5, 10, 25, 50, 100, 200, 300, 400, 500, 600, 700, 800, 900, 1000, 2000, 3500 and 5000 µL/L) with and without metabolic activation. Test substance precipitated at concentrations of 800 to 5000 µL/L (-S9) and at concentrations of 2000 to 5000 µL/L (+S9). Citotoxicity was calculated by multiplying the relative suspension growth and the relative cloning efficiency and was expressed as the relative total growth (%). In samples treated with 100 to 700 µL/L (-S9) and with 50 to 1000 µg/L (+S9), less than 3 x 10⁶ cells survived the expression period, so they were not cloned. Five samples exposed to 1 to 50 µL/L (-S9) were cloned and yielded relative total growth levels from approximately 98% at 10 µL/L to 14% at 50 µL/L. Four samples

CLH REPORT FOR ACETOCHLOR
80
exposed to 1 to 25 µL/L (+S9) were cloned and yielded relative total growth levels from approximately 55% at 1 µL/L to 14% at 25 µL/L.
In mutagenesis assays, Acetochlor was tested at concentrations of 20, 30, 45, 60, 76, 100 and 400 µL/L (-S9), and at concentrations of 5, 15, 20, 30, 40, 50, 100 and 250µL/L with S9. Triplicate samples were used for each test article concentration and for the negative and positive controls. After the exposure period (4 hours), the treatment solutions were removed and cells were resuspended in fresh medium and incubated for 2 days for expression of any mutation. After the expression period, 3 x 10⁶ cells were seeded in cloning media supplemented with TFT for determining mutations, and 600 cells were seeded in cloning medium without TFT for determining viability. After cultivation of the cells for 11 days, colonies of cells in each plate were counted.
The mutation frequency was calculated by dividing the number of mutant colonies by the number of potentially viable colonies per 3 x 10⁶ cells plated. The number of potentially viable colonies was calculated by multiplying the 3 x 10⁶ cells plated by their specific cloning efficiency. The average mutation frequency of the solvent controls was subtracted from that of each treated sample so that the results were expressed as induced mutation frequencies. The test substance is considered to be mutagenic if the mean mutation frequencies of at least two test sample concentrations with a mean relative total growth value of at least 10% are significantly greater (p< 0.01) than that of the solvent control and the linear component of the dose-response relationship is statistically significant (p< 0.01) and exhibits a positive slope for test sample concentrations with a mean relative growth value of at least 10%. The mutagenicity data were analyzed statistically using the Student´s t-test and the dose-response analysis of variance as generally outlined by Irr and Snee (1979, 1981).
In the absence of S9, cytotoxicity was observed at concentrations ≥ 76 µL/L yielding relative total growth values of less than 10%. The mutation frequencies of samples treated with four concentrations (30, 45, 60 and 76 µL/L) were analyzed statistically, and none were found to be significantly different than the solvent control. At the lowest concentration, 20 µL/L, the relative suspension growth was much lower than expected. It is likely that a more concentrated stock solution was used during the addition of the chemical, so that the actual concentration was 100 µL/L. Because of this uncertainty, and also because the average relative total growth was less than 10%, these samples were not included in the statistical analysis. Positive control gave a satisfactory response
In the presence of S9, cytotoxicity was observed at concentrations greater than 30 µL/L yielding relative total growth values of less than 10%. Six set samples treated with 5, 15, 20, 30, 40 and 50 µL/L were cloned. At 40 and 50 µL/L, the relative total growth was less than 10% that of the solvent control, so only the remaining four sets of samples were analyzed statistically. Two concentrations, 20 and 30 µL/L yielded significant increases in the mutation frequency over that of the solvent control. The maximal response at 30 µL/L had a mean mutation frequency approximately 2.2 times control. A significant dose-dependent increase in the mutation frequency was also observed. Positive control gave a satisfactory response.
Conclusion
Under the conditions of this study, Acetochlor was mutagenic in the mouse lymphoma assay (L5178Y TK+/-) in the presence of metabolic activation but not mutagenic in the absence of metabolic activation.
CLH REPORT FOR ACETOCHLOR
81
4.9.1.1.3 Mammalian chromosome aberration
Acetochlor: An Evaluation in the in vitro cytogenetic assay in human lymphocytes.
Howard, C.A., 1989 (IIA, 5.4.1b/02)
Dates of experimental work: 24 January 1989 to 8 May 1989. Date of report: 20 July 1989.
Objective: To evaluate the clastogenic potential of Acetochlor for human lymphocyte cultures.
Guidelines: OECD TG 473 (1983).
Deviations from OECD TG 473 (1983): None.
GLP: Yes.
The study is considered acceptable.
Material and methods together with findings
The test substance was Acetochlor (technical material), reference A1016/9, with purity 89.4%. The study was conducted in human lymphocytes using whole blood from two healthy donors (one male and one female). S9 was derived from livers of male AlpkaAPfSD albino rats induced with Aroclor 1254. Negative (untreated) and solvent control (DMSO) as well as appropriate positive controls, mitomycin C (without S9) and cyclophosphamide (with S9), were used concurrently.
Dose levels for the chromosome aberration assay were selected following a preliminary cytotoxicity test based on the mitotic index (MI) determination. Acetochlor was administered to duplicate cultures from both donors at concentrations ranging from 3-900 µg/mL, in the presence and absence of metabolic activation.
Accordingly, the dose levels selected for the chromosomal aberration assay were 10, 50 and 100 µg/mL. The test or control substances were administered to duplicate cultures from both donors, in the presence and absence of S9, at approximately 44 h after culture initiation, and remained in contact with the cells for approximately 2 h 30 min to 3 h 30 min. Colchicine was added two hours prior to harvesting the cultures at 72 h. Where possible, one hundred cells in metaphase were analysed from each blood culture for the incidence of structural chromosomal damage (gaps, breaks, fragments and minutes, multiple damage, interchanges, other) according to the criteria recommended by Scott et al.(1983). The MI was determined for each culture.
The total number of abnormal cells excluding gaps for each of the treatment groups was evaluated for statistical significance from the appropriate solvent controls using the Fisher's Exact Test. The results of the cytogenetic analyses are expressed as the mean percentage of abnormal cells and as the number of aberrations per cell at each dose level. Results are summarised in Table 27 and Table 28.
Statistical significant increases in chromosomal damage were observed in cultures from both donors treated with 100 µg/mL (± S9-mix). Small but statistically significant increases were also observed in cultures treated with 50 µg/mL, from both (-S9-mix) and one donor (+S9-mix). Furthermore, there was a clear dose-response curve for clastogenicity. This clastogenic response seen at 100 µg/mL was accompanied by a reduction in MI of between 36 and 69%. Positive and negative controls gave a satisfactory response.
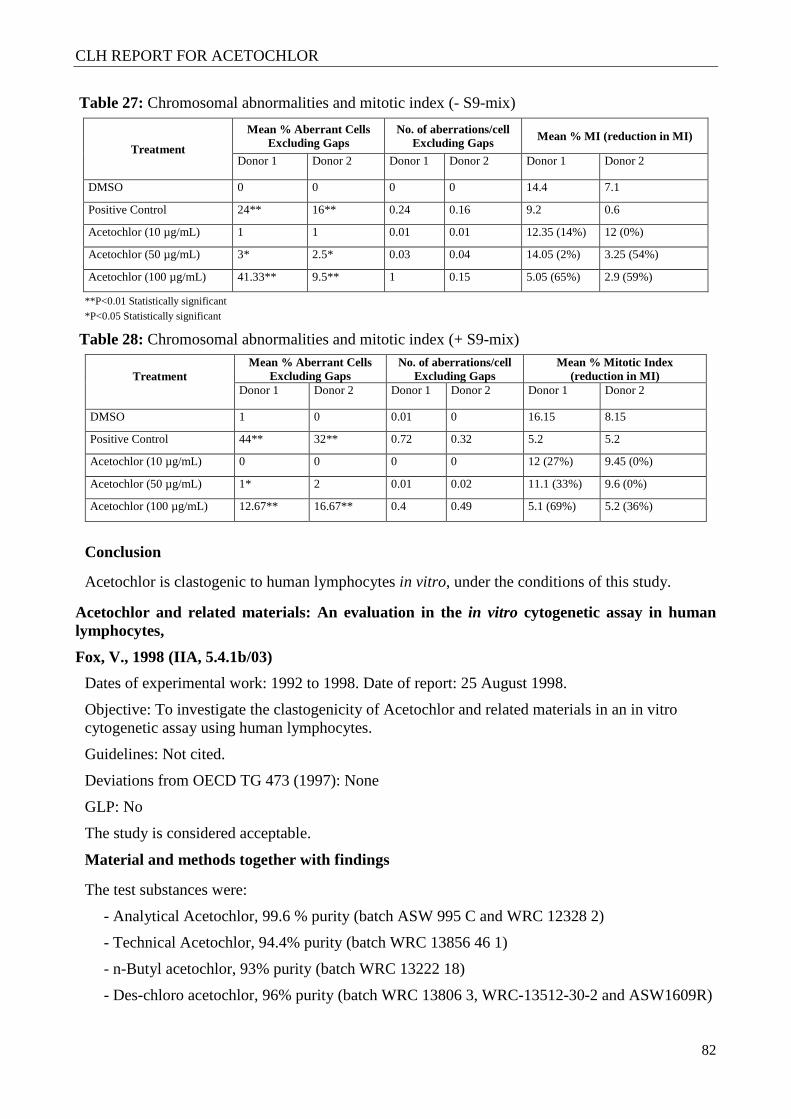
CLH REPORT FOR ACETOCHLOR
82
Table 27: Chromosomal abnormalities and mitotic index (- S9-mix)
Treatment
Mean % Aberrant Cells Excluding Gaps
No. of aberrations/cell Excluding Gaps Mean % MI (reduction in MI)
Donor 1 Donor 2 Donor 1 Donor 2 Donor 1 Donor 2
DMSO 0 0 0 0 14.4 7.1
Positive Control 24** 16** 0.24 0.16 9.2 0.6
Acetochlor (10 µg/mL) 1 1 0.01 0.01 12.35 (14%) 12 (0%)
Acetochlor (50 µg/mL) 3* 2.5* 0.03 0.04 14.05 (2%) 3.25 (54%)
Acetochlor (100 µg/mL) 41.33** 9.5** 1 0.15 5.05 (65%) 2.9 (59%)
**P<0.01 Statistically significant
*P<0.05 Statistically significant
Table 28: Chromosomal abnormalities and mitotic index (+ S9-mix)
Treatment Mean % Aberrant Cells
Excluding Gaps No. of aberrations/cell
Excluding Gaps Mean % Mitotic Index
(reduction in MI) Donor 1 Donor 2 Donor 1 Donor 2 Donor 1 Donor 2
DMSO 1 0 0.01 0 16.15 8.15
Positive Control 44** 32** 0.72 0.32 5.2 5.2
Acetochlor (10 µg/mL) 0 0 0 0 12 (27%) 9.45 (0%)
Acetochlor (50 µg/mL) 1* 2 0.01 0.02 11.1 (33%) 9.6 (0%)
Acetochlor (100 µg/mL) 12.67** 16.67** 0.4 0.49 5.1 (69%) 5.2 (36%)
Conclusion
Acetochlor is clastogenic to human lymphocytes in vitro, under the conditions of this study.
Acetochlor and related materials: An evaluation in the in vitro cytogenetic assay in human lymphocytes,
Fox, V., 1998 (IIA, 5.4.1b/03)
Dates of experimental work: 1992 to 1998. Date of report: 25 August 1998.
Objective: To investigate the clastogenicity of Acetochlor and related materials in an in vitro cytogenetic assay using human lymphocytes.
Guidelines: Not cited.
Deviations from OECD TG 473 (1997): None
GLP: No
The study is considered acceptable.
Material and methods together with findings
The test substances were:
- Analytical Acetochlor, 99.6 % purity (batch ASW 995 C and WRC 12328 2)
- Technical Acetochlor, 94.4% purity (batch WRC 13856 46 1)
- n-Butyl acetochlor, 93% purity (batch WRC 13222 18)
- Des-chloro acetochlor, 96% purity (batch WRC 13806 3, WRC-13512-30-2 and ASW1609R)
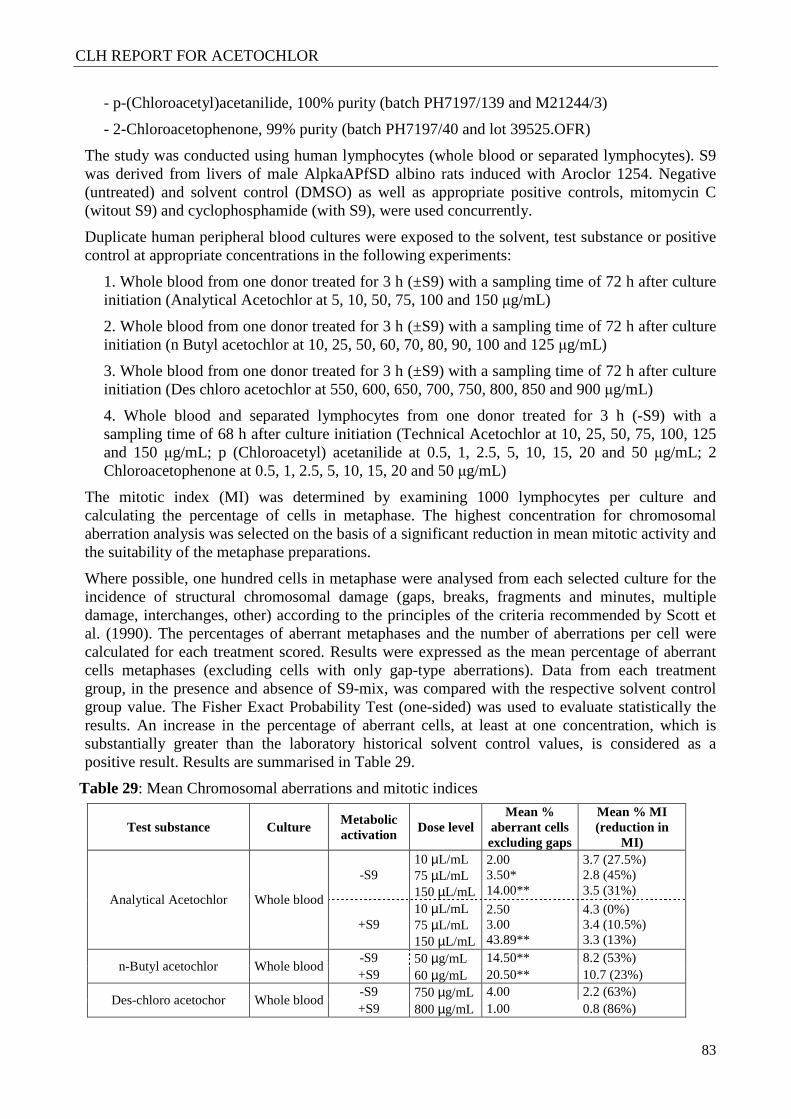
CLH REPORT FOR ACETOCHLOR
83
- p-(Chloroacetyl)acetanilide, 100% purity (batch PH7197/139 and M21244/3)
- 2-Chloroacetophenone, 99% purity (batch PH7197/40 and lot 39525.OFR)
The study was conducted using human lymphocytes (whole blood or separated lymphocytes). S9 was derived from livers of male AlpkaAPfSD albino rats induced with Aroclor 1254. Negative (untreated) and solvent control (DMSO) as well as appropriate positive controls, mitomycin C (witout S9) and cyclophosphamide (with S9), were used concurrently.
Duplicate human peripheral blood cultures were exposed to the solvent, test substance or positive control at appropriate concentrations in the following experiments:
1. Whole blood from one donor treated for 3 h (±S9) with a sampling time of 72 h after culture initiation (Analytical Acetochlor at 5, 10, 50, 75, 100 and 150 µg/mL)
2. Whole blood from one donor treated for 3 h (±S9) with a sampling time of 72 h after culture initiation (n Butyl acetochlor at 10, 25, 50, 60, 70, 80, 90, 100 and 125 µg/mL)
3. Whole blood from one donor treated for 3 h (±S9) with a sampling time of 72 h after culture initiation (Des chloro acetochlor at 550, 600, 650, 700, 750, 800, 850 and 900 µg/mL)
4. Whole blood and separated lymphocytes from one donor treated for 3 h (-S9) with a sampling time of 68 h after culture initiation (Technical Acetochlor at 10, 25, 50, 75, 100, 125 and 150 µg/mL; p (Chloroacetyl) acetanilide at 0.5, 1, 2.5, 5, 10, 15, 20 and 50 µg/mL; 2 Chloroacetophenone at 0.5, 1, 2.5, 5, 10, 15, 20 and 50 µg/mL)
The mitotic index (MI) was determined by examining 1000 lymphocytes per culture and calculating the percentage of cells in metaphase. The highest concentration for chromosomal aberration analysis was selected on the basis of a significant reduction in mean mitotic activity and the suitability of the metaphase preparations.
Where possible, one hundred cells in metaphase were analysed from each selected culture for the incidence of structural chromosomal damage (gaps, breaks, fragments and minutes, multiple damage, interchanges, other) according to the principles of the criteria recommended by Scott et al. (1990). The percentages of aberrant metaphases and the number of aberrations per cell were calculated for each treatment scored. Results were expressed as the mean percentage of aberrant cells metaphases (excluding cells with only gap-type aberrations). Data from each treatment group, in the presence and absence of S9-mix, was compared with the respective solvent control group value. The Fisher Exact Probability Test (one-sided) was used to evaluate statistically the results. An increase in the percentage of aberrant cells, at least at one concentration, which is substantially greater than the laboratory historical solvent control values, is considered as a positive result. Results are summarised in Table 29.
Table 29: Mean Chromosomal aberrations and mitotic indices
Test substance Culture Metabolic activation
Dose level Mean %
aberrant cells excluding gaps
Mean % MI (reduction in
MI)
Analytical Acetochlor Whole blood
-S9 10 µL/mL 75 µL/mL 150 µL/mL
2.00 3.50* 14.00**
3.7 (27.5%) 2.8 (45%) 3.5 (31%)
+S9 10 µL/mL 75 µL/mL 150 µL/mL
2.50 3.00 43.89**
4.3 (0%) 3.4 (10.5%) 3.3 (13%)
n-Butyl acetochlor Whole blood -S9 50 µg/mL 14.50** 8.2 (53%) +S9 60 µg/mL 20.50** 10.7 (23%)
Des-chloro acetochor Whole blood -S9 750 µg/mL 4.00 2.2 (63%) +S9 800 µg/mL 1.00 0.8 (86%)
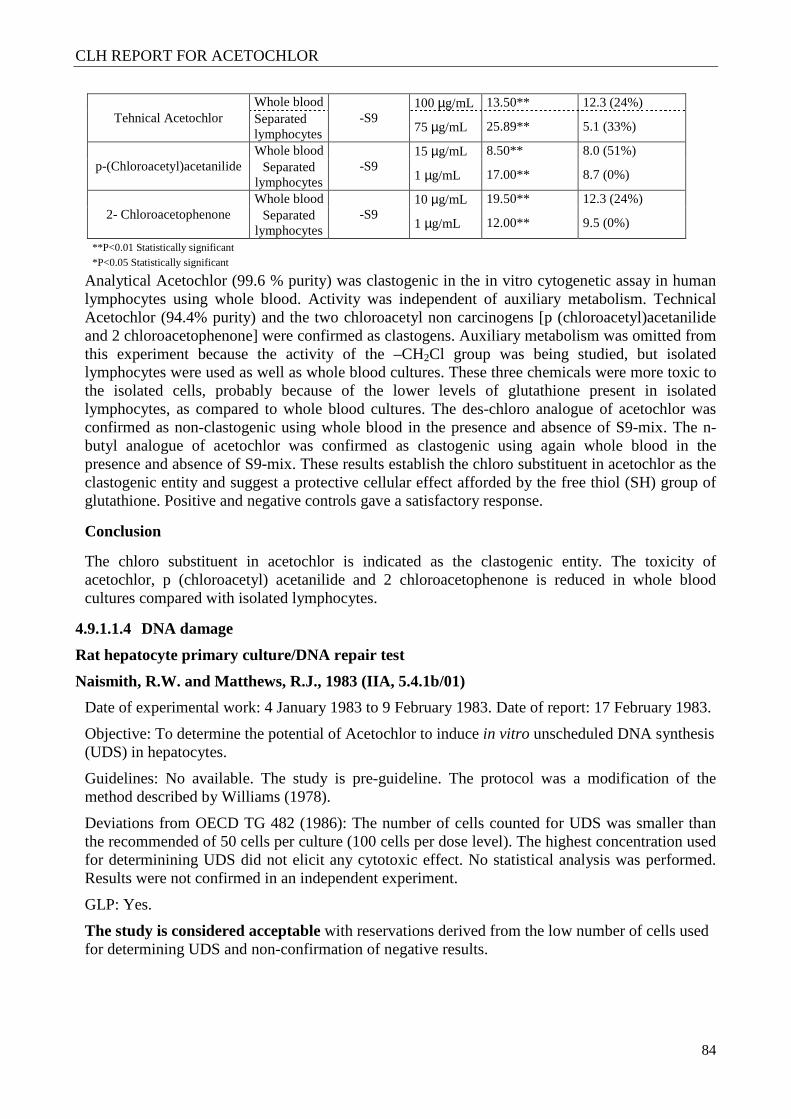
CLH REPORT FOR ACETOCHLOR
84
Tehnical Acetochlor Whole blood
-S9 100 µg/mL 13.50** 12.3 (24%)
Separated lymphocytes 75 µg/mL 25.89** 5.1 (33%)
p-(Chloroacetyl)acetanilide Whole blood
-S9 15 µg/mL 8.50** 8.0 (51%)
Separated lymphocytes 1 µg/mL 17.00** 8.7 (0%)
2- Chloroacetophenone Whole blood
-S9 10 µg/mL 19.50** 12.3 (24%)
Separated lymphocytes 1 µg/mL 12.00** 9.5 (0%)
**P<0.01 Statistically significant
*P<0.05 Statistically significant
Analytical Acetochlor (99.6 % purity) was clastogenic in the in vitro cytogenetic assay in human lymphocytes using whole blood. Activity was independent of auxiliary metabolism. Technical Acetochlor (94.4% purity) and the two chloroacetyl non carcinogens [p (chloroacetyl)acetanilide and 2 chloroacetophenone] were confirmed as clastogens. Auxiliary metabolism was omitted from this experiment because the activity of the –CH2Cl group was being studied, but isolated lymphocytes were used as well as whole blood cultures. These three chemicals were more toxic to the isolated cells, probably because of the lower levels of glutathione present in isolated lymphocytes, as compared to whole blood cultures. The des-chloro analogue of acetochlor was confirmed as non-clastogenic using whole blood in the presence and absence of S9-mix. The n-butyl analogue of acetochlor was confirmed as clastogenic using again whole blood in the presence and absence of S9-mix. These results establish the chloro substituent in acetochlor as the clastogenic entity and suggest a protective cellular effect afforded by the free thiol (SH) group of glutathione. Positive and negative controls gave a satisfactory response.
Conclusion
The chloro substituent in acetochlor is indicated as the clastogenic entity. The toxicity of acetochlor, p (chloroacetyl) acetanilide and 2 chloroacetophenone is reduced in whole blood cultures compared with isolated lymphocytes.
4.9.1.1.4 DNA damage
Rat hepatocyte primary culture/DNA repair test
Naismith, R.W. and Matthews, R.J., 1983 (IIA, 5.4.1b/01)
Date of experimental work: 4 January 1983 to 9 February 1983. Date of report: 17 February 1983.
Objective: To determine the potential of Acetochlor to induce in vitro unscheduled DNA synthesis (UDS) in hepatocytes.
Guidelines: No available. The study is pre-guideline. The protocol was a modification of the method described by Williams (1978).
Deviations from OECD TG 482 (1986): The number of cells counted for UDS was smaller than the recommended of 50 cells per culture (100 cells per dose level). The highest concentration used for determinining UDS did not elicit any cytotoxic effect. No statistical analysis was performed. Results were not confirmed in an independent experiment.
GLP: Yes.
The study is considered acceptable with reservations derived from the low number of cells used for determining UDS and non-confirmation of negative results.
CLH REPORT FOR ACETOCHLOR
85
Material and methods together with findings
The test substance was Acetochlor, lot NBP1737813, with purity 99.7%. The study was conducted using hepatocyte cultures from male Fischer 344 rats. Negative (untreated) and solvent control (DMSO) as well as the positive control 2-Acetamidofluorene (2AAF), were used concurrently.
For the DNA repair test, the test or control substances and 3H-thymidine were added to the hepatocyte cultures (5x10⁻⁵ viable cells) and incubated for 18 to 20 hours at 37°C. Acetochlor was tested at concentrations of 0.016, 0.053, 0.16, 0.53, 1.6, 5.3, 16.0, 53.3 and 160.0 µg/mL in triplicate samples along with a positive control, a solvent control and an untreated control.
Slides of hepatocytes were prepared for autoradiography and subsequently stained. Nuclear and cytoplasmic silver grains were quantified by a colony counter using 20 cells per culture (60 cells per dose level). Net nuclear grain counts were calculated by subtracting the highest of three cytoplasmic counts from the nuclear count. A test compound is considered positive if a net grain count of at least five is consistently observed at non-toxic doses.
Cytotoxicity was identified by visual observation of cell detachment, abnormal cell morphology, unusual cell staining and an overall decrease in grains relative to the solvent and untreated controls. Accordingly, Acetochlor was considered to be cytotoxic from 5.3 µg/mL.
None of the mean net nuclear grain counts of slides exposed to non-toxic concentrations of Acetochlor were greater than five. Negative and positive controls gave a satisfactory response.
Conclusion
Under conditions of this study, Acetochlor did not induce UDS in hepatocyte cultures.
4.9.1.2 In vivo data
4.9.1.2.1 Chromosome aberration in mammalian somatic cells
In vivo bone marrow chromosome study in rats with Acetochlor (MON 097)
Farrow, M.G., and Cortina, T., 1983 (IIA, 5.4.2a/01)
Date of experimental work: 16 March 1983 to10 May 1983. Date of report: 24 May 1983.
Objective: To evaluate the clastogenic potential of Acetochlor in rat bone marrow cells using the chromosomal aberration assay.
Guidelines: No available. The study is pre-guideline. It was performed according to the techniques described by Evans (1976) and Killian et al. (1977).
Deviations from OECD TG 475 (1984): The high dose tested did not produce toxicity either in animals or in the bone marrow.
GLP: Yes.
The study is not acceptable because the highest dose tested is not considered appropriate.
Material and methods together with findings
The test substance was Acetochlor, lot no Dayton Ba 29, with 96.3% purity. The vehicle control was Corn oil. The positive control was Mitomycin C. The study was conducted using male and female Sprague-Dawley rats.
A preliminary dose range finding study was performed. Three groups of two rats/sex/group were administered intraperitoneally a single injection of Acetochlor (100, 300 and 1000 mg/Kg) and observed for two days. At forty-six hours after administration of the test substance, the animals received a single intraperitoneal injection of colchicine. Three of the animals at 1000 mg/Kg died
CLH REPORT FOR ACETOCHLOR
86
prior to completion of the study and the one remaining high dose animal showed clinical observations ranging from soft faeces to slightly depressed. The three animals that died on study were observed to have dark livers and bright red lungs. The test material produced no apparent effect on the mitotic indices (MI) of the animals wich survived. Based on these results, 500 mg/Kg was chosen as the highest dose to be tested in the bone marrow cytogenetic assay.
In the cytogenetic assay, Acetochlor (40, 150 and 500 mg/kg), vehicle and Mitomycin C were administered once via intraperitoneal injection to groups of rats (24/sex/dose for test substance and vehicle groups, and 6/sex for positive control group).
Six rats/sex were sacrificed from each of the Acetochlor–treated and vehicle control groups at 6, 12, 24 and 48 hours after dosing, and from the Mitomycin C group at 24 hours after dosing. In each case, colchicine was administered by intraperitoneal injection two hours prior to sacrifice. Observations of general appearance, behavior, toxic and pharmacological effects were recorded twice daily or prior to sacrifice. Body weights were recorded once, prior to compound administration, for the 6 and 12 hour sacrifices, and twice, prior to compound administration and prior to colchicine administration, for the 24 and 48 hour sacrifices.
Where possible, 60 cells in metaphase were examined from five of the six rats chosen randomly per each sex and group for the incidence of chromosomal aberration. Chromosomal aberrations were characterized as: a) chromatid breaks (including fragments and deletions); b) chromosome breaks (including acentric fragments, deletions and minutes); c) chromatid and chromosome gaps; d) exchanges (rings, dicentrics, quadriradials and triradials); e) cells with > 10 aberrations; f) pulverized cells. The MI was recorded as the number of cells undergoing mitosis per 500 cells counted and represented as a percentage.
The mean MI, mean modal numbers, percent aberrant cells and the total number of aberrations per animal for each group were statistically compared using the Kruska1-Wa11is nonparametric analysis of variance and nonparametric all pairwise group comparisons (KW-ANOVA). Analysis was performed at a 95% confidence interval using a one-tailed test (p < 0.05).
No overt toxic effects were noted in the clinical observations. No significant differences were observed between the negative control and test groups when comparing modal number and mitotic indices. Since no evidence of mitotic delay was seen after analysis of the MI, the slides from the 48-hour sacrifice were not analyzed for chromosomal aberrations.
Results show that no statistically significant increases in the frequency of chromosomal aberrations compared to control values were seen for any of the dose levels that were tested. Mitomycin gave a satisfactory response.
Conclusion
Acetochlor under conditions of this study was considered not to be clastogenic at any of the dose leveles tested.
In vivo micronucleus assay in mice with MON 097 (Acetochlor)
Cavagnaro, J. and Cortina, T., 1985 (IIA, 5.4.2a/02)
Date of experimental work: 27 November 1984 to 25 January 1985. Date of report: 13 March 1985.
Objective: To evaluate the clastogenica potential of Acetochlor in mouse bone marrow cells using the micronucleus test.
Guidelines: Not cited.
CLH REPORT FOR ACETOCHLOR
87
Deviations from OECD TG 474 (1983): The number of polychromatic erythrocytes (PCE) analysed for micronucleus incidence was smaller (625) than the recommended (1000) when expressed per animal, but the same as the recommended (10000) when expressed per dose level. It was not specified neither the number of erythrocytes counted (it is recommended 1000 per animal) nor the formula used to obtain the ratio polychromatic to normochromatic erythrocytes (PCE/NCE). The high dose tested produced toxicity in animals but not in the bone marrow.
GLP: Yes.
The study is not considered acceptable because it does not establish that the bone marrow has been exposed to the test substance.
Material and methods together with findings
The test substance was Acetochlor, Dayton batch 18, with 96.7% purity. The vehicle was Corn oil. The positive control was cyclophosphamide. The study was conducted using male and female CD-1 mice.
A preliminary dose range finding study was performed. Three groups of two mice/sex/group were administered Acetochlor, by oral gavage in a single dose (1000, 2000 and 3000 mg/Kg), and observed for seven days. One male administered 2000 mg/Kg and both females administered 3000 mg/Kg died while on study. The severity of the abnormal observations increased with increased dose. In addition, males administered 3000 mg/Kg and females administered 2000 mg/Kg showed larger losses of body weight. Based on these results, 2000 mg/Kg was chosen as the highest dose to be tested in the micronucleus assay.
In the micronucleus test, Acetochlor (200, 660 and 2000 mg/Kg), vehicle and cyclophosphamide were administered by single oral gavage to groups of mice (27/sex/dose for test substance and vehicle groups, and 9/sex for positive control group).
Nine mice/sex were sacrificed from each of the Acetochlor–treated and vehicle control groups at 24, 48 and 72 hours after dosing, and from the cyclophosphamide group at 24 hours after dosing. Observations of general appearance, behavior, toxic and pharmacological effects were recorded twice daily or prior to sacrifice. Body weights were recorded prior to compound administration and prior to sacrifice.
Erythrocytes that stain blue or with a bluish tint were scored as PCE and those staining red or with a red tint were scored as NCE. Only cells showing good morphology were scored. Objects within a cell that appeared to be round, darkly stained and in the same focal plane as the cell were scored as micronuclei. Where possible, 625 PCE were scored for the presence of micronuclei from eight of the nine mice, chosen randomly, for each group and sex. The number of NCE per 625 PCE was also recorded.
The mean number of micronuclei per 625 PCE was statistically analysed by Analysis of Variance (ANOVA) with individual group comparisons performed by Dunnett1s t-Test, and also by Kruskal-Wallis nonparametric analysis of variance and nonparametric pairwise group comparisons (KW-ANOVA). The number of micronuclei per 625 PCE for each animal was entered into both statistical programs. The analysis was one-tailed at the 95% confidence interval (p < 0.05).
Eleven males and twelve females treated at 2000 mg/Kg died prior to their schedule sacrifice. Clinicals signs of generalized toxicity were observed at the 660 (males) and 2000 mg/Kg levels (males and females) and included urine stains, rough coat, prostrate, depressed, ataxia and labored respiration. Animals at the 2000 mg/Kg level showed a slightly larger loss of body weight (mean terminal body weights were approximately 3% less than the control group).
CLH REPORT FOR ACETOCHLOR
88
A large degree of variability was observed for the ratio of PCE/NCE within groups. The highest dose group at 72 h showed the lowest PCE/NCE ratio, 0.79:1, as compared to a control value of 1.09:1. Nevertheless, since data were not statistically analysed this result cannot be considered indicative of bone marrow toxicity.
No significant differences in the frequency of micronuclei in PCE were seen at any dose level. Positive control gave a satisfactory response
Conclusion
Acetochlor under conditions of this study was considered not to be clastogenic in the mouse bone marrow micronucleus test at any of the dose leveles tested.
Acetochlor: An evaluation in the mouse micronucleus test
Randall, V., 1989 (IIA, 5.4.2a/03)
Date of experimental work: 09 November 1988 to 28 April 1989. Date of report: 31 July 1989.
Objective: To evaluate the clastogenic potential of Acetochlor in mouse bone marrow cells using the micronucleus test.
Guidelines: OECD TG 474 (1983).
Deviations from OECD TG 474 (1983): None.
GLP: Yes, except that the stability, concentration and homogeneity of the test substance in the vehicle used were not determined by analysis.
The study is considered acceptable.
Material and methods together with findings
The test substance was Acetochlor, reference no SC31/88, with 89.4% purity. The vehicle was corn oil. The positive control was cyclophosphamide. The study was conducted using male and female C57BL/6JfCD-l/Alpk mice.
The phase I of the study involves the determination of the median lethal dose (MLD) calculated on the deaths over a four-day observation. Acetoch1or was initially administered as a single intragastric dose to two groups of two females at 2000 and 3000mg/Kg. Both animals survived at the 2000 mg/Kg level whereas both died at the 3000 mg/Kg level. Then groups of five males and five females were dosed at 2000 and 3000 mg/Kg. Three males and one female died at the 2000 mg/Kg level and all animals died at the 3000 mg/Kg level. A further five males and five females were dosed at 1000 mg/kg. No deaths were observed in either sex at this dose level. From these observations the MLD was estimated by logistic regression for each sex. The MLD was 1795 mg/Kg for males and 2149 mg/Kg for females.
The phase II of the study involves the micronucleus test. Acetochlor at dose levels being 50 and 80% of the MLD (898 and 1436 mg/Kg in males; 1075 and 1719 mg/Kg in females), vehicle and cyclophosphamide were administered by the intragastric route to groups of mice (15/sex/dose for test substance and vehicle groups, and 5/sex for positive control group).
Five mice/sex were sacrificed from each of the Acetochlor–treated and vehicle control groups at 24, 48 and 72 hours after dosing, and from the cyclophosphamide group at 24 hours after dosing.
Bone marrow smears were prepared, air dried and stained with polychrome methylene blue and eosin to visualise the various cell types. Initially 1000 polychromatic erythrocytes (PCE) per animal were evaluated for the presence of micronuclei, and 1000 erythrocytes were counted to determine the percentage of PCE in the total erythrocyte population to obtain an indication of
CLH REPORT FOR ACETOCHLOR
89
cytotoxicity. Extended evaluation of an additional 2000 PCE per animal for the incidence of micronucleus was undertaken for female animals from both Acetochlor groups and from the solvent control group, at the 24 hour sampling time.
The incidence of micronucleated polychromatic erythrocytes (MNPCE) and percentage PCE were considered by analysis of variance, regarding each combination of sampling time, dose level and sex as a separate group. The results were examined to determine whether any differences between solvent control and treated groups were consistent between sexes and across sampling times. Where extended counts were undertaken this data was also considered by analysis of variance, first, as an independent set of data and second, jointly, with the relevant original counts. These results were examined to determine whether any differences between solvent control and treated groups were consistent between the original and extended counts. The data for the incidence of MNPCE was transformed using a natural logarithmic transformation, to stabilise the variance, prior to analysis. Unbiased estimates of the group means were provided by the least square means but for simplicity standard means are presented. Each treatment group mean was compared with the solvent control group mean at the corresponding sampling time using a one-side Student's t-test, based on the error mean square in the analysis which estimates between animal variation. Comparisons were made for combined and separate sex group means.
Two females died prior to schedule sacrifice, one at 1075 mg/Kg (24 h time-sacrifice) and other at 1719 mg/Kg (72 h time-sacrifice). When combining sexes, significant reductions in % PCE were observed at 50 and 80% MLD (72 h time-sacrifice) and at 80% MLD (24 h time-sacrifice). When female data were analysed separately, significant reductions in % PCE were observed at 1075 and 1719 mg/Kg (72 h time-sacrifice). When male data were analysed separately, significant reductions in % PCE were observed at 1436 mg/Kg (24 and 72h time-sacrifice). These results suggest that Acetochlor (or a metabolite) induces cytotoxicity in the bone marrow.
There were no statistically significant increases in MNPCE in mice treated with Acetoch1or at either dose level, at any of the sampling times, when the data from both sexes were pooled prior to analysis. However, when the sexes were considered separately, there was an isolated statistically significant increase over solvent control values at the 80% MLD dose level (1719 mg/Kg) in females 24 hours after dosing. Since all Acetoch1or treated values were within the solvent control range for this study, this isolated statistically significant increase was considered not to be biologically significant. In order to assess the validity of this effect, a further 2000 PCE were examined for females at both dose levels of Acetoch1or and the solvent control at the 24 hour sampling time. Following the extended counts there were no statistically significant differences between the test groups and the solvent control whether the extended counts were analysed alone (as 2000 PCE), or combined with the original counts (as 3000 PCE). Positive control gave a satisfactory response.
Conclusion
Acetochlor under conditions of this study was considered not to be clastogenic in the mouse bone marrow micronucleus test.
4.9.1.2.2 DNA effects in mammalian somatic cells
Use of the comet assay to assess genetic toxicity in the nasal olfactory cells of rats exposed to Acetochlor in diet
Ashby, J., Clapp, M.J.L., Tinwell, H. et al., 1996 (IIA, 5.4.2b/01)
Date of experimental work: Not specified. Date of report: July 1995.
CLH REPORT FOR ACETOCHLOR
90
Objective: To measure DNA damage in nasal cells of rats exposed to Acetochlor under the exact condition of the carcinogenicity bioassay, by using the comet assay.
Guidelines: No available, although there is a project of the OECD (no. 4.36) included in the work plan of the TGP to develop a new TG on the comet assay, and is expected to be final validation report in 2012. The study was performed according to published methods (Tice, Andrews and Singh, 1990; Ashby et al., 1996; Pool-Zobel et al., 1994).
GLP: No.
The study is not acceptable because the only dose used is not considered appropriate. For in vivo tests of non-toxic substances it is recommended a dose limit of 2000 mg/Kg/day when the substance is administered once or daily for a period up to 14 days, and 1000 mg/Kg for exposures above to 14 days. In this study, the dose used (≈ 175 mg/Kg/day) was not justified by its toxicity because the study did not provide any information. In addition, this dose can be the MTD for carcinogenicity studies but does not represent the MTD for those of acute and subcronic toxicity.
Material and methods together with findings
The test substance was Acetochlor (Zeneca) with 96.6 % purity. The positive control was MNNG. The study was conducted using male Alpk: APfSD rats.
For acute dietary assays, groups of rats were fed CT1 diet for 7 days. Half of the animals were then transferred to the same diet containing Acetochlor at a concentration of 1750 ppm (87.5 mg/Kg). During the course of the 14 days, individual animal body weights were recorded daily, and food consumption monitored. After 14 days the animals were killed by an overdose of Fluothane followed by exsanguination. Two separate acute feeding experiments were conducted. In the 1st experiment, groups of 5 test and 6 controls animals were employed and whole nasal cell preparations used for DNA analysis. In the 2nd experiment, groups of 6 test and 6 controls animals were employed and olfactory cells used for DNA analysis.
For subchronic dietary assays, rats (as above) were maintained on a diet containing 1750 ppm Acetochlor (as above) for 18 weeks. Nasal cells (olfactory and respiratory) were isolated for DNA analysis. Groups of 3 test and 3 controls animals were employed.
Measurements of DNA damage were made using the single cell gel electrophoresis assay (comet assay). All preparations of cells were >90% viable (Trypan Blue exclusion). Suspensions of 2.5 x 10⁵ cells were embedded in agarose, lysed and electrophoresed. 3 slides were prepared from each animal and 50 cells from each slide were analysed. The tail length was calculated from the trailing edge of the cell. An in vitro positive control was incorporated into each experiment by incubating an aliquot of control cells with MNNG for 30 min a 37ºC.
Animals receiving diet containing Acetochlor for seven days (1750 ppm) consumed the same amount of food per day, and gained the same weight, as animals receiving normal (control) diet (data not shown). The gavage equivalent dose was calculated to be ≈ 175 mg/Kg/day per rat. This figure would reduce as the animal age; the life-average gavage equivalent was calculated to be 87.5 mg/Kg (ppm in diet divided by 20).
Data indicated that Acetochlor (7 days feeding; 1750 ppm in diet) did not induce DNA damage in a mixture of nasal olfactory/respiratory cells (Exp. 1) or nasal olfactory cells (Exp. 2). The cells obtained from one animal in Expt. 1 were few and of poor quality. Mainly for this reason, the experiment was repeated using only the target olfactory cells. Cellular characteristics (tail length, etc) varied between experiments, but in a uniform manner across both test and control cells. Similarly, no DNA damage was observed in either nasal olfactory or respiratory cells of rats maintained on Acetochlor diet (1750 ppm) for 18 weeks. The positive control gave a satisfactory response in each experiment.
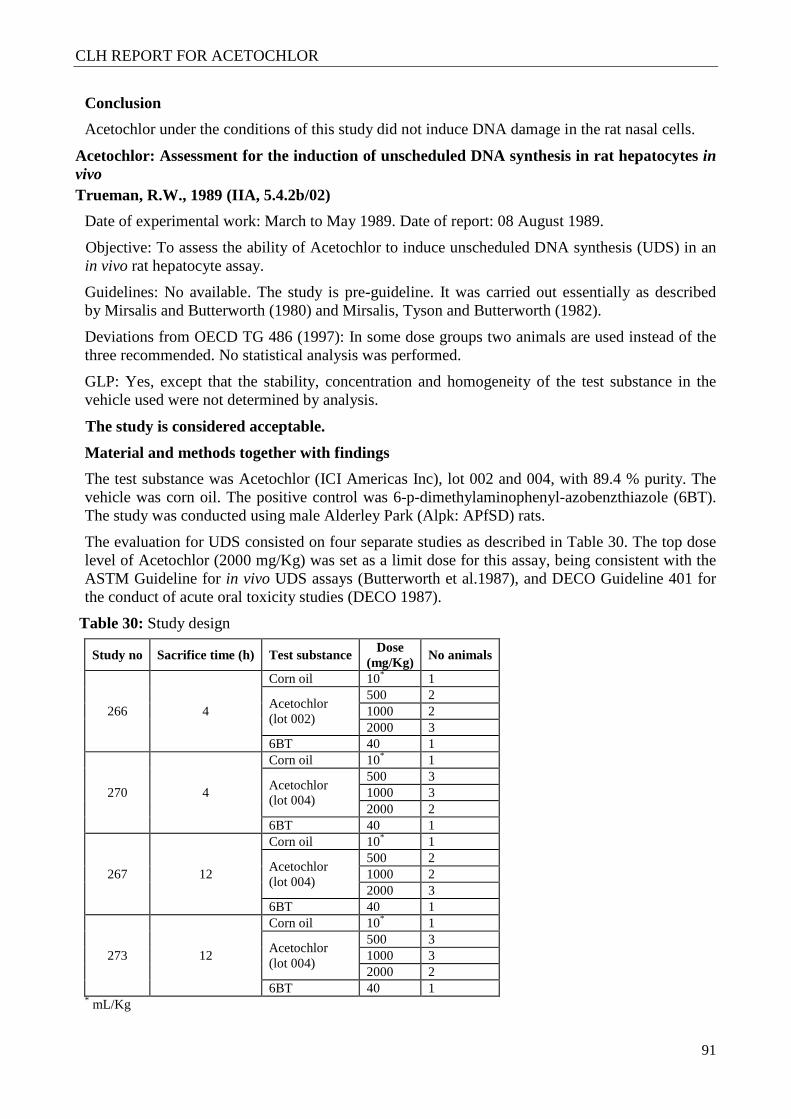
CLH REPORT FOR ACETOCHLOR
91
Conclusion
Acetochlor under the conditions of this study did not induce DNA damage in the rat nasal cells.
Acetochlor: Assessment for the induction of unscheduled DNA synthesis in rat hepatocytes in vivo Trueman, R.W., 1989 (IIA, 5.4.2b/02)
Date of experimental work: March to May 1989. Date of report: 08 August 1989.
Objective: To assess the ability of Acetochlor to induce unscheduled DNA synthesis (UDS) in an in vivo rat hepatocyte assay.
Guidelines: No available. The study is pre-guideline. It was carried out essentially as described by Mirsalis and Butterworth (1980) and Mirsalis, Tyson and Butterworth (1982).
Deviations from OECD TG 486 (1997): In some dose groups two animals are used instead of the three recommended. No statistical analysis was performed.
GLP: Yes, except that the stability, concentration and homogeneity of the test substance in the vehicle used were not determined by analysis.
The study is considered acceptable.
Material and methods together with findings
The test substance was Acetochlor (ICI Americas Inc), lot 002 and 004, with 89.4 % purity. The vehicle was corn oil. The positive control was 6-p-dimethylaminophenyl-azobenzthiazole (6BT). The study was conducted using male Alderley Park (Alpk: APfSD) rats.
The evaluation for UDS consisted on four separate studies as described in Table 30. The top dose level of Acetochlor (2000 mg/Kg) was set as a limit dose for this assay, being consistent with the ASTM Guideline for in vivo UDS assays (Butterworth et al.1987), and DECO Guideline 401 for the conduct of acute oral toxicity studies (DECO 1987).
Table 30: Study design
Study no Sacrifice time (h) Test substance Dose
(mg/Kg) No animals
266 4
Corn oil 10* 1
Acetochlor (lot 002)
500 2 1000 2 2000 3
6BT 40 1
270 4
Corn oil 10* 1
Acetochlor (lot 004)
500 3 1000 3 2000 2
6BT 40 1
267 12
Corn oil 10* 1
Acetochlor (lot 004)
500 2 1000 2 2000 3
6BT 40 1
273 12
Corn oil 10* 1
Acetochlor (lot 004)
500 3 1000 3 2000 2
6BT 40 1 * mL/Kg
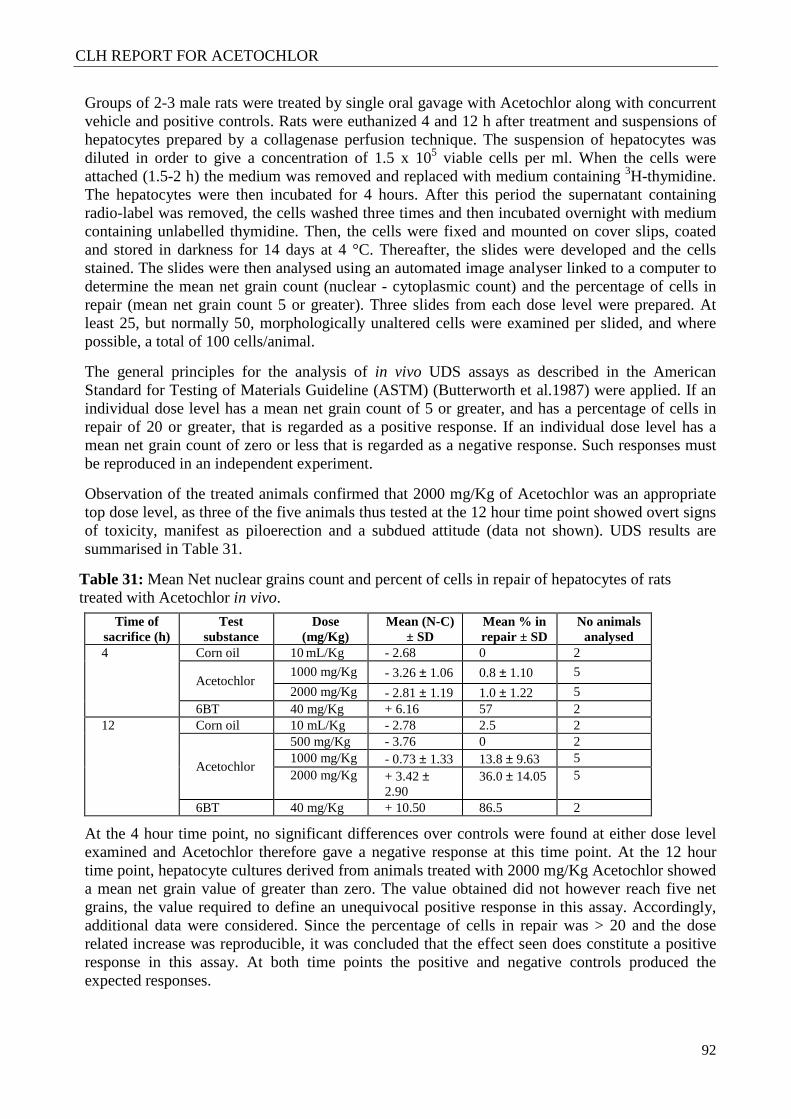
CLH REPORT FOR ACETOCHLOR
92
Groups of 2-3 male rats were treated by single oral gavage with Acetochlor along with concurrent vehicle and positive controls. Rats were euthanized 4 and 12 h after treatment and suspensions of hepatocytes prepared by a collagenase perfusion technique. The suspension of hepatocytes was diluted in order to give a concentration of 1.5 x 10⁵ viable cells per ml. When the cells were attached (1.5-2 h) the medium was removed and replaced with medium containing 3H-thymidine. The hepatocytes were then incubated for 4 hours. After this period the supernatant containing radio-label was removed, the cells washed three times and then incubated overnight with medium containing unlabelled thymidine. Then, the cells were fixed and mounted on cover slips, coated and stored in darkness for 14 days at 4 °C. Thereafter, the slides were developed and the cells stained. The slides were then analysed using an automated image analyser linked to a computer to determine the mean net grain count (nuclear - cytoplasmic count) and the percentage of cells in repair (mean net grain count 5 or greater). Three slides from each dose level were prepared. At least 25, but normally 50, morphologically unaltered cells were examined per slided, and where possible, a total of 100 cells/animal.
The general principles for the analysis of in vivo UDS assays as described in the American Standard for Testing of Materials Guideline (ASTM) (Butterworth et al.1987) were applied. If an individual dose level has a mean net grain count of 5 or greater, and has a percentage of cells in repair of 20 or greater, that is regarded as a positive response. If an individual dose level has a mean net grain count of zero or less that is regarded as a negative response. Such responses must be reproduced in an independent experiment.
Observation of the treated animals confirmed that 2000 mg/Kg of Acetochlor was an appropriate top dose level, as three of the five animals thus tested at the 12 hour time point showed overt signs of toxicity, manifest as piloerection and a subdued attitude (data not shown). UDS results are summarised in Table 31.
Table 31: Mean Net nuclear grains count and percent of cells in repair of hepatocytes of rats treated with Acetochlor in vivo.
Time of sacrifice (h)
Test substance
Dose (mg/Kg)
Mean (N-C) ± SD
Mean % in repair ± SD
No animals analysed
4 Corn oil 10 mL/Kg - 2.68 0 2
Acetochlor 1000 mg/Kg - 3.26 ± 1.06 0.8 ± 1.10 5
2000 mg/Kg - 2.81 ± 1.19 1.0 ± 1.22 5 6BT 40 mg/Kg + 6.16 57 2
12 Corn oil 10 mL/Kg - 2.78 2.5 2
Acetochlor
500 mg/Kg - 3.76 0 2 1000 mg/Kg - 0.73 ± 1.33 13.8 ± 9.63 5 2000 mg/Kg + 3.42 ±
2.90 36.0 ± 14.05 5
6BT 40 mg/Kg + 10.50 86.5 2
At the 4 hour time point, no significant differences over controls were found at either dose level examined and Acetochlor therefore gave a negative response at this time point. At the 12 hour time point, hepatocyte cultures derived from animals treated with 2000 mg/Kg Acetochlor showed a mean net grain value of greater than zero. The value obtained did not however reach five net grains, the value required to define an unequivocal positive response in this assay. Accordingly, additional data were considered. Since the percentage of cells in repair was > 20 and the dose related increase was reproducible, it was concluded that the effect seen does constitute a positive response in this assay. At both time points the positive and negative controls produced the expected responses.
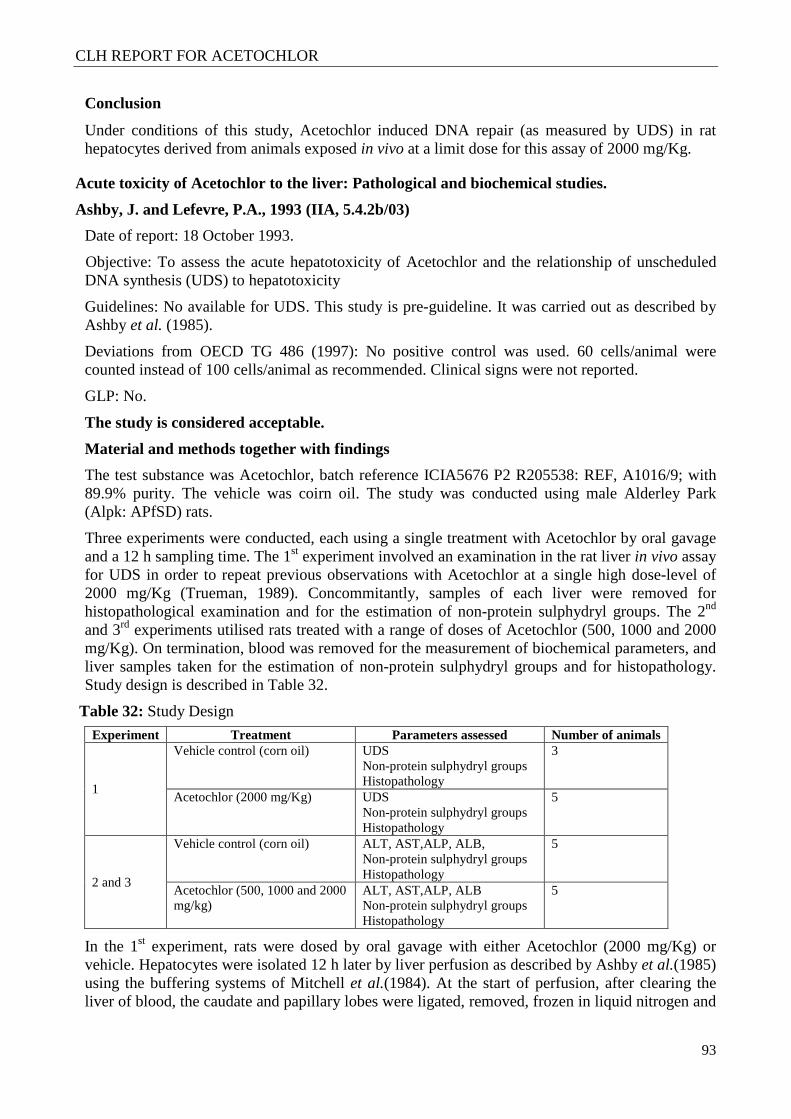
CLH REPORT FOR ACETOCHLOR
93
Conclusion
Under conditions of this study, Acetochlor induced DNA repair (as measured by UDS) in rat hepatocytes derived from animals exposed in vivo at a limit dose for this assay of 2000 mg/Kg.
Acute toxicity of Acetochlor to the liver: Pathological and biochemical studies.
Ashby, J. and Lefevre, P.A., 1993 (IIA, 5.4.2b/03)
Date of report: 18 October 1993.
Objective: To assess the acute hepatotoxicity of Acetochlor and the relationship of unscheduled DNA synthesis (UDS) to hepatotoxicity
Guidelines: No available for UDS. This study is pre-guideline. It was carried out as described by Ashby et al. (1985).
Deviations from OECD TG 486 (1997): No positive control was used. 60 cells/animal were counted instead of 100 cells/animal as recommended. Clinical signs were not reported.
GLP: No.
The study is considered acceptable.
Material and methods together with findings
The test substance was Acetochlor, batch reference ICIA5676 P2 R205538: REF, A1016/9; with 89.9% purity. The vehicle was coirn oil. The study was conducted using male Alderley Park (Alpk: APfSD) rats.
Three experiments were conducted, each using a single treatment with Acetochlor by oral gavage and a 12 h sampling time. The 1st experiment involved an examination in the rat liver in vivo assay for UDS in order to repeat previous observations with Acetochlor at a single high dose-level of 2000 mg/Kg (Trueman, 1989). Concommitantly, samples of each liver were removed for histopathological examination and for the estimation of non-protein sulphydryl groups. The 2nd and 3rd experiments utilised rats treated with a range of doses of Acetochlor (500, 1000 and 2000 mg/Kg). On termination, blood was removed for the measurement of biochemical parameters, and liver samples taken for the estimation of non-protein sulphydryl groups and for histopathology. Study design is described in Table 32.
Table 32: Study Design
Experiment Treatment Parameters assessed Number of animals
1
Vehicle control (corn oil) UDS Non-protein sulphydryl groups Histopathology
3
Acetochlor (2000 mg/Kg) UDS Non-protein sulphydryl groups Histopathology
5
2 and 3
Vehicle control (corn oil) ALT, AST,ALP, ALB, Non-protein sulphydryl groups Histopathology
5
Acetochlor (500, 1000 and 2000 mg/kg)
ALT, AST,ALP, ALB Non-protein sulphydryl groups Histopathology
5
In the 1st experiment, rats were dosed by oral gavage with either Acetochlor (2000 mg/Kg) or vehicle. Hepatocytes were isolated 12 h later by liver perfusion as described by Ashby et al.(1985) using the buffering systems of Mitchell et al.(1984). At the start of perfusion, after clearing the liver of blood, the caudate and papillary lobes were ligated, removed, frozen in liquid nitrogen and
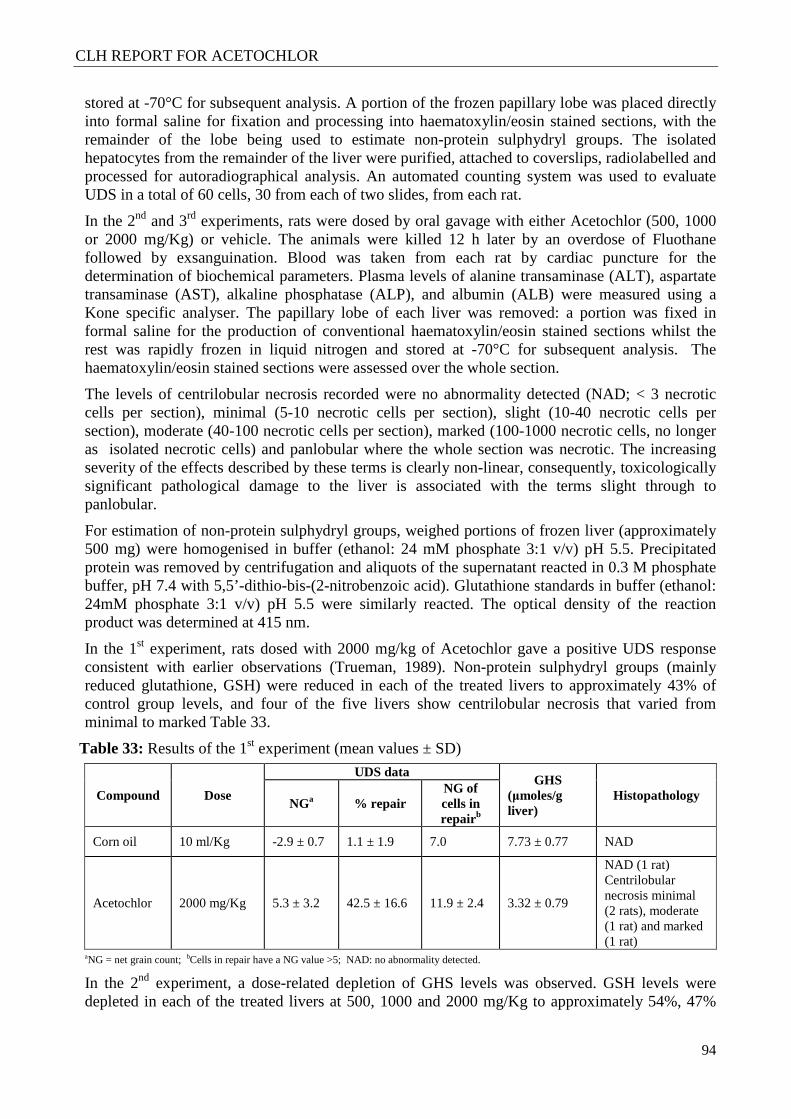
CLH REPORT FOR ACETOCHLOR
94
stored at -70°C for subsequent analysis. A portion of the frozen papillary lobe was placed directly into formal saline for fixation and processing into haematoxylin/eosin stained sections, with the remainder of the lobe being used to estimate non-protein sulphydryl groups. The isolated hepatocytes from the remainder of the liver were purified, attached to coverslips, radiolabelled and processed for autoradiographical analysis. An automated counting system was used to evaluate UDS in a total of 60 cells, 30 from each of two slides, from each rat.
In the 2nd and 3rd experiments, rats were dosed by oral gavage with either Acetochlor (500, 1000 or 2000 mg/Kg) or vehicle. The animals were killed 12 h later by an overdose of Fluothane followed by exsanguination. Blood was taken from each rat by cardiac puncture for the determination of biochemical parameters. Plasma levels of alanine transaminase (ALT), aspartate transaminase (AST), alkaline phosphatase (ALP), and albumin (ALB) were measured using a Kone specific analyser. The papillary lobe of each liver was removed: a portion was fixed in formal saline for the production of conventional haematoxylin/eosin stained sections whilst the rest was rapidly frozen in liquid nitrogen and stored at -70°C for subsequent analysis. The haematoxylin/eosin stained sections were assessed over the whole section.
The levels of centrilobular necrosis recorded were no abnormality detected (NAD; < 3 necrotic cells per section), minimal (5-10 necrotic cells per section), slight (10-40 necrotic cells per section), moderate (40-100 necrotic cells per section), marked (100-1000 necrotic cells, no longer as isolated necrotic cells) and panlobular where the whole section was necrotic. The increasing severity of the effects described by these terms is clearly non-linear, consequently, toxicologically significant pathological damage to the liver is associated with the terms slight through to panlobular.
For estimation of non-protein sulphydryl groups, weighed portions of frozen liver (approximately 500 mg) were homogenised in buffer (ethanol: 24 mM phosphate 3:1 v/v) pH 5.5. Precipitated protein was removed by centrifugation and aliquots of the supernatant reacted in 0.3 M phosphate buffer, pH 7.4 with 5,5’-dithio-bis-(2-nitrobenzoic acid). Glutathione standards in buffer (ethanol: 24mM phosphate 3:1 v/v) pH 5.5 were similarly reacted. The optical density of the reaction product was determined at 415 nm.
In the 1st experiment, rats dosed with 2000 mg/kg of Acetochlor gave a positive UDS response consistent with earlier observations (Trueman, 1989). Non-protein sulphydryl groups (mainly reduced glutathione, GSH) were reduced in each of the treated livers to approximately 43% of control group levels, and four of the five livers show centrilobular necrosis that varied from minimal to marked Table 33.
Table 33: Results of the 1st experiment (mean values ± SD)
Compound Dose
UDS data GHS
(µmoles/g liver)
Histopathology NGa % repair
NG of cells in repair b
Corn oil 10 ml/Kg -2.9 ± 0.7 1.1 ± 1.9 7.0 7.73 ± 0.77 NAD
Acetochlor 2000 mg/Kg 5.3 ± 3.2 42.5 ± 16.6 11.9 ± 2.4 3.32 ± 0.79
NAD (1 rat) Centrilobular necrosis minimal (2 rats), moderate (1 rat) and marked (1 rat)
aNG = net grain count; bCells in repair have a NG value >5; NAD: no abnormality detected.
In the 2nd experiment, a dose-related depletion of GHS levels was observed. GSH levels were depleted in each of the treated livers at 500, 1000 and 2000 mg/Kg to approximately 54%, 47%
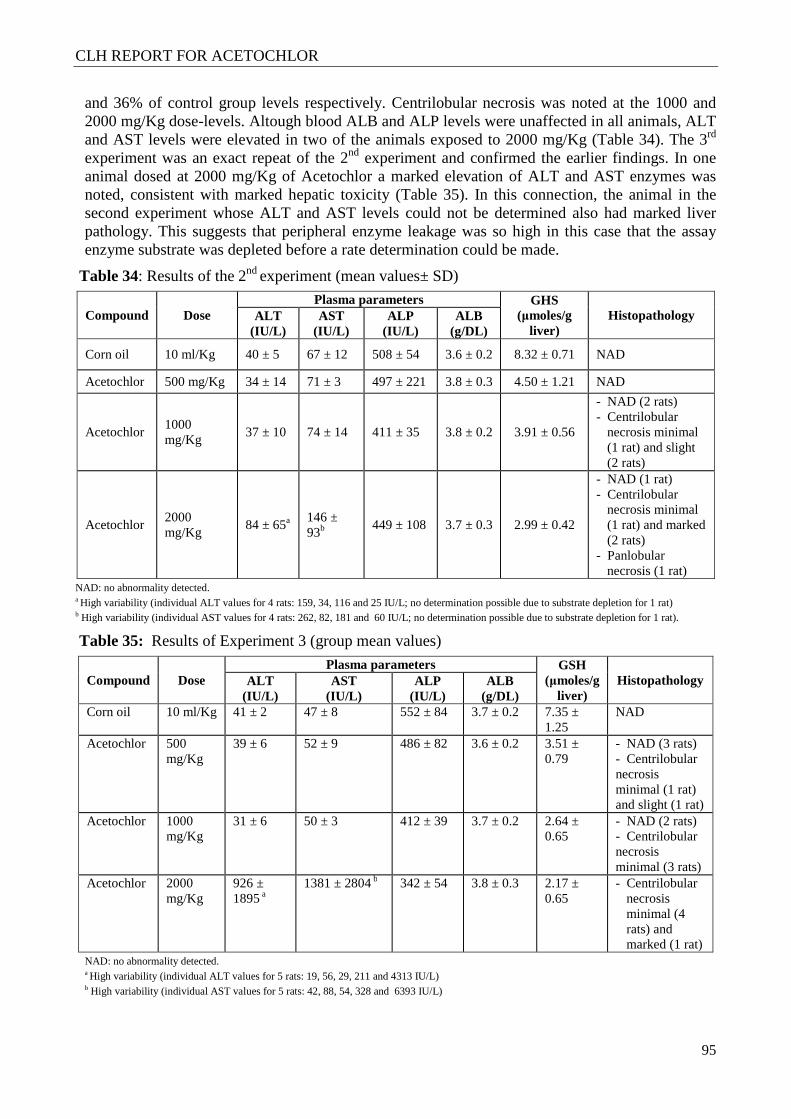
CLH REPORT FOR ACETOCHLOR
95
and 36% of control group levels respectively. Centrilobular necrosis was noted at the 1000 and 2000 mg/Kg dose-levels. Altough blood ALB and ALP levels were unaffected in all animals, ALT and AST levels were elevated in two of the animals exposed to 2000 mg/Kg (Table 34). The 3rd experiment was an exact repeat of the 2nd experiment and confirmed the earlier findings. In one animal dosed at 2000 mg/Kg of Acetochlor a marked elevation of ALT and AST enzymes was noted, consistent with marked hepatic toxicity (Table 35). In this connection, the animal in the second experiment whose ALT and AST levels could not be determined also had marked liver pathology. This suggests that peripheral enzyme leakage was so high in this case that the assay enzyme substrate was depleted before a rate determination could be made.
Table 34: Results of the 2nd experiment (mean values± SD)
Compound Dose Plasma parameters GHS
(µmoles/g liver)
Histopathology ALT (IU/L)
AST (IU/L)
ALP (IU/L)
ALB (g/DL)
Corn oil 10 ml/Kg 40 ± 5 67 ± 12 508 ± 54 3.6 ± 0.2 8.32 ± 0.71 NAD
Acetochlor 500 mg/Kg 34 ± 14 71 ± 3 497 ± 221 3.8 ± 0.3 4.50 ± 1.21 NAD
Acetochlor 1000 mg/Kg
37 ± 10 74 ± 14 411 ± 35 3.8 ± 0.2 3.91 ± 0.56
- NAD (2 rats) - Centrilobular
necrosis minimal (1 rat) and slight (2 rats)
Acetochlor 2000 mg/Kg
84 ± 65a 146 ± 93b
449 ± 108 3.7 ± 0.3 2.99 ± 0.42
- NAD (1 rat) - Centrilobular
necrosis minimal (1 rat) and marked (2 rats)
- Panlobular necrosis (1 rat)
NAD: no abnormality detected. a High variability (individual ALT values for 4 rats: 159, 34, 116 and 25 IU/L; no determination possible due to substrate depletion for 1 rat) b High variability (individual AST values for 4 rats: 262, 82, 181 and 60 IU/L; no determination possible due to substrate depletion for 1 rat).
Table 35: Results of Experiment 3 (group mean values)
Compound Dose Plasma parameters GSH
(µmoles/g liver)
Histopathology ALT (IU/L)
AST (IU/L)
ALP (IU/L)
ALB (g/DL)
Corn oil 10 ml/Kg 41 ± 2 47 ± 8 552 ± 84 3.7 ± 0.2 7.35 ± 1.25
NAD
Acetochlor 500 mg/Kg
39 ± 6 52 ± 9 486 ± 82 3.6 ± 0.2 3.51 ± 0.79
- NAD (3 rats) - Centrilobular necrosis minimal (1 rat) and slight (1 rat)
Acetochlor 1000 mg/Kg
31 ± 6 50 ± 3 412 ± 39 3.7 ± 0.2 2.64 ± 0.65
- NAD (2 rats) - Centrilobular necrosis minimal (3 rats)
Acetochlor 2000 mg/Kg
926 ± 1895 a
1381 ± 2804 b 342 ± 54 3.8 ± 0.3 2.17 ± 0.65
- Centrilobular necrosis minimal (4 rats) and marked (1 rat)
NAD: no abnormality detected. a High variability (individual ALT values for 5 rats: 19, 56, 29, 211 and 4313 IU/L) b High variability (individual AST values for 5 rats: 42, 88, 54, 328 and 6393 IU/L)
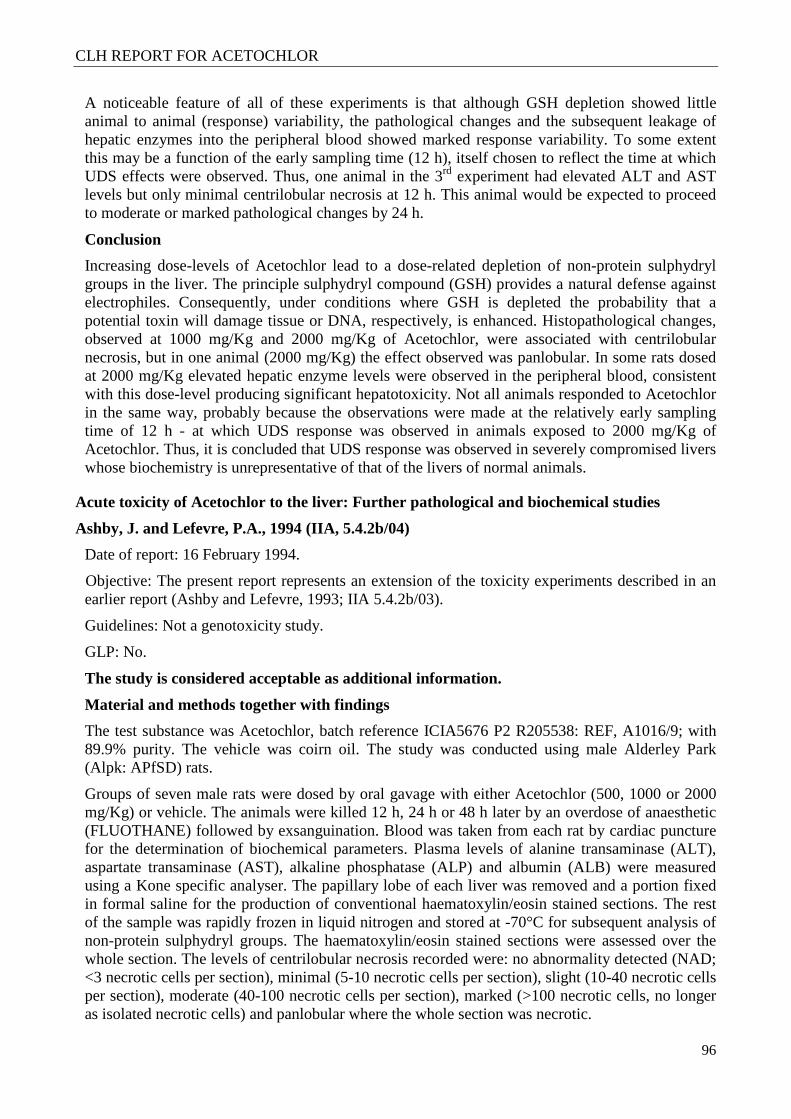
CLH REPORT FOR ACETOCHLOR
96
A noticeable feature of all of these experiments is that although GSH depletion showed little animal to animal (response) variability, the pathological changes and the subsequent leakage of hepatic enzymes into the peripheral blood showed marked response variability. To some extent this may be a function of the early sampling time (12 h), itself chosen to reflect the time at which UDS effects were observed. Thus, one animal in the 3rd experiment had elevated ALT and AST levels but only minimal centrilobular necrosis at 12 h. This animal would be expected to proceed to moderate or marked pathological changes by 24 h.
Conclusion
Increasing dose-levels of Acetochlor lead to a dose-related depletion of non-protein sulphydryl groups in the liver. The principle sulphydryl compound (GSH) provides a natural defense against electrophiles. Consequently, under conditions where GSH is depleted the probability that a potential toxin will damage tissue or DNA, respectively, is enhanced. Histopathological changes, observed at 1000 mg/Kg and 2000 mg/Kg of Acetochlor, were associated with centrilobular necrosis, but in one animal (2000 mg/Kg) the effect observed was panlobular. In some rats dosed at 2000 mg/Kg elevated hepatic enzyme levels were observed in the peripheral blood, consistent with this dose-level producing significant hepatotoxicity. Not all animals responded to Acetochlor in the same way, probably because the observations were made at the relatively early sampling time of 12 h - at which UDS response was observed in animals exposed to 2000 mg/Kg of Acetochlor. Thus, it is concluded that UDS response was observed in severely compromised livers whose biochemistry is unrepresentative of that of the livers of normal animals.
Acute toxicity of Acetochlor to the liver: Further pathological and biochemical studies
Ashby, J. and Lefevre, P.A., 1994 (IIA, 5.4.2b/04)
Date of report: 16 February 1994.
Objective: The present report represents an extension of the toxicity experiments described in an earlier report (Ashby and Lefevre, 1993; IIA 5.4.2b/03).
Guidelines: Not a genotoxicity study.
GLP: No.
The study is considered acceptable as additional information.
Material and methods together with findings
The test substance was Acetochlor, batch reference ICIA5676 P2 R205538: REF, A1016/9; with 89.9% purity. The vehicle was coirn oil. The study was conducted using male Alderley Park (Alpk: APfSD) rats.
Groups of seven male rats were dosed by oral gavage with either Acetochlor (500, 1000 or 2000 mg/Kg) or vehicle. The animals were killed 12 h, 24 h or 48 h later by an overdose of anaesthetic (FLUOTHANE) followed by exsanguination. Blood was taken from each rat by cardiac puncture for the determination of biochemical parameters. Plasma levels of alanine transaminase (ALT), aspartate transaminase (AST), alkaline phosphatase (ALP) and albumin (ALB) were measured using a Kone specific analyser. The papillary lobe of each liver was removed and a portion fixed in formal saline for the production of conventional haematoxylin/eosin stained sections. The rest of the sample was rapidly frozen in liquid nitrogen and stored at -70°C for subsequent analysis of non-protein sulphydryl groups. The haematoxylin/eosin stained sections were assessed over the whole section. The levels of centrilobular necrosis recorded were: no abnormality detected (NAD; <3 necrotic cells per section), minimal (5-10 necrotic cells per section), slight (10-40 necrotic cells per section), moderate (40-100 necrotic cells per section), marked (>100 necrotic cells, no longer as isolated necrotic cells) and panlobular where the whole section was necrotic.
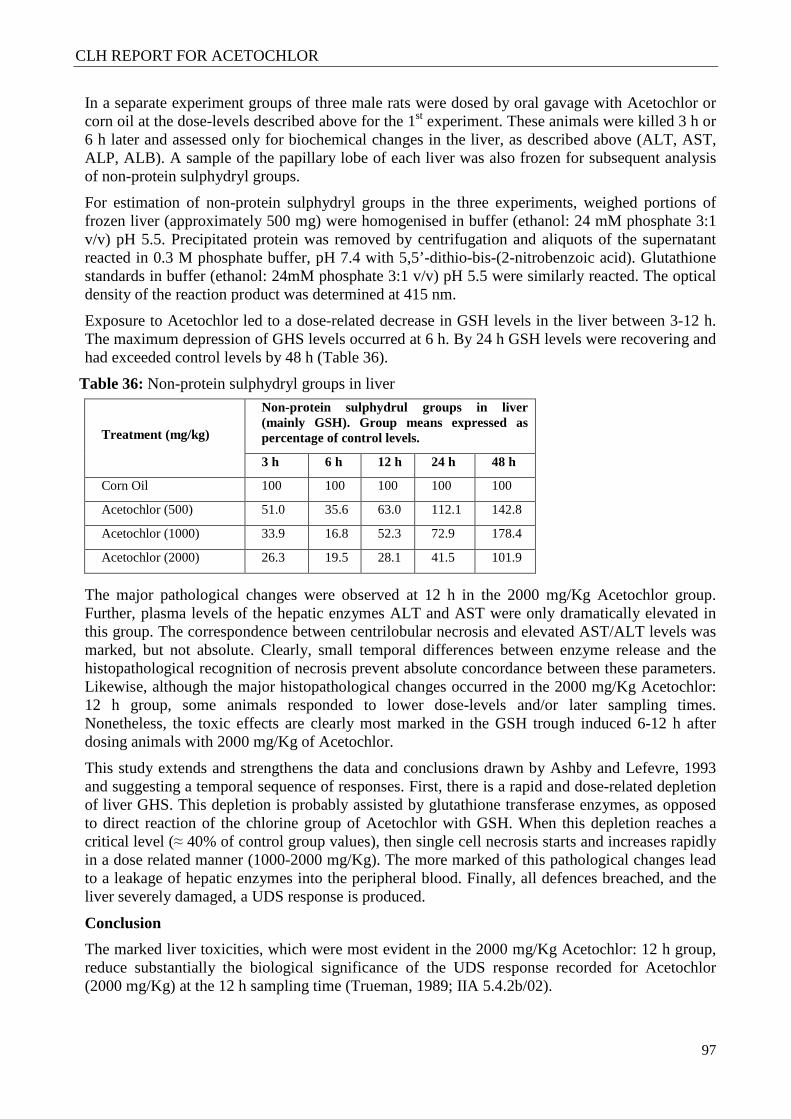
CLH REPORT FOR ACETOCHLOR
97
In a separate experiment groups of three male rats were dosed by oral gavage with Acetochlor or corn oil at the dose-levels described above for the 1st experiment. These animals were killed 3 h or 6 h later and assessed only for biochemical changes in the liver, as described above (ALT, AST, ALP, ALB). A sample of the papillary lobe of each liver was also frozen for subsequent analysis of non-protein sulphydryl groups.
For estimation of non-protein sulphydryl groups in the three experiments, weighed portions of frozen liver (approximately 500 mg) were homogenised in buffer (ethanol: 24 mM phosphate 3:1 v/v) pH 5.5. Precipitated protein was removed by centrifugation and aliquots of the supernatant reacted in 0.3 M phosphate buffer, pH 7.4 with 5,5’-dithio-bis-(2-nitrobenzoic acid). Glutathione standards in buffer (ethanol: 24mM phosphate 3:1 v/v) pH 5.5 were similarly reacted. The optical density of the reaction product was determined at 415 nm.
Exposure to Acetochlor led to a dose-related decrease in GSH levels in the liver between 3-12 h. The maximum depression of GHS levels occurred at 6 h. By 24 h GSH levels were recovering and had exceeded control levels by 48 h (Table 36).
Table 36: Non-protein sulphydryl groups in liver
Treatment (mg/kg)
Non-protein sulphydrul groups in liver (mainly GSH). Group means expressed as percentage of control levels.
3 h 6 h 12 h 24 h 48 h
Corn Oil 100 100 100 100 100
Acetochlor (500) 51.0 35.6 63.0 112.1 142.8
Acetochlor (1000) 33.9 16.8 52.3 72.9 178.4
Acetochlor (2000) 26.3 19.5 28.1 41.5 101.9
The major pathological changes were observed at 12 h in the 2000 mg/Kg Acetochlor group. Further, plasma levels of the hepatic enzymes ALT and AST were only dramatically elevated in this group. The correspondence between centrilobular necrosis and elevated AST/ALT levels was marked, but not absolute. Clearly, small temporal differences between enzyme release and the histopathological recognition of necrosis prevent absolute concordance between these parameters. Likewise, although the major histopathological changes occurred in the 2000 mg/Kg Acetochlor: 12 h group, some animals responded to lower dose-levels and/or later sampling times. Nonetheless, the toxic effects are clearly most marked in the GSH trough induced 6-12 h after dosing animals with 2000 mg/Kg of Acetochlor.
This study extends and strengthens the data and conclusions drawn by Ashby and Lefevre, 1993 and suggesting a temporal sequence of responses. First, there is a rapid and dose-related depletion of liver GHS. This depletion is probably assisted by glutathione transferase enzymes, as opposed to direct reaction of the chlorine group of Acetochlor with GSH. When this depletion reaches a critical level (≈ 40% of control group values), then single cell necrosis starts and increases rapidly in a dose related manner (1000-2000 mg/Kg). The more marked of this pathological changes lead to a leakage of hepatic enzymes into the peripheral blood. Finally, all defences breached, and the liver severely damaged, a UDS response is produced.
Conclusion
The marked liver toxicities, which were most evident in the 2000 mg/Kg Acetochlor: 12 h group, reduce substantially the biological significance of the UDS response recorded for Acetochlor (2000 mg/Kg) at the 12 h sampling time (Trueman, 1989; IIA 5.4.2b/02).
CLH REPORT FOR ACETOCHLOR
98
4.9.1.2.3 In vivo genotoxicity studies in mammalian germ cells
Acetochlor: Dominant Lethal Study in the Rat. Hodge, M.C.E., 1991 (IIA, 5.4.3/02)
Date of report: 10 May 1991. Date of work: 8 June 1990 to 26 September 1990.
Objective: To assess the mutagenic potential of Acetochlor to germ cells in the dominant lethal assay.
Guidelines: Not Cited.
Deviations from OECD TG 478 (1984): None.
GLP: Yes, except that the stability of the test substance is not given in the report, and its stability in the vehicle used was not determined by analysis.
The study is considered acceptable.
Material and methods
The test substance was Technical Acetochlor, Batch P2, with 90.4% purity. The vehicle was corn oil. The positive controls were cyclophosphamide (CP) and triethylenemelamine (TEM). The study was conducted using male and female Alpk:APfSD rats.
The dose levels of Acetochlor were selected from a dose range finding study (Hodge, 1991) and consisted of the maximum tolerated dose (MTD), 0.5 x MTD and 0.1 x MTD i.e. 2000, 1000 or 200 mg Acetochlor/Kg/day respectively.
An assessment of fertility was undertaken prior to dosing, because previously unmated males have been shown to react differently in the first week of mating when compared with the remaining weeks of the study (Green and Springer, 1973) and also to ensure that no infertile males were selected for the experiment.
Groups of between 21 and 28 fertile, male rats received a single oral dose of the vehicle or Acetochlo at 200, 1000 or 2000 mg/Kg. Two groups of 24 fertile, male rats received either a single oral dose of CP or a single intraperitoneal dose of TEM and served as positive controls. Clinical observations were recorded at least once per day. The bodyweight of each male rat was recorded prior to dosing, daily to the first pairing and then at weekly intervals after pairing.
Four days after dosing two females were housed with each male and left for 7 consecutive days. The males were separated from the females and rehoused on clean racks in another room. The females were identified by the male number and week of mating. This procedure was repeated each week with females of similar age until 10 test matings were carried out. Nineteen days after being housed for mating, the females were sacrificed and their reproductive tracts examined. The total number of corpora lutea in both ovaries were counted and recorded, together with the number of live foetuses, early and late intra-uterine deaths.
The proportion of females which were pregnant and the proportion of male successfully mating were analysed by Fisher’s Exact Test. Mean numbers of corporea lutea were calculated but not analysed statistically. The following were considered by analysis of variance: a) the number of implantations per female; b) the percentage of pre-implantation loss, defined as number of corpora lutea minus number of total implantations between number of corpora lutea; c) the number of early deaths per pregnancy; f) the percentage of implantations which were early deaths; g) the percentage of implantations which were early deaths. The above data were converted to a single value per male before calculating group means or carrying out analyses of variance. Percentages were transformed before analysis using the double arcsine transformation of Freeman and Tukey
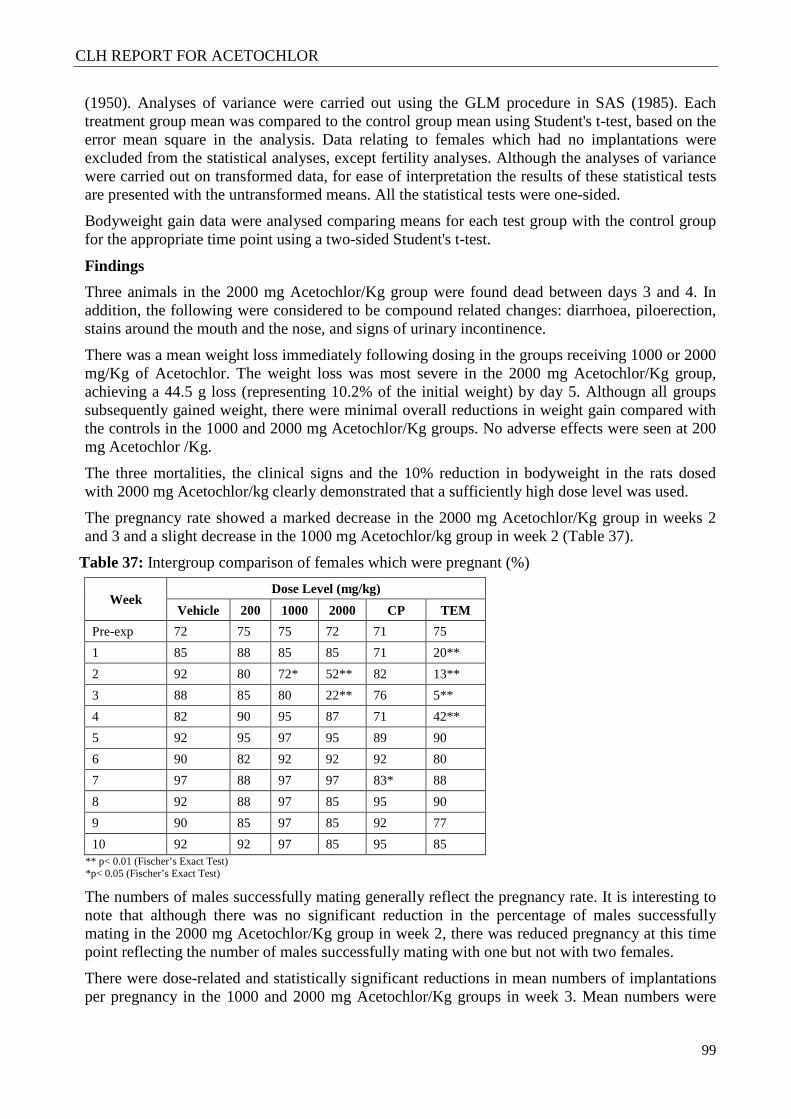
CLH REPORT FOR ACETOCHLOR
99
(1950). Analyses of variance were carried out using the GLM procedure in SAS (1985). Each treatment group mean was compared to the control group mean using Student's t-test, based on the error mean square in the analysis. Data relating to females which had no implantations were excluded from the statistical analyses, except fertility analyses. Although the analyses of variance were carried out on transformed data, for ease of interpretation the results of these statistical tests are presented with the untransformed means. All the statistical tests were one-sided.
Bodyweight gain data were analysed comparing means for each test group with the control group for the appropriate time point using a two-sided Student's t-test.
Findings
Three animals in the 2000 mg Acetochlor/Kg group were found dead between days 3 and 4. In addition, the following were considered to be compound related changes: diarrhoea, piloerection, stains around the mouth and the nose, and signs of urinary incontinence.
There was a mean weight loss immediately following dosing in the groups receiving 1000 or 2000 mg/Kg of Acetochlor. The weight loss was most severe in the 2000 mg Acetochlor/Kg group, achieving a 44.5 g loss (representing 10.2% of the initial weight) by day 5. Althougn all groups subsequently gained weight, there were minimal overall reductions in weight gain compared with the controls in the 1000 and 2000 mg Acetochlor/Kg groups. No adverse effects were seen at 200 mg Acetochlor /Kg.
The three mortalities, the clinical signs and the 10% reduction in bodyweight in the rats dosed with 2000 mg Acetochlor/kg clearly demonstrated that a sufficiently high dose level was used.
The pregnancy rate showed a marked decrease in the 2000 mg Acetochlor/Kg group in weeks 2 and 3 and a slight decrease in the 1000 mg Acetochlor/kg group in week 2 (Table 37).
Table 37: Intergroup comparison of females which were pregnant (%)
Week Dose Level (mg/kg)
Vehicle 200 1000 2000 CP TEM
Pre-exp 72 75 75 72 71 75
1 85 88 85 85 71 20**
2 92 80 72* 52** 82 13**
3 88 85 80 22** 76 5**
4 82 90 95 87 71 42**
5 92 95 97 95 89 90
6 90 82 92 92 92 80
7 97 88 97 97 83* 88
8 92 88 97 85 95 90
9 90 85 97 85 92 77
10 92 92 97 85 95 85 ** p< 0.01 (Fischer’s Exact Test) *p< 0.05 (Fischer’s Exact Test)
The numbers of males successfully mating generally reflect the pregnancy rate. It is interesting to note that although there was no significant reduction in the percentage of males successfully mating in the 2000 mg Acetochlor/Kg group in week 2, there was reduced pregnancy at this time point reflecting the number of males successfully mating with one but not with two females.
There were dose-related and statistically significant reductions in mean numbers of implantations per pregnancy in the 1000 and 2000 mg Acetochlor/Kg groups in week 3. Mean numbers were
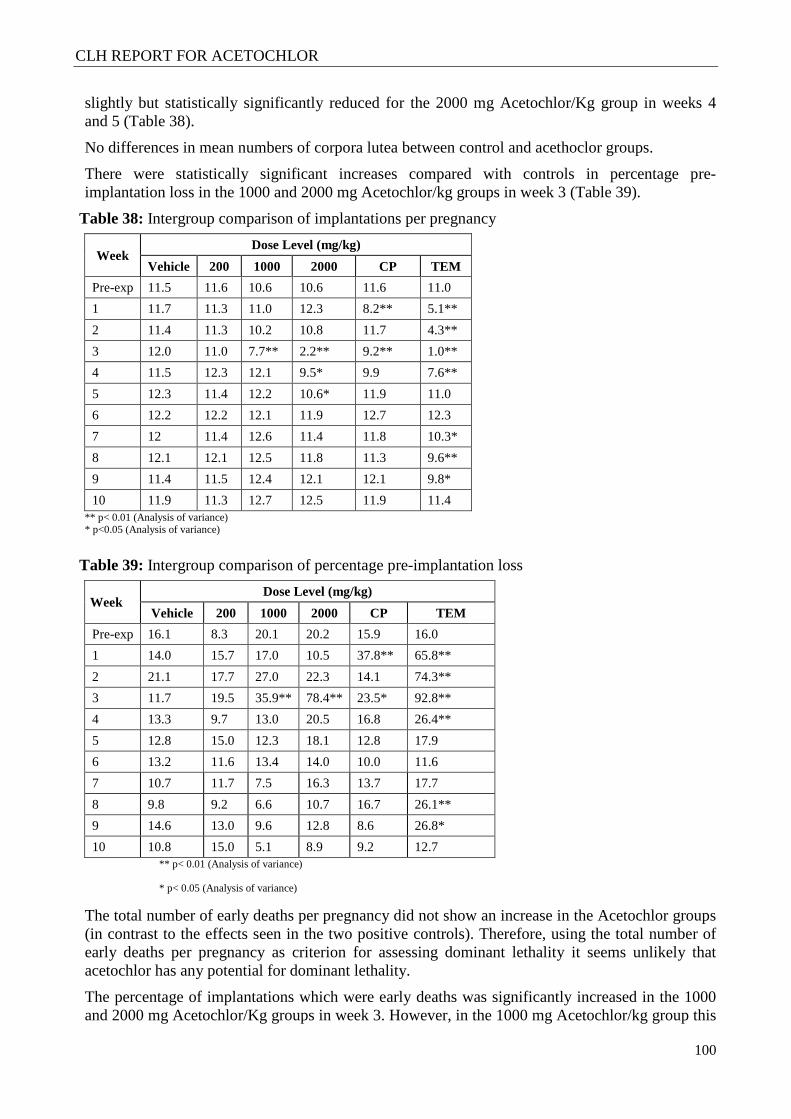
CLH REPORT FOR ACETOCHLOR
100
slightly but statistically significantly reduced for the 2000 mg Acetochlor/Kg group in weeks 4 and 5 (Table 38).
No differences in mean numbers of corpora lutea between control and acethoclor groups.
There were statistically significant increases compared with controls in percentage pre-implantation loss in the 1000 and 2000 mg Acetochlor/kg groups in week 3 (Table 39).
Table 38: Intergroup comparison of implantations per pregnancy
Week Dose Level (mg/kg)
Vehicle 200 1000 2000 CP TEM
Pre-exp 11.5 11.6 10.6 10.6 11.6 11.0
1 11.7 11.3 11.0 12.3 8.2** 5.1**
2 11.4 11.3 10.2 10.8 11.7 4.3**
3 12.0 11.0 7.7** 2.2** 9.2** 1.0**
4 11.5 12.3 12.1 9.5* 9.9 7.6**
5 12.3 11.4 12.2 10.6* 11.9 11.0
6 12.2 12.2 12.1 11.9 12.7 12.3
7 12 11.4 12.6 11.4 11.8 10.3*
8 12.1 12.1 12.5 11.8 11.3 9.6**
9 11.4 11.5 12.4 12.1 12.1 9.8*
10 11.9 11.3 12.7 12.5 11.9 11.4 ** p< 0.01 (Analysis of variance) * p<0.05 (Analysis of variance)
Table 39: Intergroup comparison of percentage pre-implantation loss
Week Dose Level (mg/kg)
Vehicle 200 1000 2000 CP TEM
Pre-exp 16.1 8.3 20.1 20.2 15.9 16.0
1 14.0 15.7 17.0 10.5 37.8** 65.8**
2 21.1 17.7 27.0 22.3 14.1 74.3**
3 11.7 19.5 35.9** 78.4** 23.5* 92.8**
4 13.3 9.7 13.0 20.5 16.8 26.4**
5 12.8 15.0 12.3 18.1 12.8 17.9
6 13.2 11.6 13.4 14.0 10.0 11.6
7 10.7 11.7 7.5 16.3 13.7 17.7
8 9.8 9.2 6.6 10.7 16.7 26.1**
9 14.6 13.0 9.6 12.8 8.6 26.8*
10 10.8 15.0 5.1 8.9 9.2 12.7 ** p< 0.01 (Analysis of variance)
* p< 0.05 (Analysis of variance)
The total number of early deaths per pregnancy did not show an increase in the Acetochlor groups (in contrast to the effects seen in the two positive controls). Therefore, using the total number of early deaths per pregnancy as criterion for assessing dominant lethality it seems unlikely that acetochlor has any potential for dominant lethality.
The percentage of implantations which were early deaths was significantly increased in the 1000 and 2000 mg Acetochlor/Kg groups in week 3. However, in the 1000 mg Acetochlor/kg group this
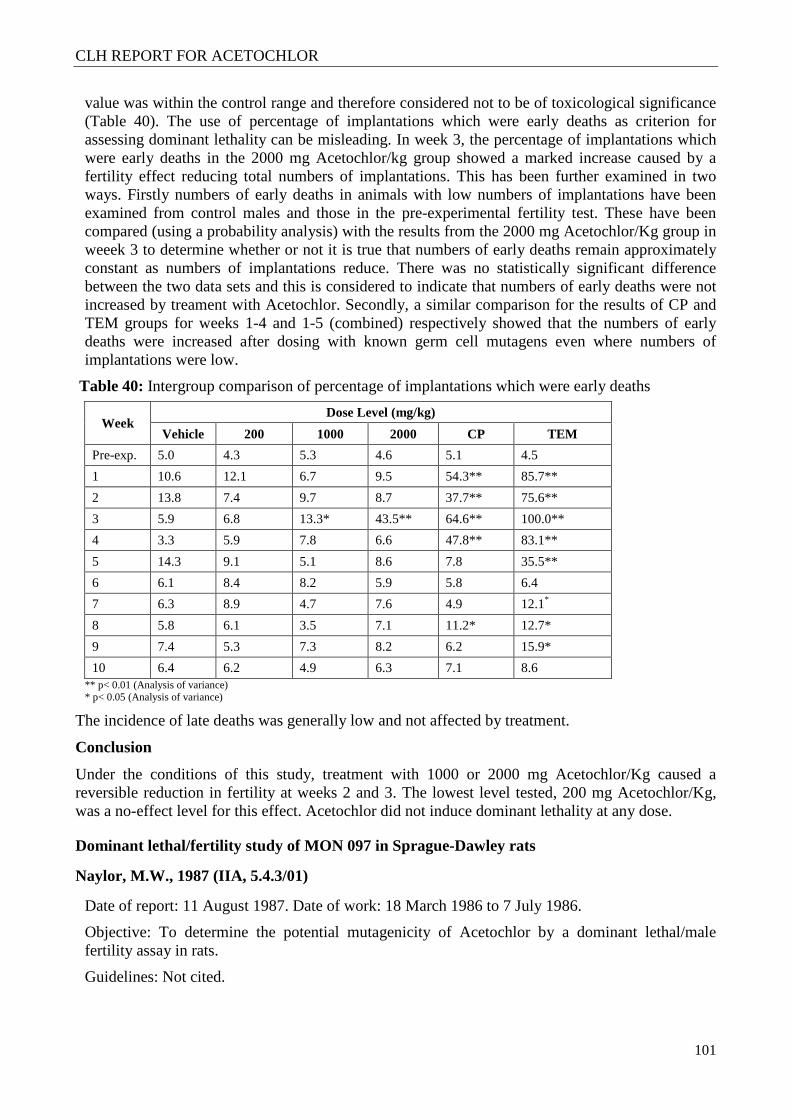
CLH REPORT FOR ACETOCHLOR
101
value was within the control range and therefore considered not to be of toxicological significance (Table 40). The use of percentage of implantations which were early deaths as criterion for assessing dominant lethality can be misleading. In week 3, the percentage of implantations which were early deaths in the 2000 mg Acetochlor/kg group showed a marked increase caused by a fertility effect reducing total numbers of implantations. This has been further examined in two ways. Firstly numbers of early deaths in animals with low numbers of implantations have been examined from control males and those in the pre-experimental fertility test. These have been compared (using a probability analysis) with the results from the 2000 mg Acetochlor/Kg group in weeek 3 to determine whether or not it is true that numbers of early deaths remain approximately constant as numbers of implantations reduce. There was no statistically significant difference between the two data sets and this is considered to indicate that numbers of early deaths were not increased by treament with Acetochlor. Secondly, a similar comparison for the results of CP and TEM groups for weeks 1-4 and 1-5 (combined) respectively showed that the numbers of early deaths were increased after dosing with known germ cell mutagens even where numbers of implantations were low.
Table 40: Intergroup comparison of percentage of implantations which were early deaths
Week Dose Level (mg/kg)
Vehicle 200 1000 2000 CP TEM
Pre-exp. 5.0 4.3 5.3 4.6 5.1 4.5
1 10.6 12.1 6.7 9.5 54.3** 85.7**
2 13.8 7.4 9.7 8.7 37.7** 75.6**
3 5.9 6.8 13.3* 43.5** 64.6** 100.0**
4 3.3 5.9 7.8 6.6 47.8** 83.1**
5 14.3 9.1 5.1 8.6 7.8 35.5**
6 6.1 8.4 8.2 5.9 5.8 6.4
7 6.3 8.9 4.7 7.6 4.9 12.1*
8 5.8 6.1 3.5 7.1 11.2* 12.7*
9 7.4 5.3 7.3 8.2 6.2 15.9*
10 6.4 6.2 4.9 6.3 7.1 8.6 ** p< 0.01 (Analysis of variance) * p< 0.05 (Analysis of variance)
The incidence of late deaths was generally low and not affected by treatment.
Conclusion
Under the conditions of this study, treatment with 1000 or 2000 mg Acetochlor/Kg caused a reversible reduction in fertility at weeks 2 and 3. The lowest level tested, 200 mg Acetochlor/Kg, was a no-effect level for this effect. Acetochlor did not induce dominant lethality at any dose.
Dominant lethal/fertility study of MON 097 in Sprague-Dawley rats
Naylor, M.W., 1987 (IIA, 5.4.3/01)
Date of report: 11 August 1987. Date of work: 18 March 1986 to 7 July 1986.
Objective: To determine the potential mutagenicity of Acetochlor by a dominant lethal/male fertility assay in rats.
Guidelines: Not cited.
CLH REPORT FOR ACETOCHLOR
102
Deviations from OECD TG 478 (1984): The highest dose level tested did not produce any signs of toxicity.
GLP: Yes.
The study is not considered acceptable because the highest dose level tested is not considered appropriate. For the dominant lethal assay the highest dose should produce signs of toxicity (e.g. slightly reduced fertility), and non-toxic substances should be tested up to 5000 mg/Kg or, if this is not practicable, then at the highest dose attainable. In this study, the highest dose level tested, 1500 ppm (≈ 106.40 mg/Kg/day), is not justified by its toxicity.
Material and methods
The test substance was Acetochlor (MON 097), lot XLF-396, with 94.3% purity. The positive control was triethylenemelamine (TEM). The study was conducted using male and female Sprague-Dawley rats.
Acetochlor at dietary concentrations of 100, 1000 and 2000 ppm was administered to groups of 30 male rats for 65 days before mating. The negative control group received only the basal diet. The positive control group received a single intraperitoneal dose of TEM 3 days before mating. Upon completion of the dosing regimen, each male was cohoused with a single untreated virgin female for up to 5 days. After a brief recovery period (2-6 days), each male was then similarly cohoused with a second untreated virgin female. Females with confirmed copulation were sacrificed on day 14 of gestation or the next working day, and females without confirmed copulation, during the second week following co-housing. Reproductive organs were examined to determine pregnancy status and implantation losses. Numbers of corpora lutea and both viable and nonviable implantation sites were recorded. Approximately two weeks after last female sacrificed, males were sacrificed and necropsied. Testes, epididymides and prostate were retained and examined.
All animals were observed twice daily for mortality and moribundity. Males were examined for signs of toxicity and weighed weekly until mating, and weighed once again at the end of mating and prior to terminal sacrifice. The male food consumption was determined weekly until mating. The untreated females were examined for signs of toxicity and weighed immediately prior to mating.
The following statistical procedures were used to detect statistically significant differences between treated or positive control animals and negative controls: a) Dunnett's Multiple Comparison Test for body weights and food consumption, b) Mann-Whitney U Test for preimplantation losses, viable and nonviable implants expressed as both per pregnant female and per corpora lutea/pregnant female, dead implants/total implants and corpora lutea/pregnant female; c) Chi-square Test for fertile males, number pregnant/number co-housed and the number of females with >1 and >2 dead implants. Other statistical routines used for some data were Bartlett's Test to evaluate homogeneity of variances and Analysis of Variance to determine if the sample (group) means could be considered as an estimate of a common population.
Findings
The diet mixtures were shown to be homogeneous and stable over the period of use, and mean analytical values obtained during the study were within 10% of target levels.
Concentrations in ppm can be converted into dose levels in mg/Kg b.w., using the food consumption data. Thus, concentrations of 100, 1000 and 2000 ppm in diet are equivalent to dose levels of 5.33, 52.80 and 106.40 mg/Kg b.w., respectively.
All animals survived until scheduled sacrifice. There were no clinical observations or gross necropsy findings considered to be related to the test substance. Small reductions of food
CLH REPORT FOR ACETOCHLOR
103
consumption and body weight gain were seen in males that received the highest dietary level of Acetochlor.
Pregnancy rate (pregnant females per females cohoused) and male fertility rate (% of cohoused males that successfully impregnated at least 1 female) were lower than expected in most groups, including the negative controls. The rates ranged from 63 to 90% for males and 40 to 73% for females. The low values appeared primarily to be a result of decreased copulatory activity since female fertility rates (pregnant females per confirmed copulations) were much higher (ranging from 62 to 98 %). Although the lowest rates were found in the positive control group, no other dose response relationship was evident. Therefore, the low percentage of impregnated females is not considered to be a resul t of treatment with Acetochlor.
All of the uterine implantation data for 3 Acetochlor-treated groups were comparable to the negative control values. However, significant differences were observed for all parameters in the TEM positive control group, thus demonstrating the sensitivity of this assay to detect dominant lethality. In addition, statistical analyses revealed that, despite the low fertility rate, a sufficient number of pregnant females were available to detect a doubling of the resorption rate with a power of 90%.
Conclusion
Acetochlor at levels of up to 2000 ppm in the diet of male rats (≈ 106.40 mg/Kg b.w.) for approximately one spermatogenic cycle had no effect on fertility nor did it produce dominant lethal mutagenic effects in offspring.
Acetochlor: Dominant Lethal Study in the Rat by Dietary Administration
Milburn, G.M., 1996a (IIA, 5.4.3/03)
Date of report: 16 May 1996. Date of work: 7 May 1995 to 15 September 1995.
Objective: To investigate the mutagenic potential of Acetochlor to germ cells in the dominant lethal assay in rats when administered orally via the diet for 10 weeks.
Guidelines: OECD TG 478 (1984).
Deviations from OECD TG 478 (1984): The highest dose level tested did not produce any signs of toxicity.
GLP: Yes.
The study is not acceptable because the highest dose level tested is not considered appropriate. For the dominant lethal assay the highest dose should produce signs of toxicity (e.g. slightly reduced fertility), and non-toxic substances should be tested up to 5000 mg/Kg or, if this is not practicable, then at the highest dose attainable. In this study, the highest dose level tested, 1500 ppm (≈ 88.5 mg/Kg/day), is not justified by its toxicity. In addition, this dose level can exceed the MTD for chronic toxicity studies, but does not represent the MTD for those of subchronic toxicity.
Material and methods
The test substance was Acetochlor, batch WRC 13856-46-1, with 94.4% purity. The positive control was methyl methane sulphonate (MMS). The study was conducted using male and female Alpk: APfSD rats.
The dose levels of Acetochlor selected for this study were based on the results of a previous feeding study in the Alpk:APfSD rat carried out in this Laboratory. A dietary concentration of 1000 ppm Acetochlor had been shown to meet the criteria for an MTD for chronic exposure in the Sprague Dawley rat.
CLH REPORT FOR ACETOCHLOR
104
A pre-experimental fertility test was carried out with the male rats. Two females were housed with each male for 7 consecutive nights and examined each morning for evidence of mating (sperm present in vaginal smear). The females were sacrificed 19 to 20 days after they were first paired, and the number of corpora lutea, live implantations and early and late intra-uterine deaths were recorded. The males were subsequently graded according to fertility and extent of background dominant lethal frequency [i.e. numbers of intra-uterine deaths (resorptions)] and then randomly allocated to the experimental groups
Groups of 20 male rats of proven fertility were fed diets containing 200, 1000 or 1500 ppm Acetochlor for 10 weeks before mating. The negative control group received only the basal diet. The positive control group received a single intraperitoneal dose of MMS in week 9 before mating.
Clinical observations were recorded once per day. The male rats were weighed immediately before feeding of experimental diets commenced and weekly thereafter. Food consumption of males was recorded continuously throughout the 10 week feeding period.
At the end of the scheduled feeding period, the males were mated (1 male: 2 females) for three consecutive 5-day periods. Each morning, the females were examined by vaginal smear for evidence of mating. Approximately 19 to 20 days after they were fist paired, the females were sacrificed and the number of corpora lutea, live implantations and early and late intra-uterine deaths were recorded. Males were sacrificed after the completion ofthe study.
Data were analysed statistically as indicated in Table 41 using, where applicable, the male as the unit of treatment.
Table 41: Statistical analysis of data
Statistical Test Parameter
Analysis of covariance Bodyweight
Analysis of variance Food consumption
Fisher’s Exact Test The proportion of females which were pregnant
The proportion of males successfully mating
Analysis of variance Number of corpora lutea
Number of implantations
Number of live implantations
Analysis of variance following a square root transformation
Early intra-uterine deaths
Late intra-uterine deaths
Findings
Analysis of the diets showed that the achieved concentration, homogeneity and stability were satisfactory throughout the study.
Concentrations in ppm can be converted into dose levels in mg/Kg b.w., using the food consumption data. Thus, concentrations of 200, 1000 and 1500 ppm in diet are equivalent to dose levels of approximately 13, 62 and 88.5 mg/Kg b.w., respectively. One rat in the 1500 ppm Acetochlor was killed during week 2 of the study. It had a twisted snout, bleeding nose and malocclusion, findings which were unrelated to Acetochlor.
There were no treatment related clinical observations in rats receiving Acetochlor in diet.
The weights of rats receiving 1500 ppm Acetochlor were slightly lower than those of controls (approximately 3%), at the start of the study and this difference was maintained throughout the
CLH REPORT FOR ACETOCHLOR
105
study. Rats receiving 200 and 1000 ppm Acetochlor in their diets showed similar growth to controls throughout the study.
Food consumption was lower in rats receiving 1500 ppm Acetochlor than controls throughout the pre-mating phase of the study. Food consumption was similar in rats receiving 200 or 1000 ppm.
The number of males successfully mating was satisfactory for all groups for each of the three matings. The number of corpora lutea, number of implants, number of live implants, number of early intra-uterine deaths and number of late intra-uterine deaths was not affected by administration of Acetochlor at any of the three successive matings. In the positive control group the number of live implants was reduced and the number of early intra-uterine deaths was increased.
Conclusion
It is concluded that Acetochlor did not induce dominant lethal effects in the rat following dietary administration of dose levels up to and including 1500 ppm (≈ 88.5 mg/Kg b.w.) for 10 weeks
Acetochlor: Dominant Lethal Study in the Mouse By Dietary Administration
Milburn, G.M., 1996b (IIA, 5.4.3/04)
Date of report: 16 May 1996. Date of work: 20 June 1995 to 6 October 1995.
Objective: To investigate the mutagenic potential of Acetochlor to germ cells in the dominant lethal assay in mice when administered orally via the diet for 8 weeks.
Guidelines: OECD TG 478 (1984).
Deviations from OECD TG 478 (1984): The highest dose level tested did not produce any signs of toxicity.
GLP: Yes.
The study is not acceptable because the highest dose level tested is not considered appropriate. For the dominant lethal assay the highest dose should produce signs of toxicity (e.g. slightly reduced fertility), and non-toxic substances should be tested up to 5000 mg/Kg or, if this is not practicable, then at the highest dose attainable. In this study, the highest dose level tested, 3500 ppm (≈ 812 mg/Kg/day), is not justified by its toxicity.
Material and methods
The test substance was Acetochlor, batch WRC 13856-46-1, with 94.4% purity. The positive control was cyclophosphamide. The study was conducted using male and female CD-1 mice.
The dose levels of Acetochlor selected for his study were selected based on the results of a previous feeding study in the CD-1 mice carried out in this laboratory.
A pre-experimental fertility test was carried out with the male mice. Two females were housed with each male for 7 consecutive nights and examined each morning for evidence of mating (vaginal plug). The females were sacrificed 14 to 15 days after they were first paired, and the number of live implantations and early and late intra-uterine deaths were recorded. The males were subsequently graded according to fertility and extent of background dominant lethal frequency [i.e. numbers of intra-uterine deaths (resorptions)]. Those males successful in fertilising both females were selected and those producing a high frequency of intra-uterine death excluded.and then randomly allocated to the experimental groups.
Groups of 20 male mice of proven fertility were fed diets containing 200, 1000 or 3500 ppm Acetochlor for 8 weeks before mating. The negative control group received only the basal diet.
CLH REPORT FOR ACETOCHLOR
106
The positive control group received a single oral dose of cyclophosphamide in week 8 before mating.
Clinical observations were recorded once per day. The male mice were weighed immediately before feeding of experimental diets commenced, daily for the first week of the study and weekly thereafter. Food consumption of males was recorded continuously throughout the 8 week feeding period.
At the end of the 8 week feeding period, the males were mated (1 male: 2 females) for three consecutive 5-day periods. Each morning, the females were examined for evidence of mating (vaginal plugs). Approximately 14 to 15 days after they were fist paired, the females were sacrificed and the number of live implantations and early and late intra-uterine deaths were recorded. Males were sacrificed after the completion ofthe study
Data were analysed statistically as indicated in Table 42 using, where applicable, the male as the unit of treatment.
Table 42: Statistical analysis of data
Statistical Test Parameter
Analysis of covariance Bodyweight (day 1)
Analysis of variance Food consumption
Fisher’s Exact Test The proportion of females which were pregnant
The proportion of males successfully mating
Analysis of variance Number of implantations
Number of live implantations
Analysis of variance following a square root transformation
Early intra-uterine deaths
Late intra-uterine deaths
Findings
Analysis of the diets showed that the achieved concentration, homogeneity and stability were satisfactory throughout the study.
Concentrations in ppm can be converted into dose levels in mg/Kg b.w., using the food consumption data. Thus, concentrations of 200, 1000 and 3500 ppm in diet are equivalent to dose levels of approximately 38, 186 and 812 mg/Kg b.w., respectively.
There were no treatment related clinical observations in mice receiving Acetochlor in diet.
Mice receiving 3500 ppm Acetochlor showed an initial weight loss. Thereafter weights of these mice were reduced (approximately 5%) below controls throughout the study. Mice receiving 200 or 1000 ppm Acetochlor in their diets showed similar growth to controls throughout the study.
Food consumption was higher in mice receiving 3500 ppm Acetochlor than controls throughout the pre-mating phase of the study. Food consumption was similar in mice receiving 200 or 1000 ppm Acetochor and controls.
The number of males successfully mating was satisfactory for all groups for each of the three matings.
The number of males successfully mating was satisfactory for all groups for each of the three matings. The total number of implants, number of live implants, number of early intra-uterine deaths and number of late intra-uterine deaths was not affected by administration of Acetochlor at
CLH REPORT FOR ACETOCHLOR
107
any of the three successive matings. In the positive control group the number of live implants was reduced and the number of early intra-uterine deaths was increased.
Conclusion
It is concluded that Acetochlor did not induce dominant lethal effects in the mouse following the dietary administration of 3500 ppm (≈ 812 mg/Kg b.w.) for 8 weeks.
4.9.2 Human information
No data available.
4.9.3 Other relevant information
No data available.
4.9.4 Summary and discussion of mutagenicity
See summary in section 4.9.1.
Accordingly, the weight of evidence suggests that Acetochlor is mutagenic in vitro but not mutagenic in vivo in either somatic or germ cells.
4.9.5 Comparison with criteria
According to CLP Regulation classification in Category 1A is based on positive evidence from human epidemiological studies. Classification into Category 1B is based on following criteria:
- Positive result (s) from in vivo heritable germ cell mutagenicity test in a mammals; or
- Positive result (s) for in vivo somatic cell mutagenicity test in mammals, in combination with some evidence that the substance has potential to cause mutations to germ cells. It is possible to derive this supporting evidence from mutagenicity/genotoxicity tests in germ cells in vivo, or by demonstrating the ability of the substance or its metabolite(s) to interact with the genetic material of germ cells; or
- Positive result from tests showing mutagenic effects in the germ cells of humans, without demonstration of transmission to progeny; for example, an increase in the frequency of aneuploidy in sperm cell of exposed people.
Classification into category 2 under CLP is required for substances which cause concern for humans owing to the possibility that they may induce heritable mutations in the germ cells of humans based on:
- Positive evidence obtained from experiments in mammals and/or in some cases from in vitro experiments, obtained from:
Somatic cell mutagenicity tests in vivo, in mammals; or
Other in vivo somatic cell genotoxicity tests which are supported by positive results from in vitro mutagenicity assays.
According to DSD classification in Category 1 is based on positive positive evidence from human mutation epidemiology studies. To place a substance in Category 2, positive results are needed from assays showing (a) mutagenic effects, or (b) other cellular interactions relevant to mutagenicity, in germ cells of mammals in vivo, or (c) mutagenic effects in somatic cells of mammals in vivo in combination with clear evidence that the substance or a relevant metabolite reaches the germ cells. Classification into category 3 under DSD, positive results are needed in
CLH REPORT FOR ACETOCHLOR
108
assays showing (a) mutagenic effects or (b) other cellular interaction relevant to mutagenicity, in somatic cells in mammals in vivo. The latter especially would normally be supported by positive results from in vitro mutagenicity assays.
In summary, in relation with the criteria for germ cell mutagenicity:
There are no human data and, therefore, classification as Muta.1A based on CLP criteria (Muta.Cat 1 based on DSD criteria) is not appropriate.
Acetochlor profile does not allow for a CLP 1B category (category 2 under DSD criteria) in absence of germ cell mutagenicity or evidence that the substance has potential to cause mutations to germ cells.
In vivo data in somatic cells: the only in vivo finding suggestive of genetic toxicity for acetochlor is in the biochemically compromised livers of rats exposed to 2000 mg/kg. The UDS assay has been forced to yield a UDS response, under extremely adverse test conditions, a response that cannot be interpreted in the context originally envisaged for this assay. These effects don’t justify the classification of acetochlor as Muta.2, under CLP criteria [Muta. Cat. 3 (DSD)].
Based on the comparison of mutagenicity data with CLP and DSD classification criteria, effects observed in the in vitro and in vivo genotoxicity studies do not trigger the criteria for classification and labelling for mutagenicity.
4.9.6 Conclusions on classification and labelling
There is no evidence of genotoxic potential of acetochlor, therefore, no classification is proposed.
Directive 67/548/EEC: A classification is not required CLP: A classification is not required
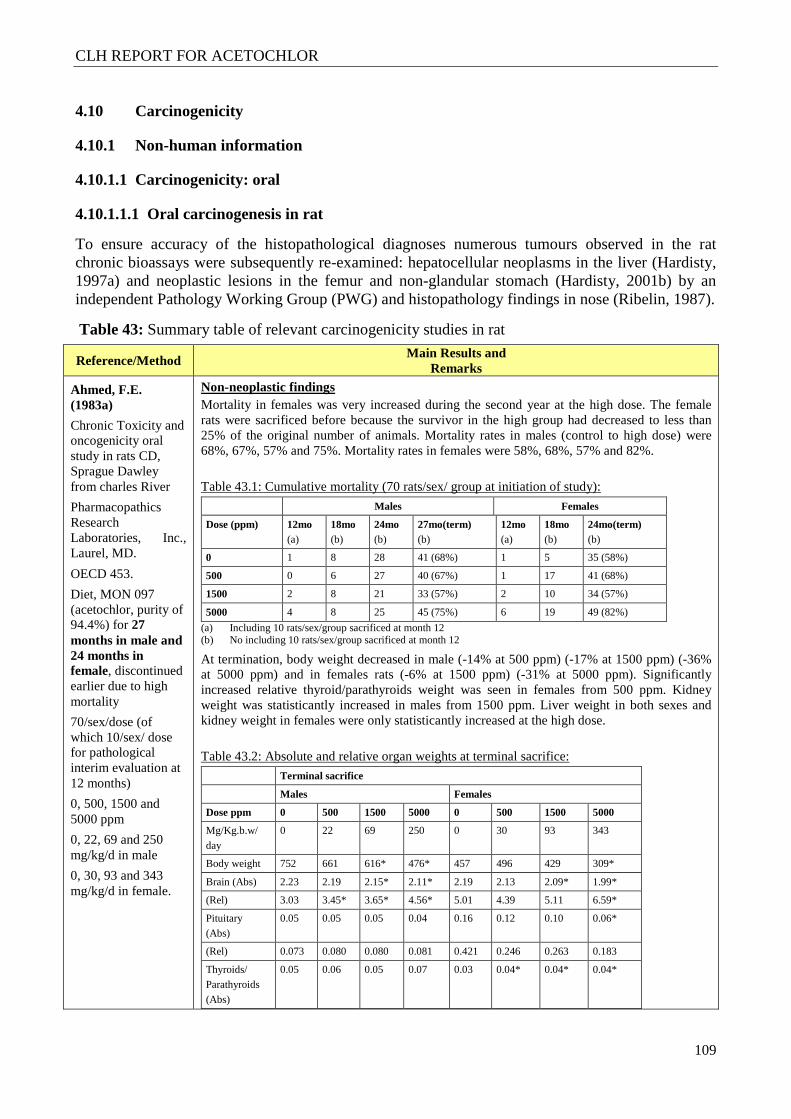
CLH REPORT FOR ACETOCHLOR
109
4.10 Carcinogenicity
4.10.1 Non-human information
4.10.1.1 Carcinogenicity: oral
4.10.1.1.1 Oral carcinogenesis in rat
To ensure accuracy of the histopathological diagnoses numerous tumours observed in the rat chronic bioassays were subsequently re-examined: hepatocellular neoplasms in the liver (Hardisty, 1997a) and neoplastic lesions in the femur and non-glandular stomach (Hardisty, 2001b) by an independent Pathology Working Group (PWG) and histopathology findings in nose (Ribelin, 1987).
Table 43: Summary table of relevant carcinogenicity studies in rat
Reference/Method Main Results and
Remarks
Ahmed, F.E. (1983a)
Chronic Toxicity and oncogenicity oral study in rats CD, Sprague Dawley from charles River
Pharmacopathics Research Laboratories, Inc., Laurel, MD.
OECD 453.
Diet, MON 097 (acetochlor, purity of 94.4%) for 27 months in male and 24 months in female, discontinued earlier due to high mortality
70/sex/dose (of which 10/sex/ dose for pathological interim evaluation at 12 months)
0, 500, 1500 and 5000 ppm
0, 22, 69 and 250 mg/kg/d in male
0, 30, 93 and 343 mg/kg/d in female.
Non-neoplastic findings Mortality in females was very increased during the second year at the high dose. The female rats were sacrificed before because the survivor in the high group had decreased to less than 25% of the original number of animals. Mortality rates in males (control to high dose) were 68%, 67%, 57% and 75%. Mortality rates in females were 58%, 68%, 57% and 82%. Table 43.1: Cumulative mortality (70 rats/sex/ group at initiation of study):
Males Females
Dose (ppm) 12mo (a)
18mo (b)
24mo (b)
27mo(term) (b)
12mo (a)
18mo (b)
24mo(term) (b)
0 1 8 28 41 (68%) 1 5 35 (58%)
500 0 6 27 40 (67%) 1 17 41 (68%)
1500 2 8 21 33 (57%) 2 10 34 (57%)
5000 4 8 25 45 (75%) 6 19 49 (82%)
(a) Including 10 rats/sex/group sacrificed at month 12 (b) No including 10 rats/sex/group sacrificed at month 12
At termination, body weight decreased in male (-14% at 500 ppm) (-17% at 1500 ppm) (-36% at 5000 ppm) and in females rats (-6% at 1500 ppm) (-31% at 5000 ppm). Significantly increased relative thyroid/parathyroids weight was seen in females from 500 ppm. Kidney weight was statisticantly increased in males from 1500 ppm. Liver weight in both sexes and kidney weight in females were only statisticantly increased at the high dose. Table 43.2: Absolute and relative organ weights at terminal sacrifice: Terminal sacrifice
Males Females
Dose ppm 0 500 1500 5000 0 500 1500 5000
Mg/Kg.b.w/
day
0 22 69 250 0 30 93 343
Body weight 752 661 616* 476* 457 496 429 309*
Brain (Abs) 2.23 2.19 2.15* 2.11* 2.19 2.13 2.09* 1.99*
(Rel) 3.03 3.45* 3.65* 4.56* 5.01 4.39 5.11 6.59*
Pituitary
(Abs)
0.05 0.05 0.05 0.04 0.16 0.12 0.10 0.06*
(Rel) 0.073 0.080 0.080 0.081 0.421 0.246 0.263 0.183
Thyroids/
Parathyroids
(Abs)
0.05 0.06 0.05 0.07 0.03 0.04* 0.04* 0.04*
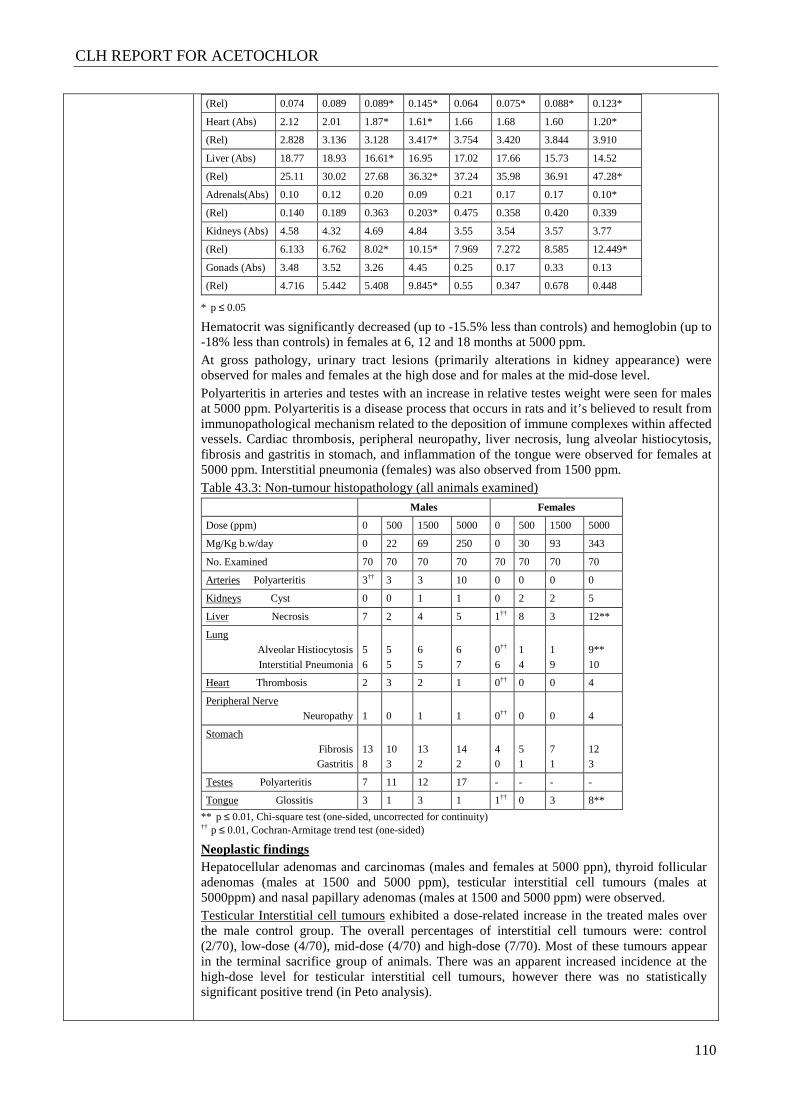
CLH REPORT FOR ACETOCHLOR
110
(Rel) 0.074 0.089 0.089* 0.145* 0.064 0.075* 0.088* 0.123*
Heart (Abs) 2.12 2.01 1.87* 1.61* 1.66 1.68 1.60 1.20*
(Rel) 2.828 3.136 3.128 3.417* 3.754 3.420 3.844 3.910
Liver (Abs) 18.77 18.93 16.61* 16.95 17.02 17.66 15.73 14.52
(Rel) 25.11 30.02 27.68 36.32* 37.24 35.98 36.91 47.28*
Adrenals(Abs) 0.10 0.12 0.20 0.09 0.21 0.17 0.17 0.10*
(Rel) 0.140 0.189 0.363 0.203* 0.475 0.358 0.420 0.339
Kidneys (Abs) 4.58 4.32 4.69 4.84 3.55 3.54 3.57 3.77
(Rel) 6.133 6.762 8.02* 10.15* 7.969 7.272 8.585 12.449*
Gonads (Abs) 3.48 3.52 3.26 4.45 0.25 0.17 0.33 0.13
(Rel) 4.716 5.442 5.408 9.845* 0.55 0.347 0.678 0.448
* p ≤ 0.05
Hematocrit was significantly decreased (up to -15.5% less than controls) and hemoglobin (up to -18% less than controls) in females at 6, 12 and 18 months at 5000 ppm. At gross pathology, urinary tract lesions (primarily alterations in kidney appearance) were observed for males and females at the high dose and for males at the mid-dose level. Polyarteritis in arteries and testes with an increase in relative testes weight were seen for males at 5000 ppm. Polyarteritis is a disease process that occurs in rats and it’s believed to result from immunopathological mechanism related to the deposition of immune complexes within affected vessels. Cardiac thrombosis, peripheral neuropathy, liver necrosis, lung alveolar histiocytosis, fibrosis and gastritis in stomach, and inflammation of the tongue were observed for females at 5000 ppm. Interstitial pneumonia (females) was also observed from 1500 ppm. Table 43.3: Non-tumour histopathology (all animals examined)
Males Females
Dose (ppm) 0 500 1500 5000 0 500 1500 5000
Mg/Kg b.w/day 0 22 69 250 0 30 93 343
No. Examined 70 70 70 70 70 70 70 70
Arteries Polyarteritis 3†† 3 3 10 0 0 0 0
Kidneys Cyst 0 0 1 1 0 2 2 5
Liver Necrosis 7 2 4 5 1†† 8 3 12**
Lung
Alveolar Histiocytosis
Interstitial Pneumonia
5
6
5
5
6
5
6
7
0††
6
1
4
1
9
9**
10
Heart Thrombosis 2 3 2 1 0†† 0 0 4
Peripheral Nerve
Neuropathy
1
0
1
1
0††
0
0
4
Stomach
Fibrosis Gastritis
13 8
10 3
13 2
14 2
4 0
5 1
7 1
12 3
Testes Polyarteritis 7 11 12 17 - - - -
Tongue Glossitis 3 1 3 1 1†† 0 3 8**
** p ≤ 0.01, Chi-square test (one-sided, uncorrected for continuity) †† p ≤ 0.01, Cochran-Armitage trend test (one-sided)
Neoplastic findings Hepatocellular adenomas and carcinomas (males and females at 5000 ppn), thyroid follicular adenomas (males at 1500 and 5000 ppm), testicular interstitial cell tumours (males at 5000ppm) and nasal papillary adenomas (males at 1500 and 5000 ppm) were observed. Testicular Interstitial cell tumours exhibited a dose-related increase in the treated males over the male control group. The overall percentages of interstitial cell tumours were: control (2/70), low-dose (4/70), mid-dose (4/70) and high-dose (7/70). Most of these tumours appear in the terminal sacrifice group of animals. There was an apparent increased incidence at the high-dose level for testicular interstitial cell tumours, however there was no statistically significant positive trend (in Peto analysis).
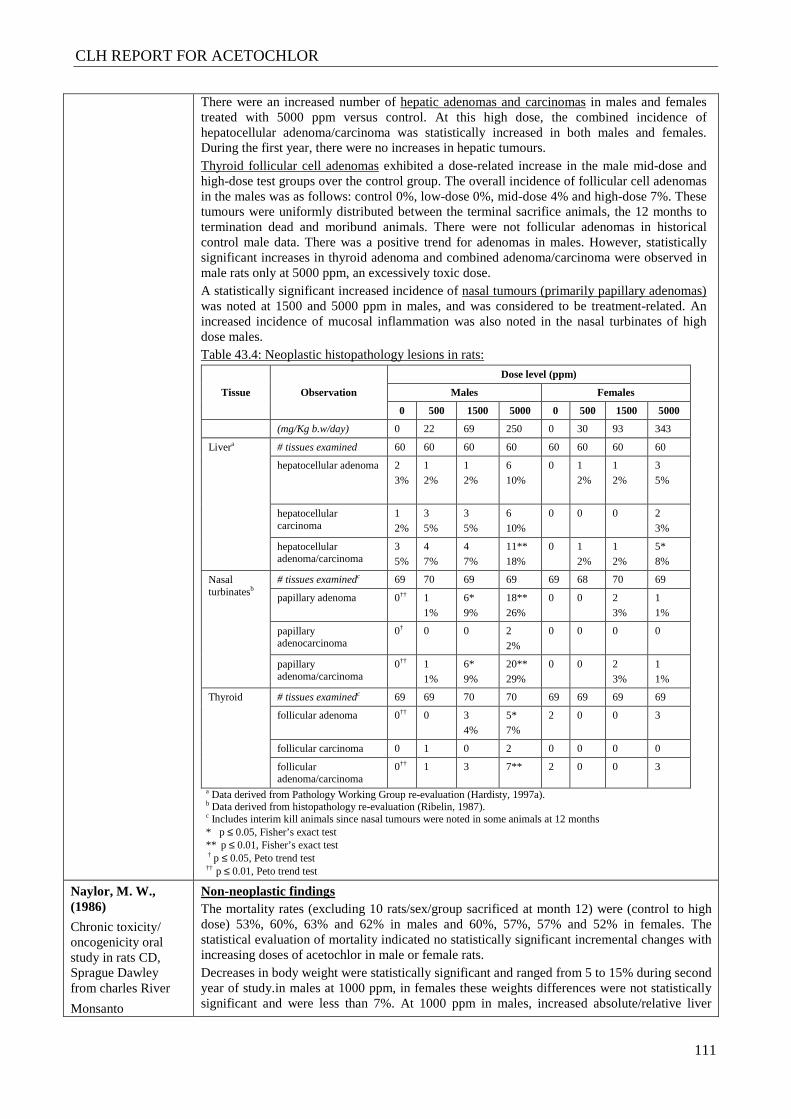
CLH REPORT FOR ACETOCHLOR
111
There were an increased number of hepatic adenomas and carcinomas in males and females treated with 5000 ppm versus control. At this high dose, the combined incidence of hepatocellular adenoma/carcinoma was statistically increased in both males and females. During the first year, there were no increases in hepatic tumours. Thyroid follicular cell adenomas exhibited a dose-related increase in the male mid-dose and high-dose test groups over the control group. The overall incidence of follicular cell adenomas in the males was as follows: control 0%, low-dose 0%, mid-dose 4% and high-dose 7%. These tumours were uniformly distributed between the terminal sacrifice animals, the 12 months to termination dead and moribund animals. There were not follicular adenomas in historical control male data. There was a positive trend for adenomas in males. However, statistically significant increases in thyroid adenoma and combined adenoma/carcinoma were observed in male rats only at 5000 ppm, an excessively toxic dose. A statistically significant increased incidence of nasal tumours (primarily papillary adenomas) was noted at 1500 and 5000 ppm in males, and was considered to be treatment-related. An increased incidence of mucosal inflammation was also noted in the nasal turbinates of high dose males. Table 43.4: Neoplastic histopathology lesions in rats:
Tissue Observation
Dose level (ppm)
Males Females
0 500 1500 5000 0 500 1500 5000
(mg/Kg b.w/day) 0 22 69 250 0 30 93 343
Livera # tissues examined 60 60 60 60 60 60 60 60
hepatocellular adenoma 2
3%
1
2%
1
2%
6
10%
0 1
2%
1
2%
3
5%
hepatocellular carcinoma
1
2%
3
5%
3
5%
6
10%
0 0 0 2
3%
hepatocellular adenoma/carcinoma
3
5%
4
7%
4
7%
11**
18%
0 1
2%
1
2%
5*
8%
Nasal turbinatesb
# tissues examinedc 69 70 69 69 69 68 70 69
papillary adenoma 0†† 1
1%
6*
9%
18**
26%
0 0 2
3%
1
1%
papillary adenocarcinoma
0† 0 0 2
2%
0 0 0 0
papillary adenoma/carcinoma
0†† 1
1%
6*
9%
20**
29%
0 0 2
3%
1
1%
Thyroid # tissues examinedc 69 69 70 70 69 69 69 69
follicular adenoma 0†† 0 3
4%
5*
7%
2 0 0 3
follicular carcinoma 0 1 0 2 0 0 0 0
follicular adenoma/carcinoma
0†† 1 3 7** 2 0 0 3
a Data derived from Pathology Working Group re-evaluation (Hardisty, 1997a). b Data derived from histopathology re-evaluation (Ribelin, 1987). c Includes interim kill animals since nasal tumours were noted in some animals at 12 months * p ≤ 0.05, Fisher’s exact test ** p ≤ 0.01, Fisher’s exact test † p ≤ 0.05, Peto trend test †† p ≤ 0.01, Peto trend test
Naylor, M. W., (1986)
Chronic toxicity/ oncogenicity oral study in rats CD, Sprague Dawley from charles River
Monsanto
Non-neoplastic findings The mortality rates (excluding 10 rats/sex/group sacrificed at month 12) were (control to high dose) 53%, 60%, 63% and 62% in males and 60%, 57%, 57% and 52% in females. The statistical evaluation of mortality indicated no statistically significant incremental changes with increasing doses of acetochlor in male or female rats. Decreases in body weight were statistically significant and ranged from 5 to 15% during second year of study.in males at 1000 ppm, in females these weights differences were not statistically significant and were less than 7%. At 1000 ppm in males, increased absolute/relative liver
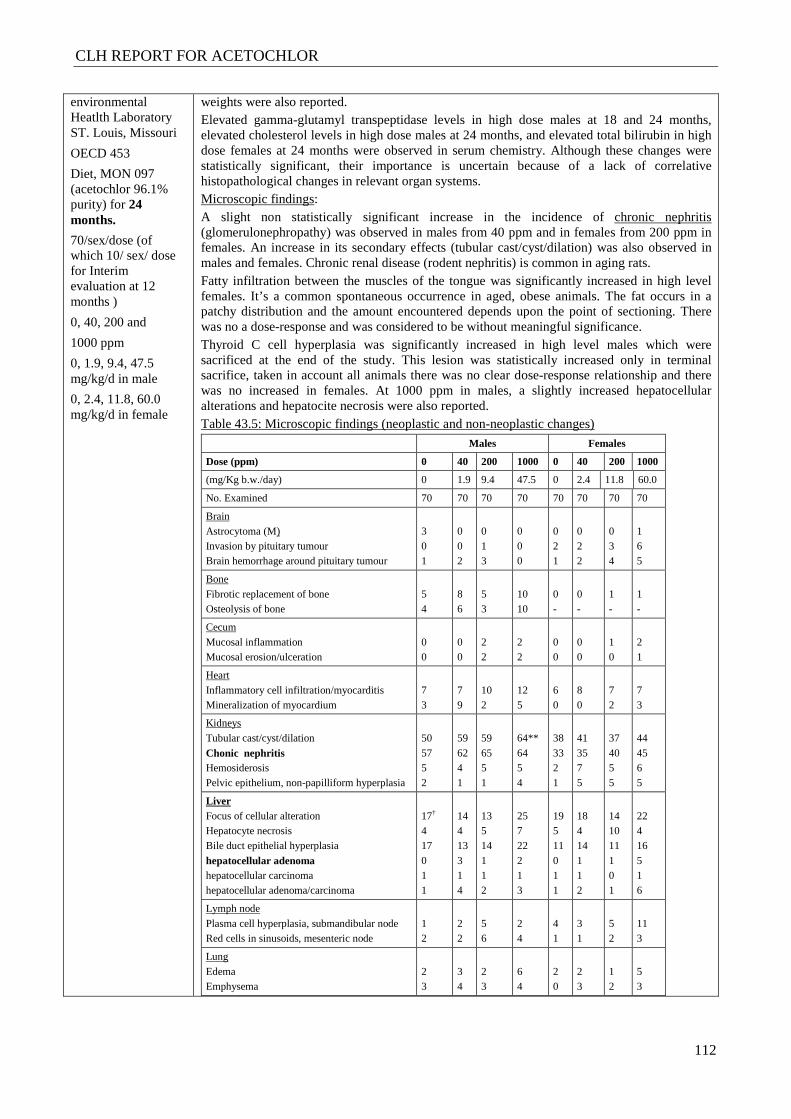
CLH REPORT FOR ACETOCHLOR
112
environmental Heatlth Laboratory ST. Louis, Missouri
OECD 453
Diet, MON 097 (acetochlor 96.1% purity) for 24 months.
70/sex/dose (of which 10/ sex/ dose for Interim evaluation at 12 months )
0, 40, 200 and
1000 ppm
0, 1.9, 9.4, 47.5 mg/kg/d in male
0, 2.4, 11.8, 60.0 mg/kg/d in female
weights were also reported. Elevated gamma-glutamyl transpeptidase levels in high dose males at 18 and 24 months, elevated cholesterol levels in high dose males at 24 months, and elevated total bilirubin in high dose females at 24 months were observed in serum chemistry. Although these changes were statistically significant, their importance is uncertain because of a lack of correlative histopathological changes in relevant organ systems. Microscopic findings: A slight non statistically significant increase in the incidence of chronic nephritis (glomerulonephropathy) was observed in males from 40 ppm and in females from 200 ppm in females. An increase in its secondary effects (tubular cast/cyst/dilation) was also observed in males and females. Chronic renal disease (rodent nephritis) is common in aging rats. Fatty infiltration between the muscles of the tongue was significantly increased in high level females. It’s a common spontaneous occurrence in aged, obese animals. The fat occurs in a patchy distribution and the amount encountered depends upon the point of sectioning. There was no a dose-response and was considered to be without meaningful significance. Thyroid C cell hyperplasia was significantly increased in high level males which were sacrificed at the end of the study. This lesion was statistically increased only in terminal sacrifice, taken in account all animals there was no clear dose-response relationship and there was no increased in females. At 1000 ppm in males, a slightly increased hepatocellular alterations and hepatocite necrosis were also reported. Table 43.5: Microscopic findings (neoplastic and non-neoplastic changes) Males Females
Dose (ppm) 0 40 200 1000 0 40 200 1000
(mg/Kg b.w./day) 0 1.9 9.4 47.5 0 2.4 11.8 60.0
No. Examined 70 70 70 70 70 70 70 70
Brain
Astrocytoma (M) Invasion by pituitary tumour Brain hemorrhage around pituitary tumour
3 0 1
0 0 2
0 1 3
0 0 0
0 2 1
0 2 2
0 3 4
1 6 5
Bone
Fibrotic replacement of bone Osteolysis of bone
5 4
8 6
5 3
10 10
0 -
0 -
1 -
1 -
Cecum
Mucosal inflammation Mucosal erosion/ulceration
0 0
0 0
2 2
2 2
0 0
0 0
1 0
2 1
Heart
Inflammatory cell infiltration/myocarditis Mineralization of myocardium
7 3
7 9
10 2
12 5
6 0
8 0
7 2
7 3
Kidneys
Tubular cast/cyst/dilation
Chonic nephritis Hemosiderosis Pelvic epithelium, non-papilliform hyperplasia
50
57 5 2
59
62 4 1
59
65 5 1
64**
64 5 4
38
33 2 1
41
35 7 5
37
40 5 5
44
45 6 5
Liver Focus of cellular alteration Hepatocyte necrosis Bile duct epithelial hyperplasia
hepatocellular adenoma hepatocellular carcinoma hepatocellular adenoma/carcinoma
17† 4 17
0 1 1
14 4 13
3 1 4
13 5 14
1 1 2
25 7 22
2 1 3
19 5 11
0 1 1
18 4 14
1 1 2
14 10 11
1 0 1
22 4 16
5 1 6
Lymph node
Plasma cell hyperplasia, submandibular node Red cells in sinusoids, mesenteric node
1 2
2 2
5 6
2 4
4 1
3 1
5 2
11 3
Lung
Edema Emphysema
2 3
3 4
2 3
6 4
2 0
2 3
1 2
5 3
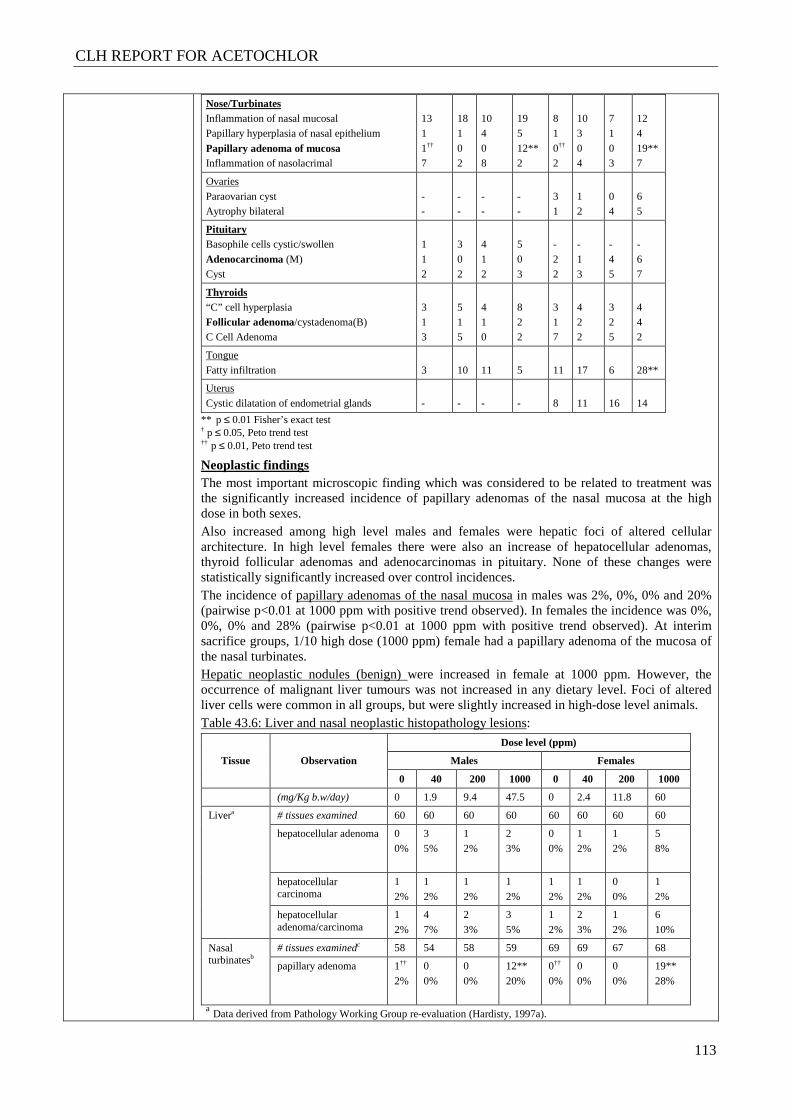
CLH REPORT FOR ACETOCHLOR
113
Nose/Turbinates Inflammation of nasal mucosal Papillary hyperplasia of nasal epithelium
Papillary adenoma of mucosa Inflammation of nasolacrimal
13 1
1†† 7
18 1
0 2
10 4
0 8
19 5
12** 2
8 1
0†† 2
10 3
0 4
7 1
0 3
12 4
19** 7
Ovaries
Paraovarian cyst Aytrophy bilateral
- -
- -
- -
- -
3 1
1 2
0 4
6 5
Pituitary Basophile cells cystic/swollen
Adenocarcinoma (M) Cyst
1
1 2
3
0 2
4
1 2
5
0 3
-
2 2
-
1 3
-
4 5
-
6 7
Thyroids “C” cell hyperplasia Follicular adenoma/cystadenoma(B) C Cell Adenoma
3 1 3
5 1 5
4 1 0
8 2 2
3 1 7
4 2 2
3 2 5
4 4 2
Tongue
Fatty infiltration
3
10
11
5
11
17
6
28**
Uterus
Cystic dilatation of endometrial glands
-
-
-
-
8
11
16
14
** p ≤ 0.01 Fisher’s exact test † p ≤ 0.05, Peto trend test †† p ≤ 0.01, Peto trend test
Neoplastic findings The most important microscopic finding which was considered to be related to treatment was the significantly increased incidence of papillary adenomas of the nasal mucosa at the high dose in both sexes. Also increased among high level males and females were hepatic foci of altered cellular architecture. In high level females there were also an increase of hepatocellular adenomas, thyroid follicular adenomas and adenocarcinomas in pituitary. None of these changes were statistically significantly increased over control incidences. The incidence of papillary adenomas of the nasal mucosa in males was 2%, 0%, 0% and 20% (pairwise p<0.01 at 1000 ppm with positive trend observed). In females the incidence was 0%, 0%, 0% and 28% (pairwise p<0.01 at 1000 ppm with positive trend observed). At interim sacrifice groups, 1/10 high dose (1000 ppm) female had a papillary adenoma of the mucosa of the nasal turbinates. Hepatic neoplastic nodules (benign) were increased in female at 1000 ppm. However, the occurrence of malignant liver tumours was not increased in any dietary level. Foci of altered liver cells were common in all groups, but were slightly increased in high-dose level animals. Table 43.6: Liver and nasal neoplastic histopathology lesions:
Tissue Observation
Dose level (ppm)
Males Females
0 40 200 1000 0 40 200 1000
(mg/Kg b.w/day) 0 1.9 9.4 47.5 0 2.4 11.8 60
Livera # tissues examined 60 60 60 60 60 60 60 60
hepatocellular adenoma 0
0%
3
5%
1
2%
2
3%
0
0%
1
2%
1
2%
5
8%
hepatocellular carcinoma
1
2%
1
2%
1
2%
1
2%
1
2%
1
2%
0
0%
1
2%
hepatocellular adenoma/carcinoma
1
2%
4
7%
2
3%
3
5%
1
2%
2
3%
1
2%
6
10%
Nasal turbinatesb
# tissues examinedc 58 54 58 59 69 69 67 68
papillary adenoma 1††
2%
0
0%
0
0%
12**
20%
0††
0%
0
0%
0
0%
19**
28%
a Data derived from Pathology Working Group re-evaluation (Hardisty, 1997a).
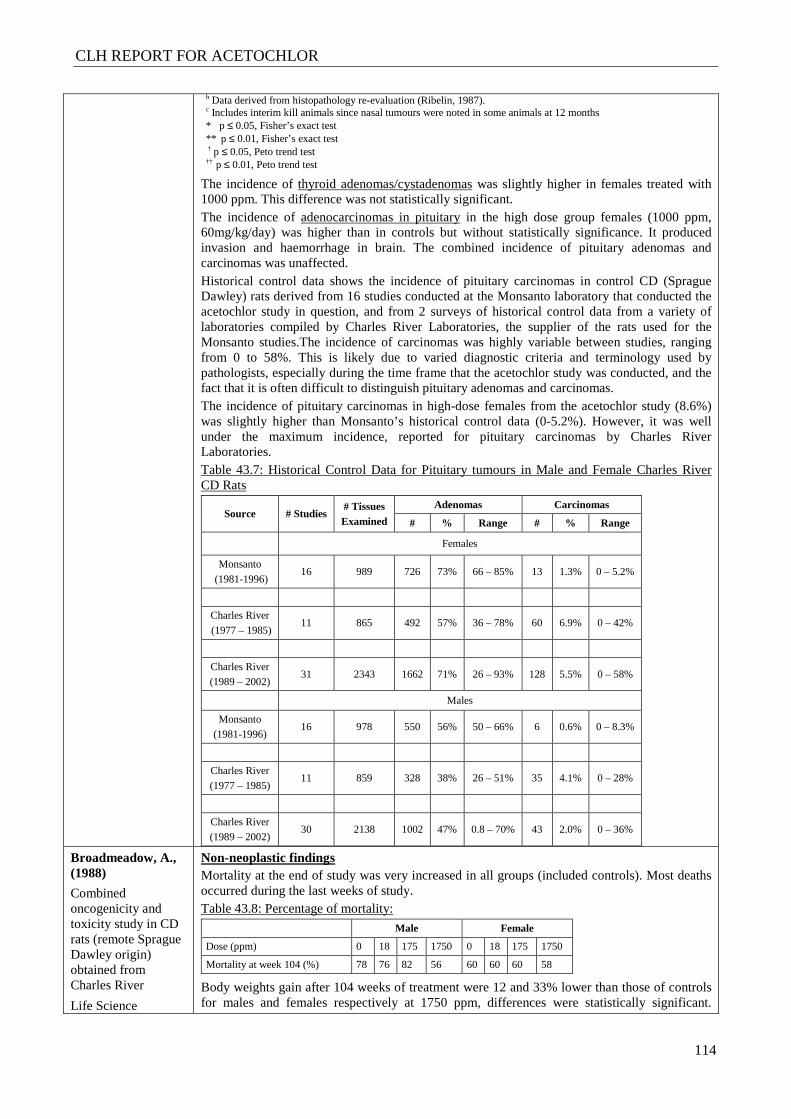
CLH REPORT FOR ACETOCHLOR
114
b Data derived from histopathology re-evaluation (Ribelin, 1987). c Includes interim kill animals since nasal tumours were noted in some animals at 12 months * p ≤ 0.05, Fisher’s exact test ** p ≤ 0.01, Fisher’s exact test † p ≤ 0.05, Peto trend test †† p ≤ 0.01, Peto trend test
The incidence of thyroid adenomas/cystadenomas was slightly higher in females treated with 1000 ppm. This difference was not statistically significant. The incidence of adenocarcinomas in pituitary in the high dose group females (1000 ppm, 60mg/kg/day) was higher than in controls but without statistically significance. It produced invasion and haemorrhage in brain. The combined incidence of pituitary adenomas and carcinomas was unaffected. Historical control data shows the incidence of pituitary carcinomas in control CD (Sprague Dawley) rats derived from 16 studies conducted at the Monsanto laboratory that conducted the acetochlor study in question, and from 2 surveys of historical control data from a variety of laboratories compiled by Charles River Laboratories, the supplier of the rats used for the Monsanto studies.The incidence of carcinomas was highly variable between studies, ranging from 0 to 58%. This is likely due to varied diagnostic criteria and terminology used by pathologists, especially during the time frame that the acetochlor study was conducted, and the fact that it is often difficult to distinguish pituitary adenomas and carcinomas. The incidence of pituitary carcinomas in high-dose females from the acetochlor study (8.6%) was slightly higher than Monsanto’s historical control data (0-5.2%). However, it was well under the maximum incidence, reported for pituitary carcinomas by Charles River Laboratories. Table 43.7: Historical Control Data for Pituitary tumours in Male and Female Charles River CD Rats
Source # Studies # Tissues Examined
Adenomas Carcinomas
# % Range # % Range
Females
Monsanto
(1981-1996) 16 989 726 73% 66 – 85% 13 1.3% 0 – 5.2%
Charles River
(1977 – 1985) 11 865 492 57% 36 – 78% 60 6.9% 0 – 42%
Charles River
(1989 – 2002) 31 2343 1662 71% 26 – 93% 128 5.5% 0 – 58%
Males
Monsanto
(1981-1996) 16 978 550 56% 50 – 66% 6 0.6% 0 – 8.3%
Charles River
(1977 – 1985) 11 859 328 38% 26 – 51% 35 4.1% 0 – 28%
Charles River
(1989 – 2002) 30 2138 1002 47% 0.8 – 70% 43 2.0% 0 – 36%
Broadmeadow, A., (1988)
Combined oncogenicity and toxicity study in CD rats (remote Sprague Dawley origin) obtained from Charles River
Life Science
Non-neoplastic findings Mortality at the end of study was very increased in all groups (included controls). Most deaths occurred during the last weeks of study. Table 43.8: Percentage of mortality:
Male Female
Dose (ppm) 0 18 175 1750 0 18 175 1750
Mortality at week 104 (%) 78 76 82 56 60 60 60 58
Body weights gain after 104 weeks of treatment were 12 and 33% lower than those of controls for males and females respectively at 1750 ppm, differences were statistically significant.
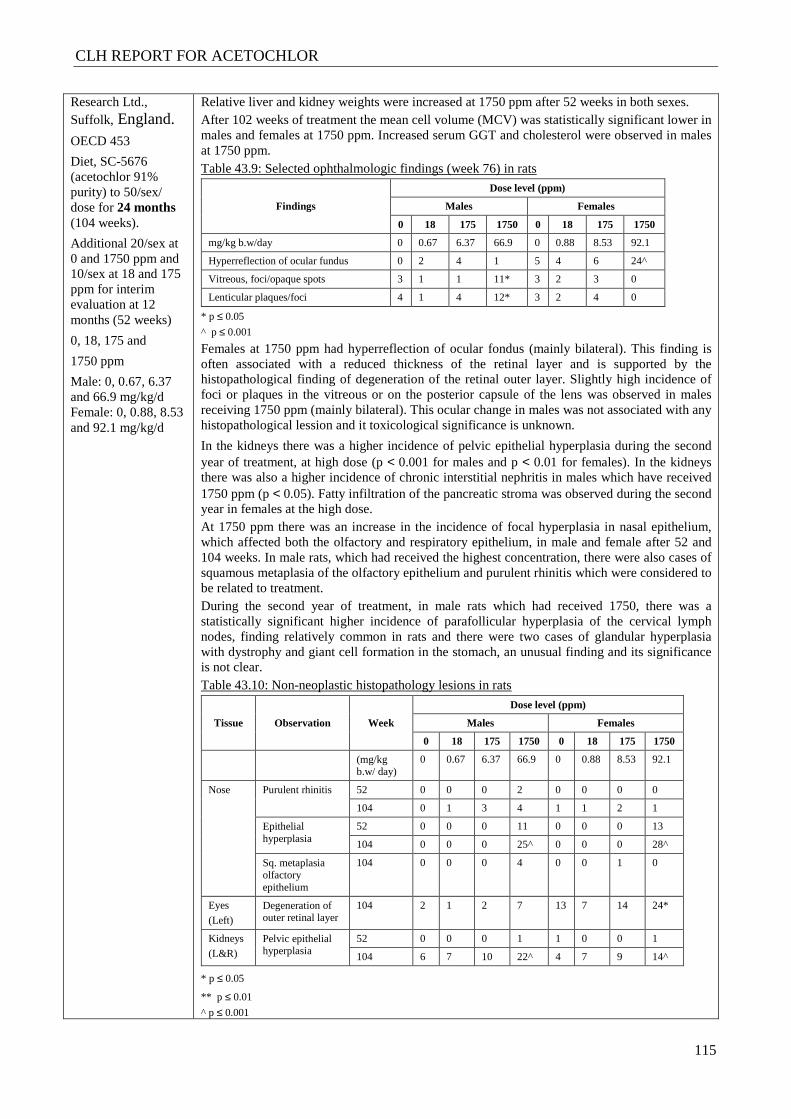
CLH REPORT FOR ACETOCHLOR
115
Research Ltd., Suffolk, England. OECD 453
Diet, SC-5676 (acetochlor 91% purity) to 50/sex/ dose for 24 months (104 weeks).
Additional 20/sex at 0 and 1750 ppm and 10/sex at 18 and 175 ppm for interim evaluation at 12 months (52 weeks)
0, 18, 175 and
1750 ppm
Male: 0, 0.67, 6.37 and 66.9 mg/kg/d Female: 0, 0.88, 8.53 and 92.1 mg/kg/d
Relative liver and kidney weights were increased at 1750 ppm after 52 weeks in both sexes. After 102 weeks of treatment the mean cell volume (MCV) was statistically significant lower in males and females at 1750 ppm. Increased serum GGT and cholesterol were observed in males at 1750 ppm. Table 43.9: Selected ophthalmologic findings (week 76) in rats
Findings
Dose level (ppm)
Males Females
0 18 175 1750 0 18 175 1750
mg/kg b.w/day 0 0.67 6.37 66.9 0 0.88 8.53 92.1
Hyperreflection of ocular fundus 0 2 4 1 5 4 6 24^
Vitreous, foci/opaque spots 3 1 1 11* 3 2 3 0
Lenticular plaques/foci 4 1 4 12* 3 2 4 0
* p ≤ 0.05
^ p ≤ 0.001 Females at 1750 ppm had hyperreflection of ocular fondus (mainly bilateral). This finding is often associated with a reduced thickness of the retinal layer and is supported by the histopathological finding of degeneration of the retinal outer layer. Slightly high incidence of foci or plaques in the vitreous or on the posterior capsule of the lens was observed in males receiving 1750 ppm (mainly bilateral). This ocular change in males was not associated with any histopathological lession and it toxicological significance is unknown.
In the kidneys there was a higher incidence of pelvic epithelial hyperplasia during the second year of treatment, at high dose (p < 0.001 for males and p < 0.01 for females). In the kidneys there was also a higher incidence of chronic interstitial nephritis in males which have received 1750 ppm (p < 0.05). Fatty infiltration of the pancreatic stroma was observed during the second year in females at the high dose. At 1750 ppm there was an increase in the incidence of focal hyperplasia in nasal epithelium, which affected both the olfactory and respiratory epithelium, in male and female after 52 and 104 weeks. In male rats, which had received the highest concentration, there were also cases of squamous metaplasia of the olfactory epithelium and purulent rhinitis which were considered to be related to treatment. During the second year of treatment, in male rats which had received 1750, there was a statistically significant higher incidence of parafollicular hyperplasia of the cervical lymph nodes, finding relatively common in rats and there were two cases of glandular hyperplasia with dystrophy and giant cell formation in the stomach, an unusual finding and its significance is not clear. Table 43.10: Non-neoplastic histopathology lesions in rats
Tissue Observation Week
Dose level (ppm)
Males Females
0 18 175 1750 0 18 175 1750
(mg/kg b.w/ day)
0 0.67 6.37 66.9 0 0.88 8.53 92.1
Nose Purulent rhinitis 52 0 0 0 2 0 0 0 0
104 0 1 3 4 1 1 2 1
Epithelial hyperplasia
52 0 0 0 11 0 0 0 13
104 0 0 0 25^ 0 0 0 28^
Sq. metaplasia olfactory epithelium
104 0 0 0 4 0 0 1 0
Eyes
(Left) Degeneration of outer retinal layer
104 2 1 2 7 13 7 14 24*
Kidneys
(L&R) Pelvic epithelial hyperplasia
52 0 0 0 1 1 0 0 1
104 6 7 10 22^ 4 7 9 14^
* p ≤ 0.05
** p ≤ 0.01
^ p ≤ 0.001
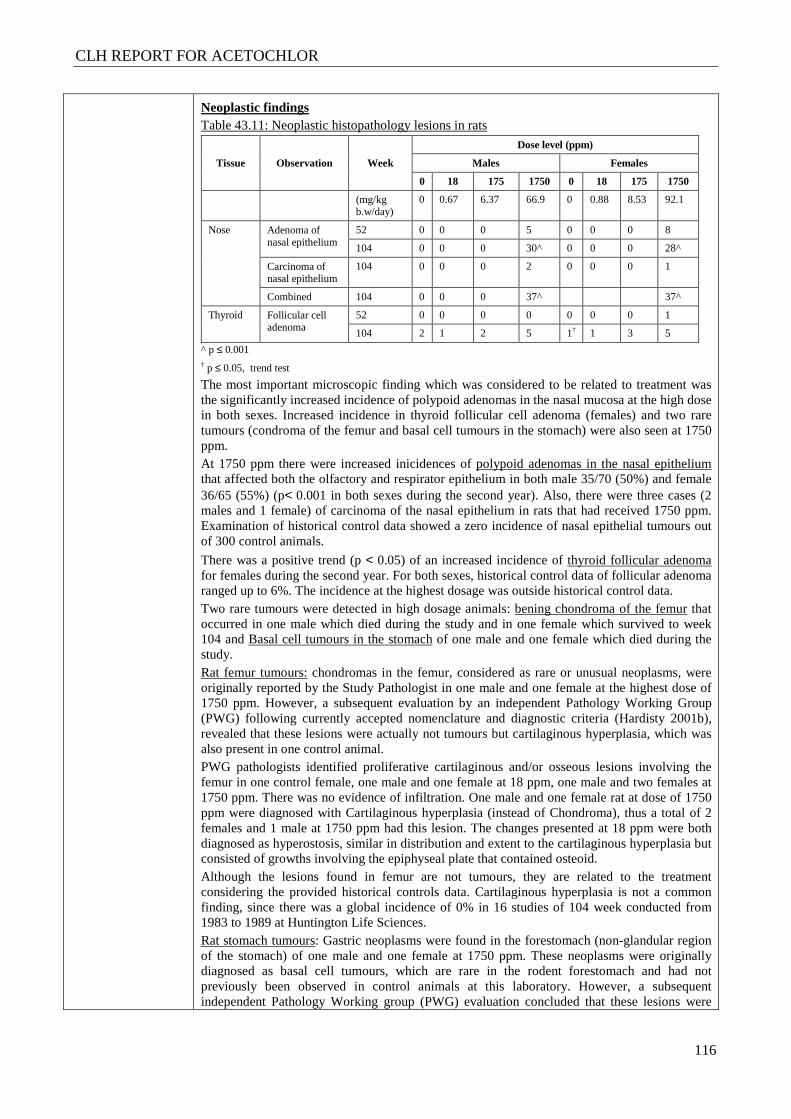
CLH REPORT FOR ACETOCHLOR
116
Neoplastic findings Table 43.11: Neoplastic histopathology lesions in rats
Tissue Observation Week
Dose level (ppm)
Males Females
0 18 175 1750 0 18 175 1750
(mg/kg b.w/day)
0 0.67 6.37 66.9 0 0.88 8.53 92.1
Nose Adenoma of nasal epithelium
52 0 0 0 5 0 0 0 8
104 0 0 0 30^ 0 0 0 28^
Carcinoma of nasal epithelium
104 0 0 0 2 0 0 0 1
Combined 104 0 0 0 37^ 37^
Thyroid Follicular cell adenoma
52 0 0 0 0 0 0 0 1
104 2 1 2 5 1† 1 3 5
^ p ≤ 0.001 † p ≤ 0.05, trend test The most important microscopic finding which was considered to be related to treatment was the significantly increased incidence of polypoid adenomas in the nasal mucosa at the high dose in both sexes. Increased incidence in thyroid follicular cell adenoma (females) and two rare tumours (condroma of the femur and basal cell tumours in the stomach) were also seen at 1750 ppm. At 1750 ppm there were increased inicidences of polypoid adenomas in the nasal epithelium that affected both the olfactory and respirator epithelium in both male 35/70 (50%) and female 36/65 (55%) (p< 0.001 in both sexes during the second year). Also, there were three cases (2 males and 1 female) of carcinoma of the nasal epithelium in rats that had received 1750 ppm. Examination of historical control data showed a zero incidence of nasal epithelial tumours out of 300 control animals.
There was a positive trend (p < 0.05) of an increased incidence of thyroid follicular adenoma for females during the second year. For both sexes, historical control data of follicular adenoma ranged up to 6%. The incidence at the highest dosage was outside historical control data. Two rare tumours were detected in high dosage animals: bening chondroma of the femur that occurred in one male which died during the study and in one female which survived to week 104 and Basal cell tumours in the stomach of one male and one female which died during the study. Rat femur tumours: chondromas in the femur, considered as rare or unusual neoplasms, were originally reported by the Study Pathologist in one male and one female at the highest dose of 1750 ppm. However, a subsequent evaluation by an independent Pathology Working Group (PWG) following currently accepted nomenclature and diagnostic criteria (Hardisty 2001b), revealed that these lesions were actually not tumours but cartilaginous hyperplasia, which was also present in one control animal. PWG pathologists identified proliferative cartilaginous and/or osseous lesions involving the femur in one control female, one male and one female at 18 ppm, one male and two females at 1750 ppm. There was no evidence of infiltration. One male and one female rat at dose of 1750 ppm were diagnosed with Cartilaginous hyperplasia (instead of Chondroma), thus a total of 2 females and 1 male at 1750 ppm had this lesion. The changes presented at 18 ppm were both diagnosed as hyperostosis, similar in distribution and extent to the cartilaginous hyperplasia but consisted of growths involving the epiphyseal plate that contained osteoid. Although the lesions found in femur are not tumours, they are related to the treatment considering the provided historical controls data. Cartilaginous hyperplasia is not a common finding, since there was a global incidence of 0% in 16 studies of 104 week conducted from 1983 to 1989 at Huntington Life Sciences. Rat stomach tumours: Gastric neoplasms were found in the forestomach (non-glandular region of the stomach) of one male and one female at 1750 ppm. These neoplasms were originally diagnosed as basal cell tumours, which are rare in the rodent forestomach and had not previously been observed in control animals at this laboratory. However, a subsequent independent Pathology Working group (PWG) evaluation concluded that these lesions were
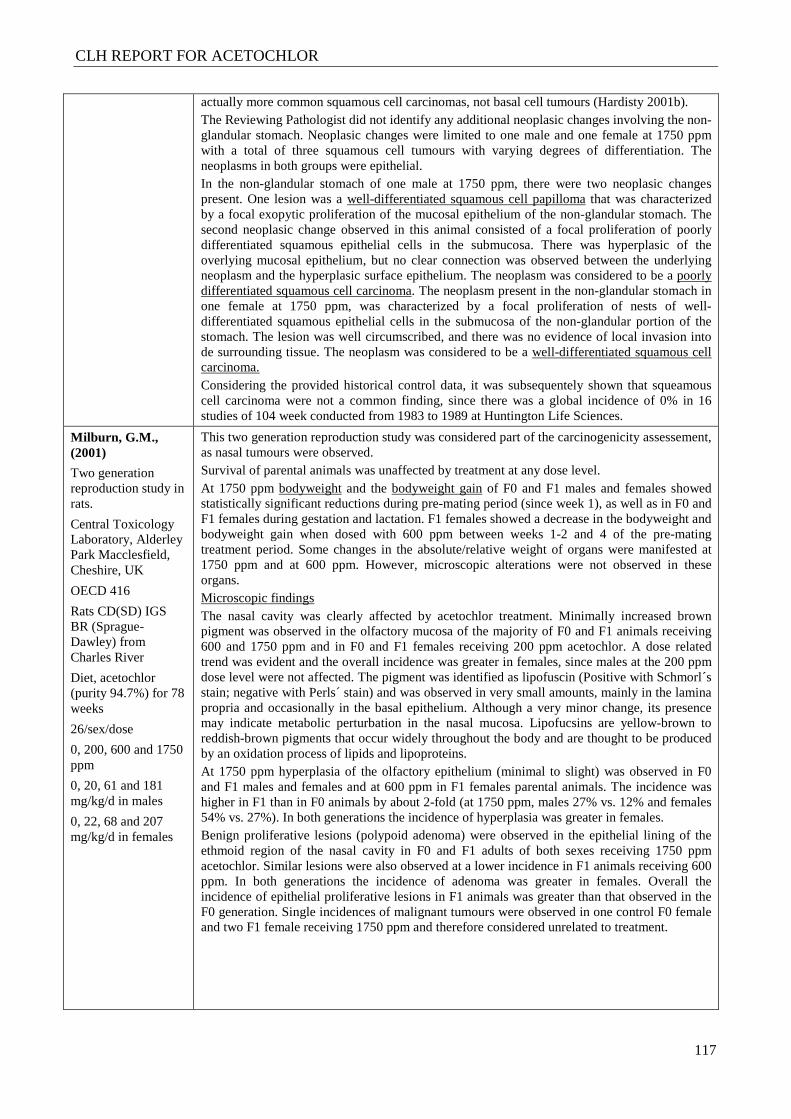
CLH REPORT FOR ACETOCHLOR
117
actually more common squamous cell carcinomas, not basal cell tumours (Hardisty 2001b). The Reviewing Pathologist did not identify any additional neoplasic changes involving the non-glandular stomach. Neoplasic changes were limited to one male and one female at 1750 ppm with a total of three squamous cell tumours with varying degrees of differentiation. The neoplasms in both groups were epithelial. In the non-glandular stomach of one male at 1750 ppm, there were two neoplasic changes present. One lesion was a well-differentiated squamous cell papilloma that was characterized by a focal exopytic proliferation of the mucosal epithelium of the non-glandular stomach. The second neoplasic change observed in this animal consisted of a focal proliferation of poorly differentiated squamous epithelial cells in the submucosa. There was hyperplasic of the overlying mucosal epithelium, but no clear connection was observed between the underlying neoplasm and the hyperplasic surface epithelium. The neoplasm was considered to be a poorly differentiated squamous cell carcinoma. The neoplasm present in the non-glandular stomach in one female at 1750 ppm, was characterized by a focal proliferation of nests of well-differentiated squamous epithelial cells in the submucosa of the non-glandular portion of the stomach. The lesion was well circumscribed, and there was no evidence of local invasion into de surrounding tissue. The neoplasm was considered to be a well-differentiated squamous cell carcinoma. Considering the provided historical control data, it was subsequentely shown that squeamous cell carcinoma were not a common finding, since there was a global incidence of 0% in 16 studies of 104 week conducted from 1983 to 1989 at Huntington Life Sciences.
Milburn, G.M., (2001)
Two generation reproduction study in rats.
Central Toxicology Laboratory, Alderley Park Macclesfield, Cheshire, UK
OECD 416
Rats CD(SD) IGS BR (Sprague-Dawley) from Charles River
Diet, acetochlor (purity 94.7%) for 78 weeks
26/sex/dose
0, 200, 600 and 1750 ppm
0, 20, 61 and 181 mg/kg/d in males
0, 22, 68 and 207 mg/kg/d in females
This two generation reproduction study was considered part of the carcinogenicity assessement, as nasal tumours were observed. Survival of parental animals was unaffected by treatment at any dose level. At 1750 ppm bodyweight and the bodyweight gain of F0 and F1 males and females showed statistically significant reductions during pre-mating period (since week 1), as well as in F0 and F1 females during gestation and lactation. F1 females showed a decrease in the bodyweight and bodyweight gain when dosed with 600 ppm between weeks 1-2 and 4 of the pre-mating treatment period. Some changes in the absolute/relative weight of organs were manifested at 1750 ppm and at 600 ppm. However, microscopic alterations were not observed in these organs. Microscopic findings The nasal cavity was clearly affected by acetochlor treatment. Minimally increased brown pigment was observed in the olfactory mucosa of the majority of F0 and F1 animals receiving 600 and 1750 ppm and in F0 and F1 females receiving 200 ppm acetochlor. A dose related trend was evident and the overall incidence was greater in females, since males at the 200 ppm dose level were not affected. The pigment was identified as lipofuscin (Positive with Schmorl´s stain; negative with Perls´ stain) and was observed in very small amounts, mainly in the lamina propria and occasionally in the basal epithelium. Although a very minor change, its presence may indicate metabolic perturbation in the nasal mucosa. Lipofucsins are yellow-brown to reddish-brown pigments that occur widely throughout the body and are thought to be produced by an oxidation process of lipids and lipoproteins. At 1750 ppm hyperplasia of the olfactory epithelium (minimal to slight) was observed in F0 and F1 males and females and at 600 ppm in F1 females parental animals. The incidence was higher in F1 than in F0 animals by about 2-fold (at 1750 ppm, males 27% vs. 12% and females 54% vs. 27%). In both generations the incidence of hyperplasia was greater in females. Benign proliferative lesions (polypoid adenoma) were observed in the epithelial lining of the ethmoid region of the nasal cavity in F0 and F1 adults of both sexes receiving 1750 ppm acetochlor. Similar lesions were also observed at a lower incidence in F1 animals receiving 600 ppm. In both generations the incidence of adenoma was greater in females. Overall the incidence of epithelial proliferative lesions in F1 animals was greater than that observed in the F0 generation. Single incidences of malignant tumours were observed in one control F0 female and two F1 female receiving 1750 ppm and therefore considered unrelated to treatment.
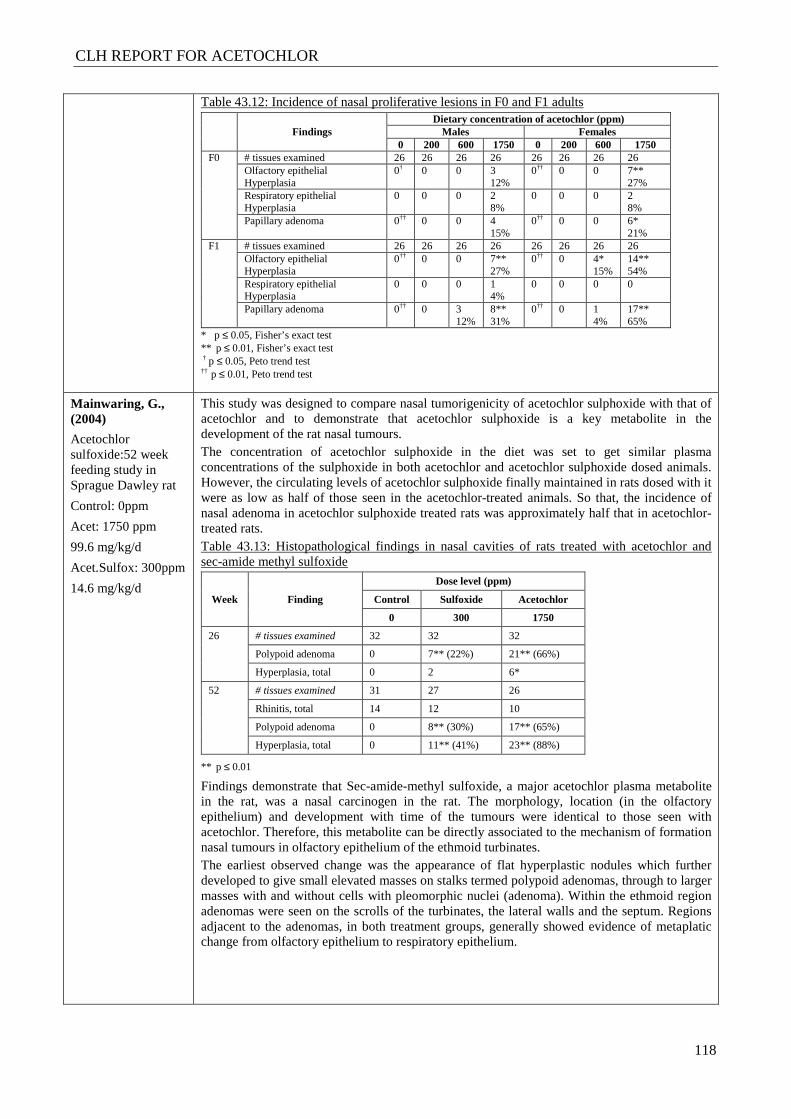
CLH REPORT FOR ACETOCHLOR
118
Table 43.12: Incidence of nasal proliferative lesions in F0 and F1 adults
Findings Dietary concentration of acetochlor (ppm)
Males Females 0 200 600 1750 0 200 600 1750
F0 # tissues examined 26 26 26 26 26 26 26 26 Olfactory epithelial Hyperplasia
0† 0 0 3 12%
0†† 0 0 7** 27%
Respiratory epithelial Hyperplasia
0 0 0 2 8%
0 0 0 2 8%
Papillary adenoma 0†† 0 0 4 15%
0†† 0 0 6* 21%
F1 # tissues examined 26 26 26 26 26 26 26 26 Olfactory epithelial Hyperplasia
0†† 0 0 7** 27%
0†† 0 4* 15%
14** 54%
Respiratory epithelial Hyperplasia
0 0 0 1 4%
0 0 0 0
Papillary adenoma 0†† 0 3 12%
8** 31%
0†† 0 1 4%
17** 65%
* p ≤ 0.05, Fisher’s exact test ** p ≤ 0.01, Fisher’s exact test † p ≤ 0.05, Peto trend test †† p ≤ 0.01, Peto trend test
Mainwaring, G., (2004)
Acetochlor sulfoxide:52 week feeding study in Sprague Dawley rat
Control: 0ppm
Acet: 1750 ppm
99.6 mg/kg/d
Acet.Sulfox: 300ppm
14.6 mg/kg/d
This study was designed to compare nasal tumorigenicity of acetochlor sulphoxide with that of acetochlor and to demonstrate that acetochlor sulphoxide is a key metabolite in the development of the rat nasal tumours. The concentration of acetochlor sulphoxide in the diet was set to get similar plasma concentrations of the sulphoxide in both acetochlor and acetochlor sulphoxide dosed animals. However, the circulating levels of acetochlor sulphoxide finally maintained in rats dosed with it were as low as half of those seen in the acetochlor-treated animals. So that, the incidence of nasal adenoma in acetochlor sulphoxide treated rats was approximately half that in acetochlor-treated rats. Table 43.13: Histopathological findings in nasal cavities of rats treated with acetochlor and sec-amide methyl sulfoxide
Week Finding
Dose level (ppm)
Control Sulfoxide Acetochlor
0 300 1750
26 # tissues examined 32 32 32
Polypoid adenoma 0 7** (22%) 21** (66%)
Hyperplasia, total 0 2 6*
52 # tissues examined 31 27 26
Rhinitis, total 14 12 10
Polypoid adenoma 0 8** (30%) 17** (65%)
Hyperplasia, total 0 11** (41%) 23** (88%)
** p ≤ 0.01
Findings demonstrate that Sec-amide-methyl sulfoxide, a major acetochlor plasma metabolite in the rat, was a nasal carcinogen in the rat. The morphology, location (in the olfactory epithelium) and development with time of the tumours were identical to those seen with acetochlor. Therefore, this metabolite can be directly associated to the mechanism of formation nasal tumours in olfactory epithelium of the ethmoid turbinates. The earliest observed change was the appearance of flat hyperplastic nodules which further developed to give small elevated masses on stalks termed polypoid adenomas, through to larger masses with and without cells with pleomorphic nuclei (adenoma). Within the ethmoid region adenomas were seen on the scrolls of the turbinates, the lateral walls and the septum. Regions adjacent to the adenomas, in both treatment groups, generally showed evidence of metaplatic change from olfactory epithelium to respiratory epithelium.
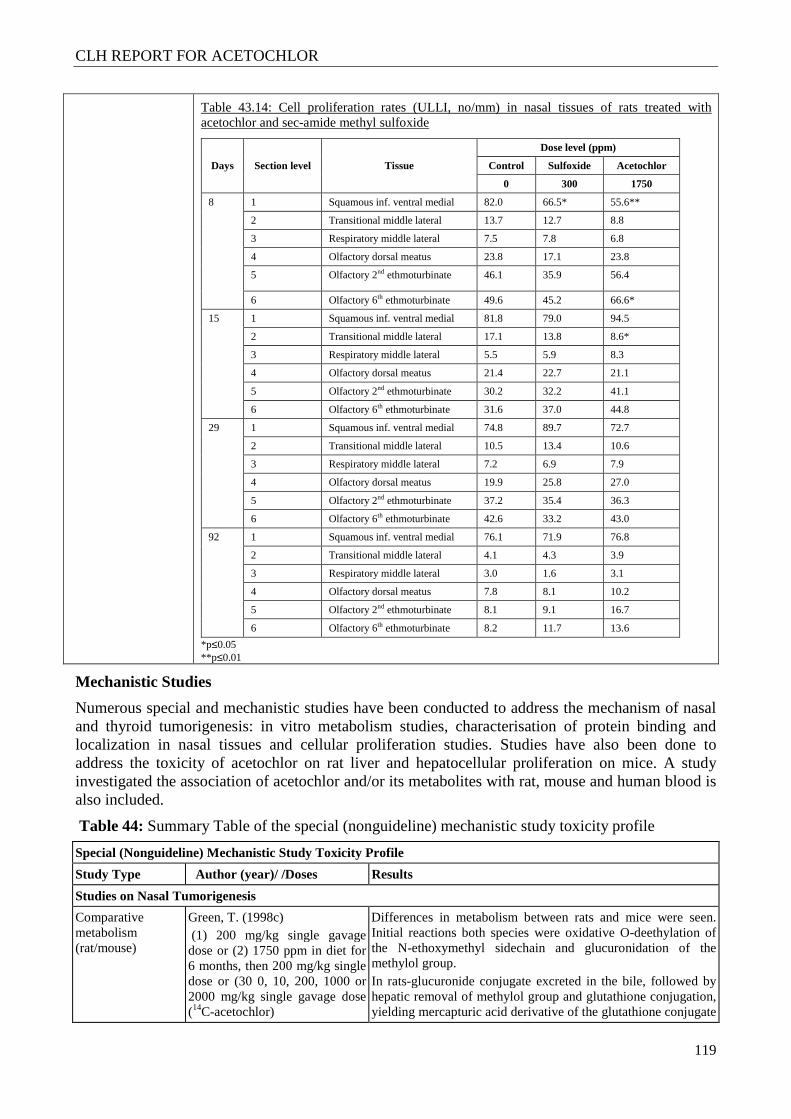
CLH REPORT FOR ACETOCHLOR
119
Table 43.14: Cell proliferation rates (ULLI, no/mm) in nasal tissues of rats treated with acetochlor and sec-amide methyl sulfoxide
Days Section level Tissue
Dose level (ppm)
Control Sulfoxide Acetochlor
0 300 1750
8 1 Squamous inf. ventral medial 82.0 66.5* 55.6**
2 Transitional middle lateral 13.7 12.7 8.8
3 Respiratory middle lateral 7.5 7.8 6.8
4 Olfactory dorsal meatus 23.8 17.1 23.8
5 Olfactory 2nd ethmoturbinate 46.1 35.9 56.4
6 Olfactory 6th ethmoturbinate 49.6 45.2 66.6*
15 1 Squamous inf. ventral medial 81.8 79.0 94.5
2 Transitional middle lateral 17.1 13.8 8.6*
3 Respiratory middle lateral 5.5 5.9 8.3
4 Olfactory dorsal meatus 21.4 22.7 21.1
5 Olfactory 2nd ethmoturbinate 30.2 32.2 41.1
6 Olfactory 6th ethmoturbinate 31.6 37.0 44.8
29 1 Squamous inf. ventral medial 74.8 89.7 72.7
2 Transitional middle lateral 10.5 13.4 10.6
3 Respiratory middle lateral 7.2 6.9 7.9
4 Olfactory dorsal meatus 19.9 25.8 27.0
5 Olfactory 2nd ethmoturbinate 37.2 35.4 36.3
6 Olfactory 6th ethmoturbinate 42.6 33.2 43.0
92 1 Squamous inf. ventral medial 76.1 71.9 76.8
2 Transitional middle lateral 4.1 4.3 3.9
3 Respiratory middle lateral 3.0 1.6 3.1
4 Olfactory dorsal meatus 7.8 8.1 10.2
5 Olfactory 2nd ethmoturbinate 8.1 9.1 16.7
6 Olfactory 6th ethmoturbinate 8.2 11.7 13.6
*p≤0.05 **p ≤0.01
Mechanistic Studies
Numerous special and mechanistic studies have been conducted to address the mechanism of nasal and thyroid tumorigenesis: in vitro metabolism studies, characterisation of protein binding and localization in nasal tissues and cellular proliferation studies. Studies have also been done to address the toxicity of acetochlor on rat liver and hepatocellular proliferation on mice. A study investigated the association of acetochlor and/or its metabolites with rat, mouse and human blood is also included.
Table 44: Summary Table of the special (nonguideline) mechanistic study toxicity profile
Special (Nonguideline) Mechanistic Study Toxicity Profile
Study Type Author (year)/ /Doses Results
Studies on Nasal Tumorigenesis
Comparative metabolism (rat/mouse)
Green, T. (1998c) (1) 200 mg/kg single gavage dose or (2) 1750 ppm in diet for 6 months, then 200 mg/kg single dose or (30 0, 10, 200, 1000 or 2000 mg/kg single gavage dose (14C-acetochlor)
Differences in metabolism between rats and mice were seen. Initial reactions both species were oxidative O-deethylation of the N-ethoxymethyl sidechain and glucuronidation of the methylol group. In rats-glucuronide conjugate excreted in the bile, followed by hepatic removal of methylol group and glutathione conjugation, yielding mercapturic acid derivative of the glutathione conjugate
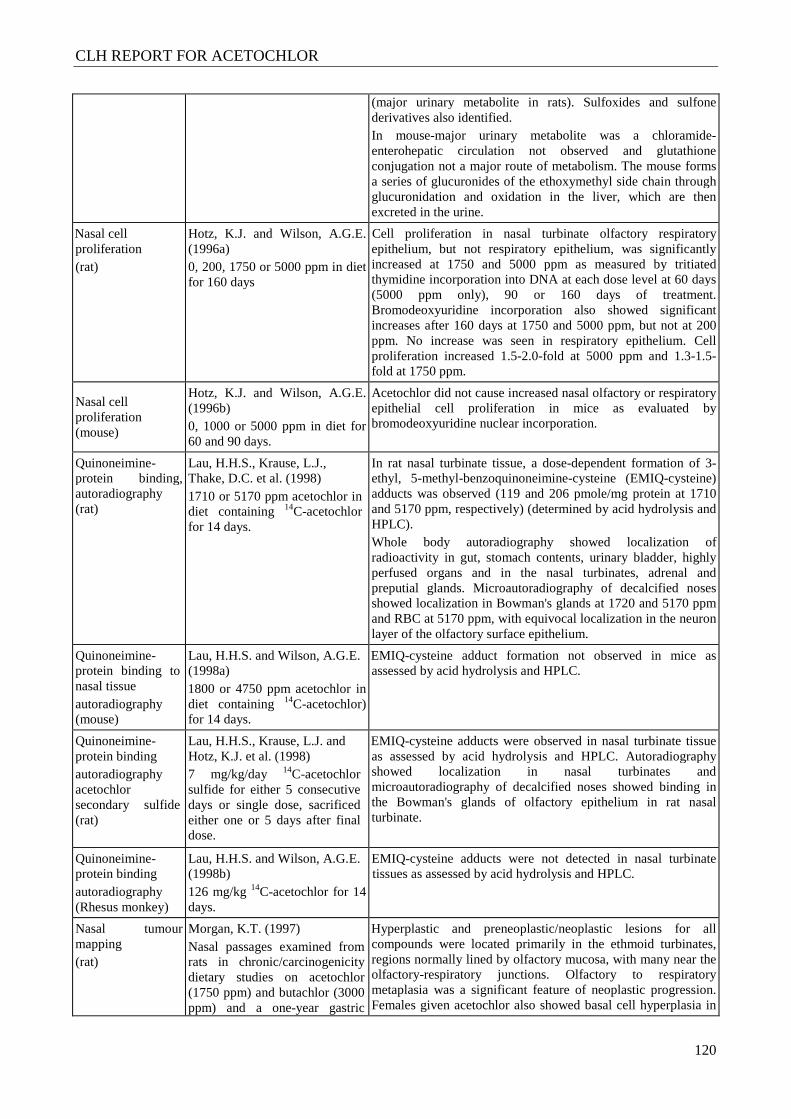
CLH REPORT FOR ACETOCHLOR
120
(major urinary metabolite in rats). Sulfoxides and sulfone derivatives also identified. In mouse-major urinary metabolite was a chloramide-enterohepatic circulation not observed and glutathione conjugation not a major route of metabolism. The mouse forms a series of glucuronides of the ethoxymethyl side chain through glucuronidation and oxidation in the liver, which are then excreted in the urine.
Nasal cell proliferation (rat)
Hotz, K.J. and Wilson, A.G.E. (1996a) 0, 200, 1750 or 5000 ppm in diet for 160 days
Cell proliferation in nasal turbinate olfactory respiratory epithelium, but not respiratory epithelium, was significantly increased at 1750 and 5000 ppm as measured by tritiated thymidine incorporation into DNA at each dose level at 60 days (5000 ppm only), 90 or 160 days of treatment. Bromodeoxyuridine incorporation also showed significant increases after 160 days at 1750 and 5000 ppm, but not at 200 ppm. No increase was seen in respiratory epithelium. Cell proliferation increased 1.5-2.0-fold at 5000 ppm and 1.3-1.5-fold at 1750 ppm.
Nasal cell proliferation (mouse)
Hotz, K.J. and Wilson, A.G.E. (1996b) 0, 1000 or 5000 ppm in diet for 60 and 90 days.
Acetochlor did not cause increased nasal olfactory or respiratory epithelial cell proliferation in mice as evaluated by bromodeoxyuridine nuclear incorporation.
Quinoneimine-protein binding, autoradiography (rat)
Lau, H.H.S., Krause, L.J., Thake, D.C. et al. (1998) 1710 or 5170 ppm acetochlor in diet containing 14C-acetochlor for 14 days.
In rat nasal turbinate tissue, a dose-dependent formation of 3-ethyl, 5-methyl-benzoquinoneimine-cysteine (EMIQ-cysteine) adducts was observed (119 and 206 pmole/mg protein at 1710 and 5170 ppm, respectively) (determined by acid hydrolysis and HPLC). Whole body autoradiography showed localization of radioactivity in gut, stomach contents, urinary bladder, highly perfused organs and in the nasal turbinates, adrenal and preputial glands. Microautoradiography of decalcified noses showed localization in Bowman's glands at 1720 and 5170 ppm and RBC at 5170 ppm, with equivocal localization in the neuron layer of the olfactory surface epithelium.
Quinoneimine-protein binding to nasal tissue autoradiography (mouse)
Lau, H.H.S. and Wilson, A.G.E. (1998a) 1800 or 4750 ppm acetochlor in diet containing 14C-acetochlor) for 14 days.
EMIQ-cysteine adduct formation not observed in mice as assessed by acid hydrolysis and HPLC.
Quinoneimine-protein binding autoradiography acetochlor secondary sulfide (rat)
Lau, H.H.S., Krause, L.J. and Hotz, K.J. et al. (1998) 7 mg/kg/day 14C-acetochlor sulfide for either 5 consecutive days or single dose, sacrificed either one or 5 days after final dose.
EMIQ-cysteine adducts were observed in nasal turbinate tissue as assessed by acid hydrolysis and HPLC. Autoradiography showed localization in nasal turbinates and microautoradiography of decalcified noses showed binding in the Bowman's glands of olfactory epithelium in rat nasal turbinate.
Quinoneimine-protein binding autoradiography (Rhesus monkey)
Lau, H.H.S. and Wilson, A.G.E. (1998b) 126 mg/kg 14C-acetochlor for 14 days.
EMIQ-cysteine adducts were not detected in nasal turbinate tissues as assessed by acid hydrolysis and HPLC.
Nasal tumour mapping (rat)
Morgan, K.T. (1997) Nasal passages examined from rats in chronic/carcinogenicity dietary studies on acetochlor (1750 ppm) and butachlor (3000 ppm) and a one-year gastric
Hyperplastic and preneoplastic/neoplastic lesions for all compounds were located primarily in the ethmoid turbinates, regions normally lined by olfactory mucosa, with many near the olfactory-respiratory junctions. Olfactory to respiratory metaplasia was a significant feature of neoplastic progression. Females given acetochlor also showed basal cell hyperplasia in
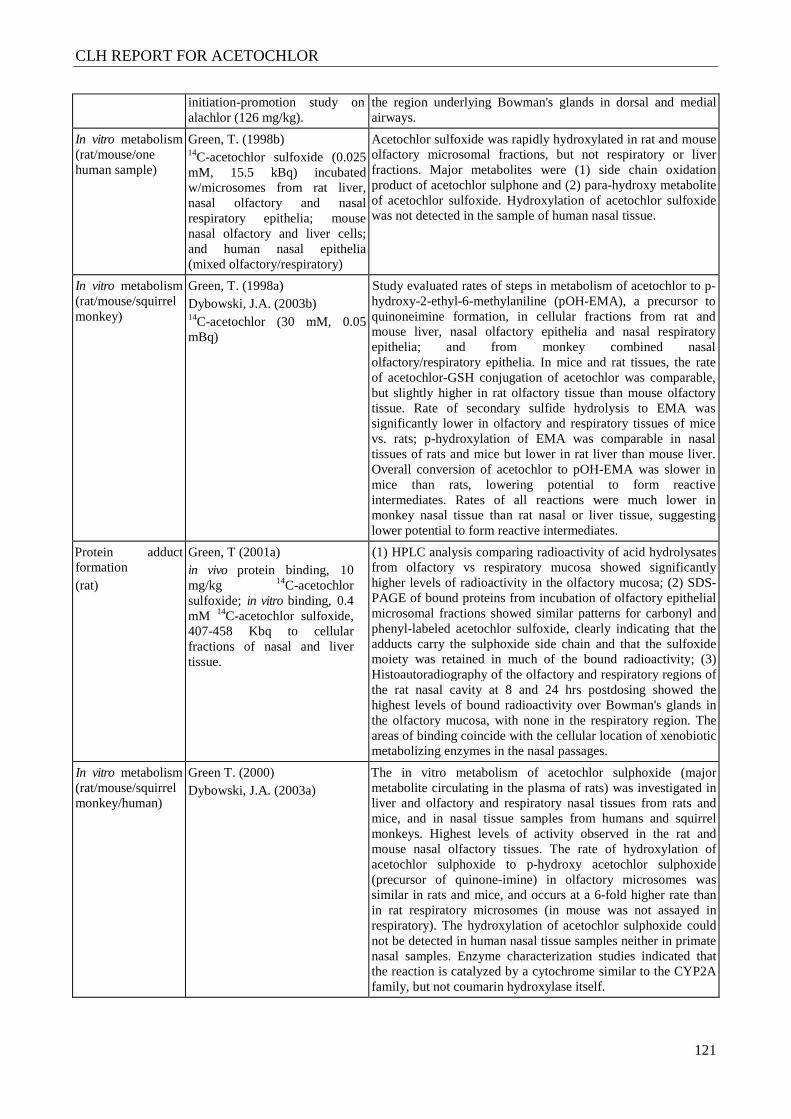
CLH REPORT FOR ACETOCHLOR
121
initiation-promotion study on alachlor (126 mg/kg).
the region underlying Bowman's glands in dorsal and medial airways.
In vitro metabolism (rat/mouse/one human sample)
Green, T. (1998b) 14C-acetochlor sulfoxide (0.025 mM, 15.5 kBq) incubated w/microsomes from rat liver, nasal olfactory and nasal respiratory epithelia; mouse nasal olfactory and liver cells; and human nasal epithelia (mixed olfactory/respiratory)
Acetochlor sulfoxide was rapidly hydroxylated in rat and mouse olfactory microsomal fractions, but not respiratory or liver fractions. Major metabolites were (1) side chain oxidation product of acetochlor sulphone and (2) para-hydroxy metabolite of acetochlor sulfoxide. Hydroxylation of acetochlor sulfoxide was not detected in the sample of human nasal tissue.
In vitro metabolism (rat/mouse/squirrel monkey)
Green, T. (1998a) Dybowski, J.A. (2003b) 14C-acetochlor (30 mM, 0.05 mBq)
Study evaluated rates of steps in metabolism of acetochlor to p-hydroxy-2-ethyl-6-methylaniline (pOH-EMA), a precursor to quinoneimine formation, in cellular fractions from rat and mouse liver, nasal olfactory epithelia and nasal respiratory epithelia; and from monkey combined nasal olfactory/respiratory epithelia. In mice and rat tissues, the rate of acetochlor-GSH conjugation of acetochlor was comparable, but slightly higher in rat olfactory tissue than mouse olfactory tissue. Rate of secondary sulfide hydrolysis to EMA was significantly lower in olfactory and respiratory tissues of mice vs. rats; p-hydroxylation of EMA was comparable in nasal tissues of rats and mice but lower in rat liver than mouse liver. Overall conversion of acetochlor to pOH-EMA was slower in mice than rats, lowering potential to form reactive intermediates. Rates of all reactions were much lower in monkey nasal tissue than rat nasal or liver tissue, suggesting lower potential to form reactive intermediates.
Protein adduct formation (rat)
Green, T (2001a) in vivo protein binding, 10 mg/kg 14C-acetochlor sulfoxide; in vitro binding, 0.4 mM 14C-acetochlor sulfoxide, 407-458 Kbq to cellular fractions of nasal and liver tissue.
(1) HPLC analysis comparing radioactivity of acid hydrolysates from olfactory vs respiratory mucosa showed significantly higher levels of radioactivity in the olfactory mucosa; (2) SDS-PAGE of bound proteins from incubation of olfactory epithelial microsomal fractions showed similar patterns for carbonyl and phenyl-labeled acetochlor sulfoxide, clearly indicating that the adducts carry the sulphoxide side chain and that the sulfoxide moiety was retained in much of the bound radioactivity; (3) Histoautoradiography of the olfactory and respiratory regions of the rat nasal cavity at 8 and 24 hrs postdosing showed the highest levels of bound radioactivity over Bowman's glands in the olfactory mucosa, with none in the respiratory region. The areas of binding coincide with the cellular location of xenobiotic metabolizing enzymes in the nasal passages.
In vitro metabolism (rat/mouse/squirrel monkey/human)
Green T. (2000) Dybowski, J.A. (2003a)
The in vitro metabolism of acetochlor sulphoxide (major metabolite circulating in the plasma of rats) was investigated in liver and olfactory and respiratory nasal tissues from rats and mice, and in nasal tissue samples from humans and squirrel monkeys. Highest levels of activity observed in the rat and mouse nasal olfactory tissues. The rate of hydroxylation of acetochlor sulphoxide to p-hydroxy acetochlor sulphoxide (precursor of quinone-imine) in olfactory microsomes was similar in rats and mice, and occurs at a 6-fold higher rate than in rat respiratory microsomes (in mouse was not assayed in respiratory). The hydroxylation of acetochlor sulphoxide could not be detected in human nasal tissue samples neither in primate nasal samples. Enzyme characterization studies indicated that the reaction is catalyzed by a cytochrome similar to the CYP2A family, but not coumarin hydroxylase itself.
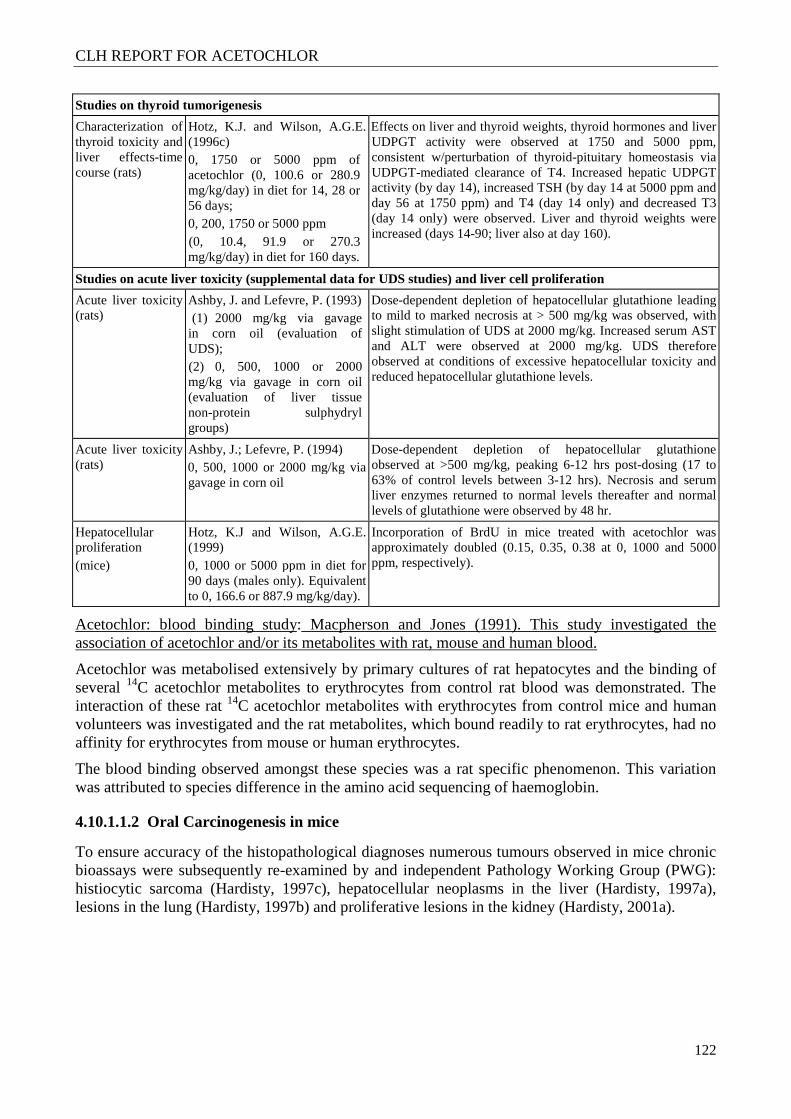
CLH REPORT FOR ACETOCHLOR
122
Studies on thyroid tumorigenesis
Characterization of thyroid toxicity and liver effects-time course (rats)
Hotz, K.J. and Wilson, A.G.E. (1996c) 0, 1750 or 5000 ppm of acetochlor (0, 100.6 or 280.9 mg/kg/day) in diet for 14, 28 or 56 days; 0, 200, 1750 or 5000 ppm (0, 10.4, 91.9 or 270.3 mg/kg/day) in diet for 160 days.
Effects on liver and thyroid weights, thyroid hormones and liver UDPGT activity were observed at 1750 and 5000 ppm, consistent w/perturbation of thyroid-pituitary homeostasis via UDPGT-mediated clearance of T4. Increased hepatic UDPGT activity (by day 14), increased TSH (by day 14 at 5000 ppm and day 56 at 1750 ppm) and T4 (day 14 only) and decreased T3 (day 14 only) were observed. Liver and thyroid weights were increased (days 14-90; liver also at day 160).
Studies on acute liver toxicity (supplemental data for UDS studies) and liver cell proliferation
Acute liver toxicity (rats)
Ashby, J. and Lefevre, P. (1993) (1) 2000 mg/kg via gavage in corn oil (evaluation of UDS); (2) 0, 500, 1000 or 2000 mg/kg via gavage in corn oil (evaluation of liver tissue non-protein sulphydryl groups)
Dose-dependent depletion of hepatocellular glutathione leading to mild to marked necrosis at > 500 mg/kg was observed, with slight stimulation of UDS at 2000 mg/kg. Increased serum AST and ALT were observed at 2000 mg/kg. UDS therefore observed at conditions of excessive hepatocellular toxicity and reduced hepatocellular glutathione levels.
Acute liver toxicity (rats)
Ashby, J.; Lefevre, P. (1994) 0, 500, 1000 or 2000 mg/kg via gavage in corn oil
Dose-dependent depletion of hepatocellular glutathione observed at >500 mg/kg, peaking 6-12 hrs post-dosing (17 to 63% of control levels between 3-12 hrs). Necrosis and serum liver enzymes returned to normal levels thereafter and normal levels of glutathione were observed by 48 hr.
Hepatocellular proliferation (mice)
Hotz, K.J and Wilson, A.G.E. (1999) 0, 1000 or 5000 ppm in diet for 90 days (males only). Equivalent to 0, 166.6 or 887.9 mg/kg/day).
Incorporation of BrdU in mice treated with acetochlor was approximately doubled (0.15, 0.35, 0.38 at 0, 1000 and 5000 ppm, respectively).
Acetochlor: blood binding study: Macpherson and Jones (1991). This study investigated the association of acetochlor and/or its metabolites with rat, mouse and human blood.
Acetochlor was metabolised extensively by primary cultures of rat hepatocytes and the binding of several 14C acetochlor metabolites to erythrocytes from control rat blood was demonstrated. The interaction of these rat 14C acetochlor metabolites with erythrocytes from control mice and human volunteers was investigated and the rat metabolites, which bound readily to rat erythrocytes, had no affinity for erythrocytes from mouse or human erythrocytes.
The blood binding observed amongst these species was a rat specific phenomenon. This variation was attributed to species difference in the amino acid sequencing of haemoglobin.
4.10.1.1.2 Oral Carcinogenesis in mice
To ensure accuracy of the histopathological diagnoses numerous tumours observed in mice chronic bioassays were subsequently re-examined by and independent Pathology Working Group (PWG): histiocytic sarcoma (Hardisty, 1997c), hepatocellular neoplasms in the liver (Hardisty, 1997a), lesions in the lung (Hardisty, 1997b) and proliferative lesions in the kidney (Hardisty, 2001a).
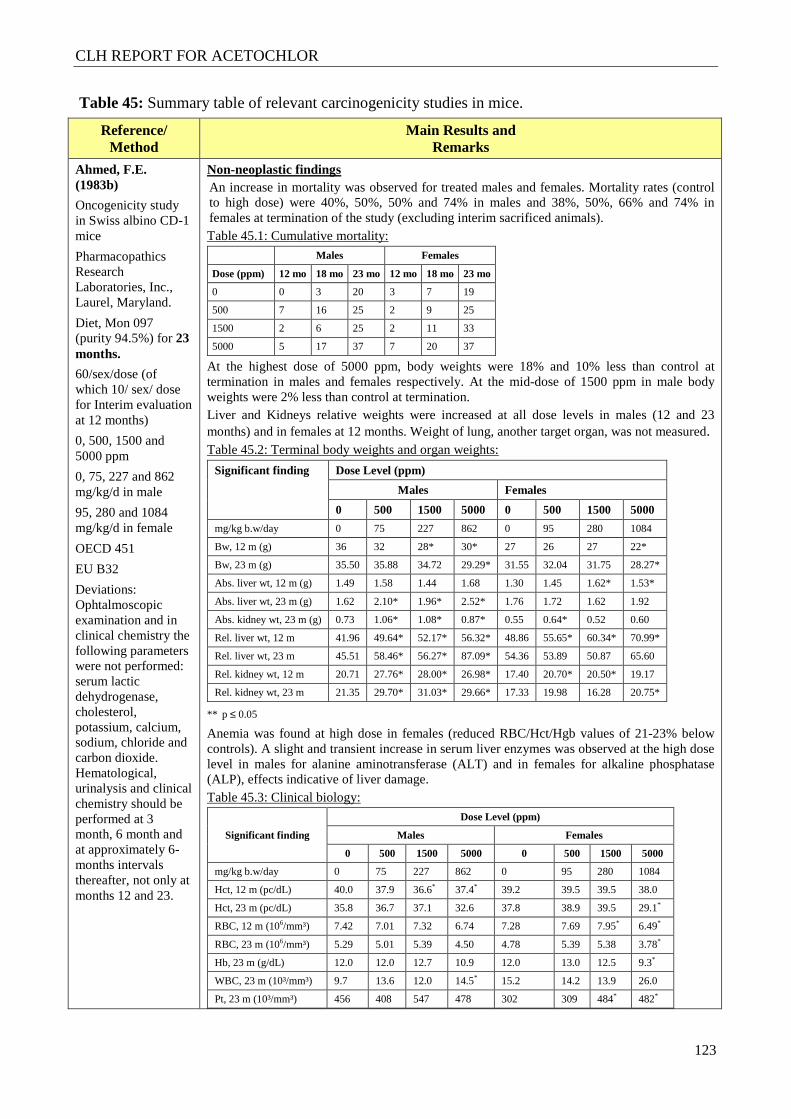
CLH REPORT FOR ACETOCHLOR
123
Table 45: Summary table of relevant carcinogenicity studies in mice.
Reference/ Method
Main Results and Remarks
Ahmed, F.E. (1983b)
Oncogenicity study in Swiss albino CD-1 mice
Pharmacopathics Research Laboratories, Inc., Laurel, Maryland.
Diet, Mon 097 (purity 94.5%) for 23 months.
60/sex/dose (of which 10/ sex/ dose for Interim evaluation at 12 months)
0, 500, 1500 and 5000 ppm
0, 75, 227 and 862 mg/kg/d in male
95, 280 and 1084 mg/kg/d in female
OECD 451
EU B32
Deviations: Ophtalmoscopic examination and in clinical chemistry the following parameters were not performed: serum lactic dehydrogenase, cholesterol, potassium, calcium, sodium, chloride and carbon dioxide. Hematological, urinalysis and clinical chemistry should be performed at 3 month, 6 month and at approximately 6-months intervals thereafter, not only at months 12 and 23.
Non-neoplastic findings An increase in mortality was observed for treated males and females. Mortality rates (control to high dose) were 40%, 50%, 50% and 74% in males and 38%, 50%, 66% and 74% in females at termination of the study (excluding interim sacrificed animals). Table 45.1: Cumulative mortality:
Males Females
Dose (ppm) 12 mo 18 mo 23 mo 12 mo 18 mo 23 mo
0 0 3 20 3 7 19
500 7 16 25 2 9 25
1500 2 6 25 2 11 33
5000 5 17 37 7 20 37
At the highest dose of 5000 ppm, body weights were 18% and 10% less than control at termination in males and females respectively. At the mid-dose of 1500 ppm in male body weights were 2% less than control at termination. Liver and Kidneys relative weights were increased at all dose levels in males (12 and 23 months) and in females at 12 months. Weight of lung, another target organ, was not measured. Table 45.2: Terminal body weights and organ weights:
Significant finding Dose Level (ppm)
Males Females
0 500 1500 5000 0 500 1500 5000
mg/kg b.w/day 0 75 227 862 0 95 280 1084
Bw, 12 m (g) 36 32 28* 30* 27 26 27 22*
Bw, 23 m (g) 35.50 35.88 34.72 29.29* 31.55 32.04 31.75 28.27*
Abs. liver wt, 12 m (g) 1.49 1.58 1.44 1.68 1.30 1.45 1.62* 1.53*
Abs. liver wt, 23 m (g) 1.62 2.10* 1.96* 2.52* 1.76 1.72 1.62 1.92
Abs. kidney wt, 23 m (g) 0.73 1.06* 1.08* 0.87* 0.55 0.64* 0.52 0.60
Rel. liver wt, 12 m 41.96 49.64* 52.17* 56.32* 48.86 55.65* 60.34* 70.99*
Rel. liver wt, 23 m 45.51 58.46* 56.27* 87.09* 54.36 53.89 50.87 65.60
Rel. kidney wt, 12 m 20.71 27.76* 28.00* 26.98* 17.40 20.70* 20.50* 19.17
Rel. kidney wt, 23 m 21.35 29.70* 31.03* 29.66* 17.33 19.98 16.28 20.75*
** p ≤ 0.05
Anemia was found at high dose in females (reduced RBC/Hct/Hgb values of 21-23% below controls). A slight and transient increase in serum liver enzymes was observed at the high dose level in males for alanine aminotransferase (ALT) and in females for alkaline phosphatase (ALP), effects indicative of liver damage. Table 45.3: Clinical biology:
Significant finding
Dose Level (ppm)
Males Females
0 500 1500 5000 0 500 1500 5000
mg/kg b.w/day 0 75 227 862 0 95 280 1084
Hct, 12 m (pc/dL) 40.0 37.9 36.6* 37.4* 39.2 39.5 39.5 38.0
Hct, 23 m (pc/dL) 35.8 36.7 37.1 32.6 37.8 38.9 39.5 29.1*
RBC, 12 m (106/mm³) 7.42 7.01 7.32 6.74 7.28 7.69 7.95* 6.49*
RBC, 23 m (106/mm³) 5.29 5.01 5.39 4.50 4.78 5.39 5.38 3.78*
Hb, 23 m (g/dL) 12.0 12.0 12.7 10.9 12.0 13.0 12.5 9.3*
WBC, 23 m (10³/mm³) 9.7 13.6 12.0 14.5* 15.2 14.2 13.9 26.0
Pt, 23 m (10³/mm³) 456 408 547 478 302 309 484* 482*
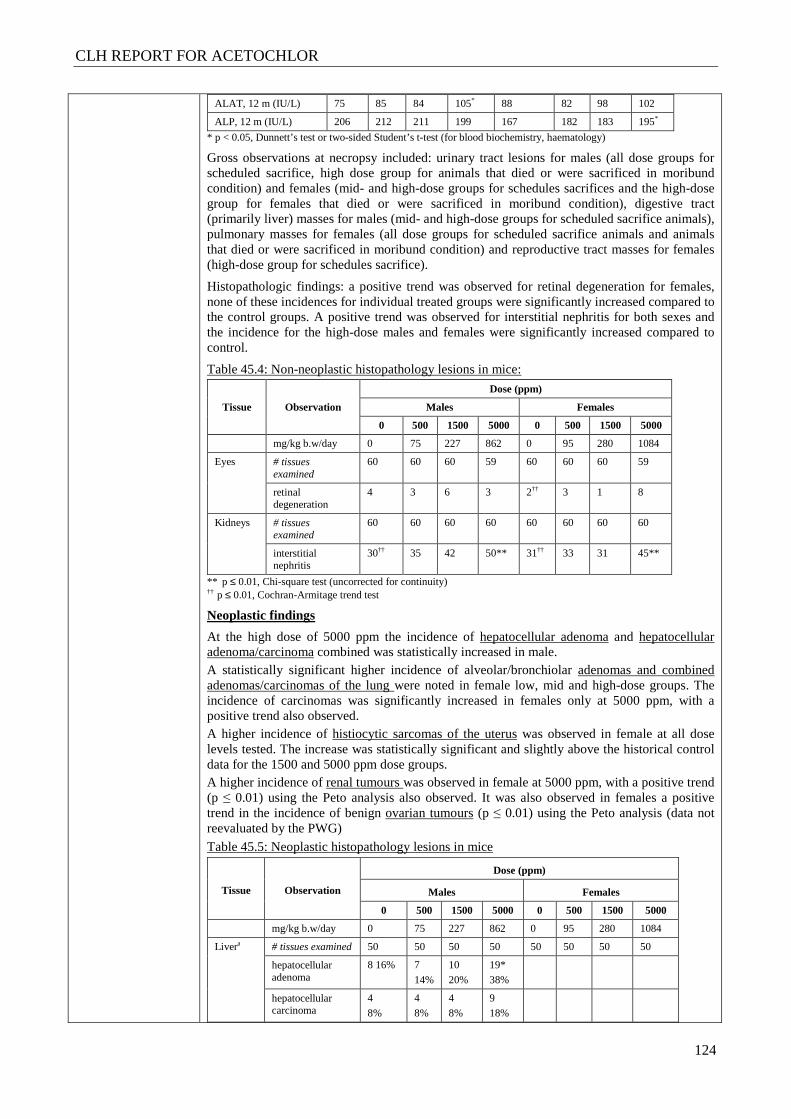
CLH REPORT FOR ACETOCHLOR
124
ALAT, 12 m (IU/L) 75 85 84 105* 88 82 98 102
ALP, 12 m (IU/L) 206 212 211 199 167 182 183 195*
* p < 0.05, Dunnett’s test or two-sided Student’s t-test (for blood biochemistry, haematology)
Gross observations at necropsy included: urinary tract lesions for males (all dose groups for scheduled sacrifice, high dose group for animals that died or were sacrificed in moribund condition) and females (mid- and high-dose groups for schedules sacrifices and the high-dose group for females that died or were sacrificed in moribund condition), digestive tract (primarily liver) masses for males (mid- and high-dose groups for scheduled sacrifice animals), pulmonary masses for females (all dose groups for scheduled sacrifice animals and animals that died or were sacrificed in moribund condition) and reproductive tract masses for females (high-dose group for schedules sacrifice).
Histopathologic findings: a positive trend was observed for retinal degeneration for females, none of these incidences for individual treated groups were significantly increased compared to the control groups. A positive trend was observed for interstitial nephritis for both sexes and the incidence for the high-dose males and females were significantly increased compared to control.
Table 45.4: Non-neoplastic histopathology lesions in mice:
Tissue Observation
Dose (ppm)
Males Females
0 500 1500 5000 0 500 1500 5000
mg/kg b.w/day 0 75 227 862 0 95 280 1084
Eyes # tissues examined
60 60 60 59 60 60 60 59
retinal degeneration
4 3 6 3 2†† 3 1 8
Kidneys # tissues examined
60 60 60 60 60 60 60 60
interstitial nephritis
30†† 35 42 50** 31†† 33 31 45**
** p ≤ 0.01, Chi-square test (uncorrected for continuity) †† p ≤ 0.01, Cochran-Armitage trend test
Neoplastic findings
At the high dose of 5000 ppm the incidence of hepatocellular adenoma and hepatocellular adenoma/carcinoma combined was statistically increased in male. A statistically significant higher incidence of alveolar/bronchiolar adenomas and combined adenomas/carcinomas of the lung were noted in female low, mid and high-dose groups. The incidence of carcinomas was significantly increased in females only at 5000 ppm, with a positive trend also observed. A higher incidence of histiocytic sarcomas of the uterus was observed in female at all dose levels tested. The increase was statistically significant and slightly above the historical control data for the 1500 and 5000 ppm dose groups. A higher incidence of renal tumours was observed in female at 5000 ppm, with a positive trend (p ≤ 0.01) using the Peto analysis also observed. It was also observed in females a positive trend in the incidence of benign ovarian tumours (p ≤ 0.01) using the Peto analysis (data not reevaluated by the PWG)
Table 45.5: Neoplastic histopathology lesions in mice
Tissue Observation
Dose (ppm)
Males Females
0 500 1500 5000 0 500 1500 5000
mg/kg b.w/day 0 75 227 862 0 95 280 1084
Livera # tissues examined 50 50 50 50 50 50 50 50
hepatocellular adenoma
8 16% 7
14%
10
20%
19*
38%
hepatocellular carcinoma
4
8%
4
8%
4
8%
9
18%
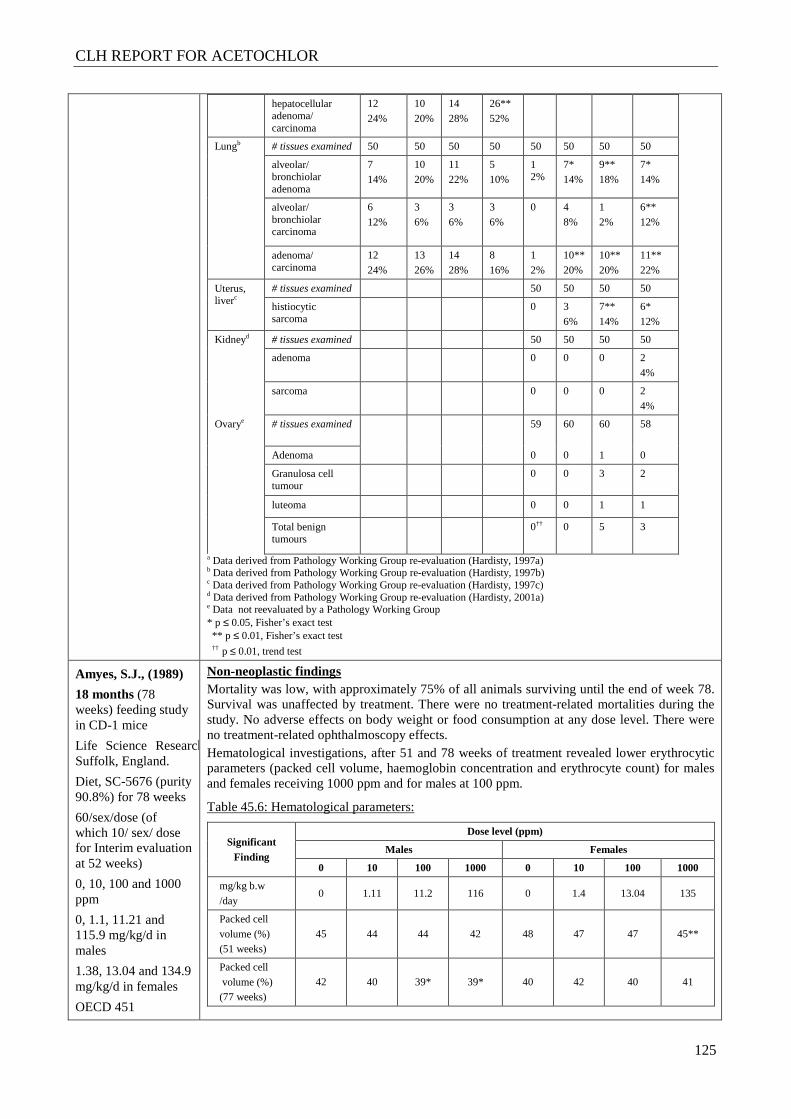
CLH REPORT FOR ACETOCHLOR
125
hepatocellular adenoma/ carcinoma
12
24%
10
20%
14
28%
26**
52%
Lungb # tissues examined 50 50 50 50 50 50 50 50
alveolar/ bronchiolar adenoma
7
14%
10
20%
11
22%
5
10% 1 2%
7*
14%
9**
18%
7*
14%
alveolar/ bronchiolar carcinoma
6
12%
3
6%
3
6%
3
6%
0 4
8%
1
2%
6**
12%
adenoma/ carcinoma
12
24%
13
26%
14
28%
8
16%
1
2%
10**
20%
10**
20%
11**
22%
Uterus, liverc
# tissues examined 50 50 50 50
histiocytic sarcoma
0 3
6%
7**
14%
6*
12%
Kidneyd # tissues examined 50 50 50 50
adenoma 0 0 0 2
4%
sarcoma 0 0 0 2
4%
Ovarye # tissues examined 59 60 60 58
Adenoma 0 0 1 0
Granulosa cell tumour
0 0 3 2
luteoma 0 0 1 1
Total benign tumours
0†† 0 5
3
a Data derived from Pathology Working Group re-evaluation (Hardisty, 1997a) b Data derived from Pathology Working Group re-evaluation (Hardisty, 1997b) c Data derived from Pathology Working Group re-evaluation (Hardisty, 1997c) d Data derived from Pathology Working Group re-evaluation (Hardisty, 2001a) e Data not reevaluated by a Pathology Working Group * p ≤ 0.05, Fisher’s exact test ** p ≤ 0.01, Fisher’s exact test †† p ≤ 0.01, trend test
Amyes, S.J., (1989)
18 months (78 weeks) feeding study in CD-1 mice
Life Science Research Ltd., Suffolk, England.
Diet, SC-5676 (purity 90.8%) for 78 weeks
60/sex/dose (of which 10/ sex/ dose for Interim evaluation at 52 weeks)
0, 10, 100 and 1000 ppm
0, 1.1, 11.21 and 115.9 mg/kg/d in males
1.38, 13.04 and 134.9 mg/kg/d in females
OECD 451
Non-neoplastic findings Mortality was low, with approximately 75% of all animals surviving until the end of week 78. Survival was unaffected by treatment. There were no treatment-related mortalities during the study. No adverse effects on body weight or food consumption at any dose level. There were no treatment-related ophthalmoscopy effects. Hematological investigations, after 51 and 78 weeks of treatment revealed lower erythrocytic parameters (packed cell volume, haemoglobin concentration and erythrocyte count) for males and females receiving 1000 ppm and for males at 100 ppm.
Table 45.6: Hematological parameters:
Significant Finding
Dose level (ppm)
Males Females
0 10 100 1000 0 10 100 1000
mg/kg b.w
/day 0 1.11 11.2 116 0 1.4 13.04 135
Packed cell
volume (%) (51 weeks)
45 44 44 42 48 47 47 45**
Packed cell
volume (%) (77 weeks)
42 40 39* 39* 40 42 40 41

CLH REPORT FOR ACETOCHLOR
126
EU B32
Deviations: Urinalysis and clinical chemistry was not performed. Hematology analyses should be performed at 3 month, 6 month and at approximately 6-months intervals thereafter, not only at weeks 52 and 78.
Hb (g%)
(51 weeks) 14.5 14.3 14.1 13.5 15.3 15.2 15.3 14.3**
RBC (106/mm3) (51 weeks)
8.6 8.25 8.10 8.00 8.85 8.62 8.76 8.22*
RBC (106/mm3) (77 weeks)
8.5 8.05 7.8* 7.66* 7.87 8.34 8.28 8.08
* p ≤ 0.05 ** p ≤ 0.01
After 78 weeks of treatment absolute kidney weights were statistically significant higher for all groups of treated males compared with controls. Relative kidney weights were statistically significant higher than controls in males which had received 1000 ppm for 52 weeks and in males which had received 100 or 1000 ppm for 78 weeks. Relative liver weights were higher for all groups of treated males compared with controls after 78 weeks of treatment. Table 45.7: Organ weights:
Significant Finding
Dose level (ppm)
Males Females
0 10 100 1000 0 10 100 1000
mg/kg b.w/day 0 1.11 11.2 116 0 1.4 13.04 135
Kidney weight,
absolute (g) (78 weeks)
0.85 0.92* 0.96** 1.12^ 0.53 0.56 0.55 0.49*
Kidney weight,
relative (g) (52 weeks)
1.859 1.995 2.125 2.706^ 1.524 1.456 1.542 1.461
Kidney weight,
relative (g)
(78 weeks)
1.826 1.929 2.120^ 2.503^ 1.475 1.561 1.458 1.363
Liver weight,
relative (g) (78 weeks)
5.07 5.96* 5.72 6.27** 4.90 5.01 4.77 5.18
* p ≤ 0.05 ** p ≤ 0.01 ^ p ≤ 0.001
After 76 weeks of treatment the incidence of vacuoles in the anterior polar region of the lens was higher among females receiving 1000 ppm than among their controls (p≤0.01). In lung, bronchiolar hyperplasia was observed in males at the two highest doses and in females at low dose. It could be related with lung tumours observed, however there were a lack of a clear dose-response relationship. In kidneys, clear chronic renal nephropathy was evident in males at 1000 ppm considering the increase in the incidence of tubular basophilia, intertitial fibrosis, cortical mineralization and hyaline casts. At the same dose level only an increase in dilatation of cortical tubules was noted in females. Significantly increase incidence of renal tubular basophilia was noted in males from the dose level of 10 ppm. In addition, there was a low incidence of hyperplasia of the renal tubular epithelium which achieved statistical significance in male which received 1000 ppm (p≤0.05). Table 45.8: Non-neoplastic histopathology lesions in mice:
Tissue Observations
Dose (ppm) Males Females
0 10 100 1000 0 10 100 1000 mg/kg b.w/
day 0 1.1 11.2 116 0 1.4 13 135
Eye lens
# tissues examined
41 39 37 34 36 42 38 37
anterior polar vacuoles
10 11 12 9 7 10 12 20**
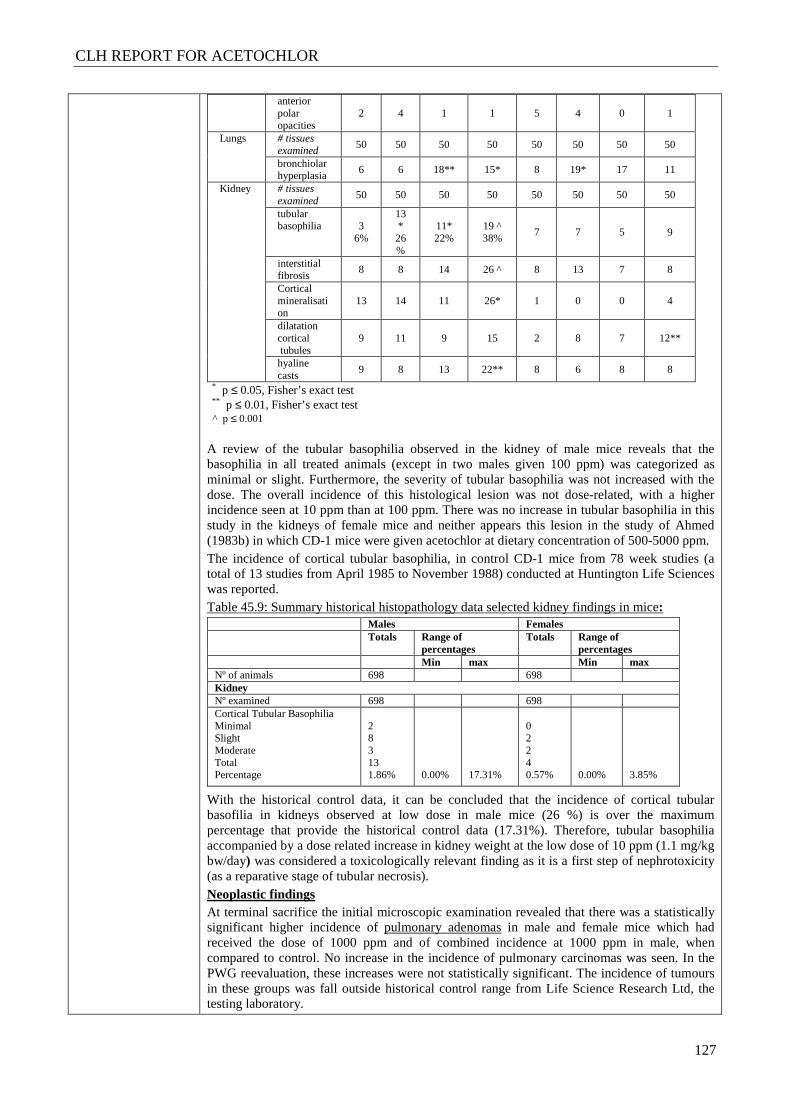
CLH REPORT FOR ACETOCHLOR
127
anterior polar opacities
2 4 1 1 5 4 0 1
Lungs # tissues examined
50 50 50 50 50 50 50 50
bronchiolar hyperplasia
6 6 18** 15* 8 19* 17 11
Kidney # tissues examined
50 50 50 50 50 50 50 50
tubular basophilia 3
6%
13 * 26%
11* 22%
19 ^ 38%
7 7 5 9
interstitial fibrosis
8 8 14 26 ^ 8 13 7 8
Cortical mineralisation
13 14 11 26* 1 0 0 4
dilatation cortical tubules
9 11 9 15 2 8 7 12**
hyaline casts
9 8 13 22** 8 6 8 8
* p ≤ 0.05, Fisher’s exact test ** p ≤ 0.01, Fisher’s exact test
^ p ≤ 0.001
A review of the tubular basophilia observed in the kidney of male mice reveals that the basophilia in all treated animals (except in two males given 100 ppm) was categorized as minimal or slight. Furthermore, the severity of tubular basophilia was not increased with the dose. The overall incidence of this histological lesion was not dose-related, with a higher incidence seen at 10 ppm than at 100 ppm. There was no increase in tubular basophilia in this study in the kidneys of female mice and neither appears this lesion in the study of Ahmed (1983b) in which CD-1 mice were given acetochlor at dietary concentration of 500-5000 ppm. The incidence of cortical tubular basophilia, in control CD-1 mice from 78 week studies (a total of 13 studies from April 1985 to November 1988) conducted at Huntington Life Sciences was reported. Table 45.9: Summary historical histopathology data selected kidney findings in mice:
Males Females Totals Range of
percentages Totals Range of
percentages Min max Min max Nº of animals 698 698 Kidney Nº examined 698 698 Cortical Tubular Basophilia Minimal Slight Moderate Total Percentage
2 8 3 13 1.86%
0.00%
17.31%
0 2 2 4 0.57%
0.00%
3.85%
With the historical control data, it can be concluded that the incidence of cortical tubular basofilia in kidneys observed at low dose in male mice (26 %) is over the maximum percentage that provide the historical control data (17.31%). Therefore, tubular basophilia accompanied by a dose related increase in kidney weight at the low dose of 10 ppm (1.1 mg/kg bw/day) was considered a toxicologically relevant finding as it is a first step of nephrotoxicity (as a reparative stage of tubular necrosis). Neoplastic findings At terminal sacrifice the initial microscopic examination revealed that there was a statistically significant higher incidence of pulmonary adenomas in male and female mice which had received the dose of 1000 ppm and of combined incidence at 1000 ppm in male, when compared to control. No increase in the incidence of pulmonary carcinomas was seen. In the PWG reevaluation, these increases were not statistically significant. The incidence of tumours in these groups was fall outside historical control range from Life Science Research Ltd, the testing laboratory.
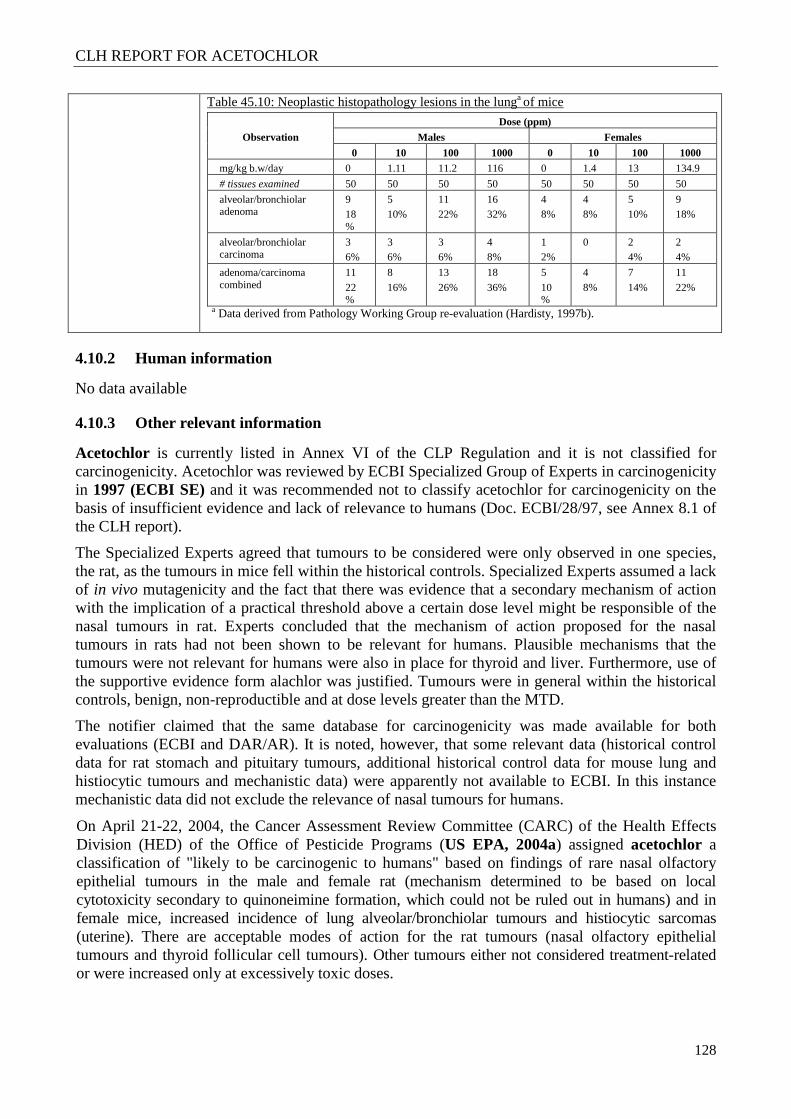
CLH REPORT FOR ACETOCHLOR
128
Table 45.10: Neoplastic histopathology lesions in the lunga of mice
Observation
Dose (ppm)
Males Females
0 10 100 1000 0 10 100 1000 mg/kg b.w/day 0 1.11 11.2 116 0 1.4 13 134.9
# tissues examined 50 50 50 50 50 50 50 50
alveolar/bronchiolar adenoma
9 18%
5 10%
11 22%
16 32%
4 8%
4 8%
5 10%
9 18%
alveolar/bronchiolar carcinoma
3 6%
3 6%
3 6%
4 8%
1 2%
0 2 4%
2 4%
adenoma/carcinoma combined
11
22%
8
16%
13
26%
18
36%
5
10%
4
8%
7
14%
11
22%
a Data derived from Pathology Working Group re-evaluation (Hardisty, 1997b).
4.10.2 Human information
No data available
4.10.3 Other relevant information
Acetochlor is currently listed in Annex VI of the CLP Regulation and it is not classified for carcinogenicity. Acetochlor was reviewed by ECBI Specialized Group of Experts in carcinogenicity in 1997 (ECBI SE) and it was recommended not to classify acetochlor for carcinogenicity on the basis of insufficient evidence and lack of relevance to humans (Doc. ECBI/28/97, see Annex 8.1 of the CLH report).
The Specialized Experts agreed that tumours to be considered were only observed in one species, the rat, as the tumours in mice fell within the historical controls. Specialized Experts assumed a lack of in vivo mutagenicity and the fact that there was evidence that a secondary mechanism of action with the implication of a practical threshold above a certain dose level might be responsible of the nasal tumours in rat. Experts concluded that the mechanism of action proposed for the nasal tumours in rats had not been shown to be relevant for humans. Plausible mechanisms that the tumours were not relevant for humans were also in place for thyroid and liver. Furthermore, use of the supportive evidence form alachlor was justified. Tumours were in general within the historical controls, benign, non-reproductible and at dose levels greater than the MTD.
The notifier claimed that the same database for carcinogenicity was made available for both evaluations (ECBI and DAR/AR). It is noted, however, that some relevant data (historical control data for rat stomach and pituitary tumours, additional historical control data for mouse lung and histiocytic tumours and mechanistic data) were apparently not available to ECBI. In this instance mechanistic data did not exclude the relevance of nasal tumours for humans.
On April 21-22, 2004, the Cancer Assessment Review Committee (CARC) of the Health Effects Division (HED) of the Office of Pesticide Programs (US EPA, 2004a) assigned acetochlor a classification of "likely to be carcinogenic to humans" based on findings of rare nasal olfactory epithelial tumours in the male and female rat (mechanism determined to be based on local cytotoxicity secondary to quinoneimine formation, which could not be ruled out in humans) and in female mice, increased incidence of lung alveolar/bronchiolar tumours and histiocytic sarcomas (uterine). There are acceptable modes of action for the rat tumours (nasal olfactory epithelial tumours and thyroid follicular cell tumours). Other tumours either not considered treatment-related or were increased only at excessively toxic doses.
CLH REPORT FOR ACETOCHLOR
129
On January 3, 2007, the Cancer Assessment Review Committee of the Health Effects Division of the Office of Pesticide Programs (US EPA, 2007b), after reevaluation, assigned acetochlor a classification of "Suggestive Evidence of Carcinogenic Potential", considering that the evidence for benign lung tumours in male and female mice and histiocytic sarcomas in female mice was weak. Mode of action data on the formation of lung tumours and histiocytic sarcomas was unavailable, although the genotoxicity data suggest that the clastogenicity of acetochlor is due to cytotoxicity from oxidative damage. The Committee considered a cytotoxic mode of action to be plausible and noted that the previous (fourth) CARC/MTARC concluded that "The database for acetochlor does not support mutagenicity as the primary mechanism of tumorigenesis", but concluded that insufficient data are available at this time to determine the mode of action for lung tumour formation. Nasal rat tumours were not reevaluated by the fifth CARC meeting USEPA.
Fourth and Fifth Report of the Cancer Assessment Review Committee (US EPA 2004a and 2007b), corresponding to the 4th and 5th CARC meetings on acetochlor are attached for information in the IUCLID dossier.
The European Food Safety Authority reached a conclusion on the peer review of the pesticide risk assessment of acetochlor (EFSA Scientific Report, 15 April of 2011). Taking into account the different tumours observed in both species, the meeting agreed to propose the classification as Carc. Cat. 3 R40. The proposal was based on following arguments: based on mechanistic studies on acetochlor (and its analogue alachlor) it seems that nasal adenomas in rats are related to the formation of an active metabolite (DABQI, dialkylbenzoquinoneimine), increased by a specific enzyme of the rat nasal epithelium. Although it is unlikely that sufficient concentrations of the active metabolite would be achieved to initiate this event, the mode of action can still be relevant for humans. Thyroid follicular adenomas and pituitary tumours were considered by the experts as not relevant to humans or incidental. In the re-evaluation of the 2-year rat study by Broadmeadow, the femoral tumours were confirmed as cartilaginous hyperplasia and not neoplasms. Gastric neoplasms in the forestomach at the high dose level (67 mg/kg bw/d) were diagnosed as squamous cell carcinomas, above historical control data, and were considered relevant findings. In both studies, lung adenomas and carcinomas were observed with increased incidences in females, often above the historical control values (provided in the addendum 2, January 2007). In the 23-month study (Ahmed, 1983b), a dose-related increased incidence of histiocytic sarcoma of the uterus is observed, above the historical control data for the two high dose groups. From this study, the experts agreed that the low dose (75 mg/kg bw/day) is a LOAEL for carcinogenic effects, because a slightly increased incidence of histiocytic sarcoma of the uterus is already observed.
Alachlor is also currently listed in Annex VI of the CLP Regulation. The general mode of action for the rat nasal tumours produce by acetochlor is essentially the same as that for alachlor, a close structural analogue. However, unlike acetochlor, alachlor was classified for carcinogenicity. There were three different tumours seen in rat, nasal, thyroid and stomach tumours and lung tumours in mice. The relevance of rat nasal tumours to humans could not be dismissed, despite all arguments used (exposure, metabolism, mechanistic and epidemiological studies). It was concluded to classify alachlor with R40 based on the same tumours found in rats and mice after administration of acetochlor (ECBI, 2002).
Alachlor was also evaluated for carcinogenic potential by the U.S. Environmental Protection Agency and the Cancer Assessment Review Committee (US EPA, 1997a) that concluded to classified alachlor as "likely" to be a human carcinogen at high doses, but "not likely" at low doses. The Committee recognizes that while the response occurs only at higher doses and quantitative differences exist in sensitivity between rats and humans, a similar mechanism for nasal tumour production is present in humans, and therefore its relevance to humans cannot be dismissed.
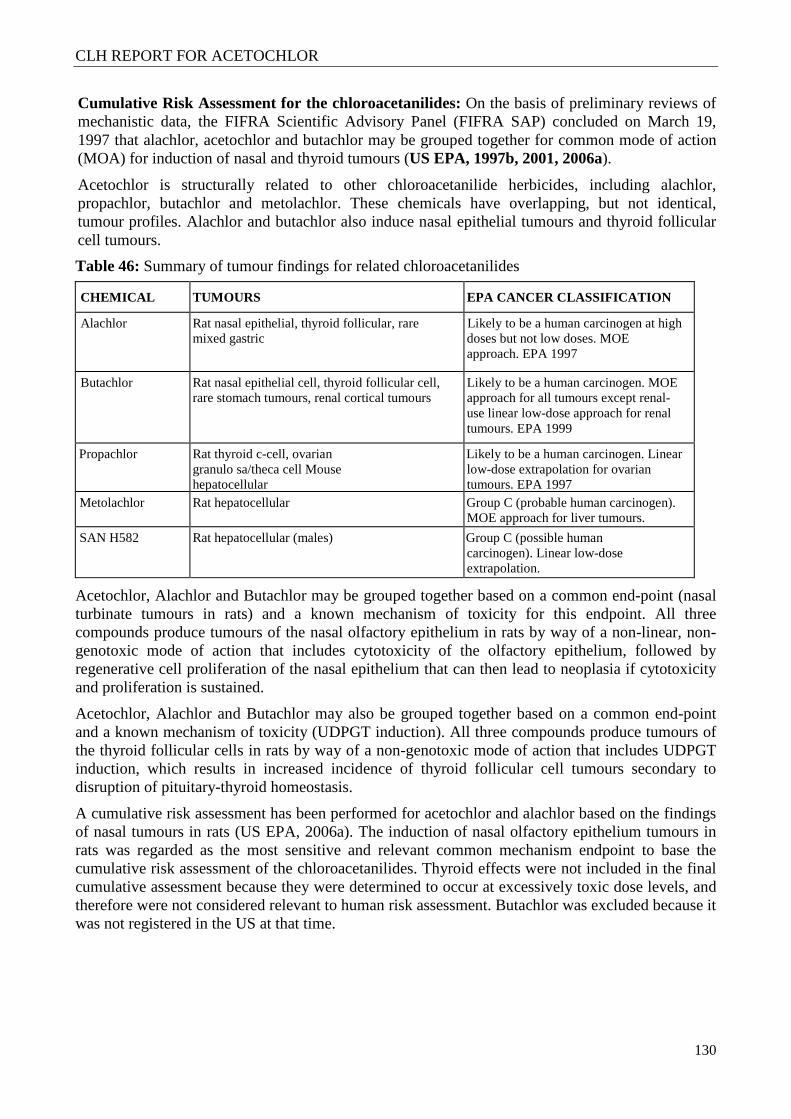
CLH REPORT FOR ACETOCHLOR
130
Cumulative Risk Assessment for the chloroacetanilides: On the basis of preliminary reviews of mechanistic data, the FIFRA Scientific Advisory Panel (FIFRA SAP) concluded on March 19, 1997 that alachlor, acetochlor and butachlor may be grouped together for common mode of action (MOA) for induction of nasal and thyroid tumours (US EPA, 1997b, 2001, 2006a).
Acetochlor is structurally related to other chloroacetanilide herbicides, including alachlor, propachlor, butachlor and metolachlor. These chemicals have overlapping, but not identical, tumour profiles. Alachlor and butachlor also induce nasal epithelial tumours and thyroid follicular cell tumours.
Table 46: Summary of tumour findings for related chloroacetanilides
CHEMICAL TUMOURS EPA CANCER CLASSIFICATION
Alachlor Rat nasal epithelial, thyroid follicular, rare mixed gastric
Likely to be a human carcinogen at high doses but not low doses. MOE approach. EPA 1997
Butachlor Rat nasal epithelial cell, thyroid follicular cell, rare stomach tumours, renal cortical tumours
Likely to be a human carcinogen. MOE approach for all tumours except renal-use linear low-dose approach for renal tumours. EPA 1999
Propachlor Rat thyroid c-cell, ovarian granulo sa/theca cell Mouse hepatocellular
Likely to be a human carcinogen. Linear low-dose extrapolation for ovarian tumours. EPA 1997
Metolachlor Rat hepatocellular Group C (probable human carcinogen). MOE approach for liver tumours.
SAN H582 Rat hepatocellular (males) Group C (possible human carcinogen). Linear low-dose extrapolation.
Acetochlor, Alachlor and Butachlor may be grouped together based on a common end-point (nasal turbinate tumours in rats) and a known mechanism of toxicity for this endpoint. All three compounds produce tumours of the nasal olfactory epithelium in rats by way of a non-linear, non-genotoxic mode of action that includes cytotoxicity of the olfactory epithelium, followed by regenerative cell proliferation of the nasal epithelium that can then lead to neoplasia if cytotoxicity and proliferation is sustained.
Acetochlor, Alachlor and Butachlor may also be grouped together based on a common end-point and a known mechanism of toxicity (UDPGT induction). All three compounds produce tumours of the thyroid follicular cells in rats by way of a non-genotoxic mode of action that includes UDPGT induction, which results in increased incidence of thyroid follicular cell tumours secondary to disruption of pituitary-thyroid homeostasis.
A cumulative risk assessment has been performed for acetochlor and alachlor based on the findings of nasal tumours in rats (US EPA, 2006a). The induction of nasal olfactory epithelium tumours in rats was regarded as the most sensitive and relevant common mechanism endpoint to base the cumulative risk assessment of the chloroacetanilides. Thyroid effects were not included in the final cumulative assessment because they were determined to occur at excessively toxic dose levels, and therefore were not considered relevant to human risk assessment. Butachlor was excluded because it was not registered in the US at that time.
CLH REPORT FOR ACETOCHLOR
131
4.10.4 Summary and discussion of carcinogenicity
4.10.4.1 Summary and discussion of carcinogenicity. Carcinogenesis in rats
Survival, MTD, statistical analysis
Three chronic rat feeding studies were conducted with acetochlor, at dietary concentration between 18 to 5000 ppm (0.67 to 250 mg/kg/day, approximately). The primary indications of toxicity, seen at the 1000 ppm dose level, were decreased body weight, mild liver toxicity (increased liver relative weights, increased levels of serum gamma-GT, bilirrubin and cholesterol, slightly increased hepatocellular alterations and hepatocyte necrosis) and chronic nephritis (tubular cast/cyst/dilatation), particularly in males. At 1500 ppm, body weights were decreased during the second year of treatment (≥ 10% below controls in males); relative thyroid/parathyroid weights were significantly increased in both sexes and relative kidney weight increased in males. Macroscopic alterations in kidneys (males) and interstitial pneumonia (females) were also observed from 1500 ppm.
The 5000 ppm dose is considered to have exceeded the Maximum Tolerated Dose (MTD). At this dose level it was observed a marked decrease of body weights (≥ 30% below controls in both sexes during the second year of the study), increased mortality (survivor in female high group decreased to less than 25% of the original number of animals), hematological effects indicative of slight anemia in females, increased in relative liver, thyroid/parathyroid and kidney weights; macroscopic alterations in kidneys; interstitial pneumonia in both sexes, polyarteritis for males and cardiac trombosis, peripheral neuropathy, liver necrosis, lung alveolar histiocytosis, fibrosis/gastritis in stomach and inflammation of the tongue for females. In the Pathology Working Group re-evaluation (Hardisty, 1997a) and in the 4th EPA Report of Cancer Assessment Review Committee (US EPA, 2004a) the dose of 5000 ppm was considered an excessive toxic dose for assessing the carcinogenic potential of acetochlor in both sexes.
The statistical analysis performed by the Pathology Working Group (PWG) re-evaluation (Hardisty, 1997a) did not adjust the number of animals for mortality (uncensored data). The EPA HED “health effect division” analysis of PWG data considered the censored incidence adjusted for mortality.
Testicular interstitial cell tumours in males Sprague Dawley rats
These tumours exhibited a dose-related increase in the treated males over the male control group in rat study (Ahmed, 1983a). No increase incidence was observed in mice. The overall percentages of interstitial cell tumours were: control (2/70), low-dose (4/70), mid-dose (4/70) and high-dose (7/70), without statistically significant positive trend (in original study with Peto analysis). The incidence of leydig cell tumours (LCT) in Sprague Dawley rat was reported to be in a range from 5% to 10% (Cook et al.1999 and Mati et al.2002). Besides, the higher increased incidence was observed at 5000 ppm, a dose that exceeded the MTD. Finally, there was no evidence of an increased incidence of testicular tumours in the other two chronic rat studies.
Hepatic tumours in Sprague Dawley rats
There were an increased number of hepatic adenomas and carcinomas in males and females treated with 5000 ppm versus control in Ahmed (1983a). At this high dose, the combined incidence of hepatocellular adenoma/carcinoma was statistically increased in both sexes. PWG re-evaluation (Hardisty, 1997a) indicated that: excessive toxicity produced by dose levels greatly exceed the MTD may not be relevant to the risk assessment of acetochlor. Doses of nongenotoxic chemicals which induce cytotoxic liver necrosis have been associated with hepatocellular proliferation leading to the induction of hepatic tumours if the dosing is frequent and is maintained for long periods. This
CLH REPORT FOR ACETOCHLOR
132
may have been the mechanism responsible for the increased incidence of hepatic neoplasms at the 5000 ppm level.
The EPA HED “Health Effect Division” analysis of PWG data, showed in the same study also a positive trend in both sexes for adenoma, carcinoma and combined adenoma/carcinoma and an statistically increased of adenomas in females at 5000 ppm. The EPA 4th CARC Committee (US EPA 2004a), taking into account Hed analys of PWG data considered that liver tumours at 5000 ppm, while showing a treatment-related increase in both sexes and exceeding Crl:CD®BR rat historical controls published by Charles River (february 1992) for carcinomas in both sexes and for adenomas in female, were only observed at an excessive toxic dose of 5000 ppm.
The HED EPA analysis of PWG data also showed in Naylor (1986) a positive trend in females for adenoma and combined adenoma/carcinoma and an statistically increased of adenomas in females at 1000 ppm. The EPA 4th CARC Committee (US EPA, 2004a), considered that there was not a treatment-related increase in the incidence of liver tumours in this study. The significant increase in adenomas at 1000 ppm in females slightly exceeded above mentioned historical control values but it was noted that the concurrent control value of 0% was lower than historical controls and that liver tumours were not increased at 1500 or 1750 ppm in the other two rat studies. EPA CARC also concluded that hepatic tumours observed in (Broadmeadow, 1988) were unrelated to treatment due to the low incidence in both sexes.
Historical control data for liver tumours considered by EPA were published by Charles River (February 1992) for neoplastic lesions in the Crl:CD®BR rat. Nineteen groups of control animals from 24 month studies conducted at independent contract toxicology laboratories evaluated between April, 1984 and November, 1986. Animals were supplied by one of three Charles River Facilities in the United Kingdom or North America. The ranges of incidence of hepatocellular adenomas were 1.3% to 18.2% in males and 1.0 to 5.5% in females. The ranges of incidence of hepatocellular carcinoma were 1.1% to 9.1% in males and 1.0 to 4.0% in females.
Mechanistic studies were conducted on the hepatotoxicity of acetochlor to assist in the interpretation of the weak positive response seen at a limit dose of 2000 mg/kg in a rat liver in vivo assay for unscheduled DNA synthesis (UDS) (Trueman, 1989). The studies evaluating the acute effects of acetochlor on rat liver (Ashby and Lefevre, 1993 and 1994) showed that at 2000 mg/kg the integrity of the liver was seriously compromised (centrilobular necrosis, dramatically elevated hepatic enzymes ALT/AST plasma levels) and that hepatic toxicity was associated with depletion of hepatocellular glutathione reserves at doses at which a slight increase in UDS was observed. Consequently, data provides some evidence that the UDS is secondary to depleted glutathione, rather than direct genotoxicity. Hepatocellular proliferation was also evaluated in mice administered acetochlor in the diet for 90 days. At higher doses, BrdU incorporation was shown to increase during this time, providing some evidence that a non-genotoxic, proliferative mechanism may be involved in formation of hepatocellular tumours.
In conclusion, liver tumours in rats, while showing a treatment-related increase in both sexes, were only observed at 5000 ppm, a dose that exceeded the MTD.
Thyroid follicular tumours in Sprague Dawley rats
The HED data compiled in the Fourth Report of the Cancer Assessment Review Committee (US EPA, 2004a) from original reports-not reevaluated by PWG- showed in Ahmed (1983a) study, a positive trend for thyroid adenoma was seen in male. Statistically significant increases in thyroid adenoma and combined adenoma/carcinoma were observed in male rats in the same study only at 5000 ppm, an excessively toxic dose. In Naylor (1986) study, the incidence of thyroid adenomas/carcinoma was slightly higher in females treated with 1000 ppm. This difference was not statistically significant. It was only identified a positive trend in females for combined
CLH REPORT FOR ACETOCHLOR
133
adenoma/carcinoma. In Broadmeadow (1988) study, statistically significant increases in thyroid follicular adenoma and combined adenoma/carcinoma were observed in female rats at 1750 ppm and also a positive trend in females for adenoma, carcinoma and combined adenoma/carcinoma. A positive trend only for adenoma was identified in this study for males; combined tumours also were increased but not significantly. No increased incidence was observed in mice.
Acetochlor has been shown to cause disruption of thyroid-pituitary homeostasis by increased activity of hepatic UDPGT enzymatic activity, leading to increased clearance of thyroid hormones and compensatory increases in pituitary release of thyroid stimulating hormone (TSH), followed by increased follicular cell division, thyroid hyperplasia and enlargement and eventually an increase in thyroid follicular tumours.
An acetochlor mechanistic study on the effects of Dietary Exposure of Acetochlor on Thyroid Toxicity in Male Sprague Dawley Rats (Hotz and Wilson, 1996c) indicated thyroid enlargement (hyperplasia was not demonstrated) and increased liver UDPGT activity. Animals were not tested for recovery, however data are suggestive of perturbation of thyroid-pituitary homeostasis. Although some of the experimental parameters that are used to support this mechanism were not evaluated in the study (e.g., evaluation of thyroid follicular cell proliferation), data are sufficient when considered together with the data on the structural analog alachlor, to classify acetochlor thyroid tumours under this non-genotoxic mechanism.
Thyroid follicular cell tumours were considered by EPA CARC Committee to be related to treatment but were not considered as part of the cancer classification, based on relatively low incidence and evidence for disruption of thyroid pituitary homeostasis secondary to increased clearance of thyroid hormones by increased hepatic UDPGT activity. This mode of action was supported by the available data on acetochlor, together with the more complete data available for thyroid tumorigenesis by the closely related chloroacetanilide alachlor (US EPA, 2004a).
This was supported by ECBI specialised experts (1999) that specifically commented on the classification of substances causing thyroid tumours in rodents. Experts agreed that there was convincing scientific evidence that humans are considerably less sensitive than rodents (especially rats) regarding: (i) perturbation of thyroid hormone homeostasis induced by non-genotoxic xenobiotics (ii) development of epithelial thyroid tumours after long-term exposure to such agents. For non-genotoxic carcinogenic substances producing thyroid tumours in rodents with low or medium potency by a clearly established perturbation of the thyroid hormone axis, in general, experts didn’t see the need to be classified (ECBI, 1999).
In the Guidance on the application of the CLP Criteria it is states that the mechanisms of certain thyroid tumours in rodents mediated by UDP glucuronyltransferase (UGT) induction are considered not relevant for humans (IARC, 1999).
Overall, the increase in thyroid adenomas is not considered to be relevant to human health, based on relatively low incidence and evidence for disruption of thyroid pituitary homeostasis secondary to increased clearance of thyroid hormones by increased hepatic UDPGT activity. This non-genotoxic, threshold-based mechanism is well established and widely considered to be not relevant to humans.
Pituitary tumours in in Sprague Dawley rats
In study Naylor (1986) study, the incidence of adenocarcinomas in pituitary in the high dose group females (1000 ppm, 60 mg/kg/day) was higher than controls, although it was not statistically significant. It produced invasion in brain and haemorrhage in brain. The incidence of pituitary carcinomas in high-dose females of this study (8.6%) was only slightly higher than Monsanto’s historical control data (0-5.2%) and it was well under the maximum incidence, reported by Charles River Laboratories for pituitary carcinomas in this strain of rat.
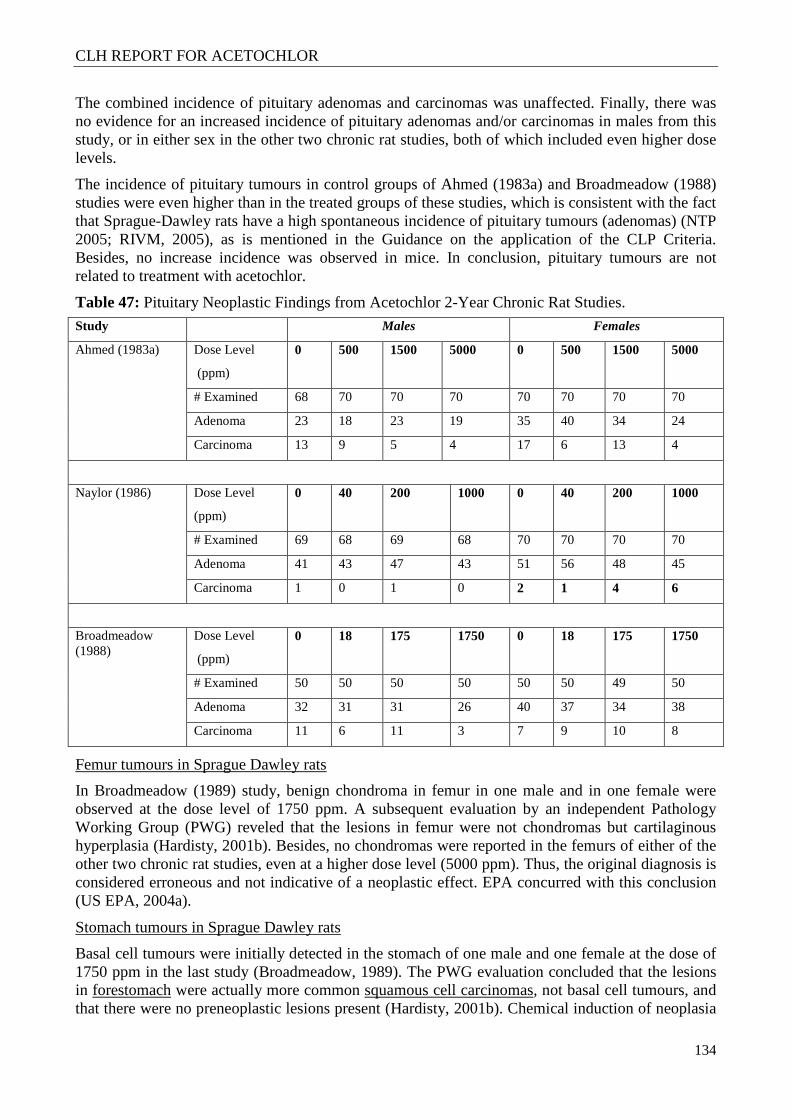
CLH REPORT FOR ACETOCHLOR
134
The combined incidence of pituitary adenomas and carcinomas was unaffected. Finally, there was no evidence for an increased incidence of pituitary adenomas and/or carcinomas in males from this study, or in either sex in the other two chronic rat studies, both of which included even higher dose levels.
The incidence of pituitary tumours in control groups of Ahmed (1983a) and Broadmeadow (1988) studies were even higher than in the treated groups of these studies, which is consistent with the fact that Sprague-Dawley rats have a high spontaneous incidence of pituitary tumours (adenomas) (NTP 2005; RIVM, 2005), as is mentioned in the Guidance on the application of the CLP Criteria. Besides, no increase incidence was observed in mice. In conclusion, pituitary tumours are not related to treatment with acetochlor.
Table 47: Pituitary Neoplastic Findings from Acetochlor 2-Year Chronic Rat Studies.
Study Males Females
Ahmed (1983a) Dose Level
(ppm)
0 500 1500 5000 0 500 1500 5000
# Examined 68 70 70 70 70 70 70 70
Adenoma 23 18 23 19 35 40 34 24
Carcinoma 13 9 5 4 17 6 13 4
Naylor (1986) Dose Level
(ppm)
0 40 200 1000 0 40 200 1000
# Examined 69 68 69 68 70 70 70 70
Adenoma 41 43 47 43 51 56 48 45
Carcinoma 1 0 1 0 2 1 4 6
Broadmeadow (1988)
Dose Level
(ppm)
0 18 175 1750 0 18 175 1750
# Examined 50 50 50 50 50 50 49 50
Adenoma 32 31 31 26 40 37 34 38
Carcinoma 11 6 11 3 7 9 10 8
Femur tumours in Sprague Dawley rats
In Broadmeadow (1989) study, benign chondroma in femur in one male and in one female were observed at the dose level of 1750 ppm. A subsequent evaluation by an independent Pathology Working Group (PWG) reveled that the lesions in femur were not chondromas but cartilaginous hyperplasia (Hardisty, 2001b). Besides, no chondromas were reported in the femurs of either of the other two chronic rat studies, even at a higher dose level (5000 ppm). Thus, the original diagnosis is considered erroneous and not indicative of a neoplastic effect. EPA concurred with this conclusion (US EPA, 2004a).
Stomach tumours in Sprague Dawley rats
Basal cell tumours were initially detected in the stomach of one male and one female at the dose of 1750 ppm in the last study (Broadmeadow, 1989). The PWG evaluation concluded that the lesions in forestomach were actually more common squamous cell carcinomas, not basal cell tumours, and that there were no preneoplastic lesions present (Hardisty, 2001b). Chemical induction of neoplasia
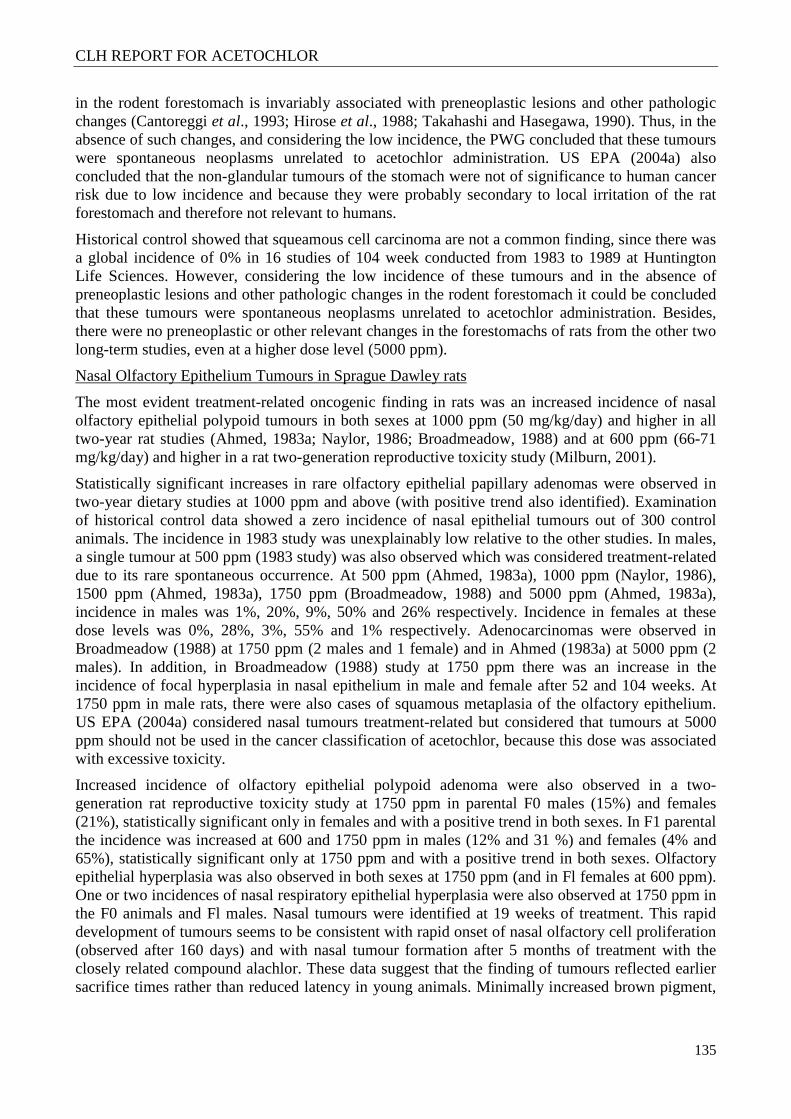
CLH REPORT FOR ACETOCHLOR
135
in the rodent forestomach is invariably associated with preneoplastic lesions and other pathologic changes (Cantoreggi et al., 1993; Hirose et al., 1988; Takahashi and Hasegawa, 1990). Thus, in the absence of such changes, and considering the low incidence, the PWG concluded that these tumours were spontaneous neoplasms unrelated to acetochlor administration. US EPA (2004a) also concluded that the non-glandular tumours of the stomach were not of significance to human cancer risk due to low incidence and because they were probably secondary to local irritation of the rat forestomach and therefore not relevant to humans.
Historical control showed that squeamous cell carcinoma are not a common finding, since there was a global incidence of 0% in 16 studies of 104 week conducted from 1983 to 1989 at Huntington Life Sciences. However, considering the low incidence of these tumours and in the absence of preneoplastic lesions and other pathologic changes in the rodent forestomach it could be concluded that these tumours were spontaneous neoplasms unrelated to acetochlor administration. Besides, there were no preneoplastic or other relevant changes in the forestomachs of rats from the other two long-term studies, even at a higher dose level (5000 ppm).
Nasal Olfactory Epithelium Tumours in Sprague Dawley rats
The most evident treatment-related oncogenic finding in rats was an increased incidence of nasal olfactory epithelial polypoid tumours in both sexes at 1000 ppm (50 mg/kg/day) and higher in all two-year rat studies (Ahmed, 1983a; Naylor, 1986; Broadmeadow, 1988) and at 600 ppm (66-71 mg/kg/day) and higher in a rat two-generation reproductive toxicity study (Milburn, 2001).
Statistically significant increases in rare olfactory epithelial papillary adenomas were observed in two-year dietary studies at 1000 ppm and above (with positive trend also identified). Examination of historical control data showed a zero incidence of nasal epithelial tumours out of 300 control animals. The incidence in 1983 study was unexplainably low relative to the other studies. In males, a single tumour at 500 ppm (1983 study) was also observed which was considered treatment-related due to its rare spontaneous occurrence. At 500 ppm (Ahmed, 1983a), 1000 ppm (Naylor, 1986), 1500 ppm (Ahmed, 1983a), 1750 ppm (Broadmeadow, 1988) and 5000 ppm (Ahmed, 1983a), incidence in males was 1%, 20%, 9%, 50% and 26% respectively. Incidence in females at these dose levels was 0%, 28%, 3%, 55% and 1% respectively. Adenocarcinomas were observed in Broadmeadow (1988) at 1750 ppm (2 males and 1 female) and in Ahmed (1983a) at 5000 ppm (2 males). In addition, in Broadmeadow (1988) study at 1750 ppm there was an increase in the incidence of focal hyperplasia in nasal epithelium in male and female after 52 and 104 weeks. At 1750 ppm in male rats, there were also cases of squamous metaplasia of the olfactory epithelium. US EPA (2004a) considered nasal tumours treatment-related but considered that tumours at 5000 ppm should not be used in the cancer classification of acetochlor, because this dose was associated with excessive toxicity.
Increased incidence of olfactory epithelial polypoid adenoma were also observed in a two-generation rat reproductive toxicity study at 1750 ppm in parental F0 males (15%) and females (21%), statistically significant only in females and with a positive trend in both sexes. In F1 parental the incidence was increased at 600 and 1750 ppm in males (12% and 31 %) and females (4% and 65%), statistically significant only at 1750 ppm and with a positive trend in both sexes. Olfactory epithelial hyperplasia was also observed in both sexes at 1750 ppm (and in Fl females at 600 ppm). One or two incidences of nasal respiratory epithelial hyperplasia were also observed at 1750 ppm in the F0 animals and Fl males. Nasal tumours were identified at 19 weeks of treatment. This rapid development of tumours seems to be consistent with rapid onset of nasal olfactory cell proliferation (observed after 160 days) and with nasal tumour formation after 5 months of treatment with the closely related compound alachlor. These data suggest that the finding of tumours reflected earlier sacrifice times rather than reduced latency in young animals. Minimally increased brown pigment,
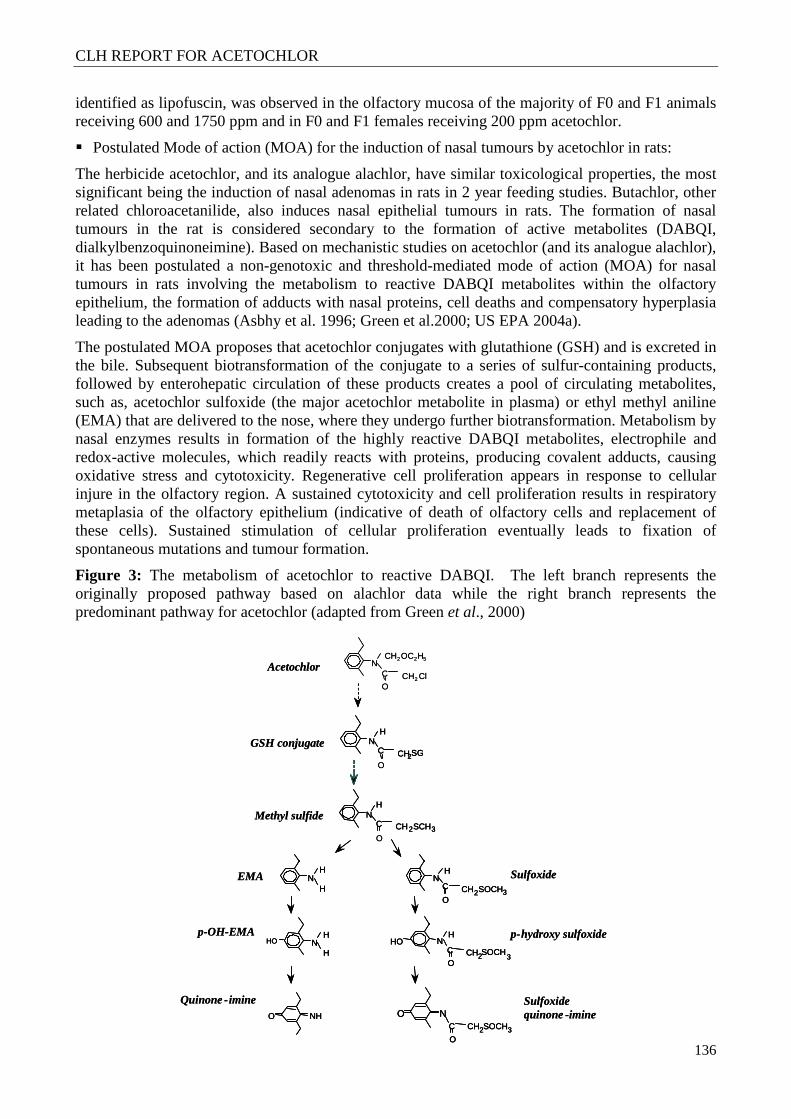
CLH REPORT FOR ACETOCHLOR
136
NC
O
CH2OC2H5
CH2 Cl
O
NC CH2SCH3
H
NH
H
NH
H
HO
Acetochlor
Methyl sulfide
EMA
p-OH-EMA
GSH conjugate
NOC
O
CH2SOCH3
NC
OCH2SOCH3
H
NC
OCH2SOCH
3
HHO
NHO
O
NC
H
CH2SG
Sulfoxide
Quinone -imine
p-hydroxy sulfoxide
Sulfoxidequinone -imine
NC
O
CH2OC2H5
CH2 Cl
O
NC CH2SCH3
HN
C CH2SCH3
H
NH
HN
H
H
NH
H
HO NH
H
HO
Acetochlor
Methyl sulfide
EMA
p-OH-EMA
GSH conjugate
NOC
O
CH2SOCH3
NOC
O
CH2SOCH3
NC
OCH2SOCH3
HN
C
OCH2SOCH3
H
NC
OCH2SOCH
3
HHO N
C
OCH2SOCH
3
HHO
NHO NHO
O
NC
H
CH2SGN
C
H
CH2SG
Sulfoxide
Quinone -imine
p-hydroxy sulfoxide
Sulfoxidequinone -imine
identified as lipofuscin, was observed in the olfactory mucosa of the majority of F0 and F1 animals receiving 600 and 1750 ppm and in F0 and F1 females receiving 200 ppm acetochlor.
� Postulated Mode of action (MOA) for the induction of nasal tumours by acetochlor in rats:
The herbicide acetochlor, and its analogue alachlor, have similar toxicological properties, the most significant being the induction of nasal adenomas in rats in 2 year feeding studies. Butachlor, other related chloroacetanilide, also induces nasal epithelial tumours in rats. The formation of nasal tumours in the rat is considered secondary to the formation of active metabolites (DABQI, dialkylbenzoquinoneimine). Based on mechanistic studies on acetochlor (and its analogue alachlor), it has been postulated a non-genotoxic and threshold-mediated mode of action (MOA) for nasal tumours in rats involving the metabolism to reactive DABQI metabolites within the olfactory epithelium, the formation of adducts with nasal proteins, cell deaths and compensatory hyperplasia leading to the adenomas (Asbhy et al. 1996; Green et al.2000; US EPA 2004a).
The postulated MOA proposes that acetochlor conjugates with glutathione (GSH) and is excreted in the bile. Subsequent biotransformation of the conjugate to a series of sulfur-containing products, followed by enterohepatic circulation of these products creates a pool of circulating metabolites, such as, acetochlor sulfoxide (the major acetochlor metabolite in plasma) or ethyl methyl aniline (EMA) that are delivered to the nose, where they undergo further biotransformation. Metabolism by nasal enzymes results in formation of the highly reactive DABQI metabolites, electrophile and redox-active molecules, which readily reacts with proteins, producing covalent adducts, causing oxidative stress and cytotoxicity. Regenerative cell proliferation appears in response to cellular injure in the olfactory region. A sustained cytotoxicity and cell proliferation results in respiratory metaplasia of the olfactory epithelium (indicative of death of olfactory cells and replacement of these cells). Sustained stimulation of cellular proliferation eventually leads to fixation of spontaneous mutations and tumour formation.
Figure 3: The metabolism of acetochlor to reactive DABQI. The left branch represents the originally proposed pathway based on alachlor data while the right branch represents the predominant pathway for acetochlor (adapted from Green et al., 2000)
CLH REPORT FOR ACETOCHLOR
137
Two pathways have been reported (see Figure 3) for production of reactive species, the original pathway proposed for the structural analogue alachlor (left branch of diagram) which involve formation of 2-ethyl-6-methylaniline (EMA), hydroxylation of EMA to pOH-EMA and the subsequent production of the quinoneimine and further investigations with acetochlor have revealed an additional activation pathway in which a sulfoxide metabolite of acetochlor play a key role (right branch of diagram). Either way, quinoneimine will then bind to tissue proteins and other nucleophiles such as GSH.
Subsequently, the metabolic pathway for the formation of quinone from sulfoxide has been also shown for alachlor. In vitro metabolism of the sulphoxide metabolite of alachlor was assessed in rat and in human nasal tissues (Green, 2001b). Alachlor sulphoxide was hydroxylated to its para-hydroxy derivative by an enzyme, believed to be an isoform of cytochrome P-450, which was concentrated in the rat nasal olfactory region. The tissue specificity and metabolic rates were comparable to those seen previously with acetochlor. As with acetochlor, there was a lack of any detectable metabolic rate in human nasal tissues.
Comparison between rats and other species of the metabolic cascade leading to the quinoneimine indicated that the production of these chemicals was greater in rats. Conjugation with GSH plus activation pathway in which a sulfoxide metabolite of acetochlor play a key role seems the major source of quinone imine in the rat. Acetochlor in rats undergoes extensive biotransformation involving enterohepatic recirculation and further activation of hepatic metabolites in the nasal tissues. The primary metabolic pathways in the rat involve O-dealkylation/glucuronidation and glutathione conjugation in the liver, excretion into the bile, metabolism by gut flora to S-methyl sulfide and similar metabolites, and subsequent reabsorption and oxidation. The predominant metabolite in rat plasma following administration of acetochlor is a secondary amide S-methyl sulfoxide (referred to as “sulfoxide”), which is subsequently para-hydroxylated by the olfactory tissue to the reactive DABQI.
Whole-body autoradiography studies established that sulfoxide accumulates and persists in the olfactory epithelium of rats. Radiolabeling of the sulfoxide molecule in the phenyl ring and in the sulfoxide side-chain demonstrated that the metabolite accumulating in nasal tissues retains the sulfoxide side-chain. The formation of a quinone imine from acetochlor sulfoxide was facilitated by hydroxylation of the phenyl ring by a cytocrome P450 concentrated mainly in the olfactory region, isoenzyme that could be specific to the nasal epithelium of rodents. The hydroxylation of acetochlor sulphoxide in rat nasal tissues by an isoform of cytochrome P450 that was highly specific for rodent nasal epithelium tissues provides an explanation for the target specificity of acetochlor sulphoxide. The product formed, p-hydroxyacetochlor sulphoxide is a precursor of a quinoneimine, the metabolite believed to be responsible for the nasal tumours seen in rats.
There are substantial differences in the rates of para-hydroxilation of the sulfoxide metabolite by nasal tissue. Unlike rodent tissues, nasal tissues from squirrel monkeys and humans were unable to para-hydroxylate the sulfoxide metabolite and form reactive DABQI (Green 2000; Green et al. 2000).
The in vitro metabolism of acetochlor sulphoxide was investigated in the liver, olfactory and respiratory nasal tissues from rats and mice, and in nasal tissue samples from humans and squirrel monkeys. The rate of hydroxylation of acetochlor sulphoxide to p-hydroxy acetochlor sulphoxide (precursor of quinoneimine) in olfactory microsomes was similar in rats and mice, and occurs at a 6-fold higher rate than in rat respiratory microsomes (it was not assayed in mouse respiratory microsomes). The hydroxylation of acetochlor sulphoxide was not detected in human nasal tissue samples neither in primate nasal samples. It should be noted that olfactory and respiratory tissues from primates and humans were not separately analyzed. A lack of detectable metabolism of
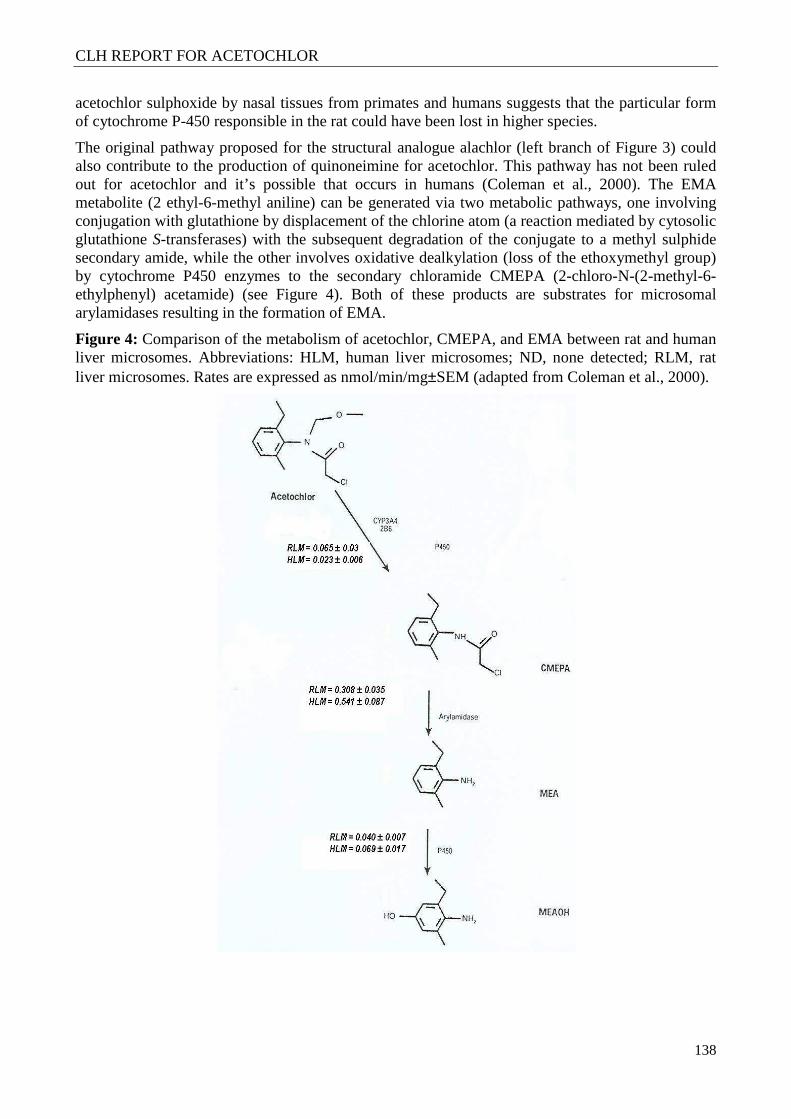
CLH REPORT FOR ACETOCHLOR
138
acetochlor sulphoxide by nasal tissues from primates and humans suggests that the particular form of cytochrome P-450 responsible in the rat could have been lost in higher species.
The original pathway proposed for the structural analogue alachlor (left branch of Figure 3) could also contribute to the production of quinoneimine for acetochlor. This pathway has not been ruled out for acetochlor and it’s possible that occurs in humans (Coleman et al., 2000). The EMA metabolite (2 ethyl-6-methyl aniline) can be generated via two metabolic pathways, one involving conjugation with glutathione by displacement of the chlorine atom (a reaction mediated by cytosolic glutathione S-transferases) with the subsequent degradation of the conjugate to a methyl sulphide secondary amide, while the other involves oxidative dealkylation (loss of the ethoxymethyl group) by cytochrome P450 enzymes to the secondary chloramide CMEPA (2-chloro-N-(2-methyl-6-ethylphenyl) acetamide) (see Figure 4). Both of these products are substrates for microsomal arylamidases resulting in the formation of EMA.
Figure 4: Comparison of the metabolism of acetochlor, CMEPA, and EMA between rat and human liver microsomes. Abbreviations: HLM, human liver microsomes; ND, none detected; RLM, rat liver microsomes. Rates are expressed as nmol/min/mg±SEM (adapted from Coleman et al., 2000).
CLH REPORT FOR ACETOCHLOR
139
The in vitro metabolism of acetochlor to p-hydroxy-2-ethyl-6-methylaniline (p-OH-EMA), a quinoneimine precursor in animals, was compared in liver and nasal tissues from rats, mice and primates. The results showed markedly higher rates in the olfactory tissue of rat than in mouse and particularly the monkey. The rate of para-hidroxilation in monkey was 4% of the rate of rats (Green, 1998a).
The relative contribution of the two pathways leading to dialkylbenzoquineimine (DABQI) metabolites for alachlor is not known since the methodology used in the alachlor nasal protein binding studies would not differentiate between diethylaniline DEA [analog of 2-ethyl-6- methyl aniline (EMA)]and methyl sulfoxide moieties. Therefore, it’s not clear that this pathway can be different between alachlor and acetochlor as propose by the notifier. Either way, quinone imine will then bind to tissue proteins and other nucleophiles such as GSH. Quinoneimines are electrophilic that can covalently bind to reduced glutathione and protein sulphydryl groups (Feng and Wratten, 1987; Feng et al., 1990) and deplete cellular antioxidants (Tee et al., 1987).
Glutathione seems to have a dual role in preventing the cytotoxicity of acetochlor, through detoxification and through the reduction of oxidized groups in critical macromolecular targets. Chloroacetanilides preferentially react with glutathione (GSH) and therefore cause depletion of the protective nucleophile. Such depletion could be of particular concern for tissues with relative low level of endogenous GSH, rendering them more susceptible to the toxic action of this or other types of reactive intermediates. The metabolism of acetochlor in the rat changes with increasing dose-levels. At low rates of acetochlor metabolism, endogenous levels of glutathione will attenuate, if not prevent, the toxicological response. This detoxification pathway would remove low levels of any DABQI precursors by conjugation with glutathione, minimizing the formation of toxic quinoneimine and/or removing the quinoneimine. Exposure to acetochlor at a sufficiently high dose to saturate this detoxification pathway, results in a depletion of target organ glutathione levels and sufficient quantities of quinoneimine accumulate to the extent that toxicity becomes evident.
When 14C-acetochlor was administered to rats in diet resulted in localization of radioactivity in the nasal tissue, particularly in the olfactory region. This involved the formation of an acetochlor protein adduct in rat nasal tissue that was derived from the quinoneimine, EMIQ (3-ethyl, 5-methyl-benzoquinoneimine). The formation of an EMIQ-derived protein adduct in rat nasal turbinate has been also reported after oral treatment with acetochlor secondary sulfide. In contrast to the results in rats, there was no evidence of localization of acetochlor or its metabolites in mouse nasal tissue (Kraus and Wilson, 1996), and no DABQI-protein adducts in nasal tissue from either mice or rhesus monkey (Lau and Wilson, 1998a, 1998b). There was also no evidence of nasal cell proliferation in mice administered acetochlor via the diet for up to 90 days at dose levels up to 5000 ppm (Hotz and Wilson, 1996b).
The formation of EMIQ in rat nasal tissue seems to be a critical step for the induction of nasal tumours in rats by acetochlor. When there is quinoneimine binding, like in the rat, there are tumours. When there are undetectable levels of quinoneimine binding (i.e. no or undetectable levels of EMIQ-cysteine adduct) as in the mouse and monkey, there are no tumours.
Besides the difference between rodents and humans in the capacity of olfactory nasal tissue to hydroxylate rat plasma metabolites there also exists significant differences between species in the production of metabolites which are believed to be the substrates of the ultimate carcinogen. Data presented by the notifier do suggest that the secondary methyl sulphide substrate may not be available to the mouse because the major route of acetochlor metabolism in the mouse is through glucuronide conjugation. This is supported by data showing that acetochlor sulfoxide is not found in mouse plasma, and therefore, it is not a circulating metabolite.
In mice, acetochlor is metabolized primarily by oxidative pathways, and glucuronidation reactions to a series of glucuronides which are excreted directly into the urine and thus bypass the key steps
CLH REPORT FOR ACETOCHLOR
140
(e.g., glutathione conjugation and enterohepatic circulation) that lead to formation of acetochlor sulfoxide. In contrast to the results with rats, only very low levels of the sulfoxide metabolite were detected in the plasma of mice after administration of acetochlor. Consequently, the plasma levels of acetochlor sulphoxide differ markedly between the two species, being approximately two orders of magnitude lower in the mouse than in the rat.
Thus, although mice have a similar complement of nasal cytochromes P450 responsible for hydroxylase activity and the rate of para-hydroxylation of acetochlor sulphoxide to p-hydroxy acetochlor sulphoxide (precursor of quinineimine) in olfactory microsomes was similar in rats and mice, the key substrate for these enzymes, acetochlor sulphoxide, is not produced in significant quantities in the mouse liver to produce enough DABQI to initiate the chain of events eventually leading to nasal tumours. There is support that the quinoneimine is formed in the rat nasal epithelium in a dose related manner, but not in the mouse. The absence of quinoneimine binding in the mouse is consistent with the negative autoradiography studies with the mouse and the negative nasal tumour results seen in the mouse chronic studies.
In monkeys, the plasma metabolic profile for acetochlor was not determined. However, analysis of urine from studies of acetochlor metabolism in monkeys indicates that monkeys produce high levels of metabolites derived from glutathione conjugation and metabolites via the mercapturic acid pathway (Purdum and Livingstone, 1983; Kurtzweil, 2003). However, these metabolites are excreted primarily via the urine rather than in the bile, due to the higher molecular weight threshold for biliary excretion in primates compared to rats (Millburn, 1975; Williams, 1971) and thus would not be subjected to the extensive enterohepatic circulation and metabolism by gut flora that occurs in the rat.
� Data consistent with the MOA for the induction of nasal tumours by acetochlor in rats:
− The absence of a demonstrated positive mutagenic effect of the chemical.
− Acetochlor administration results in dose related increases in the binding of the quinoneimine metabolite in the target tissue. This metabolite is considered to be the putative active species.
− There is respiratory metaplasia of the nasal olfactory epithelium, an indication of cytotoxicity to the original olfactory tissue. Death (and loss) of the olfactory epithelium cells results in their replacement by respiratory epithelium cells.
− Another indication of cytotoxicity is the increase of lipofucsin pigment observed in a dose related manner in the nasal olfactory epithelium of rats that show nasal olfactory tumours. Lipofucsin pigment is associated with oxidative damage to lipids and lipoproteins, which is consistent with the redox alterations known to be produced by quinones and quinoneimines.
− Acetochlor administration results in significantly dose related increases in cell proliferation in the nasal olfactory epithelium of rats at doses coinciding with tumorigenic doses. In contrast, acetochlor does not produce nasal cell proliferation in mice.
− The absence of nasal epithelial tumours in mice correlated with their inability to form adducts of the quinoneimine at the target site. This evidence of no quinoneimine binding was confirmed autoradiographically.
− Rats administered the sulfoxide metabolite of acetochlor (a proximate precursor of the toxic metabolite, the quinoneimine) show nasal olfactory mucosa adenomas after 26 weeks of treatment.
− The data on the non-genotoxic MOA for acetochlor are supported by the entire database for the analogue, alachlor, in particular:
CLH REPORT FOR ACETOCHLOR
141
i) Reversibility of cell proliferation in rats treated with alachlor for 60 days at a tumorigenic dose, after placement on basal diet for 60 days (Brewster and Hotz, 1991). This data is supportive of a threshold-based mechanism for the induction of nasal tumours in rat.
ii) Rats treated with the analog alachlor for 1 month at a tumorigenic dose (126 mg/kg/day) did not have detectable neoplasms when examined after a 5-month holding period on basal diet. No detectable olfactory mucosal lesions were observed in any of the "stop study" rats (Genter, Burman and Bolon, 2002)
� Data evaluation for mode of action:
Nasal tumour induction is dependent on the following events: (1) a quinoneimine intermediate is formed during metabolism of acetochlor (from acetochlor sulfoxide or possibly from ethylmethyl aniline (EMA)); (2) the quinone imine moiety causes binding to cellular proteins plus oxidative stress to the nasal olfactory cells; (3) cell damage results in cytotoxicity; (4) a proliferative response to cellular injury results in preneoplastic lesions (hyperplasia and respiratory metaplasia); (5) spontaneous mutations are fixed, resulting in tumours as a result of the cytotoxicity-driven cell proliferative response.
1) Data supporting initial events
There is strong evidence that the compound is well absorbed (high urinary excretion and other facts), is conjugated with GSH (major metabolites can be traced to GSH conjugation, e.g. mercapturates, sulfoxide etc.), undergoes enterohepatic recirculation (80% biliary excretion & over 70% urinary excretion), appears in plasma (e.g. the sulfoxide metabolite is found in rat plasma). Additional information (autoradiography) indicates that acetochlor and/or its metabolites distribute to the nasal turbinates, in particular to the olfactory epithelium (site of the nasal tumours) with no label at the respiratory epithelium. Autoradiographic evidence indicates that although, initially, radioactivity from acetochlor and its sulfide metabolite distributes widely, there is still significant residual radioactivity in the nasal turbinates and low background radioactivity in surrounding tissues, several days after a single oral dose. The mouse and other species do not show this pattern of nasal epithelium labeling.
2) Data supporting key events
The following three events are considered key for formation of nasal tumours by the proposed MOA: quinone imine- formation (protein binding) – cytotoxicity- cell proliferation
There is ample evidence that acetochlor is metabolized to precursors of the quinoneimine:
− After dosing with acetochlor, analysis of protein adducts obtained from nasal olfactory tissues reveals that hydrolysis of these adducts releases EMIQ-cysteine. This product is consistent with a nucleophilic attack by an SH group in a protein on a quinoneimine [formed from EMA or sec-methyl sulfoxide metabolite].
− Administration in vivo of sec-methyl sulfide or sulfoxide metabolite of acetochlor (Putative precursors of nasal protein adducts) produces adducts that release EMIQ-cysteine.
− Incubation of rat nasal tissue microsomal preparations will produce precursors of quinoneimines given appropriate substrates (e.g. sec sulfide, EMA)
− Administration of the sulfoxide metabolite of acetochlor (the postulated quinoneimine precursor) to rats produces statistically significant incidences of nasal polypoid adenomas after 26 weeks of treatment. Similar incidences were seen after 52 weeks.
CLH REPORT FOR ACETOCHLOR
142
Although it is likely that in the rat the quinoneimine is formed from the sulfoxide metabolite, the possibility that EMA might also be a precursor cannot be ruled out. Furthermore, the analysis of adducts cannot distinguish whether it is originated from the sulfide or EMA. This issue is important since in vitro work of Coleman et al. (2000) indicates that human liver microsomes are as effective as the rat in forming EMA from acetochlor.
3) Data supporting cytotoxicity
If one accepts that a quinineimine has been formed inside of the nasal epithelium and the very high reactivity of the quinineimines as electrophiles and oxidants (Monks and Jones, 2002), then cytotoxicity is to be expected. Several studies found in the open literature suggest that DABQI may induce damage to DNA through oxidative stress. This is a reasonable effect to pursue since oxidative damage to DNA may lead to cytotoxicity followed by regenerative proliferation (Clayson et al., 1994).
Data supporting cytotoxicity of acetochlor to the rat nasal olfactory epithelium consists of observations of respiratory metaplasia and lipofucsin granules in the olfactory mucosa of rats treated with acetochlor. The observation of respiratory metaplasia of the olfactory epithelium in rats treated with acetochlor, alachlor or butachlor (Morgan, 1997) is indicative of death of olfactory cells and replacement of these cells by respiratory epithelial cells, differentiating from stem cells. The presence of lipofucsin granules in olfactory epithelium of rats treated with acetochlor in the diet for 3 months at 200 -1750 ppm (Milburn, 2001) is a reflection of oxidative damage to cell membranes. Lipofucsins are yellow-brown to reddish-brown pigments that occur widely throughout the body and are thought to be produced by an oxidation process of lipids and lipoproteins.
Additionally, there is supportive data from the analog alachlor consistent with an oxidative process affecting cellular lipids and lipoproteins. There is information that alachlor affects the redox status of the cell, leading to oxidative stress and which may result in DNA damage. Oxidative damage to DNA may lead to cytotoxicity followed by regenerative cellular proliferation (Clayson et al. 1994).
Based on a genomic analysis of alachlor-induced tumours in the olfactory mucosa of Long-Evans rats exposed to 126 mg/kg/day and sampled at various intervals from 1 day to 18 months (Genter, Burman, Vijayakumar et al., 2002) proposed the following steps in the alachlor-mediated carcinogenesis model:
− Initial progression from histologically normal olfactory mucosa to foci of abnormal mucosa. This step, which is regulated by genes in the acute phase of exposure, is accompanied by "upregulation" (≥ 2-fold increase) of genes consistent with a mutagenic response possibly as a result of oxidative damage to DNA (GADD 45, apurinic/apyramidinic endonuclease). While the exact role of GADD (growth arrest and DNA-damage inducible) gene products is not known, this gene group is upregulated in response to stress to allow cells time to repair macromolecular damage or to lead cells into apoptosis so that a genetic defect is not propagated. Types of environmental stress that induce GADD genes include UV irradiation, alkylating agents and glucose starvation (Takahashi et al., 2001; Jackman et al., 1994). (Stokes et al., 2002) also demonstrated that GADD 45 gene induction occurs in response to Reactive Oxygen Species (ROS) and quinones and is abolished in the presence of the antioxidant, ascorbic acid. It is of note that quinones, which are operationally non-genotoxic (Clayson et al., 1994), are highly redox active molecules which can redox cycle with their semiquinone radicals, leading to formation of ROS, including superoxide, hydrogen peroxide, and ultimately the hydroxyl radical. Production of ROS can cause severe oxidative stress within cells through the formation of oxidized cellular macromolecules, including lipids, proteins and DNA (Bolton et al., 2000). Supporting the hypothesis of oxidative stress, (Genter, Burman, Vijayakumar et al., 2002) also observed upregulation of other genes
CLH REPORT FOR ACETOCHLOR
143
associated with oxidative stress, i.e., heme oxygenase (Otterbein and Augustine, 2000), glutathione synthase and metallothionein (Andrews, 2000)].
− Progression from histologically altered olfactory mucosa to the development of adenomas. This step was accompanied by expression of genes indicating inhibition of apoptosis [Bid3 (AI102299)] and enhancement of cell prolifer.tion (zyxin). It is of note that Sarafian and Bredesen (1994) state that ROS can serve as common mediators of apoptosis.
− Progression to a malignant adenocarcinoma phenotype. This phase was indicated by induction of genes related to the wnt signaling pathway, which are generally upregulated late in the carcinogenesis process.
− Transformation to adenocarcinomas. In the late stages of tumour progression, the activation of nuclear β-catenin genes, which is critical for tumour formation in other organs and is associated with mutations in the wnt pathway.
Several other studies support a role for oxidative stress in alachlor-induced toxicity. (Burman et al., 2003) shows that dietary exposure of Long-Evans rats to 126 mg/kg/day for 1 day caused an -20% depletion of the olfactory mucosa antioxidant, GSH followed by a significantly (p<0.001) increased expression of genes associated with increased GSH production after 2 and 4 days of treatment. A return to control values was seen by 10 days of treatment. From these results, the investigators concluded that, "Despite the fact that GSH levels recovered, acute antioxidant perturbations may have been sufficient to trigger other steps in the carcinogenic process. Therefore, acute depletion of GSH may trigger more sustained events involved in both the initiation and promotion of the carcinogenic process."
There is also evidence of the ability of alachlor to induce oxidative stress in other tissues. (Bagchi et al., 1995) evaluated the potential of alachlor to induce oxidative stress and oxidative tissue damage, as measured by production of lipid peroxidation and DNA-single strand breaks (SSB), in the liver and brain of Sprague-Dawley rats administered two equal oral doses (at 0 and 21 hours) of 300 mg/kg. As noted by (Clayson et al., 1994), SSB are considered by to be a good indicator of oxygen damage to DNA. Results from the study of (Bagchi et al., 1995) show that alachlor induced moderate lipid peroxidation in liver and brain tissues and SSB in brain but not liver DNA in samples harvested 24 hours after exposure to the first dose. The same authors also conducted in vitro studies of chemiluminescence on liver and brain homogenates, and found that 1nmol/mL alachlor induced 3-fold increases in chemiluminescence in both tissues further suggesting that alachlor induced ROS. Finally, the results from in vitro studies with cultured PC-12 neuroactive cells exposed to 100 nM alachlor illustrate the sequence of early events postulated for this MOA (generation of ROS→DNA damage→tissue damage) with a 2-fold increase in DNA-SSB and a 3-fold increase in LDH leakage. Although olfactory nasal tissue was not examined in this series of assays, the ability of alachlor to generate ROS with subsequent DNA damage and tissue damage both in vivo and in vitro has been established. Finally, Bagchi et al. (1995) cite the work of Akubue and Stohs (1991) showing that the oral administration of 800 mg/kg alachlor to rats caused the increased urinary excretion of the "oxidative lipid metabolites, malondialdehyde, formaldehyde, acetaldehyde and acetone".
Based on the above considerations, the postulated MOA (generation of ROS → DNA damage→ tissue damage→ cell proliferation→ olfactory nasal tumours) in rats is plausible and coherent. Nevertheless, these conclusions are based solely on data for alachlor. Similarly, the characterization of the hypothesized early events for this MOA draws heavily on the cDNA microarray findings of Genter, Burman, Vijayakumar et al. (2002) for alachlor which have not as yet been independently confirmed. Additionally, there are no data available on acetochlor to fully test the plausibility of
CLH REPORT FOR ACETOCHLOR
144
oxidative stress as an early and critical event leading to frank tumour formation in rat nasal olfactory tissue.
� Uncertainties and inconsistencies
Two key observations in support of the MOA (reversibility of nasal mucosal cell proliferation and the "stop study") utilized the analog alachlor. Although it is plausible that the same results will apply with acetochlor, there is no similar data to confirm this.
− Although there were direct data available to support "cytotoxicity" for acetochlor (respiratory metaplasia and lipofucsin pigment), additional information was inferred from data for the analog alachlor.
− Although the notifier measured glutathione (GSH) levels in nasal mucosal epithelium for alachlor and acetochlor, no changes in levels were observed. GSH decrease is a well recognized effect of quinoneimine generation in tissues. Although no GSH decreases were seen, the structure of the nasal epithelial tissue protein adducts confirms that a quinoneimine was formed. Decreases in GSH, however, were seen in the liver of rats gavaged with acetochlor (Ashby and Lefevre, 1993). Work by Burman et al. (2003) with the analog alachlor seems to indicate that alachlor may induce oxidative stress in the nasal mucosal olfactory epithelium, which is consistent with the presence of an electrophilic metabolite.
� Relevance of rat nasal olfactory epithelium tumours to humans
The sequence of events leading to the formation of nasal olfactory tumours appears to be specific to the rat. Mechanistic studies indicate that the reactive agent, benzoquinoneimine, has higher rates of formation in the nasal tissue of rats than in mice, primates or humans.
However, although rats are considered to be much more sensitive to formation of these nasal tumours, the potential for acetochlor to cause nasal tumours in humans cannot be ruled out at this time based on the following:
− The realization that production of a metabolite (EMA) with the capacity of undergoing transformation to a quinone imine is possible for humans (Coleman et al., 2000). Human liver microsomes metabolize acetochlor to CMEPA at a similar rate to that of rat liver microsomes and subsequent metabolic rates of CMEPA to EMA (2-ethyl-6-methylaniline) with human liver microsomes exceed those of rat liver microsomes, suggesting that, even though it’s a minoritary pathway, the formation of reactive metabolites could occur in humans. The cytochrome P450 isoforms responsible for human metabolism of acetochlor are CYP3A4 and CYP2B6 (Figure 4).
− Although nasal tissue was not included in the Coleman et al. (2000) study, the data indicate that human liver has the potential to produce EMA, a plausibly carcinogenic metabolite of acetochlor, which would be available to all organs via the circulatory system.
Therefore, via the alternate EMA pathway for quinoneimine formation humans have the potential to metabolize acetochlor to reactive intermediates with carcinogenic potential secondary to oxidative damage and induction of cell proliferation. Then, although the weight of evidence indicates that rats appear to be more sensitive than humans and it is unlikely that sufficient concentration of active metabolite would be achieved to initiate the chain of events terminating in nasal tumours, it cannot be discarded that the mode of action is relevant to humans.
CLH REPORT FOR ACETOCHLOR
145
4.10.4.2 Summary and discussion of carcinogenicity. Carcinogenesis in mice
Survival, MTD, statistical analysis
Two chronic mouse feeding studies were conducted at dietary concentration ranging from 10 to 5000 ppm (1.1 to 862mg/kg/day). The 5000 ppm dose is considered to have exceeded the Maximum Tolerated Dose (MTD) for male and female CD-1 mice, based on sharply reduce survival to less than 26% of the original number of animals in both sexes, marked reductions in body weights (up to 18% at study termination), blood chemistry effects indicative of liver damage, hematological effects indicative of anemia in females (reduced RBC/Hct/Hgb values of 21-23% below controls), significant increased liver and kidney relative weights were seen in males at all dose levels (females increased only at interim sacrifice), incidence of interstitial nephritis was significantly increased in both sexes (83% and 76%, males and females). In the Pathology Working Group re-evaluation (Hardisty, 1997a, 1997b, 1997c and 2001a) and in the 4th EPA Report of Cancer Assessment Review Committee (US EPA, 2004a) the dose of 5000 ppm was considered an excessive toxic dose for assessing the carcinogenic potential of acetochlor in both sexes.
The statistical analysis performed by the Pathology Working Group (PWG) re-evaluation (Hardisty, 1997a, 1997b,1997c and 2001a) did not adjust the number of animals for mortality (uncensored data). The EPA HED “health effect division” analysis of PWG data considered the censored incidence adjusted for mortality.
Histiocytic sarcomas in CD-1 mice
In the 23-month CD-1 mice study (Ahmed, 1983b) there was a higher incidence of histiocytic sarcomas at all dose levels tested in females. The PWG reevaluation (Hardisty, 1997c) showed a statistically increased incidence of histiocytic sarcomas of 14% (at 1500 ppm) and 12% (at 5000 ppm) in females of this study. US EPA reevaluated also these tumours (US EPA, 2007b). The HED analysis of PWG data, showed a statistically increased incidence of histiocytic sarcomas of 15% (at 1500 and 5000 ppm) and 7% (at 500 ppm). In both evaluations (PWG and EPA) the incidences at 1500 and 5000 ppm were slightly above the reported spontaneous range of 0-10% [historical control data from Charles River Laboratories (1981-1991) and Inveresk Research International (1990-1993)].
A more recent (2005) published historical control values for mouse tumours compiled by Charles River shows a range of histiocytic sarcoma incidence in females of 1.67% to 18.33% (data for 18 to 23 months studies from 11 laboratories conducted between 1987-2000). The incidence of histiocytic sarcomas in female mice was also reported in literature with a range of 0 to 15% (Greaves 2007, Haseman et al.1986). Using these data, the incidence of histiocytic sarcoma in the 23-month study would not exceed the historical control range. The incidence at 500 ppm was within the range of all the historical control available. Historical control data for Pharmacopathic Research laboratories, Inc (testing laboratory of 23-month mice study) was not available.
PWG concluded that the increase in tumour incidence at 1500 and 5000 ppm was equivocal, represented normal variation and was probably not related to dietary exposure to acetochlor. This conclusion was based on (1) low control incidence of 0% (was 4% in 18-month mice study), (2) variable spontaneous incidence observed, (3) lack of linear dose-response and (4) absence of precursor lesions.
The Fifth CARC (US EPA, 2007b) concluded that the increased incidence of histiocytic sarcomas in female mice at 1500 ppm in the 23-month study was treatment-related, however, they felt the evidence was weak based on an increased incidence of a common tumour at a single dose level (1500 ppm) that slightly exceeded the available historical control data (0-10%). The toxicity at the highest dose of 5000 ppm was excessive and tumours at this dose were considered of no relevance to humans.
CLH REPORT FOR ACETOCHLOR
146
For the 18 months mouse study, the Fifth CARC (US EPA 2007b) concluded that the incidence of histiocytic sarcomas was not treatment-related, based on the fact that there was no pair-wise significance and the incidence at 1000 ppm (8%), was within the historical control range of 0-10% from Charles River Laboratories (1995) and Inveresk Research International (1996). Historical control data for Life Sciences Research Ltd (testing laboratory of 18-month mice study) was also not available.
The incidences of hystiocytic sarcomas in the two mouse carcinogenicity studies with acetochlor were re-evaluated by a Scientific Advisory Group (SAG) (Gopinath, 2009), a European expert pathology and toxicology panel. After reviewing the morphological criteria used by the PWG panel to diagnose histiocytic sarcomas, SAG found them fully adequate and compatible with the current criteria used and considered that the two mouse bioassays were good standard and used the tumour incidences reported in the two formal PWG reports. SAG concluded that the histiocytic sarcomas were “unrelated to treatment” and not “indicative of any carcinogenic potential of acetochlor”.
These data were also reviewed by the European Chemical Bureau Group of Specialised Experts and concluded that “the tumours in mice fell within the historical controls” (ECBI, 1997).
Table 48: Historical Control Data for Histiocytic Sarcomas in Female CD-1 Mice
Source Approx Time Period
Study Duration
No. Studies Incidence (%) Range Mean
Charles River (1995)
1981-1991 18 months 12 0-10.0 2.2 21 months 3 0-6.0 3.8 24 months 8 0-10.0 3.8
Charles River (2005)
1987-2000 78 weeks 25 0-15.0 2.7 91-104 wks 29 0-18.3 6.5
Inveresk Research (1996)
1990-1993 18 months 5 0-2.0 0.8 24 months 8 0-10.0 4.0
The following factors should be considered in a weight of evidence evaluation of the toxicological significance of the incidence of histiocytic sarcomas:
− It is not considered to be a primary uterine sarcoma. It is a systemic tumour of histiocytic origin that is commonly noted in the liver of males, and the liver or uterus of females.
− There was a variable spontaneous incidence. The high variability in the incidence of histiocytic sarcoma is evident from the range of historical control data presented. Histiocytic sarcoma is a spontaneous tumour in aged mice, and the incidence rapidly increases after 18 months, especially in females (Frith et al., 1993).
− There was an unusually low incidence in 23-month study concurrent control group (0% vs 4% in 18 months mice study). The incidences of histiocytic sarcoma in the highest two treated groups from the 23-month study were not significantly different from the incidence in the untreated control group from the 18-month study.
− There was no clear dose-response relationship
− There was no increase in tumour multiplicity
− There was no decrease in tumour latency
− No increase in incidence (p>0.05) in the 18 months study.
− Lack of related preneoplastic findings in these or other mouse studies with acetochlor.
CLH REPORT FOR ACETOCHLOR
147
− There was no evidence of an increased incidence of histiocytic sarcomas in any of the carcinogenicity studies with other closely related chloroacetanilides, such as alachlor.
− Incidence within the range of more recent historical control compiled from Charles River 2005 (1.67-18.33%) and within the range of 0-15% reported in literature (Greaves, 2007; Haseman et al., 1986)
− Incidence slightly above the more relevant historical control data from Charles River Laboratories (1981-1994) with a reported spontaneous range of 0-10%.
− Lack of evidence of direct genotoxicity of acetochlor.
Taking the above factors into consideration the increased incidence of histiocytic sarcomas in female mice at 1500 ppm and at 5000 ppm in the 23-month study was treatment-related. However, toxicity at the highest dose of 5000 ppm was excessive and tumours at this dose could be considered of no relevance to humans and at 1500 ppm the evidence was weak based on an increased incidence of a common tumour that slightly exceeded the available historical control data (0-10%). For the 18-months mouse study, the incidence of histiocytic sarcomas was not treatment-related, based on the fact that there was no pair-wise significance, and the fact that the incidence at 1000 ppm (8%) was within the historical control range of 0-10% from Charles River Laboratories (1995) and Inveresk Research International. It was noted that this tumour type was not seen with butachlor or alachlor. This conclusion is in line with EPA opinion.
Lung tumours in CD-1 mice
In the two chronic mouse studies (18 and 24 months) lung adenomas and carcinomas were observed in both sexes.
In the 23 month mice study, in the PWG reevaluation (Hardisty, 1997b), a statistically significant higher incidence of alveolar/bronchiolar adenomas and combined adenomas/carcinomas were noted in all groups of females (in addition to these effects, a positive trend was also observed with the USEPA HED analysis of PWG data). The incidence of carcinomas was significantly increased in females with either PWG data or HED analysis of PWG data, but only at 5000 ppm (with a positive trend also observed). However, there was no clear dose-response relationship. From the data most adenomas and carcinomas were found during second year of treatment. See table 45.5: Neoplastic histopathology lesion in 23-Month Mouse Study (Ahmed, 1983b).
The increase in lung tumours in all treated groups of female mice in the 23 month study as compared to the control group must be evaluated in light of the abnormally low incidence of lung tumours in the concurrent control group (2% in females control groups for adenomas and combined adenomas/carcinomas) as compared to the incidence which should be expected.
In the 18 month study the initial microscopic examination revealed that there was a statistically significant higher incidence of pulmonary adenomas in male and female mice which had received the dose of 1000 ppm and of combined incidence at 1000 ppm in male. In the PWG reevaluation (Hardisty, 1997b) these increases were not statistically significant. However, with the USEPA HED analysis of PWG data the increase of adenomas and combine incidence in males at 1000 ppm was statistically significant, with a positive trend observed for adenoma in male and also a positive trend for combine incidence in both sexes. From the data most adenomas and all carcinomas were found during second year of treatment. A slight increase in bronchiolar hyperplasia was reported in male mice in 100 and 1000 ppm groups, however, there was a lack of a clear dose-response. Bronchiolar hyperplasia was not observed in females and was not substantiated in 24-m study using higher doses. See table 45.10: Lung neoplastic histopathology lesions in 18-Month Mouse Study (Amyes, 1989).
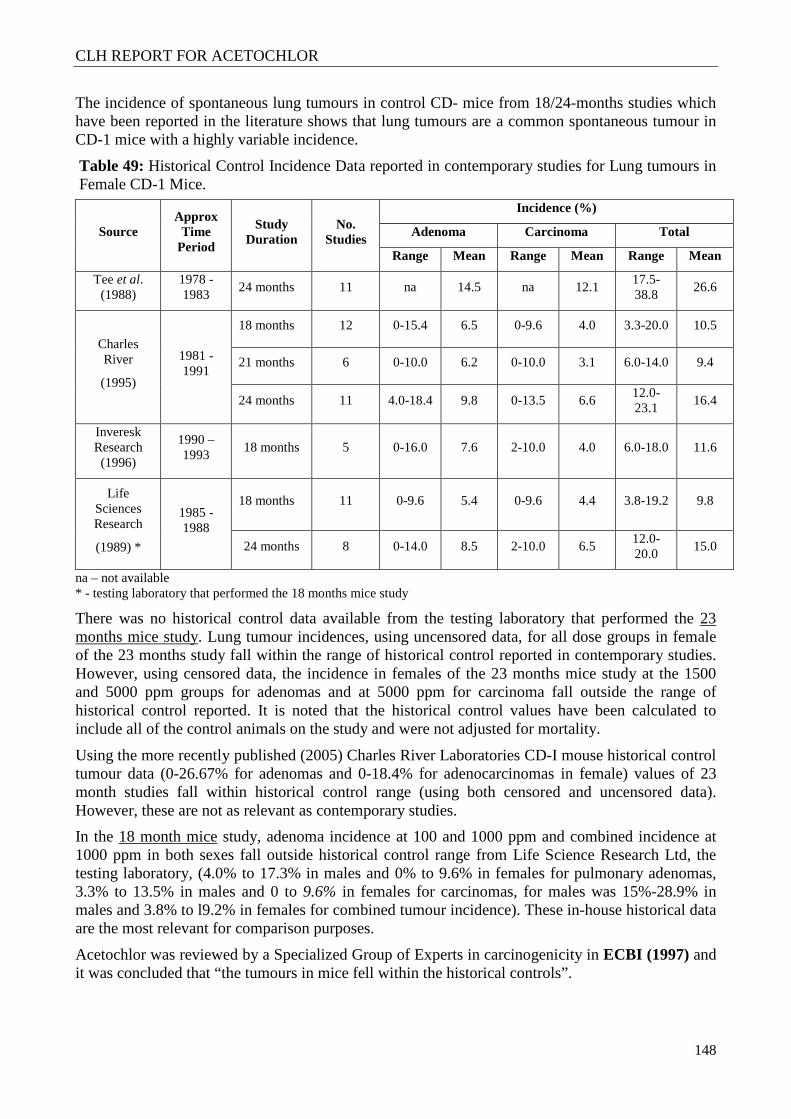
CLH REPORT FOR ACETOCHLOR
148
The incidence of spontaneous lung tumours in control CD- mice from 18/24-months studies which have been reported in the literature shows that lung tumours are a common spontaneous tumour in CD-1 mice with a highly variable incidence.
Table 49: Historical Control Incidence Data reported in contemporary studies for Lung tumours in Female CD-1 Mice.
Source Approx Time
Period
Study Duration
No. Studies
Incidence (%)
Adenoma Carcinoma Total
Range Mean Range Mean Range Mean
Tee et al. (1988)
1978 - 1983
24 months 11 na 14.5 na 12.1 17.5-38.8
26.6
Charles River
(1995)
1981 - 1991
18 months 12 0-15.4 6.5 0-9.6 4.0 3.3-20.0 10.5
21 months 6 0-10.0 6.2 0-10.0 3.1 6.0-14.0 9.4
24 months 11 4.0-18.4 9.8 0-13.5 6.6 12.0-23.1
16.4
Inveresk Research (1996)
1990 – 1993
18 months 5 0-16.0 7.6 2-10.0 4.0 6.0-18.0 11.6
Life Sciences Research
(1989) *
1985 - 1988
18 months 11 0-9.6 5.4 0-9.6 4.4 3.8-19.2 9.8
24 months 8 0-14.0 8.5 2-10.0 6.5 12.0-20.0
15.0
na – not available * - testing laboratory that performed the 18 months mice study
There was no historical control data available from the testing laboratory that performed the 23 months mice study. Lung tumour incidences, using uncensored data, for all dose groups in female of the 23 months study fall within the range of historical control reported in contemporary studies. However, using censored data, the incidence in females of the 23 months mice study at the 1500 and 5000 ppm groups for adenomas and at 5000 ppm for carcinoma fall outside the range of historical control reported. It is noted that the historical control values have been calculated to include all of the control animals on the study and were not adjusted for mortality.
Using the more recently published (2005) Charles River Laboratories CD-I mouse historical control tumour data (0-26.67% for adenomas and 0-18.4% for adenocarcinomas in female) values of 23 month studies fall within historical control range (using both censored and uncensored data). However, these are not as relevant as contemporary studies.
In the 18 month mice study, adenoma incidence at 100 and 1000 ppm and combined incidence at 1000 ppm in both sexes fall outside historical control range from Life Science Research Ltd, the testing laboratory, (4.0% to 17.3% in males and 0% to 9.6% in females for pulmonary adenomas, 3.3% to 13.5% in males and 0 to 9.6% in females for carcinomas, for males was 15%-28.9% in males and 3.8% to l9.2% in females for combined tumour incidence). These in-house historical data are the most relevant for comparison purposes.
Acetochlor was reviewed by a Specialized Group of Experts in carcinogenicity in ECBI (1997) and it was concluded that “the tumours in mice fell within the historical controls”.
CLH REPORT FOR ACETOCHLOR
149
The independent Pathology Working Group (PWG) panel (Hardisty, 1997b) after the reevaluation of both studies concluded that they were not treatment related. For the 23 month study, the statistically significant increased incidence in females was considered by the PWG “a spurious finding resulting from the abnormally low incidence of primary lung tumours in the control group and of no biological significance”. The PWG also noted: incidence in treated groups (uncensored data) within the historical control range, lack of a linear dose-response, lack of increase in precursor proliferative lesions, and absence of a dose-dependent increase in tumour multiplicity for lung tumours in mice and the common finding of these tumours in older mice. For the 18 months study, although adenomas and combined tumour incidences (uncensored data) in both sexes at 1000 ppm slightly exceeded historical control values, the PWG noted lack of statistical significance in this increase. The PWG report also noted lack of a linear dose-response, absence of a dose-dependent increase in tumour multiplicity for lung tumours in mice and the high frequency of these tumours in older mice.
The Fifth Report of the Cancer Assessment Review Committee (US EPA 2007b) determined that the 23-month (Study 1) mouse study showed weak evidence for increased benign lung tumours in females and that the 18-month study (Study 2) showed weak evidence for increased benign lung tumours in males. The high dose of 5000 ppm was considered to exceed the MTD and the tumours incidence was not considered relevant at this dose level. The CARC noted that although the increased incidence of lung adenomas at 1500 ppm (Study 1) and 1000 ppm (Study 2) were outside historical control values, the increases were equivocal, based on increases only in benign tumours, inconsistent dose-responses between the two studies, inconsistencies in the responses of males and females between the two studies, lack of pre-neoplastic lung lesions in the 23-month study (while the 18-month study showed an increase in bronchiolar hyperplasia), the high frequency of these tumours in older mice and the lack of evidence of direct genotoxicity of acetochlor.
The incidences of lung tumours in two mouse carcinogenicity studies with acetochlor were re-evaluated by a Scientific Advisory Group (SAG) (Gopinath, 2009). After reviewing the morphological criteria used by the PWG panel to diagnose the various proliferative lesions of lungs including pulmonary adenomas and carcinomas, SAG found them fully adequate and compatible with the current criteria used and considered that the two mouse bioassays were good standard and used the tumour incidences reported in the two formal PWG reports. The SAG evaluation of the lung tumour data concluded that the slightly increased incidences of lung tumours were “not related to treatment” and “not indicative of any carcinogenic potential of acetochlor”.
The following factors should be considered in a weight of evidence evaluation of the toxicological significance of the incidence of lung sarcomas:
− Lung tumours are a common spontaneous tumour in CD-1 mice with a highly variable incidence.
− In the “OECD Guidance Document nº 116 on the design and conduct of chronic toxicity and carcinogenicity studies” (April 2012) it is said that mouse CD-1, an outbred line derived from the Swiss strain has a relatively high incidence of spontaneous lung tumours and a high susceptibility to chemically induced lung tumorigenesis (Manenti et al. 2003).
− Unusually low incidence in concurrent control group in females of the 23 months study, for adenoma (2% vs 8% in 18 months mice study) and for combine incidence (2% vs 10% in 18 months mice study).
− Incidence in females of the 23 months CD-1 mice study, at all dose groups for adenomas and for carcinoma fall within (using uncensored data) or fall outside for adenoma at 1500 and 5000 ppm groups and for carcinoma at 5000 ppm (using censored data) the range of
CLH REPORT FOR ACETOCHLOR
150
historical control reported for contemporary studies. Incidence within the range of more recent published (2005) Charles River Laboratories CD-I mouse historical control data.
− In males of 18 month mice study, adenoma incidence at 100 and 1000 ppm and combined incidence at 1000 ppm were above the more relevant historical control data from testing laboratory Life Science Research Ltd.
− Inconsistencies in the responses of males and females between the two studies.
− Inconsistent dose-responses between the two studies.
− Lack of pre-neoplastic lung lesions in the 23-month study (while the 18-month study showed an increase in bronchiolar hyperplasia).
− The lack of evidence of direct genotoxicity of acetochlor.
− Shorter term studies did not identify lung as a target organ in mice or any other species.
Taking the above factors into consideration, the increased incidence of lung tumours is considered treatment-related, although the association is weak. Besides, in absence of mechanistic studies to determine the mode of action, the relevance to humans could not be ruled out.
Renal tumours in CD-1 mice
In the 23-month mice study (Ahmed, 1983b) a higher incidence of renal tumours was observed in female at 5000 ppm, with a positive trend (p ≤ 0.01) using the Peto analysis also observed. There was no evidence for an increased incidence of renal tumours in males from this study, or in either sex in the other chronic mice study. No increase incidence was observed in rats. The fourth CARC agreed with the previous conclusion of the PWG and determined that the kidney tumours were not related to treatment based on low incidence and occurrence only at an excessive dose of 5000 ppm (US EPA, 2004a). No further evaluation was conducted in the fifth CARC (US EPA, 2007b).
Data of historical control considered by 4th CARC: The “Expert Report on Renal Histopathological Changes in a Mouse Study (Monsanto Study PR-80-007) with Acetochlor” submitted with the PWG report states that the typical range for spontaneous incidence of renal adenomas would be 10-15%. Data from Charles River 1995 give a lower rate of 0-4%.
Ovarian tumours in CD-1 mice
In females of the 23-month mice study (Ahmed, 1983b), a positive trend (p ≤ 0.01) using the Peto analysis was observed in the incidence of benign ovarian tumours (data not reevaluated by the PWG).
The 4th CARC (US EPA, 2004a) determined that the ovarian benign tumours (adenoma, granulosa cell tumour and luteoma) were not related to treatment based on the low incidence of each individual type of tumour (it was not appropriate to combine the different types of benign ovarian tumours) and occurrence only at an excessive dose of 5000 ppm. The incidences for the individual tumours do not exceed historical control values.
Data of historical control on benign ovarian tumours considered by 4th CARC: Data on spontaneous neoplastic lesions in CD-1 mice for 24-month studies are available from Charles River 1995. In general, ovarian tumours are not common in this strain of mouse. Tubular adenomas are uncommon and show an incidence of 0-2.9% (mean 0.35%). Cystadenomas show a slightly higher incidence of 0-6.12% (mean 1.94%). Granulosa cell/theca cell tumours show a range of 0-6.0% (mean 1.94%). Values for luteomas or for combined tumours were not listed in the Charles River database. Based on these data, the incidences for the above individual tumours do not exceed historical control values unless the granulosa cell tumours and luteomas were combined (6.67%). Data from control
CLH REPORT FOR ACETOCHLOR
151
groups in studies from Inveresk Research International (1993-study dates not provided in available data) give a similar incidence profile. In conclusion, the ovarian tumours are not related to treatment, based on the following: (1) lack of precursor lesions in this study or the other rodent studies on acetochlor; (2) lack of tumour multiplicity or bilateral tumours, (3) lack of linear dose-response, (4) low incidence and (5) within historical control data.
Hepatic tumours in CD-1 mice
There was an increase of hepatic adenomas and carcinomas in the male and female at the high dose of 5000 ppm in the 23-month mice study (Ahmed, 1983b). The statistical analysis performed by the Pathology Working Group re-evaluation (Hardisty, 1997a), revealed that, at this dose the incidence of hepatocellular adenoma and hepatocellular adenoma/carcinoma combined was statistically increased only in male. The EPA HED analysis of PWG data showed in the same study at this dose level a statistically increased adenoma and combined adenoma/carcinoma in both sexes and carcinomas in males, with a positive trend in both sexes for adenoma, carcinoma and combined adenoma/carcinoma.
PWG re-evaluation indicated that: excessive toxicity produced by dose levels greatly exceed the MTD may not be relevant to the risk assessment of acetochlor. Doses of nongenotoxic chemicals which induce cytotoxic liver necrosis have been associated with hepatocellular proliferation leading to the induction of hepatic tumours if the dosing is frequent and is maintained for long periods. This may have been the mechanism responsible for the increased incidence of hepatic neoplasms at the 5000 ppm level.
4th CARC (US EPA, 2004a) agreed with PWG (Hardisty, 1997a) that liver tumours at 5000 ppm in 23-month mouse study, while showing a treatment-related increase in both sexes (exceeding historical controls for adenomas in both sexes and for carcinomas in female, taking into account Hed analys of PWG data) were only observed at an excessive toxic dose of 5000 ppm (considered to have exceeded the MTD) and should not be used in the cancer classification of acetochlor. No further evaluation was conducted in the fifth CARC.
Data of historical control considered by 4th CARC: historical control data on the CD-1® mouse have been published by Charles River, 1995. Ten groups of animals from 24-month studies conducted at independent contract toxicology laboratories were evaluated between July, 1983 and October, 1990. Animals were supplied by Charles River Facilities in the United Kingdom or North America. The ranges of incidence of hepatocellular adenomas were 4.08% to 37.5% in males and 0 to 11.27% in females. The ranges of incidence of hepatocellular carcinoma were 0% to 28% in males and 0 to 4% in females.
Mechanistic studies evaluating the acute effects of acetochlor on rat liver showed that hepatic toxicity was associated with depletion of hepatocellular glutathione reserves at doses at which a slight increase in UDS are observed. The data provide some evidence that the UDS is secondary to depleted glutathione, rather than direct genotoxicity. Hepatocellular proliferation was also evaluated in mice administered acetochlor in the diet for 90 days. At higher doses, BrdU incorporation was shown to increase during this time, providing some evidence that a non-genotoxic, proliferative mechanism may be involved in formation of hepatocellular tumours. Significantly increased hepatocellular tumours were only observed at excessively toxic doses in rats and mouse.
In conclusion, liver tumours observed at 5000 ppm in 23-month mouse study, exceeding the historical control values (for EPA HED analysis of PWG data), while showing a treatment-related increase in both sexes, were only observed at an excessive toxic dose of 5000 ppm, a dose that exceeded the MTD. In overall, liver tumours are considered of non relevance to humans.
CLH REPORT FOR ACETOCHLOR
152
4.10.5 Comparison with criteria
Comparison of acetochlor carcinogenicity data with the corresponding classification criteria is not trivial because the data are complex and some kind of borderline and the criteria leave a margin for different interpretations. To start with there are statistically significant increases in tumour incidences for several types of tumours in two different species. This is generally taken as positive evidence of carcinogenic activity.
The major concern is from treatment-related nasal tumours in rats, without convincing data that this carcinogenic potential is not relevant to humans. The weak experimental carcinogenic potential in lung and uterus of mice is considered to give supporting evidence since treatment-relationship could not be excluded.
As there is no epidemiological evidence regarding the carcinogenicity of acetochlor to humans, a classification in Category 1A (CLP Regulation), [Category 1 (DSD)] is not appropriate.
It is therefore necessary to decide whether to classify acetochlor in category 1B (CLP Regulation), [Category 2 (DSD)] or category 2 (CLP Regulation), [Category 3 (DSD)]. Since an increase in tumour incidence has been observed in two species an argument for classification in category 1B (CLP Regulation), [Category 2 (DSD)] classification can be made. However, on consideration of the available data, there are a number of factors that indicate that classification in category 2 (CLP Regulation), [Category 3 (DSD)] would be more appropriate.
Most significantly, the available genotoxicity data on acetochlor do not support a genotoxic mode of action for tumour induction and the extensive mechanistic data suggests that acetochlor is carcinogenic in nasal tissues by a secondary mechanism with a practical threshold. The ‘Guidance on the application of the CLP Criteria’ (chapter 3.6.2.3.2(k)) states that the existence of a secondary mechanism of action with the implication of a practical threshold above a certain dose level may lead to a classification in category 2 rather than category 1. This is also an argument that would lead to classify a substance in category 3 under DSD.
Nasal olfactory epithelial tumour mechanism was determined to be based on local cytotoxicity secondary to quinone imine formation. Although rats appear to be more sensitive than humans to formation of nasal tumours, available data do not convincingly indicate that these tumours might not be relevant for humans.
Besides, a treatment-related effect can not be excluded for the lung and uterus tumours, although the association is considered to be weak. However, in the absence of mechanistic studies, insufficient data are available at this time to determine the mode of action for lung and uterus tumours. Consequently their relevance for humans could not be ruled out. The CLP guidance (chapter 3.6.2.3.2(k)) states that only if a mode of action of tumour development is conclusively determined not to be operative in humans then the carcinogenic evidence for that tumour may be discounted. DSD coincide in this matter.
Additionally, high doses were required to induce some tumours, and they were generally above the maximal tolerated dose in the experiments conducted. It has been shown that the elevated tumour incidences at the highest dose level are linked to an unspecific weakening of the health status of the exposed animals. Thus, there is sufficiently convincing limitation of the study design in order to dismiss the findings at the highest dose level. However, CLP classification criteria do not require not classifying for carcinogenicity if the MTD is exceeded, but leave the decision for a carcinogenicity category 2 still open. Under the DSD criteria, if the MTD is exceeded, it would lead to classification in Category 3.
CLH REPORT FOR ACETOCHLOR
153
The CLP guidance (chapter 3.6.2.3.2(i)) states that “excessive toxicity, for instance toxicity at doses exceeding the MTD, can affect the carcinogenic responses in bioassays. Such toxicity can cause effects such as cell death (necrosis) with associated regenerative hyperplasia, which can lead to tumour development as a secondary consequence unrelated to the intrinsic potential of the substance itself to cause tumours at lower less toxic doses”. “Tumours occurring only at excessive doses associated with severe toxicity generally have a more doubtful potential for carcinogenicity in humans”. ”If a test compound is only found to be carcinogenic at the highest dose(s) used in a lifetime bioassay, and the characteristics associated with doses exceeding the MTD as outlined above are present, this could be an indication of a confounding effect of excessive toxicity. This may support a classification of the test compound in Category 2 or no classification”.
It is considered evident that acetochlor tumour profile does not allow for a CLP 1B category [Category 2 (DSD)]; mainly because of the rather weak dose-response relationship for lung and uterus tumours, in combination with the existence of doubts about the relevance to humans of the nasal tumour findings and, given that acetochlor is not genotoxic. Therefore, acetochlor carcinogenicity data do not fulfil the criteria for the CLP carcinogenicity 1B category. [Category 2 (DSD)].
Therefore, in view of these considerations and based on the available evidence it is deemed that acetochlor best fits the criteria for classification as Carc. 2; H351 (CLP) and Carc. Cat. 3; R40 (DSD). Based on findings of rare nasal olfactory epithelial tumours in the male and female rat (relevance to humans could not be ruled out) and based on weak evidence for benign lung tumours in male and female mice and histiocytic sarcomas in female mice (mode of actions not identified). Other tumours either not considered treatment-related or were increased only at excessively toxic doses.
4.10.6 Conclusions on Classification and Labelling
Based on the comparison of carcinogenicity data with DSD and CLP classification criteria it is justified to classify acetochlor into the Category 2 (CLP Regulation), [Category 3 (DSD)]. This proposal is also supported by the acetochlor classification adopted by EPA 2007 as “suggestive evidence of carcinogenic potential probable human carcinogen” and the classification of Alachlor (acetochlor´s analogue) adopted by ECBI as Carc. Cat 3, R40.
Directive 67/548/EEC: Carc. Cat. 3; R40 CLP: Carc. 2 – H351
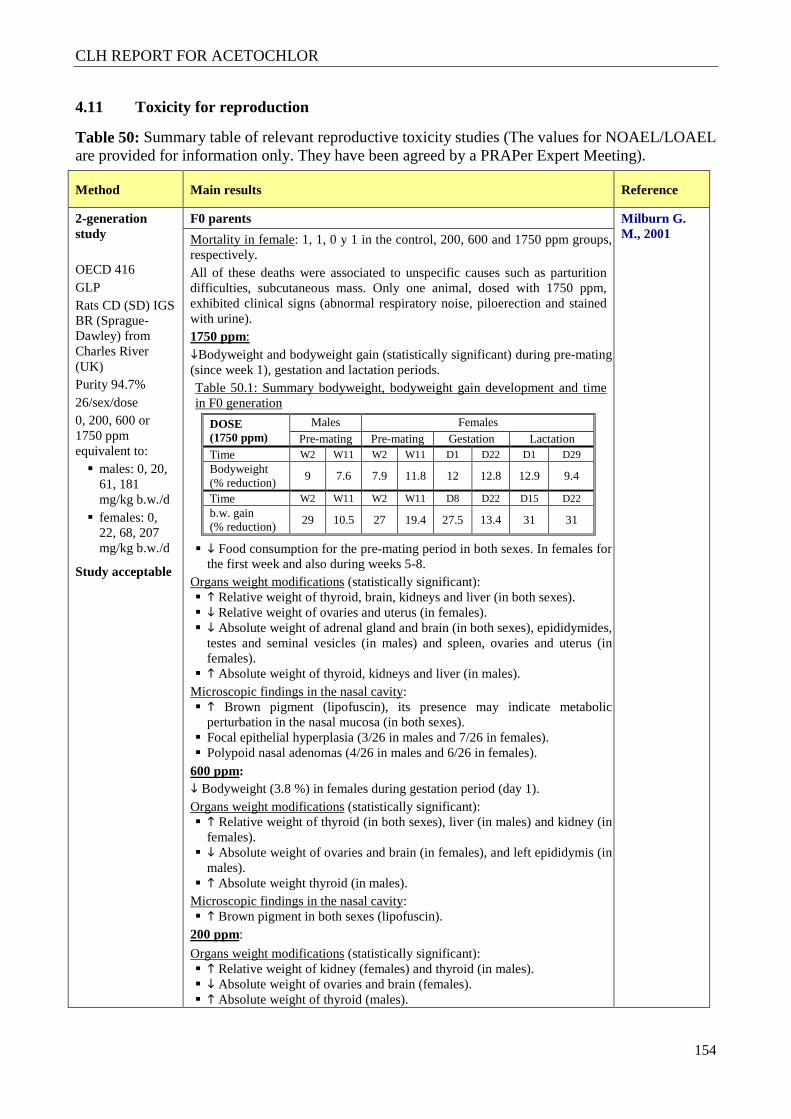
CLH REPORT FOR ACETOCHLOR
154
4.11 Toxicity for reproduction
Table 50: Summary table of relevant reproductive toxicity studies (The values for NOAEL/LOAEL are provided for information only. They have been agreed by a PRAPer Expert Meeting).
Method Main results Reference
2-generation study OECD 416 GLP Rats CD (SD) IGS BR (Sprague-Dawley) from Charles River (UK) Purity 94.7% 26/sex/dose 0, 200, 600 or 1750 ppm equivalent to: � males: 0, 20,
61, 181 mg/kg b.w./d
� females: 0, 22, 68, 207 mg/kg b.w./d
Study acceptable
F0 parents Milburn G. M., 2001 Mortality in female: 1, 1, 0 y 1 in the control, 200, 600 and 1750 ppm groups,
respectively. All of these deaths were associated to unspecific causes such as parturition difficulties, subcutaneous mass. Only one animal, dosed with 1750 ppm, exhibited clinical signs (abnormal respiratory noise, piloerection and stained with urine). 1750 ppm: �Bodyweight and bodyweight gain (statistically significant) during pre-mating (since week 1), gestation and lactation periods. Table 50.1: Summary bodyweight, bodyweight gain development and time in F0 generation
DOSE (1750 ppm)
Males Females Pre-mating Pre-mating Gestation Lactation
Time W2 W11 W2 W11 D1 D22 D1 D29 Bodyweight (% reduction)
9 7.6 7.9 11.8 12 12.8 12.9 9.4
Time W2 W11 W2 W11 D8 D22 D15 D22
b.w. gain (% reduction)
29 10.5 27 19.4 27.5 13.4 31 31
� � Food consumption for the pre-mating period in both sexes. In females for the first week and also during weeks 5-8.
Organs weight modifications (statistically significant): � � Relative weight of thyroid, brain, kidneys and liver (in both sexes). � � Relative weight of ovaries and uterus (in females). � � Absolute weight of adrenal gland and brain (in both sexes), epididymides,
testes and seminal vesicles (in males) and spleen, ovaries and uterus (in females).
� � Absolute weight of thyroid, kidneys and liver (in males). Microscopic findings in the nasal cavity: � � Brown pigment (lipofuscin), its presence may indicate metabolic
perturbation in the nasal mucosa (in both sexes). � Focal epithelial hyperplasia (3/26 in males and 7/26 in females). � Polypoid nasal adenomas (4/26 in males and 6/26 in females).
600 ppm: � Bodyweight (3.8 %) in females during gestation period (day 1). Organs weight modifications (statistically significant): � � Relative weight of thyroid (in both sexes), liver (in males) and kidney (in
females). � � Absolute weight of ovaries and brain (in females), and left epididymis (in
males). � � Absolute weight thyroid (in males).
Microscopic findings in the nasal cavity: � � Brown pigment in both sexes (lipofuscin).
200 ppm:
Organs weight modifications (statistically significant): � � Relative weight of kidney (females) and thyroid (in males). � � Absolute weight of ovaries and brain (females). � � Absolute weight of thyroid (males).
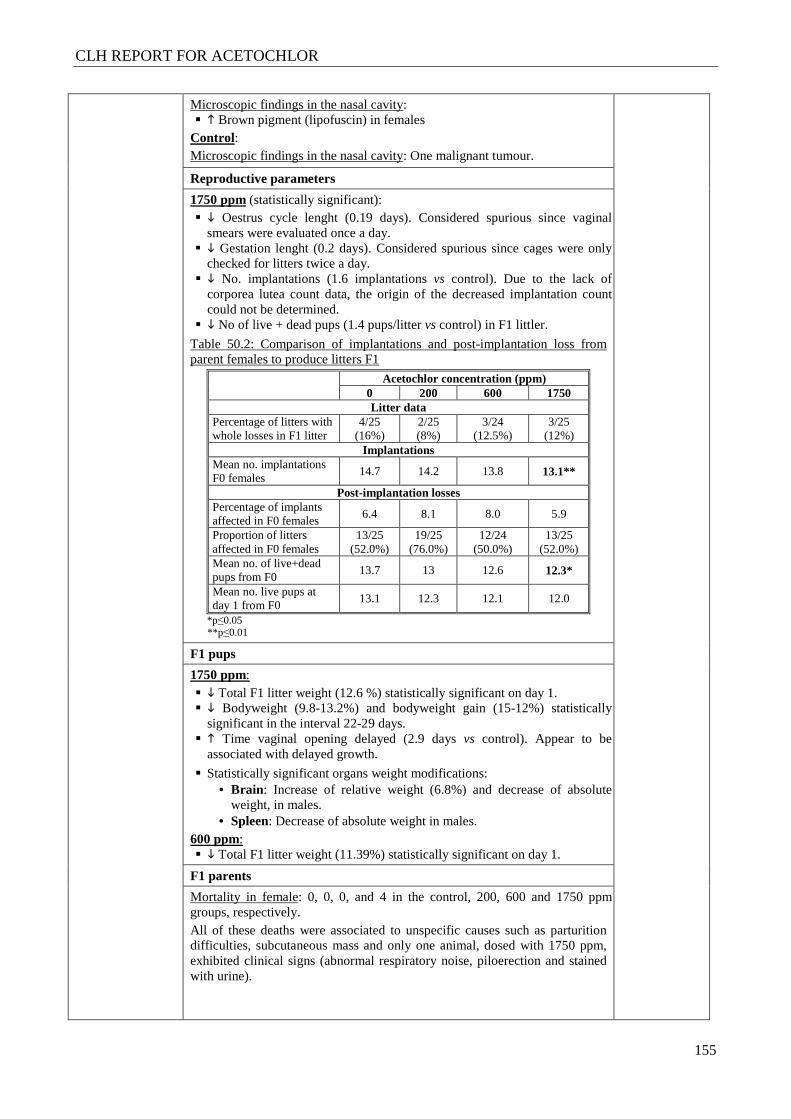
CLH REPORT FOR ACETOCHLOR
155
Microscopic findings in the nasal cavity: � � Brown pigment (lipofuscin) in females
Control : Microscopic findings in the nasal cavity: One malignant tumour.
Reproductive parameters
1750 ppm (statistically significant): � � Oestrus cycle lenght (0.19 days). Considered spurious since vaginal
smears were evaluated once a day. � � Gestation lenght (0.2 days). Considered spurious since cages were only
checked for litters twice a day. � � No. implantations (1.6 implantations vs control). Due to the lack of
corporea lutea count data, the origin of the decreased implantation count could not be determined.
� � No of live + dead pups (1.4 pups/litter vs control) in F1 littler.
Table 50.2: Comparison of implantations and post-implantation loss from parent females to produce litters F1
Acetochlor concentration (ppm)
0 200 600 1750 Litter data
Percentage of litters with whole losses in F1 litter
4/25 (16%)
2/25 (8%)
3/24 (12.5%)
3/25 (12%)
Implantations Mean no. implantations F0 females
14.7 14.2 13.8 13.1**
Post-implantation losses Percentage of implants affected in F0 females
6.4 8.1 8.0 5.9
Proportion of litters affected in F0 females
13/25 (52.0%)
19/25 (76.0%)
12/24 (50.0%)
13/25 (52.0%)
Mean no. of live+dead pups from F0
13.7 13 12.6 12.3*
Mean no. live pups at day 1 from F0
13.1 12.3 12.1 12.0
*p≤0.05 **p ≤0.01
F1 pups
1750 ppm: � � Total F1 litter weight (12.6 %) statistically significant on day 1. � � Bodyweight (9.8-13.2%) and bodyweight gain (15-12%) statistically
significant in the interval 22-29 days. � � Time vaginal opening delayed (2.9 days vs control). Appear to be
associated with delayed growth.
� Statistically significant organs weight modifications: • Brain : Increase of relative weight (6.8%) and decrease of absolute
weight, in males. • Spleen: Decrease of absolute weight in males.
600 ppm: � � Total F1 litter weight (11.39%) statistically significant on day 1.
F1 parents
Mortality in female: 0, 0, 0, and 4 in the control, 200, 600 and 1750 ppm groups, respectively. All of these deaths were associated to unspecific causes such as parturition difficulties, subcutaneous mass and only one animal, dosed with 1750 ppm, exhibited clinical signs (abnormal respiratory noise, piloerection and stained with urine).
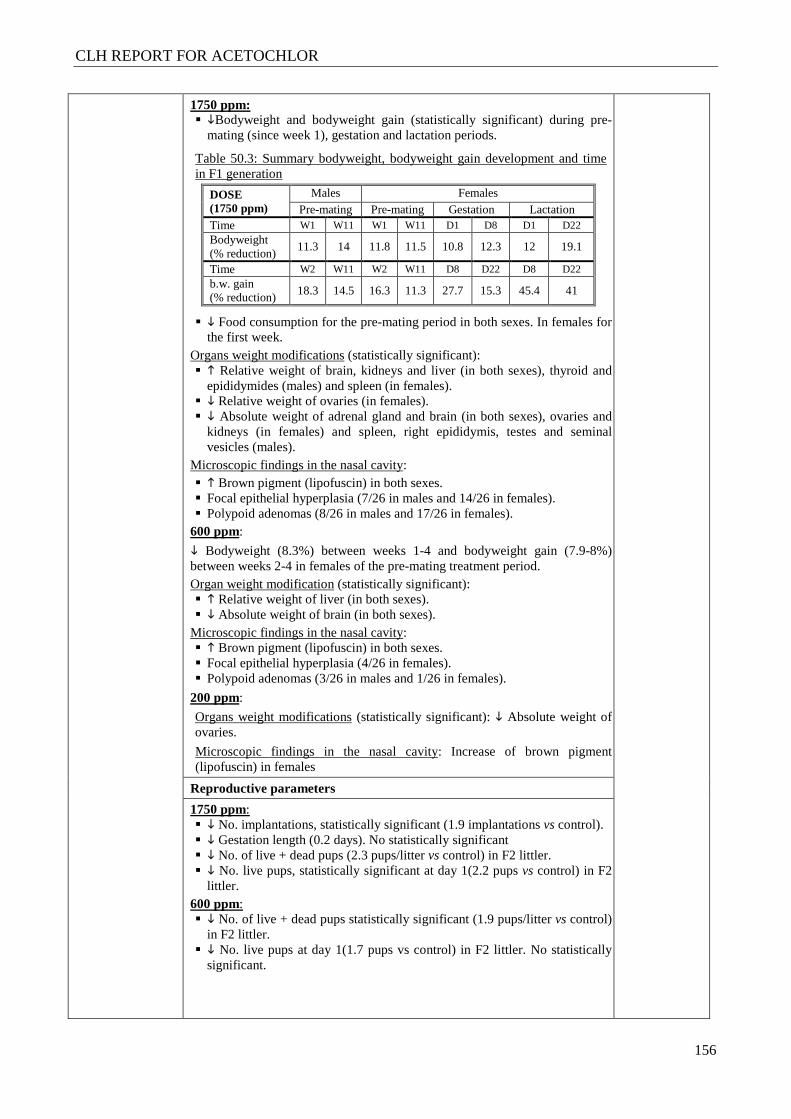
CLH REPORT FOR ACETOCHLOR
156
1750 ppm: � �Bodyweight and bodyweight gain (statistically significant) during pre-
mating (since week 1), gestation and lactation periods.
Table 50.3: Summary bodyweight, bodyweight gain development and time in F1 generation
DOSE (1750 ppm)
Males Females Pre-mating Pre-mating Gestation Lactation
Time W1 W11 W1 W11 D1 D8 D1 D22 Bodyweight (% reduction)
11.3 14 11.8 11.5 10.8 12.3 12 19.1
Time W2 W11 W2 W11 D8 D22 D8 D22
b.w. gain (% reduction)
18.3 14.5 16.3 11.3 27.7 15.3 45.4 41
� � Food consumption for the pre-mating period in both sexes. In females for the first week.
Organs weight modifications (statistically significant): � � Relative weight of brain, kidneys and liver (in both sexes), thyroid and
epididymides (males) and spleen (in females). � � Relative weight of ovaries (in females). � � Absolute weight of adrenal gland and brain (in both sexes), ovaries and
kidneys (in females) and spleen, right epididymis, testes and seminal vesicles (males).
Microscopic findings in the nasal cavity: � � Brown pigment (lipofuscin) in both sexes. � Focal epithelial hyperplasia (7/26 in males and 14/26 in females). � Polypoid adenomas (8/26 in males and 17/26 in females).
600 ppm:
� Bodyweight (8.3%) between weeks 1-4 and bodyweight gain (7.9-8%) between weeks 2-4 in females of the pre-mating treatment period. Organ weight modification (statistically significant): � � Relative weight of liver (in both sexes). � � Absolute weight of brain (in both sexes).
Microscopic findings in the nasal cavity: � � Brown pigment (lipofuscin) in both sexes. � Focal epithelial hyperplasia (4/26 in females). � Polypoid adenomas (3/26 in males and 1/26 in females).
200 ppm:
Organs weight modifications (statistically significant): � Absolute weight of ovaries.
Microscopic findings in the nasal cavity: Increase of brown pigment (lipofuscin) in females
Reproductive parameters
1750 ppm: � � No. implantations, statistically significant (1.9 implantations vs control). � � Gestation length (0.2 days). No statistically significant � � No. of live + dead pups (2.3 pups/litter vs control) in F2 littler. � � No. live pups, statistically significant at day 1(2.2 pups vs control) in F2
littler. 600 ppm: � � No. of live + dead pups statistically significant (1.9 pups/litter vs control)
in F2 littler. � � No. live pups at day 1(1.7 pups vs control) in F2 littler. No statistically
significant.
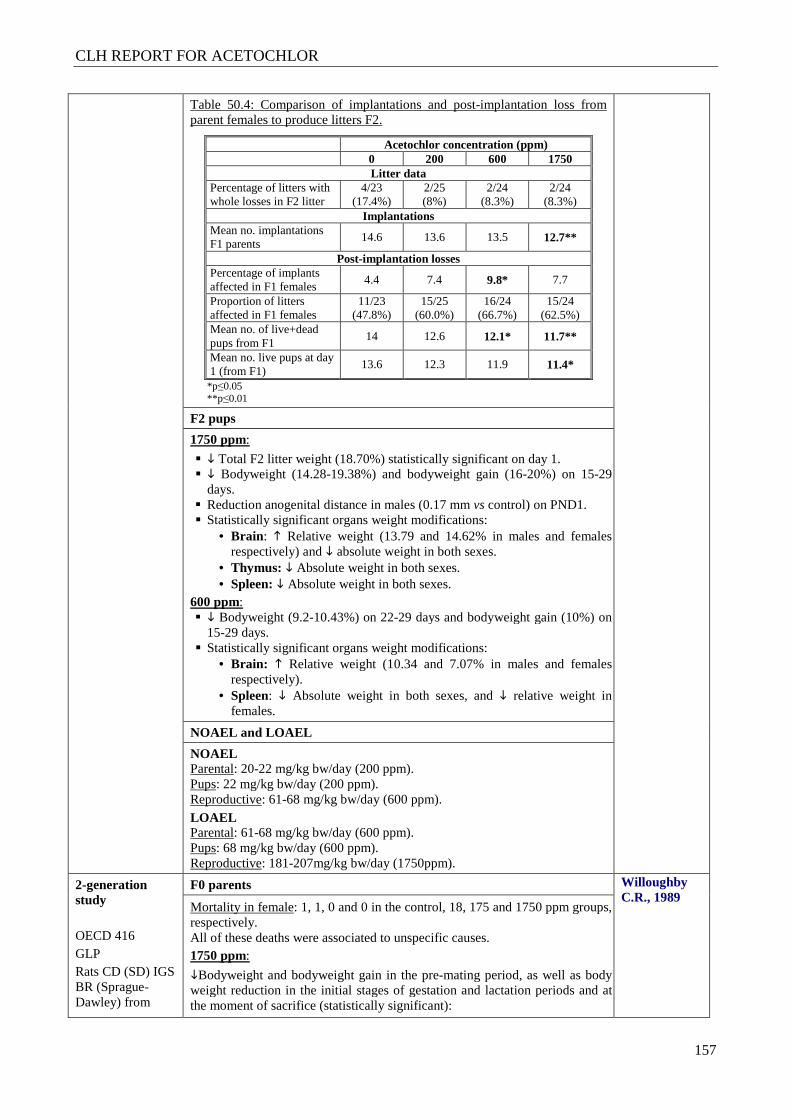
CLH REPORT FOR ACETOCHLOR
157
Table 50.4: Comparison of implantations and post-implantation loss from parent females to produce litters F2.
Acetochlor concentration (ppm) 0 200 600 1750
Litter data Percentage of litters with whole losses in F2 litter
4/23 (17.4%)
2/25 (8%)
2/24 (8.3%)
2/24 (8.3%)
Implantations Mean no. implantations F1 parents
14.6 13.6 13.5 12.7**
Post-implantation losses Percentage of implants affected in F1 females
4.4 7.4 9.8* 7.7
Proportion of litters affected in F1 females
11/23 (47.8%)
15/25 (60.0%)
16/24 (66.7%)
15/24 (62.5%)
Mean no. of live+dead pups from F1
14 12.6 12.1* 11.7**
Mean no. live pups at day 1 (from F1)
13.6 12.3 11.9 11.4*
*p≤0.05 **p ≤0.01
F2 pups
1750 ppm:
� � Total F2 litter weight (18.70%) statistically significant on day 1. � � Bodyweight (14.28-19.38%) and bodyweight gain (16-20%) on 15-29
days. � Reduction anogenital distance in males (0.17 mm vs control) on PND1. � Statistically significant organs weight modifications:
• Brain : � Relative weight (13.79 and 14.62% in males and females respectively) and � absolute weight in both sexes.
• Thymus: � Absolute weight in both sexes. • Spleen: � Absolute weight in both sexes.
600 ppm: � � Bodyweight (9.2-10.43%) on 22-29 days and bodyweight gain (10%) on
15-29 days. � Statistically significant organs weight modifications:
• Brain: � Relative weight (10.34 and 7.07% in males and females respectively).
• Spleen: � Absolute weight in both sexes, and � relative weight in females.
NOAEL and LOAEL
NOAEL Parental: 20-22 mg/kg bw/day (200 ppm). Pups: 22 mg/kg bw/day (200 ppm). Reproductive: 61-68 mg/kg bw/day (600 ppm). LOAEL Parental: 61-68 mg/kg bw/day (600 ppm). Pups: 68 mg/kg bw/day (600 ppm). Reproductive: 181-207mg/kg bw/day (1750ppm).
2-generation study OECD 416 GLP Rats CD (SD) IGS BR (Sprague-Dawley) from
F0 parents Willoughby C.R., 1989
Mortality in female: 1, 1, 0 and 0 in the control, 18, 175 and 1750 ppm groups, respectively. All of these deaths were associated to unspecific causes. 1750 ppm:
�Bodyweight and bodyweight gain in the pre-mating period, as well as body weight reduction in the initial stages of gestation and lactation periods and at the moment of sacrifice (statistically significant):
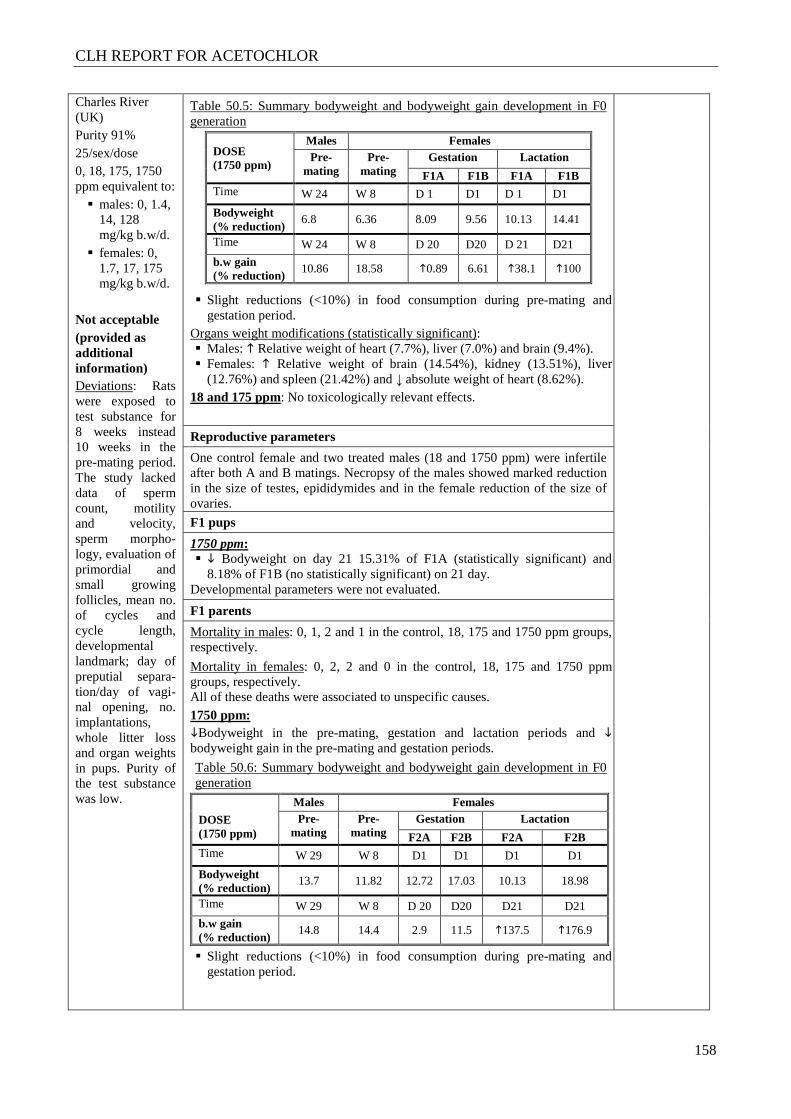
CLH REPORT FOR ACETOCHLOR
158
Charles River (UK) Purity 91% 25/sex/dose 0, 18, 175, 1750 ppm equivalent to: � males: 0, 1.4,
14, 128 mg/kg b.w/d.
� females: 0, 1.7, 17, 175 mg/kg b.w/d.
Not acceptable (provided as additional information) Deviations: Rats were exposed to test substance for 8 weeks instead 10 weeks in the pre-mating period. The study lacked data of sperm count, motility and velocity, sperm morpho-logy, evaluation of primordial and small growing follicles, mean no. of cycles and cycle length, developmental landmark; day of preputial separa-tion/day of vagi-nal opening, no. implantations, whole litter loss and organ weights in pups. Purity of the test substance was low.
Table 50.5: Summary bodyweight and bodyweight gain development in F0 generation
DOSE (1750 ppm)
Males Females Pre-
mating Pre-
mating Gestation Lactation
F1A F1B F1A F1B Time W 24 W 8 D 1 D1 D 1 D1
Bodyweight (% reduction)
6.8 6.36 8.09 9.56 10.13 14.41
Time W 24 W 8 D 20 D20 D 21 D21
b.w gain (% reduction)
10.86 18.58 �0.89 6.61 �38.1 �100
� Slight reductions (<10%) in food consumption during pre-mating and gestation period.
Organs weight modifications (statistically significant): � Males: � Relative weight of heart (7.7%), liver (7.0%) and brain (9.4%). � Females: � Relative weight of brain (14.54%), kidney (13.51%), liver
(12.76%) and spleen (21.42%) and ↓ absolute weight of heart (8.62%). 18 and 175 ppm: No toxicologically relevant effects.
Reproductive parameters
One control female and two treated males (18 and 1750 ppm) were infertile after both A and B matings. Necropsy of the males showed marked reduction in the size of testes, epididymides and in the female reduction of the size of ovaries.
F1 pups
1750 ppm: � � Bodyweight on day 21 15.31% of F1A (statistically significant) and
8.18% of F1B (no statistically significant) on 21 day. Developmental parameters were not evaluated.
F1 parents
Mortality in males: 0, 1, 2 and 1 in the control, 18, 175 and 1750 ppm groups, respectively.
Mortality in females: 0, 2, 2 and 0 in the control, 18, 175 and 1750 ppm groups, respectively. All of these deaths were associated to unspecific causes. 1750 ppm: �Bodyweight in the pre-mating, gestation and lactation periods and � bodyweight gain in the pre-mating and gestation periods.
Table 50.6: Summary bodyweight and bodyweight gain development in F0 generation
DOSE (1750 ppm)
Males Females Pre-
mating Pre-
mating Gestation Lactation
F2A F2B F2A F2B Time W 29 W 8 D1 D1 D1 D1
Bodyweight (% reduction)
13.7 11.82 12.72 17.03 10.13 18.98
Time W 29 W 8 D 20 D20 D21 D21
b.w gain (% reduction)
14.8 14.4 2.9 11.5 �137.5 �176.9
� Slight reductions (<10%) in food consumption during pre-mating and gestation period.
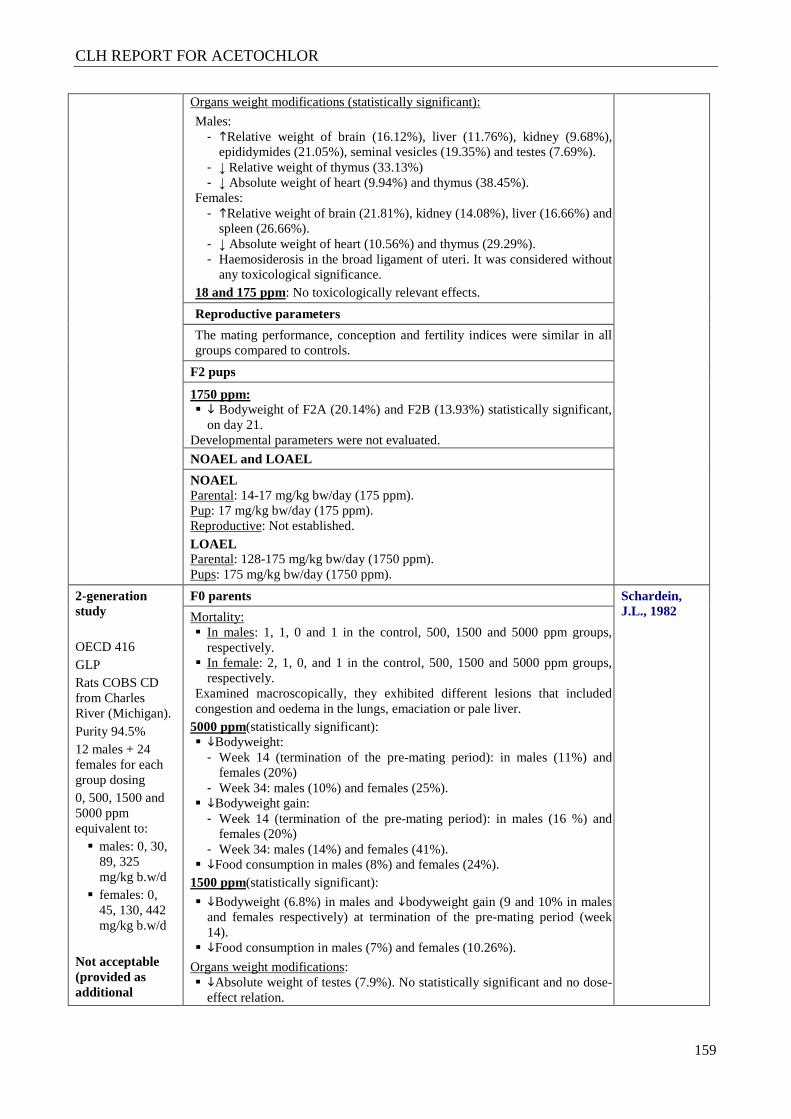
CLH REPORT FOR ACETOCHLOR
159
Organs weight modifications (statistically significant):
Males: - �Relative weight of brain (16.12%), liver (11.76%), kidney (9.68%),
epididymides (21.05%), seminal vesicles (19.35%) and testes (7.69%). - ↓ Relative weight of thymus (33.13%) - ↓ Absolute weight of heart (9.94%) and thymus (38.45%).
Females: - �Relative weight of brain (21.81%), kidney (14.08%), liver (16.66%) and
spleen (26.66%). - ↓ Absolute weight of heart (10.56%) and thymus (29.29%). - Haemosiderosis in the broad ligament of uteri. It was considered without
any toxicological significance. 18 and 175 ppm: No toxicologically relevant effects.
Reproductive parameters
The mating performance, conception and fertility indices were similar in all groups compared to controls.
F2 pups
1750 ppm: � � Bodyweight of F2A (20.14%) and F2B (13.93%) statistically significant,
on day 21. Developmental parameters were not evaluated.
NOAEL and LOAEL
NOAEL Parental: 14-17 mg/kg bw/day (175 ppm). Pup: 17 mg/kg bw/day (175 ppm). Reproductive: Not established. LOAEL Parental: 128-175 mg/kg bw/day (1750 ppm). Pups: 175 mg/kg bw/day (1750 ppm).
2-generation study OECD 416 GLP Rats COBS CD from Charles River (Michigan). Purity 94.5% 12 males + 24 females for each group dosing 0, 500, 1500 and 5000 ppm equivalent to: � males: 0, 30,
89, 325 mg/kg b.w/d
� females: 0, 45, 130, 442 mg/kg b.w/d
Not acceptable (provided as additional
F0 parents Schardein, J.L., 1982 Mortality:
� In males: 1, 1, 0 and 1 in the control, 500, 1500 and 5000 ppm groups, respectively.
� In female: 2, 1, 0, and 1 in the control, 500, 1500 and 5000 ppm groups, respectively.
Examined macroscopically, they exhibited different lesions that included congestion and oedema in the lungs, emaciation or pale liver.
5000 ppm(statistically significant): � �Bodyweight:
- Week 14 (termination of the pre-mating period): in males (11%) and females (20%)
- Week 34: males (10%) and females (25%). � �Bodyweight gain:
- Week 14 (termination of the pre-mating period): in males (16 %) and females (20%)
- Week 34: males (14%) and females (41%). � �Food consumption in males (8%) and females (24%).
1500 ppm(statistically significant):
� �Bodyweight (6.8%) in males and �bodyweight gain (9 and 10% in males and females respectively) at termination of the pre-mating period (week 14).
� �Food consumption in males (7%) and females (10.26%).
Organs weight modifications: � �Absolute weight of testes (7.9%). No statistically significant and no dose-
effect relation.
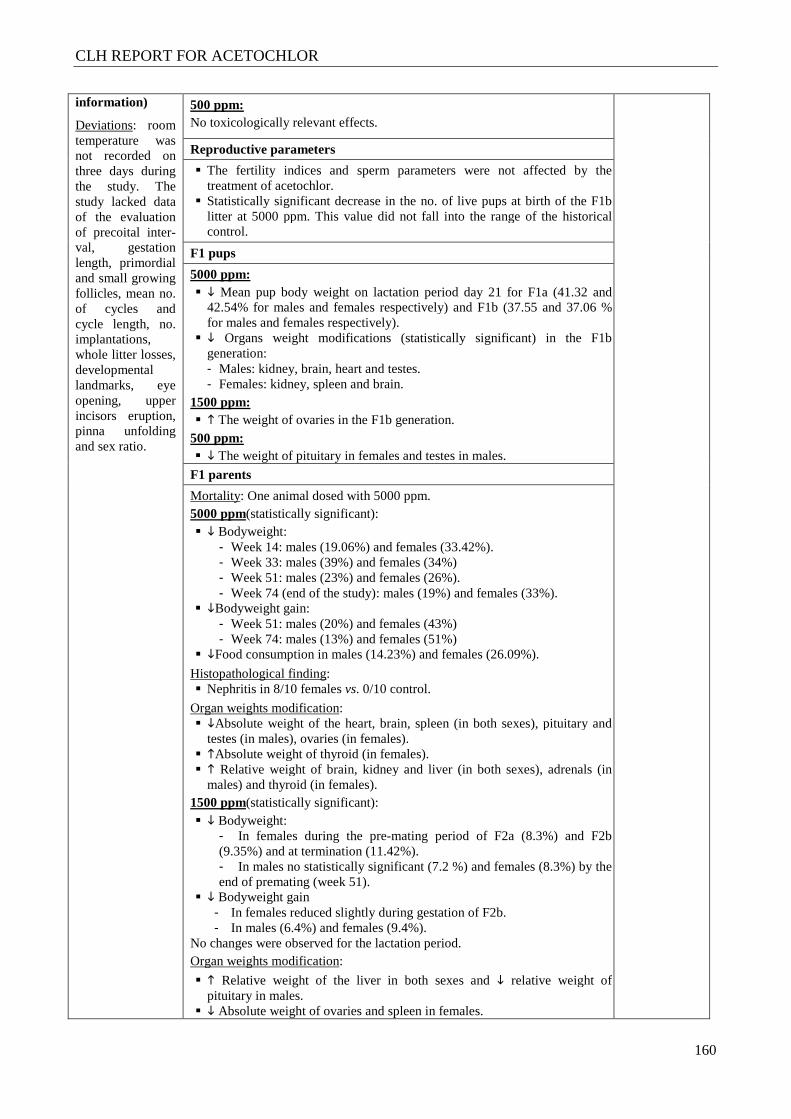
CLH REPORT FOR ACETOCHLOR
160
information)
Deviations: room temperature was not recorded on three days during the study. The study lacked data of the evaluation of precoital inter-val, gestation length, primordial and small growing follicles, mean no. of cycles and cycle length, no. implantations, whole litter losses, developmental landmarks, eye opening, upper incisors eruption, pinna unfolding and sex ratio.
500 ppm: No toxicologically relevant effects.
Reproductive parameters
� The fertility indices and sperm parameters were not affected by the treatment of acetochlor.
� Statistically significant decrease in the no. of live pups at birth of the F1b litter at 5000 ppm. This value did not fall into the range of the historical control.
F1 pups
5000 ppm: � � Mean pup body weight on lactation period day 21 for F1a (41.32 and
42.54% for males and females respectively) and F1b (37.55 and 37.06 % for males and females respectively).
� � Organs weight modifications (statistically significant) in the F1b generation: - Males: kidney, brain, heart and testes. - Females: kidney, spleen and brain.
1500 ppm: � � The weight of ovaries in the F1b generation.
500 ppm: � � The weight of pituitary in females and testes in males.
F1 parents
Mortality: One animal dosed with 5000 ppm. 5000 ppm(statistically significant): � � Bodyweight:
- Week 14: males (19.06%) and females (33.42%). - Week 33: males (39%) and females (34%) - Week 51: males (23%) and females (26%). - Week 74 (end of the study): males (19%) and females (33%).
� �Bodyweight gain: - Week 51: males (20%) and females (43%) - Week 74: males (13%) and females (51%)
� �Food consumption in males (14.23%) and females (26.09%).
Histopathological finding: � Nephritis in 8/10 females vs. 0/10 control.
Organ weights modification: � �Absolute weight of the heart, brain, spleen (in both sexes), pituitary and
testes (in males), ovaries (in females). � �Absolute weight of thyroid (in females). � � Relative weight of brain, kidney and liver (in both sexes), adrenals (in
males) and thyroid (in females). 1500 ppm(statistically significant): � � Bodyweight:
- In females during the pre-mating period of F2a (8.3%) and F2b (9.35%) and at termination (11.42%). - In males no statistically significant (7.2 %) and females (8.3%) by the end of premating (week 51).
� � Bodyweight gain - In females reduced slightly during gestation of F2b. - In males (6.4%) and females (9.4%).
No changes were observed for the lactation period. Organ weights modification:
� � Relative weight of the liver in both sexes and � relative weight of pituitary in males.
� � Absolute weight of ovaries and spleen in females.
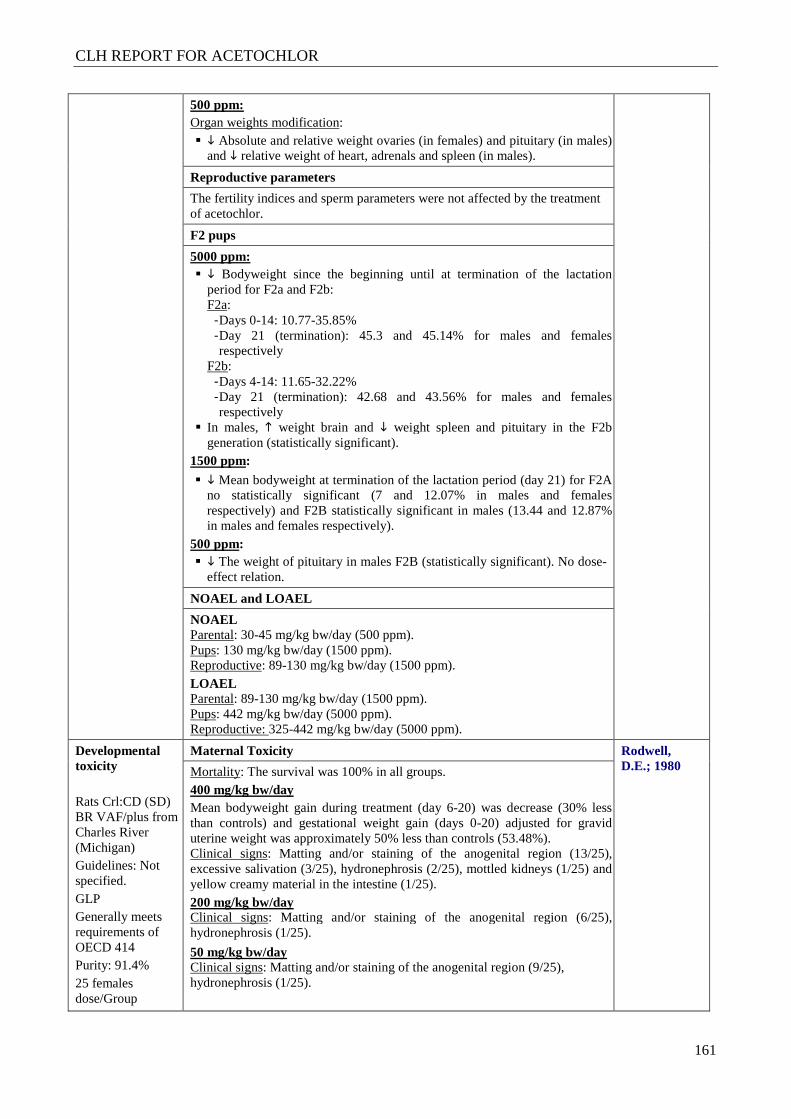
CLH REPORT FOR ACETOCHLOR
161
500 ppm: Organ weights modification: � � Absolute and relative weight ovaries (in females) and pituitary (in males)
and � relative weight of heart, adrenals and spleen (in males).
Reproductive parameters
The fertility indices and sperm parameters were not affected by the treatment of acetochlor.
F2 pups
5000 ppm: � � Bodyweight since the beginning until at termination of the lactation
period for F2a and F2b: F2a: - Days 0-14: 10.77-35.85% - Day 21 (termination): 45.3 and 45.14% for males and females respectively
F2b: - Days 4-14: 11.65-32.22% - Day 21 (termination): 42.68 and 43.56% for males and females respectively
� In males, � weight brain and � weight spleen and pituitary in the F2b generation (statistically significant).
1500 ppm:
� � Mean bodyweight at termination of the lactation period (day 21) for F2A no statistically significant (7 and 12.07% in males and females respectively) and F2B statistically significant in males (13.44 and 12.87% in males and females respectively).
500 ppm: � � The weight of pituitary in males F2B (statistically significant). No dose-
effect relation.
NOAEL and LOAEL
NOAEL Parental: 30-45 mg/kg bw/day (500 ppm). Pups: 130 mg/kg bw/day (1500 ppm). Reproductive: 89-130 mg/kg bw/day (1500 ppm). LOAEL Parental: 89-130 mg/kg bw/day (1500 ppm). Pups: 442 mg/kg bw/day (5000 ppm). Reproductive: 325-442 mg/kg bw/day (5000 ppm).
Developmental toxicity Rats Crl:CD (SD) BR VAF/plus from Charles River (Michigan) Guidelines: Not specified. GLP Generally meets requirements of OECD 414 Purity: 91.4% 25 females dose/Group
Maternal Toxicity Rodwell, D.E.; 1980 Mortality: The survival was 100% in all groups.
400 mg/kg bw/day Mean bodyweight gain during treatment (day 6-20) was decrease (30% less than controls) and gestational weight gain (days 0-20) adjusted for gravid uterine weight was approximately 50% less than controls (53.48%). Clinical signs: Matting and/or staining of the anogenital region (13/25), excessive salivation (3/25), hydronephrosis (2/25), mottled kidneys (1/25) and yellow creamy material in the intestine (1/25). 200 mg/kg bw/day Clinical signs: Matting and/or staining of the anogenital region (6/25), hydronephrosis (1/25).
50 mg/kg bw/day Clinical signs: Matting and/or staining of the anogenital region (9/25), hydronephrosis (1/25).
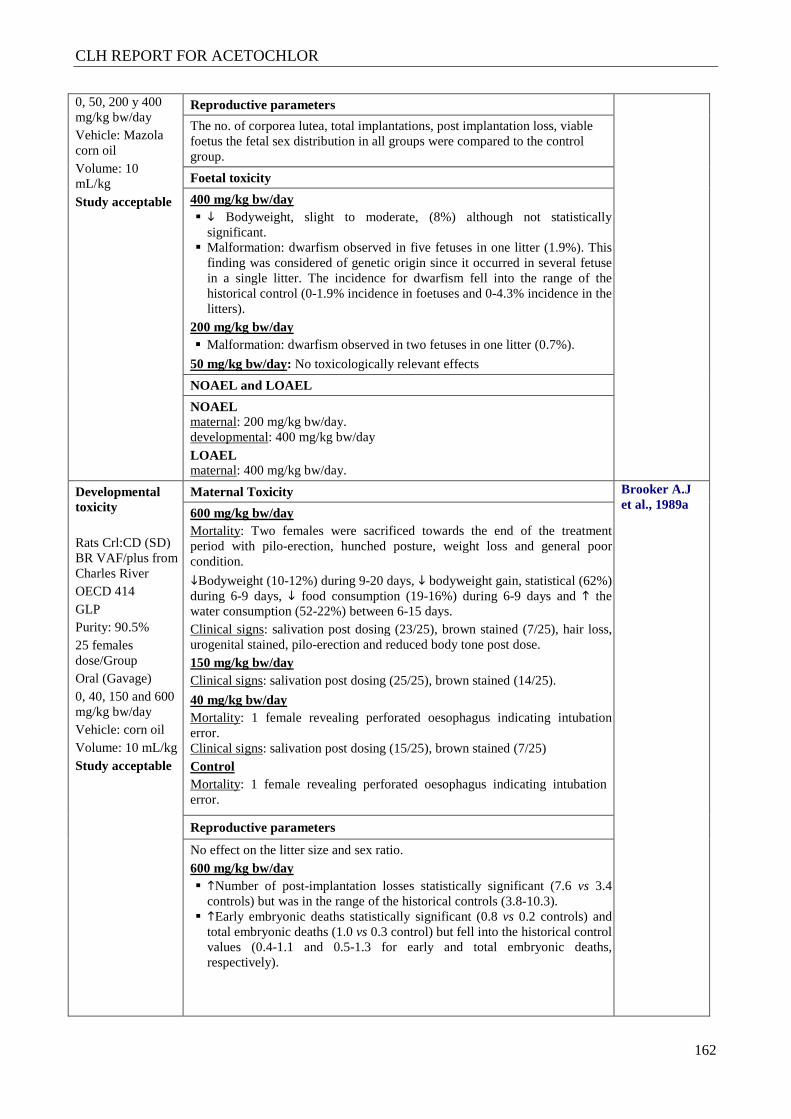
CLH REPORT FOR ACETOCHLOR
162
0, 50, 200 y 400 mg/kg bw/day Vehicle: Mazola corn oil Volume: 10 mL/kg Study acceptable
Reproductive parameters
The no. of corporea lutea, total implantations, post implantation loss, viable foetus the fetal sex distribution in all groups were compared to the control group.
Foetal toxicity
400 mg/kg bw/day � � Bodyweight, slight to moderate, (8%) although not statistically
significant. � Malformation: dwarfism observed in five fetuses in one litter (1.9%). This
finding was considered of genetic origin since it occurred in several fetuse in a single litter. The incidence for dwarfism fell into the range of the historical control (0-1.9% incidence in foetuses and 0-4.3% incidence in the litters).
200 mg/kg bw/day � Malformation: dwarfism observed in two fetuses in one litter (0.7%).
50 mg/kg bw/day: No toxicologically relevant effects
NOAEL and LOAEL
NOAEL maternal: 200 mg/kg bw/day. developmental: 400 mg/kg bw/day LOAEL maternal: 400 mg/kg bw/day.
Developmental toxicity Rats Crl:CD (SD) BR VAF/plus from Charles River OECD 414 GLP Purity: 90.5% 25 females dose/Group Oral (Gavage) 0, 40, 150 and 600 mg/kg bw/day Vehicle: corn oil Volume: 10 mL/kg Study acceptable
Maternal Toxicity Brooker A.J et al., 1989a
600 mg/kg bw/day Mortality: Two females were sacrificed towards the end of the treatment period with pilo-erection, hunched posture, weight loss and general poor condition.
�Bodyweight (10-12%) during 9-20 days, � bodyweight gain, statistical (62%) during 6-9 days, � food consumption (19-16%) during 6-9 days and � the water consumption (52-22%) between 6-15 days. Clinical signs: salivation post dosing (23/25), brown stained (7/25), hair loss, urogenital stained, pilo-erection and reduced body tone post dose. 150 mg/kg bw/day Clinical signs: salivation post dosing (25/25), brown stained (14/25).
40 mg/kg bw/day Mortality: 1 female revealing perforated oesophagus indicating intubation error. Clinical signs: salivation post dosing (15/25), brown stained (7/25) Control Mortality: 1 female revealing perforated oesophagus indicating intubation error.
Reproductive parameters
No effect on the litter size and sex ratio. 600 mg/kg bw/day � �Number of post-implantation losses statistically significant (7.6 vs 3.4
controls) but was in the range of the historical controls (3.8-10.3). � �Early embryonic deaths statistically significant (0.8 vs 0.2 controls) and
total embryonic deaths (1.0 vs 0.3 control) but fell into the historical control values (0.4-1.1 and 0.5-1.3 for early and total embryonic deaths, respectively).
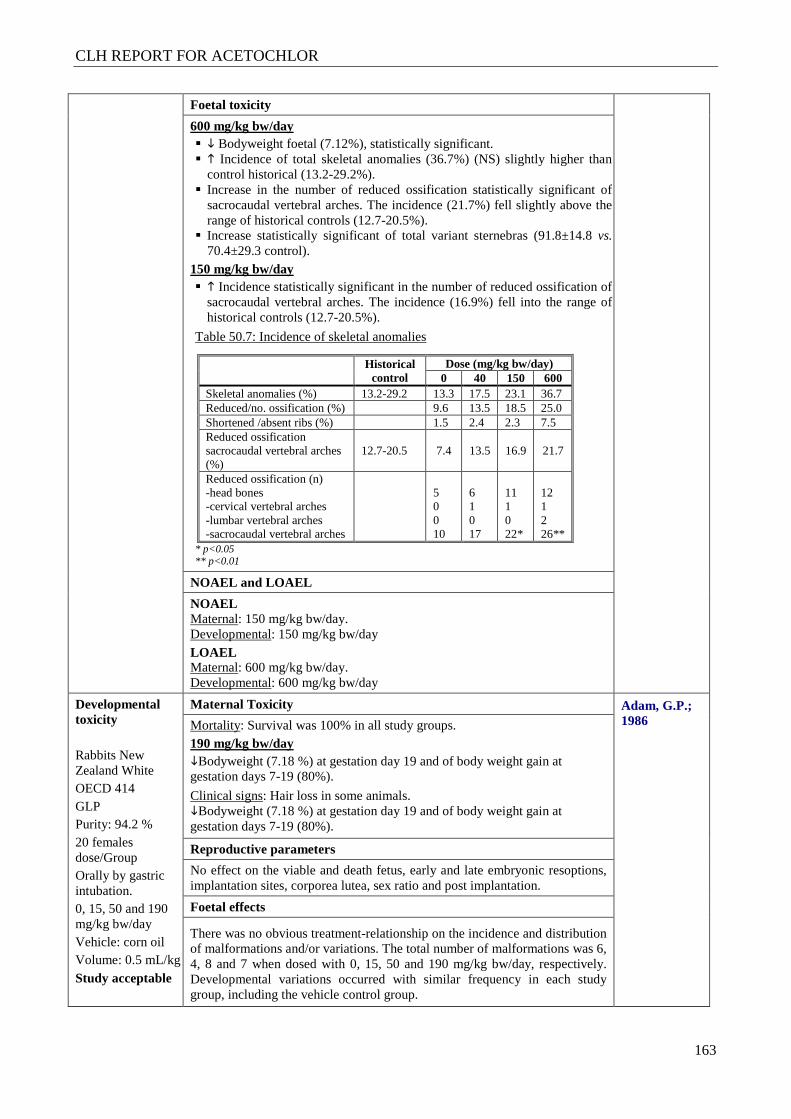
CLH REPORT FOR ACETOCHLOR
163
Foetal toxicity
600 mg/kg bw/day � � Bodyweight foetal (7.12%), statistically significant. � � Incidence of total skeletal anomalies (36.7%) (NS) slightly higher than
control historical (13.2-29.2%). � Increase in the number of reduced ossification statistically significant of
sacrocaudal vertebral arches. The incidence (21.7%) fell slightly above the range of historical controls (12.7-20.5%).
� Increase statistically significant of total variant sternebras (91.8±14.8 vs. 70.4±29.3 control).
150 mg/kg bw/day � � Incidence statistically significant in the number of reduced ossification of
sacrocaudal vertebral arches. The incidence (16.9%) fell into the range of historical controls (12.7-20.5%).
Table 50.7: Incidence of skeletal anomalies
Historical control
Dose (mg/kg bw/day) 0 40 150 600
Skeletal anomalies (%) 13.2-29.2 13.3 17.5 23.1 36.7 Reduced/no. ossification (%) 9.6 13.5 18.5 25.0 Shortened /absent ribs (%) 1.5 2.4 2.3 7.5 Reduced ossification sacrocaudal vertebral arches (%)
12.7-20.5 7.4 13.5 16.9 21.7
Reduced ossification (n) -head bones -cervical vertebral arches -lumbar vertebral arches -sacrocaudal vertebral arches
5 0 0 10
6 1 0 17
11 1 0 22*
12 1 2 26**
* p<0.05 ** p<0.01
NOAEL and LOAEL
NOAEL Maternal: 150 mg/kg bw/day. Developmental: 150 mg/kg bw/day LOAEL Maternal: 600 mg/kg bw/day. Developmental: 600 mg/kg bw/day
Developmental toxicity Rabbits New Zealand White OECD 414 GLP Purity: 94.2 % 20 females dose/Group Orally by gastric intubation. 0, 15, 50 and 190 mg/kg bw/day Vehicle: corn oil Volume: 0.5 mL/kg Study acceptable
Maternal Toxicity Adam, G.P.; 1986 Mortality: Survival was 100% in all study groups.
190 mg/kg bw/day �Bodyweight (7.18 %) at gestation day 19 and of body weight gain at gestation days 7-19 (80%).
Clinical signs: Hair loss in some animals. �Bodyweight (7.18 %) at gestation day 19 and of body weight gain at gestation days 7-19 (80%).
Reproductive parameters
No effect on the viable and death fetus, early and late embryonic resoptions, implantation sites, corporea lutea, sex ratio and post implantation.
Foetal effects
There was no obvious treatment-relationship on the incidence and distribution of malformations and/or variations. The total number of malformations was 6, 4, 8 and 7 when dosed with 0, 15, 50 and 190 mg/kg bw/day, respectively. Developmental variations occurred with similar frequency in each study group, including the vehicle control group.
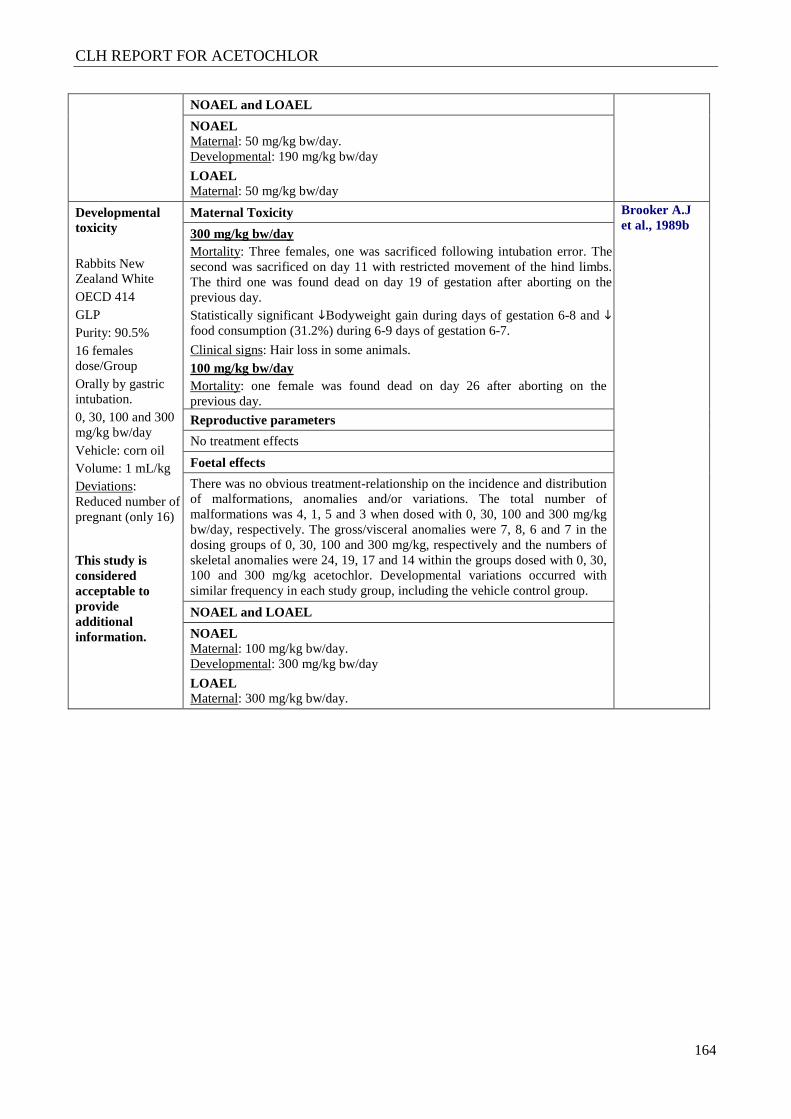
CLH REPORT FOR ACETOCHLOR
164
NOAEL and LOAEL
NOAEL Maternal: 50 mg/kg bw/day. Developmental: 190 mg/kg bw/day
LOAEL Maternal: 50 mg/kg bw/day
Developmental toxicity Rabbits New Zealand White OECD 414 GLP Purity: 90.5% 16 females dose/Group Orally by gastric intubation. 0, 30, 100 and 300 mg/kg bw/day Vehicle: corn oil Volume: 1 mL/kg Deviations: Reduced number of pregnant (only 16)
This study is considered acceptable to provide additional information.
Maternal Toxicity Brooker A.J et al., 1989b
300 mg/kg bw/day Mortality: Three females, one was sacrificed following intubation error. The second was sacrificed on day 11 with restricted movement of the hind limbs. The third one was found dead on day 19 of gestation after aborting on the previous day. Statistically significant �Bodyweight gain during days of gestation 6-8 and � food consumption (31.2%) during 6-9 days of gestation 6-7.
Clinical signs: Hair loss in some animals. 100 mg/kg bw/day Mortality: one female was found dead on day 26 after aborting on the previous day.
Reproductive parameters
No treatment effects
Foetal effects
There was no obvious treatment-relationship on the incidence and distribution of malformations, anomalies and/or variations. The total number of malformations was 4, 1, 5 and 3 when dosed with 0, 30, 100 and 300 mg/kg bw/day, respectively. The gross/visceral anomalies were 7, 8, 6 and 7 in the dosing groups of 0, 30, 100 and 300 mg/kg, respectively and the numbers of skeletal anomalies were 24, 19, 17 and 14 within the groups dosed with 0, 30, 100 and 300 mg/kg acetochlor. Developmental variations occurred with similar frequency in each study group, including the vehicle control group.
NOAEL and LOAEL
NOAEL Maternal: 100 mg/kg bw/day. Developmental: 300 mg/kg bw/day
LOAEL Maternal: 300 mg/kg bw/day.
CLH REPORT FOR ACETOCHLOR
165
4.11.1 Effects on fertility
4.11.1.1 Non-human information
The effects of acetochlor on fertility have been investigated in three multigeneration studies in rats:
In the first two generation study (Milburn, 2001), parental toxicity was evident by reduced body weight, body weight gain as well as reduced food consumption of F0 and F1 males and females during pre-mating period and F0 and F1 females during early gestation and lactation periods, at the dose of 1750 ppm, often coinciding with a decrease of food consumption. F1 females showed a decrease in the bodyweight and bodyweight gain when dosed with 600 ppm between weeks 1-2 and 4 of the pre-mating treatment period.
At 1750 ppm, relative weights of kidney, liver, brain and thyroid were significantly increased for F0 and F1 parental males and females. Relative ovarian weights were decreased for F0 and F1 females, and relative uterus weight for F0. Relative epididymides and spleen (females) weights were increased for F1 as compared to controls. At 600 ppm relative liver weights were increased for F0 parental males and for F1 parental males and females and increase of relative thyroids (both sexes) and kidneys (females) weights for F0. No gross treatment-related histopathological changes in these tissues were found.
Histopathological evaluation revealed treatment-related incidences of benign proliferative lesions (focal epithelial hyperplasia and polypoid adenomas) in the epithelial lining of the ethmoid region of the nasal cavity in F0 and F1 adult animals receiving 1750 ppm of acetochlor and in F1 animals at 600 ppm. Although no clear evidence of malignant change was apparent, the animals were just over 4 months of age and had been exposed to acetochlor for approximately 18 weeks (F0) or 25 weeks (F1) when these lesions were observed. Minimally increase of brown pigment (lipofuscin) was observed in the olfactory mucosa, in males and females of both F0 and F1 animals receiving 600 and 1750 ppm and in F0 and F1 females receiving 200 ppm acetochlor, mainly in the lamina propria and occasionally in the basal epithelium.
Pup toxicity was manifested by a significant decrease in the bodyweight and bodyweight gain of F1 pups of both sexes at 1750 ppm in the 22-29 days interval. F2 litters of both sexes showed a significant decrease of bodyweight and bodyweight gain from the day 15 at the dose of 1750 ppm and from day 22 to 29 at the dose of 600 ppm. Litter weight decreased for F1 litters from 600 ppm and for F2 litters at 1750 ppm.
Increase of relative brain weight, statistically significant in males of F1 pups at 1750 ppm and in both sexes in F2 pups at 600 and 1750 ppm. Mean absolute spleen weights were decreased in F1 males at 1750 ppm and in both sexes of F2 pups at both 600 and 1750 ppm. There was also reduction on the relative weight of spleen at 600 ppm in F2 females. Mean absolute thymus weights of both sexes were also decreased in F2 pups at the highest dose level, but not relative weight. No macroscopic changes were reported.
At the dose of 1750 ppm some reproductive parameters were affected; the mean no. of implantations was reduced in F0 and F1 females. In addition, the mean number of live pups on postnatal day 1 decreased in a dose related manner in both F1 and F2 litters with statistically significance at 1750 ppm in F2 litter. The mean number of live+dead pups per litter was statistically significantly lower in F1 at 1750 ppm and also in F2 litters from 600 ppm. These findings were considered possible evidence of fetal losses. Postnatal survival was not affected by treatment.
At 1750 ppm, vaginal opening was delayed in F1 litter and the anogenital distance in males decreased significantly in F2 litter. However, the sperm data and morphology remained unaltered.
CLH REPORT FOR ACETOCHLOR
166
Based on these results a parental and pup NOAEL of 200 ppm (average of 20-22 mg/kg bw/day in males-females) can be established based on reduction of bodyweight, changes in the weight of some organs and the occurrence of nasal hyperplasia and polypoid adenomas at the dose of 600 ppm (average of 61-68 mg/kg bw/day in males-females) in parental as well as the reduction of total litter weight and brain changes in pups occurred at dose level of 600 ppm.
The NOAEL for reproduction toxicity can be established at dose level of 600 ppm (average 68 mg/kg bw/day in females) based on the variation of some reproductive organs and the decrease of the mean no. of implantations and the number of live pups on postnatal day 1 at dose level of 1750 ppm.
In the second two generation study (Willoughby, 1989), acetochlor, at the dose level of 1750 ppm (average of 128-175 mg/kg bw/day in males-females), produced a parental toxicity in both F0 and F1 parents manifested by a decrease of the bodyweight, bodyweight gain and food consumption in the pre-mating period, as well as bodyweight reduction at initial of gestation and lactation periods and at the moment of sacrifice (only in F0) and decreased bodyweight gain in F1 during gestation.
At 1750 ppm in F0 there was an increase in the relative weight of kidney and spleen (females), heart (males) and brain and liver (both sexes). At this same dose level in F1 there was an increase in the relative weight of spleen (females) epididymides, testes and seminal vesicles (males) and brain, kidney and liver (both sexes) and a decrease in the relative weight of thymus (males).
Based on these results, it can be established a parental NOAEL of 175 ppm (average of 14-17 mg/kg bw/day in males and females respectively).
Pup toxicity was manifested at 1750 ppm; mean pup body weights were reduced on lactation day 21 in F1/F2 pups. No effects on pup survival, birth weight, gross abnormalities or other offspring parameters were observed. Based on these results the NOAEL for pups can be established at 175 ppm (average of 17 mg/kg bw/day in females).
It cannot be established a reproductive NOAEL since many of the reproductive parameters were not evaluated. In the third two generation study (Schardein, 1982), acetochlor, produced parental toxicity at the dose of 5000 ppm, manifested by the decrease of the bodyweight and bodyweight gain at termination of the premating period in F0 y F1 generation. Decrease in food consumption was also reported. At this same dose level some significant variations in absolute/relative organ weights were observed in F1 parents (e.g., testes, ovaries, thyroid, liver, kidney) and the incidence of chronic nephritis was increased in F1 females (8/10 vs. 0/10 examined). There were no treatment-related effects on survival or clinical signs of toxicity. At 1500 ppm, mean parental premating body weights were slightly reduced compared to controls for both F0 and F1 parents. In both F1 sexes, the relative weight of liver increased at this dose. In females, the absolute weight of ovaries and spleen decreased. At 500 ppm there was a decrease in the absolute and relative weight of ovaries. Based on these results, the NOAEL for parental toxicity can be established at 500 ppm (30-45 mg/kg bw/day in males and females respectively).
The offspring toxicity was manifested at the dose of 5000 ppm by decreasing bodyweight at termination of the lactation period (day 21), statistical changes in the weight of the organs and decrease in the number of live F1b pups. No effects on pup survival, birth weight, gross abnormalities or other cesarean offspring parameter were observed. Based on these results, the NOAEL for pup toxicity can be established at 1500 ppm (130 mg/kg bw/day).
The NOAEL for reproduction toxicity can be established at dose level of 1500 ppm based on the the decrease in the number of live F1b pups (average 89-130 mg/kg bw/day in males and females respectively).
CLH REPORT FOR ACETOCHLOR
167
4.11.1.2 Human information
No information available
4.11.2 Developmental toxicity
4.11.2.1 Non-human information
The developmental toxicity of acetochlor has been investigated in rats (2 studies) and rabbits (2 studies).
In the first developmental rat study (Rodwell, 1980), at the top dose (400 mg/kg bw/day), marked maternal toxicity was observed, manifested by a decrease of bodyweight gain (30%) during treatment (days 6-20) and reduction of gestational weight gain (days 0-20) approximately 50% less than controls. Excessive salivation at this dose level (post-dosing in 3 females in one occasion) and increased frequency of urogenital staining (13, 6, 9, 5 at 400, 200, 50 mg/kg bw/day and control, respectively) and hydronephrosis (2, 1, 1, 0 at 400, 200, 50 mg/kg bw/day and control, respectively) were also observed. There were no treatment-related effects on survival or cesarean parameters. The NOAEL for maternal toxicity was 200 mg/kg bw/day.
No developmental toxicity was observed in this study; only a slight but not statistically significant reduction in mean fetal weight (8%) was observed, at the top dose (400 mg/kg bw/day). At this dose, the only malformation noted was dwarfism, observed in five foetuses from the same litter. This finding was considered of genetic origin and it fell within the range of the historical control. The NOAEL for developmental toxicity can thus be considered 400 mg/kg bw/day.
In the second developmental rat study (Brooker et al., 1989a). There were two deaths at 600 mg/kg bw/day. At the same dose level, several findings were observed as clinical signs of toxicity (hair loss, urogenital stained, pilo-erection, excessive salivation and reduced body tone post-dose), decrease of bodyweight (10-12%) during 9-20 days, reduced statistical bodyweight gain (62%) during 6-9 days, decrease food consumption (19-16%) during 6-9 days and a marked increase of water consumption (52-22%) between 6-15 days. The NOAEL for maternal toxicity was 150 mg/kg bw/day. The NOAEL for developmental toxicity can be established at 150 mg/kg bw/day based on the statistically significant reduction of the mean foetal weight (7.12%) and increase within the range of historical controls of early resorptions/dam (0.8 vs. 0.2, controls), total resorptions/dam (1.0 vs. 0.3, controls) and increase of postimplantation losses (7.6% vs. 3.4%, controls) at 600 mg/kg bw/day. The increase in the incidence of skeletal anomalies, produced at doses of 150 and 600 mg/kg bw/day, such as increase in the incidence of reduced ossification sacrocaudal vertebral arches or total variant sternebras (only at 600 mg/kg bw/d), was slightly above the range of historical control only at 600 mg/kg bw/day. Only at 600 ppm there was evidence of teratogenicity.
In the first developmental rabbits study (Adam, 1986), at the top dose (190 mg/kg bw/day) maternal toxicity was observed, manifested by bodyweight loss (7.18%) observed at gestation day 19 and decrease of body weight gain (80%) over the period of days 7-19 of gestation. The NOAEL for maternal toxicity can be established at 50 mg/kg bw/day. There were no observed treatment effects on cesarean parameters and on the incidence of fetal variations or malformations. The NOAEL for developmental toxicity in the rabbit can thus be considered to be greater than 190 mg/kg bw/day.
In the second developmental rabbits study (Brooker et al., 1989b), the NOAEL for maternal toxicity can be established at 100 mg/kg bw/day based on the body weight loss observed at the top dose level (300 mg/kg bw/day) at gestation days 6-8 and the decrease of food consumption over this period. No developmental toxicity was observed in this study. The NOAEL for developmental toxicity in the rabbit can thus be considered at least 300 mg/kg bw/day.
CLH REPORT FOR ACETOCHLOR
168
4.11.2.1 Human information
No information available
4.11.3 Other relevant information
No data available.
4.11.4 Summary and discussion of reproductive toxicity
Fertility
In a two-generation study in rats (Milburn, 2001), the number of live plus dead pups per litter decreased significantly from 600 ppm in F2 litters. This effect also accurred in F1 litters at 1750 ppm. At this dose level a significant decrease in the number of implantations in F0 and F1 females and in the number of live pups on postnatal day 1 in F2 litters was observed. Significant changes in the weight of some reproductive organs were also seen during the study. A decrease in the absolute weight of the ovaries was observed from 200 ppm in F0 parents and at 1750 ppm in F1 parents. Left epididymis absolute weight decreased at 600 ppm in F0 parents. At 1750 ppm decreased relative weight of ovaries and uterus and decreased absolute weight of uterus, epididymides, testes and seminal vesicles were observed in F0 parents. In F1 parents at 1750 ppm it was observed increase in the relative weight of epididymis and decrease in the relative weight of ovaries and in the absolute weight of right epididymis, testes and seminal vesicles. However, these findings occurred in presence of maternal toxicity from 600 ppm manifested by bodyweight reduction, changes in the weight of some organs and occurrence of nasal hyperplasia and polypoid adenomas.
In other two-generation study in rats (Willoughby, 1989), considered not acceptable due to guideline deviations, significant changes in the weight of some reproductive organs were observed at 1750 ppm in F1 parents such as increase in the relative weight of epididymides, seminal vesicles and testes. These variations, in presence of maternal toxicity, were not observed in F0 parents. Something similar occurred in another two generation study in rats (Schardein, 1982), also considered not acceptable, in which a decrease in the absolute weight of testes at 5000 ppm and ovaries at all dose levels were observed in F1 parents but not in F0 parents. There was a significant decrease of the number of live pups at birth of the F1b litter out of the historical control range at 5000 ppm. However, maternal toxicity was observed at all dose levels in this study.
No evidence was adduced from the available reproductive toxicity data to support classification due to fertility impairment.
Development
In a developmental toxicity study in rats (Brooker et al., 1989a), an increase in the number of post-implantation losses and in the early/total resorptions were observed at 600 mg/kg bw/d though both effects fell into the range of historical controls. At this same dose level there was a decrease of the foetus weight and an increase slightly above the historical controls in the incidence of the skeletal anomalies and in the incidence of reduced ossification sacrocaudal vertebral arches. This last effect also occurred at 150 mg/kg bw/d but in this case the value fell into the range of historical controls. The incidence of variant sternebras also significantly increased at 600 mg/kg bw/d. However, these developmental effects at 600 mg/kg bw/d occurred in presence of maternal toxicity manifestested by mortality, clinical signs of toxicity and decrease of body weight, body weight gain and food consumption.
In a developmental toxicity study in rats (Rodwell, 1980) dwarfishm was observed in one litter at 400 and 200 ppm but the incidence fell into the range of historical controls. No treatment-related
CLH REPORT FOR ACETOCHLOR
169
effects were observed in other two developmental toxicity study in rabbits (Adam, 1986 and Brooker et al., 1989b).
Other effects indicating developmental toxicity were observed in offspring of a 2-generation study in rats (Milburn, 2001). Toxicity was manifested by significant decrease of live plus dead pups in F1 litters at 1750 ppm and in F2 litters from 600 ppm and also a reduction in the number of live pups at 1750 ppm in F2 litters. It was also observed at 1750 ppm a delay of the vagina time opening in F1 pups and a reduction in the anogenital distance in males in F2 pups. There were significant variations of the litter weight in F1 pups from 600 ppm and in F2 pups at 1750 ppm and organ weight variations, bodyweight and bodyweight gain reductions in F1 pups at 1750 ppm and in F2 pups from 600 ppm. These findings occurred in presence of maternal toxicity from 600 ppm manifested by bodyweight reduction, changes in the weight of some organs and the occurrence of nasal hyperplasia and polypoid adenomas.
Besides, in a two generation toxicity study in rats (Schardein, 1982), considered not acceptable, a significant decrease in the number of live pups at birth of the F1b litter out of the historical control range was observed in presence of maternal toxicity.
None of the studies showed any concern malformations and the observed foetal findings were considered to be a secondary non specific consequence of the maternal toxicity and not a direct effect on development. Acetochlor is not considered teratogenic to rats and rabbits.
4.11.5 Comparison with criteria
According to the classification criteria in section 3.7.2.1.1, Annex I CLP: “Substances are classified in Category 1 for reproductive toxicity when they are known to have produced an adverse effect on sexual function and fertility, or on development in humans or when there is evidence from animal studies, possibly supplemented with other information, to provide a strong presumption that the substance has the capacity to interfere with reproduction in humans. The classification of a substance is further distinguished on the basis of whether the evidence for classification is primarily from human data (Category 1A) or from animal data (Category 1B).
The classification of a substance in this Category 1A is largely based on evidence from humans.
The classification of a substance in this Category 1B is largely based on data from animal studies. Such data shall provide clear evidence of an adverse effect on sexual function and fertility or on development in the absence of other toxic effects, or if occurring together with other toxic effects the adverse effect on reproduction is considered not to be a secondary non-specific consequence of other toxic effects. However, when there is mechanistic information that raises doubt about the relevance of the effect for humans, classification in Category 2 may be more appropriate.
Substances are classified in Category 2 for reproductive toxicity when there is some evidence from humans or experimental animals, possibly supplemented with other information, of an adverse effect on sexual function and fertility, or on development, and where evidence is not sufficiently convincing to place the substance in Category 1. If deficiencies in the study make the quality of evidence less convincing, Category 2 could be the more appropriate classification. Such effects shall have been observed in the absence of other toxic effects, or if occurring together with other toxic effects the adverse effect on reproduction is considered not to be a secondary non-specific consequence of the other toxic effects”.
CLH REPORT FOR ACETOCHLOR
170
Comparison with classification criteria for reproductive toxicity (sexual function and fertility)
According to CLP Regulation (section 3.7.1.3 of Annex I), any effect of substances that has the potential to interfere with sexual function and fertility has to be regarded for a classification for reproductive toxicity. This includes, but is not limited to, alterations to the female and male reproductive system, adverse effects on onset of puberty, gamete production and transport, reproductive cycle normality, sexual behaviour, fertility, parturition, pregnancy outcomes, premature reproductive senescence, or modifications in other functions that are dependent on the integrity of the reproductive systems.
Main effects on fertility were observed in the 2-generation study in rats (Milburn, 2001) at 1750 ppm but also at 600 ppm:
- Decrease in the number of live plus dead pups from 600 ppm in F2 litters and at 1750 ppm in F1 litters. At 1750 ppm, decrease in the number of implantations in F0 and F1 females and in the number of live pups on postnatal day 1 in F2 litters.
- Changes in the weight of some reproductive organs.
However, these data don’t warrant classification for fertility for the following reasons:
- All other fertility parameters, such as mating, fertility and pregnancy indices, were not altered by the administration of acetochlor, including sperm parameters. Therefore, acetochlor hasn’t the capacity to interfere with reproduction.
- All remarkable effects occurred in presence of maternal toxicity manifested by bodyweight reduction, changes in the weight of some organs and the occurrence of nasal hyperplasia and polypoid adenomas from 600 ppm. Therefore, these fertility effects are likely to be a secondary non-specific consequence of general toxicity and not a direct consequence of administration of acetochlor.
Overall, the results show that acetochlor does not affect fertility or reproductive performance. No effects providing sufficient evidence to cause a strong suspicion of impaired fertility were observed in the absence of marked parental toxicity.
Criteria for DSD are very similar to the CLP criteria. Therefore, the MSCA concludes that based on data available, comparing these data with the relevant classification criteria, there is not sufficient and convincing evidence for classifying acetochlor for its effects on fertility according to both CLP and DSD.
Comparison with classification criteria for reproductive toxicity (development)
Adverse relevant effects on development regarded as significant and biologically relevant were the following:
- Increase slightly above the historical controls in the incidence of reduced ossification sacrocaudal vertebral arches and in the skeletal anomalies, increased incidence of variant sternebras and foetal weight reduction observed at 600 mg/kg bw/d in the teratogenicity study in rat in presence of maternal toxicity (Brooker et al., 1989a).
- In a two-generation study in rat (Milburn, 2001), decrease of live plus dead pups in F1 litters at 1750 ppm and in F2 litters from 600 ppm and reduction in the number of live pups at 1750 ppm in F2 litters. It was also observed at 1750 ppm a delay of the vagina time opening in F1 pups and reduction in the anogenital distance in males in F2 pups. Decrease of litter weight, bodyweight, bodyweight gain and organ weight variations were observed in pups from 600 mg/kg bw/d. All these findings were seen in presence of maternal toxicity manifested by bodyweight reduction, changes in the weight of some organs and the occurrence of nasal hyperplasia and polypoid adenomas from 600 ppm.
CLH REPORT FOR ACETOCHLOR
171
- In another two generation toxicity study in rats (Schardein, 1982), considered not acceptable, a significant decrease in the number of live pups at birth of the F1b litter out of the historical control range was observed in presence of maternal toxicity.
However, these data don’t warrant classification for development.
According to section 3.7.2.4 of CLP Regulation and the ECHA Guidance on the Application of the CLP Criteria, in the interpretation of the developmental outcome to decide classification for developmental effects it is important to consider the possible influence of maternal toxicity. Adverse developmental effects after acetochlor treatment were observed at doses with marked maternal toxicity (i.e. mortality, clinical signs, bodyweight reductions, food consumption decrease, variations in organ weights, occurrence of nasal hyperplasia and nasal adenomas). The MSCA is of the opinion that these reproductive effects can be regarded as irrelevant for classification due to severity of overall toxicity since they are a secondary consequence of this marked maternal toxicity.
Severity of the effects observed is not sufficient to deem a classification of acetochlor due to development impairment. Criteria in section 3.7.2.4.3 say that “Classification is not necessarily the outcome in the case of minor developmental changes, when there is only a small reduction in foetal/pup body weight or retardation of ossification when seen in association with maternal toxicity”. Section 3.7.2.4.2 of CLP Regulation says that “Classification shall be considered where there is a significant toxic effect in the offspring, e.g. irreversible effects such as structural malformations, embryo/foetal lethality, significant post-natal functional deficiencies”. All the effects occurred at doses that caused marked maternal toxicity as it has been explained above.
Besides, reproductive effects were seen only in one species. They were observed in rat but not in rabbit.
As no evidence from animal studies is available, a classification for acetochlor due to developmental toxicity is not necessary. Category 2 is not considered since the effects were not sufficiently severe and occurred at doses in presence of marked maternal toxicity. Criteria for DSD are very similar to the CLP criteria. Therefore, acetochlor does not require classification for developmental toxicity
4.11.6 Conclusions on classification and labelling
Fertility
Development
Directive 67/548/EEC: A classification is not required CLP: A classification is not required
Directive 67/548/EEC: A classification is not required CLP: A classification is not required
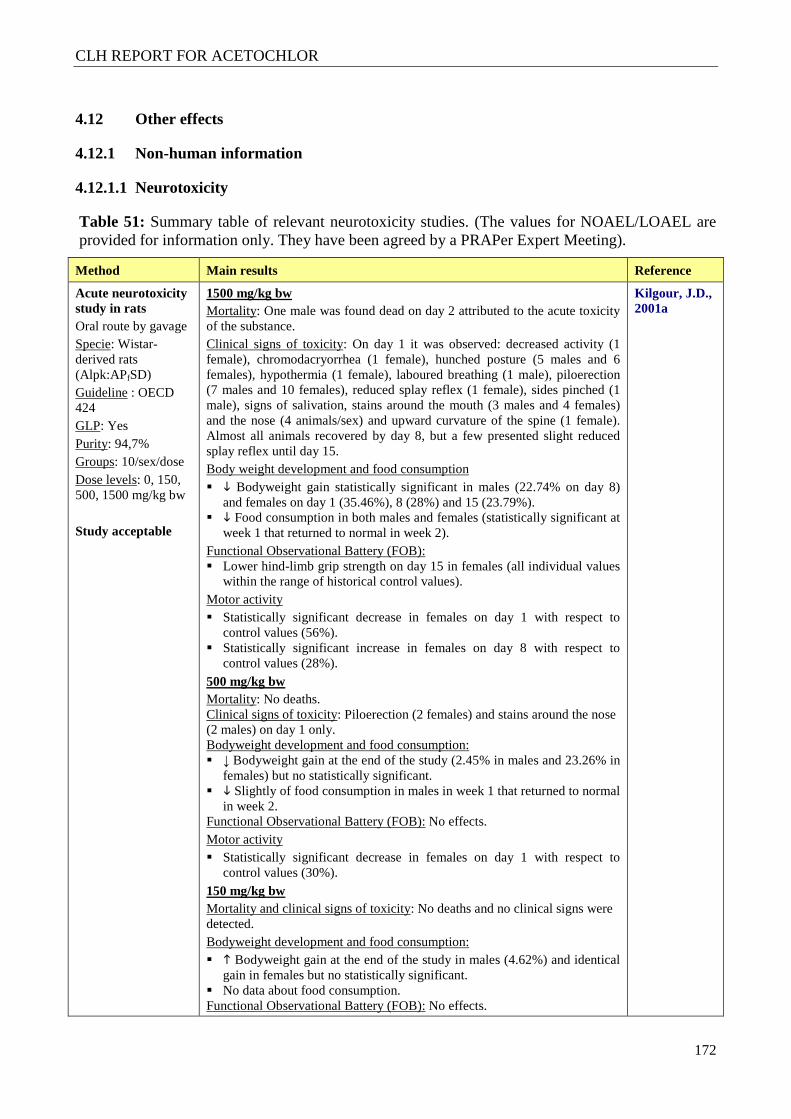
CLH REPORT FOR ACETOCHLOR
172
4.12 Other effects
4.12.1 Non-human information
4.12.1.1 Neurotoxicity
Table 51: Summary table of relevant neurotoxicity studies. (The values for NOAEL/LOAEL are provided for information only. They have been agreed by a PRAPer Expert Meeting).
Method Main results Reference
Acute neurotoxicity study in rats Oral route by gavage Specie: Wistar-derived rats (Alpk:APfSD) Guideline : OECD 424 GLP: Yes Purity: 94,7% Groups: 10/sex/dose Dose levels: 0, 150, 500, 1500 mg/kg bw Study acceptable
1500 mg/kg bw Mortality: One male was found dead on day 2 attributed to the acute toxicity of the substance. Clinical signs of toxicity: On day 1 it was observed: decreased activity (1 female), chromodacryorrhea (1 female), hunched posture (5 males and 6 females), hypothermia (1 female), laboured breathing (1 male), piloerection (7 males and 10 females), reduced splay reflex (1 female), sides pinched (1 male), signs of salivation, stains around the mouth (3 males and 4 females) and the nose (4 animals/sex) and upward curvature of the spine (1 female). Almost all animals recovered by day 8, but a few presented slight reduced splay reflex until day 15. Body weight development and food consumption � � Bodyweight gain statistically significant in males (22.74% on day 8)
and females on day 1 (35.46%), 8 (28%) and 15 (23.79%). � � Food consumption in both males and females (statistically significant at
week 1 that returned to normal in week 2). Functional Observational Battery (FOB): � Lower hind-limb grip strength on day 15 in females (all individual values
within the range of historical control values). Motor activity � Statistically significant decrease in females on day 1 with respect to
control values (56%). � Statistically significant increase in females on day 8 with respect to
control values (28%). 500 mg/kg bw Mortality: No deaths. Clinical signs of toxicity: Piloerection (2 females) and stains around the nose (2 males) on day 1 only. Bodyweight development and food consumption: � ↓ Bodyweight gain at the end of the study (2.45% in males and 23.26% in
females) but no statistically significant. � � Slightly of food consumption in males in week 1 that returned to normal
in week 2. Functional Observational Battery (FOB): No effects. Motor activity � Statistically significant decrease in females on day 1 with respect to
control values (30%). 150 mg/kg bw Mortality and clinical signs of toxicity: No deaths and no clinical signs were detected. Bodyweight development and food consumption: � � Bodyweight gain at the end of the study in males (4.62%) and identical
gain in females but no statistically significant. � No data about food consumption. Functional Observational Battery (FOB): No effects.
Kilgour, J.D., 2001a
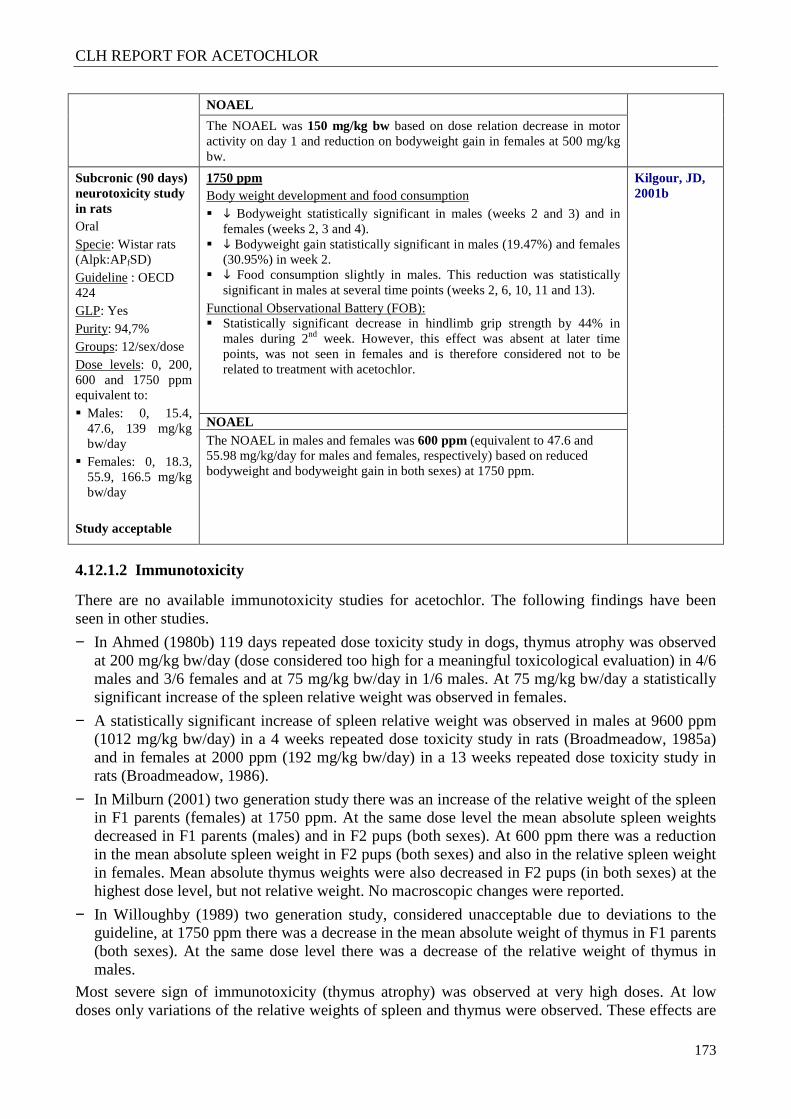
CLH REPORT FOR ACETOCHLOR
173
NOAEL
The NOAEL was 150 mg/kg bw based on dose relation decrease in motor activity on day 1 and reduction on bodyweight gain in females at 500 mg/kg bw.
Subcronic (90 days) neurotoxicity study in rats Oral Specie: Wistar rats (Alpk:APfSD) Guideline : OECD 424 GLP: Yes Purity: 94,7% Groups: 12/sex/dose Dose levels: 0, 200, 600 and 1750 ppm equivalent to: � Males: 0, 15.4,
47.6, 139 mg/kg bw/day
� Females: 0, 18.3, 55.9, 166.5 mg/kg bw/day
Study acceptable
1750 ppm Body weight development and food consumption � � Bodyweight statistically significant in males (weeks 2 and 3) and in
females (weeks 2, 3 and 4). � � Bodyweight gain statistically significant in males (19.47%) and females
(30.95%) in week 2. � � Food consumption slightly in males. This reduction was statistically
significant in males at several time points (weeks 2, 6, 10, 11 and 13). Functional Observational Battery (FOB): � Statistically significant decrease in hindlimb grip strength by 44% in
males during 2nd week. However, this effect was absent at later time points, was not seen in females and is therefore considered not to be related to treatment with acetochlor.
Kilgour, JD, 2001b
NOAEL The NOAEL in males and females was 600 ppm (equivalent to 47.6 and 55.98 mg/kg/day for males and females, respectively) based on reduced bodyweight and bodyweight gain in both sexes) at 1750 ppm.
4.12.1.2 Immunotoxicity
There are no available immunotoxicity studies for acetochlor. The following findings have been seen in other studies.
− In Ahmed (1980b) 119 days repeated dose toxicity study in dogs, thymus atrophy was observed at 200 mg/kg bw/day (dose considered too high for a meaningful toxicological evaluation) in 4/6 males and 3/6 females and at 75 mg/kg bw/day in 1/6 males. At 75 mg/kg bw/day a statistically significant increase of the spleen relative weight was observed in females.
− A statistically significant increase of spleen relative weight was observed in males at 9600 ppm (1012 mg/kg bw/day) in a 4 weeks repeated dose toxicity study in rats (Broadmeadow, 1985a) and in females at 2000 ppm (192 mg/kg bw/day) in a 13 weeks repeated dose toxicity study in rats (Broadmeadow, 1986).
− In Milburn (2001) two generation study there was an increase of the relative weight of the spleen in F1 parents (females) at 1750 ppm. At the same dose level the mean absolute spleen weights decreased in F1 parents (males) and in F2 pups (both sexes). At 600 ppm there was a reduction in the mean absolute spleen weight in F2 pups (both sexes) and also in the relative spleen weight in females. Mean absolute thymus weights were also decreased in F2 pups (in both sexes) at the highest dose level, but not relative weight. No macroscopic changes were reported.
− In Willoughby (1989) two generation study, considered unacceptable due to deviations to the guideline, at 1750 ppm there was a decrease in the mean absolute weight of thymus in F1 parents (both sexes). At the same dose level there was a decrease of the relative weight of thymus in males.
Most severe sign of immunotoxicity (thymus atrophy) was observed at very high doses. At low doses only variations of the relative weights of spleen and thymus were observed. These effects are
CLH REPORT FOR ACETOCHLOR
174
not sufficient evidence to consider that organs associated with immune function, such as the thymus and spleen, are affected by acetochlor.
4.12.1.3 Specific investigations: other studies
No data
4.12.1.4 Human information
No data
4.12.2 Summary and discussion
Evidence of neurotoxicity from exposure to acetochlor was observed in several studies. Salivation and other clinical signs (anogenital staining, diarrhea) were reported in some studies in the rat (two developmental toxicity studies) and the dog (subchronic and chronic oral).
A slight but statistically significant decrease in brain acetylcholinesterase (11%) was observed at 2000 ppm (161 and 192 mg/kg bw/day) in a 13 weeks rat study (Broadmeadow, 1986b) and small but statistically significant effects on brain weights have been observed in some studies, although the direction of the weight change (increase or decrease) was not consistent and in some instances was associated primarily with body weight changes. The dog appears to be more sensitive than the rat or mouse to effects on the nervous system.
In 52 weeks oral (capsule) study in dog (Broadmeadow, 1989) salivation in males occurred at the dose level of 10 mg/kg bw/day and frank neuropathology of the brain was observed at ht highest dose of 50 mg/kg bw/day (degeneration of granular layer in vermis, depletion of purkinje cells and demyelination and degeneration of granule cell axon). Also in this same study, pronounced neurological signs (ataxia, abnormal head movements, tremor, depressed righting, hopping and flexor reflexes, exaggerated tonic neck reflex and stiffness and rigidity of the hindlimbs) were observed at the highest dose and were associated with degenerative lesions of the cerebellum.
An acute and a subchronic oral neurotoxicity screening studies (Kilgour, 2001a and 2001b) in the rat were submitted for acetochlor. In the acute neurotoxicity study at the time of peak effect, decreased total motor activity at 500 and 1500 mg/kg bw was observed in females, but not in males; At 1500 mg/kg bw/day, both males and females showed clinical signs of toxicity (perioral staining, piloerection, hunched posture). Single animals showed signs such as chromodacryorrhea, upward curvature of the spine and hypothermia. In the subchronic neurotoxicity study, decreased body weight/weight gain in both sexes at the high dose was observed. A statistically significant decrease in hindlimb grip strength was observed in males during 2nd week. However, this effect was absent at later time points, was not seen in females and is therefore considered not to be related to treatment with acetochlor. The neurotoxicity studies did not evaluate cholinesterase levels.
No evidence of neuropathology or overt neurobehavioral effects to offspring was observed in four developmental toxicity studies (two rat and two rabbit), nor in three two-generation reproductive toxicity studies in the rat.
4.12.3 Comparison with criteria
Acetochlor does not meet the criteria for classification neither according to DSD nor according to CLP Regulation.
4.12.4 Conclusions on classification and labelling
No classification is required considering neurotoxic and neuropathologic properties.
Directive 67/548/EEC: Not classified based on available data CLP: Not classified based on available data
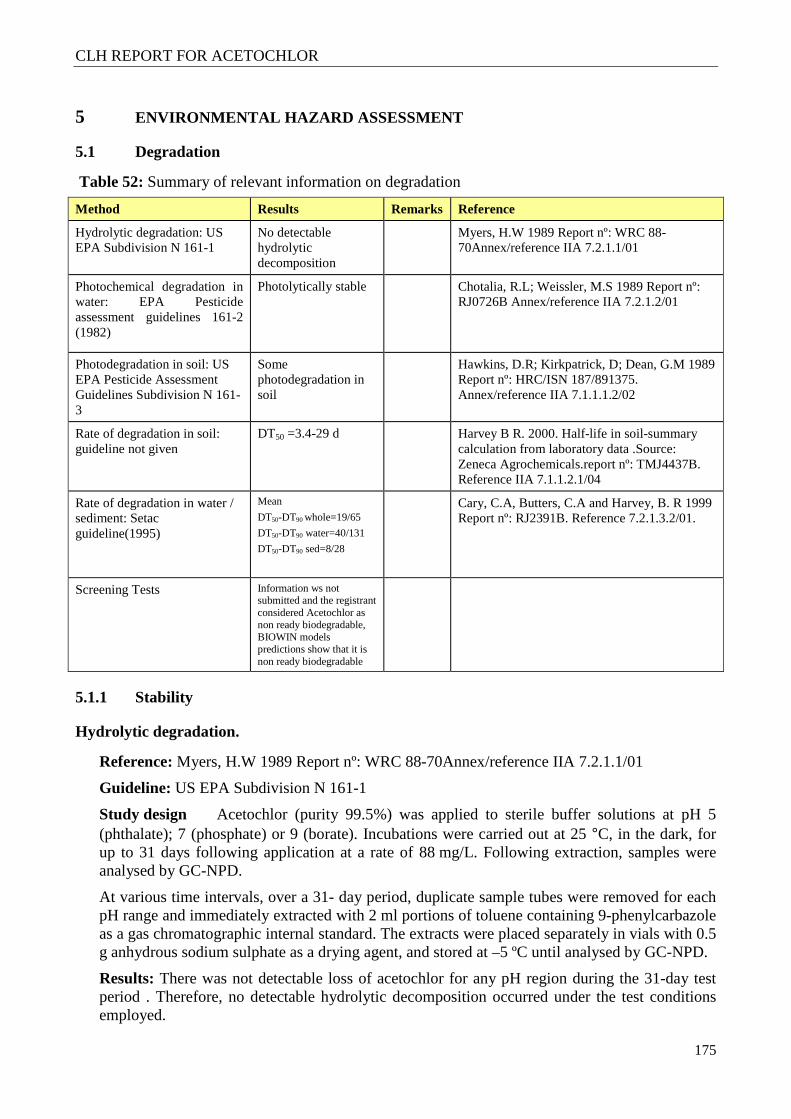
CLH REPORT FOR ACETOCHLOR
175
5 ENVIRONMENTAL HAZARD ASSESSMENT
5.1 Degradation
Table 52: Summary of relevant information on degradation
Method Results Remarks Reference
Hydrolytic degradation: US EPA Subdivision N 161-1
No detectable hydrolytic decomposition
Myers, H.W 1989 Report nº: WRC 88-70Annex/reference IIA 7.2.1.1/01
Photochemical degradation in water: EPA Pesticide assessment guidelines 161-2 (1982)
Photolytically stable Chotalia, R.L; Weissler, M.S 1989 Report nº: RJ0726B Annex/reference IIA 7.2.1.2/01
Photodegradation in soil: US EPA Pesticide Assessment Guidelines Subdivision N 161-3
Some photodegradation in soil
Hawkins, D.R; Kirkpatrick, D; Dean, G.M 1989 Report nº: HRC/ISN 187/891375. Annex/reference IIA 7.1.1.1.2/02
Rate of degradation in soil: guideline not given
DT50 =3.4-29 d Harvey B R. 2000. Half-life in soil-summary calculation from laboratory data .Source: Zeneca Agrochemicals.report nº: TMJ4437B. Reference IIA 7.1.1.2.1/04
Rate of degradation in water / sediment: Setac guideline(1995)
Mean
DT50-DT90 whole=19/65
DT50-DT90 water=40/131
DT50-DT90 sed=8/28
Cary, C.A, Butters, C.A and Harvey, B. R 1999 Report nº: RJ2391B. Reference 7.2.1.3.2/01.
Screening Tests Information ws not submitted and the registrant considered Acetochlor as non ready biodegradable, BIOWIN models predictions show that it is non ready biodegradable
5.1.1 Stability
Hydrolytic degradation.
Reference: Myers, H.W 1989 Report nº: WRC 88-70Annex/reference IIA 7.2.1.1/01
Guideline: US EPA Subdivision N 161-1
Study design Acetochlor (purity 99.5%) was applied to sterile buffer solutions at pH 5 (phthalate); 7 (phosphate) or 9 (borate). Incubations were carried out at 25 °C, in the dark, for up to 31 days following application at a rate of 88 mg/L. Following extraction, samples were analysed by GC-NPD.
At various time intervals, over a 31- day period, duplicate sample tubes were removed for each pH range and immediately extracted with 2 ml portions of toluene containing 9-phenylcarbazole as a gas chromatographic internal standard. The extracts were placed separately in vials with 0.5 g anhydrous sodium sulphate as a drying agent, and stored at –5 ºC until analysed by GC-NPD.
Results: There was not detectable loss of acetochlor for any pH region during the 31-day test period . Therefore, no detectable hydrolytic decomposition occurred under the test conditions employed.
CLH REPORT FOR ACETOCHLOR
176
Photochemical degradation in water
Reference: Chotalia, R.L; Weissler, M.S 1989 Report nº: RJ0726B Annex/reference IIA 7.2.1.2/01
Guideline: EPA Pesticide assessment guidelines 161-2 (1982)
Study design The aqueous photodegradation of [14C-phenyl]acetochlor was studied at 25 ± 1 ºC. Acetochlor was applied at a rate of 10 µg/mL to pH 7 phosphate buffer under sterile conditions.
Light Source: A xenon light was used as the light source (Intensity equivalent to Florida summer sunlight; latitude 25-35º).
Sampling interval Duplicate irradiated samples were taken at 7, 14, 21 and 30 DAT . The treated dark control vessels were wrapped in aluminium foil and stored in a constant temperature room in the dark at 25± 1 ºC for a time equivalent to the maximum irradiation period. At 0 DAT duplicate samples treated both prior to and immediately after application to the tubes to be irradiated, were analysed approximately 1 h after the treatment.
Volatile photoproducts In order to trap any radioactive volatile photodegradation products, the photolysis tubes were connected in serie via inlet and out let openings and air drawn through the system using a peristaltic pump . Prior to entry to the test system the air was drawn through a series of pre-test system traps (2x NaOH; 1x blank; 2x distilled water). Na OH was used to capture CO2 and distilled water to moisten the air in order to minimize evaporation of the test solutions. The possible volatile products were subsequently collected on polyurethane foam bungs placed in the outlet side-arms and in a series of post system trapping solutions
Analytical methods The radioactivity remaining in the photolysis tubes was analysed by LSC.
Normal (2 solvent systems) and reverse (1 solvent system) thin layer chromatography (TLC) was used for the identification and quantification of photodegradation products. All samples from the photolysis tubes and dark control vials were run in all 3 solvent system with and without an authentic reference standard of acetochlor.
All chromatograms were examined by auto-radiography and the radioactive areas on TLC plates quantified by radio-chromatogram scanning. GC/MS was selected to analyse irradiated and non irradiated 0 and 30 DAT samples (one replicate)
Results: The Acetochlor is considered photolytically stable in aqueous solution at 25 °C. Only 8% of the applied acetochlor degraded photolytically during a period equivalent to 30 days of Florida summer sunlight. No degradates of greater than 4% of applied radiocarbon were observed.
Photodegradation in soil.
Reference: Hawkins, D.R; Kirkpatrick, D; Dean, G.M 1989 Report nº: HRC/ISN 187/891375. Annex/reference IIA 7.1.1.1.2/02
Guideline: US EPA Pesticide Assessment Guidelines Subdivision N 161-3
Study design Approximately 0.29 mg of radiolabelled acetochlor was applied to a 1 mm film of sandy loam soil. The soil film had a surface area of 10 cm2. Thus, the application rate was 0.29 mg/10 cm2, which equals approximately 3 kg/ha, on a soil surface basis.
Samples were irradiated at 25 ± 5°C using a xenon arc lamp that was designed to have the same spectral distribution as natural sunlight (filtered to remove wavelengths of <290 nm). Irradiation was continuous for up to 14 DAT. The maximum irradiation period was calculated to be equivalent to greater than 30 days (range: 4.6-33.4 days) Florida sunlight (30 ºN).
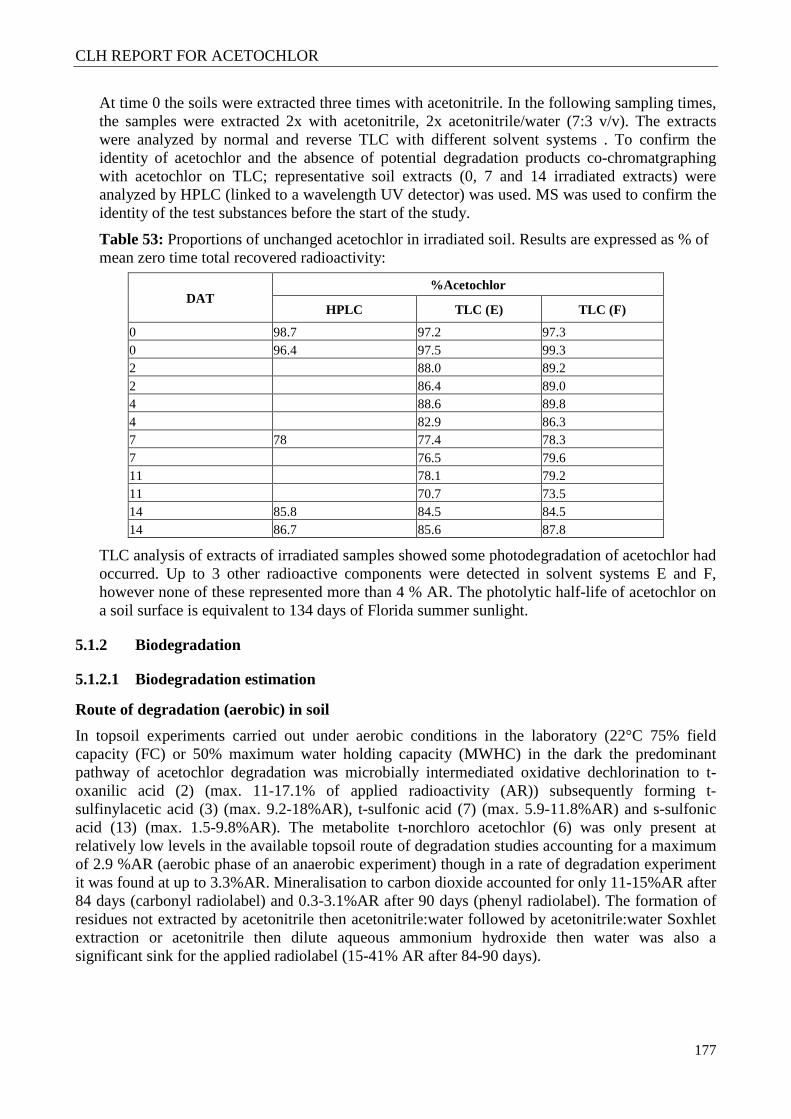
CLH REPORT FOR ACETOCHLOR
177
At time 0 the soils were extracted three times with acetonitrile. In the following sampling times, the samples were extracted 2x with acetonitrile, 2x acetonitrile/water (7:3 v/v). The extracts were analyzed by normal and reverse TLC with different solvent systems . To confirm the identity of acetochlor and the absence of potential degradation products co-chromatgraphing with acetochlor on TLC; representative soil extracts (0, 7 and 14 irradiated extracts) were analyzed by HPLC (linked to a wavelength UV detector) was used. MS was used to confirm the identity of the test substances before the start of the study.
Table 53: Proportions of unchanged acetochlor in irradiated soil. Results are expressed as % of mean zero time total recovered radioactivity:
DAT %Acetochlor
HPLC TLC (E) TLC (F)
0 98.7 97.2 97.3 0 96.4 97.5 99.3 2 88.0 89.2 2 86.4 89.0 4 88.6 89.8 4 82.9 86.3 7 78 77.4 78.3 7 76.5 79.6 11 78.1 79.2 11 70.7 73.5 14 85.8 84.5 84.5 14 86.7 85.6 87.8
TLC analysis of extracts of irradiated samples showed some photodegradation of acetochlor had occurred. Up to 3 other radioactive components were detected in solvent systems E and F, however none of these represented more than 4 % AR. The photolytic half-life of acetochlor on a soil surface is equivalent to 134 days of Florida summer sunlight.
5.1.2 Biodegradation
5.1.2.1 Biodegradation estimation
Route of degradation (aerobic) in soil
In topsoil experiments carried out under aerobic conditions in the laboratory (22°C 75% field capacity (FC) or 50% maximum water holding capacity (MWHC) in the dark the predominant pathway of acetochlor degradation was microbially intermediated oxidative dechlorination to t-oxanilic acid (2) (max. 11-17.1% of applied radioactivity (AR)) subsequently forming t-sulfinylacetic acid (3) (max. 9.2-18%AR), t-sulfonic acid (7) (max. 5.9-11.8%AR) and s-sulfonic acid (13) (max. 1.5-9.8%AR). The metabolite t-norchloro acetochlor (6) was only present at relatively low levels in the available topsoil route of degradation studies accounting for a maximum of 2.9 %AR (aerobic phase of an anaerobic experiment) though in a rate of degradation experiment it was found at up to 3.3%AR. Mineralisation to carbon dioxide accounted for only 11-15%AR after 84 days (carbonyl radiolabel) and 0.3-3.1%AR after 90 days (phenyl radiolabel). The formation of residues not extracted by acetonitrile then acetonitrile:water followed by acetonitrile:water Soxhlet extraction or acetonitrile then dilute aqueous ammonium hydroxide then water was also a significant sink for the applied radiolabel (15-41% AR after 84-90 days).
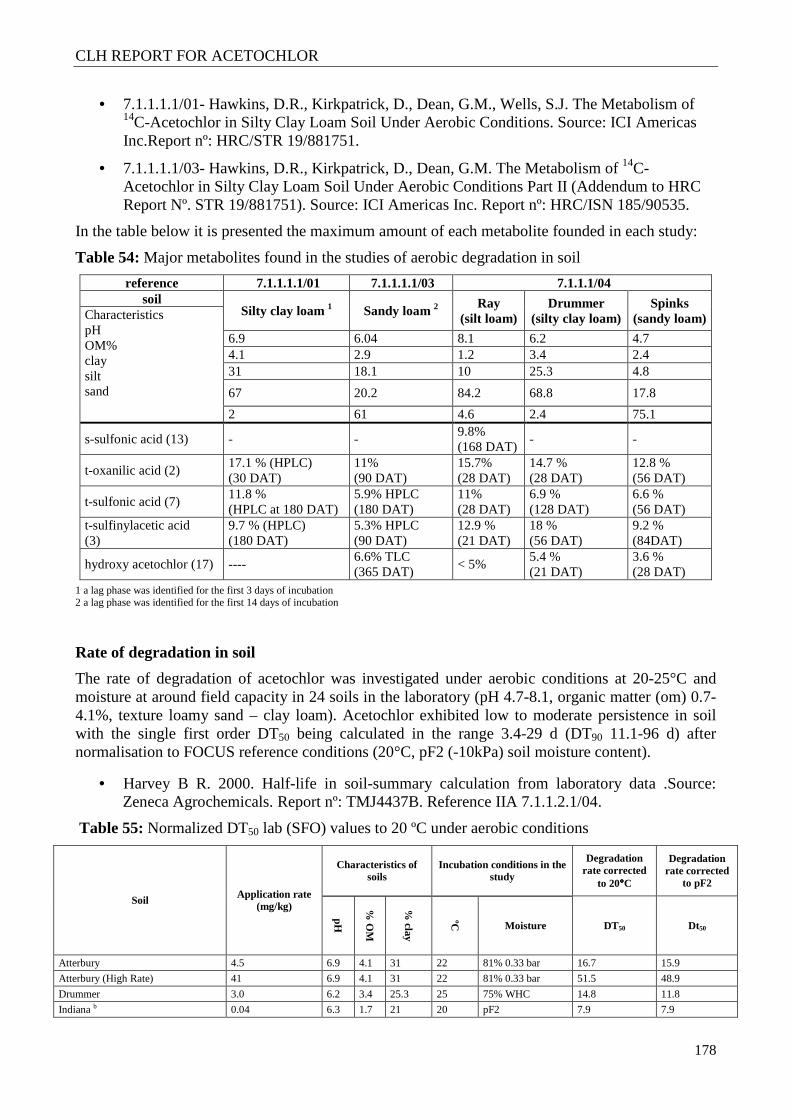
CLH REPORT FOR ACETOCHLOR
178
• 7.1.1.1.1/01- Hawkins, D.R., Kirkpatrick, D., Dean, G.M., Wells, S.J. The Metabolism of 14C-Acetochlor in Silty Clay Loam Soil Under Aerobic Conditions. Source: ICI Americas Inc.Report nº: HRC/STR 19/881751.
• 7.1.1.1.1/03- Hawkins, D.R., Kirkpatrick, D., Dean, G.M. The Metabolism of 14C-Acetochlor in Silty Clay Loam Soil Under Aerobic Conditions Part II (Addendum to HRC Report Nº. STR 19/881751). Source: ICI Americas Inc. Report nº: HRC/ISN 185/90535.
In the table below it is presented the maximum amount of each metabolite founded in each study:
Table 54: Major metabolites found in the studies of aerobic degradation in soil
reference 7.1.1.1.1/01 7.1.1.1.1/03 7.1.1.1/04 soil
Silty clay loam 1 Sandy loam 2 Ray (silt loam)
Drummer (silty clay loam)
Spinks (sandy loam) Characteristics
pH OM% clay silt sand
6.9 6.04 8.1 6.2 4.7 4.1 2.9 1.2 3.4 2.4 31 18.1 10 25.3 4.8
67 20.2 84.2 68.8 17.8
2 61 4.6 2.4 75.1
s-sulfonic acid (13) - - 9.8% (168 DAT)
- -
t-oxanilic acid (2) 17.1 % (HPLC) (30 DAT)
11% (90 DAT)
15.7% (28 DAT)
14.7 % (28 DAT)
12.8 % (56 DAT)
t-sulfonic acid (7) 11.8 % (HPLC at 180 DAT)
5.9% HPLC (180 DAT)
11% (28 DAT)
6.9 % (128 DAT)
6.6 % (56 DAT)
t-sulfinylacetic acid (3)
9.7 % (HPLC) (180 DAT)
5.3% HPLC (90 DAT)
12.9 % (21 DAT)
18 % (56 DAT)
9.2 % (84DAT)
hydroxy acetochlor (17) ---- 6.6% TLC (365 DAT)
< 5% 5.4 % (21 DAT)
3.6 % (28 DAT)
1 a lag phase was identified for the first 3 days of incubation 2 a lag phase was identified for the first 14 days of incubation
Rate of degradation in soil
The rate of degradation of acetochlor was investigated under aerobic conditions at 20-25°C and moisture at around field capacity in 24 soils in the laboratory (pH 4.7-8.1, organic matter (om) 0.7-4.1%, texture loamy sand – clay loam). Acetochlor exhibited low to moderate persistence in soil with the single first order DT50 being calculated in the range 3.4-29 d (DT90 11.1-96 d) after normalisation to FOCUS reference conditions (20°C, pF2 (-10kPa) soil moisture content).
• Harvey B R. 2000. Half-life in soil-summary calculation from laboratory data .Source: Zeneca Agrochemicals. Report nº: TMJ4437B. Reference IIA 7.1.1.2.1/04.
Table 55: Normalized DT50 lab (SFO) values to 20 ºC under aerobic conditions
Soil Application rate (mg/kg)
Characteristics of soils
Incubation conditions in the study
Degradation rate corrected
to 20°°°°C
Degradation rate corrected
to pF2
pH
% O
M
% clay
ºC Moisture DT50 Dt50
Atterbury 4.5 6.9 4.1 31 22 81% 0.33 bar 16.7 15.9
Atterbury (High Rate) 41 6.9 4.1 31 22 81% 0.33 bar 51.5 48.9
Drummer 3.0 6.2 3.4 25.3 25 75% WHC 14.8 11.8
Indiana b 0.04 6.3 1.7 21 20 pF2 7.9 7.9
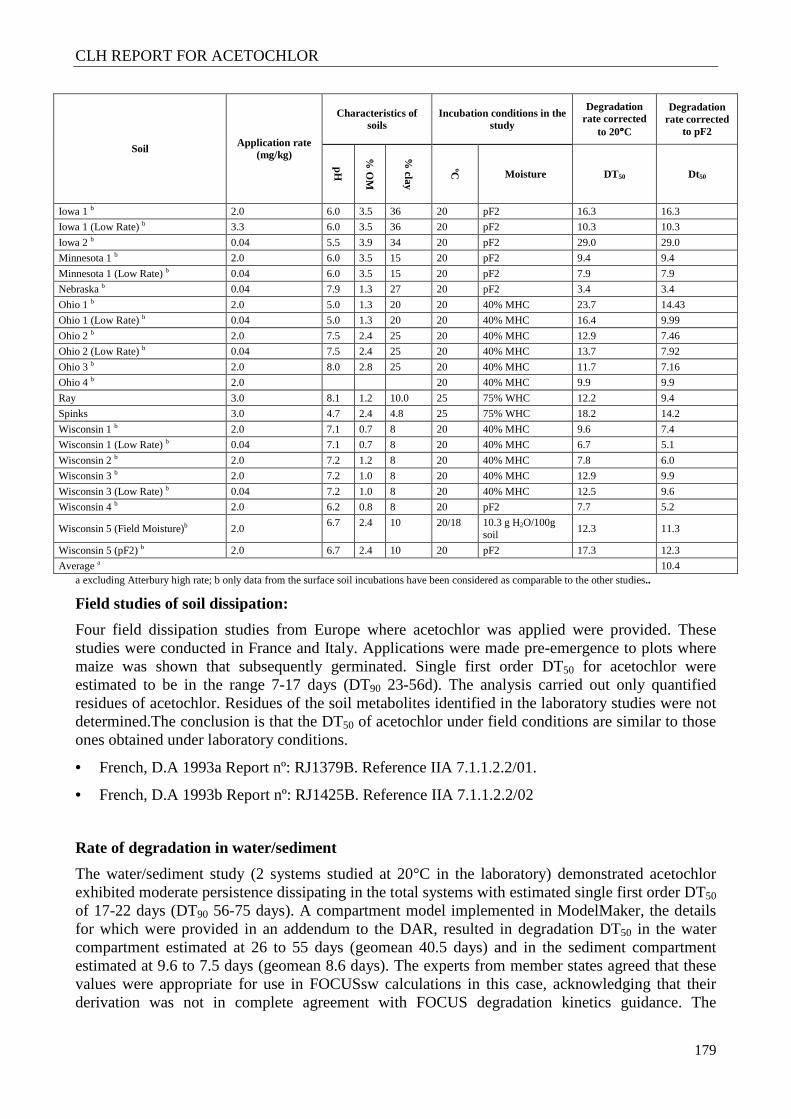
CLH REPORT FOR ACETOCHLOR
179
Soil Application rate (mg/kg)
Characteristics of soils
Incubation conditions in the study
Degradation rate corrected
to 20°°°°C
Degradation rate corrected
to pF2
pH
% O
M
% clay
ºC Moisture DT50 Dt50
Iowa 1 b 2.0 6.0 3.5 36 20 pF2 16.3 16.3
Iowa 1 (Low Rate) b 3.3 6.0 3.5 36 20 pF2 10.3 10.3
Iowa 2 b 0.04 5.5 3.9 34 20 pF2 29.0 29.0
Minnesota 1 b 2.0 6.0 3.5 15 20 pF2 9.4 9.4
Minnesota 1 (Low Rate) b 0.04 6.0 3.5 15 20 pF2 7.9 7.9
Nebraska b 0.04 7.9 1.3 27 20 pF2 3.4 3.4
Ohio 1 b 2.0 5.0 1.3 20 20 40% MHC 23.7 14.43
Ohio 1 (Low Rate) b 0.04 5.0 1.3 20 20 40% MHC 16.4 9.99
Ohio 2 b 2.0 7.5 2.4 25 20 40% MHC 12.9 7.46
Ohio 2 (Low Rate) b 0.04 7.5 2.4 25 20 40% MHC 13.7 7.92
Ohio 3 b 2.0 8.0 2.8 25 20 40% MHC 11.7 7.16
Ohio 4 b 2.0 20 40% MHC 9.9 9.9
Ray 3.0 8.1 1.2 10.0 25 75% WHC 12.2 9.4
Spinks 3.0 4.7 2.4 4.8 25 75% WHC 18.2 14.2
Wisconsin 1 b 2.0 7.1 0.7 8 20 40% MHC 9.6 7.4
Wisconsin 1 (Low Rate) b 0.04 7.1 0.7 8 20 40% MHC 6.7 5.1
Wisconsin 2 b 2.0 7.2 1.2 8 20 40% MHC 7.8 6.0
Wisconsin 3 b 2.0 7.2 1.0 8 20 40% MHC 12.9 9.9
Wisconsin 3 (Low Rate) b 0.04 7.2 1.0 8 20 40% MHC 12.5 9.6
Wisconsin 4 b 2.0 6.2 0.8 8 20 pF2 7.7 5.2
Wisconsin 5 (Field Moisture)b 2.0 6.7 2.4 10 20/18 10.3 g H2O/100g
soil 12.3 11.3
Wisconsin 5 (pF2) b 2.0 6.7 2.4 10 20 pF2 17.3 12.3
Average a 10.4 a excluding Atterbury high rate; b only data from the surface soil incubations have been considered as comparable to the other studies..
Field studies of soil dissipation:
Four field dissipation studies from Europe where acetochlor was applied were provided. These studies were conducted in France and Italy. Applications were made pre-emergence to plots where maize was shown that subsequently germinated. Single first order DT50 for acetochlor were estimated to be in the range 7-17 days (DT90 23-56d). The analysis carried out only quantified residues of acetochlor. Residues of the soil metabolites identified in the laboratory studies were not determined.The conclusion is that the DT50 of acetochlor under field conditions are similar to those ones obtained under laboratory conditions.
• French, D.A 1993a Report nº: RJ1379B. Reference IIA 7.1.1.2.2/01.
• French, D.A 1993b Report nº: RJ1425B. Reference IIA 7.1.1.2.2/02
Rate of degradation in water/sediment
The water/sediment study (2 systems studied at 20°C in the laboratory) demonstrated acetochlor exhibited moderate persistence dissipating in the total systems with estimated single first order DT50 of 17-22 days (DT90 56-75 days). A compartment model implemented in ModelMaker, the details for which were provided in an addendum to the DAR, resulted in degradation DT50 in the water compartment estimated at 26 to 55 days (geomean 40.5 days) and in the sediment compartment estimated at 9.6 to 7.5 days (geomean 8.6 days). The experts from member states agreed that these values were appropriate for use in FOCUSsw calculations in this case, acknowledging that their derivation was not in complete agreement with FOCUS degradation kinetics guidance. The
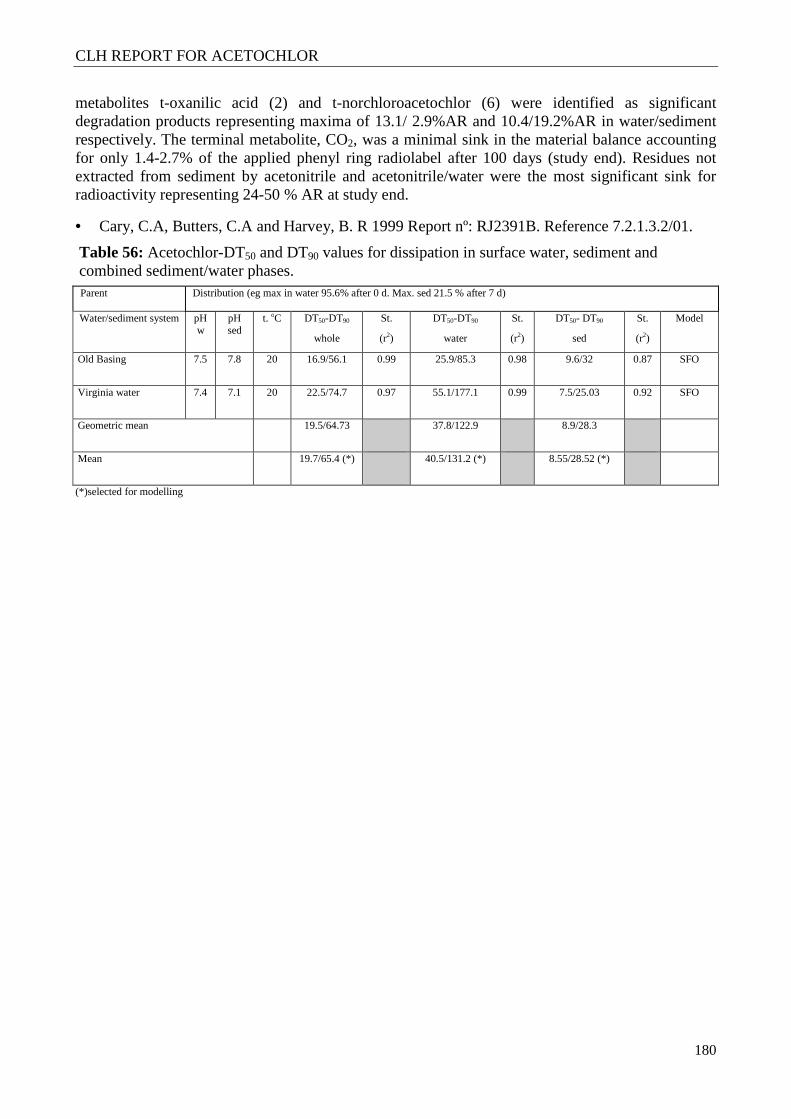
CLH REPORT FOR ACETOCHLOR
180
metabolites t-oxanilic acid (2) and t-norchloroacetochlor (6) were identified as significant degradation products representing maxima of 13.1/ 2.9%AR and 10.4/19.2%AR in water/sediment respectively. The terminal metabolite, CO2, was a minimal sink in the material balance accounting for only 1.4-2.7% of the applied phenyl ring radiolabel after 100 days (study end). Residues not extracted from sediment by acetonitrile and acetonitrile/water were the most significant sink for radioactivity representing 24-50 % AR at study end.
• Cary, C.A, Butters, C.A and Harvey, B. R 1999 Report nº: RJ2391B. Reference 7.2.1.3.2/01.
Table 56: Acetochlor-DT50 and DT90 values for dissipation in surface water, sediment and combined sediment/water phases. Parent Distribution (eg max in water 95.6% after 0 d. Max. sed 21.5 % after 7 d)
Water/sediment system pH w
pH sed
t. oC DT50-DT90
whole
St.
(r2)
DT50-DT90
water
St.
(r2)
DT50- DT90
sed
St.
(r2)
Model
Old Basing 7.5 7.8 20 16.9/56.1 0.99 25.9/85.3 0.98 9.6/32 0.87 SFO
Virginia water 7.4 7.1 20 22.5/74.7 0.97 55.1/177.1 0.99 7.5/25.03 0.92 SFO
Geometric mean 19.5/64.73 37.8/122.9 8.9/28.3
Mean 19.7/65.4 (*) 40.5/131.2 (*) 8.55/28.52 (*)
(*)selected for modelling
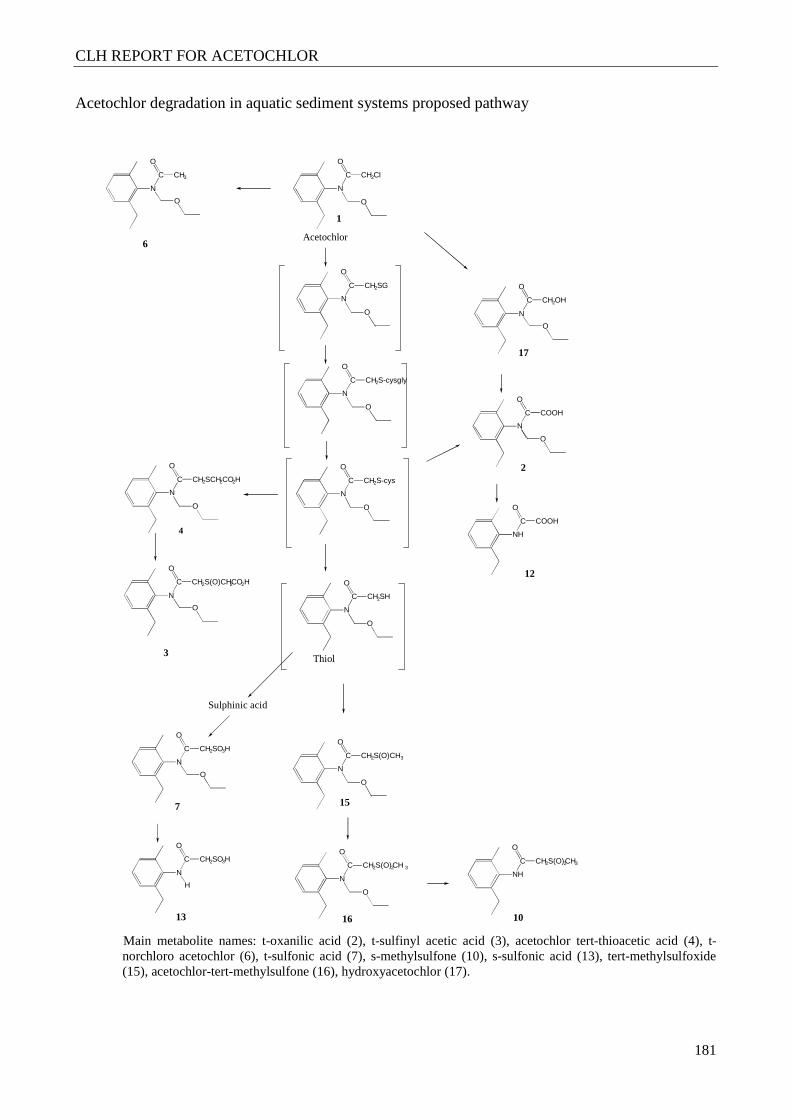
CLH REPORT FOR ACETOCHLOR
181
Acetochlor degradation in aquatic sediment systems proposed pathway
NH
C
O
COOH
N
C
O
CH3
O
N
C
O
CH2Cl
O
N
C
O
CH2OH
O
N
C
O
COOH
O
N
C
O
CH2SG
O
N
C
O
CH2S-cysgly
O
N
C
O
CH2S-cys
O
N
C
O
CH2SCH2CO2H
O
N
C
O
CH2S(O)CH 2CO2H
O N
C
O
CH2SH
O
N
C
O
CH2S(O)CH 3
O
N
C
O
CH2S(O) 2CH 3
O
N
C
O
CH2SO3H
3Thiol
Acetochlor
O
6
N
Sulphinic acid
C
O
CH2SO3H
2
7
H
17
12
13
NH
C
O
CH2S(O) 2CH3
4
15
16 10
1
Main metabolite names: t-oxanilic acid (2), t-sulfinyl acetic acid (3), acetochlor tert-thioacetic acid (4), t-norchloro acetochlor (6), t-sulfonic acid (7), s-methylsulfone (10), s-sulfonic acid (13), tert-methylsulfoxide (15), acetochlor-tert-methylsulfone (16), hydroxyacetochlor (17).
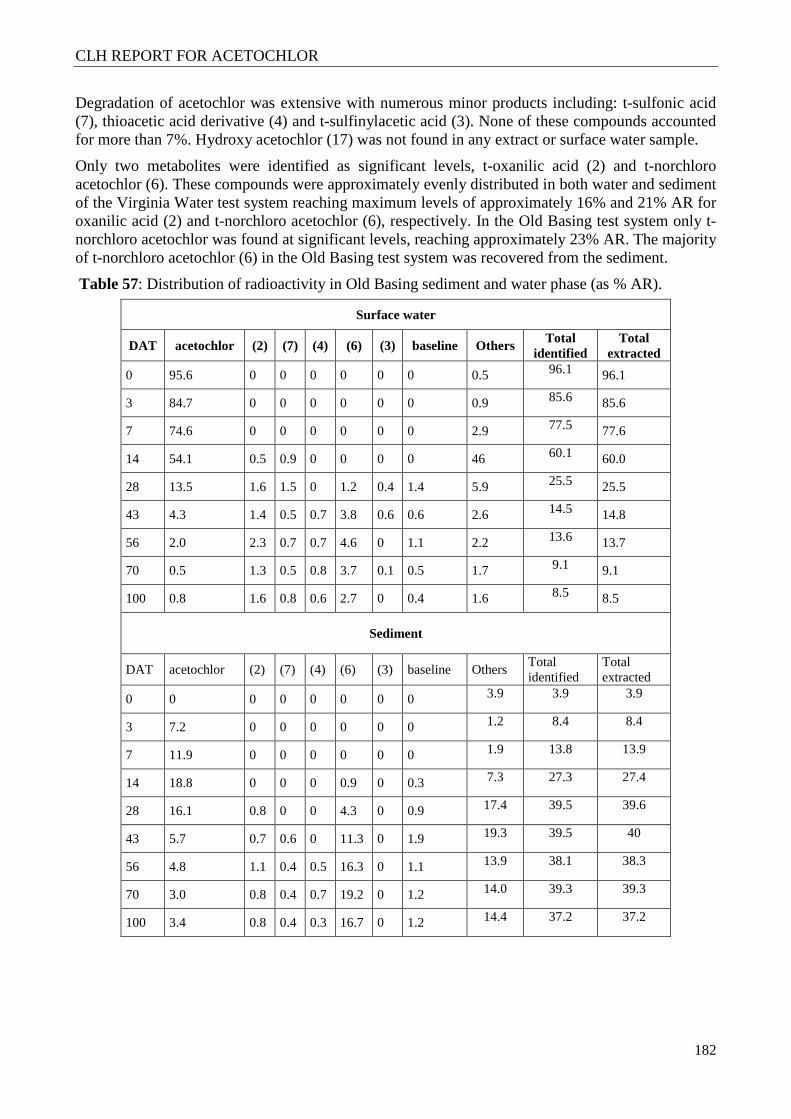
CLH REPORT FOR ACETOCHLOR
182
Degradation of acetochlor was extensive with numerous minor products including: t-sulfonic acid (7), thioacetic acid derivative (4) and t-sulfinylacetic acid (3). None of these compounds accounted for more than 7%. Hydroxy acetochlor (17) was not found in any extract or surface water sample.
Only two metabolites were identified as significant levels, t-oxanilic acid (2) and t-norchloro acetochlor (6). These compounds were approximately evenly distributed in both water and sediment of the Virginia Water test system reaching maximum levels of approximately 16% and 21% AR for oxanilic acid (2) and t-norchloro acetochlor (6), respectively. In the Old Basing test system only t-norchloro acetochlor was found at significant levels, reaching approximately 23% AR. The majority of t-norchloro acetochlor (6) in the Old Basing test system was recovered from the sediment.
Table 57: Distribution of radioactivity in Old Basing sediment and water phase (as % AR).
Surface water
DAT acetochlor (2) (7) (4) (6) (3) baseline Others Total
identified Total
extracted
0 95.6 0 0 0 0 0 0 0.5 96.1 96.1
3 84.7 0 0 0 0 0 0 0.9 85.6 85.6
7 74.6 0 0 0 0 0 0 2.9 77.5 77.6
14 54.1 0.5 0.9 0 0 0 0 46 60.1 60.0
28 13.5 1.6 1.5 0 1.2 0.4 1.4 5.9 25.5 25.5
43 4.3 1.4 0.5 0.7 3.8 0.6 0.6 2.6 14.5 14.8
56 2.0 2.3 0.7 0.7 4.6 0 1.1 2.2 13.6 13.7
70 0.5 1.3 0.5 0.8 3.7 0.1 0.5 1.7 9.1 9.1
100 0.8 1.6 0.8 0.6 2.7 0 0.4 1.6 8.5 8.5
Sediment
DAT acetochlor (2) (7) (4) (6) (3) baseline Others Total identified
Total extracted
0 0 0 0 0 0 0 0 3.9 3.9 3.9
3 7.2 0 0 0 0 0 0 1.2 8.4 8.4
7 11.9 0 0 0 0 0 0 1.9 13.8 13.9
14 18.8 0 0 0 0.9 0 0.3 7.3 27.3 27.4
28 16.1 0.8 0 0 4.3 0 0.9 17.4 39.5 39.6
43 5.7 0.7 0.6 0 11.3 0 1.9 19.3 39.5 40
56 4.8 1.1 0.4 0.5 16.3 0 1.1 13.9 38.1 38.3
70 3.0 0.8 0.4 0.7 19.2 0 1.2 14.0 39.3 39.3
100 3.4 0.8 0.4 0.3 16.7 0 1.2 14.4 37.2 37.2
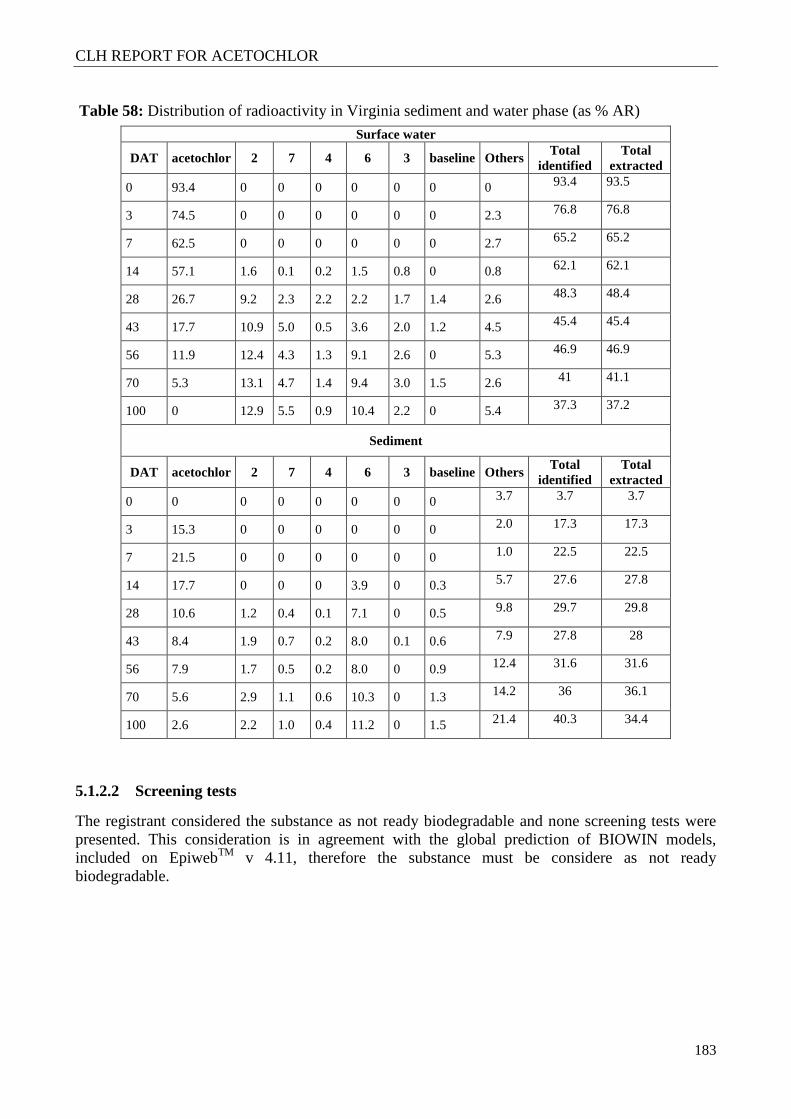
CLH REPORT FOR ACETOCHLOR
183
Table 58: Distribution of radioactivity in Virginia sediment and water phase (as % AR)
Surface water
DAT acetochlor 2 7 4 6 3 baseline Others Total
identified Total
extracted
0 93.4 0 0 0 0 0 0 0 93.4 93.5
3 74.5 0 0 0 0 0 0 2.3 76.8 76.8
7 62.5 0 0 0 0 0 0 2.7 65.2 65.2
14 57.1 1.6 0.1 0.2 1.5 0.8 0 0.8 62.1 62.1
28 26.7 9.2 2.3 2.2 2.2 1.7 1.4 2.6 48.3 48.4
43 17.7 10.9 5.0 0.5 3.6 2.0 1.2 4.5 45.4 45.4
56 11.9 12.4 4.3 1.3 9.1 2.6 0 5.3 46.9 46.9
70 5.3 13.1 4.7 1.4 9.4 3.0 1.5 2.6 41 41.1
100 0 12.9 5.5 0.9 10.4 2.2 0 5.4 37.3 37.2
Sediment
DAT acetochlor 2 7 4 6 3 baseline Others Total
identified Total
extracted
0 0 0 0 0 0 0 0 3.7 3.7 3.7
3 15.3 0 0 0 0 0 0 2.0 17.3 17.3
7 21.5 0 0 0 0 0 0 1.0 22.5 22.5
14 17.7 0 0 0 3.9 0 0.3 5.7 27.6 27.8
28 10.6 1.2 0.4 0.1 7.1 0 0.5 9.8 29.7 29.8
43 8.4 1.9 0.7 0.2 8.0 0.1 0.6 7.9 27.8 28
56 7.9 1.7 0.5 0.2 8.0 0 0.9 12.4 31.6 31.6
70 5.6 2.9 1.1 0.6 10.3 0 1.3 14.2 36 36.1
100 2.6 2.2 1.0 0.4 11.2 0 1.5 21.4 40.3 34.4
5.1.2.2 Screening tests
The registrant considered the substance as not ready biodegradable and none screening tests were presented. This consideration is in agreement with the global prediction of BIOWIN models, included on EpiwebTM v 4.11, therefore the substance must be considere as not ready biodegradable.
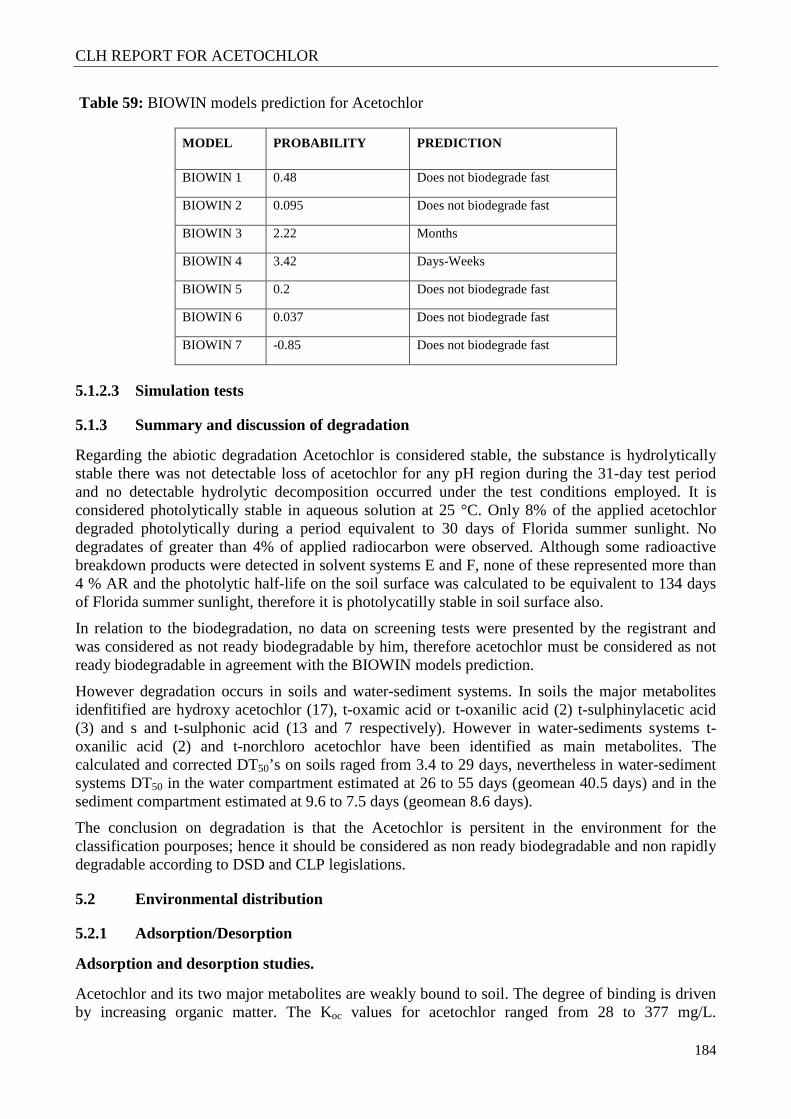
CLH REPORT FOR ACETOCHLOR
184
Table 59: BIOWIN models prediction for Acetochlor
MODEL PROBABILITY PREDICTION
BIOWIN 1 0.48 Does not biodegrade fast
BIOWIN 2 0.095 Does not biodegrade fast
BIOWIN 3 2.22 Months
BIOWIN 4 3.42 Days-Weeks
BIOWIN 5 0.2 Does not biodegrade fast
BIOWIN 6 0.037 Does not biodegrade fast
BIOWIN 7 -0.85 Does not biodegrade fast
5.1.2.3 Simulation tests
5.1.3 Summary and discussion of degradation
Regarding the abiotic degradation Acetochlor is considered stable, the substance is hydrolytically stable there was not detectable loss of acetochlor for any pH region during the 31-day test period and no detectable hydrolytic decomposition occurred under the test conditions employed. It is considered photolytically stable in aqueous solution at 25 °C. Only 8% of the applied acetochlor degraded photolytically during a period equivalent to 30 days of Florida summer sunlight. No degradates of greater than 4% of applied radiocarbon were observed. Although some radioactive breakdown products were detected in solvent systems E and F, none of these represented more than 4 % AR and the photolytic half-life on the soil surface was calculated to be equivalent to 134 days of Florida summer sunlight, therefore it is photolycatilly stable in soil surface also.
In relation to the biodegradation, no data on screening tests were presented by the registrant and was considered as not ready biodegradable by him, therefore acetochlor must be considered as not ready biodegradable in agreement with the BIOWIN models prediction.
However degradation occurs in soils and water-sediment systems. In soils the major metabolites idenfitified are hydroxy acetochlor (17), t-oxamic acid or t-oxanilic acid (2) t-sulphinylacetic acid (3) and s and t-sulphonic acid (13 and 7 respectively). However in water-sediments systems t-oxanilic acid (2) and t-norchloro acetochlor have been identified as main metabolites. The calculated and corrected DT50’s on soils raged from 3.4 to 29 days, nevertheless in water-sediment systems DT50 in the water compartment estimated at 26 to 55 days (geomean 40.5 days) and in the sediment compartment estimated at 9.6 to 7.5 days (geomean 8.6 days).
The conclusion on degradation is that the Acetochlor is persitent in the environment for the classification pourposes; hence it should be considered as non ready biodegradable and non rapidly degradable according to DSD and CLP legislations.
5.2 Environmental distribution
5.2.1 Adsorption/Desorption
Adsorption and desorption studies.
Acetochlor and its two major metabolites are weakly bound to soil. The degree of binding is driven by increasing organic matter. The Koc values for acetochlor ranged from 28 to 377 mg/L.
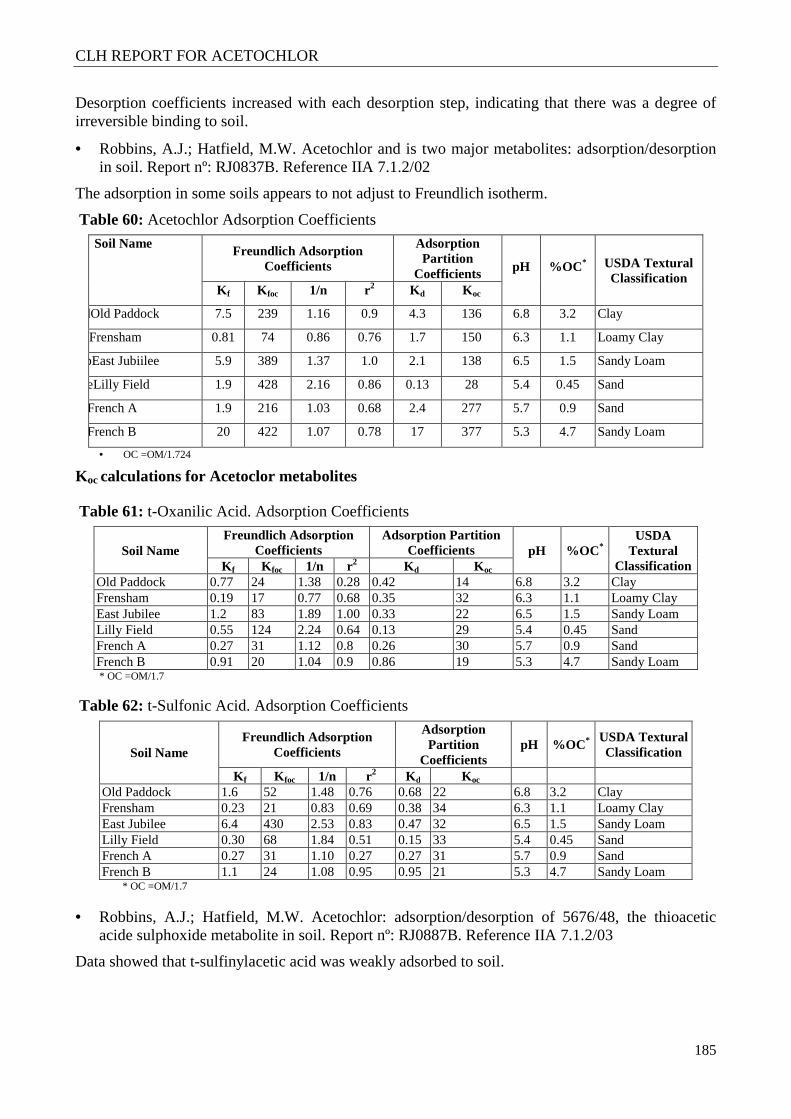
CLH REPORT FOR ACETOCHLOR
185
Desorption coefficients increased with each desorption step, indicating that there was a degree of irreversible binding to soil.
• Robbins, A.J.; Hatfield, M.W. Acetochlor and is two major metabolites: adsorption/desorption in soil. Report nº: RJ0837B. Reference IIA 7.1.2/02
The adsorption in some soils appears to not adjust to Freundlich isotherm.
Table 60: Acetochlor Adsorption Coefficients
Soil Name Freundlich Adsorption
Coefficients
Adsorption Partition
Coefficients pH %OC * USDA Textural Classification
K f K foc 1/n r2 K d Koc
Old PadOld Paddock 7.5 239 1.16 0.9 4.3 136 6.8 3.2 Clay
FrenshaFrensham 0.81 74 0.86 0.76 1.7 150 6.3 1.1 Loamy Clay
East JubEast Jubiilee 5.9 389 1.37 1.0 2.1 138 6.5 1.5 Sandy Loam
FieLilly Field 1.9 428 2.16 0.86 0.13 28 5.4 0.45 Sand
French French A 1.9 216 1.03 0.68 2.4 277 5.7 0.9 Sand
French French B 20 422 1.07 0.78 17 377 5.3 4.7 Sandy Loam
• OC =OM/1.724
Koc calculations for Acetoclor metabolites
Table 61: t-Oxanilic Acid. Adsorption Coefficients
Soil Name Freundlich Adsorption
Coefficients Adsorption Partition
Coefficients pH %OC * USDA
Textural Classification K f K foc 1/n r2 Kd Koc
Old Paddock 0.77 24 1.38 0.28 0.42 14 6.8 3.2 Clay Frensham 0.19 17 0.77 0.68 0.35 32 6.3 1.1 Loamy Clay East Jubilee 1.2 83 1.89 1.00 0.33 22 6.5 1.5 Sandy Loam Lilly Field 0.55 124 2.24 0.64 0.13 29 5.4 0.45 Sand French A 0.27 31 1.12 0.8 0.26 30 5.7 0.9 Sand French B 0.91 20 1.04 0.9 0.86 19 5.3 4.7 Sandy Loam
* OC =OM/1.7
Table 62: t-Sulfonic Acid. Adsorption Coefficients
Soil Name Freundlich Adsorption
Coefficients
Adsorption Partition
Coefficients pH %OC * USDA Textural
Classification
K f K foc 1/n r2 K d Koc Old Paddock 1.6 52 1.48 0.76 0.68 22 6.8 3.2 Clay Frensham 0.23 21 0.83 0.69 0.38 34 6.3 1.1 Loamy Clay East Jubilee 6.4 430 2.53 0.83 0.47 32 6.5 1.5 Sandy Loam Lilly Field 0.30 68 1.84 0.51 0.15 33 5.4 0.45 Sand French A 0.27 31 1.10 0.27 0.27 31 5.7 0.9 Sand French B 1.1 24 1.08 0.95 0.95 21 5.3 4.7 Sandy Loam
* OC =OM/1.7
• Robbins, A.J.; Hatfield, M.W. Acetochlor: adsorption/desorption of 5676/48, the thioacetic acide sulphoxide metabolite in soil. Report nº: RJ0887B. Reference IIA 7.1.2/03
Data showed that t-sulfinylacetic acid was weakly adsorbed to soil.
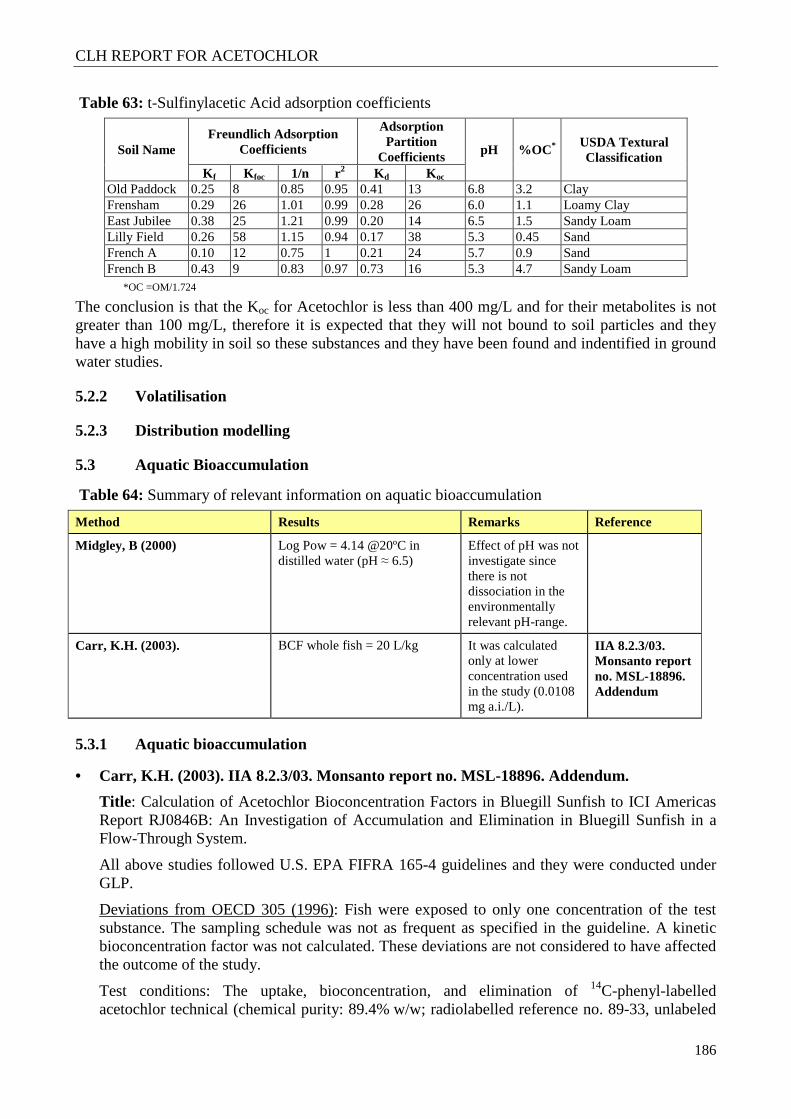
CLH REPORT FOR ACETOCHLOR
186
Table 63: t-Sulfinylacetic Acid adsorption coefficients
Soil Name Freundlich Adsorption
Coefficients
Adsorption Partition
Coefficients pH %OC * USDA Textural Classification
K f K foc 1/n r2 Kd Koc Old Paddock 0.25 8 0.85 0.95 0.41 13 6.8 3.2 Clay Frensham 0.29 26 1.01 0.99 0.28 26 6.0 1.1 Loamy Clay East Jubilee 0.38 25 1.21 0.99 0.20 14 6.5 1.5 Sandy Loam Lilly Field 0.26 58 1.15 0.94 0.17 38 5.3 0.45 Sand French A 0.10 12 0.75 1 0.21 24 5.7 0.9 Sand French B 0.43 9 0.83 0.97 0.73 16 5.3 4.7 Sandy Loam
*OC =OM/1.724
The conclusion is that the Koc for Acetochlor is less than 400 mg/L and for their metabolites is not greater than 100 mg/L, therefore it is expected that they will not bound to soil particles and they have a high mobility in soil so these substances and they have been found and indentified in ground water studies.
5.2.2 Volatilisation
5.2.3 Distribution modelling
5.3 Aquatic Bioaccumulation
Table 64: Summary of relevant information on aquatic bioaccumulation
Method Results Remarks Reference
Midgley, B (2000) Log Pow = 4.14 @20ºC in distilled water (pH ≈ 6.5)
Effect of pH was not investigate since there is not dissociation in the environmentally relevant pH-range.
Carr, K.H. (2003). BCF whole fish = 20 L/kg It was calculated only at lower concentration used in the study (0.0108 mg a.i./L).
IIA 8.2.3/03. Monsanto report no. MSL-18896. Addendum
5.3.1 Aquatic bioaccumulation
• Carr, K.H. (2003). IIA 8.2.3/03. Monsanto report no. MSL-18896. Addendum.
Title : Calculation of Acetochlor Bioconcentration Factors in Bluegill Sunfish to ICI Americas Report RJ0846B: An Investigation of Accumulation and Elimination in Bluegill Sunfish in a Flow-Through System.
All above studies followed U.S. EPA FIFRA 165-4 guidelines and they were conducted under GLP.
Deviations from OECD 305 (1996): Fish were exposed to only one concentration of the test substance. The sampling schedule was not as frequent as specified in the guideline. A kinetic bioconcentration factor was not calculated. These deviations are not considered to have affected the outcome of the study.
Test conditions: The uptake, bioconcentration, and elimination of 14C-phenyl-labelled acetochlor technical (chemical purity: 89.4% w/w; radiolabelled reference no. 89-33, unlabeled
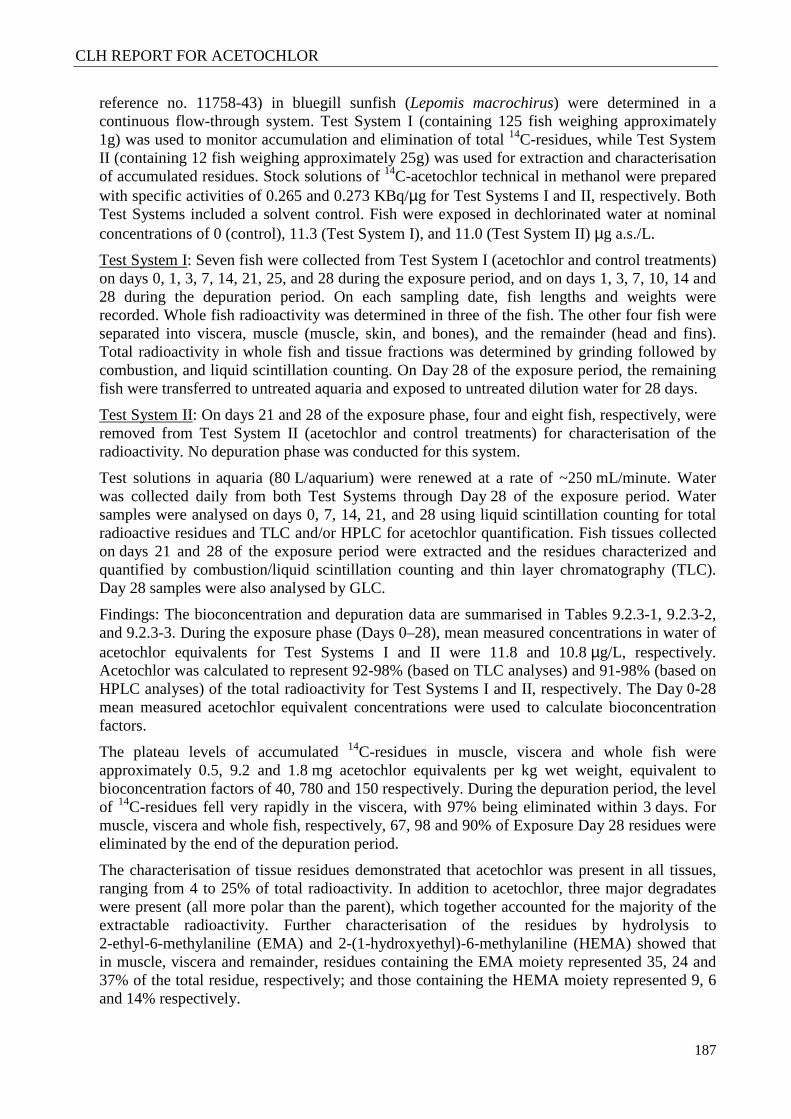
CLH REPORT FOR ACETOCHLOR
187
reference no. 11758-43) in bluegill sunfish (Lepomis macrochirus) were determined in a continuous flow-through system. Test System I (containing 125 fish weighing approximately 1g) was used to monitor accumulation and elimination of total 14C-residues, while Test System II (containing 12 fish weighing approximately 25g) was used for extraction and characterisation of accumulated residues. Stock solutions of 14C-acetochlor technical in methanol were prepared with specific activities of 0.265 and 0.273 KBq/µg for Test Systems I and II, respectively. Both Test Systems included a solvent control. Fish were exposed in dechlorinated water at nominal concentrations of 0 (control), 11.3 (Test System I), and 11.0 (Test System II) µg a.s./L.
Test System I: Seven fish were collected from Test System I (acetochlor and control treatments) on days 0, 1, 3, 7, 14, 21, 25, and 28 during the exposure period, and on days 1, 3, 7, 10, 14 and 28 during the depuration period. On each sampling date, fish lengths and weights were recorded. Whole fish radioactivity was determined in three of the fish. The other four fish were separated into viscera, muscle (muscle, skin, and bones), and the remainder (head and fins). Total radioactivity in whole fish and tissue fractions was determined by grinding followed by combustion, and liquid scintillation counting. On Day 28 of the exposure period, the remaining fish were transferred to untreated aquaria and exposed to untreated dilution water for 28 days.
Test System II: On days 21 and 28 of the exposure phase, four and eight fish, respectively, were removed from Test System II (acetochlor and control treatments) for characterisation of the radioactivity. No depuration phase was conducted for this system.
Test solutions in aquaria (80 L/aquarium) were renewed at a rate of ~250 mL/minute. Water was collected daily from both Test Systems through Day 28 of the exposure period. Water samples were analysed on days 0, 7, 14, 21, and 28 using liquid scintillation counting for total radioactive residues and TLC and/or HPLC for acetochlor quantification. Fish tissues collected on days 21 and 28 of the exposure period were extracted and the residues characterized and quantified by combustion/liquid scintillation counting and thin layer chromatography (TLC). Day 28 samples were also analysed by GLC.
Findings: The bioconcentration and depuration data are summarised in Tables 9.2.3-1, 9.2.3-2, and 9.2.3-3. During the exposure phase (Days 0–28), mean measured concentrations in water of acetochlor equivalents for Test Systems I and II were 11.8 and 10.8 µg/L, respectively. Acetochlor was calculated to represent 92-98% (based on TLC analyses) and 91-98% (based on HPLC analyses) of the total radioactivity for Test Systems I and II, respectively. The Day 0-28 mean measured acetochlor equivalent concentrations were used to calculate bioconcentration factors.
The plateau levels of accumulated 14C-residues in muscle, viscera and whole fish were approximately 0.5, 9.2 and 1.8 mg acetochlor equivalents per kg wet weight, equivalent to bioconcentration factors of 40, 780 and 150 respectively. During the depuration period, the level of 14C-residues fell very rapidly in the viscera, with 97% being eliminated within 3 days. For muscle, viscera and whole fish, respectively, 67, 98 and 90% of Exposure Day 28 residues were eliminated by the end of the depuration period.
The characterisation of tissue residues demonstrated that acetochlor was present in all tissues, ranging from 4 to 25% of total radioactivity. In addition to acetochlor, three major degradates were present (all more polar than the parent), which together accounted for the majority of the extractable radioactivity. Further characterisation of the residues by hydrolysis to 2-ethyl-6-methylaniline (EMA) and 2-(1-hydroxyethyl)-6-methylaniline (HEMA) showed that in muscle, viscera and remainder, residues containing the EMA moiety represented 35, 24 and 37% of the total residue, respectively; and those containing the HEMA moiety represented 9, 6 and 14% respectively.
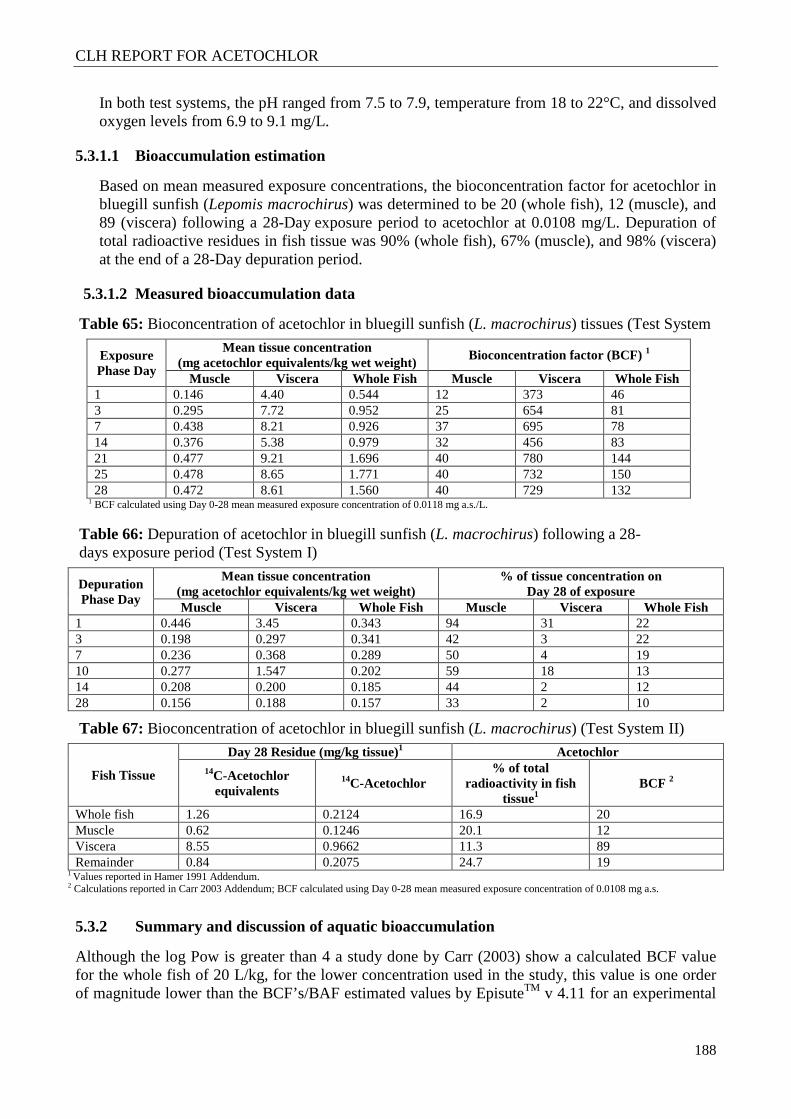
CLH REPORT FOR ACETOCHLOR
188
In both test systems, the pH ranged from 7.5 to 7.9, temperature from 18 to 22°C, and dissolved oxygen levels from 6.9 to 9.1 mg/L.
5.3.1.1 Bioaccumulation estimation
Based on mean measured exposure concentrations, the bioconcentration factor for acetochlor in bluegill sunfish (Lepomis macrochirus) was determined to be 20 (whole fish), 12 (muscle), and 89 (viscera) following a 28-Day exposure period to acetochlor at 0.0108 mg/L. Depuration of total radioactive residues in fish tissue was 90% (whole fish), 67% (muscle), and 98% (viscera) at the end of a 28-Day depuration period.
5.3.1.2 Measured bioaccumulation data
Table 65: Bioconcentration of acetochlor in bluegill sunfish (L. macrochirus) tissues (Test System
Exposure Phase Day
Mean tissue concentration (mg acetochlor equivalents/kg wet weight)
Bioconcentration factor (BCF) 1
Muscle Viscera Whole Fish Muscle Viscera Whole Fish 1 0.146 4.40 0.544 12 373 46 3 0.295 7.72 0.952 25 654 81 7 0.438 8.21 0.926 37 695 78 14 0.376 5.38 0.979 32 456 83 21 0.477 9.21 1.696 40 780 144 25 0.478 8.65 1.771 40 732 150 28 0.472 8.61 1.560 40 729 132
1 BCF calculated using Day 0-28 mean measured exposure concentration of 0.0118 mg a.s./L.
Table 66: Depuration of acetochlor in bluegill sunfish (L. macrochirus) following a 28-days exposure period (Test System I)
Depuration Phase Day
Mean tissue concentration (mg acetochlor equivalents/kg wet weight)
% of tissue concentration on Day 28 of exposure
Muscle Viscera Whole Fish Muscle Viscera Whole Fish 1 0.446 3.45 0.343 94 31 22 3 0.198 0.297 0.341 42 3 22 7 0.236 0.368 0.289 50 4 19 10 0.277 1.547 0.202 59 18 13 14 0.208 0.200 0.185 44 2 12 28 0.156 0.188 0.157 33 2 10
Table 67: Bioconcentration of acetochlor in bluegill sunfish (L. macrochirus) (Test System II)
Fish Tissue
Day 28 Residue (mg/kg tissue)1 Acetochlor 14C-Acetochlor
equivalents 14C-Acetochlor
% of total radioactivity in fish
tissue1 BCF 2
Whole fish 1.26 0.2124 16.9 20 Muscle 0.62 0.1246 20.1 12 Viscera 8.55 0.9662 11.3 89 Remainder 0.84 0.2075 24.7 19
1 Values reported in Hamer 1991 Addendum. 2 Calculations reported in Carr 2003 Addendum; BCF calculated using Day 0-28 mean measured exposure concentration of 0.0108 mg a.s.
5.3.2 Summary and discussion of aquatic bioaccumulation
Although the log Pow is greater than 4 a study done by Carr (2003) show a calculated BCF value for the whole fish of 20 L/kg, for the lower concentration used in the study, this value is one order of magnitude lower than the BCF’s/BAF estimated values by EpisuteTM v 4.11 for an experimental
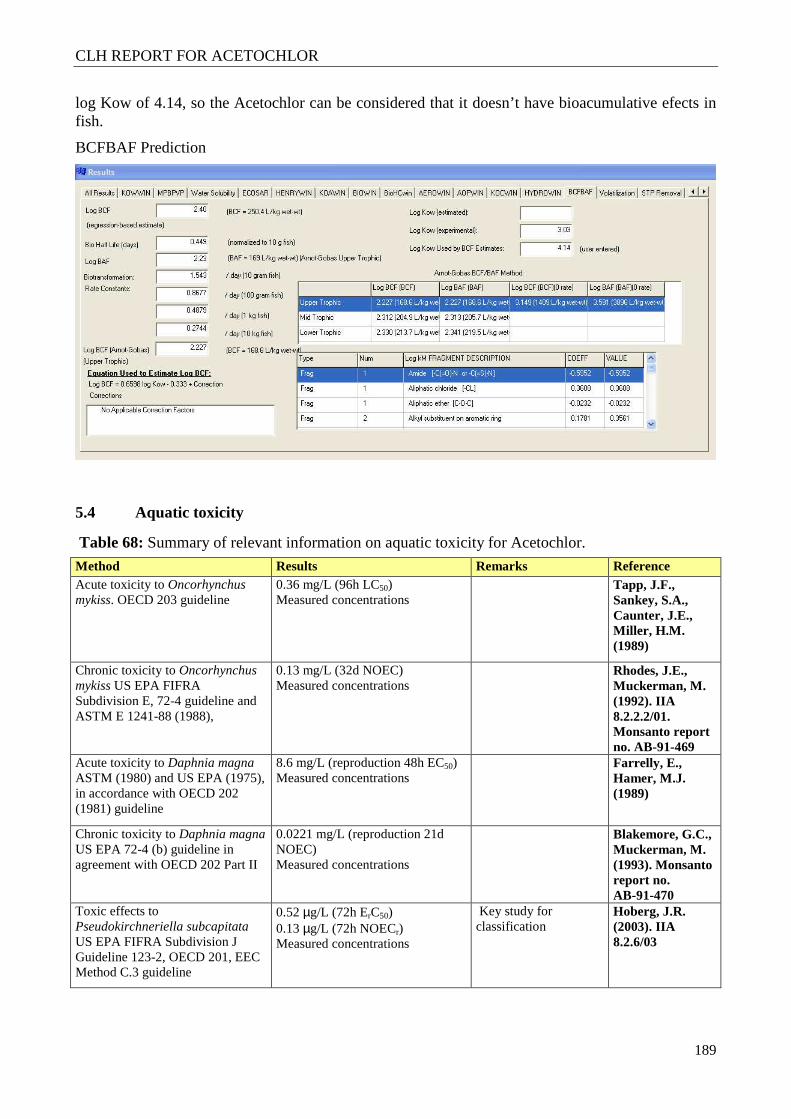
CLH REPORT FOR ACETOCHLOR
189
log Kow of 4.14, so the Acetochlor can be considered that it doesn’t have bioacumulative efects in fish.
BCFBAF Prediction
5.4 Aquatic toxicity
Table 68: Summary of relevant information on aquatic toxicity for Acetochlor.
Method Results Remarks Reference Acute toxicity to Oncorhynchus mykiss. OECD 203 guideline
0.36 mg/L (96h LC50) Measured concentrations
Tapp, J.F., Sankey, S.A., Caunter, J.E., Miller, H.M. (1989)
Chronic toxicity to Oncorhynchus mykiss US EPA FIFRA Subdivision E, 72-4 guideline and ASTM E 1241-88 (1988),
0.13 mg/L (32d NOEC) Measured concentrations
Rhodes, J.E., Muckerman, M. (1992). IIA 8.2.2.2/01. Monsanto report no. AB-91-469
Acute toxicity to Daphnia magna ASTM (1980) and US EPA (1975), in accordance with OECD 202 (1981) guideline
8.6 mg/L (reproduction 48h EC50) Measured concentrations
Farrelly, E., Hamer, M.J. (1989)
Chronic toxicity to Daphnia magna US EPA 72-4 (b) guideline in agreement with OECD 202 Part II
0.0221 mg/L (reproduction 21d NOEC) Measured concentrations
Blakemore, G.C., Muckerman, M. (1993). Monsanto report no. AB-91-470
Toxic effects to Pseudokirchneriella subcapitata US EPA FIFRA Subdivision J Guideline 123-2, OECD 201, EEC Method C.3 guideline
0.52 µg/L (72h ErC50) 0.13 µg/L (72h NOECr) Measured concentrations
Key study for classification
Hoberg, J.R. (2003). IIA 8.2.6/03
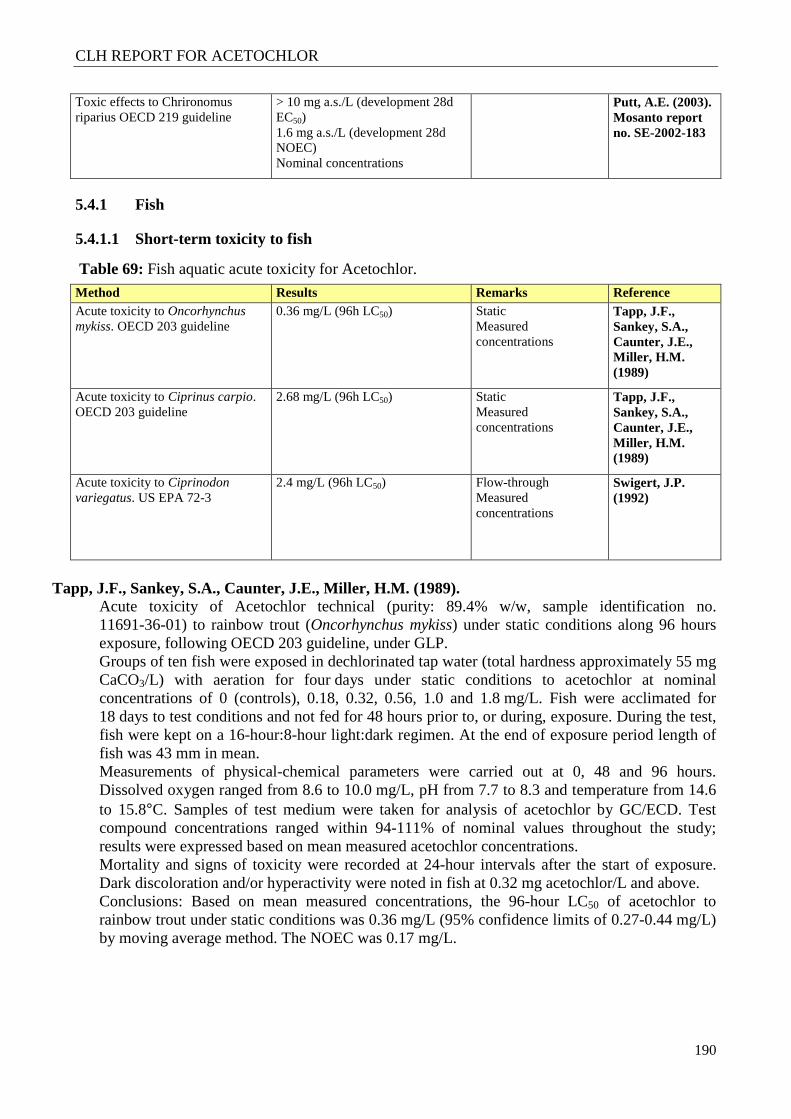
CLH REPORT FOR ACETOCHLOR
190
Toxic effects to Chrironomus riparius OECD 219 guideline
> 10 mg a.s./L (development 28d EC50) 1.6 mg a.s./L (development 28d NOEC) Nominal concentrations
Putt, A.E. (2003). Mosanto report no. SE-2002-183
5.4.1 Fish
5.4.1.1 Short-term toxicity to fish
Table 69: Fish aquatic acute toxicity for Acetochlor.
Method Results Remarks Reference Acute toxicity to Oncorhynchus mykiss. OECD 203 guideline
0.36 mg/L (96h LC50) Static Measured concentrations
Tapp, J.F., Sankey, S.A., Caunter, J.E., Miller, H.M. (1989)
Acute toxicity to Ciprinus carpio. OECD 203 guideline
2.68 mg/L (96h LC50) Static Measured concentrations
Tapp, J.F., Sankey, S.A., Caunter, J.E., Miller, H.M. (1989)
Acute toxicity to Ciprinodon variegatus. US EPA 72-3
2.4 mg/L (96h LC50) Flow-through Measured concentrations
Swigert, J.P. (1992)
Tapp, J.F., Sankey, S.A., Caunter, J.E., Miller, H.M. (1989). Acute toxicity of Acetochlor technical (purity: 89.4% w/w, sample identification no.
11691-36-01) to rainbow trout (Oncorhynchus mykiss) under static conditions along 96 hours exposure, following OECD 203 guideline, under GLP.
Groups of ten fish were exposed in dechlorinated tap water (total hardness approximately 55 mg CaCO3/L) with aeration for four days under static conditions to acetochlor at nominal concentrations of 0 (controls), 0.18, 0.32, 0.56, 1.0 and 1.8 mg/L. Fish were acclimated for 18 days to test conditions and not fed for 48 hours prior to, or during, exposure. During the test, fish were kept on a 16-hour:8-hour light:dark regimen. At the end of exposure period length of fish was 43 mm in mean.
Measurements of physical-chemical parameters were carried out at 0, 48 and 96 hours. Dissolved oxygen ranged from 8.6 to 10.0 mg/L, pH from 7.7 to 8.3 and temperature from 14.6 to 15.8°C. Samples of test medium were taken for analysis of acetochlor by GC/ECD. Test compound concentrations ranged within 94-111% of nominal values throughout the study; results were expressed based on mean measured acetochlor concentrations.
Mortality and signs of toxicity were recorded at 24-hour intervals after the start of exposure. Dark discoloration and/or hyperactivity were noted in fish at 0.32 mg acetochlor/L and above.
Conclusions: Based on mean measured concentrations, the 96-hour LC50 of acetochlor to rainbow trout under static conditions was 0.36 mg/L (95% confidence limits of 0.27-0.44 mg/L) by moving average method. The NOEC was 0.17 mg/L.
CLH REPORT FOR ACETOCHLOR
191
Tapp, J.F., Sankey, S.A., Caunter, J.E., Miller, H.M. (1989).
Acute toxicity of acetochlor technical (ID 11691-36-01, purity: 89.6% w/w) to Mirror Carp (Cyprinus carpio) under static conditions along 96 hours exposure, following OECD 203 (1984) guideline, under GLP.
Deviations from EEC Method C.1: Length of fish was slightly greater than recommended. In the report, no information is provided about feeding times prior to the test, the hours of daily illumination and the light intensity. These deviations were not considered to have affected the outcome of the study.
Groups of ten juvenile fish each were exposed in dechlorinated tap water for four days to acetochlor at nominal concentrations of 0 (control), 0.32, 0.56, 1.0, 1.8, 3.2, and 5.6 mg a.s./L. Fish were not fed during the test. Physical-chemical parameters were recorded daily after test initiation. During the test, water temperature ranged from 21.2 to 21.6°C, pH from 7.3 to 7.9, and dissolved oxygen from 5.6 to 8.4 mg/L. At 0, 48, and 96 hours, samples of the test medium were taken for quantification of acetochlor by GC. Mean measured concentrations of acetochlor ranged between 79 and 94% of nominal values.
Mortality and signs of toxicity were recorded at 24-hour intervals after test start. Behavioural and sub lethal effects were observed at concentrations ≥1.8 mg/L and included surfacing, sounding, spiralling, loss of balance, dark discoloration, and erratic swimming. No additional mortality was observed after 72 hours of exposure.
Conclusions: Based on mean measured concentrations, the 96-hour LC50 for mirror carp (Cyprinus carpio) exposed to acetochlor technical under static conditions was 2.68 mg/L (95% confidence limits of 2.21 and 3.46 mg/L) by probit. The NOEC was 0.9 mg/L.
Swigert, J.P. (1992). IIA 8.2.1/04. Monsanto report no. WL-91-224
Acute toxicity of Acetochlor technical (lot no. QUE-9001-1482-T, purity: 92.07% w/w) to sheepshead minnow (Cyprinodon variegatus).under 96-hour flow-through conditions, following US EPA 72-3 (1982) guideline, under GLP.
Deviations from EEC Method C.1: The range of fish weights used in the test was amended to 0.2-5.0 g (guideline requirement of 0.5-5.0 g). These deviations were not considered to have affected the outcome of the study.
Two groups of ten fish (24 mm in mean) were exposed to acetochlor dissolved in dimethylformamide (DMF) at nominal concentrations of 0 (control), 1.04, 1.73, 2.88, 4.8 and 8.0 mg/L. A solvent control (DMF at 0.1 mL/L) was also included. Fish were kept in natural seawater (diluted to 25‰ salinity with well water) on a 16:8 hour light:dark regimen at 22°C. At 0, 48 and 96 hours, samples of test medium from each replicate were taken for analysis of acetochlor by GC/ECD mean measured concentrations were 0, 1.1, 2.0, 3.3, 5.5, and 9.3 mg/L.
Physical-chemical parameters were measured at daily intervals. Dissolved oxygen concentrations ranged from 5.3 to 6.9 mg/L (exceeded 60% of saturation throughout the test) and pH from 8.1 to 8.2.
Mortality and behaviour were recorded at 3 and 24-hour intervals after the start of exposure. There were no treatment-related mortalities or clinical signs in the negative and solvent control groups. Lethargy and discoloration were noted in surviving fish at 72 hours at the dose of 3.3 mg/L.
Conclusions: Based on mean measured concentrations of acetochlor, the 96-hour LC50 to sheepshead minnow (Cyprinodon variegatus) under flow-through conditions was determined
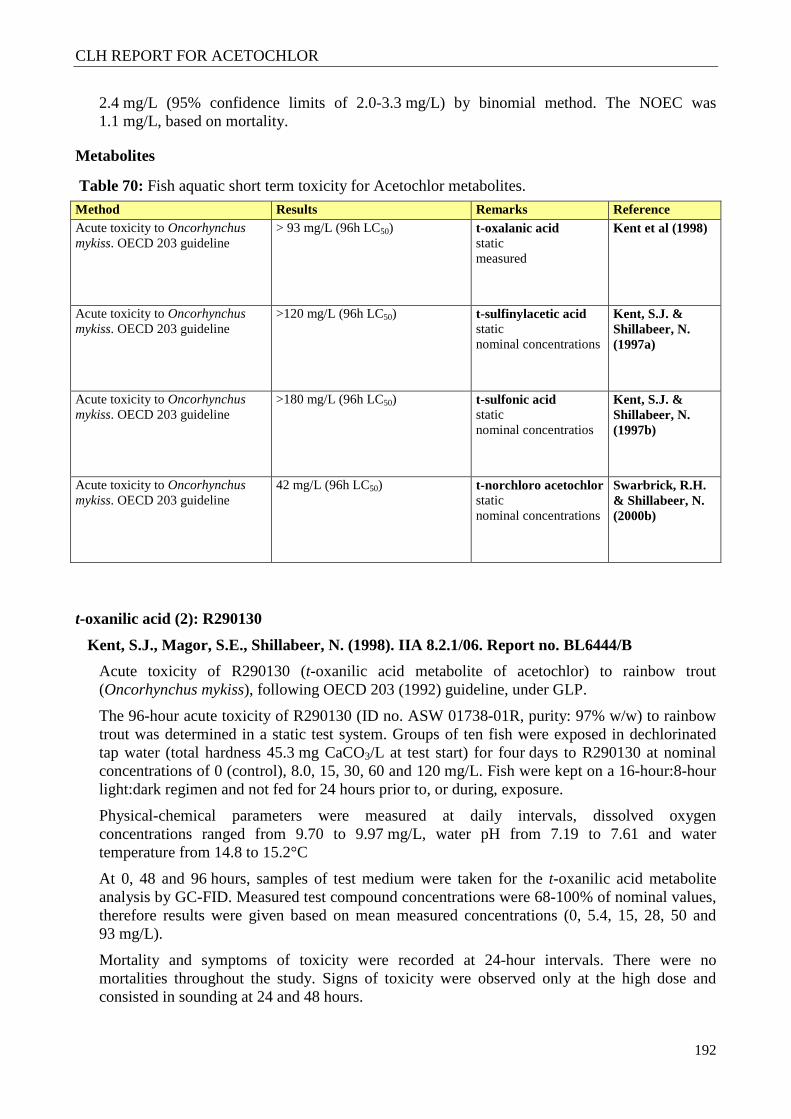
CLH REPORT FOR ACETOCHLOR
192
2.4 mg/L (95% confidence limits of 2.0-3.3 mg/L) by binomial method. The NOEC was 1.1 mg/L, based on mortality.
Metabolites
Table 70: Fish aquatic short term toxicity for Acetochlor metabolites.
Method Results Remarks Reference Acute toxicity to Oncorhynchus mykiss. OECD 203 guideline
> 93 mg/L (96h LC50) t-oxalanic acid static measured
Kent et al (1998)
Acute toxicity to Oncorhynchus mykiss. OECD 203 guideline
>120 mg/L (96h LC50) t-sulfinylacetic acid static nominal concentrations
Kent, S.J. & Shillabeer, N. (1997a)
Acute toxicity to Oncorhynchus mykiss. OECD 203 guideline
>180 mg/L (96h LC50) t-sulfonic acid static nominal concentratios
Kent, S.J. & Shillabeer, N. (1997b)
Acute toxicity to Oncorhynchus mykiss. OECD 203 guideline
42 mg/L (96h LC50) t-norchloro acetochlor static nominal concentrations
Swarbrick, R.H. & Shillabeer, N. (2000b)
t-oxanilic acid (2): R290130
Kent, S.J., Magor, S.E., Shillabeer, N. (1998). IIA 8.2.1/06. Report no. BL6444/B
Acute toxicity of R290130 (t-oxanilic acid metabolite of acetochlor) to rainbow trout (Oncorhynchus mykiss), following OECD 203 (1992) guideline, under GLP.
The 96-hour acute toxicity of R290130 (ID no. ASW 01738-01R, purity: 97% w/w) to rainbow trout was determined in a static test system. Groups of ten fish were exposed in dechlorinated tap water (total hardness 45.3 mg CaCO3/L at test start) for four days to R290130 at nominal concentrations of 0 (control), 8.0, 15, 30, 60 and 120 mg/L. Fish were kept on a 16-hour:8-hour light:dark regimen and not fed for 24 hours prior to, or during, exposure.
Physical-chemical parameters were measured at daily intervals, dissolved oxygen concentrations ranged from 9.70 to 9.97 mg/L, water pH from 7.19 to 7.61 and water temperature from 14.8 to 15.2°C
At 0, 48 and 96 hours, samples of test medium were taken for the t-oxanilic acid metabolite analysis by GC-FID. Measured test compound concentrations were 68-100% of nominal values, therefore results were given based on mean measured concentrations (0, 5.4, 15, 28, 50 and 93 mg/L).
Mortality and symptoms of toxicity were recorded at 24-hour intervals. There were no mortalities throughout the study. Signs of toxicity were observed only at the high dose and consisted in sounding at 24 and 48 hours.
CLH REPORT FOR ACETOCHLOR
193
Conclusions: Based on mean measured concentrations of R290130, the 96 hour LC50 to rainbow trout under static conditions was determined to be >93 mg/L. The corresponding NOEC was 50 mg/L based on signs of toxicity at 93 mg/L.
t-sulfinylacetic acid (3): R243797
Kent, S.J., Shillabeer, N. (1997a).
Acute toxicity of R243797 (t- sulfinylacetic acid metabolite of acetochlor) to rainbow trout (Oncorhynchus mykiss), following OECD 203 (1992) guideline, under GLP.
The 96-hour acute toxicity of R243797 (lot no. R243797/2/P2, purity: 99% w/w) to rainbow trout was determined in a static test system. Groups of ten fish were exposed in dechlorinated tap water (total hardness 47.3 mg CaCO3/L at test start) for four days to R243797 at nominal concentrations of 0 (control) and 120 mg/L. Fish were kept on a 16-hour:8-hour light:dark regimen and not fed for 24 hours prior to, or during, exposure.
Measurements of physical-chemical parameters were carried out at 0, 48 and 96 hours. Dissolved oxygen concentrations ranged from 9.6 to 10.2 mg/L, water pH from 6.80 to 7.65 and water temperature from 14.2 to 15.0°C. At 0, 48 and 96 hours, samples of test medium were taken for analysis by HPLC. The measured test compound concentration was 100% of the nominal value.
Mortality and symptoms of toxicity were recorded at 24-hour intervals after the start of exposure. There were no mortalities or symptoms of toxicity throughout the study.
Conclusions: Based on nominal concentrations of R243797, the 96 hour LC50 to rainbow trout (O. mykiss) under static conditions was determined >120 mg/L. The corresponding NOEC was 120 mg/L.
t-sulfonic acid (7): R290131
Kent, S.J., Shillabeer, N. (1997b).
Acute toxicity of R290131 (t- sulfonic acid metabolite of acetochlor) to rainbow trout (Oncorhynchus mykiss), following OECD 203 (1992) guideline, under GLP.
The 96-hour acute toxicity of R290131 (lot no. R290131/7/Na/P5, purity: 97% w/w) to rainbow trout was determined in a static test system. Groups of ten fish were exposed in dechlorinated tap water (total hardness 43.7 mg CaCO3/L at test start) for four days to R290131 at nominal concentrations of 0 (control), 18, 32, 56, 100 and 180 mg/L. Fish were kept on a 16-hour:8-hour light:dark regimen and not fed for 48 hours prior to, or during, exposure.
Measurements of physical-chemical parameters were carried out daily. Dissolved oxygen concentrations ranged from 9.8 to 10.2 mg/L, pH from 7.49 to 7.77 and water temperature from 14.4 to 15.0°C. At 0, 48 and 96 hours, samples of test medium were taken for analysis of test substance by HPLC. The measured test concentrations were 90-103% of nominal.
Mortality and symptoms of toxicity were recorded at 24-hour intervals after the start of exposure. There were no mortalities or symptoms of toxicity observed throughout the study.
Conclusions: Based on nominal concentrations of R290131, the 96 hour LC50 to rainbow trout (Oncorhynchus mykiss) under static conditions was determined to be >180 mg/L. The corresponding NOEC was 180 mg/L.
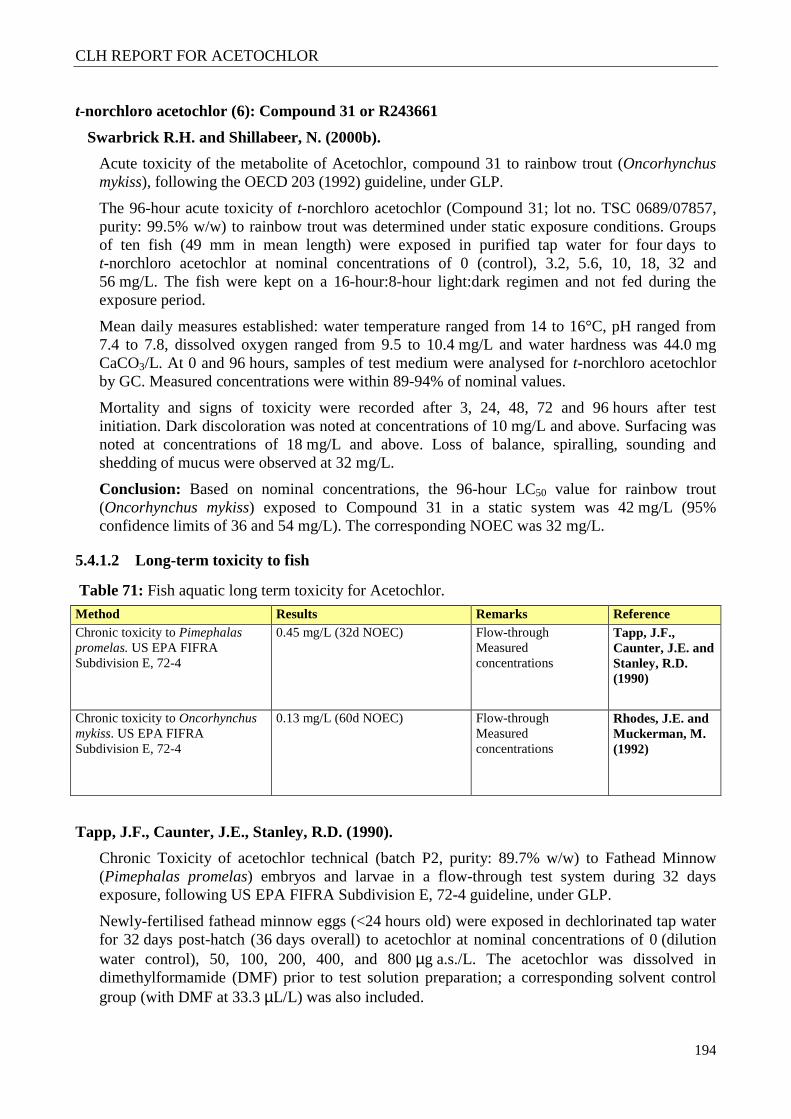
CLH REPORT FOR ACETOCHLOR
194
t-norchloro acetochlor (6): Compound 31 or R243661
Swarbrick R.H. and Shillabeer, N. (2000b).
Acute toxicity of the metabolite of Acetochlor, compound 31 to rainbow trout (Oncorhynchus mykiss), following the OECD 203 (1992) guideline, under GLP.
The 96-hour acute toxicity of t-norchloro acetochlor (Compound 31; lot no. TSC 0689/07857, purity: 99.5% w/w) to rainbow trout was determined under static exposure conditions. Groups of ten fish (49 mm in mean length) were exposed in purified tap water for four days to t-norchloro acetochlor at nominal concentrations of 0 (control), 3.2, 5.6, 10, 18, 32 and 56 mg/L. The fish were kept on a 16-hour:8-hour light:dark regimen and not fed during the exposure period.
Mean daily measures established: water temperature ranged from 14 to 16°C, pH ranged from 7.4 to 7.8, dissolved oxygen ranged from 9.5 to 10.4 mg/L and water hardness was 44.0 mg CaCO3/L. At 0 and 96 hours, samples of test medium were analysed for t-norchloro acetochlor by GC. Measured concentrations were within 89-94% of nominal values.
Mortality and signs of toxicity were recorded after 3, 24, 48, 72 and 96 hours after test initiation. Dark discoloration was noted at concentrations of 10 mg/L and above. Surfacing was noted at concentrations of 18 mg/L and above. Loss of balance, spiralling, sounding and shedding of mucus were observed at 32 mg/L.
Conclusion: Based on nominal concentrations, the 96-hour LC50 value for rainbow trout (Oncorhynchus mykiss) exposed to Compound 31 in a static system was 42 mg/L (95% confidence limits of 36 and 54 mg/L). The corresponding NOEC was 32 mg/L.
5.4.1.2 Long-term toxicity to fish
Table 71: Fish aquatic long term toxicity for Acetochlor.
Method Results Remarks Reference Chronic toxicity to Pimephalas promelas. US EPA FIFRA Subdivision E, 72-4
0.45 mg/L (32d NOEC) Flow-through Measured concentrations
Tapp, J.F., Caunter, J.E. and Stanley, R.D. (1990)
Chronic toxicity to Oncorhynchus mykiss. US EPA FIFRA Subdivision E, 72-4
0.13 mg/L (60d NOEC) Flow-through Measured concentrations
Rhodes, J.E. and Muckerman, M. (1992)
Tapp, J.F., Caunter, J.E., Stanley, R.D. (1990).
Chronic Toxicity of acetochlor technical (batch P2, purity: 89.7% w/w) to Fathead Minnow (Pimephalas promelas) embryos and larvae in a flow-through test system during 32 days exposure, following US EPA FIFRA Subdivision E, 72-4 guideline, under GLP.
Newly-fertilised fathead minnow eggs (<24 hours old) were exposed in dechlorinated tap water for 32 days post-hatch (36 days overall) to acetochlor at nominal concentrations of 0 (dilution water control), 50, 100, 200, 400, and 800 µg a.s./L. The acetochlor was dissolved in dimethylformamide (DMF) prior to test solution preparation; a corresponding solvent control group (with DMF at 33.3 µL/L) was also included.
CLH REPORT FOR ACETOCHLOR
195
Each test group consisted of two replicates of 40 eggs each (80 eggs per concentration. The eggs were placed into glass incubation cups with screened bases on Day 0, and the number of live and dead eggs was assessed daily. On Day 4 (“hatch day”), 30 larvae per replicate were removed from the incubation cups and released into the test chambers. When hatch was complete, the number of live, deformed, and dead larvae was recorded, and the percentage hatch calculated based on the number of live normal larvae in each tank. Daily observation of larval mortality, behaviour and appearance continued until 32 days post-hatch (Day 36), when the surviving larvae were counted and individually weighed and measured.
After release and until 5 days post-hatch, larvae were fed powdered Pruteen® and live rotifers or brine shrimp daily. From Day 6 to the Day 31 post-hatch, larvae were fed two or three times per Day with Artemia larvae, with Promin® fish food replacing one of the Artemia feedings each Day beginning on Day 21 post-hatch. No food was given during the last 24-hours of the test.
The test was conducted under a 16-hr:8-h light:dark (light intensity 1060 to 1150 lux) regimen, water temperatures ranged from 23.6 to 25.8 °C, dissolved oxygen levels from 4.8 to 8.0 mg/L, dilution water hardness ranged from 47.7 to 52.7 mg CaCO3/L and pH from 7.0 to 7.7. The test medium was replaced at a rate of approximately 8 complete replacements per 24 hours. Dissolved oxygen, pH, temperature and water hardness were measured in each replicate on Day 0 and twice weekly thereafter.
Samples were taken for quantification of acetochlor by GLC according to the following schedule: Replicate A: days 0, 1, 2, 3, 4, 11, 20, 26, and 33; Replicate B: days 0, 1, 2, 3, 8, 14, 21, 28 and 35. Mean measured acetochlor concentrations ranged from 100-126% of nominal concentrations.
No treatment-related effects were seen on hatchability at any dose level. The only abnormality noted was a single deformed larva in the dilution water control group. Larval survival was not significantly different from controls at concentrations of 450 µg/L and lower, but was reduced (p<0.05) at the highest tested concentration of 797 µg/L. No treatment-related effects on larval length and weight were observed at any tested concentration.
Conclusions: Based on mean measured concentrations, the NOEC of acetochlor technical to fathead minnow exposed under flow-through conditions in an early-life-stage toxicity test was 450 µg/L.
Rhodes, J.E., Muckerman, M. (1992). IIA 8.2.2.2/01. Monsanto report no. AB-91-469.
Chronic Toxicity of acetochlor technical (lot no. QUE-9001-1482-T, purity: 92.07% w/w) to the rainbow trout (Oncorhynchus mykiss) embryos and fry in a flow-through test system during 32 days exposure, following US EPA FIFRA Subdivision E, 72-4 guideline and ASTM E 1241-88 (1988), under GLP.
For the main early life stage test, groups of 40 freshly fertilised eggs were placed in glass cups with screen bases and exposed up to 60 days post-hatch to acetochlor (dissolved in dimethylformamide, DMF) at nominal concentrations of 0 (control), 0.031, 0.063, 0.13, 0.25 and 0.50 mg a.s./L. A solvent control (DMF at 0.0125 mL/L) was also included. There were four replicate groups of 120 eggs each per treatment. The test medium was replaced at a rate of 10.1 complete replacements per 24 hours. Embryo mortality was assessed daily. When hatching began, the number of eggs hatched was recorded daily until hatch was complete. The 60-Day post-hatch growth period began when 95% of the eggs in the control group had hatched.
Sac-fry were thinned to 15 individuals per replicate on Day 40 (except in one replicate at 0.50 mg/L where only 11 fry were left) and released from the incubation cups into the respective
CLH REPORT FOR ACETOCHLOR
196
growth chambers. Mortality, abnormal behaviour, normal swim-up behaviour and abnormal physical changes were recorded daily.
Feeding was initiated on Day 48 (12 days post-hatch) as normal swim-up behaviour became pronounced. Initially, the fry received live brine shrimp nauplii (Artemia) and a commercially prepared salmon starter was added on Day 57. Trout were fed ad libitum except prior to photographic measurement and study termination. Fry growth was determined by McKim and Benoit’s photographic method on Day 35 post-hatch. At the end of the study, standard length and blotted wet weight were recorded.
Water dissolved oxygen, temperature, conductivity, pH, hardness and alkalinity were measured days 0, 1 (except hardness and alkalinity), 7 and at weekly intervals thereafter. The water quality parameters remained within expected ranges throughout the test (dissolved oxygen 75-100% of the air saturation value, temperature 9.8 to 11°C, conductivity 305-382 µS, pH 7.49-8.35, hardness 132-158 mg CaCO3/L and alkalinity 148-170 mg CaCO3/L).
All test media were sampled on days 0, 1, 7 and weekly thereafter for quantification of acetochlor by GLC. Mean measured concentrations ranged from 100 to 119% of nominal values.
Toxicological findings: Preliminary tests: Based on the three range-finding tests, five nominal concentrations between 0.0031 and 0.50 mg acetochlor/L were chosen to bracket estimated effect and no effect concentrations for egg hatchability.
Main early life-stage test: Compared to pooled controls, egg hatchability was significantly (p<0.05) reduced at 0.27 and 0.51 mg/L; survival at 35 and 60 days post-hatch was significantly (p<0.05) reduced at 0.51 mg/L. At 35 and 60 days post-hatch, mean standard length and blotted wet weight (Day 60 only) at 0.27 mg/L were significantly (p<0.05) different from pooled controls. The 0.51 mg/L group was excluded from analysis due to high mortality. Time to hatch and time to initiation of swim-up behaviour were affected at 0.51 mg/L. Also, compound-related morphological and behavioural effects were noted at 0.27 and 0.51 mg/L.
Conclusions: Based on mean measured concentrations and the most sensitive endpoints of egg hatch and growth, the NOEC for embryos and larvae of rainbow trout (Oncorhynchus mykiss) exposed to acetochlor under flow-through conditions was 0.13 mg/L.
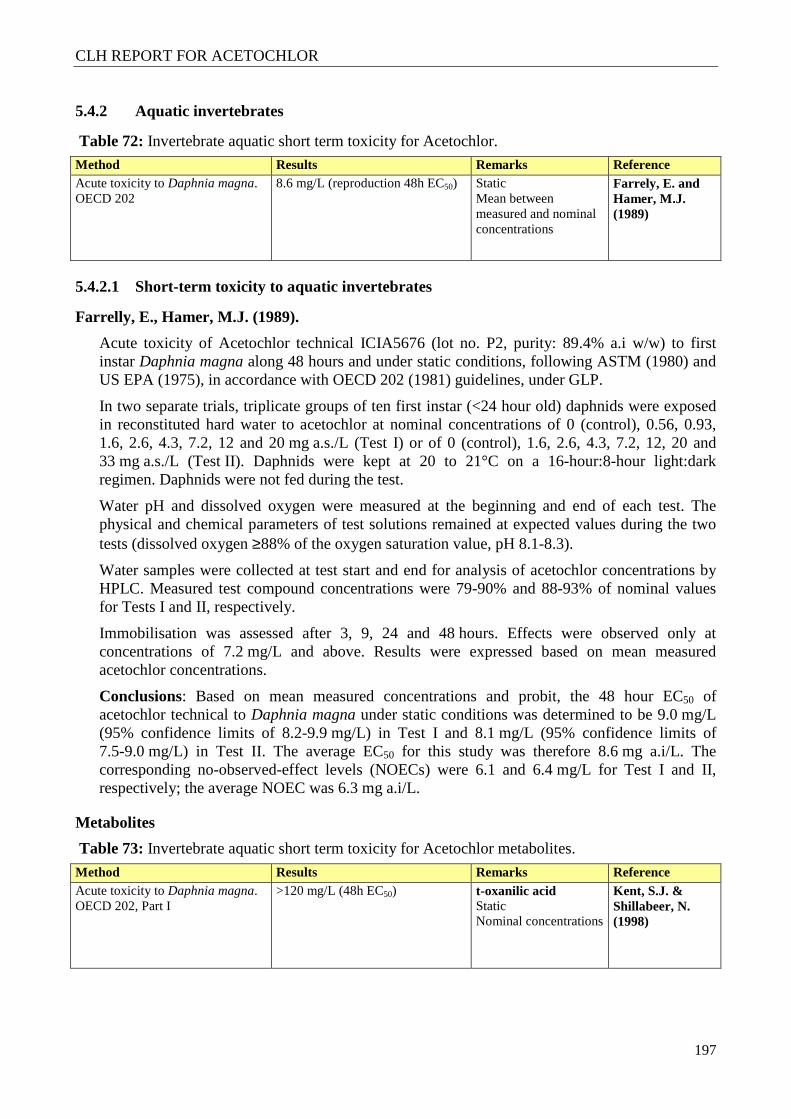
CLH REPORT FOR ACETOCHLOR
197
5.4.2 Aquatic invertebrates
Table 72: Invertebrate aquatic short term toxicity for Acetochlor.
Method Results Remarks Reference Acute toxicity to Daphnia magna. OECD 202
8.6 mg/L (reproduction 48h EC50) Static Mean between measured and nominal concentrations
Farrely, E. and Hamer, M.J. (1989)
5.4.2.1 Short-term toxicity to aquatic invertebrates
Farrelly, E., Hamer, M.J. (1989).
Acute toxicity of Acetochlor technical ICIA5676 (lot no. P2, purity: 89.4% a.i w/w) to first instar Daphnia magna along 48 hours and under static conditions, following ASTM (1980) and US EPA (1975), in accordance with OECD 202 (1981) guidelines, under GLP.
In two separate trials, triplicate groups of ten first instar (<24 hour old) daphnids were exposed in reconstituted hard water to acetochlor at nominal concentrations of 0 (control), 0.56, 0.93, 1.6, 2.6, 4.3, 7.2, 12 and 20 mg a.s./L (Test I) or of 0 (control), 1.6, 2.6, 4.3, 7.2, 12, 20 and 33 mg a.s./L (Test II). Daphnids were kept at 20 to 21°C on a 16-hour:8-hour light:dark regimen. Daphnids were not fed during the test.
Water pH and dissolved oxygen were measured at the beginning and end of each test. The physical and chemical parameters of test solutions remained at expected values during the two tests (dissolved oxygen ≥88% of the oxygen saturation value, pH 8.1-8.3).
Water samples were collected at test start and end for analysis of acetochlor concentrations by HPLC. Measured test compound concentrations were 79-90% and 88-93% of nominal values for Tests I and II, respectively.
Immobilisation was assessed after 3, 9, 24 and 48 hours. Effects were observed only at concentrations of 7.2 mg/L and above. Results were expressed based on mean measured acetochlor concentrations.
Conclusions: Based on mean measured concentrations and probit, the 48 hour EC50 of acetochlor technical to Daphnia magna under static conditions was determined to be 9.0 mg/L (95% confidence limits of 8.2-9.9 mg/L) in Test I and 8.1 mg/L (95% confidence limits of 7.5-9.0 mg/L) in Test II. The average EC50 for this study was therefore 8.6 mg a.i/L. The corresponding no-observed-effect levels (NOECs) were 6.1 and 6.4 mg/L for Test I and II, respectively; the average NOEC was 6.3 mg a.i/L.
Metabolites
Table 73: Invertebrate aquatic short term toxicity for Acetochlor metabolites.
Method Results Remarks Reference Acute toxicity to Daphnia magna. OECD 202, Part I
>120 mg/L (48h EC50) t-oxanilic acid Static Nominal concentrations
Kent, S.J. & Shillabeer, N. (1998)
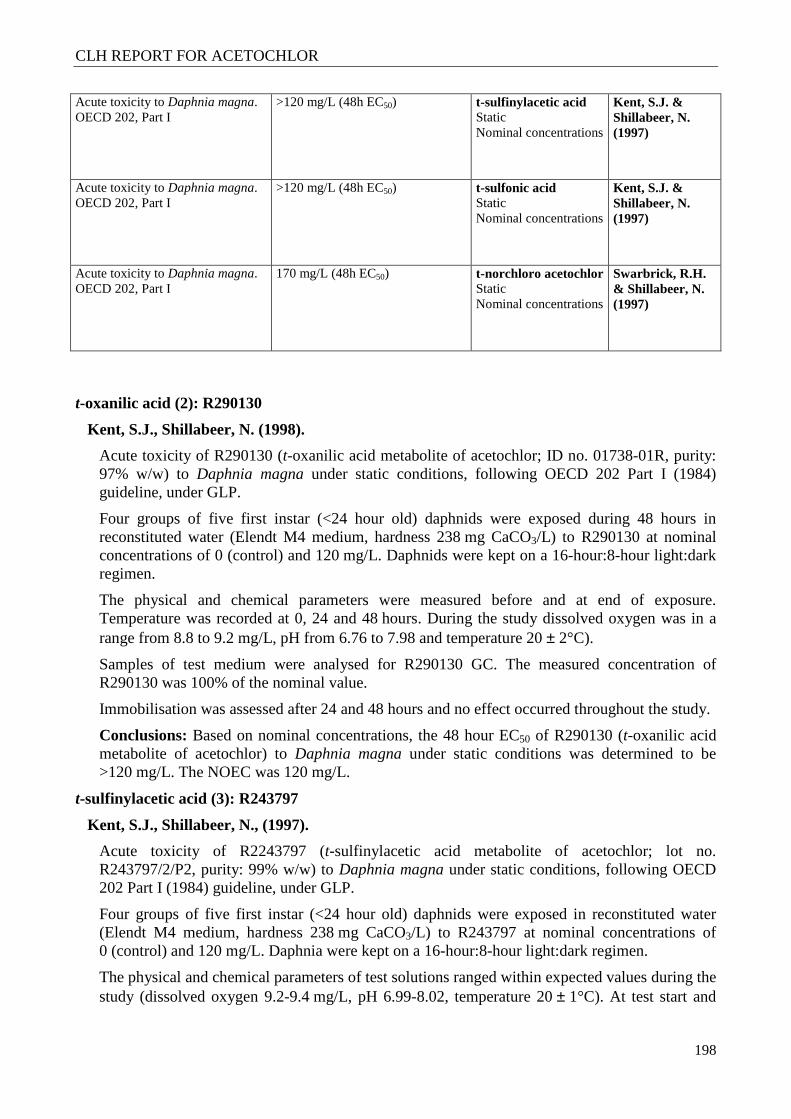
CLH REPORT FOR ACETOCHLOR
198
Acute toxicity to Daphnia magna. OECD 202, Part I
>120 mg/L (48h EC50) t-sulfinylacetic acid Static Nominal concentrations
Kent, S.J. & Shillabeer, N. (1997)
Acute toxicity to Daphnia magna. OECD 202, Part I
>120 mg/L (48h EC50) t-sulfonic acid Static Nominal concentrations
Kent, S.J. & Shillabeer, N. (1997)
Acute toxicity to Daphnia magna. OECD 202, Part I
170 mg/L (48h EC50) t-norchloro acetochlor Static Nominal concentrations
Swarbrick, R.H. & Shillabeer, N. (1997)
t-oxanilic acid (2): R290130
Kent, S.J., Shillabeer, N. (1998).
Acute toxicity of R290130 (t-oxanilic acid metabolite of acetochlor; ID no. 01738-01R, purity: 97% w/w) to Daphnia magna under static conditions, following OECD 202 Part I (1984) guideline, under GLP.
Four groups of five first instar (<24 hour old) daphnids were exposed during 48 hours in reconstituted water (Elendt M4 medium, hardness 238 mg CaCO3/L) to R290130 at nominal concentrations of 0 (control) and 120 mg/L. Daphnids were kept on a 16-hour:8-hour light:dark regimen.
The physical and chemical parameters were measured before and at end of exposure. Temperature was recorded at 0, 24 and 48 hours. During the study dissolved oxygen was in a range from 8.8 to 9.2 mg/L, pH from 6.76 to 7.98 and temperature 20 ± 2°C).
Samples of test medium were analysed for R290130 GC. The measured concentration of R290130 was 100% of the nominal value.
Immobilisation was assessed after 24 and 48 hours and no effect occurred throughout the study.
Conclusions: Based on nominal concentrations, the 48 hour EC50 of R290130 (t-oxanilic acid metabolite of acetochlor) to Daphnia magna under static conditions was determined to be >120 mg/L. The NOEC was 120 mg/L.
t-sulfinylacetic acid (3): R243797
Kent, S.J., Shillabeer, N., (1997).
Acute toxicity of R2243797 (t-sulfinylacetic acid metabolite of acetochlor; lot no. R243797/2/P2, purity: 99% w/w) to Daphnia magna under static conditions, following OECD 202 Part I (1984) guideline, under GLP.
Four groups of five first instar (<24 hour old) daphnids were exposed in reconstituted water (Elendt M4 medium, hardness 238 mg CaCO3/L) to R243797 at nominal concentrations of 0 (control) and 120 mg/L. Daphnia were kept on a 16-hour:8-hour light:dark regimen.
The physical and chemical parameters of test solutions ranged within expected values during the study (dissolved oxygen 9.2-9.4 mg/L, pH 6.99-8.02, temperature 20 ± 1°C). At test start and
CLH REPORT FOR ACETOCHLOR
199
end, samples of test medium were taken for analysis of the t-sulfinylacetic acid by HPLC. The measured concentration was 100% of the nominal value.
Immobilisation was assessed after 24 and 48 hours. No effect occurred in this study.
Conclusions: Based on nominal concentrations, the 48 hour EC50 of R243797 (the t-sulfinylacetic acid metabolite of acetochlor) to Daphnia magna was >120 mg/L. The NOEC was 120 mg/L.
t-sulfonic acid (7): R290131
Kent, S.J., Shillabeer, N. (1997).
Acute toxicity of R290131 (t-sulfonic acid metabolite of acetochlor, lot no. R290131/7/Na/P5, purity 97% w/w) to Daphnia magna under static conditions, following OECD 202 Part I (1984) guideline under GLP.
Four groups of five first instar (<24 hour old) daphnids were exposed in reconstituted water (Elendt M4 medium, hardness 237.7 mg CaCO3/L) to R290131 at nominal concentrations of 0 (control) and 120 mg/L. Daphnids were kept on a 16-hour:8-hour light:dark regimen.
The physical and chemical parameters of test solutions remained at expected values during the study (dissolved oxygen 9.0-9.2 mg/L, pH 8.04-8.15, temperature 20 ± 1°C). At test start and end, samples of test medium were taken for analysis of the t-sulfonic acid metabolite by HPLC. The measured concentration was 108% of the nominal value.
Immobilisation was assessed after 24 and 48 hours. No immobilisation occurred throughout the study.
Conclusions: Based on nominal concentrations of R290131 (t-sulfonic acid metabolite of acetochlor), the 48 hour EC50 to Daphnia magna under static conditions was >120 mg/L. The NOEC was 120 mg/L.
t-norchloro acetochlor (6): Compound 31 or R243661
Swarbrick R.H., Shillabeer, N. (2000).
Acute toxicity of the metabolite of Acetochlor, compound 31 (lot no. TSC 0689/07857, purity: 99.5% w/w) to Daphnia magna under static conditions, following OECD 202 Part I (1984) guideline, under GLP.
Groups of five first instar daphnids (<24 hour old) were exposed in reconstituted deionised water to nominal concentrations of Compound 31 at 0 (control), 10, 18, 32, 56, 100 and 180 mg/L. There were four replicates for each test concentration. Daphnids were kept on a 16-hour:8 hour light:dark regimen.
Physical-chemical parameters were as follows: water temperatures were within the range of 20 ± 1°C. pH values ranged from 7.9 to 8.3 and dissolved oxygen values ranged from 9.0 to 9.4 mg/L. At 0 and 48 hours, samples of test medium were taken for analysis of t-norchloro acetochlor by GC. The mean measured concentrations were 91-98% of nominal concentrations.
Immobilisation was assessed after 24 and 48 hours.
Conclusions: Based on nominal concentrations, the 48 hour EC50 value for Daphnia magna exposed to t-norchloro acetochlor (Compound 31) in a static system was 170 mg/L (95% confidence limits of 150 and 180 mg/L) calculated by moving average angle method. The NOEC was 100 mg/L.
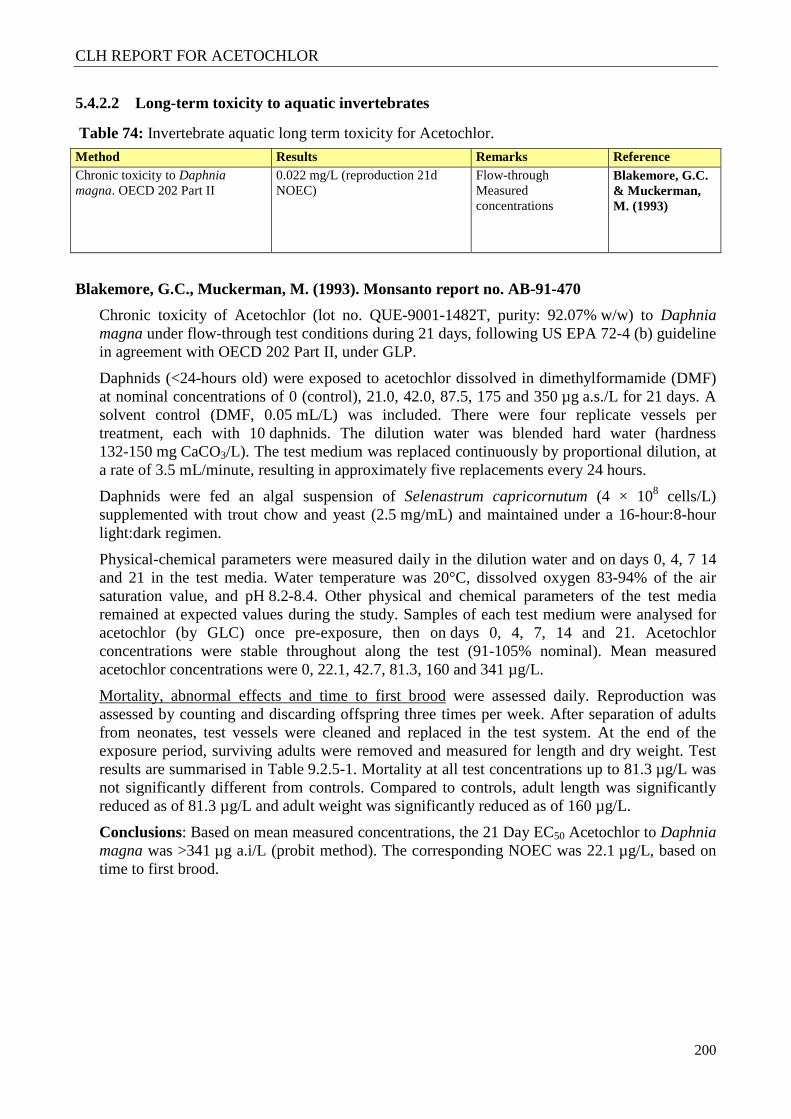
CLH REPORT FOR ACETOCHLOR
200
5.4.2.2 Long-term toxicity to aquatic invertebrates
Table 74: Invertebrate aquatic long term toxicity for Acetochlor.
Method Results Remarks Reference Chronic toxicity to Daphnia magna. OECD 202 Part II
0.022 mg/L (reproduction 21d NOEC)
Flow-through Measured concentrations
Blakemore, G.C. & Muckerman, M. (1993)
Blakemore, G.C., Muckerman, M. (1993). Monsanto report no. AB-91-470
Chronic toxicity of Acetochlor (lot no. QUE-9001-1482T, purity: 92.07% w/w) to Daphnia magna under flow-through test conditions during 21 days, following US EPA 72-4 (b) guideline in agreement with OECD 202 Part II, under GLP.
Daphnids (<24-hours old) were exposed to acetochlor dissolved in dimethylformamide (DMF) at nominal concentrations of 0 (control), 21.0, 42.0, 87.5, 175 and 350 µg a.s./L for 21 days. A solvent control (DMF, 0.05 mL/L) was included. There were four replicate vessels per treatment, each with 10 daphnids. The dilution water was blended hard water (hardness 132-150 mg CaCO3/L). The test medium was replaced continuously by proportional dilution, at a rate of 3.5 mL/minute, resulting in approximately five replacements every 24 hours.
Daphnids were fed an algal suspension of Selenastrum capricornutum (4 × 10⁸ cells/L) supplemented with trout chow and yeast (2.5 mg/mL) and maintained under a 16-hour:8-hour light:dark regimen.
Physical-chemical parameters were measured daily in the dilution water and on days 0, 4, 7 14 and 21 in the test media. Water temperature was 20°C, dissolved oxygen 83-94% of the air saturation value, and pH 8.2-8.4. Other physical and chemical parameters of the test media remained at expected values during the study. Samples of each test medium were analysed for acetochlor (by GLC) once pre-exposure, then on days 0, 4, 7, 14 and 21. Acetochlor concentrations were stable throughout along the test (91-105% nominal). Mean measured acetochlor concentrations were 0, 22.1, 42.7, 81.3, 160 and 341 µg/L.
Mortality, abnormal effects and time to first brood were assessed daily. Reproduction was assessed by counting and discarding offspring three times per week. After separation of adults from neonates, test vessels were cleaned and replaced in the test system. At the end of the exposure period, surviving adults were removed and measured for length and dry weight. Test results are summarised in Table 9.2.5-1. Mortality at all test concentrations up to 81.3 µg/L was not significantly different from controls. Compared to controls, adult length was significantly reduced as of 81.3 µg/L and adult weight was significantly reduced as of 160 µg/L.
Conclusions: Based on mean measured concentrations, the 21 Day EC50 Acetochlor to Daphnia magna was >341 µg a.i/L (probit method). The corresponding NOEC was 22.1 µg/L, based on time to first brood.
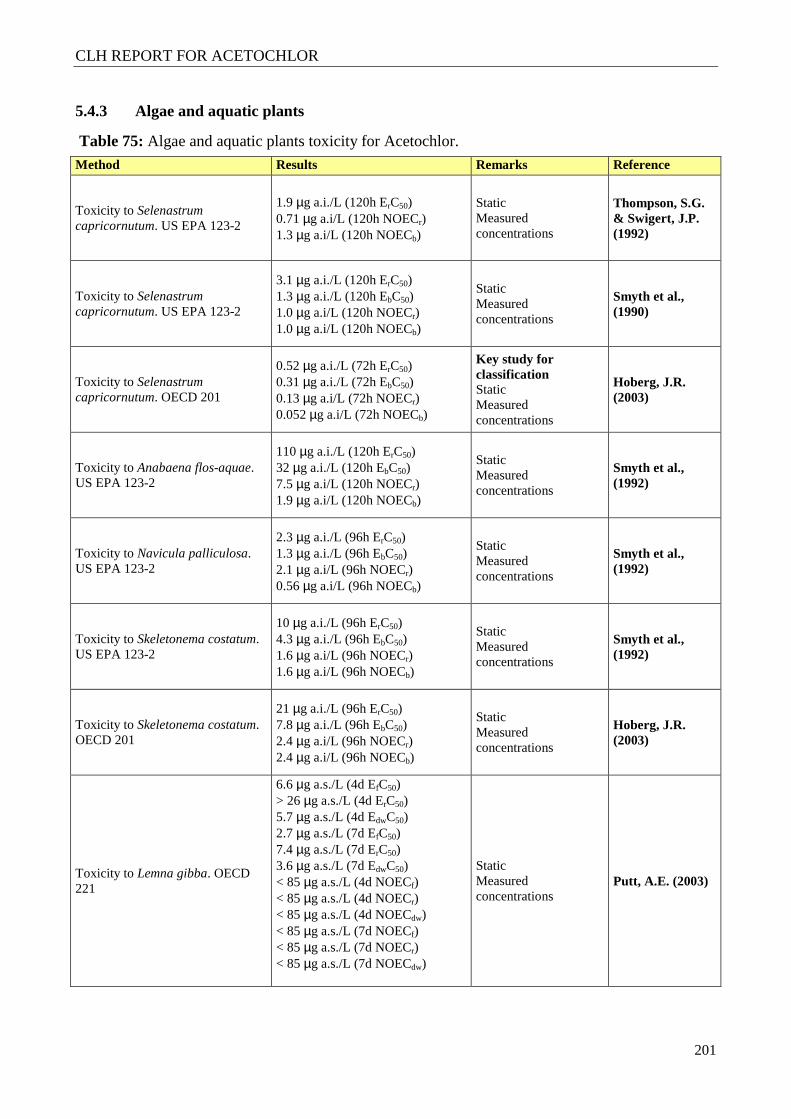
CLH REPORT FOR ACETOCHLOR
201
5.4.3 Algae and aquatic plants
Table 75: Algae and aquatic plants toxicity for Acetochlor.
Method Results Remarks Reference
Toxicity to Selenastrum capricornutum. US EPA 123-2
1.9 µg a.i./L (120h ErC50) 0.71 µg a.i/L (120h NOECr) 1.3 µg a.i/L (120h NOECb)
Static Measured concentrations
Thompson, S.G. & Swigert, J.P. (1992)
Toxicity to Selenastrum capricornutum. US EPA 123-2
3.1 µg a.i./L (120h ErC50) 1.3 µg a.i./L (120h EbC50) 1.0 µg a.i/L (120h NOECr) 1.0 µg a.i/L (120h NOECb)
Static Measured concentrations
Smyth et al., (1990)
Toxicity to Selenastrum capricornutum. OECD 201
0.52 µg a.i./L (72h ErC50) 0.31 µg a.i./L (72h EbC50) 0.13 µg a.i/L (72h NOECr) 0.052 µg a.i/L (72h NOECb)
Key study for classification Static Measured concentrations
Hoberg, J.R. (2003)
Toxicity to Anabaena flos-aquae. US EPA 123-2
110 µg a.i./L (120h ErC50) 32 µg a.i./L (120h EbC50) 7.5 µg a.i/L (120h NOECr) 1.9 µg a.i/L (120h NOECb)
Static Measured concentrations
Smyth et al., (1992)
Toxicity to Navicula palliculosa. US EPA 123-2
2.3 µg a.i./L (96h ErC50) 1.3 µg a.i./L (96h EbC50) 2.1 µg a.i/L (96h NOECr) 0.56 µg a.i/L (96h NOECb)
Static Measured concentrations
Smyth et al., (1992)
Toxicity to Skeletonema costatum. US EPA 123-2
10 µg a.i./L (96h ErC50) 4.3 µg a.i./L (96h EbC50) 1.6 µg a.i/L (96h NOECr) 1.6 µg a.i/L (96h NOECb)
Static Measured concentrations
Smyth et al., (1992)
Toxicity to Skeletonema costatum. OECD 201
21 µg a.i./L (96h ErC50) 7.8 µg a.i./L (96h EbC50) 2.4 µg a.i/L (96h NOECr) 2.4 µg a.i/L (96h NOECb)
Static Measured concentrations
Hoberg, J.R. (2003)
Toxicity to Lemna gibba. OECD 221
6.6 µg a.s./L (4d EfC50) > 26 µg a.s./L (4d ErC50) 5.7 µg a.s./L (4d EdwC50) 2.7 µg a.s./L (7d EfC50) 7.4 µg a.s./L (7d ErC50) 3.6 µg a.s./L (7d EdwC50) < 85 µg a.s./L (4d NOECf) < 85 µg a.s./L (4d NOECr) < 85 µg a.s./L (4d NOECdw) < 85 µg a.s./L (7d NOECf) < 85 µg a.s./L (7d NOECr) < 85 µg a.s./L (7d NOECdw)
Static Measured concentrations
Putt, A.E. (2003)
CLH REPORT FOR ACETOCHLOR
202
Thompson, S.G., Swigert, J.P. (1992). Monsanto report no. WL-91-227.
Toxic effect of Acetochlor technical (lot no. QUE-9001-1482-T, purity: 92.07% w/w) to a freshwater alga (Selenastrum capricornutum) in a 5-Day toxicity static test, following US EPA 123-2 (1986) guideline, under GLP.
Comment: Chemical analysis of Acetochlor were carried out only at initial (day 0) and at the end (day 5) of the test.
Growth inhibition of green algae (Selenastrum capricornutum) exposed for 5 days to acetochlor technical was determined in a static system without aeration. Cultures of algae (104 cells/mL) were exposed under continuous light (4306-5631 lux) to acetochlor dissolved in dimethylformamide (DMF) at nominal concentrations of 0 (control), 0.2, 0.4, 0.8, 1.6 and 3.2 µg a.s./L. A solvent control (DMF, 10.7 µL/L) was also included. There were three replicate vessels for each treatment level. Samples of the test media were taken for analysis of acetochlor by GLC prior to and at the end of the exposure period. Measured concentrations of acetochlor in the test media at test start ranged from 118 to 260% of nominal concentrations and dropped to 46-118% of nominal values on Day 5. Results were expressed based on mean measured concentrations (0, 0.34, 0.42, 0.71, 1.3 and 4.2 µg/L).
The pH was measured at the start and end of the study and temperature was recorded twice daily. Physical and chemical parameters of the test solutions remained at expected values during the study (pH 7.6-8.0, temperature 23.3±0.1°C).
Algal cell densities were measured daily and growth rates calculated (lotus 1-2-3, Release 3 and TOXSTAT Release 2.1) for each treatment. There were no treatment-related effects in growth rate at 0.80 µg/L. At 1.3 µg/L growth rate was reduced by 15% compared to controls, but the difference was not statistically significant (p<0.05). At 4.2 µg/L, a 100% reduction in growth rate was seen.
Conclusions: Based on mean measured concentrations, the 120-hour ErC50 (growth rate) of acetochlor to Selenastrum capricornutum in a static system was 1.9 µg/L (determined by probit). The NOErC was 0.71 µg ai/L, based on a reduction in growth rate at 1.3 µg/L. With regard to cell density, a significant effect was observed at the highest concentration tested NOEbC was 1.3 µg ai/L.
Smyth, D.V., Tapp, J.F., Sankey, S.A., Stanley, R.D. (1990). ICI Brixham report no.BL/B/3647.
Toxic effect of Acetochlor technical (lot no. R1072, purity: 89.7% w/w) to the green alga (Selenastrum capricornutum) under static conditions, following US EPA 123-2 (1986) guideline, under GLP.
Comment: The pH of the control group varied from 7.08 (Day 0) to 9.6 (Day 5). Chemical analysis of Acetochlor was carried out only at initial (day 0) and at the end (day 5) of the test.
Growth inhibition of green algae (Selenastrum capricornutum) exposed for 5 days to acetochlor technical was determined in a static system without aeration. Cultures of algae (0.31 × 10⁴ cells/mL) were exposed under continuous light to acetochlor at nominal concentrations of 0 (control), 0.32, 0.56, 1.0, 1.8, 3.2, 5.6 and 10 µg a.s./L.
There were three biological replicates for the acetochlor treatments and six replicates for the controls. One blank vessel (without algae inoculum) for each control and treatment was incubated concurrently.
CLH REPORT FOR ACETOCHLOR
203
The pH of the test solutions was measured at the start (from 7.08 to 7.20) and end of the study (from 7.44 to 10.04) and temperature was recorded daily (from 23.9 to 24.2°C). Light intensity, recorded once during the study, was 3960 lux.
Samples of each test solution were taken at study start for analysis of acetochlor by GC/ECD. Measured concentrations of acetochlor in the test media at test start ranged from 100 to 107% of nominal values. After 120 hours, measured concentrations were 88-104% of nominal. Results were expressed based on mean measured acetochlor concentrations.
Algal cell densities were measured daily and growth rates calculated for each treatment. There were no significant effects in groups exposed to acetochlor up to 1.0 µg/L. As of 1.8 µg/L, the area under the curve (determinate by Dunnett´s procedure) was significantly (p<0.05) lower than for controls.
Conclusions: Based on mean measured concentrations, the 120-hour EbC50 (biomass) of acetochlor to Selenastrum capricornutum in a static system was determined to be 1.3 µg ai/L (95% confidence interval of 0.74-2.3 µg/L) and the ErC50 (growth rate) was 3.1 µg/L (95% confidence interval of 2.1-4.7 µg/L). For both parameters, the corresponding NOEC was 1.0 µg/L.
Hoberg, J.R. (2003). IIA 8.2.6/03.
This study has been considered as the key study for classification.
Toxic effects of Acetochlor technical (lot no. BGJ2403(P11); purity: 94.7% w/w) along 96 and 168 hours static exposure and recovery potential for 4 days more post exposure of the freshwater green alga, Pseudokirchneriella subcapitata., following the US EPA FIFRA Subdivision J Guideline 123-2, OECD 201, EEC Method C.3 guideline, under GLP.
Comments: Deviations from EEC Method C.3: The medium used was a nitrate-based medium with a pH of 7.1 to 7.3 rather than the recommended ammonia-based medium with a pH of 8.0. The pH was measured at 96 hours rather than at 72 hours. Chemical analysis of Acetochlor was carried out only at initial (day 0), at 96 hours and at 196 hours of the test. During the exposure phase, light intensity was lower than recommended. The pH of the control group varied from 7.2 (Day 0) to 9.1 (Day 4). Since the algal cell density in the control group increased over 36-fold, 215-fold and 616-fold in 72, 96, and 168 hours, respectively, these deviations are not considered to have impacted the results of the study.
Growth inhibition and potential recovery of the freshwater green alga, Pseudokirchneriella subcapitata (formerly classified as Selenastrum capricornutum), was determined during 96-hour and 168-hour static exposures to acetochlor technical. The potential for recovery during 4 days, at each acetochlor test concentration, was also investigated after 96 and 168 hours of exposure.
Growth inhibition assay (Exposure phase): Algal cultures (nominally 1 × 10⁴ cells/mL) were exposed for four days (96 hours) or seven days (168 hours) to acetochlor dissolved in 0.1 mL/L dimethylformamide (DMF) and added to algal growth medium (AAP) at nominal concentrations of 0.063, 0.13, 0.25, 0.50, and 1.0 µg a.s./L. Negative control and solvent control (DMF at 0.1 mL/L) groups were also prepared at the same algal cell densities. Test concentrations were not renovated during the test. Three biological replicates were maintained in each treatment and control group. Two additional replicates per group were prepared for analytical purposes.
At test initiation, individual samples of the test solutions were taken prior to the addition of algae for quantification of acetochlor, on Day 0 ranged between 96 and 106% of nominal. At 96 hours and 168 hours, samples for acetochlor quantification were collected from the
CLH REPORT FOR ACETOCHLOR
204
additional analytical replicates prepared for each treatment, for 0-96 hours ranged between 91 and 100% of nominal and for 0-168 hours ranged between 81 and 87% of nominal. Quantification of acetochlor was by GC/ECD.
Temperature was recorded continuously and maintained at 24°C during the 96-hour and 168-hour exposure periods. Test chambers were maintained under continuous illumination using Duro-Test® Vita-Lite® fluorescent lighting. Light intensity during the exposure phases ranged from 4300 to 5100 lux. The pH was measured at test initiation, at the end of each exposure period (96 hours and 168 hours). The pH ranged from 7.1 to 7.3 on Day 0, from 7.5 to 9.2 on Day 4, and from 7.8 to 9.7 on Day 7.
At 96 hours, the three biological replicates of each test concentration were pooled to obtain a subsample for initiation of the recovery phase. After this subsample was taken, equal volumes of the pooled replicates were redistributed into three replicate flasks and the exposure continued. At 168 hours, cell densities were again determined. Cell densities were determined in each replicate at 24, 48, 72 and 96 hours.
Recovery assay: Recovery Phase (along 4 days) for each control and treatment group was initiated (subsequent to the 96 hours exposure or 168 hours) by adding an appropriate volume of the respective pooled replicate sample for each group to each of three replicate vessels containing 100 mL of fresh medium only. Each set of replicates from the same exposure period contained approximately the same cell densities at the beginning of the recovery phase (96-hour exposure: 1200 cells/mL, 168-hour exposure: 5600 cells/mL). Initial cell densities during the recovery phase were selected to avoid adding inhibitory amounts of acetochlor in the medium in which the cells were added. Cell densities were determined for each replicate at the end of the recovery phase.
Growth inhibition assay: After 72 hours of exposure, area under the growth curve was significantly reduced relative to the pooled control at 0.13, 0.23, 0.49 and 0.93 µg/L, and growth rate was significantly reduced relative to the pooled control at 0.23, 0.49 and 0.93 µg/L. After 96 and 168 hours of exposure, cell density was significantly reduced relative to the pooled controls at the three highest test concentrations (96 hour: 0.23, 0.49 and 0.93 µg/L, 168 hour: 0.20, 0.42 and 0.86 µg/L).
Recovery assay: On Day 4 of the recovery phase after the 96-hour exposure, cell densities for P. subcapitata previously exposed to acetochlor concentrations of 0.059, 0.13, 0.23, 0.49 and 0.93 µg/L were comparable to or greater than the cell density of the solvent control group (106 – 270% of the solvent control).
On Day 7 of the recovery phase after the 168-hour exposure, cell densities for P. subcapitata previously exposed to acetochlor concentrations of 0.051, 0.11, 0.20, 0.42 and 0.86 µg/L were comparable to or greater than the cell density of the pooled control group (93 – 168% of the pooled control).
Conclusions: Based on mean (0-96 hours) measured concentrations, the 72 h- EbC50 (biomass) of Acetochlor was 0.31 µg/L and the 72 h- ErC50 (growth rate) was 0.52 µg/L. The corresponding NOEbC and NOErC were 0.059 µg/L and 0.13 µg/L.
Smyth, D.V., Sankey, S.A., Grinell, A.J. (1992). ICI Brixham report no. BL4585/B
Toxic effect of Acetochlor technical (lot no. P8, purity: 95.1% w/w) to the blue-green alga Anabaena flos-aquae under static conditions along 5 days, following US EPA 123-2 (1986) guideline, under GLP.
CLH REPORT FOR ACETOCHLOR
205
Comments: Chemical analysis of Acetochlor was carried out only at initial (day 0), at the end of the test 120 hours. Considering that the Acetochlor concentrations in the test mediums at the end are very similar to those at start, this variation is not considering important for the results.
Cultures of algae (2.0 × 10⁴ cells/mL) were exposed in a static system without aeration to acetochlor at nominal concentrations of 0 (control), 1.0, 2.0, 4.0, 8.0, 16, 32, 64 and 128 µg a.s./L. Samples of each test solution were taken at study start and end for analysis of acetochlor by GC/ECD. Mean measured concentrations of acetochlor in the test media at test start ranged from 89 to 100% of nominal values and at test end (120 hours) were 91-103% of nominal values. Results were expressed based on mean measured acetochlor concentrations.
There were three biological replicates for the acetochlor treatments and six replicates for the controls. One blank vessel (without algae inoculum) for each control and treatment was incubated concurrently.
The pH of the test solutions was measured at the start and end of the study, pH ranged from 7.3 to 7.8. The temperature was recorded daily and varied between 24.0 and 24.2°C. Light intensity was continuous and recorded once during the study, it was 3260 lux.
Conclusions: Based on mean measured concentrations, the 120-hour EbC50 (biomass) of acetochlor to Anabaena flos-aquae in a static system was determined to be 32 µg ai/L (95% confidence interval of 16 – 86 µg/L) and the ErC50 (growth rate) was 110 µg ai/L (95% confidence interval of 12->130 µg/L). The corresponding NOECs were 7.5 µg/L (biomass) and 1.9 µg/L (growth rate).
Smyth, D.V., Sankey, S.A., Holland, M.M., Johnson, P.A. (1992). ICI Brixham report no. BL4561/B.
Toxicity of Acetochlor technical (lot no. P8, purity: 95.1% w/w) to the freshwater diatom Navicula pelliculosa under static conditions along 4 days, following US EPA 123-2 (1986) guideline, under GLP.
Comments: Chemical analysis of Acetochlor was carried out only at initial (day 0), at the end of the test 96 hours. Considering that the Acetochlor concentrations in the test mediums at the end are very similar to those at start, this variation is not considering important for the results.
Cultures of the freshwater diatom Navicula pelliculosa (0.3 × 10⁴ cells/mL) were exposed in a static system without aeration to acetochlor at nominal concentrations of 0 (control), 0.125, 0.25, 0.50, 1.0, 2.0, 4.0, 8.0 and 16 µg a.s./L. There were three biological replicates for the acetochlor treatments and six replicates for the controls. One blank vessel (without algae inoculum) for each control and treatment was incubated concurrently. Samples of each test solution were taken at study start for analysis of acetochlor by GC/ECD. Mean measured concentrations of acetochlor in the test media at test start ranged from 100 to 120% of nominal values and at the end (96 hours) from 105 to 128% of nominal values. Results were expressed based on mean measured acetochlor concentrations.
The pH of the test solutions was measured at the start and end of the study, pH ranged from 7.6 to 8.8. The temperature was recorded daily and varied between 23.8 and 24.2°C. Light intensity was continuous and recorded once during the study, it was 3890 lux.
Conclusions: Based on mean measured concentrations, the 96-hour EbC50 (biomass) of acetochlor to Navicula pelliculosa in a static system was determined to be 1.3 µg a.i/L (95% confidence interval of 0.75-2.1 µg/L) and the ErC50 (growth rate) was 2.3 µg a.i/L (95% confidence interval of 1.3-4.2 µg/L). The NOECs were 0.56 µg/L (biomass) and 2.1 µg/L (growth rate).
CLH REPORT FOR ACETOCHLOR
206
Smyth, D.V., Craig, N.C.D., Sankey, S.A., Penwell, A.J. (1992). IIA 8.2.6/06. ICI Brixham report no. BL4538/B.
Toxic effect of Acetochlor technical (preparation reference P8, analytical reference H0984; purity: 95.1% w/w) to the marine alga Skeletonema costatum, under static conditions along 96 hours test, following the US EPA FIFRA Subdivision J Guideline 123-2, under GLP.
Comments: Initial cell density was nominally 1.0 × 10⁴ cells/mL rather than 7.7 × 10⁴ cells/mL. Natural seawater rather than synthetic seawater was used to prepare the nutrient medium. The day:night cycle was 16-hour:8-hour rather than 14-hour:10-hour. Test containers were agitated by shaking at 100 rpm rather than at 60 rpm. Since particle density in the control groups increased by an average of 49-fold in 3 days and 152-fold in 4 days, these deviations are not considered to have negatively impacted the results of the study. The result for the most sensitive endpoint (EbC50, biomass) is of bad quality since only one concentration has been tested with effects between 20% and 80% inhibition.
Cultures of the marine diatom Skeletonema costatum (1 × 10⁴ cells/mL) were exposed during a 96 hours in a static system with aeration to acetochlor at nominal concentrations of 0 (control), 0.75, 1.5, 3.0, 6.0, 12, 24, 48 and 96 µg a.s./L. Test concentrations were not replenished during the test.
Three and six biological replicates were maintained for each treatment group and the control group, respectively. A single abiotic replicate was also prepared for each treatment group for acetochlor quantification. Quantification of acetochlor was by GC/ECD. Measured test concentrations on Day 0 ranged between 96 and 113% of nominal and for 0-96 hours ranged between 99 and 110% of nominal. Mean measured concentrations were used in the determination of EC50 values and the no-observed-effect-concentration (NOEC) values.
The pH of the test solutions was measured at the start and end of the study, pH ranged from 8.1 to 8.2. at test initiation and from 8.3 to 9.2 at test termination. The pH tended to increase relative to algal density. The temperature was recorded daily and ranged from 20.2 to 20.6°C. Test chambers were maintained under cool white fluorescent lighting with a 16-hour:8-hour light:dark regimen.
Conclusions: Based on mean measured concentrations, the 96-hour EbC50 (biomass) of acetochlor to for Skeletonema costatum was determined to be 4.3 µg ai/L (95% confidence interval of 0.79-8.8 µg/L) and the ErC50 (growth rate) was 10 µg a.i/L (95% confidence interval of 3.7-29 µg/L). The NOEC was 1.6 µg ai/L (both, biomass and growth rate).
Hoberg, J.R. (2003). IIA 8.2.6/07. Report no. 021035R, 12550.6221.
Recovery potential of the marine diatom Skeletonema costatum, after exposure of Acetochlor technical (lot no. BGJ2403(P11); purity: 94.7% w/w) along 96 and 168 hours, following US EPA FIFRA Subdivision J Guideline 123-2, OECD 201, EEC C3, under GLP.
Comments: Deviations from EPA OPPTS 850.5400: The ratio between test concentrations was greater (3.33) than recommended (1.5 to 2.0). Initial cell density was 1.0×10⁴ cells/mL rather than 7.7×10⁴ cells/mL. Natural seawater was used to prepare the nutrient medium instead of synthetic seawater, and the initial medium pH was slightly lower than recommended. The saltwater medium used contained four components at different concentrations than the medium specified in the guideline. Two additional components were added to the medium as well. The light:dark cycle was 16-hour:8-hour instead of 14-hour:10-hour. Since cell density in the control groups increased by an average of 30-fold in 3 days and 59-fold in 4 days, these deviations are not considered to have impacted the results of the study.
CLH REPORT FOR ACETOCHLOR
207
Growth inhibition of the marine diatom alga, Skeletonema was determined during 96-hour and 168-hour static exposures to acetochlor technical. The potential for recovery at each acetochlor test concentration and duration, was also monitored for 10 and 12 days post exposure respectively.
Algal cultures (nominally 1 × 10⁴ cells/mL) were exposed for four days (96 hours) or seven days (168 hours) to acetochlor dissolved in 0.1 mL/L dimethylformamide (DMF) and added to saltwater algal medium at nominal concentrations of 0.24, 0.81, 2.7, 9.0, 30 and 100 µg a.s./L. Negative control and solvent control (DMF at 0.1 mL/L) groups were also prepared at the same algal cell densities. Test concentrations were not renovated during the test. Three biological replicates test chambers were maintained in each treatment and control group. Two additional replicates per group were prepared for analytical purposes.
At test initiation, individual samples of the test solutions were taken prior to the addition of algae for quantification of acetochlor. Measured test concentrations on Day 0 ranged between 93 and 106% of nominal. At 96 hours, individual samples were collected from the pooled replicates from each treatment and control group, the mean measured test concentrations ranged between 85 and 90% of nominal. At 168 hours, samples were collected from the pooled replicates of all test concentrations except the 0.24 µg/L test group due to insufficient sample volume. Time-weighted average test concentrations for 0-168 hours for the 0.81 µg/L to 100 µg/L represented 75, 76, 75, 79, and 82% of nominal concentrations, respectively. Quantification of acetochlor was by GC/ECD. Previously samples were concentrated by a solid phase extraction technique (SPE).
Test chambers were maintained under Duro-Test® Vita-Lite® fluorescent lighting with a 16-hour:8-hour light:dark regimen, light intensity ranged from 4300 to 4600 lux. Aeration was provided by gentle shaking (60 rpm) of the culture flasks. The pH was measured at test initiation and at the end of each exposure period (96 hours and 168 hours) and ranged from 7.9 to 8.0 on Day 0, from 7.9 to 8.6 on Day 4, and from 7.8 to 9.0 on Day 7. Temperature was recorded continuously and ranged from 20 to 21°C and from 17 to 22°C during the 96-hour and 168-hour exposure periods, respectively.
Recovery assay: At 96 hours and 168 hours, a recovery phase (10 days or 12 days, respectively) for each control and treatment group was initiated by adding an appropriate volume of the respective pooled replicate sample for each group to each of three replicate vessels containing 100 mL of fresh medium only. Each set of replicates from the same exposure period contained approximately the same cell densities at the beginning of the recovery phase (96-hour exposure: 800 cells/mL, 168-hour exposure: 1000 cells/mL). Initial cell densities during the recovery phase were selected to avoid adding inhibitory amounts of acetochlor in the medium in which the cells were added.
Growth inhibition assay: Cell densities were determined on days 2, 4, 8, and 10 after the 96-hour exposure and on days 4, 8, and 12 after the 168-hour exposure. After 72 hours, area under the growth curve and growth rates were significantly reduced relative to the pooled control at 7.9, 26, and 89 µg/L. After 96 and 168 hours, cell density was also significantly reduced relative to the pooled controls at the three highest test concentrations (96 hour: 7.9, 26, and 89 µg/L, 168 hour: 6.7, 24, and 82 µg/L).
Mean measured concentrations (0-96 hours) were used in the determination of EC50 values at 24, 48, 72 and 96 hours and the NOECs at 72 hours and 96 hours. Time-weighted average values (0-168 hours) were used in the determination of 168-hour EC50 and NOEC values.
Recovery assay: Growth rates for Day 0-2 of the recovery phase for S. costatum previously exposed to concentrations of 0.22, 0.72, 2.4, and 7.9 µg a.s./L for 96 hours were comparable to
CLH REPORT FOR ACETOCHLOR
208
growth rates of the pooled control groups. Growth rates for Day 0-8 of the recovery phase for S. costatum previously exposed to concentrations of 26 and 89 µg a.s./L for 96 hours were comparable to growth rates of the pooled control groups. Growth rates for Day 0-4 of the recovery phase for S. costatum previously exposed to concentrations of 0.21, 0.61, and 2.0 µg a.s./L for 168 hours were comparable to growth rates of the pooled control groups. Growth rates for Day 0-8 of the recovery phase for S. costatum previously exposed to concentrations of 6.7, 24 and 82 µg a.s./L for 168 hours were comparable to growth rates of the pooled control groups.
Conclusions: based on the growth observed during the recovery fhase, acetochlor was considered to be algistatic rather than algicidal at the tested concentrations that produced effects. After a 96-hour exposure to concentrations up to 7.9 µg a.s./L and a 168-hour exposure to concentrations up to 2.0 µg a.s./L, growth rates recovered to control levels within two days and four days, respectively, after transfer to fresh medium not containing acetochlor. At exposure concentrations up to 89 µg a.s./L for 96 hours and 82 µg a.s./L for 168 hours, Day 0-8 growth rates after removal to fresh medium were comparable to control values.
Based on mean measured concentrations, the 96-hour EbC50 (biomass) of acetochlor to for Skeletonema costatum was determined to be 7.8 µg ai/L (95% confidence interval of 3.6-16 µg/L) and the ErC50 (growth rate) was 21 µg a.i/L (95% confidence interval of 18-26 µg/L). The NOEC was 2.4 µg ai/L (both, biomass and growth rate).
Putt, A.E. (2003). IIA 8.2.8/01. Report no. 021034
The purpose of this study was to evaluate the toxicity and recovery potential of the growth of the duckweed, Lemna gibba following the exposure to Acetochlor technical (lot no. BGJ2403(P11), purity: 94.7% w/w) under static conditions. The test followed US EPA FIFRA Subdivision J Guidelines 122-2 and 123-2, OECD 221, under GLP.
Comments: Deviations from EPA OPPTS 850.4400 (draft 1996). Light intensity during the exposure phase (6500-8500 lux) and the temperature (21 to 24°C) were slightly outside the specified ranges of 4200-6700 lux and 25°C ± 2°C, respectively detailed at EPA guidance. However, they are in agreement with OECD. Frond number was determined on days 4 and 7 instead of days 3, 5, and 7. Since the frond number in the control increased by a factor of over 21 in seven days, these deviations are not considered to have negatively impacted the results of the study.
Growth inhibition assay (Exposure phase): Fronds of duckweed were exposed for 4 days or 7 days to acetochlor dissolved in 0.1 mL/L dimethylformamide (DMF) and added to 20X algal growth medium (AAP) at nominal concentrations of 0.94, 1.9, 3.8, 7.5, 15 and 30 µg a.s./L. Negative and solvent (DMF at 0.1 mL/L) control groups were included in the test. Test concentrations were not replenished during the study. Six biological replicate test chambers (each containing 5 plants of 3 fronds each) were prepared for each treatment and control group.
The pH was measured at test initiation and at the end of each exposure period (Days 4 and 7) and ranged from 7.5 to 7.6 on Day 0, from 8.2 to 8.3 on Day 4 and from 8.1 to 8.4 on Day 7. Temperature was recorded continuously and maintained at 23°C to 24°C. Test chambers were maintained under continuous illumination using Duro-Test® Vita-Lite® fluorescent lighting. Light intensity was recorded at test initiation and daily thereafter and ranged from 6500 to 8500 lux.
At test initiation, individual samples of the test solutions were taken prior to the addition of Lemna for measurement and quantification of acetochlor. Measured test concentrations on Day 0 ranged between 85 and 98% of nominal. On Day 4 ranged between 87 and 100% of nominal. On Day 7 ranged between 84 and 97% of nominal. Mean measured concentrations
CLH REPORT FOR ACETOCHLOR
209
(Day 0-7) ranged between 86 and 95% of nominal. Quantification of acetochlor was by GC/ECD.
For each test group, frond numbers were determined on Day 4 for three replicates and on Day 7 for the remaining three replicates. Frond dry weight was determined at the end of each exposure phase in the same replicates used to determine frond number. The dry weight determination did not include plants that were removed to initiate the recovery phase. Test results are summarised in Table s 9.2.7-1 and 9.2.7-2. After 4 and 7 days of exposure, frond number, growth rate and frond dry weight (biomass) were significantly reduced relative to the pooled control at all concentrations tested. After 4 days, inhibition at 0.85 µg a.s./L for frond number, growth rate, and dry weight was 12%, 6.2% and 27%, respectively. After 7 days of exposure, inhibition at 0.85 µg a.s./L for frond number, growth rate, and dry weight was 37%, 16% and 31%, respectively.
Recovery assay: The recovery phases for the 4-Day and 7-Day exposure groups were initiated by transferring five plants (with 3 fronds each) from replicates A, B, and C (for the 4-Day exposure) and from replicates D, E, and F (for the 7-Day exposure) of each test group to test vessels containing fresh medium without acetochlor. Each test group in the recovery phase, therefore, also contained three replicates. During the recovery phase after the 4-Day exposure, frond counts were taken on days 4, 7, and 11, and dry weights were determined on Day 11. After the 7-Day exposure, frond counts were taken on days 7, 14, and 21, and dry weights were determined on Day 21.
During the recovery phase, the test chambers for each group were maintained under the same conditions as in the exposure phase. Temperature ranged from 22 to 24°C and from 21 to 24°C for the 4-Day and 7-Day exposure groups, respectively. At recovery phase termination, the pH ranged from 8.2 to 8.8 and from 8.3 to 9.2 for the 4-Day and 7-Day exposure groups, respectively. During the recovery period, the light intensity ranged from 6500 to 8400 lux and from 6500 to 8300 lux for the 4-Day and 7-Day exposure groups, respectively.
The growth rate between consecutive assessment times was used to assess duckweed recovery during the first week of each recovery phase. After the first week, however, the growth rates of the control groups declined considerably, perhaps as a result of either space or nutrient limitation. For this reason, frond number and dry weight (biomass) were used to assess recovery beyond Day 7 of each recovery phase.
• During the Day 0-4 interval of the recovery phase after a 4-Day exposure to acetochlor, the growth rate of the test group previously exposed to 0.85 µg a.s./L was comparable to that of the pooled control. During the Day 4-7 interval of this recovery phase, growth rates of the 0.85 and 1.8 µg a.s./L test groups were comparable to that of the pooled control. Final dry weights in these test groups on Day 11 of the recovery phase were 78% and 69% of the pooled control value, respectively. Although growth rate was not comparable to the control during the recovery phase in the test groups previously exposed to 3.6 to 26 µg a.s./L there was a steady increase in frond number in these groups during the 11 Day recovery period. Fronds and roots smaller than those of the control were observed in test groups previously exposed to 1.8 to 26 µg a.s./L which contributed to the lower dry weight observed in these test groups.
• During the Day 0-7 interval of the recovery phase after a 7-Day exposure to acetochlor, the growth rate of the test groups previously exposed to 0.85 µg a.s./L and 1.8 µg a.s./L were 91% and 74% of the pooled control growth rate. Frond numbers in these two test groups were 96.1% and 86%, respectively, of the pooled control value by Day 21 of the recovery phase. Final dry weights in these test groups on Day 21 of the recovery phase were 98% and 59% of the pooled control value, respectively. Although growth rate was not comparable to the control during the recovery phase in the test groups previously exposed to 3.6 to 26 µg a.s./L frond number in
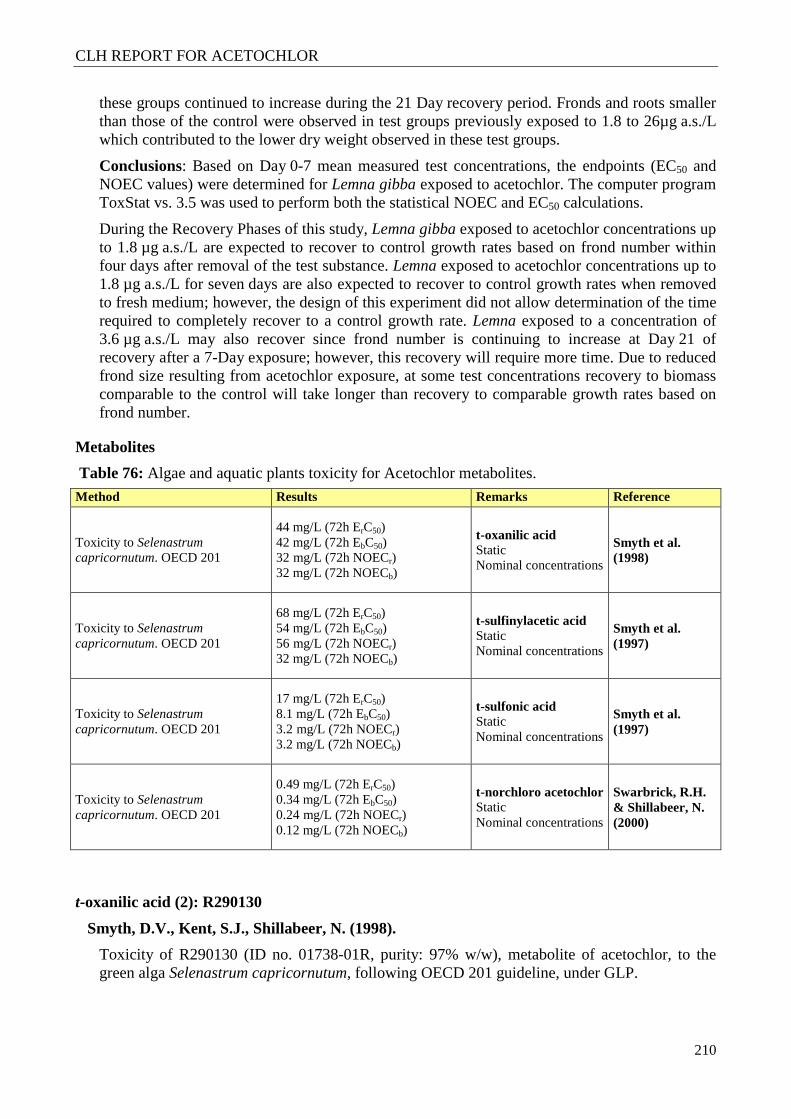
CLH REPORT FOR ACETOCHLOR
210
these groups continued to increase during the 21 Day recovery period. Fronds and roots smaller than those of the control were observed in test groups previously exposed to 1.8 to 26µg a.s./L which contributed to the lower dry weight observed in these test groups.
Conclusions: Based on Day 0-7 mean measured test concentrations, the endpoints (EC50 and NOEC values) were determined for Lemna gibba exposed to acetochlor. The computer program ToxStat vs. 3.5 was used to perform both the statistical NOEC and EC50 calculations.
During the Recovery Phases of this study, Lemna gibba exposed to acetochlor concentrations up to 1.8 µg a.s./L are expected to recover to control growth rates based on frond number within four days after removal of the test substance. Lemna exposed to acetochlor concentrations up to 1.8 µg a.s./L for seven days are also expected to recover to control growth rates when removed to fresh medium; however, the design of this experiment did not allow determination of the time required to completely recover to a control growth rate. Lemna exposed to a concentration of 3.6 µg a.s./L may also recover since frond number is continuing to increase at Day 21 of recovery after a 7-Day exposure; however, this recovery will require more time. Due to reduced frond size resulting from acetochlor exposure, at some test concentrations recovery to biomass comparable to the control will take longer than recovery to comparable growth rates based on frond number.
Metabolites
Table 76: Algae and aquatic plants toxicity for Acetochlor metabolites.
Method Results Remarks Reference
Toxicity to Selenastrum capricornutum. OECD 201
44 mg/L (72h ErC50) 42 mg/L (72h EbC50) 32 mg/L (72h NOECr) 32 mg/L (72h NOECb)
t-oxanilic acid Static Nominal concentrations
Smyth et al. (1998)
Toxicity to Selenastrum capricornutum. OECD 201
68 mg/L (72h ErC50) 54 mg/L (72h EbC50) 56 mg/L (72h NOECr) 32 mg/L (72h NOECb)
t-sulfinylacetic acid Static Nominal concentrations
Smyth et al. (1997)
Toxicity to Selenastrum capricornutum. OECD 201
17 mg/L (72h ErC50) 8.1 mg/L (72h EbC50) 3.2 mg/L (72h NOECr) 3.2 mg/L (72h NOECb)
t-sulfonic acid Static Nominal concentrations
Smyth et al. (1997)
Toxicity to Selenastrum capricornutum. OECD 201
0.49 mg/L (72h ErC50) 0.34 mg/L (72h EbC50) 0.24 mg/L (72h NOECr) 0.12 mg/L (72h NOECb)
t-norchloro acetochlor Static Nominal concentrations
Swarbrick, R.H. & Shillabeer, N. (2000)
t-oxanilic acid (2): R290130
Smyth, D.V., Kent, S.J., Shillabeer, N. (1998).
Toxicity of R290130 (ID no. 01738-01R, purity: 97% w/w), metabolite of acetochlor, to the green alga Selenastrum capricornutum, following OECD 201 guideline, under GLP.
CLH REPORT FOR ACETOCHLOR
211
Comments: the medium used was not the recommended one with a pH of 8.0 ± 0.1. The pH range in the control vessels (3.4 initially and 7.4 at 72 hours) was greater than the 1.5 units specified in the guideline. This is considered to be a function of the very high growth factors observed. (mean control cell densities at 72 hours = 238×starting densities). These deviations were not considered to have affected the outcome of the study since the quality criteria for cell number increase were achieved.
Growth inhibition of green algae (Selenastrum capricornutum) exposed for 3 days to the t-oxanilic acid of Acetochlor (R290130) was determined in a static system without aeration. Cultures of algae (104 cells/mL) were exposed under continuous light (approximately 8030 lux) to R290130 at nominal concentrations of 0 (control), 10, 18, 32, 56, 100 and 180 mg/L. There were six replicate vessels for the control group and three for each R290130 treatments.
The pH was measured at the start and end of the study and ranged from 3.4 to 7.4. A maximum shift in pH of 2.4 units was observed and considered to be a function of the very high growth factor observed. Temperature was recorded daily and varied from 24.0 to 24.1°C.
Samples of the test media were taken for analysis of t-oxanilic acid by GC prior to and at the end of the exposure period. Measured concentrations ranged from 94 to 106% of nominal.
Algal cell densities were measured after 24, 48 and 72 hours and growth rates calculated for each treatment. There were no treatment-related decreases in biomass or growth rate compared to controls up to 32 mg/L.
Conclusions: Based on nominal concentrations of the t-oxanilic acid metabolite of acetochlor, the 72-hour EbC50 (biomass) and ErC50 (growth rate) for Selenastrum capricornutum exposed to R290130 under static conditions were 44 mg/L (95% confidence limits of 34-57 mg/L) and 42 mg/L (95% confidence limits of 33-54 mg/L), respectively. The NOEC was 32 mg/L for both biomass and growth rate.
t-sulfinylacetic acid (3): R243797
Smyth, D.V., Kent, S.J., Shillabeer, N. (1997).
Toxic effects of t-sulfinylacetic acid metabolite of acetochlor (R243797; lot no. R290131/2/P2, purity: 99% w/w) to the green alga Selenastrum capricornutum, following OECD 201 (1984) guideline under GLP.
Comments: the pH range in the control vessels (3.7 initially, 9.5 at 72 hours) was higher than the 1.5 units specified in the guideline. This is considered to be a function of the very high growth factors observed. (mean control cell densities at 72 hours = 299×starting densities). These deviations were not considered to have affected the outcome of the study since the quality criteria for cell number increase were achieved.
Growth inhibition of green algae (S. capricornutum) exposed for 3 days to R243797 was determined in a static system without aeration. Cultures of algae (104 cells/mL) were exposed under continuous light (approximately 7760 lux) to R243797 at nominal concentrations of 0 (control), 3.2, 5.6, 10, 18, 32, 56, 100 and 180 mg/L. There were six replicate vessels for the control group and three for each treatment.
The pH was measured at the start and end of the study and ranged 3.7 to 9.5. A maximum shift in pH of 3.4 units was observed and considered to be a function of the very high growth factor observed. Temperature was recorded daily it varied from 23.7 to 23.9°C. Samples of the test media were taken for analysis of t-sulfinylacetic acid by HPLC prior to and at the end of the exposure period. Measured concentrations ranged from 100 to 110% of nominal.
CLH REPORT FOR ACETOCHLOR
212
Algal cell densities were measured after 24, 48 and 72 hours and growth rates calculated for each treatment. There were no treatment-related effects on biomass up to 32 mg/L and on growth rate up to 56 mg/L.
Conclusions: Based on nominal concentrations of the t-sulfinylacetic acid metabolite of acetochlor, the 72-hour EbC50 (biomass) and ErC50 (growth rate) for S. capricornutum exposed to R243797 under static conditions were 57 mg/L (95% conf. limits of 50 to 64 mg/L) and 68 mg/L (95% conf. limits of 62 and 74 mg/L), respectively. The NOECs were 32 mg/L (biomass) and 56 mg/L (growth rate).
t-sulfonic acid (7): R290131
Smyth, D.V., Kent, S.J., Shillabeer, N. (1997). Zeneca Brixham report no. BL5971/B.
Toxic effects of the t-sulfonic acid metabolite of acetochlor (R290131; lot no. R290131/7/Na/P5, purity: 97% w/w) to the green algae Selenastrum capricornutum along 3 days under static conditions, following OECD 201 (1984) guideline, under GLP.
Comments: pH range in the control vessels (7.3 initially, 9.7 at 72 hours) was higher than the 1.5 units specified in the guideline. This is considered to be a function of the very high growth factors observed. (mean control cell densities at 72 hours = 288×starting densities). These deviations were not considered to have affected the outcome of the study since the quality criteria for cell number increase were achieved.
Growth inhibition of green algae (Selenastrum capricornutum) exposed for 3 days to R290131 was determined in a static system without aeration. Cultures of algae (104 cells/mL) were exposed under continuous light (approximately 7700 lux) to R290131 at nominal concentrations of 0 (control), 0.56, 1.0, 1.8, 3.2, 5.6, 10, 18 and 32 mg/L. There were six replicate vessels for the control group and three for each R290131 treatment.
The pH was measured at the start and end of the study, pH ranged from 7.3 to 9.7. Temperature was recorded daily varying from 23.8 to 24.0°C. Samples of the test media were taken for analysis of t-sulfonic acid by HPLC prior to and at the end of the exposure period. Measured concentrations ranged from 100 to 110% of nominal.
Algal cell densities were measured after 24, 48 and 72 hours and growth rates calculated for each treatment. There were no treatment-related effects on biomass or growth rate up to 3.2 mg/L.
Conclusions: Based on nominal concentrations of the t-sulfonic acid metabolite of acetochlor, the 72-hour EbC50 (biomass) and ErC50 (growth rate) for S. capricornutum exposed to R290131 under static conditions were 8.1 mg/L (95% conf. limits of 7.2-9.1 mg/L) and 17 mg/L (95% conf. limits of 15-20 mg/L), respectively. The corresponding NOEb/rC was 3.2 mg/L for both biomass and growth rate.
t-norchloro acetochlor (6): Compound 31
Swarbrick, R.H., Shillabeer, N. (2000). Zeneca Brixham report no. BL6958/B
Toxicity of t-norchloro acetochlor (lot no. TSC 0689/07857, purity: 99.5% w/w) to the green alga Selenastrum capricornutum, following OECD 201 (1984) guideline, under GLP.
The effect of Compound 31 on the growth of the green alga S. capricornutum was determined during a 72-hour exposure period in a static test system with gentle shaking. Cultures of algae (nominally 104 cells/mL) were exposed under continuous illumination (approx. 8280 lux) to Compound 31 at nominal concentrations of 0 (control), 0.015, 0.030, 0.060, 0.12, 0.24, 0.48, 0.96 and 1.9 mg/L. There were three replicate vessels for the Compound 31 treatments and six replicates for the control level.
CLH REPORT FOR ACETOCHLOR
213
Samples were collected on Day 0 and 3 from all test concentrations for analysis of t-norchloro acetochlor by GC. The mean measured concentrations ranged between 92 and 125% of nominal. The measured pH at the start and at the end from the control and each test concentration, varied from 7.3 to 7.7. The temperature was measured daily ranging from 24.1 to 24.3°C.
Algal cell densities were measured daily using an electronic counter and growth rates were calculated for each treatment level. There were no treatment-related effects on area under the growth curve at concentrations lower than or equal to 0.12 mg/L, and no treatment-related effects on the growth rate at concentrations lower than or equal to 0.24 mg/L.
Conclusions: Based on nominal concentrations of t-norchloro acetochlor, the 72-hour EbC50 (biomass) and ErC50 (growth rate) of Compound 31 to S. capricornutum were 0.34 mg/L (0.30 - 0.38) and 0.49 mg/L (0.44 - 0.54), respectively. The corresponding NOEC for biomass was 0.12 mg/L and for growth rate was 0.24 mg/L.
5.4.4 Other aquatic organisms (including sediment)
Putt, A.E. (2003). Monsanto report no. SE-2002-183
Full life-cycle toxic effects of Acetochlor (12C: lot no. GLP-0303-13655-T, purity 95.7%; 14C: Ref. no. F0859-82D, radiochemical purity 99.8%, 57.8 mCi/mmole) on the maduration of the larvae to adult midge to Chironomus riparius under static conditions. The test followed the guideline OECD 219 (draft 2002) and it was conducted under GLP.
Comments: Deviations from OECD 219 (2002): The sediment-water system was aerated for 6 days rather than 7 days prior to introduction of the chironomids, and gentle aeration was suspended for only 3 hours after addition of chironomids to the system, rather than for 24 hours as specified in the guideline. At the end of the study, the pH in all test vessels ranged from 4.3 to 4.6, rather than 6 to 9 as specified in the guideline.
The effects of acetochlor on the life cycle of the midge (Chironomus riparius) were determined in a 28-Day study under static conditions with aeration. Groups of 20 midge larvae (2 days old) were exposed for 28 days in a water:sediment system composed of well water (300 mL per group) and natural sediment (75 mL per group, 1.5 cm deep) to 12C-/14C-acetochlor at nominal concentrations of 0.10, 0.26, 0.64, 1.6, 4.0, and 10 mg a.s./L. Acetone (0.1 mL/L) was used as a carrier solvent for acetochlor. Test solutions were gently stirred after acetochlor addition and were clear and colourless after stirring. Negative and solvent (acetone at 0.1 mL/L) control groups were included in the test.
There were eight replicates for each test concentration: four replicates for the monitoring of biological results, and four replicates for determining exposure concentrations of acetochlor in the overlying water, pore water, and sediment. Well water and field-collected sediment from a freshwater site were used in the test; calcium carbonate (1.0 g/kg) was added to buffer the sediment.
The sediment was conditioned for 7 days in flowing overlying water and was then stored at 4 ±2°C prior to use. The sediment had an organic carbon content of 4.3%, a pH of 6.0, and a water holding capacity of 22%. The particle size distribution of the sediment was 85% sand, 11% silt, and 4% clay.
The test vessels were kept in a water bath at a target temperature of 20 ±2ºC under fluorescent lighting with a 16-hour:8-hour light:dark regimen. Six days prior to addition of the test organisms, water and sediment were placed in the test vessels and a gentle aeration (1 to 3 bubbles/second) of the vessels was started. The aeration was continued throughout the study,

CLH REPORT FOR ACETOCHLOR
214
except for during and 3 hours immediately after addition of the larvae to the test vessels one Day before test initiation.
Dissolved oxygen and temperature of each replicate were measured on days –1 and 0, and daily through the study. These values ranged from 7.5 to 8.9 mg/L and from 20 to 22 °C, respectively. On days –1, 0 and 28 pH was measured in each vessel values ranging from 4.3 to 7.0.
Total hardness, alkalinity, specific conductivity, and total ammonia were measured on days 0 and 28 in overlying water of a composite sample from the control and the 10 mg/L test concentration. Light intensity ranged from 750 to 990 lux.
Test organisms: Midge larvae were fed flaked fish food (5 mg) daily. The amount of food was doubled from Day 11 onwards. All vessels were observed for midge emergence and abnormal behaviour at test initiation and daily during the 28-Day exposure period. The sex and number of adult midge that emerged were recorded daily. Adult midges were then removed from the vessels to avoid the introduction of egg ropes into the test vessel. The development rate of male, female, and male and female midge combined was determined for each exposure vessel. Effects of acetochlor on midge emergence and development rate at test termination (day 28) are summarised in Table 9.2.5.2-3
Distribution of radioactivity: Samples were removed for acetochlor concentration measurements in the overlying water, pore water, and sediment on Day 0 (one hour after application), and on days 7 and 28. Acetochlor and selected degradates were quantified in water and sediment of the lowest, middle and highest test concentrations (0.10, 0.64, and 10 mg/L) by HPLC/RAM (with radiochemical detection). Flow-through radioactivity detection was used to characterise the nature of the radioactivity in the Day 0, 7 and 28 water and sediment samples from the indicated test concentrations.
Conclusions: Based on nominal Acetochlor concentrations and the male/female midge development rate, the 28-Day NOEC for the midge (Chironomus riparius) was 1.6 mg a.s./L. The development rate NOEC for males only was 4.0 mg/L. The 28-Day EC50 was > 10 mg a.s./L based on midge emergence.
5.4.5 Summary and discussion of aquatic toxicity
Acetochlor is very toxic to all groups of aquatic organisms, the acute L(E)C50 vary from > 10 mg/L on Chironomids to the lowest value of 0.52 µg/L on the green alga P. subcapitata (four order of magnitude).The same behaviour show the long term NOEC’s, they ranged from 1.6 mg/L to 0.13 µg/L on Chironomids and P. subcapitata respectively as you can see in the table below.
Table 77: Summary of relevant information on aquatic toxicity for Acetochlor.
Method Results Remarks Reference Acute toxicity to Oncorhynchus mykiss. OECD 203 guideline
0.36 mg/L (96h LC50) Measured concentrations
Tapp, J.F., Sankey, S.A., Caunter, J.E., Miller, H.M. (1989)
Chronic toxicity to Oncorhynchus mykiss US EPA FIFRA Subdivision E, 72-4 guideline and ASTM E 1241-88 (1988),
0.13 mg/L (32d NOEC) Measured concentrations
Rhodes, J.E., Muckerman, M. (1992). IIA 8.2.2.2/01. Monsanto report no. AB-91-469
CLH REPORT FOR ACETOCHLOR
215
Acute toxicity to Daphnia magna ASTM (1980) and US EPA (1975), in accordance with OECD 202 (1981) guideline
8.6 mg/L (reproduction 48h EC50) Measured concentrations
Farrelly, E., Hamer, M.J. (1989)
Chronic toxicity to Daphnia magna US EPA 72-4 (b) guideline in agreement with OECD 202 Part II
0.0221 mg/L (reproduction 21d NOEC) Measured concentrations
Blakemore, G.C., Muckerman, M. (1993). Monsanto report no. AB-91-470
Toxic effects to Pseudokirchneriella subcapitata US EPA FIFRA Subdivision J Guideline 123-2, OECD 201, EEC Method C.3 guideline
0.52 µg/L (72h ErC50) 0.13 µg/L (72h NOECr) Measured concentrations
Key study for classification
Hoberg, J.R. (2003). IIA 8.2.6/03
Toxic effects to Chrironomus riparius OECD 219 guideline
> 10 mg a.s./L (development 28d EC50) 1.6 mg a.s./L (development 28d NOEC)
Putt, A.E. (2003). Mosanto report no. SE-2002-183
Hence Acetoclor should be classified and apropiate SCL and M factor’s should be aggregated accordingly with the current legislation criteria.
Regarding the Acetochlor metabolites only t-norchloro acetochlor shows a high toxicity to the aquatic compartment. The most sensitive specie is the green alga S. capricornutum with a 72h ErC50 and a NOECr of 0.49 mg/L and 0.29 mg/L (both nominal concentrations (Swarbrick, R.H. & Shillabeer, N. (2000))) respectivel, should be taking into account that long term toxicity data on metabolites are only available on algae, therefore t-norchloro acetoclor should be classified.
5.5 Comparison with criteria for environmental hazards (sections 5.1 – 5.4)
Comparison with DSD criteria
Acetochlor is very toxic for aquatic organism, it shows a L(E)C50 below 1 mg/L (72h ErC50 = 0.52 µg a.i./L (Hoberg, J.R. (2003))) and it is non ready biodegradable. Accordingly the classification should be:
N, R50/53, S 60-61 with SCL:
[C] ≥ 0.025% N, R50/53
0.025% > [C] ≥ 0.0025% N, R51/53
0.0025% > [C] ≥ 0.00025% R52/53
Comparison with CLP criteria
As mentioned above Acetochlor is very toxic for aquatic organism, it shows a 72h ErC50 = 0.52 µg a.i./L and a 72h NOECr of 0.13 µg a.i./L (Hoberg, J.R. (2003) and it is non rapidly degradable (it is non ready biodegradable, hydrolytically stable and persistent on soil and water/sediment systems (DT50’s greater than 16 days)). Therefore the classification should be:
Acute 1, M factor = 1000
Chronic 1, M factor = 100
H410, Very toxic for aquatic life with long lasting effects.
CLH REPORT FOR ACETOCHLOR
216
Although this classification proposal is only for Acetochlor, we want to advise that the metabolite t-norchloro acetochlor should be classified at least as N, R50/53, S60-61 and Acute 1, Chronic 2, H400, H420, according to DSD and CLP respectively, based on the experimental data, due it is non ready biodegradable, based on BIOWIN models prediction and lack of information on degradation and a high toxicity to the green alga S. capricornutum showing a 72h ErC50 and a NOECr of 0.49 mg/L and 0.29 mg/L (both nominal concentrations (Swarbrick, R.H. & Shillabeer, N. (2000))) respectively.
5.6 Conclusions on classification and labelling for environmental hazards (sections 5.1 5.4)
Acetochlor should be classified according to DSD as follow:
N, R50/53, S 60-61 with SCL:
[C] ≥ 0.025% N, R50/53
0.025% > [C] ≥ 0.0025% N, R51/53
0.0025% > [C] ≥ 0.00025% R52/53
And in agreement with the CLP sould be classified as:
Acute 1, M factor = 1000
Chronic 1, M factor = 100
H410, Very toxic for aquatic life with long lasting effects.
Also we want to remark that the metabolite t-norchloro acetochlor should be clasified as N, R50/53, S60-61 according to DSD and Acute 1, Chronic 2, H400, H420, in accordance with to CLP, based on the experimental data.
CLH REPORT FOR ACETOCHLOR
217
6 OTHER INFORMATION
CLH REPORT FOR ACETOCHLOR
218
7 REFERENCES
Authors(s) Year Title
Acetochlor Registration Partnership to EFSA
2009 Acetochlor Registration Partnership Response to the EFSA Conclusion on the Peer Review (31 July, 2008). Carcinogenic potential of acetochlor. Assessment of the carcinogenic potential of the major environmental metabolites of acetochlor. 5 June, 2009.
EC (European Commission)
2005 Acetochlor, Draft Assessment Report March, 2005.
EC 2007 Acetochlor, Final Addendum to the Draft Assessment Report. July, 2007.
EC 2010 Acetochlor, Additional Report to the Draft Assessment Report. April, 2010.
EC 2011 Acetochlor, Final Addendum to the Draft Assessment Report (DAR) and Additional Report. January, 2011.
ECBI 1997 Summary Record, Commission Group of Specialised Experts in the Fields of Carcinogenicity, Mutagenicity and Reprotoxicity. Meeting at Belgirate, 4-6 June 1997. ECBI/28/97.
ECBI 1998 Summary Record, Commission Working Group on the Classification and Labelling of Dangerous Substances. Pesticides. Meeting at ECB Ispra. 12-14 November, 1997. ECBI/52/97- Rev.1.
ECBI 1999 EU Commission Group of Specialised Experts in the fields of carcinogenicity, mutagenicity and reprotoxicity: Non genotoxic thyroid carcinogens in the rodent bioassay, ECBI/49/99 Add. 1 Rev. 2 excerpt of agenda point 3.1, 1999.
ECBI 2002 Summary Record, Commission Working Group on the Classification and Labelling of Dangerous Substances. Pesticides. Meeting at ECB Arona, 13-15 February, 2002. ECBI/62/02- Rev.3.
EFSA (European Food Safety Authority)
2004 Opinion of the Scientific Panel on Plant health, Plant protection products and their Residues on a request from the Commission related to the evaluation of alachlor in the context of Council Directive 91/414/EEC. The EFSA Journal 111:1-34.
EFSA 2007 Peer Review Report on Acetochlor. September, 2007.
EFSA 2008 EFSA Scientific Report 153, 1-130, Conclusion on the peer review of Acetochlor.
EFSA 2011 Peer Review Report on Acetochlor EFSA Journal 2011; 9(5):2143. April, 2011.
IARC 1999 Scientific Publications No. 147 Species Dif ferences in Thyroid, Kidney and Urinary Bladder Carcinogenesis.
NTP 2005 Historical Control Report, Gavage, Corn oil, Sprague-Dawley, Females, 2005. http://ntp.niehs.nih.gov/files/HIST_2005SD_TUMOR_RATS1.pdf
RIVM 2005 Report 601516013: Factsheets for the (eco)toxicological risk assessment strategy of the National Institute for Public Health and the Environment Part V. J.W.A. Scheepmaker, C.E. Smit, M.T.M. van Raaij.
US EPA 1997a U.S. Environmental Protection Agency. Fourth alachlor carcinogenicity peer review of February, 5, 1997. Office of Prevention, Pesticides, and Toxic Substances, US EPA, Washington D.C.
US EPA 1997b SAP REPORT, April 28, 1997. Report of FIFRA Scientific Advisory Panel Meeting, March 19-20, 1997, held at the Crystal Gateway Marriott, 1700 Jefferson Davies Highway, Arlington, VA 22202.
CLH REPORT FOR ACETOCHLOR
219
Authors(s) Year Title
US EPA 2001 The Grouping of a Series of Chloroacetanilide Pesticides Based on a Common Mechanism of Toxicity, Office of Pesticide Programs, US EPA (June 7, 2001)
US EPA 2004a Acetochlor. Report of the Cancer Assessment Review Committee (CARC) (Fourth Evaluation). August 31, 2004. TXR. No. 0052727. PC code: 121601
US EPA 2004b Acetochlor. Report of the Metabolism Assessment Review Committee. August 31, 2004. TXR. No. 0052813. PC code: 121601. DP barcode: 307446.
US EPA 2006a Acetochlor/alachlor: Cumulative Risk Assessment for the Chloroacetanilides. March 8, 2006. PC code: 121601&090501. DP barcode: D292317.
US EPA 2006b Acetochlor. Revised HED Chapter of the Tolerance Reassessment Eligibility Decision (TRED) Document. March 1, 2006. PC Code: 121601. DP Barcode: D292336.
US EPA 2007a Acetochlor/alachlor: Revised Cumulative Risk Assessment for the Chloroacetanilides. April 30, 2007.
US EPA 2007b Acetochlor. Fifth Report of the Cancer Assessment Review Committee. January 3, 2007. TXR. No. 0054494. PC code: 121601.
US EPA 2007c Acetochlor: Acute and Chronic Dietary Exposure Assessments to Support New Uses on Sweet Corn, Pop Corn and Sorghum & New Rotational Crops Tolerances on Potatoes, Sugar Beets, Sunflower Seeds, Dried Shelled Peas and Beans (Crop Subgroup 6C) and Cereal Grains, Except Rice and Corn (Crop Group 15). 22 January 2007. PC code: 121601. DP number: 275018. Decision No.: 300987.
US EPA 2007d Acetochlor; Pesticide Tolerance; Final Rule. Federal Register Vol. 72, No. 94. May 16, 2007; pages 27463-27469.
US EPA 2009 Acetochlor Human Health Risk Assessment for Proposed New Use of Acetochlor on Cotton and Soybeans. July 1, 2009.
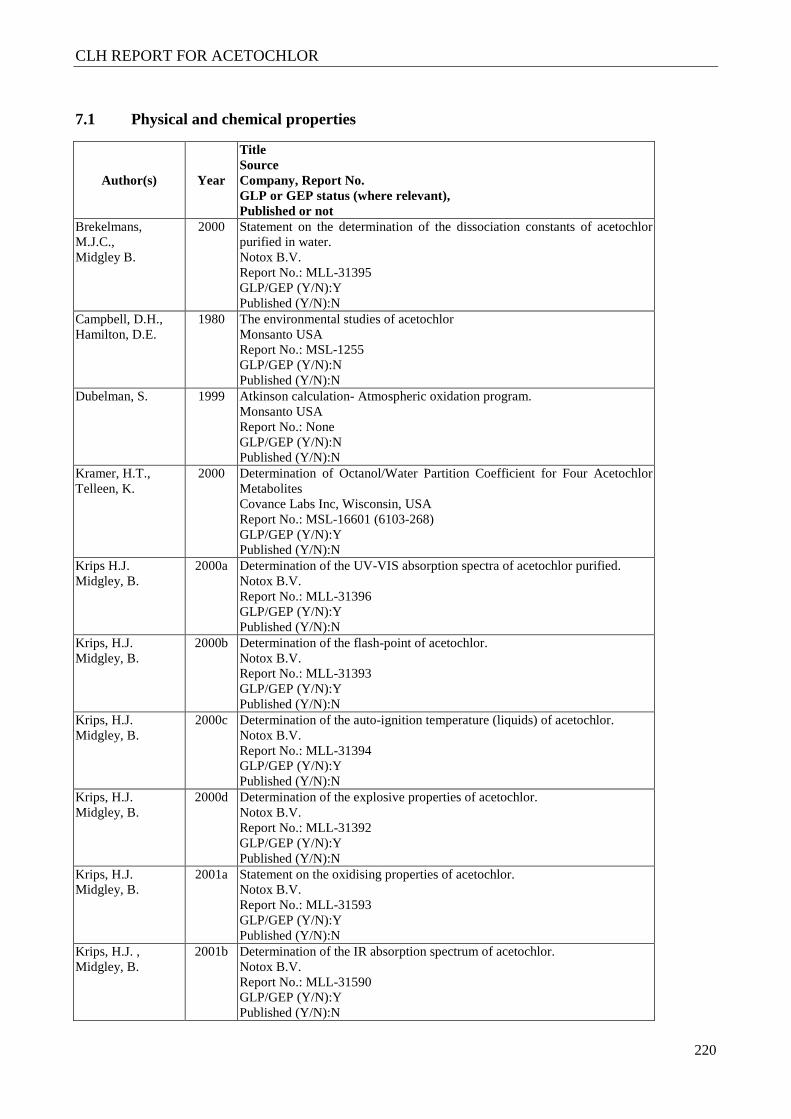
CLH REPORT FOR ACETOCHLOR
220
7.1 Physical and chemical properties
Author(s) Year
Title Source Company, Report No. GLP or GEP status (where relevant), Published or not
Brekelmans, M.J.C., Midgley B.
2000 Statement on the determination of the dissociation constants of acetochlor purified in water. Notox B.V. Report No.: MLL-31395 GLP/GEP (Y/N):Y Published (Y/N):N
Campbell, D.H., Hamilton, D.E.
1980 The environmental studies of acetochlor Monsanto USA Report No.: MSL-1255 GLP/GEP (Y/N):N Published (Y/N):N
Dubelman, S. 1999 Atkinson calculation- Atmospheric oxidation program. Monsanto USA Report No.: None GLP/GEP (Y/N):N Published (Y/N):N
Kramer, H.T., Telleen, K.
2000 Determination of Octanol/Water Partition Coefficient for Four Acetochlor Metabolites Covance Labs Inc, Wisconsin, USA Report No.: MSL-16601 (6103-268) GLP/GEP (Y/N):Y Published (Y/N):N
Krips H.J. Midgley, B.
2000a Determination of the UV-VIS absorption spectra of acetochlor purified. Notox B.V. Report No.: MLL-31396 GLP/GEP (Y/N):Y Published (Y/N):N
Krips, H.J. Midgley, B.
2000b Determination of the flash-point of acetochlor. Notox B.V. Report No.: MLL-31393 GLP/GEP (Y/N):Y Published (Y/N):N
Krips, H.J. Midgley, B.
2000c Determination of the auto-ignition temperature (liquids) of acetochlor. Notox B.V. Report No.: MLL-31394 GLP/GEP (Y/N):Y Published (Y/N):N
Krips, H.J. Midgley, B.
2000d Determination of the explosive properties of acetochlor. Notox B.V. Report No.: MLL-31392 GLP/GEP (Y/N):Y Published (Y/N):N
Krips, H.J. Midgley, B.
2001a Statement on the oxidising properties of acetochlor. Notox B.V. Report No.: MLL-31593 GLP/GEP (Y/N):Y Published (Y/N):N
Krips, H.J. , Midgley, B.
2001b Determination of the IR absorption spectrum of acetochlor. Notox B.V. Report No.: MLL-31590 GLP/GEP (Y/N):Y Published (Y/N):N
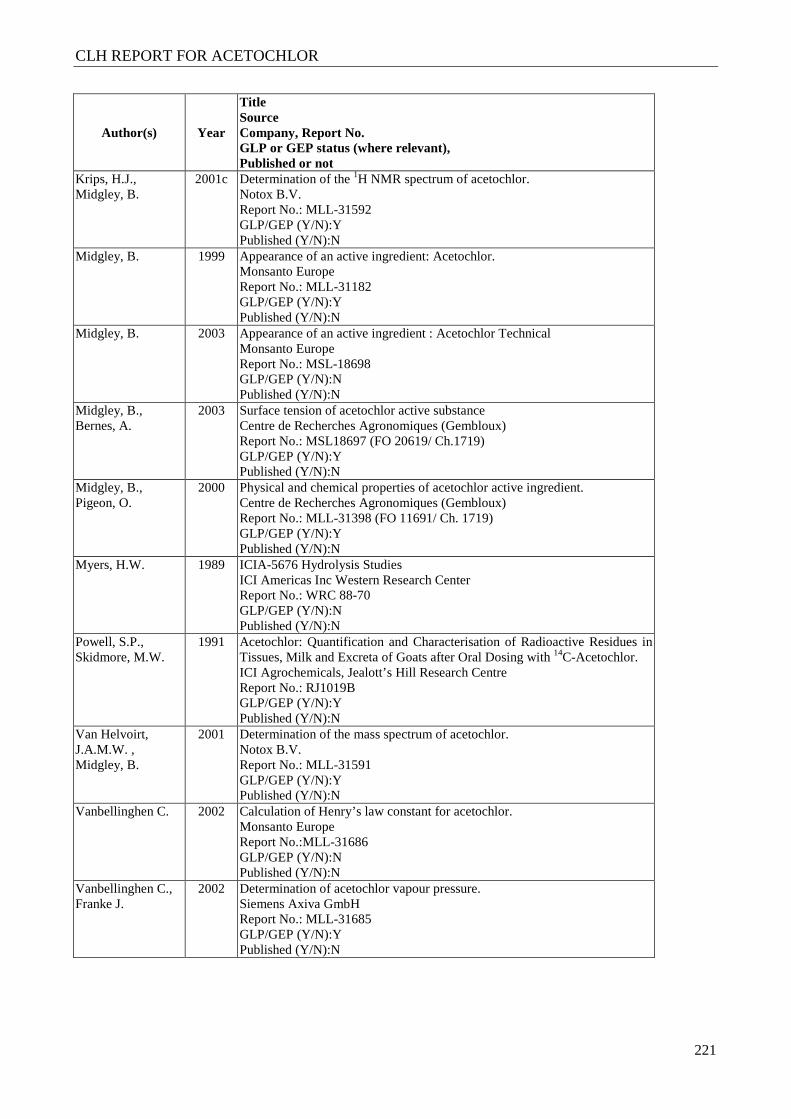
CLH REPORT FOR ACETOCHLOR
221
Author(s) Year
Title Source Company, Report No. GLP or GEP status (where relevant), Published or not
Krips, H.J., Midgley, B.
2001c Determination of the 1H NMR spectrum of acetochlor. Notox B.V. Report No.: MLL-31592 GLP/GEP (Y/N):Y Published (Y/N):N
Midgley, B. 1999 Appearance of an active ingredient: Acetochlor. Monsanto Europe Report No.: MLL-31182 GLP/GEP (Y/N):Y Published (Y/N):N
Midgley, B. 2003 Appearance of an active ingredient : Acetochlor Technical Monsanto Europe Report No.: MSL-18698 GLP/GEP (Y/N):N Published (Y/N):N
Midgley, B., Bernes, A.
2003 Surface tension of acetochlor active substance Centre de Recherches Agronomiques (Gembloux) Report No.: MSL18697 (FO 20619/ Ch.1719) GLP/GEP (Y/N):Y Published (Y/N):N
Midgley, B., Pigeon, O.
2000 Physical and chemical properties of acetochlor active ingredient. Centre de Recherches Agronomiques (Gembloux) Report No.: MLL-31398 (FO 11691/ Ch. 1719) GLP/GEP (Y/N):Y Published (Y/N):N
Myers, H.W. 1989 ICIA-5676 Hydrolysis Studies ICI Americas Inc Western Research Center Report No.: WRC 88-70 GLP/GEP (Y/N):N Published (Y/N):N
Powell, S.P., Skidmore, M.W.
1991 Acetochlor: Quantification and Characterisation of Radioactive Residues in Tissues, Milk and Excreta of Goats after Oral Dosing with 14C-Acetochlor. ICI Agrochemicals, Jealott’s Hill Research Centre Report No.: RJ1019B GLP/GEP (Y/N):Y Published (Y/N):N
Van Helvoirt, J.A.M.W. , Midgley, B.
2001 Determination of the mass spectrum of acetochlor. Notox B.V. Report No.: MLL-31591 GLP/GEP (Y/N):Y Published (Y/N):N
Vanbellinghen C. 2002 Calculation of Henry’s law constant for acetochlor. Monsanto Europe Report No.:MLL-31686 GLP/GEP (Y/N):N Published (Y/N):N
Vanbellinghen C., Franke J.
2002 Determination of acetochlor vapour pressure. Siemens Axiva GmbH Report No.: MLL-31685 GLP/GEP (Y/N):Y Published (Y/N):N
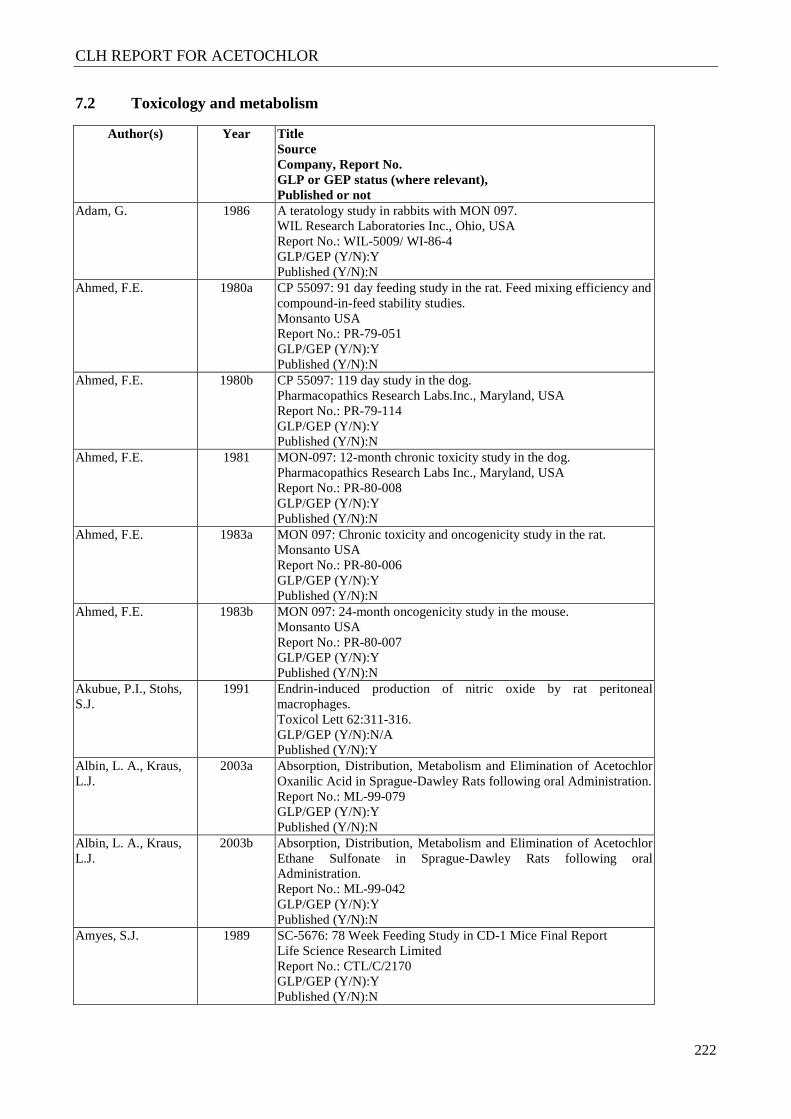
CLH REPORT FOR ACETOCHLOR
222
7.2 Toxicology and metabolism
Author(s)
Year
Title Source Company, Report No. GLP or GEP status (where relevant), Published or not
Adam, G. 1986 A teratology study in rabbits with MON 097. WIL Research Laboratories Inc., Ohio, USA Report No.: WIL-5009/ WI-86-4 GLP/GEP (Y/N):Y Published (Y/N):N
Ahmed, F.E. 1980a CP 55097: 91 day feeding study in the rat. Feed mixing efficiency and compound-in-feed stability studies. Monsanto USA Report No.: PR-79-051 GLP/GEP (Y/N):Y Published (Y/N):N
Ahmed, F.E. 1980b CP 55097: 119 day study in the dog. Pharmacopathics Research Labs.Inc., Maryland, USA Report No.: PR-79-114 GLP/GEP (Y/N):Y Published (Y/N):N
Ahmed, F.E. 1981 MON-097: 12-month chronic toxicity study in the dog. Pharmacopathics Research Labs Inc., Maryland, USA Report No.: PR-80-008 GLP/GEP (Y/N):Y Published (Y/N):N
Ahmed, F.E. 1983a MON 097: Chronic toxicity and oncogenicity study in the rat. Monsanto USA Report No.: PR-80-006 GLP/GEP (Y/N):Y Published (Y/N):N
Ahmed, F.E. 1983b MON 097: 24-month oncogenicity study in the mouse. Monsanto USA Report No.: PR-80-007 GLP/GEP (Y/N):Y Published (Y/N):N
Akubue, P.I., Stohs, S.J.
1991 Endrin-induced production of nitric oxide by rat peritoneal macrophages. Toxicol Lett 62:311-316. GLP/GEP (Y/N):N/A Published (Y/N):Y
Albin, L. A., Kraus, L.J.
2003a Absorption, Distribution, Metabolism and Elimination of Acetochlor Oxanilic Acid in Sprague-Dawley Rats following oral Administration. Report No.: ML-99-079 GLP/GEP (Y/N):Y Published (Y/N):N
Albin, L. A., Kraus, L.J.
2003b Absorption, Distribution, Metabolism and Elimination of Acetochlor Ethane Sulfonate in Sprague-Dawley Rats following oral Administration. Report No.: ML-99-042 GLP/GEP (Y/N):Y Published (Y/N):N
Amyes, S.J.
1989 SC-5676: 78 Week Feeding Study in CD-1 Mice Final Report Life Science Research Limited Report No.: CTL/C/2170 GLP/GEP (Y/N):Y Published (Y/N):N
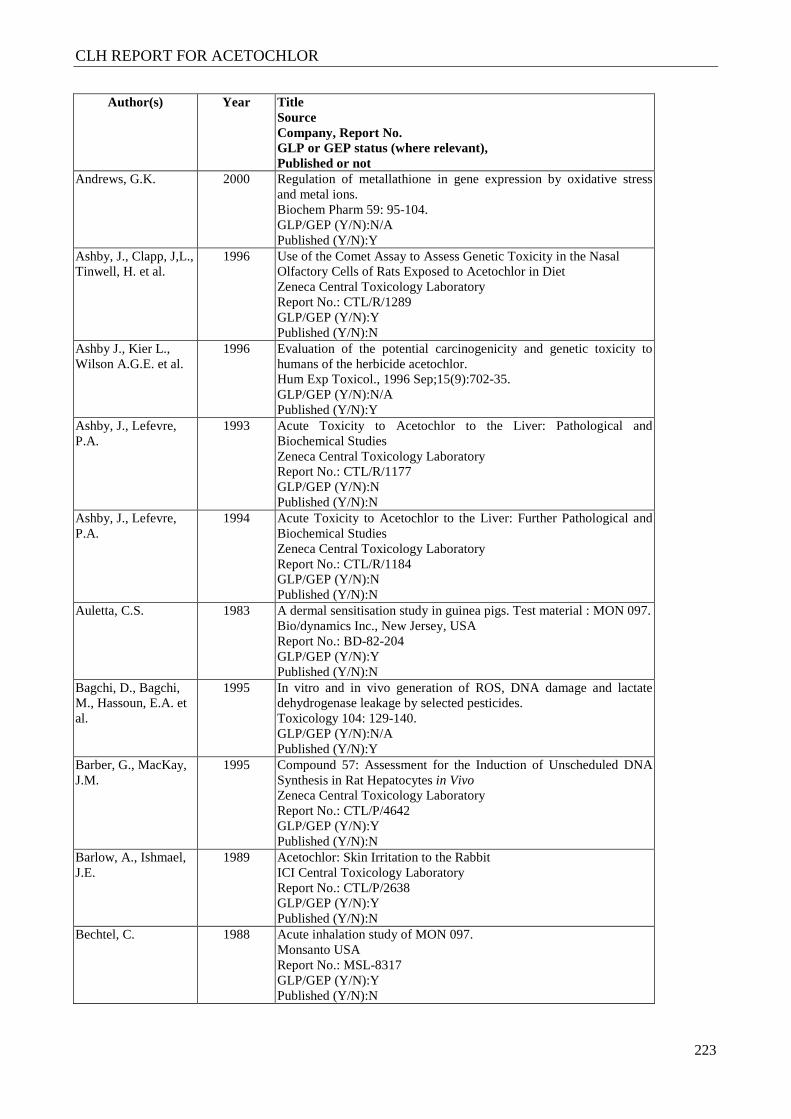
CLH REPORT FOR ACETOCHLOR
223
Author(s)
Year
Title Source Company, Report No. GLP or GEP status (where relevant), Published or not
Andrews, G.K. 2000 Regulation of metallathione in gene expression by oxidative stress and metal ions. Biochem Pharm 59: 95-104. GLP/GEP (Y/N):N/A Published (Y/N):Y
Ashby, J., Clapp, J,L., Tinwell, H. et al.
1996 Use of the Comet Assay to Assess Genetic Toxicity in the Nasal Olfactory Cells of Rats Exposed to Acetochlor in Diet Zeneca Central Toxicology Laboratory Report No.: CTL/R/1289 GLP/GEP (Y/N):Y Published (Y/N):N
Ashby J., Kier L., Wilson A.G.E. et al.
1996 Evaluation of the potential carcinogenicity and genetic toxicity to humans of the herbicide acetochlor. Hum Exp Toxicol., 1996 Sep;15(9):702-35. GLP/GEP (Y/N):N/A Published (Y/N):Y
Ashby, J., Lefevre, P.A.
1993 Acute Toxicity to Acetochlor to the Liver: Pathological and Biochemical Studies Zeneca Central Toxicology Laboratory Report No.: CTL/R/1177 GLP/GEP (Y/N):N Published (Y/N):N
Ashby, J., Lefevre, P.A.
1994 Acute Toxicity to Acetochlor to the Liver: Further Pathological and Biochemical Studies Zeneca Central Toxicology Laboratory Report No.: CTL/R/1184 GLP/GEP (Y/N):N Published (Y/N):N
Auletta, C.S. 1983 A dermal sensitisation study in guinea pigs. Test material : MON 097. Bio/dynamics Inc., New Jersey, USA Report No.: BD-82-204 GLP/GEP (Y/N):Y Published (Y/N):N
Bagchi, D., Bagchi, M., Hassoun, E.A. et al.
1995 In vitro and in vivo generation of ROS, DNA damage and lactate dehydrogenase leakage by selected pesticides. Toxicology 104: 129-140. GLP/GEP (Y/N):N/A Published (Y/N):Y
Barber, G., MacKay, J.M.
1995 Compound 57: Assessment for the Induction of Unscheduled DNA Synthesis in Rat Hepatocytes in Vivo Zeneca Central Toxicology Laboratory Report No.: CTL/P/4642 GLP/GEP (Y/N):Y Published (Y/N):N
Barlow, A., Ishmael, J.E.
1989 Acetochlor: Skin Irritation to the Rabbit ICI Central Toxicology Laboratory Report No.: CTL/P/2638 GLP/GEP (Y/N):Y Published (Y/N):N
Bechtel, C. 1988 Acute inhalation study of MON 097. Monsanto USA Report No.: MSL-8317 GLP/GEP (Y/N):Y Published (Y/N):N
CLH REPORT FOR ACETOCHLOR
224
Author(s)
Year
Title Source Company, Report No. GLP or GEP status (where relevant), Published or not
Bolton J.L., Trush M.A., Penning T.M. et al.
2000 Role of Quinones in Toxicology. Chem. Res. Toxicol. 13(3): 135-160. GLP/GEP (Y/N):N/A Published (Y/N):Y
Botham, P.A., Ishmael, J.E.
1989 Acetochlor: Skin Sensitisation to the Guinea Pig ICI Central Toxicology Laboratory Report No.: CTL/P/2577 GLP/GEP (Y/N):Y Published (Y/N):N
Brammer, A. 1989 Acetochlor: 4-Hour Acute Inhalation Toxicity Study in the Rat ICI Central Toxicology Laboratory Report No.: CTL/P/2544 GLP/GEP (Y/N):Y Published (Y/N):N
Branch, D.K. 1982a Acute oral toxicity of MON 097 to rats. Monsanto USA. Study no.: 820031. Report No.: ML-82-049 GLP/GEP (Y/N):Y Published (Y/N):N
Branch, D.K. 1982b Acute dermal toxicity of MON 097 to rabbits. Monsanto USA. Study no.: 820032. Report No.: ML-82-049 GLP/GEP (Y/N):Y Published (Y/N):N
Branch, D.K. 1982c Primary skin irritation of MON 097 to rabbits. Monsanto USA. Study no.: 820033. Report No.: ML-82-049 GLP/GEP (Y/N):Y Published (Y/N):N
Branch, D.K. 1982d Primary Eye irritation of MON 097 to rabbits. Monsanto USA. Study no.: 820034. Report No.: ML-82-049. GLP/GEP (Y/N):Y Published (Y/N):N
Breaux, E.J., Feng, P. 1984 In vitro metabolism of acetochlor by rat liver and kidney homogenates. Monsanto USA Report No.: MSL-3449 GLP/GEP (Y/N):N Published (Y/N):N
Brewster, D., Hotz, K. 1991 A Study to the Effect of Alachlor on Cell Proliferation in Specific Tissues of the Rat and Mouse. Lab Project Number: HL 87112,90059,90114; R.D. 1156: 90114. Unpublished study prepared by Monsanto. Co. 95 p.
Broadmeadow, A. 1985 SC-5676 : Preliminary Toxicity Study By Dietary Administration to CD Rats for 4 weeks Life Science Research Limited Report No.: 85/SUC009/476 GLP/GEP (Y/N):N Published (Y/N):N
CLH REPORT FOR ACETOCHLOR
225
Author(s)
Year
Title Source Company, Report No. GLP or GEP status (where relevant), Published or not
Broadmeadow, A. 1986a SC-5676: Toxicity Study by Dietary Administration to CD Rats for 13 Weeks. Life Science Research Limited Report No.: CTL/C/2193 GLP/GEP (Y/N):Y Published (Y/N):N
Broadmeadow, A. 1986b SC-5676: Toxicity Study by Oral (Capsule) Administration to Beagle Dogs for 13 Weeks Life Science Research Limited Report No.: CTL/C/2195 GLP/GEP (Y/N):Y Published (Y/N):N
Broadmeadow, A. 1988 SC-5676: Combined Oncogenicity and Toxicity Study in Dietary Administration to CD Rats for 104 Weeks Final Report Life Science Research Limited Report No.: CTL/C/2191 GLP/GEP (Y/N):Y Published (Y/N):N
Broadmeadow, A. 1989 SC-5676: Toxicity Study Oral (Capsule) Administration to Beagle Dogs for 52 Weeks Final Report Life Science Research Limited Report No.: CTL/C/2194 GLP/GEP (Y/N):Y Published (Y/N):N
Brooker, A.J., Stubbs, A., John, D.M.
1989a Acetochlor: Teratogenicity Study in the Rat Huntington Research Centre Ltd Report No.: CTL/C/2187 GLP/GEP (Y/N):Y Published (Y/N):N
Brooker, A.J., Stubbs, A., John, D.M.
1989b Acetochlor: Teratogenicity Study in the Rabbit Huntington Research Centre Ltd Report No.: CTL/C/2186 GLP/GEP (Y/N):Y Published (Y/N):N
Burman, D.M., Shertzer, H.G., Senft, A.P. et al.
2003 Antioxidant perturbations in the olfactory mucosa of alachlor-treated rats. Biochem Pharm 66:1707-1715. GLP/GEP (Y/N):N/A Published (Y/N):Y
Callander, R.D. 1991 PJ2 Acetochlor Metabolite: An Evaluation of Mutagenic Potential Using S.typhimurium and E.coli ICI Central Toxicology Laboratory Report No.: CTL/P/3358 GLP/GEP (Y/N):Y Published (Y/N):N
Callander, R.D. 1992 Acetochlor (Analytical Standard) - An Evaluation of Mutagenic Potential Using S.Typhimurium. ICI Central Toxicology Laboratory Report No.: CTL/R/1112 GLP/GEP (Y/N):Y Published (Y/N):N
CLH REPORT FOR ACETOCHLOR
226
Author(s)
Year
Title Source Company, Report No. GLP or GEP status (where relevant), Published or not
Callander, R.D. 1997a Oxanilic acid (R290130): An evaluation of mutagenic potential using S. Typhimurium and E. Coli Central Toxicology Laboratory Report No.: CTL/P/5542 GLP/GEP (Y/N):Y Published (Y/N):N
Callander, R.D. 1997b Thioacetic acid sulphoxide (R243797) : An evaluation of mutagenic potential using S.typhimurium and E.Coli Central Toxicology Laboratory Report No.: CTL/P/5541 GLP/GEP (Y/N):Y Published (Y/N):N
Callander, R.D. 1997c Sulfonic acid (R290131) : An evaluation of mutagenic potential using S.Typhimurium and E. Coli Central Toxicology Laboratory Report No.: CTL/P/5568-ZE-2000-75 GLP/GEP (Y/N):Y Published (Y/N):N
Callander, R.D. 1998 Acetochlor-An evaluation in the Salmonella/microsome assay. ICI Central Toxicology Laboratory Report No.: CTL/P/1379 GLP/GEP (Y/N):Y Published (Y/N):N
Callander, R.D. 2002 R243661 (norchloroacetochlor): Bacterial Mutation Assay in S. typhimurium and E. coli. Central Toxicology Laboratory Report No.: CTL/YV4899, ZE-2001-223 GLP/GEP (Y/N):Y Published (Y/N):N
Callander, R.D., Priestley, K.P.
1989 Acetochlor: An Evaluation in the Salmonella Mutation Assay ICI Central Toxicology Laboratory Report No.: CTL/P/2391 GLP/GEP (Y/N):Y Published (Y/N):N
Cantoreggi, S., Dietrich, D.R., Lutz W.R.
1993 Induction of Cell Proliferation in the Forestomach of F344 Rats Following Subchronic Administration os Styrene 7,8 Oxide and Butylated Hydroxyanisole. Cancer Res. 53: 3505-3508 GLP/GEP (Y/N):N/A Published (Y/N):Y
Carr, K.H., Elliott, R.C., Halasinski, K.A. et al.
1983 The metabolism of acetochlor in the laboratory rat Monsanto USA Report No.: MSL-2824 GLP/GEP (Y/N):Y Published (Y/N):N
Cavagnaro, J., Cortina, T.
1985 In vivo micronucleus assay in mice with MON 097 (Acetochlor). Hazleton Biotechnologies Corp., Virginia, USA Report No.: HL-84-405 GLP/GEP (Y/N):Y Published (Y/N):N
Cifone, M.
2006 CHO HGPRT Forward Mutation Assay with a Confirmatory Assay and Duplicate Cultures with MON 52765 Report No.: CV-2005-101 GLP/GEP (Y/N):Y Published (Y/N):N
CLH REPORT FOR ACETOCHLOR
227
Author(s)
Year
Title Source Company, Report No. GLP or GEP status (where relevant), Published or not
Clay, P. 2000a Oxanilic acid (R290130): L5178Y TK+/- mouse lymphoma mutation assay. Central Toxicology Laboratory Report No.: CTL/VV0231, ZE-2000-171 GLP/GEP (Y/N):Y Published (Y/N):N
Clay, P. 2000b Sulfonic acid (R290131): L5178Y TK+/- mouse lymphoma mutation assay. Central Toxicology Laboratory Report No.: CTL/VV0232, ZE-2000-169 GLP/GEP (Y/N):Y Published (Y/N):N
Clay, P. 2001 Thioacetic acid sulphoxide (R243797): L5178Y TK+/- mouse lymphoma mutation assay. Central Toxicology Laboratory Report No.: CTL/VV0233, ZE-2001-75 GLP/GEP (Y/N):Y Published (Y/N):N
Clay, P. 2002 R243661: L5178Y TK+/- mouse lymphoma mutation assay. Central Toxicology Laboratory Report No.: CTL/VV0234 GLP/GEP (Y/N):Y Published (Y/N):N
Clayson, D.B., Mehta, R., Iverson, F.
1994 Oxidative DNA damage-the effects certain genotoxic and operationally non-genotoxic carcinogens. International Commission for Protection Against Environmental Mutagens and Carcinogens. Mutat.Res. 317(1):25-42. GLP/GEP (Y/N):N/A Published (Y/N):Y
Coleman, S., Linderman, R., Hodgson, E. et al.
2000 Comparative metabolism of chloroacetamide herbicides and selected metabolites in human and rat liver microsomes. Environ Health Perspectives 108:1151-1157. GLP/GEP (Y/N):N/A Published (Y/N):Y
Cook J.C., Klinefelter G.R., Hardisty J.F. et al.
1999 Rodent Leydig cell tumorigenesis: a review of the physiology, pathology, mechanisms, and relevance to humans. Crit. Rev. Toxicol. 29 (2), 169-261, 1999. GLP/GEP (Y/N):N/A Published (Y/N):Y
Creasy, D.M. 2003 Acetochlor: Histopathological Reevaluation of Dog Testes and Epididymides from a One Year Study Huntingdon Life Sciences, East Millstone, NJ. Report No.: GHC 5697 GLP/GEP (Y/N):N/A Published (Y/N):N
Cummins, H.A. 1986a SC-5676 Technical: Acute Oral Toxicity in Rats. Life Science Research Ltd Report No.: CTL/C/2169 GLP/GEP (Y/N):Y Published (Y/N):N
Cummins, H.A. 1986b SC-5676 Technical: Acute Dermal Toxicity in Rats Life Science Research Ltd Report No.: CTL/C/2168 GLP/GEP (Y/N):Y Published (Y/N):N
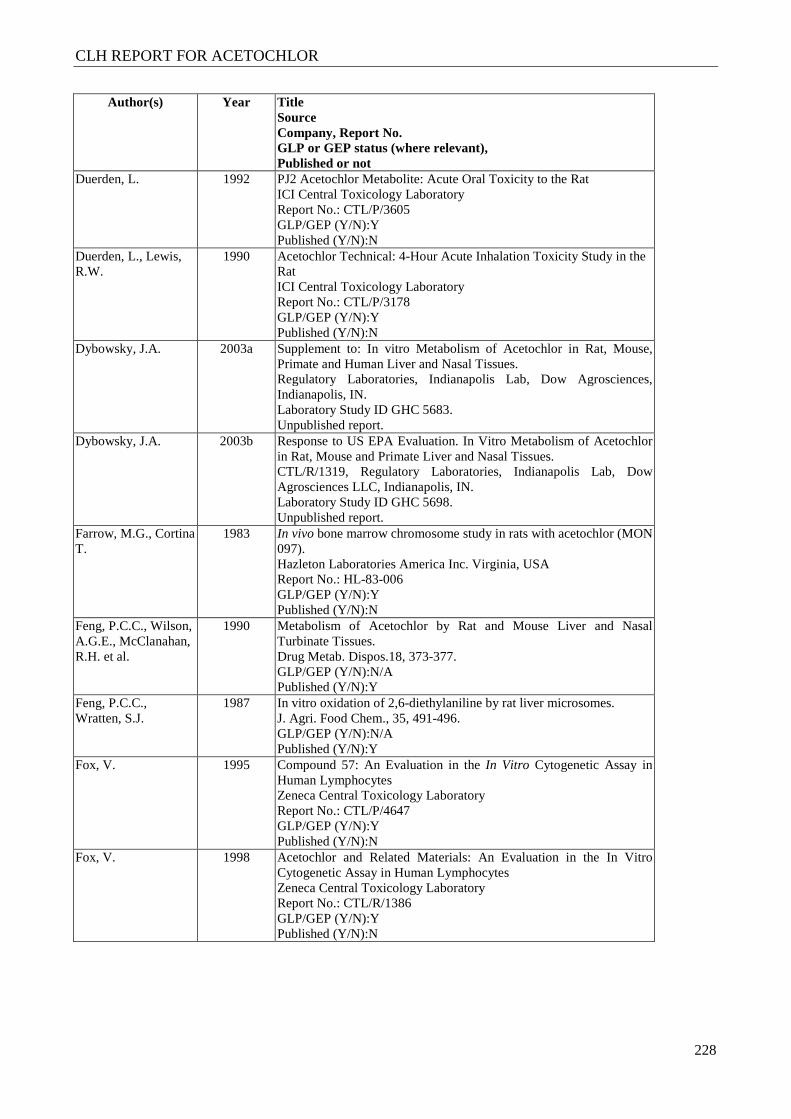
CLH REPORT FOR ACETOCHLOR
228
Author(s)
Year
Title Source Company, Report No. GLP or GEP status (where relevant), Published or not
Duerden, L. 1992 PJ2 Acetochlor Metabolite: Acute Oral Toxicity to the Rat ICI Central Toxicology Laboratory Report No.: CTL/P/3605 GLP/GEP (Y/N):Y Published (Y/N):N
Duerden, L., Lewis, R.W.
1990 Acetochlor Technical: 4-Hour Acute Inhalation Toxicity Study in the Rat ICI Central Toxicology Laboratory Report No.: CTL/P/3178 GLP/GEP (Y/N):Y Published (Y/N):N
Dybowsky, J.A. 2003a Supplement to: In vitro Metabolism of Acetochlor in Rat, Mouse, Primate and Human Liver and Nasal Tissues. Regulatory Laboratories, Indianapolis Lab, Dow Agrosciences, Indianapolis, IN. Laboratory Study ID GHC 5683. Unpublished report.
Dybowsky, J.A. 2003b Response to US EPA Evaluation. In Vitro Metabolism of Acetochlor in Rat, Mouse and Primate Liver and Nasal Tissues. CTL/R/1319, Regulatory Laboratories, Indianapolis Lab, Dow Agrosciences LLC, Indianapolis, IN. Laboratory Study ID GHC 5698. Unpublished report.
Farrow, M.G., Cortina T.
1983 In vivo bone marrow chromosome study in rats with acetochlor (MON 097). Hazleton Laboratories America Inc. Virginia, USA Report No.: HL-83-006 GLP/GEP (Y/N):Y Published (Y/N):N
Feng, P.C.C., Wilson, A.G.E., McClanahan, R.H. et al.
1990 Metabolism of Acetochlor by Rat and Mouse Liver and Nasal Turbinate Tissues. Drug Metab. Dispos.18, 373-377. GLP/GEP (Y/N):N/A Published (Y/N):Y
Feng, P.C.C., Wratten, S.J.
1987 In vitro oxidation of 2,6-diethylaniline by rat liver microsomes. J. Agri. Food Chem., 35, 491-496. GLP/GEP (Y/N):N/A Published (Y/N):Y
Fox, V. 1995 Compound 57: An Evaluation in the In Vitro Cytogenetic Assay in Human Lymphocytes Zeneca Central Toxicology Laboratory Report No.: CTL/P/4647 GLP/GEP (Y/N):Y Published (Y/N):N
Fox, V. 1998 Acetochlor and Related Materials: An Evaluation in the In Vitro Cytogenetic Assay in Human Lymphocytes Zeneca Central Toxicology Laboratory Report No.: CTL/R/1386 GLP/GEP (Y/N):Y Published (Y/N):N
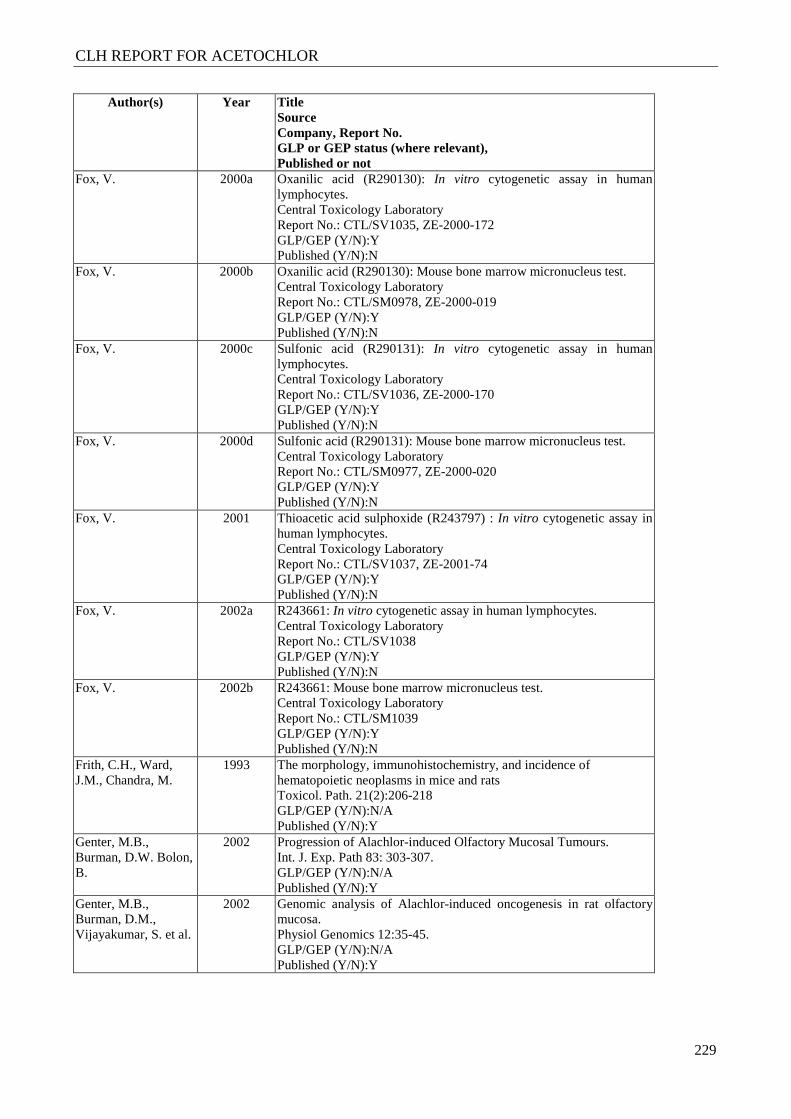
CLH REPORT FOR ACETOCHLOR
229
Author(s)
Year
Title Source Company, Report No. GLP or GEP status (where relevant), Published or not
Fox, V. 2000a Oxanilic acid (R290130): In vitro cytogenetic assay in human lymphocytes. Central Toxicology Laboratory Report No.: CTL/SV1035, ZE-2000-172 GLP/GEP (Y/N):Y Published (Y/N):N
Fox, V. 2000b Oxanilic acid (R290130): Mouse bone marrow micronucleus test. Central Toxicology Laboratory Report No.: CTL/SM0978, ZE-2000-019 GLP/GEP (Y/N):Y Published (Y/N):N
Fox, V. 2000c Sulfonic acid (R290131): In vitro cytogenetic assay in human lymphocytes. Central Toxicology Laboratory Report No.: CTL/SV1036, ZE-2000-170 GLP/GEP (Y/N):Y Published (Y/N):N
Fox, V. 2000d Sulfonic acid (R290131): Mouse bone marrow micronucleus test. Central Toxicology Laboratory Report No.: CTL/SM0977, ZE-2000-020 GLP/GEP (Y/N):Y Published (Y/N):N
Fox, V. 2001 Thioacetic acid sulphoxide (R243797) : In vitro cytogenetic assay in human lymphocytes. Central Toxicology Laboratory Report No.: CTL/SV1037, ZE-2001-74 GLP/GEP (Y/N):Y Published (Y/N):N
Fox, V. 2002a R243661: In vitro cytogenetic assay in human lymphocytes. Central Toxicology Laboratory Report No.: CTL/SV1038 GLP/GEP (Y/N):Y Published (Y/N):N
Fox, V. 2002b R243661: Mouse bone marrow micronucleus test. Central Toxicology Laboratory Report No.: CTL/SM1039 GLP/GEP (Y/N):Y Published (Y/N):N
Frith, C.H., Ward, J.M., Chandra, M.
1993 The morphology, immunohistochemistry, and incidence of hematopoietic neoplasms in mice and rats Toxicol. Path. 21(2):206-218 GLP/GEP (Y/N):N/A Published (Y/N):Y
Genter, M.B., Burman, D.W. Bolon, B.
2002 Progression of Alachlor-induced Olfactory Mucosal Tumours. Int. J. Exp. Path 83: 303-307. GLP/GEP (Y/N):N/A Published (Y/N):Y
Genter, M.B., Burman, D.M., Vijayakumar, S. et al.
2002 Genomic analysis of Alachlor-induced oncogenesis in rat olfactory mucosa. Physiol Genomics 12:35-45. GLP/GEP (Y/N):N/A Published (Y/N):Y
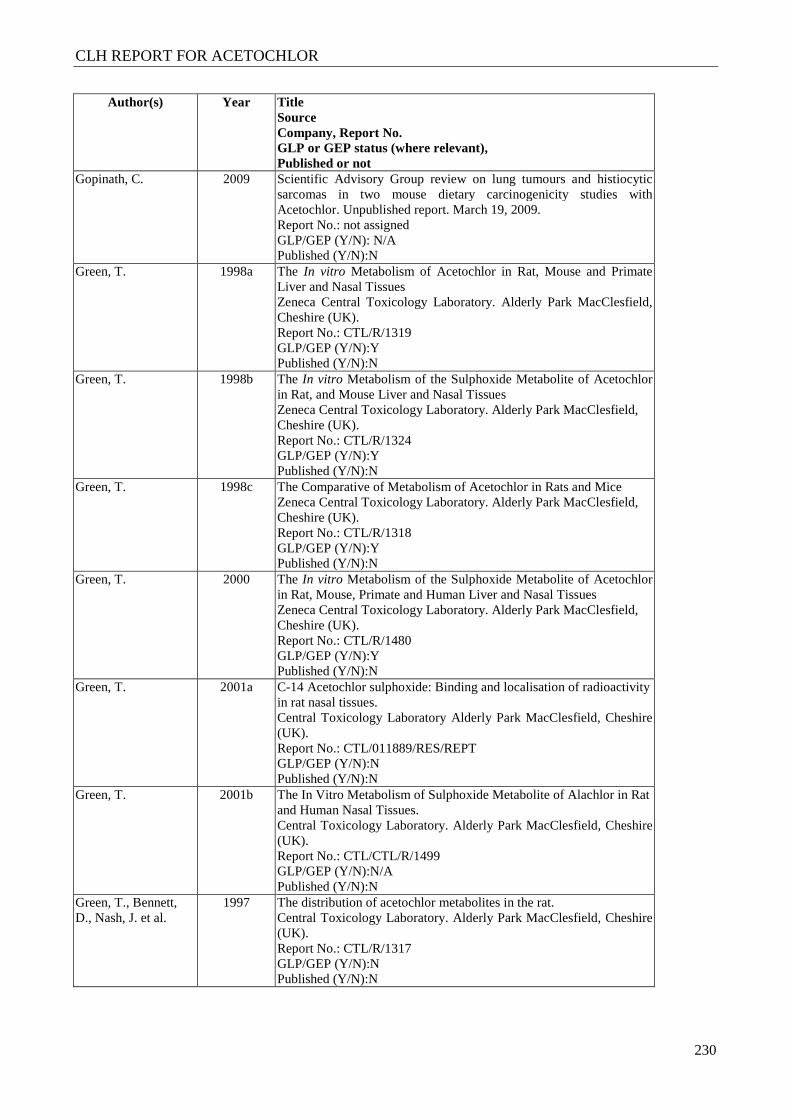
CLH REPORT FOR ACETOCHLOR
230
Author(s)
Year
Title Source Company, Report No. GLP or GEP status (where relevant), Published or not
Gopinath, C. 2009 Scientific Advisory Group review on lung tumours and histiocytic sarcomas in two mouse dietary carcinogenicity studies with Acetochlor. Unpublished report. March 19, 2009. Report No.: not assigned GLP/GEP (Y/N): N/A Published (Y/N):N
Green, T. 1998a The In vitro Metabolism of Acetochlor in Rat, Mouse and Primate Liver and Nasal Tissues Zeneca Central Toxicology Laboratory. Alderly Park MacClesfield, Cheshire (UK). Report No.: CTL/R/1319 GLP/GEP (Y/N):Y Published (Y/N):N
Green, T. 1998b The In vitro Metabolism of the Sulphoxide Metabolite of Acetochlor in Rat, and Mouse Liver and Nasal Tissues Zeneca Central Toxicology Laboratory. Alderly Park MacClesfield, Cheshire (UK). Report No.: CTL/R/1324 GLP/GEP (Y/N):Y Published (Y/N):N
Green, T. 1998c The Comparative of Metabolism of Acetochlor in Rats and Mice Zeneca Central Toxicology Laboratory. Alderly Park MacClesfield, Cheshire (UK). Report No.: CTL/R/1318 GLP/GEP (Y/N):Y Published (Y/N):N
Green, T. 2000 The In vitro Metabolism of the Sulphoxide Metabolite of Acetochlor in Rat, Mouse, Primate and Human Liver and Nasal Tissues Zeneca Central Toxicology Laboratory. Alderly Park MacClesfield, Cheshire (UK). Report No.: CTL/R/1480 GLP/GEP (Y/N):Y Published (Y/N):N
Green, T. 2001a C-14 Acetochlor sulphoxide: Binding and localisation of radioactivity in rat nasal tissues. Central Toxicology Laboratory Alderly Park MacClesfield, Cheshire (UK). Report No.: CTL/011889/RES/REPT GLP/GEP (Y/N):N Published (Y/N):N
Green, T. 2001b The In Vitro Metabolism of Sulphoxide Metabolite of Alachlor in Rat and Human Nasal Tissues. Central Toxicology Laboratory. Alderly Park MacClesfield, Cheshire (UK). Report No.: CTL/CTL/R/1499 GLP/GEP (Y/N):N/A Published (Y/N):N
Green, T., Bennett, D., Nash, J. et al.
1997 The distribution of acetochlor metabolites in the rat. Central Toxicology Laboratory. Alderly Park MacClesfield, Cheshire (UK). Report No.: CTL/R/1317 GLP/GEP (Y/N):N Published (Y/N):N
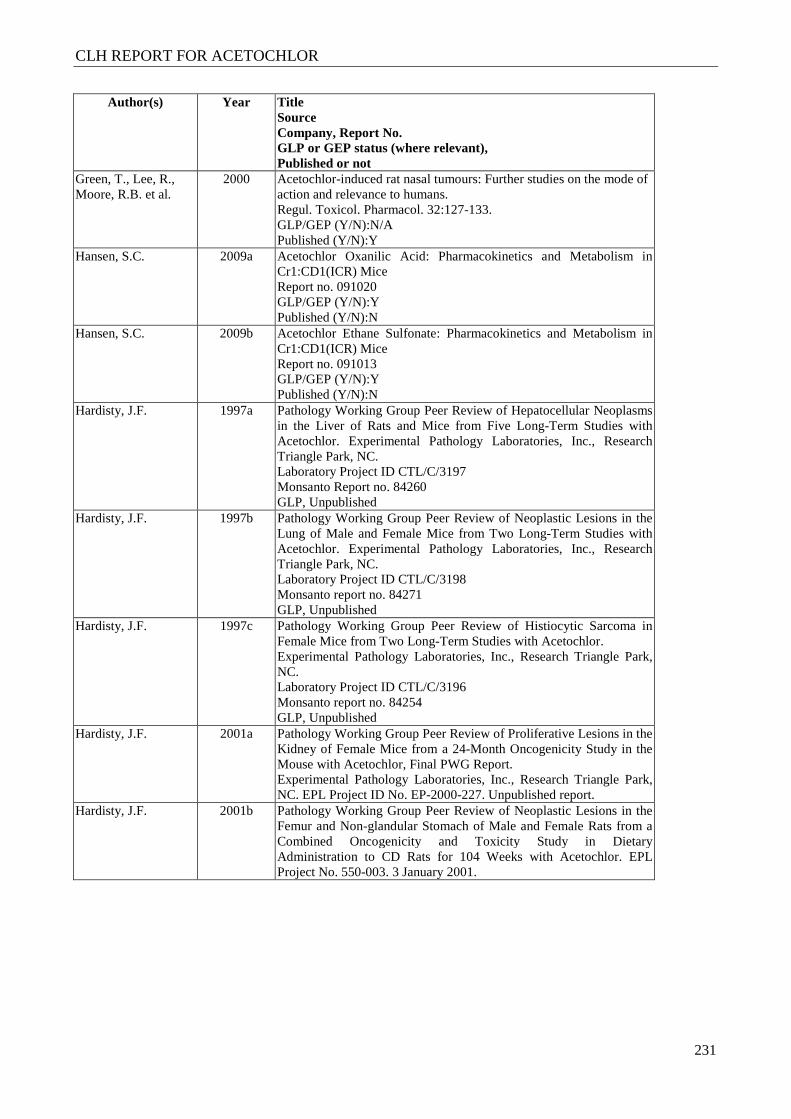
CLH REPORT FOR ACETOCHLOR
231
Author(s)
Year
Title Source Company, Report No. GLP or GEP status (where relevant), Published or not
Green, T., Lee, R., Moore, R.B. et al.
2000 Acetochlor-induced rat nasal tumours: Further studies on the mode of action and relevance to humans. Regul. Toxicol. Pharmacol. 32:127-133. GLP/GEP (Y/N):N/A Published (Y/N):Y
Hansen, S.C. 2009a Acetochlor Oxanilic Acid: Pharmacokinetics and Metabolism in Cr1:CD1(ICR) Mice Report no. 091020 GLP/GEP (Y/N):Y Published (Y/N):N
Hansen, S.C. 2009b Acetochlor Ethane Sulfonate: Pharmacokinetics and Metabolism in Cr1:CD1(ICR) Mice Report no. 091013 GLP/GEP (Y/N):Y Published (Y/N):N
Hardisty, J.F. 1997a Pathology Working Group Peer Review of Hepatocellular Neoplasms in the Liver of Rats and Mice from Five Long-Term Studies with Acetochlor. Experimental Pathology Laboratories, Inc., Research Triangle Park, NC. Laboratory Project ID CTL/C/3197 Monsanto Report no. 84260 GLP, Unpublished
Hardisty, J.F. 1997b Pathology Working Group Peer Review of Neoplastic Lesions in the Lung of Male and Female Mice from Two Long-Term Studies with Acetochlor. Experimental Pathology Laboratories, Inc., Research Triangle Park, NC. Laboratory Project ID CTL/C/3198 Monsanto report no. 84271 GLP, Unpublished
Hardisty, J.F. 1997c Pathology Working Group Peer Review of Histiocytic Sarcoma in Female Mice from Two Long-Term Studies with Acetochlor. Experimental Pathology Laboratories, Inc., Research Triangle Park, NC. Laboratory Project ID CTL/C/3196 Monsanto report no. 84254 GLP, Unpublished
Hardisty, J.F. 2001a Pathology Working Group Peer Review of Proliferative Lesions in the Kidney of Female Mice from a 24-Month Oncogenicity Study in the Mouse with Acetochlor, Final PWG Report. Experimental Pathology Laboratories, Inc., Research Triangle Park, NC. EPL Project ID No. EP-2000-227. Unpublished report.
Hardisty, J.F. 2001b Pathology Working Group Peer Review of Neoplastic Lesions in the Femur and Non-glandular Stomach of Male and Female Rats from a Combined Oncogenicity and Toxicity Study in Dietary Administration to CD Rats for 104 Weeks with Acetochlor. EPL Project No. 550-003. 3 January 2001.
CLH REPORT FOR ACETOCHLOR
232
Author(s)
Year
Title Source Company, Report No. GLP or GEP status (where relevant), Published or not
Hawkins, D,R., Kirkpatrick, D., Dean, G.
1988 The Biokinetics of 14-C-Acetochlor After Oral Administration to Rats at a Nominal Level of 10 mg/Kg Huntington Research Centre Ltd Report No.: CTL/C/2117 GLP/GEP (Y/N):Y Published (Y/N):N
Hawkins, D.R., Kirkpatrick, D., Dean, G.
1989a The Biokinetics of 14-C-Acetochlor After Oral Administration to Rats at a Nominal Level of 200 mg/Kg Huntington Research Centre Ltd Report No.: CTL/C/2182 GLP/GEP (Y/N):Y Published (Y/N):N
Hawkins, D.R., Kirkpatrick, D., Dean, G.
1989b The Distribution and Excretion of Radioactivity After Oral Administration of 14-C-Acetochlor at 10 mg/kg to Rats Pre-Treated with Non-Radiolabelled Acetochlor Huntington Research Centre Ltd Report No.: CTL/C/2183 GLP/GEP (Y/N):Y Published (Y/N):N
Hawkins, D.R., Kirkpatrick, D., Dean, G.
1989c The Metabolism of 14-C-Acetochlor in the Rat After Oral Administration Huntington Research Centre Ltd Report No.: CTL/C/2175 GLP/GEP (Y/N):Y Published (Y/N):N
Hirose, M., Fukushima S., Kurata H. et al.
1988 Modification of N-Methyl-N-nitro-N-nitrosoguanidine-induced Forestomach and Glandular Stomach Carcinogenesis by Phenolic Antioxidants in Rats. Cancer Res. 81: 5310-5315 GLP/GEP (Y/N):N/A Published (Y/N):Y
Hodge, M.C.E. 1991 Acetochlor: Dominant Lethal Study in the Rat. ICI Central Toxicology Laboratory Report No.: CTL/P/3189 GLP/GEP (Y/N):Y Published (Y/N):N
Holson, J.F. 2000 A Prenatal Developmental Toxicity Study of MON 52755 in Rats. WIL Research Laboratories Report No.:WI-99-121 GLP/GEP (Y/N):Y Published (Y/N):N
Hotz, K.J., Wilson A.G.E.
1996a A study of the effects of acetochlor on rat nasal cell proliferation. Prepared by Ceregen, a unit of Monsanto Company Environmental Health Laboratory Report No.: EHL 94096 ; ML-94-227 GLP/GEP (Y/N):Y Published (Y/N):N
Hotz, K.J., Wilson A.G.E.
1996b A study of the effects of acetochlor on mouse nasal cell proliferation. Prepared by Ceregen, a unit of Monsanto Company Environmental Health Laboratory Report No.: EHL 96030 ; ML-96-089 GLP/GEP (Y/N):Y Published (Y/N):N
CLH REPORT FOR ACETOCHLOR
233
Author(s)
Year
Title Source Company, Report No. GLP or GEP status (where relevant), Published or not
Hotz, K.J., Wilson A.G.E.
1996c Effects of dietary exposure of acetochlor on thyroid toxicity in male Sprague Dawley rats: Time course. Prepared by Ceregen, a unit of Monsanto Company Environmental Health Laboratory Report No.: EHL 95059 ; ML-95-170 GLP/GEP (Y/N):Y Published (Y/N):N
Hotz, K.J. Wilson, A.G.E.
1999 Effect of Dietary Administration of Acetochlor on Cell Proliferation in the Liver of Male CD-1 Mice. Monsanto Life Sciences Co., Monsanto Safety Evaluation – Newstead (MSE-N), St. Louis, MO. Laboratory Report number MSL 15897 (Study No. ML-99-017). Unpublished Report.
Howard, C.A. 1989 Acetochlor: An Evaluation in the In Vitro Cytogenetic Assay in Human Lymphocytes ICI Central Toxicology Laboratory Report No.: CTL/P/2617 GLP/GEP (Y/N):Y Published (Y/N):N
Jackman, J., Alamo, I., Forance, A.J.
1994 Genotoxic stress confers preferential and coordinate messenger RNA stability on the five gadd genes. Cancer res 54:5656-5662. GLP/GEP (Y/N):N/A Published (Y/N):Y
Johnson, D.E. 1981 21 day dermal toxicity study in rabbits. International Research and Development Corporation Report No.: IR-80-356 GLP/GEP (Y/N):Y Published (Y/N):N
Jones, B.K. 1990 Acetochlor: Biotransformation Study in the Rat ICI Central Toxicology Laboratory Report No.: CTL/P/2809 GLP/GEP (Y/N):Y Published (Y/N):N
Jones, D.C.L. 1982 An evaluation of mutagenic potential of MON 097 employing the L5178Y TK +/- mouse lymphoma assay. SRI International, California, USA Report No.: SR-81-150 GLP/GEP (Y/N):Y Published (Y/N):N
Kilgour, J.D 2001a Acetochlor: Acute Neurotoxicity Study in Rats Central Toxicology Laboratory Report No.: CTL/AR6884 GLP/GEP (Y/N):Y Published (Y/N):N
Kilgour, J.D. 2001b Acetochlor: Subchronic Neurotoxicity Study in Rats Central Toxicology Laboratory Report No.: CTL/PR1176 GLP/GEP (Y/N):Y Published (Y/N):N
CLH REPORT FOR ACETOCHLOR
234
Author(s)
Year
Title Source Company, Report No. GLP or GEP status (where relevant), Published or not
Kraus, L.J., Wilson A.G.E.
1996 A study of the localization and tissue distribution of 14C acetcochlor in Sprague-Dawley rats and B6C3F1 mice. Monsanto Report No. MSL-14768. Monsanto Study No. ML-93-215.
Kronenberg, J., Dybowsky, J.
2006a Kronenberg, J. Monsanto Company. Dybowsky, J. Dow AgroScience. LLC. February 15, 2006 Additional Information Regarding the Significance of Pituitary Adenocarcinomas Observed in a Chronic Rat Study with Acetochlor
Kronenberg, J., Dybowsky, J.
2006b Kronenberg, J. Monsanto Company. Dybowsky, J. Dow AgroScience. LLC. February 17, 2006 Acetochlor Induced Nasal Tumors in the Rat: R40
Kronenberg, J., Dybowsky, J.
2006c Kronenberg, J. Monsanto Company. Dybowsky, J. Dow AgroScience. LLC. February 17, 2006 An evaluation of the Genotoxicity and Carcinogenic potential of the Major Environmental Degradates of Acetochlor
Kulik, F.A., Ross, W.D.
1978 Salmonella mutagenicity assay of CP-55097. Monsanto USA Report No.: DA-78-186 GLP/GEP (Y/N):Y Published (Y/N):N
Kurtzweil, M.L. 2003 Route of Elimination and Characterisation of Metabolites in Urine Collected from Rhesus Monkeys after an Intravenous Administration of [14C]Acetochlor (Part I: Elimination of [14C]Acetochlor) Monsanto Company Environmental Sciences Technology Center & ABC Laboratories (USA) Report No.: MSL-18699 GLP/GEP (Y/N):Y Published (Y/N):N
Lau, H.H.S., Kraus, L.J., Hotz, K. et al.
1998 A study of the protein binding and cellular localisation of acetochlor secondary sulfide in rats. Environmental Health Company Monsanto Company (USA) Report No.: EHL 96223. ML-97-051. GLP/GEP (Y/N):Y Published (Y/N):N
Lau, H.H.S., Kraus, L.J., Thake, D.C. et al.
1998 Characterisation of acetochlor binding to rat nasal tissues. Environmental Health Company Monsanto Company (USA) Report No.: EHL 95060; ML-95-171. GLP/GEP (Y/N):Y Published (Y/N):N
Lau, H.H.S., Wilson, A.G.E.
1998a Characterisation of acetochlor binding to mouse nasal tissue. Environmental Health Company Monsanto Company (USA) Report No.: EHL 96063; ML-96-109. GLP/GEP (Y/N):Y Published (Y/N):N
Lau, H.H.S., Wilson, A.G.E.
1998b Characterisation of acetochlor binding to Rhesus monkey nasal tissues. Prepared by Coulston Foundation & Environmental Health Company Monsanto Company (USA) Report No.: EHL 97167; ML-97-194. GLP/GEP (Y/N):Y Published (Y/N):N
CLH REPORT FOR ACETOCHLOR
235
Author(s)
Year
Title Source Company, Report No. GLP or GEP status (where relevant), Published or not
Leah, A.M. 1989 Acetochlor: 21-Day Dermal Toxicity to the Rat ICI Central Toxicology Laboratory Report No.: CTL/P/2613 GLP/GEP (Y/N):Y Published (Y/N):N
Lees, D. 1997a Oxanilic acid (R290130) : Acute oral toxicity to the rat Central Toxicology Laboratory Report No.: CTL/P/5654 GLP/GEP (Y/N):Y Published (Y/N):N
Lees, D. 1997b Thioacetic acid sulphoxide (R243797): Acute oral toxicity to the rat Central Toxicology Laboratory Report No.: CTL/P/5642 GLP/GEP (Y/N):Y Published (Y/N):N
Lees, D. 1997c Sulfonic acid (R290131) : Acute oral toxicity to the rat Central Toxicology Laboratory Report No.: CTL/P/5648 GLP/GEP (Y/N):Y Published (Y/N):N
Lees, D. 2000a R290131: 90-day dietary toxicity study in rats. Central Toxicology Laboratory Report No.: CTL/PR1147, ZE-1999-298 GLP/GEP (Y/N):Y Published (Y/N):N
Lees, D. 2000b R 290131: 28 Day Dietary Toxicity Study in Rats (Dose Range Finder for a 90 Day Study). CTL/KR1350/RR. GLP/GEP (Y/N):Y Published (Y/N):N
Li, A.P. 1983 CHO/HGPRT Gene mutation assay with MON 097. Monsanto USA Report No.: ML-82-281 GLP/GEP (Y/N):Y Published (Y/N):N
Li, A.P., Myers, C.A. 1989 CHO/HGPRT Gene mutation assay with MON 097. Monsanto USA Report No.: ML-88-314 GLP/GEP (Y/N):Y Published (Y/N):N
MacPherson, D., Jones, B.K.
1991 Acetochlor: Blood Binding Study ICI Central Toxicology Laboratory Report No.: CTL/R/1061 GLP/GEP (Y/N):Y Published (Y/N):N
Maibach, H.I. 1983 Percutaneous absorption of 14C-acetochlor-phenyl 14C in MON 097 formulation in Rhesus monkeys following a single topical dose. Monsanto USA Report No.: MA-83-027 GLP/GEP (Y/N):N Published (Y/N):N
CLH REPORT FOR ACETOCHLOR
236
Author(s)
Year
Title Source Company, Report No. GLP or GEP status (where relevant), Published or not
Mainwaring, G. 2004 Acetochlor sulphoxide: 52 week Feeding Study in the rat. Central Toxicology Laboratory. Alderley Park, Macclesfield, Cheshire (UK) Report No.: CTL/022495/RES/REPT GLP/GEP (Y/N):Y Published (Y/N):N
Manenti, G., Galbiati, F., Noci, S. et al.
2003 Outbred CD-1 mice carry the susceptibility allele at the pulmonary adenoma susceptibility 1 (Pas1) locus. Carcinogenesis. 2003 Jun;24(6):1143-8. Epub 2003 Apr 24 GLP/GEP (Y/N):N/A Published (Y/N):Y
Mati W., Lam G., Dahl C. et al.
2002 Leydig cell tumour – a rare testicular tumour. Int. Urol. Nephrol. 33(1), 103-106, 2002. GLP/GEP (Y/N):N/A Published (Y/N):Y
Meeker, L.S.
2006a 14C-MON 52709: Whole body autoradiography in Sprague Dawley rats after oral administration. Ref Nº 050589. GLP/GEP (Y/N):Y Published (Y/N):N
Meeker, L.S.
2006b 14C-MON 52765: Whole body autoradiography in Sprague Dawley rats after oral administration. Ref Nº 050572. GLP/GEP (Y/N):Y Published (Y/N):N
Millburn, P. 1975 Excretion of Xenobiotic Compounds in Bile. In: The Hepatobiology System. Fundamental and Pathological Mechanisms. Ed. W. Tayloe, p109. Plenum Press, New York. GLP/GEP (Y/N):N/A Published (Y/N):Y
Milburn, G.M. 1996a Acetochlor: Dominant Lethal Study in the Rat by Dietary Administration Zeneca Central Toxicology Laboratory Report No.: CTL/P/4780 GLP/GEP (Y/N):Y Published (Y/N):N
Milburn, G.M. 1996b Acetochlor: Dominant Lethal Study in the Mouse By Dietary Administration Zeneca Central Toxicology Laboratory Report No.: CTL/P/4781 GLP/GEP (Y/N):Y Published (Y/N):N
Milburn, G.M. 2001 Acetochlor: Multigeneration reproduction toxicity study in rats. Central Toxicology Laboratory Report No.: CTL/RR0818, ZE-00-148 GLP/GEP (Y/N):Y Published (Y/N):N
Mitchell, A.D., Rudd, C.J., Coleman, R.L.,
1982 An Evaluation of Mutagenic Potential of MON 097 Employing the L5178Y TK+/- Mouse Lymphoma Assay SRI International, Menlo Park (USA) Report No.: LSC-2575; SR-81-150 GLP/GEP (Y/N):Y Published (Y/N):N
CLH REPORT FOR ACETOCHLOR
237
Author(s)
Year
Title Source Company, Report No. GLP or GEP status (where relevant), Published or not
Monks, T.J., Jones D.C
2002 The Metabolism and Toxicity of Quinones, Quinoneimines, Quinone Methides, and Quinone-Thioethers. Current drug Metabolism 3:425-438. GLP/GEP (Y/N):N/A Published (Y/N):Y
Morgan, K.T. 1997 Tumor Mapping in Nasal Tissue from Long-Evans and Sprague-Dawley Rats Previously Treated with Various Chloracetanilides. Lab Project Number: CIIT 95044. Unpublished study prepared by Chemical Industry Institute of Toxicology.
Murli, H. 2006 Chromosomal Aberrations In Cultured Human Peripheral Blood Lymphocytes with MON 52765 Report No.: CV-2005-102 GLP/GEP (Y/N):Y Published (Y/N):N
Naismith, R.W., Matthews, R.J.
1983 MON 097: Rat hepatocyte primary culture/DNA repair test. Pharmakon Research International Inc., Pennsylvania, USA, Report No.: PK-82-151 GLP/GEP (Y/N):Y Published (Y/N):N
Naylor, M.W. 1986 Chronic feeding study of MON 097 in albino rats. Monsanto USA Report No.: MSL-6119 GLP/GEP (Y/N):Y Published (Y/N):N
Naylor, M.W. 1987 Dominant lethal/fertility study of MON 097 in Sprague-Dawley rats. Monsanto USA Report No.: MSL-7052 GLP/GEP (Y/N):Y Published (Y/N):N
O’Neill, T. 2001 A 28-Day Oral (Diet) Toxicity Study of MON 52709 in Rats. Report No. WI-2000-084 GLP/GEP (Y/N):Y Published (Y/N):N
O’Neill, T. 2002 A 90-day oral (diet) toxicity study of MON 52709 in Rats. WIL Research Laboratories Report No.: WI-2000-085 GLP/GEP (Y/N):Y Published (Y/N):N
Otterbein, L.E., Augustine, M.K.C.
2000 Heme oxygenase: colors of defense against cellular stress. Am. J. Physiol. Lung Cell Mol. Physiol. 279: 1029-1037. GLP/GEP (Y/N):N/A Published (Y/N):Y
Pemberton, M.A., Ishmael, J.E.
1989 Acetochlor: Eye Irritation to the Rabbit ICI Central Toxicology Laboratory Report No.: CTL/P/2639 GLP/GEP (Y/N):Y Published (Y/N):N
Prout, M.S., Gledhill, A.J.
1991 Acetochlor: Additional Biotransformation in the Rat ICI Central Toxicology Laboratory Report No.: CTL/P/3413 GLP/GEP (Y/N):Y Published (Y/N):N
CLH REPORT FOR ACETOCHLOR
238
Author(s)
Year
Title Source Company, Report No. GLP or GEP status (where relevant), Published or not
Purdum, W.R., Livingstone, C.L.
1983 The metabolites of acetochlor in monkey urine obtained from dermal penetration studies. Monsanto USA Report No.: MSL-3208 GLP/GEP (Y/N):N Published (Y/N):N
Randall, V. 1989 Acetochlor: An Evaluation in the Mouse Micronucleus Test ICI Central Toxicology Laboratory Report No.: CTL/P/2578 GLP/GEP (Y/N):Y Published (Y/N):N
Ribelin, W.E. 1987 Histopathology Findings in Noses of Rats Administered MON 097 in a Lifetime Feeding Study. Tegeris Laboratories, Laurel, MD and Monsanto Environmental Health Laboratory, St. Louis, MO. Laboratory Project No. ML-86-44/EHL 86027. November 4, 1987. Unpublished report (supplement to original study report).
Rodwell, D.E. 1980 CP 55097 Technical: Teratology study in rats. International Research and Development Corporation, Michigan, USA Report No.: IR-79-009 GLP/GEP (Y/N):Y Published (Y/N):N
Sarafian, T.A., Bredesen. D.E.
1994 Is apoptosis mediated by ROS? Free Rad Res 21:1-8. GLP/GEP (Y/N):N/A Published (Y/N):Y
Schardein, J.L. 1982 MON 097: Two generation reproduction study in rats. International Research and Development Corporation, Michigan, USA Report No.: IR-80-053 GLP/GEP (Y/N):Y Published (Y/N):N
Smedley, J. 2006 An acute oral toxicity study in rats with MON 52765 (Up/Down Study Design). CRO-2005-099 GLP/GEP (Y/N):Y Published (Y/N):N
Singh, H., Yalamanchili, G., Oppenhuizen, M.E.
1985 The biliary excretion and enterohepatic circulation of acetochlor in the rat: Identification of metabolites excreted in the bile. Monsanto USA Report No.: MSL-4120 GLP/GEP (Y/N):N Published (Y/N):N
Stokes, A.H., Freeman, W.M., Mitchell, S.G. et al.
2002 Induction of GADD 45 and GADD153 in Neuroblastoma Cells by Dopamine-Induced Toxicity. NeuroToxicol 23:675-684. GLP/GEP (Y/N):N/A Published (Y/N):Y
Takahashi, M., Hasegawa, R.
1990 Tumours of the Stomach. IARC Scientific Publications 99:129-158. GLP/GEP (Y/N):N/A Published (Y/N):Y
CLH REPORT FOR ACETOCHLOR
239
Author(s)
Year
Title Source Company, Report No. GLP or GEP status (where relevant), Published or not
Takahashi, S., Saito, S., Ohtani, N. et al.
2001 Involvement of the Oct-1 regulatory Element of the gadd45 Promoter in the p53-independent Response to Ultraviolet Irradiation. Cancer Res 61:1187-1195. GLP/GEP (Y/N):N/A Published (Y/N):Y
Tee, L.B., Davies, D.S., Seddon, C.E. et al.
1987 Species differences in the hepatotoxicity of paracetamol are due to differences in the rate of conversion to its cytotoxic metabolite. Biochem. Pharmacol., 36, 1041-1052. GLP/GEP (Y/N):N/A Published (Y/N):Y
Trueman, R.W. 1989 Acetochlor: Assessment for the Induction of Unscheduled DNA Synthesis in Rat Hepatocytes in Vivo ICI Central Toxicology Laboratory Report No.: CTL/P/2604 GLP/GEP (Y/N):Y Published (Y/N):N
Walraven, J.M. 2009 A 28-day Oral (Dietary) Toxicity Study of X11425694 in Sprague-Dawley Rats. Report No.: WIL-406017 GLP/GEP (Y/N):Y Published (Y/N):N
Williams, J. 2000a R290130: 28 Day Dietary Toxicity Study in Rats (Dose Range Finder for a 90 Day Study) Report No.: CTL/KR1352 GLP/GEP (Y/N):Y Published (Y/N):N
Williams, J. 2000b R290130: 90 day dietary toxicity study in rats. Central Toxicology Laboratory Report No.: CTL/PR1148 - ZE-1999-302 GLP/GEP (Y/N):Y Published (Y/N):N
Williams, R. 1971 Fundamentals of Drug Metabolism and Drug Disposition. Ed. B. LaDu, H. Mandel, and E. Way, p.187. Williams and Wilkins, Baltimore.
Willoughby, C.R. 1989 SC-5676: Effects Upon Reproductive Performance of Rats Treated Continuously Throughout Two Successive Generations, Final Report Life Science Research Ltd Report No.: CTL/C/2192 GLP/GEP (Y/N):Y Published (Y/N):N
Xu, Y. 2006a Salmonella-Escherichia coli Mammalian-Microsome Reverse Mutation Assay with a Confirmatory Assay with Acetochlor CV-2005-103 GLP/GEP (Y/N):Y Published (Y/N):N
Xu, Y. 2006b Salmonella-Escherichia coli Mammalian-Microsome Reverse Mutation Assay with a Confirmatory Assay with MON 52765 CV-2005-100 GLP/GEP (Y/N):Y Published (Y/N):N
CLH REPORT FOR ACETOCHLOR
240
7.3 Environment
Blakemore, G.C., Muckerman, M. (1993). Chronic toxicity of Acetochlor (lot nº QUE-9001-1482T, purity: 92.07% w/w) to Daphnia magna under flow-through test conditions during 21 days, following US EPA 72-4 (b) guideline in agreement with OECD 202 Part II, under GLP. Monsanto report nº. AB-91-470.
Campbell, D.H, Hamilton, D.E. The Environmental Studies of Acetochlor Report nº: MSL-1255.
Carr, K.H. (2003). Calculation of Acetochlor Bioconcentration Factors in Bluegill Sunfish to ICI Americas Report nº RJ0846B: An Investigation of Accumulation and Elimination in Bluegill Sunfish in a Flow-Through System. Reference IIA 8.2.3/03. Monsanto report nº MSL-18896. Addendum.
Cary, C.A, Butters, C.A and Harvey, B. R 1999 Report nº: RJ2391B. Reference 7.2.1.3.2/01.
Chotalia, R.L; Weissler, M.S 1989 Report nº: RJ0726B. Reference IIA 7.2.1.2/01
Farrelly, E., Hamer, M.J. (1989). Acute toxicity of Acetochlor technical ICIA5676 (lot nº P2, purity: 89.4% a.i w/w) to first instar Daphnia magna along 48 hours and under static conditions, following ASTM (1980) and US EPA (1975), in accordance with OECD 202 (1981) guidelines, under GLP.
French, D.A 1993a Report nº: RJ1379B. Reference IIA 7.1.1.2.2/01.
French, D.A 1993b Report nº: RJ1425B. Reference IIA 7.1.1.2.2/02
Harvey B R. 2000. Half-life in soil-summary calculation from laboratory data .Source: Zeneca Agrochemicals. Report nº: TMJ4437B. Reference IIA 7.1.1.2.1/04
Hawkins, D.R., Kirkpatrick, D., Dean, G.M. The Metabolism of 14C-Acetochlor in Silty Clay Loam Soil Under Aerobic Conditions Part II (Addendum to HRC Report nº. STR 19/881751). Source: ICI Americas Inc. Report nº: HRC/ISN 185/90535.
Hawkins, D.R., Kirkpatrick, D., Dean, G.M., Wells, S.J. The Metabolism of 14C-Acetochlor in Silty Clay Loam Soil Under Aerobic Conditions. Source: ICI Americas Inc.Report nº: HRC/STR 19/881751.
Hawkins, D.R; Kirkpatrick, D; Dean, G.M 1989 Report nº: HRC/ISN 187/891375. Reference IIA 7.1.1.1.2/02.
Hoberg, J.R. (2003). Recovery potential of the marine diatom Skeletonema costatum, after exposure of Acetochlor technical (lot no. BGJ2403(P11); purity: 94.7% w/w) along 96 and 168 hours, following US EPA FIFRA Subdivision J Guideline 123-2, OECD 201, EEC C3, under GLP. Reference IIA 8.2.6/07. Report nº 021035R, 12550.6221.
Hoberg, J.R. (2003). Toxic effects of Acetochlor technical (lot no. BGJ2403(P11); purity: 94.7% w/w) along 96 and 168 hours static exposure and recovery potential for 4 days more post exposure of the freshwater green alga, Pseudokirchneriella subcapitata., following the US EPA FIFRA Subdivision J Guideline 123-2, OECD 201, EEC Method C.3 guideline, under GLP. Reference IIA 8.2.6/03.
Kent, S.J., Magor, S.E., Shillabeer, N. (1998). Acute toxicity of R290130 (t-oxanilic acid metabolite of acetochlor) to rainbow trout (Oncorhynchus mykiss) following OECD 203 (1992) guideline, under GLP. IIA 8.2.1/06. Report nº BL6444/B.
Kent, S.J., Shillabeer, N. (1997). Acute toxicity of R290131 (t-sulfonic acid metabolite of acetochlor, lot nº R290131/7/Na/P5, purity 97% w/w) to Daphnia magna under static conditions, following OECD 202 Part I (1984) guideline under GLP.
CLH REPORT FOR ACETOCHLOR
241
Kent, S.J., Shillabeer, N. (1997a). Acute toxicity of R243797 (t-sulfinylacetic acid metabolite of acetochlor) to rainbow trout (Oncorhynchus mykiss), following OECD 203 (1992) guideline, under GLP.
Kent, S.J., Shillabeer, N. (1997b). Acute toxicity of R290131 (t- sulfonic acid metabolite of acetochlor) to rainbow trout (Oncorhynchus mykiss), following OECD 203 (1992) guideline, under GLP.
Kent, S.J., Shillabeer, N. (1998). Acute toxicity of R290130 (t-oxanilic acid metabolite of acetochlor; ID nº 01738-01R, purity: 97% w/w) to Daphnia magna under static conditions, following OECD 202 Part I (1984) guideline, under GLP.
Kent, S.J., Shillabeer, N., (1997). Acute toxicity of R2243797 (t-sulfinylacetic acid metabolite of acetochlor; lot nº R243797/2/P2, purity: 99% w/w) to Daphnia magna under static conditions, following OECD 202 Part I (1984) guideline, under GLP.
Myers, H.W 1989 Report nº: WRC 88-70. Reference IIA 7.2.1.1/01.
Putt, A.E. (2003). Full life-cycle toxic effects of Acetochlor (12C: lot nº GLP-0303-13655-T, purity 95.7%; 14C: Ref. nº F0859-82D, radiochemical purity 99.8%, 57.8 mCi/mmole) on the maduration of the larvae to adult midge to Chironomus riparius under static conditions. The test followed the guideline OECD 219 (draft 2002) and it was conducted under GLP. Monsanto report nº SE-2002-18.
Putt, A.E. (2003). The purpose of this study was to evaluate the toxicity and recovery potential of the growth of the duckweed, Lemna gibba following the exposure to Acetochlor technical (lot nº BGJ2403(P11), purity: 94.7% w/w) under static conditions. The test followed US EPA FIFRA Subdivision J Guidelines 122-2 and 123-2, OECD 221, under GLP. Reference IIA 8.2.8/01. Report nº 021034.
Rhodes, J.E., Muckerman, M. (1992).Chronic Toxicity of acetochlor technical (lot nº QUE-9001-1482-T, purity: 92.07% w/w) to the rainbow trout (Oncorhynchus mykiss) embryos and fry in a flow-through test system during 32 days exposure, following US EPA FIFRA Subdivision E, 72-4 guideline and ASTM E 1241-88 (1988), under GLP. Reference IIA 8.2.2.2/01. Monsanto report no. AB-91-469.
Robbins, A.J.; Hatfield, M.W. Acetochlor and is two major metabolites: adsorption/desorption in soil. Report nº: RJ0837B. Reference IIA 7.1.2/02.
Robbins, A.J.; Hatfield, M.W. Acetochlor: adsorption/desorption of 5676/48, the thioacetic acide sulphoxide metabolite in soil. Report nº: RJ0887B. Reference IIA 7.1.2/03.
Smyth, D.V., Craig, N.C.D., Sankey, S.A., Penwell, A.J. (1992). Toxic effect of Acetochlor technical (preparation reference P8, analytical reference H0984; purity: 95.1% w/w) to the marine alga Skeletonema costatum, under static conditions along 96 hours test, following the US EPA FIFRA Subdivision J Guideline 123-2, under GLP. Reference IIA 8.2.6/06. ICI Brixham report nº BL4538/B.
Smyth, D.V., Kent, S.J., Shillabeer, N. (1997). Toxic effects of t-sulfinylacetic acid metabolite of acetochlor (R243797; lot nº R290131/2/P2, purity: 99% w/w) to the green alga Selenastrum capricornutum, following OECD 201 (1984) guideline under GLP.
Smyth, D.V., Kent, S.J., Shillabeer, N. (1997).Toxic effects of the t-sulfonic acid metabolite of acetochlor (R290131; lot nº R290131/7/Na/P5, purity: 97% w/w) to the green algae Selenastrum capricornutum along 3 days under static conditions, following OECD 201 (1984) guideline, under GLP. Zeneca Brixham report nº BL5971/B.
CLH REPORT FOR ACETOCHLOR
242
Smyth, D.V., Kent, S.J., Shillabeer, N. (1998). Toxicity of R290130 (ID nº 01738-01R, purity: 97% w/w), metabolite of acetochlor, to the green alga Selenastrum capricornutum, following OECD 201 guideline, under GLP.
Smyth, D.V., Sankey, S.A., Grinell, A.J. (1992). Toxic effect of Acetochlor technical (lot nº P8, purity: 95.1% w/w) to the blue-green alga Anabaena flos-aquae under static conditions along 5 days, following US EPA 123-2 (1986) guideline, under GLP. ICI Brixham report nº BL4585/B.
Smyth, D.V., Sankey, S.A., Holland, M.M., Johnson, P.A. (1992). Toxicity of Acetochlor technical (lot nº P8, purity: 95.1% w/w) to the freshwater diatom Navicula pelliculosa under static conditions along 4 days, following US EPA 123-2 (1986) guideline, under GLP. ICI Brixham report nº BL4561/B.
Smyth, D.V., Tapp, J.F., Sankey, S.A., Stanley, R.D. (1990).Toxic effect of Acetochlor technical (lot nº R1072, purity: 89.7% w/w) to the green alga (Selenastrum capricornutum) under static conditions, following US EPA 123-2 (1986) guideline, under GLP. ICI Brixham report noºBL/B/3647.
Swarbrick R.H. and Shillabeer, N. (2000b). Acute toxicity of the metabolite of Acetochlor, compound 31 to rainbow trout (Oncorhynchus mykiss), following the OECD 203 (1992) guideline, under GLP.
Swarbrick R.H., Shillabeer, N. (2000).Acute toxicity of the metabolite of Acetochlor, compound 31 (lot nº TSC 0689/07857, purity: 99.5% w/w) to Daphnia magna under static conditions, following OECD 202 Part I (1984) guideline, under GLP.
Swarbrick, R.H., Shillabeer, N. (2000). Toxicity of t-norchloro acetochlor (lot nº TSC 0689/07857, purity: 99.5% w/w) to the green alga Selenastrum capricornutum, following OECD 201 (1984) guideline, under GLP. Zeneca Brixham report nº BL6958/B.
Swigert, J.P. (1992). Acute toxicity of Acetochlor technical (lot nºQUE-9001-1482-T, purity: 92.07% w/w) to sheepshead minnow (Cyprinodon variegatus) under 96-hour flow-through conditions, following USEPA 72-3 (1982), under GLP. Reference IIA 8.2.1/04. Monsanto report nº WL-91-224.
Tapp, J.F., Caunter, J.E., Stanley, R.D. (1990). Chronic Toxicity of acetochlor technical (batch P2, purity: 89.7% w/w) to Fathead Minnow (Pimephalas promelas) embryos and larvae in a flow-through test system during 32 days exposure, following US EPA FIFRA Subdivision E, 72-4 guideline, under GLP.
Tapp, J.F., Sankey, S.A., Caunter, J.E., Miller, H.M. (1989). Acute toxicity of Acetochlor technical (purity: 89.4% w/w, sample identification nº 11691-36-01) to rainbow trout (Oncorhynchus mykiss) under static conditions along 96 hours exposure, following OECD 203 guideline under GLP.
Tapp, J.F., Sankey, S.A., Caunter, J.E., Miller, H.M. (1989). Acute toxicity of acetochlor technical (ID 11691-36-01, purity: 89.6% w/w) to Mirror Carp (Cyprinus carpio) under static conditions along 96 hours exposure, following OECD 203 (1984) guideline under GLP.
Thompson, S.G., Swigert, J.P. (1992). Toxic effect of Acetochlor technical (lot no. QUE-9001-1482-T, purity: 92.07% w/w) to a freshwater alga (Selenastrum capricornutum) in a 5-Day toxicity static test, following US EPA 123-2 (1986) guideline, under GLP. Monsanto report nº WL-91-227.
CLH REPORT FOR ACETOCHLOR
243
8 ANNEXES
8.1 Annex Summary records ECBI/52/97 and ECBI/28/97:
ECBI/52/97 - Rev.1
4.3.1998
SUMMARY RECORD
Commission Working Group on the
Classification and Labelling of Dangerous Substances
Pesticides
Meeting at ECB Ispra, 12 - 14th November, 1997.
Acetochlor (P518), (EEC No: 251-899-3, CAS No: 34256-82-1).
Proposal: [Carc. Cat. 3; R40] : Xn; R20 : Xi; R37/38 : R43 : N; R50-53.
ECBI/71/95 a, b, c ECB, classification proposals for P518 to P589 ECBI/71/95 - Add. 5 BE, acetochlor (p518) and Azocyclotin (P521) ECBI/71/95 - Add. 9 Acetochlor (P518) ECBI/71/95 - Add. 19 Zeneca/BE, acetochlor (P518) ECBI/71/95 - Add. 33 ES, concerns about the classification of acetochlor (P518) ECBI/71/95 - Add. 65 DE, environmental classification of pesticides ECBI/71/95 - Add. 66 ES, classification of acetochlor ECBI/71/95 - Add. 70 FR, article on carcinogenicity and genotoxicity of acetochlor ECBI/28/97 ECB, summary record of the Specialised Experts meeting, June 4-6th, 1997.
The Group noted the similarity of this substance with alachlor which is on the DG VI priority list with ES as Rapporteur. In November 1995, the Group agreed to the classification as: Xn; R20: Xi; R37/38: R43 : N; R50-53. It was agreed not to classify this substance as Carc. Cat. 3; R40. ES has since expressed concern about the lack of classification as a carcinogen. In November 1996, as no agreement was reached on the carcinogenicity, it was decided to ask the Specialised Experts for their opinion. At the SE meeting in June 1997, it was agreed that acetochlor did not warrant a classification for carcinogenicity on the basis of insufficient evidence and lack of relevance to man.
Taking into account the opinion expressed by the Specialised Experts the Group agreed no classification for carcinogenicity.
Conclusion:
The Group agreed to classify the substance with Xn; R20: Xi; R37/38: R43 : N; R50-53, symbols Xn; N; R-phrases 20-37/38-43-50/53 and S-phrases (2-)36/37-60-61. The proposal would be sent to DG XI for possible inclusion in a future TPC.
CLH REPORT FOR ACETOCHLOR
244
ECBI/28/97
30.6.1997
SUMMARY RECORD
Commission Group of Specialisded Experts in the fields of Carcinogenicity, Mutagenicity and Reprotoxicity
Meeting at Belgirate, 4-6 June 1997
Acetochlor (P518), (EEC No: 251-899-3, CAS No: 34256-82-1).
Lead Country: Spain.
At issue: [Carc. Cat. 3; R40]
There was in vivo cancer data in rats and mice, but only at doses greater than the MTD. The substance was an in vitro mutagen, but no evidence for in vivo mutagenicity. There was evidence that a secondary mechanism of action with the implication of a practical threshold above a certain dose level might be responsible. Structure activity correlations were also made with alachlor. The mechanism of action proposed for the nasal tumours in rats had not been shown to be relevant for man.
The SE agreed that there was insufficient evidence to classify acetochlor for carcinogenicity. Tumours to be considered were only observed in one species, the rat, as not to be caused by a genotoxic mechanism or relevant for man. Plausible mechanism that the tumours were no relevant for humans were also in place for thyroid and liver.
Furthermore, use of the supportive evidence from alachlor was justified. Tumours were in general within the historical controls, benign, non-reproducible and at dose levels greater than the MTD. In addition, there was an absence of genotoxic data.
Conclusion:
For carcinogenicity, a majority of the Specialised Experts recommended that acetochlor should not be classified for carcinogenicity. On the basis of insufficient evidence and lack of relevance to man.


![TRI-ANNUAL REPORT [7TH PROGRESS REPORT]](https://img.dokumen.tips/doc/110x75/6336c0900747ca5b85042fa4/tri-annual-report-7th-progress-report.jpg)


![Chapter R.8: Characterisation of dose [concentration] - ECHA](https://img.dokumen.tips/doc/110x75/632615fb051fac18490d94ac/chapter-r8-characterisation-of-dose-concentration-echa.jpg)


