Embed Size (px)
Citation preview

CLH REPORT FOR SEDAXANE
1
Annex I to the CLH report
Proposal for Harmonised Classification and LabellingBased on Regulation (EC) No 1272/2008 (CLP Regulation),
Annex VI, Part 2
International Chemical Identification:
EC Number: Not available
CAS Number: 874967-67-6
Index Number: Not available
Contact details for dossier submitter:
ANSES, on behalf of the French MSCA
10 rue Pierre et Marie Curie
94701 MAISONS-ALFORT Cedex, France
Version number: 3 Date: May 2018

CLH REPORT FOR SEDAXANE
2
CONTENTS
1 PHYSICAL HAZARDS ...........................................................................................................................................5
2 TOXICOKINETICS (ABSORPTION, METABOLISM, DISTRIBUTION AND ELIMINATION) ..............5
3 HEALTH HAZARDS.............................................................................................................................................46
3.1 ACUTE TOXICITY - ORAL ROUTE ...........................................................................................................................463.1.1 Animal data ................................................................................................................................................46
3.1.1.1 Anonymous (2008) ..................................................................................................................................................463.1.2 Human data ................................................................................................................................................493.1.3 Other data...................................................................................................................................................49
3.2 ACUTE TOXICITY - DERMAL ROUTE.......................................................................................................................493.2.1 Animal data ................................................................................................................................................49
3.2.1.1 Anonymous (2007) ..................................................................................................................................................493.2.2 Human data ................................................................................................................................................513.2.3 Other data...................................................................................................................................................51
3.3 ACUTE TOXICITY - INHALATION ROUTE ................................................................................................................513.3.1 Animal data ................................................................................................................................................51
3.3.1.1 Anonymous (2008) ..................................................................................................................................................513.3.2 Human data ................................................................................................................................................543.3.3 Other data...................................................................................................................................................54
3.4 SKIN CORROSION/IRRITATION ...............................................................................................................................543.4.1 Animal data ................................................................................................................................................54
3.4.1.1 Anonymous (2008b) ................................................................................................................................................543.4.2 Human data ................................................................................................................................................563.4.3 Other data...................................................................................................................................................56
3.5 SERIOUS EYE DAMAGE/EYE IRRITATION................................................................................................................573.5.1 Animal data ................................................................................................................................................57
3.5.1.1 Anonymous (2007) ..................................................................................................................................................573.5.2 Human data ................................................................................................................................................593.5.3 Other data...................................................................................................................................................59
3.6 RESPIRATORY SENSITISATION ...............................................................................................................................593.6.1 Animal data ................................................................................................................................................593.6.2 Human data ................................................................................................................................................593.6.3 Other data...................................................................................................................................................59
3.7 SKIN SENSITISATION .............................................................................................................................................593.7.1 Animal data ................................................................................................................................................59
3.7.1.1 Anonymous (2007) ..................................................................................................................................................593.7.2 Human data ................................................................................................................................................623.7.3 Other data...................................................................................................................................................62
3.8 GERM CELL MUTAGENICITY..................................................................................................................................623.8.1 In vitro data ................................................................................................................................................62
3.8.1.1 Sokolowski (2009) ...................................................................................................................................................623.8.1.2 Bohnenberger (2009) ...............................................................................................................................................673.8.1.3 Wollny (2009)..........................................................................................................................................................73
3.8.2 Animal data ................................................................................................................................................793.8.2.1 Anonymous (2010) ..................................................................................................................................................793.8.2.2 Anonymous (2009) ..................................................................................................................................................823.8.2.3 Anonymous (2011) ..................................................................................................................................................87
3.8.3 Human data ................................................................................................................................................943.8.4 Other data...................................................................................................................................................94
3.9 CARCINOGENICITY................................................................................................................................................943.9.1 Animal data ................................................................................................................................................94
3.9.1.1 Anonymous(2010), Amendment 1 Anonymous (2014) ..........................................................................................943.9.1.2 Anonymous (2010) ................................................................................................................................................116
3.9.2 Human data ..............................................................................................................................................1273.9.3 In vitro data (e.g. in vitro germ cell and somatic cell mutagenicity studies, cell transformation assays, gap junction intercellular communication tests) ....................................................................................................128

CLH REPORT FOR SEDAXANE
3
3.9.4 Other data (e.g. studies on mechanism of action) ....................................................................................1283.9.4.1 Anonymous (2015) ................................................................................................................................................1283.9.4.2 Anonymous (2016) ................................................................................................................................................1343.9.4.3 Anonymous (2015) ................................................................................................................................................1483.9.4.4 Anonymous (2015) ................................................................................................................................................1533.9.4.5 Anonymous (2016) ................................................................................................................................................1703.9.4.6 Vardy (2016b)........................................................................................................................................................1753.9.4.7 Anonymous (2013) ................................................................................................................................................1793.9.4.8 Omiecinski (2014) .................................................................................................................................................1843.9.4.9 Toyokawa and Sherf (2014) ..................................................................................................................................1893.9.4.10 Jolas (2015) ......................................................................................................................................................1933.9.4.11 Anonymous (2016) ...........................................................................................................................................1963.9.4.12 Anonymous (2015a) .........................................................................................................................................2023.9.4.13 Anonymous (2015b) .........................................................................................................................................2093.9.4.14 Anonymous (2016) ...........................................................................................................................................2143.9.4.15 Anonymous (2014) ...........................................................................................................................................2213.9.4.16 Anonymous (2014) ...........................................................................................................................................226
3.10 REPRODUCTIVE TOXICITY ..............................................................................................................................2303.10.1 Animal data..........................................................................................................................................230
3.10.1.1 Anonymous 2010 (Final report amendment 2, Anonymous 2013) ..................................................................2303.10.1.2 Anonymous (2009) ...........................................................................................................................................2483.10.1.3 Anonymous (2010) ...........................................................................................................................................257
3.10.2 Human data .........................................................................................................................................2663.10.3 Other data (e.g. studies on mechanism of action) ...............................................................................266
3.11 SPECIFIC TARGET ORGAN TOXICITY – SINGLE EXPOSURE ...............................................................................2663.11.1 Animal data..........................................................................................................................................266
3.11.1.1 Anonymous (2009a) .........................................................................................................................................2663.11.2 Human data .........................................................................................................................................2753.11.3 Other data............................................................................................................................................275
3.12 SPECIFIC TARGET ORGAN TOXICITY – REPEATED EXPOSURE ..........................................................................2753.12.1 Animal data..........................................................................................................................................275
3.12.1.1 Anonymous (2010) ...........................................................................................................................................2753.12.1.2 Anonymous (2009) ...........................................................................................................................................2893.12.1.3 Anonymous(2009b) ..........................................................................................................................................2993.12.1.4 Anonymous (2010) Amendment 1, Anonymous (2014) ..................................................................................3053.12.1.5 Anonymous (2008) ...........................................................................................................................................3053.12.1.6 Anonymous (2008) ...........................................................................................................................................3123.12.1.7 Anonymous (2009) ...........................................................................................................................................3193.12.1.8 Anonymous (2009c) .........................................................................................................................................329
3.12.2 Human data .........................................................................................................................................3343.12.3 Other data............................................................................................................................................334
3.12.3.1 Anonymous (2010) Final repot amendment 2, Anonymous (2013).................................................................3343.12.3.2 Anonymous (2009) ...........................................................................................................................................3353.12.3.3 Anonymous (2010) ...........................................................................................................................................335
3.13 ASPIRATION HAZARD .....................................................................................................................................3353.13.1 Animal data..........................................................................................................................................3353.13.2 Human data .........................................................................................................................................3353.13.3 Other data............................................................................................................................................335
4 ENVIRONMENTAL HAZARDS .......................................................................................................................335
4.1 DEGRADATION ....................................................................................................................................................3354.1.1 Ready biodegradability (screening studies) .............................................................................................335
4.1.1.1 Seyfried (2007) ......................................................................................................................................................3354.1.2 BOD5/COD ...............................................................................................................................................3394.1.3 Aquatic simulation tests............................................................................................................................339
4.1.3.1 Nicollier (2007)......................................................................................................................................................3394.1.4 Other degradability studies ......................................................................................................................346
4.1.4.1 Hand and Flemming (2007) ...................................................................................................................................3464.1.4.2 Stoll and Nicollier (2008) ......................................................................................................................................3554.1.4.3 Nicollier (2008)......................................................................................................................................................368
4.2 BIOACCUMULATION............................................................................................................................................3734.2.1 Bioaccumulation test on fish ....................................................................................................................373
4.2.1.1 Authors of vertebrate study (2010) ........................................................................................................................3734.2.2 Bioaccumulation test with other organisms .............................................................................................378

CLH REPORT FOR SEDAXANE
4
4.3 ACUTE TOXICITY.................................................................................................................................................3784.3.1 Short-term toxicity to fish .........................................................................................................................378
4.3.1.1 Authors of vertebrate study (2008a) ......................................................................................................................3784.3.1.2 Author of vertebrate study (2008) .........................................................................................................................3814.3.1.3 Author of vertebrate study (2006) .........................................................................................................................3834.3.1.4 Authors of vertebrate study (2008b) ......................................................................................................................386
4.3.2 Short-term toxicity to aquatic invertebrates.............................................................................................3894.3.2.1 Gallagher, Kendall and Krueger (2008c)...............................................................................................................3894.3.2.2 Ricketts and Paddick (2006) ..................................................................................................................................391
4.3.3 Algae and aquatic plants ..........................................................................................................................3944.3.3.1 Bätscher (2007a) ....................................................................................................................................................3944.3.3.2 Büche (2007a)........................................................................................................................................................3974.3.3.3 Büche (2007b)........................................................................................................................................................4014.3.3.4 Minderhout, Kendall and Krueger (2007) .............................................................................................................4054.3.3.5 Bätscher (2007b)....................................................................................................................................................410
4.4 CHRONIC TOXICITY .............................................................................................................................................4124.4.1 Fish early-life stage (FELS) toxicity test..................................................................................................412
4.4.1.1 Authors of vertebrate study (2008d) ......................................................................................................................4124.4.2 Aquatic invertebrates................................................................................................................................416
4.4.2.1 Bätscher (2007c) ....................................................................................................................................................4164.4.3 Algae and aquatic plants ..........................................................................................................................418
4.4.3.1 Bätscher (2007a) ....................................................................................................................................................4184.4.3.2 Büche (2007a)........................................................................................................................................................4184.4.3.3 Büche (2007b)........................................................................................................................................................4184.4.3.4 Minderhout, Kendall and Krueger (2007) .............................................................................................................4184.4.3.5 Bätscher (2007b)....................................................................................................................................................418
4.4.4 Long-term aquatic hazard (including bioaccumulation potential and degradation)...............................419

CLH REPORT FOR SEDAXANE
5
1 PHYSICAL HAZARDSStudies on the physical chemical properties of sedaxane have been previously reviewed and are included in the DAR (June 2012).
2 TOXICOKINETICS (ABSORPTION, METABOLISM, DISTRIBUTION AND
ELIMINATION)The mammalian metabolism of sedaxane (SYN524464) has been assessed in studies investigating the absorption, distribution, metabolism and excretion of sedaxane in rats. These have been previously reviewed and are included in the DAR (June 2012).
Report: Anonymous (2009) SYN524464 - Excretion and Tissue Distribution in the Rat Following Single Oral Administration of 1 mg or 80 mg [Pyrazole-5-14C]-SYN524464/kg. Report No. 28878. Issue date 30 September 2009. Unpublished
Guidelines: OECD 417 ; EPA OPPTS 870.7485; JMAFF 12 Nohsan No 8147
GLP standards: Yes
Study acceptable: Yes
MATERIALS AND METHODS:
Material:Radiolabelled Test Material: [Pyrazole-5-14C]-SYN524464 (a mixture of trans and cis isomers mixed in the ratio
of approximately 6:1)Specific activity: Low Dose: 5.0024MBq/mg (135.2 µCi/mg)
High Dose: 0.0629MBq/mg (1.7 µCi/mg) Radiochemical purity: Low Dose: 99.2%
Proportion of trans isomer SYN508210: 84.6%Proportion of cis-isomer SYN508211: 15.4%High Dose: 97.0% Proportion of trans isomer SYN508210: 85.9%Proportion of cis-isomer SYN508211: 14.1%
Source: Syngenta Corp Protection Inc.Lot/Batch number: Low Dose: CL-LXII-15
High Dose: CL-LXII-14Structure:
NNCH3
NHO
HF2C
*
* position of [14C]-labelVehicle Radiolabelled SYN524464 was homogenously suspended in corn oil for dosing.
Test system:
Group Arrangements: Animals were assigned to 2 groups as shown in the table below.

CLH REPORT FOR SEDAXANE
6
Table 2- 1: Dosing groups for pharmacokinetic studies for [14C]-SYN524464Test Group Dose level (mg/kg) Number/sex Remarks
Group 1Single oral dose (low dose level)
1 4 males,4 females
Excreta collection over 168 hours and selected tissues taken for analysis.
Group 2Single oral dose (high dose level)
80 4 males,4 females
Excreta collection over 168 hours and selected tissues taken for analysis.
Dosing and sample collection: A single oral dose of [14C]-SYN524464 suspended in corn oil was administered to each rat by gavage at a dose rate of 5 mL/kg. Animals in group 1 received a dose corresponding to a low dose level of 1 mg/kg, and animals in group 2 received a dose corresponding to a high dose level of 80 mg/kg. For both dose levels, the animals received a target radioactive dose of 5 MBq/kg.Urine and faeces were collected individually and separately. Urine and faeces were frozen immediately upon collection. At the end of each faeces collection period, cage wash samples were collected (water).Animals were terminated by overexposure to anaesthetic vapour. Each terminal blood sample was divided between two heparinised tubes, one of which was centrifuged to separate plasma. The following tissues were taken for radioactivity analysis: adrenals, bone mineral, brain, renal fat, heart, kidneys, liver, lungs, muscle, ovaries (females), pancreas, spleen, testes (males), thymus, thyroid, uterus (females), gastrointestinal tract plus contents and residual carcasses. All samples were analysed for radioactivity by liquid scintillation counting either directly or following sample oxidation.Excretion studies: Urine was collected at intervals of 6, 12, 24, 48, 72, 96, 120, 144 and 168 hours after dosing. Faeces and cage wash were collected at intervals of 24, 48, 72, 96, 120, 144 and 168 hours after dosing. To investigate pharmacokinetics, terminal blood samples were collected via the vena cava at 168 hours after dosing.
RESULTS:
Excretion: The recovery of radioactivity in excreta and tissues, following administration of a single oral dose of [14C]-SYN524464 at dose levels of 1 or 80 mg/kg is presented in the table below.
Table 2-2: Recovery of radioactivity in excreta and tissues after administration of a single oral dose of [14C]-SYN524464 to rats
Group mean excretion data (percentage of radioactive dose recovered)
Group 1 Group 21mg/kg 80 mg/kg
Male (n=4)
Female (n=4)
Male (n=4)
Female (n=4)
0-6 h 3.0 4.0 2.0 1.76-12 h 3.7 6.5 2.0 3.012-24 h 3.0 6.2 3.9 6.824-48 h 1.6 2.4 2.7 4.348-72 h 0.3 0.4 0.9 1.472-96 h 0.1 0.1 0.3 0.296-120 h <0.1 0.1 0.1 <0.1120-144 h <0.1 <0.1 <0.1 <0.1144-168 h <0.1 <0.1 <0.1 <0.1
Urine
Sub Total 11.8 19.6 11.9 17.60-24 h 68.3 57.8 41.0 36.324-48 h 16.2 19.4 28.1 28.748-72 h 2.9 1.8 11.1 8.872-96 h 0.7 0.3 2.3 0.996-120 h 0.3 0.1 0.4 0.2120-144 h 0.1 <0.1 0.1 0.1
Faeces
144 -168 h <0.1 <0.1 0.1 <0.1

CLH REPORT FOR SEDAXANE
7
Subtotal 88.4 79.4 83.1 74.9Cage wash 1.7 5.8 2.0 3.7
GI tract + contents <0.1 <0.1 <0.1 <0.1Tissues + carcass 0.2 0.1 0.3 0.1Total Recovery 102.1 104.9 97.2 96.3
Single low dose level: following a single oral dose of 1 mg [14C]-SYN524464/kg, the major route of elimination was via the feces in both males and females, with 88.4 and 79.4% of the administered radioactivity recovered by seven days post dose, respectively. Urinary excretion accounted for 11.8 and 19.6 % of the administered dose in males and females, respectively, by the end of the sampling period.
Single high dose level: Following a single oral dose of 80 mg [14C]-SYN524464/kg, the major route of elimination was via the faeces in both males and females, with 83.1 and 74.9% of the administered radioactivity recovered by seven days, respectively. Urinary excretion accounted for 11.9 and 17.6% of the administered dose in both males and females, respectively, by the end of the sampling period.
Excretion was rapid with the majority of the administered radioactivity excreted in the first 72 h post dose ( ca 100.4 and 103.5% in males and females, respectively for the low dose and ca 93.4 and 94.6% in males and females, respectively for the high dose). There was no significant radioactivity remaining in the carcass or gastrointestinal tract, indicating a complete excretion by 168 hours post dose.
Tissue distribution: The concentrations of radioactivity in tissues and organs at 168 hours after administration of a single oral dose of [14C]-SYN524464 at dose levels of 1 or 80 mg/kg are presented in the table below.
Table 2-3: Distribution of radioactivity tissues/organs 168 hours after administration ofa single oral dose of [14C]-SYN524464 to rats
Group mean tissue residues (µg equivalents of SYN524464/g )
Group 1 Group 21 mg/kg 80 mg/kg
Tissue/organ Male (n=4) Female (n=4) Male (n=4) Female (n=4)Adrenals <0.002 <0.001 <0.78A <0.13
Bone Mineral <0.001 <0.001 <0.05 <0.02Brain <0.001 <0.001 <0.02 <0.01
Fat- renal <0.001 <0.001 <0.02 <0.02Heart <0.001 <0.001 <0.10 <0.06
Kidneys 0.006 0.003 0.48 0.32Liver 0.020 0.008 1.34 1.01Lungs <0.002 <0.001 0.14 <0.09Muscle <0.001 <0.001 <0.05 <0.01Ovaries NA <0.001 NA <0.08Pancreas <0.001 <0.001 <0.06 <0.03Plasma <0.003 <0.001 <0.17 <0.07
Residual Carcass <0.001 <0.001 <0.18 <0.06Spleen <0.001 <0.001 0.15 <0.08Testes <0.001 NA <0.04 NA
Thymus <0.001 <0.001 <0.04 <0.04Thyroid <0.005 <0.003 0.84 <0.47Uterus NA <0.001 NA <0.02
Whole Blood 0.003 <0.001 <0.26 0.15A = mean of three animals only

CLH REPORT FOR SEDAXANE
8
Single low dose level: seven days after dosing, the mean blood concentration in male rats was 0.003 μg equiv/g.. The highest mean concentration was noted in the liver with values of 0.020 and 0.008 μg equiv/g in males and females, respectively. The kidney had mean values of 0.006 μg equiv/g and 0.003μg equiv/g for males and females, respectively.Other tissue concentrations were below the limit of reliable measurement at this terminal time point.
Single high dose level: seven days after dosing, the mean blood concentration in female rats was 0.15 μg equiv/g. The highest concentrations were found in the liver with values of 1.34 and 1.01 μg equiv/g, in males and females respectively. The kidney had mean values of 0.48 μg equiv/g and 0.32 μg equiv/g for males and females, respectively. In males, the lungs, spleen and thyroid had concentrations of 0.14, 0.15 and 0.84 μg equiv/g, respectively. Other tissue concentrations in males and females were below the limit of reliable measurement at this terminal time point.
CONCLUSION:
Irrespective of dose level or sex, a single oral dose of 1 or 80 mg [pyrazole-14C]-SYN524464/kg was rapidly and extensively eliminated. At both dose levels, the major route of elimination was via the faeces and was slightly higher in males. Urinary elimination was slightly greater in females.
At both dose levels, residues of radioactivity were very low in blood and tissues by 7 days post dose and were only reliably detected in both sexes in the liver and kidney. Tissue distribution was generally similar in both sexes at both dose levels, with only slightly higher residues in thyroid, spleen, lung and the gastrointestinal tract in male rats at the high dose level. These very low tissue residues were consistent with the extensive excretion of the administered dose.
Report: Anonymous (2009a). SYN524464 - Pharmacokinetics in the Rat following a Single Oral Administration of 1 mg or 80 mg [Pyrazole-5-14C]-SYN524464/kg. Report No. 28876. Issue date 28 October 2009. (Unpublished. Syngenta File No. SYN524464_11149)
Guidelines: OECD 417 ; EPA OPPTS 870.7485; JMAFF 12 Nohsan No 8147
GLP standards: Yes
Study acceptable: Yes
MATERIALS AND METHODS Material:

CLH REPORT FOR SEDAXANE
9
Radiolabelled Test Material [Pyrazole-5-14C]-SYN524464 (a mixture of trans and cis isomers mixed in the ratio of approximately 6:1)
Specific activity: Low dose: 5.0024 MBq/mg (groups 1 and 3) High dose: 0.0629 MBq/mg (group 2 and 4)
Radiochemical purity: Low dose: 99.2%/98.1% (groups 1 and 3) Proportion of trans isomer SYN508210: 84.6%Proportion of cis-isomer SYN508211: 15.4%High dose: 97.0%/98.9% (groups 2 and 4)Proportion of trans isomer SYN508210: 85.9%Proportion of cis-isomer SYN508211: 14.1%
Source: Syngenta Crop Protection IncLot/Batch number: Low dose: CL-LXII-15 (groups 1 and 3)
High dose: CL-LXII-14 (groups 2 and 4)Structure:
NNCH3
NHO
HF2C
*
* position of [14C]-labelVehicle Radiolabelled SYN524464 was homogenously suspended in corn oil for dosing.
Test system:
Group Arrangements: Animals were assigned to 4 groups as shown in the table below.Table 2-4 Summary of dosing groups for pharmacokinetic studies for [14C]-SYN524464
Test Group Dose level (mg/kg) Number/sex Remarks Group 1
Blood and plasma collection, Excretion kinetics (low dose level)
1 9 males,9 females
Serial blood collections over a time course.3M & 3F also used for excreta collections
over 3 days
Group 2Blood and plasma collection;
Excretion kinetics(high dose level)
80 9 males,9 females
Serial blood collections over a time course.3M & 3F also used for excreta collections
over 3 days
Group 3Blood and plasma collection
(low dose level)1 2 males,
2 femalesTerminal blood collections at Cmax. Plasma
provision for chromatographic analysis
Group 4Blood and plasma collection
(high dose level)80 2 males,
2 femalesTerminal blood collections at Cmax. Plasma
provision for chromatographic analysis
Dosing and sample collection: A single oral dose of [14C]-SYN524464 suspended in corn oil was administered to each rat by gavage at a dose rate of 5 mL/kg. Animals in groups 1 and 3 received a dose corresponding to a nominal low dose level of 1 mg/kg, and animals in groups 2 and 4 received a dose corresponding to a nominal high dose level of 80 mg/kg.
Urine and faeces were collected individually and separately from 3 males and 3 females in groups 1 and 2 and were frozen immediately upon collection. At the end of the collection period, terminal cage wash samples were collected.
Serial blood samples were removed at 4 alternate time points per group (groups 1 and 2) of 3 male and 3 female animals by venepuncture of a tail vein. Blood was collected into heparinised tubes. A sample of blood was retained and plasma was then separated from the remaining blood sample by centrifugation. Blood cells were discarded.

CLH REPORT FOR SEDAXANE
10
Animals used for excreta collection were terminated by CO2 narcosis at 72 hours post dose. A terminal blood sample was collected and divided between two heparinised tubes. One portion was retained for whole blood analysis and the remainder centrifuged to separate plasma. All samples were analysed for radioactivity by liquid scintillation counting either directly or following sample oxidation.
Animals used for plasma collection for metabolite characterization (groups 3 and 4) were terminated at 1 and 1.5 hours respectively following administration of the low dose level and 5 hours following administration of the high dose level. Blood samples (collected into lithium heparin tubes), comprising the highest volumes achievable (ca 5-10 mL), were collected from the vena cava at termination. A sample of blood was retained and plasma was then separated from the remaining blood sample by centrifugation.
Pharmacokinetic studies: To investigate pharmacokinetics, serial blood samples were collected (groups 1 and 2) by tail vein bleeding at intervals of 0.5, 1, 1.5, 2, 3, 4, 5, 6, 12, 24, and 48 h after dosing. The 72 h blood sample was a terminal sample.
Urine and faeces were collected at intervals of 0-24, 24-48 & 48-72 hours after dosing.
Metabolite characterization studies: Metabolite characterization on selected plasma samples (from groups 3 and 4) was undertaken in a separate study Anonymous 2009 (Syngenta File No. SYN524464_11206). (see B.6.1.1.5)
RESULTS:
Pharmacokinetic Studies:
Excretion:
Following oral administration at either dose level in both sexes, the majority of the administered radioactivity was excreted via the faeces accounting for 71.9-83.4% over the 72 hours collection period. Urinary excretion accounted for 11.8-17.2% of the administered radioactivity.
The excretion of total radioactivity was rapid with the majority of the administered radioactive dose (>85%) recovered by 48 hours following administration. Levels of total radioactivity in the gastrointestinal tract accounted for 0.6- 1.4% and indicated that the administered radioactivity was almost completely eliminated by the end of the collection period. Recovery of administered radioactivity was quantitative with 91.5- 101.1% of the dose (including levels detected in cage wash) recovered.
Table 2–5: Recovery of radioactivity in excreta and tissues after administration of a single oral dose of [14C]-SYN524464 to rats
Group mean excretion data (percentage of radioactive dose recovered)
Group 1 Group 2
1 mg/kg 80 mg/kg
Male (n=3)
Female (n=3)
Male (n=3)
Female (n=3)
Urine
0-24 h24-48 h48-72 hSubtotal
9.32.00.411.8
13.82.50.516.8
10.42.10.613.1
12.04.21.017.2
Faeces
0-24 h24-48 h48-72 hSubtotal
49.225.05.279.3
54.813.33.971.9
48.130.35.083.4
43.225.94.373.4
Cage wash 1.7 1.8 2.3 5.1
GI tract + contents 1.2 0.7 1.4 0.6
Carcass 0.5 0.3 0.8 0.3
Total Recovery 94.4 91.5 101.1 96.6

CLH REPORT FOR SEDAXANE
11
Blood kinetics:
The concentration of total radioactivity in plasma and whole blood following a single oral administration of [14C]-SYN524464 to nominal dose levels of 1 and 80 mg/kg are presented in the tables below.
Table 2-6: Concentrations of radioactivity in plasma over a time course after administration of [14C]-SYN524464
Group mean plasma concentrations (µg equivalents of [14C]-SYN524464/g)Group 1 Group 2
1 mg/kg 80 mg/kg
Sampling time
Male (n=3) Female (n=3) Male (n=3) Female (n=3)
0.5 h 0.04 0.06 3.5 4.11 h 0.11 0.08 5.6 9.21.5 h 0.08 0.11 5.7 9.22 h 0.07 0.08 4.7 8.03 h 0.08 0.09 9.6 9.74 h 0.08 0.05 9.9 10.95 h 0.05 0.05 10.6 10.36 h 0.07 0.06 9.1 12.412 h 0.04 0.03 6.1 5.024 h <0.02 <0.01 2.6 1.548 h <0.01 <0.01 <0.5 <0.972 h 0.006 0.005 1.19 0.36
Table 2–7: Summary of plasma toxicokinetic parameters following administration of [14C]-SYN524464Toxicokinetic parametersGroup 1 Group 21 mg/kg 80 mg/kgMale Female Male Female
Cmax (µg equiv/g) 0.106 0.110 10.572 12.432Tmax (h) 1 1.5 5 6AUC0-t (µg equiv .h/g)
1.663 1.625 233.5 192.2
T1/2 (h) 22.65 24.85 28.76 23.29
Single low dose level: following a single dose of 1 mg [14C]-SYN524464/kg to male and female rats, the observed mean peak concentration (Cmax ) of radioactivity in plasma was 0.11 µg equiv/mL in males and females respectively with Tmax, the time taken to reach plasma Cmax, ranging between 1 and 1.5 hours post dose. Plasma concentrations then remained close to the Cmax between 3 to 6 hours post dose before declining. Terminal half-lives (T1/2 term) were 22.65 hours in males and 24.85 hours in females and radioactivity was still detectable at 72 hours after dosing. Some individual 24 and 48 hour plasma samples were excluded from the calculations because they were below the limit of quantification (due to small aliquot size); however, the estimated terminal half-lives were comparable to the values obtained for whole blood. Values for the area under the concentration curve, up until the last measurable time point (AUC0-t), were 1.663 h.µg equiv/mL in males and 1.625 h.µg equiv/mL in females. At the low dose level the profiles of radioactivity in blood were similar to those in plasma for both sexes, and the derived kinetic parameters were therefore of similar magnitude.
Single high dose level: following a single oral dose of 80 mg [14C]-SYN524464/kg to male and female rats, the observed mean peak concentrations of radioactivity in plasma were 10.6 and 12.4 µg equiv/mL in both males and

CLH REPORT FOR SEDAXANE
12
females, with Tmax ranging between 5 and 6 hours post dose. Thereafter, plasma concentrations declined steadily although residues of radioactivity were still evident 72 hours after dosing. Calculated terminal half-lives (T1/2 term) in plasma were 28.76 hours in males and 23.29 hours in females. Values for AUC(0-t), were 233.5 h.µg equiv/mL in males and 192.2 h.µg equiv/mL in females. At the high dose level the profiles of radioactivity in blood were again similar to those in plasma for both sexes.At 1 mg/kg, no marked differences were observed between AUC and Cmax values for males and females. At 80 mg/kg, male rats had slightly higher AUC values than female rats, whereas females had slightly greater Cmax values compared to males at this dose level. However, these differences were considered to be within the range of inter-animal variation. Hence, at both dose levels, there appeared to be no pronounced differences in systemic exposure to Sedaxane between the sexes.
As doses of [14C]-SYN524464 were increased from 1 to 80 mg/kg, systemic exposure to total radioactivity exhibited a 120-140 fold increase but, due to the observed variability in the concentrations for individual rats, this was considered not to be significant. Comparison of whole blood and plasma values showed that concentrations were slightly higher in plasma than in whole blood at most time points. This suggests that total radioactivity was relatively evenly distributed between plasma and the cellular component of the blood at both dose levels.
CONCLUSION:
Following a single oral dose of 1mg or 80 mg [pyrazole-5-14C]-SYN524464/kg to male and female rats, the peak plasma concentrations were reached after approximately 1 hour at the low dose level and 5 hours at the high dose level. Systemic exposure was similar for males and females at both dose levels.
Report: Anonymous (2009b) SYN524464 - Excretion in Bile Duct Cannulated Rats Following Single Oral Administration of 1 mg or 80 mg [Pyrazole-5-14C]-SYN524464/kg – Final Report Amendment 1.Report No. 28877. Issue date 29 November 2009. Unpublished
Guidelines: OECD 417 ; EPA OPPTS 870.7485; JMAFF 12 Nohsan No 8147
GLP standards: Yes
Study acceptable: Yes
MATERIALS AND METHODS
Test system:

CLH REPORT FOR SEDAXANE
13
Radiolabelled Test Material: [Pyrazole-5-14C]-SYN524464 (a mixture of trans and cis isomers mixed in the ratio of approximately 6:1)
Specific activity: Low Dose: 5.0024MBq/mg (135.2 µCi/mg) High Dose: 0.0629MBq/mg (1.7 µCi/mg)
Radiochemical purity: Low Dose: 99.2% Proportion of trans isomer SYN508210: 84.6%Proportion of cis-isomer SYN508211: 15.4%High Dose: 97.0% Proportion of trans isomer SYN508210: 85.9%Proportion of cis-isomer SYN508211: 14.1%
Source: Syngenta Corp Protection Inc.Lot/Batch number: Low Dose: CL-LXII-15
High Dose: CL-LXII-14Structure:
NNCH3
NHO
HF2C
*
* position of [14C]-labelVehicle: Radiolabelled SYN524464 was homogenously suspended in corn oil for dosing.
Group Arrangements: Animals were assigned to 2 groups as shown in the table below.
Table 2-8: Dosing groups for pharmacokinetic studies for [14C]-SYN524464
Dosing and sample collection: A single oral dose of [14C]- SYN524464 suspended in corn oil was administered to each rat by gavage at a dose rate of 5 mL/kg. Animals in group 1 received a dose corresponding to a low dose level of 1 mg/kg, and animals in group 2 received a dose corresponding to a high dose level of 80 mg/kg. For both dose levels, the animals received a target radioactive dose of 5 MBq/kg.Urine and faeces were collected individually and separately. Urine, faeces and bile were frozen immediately upon collection. At the end of each faeces excreta period, cage wash samples were collected (water).Animals were terminated by overexposure to anaesthetic vapour. Each terminal blood sample was divided between two heparinised tubes, one of which was centrifuged to separate plasma. The gastrointestinal tract (and contents) and carcass were also retained separately. All samples were analysed for radioactivity by liquid scintillation counting either directly or following sample oxidation.Excretion studies: Bile was collected at intervals of Pre-dose, 0.5, 1, 2, 4, 8, 24 and 48 hours after dosing. Urine, faeces and cage wash were collected at daily intervals until the termination of the study.To investigate pharmacokinetics, terminal blood samples were collected via the vena cava at 48 hours after dosing.
RESULTS:
Absorption: The percentage of absorption of radioactivity over 48 hours after dosing was estimated from the radioactivity recovered from bile duct cannulated rats in urine, bile, cage wash and carcass.
As summarised in the table below, the extent of absorption was similar in both sexes and both dose levels. Following a single oral dose of 1 mg [14C]-SYN524464/kg, 87.4 and 87.9% of the administered dose were absorbed
Test Group Dose level (mg/kg) Number/sex Remarks Group 1
Bile duct cannulation(low dose level)
1 4 males,4 females Excreta and bile collection over 2 days.
Group 2Bile duct cannulation
(high dose level)80 4 males,
4 females Excreta and bile collection over 2 days.

CLH REPORT FOR SEDAXANE
14
in males and females, respectively. Following a single oral dose of 80 mg [14C]-SYN524464/kg, 89.5 and 92.5% of the administered dose were absorbed in males and females, respectively.
Table 2.9: Absorption of radioactivity after administration of [14C]-SYN524464Absorption after oral administration
(Percent of radioactive dose)Group 1 Group 21 mg/kg 80 mg/kg
Male (n=4) Female (n=4) Male (n=4) Female (n=3)Urine 6.7 6.9 5.9 10.2Bile 79.0 79.4 81.8 81.2
Cage wash 1.4 1.5 1.3 0.9Carcass 0.3 0.1 0.5 0.2
% Absorbed 87.4 87.9 89.5 92.5
Excretion: The recovery of radioactivity in excreta and bile, following administration of a single oral dose of [14C]- SYN524464 at dose levels of 1 or 80 mg/kg are presented in the table below.
Table 2.10: Recovery of radioactivity in excreta and bile after administration of a single oral dose of [14C]-SYN524464 to bile duct cannulated rats
Group mean excretion data (percentage of radioactive dose recovered)
Group 1 Group 21 mg/kg 80 mg/kg
Male (n=4)
Female (n=4)
Male (n=4)
Female (n=3)
Urine 0-24 h24-48 hSubtotal
6.50.26.7
6.70.16.9
5.60.35.9
10.00.210.2
Faeces 0-24 h24-48 hSubtotal
6.30.46.6
4.60.24.7
6.50.67.1
2.90.43.3
Bile 0-0.5 h0.5-1 h1-2 h2-4 h4-8 h8-24 h24-48 hSubtotal
<0.1<0.215.621.026.715.20.479.0
<0.13.216.821.624.812.90.279.4
<0.10.85.711.323.738.51.981.8
<0.10.44.110.620.844.31.081.2
Cage wash 1.4 1.5 1.3 0.9GI tract + contents <0.1 <0.1 <0.1 <0.1
Carcass 0.3 0.1 0.5 0.2Total Recovery 94.1 92.6 96.6 95.9
Single low dose level: following a single oral dose of 1 mg [14C]-SYN524464/kg, the major route of elimination was via the bile in both males and females, with 79.0 and 79.4% of the administered radioactivity recovered by two days post dose, respectively. Urinary excretion accounted for 6.7 and 6.9% of the dose in males and females, respectively. Faecal excretion accounted for 6.6% of the administered dose in males and 4.7% in females by the end of the sampling period. Excretion was rapid with the majority of the administered radioactivity excreted by 24 hours post dose (ca 91.4 and 90.5% in males and females, respectively). There was no significant radioactivity remaining in the carcass or gastrointestinal tract, indicating a complete excretion by 48 hours post dose.

CLH REPORT FOR SEDAXANE
15
Single high dose level: following a single oral dose of 80 mg [14C]-SYN524464/kg, the major route of elimination was via the bile in both males and females, with 81.8 and 81.2% of the administered radioactivity recovered by two days post dose, respectively. Urinary excretion accounted for 5.9 and 10.2% of the dose in males and females, respectively. Faecal excretion accounted for 7.1% of the administered dose in males and 3.3% in females by the end of the sampling period. Excretion was rapid with the majority of the administered radioactivity excreted by 24 hours post dose (92.0 and 93.1% in males and females, respectively). There was no significant radioactivity remaining in the carcass or gastrointestinal tract, indicating excretion was complete by 48 hours post dose.
CONCLUSION:
Irrespective of dose level or sex, a single oral dose of 1 mg or 80 mg [pyrazole-5-14C]-SYN524464/kg was extensively absorbed, representing at least 87% of the dose, and was rapidly and extensively eliminated, predominantly via the bile. By two days after dosing carcass residues represented 0.5% of the dose or less.
Report: Anonymous (2009c) SYN524464 - Excretion in Bile Duct Cannulated Rats Following Single Oral Administration of 1 mg or 80 mg [Phenyl-U-14C]-SYN524464/kg - Final Report Amendment 1. Report No. 29354. Issue date 26 November 2009. Unpublished.
Guidelines: OECD 417 ; EPA OPPTS 870.7485; JMAFF 12 Nohsan No 8147
GLP standards: Yes
Study acceptable: Yes
MATERIALS AND METHODS:
Material:
Radiolabelled Test Material: [Phenyl-U-14C]-SYN524464 (a mixture of trans and cis isomers mixed in the ratio of approximately 6:1)
Specific activity: Low Dose: 4.5251 MBq/mg (122.3 µCi/mg) High Dose: 0.0666 MBq/mg (1.8 µCi/mg)
Radiochemical purity: Low Dose: 99.1% Proportion of trans isomer SYN508210: 86.0%Proportion of cis-isomer SYN508211: 14.0%High Dose: 98.6% Proportion of trans isomer SYN508210: 85.6%Proportion of cis-isomer SYN508211: 14.4%
Source: Syngenta Corp Protection Inc.Lot/Batch number: Low Dose: RDR-III-25
High Dose: RDR-III-24Structure:
NNCH3
NHO
HF2C
*
* position of [14C]-labelVehicle Radiolabelled SYN524464 was homogenously suspended in corn oil for dosing.
Test system:
Group Arrangements: Animals were assigned to 2 groups as shown in the table below.

CLH REPORT FOR SEDAXANE
16
Table 2-11: Dosing groups for pharmacokinetic studies for [14C]-SYN524464Test Group Dose level (mg/kg) Number/sex Remarks
Group 1Bile duct cannulation
(low dose level)1 4 males,
4 femalesExcreta and bile collection over 2
days.
Group 2Bile duct cannulation
(high dose level)80 4 males,
4 femalesExcreta and bile collection over 2
days.
Dosing and sample collection: A single oral dose of [14C]-SYN524464 suspended in corn oil was administered to each rat by gavage at a dose rate of 5 mL/kg. Animals in group 1 received a dose corresponding to a low dose level of 1 mg/kg, and animals in group 2 received a dose corresponding to a high dose level of 80 mg/kg. For both dose levels, the animals received a target radioactive dose of 5 MBq/kg.Urine and faeces were collected individually and separately. Urine, faeces and bile were frozen immediately upon collection. At the end of each excreta collection period, cage wash samples were collected (water).Animals were terminated by overexposure to anaesthetic vapour. Each terminal blood sample was divided between two heparinised tubes, one of which was centrifuged to separate plasma. The gastrointestinal tract (and contents) and carcass were also retained separately. All samples were analysed for radioactivity by liquid scintillation counting either directly or following sample oxidation.
Excretion studies: Bile was collected at intervals of Pre-dose, 0.5, 1, 2, 4, 8, 24 and 48 hours after dosing. Urine, faeces and cage wash were collected at daily intervals until the termination of the study.To investigate pharmacokinetics, terminal blood samples were collected via the vena cava at 48 hours after dosing
RESULTS:
Absorption: The percentage of absorption of radioactivity over 48 hours after dosing was estimated from the radioactivity recovered from bile duct cannulated rats in urine, bile, cage wash and carcass.
As summarised in the table below, the extent of absorption was similar in both sexes and at both dose levels. Following a single oral dose of 1 mg [14C]-SYN524464/kg, 89.1 and 87.5% of the administered dose were absorbed in males and females, respectively. Following a single oral dose of 80 mg [14C]-SYN524464/kg, 93.9 and 87.1% of the administered dose were absorbed in males and females, respectively.
Table 2-12:Absorption of radioactivity after administration of [14C]-SYN524464Absorption after oral administration
(Percent of radioactive dose)Group 1 Group 21 mg/kg 80 mg/kg
Male (n=4) Female (n=4) Male (n=4) Female (n=3)Urine 6.5 8.1 6.7 5.3Bile 81.1 78.6 85.3 81.0
Cage wash 1.2 0.7 1.6 0.7Carcass 0.3 0.2 0.3 0.1
% Absorbed 89.1 87.5 93.9 87.1
Excretion:
The recovery of radioactivity in excreta and bile, following administration of a single oral dose of [14C]-SYN524464 at dose levels of 1 or 80 mg/kg is presented in the table below.

CLH REPORT FOR SEDAXANE
17
Table 2-13: Recovery of radioactivity in excreta and bile after administration of a single oral dose of [14C]-SYN524464 to bile duct cannulated rats
Group mean excretion data (percentage of radioactive dose recovered)
Group 1 Group 21 mg/kg 80 mg/kg
Male (n=4)
Female (n=4)
Male (n=4)
Female (n=3)
Urine 0-24 h24-48 hSubtotal
6.40.26.5
7.90.28.1
6.40.46.7
5.10.25.3
Faeces 0-24 h24-48 hSubtotal
5.50.25.7
8.30.38.6
4.00.44.4
10.00.510.6
Bile 0-0.5 h0.5-1 h1-2 h2-4 h4-8 h8-24 h24-48 hSubtotal
<0.1<0.314.024.929.112.70.381.1
<0.1<1.815.418.224.717.90.678.6
<0.10.65.19.424.145.20.985.3
<0.1<0.54.79.921.144.01.081.0
Cage wash 1.2 0.7 1.6 0.7GI tract + contents <0.1 <0.1 0.1 <0.1
Carcass 0.3 0.2 0.3 0.1Total Recovery 94.9 96.1 98.4 97.7
Single low dose level: following a single oral dose of 1 mg [14C]-SYN524464/kg, the major route of elimination was via the bile in both males and females, with 81.1 and 78.6% of the administered radioactivity recovered by two days post dose, respectively. Urinary excretion accounted for 6.5 and 8.1% of the dose in males and females, respectively. Faecal excretion accounted for 5.7% of the administered dose in males and 8.6% in females by the end of the sampling period. Excretion was rapid with the majority of the administered radioactivity excreted by 24 hours post dose (93.6 and 94.5% in males and females, respectively). There was no significant radioactivity remaining in the carcass or gastrointestinal tract, indicating excretion was complete by 48 hours post dose.
Single high dose level: following a single oral dose of 80 mg [14C]-SYN524464/kg, the major route of elimination was via the bile in both males and females, with 85.3 and 81.0% of the administered radioactivity recovered by two days post dose, respectively. Urinary excretion accounted for 6.7 and 5.3% of the dose in males and females, respectively. Faecal excretion accounted for 4.4% of the administered dose in males and 10.6% in females by the end of the sampling period. Excretion was rapid with the majority of the administered radioactivity excreted by 24 hours post dose (96.1 and 95.7% in males and females, respectively). There was no significant radioactivity remaining in the carcass or gastrointestinal tract, indicating excretion was complete by 48 hours post dose.
CONCLUSION:
Irrespective of dose level or sex, a single oral dose of 1 mg or 80 mg [phenyl-U-14C]-SYN524464/kg was extensively absorbed, representing at least 87% of the dose, and was rapidly and extensively eliminated, predominantly via the bile. By two days after dosing, carcass residues represented 0.3% of the dose or less.
Report: Anonymous (2009) SYN524464 - Tissue Depletion in the Rat Following Single Oral Administration of 1 mg or 80 mg [Pyrazole-5-14C]-SYN524464/kg. Laboratory Report No. 29149. Issue date 08 December 2009. Unpublished Syngenta File No.SYN524464_11226

CLH REPORT FOR SEDAXANE
18
Guidelines: OECD 417 ; EPA OPPTS 870.7485; JMAFF 12 Nohsan No 8147
GLP standards: Yes
Study acceptable: YesMATERIALS AND METHODS
Test system:Radiolabelled Test Material: [Pyrazole-5-14C]-SYN524464 (a mixture of trans and cis isomers mixed in the ratio
of approximately 6:1)Specific activity: Low dose level: 5.0024 MBq/mg (135.2 µCi/mg)
High dose level: 0.0629 MBq/mg (1.7 µCi/mg)Radiochemical purity: Low dose level: 99.2%
Proportion of trans isomer SYN508210: 84.6%Proportion of cis-isomer SYN508211: 15.4%High dose level: 97.0%Proportion of trans isomer SYN508210: 85.9%Proportion of cis-isomer SYN508211: 14.1%
Source: Syngenta Crop Protection IncLot/Batch number: Low dose level: CL-LXII-15
High dose level: CL-LXII-14Structure:
NNCH3
NHO
HF2C
*
* position of [14C]-labelDose vehicle: Radiolabelled SYN524464 was homogenously suspended in corn oil for dosing.
Group Arrangements: Animals were assigned to 2 groups as shown in the table below.
Table 2-14: Dosing groups for pharmacokinetic studies for [14C]-SYN524464Test Group Dose level (mg/kg) Number/sex Remarks
Group 1Tissue distribution
1 15 males,15 females
Tissue collection (sub-groups of 3 males and 3 females terminated at 1 h (males only), 1.5 h (females only), 8 h,
24 h, 48 h and 96 h
Group 2Tissue distribution
8015 males,
15 femalesTissue collection (sub-groups of 3 males and 3 females
terminated at 5 h, 12 h, 24 h, 48 h and 96 h
Dosing and sample collection: A single oral dose of [14C]-SYN524464 (purity 97.0 and 99.2% for low and high dose levels, respectively) suspended in corn oil was administered to each rat by gavage at a dose rate of 5 mL/kg. Animals in group 1 received a dose corresponding to a nominal low dose level of 1 mg/kg, and animals in group 2 received a dose corresponding to a nominal high dose level of 80 mg/kg. For both dose levels, the animals received a target radioactive dose of 5 MBq/kg.
Animals were terminated by overexposure to anaesthetic vapour at various time points after the dosing initiation. Each terminal blood sample was divided between two heparinised tubes, one of which was centrifuged to separate plasma. The following tissues were taken for radioactivity analysis: adrenals, bone mineral, brain, renal fat, heart, kidneys, liver, lungs, muscle, ovaries (females), pancreas, spleen, testes (males), thymus, thyroid, uterus (females), gastrointestinal tract plus contents and residual carcasses.

CLH REPORT FOR SEDAXANE
19
All samples were analysed for radioactivity by liquid scintillation counting either directly or following sample oxidation
RESULTS:
Tissue distribution: The concentrations of radioactivity in tissues and organs at various timepoints after single oral administration of [14C]-SYN524464 at a nominal dose level of 1 or 80 mg/kg are presented in the tables below:
Table 2-15: Distribution of radioactivity in tissues/organs 1, 8, 24, 48 and 96 hours after administration of [14C] SYN524464 to male rats at a dose level of 1 mg/kg
Group mean tissue residues (µg equiv of SYN524464/g tissues or mL)Time after dosing 1 h 8 h 24 h 48 h 96 h
Adrenals 0.245 0.084 0.016 <0.006 <0.003Bone Mineral 0.024 0.029 0.004 <0.002 <0.001
Brain 0.036 0.008 0.001 <0.001 <0.001Fat-Renal 0.124 0.097 0.008 <0.002 <0.001G.I. Tract 5.372 4.759 1.037 0.139 0.013
G.I Tract contents 11.131 10.284 2.541 0.244 0.025Heart 0.073 0.029 0.009 0.003 0.001
Kidneys 0.208 0.118 0.035 0.013 0.006Liver 1.103 0.512 0.166 0.055 0.025Lungs 0.086 0.036 0.014 0.007 0.002Muscle 0.048 0.043 0.004 0.002 <0.001
Pancreas 0.162 0.050 0.011 0.004 <0.001Plasma 0.079 0.047 0.028 0.014 0.004
Residual carcass 0.057 0.047 0.026 0.006 <0.003Spleen 0.060 0.024 0.008 0.003 0.001Testes 0.032 0.017 0.005 0.002 0.001
Thymus 0.042 0.015 0.004 <0.002 <0.001Thyroid 0.077 <0.029 0.027 <0.009 <0.008
Whole blood 0.058 0.045 0.028 0.014 <0.005
Table 2-16: Distribution of radioactivity in tissues/organs 1.5, 8, 24, 48 and 96 hours after administration of [14C] SYN524464 to female rats at a dose level of 1 mg/kg
Group mean tissue residues (µg equiv/g or mL)Time after dosing 1.5 h 8 h 24 h 48 h 96 h
Adrenals 0.312 <0.033 0.008 0.006 <0.003Bone Mineral 0.021 0.011 0.003 <0.002 <0.001
Brain 0.057 0.011 <0.001 <0.001 <0.001Fat-Renal 0.295 0.133 0.004 <0.001 <0.001G.I. Tract 5.923 5.126 1.038 0.118 0.017
G.I Tract contents 10.423 10.609 3.443 0.210 0.027Heart 0.098 0.034 0.005 <0.001 <0.001
Kidneys 0.227 0.161 0.029 0.008 0.004Liver 1.029 0.700 0.088 0.028 0.014Lungs 0.129 0.043 0.009 0.003 <0.002

CLH REPORT FOR SEDAXANE
20
Muscle 0.057 0.021 0.003 <0.002 <0.001Ovaries 0.120 <0.042 0.005 <0.002 <0.002Pancreas 0.317 0.075 0.010 0.002 <0.001Plasma 0.115 0.063 0.014 0.004 <0.002
Residual carcass 0.087 0.040 0.023 0.008 0.005Spleen 0.323 0.027 0.005 <0.002 <0.002
Thymus 0.063 0.021 0.003 <0.001 <0.001Thyroid 0.155 <0.192 0.018 <0.007 <0.010Uterus 0.073 0.035 0.004 <0.002 <0.001
Whole blood 0.072 0.047 0.013 0.005 0.002
As summarised above, following a single oral administration of [14C]-SYN524464 at target dose of 1 mg/kg, highest concentrations of radioactivity were observed at the first sampling time (1 hour post dose in males and 1.5 hours post dose in females). The highest concentration of radioactivity was present in the liver of both sexes, with liver and kidney concentrations remaining above plasma concentrations throughout the course of the experiment. High concentrations were also present in the pancreas, adrenals and adipose tissue until approximately 8 hours post dose. Thereafter, all tissue concentrations declined steadily up to 96 hours post dose, when with the exceptions of liver and kidney all mean tissue concentrations were close to or below the limit of reliable measurement. The total residues in tissues and carcass at 96 hours accounted for only 0.57% of the dose in males and 0.68% in females.
Table 2-17: Distribution of radioactivity in tissues/organs 5, 12, 24, 48 and 96 hours after administration of [14C] SYN524464 to male rats at a dose level of 80 mg/kg
Group mean tissue residues (µg equiv/g or mL)Time after dosing 5 h 12 h 24 h 48 h 96 h
Adrenals 32.39 11.33 1.28 0.50 <0.27Bone Mineral 4.23 1.59 0.27 <0.11 <0.06
Brain 12.90 1.79 0.13 <0.05 <0.03Fat-Renal 62.74 49.05 3.17 0.17 <0.04G.I. Tract 605.34 358.62 147.20 22.92 1.60
G.I Tract contents 709.60 554.21 261.53 50.41 2.65Heart 18.93 4.09 0.64 0.27 0.14
Kidneys 35.18 10.43 2.72 1.05 0.59Liver 71.74 40.14 11.88 5.63 2.85Lungs 18.45B 4.37 0.85 0.44 0.19Muscle 9.36 3.02 0.42 0.11 0.06
Pancreas 47.09 11.68 1.01 <0.22 <0.07Plasma 10.41 3.67 1.02 0.68 <0.20
Residual carcass 19.35 7.07 2.67 0.63 0.21Spleen 14.05 7.09 0.55 <0.24 <0.19Testes 8.16 3.19 0.43 0.14 <0.07
Thymus 28.45 7.34 0.25 <0.12 <0.05Thyroid 19.35 9.67 2.12 1.35 1.05
Whole blood 7.60 3.53 1.37 0.72 0.38

CLH REPORT FOR SEDAXANE
21
Table 2-18: Distribution of radioactivity in tissues/organs 5, 12, 24, 48 and 96 hours after administration of [14C] SYN524464 to female rats at a dose level of 80 mg/kg
Group mean tissue residues (µg equiv/g or mL)Time after dosing 5 h 12 h 24 h 48 h 96 h
Adrenals 65.45 21.36 1.66 0.46 <0.26Bone Mineral 4.71 2.19 0.36 <0.10 <0.06
Brain 20.45 3.45 0.11 <0.03 <0.01Fat-Renal 107.55 73.66 3.25 0.27 <0.05G.I. Tract 295.64 370.70 142.70 24.55 1.27
G.I Tract contents 626.13 815.33 433.52 55.69 2.40Heart 20.43 6.21 0.63 0.18 <0.07
Kidneys 31.42 13.51 3.34 1.14 0.45Liver 64.56 34.92 11.38 4.08 1.42Lungs 23.24 6.49 1.05 0.35 0.14Muscle 16.99 4.26 0.34 0.11 <0.03Ovaries 46.03 19.75 0.92 0.21 <0.10Pancreas 65.70 15.57 0.70 0.20 <0.06Plasma 15.48 5.59 1.63 0.53 <0.20
Residual carcass 24.69 13.47 5.72 0.71 0.29Spleen 20.27 6.98 0.79 0.23 0.13
Thymus 17.96 3.85 0.36 <0.08 <0.04Thyroid 79.01 7.80 2.52 1.01 <0.89Uterus 24.89 23.95 0.75 0.19 <0.10
Whole blood 11.06 4.26 1.54 0.67 0.29
As summarised above, following a single oral administration of [14C]-SYN524464 at target dose of 80 mg/kg, highest concentrations of radioactivity were observed at the first sampling time (5 hours post dose in both sexes). The highest concentrations of radioactivity were present in the liver and adipose tissue of both sexes. However, the levels in fat declined rapidly and by 48 hours were below plasma concentrations in both sexes. High concentrations were also present in the pancreas, adrenals and thyroid up to approximately 24 hours post dose. Thereafter, these concentrations declined to values close to or below mean plasma concentrations. In both sexes the liver and kidney concentrations remained above plasma concentrations throughout the course of the experiment. By 96 hours post dose, total radioactivity had declined extensively in all other tissues, with concentrations close to or below the limit of reliable measurement. The total residues in tissues and carcass at 96 hours accounted for only 0.75% of the dose in males and 0.63% in females. There was no pronounced sex difference in tissue distribution or depletion profiles.
Tissue elimination: The half-lives of elimination from tissues and organs following single oral administration of [14C]-SYN524464 at dose levels of 1 or 80 mg/kg are presented in the table below.
Table 2-19: Elimination of radioactivity from rat tissues/organs after single administration of [14C] SYN524464 to rats at a dose level of 1 or 80 mg/kg
Values are expressed as T½el(h).Each value is a mean of 3 rats
1 mg/kg 80 mg/kgTissue Male Female Male FemaleAdrenals 11.58 10.62 40.37 7.00Bone Mineral 13.10 16.79 10.92 10.21Brain 4.59 3.97 2.90 2.51Fat-Renal 8.34 3.53 4.56 4.68Heart 27.23 9.11 33.75 27.70

CLH REPORT FOR SEDAXANE
22
Kidneys 30.62 27.90 34.77 26.02Liver 27.87 28.52 36.45 24.83Lungs 25.51 36.11 34.15 26.49Muscle 42.46 13.87 28.03 21.85Ovaries NA 8.42 NA 25.63Pancreas 21.30 7.39 20.63 25.22Plasma 25.84 27.53 32.33 27.67Spleen 25.19 11.05 59.22 30.47Testes 30.88 NA 29.82 NAThymus 14.02 5.01 6.32 7.47Thyroid 48.38 NC 75.88 47.69Uterus NA 10.23 NA 26.70Whole Blood 29.49 31.22 40.10 31.01NA = Not applicableNC = Not calculated As summarised above, following a single oral administration of [14C]-SYN524464 at target dose of 1 or 80 mg/kg, it was possible to calculate the elimination half-life for all the selected tissues with the exception of the thyroid in females at the low dose level. The elimination half-lives ranged from 0.1-0.2 days in the brain to 2.0-3.2 days in the thyroid. However, some of the tissue measurements made over the course of this study were variable and this, coupled with many low tissue concentrations, made some of the half life calculations more difficult. A companion study in similarly dosed rats Anonymous (2009): (Syngenta File No. SYN524464_11144. ) investigated excretion over 7 days followed by residue measurements in the same range of tissues. The mean tissue concentrations were close to or at the limit of reliable measurement by 168 hours after dosing, irrespective of dose level or sex, and therefore the estimations of elimination half-lives in the current study, based on very low tissue concentrations, are likely to have inherent errors in their estimates.The effect of increasing dose level of [14C]-SYN524464 was apparent in spleen, ovaries and uterus; the half life of tissue depletion of total radioactivity in these tissues was longer following dosing with [14C]-SYN524464 at 80 mg/kg compared with 1 mg/kg. No other consistent dose related trends were noted.
CONCLUSION:
Irrespective of dose level or sex, the tissue distribution of radioactivity was similarly extensive following a single oral dose of 1 or 80 mg [14C]-SYN524464/kg to rats. Tissue concentrations of radioactivity were highest at the first sampling time (1/1.5 hours for low dose and 5 hours for high dose) and progressively declined thereafter with elimination half lives of between 0.1 and 3.2 days. Most tissue concentrations were close to or below the limit of reliable measurement by 96 hours post dose, when total tissue and carcass residues accounted for less that 0.8% of the dose. The high levels of radioactivity in the gastrointestinal tract and its contents throughout the 96-hour time course were consistent with the established biliary elimination and faecal excretion of SYN524464 metabolites.
Report: Anonymous (2009d) SYN524464 - Tissue Distribution and Elimination in the Rat Following Repeated Daily Oral Administration of 1 mg [Pyrazole-5-14C]-SYN524464/kg. Report No. 29373. Issue date 12 November 2009. Unpublished. Syngenta File No. SYN524464_11205
MATERIALS AND METHODS
Guidelines: OECD 417 ; EPA OPPTS 870.7485; JMAFF 12 Nohsan No 8147
GLP standards: Yes
Study acceptable: Yes
MATERIALS AND METHODS:
Material:

CLH REPORT FOR SEDAXANE
23
Radiolabelled Test Material: [Pyrazole-5-14C]-SYN524464 (a mixture of trans and cis isomers mixed in the ratio of approximately 6:1)
Specific activity: 1.0138 MBq/mg (27.4 µCi/mg)Radiochemical purity: 98.6%
Proportion of trans isomer SYN508210: 86.4%Proportion of cis-isomer SYN508211: 13.6%
Source: Syngenta Crop Protection IncLot/Batch number: RDR-II-75Structure:
NNCH3
NHO
HF2C
*
* position of [14C]-labelDose vehicle: Radiolabelled SYN524464 was homogenously suspended in corn oil for dosing.
Test system:
Group Arrangements: Animals were assigned to 2 groups as shown in the table below:
Table 2-20: Dosing groups for pharmacokinetic studies for [14C]-SYN524464Test Group Dose level (mg/kg) Number/sex Remarks
Tissue distribution 30 males Tissue collection (sub-groups of 3 males terminated 24 hours after
administration on Day 3, Day 7, Day 10 and Day 14, and 3, 7, 10, 14, 21, and 28
days after administration on Day 14Excretion and tissue
distribution
1
3 males Excreta collection (0-24 hours post-dose of Day 1 and Day 14) and
tissue collection 42 days after administration on Day 14
Dosing and sample collection: A single daily oral dose of [14C]-SYN524464 suspended in corn oil was administered to each rat by gavage at a dose rate of 5 mL/kg for up to 14 consecutive days.Animals were terminated by overexposure to anaesthetic vapour at various time points after the dosing initiation. Each terminal blood sample was divided between two heparinised tubes, one of which was centrifuged to separate plasma. The following tissues were taken for radioactivity analysis: adrenals, bone mineral, brain, renal fat, heart, kidneys, liver, lungs, muscle, pancreas, spleen, testes, thymus, thyroid, gastrointestinal tract plus contents and residual carcasses. Urine and faeces were collected individually and separately from 3 animals selected for excreta collection at the 0-24 hour interval after Day 1 and Day 14. Urine and faeces were frozen immediately upon collection. All samples were analysed for radioactivity by liquid scintillation counting either directly or following sample oxidation.
RESULTS:
Tissue distribution: The concentrations of radioactivity in tissues and organs at various timepoints after repeated oral administration of [14C]-SYN524464 for 14 days at a nominal dose level of 1 mg/kg are presented in the tables below:

CLH REPORT FOR SEDAXANE
24
Table 2-21: Distribution of radioactivity in tissues/organs 24 hours after Day 3, 7, 10 and 14 of a repeated administration of [14C]-SYN524464 to male rats at a dose level of 1 mg/kg
Group mean tissue residues (µg equiv/g or mL)Time after dosing Day 3 Day 7 Day 10 Day 14
Adrenals <0.032 <0.033 0.047 0.099Bone Mineral <0.012 0.010 0.012 0.032
Brain <0.003 <0.005 <0.003 0.013Fat-Renal <0.013 0.013 0.008 0.023G.I. Tract 1.609 2.191 1.414 2.639
G.I Tract contents 4.553 6.120 5.010 5.496Heart 0.013 0.020 0.024 0.026
Kidneys 0.066 0.119 0.094 0.194Liver 0.287 0.460 0.416 0.507Lungs 0.023 0.037 0.041 0.044Muscle 0.008 0.010 0.012 0.020
Pancreas 0.018 0.032 0.017 0.022Plasma 0.037 0.060 0.088 0.066
Residual carcass 0.034 0.044 0.068 0.083Spleen 0.013 0.019 0.022 0.027Testes 0.008 0.013 0.013 0.013
Thymus <0.008 0.010 0.011 0.013Thyroid <0.050 <0.087 0.140 0.189
Whole blood 0.037 0.062 0.079 0.070

CLH REPORT FOR SEDAXANE
25
Table 2-22: Distribution of radioactivity in tissues/organs up to 42 days after Day 14 of repeated administration of [14C]-SYN524464 to male rats at a dose level of 1 mg/kg
Group mean tissue residues (µg equiv/g or mL)Time after
Day 14 dosing
Day 3 Day 7 Day 10 Day 14 Day 21 Day 28 Day 42
Adrenals <0.022 0.028 <0.034 <0.010 <0.026 <0.005 <0.009Bone
Mineral <0.007 <0.005 <0.008 <0.002 <0.006 <0.002 <0.002
Brain <0.002 <0.002 <0.005 <0.001 <0.001 <0.001 <0.001Fat-Renal <0.003 <0.002 <0.014 <0.002 <0.002 <0.001 <0.001G.I. Tract 0.192 0.025 0.007 0.004 0.004 <0.002 <0.002G.I Tract contents 0.355 0.049 0.011 0.005 0.004 <0.002 <0.001
Heart 0.009 0.006 0.026 <0.003 <0.003 <0.001 <0.001Kidneys 0.056 0.050 0.039 0.024 0.025 0.014 0.008
Liver 0.177 0.146 0.087 0.048 0.037 0.027 0.009Lungs 0.017 0.010 0.007 <0.004 <0.003 <0.002 <0.002Muscle 0.005 <0.004 0.004 <0.001 <0.002 <0.001 <0.001
Pancreas <0.007 <0.004 <0.006 <0.001 <0.002 <0.001 <0.001Plasma 0.034 0.011 <0.002 <0.001 <0.001 <0.001 <0.001
Residual carcass 0.028 0.022 0.022 0.010 0.010 0.006 <0.005
Spleen 0.014 0.012 0.015 0.008 0.008 0.007 0.005Testes 0.006 0.003 <0.003 <0.001 <0.001 <0.001 <0.001
Thymus <0.005 <0.003 <0.006 <0.001 <0.002 <0.001 <0.001Thyroid 0.082 <0.066 0.071 0.048 0.028 <0.034 <0.024
Whole blood 0.035 0.022 0.014 0.007 0.006 <0.002 <0.002
As summarised above, following a repeated oral administration of [14C]-SYN524464 at a target dose of 1 mg/kg/day, highest concentrations of radioactivity were observed at 24 h following the fourteenth and final dose with the exception of whole blood and plasma, for which the highest mean concentrations were observed 24 hours after the tenth dose. The highest mean concentrations after 14 doses were observed in the liver, with 0.507 µg equiv/g followed by the kidney with 0.194 µg equiv/g. Most mean tissue concentrations appeared either to have attained or to be approaching steady state kinetics by the end of the 14 day dosing period. Mean tissue concentrations of total radioactivity declined at the subsequent time points investigated (3, 7, 10, 14, 21, 28 and 42 days post dose Day 14). At 42 days post dose, concentrations of radioactivity were measurable in the liver, kidney and spleen only, with concentrations of 0.009, 0.008 and 0.005 µg equiv/g, respectively. All other mean values were below the limit of reliable measurement.
Tissue elimination: The half-lives of elimination from tissues and organs following multiple oral administration of [14C]-SYN524464 at a dose level of 1 mg/kg are presented in the table below.
Table 2-23: Elimination of radioactivity from rat tissues/organs after multiple administration of [14C]-SYN524464 to rats at a dose level of 1 mg/kg
Half life values for the elimination of radioactivity from tissuesTissues/organs T½el (days)
Adrenals NCBone Mineral NC
Brain NCFat-Renal NC
Heart NCKidneys 16.0
Liver 11.7Lungs 8.0

CLH REPORT FOR SEDAXANE
26
Muscle NCPancreas NCPlasma 2.3Spleen 33.0Testes 5.5
Thymus NCThyroid NC
Whole Blood 6.9NC = Not calculated
As summarised above, following a repeated oral administration of [14C]-SYN524464 at target dose of 1 mg/kg/day, it was possible to calculate an elimination half-life for approximately half the selected tissues. The elimination half-lives ranged from 2.3 days in the plasma to 33 days in the spleen. The calculation of half lives for some tissues was made difficult because of variable but low tissue concentrations measured over the course of this study. However, with the exceptions of liver, kidney and spleen, tissue concentrations had declined to values close to or below the limit of reliable measurement by day 28 after the cessation of dosing.
Excretion: The recovery of radioactivity in excreta following multiple oral administration of [14C]-SYN524464 at a nominal dose level of 1 mg/kg is presented in the table below.
Table 2-24: Recovery of radioactivity in excreta after multiple administration of [14C]-SYN524464 to rats a dose level of 1 mg/kg
Group mean excretion data (percentage of radioactive dose recovered)
Day 1 Day 14Male (n=3)
Male (n=3)
Urine 0-24 h 13.0 15.9Faeces 0-24 h 60.9 72.0
Cage wash 1.9 1.5Total Excreted 75.7 89.4
Following oral administration on Day 1, the majority of the administered radioactivity was excreted via the faeces accounting for 60.9% over the 24 h collection period. Urinary excretion accounted for 13.0% of the administered radioactivity recovered over the same collection period. Recovery of administered radioactivity was incomplete by 24 h post-dose with 75.7% of the dose (including levels detected in cage wash) recovered over this period.Following 14 daily oral administrations, the majority of the administered radioactivity was excreted via the faeces accounting for 72.0% over the 24 h collection period. Urinary excretion accounted for 15.9% of the administered radioactivity recovered over the same collection period. Recovery of administered radioactivity at 24 h post-dose 14 accounted for 89.4% of the dose (including levels detected in cage wash) recovered over this period.Radioactivity excreted in urine and faeces as a proportion of the administered daily dose was higher 24 hours post dose on day 14 rather than 24 hours post dose day 1. This indicates that the radioactivity excreted over 24 hours after the fourteenth dose also comprised the continued excretion from the thirteenth and previous doses
CONCLUSION:Following repeated daily oral administration of 1 mg [14C]-SYN524464/kg to male rats, tissue distribution of radioactivity was extensive and most tissue concentrations appeared either to have attained or to be approaching steady state levels after 14 doses. During the period of dosing, tissue concentrations of radioactivity were highest in the liver followed by the kidney. Following the cessation of dosing, all tissue concentrations declined, with no evidence of any persistence. By the final sampling time (42 days post dose 14), concentrations were measurable only in the liver, kidney and spleen. The terminal half-lives for tissue depletion were variable and ranged from 2.3 days for plasma to 33.0 days for the spleen.

CLH REPORT FOR SEDAXANE
27
Report: Anonymous (2009) SYN524464 - Investigation of the Nature and Identity of Radiolabelled Metabolites Present in Plasma, Urine, Faeces and Bile Collected from Rats Following Oral Administration of [14C]-SYN524464 Report No. 29151, issue date 26 November 2009. Unpublished. Syngenta File No. SYN524464_11206
MATERIALS AND METHODS
Guidelines: OECD 417 ; EPA OPPTS 870.7485; JMAFF 12 Nohsan No 8147
GLP standards: Yes
Study acceptable: Yes
Test system:
The toxicokinetic fate of Sedaxane in rats ( Han Wistar) following administration of a single or multiple oral doses was investigated in previous studies samples from which were used during this study.
Materials:Radiolabelled Test Material: [Pyrazole-5-14C]-SYN524464 (a mixture of trans and cis isomers mixed in
the ratio of approximately 6:1)Radiochemical purity: 99.2% (Single 1 mg/kg dose)
97.0% (Single 80 mg/kg dose)98.6% (Repeated daily 1 mg/kg dose)
Source: Syngenta Crop Protection Inc.
Lot/Batch number: CL-LXII-15 (Single 1 mg/kg dose)CL-LXII-14 (Single 80 mg/kg dose)RDR-II-75 (Repeated daily 1 mg/kg dose)
Structure:
NN
HF2C NHO
CH3
*
* position of [14C]-labelRadiolabelled Test Material: [Phenyl-U-14C]-SYN524464 (a mixture of trans and cis isomers mixed in
the ratio of approximately 6:1)Radiochemical purity: 99.1% (Single 1 mg/kg dose)
98.6% (Single 80 mg/kg dose)Source: Syngenta Crop Protection Inc.
Lot/Batch number: RDR-III-25 (Single 1 mg/kg dose)RDR-III-24 (Single 80 mg/kg dose)
NN
HF2C NHO
CH3
*
* position of [14C]-labelDose vehicle: Radiolabelled SYN524464 was homogenously suspended in corn oil for
dosing.
Full details of the test animals were reported in separate studies.
Study Design and Methods:
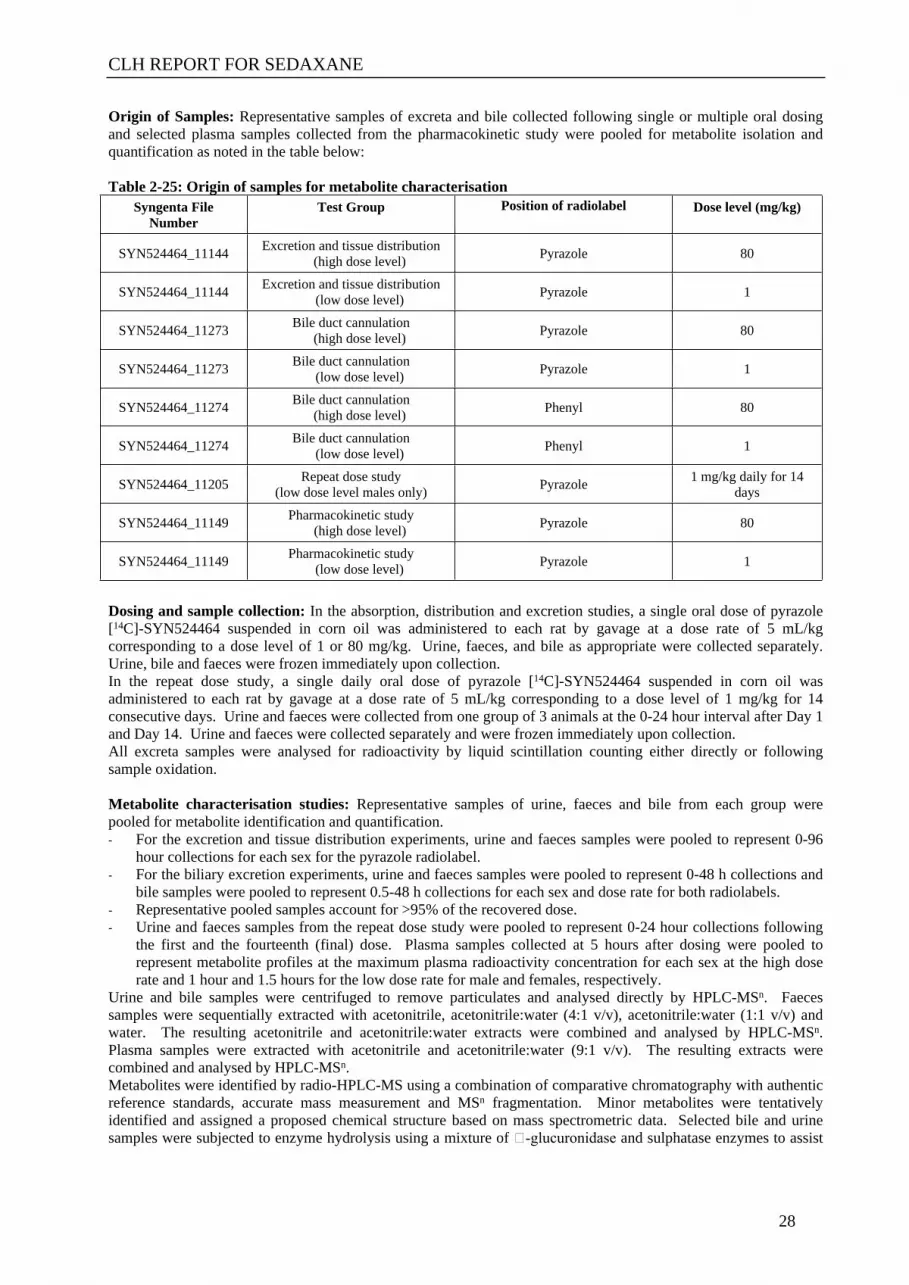
CLH REPORT FOR SEDAXANE
28
Origin of Samples: Representative samples of excreta and bile collected following single or multiple oral dosing and selected plasma samples collected from the pharmacokinetic study were pooled for metabolite isolation and quantification as noted in the table below:
Table 2-25: Origin of samples for metabolite characterisationSyngenta File
NumberTest Group Position of radiolabel Dose level (mg/kg)
SYN524464_11144 Excretion and tissue distribution (high dose level) Pyrazole 80
SYN524464_11144 Excretion and tissue distribution (low dose level) Pyrazole 1
SYN524464_11273 Bile duct cannulation (high dose level) Pyrazole 80
SYN524464_11273 Bile duct cannulation (low dose level) Pyrazole 1
SYN524464_11274 Bile duct cannulation (high dose level) Phenyl 80
SYN524464_11274 Bile duct cannulation (low dose level) Phenyl 1
SYN524464_11205 Repeat dose study(low dose level males only) Pyrazole 1 mg/kg daily for 14
days
SYN524464_11149 Pharmacokinetic study(high dose level) Pyrazole 80
SYN524464_11149 Pharmacokinetic study(low dose level) Pyrazole 1
Dosing and sample collection: In the absorption, distribution and excretion studies, a single oral dose of pyrazole [14C]-SYN524464 suspended in corn oil was administered to each rat by gavage at a dose rate of 5 mL/kg corresponding to a dose level of 1 or 80 mg/kg. Urine, faeces, and bile as appropriate were collected separately. Urine, bile and faeces were frozen immediately upon collection. In the repeat dose study, a single daily oral dose of pyrazole [14C]-SYN524464 suspended in corn oil was administered to each rat by gavage at a dose rate of 5 mL/kg corresponding to a dose level of 1 mg/kg for 14 consecutive days. Urine and faeces were collected from one group of 3 animals at the 0-24 hour interval after Day 1 and Day 14. Urine and faeces were collected separately and were frozen immediately upon collection.All excreta samples were analysed for radioactivity by liquid scintillation counting either directly or following sample oxidation.
Metabolite characterisation studies: Representative samples of urine, faeces and bile from each group were pooled for metabolite identification and quantification. - For the excretion and tissue distribution experiments, urine and faeces samples were pooled to represent 0-96
hour collections for each sex for the pyrazole radiolabel. - For the biliary excretion experiments, urine and faeces samples were pooled to represent 0-48 h collections and
bile samples were pooled to represent 0.5-48 h collections for each sex and dose rate for both radiolabels. - Representative pooled samples account for >95% of the recovered dose. - Urine and faeces samples from the repeat dose study were pooled to represent 0-24 hour collections following
the first and the fourteenth (final) dose. Plasma samples collected at 5 hours after dosing were pooled to represent metabolite profiles at the maximum plasma radioactivity concentration for each sex at the high dose rate and 1 hour and 1.5 hours for the low dose rate for male and females, respectively.
Urine and bile samples were centrifuged to remove particulates and analysed directly by HPLC-MSn. Faeces samples were sequentially extracted with acetonitrile, acetonitrile:water (4:1 v/v), acetonitrile:water (1:1 v/v) and water. The resulting acetonitrile and acetonitrile:water extracts were combined and analysed by HPLC-MSn. Plasma samples were extracted with acetonitrile and acetonitrile:water (9:1 v/v). The resulting extracts were combined and analysed by HPLC-MSn.Metabolites were identified by radio-HPLC-MS using a combination of comparative chromatography with authentic reference standards, accurate mass measurement and MSn fragmentation. Minor metabolites were tentatively identified and assigned a proposed chemical structure based on mass spectrometric data. Selected bile and urine samples were subjected to enzyme hydrolysis using a mixture of -glucuronidase and sulphatase enzymes to assist

CLH REPORT FOR SEDAXANE
29
in the identification of conjugated metabolites. Metabolites were quantified by radiochemical detection. Radioactivity in all samples was measured by liquid scintillation counting (LSC).Statistics: Not applicable.
RESULTS:
Metabolite characterization studies: Representative pooled samples of urine, faeces and bile were analysed to determine the metabolite profile. The main metabolites of SYN524464 shown in the table below were identified in the rat.
For information: the column “% observed in rat” corresponds to the highest % of metabolite found in all studies (acute or repeated, all dose tested)
Table 2-26: Metabolites of [14C]-SYN524464 found in the ratMetabolite Class % in rats
(based on pyrazol labelled)
Structure
SYN524464 4.25% (feces)1.4% (bile)
NN
HF2C NH
O
H
CH3
H
CSCD659087 9.3% (urine)35% (feces)3.46% (Bile)
NH
N
HF2C NH
O
H H
OH
CSCD668404 1.55% (urine)9.32% (feces)1.17% (bile)
NH
N
HF2C NH
O
H H
OH
CSCD6590882.08% (feces)0.59% (bile)
NH
N
HF2C NH
O
H H
OH
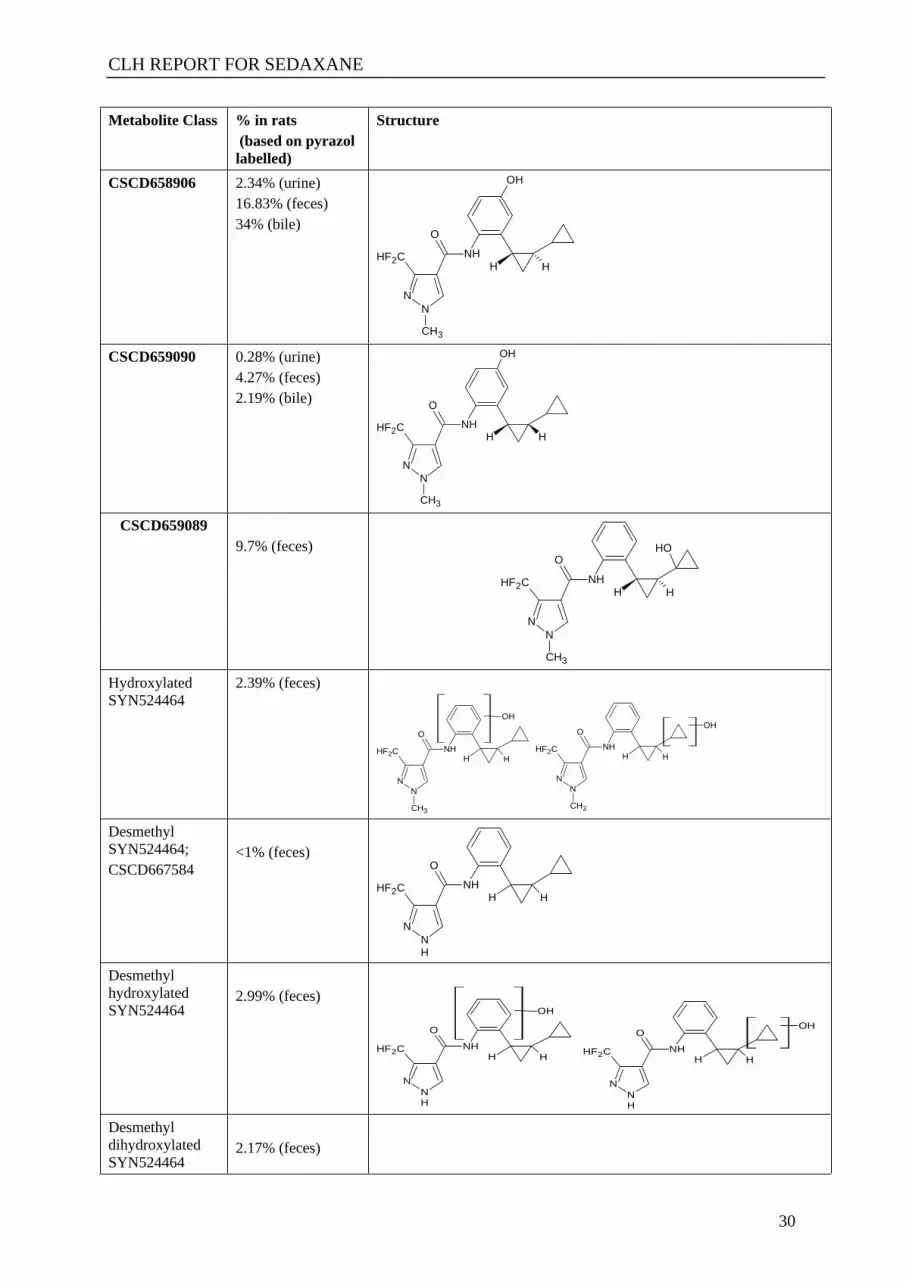
CLH REPORT FOR SEDAXANE
30
Metabolite Class % in rats (based on pyrazol labelled)
Structure
CSCD658906 2.34% (urine)16.83% (feces)34% (bile)
NN
HF2C NH
O
H
CH3
H
OH
CSCD659090 0.28% (urine)4.27% (feces)2.19% (bile)
NN
HF2C NH
O
H
CH3
H
OH
CSCD6590899.7% (feces)
NN
HF2C NH
O
H
CH3
H
OH
Hydroxylated SYN524464
2.39% (feces)
NN
HF2C NH
O
H
CH3
H
OH
NN
HF2C NH
O
H
CH3
H
OH
Desmethyl SYN524464; CSCD667584
<1% (feces)
NH
N
HF2C NH
O
H H
Desmethyl hydroxylated SYN524464
2.99% (feces)
NH
N
HF2C NH
O
H H
OH
NH
N
HF2C NH
O
H H
OH
Desmethyl dihydroxylated SYN524464
2.17% (feces)

CLH REPORT FOR SEDAXANE
31
Metabolite Class % in rats (based on pyrazol labelled)
Structure
0.66% (bile)
NH
N
HF2C NH
O
H H
OH
OH
Dihydroxylated SYN524464
0.23% (urine)2.57% (feces)
NN
HF2C NH
O
H
CH3
H
OH
OH
NN
HF2C NH
O
H
CH3
H
OH
OH
Desmethyl -hydroxycarbonyl
5.76% (urine)
NH
N
HF2C NH
O
H H
O
OH
-Hydroxycarbonyl: CSCD668403
0.25% (urine)
NN
HF2C NH
O
H
CH3
H
O
OH
Hydroxylated -hydroxycarbonyl
2.36% (feces)0.57% (urine)
NN
HF2C NH
O
H
CH3
H
O
OH
OH
pyrazole amideCSCC210616
<1% (bile)
NN
HF2C NHO
H
CH3
H
NH
N
HF2C NHO
H H
SYN524464
CSCD667584
CSCD659087 and CSCD668404
NH
N
HF2C NHO
H H
OH
NH
N
HF2C NHO
H H
OH
CSCD659088
Glucuronide conjugate
CSCD659089
CSCD658906 and CSCD659090
NN
HF2C NHO
H
CH3
H
OH
NN
HF2C NHO
H
CH3
H
OH
CSCD668403 NN
HF2C NHO
H
CH3
H
O
OH
CSCC210616
NN
HF2C NH2
O
CH3
Glucuronide conjugates
Glucuronide conjugates
Glucuronide conjugates

CLH REPORT FOR SEDAXANE
32
Metabolite profile in excreta:
The metabolite profiles in urine, faeces and bile following administration of a single oral dose of [14C]-SYN524464 at dose levels of 1 or 80 mg/kg or 14 consecutive daily oral doses of 1 mg/kg are presented in the tables below:
Losses/gains on fractionation incorporate procedural losses. This is calculated from the sum of the % administered dose in each component subtracted from the % administered dose in sample.
Single oral dose pyrazol radiolabel:
Pyrazole-radiolabel high dose level (non-cannulated rats): Found in urine: At least 22 metabolites were present in urine from male rats and 19 in urine from female rats. Four components, a desmethyl -hydroxycarbonyl metabolite, CSCD659087, CSCD658906 and a sulphate conjugate of hydroxylated desmethyl SYN524464, exceeded 1% of the administered dose in urine from male rats. The most abundant of these was CSCD658906 which accounted for 1.70%. None of the remaining 18 metabolites individually exceeded 0.73% of the administered dose. A total of 8 components remained unidentified. Four components exceeded 1% of the administered dose in urine from female rats. These included two unresolved metabolites identified as a glucuronic acid conjugate of hydroxylated desmethyl SYN524464 and a desmethyl -hydroxycarbonyl metabolite which together accounted for 4.78% of the administered dose. The other metabolites exceeding 1% dose were identified as a glucuronic acid conjugate of SYN524464 hydroxylated on the phenyl moiety (3.08%), CSCD659087 (2.85%) and CSCD658906 (2.02%). None of the remaining 15 components individually exceeded 0.84% of the administered dose, 8 of these remained unidentified.
Found in faeces: At least 16 components were present in faeces from male rats and 20 in faeces from female rats. The majority of metabolites in faeces exceeded 1% of the administered dose. The most abundant components in faeces from male rats were identified as CSCD659087, CSCD658906 and CSCD659089 which accounted for 15.38%, 16.83% and 9.77% of the administered dose respectively. The remaining components were identified as SYN524464 (4.25%), unresolved metabolites identified as CSCD659090 and a glucuronic acid conjugate of desmethyl SYN524464 (4.27%), unresolved metabolites identified as a glucuronic acid conjugate of desmethyl SYN524464 and hydroxylated desmethyl SYN524464 (2.95%), three metabolites of SYN524464 dihydroxylated on the phenyl moiety (2.57%, 1.25% and 1.21%), a hydroxylated -hydroxycarbonyl metabolite (2.36%), CSCD668404 (3.04%), a glucuronic acid conjugate of hydroxylated SYN524464 (2.02%) and CSCD659088 (2.08%). None of the 4 remaining components, including 2 that were unidentified, individually exceeded 0.99% of the administered dose. The most abundant components in faeces from female rats were identified as CSCD659087, CSCD658906 and CSCD668404 which accounted for 22.41%, 16.65% and 6.99% of the administered dose respectively. The other components that exceeded 1% of the dose included unresolved metabolites identified as CSCD659090 and a glucuronic acid conjugate of desmethyl SYN524464 (3.37%), unresolved metabolites identified as a glucuronic acid conjugate of desmethyl SYN524464 and hydroxylated desmethyl SYN524464 (2.43%), SYN524464 (1.68%), a hydroxylated -hydroxycarbonyl metabolite of SYN524464 (1.54%), two metabolites of SYN524464 dihydroxylated on the phenyl moiety (1.64% and 1.14%) and CSCD659089 (1.22%). None of the other metabolites, including 4 that were unidentified, individually exceeded 0.96% of the administered dose.
The results are presented in the table below:
Table B.6.1.1.5–3: Metabolite profile in excreta of rats following a single oral dose of [pyrazole 5 14C]-SYN524464 at the high dose level of 80 mg/kg
Percent of administered dose (number of isomers)StudyNo.: 187633
Pyrazole [14C]-SYN524464 80 mg/kgMale FemaleCompound
Urine(0-96 h)
Faeces(0-96 h)
Total excreta
Urine(0-96 h)
Faeces(0-96 h)
Total excreta
SYN524464 - 4.25 4.25 - 1.68 1.68CSCD659087 1.68 15.38 17.06 2.85 22.41 25.26CSCD668404 0.24 3.04 3.28 0.27 6.99 7.26CSCD659088 - 2.08 2.08 - 0.96 0.96CSCD658906 1.70 16.83 18.53 2.02 16.65 18.67CSCD658089 - 9.77 9.77 - 1.22 1.22

CLH REPORT FOR SEDAXANE
33
CSCD659090 - 4.27b 4.27 0.26 3.37b 3.63CSCD668403 0.25 - 0.25 0.25 - 0.25-Hydroxycarbonyl cysteine conjugate - 0.83 0.83 - 0.75 0.75
Desmethyl hydroxy - 2.95b 2.95 - 2.43b 2.43Desmethyl dihydroxy - 0.99 (1) 0.99 - 1.84 (3) 1.84Desmethyl -hydroyxcarbonyl 1.22 (1) - 1.22 4.78 (1)d - 4.78
Dihydroxy 0.20 (1) 5.03 (3) 5.23 0.23 (1) 2.78 (2) 3.01Dihydroxy/ -hydroyxcarbonyla 0.40 (1)a - 0.40 0.17 (1)a - 0.17
Carboxylic acid 0.73 (1) - 0.73 - -Hydroxy -hydroyxcarbonyl 2.02(5) 2.36 (1) 4.38 0.19 (1) 1.54 (1) 1.73
Desmethyl hydroxy sulphate conjugate 1.32 (1) - 1.32 - - -
Desmethyl glucuronide - (2)c - - (2)c -Desmethyl hydroxy glucuronide - - - 0.48 (2)e - 0.48
Hydroxy glucuronide - 2.02 (1) 2.02 3.08 (1) 0.73 3.81Post extraction solids NA 10.00 10.00 NA 8.20 8.20Total identified 9.76 69.80 79.56 14.58 63.35 77.93Total unidentified 2.83 1.20 4.03f 3.63 2.55 6.18g
Total accounted for 12.59 81.00 93.59 18.21 74.10 92.31Losses/Gains -0.99 0.80 -0.19 -1.11 0.70 -0.41Total 11.60 81.80 93.40 17.10 74.80 91.90a The empirical formula for these structures is the same therefore this metabolite could not be identified based on accurate mass measurement. With the exception of urine obtained from female rats administered pyrazole labelled [14C]-SYN524464 (80 mg/kg), in which this component was identified as a -hydroxycarbonyl, fragmentation data was not available to define the identificationb Includes an unresolved desmethyl glucuronide metabolitec Two desmethyl glucuronide metabolites were detected and unresolved from CSCD659090 and desmethyl hydroxy SYN524464d Includes an unresolved desmethyl hydroxy glucuronide (phenolic) metabolitee Two desmethyl hydroxy glucuronide metabolites were detected, one unresolved from a desmethyl -hydroxycarbonyl metabolite.f Ten components none greater than 0.68 % of the administered dose g Eleven components none greater than 0.89 % of the administered doseNA = Not applicable
Pyrazole-radiolabel low dose level (non-cannulated rats): At least 17 metabolites were present in urine from male rats and 13 in urine from female rats. Three components, CSCD659087 (2.58%), a desmethyl -hydroxycarbonyl metabolite (2.11%) and CSCD658906 (1.46%) exceeded 1% of the administered dose in urine from male rats. None of the other 14 components individually exceeded 0.84% of the administered dose. A total of 6 components remained unidentified. The most abundant component in urine from female rats, CSCD659087, comprised 9.33% of the administered dose. Four other components, exceeded 1% of the administered dose, including two unresolved metabolites identified as a glucuronic acid conjugate of hydroxylated desmethyl SYN524464 and a desmethyl -hydroxycarbonyl metabolite which together accounted for 2.71% of the administered dose, CSCD668404 and CSCD658906 which accounted for 1.55% and 2.34% of the dose respectively. None of the 9 remaining components, including 6 that were unidentified, exceeded 0.96% of the administered dose.At least 23 components were present in faeces from male rats and 14 in faeces from female rats. The most abundant of these in faeces from male rats were identified as CSCD659087, CSCD658906, CSCD668404 and CSCD659089 which accounted for 26.86%, 10.05%, 5.08% and 5.05% of the administered dose respectively. The remaining components were identified as CSCD659088 (1.32%), unresolved metabolites identified as CSCD659090 and a glucuronic acid conjugate of desmethyl SYN524464 (2.29%), three metabolites of SYN524464 dihydroxylated on the phenyl moiety (2.39%, 1.49% and 1.29%), dihydroxylated desmethyl SYN524464 (2.17%), SYN524464 (1.71%) and unresolved metabolites identified as a glucuronic acid conjugate of desmethyl SYN524464 and hydroxylated desmethyl SYN524464 (1.26%), a glucuronic acid conjugate of hydroxylated SYN524464 (1.21%) and 6 unidentified components none of which individually exceeded 1.98% of the administered dose. No other component, including 3 that were unidentified, individually exceeded 0.99% of the administered dose. The most abundant components in faeces from female rats were identified as CSCD659087, CSCD668404 and CSCD658906 which accounted for 29.16%, 9.32% and 11.74% of the administered dose respectively. The other components that exceeded 1% of the dose included unresolved metabolites identified as a glucuronic acid conjugate of desmethyl

CLH REPORT FOR SEDAXANE
34
SYN524464 and hydroxylated desmethyl SYN524464 (2.99%), a glucuronic acid conjugate of hydroxylated SYN524464 (2.10%), desmethyl SYN524464 dihydroxylated on the phenyl moiety (1.63%), SYN524464 dihydroxylated on the phenyl moiety (1.56%), unresolved metabolites identified as CSCD659090 and a glucuronic acid conjugate of desmethyl SYN524464 (1.98%), SYN524464 (1.56%), CSCD659088 (1.47%) and an unidentified component (1.60%). None of the other metabolites, including two that were unidentified, individually exceeded 0.97% of the administered dose.
The results are presented in the table below:
Table 2-27: Metabolite profile in excreta of rats following a single oral dose of [pyrazole 5 14C]-SYN524464 at the low dose level of 1 mg/kg
Percent of administered dose (number of isomers)StudyNo.: 187633
Pyrazole [14C]-SYN524464 1 mg/kgMale Female
Compound
Urine(0-96 h)
Faeces(0-96 h)
Total excreta
Urine(0-96 h)
Faeces(0-96 h)
Total excreta
SYN524464 - 1.71 1.71 - 1.56 1.56CSCD659087 2.58 26.86 29.44 9.33 29.16 38.49CSCD668404 0.35 5.08 5.43 1.55 9.32 10.87CSCD659088 - 1.32 1.32 - 1.47 1.47CSCD658906 1.46 10.05 11.51 2.34 11.74 14.08CSCD659089 - 5.05 5.05 - - -CSCD659090 - 2.29b 2.29 0.28 1.98b 2.26Desmethyl hydroxy - 1.26 (1)b 1.26 - 2.99 (1)b 2.99Desmethyl dihydroxy - 2.17 (1) 2.17 - 1.63 (1) 1.63Desmethyl -hydroxycarbonyl 2.11 (1) - 2.11 2.71 (1)d - 2.71
Dihydroxy 0.22 (1) 5.17 (3) 5.39 - 1.56 (1) 1.56Dihydroxy/ -Hydroxycarbonyla 0.30 (1)a - 0.30 - - -
Carboxylic acid 0.56 (1) - 0.56 - - -Hydroxy -hydroxycarbonyl 0.70 (3) 0.88 (1) 1.58 - 0.80 (1) 0.80
Desmethyl hydroxy sulphate conjugate 0.42 (1) - 0.42 - - -
Desmethyl glucuronide - (2)c - - (2)c -Desmethyl hydroxy glucuronide - - - 0.36 (2)e - 0.36
Hydroxy glucuronide - 1.21 (1) 1.21 0.96 (1) 2.10 (1) 3.06Post extraction solids NA 13.60 13.60 NA 11.00 11.00Total identified 8.70 63.05 71.75 17.53 64.31 81.84Total unidentified 3.01 10.66 13.67f 1.87 3.30 5.17g
Total accounted for 11.71 87.31 99.02 19.40 78.61 98.01Losses/Gains -0.01 1.09 1.08 -0.20 0.79 0.59Total 11.70 88.40 100.1 19.20 79.40 98.60a The empirical formula for these structures is the same therefore this metabolite could not be identified based on accurate mass measurement. With the exception of urine obtained from female rats administered pyrazole labelled [14C]-SYN524464 (80 mg/kg), in which this component was identified as a -hydroxycarbonyl, fragmentation data was not available to define the identificationb Includes an unresolved desmethyl glucuronide metabolitec Two desmethyl glucuronide metabolites were unresolved from CSCD659090 and desmethyl hydroxy SYN524464d Includes an unresolved desmethyl hydroxy glucuronide (phenolic) metabolitee Two desmethyl hydroxy glucuronide metabolites were detected, one unresolved from a desmethyl -hydroxycarbonyl metabolite. f Fifteen components none greater than 1.98 % of the administered doseg Nine components none greater than 1.60 % of the administered doseNA = Not applicable
Repeated oral dose (14 days)Pyrazole-radiolabel repeated doses of low dose level:

CLH REPORT FOR SEDAXANE
35
Comparison of the urinary profiles obtained from male rats after the first and fourteenth (final) dose of a 14-day repeat dose study indicated that the there were no qualitative differences in the metabolite profile following repeated dosing. Comparison of the faecal profiles obtained from male rats after the first and fourteenth dose of a 14-day repeat dose study indicated that the only qualitative difference in the metabolite profile following repeated dosing was the presence of SYN524464 after the first dose but not after the fourteenth dose.
Table2-28: Metabolite profile in excreta of male rats following a repeated oral dosing of [pyrazole 5 14C]-SYN524464 at the low dose level of 1 mg/kg
Percent of administered dose (number of isomers)Study No.: 187654
Pyrazole [14C]-SYN524464 1 mg/kg/day to male rats0-24 h 312-336 h
Compound
Urine Faeces Total excreta
Urine Faeces Total excreta
SYN524464 - 3.86 3.86 - - -CSCD659087 3.56 21.70 25.26 1.03 35.14 36.17CSCD668404 0.40 5.26 5.66 0.25 7.46 7.71CSCD659088 - - - - - -CSCD658906 1.52 7.32 8.84 0.59 11.53 12.12CSCD659089 - 5.33d 5.33 - 2.92 2.92CSCS659090 - (1)e - - 2.03 2.03Desmethyl -hydroxycarbonyl 2.96 (1)b - 2.96 5.76(1)b - 5.76
Dihydroxy/ -hydroxycarbonyla 0.95 (1)a - 0.95 0.95 (1)a - 0.95
Desmethyl hydroxy sulphate conjugate - - - 0.48 (1) - 0.48
Desmethyl glucuronide - (1)e - - - -Desmethyl hydroxy glucuronide 1.00 (2)c - 1.00 0.64 (2)c - 0.64
Hydroxy glucuronide 1.58 (1) - 1.58 4.29 (1) - 4.29Post extraction solids NA 12.10 12.10 NA 8.70 8.70Total identified 11.97 43.47 55.44 13.99 59.08 72.43Total unidentified 1.03 4.73 5.76f 1.31 3.33 4.64g
Total accounted for 13.00 60.30 73.30 15.30 71.11 85.77Losses/Gains 0.00 0.60 0.60 0.60 0.89 2.13Total 13.00 60.90 73.90 15.90 72.00 87.90a The empirical formula for these structures is the same therefore this metabolite could not be identified based on accurate mass measurementb Includes an unresolved desmethyl hydroxy glucuronide metabolitec Two desmethyl hydroxy glucuronide metabolites were detected, one was unresolved from a desmethyl -hydroxycarbonyl metabolited Includes unresolved components CSCD659090 and a desmethyl glucuronide metabolitee Component detected within a region of unresolved components including CSCD659089, CSCD659090 and a desmethyl glucuronide metabolite f Four components none greater than 4.73 % of the administered doseg Three components none greater than 3.33 % of the administered dose NA = Not applicable
Bile duct cannulated study single oral
Pyrazole-radiolabel high dose level (bile duct cannulated rats): At least 20 components were present in bile from male rats and 15 in bile from female rats. The most abundant component in male rats was identified as a glucuronic acid conjugate of SYN524464 hydroxylated on the phenyl moiety and accounted for 29.31% of the administered dose. Another three components, including a glucuronic acid conjugate of desmethyl SYN524464 hydroxylated on the phenyl moiety (11.66%), a glucuronic acid conjugate of SYN524464 hydroxylated on the cyclopropyl moiety (6.95%) and CSCD658906 (5.30%) exceeded 5% of the administered dose. Ten components, including SYN524464 (1.40%) exceeded 1% of the administered dose. These were identified as a glucuronic acid conjugate of SYN524464 hydroxylated on the cyclopropyl moiety (2.65%) and CSCD659087 (2.34%); two unresolved metabolites identified as CSCD659090 and a glucuronic acid conjugate of desmethyl SYN524464 (2.19%); two unresolved components identified as a glutathione conjugate of hydroxylated SYN524464 and a glucuronic acid conjugate of hydroxylated desmethyl SYN524464 (2.09%); a glucuronic acid conjugate of desmethyl SYN524464 hydroxylated on the phenyl moiety (1.53%); a glucuronic acid conjugate of

CLH REPORT FOR SEDAXANE
36
desmethyl SYN524464 (1.18%); a glucuronic acid conjugate of SYN524464 hydroxylated on both the phenyl and cyclopropyl moieties (1.11%), two unresolved components identified as CSCD668404 and a glucuronic acid conjugate of hydroxylated SYN524464 (1.01%) and one unidentified component (1.04%). None of the remaining 6 components, including 1 that was unidentified, individually exceeded 0.96% of the administered dose. The most abundant of components in bile from female rats were identified as glucuronic acid conjugates of SYN524464 and desmethyl SYN524464 hydroxylated on the phenyl moiety which accounted for 38.46% and 19.84% of the administered dose respectively. The 7 other components that exceeded 1% of the administered dose were identified as two glucuronic acid conjugates of SYN524464 hydroxylated on the cyclopropyl moiety (3.90% and 1.04%), CSCD658906 (3.15%), a glucuronic acid conjugate of desmethyl SYN524464 hydroxylated on the phenyl moiety (2.79%), two unresolved components including CSCD659090 and a glucuronic acid conjugate of desmethyl SYN524464 (2.18%), CSCD659087 (1.67%) and a glucuronic acid conjugate of desmethyl SYN524464 (1.10%). None of the 6 remaining components individually exceeded 0.98% of the administered dose.
At least 23 components were present in urine from male bile duct cannulated rats none of which exceeded 0.73% of the administered dose. At least 17 radiolabelled were present in urine from female bile duct cannulated rats, the most abundant of these included two unresolved metabolites identified as a glucuronic acid conjugate of hydroxylated desmethyl SYN524464 and a desmethyl -hydroxycarbonyl metabolite which together accounted for 1.29% of the administered dose; CSCD659087 (1.89%) and CSCD658906 (1.84%). None of the remaining 14 components, including 3 unidentified components, individually exceeded 0.71% of the administered dose.Faeces obtained from bile duct cannulated rats contained 2 isomers of SYN524464 which comprised 5.18% and 1.81% of the administered dose in male rats and 1.76% and 0.93% in faeces from female rats and were likely to be the trans and cis isomers. CSCD667584 was present in faeces from female rats at <1.0% of the administered dose. These faecal metabolites from bile duct cannulated rats were taken to represent the unabsorbed dose:
Table 2-29: Metabolite profile in excreta of bile duct cannulated rats following a single oral dose of [pyrazole 5 14C]-SYN524464 at the high dose level of 80 mg/kg
Percent of administered dose (number of isomers)Study No.: 187628
Pyrazole [14C]-SYN524464 80 mg/kgMale FemaleBile (0.5-48 h) Bile (0.5-48 h)
Compound
Urine(0-48
h)
Faeces(0-48
h)(e) (f)
Total excreta
(m)
Urine(0-48
h)
Faeces(0-48
h)(e) (f)
Total excreta
(m)SYN524464 0.05 6.99(d) 1.40 0.59 8.44 - 2.69(d) 0.98 - 3.67CSCC210616 - - 0.96 - 0.96 - - 0.52 - 0.52CSCD659087 0.22 - 2.34 14.70 2.56 1.89 - 1.67 20.10 3.56CSCD668404 - - 1.01(g) 2.15 1.01 0.34 - 0.85(g) 5.09 1.19CSCD659088 - - 0.59 1.60 0.59 - - - 1.37 -CSCD658906 0.23 - 5.30 30.87 5.53 1.84 - 3.15 34.89 4.99CSCD659089 - - - 9.85 - - - - 5.09 -CSCS659090 0.70 - 2.19(h) 7.53 2.89 - - 2.18(h) 8.20 2.18CSCD668403 - - - - - 0.18 - - - 0.18-Hydroxycarbonyl cysteine conjugate - - - 0.52
(1) - - - - - -
Desmethyl SYN524464 - - - - - - 0.41
(1) - - 0.41
Hydroxy - - - 0.96 (1) - - - - - -
Desmethyl -hydroxycarbonyl
0.73 (1)(b) - - - 0.73 1.29
(1)(b) - - - 1.29
Dihydroxy/-hydroxycarbonyl(a)
0.16 (1)(a) - - - 0.16 0.33
(1)(n) - - - 0.33
-hydroxycarbonyl - - - - - 0.57 (1) - - - 0.57
Dihydroxy - - - 0.74 (1) - - - - - -
Carboxylic acid 0.49 (1) - - - 0.49 0.34
(1) - - 0.34
Hydroxy -hydroxycarbonyl
0.76 (4) - - - 0.76 0.37
(1) - - - 0.37
Hydroxy sulphate 0.28 - - - 0.28 0.16 - - - 0.16

CLH REPORT FOR SEDAXANE
37
conjugate (1) (1)Hydroxy cysteine conjugate - - - 0.15
(1) - - - - - -
Desmethyl glucuronide - - 1.18(2)(i) 2.59
(1) 1.18 0.90 (2) - 1.10
(2)(i)3.25 (1) 2.00
Desmethyl hydroxy glucuronide
0.09 (2)(c) - 16.87
(5)(j) - 16.96 0.20 (2)(c) - 23.82
(4)(p) - 24.02
Hydroxy glucuronide
0.32 (1) - 38.91
(4)(k) - 40.25 0.71(2)(o) - 43.40
(4)(k) - 44.11
Dihydroxy glucuronide - - 1.11 (1) - 1.11 - - - - -
Hydroxy glutathione conjugate
- - (1)(l) - - - - 0.32 (1)(l) - 0.32
Dihydroxy glutathione - - 0.61 (1) - 0.61 - - - - -
Post extraction solids NA 0.20 NA NA 0.20 NA 0.20 NA NA 0.20
Total identified 4.03 6.99 72.47 72.25 83.49 9.12 3.10 77.99 77.99 90.21Total unidentified 1.67 0.00 1.84 2.05 3.51(q) 0.68 0.00 0.00 0.00 0.68(r)Total accounted for 5.70 7.19 74.31 74.30 87.20 9.80 3.30 77.99 77.99 91.09Losses/Gains 0.20 0.03 7.49 7.50 7.72 0.40 -0.06 3.21 3.21 3.55Total 5.90 7.22 81.80 81.80 94.92 10.20 3.24 81.20 81.20 94.64a The empirical formula for these structures is the same therefore this metabolite could not be identified based on accurate mass b Includes an unresolved desmethyl hydroxy glucuronide metabolitec Two desmethyl hydroxy glucuronide metabolites were detected, one unresolved from a desmethyl -hydroxycarbonyl metabolited Postulated to include the trans and cis isomers comprising SYN524464e Unhydrolyesd bilef Hydrolysed bileg Includes an unresolved hydroxy glucuronide (phenolic) metaboliteh Includes an unresolved desmethyl glucuronide metabolitei Two desmethyl glucuronide metabolites were detected, one unresolved from CSCD659090j Includes two hydroxy glutathione metabolites unresolved from a desmethyl hydroxy glucuronide metabolitek Four hydroxy glucuronide metabolites were detected, one unresolved from CSCD668404L One hydroxy glutathione metabolite was unresolved from a desmethyl hydroxy glucuronide metabolitem Sum of urine, faeces and unhydrolysed bilen Includes an unresolved hydroxy glucuronide metaboliteo Two isomers of hydroxy glucuronide metabolites were detected, one unresolved from a dihydroxy/-hydroxycarbonyl metabolitep Includes a hydroxy glutathione metabolite unresolved from an isomer of a desmethyl hydroxy glucuronide metabolite q Eleven components none greater than 1.04 % of the administered doser Three components none greater than 0.36 % of the administered doseNA = Not applicable
Pyrazole-radiolabel low dose level (bile duct cannulated rats): At least 21 components were present in bile from male rats and 18 in bile from female rats. The two most abundant components in bile from males rats were identified as glucuronic acid conjugates of desmethyl SYN524464 and SYN524464 hydroxylated on the phenyl moiety which accounted for 26.79% and 24.49% of the administered dose, respectively. The 8 other components that exceeded 1% of the administered dose were identified as a glucuronic acid conjugate of SYN524464 hydroxylated on the cyclopropyl moiety (5.90%), CSCD659087 (3.46%), a glucuronic acid conjugate of desmethyl SYN524464 hydroxylated on the phenyl moiety (3.15%), CSCD658906 (2.30%), two unidentified components (1.96% and 1.64%), a glucuronic acid conjugate of SYN524464 hydroxylated on the cyclopropyl moiety (1.42%) and two unresolved components including CSCD659090 and a glucuronic acid conjugate of desmethyl SYN524464 (1.06%). None of the remaining 11 components, including 3 that were unidentified individually exceeded 0.96% of the administered dose. The most abundant components in bile from female rats were identified as glucuronic acid conjugates of desmethyl SYN524464 and SYN524464 hydroxylated on the phenyl moiety and accounted for 26.01% and 25.14% of the administered dose respectively. The 12 components that exceeded 1% of the administered dose were identified as CSCD658906 (3.06%), CSCD659087 (3.05%), two glucuronic acid conjugates of desmethyl SYN524464 hydroxylated on the phenyl moiety (4.01% and 1.60%), two glucuronic acid conjugates of SYN524464 hydroxylated on the cyclopropyl moiety (2.96% and 2.10%), a glucuronic acid conjugate of SYN524464 hydroxylated on the phenyl moiety unresolved from CSCD668404 (1.17%), a glucuronic acid conjugate of SYN524464 hydroxylated on the phenyl and cyclopropyl moieties (1.25%), a glucuronic acid conjugate of desmethyl SYN524464 (1.20%) and 2 components that were unidentified (2.59 and 1.07%). None of the remaining components, including one that was unidentified, individually exceeded 0.84% of the administered dose.

CLH REPORT FOR SEDAXANE
38
At least 13 components were present in urine from male bile duct cannulated rats. The most abundant of these comprised 1.04% of the administered dose and was identified as CSCD659087 while none of the remaining components exceeded 0.87% of the administered dose. At least 8 radiolabelled were present in urine from female bile duct cannulated rats, the most abundant of these included CSCD659087 (2.36%) and two unresolved metabolites identified as a glucuronic acid conjugate of desmethyl SYN524464 hydroxylated on the phenyl moiety and a desmethyl -hydroxycarbonyl metabolite which together accounted for 1.66% of the dose. None of the remaining metabolites, including one unidentified component, individually exceeded 0.62% of the administered dose.A single radiolabelled component identified as SYN524464 (6.41%) was present in faeces from male bile duct cannulated rats. Faeces obtained from female bile duct cannulated rats contained 2 isomers of SYN524464 which comprised 3.20% and 1.29% of the administered dose and were likely to be the trans and cis isomers.
Table 2-30: Metabolite profile in excreta of bile duct cannulated rats following a single oral dose of [pyrazole 5 14C]-SYN524464 at the low dose level of 1 mg/kg
Percent of administered dose (number of isomers)StudyNo.: 187628
Pyrazole [14C]-SYN524464 1 mg/kgMale FemaleBile (0.5-48 h) Bile (0.5-48 h)
Compound
Urine(0-48
h)
Faeces(0-48
h)(d) (e)
Total excreta
(l)
Urine(0-48
h)
Faeces(0-48
h)(d) (e)
Total excreta
(l)SYN524464 - 6.41 0.34 0.72 6.75 - 4.49 0.73 - 5.22CSCC210616 - - 0.16 - 0.16 - - 0.84 - 0.84CSCD659087 1.04 - 3.46 25.41 4.50 2.36 - 3.05 28.80 5.41CSCD668404 - - 0.96(f) 5.13 0.96 0.50 - 1.17(f) 6.59 1.67CSCD659088 - - - 1.32 - - - - 1.52 -CSCD658906 0.86 - 2.30 22.46 3.16 0.62 - 3.06 25.03 3.68CSCD659089 - - - 4.99 - - - - 2.33 -CSCS659090 - - 1.06(g) 5.63 1.06 - - 0.57(g) 5.99 0.57Hydroxy - - - 0.57 - - - - - -Desmethyl -hydroxycarbonyl 0.87(b) - - - 0.87 1.66(b) - - - 1.66
Dihydroxy/-hydroxycarbonyl(a)
0.39(a) - - - 0.39 - - - - -
-Hydroxycarbonyl - - - - - 0.22 (1) - - - 0.22
Dihydroxy - - - 0.60 - - - - - -Carboxylic acid 0.36 - - - 0.36 0.23 - - - 0.23Hydroxy -hydroxycarbonyl 0.42 - - - 0.42 - - - - -
Hydroxy cysteine conjugate - - - 2.77 - - - - - -
Desmethyl glucuronide - - 0.51
(2)(h) 3.07 0.51 - - 1.20 (2)(h) 3.03 1.20
Desmethyl hydroxy glucuronide (1)(c) - 31.68
(4)(i) - 31.68 (1)(c) - 33.56 (4) - 33.56
Hydroxy glucuronide 0.47 - 31.81
(4)(j) - 32.28 0.47 (1) - 30.20
(4)(j) - 30.67
Dihydroxy glucuronide - - 0.85
(1) - 0.85 - - 1.25 (1) - 1.25
Hydroxy glutathione conjugate
- - (1)(k) - - - - - - -
Dihydroxy glutathione - - 0.32
(1) - 0.32 - - - - -
Post extraction solids NA 0.30 NA NA 0.30 NA 0.20 NA NA 0.20
Total identified 4.41 6.41 73.45 72.67 84.27 6.06 4.49 75.63 73.29 86.18Total unidentified 2.10 0.00 4.97 5.75 7.07(m) 0.34 0.00 4.19 6.52 4.53(n)Total accounted for 6.51 6.71 78.42 78.42 91.64 6.40 4.69 79.82 79.81 90.91Losses/Gains 0.19 0.01 0.58 0.58 1.28 0.50 0.04 -0.42 -0.41 0.12Total 6.70 6.70 79.00 79.00 92.92 6.90 4.73 79.40 79.40 91.03

CLH REPORT FOR SEDAXANE
39
a The empirical formula for these structures is the same therefore this metabolite could not be identified based on accurate mass b Includes an unresolved desmethyl hydroxy glucuronide metabolitec A desmethyl hydroxy glucuronide metabolite was unresolved from a desmethyl -hydroxycarbonyl metabolited Unhydrolysed bilee Hydrolysed bilef Includes an unresolved hydroxy glucuronide (phenolic) metaboliteg Includes an unresolved desmethyl glucuronide metaboliteh Two desmethyl glucuronide metabolites were detected, one unresolved from CSCD659090i Includes a hydroxy glutathione metabolite unresolved from a desmethyl hydroxy glucuronide metabolitej Four hydroxy glucuronide metabolites were detected, one unresolved from CSCD668404k A hydroxy glutathione metabolite was unresolved from a desmethyl hydroxy glucuronide metaboliteL Sum of urine, faeces and unhydrolysed bilem Eleven components none greater than 1.96 % of the administered dosen Four components none greater than 2.59 % of the administered doseNA = Not applicable
Phenyl-radiolabel high dose level (bile duct cannulated rats): At least 15 metabolites were present in bile from male rats and 13 in bile from female rats. The most abundant metabolites were glucuronic acid conjugates of SYN524464 and desmethyl SYN524464 hydroxylated on the phenyl moiety which accounted for 37.86% and 23.53% of the administered dose respectively. The remaining components were identified as two glucuronic acid conjugates of SYN524464 hydroxylated on the cyclopropyl moiety (7.44% and 3.48%), three glucuronic acid conjugates of desmethyl SYN524464 hydroxylated on the phenyl moiety (2.83%,1.79% and 1.01%), a glutathione conjugate of hydroxylated SYN524464 unresolved from a glucuronic acid conjugate of hydroxylated desmethyl SYN524464 (2.71%), a glucuronic acid conjugate of desmethyl SYN524464 (2.11%), two unresolved components which included CSCD659090 and a glucuronic acid conjugate of desmethyl SYN524464 (1.88%), CSCD658906 (1.55%) and a glucuronic acid conjugate of SYN524464 hydroxylated on the phenyl moiety unresolved from CSCD668404 (1.35%). No other component individually exceeded 0.94% of the administered dose. The most abundant metabolites present in bile from female rats were glucuronic acid conjugates of SYN524464 and desmethyl SYN524464 hydroxylated on the phenyl moiety which accounted for 36.80% and 31.93% of the administered dose respectively. The remaining metabolites were identified as two glucuronic acid conjugates of desmethyl SYN524464 hydroxylated on the phenyl moiety (4.36% and 1.23%), two glucuronic acid conjugates of SYN524464 hydroxylated on the cyclopropyl moiety (2.79% and 1.12%), unresolved components which included CSCD659090 and a glucuronic acid conjugate of desmethyl SYN524464 (2.42%), a glutathione conjugate of hydroxylated SYN524464 unresolved from a desmethyl hydroxy glucuronide (1.92%). None of the remaining components, including one that was unidentified exceeded 0.86% of the administered dose. At least 26 metabolites were present in urine from male rats, none of which exceeded 0.67% of the administered dose. At least 13 metabolites were present in urine from female rats. One of these, identified as CSCD659087 accounted for 1.30%. None of the remaining 12 components, including 4 that were unidentified, individually exceeded 0.96% of the administered dose. At least 3 radiolabelled components were detected in faeces from male rats and 4 in faeces from female rats. These were identified in male rats as SYN524464 which accounted for 3.69% of the administered dose, CSCD658906 (0.27%) and a desmethyl -hydroxycarbonyl metabolite (0.23%). The metabolites present in faeces from female rats were identified as SYN524464 which accounted for 9.60% of the administered dose and CSCD658906 (0.31%), CSCD668404 (0.20%) and desmethyl SYN524464 (0.19%).
Table 2-31: Metabolite profile in excreta of bile duct cannulated rats following a single oral dose of [phenyl U-14C]-SYN524464 at the high dose level of 80 mg/kg
Percent of administered dose (number of isomers)Study No.: 188574
Phenyl [14C]-SYN524464 80 mg/kgMale Female
Compound
Urine(0-48 h)
Faeces(0-48 h)
Bile (0.5-48 h)
Total excreta
Urine(0-48 h)
Faeces(0-48 h)
Bile(0.5-48 h)
Total excreta
SYN524464 - 3.69 0.87 4.56 - 9.60 - 9.60CSCD659087 0.31 - 0.75 1.06 1.30 - 0.57 1.87CSCD668404 - - 1.35b 1.35 0.21 0.20 0.47b 0.88CSCD658906 0.29 0.27 1.55 2.11 0.68 0.31 0.69 1.68CSCD659090 - - 1.88c 1.88 - - 2.42c 2.42Desmethyl SYN524464 - - - - - 0.19 (1) - 0.19
Desmethyl -hydroxycarbonyl 0.44 (1) 0.23 (1) - 0.67 0.96 (1)h - - 0.96
Dihydroxy/ - 0.67 (1)a - - 0.67 0.27 (1)a - - 0.27

CLH REPORT FOR SEDAXANE
40
hydroxycarbonyla
Carboxylic acid 0.56 (1) - - 0.56 0.21 (1) - - 0.21Hydroxy -hydroxycarbonyl 0.50 (4) - - 0.50 - - - -
Desmethyl hydroxy sulphate conjugate 0.47 (1) - - 0.47 - - - -
Hydroxy sulphate conjugate 0.16 (1) - - 0.16 - - - -
Desmethyl glucuronide - - 2.11 (2)d 2.11 0.38 (2) - 0.86 (2)d 1.24
Desmethyl hydroxy glucuronide 0.58 (2) - 32.81 (6)e 33.39 (1)i - 39.44 (4)e 39.44
Hydroxy glucuronide 0.63 (2) - 48.78 (4)f 49.41 0.40 (1) - 40.71 (4)f 41.11
Hydroxy glutathione conjugate
- - (1)g - - - (1)g -
Post extraction solids NA 0.20 NA 0.20 NA 0.20 NA 0.20
Total identified 4.61 4.19 90.10 98.90 4.41 10.30 85.16 99.87Total unidentified 1.09 0.00 0.00 1.09j 0.50 0.00 0.34 0.84k
Total accounted for 5.70 4.39 90.10 100.19 4.91 10.5 85.50 100.91Losses/Gains 1.00 0.01 -4.80 -3.79 0.39 0.1 -4.50 -4.01Total 6.70 4.40 85.30 96.40 5.30 10.6 81.00 96.90a The empirical formula for these structures is the same therefore this metabolite could not be identified based on accurate mass b Includes an unresolved hydroxy glucuronide (phenolic) metabolitec Includes an unresolved desmethyl glucuronide metabolited Two desmethyl glucuronide metabolites were detected, one unresolved from CSCD659090e Includes a hydroxy glutathione metabolite unresolved from a desmethyl hydroxy glucuronide metabolitef Four hydroxy glucuronide metabolites were detected, one was unresolved from CSCD668404g A hydroxy glutathione metabolite was unresolved from an isomer of a desmethyl hydroxy glucuronide metaboliteh Includes an unresolved desmethyl hydroxy glucuronide (phenolic) metabolitei A desmethyl hydroxy glucuronide (phenolic) metabolite was unresolved from a desmethyl -hydroxycarbonyl metabolitej Eleven components none greater than 0.24 % of the administered dosek Five components none greater than 0.34 % of the administered doseNA = Not applicable
Phenyl-radiolabel low dose level (bile duct cannulated rats): At least 14 metabolites were present in bile from male rats and 15 in bile from female rats. The most abundant metabolites in bile from male rats were glucuronic acid conjugates of desmethyl SYN524464 and SYN524464 hydroxylated on the phenyl moiety which accounted for 29.44% and 27.77% of the administered dose respectively. The remaining components were identified as two glucuronic acid conjugates of SYN524464 hydroxylated on the cyclopropyl moiety (6.67% and 2.49%), a glutathione conjugate of hydroxylated SYN524464 unresolved from a glucuronic acid conjugate of hydroxylated desmethyl SYN524464 (4.98%), two glucuronic acid conjugates of desmethyl SYN524464 hydroxylated on the phenyl moiety (4.12% and 1.69%), CSCD659087 (1.47%), CSCD658906 (1.22%), two unresolved components which included CSCD659090 and a glucuronic acid conjugate of desmethyl SYN524464 (1.19%), SYN524464 (1.17%), a glucuronic acid conjugate of SYN524464 hydroxylated on the phenyl moiety unresolved from CSCD668404 (1.04%) and a glucuronic acid conjugate of desmethyl SYN524464 (1.02%). One component that accounted for 1.06% of the dose remained unidentified. The most abundant metabolites in bile from female rats were glucuronic acid conjugates of desmethyl SYN524464 and SYN524464 hydroxylated on the phenyl moiety which accounted for 30.12% and 29.64% of the administered dose respectively. The remaining metabolites were identified as three glucuronic acid conjugates of desmethyl SYN524464 hydroxylated on the phenyl moiety (4.41%, 3.12% and 2.00%), a cysteine conjugate of hydroxylated SYN524464 (2.33%), a glucuronic acid conjugate of SYN524464 hydroxylated on the cyclopropyl moiety (1.87%), a glutathione conjugate of hydroxylated SYN524464 unresolved from a glucuronic acid conjugate of hydroxylated desmethyl SYN524464 (1.22%), CSCD659087 (1.27%) and an unidentified component (2.73%). None of the remaining components, including one that was unidentified exceeded 0.98% of the administered dose. At least 15 metabolites were present in urine from male rats, none of which exceeded 0.91% of the administered dose. At least 12 metabolites were present in urine from female rats. The 2 components that exceeded 1% of the administered dose were identified as two unresolved metabolites: a glucuronic acid conjugate of hydroxylated desmethyl SYN524464 and a desmethyl -hydroxycarbonyl metabolite which together accounted for 2.51% of the

CLH REPORT FOR SEDAXANE
41
dose and CSCD659087 which accounted for 1.62% dose. None of the remaining 10 components, including 3 which were not identified, exceeded 0.85% of the administered dose.At least 4 radiolabelled components were detected in faeces from male rats and 4 in faeces from female rats. The most abundant of these in faeces from male rats was identified as SYN524464 which accounted for 4.31% of the administered dose. The other components were identified as a desmethyl -hydroxycarbonyl metabolite of SYN524464, CSCD658906 each of which accounted for 0.38% of the administered dose, and CSCD659089 which accounted for 0.33% of the administered dose. The most abundant component in faeces from female rats was identified as SYN524464 which accounted for 7.38% of the administered dose. The remaining metabolites were identified as CSCD668404 (0.57%), CSCD658906 (0.27%), and CSCD658089 (0.18%).
Table 2-32: Metabolite profile in excreta of bile duct cannulated rats following a single oral dose of [phenyl U-14C]-SYN524464 at the low dose level of 1 mg/kg
Percent of administered dose (number of isomers)Study No.: 188574
Phenyl [14C]-SYN524464 1 mg/kgMale Female
Compound
Urine(0-48 h)
Faeces(0-48 h)
Bile (0.5-48 h)
Total excreta
Urine(0-48 h)
Faeces(0-48 h)
Bile(0.5-48 h)
Total excreta
SYN524464 - 4.31 1.17 5.48 - 7.38 - 7.38CSCD659087 0.86 - 1.47 2.33 1.62 - 1.27 2.89CSCD668404 - - 1.04b 1.04 0.54 0.57 - 1.11CSCD658906 0.46 0.38 1.22 2.06 0.64 0.27 0.79 1.70CSCD659089 - 0.33 - 0.33 - 0.18 - 0.18CSCD659090 - - 1.19c 1.19 - - 0.50c 0.50Desmethyl -hydroxycarbonyl - 0.38 (1) - 0.38 2.51 (1)h - - 2.51
Dihydroxy/ -hydroxycarbonyla
0.75 (1)a - - 0.75 0.15 (1)a - - 0.15
Carboxylic acid 0.43 (1) - - 0.43 0.13 (1) - - 0.13Hydroxy -hydroxycarbonyl 0.29 (1) - - 0.29 0.33 (1) - - 0.33
Hydroxy cysteine conjugate - - - - - - 2.33 (1) 2.33
Desmethyl glucuronide - - 1.02 (2)d 1.02 - - 0.65 (2)d 0.65
Desmethyl hydroxy glucuronide 1.12 (2) - 40.23 (4)e 36.37 0.26 (2)i - 40.87 (5)e 41.13
Hydroxy glucuronide 0.32 (1) - 36.93 (4)f 37.25 0.85 (1) - 32.49 (3) 33.34
Hydroxy glutathione conjugate
- - (1)g - - - (1)g -
Post extraction solids NA 0.20 NA 0.20 NA 0.10 NA 0.10
Total identified 4.23 5.40 84.27 93.90 7.03 8.40 78.90 94.33Total unidentified 1.57 0.00 1.06 2.63j 0.46 0.00 3.21 3.67k
Total accounted for 5.80 5.60 85.33 96.73 7.49 8.50 82.11 98.10Losses/Gains 0.70 0.10 -4.23 -3.43 0.61 0.10 -3.51 -2.80Total 6.50 5.70 81.10 93.30 8.10 8.60 78.60 95.30a The empirical formula for these structures is the same therefore this metabolite could not be identified based on accurate mass b Includes an unresolved hydroxy (phenolic) glucuronide metabolitec Includes an unresolved desmethyl glucuronide metabolited Two desmethyl glucuronide metabolites were detected, one unresolved from CSCD659090e Includes a hydroxy glutathione metabolite unresolved from a desmethyl hydroxy glucuronide metabolitef Four hydroxy glucuronide metabolites were unidentified, one unresolved from CSCD668404g A hydroxy glutathione metabolite was unresolved from a desmethyl hydroxy glucuronide metaboliteh Includes an unresolved desmethyl hydroxy glucuronide (phenolic) metabolite

CLH REPORT FOR SEDAXANE
42
i Two desmethyl hydroxy glucuronide metabolites were detected, one unresolved from a desmethyl -hydroxycarbonyl metabolitej Eight components none greater than 1.06 % of the administered dosek Five components none greater than 2.73 % of the administered doseNA = Not applicable
Pyrazole-radiolabel high dose level plasma: At least 7 radiolabelled components were detected in plasma obtained at Cmax from male rats and 6 in plasma similarly obtained from female rats. SYN524464 was the most abundant component in plasma, present at a concentration of 4.727 mg/kg in male rats and 8.117 mg/kg in female rats. Two metabolites, CSCD667584 and another isomer of desmethyl SYN524464, were the major metabolites detected and were present at a concentration of 3.297 mg/kg and 0.715 mg/kg in male rats and 3.652 mg/kg and 1.082 mg/kg in female rats. The remaining metabolites in male rats were identified as CSCD659089 (0.933 mg/kg), CSCD659088 (0.536 mg/kg), CSCD668403 (0.496 mg/kg) and CSCD658906 (0.417 mg/kg). The remaining metabolites in female rats were identified as CSCD658906 (0.237 mg/kg), a glucuronic acid conjugate of desmethyl SYN524464 hydroxylated on the phenyl moiety (0.204 mg/kg) and CSCD659088 (0.102 mg/kg).
Pyrazole-radiolabel low dose level plasma: At least 3 radiolabelled components were detected in plasma obtained at Cmax from male rats and 4 in plasma similarly obtained from female rats. A metabolite identified as CSCD667584 was the major metabolite present at a concentration of 0.051 mg/kg in male rats. SYN524464, present at a concentration of 0.022 mg/kg, was also detected in male rats. The remaining metabolite was identified as CSCD659088 (0.015 mg/kg). Two metabolites, CSCD667584 and another isomer of desmethyl SYN524464 present at a concentration of 0.038 mg/kg and 0.016 mg/kg were the major metabolites detected in female rats. SYN524464 was present at a concentration of 0.018 mg/kg and the remaining metabolite was identified as a glucuronic acid conjugate of desmethyl SYN524464 hydroxylated on the phenyl moiety (0.012 mg/kg).
The majority of metabolites excreted in urine tended to be unconjugated comprising hydroxylated and/or metabolites formed by cleavage and oxidation of the cyclopropyl moiety of both SYN524464 and desmethyl SYN524464. Some glucuronic acid and sulphate conjugates of these metabolites were also detected. The major metabolites were CSCD659087, CSCD658906, a desmethyl β-hydroxycarbonyl metabolite, a desmethyl hydroxy glucuronide (phenolic) metabolite, and a hydroxy glucuronide (phenolic) metabolite. No individual metabolite was greater than 5% of the administered dose with the exception of CSCD659087 (9.33%) in urine from female rats administered a 1 mg/kg dose.
The majority of metabolites present in bile were conjugates of hydroxy and desmethyl hydroxy metabolites of SYN524464. In addition to glucuronic acid conjugates, glutathione and cysteine conjugates were also present. The two major metabolites were a desmethyl hydroxy glucuronide (phenolic) metabolite (12-27%) and a hydroxy glucuronide (phenolic) metabolite (24-38%) prior to enzyme hydrolysis. Following treatment with a mixture of β-glucuronidase and sulphatase enzymes the major components were identified as CSCD659087 (15-29%) and CSCD658906 (22-35%). CSCD659089 (2-10%), CSCD659090 (6-8%), CSCD668404 (2-7%), a glucuronic acid conjugate of desmethyl SYN524464 (ca3%) and CSCD659088 (1-2%) were also observed.
The majority of metabolites excreted in faeces were identified as phenolic and hydroxyl metabolites and/or metabolites formed by cleavage and oxidation of the cyclopropyl moiety of both SYN524454 and desmethyl SYN524464. The two major metabolites were CSCD659087 (15-35%) and CSCD658906 (7-17%). CSCD668404 (3-9%), CSCD659089 (1-10%) and CSCD659090 (2-5%), SYN524464 (2-4%), CSCD659088 (1-2%) and a number of dihydroxy metabolites (1-3%) were also observed. Some glucuronic acid conjugates of these hydroxy metabolites were also present. Faeces from bile duct cannulated rats contained SYN524464 as the major component.
Metabolic pathway
The biotransformation of SYN524464 was postulated to proceed by: N-Demethylation

CLH REPORT FOR SEDAXANE
43
Hydroxylation of SYN524464 to give the para phenols CSCD658906 and CSCD659090 and the cyclopropyl alcohol CSCD659089. These metabolites were excreted primarily in the bile as glucuronide conjugates.
Hydroxylation of desmethyl SYN524464 to give the desmethyl para phenols CSCD659087 and CSCD668404 and the desmethyl cyclopropyl alcohol CSCD659088. These metabolites were excreted primarily in the bile as glucuronide conjugates
Opening of the terminal cyclopropyl moiety followed by oxidation of the SYN524464 and desmethyl SYN524464 to give -hydroxycarbonyl SYN524464 (the trans isomer CSCD668403 was identified) and -hydroxycarbonyl desmethyl SYN524464 metabolites.
Further hydroxylation and oxidation of hydroxy and desmethyl hydroxy metabolites
Further hydroxylation and oxidation of -hydroxycarbonyl SYN524464 and desmethyl -hydroxycarbonyl SYN524464 metabolites
Glucuronic acid together with minor amounts of sulphate conjugation of hydroxylated metabolites
Glutathione conjugation
The biotransformation pathway proposed for SYN524464 is presented in the figures below.

CLH REPORT FOR SEDAXANE
44
NN
HF2C NHO
H
CH3
H
NH
N
HF2C NHO
H H
SYN524464
CSCD667584 and
desmethyl SYN 524464
CSCD659087 and CSCD668404
NH
N
HF2C NHO
H H
OH
NH
N
HF2C NHO
H H
OH
CSCD659088
Glucuronide conjugate
CSCD659089
CSCD658906 and CSCD659090
NN
HF2C NHO
H
CH3
H
OH
NN
HF2C NHO
H
CH3
H
OH
CSCD668403 NN
HF2C NHO
H
CH3
H
O
OH
CSCC210616
NN
HF2C NH2
O
CH3
Glucuronide conjugates
Glucuronide conjugates
Glucuronide conjugates
Figure 2–1: Biotransformation Pathways Based on Identified Metabolites of SYN524464

CLH REPORT FOR SEDAXANE
45
Figure 2–2: Overall Summary of the Biotransformation Pathway of SYN524464 in Rat
NN
HF2C NHO
H
CH3
H
NH
N
HF2C NHO
H HSYN524464 Desmethyl
SYN524464
NH
N
HF2C NHO
H H
OHNH
N
HF2C NHO
H H
OH
Glucuronide conjugate
Hydroxy metabolites
NN
HF2C NHO
H
CH3
H
OH
NN
HF2C NHO
H
CH3
H
OH
-Hydroxycarbonyl metabolitesN
N
HF2C NHO
H
CH3
H
O
OH
CSCC210616
Glucuronide, sulphate, cysteine and glutathione conjugates
NH
N
HF2C NHO
H H
OH
Desmethyl hydroxy metabolites
NH
N
HF2C NHO
H H
O
OH
Desmethyl -hydroxycarbonyl metabolites
NN
HF2C NHO
H
CH3
H
O
OH
OH
NN
HF2C NHO
H
CH3
H
O
OH
O
Hydroxy -hydroxycarbonyl metabolites N
N
HF2C NHO
H
CH3
H
OHOH
NN
HF2C NHO
H
CH3
H
OH
OH
Dihydroxy metabolites N
H
N
HF2C NHO
H H
OHOH
NH
N
HF2C NHO
H H
OHOH
Desmethyl dihydroxy metabolites
Glucuronide, sulphate, cysteine and glutathione conjugates
Glucuronide, sulphate, cysteine and glutathione conjugates
Glucuronide, sulphate, cysteine and glutathione conjugatesCysteine and glutathione
conjugates
NN
HF2C NHO
H
CH3
H
OH
NN
HF2C NH2
O
CH3
Carboxylic acid

CLH REPORT FOR SEDAXANE
46
CONCLUSION:
[14C]-SYN524464 was extensively metabolised by rats via demethylation, hydroxylation, oxidation and conjugation affording an array of hydroxylated metabolites and metabolites formed by cleavage of the terminal cyclopropyl moiety. An equivalent range of metabolites of desmethyl SYN524464 were formed. The major metabolites were identified as the trans para phenol CSCD658906 and the desmethyl trans para phenol CSCD659087 which together with the equivalent cis para phenol isomers CSCD659090 and CSCD668404 accounted for approximately half the administered dose. Glucuronic acid, sulphate and glutathione conjugates were formed.
3 HEALTH HAZARDS
3.1 Acute toxicity - oral route 3.1.1 Animal data
3.1.1.1 Anonymous (2008)
Report: Anonymous, 2008. SYN524464 - Acute Oral Toxicity Study in the Rat (Up and Down Procedure). B35537. 14 January 2008. Unpublished. (Syngenta File No.SYN524464/0053).
GUIDELINES: OECD Test Guideline, Number 425 (2001); EPA OPPTS 870.1100 (2002)
GLP: Signed and dated GLP and Quality Assurance statements were provided.
There were no deviations from the current regulatory guideline considered to compromise the scientific validity of the study.
EXECUTIVE SUMMARYA limit test with 1 animal (female HanRcc:WIST (SPF) rat) was conducted. This animal was treated with SYN524464 by gavage at the limit dosage of 5000 mg/kg body weight). The animal died shortly after dosing. Thereafter, following the AOT 425 Statistical program, a main test was conducted starting at a dose of 175 mg/kg (one animal) and using further animals treated at 550 mg/kg (1 animal), 1750 mg/kg (4 animals) and 5000 mg/kg (6 animals). For the dose of 5000 mg/kg, the application volume was 20 mL/kg in 0.5% CMC. An application volume of 10 mL/kg in 0.5% CMC was used for the doses of 175 mg/kg, 550 mg/kg or 1750 mg/kg.
Two animals, one treated at 175 and one at 550 mg/kg and the four animals treated at 1750 mg/kg, survived until the end of the study period. From the 7 animals treated at 5000 mg/kg, four animals were killed for ethical reasons after treatment at 5000 mg/kg 3 or 5 hours post-dosing on test day 1 and one female was found dead on test day 2; the remaining two animals survived. No gross abnormalities were noted when necropsied following the 14-day observation period.
The 175 mg/kg treated female showed minor clinical signs approximately 30 minutes post-dose up to the 5-hour reading. The 550 mg/kg treated female showed minor clincal signs from the 1 hour post-dose up to test day 3 only. No gross abnormalities were noted upon necropsy.
In the four 1750 mg/kg treated females, slight to moderate clinical signs were observed shortly after dosing and persisted until day 4 or 5 in three animals and the remaining animal until day 15. No gross abnormalities were noted upon necropsy.
In the seven 5000 mg/kg females, clinical observations noted prior to death included ruffled fur, hunched posture, sedation, poor co-ordination, ventral recumbency, deep respiration, rales, salivation and bradypnea. The surviving two animals showed signs of toxicity up to test day 8 and 10 respectively. The body weight of the surviving animals was within the range commonly recorded for this strain and age.

CLH REPORT FOR SEDAXANE
47
A yellowish discolorated jejunum was recorded in the first 5000 mg/kg treated female that was killed in extremis. In the last 5000 mg/kg treated female the lungs, whilst not collapsed, were discolored, pale at necropsy. No macroscopic findings were recorded in the surviving animals.
The median lethal dose of SYN524464 after single oral administration to female rats, observed over a period of 14 days is:
Estimated LD50 (female rat): 5000 mg/kg body weight (approximate 95 % PL confidence interval 2513 to 9210 mg/kg body weight (profile likelihood based confidence interval).
MATERIALS AND METHODSMaterials:
Test Material: SYN524464Description: Solid; white powderLot/Batch number: SMU6LP006/MILLEDPurity: 95.3%. ratio of isomers 83.0% trans, 12.3% cisStability of test compound: Stable under storage conditions. Retest date: 31-JAN-2011
Test Animals:Species RatStrain HanRcc:WIST (SPF)Age/weight at dosing 10-11 weeks / 179.9 – 195.7 g body weightSourceHousing In groups of three in Makrolon type-4 cages with wire mesh tops and standard
softwood bedding ('Lignocel' Schill AG, CH-4132 Muttenz/Switzerland).Acclimatisation period 7 daysDiet Pelleted standard Provimi Kliba 3433 rat/mouse maintenance diet, batch nos.
89/96 and (Provimi Kliba AG, CH-4303 Kaiseraugst/Switzerland) ad libitum. Water Community tap water from Füllinsdorf ad libitum. Environmental conditions Temperature: 22 ± 3 °C
Humidity: 30-70 % (values above 70 % during cleaning process possible)Air changes: 10-15 / hPhotoperiod: 12 hours light and 12 hours dark
Study Design and Methods:In-life dates: Start: 18 April 2007 End: 24 July 2007
Animal assignment and treatment: The animals received a single dose of the test item by oral gavage administration after being fasted for approximately 16 to 20 hours, but with free access to water. Food was presented approximately 3 to 4 hours after dosing.
Dosing started in one female animal at a dosage level of 5000 mg/kg. The application volume was 20 mL/kg in 0.5% CMC. As the animal died shortly after dosing, a main test was performed by using further dose levels according to the criteria described in the OECD 425. A minimum of 48 hours was allowed before dosing the next animal in the sequence. An application volume of 10 mL/kg in 0.5% CMC was used for the doses of 175 mg/kg, 550 mg/kg or 1750 mg/kg.
The animals were examined daily during the acclimatization period and mortality, viability and clinical signs were recorded. All animals were examined for clinical signs once during the first 30 minutes and at approximately 1, 2, 3 and 5 hours after treatment on day 1 and once daily during test days 2-15. Mortality/viability was recorded once during the first 30 minutes and at approximately 1, 2, 3 and 5 hours after administration on test day 1 (with the clinical signs) and twice daily during days 2-15. Body weights were recorded on day –1 (prior to removal of food), day 1 (prior to administration) and on days 8 and 15. All animals were necropsied and examined macroscopically.

CLH REPORT FOR SEDAXANE
48
Statistics: The statistical programme (AOT 425 Stat Pgm) version: 1.0, 2001. [http://www.oecd.org/pages/home/display general/0,3380,EN-document-524-nodirectorite-0-24-6775-8,FF.html) was used for the selection of dose levels and estimation of the LD50.
RESULTS AND DISCUSSIONMortality: A limit test with 1 animal (female HanRcc:WIST (SPF) rat) was conducted. This animal was treated with SYN524464 by gavage at the limit dosage (5000 mg/kg body weight) at a volume dosage of 20 mL/kg in 0.5% CMC.
Animal Number Dose [mg/kg body weight]
Volume given [mL/kg body weight]
Survival
1 5000 20 Killed in extremis (3 hours after dosing)
The animal treated with 5000 mg/kg in the limit test was killed in extremis approximately 3 hours after treatment. Thereafter, following the AOT 425 Statistical program, a main test was conducted starting at a dose of 175 mg/kg as follows:
Table 3.1.1.1-1: Acute oral toxicity of SYN524464 in the rat, application scheme and mortality dataAnimal number Dose
(mg/kg bodyweight)Volume given
(mL/kg bodyweight) Survival
2 175 10 Survived
3 550 10 Survived
4 1750 10 Survived
5 5000 20 Survived
6 5000 20 Found dead (2 days after dosing)
7 1750 10 Survived
8 5000 20 Survived
9 5000 20 Killed in extremis (5 hours after dosing)
10 1750 10 Survived
11 5000 20 Killed in extremis (5 hours after dosing)
12 1750 10 Survived
13 5000 20 Killed in extremis (5 hours after dosing)
Clinical observations: The only 175 mg/kg treated female had slightly ruffled fur approximately 30 minutes post-dose, up to the 5-hour reading. A hunched posture was observed 2 to 3 hours after dosing and at the 3-hour evaluation was slightly sedated.
The only 550 mg/kg treated female had slightly ruffled fur from the 1 hour post-dose up to test day 3. A hunched posture was noted 2 hours up to 5 hours after treatment but was free from clinical signs from test day 4 to 15 and gained body weight over the observation period.
No gross abnormalities were noted upon necropsy.
In the four 1750 mg/kg treated females, slightly ruffled fur was observed shortly after dosing and persisted until day 4 or 5 in three animals and the remaining animal until day 15. Additionally, hunched posture and slight sedation (moderate in one animal) were observed up to test day 5. One animal showed poor coordination 1 hour post dose and in another ventral recumbency was noted at the 3-hour evaluation.

CLH REPORT FOR SEDAXANE
49
No clinical signs were visible after test day 5 to 6 until the end of the observation period.
In the seven 5000 mg/kg females, the clinical observations noted prior to death included ruffled fur, hunched posture, sedation, poor co-ordination, ventral recumbency, deep respiration, rales, salivation and bradypnea. The surviving two animals had hunched posture up to test day 2 or 9 respectively, slightly to moderately ruffled fur until day 7 or 15 respectively, poor co-ordination on the day of dosing (until test day 2 in one animal), were sedated on the day of dosing (persisting in one animal until day 3) and had deep respiration on the day of dosing (one animal). The surviving animals were free of clinical signs from test day 8 or 10 until day 15. No gross abnormalities were noted upon necropsy.
Bodyweight: The body weight of the surviving animals was within the range commonly recorded for this strain and age. All animals lost weight from test day -1 (removal of the food) to test day 1 (day of application).
Necropsy: A yellowish discolorated jejunum was recorded in the first 5000 mg/kg treated female that was killed in extremis. In the last 5000 mg/kg treated female the lungs, whilst not collapsed, were discolored, pale at necropsy. No macroscopic findings were recorded in the surviving animals.
CONCLUSION: The median lethal dose of SYN524464 after single oral administration to female rats, observed over a period of 14 days is:
Estimated LD50 (female rat): 5000 mg/kg body weight , approximate 95 % PL confidence interval is 2513 to 9210 mg/kg body weight.
3.1.2 Human data
No relevant studies
3.1.3 Other dataNo relevant studies
3.2 Acute toxicity - dermal route3.2.1 Animal data3.2.1.1 Anonymous (2007)
Report: Anonymous, 2007. SYN524464 - Acute Dermal Toxicity Study in the Rat. Report number B35548. 28 December 2007. Unpublished. (Syngenta File No SYN524464/0049)
GUIDELINES: Acute Dermal Toxicity (rat) OECD 402 (1987): OPPTS 870.1200 (1998): 92/69/EEC B.3 (1992)
GLP: Signed and dated GLP and Quality Assurance statements were provided.
There were no deviations from the current regulatory guideline considered to compromise the scientific validity of the study.
EXECUTIVE SUMMARYA group of one male and one female and a second group of four male and four female HanRcc:WIST (SPF) rats were treated with SYN524464 at 5000 mg/kg by dermal application. The test item was applied undiluted and moistened with approximately 1 mL purified water for treatment. The application period

CLH REPORT FOR SEDAXANE
50
was 24 hours and the animals were observed for a period of 14 days post treatment. At the end of the study the animals were killed and subjected to a macroscopic examination post mortem.
All animals survived until the end of observation time and there were no signs of systemic toxicity. The bodyweight of the animals was within the range commonly recorded for this age and strain. No macroscopic findings were observed at necropsy.
The median lethal dose of SYN524464 after single dermal administration to rats of both sexes, observed over a period of 14 days is greater than 5000 mg/kg body weight.
MATERIALS AND METHODSMaterials:
Test Material: SYN524464Description: Solid; white powderLot/Batch number: SMU6LP006/MILLEDPurity: 95.3%. ratio of isomers 83.0% trans, 12.3% cisStability of test compound: Stable under storage conditions. Retest date: 31-JAN-2011
Vehicle and/or positive control: None
Test Animals:Species RatStrain HanRcc:WIST (SPF)Age/weight at dosing 8-11 weeks / 193.7 – 260.2 g body weightSourceHousing During acclimatization in groups of five per sex in Makrolon type-4 cages
with standard softwood bedding. Individually in Makrolon type-3 cages with standard softwood bedding during treatment and observation.
Acclimatisation period 7 - 8 daysDiet Pelleted standard Provimi Kliba 3433 rat/mouse maintenance diet, batch no.
89/06 (Provimi Kliba AG, CH-4303 Kaiseraugst/Switzerland) ad libitum. Water Community tap water from Füllinsdorf ad libitum.Environmental conditions Temperature: 22 ± 3 °C
Humidity: 30-70 % (values above 70 % during cleaning process possible)Air changes: 10-15 / hPhotoperiod: 12 hours light and 12 hours dark
Study Design and Methods:In-life dates: Start: 18 April 2007 End: 10 May 2007.
Animal assignment and treatment: A group of one male and one female and a second group of four male and four female HanRcc:WIST (SPF) rats were treated with SYN524464 at 5000 mg/kg by dermal application. The test item was applied undiluted and moistened with approximately 1 mL purified water for treatment. The application period was 24 hours and the animals were observed for a period of 14 days post treatment. One day before treatment, the backs of the animals were clipped with electric clippers, exposing an area of approximately 10 % of the total body surface. Only those animals without injury or irritation on the skin were used in the test. On test day 1, the test item was applied evenly on the intact skin and was covered with a semi-occlusive dressing. The dressing was wrapped around the abdomen and fixed with an elastic adhesive bandage. Twenty-four hours after the application the dressing was removed and the skin was flushed with lukewarm tap water and dried with disposable paper towels. Thereafter, the reaction sites were assessed.
The animals were examined daily during the acclimatization period concerning viability/mortality and clinical signs. After treatment they were examined during the first 30 minutes and at approximately 1, 2, 3 and 5 hours after administration on test day 1 for local and clinical signs as well as viability/mortality. On test days 2 to 15 local and clinical signs were recorded once daily and viability/mortality twice daily. The body weights were recorded on test days 1 (prior to administration), 8 and 15. At the end of the scheduled

CLH REPORT FOR SEDAXANE
51
observation period, all animals were necropsied and examined macroscopically.
Statistics: No statistical analysis was used.
RESULTS AND DISCUSSIONMortality: No deaths occurred during the study.
Table 3.2.1.1–1: Acute dermal toxicity of SYN524464 in the rat (mortality data)Dose Level Day Number Number of Deaths(mg/kg) Male Female5000 1 0 0
Total at day 14 0/5 0/5
Clinical observations: No clinical signs were observed during the course of the study.
Bodyweight: The bodyweight of the animals was within the range commonly recorded for this age and strain.
Necropsy: No macroscopic findings were observed at necropsy.
CONCLUSION: The median lethal dose of SYN524464 after single dermal administration to rats of both sexes, observed over a period of 14 days is greater than 5000 mg/kg body weight
3.2.2 Human dataNo relevant studies.
3.2.3 Other dataNo relevant studies.
3.3 Acute toxicity - inhalation route3.3.1 Animal data3.3.1.1 Anonymous (2008)
Report: Anonymous (2008). SYN524464 - 4-Hour Acute Inhalation Toxicity Study in Rats. Report number: B36235. 22-January-2008. Unpublished. (Syngenta File No. SYN524464/0054).
GUIDELINES: Acute Inhalation Toxicity – Rat; OECD 403 (1981): OPPTS 870.1300 (1998): 92/69/EEC B.2 (1992) + amendment 2001/59/EC.
GLP: Signed and dated GLP and Quality Assurance statements were provided.
There were no relevant deviations from the current regulatory guidelines. In order to facilitate the generation of an aerosol suitable for acute inhalation toxicity testing in rats, the test item was liquefied by warming it and an aerosol was generated from the liquefied test item by use of a nebuliser and pre-warmed air. Extra diluent air was not pre-warmed.
EXECUTIVE SUMMARYA group of five male and five female albino rats [HanRcc:WIST(SPF)] was exposed for four hours by nose-only, flow-past inhalation to SYN524464 at a gravimetrically determined mean aerosol concentration of 5.244 mg/L air. The particle size distribution of the test atmosphere was analysed twice during the exposure period. The animals were observed for a period of 15 days (including the exposure

CLH REPORT FOR SEDAXANE
52
day as test day 1 of 15). Clinical observations and bodyweights were recorded throughout the study and at the end of the scheduled period, the animals were killed and subjected to a gross examination post mortem.
The achieved test atmosphere had the following characteristics:Target concentration
mg/l air
Achieved aerosol concentration
mg/L air
MMAD*
m
GSD+
5 5.244 mg/L (s.d. 0.062) 3.02, 2.97 2.84, 2.87
* Mass Median Aerodynamic Diameter (m)+ Geometric Standard Deviation
There were no deaths and no macroscopic pathology findings. Transient clinical signs comprising effects on breathing [bradypnea and breath sounds (rales)], decreased spontaneous activity, hunched posture and ruffled fur, and transient, slight retardation in bodyweight gain or marginal to moderate bodyweight loss in all animals were attributed to the treatment with the test item, although slight physical stress during restraint in the exposure tubes may have contributed to the effects on bodyweight.
The LC50 of SYN524464 for acute 4-hour inhalation toxicity in male and female rats observed for a period of 15 days was estimated to be greater than 5.244 mg/L air (gravimetrically determined mean aerosol concentration), as exposure to this aerosol concentration induced no deaths. There was no indication of sex-related differences in toxicity of the test item.
MATERIALS AND METHODSMaterials:
Test Material: SYN524464Description Off-white powderLot/Batch number SMU6LP006/MILLEDContent of SYN524464 SYN524464 (95.3%: 83.0% Trans isomer, 12.3% Cis isomer)CAS# Not reportedStability of test compound Stable under storage conditions and for at least 8 hours at 190°C
(Sicherheitsinstitut 2006). Reanalysis date: January 2011

CLH REPORT FOR SEDAXANE
53
Test Animals:Species RatStrain HanRcc:WIST (SPF)Age/ bodyweight at dosing Males: 9 weeks / 238.3 – 255.3 g
Females: 10 weeks / 203.5 – 222.8 gSource
Housing In groups of five in Makrolon type-IV cages with wire mesh tops and standard softwood bedding ("Lignocel", Schill AG, 4132 Muttenz, Switzerland).
Acclimatisation period 5 daysDiet Pelleted standard Kliba-Nafag 3433, rat maintenance diet, Batch No. 80/06
(Provimi Kliba AG, 4303 Kaiseraugst, Switzerland), except during the approximately 4-hour period, when the animals were restrained in exposure tubes. Results of the analyses for contaminants are archived at RCC.
Water Community tap-water from Füllinsdorf (chlorinated to approx. 0.5 ppm), except during the approximately 4-hour period, when the animals were restrained in exposure tubes. Results of the bacteriological, chemical and contaminant analyses are archived at RCC.
Environmental conditions Temperature: 20 to 21°CHumidity: usually 44 to 70% (occasionally, for a total of approximately 15 hours up to a maximum of 78%)Air changes: 10-15 / hPhotoperiod: 12 hours light and 12 hours darkBackground noise: radio played during most of the light period
Study Design and Methods:In-life dates: Start: 29 June 2007 End: 18 July 2007
Animal assignment and treatment: A group of five male and five female albino rats [HanRcc:WIST(SPF)] was exposed for four hours by nose-only, flow-past inhalation to the test item, SYN524464, at a gravimetrically determined mean aerosol concentration of 5.244 mg/L air. In order to facilitate the generation of an aerosol suitable for acute inhalation toxicity testing in rats, the test item was liquefied by warming it to approximately 135 to 145° C and an aerosol was generated from the liquefied test item by use of a nebuliser and pre-warmed air. Extra diluent air was not pre-warmed.
All animals were observed for clinical signs and mortality during and following the inhalation exposure, i.e. over a 15-day observation period. Body weights were recorded prior to exposure on test day 1, and during the observation period on test days 4, 8 and 15. On day 15, all animals were sacrificed and necropsied.
Statistics: No statistical analysis was used.
RESULTS AND DISCUSSION Mortality: No deaths occurred during the study.
Clinical observations: Clinical signs comprised effects on breathing [bradypnea and breath sounds (rales)], decreased spontaneous activity, hunched posture and ruffled fur in all animals (five males and five females). The finding of bradypnea was seen from approximately 3 hours after exposure start, all other findings were first noticed approximately 4 hours after exposure start (outside the exposure tubes immediately after the end of exposure). Bradypnea and hunched posture had cleared in all animals by the day after the exposure (test day 2) and breath sounds [rales], decreased spontaneous activity, and ruffled fur by two days afterwards (test day 3). From test day 3 until termination of the study on test day 15, all animals remained free from clinical signs.

CLH REPORT FOR SEDAXANE
54
Bodyweight: Slight retardation in body weight gain was evident in all male animals (mean weight gain in males +1.4%) and one female animal (+0.6% weight gain), and body weight loss was evident in the other four female animals (mean weight loss in the affected females –1.3%), over the first three days following the inhalation exposure (test days 1 to 4). These effects on body weight were only transient and were followed by normal body weight gain in all animals.
Necropsy: No macroscopic findings were observed at necropsy.
CONCLUSION: The LC50 of SYN524464 obtained in this study was estimated to be greater than 5.244 mg/L air (gravimetrically determined mean aerosol concentration). There was no indication of sex-related differences in toxicity of the test item.
3.3.2 Human dataNo relevant studies.
3.3.3 Other dataNo relevant studies.
3.4 Skin corrosion/irritation3.4.1 Animal data3.4.1.1 Anonymous (2008b)
Report: Anonymous . 2008b. SYN524464 - Primary Skin Irritation Study in Rabbits (4 Hour Semi-Occlusive Application). B35550. 18 December 2008. Unpublished. (Syngenta File No. SYN524464/0048).
GUIDELINES: Primary Dermal Irritation (rabbit) OECD 404 (2002): OPPTS 870.2500 (1998): 2004/73/EC B.4 (2004).
GLP: Signed and dated GLP and Quality Assurance statements were provided.
There were no deviations from the current regulatory guideline considered to compromise the scientific validity of the study.
EXECUTIVE SUMMARYThe primary skin irritation potential of SYN524464 was investigated according to OECD test guideline no. 404. The test item was applied by topical semi-occlusive application of 0.5 g to the intact left flank of each of three young adult New Zealand White rabbits. The duration of treatment was four hours. The scoring of skin reactions was performed 1, 24, 48 and 72 hours, after removal of the dressing.The primary irritation index was calculated by totaling the mean cumulative scores at 24, 48 and 72 hours and then dividing by the number of data points. The primary irritation index was 0.00 (on a scale of 0.0 to 8.0).
No clinical signs were observed in all animals during the whole observation period.
The application of SYN524464 to the skin resulted in no signs of irritation in all three animals throughout 72 hours of observation. The test item caused no staining of the treated skin. No corrosive effects were noted on the treated skin of any animal at any of the measuring intervals and no clinical signs were observed.

CLH REPORT FOR SEDAXANE
55
According to Draize classification criteria SYN524464 is considered to be “not irritant” to rabbit skin (P.I.I. = 0).
MATERIALS AND METHODSMaterials:
Test Material: SYN524464Description: Solid; white powderLot/Batch number: SMU6LP006/MILLEDPurity: 95.3% iatio of Isomers 83.0% trans, 12.3% cisCAS#: 599194-51-1Stability of test compound: Stable under storage conditions. Retest date: 31-JAN-2011
Test Animals:Species Young Adult New Zealand White Rabbit, SPFAge/weight at dosing 11-15 weeks / 2337-2614 gSource
Housing Individually in stainless steel cages equipped with feed hoppers and drinking water bowls. Wood blocks (RCC Ltd, Füllinsdorf) and haysticks 4642 (batch no. 08/07, Provimi Kliba AG) were provided for gnawing.
Acclimatisation period 5 daysDiet Pelleted standard Provimi Kliba 3418 rabbit maintenance diet ad libitum
(batch no. 01/07) provided by Provimi Kliba AG, CH-4303 Kaiseraugst. Results of analysis for contaminants are archived at RCC Ltd.
Water Community tap water from Füllinsdorf ad libitum. Results of bacteriological, chemical and contaminant analyses are archived at RCC Ltd.
Environmental conditions Temperature: 17-23 °CHumidity: 30-70 %Air changes: 10-15 / hPhotoperiod: 12 hours light and 12 hours dark
Study Design and Methods:In-life dates: Start: 02 May 2007 End:11 May 2008
Animal assignment and treatment: The primary skin irritation potential of SYN524464 was investigated according to OECD test guideline no. 404. The test item was applied by topical semi-occlusive application of 0.5 g to the intact left flank of each of three young adult New Zealand White rabbits. The duration of treatment was four hours. The scoring of skin reactions was performed 1, 24, 48 and 72 hours after removal of the dressing.
Four days before treatment, the left flank was clipped with an electric clipper, exposing an area of approximately 10 cm x 10 cm. The skin of the animals was examined one day before treatment, and re-grown fur of all animals was clipped again. Animals with overt signs of skin injury or marked irritation which may have interfered with the interpretation of the results were not used in the test.
On the day of treatment, 0.5 g of SYN524464 was placed on a surgical gauze patch (approximately 2.5 cm x 2.5 cm). This gauze patch was applied to the intact skin of the clipped area. The patch was covered with a semi-occlusive dressing. The dressing was wrapped around the abdomen and anchored with tape. The duration of treatment was 4 hours, then the dressing was removed and the skin was flushed with lukewarm tap water to clean the application site so that any reactions (erythema) were clearly visible at that time.

CLH REPORT FOR SEDAXANE
56
The animals were checked daily for signs of systemic toxicity and mortality. The skin reaction was assessed according to the numerical scoring system listed in the Commission Directive 2004/73/EC, April 29, 2004, approximately 1, 24, 48 and 72 hours after the removal of the dressing, gauze patch and test item.The Primary Irritation Index (P.I.I.) was calculated by totalling the mean cumulative scores at 24, 48 and 72 hours and then dividing by the number of available figures.The irritation was classified according to the following criteria:P.I.I. = 0 Not Irritant0 < P.I.I. 2 Mild Irritant2 < P.I.I. 5 Moderate Irritant5 < P.I.I. Severe Irritant
RESULTS AND DISCUSSION No clinical signs of systemic toxicity were observed in the animals during the study and no mortality occurred. The bodyweights of all rabbits were considered to be within the normal range of variability.
The mean score was calculated across 3 scoring times (24, 48 and 72 hours after patch removal) for each animal for erythema/eschar grades and for oedema grades, separately.
The application of SYN524464 to the skin in no signs of irritation in all three animals throughout 72 hours of observation. The test item caused no staining of the treated skin. No corrosive effects were noted on the treated skin of any animal at any of the measuring intervals and no clinical signs were observed.
Table 3.4.1.1-1 : Individual and mean skin irritation scores of SYN524464 according to the Draize schemeTime Erythema Oedema
Animal number 67 68 69 67 68 69
after 1 hour 0 0 0 0 0 0
after 24 hours 0 0 0 0 0 0after 48 hours 0 0 0 0 0 0after 72 hours 0 0 0 0 0 0
mean score 24-72 h 0 0 0 0 0 0
CONCLUSION: According to Draize classification criteria SYN524464 is considered to be “not irritant” to rabbit skin (P.I.I. = 0).
References: Draize, J.H. (1959): Dermal Toxicity. In appraisal of the Safety of Chemicals in Foods, Drugs and Cosmetics, pp. 46-49. Austin, Texas: Association of Food and Drug Officials of the United States.
Draize, J.H., Woodward, G. & Calvery, H.O. (1944): Methods for the study of irritation and toxicity of substances applied topically to the skin and mucous membranes. J. Pharmacol. Exper. Therap. 83: 377-390.
3.4.2 Human dataNo relevant studies.
3.4.3 Other dataNo relevant studies.

CLH REPORT FOR SEDAXANE
57
3.5 Serious eye damage/eye irritation3.5.1 Animal data3.5.1.1 Anonymous (2007)
Report: Anonymous (2007). SYN524464- Primary Eye Irritation Study in Rabbits – Final Report Amendment 1. Laboratory report No. B35561. Issue date 18 December 2007. Unpublished. (Syngenta File No. SYN524464/0047)
GUIDELINES: Primary Eye Irritation (rabbit) OECD 405 (2002): OPPTS 870.2400 (1998): 2004/73/EC B.5 (2004)
GLP: Signed and dated GLP and Quality Assurance statements were provided.
There were no deviations from the current regulatory guideline considered to compromise the scientific validity of the study.
EXECUTIVE SUMMARYThe primary eye irritation potential of SYN524464 was investigated according to OECD test guideline no. 405. The test item was applied by instillation of 0.1 g into the left eye of each of three young adult New Zealand White rabbits. Scoring of irritation effects was performed approximately 1, 24, 48 and 72 hours after test item instillation.
The mean score was calculated across 3 scoring times (24, 48 and 72 hours after instillation) for each animal for corneal opacity, iris, redness and chemosis of the conjunctivae, separately.
The instillation of SYN524464 into the eye resulted in mild, early-onset and transient ocular changes, such as reddening of the conjunctivae and sclerae, discharge and chemosis. These effects were reversible and were no longer evident 72 hours after treatment, the end of the observation period for all animals. No abnormal findings were observed in the cornea or iris of any animal at any of the examinations. No corrosion was observed. No staining of the treated eyes by the test item was observed and no clinical signs were observed.
Thus, the test item did not induce irreversible damage to the rabbit eye.
Under the conditions of this study, the instillation of SYN524464 into the eye resulted in mild, early-onset and transient ocular changes. These effects were reversible and were no longer evident 72 hours after treatment.
MATERIALS AND METHODSMaterials:
Test Material: SYN524464Description: Solid; white powderLot/Batch number: SMU6LP006/MILLEDPurity: 95.3% ratio of isomers 83.0% trans, 12.3% cisStability of test compound: Stable under storage conditions. Retest date: 31-JAN-2011
Vehicle and/or positive control: None

CLH REPORT FOR SEDAXANE
58
Test Animals:Species Young Adult New Zealand White Rabbit, SPFAge/weight at dosing 11-16 weeks / 2623-2813gSource
Housing Individually in stainless steel cages equipped with feed hoppers and drinking water bowls. Wood blocks and haysticks 4642 (batch no. 08/07, Provimi Kliba AG) were provided for gnawing.
Acclimatisation period 5 daysDiet Pelleted standard Provimi Kliba 3418 rabbit maintenance diet ad libitum
(batch no. 13/07) provided by Provimi Kliba AG, CH-4303 Kaiseraugst. Water Community tap water from Füllinsdorf ad libitum. Environmental conditions Temperature: 17-23 °C
Humidity: 30-70 %Air changes: 10-15 / hPhotoperiod: 12 hours light and 12 hours dark
Study Design and Methods:In-life dates: Start 11 May 2007 End: 21 May 2008.
Animal assignment and treatment: The primary eye irritation potential of SYN524464 was investigated according to OECD test guideline no. 405. The test item was applied by instillation of 0.1 g into the left eye of each of three young adult New Zealand White rabbits. Scoring of irritation effects was performed approximately 1, 24, 48 and 72 hours after test item instillation.
On the day of treatment, 0.1 g of SYN524464 was placed in the conjunctival sac of the left eye of each animal after gently pulling the lower lid away from the eyeball. The lids were then gently held together for about one second to prevent loss of test item. The right eye remained untreated and served as the reference control. The treated eyes were not rinsed after instillation.
The ocular reaction (i.e. corneal opacity, iridic effects, conjunctivae and chemosis) was assessed according to the numerical scoring system listed in the Commission Directive 2004/73/EC, April 29, 2004, at approximately 1, 24, 48 and 72 hours after instillation.
Additionally, ocular discharge, reddening of the sclerae and staining of conjunctivae, sclerae and cornea by the test item was assessed according to a 0-3 point scheme.
RESULTS AND DISCUSSION No clinical signs of systemic toxicity were observed in the animals during the study and no mortality occurred. The body weights of the rabbits were considered to be within the normal range of variability.
The mean score was calculated across 3 scoring times (24, 48 and 72 hours after instillation) for each animal for corneal opacity, iris effects, and redness and chemosis of the conjunctivae. The individual mean scores for corneal opacity and iris effects were 0.00 for all three animals. The individual mean scores for the conjunctivae were 0.33, 0.67 and 0.33 for reddening for each of the three animals, and 0.00 for chemosis. No abnormal findings were observed in the cornea or iris of any animal at any of the measurement intervals.
No abnormal findings were observed in the cornea or iris of any animal at any of the examinations. No corrosion was observed at any of the measuring intervals. No staining of the treated eyes by the test item was noted.
No abnormal findings were observed in the treated eye of any animal 72 hours after treatment.

CLH REPORT FOR SEDAXANE
59
Table 3.5.1.1–1: Eye irritation scores of SYN524464 according to the Draize schemeTime Cornea Iris Conjunctiva
Redness Chemosis Animal number 67 68 69 67 68 69 67 68 69 67 68 69
after 1 hour 0 0 0 0 0 0 1 1 1 0 1 0after 24 hours 0 0 0 0 0 0 1 1 1 0 0 0after 48 hours 0 0 0 0 0 0 0 1 0 0 0 0after 72 hours 0 0 0 0 0 0 0 0 0 0 0 0
mean scores 24-72h 0 0 0 0 0 0 0.33 0.67 0.33 0 0 0
CONCLUSION: The instillation of SYN524464 into the eye resulted in mild, early-onset and transient ocular changes. These effects were reversible and were no longer evident 72 hours after treatment.
3.5.2 Human dataNo relevant studies.
3.5.3 Other dataNo relevant studies.
3.6 Respiratory sensitisation3.6.1 Animal dataNo relevant studies.
3.6.2 Human dataNo relevant studies.
3.6.3 Other dataNo relevant studies.
3.7 Skin sensitisation3.7.1 Animal data3.7.1.1 Anonymous (2007)
Report: Anonymous, 2007. Local Lymph Node Assay in the Mouse. Study number 2364/0054. 20 December 2007. Unpublished. (Syngenta File No.SYN524464/0050)
GUIDELINES: Dermal Sensitisation Local Lymph Node Assay OECD 429 (2002): OPPTS 870.2600 (2003): 2004/73/EC B.42 (2004)
GLP: Signed and dated GLP and Quality Assurance statements were provided.
There were no deviations from the current regulatory guideline considered to compromise the scientific validity of the study.

CLH REPORT FOR SEDAXANE
60
EXECUTIVE SUMMARYA sample of SYN524464 was assessed for its skin sensitisation potential using the mouse Local Lymph Node Assay. The assay determines the level of T lymphocyte proliferation in the lymph nodes draining the site of chemical application, by measuring the amount of radiolabelled thymidine incorporated into the dividing cells. The criterion for a positive response is that one or more of the concentrations tested should elicit a 3-fold or greater increase in isotope incorporation relative to the vehicle control group. The test substance was applied as 10, 25 or 50% w/w preparations in (acetone/olive oil 4:1).
The test substance did not have the capacity to cause skin sensitisation when applied as 10, 25 or 50% w/w preparations in (acetone/olive oil 4:1).
In a positive control study, (hexylcinnamaldehyde) was shown to have the capacity to cause skin sensitisation when applied as 15% v/v preparations in (Acetone/olive oil 4:1), confirming the validity of the protocol used for this study.
The test material was considered to be a non-sensitiser under the conditions of the test.
MATERIALS AND METHODSMaterials:
Test Material: SYN524464Description: Off white powderLot/Batch number: SMU6LP006/MILLEDPurity: 95.3 % a.iCAS#: Not reportedStability of test compound: Not reported
Vehicle and/or positive control: The vehicle for the test substance was acetone/olive oil 4:1 and that for the positive control (hexylcinnamaldehyde) was acetone/olive oil 4:1.
Test Animals:Species MouseStrain CBA/Ca (CBA/CaBkl) strain mice Age/weight at dosing 15 to 23 g, and were eight to twelve weeks oldSourceHousing Individual in suspended solid floor polypropylene cages Acclimatisation period At least 5 daysDiet Certified Rat and Mouse Diet supplied by BCM IPS Ltd., London, UK Water Ad libitumEnvironmental conditions Temperature: 19-25°C
Humidity: 30-70%Air changes:15 per hourPhotoperiod: twelve hours continuous light (06.00 to 18.00) and twelve hours darkness
Study Design and Methods:In-life dates: Start: 18 June 2007 End: 20 December 2007
A sample of SYN524464 was assessed for its skin sensitisation potential using the mouse Local Lymph Node Assay. The assay determines the level of T lymphocyte proliferation in the lymph nodes draining the site of chemical application, by measuring the amount of radiolabelled thymidine incorporated into the dividing cells.
Animal assignment and treatment: Twenty six animals were used in the study. One animal was used in a preliminary screening test and three groups of five animals were treated with 10, 25 & 50%

CLH REPORT FOR SEDAXANE
61
concentrations of the test material in acetone/olive oil 4:1. Two further groups of five animals were treated with the vehicle alone or the positive control material (15% hexylcinnamaldehyde in acetone/olive oil 4:1).
Dose selection rationale: The main test dose levels as were chosen as the preliminary screening test suggested that the test material would not produce systemic toxicity or excessive local irritation at the highest suitable concentration.
Treatment preparation and administration: Three days after the third application, all animals were injected via the tail vein with approximately 250 L of phosphate buffered saline (PBS) containing approximately 20 Ci of a 2.0Ci/mmol specific activity 3H-methyl thymidine. Approximately 5 hours later, the animals were killed and the draining auricular lymph nodes removed. Group pooled samples were placed in a container of PBS.
A single cell suspension was prepared by mechanical disaggregation of lymph nodes through a 200-mesh stainless steel gauze. The lymph node cells were rinsed through the gauze with 4 ml of PBS into a petri dish. The lymph node cells suspension was transferred to a centrifuge tube. The petri dish was washed with an additional 5 ml of PBS to remove all remaining lymph node cells and these were added to the centrifuge tube. The lymph node cells were pelleted at 1400 rpm (approximately 190 g) for ten minutes. Following rinsing of the isolated lymphocytes, the radiolabelled material incorporated into cellular components was precipitated by resuspending the cells in 5% Trichloroacetic acid (TCA). The extent of incorporation of radiolabel above control levels is a measurement of cell proliferation of lymphocytes, which can be induced by sensitisers.
After approximately eighteen hours incubation at approximately 4°C, the precipitates were recovered by centrifugation at 2100 rpm (approximately 450 g) for ten minutes, resuspended in 1 ml of TCA and transferred to 10 ml of scintillation fluid. 3HTdR incorporation was measured by -scintillation counting. The vials containing the samples and scintillation fluid were placed in the sample changer of the scintillator and left for approximately twenty minutes then shaken vigorously.
Statistics / Data Evaluation: The results are expressed as a disintegrations per minute (dpm) value per lymph node for each animal. The activity of each test group is then divided by the activity of the vehicle control group to give a test:control ratio known as the stimulation index (SI), for each concentration.
The criterion for a positive response is that one or more concentrations of the test substance should elicit a 3-fold or greater increase in isotope incorporation relative to the vehicle control group. The assay is able to identify those materials that elicit responses in standard guinea pig tests for skin sensitisation (Kimber et al, 1994). Consequently, a test substance which does not fulfil the above criterion is designated as unlikely to be a skin sensitiser.
RESULTS AND DISCUSSION The application of SYN524464 at concentrations of 10, 25 and 50% w/w in acetone/olive oil 4:1 resulted in an increase in isotope incorporation which was less than 3-fold at all concentrations. Consequently, the test substance was shown to be unlikely to be a skin sensitiser under the conditions of the test.
Table 3.7.1.1-1: Skin sensitisation potential of SYN524464 Concentration of test
substance (%w/w)Number of lynph nodes
assayedMean dpm per Animal Test : control ratio (SI)
Acetone/olive oil 4:1 10 1563.74 N/A10% 10 1744.14 1.1225% 10 1503.00 0.9650% 10 1107.97 0.71
N/A = not applicable

CLH REPORT FOR SEDAXANE
62
In a positive control study, hexylcinnamaldehyde induced positive responses when applied as 15% w/v preparations in Acetone/olive oil 4:1, confirming the validity of the protocol used in this study.
Table 3.7.1.1-2: Radiolabel incorporation into lymph-nodes of mice treated with the positive control substance (hexylcinnamaldehyde)
Concentration of hexylcinnamaldehyde
(%v/v)
Number of lynph nodes assayed
Total disintegrations per minute (dpm)
M,ean dpm per Animal Test : control ratio (SI)
0 (acetone/olive oil 4:1) 10 7818.7 1563.74 N/A15% 10 44370.79 8874.16 5.67
N/A not applicable
CONCLUSION: SYN524464 is unlikely to be a skin sensitiser under the conditions of the test.
References:Kimber I, Dearman RJ, Scholes EW and Basketter DA (1994). The Local Lymph Node Assay: Developments and Applications. Toxicology, 93, 13-31.
3.7.2 Human dataNo relevant studies.
3.7.3 Other dataNo relevant studies.
3.8 Germ cell mutagenicity3.8.1 In vitro data3.8.1.1 Sokolowski (2009)
Report: Sokolowski A (2009) SYN524464 - Salmonella Typhimurium and Escherichia Coli Reverse Mutation Assay - Final Report Amendment 1. RCC Cytotest Cell Research GmbH, In den Leppsteinswiesen 19, 64380 Rossdorf Germany. Laboratory Report No. 1074301, issue date 22 October 2007 (amended 05 November 2009). Unpublished (Syngenta File No. SYN524464_10867)
GUIDELINES: Reverse Mutation Test Using Bacteria. OECD 471 (1997): OPPTS 870.5100 (1998): 2000/32/EEC B.13/B.14 (2000)
GLP: Signed and dated GLP and Quality Assurance statements were provided.
There were no deviations from the current regulatory guideline considered to compromise the scientific validity of the study.
EXECUTIVE SUMMARYThis study was performed to investigate the potential of SYN524464 to induce gene mutations in the plate incorporation test (Experiment I) and the pre-incubation test (Experiment II) using the Salmonella typhimurium strains TA 1535, TA 1537, TA 98, and TA 100, and the Escherichia coli strains WP2 uvrA (pKM 101), and WP2 (pKM 101). The plates incubated with the test item showed normal background growth with and without metabolic activation in all strains in both experiments over the range;

CLH REPORT FOR SEDAXANE
63
Experiment I; 3, 10, 33; 100; 333; 1000; 2500; and 5000 µg/plate and Experiment II; 33; 100; 333; 1000; 2500; and 5000 µg/plate.
No toxic effects, evident as a reduction in the number of revertants, occurred in the test groups with and without metabolic activation. Only in experiment I in strain TA 98 with metabolic activation a minor reduction was observed at 1000 µg/plate.
No substantial increase in revertant colony numbers of any of the six tester strains was observed following treatment with SYN524464 at any dose level, neither in the presence nor absence of metabolic activation (S9 mix). There was also no tendency of higher mutation rates with increasing concentrations in the range below the generally acknowledged border of biological relevance. The positive controls induced the appropriate responses in the corresponding strains.
In conclusion, it can be stated that during the described mutagenicity test and under the experimental conditions reported, the test item did not induce gene mutations by base pair changes or frameshifts in the genome of the strains used. Therefore, SYN524464 is considered to be non-mutagenic in this Salmonella typhimurium and Escherichia coli reverse mutation assay.
MATERIALS AND METHODSMaterials:
Test Material: SYN524464Description: Solid, Off-whiteLot/Batch number: SMU6LP006/MilledPurity: 95.3 % (sum of 83.0 % SYN508210 and 12.3 % SYN508211)Stability of test compound: Not indicated by the sponsor
Control Materials:Negative: Concurrent untreated and solvent controls were performedSolvent control (final concentration):
100l/plate
Positive control: Nonactivation:Sodium azide 10 µg/plate TA100, TA15354-nitro-o-phenylene-diamine, 50 µg/plate TA1537, 10 µg/plate TA98methyl methane sulfonate 3 µL/plate WP2 (pKM101), WP2 uvrA (pKM101)
Activation:2-Aminoanthracene2.5 µg/plate TA1535, TA1537, TA100, TA9810 µg/plate WP2 (pKM101), WP2 uvrA (pKM101)
Mammalian metabolic system: S9 derivedX Induced Aroclor 1254 X Rat X Liver
Non-induced X Phenobarbitol Mouse LungNone Hamster Other
X Other β-naphthoflavone
Other
Before the experiment an appropriate quantity of S9 supernatant was thawed and mixed with S9 co-factor solution. The amount of S9 supernatant was 10% v/v in the S9 mix. Cofactors are added to the S9 mix to reach the following concentrations in the S9 mix:
8 mM MgCl233 mM KCl5 mM Glucose-6-phosphate5 mM NADP
in 100 mM sodium-ortho-phosphate-buffer, pH 7.4.During the experiment the S9 mix was stored in an ice bath.

CLH REPORT FOR SEDAXANE
64
Test organisms:S. typhimurium strains
TA97 X TA98 X TA100 TA102 TA104X TA1535 X TA1537 TA1538 list any othersE. coli strainsX WP2 (pKM101) X WP2 uvrA
(pKM101)
Properly maintained? X Yes NoChecked for appropriate genetic markers (rfa mutation, R factor)? X Yes No
Test compound concentrations used Pre-Experiment/Experiment I: 3; 10; 33; 100; 333; 1000; 2500; and 5000 µg/plateExperiment II: 33; 100; 333; 1000; 2500; and 5000 µg/plate
Study Design and Methods:In-life dates: Start: 07 March 2007 End: 27 March 2007
TEST PERFORMANCEPreliminary Cytotoxicity Assay: Not performed.
Type of Bacterial assay: X standard plate test (pre-experiment/experiment I; –S9, +S9) X pre-incubation (60 minutes) (second experiment ; –S9, +S9) __ “Prival” modification (i.e. azo-reduction method) __ spot test __ other
Protocol: For each strain and dose level including the controls, three plates were used.The following materials were mixed in a test tube and poured onto the selective agar plates:
100 µL Test solution at each dose level, solvent (negative control) or reference mutagen solution (positive control),
500 µL S9 mix (for test with metabolic activation) or S9 mix substitution buffer (for test without metabolic activation),
100 µL Bacteria suspension (cf. test system, pre-culture of the strains),2000 µL Overlay agar
In the pre-incubation assay 100 µL test solution, 500 µL S9 mix / S9 mix substitution buffer and 100 µL bacterial suspensions were mixed in a test tube and shaken at 37° C for 60 minutes. After pre-incubation 2.0 mL overlay agar (45° C) was added to each tube. The mixture was poured on selective agar plates. After solidification the plates were incubated upside down for at least 48 hours at 37° C in the dark.
Statistical analysis: None - see Evaluation Criteria below.
Evaluation criteria: A test item is considered as a mutagen if a biologically relevant increase in the number of revertants exceeding the threshold of twice (strains TA 98, TA 100, WP2 uvrA (pKM 101), and WP2 (pKM 101)) or thrice (strains TA 1535 and TA 1537) the colony count of the corresponding solvent control is observed.
A dose dependent increase is considered biologically relevant if the threshold is exceeded at more than one concentration.
An increase exceeding the threshold at only one concentration is judged as biologically relevant if reproduced in an independent second experiment.

CLH REPORT FOR SEDAXANE
65
A dose dependent increase in the number of revertant colonies below the threshold is regarded as an indication of a mutagenic potential if reproduced in an independent second experiment. However, whenever the colony counts remain within the historical range of negative and solvent controls such an increase is not considered biologically relevant.
RESULTS AND DISCUSSIONPreliminary cytotoxicity assay: Not performed.
Mutagenicity assay: The test item SYN524464 was assessed for its potential to induce gene mutations in the plate incorporation test (experiment I) and the pre-incubation test (experiment II) using Salmonella typhimurium strains TA 1535, TA 1537, TA 98, and TA 100, and the Escherichia coli strains WP2 uvrA (pKM 101) and WP2 (pKM 101).
The assay was performed in two independent experiments both with and without liver microsomal activation. Each concentration, including the controls, was tested in triplicate. The test item was tested at the following concentrations:
Pre-Experiment/Experiment I: 3, 10, 33; 100; 333; 1000; 2500; and 5000 µg/plateExperiment II: 33; 100; 333; 1000; 2500; and 5000 µg/plate
The plates incubated with the test item showed normal background growth with and without metabolic activation in all strains in both experiments.
No toxic effects, evident as a reduction in the number of revertants, occurred in the test groups with and without metabolic activation. Only in experiment I in strain TA 98 with metabolic activation a minor reduction was observed at 1000 µg/plate.
The test item precipitated in the overlay agar in the test tubes from 2500 µg/plate up to 5000 µg/plate in both experiments and precipitation on the agar plates was observed from 1000 µg/plate up to 5000 µg/plate in both experiments with and without metabolic activation. The undissolved particles had no influence on the data recording.
No substantial increase in revertant colony numbers of any of the six tester strains was observed following treatment with SYN524464 at any dose level, neither in the presence nor absence of metabolic activation (S9 mix). There was also no tendency of higher mutation rates with increasing concentrations in the range below the generally acknowledged border of biological relevance.
In experiment II with metabolic activation, the data in the negative control of strain WP2 (pkM 101) were slightly above our historical control range. Since this deviation is rather small, this effect is considered to be based upon biologically irrelevant fluctuations in the number of colonies.
Appropriate reference mutagens were used as positive controls. They showed a distinct increase of induced revertant colonies.

CLH REPORT FOR SEDAXANE
66
Table 3.8.1.1–1: Summary of Results Pre-Experiment/Experiment IMetabolic Activation
Test Group
Dose Level (µg/plate)
Revertant Colony Counts (Mean ±SD)
TA 1535 TA 1537 TA 98 TA 100 WP2 uvrA pkm 101
WP2pKm 101
DMSO 16 ± 5 12 ± 4 26 ± 4 129 ± 9 196 ± 14 74 ± 4
Untreated 15 ± 6 10 ± 6 32 ± 5 131 ± 6 245 ± 16 99 ± 21
SYN 524464 3 µg 16 ± 3 13 ± 2 23 ± 8 124 ± 4 251 ± 16 96 ± 22
10 µg 20 ± 3 8 ± 2 29 ± 4 132 ± 9 204 ± 9 75 ± 23
33 µg 24 ± 5 9 ± 3 32 ± 6 125 ± 11 204 ± 44 76 ± 8
100 µg 21 ± 5 9 ± 1 29 ± 2 120 ± 2 204 ± 8 83 ± 10
333 µg 16 ± 7 10 ± 4 30 ± 5 129 ± 6 219 ± 17 105 ± 14
1000 µg 16 ± 3 P M 6 ± 2 P M 23 ± 2 P M 117 ± 6 P M 200 ± 9 P M 82 ± 7 P M
2500 µg 19 ± 5 P M 9 ± 4 P M 20 ± 2 P M 123 ± 12 P M 187 ± 9 P M 89 ± 8 P M
5000 µg 18 ± 6 P M 8 ± 2 P M 21 ± 4 P M 110 ± 4 P M 187 ± 11 P M 96 ± 5 P M
NaN3 10 µg 1860 ± 54 2107 ± 75
4-NOPD 10 µg 429 ± 48
4-NOPD 50 µg 106 ± 8
Without Activation
MMS 3.0 µL 4255 ± 507 3578 ± 527
DMSO 18 ± 1 19 ± 0 37 ± 10 147 ± 19 165 ± 23 82 ± 7
Untreated 19 ± 3 21 ± 7 47 ± 10 157 ± 12 205 ± 13 103 ± 11
SYN 524464 3 µg 12 ± 5 17 ± 3 43 ± 1 131 ± 9 148 ± 26 87 ± 6
10 µg 17 ± 4 18 ± 3 51 ± 4 133 ± 19 160 ± 8 69 ± 6
33 µg 18 ± 5 17 ± 4 50 ± 3 139 ± 17 115 ± 29 68 ± 12
100 µg 18 ± 5 17 ± 7 49 ± 4 133 ± 5 110 ± 11 71 ± 7
333 µg 20 ± 4 23 ± 11 47 ± 10 148 ± 7 152 ± 30 80 ± 6
1000 µg 14 ± 4 P M 12 ± 3 P M 16 ± 6 P M 126 ± 12 P M 117 ± 4 P M 68 ± 5 P M
2500 µg 12 ± 2 P M 10 ± 3 P M 23 ± 2 P M 123 ± 9 P M 114 ± 9 P M 71 ± 7 P M
5000 µg 10 ± 3 P M 11 ± 5 P M 22 ± 3 P M 121 ± 9 P M 112 ± 9 P M 66 ± 4 P M
2-AA 2.5 µg 242 ± 7 170 ± 17 1375 ± 77 1573 ± 68
With Activation
2-AA 10.0 µg 2014 ± 70 394 ± 77
Key to Positive Controls Key to Plate Postfix Codes
NaN3 2-AA 4-NOPD MMS
sodium azide 2-aminoanthracene 4-nitro-o-phenylene-diamine methyl methane sulfonate
P M
Precipitate Manual count

CLH REPORT FOR SEDAXANE
67
Table 3.8.1.1–2: Summary of Results Experiment IIMetabolic Activation
Test Group
Dose Level (µg/plate)
Revertant Colony Counts (Mean ±SD)
TA 1535 TA 1537 TA 98 TA 100 WP2 uvrA pkm 101
WP2pKm 101
DMSO 15 ± 8 11 ± 6 39 ± 4 107 ± 5 183 ± 27 100 ± 11
Untreated 16 ± 4 10 ± 3 40 ± 12 131 ± 8 234 ± 29 96 ± 5
SYN 524464 33 µg 12 ± 2 11 ± 7 35 ± 3 117 ± 8 208 ± 10 104 ± 14
100 µg 17 ± 5 9 ± 2 32 ± 3 129 ± 7 208 ± 17 97 ± 12
333 µg 17 ± 4 11 ± 2 31 ± 2 110 ± 28 185 ± 20 102 ± 4
1000 µg 16 ± 3 P M 8 ± 2 P M 32 ± 4 P M 106 ± 14 P M 191 ± 17 P M 97 ± 5 P M
2500 µg 18 ± 3 P M 8 ± 2 P M 29 ± 3 P M 96 ± 7 P M 209 ± 18 P M 83 ± 4 P M
5000 µg 19 ± 1 P M 12 ± 2 P M 27 ± 3 P M 105 ± 11 P M 192 ± 20 P M 93 ± 10 P M
NaN3 10 µg 1862 ± 95 1967 ± 70
4-NOPD 10 µg 516 ± 14
4-NOPD 50 µg 126 ± 6
Without Activation
MMS 3.0 µL 1883 ± 260 1329 ± 45
DMSO 18 ± 2 12 ± 3 41 ± 4 128 ± 9 146 ± 10 94 ± 11
Untreated 21 ± 2 16 ± 3 46 ± 3 163 ± 12 236 ± 17 113 ± 9
SYN 524464 33 µg 16 ± 3 11 ± 2 47 ± 10 161 ± 18 140 ± 6 108 ± 12
100 µg 16 ± 5 10 ± 3 41 ± 6 135 ± 15 129 ± 13 97 ± 9
333 µg 24 ± 2 14 ± 3 39 ± 5 132 ± 5 138 ± 25 111 ± 10
1000 µg 13 ± 4 P M 10 ± 3 P M 30 ± 4 P M 123 ± 10 P M 159 ± 11 P M 97 ± 9 P M
2500 µg 13 ± 4 P M 6 ± 1 P M 28 ± 4 P M 105 ± 21 P M 144 ± 6 P M 91 ± 12 P M
5000 µg 12 ± 3 P M 8 ± 3 P M 29 ± 2 P M 94 ± 14 P M 150 ± 16 P M 91 ± 10 P M
2-AA 2.5 µg 184 ± 9 113 ± 11 696 ± 210 700 ± 17
With Activation
2-AA 10.0 µg 2015 ± 153 2112 ± 120
Key to Positive Controls Key to Plate Postfix Codes
NaN3 2-AA 4-NOPD MMS
sodium azide 2-aminoanthracene 4-nitro-o-phenylene-diamine methyl methane sulfonate
P M
Precipitate Manual count
CONCLUSION: In conclusion, it can be stated that during the described mutagenicity test and under the experimental conditions reported, the test item did not induce gene mutations by base pair changes or frameshifts in the genome of the strains used.
3.8.1.2 Bohnenberger (2009)Report: Bohnenberger, S. (2009) CSAA798670 - Chromosome Aberration Test in Human Lymphocytes
In Vitro. Harlan Cytotest Cell Research GmbH (Harlan CCR), In den Leppsteinswiesen 19, 64380 Rossdorf, Germany. Laboratory Report No. 1266902, issue date: 26 November 2009. Unpublished. (Syngenta File No. NOA449410_10001)
GUIDELINES: Chromosome Aberration Test in Human Lymphocytes In Vitro. OECD 473 (1997); OPPTS 870.5375 (1998); EC 440/2008 B10 (2008); Kampoan No. 287; Eisei No. 127; Heisei 09/10/31; JMAFF No. 12
GLP: Signed and dated GLP and Quality Assurance statements were provided.

CLH REPORT FOR SEDAXANE
68
EXECUTIVE SUMMARYThis in vitro assay was performed to assess the potential of CSAA798670 to induce structural chromosomal aberrations in the absence and presence of an exogenous metabolic activation system (liver S9 mix from phenobarbital/-naphthoflavone treated male rats).
In each experimental group two parallel cultures were analysed. Per culture 100 metaphase plates were scored for structural chromosomal aberrations.
The highest applied concentration in this study (1810.0 µg/mL of the test item, approx. 10 mM) was chosen with regard to the molecular weight of the test item and with respect to the current OECD Guideline 473.
Dose selection of the cytogenetic experiments was performed considering the toxicity data and in accordance with OECD Guideline 473.
In the absence and presence of S9 mix, no cytotoxicity was observed up to the highest applied concentration.
In both independent experiments, no biologically relevant increase in the number of cells carrying structural chromosomal aberrations was observed after treatment with the test item.
No evidence of an increase in polyploid metaphases was noticed after treatment with the test item as compared to the control cultures.
Appropriate mutagens were used as positive controls. They induced statistically significant increases (p < 0.05) in cells with structural chromosome aberrations.
It can be stated that under the experimental conditions reported, the test item did not induce structural chromosomal aberrations in human lymphocytes in vitro.
Therefore, CSAA798670 is considered to be non-clastogenic in this chromosome aberration test in the absence and presence of metabolic activation when tested up to the highest required concentration.
MATERIALS AND METHODSMaterials:
Test Material: CSAA798670Description: Light brown, solid (powder)Lot/Batch number: LT-DFPA09001Purity: 97.4 % CAS#: -Stability of test compound:
Stability in DMSO for several hours at ambient temperature was verified by sponsor via NMR
Control Materials:Negative: -Solvent control (final concentration):
DMSO (0.5 %)
Positive control: Absence of S9 mix: Ethylmethane sulfonate, 825 µg/mL (Experiment I), 660 g/ml (Experiment II)Presence of S9 mix: Cyclophosphamide 7.5 µg/mL
Mammalian metabolic system: S9 derivedX Induced Aroclor 1254 X Rat X Liver

CLH REPORT FOR SEDAXANE
69
Non-induced X Phenobarbitol Mouse LungNone Hamster Other
X Other β-naphthoflavone
Other
X indicates those that apply
An appropriate quantity of S9 supernatant was thawed and mixed with S9 cofactor solution to result in a final protein concentration of 0.75 mg/mL in the cultures. Cofactors were added to the S9 mix to reach the following concentrations:
8 mM MgCl233 mM KCl 5 mM glucose-6-phosphate 4 mM NADP
in 100 mM sodium-ortho-phosphate-buffer, pH 7.4. The concentration in the final test medium was 5 % (v/v).
Test cells: mammalian cells in cultureV79 cells (Chinese hamster lung fibroblasts)
X Human lymphocytes. Obtained on the days of culture initiation from healthy, non-smoking donors. All donors had a previously established low incidence of chromosomal aberrations in their peripheral blood lymphocytes.Chinese hamster ovary (CHO) cells
X indicates those that apply
Media: DMEM/Ham’s F12 (1:1)Properly maintained? X Yes NoPeriodically checked for Mycoplasma contamination? Yes NoPeriodically checked for karyotype stability? Yes NoX indicates those that apply
Test compound concentrations used: Absence of S9 mix Experiment 1
Experiment 2591.0, 1034.3, 1810.0 µg/mL591.0, 1034.3, 1810.0 µg/mL
Presence of S9 mix Experiment 1Experiment 2
591.0, 1034.3, 1810.0 µg/mL591.0, 1034.3, 1810.0 µg/mL
Study Design and Methods:In-life dates: Start: 23 July 2009 End: 24 August 2009
TEST PERFORMANCEPreliminary Cytotoxicity Assay: Not performed.
Cytogenetic Assay:Cell exposure time: Test Material Solvent Control Positive Control
Experiment 1- S9 mix + S9 mix-S9 mix+ S9 mix Experiment 2
4h4h22h4h
4h4h22h4h
4h4h22h4h
Spindle inhibition:Inhibitor used/ concentration: Colcemid 0.2 µg/mL
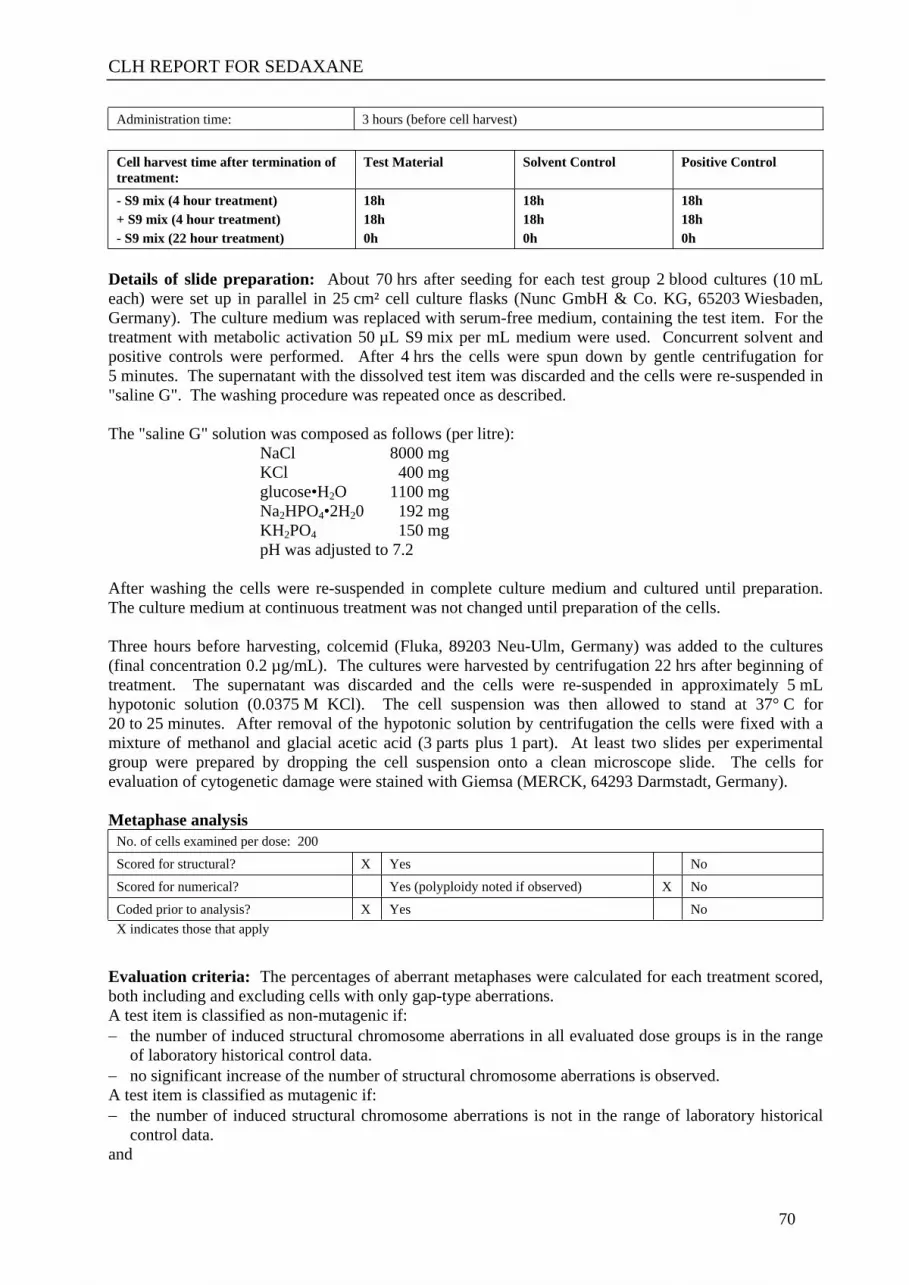
CLH REPORT FOR SEDAXANE
70
Administration time: 3 hours (before cell harvest)
Cell harvest time after termination of treatment:
Test Material Solvent Control Positive Control
- S9 mix (4 hour treatment)+ S9 mix (4 hour treatment)- S9 mix (22 hour treatment)
18h18h0h
18h18h0h
18h18h0h
Details of slide preparation: About 70 hrs after seeding for each test group 2 blood cultures (10 mL each) were set up in parallel in 25 cm² cell culture flasks (Nunc GmbH & Co. KG, 65203 Wiesbaden, Germany). The culture medium was replaced with serum-free medium, containing the test item. For the treatment with metabolic activation 50 µL S9 mix per mL medium were used. Concurrent solvent and positive controls were performed. After 4 hrs the cells were spun down by gentle centrifugation for 5 minutes. The supernatant with the dissolved test item was discarded and the cells were re-suspended in "saline G". The washing procedure was repeated once as described.
The "saline G" solution was composed as follows (per litre):NaCl 8000 mgKCl 400 mgglucose•H2O 1100 mgNa2HPO4•2H20 192 mgKH2PO4 150 mgpH was adjusted to 7.2
After washing the cells were re-suspended in complete culture medium and cultured until preparation. The culture medium at continuous treatment was not changed until preparation of the cells.
Three hours before harvesting, colcemid (Fluka, 89203 Neu-Ulm, Germany) was added to the cultures (final concentration 0.2 µg/mL). The cultures were harvested by centrifugation 22 hrs after beginning of treatment. The supernatant was discarded and the cells were re-suspended in approximately 5 mL hypotonic solution (0.0375 M KCl). The cell suspension was then allowed to stand at 37° C for 20 to 25 minutes. After removal of the hypotonic solution by centrifugation the cells were fixed with a mixture of methanol and glacial acetic acid (3 parts plus 1 part). At least two slides per experimental group were prepared by dropping the cell suspension onto a clean microscope slide. The cells for evaluation of cytogenetic damage were stained with Giemsa (MERCK, 64293 Darmstadt, Germany).
Metaphase analysisNo. of cells examined per dose: 200Scored for structural? X Yes NoScored for numerical? Yes (polyploidy noted if observed) X NoCoded prior to analysis? X Yes NoX indicates those that apply
Evaluation criteria: The percentages of aberrant metaphases were calculated for each treatment scored, both including and excluding cells with only gap-type aberrations.A test item is classified as non-mutagenic if: the number of induced structural chromosome aberrations in all evaluated dose groups is in the range
of laboratory historical control data. no significant increase of the number of structural chromosome aberrations is observed.A test item is classified as mutagenic if: the number of induced structural chromosome aberrations is not in the range of laboratory historical
control data.and

CLH REPORT FOR SEDAXANE
71
either a concentration-related or a significant increase of the number of structural chromosome aberrations is observed.
Statistical significance was confirmed by means of the Fisher´s exact test. However, both biological and statistical significance should be considered together. If the above mentioned criteria for the test item are not clearly met, the classification with regard to the historical data and the biological relevance is discussed and/or a confirmatory experiment is performed.
Statistical analysis: Data were evaluated for statistical significance using the Fisher Exact Probability Test (one-sided).
RESULTS AND DISCUSSIONPreliminary cytotoxicity assay: Not performed.
Cytogenetic assay: In Experiment I, in the absence of S9 mix, a clearly reduced mitotic index below 50 % of control could be observed at the highest evaluated concentration (29.7 % of control). In all other experimental parts of this study, concentrations showing clear cytotoxic effects were not scorable for cytogenetic damage.
In both experiments, in the absence and presence of S9 mix, no biologically relevant increase in the number of cells carrying structural chromosome aberrations was observed. The aberration rates of the cells after treatment with the test item (0.0 - 4.0 % aberrant cells, excluding gaps) were slightly above the solvent control value (1.0 % aberrant cells, excluding gaps) and within the range of the laboratory’s historical control data: 0.0 - 4.0 % aberrant cells, excluding gaps. A single significant increase was observed in Experiment I, without S9 mix, at exposure period 4 hrs after treatment with 123.9 µg/mL.
Table 3.8.1.2–1: Summary of Results of the Chromosomal Aberration Study with SYN524464 without S9 mix
Exp. Preparation Test item Polyploid Mitotic indices Aberrant cells
interval concentration cells in % in %
in µg/mL in % of control incl. gaps* excl. gaps* with exchanges
Exposure period 4 hrs without S9 mix
I 22 hrs Solvent control1 0.2 100.0 1.0 1.0 0.0
Positive control2 0.0 45.3 13.0 12.5S 2.0
70.8 0.0 79.1 1.5 1.0 0.0
123.9 0.0 64.2 4.0 4.0S 0.0
216.8P 0.2 29.7 2.5 2.0 0.0
Exposure period 22 hrs without S9 mix
II 22 hrs Solvent control1 0.0 100.0 1.5 1.0 0.0
Positive control3 0.0 48.1 22.0 21.0S 8.0
23.1 0.4 94.1 2.0 1.5 0.0
40.5P 0.0 109.2 2.5 1.5 0.0

CLH REPORT FOR SEDAXANE
72
70.8P 0.0 80.3 2.0 1.0 0.0
* Including cells carrying exchangesP Precipitation occurredS Aberration frequency statistically significant higher than corresponding control values1 DMSO 0.5 % (v/v)2 EMS 825.0 µg/mL3 EMS 550.0 µg/Ml
Although this increase of 4.0 % aberrant cells, excluding gaps, was statistically significant compared to the low response (1.0 % aberrant cells, excluding gaps) in the solvent control data, the response is within the laboratory’s historical control data range (0.0 - 4.0 % aberrant cells, excluding gaps). Therefore, the statistical significance has to be regarded as being biologically irrelevant.
In both experiments, no biologically relevant increase in the rate of polyploid metaphases was found after treatment with the test item (0.0 – 0.4 %) as compared to the rates of the solvent controls (0.0 – 0.4 %).
In both experiments, EMS (825 and 550 µg/mL, respectively) and CPA (37.5 and 30.0 µg/mL, respectively) were used as positive controls and showed distinct increases in cells with structural chromosome aberrations.
Table 3.8.1.2–2: Summary of Results of the Chromosomal Aberration Study with SYN524464 with S9
Exp. Preparation Test item Polyploid Mitotic indices Aberrant cells
interval concentration cells in % in %
in µg/mL in % of control incl. gaps* excl. gaps* with exchanges
Exposure period 4 hrs with S9 mix
I 22 hrs Solvent control1 0.4 100.0 1.0 1.0 0.0
Positive control2 0.0 54.1 12.5 11.5S 4.5
70.8 0.0 111.5 1.0 0.5 0.0
123.9 0.4 107.7 0.0 0.0 0.0
216.8 0.4 54.5 3.5 2.5 0.0
II 22 hrs Solvent control1 0.2 100.0 1.0 1.0 1.0
Positive control3 0.0 35.7 13.0 12.5S 1.5
100.0 0.2 114.8 1.0 0.5 0.0
150.0 0.0 114.3 1.5 1.5 0.0
200.0P 0.0 94.9 1.0 0.5 0.0
* Including cells carrying exchangesP Precipitation occurredS Aberration frequency statistically significant higher than corresponding control values1 DMSO 0.5 % (v/v)2 CPA 37.5 µg/mL3 CPA 30.0 µg/mL

CLH REPORT FOR SEDAXANE
73
CONCLUSION: In conclusion, it can be stated that under the experimental conditions reported, the test item CSAA798670 did not induce structural chromosomal aberrations in human lymphocytes in vitro in the absence and presence of metabolic activation, when tested up to the highest required concentration.
3.8.1.3 Wollny (2009)Report: Wollny H (2009). CSAA798670: Cell mutation assay at the thymidine kinase locus (TK+/-) in
mouse lymphoma L5178Y cells. Harlan Cytotest Cell Research GmbH, (Harlan CCR), In den Leppsteinswiesen 19, 64380 Rossdorf, Germany. Laboratory Report No. 1266901, 30 November 2009. Unpublished. (Syngenta File No. NOA449410_10000).
GUIDELINES: In Vitro Mammalian Cell Gene Mutation Test OECD 476 (1997): OPPTS 870.5300 (1998): 2008/440/EC B.17 (2008): Kanpoan No. 287: Eisei No. 127: Heisei 09/10/31: JMAFF No. 12
GLP: Signed and dated GLP and Quality Assurance statements were provided.
There were no deviations from the current regulatory guideline considered to compromise the scientific validity of the study.
EXECUTIVE SUMMARYIn a mammalian cell gene mutation assay, the potential of CSAA798670 (purity 97.4%) to induce mutations at the mouse lymphoma thymidine kinase locus using the cell line L5178Y was investigated. The assay was performed in two independent experiments, using two parallel cultures each. The main experiments were performed with and without liver microsomal activation and a treatment period of 4 hours. The cells cultured in vitro were exposed at the following concentrations: 113.1, 226.3, 425.5, 905.0 and 1810.0 µg/mL
The highest applied concentration (1810 μg/mL) was chosen with regard to the molecular weight of the test item corresponding to a molar concentration of about 10 mM.
No reproducible cytotoxic effects occurred in both main experiments up to the maximum concentration in the absence and presence of metabolic activation.
No substantial and reproducible dose dependent increase in mutant colony numbers was observed up to the maximum concentration with and without metabolic activation.
Appropriate reference mutagens were used as positive controls and showed a distinct increase in induced mutant colonies, indicating that the tests were sensitive and valid.
In conclusion it can be stated that during the mutagenicity test described and under the experimental conditions reported CSAA798670 did not induce mutations in the mouse lymphoma thymidine kinase locus assay using the cell line L5178Y in the absence and presence of metabolic activation.
Therefore, CSAA798670 is considered to be non mutagenic in this mouse lymphoma assay.

CLH REPORT FOR SEDAXANE
74
MATERIALS AND METHODSMaterials:
Test Material: CSAA798670Description: Light brown powderLot/Batch number: LT-DFPA09001Purity: 97.4% a.i (by HPLC)CAS#: 176969-34-9Stability of test compound: Reanalysis end March 2011 (Storage condition of test material <30°C)
Control Materials:Solvent control (final concentration):
DMSO
Positive control: Without metabolic activation: Methyl Methane Sulfonate (MMS), 19.5 µg/mL = 0.18 mMWith metabolic activation: Cyclophosphamide (CPA); 3.05 µg/mL = 10.7 µM and 4.5 µg/mL = 16.1 µM
Mammalian metabolic system: S9 derived X Induced Aroclor 1254 X Rat X Liver
Non-induced X Phenobarbitol Mouse LungNone Hamster Other
X Other β-naphthoflavone
Other
X indicates those that apply
Phenobarbital/β-naphthoflavone induced rat liver S9 was used as the metabolic activation system. The S9 was prepared from 8-12 weeks old male Wistar HsdCpb rats, induced by applications of 80 mg/kg bw phenobarbital i.p. and β-naphthoflavone p.o. each on three consecutive days. The livers were prepared 24 hours after the last treatment. The S9 fractions were produced by dilution of the liver homogenate with a KCl solution (1:4 v/v) followed by centrifugation at 9000 g. Aliquots of the supernatant were frozen and stored. The protein concentration of the S9 preparation was 35.6 mg/mL (pre-experiment and experiment I) and 32.3 mg/mL in experiment II.
An appropriate quantity of S9 supernatant was thawed and mixed with S9 cofactor solution to give a final protein concentration of 0.75 mg/mL in the cultures. Cofactors were added to the S9 mix to reach the following concentrations:
8 mM MgCl2 33 mM KCl 5 mM Glucose-6-phosphate 4 mM NADP
in 100 mM sodium-ortho-phosphate-buffer, pH 7.4.
During the experiment, the S9 mix was stored in an ice bath. The S9 mix preparation was performed according to Ames et al. (1977). The concentration in the final test medium was 5% (v/v).

CLH REPORT FOR SEDAXANE
75
Test cells: mammalian cells in culture X Mouse lymphoma L5178Y cells V79 cells (Chinese hamster lung fibroblasts)
Chinese hamster ovary (CHO) cells List any othersMedia: RPMI 1640Properly maintained? X Yes NoPeriodically checked for Mycoplasma contamination? X Yes NoPeriodically checked for karyotype stability? X Yes NoPeriodically “cleansed” against high spontaneous background? X Yes NoX indicates those that apply
Locus Examined:
Thymidine kinase (TK)
Hypoxanthine-guanine-phosphoribosyl transferase (HGPRT)
Na+/K+ATPase
Selection agent: Bromodeoxyuridine (BrdU)
8-azaguanine (8-AG) ouabain
Fluorodeoxyuridine (FdU)
6-thioguanine (6-TG)
X Trifluorothymidine (TFT)
X indicates those that apply
Test compound concentrations used: Experiment I: without S9 mix: 113.1, 226.3, 425.5, 905.0 and 1810.0 µg/mL with S9 mix: 113.1, 226.3, 425.5, 905.0 and 1810.0 µg/mLExperiment II: without S9 mix: 113.1, 226.3, 425.5, 905.0 and 1810.0 µg/mLwith S9 mix: 113.1, 226.3, 425.5, 905.0 and 1810.0 µg/mL
Study Design and Methods:Experimental dates: Start: 22 July End: 31 August 2009
Pre-test on toxicity: 1x10⁷ cells were exposed to each of 8 concentrations (14.1 to 1810 µg/mL) of CSAA798670 for 4 hours with and without metabolic activation. Following treatment the cells were washed twice by centrifugation and re-suspended in "saline G". Subsequently the cells were resuspended in 30 mL complete culture medium for a 2-day growth period. The cell density was determined immediately after treatment and at each day of the growth period and adjusted to 3 × 10⁵ cells/mL, if necessary. The relative suspension growth (RSG) of the treated cell cultures was calculated at the end of the growth period according to the method of Clive and Spector (1975). The doses of the main experiments were selected according to the results obtained in the pre-experiment.
Mutation experiment:Cell treatment: In the mutation experiment 1×10⁷ cells/flask (80 cm2 flasks) suspended in 10 mL RPMI medium with 3% horse serum were exposed to various concentrations of the test item either in the presence or absence of metabolic activation. After 4 h the test item was removed by centrifugation (425 × g, 10 min) and the cells were washed twice with "saline G". Subsequently the cells were resuspended in 30 mL complete culture medium and incubated for an expression and growth period of 48 h.
The cell density was determined each day and adjusted to 3×10⁵ cells/mL, if necessary. The relative suspension growth (RSG) of the treated cell cultures was calculated by the day 1 fold-increase in cell number multiplied by the day 2 fold-increase in cell number according to the method of Clive and

CLH REPORT FOR SEDAXANE
76
Spector (1975). One sample of the cells was taken at the end of treatment, diluted and seeded into microtiter plates, to determine the viability of the cells after treatment (cloning efficiency 1).
After the expression period the cultures were selected. Cells from each experimental group were seeded into 2 microtiter plates so that each well contained approximately 4×10³ cells in selective medium with TFT (SERVA, D-69042 Heidelberg). The viability (cloning efficiency 2) was determined by seeding about 2 cells per well into microtiter plates (same medium without TFT). The plates were incubated at 37±1.5°C in 4.5% CO2/95.5% water saturated air for 10-15 days. Then the plates were evaluated.
Colonies were counted manually. In accordance with their size the colonies were classified into two groups. The colony size distribution was determined in the controls and at all concentrations of the test item. Criteria to determine colony size were the absolute size of the colony (more than 1/3 of a well for large colonies) and the optical density of the colonies (the optical density of the small colonies is generally higher than the large colonies).
Evaluation criteria: A test item is classified as mutagenic if the induced mutation frequency reproducibly exceeds a threshold of 126 colonies per 106 cells above the corresponding solvent control or negative control, respectively.
A relevant increase of the mutation frequency should be dose-dependent.
A mutagenic response is considered to be reproducible if it occurs in both parallel cultures.
However, in the evaluation of the test results the historical variability of the mutation rates in negative and vehicle controls and the mutation rates of all negative and vehicle controls of this study were taken into consideration.
Results of test groups are generally rejected if the relative total growth, and the cloning efficiency 1 is less than 10% of the vehicle control unless the exception criteria specified by the IWGT recommendations are fulfilled.
Whenever a test item is considered mutagenic according to the above mentioned criteria, the ratio of small versus large colonies is used to differentiate point mutations from clastogenic effects. If the increase of the mutation frequency is accompanied by a reproducible and dose dependent shift in the ratio of small versus large colonies clastogenic effects are indicated.
Statistical methods: A linear regression (least squares) was performed to assess a possible dose dependent increase of mutant frequencies using SYSTAT®11 (SYSTAT Software, Inc., 501, Canal Boulevard, Suite C, Richmond, CA 94804, USA) statistics software. The number of mutant colonies obtained for the groups treated with the test item was compared to the solvent control groups. A trend was judged as significant whenever the p-value (probability value) was below 0.05. However, both, biological relevance and statistical significance were considered together.
RESULTS AND DISCUSSIONPreliminary toxicity assay: Toxic effects leading to RSG values below 50% were not observed up to the maximum concentration in the absence and presence of metabolic activation. The test medium was checked for precipitation or phase separation at the end of the treatment period (4 hours) before the test item was removed. No precipitation occurred up to the highest concentration with and without metabolic activation.
Both pH value and osmolarity were determined in the pre-experiment at the maximum concentration of the test item and in the solvent control without metabolic activation. No relevant increase in the osmolarity or pH value was observed (solvent control: 311 mOsm, pH 7.30 versus 317 mOsm and pH 7.35 at 1810 µg/mL).

CLH REPORT FOR SEDAXANE
77
Since no relevant cytotoxic effects were noted in the pre-experiment the maximum concentration of 1810 µg/mL equal to approximately 10 mM was also used in both main experiments. The lower doses of both main experiments were spaced by a factor of two.
Mutation assay: The test medium was checked for precipitation visible to the naked eye at the end of the 4 hours treatment just before the test item was removed. No precipitation meeting the criteria mentioned above was noted in the main experiments at analysed concentrations.
No relevant toxic effects indicated by a relative cloning efficiency 1 (survival) or a relative total growth (RTG) of less than 50% in both cultures occurred in experiment I and II up to the maximum concentration with and without metabolic activation. An isolated reduction of the relative cloning efficiency 1 to 49.3% was noted in the second culture of the first experiment at 1810 µg/mL without metabolic activation. However, the corresponding RTG level was 80.6% and no cytotoxic effect was observed in the parallel culture under identical conditions. A similar effect occurred in the first culture of the second experiment at 1810 µg/mL. The RTG was reduced to 37.4% but the corresponding cloning efficiency 1 was 150.2%. Again, no reduction was noted in both parameters of cytotoxicity in the parallel culture under identical experimental conditions.
No substantial and reproducible dose dependent increase of the mutation frequency was observed in experiment I and II up to the maximum concentration with and without metabolic activation. The threshold of 126 above the corresponding solvent control was not reached or exceeded at any test point with and without metabolic activation.
A linear regression analysis (least squares) was performed to assess a possible dose dependent increase of mutant frequencies using SYSTAT® statistics software. A single significant dose dependent trend of the mutation frequency indicated by a probability value of <0.05 was determined in culture I of the second experiment without metabolic activation. Since the mutation frequency did not exceed the threshold in any of the concentrations tested, as indicated above, the statistical result was considered as biologically irrelevant.
In this study the range of the solvent controls was from 114 up to 198 mutant colonies per 106 cells; the range of the groups treated with the test item was from 98 up to 267 mutant colonies per 106 cells. The solvent controls of the first culture of experiment I without metabolic activation, the second culture of the first experiment with metabolic activation, and the first culture of the second experiment with metabolic activation exceeded the upper limit of the acceptance criteria somewhat (170 mutant colonies/106 cells). The data are acceptable however, since the mutation frequency of each parallel culture remained within the range of 50–170 mutant colonies/106 cells.
MMS (19.5 µg/mL) and CPA (3.0 µg/mL and 4.5 µg/mL in both main experiments) were used as positive controls and showed a distinct increase in induced total mutant colonies at acceptable levels of toxicity with at least one of the concentrations of the controls.

CLH REPORT FOR SEDAXANE
78
Table 3.8.1.3–1: Summary of Resultsrelative relative mutant relative relative mutant
conc. µg S9 cloning total colonies / cloning total colonies /per mL mix efficiency 1 growth 106 cells threshold efficiency 1 growth 106 cells threshold
Column 1 2 3 4 5 6 7 8 9 10culture I culture II
Neg. control with medium - 100.0 100.0 175 100.0 100.0 55Solv. control with DMSO - 100.0 100.0 149 275 100.0 100.0 58 184Pos. control with MMS 19.5 - 74.8 18.2 302 275 56.8 22.4 352 184Test item 6.9 - 95.3 75.5 110 275 83.1 102.1 60 184Test item 13.8 - 101.7 99.9 108 275 95.8 57.3 107 184Test item 27.5 - 98.4 107.7 131 275 114.2 75.8 93 184Test item 55.0 - 108.8 99.0 102 275 77.4 64.0 82 184Test item 82.5 - 40.2 17.4 134 275 71.1 47.2 96 184Test item 110.0 - 1.9 4.3
Neg. control with medium + 100.0 100.0 66 100.0 100.0 71Solv. control with DMSO + 100.0 100.0 61 187 100.0 100.0 63 189Pos. control with CPA 4.5 + 8.5 9.9 737 187 97.2 28.0 310 189Pos. control with CPA 5.4 + 4.3 5.6 986 187 20.6 19.3 139 189Test item 6.9 + 70.5 81.8Test item 13.8 + 66.6 75.2 95 187 80.6 91.3 45 189Test item 27.5 + 80.4 81.4 79 187 95.7 95.6 42 189Test item 55.0 + 62.9 73.2 146 187 83.0 67.8 63 189Test item 82.5 + 45.9 46.9 98 187 9.0 67.3 94 189Test item 110.0 + 8.0 8.1 161 187 0.4 5.0 97 189
culture I culture IINeg. contr. with medium - 100.0 100.0 105 100.0 100.0 58Solvent control with DMSO - 100.0 100.0 112 238 100.0 100.0 42 168Pos. control with MMS 19.5 - 76.7 38.1 286 238 75.3 21.5 347 168Test item 20.0 - 93.0 81.7 78 238 132.9 84.5 72 168Test item 40.0 - 87.8 70.4 89 238 191.7 45.2 59 168Test item 60.0 - 89.1 81.2 72 238 165.9 71.0 58 168Test item 80.0 - 35.1 20.8 146 238 79.2 46.7 70 168Test item 90.0 - 14.4 6.8 83 238 36.4 16.4 43 168Test item 100.0 - 1.7 4.8
culture I culture IINeg. contr. with medium + 100.0 100.0 58 100.0 100.0 65Solvent control with DMSO + 100.0 100.0 60 186 100.0 100.0 46 172Pos. control with CPA 4.5 + 14.3 9.3 312 186 7.4 6.4 345 172Pos. control with CPA 5.4 + 4.2 1.7 1456 186 13.5 9.4 185 172Test item 20.0 + 67.3 57.3 87 186 19.2 68.5 69 172Test item 40.0 + 52.8 64.4 58 186 92.5 76.2 61 172Test item 80.0 + 46.4 31.2 64 186 65.2 46.7 78 172Test item 90.0 + 23.1 25.8 49 186 33.8 21.9 62 172Test item 100.0 + 13.3 7.9 104 186 16.2 9.8 72 172Test item 110.0 + 2.3 3.1culture was not continued#
culture was not continued#
culture was not continued## culture was not continued##
culture was not continued# culture was not continued#
culture was not continued#
Experiment II / 4 h treatment
Experiment I / 4 h treatment
culture was not continued#
Experiment II / 4 h treatment
threshold = number of mutant colonies per 106 cells of each solvent control plus 126)
# culture was not continued due to exceedingly strong toxic effects
## culture was not continued since a minimum of four concentrations is required by the guidelines
The values printed in bold are judged as invalid, since the acceptance criteria are not met.
CONCLUSION: In conclusion it can be stated that during the mutagenicitiy test described and under the experimental conditions reported the test item CSAA798670 did not induce mutations in the mouse lymphoma thymidine kinase locus assay using the cell line L5178Y in the absence and presence of metabolic activation.Therefore, CSAA798670 is considered to be non-mutagenic in this mouse lymphoma assay.References:Clive D, Spector JFS Laboratory procedure for assessing specific locus mutation at the TK locus in cultured L5178Y mouse lymphoma cells Mutat. Res. 31, 17-29, 1975

CLH REPORT FOR SEDAXANE
79
Ames BN, McCann J and Yamasaki E, Methods for detecting carcinogens and mutagens with the Salmonella/mammalian microsome mutagenicity test In: Kilbey BJ et al. (Eds.) "Handbook of Mutagenicity Test Procedures", Elsevier, Amsterdam, 1-17, 1977
3.8.2 Animal data3.8.2.1 Anonymous (2010)Report: Anonymous (2010), SYN524464 – Micronucleus Assay in Bone Marrow Cells of the Mouse –
Final Report Amendment 1. Laboratory Report No. 1074304, issue date 22 February 2008 (amended 15 February 2010). Unpublished. (Syngenta File No. SYN524464/0061)
GUIDELINES: Mouse bone marrow micronucleus test OECD 474 (1997); OPPTS 870.5395 (1998); 2000/32/EEC B.12 (2000); ICH S2A (1995)/ S2B (1997)
GLP: Signed and dated GLP and Quality Assurance statements were provided.
There were no deviations from the current regulatory guideline considered to compromise the scientific validity of the study.
EXECUTIVE SUMMARYIn a NMRI mouse bone marrow micronucleus assay, 6/males/dose were treated orally with SYN524464 (95.3 % (sum of 83.0 % SYN508210 and 12.3 % SYN508211)) at doses of 0, 500, 1000 and 2000 mg/kg bw. Bone marrow cells were harvested at 24h (all doses) and 48 h (only the high dose) post-treatment. The vehicle was 0.5% CMC. All animals were treated once orally (gavage) at an application volume of 20 mL/kg b.w. (except the positive control group, which were treated with 10 mL/kg b.w.).
There were no signs of toxicity during the study. SYN524464 was tested at an adequate dose (maximum recommended dose by the OECD guideline). The positive control induced the appropriate response.
There was not a significant increase in the frequency of micronucleated polychromatic erythrocytes in bone marrow after any treatment time.
MATERIALS AND METHODSMaterials:
Test Material: SYN524464Description: solid, off-whiteLot/Batch number: SMU6LP006/MILLEDPurity: 95.3 % (sum of 83.0 % SYN508210 and 12.3 % SYN508211)Stability of test compound: not available
Control Materials:Negative control (if not vehicle) :
N/A Final Volume: N/A Route: N/A
Vehicle: 0.5% CMC Final Volume: 20ml/kg(10 ml/kg for positive control)
Route: oral
Positive control : Cyclophosphamide Final Doses: 40mg/kg Route: oral

CLH REPORT FOR SEDAXANE
80
Test Animals:Species MouseStrain NMRIAge/weight at dosing 7-8 weeksSourceHousing 1/cageAcclimatisation period At least 5 daysDiet ad libitumWater tap water ad libitumEnvironmental conditions Temperature: 19-25°C
Humidity: 30-84%Photoperiod: 12hours dark/12 hours light
Test compound administration: Dose Levels Final Volume Route
Preliminary:
Main Study:
100, 1000, 2000 mg/kg b.w.500, 1000, 2000 mg/kg b.w.
20 mL/kg b.w.
20 mL/kg b.w.
oral
oral
Study Design and Methods:In-life dates: Start: 03 April, 2007 End: 21 May, 2007
Preliminary Toxicity Assay: A maximum tolerated dose (MTD) was determined, based on patterns of lethalities or severe toxicity observed over a two-day observation period following a single oral dose.
Micronucleus Test:
Table 3.8.2.1–1: Experimental DesignTreatment Dose Number of Animals /Time of kill
24 hours 48 hoursVehicle control 10 ml/kg 6* 6*Positive control 40 mg/kg 6*Test substance 2000 mg/kg 6* 6*Test substance 1000 mg/kg 6*Test substance 500 mg/kg 6*
*: the 6th animal was used as a reserve.
Slide Preparation: All animals designated for bone marrow smears were terminated by over-exposure to CO2 followed by bleeding.
The animals were sacrificed using CO2 followed by bleeding. The femora were removed, the epiphyses were cut off and the marrow was flushed out with foetal calf serum using a syringe. The cell suspension was centrifuged at 1500 rpm (390 × g) for 10 minutes and the supernatant was discarded. A small drop of the re-suspended cell pellet was spread on a slide. The smear was air-dried and then stained with May-Grünwald Giemsa. Cover slips were mounted with EUKITT. At least one slide was made from each bone marrow sample.
Slide Analysis: Slides were coded and scored blind. Two thousand immature erythrocytes were examined for the presence of micronuclei for each animal. The slides were also examined for evidence of cytotoxicity, which may be manifest by alterations in the ratio of different cell types in the bone marrow. This was assessed by counting the ratio of immature to mature erythrocytes and expressed in immature erythrocytes per 2000 erythrocytes.

CLH REPORT FOR SEDAXANE
81
RESULTS AND DISCUSSIONPreliminary toxicity assay: In the first pre-experiment 4 animals (2 males, 2 females) received orally a single dose of 100 mg/kg b.w. SYN524464 formulated in 0.5% CMC. The volume administered was 20 mL/kg b.w.
The animals treated with 100 mg/kg b.w. did not express any toxic reactions.
In the second pre-experiment 4 animals (2 males, 2 females) received orally a single dose of 1000 mg/kg b.w. SYN524464 formulated in 0.5% CMC. The volume administered was 20 mL/kg b.w.
The animals treated with 1000 mg/kg b.w. did not express any toxic reactions.
In the third pre-experiment 4 animals (2 males, 2 females) received orally a single dose of 2000 mg/kg b.w. SYN524464 formulated in 0.5% CMC. The volume administered was 20 mL/kg b.w.
The animals treated with 2000 mg/kg b.w. did not express any toxic reactions. On the basis of these data 2000 mg/kg b.w. was estimated to be suitable as the highest dose level. Since gender-specific differences in the sensitivity to the test item were not observed, the main experiment was performed using only males.
Micronucleus test: In the main experiment for the highest dose group 12 males received orally a single dose of 2000 mg/kg b.w. SYN524464 formulated in 0.5% CMC. For the mid and low doses 6 males per group received orally a single dose of 1000 or 500 mg mg/kg b.w. SYN524464 formulated in 0.5% CMC . The volume administered was 20 mL/kg b.w.
Neither the test item treated animals nor those treated with the vehicle control (0.5% CMC) expressed any toxic reactions.
The mean number of polychromatic erythrocytes was not decreased after treatment with the test item as compared to the mean value of PCEs of the vehicle control, indicating that SYN524464 did not have any cytotoxic properties in the bone marrow. Therefore, it cannot be clearly demonstrated that the bone marrow has been exposed even at the limit dose of 2000 mg/kg b.w. However based on the ADME data, bone marrow exposure after oral administration of hich dose levels sedaxane is assumed. Indeed, the maximal concentration of total radioactivity in plasma Cmax following a single oral administration of 80 mgkg bw[14C]-SYN524464 was 10.6 and 12.4 µg equiv/mL in males and females respectively.
In comparison to the corresponding vehicle controls there was no biologically relevant enhancement in the frequency of the detected micronuclei at any preparation interval and dose level after administration of the test item.
Table 3.8.2.1–2: Summary of Micronucleus Test ResultsTest Group Dose mg/kg b.w. Sampling Time
(h)PCEs with
micronuclei (%)Range PCE per 2000
erythrocytesVehicle 0 24 0.100 0 – 4 1073Test item 500 24 0.150 1 – 5 1094Test item 1000 24 0.160 1 – 6 1174Test item 2000 24 0.120 0 – 5 1239Positive Control 40 24 1.610 17 – 41 1159Vehicle 0 48 0.040 0 – 2 1192Test item 2000 48 0.110 1 – 3 1170
CONCLUSION: In conclusion, it can be stated that during the study described and under the experimental conditions reported, the test item did not induce micronuclei as determined by the micronucleus test in the bone marrow cells of the mouse.

CLH REPORT FOR SEDAXANE
82
3.8.2.2 Anonymous (2009)Report: Anonymous (2009) SYN524464 - In vivo Liver Unscheduled DNA Synthesis (UDS) Assay.
Laboratory Report No. 2364/0089, issue date 25 November 2009. Unpublished. (Syngenta File No.SYN524464_11220)
GUIDELINES: Unscheduled DNA Synthesis (UDS) with Mammalian Liver Cells In Vivo OECD 486 (1997); 2000/32/EEC B.39 (2000).
GLP: Signed and dated GLP and Quality Assurance statements were provided.
A few animals, in each experiment, had bodyweights that were below the lower 220 g limit stated in the standard test method (STM). However, they were of the correct age and were considered to be acceptable for use in the study.
This deviation from the current regulatory guideline was considered not to compromise the scientific validity of the study.
EXECUTIVE SUMMARYThis study was performed to assess the potential of the test material to induce DNA repair in isolated rat hepatocytes following in vivo administration. A range-finding study was performed to find suitable dose levels of the test material, and to investigate to see if there was a marked difference in toxic response between the sexes. There was no marked difference in test material toxicity between the sexes therefore the main study was performed using only male rats.
The unscheduled DNA synthesis (UDS) assay was conducted using the test material (SYN524464) as a suspension in 0.5% aqueous carboxymethyl cellulose (CMC) at the Maximum Recommended Dose (MRD) of 2000 mg/kg with 667 mg/kg as the lower dose level. The study was performed in two parts, in Experiment 1 the livers were perfused approximately 16 hours after dosing and, in Experiment 2; perfusion was performed approximately 2 hours after dosing. Following perfusion the liver hepatocytes were processed to give stained slides which were then scored for net nuclear grain counts (NNG) and percentage of cells in repair using a microscope and an automated image analysis system. The method used for scoring the hepatocytes was an area counting method which complies with the UKEMS guidelines and OECD test method. Further groups of rats were given a single oral dose of 0.5% carboxymethyl cellulose (CMC), 2-acetylaminofluorene (2AAF) or N,N’-dimethylhydrazine dihydrochloride (NDHC) to serve as vehicle and positive controls. For the positive controls, the 2-AAF group was processed after 16 hours, and the NDHC group was processed after 2 hours.
The test material SYN524464 did not induce any statistically significant increases above control values in the group mean net nuclear grain counts.However, at the high dose level and at the 16 hour harvest time point, all the parameters assessing mutagenicity (NNGC, N-C and % in repair) were increased. Indeed, the NNGC was 0.9 vs 0.2 in the vehicle controls, the NNGC of cells in repair was 7.6 vs 6.6 and the percentage of cells in repair was 11 % vs 5.7% in the vehicle controls.
Both positive controls produced marked statistically significant increases in the incidences of cells in repair and in net nuclear grain counts, and the vehicle control groups gave acceptable values for net nuclear grain counts.
In this assay, no statistically significant increase was observed with the test material SYN524464. However, at 2000 mg/kg and the 16 hours harvest time point, the mutagenic parameters were numerically increased and slightly exceeded the historical control data.
Therefore the result of this test should be considered as equivocal.

CLH REPORT FOR SEDAXANE
83
MATERIALS AND METHODSMaterials:
Test Material: SYN524464Description: Off-white powderLot/Batch number: SMU6LP006/MILLEDPurity: 95.3%, comprised of 83.0% SYN508210 (trans isomer) and 12.3%
SYN508211 (cis isomer)Stability of test compound: Reassay date: January 2011
Control Materials:Negative control (if not vehicle) :
N/A Final Volume: N/A Route: N/A
Vehicle: 0.5% Carboxymethyl cellulose (CMC)
Final Volume: 10 mL/kg Route: oral
16-hour Positive control :
2-Acetylaminofluorene (2-AAF)
Final Doses: 50 mg/kg Route: oral
2-hour Positive control :
Dimethylhydrazine dihydrochloride (NDHC)
Final Doses: 40 mg/kg Route: oral
Test Animals:Species RatStrain Sprague-Dawley CD (Crl : CD® (SD) IGS BR)Age/weight at dosing Approximately 9 weeks / 216-238 gSourceHousing Up to 5 per cage in solid-floor polypropylene cages with woodflake beddingAcclimatisation period At least 5 daysDiet Certified Rat and Mouse Diet (Code 5LF2, IPS Ltd., London, UK) ad libitumWater Mains water ad libitumEnvironmental conditions Temperature: 19-25°C
Humidity: 30-70%Air changes: 15/hourPhotoperiod: 12hours dark/12 hours light
Test compound administration: Dose Levels RoutePhase 1: (determination of MTD) 2000 mg/kg oralPhase 2: Main UDS study 667, 2000 mg/kg oral
Study Design and Methods:In-life dates: Start: 13 August 2007 End: 12 December 2007
Preliminary Toxicity Assay: A maximum tolerated dose (MTD) was determined, based on patterns of lethalities or severe toxicity observed over a 24 hour observation period following a single oral dose.
UDS Assay:

CLH REPORT FOR SEDAXANE
84
Table 3.8.2.2-1: Experimental Design
Experiment 1:Treatment GroupDose Level
(mg/kg)Dose Volume
(ml/kg)
Perfusion Time
(Hours After Dosing)
Number of Animals
1. Vehicle Control (0.5% CMC) 0 10 16 5
2. SYN524464 667 10 16 4
3. SYN524464 2000 10 16 4
4. Positive Control (2AAF) 50 10 16 3
Experiment 2: Treatment GroupDose Level
(mg/kg)Dose Volume
(ml/kg)
Perfusion Time
(Hours After Dosing)
Number of Animals
1. Vehicle Control (0.5% CMC) 0 10 2 5
2. SYN524464 667 10 2 4
3. SYN524464 2000 10 2 4
4. Positive Control (NDHC) 40 10 2 3
Only male rats were used in the main UDS test. In Experiment 1, two groups of four rats were dosed with test material at 667 or 2000 mg/kg. In addition, two further groups of rats were included in the experiment, one group (five rats) was dosed with the vehicle alone (0.5% CMC) and the second group (three rats) was dosed with 2-acetylaminofluorine (2AAF) as a positive control. All animals were perfused approximately 16 hours after dosing.
For Experiment 2, the dose groups and group sizes were as for Experiment 1 except that the positive control was NDHC and animals were perfused approximately 2 hours after dosing.
Cell Preparation: The isolation of the hepatocytes was carried out using a two stage in situ method, and was performed immediately after termination of the animal. The post-aortic vena cava was ligatured, and then cannulae were introduced into the hepatic portal vein and superior vena cava. This allowed a flow of liquid through the liver and out through the heart. Livers were first perfused with a buffered medium containing chelating agents to remove metal ions. This was followed by a digest medium containing collagenase and calcium causing the liver to disassociate into a single cell population.
The liver was removed from the body and the capsule opened and the liver cells were suspended in attachment medium. The suspended cells were then passed through nylon gauze to remove large particles and debris. The cells were centrifuged and washed three times using a buffered medium and finally suspended in attachment medium at 2 × 10⁵ viable cells/mL. Cell viability and cell concentrations were estimated using a haemocytometer slide and Trypan blue exclusion dye. They were then seeded onto 22 mm cover slips in 35 mm six-well plates at 3 mL/well (six cover slips per animal). The plates were incubated at 37C in 5% CO2:95% air in a humidified incubator for 1½ to 2 hours to allow cell attachment.
Radiolabelling of cells: After cell attachment, the medium was aspirated using aseptic technique. The hepatocytes were washed with serum-free medium which was replaced with 2 mL of serum-free medium containing 10 µCi/mL (370 kBq/ml) of [methyl-3H] thymidine. The cultures were then incubated for a further 3 hours at 37C in 5% CO2/95% air.
Cultures were washed three times with serum-free medium containing 0.25 mM unlabelled thymidine solution. This was a ‘cold chase’ procedure to remove excess radiolabel from the cultures. The cells were incubated overnight with 2 ml of ‘cold chase’ medium.

CLH REPORT FOR SEDAXANE
85
Preparation of Autoradiographs/Grain Development: The medium was removed by aspiration and the cells washed with phosphate buffer solution. The cells were fixed in freshly prepared 1:3 acetic acid:methanol; three changes of fixative were used. Finally cells were washed with distilled water and the cover slips allowed to air dry and then mounted onto the ends of glass slides, cell side up, and left to dry overnight in a dust free environment. The cover slips were coated with autoradiographic emulsion and incubated at approximately 4C for 7 to 14 days in a sealed light proof container.
The emulsion is sensitive to the emission of radioactive particles, causing a deposit of silver, visualised as black grains when development is complete.
Following the exposure period the slides were processed using photographic developer and fixative, and then the cells were stained using haematoxylin/eosin. When the cells were dry a cover slip was applied using a mounting medium. The slides were then assessed for obvious signs of toxicity, reduced numbers of cells and poor labelling.
Three good quality slides from each animal were selected and coded using a code supplied by the ‘Grain’ computer programme.
Grain Counting: The coded slides were scored using an automated image analysis system linked to a computer programme (Grain) which followed the UKEMS guidelines for statistical analysis. Where ever possible three slides for each animal were scored with a maximum of 50 cells per slide giving an accumulative total of 150 cells per animal. To meet the OECD Guidelines a minimum of 100 cells per animal must be scored and this minimum number of cells was scored or exceeded via the process used in this study.
The number of silver grains within the nucleus were first observed and recorded as the Nuclear Grain Count (N). Three cytoplasmic areas (each equal to the nuclear area) were also scored to give the Mean Cytoplasmic Grain Count (C). A net Nuclear Grain Count (N-C) was then calculated. Cells in ‘S’-phase were not scored for grain counts, these were easily recognisable due to the dense ‘graining’ appearance of the nucleus. Mean values (N), (C), (N-C) and percentage cells in repair (%R) were calculated. “Cells in repair” were defined as those with a net Nuclear Grain Count (N-C) greater than or equal to 5.
Based on the assessment criteria described in OECD Guideline 486 the data for net nuclear grain counts (NNG) and percentage cells in repair were assessed for statistically significant differences between control and treated groups, which was the criteria for indication of a positive UDS response.
Statistical analysis: Data for net nuclear grain counts (NNG) and percentage cells in repair for each animal were analysed using the SPSS and Epistat (1974) statistical analysis packages. To stabilize the variances, the data for NNG was transformed using √(x + 2) and the data for percentage cells in repair was analysed using a double arcsine transformation as follows:
0.5 ×( arcsin(sqrt(r/(n+1)))+arcsin(sqrt(r+1/(n+1))) ).Where r is the number of cells in repair and n is the number examined.
Treatment groups were compared to the negative control group using Dunnett’s test based on the error mean square in the analysis variance. Analyses were carried out separately for the Sedaxane treated groups and control and positive control group and control.
Analysis of the net nuclear grain count for the Experiment 1 positive control was carried out using Epistat; all other analyses were carried out using SPSS.
RESULTS AND DISCUSSIONPreliminary toxicity assay: The data are summarised as follows:

CLH REPORT FOR SEDAXANE
86
Deaths on Day Total DeathsDose Level(mg/kg)
Sex Route Number of Animals Treated 0 1
Male 2 0 02000
Femaleoral
2 0 00/4
In animals dosed with the test material via the oral route there were no premature deaths; clinical signs seen at 2000 mg/kg were hunched posture and lethargy. The test material showed no marked difference in its toxicity to male or female rats; it was therefore considered to be acceptable to use males only for the main test. The Maximum Recommended Dose (MRD) of the test material, 2000 mg/kg, was selected for use in the main test, with 667 mg/kg as the lower dose level.
UDS assay: There were no premature deaths seen in any of the dose groups. Clinical signs were observed in animals dosed with test material at 2000 mg/kg in both of the two experiments and included as follows: hunched posture, lethargy and pilo-erection. According to the OECD Guideline 486, liver cells from negative control animals should have a viability of at least 50%. For the animals in the control groups in both experiments all but one had cell viability determinations that exceeded 50%. However, the slides from this animal (with a viability value of 34% in experiment 1) were processed and scored and provided acceptable data which was included in the report.
In experiment 1, all animals from the vehicle control group and the 2000 mg/kg group, and three out of four from the 667 mg/kg test material groups were processed to provide slides suitable for scoring. One animal out of three positive control group animals did not provide slides suitable for scoring but this did not affect the integrity of the study because the minimum number of animals specified in the test guideline (three) was achieved in the vehicle control and the test material dose groups.
The test material SYN524464 did not induce any statistically significant increases above control values in the group mean net nuclear grain counts.However, at the high dose level and at the 16 hour harvest time point, all the parameters assessing mutagenicity (NNGC, N-C and % in repair) were increased. Indeed, the NNGC was 0.9 vs 0.2 in the vehicle controls, the NNGC of cells in repair was 7.6 vs 6.6 and the percenrage of cells in repair was 11 % vs 5.7% in the vehicle controls.
In experiment 2, all animals from all of the dose groups provided slides suitable for scoring.
The test material SYN524464 did not induce any statistically significant increases in net nuclear grain counts or in the incidence of cells in repair at either dose level.
In both experiments, the vehicle control gave acceptable values for net nuclear grain count that were consistent with the historical control data. The positive controls 2-acetylaminofluorene (2AAF) and N,N’-dimethylhydrazine dihydrochloride (NDHC) induced marked, statistically significant increases in the percentage of cells in repair, (94.7 – 96.7%) and (54.0 – 58.0%) respectively and in net nuclear grain counts, demonstrating that the test method was operating satisfactorily.

CLH REPORT FOR SEDAXANE
87
Table 3.8.2.2-2: Group Mean Net Nuclear Grain Count Values and Percentage Cells in Repair
Experiment 1: 16 Hours Harvest Time
Dose Level(mg/kg)
Net Nuclear Grain Count(N-C)
Net Nuclear Grain Count of Cells in Repair
Percentage of Cells in Repair (N-C 5)
Mean SD Mean SD Mean SD
0 Vehicle 0.2 0.3 6.6 0.4 5.7 2.3
667 Sedaxane 0.1 0.8 6.1 0.7 4.9 3.8
2000 Sedaxane 0.9 0.9 7.6 0.3 11.0 5.0
50 2AAF 18.4** 0.0 18.9 0.1 95.7** 1.4
Historical control(range)
-0.26(-2.09 _0.83)
0.55 7.07(5.7 - 15.7)
1.70 3.38(0.1- 9.1)
2.09
Experiment 2: 2 Hours Harvest Time
Net Nuclear Grain Count(N-C)
Net Nuclear Grain Count of Cells in Repair
Percentage of Cells in Repair (N-C 5)Dose Level
(mg/kg)Mean SD Mean SD Mean SD
0 Vehicle -0.4 0.5 6.6 1.1 3.2 2.6
667 Sedaxane -0.5 0.3 6.6 1.0 2.2 0.6
2000 Sedaxane -0.4 0.4 7.5 0.2 3.7 1.8
40 NDHC 6.5** 0.8 10.5 1.6 56.4** 2.1SD = standard deviationVehicle = 0.5% CMC2AAF = 2-AcetylaminofluoreneNDHC = N,N’-Dimethylhydrazine dihydrochloride** = statistically significantly different from control means by Dunnett’s test, p < 0.01
CONCLUSION: In this assay, no statistically significant increase was observed with the test material SYN524464. However, at 2000 mg/kg and the 16 hours harvest time point, the mutagenic parameters were numerically increased and slightly exceeded the historical control data.
Therefore the result of this test should be considered as equivocal.
In order to clarify the equivocal results in this in vivo UDS test, a supplementary UDS test was carried out.
3.8.2.3 Anonymous (2011)
Report: Anonymous (2011) Sedaxane – In Vivo Unscheduled DNA Synthesis in Rat Hepatocytes.
. Laboratory Report No. 1449100, issue date: 16 December, 2011, Unpublished (or if published give reference). (Syngenta File No. SYN524464_11461)
GUIDELINES: Unscheduled DNA Synthesis (UDS) with Mammalian Liver Cells In Vivo OECD 486 (1997): 2000/32/EEC B.39 (2000)
GLP: Signed and dated GLP and Quality Assurance statements were provided.

CLH REPORT FOR SEDAXANE
88
There were no deviations from the current regulatory guideline considered to compromise the scientific validity of the study.
EXECUTIVE SUMMARYThe test item sedaxane was assessed in the in vivo unscheduled DNA synthesis (UDS) assay for its potential to induce DNA repair in the hepatocytes of rats. The test item was formulated in 0.5 % carboxymethylcellulose (CMC), which was also used as the vehicle control. The volume administered orally was 10 mL/kg body weight. After a single oral treatment to male Wistar rats at dose levels of 2000, and 1000 mg/kg and a post-treatment period of 4 or 16 hours, the animals were terminally anaesthetised and liver perfusion was performed. Primary hepatocyte cultures were established and exposed for 4 hours to 3HTdR (methyl-3H-thymidine), which is incorporated if UDS occurs.
The test item was tested at the following dose levels: 4 and 16 hours preparation intervals: 1000 and 2000 mg/kg b.w.. The highest dose used was estimated in a pre-experiment to be the maximum OECD recommended dose for this assay. For each experimental group hepatocytes of four treated animals were assessed for the occurrence of UDS. For the negative and positive control groups two animals were assessed for the occurrence of UDS. The viability of the hepatocytes was not substantially affected by the in vivo treatment with the test item. None of the dose levels tested revealed UDS induction in the hepatocytes of the treated animals as compared to the corresponding vehicle controls. Appropriate reference mutagens [N,N´-dimethylhydrazinedihydrochloride (DMH) , 80 mg/kg b.w. and 2-acetylaminofluorene (2-AAF), 100 mg/kg b.w.] were used as positive controls. Treatment with the positive control substances revealed distinct increases in the number of nuclear and net grain counts , indicating UDS, as well as in the percentage of cells in repair, consistent with a UDS response.
In conclusion, it can be stated that under the experimental conditions reported, i.e. oral administration up to 2000 mg/kg, the maximum OECD guideline recommended dose, the test item did not induce DNA-damage leading to increased repair synthesis in the hepatocytes of the treated rats. Therefore, sedaxane is considered to be non-genotoxic in this in vivo UDS test system.
MATERIALS AND METHODSMaterials:
Test Material: SedaxaneIdentity: SYN524464 TechnicalProduct design code: SYN524464Description: White-off white, solidLot/Batch number: SMU6LP006/MILLEDPurity: 95.3 % (w/w) content of SYN524464 comprised of
83.0 % (w/w) SYN508210 (trans isomer)12.3 % (w/w) SYN508211 (cis isomer)Dose calculation was not adjusted to purity
CAS# 874967-67-6Stability of test compound: Not indicated by the sponsor
Control Materials:Negative control (if not vehicle) :
N/A Final Volume: N/A Route: N/A
Vehicle: Sterile water Final Volume: 10ml/kg Route: oralPositive control :
N,N´-dimethylhydrazinedi-hydrochloride (DMH) – 4 hour preparation interval;2-acetylaminofluorene (2-AAF) – 16 hour preparation interval
Final Doses: 80 mg/kg
100 mg/kg
Route: oral
oral

CLH REPORT FOR SEDAXANE
89
Test Animals:Species ratStrain WistarAge/weight at dosing 8 – 9 weeks (at start of experiment); mean value 184.3 g (Standard
Deviation ± 19.7 g), range 156.6 – 220.3 gSourceHousing Grouped, in Makrolon Type III/IV cage, with wire mesh top, and
granulated soft wood beddingAcclimatisation period At least 5 daysDiet Pelleted standard diet, ad libitumWater Tap water, ad libitumEnvironmental conditions Temperature: 20-24°C
Humidity: 30-65%Air changes: 15/hourPhotoperiod: 12hours dark/12 hours light
Test compound administration: Dose Levels Final Volume Route
Preliminary:Main Study:
2000 mg/kg b.w.1000 and 2000 mg/kg b.w.
10 mL/kg b.w.10 mL/kg b.w.
oraloral
Study Design and Methods:In-life dates: Start: 25 October 2011 End: 05 December 2011
Preliminary Toxicity Assay: A maximum tolerated dose (MTD) was determined, based on patterns of lethalities or severe toxicity observed over a 24 h observation period following a single oral dose.
UDS Assay:
Table 3.8.2.3-1: Experimental DesignTreatment Dose Number of Animals /Time of kill
4 hours 16 hoursVehicle control 10 ml/kg 2 2Positive control 100 mg/kg / 80 mg/kg 2 2Test substance 1000 mg/kg 4 4Test substance 2000 mg/kg 4 4
No sex specific differences in toxic symptoms were observed, therefore, the main experiment was performed using male animals only
Cell Preparation: After terminally anaesthetising the rats with 46% Ketamin (Ketavet 100, Pharmacia GmbH, 76139 Karlsruhe, Germany), 23% Xylazin (Rompun 2%, Bayer Vital GmbH, 51368 Leverkusen, Germany) and 31% Midazolan (Dormicum, Roche Pharma AG, 79639 Grenzach-Wyhlen, Germany) (approx. 2 mL/kg body weight) the liver was perfused through the vena portae with Hanks' balanced salt solution (HBSS, Invitrogen, 76344 Eggenstein, Germany) supplemented with collagenase (0.05 % (w/v), Roche Diagnostics, 68305 Mannheim, Germany) adjusted to pH 7.4 and maintained at 37° C.
The isolated hepatocytes from the liver were washed twice with HBSS. The crude cell suspension was filtered through a stainless steel mesh to yield a single cell suspension. The quality of the perfusion was determined by the trypan blue dye exclusion method. In addition, the number of the isolated cells was determined.

CLH REPORT FOR SEDAXANE
90
The washed hepatocytes were centrifuged and transferred into Williams medium E (WME, Invitrogen, 76344 Eggenstein, Germany) supplemented with:
Hepes 2.38 mg/mL L-Glutamine 0.29 mg/mL Penicillin 100 units/mL Insulin 0.50 µg/mLStreptomycin 0.10 mg/mL Foetal calf serum (FCS) 100 µL/mL
This complete medium was adjusted to pH 7.6.
Three cultures were established from each animal. Aliquots of 2.5 mL with freshly isolated hepatocytes in complete culture medium (2.0 105 viable cells/mL) were added to 35 mm six-well dishes containing one 25 mm round plastic coverslip per well coated with gelatine.
After an attachment period of approximately 1.5 h in a 95 % air/ 5 % CO2 humidified incubator at 37° C the culture medium was discarded. The cell layer was then rinsed once with PBS to remove non-adherent cells. Subsequently, 3HTdR (5 µCi/mL, specific activity 20 Ci/mmol; GE Healthcare, 80807 Munich, Germany) in 2.0 mL culture medium (WME, 1 % (v/v) FCS) was added to the cultures. After a labeling time of 4 h the cells were washed twice with WME supplemented with 1 % (v/v) FCS and 0.25 mM unlabeled thymidine. Cultures were incubated overnight using the same medium. To prepare for autoradiography the medium was replaced by a hypotonic solution of 1 % (w/v) sodium citrate for 10 minutes to swell the nuclei for better grain detection. The cells on the coverslips were then fixed by three changes of methanol:acetic acid (3:1 v/v) for 20 minutes each, rinsed with 96 % (v/v) ethanol, and air-dried.
Preparation of Autoradiographs/Grain Development: The cover slips were mounted on glass slides, cell side upwards and coated with KODAK NTB (Integra Biosciences, 34563 Fernwald, Germany) photographic emulsion in the dark. The coated slides were stored in light-proof boxes in the presence of a drying agent for 14 days at 4° C. The photographic emulsion was then developed (Firma Hobbylab, 3303 Jegenstorf, Switzerland) at room temperature, fixed in Fixer (Firma Hobbylab, 3303 Jegenstorf, Switzerland) and stained with haematoxylin/eosin.
Grain Counting: Evaluation was performed microscopically on coded slides using NIKON microscopes with oil immersion objectives. Slides were examined to ensure sufficient cells of normal morphology were present before analysis. The cells for scoring were randomly selected according to a fixed scheme. The number of silver grains in the nuclear area was counted automatically using the Sorcerer UDS device version 2.0 DT3152 (Perceptive Instruments). In addition, the number of grains of the most heavily labeled nuclear-sized cytoplasm area adjacent to the nucleus was counted. Two slides per animal and 50 cells per slide were evaluated. Heavily radio-labeled cells undergoing replicative DNA synthesis were excluded from counting. Per group all animals were evaluated as described above.
Nuclear and net grain counts are estimated together. Increased net grains should be based on enhanced nuclear grain counts rather than on decreased cytoplasmic grain counts.
A test item is classified as positive if the mean number of net grains is higher than five per nucleus at one of the test points.
A group average between 0 and 5 net grains is considered as a marginal positive response. A dose-related increase in nuclear and net grains and/or a substantial shift of the percentage distribution of the nuclear grain counts to higher values provide additional information to confirm a positive response with less than 5 net grains.
Statistical significance may give further evidence for a positive evaluation. Statistical significance can be evaluated by means of the non-parametric Mann-Whitney test.
A test item producing net grains not greater than 0 or not significantly greater than the concurrent control, at any of the test points is considered negative in this system.

CLH REPORT FOR SEDAXANE
91
RESULTS AND DISCUSSIONPreliminary toxicity assay: In the pre-experiment 2 males and 2 females rats received a single oral dose of 2000 mg/kg b.w. sedaxane suspended in 0.5 % CMC. The administration volume was 10 mL/kg b.w..
The treated animals expressed clinical signs of toxicity as shown below.
Table 3.8.2.3-2: Pre-Experiment for Toxicity: 2000 mg/kg b.w. Sedaxane
clinical signs of toxicity
hours post-treatment
male / female
1 h 2-4 h 6 h 24 h
ruffled fur 0/0 0/0 1/1 1/0
On the basis of these data 2000 mg/kg b.w., the limit dose for the assay was considered as suitable maximum dose.
No gender specific differences in toxicity were observed so the main study was performed using male animals only, as permitted by the OECD Guideline.
UDS assay: For both treatment periods (4 h and 16 h) each group of 4 male rats received orally a single dose of 1000 or 2000 mg/kg b.w. sedaxane suspended in 0.5 % CMC. The administration volume was 10 mL/kg b.w.. The treated animals expressed clinical signs of toxicity as shown in Table 3.8.2.3-3. Animals in the negative and positive control groups did not show any signs of toxicity.
Table 3.8.2.3-3: Toxic Symptoms in the Main Experiment: 1000 mg/kg b.w. and 2000 mg/kg b.w. Sedaxane (Preparation Interval 4 h and 16 h)
clinical signs of toxicity hours post-treatment
4 h treatment period 1000 mg/kg b.w. 2000 mg/kg b.w.
1 h 2 h 4 h 1 h 2 h 4 h
reduction of spontaneous activity 4 4 4 4 4 4
abdominal position 4 4 4 4 4 4
16 h treatment period 1000 mg/kg b.w. 2000 mg/kg b.w.
1 h 2-4 h 16 h 1 h 2-4 h 16 h
reduction of spontaneous activity 4 4 4 4 4 4
abdominal position 4 4 4 4 4 4
The test item sedaxane was assessed in the in vivo UDS assay for its potential to induce unscheduled DNA repair (UDS) in the hepatocytes of rats with doses of 1000 mg/kg b.w. or 2000 mg/kg b.w. after post treatment intervals of 4 and 16 hours.

CLH REPORT FOR SEDAXANE
92
The test item was suspended in 0.5 % CMC, which was also used as the vehicle control. The volume administered orally was 10 mL/kg body weight. After single oral treatment and a post-treatment period of 4 or 16 hours, respectively, the animals were sacrificed by terminal anaesthesia and then liver perfusion was performed. Primary hepatocyte cultures were established and exposed for 4 hours to 3HTdR (methyl-3H-thymidine), which is incorporated if UDS occurs. The highest dose was estimated in the pre-experiment to be the maximum OECD recommended dose. The treated animals expressed clinical signs of toxicity as shown in Table 3.8.2.3-3.
The viability of the hepatocytes was not substantially affected by the in vivo treatment with the test item at any of the treatment periods or dose groups (Table 3.8.2.3-4). The interindividual variations obtained for the numbers and the viabilities of the isolated hepatocytes are in the range of the laboratory historical control data reported previously.
No UDS induction in the hepatocytes of the sedaxane treated animals as compared to the concurrent vehicle controls was observed at either 1000 or 2000 mg/kg b.w. (Tables 3.8.2.3-4 and 3.8.2.3-5). Neither the nuclear grain counts nor the resulting net grain counts were distinctly enhanced due to the in vivo treatment of the animals with the test item for 4 hours or 16 hours, respectively. Therefore, the mean net grain counts obtained after treatment with the test item were consistently negative. As no UDS response was observed statistical analysis of the data was not performed. In addition, and further confirming the lack UDS, no substantial shift to higher values was obtained in the percentage of cells in repair.
Appropriate reference mutagens [DMH (10), 80 mg/kg b.w. and 2-AAF, 100 mg/kg b.w.] were used as positive controls. In vivo treatment with DMH or 2-AAF revealed distinct increases in the number of nuclear and net grain counts, indicating UDS, as well as in the percentage of cells in repair, consistent with a UDS response.

CLH REPORT FOR SEDAXANE
93
Table 3.8.2.3-4: Mean Nucleus, Cytoplasmic Area and Net Grains of Individual Animals and Group Means (Preparation Interval 4 h)
Animal No.
Cells in Repair
Test Group Mean SD Mean SD Mean SD Mean SD %vehicle 1 9.46 5.90 12.52 6.39 -3.06 5.27 6.00 1.55 6control 2 9.75 4.78 12.92 4.35 -3.17 4.58 6.80 3.49 5
(CMC 0.5 %) mean 9.61 5.34 12.72 5.37 -3.11 4.92 6.40 2.52 63 9.52 3.82 14.15 4.78 -4.63 5.05 5.00 0.00 2
1000 4 8.95 5.16 13.87 7.05 -4.92 5.40 6.00 0.82 4mg/kg b.w. 5 9.27 4.06 13.11 5.53 -3.84 5.12 6.67 1.51 6Sedaxane 6 8.87 5.03 9.97 4.94 -1.10 4.15 6.33 2.18 9
mean 9.15 4.52 12.77 5.57 -3.62 4.93 6.00 1.13 57 7.37 3.98 9.92 4.00 -2.55 4.26 6.33 1.53 3
2000 8 7.03 4.24 12.61 4.68 -5.58 4.77 5.33 0.58 3mg/kg b.w. 9 9.24 4.31 11.75 4.79 -2.51 4.45 6.20 1.30 5Sedaxane 10 9.78 4.87 13.82 5.67 -4.04 5.98 7.33 2.07 6
mean 8.36 4.35 12.03 4.79 -3.67 4.87 6.30 1.37 4positive 11 16.97 6.74 13.79 4.79 3.18 7.12 10.15 4.93 40control 12 14.53 7.11 10.37 6.30 4.16 7.06 10.14 6.09 43DMH mean 15.75 6.92 12.08 5.55 3.67 7.09 10.14 5.51 42
Nuclear Grain Count
Cytoplasmic Grain Count
Net Grain Counts Nuclear Grain Counts of Cells in Repair
Standard deviation. The Standard deviation shown for each animal is the deviation between the 100 analysed cells. The deviation shown for the mean of each group is the mean of the standard deviations obtained for each animal for a group consisting of four animals (test item groups) or two animals (control groups).

CLH REPORT FOR SEDAXANE
94
Table 3.8.2.3-5: Mean Nucleus, Cytoplasmic Area and Net Grains of Individual Animals and Group Means (Preparation Interval 16 h)
Animal No.
Cells in Repair
Test Group Mean SD Mean SD Mean SD Mean SD %vehicle 13 9.38 3.74 14.76 3.98 -5.38 4.94 6.50 1.29 4control 14 6.88 3.07 9.00 3.68 -2.12 3.63 5.50 0.71 2
(CMC 0.5 %) mean 8.13 3.40 11.88 3.83 -3.75 4.28 6.00 1.00 315 7.86 4.06 10.68 4.24 -2.82 4.10 7.25 2.22 4
1000 16 8.41 4.27 10.74 4.34 -2.33 4.39 8.25 4.50 4mg/kg b.w. 17 9.97 4.61 12.51 5.20 -2.54 4.54 7.75 2.99 4Sedaxane 18 9.84 4.32 13.33 4.82 -3.49 5.25 6.71 1.80 7
mean 9.02 4.32 11.81 4.65 -2.80 4.57 7.49 2.88 519 8.88 4.78 12.25 4.45 -3.37 4.59 6.60 1.34 5
2000 20 14.46 8.90 17.79 8.24 -3.33 6.88 7.80 3.19 10mg/kg b.w. 21 12.08 5.51 17.51 6.68 -5.43 5.12 6.00 0.00 1Sedaxane 22 11.58 5.07 17.06 4.75 -5.48 5.71 8.00 2.16 4
mean 11.75 6.07 16.15 6.03 -4.40 5.57 7.10 1.67 5positive 23 12.90 5.40 7.33 4.17 5.57 4.73 8.69 2.76 59control 24 19.15 7.65 19.95 7.77 -0.80 6.89 7.52 2.91 272-AAF mean 16.02 6.53 13.64 5.97 2.38 5.81 8.11 2.84 43
Nuclear Grain Count
Cytoplasmic Grain Count
Net Grain Counts Nuclear Grain Counts of Cells in Repair
Standard deviation. The Standard deviation shown for each animal is the deviation between the 100 analysed cells. The deviation shown for the mean of each group is the mean of the standard deviations obtained for each animal for a group consisting of four animals (test item groups) or two animals (control groups).
CONCLUSION: In conclusion, it can be stated that under the experimental conditions reported, i.e. Oral administration up to 2000 mg/kg, the maximum oecd guideline recommended dose, the test item did not induce dna-damage leading to increased repair synthesis in the hepatocytes of the treated rats. Therefore, sedaxane is considered to be non-genotoxic in this in vivo uds test system.
3.8.3 Human dataNo relevant studies.
3.8.4 Other dataNo relevant studies.
3.9 Carcinogenicity3.9.1 Animal data3.9.1.1 Anonymous(2010), Amendment 1 Anonymous (2014)
Report: Anonymous (2014). SYN524464 - Laboratory Report No. 30196 issue date: 27 January 2014. Unpublished. (Syngenta File No. SYN524464_11306).
GUIDELINES: Carcinogenicity – Rat (dietary). OECD 453 (1981): OPPTS 870.4200 (1998): 96/54/EEC B.33 (2001): No. 12-Nousan-8147 (2000)
GLP: Signed and dated GLP and Quality Assurance statements were provided.

CLH REPORT FOR SEDAXANE
95
There were no deviations from the current regulatory guideline considered to compromise the scientific validity of the study. Amendment 1 was issued to correct the historic control range quoted for phosphate levels for males and to update two histopathology tables to ensure consistency.
EXECUTIVE SUMMARYFour groups of 52 male and 52 female Han Wistar rats were assigned to the carcinogenicity study and dosed with diets containing 0, 200, 1200 or 3600 ppm SYN524464 for at least 104 consecutive weeks. In addition, a toxicity study comprising a further 4 groups of 12 male and 12 female animals were included and dosed in an identical fashion for a period of 52 consecutive weeks.
The following were assessed at pre-determined intervals from pretrial until study completion from carcinogenicity and toxicity study animals: clinical observations, body weight, food consumption, haematology, coagulation, clinical chemistry, organ weights, gross necropsy and histopathology. Additionally, carcinogenicity study animals had samples taken for urinalysis and underwent ophthalmoscopy examinations. In addition, toxicity study animals received a detailed functional observation battery assessment at week 51/52.
All surviving carcinogenicity and toxicity study animals were terminated after the completion of 104 or 52 weeks of treatment, respectively, and underwent a detailed necropsy examination with a comprehensive histological evaluation. Animals that died prior to scheduled termination or were sacrificed due to clinical condition were examined both macroscopically and microscopically by the same methods.
Dietary administration of SYN524464 for at least 104 consecutive weeks at 1200 ppm and above in females and 3600 ppm in males was associated with a decrease in body weight and body weight gain. Maximal decrease in body weight gain at termination at 3600 ppm was 24 % in males and 50 % in females. A corresponding decrease in food consumption and utilisation was noted in males and females at 3600 ppm.
There were no treatment-related differences in mortality between the control and any other groups for males or females. In addition, there were no indications for a cause of death which varied from the expected pattern seen at this laboratory.
At 52 weeks, no treatment-related effects were observed in detailed clinical observations, motor activity or any other functional observation battery parameter.
There were no ophthalmoscopy findings associated with treatment.
Prothrombin time was higher than control values in males at 3600 ppm at multiple measurement times. There were no other consistent differences between control and treatment groups in any other haematology parameters.
Glucose and phosphate levels were higher than control values in males treated at 3600 ppm at several time points over the duration of treatment, with a possible increase in glucose at 1200 ppm based on two occurrences of statistically significant increases. Cholesterol was higher in females at 3600 ppm at weeks 14 and 27 during the study. There were no effects on clinical chemistry parameters at 200 ppm in males or females.
There were no necropsy findings following 52 weeks of treatment. At necropsy following 104 weeks of treatment, no adverse effects were observed.
Micropathology and organ weight changes in liver confirmed an effect of treatment at 1200 and 3600 ppm in males and females. Microscopically at 52 weeks an increase in hepatocyte hypertrophy and pigmented hepatocytes at 3600 ppm in both males and females was noted. Treatment-related findings at 104 weeks involved centrilobular hepatocyte hypertrophy in males at 1200 and 3600 ppm, and hepatocyte

CLH REPORT FOR SEDAXANE
96
hypertrophy with pigmented hepatocytes in females at 3600 ppm. Liver weights (adjusted for terminal bodyweight) were higher in males and females at 1200 and 3600 ppm. Correlating clinical chemistry changes involving higher protein, albumin and globulin levels in males and females at 3600 ppm were consistent with the micropathology changes that suggested adaptive changes to the liver caused by SYN524464, but not evident hepatotoxicity. Slightly higher gamma glutamyl transferase values in males at 3600 ppm were observed at 104 weeks, but there were no increases in aspartate aminotransferse, alanine aminotransferase or other markers of actual hepatic injury.
Micropathology changes in the thyroid were observed at 52 weeks, consisting of follicular cell hypertrophy at 1200 and 3600 ppm in both males and females. At 104 weeks an increase in follicular hyperplasia was noted in males treated at 3600 ppm. The incidence of colloid basophilia and desquamation of the follicular epithelium of the thyroid was increased in females at 1200 and 3600 ppm compared to Controls. In addition, colloid basophilia was increased in males treated at 3600 ppm.
Neoplastic findings: In females dosed at 3600 ppm there was a statistically significant increased incidence of uterine adenocarcinomas (p<0.01) compared to the concurrent control group.In males at 3600 ppm, although not statistically significant by pair-wise comparison there was a higher incidence of hepatocellular adenomas, thyroid follicular cell adenomas and carcinomas and thyroid follicular cell adenomas/carcinomas with statistically significant trend and exceeding the HCD range from the same laboratory.
Under the conditions of this study, a No Observed Adverse Effect Level (NOAEL) was considered to be 200 ppm for both males and females, equating to 11 mg/kg/SYN524464 in males and 14 mg/kg/day in females.
The NOAEL for carcinogenicity in rat was be 200 ppm for both males and females, (equal to 11/14 mg/kg bw per day in M/F).
NB: the applicant (Syngenta) is of the view that the tumours observed at the high dose levels (uterine tumours in females and liver and thyroid tumours in males) are within the range of variable spontaneous tumour incidences for the tested strain and is not related to sedaxane treatment.
MATERIALS AND METHODSMaterials:
Test Material: SYN524464Description: Off white powderLot/Batch number: SMU6LP006/MILLEDPurity: 95.3%, comprised of:
83.0% trans isomer (SYN508210) and 12.3% cis isomer (SYN508211)
Stability of test compound: 31 January 2011
Vehicle control: Rat and Mouse (Modified) No.1 Diet SQC Expanded (Ground), supplied by Special Diets Services Limited, Witham, Essex.

CLH REPORT FOR SEDAXANE
97
Test Animals:Species RatStrain CrL:WI(Han)Age/weight at dosing Approx 6 weeks. Males: 118-183g and females: 103-158 g SourceHousing 4 per cage (unless reduced by mortality)Acclimatisation period 13 daysDiet R&M (Modified) No.1 Diet SQC Expanded (Ground) ad libitumWater Mains water ad libitumEnvironmental conditions Temperature: 18-25.5°C
Humidity:11.08-80.65%Air changes: 15 changes per hourPhotoperiod: 12 hours light 12 hours dark
Study Design and Methods:In-life dates: Start: 9 April 2007 End: 19 October 2009
Animal assignment: On arrival from the supplier, the animals were introduced to cages on racks. Cages were racked by treatment group and vertically throughout the rack. Each month, from the commencement of Pretrial, each column of cages on a rack was moved one position to the right. These changes were carried out to minimize environmental effects.
During Pretrial, group mean body weights were checked to ensure that all groups had a similar body weight for each sex and all were found to be within the 5% limit of variation.
Table 3.9.1.1–1: Study designCarcinogenicity Study
(104 weeks)Toxicity Study
(52 weeks)Test group Dietary
concentration(ppm) male female male female
Control 0 1-52 209-260 417-428 465-476Low 200 53-77, 514, 79-104 261-312 429-440 477-488Mid 1200 105-156 313-364 441-452 489-500High 3600 157-208 365-394, 519, 396-416 453-464 501-512
Diet preparation and analysis: Formulated diets were prepared by direct admixture of test item to a required amount of untreated diet and blended for 20 minutes in a diet mixer. Blank diet (without the test item under investigation) was prepared for Control animals. Diet formulations were prepared and dispensed weekly for administration to the animals and were stored at ambient temperature.
Analysis of diet formulations was carried out with regard to concentration and homogeneity. During the study, triplicate samples (3 x 50 g from the top, middle and bottom) were taken from each formulated diet (including Control) immediately after preparation at approximately 3 monthly intervals. Samples were stored at -20°C until analysed. The samples were assayed at h using methodology previously supplied by the Sponsor and validated in the Analytical Chemistry Services of under a separate protocol and contract ( Study No. 423905, Method No. 2390). In the preliminary study, stability of SYN524464 in the diet at concentrations of 100 ppm and 10000 ppm was demonstrated for at least 15 days at ambient temperature and for at least 33 days at -20°C. For test diet analysis, the mean values from three analysed aliquots of each test diet were determined. Test diets were considered acceptable for achieved concentration if the mean value was within ±10% of the nominal concentration. Coefficient of variation (CV%) was calculated as a measure of homogeneity and considered acceptable if the value was within ± 10%.

CLH REPORT FOR SEDAXANE
98
Analysed concentrations of test item within the diet were found to be within ±6% of the theoretical concentrations on all occasions, indicating acceptable accuracy of formulation. The coefficient of variation was low (6.9% or lower) indicating satisfactory homogeneity. However in Week 79 the 1200 ppm test diet showed a coefficient of variance of 11.8% (confirmed on re-analysis); as this was an isolated incident it was not considered to affect the integrity of the study. SYN524464 was not detected in the control diet.
Statistics: Body weight, cumulative body weight gain, food consumption, food utilisation, haematology, coagulation, clinical chemistry, quantitative urinalysis values, quantitative FOB measurements, motor activity and organ weight data were analysed using a parametric ANOVA and pairwise comparisons made using the Dunnett’s t-test. The following pairwise comparisons were performed:Control vs Low DoseControl vs Intermediate DoseControl vs High DoseOrgan weights were also analyzed by analysis of covariance (ANCOVA) using terminal kill body weight as covariate (Shirley 1977). Summary statistics (mean, standard deviation and number of observations) and individual values are presented for organ weights as a percentage of body weight. However, statistical comparisons to control values were not performed for relative organ weight (%), because the ANCOVA results with terminal body weight as covariate provide a more robust statistical determination of this parameter.
Analyses of variance and covariance were carried out using the MIXED procedure in SAS (9.1.3). Individual values were rounded before printing. All derived values that appear in the tables represent the rounded results of calculations that are based on the exact (non-rounded) raw data values. Statistical analysis was carried out on the exact raw data values. Least-squares means for each group were calculated using the LSMEAN option in SAS PROC MIXED. Unbiased estimates of differences from control were provided by the difference between each treatment group least-squares mean and the control group least-squares mean. Differences from control were tested statistically by comparing each treatment group least-squares mean with the control group least-squares mean using a two-sided Dunnett’s t-test, based on the error mean square in the analysis. All statistical tests were two sided and performed at the 5% and 1% levels. All means were presented with standard deviations. Males and females were analyzed separately.
The Dunnett’s test was performed for all continuous data parameters, regardless of whether the initial ANOVA or ANCOVA was statistically significant and statistical flags are presented in the tables.
Kaplan-Meier survival estimates (Kaplan-Meier, 1958) were calculated separately for each sex and Carcinogenicity Study treatment group. Mortalities resulting from animals killed following accidents or scheduled termination were considered censored observations. Intergroup comparisons of mortality comparing each treatment group with the control group and an overall test for trend was performed separately for males and females using a logrank test (Peto and Pike, 1973). Significant results at the 5% significance level are discussed.
Pairwise comparisons of the incidence of tumour and histological lesions was made using Fisher’s Exact test (two-tailed). Non-neoplastic histological findings with multiple severities were also analysed using the Mann-Whitney U test, which takes both severity and incidence into account. Further analyses were performed using Peto’s time adjusted methods.
The statistical evaluation of the tumour data was performed in SAS (v8.2) using PROC MULTTEST. Methods used for the age-adjusted analysis of fatal and non-fatal tumours were based on the IARC guidelines (Peto et al,1980: Fairweather,1998: Hoel and Wahlburg,1972). For clinically non-observable tumours, the study pathologist classified each of the tumours as fatal, probably fatal, probably incidental or incidental. For the purposes of statistical analysis, tumours classified as either fatal or probably fatal were considered fatal and those tumours classified as probably incidental or incidental were considered incidental. All tumours detected in animals that died in the terminal sacrifice were automatically

CLH REPORT FOR SEDAXANE
99
classified as incidental. For the purposes of statistical analysis only, all clincally observable tumours were considered to be fatal and the time of first detection was used in the age-adjusted analysis. For observable tumours not detected in-life, the time to death was used in the analysis. The analysis of incidental tumours was conducted by dividing the experimental period into the following fixed time intervals: 1-52 weeks, 53-78 weeks, 79-92 weeks, over 92 weeks and single intervals for any planned sacrifices.
For each considered dataset, the significance of a linear dose related increase in tumour incidence was evaluated using a two-sided Peto trend test using the group numbers (Groups 1-4). If the overall Peto trend was significant at the 5% level for any given tumour incidence, then the oveall Peto trend was re-analysed for Groups 1-3; if still significant it was re-analysed for Groups 1-2. Males and females were analysed separately. Significant results at the 5% significance level are discussed. For each statistical test performed on a dataset containing 10 or less tumours, the discrete permutation distribution was used to calculate the corresponding p-value.
For qualitative data (e.g. possible values of 0, 1, 2 or present/absent), results are presented as summary data, but were not analysed statistically.
Observations: All animals were checked early morning and as late as possible each day for signs of viability. Once each week all animals received a detailed clinical examination, including appearance, movement and behaviour patterns, skin and hair condition, eyes and mucous membranes, respiration and excreta.
Bodyweight: Body weights were recorded once weekly during pretrial up until Week 14 of treatment, and once every 2 weeks from Week 16 up until the end of treatment.
Food consumption and test substance intake: The quantity of food consumed by each cage of animals was measured and recorded once weekly during Pretrial up until Week 14 of treatment, and once every 4 weeks from Week 16 up until the end of treatment.The amount of test item ingested was calculated at regular intervals during treatment using the following formula:Achieved intake (mg/kg/day) = Nominal Concentration (p.p.m) x Food Consumption (g/day)
Mid-point Body Weight (g)**The mid-point body weight is an average of the body weights at the start and end of each period for which food consumption was measured.
Ophthalmoscopic examination: The eyes were examined using an indirect ophthalmoscope following application of a mydriatic agent (1% Tropicamide, Mydriacyl®). The cornea, anterior chamber, iris, lens, posterior chamber, retina and vessels of the optic disc were examined from all carcinogenicity animals during Pretrial and all carcinogenicity study Control and High dose animals during Weeks 53 and 102.
Functional observation battery: Once during the treatment period (Week 51/52) a more detailed examination was made of all surviving toxicity study animals. The examinations were made by a technician not involved in the dosing procedures or in the collection of body weights and food consumption data, and were performed at an approximately standardised time of day. Prior to the independent technician entering the room, standard cage cards were removed and only neurotoxicity cards were shown. The assessor was then allowed to enter the room. Three animals from each cage had their tail marked for identification purposes.
Cageside observations: Posture/condition on first approach (animal undisturbed), checking for:
ProstrationLethargyWrithingCirclingBreathing abnormalities

CLH REPORT FOR SEDAXANE
100
Gait abnormalitiesTremorFasciculationConvulsionsBiting (of cage components or self mutilating)VocalisationsPiloerection
Ease of removal from the cageBody temperature was taken directly from the implanted electronic chip and recorded. Temperature was taken by rectal thermometer if the chip failed.Condition of the eyes, checked for:
Pupillary functionMiosisMydriasisExophthalmosEncrustationLacrimation
Condition of the coatPresence of salivationOverall ease of handling
Observations in a standardized area (2 min observation):Latency (time to first locomotory movement)Level of mobilityRearingGroomingUrination/defecationArousal (level of alertness)Posture, tremor/convulsions, vocalisation, piloerection – recorded as for cageside observationsPalpebral closureGait abnormalitiesStereotypy (excessive repetition of behaviours) and/or unusual behaviours.
Functional Tests:Once during the treatment period (Week 51/52), the following additional functional tests were performed. Again, these assessments were performed at an approximately standardized time of day.
Reaction to sudden sound (click above the head)Reaction to touch on the rump with a blunt probeGrip strength: This was measured using a method derived from that of Meyer et al (1979). A
strain gauge was used, to which is attached a wire pull-bar. Once the animal had gripped the bar, the body was pulled until its grasp was broken; the strain gauge recorded the force required. The procedure was repeated 3 times for the forelimbs and 3 times for the hindlimbs, and the mean fore and hind grip strengths calculated.
Pain perception:This was assessed by measurement of the tail flick response, using a technique based on the method devised by D`Amour and Smith (1941). The apparatus used shone a calibrated infra-red heat source onto the tail and automatically measured the reaction time of the animal (accurate to 0.1 s). It was ensured that no visible injury to the tail was caused during this test.
Landing Foot Splay:Maize oil was applied to the hind paws of each animal. The animal was then held in a horizontal, prone position with the nose ca 30 cm above a bench surface covered with absorbent paper. When the animal was calm, it was dropped. The distance between the prints of the central footpads was measured and the average measurement recorded. The procedure was repeated 3 times. If the rat did not land properly on its feet, this was recorded.
Motor activity:Each animal was placed in an individual monitoring cage, scanned by a motion sensor utilising infra-red pyroelectric detectors. Movement was detected in 3 dimensions anywhere in the

CLH REPORT FOR SEDAXANE
101
cage, and was differentiated into large and small movements. Each animal was monitored for one session of 1 h, activity counts were recorded over successive periods of 5 min each.
Haematology and clinical chemistry: Blood samples for haematology, coagulation and clinical chemistry were obtained, via the tail vein and without anaesthesia, from 13 males and 13 females per group from the Carcinogenicity study at Weeks 14, 27, 53 and 79, all surviving Carcinogenicity study animals during Weeks 104/105, and all surviving Toxicity study animals during Week 52. The animals were not deprived of food overnight prior to sampling.
Approximately 0.5 mL of whole blood was transferred into tubes containing EDTA for haematology investigations.
Approximately 0.5 mL blood was transferred into tubes containing 0.045 mL trisodium citrate (w/v) for assessment of coagulation. The final sample volume was as close as possible to 0.5 mL to give a final concentration of 0.38% (blood to citrate ratio of 9:1).
Approximately 1.5 mL of whole blood was taken into lithium heparin tubes to be used for clinical chemistry investigations.
Haematology and coagulation: haemoglobin mean cell haemoglobin concentrationhaematocrit platelet countred blood cell count total white cell countmean cell volume differential white cell countmean cell haemoglobin prothrombin time
activated partial thromboplastin time
Clinical chemistry: urea alkaline phosphatase activitycreatinine aspartate aminotransferase activityglucose alanine aminotransferase activityalbumin gamma-glutamyl transferase activitytotal protein calciumglobulin phosphorus (as phosphate)A/G ratio sodiumcholesterol potassiumtriglycerides chloridetotal bilirubincreatine phosphokinase activity
Urinalysis: Urine samples were collected over a 4 h period from 13 male and 13 female Carcinogenicity study animals during Weeks 13, 26, 52, 78 and 103. The animals were housed individually in metabolism cages and were deprived of food and water during the 4 hour urine collection.
volume glucosecolour ketonesspecific gravity proteinpH bilirubinurobilinogen Blood pigments
microscopy
Investigations post mortem: After at least 52 or 104 weeks of treatment all surviving animals were killed in random order by exposure to carbon dioxide and had their terminal body weight recorded, followed by exsanguination.
Additional blood samples (approximately 1 mL) were collected for possible future use from all Toxicity study animals via the vena cava at terminal necropsy. Blood was taken into plastic BD Microcontainer

CLH REPORT FOR SEDAXANE
102
serum tubes and left to stand at room temperature for ca 1 h before centrifugation (3000 r.p.m. at ca 4°C for 10 minutes). Serum was then transferred into plastic tubes labelled with the study number, animal identification, dose level and date of collection. The serum was frozen and stored at approximately -20°C at until further notice. The Sponsor will be contacted after completion of the study with regard to sample transfer, retention or disposal. Any subsequent analysis on these samples will not be covered by this study plan and will not be reported in the study report.
Macroscopic examination: Each animal was subjected to a detailed necropsy under the guidance of a veterinary pathologist, who visited on the day of necropsy and remained on-call throughout the necropsy period. The necropsy consisted of a complete external and internal examination which included body orifices (ears, nostrils, mouth, anus, vulva) and cranial, thoracic and abdominal organs and tissues. All gross findings were recorded in descriptive terms, including location(s), size (in mm), shape, colour, consistency and number.
Organ weights: From all animals surviving to scheduled termination, the following organs were removed and weighed from all Toxicity study animals and all surviving animals at the Week 104 terminal kill, prior to sampling and preservation. Paired organs were weighed separately and the sum of the individual organs used for reporting purposes. Terminal body weights were used for organ weight analysis.
adrenal glands liverbrain ovariesepididymides spleenheart testeskidneys thyroid with parathyroid
uterus (with oviducts)
Tissue submission: The following tissues were examined in situ, removed and examined, fixed in an appropriate fixative, and processed to paraffin wax block from all animals. Sections were cut 4-6 µm thick, stained with haematoxylin and eosin, and histologically evaluated by the Study Pathologist. Duplicate femoral bone marrow smears were also taken at necropsy and one was stained using May-Grunwald-Giemsa Romanowsky stain for possible examination. Smears were not evaluated as there were no significant haematology findings. The second smear remained unstained and is retained in the pathology department.
abnormal tissue oesophagus adrenal gland ovary aorta oviduct brain (forebrain, midbrain, cerebellum and pons) Peyer’s patchesbone marrow (femur) pancreascaecum parathyroid glandcolon pharynxduodenum pituitary glandepididymis prostate glandeyes (including retina and optic nerve) rectumfemur (including knee joint) salivary gland (submaxillary)Harderian gland seminal vesicleheart spinal cord (cervical, midthoracic, lumbar)ileum skinjejunum spleenkidney sternumlacrimal gland stomachlarynx testisliver thymus

CLH REPORT FOR SEDAXANE
103
lung thyroid glandlymph node - submandibular tonguelymph node - mesenteric tracheamammary gland urinary bladdernerve - sciatic uterus (with oviducts)nasal cavity (if clinical signs dictate) vagina
voluntary muscle (thigh)
Microscopic examination: All processed tissues were examined by light microscopy.
RESULTS AND DISCUSSIONMortality: There were 4 females from the toxicity study that were killed on welfare grounds during the course of the 52-weeks of treatment. In addition, there were a total of 38 males and 48 females from the main (carcinogenicity) study that died or were killed on welfare grounds during the course of the 104weeks of treatment. The deaths were distributed as follows:
Table 3.9.1.1–2: Mortality – number of deathsCarcinogenicity Study
(104 weeks)Toxicity Study
(52 weeks)Test group Dietary concentration
(ppm)male female male female
Control 0 9/52 [0, 9] 8/52 [1, 7] 0/12 0/12
Low 200 12/52 [3, 9] 17/52 [2, 15] 0/12 1/12 [0, 1]
Mid 1200 9/52 [2, 7] 15/52 [3, 12] 0/12 1/12 [0, 1]
High 3600 8/52 [2, 6] 8/52 [1, 7] 0/12 2/12 [0, 2]Figures in [] = number found dead, number killed
Overall percent survival in each main (carcinogenicity) group was as follows:
Table 3.9.1.1–3: Survival – number and percentage incidence of survivorsCarcinogenicity Study
(104 weeks)Test group Dietary concentration
(ppm)male female
Control 0 43/52 (83%) 44/52 (85%)
Low 200 40/52 (77%) 35/52 (67%)
Mid 1200 43/52 (83%) 37/52 (71%)
High 3600 44/52 (85%) 44/52 (85%)
There were no statistically significant differences in mortality between the control and any other groups for males. Mortality in the 200 ppm female group was found to be significantly higher than that seen in the control group (p=0.029) by the Logrank test. However, the trend test was not statistically significant for either males or females. Considering the lack of dose response, the slightly higher mortality in only the 200 ppm females did not reflect an affect of treatment.
Clinical observations: There were no increases in clinical observations which could be attributed to treatment with SYN524464. In the Carcinogenicity study animals, there were smaller incidences of externally palpable masses and perigenital swelling in females receiving 3600 ppm than in the other groups, which were of no toxicological significance.
The types of recorded observations were considered to be typical of chronic rodent studies conducted at

CLH REPORT FOR SEDAXANE
104
Bodyweight and weight gain: Males and females treated at 3600 ppm showed statistically significantly lower body weight gain compared to their respective Controls throughout the treatment period. A slight decrease in male and female group mean body weight was noted during Week 32 when compared to the previous measurement in 3600 ppm animals; the deficit was made up by the following measurement. No explanation for this transient effect could be found and it was not considered to have affected the integrity of the study. Females treated at 1200 ppm also showed a slightly lower body weight gain that was statistically significant occasionally from Week 34 on, and was consistently lower than control from Week 66 to the end of the study.
Cumulative body weight gain was also statistically significantly lower than control values for 3600 ppm males and females throughout the study. This represented a maximum of 23.5% decrease in males and 49.6% decrease in females at termination. In the 1200 ppm females, body weight gain was numerically lower than controls throughout the study, achieving statistical significance at the majority of time intervals from Week 14 to the end of the study.
Males and females treated 200 ppm and males at 1200 closely resembled body weight profiles displayed by their respective controls.
Table 3.9.1.1–4: Intergroup comparison of bodyweights (g) (mean values shown for selected weeks)
Dietary Concentration of SYN524464 (ppm)
Males Females
week 0 200 1200 3600 0 200 1200 3600
013132630323452104
148.5197.6260.6381.0438.5450.7460.3467.0518.8613.5
150.6201.3267.5398.6*453.7467.7473.8478.1537.9657.2
145.6191.0254.8373.7425.4438.9440.4448.2506.5590.5
149.3182.7**232.4**336.6**379.2**394.1**383.7**404.0**450.0**503.6**
129.4152.7183.4235.5259.0261.1264.8268.3292.9392.5
129.9152.5185.0238.0259.0262.8266.5269.4295.5389.9
129.9150.4180.5232.2
249.0**254.8257.4258.6*281.1362.2*
132.5144.9**167.9**205.4**219.4**224.2**209.3**228.1**240.2**264.1**
* Statistically significant difference from control group mean, p<0.05 (Dunnett’s test, 2-sided)** Statistically significant difference from control group mean, p<0.01 (Dunnett’s test, 2-sided)
Table 3.9.1.1–5: Intergroup comparison of cumulative bodyweight change (g)Dietary Concentration of SYN524464 (ppm)
Males Females
week 0 200 1200 3600 0 200 1200 3600
0-10-30-130-520-104
49.1112.1232.5370.3464.9
50.7116.8247.9*387.3509.7*
45.4**109.2228.0360.9447.9
33.3**83.0**187.3**300.7**355.7**
23.254.0106.1163.5262.6
22.655.1108.1165.6259.2
20.5**50.6102.2
151.1**232.7*
12.4**35.4**72.9**108.1**132.4**
* Statistically significant difference from control group mean, p<0.05 (Dunnett’s test, 2-sided)** Statistically significant difference from control group mean, p<0.01 (Dunnett’s test, 2-sided)
Food consumption and compound intake: Females treated at 3600 ppm showed statistically significantly lower food consumption compared to their respective Controls throughout the treatment period. Males treated at 3600 ppm had statistically significantly lower food consumption during weeks 1-7, but were comparable to Controls thereafter.

CLH REPORT FOR SEDAXANE
105
The food consumption profiles of males and females receiving 200 or 1200 ppm closely resembled those displayed by their respective Controls.
Table 3.9.1.1-6: Intergroup comparison of food intake (g/rat/day) (mean values shown for selected weeks)
Dietary Concentration of SYN524464 (ppm)Males Females
week 0 200 1200 3600 0 200 1200 3600
-117132852104
19.522.721.620.721.022.322.2
19.723.021.821.221.722.422.4
19.221.6*21.320.821.921.521.0
19.719.5**20.3*20.321.621.621.3
16.416.617.117.016.618.418.5
16.516.717.517.017.5*18.219.7
16.716.216.817.117.117.318.2
17.0*14.4**15.2**14.6**14.1**15.5**16.2*
* Statistically significant difference from control group mean, p<0.05 (Dunnett’s test, 2-sided)** Statistically significant difference from control group mean, p<0.01 (Dunnett’s test, 2-sided)
Table 3.9.1.1-7: Mean Dose Received (mg/kg/day)Mean Dose Received (mg/kg/day)
Dietary Concentration of SYN524464 (ppm) 200 1200 3600
Males 11 67 218
Females 14 86 261
Food utilisation: Males and females treated at 3600 ppm had statistically significantly lower food utilisation during the intervals 1-4 and 9-13, and overall for Weeks 1-13 in comparison to Controls. The food utilisation profiles of males and females receiving 200 or 1200 ppm closely resembled those displayed by their respective controls.
Table 3.9.1.1-8: Food utilisation (g/100g of diet consumed) (mean values shown for selected weeks)
Dietary Concentration of SYN524464 (ppm)Males Females
week 0 200 1200 3600 0 200 1200 3600
1-45-89-131-13
21.38.45.4
11.4
22.18.66.1
12.0*
21.57.75.911.4
16.8**9.34.1*9.6**
13.74.82.86.8
13.65.32.66.8
12.8*5.42.86.6
10.1**5.4
1.5**5.3**
* Statistically significant difference from control group mean, p<0.05 (Dunnett’s test, 2-sided)** Statistically significant difference from control group mean, p<0.01 (Dunnett’s test, 2-sided)
Ophthalmoscopic examination: No intergroup differences were evident that could be attributed to treatment. Those observations made were considered to be typical for chronic rodent studies conducted at
Functional observation battery parameters: Functional observational battery parameters were performed on Toxicity Study animals during Weeks 51/52. There were no differences in the detailed clinical observations that were considered to due to the consumption of diets containing SYN524464.

CLH REPORT FOR SEDAXANE
106
There were no differences in motor activity that were considered to be due to the consumption of diets containing SYN524464. All control and treated groups showed similar habituation during the 60-minute observation period. Compared to their Control group, activity was noted to be significantly lower in males treated at 200 ppm at 16-20 minutes, and at 200 and 1200 ppm in males at 36-40 minutes. Due to the isolated nature of these differences, and the absence of any significant overall changes, these findings were considered not to be related to treatment.
There were no differences in quantitative functional observational battery measurements that were attributed to the consumption of diets containing SYN524464. Hind grip strength was statistically significantly lower in males fed diets containing 1200 or 3600 ppm SYN524464 compared to Control values. There were no corresponding differences between groups in foregrip strength or any other quantitative parameter for males. Females did not show any pattern of effect on hind grip strength. In fact, hind grip strength was statistically significantly higher than Controls at the intermediate dose of 1200 ppm for females. Considering the small magnitude of the differences and the lack of any corroborating findings, the differences in hind grip strength in males are considered normal variability and do not reflect an effect of treatment.
Haematology: Prothrombin time was significantly higher in males receiving 3600 ppm SYN524464 during weeks 14, 27, 52 and 79 compared to Control values. Isolated incidences of slightly higher prothrombin time were noted in males treated at 200 ppm during Week 52 and in 1200 ppm males during Week 27. These however were not part of a consistent or dose-responsive pattern and are not consider related to treatment.
There were no statistically significant differences in activated partial prothrombin time in males or females at any dose level, except for a higher value in females treated at 3600 ppm during Week 104. Considering the small difference and the lack of effects at other times or in males during Week 104, this was not considered an effect of treatment.
Several parameters showed statistically significant differences from Control in males or females treated at 3600 ppm at one time point only over the duration of the study. These included decreased red blood cell count (males, Week 14), decreased haematocrit (females, Week 27), increased platelet count (females, Week 52), and decreased mean cell haemoglobin and mean cell volume (males, Week 104). Considering the small magnitude of these differences and lack of any effects at other timepoints, these isolated instances are not an effect of treatment.
Total white blood cell counts were higher in males at Week 27 and females at Week 14 in animals treated at 3600 ppm SYN524464. Correlated increases in lymphocytes, monocytes and large unclassified cells (males) and lymphocytes and large unclassified cells (females) were observed at these same time points, but not at any others. Considering the small magnitude of these differences and lack of any consistency, these isolated instances are not considered an effect of treatment.
There were other occasional changes seen in selected haematology parameters in animals treated at 200 or 1200 ppm, however, due to the small magnitude of change, lack of a dose relationship, and lack of consistency across time, they were considered not to be related to treatment with SYN524464.
Blood clinical chemistry: Males treated at 3600 ppm showed statistically significantly higher gamma glutamyl transferase (GGT) values compared to Control values at most time intervals, however the magnitude of the difference was small. For females, a higher GGT value was observed only at Week 14. For individual GGT values that were <LOQ, the limit of quantitation value of 3.0 was used for calculation of the group mean values and statistics. Considering that many of the individual GGT values used in calculations were <LOQ in Control and treated groups, only the higher value for males at week 104/105 compared to the Control mean value is considered a possible effect of treatment.
Total protein was higher at most time intervals in animals treated at 3600 ppm SYN524464. A higher value in males treated at 1200 ppm was also observed during Weeks 27, 53 and 104/105.

CLH REPORT FOR SEDAXANE
107
Albumin was higher at 3600 ppm for males (Weeks 27 and 52), and at one time point only in females (Week 104/105). Globulins were higher than Control values at multiple time intervals at 3600 ppm in both males and females. In all treated male groups, globulin was statistically significantly higher than Controls during Week 104/105, but showed no dose-response and only minimal difference from Control. Albumin/globulin ratio was generally unaffected in males, but was lower than Control values at 3 time points in females at 3600 ppm. Overall, the pattern of effect on albumin and globulin indicates treatment-related effects only at 3600 ppm in males and females.
Females treated at 3600 ppm showed lower levels of alanine aminotransferase (ALT) and aspartate aminotrasnferase (AST) at most time points. Additionally, lower values were seen in females treated at 1200 ppm during Weeks 27 (AST) and 104/105 (ALT and AST). Given the direction of the changes, these lower values for ALT and AST were not considered toxicologically significant.
Cholesterol levels in females treated at 3600 ppm were higher than Control values at Weeks 14 and 27. No consistent pattern of effects on cholesterol was observed in males.
Phosphate levels in males treated at 3600 ppm were higher than Control values at most time points. Values were also higher than Control for males treated at 1200 ppm during Weeks 14 and 104/105. During Week 104/105, values were within the historical Control range (1.06-1.24) for this laboratory, whereas the concurrent Control value was low. At Week 79, all male group phosphate values were higher than control, but there was no semblance of a dose response. Overall, higher phosphate levels are considered treatment related only in males at 3600 ppm, based on consistency of the pattern over time.
Glucose levels were higher in males at 1200 ppm or 3600 ppm during Weeks 79 and 104/105, with higher values seen at the 3600 ppm dose at earlier time intervals, occasionally attaining statistical significance. In contrast, females did not show any consistent pattern of change in glucose levels. Values were statistically significantly lower in all dose groups during Week 52, and significantly higher during Week 104/105 with no apparent dose-response at either time point. There were no correlating changes in glucose levels at the other time intervals, and therefore, it was considered that there were no treatment-related effects on glucose in females.
Urea levels were higher in males during Week 79 and in both males and females during Week 104/105 in animals treated at 3600 ppm. In males, creatinine was higher than Control in animals treated at 1200 or 3600 ppm during Week 53 and in females creatinine level was higher than Control during Week 104 at 3600 ppm. In the absence of any associated findings and considering the sporadic nature of these small changes, they are not considered treatment-related effects.
Other changes in clinical chemistry parameters were isolated to a single time point, were only seen at the 1200 ppm dose level, or did not form part of a plausible dose-response. These isolated differences were incidental to treatment.

CLH REPORT FOR SEDAXANE
108
Table 3.9.1.1-9: Intergroup comparison of selected clinical chemistry parametersDietary Concentration of SYN524464 (ppm)
Males Females
Parameter 0 200 1200 3600 0 200 1200 3600
GGT – Week 14– Week 27– Week 52– Week 53– Week 79–
Week104
Total Protein – Week 14– Week 27– Week 52– Week 53– Week 79- Week
104
Globulin – Week 14– Week 27– Week 52– Week 53– Week 79- Week
104
Cholesterol – Week 14- Week 27– Week 52– Week 53– Week 79- Week
104
Phosphate – Week 14- Week 27– Week 52– Week 53- Week 79- Week
104
Glucose – Week 14– Week 27– Week 52– Week 53- Week 79- Week
104
333333
676873727373
242530293031
1.71.82.32.12.83.5
1.801.481.361.311.241.06
6.876.987.477.437.586.60
333333
697073747274
2626303031
34**
1.81.92.32.22.63.7
1.711.511.321.341.46*1.12
7.147.438.167.667.936.99
333333
6971*7576*7675*
252732*3133
33**
1.61.72.22.02.73.4
2.00*1.611.421.421.43*1.20**
7.187.75*8.098.278.34*7.25**
3**4*33*4**6**
71**71**78**77**76
76**
27**2732*32*3333*
1.51.5*1.91.92.23.1
2.00*1.691.431.45
1.49**1.30**
7.267.717.35
8.79**8.32*7.63**
333333
727378777475
222226252627
1.61.82.12.22.22.8
1.501.361.211.101.171.06
7.097.107.987.647.625.92
333353
747377787575
232225262827
1.51.52.11.92.32.9
1.481.301.171.111.371.11
7.307.577.25*7.677.43
6.62**
333333
727280797877
232327272727
1.51.62.11.92.22.4*
1.681.481.281.261.45*1.16
7.557.96*7.12*8.157.47
7.26**
4**33333
74737981*79*81**
26**25**28
28**2829
2.2**2.1*2.62.42.42.6
1.92**1.561.211.231.401.16
7.287.13
7.04**7.277.22
6.87**
Statistically significant difference from control group mean; *=p<0.05, **= p<0.01 (Dunnett’s test, 2-sided)
Urinalysis: There were no differences noted in quantitative urinalysis parameters throughout treatment which were positively attributed to treatment with SYN524464. Urine volume was lower than Control values for 3600 ppm females during Week 78 and 103, however in the absence of any associated findings

CLH REPORT FOR SEDAXANE
109
and considering the sporadic nature of the changes, they are not considered treatment related effects.
Sacrifice and pathology: Organ weights: Toxicity study (52 weeks): A dose related statistically significant increase in liver weight, adjusted for body weight (covariate analysis) was seen in males treated with 1200 or 3600 ppm SYN524454 and females receiving 3600 ppm. The absolute liver weights were also statistically significantly higher than Control values for males treated at 1200 or 3600 ppm, but not for females at 3600 ppm. Absolute heart and spleen weight were lower than Control values in females treated with 3600 ppm, however this was considered a reflection of the lower body weights in this dose group and not an effect of treatment.
Table 3.9.1.1-10: Intergroup comparison of selected organ weight parameters after 52 weeksDietary Concentration of SYN524464 (ppm)
Males Females
Parameter 0 200 1200 3600 0 200 1200 3600
Liver-absolute (g)-adjusted (g)
16.3016.10
17.0916.03
19.29*18.94**
21.01**22.63**
9.218.86
9.339.18
9.899.50
10.3911.39**
* Statistically significant difference from control group mean, p<0.05 (Dunnett’s test, 2-sided)** Statistically significant difference from control group mean, p<0.01 (Dunnett’s test, 2-sided)
Carcinogenicity study (104 weeks): Terminal group mean body weights were markedly reduced in comparison to respective Controls for both males and females treated with 3600 ppm SYN524464.
A dose related statistically significant increase in covariate liver weight was seen in males and females animals treated with 1200 and 3600 ppm SYN524454. The absolute liver weights were also statistically significantly higher than Control values for males treated with 1200 or 3600 ppm SYN524464.
Absolute heart, kidney and spleen weight were lower than Control values in animals treated with 3600 ppm, however covariate weights were unaffected. The changes in organ weights were therefore a reflection of the lower body weight in this dose group and considered not related to treatment.
Table 3.9.1.1-11: Intergroup comparison of selected organ weight parameters after 104 weeksDietary Concentration of SYN524464 (ppm)
Males Females
Parameter 0 200 1200 3600 0 200 1200 3600
Liver-absolute (g)-adjusted (g)
18.5718.10
19.4018.06
20.21*20.21**
22.52**24.20**
12.7211.56
13.2412.05
13.0712.65**
12.1714.64**
* Statistically significant difference from control group mean, p<0.05 (Dunnett’s test, 2-sided)** Statistically significant difference from control group mean, p<0.01 (Dunnett’s test, 2-sided)
Macroscopic findings: Toxicity study (52 weeks): All necropsy findings were typical of spontaneously arising background findings in rats of this strain and age on this type of study at .
A small number of lesions were observed, none of which was related to treatment.
Carcinogenicity study (104 weeks): Administration of SYN524464 was associated with a decreased incidence of subcutaneous masses in females given 3600 ppm SYN524464.
Microscopic findings:

CLH REPORT FOR SEDAXANE
110
Toxicity study (52 weeks): Minimal to moderate centrilobular hepatocyte hypertrophy in the liver was seen in all females and most males given 3600 ppm SYN524464. Additionally in these groups, there was a statistically significant increase in the incidence of pigment in centrilobular or midzonal hepatocytes. There were no differences in these findings at 200 or 1200 ppm.
Minimal to mild thyroid follicular cell hypertrophy of the thyroid gland was seen in some animals of both sexes dosed at 1200 ppm and above. The higher incidence compared to control was statistically significant in the male groups dosed with 1200 ppm (Fisher’s test and Mann-Whitney test) and with 3600 ppm (Mann-Whitney test only).
There was a statistically significantly lower incidence of clear cell foci in the liver of males given 3600 ppm SYN524464 and in the incidence of basophilic cell foci in the liver of females dosed in the diet with SYN524464 at 1200 and 3600 ppm. Considering the direction of the change, these findings are considered not to be of toxicological significance.
All other histological findings were typical of spontaneously arising background findings in rats of this strain and age on this type of study at
Table 3.9.1.1-12: Intergroup comparison of microscopy changes in the liver and thyroid after 52 weeks
Dietary Concentration of SYN524464 (ppm)Males Females
Non-tumour findings 0 200 1200 3600 0 200 1200 3600
Liver(12) (12) (12) (12) (12) (12) (12) (12)
- Basophilic cell focus, tigroid- Clear cell focus- Hepatocyte hypertrophy, centrilobular- Hepatocyte pigment
1110
0
160
0
090
0
04**
11***
7**
510
1
100
1
0*10
1
0*1
12***
7*
Thyroid Gland(12) (12) (12) (12) (12) (12) (12) (12)
- follicular cell hypertrophy 0 0 5*, + 4+ 0 0 2 3*p<0.05, **p<0.01; ***p<0.001, pairwise Fisher’ Exact Test+p<0.05, Mann-Whitney U-test. Other Mann-Whitney results for the indicated statistical results were similar to Fisher’s test results.
Carcinogenicity study (104 weeks):Non-neoplastic: In the liver, the incidence of hepatocyte hypertophy was higher in males dosed in the diet with SYN524464 at 1200 or 3600 ppm and females dosed at 3600 ppm compared to respective controls. In females at 3600 ppm, a higher incidence of heptocyte pigmentation was observed.
The incidence of eosinophilic cell foci in the liver was statistically significantly higher than control values in males dosed in the diet with SYN524464 at 3600 ppm, and in all treated females compared to Controls (Fishers’ Exact test). A similar pattern was observed with the Mann-Whitney U-test. However, historical control data for eosinophilic foci demonstrate that the incidences in the control groups in the current study were much lower than typical control values for animals of this strain and age. Only one male historic control group had a value close to the concurrent control (16%); the other five studies had values of 62 – 86%. Only one female historic control group had a value close to the concurrent control group (7%); the other four studies had values of 16%, 30%, 31% and 32%. Thus, the majority of the historic control incidence values for males and females were greater than any of the treated group values in this current study.

CLH REPORT FOR SEDAXANE
111
In summary, the apparent increased incidences of eosinophilic foci in the liver reflect the atypically low control values in this study and do not reflect an effect of treatment.
Table 3.9.1.1-13: Intergroup comparison of microscopy changes in the liver after 104 weeksDietary Concentration of SYN524464 (ppm)
Males Females
Non-tumour findings 0 200 1200 3600 0 200 1200 3600
Liver(52) (52) (52) (52) (52) (52) (52) (52)
- Eosinophilic cell focus 8(15.4%)
7(13.5%)
15(28.8%
25***(48.1%)
2(3.8%)
10*(19.2%)
12**(23.1%)
14**(26.9%)
Historical Range at Laboratory 16-86% 7-32%
Basophilic cell focus, homogenous 2 0 1 0 1 0 2 1Basophilic cell focus, tigroid 4 7 6 5 36 35 42 31Clear cell focus 33 39 37 19* 12 16 14 12Hepatocyte hypertrophy, centrilobular
0 0 8** 16*** 0 0 1 38***
Hepatocyte pigment 0 1 0 1 2 3 1 15*****p<0.01; ***p<0.001, pairwise Fisher’ Exact TestMann-Whitney results for the indicated statistical results were similar to Fisher’s test results.
In parallel with this, there was a lower incidence of clear cell foci in 3600 ppm males. This reflects normal variability and considering the direction of change, they do not represent a treatment related effect.
Epithelial tubular hyperplasia of the thymus was of a higher incidence in females receiving 3600 ppm compared to controls. This is a relatively common finding in female rats, and the severity was primarily minimal to mild. Although a treatment-related effect at 3600 ppm in females cannot be excluded, the higher incidence of this common finding at 3600 ppm is seen only in the presence of significant systemic toxicity and is thus considered in itself not to be toxicologically significant.
Table 3.9.1.1-14: Intergroup comparison of microscopy changes in the thymus after 104 weeksDietary Concentration of SYN524464 (ppm)
Males Females
Non-tumour findings 0 200 1200 3600 0 200 1200 3600
Thymus(52) (50) (48) (49) (50) (52) (50) (51)
- Hyperplasia, epithelial tubular 3 1 5 5 18 17 18 31**p<0.05, pairwise Fisher’ Exact TestMann-Whitney results for the indicated statistical results were similar to Fisher’s test results.
In the thyroid, the incidence of follicular cell hyperplasia was higher than control in 3600 ppm males. This was not statistically significant in a pairwise comparison, but was significant in the Mann-Whitney U-test that considers severity and incidence. Although scattered incidences of this finding were seen in females at 200 and 3600 ppm, there was no semblance of a dose response, and these differences were not treatment related in female rats.
The incidences of colloid basophilia and desquamation of the follicular epithelium of the thyroid was increased in females dosed in the diet with SYN524464 at 1200 and 3600 ppm compared to controls. In addition, colloid basophilia was higher in males at 3600 ppm based on the Mann-Whitney U-test.

CLH REPORT FOR SEDAXANE
112
The incidence of diffuse c-cell hyperplasia was decreased in both sexes receiving 3600 ppm compared to controls, but considering the direction of the change, this is not considered toxicologically significant.
Table 3.9.1.1-15: Intergroup comparison of microscopy changes in the thyroid after 104 weeksDietary Concentration of SYN524464 (ppm)
Males Females
Non-tumour findings 0 200 1200 3600 0 200 1200 3600
Thyroid Gland(52) (52) (52) (52) (52) (52) (52) (52)
-desquamation, epithelial follicular 7 8 11 16 2 5 9* 14**-basophilia, colloid 7 9 12 16+ 3 6 11* 17***-diffuse C-cell hyperplasia 27 27 24 10*** 29 31 27 5***-focal follicular cell hyperplasia 7 8 8 16+ 0 4+ 0 4+*p<0.05, **p<0.01, ***p<0.001, pairwise Fisher’ Exact Test+p<0.05, Mann-whitney U-test. Mann-Whitney results for the other indicated statistical results were similar to Fisher’s test results. Desquamation , epithelial follicular was not evaluated by the Mann-Whitney test.
There was a decreased incidence of chronic progressive nephropathy, pelvic mineralisation, inflammation/inflammatory cell infiltration and transitional cell hyperplasia in the kidney in females receiving 3600 ppm compared to controls. Pelvic mineralization was also decreased in males at 1200 and 3600 ppm. Chronic progressive nephropathy and associated changes are normal, age-related findings in rats that commonly occur at the end of 2-yr studies. These decreases at 3600 ppm may be a reflection of the large body weight decreases in females, as well as males, at this dose level, and given the direction of this change, they are not toxicologically significant.
The incidence of mucification of the vagina and mammary gland lobular hyperplasia were decreased in females receiving 3600 ppm compared to controls. Mucification of the vagina is a normal age-related change in female rats as they reach senescence and stop cycling. A blinded histopathology re-evaluation of the vagina, ovaries and uterus has been performed and the findings are reported point 3.9.4.11. According to this reevaluation, the incidence of vaginal mucification was only slightly lower in 3600 ppm group compared to control group (21/51 vs 29/50).
Table 3.9.1.1-16: Incidence of non-neoplastic changes in kidney, vagina and mammary gland after 104 weeks
Dietary Concentration of SYN524464 (ppm)Males Females
Non-tumour findings 0 200 1200 3600 0 200 1200 3600
Kidney(52) (52) (52) (52) (52) (52) (52) (52)
- Chronic progressive nephropathy- Pelvic mineralisation- Inflammation/inflammatorycell infiltration- Transitional cell hyperplasia
33147
11
3693
15
375*5
10
375*8
5
24308
29
22369
37
203310
37
9**9***19*
17*Vagina-Mucification
(51)15
(52)22
(52)16
(52)3**
Mammary gland-Lobular hyperplasia
(43)7
(43)1
(45)1*
(41)4
(52)34
(50)34
(51)32
(52)21*
*p<0.05, **p<0.01; ***p<0.001, pairwise Fisher’ Exact Test
The following findings which showed statistically significant increases or decreases were considered to represent biological variation in the incidence of expected spontaneous findings, considering the direction of change and/or their occurrence in isolated groups with no dose response:

CLH REPORT FOR SEDAXANE
113
Males: Lungs: Decreased Alveolar macrophage accumulation (1200 ppm) Spinal Cord: Decreased Radiculoneuropathy (1200 or 3600 ppm) Kidney: Increased Pyelnephritis (200 ppm only) Skin: Increased Epidermal Cyst (1200 ppm only) Liver: Increased Angiectasis (1200 and 3600 ppm) Liver: Decreased Clear cell focus (3600 ppm)
Females: Compression by pituitary tumour in the brain (200 ppm) Lymph node, mandibular: Increased Plasmacytosis (200 ppm only)
Neoplastic: In females dosed in the diet with SYN524464 at 3600 ppm there was a statistically increased incidence of uterine adenocarcinomas (p<0.01) compared to the concurrent control group. While within the laboratory’s historical control range, the incidence was far above the historical control mean from the testing laboratory.
NB: The notifier has also reported HCD from RITA database. However, historical control data submitted for consideration should be obtained from the laboratory at which the study being assessed was carried out, and relate to animals of the same strain, age and sex, and obtained from the same supplier, as those used in the study. They should come only from studies conducted within five years, or two to three years either side, of the study under review. Therefore, only the HCD from the same laboratory were taken into consideration for assessment of uterine tumours as well as for other carcinogenic findings.
The following table summarises the incidences:
Table 3.9.1.1-17: Intergroup comparison of microscopy changes in the uterus after 104 weeksDietary Concentration of SYN524464 (ppm)
Females Historical Control Data
Tumour findings 0 200 1200 3600 CR RITA
Uterus (52) (52) (52) (52)
- Adenocarcinoma[M] 0^ 34.7%
23.1%
9**17.3% 0-19%
Mean: 7%0-28%
-Adenoma 0 0 1 0
**p<0.01, pairwise Fisher’ Exact Test^p<0.05, Positive trend by Peto Trend Test (Groups 1-4). P-value for linear trend including groups 1 to 4 = 0.002. P-value for linear trend including groups 1 to 3 = 0.22Same laboratory historic data = 10 studies, all started between 2002 and 2012RITA historic control data is shown for studies of 22 to 25 months duration. RITA = Registry of Industrial Toxicology Animal-data.
Table 3.9.1.1-18: Background Incidence of uterine adenocarcenoma in Untreated Han Wistar Rat (Crl:WI(Han)) in 104 Week studies at the same laboratory
Uterine Adenoma Uterine Adenocarcinoma Total Uterine Tumours
Study Identifier Study Start
Number of Animals
Examined Incidence Percent Incidence Incidence Percent Incidence IncidencePercent
Incidence
811 2002 50 2 4 0 0 2 2
894 2003 100 2 2 9 9 11 11
993 2004 99 4 4 10 10 14 14
384 2005 50 0 0 7 14 7 14

CLH REPORT FOR SEDAXANE
114
666 2005 110 4 4 21 19 25 23
325 2007 52 3 6 4 8 7 13
930 2007 110 0 0 8 7 8 7
580 2009 52 0 0 0 0 0 0
072 2009 120 0 0 4 3 4 3
962 2012 64 0 0 2 3 2 3
Mean 2 Mean 7 Mean 9
SD 2 SD 6 SD 7
Range 0-6 Range 0-19 Range 0-23
N 10 N 10 N 10Data refers to 10 prior or concurrent studies at the same laboratory in 2002-2012, ± 5 years from start of sedaxane rat chronic/carcinogenicity study .
Statistical significance by a pairwise test was achieved for the 3600 ppm incidence (17.3%) at p<0.01. By the Peto trend test, a significantly increasing trend was observed, but this was not statistically significant when Group 4 (3600 ppm) was excluded. Uterine adenocarcinoma is a common finding in aging Wistar rats, as demonstrated by historic control data from the laboratory (2002-2012). It is also acknowledged that uterine adenocarcinoma incidence in the concurrent control animals (0%) was low. However, as shown in the Historic control data from the same laboratory, 2 other study out of the 10 during this period had a control group with a 0.0% incidence. Moreover looking at the HCD distribution, the incidence of uterine adenocarcinoma in sedaxane high dose group is far above the HCD mean and above the incidence of nine out of ten historical controls.Furthermore, regarding structure-activity relationships, another SDHI fungicide similar to sedaxane, “isopyrazam” also induced uterine adenocarcinoma at a high dose level of 3000 ppm (233 mg/kg/day).Therefore, the statistically increased incidence of uterine tumours observed at high dose level (sedaxane3600 ppm) could not be ruled out as unrelated to treatment.
There were no treatment-related effects on the uterus at the 52 Week interim sacrifice, and no non-neoplastic micropathology changes to the uterus in the 104 Week Carcinogenicity study. However decreased vaginal mucification and decreased incidence of mammary gland lobular hyperplasia (see Table 3.9.1.1-16) as well as a statistically significant decreased incidence of mammary fibroadenomas in females receiving 3600 ppm when compared to controls suggesting disruption in serum prolactin.There was also a tendency for decreased pituitary adenomas in the high dose females.
Table 3.9.1.1-19: Incidences of Mammary Gland Fibroadenomas, and Pituitary Gland Adenomas in Females after 104 weeks
Dietary inclusion level of Sedaxane in ppm (mg/kg/day)Tumour Type 0 200
(14 mg/kg/day)1200
(86 mg/kg/day)3600
(261 mg/kg/day)
Mammary Gland
Fibroadenoma(%) 14/52^(27%)
9/50(18%)
10/51(20%)
0/52***(0%)
Pituitary Gland
Adenoma, Anterior lobe (%)
23/52(44%)
29/52(56%)
20/52(38%)
16/52(31%)
***p<0.001, pairwise Fisher’ Exact Test^p<0.05, Negative trend by Peto Trend Test (Groups 1-4). P-value for linear trend including groups 1 to 4 = <0.001. P-value for linear trend including groups 1 to 3 = 0.51
Although not statistically significant by pair-wise comparison there was a higher incidence of hepatocellular adenomas, thyroid follicular cell adenomas and thyroid follicular cell adenomas/carcinomas combined in males at 3600 ppm with statistically significant trend and exceeding the HCD range from the same laboratory.

CLH REPORT FOR SEDAXANE
115
The combined thyroid tumour increase was driven by the increased incidence of adenomas (no increase in malignant tumours).
Table 3.9.1.1-20: Intergroup comparison of selected neoplastic changes in malesMALES Dietary Concentration of SYN524464 (ppm)
Tumour findings 0 200 1200 3600
Number examined excluding those died or sacrificed before week 54
52 52 52 52
LiverHepatocellular Adenoma 1(2%)^ 1(2%) 1(2%) 5(10%)
ThyroidThyroid follicular cell adenoma 3(6%)^ 3 (6%) 4 (8%) 8 (15%)
Thyroid follicular cell carcinoma 0 0 2 (4%) 1 (2%)
Combined thyroid follicular cell adenoma and carcinoma
3 (6%)^ 3 (6%) 6(12%) 9(17%)
No statistically significant differences from control group by Fisher’s Exact Test (p<0.05)^p < 0.05 Trend analysis (significance of trend denoted at control) by Exact Trend TestHistorical control data from the testing laboratory including 5 prior or concurrent studies started in 2002-2005 ranged from 0-3% (mean: 1.2%) for hepatocellular adenoma, 2-11% (mean: 6.8%) for follicular cell adenoma and 0-6% (mean:1.8%) for follicular cell carcinoma and 2-15% (mean: 8%) for follicular cell adenoma/carcinoma combined
CONCLUSION: At 3600 ppm, a large and consistent effect on body weight and body weight gain was observed in both sexes. Lower values for food consumption and food utilisation were noted in males and females at 3600 ppm. Higher liver weights were observed in males and females. The liver weight increases correlated with micropathology findings of centrilobular hepatocyte hypertrophy and hepatocyte pigmentation, and with clinical chemistry changes involving higher total protein, albumin and globulin levels in males and females that were consistent with an adaptive change in the liver. In the thyroid, follicular cell hypertrophy was observed in both sexes at 52 weeks, with findings at 104 weeks of follicular hyperplasia in males, desquamation of epithelium in females, and basophilic colloid in both sexes at 3600 ppm. Additional treatment related changes at 3600 ppm included higher prothrombin time in males, higher glucose and phosphate levels in males, and higher cholesterol levels in females. Slightly higher gamma glutamyl transferase values were possibly treatment-related in males only at 104 weeks.
In females dosed at 3600 ppm there was a statistically significant increased incidence of uterine adenocarcinomas (p<0.01) compared to the concurrent control group.In males at 3600 ppm, although not statistically significant by pair-wise comparison there was a higher incidence of hepatocellular adenomas, thyroid follicular cell adenomas and carcinomas and thyroid follicular cell adenomas/carcinomas with statistically significant trend and exceeding the HCD range from the same laboratory.
At 1200 ppm, body weight and body weight gain were decreased in females but not in males. Liver weight was increased in both males and females, and micropathology findings were seen in both the liver and the thyroid of males and females, but to a lesser extent than at 3600 ppm. At 1200 ppm, glucose and total protein levels were higher than control values in males at two time points.
There were no effects of treatment at 200 ppm in this study in males or in females.
Under the conditions of this study, a No Observed Adverse Effect Level (NOAEL) was considered to be 200 ppm for both males and females, equating to 11 mg/kg/SYN524464 in males and 14 mg/kg/SYN524464 in females.

CLH REPORT FOR SEDAXANE
116
The NOAEL for carcinogenicity in rat was be 200 ppm for both males and females, (equal to 11/14 mg/kg bw per day in M/F).
References:Currie, L (2007). Development of Methodologies for the Analysis of SYN524464Ain Dietary Formulations. Charles River Laboratories Study No. 423905, Method No. 2390.
D’Amour and Smith (1941): J Pharmac Exp Therapy 72, 74
Meyer O A, Tilson H A, Byrd W C and Riley M T (1979): Neurobehavioral Toxicology 1, 233-236
Shirley (1977). The Analysis of Organ Weight Data. Toxicology 8 p 13-22.
Kaplan EL and Meier P (1958). Nonparametic estimation from incomplete observations. J Am Statist Assoc 53 p 457-481
Peto R and Pike MC (1973). Conservatism of the Approximation Σ(O-E)2/E in the LogRank test for Survival Data or Tumour Incidence Data, Biometrics 29 p 579-584
Hoel DG. and Walburg HE. Statistical Analysis of Survival Experiments. Journal of the National Cancer Institute 1972; 49:361-373
Fairweather, W. R. et al. (1998). Biostatistical Methodology in Carcinogenicity Studies. Drug Information Journal. Volume 32, pp. 401-421
Peto R., Pike M.C., Day N.E., Gray P.G., Lee P.N., Parish S., Peto J., Richard S. and Wahrendorf, J. Guidelines for Simple, Sensitive Significance Tests for Carcinogenic Effects in Long-term Animal Experiments. IARC Monographs, Supplement 2, IARC, Lyon (1980)
3.9.1.2 Anonymous (2010)Report: Anonymous (2010). SYN524464 – 80 Week Mouse Dietary Carcinogenicity Study. Laboratory
Report No. 30194 issue date. 28 January 2010. Unpublished. (Syngenta File No. SYN524464_11261)
GUIDELINES: Carcinogenicity –Mouse (dietary). OECD 451 (1981): OPPTS 870.4200 (1998): 87/302/EEC B.32 (1988): JMAFF 12 Nohsan N0.8147 (2000)
GLP: Signed and dated GLP and Quality Assurance statements were provided.
There were no deviations from the current regulatory guideline considered to compromise the scientific validity of the study.
EXECUTIVE SUMMARY
Groups of 50 male and 50 female CD-1 mice were fed diets containing 0, 200, 1250 and 7000 ppm of SYN524464 for a period of at least 80 weeks.
The animals were monitored regularly for viability and for signs of ill health or reaction to treatment. Body weights and food consumption were measured and recorded at pre-determined intervals from pretrial up until the completion of treatment. Blood samples for haematology were also collected from all surviving animals prior to terminal kill at Week 80. Blood films were made from all surviving animals

CLH REPORT FOR SEDAXANE
117
during Week 52/53 and at Week 80. However, blood cell morphology was not performed as no abnormal treatment related effects were seen.
All surviving animals were terminated and subjected to a detailed necropsy examination after the completion of treatment. Tissues from all animals were subject to a comprehensive histological evaluation.
Dietary administration of SYN524464 at 0, 200, 1250 and 7000 ppm, for a period of at least 80 weeks, was associated with lower body weights and body weight gains for males and females treated at 7000 ppm. The maximum difference from Control for body weight was 7% in males and 9% in females.
While overall food utilisation for Weeks 1-13 was not statistically significantly different from control values for males or females at 7000 ppm, lower values were observed during two of the three measurement intervals, suggesting that these differences reflect an effect of treatment.
There were no treatment-related effects on haematological parameters in male and female treated groups.
Liver weight was increased, following covariate analysis, to a limited extent in males at 7000 ppm (+16%), but this reflected an adaptive response that is not adverse given the absence of any treatment-related micropathology changes.
Neoplastic findings: There was a lower incidence of lymphomas in females that is considered not to be toxicologically significant given the direction of the change. In male mice at 7000 ppm, the incidences of hepatocellular adenoma and adenomas/carcinomas combined were slightly, but statistically significantly, higher than those of the control group.
Dietary administration of 7000 ppm was associated with a decrease in body weight and body weight gain in males and females, and a decrease in food utilization during the early stages of the study.
The No Observed Adverse Effect Level (NOAEL) for this study was 1250 ppm for both sexes, equating to achieve dose levels of 157 mg SYN524464/kg/day in males and 185 mg SYN524464/kg/day in females.
Statistically significant increased incidences of hepatocellular adenomas and hepatocellular adenomas/carcinomas combined were observed in male mice at the high dose.
The NOAEL for carcinogenicity in mice was 1250 ppm (equal to 157 mg/kg bw per day).
NB: the applicant (Syngenta) is of the view that the liver tumours observed at the high dose level in males are within the range of variable spontaneous tumour incidences for the tested strain and is not related to sedaxane treatment.
MATERIALS AND METHODSMaterials:
Test Material: SYN524464Description: Off white powderLot/Batch number: SMU6LP006/MILLEDPurity: 95.3%, consisting of:
83.0% trans isomer (SYN508210)12.3% cis isomer (SYN508211)
Stability of test compound: Expiry Date January 2011

CLH REPORT FOR SEDAXANE
118
Vehicle and/or positive control: The test substance was administered via RM1 diet SQC Expanded (Ground).
Test Animals:Species Mouse Strain Crl:CD-1(ICR)Age/weight at dosing Approx 6 weeks: 27.1-40.7g (males); 20.5-28.0 (females)Source .Housing Males individually; females, 3/cageAcclimatisation period Approximately 2 weeksDiet R&M (modified) No.1 Diet SQC Expanded (ground) ad libitumWater Mains water ad libitumEnvironmental conditions Temperature: 19-23°C
Humidity: 40-70%Air changes: minimum of 15/hourPhotoperiod: 0700-1900 hrs
Study Design and Methods:In-life dates: Start: 12 September 2007 End: 28 July 2009
Animal assignment: On arrival from the suppliers the animals were introduced to cages on racks. Cages were racked by treatment group and vertically throughout the rack. From the commencement of pretrial, each column of cages on a rack was moved one position along the racks assigned to that sex, with the end column returning to the start of the first rack. These changes were carried out to minimize environmental effects, and were performed at approximately monthly intervals.
During pretrial, group mean body weights were checked to ensure that all groups had a similar body weight for each sex; however, in error no positive entry was made to confirm this check had been performed. This was considered not to have affected the study integrity as there were no statistically significant differences between group mean bodyweights at the commencement of the treatment period.
Table 3.9.1.2-1: Study designTest group Dietary concentration
(ppm)male female
Control Control 0 1-50 201-250Low Low 200 51-100 251-300Mid Intermediate 1250 101-150 301-350High High 7000 151-200 351-400
Diet preparation and analysis: Formulated diets were prepared by direct admixture of test item to a required amount of untreated diet and blended for 20 minutes in a diet mixer.
Blank diet (without the test item under investigation) was prepared for Control animals.
Diet formulations were prepared and dispensed approximately once every 2 weeks and were stored at ambient temperature, in the dark.
Prior to study commencement, stability data was generated by under a separate protocol and contract ( Study Number 423905). Stability of SYN524464 in the diet at concentrations of 100 ppm and 10000 ppm was demonstrated for at least 15 days at ambient temperature and for at least 33 days at -20°C in the dark.
Analysis of diet formulations was carried out with regard to concentration and homogeneity.

CLH REPORT FOR SEDAXANE
119
During the study, triplicate samples (3 x 50 g) were taken from each formulated diet (including Control) immediately after preparation at approximately 3 monthly intervals.
Samples were stored at -20°C until analysed.
Analysed concentrations of test item in formulated diets were found to be within ±8.5% (Week 1), ±1.5% (Week 13), ±8.9% (Week 27), ±12.6% (Week 41), ±7.6% (Week 52), ±15.3% (Week 65) and ±6.8% (Week 79) of the theoretical concentrations. The 1250 ppm dose group formulations for Weeks 41 and 65 were found to be outside the acceptance criteria of ±10%, however, due to the small magnitude of deviation and the accuracy of the formulation, this was considered not to have affected the outcome or integrity of the study.
The coefficient of variation was low (3.2% or lower) indicating satisfactory homogeneity. SYN524464 was not detected in the Control specimen.
Statistics: Body weight, cumulative body weight gain, food consumption, food utilisation, haematology and organ weight data were analyzed using a parametric ANOVA and pairwise comparisons made using the Dunnett’s t-testThe following pairwise comparisons were performed:
Control vs Low DoseControl vs Intermediate DoseControl vs High Dose
Organ weights were also analyzed by analysis of covariance (ANCOVA) using terminal kill body weight as covariate. Summary statistics (mean, standard deviation and number of observations) and individual values are presented for organ weights as a percentage of body weight.
Analyses of variance and covariance were carried out using the MIXED procedure in SAS (v9.1.2). Individual values were rounded before printing. All derived values that appear in the tables represent the rounded results of calculations that are based on the exact (nonrounded) raw data values. Statistical analysis was carried out on the exact raw data values. Least-squares means for each group were calculated using the LSMEAN option in SAS PROC MIXED. Unbiased estimates of differences from control were provided by the difference between each treatment group least-squares mean and the control group least squares mean. Differences from control were tested statistically by comparing each treatment group least-squares mean with the control group least-squares mean using a two-sided Dunnett’s t-test, based on the error mean square in the analysis. All statistical tests were two sided and performed at the 5% and 1% levels. All means were presented with standard deviations. Males and females were analyzed separately.
The Dunnett’s test was performed for all continuous data parameters, regardless of whether the initial ANOVA or ANCOVA was statistically significant.
Kaplan-Meier survival estimates (Kaplan-Meier, 1958 and Cox DR, 1972) were calculated for the Control and each of 3 dose groups of the test material. Intergroup comparisons of mortality comparing each treatment group with the Control group and an overall test for trend were performed using a logrank test.
Pairwise comparisons of the incidence of tumour and histological lesions was made using Fisher’s Exact test (two-tailed). Non-neoplastic histological findings with multiple severities were also analysed using the Mann-Whitney U test, which takes both severity and incidence into account. Further analyses were performed using Peto’s time adjusted methods.
The statistical evaluation of the tumour data was performed in SAS (v8.2) using PROC MULTTEST. Methods used for the age-adjusted analysis of fatal and non-fatal tumours were based on the IARC guidelines (Peto et al,1980: Fairweather,1998: Hoel and Wahlburg,1972).

CLH REPORT FOR SEDAXANE
120
For clinically non-observable tumours, the study pathologist classified each of the tumours as either fatal, probably fatal, probably incidental or incidental. For the purposes of statistical analysis, tumours classified as either fatal or probably fatal were considered fatal and those tumours classified as probably incidental or incidental were considered incidental. All tumours detected in animals that died in the terminal sacrifice were automatically classified as incidental.
For the purposes of statistical analysis, all observable tumours were considered to be fatal and the time of first detection was used in the age-adjusted analysis. For observable tumours not detected in-life, the time to death was used in the analysis.
The analysis of incidental tumours was conducted by dividing the experimental period into the following fixed time intervals: 1-52 weeks and 53-80 weeks.
For each considered dataset, the significance of a linear dose related increase in tumour incidence was evaluated using a two-sided Peto trend test using the group numbers (Groups 1-4). If the overall Peto trend was significant at the 5% level for any given tumour incidence, then the overall Peto trend was re-analysed for Groups 1-3; if still significant it was reanalysed for Groups 1-2. Males and females were analysed separately. For each statistical test performed on a dataset containing 10 or less tumours, the discrete permutation distribution was used to calculate the corresponding p-value.
For qualitative data (e.g. possible values of 0, 1, 2 or present/absent): Qualitative parameters not specifically mentioned above that yield qualitative data are presented as summary data, but were not analysed statistically.
Observations: All animals were checked early morning and as late as possible each day for signs of viability.Once each week all animals received a detailed clinical examination, including appearance, movement and behaviour patterns, skin and hair condition, eyes and mucous membranes, respiration and excreta.
Bodyweight: Body weights were recorded once weekly during pretrial up until Week 14 of treatment, and once every 2 weeks from Week 15 up until the end of treatment.
Food consumption and test substance intake: The quantity of food consumed by each cage of animals was measured and recorded once weekly during pretrial up until Week 14 of treatment, and once every 4 weeks from Week 16 up until the end of treatment.
The amount of test item ingested was calculated at regular intervals during treatment using the following formula:Achieved intake (mg/kg/day) = Nominal Concentration (ppm) x Food Consumption (g/day)
Mid-point Body Weight (g)**The mid-point body weight is an average of the body weights recorded prior to and during each period for which food consumption was measured.
Food utilisation: Food utilisation was calculated for Weeks 1-4, 5-8, 9-13 and 1-13 according to the following formula:
(Cage mean weight gain x 100) / cage total food consumption
Reported values show the amount of weight gained (g) for every 100g of food consumed.
Ophthalmoscopic examination: Not performed.
Haematology: Blood samples (as much blood as possible) were obtained from all surviving animals via the orbital sinus under isoflurane anaesthesia and transferred into tubes containing EDTA prior to the terminal kill. The animals were not deprived of food overnight prior to sampling. The parameters examined for haematology were as follows:
CLH REPORT FOR SEDAXANE
121
white blood cell countdifferential white blood cell count:
neutrophils,eosinophilsbasophils
lymphocytes,monocytes
large unclassified cells
A blood film smear was made from all surviving animals at Week 52/53, with samples obtained from the saphenous vein. A blood film smear was also made from all EDTA haematology samples obtained via the orbital sinus prior to termination. All blood films prepared from Week 52/53 and prior to terminal kill were stained for possible examination.Femoral bone marrow smears were taken at necropsy and stored for possible evaluation.
However, blood and bone marrow smears were not examined as haematological findings indicated that evaluation would not yield any further information.
Clinical Chemistry and Urinalysis: Not performed
Investigations post mortem: Macroscopic examination: After at least 80 weeks of treatment all surviving animals were killed in random order by exposure to carbon dioxide and had their terminal body weight recorded followed by exsanguination.
Each animal was subjected to a detailed necropsy under the guidance of a veterinary pathologist, who visited on the day of necropsy, and remained on-call throughout the necropsy period. The necropsy consisted of a complete external and internal examination which included body orifices (ears, nostrils, mouth, anus, vulva) and cranial, thoracic and abdominal organs and tissues. All gross findings were recorded in descriptive terms, including location(s), size (in mm), shape, colour, consistency and number.
Organ weights: From all animals surviving to scheduled termination, the following organs were removed, trimmed free of extraneous tissue and weighed:
adrenal glands ovariesbrain spleenepididymides testesheart thymuskidneys uterus (with cervix)liver and gall bladdder
Paired organs were weighed separately and the sum of the individual organs used for reporting purposes.Tissue submission: The following tissues were examined in situ, removed and examined and fixed in appropriate fixatives:
abnormal tissue including masses oesophagus adrenal gland ovary aortic arch oviduct brain pancreasbone marrow (femur) parathyroid glandcaecum pharynxcolon pituitary glandduodenum prostate gland

CLH REPORT FOR SEDAXANE
122
epididymis rectumeyes and optic nerve salivary gland (submaxillary and sublingual)femur (including stifle joint) seminal vesicleHarderian gland spinal cord (cervical, thoracic, lumbar)heart spleenileum sternumjejunum stomachkidney testislacrimal gland thymuslarynx thyroid glandliver and gall bladder tonguelung trachealymph node - mesenteric urinary bladderlymph node - submandibular uterus (with cervix)mammary gland vaginamuscle - thighnerve - sciatic
Microscopic examination: All processed tissues were examined by light microscopy.
RESULTS AND DISCUSSION Mortality: There were 32/50, 34/50, 33/50 and 34/50 surviving males in Groups 1, 2, 3 and 4 respectively. There were 34/50, 38/50, 41/50 and 38/50 surviving females in Groups 1, 2, 3 and 4 respectively.
There were no statistically significant differences in mortality between the control and any other group for either males or females. There were no incidences for cause of death which were considered to vary from the expected pattern seen in this strain of mice at
Clinical observations: Some male and female treated animals displayed occasional increased activity and agitation; however there was no relationship to dose administered. It is considered that there were no clinical observations attributed to treatment.
Bodyweight and weight gain: Males and females treated at 7000 ppm had lower body weights and cumulative body weight gains throughout the treatment period when compared to their respective controls. Some statistically significant values were noted at various timepoints, however, the slight decreases in body weight and body weight gain were consistent throughout the treatment period in both sexes and were considered treatment related effects. The maximum difference from Control for body weights was -7% in males and -9% in females respectively.
Males and females treated at 200 and 1250 ppm closely resembled body weight profiles displayed by their respective Controls.

CLH REPORT FOR SEDAXANE
123
Table 3.9.1.2-2: Intergroup comparison of bodyweights (g) (mean values for selected weeks)Dietary Concentration of SYN524464 (ppm)
Males Females
week 0 200 1250 7000 0 200 1250 7000
01313265280
34.036.338.548.055.159.861.3
34.236.038.647.353.957.659.6
33.035.0*37.746.852.856.758.7
33.334.9*37.545.652.457.957.6
24.025.227.232.840.646.149.4
23.824.826.731.838.344.348.2
24.225.327.132.639.445.049.2
23.925.126.3*31.136.9*42.745.6
* p ≤0.05 by Dunnett’s test
Table 3.9.1.2-3: Intergroup comparison of cumulative bodyweight change (g) (mean values shown for selected intervals)
Dietary Concentration of SYN524464 (ppm)Males Females
week 0 200 1250 7000 0 200 1250 7000
0-10-30-130-80
2.24.414.027.5
1.8**4.313.025.7
2.04.713.725.8
1.6**4.212.324.7
1.23.38.925.5
1.12.98.124.3
1.22.98.425.1
1.22.4**7.221.7
** p ≤0.01, * p ≤0.05 by Dunnett’s test
Food consumption and compound intake: The food consumption profiles in all treated groups closely resembled those displayed by their respective Controls.
A few statistically significant values were noted on isolated occasions in either sex, however, due to a lack of consistency, corroborating evidence or any dose related response, these findings were considered not to be treatment related.
Achieved dose levels were 25, 157 and 900 mg SYN524464/kg/day for males, and 29, 185 and 1001 mg SYN524464/kg/day for females, corresponding to dietary inclusion levels of 200, 1250 and 7000 ppm respectively for both sexes.
Table 3.9.1.2-4: Intergroup comparison of food intake (g/mouse/day) (mean values shown for selected weeks)
Dietary Concentration of SYN524464 (ppm)Males Females
week 0 200 1250 7000 0 200 1250 7000
-11313285280
6.66.66.55.85.95.65.9
6.76.66.45.85.85.75.7
6.86.46.55.65.85.35.5
7.1*6.66.45.86.15.55.6
5.14.95.64.65.04.84.9
4.84.85.34.65.14.85.3*
5.14.95.55.05.14.75.3*
4.94.85.34.44.64.55.2
* p ≤0.05 by Dunnett’s test
Food utilisation: Males and females treated at 7000 ppm had a slightly lower food utilisation during Weeks 9-13 in comparison to Controls, and this achieved statistical significance in males. Additionally,

CLH REPORT FOR SEDAXANE
124
food utilisation was statistically significantly lower than Control values in 7000 ppm females during Weeks 1-4, and numerically lower than Control values for males during this initial time period.
While overall food utilisation for Weeks 1-13 was not statistically significantly different from Control values for males or females at 7000 ppm, the lower values during two of the three measurement intervals suggest that these reflect an effect of treatment.
There was no effect on food utilisation at 200 or 1250 ppm.
Table 3.9.1.2-5: Food utilisation (g/100g of diet consumed) (mean values shown for selected weeks)
Dietary Concentration of SYN524464 (ppm)Males Females
week 0 200 1250 7000 0 200 1250 7000
1-45-89-131-13
3.02.42.02.4
3.02.11.92.3
3.32.22.02.5
2.82.31.5*2.2
2.71.51.61.9
2.51.41.51.8
2.31.61.51.8
2.2*1.61.11.7
* P ≤0.05 by Dunnett’s test
Haematology: There were no treatment-related effects on the measured haematology parameters at any dose level.The only statistically significant difference from Controls was a lower basophil count in 1250 ppm females, but considering the large variability in the control group and lack of a dose response, this was considered not to be an effect of treatment.
Sacrifice and pathology: Organ weights: Liver weight (covariate analysis) was statistically significantly higher than the Control value (+16%) in males at 7000 ppm. No comparable effects were seen in males at 200 and 1250 ppm, or in females at any dose level.
Adrenal weight was seen to be statistically significantly higher in females at 1250 ppm, however, due to the small magnitude of difference from the Control and the lack of a dose response relationship, it is considered that this increase in adrenal weight was not related to treatment.
Table 3.9.1.2-6: Organ weights (g) (absolute and adjusted)Dietary Concentration of SYN524464 (ppm)
Males Females
Organ 0 200 1250 7000 0 200 1250 7000
Liver – absoluteLiver – adjusted
Adrenal - absolute
3.203.04
0.0057
3.133.13
0.0058
3.093.15
0.0051
3.443.53*
0.0061
2.152.13
0.0084
1.981.97
0.0095
2.021.99
0.0101*
2.112.17
0.0100Adrenal - adjusted 0.0056 0.0057 0.0052 0.0061 0.0084 0.0095 0.0101* 0.0100
* P ≤0.05 by Dunnett’s test
Other numerical differences in organ weights were not dose responsive, did not achieve statistical significance, and did not reflect an effect of treatment.
Macroscopic findings: There were no necropsy findings that could be attributed to treatment with SYN524464. All necropsy findings were considered background findings typically associated with this age and strain of mice on this kind of study at .

CLH REPORT FOR SEDAXANE
125
Microscopic findings: Non-neoplastic: All non-neoplastic histology findings were considered background findings associated with this age and strain of mice, on this kind of study at .
Neoplastic: There was a statistically significant decrease in the incidence of lymphomas in females from the 1250 ppm and 7000 ppm treated groups based on the Peto Trend test. The incidences were not statistically significant in a pairwise Fishers Exact test. Historic control incidences of lymphoma are also summarized in the table below; these data suggest that the incidence in the concurrent control group from this study was higher than usual. While a treatment-related effect of a decrease in incidence of this finding is possible, the comparison with the historic control data makes it appear unlikely.
Table 3.9.1.2-7: Incidence of Lymphoma in Crl:CD-1 Female MiceTreatment 0 ppm 200 ppm 1250 ppm 7000 ppm
Animals per group 50 50 50 50
Lymphoma 16 9 7 7
Significant negative Peto trend test for Groups 1-4 (p=0.021 for females) and for Groups 1-3 (p=0.024 for females). For Groups 1-2, no significant trend (p=0.12 for females).
Table 3:9.1.2-8 Background Incidence of Lymphoma in Untreated Crl:CD-1Female Mice in 80 Week Studies at CRL
Study Number Year Animals Lymphoma
45829 2007 100 5
45813 2007 100 1
458346 2007 50 5
Total 250 11
In male mice at 7000 ppm, the incidence of hepatocellular adenomas was numerically higher than the incidence in the Control or other male treatment groups, but there were no statistically significant differences by the Peto trend test or a pairwise Fishers Exact test when taking into account all animals examined (i.e.: 50/group). Comparison to historic control data, and the Control and treated groups from a parallel study that was completed in the same time frame, clearly show that the incidence at 7000 ppm was slightly above the range of normal variability for male hepatocellular adenomas in this laboratory and strain of mice. In a parallel study conducted at the same laboratory, using the same strain, supplier, water supply, test diet and accommodation unit as the SYN524464 study, the incidence of adenomas (26-34%) in control group was 28% (Table 3.9.1.2-9).
Similarly, in male mice at 7000 ppm, the incidence of hepatocellular carcinomas was numerically higher than incidence in the Control, but was not statistically significantly different from the concurrent Control value by the Peto trend test or a pairwise Fishers Exact test when taking into account all animals examined (i.e.: 50/group). However, the incidence at 7000 ppm was above the historical control data range of the same laboratory (Table 3.9.1.2-10).
While HCD from RITA database have been reported, historical control data submitted for consideration should be obtained from the laboratory at which the study being assessed was carried out, and relate to animals of the same strain, age and sex, and obtained from the same supplier, as those used in the study. They should come only from studies conducted within five years, or two to three years either side, of the study under review. Therefore, only the HCD from the same laboratory were taken into consideration for assessment of carcinogenic findings.

CLH REPORT FOR SEDAXANE
126
Furthermore, when excluding animals that died before week 49, statistical analysis showed that the incidences of hepatocellular adenoma and adenomas/carcinomas combined were statistically significantly, higher than those of the control group by pair-wise comparison (Table 3.9.1.2-11). There was also a significant trend for adenoma, adenocarcinoma and adenomas/carcinomas combined (SEDAXANE 769–839 JMPR 2012).
Therefore it cannot be excluded that the increased incidences of adenomas and adenomas/carcinomas combined observed in male mice at 7000 ppm were treatment related.
The incidences of hepatocellular adenomas and carcinomas in female mice in the current study were extremely low in all Control and treated groups (maximum 1/50).
Table 3.9.1.2-9: Comparison of Male Hepatocellular Adenoma Incidence to Historic Control Data and a Concurrent study
Dietary concentration SYN524464 (ppm) Historical Control IncidenceHepatocellular adenoma
0 200 1250 7000 Lab (Range)a RITA (Range) b
No. Animals 50 50 50 50
Intercurrent 1 2 1 3
Terminal kill 6 7 9 12
Total 7(14%)
9(18%)
10(20%)
15(30%)
(10-28%) (0.0 – 13.6%)
0 ppm Low Mid High
From concurrent study 14/50(28%)
17/50(34%)
17/50(34%)
13/50(26%)
a Lab historic control data = 4 studies, all started in 2007 including the concurrent study 458346b RITA historic control data is shown for studies of 18 to 19 months duration. RITA = Registry of Industrial Toxicology Animal-data.c Concurrent Study 458346 conducted in parallel with SYN524464 study, but with different test item.
Table 3.9.1.2-10: Comparison of Male Hepatocellular Carcinoma Incidence to Historic Control Data and a Concurrent study
Dietary concentration SYN524464 (ppm) Historical Control IncidenceHepatocellular adenoma
0 200 1250 7000 #Lab (Range)a RITA (Range) b
No. Animals 50 50 50 50
Intercurrent 1 0 0 4
Terminal kill 4 5 3 6
Total 5(10%)
5(10%)
3(6%)
10(20%)
(6-10%) (4.0 – 22.0%)
0 ppm Low Mid High
From concurrent study 3/50(6%)
10/50(20%)
3/50(6%)
4/50(8%)
a Lab historic control data = 4 studies, all started in 2007 including the concurrent study 458346b RITA historic control data is shown for studies of 18 to 19 months durationc Concurrent Study 458346 conducted in parallel with SYN524464 study, but with different test item.
Table 3.9.1.2-11: Incidence of hepatocellular adenoma and carcinoma in male mice orally treated with sedaxane for 80 weeks excluding animals died before week 49

CLH REPORT FOR SEDAXANE
127
Dietary concentration SYN524464 (ppm)Hepatocellular adenoma
0 200 1250 7000
No. Animals 48 45 45 48
Adenoma
(%)
7/48^
(15%)
9/45
(20%)
10/45
(22%)
15/48*
(31%)
Carcinoma
(%)
5/48^
(10%)
5/45
(11%)
3/45
(7%)
10/48
(21%)
Adenoma/carcinoma combined
(%)
9/48^
(19%)
13/45
(29%)
12/45
(27%)
15/48*
(40%)
^ p < 0.05 Trend analysis : significance of trend denoted at control by Exact Test for trend
* p < 0.05 Pair-wise comparison : significance denoted at dose level by Fisher Exact Test
Number of animals bearing both an adenoma and a carcinoma were 3, 1, 1 and 6 at 0, 200, 1250 and 7000 ppm, respectively
CONCLUSION: Dietary administration of 7000 ppm was associated with a decrease in body weight and body weight gain in males and females, and a decrease in food utilization during the early stages of the study. In high dose males, statistically significant increased incidences of hepatocellular adenomas and adenomas/carcinomas combined were observed in comparison with the control group incidence.
The No Observed Adverse Effect Level (NOAEL) for this study was 1250 ppm for both sexes, equating to achieved dose levels of 157mg SYN524464/kg/day in males and 185mg SYN524464/kg/day in females.
The NOAEL for carcinogenicity in mice was 1250 ppm (equal to 157 mg/kg bw per day).
References:Cox DR (1972) Regression Models and Life Tables Journal of the Royal Statistical Society,B, 34, pp 187-22
Kaplan EL and Meier P (1958) Non Parametric Estimation from Incomplete Observations Journal of the American Statistical Association, 53, pp 457-481
Hoel DG. and Walburg HE. Statistical Analysis of Survival Experiments. Journal of the National Cancer Institute 1972; 49:361-373
Fairweather, W. R. et al. (1998). Biostatistical Methodology in Carcinogenicity Studies. Drug Information Journal. Volume 32, pp. 401-421
Peto R., Pike M.C., Day N.E., Gray P.G., Lee P.N., Parish S., Peto J., Richard S. and Wahrendorf, J. Guidelines for Simple, Sensitive Significance Tests for Carcinogenic Effects in Long-term Animal Experiments. IARC Monographs, Supplement 2, IARC, Lyon (1980)
3.9.2 Human dataNo relevant studies.

CLH REPORT FOR SEDAXANE
128
3.9.3 In vitro data (e.g. in vitro germ cell and somatic cell mutagenicity studies, cell transformation assays, gap junction intercellular communication tests)
No relevant studies.
3.9.4 Other data (e.g. studies on mechanism of action)
3.9.4.1 Anonymous (2015)
Report: Anonymous, 2015. Sedaxane: A 14 Day range finding study by oral (dietary) administration in male CD-1 mice. Laboratory Final Report Amendment 1 No. 34425, 16 October 2015. Unpublished. (Syngenta File No. SYN524464/50815).
GUIDELINES: This was an investigative study with no applicable guidelines (supplemental to EPA Guideline 870.4300).
GLP: Good Laboratory Practice (GLP) regulations are not applicable to studies of this nature, therefore, no claim of GLP compliance is made. The study was conducted in a GLP compliant facility and the practices and procedures adopted during its conduct were consistent with the OECD Principles of Good Laboratory Practice as incorporated into the United Kingdom Statutory Instrument for GLP. The study was not subjected to any study specific Quality Assurance procedures.
JUSTIFICATION FOR TEST SYSTEM SELECTION: At this time, studies in laboratory animals provide the best available basis for extrapolation to humans and are required to support regulatory submissions. Acceptable models which do not use live animals currently do not exist. The mouse was selected because it is accepted by regulatory authorities as a rodent animal model for toxicity studies, high quality animals are readily available and a large amount of background pathology data is available in this species. The number of animals chosen for this study is the smallest number considered necessary to provide sufficient data. The mouse is also the species that will be used for the subsequent liver tumour mode of action study.
The dietary route of administration was selected for this study as this route has been defined by the Sponsor as a possible route of human exposure.
The dose levels were selected on the basis of information, provided by the Sponsor, from a 28 day study and a 90 day study in the mouse. These studies showed that there were no adverse signs in mice treated at 7000 ppm. Therefore, dose levels up to 14000 ppm were not expected to have significant adverse effects.
EXECUTIVE SUMMARYSedaxane, was provided to four groups of five male CD-1 mice via dietary administration for 14 days at concentrations of 0 (control), 7000, 10000 and 14000 ppm. The control substance and vehicle was Rat and Mouse (Modified) No. 1 Diet SQC Expanded (Ground) SDS.
The animals were monitored regularly for signs of reaction to treatment. Body weights and food consumption were recorded. Blood and liver samples were collected at necropsy for determination of concentrations of trans: SYN508210 and cis: SYN508211 (the trans isomer and cis isomer, respectively, of sedaxane) and also of CSCD667584 (the trans-isomer of desmethyl sedaxane). Blood samples were also collected at necropsy for determination of selected clinical chemistry parameters. Liver weights were recorded and samples were taken for histopathological examination.
The overall mean achieved dosages were approximately 970, 1389 and 2155 mg sedaxane/kg/day, corresponding to dietary inclusion levels of 7000, 10000 and 14000 ppm, respectively.
There were no unscheduled deaths during the study and no clinical signs of reaction to treatment recorded

CLH REPORT FOR SEDAXANE
129
in any animal throughout the observation period. Body weight and body weight gain were unaffected by treatment with sedaxane and there was no effect on food consumption.
No clinical pathology samples were obtained from four animals at termination. In addition, one sample was insufficient for analysis. One control animal had very high values for both alanine aminotransferase and aspartate aminotransferase when compared with historical control data held at these laboratories. Other than the values for this one control animal, the individual values for alanine aminotransferase and aspartate aminotransferase were similar in all groups and, therefore, no effects of treatment with sedaxane were observed on these parameters.
Concentrations of parent sedaxane and/or desmethyl metabolites in Day 15 whole blood samples were relatively low, with values that were below the limit of quantitation (10 ng/mL) in some animals of each group. In contrast, quantifiable levels of the trans- and cis-isomers of sedaxane and the trans- and cis-isomers of desmethyl sedaxane were observed in the livers of the treated animals.
Wide variations between animals for levels of the isomers of sedaxane and the desmethyl metabolite in liver were observed. Levels of trans and cis isomers of sedaxane were generally consistent to their ratio in the test material (83.0% trans and 12.3% cis = 7:1 ratio) with values of 7:1, 8:1 and 9:1 for 7000, 10000 and 14000 ppm, respectively. In contrast, for the desmethyl metabolites, the trans to cis ratios were 0.6:1, 0.9:1 and 1.1:1 for 7000, 10000 and 14000 ppm, respectively. An analytical standard of cis-desmethyl sedaxane was not available and the results are based on relative response vs. the trans-desmethyl sedaxane. Therefore, these results for isomers of desmethyl sedaxane are only approximations.
No test substance-related macroscopic findings were noted. Group mean liver weights adjusted for body weight were 16% higher than controls at 14000 ppm. This difference attained statistical significance (p<0.01 after analysis of absolute liver weights and also after covariance analysis), and this correlated with minimal centrilobular hypertrophy in two of five animals.
Conclusion: Dietary administration of sedaxane at concentrations of 7000, 10000 or 14000 ppm for 14 days was well tolerated, and there was no clear effect on the plasma levels of the liver enzymes, alanine aminotransferase and aspartate aminotransferase. At 14000 ppm, mean relative liver weights were 16% higher than controls, and minimal hepatic centrilobular hypertrophy was seen in two of five animals. In conclusion, diet concentrations of up to 14000 ppm would be expected to produce effects on liver weight and liver micropathology in male CD-1 mice, but it is not anticipated that such effects would be excessive.
MATERIALS AND METHODSMaterials:
Test Material: Sedaxane (SYN524464)Description: Off white powder. Mixture of trans and cis isomers.Lot/Batch number: SMU6LP006/MILLEDPurity: 95.3% (sum of 83.0% SYN508210 and 12.3% SYN508211)CAS#: 874967-67-6 (trans isomer # 599197-38-3, cis isomer # 599194-51-1)Stability of test material: Reanalysis date end January 2015 (stored at <30°C)
Vehicle: The control substance and vehicle was Rat and Mouse (Modified) No. 1 Diet SQC Expanded (Ground) SDS.

CLH REPORT FOR SEDAXANE
130
Test Animals:Species MouseStrain CD - 1 strain, designation Crl:CD-1 (ICR)Age/weight at dosing 8-9 weeks / 39.7-47.3 gSourceHousing Individually housed in appropriately sized solid bottomed cages with
stainless steel mesh tops.Acclimatisation period 14 daysDiet Rat and Mouse (Modified) No. 1 Diet SQC Expanded (Ground) SDS
ad libitum (except for fasting 2 hours before blood collection)Water Water from public supply ad libitumEnvironmental conditions
Temperature: 19-23°C (actual 18-24°C)Humidity: 40-70% (actual 39-78%)Air changes: Minimum of 10/hourPhotoperiod: 12 hours light/12 hours dark
In-life dates: Start: 26 March 2013, End: 02 May 2013
Study Design and Methods: The purpose of this study was to determine an appropriate high dose level for a subsequent liver tumour mode of action study in male CD-1 mice. The test substance was administered by oral (dietary) administration for 14 days.
Animal assignment: Animals were assigned to groups by a stratified randomisation scheme designed to achieve similar group mean body weights. Cages were racked by treatment group and vertically throughout the rack. Control animals were housed on a separate rack. Treated groups were housed on the same rack.
Table 3.9.4.1-1: Study design
Group number Dietary concentration (ppm) Number of male mice1 0 (control) 52 7000 53 10000 54 14000 5
Diet preparation and analysis: Test diets were prepared once each week, on Days -1 and 7. The test diets were stored at ambient temperature in the dark before being provided to the animals. For each concentration, the test substance was ground using a mortar and pestle and a 500 micron sieve was used to remove any lumps. The required amount of test substance was weighed into a suitable container and the required amount of diet was weighed into an appropriately sized diet bin. The weighed test substance was added to the bin containing the diet and the test substance container was rinsed with diet. The rinsings were then transferred to the diet bin, which was then sealed. The formulations were then mixed for approximately 20 min with a diet mixer.
Diet samples were collected on day -1 from all groups for analysis of concentration and from groups 2, 3 and 4 for analysis of homogeneity (the homogeneity results obtained from the top, middle and bottom for the Group 2 to 4 preparations were averaged and utilised as the concentration results). No samples for analysis were taken from the diets that were prepared on Day 7. The analyses were performed by HPLC with u.v. detection.
Stability analyses were performed previously and demonstrated that the test substance is stable in the vehicle for 15 days when prepared at 100 to 10000 ppm and stored at ambient temperature in the dark. In addition, stability for 33 days and 46 days was demonstrated for 100 ppm and 10000 ppm diets,

CLH REPORT FOR SEDAXANE
131
respectively, when stored at approximately -20°C in the dark. The test substance is stable at a concentration of 14000 ppm for 14 days at ambient temperature in the dark and also when stored at -20°C in the dark.
Analysis results: Analysis showed that the control diet did not contain any test substance. All test diets were within the acceptance criteria for concentration and homogeneity.
Observations: Animals were examined twice daily for viability All animals were inspected in their cages for signs of reaction to treatment on each day of the dosing period and each animal was removed from its cage and subjected to a detailed clinical examination at weekly intervals.
Body weight: All animals were weighed three times before the start of dosing and daily from the first day of dosing (Day 1) until the end of the observation period. In addition, body weights were recorded before necropsy.
Food consumption and test substance intake: Food consumption was recorded twice before the start of dosing and twice-weekly during the dosing period and the estimated achieved dose was calculated for each cage over every period of food consumption during treatment.
Water consumption: Water consumption was monitored on a regular basis throughout the study by visual inspection of the water bottles.
Clinical chemistry: Blood was collected, if possible, from all animals at termination (day 15) under CO2 anaesthesia by cardiac puncture. Alanine aminotransferase activity and aspartate aminotransferase activity were measured.
Investigations post mortem: All animals were killed on Day 15 by exposure to a rising concentration of carbon dioxide.
Macroscopic examination: Animals were subjected to a complete necropsy examination, which included evaluation of the carcass and musculoskeletal system; all external surfaces and orifices; cranial cavity and external surfaces of the brain; and thoracic, abdominal and pelvic cavities, with their associated organs and tissues.
Organ weights: The liver was removed, trimmed free of extraneous tissue and weighed:
Tissue submission: After the liver had been weighed, a single tissue section (approximately 4 mm thick) was taken from the left lateral lobe, divided into two and snap frozen in liquid nitrogen. These genomic samples were placed in RNAase-free tubes prior to storage at approximately -80°C. Samples were stored frozen for possible future use (e.g. toxicogenomic assessment).
In addition, the right lobe of the liver was taken, cut into four pieces, snap frozen in liquid nitrogen and stored at approximately -80°C for use in bioanalytical measurements (toxicokinetics).
After these frozen samples were taken, a representative section from the left and median lobe (through the bifurcation), including the gall bladder, was taken and fixed in 10% neutral buffered formalin. The liver micropathology sections were processed after 48 h to paraffin wax blocks.
After micropathology sections were taken, the remainder of the liver was sectioned into four pieces and snap frozen in liquid nitrogen, as a single foil packet, prior to storage at approximately -80°C. These sections were stored frozen for possible future use.
Microscopic examination: Liver sections were examined by light microscopy.

CLH REPORT FOR SEDAXANE
132
Bioanalysis: Blood and liver samples were analysed for concentration of the trans-isomer and cis-isomer of sedaxane (trans: SYN508210 and cis: SYN508211) and the trans-isomer of desmethyl sedaxane (CSCD667584). The concentration of the cis-isomer of desmethyl sedaxane was also measured, based on the peak area relative to CSCD667584; therefore, quantitation of this isomer was only an approximation, due to the lack of an analytical standard.
Weighed amounts of the frozen section of liver from each animal retained for bioanalysis were homogenised with water before being extracted using acetonitrile in order to facilitate the quantification of the concentration of the test substance in liver samples after 14 days.
Statistics: Pairwise comparisons were performed against the control group. All analyses were two-tailed for significance levels of 5% and 1%. If the variances were clearly heterogeneous, appropriate transformations (e.g. log, square root, double arcsine) were used in an attempt to stabilise the variances.
For quantitative data: Body weights, cumulative body weight gain, food consumption, clinical chemistry and absolute organ weights were analysed initially by a one-way analysis of variance (ANOVA). Food utilisation was not analysed. Organ weights were also analysed by analysis of covariance (ANCOVA) on final body weight. This statistical analysis provided an adjusted organ weight value. For all of the parameters evaluated initially by ANOVA or ANCOVA, Dunnett’s test was used to compare the control and treated groups, based on the error mean square in the ANOVA or ANCOVA. The Dunnett’s test was performed for all continuous data parameters, regardless of whether the initial ANOVA or ANCOVA was statistically significant. Macropathology incidence data were not analysed statistically. Micropathology incidence data were analysed using Fisher’s Exact Test.
For qualitative data such as clinical observations or any other parameters not specifically mentioned above that yield qualitative data were not analysed statistically. The mean and standard deviation of measured concentrations of sedaxane and desmethyl sedaxane on Day 15 in blood and in liver were not analysed statistically.
RESULTS AND DISCUSSION
Mortality: There were no unscheduled deaths during the study.
Clinical observations: There were no clinical signs of reaction to treatment recorded in any animal throughout the observation period.
Bodyweight and weight gain: Body weight and body weight gain were unaffected by treatment with sedaxane.
Food consumption and compound intake: Dietary administration of sedaxane at concentrations of up to 14000 ppm had no effect on food consumption.
Dose rates (based on nominal dietary levels of sedaxane were calculated in terms of mg sedaxane/kg body weight. Mean values are shown below:
Table 3.9.4.1-2: Mean Dose Received (mg/kg/day)
Sedaxane (ppm)7000 10000 14000
Males 970 1389 2155
Blood clinical chemistry: One control animal had very high values for both alanine aminotransferase and aspartate aminotransferase when compared with historical control data held at these laboratories. Other than the values for this one control animal, the individual values for alanine aminotransferase and

CLH REPORT FOR SEDAXANE
133
aspartate aminotransferase were similar in all groups and, therefore, no effects of treatment with sedaxane were observed on these parameters.
Sacrifice and pathology: Macroscopic findings: No test substance-related macroscopic findings were noted at necropsy.
Organ weights: Group mean liver weights, adjusted for body weight, were similar to control values in Groups 2 (7000 ppm) and 3 (10000 ppm), but were 16% higher for Group 4 (14000 ppm) (p<0.01 after analysis of absolute liver weights and also after covariance analysis).
Microscopic findings: Minimal hepatic centrilobular hypertrophy was observed in two Group 4 animals.
Bioanalysis: There were no quantifiable levels of either the trans isomer or cis isomer of sedaxane (trans: SYN508210 and cis: SYN508211), or of the trans-isomer of desmethyl sedaxane, CSCD667584, in the blood or liver of any control animal.
The group mean concentrations of the trans isomer and cis isomer of sedaxane and of the trans-isomer of desmethyl sedaxane in the blood or liver of the treated groups were as follows:
Table 3.9.4.1-3: Analyte Concentrations in Blood and Liver
Group Analyte Mean concentration in whole blood (ng/mL)
Mean concentration in liver (ng/g)
2 13.0# 5953 NQA 5784
SYN508210
15.8@ 12562 NQ4 823 NQA 694
SYN508211
NQ4 1352 10.7# 1013 11.2# 1004
CSCD667584
13.6* 1872 NA 1783 NA 1174
Cis-desmethyl sedaxane (β)
NA 175# = One value only* = Mean of 2 values only@ = Mean of 3 values onlyβ = Liver concentration estimates derived from ratios of peak areas of 2 metabolite isomersNQA = Values not quantifiable (<10 ng/mL) for all animalsNQ4 = Values not quantifiable (4 animals) and no sample available from the remaining animalNA = Not applicable: no approximations of blood concentration of desmethyl sedaxane cisisomer calculated
Concentrations of parent sedaxane and/or desmethyl metabolites in Day 15 blood samples were relatively low, with values that were below the limit of quantitation (10 ng/mL) in some animals of each group. In contrast, quantifiable levels of the trans- and cis-isomers of sedaxane and the trans- and cis-isomers of desmethyl sedaxane were observed in the livers of the treated animals.
Wide variations between animals for levels of the isomers of sedaxane and the desmethyl metabolite in liver were observed.
Levels of trans and cis isomers of sedaxane were generally consistent to their ratio in the test material (83.0% trans and 12.3% cis = 7:1 ratio) with values of 7:1, 8:1 and 9:1 for Groups 2, 3, and 4,

CLH REPORT FOR SEDAXANE
134
respectively. In contrast, for the desmethyl metabolites, the trans to cis ratios were 0.6:1, 0.9:1 and 1.1:1 for Groups 2, 3, and 4, respectively. An analytical standard of cis-desmethyl sedaxane was not available and the results are based on relative response vs. the trans-desmethyl sedaxane. Therefore, these results for isomers of desmethyl sedaxane are only approximations.
CONCLUSION: Dietary administration of sedaxane at concentrations of 7000, 10000 or 14000 ppm for 14 days was well tolerated, and there was no clear effect on the plasma levels of the liver enzymes, alanine aminotransferase and aspartate aminotransferase. At 14000 ppm, mean relative liver weights were 16% higher than controls, and minimal hepatic centrilobular hypertrophy was seen in two of five animals. In conclusion, diet concentrations of up to 14000 ppm would be expected to produce effects on liver weight and liver micropathology in male CD-1 mice, but it is not anticipated that such effects would be excessive.
3.9.4.2 Anonymous (2016)Report: Anonymous, 2016. Sedaxane: A 21 day dietary liver mode of action study in male CD-1 Mice.
Laboratory Report number 35327, Final Report Amendment 1, 12 February 2016. Unpublished. (Syngenta File No. SYN524464_50900).
GUIDELINES: This was an investigative study with no applicable guidelines (supplemental to EPA Guideline 870.4200).
GLP: A signed and dated GLP compliance statement and Quality Assurance statements are included in the report. The parts performed by
were performed in accordance with Principles of GLP. No claim of GLP compliance for the work conducted by MicroMatrices Ltd (immunohistochemistry BrdU cell proliferation evaluation phase) or the work conducted by CXR Biosciences Ltd (tissue microarray analysis phase) is made. Any exceptions to the regulations or GLP deviations were considered not to affect the overall integrity of the study or the interpretation of the results and conclusions. The study was not subjected to any study specific Quality Assurance procedures.
JUSTIFICATION FOR TEST SYSTEM SELECTION: The objective of this study was to measure the effects of sedaxane treatment on a series of liver-related parameters (including weights, clinical pathology, histopathology, toxicogenomics, biochemistry and hepatocellular proliferation) in male CD-1 mice administered sedaxane by dietary administration for up to 21 days. These measurements were designed to explore a possible mode of action for a higher incidence of liver tumours that occurred in a prior 18-month study in CD-1 mice dosed at 7000 ppm.
The dietary route of administration was selected for this study as a possible route of human exposure. The dose levels were selected on the basis of information from previous 14, 28 and 90 day mouse studies in which diet concentrations of up to 14000 ppm sedaxane were administered, and based on the dose levels in a prior 18-month carcinogenicity study in mice. In a 14 day range-finding study there was no effect on body weight and no adverse signs in male CD-1mice at or 14000 ppm. Slight liver weight increases were expected in mice receiving sedaxane at 14000 and possibly 7000 ppm. In addition, some liver micropathology (e.g.hypertrophy) was anticipated at 14000 ppm. An increase in liver tumours was observed in an 18 month study in male CD-1 mice at 7000 ppm and 1250 ppm was a No Observable Effect Level (NOEL) in that study.
EXECUTIVE SUMMARYThe objective of this study was to measure the effects of sedaxane treatment on a series of liver-related parameters and to explore a possible mode of action for a higher incidence of liver tumours that occurred in a prior 18-month study in CD-1 mice dosed at 7000 ppm.The study design was as follows:

CLH REPORT FOR SEDAXANE
135
Number of male miceTermination time (Study day)
Group Treatment
2 4 8 221 Control: Untreated diet 6 6 6 62 Sedaxane: 1250 ppm in diet 6 6 6 63 Sedaxane: 7000 ppm in diet 6 6 6 64 Sedaxane: 14000 ppm in diet 6 6 6 65 Positive control: TCPOBOP in DMSO 3 mg/kg ip 61 62 - -6 DMSO Vehicle control 61 62 - -
1 The first six mice in Groups 5 and 6 were euthanised approximately 12 hours after a single intraperitoneal (ip) dose of TCPOBOP (or vehicle). TCPOBOP (1,4-bis[2-(3,5-dichloropyridyloxy)]benzene) is a known mouse CAR activator and served as a positive control.2 The last six mice in Groups 5 and 6 were dosed twice with TCPOBOP (or vehicle), appropriately 48 hours between doses, and euthanised approximately 12 hours after the second dose of TCPOBOP (or vehicle).
The mice were monitored regularly for viability, signs of ill health and reaction to treatment. Body weights and food consumption were measured and recorded at pre-determined intervals.
At approximately 2 hours prior to termination on Day 2, 4, 8 or 22, each mouse received a subcutaneous injection of DNA labelling reagent (75 mg/kg BrdU). Just prior to termination, a blood sample was collected from each mouse for the determination of plasma aspartate aminotransferase (AST) and alanine aminotransferase (ALT) activities.
All mice were subjected to a detailed necropsy. Livers were collected, weighed, and sampled as follows:• For toxicogenomic analysis (RT-PCR): Subsamples of liver were collected from the left lateral lobe of the liver, immersed in RNAlater reagent in an RNAase free tube and stored frozen (ca -80°C).• For standard histopathology examination and hepatocellular proliferation assessments (BrdU and Ki67 analyses): A representative section from the left and median lobes (through the bifurcation) and including the gall bladder was taken and fixed in 10% neutral buffered formalin. The fixed liver sections were processed after 48 hours to paraffin wax blocks.• For liver tissue biochemistry analysis and toxicogenomic analysis (microarrays): The remainder of each liver was sectioned into 4 or 5 pieces, snap frozen in liquid nitrogen, and stored frozen at ca -80°C.In addition to liver, a small sample of duodenum was collected, fixed in formalin, and processed to paraffin wax block along with the liver sections.
The overall mean achieved dose levels at the 1250, 7000 and 14000 ppm dietary sedaxane concentrations were 170, 944 and 1792 mg/kg/day, respectively.
There were no clinical signs associated with dietary administration of sedaxane or with the injections of the positive control substance, TCPOBOP.
There was no obvious effect of sedaxane on body weights. Overall (Day 1-22) body weight changes of the sedaxane-treated mice were similar to controls. Food consumption values after 3 days of treatment for the 1250, 7000 and 14000 ppm sedaxane-treated mice were decreased by 16, 24, and 27%, respectively, relative to controls; these decreases were statistically significant. This lower food consumption was not accompanied by an obvious effect on body weight gain over the same interval. After seven days of dietary administration, as well as at subsequent intervals, food consumption was similar to controls in all sedaxane-treated groups. TCPOBOP produced no apparent effects on body weights or food consumption.
The ALT and AST values for the sedaxane-treated mice terminated on Days 2, 4, and 8 were similar to control values. On Day 22, the ALT and AST values for the 7000 and 14000 ppm sedaxane-treated mice were statistically significantly lower than controls, whereas at 1250 ppm the values were similar to control values. The mean ALT and AST values for the positive control (TCPOBOP) mice were similar to the DMSO controls on Day 2, but higher than control values on Day 4 (statistically significant for ALT).

CLH REPORT FOR SEDAXANE
136
Statistically significant increases in mean adjusted liver weights were noted for the 14000 ppm sedaxane-treated mice terminated on Day 4, and for the 7000 and 14000 ppm sedaxane-treated mice terminated on Days 8 and 22, as compared to the mean adjusted liver weights of controls. In addition, the mean absolute liver weights for mice terminated on Days 8 and 22 were statistically significantly higher than the control values for the 14000 ppm group. The mean adjusted liver weights for the positive control (TCPOBOP) mice euthanised on Days 2 and 4 were statistically significantly higher than those of the DMSO vehicle controls. In addition, the absolute liver weights for the TCPOBOP-treated mice were statistically significantly higher than the controls on Day 4.
No treatment-related macroscopic pathology findings were noted for any of the mice that received sedaxane, whereas one TCPOBOP mouse that received two doses was noted with prominent lobular architecture in the liver, which correlated with centrilobular hepatocyte hypertrophy.
Hepatocyte hypertrophy (centrilobular or diffuse) was apparent on Days 2, 4, 8 and 22 of dietary administration of sedaxane, and an increased incidence over time was evident. At Days 2 and 4 the effects were observed at 14000 ppm only, whereas at Days 8 and 22 hypertrophy was seen at both 7000 and 14000 ppm.
The Ki67 immunostaining demonstrated a slight treatment-related effect at the Day 8 sacrifice interval, as indicated by statistically significant increases relative to controls in mean labelling index (LI) values for hepatocellular zones 1, 2, and 3 combined in the 7000 ppm and 14000 ppm dose groups. These significant results for the combined zones were driven primarily by mean LI increases in zone 3 (7000 and 14000 ppm) and zone 1(14000 ppm), no significant changes in LI in zone 2 were noted at any time point or sedaxane dietary treatment level.
The results of the BrdU analyses [non-GLP] were generally consistent with the results of the Ki67 analysis; treatment with sedaxane produces a mild hepatocellular proliferation. Specifically, a slight increase in BrdU counts were noted for the 7000 and 14000 ppm sedaxane-treated mice at Day 8 and Day 22, although these increases were not statistically significant.
The toxicogenomic analysis by RT-PCR and biochemical analysis of liver tissues demonstrated significant dose-dependent increases in hepatic Cyp2b10 mRNA levels for the 1250, 7000 and 14000 ppm sedaxane-treated mice on Days 2, 4, 8 and 22. With the exception of the effect of treatment with 1250 ppm on Day 22, a significant dose-dependent up-regulation of Cyp2c65 mRNA levels was also observed at all dose levels and time points. Sedaxane at 14000 ppm on Days 2, 4 and 8 also produced significant increases in hepatic Gadd45β mRNA levels, and sedaxane at 7000 ppm increased Gadd45β on Day 2. Sedaxane had no treatment-related effects on Cdc20 or Fos gene expression. In biochemical analysis on Day 8 liver samples, sedaxane at 1250, 7000 or 14000 ppm produced significant dose dependent increases in 7-pentoxyresorufin O-depentylase (PROD) activity. While treatment with sedaxane had no significant effect on microsomal protein content, treatment with 14000 ppm sedaxane produced a significant increase in testosterone 6β-hydroxylase activity. Treatment with a single ip dose of TCPOBOP resulted in significant increases in hepatic Cyp2b10, Cyp2c65 and Gadd45β mRNA levels, whereas treatment with two ip TCPOBOP doses resulted in significant increases in hepatic Cyp2b10, Cyp2c65, Gadd45β and Cdc20 mRNA levels.
In the toxicogenomics results from liver microarrays [non-GLP], there were only minimal differences between control and 1250 ppm groups in the number of differentially expressed genes (DEGs), whereas progressively greater numbers of DEGs were observed with 7000 and 14000 ppm sedaxane treatment. Pathway analysis revealed changes involved in xenobiotic metabolism at 7000 ppm and 14000 ppm on Days 2, 4, and 22. The changes involving Cyp2b10 (maximal at Day 4, 14000 ppm, ca.126 foldup-regulated) and Cyp3a11(maximal at Day 2, 14000 ppm, ca.15 fold up-regulated) indicate the involvement of the nuclear receptors CAR and PXR, respectively; however, cross-talk between CAR and PXR and overlap in the genes that these nuclear receptors activate is known to occur. Data from canonical pathway analysis by IPA also demonstrated involvement of these nuclear receptors, and the top 10 IPA pathways

CLH REPORT FOR SEDAXANE
137
affected by sedaxane treatment were concordant with those of model CAR activators administered to mice by Oshida et al. (2015). A lack of Cyp4a induction coupled with minimal PPAR-α pathway gene induction suggests no significant involvement of peroxisome proliferator-activated receptor alpha (PPAR-α). In the absence of Cyp1a1 induction there is no strong evidence for Aryl hydrocarbon receptor (AhR) activation. The few changes observed related to AhR were relatively small in number and were not definitive of AhR activation due to the fact that they are also regulated by other nuclear hormone receptors. Changes in genes involved in cell cycle including up-regulation of GADD45β (14000 ppm at Days 2, 4 and 22) and down-regulation of GADD45gamma (7000 ppm at Day 22) were noted only at higher dose levels. The polarity and magnitude of fold change values may be consistent with a weak/mild proliferative effect in the liver at these dose levels.
Daily dietary administration of sedaxane to male CD-1 mice at concentrations of 1250, 7000 or 14000 ppm for 1, 3, 7 and 21 days, resulted in hepatocyte hypertrophy (centrilobular or diffuse) at 7000 or 14000 ppm, that tended to increase in incidence with time. For animals terminated on Days 2 or 4, the effects were observed at 14000 ppm only, whereas for mice euthanised on Days 8 or 22, hypertrophy was seen in mice that received sedaxane at both 7000 and 14000 ppm. There were no effects at the 1250 ppm concentration. Higher liver weights were observed at 14000 ppm on Day 4 and at 7000 and 14000 ppm on Days 8 and 22.
Based on the quantitative evaluation of Ki67-stained liver sections, the sole effect of dietary sedaxane on hepatocellular proliferation in male CD-1 mice was a slight transient increase relative to controls in the mean labelling index on Day 8 in the 7000 and 14000 ppm dose groups. There is no evidence that this effect was present in the lower (i.e. 1250 ppm) dose group, or that it persisted to the Day 22 sacrifice.
Results from the BrdU-labelling liver assessment study [non-GLP] were generally similar to those of the Ki67-assessments; slight increases (1.3 to 2.0-fold compared to the time-matched controls) in hepatocellular proliferation were noted at the two higher dose levels, although these slight increases were not statistically significant.
In the toxicogenomic analysis by RT-PCR, sedaxane produced a significant dose-dependent up-regulation of hepatic Cyp2b10 and Cyp2c65 mRNA levels at most dose levels and time points. In contrast, Gadd45β mRNA levels were increased by 7000 ppm sedaxane (Day 2) and 14000 ppm sedaxane (Days 2, 4 and 8), but not by 1250 ppm sedaxane. Biochemical measurements were only made on Day 8 liver samples, and sedaxane produced a significant dose-dependent increase in 7-pentoxyresorufin O-depentylase activity (all dose levels) and a small increase in testosterone 6β-hydroxylase activity (14000 ppm).
The microarray toxicogenomics analysis [non-GLP] generally supports the findings from the biochemical analysis, and provides evidence for dose-dependent increases in expression of xenobiotic metabolizing enzymes (e.g. Cyp2b10, Cyp3a11) and other genes that are associated with CAR and/or PXR activation in mice dosed with sedaxane at 7000 or 14000 ppm. Focused analysis showed that changes consistent with a potential proliferative effect in the liver were seen at the higher dose levels of sedaxane (14000 ppm, Days 2, 4 and 22, and possibly at 7000 ppm, Day 22), but not at the lower dose level of 1250 ppm.
Intraperitoneal administration of the positive control substance, TCPOBOP, in DMSO at a dose level of 3 mg/kg/dose on one or two occasions elicited the anticipated effects in liver parameters.

CLH REPORT FOR SEDAXANE
138
MATERIALS AND METHODSMaterials:
Test Material: Sedaxane (SYN524464)Description: Off white solidLot/Batch number: SMU6LP006/MILLEDPurity: 95.3%CAS#: 874967-67-6Stability of test compound: Reanalysis date 31 January 2018 (stored at <30°C)
Vehicle: The control substance and vehicle was Rat and Mouse (Modified) No. 1 Diet SQC Expanded (Ground) SDS.
Positive control: TCPOBOP (1,4-bis[2-(3,5-dichloropyridyloxy)]benzene), which was prepared in a DMSO vehicle.
Test Animals:Species MouseStrain CD - 1 strain, designation Crl:CD-1 (ICR)Age/weight at dosing 6-8 weeks / 29.5-38.5 gSourceHousing Individually housed in in suspended polypropylene cages (overall dimensions
48 x 15 x 13 cm) with stainless steel grid tops and solid bottoms with an integrated stainless steel food hopper.
Acclimatisation period Minimum of 13 daysDiet Rat and Mouse (Modified) No. 1 Diet SQC Expanded (Ground) SDS ad
libitum (except for fasting 2 hours before blood collection)Water Water from public supply ad libitumEnvironmental conditions Temperature: mean daily range 20-22°C
Humidity: mean daily range 53-54%Air changes: Minimum of 10/hourPhotoperiod: 12 hours light/12 hours dark
Study Design and Methods:Experimental dates: Start: 29 November 2013, End: 13 January 2016
Animal assignment: On arrival from the suppliers, animals were allocated to cages on racks. Cages were racked by treatment group and vertically throughout the rack. Control animals were housed on a separate rack. Treated animals were housed on one rack. During pre-trial, group mean body weights were checked and found to be within ±20% of the mean weight of all animals in the study, indicating acceptable homogeneity.

CLH REPORT FOR SEDAXANE
139
Table 3.9.4.2-1: Study designNumber of male mice
Termination time (Study day)Group Treatment
2 4 8 221 Control: Untreated diet 6 6 6 62 Sedaxane: 1250 ppm in diet 6 6 6 63 Sedaxane: 7000 ppm in diet 6 6 6 64 Sedaxane: 14000 ppm in diet 6 6 6 65 Positive control: TCPOBOP in DMSO 3 mg/kg ip 61 62 - -6 DMSO Vehicle control 61 62 - -
1 The first six mice in Groups 5 and 6 were euthanised approximately 12 hours after a single intraperitoneal (ip) dose of TCPOBOP (or vehicle). TCPOBOP (1,4-bis[2-(3,5-dichloropyridyloxy)]benzene) is a known mouse CAR activator and served as a positive control.2 The last six mice in Groups 5 and 6 were dosed twice with TCPOBOP (or vehicle), appropriately 48 hours between doses, and euthanised approximately 12 hours after the second dose of TCPOBOP (or vehicle).
Diet preparation and analysis: Test diets were prepared on the day before the start of dosing and on Day 12 and were stored in a freezer set to maintain -20°C, in the dark, and used within 14 days. For each concentration, the required amount of test substance was weighed into an appropriately sized diet bin. The required amount of diet was weighed into a second appropriately sized diet bin. The weighed test substance was then transferred to the bin containing the diet. The bin containing the test substance was rinsed with diet and the rinsings transferred to the diet bin, which was then sealed. The formulation was then mixed for approximately 20 min with a diet mixer. During sampling of the first preparation of the diet formulations for Groups 3 and 4, it was noted that particles that appeared to be test substance were visible. Therefore all the sedaxane diets were ground in an automatic mortar and pestle to ensure homogeneity.
Dose formulation samples (duplicate samples, taken from top, middle and bottom of each diet preparation for Groups 1 to 4) were collected for analysis (concentration and homogeneity) on day 1 and during week 3. Stability analyses performed in earlier studies have demonstrated that the test substance is stable in the control diet (i) for 15 days when prepared at concentrations of 100 to 10000 ppm and stored at ambient temperature in the dark; (ii) for 33 days and 46 days when prepared at 100 ppm and 10000 ppm and stored at -20°C in the dark (iii) for 15 days when prepared at 14000 ppm and stored at both ambient temperature in the dark and at -20°C in the dark.
Analysis results: Analysis showed that the control diet did not contain any test substance. Analysis of test diets formulated at theoretical concentrations of 1250, 7000 and 14000 ppm sedaxane were found to be within ±10% of these concentrations, indicating acceptable accuracy of preparation. The coefficient of variation was 2.4% or lower, indicating acceptable homogeneity.
Administration: The test substance, sedaxane, was administered to the appropriate mice ad libitum from Day 1 for up to 21 days, and up to 24 hours before scheduled euthanasia.
Mice receiving a single dose of the positive control substance (first 6 mice in Group 5) were injected intraperitoneally with 3 mg/kg TCPOBOP in DMSO (6 mg/mL) on Day 1 and killed on Day 2, 12 hours after the dose of TCPOBOP. Mice receiving 2 doses of the positive control (last 6 mice in Group 5) were injected with 3 mg/kg/dose TCPOBOP in DMSO (6 mg/mL/dose) on Days 2 and 4 (approximately 22.00 h). These mice were killed on Day 5, 12 hours after the second ip dose. For the vehicle control (Group 6), DMSO was injected at same time intervals as above, intraperitoneally, to groups of 6 mice and killed at same time intervals as Group 5.
2 hours before the designated termination a solution of BrdU was injected into the scapular region of each animal. The BrdU was prepared in 0.9% w/v sodium chloride solution vehicle at a concentration 15

CLH REPORT FOR SEDAXANE
140
mg/mL. A dose volume of 5 mL/kg was administered in order to achieve a dose of 75 mg/kg body weight.
Observations: Animals were examined twice daily for viability Once each week, starting during pretrial, all animals were removed from their cage and received a detailed clinical examination including appearance, movement and behaviour patterns, skin and hair condition, eyes and mucous membranes, respiration and excreta.
Bodyweight: Body weights were recorded once during pre-trial and on Day 1 only for Day 2 and Day 4 sacrifice animals and twice weekly for Day 8 and Day 22 sacrifice animals.
Food consumption: For all animals, the quantity of food consumed by each cage of animals was measured and recorded once during pre-trial. For Day 2 and Day 4 sacrifice animals, food consumption was also recorded on the day of termination. For Day 8 and Day 22 sacrifice animals, food consumption was recorded twice weekly after the start of treatment.
Water consumption: Water consumption was monitored on a regular basis throughout the study by visual inspection of the water bottles.
Clinical chemistry: Blood samples for clinical chemistry were obtained from all animals, via the orbital sinus under isoflurane anaesthesia before termination. Animals were not fasted prior to sampling. The following parameters were examined:
alanine aminotransferase activity aspartate aminotransferase activity
Investigations post mortem: All animals were killed on Days 2, 4, 8 or 22 (i.e., after 1, 3, 7 or 21 full days of dietary exposure) by exposure to a rising concentration of carbon dioxide. After euthanasia, each animal was weighed and then exsanguinated by severance of major blood vessels.
Macroscopic examination: All animals were subject to a detailed necropsy consisting of an external and internal examination. The necropsy consisted of an evaluation of the carcass and musculoskeletal system; all external surfaces and orifices; cranial cavity and external surfaces of the brain; and thoracic, abdominal and pelvic cavities, with their associated organs and tissues.
Organ weights: From all animals surviving to scheduled termination, the liver was removed, trimmed free of extraneous tissue and weighed.
Tissue submission: After weighing the liver, two tissue sections of the liver were taken from the left lateral lobe. The sections were immersed in RNAlater reagent in an RNAase free tube and stored at approximately -80 ºC.
After the samples for freezing were taken, representative sections from the left and median lobes (through the bifurcation) and including the gall bladder were taken and fixed in 10% neutral buffered formalin. A small sample of the duodenum was also taken and fixed in formalin. These liver micropathology sections along with a cross section of the fixed duodenum were processed to paraffin wax block.
After micropathology sections were taken, the remainder of the liver was sectioned into 4-5 pieces and snap frozen in liquid nitrogen prior to storage at -80°C.
Microscopic examination: Liver tissues were examined by light microscopy.
Toxicogenomics (RT-PCR) and liver biochemistry: Liver samples of around 50 mg stored in RNAlater RNA stabilisation reagent were provided from all animals (n=120, comprising n=36 for both Days 2 and 4 and n=24 for both Days 8 and 22), together with the remaining liver samples (snap frozen in liquid nitrogen) from the Day 8 time point (n=24 animals). Total RNA was extracted from all the liver samples

CLH REPORT FOR SEDAXANE
141
stored in RNAlater and cDNA prepared. The cDNA preparation from each animal (n=120) was assayed for Cyp2b10, Cyp2c65, Gadd45β, Cdc20 and Fos mRNA levels. To normalise for RNA loading, the levels of each mouse liver mRNA was expressed as a ratio to levels of β-actin mRNA. Each mouse cDNA preparation was assayed in duplicate for each of the mRNAs listed above by real-time quantitative polymerase chain reaction (RT-PCR) methodology (TaqMan®).
Each remaining liver sample from the Day 8 time point (n=24 animals) was separately homogenised and microsomal and cytosolic fractions prepared by differential centrifugation. Aliquots of the whole homogenate, microsomal and cytosolic fractions from each animal were stored at -70 °C or below. Liver microsomes from each animal were assayed for protein content and for activities of 7-pentoxyresorufin O-depentylase and testosterone 6β-hydroxylase.
Immunohistochemistry (BrdU cell proliferation evaluation) [non-GLP]: Formalin-fixed paraffin-embedded liver samples were shipped to MicroMatrices for analysis. BrdU staining as a marker for cell proliferation was performed in each liver sample via immunohistochemistry, and the labelling index (BrdU-stained cells/total number of cells) was determined by image analysis for a region of liver containing approximately 3000 hepatocytes.
Ki67 Zonal Count Analysis: The effects of sedaxane treatment on a number of liver parameters were measured in order to determine key events that occur in the livers of male CD-1 mice. Liver sections were stained immunohistochemically for Ki67, and then several parameters within each of three liver zones (Zone 1 = periportal, Zone 2 = midzonal, and Zone 3 = centrilobular), were evaluated quantitatively, via image analysis, together with values for all three zones combined. Specific endpoints that were evaluated included: 1) the area of each zone, 2) the number of Ki67 immunostained hepatocyte nuclei within zone, and 3) the total number of hepatocyte nuclei within each zone. A proliferative index was then derived from the latter two values.
Three regions of interest (ROI) were evaluated per image: 1) Zones 1, 2, and 3 combined; 2) Zones 1 and 2 combined; and 3) Zone 1. Liver zones designations were in general accordance with Rappaport et al. (Rappaport et al., 1954). For each ROI, three parameters were evaluated: 1) The total number of hepatocyte nuclei; 2) The number of Ki67-immunostained hepatocyte nuclei; and 3) The ROI area. ROI were delineated via a combination of manual contouring and user-defined colorimetric thresholds that were programmed into the IPP software. Detection of immunostained and non-immunostained hepatocyte nuclei within each ROI occurred automatically via user-defined colorimetric, size, and shape thresholds.
Statistics: Main study: Body weights, cumulative body weight gain, food consumption, food utilisation, clinical chemistry and absolute organ weights were analysed initially by a one-way analysis of variance (ANOVA). Organ weights were analysed by analysis of covariance (ANCOVA) on final body weight measured just prior to termination. Summary values of organ to body weight ratios were not analysed statistically. For all of the parameters evaluated initially in control and sedaxane-treated groups by ANOVA or ANCOVA, Dunnett’s test was used to compare the control and treated groups (Groups 1 to 4), based on the error mean square in the ANOVA or ANCOVA. The Dunnett’s test was performed for all continuous data parameters, regardless of whether the initial ANOVA or ANCOVA was statistically significant. Similarly, for all parameters evaluated initially in intraperitoneally-dosed control and TCPOBOP treated groups (Groups 5 and 6) by ANOVA or ANCOVA, Student’s t-test was used to compare the intraperitoneally-dosed control and treated groups, based on the error mean square in the ANOVA or ANCOVA. Macropathology findings were not analysed statistically. Micropathology incidence data were analysed using Fisher’s Exact Test. Qualitative parameters or any other parameters not specifically mentioned above that yielded qualitative data were not analysed statistically.
Toxicogenomics (RT-PCR) and liver biochemistry: Data were summarised in the form of mean and standard deviations (SDs) of the mean. Hepatic Cyp2b10, Cyp2c65, Gadd45β, Cdc20 and Fos mRNA levels (expressed as ΔCt values) at all time points and microsomal protein content and 7-pentoxyresorufin O-depentylase and testosterone 6β-hydroxylase activities after 7 days treatment were tested for normality using the Kolmogorov-Smirnov test (level of significance determined to be at p<0.05) and heterogeneity

CLH REPORT FOR SEDAXANE
142
using Bartlett’s test (level of significance p<0.01). Control and Sedaxane treated groups were subjected to a one-way analysis of variance and comparisons between control and Sedaxane treated groups were made using two-sided Dunnett’s tests. The data from the vehicle control and TCPOBOP treated groups were subjected to a one-way analysis of variance and comparisons between control and TCPOBOP treated groups were made using two-sided Dunnett’s tests. In all Dunnett’s test comparisons a probability level of p<0.05 was taken to indicate statistical significance.
Immunohistochemistry phase (BrdU Labelling): Statistical analysis on BrdU Labelling Index (LI%) results were performed using a two-tailed Student's T Test from Microsoft Excel 2007. As an additional statistical test, the 0 ppm dietary control group and sedaxane-treated groups were compared by analysis of variance (ANOVA), and individual group means were compared to the control group mean by Dunnett’s test. Statistical significance was assigned at p<0.05 and p<0.01.
Ki67 Zonal Count Analysis: An ANOVA (using SAS v8.2) was used to determine the percent of Ki67 immunostained hepatocyte nuclei per total number of hepatocyte nuclei at each time point for the following regions of interest (ROI): Zones 1, 2, and 3 combined, Zone 1, Zone 2, Zone 3. Dunnett’s test was used to compare the treated groups (Groups 2, 3, and 4) to the control group (Group 1) at each time point, based on the error mean square of the ANOVA. In addition, for each ROI and time point separately, pairwise comparisons between Group 1 and Groups 2, 3, and 4 were made using Student’s t-tests assuming equal variances.
RESULTS AND DISCUSSIONAchieved dose: Dose rates (based on nominal dietary levels of sedaxane were calculated in terms of mg sedaxane/kg body weight. Mean values are shown below:
Table 3.9.4.2-2: Mean Dose Received (mg/kg/day)Sedaxane (ppm) 1250 7000 14000
Males 170 944 1792
Mortality: There were no unscheduled deaths during the study.
Clinical observations: There were no clinical signs of reaction to treatment recorded in any animal throughout the observation period.
Bodyweight and weight gain: There was no obvious effect of sedaxane on body weights. Overall (Day 1-22) mean body weights changes of the sedaxane-treated mice were similar to controls. Although a statistically significantly lower body weight change was noted for the low dose (1250 ppm) sedaxane-treated mice, relative to control, over the first 3 days of treatment, this finding was not attributed to treatment due to lack of the dose-response relationship. There was no effect of TCPOBOP on body weights.
Food consumption: Food consumption values after 3 days of treatment for the 1250, 7000 and 14000 ppm sedaxane-treated mice were decreased by 16, 24, and 27%, respectively, relative to the dietary control mice; these decreases were statistically significant. This lower food consumption was not accompanied by an obvious effect on body weight change over the same interval. After seven days of dietary administration, as well as at subsequent intervals, food consumption was similar to controls in all sedaxane-treated groups. There was no apparent effect of TCPOBOP on food consumption.

CLH REPORT FOR SEDAXANE
143
Table 3.9.4.2-3: Intergroup comparison of mean food consumption (g/animal/day) – selected time points
DayConcentration (ppm)1 3 7 14 21
0 (control) 3.9 4.9 4.7 4.9 4.71250 4.3 4.1* 4.8 5.2 5.27000 1.6** 3.7** 5.0 4.6 5.014000 2.2* 3.6** 4.7 4.8 4.5
TCPOBOP (3mg/kg/day) 5.1 - - - -DMSO 5.8 - - - -
* statistically significant mean values vs. the control group p<0.05** statistically significant mean values vs. the control group p<0.01
Water consumption: There were no treatment-related effects.
Blood clinical chemistry: No effects of sedaxane on ALT and AST values were noted for mice terminated on Days 2,4, and 8. On Day 22, the mean ALT and AST values in the 7000 and 14000 ppm sedaxane treated mice were statistically significantly lower than controls.
Table 3.9.4.2-4: Effect of Sedaxane on ALT and AST Activities on Day 22Day 22 mean ALT and AST activities (% change from control)
Concentration (ppm)0 (control) 1250 7000 14000
ALT (U/L) 64 46 (-28) 38 (-41) 39 (-39)AST (U/L) 107 73 (-32) 55 (-49) 48 (-55)
For the positive control (TCPOBOP) mice the ALT and AST values on Day 2 were similar to the controls that received DMSO. Mean ALT and AST values in animals that received two intraperitoneal injections of TCPOBOP were higher than control values on Day 4, and this attained statistical significance for AST (p<0.05).
Sacrifice and pathology: Macroscopic findings: No gross findings were noted in any mouse that received sedaxane. Prominent lobular architecture of the liver was observed in one animal that received 3 mg/kg of TCPOBOP and was terminated on Day 4. This finding correlated with centrilobular hepatocyte hypertrophy.
Organ weights: Statistically significant increases in mean adjusted liver weights were noted for the 14000 ppm sedaxane-treated mice terminated on Day 4, and for the 7000 and 14000 ppm sedaxane-treated mice terminated on Days 8 and 22, as compared to the mean adjusted liver weights of controls, as shown in the table below. In addition, the mean absolute liver weights for mice terminated on Days 8 and 22 were statistically significantly higher than the control values for the 14000 ppm group. There were no effects on absolute or adjusted liver weight for the 1250 ppm group.
The mean adjusted liver weights for the positive control (TCPOBOP) mice killed on Days 2 and 4 were statistically significantly higher than those of the DMSO vehicle controls. In addition, the absolute liver weights for the TCPOBOP treated mice were statistically significantly higher than the controls on Day 4.

CLH REPORT FOR SEDAXANE
144
Table 3.9.4.2-5: Effect of Sedaxane on Absolute and Body Weight Covariate-Adjusted Liver Weights
Mean Liver Weights (g)Group Concentration (ppm)Day 2 Day 4 Day8 Day 22
absolute 1.99 2.22 2.01 1.791 0 (control)adjusted 1.98 2.18 2.02 1.78absolute 2.09 2.20 2.11 1.862 1250adjusted 2.06 2.20 2.07 1.85absolute 1.88 2.31 2.30 1.983 7000adjusted 1.87 2.34 2.33* 1.99*absolute 1.88 2.60 2.62* 2.35*4 14000adjusted 1.91 2.61* 2.60* 2.36*absolute 2.30 2.95*5 TCPOBOPadjusted 2.29* 2.95*absolute 2.14 2.256 DMSO
Vehicle adjusted 2.15 2.25* statistically significant mean values vs. the control group
Microscopic findings: Hepatocyte hypertrophy (centrilobular or diffuse) in the livers of mice treated with sedaxane or with TCPOBOP was apparent beginning on Day 2, and it increased in incidence over time. An increased incidence of hepatocyte hypertrophy (mild severity) was observed in the 14000 ppm treated animals on Days 2 and 4, and in the 7000 and 14000 ppm animals on Days 8 and 22. There were no treatment-related histological findings in the liver for the 1250 ppm group.
Other microscopic findings observed were considered incidental, of the nature commonly observed in this strain and age of mice, and were of similar incidence and severity in control and treated animals and, therefore, were considered unrelated to administration of sedaxane.
Table 3.9.4.2-6: Effect of Sedaxane on Hepatocyte Hypertrophy (Mild)Incidence of Hepatocyte Hypertrophy
Centrilobular (mild) Diffuse (mild) Centrilobular & Diffuse(mild) Combined
Group Concentration (ppm)
Day 2
Day 4
Day 8
Day 22
Day 2
Day 4
Day 8
Day 22
Day 2
Day 4
Day 8
Day 22
1 0 (control) 0 0 0 0 0 0 0 0 0 0 0 02 1250 0 0 0 0 0 0 0 0 0 0 0 03 7000 0 0 4 5 0 0 2 0 0 0 6 54 14000 2 3 0 6 0 1 6 0 2 4 6 65 TCPOBOP 4 4 - - 0 0 - - 4 4 0 06 DMSO Vehicle 0 0 - - 0 0 - - 0 0 - -
Cell proliferation by Ki67 with zonal counts: The Ki67 immunostaining (brown chromogenic labelling with DAB) was appropriately restricted to the nuclei of hepatocytes and occasionally other cell types (e.g., Kupffer cells). The image analysis software was able to distinguish between these cell types via size and shape criteria.
A slight treatment-related effect was observed at the Day 8 sacrifice, as indicated by statistically significant increases relative to controls in mean labelling index (LI) values for Zones 1, 2, and 3 combined in the 7000 ppm (p = 0.0386) and 14000 ppm (p = 0.0097) dose groups as determined by the Student’s t-test analysis. These results also approached significance using the Dunnett’s test (with p-

CLH REPORT FOR SEDAXANE
145
values of 0.0604 and 0.0569, respectively). The overall ANOVA analysis for all dose groups and combined zones at Day 8 was additionally significant at p = 0.0186. These significant results for the combined zones were driven primarily by mean LI increases in zone 3 (7000 and 14000 ppm) and zone 1 (14000 ppm); no significant changes in LI in zone 2 were noted at any time point or sedaxane dietary treatment level.
The only other significant results were decreases relative to controls in the combined zone (p = 0.0011) and Zone 1 (p = 0.0479) mean LI values for the 1250 ppm dose group at the Day 22 sacrifice based on the Student’s t-test. However, there were no comparable mean LI decreases in the two higher (i.e., 7000 and 14000 ppm) dose groups, and analysis results for the 1250 ppm dose group did not approach significance in either the Dunnett’s or ANOVA tests; thus it is unlikely that these single group decreases in mean LI are toxicologically meaningful.
Table 3.9.4.2-7: Liver Ki67 Labelling Index - Zones 1, 2, 3 CombinedConcentration (ppm)Day
0 (control) 1250 7000 14000Mean LI% 0.65637 0.71701 0.92870 0.587312
SD 0.43807 0.53504 1.17228 0.22803Mean LI% 0.66599 0.54734 0.46424 0.521104
SD 0.41973 0.13926 0.37552 0.22440Mean LI% 0.46856 0.45151 0.92718* 0.93277**8
SD 0.24984 0.36586 0.40026 0.25484Mean LI% 0.35519 0.17224** 0.34607 0.3740722
SD 0.08270 0.05527 0.14801 0.26658* statistically significant mean values vs. the control group p<0.05 (Student’s t-test)** statistically significant mean values vs. the control group p<0.01 (Student’s t-test)
Cell proliferation by BrdU: The treatment of male mice with sedaxane in their diets did not cause a statistically significant increase in BrdU labelling index at any time point. However, there was a numerical trend toward higher mean values in the 7000 ppm and 14000 ppm sedaxane groups on Days 8 and 22 of treatment (1.3 – 2.0-fold) compared to the time-matched controls. The positive control agent TCPOBOP produced a 14-fold increase in BrdU labelling index (p<0.01) after two treatments at 3 mg/kg/day ip (Day 4), but it had no effect after one treatment (Day 2).
Table 3.9.4.2-8: Liver BrdU Labeling Index Results
BrdU Labeling Index (mean LI% ± SD)
Sacrifice Timepoints
Group No.
Treatment
Day 2 Day 4 Day 8 Day 22
1Control
Basal Diet0.27 ± 0.17 0.37 ± 0.20 0.29 ± 0.13 0.24 ± 0.09
21250 ppm Sedaxane
0.40 ± 0.31 0.18 ± 0.07 0.23 ± 0.12 0.27 ± 0.11
37000 ppm Sedaxane
0.33 ± 0.33 0.38 ± 0.29 0.41 ± 0.23 0.39 ± 0.16
414000 ppm
Sedaxane0.24 ± 0.21 0.18 ± 0.16 0.39 ± 0.27 0.49 ± 0.37
5 TCPOBOP 0.17 ± 0.09 2.68 ± 1.30* NA NA
6 DMSO Vehicle 0.10 ± 0.06 0.19 ± 0.08 NA NA

CLH REPORT FOR SEDAXANE
146
* Statistically different from the control student’s t-test, p<0.01 NA= data not available
Toxicogenomics (RT-PCR) and liver biochemistry: Based on analysis of liver mRNA expression by RT-PCR, the treatment of male mice with 1250, 7000 or 14000 ppm sedaxane resulted in a significant dose-dependent up-regulation of Cyp2b10 mRNA levels at all dose levels and time points. With the exception of the effect of treatment with 1250 ppm for 21 days, a significant dose-dependent up-regulation of Cyp2c65 mRNA levels was also observed at all dose levels and time points. The treatment of male mice with 14000 ppm significantly up-regulated hepatic Gadd45β mRNA levels on Days 2, 4 and 8, and Gadd45β mRNA levels also were significantly up-regulated after treatment with 7000 ppm on Day 2. A large mean value for Gadd45β mRNA in the 7000 ppm treated animals was also observed on Day 4, but the effect was not statistically significant when one outlier animal was excluded from the analysis. Sedaxane had no treatment-related effects on hepatic Cdc20 mRNA levels or Fos mRNA levels at any time point. Statistical differences in Fos mRNA on Day 4 were attributable to low control group ΔCt values at this time point, rather than to any effect of sedaxane.
Table 3.9.4.2-9: Summary Fold Change Data and Statistics for Hepatic mRNA LevelsHepatic mRNA- fold inductionDay Concentration
(ppm) Cyp2b10 Cyp2c65 Gadd45β Cdc20 Fos0 (control) 1.0 1.0 1.0 1.0 1.0
1250 44.2** 4.5** 2.5 1.4 1.37000 163.0** 13.2** 12.5** 2.2 1.314000 231.1** 19.6** 38.8** 2.0 2.9
DMSO Vehicle 1.0 1.0 1.0 1.0 1.0
2
TCPOBOP 1436.8** 11.0** 35.5** 0.9 0.80 (control) 1.0 1.0 1.0 1.0 1.0
1250 61.7** 4.3** 3.9 0.9 0.2**7000 197.1** 20.2** 20.5* 1.0 0.1**14000 294.7** 49.0** 7.0* 1.5 0.1**
DMSO Vehicle 1.0 1.0 1.0 1.0 1.0
4
TCPOBOP 62.4** 68.9** 20.9** 56.4** 16.3*0 (control) 1.0 1.0 1.0 1.0 1.0
1250 15.4** 2.4** 1.1 1.3 0.97000 52.0** 14.8** 1.7 1.5 0.7
8
14000 98.0** 49.1** 4.1** 1.1 0.70 (control) 1.0 1.0 1.0 1.0 1.0
1250 4.4** 1.3 0.9 1.0 1.17000 9.6** 13.5** 0.7 1.5 1.9
22
14000 19.0** 67.0** 0.9 1.3 1.6* statistically significant mean values vs. the control group p<0.05** statistically significant mean values vs. the control group p<0.01
With Day 8 liver samples, treatment of male mice with 1250, 7000 or 14000 ppm sedaxane produced a significant dose-dependent induction of 7-pentoxyresorufin O-depentylase (PROD) activity, and treatment with 14000 ppm also produced a significant increase in testosterone 6β-hydroxylase activity.

CLH REPORT FOR SEDAXANE
147
Table 3.9.4.2-10: Effect of Treatment of Male Mice with Sedaxane for 7 Days on Hepatic Microsomal Protein Content and 7-Pentoxyresorufin O-depentylase and Testosterone 6β-hydroxylase Activities
Concentration (ppm)
Microsomal protein(mg/g liver)
7-Pentoxyresorufin O-depentylase
(pmol/min/mg protein)
Testosterone 6β-hydroxylase(nmol/min/mg protein)
0 (control) 30.3 ± 2.25 18 ± 6.2 0.98 ± 0.2631250 32.6 ± 2.53 50 ± 12.3** 0.96 ± 0.1957000 32.1 ± 1.97 266 ± 45.5** 1.23 ± 0.15814000 31.3 ± 2.22 439 ± 84.6** 2.55 ± 0.551**
** statistically significant mean values vs. the control group p<0.01
Treatment with a single 3 mg/kg intraperitoneal dose of TCPOBOP resulted in significant increases in hepatic Cyp2b10, Cyp2c65 and Gadd45β mRNA levels, whereas treatment with two 3 mg/kg intraperitoneal doses of TCPOBOP resulted in significant increases in hepatic Cyp2b10, Cyp2c65, Gadd45β and Cdc20 mRNA levels. While an up-regulation of Fos mRNA levels on Day 4 was also observed, this effect was not statistically significant when one animal considered to be an outlier was excluded from the analysis.
Liver toxicogenomics (microarray analysis): Liver microarrays were evaluated for changes in overall pathways (by IPA analysis) and for significant changes in families of related mRNAs for the sedaxane-treated groups on Days 2, 4 and 22. There were only minimal differences between control and 1250 ppm groups in the number of differentially expressed genes (DEGs), whereas progressively greater numbers of DEGs were observed with 7000 and 14000 ppm sedaxane treatment. Pathway analysis revealed changes involved in xenobiotic metabolism at 7000 ppm and 14000 ppm on Days 2, 4,and 22. The changes involving Cyp2b10 (maximal at Day 4, 14000 ppm, ca.126 fold upregulated) and Cyp3a11 (maximal at Day 2, 14000 ppm, ca.15 fold up-regulated) indicate the involvement of the nuclear receptors CAR and PXR, respectively. However, cross-talk between CAR and PXR and overlap in the genes that these nuclear receptors activate is known to occur.
Table 3.9.4.2-11: Genespring Analysis : Total Number of Differentially Expressed Genes as a Function of Dose Level and Study Day
Dose Concentration (ppm) Day 2 Day 4 Day 221250 0 3 07000 9 17 10614000 395 178 963
Data from canonical pathway analysis by IPA also demonstrates involvement of these nuclear receptors. Unbiased pathway analyses of the microarray results from Genespring using IPA were in concordance with those of Oshida et.al. (2015), where the top 10 IPA pathways in mouse liver following treatment with model CAR activators were virtually identical to those identified for sedaxane.
A lack of Cyp4a induction coupled with minimal PPAR-α pathway gene induction suggests no significant involvement of peroxisome proliferator-activated receptor alpha (PPAR-α). In the absence of Cyp1a1 induction there is no strong evidence for Aryl hydrocarbon receptor (AhR) activation. The few changes observed related to AhR were relatively small in number and were not definitive of AhR activation due to the fact that they are also regulated by other nuclear hormone receptors.
Changes in genes involved in cell cycle including up-regulation of GADD45β (14000 ppm at Days 2, 4 and 22) and down-regulation of GADD45gamma (7000 ppm at Day 22) were noted only at higher dose levels. The polarity and magnitude of fold change may be consistent with a weak/mild proliferative effect in the liver at these dose levels.

CLH REPORT FOR SEDAXANE
148
CONCLUSION: Daily dietary administration of sedaxane to male CD-1 mice at concentrations of 1250, 7000 or 14000 ppm for 1, 3, 7 and 21 days, resulted in hepatocyte hypertrophy (centrilobular or diffuse) at 7000 or 14000 ppm, that tended to increase in incidence with time. For animals terminated on Days 2 or 4, the effects were observed at 14000 ppm only, whereas for mice euthanised on Days 8 or 22, hypertrophy was seen in mice that received sedaxane at both 7000 and 14000 ppm. There were no effects at the 1250 ppm concentration. Higher liver weights were observed at 14000 ppm on Day 4 and at 7000 and 14000 ppm on Days 8 and 22.
Based on the quantitative evaluation of Ki67-stained liver sections, the sole effect of dietary sedaxane on hepatocellular proliferation in male CD-1 mice was a slight transient increase relative to controls in the mean labelling index on Day 8 in the 7000 and 14000 ppm dose groups. There is no evidence that this effect was present in the lower (i.e. 1250 ppm) dose group, or that it persisted to the Day 22 sacrifice.
Results from the BrdU-labelling liver assessment study [non-GLP] were generally similar to those of the Ki67-assessments; slight increases (1.3 to 2.0-fold compared to the time-matched controls) in hepatocellular proliferation were noted at the two higher dose levels, although these slight increases were not statistically significant.
In the toxicogenomic analysis by RT-PCR, sedaxane produced a significant dose-dependent up-regulation of hepatic Cyp2b10 and Cyp2c65 mRNA levels at most dose levels and time points. In contrast, Gadd45β mRNA levels were increased by 7000 ppm sedaxane (Day 2) and 14000 ppm sedaxane (Days 2, 4 and 8), but not by 1250 ppm sedaxane. Biochemical measurements were only made on Day 8 liver samples, and sedaxane produced a significant dose-dependent increase in 7-pentoxyresorufin O-depentylase activity (all dose levels) and a small increase in testosterone 6β-hydroxylase activity (14000 ppm).
The microarray toxicogenomics analysis [non-GLP] generally supports the findings from the biochemical analysis, and provides evidence for dose-dependent increases in expression of xenobiotic metabolizing enzymes (e.g. Cyp2b10, Cyp3a11) and other genes that are associated with CAR and/or PXR activation in mice dosed with sedaxane at 7000 or 14000 ppm. Focused analysis showed that changes consistent with a potential proliferative effect in the liver were seen at the higher dose levels of sedaxane (14000 ppm, Days 2, 4 and 22, and possibly at 7000 ppm, Day 22), but not at the lower dose level of 1250 ppm.
Intraperitoneal administration of the positive control substance, TCPOBOP, in DMSO at a dose level of 3 mg/kg/dose on one or two occasions elicited the anticipated effects in liver parameters.
3.9.4.3 Anonymous (2015)
Report: Anonymous, 2015. Method Validation of Radioimmunoassay Analysis of Control Rat Serum for TSH. Laboratory Report No. TK0172606-001. February 17th 2015. Unpublished. (Syngenta File No. SYN524464_50779; Appendix 11)
STUDY TYPE: Method Validation of Radioimmunoassay Analysis of Control Rat Serum for TSH
TEST MATERIAL (PURITY): N/A
SYNONYMS: N/A
SPONSOR: Syngenta Crop Protection, LLC, 410 Swing Road, Post Office Box 18300, Greensboro, NC 27419-8300 USA.
COMPLIANCE: This method validation study was not conducted in accordance with Good Laboratory Practice (GLP) and Quality Assurance statements are not provided.

CLH REPORT FOR SEDAXANE
149
Experimental work was completed in accordance with the Standing Operating Procedures of Ani Lytics, Inc
EXECUTIVE SUMMARY
A pool of male Han Wistar rat serum was analysed with a radioimmunoassay (RIA) for thyroid stimulating hormone (TSH) at Ani Lytics, Inc. to evaluate the ability to measure serum volumes in the range of 25 – 200 uL. Following the laboratory’s Standard Operating Procedures, a standard curve was derived and the rat serum pool was assayed using volumes of 200 uL, 100 uL (the amount typically used in this RIA), 50 uL and 25 uL. Additional assays of each volume were conducted, after the addition of varying amounts of TSH standard, and the % recovery of each target concentration was determined.
A good standard curve was obtained for rat serum TSH, with standards in the range of 0.39 – 50 ng/mL giving linear results over the full range of concentrations (R = 0.99906). Analysis and re-analysis of a pool of male Han Wistar rat serum showed that volumes of 25 uL – 200 uL are usable for TSH analysis, but slightly more variability might occur when the smaller volumes are used. When compared to the 100 uL volume results for the pooled rat serum, the 50 uL volume gave results within ±8-10% of the TSH value, and the 25 uL volume gave results within ±16-17% of the TSH value. Spiking additional TSH into the dilutions of this serum sample and analysing gave good recoveries (87 – 116%) for all target concentrations and volumes.
The results of this validation work indicate good reproducibility of this RIA method for TSH at volumes of 25 – 200 uL. More consistent values appear to be attained when the same volume as used for the standard curve (100 uL) or higher volumes (200 uL) are used, but if availability of serum is limited (in the range of 25-50 uL), reasonable quantitative values for rat TSH can be attained.
INTRODUCTION
The purpose of these experiments was to evaluate:
Ability of a radioimmunoassay (RIA) to measure thyroid stimulating hormone (TSH) in control rat serum down to levels (less than 1 ng/mL) that might be encountered in some experimental samples
Linearity of the standard curve in the range of 0.39 – 50 ng/mL Ability to measure TSH with smaller serum volumes (down to 25 uL) than is normally used by
the performing laboratory (100 – 200 uL per analysis) Accuracy of the measurements when known amounts of TSH are spiked into control rat serum at
varying levels.
MATERIALS AND METHODS
Control Male Rat Serum
A pool of serum from male Han Wistar rats was obtained fresh via cardiac puncture under carbon dioxide anaesthesia at BioreclamationIVT (New York, USA) under contract with the Sponsor. From each rat, blood was collected into a tube containing no anticoagulant. The tube was stored at room temperature for 30 minutes, and then the tube was stored at 2 - 8 ° C for 120 minutes, to allow clotting to occur. Then the tube was spun at 2,800 – 3,000 x g for 20 minutes in a refrigerated centrifuge at 2 - 8 ° C., and the serum was drawn off the top into a fresh tube. Samples from multiple rats were then combined into a pooled sample.

CLH REPORT FOR SEDAXANE
150
The rat serum (20 mL) was not filtered; it was separated into 4 x 5 mL vials and stored frozen, and shipped by overnight courier in a frozen state to Ani Lytics, Inc. The samples were received in good condition frozen on dry ice on 15 January 2015 and stored in a freezer maintained at -50 degrees C. or below until use.
Experimental Design
Methods for RIA Assay of Rat TSH
The RIA for rat TSH at AniLytics Inc. is an in-house procedure that is described in detail in a Standard Operating Procedure. Briefly, 125I-labeled rat TSH is incubated overnight in glass tubes along with appropriate cofactors and antibodies against TSH. A standard curve is generated using a series of solutions with known amounts of unlabelled TSH (0.39 – 50 ng/mL). During the incubation, the labelled and unlabelled TSH hormone compete for the limited antibody binding sites. Following incubation, a second antibody that binds to the TSH-antibody complex is added, and the precipitates containing bound hormone are separated by centrifugation and counted in a gamma counter. The counts per minute (CPM) in the precipitate reflect the amount of 125I-labeled rat TSH that was bound to the TSH antibody. With increasing amounts of unlabelled TSH in the tube, the amount of bound 125I-labeled rat TSH decreases. Unknown serum samples are incubated in a similar manner, and the concentration of TSH (ng/mL) is determined based on the standard curve.
Maximum binding (B0) is determined from a tube containing no added non-radiolabelled TSH. This maximum binding is typically in the range of 25-35%.
Non-specific binding (NSB) is determined from a tube containing 125I-labeled rat TSH but no antibody against TSH, and reflects binding of 125I-labelled rat TSH to the glassware. This value is typically ≤2%; the calculations are therefore not adjusted for NSB since it would have minimal impact on the results and is considered to be constant across all samples.
Calculation of “% of Maximum Binding” (B/B0 or BB0) is determined as follows:
𝐵𝐵𝑂 = 𝑎𝑣𝑒𝑟𝑎𝑔𝑒 𝑐𝑝𝑚 (𝐵, 𝑠𝑎𝑚𝑝𝑙𝑒)
𝑎𝑣𝑒𝑟𝑎𝑔𝑒 𝑐𝑝𝑚 (𝐵0;𝑛𝑜 𝑐𝑜𝑚𝑝𝑒𝑡𝑖𝑛𝑔 𝑇𝑆𝐻 𝑝𝑟𝑒𝑠𝑒𝑛𝑡) 𝑥 100
For the standard curve, the CPM are used to derive a BB0 value (range = 0 – 100%), and results are plotted with:
A log scale on the X-axis (concentration in ng/mL)
A logit scale (from -3.0 to 3.0) on the Y-axis (BB0 value for % of maximum possible binding).
For unknown serum samples, a BB0 value is derived from the CPM values, and the concentration of TSH (ng/mL) is obtained from the standard curve.
Experiments with Han Wistar Rat Serum Pool
The validation work conducted with control male Wistar rat serum pool consisted of three experiments. For all assays, replicates of four were run to obtain a mean value.
Experiment 1: a standard curve was constructed using standard concentrations from 0.39 – 50 ng/mL TSH. The volume of standard solution added to each tube is 100 uL and then 100 uL of buffer = total volume of 200 uL.

CLH REPORT FOR SEDAXANE
151
Experiment 2: analysis of the rat serum pool was conducted using varied volumes of serum, as follows:
200 uL (= 2 times the amount added for the standard curve). The readout from this analysis (ng/mL) will be 2X the actual value, since a 2-fold volume was analysed.
100 uL (= 1 times the amount added for the standard curve) + 100 uL buffer
50 uL (= 0.5 times the amount added for the standard curve) + 150 uL buffer
25 uL (= 0.25 times the amount added for the standard curve) + 175 uL buffer
For each analysis, a constant volume of 200 uL was maintained. The concentration values derived from the standard curve were initially stated as if 100 uL of the unknown serum sample had been added. Subsequently, the concentration of TSH was adjusted (based on the difference in volume added) to calculate the original ng/mL in the serum pool.
Experiment 3: a repeat analysis of each dilution of the control rat serum pool was conducted (i.e. reflecting 200, 100, 50 or 25 uL of serum used, diluted with buffer to a total volume of 200 uL). Each serum pool dilution (200uL) was spiked with an equal volume (200 uL) of the indicated TSH standard (final volume 400 uL), and a 200 uL sub-sample of this mixture was analyzed for total TSH content. With this approach, the volume of sample added to every tube was kept constant at 200 uL. The additional TSH added was 0.39 – 12.5 ng. A recovery value (% of target) was determined for each spiked sample.
Data Evaluation
Mean values (ng/mL) were calculated for TSH levels. Recoveries in Experiment 3 (spiked serum samples) were calculated as follows.
The calculations are illustrated using the example of the 2X rat pool (200ul, undiluted) containing a measured concentration of 4.87 ng/mL, spiked with an equal volume (200 uL) of 25 ng/mL TSH solution, and then a 200 uL aliquot of the mixture was analysed:
Target Concentration:
=4.87
𝑛𝑔𝑚𝐿𝑖𝑛 𝑝𝑜𝑜𝑙 + 25
𝑛𝑔𝑚𝐿𝑎𝑑𝑑𝑒𝑑
2 =29.87 𝑛𝑔/𝑚𝐿
2 = 14.935𝑛𝑔𝑚𝐿𝑎𝑠𝑠𝑎𝑦𝑒𝑑
Recovery:
= 𝑚𝑒𝑎𝑠𝑢𝑟𝑒𝑑 𝑇𝑆𝐻 𝑣𝑎𝑙𝑢𝑒
𝑡𝑎𝑟𝑔𝑒𝑡 𝑇𝑆𝐻 𝑣𝑎𝑙𝑢𝑒 𝑥 100
=17.29 𝑛𝑔/𝑚𝐿
14.935 𝑛𝑔/𝑚𝐿 𝑥 100 = 116% 𝑟𝑒𝑐𝑜𝑣𝑒𝑟𝑦
RESULTS AND DISCUSSION
Experiment 1 - Standard Curve
The standard curve was linear in the range of 0.39-50ng/mL with a correlation coefficient (R) of 0.99906.

CLH REPORT FOR SEDAXANE
152
The maximum binding was 37% (in a sample with just the antibody and 125I-labeled rat TSH in the absence of non-radiolabelled TSH).
The non-specific binding was approximately 2%.
Experiment 2 – Analysis of Male Wistar Rat Serum Pool with Varying Volumes
Results for TSH concentration were determined using volumes of 200 uL, 100 uL, 50 uL and 25 uL of pooled rat serum. Reaction volumes were adjusted to 200ul with buffer. The 200 uL and 100 uL volumes gave identical final concentration values of 2.3 ng/mL TSH. This value is in a similar range to what has been seen before in a study in male and female Sprague Dawley rats, with analysis performed by Ani Lytics (Finch et al., 2006).
The results with 50 uL volumes (2.06 ng/mL) and with 25 uL volumes (1.92 ng/mL) were slightly lower. This may be due to a slight decrease in sensitivity and/or a matrix related effect when using a smaller serum volume. These volumes represented recoveries of 90% and 83%, compared to the 100 uL volume with a recovery of 100%.
Table 3.9.4.3-1 Results – Experiment 2 for RIA Assay of TSH in Wistar Rat Serum Pool with Varying Volumes
Volume Serum Added
CPM TSH Concentration
from Std. Curve(ng/mL)
Final TSH Concentration
(ng/mL)
% Recovery(based on 1X sample result)
2X 200 uL 7517 4.377259 4.807255 4.817478 4.34
Averages: 7377 4.60 2.30 100%
1X 100 uL 9377 2.108927 2.549111 2.359264 2.20
Averages: 9170 2.30 2.30 100%
0.5X 50 uL 11041 0.8510587 1.1410725 1.0410665 1.08
Averages: 10755 1.03 2.06 90%
0.25X 25 uL 11778 0.4511774 0.4511650 0.5111644 0.52
Averages: 11712 0.48 1.92 83%Final TSH concentration = TSH concentration from std. curve x dilution factor
The results from quadruplicate assays at each volume used were quite reproducible.
Experiment 3 – Analysis of Rat Serum Pool Spiked with Varying Amounts of TSH

CLH REPORT FOR SEDAXANE
153
The rat serum pool was tested using the same range of volumes (200 ul, 100 uL, 50 uL and 25 uL) as in Experiment 2. To this amount of serum diluted up to 200 uL with buffer, an equal volume (200 uL) of the TSH standard dilutions (50 ng/mL to 0.78 ng/mL) was added, and a total reaction volume of 200 uL of the mixture was tested in each tube. As a first step, the CPM and ng/mL at each dilution volume were calculated anew, based on serum without any spiked TSH in it. The amounts in these fresh aliquots were as follows, compared to the Experiment 2 results:
Table 3.9.4.3-2 Results – Experiment 3 analysis of Rat Serum Pool Spiked with Varying Amounts of TSH
Volume Serum Added
Average Conc. TSH, Re-assay
(ng/mL)
Final TSH Concentration,
Experiment 3 (x dilution factor) (ng/mL)
% of the 100 uL Value
(Experiment 3)
Average Final Conc. TSH, Experiment 2
(ng/mL)
200 uL 4.87 2.44 97% 2.30100 uL 2.52 2.52 100% 2.3050 uL 1.36 2.72 108% 2.0625 uL 0.73 2.92 116% 1.92
In Experiment 3 results, the ng/mL were slightly higher than the Experiment 2 results for each volume of serum used. Further, the recoveries with the smaller volumes (50 and 25 uL) were now slightly greater than the values using the larger volumes (200 and 100 uL).
The % recovery of the spiked serum samples were all fairly close to the target concentrations of TSH (range: 87% - 116%). Within the set of values for the 50uL and 25uL serum volumes, the % recoveries were slightly lower for the lowest target concentrations, compared to the larger volume target concentrations.
CONCLUSION:
The results of this validation work indicate good reproducibility of the RIA method for Rat TSH at volumes of 25 – 200 uL. More consistent values appear to be attained when the same volume as used for the standard curve (100 uL) or higher volumes (200 uL) are used, but if availability of serum is limited (in the range of 25-50 uL), reasonable quantitative values for rat TSH can be attained.
3.9.4.4 Anonymous (2015)Report: Anonymous, 2015. Sedaxane: 28 Day oral (dietary) mechanistic study to evaluate effects on the
liver and thyroid in the male rat. Laboratory Report No. BFI0212, 18 November 2015. Unpublished. (Syngenta File No. SYN524464_11635)
GUIDELINES: Not applicable.
GLP: Signed and dated GLP and Quality Assurance statements were provided.
JUSTIFICATION FOR TEST SYSTEM SELECTION: The objective of this study was to gain mechanistic understanding of the effects of Sedaxane on the liver and thyroid of male Han Wistar rats after continuous dietary administration for up to 28 days and to assess the reversibility of observed effects over a subsequent 60 day treatment-free period.
There are no specific guidelines for this type of study. The route of administration, strain of rat and dietary concentrations were chosen by the Sponsor in light of findings from the previous dietary carcinogenicity and chronic toxicity study (Anonymous 2010) which this mechanistic study is intended to support.

CLH REPORT FOR SEDAXANE
154
The dietary concentration of the positive control, sodium phenobarbital, was selected by the Sponsor in light of published data and was expected to produce robust changes in markers of thyroid perturbation and liver cell proliferation without producing excessive general toxicological effects.
EXECUTIVE SUMMARYThree hundred and thirty male Crl:WI(Han) strain rats were allocated to the study and treated as follows:
Group Number of Males Necropsy Days* Dietary Concentration
1 90 2, 4, 8, 15, 29 and 89 0 ppm (Vehicle Control, basal diet)
2 75 2, 4, 8, 15 and 29 1200 ppm Sedaxane
3 90 2, 4, 8, 15, 29 and 89 3600 ppm Sedaxane
4 75 2, 4, 8, 15 and 29 Positive control (1200 ppm sodium phenobarbital)
* Fifteen males per group were killed on each necropsy day, working upwards from the animals with the lowest identification numbers
The positive control (sodium phenobarbital) and Sedaxane (purity 95.3%) were administered continuously, for up to 28 days, in the diet, which was freely available. Following 28 days of treatment, 15 animals from the Control group and the group given 3600 ppm Sedaxane were retained off-dose for a further 60 days to assess the reversibility of the effects of treatment.
Clinical observations were recorded daily. Body weights and food consumption were recorded daily for the first week and then weekly thereafter.
On the day of necropsy, a blood sample was taken from each animal for thyroid hormone analysis. Following this blood sampling, a subcutaneous injection of 75 mg/kg of 5-Bromo-2’-Deoxyuridine (BrdU) was given to each animal notionally 2 hours before necropsy. At necropsy blood samples were taken from each animal for estimation of plasma triglycerides, alkaline phosphatase and alanine aminotransferase.
Liver and thyroid weights were recorded and these tissues were stained with haematoxylin and eosin and examined microscopically. Immunohistochemistry was applied to other fixed liver tissue to show uptake of BrdU, with subsequent quantitation of the BrdU labelling index. A sample of liver was frozen for subsequent biochemistry and a further two samples from each liver were taken into individual RNAlater®-containing tubes, placed in refrigerated storage overnight and then transferred to a -80 °C freezer for long-term storage pending possible future analysis.
There were no deaths and clinical signs were confined to an abnormal gait shown by sodium phenobarbital treated animals (an expected finding), most noticeable during the first week of treatment. An initial reduction in food intake for animals given 3600 ppm Sedaxane was associated with an initial weight loss such that these animals ended the study 10 % lighter than Controls. Increases in plasma triglycerides were seen from Day 8 in animals given 3600 ppm Sedaxane and from Day 2 in phenobarbital treated animals. This increase was shown to be reversible in Sedaxane treated rats following the treatment-free period.
Sodium phenobarbital at 1200 ppm in the diet produced expected changes in the liver and thyroid. The liver effects included an increase in BrdU labelling that was maximal after 3 days of treatment, and increases in liver weight, PROD activity and hepatocellular hypertrophy. Sodium phenobarbital increased hepatic microsomal UDP-glucuronosyltransferase activity towards thyroxine as substrate after ≥3 day of treatment. In accord with this elevated T4 conjugation activity, reductions in Total T3 and Total T4

CLH REPORT FOR SEDAXANE
155
levels were observed at the majority of the timepoints assessed, and elevations in TSH were observed after ≥14 days of treatment. Sodium phenobarbital produced elevated thyroid weights after 1, 14 and 28 days of treatment and dose and time dependent increases in thyroid epithelial cell hypertrophy after ≥14 days of treatment. These results are consistent with the expected set of responses and therefore demonstrate the sensitivity of the test system.
In the liver, dietary administration of Sedaxane at concentrations of ≥1200 ppm resulted in increased hepatic microsomal protein content after ≥1 days of treatment, increased gross and adjusted liver weights after ≥3 days of treatment, and elevated hepatic PROD activity after 7 days of treatment. A transiently increased, dose dependent burst of hepatocellular proliferation as measured via the hepatic BrdU labelling index was observed after 1 to 3 days of treatment but not after ≥7 days of treatment. Dose and time-dependent increases in hepatocellular hypertrophy were also observed at concentrations of ≥1200 ppm after ≥3 days of treatment.
Dietary administration of Sedaxane at concentrations of ≥1200 ppm resulted in increased hepatic microsomal UDP-glucuronosyltransferase activity towards thyroxine as substrate after ≥1 day of treatment, elevated thyroid weights after 29 days of treatment and increases in thyroid epithelial cell hypertrophy after ≥14 days of treatment. Reductions in total T3 were observed after 1, 3, 7 and 14 days of treatment and decreased total T4 was observed after 2 days of treatment. While a clear TSH increase was not observed, TSH levels were numerically higher than Controls after 15 and 29 days of treatment, which matched the time points when the effect of Sodium Phenobarbital on TSH was maximal, but these differences in the Sedaxane groups were not statistically significant at the time intervals that were assessed in this study. Taken together, these data indicate that sedaxane has a mild effect on the thyroid gland and thyroid hormone homeostasis, in a manner that is similar to the pattern seen with phenobarbital, but less severe. The changes seen following 3600 ppm Sedaxane treatment were largely reversible after a 60-day treatment-free period.
Dietary administration of 1200 and 3600 ppm Sedaxane to the male Han Wistar rat resulted in a spectrum of effects that included elevations in liver biochemistry, hepatocellular proliferative rate and histopathological changes. A statistically significant decrease in one or both Sedaxane treatment groups on Days 2, 4, 8 and 15. However total T4 was statistically significantly decreased by treatment with Sedaxane only at Day 2. A marginal increase in TSH levels following Sedaxane treatment could possibly be present at Days 15 and 29, but clear statistically significant changes in TSH were not discernible for the time points that were assessed in this study. Sedaxane induced increased thyroid weight from 1200 ppm and thyroid follicular cell hypertrophy at 3600 ppm in line with associative event 2.
Treatment with the positive control, sodium phenobarbital, produced the expected responses, indicating that the experimental system was suitable to assess the effects of Sedaxane. However TSH increase was not really demonstrated.
MATERIALS AND METHODSMaterials:
Test Material: SedaxaneDescription: Off white powderSupplied by: Syngenta LtdLot/Batch number: SMU6LP006/MILLEDPurity: 95.3 % a.iCAS#: 874967-67-6Stability of test compound: Expiry date 31 January 2015 (stored at room temperature)
Vehicle and/or positive control: The test substance was administered via powdered rodent diet, RM1 (E) FG SQC supplied by SDS, PO Box 705, Witham, Essex, UK. The positive control was sodium phenobarbital (NaPB, 99.9% purity, supplied by Sigma-Aldrich).

CLH REPORT FOR SEDAXANE
156
Test Animals:Species RatStrain Crl:WI(Han)Age/weight at dosing 46-50 days / 155-286 gSourceHousing In groups of five in grid-floor cages suspended over paper-lined traysAcclimatisation period At least 13 daysDiet RM1 (E) FG SQC supplied by SDS, PO Box 705, Witham, Essex, UK ad libitumWater Mains tap water ad libitumEnvironmental conditions Temperature: 19-23°C
Humidity: 40-70%Air changes: Not reportedPhotoperiod:12 h light, 12 h dark
Study Design and Methods:In-life dates: Start: 11 April 2014, End: 23 July 2015
Animal assignment: Animals were allocated to groups using a stratified body weight randomisation procedure based on individual body weights recorded on arrival as shown below:
Table 3.9.4.4-1: Study design
Group Number of Males Necropsy Days* Dietary Concentration
1 90 2, 4, 8, 15, 29 and 89 0 ppm (Vehicle Control, basal diet)
2 75 2, 4, 8, 15 and 29 1200 ppm Sedaxane
3 90 2, 4, 8, 15, 29 and 89 3600 ppm Sedaxane
4 75 2, 4, 8, 15 and 29 Positive control (1200 ppm sodium phenobarbital)
* Fifteen males per group were killed on each necropsy day, working upwards from the animals with the lowest identification numbers
Diet preparation and analysis: Diets were formulated weekly. Initially, a premix was made at the highest concentration to be used (3600 ppm). The specified quantity of test item was dispensed into a steel bowl and basal diet was added, followed by mixing with a laboratory grinder until a visibly homogeneous blend was obtained. This was then mixed with further basal diet in a desk-top mixer for at least two minutes, before final mixing of the full quantity of premix for at least 15 minutes in a double cone blender.
To prepare the 1200 ppm diet, a quantity of premix was mixed with basal diet for at least two minutes in a desk-top laboratory mixer.
Formulated diets were stored at room temperature since the test item had been shown to be stable in diet, over the concentrations prepared in this study, for at least eight days at room temperature in a previous study.
Duplicate samples were taken from the top, middle and bottom of each test item formulation prepared for Day 1 and were analysed for Sedaxane to confirm homogeneity and achieved concentrations. Having satisfactorily confirmed homogeneity on Day 1, duplicate samples were taken from the middle of all test item formulations prepared for the last day of treatment and analysed simply to confirm satisfactory concentration. Duplicate samples were also taken from negative Controls at these time-points and analysed to confirm absence of test item.

CLH REPORT FOR SEDAXANE
157
Analysis results: Mean concentrations of Sedaxane diet formulations fed to animals during Weeks 1 and 4 were within 5% of nominal, with coefficients of variation no greater than 1.8 % for Week 1. This fulfilled the acceptance criteria of ±10 % for accuracy and <10 % for homogeneity. No Sedaxane was found in diet fed to Controls.
Observations: Animals were examined twice daily for mortality and morbidity and were given a detailed clinical examination daily from the start of treatment.
Bodyweight: All animals were weighed daily during the first week of treatment and then weekly until necropsy.
Food consumption and test substance intake: The amount of food consumed by each cage of animals was recorded daily during the first week of treatment and then weekly until necropsy. Mean achieved dosage (mg/kg/day) was calculated (ppm x daily food intake / mid-period body weight) retrospectively for each dose group.
Thyroid Hormone Analysis: Blood samples (1.5 mL) were taken under isoflurane anaesthesia from the sublingual vein of all animals on their necropsy day, before subcutaneous administration of BrdU. Samples were taken into plain tubes and were allowed to clot for at least 30 minutes before being centrifuged (3000 g) for 10 minutes, at approximately 4°C. The resultant serum was stored frozen (< 70°C) until analysis.
Serum samples were analysed for total thyroxine (T4), total triiodothyronine (T3), free T4, free T3 and thyroid-stimulating hormone (TSH). Each analysis used a previously validated method following the test kit manufacturers’ protocols.
Subsequent to the analysis of serum samples for the presence of TSH by immunometric methods, the results were close to or below the lower limit of detection for the assay. Therefore, in order to clarify the TSH findings, all residual serum samples (where remaining sample volume permitted) were analysed by radioimmuno assay (RIA).
Clinical chemistry: Blood samples (0.5 mL) were taken from the vena cava into lithium heparin containing tubes, before exsanguination at necropsy, from all animals. Samples were centrifuged at 3000 g for 10 minutes and the plasma transferred to a suitable container for analysis. With the exception of plasma samples obtained on Day 89 which were stored refrigerated overnight before being analysed on the following day, all plasma samples were stored frozen at (≤ 80 C) until analysis. The following parameters were estimated:
alkaline phosphatase activity aspartate aminotransferase activitytriglycerides
Investigations post mortem: On the day of necropsy, following blood sampling, a subcutaneous injection of 75 mg/kg of 5-Bromo-2’-Deoxyuridine (BrdU) was given to each animal approximately 2 hours before necropsy.
On each of the designated necropsy days (Days 2, 4, 8, 15, 29 and 89), animals were killed by exposure to carbon dioxide gas in a rising concentration, in the order of BrdU dosing. With the exception of Day 2, animals were killed 2 hours ±10 minutes after BrdU administration. On Day 2, most animals were exposed to BrdU for longer than this period (up to 3 hours and 26 minutes). However, as BrdU indices did not increase with increased exposure time to BrdU, this deviation is concluded to have had no effect on the scientific outcome of the study.
All animals were weighed and examined externally and the abdominal cavity was opened. A blood sample was taken before exsanguination from the caudal vena cava, as detailed above. The cranial and

CLH REPORT FOR SEDAXANE
158
thoracic cavities were opened and a full internal examination was performed. Macroscopic abnormalities were recorded but not retained. The thyroids (including parathyroids) and liver from all animals were collected. The duodenum was also processed to serve as a positive control for BrdU uptake.
Liver and thyroid weights and processing: The liver was weighed fresh after trimming of fat and other contiguous tissue. The thyroids (including the parathyroids) were weighed about 24 hours into their fixation period.
The liver (representative sections from the left lateral lobe, the right median lobe and the caudate lobe of the liver), thyroids and a section of duodenum were fixed and processed to wax block stage. A piece of duodenum was incorporated into each tissue block as a comparator and slides were then prepared for histopathological evaluation and immunohistochemistry evaluation.
For each animal, an approximately 2 g sample of liver was taken from the left lateral lobe and was snap frozen in liquid nitrogen and stored at -80°C for liver biochemistry assessments (by Professor Brian G Lake, Leatherhead Food Research (LFR), Molecular Sciences Department, Randalls Road, Leatherhead, Surrey, KT22 7RY, UK).
Two sections of liver, of no more than 5 mm thickness in at least one dimension, were taken from the left lateral lobe. Each section was then cut into four pieces of approximately equal size. Each individual piece was then placed in individual RNAlater®-containing tubes. All samples were taken as quickly as possible. After collection, the samples were stored overnight at 2-8oC, after which they were stored at -80°C for long-term storage pending possible future analysis. The remainder of the liver was cut into suitably sized pieces and snap frozen in liquid nitrogen. Samples were stored at -80°C pending possible future analysis.
Histopathological evaluation: samples of liver, thyroid gland and duodenum were cut at a nominal thickness of 4 µm to 5 µm, stained with haematoxylin and eosin and then the liver and thyroids from all animals were examined microscopically.
Immunohistochemistry Evaluation (BrdU Labelling Index): Uptake of BrdU was detected using standard immunohistochemistry techniques.
Sections of liver were rehydrated through xylene and graded alcohols to deionised water and then immersed in 0.6% hydrogen peroxide in tap water for 15 minutes, before washing in deionised water. The sections were then transferred into 2 M hydrochloric acid (HCl) at 37°C (± 2°C) for 30 minutes before washing in deionised water. The sections were transferred into 0.1 M disodium tetraborate pH 8.5 for two five minute intervals and washed again in deionised water before being transferred into 0.01 M PBS (phosphate buffered saline) and then placed into sequenzer clips.
Sections were covered in 5% horse serum in PBS to block any non-specific reactivity for at least 10 minutes before adding 100 μL primary antibody (Santa Cruz Biotechnology BrdU Antibody (IIB5) cat. No. sc32323 supplied by Insight Biotechnology Ltd., P.O. Box 520, Wembley, Middlesex HA9 7YN, UK) diluted 1:800 in antibody diluent and then incubated for 60 minutes at room temperature. After this time, sections were rinsed in PBS-tween for at least five minutes, before adding 100 μL secondary antibody (Biotinylated Horse anti-mouse IgG antibody, Rat adsorbed. Cat No. BA-2001 supplied by Vector Laboratories Ltd. United Kingdom, 3 Accent Park, Bakewell Road, Orton Southgate, Peterborough PE2 6XS, UK) diluted 1:100 in antibody diluent and allowed to stand for 30 minutes. Following further rinsing in PBS-tween for at least five minutes, horseradish peroxidase labelled Streptavidin was added and allowed to stand for 30 minutes. After rinsing in PBS for at least five minutes, diaminobenzidine was applied and left for 12 minutes before rinsing with PBS for at least five minutes.
The sequenzer clips were unloaded into PBS and washed in running tap water for at least five minutes before counterstaining in haematoxylin for one minute. Haematoxylin was then differentiated in 0.5 % HCl in 70 % alcohol and sections were then dipped in Scotts tap water before checking for blue

CLH REPORT FOR SEDAXANE
159
colouration of the nuclei under the microscope. Finally, the sections were dehydrated through graded alcohols to xylene and a coverslip was placed on top.
Determination of the BrdU labelling index for the liver was performed by manual analysis of 1000 nuclei in the left lateral lobe with quantification index. A positive stain was indicated by brown/yellow colouration, whereas negative staining was indicated by blue colouration. A piece of duodenum was inserted into each block as a positive control tissue for BrdU immunohistochemical evaluation, but no quantitation of labelling index was conducted for duodenum.
Liver biochemistry: The liver samples from the left lateral lobe were separately homogenised and microsomal and cytosolic fractions were prepared by differential centrifugation. Aliquots of the whole homogenate, microsomal and cytosolic fractions from each animal were stored at -70°C or below. Liver microsomes from each animal were assayed for protein content and 7-pentoxyresorufin O-depentylase (PROD) and UDPglucuronosyltransferase (UGT) activity. In addition, 40 liver microsomal preparations from the animals killed on Day 8 were assayed for total cytochrome P450 (CYP) and for PROD activity.
Each liver sample was thawed and weighed. Whole homogenates of the individual liver samples were prepared in 0.154 M KCl containing 50 mM Tris-HCl, pH 7.4 using a Potter type, Teflon-glass, motor driven homogeniser. Liver whole homogenates were centrifuged at 10,000 g average for 20 minutes to obtain the postmitochondrial supernatants which were subsequently centrifuged at 105,000 g average for 60 minutes to separate the microsomal fraction from the cytosol. The microsomal fraction of each animal was resuspended in fresh homogenising medium. Aliquots of liver whole homogenate, microsomal and cytosolic fractions from each animal were stored at -70°C or below.
Liver microsomal protein content was determined by the general procedure of Lowry et al. (1951), as described by (Lake, 1987), employing bovine serum albumin as standard.
Hepatic microsomal total Cytochrome P450 content was assayed as described by (Lake, 1987). Microsomal 7-pentoxyresorufin O-depentylase activity was determined as described in incubation mixtures containing 20 μM 7-pentoxyresorufin substrate (Japenga et al., 1993; Lake, 1987).
Hepatic microsomal UDP-glucuronosyltransferase activity towards thyroxine as substrate was determined in incubation mixtures containing 10 μM thyroxine and 5 mM UDPGA (Finch et al. 2006). The formation of thyroxine glucuronide was quantified by ultra performance liquid chromatography-mass spectrometry-mass spectrometry (UPLC-MS-MS), employing a Waters Acquity UPLC system coupled to a Waters Xevo TQ mass spectrometer.
Statistics: Data were processed to give group mean values and standard deviations, where appropriate. Where the data allowed, the following methods were used for statistical analysis.
All statistical tests were two-sided with minimum significance levels of 5% and 1%. Non-parametric statistics were not routinely conducted. When used, Dunnett’s test was conducted regardless of the outcome of the analysis of analysis of variance (ANOVA) or analysis of covariance (ANCOVA).Data were examined for unusually high or low values which could influence the statistical analysis and interpretation (possible outliers). After examining for any outliers, if the variances were clearly heterogeneous, transformations (e.g. log, double arcsine or square root) were used in an attempt to stabilise the variances. If the transformations failed, the data set was examined and a decision taken on further action.
Body weight, cumulative body weight gain from the start of dosing, food intake, clinical chemistry parameters, absolute liver and thyroid weight and BrdU labelling index for the liver, and thyroid hormone analysis in the serum samples were analysed using a parametric ANOVA. Liver and thyroid weights were also analysed by ANCOVA on final body weights. This statistical analysis provided an adjusted liver and thyroid weight value. Summary values of liver and thyroid to body weight ratios were presented but not analysed statistically.

CLH REPORT FOR SEDAXANE
160
For all of the parameters evaluated initially by ANOVA or ANCOVA, Dunnett’s test was used to compare the Control and treated groups, based on the error mean square in the ANOVA or ANCOVA. The Dunnett’s test was performed for all continuous data parameters, regardless of whether the initial ANOVA or ANCOVA was statistically significant.
Microscopic pathology findings (combined incidences per group, for findings with multiple severities) were analysed by Fisher’s Exact Test. Findings with total indices of less than 3 were not analysed statistically.
For liver biochemistry statistical analysis of data was performed with an in house computer software program (BIBSTAT version 1.0). Hepatic microsomal protein content, total CYP content, 7- pentoxyresorufin O-depentylase activity and UDP-glucuronosyltransferase enzyme activity data were tested for normality using the Kolmogorov-Smirnov test (level of significance determined to be at p<0.05) and heterogeneity using Bartlett’s test (level of significance p<0.01). Control, Sedaxane- and NaPB-treated groups were subjected to a one-way analysis of variance and comparisons between control and Sedaxane- and NaPB-treated groups were made using two-sided Dunnett’s tests. In all Dunnett’s test comparisons a probability level of p<0.05 was taken to indicate statistical significance.
RESULTS AND DISCUSSION Mortality: There were no mortalities.
Clinical observations: With the exception of scabbing of the tail, which was observed from Day 6 up to Day 28 for a proportion of animals (up to 4 out of 15) given 3600 ppm Sedaxane, there were no test item-related clinical signs. The tail scabbing, which was not apparent for animals given 1200 ppm Sedaxane or in Controls, rapidly regressed during the treatment-free period. Animals treated with 1200 ppm sodium phenobarbital had an abnormal gait during the first eight days of the treatment period. This observation persisted in one animal until Day 12 and was also observed for one male from Day 17 to Day 20.
Bodyweight and weight gain: Animals given 3600 ppm Sedaxane lost weight during the first day of the study and most animals did not regain their initial starting body weight until Day 4. Group mean body weights continued to lag behind Controls such that by Day 29 they were 10% lighter than Controls (p<0.01). By the end of the treatment-free period, animals previously fed 3600 ppm Sedaxane were only 5% lighter than Controls and the difference in body weight between these two groups was no longer statistically significant.
There was no effect on bodyweight for animals treated with 1200 ppm Sedaxane or 1200 ppm sodium phenobarbital.
Table 3.9.4.4-2: Intergroup comparison of bodyweights (g) -selected timepointsTreatment
day 0 (Control) 1200 ppm Sedaxane 3500 ppm Sedaxane 1200 ppm sodium phenobarbital
1 212.2 214.1 213.5 214.72 218.2 217.6 207.4** 222.83 226.3 227.7 212.7** 233.44 231.6 232.1 218.3** 238.815 273.7 278.8 251.9** 280.129 302.3 299.1 272.8**(↓ 9.8%) 313.7
Recovery animals (day 89) 396.7 - 375.5 -* Statistically significant difference from control group mean, p<0.05 Dunnett’s test** Statistically significant difference from control group mean, p<0.01 Dunnett’s test

CLH REPORT FOR SEDAXANE
161
Food consumption and compound intake: A substantial reduction in group mean food intake was observed for animals given 3600 ppm Sedaxane over the first day of the study when compared with Controls. Improvement was observed thereafter, such that food intake was comparable to Control values from Days 4 to 5 onwards, through to the end of the treatment-free period. No adverse effects on food intake were evident for animals given 1200 ppm Sedaxane or 1200 ppm sodium phenobarbital.
Table 3.9.4.4-3: Intergroup comparison of food consumption (g/rat/day) - selected timepointsTreatment
day 0 (Control) 1200 ppm Sedaxane 3500 ppm Sedaxane 1200 ppm sodium phenobarbital
1-2 24.2 23.3 12.2** 24.22-3 22.4 24.4 17.9** 24.23-4 24.5 25.0 21.8* 24.64-5 22.7 24.2 21.2 25.2**1-4 23.77 24.19 17.4** 24.411-29 21.81 22.42 19.98 22.60
Recovery animals (1-29) 22.07 - 19.79 -Recovery animals (29-89) 20.64 - 20.34 -
* Statistically significant difference from control group mean, p<0.05 Dunnett’s test** Statistically significant difference from control group mean, p<0.01 Dunnett’s test
The mean achieved dosages were calculated based on body weight and food consumption data for each of the time intervals shown below.
Table 3.9.4.4-4: Mean Dose Received (mg/kg/day)Treatment Mean achieved dose (mg/kg/day)
days 1-2 days 1-4 days 1-8 days 1-15 days 1-29
1200 ppm Sedaxane 129.5 134.5 124.2 115.9 95.4
3600 ppm Sedaxane 208.6 363.5 352.6 338.8 278.3
1200 ppm sodium phenobarbital 132.7 133.3 119.3 109.6 97.2
Clinical chemistry: Test item-related blood chemistry changes were confined to a reversible increase in group mean plasma triglycerides for animals given 3600 ppm Sedaxane, manifesting as an approximately two fold increase over Control values on Days 8 and 15 (p<0.01) with a notable, but not statistically significant increase still apparent on Day 29. After the treatment-free period, no differences for triglycerides existed between animals previously fed 3600 ppm Sedaxane and Controls.
Plasma triglycerides were statistically significantly higher (p<0.05 - p<0.01), than Control values on Days 2,4, 8 and 15 in sodium phenobarbital treated animals but no such difference was apparent on Day 29.
At 1200 and 3600 ppm isolated instances of statistically significant intergroup differences for ALP or ALT were minor and often in the opposite direction to that usually associated with toxicity and were considered to reflect normal biological variation rather than any effect of treatment with sedaxane or sodium phenobarbital.

CLH REPORT FOR SEDAXANE
162
Table 3.9.4.4-5: Intergroup comparison of plasma trigylcerides (mg/dL)Treatment
Day 0 (Control) 1200 ppm Sedaxane 3500 ppm Sedaxane 1200 ppm sodium phenobarbital
2 109.3 142.4 119.2 173.9**4 131.1 148.1 146.3 178.1**8 122.9 176.1 242.9** 190.3**15 118.3 162.9 259.7** 156.1*29 154.9 194.2 210.7 109.3**89 135.1 - 118.3 -
* Statistically significant difference from control group mean, p<0.05 Dunnett’s test** Statistically significant difference from control group mean, p<0.01 Dunnett’s test
Sacrifice and pathology: Organ weights: Liver weights (absolute, adjusted for body weight and expressed as a percentage of body weight), were notably elevated from Day 4 onwards for animals given 1200 or 3600 ppm Sedaxane. Where statistical analysis was applied (absolute and adjusted for body weight), these differences were significant (p<0.05 or p<0.01) when compared with Controls. At the end of the treatment-free period, liver weights in animals previously treated at 3600 ppm Sedaxane were similar to Controls indicating the liver weight increases were fully reversible. Thyroid weights were significantly (p<0.01) increased on Day 29 at both 1200 and 3600 ppm Sedaxane and these increases were also found to be fully reversible.
In animals given 1200 ppm sodium phenobarbital, absolute liver weights were elevated on Day 2 and both absolute and body weight adjusted liver weights were significantly increased from Day 4 onward (p<0.05 - p<0.01). This group showed elevated thyroid weights on Days 2, 15 and 29 but not on Days 4 or 8.

CLH REPORT FOR SEDAXANE
163
Table 3.9.4.4-6: Intergroup comparison of liver and thyroid weightsTreatment
Organ Day 0 (Control) 1200 ppm Sedaxane 3500 ppm Sedaxane 1200 ppm sodium phenobarbital
2 abs 8.82 9.05 8.24 9.33*
adj 8.62 8.87 8,61 9.18
rel 4.46 4.58 4.38 4.54
4 abs 9.75 10.8* 11.29** 12.31**
adj 9.62 10.52** 11.70** 11.98**
rel 4.18 4.57 5.08 5.0
8 abs 9.91 11.43** 12.42** 12.66**
adj 9.46 11.28** 13.02** 12.55**
rel 4.20 4.92 5.69 5.27
15 abs 10.68 12.53** 13.12** 14.05**
adj 10.43 12.06** 13.86** 14.02**
rel 3.88 4.46 5.18 5.07
29 abs 10.48 11.88* 12.80** 14.56**
adj 10.15 11.48** 13.53** 14.17**
rel 3.51 3.97 4.69 4.63
89 abs 11.90 - 11.16 -
adj 11.56 - 11.49 -
Liver
rel 3.05 - 3.01 -
2 abs 0.014 0.014 0.015 0.016**
adj 0.014 0.014 0.015 0.016*
rel 0.007 0.007 0.008 0.008
4 abs 0.018 0.017 0.018 0.018
adj 0.018 0.017 0.019 0.018
rel 0.008 0.007 0.008 0.007
8 abs 0.015 0.014 0.015 0.016
adj 0.015 0.014 0.015 0.016
rel 0.007 0.006 0.007 0.007
15 abs 0.026 0.026 0.026 0.029**
adj 0.026 0.026 0.026 0.029**
rel 0.009 0.009 0.010 0.010
29 abs 0.014 0.018** 0.017** 0.025**
adj 0.014 0.018** 0.018** 0.025**
rel 0.005 0.006 0.006 0.008
89 abs 0.021 - 0.020 -
adj 0.021 - 0.020 -
Thyroid
rel 0.006 - 0.005 -
abs = absolute weight (g), adj = adjusted weight (g) rel = relative to body weight (%, not tested statistically)* Statistically significant difference from control group mean, p<0.05 Dunnett’s test** Statistically significant difference from control group mean, p<0.01 Dunnett’s test
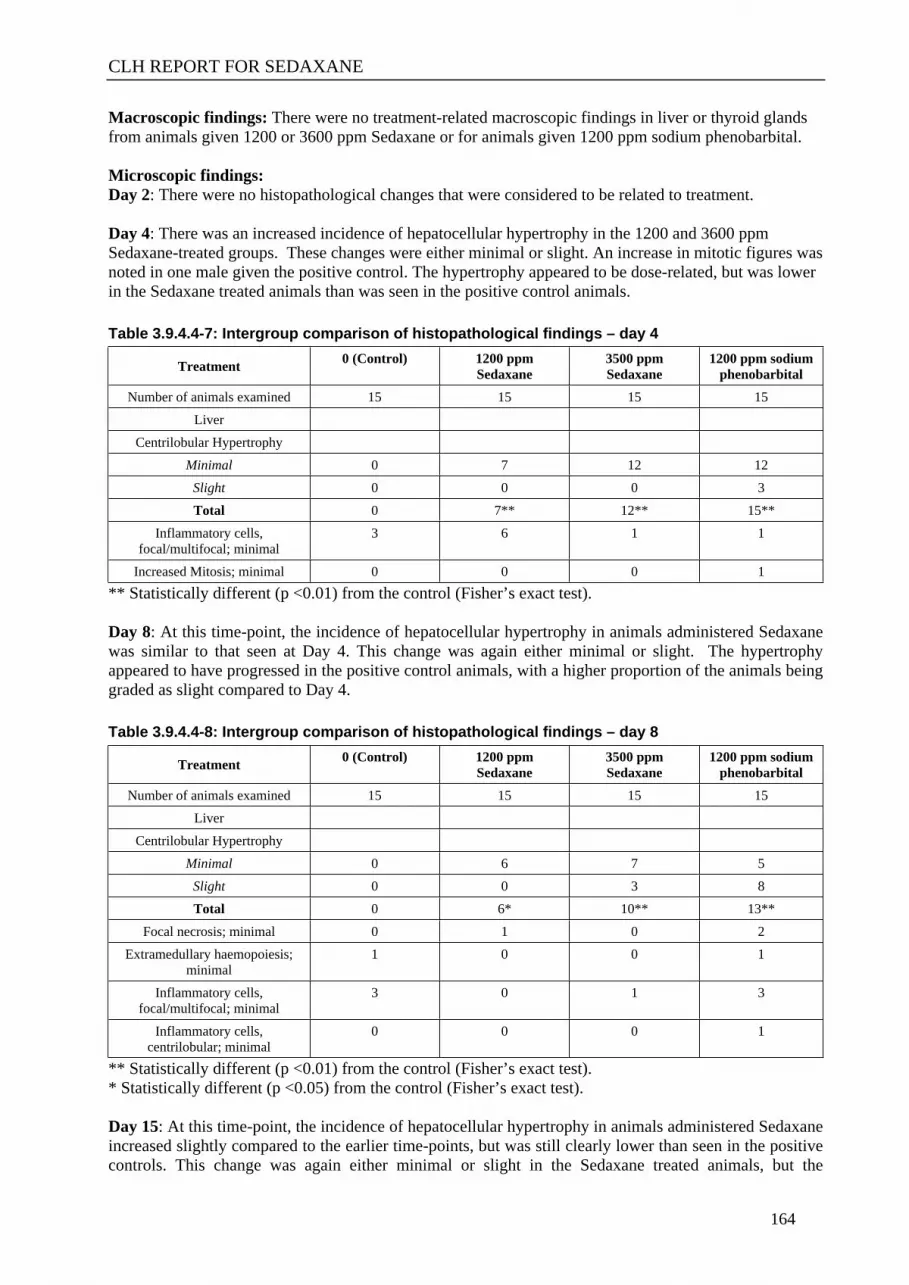
CLH REPORT FOR SEDAXANE
164
Macroscopic findings: There were no treatment-related macroscopic findings in liver or thyroid glands from animals given 1200 or 3600 ppm Sedaxane or for animals given 1200 ppm sodium phenobarbital.
Microscopic findings:Day 2: There were no histopathological changes that were considered to be related to treatment.
Day 4: There was an increased incidence of hepatocellular hypertrophy in the 1200 and 3600 ppm Sedaxane-treated groups. These changes were either minimal or slight. An increase in mitotic figures was noted in one male given the positive control. The hypertrophy appeared to be dose-related, but was lower in the Sedaxane treated animals than was seen in the positive control animals.
Table 3.9.4.4-7: Intergroup comparison of histopathological findings – day 4
Treatment 0 (Control) 1200 ppm Sedaxane
3500 ppm Sedaxane
1200 ppm sodium phenobarbital
Number of animals examined 15 15 15 15Liver
Centrilobular HypertrophyMinimal 0 7 12 12
Slight 0 0 0 3Total 0 7** 12** 15**
Inflammatory cells, focal/multifocal; minimal
3 6 1 1
Increased Mitosis; minimal 0 0 0 1** Statistically different (p <0.01) from the control (Fisher’s exact test).
Day 8: At this time-point, the incidence of hepatocellular hypertrophy in animals administered Sedaxane was similar to that seen at Day 4. This change was again either minimal or slight. The hypertrophy appeared to have progressed in the positive control animals, with a higher proportion of the animals being graded as slight compared to Day 4.
Table 3.9.4.4-8: Intergroup comparison of histopathological findings – day 8
Treatment 0 (Control) 1200 ppm Sedaxane
3500 ppm Sedaxane
1200 ppm sodium phenobarbital
Number of animals examined 15 15 15 15Liver
Centrilobular HypertrophyMinimal 0 6 7 5
Slight 0 0 3 8Total 0 6* 10** 13**
Focal necrosis; minimal 0 1 0 2Extramedullary haemopoiesis;
minimal1 0 0 1
Inflammatory cells, focal/multifocal; minimal
3 0 1 3
Inflammatory cells, centrilobular; minimal
0 0 0 1
** Statistically different (p <0.01) from the control (Fisher’s exact test).* Statistically different (p <0.05) from the control (Fisher’s exact test).
Day 15: At this time-point, the incidence of hepatocellular hypertrophy in animals administered Sedaxane increased slightly compared to the earlier time-points, but was still clearly lower than seen in the positive controls. This change was again either minimal or slight in the Sedaxane treated animals, but the

CLH REPORT FOR SEDAXANE
165
hypertrophy appeared to have progressed further in the positive control animals, to the extent that 4/15 animals were now graded as moderate, with the remainder being slight.
Changes were seen in the thyroid glands (epithelial hypertrophy). This was seen in one and two animals respectively in the Sedaxane treated animals, and eight in the positive control group.
Table 3.9.4.4-9: Intergroup comparison of histopathological findings – day 15
Treatment 0 (Control) 1200 ppm Sedaxane
3500 ppm Sedaxane
1200 ppm sodium phenobarbital
Number of animals examined 15 15 15 15Liver
Centrilobular HypertrophyMinimal 0 9 5 0
Slight 0 2 8 11Moderate 0 0 0 4
Total 0 11** 13** 15**Inflammatory cells,
focal/multifocal; minimal5 2 7 1
Thyroid GlandEpithelial Hypertrophy
Minimal 0 1 2 6Slight 0 0 0 2Total 0 1 2 8
** Statistically different (p <0.01) from the control (Fisher’s exact test).
Day 29: The incidence and severity of hepatocellular hypertrophy in animals administered Sedaxane had progressed further from that seen at the earlier time-points, but was still clearly lower than seen in the positive controls. This change was again either minimal or slight in most of the Sedaxane treated animals, although 2 out of 15 were graded as moderate in the animals given 3600 ppm of Sedaxane.
Hypertrophy appeared to be to have progressed a little further in the positive control animals, to the extent that 5 out of 15 animals were now graded as moderate.
Changes seen in the thyroid glands (epithelial hypertrophy) had progressed further in the positive controls and to a lesser extent in the group given 3600 ppm Sedaxane. This was also seen in one animal in the group given 1200 ppm Sedaxane

CLH REPORT FOR SEDAXANE
166
Table 3.9.4.4-10: Intergroup comparison of histopathological findings – day 29
Treatment 0 (Control) 1200 ppm Sedaxane
3500 ppm Sedaxane
1200 ppm sodium phenobarbital
Number of animals examined 15 15 15 15Liver
Centrilobular Hypertrophy
Minimal 0 8 2 1Slight 0 4 10 9
Moderate 0 0 2 5Total 0 12** 14** 15**
Inflammatory cells, focal/multifocal; minimal
3 6 2 1
Inflammatory cells, centrilobular; minimal
0 1 0 0
Thyroid GlandEpithelial Hypertrophy
Minimal 0 1 3 3Slight 0 0 1 9
Moderate 0 0 0 2Total 0 1 4 14**
** Statistically different (p <0.01) from the control (Fisher’s exact test).
Day 89 (End of treatment-free period): Animals previously given 3600 ppm of Sedaxane were examined after a 60 day treatment-free period. After this recovery period, there were no findings that were considered to be related to treatment.
BrdU labelling indices: A statistically significant transient increase in hepatocellular proliferation, as indicated by an elevated hepatic BrdU labelling index was evident after 2 days of treatment with Sedaxane at both 1200 and 3600 ppm. Proliferation, as measured by the labelling index, was less evident on Day 4 of treatment (with only the 1200 ppm Sedaxane treatment achieving statistical significance) and by Day 29 of treatment, the labelling index in all the Sedaxane treatment groups returned to baseline levels which was maintained through Day 89.Labelling indices of the positive control (sodium phenobarbital) increased in a manner consistent with the known toxicity of the test item.
Table 3.9.4.4-11: Intergroup comparison of BrdU cell counts (BrdU/1000)Treatment
Day 0 (Control) 1200 ppm Sedaxane 3500 ppm Sedaxane 1200 ppm sodium phenobarbital
2 5.426 15.272** 21.387** 12.048**
4 3.006 5.297* 4.210 13.342**8 2.006 3.695 3.231 7.365**15 1.994 5.265** 1.993 3.903**29 1.136 1.396 1.963 3.276*89 0.972 - 1.473 -
* Statistically significant difference from control group mean, p<0.05 Dunnett’s test** Statistically significant difference from control group mean, p<0.01 Dunnett’s test
Thyroid hormone analysis: The data generated in this study with the positive control compound (sodium phenobarbital) supports a mode of action in the rat secondary to increased hepatic clearance of thyroid hormones. Decreases in Total T3 and Total T4 were observed with sodium phenobarbital treatment at

CLH REPORT FOR SEDAXANE
167
most time-points, beginning on Day 2, while elevations of TSH were observed at later times (i.e. Days 8, 15 and 29), consistent with the temporal nature of thyroid hormone and TSH homeostasis.
The changes in the Sedaxane treated groups suggested a similar thyroid mode of action but the effects on TSH and T4 were less clear in these groups. Total T3 showed a statistically significant decrease in one or both Sedaxane treatment groups on Days 2, 4, 8 and 15. Total T4 was statistically significantly decreased by treatment with Sedaxane only at Day 2 but some low individual values were also apparent at Day 4 (1200 and 3600 ppm groups).
Based on the ELISA methodology, treatment with 1200 ppm Sedaxane resulted in a statistically significant decrease in TSH at Day 4 and a statistically significant increase at Day 8, while no alteration was observed at Days 2 and 29. Treatment with 3600ppm Sedaxane resulted in statistically significant decreases in TSH at Days 4 and 15, while no statistically significant differences were observed at Days 2, 8, 29 and 89.
Based on RIA analysis, treatment with 1200 ppm Sedaxane resulted in a statistically significant increase in TSH at Day 2 only, with no statistically significant differences from Control values on Days 4, 8, 15 and 29. No statistically significant differences in TSH values were observed at any timepoint of 3600 ppm Sedaxane treatment. Considering the lack of an effect on Day 2 at the higher dose level, the one significant difference in TSH observed in the 1200 ppm group is considered not to be a treatment-related effect.
A clear increase in TSH levels was observed with the positive control treatment, and this increase was largest in magnitude on Days 15 and 29. TSH concentrations in Sedaxane treated groups at these same time intervals were in general highly variable between individual animals and the mean values, though numerically higher (in the RIA assay) than controls, were not statistically significant. Therefore, based on these observations, a marginal increase in TSH could possibly be present after 14 – 28 days of Sedaxane treatment, but definitive increases in TSH levels for Sedaxane treated groups were not discernible for the time points that were assessed in this study.
Table 3.9.4.4-12: Intergroup comparison of Total T3 (ng/mL)Treatment
Day 0 (Control) 1200 ppm Sedaxane 3500 ppm Sedaxane 1200 ppm sodium phenobarbital
2 1.287 1.132 0.945** 0.879**
4 1.125 0.908** 0.944** 0.725**8 1.235 0.673** 0.923** 0.849**15 1.118 0.797** 0.582** 0.514**29 0.883 1.147* 1.285** 1.205**89 1.149 - 0.943* -
* Statistically significant difference from control group mean, p<0.05 Dunnett’s test** Statistically significant difference from control group mean, p<0.01 Dunnett’s test

CLH REPORT FOR SEDAXANE
168
Table 3.9.4.4-13: Intergroup comparison of Total T4 (µg/dL)Treatment
Day 0 (Control) 1200 ppm Sedaxane 3500 ppm Sedaxane 1200 ppm sodium phenobarbital
2 3.865 3.666 2.725** 3.137*
4 4.013 3.428 3.526 2.539**8 3.191 3.984* 3.975* 2.385*15 4.240 3.823 5.428** 4.05929 3.355 3.935 3.515 2.820*89 3.708 - 3.546 -
* Statistically significant difference from control group mean, p<0.05 Dunnett’s test** Statistically significant difference from control group mean, p<0.01 Dunnett’s test
Table 3.9.4.4-14: Intergroup comparison of TSH (ng/mL) based on the ELISA methodologyTreatment
Day 0 (Control) 1200 ppm Sedaxane 3500 ppm Sedaxane 1200 ppm sodium phenobarbital
2 0.666 0.886 0.565 1.012*
4 1.704 0.973* 0.824** 1.4608 0.755 1.158* 0.744 1.06815 1.486 1.976 0.695* 2.588*29 1.283 0.997 1.173 1.90789 0.545 - 0.684 -
* Statistically significant difference from control group mean, p<0.05 Dunnett’s test** Statistically significant difference from control group mean, p<0.01 Dunnett’s test
Table 3.9.4.4-15: Intergroup comparison of TSH (ng/mL) based on the RIA assayTreatment
Day 0 (Control) 1200 ppm Sedaxane 3500 ppm Sedaxane
2 0.752 1.111* 0.831
4 1.220 1.091 0.8898 0.769 1.112 0.78715 0.770 1.504 0.97229 0.875 1.076 1.17589 0.669 - 0.856
* Statistically significant difference from control group mean, p<0.05 Dunnett’s test
Liver biochemistry: The treatment of male rats with 1200 ppm Sedaxane for 3, 14 and 28 days and 3600 ppm Sedaxane for 3, 7, 14 and 28 days resulted in significant increases in hepatic microsomal protein content. Treatment with 1200 and 3600 ppm Sedaxane for 1, 3, 7, 14 and 28 days significantly increased hepatic microsomal UDP-glucuronosyltransferase activity towards thyroxine as substrate expressed as specific activity, per gram of liver, per total liver and per relative liver weight. The hepatic enzyme induction effects of Sedaxane were reversible, as the statistically significant increases in microsomal protein content and UDP-glucuronosyltransferase activity towards thyroxine as substrate that were observed after 28 days of Sedaxane treatment were no longer observed following the recovery period. Small but statistically significant decreases in UDP-glucuronosyltransferase activity were observed when enzyme activity was expressed per gram of liver, per total liver and per relative liver weight after the recovery period, but considering the direction of change versus control, these small decreases in hepatic UDP-glucuronosyltransferase activity are not considered to be of any toxicological significance.

CLH REPORT FOR SEDAXANE
169
Treatment with 1200 ppm phenobarbital as a positive control for 3, 7, 14 and 28 days resulted in significant increases in hepatic microsomal protein content and in UDP-glucuronosyltransferase activity towards thyroxine as substrate expressed as specific activity, per gram of liver, per total liver and per relative liver weight. The treatment of male rats with 3600 ppm Sedaxane and 1200 ppm phenobarbital for 7 days resulted in significant increases in hepatic microsomal total CYP content. Hepatic microsomal 7-pentoxyresorufin O-depentylase activity (PROD) was significantly increased by treatment with 1200 and 3600 ppm Sedaxane and 1200 ppm phenobarbital for 7 days.
Table 3.9.4.4-16: Intergroup comparison of Hepatic microsomal protein content (mg/g liver)Treatment
Day 0 (Control) 1200 ppm Sedaxane 3500 ppm Sedaxane 1200 ppm sodium phenobarbital
2 27.8 27.9 28.7 25.5
4 30.3 34.3** 34.4** 34.3**8 28.5 30.9 33.1** 37.6**15 27.6 33.8** 35.8** 40.0**29 28.3 31.9** 34.6** 37.7**89 30.6 - 29.4 -
** Statistically significant difference from control group mean, p<0.01
Table 3.9.4.4-17: Intergroup comparison of Hepatic microsomal UDP-glucuronosyltransferase activity towards thyroxine as substrate (nmol/min/liver weight/kg body weight)
Treatment
Day 0 (Control) 1200 ppm Sedaxane 3500 ppm Sedaxane 1200 ppm sodium phenobarbital
2 9.50 12.96** 13.83** 10.38
4 13.20 24.94** 42.45** 27.08**8 7.52 15.82** 33.03** 25.06**15 7.81 16.10** 28.96** 26.30**29 6.41 10.54** 25.42** 28.07**89 4.39 - 3.62* -
* Statistically significant difference from control group mean, p<0.05** Statistically significant difference from control group mean, p<0.01
Table 3.9.4.4-18 Effect of Treatment of Male Rats with Sedaxane and NaPB for 7 Days on Hepatic Microsomal Total CYP Content and 7-Pentoxyresorufin O-Depentylase Activity
Treatment
Day 0 (Control) 1200 ppm Sedaxane 3500 ppm Sedaxane 1200 ppm sodium phenobarbital
Total CYP content (nmol/mg protein)
0.35 (100) 0.38 (109) 0.46 (131)** 1.04 (297)**
7-Pentoxyresorufin O-depentylase
(pmol/min/mg protein)
15 (100) 486 (3240) 1035 (6900)** 1569 (10460)**
Values in parentheses are percentage of control levels.** Statistically significant difference from control group mean, p<0.01
CONCLUSION: Dietary administration of 1200 and 3600 ppm Sedaxane to the male Han Wistar rat resulted in a spectrum of effects that included elevations in liver biochemistry, hepatocellular proliferative rate and histopathological changes. A statistically significant decrease in one or both Sedaxane treatment groups on Days 2, 4, 8 and 15. However total T4 was statistically significantly decreased by treatment with Sedaxane only at Day 2. A marginal increase in TSH levels following Sedaxane treatment could

CLH REPORT FOR SEDAXANE
170
possibly be present at Days 15 and 29, but clear statistically significant changes in TSH were not discernible for the time points that were assessed in this study. Sedaxane induced increased thyroid weight from 1200 ppm and thyroid follicular cell hypertrophy at 3600 ppm in line with associative event 2.
Treatment with the positive control, sodium phenobarbital, produced the expected responses, indicating that the experimental system was suitable to assess the effects of Sedaxane. However TSH increase was not really demonstrated.
References:Japenga, A.C., Davies, S., Price, R.J., Lake, B.G., 1993. Effect of treatment with pyrazine and some derivatives on cytochrome P450 and some enzyme activities in rat liver. Xenobiotica 23, 169-179.
Lake, B.G., 1987. Preparation and characterisation of microsomal fractions for studies of xenobiotic metabolism, In: Snell, K., Mullock, B. (Eds.), Biochemical Toxicology: A Practical Approach, IRL Press, Oxford, pp. 183−215.
Lowry, O.H., Rosebrough, N.J., Farr, A.L., Randall, R.J., 1951. Protein measurement with the Folin phenol reagent. J. Biol. Chem. 193, 265-275.
Anonymous 2010. SYN524464 - 104 Week Rat Dietary Carcinogenicity Study with Combined 52 Week Toxicity Study. Laboratories Study No. 458304. Report No. 30196 (February 2010).
3.9.4.5 Anonymous (2016)Report: Anonymous 2016. Sedaxane – Enzyme and DNA synthesis induction in cultured male Han
Wistar rat hepatocytes. Laboratory Report No. CXR1569, 21 January 2016. Unpublished. (Syngenta File No. SYN524464_11640).
GUIDELINES: This was an investigative study with no applicable guidelines.
GLP: This study was not conducted according to Good Laboratory Practice Standards as defined by OECD Principles of Good Laboratory Practice (1997). This study has not been subjected to any study specific Quality Assurance procedures. Study activities at the Test Facility were conducted according to relevant SOPs. There were no deviations from the protocol, or from company procedures, to affect the quality, integrity or achievement of the study objectives.
JUSTIFICATION FOR TEST SYSTEM SELECTION: The aim of this study was to investigate the potential for sedaxane to stimulate hepatocellular proliferation (measured as the change in replicative DNA synthesis [S-phase of the cell cycle]) and cytochrome P450 (CYP) enzyme activities in isolated male Han Wistar rat hepatocyte cultures.
EXECUTIVE SUMMARYThe aim of this study was to investigate the potential for sedaxane to stimulate hepatocellular proliferation (measured as the change in replicative DNA synthesis [S-phase of the cell cycle]) and cytochrome P450 (CYP) enzyme activities in isolated male Han Wistar rat hepatocyte cultures. ATP depletion as a measure of cytotoxicity was assessed in parallel. Phenobarbital (PB) and epidermal growth factor (EGF) served as Positive Control items, where appropriate.
Primary monolayer cultures of hepatocytes were prepared and exposed to sedaxane at 6 concentrations (1, 3, 10, 30, 65 and 100 µM) or to a vehicle control (0.5% DMSO). Separate cultures were exposed to PB at 3 concentrations (10, 100 and 1000 µM) as a positive control. There were 3 replicates for each concentration for pentoxyresorufin-O-depentylation [PROD] and benzyloxyresorufin-O-debenzylation [BROD] activity measurements, 5 replicates for each concentration for replicative DNA synthesis

CLH REPORT FOR SEDAXANE
171
(incorporation of 5-bromo-2-deoxyuridine [BrdU]) and 6 replicates for each concentration for cytotoxicity measurements (measured as the change in cellular adenosine-5’-triphosphate [ATP]). EGF was tested at a single concentration (25 ng/mL) as a positive control agent for replicative DNA synthesis.
Treatment with 100 μM sedaxane resulted in ATP levels being reduced to 78% of control. Although not statistically significant, this reduction was considered evidence of cytotoxicity. The reduction in ATP at 100 μM sedaxane was coupled with a visible reduction in hepatocyte number when the cultures were evaluated microscopically, further indicating cytotoxicity at this concentration. A visible reduction in cell number was also noted at 65 µM sedaxane, albeit to a lesser extent.
Treatment with ≤30 μM sedaxane caused a statistically significant increase in replicative DNA synthesis as determined by the S-phase labelling index. The statistically significant decreases in replicative DNA-synthesis observed at higher concentrations of sedaxane (65 and 100 μM) were considered to be a result of cytotoxicity. Treatment with PB or EGF resulted in statistically significant increases in replicative DNA synthesis, as expected.
Treatment with sedaxane caused concentration-dependent increases in PROD and BROD activities, which are mainly representative of CYP2B and CYP2B/3A induction, respectively. Treatment with PB resulted in statistically significant increases in both PROD and BROD, as expected.
Treatment of isolated male Han Wistar rat hepatocyte cultures with sedaxane resulted in increases in replicative DNA synthesis as determined by the S-phase labelling index, and increases in PROD and BROD activities, which are mainly representative of CYP2B and CYP2B/3A induction, respectively.
MATERIALS AND METHODSMaterials:
Test Material: SedaxaneDescription: Off-white powderLot/Batch number: SMU6LP006/MILLEDPurity: 95.3% wt/wtCAS#: 874967-67-6Stability of test compound: Expiry date end October 2020 (stored at <30°C)
Vehicle / positive controls: 0.5% v/v dimethyl sulfoxide (DMSO) / Phenobarbital sodium salt (PB) and epidermal growth factor (EGF).
Test Animals:Species RatStrain Crl:WI(Han)Age/weight at dosing 8 to 9 weeks /weight not reportedSourceHousing Housed in groups in solid bottomed polypropylene cages Acclimatisation period 5 daysDiet RM1 pelleted diet (Special Diets Services Ltd., Stepfield, Witham, Essex, UK)Water Not reportedEnvironmental conditions Temperature: 19-23°C
Humidity: 40-70% Air changes: Minimum of 14-15/hourPhotoperiod: 12 hours light/12 hours dark
Study Design and Methods:Experimental dates: Start: 05 November 2015 End: 24 November 2015
Preparation and treatment of hepatocyte cultures: Rats were terminally anaesthetised using euthatal and hepatocytes isolated by in situ perfusion (Mitchell et al. 1984). Viabilities of the hepatocyte

CLH REPORT FOR SEDAXANE
172
preparations, determined by trypan blue exclusion, were in excess of 80%. Hepatocytes from two independent perfusions were pooled. Primary monolayer cultures of hepatocytes were prepared in 25 cm2 flasks, 96- and 6-well plastic tissue culture plates. In all 96-well plate cultures the outside wells were not used, but filled with sterile phosphate buffered saline.
Hepatocytes were cultured in Leibowitz CL15 medium for 4 h (to allow adherence). The medium was changed and the hepatocytes exposed to PB at 3 concentrations (10, 100 and 1000 µM) as a positive control, to sedaxane at 6 concentrations (1, 3, 10, 30, 65 and 100 µM) or to a vehicle control (0.5% DMSO).
The media, with Test/Control Items, was replenished daily for a further 3 days. There were 3 replicates for each concentration in 25 cm2 flasks for enzyme activity measurements, 5 replicates for each concentration in 6-well plates for replicative DNA synthesis (S-phase) analysis and 6 replicates for each concentration in 96-well plates for ATP depletion measurements.
The Test/Control Items were formulated in DMSO and administered such that the final DMSO concentration in all cultures was 0.5% (5 µL DMSO/mL medium).
In addition to hepatocytes exposed to sedaxane or PB, 5 replicates in 6-well plates were exposed to EGF (25 ng/mL) as a Positive Control for induction of replicative DNA synthesis (S-phase).
After 96 h in culture, hepatocytes were either methanol fixed for S-phase assessment or harvested by scraping into SET buffer (0.25 M sucrose, 5 mM EDTA, 20 mM Tris-HCl, pH 7.4) for CYP enzyme activities. The scraped mixture was sonicated and stored at –70°C until enzyme analyses were completed. Protein was determined by the method of Lowry et al. (1951)
Assays:Adenosine 5’-triphosphate (ATP): The bioluminescent determination of ATP released from viable somatic cells was carried out using an assay kit supplied by Promega (CellTitre-Glo luminescent cell viability assay). Results were expressed as a percentage of the maximum amount of ATP released (i.e. the value of control cells).
Replicative DNA synthesis (S-phase): The number of hepatocytes undergoing replicative DNA synthesis (S-phase) was determined by the incorporation of 5-bromo-2-deoxyuridine (BrdU) followed by immunostaining. S-phase was determined immunocytochemically following the incorporation of BrdU into hepatocyte nuclei over the last 3 days of culture. Immunostaining was performed after fixation at 96 h. Cells were visualised by light microscopy. The number of hepatocytes undergoing DNA synthesis was recorded as the labelling index [(no. of labelled hepatocytes/total no. of hepatocytes) x 100]. Only homogeneously stained, dark-brown nuclei were counted as labelled. A total of 1381-1647 hepatocytes was counted per replicate for each concentration.
Pentoxyresorufin-O-depentylation (PROD): PROD activity in cultured hepatocytes was determined spectrofluorometrically by the formation of resorufin from pentoxyresorufin, as described by Burke et al. (1985).
Benzyloxyresorufin-O-debenzylation (BROD): BROD activity in cultured hepatocytes was determined spectrofluorometrically by the formation of resorufin from benzyloxyresorufin, as described by Burke et al. (1985).
Statistics: Where applicable, statistical comparisons between Test/Control Item-treated rat hepatocytes and their respective vehicle control groups were undertaken for numerical data sets using ANOVA and Dunnett’s post-test. Statistical significance was reported at p<0.05 and p<0.01.
RESULTS AND DISCUSSION

CLH REPORT FOR SEDAXANE
173
ATP: Treatment with 100 μM sedaxane resulted in ATP levels being reduced to 78% of control. Although not statistically-significant, this reduction was considered evidence of cytotoxicity. Treatment with PB had no effect on ATP levels. A slightly lower ATP level with 10 μM PB (84%) was considered normal variation, considering the lack of any similar ATP values with 100 or 1000 μM PB treatment.
Replicative DNA synthesis (S-phase): Treatment with 100 μM sedaxane resulted in a visible reduction in hepatocyte number when the cultures were evaluated microscopically. At 100 μM, an average of 1426 hepatocytes were counted per replicate whereas the average number of hepatocytes counted in the control cultures was 1535. A visible reduction in cell number was also noted at 65 µM sedaxane, albeit to a lesser extent (an average of 1474 hepatocytes were counted per replicate).
Treatment with ≤30 μM sedaxane caused a statistically-significant increase in replicative DNA synthesis as determined by the S-phase labelling index. The statistically significant decreases in replicative DNA-synthesis observed at higher concentrations of sedaxane (65 and 100 μM) were considered to be a result of cytotoxicity. Treatment with PB or EGF resulted in statistically-significant increases in replicative DNA-synthesis, as expected.
Pentoxyresorufin-O-depentylation (PROD): Treatment with sedaxane caused concentration-dependent increases in PROD activity, with statistically significant increases observed at concentrations ≥30 μM. Treatment with PB resulted in statistically-significant increases in PROD, as expected.
Benzyloxyresorufin-O-debenzylation (BROD): Treatment with sedaxane caused concentration-dependent increases in BROD activity, with statistically significant increases observed at concentrations ≥30 μM. Treatment with PB resulted in statistically-significant increases in BROD, as expected.

CLH REPORT FOR SEDAXANE
174
Table 3.9.4.5-1: Biochemical parameters in cultured male rat hepatocytesTreatment ATP content
(luminescence units) aS-phase labelling
index bPROD (pmol
resorufin/min/mg) cBROD (pmol
resorufin/min/mg) c
Vehicle control
(0.5% [v/v] DMSO)
537910 ± 74659
(100.0 ± 13.9)
8.55 ± 0.45
(100.0 ± 5.3)
0.24 ± 0.03
(100.0 ± 12.3)
0.77 ± 0.03
(100.0 ± 4.0)
10 µM PB451720 ± 161415
(84.0 ± 30.0)
10.01 ± 0.95
(117.0 ± 11.1)
0.38 ± 0.07
(158.3 ± 27.7)
1.62 ± 0.13
(209.9 ± 16.7)
100 µM PB509858 ± 159540
(94.8 ± 29.7)
15.49 ± 1.23**
(181.0 ± 14.3)
1.03 ± 0.11**
(431.8 ± 46.2)
5.18 ± 0.48*
(673.0 ± 62.4)
1000 µM PB556985 ± 164052
(103.5 ± 30.5)
12.83 ± 1.51**
(150.0 ± 17.7)
20.6 ± 0.34**
(866.3 ± 144.5)
11.12 ± 1.26**
(1444.6 ± 163.0)
1 µM sedaxane556339 ± 115319
(103.4 ± 21.4)
16.10 ± 1.06**
(188.2 ± 12.4)
0.27 ± 0.04
(114.3 ± 14.8)
1.26 ± 0.03
(163.0 ± 3.4)
3 µM sedaxane491764 ± 171729
(91.4 ± 31.9)
19.55 ± 1.04**
(228.5 ± 12.1)
0.33 ± 0.05
(139.1 ± 18.8)
1.52 ± 0.09
(197.2 ± 12.2)
10 µM sedaxane521083 ± 149362
(96.9 ± 27.8)
21.22 ± 1.85**
(248.0 ± 21.6)
0.48 ± 0.03
(204.1 ± 14.2)
2.48 ± 0.22
(322.0 ± 28.7)
30 µM sedaxane495132 ± 151481
(92.0 ± 28.2)
15.20 ± 3.59**
(177.7 ± 42.0)
0.88 ± 0.07**
(370.2 ± 30.6)
4.88 ± 0.17*
(633.9 ± 22.6)
65 µM sedaxane#576947 ± 131268
(107.3 ± 24.4)
4.86 ± 1.38**
(56.8 ± 16.1)
2.14 ± 0.09**
(902.9 ± 39.6)
13.94 ± 0.47**
(1810.3 ± 60.7)
100 µM sedaxane#420892 ± 101680
(78.2 ± 18.9)
2.70 ± 0.35**
(31.5 ± 4.1)
2.73 ± 0.17**
(1151.5 ± 70.0)
15.81 ± 4.91**
(2053.5 ± 637.5)
25 ng/mL EGF- 40.78 ± 2.77**
(476.7 ± 32.4)
- -
Values are mean ± SD. Values in parenthesis are mean % control ± SD. a n = 6 per group, b n = 5 per group, c n = 3 per groupStatistically different from control *p<0.05; **p<0.01 (One way ANOVA with Dunnett’s post test). # S-phase assessment, the hepatocytes at these concentrations looked healthy microscopically. However, there were fewer hepatocytes present, particularly following 100 µM sedaxane administration.
CONCLUSION: Treatment of isolated male Han Wistar rat hepatocyte cultures with sedaxane resulted in increases in replicative DNA-synthesis as determined by the S-phase labelling index, and increases in PROD and BROD activities, which are mainly representative of CYP2B and CYP2B/3A induction, respectively.
References:Burke M.D., Thompson, S., Elcombe, C.R., Halpert, J., Haaparanta, T. & R.T. Mayer (1985) Ethoxy-, pentoxy- and benzyloxyphenoxazones and homologues: a series of substrates to distinguish between different induced cytochromes P-450. Biochem. Pharmacol. 34:3337-3345.
Lowry, O.H., Rosebrough, N.J., Farr, A.L. & R.J. Randall (1951). Protein measurement with the Folin phenol reagent. J. Biol. Chem. 193:265–275.

CLH REPORT FOR SEDAXANE
175
Mitchell, A.M., Bridges, J.W. & C.R. Elcombe (1984) Factors influencing peroxisome proliferation in cultured rat hepatocytes. Arch. Toxicol. 55:239-246
3.9.4.6 Vardy (2016b)Report: Vardy, A (2016b). Sedaxane – Enzyme and DNA synthesis induction in cultured male human
hepatocytes. Final Report . CXR Biosciences, 2 James Lindsay Place, Dundee Technopole, Dundee, DD1 5JJ, Scotland, UK.. Laboratory Report No. CXR1567, 21 January 2016. Unpublished. (Syngenta File No. SYN524464_11639).
GUIDELINES: This was an investigative study with no applicable guidelines.
GLP: This study has not been subjected to any study specific Quality Assurance procedures. Study activities at the Test Facility were conducted according to relevant SOPs. There were no deviations from the protocol, or from company procedures, to affect the quality, integrity or achievement of the study objectives. This study was not conducted according to Good Laboratory Practice standards as defined by 40 CFR part 160. No claim of GLP compliance was made for this study.
EXECUTIVE SUMMARYThis study investigated the potential for sedaxane to to stimulate hepatocellular proliferation (measured as the change in replicative DNA synthesis [S-phase of the cell cycle]) and cytochrome P450 (CYP) enzyme activities in isolated male human hepatocyte cultures. ATP depletion as a measure of cytotoxicity was assessed in parallel. Phenobarbital (PB) and epidermal growth factor (EGF) served as Positive Control items, where appropriate.
Primary monolayer cultures of hepatocytes were prepared and exposed to sedaxane at 6 concentrations (1, 3, 10, 30, 65 and 100 µM) or to a vehicle control (0.5% DMSO). Separate cultures were exposed to PB at 3 concentrations (10, 100 and 1000 µM) as a positive control. There were 3 replicates for each concentration for pentoxyresorufin-O-depentylation [PROD] and benzyloxyresorufin-O-debenzylation [BROD] activity measurements, 5 replicates for each concentration for replicative DNA synthesis (incorporation of 5-bromo-2-deoxyuridine [BrdU]) and 6 replicates for each concentration for cytotoxicity measurements (measured as the change in cellular adenosine-5’-triphosphate [ATP]). EGF was tested at a single concentration (25 ng/mL) as a positive control agent for replicative DNA synthesis.
Treatment with >30 μM sedaxane resulted in cytotoxicity with ATP levels reduced to <70% of control. The reduction in ATP was coupled with a visible reduction in hepatocyte number and lower cell confluence at 30 µM when the cultures were evaluated microscopically, further indicating cytotoxicity at this concentration. Severe toxicity was observed microscopically following administration of sedaxane at both 65 and 100 µM. As a result, data generated at sedaxane concentrations >30 µM were not considered during the statistical analysis.
Treatment with ≤10 μM sedaxane had no effect on the hepatocellular S-phase labelling index. Similarly, PB had no effect on replicative DNA-synthesis, but EGF resulted in a statistically-significant increase in replicative DNA synthesis as expected.
Treatment with ≤10 μM sedaxane caused concentration-dependent increases in BROD activity, which is mainly representative of CYP2B/3A induction. Sedaxane had no effect on PROD activity at any concentration assessed. Treatment with PB resulted in statistically-significant increases in BROD activity, and a slight numerical increase in PROD activity at the highest test concentration (1000 μM) that was not statistically significant..
Treatment of isolated male human hepatocyte cultures with sedaxane had no effect on replicative DNA-synthesis, as determined by the S-phase labelling index. In sedaxane-treated cultures, BROD activity was induced, which is mainly representative of CYP2B/3A induction. In contrast, PROD

CLH REPORT FOR SEDAXANE
176
activity was unaffected by treatment with sedaxane; PROD is mainly representative of CYP2B induction.
MATERIALS AND METHODSMaterials:
Test Material: SedaxaneDescription: Off-white powderLot/Batch number: SMU6LP006/MILLEDPurity: 95.3% wt/wtCAS#: 874967-67-6Stability of test compound: Recertification 31 October 2020 (stored at <30°C)
Vehicle / positive controls: 0.5% v/v dimethyl sulfoxide (DMSO) / Phenobarbital sodium salt (PB) and epidermal growth factor (EGF).
Study Design and Methods:Experimental dates: Start: 01 December 2015 End: 22 December 2015
Preparation and treatment of hepatocyte cultures: Primary male human hepatocytes (cryopreserved and plateable) were sourced from Life Technologies, 7 Kingsland Grange, Warrington, Cheshire, WA1 4SR. Viabilities of the hepatocyte preparation, as determined by Trypan Blue exclusion (Laboratory Method Sheet (LMS) TIC-002), were in excess of 70%. Hepatocytes were sourced from a single male donor.
Primary monolayer cultures of hepatocytes were prepared in collagen coated 25 cm2 flasks, 96- and 6-well plastic tissue culture plates, using Leibowitz HCL15 (Mitchell et al 1984) as the medium. In all 96-well plate cultures the outside wells were not used, but filled with sterile phosphate buffered saline.
Hepatocytes were resuscitated in Cryopreserved Hepatocyte Recovery Medium (CHPM), then cultured in Cryopreserved Hepatocytes Plating Medium (CHPM) for up to 6 hours to allow adherence. The medium was changed and the hepatocytes exposed to PB at 3 concentrations (10, 100 and 1000 µM) as a positive control, to sedaxane at 6 concentrations (1, 3, 10, 30, 65 and 100 µM) or to a vehicle control (0.5% DMSO). The media, with Test/Control Items, was replenished daily for a further 3 days. There were 3 replicates for each concentration in 25 cm2 flasks for enzyme activity measurements, 5 replicates for each concentration in 6-well plates for replicative DNA synthesis (S-phase) analysis and 6 replicates for each concentration in 96-well plates for cell toxicity (ATP depletion) measurements. The Test/Control Items were formulated in DMSO and administered such that the final DMSO concentration in all cultures was 0.5% (5 µL DMSO/mL medium).
In addition to hepatocytes exposed to sedaxane or PB, 5 replicates in 6-well plates were exposed to EGF (25 ng/mL) as a positive control for induction of replicative DNA synthesis (S-phase).
After 96 hours in culture, hepatocytes were either methanol fixed for S-phase assessment or harvested by scraping into SET buffer (0.25 M sucrose, 5 mM EDTA, 20 mM Tris-HCl, pH 7.4) for CYP enzyme activities. The scraped mixture was sonicated and stored at -70oC until enzyme analyses were completed. Protein was determined by the method of Lowry et al. (1951).
Assays:Adenosine 5’-triphosphate (ATP): ATP depletion was assessed following 96 hours of culture. The bioluminescent determination of ATP released from viable somatic cells was carried out using an assay kit supplied by Promega (CellTitre-Glo luminescent cell viability assay). Results were expressed as a percentage of the maximum amount of ATP released (i.e. the value of control cells).
Replicative DNA synthesis (S-phase): The number of hepatocytes undergoing replicative DNA synthesis (S-phase of the cell cycle) was determined immunocytochemically following the incorporation

CLH REPORT FOR SEDAXANE
177
of 5-bromo-2-deoxyuridine (BrdU, 10 μM) into hepatocyte nuclei over the last 72 h of culture. Immunostaining was performed after fixation at 96 h. Data are expressed as a labelling index (% of total hepatocytes that have incorporated BrdU). Epidermal growth factor (EGF; 25 ng/mL, n=5) was included as a positive control.
Pentoxyresorufin-O-depentylation (PROD): The activity of CYP2B/3A in cultured hepatocytes was determined spectrofluorometrically by the formation of resorufin from pentoxyresorufin, as described by Burke et al. (1985).
Benzyloxyresorufin-O-debenzylation (BROD): The activity of CYP2B/3A in cultured hepatocytes was determined spectrofluorometrically by the formation of resorufin from benzyloxyresorufin, as described by Burke et al. (1985).
Statistics: Where applicable, statistical comparisons between Test/Control Item-treated human hepatocytes and their respective vehicle control groups were undertaken for numerical data sets using ANOVA and Dunnett’s post-test. Statistical significance was reported at p<0.05 and p<0.01.
RESULTS AND DISCUSSIONCytotoxicity assessment: Treatment with >30 μM sedaxanxe resulted in hepatocellular cytotoxicity with ATP levels being reduced to <70% of control. Treatment with PB did not result in a decrease in ATP levels.
Pentoxyresorufin-O-depentylation (PROD): Sedaxane administration had no effect on PROD activity at any concentration examined. Treatment with 1000 µM PB produced a slight increase in PROD activity, but the increase did not reach statistical significance.
Benzyloxyresorufin-O-debenzylation (BROD): Treatment with ≤10 µM sedaxane caused concentration-dependent increases in BROD activity, which were statistically-significant. Sedaxane concentrations >30 µM were not included in the statistical analysis due to cytotoxicity measured at these concentrations. Treatment with PB resulted in statistically-significant increases in BROD, as expected
Replicative DNA synthesis (S-phase): Adminitration of up to 10 µM sedaxane had no effect on the hepatocellular S-phase labelling index. Sedaxane at 30 µM reduced the labelling index to 51% of control, but cytotoxicity was observed at this concentration based on ATP levels <70% of control. In addition, microscopic examination of the 30 µM sedaxane cultures revealed fewer hepatocytes present (an average of 774 hepatocytes counted per replicate, compared to 1430 hepatocytes in the control cultures) and a lower cell confluence compared to the control cultures. Treatment with 65 and 100 μM sedaxane resulted in severe cytotoxicity to the degree that the labelling index could not be established.
Treatment with PB also had no effect on replicative DNA synthesis at any test concentration. In contrast, EGF resulted in a statistically-significant increase in replicative DNA synthesis, as expected.

CLH REPORT FOR SEDAXANE
178
Table 3.9.4.6-1: Biochemical parameters in cultured male human hepatocytesTreatment ATP (luminescence
units released) aS-phase labelling
index (%)aPROD (pmol
resorufin/min/mg) bBROD (pmol
resorufin/min/mg) b
Vehicle control(0.5% [v/v] DMSO)
338973 ± 11205
(100.0 ± 3.3)
0.31 ± 0.04
(100.0 ± 13.3)
0.34 ± 0.08
(100.0 ± 22.9)
1.14 ± 0.17
(100.0 ± 15.1)
PB 10 μM 379045 ± 12845*
(111.8 ± 3.8)
0.27 ± 0.08
(86.5 ± 26.1)
0.26 ± 0.03
(77.4 ± 9.1)
1.45 ± 0.15
(127.5 ± 12.8)
PB 100 μM 365488 ± 31392
(107.8 ± 9.3)
0.26 ± 0.06
(85.5 ± 18.4)
0.27 ± 0.02
(78.5 ± 4.8)
2.66 ± 0.02**
(233.1 ± 1.7)
PB 1000 μM 341258 ± 8614
(100.7 ± 2.5)
0.19 ± 0.08
(60.1 ± 26.8)
0.46 ± 0.05
(136.1 ± 13.5)
6.28 ± 0.33**
(550.3 ± 29.0)
Sedaxane1 μM
349693 ± 20884
(103.2 ± 6.2)
0.29 ± 0.10
(93.5 ± 33.7)
0.32 ± 0.02
(94.9 ± 5.7)
1.68 ± 0.07*
(147.7 ± 6.4)
Sedaxane3 μM
361199 ± 12117
(106.6 ± 3.6)
0.31 ± 0.04
(101.9 ± 13.5)
0.29 ± 0.05
(86.2 ± 13.4)
1.99 ± 0.23**
(174.7 ± 19.9)
Sedaxane10 μM
319556 ± 19738
(94.3 ± 5.8)
0.31 ± 0.03
(99.3 ± 10.1)
0.36 ± 0.02
(106.5 ± 5.8)
3.07 ± 0.19**
(268.8 ± 16.4)
Sedaxane30 μM
237814 ± 29362**
(70.2 ± 8.7)
0.16 ± 0.06#
(50.5 ± 19.2)
0.28 ± 0.05#
(81.5 ± 14.8)
1.98 ± 0.02#
(173.3 ± 1.8)
Sedaxane65 μM
150469 ± 13607**
(44.4 ± 4.0)
No labelling index due to excessive cytotoxicty
0.32 ± 0.08#
(95.3 ± 24.1)
0.62 ± 0.03#
(54.4 ± 2.8)
Sedaxane100 μM
85709 ± 9797**
(25.3 ± 2.9)
No labelling index due to excessive cytotoxicty
0.25 ± 0.04#
(72.3 ± 12.0)
0.29 ± 0.05#
(25.3 ± 4.4)
EGF25 ng/mL
- 3.19 ± 0.24**
(1034.3 ± 76.3)
- -
Values are mean ± SD. Values in parenthesis are mean % control ± SD. a n = 6 per group, b n = 3 per groupStatistically different from control *p<0.05; **p<0.01 (One way ANOVA with Dunnett’s post test). #Excluded from statistical analysis due to cytotoxicity at these concentrations.
CONCLUSION: Treatment of isolated male human hepatocyte cultures with sedaxane had no effect on replicative DNA-synthesis, as determined by the S-phase labelling index. In sedaxane-treated cultures, BROD activity was induced, which is mainly representative of CYP2B/3A induction. In contrast, PROD activity was unaffected by treatment with sedaxane; PROD is mainly representative of CYP2B induction.
References:Mitchell et al. (1984) Arch. Toxicol. 55, 239-246.
Lowry et al. (1951) J. Biol. Chem. 193, 265-275.
Burke et al. (1985) Biochem. Pharmacol. 34, 18. 3337-3345.

CLH REPORT FOR SEDAXANE
179
3.9.4.7 Anonymous (2013)Report: Anonymous, 2013. Sedaxane: Hepatic enzyme activities after 28 and 90 days of dietary
administration to male CD-1 mice. Laboratory Report No. 5511/1/2/2013, 02 May 2013. Unpublished. (Syngenta File No. SYN524464_11556).
GUIDELINES: This was a mode of action study with no applicable guidelines.
GLP: This study was performed to the highest scientific standards employing LFR Standard Operating Procedures. However, neither the study, nor any study data, was audited by the LFR Quality Assurance Unit. The study was not conducted in compliance with OECD Principles of Good Laboratory Practice 1997 and The UK Good Laboratory Practice Regulations 1999, as amended by S.I. 2004 No. 994.
JUSTIFICATION FOR TEST SYSTEM SELECTION: The aim of this study was to analyse liver samples from 28 and 90 day dietary studies with sedaxane in male CD-1 mice for protein and cytochrome P450 (CYP) content and some selected enzyme activities. The liver is the major site of xenobiotic metabolism in mammals and many chemicals have been shown to either induce or inhibit hepatic xenobiotic metabolising enzyme activities. In addition, some chemicals have been shown to produce hepatic peroxisome proliferation in rodents. The mouse is an appropriate test species to assess the effect of sedaxane on markers of hepatic xenobiotic metabolism and peroxisome proliferation.
EXECUTIVE SUMMARYThe aim of this study was to evaluate the effect of sedaxane treatment on selected measures of hepatic xenobiotic metabolism and peroxisome proliferation in male CD-1 mice at dietary levels of 0 (control), 1000 and 7000 ppm for 28 days and at dietary levels of 0 (control) and 7000 ppm for 90 days. To assess the effect on markers of hepatic phase I xenobiotic metabolism, microsomal protein and total cytochrome P450 (CYP) content were determined, together with the activities of the CYP1A marker 7-ethoxyresorufin O-deethylase, the CYP2B marker 7-pentoxyresorufin O-depentylase, the CYP3A marker testosterone 6β-hydroxylase and the CYP4A marker lauric acid 12-hydroxylase. In addition, to assess hepatic peroxisome proliferation in rat liver (which is associated with CYP4A enzyme induction), whole homogenate cyanide-insensitive palmitoyl-CoA oxidation activity was determined.
The treatment of male mice with 1000 and 7000 ppm sedaxane in the diet for 28 days had no statistically significant effect on hepatic whole homogenate palmitoyl-CoA oxidation activity. Hepatic microsomal total CYP content was significantly increased by treatment with 7000 ppm sedaxane for 28 days, and treatment with 1000 and 7000 ppm sedaxane produced a significant dose-dependent induction of microsomal 7-pentoxyresorufin O-depentylase activity. Treatment with 1000 and 7000 ppm sedaxane for 28 days had no statistically significant effect on hepatic microsomal 7-ethoxyresorufin O-deethylase and lauric acid 12-hydroxylase activities. Although the testosterone 6β-hydroxylase activities after 28 days of sedaxane treatment were not statistically significantly different from the control value, the increase in activity at 7000 ppm (135% of control) was similar to the increase after 90 days at 7000 ppm (147% of control) and was therefore considered to be an effect of treatment.
The treatment of male mice with 7000 ppm sedaxane in the diet for 90 days had no statistically significant effect on hepatic whole homogenate palmitoyl-CoA oxidation activity. Treatment with 7000 ppm sedaxane for 90 days produced significant increases in hepatic microsomal total CYP content and 7-pentoxyresorufin O-depentylase activity. Hepatic microsomal testosterone 6β-hydroxylase activity was also significantly increased after treatment with 7000 ppm sedaxane for 90 days, whereas sedaxane treatment for 90 days had no significant effect on microsomal 7-ethoxyresorufin O-deethylase and lauric acid 12-hydroxylase activities.
Treatment of male mice with sedaxane in the diet for 28 and 90 days resulted in significant increases in some of the measured hepatic markers of xenobiotic metabolism. Hepatic microsomal total CYP content was significantly increased by treatment with 7000 ppm sedaxane for 28 or 90 days. Treatment with sedaxane for 28 days at 1000 or 7000 ppm and for 90 days at 7000 ppm

CLH REPORT FOR SEDAXANE
180
resulted in significant increases in CYP2B-dependent 7-pentoxyresorufin O-depentylase activity. Lesser increases in CYP3A-dependent testosterone 6β-hydroxylase activity were also measured following treatment for 28 and 90 days at 7000 ppm.
MATERIALS AND METHODSExperimental dates: Start: 20 December 2012, End: 13 February 2013
Test system: The test system consisted of frozen samples of mouse liver. Liver samples were collected from a 28 day dietary toxicity study in CD-1 mice (Study number 458168) and from a 90 day dietary toxicity study in CD-1 mice (Study number 458278) performed at
). The liver samples were snap-frozen and stored at approximately -70°C prior to being transported to LFR Molecular Sciences, where they were received frozen in dry ice. The liver samples were stored in their containers as supplied at -70°C or below prior to being homogenised. Each liver sample was coded with the LFR Study number (5511/1-001- for 28 day samples and 5511/1-002- for 90 day samples) and the animal number provided by as shown below:
Study duration Treatment Animal numbersControl 1-5
Sedaxane 1000 ppm 6-1028 Days ( Study No. 458168)
Sedaxane 7000 ppm 16-20Control 1-1090 Days ( Study No. 458278)
Sedaxane 7000 ppm 31-40
Preparation of liver fractions: Each liver sample was thawed and weighed. Whole homogenates of the individual liver samples were prepared in 0.154 M KCl containing 50 mM Tris-HCl, pH 7.4 using a Potter type, Teflon-glass, motor driven homogeniser. Liver whole homogenates were centrifuged at 10,000 g average for 20 minutes to obtain the post-mitochondrial supernatants, which were subsequently centrifuged at 105,000 g average for 60 minutes to separate the microsomal fraction from the cytosol. The microsomal fraction of each animal was re-suspended in fresh homogenising medium. Aliquots of liver whole homogenate, microsomal and cytosolic fractions from each animal were stored at -70°C or below.
Assay of Protein Content: Liver whole homogenate and microsomal protein content was determined by the general procedure of Lowry et al. (1951), as described by Lake, 1987, employing bovine serum albumin as standard.
Assay of total CYP content: Liver microsomes were diluted with 0.2 M phosphate buffer, pH 7.4. Microsomal CYP content was determined from a difference spectrum of carbon monoxide treated liver microsomes reduced with sodium dithionite against liver microsomes reduced with sodium dithionite as described previously (Lake, 1987).
Assay of Enzyme Activities: Liver whole homogenates were assayed for cyanide-insensitive palmitoyl-CoA oxidation activity as described previously (Gray et al., 1983), but with the addition of 10 MM FAD to each cuvette. Spectrophotometer cuvettes contained 0.05 mM palmitoyl-CoA (added to test cuvette only), 0.25 mM NAD, 0.125 mM coenzyme A, 10 μM FAD, 6.25 mM dithiothreitol, 1.5 mM KCN, 0.01 % (w/v) Triton X-100, 0.15 mg bovine serum albumin, 42 mM Tris-HCl buffer, pH 7.6 and 0.11-0.24 mg whole homogenate protein in a final volume of 1.01 ml. Enzyme activity was determined at 37°C by monitoring the change in absorbance with time at 340 nm.
Hepatic microsomal 7-ethoxyresorufin O-deethylase and 7-pentoxyresorufin O-depentylase activities were determined as described previously (Japenga et al., 1993; Lake, 1987). Incubation mixtures for 7-ethoxyresorufin O-deethylase contained 2 μM 7-ethoxyresorufin, 0.5 mM NADP, 7.5 mM DL-isocitric acid, 1 unit isocitric dehydrogenase, 5 mM MgSO4, 45 mM Tris-HCl buffer, pH 8.2 and 0.05-0.13 mg microsomal protein in a final volume of 1 ml; whereas incubation mixtures for 7-pentoxyresorufin O-depentylase contained 20 μM 7-pentoxyresorufin, 0.5 mM NADP, 7.5 mM DL-isocitric acid, 1 unit

CLH REPORT FOR SEDAXANE
181
isocitric dehydrogenase, 5 mM MgSO4, 45 mM Tris-HCl buffer, pH 7.8 and 0.05-0.13 mg microsomal protein in a final volume of 1 ml. After a 5 minute preincubation in a shaking water bath at 37°C the reactions were initiated by addition of either the 7-ethoxyresorufin or the 7-pentoxyresorufin substrates. Following a 5 or 10 minute incubation in a shaking water bath at 37°C, the reactions were terminated by the addition of 0.5 ml of 5% (w/v) ZnSO4 and 0.5 ml of saturated Ba(OH)2. The tubes were centrifuged to remove protein and a 1 ml aliquot of the deproteinised supernatant was mixed with 2 ml of 0.5 M glycine-NaOH buffer, pH 8.5. The resorufin product was determined fluorimetrically employing excitation and emission wavelengths of 535 and 582 nm, respectively.
Hepatic microsomal testosterone 6β-hydroxylase and lauric acid 12-hydroxylase activities were determined as described previously (Lake et al., 1996, 1998). Incubation mixtures for testosterone 6β-hydroxylase contained 250 μM testosterone, 1 mM NADPH, 49 mM Tris-HCl buffer, pH 7.4 and 0.05 mg microsomal protein in a final volume of 0.5 ml; whereas incubation mixtures for lauric acid 12-hydroxylase contained 60 μM lauric acid, 1 mM NADPH, 60 mM Tris-HCl buffer, pH 7.5 and 0.15 mg microsomal protein in a final volume of 0.5 ml. After a 5 minute preincubation in a shaking water bath at 37°C the reactions were initiated by addition of NADPH. Following a 5 minute incubation in a shaking water bath at 37°C, the reactions were terminated by the addition of 0.5 ml of ice-cold acetonitrile. The tubes were centrifuged to remove protein and the formation of 6β-hydroxytestosterone and 12-hydroxylauric acid was quantified by ultra performance liquid chromatography-mass spectrometry-mass spectrometry (UPLC-MS-MS). Mobile phases for 6β-hydroxytestosterone were 2 mM ammonium formate containing 0.01% formic acid and acetonitrile containing 0.01% formic acid with detection (positive electrospray mode) using a transition of 305.24 → 269.21. For 12-hydroxylauric acid mobile phases were 0.6% acetic acid and acetonitrile with detection (negative electrospray mode) using a transition of 215.16 → 169.14.
Assays with reference items: The response of the hepatic microsomal CYP-dependent enzyme activities to inducers of selected CYP forms was assessed with liver microsomes from vehicle treated (saline or corn oil) and CYP inducer treated male Sprague-Dawley rats. The CYP inducers comprised β-naphthoflavone (BNF), phenobarbital (PB), dexamethasone (DEX) and clofibric acid (CA), which are known to induce CYP1A, CYP2B, CYP3A and CYP4A subfamily enzymes, respectively.
Statistics: Data were summarised in the form of mean and standard deviations (SDs) of the mean. Hepatic whole homogenate and microsomal protein content, microsomal total CYP content and all enzyme activity data were tested for normality using the Kolmogorov-Smirnov test (level of significance determined to be at p<0.05) and heterogeneity using Bartlett’s test (level of significance p<0.01). Only the data for the effect of sedaxane treatment for 28 days on 7-pentoxyresorufin O-depentylase activity required transformation. The data from the 28 day control and sedaxane treated groups were subjected to a one-way analysis of variance and comparisons between control and sedaxane treated groups were made using two-sided Dunnett’s tests. The data from the 90 day control and sedaxane treated groups were subjected to a one-way analysis of variance and comparisons between control and sedaxane treated groups were made using two-sided Student’s t-tests. In all Dunnett’s test and Student’s t-test comparisons a probability level of p<0.05 was taken to indicate statistical significance.
RESULTS AND DISCUSSIONMice treated for 28 days: The treatment of male mice with 1000 and 7000 ppm sedaxane for 28 days had no statistically significant effect on hepatic whole homogenate protein content and cyanide insensitive palmitoyl-CoA oxidation activity.
The treatment of male mice with 1000 and 7000 ppm sedaxane for 28 days had no statistically significant effect on hepatic microsomal protein content. While treatment with 1000 ppm sedaxane had no statistically significant effect on microsomal total CYP content, treatment with 7000 ppm sedaxane significantly increased microsomal total CYP content to 148% of control.
The treatment of male mice with 1000 and 7000 ppm sedaxane for 28 days had no statistically significant effect on hepatic microsomal 7-ethoxyresorufin O-deethylase activity.

CLH REPORT FOR SEDAXANE
182
The treatment of male mice with 1000 and 7000 ppm sedaxane for 28 days significantly increased hepatic microsomal 7-pentoxyresorufin O-depentylase activity to 233 and 1933% of control, respectively.
The treatment of male mice with 1000 and 7000 ppm sedaxane for 28 days had no statistically significant effect on hepatic microsomal testosterone 6β-hydroxylase activity. However, the hepatic microsomal testosterone 6β-hydroxylase activity for the 7000 ppm dose group was 135% of the control value.
The treatment of male mice with 1000 and 7000 ppm sedaxane for 28 days had no statistically significant effect on hepatic microsomal lauric acid 12-hydroxylase activity.
Table 3.9.4.7-1: Effect of Treatment of Male Mice with Sedaxane for 28 Days on Hepatic Enzyme Activities
Dose level (ppm)0 (Control) 1000 7000
Whole homogenate protein(mg/g liver)
196±12.5 208±2.3 202±13.4
Palmitoyl-CoA oxidation(nmol/min/mg protein)
5.4±0.44 4.4±1.12 5.6±1.03
Microsomal protein(mg/g liver)
22.6±3.01 24.7±3.85 23.5±2.96
Cytochrome P450 content(nmol/mg protein)
0.23±0.042 0.23±0.052 0.34±0.047**
7-Ethoxyresorufin O-deethylase
(pmol/min/mg protein)
34±8.4 28±10.5 35±4.2
7-Pentoxyresorufin O-depentylase
(pmol/min/mg protein)
6±1.9 14±3.3** 116±26.4**
Testosterone 6β-hydroxylase(nmol/min/mg protein)
0.84±0.238 0.80±0.268 1.13±0.323
Lauric acid 12-hydroxylase(nmol/min/mg protein)
0.47±0.160 0.39±0.081 0.55±0.260
** Values significantly different from control (p<0.01).
Mice treated for 90 days: The treatment of male mice with 7000 ppm sedaxane for 90 days had no statistically significant effect on hepatic whole homogenate protein content and cyanide-insensitive palmitoyl-CoA oxidation activity.
The treatment of male mice with 7000 ppm sedaxane for 90 days had no statistically significant effect on hepatic microsomal protein content, but significantly increased microsomal total CYP content to 140% of control.
The treatment of male mice with 7000 ppm sedaxane for 90 days had no statistically significant effect on hepatic microsomal 7-ethoxyresorufin O-deethylase activity.
The treatment of male mice with 7000 ppm sedaxane for 90 days significantly increased hepatic microsomal 7-pentoxyresorufin O-depentylase activity to 1400% of control.
The treatment of male mice with 7000 ppm sedaxane for 90 days significantly increased hepatic microsomal testosterone 6β-hydroxylase activity to 147% of control.

CLH REPORT FOR SEDAXANE
183
The treatment of male mice with 7000 ppm sedaxane for 90 days had no statistically significant effect on hepatic microsomal lauric acid 12-hydroxylase activity.
Table 3.9.4.7-2: Effect of Treatment of Male Mice with Sedaxane for 90 Days on Hepatic Enzyme Activities
Dose level (ppm)0 (Control) 7000
Whole homogenate protein(mg/g liver)
213±15.2 210±12.1
Palmitoyl-CoA oxidation(nmol/min/mg protein)
6.1±1.43 5.4±0.95
Microsomal protein(mg/g liver)
24.0±2.90 24.8±2.26
Cytochrome P450 content(nmol/mg protein)
0.30±0.033 0.42±0.043**
7-Ethoxyresorufin O-deethylase
(pmol/min/mg protein)
36±8.9 40±6.5
7-Pentoxyresorufin O-depentylase
(pmol/min/mg protein)
10±3.7 140±23.1**
Testosterone 6β-hydroxylase(nmol/min/mg protein)
0.86±0.164 1.26±0.358**
Lauric acid 12-hydroxylase(nmol/min/mg protein)
0.39±0.075 0.38±0.081
** Values significantly different from control (p<0.01).
Reference items: Compared to their respective controls, microsomal 7-ethoxyresorufin O-deethylase, 7-pentoxyresorufin O-depentylase, testosterone 6β-hydroxylase and lauric acid 12-hydroxylase activities were all increased when assayed with liver microsomes from rats treated with the appropriate CYP inducer. Overall, the results of the assays with the reference rat liver microsomal preparations confirmed appropriate responses for all of the hepatic microsomal CYP-dependent enzyme activities to known CYP inducers and confirmed that the analytical methods used were sensitive and selective for the appropriate CYP enzyme activities.
CONCLUSION: Treatment of male mice with sedaxane in the diet for 28 and 90 days resulted in significant increases in some of the measured hepatic markers of xenobiotic metabolism. Hepatic microsomal total CYP content was significantly increased by treatment with 7000 ppm sedaxane for 28 or 90 days. Treatment with sedaxane for 28 days at 1000 or 7000 ppm and for 90 days at 7000 ppm resulted in significant increases in CYP2B-dependent 7-pentoxyresorufin O-depentylase activity. Lesser increases in CYP3A-dependent testosterone 6β-hydroxylase activity were also measured following treatment for 28 and 90 days at 7000 ppm.
References:Gray, T.J.B., Lake, B.G., Beamand J.A., Foster J.R., Gangolli, S.D., 1983. Peroxisome proliferation in primary cultures of rat hepatocytes. Toxicol. Appl. Pharmacol. 67, 15-25.
Japenga, A.C., Davies, S., Price, R.J., Lake, B.G., 1993. Effect of treatment with pyrazine and some derivatives on cytochrome P450 and some enzyme activities in rat liver. Xenobiotica 23, 169-179.
Lake, B.G., 1987. Preparation and characterisation of microsomal fractions for studies of xenobiotic metabolism, In: Snell, K., Mullock, B. (Eds.), Biochemical Toxicology: A Practical Approach, IRL Press, Oxford, pp. 183−215.

CLH REPORT FOR SEDAXANE
184
Lake, B.G., Charzat, C., Tredger, J.M., Renwick, A.B., Beamand, J.A., Price, R.J., 1996. Induction of cytochrome P450 isoenzymes in cultured precision-cut rat and human liver slices. Xenobiotica 26, 297-306.
Lake, B.G., Renwick, A.B., Cunninghame, M.E., Price, R.J., Surry, D., Evans, D.C., 1998. Comparison of the effects of some CYP3A and other enzyme inducers on replicative DNA synthesis and cytochrome P450 isoforms in rat liver. Toxicology 131, 9-20.
Lowry, O.H., Rosebrough, N.J., Farr, A.L., Randall, R.J., 1951. Protein measurement with the Folin phenol reagent. J. Biol. Chem. 193, 265-275.
3.9.4.8 Omiecinski (2014)Report: Omiecinski C, 2014. Sedaxane: CAR3 Transactivation assay with mouse, rat and human CAR.
Department of Veterinary & Biomedical Sciences, 101 Life Sciences Building, Penn State University, University Park, PA 16802, USA. Laboratory Report No. TK0212217, 19 September 2014. Unpublished. (Syngenta File No. SYN524464_50760).
GUIDELINES: This was a mode of action study with no applicable guidelines (supplemental to EPA Guideline 870.4300).
GLP: The study was not conducted in compliance with EPA Good Laboratory Practice 40 CFR Part 160.
JUSTIFICATION FOR TEST SYSTEM SELECTION: The purpose of these experiments was to evaluate the effects of sedaxane as a direct CAR activator in different mammalian species using the cell based CAR3 transactivation assay (Omiecinski et al., 2011b).
EXECUTIVE SUMMARYSedaxane was tested for its ability to directly activate the constitutive androstane receptor (CAR, NR1I3; receptor system reviewed in Omiecinski et al., 2011a) in a reporter assay that was developed at Penn State University and published in a peer-reviewed journal (Omiecinski et al., 2011b). Briefly, cDNA expression vectors for CAR3 variants of mouse, rat and human CAR were transfected into COS-1 cells, along with necessary cofactors and a CYP2B6 response element-luciferase reporter construct. After a suitable expression time, the cells were incubated with sedaxane at concentrations of 1, 3, 10, and 30 μM. The direct CAR activator artemisinin was also incubated at these same concentrations, and model direct-acting substrates for mouse, rat or human CAR were each incubated at a single concentration. Light emission from the luciferase reporter was quantified to indicate the extent of CAR activation upon incubation with suspected ligands, including sedaxane. Results were reported as normalized luciferase activity and fold change compared to a DMSO solvent control.
Sedaxane was tested in the human, mouse and rat assays, using the respective species’ CAR3 reporter constructs. A concentration-dependent activation of mouse CAR3 by sedaxane was observed, with up to 19-fold activation of mouse CAR3. At similar concentrations, sedaxane produced up to a 6-fold activation of rat CAR3. The human CAR3 response was only statistically significant at 30 mM, the highest dose tested, and this response represented a 4-fold activation above solvent control.
The model activators CITCO, TCPOBOP and clotrimazole produced robust responses in human, mouse and rat CAR3 constructs, respectively. Artemisinin also was tested and produced a concentration-dependent response that was much more marked with rat CAR3 than with human or mouse CAR3.
In summary, these data demonstrate that sedaxane is a direct activator of mouse, rat and human CAR. Under the conditions of this analysis, the activation of mouse CAR was stronger than the activation of rat or human CAR.

CLH REPORT FOR SEDAXANE
185
MATERIALS AND METHODSMaterials:
Test Material: Sedaxane (Product code SYN524464)Description: Off white powder. Mixture of trans and cis isomersLot/Batch number: SMU6LP006/MILLEDPurity: 95.3% (sum of 83% SYN508210 and 12.3% SYN508211)CAS# 874967-67-6 (trans isomer # 599197-38-3, cis isomer # 599194-51-1)Stability of test compound: Reanalysis date end January 2015 (stored at <30°C)
Vehicle: A master stock of 10 mM sedaxane was prepared using DMSO.Positive control: Artemisinin (CAS # 63968-61-9, purity 98%)
Study Design and Methods:Experimental dates: Start: 11 April 2014, End: 20 June 2014
Test system: The purpose of these experiments was to evaluate the effects of sedaxane as a direct CAR activator in different mammalian species using the cell based CAR3 transactivation assay (Omiecinski et al., 2011b). Reporter assays have been developed that allow for quantitative detection of direct CAR ligands. The assay offers very high signal to noise level of CAR activation across different mammalian species’ CARs.
General Principles of Reporter Gene Assays: cDNA plasmids were synthesized by PCR, verified by DNA sequencing and used in transfection assays conducted with the mammalian COS-1 (Cos-1) cell line. COS -1 cells are ideal for these transactivation assays as they are primate-derived, do not express endogenous CAR and thus exhibit negligible background activities, can be transfected with extremely high efficiencies, grow rapidly in culture and are transcriptionally competent. The plasmids used in the transfection/reporter assays encoded the production of:
· CAR3 from a particular species· An exogenous source of the RXRa dimerization protein· The CYP2B6 gene’s transcriptional response elements fused to a luciferase reporter· An exogenous Renilla gene which is used to normalize for transfection efficiency only, as it is
possible that cells growing independently in different culture wells may take up the DNA ‘cocktail’ with slightly differing efficiencies
After the various cDNA encoding plasmids were allowed to be expressed in COS-1 cells for approximately 16 to 24 h, the cells were incubated with test chemical or DMSO vehicle for an additional 24 h. Direct activation of the CAR3 construct by ligand binding leads to dimerization with RXR and binding of the dimer to the CYP2B6 response elements that are linked to the luciferase reporter within the plasmid construct. That interaction in turn activates transcription of the luciferase protein whose level of expression can be monitored directly by measure of the corresponding increase in luminescent light output. The light emissions occur in direct proportion to the strength of the CAR3 promoter activation. The output from the COS-1 cells is measured with a luminometer for each experimental condition using the Dual Luciferase Reporter Assay (Promega, Madison, WI). As described by the manufacturer, in the assay the activities of firefly (Photinus pyralis) and Renilla (Renilla reniformis) luciferases are measured sequentially from a single sample. The firefly luciferase reporter is measured first by adding a reagent to generate a “glow-type” luminescent signal. After quantifying the firefly luminescence, this reaction is quenched, and the Renilla luciferase reaction is initiated by simultaneously adding a second reagent to the same tube. This reagent produces a “glow-type” signal from the Renilla luciferase, which decays slowly over the course of the measurement. In the Dual Luciferase Assay System, both reporters yield linear assays with subattomole (<10-18) sensitivities and no endogenous activity of either reporter in the experimental host cells. Final outputs are then expressed as normalized luciferase activity (i.e., firefly luciferase/Renilla activities) and as a fold-change compared to solvent (DMSO) control.
This CAR3 reporter assay is a sensitive method for detecting direct activators of CAR; it does not respond

CLH REPORT FOR SEDAXANE
186
to indirect activators of CAR (such as PB), because the second messenger systems that are believed to be responsible for indirect activation are not present in COS-1 cells.
CAR3 Reporter Assay: All transfections using COS-1 cells for luciferase reporter assays were performed in a 48-well format and each condition performed in quadruplicate. On day 1, cells were plated to approximately 50,000 cells per well. While the cells were attaching, DNA transfection mixtures were assembled using Fugene6 transfection reagent. In all transfections, the transfection reagent was used at a ratio of 1:3 (micrograms of DNA to microliters of transfection reagent). Within a given experiment, all transfections contained the same total amount of DNA. At the time of transfection (within 1–6 h after plating), cells were approximately 80% confluent and had initiated cell division (in the case of COS-1 cells). 16–18 h after transfection, cells were treated with chemical agents dissolved in DMSO. The test material (sedaxane) was evaluated at 1, 3, 10 and 30 μM concentrations for each construct, including the negative empty vector control. Artemisinin (1, 3, 10 and 30 μM) was also evaluated as a substrate that had been tested for concentration-response in prior experiments (Omiecinski et al., 2011b). DMSO was used as a solvent control. A positive control assay with a model direct CAR activator for each construct was used at a single concentration. These consisted of:
· CITCO at a concentration of 5 μM (model substrate for human CAR3) · TCPOBOP at a concentration of 0.5 μM (model substrate for mouse CAR3) · Clotrimazole at a concentration of 10 μM (model substrate for rat CAR3)
In addition, phenobarbital (PB) was evaluated at a single concentration of 1 mM, to investigate whether this indirect CAR activator might produce some response in the direct CAR3 reporter assay when tested at a relatively high concentration.
In all treatments, DMSO levels never exceeded 0.1% (v/v). On day 3 (24 h after chemical treatment), cells were washed with PBS and luciferase assays were performed using the Dual-Luciferase Reporter Assay System (Promega) and measured with a Veritas Microplate Luminometer (Turner Biosystems/ Promega). Luciferase assay and stop and glow reagents were diluted with 1× Tris-buffered saline, pH 8.0, to a 0.5X final concentration, as described earlier (Auerbach et al, 2005; Dekeyser et al., 2007). All other aspects of the assay were performed in accordance to the manufacturer's protocol. Dilution of luciferase reagent had no effect on normalized luciferase values.
Cell Viability Assay: The CellTiter-Glo® Luminescent Viability Assay (Promega) was used to measure the effect of the chemicals on the viability of the COS-1 cells. The assays were performed in a 48-well plate format and each condition was performed in triplicate. On day 1, cells were plated to approximately 50,000 cells per well. The cells were either transfected following the same protocol used for the transactivation assays or remained un-transfected. 16–18 h after transfection cells were treated with the respective chemical agents. For the transfected cells, a single concentration of the solvent control, the corresponding positive controls (model CAR activator for each species) PB, the test compound, or artemisinin were used at the highest concentrations used in the reporter assays. For the un-transfected COS-1 cells, the test chemical and artemisinin were evaluated at 1, 3, 10, and 30 μM concentrations in addition to single concentrations of the solvent control, PB or the positive control compounds. DMSO was used as a solvent control. On day 3 (24 h after chemical treatment), the cells were incubated at room temperature for 30 min, then washed and the media was replaced with 100 μL of PBS. An equal amount of CellTiter-Glo® Reagent was added to each well (100 μL). The cells were placed on an orbital shaker at room temperature for 2 min to induce lysis and then incubated at room temperature for 10 min to stabilize the luminescent signal. The samples were then transferred to a 96 well white plate (LUMITRAC 200, Greiner Bio-One, Monroe, NC) and the luciferase levels were measured with an Infinite M200 Pro Microplate Luminometer (Tecan, Mannedorf, Switzerland). Results were subsequently normalized to the DMSO solvent control and graphed.
Statistics: Data are expressed as means ± S.D. Quantitative data were examined by one way analysis of variance followed by the Dunnett’s post hoc test to compare both the test compound and artemisinin for statistical difference relative to the DMSO control. A two-tailed unpaired t-test was performed comparing all individual controls and single dose compounds to DMSO. Significance was declared if p < 0.01. All

CLH REPORT FOR SEDAXANE
187
statistical analyses were performed using GraphPad Prism v5.03 for Windows (GraphPad Software, San Diego, CA).
RESULTS AND DISCUSSIONCAR3 Reporter Assay: The results of the cell viability assays indicated that the treatment chemicals were largely well tolerated by the COS-1 cells, exhibiting at minimum 85% viability.
A concentration-dependent activation of mouse CAR3 by sedaxane was observed, with up to ~19-fold activation of mouse CAR3. The responses with mouse CAR were statistically significantly higher than control values at 3 – 30 μM sedaxane.
Sedaxane produced up to ~6-fold activation of rat CAR3, and the fold-change values were statistically significant at 10 and 30 μM.
The human CAR3 response to sedaxane was only statistically significant at 30 mM, the highest dose tested, and this latter response represented ~4-fold activation above solvent control.
The model positive control activators, CITCO, TCPOBOP and clotrimazole, produced robust responses in human, mouse and rat CAR3 constructs, respectively.
Artemisinin was also tested at 1, 3, 10 and 30 μM test concentrations and produced a concentration-dependent response that was much more marked with rat CAR3, followed by mouse CAR3 and human CAR3, respectively.
PB at a relative high concentration (1 mM) produced a statistically significant response in rat CAR3 (6-fold) and mouse CAR3 (2-fold), but it did not produce a response with human CAR3.

CLH REPORT FOR SEDAXANE
188
Table 3.9.4.8-1: CAR3 Report Assay Results with Sedaxane and Model Ligands SummaryConstruct Treatment Normalised luciferase
activityFold change
DMSO 0.011601867 1.0000PB 1mM 0.010391490 0.8957CITCO 5 µM 0.010286748 0.8866TCPOBOP 0.5 µM 0.008661510 0.7466CLOT 10 µM 0.016245838 1.4003Sedaxane 30 µM 0.010511278 0.9060
Empty vector
Artemisinin 30 µM 0.010042641 0.8656DMSO 0.006283901 1.000PB 1 mM 0.005458657 0.8687CITCO 5 µM 0.064987884** 10.3420
1 µM 0.004877789 0.77623 µM 0.005263889 0.837710 µM 0.013266357 2.1112
Sedaxane
30 µM 0.026488613** 4.21531 µM 0.007720766 1.22873 µM 0.010188791 1.621410 µM 0.017774689 2.8286
hCAR3
Artemisinin
30 µM 0.051286910** 8.1616DMSO 0.011443407 1.0000PB 1 mM 0.023631748** 2.0651TCPOBOP 0.5 µM 0.518724797** 45.3296
1 µM 0.019503281 1.70433 µM 0.059043391** 5.159610 µM 0.205904192** 17.9933
Sedaxane
30 µM 0.221323792** 19.34071 µM 0.021702898 1.89653 µM 0.045019349** 3.934110 µM 0.125842190** 10.9969
mCAR3
Artemisinin
30 µM 0.147682711** 12.9055DMSO 0.005454521 1.0000PB 1 mM 0.032469909** 5.9528CLOT 10 µM 0.5250540006** 95.4328
1 µM 0.006185896 1.13413 µM 0.007259148 1.330810 µM 0.014510891** 2.6603
Sedaxane
30 µM 0.034821633** 6.38401 µM 0.015965526 2.92703 µM 0.061147666 11.210510 µM 0.206790225** 37.9117
rCAR3
Artemisinin
30 µM 0.286011677** 52.4357** Statistically significant P<0.01
CONCLUSION: In summary, these data demonstrate that sedaxane is a direct activator of mouse, rat and human CAR. Under the conditions of this analysis, the activation of mouse CAR was stronger than the activation of rat or human CAR.

CLH REPORT FOR SEDAXANE
189
References:Auerbach S.S., Stoner M.A., Su S., Omiecinski C.J. (2005). Retinoid x receptor-α-dependent transactivation by a naturally occurring structural variant of human constitutive androstane receptor (NR1I3). Molecular Pharmacology 68: 1239-1253
Dekeyser J.G., Stagliano M.C., Auerbach S.S., Prabu K.S., Jones A.D., Omiecinski C.J. (2009). Di(2-ethylhexyl) phthalate is a highly potent agonist for the human constitutive androstane receptor splice variant, CAR2. Molecular Pharmacology 75: 1005-1013.
Omiecinski C.J., Vanden Heuvel J.P., Perdew G.P., Peters J.P. (2011a). Xenobiotic metabolism, disposition and regulation by xenobiotic receptors: from biochemical phenomenon to predictors of major toxicities. Toxicological Sciences 120 (S1): S49-S75.
Omiecinski C.J., Coslo D.M., Chen T., Laurenzana E.M., Peffer R.C. (2011b). Multi-species analyses of direct activators of the constitutive androstane receptor. Toxicological Sciences 123: 550-562.
3.9.4.9 Toyokawa and Sherf (2014)Report: Toyokawa K and Sherf B, 2014. Sedaxane: SYN524464 - Pregnane X receptor (PXR) trans-
activation assays with rat, mouse and human PXR. INDIGO Biosciences, Inc., 1981 Pine Hall Road, State College, PA 16801, USA. Laboratory Report No. TK0212218, 17 July 2014. Unpublished. (Syngenta File No. SYN524464_50730).
GUIDELINES: This was a mode of action study with no applicable guidelines (supplemental to EPA Guideline 870.4300).
GLP: The study was not conducted in compliance with EPA Good Laboratory Practice 40 CFR Part 160.
JUSTIFICATION FOR TEST SYSTEM SELECTION: The purpose of this study was to evaluate SYN524464 and clotrimazole for their potential to activate PXR, a nuclear receptor that transcriptionally regulates genes encoding transporters and drug-metabolizing enzymes primarily in the liver and intestine. The compounds were tested for agonist activity directed against human, rat and mouse PXR.
EXECUTIVE SUMMARYThe test substance, SYN524464, was evaluated for its potential to activate the pregnane X receptor (PXR) of human, rat and mouse. An additional compound, clotrimazole, was also tested for possible future use as a reference material. For PXR transactivation assays in human embryonic kidney cells, the ligand-binding domain of human, rat or mouse PXR was fused to the DNA binding domain of the transcription factor Gal4. The reporter vector used in this study was the firefly luciferase gene functionally linked to the Gal4 activation sequence. Concentrations of SYN524464 from 14 nM to 30,000 nM, and clotrimazole from 41 nM to 30,000 nM were prepared by serial dilution and tested in the PXR reporter assay system. TO901317 and pregnenolone-16α-carbonitrile were also tested at appropriate range of concentrations as positive or negative control compounds. After 24 hr, the emission of light was measured to quantify the relative light units, which is a surrogate measure of PXR activity. At each concentration of SYN524464, clotrimazole and the positive/negative controls, cell viability was also assessed using INDIGO’s Live Cell Multiplex (LCM) assay.
SYN524464 showed low, but statistically significant, agonist activity in the Human PXR assay from 3.33 µM to 30 µM. SYN524464 showed a maximum activity approximately 3.9-fold higher than the DMSO vehicle control and was considered to be an activator of human PXR.

CLH REPORT FOR SEDAXANE
190
SYN524464 showed emerging agonist activity in the rat PXR assay at a concentration of 30 µM. The maximum activity was approximately 3.1-fold higher than the DMSO vehicle control, and therefore SYN524464 was a considered to be an activator of rat PXR.
SYN524464 showed no agonist activity in the mouse PXR assay.
Clotrimazole showed low, but statistically significant, agonist activity in the Human PXR assay from 1.1 µM to 30 µM. Clotrimazole showed a maximum activity approximately 3.1-fold higher than the DMSO vehicle control and was considered to be an activator of human PXR.
Clotrimazole showed mild agonist activity in the rat PXR assay from 1.11 µM to 30 µM. Clotrimazole showed a maximum activity approximately 4.5-fold higher than the DMSO vehicle control and was considered to be an activator of rat PXR.
Clotrimazole did not show agonist activity in the mouse PXR assay.
The positive/negative control compounds produced appropriate responses that were species specific. TO901317 was the most potent activator of human PXR, whereas pregnenolone-16α-carbonitrile was the most potent activator of rat and mouse PXR. Cell viability was near 100% at all concentrations tested for both SYN524464 and the positive/negative controls. The highest concentration of clotrimazole (30 µM) gave an indication of emerging cytotoxicity in the mouse, rat and human PXR assays.
Based on the results of these luciferase reporter assays, SYN524464 is an activator of human PXR at concentrations ≥ 3.3 µM.
In the rat PXR assay, only the highest concentration of SYN524464 tested (30 µM) showed statistically significant activity exceeding a 2-fold increase. Thus, SYN524464 is an activator of rat PXR at a concentration of 30 µM.
SYN524464 was not an activator of mouse PXR.
Clotrimazole was an activator of both human and rat PXR, but not mouse PXR.
MATERIALS AND METHODSMaterials:
Test Material: SYN524464Description: Off white powder. Mixture of trans and cis isomersLot/Batch number: SMU6LP006/MILLEDPurity: 95.3% (sum of 83.0% SYN508210 and 12.3% SYN508211)CAS# 874967-67-6 (trans isomer # 599197-38-3, cis isomer # 599194-51-1)Stability of test compound: Reanalysis date end January 2015 (stored at 4°C)
Vehicle: DMSO.
Additional compounds: Clotrimazole (tested for possible future use as a reference material).TO901317 (positive control)Pregnenolone-16α-carbonitrile (negative control)
A stock dilution of SYN524464 (30 mM) and clotrimazole (40 mM) were prepared using DMSO. SYN524464 stock was stored at 4°C. Clotrimazole stock was stored at -20°C.
Experimental dates: Start: 20 February 2014, End: 21 February 2014,

CLH REPORT FOR SEDAXANE
191
Study Design and Methods:Reporter assays for human, rat and mouse PXRs were conducted with eight concentrations of SYN52446 ranging from 30,000 nM to a minimum concentration of 14 nM and with seven concentrations of clotrimazole ranging from 30,000 nM to a minimum concentration of 41 nM. Treatments were performed in triplicate. Performance of the all PXR agonist assays was validated by performing Reference Agonist dose response curves.
Assay methods: Plasmids. This study utilized proprietary nuclear receptor expression vectors encoding a hybrid receptor comprising the N-terminal Gal4 DNA binding domain fused to the ligand binding domain of the specific human, rat and mouse nuclear receptors (hPXR, rPXR and mPXR). The reporter vector used in this study comprised the firefly luciferase gene functionally linked to the Gal4 activation sequence (UAS).
PXR Assay Setup. Reporter Cells were generated by co-transfecting human embryonic kidney cells (INDIGO Biosciences archived stock) with the species specific PXR expression vectors and luciferase reporter vectors. 100 µL of respective reporter cell suspensions were dispensed into wells of white 96-well assay plates.
Agonist assays: Immediately prior to assay setup, the stock of SYN524464 was serially diluted using cell culture media to generate 2x-concentration media of 60,000, 20,000, 6,667, 2,222, 741, 247, 82, and 27.4 nM for all PXR assays, and the stock of clotrimazole was serially diluted using cell culture media to generate 2x-concentration media of 60,000, 20,000, 6,667, 2,222, 741, 247 and 82nM for all PXR assays. 100 µL of each 2x-treatment media containing dilutions of SYN524464 and clotrimazole were dispensed into triplicate assay wells containing PXR Reporter Cells. Final assay concentrations of SYN524464 were 30,000, 10,000, 3,333, 1,111, 370, 123, 41, and 14 nM for all PXR assays. Final assay concentrations of clotrimazole were 30,000, 10,000, 3,333, 1,111, 370, 123 and 41 nM for all PXR assays. Each individual treatment concentration contained 0.1% residual DMSO. Treated Reporter Cells were incubated at 37°C for 24 hr prior to quantifying nuclear receptor activity. INDIGO's media formulations utilize charcoal-stripped foetal bovine serum.
Serial dilutions of the reference compounds (TO901317 and pregnenolone-16α-carbonitrile) in DMSO were prepared in a similar manner, to achieve 7 incubation concentrations of each compound. The range of concentrations tested was based on prior experience with these model PXR activators. Reference groups always include a vehicle control group (0.1% DMSO) to determine background activity in the assay and to calculate fold-activation.
Measuring Cell Viability and PXR Activity. The INDIGO Biosciences Live Cell Multiplex Assay utilizes the fluorogenic substrate Calcein-AM to provide a sensitive, quantitative measure of the relative number of live Reporter Cells remaining in assay wells following their exposure to test compounds. Calcein-AM is a hydrophobic, non-fluorescent molecule that readily crosses cellular membranes. Once in the intracellular environment, Calcein-AM is hydrolyzed by endogenous esterases in a time- and temperature-dependent manner to generate calcein, a hydrophilic, highly fluorescent molecule. Due to the high charge density on the resulting reaction product, there is no appreciable loss of calcein from the intracellular compartment during the brief reaction period of the LCM Assay.
LCM assays were performed in multiplex, measuring relative cell viability from the same treated assay wells that were also measured for PXR activity. LCM assays were conducted in triplicate. After 24 hr treatment, the treatment media were manually removed from the PXR Reporter Cells. Assay wells were rinsed once with LCM Buffer, and LCM substrate was added. Following incubation at 37°C for 30 min, fluorescence was measured using a TECAN XFluor4 GENiosPro [485 nmEx 535 ׀ nmEm] to calculate relative numbers of live cells per assay well. LCM assay substrate was then manually removed, and 100 μL/well of INDIGO Luciferase Detection Reagent was added to each well. A GloMax Multi+ luminometer was used to quantify relative light units, which is a surrogate measure of PXR activity.

CLH REPORT FOR SEDAXANE
192
Assay validation: Reference compounds, TO901317 and pregnenolone-16α-carbonitrile were utilized to confirm the performance of the specific lot of Nuclear Receptor Reporter Cells treated with the test compound. Reference compound and test compound assays were performed at the same time and, hence, were exposed to the same assay reagents and environmental conditions. TO901317 and pregnenolone-16α-carbonitrile were tested in the human, rat and mouse PXR agonist assays and were expected to show species-specific activation of PXR reporters based on prior experience in this laboratory. Reference groups included a vehicle control group (0.1% DMSO) to determine background activity in the assay and to calculate fold-activation.
Statistics: Separately for each test compound or positive control material, quantitative data were examined by one-way analysis of variance followed by the Dunnett’s post hoc test to compare all groups for statistical difference relative to the DMSO control. Significance was declared if p < 0.01.
A test compound is assigned to be an activator of PXR in that species when: at least one concentration produces >2-fold increase vs. control and is statistically significant
(p<0.01), or two or more test concentrations produce statistically significant increases (p<0.01) and they
increase in a concentration-responsive manner.
A test compound that produces a statistically significant increase in PXR activity at only one high concentration that is not >2 fold vs. control is assigned as equivocal for activation.
RESULTS AND DISCUSSIONSYN524464 showed low, but statistically significant, agonist activity in the Human PXR assay from 3.33 µM to 30 µM. SYN524464 showed a maximum activity approximately 3.9-fold higher than the DMSO vehicle control, and was considered to be an activator of human PXR.
SYN524464 showed emerging agonist activity in the rat PXR assay at a concentration of 30 µM. The maximum activity was approximately 3.1-fold higher than the DMSO vehicle control, and therefore SYN524464 was considered to be an activator of rat PXR.
SYN524464 showed no agonist activity in the mouse PXR assay.
Clotrimazole showed low, but statistically significant, agonist activity in the Human PXR assay from 1.1 µM to 30 µM. Clotrimazole showed a maximum activity approximately 3.1-fold higher than the DMSO vehicle control and was considered to be an activator of human PXR.
Clotrimazole showed mild agonist activity in the rat PXR assay from 1.11 µM to 30 µM. The maximum activity was approximately 4.5-fold higher than the DMSO vehicle control, and therefore was considered an activator of rat PXR.
Clotrimazole did not show agonist activity in the mouse PXR assay.
In the LCM assays, a decrease in the % of live cells was observed at the highest test concentration of 30 µM clotrimazole for human PXR (88%), rat PXR (86%) and mouse PXR (75%). The partial cytotoxicity at 30 µM is probably responsible for the lower PXR activation responses at 30 µM compared to 10 µM with clotrimazole in the human and rat PXR assays.
The positive/negative control compounds gave appropriate responses that were species specific. TO901317 was the most potent activator of human PXR. Pregnenolone-16α-carbonitrile was inactive. In contrast, pregnenolone-16α-carbonitrile was the most potent activator of rat and mouse PXR. TO901317 was a weaker activator of rat and mouse PXR. Cell viabilities were close to 100% at all concentrations tested for both SYN524464 and the positive/negative controls. The highest concentration of clotrimazole (30 µM) showed emerging cytotoxicity in the mouse, rat and human PXR assays.

CLH REPORT FOR SEDAXANE
193
Table 3.9.4.9-1: Summary of Human, Rat and Mouse PXR Assay DataHuman Rat MouseCompound nM
PXR agonist assay
(fold-change)
LCM assay(% live cells)
PXR agonist assay
(fold-change)
LCM assay(% live cells)
PXR agonist assay
(fold-change)
LCM assay(% live cells)
13.7 0.97 101 1.0 101 1.09 10641.2 1.0 101 1.3** 102 1.1 106123 1.1 102 1.3** 102 1.0 106370 1.0 102 1.3** 101 1.1 1061111 1.3 104 1.3** 104 1.2 1063333 1.7** 105 1.5** 102 1.24 10610000 3.0** 103 1.7** 101 1.2 101
SYN524464
30000 3.9** 97 3.1** 99 0.75 97DMSO 0.1% 1.0 100 1.0 100 1.0 100
41.2 0.98 102 1.2 100 1.0 100123 1.0 101 1.2 102 0.81 101370 1.4 103 1.4 98 0.70** 981111 2.0** 105 1.8** 103 0.64** 1013333 3.1** 105 3.4** 100 0.43** 9810000 3.1** 100 4.5** 98 0.31** 90
Clotrimazole
30000 2.0** 88 2.7** 86 0.13** 75DMSO 0.1% 1.0 100 1.0 100 1.0 100
**Statistically significant p<0.01
CONCLUSION: Based on the results of these luciferase reporter assays, SYN524464 is an activator of human PXR at concentrations ≥ 3.3 µM.
In the rat PXR assay, only the highest concentration of SYN524464 tested (30 µM) showed statistically significant activity exceeding a 2-fold increase. Thus, SYN524464 is an activator of rat PXR at a concentration of 30 µM.
SYN524464 was not an activator of mouse PXR.
Clotrimazole was an activator of both human and rat PXR, but not mouse PXR.
3.9.4.10 Jolas (2015)Report: Jolas T, 2015. Sedaxane - In vitro dopamine D2S receptor binding assay. Eurofins Cerep, Le
Bois l'Evêque, B.P. 30001, 86 600 Celle l'Evescault, France. Laboratory Report No. 100014536, 03 June 2015. Unpublished. (Syngenta File No. SYN524464_11618)
GUIDELINES: Not applicable.
GLP: This study was not conducted according to Good Laboratory Practice Standards as defined by OECD. No claim of GLP compliance was made for this study.
Eurofins Cerep 's Quality Assurance Unit certifies that results presented in this report were generated using the materials and methods mentioned and that these results accurately reflect the raw data.

CLH REPORT FOR SEDAXANE
194
JUSTIFICATION FOR TEST SYSTEM SELECTION: The purpose of the study was to determine the potential of sedaxane to bind the dopamine D2S receptor in vitro.
EXECUTIVE SUMMARYSedaxane (purity 95.3%) was tested in triplicate at a concentration of 10 μM for its potential to bind the dopamine D2S receptor in vitro. Briefly, the assay determined the potential of sedaxane to bind to the dopamine receptor (D2S isoform, human recombinant, obtained from HEK-293 cells transfected at Eurofins Cerep with and stably expressing the human D2S gene) in vitro. Binding was assessed by displacement of [3H]methyl-spiperone, a known binder of the dopamine receptor.
When tested at a concentration of 10 μM, sedaxane did not trigger any significant reduction in control specific binding (<50%).
Under the conditions of the assay, sedaxane was not considered to bind to the dopamine D2S receptor in vitro.
MATERIALS AND METHODSMaterials:
Test Material: SedaxaneDescription: Off-white powder (mixture of 83.0% trans isomer and 12.3% cis isomer)Lot/Batch number: SMU6LP006/MILLEDPurity: 95.3% CAS#: 874967-67-6Stability of test compound: recertification date end January 2015, stored at <30°C
Vehicle: 1% DMSO
Reference standard: Non-tritiated (+)butaclamol
Experimental dates: Start: 08 April 2014, End: 09 April 2014
Experimental design: Sedaxane was tested in triplicate at a concentration of 10 μM (in 1% DMSO) for its potential to bind the dopamine receptor in vitro according to the relevant Cerep SOP (1B022). This assay is listed in the Eurofins Cerep online catalogue assay reference 0046, is based on that described by Grandy et al., 1989 and has been shown to be capable of detecting a range of dopamine D2S receptor binding compounds. Briefly, the assay determined the potential of sedaxane to bind to the dopamine D2S receptor (D2S isoform, human recombinant, obtained from HEK-293 cells transfected with and stably expressing the human D2S gene) in vitro. Binding was assessed by displacement of [3H]methyl-spiperone, a known binder (and antagonist) of the dopamine receptor. In order to check assay performance, displacement of [3H]methyl-spiperone by non-tritiated (+)butaclamol (a known binder [and antagonist] of the dopamine D2S receptor) as a reference standard was evaluated over the concentration range 30 pM – 1 μM (in 1% DMSO).
Data evaluation: The data are expressed as a percent of control specific binding and as a percent inhibition of control specific binding. The IC50 value (concentration causing a half-maximal inhibition of control specific binding) and Hill coefficient (nH) for (+)butaclamol were determined by non-linear regression analysis of the competition curves generated with mean replicate values using Hill equation curve fitting. The inhibition constant (Ki ) for (+)butaclamol was calculated using the Cheng Prusoff equation.
For the test substance, strict criteria for determination of a positive response for dopamine D2S receptor binding were not applied to the assay. However, a guideline value of ≥50% inhibition of control specific

CLH REPORT FOR SEDAXANE
195
binding was used to indicate a positive response, in conjunction with other considerations, if applicable, such as increasing effect with increasing concentration.
RESULTS AND DISCUSSION
Assay performance: In order to assess assay performance, a reference standard was included in the assay ((+)butaclamol over the concentration range 30 pM – 1 μM). The calculated IC50, Ki and nH values were consistent with those previously obtained at Eurofins Cerep, indicating the assay performed as expected.
Table 3.9.4.10-1: Calculated IC50, Ki and nH Values for the Assay Reference Standard (+)Butaclamol
Compound IC50 (nM) Ki (nM) nH
(+)butaclamol 2.2 0.72 1.1
Assay results: When tested at a concentration of 10 μM, sedaxane did not trigger any significant reduction in control specific binding (<50%).
Table 3.9.4.10-2: Mean (± Standard Deviation) Data for SedaxaneConcentration (µM) % of Control Specific Binding (Mean
± SD)% Inhibition of Control Specific
Binding (Mean ± SD)10 93.7±2.4 6.3±2.4
CONCLUSION: Under the conditions of the assay, sedaxane was not considered to bind to the dopamine D2S receptor in vitro.
References:Grandy, D.K et al.,1989. Proc. Natl. Acad. Sci. U.S.A., 86: 9762-9766.
DS comment: a justification of the tested concentration has been requested. The applicant has provided the following statement.
A maximum concentration of 10 µM sedaxane for in vitro mechanistic testing was based on the approximate in vivo blood concentration that was achieved at steady-state following dietary administration to male rats. The concentration of 10 µM was selected using data from a 28-day comparative dietary study of sedaxane and its individual isomers in Wistar rats, where SYN524464 = sedaxane (1:1 ratio of trans and cis isomers), SYN508210 = the trans isomer, and SYN508211 = the cis isomer (see 3.12.1.1). The maximum µM concentration was calculated based upon the Cmax at Day 14 of dietary administration, which would represent the maximum concentration at steady state. The steady state concentration (Css) is a dynamic equilibrium where the rate of input is equal to the rate of elimination. Generally, it is considered that steady state has been achieved after approximately 4-5 times the half-life for a substance after regular dosing is started. Because the Css is approximately the total exposure during a dosing interval divided by time of the dosing interval, the Cmax at Day 14 would represent a more conservative value for dose setting for the in vitro mode of action studies due to the assumption that animals feed primarily during the dark cycle but also sporadically during the light cycle. The following was the conversion of µg/mL to µM for the Cmax:
Cmax (µg/mL) x 1 µmol/331.4 µg x 1000 mL/Lwhere 331.4 µg/µmol is the molecular weight of sedaxane.
Table 3.9.4.10-3: µM Cmax values for Day 14 at 2000 and 5000 ppm Cmax (µM)

CLH REPORT FOR SEDAXANE
196
2000 ppmMale
2000 ppmFemale
5000 ppmMale
5000 ppmFemale
Group trans cis trans cis trans cis trans cisSYN508210 1.7 7.3 14.3 15.4SYN508211 1.0 2.0 0.6 4.5
0.5 N/A 1.4 0.1 1.9 0.1 3.9 0.2SYN5244640.5 1.5 2.0 4.1
As shown above, the high dose group (5000 ppm) females administered SYN508210 (trans) had the highest Cmax at steady state with a value of 15.4 µM (based on a measured value of 5.11 µg/mL SYN508211) while the 5000 ppm dose group administered SYN524464 (1:1 trans:cis) had Cmax at steady state of 4.1 µM (trans + cis). The 2000 ppm dose group females administered SYN508210 (trans) had Cmax at steady state of 7.3 µM while the 2000 ppm dose group administered SYN524464 (1:1 trans:cis) had Cmax at steady state of 1.5 µM (trans + cis).
The technical active ingredient ratio used in the 2-year chronic/carcinogenicity study was ~ 85%trans and 15% cis isomers. Therefore, based on the values for Cmax, it was reasonable to conclude that the 3600 ppm dose groups of the 2-year chronic/carcinogenicity study would have average blood concentrations at steady state (Css) of ~ 10 µM or less. Hence, for the Jolas (2015) and Lake (2014) Annex I. 3.9.4.16, in vitro mode of action studies used to support human non-relevance of the uterine tumours in the female rat and thyroid tumours in male rat at 3600 ppm, it was determined that a top concentration of 10 µM would be appropriate and provide meaningful testing results at conservative, physiologically relevant concentrations reflected in the 2 year chronic/carcinogenicity study.
The justification submitted is considered acceptable.
3.9.4.11 Anonymous (2016)Report: Anonymous, 2016. Sedaxane: SYN524464 - Microscopic evaluation of vagina, uterus and ovary
from subchronic and chronic rat dietary studies to determine cycle stage. Laboratory Report No. 140-130, 01 February 2016. Unpublished. (Syngenta File No. SYN524464_50894).
GUIDELINES: This was an investigative study with no applicable guidelines (supplemental to EPA Guideline 870.4300).
GLP: The study was not conducted according to EPA Good Laboratory Practice Standard 40 CFR Parts 160 and 792. The pathology methodology and reporting were subjected to quality assurance audit.
JUSTIFICATION FOR TEST SYSTEM SELECTION: The objective of this study was to determine the cycle stage based on the microscopic examination of the vagina, uterus, and ovary of female rats exposed to SYN524464 (sedaxane) in their diets for intervals ranging from 13 to 104 weeks.
EXECUTIVE SUMMARYThe reproductive status of 212 female Wistar rats from 2 dietary toxicity studies with sedaxane was determined from the examination of H&E stained sections of vagina, uterus and ovaries. Slides for examination were separated into 5 different subgroups (A - E) based on the time period when necropsy occurred in the studies, as follows:A = sacrificed at 13 weeksB = died 0 - 52 weeksC = sacrificed at 52 weeksD =died 53 -104 weeksE = sacrificed at 104 weeks
The tissues were coded. Histological features of oestrous cyclicity as published by Westwood (2008) were used as the basis for determining the reproductive cycle (dioestrus, proestrus, oestrus and metoestrus) of

CLH REPORT FOR SEDAXANE
197
each animal. In addition to oestrous cyclicity, older rats not regularly cycling were evaluated for histological evidence of persistent oestrus, repetitive pseudopregnancy, or persistent anoestrus, which are the three major stages of reproductive senescence in rats. Although these stages were evaluated by examining the vagina, uterus and ovaries, the diagnosis was assigned only to the vagina and supported by characteristic histological features, if present, in the uterus and or ovaries. "Asynchrony" was noted in those cases where the ovary and/or uterus findings did not match the appropriate vaginal morphology for a particular oestrous cycle stage of regularly cycling animals that were not in persistent oestrus, repetitive pseudopregnancy, or persistent anoestrus.
All findings that were observed in the vagina, uterus and ovaries during microscopic examination were recorded and an overall diagnosis of the reproductive cycle stage was made. A peer review of the coded findings was conducted by a second pathologist, prior to decoding the results. After agreement on the final assignments, the individual animal data were decoded and incidences of each cycle stage and/or descriptors in the vagina, uterus and ovaries were summarized by treatment group.
Generally, in looking across all age groups, the results indicated that regardless of treatment group, virtually all of the females in the 13-week study as well as the 52-week interim sacrifice subgroup were cycling, but by 104 weeks the vast majority animals were in either repetitive pseudopregnancy or persistent anoestrus, regardless of treatment group. In contrast, the incidence of persistent oestrus in these Wistar rats was extremely low at all time intervals. While correlating findings across the three tissues were apparent in rats up through 52 weeks of age (in accord with the descriptors of Westwood, 2008), much greater variability across these tissues was the norm in animals from 53 - 104 weeks of age.
In rats from 13 weeks to 52 weeks of age, there were no clear differences between the SYN524464 treated groups and the control group. In rats beyond 53 weeks of age (including decedents plus 104-week terminal sacrifice), the majority of animals showed evidence of either repetitive pseudopregnancy or persistent anoestrus. Persistent oestrus was virtually absent at all ages up through 104 weeks. In older rats (subgroups D and E combined), a lower incidence of repetitive pseudopregnancy and vaginal mucification, and a higher incidence of persistent anoestrus, was observed for the 3600 ppm animals compared to the controls. In the 1200 ppm animals, no differences from the concurrent group were observed in cycle stages or in descriptors in individual tissues.
While correlating findings across the three tissues were apparent in rats up through 52 weeks of age (in accord with the descriptors of Westwood, 2008), much greater variability across these tissues was the norm in animals from 53 – 104 weeks of age.
In rats from 13 weeks to 52 weeks of age, the majority of animals were cycling and there were no clear differences between the SYN524464 treated groups and the control group. In rats beyond 53 weeks of age (including decedents plus 104-week terminal sacrifice), the majority of animals showed evidence of senescent stages either repetitive pseudopregnancy or persistent anoestrus. Persistent oestrus was virtually absent at all ages up through 104 weeks. In older rats (subgroups D and E combined), a lower incidence of repetitive pseudopregnancy and vaginal mucification, and a higher incidence of persistent anoestrus, was observed for the 3600 ppm animals compared to the controls. In the 1200 ppm animals, no differences from the concurrent group were observed in cycle stages or in descriptors in individual tissues.
MATERIALS AND METHODSExperimental dates: Start 08 September 2015 End 10 November 2015
Samples: Microscopic slides of female tissues (vagina, uterus, ovaries) were provided from two dietary studies:
Anonymous (2009) SYN524464 - 13 Week Rat Dietary Toxicity Study. Report Number 28825, Final Report Amendment 1, Laboratory Study Num
458299, (Syngenta File No. SYN524464/11146). Treatment groups examined: 0 and 4000 ppm SYN524464

CLH REPORT FOR SEDAXANE
198
Anonymous (2010) SYN524464- 104 Week Rat Dietary Carcinogenicity Study with Combined 52 Week Toxicity Study. Laboratory Report Number 30196, Laboratory Study Number 458304, (Syngenta File No. SYN524464/11306). Treatment groups examined: 0, 1200 and 3600 ppm SYN524464
The animals were divided into 5 different subgroups based on the time period (age) and fate (i.e. deceased or scheduled sacrifice) as shown:
Subgroup Time period / fate Total number of ratsA 13 weeks, scheduled sacrifice 20B 0-52 weeks, deceased 5C 52 weeks, scheduled sacrifice 33D 53-104 weeks, deceased 29E 104 weeks, scheduled sacrifice 125
For each designated subgroup (A- E) the slides were coded. Therefore, the pathologist had knowledge of the time/fate group assignment, but no knowledge of the treatment for each individual animal within that group.
For each animal, 4 slides were present which generally included a cross section of the vagina, a longitudinal section of both uterine horns; cross sections of the uterine horns, and 1section of each ovary. The slides were stained by haematoxylin and eosin (H&E).
Study Design and Methods:Prior to the microscopic examination, a set of descriptive terms to be used by the study pathologist was jointly agreed upon by Syngenta and the study pathologist. The reproductive oestrous cycle of each animal was determined by examining the vagina, uterus, and ovaries according to collective criteria regarding histologic changes associated with the oestrous cycle of the female rat reproductive system. In particular, histologic features of oestrous cyclicity as published by Westwood (2008) were used by the study pathologist as the basis for determining the reproductive cycle of each animal.
In addition to oestrous cyclicity, older rats not regularly cycling were evaluated for histological evidence of persistent oestrus, repetitive pseudopregnancy, or persistent anoestrus, which are the three major stages of reproductive senescence in rats. Although these stages were evaluated by examining the vagina, uterus, and ovaries, the diagnosis was assigned only to the vagina and supported by characteristic histological features, if present, in the uterus and or ovaries. "Asynchrony" was noted in those cases where the ovary and/or uterus findings did not match the appropriate vaginal morphology for a particular oestrous cycle stage of regularly cycling animals that were not in persistent oestrus, repetitive pseudopregnancy, or persistent anoestrus.
In addition to cyclicity, a non-quantitative assessment was made for the presence of various follicles and corpora lutea in the ovaries. The ovarian follicles were evaluated as primary, secondary, antral, Graffian or atretic follicles. Corpora lutea were either assessed as mature, new or cystic. No attempt to stage the age of the corpora lutea (to growth or regression) was conducted.
After the histology descriptors for each tissue had been assigned based on an examination of slides via light microscopy, a peer review of the coded pathology findings was performed by the Syngenta pathologist (Dr. Doug Wolf, Syngenta Crop Protection, LLC, Greensboro, NC). After this peer review, the coding of animals within each subgroup was revealed, and the incidences of cycle stages and descriptors for each tissue were tabulated by treatment group.
Statistics: Not applicable. Analysis of study data was limited to visual comparison of the combined incidences across control and treated groups.

CLH REPORT FOR SEDAXANE
199
RESULTS AND DISCUSSIONGenerally, in looking across all age groups, the results indicated that regardless of treatment group, virtually all of the females in the 13-week study as well as the 52-week interim sacrifice subgroup were cycling, but by 104 weeks the vast majority animals were in either repetitive pseudopregnancy or persistent anoestrus, regardless of treatment group. In contrast, the incidence of persistent oestrus in these Wistar rats was extremely low at all time intervals.
Subgroup A [13 Weeks - Scheduled Kill]: In general, all Group A females appeared to be cycling. Two 4000 ppm Sedaxane females appeared to have asynchronized cycles. There were no females in persistent oestrus, repetitive pseudopregnancy, or in persistent anoestrus.
Subgroup B [0-52 Weeks - Animals Deceased]: There were only five animals in this group. All were cycling except for one female in the control group which appeared to be in repetitive pseudopregnancy. There was nothing unusual to note across the treatment groups.
Subgroup C [52 Weeks- Scheduled Kill]: Group C females were also cyclic (with one exception) but had a tendency of increased asynchrony across controls and both treated groups.
Subgroup D [53-104 Weeks-Animals Deceased]: Females in this group became increasingly acyclic and were primarily in either repetitive pseudopregnancy or persistent anoestrus.
Subgroup E [104 Weeks - Scheduled Kill]: By 104 weeks nearly all females, regardless of treatment group, had a reproductive cycle stage of either repetitive pseudopregnancy or persistent anoestrus. A small number of rats were still cycling, and the majority of these showed synchronous findings across the three tissues.
The combined incidences in Subgroups D and E (animals that survived to terminal sacrifice and those that died at an unscheduled interval prior to terminal sacrifice) showed a slightly lower incidence of vaginal mucification for the 3600 ppm sedaxane females. Most likely this incidence reflects both the lower incidence of repetitive pseudopregnancy and increased incidence of persistent anoestrus in the 3600 ppm treatment group compared to the control group. In contrast, there were no apparent differences in vaginal descriptive findings or cycle stages between the 1200 ppm treatment group and the controls.

CLH REPORT FOR SEDAXANE
200
Table 3.9.4.11-1 Summary data for subgroups A, B, C, D and ESubgroup
ASubgroup
BSubgroup
CSubgroup
DSubgroup
EDietary concentration sedaxane (ppm)
Descriptive finding
0 4000 0 1200 3600 0 1200 3600 0 1200 3600 0 1200 3600Ovary (no. examined)
10 10 1 1 3 12 11 10 7 15 7 44 37 44
NAD 0 0 0 0 0 0 0 0 0 1 1 0 1 0Primary follicles 10 4 1 0 1 5 3 0 0 1 0 4 1 3Secondary follicles 10 10 1 1 3 10 5 7 3 5 3 21 15 18Antral follicles 10 10 1 1 3 9 10 9 3 9 3 26 21 23Graafian follicles 3 1 0 0 1 4 3 3 1 0 0 0 3 6Atretic follicles 10 8 1 1 3 9 8 7 6 12 5 37 29 32Cystic follicles 0 3 0 0 1 3 3 1 0 2 0 8 15 12Corpora lutea (mature)
10 10 1 1 3 10 10 9 7 13 5 40 36 42
Corpora lutea (new)
4 2 0 0 1 3 4 4 1 1 0 2 2 1
Cyst; corpora lutea 0 0 0 0 0 0 0 0 0 1 1 0 0 2Leutinised follicles (unruptured)
0 0 0 0 0 0 0 0 0 0 0 1 0 0
Ovary oestrus cycle (no. examined)
10 10 1 1 3 12 11 10 7 15 7 44 37 44
NAD 0 1 0 1 0 1 0 1 6 13 7 39 34 41Dioestrus 2 5 0 1 0 6 5 4 0 1 0 3 1 1Metoestrus 5 2 0 0 0 3 4 2 0 1 0 1 2 0Oestrus 3 1 0 0 1 0 0 2 0 0 0 1 0 1Proestrus 0 1 0 0 1 2 2 1 1 0 0 0 0 1
Uterus (no. examined)
10 10 1 1 3 12 11 10 7 15 7 44 37 44
NAD 2 6 0 1 0 5 3 4 1 8 2 8 7 7Cystic endometrial hyperplasia
0 0 0 0 0 2 0 0 0 0 0 10 5 7
Apoptosis; gland/surface epi.
8 3 0 0 2 4 7 4 0 1 0 2 2 2
Dilation; lumen 0 1 0 0 1 2 1 2 1 0 0 1 0 3Squamous metaplasia
0 0 0 0 0 0 1 0 0 0 0 0 0 0
Folded epithelium 0 0 1 0 0 0 0 1 1 1 0 19 15 14Endometrium; inactive
0 0 0 0 0 0 0 0 4 5 5 11 10 15
Uterus oestrous Cycle (no. examined)
10 10 1 1 3 12 11 10 7 15 7 44 37 44
NAD 0 0 1 0 0 0 0 1 6 14 7 39 34 40Dioestrus 2 4 0 1 0 7 3 3 0 0 0 3 1 1Metoestrus 5 2 0 0 2 3 6 2 0 1 0 1 2 0Oestrus 3 2 0 0 0 0 1 3 0 0 0 1 0 2Proestrus 0 3 0 0 1 2 1 1 1 0 0 0 0 1
Vagina (no. examined)
10 10 1 1 3 12 11 10 6 15 7 44 37 44
NAD 7 6 0 1 1 9 9 5 1 2 0 3 2 1Epithelium, inactive
0 0 0 0 0 0 0 0 3 6 6 12 12 21
Mucification 0 1 1 0 2 1 2 1 2 6 1 27 23 20Cornification 3 3 0 0 0 2 0 4 0 1 0 2 0 2
Vaginal oestrus cycle (no.
10 10 1 1 3 12 11 10 6 15 7 44 37 44

CLH REPORT FOR SEDAXANE
201
examined)Asynchrony 0 2 0 0 1 4 4 2 0 0 0 1 1 0Repetitive pseudopregnancy
0 0 1 0 0 0 0 1 2 6 1 27 22 18
Persistent anoestrus
0 0 0 0 0 0 0 0 3 6 6 12 12 21
Persistent oestrus 0 0 0 0 0 0 0 0 0 1 0 0 0 1Dioestrus 2 4 0 1 0 4 3 3 0 1 0 2 1 1Metoestrus 5 2 0 0 1 5 6 2 0 1 0 1 1 0Oestrus 3 3 0 0 0 2 0 4 0 0 0 2 0 1Proestrus 0 1 0 0 2 1 2 0 1 0 0 0 1 2NAD = nothing abnormal discovered
Table 3.9.4.11-2: Incidences of Vagina and Oestrus Cycle Stages in Subgroups D and E CombinedDietary concentration sedaxane (ppm)
0 (control) 1200 3600Vagina Descriptive findings. No. examined 50 52 51Nothing Abnormal Discovered 4 4 1Epithelial, inactive 15 18 27Mucificatiom 29 29 21Cornification 2 1 2
Vagina oestrus cycle. No. examined 50 52 51Repetitive pseudopregnancy 29 28 19Persistent anoestrus 15 18 27Persistent oestrus 0 1 1Total – senescent stages 44 47 47Dioestrus 2 2 1Metoestrus 1 2 0Oestrus 2 0 1Proestrus 1 1 2
CONCLUSION: While correlating findings across the three tissues were apparent in rats up through 52 weeks of age (in accord with the descriptors of Westwood, 2008), much greater variability across these tissues was the norm in animals from 53 – 104 weeks of age.
In rats from 13 weeks to 52 weeks of age, the majority of animals were cycling and there were no clear differences between the SYN524464-treated groups and the control group. In rats beyond 53 weeks of age (including decedents plus 104-week terminal sacrifice), the majority of animals showed evidence of senescent stages, either repetitive pseudopregnancy or persistent anoestrus. Persistent oestrus was virtually absent at all ages up through 104 weeks. In older rats (subgroups D and E combined), a lower incidence of repetitive pseudopregnancy and vaginal mucification, and a higher incidence of persistent anoestrus, was observed for the 3600 ppm animals compared to the controls. In the 1200 ppm animals, no differences from the concurrent group were observed in cycle stages or in descriptors in individual tissues.
References:Westwood FR. (2008). The female rat reproductive cycle: A practical histological guide to staging. Toxicol Pathol 36, 375-384.

CLH REPORT FOR SEDAXANE
202
3.9.4.12 Anonymous (2015a)Report: Anonymous 2015a. Isopyrazam – Evaluation of hypothalamic tyrosine hydroxylase in control
female Wistar rats at 3, 12 or 24 months by immunohistochemistry and in-situ hybridization. Laboratory Report No. MM011, 20 March 2015. Unpublished. (Syngenta File No. SYN520453_50242).
GUIDELINES: This was an investigative study with no applicable guidelines (supplemental to EPA Guideline 870.4300).
GLP: The study was not conducted according to EPA Good Laboratory Practice Standard 40 CFR Parts 160 and 792. This study was not audited by a Quality Assurance Unit.
JUSTIFICATION FOR TEST SYSTEM SELECTION: The purpose of this experiment was to visualise and quantify dopaminergic neurons in the TIDA region of the hypothalamus from control female Wistar rats of different ages (3-month, 12-month and 24-month groups) using tyrosine hydroxylase (TH) immunohistochemistry (IHC) and RNAscope™ in situ hybridisation (ISH).
EXECUTIVE SUMMARYThis study examined formalin-fixed, paraffin-embedded (FFPE) tissue sections from the hypothalamus from control female Wistar rats, to determine the changes over time in the number of dopaminergic (tyrosine hydroxylase, TH positive) neurons. The rats were obtained from a 90-day and a combined 12- and 24-month dietary study with isopyrazam. FFPE blocks were sectioned to explore TH staining in the ARC and ME areas. TH stained brain sections from the control brains from both studies were examined by a pathologist to explore their suitability in terms of the appropriate topography (Bregma level 2.16 – 3.14) by examination of the arcuate nucleus (ARC) and median emminence (ME) areas of the tuberoinfundibular dopaminergic (TIDA) region. Homologous sections from each animal were stained for TH using immunohistochemistry (IHC) to detect TH protein and RNAscopeTM in situ hybridisation (ISH) for TH mRNA. The TH stained sections were evaluated and selected for Image Analysis on the basis of appropriate TIDA topography. TH staining of the ARC, ME and the combined ARC + ME areas of TIDA neurons was quantified using intensity based image analysis. For each age group, the IHC staining displayed higher amounts in the ME region than in the ARC region of the TIDA, which is consistent with localization of tyrosine hydroxylase protein to a greater extent in the axons (ME) than in the cell bodies (ARC). In contrast, the ISH staining for tyrosine hydroxylase mRNA was predominantly in the ARC, which is consistent with localization of TH mRNA predominantly in the cell bodies (ARC) rather than the axons (ME).
Image analysis of the tyrosine hydroxylase (TH) immunostained ARC alone, ME alone and ARC+ME regions of interest (ROIs) indicated that mean values were statistically significantly lower in all three regions for the 2-year animals compared to the 1-year animals.
By contrast there was a slight but significant (p<0.05) increase in TH protein staining in the ME and ARC+ME regions of the 1-year control animals compared to the 90-day control animals.
Image analysis of the tyrosine hydroxylase (TH) ISH-stained mRNA in the ARC alone and ARC+ME regions of interest (ROIs) indicated that there was a statistically significantly lower (p<0.01) level of TH mRNA staining in these regions for the 2-year animals compared to the 90-day controls. Although the 12-month control TH ISH staining in the ARC alone and ARC+ME regions appeared lower than in the 90-day control group, this was not statistically significant due to large standard deviations for data in these groups. Plots of the individual animal data for ISH staining in the ARC alone and the ARC+ME regions also reflected these same patterns, including the general trend of lower values from 90 days to 1 year to 2 years in control animals.

CLH REPORT FOR SEDAXANE
203
Examination of TH expression in the TIDA neurons of the hypothalamus of the 90-day, 12-month and 2-year control groups showed that the mRNA expression of TH in the ARC and ARC+ME decreased progressively with age. Despite large variation between individual animals, the difference in these ISH values was statistically significant when comparing the 1-year and 2-year control groups. TH protein expression in the ARC alone, ME alone and ARC+ME was also statistically significantly lower at the 2-year time point than at the 1-year time point, but not when comparing the 90-day and 2-year control groups. TH protein expression in the ME alone and ARC+ME was a statistically significantly higher at the 1-year time point than at the 90-day time point which is conflicting with ISH measurements. While decline in the expression of TH protein in the ARC and ME regions of the hypothalamus in aging rats caused by senescence of dopaminergic TIDA neurons are reported in literature (Sanchez, et al., 2003), in the present study, the absence of correlation between mRNA staining and protein staining weakens the strength of the results to support age-related senescence of dopaminergic TIDA neurons.
MATERIALS AND METHODSExperimental dates: Start: 17 October 2012, End: 1 May 2013
Samples: Formalin-fixed, paraffin-emedded (FFPE) tissue sections from the hypothalamus from control female Wistar rats were provided from two dietary studies:
2007. 13-Week Dietary Study with Isopyrazam in Wistar Rats. (3-Month control group: 10 female rats)
, 2008. Two Year Chronic Toxicity and Carcinogenicity Study with Isopyrazam in Wistar Rats. (12-Month control group: 12 female rats and 24-Month control group, including decedents: 52 female rats).
The brains for further image analysis were selected on the basis of their TIDA morphology. The aim was to select sections at Bregma level 2.4 mm for the ARC nuclei and ME. The selection was based upon sections which were at or nearest to Bregma 2.4 mm, and preferably within 2.16-3.24 mm. Subsequent to TH IHC staining possible candidates were selected for image analysis based on TIDA morphology. The 24-month control rat tissues were selected, stained and evaluated for proper morphology as described in an earlier report ( , 2015a; Report number MM005).
The staining batches and image analysis procedures were conducted on these animals’ TIDA neurons on the following dates:
Control Group
Date of IHC staining
Date of ISH staining
Date of ISC image analysis
Date of ISH image analysis
3 month 25/01/2013 19/03/2013 17/04/2013 20/04/2013
12 month 13/11/2012 30/11/2012 16/04/2013 17/04/2013
24 month 28/08/2012 3-5/09/2012 (a) 19/04/2013 20/04/2013
(a) 2 yr TH ISH slides stained in 3 batches on consecutive days
Study Design and Methods: Tyrosine hydroxylase immunohistochemical staining: FFPE brain sections containing the hypothalamus (4 µM thickness, 1 section per animal) were immunostained as follows:
Following heat induced epitope retrieval (HIER) in NovocastraTM pH6 retrieval buffer, sections were stained using a Vision Biosystems Bond x staining robot. Sections were dehydrated with xylene, coverslipped and imaged using an Olympus Provis research microscope. The primary anti-tyrosine hydroxylase antibody (Abcam#Ab211) was used at a 1:20,000 dilution, then a secondary antibody (Leica Biosystems BondTM anti rabbit HRP polymer #DS9800) was applied. The signal was detected using 3,3’-

CLH REPORT FOR SEDAXANE
204
diaminobenzidine (DAB) solution. In the presence of horseradish peroxidase (HRP), DAB substrate oxidatively polymerized to an insoluble brown polymer, which could be detected visually. The slides were counterstained with Gill’s haematoxylin (cell nuclei staining). Montages of microscopic images of each slide were prepared in Adobe™ photoshop and stored with the study data.
Tyrosine hydroxylase RNAscope™ in situ hybridisation staining: FFPE brain sections containing the hypothalamus (4 µM thickness, 1 section per animal) were stained for TH mRNA as follows:
RNAscopeTM in situ hybridisation was performed on rat brain FFPE sections as described in the Advanced Cellular Diagnostics method entitled RNAscope™ 2.0 FFPE Assay User Manual. Briefly, FFPE sections were deparaffinised and subjected to proteinase K digestion. After washing, tissue sections were hybridised with TH probes at 40ºC for 2 h. The hybridisation signal was amplified using sequential hybridisation with a series of specialised oligonucleotides (Amp1-Amp4) and lastly a horseradish peroxidase (HRP)-linked oligonucleotide. The hybridisation signal was detected using DAB solution. In the presence of HRP, DAB substrate oxidatively polymerized to an insoluble brown polymer, which could be detected visually. Finally, slides were counterstained with Gill’s haematoxylin (cell nuclei staining), dehydrated though a series of alcohols and mounted using Cytoseal mounting medium. Montages of microscopic images of each slide were prepared in Adobe™ photoshop and stored with the study data.
Image analysis for Tyrosine hydroxylase immunohistochemical and RNAscope™ in situ hybridisation staining: The IHC and ISH stained brain sections were evaluated by light microscopy and selected based on TIDA topography for image analysis.
The selected sections were gridded and from these grids the grid numbers which covered the regions of interest (ROI) were identified, namely the ARC and ME from the TIDA of the hypothalamus. The images were measured in a blinded fashion. Image aquisition was performed on an Olympus Provis microscope equipped with a Zeiss axiocam video camera using Image Pro Plus software (Media Cybernetics). The TH DAB labelling was quantified using image J software.
To quantify the chosen fields for DAB labelling, images were filtered on the basis of their colour and all red/brown pixels were isolated and used to generate a mask that exclusively showed all detected pixels/areas as labelled by DAB. Based on the pixel dimensions the area occupied by DAB positive pixels within the ROI was calculated (µM2). Hence this data represented the summed area of DAB/TH staining from multiple grid squares. The measurements were expressed as the mean and the standard deviation (SD) of the total DAB-labelled area per region of interest (ROI).
Statistical analysis: Statistical analysis on TH IHC and TH ISH image analysis results was performed via a Student’s T Test (one-tailed) using Microsoft Excel 2007. Pairwise comparisons were conducted between each of the 3 different control groups’ values, and statistical significance was assigned at p<0.05 and p<0.01.
RESULTS AND DISCUSSIONTyrosine hydroxylase immunohistochemical staining: The results from the 90-day, 12-month and 2-year control groups were compared to look for trends in IHC staining of the TIDA region with age. For each age group, the IHC staining displayed higher amounts in the ME region than in the ARC region of the TIDA, which is consistent with localization of tyrosine hydroxylase protein to a greater extent in the axons (ME) than in the cell bodies (ARC).
Image analysis of the tyrosine hydroxylase (TH) immunostained ARC alone, ME alone and ARC+ME regions of interest (ROIs) indicated that mean values were statistically significantly lower in all three regions for the 2-year animals compared to the 1-year animals. By contrast there was a slight but significant (p<0.05) increase in TH protein staining in the ME and ARC+ME regions of the 1-year control animals compared to the 90-day control animals.

CLH REPORT FOR SEDAXANE
205
It should be noted that there was no statistical decrease in TH protein staining in the ARC, the ME and ARC+ME regions of the 2-year control animals compared to the 90-day control animals.
Figure3.9.4.12-1 : Quantification of TH protein in the TIDA region based on the IHC labeling in control groups of increasing age. Histogram shows the DAB positive area (µM2) for IHC staining in the ARC only, ME only and ARC+ME of the TIDA for 90-day, 12-month and 2-year control animals. Results are mean (DAB +ve threshold/ROI area μM2) ± SD, n=8-10.
* statistically significantly different p<0.05, by students t-test 1 tailed type 2
**statistically significantly different p<0.01, by students t-test 1 tailed type 2
Tyrosine hydroxylase RNAscopeTM in situ hybridization (ISH) staining: The results from the 90-day, 12-month and 2-year control groups were compared to look for trends in ISH staining of the TIDA region with age. In all of the age groups, the ISH staining for tyrosine hydroxylase mRNA was predominantly in the ARC, which is consistent with localization of TH mRNA predominantly in the cell bodies (ARC) rather than the axons (ME).
Image analysis of the tyrosine hydroxylase (TH) ISH-stained mRNA in the ARC alone and ARC+ME regions of interest (ROIs) indicated that there was a statistically significantly lower (p<0.01) level of TH mRNA staining in these regions for the 2-year animals compared to the 90-day controls. Although the 12-month control TH ISH staining in the ARC alone and ARC+ME regions appeared lower than in the 90-day control group, this was not statistically significant due to large standard deviations for data in these groups. Plots of the individual animal data for ISH staining in the ARC alone and the ARC+ME regions also reflected these same patterns, including the general trend of lower values from 90 days to 1 year to 2 years in control animals.
There was a significantly (P<0.01) higher level of TH mRNA staining in the ME alone of the 2-year control group compared to the 90-day control group. However, the level of TH mRNA staining in this region was very low compared to the ARC region (>10 fold lower than the ARC), and therefore this apparent difference is not considered biologically significant.

CLH REPORT FOR SEDAXANE
206
Figure 3.9.4.12-1 Quantification of TH mRNA in the TIDA region based on the ISH labeling in control groups of increasing age. Histogram shows the image analysis data for ISH staining in the ARC only, ME only and ARC+ME of the TIDA for 90-day, 12-month and 2-year control animals. Results are mean (DAB +ve threshold/ROI area μM2) ± SD, n=8-10.
* statistically significantly different p<0.05, by students t-test 1 tailed type 2
**statistically significantly different p<0.01, by students t-test 1 tailed type 2
Table 3.9.4.12-1: Image analysis of ARC only, ME only or ARC+ME regions of interest (ROI) from the TIDA of the hypothalamus (IHC and ISH staining for 3-month, 12-month and 24-month controls)
ARC only ME only ARC + MEAnimal number RNAscope ISH
(DAB +ve, μm2)IHC
(DAB +ve, μm2)RNAscope
ISH (DAB +ve,
μm2)
IHC(DAB +ve, μm2)
RNAscope ISH (DAB +ve, μm2)
IHC(DAB +ve, μm2)
90 day control90 6671.8 5077.2 31.1 1146.0 6703.0 6223.292 2011.1 3168.1 1.1 1955.1 2012.2 5123.294 1282.7 2740.9 78.9 6349.5 1361.6 9090.395 2802.7 2780.4 0.0 4030.4 2802.7 6810.996 2107.8 6181.9 1.1 7826.3 2108.8 14008.298 3830.2 1424.7 2.6 3766.4 3832.8 5191.199 1071.6 2322.0 0.0 1182.5 1071.6 3504.6100 2230.6 4494.0 117.4 8278.8 2348.0 12772.9
Mean DAB+ve ROI
2751.1±1802.7 3523.7±1583.9 29±45 4317±2878 2780.1±1799.0 7840.5±3795

CLH REPORT FOR SEDAXANE
207
ARC only ME only ARC + MEAnimal number RNAscope ISH
(DAB +ve, μm2)IHC
(DAB +ve, μm2)RNAscope
ISH (DAB +ve,
μm2)
IHC(DAB +ve, μm2)
RNAscope ISH (DAB +ve, μm2)
IHC(DAB +ve, μm2)
12 month control309 2139.6 5259.9 74.6 3598.0 2214.2 8857.9311 577.1 6513.4 14.1 1132.2 591.2 7645.5312 1983.6 2358.8 46.1 7219.3 2029.7 9578.1313 831.8 3216.8 3.9 15430.0 835.7 18646.8314 149.2 1067.5 18.4 5037.4 167.6 6104.9316 7404.0 9449.7 294.5 22009.1 7698.5 31458.8317 1802.0 4949.4 1011.7 4774.9 2813.7 9724.3319 923.3 8082.3 136.9 8101.3 1060.2 16183.6320 745.5 13779.6 3.7 16126.7 749.2 29906.3
Mean DAB+ve ROI
1839.6±2196.0 6075.3±3936.3 178.2±326.2 9269.9±6976.2 2017.8±2300.1 15345.1±9584.4
P value 1 yr vs
90d
0.184 0.054 0.110 0.041* 0.231 0.028*

CLH REPORT FOR SEDAXANE
208
ARC only ME only ARC + MEAnimal number RNAscope ISH
(DAB +ve, μm2)IHC
(DAB +ve, μm2)RNAscope
ISH (DAB +ve,
μm2)
IHC(DAB +ve, μm2)
RNAscope ISH (DAB +ve, μm2)
IHC(DAB +ve, μm2)
2 year control262 643.9 127.4 148.3 1455.6 792.2 1583.0269 450.2 622.1 5.6 1125.9 455.8 1748.0292 262.9 1417.6 112.0 2889.0 374.9 4306.6293 2358.8 518.1 106.0 3636.5 2464.8 4154.6296 283.9 1095.4 3.7 660.1 287.6 1755.5306 603.7 2142.6 317.6 7522.9 921.3 9665.5263 498.0 1427.7 435.3 10688.0 933.2 12115.7276 175.6 214.3 174.7 3710.6 350.3 3924.9288 2436.6 5315.9 230.1 3706.8 2666.7 9022.6291 2250.0 6612.8 557.2 7995.1 2807.3 14608.0
Mean DAB
+ve ROI
996±946 1949±2225 209±180 4339±3323 1205±1024 6288±4707
P value 2yr vs 90d
0.008** 0.056 0.007** 0.494 0.016* 0.231
P value 2yr vs 1yr
0.142 0.006** 0.399 0.031* 0.163 0.008**
Statistical significance: *p<0.05; **p<0.01
CONCLUSION: Examination of TH expression in the TIDA neurons of the hypothalamus of the 90-day, 12-month and 2-year control groups showed that the mRNA expression of TH in the ARC and ARC+ME decreased progressively with age. Despite large variation between individual animals, the difference in these ISH values was statistically significant when comparing the 1-year and 2-year control groups. By contrast there was a slight but significant (p<0.05) increase in TH protein staining in the ME and ARC+ME regions of the 1-year control animals compared to the 90-day control animals which was conflicting with the numerically lower mRNA expression of TH.
While, TH protein expression in the ARC alone, ME alone and ARC+ME was also statistically significantly lower at the 2-year time point than at the 1-year time point. No statistical decrease in TH protein staining in the ME and ARC+ME regions of the 2-year control animals compared to the 90-day control animals was observed. While decline in the expression of TH protein in the ARC and ME regions of the hypothalamus in aging rats caused by senescence of dopaminergic TIDA neurons are reported in literature (Sanchez, et al., 2003), in the present study, the absence of correlation between mRNA staining and protein staining weakens the strength of the results to support age-related senescence of dopaminergic TIDA neurons.
References:. (2007). SYN520453: 90 Day dietary toxicity study in rats. Syngenta
Unpublished Report No. PR1349-REG. Issue date 25 June 2007. (Syngenta File No. SYN520453/0084).

CLH REPORT FOR SEDAXANE
209
. (2008). SYN520453: Two year chronic toxicity and carcinogenicity study in rat. . Laboratory Report
No.PR1353-REG. Issue date 29 August 2008. Unpublished. (Syngenta File No. SYN520453_11204)
Sanchez, H. L., Silva, L. B., Portiansky, E. L., Goya, R. G., and Zuccolilli, G. O. (2003). Impact of very old age on hypothalamic dopaminergic neurons in the female rat: a morphometric study. The Journal of comparative neurology 458 (4), 319-25, 10.1002/cne.10564.
3.9.4.13 Anonymous (2015b)Report: Anonymous, 2015b. Sedaxane: Analysis of stored tissue from 2-year rat study for hypothalamic
tyrosine hydroxylase via immunohistochemistry and in situ hybridization. Laboratory Report No. MM022, 17 April 2015. Unpublished. (Syngenta File No. SYN524464_50818).
GUIDELINES: This was a mode of action study with no applicable guidelines (supplemental to EPA Guideline 870.4300).
GLP: The study was not conducted according to EPA Good Laboratory Practice Standard 40 CFR Part 160 or OECD Principles of Good Laboratory Practice.
JUSTIFICATION FOR TEST SYSTEM SELECTION: The purpose of these experiments was to explore aspects of the MoA hypothesis using formalin fixed paraffin embedded (FFPE) tissues (hypothalamus) available from the chronic toxicity and carcinogenicity study with sedaxane (Anonymous, 2010). Dopaminergic neurones in the hypothalamus from female rats treated with 0 (controls), 1200 and 3600 ppm sedaxane were visualised and quantified using tyrosine hydroxylase (TH) IHC and RNAscope™ ISH.
EXECUTIVE SUMMARYDietary administration of sedaxane (SDX) to Han Wistar rats at 0, 200, 1200 and 3600 ppm for 2 years resulted in a higher incidence of uterine adenocarcinomas in the animals receiving 3600 ppm. At this dose the rats also showed a statistically significant reduction in body weight gain, food consumption and food utilization. In addition there was a reduction in mammary gland and anterior pituitary tumours. Prior published work has outlined a hypothesized mechanism where large reductions in body weight due to caloric restriction can produce a similar shift in uterine, mammary and pituitary tumour incidence vs. untreated controls, as a consequence of delayed senescence of the hypothalamic axis controlling prolactin secretion in Wistar rats.
This study set out to explore several aspects of the signalling pathways involved in this hypothesized mechanism, using formalin fixed paraffin embedded (FFPE) tissue from the 2 year bioassay (control, 1200 ppm and 3600 ppm groups). Tyrosine hydroxylase (TH), a rate limiting enzyme in the synthesis of dopamine, was measured in the tuberoinfundibular dopaminergic (TIDA) neurons of the hypothalamus by immunohistochemistry (IHC, to detect protein) and by RNAscopeTM in situ hybridisation (ISH, to detect mRNA) followed by quantitative image analysis. Examination of the stained slides was conducted to determine which slides were from the appropriate region of the TIDA neurons and homologous with the sections from other animals. Staining in the arcuate nucleus and median eminence region of TIDA neurons was quantified using intensity based image analysis.
Compared to the control group, there was a statistically significant higher TH protein level in the arcuate nucleus (ARC) only, median eminence (ME) only and combined arcuate nucleus and median eminence (ARC+ME) regions in the 1200 ppm group. There was also a statistically significant higher TH protein level in the ME only and ARC+ME regions in the 3600 ppm group compared to control. However it was not dose-related (higher TH protein level in 1200 ppm group compared to 3600 ppm group).

CLH REPORT FOR SEDAXANE
210
Compared to the control group, there was a statistically significant higher TH mRNA expression in the ARC and ARC+ME regions in the 3600 ppm group compared to the controls. There were no statistically significant differences in TH mRNA expression in the 1200 ppm treated group compared to the controls.
For each group, the IHC staining displayed higher amounts of TH in the ME region than in the ARC region of the TIDA, which is consistent with localization of tyrosine hydroxylase protein to a greater extent in the axons (ME) than in the cell bodies (ARC) of these neurons. The ISH staining for tyrosine hydroxylase mRNA was predominantly in the ARC, which is consistent with localization of TH mRNA predominantly in the cell bodies (ARC) rather than the axons (ME).
In 2-year brain samples from 1200 ppm and 3600 ppm treated female rats, statistically significantly higher levels of TH protein were observed (compared to control animals) in the dopaminergic neurons that control the release of prolactin from the anterior pituitary. However this increase was not dose related. When these same animals were evaluated for TH mRNA levels by ISH, statistically significantly higher levels were observed in the 3600 ppm group, but not in the 1200 ppm group. These results support that at high dose level sedaxane increased TH expression in the TIDA region at 2 years.
MATERIALS AND METHODSExperimental dates: Start: 17 October 2012, End: 1 May 2013
Samples and selection criteria: Formalin fixed paraffin embedded (FFPE) hypothalamus tissues from female Han Wistar rats treated with 0 (controls), 1200 and 3600 ppm sedaxane in a 2 year chronic toxicity and carcinogenicity study (Anonymous, 2010). Staining and image analysis measurements were performed on the hypothalamus tissue. A summary of the total samples available including those samples that were stained for TH by IHC/ISH and those considered to possess acceptable morphology to be evaluated by image analysis is shown below:
Table 3.9.4.13-1: Summary of total brain samples available to study, number of brain sections stained (TH IHC and ISH) and number of sections evaluated using image analysis
Dietary concentration
(ppm)
No. rats at study start
Interim sacrifice or
died prior to week 53
No. brains available for
staining
No. brains used
No. usable brain
sections
No. brains evaluated
0 64 13 51 30 15 12
200 63 13 50 0 n/a n/a
1200 63 12 51 30 16 12
3600 64 13 51 27 13 12
The brains for further image analysis, chosen after evaluation by light microscopy (H&E staining), were selected for image analysis on the basis of their TIDA morphology. The aim was to select sections at Bregma level 2.4 mm for the ARC and ME. As the brain sections were taken as part of a regulatory study, they had not been specifically sectioned for TIDA, and the morphology was not always optimal. Consequently the selection was based upon sections which were at or nearest to Bregma 2.4mm, and preferably within 2.16-3.24 mm. Subsequent to TH IHC staining possible candidates were selected for image analysis based on TIDA morphology.
The selection/ exclusion process for TH IHC and ISH images that were used for image analysis is described below:
Step 1: Of the 51 animals available for sectioning/staining, we excluded 21, 21 and 24 animals for control, 1200 ppm and 3600 ppm, respectively, based on incorrect region (i.e. not in Bregma 2.16-3.14 mm) and/or presence of a pituitary tumour that caused compression of hypothalamic morphology. This process was performed by reviewing archival H&E sections that had been

CLH REPORT FOR SEDAXANE
211
previously cut from the brain blocks by Step 2: Of the 30, 30 and 27 animals stained for TH IHC we excluded a further 15, 14 and 14,
respectively, by reviewing the TH IHC stained images. Exclusions were based on TIDA morphology of the section with regard to integrity of the arcuate nucleus (ARC) and median eminence (ME) regions. This process left 15, 16 and 13 that were considered possible candidates for image analysis.
Step 3: A previous study had established that image analysis of 12 sections was a sufficient number to show a significant difference between the groups; hence to achieve a consistent number of data points in each treatment group we selected 12 animals of the possible candidates (above) for image analysis based on those that had acceptable TIDA region (ARC and ME) morphology. The 12 animals selected per group for image analysis were selected based on those that had what was considered to be the most acceptable TIDA region (ARC and ME) morphology.
Step 4: The same 12 animals that were chosen for IHC image analysis were used for ISH image analysis.
Study Design and Methods:Tyrosine hydroxylase immunohistochemical staining: Hypothalamus sections (4 µM thickness, 1 section per animal) were immunostained as follows.
Following heat induced epitope retrieval (HIER) in NovocastraTM pH6 retrieval buffer, sections were stained using a Vision Biosystems Bond x staining robot using a refine 120, 15 protocol. Sections were dehydrated with xylene, coverslipped and imaged using an Olympus Provis research microscope. The primary rabbit anti-rat tyrosine hydroxylase antibody (Abcam#Ab211) 1:20,000 dilution was incubated with the hypothalamus section for 2 hr at room temperature, then a secondary antibody (Vector Laboratories Goat anti-rabbit horseradish peroxidase (HRP) antibody, 1:500 dilution) was applied and incubated for 1 hr at room temperature. The signal was detected using 3,3’-diaminobenzidine (DAB) solution. In the presence of HRP, the DAB substrate is oxidatively polymerized to an insoluble brown polymer, which can be detected visually. The slides were counterstained with Gill’s haematoxylin (cell nuclei staining). Sections were dehydrated with xylene, coverslipped and imaged using an Olympus Provis research microscope. Montages were prepared in Adobe™ Photoshop.
A total of 12 animals in the control and treated groups were selected for further image analysis:
Tyrosine hydroxylase RNAscopeTM in situ hybridisation staining: Hypothalamus sections (4 µM thickness, 1 section per animal) from 2 year control (30 samples), 1200 ppm (12 samples) and 3600 ppm (27 samples) SDX treated animals were stained as follows:
RNAscopeTM in situ hybridisation was performed on rat brain FFPE sections. Briefly, FFPE sections were deparaffinised and subjected to proteinase K digestion. After washing, tissue sections were hybridised with tyrosine hydroxylase (TH) probes at 40ºC for 2 h. The hybridisation signal was amplified using sequential hybridisation with a series of specialised oligonucleotides (Amp1-Amp4) and lastly a horseradish peroxidase (HRP)-linked oligonucleotide. The sequences of the specialised oligonucleotides are proprietary to ACD and therefore not available. The hybridisation signal was detected using DAB solution. In the presence of HRP, the DAB substrate oxidatively polymerized to an insoluble brown polymer, which could be detected visually. Finally, slides were counterstained with Gill’s haematoxylin (cell nuclei staining), dehydrated through a series of alcohols and mounted using Cytoseal mounting medium.
The TH RNAscope in situ hybridisation (ISH ) staining for control, SDX 3600 ppm high dose and SDX 1200 ppm mid dose animals was performed using the same batch of TH RNAscope probe. The TH ISH staining of control and 3600 ppm SDX-treated samples was performed in 5 batches on different days; equal numbers of control and 3600 ppm animals were stained on each of the 5 days. The staining of the 1200 ppm SDX-treated samples was performed in 1 batch on a later date.

CLH REPORT FOR SEDAXANE
212
The animals selected for TH ISH image analysis were the same as those selected for the TH IHC image analysis and this was performed in the same way on both samples.
Montages of x4, x10 and x40 images of the TH ISH staining for 2 year control, 1200 ppm and 3600 ppm samples were prepared in Adobe™ Photoshop.
Image analysis for Tyrosine hydroxylase immunohistochemical and RNAscope™ in situ hybridisation staining: Images of the slides stained for IHC and ISH were evaluated (one IHC and one ISH slide/image per animal) and selected on the basis that they had acceptable/correct hypothalamic topography; 12 control, 12 of the 1200 ppm animals and 12 of the 3600 ppm animals were analysed.
Image acquisition was performed on a Olympus Provis microscope equipped with a Zeiss Axiocam video camera using Image Pro Plus software (Media Cybernetics).
Image analysis and quantitation was performed in a similar manner for the IHC and ISH stained slides. The selected sections were overlaid with grids in low resolution copies/tiled images (1 image/slide per animal) of the raw image data. The grid was consistently positioned over low resolution images such that the bottom of the grid covered the bottom of the section and also encompassed the entire ARC/ME region. The grid numbers which covered the regions of interest (ROI), namely the ARC and ME from the TIDA region of the hypothalamus were identified. The image analysis was performed in coded (blinded) fashion. The total DAB labelled area (μM2) was quantified by using ImageJ software for analysis.
To quantify the chosen fields for DAB-labelling, images were analysed for their colour and intensity. DAB-labelling was identified by its red/brown colour and darker intensity compared to unlabelled areas in the images, and the resulting image parameters (colour and intensity) were used to generate a filter for analysis. Based on these parameters, all red/brown pixels were identified by user-independent usage of the ImageJ analysis software and based on the positive pixels a mask was generated, that exclusively shows all detected pixels as labelled by DAB. Based on the pixel dimensions, the area occupied by DAB-positive pixels within the ROI was calculated (mm2). Hence this data represented the summed area of DAB staining of TH from multiple grid squares. The measurements were expressed as the mean and the standard deviation (SD) of the total DAB-labelled area per region of interest (ROI).
Statistics: Statistical analysis on TH IHC and TH ISH staining results were performed using a Student's T Test from Microsoft Excel 2007. Pairwise comparisons were conducted between the control group and treated groups’ values, and statistical significance was assigned at p<0.05 and p<0.01.
RESULTS AND DISCUSSION Tyrosine hydroxylase immunohistochemical staining: For each treatment group, the IHC staining displayed higher amounts in the ME region than in the ARC region of the TIDA, which is consistent with localization of tyrosine hydroxylase protein to a greater extent in the axons (ME) than in the cell bodies (ARC). There was a statistically significant (p<0.01 or p<0.05) higher TH protein level in the arcuate nucleus (ARC) only, median eminence (ME) only and combined arcuate nucleus and median eminence (ARC+ME) regions in the 1200 ppm group compared to control. There was also a statistical significant (p<0.01 or p<0.05) TH protein level in the ME only and ARC+ME regions in the 3600 ppm group compared to control.
Tyrosine hydroxylase RNAScopeTM in situ hybridization staining: In all of the treatment groups, the ISH staining for tyrosine hydroxylase mRNA was predominantly in the ARC, which is consistent with localization of TH mRNA predominantly in the cell bodies (ARC) rather than the axons (ME).
There was a statistically significant (p<0.05) higher TH RNA expression in the ARC and ARC+ME regions in the 3600 ppm group compared to the controls. In contrast, there were no statistically significant differences in TH mRNA expression in the 1200 ppm treated group compared to the controls.

CLH REPORT FOR SEDAXANE
213
Table 3.9.4.13-2: Image analysis of ARC only, ME only and ARC/ME (ROI) from the TIDA of the hypothalamus (IHC and ISH staining for 2 year Sedaxane treated female rats). Mean (DAB+threshold/ROI area μM2)
ARC only ME only ARC + MEDose (ppm) RNAscope
ISH (DAB+ve,
μm2)
IHC(DAB+ve,
μm2)
RNAscope ISH
(DAB+ve, μm2)
IHC(DAB+ve,
μm2)
RNAscope ISH
(DAB+ve, μm2)
IHC(DAB+ve, μm2)
0 5130±4187 3061±2793 1094±1323 4062±3447 6224±5053 7123±52121200 5393±5478 7821±4269** 1029±930 11231±10928* 6422±5647 19052±14534**3600 9490±5329* 5618±5010 1854±2320 8515±6852* 11344±6878* 14133±8023**
ROI = region of interest* statistically significantly different from control p<0.05 (S students T test 1 tailed type 2)** statistically significantly different from control p≤0.01 (S students T test 1 tailed type 2)
Table 3.9.4.13-1: Histogram showing the DAB positive area (mM2) for IHC staining in the arcuate nucleus (ARC) only, median eminence (ME) only and arcuate nucleus plus median eminence (ARC+ME) of the TIDA for control, mid dose (1200ppm) and high dose (3600ppm) SDX treated animals.

CLH REPORT FOR SEDAXANE
214
Table 3.9.4.13-2: Histogram showing the image analysis data for ISH staining in the arcuate nucleus (ARC) only, median eminence (ME) only, and arcuate nucleus/median eminence (ARC+ME) of the TIDA for control, mid dose (1200ppm) and high dose (3600 ppm) SDX treated animals.
CONCLUSION: In 2-year brain samples from 1200 ppm and 3600 ppm treated female rats, statistically significantly higher levels of TH protein were observed (compared to control animals) in the dopaminergic neurons that control the release of prolactin from the anterior pituitary. However this increase was not dose related. When these same animals were evaluated for TH mRNA levels by ISH, statistically significantly higher levels were observed in the 3600 ppm group, but not in the 1200 ppm group. These results support that at 3600 ppm sedaxane increased TH expression in the TIDA region at 2 years.
References:Anonymous, (2010). SYN524464 - 104 Week Rat Dietary Carcinogenicity Study with Combined 52 Week Toxicity Study. Syngenta Report Number: 30196. Annex I. 3.9.1.1
3.9.4.14 Anonymous (2016)Report: Anonymous, 2016. Sedaxane: Analysis of prolactin, leptin and adiponectin in serum samples
from a one-year sacrifice of female Wistar rats. Laboratory Report No. TK0214994, 27 June 2016. Unpublished. (Syngenta File No. SYN524464_50973).
GUIDELINES: This was a non-standard, mechanistic study with no applicable guidelines.
GLP: A signed and dated GLP compliance statement was provided, no QA. The study was conducted in compliance with US EPA GLP standards (40 CFR Part 160) with the following exceptions:(1) The study involved analysis of serum samples obtained from a prior study. The performing laboratory was skilled in the practice of analysis of rat hormones using specialised techniques.(2) The performing laboratory does not routinely conduct studies in accordance with GLP standards several subparts were listed as exceptions.

CLH REPORT FOR SEDAXANE
215
JUSTIFICATION FOR TEST SYSTEM SELECTION: The purpose of this study was to analyse frozen 1-year (52-week) serum samples from the interim sacrifice of the sedaxane 104-week rat study (Anonymous, 2010 Annex I. 3.9.1.1) for the following three proteins: prolactin, leptin and adiponectin.
EXECUTIVE SUMMARYIn a stability study, control female serum samples from a subchronic study in rats (Anonymous, 2010) were shipped frozen after 7+ years of storage at -20°C to the Department of Biomedical Sciences, Colorado State University. For comparison, serum samples were obtained from female Wistar rats maintained up to a similar age (20 weeks) at Colorado State University facilities. Prolactin, leptin and adiponectin concentrations were determined in long-term stored samples and short-term stored samples and compared, to assess stability.
Serum samples from female Wistar rats taken after 1 year in a chronic/carcinogenicity study with sedaxane (Anonymous, 2010 Annex I. 3.9.1.1) were shipped frozen to Colorado State University for subsequent analysis. Prolactin, leptin and adiponectin concentrations were evaluated in serum samples from the 0, 1200 and 3600 ppm groups by radioimmunoassay or enzyme-immunoassay methods, and mean values were compared to determine any differences related to treatment.
In the stability study, the results confirmed that measurable prolactin, leptin and adiponectin concentrations were broadly similar in freshly obtained serum samples and in samples stored for 7+ years at -20°C. Thus, these analytes were concluded to be stable for extended periods at -20°C.
In the 1-year serum samples, prolactin values ranged from 9.62 to 188 ng/mL in the control group, 10.8 to 223 ng/mL in the 1200 ppm group and 3.79 to 156 ng/mL in the 3600 ppm group. Considering the inherent level of variation between individual animals at 52 weeks of age, it was not possible to determine any differences between control and sedaxane-treated groups regarding prolactin levels based on the available serum samples.
For leptin levels at 1 year, group means were 4.46, 4.37 and 3.78 ng/mL for the 0, 1200 and 3600 ppm females, respectively. The mean leptin value for the 3600 ppm females was 15% lower than the control group mean value, and this difference (although not statistically significant), matched the 13% lower body weights in the 3600 ppm females that were statistically significant. Based on these comparisons, and an observed correlation of leptin levels with body weight, the lower leptin levels for the 3600 ppm group were considered to be a treatment-related effect.
Mean values for adiponectin at 1 year showed no differences between groups. Group means were 29.29, 24.76 and 28.70 ug/mL for the 0, 1200 and 3600 ppm females, respectively, and there were no statistically significant differences between groups.
In a stability study with serum from female Wistar rats that were approximately 20 weeks of age, the results confirmed that prolactin, leptin and adiponectin were stable for extended periods at -20°C.
Due to the inherent level of variation in prolactin levels between individual animals at 52 weeks of age, it was not possible to determine any differences in prolactin concentrations between control and sedaxane-treated groups from the available serum samples.
There were no differences in adiponectin levels between control and treatment groups.
While not statistically different, the mean leptin level at the high dose of 3600 ppm was 15% lower than control value. Body weights in the 3600 ppm group were 13% lower compared to the control group (p<0.01), and leptin values were directly proportional to body weight in all groups. The lower leptin levels after 3600 ppm sedaxane treatment were considered to be an effect of treatment.

CLH REPORT FOR SEDAXANE
216
MATERIALS AND METHODSPurpose: The purpose of this study was to analyse frozen 1-year (52-week) serum samples from the interim sacrifice of the sedaxane 104-week rat study (Anonymous, 2010 Annex I. 3.9.1.1) for the following three proteins: prolactin, leptin and adiponectin. The three proteins were measured in rat serum samples following 7+ years of storage at -20ºC; these analyses were conducted for female rats in the 0, 1200 and 3600 ppm sedaxane groups. A preliminary experiment assessed the stability of prolactin, leptin and adiponectin in serum after storage for 7+ years at -20ºC based on samples from 20 week old female Wistar rats.
Experimental dates: Start: 17 December 2015, End: 11 February 2016
Stability study:20-Week female rat control samples, long-term frozen storage: Control serum samples from a 13-week study in rats (Anonymous, 2010) were provided. Only samples from the control group female were used in the preliminary stability study. At the time of termination and preparation of serum samples, the rats were approximately 20 weeks old.
Freshly prepared female rat control samples, short-term frozen storage: Female Han Wistar rats were maintained until 20 weeks old when they were euthanized. To approximate the same conditions for blood collection as the earlier 90-day rat study, the rats were anaesthetised under isoflurane and blood samples were collected, via the vena cava, at approximately the same time of day that the majority of rats in the prior study were sampled.
The oestrus cycle stage was determined for each rat for several days prior to and including the day of termination, via a vaginal lavage.
In order to minimize the effect of stress on prolactin levels, the removal of each rat from its home cage, anaesthesia and blood sampling from the vena cava was accomplished quickly for each rat (within approximately 5-6 minutes).
Animals were weighed immediately after removal from their cages. Blood was drawn via the vena cava into tubes without anticoagulant and placed on ice. The tubes were allowed to clot for ca 1 hr, then centrifuged at 3000 rpm. Serum was transferred to one tube per rat, and stored frozen at -20°C prior to analysis.
Analysis of serum samples – Preliminary stability determination:For each control rat from the Long-term frozen storage group and the Short-term frozen storage group, aliquots of serum were analysed for prolactin, leptin and adiponectin. Mean values plus individual animal values were compared between groups to determine the stability of these three analytes upon long-term frozen storage.
Study Design and Methods:Source of serum samples – 1-Year timepointAll serum samples (from both male and female rats) that were collected at the 1-year (52-week) sacrifice as part of the rat carcinogenicity study with sedaxane (Anonymous, 2010 Annex I. 3.9.1.) were shipped frozen to the Department of Biomedical Sciences, Colorado State University. However, only the serum samples from females in Groups 1, 3 and 4 were analyzed for prolactin, leptin and adiponectin in the current study.
Analysis of serum samples – 1-Year (52-week) samplesFor each female rat from the 0, 1200 and 3600 ppm female groups that were sacrificed after 1 year (52 weeks), aliquots of serum were analyzed for prolactin, leptin and adiponectin.

CLH REPORT FOR SEDAXANE
217
Prolactin Radioimmunoassay: Circulating prolactin levels were measured using radioimmunoassay (RIA). For these assays, rat prolactin (PRL) was iodinated with 125I, using the chloramine T methodology which attaches the 125I to tyrosine residues through oxidation.
The radioimmunoassay measures concentrations of hormone in plasma using a polyclonal rabbit antibody targeting rat PRL. A radiolabelled antigen (125I-PRL) of known amount (ca 20,000 cpm), and the PRL antibody (NIH-RIA-9, diluted 1: 105,000) are added to borosilicate glass tubes in a total volume of 200ul physiologically buffered saline. The unknown sample is added to the tube and the PRL within the sample competes with the 125I-PRL for antibody binding sites. If the unknown PRL increases this acts to displace the 125I-PRL. Following incubation at 4°C for 48 hrs, antibody-bound and -free 125I-PRL are separated by addition of goat anti-rabbit gamma globulin which precipitates the anti-PRL antibody. Following centrifugation (3000 rpm) the supernatant is removed and the radioactivity in the pellet is counted using a gamma counter. All samples are run in duplicate tubes and resulting bound cpms are compared to a standard curve prepared and analysed in the same manner using known amounts of rat PRL (NIH RP-3) that are run concurrently. Data reduction is accomplished using Graphpad PRISM software (ver 6.0) following log transformation. All data are expressed in ng PRL per ml plasma. A pool of quality control samples is also run alongside the unknowns to calculate intra-assay coefficient of variation.
Leptin enzyme-linked immunoassay (EIA): Circulating leptin levels were measured using a rat leptin EIA kit according to the manufacturer’s directions. All reagents and standards were included in the kit. The EIA uses a solid phase approach to measure hormone levels using a double antibody technique. The wells of the assay plate are coated with a polyclonal antibody specific to rat leptin. This antibody will bind leptin in the samples (or standards). After a prescribed incubation time, the plates are washed to remove all unbound leptin. Subsequently, a second biotin-labelled anti leptin antibody is added, which detects and binds to a different part of the leptin molecule. After a prescribed incubation time, the plates are washed to remove the unbound biotin-labelled antibody. A streptavidin (SA)-horseradish peroxidase (HRP) conjugate is added. The SA binds the biotin molecule with high affinity and the enzymatic activity of the attached HRP is detected with hydrogen peroxide/ Trimethylbenzidine (TMB). The intensity of the TMB colour, is determined using a Synergy H1 microplate spectrophotometer and optical density is proportional to the amount of leptin in the sample. All samples are run in duplicate and spectrophotometric readings are compared to values obtained with a standard curve of known amounts of rat leptin. Data are reduced using Graphpad PRISM software (ver 6.0) following log transformation. All data are expressed as ng leptin/ mL plasma.
Adiponectin EIA: Circulating adiponectin levels were measured using a rat adiponectin enzyme-linked immunoassay (EIA) kit according to the manufacturer’s directions. All reagents and standards are included in the kit. The EIA uses a solid phase approach to measure hormone levels using a double antibody technique. The wells of the assay plate are coated with a polyclonal antibody specific to rat adiponectin. This antibody will bind adiponectin in the samples (or standards). After a prescribed incubation time, the plates are washed to remove all unbound adiponectin. Subsequently, a second biotin labelled anti adiponectin antibody is added, which binds a different part of the adiponectin molecule. After a prescribed incubation time, the plates are washed to remove the unbound biotin-labelled antibody. A streptavidin-horseradish peroxidase (HRP) conjugate is added; the streptavidin binds the biotin molecule with high affinity and the enzymatic activity of the attached HRP is detected with tetramethylbenzidine (TMB). The oxidation of TMB is measured as changes in colour intensity which is determined using a Synergy H1 microplate spectrophotometer and optical density is directly proportional to the amount of adiponectin in the sample. All samples are run in duplicate and spectrophotometric readings are compared to values obtained with a standard curve of known amounts of rat adiponectin. Data are reduced using Graphpad PRISM software (ver 6.0) following log transformation. All data are expressed as ug adiponectin/ mL plasma.
Data evaluation / statistics: For each analyte, group means and standard deviations were determined. Group means were compared initially between short and long term stored samples using a Student’s t test. Subsequent treatment differences were examined by one-way Analysis of Variance (ANOVA) with dose of sedaxane (0 ppm, 1200 ppm, 3600 ppm) as the independent variables. For all of the parameters

CLH REPORT FOR SEDAXANE
218
evaluated initially by ANOVA, Dunnett’s test was used to compare the groups, based on the error mean square in the ANOVA. All analyses were two-tailed and statistical significance was declared at p<0.05 and p<0.01.
Prolactin data were analysed in relationship to stage of the oestrous cycle, as cycle state can affect prolactin levels. In qualitative comparisons (i.e. values were not analysed statistically due to the small numbers per group), mean values per group for animals in proestrus + oestrus were calculated, as well as mean values per group for animals in metoestrus + dioestrus, under the assumption that normal, cycling rats experience a surge of prolactin during the afternoon of proestrus that continues into the morning of oestrus. However, as rats age and start to show irregular cycles and senescent stages such as repetitive pseudopregnancy, the timing of prolactin surges differs.
For leptin and adiponectin, values per animal were plotted vs. the terminal body weight of the rat, and a linear trend line was plotted. In addition, a correlation coefficient (R) was calculated to determine the extent to which hormone levels and body weight were inter-related. A correlation coefficient value of 1.0 is a total positive correlation, -1.0 is a total negative correlation and 0 is no correlation.
RESULTS AND DISCUSSION Stability Study: The results confirmed that measurable prolactin, leptin and adiponectin concentrations were broadly similar in freshly obtained serum samples and in samples stored for 7+ years at -20°C. Thus, these analytes were concluded to be stable for extended periods at -20°C.
Prolactin: Values showed wide variation among individual animals, ranging from 26.5 to 208 ng/ml in the long-term storage group and 4.33 to 253 ng/ml in the short-term storage group. Mean values were similar between the two groups, and no statistically significant differences were found between groups. The relative standard deviations (%RSD) for prolactin values were predictably large, 67% and 91% for the long-term and short-term storage groups, respectively. This degree of variability is expected, since prolactin levels can vary approximately 20-fold during a normal oestrous cycle. Due to this wide range of variability of prolactin during an oestrous cycle, animals were grouped by proestrus/oestrus or metoestrus/dioestrus to compare the long-term vs short-term storage groups. The proestrus/oestrus animals were grouped together because regularly cycling animals would experience a prolactin surge during the afternoon of proestrus that continues into the morning of oestrus. The mean prolactin values for animals in proestrus/oestrus were similar for both long-term and short-term storage groups (92.7 and 128.4 ng/mL, respectively). Similarly, the mean prolactin values for animals in metoestrus/dioestrus were similar between the two groups (58.4 and 46.8 ng/mL). Moreover, the values for animals in proestrus/oestrus were numerically higher than for animals in metoestrus/dioestrus.
The baseline values for the short-term storage animals were within the normal range expected for young, cycle female rats (4-16 ng/mL), whereas the lowest values in the long-term storage animals were notably higher (27- 51 ng/mL). In the long-term storage study (90-day control females), animals had blood drawn for clinical chemistry determinations earlier in the same day via the orbital sinus under isoflurane anaesthesia, prior to the terminal anaesthesia via CO2 and serum sampling from the vena cava followed by necropsy. Orbital sinus bleeding and similar manipulations of rats has been shown to produce sufficient stress in rats to elevate the baseline prolactin levels for at least 90 minutes and the difference in baseline prolactin values vs. the short-term storage samples is likely a reflection of this additional stress. In contrast, the highest individual animal values per group were similar for the long-term storage animals (208 ng/mL) and the short-term storage animals (196 – 253 ng/mL), indicating that significant deterioration of prolactin did not occur during 7+ years of frozen storage.
Leptin and Adiponectin: Mean leptin values showed no difference between the long-term storage group (6.75 ng/ml, n=10) and the short-term storage group (6.18 ng/ml, n=11). The %RSD for leptin measurements were 29% and 42% in the short-term and long-term storage groups, respectively.

CLH REPORT FOR SEDAXANE
219
Mean adiponectin values showed no differences between the long-term storage group (40.97 ug/ml, n=10) and the short-term storage group (39.74 ug/ml, n=11). The %RSD values for adiponectin were 49% and 52% for long-term and short-term storage groups, respectively.
Hormone Analysis in Control and Sedaxane-Treated Female Rats - One-year Samples:Prolactin: Group means for prolactin were 67.5, 76.6 and 70.5 ng/mL for the 0, 1200 and 3600 ppm groups, respectively. The individual prolactin values were variable in each group and the mean values in sedaxane-treated groups were not statistically significant different when compared to the control group. Prolactin values ranged from 9.62 to 188 ng/mL in the control group, 10.8 to 223 ng/mL in the 1200 ppm group and 3.79 to 156 ng/mL in the 3600 ppm group in 1-year serum samples.
For all treatment groups, the mean values for animals in proestrus/oestrus (107.80, 136.20 and 80.90 ng/mL) were numerically higher than mean values for animals in metoestrus/dioestrus (54.04, 63.36 and 63.62 ng/mL) for 0, 1200 and 3600 ppm groups, respectively. However, a number of individual animals at 52 weeks deviated from the expected pattern of cycle-related prolactin levels. One of two rats in the proestrus /oestrous stage grouping for 1200 ppm treated rats (animal 489) had a pituitary adenoma, and based on the high measured prolactin value for this rat (223 ng/mL), it is likely that this was a prolactin-secreting tumour. In contrast, two rats in the 0 ppm group (animals 465 and 466) had focal hyperplasia (mild) of the anterior pituitary, but the observed prolactin values in these rats (78.7 and 13.1 ng/mL) suggested that this finding did not indicate a greater tendency for prolactin secretion, unlike the anterior pituitary adenoma.
In summary, mean values for prolactin across all animals showed no differences between the 0, 1200 and 3600 ppm groups at 52 weeks, and the extent of variability in this hormone level prevented any clear conclusions regarding treatment-related effects.
Leptin and Adiponectin: Mean values for leptin in the 1-year rats showed a decreasing trend with increasing dose of sedaxane. Group means were 4.46, 4.37 and 3.78 ng/mL for the 0, 1200 and 3600 ppm females, respectively. The mean leptin value for the 3600 ppm females was 15% lower than the control group mean value. This difference was not statistically significant (p>0.05), but the 15% difference in leptin values was similar in magnitude to the 13% difference in body weights, which was statistically significant by Dunnett’s test at 3600 ppm (p<0.01). In addition, there was a clear correlation of leptin levels to body weight, with correlation coefficients of 0.56, 0.84 and 0.49 in the 0, 1200 and 3600 ppm rats, respectively.
Mean values for adiponectin showed no differences among the groups. Group means were 29.29, 24.76 and 28.70 ug/mL for the 0, 1200 and 3600 ppm females, respectively. Adiponectin values showed no correlation with body weight, and correlation coefficients were 0.14, -0.28 and 0.18 for 0, 1200 and 3600 ppm rats, respectively.

CLH REPORT FOR SEDAXANE
220
Table 3.9.4.12-1: Summary of Stability Determinations for Prolactin, Leptin and Adiponectin in Serum of Female Rats
Analyte Value Long term storage serum samples
Short term storage serum samples
Mean 75.5 99.1SD 50.4 90.5
% RSD 67 91N 10 11
minimum 26.5 4.33
Prolactin (ng/mL)
maximum 208 253Mean 6.75 6.18SD 1.98 2.62
% RSD 29 42
Leptin (ng/mL)
N 10 11Mean 40.97 39.74SD 19.90 20.80
% RSD 49 52
Adiponectin (ug/mL)
N 10 11% RSD = relative standard deviation. No statistically significant differences were observed (Student’s t-test, p<0.05).

CLH REPORT FOR SEDAXANE
221
Table 3.9.4.12-2: Summary of Prolactin, Leptin and Adiponectin Concentrations in Serum of Female Rats Treated with 0, 1200 and 3600 ppm Sedaxane for 1 Year
Dietary concentration of sedaxane (ppm)Analyte Value0 1200 3600
Prolactin (ng/mL) Mean 67.5 76.6 70.5SD 56.0 57.2 60.2N 12 11 10
minimum 9.62 10.8 3.79maximum 188 223 156
Leptin (ng/mL) Mean 4.46 4.37 3.78SD 2.62 3.21 1.47N 12 11 10
% of control - 98 85Correlation coefficient 0.56 0.84 0.49
Adiponectin (ug/mL) Mean 29.93 24.76 28.70SD 6.83 11.11 6.75N 11 9 9
% of control - 83 96Correlation coefficient 0.14 -0.28 0.18
Body weight (g) Mean 276 277 239**SD 20 36 22N 12 11 10
% of control - 100 87** Statistically significant difference vs. control value (ANOVA + Dunnett’s test, p<0.01).
CONCLUSION: In a stability study with serum from female Wistar rats that were approximately 20 weeks of age, the results confirmed that prolactin, leptin and adiponectin were stable for extended periods at -20°C.
Due to the inherent level of variation in prolactin levels between individual animals at 52 weeks of age, it was not possible to determine any differences in prolactin concentrations between control and sedaxane-treated groups from the available serum samples in this study.
There were no differences in adiponectin levels between control and treatment groups.
While not statistically different, the mean leptin level at the high dose of 3600 ppm was 15% lower than control value. Body weights in the 3600 ppm group were 13% lower compared to the control group (p<0.01), and leptin values were directly proportional to body weight in all groups. The lower leptin levels after 3600 ppm sedaxane treatment were considered to be an effect of treatment.
3.9.4.15 Anonymous (2014)Report: Anonymous, 2014. Sedaxane: Uterotrophic assay in ovariectomized Wistar Han rats. Laboratory
Report No. -639220, 03 November 2014. Unpublished. (Syngenta File No.SYN524464_11572).
GUIDELINES: OECD Guideline 440 (2007): United States EPA OPPTS 890.1600 (2009).

CLH REPORT FOR SEDAXANE
222
GLP: Signed and dated GLP and Quality Assurance statements were provided.
Deviation: only one dose tested while a minimum of 2 test groups is required in the the current regulatory guidelines
JUSTIFICATION FOR TEST SYSTEM SELECTION: The rat was selected as the test species as it is recognized by international guidelines as a preferred test species. The number of animals used was considered to be the minimum required to meet the scientific and regulatory objectives of the study.
EXECUTIVE SUMMARYSedaxane, in the vehicle (0.5% w/v carboxymethylcellulose), was administered orally, by gavage, to one group of six young adult female ovariectomized Crl:WI(Han) rats once daily for 3 consecutive days at a dose level of 375 mg/kg bw/day. A positive control group of 6 ovariectomized rats received the oestrogenic positive control agent (17α-ethynylestradiol) in corn oil at a dose level of 0.3 mg/kg bw/day and a control group of 6 ovariectomized rats received the vehicle on a comparable regimen. All animals were observed twice daily for mortality and moribundity. Clinical observations, body weights, and food consumption were recorded daily. All animals were euthanized by carbon dioxide inhalation on study day 3 (approximately 24 hours following the last dose) and a gross examination of the uterus was conducted; uterine weights (wet and blotted) were recorded.
All females survived to the scheduled necropsy on study day 3. No remarkable clinical findings or macroscopic findings in the uterus were noted. At 375 mg/kg bw/day there was a lower cumulative mean body weight gain with corresponding reduced mean food consumption. As a result, mean body weight in this group was slightly (4.0%) lower than the control group on study day 3. Mean wet and blotted uterus weights in the 375 mg/kg bw/day group were similar to the control group values. The absence of effects on uterus weights demonstrated a lack of oestrogenicity for the test substance at the dose level evaluated.
Administration of 0.3 mg/kg bw/day of 17α-ethynylestradiol (positive control) resulted in a cumulative mean body weight loss with corresponding reduced mean food consumption during the dosing period. As a result, mean body weight in this group was 10.3% lower than the control group on study day 3. Increases in mean wet and blotted uterus weights (7.1 and 3.9-fold, respectively) were noted compared to the control group. These increases in uterine weight demonstrated the expected oestrogenic effect of the positive control substance.
Treatment with sedaxane at a dose level of 375 mg/kg bw/day had no effect on either wet or blotted uterine weights of ovariectomized female Crl:WI(Han) rats. Therefore, sedaxane can be considered to be negative for oestrogenicity in the uterotrophic assay. The positive control substance (17α-ethynylestradiol) elicited the expected increases in uterine (wet and blotted) weights.
MATERIALS AND METHODSMaterials:
Test Material: SedaxaneDescription: Off white powderLot/Batch number: SMU6LP006/MILLEDPurity: 95.3% w/w (83.0% SYN508210 (trans isomer), 12.3% SYN508211 (cis isomer)CAS#: 874967-67-6Stability of test compound: Expiry date end January 2015 (stored at <30°C)
Vehicle / positive controls: 0.5% w/v aqueous carboxymethylcellulose sodium / 17α-ethynylestradiol

CLH REPORT FOR SEDAXANE
223
Test Animals:Species: RatStrain: Wistar Han [Crl:WI(Han)]Age when ovariectomised: 42 daysAge/weight at dosing: 56 days / 165.2-215.9 gSource:Acclimatisation: 7 daysHousing: Individually in stainless steel, wire-mesh cages suspended above cage-board.Diet: Harlan Laboratories 2016CM Teklad Global 16% Protein Extruded Rodent Diet ad
libitumWater: Municipal water ad libitumEnvironmental conditions: Temperature: 21.3-21.4°C
Humidity: 41.7-45.6%Air changes: Minimum of 10/hourPhotoperiod: 12 hours light / 12 hours dark
Study Design and Methods:In-life dates: Start: 15 April 2014 End: 18 April 2014
Animal assignment: Daily vaginal lavages were performed for 5 consecutive days (at least 9 days following ovariectomy) prior to assignment of females on study to ensure that females used for study were in persistent dioestrous, with no apparent residual ovarian tissue.
At the conclusion of the pre-test oestrous evaluation period, all available females were weighed and examined in detail for physical abnormalities and absence of oestrous cyclicity. All suitable animals were assigned to groups using a WTDMS™ computer program which randomized the animals based on stratification of body weights in a block design.
Table 3.9.4.15-1: Study designTest group Dose level
(mg/kg bw/day)Dose volume (mL/kg bw)
Number of females
Vehicle control 0 5 6Positive control
(17α-Ethynylestradiol)0.3 5 6
Sedaxane 375 5 6
Dose selection rationale: Dose levels were selected based on the results of a previous dose range-finding study in rats ( , 2014, -639219). In this study, Wistar Han female rats (4/group) were dosed with sedaxane in 0.5% w/v aqueous carboxymethylcellulose at 0, 260, 320 and 375 mg/kg bw/day for 3 consecutive days. The dose level of 375 mg/kg bw/day was selected for the uterotrophic assay and was expected to display clinical signs of toxicity (slight decreases in body weight and food consumption) but not excessive toxicity that would prevent meaningful evaluation of the data.
Dose preparation and analysis: The test substance formulation was prepared daily as a single formulation and stored at room temperature. An appropriate amount of the test substance was weighed into a tared glass mortar and ground with a pestle with a small amount of vehicle until a smooth paste was obtained. The mixture was quantitatively transferred into a calibrated glass container, and approximately 70% of the total volume of vehicle was added. The formulation was mixed until uniform and then homogenized. The test substance formulation was stirred continuously throughout the preparation, sampling, and dose administration procedures.
A stock solution of 17α-ethynylestradiol (0.1 mg/mL) was prepared 1 day prior to the initiation of dosing. An appropriate amount of 17α-ethynylestradiol was weighed, then dissolved in a minimal amount of 95% (v/v) ethanol, and added to corn oil to prepare the stock solution. The stock solution was prepared once

CLH REPORT FOR SEDAXANE
224
and stored at room temperature, protected from light. On each dosing day, the stock solution was thoroughly mixed, and the dosing formulation was prepared fresh by making a dilution of the stock solution using corn oil. All formulations were prepared within a VBSE hood, and were stirred continuously throughout use.
Sedaxane suspensions in high viscosity aqueous carboxymethylcellulose (0.5% w/v) were homogeneous and stable following 7 days of refrigerated storage at concentrations between 25 and 100 mg/mL (
-639035). Therefore, stability assessments were not conducted on this study.
Samples for homogeneity and concentration analysis were collected from the top, middle, and bottom strata of each dosing formulation prepared during the in-life phase of the study (including the control group) and analysed using a transfer-validated high performance liquid chromatography method with UV absorbance detection .
Concentration analysis results: The dosing formulations were within 85-115% of nominal concentrations and were homogeneous. No test substance was detected in the vehicle formulation dosed to controls.
Observations: All rats were observed twice daily, once in the morning and once in the afternoon, for moribundity and mortality. Individual clinical observations were recorded daily (prior to dose administration during the treatment period) through to the day of euthanasia. Animals were also observed for signs of toxicity approximately 4 hours following dosing.
Body weight: The body weight of each animal was recorded on the day of randomization, daily prior to each test substance administration, and on the day of euthanasia.
Food consumption: Individual food consumption was recorded daily, beginning 1 day prior to the start of the treatment period (study day -1).
Macroscopic examination and uterine weights: All females were euthanized by carbon dioxide inhalation at 59 days of age approximately 24 hours following administration of the last dose. Macroscopic examination was limited to the uteri. All females were examined for residual ovarian tissue. Each uterus was carefully dissected and trimmed, being careful to retain the luminal fluid. Each “wet” uterus was weighed intact (with the luminal fluid) to the nearest 0.1 mg, then opened longitudinally and blotted with filter paper to remove the luminal fluid. The blotted uterus was then weighed to the nearest 0.1 mg. Any loss in luminal content was recorded. The uterus and vagina were preserved for possible future histopathologic examination and the carcass discarded.
Statistics: All analyses were two-tailed for significance levels of 5% and 1%, with the exception of uterine weights, where all analyses were one-tailed for significance levels of 5% and 1%. Each endpoint was tested for homogeneity of variance using Levene’s test (Levene, 1960). If the test was significant at p=0.01, then a log transformation was applied, and Levene’s test conducted on the transformed data. If that test was still significant, then the square root transformation was applied to the raw data, and Levene’s test conducted again. If the test was still significant, then a nonparametric test, as described below, was used to analyze the data.Body weights, cumulative body weight gain, food consumption, and absolute organ weights were analyzed initially by a one-way analysis of variance (ANOVA) (Snedecor, 1980). Organ weights were analyzed by analysis of covariance (ANCOVA) on final body weight (Shirley, 1977). This statistical analysis provided an adjusted organ weight value.
For all of the parameters evaluated initially by ANOVA or ANCOVA, pairwise comparisons were conducted using Dunnett’s test (Dunnett, 1964) looking for significant differences from the vehicle control. If the transformations were unsuccessful in making the variances homogeneous, then the nonparametric Kruskal-Wallis test (Kruskal and Wallis, 1952) was used, followed by Dunn’s test (Dunn, 1964) to compare each dose group (17α-ethynylestradiol or sedaxane) with the vehicle control, looking

CLH REPORT FOR SEDAXANE
225
for significant differences. Because the individual pairwise comparisons were pre-planned, they were conducted, regardless of whether the initial ANOVA or ANCOVA was statistically significant.
RESULTS AND DISCUSSIONMortality: There were no mortalities.
Clinical observations: No test substance-related clinical findings were noted.
Body weight and weight gain: A test substance-related, statistically significantly lower mean body weight gain was noted for the 375 mg/kg bw/day group when the overall treatment period (study days 0-3) was evaluated compared to the control group, a result of the lower mean body weight gains or body weight losses noted in this group throughout the dosing period. As a result, a slightly lower (4.0%) mean body weight was noted in the 375 mg/kg bw/day group compared to the control group on study day 3; the difference was not statistically significant.
In the positive control group, mean body weight losses were noted on each day throughout the dosing period compared to the control group, resulting in a statistically significant mean body weight loss in this group when the overall dosing period (study days 0-3) was evaluated. Consequently, mean body weight in the positive control group was 10.3% lower (not statistically significant) than the control group on study day 3.
Table 3.9.4.15-2: Intergroup comparison of body weights and body weight gain (g)Treatment Days
Vehicle control Positive control Test substance
-1 177.6 176.5 180.90 185.5 182.2 186.01 190.1 182.1 188.72 194.8 179.5 190.93 196.5 176.2 188.60-3 11.1 -6.0 2.6No statistically significant differences from control group mean
Food consumption: Mean food consumption in the 375 mg/kg bw/day group was statistically significantly lower than the control group during study days 0-3. The lower mean food consumption corresponded to the lower cumulative mean body weight gain noted in this group and was considered test substance-related.
In the positive control group, statistically significantly lower mean food consumption was noted during study days 0-3 compared to the control group, which corresponded to the mean body weight loss noted in this group during this period.
Table 3.9.4.15-3: Intergroup comparison of food consumption (g/animal/day)Treatment Days
Vehicle control Positive control Test substance
-1-0 20.3 19.1 18.50-1 21.3 14.5 18.81-2 20.9 12.1 16.42-3 20.7 10.9 13.80-3 21.0 12.5* 16.3** Statistically significant difference from control group mean at 0.05 (Dunnett’s test)

CLH REPORT FOR SEDAXANE
226
Macroscopic findings: There were no treatment-related macroscopic findings.
Uterus weights: Mean wet and blotted uterus weights were unaffected by test substance administration at a dose level of 375 mg/kg bw/day.
The positive control substance produced the expected results, as mean wet and blotted uterus weights in this group were statistically significantly higher (7.1 and 3.9-fold, respectively) than the control group.
Table 3.9.4.15-4: Intergroup comparison of uterine weights (g)Treatment Days
Vehicle control Positive control Test substance
Blotted 0.0709 0.2766* 0.0739Wet 0.0820 0.5807* 0.0841* Statistically significant difference from control group mean at 0.05 (Dunnett’s test)
CONCLUSION: Treatment with sedaxane at a dose level of 375 mg/kg bw/day had no effect on either wet or blotted uterine weights of ovariectomized female Crl:WI(Han) rats. Therefore, sedaxane can be considered to be negative for oestrogenicity in the uterotrophic assay. The positive control substance (17α-ethynylestradiol) elicited the expected increases in uterine (wet and blotted) weights.
References: Dunn OJ. Multiple comparisons using rank sums. Technometrics 1964, 6(3), 241-252.
Dunnett CW. New tables for multiple comparisons with a control. Biometrics 1964, 20, 482-491.
Sedaxane -A Dose Range-Finding Oral (Gavage) Toxicity Study in Young Adult Female Wistar Han Rats (Study No. -639219). , 2014.
Kruskal WH, Wallis WA. Use of ranks in one-criterion variance analysis. Journal of the American Statistical Association 1952, 47, 583-621.
Levene H. Robust tests for equality of variances. In: Contributions to Probability Statistics; Stanford University Press: Alto, CA, 1960, pp 278-292.
Shirley E. The Analysis of Organ Weight Data. Toxicology 1977, 8, 13-22.
SYN524464 - A Ten-Day Tolerability Study in Non-Pregnant New Zealand White Rabbits (Study/Report No. 639035).
Snedecor GW, Cochran WG. One Way Classifications; Analysis of Variance. In Statistical Methods, 7th ed.; The Iowa State University Press: Ames, IA, 1980; pp 215-237.
3.9.4.16 Anonymous (2014)Report: Anonymous, 2014. Sedaxane: Effect on rat thyroid peroxidase activity in vitro. Laboratory
Report No. 5525/1/1/2014 (Amendment 1), 11 November 2014. Unpublished. (Syngenta File No. SYN524464_11574).
GUIDELINES: This was an investigative study with no applicable guidelines.
GLP: This study has not been subjected to any study specific Quality Assurance procedures. Study activities at the Test Facility were conducted according to relevant SOPs. There were no deviations from

CLH REPORT FOR SEDAXANE
227
the protocol to affect the quality, integrity or achievement of the study objectives. This study was not conducted according to Good Laboratory Practice standards as defined by 40 CFR part 160. No claim of GLP compliance was made for this study.
EXECUTIVE SUMMARYThis study evaluated the effect of sedaxane on rat thyroid peroxidase activity in vitro. Thyroid glands were isolated from five male Wistar Han rats and a pooled microsomal fraction was assayed for thyroid peroxidase activity by determining the monoiodination of L-tyrosine. The following concentrations of sedaxane were tested: 0 (control), 0.01, 0.1, 1 and 10 μM. 10 µM 6-propyl-2-thiouracil (PTU) was used as a positive control as it is a known inhibitor of thyroid peroxidase.
Treatment with sedaxane had no significant effect on rat thyroid peroxidase activity at any concentration tested. Treatment with PTU resulted in a >99.9% inhibition of thyroid peroxidase activity.
Sedaxane is not an inhibitor of rat thyroid peroxidase activity in vitro.
MATERIALS AND METHODSMaterials:
Test Material: SedaxaneDescription: Off white powderLot/Batch number: SMU6LP006/MILLEDPurity: 95.3% w/w (83.0% SYN508210 (trans isomer), 12.3% SYN508211 (cis isomer)CAS#: 874967-67-6Stability of test compound: Expiry date end January 2015 (stored at <30°C)
Vehicle / positive controls: Dimethyl sulfoxide (DMSO) / 6-propyl-2-thiouracil (PTU).
Test Animals:Species RatStrain Wistar HanAge/weight at sacrifice 67-74 days / 291-309 gSource Charles River UK Ltd, Manston Road, Margate, Kent CT9 4LT, England, UK.Housing 3 per cage in Macrolon cages type IVDiet Laboratory animal diet ad libitumWater Tap water ad libitum
Study Design and Methods:Experimental dates: Start: 12 March 2014 End: 28 March 2014
Preparation of thyroid gland microsomes: Five male rats were killed by exsanguination under ketamine (75 mg/kg bw) and medetomidine (0.5 mg/kg bw) anaesthesia (administered by intraperitoneal injection) and the thyroid glands attached to part of the trachea immediately removed and snap frozen in dry ice. The trachea/thyroid gland samples were stored at -70°C or below prior to preparation of thyroid gland microsomes. The trachea/thyroid glands were thawed and each thyroid gland dissected from the attached trachea. A whole homogenate of the pooled thyroid glands from five rats was prepared in 0.154 M KCl containing 50 mM Tris-HCl, pH 7.4 using a Potter type, Teflon-glass, motor driven homogeniser (Lake, 1987). The thyroid gland whole homogenate was centrifuged at 9000 g average for 20 minutes to obtain the postmitochondrial supernatant which was subsequently centrifuged at 105000 g average for 60 minutes to separate the microsomal fraction from the cytosol. The pooled thyroid gland microsomal fraction was resuspended in fresh homogenising medium. Aliquots of the pooled thyroid gland microsomal fraction were stored at -70°C or below and were thawed once only for the determination of thyroid peroxidase activity.
Assays:

CLH REPORT FOR SEDAXANE
228
Protein Content: Thyroid gland microsomal protein content was determined by the general procedure of Lowry et al. (1951), as described by (Lake, 1987), employing bovine serum albumin as standard. The microsomal protein content of the pooled thyroid gland preparation was calculated to be 17.5 mg protein/g tissue.
Thyroid Peroxidase Activity: Thyroid peroxidase activity was assayed by determining the monoiodination of L-tyrosine by a method based on studies by Doerge et al. (1998) and Freyberger and Ahr (2006).
Incubations contained 500 μM L-tyrosine, 150 μM potassium iodide, 38 μg thyroid microsomal protein, either sedaxane or PTU dissolved in dimethyl sulphoxide (2.5 μL/incubation) and 0.1 M phosphate buffer pH 7.4 in a total volume of 0.25 mL. Sedaxane concentrations studied were 0 (control), 0.01, 0.1, 1 and 10 μM, PTU concentration was 10 μM. After a 10 minute preincubation in a shaking water bath at 37°C, the reaction was initiated by the addition of 200 μM hydrogen peroxide. Blank incubations (to correct for non-enzymatic formation of 3-iodo-L-tyrosine) contained all additions except for thyroid gland microsomes. After a 10 minute incubation in a shaking water bath at 37°C the reaction was terminated and levels of 3-iodo-L-tyrosine in deproteinised supernatants determined by ultra-performance liquid chromatography-mass spectrometry-mass spectrometry (UPLC-MS-MS). Under these conditions the rate of formation of 3-iodo-L-tyrosine was linear with respect to both incubation time and protein concentration and the formation of 3,5-diiodo-L-tyrosine in control incubations was <2.5% of the formation of 3-iodo-L-tyrosine.
Statistics: Data were summarised in the form of mean and standard deviations (SDs) of the mean. Enzyme activity data were tested for normality using the Kolmogorov-Smirnov test (level of significance determined to be at p<0.10) and heterogeneity using Bartlett’s test (level of significance p<0.01). Control and sedaxane treated groups and control and PTU treated groups were subjected to a one-way analysis of variance. Comparisons between control and sedaxane treated groups were made using two-sided Dunnett’s tests and between control and PTU treated groups were made using a Student’s t-test. In all Dunnett’s test and t-test comparisons a probability level of p<0.05 was taken to indicate statistical significance.
RESULTS AND DISCUSSIONTreatment with sedaxane had no significant effect on rat thyroid peroxidase activity at any concentration tested. Treatment with PTU resulted in a >99.9% inhibition of thyroid peroxidase activity
Table 3.9.4.14-1: Effect of sedaxane and PTU on rat thyroid peroxidase activityTreatment Thyroid peroxidase activity (nmol/min/mg protein)
Control (DMSO only) 5.24 ± 0.567 (100)
Sedaxane 0.01 μM 5.03 ± 0.297 (96)
Sedaxane 0.1 μM 5.06 ± 0.212 (97)
Sedaxane 1 μM 4.94 ± 0.114 (94)
Sedaxane 10 μM 4.98 ± 0.282 (95)
PTU 10 μM 0.002 ± 0.0015** (0.04)
Statistically different from control **p<0.01.
CONCLUSION: Sedaxane is not an inhibitor of rat thyroid peroxidase activity in vitro.DS comment: a justification of the tested concentration has been requested. The applicant has provided the following statement.
A maximum concentration of 10 µM sedaxane for in vitro mechanistic testing was based on the approximate in vivo blood concentration that was achieved at steady-state following dietary

CLH REPORT FOR SEDAXANE
229
administration to male rats. The concentration of 10 µM was selected using data from a 28-day comparative dietary study of sedaxane and its individual isomers in Wistar rats, where SYN524464 = sedaxane (1:1 ratio of trans and cis isomers), SYN508210 = the trans isomer, and SYN508211 = the cis isomer (see 3.12.1.1). The maximum µM concentration was calculated based upon the Cmax at Day 14 of dietary administration, which would represent the maximum concentration at steady state. The steady state concentration (Css) is a dynamic equilibrium where the rate of input is equal to the rate of elimination. Generally, it is considered that steady state has been achieved after approximately 4-5 times the half-life for a substance after regular dosing is started. Because the Css is approximately the total exposure during a dosing interval divided by time of the dosing interval, the Cmax at Day 14 would represent a more conservative value for dose setting for the in vitro mode of action studies due to the assumption that animals feed primarily during the dark cycle but also sporadically during the light cycle. The following was the conversion of µg/mL to µM for the Cmax:
Cmax (µg/mL) x 1 µmol/331.4 µg x 1000 mL/Lwhere 331.4 µg/µmol is the molecular weight of sedaxane.
Table 3.9.4.10-3: µM Cmax values for Day 14 at 2000 and 5000 ppm Cmax (µM)
2000 ppmMale
2000 ppmFemale
5000 ppmMale
5000 ppmFemale
Group trans cis trans cis trans cis trans cisSYN508210 1.7 7.3 14.3 15.4SYN508211 1.0 2.0 0.6 4.5
0.5 N/A 1.4 0.1 1.9 0.1 3.9 0.2SYN5244640.5 1.5 2.0 4.1
As shown above, the high dose group (5000 ppm) females administered SYN508210 (trans) had the highest Cmax at steady state with a value of 15.4 µM (based on a measured value of 5.11 µg/mL SYN508211) while the 5000 ppm dose group administered SYN524464 (1:1 trans:cis) had Cmax at steady state of 4.1 µM (trans + cis). The 2000 ppm dose group females administered SYN508210 (trans) had Cmax at steady state of 7.3 µM while the 2000 ppm dose group administered SYN524464 (1:1 trans:cis) had Cmax at steady state of 1.5 µM (trans + cis).
The technical active ingredient ratio used in the 2-year chronic/carcinogenicity study was ~ 85%trans and 15% cis isomers. Therefore, based on the values for Cmax, it was reasonable to conclude that the 3600 ppm dose groups of the 2-year chronic/carcinogenicity study would have average blood concentrations at steady state (Css) of ~ 10 µM or less. Hence, for the Jolas (2015) and Anonymous (2014) Annex I. 3.9.4.1, in vitro mode of action studies used to support human non-relevance of the uterine tumours in the female rat and thyroid tumours in male rat at 3600 ppm, it was determined that a top concentration of 10 µM would be appropriate and provide meaningful testing results at conservative, physiologically relevant concentrations reflected in the 2 year chronic/carcinogenicity study.
The justification submitted is considered acceptable.
References: Doerge DL, Chang HC, Divi, R.L, Churchwell MI, 1998. Mechanism for inhibition of thyroid peroxidase by Leucomalachite Green. Chemical Research in Toxicology 11, 1098-1104.
Freyburger, A., Ahr, H.-J., 2006. Studies on the goitrogenic mechanism of action of N,N,N',N'-tetramethylthiorea. Toxicology, 169-175.

CLH REPORT FOR SEDAXANE
230
Lake BG, 1987. Preparation and characterisation of microsomal fractions for studies of xenobiotic metabolism, In: Snell K, Mullock B (Eds.), Biochemical Toxicology: A Practical Approach, IRL Press, Oxford, pp. 183−215.
Lowry OH, Rosebrough NJ, Farr AL, Randall RJ, 1951. Protein measurement with the Folin phenol reagent. J. Biol. Chem. 193, 265-275
3.10 Reproductive toxicity3.10.1 Animal data3.10.1.1 Anonymous 2010 (Final report amendment 2, Anonymous 2013)
Report: Anonymous, 2010 (including amendment 1). SYN524464 - Two-Generation Reproduction Toxicity Study in the Han Wistar Rat. Laboratory Report No. C18904, 26 January 2010. Unpublished. (Syngenta File No SYN524464_11262). Amendment 2, 14 August 2013).
GUIDELINES: OECD 416 (2001): OPPTS 870.3800 (1998): Ministry of Agriculture, Forestry and Fisheries, Japan, 12 – NohSan No.8147, 2000.
GLP: Signed and dated GLP and Quality Assurance statements were provided.
There were no deviations from the current regulatory guideline considered to compromise the scientific validity of the study. Amendment 1 to the final report was issued to initiate additional ovarian histopathology in the intermediate groups. Amendment 2 to the final report was issued by
. to describe the results of ovarian follicle counts, corpora lutea counts and additional micropathology of ovaries from P and F1 females of Groups 1 through 4.
EXECUTIVE SUMMARYFour groups of HanRcc: WIST(SPF) rats (P generation) received the test article, SYN524464, in the diet for 10 weeks and were then paired (one male with one female) for mating. The F1 generation animals were selected from the weaned F1 litters. The F1 parents were maintained on test diets for at least 91 days and were then paired for mating. The F2 offspring were sacrificed at weaning. Each group consisted of 25 male and 25 female rats. SYN524464 was administered orally, by ingestion, continuously throughout the study at dose levels of 0 (control), 200, 500 and 1500 ppm. All dams and remaining pups were sacrificed on day 21 post-partum and males were sacrificed when they were no longer needed for reproduction.
In the 1500 ppm group, a reduction in mean food consumption was noted in the P generation males and in the females in both generations. Mean body weight and body weight gain were reduced in the females in both generations, and they were slightly reduced in the males of the F1 generation only. The liver (males and females) and thyroid (males only) showed increased weights and/or micropathology changes, which consisted of centrilobular hepatocellular hypertrophy in the liver and diffuse follicular hypertrophy in the thyroid. Liver weights were also higher in male and female pups at 1500 ppm.
In the dams of the 1500 ppm dose group there was a lower number of antral follicles and corpora lutea in the ovaries and a higher number of dams in lactational diestrus in both generations. These differences in both parental generations may be indirect consequences of high-dose effects on pup and maternal body weight. The time until vaginal patency in the F1 female pups at 1500 ppm was increased concurrently concurrent body weight decrease.
In the 500 ppm group, a slight increase in liver weight in the P generation and F1 generation males was not accompanied by any macroscopic or microscopic changes in the liver, and is therefore not considered adverse.

CLH REPORT FOR SEDAXANE
231
In the 200 ppm group, no test item-related findings were noted in either generation during the study.
SYN524464 had no effect on any parameter of reproduction across two generations at dose levels up to 1500 ppm in the diet. Conclusion: Based on the results of this study, the parental NOAEL (No Observed Adverse Effect Level) was considered to be 500 ppm (equivalent to 41 mg/kg/day for P generation males during pre-pairing) and the offspring NOAEL for general toxic effects was 500 ppm (equivalent to 41 mg/kg/day). The NOAEL for reproduction was 1500 ppm (equivalent to 120 mg/kg/day for P generation males during pre-pairing).
MATERIALS AND METHODSMaterials:
Test Material: SYN524464Description: Off-white powderLot/Batch number: SMU6LP006/MILLEDPurity: 95.3% [Comprised of 83.0% SYN508210 (trans isomer) and 12.3%
SYN508211 (cis isomer)]CAS#: Not availableStability of test compound: Expiry date: 31 January 2011
Vehicle and/or positive control: Experimental diets were prepared in granulated standard Kliba-Nafag 3433 rat/mouse maintenance diet (Provimi Kliba AG, 4303 Kaiseraugst, Switzerland).
Test Animals:Species RatStrain HanRcc: WIST(SPF)Age/weight at dosing Males: 8 weeks, 211-253 g
Females: 7 weeks 137-176 gSource
Housing Individually (except during pairing) in Makrolon type-3 cages with wire mesh tops and sterilized standard softwood bedding (Lignocel Schill AG, 4132 Muttenz, Switzerland).
Acclimatisation period 7 daysDiet Granulated standard Kliba-Nafag 3433 rat/mouse maintenance diet (Provimi
Kliba AG, 4303 Kaiseraugst, Switzerland) ad libitumWater Community tap-water from Füllinsdorf was available ad libitumEnvironmental conditions Temperature: 22 ±3°C
Humidity: 30-70%%Air changes: Air-conditioned with 10-15 air changes per hourPhotoperiod: 12-hour fluorescent light / 12-hour dark cycleOther: music during the light period. A wood stick was provided.
Study Design and Methods:In-life dates: Start: 10 November 2008 End: 12 August 2009
Mating procedure: One male was caged with one female from the same test group until copulation plugs were seen or sperm cells were observed in vaginal smears taken daily during the mating period. If plugs/sperm were not found after 14 days' observation, the first male was removed and was replaced by another male with proven fertility in the same test group. Sibling matings were avoided. The day of mating was designated day 0 post coitum.
After successful mating, each pregnant female was individually housed.

CLH REPORT FOR SEDAXANE
232
Study schedule: The P parental animals were given test diets for 10 weeks before they were mated, and the F1 parental animals were not mated until 10 weeks after they were selected from the F1 litters. Selection of parents for the F1 generation was made when the pups were 21 days of age, and the mated animals in the study were approximately 13 weeks of age at mating.
Duration of treatment period: P Generation: SYN524464 was administered over a 70-day pre-pairing period and during the pairing and after pairing periods in males and during the pairing, gestation and lactation periods in females for breeding of the F1 litters.
F1 Generation: Following weaning of the F1 litters on day 21 post partum, F1 animals were selected for the next generation. Treatment was considered to have commenced when the selected F1 animals were about four weeks of age but the animals were maintained on their respective diets from weaning. SYN524464 was administered during growth of the F1 generation to adulthood (at least a 91-day pre-pairing period) and also during the pairing, gestation and lactation periods for breeding of the F2 litters.
Animal assignment: Parental animals were assigned to test groups using a computer-generated random algorithm. In addition body weights (recorded on the day of allocation) were taken into consideration in order to ensure similar mean body weights in all groups. Selection of F1 and F2 pups for different allocations (culling on day 4 post partum, necropsy and breeding) was based on randomly allocated pup numbers on day 1 post partum).
Animal numbers and treatment groups
Dietary Concentration of SYN524464 (ppm)Males Females
generation 0 200 500 1500 0 200 500 1500
P 1 - 25 26-50 51-75- 76-100 101-125 126-150 151-175 176-200F1 201 - 225 226-250 251-275 276-300 301-325 326-350 351-375 376-400
Dose selection rationale: Dietary concentrations were based on the results of a single generation study and long term feeding studies in Han Wistar rats with the same batch no. of SYN524464.
Diet/dosage preparation and analysis: Dietary admixtures were prepared weekly using SYN524464 as supplied. SYN524464 was weighed into a tared glass beaker on a suitable precision balance, and mixed with microgranulated feed separately for each dose group. Control feed for the animals of group 1 was prepared similarly, but without SYN524464.
Samples for analyses of SYN524464, its content and homogeneity in the feed were taken at the start of the main pre-pairing periods and thereafter at approximately two-month intervals One sample taken at two-monthly intervals from each dose was retained until completion of the study for possible subsequent analysis. Stability was verified at the start of the pre-pairing period. For assessment of achieved concentration, an 80 g sample was collected from the top, middle and bottom of every dietary admixture of the respective diet preparation (from group 1 admixtures only one sample was drawn from the middle of the preparation). For assessment of homogeneity, samples were collected as above from the low and high dose group only. For assessment of stability, an 80 g sample was drawn from the middle of the dietary admixture of the low and the high dose group on the day of preparation, stored at room temperature for 1 week and consequently frozen as described above.
Concentration analysis results: The mean concentrations of SYN524464 in each batch of diet ranged from 91.4-106.4% i.e. within 10% of the nominal concentration.
Homogeneity results: The homogeneity of SYN524464 in diet at concentrations of 200 ppm and 5000 ppm, was determined and considered satisfactory, percentage deviations in 200 ppm diets from the overall mean were within 3%. Values for 1500 ppm diets were within 10%, apart from one diet which was 12.6% outside the mean value.

CLH REPORT FOR SEDAXANE
233
Stability results: SYN524464 was stable in RM1 diet at room temperature for a period of up to 10 days at concentrations of 200 ppm and 1500 ppm.
Observations:Parental animals: All adult animals were individually assessed as follows:
Observation Frequency Mortality and morbidity: Twice dailyClinical signs: Daily cage-side clinical observations. Additionally, a detailed clinical examination was
conducted on a weekly basis on the same day as the recording of the body weight. Detailed clinical observations were performed outside the home cage. Animals were observed for the following: changes in skin, fur, eyes, mucous membranes, occurrence of secretions and excretions, and autonomic activity (e.g. lachrymation, piloerection, pupil size, unusual respiratory pattern). Changes in gait, posture and response to handling as well as the presence of clonic or tonic movements, stereotypes or bizarre behaviour were also reported.
Body weight: All animals were weighed on the first day of administration of experimental diets and thereafter at weekly intervals, with the exception of the pairing period. After mating, females were weighed on days 0, 7, 14 and 21 post coitum. Dams which littered were weighed on days 0/1, 4, 7, 14 and 21 post partum and on the day the animals were sacrificed.
Food consumption: Food consumption was recorded once weekly for a 24- hour period together with the recording of body weights during the pre-pairing and gestation periods. During the lactation period, food consumption of the females was recorded to day 21 post partum. From week 9 of the pre-pairing period onwards, food consumption was recorded for 3 periods per week at intervals of 2 or 3 days during the pre-pairing, gestation and lactation periods up to day 21 post partum.
Determination of the oestrus cycle stage:
For P and F1 generation, 21 days prior to pairing and throughout pairing until the smear was sperm-positive or a copulation plug was observed. A vaginal smear was taken immediately before termination of each P generation female.
Litter observations: The following litter observations were made, each pup (F1 and F2) was individually assessed as follows:
Observation Frequency (during lactation period)
Viability/mortality: Number of missing (cannibalized) or dead pups: DailySex: Sex ratio: Days 0/1, 4 and 21 post partumClinical signs: Abnormal findings recorded daily Body weight: Measured individually on days 0, 4, 7, 14, and 21 post partum. F2 pups were weighed on day 10
as weights were not collected on day 7 in error.Sexual development For the F1 selected for breeding of F2 generation, the age and body weight at which vaginal
opening or preputial separation occurred were recorded.Anogenital distance was recorded on day 1 post partum for F2 pups.
F1 and F2 pups were culled by random selection to select 8 pups from each litter (as nearly as possible 4 males and 4 females) on day 4 post partum. Culling was not conducted on litters of less than 8 pups.
Investigations post mortem: Parental animals: All P animals and F1 adult animals selected for breeding were killed when they were no longer necessary for the assessment of reproductive effects (at the age of approximately 26 weeks for P males, approximately 24-26 weeks for P females, approximately 25-26 weeks for F1 males, and approximately 23-27 weeks for F1 females).
Maternal animals were killed on day 21 post partum. Females for which no pregnancy was detected were sacrificed after a decision had been made that they were no longer required for a possible second mating.

CLH REPORT FOR SEDAXANE
234
All animals were killed by an injection of sodium pentobarbital and examined macroscopically for any structural abnormalities or pathological changes. Vaginal smears were taken from all P generation dams.
For the parent animals, special attention was directed at the organs of the reproductive system.
The number of implantation sites was noted for all mated females. The uteri of all dams, in which implantation sites were not visible, were placed in a solution of ammonium sulphide to visualize possible haemorrhagic areas of implantation sites and the number of implantation sites were noted.
The following tissues from all P and F1 parental males and females were collected at necropsy and fixed in neutral phosphate buffered 4% formaldehyde solution, except where noted otherwise:
gross lesions ovariespituitary uterus and cervix adrenal gland vaginaliver (target organ) oviductsprostate *spleenseminal vesicles with coagulating gland *kidneythyroid gland *brain (including brainstem)right testis and epididymis (in Bouin’s fixative)
The following organ weights were recorded for all P and F1 parental males and females on day 21 post partum, or shortly thereafter:
brain (including entire brainstem) testeskidneys seminal vesicles with coagulating glands and fluidspituitary epididymides (total weight as cauda separately)adrenal glands prostateliver ovariesspleen uterus (including cervix, excluding oviducts)thyroid Epidcaud*Paired organs were weighed separately*Total weight of left and right epididymides including the cauda, were determined separately at necropsy. The cauda epididymis was then removed from each tissue. The left cauda epididymis was immediately preserved without weighing for sperm measurements. The right cauda epididymis was weighed for each animal.
Microscopic examination: All processed tissues were examined by light microscopy. Slides of all organs and tissues, including gross lesions, (except spleen, kidney and brain) collected at terminal sacrifice from the animals of the control and high-dose groups were examined.
In examination of the testis, special emphasis was made on the stages of spermatogenesis and histopathology of interstitial cell structure.
Initial ovarian histopathology, in addition to qualitative examination, included quantitative evaluation of primordial follicles, growing follicles and antral follicles from 10 sections per ovary in the first 10 females of the P and F1 generations in groups 1 and 4. Additionally, corpora lutea were counted on one section per ovary. Due to test item-related changes observed in group 4 (1500 ppm), the ovaries from the first 10 females in groups 2 and 3 (200 and 500 ppm respectively) of the P and F1 generations were prepared as described in section 3.10.4. As with groups 1 and 4, ten serial sections from the selected ovaries were processed to slide. The slides from groups 2 and 3 were evaluated by the criteria described below by an experienced pathology technician, and this same technician re-evaluated the slides already prepared from groups 1 and 4. Animals from groups 1, 2, 3 and 4 were evaluated in a random order. In

CLH REPORT FOR SEDAXANE
235
addition, corpora lutea were counted from one section (mid section/10th section) per ovary in a random order.
If SYN524464-related microscopic changes were detected in organs of any high-dose animal, those same organs from the mid- and low-dose group were examined. In addition, the vaginas from the 200 and 500 ppm groups in the F1 generation were examined.
Histological examination of ovaries was carried out on any females that did not give birth.
Seminology and spermatid count:Motility: At necropsy of adult males an epididymal sperm sample was obtained from the left caudal epididymidis of each male. The sample was diluted with a pre-warmed (about 35°C) physiological medium, and shortly after being obtained, one hundred sperm were counted microscopically for determination of percentage of not motile, stationary motile and progressively motile sperm.
Morphology: A sperm sample from the left vas deferens was used for morphological assessment after fixation and Eosin staining. 500 sperm per sample were evaluated microscopically and classified into the following categories:
Code DescriptionA Normal, complete spermB Normal head only (tail detached)C Complete sperm, misshapen hookD Complete sperm, abnormally curved hookE Complete sperm, reversed headF Abnormal head only (tail detached)
Morphological sperm evaluation was performed initially only for group 1 and 4 males. In the absence of a treatment-related effect the slides for the group 2 and 3 males were not evaluated.
Sperm, spermatid count: The left caudal epididymis and left testis were taken for determination of homogenization-resistant spermatids and caudal epididymal sperm reserve. Sperm or spermatid heads were counted microscopically using a modified Neubauer chamber. These evaluations were performed in the first instance only for group 1 and 4 males. In the absence of a treatment-related effect the remaining frozen tissues were not evaluated.
Offspring: The F1 offspring not selected as parental animals and all F2 offspring were killed at 21 days of age. These animals were subjected to examination post-mortem (macroscopic and/or microscopic examination).
The following organ weights were recorded from one randomly selected male and female pup from each F1 and F2 litter (on day 21 post partum precisely):
brain spleen
liver thymus
thyroid
One male and one female pup per litter selected for organ weights - organs weighed at necropsy and thyroids were fixed in neutral phosphate buffered 4% formaldehyde solution but were not examined.
Statistics: The following statistical methods were used to analyze food consumption, body weights and reproduction data:
Means and standard deviations of various data were calculated.

CLH REPORT FOR SEDAXANE
236
All statistical tests were two-sided. Statistical significance between groups was evaluated by Analysis of Variance (ANOVA). In the
case where variances were non-homogenous, appropriate transformations were applied (e.g. log, square root, or double arcsine) to stabilize the variances before the ANOVA. Dunnett many-one t-test was then used to compare each group to control based on the error mean square in the ANOVA.
Fisher’s exact-test was applied if the variables could be dichotomized without loss of information.
Organ weights were analyzed using ANOVA as above and by analysis of covariance (ANCOVA) using terminal kill body weight as covariate.
Ovarian Ovarian counts of follicles and corpora lutea were evaluated by Wilcoxon’s test Oestrous cycle staging based on vaginal smears was evaluated by a Kruskal-Wallis test.
Indices: Reproductive indices: The following reproductive indices were calculated from breeding and parturition records of animals in the study.
Percentage mating = (Females mated / Females paired) x 100 Fertility index = (Females achieving a pregnancy / Females paired) x 100 Conception rate = (Females achieving a pregnancy / Females mated) ) x 100 Gestation index = (Number of females with living pups / Number of females pregnant) x 100 Birth index = (number of pups born alive / number of implantations) x 100 Viability index = (number of pups alive on day 4 p.p. / number of pups born alive) x 100 Weaning index = (number of pups alive on day 21 p.p / number of pups alive on day 4 p.p) x 100
RESULTS AND DISCUSSIONParental animals: Mortality and clinical signs: All animals survived until the scheduled necropsy. No treatment-related clinical signs were noted in the parental males or females of either generation at any dose level.
Bodyweight: In the 1500 ppm group, mean body weight and body weight gain in the P generation males were not affected by treatment with SYN524464. In the F1 generation males, mean body weight and body weight gain were lower during the study but rarely achieved statistical significance. In the 1500 ppm females in both generations, mean body weight gain was statistically significantly reduced in the pre-pairing period. Mean body weight was reduced, often statistically significantly, during the whole of the study in both generations.
In the 200 and 500 ppm groups, mean body weight and body weight gain were similar to the control group in the males and females in both generations.
Selected body weight results are summarized below.
Table 3.10.1.1-1: Intergroup comparison of body weights (selected time points; mean values shown for days 1, 8 and 70/71 for P and F1 males
0 200 500 1500 0 200 500 1500Doses SYN524464 (ppm)
P male F1 male
Number of animals/group 25 25 25 25 25 25 25 25
Body weight (g) Pre mating day 1 231 234 231 232 106 105 105 95**
Pre mating day 8 267 270 264 267 159 163 162 152

CLH REPORT FOR SEDAXANE
237
Pre mating day 70/71 411 409 405 404 417 414 420 395
* / ** : Dunnett-Test based on pooled variance significant at 5% (*) or 1% (**) level
Table 3.10.1.1-2: Intergroup comparison of body weights (selected time points; mean values shown for days 1, 15 and 70/71 pre mating, days 0 and 21 of gestation and 1 and 21 of lactation for P and F1 females
0 200 500 1500 0 200 500 1500Doses SYN524464 (ppm)
P female F1 female
Number of animals/group 25 25 25 25 25 25 25 25
Body weight (g) Pre mating day 1 161 161 160 158 96 98 95 89
Pre mating day 15 198 201 197 190** 157 158 157 152
Pre mating day 70/71 261 263 255 243** 243 241 244 229*
Gestation day 0 259 260 254 240** 254 249 251 237**
Gestation day 21 385 381 380 359** 363 360 365 344
Lactation day 1 279 282 277 263* 273 268 275 253**
Lactation day 21 313 314 310 292** 301 300 303 284*
* / ** : Dunnett-Test based on pooled variance significant at 5% (*) or 1% (**) level
Food consumption: In the 1500 ppm, group, mean food consumption in the P generation males was statistically significantly reduced at the start of the pre-pairing period. In the F1 generation, mean food consumption in the males was not affected by treatment with SYN524464. In the females of both generations, it was reduced for the majority of the study and was often statistically significantly reduced.
In the 200 and 500 ppm groups, mean food consumption was not affected by treatment with SYN524464 in males or females in either generation.
Food utilization was statistically significantly increased at the start of the pre-pairing period in the 1500 ppm group males in both generations and in the F1 females.
Selected food consumption results are summarized below.

CLH REPORT FOR SEDAXANE
238
Table 3.10.1.1-3: Intergroup comparison of food consumption (selected time points; mean values shown for days 8-9/10, 15-16/17 and 68-70/71 for P and F1 males
0 200 500 1500 0 200 500 1500Doses SYN524464 (ppm)
P male F1 male
Number of animals/group 25 25 25 25 25 25 25 25
Food consumption (g/rat/day)
Pre mating day 8-9, 8-10 42.7 33.8 35.5 30.9* 21.9 21.9 22.1 21.1
Pre mating day 15-16, 15-17 23.9 23.5 23.4 22.6* 24.0 24.1 24.0 23.1
Pre mating day 68-70, 68-71 23.8 23.9 23.6 23.3 24.9 24.6 25.6 24.7
* / ** : Dunnett-Test based on pooled variance significant at 5% (*) or 1% (**) level
Table 3.10.1.1-4: Intergroup comparison of food consumption (selected time points; mean values shown for days 1-2/3, 15-16/17, 29-30/31, 50-51/52 and 68-70/71 pre mating, days 0-2 and 18-21 of gestation and 1-3, 14-16 and 20-21 of lactation for P and F1 females
0 200 500 1500 0 200 500 1500Doses SYN524464 (ppm)
P female F1 female
Number of animals/group 25 25 25 25 25 25 25 25
Food consumption (g/rat/day)
Pre mating day 1-2, 1-3 31.9 25.7 28.3 38.3 14.8 15.4 15.2 14.5
Pre mating day 15-16, 15-17 19.1 19.0 18.1 16.4** 17.8 17.8 17.5 16.3**
Pre mating day 29-30, 29-31 20.7 19.6 19.2* 18.4** 18.8 18.6 19.0 17.5*
Pre mating day 50-51, 50-52 19.8 19.2 18.7 17.4** 18.3 16.9* 17.6 17.4
Pre mating day 68-70, 68-71 18.9 18.9 17.4 16.6** 19.4 17.7 18.5 17.1*
Gestation day 0-2 20.9 20.0 19.7 18.6* 18.5 17.7 18.4 17.2
Gestation day 18-21 25.0 26.3 27.6* 25.2 26.7 26.1 27.5 23.9**
Lactation day 1-3 30.1 29.0 32.4 29.3 33.2 36.9 34.0 32.3
Lactation day 14-16 70.0 66.0 62.7 54.6** 66.1 65.6 64.2 58.6*
Lactation day 20-21 70.9 69.2 63.2* 60.4** 75.3 71.8 71.8 70.8
* / ** : Dunnett-Test based on pooled variance significant at 5% (*) or 1% (**) level
Dose received: Dose rates (based on nominal dietary levels of SYN524464) were calculated in terms of mg SYN524464/kg body weight/day. Mean values are shown below:

CLH REPORT FOR SEDAXANE
239
Table 3.10.1.1-5: Mean Dose Received (mg/kg/day)SNY524464 (ppm) 200 500 1500
Males P Pre mating period 16.3 40.7 120.3
Males P After pairing period 11.4 29.1 87.2
Females P Pre mating period 18.4 46.3 143.2
Females P Gestation period 15.4 39.9 119.5
Females P Lactation period 35.5 87.2 252.0
Males F1 Pre mating period 17.2 43.3 133.5
Males F1 After pairing period 11.5 28.5 88.6
Females F1 Pre mating period 18.5 47.3 140.8
Females F1 Gestation period 16.1 40.2 116.8
Females F1 Lactation period 38.2 93.3 281.6
Reproductive function:Oestrous cycle length and periodicity: No SYN524464-related findings were noted in the oestrous cycle data. No dose-dependent pattern was observed in the length of the cycles.
Sperm measures: No treatment-related effects were noted. Sperm morphology, concentration and motility were similar across the groups for both generations.
The sperm head count in the testis was similar in the control group and in the 1500 ppm group and was within the range of the historical control data. The count in the cauda epididymides in the 1500 ppm group (757.18) was slightly higher than the range of the historical control data (657.6 - 720.76), but it was not statistically significantly different from the concurrent control group and does not reflect an effect of treatment.
Reproductive Performance: Reproductive performance was not affected by treatment with SYN524464.

CLH REPORT FOR SEDAXANE
240
Table 3.10.1.1-6: Reproductive Performance 0 200 500 1500 0 200 500 1500Doses SYN524464 (ppm)
P Generation F1 Generation
Number of animals paired 25 25 25 25 25 25 25 25
Mean pre coital interval (days)
3.6 3.1 3.2 3.5 4.3 4.0 3.0 5.0
Number of litter 23 25 24 25 23 23 23 25
Mean gestation (days) 21.7 21.6 21.4 21.6 21.7 21.6 21.7 21.6
Fertility index % 92.0 100.0 96.0 100.0 96.0 92.0 92.0 100.0
Percentage mating % 100.0 100.0 100.0 100.0 100.0 100.0 100.0 100.0
Conception rate % 92.0 100.0 96.0 100.0 96.0 92.0 92.0 100.0
Gestation index % 100.0 100.0 100.0 100.0 95.8 100.0 100.0 100.0
* / ** : Fisher's Exact Test significant at 5% (#) or 1% (##) level Percentage mating = (Females mated / Females paired) * 100Fertility index = (Females achieving a pregnancy / Females paired) * 100Conception rate = (Females achieving a pregnancy / Females mated) * 100Gestation index = (Number of females with living pups / Number of females pregnant) * 100
Sacrifice and pathology: Parental animals:Macroscopic findings: An increased incidence of enlarged liver was noted in the females of both generations in the 1500 ppm group, and the incidence was statistically significant in the F1 generation.
Table 3.10.1.1-7: Macroscopic findings females P and F1 generations0 200 500 1500 0 200 500 1500Doses SYN524464
(ppm)P females F1 females
Number of animals/group
25 25 25 25 25 25 25 25
Liver enlarged (no.) 0 0 0 3 1 0 2 14##
Liver enlarged % 0 0 0 12 4 0 8 56
# / ## : Fisher's Exact Test based on counts significant at 5% (#) or 1% (##) level
Organ weights: For the liver, the absolute weights and weights adjusted for body weight were statistically significantly increased in the males and females in the 1500 ppm group in both generations. Liver weight corrected for body weight was also increased in P and F1 generation males at 500 ppm. However, considering the small magnitude of the change (+6 to +9%) and the absence of any microscopic changes in the liver at this dose level, these minor differences were not considered adverse. At 200 ppm, there were no treatment-related differences from control values in liver weight.
In 1500 ppm males, an increase in thyroid weights was observed in the P generation, but not in the F1 generation.

CLH REPORT FOR SEDAXANE
241
In females at 1500 ppm, the absolute ovary weights were lower than control values, which was statistically significant for the left ovary only. Adjusted ovary weights were not statistically different from the control values.
Other statistically significant changes in organ weights were recorded which were not considered to be SYN524464-related; none of these differences corresponded to any macroscopical or pathological findings in this study.
Table 3.10.1.1-8: Mean parental organ weights and organ weights adjusted for body weight P and F1 males
0 200 500 1500 0 200 500 1500Doses SYN524464 (ppm)
P males F1 males
Animals/group 25 25 25 25 25 25 25 25
Mean weight (g)
Liver 12.18 12.69 12.93* 14.51** 13.45 13.59 14.23 15.42**
Adjusted liver 11.995 12.623** 13.086** 14.597** 13.183 13.554 13.962* 15.997**
Kidney (R) 1.12 1.13 1.12 1.17 1.17 1.16 1.19 1.16
Adjusted kidney (R) 1.108 1.126 1.134 1.178** 1.157 1.162 1.177 1.193
Kidney (L) 1.10 1.13 1.09 1.14 1.16 1.17 1.17 1.17
Adjusted kidney (L) 1.091 1.127 1.101 1.145* 1.147 1.167 1.159 1.198
Prostate 0.93 0.99 0.88 1.05* 1.04 0.99 1.00 0.99
Adjusted prostate 0.925 0.988 0.886 1.055** 1.039 0.991 1.002 0.989
Adrenal (R) 0.027 0.026 0.026 0.026 0.030 0.029 0.029 0.029
Adjusted adrenal (R) 0.027 0.026 0.026 0.27 0.030 0.029 0.029 0.029
Adrenal (L) 0.031 0.028* 0.028* 0.028* 0.032 0.029* 0.031 0.032
Adjusted adrenal (L) 0.031 0.028* 0.029 0.028* 0.032 0.029 0.030 0.032
Thyroid (R) 0.010 0.011 0.011 0.012* 0.015 0.014 0.015 0.015
Adjusted thyroid (R) 0.010 0.011 0.011 0.012* 0.015 0.014 0.015 0.015
Thyroid (L) 0.011 0.011 0.010 0.012 0.015 0.014 0.016 0.015
Adjusted thyroid (L) 0.011 0.011 0.011 0.013 0.015 0.014 0.015 0.015
* / ** : Dunnett-Test based on pooled variance significant at 5% (*) or 1% (**) level

CLH REPORT FOR SEDAXANE
242
Table 3.10.1.1-9: Mean parental organ weights and organ weights adjusted for body weight P and F1 females
0 200 500 1500 0 200 500 1500Doses SYN524464 (ppm)
P females F1 females
Animals/group 25 25 25 25 25 25 25 25
Mean weight (g)
Liver 13.29 13.35 13.62 15.97** 12.56 13.03 12.73 16.29**
Adjusted liver 12.937 13.003 13.472 16.786** 12.094 12.713 12.616 17.115**
Ovary (R) 0.056 0.055 0.055 0.049 0.057 0.056 0.054 0.043**
Adjusted ovary (R) 0.055 0.054 0.055 0.052 0.055 0.055 0.054 0.045**
Ovary (L) 0.059 0.056 0.056 0.050* 0.055 0.058 0.054 0.047**
Adjusted ovary (L) 0.058 0.056 0.056 0.051 0.055 0.058 0.054 0.048
Uterus 0.83 0.87 0.96 0.74 0.79 0.80 0.78 0.62**
Adjusted uterus 0.838 0.877 0.964 0.735 0.780 0.791 0.781 0.634*
* / ** : Dunnett-Test based on pooled variance significant at 5% (*) or 1% (**) level
Microscopic findings: In the liver, increased incidence and severity of centrilobular hepatocellular hypertrophy was recorded in both sexes from both the P and F1 generation at 1500 ppm. This alteration was considered to be an adaptive response (Table 3.10.1.1-10).
In the thyroid glands, a marginally increased incidence and severity of diffuse follicular hypertrophy was recorded in F1 males at 1500 ppm only (Table 3.10.1.1-10).
Ovary staging (Table 3.10.1.1-11)
Statistically significantly lower values for primordial follicles were observed in the ovaries of the P-generation 1500 ppm group, but the observed differences from control were considered unrelated to treatment. There were no differences from control values for primordial follicles in the F1-generation. Primordial follicles are established in the ovary during fetal development and the post-partum development of rats prior to sexual maturity. Lower primordial follicles in the P-generation ovaries, but not the F1-generation ovaries, therefore lacks biological plausibility considering the greater length of exposure to the F1 animals, including exposure during more sensitive time periods for primordial follicle generation. Therefore, this is not considered a treatment-related effect. Numerically lower growing follicle counts were observed in all treated groups inthe F1-generation, but none of these values were statistically different from the control groupvalue and there was no dose-response. In addition there were no differences from control forgrowing follicles in the P-generation at any dose level. All of these values were within the range of historic control data (Appendix 6) for growing follicles (8.7 – 21.3), with the exception of the F1-generation control group which was higher than historical control. Considering the lack of a dose response and absence of similar findings in the P-generation, the differences in the F1 growing follicle counts were not considered treatment-related.In the 1500 ppm group, corpora lutea counts were lower than control values in the P-generation (not statistically significant) and in the F1 generation (statistically significant). In the F1 generation, there was also a lower number of antral follicles in the 1500 ppm group.

CLH REPORT FOR SEDAXANE
243
Micropathology examination of the vagina was performed and included an evaluation of the oestrus cycle stage of each animal at the end of lactation. In both generations, there were more animals still under lactational diestrus (i.e. not cycling) in high dose groups compared to controls:P-Generation: 12 vs 7 animals (1500 ppm vs control group)F1-Generation 20 vs 8 animals (1500 ppm vs control group).
Qualitative evaluation of the ovaries showed that in the ovaries from the animals with vaginal evidence of lactational diestrus, the majority of corpora lutea were large (unless degenerating), comprising eosinophilic/vacuolated cells, suggesting that they were corpora lutea of pregnancy. There was no evidence of smaller newer corpora lutea, which would suggest recent ovulation. These findings suggest that the reduction in ovarian corpora lutea recorded in the high dose animals reflects the prolonged lactational diestrus observed, with the delayed return to cyclicity.
The study author considered that the reduction in ovarian corpora lutea and the changes in ovarian follicle counts recorded in the high dose animals (P and F1), reflects the prolonged lactational diestrus observed, with the delayed return to cyclicity. These findings are consistent with the reduction in body weight seen in the 1500 ppm maternal animals and their pups during lactation, and a delay in returning to estrous cycling due to the prolonged stimulus of nursing by the pups. Based on these observations, the author attributed the lack of estrous cyclicity in high dose females to a prolonged suckling period by the pups secondary to systemic toxicity.
In P and F1 generation females from the 200 ppm and 500 ppm groups, there were no treatment-related differences from control values in ovarian follicle and corpora lutea counts and the incidence of lactational diestrus was similar to control values.
SYN524464 did not reveal effects on the completeness of sperm stages or sperm cell populations. There was no indication for maturation arrest, re-absorption of sperm or any other degenerative type.

CLH REPORT FOR SEDAXANE
244
Table 3.10.1.1-10: Selected histopathology findings males and females P and F1 generations0 200 500 1500 0 200 500 1500Doses SYN524464 (ppm)
P males P females
Number of animals/group
25 25 25 25 25 25 25 25
Affected (Mean severity)
Liver hepatocellular hypertrophy
13(1.1)
6(1.0)
6(1.0)
20(1.3)
0 1(1.0)
0 10(1.3)
Thyroid diffuse follicular hypertrophy
11(1.3)
14(1.3)
11(1.5)
14(1.1)
2(1.0)
- - 3(1.0)
Doses SYN524464 (ppm) 0 200 500 1500 0 200 500 1500
F1 males F1 females
Number of animals/group
25 25 25 25 25 25 25 25
Affected (Mean severity)
Liver hepatocellular hypertrophy
10(1.0)
7(1.0)
3(1.0)
22(1.1)
0 0 0 17(1.1)
Thyroid diffuse follicular hypertrophy
5(1.0)
7(1.0)
3(1.0)
9(1.2)
1(1.0)
- - 1(1.0)
Not examined: -
Table 3.10.1.1-11 Final ovarian staging results – counting all control and treated groups (mean/animal)
FolliclesP Generation Dose level (ppm)
Primordial Growing Antral
Corpora lutea
0 (control) 240.4 19.70 10.30 18.30
200 219.70 15.60 11.20 17.30
500 255.60 16.20 8.90 16.00
1500 158.50**(-34%) 19.50 9.00 (-13%) 15.50 (-15%)
F1 Generation
0 (control) 235.2 23.90 10.80 17.20
200 240.0 15.30 8.60 15.80
500 238.1 16.50 9.40 15.40
1500 247.0 15.40 (-36%) 5.20**(-52%) 12.30*(-28%)
*/** Statistically significant (*p<0.05; ** p<0.01), ANOVA and Dunnett’s test following square root transformation.
Offspring:

CLH REPORT FOR SEDAXANE
245
Viability and clinical signs: F1 Pups: There was no effect of SYN524464 on pup viability and there were no treatment related clinical signs. The sex ratio was close to 50% in all dose groups in both generations.The total number of post-implantation losses was statistically significantly higher in the P generation 1500 ppm group (33 compared to 17 in the control group). However, the mean number per dam (1.3 compared to 0.7 in the control group) was not statistically significantly different from control and was within the historical control. The values for the P generation 1500 ppm group were very similar to those of the F1 generation control group (40 total, 1.7 per litter) and therefore do not represent a treatment related effect.
Mean litter size and viability results from pups during lactation are summarized below:
Table 3.10.1.1-12: Litter parameters for F1 and F2 0 200 500 1500 0 200 500 1500Doses SYN524464 (ppm)
F1 litter F2 litter
Number of litters/group 23 25 24 25 23 23 23 25
Mean implantations 13.7 13.8 14.3 13.1 13.0 12.7 13.1 13.0
17 27 27 33# 40 30 40 29Post implantation loss (total)
Post implantation loss (mean/dam)
0.7 1.1 1.1 1.3 1.7 1.3 1.7 1.2
No. dead pups at first litter check, total for group
3 0 1 2 1 1 3 2
Mean live pups/litter day 1 13.0 12.8 13.1 11.8 11.3 11.4 11.4 11.8
Post-natal loss days 0-4 pp/total for group
1 1 3 1 1 2 4 5
Mean live pups/litter post cull 7.9 8.0 7.7 7.9 7.8 7.9 7.6 7.8
Breeding loss days 5-21/total for group
0 0 3 2 3 1 0 1
Mean live pups/litter day 21 7.9 8.0 7.6 7.8 7.7 7.8 7.6 7.8
* / ** : Dunnett-Test based on pooled variance significant at 5% (*) or 1% (**) level# / ## : Fisher's Exact Test significant at 5% (#) or 1% (##) level
Bodyweight: In both generations, the mean body weight of the pups was similar in all dose groups at the start of the rearing period.
In the 1500 ppm group, mean pup body weights became statistically significantly reduced during the rearing period in both generations.
In the 200 and 500 ppm groups, mean pup body weights in both generations were similar to the control group during the whole of the rearing period.

CLH REPORT FOR SEDAXANE
246
Table 3.10.1.1-13: F1 and F2 Intergroup comparison of pup body weights0 200 500 1500 0 200 500 1500Doses SYN524464 (ppm)
F1 males F1 females
Number of litters/group 23 25 24 25 23 25 24 25
Mean pup body weight (g)
Day 1 pp 6.3 6.2 6.1 6.3 6.0 6.0 5.7 6.0
Day 4 pp 8.9 9.1 8.6 9.3 8.6 8.8 8.3 8.9
Day 7 pp 15.0 15.1 14.4 14.3 14.3 14.6 13.9 13.9
Day 14 pp 30.7 31.3 29.8 28.4** 29.6 30.5 29.4 27.7*
Day 21 pp 50.0 49.9 48.2 45.1** 47.8 48.5 46.9 43.3**
0 200 500 1500 0 200 500 1500Doses SYN524464 (ppm)
F2 males F2 females
Number of litters/group 23 23 23 25 23 23 23 25
Mean pup body weight (g)
Day 1 pp 6.5 6.5 6.5 6.5 6.2 6.1 6.1 6.1
Day 4 pp 9.7 9.7 9.4 9.5 9.4 9.3 9.0 9.1
Day 10 pp 22.7 22.6 21.8 21.5 22.0 21.9 21.3 21.1
Day 14 pp 31.8 32.0 31.0 29.9* 31.1 31.1 30.2 29.3*
Day 21 pp 51.4 51.6 50.1 46.9** 49.6 49.5 48.0 45.7**
* / ** : Dunnett-Test based on pooled variance significant at 5% (*) or 1% (**) level
Sexual maturation (recorded for F1 pups): The time until vaginal patency was reached was statistically significantly increased in the 1500 ppm group, although the weight at sexual maturation was similar to control.
Anogenital distance (recorded for F2 pups): The anogenital distance was slightly but statistically significantly increased in the female pups in the 1500 ppm group on day 1 p.p. Although statistically significant, considering the inherent variability in the measurement of anogenital distance and the small magnitude of the difference, the increase was only slight and was considered to be equivocal.

CLH REPORT FOR SEDAXANE
247
Table 3.10.1.1-14: F1 Sexual developmental landmarks (preputial separation males, vaginal opening females)Doses SYN524464 (ppm)
0 200 500 1500 0 200 500 1500
F1 males F2 females
Number of animals 25 25 25 25 25 25 25 25
Day of landmark 27.6 27.9 28.0 28.1 32.5 33.3 32.7 34.2**
Weight at landmark 82.98 83.64 81.96 75.58** 99.59 104.52 100.70 102.58
* / ** : Dunnett-Test based on pooled variance significant at 5% (*) or 1% (**) level
Table 3.10.1.1-15: Ano-Genital Distance in F2 Offspring (mean values litter basis)F2 males F2 femalesDoses SYN524464
(ppm) 0 200 500 1500 0 200 500 1500Number of litters 23 23 23 25 22 23 23 25Mean Body weight of pups (g)
6.54 6.49 6.47 6.46 6.24 6.13 6.08 6.13
Ano-genital distance (mm) 1.79 1.85 1.88 1.93 *
(min-max /group)3.63 3.66 3.80 3.73
1.43 - 2.05 1.45-2.14 1.70-2.34 1.61-2.30Corrected Ano-genital distance 1.94 1.96 2.04* 2.0 0.97
0.7 -1.141.01
0.8- 1.291.03
0.78- 1.31.05*
0.81- 1.26Number of animals having AGD > control
16 15 18 18 13 13 17 18
* / **: Dunnett-Test based on pooled variance significant at 5% (*) or 1% (**) level
Offspring post-mortem results:Pathology: Macroscopic examination: There were no findings in pups which were related to administration of SYN524464.
Organ weights: The liver weights adjusted for body weight were statistically significantly increased in male and female pups in the 1500 ppm group in both generations. There were no effects at the lower dose

CLH REPORT FOR SEDAXANE
248
Table 3.10.1.1-16: Mean pup organ weights adjusted for body weight0 200 500 1500 0 200 500 1500Doses SYN524464
(ppm)F1 males F2 males
Number of animals/group
23 25 24 25 23 23 23 25
Mean liver weight (g) 1.76 1.83 1.78 1.85 1.85 1.93 1.85 1.87
Mean adjusted liver weight (g)
1.719 1.773 1.772 1.956** 1.778 1.838 1.837 2.030**
Mean spleen weight (g) 0.24 0.23 0.22 0.19** 0.26 0.25 0.23* 0.21**
Mean adjusted spleen weight (g)
0.231 0.216 0.215 0.211 0.251 0.234 0.229* 0.234
0 200 500 1500 0 200 500 1500Doses SYN524464 (ppm)
F1 females F2 females
Number of animals/group
23 25 23 24 22 23 23 25
Mean liver weight (g) 1.60 1.69 1.64 1.59 1.73 1.78 1.67 1.74
Mean adjusted liver weight (g)
1.560 1.599 1.626 1.726** 1.650 1.722 1.670 1.858**
Mean spleen weight (g) 0.24 0.23 0.23 0.19** 0.25 0.24 0.23 0.21**
Mean adjusted spleen weight (g)
0.233 0.211 0.227 0.214 0.241 0.234 0.228 0.230
* / ** : Dunnett-Test based on pooled variance significant at 5% (*) or 1% (**) level
CONCLUSION: SYN524464 had no effect on any parameter of reproduction across two generations at dose levels up to 1500 ppm in the diet. Based on the results of this study, the parental NOAEL (No Observed Adverse Effect Level) was considered to be 500 ppm (equivalent to 41 mg/kg/day for P generation males during pre-pairing) and the offspring NOAEL for general toxic effects was 500 ppm (equivalent to 43 mg/kg/day). The NOAEL for reproduction was 1500 ppm (equivalent to 120 mg/kg/day for P generation males during pre-pairing).
3.10.1.2 Anonymous (2009)Report: Anonymous (2009). SYN524464 - Prenatal Developmental Toxicity Study in the Han Wistar Rat
- Final Report Amendment 1. Report No. C23955. Issue date: 28 December 2009. Unpublished. (Syngenta File No.SYN524464_11270)
GUIDELINES: Prenatal Developmental Toxicity Study (rat) adapted from OPPTS 870.3700 (1998): OECD 414 (2001): 2004/73/EC B.31 (2004): JMAFF, 12 Nohsan No. 8147 (2000)
GLP: Signed and dated GLP and Quality Assurance statements were provided.
There were no deviations from the current regulatory guideline considered to compromise the scientific validity of the study.

CLH REPORT FOR SEDAXANE
249
EXECUTIVE SUMMARYIn a prenatal developmental toxicity study, groups of 24 mated female Han Wistar rats were dosed orally by gavage, with 0, 25, 100 or 200 mg SYN524464/kg/day on days 6-20 post coitum using 0.5% CMC high viscosity as a vehicle.
A standard dose volume of 10 mL/kg body weight with a daily adjustment to the actual body weight was used. Control dams were dosed with the vehicle alone (0.5% CMC high viscosity). Dams were checked for mortality/morbidity twice daily. Clinical signs were assessed and recorded daily. Individual body weights were recorded daily. Food consumption data was recorded on days 0-4, 4-6, 6-9, 9-12, 12-15, 15-18 and 18-21 post coitum.
All surviving dams were sacrificed on day 21 post coitum and the foetuses were removed by Caesarean section. Examination of dams and foetuses was performed in accordance with international recommendations, which included external examination of all foetuses, and visceral or skeletal examination of approximately equal numbers of foetuses from each treatment group.
At 200 mg/kg/day, mean food consumption and mean body weights were reduced during the treatment period in dams. At 100 mg/kg/day, mean food consumption and mean body weights of dams were slightly reduced during the treatment period.
A slight reduction in mean foetal weight was noted only in females at 200 mg/kg/day, but this only represented a difference of 4.3% compared to controls in one sex. Since no effects were observed on foetal development and there was no delay in the stage of ossification observed, this finding was considered to be not adverse. No test item-related effects on foetal survival or the numbers and types of foetal abnormalities and variations were noted in any group.
Based on these results, the NOAEL (No Observed Adverse Effect Level) for dams was considered to be 25 mg/kg body weight/day. The NOAEL for foetuses was considered to be 200 mg/kg body weight/day. Under the conditions described for this study, SYN524464 did not reveal teratogenic potential up to and including 200 mg/kg body weight/day.
MATERIALS AND METHODSMaterials:
Test Material: SYN524464Description: Off-white powderLot/Batch number: SMU6LP006/MILLEDPurity / Composition: 95.3%, w/w, comprised of: 83.0% SYN508210 (trans isomer) and 12.3%
SYN508211 (cis isomer)Stability of test compound: Stable under storage conditions.
Expiry date: 31 January 2011
Vehicle: 0.5% CMC high viscosity

CLH REPORT FOR SEDAXANE
250
Test Animals:Species RatsStrain Rat, HanRcc:WIST (SPF Quality)Age/weight at day 0 p.c. 11 weeks / 185 to 231 gSource
Housing Individually in Makrolon type-3 cages with wire mesh tops and standardized softwood bedding ("Lignocel", Schill AG, 4132 Muttenz/Switzerland).
Acclimatisation period 7 days Diet Pelleted standard Kliba-Nafag 3433 rodent maintenance diet (Provimi Kliba
AG, 4303 Kaiseraugst/ Switzerland) was available ad libitum (batch nos. 61/08 and 76/08).
Water Community tap water from Füllinsdorf, ad libitum.Environmental conditions Temperature: 22 ± 3 °C
Humidity: 30-70 %Air changes: 10-15 / hPhotoperiod: 12 hours light and 12 hours darkMusic: Background music played at a centrally defined low volume during the light period.
Study Design and Methods:In-life dates: Start: 16-March-2009 End: 29-July-2009
Mating procedure: After acclimatisation, females were housed with sexually mature males (1:1) in special automatic mating cages i.e. with synchronized timing to initiate the nightly mating period, until evidence of copulation was observed. After mating, the females were removed and placed in individual cages. The day of mating was designated day 0 post coitum.
Male rats from the same source and strain were used for the mating only. These male rats are in the possession of and were not considered part of the test system. The fertility of these males had been proven and was continuously monitored.
Animal assignment: Mated rats were assigned to the four groups using a randomisation procedure based on body weight, adjusted if necessary, so that a similar number of rats were allocated to each group on each day of mating and ensuring an acceptable distribution of males to which the females were mated. The group identification and animal numbers assigned to treatment are stated in the following table.
Table 3.10.1.2-1: Animal numbers and treatment groupsDose Levels (mg/kg bw./day)
0 (control) 25 (group 2) 100 (group 3) 200 (group 4)
Females 1 - 24 25 - 48 49 - 72 73 - 96
Dose level selection: The dose levels were selected based on a previous dose range-finding toxicity study in Han Wistar rats, Study C23944 (Anonymous, 2010 Annex I. 3.10.1.1 ), in which a dose of 200 mg/kg/day resulted in decreased maternal body weight gain and food consumption. The high dose of 200 mg/kg/day was selected as the high dose as this level was expected to produce some effects on maternal body weight and food consumption without causing excessive toxicity. A mid dose of 100 mg/kg/day was selected to provide an evaluation of dose-response relationships for any maternal or foetal effects. A low dose of 25 mg/kg/day was selected as this dose was expected to be a clear NOEL for both maternal and foetal effects.

CLH REPORT FOR SEDAXANE
251
Dose preparation and analysis: Dose formulations were prepared by the study scientist using the test item as supplied by the Sponsor. The dose preparations were made weekly and stored in the refrigerator (2 - 8 °C).
Samples for determination of concentration and homogeneity of the dose formulations were taken before the first day of treatment. During the last week of the treatment, aliquots were taken from the middle of each preparation to confirm concentration. After the first week of treatment dose formulations used were transferred to the analytical laboratory where storage stability samples were taken 12 days after preparation and analysed. The aliquots for analysis of dose formulations were frozen and stored at -20 ± 5 °C until analysis.
The identity of SYN524464 was confirmed by its retention time which was similar to that measured in the working standards. The test item content in all samples (91.8% to 108.8% of target) was found to be within the accepted range of ±10% of the nominal content. In addition, the homogeneous distribution of Sedaxane in 0.5% CMC high viscosity was demonstrated, because single results found did not deviate more than 9% (<15%) from the corresponding mean. The dosing formulations were demonstrated to be stable for 12 days when kept in the refrigerator (5±3°C). In conclusion, the results obtained within this part confirm the correct use of the test item during the conduct of this study.
Dosage administration: The rats were dosed orally, by gavage once daily in the morning from day 6 post coitum through to day 20 post coitum. All animals received a dose volume of 10 mL/kg body weight with a daily adjustment of the individual volume to the actual body weight. Control animals were dosed similarly with the vehicle alone.
Maternal observations: The rats were observed for mortality twice daily. Animals were observed once daily for signs of reaction to the treatment and/or symptoms of ill health during acclimatisation and during gestation up to the day of necropsy. Food consumption was recorded for the following periods: 0-4, 4-6, 6-9, 9-12, 12-15, 15-18 and 18-21 post coitum. Body weight was recorded daily from day 0 to day 21 post coitum.
Any female sacrificed was subjected to macroscopic examination. Examinations at sacrifice consisted of: post mortem examination, including gross macroscopic examination of all internal organs with emphasis on the uterus, uterine contents, position of foetuses in the uterus and the number of corpora lutea. The uteri (and contents) of all females with live foetuses were weighed during necropsy on day 21 post coitum to enable the calculation of the corrected body weight gain.
Foetal observations: Foetuses were removed from the uterus, sexed, weighed individually, examined for gross external abnormalities, sacrificed by a subcutaneous injection of sodium pentobarbital and allocated to one of the following procedures:
1. Microdissection technique (sectioning/dissection technique). At least one half of the foetuses from each litter was fixed in Bouin's fixative (one foetus per container). They were examined by a combination of serial sections of the head and microdissection of the thorax and abdomen. This included detailed examination of the major blood vessels and sectioning of the heart and kidneys. After examination, the tissue was preserved in a solution of glycerin/ethanol (one foetus per container). Descriptions of any abnormalities and variations were recorded.
2. The remaining foetuses were eviscerated and with the exception of over the paws, the skin was removed and discarded. Carcasses were processed through solutions of ethanol, glacial acetic acid with Alcian blue (for cartilage staining), potassium hydroxide with Alizarin red S (for clearing and staining ossified bone) and aqueous glycerin for preservation and storage. The skeletons were examined and all abnormal findings and variations were recorded. The specimens were preserved individually in plastic vials.
Foetuses with abnormalities were photographed.
CLH REPORT FOR SEDAXANE
252
Statistical analyses: The following statistical methods were used to analyse maternal, reproduction, and foetal examination data: Means and standard deviations of various data were calculated.All statistical tests were two-sided.Statistical significance between groups was evaluated by Analysis of Variance (ANOVA). In the case where variances were non-homogeneous, appropriate transformations were applied (e.g. log, square root, or double arcsine) to stabilize the variances before the ANOVA. The Dunnett many-one t-test was then used to compare each group to control based on the error mean square in the ANOVA.Fisher's Exact test was applied if the variables could be dichotomized without loss of information.For statistical tests on foetal data, comparisons are made between groups for number of foetuses affected and number of litters affected, for completeness. The litter is considered the proper unit of measurement for overall study evaluation.
Indices: The following data were recorded on-line: food consumption, body weights, reproduction data, uterus weights at Caesarean section and skeletal examination data (RCC-TOX LIMS).
All other data were recorded on data sheets and compiled manually.From the on-line recorded reproduction data, the following parameters were calculated: pre- and post-implantation losses, embryonic and foetal deaths (i.e. early and late resorptions), live and dead foetuses, abnormal foetuses, foetal sex ratios and foetal body weights.
For reproduction data, group mean values were calculated both on a litter basis and on a percentage per group basis. Mean foetal weights were calculated from the individual weights both on a per group and on a per litter basis.
Computer-generated values in the tables represent the rounded-off results of calculations which used the exact raw data values.
Maternal body weight gain was calculated as cumulative weight gain (in grams) compared to Day 6 of gestation.
Historical control data: Historical control data from effects on embryo-foetal development studies performed during 2006 - 2008 were provided.
RESULTS AND DISCUSSIONMaternal toxicity:Mortality and clinical signs: All females survived until scheduled necropsy. There were no test item-related clinical signs or symptoms noted in any group.
Body weight: At 200 mg/kg/day, mean body weight gain was statistically significantly reduced throughout the treatment period compared to the control group, which resulted in statistically significantly lower mean body weights during the second half of gestation. Additionally, body weight gain (corrected for the gravid uterus) was statistically significantly reduced at the end of the treatment period.
At 100 mg/kg/day, mean body weight gain was slightly reduced during the treatment period, reaching statistical significance only from day 11 to 14 post coitum (14.3% to 11.1% difference from control). Mean corrected body weight gain (corrected for the gravid uterus) was slightly but not statistically significantly reduced (27.1 g) compared to controls (31.2 g); this represented a difference of 13.1%. These slight weight reductions were considered to be a consequence of the slightly reduced mean food consumption and therefore considered to be treatment-related.
At 25 mg/kg/day, mean body weight, mean body weight gain and mean corrected body weight gain were similar to the control group.

CLH REPORT FOR SEDAXANE
253
Table 3.10.1.2-2: Inter-group comparison of body weight in gramsDose Levels (mg/kg b.w./day)
Day post coitum 0 (control) 25 (group 2) 100 (group 3) 200 (group 4)
0 205 202 204 2081 211 207 208 2132 215 211 213 2173 219 215 218 2214 223 220 221 2265 228 223 225 2286 230 226 227 2317 234 230 230 2308 238 234 234 2319 243 238 238 23510 247 243 242 23911 253 249 247 244*12 258 254 251 24813 262 258 255 249**14 266 263 259 253**15 273 270 266 259**16 281 279 274 267**17 292 292 284 277**18 305 304 297 288**19 316 318 307 299**20 328 332 321 309**21 342 347 334 324*
Corrected body weight gain
Day 6-21 31.2 33.1 27.1 14.8** * / ** : Dunnett-Test based on pooled variance significant at 5% (*) or 1% (**) level
Table 3.10.1.2-3: Inter-group comparison of cumulative body weight gain in gramsDose Levels (mg/kg bw/day
Day post coitum 0 (control) 25 (group 2) 100 (group 3) 200 (group 4)
6 0 0 0 09 13 12 12 4**11 23 23 20* 13**14 36 37 32* 22**18 75 79 70 57**21 112 121 107 93***/** Dunnett-Test based on pooled variance significant at 5% (*) or 1% (**) level.
Food consumption: At 200 mg/kg/day, mean food consumption was statistically significantly reduced throughout the treatment period. At 100 mg/kg/day, mean food consumption was slightly reduced, reaching statistical significance for the days 6-9 and 9-12 periods. At 25 mg/kg/day, mean food consumption was similar to the control group.

CLH REPORT FOR SEDAXANE
254
Table 3.10.1.2-4: Inter-group comparison of food consumption in gramsDose Levels (mg/kg b.w./day)
Days post coitum 0 (control) 25 (group 2) 100 (group 3) 200 (group 4)
0-4 21.2 20.2 20.6 21.14-6 21.7 21.4 21.5 21.86-9 22.7 21.7 20.8* 17.7**9-12 23.7 23.5 22.0* 20.4**12-15 24.9 24.4 23.9 21.1**15-18 26.3 26.1 24.9 23.1**18-21 24.0 24.2 23.3 21.3*** / ** : Dunnett-Test based on pooled variance significant at 5% (*) or 1% (**) level
Sacrifice and pathology: Gross pathology: No abnormal macroscopical findings were observed in any dam at necropsy. Caesarean section data: There was no test item- and/or dose-related effect on the reproduction parameters in any dose group. The pre-implantation loss, the implantation rate, the post implantation loss, and the number of living foetuses were not affected by treatment with the test item at any dose level. The mean number of foetuses per dam was 12.4 13.6, 12.5 and 12.5 in order of ascending dose level.

CLH REPORT FOR SEDAXANE
255
Table 3.10.1.2-5: Caesarean section observations for all pregnant femalesDose Levels of SYN524464 (mg/kg/day)Observation 0 (control) 25 (group 2) 100 (group 3) 200 (group 4)
No. Animals Assigned (Mated) 24 24 24 24No. Animals Pregnant 24 24 24 24No. Nonpregnant 0 0 0 0 No. Intercurrent deaths 0 0 0 0 No. Died Pregnant 0 0 0 0 No. Died Nonpregnant 0 0 0 0 No. With totally resorbed litters 0 0 0 0No. Corpora Lutea/Dam 14.2 14.5 14.3 14.5No. Implantations/Dam 13.4 14.0 13.6 13.2Total No. Litters (viable) 24 24 24 24No.Live Foetuses/Dam 12.4 13.6 12.5 12.5Pre-implantation Loss (% of corpora lutea) (+)
Post-implantation Loss (% of implant sites) (+)
Total No. Post-Implantation Losses (No. Dams affected)
5.3
7.5
24 (11)
3.7
3.0
10 (7)
5.0
7.7
25 (12)
8.6
5.4
17 (11)
No. Embryonic [Early] Resorptions (No. Dams affected)
24 (11) 8 (6) 23 (12) 15 (9)
No. Foetal [Late] Resorptions (No. Dams affected)
0 (0) 2 (2) 2 (1) 2 (2)
# Dead foetuses (# Dams affected) 0 (0) 0 (0) 0 (0) 0 (0)Gravid Uterus Weight (g) 80.8 87.8 80.1 78.0Mean Foetal Weight (g) 4.8 4.8 4.7 4.6 Males (g) 4.9 4.9 4.9 4.7 Females (g) 4.7 4.7 4.6 4.5*Sex Ratio (% Males per litter) 49.0 51.2 47.2 49.0
* / ** : Dunnett-Test based on pooled variance significant at level 5% (*) or 1% (**) +/++ : Dunnett-Test after double arcsine transformation of the proportion, based on pooled variance significant at level 5% (*) or 1% (**)
Sex ratios and Body weights of live foetuses (per dam): No test item-related effects on the sex ratio of the foetuses were noted in any group. At 200 mg/kg/day, the mean weights of female foetuses, but not males, were statistically significantly lower than controls. This only represented a difference of 4.3% compared to controls in the female foetuses. Since neither effect on foetal development nor any delay in the stage of ossification was observed, this finding was considered to be not adverse.
Developmental Toxicity: The numbers of foetuses (litters) available for morphological evaluation were 298(24), 326(24), 301(24), and 300(24) in the control, 25, 100, and 200 mg/kg/day groups, respectively. Abnormalities were observed in 2(2), 6(5), 3(3), and 3(2) foetuses (litters) in these same respective dose groups and were considered spontaneous in origin.
External and visceral examinations: No test item-related findings were noted during external examination of the foetuses in any group. At 25 mg/kg/day, for one foetus a small umbilical hernia was noted. At 200 mg/kg/day, one foetus had an agnathia. Due to the isolated occurrence, these findings were considered to be incidental.
Visceral examination revealed no test item-related findings in any dose group. A low incidence of common abnormalities was observed across all dose groups, including controls. Abnormalities were

CLH REPORT FOR SEDAXANE
256
found in two foetuses (two litters) in the controls, three foetuses (three litters) in the low-dose (25 mg/kg/day) group, two foetuses (two litters) in the mid-dose (100 mg/kg/day) group and a single foetus in the high-dose (200 mg/kg/day) group. The type and frequencies of commonly noted variations were similar in nature for the groups receiving the test item and the control group and did not indicate any dose-dependency or were in the range of the historical control data.
Skeletal examinations: No treatment-related effects on skeletal development were noted. Bone abnormalities were found in two foetuses (two litters) each at 25 and 200 mg/kg/day, and in one foetus at 100 mg/kg/day. These were common abnormalities in the control population, and their low incidence did not indicate an effect of treatment. During the examinations no test item-related findings were noted in the common bone and cartilage variations. The type and frequencies of commonly noted variations were similar in nature for the groups receiving the test item and the control group and did not indicate any dose-dependency or were in the range of the historical control data. No cartilage abnormalities were noted.
Ossification stage of foetuses did not reveal any test item-related findings. At 200 mg/kg, occasional statistically significant differences were noted which reflected lower incidences of common findings and were therefore considered to be incidental.
Table 3.10.1.2-6: Foetal Observations - AbnormalitiesDose Level (mg/kg/day)Observation
0 (control) 25 100 200Total No. Foetuses (No. Litters) 298(24) 326(24) 301(24) 300(24)
No. Foetuses (No. Litters) AffectedExternalNo. Foetuses (No. Litters) Examined 157(24) 168(24) 158(24) 158(24)
Umbilical Hernia 0 1(1) 0 0Agnathia 0 0 0 1(1)a
VisceralNo. Foetuses (No. Litters) Examined 157(24) 168(24) 158(24) 158(24)
Situs Inversus 0 0 1(1) 0Small Pituitary 0 1(1) 0 0Ventricular Septal Defect 0 1(1)b 0 0Diaphragmatic Hernia 0 1(1)b 1(1) 0Diaphragm Severely Thinned 0 0 0 1(1)Stomach Rotated 0 1(1) 0 0Renal pelvis and ureter severely dilated 2(2) 0 0 0
SkeletalNo. Foetuses (No. Litters) Examined 141(24) 158(24) 143(24) 142(23)
Multiple Skeletal Abnormalities 0 2(2) 1(1) 1(1)a
Costal Cartilage Interrupted and Fused 0 0 0 1 (1)
Total Abnormalities 2(2) 6(5) 3(3) 3(2)
a,b Malformations with the same superscript occurred in the same foetus.#/## Fisher's Exact Test significant at level 5% (#) or 1% (##)

CLH REPORT FOR SEDAXANE
257
CONCLUSION: Based on these results, the NOAEL (No Observed Adverse Effect Level) for dams was considered to be 25 mg/kg body weight/day. The NOAEL for foetuses was considered to be 200 mg/kg body weight/day. Under the conditions described for this study, SYN524464 did not reveal teratogenic potential up to and including 200 mg/kg body weight/day.
3.10.1.3 Anonymous (2010)Report: Anonymous (2010). SYN524464 - A prenatal developmental toxicity study in New Zealand
White rabbits. Laboratory Report No. 639037. Issue date: 26 January 2010. Unpublished. (Syngenta File No. SYN524464_11313)
GUIDELINES: Prenatal Developmental Study (rabbit) OECD 414 (2001): OPPTS 870.3700 (1998): 2004/73/EC B.31 (2004): JMAFF, 12 Nousan No. 8147 (2000).
GLP: Signed and dated GLP and Quality Assurance statements were provided.
There were no deviations from the current regulatory guidelines considered to compromise the scientific validity of the study.
EXECUTIVE SUMMARYThe test substance, SYN524464, in the vehicle, 0.5% (w/v) aqueous high viscosity carboxymethylcellulose (CMC), was administered orally by gavage to 3 groups of 25 time-mated female New Zealand White [Hra:(NZW)SPF] rabbits once daily from gestation days 7 through 28. Dose levels were 25, 100, and 200 mg/kg/day administered at a dose volume of 10 mL/kg. A concurrent control group composed of 25 time-mated females received the vehicle (0.5% high viscosity CMC) on a comparable regimen. The females were approximately 6 months of age at the initiation of dose administration. All animals were observed twice daily for mortality and moribundity. Clinical observations, body weights, and food consumption were recorded at appropriate intervals. On gestation day 29, a laparohysterectomy was performed on each surviving female. The uteri, placentae, and ovaries were examined, and the numbers of foetuses, early and late resorptions, total implantations, and corpora lutea were recorded. Gravid uterine weights were recorded, and net body weights and net body weight changes were calculated. In addition, the livers from all females examined at the scheduled necropsy were weighed. The foetuses were weighed, sexed, and examined for external, visceral, and skeletal malformations and developmental variations.
At 200 mg/kg/day, decreased maternal body weight gain and food consumption were observed during treatment, though the decreased weight gain was not sufficient to affect mean body weights. Increases in liver weights, both absolute weight (13%) and adjusted to net body weight as a covariate (14%), were observed at 200 mg/kg/day when compared to controls. Liver weight increases of 11% (absolute) and 9% (adjusted) observed at 100 mg/kg/day were considered adaptive. There were no maternal effects noted at 25 mg/kg/day.
Foetal examination revealed slightly lower mean foetal weights at 200 mg/kg/day. However, there were no treatment-related effects on foetal development in this group, and no effects on intrauterine growth and development were observed at 25 and 100 mg/kg/day.The only statistical increase in skeletal variations was in the foetal incidence of 13th full rib(s) at 200 mg/kg/day
Based on the reduced mean body weight gains (or body weight losses) and food consumption at 200 mg/kg/day, a dose level of 100 mg/kg/day was considered to be the no-observed-adverse-effect level (NOAEL) for maternal toxicity. Based on the reduced mean foetal weights and the increased foetal incidence of 13th full rib(s) at 200 mg/kg/day, a dose level of 100 mg/kg/day was considered to be the NOAEL for prenatal development when SYN524464 was administered orally by gavage to pregnant New Zealand White rabbits.

CLH REPORT FOR SEDAXANE
258
MATERIALS AND METHODSMaterials:
Test Material: SYN524464Description: Off-white powderLot/Batch number: SMU6LP006/MilledPurity: 95.3%, comprised of 83.0% trans isomer (SYN508210) and
12.3% cis isomer (SYN508211)Stability of test compound: January 2011 expiration date
Vehicle and/or positive control: The test substance was administered in 0.5% (w/v) aqueous high viscosity carboxymethylcellulose
Test Animals:Species RabbitStrain New Zealand White [Hra:(NZW)SPF]Age/weight at dosing 6 months/3084 g to 3910 gSourceHousing Suspended, stainless steel cagesAcclimatisation period NoneDiet gradual increments on day of receipt, and ad libitum, thereafterWater ad libitumEnvironmental conditions Temperature: 18.4°C to 19.2°C
Humidity: 47.8% to 52.1%Air changes: 10 fresh air changes per hourPhotoperiod: 12-hour light (0600 to 1800 hours)/12-hour dark
Study Design and Methods:In-life dates: Start: 4 January 2009 (first gestation day 0)
End: 18 March 2009 (last foetal skeletal examination)
Mating Procedure: Females were time-mated by the supplier and received on gestation day 1, 2, or 3.
Animal assignment: Animals were randomly assigned to test groups based on body weight stratification in a block design using the Toxicology Data Management System (WTDMS™) as shown in the following table.
Table 3.10.1.3-1: Animal numbers and treatment groupsDose Level (mg/kg/day)
0 (control) 25 100 200
Concentration of Dose Formulation (mg/ml) 0 2.5 10 20
Number of Females 25 25 25 25
Dose Selection Rationale: Dose levels were selected based on the results of a previous tolerability study in which non-pregnant female rabbits were administered SYN524464 once daily from study days 0 through 9 at dose levels of 250, 500, 750, and 1000 mg/kg/day (Anonymous, 2008) and a dose range-finding study in which pregnant female rabbits were administered SYN524464 once daily from gestation days 7 through 28 at dose levels of 100, 300, and 500 mg/kg/day (Anonymous, 2010). In the tolerability study, dose levels of 750 and 1000 mg/kg/day were not well tolerated based on body weight losses or lack of body weight gain and marked reductions in food consumption throughout the treatment period. A trend toward increased liver weights was also noted in the 750 and 1000 mg/kg/day groups. Dose levels of 250 and 500 mg/kg/day were well tolerated. In the dose range-finding study, oral (gavage)

CLH REPORT FOR SEDAXANE
259
administration of SYN524464 on gestation days 7-28 resulted in moribundity at 500 mg/kg/day and body weight loss and reduced food consumption at 300 and 500 mg/kg/day. In addition, a trend towards increased liver weights was noted at 100, 300, and 500 mg/kg/day. There was no evidence of developmental toxicity at any dose level. Based on these results, dose levels of 25, 100, and 200 mg/kg/day were selected for the current study.
Dosage Preparation and Analysis: The test substance formulations were weight/volume (test substance/vehicle) mixtures. The test substance formulations or vehicle control solutions were prepared approximately every 4-5 days as single formulations for each dose level, divided into aliquots for daily dispensation, and stored refrigerated (approximately 4ºC). The test substance formulations were stirred continuously throughout the preparation, sampling, and dose administration procedures.
Stability of the test substance in 0.5% aqueous high viscosity carboxymethylcellulose has been previously established at concentrations between 10 and 100 mg/mL for 7 days of refrigerated storage.
Prior to the initiation of dose administration, quadruplicate samples for concentration and homogeneity determinations were collected from the top, middle, and bottom strata of 2.5 and 20 mg/mL formulations that were prepared for analytical evaluation but were not for use in actual dosing (non-dosing formulations). In addition, an aliquot equivalent in volume to that needed for 1 day of dose administration was collected from these same non-dosing formulations and stored refrigerated (approximately 4°C) for 7 days. Following remixing for at least 30 minutes, quadruplicate samples for stability and resuspension homogeneity determinations were collected from the top and bottom strata of these aliquots after 7 days. Quadruplicate samples from the first and last dosing preparations were collected for concentration and homogeneity analyses from the middle stratum of the control group formulation and top, middle, and bottom strata of each test substance formulation. One set of duplicate samples from each collection was analysed by the Analytical Chemistry Department,
, using a validated high performance liquid chromatography method using ultraviolet (UV) absorbance detection. The second set of duplicate samples was stored frozen (-70°C ± 5°C) as backup and discarded following acceptance of the analytical results.
Concentration Analysis Results: The mean concentrations of the analysed dosing formulations (102 – 103% of target) met the protocol-specified acceptance criteria (85% to 115%) for solutions and suspensions.Homogeneity Analysis Results: The homogeneity of Sedaxane in 0.5% (w/v) aqueous high viscosity carboxymethylcellulose at concentrations of 2.5, 10 and 20 mg/mL was determined and considered acceptable, with relative standard deviations of 0.45 – 2.8%.Resuspension Homogeneity and Stability Analysis Results: Sedaxane in 0.5% (w/v) aqueous high viscosity carboxymethylcellulose was stable after 7 days of refrigerated (approximately 4ºC) storage.
Dosage Administration: All doses were administered once daily during gestation days 7-28 in a volume of 10 mL/kg. Following administration of each dose, the catheter was flushed with 5 mL of deionized water to ensure delivery of the entire dose. Individual doses were based on the most recently recorded body weights.
Observations:Maternal Observations: Animals were observed twice daily, once in the morning, and once in the afternoon, for moribundity and mortality. Individual detailed clinical observations were recorded from the day of receipt through gestation day 29 (prior to dose administration during the treatment period). Animals were also observed for signs of toxicity approximately 4 hours following dose administration. Maternal body weights were recorded on gestation days 0 (by supplier), 4 and 7-29 (daily), and food consumption was recorded on gestation days 4-29 (daily). Dams were sacrificed on day 29 of gestation; the thoracic, abdominal, and pelvic cavities were opened by a ventral mid line incision, and the contents were examined. The uterus and ovaries were then exposed and excised. The number of corpora lutea on each ovary was recorded. The trimmed uterus was weighed and opened, and the number and location of all foetuses, early and late resorptions, and the total number of implantation sites were recorded. The

CLH REPORT FOR SEDAXANE
260
placentae were also examined. The individual uterine distribution of implantation sites was documented using the following procedure. All implantation sites, including resorptions, were numbered in consecutive order beginning with the left distal to the left proximal uterine horn, noting the position of the cervix, and continuing from the right proximal to the right distal uterine horn. Uteri with no macroscopic evidence of implantation were opened and subsequently placed in 10% ammonium sulfide for detection of early implantation loss. Livers from all females were weighed and samples from the same lobe and location in each animal were preserved in 10% neutral-buffered formalin.
Foetal Observations: Each viable foetus was examined externally, individually weighed, euthanized by hypothermia followed by an intrathoracic injection of sodium pentobarbital (if necessary), and tagged for identification. The detailed external examination of each foetus included, but was not limited to an examination of the eyes, palate and external orifices, and each finding was recorded. Crown rump measurements, degrees of autolysis, and gross examinations, if possible, were recorded for late resorptions, and the tissues were discarded. Each viable foetus was then subjected to a visceral examination using a modification of the Stuckhardt and Poppe (19841) fresh dissection technique to include the heart and major blood vessels. The sex of each foetus was determined by internal examination. Foetal kidneys were examined and graded for renal papillae development. Heads from all foetuses were examined by a mid-coronal slice. All carcasses were eviscerated and fixed in 100% ethyl alcohol. Following fixation in alcohol, each foetus was stained with Alizarin Red S and Alcian Blue and subjected to a skeletal examination.
Statistical Analyses: All statistical tests were performed using appropriate computing devices or programs. Analyses were conducted using two-tailed tests (except as noted otherwise) for minimum significance levels of 1% and 5%, comparing each test substance-treated group to the control group. Each mean was presented with the standard deviation (S.D.), standard error (S.E.), and the number of animals (N) used to calculate the mean. Data obtained from nongravid animals were excluded from statistical analyses. Due to the use of significant figures and the different rounding conventions inherent in the types of software used, the means and standard deviations on the summary and individual tables may differ slightly. Where applicable, the litter was used as the experimental unit.
Mean maternal body weights (absolute and net), body weight changes (absolute and net) and food consumption, gravid uterine weights, numbers of corpora lutea, implantation sites and viable foetuses, absolute liver weights, and foetal body weights (separately by sex and combined) were subjected to a parametric one-way analysis of variance (ANOVA) followed by Dunnett's test. Mean liver weights were also subjected to a parametric one-way analysis of covariance (ANCOVA), with net body weight as the covariate, followed by Dunnett’s test, to determine intergroup differences.
Maternal performance data (e.g. proportion of females with live foetuses, abortions, and total resorptions) and macroscopic findings were analysed using Fisher’s Exact test, comparing each test substance-treated group to the control group. The incidence of foetal malformations and developmental variations (external, visceral, skeletal, and combined) were summarised as the proportion of foetuses affected and the proportion of litters affected. The proportions were analysed using a two-tailed Fisher’s Exact test, comparing each test substance-treated group to the control group.
Mean litter proportions (percent per litter) of prenatal data (viable and nonviable foetuses, early and late resorptions, total resorptions, pre- and post implantation loss, and foetal sex distribution) were summarised as the group proportion affected. The litter based mean percentage was summarised and subjected to a double arcsine transformation followed by ANOVA and Dunnett’s test.
1 Stuckhardt, J.L.; Poppe, S.M. (1984) Fresh visceral examination of rat and rabbit fetuses used in teratogenicity testing. Teratogenesis, Carcinogenesis and Mutagenesis 4: 181-188.

CLH REPORT FOR SEDAXANE
261
Statistical analyses of mean liver weights (using net body weight as the covariate) and mean litter proportions of prenatal data were performed using the SASTM System software.
Indices: Intrauterine data were summarised using two methods of calculation. An example of each method of calculation follows:
1. Group Mean Litter Basis:
No. Dead Foetuses,Resorptions (Early/Late)/Group
Post implantation Loss/Litter = No. Gravid Females/Group
2. Proportional Litter Basis:
Sum of Postimplantation Loss/Litter (%)Summation Per Group (%) =
No. Litters/Group
Where:
No. Dead Foetuses, Resorptions (Early/Late)/LitterPostimplantation Loss/Litter (%) =No. Implantation Sites/Litter
x 100
The foetal developmental findings were summarised by: 1) presenting the incidence of a given finding both as the number of foetuses and the number of litters available for examination in the group; and 2) considering the litter as the basic unit for comparison and calculating the number of affected foetuses in a litter on a proportional basis as follows:
Sum of Viable Foetuses Affected/Litter (%)Summation per Group (%) =
No. Litters/Group
Where:
No. Viable Foetuses Affected/LitterViable Foetuses Affected/Litter (%) =
No. Viable Foetuses/Litterx 100
Historical Control Data: The current historical control database (Version 1.2) is composed of 762 dams from 34 datasets. Additionally, 6125 foetuses from 701 litters received external, visceral and skeletal examinations.
RESULTS AND DISCUSSIONMaternal Toxicity: Mortality and Clinical Signs: In the 200 mg/kg/day group, female nos. 57745 and 57754 aborted on gestation days 24 and 28, respectively, and female no. 57697 delivered on gestation day 29. In addition, female nos. 57760 and 57707 in the 25 and 100 mg/kg/day groups, respectively, aborted on gestation day 28. These females exhibited body weight losses of 145 g - 432 g during the treatment period, with little to no food consumption (≤ 12 g/animal/day) 3 to 10 days prior to abortion/delivery. Decreased defecation was noted for these females on 2 to 10 occasions prior to abortion/delivery, and corresponded to minimal food consumption. There were no other indications of toxicity (adverse clinical findings or maternal macroscopic findings indicative of a test substance-related effect) for these females. Low incidences of abortion and delivery have been noted for females in the historical control data. Furthermore, it has

CLH REPORT FOR SEDAXANE
262
been demonstrated that feed restriction of 15 g/day or less and a subsequent reduction in body weight gain can result in increased risk of abortion in New Zealand White rabbits (Cappon et al., 20052). Therefore, these abortions and the single delivery were not attributed to test substance administration. All other females survived to the scheduled euthanasia on gestation day 29.
For females surviving to the scheduled necropsy, a dose-related increased incidence of decreased defecation was noted in the 25, 100, and 200 mg/kg/day groups at the daily examinations. This finding was noted as early as gestation day 10; however, most instances occurred during the last week of gestation when spontaneous decreased food consumption is frequently observed. The decreased defecation noted in the 200 mg/kg/day group corresponded to lower mean body weight gains and decreased food consumption and was considered test substance-related. At 25 and 100 mg/kg/day mean body weight gains and food consumption were similar to the control group, and the decreased defecation was considered a reflection of normal variability. Other clinical findings noted at the daily examinations or approximately 4 hours following dose administration in the test substance-treated groups occurred infrequently or in a manner that was not dose-related and were not attributed to test substance administration.
Body Weight: Treatment-related decreased maternal body weight gain/body weight loss was noted at 200 mg/kg/day. Cumulative mean body weight changes in the 200 mg/kg/day group were lower than the control group throughout the treatment period; differences were generally statistically significant during the first week of treatment. The mean body weight losses or reduced mean body weight gains noted in this group were not of sufficient magnitude to affect mean body weights during gestation.
There were no treatment-related effects on body weight or body weight gain in the 25 or 100 mg/kg/day groups. Statistically significantly higher weight gains observed in the 25 mg/kg/day dose group were considered a reflection of normal variability. Mean net body weights, net body weight losses, and gravid uterine weights in all test substance-treated groups were similar to the control group; no statistically significant differences were noted.
Table 3.10.1.3-2: Intergroup comparison of body weight (g)Dose Level (mg/kg/day)
day 0 (control) 25 100 200
0 3348 3346 3355 3365
7 3451 3511 3479 3462
8 3440 3508 3460 3425
14 3507 3606 3550 3455
19 3539 3687 3590 3484
24 3588 3747 3637 3557
29 3602 3711 3643 3549* Statistically significant difference from control group mean, p<0.05
2 Cappon. G.D.; Fleeman, T.L.; Chapin, R.E.; Hurtt, M.E. (2005). Effects of Feed Restriction during Organogenesis on Embryo-Fetal Development in the Rabbit. Birth Defects Research (Part B) 2005, 74(5), 424-430.

CLH REPORT FOR SEDAXANE
263
Table 3.10.1.3-3: Inter-group comparison of cumulative body weight gain (g)Dose Level (mg/kg bw/day)
Day post coitum 0 (control) 25 100 200
7 0 0 0 08 -11 -3 -19 -37**9 -10 -3 -7 -35*11 4 20 3 -3014 55 95 71 -7*18 89 161 99 1020 97 192* 122 3623 126 235* 163 7329 150 196 159 71
* Statistically significant difference from control group mean, p<0.05** Statistically significant difference from control group mean, p<0.01
Food Consumption: Mean maternal food consumption, evaluated as g/animal/day, in the 200 mg/kg/day group was generally slightly lower than the control group throughout the treatment period (gestation days 7-29); the difference in mean food consumption achieved statistical significance during gestation days 7-8, 10-13, and 27-28. These results corresponded to mean body weight losses or reduced body weight gains noted in this group during the treatment period.
Mean food consumption in the 25 and 100 mg/kg/day groups was similar to that in the control group. Differences from the control group during the treatment period were slight, did not occur in a dose-related manner, and/or were not statistically significant.
Table 3.10.1.3-4: Intergroup comparison of food consumption (g/animal/day)Dose Level (mg/kg/day)
day 0 (control) 25 100 200
7-10 147 162 150 132
10-13 131 149 132 103*
13-21 116 144 124 100
21-29 82 81 75 69
7-29 110 126 113 97* Statistically significant difference from control group mean, p<0.05
Sacrifice and Pathology: Gross Pathology: Female no. 57745 in the 200 mg/kg/day group aborted 9 dead foetuses (no apparent malformations) on gestation day 24. Female no. 57754 in the 200 mg/kg/day group aborted 2 live, 7 dead (no apparent malformations), and 3 cannibalized foetuses on gestation day 28. Female no. 57697 in the 200 mg/kg/day group delivered 6 live and 3 dead kits on gestation day 29. The only internal finding noted for the aforementioned females was green areas of thoracic tissue noted for female no. 57697. Female no. 57707 in the 100 mg/kg/day group aborted 5 late resorptions on gestation day 28, retaining 4 late resorptions in utero; no apparent malformations were noted for these late resorptions. This female was noted internally with thick white contents in the thoracic cavity, a firm oesophagus, lung adhesions, and a cystic oviduct at necropsy. Female no. 57760 in the 25 mg/kg/day group aborted 4 live, 5 dead (no apparent malformations), and 1 cannibalized foetus on gestation day 28. This female was noted with an accessory spleen at necropsy. The macroscopic findings were not attributed to test substance administration. All other females survived to the scheduled euthanasia on gestation day 29.

CLH REPORT FOR SEDAXANE
264
At the scheduled necropsy on gestation day 29, no internal findings were noted that were indicative of a test substance-related effect. One female each in the 25 and 100 mg/kg/day groups was determined to be nongravid.
Liver Weights: Dose-related increases in mean liver weight (absolute and adjusted for net body weight) were noted at 100 and 200 mg/kg/day compared to the control group; these differences were statistically significant. At 200 mg/kg/day, absolute liver weight was increased approximately 13% and adjusted liver weight was increased approximately 14% compared to controls. At 100 mg/kg/day, the corresponding weights were increased approximately 11% and 9%, respectively, and were considered adaptive due to the small magnitude of the change. Mean liver weight in the 25 mg/kg/day group was unaffected by test substance administration; the difference from the control group was not statistically significant.
Caesarean Section Data: Mean foetal weights (male, female, and combined) in the 200 mg/kg/day group were 8.0% to 8.6% lower than the control group values, and the difference in mean female foetal weight achieved statistical significance. These differences at 200 mg/kg/day were considered treatment related.
Mean foetal weights in the 25 and 100 mg/kg/day groups were not statistically significantly different from the control group. Mean live litter size, postimplantation loss, and foetal sex ratio in all test substance-treated groups were unaffected by test substance administration. The mean numbers of corpora lutea and implantation sites, and the mean litter proportions of preimplantation loss were similar across all groups.
Table 3.10.1.3-5: Caesarean section observations for all pregnant femalesDose Level (mg/kg/day)Observation
0 (control) 25 100 200No. Animals Assigned (Mated) 25 25 25 25
No. Animals Pregnant 25 24 24 25No. Nonpregnant 0 1 1 0
No. Aborted 0 1 1 2No. Prematurely delivered 0 0 0 1
No. Totally resorbed 0 0 0 0No. Corpora Lutea/Dam 9.3 9.6 10.0 9.6No. Implantations/Dam 8.7 9.1 9.0 9.0
Total No. Litters (viable) 25 23 23 23a
No. Live Foetuses/Dam 8.4 8.7 8.6 8.4Preimplantation Loss (% per litter)
Post-implantation Loss (% per litter)5.73.1
5.34.1
8.54.9
6.04.3
Early Resorptions (% per litter) 2.3 3.3 3.6 3.1Late Resorptions (% per litter) 0.8 0.8 1.4 1.2
Gravid Uterine Weight (g) 458.9 457.4 445.8 443.7Mean Foetal Weight (g) 40.0 38.7 37.6 36.8
Males (g) 40.8 38.5 38.0 37.5Females (g) 39.4 38.6 37.1 36.0*
Sex Ratio (% Males per litter) 46.2 43.4 47.6 51.7* Statistically significant difference from control group mean, p<0.05a = Includes female no. 57697 that delivered on gestation day 29
Developmental Toxicity: The numbers of foetuses (litters) available for morphological evaluation were 211(25), 200(23), 198(23), and 194(23) in the control, 25, 100, and 200 mg/kg/day groups, respectively. Malformations were observed in 1(1), 0(0), 2(2), and 1(1) foetuses (litters) in these same respective dose groups and were considered spontaneous in origin.

CLH REPORT FOR SEDAXANE
265
Table 3.10.1.3-6: Foetal Observations Dose Level (mg/kg/day)Observation
0 (control) 25 100 200No. Foetuses (No. Litters) Examined 211 (25) 200 (23) 198 (23) 194 (23)
No. Foetuses (No. Litters) AffectedMalformationsExternal
Carpal Flexure 0 0 1 (1) 0Visceral
Stenotic Pulmonary Trunk 1 (1) 0 0 0
SkeletalRib Anomaly 0 0 1 (1) 0Vertebral Anomaly with or without Rib Anomaly
0 0 1 (1) 1 (1)
Total Malformations 1 (1) 0 2 (2) 1 (1)
Selected VariationsSkeletal
13th Full Ribs 52 (17) 61 (18) 50 (15) 74*(19)Sternebrae, #5 and/or #6 Unossified 45 (16) 28 (12) 35 (14) 24*(11)
* Statistically significant difference from control group mean, p<0.05
External Examinations: A single foetus (no. 57694-02) in the 100 mg/kg/day group had carpal flexure (bilateral) with no apparent skeletal origin. This finding was not considered test substance-related.
No external developmental variations were observed in foetuses in this study.
Visceral Examinations: The only visceral malformation noted in this study was a stenotic pulmonary trunk noted for foetus no. 57764-01 in the control group.
Visceral developmental variations noted in the test substance-treated groups occurred in a frequency similar to the control group and/or in a manner that was not dose-related. Also, no statistically significant differences from the concurrent control group were noted and/or the mean litter proportions of visceral developmental variations were within the ranges of the historical control data. Therefore, noted visceral developmental variations were not considered test substance-related.
Renal papilla(e) not fully developed (Woo and Hoar (1972) grade 13) was observed for foetus nos. 57761-03 and 57724-02 in the control and 200 mg/kg/day groups, respectively. Dark red areas of the kidney were observed for foetus nos. 57749-04, 57749-05, and 57749-06 in the 25 mg/kg/day group. A distended stomach was noted for foetus no. 57710-06 in the 25 mg/kg/day group, foetus nos. 57779-07 and 57779-08 in the 100 mg/kg/day group, and foetus no. 57711-08 in the 200 mg/kg/day group. These findings were not classified as either malformations or developmental variations and were not considered test substance-related.
Skeletal Examinations: There were no treatment-related increases in the incidence of skeletal malformations in this study. Foetus nos. 57692-04 and 57786-01 in the 100 and 200 mg/kg/day groups,
3 Woo, D.C.; Hoar, R.M. (1972) Apparent hydronephrosis as a normal aspect of renal development in late gestation of rats: the effect of methyl salicylate. Teratology 6: 191-196.

CLH REPORT FOR SEDAXANE
266
respectively, had vertebral anomaly with or without associated rib anomaly consisting of extra ribs and arches and arches located more anterior or posterior than normal. Additionally, foetus no. 57694-02 in the 100 mg/kg/day group had rib anomaly consisting of left rib nos. 6 and 7 fused medially (this foetus also had carpal flexure). These findings occurred in single foetuses, the mean litter proportions in the 100 and 200 mg/kg/day groups (0.5% and 0.6% per litter, respectively) were within the range of values in the
historical control data, and the values were not statistically significantly different from the concurrent control group. A number of skeletal developmental variations were observed that were scattered across all dose groups, including controls, none of which were considered treatment-related. The only statistical increase in skeletal variations was in the foetal incidence of 13th full rib(s) at 200 mg/kg/day (74 foetuses) when compared to the controls (52 foetuses). The mean litter proportion of this finding was within the historical control range (mean 32.5%, range 16.5% – 45.7%). However the range of litter incidences from HCD has not been provided. Therefore, it could not be totally excluded that this effect was treatment related.While, short supernumerary ribs are transient findings that disappear after birth, full supernumerary ribs seem to be permanent structures.However, both are considered not to impact pup survival or health (Solecki R et al., 2013)4 and therefore are generally classified as foetal variations.
Therefore, this was not considered treatment-related. The only other statistical difference was a decrease in the foetal incidence of unossified #5 and/or #6 sternebra(e), at 200 mg/kg/day, which was within the historical control range and considered a reflection of the normal variability in this species.
CONCLUSION: Based on the reduced mean body weight gains (or body weight losses) and food consumption at 200 mg/kg/day, a dose level of 100 mg/kg/day was considered to be the no-observed-adverse-effect level (NOAEL) for maternal toxicity. Based on the reduced mean foetal weights and increased incidence of 13th full rib(s) at 200 mg/kg/day, a dose level of 100 mg/kg/day was considered to be the NOAEL for prenatal development when SYN524464 was administered orally by gavage to pregnant New Zealand White rabbits.
3.10.2 Human dataNo relevant studies.
3.10.3 Other data (e.g. studies on mechanism of action)No relevant studies.
3.11 Specific target organ toxicity – single exposure3.11.1 Animal data3.11.1.1 Anonymous (2009a)
Report: Anonymous, 2009a. Acute Oral (Gavage) Neurotoxicity Study in Rats. Laboratory Report No. B86591. Issue Date 08 October 2009. Unpublished (Syngenta File No.SYN524464_11145).
GUIDELINES: Acute Neurotoxicity Study. OECD 424 (1997): U.S. EPA OPPTS 870.6200 (1998): EU Council Directive 67/548/EEC B.43 (2000): JMAFF Notification No. 12 NohSan 8147 (2000)
4 Solecki R et al., (2013) Harmonization of description and classification of fetal observations: Achievements and still standing problems. Report of the 7th Workshop on the Terminology in Developmental Toxicology Berlin, 4–6 May 2011 Reprod Toxicol in press

CLH REPORT FOR SEDAXANE
267
GLP: Signed and dated GLP and Quality Assurance statements were provided.
There were no deviations from the current regulatory guideline considered to compromise the scientific validity of the study.
EXECUTIVE SUMMARYGroups of ten male and ten female HanRcc: Wistar (SPF) rats were administered single oral doses of 0 (control), 30, 250 or 2000 mg/kg SYN524464 in 0.5% w/v aqueous carboxy-methylcellulose (CMC), and observed for 16 days.
General cageside observations were made in all animals prior to study start and at approximately 1 hour after dose administration on day 1, and once daily thereafter throughout the study. In addition, detailed clinical observations comprising open field evaluation of clinical signs were performed in a randomized order once prior to study start and on days 8 and 15. On day 1 these detailed observations were included in the functional observation battery (FOB) evaluation. Furthermore, an FOB including quantitative assessment of landing foot splay, sensory perception and muscle weakness, was performed in all animals in a randomized order once prior to study start, and on days 1 (approximately 2 hours after dose administration), 8 and 15. Locomotor activity was assessed over a time period of 30 minutes after each FOB evaluation. Food consumption was recorded once prior to study start and on days 1, 8 and 15 over a 24 hour period each. Body weights were measured once during acclimatization and on days 1, 8 and 15. At the end of the scheduled period, 5 rats/sex/group were perfusion-fixed in situ. Selected nervous system tissues were dissected, processed and examined microscopically.
On the day of dose administration, four males and three females of the high dose groups had to be sacrificed in moribund condition. Clinical signs observed in these animals had progressed to severe laboured respiration, a heavily reduced activity, the occurrence of ventral or lateral recumbency, a drop in rectal temperature and/or piloerection. The remaining animals survived until their scheduled study period.
Daily cageside observations: On days 3 to 4 or one hour post dose a slightly weakened condition was present in a few males treated at 2000 mg/kg and females at 250 and 2000 mg/kg, respectively. Decreased activity and swaying gait were observed in females at 250 and 2000 mg/kg. These observations had disappeared by day 7 post dosing. In addition, a single incidence of prostration and hunched posture was recorded in females at 2000 mg/kg on day 2 and 5 respectively.
Detailed clinical observations: On day 1, signs were recorded after FOB evaluation: Most males and females of the high dose groups had a reduced activity and a decreased rearing activity, whereas some of them had also bradypnea, a reduced muscle tone, and showed an initial inactivity. Furthermore, a hunched posture was seen in one male and an abnormal gait in 2 females. A reduced activity and a decreased rearing activity occurred also in most of the males and females at 250 mg/kg. Initial inactivity was noted in 4 males and one female at 250 mg/kg. In addition, one male of this dose group showed recumbency, 3 males had piloerection and one female had a reduced muscle tone and another female had a hunched posture. On days 8 and 15, no clinical signs have been observed in any animals of any dose groups.
In the FOB, the only findings that were considered to be possibly test item-related were slightly reduced activity and decreased rearing activity, piloerection, a reduced muscle tone, an initial inactivity and bradypnea observed in most males and females at 250 and 2000 mg/kg on day 1 only. In addition, a reduced activity and decreased rearing activity were also noted in a small number of males and females treated at30 mg/kg. These findings were dose related.
On day 1 only, a slightly lower body temperature was recorded in some males and females at 2000 mg/kg, and lower grip strength in the fore- and hind paws was present in some females at 2000 mg/kg. There were no effects on landing foot splay that were considered to be related to treatment with SYN524464.

CLH REPORT FOR SEDAXANE
268
Treatment related effects on the locomotor activity (LMA) parameters were limited to the 250 and 2000 mg/kg males at approximately 3 hours post-dose on day 1.
On day 1, food consumption was dose dependently reduced in males and females at 250 mg/kg by 40.2% and 22.1%, respectively, and 2000 mg/kg by 71.4% and 60.3%, respectively.
On day 8, body weights were lower in males and females at 2000 mg/kg. A significant decrease in mean body weight gain was noted at 250 and 2000 mg/kg in males over the first week of treatment. The mean body weight gain for the treated and control males over the second week of treatment were comparable indicating that this decrease in mean body weight gain during the first weeks was a transient effect of treatment. The reduction in body weight and/or body weight gain (which was shown to recover by day 15) is considered to reflect transient general toxicity and was not indicative of neurotoxicity.
No test item related effects on absolute, relative and adjusted brain weights were evident in males or females.
There were no macroscopic findings or microscopic lesions present in the tissues examined that could be attributed to treatment.
Administration of a single oral gavage dose of SYN524464 to Wistar rats at dose levels of 30, 250, and 2000 mg/kg did not produce any evidence of neurotoxicity. Treatment-related findings associated with a generalized toxicity were noted at 250 and 2000 mg/kg, and included reduced activity, decreased rearing and a decreased body weight in males and females at 2000mg/kg and a lower body weight gain in males at 250 and 2000mg/kg, and a decreased food consumption in males and females at 250 and 2000 mg/kg. These findings were transient as there was no evidence of treatment related findings subsequent to day 8 of the study. There were no treatment-related neurohistopathological findings.
There was no evidence of neurotoxicity after a single oral administration of doses up to 2000 mg/kg bw. The NOAEL for general toxicity following a single oral dose of Sedaxane was 30 mg/kg in both males and females.
MATERIALS AND METHODSMaterials:
Test Material: SYN524464Description: Off-white powderLot/Batch number: SMU6LP006Purity: 95.3 % w/w, comprised of
83.0% trans isomer and 12.3% cis isomer. CAS#Stability of test compound: Stable under storage conditions of <10oC. Expiry date 31 January 2011.
Vehicle control: 0.5% w/v carboxymethylcellulose (CMC), high viscosity grade, in distilled water. Source: Fluka BioChemika, 9470 Buchs, Switzerland, batch number: 1140855. Expiry date: 06 February 2009.

CLH REPORT FOR SEDAXANE
269
Test Animals:Species RatStrain HanRcc: WIST (SPF)Age/weight at dosing At least 49 days old / males 162-201g, females 127-157g. Source
Housing Standard Laboratory Conditions. Individually in Macrolon type-3 cagesAcclimatisation period 7 days for males, 8 days for femalesDiet ad libitum Water ad libitum.Environmental conditions Temperature:223°C
Humidity: 30-70%Air changes: 10-15 changes/hourPhotoperiod: 12 hours light/12 hours dark
Study Design and Methods:In-life dates: Start: 05 May 2008 End: 29 May 2008 (males), 30 May 2008 (females)
Animal assignment and treatment: Animals were assigned to the test groups in randomized order and the cages were arranged in columns comprising 10 cages per group/sex on the racks. The columns were rotated weekly on the racks.
The rats were dosed once on day 1 at 10 ml/kg according to their individual bodyweights at the time of dosing. Control animals received the vehicle (0.5% w/v aqueous CMC), only.
At the end of the scheduled period, 5 rats/sex/group were perfused in situ. Selected nervous system tissues were removed, and preserved in an appropriate fixative. From the five animals/sex/group killed by perfusion fixation, the brain was removed and the weight recorded. The remaining animals were killed and discarded. Submitted tissues from top dose and control animals were examined by light microscopy.
Table 3.11.1.1-1: Study designExperimental Parameter Dose Group (mg/kg)
0 (control) 30 250 2000
Total number of animals/group 10/sex 10/sex 10/sex 10/sex
Behavioural testing (FOB, Locomotor Activity) 10/sex 10/sex 10/sex 10/sex
Neuropathology 5/sex 5/sex 5/sex 5/sex
Test substance preparation and analysis: For each dose level, an appropriate amount of vehicle (0.5% w/v aqueous CMC) was added to a weighed amount of test substance to provide one preparation (w/v) of the required concentration. This was stored at room temperature and re-suspended prior to dosing on the day of administration.
Samples of each dose preparation were analyzed prior to the start of dosing to verify the achieved concentrations of SYN524464 in 0.5% CMC according to an analytical method developed and validated at (studynumbers B77501 and C23415). Prior to dosing, the homogeneity of SYN524464 in 0.5% CMC was determined by analyzing samples from the low, mid and high dose levels. The stability of SYN524464 in 0.5% CMC was confirmed for 10 days at room temperature and at -20°C at concentrations of 1 and 200 mg/mL, and was sufficient to cover the period of storage and conditions of use for this study.
A contemporary positive control study was performed at the laboratory demonstrating the adequacy of these methods to detect neurotoxicity.

CLH REPORT FOR SEDAXANE
270
Statistics: All statistical tests were performed using appropriate computing devices or programs, which were documented in the final report. The following statistical approaches were used in this study:
All analyses were two-tailed for significance levels of 5% and 1%.
All means were presented with standard deviations.
If the variances were clearly heterogeneous, appropriate transformations (e.g. log, square root, double arcsine) were used in an attempt to stabilize the variances.
For quantitative data: body weights, cumulative body weight gain, food consumption, food utilization, quantitative FOB measurements (grip strength, landing foot splay and body temperature), locomotor activity data at each measurement interval and overall activity, and absolute organ weights were analyzed initially by a one-way analysis of variance (ANOVA).
Organ weights were also analyzed by analysis of covariance (ANCOVA) on final body weight (Shirley, 1977). This statistical analysis provided an adjusted organ weight value, which has been displayed in the results table in the final report along with flags for statistical significance.
Summary values of organ to body weight ratios were presented but not analyzed statistically.
For all of the parameters evaluated initially by ANOVA or ANCOVA, Dunnett’s test was used to compare the control and treated groups, based on the error mean square in the ANOVA or ANCOVA. The Dunnett’s test was performed for all continuous data parameters, regardless of whether the initial ANOVA or ANCOVA was statistically significant, and statistical flags are presented in the tables of results in the final report.
For qualitative data ( e.g. possible values of 0, 1, 2 or present/absent): Qualitative functional observational battery parameters or any other parameters not specifically mentioned above that yield qualitative data have been presented as summary data, but were not analyzed statistically.
Individual values were rounded before printing. All derived values that appear in the report tables represent the rounded results of calculations that are based on the exact (non-rounded) raw data values. Statistical analyses also were carried out on the exact raw data values.
Mortality and clinical observations: Prior to the start of the study, all rats were examined to ensure that they were physically normal and exhibited normal activity. Observations for viability/mortality were recorded twice daily. General cageside observations: All animals were observed for clinical signs once prior to first administration; and at approximately 1 hour after dose administration on day 1, and once daily thereafter. Detailed clinical observations: The animals were observed in their home cages, outside their home cages in a standard arena and in the hand. These observations were performed in random sequence once prior to treatment start and once weekly thereafter. On day 1 these detailed clinical observations were performed prior to dosing.
Body weights: Body weights were recorded once prior to treatment start, on the day of dose administration (day 1), and on days 8 and 15 of the observation period.
Food consumption: Food consumption was recorded once prior to treatment start, on the day of dose administration (day 1), and on days 8 and 15 of the observation period over a 24 hour time interval each. In the table mean values are expressed as g food/rat/day.
Functional observational battery (FOB): All animals were evaluated with an FOB (including grip strength of fore- and hind paws, landing foot splay, rectal body temperature and Preyer’s reflex) once prior to treatment, and on days 1 (approx. 2 hours after dosing), 8 and 15. Animals were randomized and the cage labels covered with the corresponding FOB number (see section 3.4.3. above) in order to eliminate bias with regards to treatment group. Observations were conducted in the home cage, during handling and in an open field over the functional domains of CNS activity: CNS excitation, sensorimotor, autonomic and physiological functions. These

CLH REPORT FOR SEDAXANE
271
observations were made by one observer who was ‘blind’ with respect to the animals’ treatment, and recorded on a computer system by personnel not directly involved in the clinical observations. The presence and/or absence of all listed observations were recorded and the degree of condition noted (slight, moderate or extreme) where appropriate.
Locomotor activity (LMA): LMA was assessed after conduct of the FOB once prior to treatment start and on days 1 (approximately 3 hours after dosing), 8 and 15, using an automated open field device (TRUSCAN, Coulbourn Instruments, Allentown, USA). The test boxes (40 x 40 x 40 cm) were made of transparent plexiglass. Horizontal activity was monitored by 16 infrared beams per side that cross the box at 3 cm above the floor. To register vertical activity, a single row of 16 photobeams is mounted at an approximate height of ¾ of the rat’s body length. LMA was recorded over 30 minutes at 3-minute intervals. The test room had the same environmental conditions as the animal room. Animals were allocated to the different runs and test boxes by means of a Latin square design so that treatment groups were equally distributed. Males and females were tested on separate days. The following parameters were evaluated: Horizontal activity as total distance (in cm), vertical activity as number of rearings (counts), and center time as the time spent in the central quadrant (in sec.).
Termination and pathology: At termination on day 16, the first 5 animals of allocation Group B were subjected to deep anesthesia by intraperitoneal injection of Eutha 77® (about 400 mg/kg body weight) and sacrificed by perfusion fixation in situ with 1 mL of 50 IU heparin followed by 0.9% w/v saline buffer as rinsing solution. Due to the premature death of two males (nos. 38 and 40) and one female (no. 80) of the high dose group in Allocation Group B animals on the day of administration, two males (nos. 32 and 33) and one female (no. 71) of the high dose group in Allocation Group A had to be submitted to perfusion fixation as replacements. For fixation, a 10% formalin solution was used. The animals fixed by perfusion were kept in situ in a plastic container containing 4% formaldehyde for approximately one week until post-fixation was performed. At that point in time, peripheral nerves were removed and then post-fixed with 4% paraformaldehyde, 5% glutaraldehyde in 0.1 M sodium phosphate buffer (at pH 7.4) for approximately 2 hours at 4 ± 3 °C. Rinsing with 0.1 M sodium phosphate buffer was done 3 times for approximately 10 minutes each. Furthermore, the control and high dose groups were post-fixed with 2% osmiumtetraoxide and 1.8% potassiumhexacyanoferrate II trihydrate (C6FeK4N6 x 3 H2O) in 0.1 M sodium phosphate buffer for approximately 2 hours at room temperature (20 ± 5 °C). The fixed brains were weighed 24 hours after its removal, before any further processing. For determination of the relative weight, terminal body weights were used. The following tissues were taken from all rats killed by perfusion fixation and preserved in an appropriate fixative.
brain
eye (with optic nerve and retina)*
spinal cord (including cervical and lumbar swellings)
spinal nerve roots (dorsal and ventral root fibres) of cervical swelling
spinal nerve roots (dorsal and ventral root fibres) of lumbar swelling
dorsal root ganglia at cervical swelling
dorsal root ganglia at lumbar swelling
proximal sciatic nerve*
proximal tibial nerve*
distal tibial nerve (tibial nerve calf muscle branches)*
Gasserian ganglia with nerve*
gastrocnemius muscle** = left component was taken and processed, right component was taken and stored in 4% formaldehyde solution.
All submitted tissues from control and high dose group animals were processed.

CLH REPORT FOR SEDAXANE
272
Paraffin wax sections: Transverse sections of the brain (frontal lobe, parietal lobe with diencephalon, midbrain (hippocampus), pons and cerebellum, medulla oblongata, eye with retina and optic nerve, and spinal cord (cervical (C4-C7) and lumbar (L4, L5) segment), and longitudinal sections of the spinal cord (C4-C7, L4, L5), Gasserian ganglia with nerve, and the gastrocnemius muscle were trimmed and embedded in paraffin wax. From these blocks 5m sections were cut and stained with haematoxylin and eosin.
Plastic sections: Transverse and longitudinal sections of dorsal root ganglia (C4-C7, L4 and L5) and spinal nerve roots (dorsal and ventral root fibres of C4-C7, L4 and L5), proximal sciatic nerve, proximal tibial nerve (at knee) and distal tibial nerve (tibial nerve calf muscle branches) were embedded in resin and semi-thin sections cut and stained with toluidine blue.
All submitted tissues from top dose and control animals, except those indicated for storage, were examined by light microscopy and assessed.
RESULTS AND DISCUSSIONDiet analytics:Homogeneity analysis: The homogeneity of SYN524464 in the dose formulations did not deviate more than 1.7% from the corresponding mean.
Concentration analysis: The achieved concentration of SYN524464 was determined to be in the range of 98.2% to 101.8%.
Clinical signs and mortality: On the day of dose administration, four males and three females of the high dose groups had to be sacrificed in moribund condition. Clinical signs observed in these animals had progressed to laboured respiration with a score of up to 3, a reduced activity with a score of up to 2, ventral or lateral recumbency, a drop in rectal temperature and/or piloerection. The remaining animals survived until their scheduled study period.
General cageside observations: On days 3 or 4 or one hour postdose, cageside observations of a slightly weakened condition was present in a few males treated at 2000 mg/kg and females at 250 and 2000 mg/kg, respectively. Decreased activity and swaying gait were noted in females at 250 and 2000 mg/kg. These observations had disappeared by day 7 post dosing. In addition, a single incidence of prostration and hunched posture was recorded in females at 2000 mg/kg on day 2 and 5, respectively.
Detailed clinical observations: On day 1, the following clinical observations were recorded approximately six hours after FOB evaluation A slightly reduced activity and decreased rearing activity were observed in one male of the control group, three males at 30 mg/kg, 6 and 7 males at 250 mg/kg and 10 and 5 males at 2000 mg/kg, respectively. There were no clinical observations that could be conclusively attributed to treatment with SYN520453. Other cageside observations occasionally noted (including hair loss, scabs, and increased activity) were considered not to be treatment related due to their low incidence and a lack of a dose-response relationship.
Food consumption: Food consumption was dose-dependently reduced in males and females at 250 mg/kg and 2000 mg/kg on day 1. At the end of the observation period, food consumption in males at 2000 mg/kg was still lower but the difference was not statistically significantly different to controls. There were no effects on day 8 for food consumption in males or females at any dose level compared to controls.
Body weight: Body weights were statistically significantly lower in males and females at 2000 mg/kg on day 8. In addition, body weight gain was lower in males at 250 and 2000 mg/kg on day 8 which was considered to be related to treatment.

CLH REPORT FOR SEDAXANE
273
On day 1, body weight was lower in males at 30 mg/kg, this is considered to be anomalous as this value is pre-treatment. In addition, the higher body weight gain in females at 30 mg/kg on day 8 is considered to be unrelated to treatment in the absence of an effect in the higher dose groups and in males on days 8 and 15.
Table 3.11.1.1-2: Intergroup comparison of male body weight (g)Dose Group (mg/kg)
0 (control) 30 250 2000
Day 1 (post dosing) 185.5 175.9* 185.3 180.8
Day 8 226.8 219.3 218.3 202.2**
Day 15 249.1 249.8 242.5 236.0* Statistically significant difference from control group mean at the 5% level (Dunnett’s t-test)** Statistically significant difference from control group mean at the 1% level (Dunnett’s t-test)
Table 3.11.1.1-3: Intergroup comparison of female body weight (g)Dose Group (mg/kg)
0 (control) 30 250 2000
Day 1 (post dosing) 143.2 140.1 136.9 137.6
Day 8 157.9 160.6 155.7 147.8*
Day 15 175.5 174.5 172.2 167.8* Statistically significant difference from control group mean at the 5% level (Dunnett’s t-test)** Statistically significant difference from control group mean at the 1% level (Dunnett’s t-test)
Table 3.11.1.1-4: Intergroup comparison of male body weight gain (g)Dose Group (mg/kg)
0 (control) 30 250 2000
Day 1 (post dosing) 0 0 0 0
Day 8 41.3 43.4 33.1* 23.5**
Day 15 63.6 74.0 57.3 57.3* Statistically significant difference from control group mean at the 5% level (Dunnett’s t-test)** Statistically significant difference from control group mean at the 1% level (Dunnett’s t-test)
Table 3.11.1.1-5: Intergroup comparison of female body weight gain (g)Dose Group (mg/kg)
0 (control) 30 250 2000
Day 1 (post dosing) 0 0 0 0
Day 8 14.7 20.5* 18.7 9.5
Day 15 32.3 34.4 35.2 29.5* Statistically significant difference from control group mean at the 5% level (Dunnett’s t-test)** Statistically significant difference from control group mean at the 1% level (Dunnett’s t-test)
Neurobehavioural Assessment:
Functional observational battery (FOB): The only findings that are considered to be possibly test item-related were slightly reduced activity and decreased rearing activity in a small number of males and females at 250 and 2000 mg/kg on day 1 only. The incidence of these findings was low and did not show a coherent dose relationship.

CLH REPORT FOR SEDAXANE
274
FOB: Body temperature: On day 1, body temperature was statistically significantly lower in males and females at 2000 mg/kg.
FOB: Grip strength: On day 1, group mean grip strength in the fore- and hind paws was statistically significantly lower in females at 2000 mg/kg and was considered to be related to the clinical condition of the animals in this group.
In addition, on day 15, group mean grip strength in the fore paws was lower in all treated females. In the absence of any effect observed in males during the treatment period this finding is considered not to be treatment related.
FOB: Landing foot splay: Landing foot splay was not significantly affected by treatment with the test item. Furthermore, on day 15, group mean landing foot splay in males was statistically significantly higher in males at 30 mg/kg. However, in the absence of an effect on days 1 and 8, or in females, and the lack of a dose response, this effect is considered not to be test item-related.
Locomotor activity: Treatment-related effects on the LMA parameters were limited to the 250 and 2000 mg/kg males and females at approximately 3 hours post dose on day 1. Total distance (37% of control) was significantly decreased in the 2000 mg/kg males, and total distance (45% of control) was significantly decreased in the 250 mg/kg males. Total distance (21% of control) was significantly decreased in the 2000 mg/kg females. Significant differences in LMA parameters noted on day 8 and day 15 were not considered treatment related since there was no consistent trend and no dose-response relationship.
Sacrifice and pathology:Organ weights: No test item-related effects on absolute, relative and adjusted brain weights were evident in males or females.
Macroscopical findings: No macroscopic findings were recorded at necropsy.
Microscopical findings: There were no neurohistopathological lesions present that could be attributed to treatment with the test item.
DISCUSSION: Transient treatment-related findings observed at 250 and 2000 mg/kg comprised reduced activity and decreased rearing activity in males and females on day 1, slightly reduced locomotor activity in females on day 1, lower body weight and/or body weight gain and lower food consumption on day 8 in females. These observations were seen in both the general observations and the FOB/LMA. In the absence of any effects on day 15 or any neuropathological findings these observations are considered to be transient effects reflecting general toxicity and are not indicative of a neurotoxic effect of SYN524464.
CONCLUSION: Administration of a single oral dose of SYN524464 to Wistar rats at dose levels of 30, 250, and 2000 mg/kg did not produce any specific evidence of neurotoxicity. Treatment-related findings associated with a generalized malaise (general toxicity) were noted at 250 and 2000 mg/kg, and included reduced activity, decreased rearing and decreased body weight gain (females only), and decreased food consumption (2000 mg/kg females only). These findings were transient as there was no evidence of treatment-related findings subsequent to day 8 of the study. There were no treatment-related neurohistopathologic findings.
There were no treatment related effects at 30 mg/kg. The no-observed-adverse-effect level (NOAEL) for neurotoxicity is 2000 mg/kg body weight.
References:Shirley E (1977). The Analysis of Organ Weight Data. Toxicology 8 p13-22.

CLH REPORT FOR SEDAXANE
275
Flade D (2009). SYN520453 - Full Validation of an Analytical Method for the Determination of SYN520453 in 0.5% Carboxymethylcellulose Aqueous Solution (w/v) and Diet.
Anonymous (2005). Acrylamide: 28-Day Oral Neurotoxicity (Gavage) Validation Study in Rats. Study No. 852323.
3.11.2 Human dataNo relevant studies.
3.11.3 Other dataNo relevant studies.
3.12 Specific target organ toxicity – repeated exposure3.12.1 Animal data3.12.1.1 Anonymous (2010)
Report: Anonymous (2010). SYN508210, SYN508211 and SYN524464 - 28 Day Comparative Study in the Rat. Syngenta
. Laboratory report No. KR1595-TEC-Amendment 1. Issue date10 July 2007. Amendment 1 issued 26 February 2010. Unpublished. (Syngenta File No. SYN508210/0005)
GUIDELINES: This study was not conducted according to any specific regulatory guidelines. This was a preliminary study to investigate the relative toxicity profiles of the trans isomer (SYN508210), the cis isomer (SYN508211) and a 1:1 mix of the isomers (termed “SYN524464” for the purpose of this report). The 1:1 mix of isomers that is termed SYN524464 in this study differs from the isomer ratio of the final specification of SYN524464 (minimum 81% trans, maximum 15% cis). Exploratory investigations of certain liver biochemistry, toxicokinetic and serum thyroid hormone parameters were also a part of this preliminary study.
GLP: Signed and dated GLP statement was provided. The study was conducted in compliance with GLP standards, with the exceptions that:
The protocol, procedures and report were not audited by a Quality Assurance Unit. Liver biochemistry analyses were not performed in a GLP facility.
EXECUTIVE SUMMARYGroups of five male and five female HsdBrlHan:Wistar rats were fed diets containing 0 (control), 500, 2000 or 5000 ppm SYN508210 (trans isomer), SYN508211 (cis isomer) or SYN524464 (1:1 mix of isomers) for 28 consecutive days.Clinical observations, bodyweights and food consumption were measured throughout the study. At the end of the scheduled period, the animals were killed and examined post mortem. Cardiac blood samples were taken for clinical pathology and thyroid hormone analysis, selected organs were weighed and specified tissues were taken for subsequent histopathological examination. Samples of liver were also analysed for total cytochrome P450 and cytochrome P450 dependent isoenzyme activities.
Separate satellite groups of three male and three female rats per sampling day were treated with the same test diets and utilised for toxicokinetic analysis. Blood samples for toxicokinetic analysis were taken from eight hours after the administration of test diets, and at four hour intervals thereafter (approximately 17.00, 21.00, 01.00, 05.00, 09.00 and 13.00 hours) on day 1/2 and on day 14/15 of the study.
There were no deaths or treatment related clinical signs. Bodyweights adjusted for initial weight were lower, compared with the controls, for males and females that received SYN508210, SYN508211 or

CLH REPORT FOR SEDAXANE
276
SYN524464 at 5000 ppm. The magnitude of the difference from the controls was consistent across all three test compounds. There was a slightly lower bodyweight, compared with the controls, for males and females at 2000 ppm, although this was generally not of statistical significance. Food consumption was lower than the controls for both males and females that received SYN508210, SYN508211 or SYN524464 at 5000 ppm, and to a lesser extent for females at 2000 ppm.
There were no clear differences in mean Tmax between SYN508210, SYN508211 or SYN524464. Mean Cmax and AUC, however, were generally considerably lower for SYN508211 compared with SYN508210 when administered separately or when administered as SYN524464 (1:1 mix of SYN508210 and SYN508211), although only the parent compounds (SYN508210 or SYN508211) were analysed in the plasma.
Haematology parameters were unaffected, with the exception of a slightly higher but not dose related prothrombin time in males treated with SYN508210 at 2000 and 5000 ppm. There were higher plasma total protein, cholesterol and triglyceride concentrations for males and females receiving SYN508210, SYN508211 or SYN524464 at 5000 ppm, and for females at 2000 ppm, when compared with the controls. Total protein concentration was higher than the controls with all test compounds in males at 2000 ppm, and females that received SYN508211 at 500 ppm. Triglyceride concentrations were slightly higher than the controls with all test compounds in females at 500 ppm and cholesterol concentration was higher than the controls in females that received SYN508211 at 500 ppm. Total bilirubin concentrations were higher than the controls at 5000 ppm in males receiving SYN508210, females receiving SYN508211 and both males and females receiving SYN524464. Gamma-glutamyl transferase was higher than the controls at 5000 ppm, in females receiving SYN508210, and both sexes receiving SYN508211 or SYN524464.
None of the three test compounds caused an effect on serum thyroid hormone levels.
Liver pentoxyresorufin-O-dealkylase (PROD) activity was increased for males only receiving SYN508210 at 500 ppm, for both males and females receiving SYN508211 or SYN524464 at 500 ppm, and for both males and females receiving all three test substances at 2000 or 5000 ppm. Increases were greater for males than for females. Slightly increased ethoxyresorufin-O-dealkylase (EROD) activity was seen at all dose levels for SYN508211, for females only receiving SYN524464 at 2000 or 5000 ppm, and females only receiving SYN508210 at 5000 ppm. There were no effects of treatment on total P450.
SYN508210, SYN508211 and SYN524464 significantly increased the hydroxylation of 16 β hydroxytestosterone. In addition the three test compounds caused decreased 16 α and 2 α testosterone hydroxylase activity in male rats but increases in female rats, and there was a greater increase in the 2 β and 6 β hydroxytestosterone activity in female rats than males.
Immunoblotting showed increased levels of CYP 2B and CYP 3A relative to the controls for all three compounds, providing further qualitative support for the increased enzyme activity, noted in liver biochemistry, of these two CYP isoenzymes.
There were statistically significant higher liver weights and liver weights adjusted for bodyweights for males and females at 2000 ppm and 5000 ppm with SYN508210, SYN508211 and SYN524464. There was a consistent response across males and females and with each test substance.
There were no treatment related macroscopic findings in the liver or any other tissue at necropsy with any of the three test compounds.Treatment related microscopic findings were restricted to the liver and consisted of centrilobular hypertrophy. This finding was observed in males and females at 5000 ppm for all test compounds, and in males at 2000 ppm after treatment with SYN508210 or SYN524464.
Electron microscopy of the liver from a limited number of animals in the control and 5000 ppm groups revealed a proliferation of smooth endoplasmic reticulum and more frequent condensed cells than in the

CLH REPORT FOR SEDAXANE
277
controls, for those that received SYN508210, SYN508211 or SYN524464 at 5000 ppm. There also appeared to be an increase in amount of fat and number of lysosomes in treated animals, especially males. The changes that were observed were similar with all three test compounds.
Administration of SYN508210 (trans isomer), SYN508211 (cis isomer) and SYN524464 (1:1 mix of isomers) at 5000 ppm was associated with centrilobular hypertrophy in the liver. SYN508210 and SYN524464 when fed at 2000 ppm also showed centrilobular hypertrophy in male animals. All three test materials produced similar histopathological changes (centrilobular hypertrophy) with no evidence of cytotoxicity. Clinical chemistry results were consistent with this. Toxicokinetic analysis indicated that there was a higher Cmax and AUC with SYN508210 compared with SYN508211. PROD activity was significantly increased across all three test materials and all levels tested, but there was only a minimal increase in EROD activity. There were also some treatment related differences in testosterone hydroxylation activites for all three test compounds and at all levels tested. The few biochemical or clinical chemistry changes noted at 500 ppm were not accompanied by any changes in micropathology, organ weight, or other markers of toxicity, and were not representative of adverse effects.
The three test compounds caused the same qualitative effects and overall, there was very little difference in the incidence or severity of findings between the three test compounds.
MATERIALS AND METHODSMaterials:
Test Material: SYN508210 (trans isomer), SYN508211 (cis isomer) and SYN524464 (1:1 mixture of trans & cis isomers)
Description: White solidLot/Batch number: KI 7193/5 and KI-7245/5CTL test substance reference numbers:
Y12305/004, Y13008/002 & Y13272/001
Purity: Not confirmed. Assumed 100% for each individual isomer in diet preparations.
Stability of test compound:
Stability of each isomer in RM1 diet for at least 50 days at room temperature was confirmed in the current study.
Vehicle and/or positive control: The test substance was administered via RM1 diet.
Test Animals:Species RatStrain HsdBrlHan WistarAge/weight at dosing Approximately 6 - 7 weeks old at start. Main study (mean ± SD) males:
158.0 ± 8.2 g, females: 122.2 ± 6.3 gSourceHousing Rats were housed, sexes separately, up to 5 per cage.Acclimatisation period 5 daysDiet RM1 diet ad libitumWater Mains water ad libitumEnvironmental conditions Temperature: 22±3°C
Humidity: 30-70%Air changes: 15/hourPhotoperiod: Artificial giving 12 hours light, 12 hours dark
Study Design and Methods:In-life dates: Start: 26-January-2005 End: 23-February-2005
Animal assignment: Rats were randomly allocated to cages

CLH REPORT FOR SEDAXANE
278
Table 3.12.1.1–1: Study designMain Study Satellite Study Test group Dietary
concentration(ppm) Males Females Males Females
1 Control 0 1-5 51-55 101-102 157-1582 SYN508210 500 6-10 56-60 103-108 159-1643 SYN508210 2000 11-15 61-65 109-114 165-1704 SYN508210 5000 16-20 66-70 115-120 171-1765 SYN508211 500 21-25 71-75 121-126 177-1826 SYN508211 2000 26-30 76-80 127-132 183-1887 SYN508211 5000 31-35 81-85 133-138 189-1948 SYN524464 500 36-40 86-90 139-144 195-2009 SYN524464 2000 41-45 91-95 145-150 201-20610 SYN524464 5000 46-50 96-100 151-156 207-212
Diet preparation and analysis: The test substances were administered via the diet. The experimental diets were initially given on 26 or 27 January 2005 and were fed to main study animals for 28 consecutive days. Satellite study animals for sampling on days 1 and 14 received the prepared diet for 1 or 14 days respectively. Samples from all dietary levels (including controls) were taken prior to the start of the study and analysed quantitatively for SYN508210, SYN508211 and SYN524464.
Prior to feeding the experimental diets, the homogeneity of SYN508210, SYN508211 and SYN524464 in RM1 diet was determined by analysing samples from the low and high dose levels and the chemical stability of SYN508210, SYN508211 and SYN524464 in diet was determined at these same dose levels over a period of at least 50 days at room temperature and in the freezer (approximately -20C).
Concentration analysis results: SYN508210 (trans isomer); the mean concentrations for all batches of diet analysed were within 3% of the nominal concentration. SYN508211 (cis isomer); the mean concentrations for all batches of diet analysed were within 6% of the nominal concentration.SYN524464 (1:1 mixture of trans and cis isomers); the concentrations of the cis and trans isomers contained in diets prepared using SYN524464 were quantified separately. The mean concentrations for all batches of diet analysed were within 6% of the nominal concentration for both isomers.
Homogeneity results: SYN508210 (trans isomer); the homogeneity of SYN508210, in diet at concentrations of 500 ppm and 5000 ppm, (for a batch size of 12kg), was determined and considered satisfactory, percentage deviations from the overall mean were within 5%.SYN508211 (cis isomer); the homogeneity of SYN508211 in diet at concentrations of 500 ppm and 5000 ppm, (for a batch size of 12kg), was determined and considered satisfactory, percentage deviations from the overall mean were within 6%. SYN524464 (1:1 mixture of trans and cis isomers); the homogeneity of SYN524464 in diet at concentrations of 500 ppm and 5000 ppm (250 ppm and 2500 ppm of each isomer), (for a batch size of 12kg), was determined and considered satisfactory, percentage deviations from the overall mean, for both isomers, were within 3%.
Stability results: SYN508210 (trans isomer); reanalysis in diet at concentrations of 500 ppm and 5000 ppm when stored at room temperature was shown to be acceptable for 50 days and when stored in a freezer was shown to be acceptable for 57 days, covering the period of dosing.

CLH REPORT FOR SEDAXANE
279
SYN508211 (cis isomer); reanalysis in diet at concentrations of 500 ppm and 5000 ppm when stored at room temperature was shown to be acceptable for 50 days and when stored in a freezer was shown to be acceptable for 56 days, covering the period of dosing.SYN524464 (1:1 mixture of trans and cis isomers); reanalysis in diet at concentrations of 500 ppm and 5000 ppm (250 ppm and 2500 ppm of each isomer) when stored at room temperature was shown to be acceptable for 50 days and when stored in a freezer was shown to be acceptable for 55 days, covering the period of dosing.
Statistics: Bodyweights were considered by analysis of covariance on initial (day 1) bodyweight, separately for males and females.
No statistical analysis was performed for food consumption as there was only one observation per group.Haematology and blood clinical chemistry were considered by analysis of variance. Male and female data were analysed together, and the results examined to determine whether any differences between control and treated groups were consistent between the sexes. (Plasma cholesterol and plasma triglycerides were analysed following a log transformation to stabilise the variance).
Thyroid hormones and liver biochemistry parameters were considered by analysis of variance, separately for males and females. (Liver biochemistry parameters were analysed following a log transformation to stabilise the variance).
Organ weights were considered by analysis of variance and analysis of covariance on final bodyweight, separately for males and females. Summary data are presented for organ to bodyweight ratios but these were not analysed statistically as the analysis of covariance provides a better method of allowing for differences in terminal bodyweights (Shirley, 1996).
Analyses of variance and covariance were carried out using the MIXED procedure in SAS (2004). Least-squares means for each group were calculated using the LSMEAN option in SAS PROC MIXED. Unbiased estimates of differences from control were provided by the difference between each treatment group least-squares mean and the control group least-squares mean. Differences from control were tested statistically by comparing each treatment group least-squares mean with the control group least-squares mean using a two-sided Student’s t-test, based on the error mean square in the analysis.
Observations: Prior to the start of the study, all rats were examined to ensure that they were physically normal and exhibited normal activity. Cage-side observations, which included recording any changes in clinical condition or behaviour, were also made twice daily. Detailed clinical observations, including the finding of ‘no abnormalities detected’, were recorded at the same time that the bodyweights were recorded.
Bodyweight: The bodyweight of each rat was recorded immediately before feeding of the experimental diets commenced and then daily until termination.
Food consumption and test substance intake: Recorded continuously throughout the study for each cage of rats and calculated, at weekly intervals, as a mean value (g food/rat/day) for each cage. The food utilisation value per cage was calculated as the bodyweight gained by the rats in the cage per 100g of food eaten.
Toxicokinetic analysis (Satellite groups only): Blood samples for toxicokinetic analysis were taken into 0.2ml tubes containing lithium heparin as an anticoagulant. Samples were taken from eight hours after the administration of test diets and at four hour intervals thereafter (approximately 17.00, 21.00, 01.00, 05.00, 09.00 and 13.00 hours) on day 1/2 and on day 14/15 of the study. The lowest three animal numbers in each group (excluding the controls) were used for sampling on day 1/2 and the highest three animal numbers used for sampling on day 14/15. One male and one female control animal were sampled at approximately 09.00 hours on days 1 and 14. For each animal, serial bleeds were performed via the tail vein (using a blue butterfly needle) and blood collected into the labelled tubes (females estimated to be

CLH REPORT FOR SEDAXANE
280
approximately 100g bodyweight on day 1 allowing 0.13ml blood for each of 5 samples, approximately 150g on day 14 allowing 0.2ml x 5 samples, males approximately 150g on day 1 allowing 0.2ml x 5 samples; and approximately 220g on day 14 allowing 0.28ml x 5 samples). The last blood sample from each animal was a terminal sample (collected following an overdose of anaesthetic). Blood samples were centrifuged in an Eppendorf 5415D at 6,000rpm for 5 minutes at room temperature and the plasma separated and stored at approximately -20ºC pending appropriate analysis by Metabolism and Analytical Sciences Section, CTL. The animals were discarded following collection of the last sample. Residue plasma from the initial analysis was retained frozen (approximately -20ºC) pending any requirement for additional analysis.
Haematology and clinical chemistry: Blood was collected using EDTA as an anticoagulant and the following haematology parameters were determined:
haemoglobin mean cell haemoglobin concentrationhaematocrit platelet countred blood cell count total white cell countmean cell volume differential white cell countmean cell haemoglobin blood cell morphology
Prothrombin time and activated partial thromboplastin time were made on samples of blood collected in tubes containing sodium citrate as an anticoagulant. Blood cell morphology, including a differential white blood cell count was assessed by automated methods for all animals. Manual blood films were prepared and analysed as necessary.
Clinical chemistry: The following were determined on the plasma from blood samples collected into tubes containing lithium heparin as an anticoagulant:
urea alkaline phosphatase activitycreatinine aspartate aminotransferase activityglucose alanine aminotransferase activityalbumin gamma-glutamyl transferase activitytotal protein calciumcholesterol phosphorus (as phosphate)triglycerides sodiumtotal bilirubin potassiumcreatine kinase activity chloride
Thyroid hormones: The following were determined on the serum from blood samples collected in to plain tubes containing no anticoagulant
TSH T4 (free)T3 (free) T4 (total)T3 (total)
Investigations post mortem: Macroscopic examination: All animals were examined post mortem. This involved an external observation and an internal examination of all organs and structures.
Organ weights: From all animals surviving to scheduled termination, the following organs were removed, trimmed free of extraneous tissue and weighed:
adrenal glands liverbrain spleen

CLH REPORT FOR SEDAXANE
281
epididymides testesheart thymuskidneys uterus (with cervix)
Paired organs were weighed together.
Tissue submission: The following tissues were examined in situ, removed and examined and fixed in an appropriate fixative:
Abnormal tissue pancreasadrenal gland parathyroid glandaorta Peyer’s patchesbone (femur including stifle joint ) pharynxbrain (cerebrum, cerebellum and brainstem) pituitary glandcaecum prostate glandcolon rectumduodenum salivary glandepididymis seminal vesicleeye Skin (right flank)heart spinal cord (cervical, thoracic, lumbar)ileum spleenjejunum Sternum with bone marrowkidney stomachlarynx testisLiver# thymuslung thyroid glandlymph node - cervical trachealymph node - mesenteric urinary bladdermammary gland (inguinal female only) uterus (with cervix)nerve - sciatic vaginanose voluntary muscleoesophagus ovary and oviduct# A small sample from the left and right liver lobes only were submitted for examination by light microscopy and immunohistochemical evaluation of CYP 2B/3A activity. Small pieces (blocks of about 1-2mm) from the left lobe were fixed in glutaraldehyde and processed for plastic embedding. These samples were for electron microscopy. Samples of liver were also taken and quenched in liquid nitrogen for possible future histochemical evaluation. The remainder was used for liver biochemical analyses).
Microscopic examination: All submitted tissues, including any abnormal tissues, were examined by light microscopy from any decedents and also the control and high dose groups (main study groups 4, 7 and 10) from the scheduled termination. If treatment-related findings were observed at 5000 ppm, the corresponding tissue was examined from the 500 and 2000 ppm treatment groups. Samples of liver were examined by electron microscopy for a selected number of control and 5000 ppm livers from each treatment.
Frozen sections of liver from the control group (group 1) and each of the highest treatment groups (group 4, 7 and 10) were sectioned on a cryostat and stained with Oil Red O.
Liver biochemistry: A sample of liver was taken at the examination post mortem and put in buffer and fresh subcellular fractions prepared. These were stored at approximately -70°C prior to biochemical analysis of the following parameters:
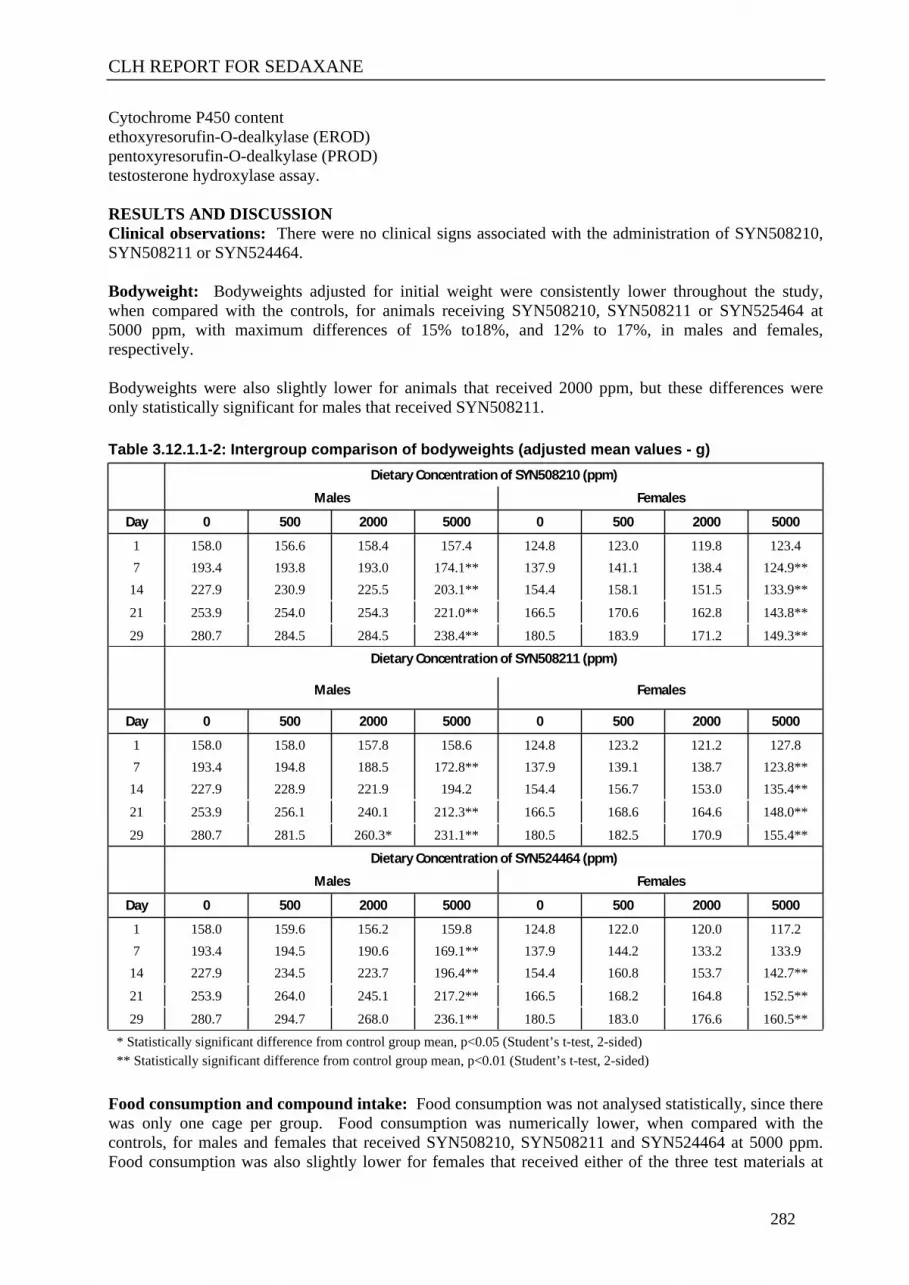
CLH REPORT FOR SEDAXANE
282
Cytochrome P450 contentethoxyresorufin-O-dealkylase (EROD)pentoxyresorufin-O-dealkylase (PROD) testosterone hydroxylase assay.
RESULTS AND DISCUSSIONClinical observations: There were no clinical signs associated with the administration of SYN508210, SYN508211 or SYN524464.
Bodyweight: Bodyweights adjusted for initial weight were consistently lower throughout the study, when compared with the controls, for animals receiving SYN508210, SYN508211 or SYN525464 at 5000 ppm, with maximum differences of 15% to18%, and 12% to 17%, in males and females, respectively.
Bodyweights were also slightly lower for animals that received 2000 ppm, but these differences were only statistically significant for males that received SYN508211.
Table 3.12.1.1-2: Intergroup comparison of bodyweights (adjusted mean values - g)Dietary Concentration of SYN508210 (ppm)
Males Females
Day 0 500 2000 5000 0 500 2000 5000
1 158.0 156.6 158.4 157.4 124.8 123.0 119.8 123.47 193.4 193.8 193.0 174.1** 137.9 141.1 138.4 124.9**14 227.9 230.9 225.5 203.1** 154.4 158.1 151.5 133.9**
21 253.9 254.0 254.3 221.0** 166.5 170.6 162.8 143.8**
29 280.7 284.5 284.5 238.4** 180.5 183.9 171.2 149.3**
Dietary Concentration of SYN508211 (ppm)
Males Females
Day 0 500 2000 5000 0 500 2000 5000
1 158.0 158.0 157.8 158.6 124.8 123.2 121.2 127.87 193.4 194.8 188.5 172.8** 137.9 139.1 138.7 123.8**14 227.9 228.9 221.9 194.2 154.4 156.7 153.0 135.4**
21 253.9 256.1 240.1 212.3** 166.5 168.6 164.6 148.0**
29 280.7 281.5 260.3* 231.1** 180.5 182.5 170.9 155.4**
Dietary Concentration of SYN524464 (ppm)
Males Females
Day 0 500 2000 5000 0 500 2000 5000
1 158.0 159.6 156.2 159.8 124.8 122.0 120.0 117.27 193.4 194.5 190.6 169.1** 137.9 144.2 133.2 133.914 227.9 234.5 223.7 196.4** 154.4 160.8 153.7 142.7**
21 253.9 264.0 245.1 217.2** 166.5 168.2 164.8 152.5**
29 280.7 294.7 268.0 236.1** 180.5 183.0 176.6 160.5*** Statistically significant difference from control group mean, p<0.05 (Student’s t-test, 2-sided)** Statistically significant difference from control group mean, p<0.01 (Student’s t-test, 2-sided)
Food consumption and compound intake: Food consumption was not analysed statistically, since there was only one cage per group. Food consumption was numerically lower, when compared with the controls, for males and females that received SYN508210, SYN508211 and SYN524464 at 5000 ppm. Food consumption was also slightly lower for females that received either of the three test materials at

CLH REPORT FOR SEDAXANE
283
2000 ppm. The magnitude of effect was consistent with all three test compounds. The greatest difference from the controls was in week 1, but was seen for remainder of the study.
Table 3.12.1.1-3: Intergroup comparison of food consumption (g/rat/day)Dietary Concentration of SYN508210 (ppm)
Males Females
Week 0 500 2000 5000 0 500 2000 5000
1 18.9 19.4 18.9 14.7 15.3 14.1 12.1 8.72 21.0 21.1 20.8 18.3 15.7 15.1 13.2 10.73 21.2 21.7 21.9 18.8 16.4 15.9 13.6 11.5
4 20.5 21.2 21.2 17.6 16.2 15.6 13.2 11.0
Dietary Concentration of SYN508211 (ppm)
Males Females
Week 0 500 2000 5000 0 500 2000 5000
1 18.9 19.6 18.5 13.9 15.3 13.5 12.8 11.12 21.0 20.7 20.7 18.1 15.7 15.0 13.5 12.23 21.2 21.3 19.6 18.2 16.4 15.5 14.0 13.7
4 20.5 20.3 18.7 17.4 16.2 15.1 13.8 12.5
Dietary Concentration of SYN524464 (ppm)
Males Females
Week 0 500 2000 5000 0 500 2000 5000
1 18.9 20.3 18.4 14.0 15.3 13.9 12.1 10.02 21.0 22.0 19.7 18.6 15.7 14.6 13.9 11.73 21.2 22.6 19.9 18.9 16.4 14.9 14.4 13.2
4 20.5 21.9 19.3 18.1 16.2 14.7 14.5 12.7
The following overall mean dose rates (based on nominal dietary levels of SYN508210, SYN508211 and SYN524464) were calculated in terms of mg SYN508210, SYN508211 and SYN524464/kg bodyweight/day:
Table 3.12.1.1–4: Mean Dose Received (mg/kg/day)SYN524464 SYN508210 SYN508211
ppm 500 2000 5000 500 2000 5000 500 2000 5000
Males 47.5 181.2 444.6 47.0 187.4 438.2 45.9 182.7 438.2
Females 46.7 181.1 428.1 48.4 177.1 384.3 47.6 179.6 435.8
Toxicokinetic examination: Toxicokinetic analysis revealed mean Tmax values between 12 to 20 hours, with no obvious differences between the trans isomer (SYN508210) and cis isomer (SYN508211). Mean Cmax and AUC values were significantly lower (frequently by a factor of approximately 10) for groups that received the cis isomer compared with the trans isomer. However, only the parent compound(s) (SYN508210 or SYN508211) were analysed in plasma, so the overall absorption and rate of conversion to metabolites for the trans and cis isomers cannot be determined from the available data.
Haematology: Prothrombin time was higher than control values in males with SYN508210 treatment at 2000 and 5000 ppm although the difference was not related to dose. There were no other effects on haematology parameters that were considered to be attributable to treatment.

CLH REPORT FOR SEDAXANE
284
Blood clinical chemistry: Plasma total protein, cholesterol and triglyceride concentrations were consistently higher, when compared with the controls, across all groups of animals that received 5000 ppm (SYN508210, SYN508211 and SYN524464). These parameters for females were also generally statistically significant higher at 2000ppm, except for total protein in females receiving SYN508211. Total protein concentrations were higher in males that received SYN508211 at 2000 ppm and for females that received SYN508211 at 500 ppm. Triglyceride concentrations were also slightly higher with all three test compounds in females receiving 500 ppm, although this was not statistically significant with SYN508211. Plasma cholesterol concentration was higher in females that received SYN508211 at 500 ppm.
Plasma total bilirubin was higher than the controls in males at 5000 ppm with SYN508210, in females at 5000 ppm with SYN508211 (not statistically significant), and for both males (not statistically significant) and females at 5000 ppm with SYN524464.
Plasma gamma-glutamyl transferase activity was higher than the controls at 5000 ppm, in females with SYN508210, whereas both sexes were affected by SYN508211 and SYN524464.
Thyroid hormones: There were no effects of treatment on thyroid hormones with SYN508210, SYN508211 or SYN524464 at up to 5000 ppm.
Liver biochemistry: Total P450 content SYN508210 had no effect on total P450 content in male and female rats.
In male rats, SYN508211 caused a 20% decrease in total P450 content (per mg protein) at 5000 ppm. Expressed as nmol/gram liver, SYN508211 caused a 40 % increase at 2000 ppm. In female rats, SYN508211 caused an increase in total P450 content at 500 ppm of 31 and 47%, data expressed as nmol/mg protein and nmol/gram liver, respectively. The lack of consistency and lack of dose response implies these findings are unlikely to be related to treatment.
In male rats, SYN524464 caused a decrease in total P450 (per mg protein) of 25 % at 5000 ppm. Expressed as nmol/gram liver, SYN524464 caused a 37 % increase at 2000 ppm In female rats, SYN524464 caused an increase in total P450 (per mg protein) at 2000 and 5000 ppm of 22 %. Expressed as per gram liver, total P450 content was increased at 2000 and 5000 ppm by 41 and 70 %, respectively. The lack of consistency and lack of dose response implies these findings are unlikely to be related to treatment.
Pentoxyresorufin (PROD)In male rats, SYN508210 caused an increase in PROD activity (per mg protein) at 500, 2000 and 5000 ppm of 2, 64 and 118 fold, respectively. Expressed as PROD activity per gram liver, SYN508210 caused an increase at 500, 2000 and 5000 ppm of 2.7, 73 and 150 fold, respectively. In female rats, PROD activity (per mg protein) was increased at 2000 and 5000 ppm by 18 and 12 fold. Expressed as per gram liver, PROD activity was increased at 2000 and 5000 ppm by 20 and 15 fold, respectively.
In male rats, SYN508211 caused an increase in PROD activity (per mg protein) at 500, 2000 and 5000 ppm of 5.5, 52 and 46 fold, respectively, and expressed as per gram liver a 7, 61 and 43 fold increase respectively. In female rats, SYN508211 caused an increase in activity (per mg protein) at 500, 2000 and 5000 ppm of 2.3, 7 and 9 fold, respectively, and expressed as per gram liver an increase at 500, 2000 and 5000 ppm of 2.7, 8 and 10 fold, respectively.
In male rats, SYN524464 caused an increase in PROD activity (per mg protein) at 500, 2000 and 5000 ppm of 3.5, 73 and 50 fold, respectively and expressed as per gram liver an increase at 500, 2000 and 5000 ppm of 4.7, 100 and 52 fold, respectively. In female rats, SYN524464 caused an increase in activity (per mg protein) at 500, 2000 and 5000 ppm of 2, 10 and 12 fold, respectively, and expressed as per gram liver an increase at 500, 2000 and 5000 ppm of 2, 12 and 18 fold, respectively.

CLH REPORT FOR SEDAXANE
285
The marked increase in hepatic PROD activity data with all three test compounds indicates that they are potent inducers of CYP 2B isoforms.
Ethoxyresorufin (EROD)SYN508210 had no clear effect on this parameter for male rats. For females at 5000 ppm there was a slight increase in EROD activity.
SYN508211 caused a slight increase in EROD activity. In male rats, SYN508211 caused an increase in activity (per mg protein) at 500 and 2000 ppm of 2 fold and 1.6 fold, respectively. Expressed as EROD activity per gram liver, SYN508211 caused an increase of 2 and 1.9 fold at 500 and 2000 ppm, respectively. In female rats, EROD activity (per mg protein) was increased at 500, 2000 and 5000 ppm by 1.5, 1.4 and 1.5 fold respectively. Expressed as per gram liver, EROD activity was increased at 500, 2000 and 5000 ppm by 1.7, 1.6 and 1.6 fold, respectively.
SYN524464 caused a slight increase in EROD activity. In male rats, SYN524464 caused an increase in EROD activity (per gram liver) at 2000 ppm of 1.7 fold. In female rats, activity (per mg protein) was increased at 2000 and 5000 ppm by 1.5 and 1.7 fold respectively. Expressed as EROD activity per gram liver, SYN524464 caused an increase at 2000 and 5000 ppm of 1.7 and 2.4 fold, respectively.The weakly increased EROD activity indicates that SYN508210, SYN508211 and SYN524464 possess low potential for inducing CYP1A isoforms.
7 α testosterone hydroxylase In male rats, SYN508210 at 5000 ppm caused increased hydroxylation at the 7 α hydroxy position of 71 %. There was no effect on this parameter in female rats. SYN508211 caused slightly increased hydroxylation at the 7 α position in male rats at 2000 ppm of 42 % and in female rats at 5000 ppm of 74 %. In male rats, SYN524464 caused increased hydroxylation at the 7 α position at 2000 and 5000 ppm of 61 and 63 %, respectively, and in female rats a 2 fold increase at 5000 ppm.
6 β testosterone hydroxylase In male rats, SYN508210 at 5000 ppm caused increased hydroxylation at the 6 β hydroxy position of 89 %. There was no effect on this parameter in female rats. In male rats, SYN508211 caused increased hydroxylation at the 6 β position at 2000 and 5000 ppm of 129 and 66 %, respectively and in female rats at 5000 ppm an 8.8 fold increase. In male rats, SYN524464 caused increased hydroxylation at the 6 β position at 2000 ppm of 2.2 fold, and in female rats at 5000 ppm an 11 fold increase in 6 β hydroxylation.
16 α testosterone hydroxylase In male rats, SYN508210 caused a reduction in hydroxylation at the 16 α hydroxy position at 500 and 2000 ppm of 30 and 32 %, respectively. In female rats, SYN508210 caused an increase in hydroxylation at 2000 and 5000 ppm of 13 fold. In male rats, SYN508211 caused decreased hydroxylation at the 16 α position at 500, 2000 and 5000 ppm of 25, 24 and 43 %, respectively. In female rats, SYN508211 caused increased hydroxylation at the 16 α position at 5000 ppm of 11 fold. In male rats, SYN524464 caused decreased hydroxylation at the 16 α position at 500 and 5000 ppm of 29 and 44 %, respectively. In female rats, SYN524464 caused an increase at 5000 ppm of 19 fold.
16 β testosterone hydroxylaseIn male rats, SYN508210 caused increased hydroxylation at the 16 β hydroxy position at 2000 and 5000 ppm of 24 and 36 fold, respectively. In female rats, hydroxylation was increased at 2000 and 5000 ppm by 14 fold. SYN508211 caused increased hydroxylation at the 16 β position in male rats at 2000 and 5000 ppm of 20 and 21 fold, respectively. In female rats, SYN508211 caused slightly increased hydroxylation at the 16 β position at 5000 ppm of 12 fold.
In male rats, SYN524464 caused increased hydroxylation at the 16 β position at 2000 and 5000 ppm of 23 and 22 fold, respectively, and in female rats a 20 fold increase at 5000 ppm.

CLH REPORT FOR SEDAXANE
286
2 α testosterone hydroxylase In male rats, SYN508210 caused decreased hydroxylation at the 2 α hydroxy position at 2000 and 5000 ppm of 76 and 85 %, respectively. There was no effect on this parameter in female rats. SYN508211 caused decreased hydroxylation at the 2 α position in male rats at 2000 and 5000 ppm of 63 and 84 %, respectively. In female rats, SYN508211 caused an increase in hydroxylation at the 2 α position of 3.4 fold at 5000 ppm. In male rats, SYN524464 caused decreased hydroxylation at the 2 α position at 2000 and 5000 ppm of 62 and 88 %, respectively. In female rats, SYN524464 caused a slight increase in hydroxylation at the 2 α position at 5000 ppm of 2.3 fold.
2 β testosterone hydroxylase SYN508210 had no effect on this parameter in male and female rats. In male rats, SYN508211 caused increased hydroxylation at the 2 β position at 2000 and 5000 ppm of 53 and 75 %, respectively. In female rats, SYN508211 caused increased hydroxylation at the 2 β position at 2000 and 5000 ppm by 6 and 12 fold, respectively. In male rats, SYN524464 had no effect on this parameter. In female rats, SYN524464 caused an increased hydroxylation at the 2 β position at 5000 ppm of 14 fold.
CYP 2B SYN508210, SYN508211 and SYN524464 caused an increase at 500, 2000 and 5000 ppm in CYP 2B content (per mg protein and per gram liver) in male and female rats.
CYP 3A SYN508210, SYN508211 and SYN524464 caused an increase at 500, 2000 and 5000 ppm in CYP 3A content (per mg protein and per gram liver) in male rats.
In female rats, SYN508210, SYN508211 and SYN524464 caused an increase in CYP 3A content (per mg protein and per gram liver) at 500, 2000 and 5000 ppm except for SYN508210 (per mg protein) at 500 ppm and SYN524464 at 500 ppm (per gram liver) where there was no effect.
Protein content SYN508210 had no effect on this parameter in male and female rats when expressed as mg protein/ml and in female rats when expressed as mg protein/gram liver. In male rats expressed as mg protein/gram liver SYN508210 caused a slight increase at 500 and 5000 ppm of 27 and 28 %, respectively. SYN508211 had no effect on this parameter in male and female rats.
SYN524464 caused a slight increase in protein (mg protein/ml) in male rats at 500 ppm of 34 % and in female rats at 5000 ppm of 43 %. In male rats, SYN524464 caused a slight increase in protein (mg protein/gram liver) at 500 and 2000 ppm of 34 and 27 %, and in female rats a slight increase of 45 % at 5000 ppm.
Sacrifice and pathology: Organ weights: Absolute and bodyweight-relative liver weights were higher, when compared with the controls, for males and females at 2000 ppm and 5000 ppm with all three test compounds.
Absolute and organ weight adjusted for bodyweight uterus with cervix weights were lower than the controls for all groups at 5000 ppm (but only statistically significant for those receiving SYN508211).
The absolute and organ weight adjusted for bodyweight adrenal weights were slightly higher, when compared with the controls, for males that received SYN508210, SYN508211 or SYN524464 at 5000 ppm. The adrenal weights for females, however, were lower than the concurrent controls and consequently these differences are considered to be incidental to treatment.
Other differences that achieved statistical significance were generally attributed to differences in terminal bodyweight (brain, heart, kidneys, spleen and thymus), and not directly related to treatment.

CLH REPORT FOR SEDAXANE
287
Macroscopic findings: There were no treatment related macroscopic findings in the livers or any other tissues.
Microscopic findings: Treatment related findings were restricted to the liver and consisted of centrilobular hypertrophy. This finding was observed in males and females at 5000 ppm for all test compounds, and in males at 2000 ppm after treatment with SYN508210 or SYN524464. The presence/absence of centrilobular hypertrophy was associated with the observed liver weight increases, except for 2000 ppm females which showed increases in liver weight without accompanying micropathology changes.
Electron microscopy: Toluidine blue stained semi-thin sectionsThere was a slight increase in size in individual hepatocytes in some treated animals and condensed cells were more common in treated animals also.
Ultra-thin sectionsIn the examination of ultrathin sections of liver in control and 5000 ppm groups, there was an increase in smooth endoplasmic reticulum and condensed cells in treated animals compared to controls. There was also an increase in the amount of fat and number of lysosomes in treated animals, particlarly in males. Glycogen was more common in control animals. Occasional damaged mitochondria were observed, but these are probably artefactual.
Table 3.12.1.1–5: Summary of Liver Data SYN508210 (trans isomer)
0 ppm 500 ppm 2000 ppm 5000 ppmLiver Enzymes: PROD Activity (pmol/min/mg protein) 4.04 8.40** 258.81** 475.24** EROD Activity (pmol/min/mg protein) 20.4 22.7 22.1 16.5 Testosterone 6β-hydroxylase Activity (nmol/10 min/mg protein) 5.098 5.720 6.885 9.627** Testosterone 16β-hydroxylase Activity (nmol/10 min/mg protein) 0.293 0.647 7.086*** 10.422***
Weights: Terminal Body Wt. (g)a 280.6 282.6 285.0 237.6** Adjusted Liver Wt. (g) 9.4 10.0 11.9** 16.1**Liver Histopathology (n): (5) (5) (5) (5) Centrilobular hypertrophy 0 0 5** 5**
SYN508211 (cis isomer)0 ppm 500 ppm 2000 ppm 5000 ppm
Liver Enzymes: PROD Activity (pmol/min/mg protein) 4.04 22.21** 209.28** 184.77** EROD Activity (pmol/min/mg protein) 20.4 39.9* 33.3* 28.4 Testosterone 6β-hydroxylase Activity (nmol/10 min/mg protein) 5.098 6.080 11.688*** 8.464* Testosterone 16β-hydroxylase Activity (nmol/10 min/mg protein) 0.293 1.411 5.838*** 6.066***
Weights: Terminal Body Wt. (g)a 280.6 281.4 260.0* 231.8** Adjusted Liver Wt. (g) 9.4 10.0 12.6** 15.6**Liver Histopathology (n): (5) (5) (5) (5) Centrilobular hypertrophy 0 0 0 5**
SYN524464 (1:1 isomer ratio)0 ppm 500 ppm 2000 ppm 5000 ppm

CLH REPORT FOR SEDAXANE
288
Liver Enzymes: PROD Activity (pmol/min/mg protein) 4.04 14.06** 294.53** 201.28** EROD Activity (pmol/min/mg protein) 20.4 26.7 30.7 20.9 Testosterone 6β-hydroxylase (nmol/10 min/mg protein) 5.098 6.297 11.440*** 6.986 Testosterone 16β-hydroxylase (nmol/10 min/mg protein) 0.293 1.274 6.835*** 6.557***
Weights: Terminal Body Wt. (g)a 280.6 296.8 265.6 238.4** Adjusted Liver Wt. (g) 9.4 9.8 12.6** 16.5**Liver Histopathology (n): (5) (5) (5) (5) Centrilobular hypertrophy 0 0 5** 5***, **, *** Statistically-significantly different from control with p<0.05, p<0.01 and p<0.001, respectively. a Terminal body weight was statistically analysed after adjustment for initial Day 1 weight.
DISCUSSION: All three treatment groups produced broadly similar effects on clinical chemistry. The changes seen at 2000 or 5000 ppm are consistent with the adaptive liver hypertrophy noted upon histopathological examination, and do not reflect hepatocyte cytotoxicity. Findings at 2000 and 5000 ppm of liver hypertrophy accompanied by the increase in liver weight, the treatment related increases in plasma total protein, plasma total bilirubin and gamma-glutamyl transferase are considered to be of toxicological significance. However, the minor changes in blood clinical chemistry as well as liver biochemistry measurements at 500 ppm in the absence of histopathological change or organ weight differences in the liver were considered not to be toxicologically adverse findings.
The electron microscopy at 5000 ppm provided evidence that the liver hypertrophy seen after treatment with SYN508210, SYN508211 and SYN524464 in this study was as a result of proliferation of smooth endoplasmic reticulum, with an associated increase in fat and lysosomes in some animals. The changes observed were similar with all three compounds.
The marked increase in hepatic PROD activity data with all three test compounds indicates that they are potent inducers of CYP 2B isoforms.
SYN508210, SYN508211 and SYN524464 significantly increased 16 β hydroxylation of testosterone, consistent with being potent inducers of CYP 2B isoforms. The three test compounds caused decreased 16 α and 2 α hydroxylation in male rats but increases in female. Both 16 α and 2 α are markers for the cytochrome isoenzyme CYP 2C11. In addition there was a greater increase in the 2 β and 6 β hydroxylation, measures of CYP3A activity, in female rats than males.
Immunoblotting showed increased levels of CYP 2B and CYP 3A relative to the controls for all three compounds, providing further qualitative support for the increased enzyme activity of these two CYP isoenzymes.
The weakly increased EROD activity indicates that SYN508210, SYN508211 and SYN524464 do not act as polycyclic aromatic hydrocarbon-type inducers.
CONCLUSION: Administration of SYN508210 (trans isomer), SYN508211 (cis isomer) and SYN524464 (1:1 mix of isomers) at 5000 ppm was associated with centrilobular hypertrophy of the liver. SYN508210 and SYN524464 when fed at 2000 ppm also showed centrilobular hypertrophy in male animals. All three test materials produced similar histopathological changes (centrilobular hypertrophy) with no evidence of cytotoxicity. Clinical chemistry results were consistent with this. Toxicokinetic analysis indicated that there was a higher Cmax and AUC with SYN508210 compared with SYN508211. PROD activity was significantly increased across all three test materials and all levels tested, but there

CLH REPORT FOR SEDAXANE
289
was only a minimal increase in EROD activity. There were also some treatment related differences in testosterone hydroxylation for all three test compounds and at all levels tested.
The three test compounds caused the same qualitative effects and overall, there was very little difference in the incidence or severity of findings between the three test compounds.
3.12.1.2 Anonymous (2009)Report: Anonymous 2009. SYN524464 - 13 Week Rat Dietary Toxicity Study. Laboratory Report No.
28825. Issue date 22 Oct 2009. Unpublished. (Syngenta File No. SYN524464_11146)
GUIDELINES: Subchronic Oral Toxicity - Rat Dietary OECD 408 (1998): OPPTS 870.3100 (1998): 2001/59/EC B.26 (2001): JMAFF12 Nousan No 8147 (2000)
GLP: Signed and dated GLP and Quality Assurance statements were provided.
There were no deviations from the current regulatory guideline considered to compromise the scientific validity of the study.
EXECUTIVE SUMMARYGroups of 10 male and 10 female Han Wistar rats were fed diets containing 0, 300, 2000 or 4000 ppm SYN524464 for a period of at least 90 days.
The animals were monitored regularly for viability and for signs of ill health or reaction to the diet. Detailed functional observations were performed once during treatment over a two week period (Weeks 12/13). Body weights and food consumption were measured and recorded at pre-determined intervals from Pretrial up until the completion of treatment. Ophthalmic assessments were undertaken on all animals during Pretrial and Week 13 of the study. Blood samples were collected for laboratory investigations during Week 14 of the study.
All animals were subjected to a detailed necropsy examination after the completion of treatment. Tissues from all animals in the Control and High dose groups were subjected to comprehensive histological evaluation. In addition, the liver and thyroid were also examined from all animals in the Low and Intermediate dose groups.
SYN524464 administered daily in the diet for 90 days at concentrations of up to 4000ppm was generally well tolerated with no mortality and no treatment related clinical signs during weekly examinations.
In male and female animals treated at 4000 ppm, body weight, body weight gain and food consumption were significantly decreased. In females body weight and body weight gain were reduced at 2000 ppm. SYN524464 had no effects on body weight or body weight gain at 300 and 2000 ppm in males, and at 300 ppm in females, and no effect on food consumption at 300 or 2000 ppm in either sex.
In detailed FOB examinations, males treated at 4000 ppm showed a statistically significant increase in hunched posture and piloerection when being observed in the arena. Significant decreases were observed in females in fore grip strength at 2000 and 4000 ppm and hind grip strength at 4000 ppm. No treatment related effects were observed on motor activity or any other functional observation battery parameter.
At 4000 ppm gamma glutamyl transferase was increased in both sexes, triglycerides and total protein were increasedin males and cholesterol levels were increased in females.Prothrombin time was significantly increased in males and females receiving 4000 ppm.
No treatment related effects were observed at necropsy.

CLH REPORT FOR SEDAXANE
290
Absolute liver weights and liver weights adjusted for body weight were increased at 4000 ppm and adjusted liver weights were increased at 2000 ppm in males and females.Mild to moderate centrilobular hepatocyte hypertrophy was observed at 4000 ppm accompanied by minimal to mild hepatocyte pigmentation in both sexes. Minimal tomoderate diffuse thyroid follicular cell hypertrophy was observed in 5 males and 1 female at4000 ppm.
There were no treatment related findings at 300 ppm.
Dietary administration of SYN524464 to rats at 4000 ppm, for at least 90 consecutive days, resulted in a reduction in body weight and food consumption, along with piloerection and hunched posture in males and decreased grip strength in females. At 4000 ppm, increases in gamma glutamyl transferase and liver weight were observed in males and females. The liver weight increases correlated with micropathology findings of centrilobular hepatocyte hypertrophy and hepatocyte pigmentation. In the thyroid, follicular cell hypertrophy was observed in both sexes, with a higher incidence in males (5) than females (1). Additional treatment related changes at 4000 ppm included higher prothrobmin time in both sexes, higher triglycerides and total protein levels in males, and higher cholesterol levels in females.
At 2000 ppm body weight and fore grip strength was decreased in females. Liver weight was increased in males and females at this dose level. However, the increase in liver weight at 2000 ppm was limited, and in the absence of any treatment related micropathology changes this was considered not to be adverse. Therefore, 2000 ppm represents a No Observed Adverse Effect Level (NOAEL) in male rats, equating to 168.0 mg/kg/day.
No effects were observed in males or females at 300 ppm and this represents the No Observed Effect Level (NOEL) equating to 24.8 mg SYN524464/kg/day in males and 28.3 mg SYN524464/kg/day in females.
MATERIALS AND METHODSMaterials:
Test Material: SYN524464Description: Off white powderLot/Batch number: SMU6LP006 / MilledPurity: 95.3% (83.0% trans isomer, 12.3% cis isomer)CAS#: N/AStability of test compound: Reanalysis date January 2011
Vehicle and/or positive control: Rat and Mouse (modified) No. 1 Diet SQC Expanded (Ground).
Test Animals:Species RatStrain Han Wistar (Crl:WI(Han))Age/weight at dosing Approx 6 weeks old (151-180 g for males and 105-139 g for females)SourceHousing two per cage by sex and dose group in suspended polycarbonate cages
(overall dimensions 59 x 38.5 x 20 cm)Acclimatisation period 13 days prior to the administration of experimental dietsDiet Rat and Mouse (modified) No. 1 Diet SQC Expanded (Ground) ad libitumWater Mains water ad libitumEnvironmental conditions Temperature:19-23 °C
Humidity: 40-70%Air changes: 15 air changes/hrPhotoperiod: 0700-1900 h
Study Design and Methods:In-life dates: Start: 12 February 2007 End: 21 May 2007

CLH REPORT FOR SEDAXANE
291
Animal assignment: Animals were allocated to cages on two racks per sex. Cages were racked by treatment group, vertically throughout the rack, with empty cages being placed in any spaces not occupied. Control animals were housed on the same racks as treated groups.
Table 3.12.1.2-1: Study designTest group Dietary concentration
(ppm)Dose to animal
(mg/kg)male female
Control 0 0 1-10 41-50Low 300 24.8 11-20 51-60Mid 2000 168.0 21-30 61-70High 4000 325.1 31-40 71-80
Diet preparation and analysis: Untreated diet and blended for 20 minutes in a diet mixer.Blank diet (Rat and Mouse (modified) No. 1 Diet SQC Expanded (Fine Ground)) wasprepared for Control animals. Diet formulations were generally prepared on a weekly basis and stored at ambient temperature.
Analysed concentrations of test item within the diet were found to be within -8.7% to +4.7% of the theoretical concentrations, indicating acceptable accuracy of formulations. The coefficient of variation was low (3% or lower) indicating satisfactory homogeneity.
Statistics: Body weights, cumulative weekly body weight gain, food consumption, food utilization, haematology, coagulation, clinical chemistry, selected urinalysis, motor activity and quantitative FOB measurements were analysed using a parametric ANOVA and pairwise comparisons made using Dunnett’s test. If the variances were clearly heterogeneous, log or square root transformations were used in an attempt to stabilise the variances.
Organ weights were analysed using ANOVA as above and by analysis of covariance(ANCOVA) using terminal kill body weights as covariate. Adjusted organ weights from theANCOVA underwent pairwise comparisons using Dunnett’s test, based on the error mean square in the ANCOVA. Tabulated results for adjusted organ weight analysis include the overall mean body weight across all groups, the adjusted organ weight values for each individual group (Mean), the standard error values (SE) for the adjusted means based on the error mean square in the ANCOVA, and the number of organs per group (n).
Summary statistics (mean, standard deviation and number of observations) and individual values are presented for organ weights as a percentage of body weight. However, statistical comparisons to Control values were not performed for organ weights as a percentage of body weight, because the ANCOVA results with terminal body weight as covariate provide a more robust statistical determination of this parameter.
The following pairwise comparisons were performed:Control vs Low DoseControl vs Intermediate DoseControl vs High Dose
Histological incidence data were analysed using Fisher’s Exact Probability Test. Histological findings with multiple severities were also analysed using the Mann-Whitney U test.
All statistical tests were two-sided and performed at 1% and 5% significance levels using inhouse software. Males and females were analysed separately.

CLH REPORT FOR SEDAXANE
292
Observations: All animals were checked early morning and between 1430 - 1645 h on week days and 1024 - 1239 h at the weekend for viability. Once each week all animals received a detailed clinical examination, including appearance, movement and behaviour patterns.
Bodyweight: Body weights were recorded once each week commencing one week prior to treatment up until the end of the treatment period.
Food consumption and test substance intake: The quantity of food consumption by each cage of animals was measured and recorded once each week commencing one week prior to the start of treatment up until the end of the treatment period.
The amount of test item (mg) per kg body weight per day that was ingested was calculated atregular intervals during treatment using the following formula:
Achieved intake (mg/kg/day) = Concentration (ppm) x Food Consumption (g/day)Mid-point Body Weight (g)
Water consumption: Water consumption was qualitatively measured by visual inspection on a weekly basis commencing one week prior to treatment up until the end of the treatment period.
Ophthalmoscopic examination: The eyes were examined using an indirect ophthalmoscope following application of a mydriatic agent (1% Tropicamide, Mydriacyl®). The cornea, anterior chamber, iris, lens posterior chamber, retina and vessels of the optic disc were examined. An ophthalmic examination was conducted for all animals during Pretrial and Week 13.
Functional observation battery: Once during the treatment period (Week 12/13) a more detailed examination was made of all animals. The examinations were made by a technician not involved in the dosing procedures or in the collection of body weights and food consumption data, and were performed at an approximately standardized time of day. Prior to the independent technician entering the room, standard cage cards were removed and only neurotoxicity cards were shown. Cages were transferred onto a separate rack in neurotoxicity number order. The assessor was then allowed to enter the room. One animal from each cage had their tail marked for identification purposes.
Cageside observations: Posture/condition on first approach (animal undisturbed), checking for: prostration, lethargy,
writhing, circling, breathing abnormalities, gait abnormalities, tremor, fasciculation, convulsions, biting (of cage components or self mutilating), vocalisations and piloerection.
Ease of removal from the cage. Body temperature was taken and recorded from the implanted electronic identification chip. Condition of the eyes, checked for: pupillary function, miosis, mydriasis, exophthalmos,
encrustation, and lacrimation. Condition of the coat. Presence of salivation. Overall ease of handling.
Observations in a standardized area (2 min observation): Latency (time to first locomotory movement), level of mobility, rearing, grooming,
urination/defecation, arousal (level of alertness), posture, tremor/convulsions, vocalisation, piloerection (recorded as for cageside observations), palpebral closure, gait abnormalities, stereotypy (excessive repetition of behaviours) and/or unusual behaviours.
Functional Tests:Once during the treatment period (Week 12/13), the following additional functional tests were performed. Again, these assessments were performed at an approximately standardized time of day.

CLH REPORT FOR SEDAXANE
293
Reaction to sudden sound (click above the head) Reaction to touch on the rump with a blunt probe Grip strength: This was measured using a method derived from that of Meyer et al (1979). A strain gauge was used, to which is attached a wire pull-bar. Once the animal had gripped the
bar, the body was pulled until its grasp was broken; the strain gauge recorded the force required. The procedure was repeated 3 times for the forelimbs and 3 times for the hindlimbs, and the mean fore and hind grip strengths calculated.
Pain perception: This was assessed by measurement of the tail flick response, using a technique based on the method devised by D`Amour and Smith (1941). The apparatus used shone a calibrated infra-red heat source onto the tail and automatically measured the reaction time of the animal (accurate to 0.1 s). It was ensured that no visible injury to the tail was caused during this test.
Landing Foot Splay: Maize oil was applied to the hind paws of each animal. The animal was then held in a horizontal, prone position with the nose ca 30 cm above a bench surface covered with absorbent paper. When the animal was calm, it was dropped. The distance between the prints of the central footpads was measured and the average measurement recorded. The procedure was repeated 3 times. If the rat did not land properly on its feet, this was recorded. In the protocol it stated that animals would be dropped from a height of ca
32 cm, however, the technicians followed the SOP which stated ca 30 cm in error. Given the small difference in height this deviation was considered not to have affected the outcome or integrity of the study.
Motor activity: Each animal was placed in an individual monitoring cage, scanned by a motion sensor utilising infra-red pyroelectric detectors. Movement was detected in 3 dimensions everywhere in the cage, and was differentiated into large and small movements. Each animal was monitored for one session of 1 h, activity counts were recorded over successive periods of 5 minutes each.
Other physical/functional abnormalities: Any other abnormality not already recorded in the above screening battery.
Haematology and clinical chemistry: Blood samples for haematology, coagulation and clinical chemistry were obtained from all animals via the orbital sinus under isoflurane anaesthesia, prior to terminal kill. Animals were not deprived of food or water overnight prior to random sampling. The parameters examined for haematology, coagulation and clinical chemistry were as follows:
Haematology: Approximately 0.5 mL of whole blood was collected into tubes containing EDTA for haematology investigations.
Approximately 0.45 mL of whole blood was collected into tubes containing 0.05 mL trisodium citrate (w/v). The final sample volume was as close as possible to 0.5 mL to give a final concentration of 0.38 % trisodium citrate (blood to citrate ratio of 9:1) for coagulation investigations. The citrated blood samples were then centrifuged and the plasma separated into plain plastic tubes.
Haemoglobin Mean cell haemoglobin concentrationHaematocrit PlateletsRed blood cell count ReticulocytesDifferential white blood cell count: White blood cell count
Neutrophils Mean cell volumeLymphocytes Mean cell haemoglobinMonocytesEosinophils Coagulation:Basophils Prothrombin timeLarge unclassified cells Activated Partial Thromboplastin Time
Clinical chemistry: Approximately 1.5 mL of whole blood was collected into tubes containing lithium heparin for clinical chemistry investigations.

CLH REPORT FOR SEDAXANE
294
Urea AlbuminGlucose Globulin – derivedAspartate aminotransferase AG ratio – derived Alanine aminotransferase CholesterolAlkaline phosphatase TriglyceridesGamma-glutamyl transferase CreatinineGlutamate dehydrogenase Creatine kinaseSodium Total bilirubinPotassium CalciumChloride PhosphateTotal protein
Urinalysis: Urine samples were obtained from all animals during Week 13. Animals were placed into metabolism cages and samples were collected over a 4 hour period. During this time animals were deprived of food and water.
Volume KetonesSpecific gravity UrobilinogenColour BilirubinpH Blood pigments
Protein Microscopy of Spun Deposit
Glucose
Investigations post mortem: After at least 90 days of treatment all animals were terminally killed in random order by
exposure to carbon dioxide and were immediately weighed, followed by severance of majorblood vessels.
Macroscopic examination: Each animal was subject to a detailed necropsy that consisted of a complete external and internal examination, which included body orifices (ears, nostrils, mouth, anus, vulva) and cranial, thoracic and abdominal cavities. All gross findings were recorded in terms of location(s), size (mm), shape, colour and number.
Organ weights: From all animals surviving to scheduled termination, the following organs were removed, trimmed free of extraneous tissue and weighed:. Paired organs were weighed separately and the sum of the individual organs used for reporting purposes.
Adrenal x2 SpleenBrain TestisEpididymis x2 ThymusHeart Thyroid with parathyroid x2Kidney x2 UterusLiverOvary x2
Tissue submission: The following tissues were examined in situ, removed and examined and fixed in an appropriate fixative:
Abnormal tissue Ovary x2Adrenal x2 OviductsAortic arch PancreasBrain PharynxEye x2 PituitaryGastro-intestinal tract Prostrate

CLH REPORT FOR SEDAXANE
295
Stomach Sciatic nerveDuodenum Seminal vesiclesJejunum Skin & mammary glandIleum Spinal cordCaecum SpleenColon Sternum
Rectum Submandibular lymph nodeHarderian gland Submxillary (mandibular) salivary glandHeart TestisKidney x2 Thigh muscleLarynx ThymusLiver & gall bladder Thyroid with parathyroid x2Lung TongueMarrow smear (femur) TracheaMesenteric lymph node Urinary bladderNasal cavity UterusOesophagus VaginaOptic Nervex2
Microscopic examination: Tissues listed in the table above, were processed from all animals in the Control and High dose groups for micropathology evaluation. In addition, the thyroid and liver from all animals in the Low and Intermediate dose group were evaluated. Sections were cut 4-6 μm thick and stained with haematoxylin and eosin (H&E) (unless otherwise stated) and were evaluated by a pathologist.
Liver Sampling for Genomic, Immunohistochemistry and Biochemistry: Multiple samples of liver (12 x ca 150 mg) were taken from two additional 5 mm sections of the left lobe and snap frozen in liquid nitrogen. All samples were taken as quickly as possible and stored at ca -70°C for possible RT-PCR and gene expression profiling and metabonomics (LC/MS, GC/MS and NMR analysis of liver extract). Samples for possible genomics analysis were stored in RNA-ase free tubes prior to freezing. A small piece of duodenum was included with the liver sampled and processed to paraffin wax block for histology and also to serve as a positive control for subsequent immunohistochemistry analysis.
RESULTS AND DISCUSSIONMortality: There were no premature decedents during this study.
Clinical observations: There were no treatment-related effects on clinical observations.Agitated behaviour was noted on occasion in both sexes treated at 2000 and 4000 ppm and intwo Control females. However, due to the fact there were no other signs, the agitated behaviour was not seen during the more comprehensive FOB’s and the sporadic nature of these observations, the findings were considered to be coincidental and not due to treatment with SYN524464.
Bodyweight and weight gain: A statistically significant decrease in body weight relative to Controls was observed in males treated with SYN524464 at 4000 ppm from Day 7 to 56. Cumulative body weight gain was statistically significantly decreased in 4000 ppm males relative to Controls up through Day 63 and again at Day 84. In females, group mean body weight was statistically significantly decreased relative to Controls on most occasions from Day 70 at 2000 ppm and from Day 49 at 4000 ppm until the end of the study. Cumulative body weight gain in females was statistically significantly reduced when compared to Control from Day 42 to Day 91 at 2000 ppm and throughout treatment at 4000 ppm.
There were no treatment-related effects on body weight or body weight gain for males at 2000 ppm or animals of either sex at 300 ppm.

CLH REPORT FOR SEDAXANE
296
Table 3.12.1.2-2: Intergroup comparison of bodyweights (group mean values (g))Dietary Concentration of SYN524464 (ppm)
Males (g) Females (g)
Day 0 300 2000 4000 0 300 2000 4000
0 167 167 166 165 121 121 121 12328 289 284 274 263* 188 189 180 17863 384 386 373 342 232 232 215 208*91 420 421 406 375 247 244 222 218*
* Statistically significant difference from control group mean, p<0.05 (Student’s t-test, 2-sided)
Food consumption and compound intake: At 4000 ppm, males and females had reduced food consumption throughout the treatment period when compared to their respective Control. These differences mostly achieved statistical significance from Day 7 – 49 in males and generally throughout treatment in females. There were no differences in food consumption considered to be treatment related at 300 or 2000 ppm in either sex. Females at 2000 ppm had significantly lower values compared to Controls on two occasions (Day 14 and Day 49), but these isolated instances were considered not to be treatment-related effects.
Food utilisation was statistically significantly lower than Control in weeks 5-8 only for females treated at 4000 ppm. There were no other differences in food utilisation that were considered to be related to treatment with SYN524464.
Table 3.12.1.2-3: Intergroup comparison of food consumtion(g/animal/day)Dietary Concentration of SYN524464 (ppm)
Males (g/animal/day) Females (g/animal/day)
Day 0 300 2000 4000 0 300 2000 4000
0 23.1 23.4 23.4 22.8 17.8 17.9 17.5 18.028 26.8 25.1 24.2 23.2* 18.8 18.9 17.0 15.7**63 25.6 26.8 26.8 23.9 20.5 19.8 18.6 16.8*91 25.0 25.7 25.8 23.8 19.0 18.2 16.8 15.7**
* Statistically significant difference from control group mean, p<0.05 (Student’s t-test, 2-sided)** Statistically significant difference from control group mean, p<0.01 (Student’s t-test, 2-sided)
Water consumption: Visual inspection indicated no observable differences between groups throughout the treatment period.
Ophthalmoscopic examination: There were no intergroup differences noted which were considered to be related to treatment.
Functional Observation Battery: Males treated at 4000 ppm showed a statistically significant increase in hunched posture and piloerection when being observed in the arena. There were no other clinical signs seen in the FOB that were considered to be related to treatment with SYN524464.
There were no differences in motor activity measurements that were considered to be related to treatment with SYN524464.
A dose-related decrease in fore grip strength for females at 2000 and 4000 ppm was accompanied by a reduction in hind grip strength, at 4000 ppm. Other statistically significant differences, specifically decreased fore grip strength at 2000 ppm and decreased time to tail flick at 300 ppm in males, were considered not to be related to treatment due the lack of a dose related response and/or the small magnitude of change.

CLH REPORT FOR SEDAXANE
297
Haematology: Prothrombin time was significantly increased in males and females receiving 4000 ppm. There were no statistically significant differences in activated partial prothrombin time in males or females at any dose level; a lower number of samples per group were available for this parameter. Males receiving 4000 ppm showed a slightly lower statistically significant red blood cell count. The value for the 4000 ppm males (8.67) was in the middle of the historic control range (8.28 – 9.10), whereas the concurrent Control value (9.15) was at the upper end of this range. Therefore, due to the small magnitude of the difference, the lack of a response in females, and the relatively high concurrent Control value, this was not an effect of treatment with SYN524464.
Table 3.12.1.2-4: Intergroup comparison of selected haematology parametersDietary Concentration of SYN524464 (ppm)
Males Females
Parameter 0 300 2000 4000 0 300 2000 4000
Prothombin Time (s)
14.8 14.7 16.1 16.8* 15.2 15.2 15.4 16.5*
Red Blood Cell Count (x1012/L)
9.15 8.92 8.75 8.67* 8.32 8.03 8.01 8.20
* Statistically significant difference from control group mean, p<0.05 (Student’s t-test, 2-sided)
Blood clinical chemistry: Animals treated at 4000 ppm showed a statistically significant increase in gamma glutamyl transferase. At 4000 ppm, males had statistically significant increases in triglycerides and total protein when compared to their Controls. Females at 4000 ppm, had a statistically significant increase in cholesterol when compared to their Controls. In addition, females receiving 4000 ppm had a small but statistically significant decrease in aspartate aminotransferase. Although 4000 ppm males and females had statistically significantly lower glucose levels when compared to their Controls, their values were consistent with historic control ranges and the respective concurrent Control values were at the high end of the historic control ranges. Therefore, this reflects normal variability and not a treatment-related effect.
Glutamate dehydrogenase was statistical significantly lower than the respective control means values in males treated at 2000 ppm and females treated at 4000 ppm. However, this parameter is normally subject to large inter-individual variability, as shown by the historic control data. The Control mean values for both sexes were influenced by higher individual values for two animals in each sex (2M, 3M and 44F, 49F). When the values for these animals were excluded, values for glutamate dehydrogenase were similar for all groups. Therefore there was no effect of treatment with SYN524464 on glutamate dehydrogenase.
Phosphate levels were statistically significantly higher than Control values in 4000 ppm males. However, all mean values were well within the historic control range, and given thesmall magnitude of change this was considered not to be a treatment-related effect.
There were other changes seen in selected parameters, however, due to the small magnitude of change, lack of a dose relationship and no corroborating histological evidence they were considered not to be related to treatment with SYN524464.
Urinalysis: There were no intergroup findings considered to be related to treatment with SYN524464.
Sacrifice and pathology: Organ weights: Absolute liver weight at 4000 ppm and adjusted liver weight at 2000 and 4000 ppm were statistically significantly increased in males and females when compared to Controls. Adrenal weights in males treated at 4000 ppm were statistically significantly higher than the Control value after adjustment for body weight.

CLH REPORT FOR SEDAXANE
298
Males treated at 300 and 4000 ppm showed a statistically significantly lower absolute and adjusted thyroid weights when compared to their Controls. In contrast, the 2000 ppm malevalues for absolute and adjusted thyroid weights were virtually identical to the Control values. In the absence of a dose-related response and considering that all mean values were within the historical control range for both absolute weight (0.0173-0.0288 g) and relative (%) thyroid weight (0.00418-0.00671), these differences reflect normal variability in a relatively small organ weight, and they do not represent a treatment related effect. Testis weights of 4000 ppm males were statistically significantly higher than Controls only after adjustment for body weight. Considering the large effect on body weight in this group and the normal conservation of weight in the testis, the difference in the adjusted values does not reflect an effect of treatment. Absolute kidney weights were statistically significantly lower than Controls in females at 2000 and 4000 ppm. However, there were no differences from Controls after adjustment for body weight, and no effects on kidney weights in males; therefore, these minor differences are considered not to be a treatment-related effect.
A small number of other statistically significant changes were noted, however, due to the small magnitude of change, the lack of a dose response and no corroborating histological evidence they were considered not to be due to administration of SYN524464.
Macroscopic findings: All necropsy findings were typical of spontaneously occurring background findings for rats of this strain and age, on this type of study at
Microscopic findings: Centrilobular hepatocyte hypertrophy was seen in all animals treated with 4000 ppm. This was graded moderate in males and mild to moderate in females. This finding achieved statistical significance (p ≤ 0.001) in both sexes. In some animals this change was accompanied by minimal to mild hepatocyte pigmentation. This finding was statistically significant in animals treated at 4000 ppm (p ≤ 0.001 in males and p ≤ 0.01 in females). Hepatocyte pigment, graded mild, was seen in one female animal receiving 2000 ppm, but this single incidence in the absence of any other micropathology findings at 2000 ppm is considered not to be treatment-related. Diffuse thyroid follicular cell hypertrophy, graded minimal to moderate, was seen in 5/10 males and 1/10 females treated with 4000 ppm. This finding reached statistical significance (p ≤ 0.05) in males receiving 4000 ppm.
All other histology findings were typical of spontaneously arising background findings in ratsof this strain and age, on this kind of study at
.
CONCLUSION: Dietary administration of SYN524464 to rats at 4000 ppm, for at least 90 consecutive days, resulted in a reduction in body weight and food consumption, along with piloerection and hunched posture in males and decreased grip strength in females. At 4000 ppm, increases in gamma glutamyl transferase and liver weight were observed in males and females. The liver weight increases correlated with micropathology findings of centrilobular hepatocyte hypertrophy and hepatocyte pigment. In the thyroid, follicular cell hypetrophy was observed in both sexes, with a higher incidence in males (5) than females (1). Additional treatment related changes at 4000 ppm included higher prothrobmin time in both sexes, highertriglycerides and total protein in males, and higher cholesterol levels in females.
At 2000 ppm body weight and fore grip strength was decreased in females. Liver weight was increased in males and females at this dose level. However, the increase in liver weight at 2000 ppm was limited, and in the absence of any treatment-related micropathology changes this was considered not to be adverse. Therefore, 2000 ppm represents a No Observed Adverse Effect Level (NOAEL) in male rats, equating to 168.0 mg/kg/day.
No effects were observed in males or females at 300 ppm and this represents the No Observed Effect Level (NOEL) equating to 24.8 mg SYN524464/kg/day in males and 28.3 mg SYN524464/kg/day in females.
CLH REPORT FOR SEDAXANE
299
3.12.1.3 Anonymous(2009b)Report: Anonymous, 2009b. 90 Day Neurotoxicity (Dietary) Study in the Rat. Unpublished Report No.
B67432. 29 Oct 2009 (Syngenta File No. SYN524464_11148)
GUIDELINES: 90 Day Dietary Neurotoxicity Study. OECD 424 (1997): US EPA OPPTS 870.6200 (1998): EU Council Directive 67/548//EEC B.43 (2000): JMAFF Notification No. 12 NohSan 8147 (2000)
GLP: Signed and dated GLP and Quality Assurance statements were provided.
There were no deviations from the current regulatory guidelines considered to compromise the scientific validity of the study.
EXECUTIVE SUMMARYGroups of twelve male and twelve female HanRcc:WIST (SPF) rats were fed SYN524464 admixed to the diet at concentrations of 0, 300, 1000, and 4000 ppm for up to 92 days.
All animals were observed prior to the study start and daily throughout the study for any changes in clinical condition. In addition, detailed clinical observations were performed in randomized order once prior to study start and once weekly thereafter. Furthermore, a functional observation battery (FOB), including quantitative assessments of landing foot splay, sensory perception and muscle weakness, and an assessment of locomotor activity were performed in all animals in randomized order once prior to study start, and in weeks 2, 5, 9 and 13. Body weights were recorded once prior to study start, on day 1 and weekly thereafter. Food consumption was monitored twice a week throughout the study and reported weekly during week 1 through 13. Ophthalmoscopic examination was performed in all animals once prior to study start, and in animals of groups 1 and 4 in week 13. At the end of the scheduled period, 5 rats/sex/group were perfused in situ, brain weight was recorded, organs and selected nervous tissue were assessed for macroscopic changes. The remaining animals were killed and discarded. Tissues of the peripheral and central nervous system of the control and 4000 ppm dose groups were examined neurohistopathologically.
All animals survived the scheduled study period. Detailed clinical observations and FOB evaluations of clinical symptoms revealed no treatment related effects of SYN524464. Body temperature, landing foot splay and grip strength in the fore- and hind limbs were not affected by treatment with SYN524464.
Food consumption was significantly reduced in males and females at 4000 ppm. At 4000 ppm, mean body weights were generally lower in males and females throughout the study, achieving statistical significance beginning on day 57 in males and day 15 in females. Mean cumulative body weight gains were statistically significantly lower in males and females beginning on day 8 and continuing throughout the study.
Mean locomotor activity total distance values for the 4000 ppm males and females during treatment were generally lower than controls, achieving statistical significance in males at 4000 ppm during weeks 2 and 5. These lower total distance values are not considered to represent a direct neurotoxicologic insult, but rather are reflective of general toxicological effects, as indicated by the treatment-related decreases in mean food consumption and body weight.
No macroscopic findings were noticed at necropsy. Brain weights and adjusted brain weights were not affected by treatment with the test item. There were no treatment-related effects on neuropathology. No effects of treatment were noted in rats treated with SYN524464 at 300 and 1000 ppm.

CLH REPORT FOR SEDAXANE
300
Under the conditions of this study, SYN524464 did not produce any evidence of neurotoxicity in rats administered the test item in their diet at 300, 1000, and 4000 ppm. Therefore, the high dose level of 4000 ppm represents the “no observed effect level” (NOEL) for neurotoxicity, corresponding to a dose of 260.0 mg/kg/day in males and 302.9 mg/kg/day in females.
MATERIALS AND METHODSMaterials:
Test Material: SYN524464Description: Off-white powderLot/Batch number: SMU6LP006/MILLEDPurity: SYN524464: 95.3% w/w; comprised of :
SYN508210 (trans isomer): 83.0% SYN508211 (cis isomer): 12.3%
CAS#Stability of test compound: Stable under storage conditions of <30oC. Expiry date 31 January 2011.
Vehicle control: Powdered standard Kliba Nafag 3433 rodent maintenance diet, batch nos. 81/07 and 12/08 (from 03 April 2008) (Provimi Kliba SA, 4303 Kaiseraugst / Switzerland).
Test Animals:Species Rat Strain HanRcc: WIST (SPF)Age/weight at dosing At least 49 days old / males 171.8 to 211.1 g, females 138.0 to 165.6 g. Source
Housing Standard Laboratory Conditions. Individually in Makrolon type-3 cagesAcclimatization period 7 days for males, 8 days for females.Diet ad libitum Water ad libitum.Environmental conditions Temperature:223°C
Humidity: 30-70%Air changes: 10-15 changes/hourPhotoperiod: 12 hours light/12 hours dark
Study Design and Methods:In-life dates: Start: 28 February 2008 End: 05 June 2008 (males), 06 June 2008 (females)
Animal assignment and treatment: Animals were assigned to the test groups in randomized order. Animals were individually housed in Makrolon type-3 cages with wire-mesh tops and sterilized standard softwood bedding.Animals were fed dietary admixtures, freshly prepared every 2 weeks.
At study termination, 5 rats/sex/group were perfused in situ. Selected nervous system tissues were removed, and preserved in an appropriate fixative. From the five animals/sex/group killed by perfusion fixation, the brain was removed and the weight recorded. The remaining animals were killed and discarded. Submitted tissues from top dose and control animals were examined by light microscopy.
Table3.12.1.3-1: Study design
Experimental Parameter Dose Group (ppm)
0 (control) 300 1000 4000
Total number of animals/group 12/sex 12/sex 12/sex 12/sex

CLH REPORT FOR SEDAXANE
301
Behavioural testing (FOB, Motor Activity) 12/sex 12/sex 12/sex 12/sex
Neuropathology 5/sex 5/sex 5/sex 5/sex
Test substance preparation and analysis: Dietary admixtures were prepared with material as supplied. SYN524464 was weighed into a tared glass beaker on a suitable precision balance with target concentration levels of 300, 1000 and 4000 ppm, and mixed with microgranulated feed separately for each dose group. Control feed for the animals of group 1 was prepared similarly, but without test item.
Concentration and homogeneity of the test item in the diets were determined in samples taken from each of the diet preparations prior to administration to the animals. A 50 g sample was collected from each the top, middle and bottom of every dietary admixture (including controls) from each diet preparation. The analytical method was developed and validated over the concentration levels of 250 to 7000 ppm at
. under study numbers B77501 and C23415. The stability of the test item in diet was confirmed for 10 days at room temperature (20 °C ± 5 °C) at concentrations of 150 and 7000 ppm ( study numbers B77501 and C23415) and was sufficient to cover the period of storage and conditions of use for this study.
A contemporary positive control study was performed at the laboratory demonstrating the adequacy of these methods to detect neurotoxicity.
Statistics: All statistical tests were performed using appropriate computing devices or programs, which were documented in the final report. The following statistical approaches were used in this study:
All analyses were two-tailed for significance levels of 5% and 1%. All means were presented with standard deviations. If the variances were clearly heterogeneous, appropriate transformations (e.g. log, square root,
double arcsine) were used in an attempt to stabilize the variances. In the final report, any transformations that were utilized were indicated in the specific results tables and/or the statistical methods section.
For quantitative data: body weights, cumulative body weight gain, food consumption, food utilization, quantitative FOB measurements (grip strength and landing foot splay and body temperature), motor activity data at each measurement interval and overall activity, and absolute organ weights were analyzed initially by a one-way analysis of variance (ANOVA).
Organ weights were also analyzed by analysis of covariance (ANCOVA) on final body weight (Shirley, 1977). This statistical analysis provided an adjusted organ weight value, which has been displayed in the results table in the final report along with flags for statistical significance.
Summary values of organ to body weight ratios were presented but not analyzed statistically. For all of the parameters evaluated initially by ANOVA or ANCOVA, Dunnett’s test was used to
compare the control and treated groups, based on the error mean square in the ANOVA or ANCOVA. The Dunnett’s test was performed for all continuous data parameters, regardless of whether the initial ANOVA or ANCOVA was statistically significant, and statistical flags are presented in the tables of results in the final report.
For qualitative data ( e.g. possible values of 0, 1, 2 or present/absent): Qualitative FOB parameters or any other parameters not specifically mentioned above that yield qualitative data have been presented as summary data, but were not analyzed statistically.
Mortality and clinical observations: Prior to the start of the study, all rats were examined to ensure that they were physically normal and exhibited normal activity. Observations for viability/mortality were recorded twice daily. All animals were observed for clinical signs once prior to first administration and once daily during the treatment period. Detailed clinical observations were recorded once prior to treatment start and once weekly thereafter.
Body weights: Body weights were recorded once prior to treatment start and on day 1 and weekly thereafter.

CLH REPORT FOR SEDAXANE
302
Food consumption: Food consumption values were recorded twice a week throughout the study, and reported as mean overall daily food consumption values (g food/rat/day) for each week. Food utilization values are reported for weeks, 1 to 4, 5 to 8, and 9 to 13, and the overall food utilization values for weeks 1 to 13 are presented.
Ophthalmoscopy: Ophthalmoscopic examinations were performed in all animals once prior to study start, and in all group 1 and 4 animals once during week 13. Since no test item-related findings were noted in the high dose rats (4000 ppm), there was no necessity to examine animals of the low and mid dose rats (300 and 1000 ppm, respectively).
Neurobehavioral Assessment:Functional observational battery (FOB): FOB evaluations were conducted on all animals prior to study start, and at weeks 2, 5, 9 and 13, and included grip strength of fore- and hind paws, landing foot splay, rectal body temperature, and Preyer’s reflex. For the conduct of the FOB, animals were randomized and the cage labels covered to assure that experimenters were unaware of the animal’s treatment group. Observations were conducted in the home cage, during handling and in an open field over the functional domains of CNS activity: CNS excitation, sensorimotor, autonomic, and physiological functions.
Locomotor activity: Locomotor activity was performed after conduct of the FOB prior to treatment start and in weeks 2, 5, 9 and 13 using an automated open field device. Locomotor activity was recorded over 30 minutes at 3-minute intervals. The test room had the same environmental conditions as the animal room. Animals were allocated to the different runs and test boxes by means of a Latin square design so that treatment groups were equally distributed. Males and females were tested on separate days. The following parameters were evaluated:
Horizontal activity as total distance (in cm) Vertical activity as number of rearings (counts) Centre time as the time spent in the central quadrant (in sec.)
Termination and pathology: At termination on day 92, the first 5 animals of allocation Group B were subjected to deep anesthesia by intraperitoneal injection of Eutha 77® (about 400 mg/kg body weight) and sacrificed by perfusion fixation in situ with 1 mL of 50 IU heparin followed by 0.9% w/v saline buffer as rinsing solution. For fixation, a 10% formalin solution was used. The animals fixed by perfusion were kept in situ in a plastic container containing 4% formaldehyde for approximately one week until post-fixation was performed. At that point in time, peripheral nerves were removed and then post-fixed with 4% paraformaldehyde, 5% glutaraldehyde in 0.1 M sodium phosphate buffer (at pH 7.4) for approximately 2 hours at 4 ± 3 °C. Rinsing with 0.1 M sodium phosphate buffer was done 3 times for approximately 10 minutes each. Furthermore, the control and high dose groups were post-fixed with 2% osmiumtetraoxide and 1.8% potassiumhexacyanoferrate II trihydrate (C6FeK4N6 x 3 H2O) in 0.1 M sodium phosphate buffer for approximately 2 hours at room temperature (20 ± 5 °C). The fixed brains were weighed 24 hours after its removal, before any further processing. For determination of the relative weight, terminal body weights were used. The following tissues were taken from all rats killed by perfusion fixation and preserved in an appropriate fixative:
braineye (with optic nerve and retina)*spinal cord (including cervical and lumbar swellings)spinal nerve roots (dorsal and ventral root fibres) of cervical swellingspinal nerve roots (dorsal and ventral root fibres) of lumbar swellingdorsal root ganglia at cervical swellingdorsal root ganglia at lumbar swellingproximal sciatic nerve*proximal tibial nerve*

CLH REPORT FOR SEDAXANE
303
distal tibial nerve (tibial nerve calf muscle branches)*Gasserian ganglia with nerve*gastrocnemius muscle*
* = left component was taken and processed, right component was taken and stored in 4% formaldehyde solution.
All submitted tissues from control and high dose group animals were processed. Transverse sections of the brain (frontal lobe, parietal lobe with diencephalon, midbrain (hippocampus), pons and cerebellum, medulla oblongata, eye with retina and optic nerve, and spinal cord (cervical (C4-C7) and lumbar (L4, L5) segment), and longitudinal sections of the spinal cord (C4-C7, L4, L5), Gasserian ganglia with nerve, gastrocnemius muscle, were trimmed and embedded in paraffin wax. From these blocks 5m sections were cut and stained with haematoxylin and eosin.
Transverse and longitudinal sections of dorsal root ganglia (C4-C7, L4 and L5) and spinal nerve roots (dorsal and ventral root fibres of C4-C7, L4 and L5), proximal sciatic nerve, proximal tibial nerve (at knee) and distal tibial nerve (tibial nerve calf muscle branches) were embedded in resin and semi-thin sections cut and stained with toluidine blue.
All submitted tissues from top dose and control animals, except those indicated for storage, were examined by light microscopy and assessed.
RESULTS AND DISCUSSION Diet analytics: The achieved concentration of SYN524464 (sum of trans and cis isomer) in 227 out of a total of 237 samples was found to be within the Sponsor’s acceptable range of ±10% of the nominal concentration. The results of the 10 samples that were out of this acceptable range, most of which were at the low-dose level, were only slightly below this limit (86.1% to 89.9% of target), and therefore did not adversely impact study findings. No test item was detected in control samples. In addition, the homogenous distribution of SYN524464 in the diet preparations was demonstrated; results did not deviate more than 10.8% from the mean.
Clinical signs and mortality: There were no deaths and no treatment related clinical signs were observed in any animals of any dose groups throughout the study period. There were noophthalmoscopic findings. Detailed clinical observations revealed no treatment-related effects of SYN524464.
Body weight and body weight gain: At 4000 ppm, mean body weights were generally lower in males and females throughout the study, achieving statistical significance beginning on day 57 in males and day 15 in females. Near the end of treatment, the mean body weight values of the 4000 ppm males and females were approximately 9.4% and 10.0% less than controls, respectively. At 4000 ppm, mean cumulative body weight gains were statistically significantly lower in males and females beginning on day 8 and continuing throughout the study and were attributed to treatment. The overall cumulative body weight change values of the 4000 ppm males and females were 18.1% and 24.8% less than controls, respectively.
There were no effects of treatment in males and females treated at 300 and 1000 ppm on mean body weights and/or cumulative body weight changes.
Food consumption: Food consumption was lower in males and females at 4000 ppm throughout the study, achieving statistical significance in males during weeks 1, 7, 8 and 9 and in females during weeks 1, 8, 10 and 11. The difference from control was greatest during week 1 in 4000 ppm males and females (26.5% and 34.8%, respectively). At 300 and 1000 ppm, there were no effects on food consumption in males or females.

CLH REPORT FOR SEDAXANE
304
Table 3.12.1.3-2: Intergroup comparison of food consumption (g/animal/day) in malesDose Group (ppm)
0 (control) 300 1000 4000
Week 1 19.925 19.670 20.071 14.645**
Week 7 23.325 24.008 23.093 21.055*
Week 8 22.761 23.289 23.403 20.712*
Week 9 23.135 23.221 23.403 20.917** Statistically significant difference from control group mean at the 5% level (Dunnett’s t-test, 2-sided)** Statistically significant difference from control group mean at the 1% level (Dunnett’s t-test, 2-sided)
Table 3.12.1.3-3: Intergroup comparison of food consumption (g/animal/day) in femalesDose Group (ppm)
0 (control) 300 1000 4000
Week 1 15.770 15.749 15.560 10.280**
Week 8 19.457 18.985 18.210 15.016**
Week 10 17.359 17.278 16.641 14.805**
Week 11 17.258 19.200 17.802 14.855** Statistically significant difference from control group mean at the 5% level (Dunnett’s t-test, 2-sided)** Statistically significant difference from control group mean at the 1% level (Dunnett’s t-test, 2-sided)
Food utilization: There were no treatment-related effects on food utilization during the study.
Neurobehavioural Assessment:
Functional observational battery (FOB): No treatment related clinical observations were present during the FOB evaluations performed during weeks -1, 2, 5, 9 and 13.
Mean body temperature: No test item-related changes in mean body temperature were noted.
Grip strength: Grip strength in the fore- and hind paws during weeks 2, 5, 9 and 13 was not affected by treatment with SYN524464.
Landing foot splay: Landing foot splay measurements during weeks 2, 5, 9 and 13 revealed no treatment related effect of SYN524464.
Locomotor activity: Mean locomotor activity total distance values for the 4000 ppm males and females during treatment were generally lower than controls, achieving statistical significance in males at 4000 ppm during weeks 2 and 5. These lower total distance values are not considered to represent a direct neurotoxicologic insult, but rather are reflective of general toxicological effects, as indicated by the treatment-related decreases in mean food consumption and body weight.
Sacrifice and pathology: Macroscopic inspection of selected neuronal organs and tissues revealed no treatment-related findings.
Brain weight: Brain weights and adjusted brain weights were not affected by treatment with the test item.

CLH REPORT FOR SEDAXANE
305
Neuropathology: No test item-related microscopic changes were observed. Microscopic examination of the neuronal organs and tissues revealed intact nerve cells and nerve fibers, as well as the supporting cells, blood vessels and connecting tissue elements.
CONCLUSION: Detailed clinical observations and FOB evaluations of clinical symptoms revealed no treatment related effects of SYN524464. Locomotor activity (total distance) was significantly lower in males at 4000 ppm during weeks 2 and 5. This finding is regarded as an incidental alteration without any toxicological relevance as all of the principal findings observed revealed an increased activity rather than a reduction in the activity pattern. Therefore, this reduction in locomotor activity in males at 4000 ppm is considered to represent a transient biological pattern and not a treatment related effect. There were no treatment-related effects on neuropathology.
Treatment related effects were confined to lower food consumption, bodyweight and body weight gain in males and females at 4000 ppm. No effects of treatment were noted in rats treated with SYN524464 at 300 and 1000 ppm.
In conclusion, under the conditions of this study, SYN524464 did not produce any evidence of neurotoxicity in rats administered the test item in their diet at 300, 1000, and 4000 ppm. Therefore, the high dose level of 4000 ppm represents the no observed effect level (NOEL) for neurotoxicity, corresponding to a dose of 260.0 mg/kg/day in males and 302.9 mg/kg/day in females.
3.12.1.4 Anonymous (2010) Amendment 1, Anonymous (2014)See Section 3.9.1.1
3.12.1.5 Anonymous (2008)Report: Anonymous (2008). SYN524464 - 90 Day Mouse Preliminary Carcinogenicity Study.
Laboratory Report No. 29170 issue date 17 December 2008. Unpublished. (Syngenta File No. SYN524464_11115)
GUIDELINES: Repeated Dose 90-day Oral Toxicity in Rodents. OECD 408 (1998): OPPTS 870.3100 (1998): JMAFF Nousan No. 8147 (2000)
GLP: Signed and dated GLP and Quality Assurance statements were provided.
There were no deviations from the current regulatory guideline considered to compromise the scientific validity of the study.
EXECUTIVE SUMMARYGroups of 10 male and 10 female CD-1 mice were fed diets containing 0, 500, 3500 or 7000 ppm SYN524464 for a period of at least 90 days.
Animals were monitored regularly for viability and for signs of ill health or reaction to treatment. Body weights and food consumption were measured and recorded at predetermined intervals from pretrial up until the completion of treatment. Blood samples were collected prior to terminal necropsies during Week 14 for laboratory investigations.
All animals were subjected to a detailed necropsy examination after the completion of treatment. Tissues from all animals in the Control and High dose groups were subjected to histological evaluation. Additional liver tissue from all animals was taken and stored for possible genomics, immunohistochemistry and biochemistry investigations.

CLH REPORT FOR SEDAXANE
306
Achieved dose levels were 0, 80, 567 and 1167 mg SYN524464/kg/day for males and 0, 112, 810 and 1455 mg SYN524464/kg/day for females, corresponding to dietary inclusion levels of 0, 500, 3500 and 7000 ppm, respectively.
Males at 7000 ppm had lower body weight and body weight gain, and lower food utilisation.
There were a small number of other treatment-related effects in males and females at 7000 ppm and in all male treated groups: at 7000 ppm males had lower alkaline phosphatase, lower total bilirubin, higher liver and testes weights and females had lower kidney and heart weights (adjusted for bodyweight); at 3500 ppm males had lower alkaline phosphatase and higher adjusted liver weight; at 500 ppm males had slightly higher adjusted liver weight. Due to the modest size of the differences and the lack of any associated pathological findings, these clinical chemistry and organ weight differences are considered not to be toxicologically significant.
There were no treatment related effects in females at 3500 or 500 ppm.
Dietary administration of SYN524464 to mice for at least 90 consecutive days resulted in evidence of slight toxicity in males treated at 7000 ppm, involving a decrease in body weight gain and food utilization throughout the study, increased liver weight (relative) and testis weight (absolute and relative). No toxicologically significant effects were seen at 3500 or 500 ppm in males or in females at any dose level.
Therefore, under the conditions of this study the No Observed Adverse Effect Level (NOAEL) was considered to be 3500 ppm in male mice, equating to 567 mg SYN524464/kg/day. The NOAEL in females was 7000 ppm, the highest dose tested, equating to 1455 mg SYN524464/kg/day.
MATERIALS AND METHODSMaterials:
Test Material: SYN524464Description: Off white powderLot/Batch number: SMU6LP006/MilledPurity: 95.3% w/wStability of test compound: Reanalysis date January 2011
Vehicle and/or positive control: The test substance was administered via Rat and Mouse (modified) No. 1 Diet SQC Expanded (Fine Ground) supplied by Special Diet Services Limited, 1 Stepfield, Witham, Essex. Control animals received the diet alone.
Test Animals:Species MouseStrain Crl:CD-1(ICR)Age/weight at dosing Approx 6 weeks old. Males 28.6-38.8 g, females 20.7-27.6 g.Source .Housing Individually (males) or 2/cage (females)Acclimatisation period 2 weeksDiet Rat and Mouse (modified) No.1 Diet SQC Expanded (Fine Ground) ad
libitumWater Mains water ad libitumEnvironmental conditions Temperature: 19-23°C
Humidity: 40-70% (measured 28-72%)Air changes:15 air changes/hourPhotoperiod:0700-1900 h
Study Design and Methods:

CLH REPORT FOR SEDAXANE
307
Experimental dates: Start: 27 March 2007, End: 30 August 2007
Animal assignment: On arrival from the suppliers the animals were allocated to cages on racks. A prescribed arrangement and regular movement of cages was carried out in order to minimise environmental effects across each group. Cages were positioned on the rack so that each treatment group was arranged in vertical columns, with empty cages being placed in any spaces not occupied. Males and females were housed on different racks. During Pretrial group mean body weights were checked to ensure all groups had a similar body weight for each sex. Changes made to achieve a similar body weight across the groups have been retained in the study data. Control animals were housed on the same racks as treated groups. Each week, from the commencement of Pretrial (Day -7), each column of cages on a rack was moved horizontally one position on the rack.
Animals were allocated to dose groups as follows:
Table 3.12.1.5-1: Study designTest group Dietary concentration male female
Control 0 1-10 41-50Low 500 11-20 51-60Mid 3500 21-30 61-64, 66-70, 84High 7000 31-40 71-80
Diet preparation and analysis: Formulated diets were prepared by direct admixture of the test item to a required amount of untreated diet and blended for 20 minutes in a diet mixer.Blank diet (Rat and Mouse (modified) No. 1 Diet SQC Expanded (Fine Ground)) was provided to Control Animals.
Diet formulations were prepared on a weekly basis and stored at ambient temperature.Formulated diets in the concentration range 100-10000 ppm were investigated for stability, concentration and homogeneity under a separate protocol Currie L, 2007. Triplicate samples (3 x 50 g) were taken from each formulated diet (including Control) immediately after preparation for feeding in Weeks 1, 6 and 12. The samples were stored at ca -20°C until analysed. Analysed concentrations of test item within the diet were found to be within -6.0 to +1.1 % of the theoretical concentrations, indicating acceptable accuracy of formulations. The coefficient of variation was low (1.4% or lower) indicating satisfactory homogeneity.
Statistics: Body weights, weekly body weight gain, food consumption, food utilization, haematology and clinical chemistry were analysed using a parametric ANOVA. If the variances were clearly heterogeneous, log or square root transformations were used in an attempt to stabilise the variances.
Organ weights were analysed using ANOVA as above and by analysis of covariance (ANCOVA) using terminal kill body weights as covariate.
For all of the parameters initially evaluated by ANOVA or ANCOVA, pairwise comparisons between the Control and treated groups were made using Dunnett’s test, based on the error mean square in the ANOVA or ANCOVA.
Summary statistics (mean, standard deviation and number of observations) and individual values are presented for weekly body weights and organ weights as a percentage of body weight.The following pairwise comparisons were performed:- Control vs Low Dose- Control vs Intermediate Dose- Control vs High Dose-

CLH REPORT FOR SEDAXANE
308
Histological incidence data was analysed using Fisher’s Exact Probability Test. No histological findings with multiple severities were noted, therefore no analysis was conducted.
All statistical tests were two-sided and performed at the 5% and 1% significance levels using in-house software. Males and females were analysed separately.
Observations: All animals were checked early morning and towards the end of each working day for viability. Once each week all animals received a detailed clinical examination, including appearance, movement and behaviour patterns, skin and hair condition, eyes and mucous membranes, respiration and excreta.
Bodyweight: Body weights were recorded once each week commencing one week prior to treatment up until the end of the treatment period.
Food consumption and test substance intake: The quantity of food consumed by each cage was measured and recorded once each week commencing one week prior to the start of treatment up until the end of the treatment period.
The amount of test item ingested was calculated at regular intervals during treatment using the following formula:Achieved intake (mg/kg/day) = Concentration (ppm) x Food Consumption (g/day)
Mid-point Body Weight (g)
Concentration in the diet (ppm) was the nominal concentration. For reporting purposes the results are shown as mg/kg/day.
Food Utilisation: Food utilisation was calculated for weeks 1-4, 5-8, 9-13 and 1-13 according to the following formula:(Cage mean weight gain x 100) / cage total food consumption
Reported values show the amount of weight gained (g) for every 100g of food consumed.
Water consumption: Water consumption was qualitatively measured by visual inspection on a weekly basis commencing one week prior to treatment up until the end of the treatment period.
Haematology and clinical chemistry: Blood samples for haematology and clinical chemistry were obtained in a random order from all animals via the orbital sinus under isoflurane anaesthesia, prior to terminal kill. Animals were not deprived of food or water overnight.
Approximately 0.35 mL of whole blood was collected into tubes containing EDTA for haematology investigations.
As much whole blood as possible was collected into tubes containing lithium heparin, for clinical chemistry investigations.
The parameters examined for haematology and clinical chemistry were as follows:Haematology:
Haemoglobin mean cell haemoglobin concentrationHaematocrit platelet countred blood cell count total white cell countmean cell volume differential white cell countmean cell haemoglobinReticulocytes
Clinical chemistry:

CLH REPORT FOR SEDAXANE
309
Urea alkaline phosphatase activityCreatinine aspartate aminotransferase activityGlucose alanine aminotransferase activityAlbumin gamma-glutamyl transferase activitytotal protein glutamate dehydrogenaseglobulin –derived CalciumA/G ratio – derived by calculation phosphorus (as phosphate)Cholesterol SodiumTriglycerides Potassiumtotal bilirubin Chloridecreatine kinase activity
A blood film smear was made from all EDTA haematology samples and stained for possible examination. Femoral bone marrow smears were also taken and stored for possible examination. However, blood and bone marrow smears were not examined, as haematological findings indicated that evaluation would not yield any further information.
Investigations post mortem: Macroscopic examination: All animals were examined post mortem. This involved an external observation and an internal examination of all organs and structures.
Organ weights: From all animals surviving to scheduled termination, the following organs were removed, trimmed free of extraneous tissue and weighed:
adrenal glands OvariesBrain SpleenEpididymides TestesHeart ThymusKidneys uterus (with cervix)liver + gall bladder
Paired organs were weighed separately and the sum of the individual organs used for reporting purposes.
Tissue submission: The following tissues were examined in situ, removed and examined and fixed in an appropriate fixative:
gross lesions including masses ovary adrenal gland oviduct aorta Peyer’s patchesbrain (forebrain, midbrain and cerebellum and pons) Pancreasbone marrow (femur) parathyroid glandcaecum Pharynxcolon pituitary glandduodenum preputial/clitoral glandepididymis prostate glandeyes (retina, optic nerve) Rectumfemur (including stifle joint) salivary glandHarderian gland seminal vesicleheart spinal cord (cervical, thoracic, lumbar)ileum Skinjejunum Spleen

CLH REPORT FOR SEDAXANE
310
kidney SternumLarynx Stomachliver + gall bladder Testislung Thymuslymph node - mesenteric thyroid glandmammary gland (females only) Tracheanerve - sciatic urinary bladdernasal cavity uterus (with cervix)Oesophagus voluntary muscle (thigh)
Microscopic examination: All processed tissues were examined by light microscopy.
RESULTS AND DISCUSSIONMortality: There were no premature decedents during the conduct of this study.
Clinical observations: There were no clinical signs observed that were considered to be attributable to treatment with Sedaxane.
Bodyweight and weight gain: Males treated at 7000 ppm were generally noted to have a reduced body weight throughout the treatment period. This was accompanied by statistically significantly lower cumulative body weight gain throughout the treatment period when compared to control.Males treated at 500 and 3500 ppm were noted to have a numerically lower body weight and body weight gain when compared to their Control. However, differences were considered not to be treatment related due to the lack of statistical significance and as treated group mean values were within the range of historical control means, whilst control group means were high compared to historical control.
There were no other differences in body weight or body weight gain in females that could be attributed unequivocally to treatment.
Table 3.12.1.5-2: Intergroup comparison of bodyweight (week 13) and bodyweight gain (weeks 0-13)
Dietary Concentration of SYN524464 (ppm)Males Females
week 0 500 3500 7000 0 500 3500 7000
13 50.4 47.0 46.5 44.8 33.5 31.9 30.2 35.70-13 16.7 14.3 14.5 11.4* 9.1 7.8 7.0 11.8
* Statistically significant difference from control group mean, p<0.05 (Dunnett’s test, 2-sided
Food consumption and compound intake: Food consumption values in all treated groups were similar to respective control groups throughout the study for both males and females.
Dose rates (based on nominal dietary levels of SYN524464 were calculated in terms of mg SYN524464/kg body weight. Mean values are shown below:
Table 3.12.1.5-3: Mean Dose Received (mg/kg/day)SYN524464 (ppm) 500 3500 7000
Males 80 566 1167
Females 112 810 1455
Food utilisation: Males treated at 7000 ppm had lower food utilisation over the 13 weeks of treatment.

CLH REPORT FOR SEDAXANE
311
There were no other differences in food utilisation in any group that were considered to be related to treatment with SYN524464. Food utilisation in females receiving 7000 ppm was higher than control during Weeks 1-4 and 5-8 (Statistically significant). In the absence of an effect on overall food utilization this is considered to be incidental.
Water consumption: Visual inspection indicated no observable differences between groups throughout the treatment period.
Haematology: There were no effects on haematology parameters that reflected an effect of treatment with SYN524464.
Statistically significantly lower white blood cell and lymphocyte counts were noted in all male treated groups. However, the control value for lymphocytes was considered to be elevated when compared to the historical mean (ca 5.00) and in the absence of any dose response relationship these differences are considered to be incidental to treatment.
Blood clinical chemistry: A dose related reduction in alkaline phosphatase was noted in males at 3500 and 7000 ppm. Total bilirubin was also lower in males at 7000 ppm. Similar differences were not seen in the females.
There were no other treatment related differences in clinical chemistry. The only other statistically significant difference from controls was a higher total protein in 500 ppm males only. This isolated finding at the low dose level was considered incidental to treatment.
Table 3.12.1.5-4: Intergroup comparison of selected clinical chemistry parametersDietary Concentration of SYN524464 (ppm)
Males Females
Parameter 0 500 3500 7000 0 500 3500 7000
Alkaline phosphatase 62 52 47* 44** 62 60 56 56Total bilirubin 3.6 3.7 2.9 2.1** 2.4 2.4 2.8 2.4
* Statistically significant difference from control group mean, p<0.05 (Dunnett’s test, 2-sided)** Statistically significant difference from control group mean, p<0.01 (Dunnett’s test, 2-sided)
Sacrifice and pathology: Organ weights: Testes weights (absolute and/or adjusted) and liver weights (adjusted only) in all male treated groups were higher when compared to control. Due to the modest size of the differences and the lack of any associated pathological findings, these organ weight differences are considered to be toxicologically significant only at the high dose level
Females treated at 7000 ppm had slight lower adjusted kidney and heart weight when compared to control. However, due to the small magnitude of the difference and the absence of histological findings, these differences were considered not to be of toxicological significance.
The only other statistically significant difference from control in organ weights was a lower absolute and adjusted adrenal weight in 500 ppm males, but due to the small magnitude of the difference and the lack of a dose response, this is not a treatment-related effect.

CLH REPORT FOR SEDAXANE
312
Table 3.12.1.5-5: Intergroup comparison of selected organ weights (absolute and adjusted)Dietary Concentration of SYN524464 (ppm)
Males Females
Organ 0 500 3500 7000 0 500 3500 7000
Liver (g) 2.24 2.28 2.26 2.49 1.71 1.69 1.66 2.02Liver – adjusted (g) 2.05 2.29* 2.30* 2.61** 1.69 1.73 1.80 1.85
Testis (g) 0.25 0.27 0.29 0.31** - - - -Testis - adjusted 0.25 0.27 0.29* 0.31** - - - -
* Statistically significant difference from control group mean, p<0.05 (Dunnett’s test, 2-sided)** Statistically significant difference from control group mean, p<0.01 (Dunnett’s test, 2-sided)
There were a small number of other treatment-related effects in males and females at 7000 ppm and in all male treated groups: at 7000 ppm males had lower alkaline phosphatase, lower total bilirubin, higher liver and testes weights and females had lower kidney and heart weights (adjusted for bodyweight); at 3500 ppm males had lower alkaline phosphatase and higher adjusted liver weight; at 500 ppm males had slightly higher adjusted liver weight. Due to the modest size of the differences and the lack of any associated pathological findings, these clinical chemistry and organ weight differences are considered not to be toxicologically significant.
Macroscopic findings: All necropsy findings were typical of spontaneously arising background findings in mice of this strain and age, on this kind of study at
Microscopic findings: All histology findings were typical of spontaneously arising background findings in mice of this strain and age, on this kind of study at In males and females, inflammatory cell foci and/or tubular cystic hyperplasia were seen in the kidney of control and 7000 ppm treated groups. However, the incidence and severity are reflective of normal spontaneous findings, and they are not related to treatment.
CONCLUSION: Dietary administration of SYN524464 to mice for at least 90 consecutive days resulted in evidence of slight toxicity in males treated at 7000 ppm, involving a decrease in body weight gain and food utilization throughout the study. No toxicologically significant effects were seen at 3500 or 500 ppm in males or in females at any dose level.
Therefore, under the conditions of this study the No Observed Adverse Effect Level (NOAEL) was considered to be 3500 ppm (567mg/kg/d) in male mice due to the decrease in body weight gain, food utilisation and effect on liver and testis. The NOAEL in females was 7000 ppm (1455 mg SYN524464/kg/day), the highest dose tested.
3.12.1.6 Anonymous (2008)Report: Anonymous (2008). SYN524464 – 13-Week Oral (Capsule) Toxicity Study in the Beagle Dog.
Report Number: B18911, issue date 09 December 2008. Unpublished (Syngenta File No. SYN524464_11112)
GUIDELINES: 13-Week Oral (Capsule) Toxicity Study in the Beagle Dog. OECD 409 (1998): OPPTS 870.3150 (1998)
GLP: Signed and dated GLP and Quality Assurance statements were provided.
There were no deviations from the current regulatory guideline considered to compromise the scientific validity of the study.
EXECUTIVE SUMMARY

CLH REPORT FOR SEDAXANE
313
Groups of four male and four female Beagle dogs were dosed orally by capsule with SYN524464 at 0, 50, 150 and 400 mg/kg/day for a period of 13 weeks.
Clinical signs, body weight and food consumption were recorded throughout the study. Ophthalmoscopy and veterinary examinations were performed and blood and urine samples were collected for clinical laboratory investigations at intervals during the study. Following completion of the scheduled treatment period, a detailed necropsy was performed on all animals and various organs were weighed. A full set of tissues and organs were prepared and examined histopathologically.
All animals survived the scheduled treatment period. No significant adverse clinical signs were observed that were considered to be related to treatment with the test item. A slightly higher incidence of vomiting of feed (males and females) and vomiting of mucus (females only) at 400 mg/kg/day. Decreases in food consumption with an associated loss of body weight were observed in females after treatment at 150 mg/kg/day and males and females at 400 mg/kg/day during the first week of the treatment phase. The duration of feed availability was increased from three hours to overnight for all control and treatment groups after the first week of the study, and food intake increased after extension of the feeding time for all control and treatment groups. After week 1, food consumption was consistently lower than the control group only in 400 mg/kg/day females. However, cumulative body weight gain remained statistically significantly lower than control for the remainder of the study in males and females at 400 mg/kg/day. Cumulative body weight gain in females at 150 mg/kg/day was lower than control from day 71 to the end of the study.
The only possible treatment-related difference in clinical biochemistry was lower cholesterol in males at 400 mg/kg/day from week 4.
Lower total leukocyte, lymphocyte and monocyte counts were observed in females at 400 mg/kg/day and 150 mg/kg/day in week 13, plus lower total leukocyte count in males at 400 mg/kg/day in week 13.
There were decreased spleen weights (absolute and relative) in both males and females at 400 mg/kg bw/day.
An increased incidence of thyroid follicular cell hypertrophy was seen in all treated group male dogs and in females at 400 mg/kg/day. The effect was minimal, showed no relationship to dose and was considered unlikely to be adverse.
Treatment-related effects at 150 and 400 mg/kg/day comprised initial body weight loss and lower body weight gain and food consumption, a slightly increased incidence of vomiting, minor changes in haematology and clinical chemistry parameters and minimal thyroid follicular cell hypertrophy. In the absence of a dose response and considering the minimal severity, thyroid follicular hypertrophy at 150 and 400 mg/kg/day is unlikely to be adverse.
The only treatment-related effect at 50 mg/kg/day was minimal thyroid follicular cell hypertrophy in one male dog, which in the absence of any other effect is considered not to be adverse.
The no observed adverse effect level (NOAEL) was considered to be 50 mg/kg/day.

CLH REPORT FOR SEDAXANE
314
MATERIALS AND METHODSMaterials:
Test Material: SYN524464Description: Off-white powderLot/Batch number: SMU6LP006/MILLEDPurity: 95.3% (sum of 83.0% SYN508210 and 12.3% SYN508211)CAS#: 599194-51-1Stability of test compound: Stable under storage conditions. Reanalysis date: January 2011
Test Animals:Species DogStrain Beagle DogAge/weight at dosing 5 – 6 months / 5.1 – 9.3 kgSource
Housing Individual pen or group housing with minimum of 2.0 square meters floor space per dog. Dogs were separated during feeding periods and after dosing to facilitate recording of clinical signs. The animals of each treatment group were housed in adjacent pens.
Pretest period 7 daysDiet 350 g pelleted standard Kliba 3353 dog maintenance diet (Provimi Kliba
AG, 4303 Kaiseraugst / Switzerland). Water Community tap water ad libitum. Environmental conditions Temperature: 20 ± 3 °C
Humidity: 30-70% (values above 70 % during cleaning process possible)Air changes: 10-15/hPhotoperiod: 12 hours light and 12 hours dark
Study Design and Methods:In-life dates: Start: 09 May 2007 End: 22/23 August 2007
Animal assignment and treatment: After arrival the dogs were weighed and the weights were ranked. They were allocated to groups based on a four by four Latin square. The allocation was checked for the presence of litter mates and these were distributed through the groups. The animals received the test item at dose levels of 0, 50, 150 or 400 mg/kg body weight orally by capsule over a period of 13 weeks.
Dose preparation and analysis: No analysis of dose preparations (capsules) was performed as the material was dosed as supplied without correction for purity. The control animals received empty gelatin capsules of the same size and number as those given to the high dosage level animals.
Statistics: Body weights, body weight gain, food consumption, haematology, clinical biochemistry, urinalysis and organ weights were considered by analysis of variance, separately for males and females.
Organ weights were also considered by analysis of covariance on terminal body weight, separately for males and females. Summary data are presented for organ to body weight ratios but these were not analysed statistically as the analysis of covariance provides a better method of allowing for differences in terminal body weights (Shirley, 1977).
Analyses of variance and covariance were carried out using the MIXED procedure in SAS (2004). Differences from control were tested statistically by comparing each treatment group mean with the control group mean using Dunnett’s test, based on the error mean square in the analysis.

CLH REPORT FOR SEDAXANE
315
Observations: Throughout the study including the acclimation period, the animals were examined at least twice daily for viability and clinical signs. During treatment period (except for weeks 3, 4, 5, 6, 10, 12) each animal was examined thoroughly outside the pen.
Bodyweight: The bodyweight of each animal was recorded weekly in the morning.
Food consumption: Food consumption was recorded from each animal daily and reported weekly.
Ophthalmoscopic and veterinary examinations: Each animal was examined pretest and in week 13.
Haematology and clinical chemistry: Blood was collected pre-study and in weeks 1, 4, 8 and 14. The animals were fasted overnight but allowed access to water ad libitum. During week 4 and 8 the animals were not fasted the night before blood sampling in error. The samples were collected early in the working day in a randomized order to reduce biological variation caused by circadian rhythms. Blood samples were drawn from the jugular vein.
The following haematology parameters were determined:
erythrocyte count platelet count hemoglobin concentration reticulocyte counthaematocrit reticulocyte maturity indexmean corpuscular volume total leukocyte countred cell volume distribution width differential leukocyte countmean corpuscular hemoglobin coagulationmean corpuscular hemoglobin concentration thromboplastin timehemoglobin concentration distribution width activated partial thromboplastin time
The following clinical biochemistry parameters were determined:
glucose alkaline phosphatase urea gamma-glutamyl-transferasecreatinine calciumbilirubin, total phosphoruscholesterol, total sodiumtriglycerides potassiumaspartate aminotransferase chloridealanine aminotransferase protein, totalglutamate dehydrogenase albumincreatine kinase globulinlactate dehydrogenase albumin/globulin ratio
Urinalysis: Urine was collected pre-study and in weeks 1, 6 and 14. The animals were fasted overnight but allowed access to water ad libitum. During week 6 the animals were not fasted the night before urine sampling in error. The samples were collected early in the working day to reduce biological variation caused by circadian rhythms. Urine was collected into a specimen vial using a catheter.The following urinalysis parameters were determined:
relative density glucosecolor ketoneappearance urobilinogen pH bilirubinnitrite erythrocytesprotein leukocytes
Investigations post mortem:

CLH REPORT FOR SEDAXANE
316
Macroscopic examination: All animals were examined post mortem. This involved an external observation and an internal examination of all organs and structures.
Organ weights: From all animals surviving to scheduled termination, the following organs were removed, trimmed free of extraneous tissue and weighed:
adrenal gland (l, r) ovaries (l, r)brain (including brainstem) spleen liver testes with epididymides (l, r)kidney (l, r) thyroid gland with parathyroid (l, r)
Tissue submission: The following tissues were examined in situ, removed and examined and fixed in an appropriate fixative:
adrenal glands parathyroid glandaorta Peyer’s patchesbone - femur including articular surface pituitary glandbone marrow - femur, sternum prostate glandbrain (forebrain, upper brain stem, mid brain, medulla oblongata, pons, cerebral and cerebellar cortex)
salivary - mandibular, parotid, sublingual
epididymis sciatic nerveesophagus skeletal muscle - semimembranosus, tibialis
cranialis, vastus medialis and gastrocnemiuseyes (including optic nerve) skin and subcutaneous tissuefemale and male mammary gland area small intestine - duodenum, jejunum, ileum gallbladder spinal cord (cervical (C1), midthoracic (T7) and
lumbar (L7) segments including roots and dorsal root ganglia at lumbar levels)
heart spleenileum stomachjejunum testiskidneys and ureters thymuslarge intestine – cecum, colon, rectum thyroid glandlarynx tongueliver trachealung with bronchi and bronchioles urinary bladderlymph node – retropharyngeal, mesenteric uterus (with cervix and oviducts)nasal cavities (only level 3 of 4) vaginaoro-nasal pharynx - adjacent to hard palate All gross lesionsovariespancreas
Microscopic examination: All processed tissues except for those marked with an asterisk were examined by light microscopy
RESULTS AND DISCUSSIONMortality: All animals survived the scheduled treatment period. Clinical observations: There were no significant adverse clinical signs considered to be related to treatment with the test item.
There was a slightly higher incidence of vomiting of feed (males and females) and vomiting of mucus (females only) at 400 mg/kg/day. Although incidences were higher than historical control ranges they

CLH REPORT FOR SEDAXANE
317
remained sporadic, are common findings in the dog and consequently were considered not to be of toxicological significance.
Food Consumption: Decreases in food consumption were observed in females after treatment at 150 mg/kg/day and in males and females at 400 mg/kg/day during the first week of the treatment phase. The duration of feed availability was increased from three hours to overnight for all control and treated groups after the first week of the study, and food intake increased after extension of the feeding time for all control and treated groups. After week 1, food consumption was consistently lower than control group only in 400 mg/kg/day males and females.
There were no other effects on food intake considered to be related to treatment with the test item.
Bodyweight: Loss of body weight was observed during the first week of treatment in females at 150 mg/kg/day and in males and females at 400 mg/kg/day. Thereafter, mean values indicated a general increase in body weight and body weight gain during the study for all treatment groups. However, cumulative body weight gain was statistically lower than control in males and females at 400 mg/kg/day throughout the study. In addition, females at 150 mg/kg/day had lower cumulative body weight gain compared to controls from day 71 to the end of the study.
Table 3.12.1.6-1: Intergroup comparison of bodyweight gain (selected timepoints)Dose Level of SYN524464 (mg/kg/day)
Males Females
day 0 50 150 400 0 50 150 400
8 0.03 0.11 -0.21 -0.62** 0.09 0.06 -0.30** -0.57**15 0.37 0.28 0.33 -0.17 0.54 0.74 0.43 -0.17**22 0.87 0.52 0.62 0.15** 0.93 0.93 0.64 0.22*64 2.14 1.38 1.51 0.81** 2.07 1.85 1.45 1.01*71 2.40 1.51 1.66 1.02** 2.20 1.90 1.38* 1.07**78 2.60 1.70* 1.66* 0.99** 2.38 2.05 1.43* 1.33**85 2.58 1.66 1.65 1.14** 2.51 1.93 1.35** 1.15**
92/93+ 2.57 2.02 1.73 1.07** 2.56 1.77 1.22** 1.03**
* Statistically significant difference from control group mean, p<0.05 (Dunnett’s test, 2-sided)** Statistically significant difference from control group mean, p<0.01 (Dunnett’s test, 2-sided)+ day 92 (males), day 93 (females)
Table 3.12.1.6-2: Intergroup comparison of bodyweights (selected timepoints)Dose Level of SYN524464 (mg/kg/day)
Males Females
day 0 50 150 400 0 50 150 400
0 7.06 8.27 8.44 8.10 6.11 5.68 5.82 6.191 7.03 8.07 8.26 7.94 6.00 5.60 5.82 6.058 7.06 8.18 8.05 7.32 6.10 5.66 5.53 5.4815 7.40 8.35 8.59 7.77 6.54 6.34 6.25 5.8885 9.61 9.73 9.91 9.08 8.61 7.45 6.97** 7.07*
* Statistically significant difference from control group mean, p<0.05 (Dunnett’s test, 2-sided)** Statistically significant difference from control group mean, p<0.01 (Dunnett’s test, 2-sided)
There were no treatment-related effects on body weight or body weight gain at 50 mg/kg/day.
Ophthalmoscopy: No treatment-related changes were observed during ophthalmoscopic examination.

CLH REPORT FOR SEDAXANE
318
Veterinary Examination: There were no treatment-related effects noted during veterinary examination.
Haematology: A small number of statistically significant differences were seen which were also outside of historical control range and thus are concluded to be possibly treatment-related. These were: lower total leukocyte, lymphocyte and monocyte count in females at 400 and 150 mg/kg/day in week 13; lower total leukocytes in males at 400 mg/kg/day.
Table 3.12.1.6-3: Intergroup comparison of haematology – selected parameters, selected weeks Dose Level of SYN524464 (mg/kg/day)
Males Females
Parameter Wk 0 50 150 400 0 50 150 400
Total leukocyte count (g/L)
Pretest13
11.911.7
12.711.7
12.49.1
11.88.6*
12.713.7
11.411.0
10.59.8*
10.99.2*
Lymphocyte count (g/L)
Pretest13
4.023.39
3.663.06
3.852.67
3.722.57
4.214.02
3.553.24
3.652.75*
3.362.59**
Monocyte count (g/L)
Pretest13
0.7630.520
0.9280.705
0.8780.435
1.0600.548
0.9800.803
0.9150.510
0.7080.440*
0.6230.445*
* Statistically significant difference from control group mean, p<0.05 (Dunnett’s test, 2-sided)** Statistically significant difference from control group mean, p<0.01 (Dunnett’s test, 2-sided) Wk – week number
Clinical biochemistry: The only possible treatment-related difference in clinical biochemistry was lower cholesterol in males at 400 mg/kg/day from week 4.
Table 3.12.1.6-4: Intergroup comparison of clinical biochemistry – selected parameterDose Level of SYN524464 (mg/kg/day)
Males
Parameter Wk 0 50 150 400
Plasma cholesterol (mmol/L) 0 3.64 2.74** 3.26 3.271 2.73 2.11 2.57 2.83
4 3.05 2.31* 2.62 2.41*
8 3.49 2.53** 3.03 2.72*
13 3.43 2.34** 2.93* 2.53**
* Statistically significant difference from control group mean, p<0.05 (Dunett’s test, 2-sided)** Statistically significant difference from control group mean, p<0.01 (Dunnett’s test, 2-sided) Wk – week number
Urinalysis: No changes in urinalysis parameters were observed which were considered to be related to treatment with the test item.
Organ weight :- Not statistically but markedly decreased mean absolute and relative spleen weights were observed in males and females. Although not correlated to histopathological finding, decreased spleen weight was considered to be significant since decreases in leukocyte, lymphocyte and monocyte counts were observed in females at 150 mg/kg bw/day and reductions in lymphocyte counts in males at 400 mg/kg bw/day.
Table 3.12.1.6-5: Selected group mean (±SD) organ weights (% change from controls)Dose (mg/kg bw/day) 0
n = 450
n = 4150
n = 4400
n = 4
Males

CLH REPORT FOR SEDAXANE
319
Terminal BW (g) 9600±1640 10089±1100 9990±577 9008±922 ( 6%)
Abs. Spleen (g) 64.1±26.4 30.3±6.7 48.5±38.3 29.9±8.2( 53%)
Rel. Spleen to BW (%) 0.69±0.31 0.30±0.04 0.50±0.44 0.33±0.07 ( 52%)
Females
Terminal BW (g) 8563±687 7374±426 7044±485 7084±740 ( 17%)
Abs. Spleen (g) 37.7±5.1 44.5±28.8 26.4±11.4 23.9±6.0 ( 37%)
Rel. Spleen to BW (%) 0.44±0.08 0.62±0.43 0.37±0.14 0.34±0.06 ( 23%)
Histopathology: Higher incidences of thyroid follicular cell hypertrophy were seen in all male treatment groups and in females at 400 mg/kg bw/day. This effect was graded as minimal, showed no dose-response relationship and was not observed in the 1 year dog study up to 200 mg/kg bw/day. Therefore, it was considered to be of limited toxicological significance. .
Table 3.12.1.6-6: Intergroup comparison of pathology – thyroid follicular cell hypertrophyDose Level of SYN524464 (mg/kg/day)
Males Females
Parameter 0 50 150 400 0 50 150 400
Thyroid follicular cell hypertrophy GRADE 1 (incidence out of 4 dogs examined)
0 1 2 1 0 0 0 2
CONCLUSION: Treatment-related effects at 150 and 400 mg SYN524464/kg/day were initial body weight loss and lower body weight gain and food consumption, a slightly increased incidence of vomiting, changes in haematology decreased lymphocyte counts from 150 mg/kg bw/day ine females and at 400 mg/kg bw/day in males and decreased plasma cholesterol levels in high dose males. The only treatment-related effect at 50 mg/kg/day was minimal thyroid follicular cell hypertrophy in one male dog, which in the absence of any other effect is considered not to be adverse.
The no observed adverse effect level (NOAEL) was considered to be 50 mg/kg/day.
3.12.1.7 Anonymous (2009)Report: Anonymous (2009). SYN524464 – 52-week oral (capsule) toxicity study in the dog. Laboratory
Report Number: B18900, issue date 25 November 2009. Unpublished. (Syngenta File No. SYN524464_11223)
GUIDELINES: Chronic Toxicity, Dog, 52-Week Oral (Capsule) Toxicity Study: OECD 452 (1981): OPPTS 870.4100 (1998): 88/303/EEC B.30 (1988)
GLP: Signed and dated GLP and Quality Assurance statements were provided.
There were no deviations from the current regulatory guideline considered to compromise the scientific validity of the study.
EXECUTIVE SUMMARY

CLH REPORT FOR SEDAXANE
320
In a chronic toxicity study, SYN524464 was administered to four Beagle dogs/sex/dose orally, by capsule, at dose levels of 0, 15, 50, 200 mg/kg bw/day for a period of up to 52 weeks.
Clinical signs, body weight and food consumption were recorded throughout the study. Ophthalmoscopy and veterinary examinations were performed and blood and urine samples were collected for clinical laboratory investigations at intervals during the study. Following completion of the scheduled treatment period, a detailed necropsy was performed on all animals and selected organs were weighed. A full set of tissues and organs were prepared and examined histopathologically.
All animals survived the scheduled treatment period. No significant adverse clinical signs were observed that were considered to be related to treatment with the test item.
Treatment with SYN524464 at dose levels of 15 and 50 mg/kg/day did not result in any toxicity.
Decreased food consumption with a corresponding loss of body weight or low body weight gain (occasionally statistically significant) was observed throughout the treatment period in the animals dosed at 200 mg/kg/day. Food intake was reduced from the first week of the treatment period. Following extension of the feeding period food intake improved transiently in the males but remained low in the females over the remainder of the treatment period.
Possible treatment-related difference in clinical biochemistry parameters included lower glucose levels and higher alkaline phosphatase in males and females dosed at 200 mg/kg/day. Cholesterol values in males at 200 mg/kg/day were lower than control values (statistically significant in week 26). Phosphorous was lower than control values in males at 200 mg/kg/day (statistically significant in week 13 and week 26).
Mean liver weights, absolute and adjusted for terminal body weight, were increased in males dosed at 200 mg/kg/day. The magnitude of the difference from controls in adjusted liver weight for males (+18%) was similar to the difference for females at 200 mg/kg/day (+21%). Although the female liver weights were not statistically significantly different, this likely reflects a treatment-related effect in both males and females. Decreased spleen weights were observed in males and females. Although the male spleen weights were not statistically significantly different, this likely reflects a treatment-related effect in both males and females. Absolute and relative mean testes weights were lower than controls at 200 mg/kg/day.
Oral administration of SYN524464 for 52 weeks at 200 mg/kg/day resulted in decreased food consumption with corresponding initial body weight loss and low body weight gain, minor changes in clinical biochemistry, decreased testes weights, higher liver weights and lower spleen weights in males and females.
Treatment at 15 or 50 mg/kg/day did not result in any signs of toxicity.
Based on the results of this study, the no observed adverse effect level (NOAEL) was considered to be 50 mg/kg/day.
MATERIALS AND METHODSMaterials:
Test Material: SYN524464Description: Off-white powderLot/Batch number: SMU6LP006/MILLEDPurity: 95.3% (sum of 83.0% SYN508210 and 12.3% SYN508211)Stability of test compound: Stable under storage conditions. Reanalysis date: January 2011
The test substance was weighed directly into gelatin capsules (Torpac Inc, size 11, batches 1980 and 1894). Empty gelatin capsules were administered to the control group.

CLH REPORT FOR SEDAXANE
321
Test Animals:Species DogStrain Beagle DogAge/weight at dosing 6 months / 6.2 – 10.4 kgSource
Housing Solid floor pens, housed individually or in groups of two/group/sex, with minimum of 2.0 square meters floor space per dog. Dogs were separated during the feeding period. A raised bed was available in each pen. Toys were supplied during the exercise period.
Acclimatisation period 2 weeksDiet 350 g/day pelleted standard Kliba 3353 dog maintenance diet (Provimi Kliba
AG, 4303 Kaiseraugst / Switzerland). Water Community tap water ad libitum. Environmental conditions Temperature: 20 ± 3 °C
Humidity: 30-70% (values above 70 % during cleaning process possible and once below 30%)Air changes: 10-15/hPhotoperiod: 12 hours fluorescent light and 12 hours dark
Study Design and Methods:In-life dates: Start: 3 October 2007 End: 16 October 2008
Animal assignment: After arrival the dogs were weighed and the weights ranked. They were allocated to groups based on a four by four Latin square. The allocation was checked for the presence of litter mates which were distributed through the groups. One spare male and female were allocated to group 5 and assigned numbers 33 and 34. After the animal exchange at the end of pre-test the rejected spare animals were removed from the study.
Table 3.12.1.7-1 Study designTest group Dose
(mg/kg/day)Animal Numbers (male) Animal Numbers (female)
Control 0 1 – 4 17 – 20Low 15 5 – 8 21 – 24Mid 50 9 – 12 25 – 28High 200 13 – 16 29 – 32
Dose preparation and analysis: The test item was weighed directly into gelatin capsules. The control animals received empty gelatin capsules of the same size and number as those given to the high dose level animals. No analysis of dose preparations (capsules) was performed as the material was dosed as supplied without correction for purity.
Statistics: Body weights, body weight gain, food consumption, haematology, clinical biochemistry, continuous urinalysis and organ weights were considered by analysis of variance, separately for males and females. Prior to the analysis of variance data for plasma alanine aminotransferase, plasma glutamate dehydrogenase and plasma alkaline phosphatase data were transformed using a natural logarithmic transformation to stabilize the variance.
Organ weights were additionally considered by analysis of covariance using terminal body weight as the covariate, separately for males and females. Summary data are presented for organ to body weight ratios

CLH REPORT FOR SEDAXANE
322
but these were not analysed statistically as the analysis of covariance provides a better method of allowing for differences in terminal body weights (Shirley, 1977)5.
Analyses of variance and covariance were carried out using the MIXED procedure in SAS (2004)6. Differences from control were tested statistically by comparing each treatment group mean with the control group mean using Dunnett’s test7, based on the error mean square in the analysis.
Micropathology data was analysed statistically using a one-side Fishers test (PathData V6.2d1).
Observations: Animals were examined/observed at least twice daily for viability and clinical signs throughout the study including the acclimation period. During the treatment period each animal was examined once weekly thoroughly outside the pen.
Bodyweight: The bodyweight of each dog was recorded at least once weekly during the pretest period, once weekly (in the morning) during the treatment period, and before necropsy.
Food consumption: Food consumption for each animal was recorded daily and reported weekly from commencement of the pretest period until the end of the study.
Ophthalmoscopic and veterinary examinations: Eyes of all animals were examined once pre-test and during week 52. Veterinary examinations were performed once pretest and during week 52.
Haematology and clinical chemistry: Blood and urine was collected pretest and in weeks 13, 26 and 52 from all animals. The animals were fasted overnight but allowed access to water ad libitum. The samples were collected early in the working day in a randomized order to reduce biological variation caused by circadian rhythms. Blood samples were drawn from the jugular vein. The following parameters were examined.
Haematology:haemoglobin concentration platelet countHaematocrit reticulocate counterythrocyte count reticulocyte maturity indexred cell volume distribution width total leukocyte countmean corpuscular volume differential leukocyte countmean corpuscular haemoglobin coagulation:mean corpuscular haemoglobin concentration thromboplastin timehaemoglobin concentration distribution width activated partial thromboplastin time
Clinical chemistry:urea nitrogen alkaline phosphatase activityCreatinine aspartate aminotransferase activityGlucose alanine aminotransferase activityAlbumin gamma-glutamyl transferase activitytotal protein calciumtotal cholesterol phosphorus
5 Shirley E (1977). The analysis of organ weight data. Toxicology 8, p13-22.
6 SAS Institute Inc. SAS/STAT 9.1 User's Guide, Cary, NC: SAS Institute Inc, 2004.7 Dunnett C W (1955). A multiple comparison procedure for comparing several treatments with a control. JASA 50, p1096-1121.

CLH REPORT FOR SEDAXANE
323
Triglycerides sodiumtotal bilirubin potassiumcreatine kinase activity chloridelactate deyhdrogenase chlorideglutamate dehydrogenase globulin
albumin/globulin ratioUrinalysis: Urine was collected into a specimen vial using a catheter. The following parameters were measured:
volume (catheterized sample) glucoseColour ketonesAppearance proteinspecific gravity bilirubinPh urobilinogenNitrite erythrrocytes
leukocytes
Investigations post mortem: At the end of the treatment period all animals were anesthetized by intravenous injection of sodium pentobarbital and terminated by exsanguination.
Macroscopic examination: All animals were examined post mortem. This involved an external observation and an internal examination of all organs and structures.
Organ weights: From all animals surviving to scheduled termination, the following organs were removed, trimmed free of extraneous tissue and weighed. Paired organs were weighed separately and analysed both separately and as a combined weight:
adrenal glands ovariesbrain (including brainstem) spleenEpididymides testesHeart thymusKidneys thyroid glands with parathyroidliver with gallbladder uterus
Tissue submission: The following tissues were examined in situ, removed and examined and fixed in an appropriate fixative:
gross lesions oesophagus adrenal gland ovary aorta oviduct brain (cerebrum, cerebellum, medulla / pons and brainstem) Peyer’s patchesbone marrow (femur, sternum) Pancreascaecum parathyroid glandcolon pharynx*duodenum pituitary glandepididymis prostate glandeyes (retina, optic nerve) rectumfemur (including stifle joint) salivary gland (mandibular, parotid, sublingual)gall bladder skeletal muscle (semimembranosus, tibialis cranialis,
vastus medialis and gastrocnemius

CLH REPORT FOR SEDAXANE
324
heart spinal cord (cervical, thoracic, lumbar)ileum skin and subcutaneous tissuejejunum spleenkidney and ureter sternumlarynx* stomachliver testislung (including bronchi and bronchioles) thymuslymph node – retropharyngeal thyroid glandlymph node - mesenteric tonguemammary gland (females only) tracheanerve - sciatic urinary bladdernose (only level 3 of 4)* uterus (with cervix)
vagina
Microscopic examination: All processed tissues, except for those marked with an asterisk (*), were examined by light microscopy.
RESULTS AND DISCUSSION Mortality: All animals survived the scheduled treatment period.
Clinical observations: The most common findings, loose or watery faeces, were occasionally observed with similar incidences in control and treated groups, and therefore were considered to be unrelated to treatment with the test item. Low incidences of vomiting of mucus or feed, pale or yellow faeces, and faeces containing mucus were recorded in some animals of control and treated groups, and vomiting of the capsule was seen on only one occasion in a single animal. The incidence of all of these signs did not show a dose-related pattern and, therefore, they were not related to treatment.
Sporadic occurrences of nodules on the snout, localized swelling or hair loss on the head, erythema and hair loss on the tail, thickened area on abdomen and crusts and/or wounds on the paw or ear recorded in individual animals were considered to be unrelated to treatment with the test item.
The females were examined regularly during the study from commencement of pretest for signs of estrus, evidence of which was observed in all animals except no. 32 during the study. This observation is consistent with the age of the dogs.
Bodyweight and weight gain: There were no treatment related effects on body weight and body weight gain throughout the treatment period in animals dosed at 15 or 50 mg/kg/day.
Loss of body weight was recorded during the first week of treatment (days 1 - 8) in 1/4 males and 4/4 females dosed at 200 mg/kg/day. After the duration of the daily feeding period was extended on day 11, mean cumulative body weight gain remained statistically significantly lower than control values until approximately day 99 for males and day 197 for females. All animals eventually gained weight over the course of the study, but some individual 200 mg/kg/day males and females had body weights slightly lower than their day 1 weight well into the treatment period. The effect on body weight and cumulative body weight gain was more pronounced in 200 mg/kg/day females than males.

CLH REPORT FOR SEDAXANE
325
Table 3.12.1.7-2: Intergroup comparison of bodyweights (kg) (selected timepoints)Dose level of SYN524464 (mg/kg/day)
Males Females
day 0 15 50 200 0 15 50 200
1 9.25 8.84 9.18 8.96 7.37 7.14 7.75 7.298 9.59 9.26 9.47 8.98 7.56 7.28 7.91 7.0092 10.83 11.02 11.25 9.59 9.01 8.70 9.63 7.40*
365/366 11.50 12.54 12.71 10.54 10.07 10.16 10.98 8.21* Statistically significant difference from control group mean, p<0.05 (Dunnett’s test)
Table 3.12.1.7-3: Intergroup comparison of cumulative bodyweight gain (kg, selected timepoints)
Dose level of SYN524464 (mg/kg/day)Males Females
day 0 15 50 200 0 15 50 200
8 0.34 0.42 0.28 0.02* 0.19 0.15 0.16 -0.29**15 0.34 0.42 0.48 0.17 0.38 0.29 0.32 -0.29**50 1.26 1.62 1.48 0.51** 1.27 1.10 1.33 0.14**92 1.58 2.18 2.06 0.63* 1.64 1.56 1.88 0.11**169 1.67 2.55 2.52 1.26 1.82 2.20 2.64 0.60*239 1.76 3.06 2.96 1.68 2.02 2.26 3.14 0.69
365/366 2.25 3.70 3.53 1.58 2.70 3.02 3.23 0.92* Statistically significant difference from control group mean, p<0.05 (Dunnett’s test)** Statistically significant difference from control group mean, p<0.01 (Dunnett’s test)
Food consumption: Food consumption was unaffected throughout the treatment period in animals dosed at 15 or 50 mg/kg/day.
At 200 mg/kg/day, food intake was statistically significantly lower than control values during the first week of the treatment period in males (-19%) and females (-41%). Following extension of the daily feeding period (day 11), food intake remained lower than control values in both males and females at 200 mg/kg/day, but these animals ate sufficient amounts of food to remain in good clinical condition. Fluctuations in food intake of individual animals of the 200 mg/kg/day dose group occurred throughout the remainder of the treatment period, but the overall pattern of consumption was lower throughout the treatment period when compared to the pretest period or the control group values.

CLH REPORT FOR SEDAXANE
326
Table 3.12.1.7-4: Intergroup comparison of food consumption (g/dog/day) (selected timepoints)Dose level of SYN524464 (mg/kg/day)
Males Females
day 0 15 50 200 0 15 50 200
pretest-6 to 1
348 345 345 350 329 333 317 310
1-8 350 347 350 282* 327 341 328 192**8-15 350 350 350 295 345 349 322 214**92-99 347 345 350 294* 325 333 322 233**
106-113 345 350 349 320 295 347 306 227190-197 344 350 350 326 306 304 296 220*358-365 339 339 350 306 245 298 288 212* Statistically significant difference from control group mean, p<0.05 (Dunnett’s test)** Statistically significant difference from control group mean, p<0.01 (Dunnett’s test)
Ophthalmoscopic examination: There were no treatment-related ophthalmoscopic changes observed.
Veterinary examination: There were no treatment-related effects recorded in the veterinary examination.
Haematology: There were no differences in haematological parameters which were considered to be related to treatment.
Clinical chemistry: Possible treatment-related differences in clinical biochemistry were lower glucose levels and higher alkaline phosphatise in males and females at 200 mg/kg/day and lower cholesterol and phosphorous values in males at 200 mg/kg/day.
There were no other differences in blood clinical chemistry parameters which were considered to be related to treatment.

CLH REPORT FOR SEDAXANE
327
Table 3.12.1.7-5: Intergroup comparison of selected clinical chemistry parametersDose level of SYN524464 (mg/kg/day)
Males Females
Parameter 0 15 50 200 0 15 50 200
Glucose (mmol/L)Pre-test 5.75 6.07 6.11 5.77 6.22 5.95 5.96 5.52*week 13 5.49 5.78 5.76 5.01* 5.82 5.82 5.64 4.98week 26 5.25 5.70 5.57 4.93 5.58 5.55 5.80 5.03week 52 5.71 5.55 5.61 4.90* 5.89 5.89 6.01 5.10*Alkaline
phosphatase (U/L)Pre-test 189 163 214 161 142 175 134 147week 13 112 99 145 155 96 108 86 118week 26 78 77 114 145* 72 79 79 114*week 52 66 81 112 180* 61 86 63 132**
Cholesterol (mmol/L)Pre-test 2.82 2.39 2.75 2.43week 13 3.25 2.62 2.99 2.30week 26 3.31 3.02 3.46 2.46*week 52 3.52 3.27 3.63 2.35
Phosphorus (mmol/L)Pre-test 2.28 2.27 2.28 2.28week 13 1.86 1.72 1.67 1.58*week 26 1.43 1.32 1.24 1.22*week 52 1.28 1.12 1.13 1.10
* Statistically significant difference from control group mean, p<0.05 (Dunnett’s test, 2-sided)** Statistically significant difference from control group mean, p<0.01 (Dunnett’s test, 2-sided)
Urinalysis: There were no differences in urinalysis parameters which were considered to be related to treatment.
Sacrifice and pathology: Organ weights: There were no differences in organ weights which were considered to be related to treatment at 15 or 50 mg/kg/day.
Increased mean liver weights were recorded in males and females at 200 mg/kg/day with statistical significance in the males only. The magnitude of the difference from controls in adjusted liver weight for males (+18%) was similar to the difference for females (+21%) at 200 mg/kg/day. Although the female liver weights were not statistically significantly different, this likely reflects a treatment-related effect in both males and females. No corresponding microscopic findings were observed.
Decreases in mean spleen weights were observed in both sexes at 200 mg/kg bw/day. Although the change in males did not achieve statistical signifance, based on the relatively large magnitude of the change from concurrent controls and a similar effect occurring in females, this observation was considered to be adverse in both sexes.
Testes weights were lower than controls at 200 mg/kg/day. Historical control data from 1991-2007 were included in the study report; however, only data within 5 years of the in-life dates and with the same route of administration (studies 8, 11, 12, 13, 14 and 15 of the HCD) were considered to be most relevant for comparison to concurrent controls. From the 6 selected studies, historical mean absolute testes weights

CLH REPORT FOR SEDAXANE
328
ranged from 15.55-19.86 g. The results observed at 200 mg/kg bw/day are considered to be treatment-related.
Table 3.12.1.7-6: Intergroup comparison of selected organ weightsDose level of SYN524464 (mg/kg/day)
Males Females
Parameter 0 15 50 200 0 15 50 200
Liver weight 356 366 384 416* 325 365 343 338Liver weight
adjusted for body weight
357 362 379 423* 318 356 311 384
Spleen weight 67.7 59.0 78.1 41.8 76.0 52.6 56.1 28.2*Spleen weight
adjusted for body weight
65.9 62.9 82.9 34.9 76.3 52.9 57.5 26.2
Testes weight 16.9 14.4 15.3 13.2*Testes weight
adjusted for body weight
16.9 14.4 15.2 13.3*
* Statistically significant difference from control group mean, p<0.05 (Dunnett’s test)
Microscopic findings: Minimal thyroid follicular cell hypertrophy was recorded in female animals but was unrelated to dose level and not associated with organ weight modifications. Additionally, there was no progression of the minor differences described in an earlier dog study (Anonymous, 2008) when duration of dosing was increased from 13 weeks to 52 weeks, no consistency between the sexes and no dose response. Therefore, these observations are considered unrelated to treatment with SYN524464.
Testis tubular atrophy was described in all groups, including the control, with similar incidence. The two dogs with decreased testes weights also exhibited an increased severity of multi-nucleated spermatid giant cells and tubular atrophy. These two histopathological observations were noted spontaneously in all dose groups (including the concurrent controls) at a similar incidence and severity and as such were not considered to be treatment-related.
Table 3.12.1.7.7: Animals With Microscopic Findings on testes and grade .Dose group 0 15mg/kg 50mg/kg 200 mg/kg Historical data
(6 studies )Number of animals observed 4 4 4 4
Inflammation - 25%Grade 2 - 25%
Grade 3 0%-16.7%
Multinucleated spermatid giant cells
50%Grade 1
25%Grade 2
50%Grade 1
50%Grade 1& 2 0%-33.7%
Tubular atrophy(degeneration and vacuolization)
50%Grade 1& 2
75%Grade 1& 2
50%Grade 1
50%Grade 2 & 4
0%-37.5%(grade 2 to 4)
CONCLUSION:
Treatment at 15 or 50 mg/kg/day did not result in any signs of toxicity.
The no observed adverse effect level (NOAEL) was considered to be 50 mg/kg/day.

CLH REPORT FOR SEDAXANE
329
3.12.1.8 Anonymous (2009c)Report: Anonymous (2009c). SYN524464 - 28-Day Dermal Toxicity (Semi-Occlusive) Study in the
Wistar Rat. Report No. C21075. Issue date 10 December 2009. Unpublished. (Syngenta File No. SYN524464_11235)
GUIDELINES: 28-Day Dermal Toxicity (Semi-Occlusive) Study (Wistar Rat): OECD 410 (1981): U.S. EPA OPPTS 870.3200 (1998): EU Directive 440 / EC, B.9 (2008): JMAFF 12 Nohsan 8147 (2000):
GLP: Signed and dated GLP and Quality Assurance statements were provided.
There were no deviations from the current regulatory guideline considered to compromise the scientific validity of the study.
EXECUTIVE SUMMARYGroups of ten male and ten female HanRcc:WIST (SPF) rats were administered under semi-occlusive conditions dermal doses of 0 (control), 100, 300 or 1000 mg SYN524464/kg bw/day in bi-distilled water for 6 hours per day for 5 days each week over a period of 28 days. The exposure was to an area of skin approximately 25 cm2 in size.
General clinical observations, detailed behavioural observations, body weight measurements and food consumption measurements were made once weekly during the acclimatisation and treatment periods. A functional observational battery (FOB) including grip strength and locomotor activity measurements was conducted during the last week of treatment before the dermal administration for that day. Ophthalmoscopic examinations were performed in all animals during acclimatisation and during week 4 in animals of the control and high dose groups. Clinical laboratory investigations were conducted with blood samples obtained from fasted animals at the end of the treatment period. At necropsy selected organs were weighed and a range of tissues and organs were examined macro- and microscopically.
All animals survived their scheduled study period.
No test item-related effects were recorded at the treated skin sites. General clinical observations, detailed behavioral observations, ophthalmoscopic examination, and FOB investigations including grip strength and locomotor activity measurements revealed no test item-related effects. Food consumption and body weight development were not affected by the treatment with the test item. Clinical laboratory data gave no indication of a test item-related effect in any of the investigated parameters in haematology, clinical chemistry and urinalysis. No treatment related macroscopic findings were present. There were no test item related effects on organ weights. Histopathologic investigation of the treated skin, selected organs and tissue samples revealed no adverse effects from the test item at any dose group in males and females.
Dermal administration of SYN524464 at doses up to 1000 mg/kg/day during 6 hours a day for 5 days each week over four consecutive weeks resulted in no toxicologically significant findings.
Based on the results of this study a no-observed-adverse effect level (NOAEL) was determined to be 1000 mg/kg/day.
MATERIALS AND METHODSMaterials:

CLH REPORT FOR SEDAXANE
330
Test Material: SYN524464Description: Off-white powderLot/Batch number: SMU6LP006/MilledPurity: 95.3% w/w; comprised of
- SYN508210 (trans isomer): 83.0%- SYN508211 (cis isomer): 12.3%
Stability of test compound: Re-analysis date 31 Jan 2011
Vehicle control: bi-distilled water
Test Animals:Species: RatStrain: HanRcc: WIST (SPF)Age/weight at dosing: 7 weeks/males: 154.7 to 176.1 g; females: 124.3 to 144.6 gSource:
Housing: Individually in Makrolon type-3 cagesAcclimatisation period: 7 daysDiet: Pelleted standard Kliba Nafag 3433 rodent maintenance diet ad libitumWater: Community tap water from Itingen ad libitumEnvironmental conditions:
Temperature: 22±3 °CHumidity: 30-70%Air changes: 10-15 air changes per hourPhotoperiod: 12-hour fluorescent light / 12-hour dark cycle, with music during the light period.
Study Design and Methods:In-life dates: Start: 29 December 2008, End: 02 February 2009
Animal assignment: The animals were assigned to each group following a computer-generated random algorithm. The group identification and animal numbers assigned are stated in the table below:
Table 3.12.1.8-1: Study designTest group Test item concentration # male # female
Control 0 mg/kg/day 01-10 41-50Low 100 mg/kg/day 11-20 51-60Mid 300 mg/kg/day 21-30 61-70High 1000 mg/kg/day 31-40 71-80
Preparation and treatment of animal skin: Shortly before the first application and at least once weekly thereafter, the fur of each test animal was clipped from the dorsal area of the trunk over an area of at least 10% of the body surface, exposing an area of approximately 25 cm². The application was semi-occlusive for 6 hours a day for a total of 5 days each week.
After each 6 hour exposure period, the dressing and gauze patch were removed carefully and the treated area was gently rinsed with lukewarm tap water and the skin was dried with a disposable towel.Rats in the control group were exposed to the vehicle bi-distilled water using the same procedure as described for the treated rats.
Statistics: The following statistical approaches were used in this study: All analyses were two-tailed for significance levels of 5% and 1%. All means were presented with standard deviations.

CLH REPORT FOR SEDAXANE
331
If the variances were clearly heterogeneous, appropriate transformations (e.g. log, square root, double arcsine) have been used in an attempt to stabilize the variances.
For continuous data: Body weights, cumulative body weight gain, food consumption, clinical pathology values (hematology, clinical chemistry, and quantitative urinalysis parameters), quantitative FOB measurements (grip strength), motor activity data at each measurement interval and overall activity, and absolute organ weights were analysed initially by a one-way analysis of variance (ANOVA).
Organ weights were analysed by analysis of covariance (ANCOVA) on final body weight. Summary values of organ to body weight ratios are presented but these have not been analysed statistically.
For all of the parameters evaluated initially by ANOVA or ANCOVA, Dunnett’s test were used to compare the control and treated groups, based on the error mean square in the ANOVA or ANCOVA. The Dunnett’s test was performed for all continuous data parameters, regardless of whether the initial ANOVA or ANCOVA was statistically significant.
Parameters that yield discontinuous or descriptive data were analysed by Fisher’s Exact Test. Ophthalmoscopy, macropathology and micropathology incidence data were analysed using Fisher’s Exact Test. Findings with multiple severities were analysed using a Mann-Whitney U-test.
For qualitative data (e.g. possible values of 0, 1, 2 or present/absent): General clinical signs, detailed clinical observations and qualitative functional observational battery parameters have been presented as summary data, but were not analysed statistically.
Observations: Animals were observed daily for signs of mortality, general signs of toxicity, and the presence of dermal irritation. The animals were examined for signs of local skin irritation approximately 1 hour after removing the gauze patches and were evaluated using the Draize method. Weekly FOB evaluation including grip strength and locomotor activity were performed. An ophthalmoscopic examination was performed during acclimatisation and week 4. Clinical laboratory investigations were performed from blood samples collected after 4 weeks.
Bodyweight: Animals were weighed prior to initiation of the study and at the beginning of each study week.
Food consumption: Food consumption for each animal was determined weekly during acclimatisation and treatment periods.
Ophthalmoscopic examination: Eyes were examined in all animals during acclimatisation. During week 4, animals of the control and high concentration groups were examined before treatment was applied for that day.
Haematology and clinical chemistry: Blood samples were drawn from the retro-orbital plexus from all animals, in a random order, under light isoflurane anesthesia. The animals were fasted for approximately 18 hours before blood sampling but allowed access to water ad libitum. The samples were collected early in the working day to reduce biological variation caused by circadian rhythms. Urine was collected from all animals during the 18 hours fasting period into a specimen vial, using a metabolism cage.
The following parameters were examined:
Haematology:Haemoglobin reticulocyte countHaematocrit reticulocytec maturity index (low, medium, high fluorescence)red blood cell count total white cell countmean corpuscular volume differential white cell count:red cell volume distribution width neutrophils, eosinophils, basophils, lymphocytes,mean corpuscular haemoglobin monocytes, large unstained cellsmean cell haemoglobin concentration platelet count

CLH REPORT FOR SEDAXANE
332
haemoglobin concentration distribution width methemoglobin prothrombin time activated partial thromboplastin time
Clinical chemistry:Urea alkaline phosphatase activityCreatinine aspartate aminotransferase activityGlucose alanine aminotransferase activityAlbumin gamma-glutamyl transferase activitytotal protein calciumCholesterol phosphorus (as phosphate)Triglycerides sodiumtotal bilirubin potassiumcreatine kinase activity chloridelactate dehydrogenase activity globulinglutamate dehydrogenase activity albumin/globulin ratio
Urinalysis:relative density glucoseurine volume (18 hours) ketoneColor urobilinogen Appearance bilirubinPh erythrocytesnitrite leukocytes Protein
Investigations post mortem: All animals were weighed and necropsied in a random order. All animals surviving to the end of the observation period were anesthetized by intraperitoneal injection of pentobarbitone and terminated by exsanguination.
Macroscopic examination: All animals were examined post mortem. This involved an external observation and an internal examination of all organs and structures.
Organ weights: From all animals surviving to scheduled termination, the following organs were removed, trimmed free of extraneous tissue and weighed (Paired organs were weighed together):
adrenal glands liverBrain ovariesEpididymides spleenHeart testesKidneys thymus
Tissue submission: The following tissues were examined in situ, removed, fixed in an appropriate fixative and processed for histopathologic examination:
gross lesions nasal cavityadrenal glands ovariesaorta Peyer’s patchesbrain (cerebrum, cerebellum and brainstem) pancreasbone marrow (femur) parathyroid glandcaecum pharynxcolon pituitary glandduodenum prostate gland

CLH REPORT FOR SEDAXANE
333
epididymides (fixed in Bouin’s solution) rectumEsophagus salivary glandeyes (retina, optic nerve) (fixed in Davidson’s solution)
seminal vesicle
femur (including stifle joint) skeletal muscleharderian gland (fixed in Davidson’s solution) spinal cord (cervical, thoracic, lumbar)heart skin (treated and untreated)ileum spleenjejunum sternumkidneys stomachlacrimal gland, exorbital testes (fixed in Bouin’s solution)Larynx thymusliver thyroid glandlungs tonguelymph node – mandibular trachealymph node - mesenteric urinary bladderlymph node –popliteal uterus (with cervix)mammary gland (females only) vaginanerve - sciatic
Microscopic examination: All processed tissues were examined by light microscopy from the control and high-dose group.
As there were no test item-related morphologic changes detected in organs of any high-dose animal, those same organs from the mid- and low-dose group were not examined.
RESULTS AND DISCUSSION Mortality: All animals survived their scheduled study period.
Clinical observations: No test item-related effects were recorded at the treated skin sites. No treatment-related clinical signs were observed.
Functional Observational Battery: No treatment-related effects on behavior were observed in the weekly detailed clinical observations. Functional observation battery investigations revealed no test item-related effects. Fore- and hind limbs grip strength measurements were not affected by treatment, and no test item related effects on locomotor activity were detected.
Bodyweight and weight gain: No treatment-related effects were noted on body weight or bodyweight gain.
Food consumption: There were no treatment-related effects on food consumption.
Ophthalmoscopic examination: No treatment-related changes to the eyes were observed.
Haematology: No changes were noted in any of the hematology parameters examined that were attributable to treatment.
Blood clinical chemistry: No changes were noted in any of the clinical biochemistry parameters examined that were attributable to treatment.
Urinalysis: No changes were noted in any of the urinalysis parameters examined that were attributable to treatment.

CLH REPORT FOR SEDAXANE
334
Sacrifice and pathology: Organ weights: Organ weights were not adversely affected by treatment with the test item.
Adjusted liver weights in test item-treated females were statistically significantly higher than control values by 7.6%, 8.7% and 8.8% in the 100, 300 and 1000 mg/kg/day treatment groups (p<0.01), respectively. However, the absolute liver weights were not significantly different from controls in any of the dose groups. Comparison to historic control data indicates that the absolute liver weights for treated groups (6.76 - 7.54 g) were within the typical control range (4.57 - 8.24 g; mean 6.71 g), and the organ to BW ratio (%) values for treated groups (3.47 - 3.55%) were also within the typical control range (2.93 - 3.86%; mean 3.25%). Considering the lack of a clear dose response, lack of any differences in males, and the absence of any related microscopical changes in the liver, this finding was a reflection of normal variability and did not represent an effect of treatment.
Table 3.12.1.8-2: Intergroup comparison of selected organ weightsDose level of SYN524464 (mg/kg/day)
Males Females
Parameter 0 100 300 1000 0 100 300 1000
Terminal body weight (g)
288.4 279.8 294.4 276.1 207.0 194.6 212.5 209.6
Liver weight (g) 8.72 8.72 8.68 8.46 6.75 6.76 7.54 7.43Liver weight
adjusted for body weight (g)
8.62 8.85 8.42 8.69 6.70 7.21** 7.28** 7.29**
Liver to body weight ratio (%)
3.03 3.12 2.95 3.06 3.25 3.47 3.55 3.55
** Statistically significant difference from control group mean, p<0.01 (Dunnett’s test) Liver to body weight ratios (%) were not analysed statistically.
Macroscopic findings: All lesions recorded during the macroscopic observation were deemed to be unrelated to treatment and were within the range of background alterations that may be recorded in this type of study, and in rats of this strain and age.
Microscopic findings: There were no microscopic findings present in rats treated with Sedaxane that could be considered to represent a test item-related effect.
CONCLUSION: Dermal administration of SYN524464 to Wistar rats at doses of 100, 300 and 1000 mg/kg/day for 6 hours a day for 5 days each week over a period of 28 days resulted in no toxicologically significant findings.
Based on the results of this study a no-observed-adverse effect level (NOAEL) was determined at 1000 mg/kg/day.
3.12.2 Human dataNo relevant studies.
3.12.3 Other data
3.12.3.1 Anonymous (2010) Final repot amendment 2, Anonymous (2013)See Section 3.10.1.1

CLH REPORT FOR SEDAXANE
335
3.12.3.2 Anonymous (2009)
See section 3.10.1.2
3.12.3.3 Anonymous (2010)See section 3.10.1.3
3.13 Aspiration hazard
3.13.1 Animal dataNo relevant studies.
3.13.2 Human dataNo relevant studies.
3.13.3 Other dataNo relevant studies.
4 ENVIRONMENTAL HAZARDSStudies on the environmental properties of sedaxane have been previously evaluated in the framework of approval of sedaxane at EU level and therefore have been included in the DAR of sedaxane (June, 2012). No new studies have been submitted. The summary of the different studies which were all considered acceptable is presented below.
Either indicated otherwise, the following ecotoxicological studies have been previously evaluated in the framework of approval of sedaxane at EU level and are considered fully reliable.
4.1 Degradation4.1.1 Ready biodegradability (screening studies)4.1.1.1 Seyfried (2007)
Report: Seyfried B, 2007, SYN524464 - Ready biodegradability in a manometric respirometry test. Report Number B27887. 11 December 2007. RCC Ltd, Itingen, Switzerland. (Syngenta File No. SYN524464/0052)
Guidelines : OECD Guideline for Testing of Chemicals No. 301 F, Ready Biodegradability: Manometric Respirometry
Test, 1992: EU Commission Directive 92/69 EEC, C.4-D, Manometric Respirometry Test, 1992.
EU Commission Directive 92/69 EEC, C.4-D, Manometric Respirometry Test, 1992.
Deviations: no
Dates of experimental work: Start 13 August, 2007 End 13 September, 2007.
GLP: Yes
EXECUTIVE SUMMARY

CLH REPORT FOR SEDAXANE
336
The ready biodegradability of sedaxane was determined by observing the BOD (biochemical oxygen demand) using manometric methods. An inoculum control and a procedure control as well as abiotic and toxicity controls were incubated for 28 days. Aerobic activated sludge was used as the inoculum. As a procedure control, the reference item sodium benzoate was tested. The toxicity control contained both test material and the reference item sodium benzoate. The abiotic control contained test material and mercury dichloride. The test material sedaxane was found not to be biodegradable under the conditions of the test within 28 days
MATERIALS AND METHODS
Materials:
Test Material SedaxaneDescription: Off-white powderLot/Batch #: SMU6LP006/MILLEDPurity 95.3%Expiry: Reanalysis date - January 2011Density: Not statedTreatments
Test concentrations: 101 mg ai/L (corresponding to a theoretical oxygen demand of 189 mg O2)
Positive controls: sodium benzoate: 100 mg/L (corresponding to a theoretical oxygen demand of 167 mg O2)
Toxicity control:test material: 101 mg ai/L and reference item sodium benzoate: 100 mg/L (corresponding to a total theoretical oxygen demand of 356 mg O2)
Abiotic control: 100 mg ai/L test item (no activated sludge added)Analysis of test concentrations: No
Test system Aerobic activated sludge microorganisms
Source: Wastewater treatment plant treating predominantly domestic wastewater (ARA Ergolz II, Füllinsdorf, Switzerland)
Concentration: 30 mg dry material per literTest design
Test vessels: 500 mL glass Erlenmeyer flasks
Incubator: SAPROMAT D12 Manometric respirometer (Voith GmbH, Heidenheim, Germany)
Duration: 28 daysEnvironmental conditionsTest temperature: 22°C, maintained with a built-in thermostat and checked once per week
pH:Start of the test: 7.3 – 7.4End of the test (Day 28): 7.2 – 7.6
Light conditions: Darkness

CLH REPORT FOR SEDAXANE
337
Study Design and Methods
The test flasks were continuously stirred and incubated in a manometric respirometer. Oxygen consumption was recorded daily on each working day. The biodegradation process consumes the dissolved oxygen in the liquid and generates CO2. The CO2 is adsorbed by soda lime and the total pressure decreases in the airtight test flasks. The pressure drop is detected and converted into an electrical signal by means of an electrode type manometer. The consumed oxygen is replaced by electrolytically generated oxygen from a copper sulphate solution.
The test item was weighed and transferred to the test flasks. No emulsifiers or solvents were used. The reference item sodium benzoate was added from a stock solution (positive control). Activated sludge was added to each flask (with the exception of the abiotic control) and the flasks were made up to a volume of 250 mL with test water.
RESULTS AND DISCUSSION
The percentage biodegradation of test material and of the reference item sodium benzoate was calculated based on their biochemical oxygen demand (BOD) and theoretical oxygen demand (ThOD).
The BOD of the test item in the test media was in the normal range found for the inoculum controls throughout the study period; hence the test material was not biodegradable under the conditions of the test within 28 days.
There was no degradation of the abiotic control under the conditions of the test.
In the procedure controls, the reference item was degraded by an average of 90% by day 14, confirming the suitability of the activated sludge.
In the toxicity control, the course of biodegradation over the 28-day exposure period was similar to that in the two procedure controls containing the reference item. Within 14 days of exposure, biodegradation of 43% was observed. Thus, according to the test guidelines, the test item had no inhibitory effect on activated sludge microorganisms because biodegradation in the toxicity control was >25% within 14 days.

CLH REPORT FOR SEDAXANE
338
Table 4.1.1.1-1: Biodegradation of sedaxane and the reference item in a manometric respirometry test over 28 days
Percentage Biodegradation1
Test item Procedure control Toxicity controlFlask No. Flask No. Flask No.
Time(days)
1 2 1 2 1
0 0 0 0 0 01 0 0 14 17 72 - - - - -3 - - - - -4 -1 -1 73 74 365 0 1 77 78 376 -1 1 80 80 387 -1 1 81 83 398 -1 1 83 83 409 - - - - -10 - - - - -11 -1 1 87 88 4212 -1 1 89 89 4213 -1 1 90 90 4214 0 1 90 90 4315 0 2 91 91 4316 - - - - -17 - - - - -18 0 2 92 92 4419 1 2 92 93 4420 1 2 93 93 4521 1 2 93 93 4522 1 2 93 93 4523 - - - - -24 - - - - -25 1 2 93 94 4526 1 2 93 94 4527 1 2 94 95 4528 1 2 94 95 45
Mean (Day 28) 1 94 Not applicable
1 Corrected for the mean oxygen uptake of the inoculum controls--: Not determined
CONCLUSION:

CLH REPORT FOR SEDAXANE
339
The test material sedaxane was found not to be biodegradable under the conditions of the test within 28 days.
(Seyfried B, 2007)
COMMENT : The study is considered acceptable and was already assessed at EU level in the framework of sedaxane EU approval.
4.1.2 BOD5/CODNo relevant studies.
4.1.3 Aquatic simulation tests4.1.3.1 Nicollier (2007)Report: Nicollier. G 2007, SYN524464 – Hydrolysis of [Phenyl-U-14C]-labelled Material under Laboratory
Conditions. Report Number T014707-05-REG. 2007. Syngenta Crop Protection, Global Environmental Fate and Exposure, Ecochemistry, CH-4002 Basel, Switzerland. (Syngenta File No. SYN524464/0032)
Guidelines:
European Community Commission Directive 94/37/EC of July 22, 1994 and 95/36/EC of July 14, 1995 both amending Council Directive 91/414/EEC: Annex I: 2.9.1 Hydrolysis rate and Annex II: 7.2.1.1 Hydrolytic degradation.
OECD Guidelines for the Testing of Chemicals, Guideline 111: Hydrolysis as a function of pH (adopted 13th May 2004).
US EPA, Subdivision N, §161-1: Hydrolysis Studies
Dates of experimental work: 2007
Deviations: no
GLP: Yes
EXECUTIVE SUMMARY
The hydrolysis of sedaxane was studied at 50°C for up to 5 days in sterile aqueous solutions buffered at pH 4, pH 5, pH 7 and pH 9 in the dark (preliminary test). Subsequently hydrolysis was studied at 25°C for up to 30 days in sterile aqueous solutions buffered at pH 5, pH 7 and pH 9 in the dark (confirmatory test). The nominal concentration of sedaxane was 0.0017 mg/mL for all pH values tested. In each test, duplicate samples were taken for analysis at 5 (preliminary test) or 3 intervals (confirmatory test) during incubation. For the preliminary test at 50 C, the mean recoveries of radioactivity ranged from 96.1% to 110.9% AR for all pH values. For the confirmatory test at 25°C, the corresponding range was 95.9% to 109.7% AR. Sedaxane was shown to be stable to hydrolysis at all four pH values. Less than 10% hydrolysis of sedaxane was observed for all four pH values after 5 days at 50°C (which equates to a DT50 >1 year at 25 C). Two minor degradates were formed, not exceeding 5.4% and 2.4% AR at any time point throughout the preliminary or confirmatory tests.
MATERIALS AND METHODS

CLH REPORT FOR SEDAXANE
340
Materials:
14C-labelled Test Item:
[phenyl-U-14C]-sedaxane
NN
CH3
HF2C NH
O *
Lot/Batch #: BPM-XXXII-33Specific activity: 2.41 MBq/mgRadiochemical purity: 99.1%Stability in Vehicle Stable since the content of test item in the time 0 samples was >97.9%Application vehicle: AcetonitrileUnlabelled Test Item: Sedaxane mixture of SYN508210 trans isomer and SYN508211 cis isomer
Chemical Name (IUPAC):
Trans isomer:3-(Difluoromethyl-1-methyl-1H-pyrazole-4-carboxylic acid-2-bicyclopropyl-2-yl-phenyl)-amide, relative stereochemistryCis isomer: 3-(Difluoromethyl-1-methyl-1H-pyrazole-4-carboxylic acid-2-bicyclopropyl-2-yl-phenyl)-amide, relative stereochemistry
Lot/Batch #: AMS 1238/1Purity: 99.6%Solubility in water: 35 ppm (pH 7, 25°C)
Properties of buffers:
Buffer Concentration[mol/L]
Description
pH 4 0.01
Citrate buffer: in 1 L Tritisol-buffer (Merck) are 0.0559 mole citric acid, 0.0439 mole hydrogen chloride and 0.1120 mole sodium hydroxide. An aliquot of the Tritisol-buffer (25 ml) was transferred to volumetric flask (250 ml) and brought to volume with water.
pH 5 0.01
Acetate: in 1 L acetate buffer (Fluka) are 0.825 mol acetic acid and 1.795 mole sodium acetate. An aliquot of the acetate-buffer (3.8 ml) was transferred to volumetric flask (1000 ml) and brought to volume with water then at pH 5 adjusted.
pH 7 0.01
Phosphate buffer (Fluka #73173): in 1 L phosphate buffer are 0.069 mole phosphate buffer: 0.028 mole potassiumdihydrogenphosphate and 0.041 mole disodium hydrogenphosphate. An aliquot of the phosphate-buffer (145 ml) was transferred to volumetric flask (1000 ml) and brought to volume with water.
pH 9 0.01
Borax Buffer: in 1 L borax-buffer are 0.017 mole potassiumdihydrogenphosphate and 0.043 mole disodiumtetraborate. An aliquot of the borax-buffer (167 ml) was transferred to volumetric flask (1000 ml) and brought to volume with water.
Experimental design

CLH REPORT FOR SEDAXANE
341
Parameter DescriptionDuration of the test 50ºC – 5 days, 25ºC – 30 days Test system Aqueous buffers at pH 4, 5, 7, 9 (sterilized by filtration)Test concentration (mg/L) 1.7Control conditions DarknessNumber of replicates 2Test apparatus Borosilicate glass hydrolysis vessels
Identity of solvent Dosed in bufferVolume of test solution used/treatment
100 µLTest material application
Application method 250 µL Hamilton syringeIndication of test material adsorbing to walls of test apparatus No
Experimental conditions Temperature (°C) 49.5 ± 0.85 or 25.3 ± 0.1
Sampling
Parameter Description
50ºC Duplicate samples: 0, 1, 2, 3, 4, 5 DAT. pH measured at each sampling point.
Sampling intervals25ºC Duplicate samples: 0, 15, 30 DAT. pH measured at each
sampling point
Soil sampling procedures Complete treated samples were removed at each sampling time.
Sample storage before analysis All samples were extracted on the day of sampling.
Verification of sterility
Sterility was confirmed at Day 0 and at study termination. Sterility was confirmed using petrislide filled with sterile Total Count Standard Medium 2ml plastic ampoule: Millipore M00000P2T Tryptone Glucose extract.
Verification of pH
pH was measured at all sampling points.4.01 ± 0.04, 5.00 ± 0.04, 6.99 ± 0.04, 8.97 ± 0.04 (preliminary test)5.06 ± 0.05, 7.00 ± 0.04, 9.00 ± 0.05 (confirmatory test)
Description of analytical procedures
The quantity of radioactivity was determined by LSC. HPLC was the primary analytical method used to determine the radiochemical purity of the test item and its amount and any degradation products in the samples.
Selected samples were additionally analyzed by two-dimensional (2D-) TLC in order to confirm the results obtained by HPLC.

CLH REPORT FOR SEDAXANE
342
RESULTS AND DISCUSSION
The total recoveries and distribution of radioactivity in each test set are shown in detail in Table 4.1.1.1-2 and Table 4.1.1.1-3.
Mass Balance
Total radioactivity Sum of activity in the treatment solutions
Recovery at 0 DAT Range 96.1 to 101.0% AR Overall recovery (all samples) Range 96.1 to 110.9% AR
Transformation of Parent Material
Less than 10% hydrolysis of sedaxane was observed for all pH values after 5 days at 50°C. The amount of test item on day 5 represented 98.2%, 99.3%, 100.7% and 98.7% AR at pH 4, 5, 7 and 9, respectively (Table 4.1.1.1-2 ; Table 4.1.1.1-3).
After 30 days of incubation at 25°C, the test item still accounted for 95.9%, 102.8% and 101.3% of AR at pH 5, 7 and 9, respectively, thereby confirming its hydrolytic stability Table 4.1.1.1-4; Table 4.1.1.1-5. Two minor degradates were formed, not exceeding 5.4% and 2.4% AR at any time point throughout the preliminary or confirmatory tests. The hydrolytic half life of sedaxane at 25 C was therefore estimated to be over a year at all four pH values.
Table 4.1.1.1-2: Mass Balance and distribution of radioactivity at 50ºC (preliminary test) individual replicates (values as % of applied)
Incubation time (days)pH Fraction Rep.0 1 2 3 4 5
A 84.9 80.0 84.6 84.2 85.0 87.6B 84.5 88.2 86.3 82.7 90.9 84.5Trans isomer
(SYN508210)mean 84.7 84.2 85.5 83.5 88.0 86.1
A 15.6 12.7 13.1 11.3 14.7 10.9B 12 13.9 12.6 13.2 17.2 13.3Cis isomer
(SYN508211)mean 13.8 13.3 12.9 12.3 15.9 12.1
A 100.5 92.7 97.7 95.5 99.7 98.5B 96.5 102.2 98.9 95.9 108.1 97.8Sedaxane Total
mean 98.5 97.5 98.3 95.7 103.9 98.2A 2.7 4.6 3.5 4.6 5.2 1.7B 2.1 3.8 4.8 4.3 5.7 1.5M1(unknown)
mean 2.4 4.2 4.2 4.5 5.4 1.6A <LD 1.5 <LD <LD <LD <LDB <LD <LD 2.1 2.0 3.0 <LDM2 (unknown)
mean <LD 0.8 1.0 1.0 1.5 <LDA 103.3 98.8 101.2 100.1 104.9 100.2
RecoveryB 98.6 106 105.7 102.1 116.8 99.3
4
Mean ± SD 103.1 ± 4.0
A 84.2 85.7 86.9 84.4 90.0 87.3B 86.9 90.0 91.4 83.3 74.3 84.6Trans Isomer
(SYN508210)mean 85.6 87.9 89.1 83.9 82.2 86.0
5
Cis isomer A 12.5 14.3 12.3 14.1 12.6 12.4

CLH REPORT FOR SEDAXANE
343
Incubation time (days)pH Fraction Rep.0 1 2 3 4 5
B 14.5 14.9 12.9 9.2 14.6 14.2(SYN208211)
mean 13.5 14.6 12.6 11.6 13.6 13.3A 96.7 100 99.1 98.5 102.6 99.7B 101.4 104.9 104.3 92.5 88.9 98.8Sedaxane Total
mean 99.1 102.5 101.7 95.5 95.8 99.3A 1.0 <LD 3.0 5.1 2.7 <LDB 1.3 <LD 1.5 4.3 4.1 1.4M1(unknown)
mean 1.2 <LD 2.3 4.7 3.4 1.4A 0.7 <LD <LD 2.3 2.3 <LDB <LD <LD 2.3 2.4 1.7 0.8M2 (unknown)
mean 0.4 <LD 1.2 2.3 2.0 0.4A 98.4 100 102.2 105.8 107.7 99.7
RecoveryB 102.6 104.9 108.1 99.1 94.6 101.1
Mean ± SD 102.05 ± 1.8LD=limit of detection

CLH REPORT FOR SEDAXANE
344
Table 4.1.1.1-3: Mass Balance and distribution of radioactivity at 50ºC (preliminary test) individual replicates (values as % of applied) (continued)
Incubation time (days)pH Fraction Rep.
0 1 2 3 4 5
A 83.9 82.4 81.5 83 86.1 87.2B 85.9 84.3 85.7 83.5 84.8 88.5Trans Isomer
(SYN508210)mean 84.9 83.4 83.6 83.3 85.5 87.9
A 14.6 13.3 14.5 15.7 14.7 13B 14.1 14.1 15.7 16 15.1 12.7Cis isomer (SYN208211)
mean 14.4 13.7 15.1 15.9 14.9 12.9A 98.5 95.3 96 98.7 100.8 100.2B 100 98.4 101.4 99.5 99.8 101.1Sedaxane Total
mean 99.3 96.9 98.7 99.1 100.3 100.7A 1.7 1.1 1.4 1.3 1.2 1.6B <LD 1.8 2 <LD 1.8 <LDM1(unknown)
mean 0.9 1.5 1.7 0.7 1.5 0.8A <LD 0.5 1.2 <LD 1.5 <LDB <LD 0.4 <LD <LD 1.1 <LDM2(unknown)
mean <LD 0.5 0.6 <LD 1.3 <LDA 100.2 97.2 98.6 99.9 103.5 101.8
RecoveryB 100 100.6 103.3 99.5 102.8 101.1
7
Mean ± SD 100.7 ± 1.5
A 79.6 82.4 84.5 84.6 81.5 84.1B 82.6 82.4 85.4 82.8 83.7 82.5Trans Isomer
(SYN508210)mean 81.1 82.4 85 83.7 82.6 83.3
A 13.5 14 14.6 11.2 15.6 13.7B 14.2 12 13.5 16.4 17.1 17.1Cis isomer (SYN208211)
mean 13.9 13 14.1 13.8 16.4 15.4A 93.1 96.4 99.1 95.8 97.1 97.8B 96.8 94.4 98.9 99.2 100.8 99.6Sedaxane Total
mean 95.0 95.4 99.0 97.5 99.0 98.7A 1 2.4 0.9 2.6 2.1 1.9B 1.2 1.5 2 1.9 1.5 2.7M1(unknown)
mean 1.1 2 1.5 2.3 1.8 2.3A <LD <LD 0.9 <LD 0.7 <LDB <LD <LD <LD <LD <LD <LDM1(unknown)
mean <LD <LD 0.5 <LD 0.4 <LDA 94.1 98.8 100.9 98.3 99.9 99.6
RecoveryB 98 95.9 100.9 101 102.4 102.2
9
Mean ± SD 99.4 ± 2.1LD=limit of detection

CLH REPORT FOR SEDAXANE
345
Table 4.1.1.1-4: Mass Balance and distribution of radioactivity at 25ºC (confirmatory test) individual replicates (values as % of applied)
Incubation time (days)pH Fraction Rep.
0 15 30
A 85.1 82.5 82.8B 85.1 84.3 82.4Trans Isomer
(SYN508210)mean 85.1 83.4 82.6
A 15.2 14.1 14.9B 14.2 14.0 11.7Cis isomer
(SYN208211)mean 14.7 14.1 13.3
A 100.3 96.6 97.7B 99.3 98.3 94.1Sedaxane Total
mean 99.8 97.5 95.9A 1.3 1.4 <LDB 1.9 <LD <LDM1(unknown)
mean 1.6 0.7 <LDA <LD <LD <LDB 0.6 <LD <LDM2(unknown)
mean 0.6 <LD <LDA 101.5 98.0 97.7
RecoveryB 101.8 98.3 94.1
5
Mean ± SD 98.6 ± 2.9
A 85.0 93.6 86.5B 84.8 91.8 89.5Trans Isomer
(SYN508210)mean 84.9 92.7 88.0
A 13.8 16.2 15.7B 14.8 16.4 13.9Cis isomer
(SYN208211)mean 14.3 16.3 14.8
A 98.9 109.8 102.2B 99.6 108.2 103.4Sedaxane Total
mean 99.3 109.0 102.8A <LD <LD <LDB 1.5 1.4 <LDM1(unknown)
mean 0.7 0.7 LDA 98.9 109.8 102.2
RecoveryB 101.2 109.6 103.4
7
Mean ± SD 103.8 ± 5.5LD=limit of detection

CLH REPORT FOR SEDAXANE
346
Table 4.1.1.1-5: Mass Balance and distribution of radioactivity at 25ºC (confirmatory test) individual replicates (values as % of applied) continued
Incubation time (days)pH Fraction Rep.
0 15 30
A 82.2 88.1 88.7B 83.9 84.6 86.6Trans Isomer (SYN508210)
mean 83.1 86.4 87.7A 13.6 14.5 12.5B 13.7 13.2 14.7Cis isomer (SYN208211)
mean 13.7 13.9 13.6A 95.8 102.6 101.2B 97.6 97.8 101.3Sedaxane Total
mean 96.7 100.2 101.3A 2.7 1.4 2.4B 2.1 1.3 2.0M1(unknown)
mean 2.4 1.4 2.2A 98.4 104.0 103.6
RecoveryB 99.7 99.1 103.3
9
Mean ± SD 101.4 ± 2.2
CONCLUSION:
Sedaxane was stable to hydrolysis under acidic, neutral and alkaline conditions.
(Nicollier G, 2007)
COMMENT : The study is considered acceptable ans was already assessed at EU level in the framework of sedaxane EU approval.
4.1.4 Other degradability studies4.1.4.1 Hand and Flemming (2007)Report: Hand L, Fleming E 2007, SYN524464 : Aqueous Photolysis in Sterile Buffer Solution and Sterile
Natural Water, Report Number T014708-05-REG,28 January 2008. Jealott’s Hill International Research Centre, Bracknell, UK (Syngenta File No. SYN524464/0042)
Guidelines: OECD Guidelines for the Testing of Chemicals: Phototransformation of Chemicals in Water-
Direct and Indirect Photolysis (Draft, August 2000).
Japanese Ministry of Agriculture, Forestry and Fisheries, Test Data for Registration of Agricultural Chemicals, 12 Nousan No 8147, Agricultural Production Bureau, November 24, 2000 revised 26th June 2001.
Pesticide Assessment Guidelines, Subdivision N, Chemistry: Environmental Fate, EPA-540/9-82-021, Section 161-2: Photodegradation Studies in Water, U.S. Environmental Protection Agency, October 18, 1982.
Deviations: no
Dates of experimental work: 2007

CLH REPORT FOR SEDAXANE
347
GLP: Yes
EXECUTIVE SUMMARY
The molar absorptivities of both sedaxane and its individual isomeric forms (SYN508210 and SYN508211) were determined by UV/VIS spectroscopy and exceeded the trigger values stated in the test guideline, necessitating the conduct of the direct photolysis test. Then the photolysis of sedaxane was investigated in both sterile pH 7 phosphate buffer (direct photolysis) and sterile natural water (indirect photolysis). 14C-sedaxane (both 14C-phenyl and 14C-pyrazole labelled) was applied, at rates equivalent to ca. 2 µg mL-1, to the aqueous media in individual photolysis vessels. Aliquots (15 mL) were continuously irradiated using light from a suntest xenon arc lamp. The emitted light was filtered to give a spectral distribution close to that of natural sunlight. The samples were maintained at 25±2°C and were irradiated for periods at least the equivalent of 30 days summer sunlight.
In each test, duplicate samples (one 14C-phenyl labelled and one 14C-pyrazole labelled) were taken for analysis up to 7 intervals during irradiation. During irradiation, volatile products were trapped, using a sealed system, in 2M sodium hydroxide solution. Two ‘dark control’ samples were also prepared and maintained at ca. 25°C for the duration of the irradiation.
In the direct photolysis test, the mass balance from the 14C-phenyl labelled irradiated samples ranged from 98.1 - 101.4% AR. The recovery from dark control sample was 110.1%. The mass balance from the 14C-pyrazole labelled irradiated samples ranged from 91.5 - 99.2% AR. The recovery from dark control sample was 95.2%. Trapped volatiles accounted for up 1.8% AR in the 14C-phenyl labelled samples, whilst no significant radioactivity was evolved by the 14C-pyrazole labelled samples. Direct photolysis of sedaxane followed first order kinetics. The quantum yield was calculated as 0.0277 molecules degraded/photon (by comparison of the direct photolysis degradation rate of the test item with that of a p-nitroanisole (PNA) actinometer under the same conditions) and, from this, the DT50 was estimated at 42, 52 and 71 days summer sunlight at 30, 40 and 50°N, respectively. The half-life was also estimated (using the calculation specified in the JMAFF (Japanese Ministry of Agriculture, Forestry, and Fisheries) test guideline as 172 days Tokyo spring sunlight. At the end of the irradiation period 14C-sedaxane represented 57.3% AR. Four discrete metabolites were formed, namely CSAA798670 (representing a maximum of 11.7%AR), CSCC210616 (representing a maximum of 1.4%AR), CSCD668095 (representing a maximum of 5.8%AR) and CSCD668094 (representing a maximum of 5.1%AR). No other component represented greater than 2% AR. No significant degradation was apparent in the ‘dark controls’ indicating that the degradation in irradiated samples was due to photodegradation only.
In the indirect photolysis test, the mass balance from the 14C-phenyl labelled irradiated samples ranged from 94.5 - 107.6%AR. The recovery from dark control sample was 100.1%. The mass balance from the 14C-pyrazole labelled irradiated samples ranged from 98.2 - 105.4%AR. The recovery from dark control sample was 95.3%. Trapped volatiles accounted for up 11.1%AR in the 14C-phenyl labelled samples, whilst no significant radioactivity was evolved by the 14C-pyrazole labelled samples. Of this, 6.6% was characterised as 14CO2, whilst the remaining 4.5% was assumed to be due to one or more other small, volatile molecules.
Indirect photolysis of sedaxane followed first order kinetics with an estimated DT50 of 371.6 hours (15.5 days) continuous irradiation. From this, the DT50 was estimated as 16.3, 16.5 and 17.1 days summer sunlight at 30, 40 and 50°N, respectively (using the calculation specified in the OECD test guideline). The half-life was also estimated (using the calculation specified in the JMAFF test guideline) as 48 days Tokyo spring sunlight. At the end of the irradiation period 14C-sedaxane represented 23.9% AR. Four significant degradates were formed, namely CSAA798670 (representing a maximum of 25.7%AR), CSCC210616 (representing a maximum of 5.4%AR), CSCD668095 (representing a maximum of 15.8%AR) and CSCD668094 (representing a maximum of 14.8%AR). No other component represented greater than 4% AR. No significant degradation was apparent in the ‘dark controls’ indicating that the degradation in irradiated samples was due to photodegradation only.
Both direct and indirect photodegradation of sedaxane were shown to be extensive, with indirect photolysis being approximately 3 times faster than direct photolysis.
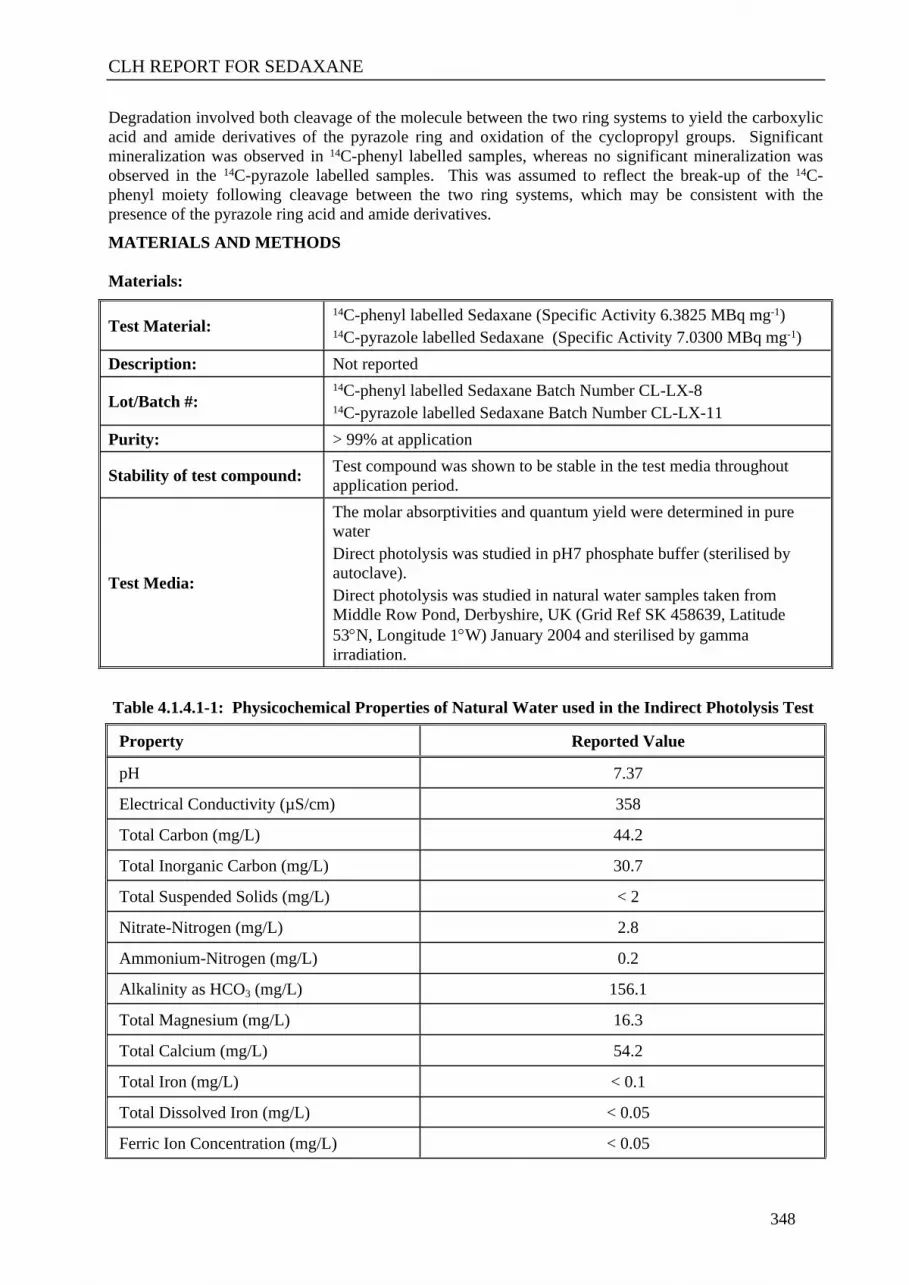
CLH REPORT FOR SEDAXANE
348
Degradation involved both cleavage of the molecule between the two ring systems to yield the carboxylic acid and amide derivatives of the pyrazole ring and oxidation of the cyclopropyl groups. Significant mineralization was observed in 14C-phenyl labelled samples, whereas no significant mineralization was observed in the 14C-pyrazole labelled samples. This was assumed to reflect the break-up of the 14C-phenyl moiety following cleavage between the two ring systems, which may be consistent with the presence of the pyrazole ring acid and amide derivatives.
MATERIALS AND METHODS
Materials:
Test Material:14C-phenyl labelled Sedaxane (Specific Activity 6.3825 MBq mg-1) 14C-pyrazole labelled Sedaxane (Specific Activity 7.0300 MBq mg-1)
Description: Not reported
Lot/Batch #:14C-phenyl labelled Sedaxane Batch Number CL-LX-814C-pyrazole labelled Sedaxane Batch Number CL-LX-11
Purity: > 99% at application
Stability of test compound: Test compound was shown to be stable in the test media throughout application period.
Test Media:
The molar absorptivities and quantum yield were determined in pure waterDirect photolysis was studied in pH7 phosphate buffer (sterilised by autoclave).Direct photolysis was studied in natural water samples taken from Middle Row Pond, Derbyshire, UK (Grid Ref SK 458639, Latitude 53N, Longitude 1W) January 2004 and sterilised by gamma irradiation.
Table 4.1.4.1-1: Physicochemical Properties of Natural Water used in the Indirect Photolysis Test
Property Reported Value
pH 7.37
Electrical Conductivity (µS/cm) 358
Total Carbon (mg/L) 44.2
Total Inorganic Carbon (mg/L) 30.7
Total Suspended Solids (mg/L) < 2
Nitrate-Nitrogen (mg/L) 2.8
Ammonium-Nitrogen (mg/L) 0.2
Alkalinity as HCO3 (mg/L) 156.1
Total Magnesium (mg/L) 16.3
Total Calcium (mg/L) 54.2
Total Iron (mg/L) < 0.1
Total Dissolved Iron (mg/L) < 0.05
Ferric Ion Concentration (mg/L) < 0.05

CLH REPORT FOR SEDAXANE
349
Property Reported Value
Ferrous Ion Concentration (mg/L) < 0.05
Study Design and Methods
The study was performed in four phases, as listed below.
- Determination of the extinction coefficient of sedaxane and its individual isomers (SYN508210 and SYN508211) in ultra-pure water.
- The route and rate of photo-degradation for sedaxane was then determined in pH 7 phosphate buffer solution (direct photolysis).
- The route and rate of photo-degradation for sedaxane was then determined in Middle Row Pond natural water (indirect photolysis).
- Calculation of the quantum yield of sedaxane by comparison of the direct photolysis degradation rate of the test item with that of a chemical actinometer under the same conditions.
Determination of Molar Absorptivity
Solutions of sedaxane (0.00015M), SYN508210 (0.00013M) and SYN508211 (0.00011M) in ultra-pure water were prepared. Aliquots of these were transferred to quartz glass cuvettes with a path length of 1 cm and UV/VIS spectra were obtained between 200 and 800 nm (at 2.5 nm intervals). The molar absorptivity of each compound at each wavelength was then calculated using an equation derived from the Beer-Lambert law.
Direct Photolysis Test14C-Sedaxane (both 14C-phenyl and 14C-pyrazole labelled) was applied to sterilised pH 7 buffer solution at concentration of 2 g mL-1. The treated samples were continuously irradiated using light from a xenon arc lamp, which was filtered to give a spectral distribution close to that of natural sunlight. The samples were maintained at 25ºC 2ºC and irradiated for periods up to 34 days. Duplicate dark control samples (one 14C-phenyl labelled and one 14C-pyrazole labelled) were maintained in the dark at 25ºC 2ºC for a duration equivalent to the maximum irradiation time. Volatile radioactivity was continuously flushed from the irradiated samples (using a peristaltic pump) and collected in separate 2M NaOH traps. The apparatus, test medium and test solution were sterilised at the beginning of the study. The samples were then maintained under sterile conditions and removal of samples for analysis was also conducted under sterile conditions. The sterility of the test medium was confirmed before and after irradiation. The incubation conditions are summarised below.
On 7 occasions after application, duplicate samples (one 14C-phenyl labelled and one 14C-pyrazole labelled) were removed, quantified and analysed by reversed-phase HPLC to determine the levels of sedaxane and its degradates present. At each time-point the sodium hydroxide trapping solutions were also removed for quantification and replaced with fresh solution. The dark control vessels were analysed after 34 days incubation, in the same manner as the irradiated samples.
Table 4.1.4.1-2: Irradiation set up (Direct Photolysis)
Irradiation Artificial Xenon ArcFilter used to exclude wavelength < 290 nm: YesIf artificial irradiation, correlation made to natural sunlight intensity: Yes
Irradiance (W/m2) 26.91 over 300-400 nm
Dark control: Yes (replicate samples, maintained at 252C for 34 days)
Test duration: 34 days (> 30 days at 30N latitude)

CLH REPORT FOR SEDAXANE
350
Irradiation Artificial Xenon ArcSampling intervals: 0, 1, 4, 8, 14, 21, 34 daysReplicates: YesSterilisation of the test system: Yes, by autoclave and rinsing with ethanol:water (70:30)Test temperature: 25 2°C
A mass balance for each sample was determined by summation of the radioactivity recovered in the aqueous sample and the 14CO2 evolved by that sample. These were then averaged for the duplicate samples removed at each sampling interval. The levels of 14C-sedaxane remaining in each sample (from the HPLC analysis) were plotted against time in Microsoft Excel 2000 to determine the degradation rate constant and modelled using a simple first order model within ModelManager version 1.1 (ModelKinetix, UK) to determine the DT50 in days Tokyo spring sunlight.
The quantum yield of sedaxane was determined by comparison of the direct photolysis degradation rate constant with that of a chemical actinometer with a known quantum yield. The actinometer used was a mixture of p-nitroanisole (PNA, 1 x 10⁻⁶ M) and pyridine. This actinometer was irradiated under the same conditions as the test compound and samples were taken regularly for analysis by HPLC to determine its degradation rate. Using the molar absorptivities and degradation rates of the test compound and actinometer, the suntest lamp irradiance and the actinometer quantum yield, the test compound quantum yield was then calculated.
The DT50 for direct photolysis was then calculated in terms of days of summer sunlight at 30, 40 and 50°N using this quantum yield.
Indirect Photolysis Test
This test was conducted in the same manner as the direct photolysis test. The details of the irradiation are given below in the following table.Table 4.1.4.1-3: Irradiation set up (Indirect Photolysis)
Irradiation Artificial Xenon ArcFilter used to exclude wavelength < 290 nm: Yes
If artificial irradiation, correlation made to natural sunlight intensity: Yes
Dark control: Yes (replicate samples, maintained at 252C for 34 days)Test duration: 28 days (ca. 30 days at 30N latitude)Sampling intervals: 0, 1, 4, 8, 14, 21, 28 daysReplicates: YesSterilisation of the test system: Yes, by autoclave and rinsing with ethanol:water (70:30)Test temperature: 25 2°C
The levels of 14C-sedaxane remaining in each sample (from the HPLC analysis) were plotted against time and modelled using a simple first order model within ModelManager version 1.1 (ModelKinetix, UK) to determine the DT50 in days at 30, 40 and 50°N and days Tokyo spring sunlight.
RESULTS AND DISCUSSION
The molar absorptivity for sedaxane and its component isomers (SYN508210 and SYN508211) are summarised below.

CLH REPORT FOR SEDAXANE
351
Table 4.1.4.1-4: Molar Absorptivity for SYN508210, SYN508211 and sedaxane (ε)
SYN508210 SYN508211 Sedaxanenm
A ε (L mol-1 cm-1) A ε
(L mol-1 cm-1) A ε(L mol-1 cm-1)
295.0 0.01785 137.3 0.15270 1388.2 0.0585 389.7297.5 0.00525 40.4 0.12375 1125.0 0.0425 283.3300.0 0.00000 0.0 0.09780 889.1 0.0292 194.7302.5 0.00000 0.0 0.07635 694.1 0.0205 136.3305.0 0.00000 0.0 0.05770 524.5 0.0114 75.7307.5 0.00000 0.0 0.04280 389.1 0.0062 41.3310.0 0.00000 0.0 0.03205 291.4 0.0016 10.7312.5 0.00000 0.0 0.02075 188.6 0.00000 0.0315.0 0.00000 0.0 0.01405 127.7 0.00000 0.0317.5 0.00000 0.0 0.01130 102.7 0.00000 0.0320.0 0.00000 0.0 0.00125 0.0 0.00000 0.0
≥ 322.5 0.00000 0.0 0.00000 0.0 0.00000 0.0
Direct Photolysis Test
The mass balance from the 14C-phenyl labelled irradiated samples ranged from 98.1 - 101.4% AR. The recovery from dark control sample was 110.1%. The mass balance from the 14C-pyrazole labelled irradiated samples ranged from 91.5 - 99.2% AR. The recovery from dark control sample was 95.2%. The mass balance for each sampling point is given in the following table.
Table 4.1.4.1-5: Mass Balance (% of Applied Radioactivity)14C-Phenyl Label 14C-Pyrazole Label
DAT Aqueous Phase
NaOH Trap Total Aqueous
PhaseNaOH Trap Total
0 101.3 0.0 101.3 97.8 0.0 97.81 98.1 0.0 98.1 99.2 0.0 99.24 98.1 0.0 98.1 91.5 0.0 91.58 97.9 0.2 98.1 95.0 0.0 95.014 99.9 0.6 100.5 99.2 0.0 99.221 101.2 0.2 101.4 91.7 0.2 91.934 96.3 1.8 98.1 91.1 0.2 91.3
Dark Control 110.1 NA 110.1 95.6 NA 95.6Overall Mean 100.7 Overall Mean 95.2
Degradation of sedaxane by direct photolysis during the irradiation period was significant, such that the parent compound represented 57.4% AR after 34 days of continuous irradiation. The ratio of the trans and cis isomers changed during irradiation from approximately 6:1 at the beginning to approximately 2:1 after 34 days. Six discrete degradates were observed in the irradiated samples. Two were identified, by co-chromatography with reference standards and LC-MS/MS, as metabolite CSAA798670 (which

CLH REPORT FOR SEDAXANE
352
reached a maximum level of 11.7% AR after 34 days) and metabolite CSCC210616 (which reached a maximum level of 1.4%AR after 34 days).
In total, four unknown degradation products were observed, two of which were identified as metabolite CSCD668095, which reached a maximum of 5.8%AR, and metabolite CSCD668094, which reached a maximum of 5.1% AR. No other degradates were observed at > 5% AR. The level of polar, unretained radioactivity in the 14C-phenyl labelled samples reached a maximum of 5.4% AR after 34 days. This unretained peak was isolated by HPLC and re-analysed using different HPLC conditions. This analysis showed that this peak consisted of a number of minor degradates, none of which represented > 1.3% AR. These data are summarised below.
Table 4.1.4.1-6: Summary of the Characterisation / Identification: Direct Photolysis
DAT Sedaxane CSAA798670 CSCC210616 CSCD668095 CSCD668094 U3 U614C-
PhenylUnretained
14C-PyrazoleUnretained
0 99.6 0.0 0.0 0.0 0.0 0.0 0.0 0.0 0.0
1 98.7 0.0 0.0 0.0 0.0 0.0 0.0 0.0 0.0
4 92.1 3.3 0.5 0.6 0.3 0.0 0.0 0.0 0.0
8 95.1 1.5 0.0 0.2 0.5 0.0 0.0 0.0 0.0
14 84.5 8.9 0.7 2.6 2.3 0.2 0.0 3.2 0.0
21 82.3 6.1 1.4 2.6 3.0 0.6 0.6 1.1 0.4
34 57.4 11.7 1.4 5.8 5.1 1.9 0.9 5.4 0.8
Dark Control 102.9 0.0 0.0 0.0 0.0 0.0 0.0 0.0 0.0
The quantum yield for sedaxane was calculated, by comparison of the degradation rate with that of a chemical actinometer, as 0.0277 molecules degraded/photon. The rate constant for direct photolysis was calculated in terms of days of summer sunlight at 30, 40 and 50°N using the above quantum yield. The half-lives for degradation were 42, 52 and 71 days summer sunlight at 30, 40 and 50°N, respectively. The half-live in days Tokyo spring sunlight was determined by plotting the percentage of applied radioactivity present as parent sedaxane against days of Tokyo spring sunlight and fitting the data to simple first order kinetics using ModelManager version 1.1. The estimated half-life was 172 days Tokyo spring sunlight.
Indirect Photolysis Test
The mass balance from the 14C-phenyl labelled irradiated samples ranged from 94.5 - 107.6% AR. The recovery from dark control sample was 100.1%. The mass balance from the 14C-pyrazole labelled irradiated samples ranged from 98.2 - 105.4% AR. The recovery from dark control sample was 95.3%. The mass balance for each sampling point is given in the following table.
Table 4.1.4.1-7: Mass Balance (% of Applied Radioactivity)14C-Phenyl Label 14C-Pyrazole Label
DAT Aqueous Phase
NaOH Trap Total Aqueous
PhaseNaOH Trap Total
0 103.4 0.0 103.4 103.6 0.0 103.61 101.6 0.0 101.6 101.8 0.0 101.84 100.9 0.8 101.7 103.2 0.1 103.38 99.0 2.1 101.1 102.1 0.1 102.214 90.4 4.1 94.5 98.0 0.2 98.2

CLH REPORT FOR SEDAXANE
353
14C-Phenyl Label 14C-Pyrazole LabelDAT Aqueous
PhaseNaOH Trap Total Aqueous
PhaseNaOH Trap Total
21 93.7 2.4 96.1 105.1 0.3 105.428 96.5 11.1 107.6 98.6 0.8 99.4
Dark Control 100.1 0.0 100.1 95.3 0.0 95.3Overall Mean 100.8 Overall Mean 101.2
Degradation of sedaxane during the irradiation period was rapid, such that the parent compound represented only 23.9% AR after 28 days of continuous irradiation. The ratio of the trans and cis isomers changed during irradiation from approximately 6:1 at the beginning to approximately 1:1 after 28 days. Seven discrete degradates were observed in the irradiated samples. Two were identified, by co-chromatography with reference standards and LC-MS/MS, as CSAA798670 (which reached a maximum level of 25.7% AR after 28 days) and CSCC210616 (which reached a maximum level of 5.4% AR after 28 days). Two significant unknowns were observed. These were identified as CSCD668095 (which reached a maximum of 15.8% AR) and CSCD668094 (which reached a maximum of 14.8% AR). Three additional minor unknown components were also observed, at < 4% AR. The level of polar, unretained radioactivity in the 14C-phenyl labelled samples reached a maximum of 21.5% AR after 28 days. This unretained peak was isolated by HPLC and re-analysed using different HPLC. This analysis showed that this peak consisted of a number of minor degradates, none of which represented > 3.9% AR. These data are summarised below.
Table 4.1.4.1-8: Summary of the Characterisation / Identification: Indirect Photolysis
DAT SedaxaneCSAA798670
CSCC210616
CSCD668095
CSCD668094
U3 U4 U514C-
PhenylUnretained
14C-PyrazoleUnretained
0 103.5 0.0 0.0 0.0 0.0 0.0 0.0 0.0 0.0 0.0
1 88.7 2.0 0.0 1.9 2.4 0.7 0.0 3.4 0.5 0.0
4 72.5 5.0 0.4 5.5 5.2 1.8 1.6 1.7 4.8 0.0
8 63.6 10.1 1.5 8.0 8.1 2.4 2.1 1.2 6.4 0.0
14 43.1 15.2 2.5 9.5 11.1 3.2 3.4 0.6 8.3 0.0
21 52.7 13.3 2.9 10.8 9.3 2.8 3.4 1.0 6.4 0.8
28 23.9 25.7 5.4 15.8 14.8 3.8 3.8 0.2 21.5 2.0
Dark Control 97.7 0.0 0.0 0.0 0.0 0.0 0.0 0.0 0.0 0.0
The percentage of applied radioactivity present as parent sedaxane was plotted against hours of continuous irradiation and fitted to simple first order kinetics using ModelManager version 1.1. The DT50 and DT90 obtained from this were then converted to summer day sunlight at 30, 40 and 50°N and Tokyo spring sunlight. The estimated half-lives for degradation were 16.3, 16.5 and 17.1 days summer sunlight at 30, 40 and 50°N, respectively and 48 days Tokyo spring sunlight.
The proposed photolysis pathway for both direct and indirect photolysis in water is given below in the following figure.

CLH REPORT FOR SEDAXANE
354
NN
CH3
HF2C NH
O
NN
HF2C NH2
O
CH3
NN
HF2C OHO
CH3
NN
CH3
HF2C NH
O
OHOH
NN
CH3
HF2C NH
O
OH OOH
CSCC210616
CSAA798670
CSCD668094
CO2
Sedaxane
CSCD668095
Figure 4.1.4.1–1: Proposed photolysis pathway in water
CONCLUSION:
Direct photolysis of sedaxane in pH 7 buffer solution was significant, such that the parent compound represented 57.3% AR after 34 days of continuous irradiation. Indirect photolysis was significantly faster than direct photolysis, such that the parent compound represented only 23.9% AR after 28 days of continuous irradiation. The route of degradation was the same in both direct and indirect photolysis test. The main degradates observed in both tests were metabolites CSAA798670, CSCC210616, CSCD668095 and CSCD668094. Increased levels of metabolites were observed in the indirect photolysis test with maximum levels of 25.7, 5.4, 15.8 and 14.8% for CSAA798670, CSCC210616, CSCD668095 and CSCD668094 respectively.
(Hand L and Fleming E, 2007)
COMMENT : The study is considered acceptable and was already assessed at EU level in the framework of sedaxane EU approval.

CLH REPORT FOR SEDAXANE
355
4.1.4.2 Stoll and Nicollier (2008)Report: Stoll, R. and Nicollier, G (2008), SYN524464, –Metabolism and rate of Degradation of [Phenyl-U-
14C]SYN524464 under Aerobic and Anaerobic Laboratory Conditions in Aquatic Systems, Report Number T014706-05-REG. 23 October 2008. Syngenta Crop Protection AG, Global Environmental Fate and Exposure, Ecochemistry, 4002 Basel, Switzerland. Study Date: 09.2006-10.2008. (Syngenta file No.SYN524464_11105)
Guidelines: Guidelines: European Community Commission Directive 95/36/EC of July 14, 1995 amending Council
Directive 91/414/EEC: Annex II: 7.2.1.3.2 Water/sediment study
OECD Guidelines for the Testing of Chemicals (308). May 2002: Aerobic and Anaerobic Transformation in Aquatic Sediment.
US EPA, Subdivision N, §162-3: Anaerobic Aquatic Metabolism Studies, §162-4: Aerobic Aquatic Metabolism Studies
Deviations: no
Dates of experimental work: 09.2006-10.2008
GLP: Yes.
EXECUTIVE SUMMARY
The degradation of 14C phenyl sedaxane, was investigated in two laboratory incubated aquatic sediment systems, under aerobic and anaerobic conditions. Two texturally different natural sediments were used; the sediments were collected from a river (sandy loam) and a pond (silt loam). The water-sediment systems were set up in 1 litre cylindrical glass bottles, with the final ratio of sediment dry matter to water of 1:4 (river) to 1:7.5 (pond) (w/w), and maintained in a flow-through system at 201oC in the dark. The flow gases used through the systems were air for the aerobic systems and oxygen-free nitrogen for the anaerobic systems. 14C-sedaxane was applied to the surface water in each vessel to give a nominal initial concentration of 0.03 g / mL in the water phase, equivalent to a single surface overspray application of 148 g ai/ha, evenly distributed to a depth of 30 cm. The test systems were incubated in the dark for up to 179 days for the aerobic system and 360 days for the anaerobic system. The mean mass balance from all aerobic water/sediment systems ranged from 93.9 to 104.0%. The mean mass balance from all anaerobic water/sediment systems ranged from 97.1 to 105.2%.
Under aerobic conditions in both systems, sedaxane dissipated rapidly from the water phase to the sediment; and slowly under anaerobic conditions, however degradation of the sedaxane in the whole water/sediment systems was very slow. The dissipation and degradation rates for the various systems were calculated using simple first-order kinetics (SFO) as presented below.

CLH REPORT FOR SEDAXANE
356
Table 4.1.4.2-1: Dissipation and degradation rates of Sedaxane in two water/sediment systemsSFO
Rate of dissipation from water phase Rate of degradation in whole systemWater/sedimentDT50
[days]DT90
[days] χ2 * DegT50[days]
DegT90[days] χ2 *
Aerobic
River 6.4 21.2 19.0 >>1 year >> 1 year 1.5
Pond 5.5 18.4 18.9 >> 1 year >> 1 year 2.1
Anaerobic
River 43.4 144.0 14.7 >> 1 year >> 1 year 1.0
Pond 31.3 104.0 15.9 >> 1 year >> 1 year 1.1* χ2 was calculated using FOCUS_DEGKIN V2 ( visual assessment and chi2-test for SFO kinetics)
In all systems the ratio of the isomer SYN508210 (trans isomer) and SYN508211 (cis isomer) remained unchanged during the study.
Degradation of sedaxane under aerobic conditions led to the production of at least 15 minor metabolites, all observed in the total systems at less than 1% AR. Volatile radioactivity in form of CO2 was negligible at <2% and the unextracted radioactivity reached a maximum of 12.6% at the end of the study.
Degradation of sedaxane under anaerobic conditions led to the production of up to four minor metabolites, all observed at less than 1% AR. Volatile radioactivity in form of CO2 was negligible at <1% and the unextracted radioactivity reached a maximum of 7.9% at the end of the study.
MATERIALS AND METHODS
Materials
Test Material:
14C[Phenyl-U-14C] labelled Sedaxane mixture of both isomers trans and cis:SYN508210:trans isomer and SYN508211: cis isomer
NN
CH3
HF2C NH
O *
Description: White crystalline powder
Lot/Batch #: ILA-487.2
Specific activity: 6.13 MBq mg-1
Purity: 96.0%
Trans:Cis Ratio 6 : 1
Stability of test compound: Stable, determined within study
Application vehicle: Acetonitrile
Water/sediment: Two water/sediment systems were used for the study; they were chosen to represent two differing sediment types in respect of texture and organic carbon content.

CLH REPORT FOR SEDAXANE
357
Name River Pond
Sampling location Möhlin, Switzerland Rothenfluh, Switzerland
Site description Rhein river by the bank Natural pond near a forest
Geographical region/ Global co-ordinates
Northern Europe / 55º 39´ N01º 20´ W
Date of collection August, 17, 2006
Collection procedure Water: Immersion of container. For the strictly anaerobic study the water was maintained and transported carefully under nitrogen.Sediment: Scooped by hand and taken from the aerobic and anaerobic zones of the surface water bodies
Sampling depth (cm) Water: 20 cm below surfaceSediment: 5 – 10 cm thickness
Storage conditions after sampling
Samples immediately returned to laboratory then kept at ~15ºC, aerobicAnaerobic samples were kept under nitrogen.
Storage conditions at testing facility
~15ºC, aerobic and under nitrogen for anaerobic samples
Duration of storage (prior to use)
Three weeks
Preparation prior to use Water: sieved to 0.2 mmSediment: 2 mm sieve
Physical and chemical properties of sediment
Particle size (% w/w): Aerobic / Anaerobic Aerobic / Anaerobic
Clay (<2 µm) 11.0 9.0 31.0 31.0
Silt (50-2 µm) 31.0 23.0 60.0 60.0
Sand (2000-50 µm) 58.0 68.0 9.0 8.0
Texture (USDA) Sandy loam Sandy loam Silt Clay loam Silt Clay loam
pH (CaCl2) 7.4 7.3 7.2 7.2
Redox potential (mV)
Start of acclimation -298 -419 -421 -487
Start of study -263 -408 -216 -419
End of study -228 -463 -233 -460
Organic carbon (%) 1.7 1.5 5.6 5.4
CEC (meq/100 g soil) 9.7 7.8 26.3 12.9
Moisture content 0.846 0.703 1.984 1.857
Biomass (mg carbon/100 g soil):
Initial (start of study) 32.2 n.a. 118.3 n.a.
Final (end of study) 48.2 n.a. 104.1 n.a.
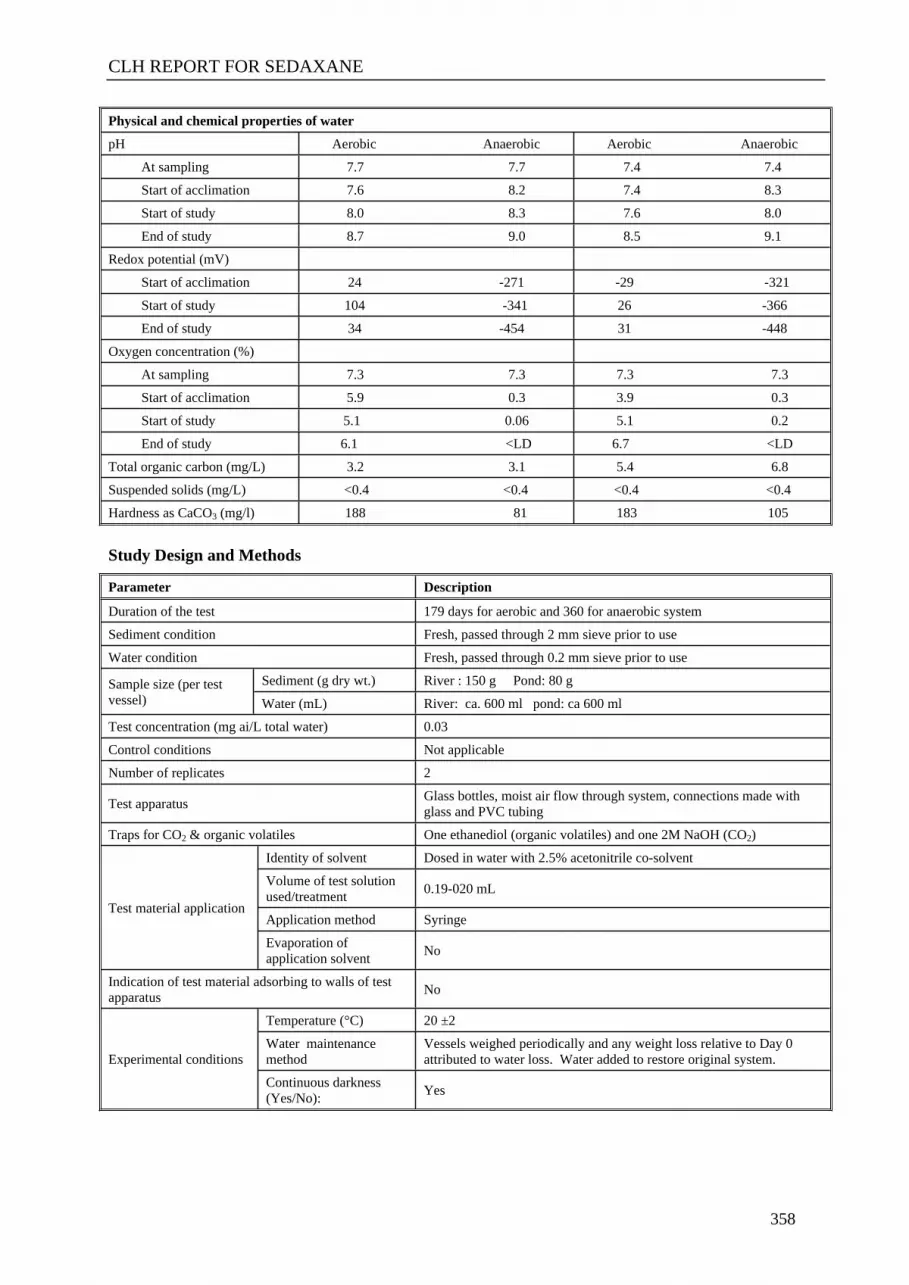
CLH REPORT FOR SEDAXANE
358
Physical and chemical properties of water
pH Aerobic Anaerobic Aerobic Anaerobic
At sampling 7.7 7.7 7.4 7.4
Start of acclimation 7.6 8.2 7.4 8.3
Start of study 8.0 8.3 7.6 8.0
End of study 8.7 9.0 8.5 9.1
Redox potential (mV)
Start of acclimation 24 -271 -29 -321
Start of study 104 -341 26 -366
End of study 34 -454 31 -448
Oxygen concentration (%)
At sampling 7.3 7.3 7.3 7.3
Start of acclimation 5.9 0.3 3.9 0.3
Start of study 5.1 0.06 5.1 0.2
End of study 6.1 <LD 6.7 <LD
Total organic carbon (mg/L) 3.2 3.1 5.4 6.8
Suspended solids (mg/L) <0.4 <0.4 <0.4 <0.4
Hardness as CaCO3 (mg/l) 188 81 183 105
Study Design and Methods
Parameter Description
Duration of the test 179 days for aerobic and 360 for anaerobic system
Sediment condition Fresh, passed through 2 mm sieve prior to use
Water condition Fresh, passed through 0.2 mm sieve prior to use
Sediment (g dry wt.) River : 150 g Pond: 80 gSample size (per test vessel) Water (mL) River: ca. 600 ml pond: ca 600 ml
Test concentration (mg ai/L total water) 0.03
Control conditions Not applicable
Number of replicates 2
Test apparatus Glass bottles, moist air flow through system, connections made with glass and PVC tubing
Traps for CO2 & organic volatiles One ethanediol (organic volatiles) and one 2M NaOH (CO2)
Identity of solvent Dosed in water with 2.5% acetonitrile co-solvent
Volume of test solution used/treatment 0.19-020 mL
Application method SyringeTest material application
Evaporation of application solvent No
Indication of test material adsorbing to walls of test apparatus No
Temperature (°C) 20 ±2
Water maintenance method
Vessels weighed periodically and any weight loss relative to Day 0 attributed to water loss. Water added to restore original system.Experimental conditions
Continuous darkness (Yes/No): Yes

CLH REPORT FOR SEDAXANE
359
Experimental designSampling
Parameter Description
Aerobic, non-sterileDuplicate samples from each water/sediment type:0, 1, 3, 7, 14, 35, 70, 100 and 179 DAT
Anaerobic, non-sterile Duplicate samples from each water/sediment type: 0, 1, 3, 7, 14, 35, 70, 100, 179 and 360 DATSampling intervals
Untreated systems for biomass or plate count
0 and 182 DAT for aerobic anaerobic plate count at 0, 100 and 360 DAT
Sampling procedures Complete test systems were removed at each sampling time. Water was removed by pipette and sediment extracted as detailed below.
Collection of CO2 and volatile organicsTraps replaced with fresh media at 3, 7, 15, 30, 60, 90 and120 DAT. Volume of solutions measured and duplicate aliquots taken for LSC.
pH Water only at the same times as sampling intervals
Redox potential Water and sediment at the same times as sampling intervals
Dissolved oxygen Water only at the same times as sampling intervalsMeasurement intervals
Sterility check Not applicable
Sample storage before analysis All samples were extracted on the day of sampling.
Description of analytical procedures
At each sampling time two complete aerobic and anaerobic systems were taken. The water supernatant was pipetted off the sediment, the volume was measured and aliquots of these samples were taken for quantification by LSC. Subsequently the supernatant water was concentrated and aliquots were measured by LSC and then analysed by HPLC.
Each sediment sample was extracted as follows:
Sediment was transferred to a 500 mL centrifuge tube.
250 mL of acetonitrile was added to the tube.
The tube was shaken using a flatbed shaker at ca 190 rpm for 0.5 hour.
The tube was then centrifuged at 1800 rpm for 10 minutes.
The extract was then removed into a volumetric flask (250 mL) and aliquots were measured.
Steps 2 - 5 were repeated three times with acetonitrile:water (80:20) and the supernatant was then combined in the same volumetric flask.
All sediment samples, with the exception of Day 0-7, were further extracted under reflux with 200 ml acetonitrile for 1 hour, followed by step 4 and 5.
The radioactivity in all the extracts was quantified by LSC. The combined sediment extracts for each individual sample were concentrated by evaporating the solvent under reduced pressure. Recovery checks were made after the concentration step. Aliquots of the concentrated extracts were then analysed by HPLC or 2D-TLC analysis.
Repeat injections were performed on selected samples to verify the HPLC method. Selected extracts were also analysed by 2D-TLC to confirm both the co-chromatography with reference standards and the quantification of the main components. LC-MS/MS were also used to provide qualitative confirmation of the identification of sedaxane.
Extracted sediment debris was air-dried prior to combustion. Subsamples of the ground soil were weighed (0.4 -0.5 g) and combusted at 900 °C under a stream of oxygen in a sample oxidiser with copper oxide as catalyst. A mass balance for each sample was determined by summation of the radioactivity

CLH REPORT FOR SEDAXANE
360
recovered in the sediment extracts, the aqueous phase, the total 14CO2 evolved and the unextracted residues.
The half-life and DT90 dissipation values of 14C-sedaxane from water to sediment as well as the degradation (DegT50) of 14C-sedaxane in the whole system in each test system (from the HPLC analysis) were determined using a Simple First Order (SFO) kinetic model.
RESULTS AND DISCUSSION
The total recoveries and distribution of radioactivity from each water/sediment system are shown in detail in Table 4.1.4.2-2 to Table 4.1.4.2-5.
Mass Balance
Total radioactivity Sum of activity in the surface water, sediment extracts, sediment residue on combustion and that trapped as 14CO2 in the 2M sodium hydroxide and ethylene glycol traps.
Recovery at 0 DAT Range 101.4 to 104.5% of applied doseAverage 102.6%
Overall recovery (all mean samples)
Range 93.9 to 105.2%Average 103.1%
Water, Extractable and Bound Residues
Water residues declined with time in both test systems
Total water residues at 0 DAT
River aerobic: 100.4%Pond aerobic: 100.7%River anaerobic: 103.2%Pond anaerobic: 100.5%Water residues
Total water residues at end of study
River aerobic: 6.8%Pond aerobic: 9.5%River anaerobic: 11.6%Pond anaerobic: 10.4%
Sediment Extractable residues increased with time in both test systems.
Total extractable residues at 0 DAT
River aerobic: 2.1%Pond aerobic: 1.6%River anaerobic: 1.0%Pond anaerobic: 1.0%Extractable
residues
Total extractable residues at end of study
River aerobic: 82.2%Pond aerobic: 79.5%River anaerobic: 85.3%Pond anaerobic: 85.1%
Bound residues increased throughout the incubation period in both test systems.
Bound residuesBound residues at end of study
River aerobic: 12.6%Pond aerobic: 11.5%River anaerobic: 7.9%Pond anaerobic: 7.0%
Volatilisation
Carbon dioxide evolution very slowly increased in all systems throughout the incubation
14CO2 14CO2 evolved at end of study
River aerobic: 1.9%Pond aerobic: 1.8%River anaerobic: 0.3%Pond anaerobic: 0.3%
Other volatiles No other volatiles were observed <LOD

CLH REPORT FOR SEDAXANE
361
Transformation of Parent Material
In both the river and pond aerobic incubation systems the dissipation of sedaxane from the water phase to sediment was rapid, with the parent compound representing only 39.8 - 41.4% (averaged) of the applied radioactivity after 7 days of incubation. In the sediment sedaxane increased from 0.7 - 2.1% at day 0 to 83.1 – 88.4% at day 70 and decreased to 78.3 - 82.2% at the end of the study, Day 179 (mean value of two replicates). Mineralisation to 14CO2 was minimal (<2%) and formation of bound residues was <13% AR. The route of degradation was similar in both systems. Up to fifteen minor metabolites were detected in the aqueous phase and one in the sediment extracts from river and four in pond sediment extracts but all in low amounts < 1.0 % in the total systems; see Table 4.1.4.2-6 and Table 4.1.4.2-7.
In both the river and pond anaerobic incubation systems the dissipation of sedaxane from the water phase to sediment was slow, with the parent compound representing 31.1 - 41.6% AR (averaged) after 35 days of incubation. In the sediment sedaxane increased from 0.5% at day 0 to 84.3 - 85.3% at the end of the study, Day 360 (mean value of two replicates). Mineralisation to 14CO2 and formation of the bound residues was minimal (< 8.2% AR). The route of degradation was similar to that in the aerobic systems. Four minor metabolites were detected in the aqueous phase and up to four of them in the sediment extracts all below < 1.0 % in the total system mean value; see Table 4.1.4.2-8 and Table 4.1.4.2-9.
The dissipation rate from water and the degradation rate (DegT50) of the parent in the total system from river and pond aerobic and anaerobic test systems were determined using non-linear regression with a simple first order kinetic model. The dissipation of sedaxane from water was poorly fitted with SFO kinetics as indicated by the high Chi-square (χ2) 8 error % above 14. However SFO kinetics was used to determine the degradation of sedaxane in the whole system with a Chi-square (χ2) error % ranging from 1.0 to 2.1. The results are presented in Table 4.1.4.2-1.
8 χ2 was calculated using FOCUS_DEGKIN V2 ( visual assessment and chi2-test for SFO kinetics)

CLH REPORT FOR SEDAXANE
362
Table 4.1.4.2-2: Mass Balance and distribution of radioactivity in aerobic River – individual replicates (values as % of applied)
Incubation time (days)Fraction R
ep.
0 1 3 7 14 35 70 100 179
A 100.5 81.5 53.8 36.6 32.6 11.2 8.5 6.6 7.2Surface water
B 100.3 78.4 40.0 46.2 29.0 11.3 6.8 6.9 6.4
A 2.0 22.5 45.0 60.7 66.1 89.0 87.7 83.2 85.1Sediment Extraction + Reflux B 2.3 25.6 59.4 52.1 69.7 86.4 89.0 86.3 79.2
Total Extractables mean 2.1 24.1 52.2 56.4 67.9 87.7 88.4 84.8 82.2
A n.p. n.p. 0.8 3.0 2.3 3.1 6.7 6.4 12.5Non-Extractables
B n.p. n.p. 1.0 2.7 2.1 3.1 5.7 6.4 12.8
A n.p. n.p. <0.1 0.1 0.2 0.5 0.6 0.9 1.814CO2
B n.p. n.p. <0.1 <0.1 0.2 0.4 0.1 1.0 2.0
Other Volatiles A n.p. n.p. <0.1 <0.1 <0.1 <0.1 <0.1 <0.1 <0.1
in ethylene glycol B n.p. n.p. <0.1 <0.1 <0.1 <0.1 <0.1 <0.1 <0.1
A 102.5 104.0 99.6 100.3 101.1 103.8 103.4 97.2 106.6TOTAL
B 102.6 104.0 100.4 101.0 100.9 101.3 101.6 100.6 100.5
Mean ± SD 101.7 ± 2.1%
Table 4.1.4.2-3: Mass Balance and distribution of radioactivity in aerobic Pond – individual replicates (values as % of applied)
Incubation time (days)Fraction R
ep.
0 1 3 7 14 35 70 100 179
A 100.8 79.9 46.5 41.4 24.9 21.0 9.5 10.4 9.4Surface water
B 100.5 77.2 47.7 38.2 24.4 10.2 10.7 10.0 9.6
A 1.9 23.9 47.0 56.3 70.1 75.6 84.2 80.5 81.2Sediment Extraction + Reflux B 1.4 24.9 44.0 60.3 71.3 84.3 82.0 81.6 77.9
Total Extractables mean 1.6 24.4 45.5 58.3 70.7 79.9 83.1 81.0 79.5
A n.p. n.p. 0.2 1.0 2.5 1.7 7.0 2.0 10.6Non-Extractables
B n.p. n.p. 0.3 1.4 2.7 1.8 6.8 2.3 12.3
A n.p. n.p. 0.1 <0.1 0.2 0.2 1.2 1.2 1.214CO2
B n.p. n.p. 0.1 0.1 0.2 0.3 1.2 1.4 2.4
Other Volatiles in A n.p. <0.1 <0.1 <0.1 <0.1 <0.1 <0.1 <0.1 <0.1
ethylene glycol B n.p. <0.1 <0.1 <0.1 <0.1 <0.1 <0.1 <0.1 <0.1
A 102.7 103.9 94.6 100.3 97.7 98.5 101.9 94.0 102.6TOTAL
B 101.9 102.1 93.2 101.2 98.6 96.6 100.8 95.4 102.1
Mean ± SD 99.33 ± 3.4%

CLH REPORT FOR SEDAXANE
363
Table 4.1.4.2-4: Mass Balance and distribution of radioactivity in anaerobic River – individual replicates (values as % of applied)
Incubation time (days)Fraction R
ep.
0 1 3 7 14 35 70 100 179 360
A 103.5 99.3 82.5 68.7 56.5 48.5 34.8 26.3 14.3 12.1Surface water
B 102.9 91.1 77.1 64.0 62.5 34.8 32.7 23.9 13.6 11.0
A 1.1 3.6 19.2 32.0 43.8 50.1 67.4 73.4 83.8 85.2Sediment Extraction + Reflux B 0.9 12.8 26.0 34.3 37.7 63.7 69.7 76.0 84.8 85.3
Total Extractables mean 1.0 8.2 22.6 33.2 40.8 56.9 68.6 74.7 84.3 85.3
A n.p. n.p. 0.2 1.1 1.0 2.5 2.3 5.3 4.4 7.4Non-Extractables
B n.p. n.p. 0.3 1.4 0.9 2.5 2.4 5.3 4.7 8.3
A n.p. <0.1 <0.1 <0.1 <0.1 <0.1 0.1 0.1 0.3 0.314CO2
B n.p. <0.1 <0.1 <0.1 <0.1 0.1 0.1 0.1 0.4 0.4
Other Volatiles A n.p. <0.1 <0.1 <0.1 <0.1 <0.1 <0.1 <0.1 <0.1 <0.1
en ethylene glycol B n.p. <0.1 <0.1 <0.1 <0.1 <0.1 <0.1 <0.1 <0.1 <0.1
A 104.5 102.9 101.9 101.9 101.4 101.1 104.6 105.1 102.9 105.2TOTAL
B 103.8 104.0 103.4 99.7 101.2 101.1 105.0 105.4 103.5 105.1
Mean ± SD 103.1 ± 1.8%
Table 4.1.4.2-5: Mass Balance and distribution of radioactivity in anaerobic Pond – individual replicates (values as % of applied)
Incubation time (days)Fraction R
ep.
0 1 3 7 14 35 70 100 179 360
A 100.8 91.4 80.3 62.8 51.6 32.2 30.5 22.3 14.8 10.5Surface water
B 100.1 90.5 78.0 52.5 64.4 30.0 23.3 19.0 14.0 10.3
A 0.6 10.7 19.6 37.3 48.8 67.9 71.0 77.1 85.1 85.2Sediment Extraction + Reflux B 1.4 13.0 24.5 47.1 35.5 69.4 78.1 79.1 74.4 84.9
Total Extractables mean 1.0 11.8 22.1 42.2 42.2 68.7 74.5 78.1 79.8 85.1
A n.p. n.p. 0.2 1.1 1.0 1.6 1.8 5.0 2.8 7.0Non-Extractables
B n.p. n.p. 0.3 1.2 0.9 1.6 2.0 5.7 2.8 6.9
A n.p. <0.1 <0.1 <0.1 <0.1 <0.1 <0.1 0.1 0.1 0.314CO2
B n.p. <0.1 <0.1 <0.1 <0.1 <0.1 0.1 0.1 0.2 0.2
Other Volatiles A n.p. <0.1 <0.1 <0.1 <0.1 <0.1 <0.1 <0.1 <0.1 <0.1
in ethylene glycol B n.p. n.p. <0.1 <0.1 <0.1 <0.1 <0.1 <0.1 <0.1 <0.1
A 101.4 102.1 100.2 101.3 101.5 101.8 103.3 104.6 102.8 103.1TOTAL
B 101.5 103.5 102.8 100.8 100.9 101.1 103.5 103.9 91.4 102.5
Mean ± SD 101.7 ± 2.8%

CLH REPORT FOR SEDAXANE
364
Table 4.1.4.2-6: Summary of product distribution in the river aerobic system (values as % of applied)
Incubation time (days)
Fraction
Rep
licat
e
Com
part
men
t
0 1 3 7 14 35 70 100 179
Water A 87.90 71.13 45.97 31.75 28.62 9.75 7.00 5.28 5.48
Water B 87.49 68.09 34.82 39.97 25.65 9.91 5.81 5.32 4.96
mean 87.68 69.61 40.39 35.86 27.13 9.83 6.40 5.30 5.22
Sediment A 1.70 19.13 38.66 52.28 56.71 76.96 76.38 71.42 73.14
Sediment B 1.93 21.74 51.15 44.67 60.51 74.27 76.28 73.60 66.94
Sedaxanetrans isomer
(SYN508210)
mean 1.81 2056 40.39 48.47 58.61 75.60 76.33 72.51 70.04
Water A 12.64 10.33 6.50 4.85 3.94 1.47 1.01 0.65 0.80
Water B 12.85 10.27 4.33 6.21 3.32 1.40 0.71 0.71 0.60
mean 12.74 10.30 5.41 5.53 3.63 1.44 0.86 0.68 0.70
Sediment A 0.30 3.13 6.32 8.39 9.38 12.04 11.35 11.62 11.95
Sediment B 0.33 3.88 8.26 7.42 9.15 12.15 12.75 12.35 12.30
Sedaxanecis isomer
(SYN508211)
mean 0.31 3.50 7.29 7.90 9.27 12.10 12.05 11.99 12.12
Water A 100.53 81.46 52.47 36.60 32.55 11.22 8.01 5.93 6.28
Water B 100.35 78.36 39.15 46.18 28.97 11.32 6.52 6.03 5.56
mean 100.44 79.91 45.81 41.39 30.76 11.27 7.26 5.98 5.92
Sediment A 2.00 22.50 44.98 60.67 66.09 89.00 87.73. 83.04 85.09
Sediment B 2.26 25.62 59.41 52.09 69.67 86.42 89.03 85.95 79.24
TotalSedaxane
mean 2.13 24.06 52.20 56.38 67.88 87.71 88.38 84.50 82.16
Water A <LD <LD 1.37 <LD <LD >LD 0.45 0.69 0.99
Water B <LD <LD 0.83 <LD <LD <LD 0.18 0.87 0.89
mean <LD <LD 1.10 <LD <LD <LD 0.32 0.78 0.94
Sediment A <LD <LD <LD <LD <LD <LD <LD 0.19 <LD
Sediment B <LD <LD <LD <LD <LD <LD <LD 0.37 <LD
U1-U14(Unknown)
mean <LD <LD <LD <LD <LD <LD <LD 1.28 <LD LD for U1-U14= <0.01-0.40%

CLH REPORT FOR SEDAXANE
365
Table 4.1.4.2-7: Summary of product distribution in the pond aerobic system (values as % of applied)
Incubation time (days)
Fraction
Rep
licat
eC
ompa
rtm
ent
0 1 3 7 14 35 70 100 179
Water A 87.74 69.75 40.79 36.49 22.15 18.38 7.79 8.66 7.49
Water B 87.19 67.06 42.13 33.40 21.62 8.91 9.12 8.05 7.32
mean 87.47 68.41 41.46 34.94 21.89 13.64 8.46 8.36 7.41
Sediment A <LD 20.35 40.62 49.13 60.00 66.22 71.75 68.42 68.39
Sediment B 1.41 21.08 38.05 52.90 60.80 72.78 70.57 70.69 64.83
Sedaxanetrans isomer
(SYN508210)
mean 0.71 20.71 39.33 51.02 60.40 69.50 71.16 69.55 69.55
Water A 13.10 10.17 5.76 4.92 2.70 2.35 1.06 0.87 0.93
Water B 13.29 10.11 5.53 4.77 2.80 1.07 1.00 1.01 0.93
mean 13.20 10.14 5.65 4.84 2.75 1.71 1.03 0.94 0.96
Sediment A <LD 3.60 6.37 7.18 10.13 9.34 71.75 12.06 11.90
Sediment B 0.19 3.80 5.92 7.35 10.46 11.52 70.57 10.90 11.46
Sedaxanecis isomer
(SYN508211)
mean 0.10 3.70 6.14 7.27 10.29 10.43 71.16 11.46 11.68
Water A 100.84 79.92 46.55 41.41 24.85 20.73 8.85 9.53 8.42
Water B 100.49 77.17 47.66 38.17 24.42 9.97 10.12 9.06 8.28
mean 100.66 78.55 47.10 39.79 24.64 15.35 9.49 9.29 8.35
Sediment A 0.00 23.95 46.98 56.31 70.12 75.56 84.83 80.48 80.30
Sediment B 1.41 24.88 43.98 60.25 71.26 84.30 82.04 81.59 76.29
TotalSedaxane
mean 0.71 24.41 45.48 58.28 70.69 79.93 83.13 81.03 78.29
Water A <LD <LD <LD <LD <LD 0.29 0.55 0.76 0.96
Water B <LD <LD <LD <LD <LD 0.21 0.61 0.98 1.27
mean <LD <LD <LD <LD <LD 0.25 0.58 0.87 1.20
Sediment A <LD <LD <LD <LD <LD <LD <LD <LD 0.95
Sediment B <LD <LD <LD <LD <LD <LD <LD <LD 1.55
U1-U14(Unknown)
mean <LD <LD <LD <LD <LD <LD <LD <LD 0.99LD for U1-U14= <0.01-0.40%

CLH REPORT FOR SEDAXANE
366
Table 4.1.4.2-8: Summary of product distribution in the river anaerobic system (values as % of applied)
Incubation time (days)
Fraction
Rep
licat
e
Com
part
men
t
0 1 3 7 14 35 70 100 179 360
Water A 90.03 85.94 71.61 60.68 49.73 42.46 30.63 23.00 12.42 10.70
Water B 88.93 79.19 67.05 56.78 54.29 30.42 28.88 20.79 11.74 9.60
mean 89.48 82.57 69.33 58.73 52.01 36.44 29.75 21.90 12.08 10.15
Sediment A <LD 3.01 16.65 27.81 37.81 42.66 58.15 62.68 72.09 73.39
Sediment B 0.80 10.92 22.38 29.81 32.84 54.53 60.30 64.86 72.88 73.38
Sedaxanetrans isomer
(SYN508210)
mean 0.40 6.96 19.52 28.81 35.33 36.44 59.22 63.77 72.48 73.38
Water A 13.43 13.34 10.86 8.08 6.81 6.01 4.14 3.27 1.84 1.43
Water B 13.94 11.95 10.07 7.20 8.22 4.39 3.86 3.11 1.80 1.40
Mean 13.68 12.65 10.47 7.64 7.52 5.20 4.00 3.19 1.82 1.41
Sediment A <LD 0.57 2.53 4.23 6.01 7.46 9.29 10.75 11.73 11.85
Sediment B 0.14 1.90 3.61 4.47 4.90 9.21 9.43 11.76 11.92 11.96
Sedaxanecis isomer
(SYN508211)
mean 0.07 1.23 3.07 4.35 5.46 8.33 9.36 10.95 11.82 11.90
Water A 103.46 99.28 82.48 68.75 56.54 48.47 34.77 26.28 14.27 12.13
Water B 102.87 91.14 77.12 63.98 62.51 34.82 32.73 23.90 13.54 10.99
Mean 103.16 95.21 79.80 66.37 59.53 41.64 33.75 25.09 13.90 11.56
Sediment A <LD 3.58 19.18 32.03 43.83 50.12 67.43 73.43 83.81 85.23
Sediment B 0.94 12.82 25.99 34.27 37.74 63.74 69.73 76.02 84.80 85.34
TotalSedaxane
mean 0.47 8.20 22.59 33.15 40.78 56.93 68.58 74.72 84.31 85.28
Water A <LD <LD <LD <LD <LD <LD <LD <LD 0.08 <LD
Water B <LD <LD <LD <LD <LD <LD <LD <LD 0.06 <LD
mean <LD <LD <LD <LD <LD <LD <LD <LD <LD <LD
Sediment A <LD <LD <LD <LD <LD <LD <LD <LD <LD <LD
Sediment B <LD <LD <LD <LD <LD <LD <LD <LD <LD <LD
U1-U14(Unknown)
mean <LD <LD <LD <LD <LD <LD <LD <LD <LD <LD
LD for U1-U14= <0.01-0.40%

CLH REPORT FOR SEDAXANE
367
Table 4.1.4.2-9: Summary of product distribution in the pond anaerobic system (values as % of applied)
Incubation time (days)
Fraction
Rep
licat
e
Com
part
men
t
0 1 3 7 14 35 70 100 179 360
Water A 86.62 78.60 69.39 55.27 44.69 28.34 26.66 19.75 12.85 9.29
Water B 87.52 78.44 67.64 46.26 55.40 26.54 20.53 16.68 12.00 8.92
mean 87.07 78.52 68.52 50.77 50.05 27.44 23.60 18.22 12.42 9.11
Sediment A <LD 9.10 16.85 32.43 42.02 58.16 61.14 66.23 73.44 71.77
Sediment B <LD 11.07 20.82 41.20 30.28 59.02 67.39 67.02 64.02 71.08
Sedaxanetrans isomer
(SYN508210)
mean <LD 10.08 18.84 36.82 36.15 58.59 71.42 66.63 68.73 71.42
Water A 14.19 12.81 10.95 7.57 6.92 3.87 3.80 2.57 1.72 1.15
Water B 12.57 12.11 10.33 6.19 9.01 3.47 2.77 2.34 1.75 1.19
mean 13.38 12.46 10.64 6.88 7.96 3.67 3.28 2.45 1.74 1.17
Sediment A <LD 1.60 2.77 4.89 6.80 9.74 9.82 10.89 11.70 12.89
Sediment B <LD 1.89 3.74 5.89 5.30 10.38 10.72 12.13 10.35 12.82
Sedaxanecis isomer
(SYN508211)
mean <LD 1.74 3.25 5.39 7.96 10.06 10.27 11.51 11.03 12.85
Water A 100.81 91.41 80.34 62.85 51.61 32.20 30.46 22.32 14.57 10.45
Water B 100.09 90.55 77.98 52.45 64.41 30.01 23.30 19.01 13.75 10.11
Mean 100.45 90.98 79.16 57.65 58.01 31.11 26.88 20.67 14.16 10.28
Sediment A <LD 10.69 19.63 37.33 48.82 67.91 70.96 77.12 85.14 84.65
Sediment B <LD 12.95 24.56 47.09 35.58 69.41 78.11 79.15 88.13 83.90
TotalSedaxane
Mean <LD 11.82 22.09 42.21 42.20 68.66 74.54 78.13 79.76 84.27
Water A <LD <LD <LD <LD <LD <LD <LD <LD 0.22 0.05
Water B <LD <LD <LD <LD <LD <LD <LD <LD 0.21 0.20
Mean <LD <LD <LD <LD <LD <LD <LD <LD 0.22 0.13
Sediment A <LD <LD <LD <LD <LD <LD <LD <LD <LD 0.52
Sediment B <LD <LD <LD <LD <LD <LD <LD <LD <LD 1.04
U1-U14(Unknown)
mean <LD <LD <LD <LD <LD <LD <LD <LD <LD 0.78
LD for U1-U16 = <0.01-0.40%
Table 4.1.4.2-10: Dissipation and degradation rates of sedaxane in two water/sediment systems
SFO
Rate of dissipation from water phase Rate of degradation in whole systemWater/sedimentDT50
[days]DT90
[days] χ2 * DegT50[days]
DegT90[days] χ2 *
Aerobic
River 6.4 21.2 19.0 >>1 year >> 1 year 1.5
Pond 5.5 18.4 18.9 >> 1 year >> 1 year 2.1
Anaerobic
River 43.4 144.0 14.7 >> 1 year >> 1 year 1.0
Pond 31.3 104.0 15.9 >> 1 year >> 1 year 1.1* χ2 was calculated using FOCUS_DEGKIN V2 ( visual assessment and chi2-test for SFO kinetics)

CLH REPORT FOR SEDAXANE
368
CONCLUSION:Dissipation of sedaxane from the surface water was rapid in both aerobic water/sediment systems with half-lives (DT50) of 5.5 and 6.4 days for pond and river system respectively. Half-lives (DT50) in the total systems were very slow in both aerobic systems and were calculated to be beyond the duration of the study. Dissipation of sedaxane from the surface water was relatively slow in both anaerobic water/sediment systems with half-lives (DT50) of 31.3 and 43.4 days for pond and river system respectively. Half-lives (DegT50) in the total systems were very slow in both anaerobic systems beyond the duration of the study.
Fifteen minor degradation products were found reaching a maximum level of 1.0% AR in the total phase of aerobic pond system (mean value). In both anaerobic systems, they were below 1.0%. No other single metabolite was observed at >1.0% of the applied dose.
Very low levels of radiolabelled carbon dioxide were produced during the incubation indicating full mineralisation of sedaxane. Accumulated levels reached a maximum of 1.9%, 1.8% and 0.3%, 0.3% AR dose in the aerobic, anaerobic river systems and in aerobic and anaerobic pond systems, respectively.
Unextracted residues increased slowly throughout the incubation period. Maximum levels for river aerobic and anaerobic systems were 12.6% and 7.9%, and for pond aerobic and anaerobic systems were 5.3% and 7.0% AR, respectively.
(Stoll R and Nicollier G, 2008)
COMMENT : The study is considered acceptable and was already assessed at EU level in the framework of sedaxane EU approval.
4.1.4.3 Nicollier (2008)Report: Nicollier G, (2008), SYN524464: Adsorption/Desorption of [Phenyl-U-14C]-labelled SYN524464 on six
soils (Gartenacker, Marsillargues, 18-Acres, Visalia, Washington and Champaign), Report Number T003699-06-REG. 28 January 2008. Syngenta Crop Protection AG, Global Environmental Fate and Exposure, Ecochemistry, 4002 Basel, Switzerland. (Syngenta file No. SYN524464/0056)
Guidelines: Guidelines: European Community Commission Directive 95/36/EC of July 14, 1995 amending Council
Directive 91/414/EEC: Annex II: 7.1.2 Adsorption and Desorption
OECD Guidelines for the Testing of Chemicals, Guideline 106: Adsorption/Desorption using a Batch Equilibrium Method (adopted 21st January 2000).
US EPA, Subdivision N, §163-1: Leaching and Adsorption/Desorption Studies
Deviations: no
Dates of experimental work: 2008
GLP: Yes
EXECUTIVE SUMMARY
The adsorption characteristics of 14C-phenyl ring labelled sedaxane was investigated in six different soils: Gartenacker (loam), Marsillargues (silty clay), 18 Acres (sandy clay loam), Visalia (sandy loam), Champaign (silty clay) and Washington (sand) using a standard batch equilibrium method. The soil adsorption coefficients Kd and KOC, together with the Freundlich adsorption constants KF and KFOC, were determined for each soil. The reversibility of the adsorption (desorption) was also determined. The mass balance from all soils was between 90 and 110% of the applied radioactivity. Sedaxane can be classified as having a "low" potential mobility in 18 Acres, Visalia, Washington, Champaign and Marsillargues soils and "medium" potential mobility in Gartenacker. The mean KFOC from all soils was 534 mL/goc and the slopes (1/n) of the adsorption and desorption isotherms ranged from 0.8 to 0.9. These data indicate

CLH REPORT FOR SEDAXANE
369
that the Freundlich adsorption/desorption isotherms tended to follow the Freundlich distribution law with increasing sorption strength at decreasing equilibrium concentrations. A summary of the key values is presented below. The desorption constants of sedaxane were higher than the adsorption constants illustrating common hysteresis.
Table 4.1.4.3-1: Soil adsorption constants for Sedaxane in 6 Soils
Parameter Gartenacker (loam)
Marsillargues (silty clay)
18 Acres (sandy clay
loam)
Visalia (sandy loam)
Champaign (silty clay)
Washington (sand)
pH (0.01M CaCl2) 6.8 7.5 5.1 5.7 7.1 7.0
%OC 2.6 1.04 2.78 0.52 2.44 0.3
KF 6.82 5.72 16.74 3.06 13.13 2.00
KF,OC 262 548 602 588 538 666
1/n 0.81 0.86 0.91 0.91 0.84 0.86
r2 0.99 1.00 1.00 0.99 1.00 1.00
KF (desorption) 9.55 7.39 19.90 3.94 18.75 2.72
KFOC (desorption) 367 708 716 758 769 907
1/n 0.80 0.86 0.89 0.92 0.86 0.87
r2 0.99 0.99 0.99 0.98 1.00 0.99
MATERIALS AND METHODS
Materials
Test Material:
14C phenyl uniformly ring labelled Sedaxane
NN
CH3
HF2C NH
O *
Lot/Batch #: CL-LX-8
Specific activity: 6.383 MBq mg-1
Purity: 99%
Stability of test compound: Stable, determined within study
Application vehicle: Acetonitrile
Six soils were used for the study, soils which were chosen to represent arable farming conditions in respect of soil texture and pH.
Table 4.1.4.3-2: Properties of the soils used to investigate the adsorption behaviour of sedaxane
Name Gartenacker Marsillargues 18 Acres Visalia Champaign Washington
Sampling location Switzerland France UK USA USA USADate of collection 21/02/2006 16/03/2006 16/05/2004 12/07/2004 07/04/2003 19/07/2006Sampling depth (cm) < 20 cm < 20 cm < 20 cm < 20 cm < 20 cm < 20 cmParticle size (% w/w):
Clay (<2 µm)10 41 24 10 44 4
Silt (50-2 µm) 46 56 20 24 49 7Sand (2000-50 44 3 56 66 7 89

CLH REPORT FOR SEDAXANE
370
Name Gartenacker Marsillargues 18 Acres Visalia Champaign Washingtonµm)Texture (USDA) Loam Silty clay Sandy clay
loamSandy loam Silty clay Sand
Taxonomy Entisols Entisols Alfisols Not required Not required Not requiredpH (water) 7.3 8.2 5.8 6.0 7.5 7.7pH (0.01M CaCl2) 6.8 7.5 8.1 5.7 7.1 7.0Organic matter (%) 4.4 1.8 4.8 0.9 4.2 0.5Organic carbon (%) 2.6 1.04 2.78 0.52 2.44 0.3CEC (meq/100 g soil) 10.5 17.5 22.5 7.3 12.8 3.5
Study Design and MethodsExperimental designThe equilibration time was determined in preliminary testing on all soils. With a soil solution ratio of 1: 10 for Gartenacker, 18 Acres, and Champaign soils, 2: 10 for Marsillargues and Visalia and 4: 10 for Washington soil, equilibrium was reached for all soils after 24 to 48 hours. At equilibrium the amount of test substance adsorbed ranged from 37 to 67%AR.
The mass balance was determined, after the adsorption step, in duplicate on all soils at the highest concentration and at all concentrations after the desorption step. The stability of the test item was determined, after the adsorption step, in the highest concentration for all soils.Adsorption phase (Main Test)
Parameter Description
Soil condition Air dried soil, passed through 2 mm sieve prior to use
Soil sample weight1 g (dry weight) per replicate for Gartenacker, 18 Acres and Marsillargues soils, 2 g (dry weight) per replicate for Champaign and Visalia soils and 4 g (dry weight) per replicate for Washington soil
Equilibration solution 0.01M CaCl2 (10 mL for Gartenacker, 18 Acres, Marsillargues, Visalia and Washington soil; 20 mL for Champaign soil)
Control conditions No soil (to test losses to test vessels)
Number of replicates 2 (at each concentration)
Test apparatus 250 mL glass centrifuge tubes
Identity of solvent Dosed in 0.01M CaCl2 with acetonitrile co-solvent
Volume of test solution used/treatment 0.1 to 1 mLTest material application
Evaporation of application solvent
No
Nominal application rates (µg ai/mL)
0.010.040.10.41.0Test material
concentration
Actual application rates (µg ai/mL)
0.008 - 0.0110.035 - 0.0410.08 - 0.090.35 - 0.400.91 - 0.95
Soil: Solution ratio 1: 10 for Gartenacker, Marsillargues, 18 Acres, and Champaign soils, 2: 10 for Visalia soil and 4: 10 for Washington soil
Indication of test material adsorbing to walls of test apparatus
No

CLH REPORT FOR SEDAXANE
371
Parameter Description
Temperature (°C) 20 ±2
Time 48 hours
Continuous darkness (Yes/No):
YesEquilibration conditions
Shaking method 75 r.p.m.
Method of separation of supernatant Centrifugation
Speed 2000 r.p.m.
Duration (min) 60CentrifugationMethod of separating supernatant
Decanting
Desorption phase
Parameter Description
Soil samples from adsorption phase used Yes
Number of desorption cycles 1
Equilibration solution 0.01M CaCl2 (10 mL for Gartenacker, 18 Acres, Marsillargues, Visalia and Washington soil; 20 mL for Champaign soil)
Control conditions Not done
Number of replicates 2
Test apparatus 250 mL glass centrifuge tubes
Soil: Solution ratio 1: 10 for Gartenacker, Marsillargues, 18 Acres, and Champaign soils, 2: 10 for Visalia soil and 4: 10 for Washington soil
Temperature (°C) 20 ±2
Time 24 hours
Continuous darkness (Yes/No):
YesEquilibration conditions
Shaking method 75 r.p.m.
Method of separation of supernatant Centrifugation
Speed (g) 2000 r.p.m.
Duration (min) 60CentrifugationMethod of separating supernatant
Decanting
Description of analytical proceduresAll supernatants were radioassayed with LSC and the concentrations in each aqueous phase were calculated. The concentrations adsorbed to the soil were calculated by subtraction of the mass of the test compound recovered in the aqueous phase from the mass applied.
The soil samples from two samples (treated at the highest concentration) were extracted, after the adsorption step, by shaking in the presence of acetonitrile and the extracts were radioassayed by LSC. Mass balances in these samples were calculated by summation of the percentages of applied radioactivity recovered in the aqueous phase, soil extracts and that remaining in the soil after extraction (following sample oxidation/LSC). For stability in these samples, the test item in the supernatants and soil extracts was quantified via reverse phase HPLC with radio-detection.
The mass balance in the remaining samples (which were subjected the desorption step) was calculated by summation of the percentages of applied radioactivity recovered in the aqueous phase and that remaining in the soil after extraction. The stability after desorption was confirmed by analysis of the supernatants by HPLC.

CLH REPORT FOR SEDAXANE
372
RESULTS AND DISCUSSION
The recovery of radioactivity was quantitative, with recoveries generally within the acceptable range of 90-110% AR. Loss to the walls of the test vessels were < 6% AR in the control samples (in the absence of soil) and < 1.5% AR in the presence of soil (after glass washing following removal of the soil residue).Table 4.1.4.3-3: Summary of overall mass balance results
Total radioactivity Sum of activity in the soil extracts, soil residue on combustion.
Gartenacker recovery (all samples) Range 91.5 to 105.8%
Marsillargues recovery (all samples) Range 94.8 to 105.1%
18 Acres recovery (all samples) Range 90.1 to 112.6%
Visalia recovery (all samples) Range 91.2 to 109.7%
Champaign recovery (all samples) Range 93.0 to 104.9%
Washington recovery (all samples) Range 94.3 to 104.3%
No degradation was observed in the supernatants (after either the adsorption or desorption steps) or the soil extracts after the adsorption step. The test item was, therefore, considered to be stable throughout the incubation period. The Freundlich coefficients are summarised below.Table 4.1.4.3-4: Summary of Freundlich Coefficients
ParameterGartenacker (loam)
Marsillargues (silty clay)
18 Acres (sandy clay loam)
Visalia (sandy loam)
Champaign (silty clay)
Washington (sand)
pH (0.01M CaCl2)
6.8 7.5 5.15.7 7.1 7.0
%OC 2.6 1.04 2.78 0.52 2.44 0.3KF mL/g 6.82 5.72 16.74 3.06 13.13 2.00KF,OC mL/goc 262 548 602 588 538 6661/n 0.81 0.86 0.91 0.91 0.84 0.86r2 0.99 1.00 1.00 0.99 1.00 1.00
KF mL/g (desorption) 9.55 7.39 19.90 3.94 18.75 2.72
KFOC mL/goc (desorption) 367 708 716 758 769 907
1/n 0.80 0.86 0.89 0.92 0.86 0.87r2 0.99 0.99 0.99 0.98 1.00 0.99
Mean Kfoc (mL/goc)Median Kfoc
534568
Mean 1/nMedian 1/n
0.8650.86

CLH REPORT FOR SEDAXANE
373
KF KF,OC KF,OMSoil %
OC%
ClaypH
(CaCl2)CEC 1/n r2
(mL/g)
Adsorption 0.8077 0.9934 6.82 262.42 152.21
DesorptionGartenacker 2.60 10 6.8 10.5
0.7963 0.9898 9.55 367.34 203.07
Adsorption 0.8569 0.9972 5.72 547.77 317.73
DesorptionMarsillargues 1.04 41 7.5 17.5
0.8592 0.9895 7.39 707.69 410.49
Adsorption 0.9068 0.9984 16.74 602.69 349.22
Desorption18 Acres 2.78 24 8.1 22.5
0.8890 0.9936 19.90 715.97 415.29
Adsorption 0.9065 0.9942 3.06 588.21 341.19
DesorptionVisalia 0.52 10 5.7 7.3
0.9185 0.9817 3.94 757.54 439.41
Adsorption 0.8417 0.9996 13.13 537.94 312.03
DesorptionChampaign 2.44 44 7.1 12.8
0.8610 0.9973 18.75 768.65 445.85
Adsorption 0.8590 0.9972 2.00 665.78 386.18
DesorptionWashington 0.30 4 7.0 3.5
0.8733 0.9933 2.72 906.91 526.05
Adsorption (n=6) 0.863 534.14 309.76Mean
Desorption (n=6) 0.866 704.02 406.69
Adsorption (n=6) 567.99 329.46Median
Desorption (n=6) 736.76 427.35
CONCLUSION: The adsorption/desorption behaviour of 14C-sedaxane has been studied in six soils and showed KFOC values ranging from 262 to 666 in the six different soils and a corresponding mean of 534 mL/goc and a corresponding median of 568 mL/goc. According to the McCall Classification scale sedaxane can be classified as having a "low" potential mobility (18 Acres, Visalia, Washington, Champaign and Marsillargues soils) and a "medium" potential mobility (Gartenacker soil). Based on the average value, sedaxane can be classified as having a low mobility. Corresponding 1/n values were ranging from 0.80 to 0.92 with a corresponding mean of 0.865 and median of 0.86. The corresponding mean Kfoc of 534 mL/goc and median of 568 mL/goc were calculated.
(Nicollier G, 2008)
COMMENT : The study is considered acceptable and was already assessed at EU level in the framework of sedaxane EU approval.
4.2 Bioaccumulation4.2.1 Bioaccumulation test on fish4.2.1.1 Authors of vertebrate study (2010)
Report: Authors of vertebrate study (2010). SYN524464 - Determination of the accumulation and elimination of 14[C]-Sedaxane in rainbow trout (Oncorhynchus mykiss), Report Number BL8620/B, 21 March 2010. Lab of vertebrate study. (Syngenta File No. SYN524464_11128)
GUIDELINES: OECD (1996). OECD Guidelines for Testing of Chemicals, Proposal for Updating Guideline 305, Bioconcentration: Flow-through Fish Test. Paris, France. The test deviated from the guideline as only one test concentration was used, as the determination of the BCF does not require a concentration range and to minimise numbers of fish used for animal welfare reasons.
GLP: Yes

CLH REPORT FOR SEDAXANE
374
EXECUTIVE SUMMARYThe study was undertaken to determine the bioconcentration and subsequent depuration of 14[C]-Sedaxane in rainbow trout (Oncorhynchus mykiss). Calculated bioconcentration factors (BCF) were based on analyses of water and fish tissues for total radioactive residues. The study was run with nominal concentration of 0.5 µg 14[C]-Sedaxane /L and a solvent control.
The measured BCF value (to 2 significant figures) obtained for whole fish tissues was 97. The uptake rate constant (k1) was 1934 day-1 and the depuration rate constants (k2) was 20.2 day-1. The kinetic BCF (k1/k2) was 96.
The plateau concentration of radioactivity in whole fish (µg 14[C]-Sedaxane equivalents/kg) was attained on day 1 of the exposure phase. The mean whole body bioconcentration factor at steady state (BCFss) was 97. On transfer to clean water, the depuration of accumulated residue from the whole body was rapid, with <95% of the steady state concentration remaining within 3 days.
MATERIALS AND METHODSMaterials:
Test Material: 14[C]-Sedaxane
Description: Beige solid
Lot/Batch #: RDR-111-14
Purity: Chemical purity 95.2% (measured by HPLC), radiochemical purity 99.1% (measured by TLC). The isomer ratio was 86.0% SYN508210 and 14.0% SYN508211
Specific activity 172.5 µCi mg-1
Stability of test compound: Expiry date August 31 2008.
Test concentrations: Solvent control and nominal concentration of 0.5µg 14[C]-Sedaxane /L
Vehicle and/or positive control:
DMF @ 50 µL/L. No positive control
Analysis of test concentration:
Yes
Test animals
Species: Juvenile rainbow trout (Oncorhynchus mykiss), batch 91-08
Source:
Acclimatisation period: 23 days post treatments
Treatment for disease: Malachite green & formalin for 9 days (as prophylactic), and maintained in 25% seawater for 10 days.
Weight and length of fish prior to exposure period:
Mean weight: 2.07 – 2.22 gMean length:48 mm
Feeding: Proprietary fish food, at a rate of 2% of the total fish weight per day
Environmental conditions
Test temperature: 15.1 – 15.3 oC
pH range: 7.24 – 7.69
Dissolved oxygen: 8.2 – 10.2 mg/L
Total Organic Carbon 22.9 – 23.9 mg/L
Total hardness of dilution water:
38.7 – 41.0 mg/L as CaCO3

CLH REPORT FOR SEDAXANE
375
Lighting: 16 hours fluorescent light and 8 hours dark with 20 minute dawn and dusk transition periods (390 – 420 lux).
Length of test: Uptake phase – 10 to – 24 June 2008 (14 days)Depuration phase – 24 June to 8 July 2008 (14 days)
Study Design and MethodsExperimental dates: Start 30 May, End 1 September 2008.
ApparatusA dynamic, continuous flow-through system was used to expose fish to a nominal 14[C]-Sedaxane concentration of 0.5 g/L for a 28-day exposure period (14-day uptake, 14-day depuration). In addition, a solvent control was used. Glass vessels with a maximum capacity of 120 L and a working volume of 105 L were used to hold the test and control fish. The test and control solutions were renewed at a nominal rate of 1000 mL/min, giving around 14 volume replacements per day.
A radioactive concentrate solution was prepared by adding 27.5 mg of 14[C]-Sedaxane to 25 mL methanol (1.1 mg/mL, 7.05 MBq/mL). This was stored in a freezer until required. At the start of the study a stock solution (nominally 10 mg Sedaxane/L) was prepared from the radioactive concentrate by adding 12.5 mL to a 2.5-L glass jar, evaporating the methanol and adding 1586 mL dimethylformamide (DMF). Liquid scintillation counting (LSC) showed this contained 10.2 mg Sedaxane/L.
The 10 mg/L stock solution was delivered at 0.050 mL/min. to a mixing chamber where it was mixed with dilution water at 1000 mL/min. The test and control vessels each received a constant nominal DMF concentration of 50 µL/L.
Test procedureThe uptake phase was initiated by transferring 80 fish to each of the solvent control and treatment chambers. The population of fish in each tank were fed proprietary fish food at a rate of 2% of the total fish weight per day. At the end of the uptake phase (day 14) the fish were transferred to clean test vessels receiving dilution water alone at the same nominal rate as during the uptake phase (1000 mL/min.). The fish were maintained in this depuration phase for a further 14 days.
Analysis of fish tissuesFish were sampled throughout the uptake and depuration period. During the uptake phase fish were taken from the exposure treatment for tissue analysis on days 1, 3, 7, 10 and 14. During the depuration phase fish were taken from the exposure treatment for tissue analysis on days 17, 21, 24. On each of the fish sampling occasions, four fish were randomly selected from each test vessel and dissected into edible (flesh), viscera (internal organs) and remaining tissue (carcass) portions. Each tissue type was analysed by LSC following combustion with a biological oxidiser. The values obtained from the individual tissue analyses were added together to calculate the whole wet body total radioactive residue (µg/kg equivalents of 14[C]-Sedaxane). Analysis of the control fish during the study showed radioactivity levels below the detection limit (0.04 μg kg-1).
Parent residues in whole fish were characterised and quantified once steady state had been reached (day 14), by solvent extraction followed by LCS of the acetonitrile and acetonitrile/water extracts and both normal and reverse phase Thin Layer Chromatography (TLC).
The lipid content of five stock fish was determined on day 0, and from each vessel on days 14 and 28 (end of uptake and depuration phases). Known weights of homogenised fish tissue were placed in screw top bottles, 80 mL chloroform:methanol (50:50) added and the homogenate extracted for 2 minutes. The homogenate was then filtered and the filtrate collected in a pre-weighed flask. The solvents were then evaporated and the remaining lipid fraction dried at 50 oC, then the flask was re-weighed. The mean lipid content of the homogenised fish tissue sample was then determined.

CLH REPORT FOR SEDAXANE
376
Analysis of test waterWater samples were taken from the test concentration at -2, -1 and 0 days, then on each subsequent fish sampling occasion during the uptake phase. Samples were taken once during the depuration phase. The analytical methods employed to measure the concentrations of 14[C]-Sedaxane in the test solutions were based on LSC to determine total [14C] residues. All results based on LSC are quoted as µg/kg equivalents of 14[C]-Sedaxane.
Physical and chemical parametersDissolved oxygen, pH, temperature and dilution water and stock solution flow measurements were made throughout the study. The, total hardness and total organic carbon in the dilution water were determined periodically. Representative samples of the laboratory freshwater supply were also analysed for heavy metals and pesticides on a periodic basis.
Calculation of Bioconcentration Factors (BCF)
Measured bioconcentration factor (BCFss)
tissues
waterss C
CBCF
Calculated bioconcentration factor (BCFk)
d
uk k
kBCF
The uptake constant (Ku) was calculated as follows:
Uptake constant (Ku): C C e t tt wkk
k tu
u
dd 1 0
Where:ct = tissue concentration at time tCw = mean water concentration during uptake phaseku = uptake constantkd = depuration constant from fish tissuetu = time at the end of the exposure phase
The depuration constant (Kd) was calculated as follows:
Depuration constant (Kd):u
tkdtkdt tteCeCC )()( 2
0201
Where:C01 = concentration of component(s) 1 in fish tissue at steady state (e.g. extractable residues)C02 = concentration of component(s) 2 in fish tissue at steady state (e.g. non-extractable residues)kd1 = depuration constant of component(s) 1 from fish tissuekd2 = depuration constant of component(s) 2 from fish tissue
RESULTS AND DISCUSSIONThe mean measured concentration during the exposure period was maintained consistently over the range 0.47 to 0.51 µg/L with a mean value of 0.49 µg/L 14[C]-Sedaxane equivalents, representing 98% of the nominal value.

CLH REPORT FOR SEDAXANE
377
Confirmation that the radioactivity present was test material and that test material was stable throughout the exposure phase was monitored during the pre-exposure phase using TLC analysis. The radiochemical purity was 99.1%, measured by TLC.
The concentrations of 14[C]-Sedaxane equivalents in fish tissue during the 14 day uptake phase followed by the 14 day depuration phase for rainbow trout are given in the table below:
Table 4.2.2.1-1: Uptake and depuration of 14[C]-Sedaxane equivalents in the rainbow trout (Oncorhynchus mykiss)
Mean concentration of 14[C]-Sedaxane (g/kg)Day
Edible tissues Non-edible tissues Whole body
1 90 158 483* 14 234 407* 16 200 5410* 16 287 51
Upt
ake
phas
e
14* 15 235 43
3 0.93 8.98 1.90
7 0.58 4.05 1.20
10 0.24 4.39 0.94
Dep
urat
ion
phas
e
14 0.30 3.85 0.80
Average steady state 15.25 239 47
Upper confidence limit (+ 20%)
18.3 287 56.4
Lower confidence limit (- 20%)
12.2 191 37.6
BCFSS n/a n/a 97
* = steady state, n/a = not applicable.
The radioactivity, expressed as 14[C]-Sedaxane equivalents, was found to accumulate within the tissues and reached a plateau (whole body concentration of 47 µg 14[C]-Sedaxane equivalents/kg) on day 1. The whole body BCFss, based on 14[C]-Sedaxane equivalents, was 97. During the 14 day depuration phase, the levels of 14[C]-Sedaxane equivalents in the whole fish decreased rapidly. Within three days of transfer to clean water the whole body residues were <95% of the steady state concentration.
The whole fish uptake rate constant (k1) was calculated to be 1934/day. The whole tissue depuration rate constant (k2) was calculated to be 20.1/day. Based on these values the kinetic bioconcentration factor (BCFk) was 96.
The mean lipid content of the fish exposed to 14[C]-Sedaxane on days 0, 14 (during steady state) and 28 (post depuration) was 10.7, 11.5 and 10.6 5 (w/w) respectively. The overall mean lipid content was 10.6% (w/w).
The physical and chemical data in both the solvent control and exposure tank showed little variation during the whole study period. Dissolved oxygen ranged from 8.2 to 10.2 mg/L, the pH ranged from 7.24 to 7.69 and the temperature ranged from 15.1 to 15.3 °C. The test solution flow rates to the individual tanks ranged from 980 to 1060 ml/min (nominal 1000 ml/min).
CONCLUSION: The measured BCFss value for the whole fish tissues was 97. The depuration of accumulated residues was rapid with approximately 95% depuration after three days.
(Author of vertebrate study, 2010)

CLH REPORT FOR SEDAXANE
378
COMMENT: according to EFSA journal 2012 (10(7):2823), this study was not considered as fully valid but was considered to be of sufficient quality for informative data (Please refer to the EU review of sedaxane 2012).
4.2.2 Bioaccumulation test with other organismsNo relevant studies.
4.3 Acute toxicity4.3.1 Short-term toxicity to fish4.3.1.1 Authors of vertebrate study (2008a)
Report: Authors of vertebrate study 2008a, SYN524464- A 96-hour static toxicity test with the common carp (Cyprinus carpio), Report Number 528A-174, 26 September 2008. Lab of vertebrate study, (Syngenta File No. SYN524464_11104)
GUIDELINES: OECD Guidelines for Testing of Chemicals, Section 2 - Effects on Biotic Systems, Method 203: Fish, Acute Toxicity Test (1992): US EPA Ecological Effects Test Guidelines, OPPTS 850.1074: Fish Acute Toxicity Test, Freshwater and Marine (1996): JMAFF Agchem Test Guidelines 12 Nohsan No. 8147, Effects on Aquatic Organisms, 2-7-1: Acute fish toxicity (2001)
GLP: Yes
EXECUTIVE SUMMARYThe acute toxicity of SYN524464 technical to common carp (Cyprinus carpio) was determined in a static test. Fish were exposed to a range of mean measured concentrations of 0.12, 0.27, 0.37, 0.73 and 1.6 mg ai/L, alongside a dilution water control. Mortality and sub-lethal effects were observed at concentrations of 0.73 mg/L and above. The 96 hour LC50 was 0.62 mg ai/L, based on mean measured concentrations.
MATERIAS AND METHODSMaterials:
Test Material SYN524464
Lot/Batch #: SMU6LP006/MILLED
Purity: 95.3%SYN508210 (trans isomer): 83.0%SYN508211 (cis isomer): 12.3%
Description: Off-white powder
Stability of test compound:
Stable under test conditions
Reanalysis/expiry date: January 2011
Treatments
Test concentrations: Dilution water control and mean measured concentrations of 0.12, 0.27, 0.37, 0.73 and 1.6 mg ai/L
Solvent: None
Analysis of test concentrations:
Yes. Analysis of SYN524464 at 0, 48 and 96 hours using a HPLC method.
Test organisms

CLH REPORT FOR SEDAXANE
379
Species: Common carp (Cyprinus carpio)
Source:
Acclimatisation period: 14 days
Treatment for disease: None
Weight and length of sub-sample from batch of fish at start of test:
Mean length: 2.7 cm (range 2.2 – 3.0 cm)Mean weight: 0.20 g (range 0.09 – 0.26 g)
Feeding: None during test
Test design
Test vessels: 9 L glass aquaria containing 7 L water
Test medium: Filtered non chlorinated well water
Replication: None
No of fish per tank: 7
Exposure regime: Static
Duration: 96 hours
Environmental conditions
Test temperature: 21.5 – 22.1° C
pH: 8.3 – 8.5
Dissolved oxygen: 7.0 – 8.8 mg/L
Hardness of dilution water:
140 mg/L CaCO3
Lighting: 321 Lux.16 hours light and 8 hours dark with 30 minute dawn and dusk transition periods
Study Design and MethodsExperimental dates: Start 1 July, End 6 July 2008.
A stock solution with a nominal concentration of 5.0 mg/L was prepared by mixing 0.0788 g of SYN534464 into 15 L of dilution water. This was stirred overnight with sonication. After this stirring period the stock solution was allowed to stand for around 4 hours, then approximately 13.5 L of was removed by siphoning. Appropriate volumes of the stock were then made up to 7 L with dilution water in each test vessel to give the test concentrations. The control consisted of dilution water only.
At the start of the test seven fish were randomly allocated to each of the test concentrations and the dilution water control. Observations for mortalities and symptoms of toxicity were made at 3.5, 24, 48, 72 and 96 hours.
Daily measurements of the test solutions were undertaken for pH and dissolved oxygen concentration. Temperature was measured at the start and end of the test, and recorded continually in the control.The test concentrations were verified by chemical analysis of SYN524464 at 0, 48 and 96 hours using an HPLC method.
RESULTS AND DISCUSSIONAt the start of the test, the measured concentrations were in the range 93 to 99.4% of the nominal values. At 48 hours they ranged from 89.7 to 147% of the nominal values and at the end of the test were in the

CLH REPORT FOR SEDAXANE
380
range 90.9 to 158% of the nominal values (see table below). The limit of quantification in this study was 0.0500 mg ai/L. Mean measured concentrations were used for the calculation and reporting of results.
Table 4.3.1.1-1: Analysis of SYN524464Nominal
concentration(mg ai/L)
% of nominal at 0 hours
% of nominal at 48 hours
% of nominal at 96 hours
Mean measured
concentration (mg ai/L)
Mean measured % of nominal
Control <LOQ <LOQ <LOQ Control
0.1 99.4 125 132 0.12 120
0.2 97.7 147 158 0.27 135
0.4 97.1 91.5 91.8 0.37 93
0.8 93.7 89.7 90.9 0.73 91
1.6 93 108 * 1.6 100* No sample taken as all test fish were dead.
The median lethal concentration (LC50) was defined as the concentration resulting in 50% mortality of the fish at 24 hours was calculated by the Probit method. Due to the pattern of mortality at 48, 72 and 96 hours nonlinear interpolation was used to calculate the LC50s at these exposure intervals. The NOEC (No Observed Effect Concentration) is defined as the highest tested concentration which did not produce an adverse effect when compared to the control and was determined by visual inspection of the data. Mortalities were observed at mean measured ai concentrations of 0.37 mg ai/L and above. Symptoms of toxicity observed included fish lying on the base of the test vessels, lethargy, loss of equilibrium and surfacing. These symptoms were observed at concentrations of 0.73 mg ai/L and above. No mortality or symptoms of toxicity were observed in the control.
The mortality data and estimated LC50 values are shown in the table below:
Table 4.3.1.1-2: Effects of SYN524464 on the survival of Cyprinus carpioMortality observed (Cumulative number of dead fish)Mean measured
concentration (mg a.i./L)
3.5 hour 24 hours 48 hours 72 hours 96 hours
Dilution water control 0 0 0 0 0
0.12 0 0 0 0 0
0.27 0 0 0 0 0
0.37 0 0 0 0 0
0.73 0 1 5 5 5
1.6 0 6 7 7 7
LC50 mg a.i./L nd 1.1 0.62 0.62 0.62
95% confidence interval nd 0.73 – 1.7 0.37 – 1.6 0.37 – 1.6 0.37 – 1.6
NOEC 1.6 0.37 0.37 0.37 0.37Nd = not determoined
CONCLUSION: The acute toxicity of SYN524464 technical to common carp (Cyprinus carpio) was determined in a static test. Fish were exposed to a range of mean measured concentrations of 0.12, 0.27, 0.37, 0.73 and 1.6 mg ai/L, alongside a dilution water control. Mortality and sub-lethal effects were observed at concentrations of 0.73 mg/L and above. The 96 hour LC50 was 0.62 mg ai/L, based on mean measured concentrations.
(Authors of vertebrate study, 2008a)

CLH REPORT FOR SEDAXANE
381
4.3.1.2 Author of vertebrate study (2008)Report: Author of vertebrate study 2008, SYN524464- Acute toxicity to rainbow trout (Oncorhynchus
mykiss) in a 96-hour static test, Report Number B27911, 9 May 2008. , Lab of vertebrate study, (Syngenta File No. SYN524464/0067)
GUIDELINES: OECD Guidelines for Testing of Chemicals, Section 2 - Effects on Biotic Systems, Method 203: Fish, Acute Toxicity Test (1992): Official Journal of the European Communities, Dir 92/69/EEC, O.J. L383A, Part C.1: Acute Toxicity For Fish (1992): US EPA Ecological Effects Test Guidelines, OPPTS 850.1074: Fish Acute Toxicity Test, Freshwater and Marine (1996): JMAFF Agchem Test Guidelines 12 Nohsan No. 8147, Effects on Aquatic Organisms, 2-7-1-1: Acute fish toxicity (2001)
GLP: Yes
EXECUTIVE SUMMARYThe acute toxicity of SYN524464 technical to Rainbow trout (Oncorhynchus mykiss) was determined in a static test. Fish were exposed to a range of mean measured concentrations (0.11, 0.23, 0.49, 1.0, 2.0 and 4.2 mg ai/L) of the test item in the dilutions 1:80, 1:40, 1:20, 1:10, 1:5 and 1:2.5, alongside a dilution water control, due to limited water solubility of the test item. Mortality and sub-lethal effects were observed at concentrations of 1.0 mg/L and above. The 96 hour LC50 was 1.1 mg/L.
MATERIALS AND METHODSMaterials:
Test Material SYN524464
Lot/Batch #: SMU6LP006/MILLED
Purity: 95.3%SYN508210 (trans isomer): 83.0%SYN508211 (cis isomer): 12.3%
Description: Off-white powder
Stability of test compound:
Stable under test conditions
Reanalysis/expiry date: January 2011
Treatments
Test concentrations: Dilution water control and mean measured concentrations of 0.11, 0.23, 0.49, 1.0, 2.0 and 4.2 mg ai/L (as dilutions 1:80, 1:40, 1:20, 1:10, 1:5 and 1:2.5)
Solvent: None
Analysis of test concentrations:
Yes, analysis of SYN524464 at 0 and 96 hours
Test organisms
Species: Rainbow trout Oncorhynchus mykiss
Source:
Acclimatisation period: 7 days
Treatment for disease: None
Weight and length of sub-sample from batch of fish at start of test:
Mean length: 5.2 cm (standard deviation 0.2 cm)Mean weight: 1.2 g (standard deviation 0.1 g)
Feeding: None during test
Test design

CLH REPORT FOR SEDAXANE
382
Test vessels: Glass vessels containing 15 L water
Test medium: Non chlorinated well water
Replication: None
No of fish per tank: 7
Exposure regime: Static
Duration: 96 hours
Environmental conditions
Test temperature: 13° C
pH: 8.2 – 8.4
Dissolved oxygen: 9.6 – 9.9 mg/L
Hardness of dilution water:
205 mg/L CaCO3
Lighting: 100 - 560 Lux.16 hours light and 8 hours dark with 30 minute dawn and dusk transition periods
Study Design and MethodsExperimental dates: Start 3 October 2007 End 11 April 2008.
A saturated stock solution with a nominal concentration of 100 mg ai/L was prepared by adding two batches of test item (600.1 and 602.3 mg) to 2 x 6000 mL of dilution water. After 15 minutes of ultrasonic dispersion the solutions were stirred for 3 hours to dissolve the maximum amount of the test material. After this stirring period each solution was filtered through 0.45µm membrane filters and the filtrates combined to produce around 1.2 L of saturated stock solution. Appropriate volumes of the saturated stock were then made up to 15 L of dilution water in each test vessel to give the appropriate dilutions. The control consisted of dilution water only.
At the start of the test seven fish were randomly allocated to each of the test concentrations and the dilution water control. Observations for mortalities and symptoms of toxicity were made at 3, 24, 48, 72 and 96 hours.
Daily measurements of the test solutions were undertaken throughout the 96 hour period for pH, temperature and dissolved oxygen concentration.
The test concentrations were verified by chemical analysis of SYN524464 at 0 and 96 hours using an HPLC method with UV/VIS-detection.
RESULTS AND DISCUSSIONAt the start of the test, the measured concentrations of the test item in the dilutions 1:80, 1:40, 1:20, 1:10, 1:5 and 1:2.5 of the saturated solution were 0.12, 0.25, 0.53, 1.0, 2.1 and 4.2 mg/L, respectively. At the end of the test, 84 to 92% of the initially measured concentrations were found in the dilutions 1:80 to 1:10. Thus, the test item was stable in the test media over the test period of 96 hours. The concentration measured in the dilution 1:5 of the filtrate after the test period of 24 hours was 98% of the initially measured concentration The biological results were based on the mean measured concentrations of the test item (average concentrations measured in the non-filtered samples at the start and the end of exposure):

CLH REPORT FOR SEDAXANE
383
Table 4.3.1.2-1: Analysis of SYN524464Treatment (dilution of the
saturated solution)Mean measured
concentration of the test item
(mg/L)
Dilution 1:80 0.11
Dilution 1:40 0.23
Dilution 1:20 0.49
Dilution 1:10 1.0
Dilution 1:5 2.0 *
Dilution 1:2.5 4.2 *** Mean value of the concentrations measured at the start of the test and after 24-hours (samples were taken after 24 hours as all test fish had died within this period) ** Concentration measured at start of test (no further samples were taken as all test fish were dead within 3 hours of exposure).
The median lethal concentration (LC50) was defined as the concentration resulting in 50% mortality of the fish in the time period specified and was calculated by the Probit method. The NOEC (No Observed Effect Concentration) is defined as the highest tested concentration which did not produce an adverse effect when compared to the control and was determined by visual inspection of the data. Mortalities were observed at mean measured ai concentrations of 1.0 mg ai/L and above. Symptoms of toxicity observed included convulsions, fish lying on their sides or backs on the base of the test vessels and fish exhibiting tumbling during swimming. These symptoms were observed at concentrations of 1.0 mg ai/L and above. No mortality or symptoms of toxicity were observed in the control.
The mortality data and estimated LC50 values are shown in the table below:
Table 4.3.1.2-2: Effects of SYN524464 on the survival of Oncorhynchus mykiss Mortality observed (Cumulative number of dead fish)Mean measured
concentration (mg a.i./L)
3 hour 24 hours 48 hours 72 hours 96 hours
Dilution water control 0 0 0 0 0
0.11 0 0 0 0 0
0.23 0 0 0 0 0
0.49 0 0 0 0 0
1.0 0 0 1 1 2
2.0 0 7 - - -
4.2 7 - - - -
LC50 mg a.i./L 2.9 1.4 1.2 1.2 1.1
95% confidence interval 2.0 – 4.2 1.0 – 2.0 0.90 – 1.6 0.90 – 1.6 0.83 – 1.4
NOEC 0.49 0.49 0.49 0.49 0.49
CONCLUSION: Based on mean measured concentrations, the 96-hour LC50 for SYN524464 to rainbow trout Oncorhynchus mykiss was 1.1 mg ai/L and the 96-hour NOEC was 0.49 mg ai/L
(Author of vertebrate study, 2008)
4.3.1.3 Author of vertebrate study (2006)Report: Author of vertebrate study, 2006. SYN524464- Acute toxicity to fathead minnow (Pimephales
promelas), Report Number T016857-04-REG, 19 January 2007. Syngenta, Lab of vertebrate study.(Syngenta File No. SYN524464/0012)

CLH REPORT FOR SEDAXANE
384
GUIDELINES: OECD Guideline for testing of chemicals 203 ‘Fish Acute Toxicity Test’. Adopted 17 July 1992: EU Official Journal of the European Communities No L 383 A/163 Part C.1. ‘Acute Toxicity For Fish’. Adopted 29 December 1992: OPPTS 850.1075 Ecological Effects Test Guidelines ‘Fish Acute Toxicity Test, Freshwater and Marine’. Public draft April 1996: JMAFF 2-7-1. Agchem Test Guidelines 12 Nousan No. 8147. “Acute fish toxicity”. (2001)
GLP: Yes
EXECUTIVE SUMMARYThe acute toxicity of SYN524464 tech. to fathead minnow (Pimephales promelas) was determined in a static test. Fish were exposed to a range of nominal concentrations of 0.65, 1.3, 3.0, 5.0, and 10 mg/L. Results are expressed as mean measured concentrations.
Mortality and sub-lethal effects were observed at concentrations of 1.0 mg/L and above. The 96 hour LC50 was 0.98 mg/L (95% confidence interval 0.48 – 2.5 mg/L).
MATERIALS AND METHODSMaterials:
Test Material SYN524464 tech.Description: white powderLot/Batch #: S01F002249U MilledPurity: SYN524464 nominal: 100% analysed: 98.2% (w/w)Density: Not statedStability of test compound: Reanalysis date April 2007
Test concentrations: 0.65, 1.3, 3.0, 5.0, and 10 mg/LVehicle and/or positive control:
Dechlorinated tap water; none
Analysis of test concentrations: Yes (0, 48 and 96 hours)
Test animalsSpecies: Fathead minnow (Pimephales promelas)Source:
Acclimatisation period: 12 daysTreatment for disease: NoneWeight and length of sub-sample from batch of fish at start of test:
Mean length: 2.8 cm (standard deviation 0.3 cm)Mean weight: 0.25 g (standard deviation 0.1 g)
Feeding: None during test
Test designExposure regime: StaticAeration: Yes, gentleReplication: NoneNo of fish per tank: 7
Environmental conditionsTest temperature: 24.1 to 24.5 oCpH: 7.59 to 8.29Dissolved oxygen: 99 to 106% ASVHardness of dilution water and highest test concentration:
225 mg/L and 226 mg/L CaCO3

CLH REPORT FOR SEDAXANE
385
Lighting: 16 hours fluorescent light and 8 hours dark with 30 minute dawn and dusk transition periods
Length of test: 96 hours
Study Design and MethodsExperimental dates: Start 13 August 2006 End 18 August 2006.
Test procedure and apparatusA static test system was employed. Glass vessels with a working volume of 2.5 L were used for the dilution water control and the test solutions. At the start of the test 7 fish were randomly allocated to the test concentrations and the dilution water control. The fish were not fed during the course of the test. The test was undertaken in a temperature controlled water-bath.
Preparation of test solutionsFish were exposed to nominal concentrations of 0.65, 1.3, 3.0, 5.0, and 10 mg/L. Aqueous test solution was prepared by direct addition of known amounts of test material to 2.5 L volumes of dilution water and autostirring these for 23 hours
Analytical methodThe concentrations of SYN524464 in the test solutions were measured at 0, 48 and 96 hours using high performance liquid chromatography (HPLC) with UV detection. Samples for analysis were taken from the centre of the test solutions.
Observations for mortality and symptoms of toxicityObservations of mortalities and symptoms of toxicity were made at 3, 24, 48, 72 and 96 hours. The LC50 values were estimated from the data obtained.
Physical and chemical parametersDaily measurements of the test solutions were undertaken throughout the 96-hour period for pH, temperature and dissolved oxygen concentration using calibrated meters. Temperature was also recorded automatically in one test vessel using an electronic recording system.
RESULTS AND DISCUSSIONAnalytical dataThe concentrations of SYN524464 tech. were determined in the test. The limit of detection of SYN524464 was 0.1 mg/L. The measured concentrations at the start of the test ranged from 76 to 85% of nominal, at 48 hours from 72 to 93% of nominal and at the end of the test from 69 to 86% of nominal. Mean measured concentrations were used for the calculation and reporting of the results. These concentrations were 0.48, 1.0, 2.5, 3.9 and 7.7 mg/L.
Biological dataMortalities and sub-lethal effects were observed at concentrations of 1.0 mg/L and above. Symptoms of toxicity observed included unusual swimming and positioning in the test vessels, loss of equilibrium and moribund fish. No mortality or symptoms of toxicity were observed in the control.

CLH REPORT FOR SEDAXANE
386
Table 4.3.1.3-1: Effects of SYN524464 on the survival of Pimephales promelasCumulative mortality observedMean measured
concentration(mg /L) 3 hour 24 hours 48 hours 72 hours 96 hours
Dilution water control 0 0 0 0 00.48 0 0 0 0 01.0 0 0 0 0 42.5 0 0 4 7 73.9 0 1 7 7 77.7 6 7 7 7 7
The LC50 values obtained (based on mean measured concentrations) were:
Table 4.3.1.3-2: SYN524464: LC50 values for Pimephales promelasTime 24 hours 48 hours 72 hours 96 hours
LC50 (mg/L) 4.12 2.47 1.58 0.98
CONCLUSION: The 96 hour LC50 for SYN524464 tech. to fathead minnow (Pimephales promelas) is 0.98 mg/L (95% confidence interval 0.48 – 2.5 mg/L) based on mean measured concentrations.
(Author of vertebrate study, 2006)
4.3.1.4 Authors of vertebrate study (2008b)Report: Authors of vertebrate study. 2008b, SYN524464 – A 96-Hour Static Acute Toxicity Test with the
Sheepshead Minnow (Cyprinodon variegatus), Report Number 528A-163A. 8 April 2008. Lab of vertebrate study. .(Syngenta File No. SYN524464/0062)
GUIDELINES: OPPTS 850.1075 Ecological Effects Test Guidelines ‘Fish Acute Toxicity Test, Freshwater and Marine’. Public draft April 1996.: U.S. Environmental Protection Agency. 1985. Standard Evaluation Procedure, Acute Toxicity Test for Estuarine and Marine Organisms (Estuarine Fish 96-Hour Acute Toxicity Test). Hazard Evaluation Division. Office of Pesticide Programs. EPA-540/9-85-006. Washington, DC.: ASTM Standard E729-96. 1996. Standard Guide for Conducting Acute Toxicity Tests on Test Materials with Fishes, Macroinvertebrates, and Amphibians. American Society for Testing and Materials.
GLP: Yes
EXECUTIVE SUMMARYThe acute toxicity of SYN524464 to sheepshead minnow (Cyprinodon variegatus) was determined under static conditions. Fish were exposed to a range of mean measured concentrations of 0.36, 0.67, 1.4, 3.0 and 5.8 mg a.i./L and a dilution water control. The 96 hour LC50 (based on mean measured concentrations of SYN524464) was 4.2 mg a.i./L.
MATERIALS AND METHODSMaterials:
Test Material SYN524464
Lot/Batch #: SMU6LP006/MILLED
Purity: 95.3% (sum of 83.0% SYN508210 and 12.3% SYN508211)
Description: Off-white powder
Stability of test Stable under standard conditions
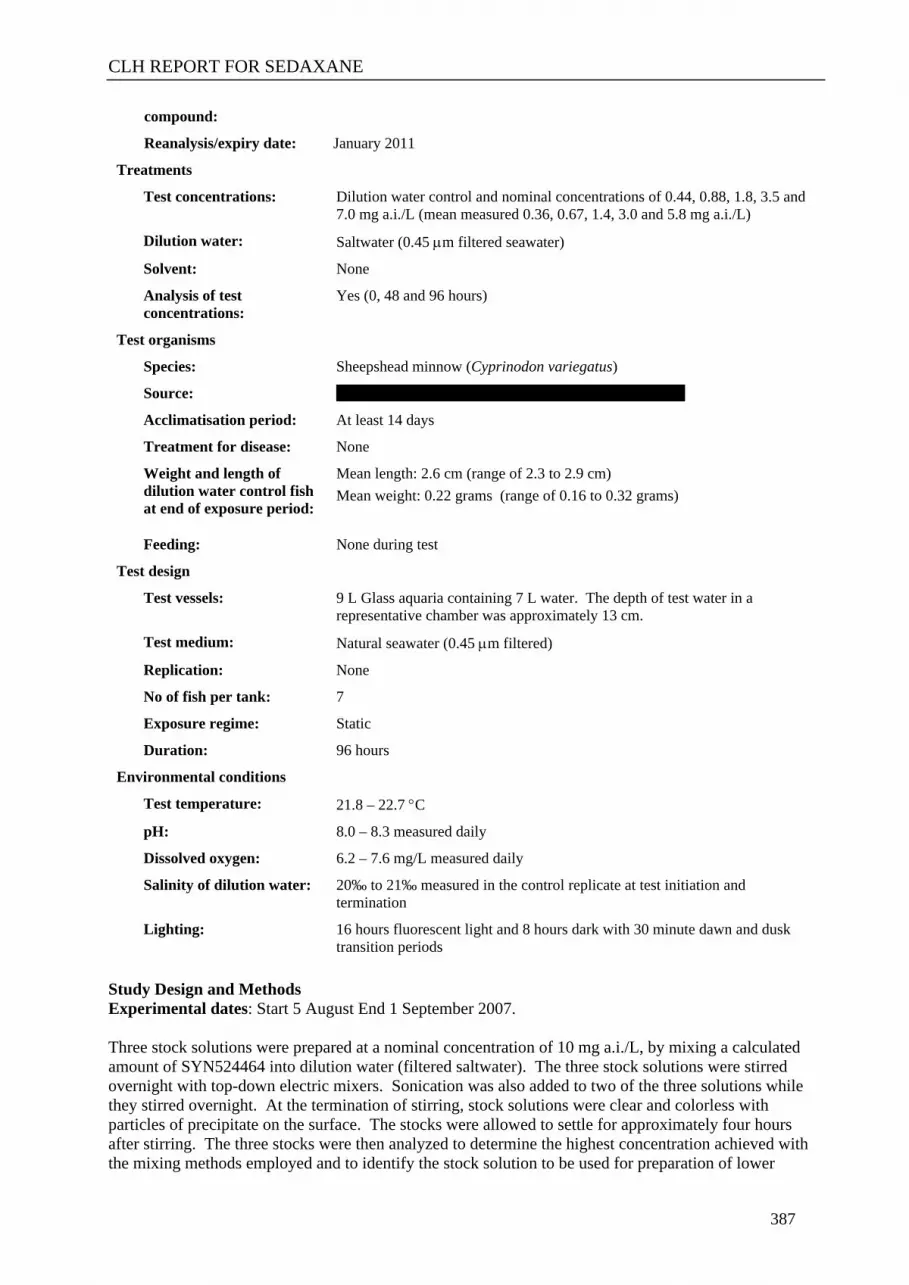
CLH REPORT FOR SEDAXANE
387
compound:
Reanalysis/expiry date: January 2011
Treatments
Test concentrations: Dilution water control and nominal concentrations of 0.44, 0.88, 1.8, 3.5 and 7.0 mg a.i./L (mean measured 0.36, 0.67, 1.4, 3.0 and 5.8 mg a.i./L)
Dilution water: Saltwater (0.45 m filtered seawater)
Solvent: None
Analysis of test concentrations:
Yes (0, 48 and 96 hours)
Test organisms
Species: Sheepshead minnow (Cyprinodon variegatus)
Source:
Acclimatisation period: At least 14 days
Treatment for disease: None
Weight and length of dilution water control fish at end of exposure period:
Mean length: 2.6 cm (range of 2.3 to 2.9 cm)Mean weight: 0.22 grams (range of 0.16 to 0.32 grams)
Feeding: None during test
Test design
Test vessels: 9 L Glass aquaria containing 7 L water. The depth of test water in a representative chamber was approximately 13 cm.
Test medium: Natural seawater (0.45 m filtered)
Replication: None
No of fish per tank: 7
Exposure regime: Static
Duration: 96 hours
Environmental conditions
Test temperature: 21.8 – 22.7 C
pH: 8.0 – 8.3 measured daily
Dissolved oxygen: 6.2 – 7.6 mg/L measured daily
Salinity of dilution water: 20‰ to 21‰ measured in the control replicate at test initiation and termination
Lighting: 16 hours fluorescent light and 8 hours dark with 30 minute dawn and dusk transition periods
Study Design and MethodsExperimental dates: Start 5 August End 1 September 2007.
Three stock solutions were prepared at a nominal concentration of 10 mg a.i./L, by mixing a calculated amount of SYN524464 into dilution water (filtered saltwater). The three stock solutions were stirred overnight with top-down electric mixers. Sonication was also added to two of the three solutions while they stirred overnight. At the termination of stirring, stock solutions were clear and colorless with particles of precipitate on the surface. The stocks were allowed to settle for approximately four hours after stirring. The three stocks were then analyzed to determine the highest concentration achieved with the mixing methods employed and to identify the stock solution to be used for preparation of lower

CLH REPORT FOR SEDAXANE
388
concentrations. The analyses indicated that the highest stock concentration, using sonication and stirring, was approximately 7 mg a.i./L.
The 7.0 mg a.i./L stock solution was used as the highest concentration test solution. Aliquots of the 7.0 mg a.i./L stock solution were siphoned off, being careful to avoid any particulate matter, and proportionally diluted with saltwater to prepare 6 L of test solution at target concentrations of 0.44, 0.88, 1.8 and 3.5 mg a.i./L. The solutions were mixed by stirring. At test initiation and termination, all solutions appeared clear and colorless.
At the start of the test seven fish were indiscriminately allocated to each of the test concentrations and the dilution water control. Test chambers were indiscriminately positioned in an environmental chamber set to maintain the desired test temperature. Observations for mortalities and symptoms of toxicity were made at 3.5, 24, 48, 72 and 96 hours. The LC50 values were estimated from the data obtained.
Temperature was measured in each test chamber at test initiation and at approximately 24-hour intervals during the test using a liquid-in-glass thermometer. A continuous temperature recorder (Fulscope ER/C Recorder) was used to measure the temperature in the negative control test chamber throughout the test. The concentrations of SYN524464 in the test solutions were measured at 0, 48 and 96 hours using high performance liquid chromatography (HPLC) using variable wavelength detection.
RESULTS AND DISCUSSIONThe concentrations of SYN524464 were determined in the test. Mean measured concentrations calculated from the average of all samples ranged from 76 to 86% of nominal concentrations. Mean measured concentrations were used for the reporting of the results.
All sheepshead minnows in the negative control group and in the 0.36 and 0.67 mg a.i./L treatment groups appeared normal throughout the test. Percent mortality in the 1.4, 3.0 and 5.8 mg a.i./L treatment groups at test termination was 0, 0 and 100%, respectively. All fish in the 1.4 mg a.i./L treatment group appeared lethargic at test termination. All fish in the 3.0 mg a.i./L treatment group were also exhibiting signs of toxicity at test termination. The no-mortality concentration was 3.0 mg a.i./L. The NOEC was 0.67 mg a.i./L.
Table 4.3.1.4-1: Effects of SYN524464 on the survival of the Sheepshead Minnow (Cyprinodon variegates)
Cumulative percentage mortality observedMeasured concentration(mg a.i./L) 3 hour 24 hours 48 hours 72 hours 96 hours
Dilution water control 0 0 0 0 0
0.36 0 0 0 0 0
0.67 0 0 0 0 0
1.4 0 0 0 0 0
3.0 0 0 0 0 0
5.8 0 0 0 0 100
LC50 mg formulation/L >5.8 >5.8 >5.8 >5.8 4.2
(95% confidence interval) - - - - 3.0 – 5.8
CONCLUSION: The 96-hour LC50 for SYN524464 to sheepshead minnow (Cyprinodon variegatus) was 4.2 mg a.i./L, based on the mean measured concentrations of SYN524464.
(Authors of vertebrate study, 2008b)
COMMENT: the study has not been submitted the in the framework of sedaxane EU approval but is considered fully reliable.

CLH REPORT FOR SEDAXANE
389
4.3.2 Short-term toxicity to aquatic invertebrates4.3.2.1 Gallagher, Kendall and Krueger (2008c)
Report: Gallagher, T. Kendall and H. Krueger. 2008c, SYN524464 – A 96-hour static acute toxicity test with the saltwater mysid (Americamysis bahia). Report Number 528A-162. 15 February 2008. Wildlife International Ltd, Easton, MD, USA. (Syngenta File No. SYN524464/0059)
GUIDELINES: U.S. Environmental Protection Agency. 1996. OPPTS Number 850.1035: Mysid Acute Toxicity Test. Series 850 – Ecological Effects Test Guidelines (draft).: U.S. Environmental Protection Agency. 1985. Standard Evaluation Procedure, Acute Toxicity Test for Estuarine and Marine Organisms (Shrimp 96-Hour Toxicity Test). Hazard Evaluation Division. Office of Pesticide Programs. EPA-540/9-85-010. Washington, DC.: ASTM Standard E729-96. 1996. Standard Guide for Conducting Acute Toxicity Tests on Test Materials with Fishes, Macroinvertebrates, and Amphibians. American Society for Testing and Materials.
GLP: Yes
EXECUTIVE SUMMARYThe acute toxicity of SYN524464 to saltwater mysids (Americamysis bahia) was determined under static conditions. This study was run with mean measured concentrations of 0.57, 1.2, 2.3, 4.7, and 8.1 mg a.i./L together with a negative control.
The LC50 was 1.5 mg a.i./L based on mean measured concentrations.
MATERIALS AND METHODSMaterials:
Test Material SYN524464
Lot/Batch #: SMU6LP006/MILLED
Purity: 95.3% (sum of 83.0% SYN508210 and 12.3% SYN508211)
Description: Off-white powder
Stability of test compound:
Stable under standard conditions
Reanalysis/expiry date: January 2011
Treatments
Test concentrations: Dilution water control and nominal concentrations of 0.63, 1.3, 2.5, 1.3, 2.5 and 5.0 mg a.i./L (mean measured 0.57, 1.2, 2.3, 4.7 and 8.1 mg a.i./L)
Dilution water: Saltwater (0.25 m filtered seawater)
Solvent: None
Analysis of test concentrations:
Yes (0 and 96 hours)
Test organisms
Species: Saltwater mysid (Americamysis bahia)
Source: Test facility
Acclimatisation period: Adults acclimated 14 days before collection of juveniles
Treatment for disease: None
Life stage of test organism:
Juvenile
Feeding: Live brine shrimp (Artemia sp.) daily during test

CLH REPORT FOR SEDAXANE
390
Test design
Test vessels: Test chambers were 2L glass beakers containing 1.5 L of test solution. The depth of the test water in a representative test chamber was approximately 11.8 cm.
Replication: 2 replicates, 10 mysids per replicate
Exposure regime: Static
Duration: 96 hours
Environmental conditions
Test temperature: 24.9 to 25.4 C at start and 25.2 to 25.3 C at end, also monitored continuously in one negative control replicate
pH range: 8.1 to 8.2 measured daily
Dissolved oxygen: 6.5 to 7.1 mg/L measured daily
Salinity of dilution water:
20‰ at test start
Lighting: 16 hours fluorescent light and 8 hours dark daily, with 30 minute dawn and dusk transition periods. Light intensity 313 lux at water surface.
Study Design and MethodsExperimental dates: Start 8 August End 13 August 2007The chambers were indiscriminately positioned by treatment group in an environmental chamber designed to maintain the desired test temperature throughout the test period. Two replicate tanks were prepared for the control and each test solution. Ten mysids were randomly allocated to each prepared test vessel.
Stock solutions were prepared at nominal concentrations of 5.0 or 10 mg a.i./L, the two highest test concentrations, by mixing a calculated amount of SYN524464 into dilution water (filtered saltwater). The stock solutions were sonicated for approximately 30 minutes and then stirred overnight. At the termination of stirring, stock solutions were clear and colorless with a few particles of precipitate on the surface. The 10 mg a.i./L stock solutions had more precipitate than the 5.0 mg a.i./L solutions. The 10 mg a.i./L stock solutions were used as the highest concentration test solution. Aliquots of the 5.0 mg a.i./L stock solution were proportionally diluted with saltwater to prepare 1500 mL of test solution at nominal concentrations of 0.63, 1.3 and 2.5 mg a.i./L. The solutions were mixed by stirring. All test solutions were adjusted to 100% active ingredient during preparation, based on the test substance purity (95.3%).
The concentrations of SYN524464 in the test solutions were measured at 0 and 96 hours using high performance liquid chromatography (HPLC) using variable wavelength detection.
Observations were made for mortality and clinical symptoms of toxicity at approximately 4.5, 24, 48, 72 and 96 hours.
RESULTS AND DISCUSSIONMean measured concentrations for the study were 0.57, 1.2, 2.3, 4.7 and 8.1 mg a.i./L, representing 90, 92, 92, 94 and 81% of nominal concentrations, respectively. Mean measured concentrations were used for the reporting of the results.
All saltwater mysids in the negative control group and in the 0.57 mg a.i./L treatment group appeared normal throughout the test. Percent mortality in the 1.2, 2.3, 4.7 and 8.1 mg a.i./L treatment groups at test termination was 10, 100, 100 and 100%, respectively. Surviving mysids in the 1.2 mg a.i./L treatment group were normal in appearance at test termination. The no-mortality concentration and the NOEC were both 0.57 mg a.i./L.

CLH REPORT FOR SEDAXANE
391
Table 4.3.2.1-1: Effects of test material on the survival of saltwater mysids (Americamysis bahia) following exposure for 96 hours in a flow-through test
Mean measured concentration Cumulative mortality observed, n = 20 a
(mg a.i./L) 4.5 hour 24 hour 48 hour 72 hour 96 hour
Dilution water control 0 0 0 0 0
0.57 0 0 0 0 0
1.2 0 0 2 2 2
2.3 0 12 20 20 20
4.7 0 20 20 20 20
8.1 0 20 20 20 20
LC50 (mg ai/L) - 2.1 1.5 1.5 1.5
95% confidence limits - 1.2 – 4.7 1.2 – 2.3 1.2 – 2.3 1.2 – 2.3
Method - Nonlinear Interpolationa Ten mysids were exposed in each test vessel, two replicates per treatment.
CONCLUSION: The 96 hour LC50 for test material to the saltwater mysid (Americamysis bahia) was calculated to be 1.5 mg a.i./L, based on mean measured concentrations.
(Gallagher S, Kendall T and Krueger H, 2008c)
COMMENT: the study has not been submitted the in the framework of sedaxane EU approval but is considered fully reliable.
4.3.2.2 Ricketts and Paddick (2006)Report: Ricketts D & Paddick W (2006). SYN524464 - Acute toxicity to Daphnia magna under static
conditions, Report Number T016850-04-REG, 13 December 2006. Syngenta, Jealott’s Hill International Research Centre, Bracknell, Berkshire, RG42 6EY, UK. (Syngenta File No. SYN524464/0011)
GUIDELINES: OECD Guidelines for the Testing of Chemicals, Section 2: Effects on Biotic Systems. Method 202. Daphnia sp., Acute Immobilisation Test. (Adopted 13 April 2004): EPA 712-C-96-114 Ecological Effects Test Guidelines: OPPTS 850.1010 Aquatic Invertebrate Acute Toxicity Test, Freshwater Daphnids (April 1996): JMAFF 2-7-2-1 Agchem Test Guidelines 12 Nousan No.8147, “Daphnia immobilisation2 (2001)
GLP: Yes
EXECUTIVE SUMMARYThe acute toxicity of Sedaxane technical to Daphnia magna was determined in a static test. Organisms were exposed to nominal concentrations of 0.5, 1, 2, 4 and 8 mg/L and a dilution water control. The 48 hour EC50 (based on mean measured concentrations) was 6.10 mg/L.
MATERIALS AND METHODSMaterials:
Test Material: Sedaxane Lot/Batch #: S01F002249UPurity: 98.2%
SYN508210 (trans isomer) 83.4%; SYN508211 (cis isomer) 14.8%
Description: White powderStability of test The test item was assumed to be stable for the test conditions and period of

CLH REPORT FOR SEDAXANE
392
compound: use in the study, pending concurrent batch reanalysis. Reanalysis/expiry date: Reanalysis date: April 2007
Treatments:Test concentrations:: Dilution water control and nominal concentrations of 0.5, 1, 2, 4 and 8 mg/LSolvent: NoneAnalysis of test concentrations:
Yes (based on measurement of Sedaxane at 0 and 48 hours)
Test animalsSpecies: Freshwater crustacean, Daphnia magna Straus 1820, Clone 5Source: Continuous laboratory cultures originally obtained from Huntingdon Life
Sciences, Huntingdon Research Centre, Woolley, Alconbury, Huntingdon, Cambridgeshire, PE28 4HS, UK on 15 September 2005.
Acclimatisation period:Treatment for disease: None
Feeding: None during testTest designTest vessels: Glass vessels containing 100 mL test mediumTest medium: Elendt’s M7 mediumReplication: Four replicates each containing 5 organisms per test concentration.No of Daphnia per test concentration:
20
Exposure regime: StaticAeration: NoneDuration: 48 hours
Environmental conditionsTest temperature: 20.7 to 21.2°C (in test vessels). Temperatures recorded in some of the test
vessels at the start of the test were not within the required range of 20oC + 1oC. This was not considered to have had a detrimental effect on the outcome or validity of the test as the control Daphnia showed no adverse effects.Temperature within the room monitored in a vessel filled with deionised water by means of a data logger, ranged from 19.2 to 20.2oC
pH: 7.50 – 7.59Dissolved oxygen: 88 - 99%Total hardness of dilution water:
267.2 – 268.6 mg/L CaCO3
Lighting: 16 hours fluorescent light and 8 hours dark with 20 minute dawn and dusk transition periods. Light intensity measured at the start of the test ranged from 606 - 720 Lux.
Study Design and MethodsExperimental dates: Start 9 October End 12 October 2006.
Test solutions for the 2, 4 and 8 mg/L nominal test concentrations were each prepared by direct weighing and addition of Sedaxane to dilution water. White powder was observed on the surface in all the test solutions. These test solutions were left to stir for 24 hours and after this time were each filtered through a 0.45 µm hydrophilic PTFE filter to remove any remaining un-dissolved technical material. The appearance of all the test solutions after filtering was clear and colourless.
An appropriate aliquot from the 2 mg/L test solution was then taken and diluted with dilution water to produce the lower test concentrations. The appearance of these test solutions was clear and colourless. The control consisted of test medium only.

CLH REPORT FOR SEDAXANE
393
At the start of the test twenty Daphnia per test concentration and control were randomly distributed among the test vessels to give four replicates of five organisms each. Immobility of Daphnia was determined by visual observations after 24 and 48 hours of exposure. Those organisms not able to swim within 15 seconds after applying a gentle stimulus were considered to be immobile.
At the start and end of the test pH, dissolved oxygen and water temperature were determined in each test concentration and the control. The temperature within the room was monitored in a vessel filled with deionised water throughout the exposure period by means of a data logger. Hardness of the dilution water and light intensity was also recorded at the start of the test.
The concentrations of Sedaxane in the test solutions were measured at 0 and 48 hours using HPLC with UV detection.
RESULTS AND DISCUSSIONMeasured concentrations at the start of the test ranged from 77 - 96% of the nominal values. At the end of the test, concentrations ranged from 77 - 93% of the nominal values.
At the start of the test, measured concentrations at 8 mg/L Sedaxane were 77% of nominal. At the end of the test, measured concentrations at 0.5 mg/L and 8 mg/L Sedaxane were 78% and 77% of nominal, respectively. The biological results are therefore based upon mean measured concentrations as these values were below 80% of nominal concentrations.
The limit of quantification (LOQ) in this study was 0.2 mg/L Sedaxane.
The EC50 is defined as the concentration resulting in 50% immobility in the Daphnia within the test period. The NOEC (No Observed Effect Concentration) is defined as the highest tested concentration which did not produce an adverse effect when compared to the control.
The numbers of D. magna immobilised after 24 and 48 hours and the estimated EC50 and NOEC are given in the Table below:
Table 4.3.2.2-1: Effect of Sedaxane on Daphnia magnaNumber immobilised/Total number testedNominal concentration
(mg a.i./L)Mean measured concentration
(mg a.i./L)24 h 48 h
Dilution water control 0/20 0/20
0.5 0.395 0/20 0/20
1 0.810 0/20 0/20
2 1.61 0/20 0/20
4 3.79 0/20 3/20
8 6.14 1/20 10/20
EC50 mg Sedaxane/L > 6.14* 6.10
95% confidence interval n/a 5.05 – 11.0
NOEC mg Sedaxane/L 3.79 1.61Mean measured concentrations and confidence limits reported to 3 significant figuresEndpoints based on mean measured concentrations* Estimated from visual inspection of the raw data
CONCLUSION: The 48 hour EC50 for Sedaxane technical to Daphnia magna was 6.10 mg/L based on mean measured concentrations.
(Ricketts D and Paddick W 2006)

CLH REPORT FOR SEDAXANE
394
4.3.3 Algae and aquatic plants4.3.3.1 Bätscher (2007a)
Report: Bätscher R (2007a). SYN524464 - Toxicity to Pseudokirchneriella subcapitata (formerly Selenastrum capricornutum) in a 96-hour algal growth inhibition test, Report Number B02610, 17 August 2007. RCC Ltd, CH-4452 Itingen, Switzerland. (Syngenta File No. SYN524464/0037)
GUIDELINES: OECD (1984). OECD Guidelines for Testing of Chemical 201. Alga, Growth Inhibition Test. Adopted 7 June 1984.: Official Journal of the European Communities, L 383 A, Part C.3, Algal inhibition test. 29 December 1992.: OPPTS Guideline No. 850.5400, Public Draft, April 1996.: JMAFF test guidelines, 2-7-7, Algae growth inhibition, 2005.
GLP: Yes
EXECUTIVE SUMMARYThe toxicity of Sedaxane to the green alga Pseudokirchneriella subcapitata (formerly Selenastrum capricornutum) was determined. The study was run with a culture medium control and concentrations of 0.21, 0.45, 1.0, 2.2, 4.6 and 9.8 mg ai/L. The 72-hour EbC50 was 1.9 mg ai/L and the 72-hour ErC50 was 2.8 mg ai/L, based on mean measured concentrations.
MATERIALS AND METHODSMaterials:
Test Material: Sedaxane
Description: Off-white powder
Lot/Batch #: SMU6LP006 milled
Purity 95.3%SYN508210 (trans isomer): 83.0%SYN508211 (cis isomer): 12.3%
Stability of test compound: Reanalysis date: January 2011
Test concentrations: Culture medium control and measured concentrations of 0.21, 0.45, 1.0, 2.2, 4.6 and 9.8 mg Sedaxane/L
Vehicle and/or positive control:
None / Potassium dichromate
Analysis of test concentrations:
Yes (0 and 96 hours)
Test organism
Species: Pseudokirchneriella subcapitata, Strain No. 61.81 SAG
Source: Collection of Algal Cultures (SAG, Institute for Plant Physiology, University of Göttingen, Germany). The algae are cultured in the RCC laboratories under standardized conditions according to the test guidelines.
Test design
Exposure regime: Static
Aeration: No
Replication: Six vessels for the control and three vessels for each test concentration
Starting cell density: 10000 cells/mL
Environmental conditions

CLH REPORT FOR SEDAXANE
395
Test Material: Sedaxane
Test temperature: 22 - 23°C
pH: test start: 8.2test end: 8.1 to 9.2
Lighting: Continuous illumination at 4450 to 5440 Lux (mean 4900 Lux)
Length of test: 96 hours
Study Design and MethodsExperimental dates: Start 11 May End 5 June 2007.
Test procedure and apparatus:The test vessels were 50 mL Erlenmeyer flasks covered with glass dishes. Each flask contained 15 mL of algal suspension. Six replicate cultures of the culture medium control and three replicates of each test concentration were employed. The test solutions were continuously stirred by magnetic stirrers. The test was started by inoculation of 10,000 algal cells per mL of test medium. The flasks were incubated in a temperature controlled water bath at a temperature of 22 - 23 °C and continuously illuminated at 4900 Lux (range 4450 to 5440 Lux).
Small volumes of all test concentrations and the control (1.0 mL) were taken from all test flasks after 24, 48, 72 and 96 hours of exposure. The algal cell densities in the samples were determined by counting with an electronic particle counter. In addition, after 96 hours exposure, a sample was taken from the control and from a test concentration with reduced algal growth (nominal 9.8 mg/L). The shape of the algal cells was examined microscopically in these samples.
A stock solution of nominally 100 mg/L was prepared by mixing 50.1 mg of the test item into 500 mL of test water using ultrasonic treatment for 15 minutes and intense stirring for 3 hours. The stock solution was filtered (0.45µm), then diluted in a series of sequential dilutions with test water to produce the test solutions at measured concentrations of 0.21, 0.45, 1.0, 2.2, 4.6 and 9.8 mg Sedaxane/L. The control consisted of culture medium only. For evaluation of the algal quality and the experimental conditions, potassium dichromate is tested as a positive control at least once per year.
The concentrations of Sedaxane in the test solutions were measured at 0 and 96 hours using a high performance liquid chromatography mass spectrometry method with UV/visible detection. The concentration of Sedaxane was analysed in the nominal test concentrations of 1.0 – 9.8 mg Sedaxane/L. The samples from the remaining test concentrations were not analysed since these concentrations were below the 96-hour NOEC determined in this study.
The pH was measured at the start and at the end of the test. The water temperature was measured daily in a flask incubated under the same conditions as the test flasks. The appearance of the test media was also recorded daily.
RESULTS AND DISCUSSIONAt the start of the test, the measured concentrations of the test concentrations (nominally 1.0 – 9.8 mg/L) were 1.1, 2.2, 4.7 and 9.9 mg/L. At the end of the test, the measured values ranged from 97 to 100% of the initial measured values. The arithmetic mean measured concentrations were used for the calculation and reporting of the results.
At the start of the test the pH was 8.2 and at the end of the test the range was from 8.1 to 9.2. The water temperature was 22 - 23°C. The mean light intensity was 4900 Lux. The water hardness was 24 mg/L as CaCO3.

CLH REPORT FOR SEDAXANE
396
The algal cell densities were measured at 24, 48, 72 and 96 hours and the means of these values were calculated. The 72-hour and 96-hour EbC50 and ErC50 values were calculated by probit analysis. For determination of the LOEC and NOEC values, a Dunnett’s test was used to identify significant differences in the calculated mean biomass and mean growth rate at the test concentrations, compared to the control.
The area under the growth curve 0 to 72 hours and 0 to 96 hours were calculated for each replicate culture.
Table 4.3.3.1-1: Mean values at each concentration of Sedaxane for the area under the growth curve at 72 and 96 hours for Pseudokirchneriella subcapitata
Mean measured test concentrations(mg ai/L)
Mean area under growth
curve(0 – 72 hrs)
Percentage inhibition
Mean area under growth
curve(0 – 96 hrs)
Percentage inhibition
Control 41.4 0.0 123.7 0.0
0.21 49.0 -18.4 144.7 -16.9
0.45 47.1 -13.7 136.7 -10.5
1.0 43.4 -4.8 126.6 -2.4
2.2 12.9* 68.7 32.9* 73.4
4.6 3.0* 92.8 4.2* 96.6
9.8 3.7* 91.0 5.1* 95.9* Significant difference (P=0.05) from the control- % inhibition: increase in growth relative to that of the solvent control
There was a statistically significant inhibitory effect on the biomass of P. subcapitata at 72 and 96 hours at concentrations at concentrations of 2.2 mg ai/L and above.
The 72-hour EbC50 was 1.9 mg ai/L (95% confidence limits not determined) and the 96-hour EbC50 was also 1.9 mg ai/L (95% confidence limit not determined).
The growth rate 0 to 72 hours and 0 to 96 hours were calculated for each replicate culture.
Table 4.3.3.1-2: Mean growth rates at each concentration of Sedaxane at 72 and 96 hours for Pseudokirchneriella subcapitata
Mean measured test concentrations(mg Sedaxane/L)
Mean growth rate
(0 – 72 hrs)
Percentage inhibition
Mean growth rate
(0 – 96 hrs)
Percentage inhibition
Control 1.32 0.0 1.18 0.00.21 1.39 -4.8 1.21 -2.70.45 1.37 -3.4 1.20 -1.31.0 1.34 -1.1 1.18 0.12.2 0.81* 39.0 0.86* 27.74.6 0.24* 82.0 0.22* 81.69.8 0.28* 79.0 0.23* 80.7
* Significant difference (P=0.05) from the control- % inhibition: increase in growth relative to that of the solvent control
There was a statistically significant inhibitory effect on the growth rate of P. subcapitata at 72 and 96 hours at concentrations of 2.2 mg ai/L and above.

CLH REPORT FOR SEDAXANE
397
The 72-hour ErC50 was 2.8 mg ai/L (95% confidence limits not calculated) and the 96-hour ErC50 was 3.0 mg ai/L (95% confidence limits not calculated).
The 72-hours and 96-hour NOEC were 1.0 mg ai/L.
CONCLUSION: Based on mean measured concentrations, the 72 hour EbC50 for Sedaxane to the green alga Pseudokirchneriella subcapitata (formerly Selenastrum capricornutum) was 1.9 mg ai/L. The 72 hour ErC50 was 2.8 mg ai/L. The 72 hours NOEC was 1.0 mg ai/L
(Bätscher R, 2007a)
4.3.3.2 Büche (2007a)Report: Büche C (2007a). SYN524464 - Toxicity to Navicula pelliculosa in a 96-hour algal growth test,
Report Number B37743, 14 December 2007. RCC Ltd, Itingen, Switzerland. (Syngenta File No. SYN524464/0044)
GUIDELINES: OECD Guidelines for Testing of Chemicals, Section 2 - Effects on Biotic Systems, Method 201: Freshwater Alga and Cyanobacteria, Growth Inhibition Test (2006): Official Journal of the European Communities, Dir 92/69/EEC, O.J. L383A, Part C.3: Algal inhibition test (1992): US EPA Ecological Effects Test Guidelines, OPPTS 850.5400: Algal Toxicity, Tiers I and II, (1996)
GLP: Yes
EXECUTIVE SUMMARYThe toxicity of Sedaxane to the freshwater diatom algal species Navicula pelliculosa was determined. This study was run with a culture medium control and with a saturated solution (undiluted filtrate) and dilutions 1:2, 1:4, 1:8, 1:16, and 1:32. The reported biological results were based on the mean measured test item concentrations, which were 1.2 mg/L (dilution 1:8), 2.4 mg/L (dilution 1:4), 4.7 mg/L (dilution 1:2) and 12 mg/L (undiluted filtrate with the loading rate of 100 mg/L). Based on the mean measured concentrations, the 72-hour ErC50 was 8.7 mg/L, the EyC50 was 4.8 mg/L and the EbC50 was 4.8 mg/L. The 96-hour ErC50 was 10 mg/L, the EyC50 was 5.7 mg/L and the EbC50 was 5.3 mg/L.
MATERIALS AND METHODSMaterials:
Test Material Sedaxane
Lot/Batch #: SMU6LP006/MILLED
Purity: 95.3%SYN508210 (trans isomer): 83.0%SYN508211 (cis isomer): 12.3%
Description: Off-white powder
Stability of test compound:
Not indicated by the Sponsor
Reanalysis/expiry date: January 2011
Treatments
Test concentrations: Culture medium control and a saturated solution (undiluted filtrate) and dilutions 1:2, 1:4, 1:8, 1:16, and 1:32 of the filtrate
Solvent: None
Positive control: None
Analysis of test concentrations:
Yes, analysis of Sedaxane (samples from 0 and 96 hours)

CLH REPORT FOR SEDAXANE
398
Test organism
Species: Navicula pelliculosa, UTEX B664
Source: UTEX Culture Collection of Algae/MCDB, University of Texas at Austin, USA
Test design
Test vessels: 125-mL glass Erlenmeyer flasks containing 50 mL of media covered with glass dishes
Test medium: AAP algal medium
Replication: Six vessels for the control and four vessels for each test concentration
Starting cell density: 10,000 cells/mL
Exposure regime: Static
Aeration: No
Duration: 96 hours
Environmental conditions
Test temperature: 23 °C
pH: test start: 7.4test end: 7.7 to 9.2
Lighting: Continuous illumination at 7240 to 8270 Lux
Study Design and MethodsExperimental dates: Start 31 August End 29 September 2007.
Due to the low water solubility of the test item, a dispersion of the test item with the loading rate of 100 mg/L was prepared by dispersing 100.02 mg of the test item in 1000 mL of test water using ultrasonic treatment and intense stirring. After 3-hour stirring, the dispersion was filtered. The undiluted filtrate of the dispersion and dilutions 1:2, 1:4, 1:8, 1:16, and 1:32 were used as test media. The control consisted of culture medium only.
An aliquot of test solution was placed into each test vessel and the test was started by inoculation of 10,000 algal cells per mL of test medium. Test solutions were shaken by hand at least twice a day and were held in a temperature controlled water bath under continuous illumination.
Small volumes of all test concentrations and control were taken from all test flasks after 24, 48, 72 and 96 hours of exposure. The algal cell densities in these samples were determined by an electronic particle counter. In addition, after 96 hours exposure, a sample was taken from the control and from a test concentration with reduced algal growth (dilution 1:2). The shape of the algal cells was examined microscopically in these samples.
The pH was measured at the start and at the end of the test. The water temperature was measured daily in a flask incubated under the same conditions as the test flasks.
The test concentrations were determined by chemical analysis of Sedaxane at 0 and 96 hours, using high performance liquid chromatography.
RESULTS AND DISCUSSIONAt the start of the test, the test concentrations in the dilutions 1:8, 1:4, 1:2 and the undiluted filtrate with the loading rate of 100 mg/L were 1.4, 2.8, 5.1 and 11 mg/L, respectively (see table below). The concentrations measured at the end of the test were 1.1, 2.0, 4.4 and 13.5 mg/L, corresponding to between

CLH REPORT FOR SEDAXANE
399
74 and 123% of the initially measured values. The limit of quantification in this study was 0.202 mg/L. Mean measured concentrations were used for the calculation and reporting of results.
Table 4.3.3.2-1: Analytical resultsConcentration of Sedaxane (mg/L) measured at Treatment / Dilution
0 hours 96 hours
Mean measured concentration
(mg/L)
Control n.d. n.d. n.d.
1:32 not analyzed
1:16 not analyzed
1:8 1.40 1.06 1.2
1:4 2.75 2.03 2.4
1:2 5.06 4.40 4.7
Undiluted filtrate (loading rate 100 mg/L) 11.0 13.5 12
n.d.: no test item detected
The algal biomass was measured at 24, 48, 72 and 96 hours and the means of these values were calculated. The 72-hour and 96-hour EbC50, EyC50 and ErC50 values (defined as the concentration resulting in 50% reduction of each parameter) were calculated using Probit analysis. For determination of the LOEC (Lowest Observed Effect Concentration) and NOEC (No Observed Effect Concentration) values, a Dunnett’s test was used to identify significant differences in the calculated mean areas under the growth curve (biomass integral), growth rate and yield of test item treatments compared to the control.
There were no abnormalities, observed microscopically, in the control or in the dilution 1:2 at 96 hours.
Growth rates: The growth rate for 0 to 72 hours and 0 to 96 hours was calculated for each replicate culture and the means are shown below, alongside the estimated EC50 values.
Table 4.3.3.2-2: Mean values at each concentration of Sedaxane for the growth rate at 72 and 96 hours for Navicula pelliculosa and relevant endpoints
Treatment / Dilution
Mean measured
concentrations of Sedaxane
(mg/L)
Mean growth rate (x 104 cells/mL/day)
0 – 72 hrs
Percentage inhibition
Mean growth rate(x 104 cells/mL/day)
0 – 96 hrs
Percentage inhibition
Control --- 1.6 0.0 1.5 0.0
1:32 n.a. 1.6 0.0 1.5 0.8
1:16 n.a. 1.6 0.2 1.5 0.5
1:8 1.2 1.6 -0.2 1.5 0.5
1:4 2.4 1.6 0.4 1.4 1.9
1:2 4.7 1.4 * 13.4 1.4 * 6.3
Undiluted filtrate
(loading rate 100 mg/L)
12 0.4 * 74.0 0.5 * 63.5
ErC50 mg/L(95% confidence limits)
8.7(8.5-8.9)
10(9.6-11)
ErC10 mg/L(95% confidence limits)
4.34.1-4.5
5.3(4.2-6.2)
NOEC 2.4 2.4

CLH REPORT FOR SEDAXANE
400
LOEC 4.7 4.7n.a.: not analyzed- % inhibition: increase in growth relative to that of control*: mean value significantly lower than in control
Yield: The yield for 0 to 72 hours and 0 to 96 hours was calculated for each replicate culture and the means are shown below, alongside the estimated EC50 values.
Table 4.3.3.2-3: Mean values at each concentration of Sedaxane for the yield at 72 and 96 hours for Navicula pelliculosa and relevant endpoints
Treatment / Dilution
Mean measured
concentrations of Sedaxane
(mg/L)
Mean yield(x 104 cells/mL)
0 – 72 hrs
Percentage inhibition
Mean yield(x 104 cells/mL)
0 – 96 hrs
Percentage inhibition
Control --- 136.8 0.0 375.6 0.0
1:32 n.a. 136.8 0.1 358.6 4.5
1:16 n.a. 135.4 1.1 364.6 2.9
1:8 1.2 138.3 -1.1 366.3 2.5
1:4 2.4 134.1 2.0 336.0 * 10.5
1:2 4.7 70.2 * 48.7 259.2 * 31.0
Undiluted filtrate (loading rate 100 mg/L)
12 2.6 * 98.1 7.9 * 97.9
EyC50 mg/L(95% confidence limits)
4.8(4.6-5.1)
5.7(3.9-9.3)
EyC10 mg/L(95% confidence limits)
3.0(2.2-3.5)
3.0(0.75-4.2)
NOEC 2.4 1.2
LOEC 4.7 2.4n.a.: not analyzed- % inhibition: increase in growth relative to that of control*: mean value significantly lower than in control
Biomass Integral (Areas under the Growth Curve): The biomass integral (areas under the growth curve) for 0 to 72 hours and 0 to 96 hours was calculated for each replicate culture and the means are shown below, alongside the estimated EC50 values.
Table 4.3.3.2-4: Mean values at each concentration of Sedaxane for the biomass integral (areas under the growth curve) at 72 and 96 hours for Navicula pelliculosa and relevant endpoints
Treatment / Dilution
Mean measured concentrations of
Sedaxane(mg/L)
Mean biomass integral (x 104 cells/mL x day)
0 – 72 hrs
Percentage inhibition
Mean biomass integral (x 104 cells/mL x day)
0 – 96 hrs
Percentage inhibition
Control --- 90.4 0.0 357.2 0.0
1:32 n.a. 89.4 1.1 347.4 2.8
1:16 n.a. 88.0 2.6 348.4 2.5
1:8 1.2 90.2 0.2 352.9 1.2
1:4 2.4 89.2 1.3 334.1 * 6.5
1:2 4.7 46.6 * 48.5 218.1 * 38.9

CLH REPORT FOR SEDAXANE
401
Undiluted filtrate
(loading rate 100 mgL)
12 3.1 * 96.6 8.6 * 97.6
EbC50 mg/L(95% confidence limits)
4.8(4.4-5.6)
5.3(4.8-6.1)
EbC10 mg/L(95% confidence limits)
3.0(1.7-3.5)
2.9(2.2-3.3)
NOEC 2.4 1.2
LOEC 4.7 2.4n.a.: not analyzed*: mean value significantly lower than in control
CONCLUSION: Based on mean measured concentrations, the 72-hour ErC50 for Sedaxane to Navicula pelliculosa was 8.7 mg/L, the EyC50 was 4.8 mg/L and the EbC50 was 4.8 mg/L. The 96-hour ErC50 was 10 mg/L, the EyC50 was 5.7 mg/L and the EbC50 was 5.3 mg/L.
The 72-hour ErC10 was 4.3 mg/L, the EyC10 was 3.0 mg/L and the EbC10 was 3.0 mg/L; The 96-hour ErC10 was 5.3 mg/L, the EyC10 was 3.0 mg/L and the EbC10 was 2.9 mg/L.
The 72-hour NOErC was 2.4 mg/L, the NOEyC was 2.4 mg/L and the NOEbC was 2.4 mg/L; The 96-hour NOErC was 2.4 mg/L, the NOEyC was 1.2 mg/L and the NOEbC was 1.2 mg/L.
(Büche C, 2007a)
4.3.3.3 Büche (2007b)Report: Büche C (2007b). SYN524464 - Toxicity to Anabaena flos-aquae in a 96-hour algal growth
inhibition test, Report Number B37776, 14 December 2007. RCC Ltd, Itingen, Switzerland. (Syngenta File No. SYN524464/0045)
GUIDELINEES: OECD Guidelines for Testing of Chemicals, Section 2 - Effects on Biotic Systems, Method 201: Freshwater Alga and Cyanobacteria, Growth Inhibition Test (2006): Official Journal of the European Communities, Dir 92/69/EEC, O.J. L383A, Part C.3: Algal inhibition test (1992): US EPA Ecological Effects Test Guidelines, OPPTS 850.5400: Algal Toxicity, Tiers I and II, (1996)
GLP: Yes
EXECUTIVE SUMMARYThe toxicity of Sedaxane to the freshwater cyanobacterium Anabaena flos-aquae was determined. This study was run with a culture medium control and with a saturated solution (undiluted filtrate) and dilutions of 1:2.2, 1:4.6, 1:10, 1:22, and 1:46. The reported biological results were based on the mean measured test item concentrations, which were 4.3 mg/L (dilution 1:2.2) and 6.5 mg/L (undiluted filtrate with the loading rate of 100 mg/L). Based on the mean measured concentrations, the 72-hour ErC50 was >6.5 mg/L, the EyC50 was >6.5 mg/L and the EbC50 was >6.5 mg/L. The 96-hour ErC50 was >6.5 mg/L, the EyC50 was >6.5 mg/L and the EbC50 was >6.5 mg/L.
MATERIALS AND METHODSMaterials:
Test Material Sedaxane
Lot/Batch #: SMU6LP006/MILLED
Purity: 95.3%SYN508210 (trans isomer): 83.0%

CLH REPORT FOR SEDAXANE
402
SYN508211 (cis isomer): 12.3%
Description: Off-white powder
Stability of test compound:
Not indicated by the Sponsor
Reanalysis/expiry date: January 2011
Treatments
Test concentrations: Culture medium control and a saturated solution (undiluted filtrate) and dilutions 1:2.2, 1:4.6, 1:10, 1:22, and 1:46.
Solvent: None
Positive control: None
Analysis of test concentrations:
Yes, analysis of Sedaxane (samples from 0 and 96 hours)
Test organism
Species: Anabaena flos-aquae, UTEX 1444
Source: UTEX Culture Collection of Algae/MCDB, University of Texas at Austin, USA
Test design
Test vessels: 125-mL glass Erlenmeyer flasks containing 50 mL of media covered with glass dishes
Test medium: Synthetic test water, prepared according to the test guidelines.
Replication: Six vessels for the control and three vessels for each test concentration
Starting cell density: 10,000 cells/mL
Exposure regime: Static
Aeration: No
Duration: 96 hours
Environmental conditions
Test temperature: 22 - 23 °C
pH: test start: 8.5test end: 9.0 to 9.1
Lighting: Continuous illumination at 5300 Lux (4560 to 8740)
Study Design and MethodsExperimental dates: Start 7 September End 29 September 2007.
Due to the low water solubility of the test item, a dispersion of the test item with the loading rate of 100 mg/L was prepared by dispersing 100.04 mg of the test item in 1000 mL of test water using ultrasonic treatment and intense stirring. After 3-hour stirring, the dispersion was filtered. The undiluted filtrate of the dispersion and dilutions 1:2.2, 1:4.6, 1:10, 1:22, and 1:46 were used as test media. The mean measured concentration for the undiluted filtrate and the 1:2.2 dilution were 4.3 and 6.5mg ai/L respectively, these were the only test concentrations that were analyzed. The control consisted of culture medium only.
An aliquot of test solution was placed into each test vessel and the test was started by inoculation of 10,000 algal cells per mL of test medium. Test solutions were stirred four times each day for 0.5 hours, using magnetic stirrers.

CLH REPORT FOR SEDAXANE
403
Small volumes of all test concentrations and control were taken from all test flasks after 24, 48, 72 and 96 hours of exposure. The algal cell densities in these samples were determined by an electronic particle counter after brief ultrasonification to break up the filaments of algal cells to single cells. In addition, after 96 hours exposure, a sample was taken from the control and from the highest test concentration (undiluted filtrate). The shape of the algal cells was examined microscopically in these samples.
The pH was measured at the start and at the end of the test. The water temperature was measured daily in a flask incubated under the same conditions as the test flasks.
The test concentrations were verified by chemical analysis of Sedaxane at 0 and 96 hours, using high performance liquid chromatography.
RESULTS AND DISCUSSIONAt the start of the test, the measured test concentrations in the dilutions 1:2.2 and the undiluted filtrate with the loading rate of 100 mg/L were 4.55 and 10.2 mg/L, respectively (see table below). The concentrations measured at the end of the test were 4.06 and 4.12 mg/L. The limit of quantification in this study was 0.202 mg/L. Mean measured concentrations were used for the calculation and reporting of results.
Table 4.3.3.3-1: Analytical resultsConcentration of Sedaxane (mg/L) measured at Treatment / Dilution
0 hours 96 hours
Mean measured concentration
(mg/L)
Control n.d. n.d. n.d.
1:46 not analyzed
1:22 not analyzed
1:10 not analyzed
1:46 not analyzed
1:2.2 4.55 4.06 4.3
Undiluted filtrate (loading rate 100 mg/L) 10.2 4.12 6.5
n.d.: no test item detected
The algal biomass was measured at 24, 48, 72 and 96 hours and the means of these values were calculated. The 72-hour and 96-hour EbC50, EyC50 and ErC50 values (defined as the concentration resulting in 50% reduction of each parameter) were calculated using Probit analysis. For determination of the LOEC (Lowest Observed Effect Concentration) and NOEC (No Observed Effect Concentration) values, a Dunnett’s test was used to identify significant differences in the calculated mean areas under the growth curve (biomass integral), growth rate and yield of test item treatments compared to the control.
There were no abnormalities, observed microscopically, in the control or in the undiluted filtrate at 96 hours.
Growth rates: The growth rate for 0 to 72 hours and 0 to 96 hours was calculated for each replicate culture and the means are shown below, alongside the estimated EC50 values.

CLH REPORT FOR SEDAXANE
404
Table 4.3.3.3-2: Mean values at each concentration of Sedaxane for the growth rate at 72 and 96 hours for Anabaena flos-aquae
Treatment / Dilution
Mean measured
concentrations of Sedaxane
(mg/L)
Mean growth rate (x 104 cells/mL/day)
0 – 72 hrs
Percentage inhibition
Mean growth rate(x 104 cells/mL/day)
0 – 96 hrs
Percentage inhibition
Control --- 1.2 0.0 1.1 0.0
1:46 n.a. 1.2 0.0 1.1 -1.3
1:22 n.a. 1.2 0.1 1.1 -1.0
1:10 n.a 1.2 -4.3 1.1 -2.9
1:46 n.a 1.3 -5.2 1.1 -4.2
1:2.2 4.3 1.2 -0.7 1.0 3.8
Undiluted filtrate
(loading rate 100 mg/L)
6.5 1.1* 7.6 1.0* 9.8
ErC50 mg/L(95% confidence limits)
>6.5 >6.5
NOEC 4.3 4.3
LOEC 6.5 6.5n.a.: not analyzed- % inhibition: increase in growth relative to that of control*: mean value significantly lower than in control
Yield: The yield for 0 to 72 hours and 0 to 96 hours was calculated for each replicate culture and the means are shown below, alongside the estimated EC50 values.
Table 4.3.3.3-3: Mean values at each concentration of Sedaxane for the yield at 72 and 96 hours for Anabaena flos-aquae
Treatment / Dilution
Mean measured
concentrations of Sedaxane
(mg/L)
Mean yield(x 104 cells/mL)
0 – 72 hrs
Percentage inhibition
Mean yield(x 104 cells/mL)
0 – 96 hrs
Percentage inhibition
Control --- 34.6 0.0 74.5 0.0
1:46 n.a. 34.6 0.0 78.8 -5.8
1:22 n.a. 34.5 0.4 77.8 -4.5
1:10 n.a 40.4 -16.8 84.4 -13.3
1:46 n.a 41.8 -2.9 89.3 -19.9
1:2.2 4.3 35.6 48.7 66.9 10.1
Undiluted filtrate (loading rate 100 mg/L)
6.5 26.2 * 24.3 48.4* 35.0
EyC50 mg/L(95% confidence limits)
>6.5 >6.5
NOEC 4.3 4.3
LOEC 6.5 6.5n.a.: not analyzed- % inhibition: increase in growth relative to that of control*: mean value significantly lower than in control

CLH REPORT FOR SEDAXANE
405
Biomass Integral (Areas under the Growth Curve): The biomass integral (areas under the growth curve) for 0 to 72 hours and 0 to 96 hours was calculated for each replicate culture and the means are shown below, alongside the estimated EC50 values.
Table 4.3.3.3-4: Mean values at each concentration of Sedaxane for the biomass integral (areas under the growth curve) at 72 and 96 hours for Anabaena flos-aquae
Treatment / Dilution
Mean measured concentrations of
Sedaxane(mg/L)
Mean biomass integral (x 104 cells/mL x day)
0 – 72 hrs
Percentage inhibition
Mean biomass integral (x 104 cells/mL x day)
0 – 96 hrs
Percentage inhibition
Control --- 30.3 0.0 84.8 0.0
1:46 n.a. 29.9 1.5 86.5 -2.0
1:22 n.a. 29.9 1.2 86.1 -1.5
1:10 n.a 33.5 -10.5 95.9 -13.0
1:46 n.a 34.6 -14.3 100.2 -18.1
1:2.2 4.3 31.1 -2.5 82.3 3.0
Undiluted filtrate
(loading rate 100 mg/L)
6.5 23.4* 22.7 60.7* 28.4
EbC50 mg/L(95% confidence limits)
>6.5 >6.5
NOEC 4.3 4.3
LOEC 6.5 6.5n.a.: not analyzed- % inhibition: increase in growth relative to that of control*: mean value significantly lower than in control
CONCLUSION: Based on mean measured concentrations, the 72-hour ErC50 for Sedaxane to Anabaena fols-aquae was >6.5 mg/L, the EyC50 was >6.5 mg/L and the EbC50 was >6.5 mg/L. The 96-hour ErC50 was >6.5 mg/L, the EyC50 was >6.5 mg/L and the EbC50 was >6.5 mg/L.
The 72 hour and 96 hour NOEC was 4.3 mg/L
(Büche C, 2007b)
4.3.3.4 Minderhout, Kendall and Krueger (2007)Report: Minderhout T, Kendall T and Krueger H, 2007, Report title SYN524464: a 96-hour toxicity test with
the marine diatom (Skeletonema costatum), Report Number 528A-165, 24 January 2008. Wildlife International, Ltd., Easton, Maryland. (Syngenta File No. SYN524464/0058)
GUIDELINES: ISO 10253 Standard: Water Quality – Marine Algal Growth Inhibition Test with Skeletonema costatum and Phaeodactylum tricornutum. 2nd Edition, Technical Committee ISO/TC 147, Water Quality Subcommittee SC 5, Biological Methods (2006): OECD Guidelines for Testing of Chemicals, Section 2 - Effects on Biotic Systems, Method 201: Freshwater Alga and Cyanobacteria, Growth Inhibition Test (2006): Official Journal of the European Communities, Dir 92/69/EEC, O.J. L383A, Part C.3: Algal inhibition test (1992): US EPA Ecological Effects Test Guidelines, OPPTS 850.5400: Algal Toxicity, Tiers I and II, (1996): ASTM, Standard Guide for Conducting Static 96-Hour Toxicity Tests with Microalgae (1990)
GLP: Yes
EXECUTIVE SUMMARY

CLH REPORT FOR SEDAXANE
406
The toxicity of SYN524464 to the marine diatom Skeletonema costatum was determined. Algae were exposed to nominal concentrations of 0.44, 0.88, 1.8, 3.5 and 7.0 mg ai/L alongside a culture medium control. Based on mean measured concentrations, the 72-hour EbC50, ErC50 and EyC50 were all >6.0 mg ai/L, the highest concentration tested. The 96-hour EbC50, ErC50 and EyC50 were also all >6.0 mg ai/L, the highest concentration tested.
MATERIALS AND METHODSMaterials:
Test Material SYN524464
Lot/Batch #: SMU6LP006/MILLED
Purity: 95.3% (sum of 83.0% SYN508210 and 12.3% SYN508211)
Description: Solid
Stability of test compound:
Stable under standard conditions
Reanalysis/expiry date: January 2011
Treatments
Test concentrations: Culture medium control and nominal concentrations of 0.44, 0.88, 1.8, 3.5 and 7.0 mg ai/L
Solvent: None
Positive control: Not applicable
Analysis of test concentrations:
Yes, analysis of SYN524464 at 0 and 96 hours
Test organism
Species: Skeletonema costatum, Strain No. CCMP 1332
Source: Continuous laboratory cultures, originally obtained from Provasoli-Guillard National Center for Culture of Marine Phytoplankton (CCMP), West Booth Bay Harbor, Maine, USA.
Test design
Test vessels: 250 mL glass Erlenmeyer flasks containing 100 mL of media covered with glass dishes
Test medium: Saltwater algal medium
Replication: Three vessels for the control and three vessels for each test concentration
Starting cell density: 7.7 × 10⁴ cells/mL
Exposure regime: Static
Aeration: No
Duration: 96 hours
Environmental conditions
Test temperature: 19.8 – 20.5°C
pH: test start: 8.1 to 8.1test end: 8.4 to 8.5
Lighting: 16 hours per day of cool-white fluorescent lighting at an intensity of 3,680 to 4,460 Lux, and 8 hours of darkness
Study Design and MethodsExperimental dates: Start 2 November End 6 November, 2007.

CLH REPORT FOR SEDAXANE
407
A stock solution with a nominal concentration of 7.0 mg ai/L was prepared by dissolving 0.1049 g of the test item completely in 1,000 mL of algal medium. Appropriate volumes of the stock solution were diluted to give the test concentration series. The control consisted of culture medium only.
An aliquot of test solution was placed into each test vessel and the test was started by inoculation of 77,000 algal cells per mL of test medium. Test solutions were constantly shaken and were held in a temperature controlled incubator under continuous illumination.
Small volumes of all test concentrations and controls were taken from all test flasks after 24, 48, 72 and 96 hours of exposure. The algal cell densities in these samples were determined by counting using a hemacytometer and microscope. In addition, after 96 hours exposure, a sample was taken from the control and from each treatment group. The shape of the algal cells was examined microscopically in these samples.
The pH was measured at the start and at the end of the test. The water temperature was measured daily in a flask incubated under the same conditions as the test flasks and ranged from 19.8 to 20.5°C.
The test concentrations were verified by chemical analysis of SYN524464 at 0 and 96 hours, using high performance liquid chromatography.
RESULTS AND DISCUSSIONAt the start of the test, the measured concentrations were in the range 99.0 to 101% of the nominal values and at the end of the test were in the range 69.1 to 89.9% (see table below). The limit of quantification in this study was 0.300 mg ai/L. Mean measured concentrations were used for the calculation and reporting of results.
Table 4.3.3.4-1: Analytical resultsNominal concentrations of
ai(mg/L)
% of nominal measured at 0 hours
% of nominal measured at 96 hours
Mean measured concentration (mg ai/L)
Control (0.0) <LOQ <LOQ --
0.44 99.5 85.8 93
0.88 99.5 88.3 94
1.8 99.0 87.0 94
3.5 99.8 89.9 94
7.0 101 69.1 86
The algal cell densities were measured at 24, 48, 72 and 96 hours and the mean biomass, growth rate and yield calculated. The 72-hour and 96-hour EbC50, EyC50 and ErC50 values (defined as the concentration resulting in 50% reduction of each parameter) were calculated using non-linear regression and linear interpolation analysis. For determination of the LOEC (Lowest Observed Effect Concentration) and NOEC (No Observed Effect Concentration) values, a Dunnett’s test was used to identify significant differences in the calculated mean biomass, growth rate and yield of test item treatments compared to the control.
There were no abnormalities, observed microscopically, in the control or any of the treatment groups at 96 hours.
Cell Density: The cell density values for 0 to 72 hours and 0 to 96 hours were calculated for each replicate culture and the means are shown below, alongside the estimated EC50 values.

CLH REPORT FOR SEDAXANE
408
Table 4.3.3.4-2: Mean values at each concentration of SYN524464 for the cell density at 72 and 96 hours for Skeletonema costatum and relevant endpoints
Nominal concentrations of ai(mg/L)
Mean cell density(x 106)
0 – 72 hrs *
Percentage inhibition
Mean cell density(x 106)
0 – 96 hrs *
Percentage inhibition
Control (0.0) 1.6 -- 2.7 --
0.44 1.8 -9.0 2.7 1.2
0.88 2.0 -20 2.9 -6.1
1.8 1.3 23 2.2 20
3.5 2.1 -26 2.7 -1.0
7.0 2.2 -32 2.9 -6.9
EC50 mg ai/L(95% confidence limits)
>6.0(Not Calculable)
>6.0(Not Calculable)
NOEC 6.0 6.0
LOEC >6.0 >6.0* = No statistically significant differences (p>0.05) from the negative control
Biomass (area under the growth curve): The areas under the growth curve for 0 to 72 hours and 0 to 96 hours were calculated for each replicate culture and the means are shown below, alongside the estimated EC50 values.
Table 4.3.3.4-3: Mean values at each concentration of SYN524464 or the biomass integral (area under the growth curve) at 72 and 96 hours for Skeletonema costatum and relevant endpoints
Nominal concentrations of ai(mg/L)
Mean biomass integral (x 107)
0 – 72 hrs *
Percentage inhibition
Mean biomass integral (x 107)
0 – 96 hrs *
Percentage inhibition
Control (0.0) 44,155,780 -- 94,496,656 --
0.44 47,256,500 -7.0 98,972,780 -4.7
0.88 47,208,928 -6.9 103,549,592 -9.6
1.8 28,728,148 35 68,051,956 28
3.5 45,607,312 -3.3 101,367,644 -7.3
7.0 51,463,636 -17 110,353,608 -17
EbC50 mg ai/L(95% confidence limits)
>6.0(Not Calculable)
>6.0(Not Calculable)
NOEC 6.0 6.0
LOEC >6.0 >6.0* = No statistically significant differences (p>0.05) from the negative control
Growth rates: The growth rate 0 to 72 hours and 0 to 96 hours were calculated for each replicate culture and the means are shown below, alongside the estimated EC50 values.

CLH REPORT FOR SEDAXANE
409
Table 4.3.3.4-4: Mean values at each concentration of SYN524464 for the growth rate at 72 and 96 hours for Skeletonema costatum and relevant endpoints
Nominal concentrations of ai(mg/L)
Mean growth rate 0 – 72 hrs *
Percentage inhibition
Mean growth rate0 – 96 hrs *
Percentage inhibition
Control (0.0) 0.0425 -- 0.0370 --
0.44 0.0436 -2.4 0.0369 0.23
0.88 0.0451 -6.0 0.0377 -1.8
1.8 0.0376 12 0.0345 6.6
3.5 0.0456 -7.2 0.0372 -0.39
7.0 0.0463 -8.8 0.0377 -1.9
ErC50 mg ai/L(95% confidence limits)
>6.0(Not Calculable)
>6.0(Not Calculable)
NOEC 6.0 6.0
LOEC >6.0 >6.0* = No statistically significant differences (p>0.05) from the negative control
Yield: The yield 0 to 72 hours and 0 to 96 hours were calculated for each replicate culture and the means are shown below, alongside the estimated EC50 values.
Table 4.3.3.4-5: Mean values at each concentration of SYN524464 for the yield at 72 and 96 hours for Skeletonema costatum and relevant endpoints
Nominal concentrations of ai(mg/L)
Mean yield(x 106 cells/mL)
0 – 72 hrs *
Percentage inhibition
Mean yield(x 106 cells/mL)
0 – 96 hrs *
Percentage inhibition
Control (0.0) 1,571,175 -- 2,623,898 --
0.44 1,718,768 -9.4 2,590,922 1.3
0.88 1,905,282 -21 2,789,773 -6.3
1.8 1,198,017 24 2,078,967 21
3.5 1,995,238 -27 2,651,456 -1.1
7.0 2,097,777 -34 2,809,721 -7.1
EyC50 mg ai/L(95% confidence limits)
>6.0(Not Calculable)
>6.0(Not Calculable)
NOEC 6.0 6.0
LOEC >6.0 >6.0* = No statistically significant differences (p>0.05) from the negative control
CONCLUSION: Based on mean measured concentrations, the 72-hour EC50, EbC50, ErC50 and EyC50 values for SYN524464 to Skeletonema costatum were all >6.0 mg ai/L. The 96-hour EC50, EbC50, ErC50 and EyC50 values for SYN524464 to Skeletonema costatum were all >6.0 mg ai/L.
The Lowest Observed Effect Concentration at 72 and 96 hours, based on cell density, biomass integral, growth rate and yield, was >6.0 mg ai/L, and the No Observed Effect Concentration was 6.0 mg ai/L.
(Minderhout T, Kendall T and Krueger H, 2007)
COMMENT: the study has not been submitted the in the framework of sedaxane EU approval. One of the validity criteria of the OECD guideline is not met: the mean coefficient of variation for section-by-section specific growth rates in the control cultures is 72% but should not have exceeded 35%. The validity criteria of the guideline are not designed for the marine algae S. costatum. Given that no effect has been observed in the study, the exceedance of this validity criteria is considered to have no outcome

CLH REPORT FOR SEDAXANE
410
on the study results. The study is considered less reliable but sufficiently informative for the purpose of classificiation.
4.3.3.5 Bätscher (2007b)Report: Bätscher R 2007b, SYN524464 – Toxicity to the aquatic higher plant Lemna gibba in a 7-day semi-
static growth inhibition test. Report Number B27898, 17 August 2007. RCC Ltd, CH-4452 Itingen, Switzerland. (Syngenta file no SYN524464/0039)
GUIDELINES: OECD 221 (2004), EPA OPPTS 850.4400 (1996)
GLP: Yes
EXECUTIVE SUMMARYThe toxicity of SYN524464 to the aquatic plant Lemna gibba was determined in a 7-day semi-static test. The test incorporated 6 concentrations (0.28, 0.59, 1,2, 2.4, 5.0 and 9.9 mg ai/L, based on mean measured concentrations) and a dilution water control.
For frond number, the 7-day EC50 for yield (EyC50) and growth rate (ErC50) for SYN524464 to Lemna gibba were 0.67 and 1.8 mg ai/L respectively, based on mean measured concentrations.
For dry weight, the 7-day EC50 for yield (EyC50) and growth rate (ErC50) for SYN524464 to Lemna gibba were 0.73 and 1.0 mg ai/L respectively, based on mean measured concentrations.
MATERIALS AND METHODSMaterials:
Test Material: SYN524464
Description: Off-white powder
Batch number: SMU6LP006/MILLED
Purity: 95.3%SYN508210 (trans isomer): 83.0%SYN508211 (cis isomer): 12.3%
Stability: Reanalysis date: January 2011
Treatments
Test concentrations: Dilution water control; mean measured concentration of 0.28, 0.59, 1,2, 2.4, 5.0 and 9.9 mg ai/L.
Vehicle and/or positive control:
n/a
Analysis of test concentrations:
Yes, days 0 (fresh solutions) and 7 (old solutions) (based on analysis of SYN524464)
Test organisms
Species: Lemna gibba
Source: In-house cultures
Test design
Test vessels: 250 mL glass dishes
Test medium:
Replication: Three vessels for the control and each test concentration
Initial frond number: 3 plants each consisting of 4 fronds, total 12 fronds

CLH REPORT FOR SEDAXANE
411
Exposure regime: Semi-static (medium renewal on day 5)
Environmental conditions
Temperature: 23°C
pH: 7.3 to 7.4 at test initiation; 8.6 to 9.0 at test termination
Lighting: Continuous illumination, mean light intensity of 7500 Lux (range 6700 – 8200 Lux).
Study Design and MethodsExperimental dates: Start 15 May End 3 July 2006
Saturated stock solutions of SYN524464 were prepared by stirring 100 mg (test initiation) and 100.1 mg (medium renewal) of test item in 1000 mL nutrient medium for 3 hours. These were then filtered (0.45µm) and diluted 1:2, 1:4, 1:8, 1:16 and 1:32 to produce the test concentration range. Test solutions were transferred into 250 mL crystallizing dishes and inoculated with Lemna plants. Cultures were then transferred to a temperature-controlled room where they were maintained for 7 days under the conditions indicated above. Assessments of frond number were made on days 0, 3, 5 and 7. Fronds were harvested for measurement of dry weight after 7 days, and the initial dry weight was determined using 12 fronds from pre-test cultures collected at day 0. Temperature was measured daily while pH was recorded at 0 and 7 days. Light intensity was recorded at nine locations over the experimental area before the start of the test.
RESULTS AND DISCUSSIONChemical analyses of fresh solutions (days 0 and 5) indicated that test concentrations were 0.31 and 0.26, 0.64 and 0.58, 1.3 and 1.2, 2.4 and 2.4, 5.0 and 5.1 and 9.7 and 10.3 mg ai/L respectively. At the end of the respective medium renewal periods 87 – 103% of the initially measured concentrations were found. Results were expressed in terms of mean measured concentrations. Mean frond numbers and dry weights are presented below:
Table 4.3.3.5-1: Effect of SYN524464 on frond number and dry weight of Lemna gibbaNominal
concentration(mg ai/L)
Mean No. fronds/replicate
(day 7)
Frond No. yield
Frond No. average specific
growth rate
Mean dry weight
(mg)/replicate (day 7)
Dry weight yield
Dry weight average specific
growth rate
Control 142.3 130.3 0.353 16.1 14.4 0.321
0.28 130.7 118.7(*) 0.341 15.2 13.5 0.313
0.59 128.3 116.3(*) 0.338 15.3 13.6 0.314
1.2 120.7 108.7* 0.330* 14.4 12.8 0.306
2.4 102.7 90.7* 0.307* 9.6 7.9* 0.246*
5.0 64.7 52.7* 0.240* 4.9 3.2* 0.151*
9.9 23.3 11.3* 0.094* 2.0 1.2* 0.074*
Inoculum = 12 fronds/vessel (1.7 mg dry weight), * = mean value statistically significantly lower than the control (p = 0.05)
Data for frond number and dry weight was used to fit growth curves from which average specific growth rates were calculated for the control and each exposure concentration. A probit model was then used to calculate the 7-day ErC50 and EyC50 and their respective 95% confidence intervals, based on percent inhibition relative to the control. Results are shown below:

CLH REPORT FOR SEDAXANE
412
Table 4.3.3.5-2: Summary of EC50 parameters and confidence limits for SYN524464 to L. gibba (mg ai/L)
Frond numbers Dry weight of plantsParameter
Growth rate ( r) Yield (y) Growth rate ( r) Yield (y)
7-d EC50 (95% confidence interval)
6.5(5.3 – 8.2)
3.6(2.5 – 5.2)
4.8(4.4 – 5.2)
2.7(2.3 – 3.3)
7-d EC10 (95% confidence interval)
2.4(1.2 – 3.3)
0.97(0.29 – 1.6)
1.5(1.2 – 1.7)
0.98(0.61 – 1.3)
NOEC 0.59 0.59 1.2 1.2
CONCLUSION: For frond number, the 7-day ErC50 and EyC50 for SYN524464 to Lemna gibba are 6.5 and 3.6 mg ai/L respectively, based on mean measured concentrations.For dry weight, the 7-day ErC50 and EyC50 for SYN524464 to Lemna gibba are 4.8 and 2.7 mg ai/L respectively, based on mean measured concentrations.For frond number, the 7-day ErC10 and EyC10 for SYN524464 to Lemna gibba are 2.4 and 0.97 mg ai/L respectively, based on mean measured concentrations.For dry weight, the 7-day ErC10 and EyC10 for SYN524464 to Lemna gibba are 1.5 and 0.98 mg ai/L respectively, based on mean measured concentrations.For frond number, the 7-day NOEC was 0.59 mg ai/L, based on mean measured concentrations.For dry weight, the 7-day NOEC was 1.2 mg ai/L, based on mean measured concentrations.
(Bätscher R, 2007b)
COMMENT: the study has not been submitted the in the framework of sedaxane EU approval but is considered fully reliable.
4.4 Chronic toxicity4.4.1 Fish early-life stage (FELS) toxicity test4.4.1.1 Authors of vertebrate study (2008d)
Report: Authors of vertebrate study. (2008d). SYN524464 – An early life stage toxicity test to fathead minnow (Pimephales promelas), Report Number 528A-168 (Syngenta Study No. T016864-04). 16 April 2008. Lab of vertebrate study. (Syngenta File No. SYN524464/0065)
GUIDELINES: OECD Guidelines for testing of chemicals 210 “Fish, Early-life Stage Toxicity Test” (adopted by the Council 17th July 1992): Ecological Effects Test Guidelines OPPTS 850.1400 “Fish, Early-life Stage Toxicity Test”, Public Draft, (April 1996)
GLP: Yes
EXECUTIVE SUMMARYThe toxicity of Sedaxane to early life-stages of fathead minnow (Pimephales promelas) was determined in a flow-through test. Fish were exposed to a range of nominal concentrations of 6.2, 19, 56, 170 and 500 µg ai/L, a solvent control and a dilution water control. Results are expressed as mean measured concentrations.
There were no statistically significant treatment-related effects on hatching success at any of the concentrations tested. There were also no statistically significant treatment-related effects on survival or growth at the 6.1, 18, 56 and 165 µg a.i./L test concentrations. There was a statistically significant reduction in survival at the 469 µg a.i./L test concentration that resulted in 100% mortality for this treatment group. Consequently the NOEC was 165 µg a.i./L and the LOEC was 469 µg a.i./L.

CLH REPORT FOR SEDAXANE
413
MATERIALS AND METHODSMaterials:
Test Material Sedaxane
Lot/Batch #: SMU6LP006/MILLED
Purity: SYN524464: 95.3% SYN508210, trans-isomer: 83.0%SYN508211, cis-isomer: 12.3%
Description: Off-white powder
Density: Not given
Stability of test compound:
Stable under test conditions
Reanalysis/expiry date:
Reanalysis date January 2011
Treatments Sedaxane
Test concentrations: Nominal - 6.2, 19, 56, 170 and 500 µg a.i./L, a solvent control and a dilution water control. Mean measured - 6.1, 18, 56, 165 and 469 µg a.i./L, a solvent control and a dilution water control.
Solvent: Dimethyl formamide
Analysis of test concentrations:
Yes, analysis of Sedaxane at 0, 7, 14, 21, 28 and 33 days.
Test organismss
Species: Fathead minnow (Pimephales promelas)
Source:
Acclimatisation period: None
Treatment for disease: None
Feeding: Newly hatched larvae were fed live brine shrimp nauplii (Artemia sp.), three times daily during the first 10 days post-hatch. Thereafter they were fed live brine shrimp nauplii three times daily during the week and twice daily on weekends and holidays. No food given during last 48 hours of the study.
Test design
Test vessels: Glass vessels containing 7 L of water
Test medium: Well water, filtered to 0.45 µm
Replication: 4
No of eggs per tank: 20
Exposure regime: Flow-through
Duration: 28 days post-hatch (33 days exposure)
Environmental conditionsDilution water: Well water, filtered to 0.45 µm
Test temperature: 23.9 to 25.4oC
pH: 8.1 to 8.3
Dissolved oxygen: 6.5 to 8.2 mg/L

CLH REPORT FOR SEDAXANE
414
Hardness of dilution water: Alkalinity of dilution water:
138 - 148 mg/L as CaCO33
176 – 188 mg/L as CaCO3
Conductivity of dilution water: 325 - 370 µmhos/cm
Lighting: 16 hours fluorescent light (572 Lux) and 8 hours dark with 30 minute dawn and dusk transition periods.
Study Design and MethodsExperimental dates: Start 26 November 2007 End 2 January 2008.
Stock solutions were prepared three times during the study, at approximately two week intervals. A primary stock solution was prepared in dimethyl formamide at 5 mg a.i./mL. From this four secondary stock solutions were prepared in well water at 0.062, 0.19, 0.56 and 1.7 mg a.i./mL. These were stored under refrigeration and used to fill syringe pumps every other day during the test.
The five stock solutions were delivered to mixing chambers in a diluter system at 20 µL/minute, where they were mixed with 200 mL/minute of well water to produce the nominal test solution concentrations of 6.2, 19, 56, 170 and 500 µg ai/L.
At the start of the test 20 eggs were randomly allocated to egg cups and one egg cup suspended in each of four replicate test vessels at each test and control treatment. The control treatments consisted of a water (negative) and solvent control. Hence, 80 eggs were exposed at each treatment. The test was undertaken in a temperature controlled environmental chamber. Observations for time to hatch, hatching success, larval mortality, deformed larvae and other symptoms of toxicity were made daily during the pre and post-hatch phases, as appropriate. At the end of the test, lengths and wet and dry weights of the surviving fry were measured.
Temperature was measured in each test chamber at the beginning and end, and at weekly intervals during the test. Temperature was also continually recorded automatically in one negative control vessel using an electronic recording system.
Dissolved oxygen was measured in alternate replicates of each treatment and control group at the beginning and end of the test, daily during the first seven days, and then at weekly intervals during the test.
The pH was measured in alternating replicates of each treatment and control group at the beginning and end of the test, and at approximately weekly intervals during the test.
The concentrations of Sedaxane in the test solutions were measured at 0, 7, 14, 21, 28 and 33 days using a HPLC method with variable wavelength detection set at 220 nm. The limit of quantification was 4.00 µg a.i./L. Samples for analysis were taken at mid-depth in the test chambers.
RESULTS AND DISCUSSIONThe mean measured concentrations of Sedaxane determined in the test solutions ranged from approximately 87 to 109% of the nominal concentrations. When the measured concentrations of the test samples were averaged, the mean measured concentrations (6.1, 18, 56, 165 and 469 µg/L) were 94 to 100% of the nominal concentrations.
The mean measured concentrations were used for calculating and reporting the results.
Biological data:The dilution water and solvent controls were compared using a t-test. No statistically significant differences between controls were identified for any of the endpoints examined, so the data were pooled for further analysis. For the quantal responses, Chi-square and Fisher’s Exact tests were

CLH REPORT FOR SEDAXANE
415
used to identify statistically significant differences from the control (p<0.05). The NOECs were identified using scientific judgement to determine if statistical differences were biologically meaningful. For the non-quantal responses, the NOECs were determined using Dunnett’s test (p<0.05). All analyses were performed using a personal computer with TOXSTAT software.
Time to hatching: Hatching started in all replicates (controls and treatments) on days 4 to 5. There were no statistical differences in time to hatching between the pooled control and any of the test treatments.
Hatching success: There was no statistically significant difference in hatching success between the dilution water control and the solvent control, or between the pooled controls and any of the treatments.
Fry survival: There was no statistically significant difference in fry survival from day 5 to day 33 between the dilution water control and the solvent control. At 469 µg ai/L, the highest concentration tested, no fry survived to the end of the test. Hence, there was a statistically significant difference between the pooled controls and this treatment. Statistical analysis of the remaining treatments identified no significant reductions in fry survival.
Length: No statistically significant differences in length were found between the dilution water control and solvent control. At 469 µg ai/L, the highest concentration tested, no fry survived to the end of the test. Statistical analysis of the remaining treatments showed there were no significant reductions in fry length, compared with the pooled controls, at lower concentrations.
Wet weight: No statistically significant differences in wet weight were found between the control and solvent control. At 469 µg ai/L, the highest concentration tested, no fry survived to the end of the test. Statistical analysis of the remaining treatments showed there were no significant reductions in wet weight, compared with the pooled controls, at lower concentrations.
Dry weight: No statistically significant differences in dry weight were found between the control and solvent control. At 469 µg ai/L, the highest concentration tested, no fry survived to the end of the test. Statistical analysis of the remaining treatments showed there were no significant reductions in dry weight, compared with the pooled controls, at lower concentrations.
Table 4.4.1.1–1: Effects of Sedaxane on the growth of Pimephales promelasQuantal responses Non quantal responsesMean measured
concentration (µg a.i./L)
Hatching success (%)1
Fry survival to test end (%)2
Mean length (mm)±SD
Mean wet weight (mg)±SD
Mean dry weight (mg)±SD
Control 100 86 19.8 ± 0.59 53.1 ± 4.71 9.6 ± 0.89
Solvent control 96 83 20.5 ± 0.65 63.8 ± 7.74 11.1 ± 1.41
Pooled control 98 85 20.2 ± 0.70 58.4 ± 8.23 10.3 ± 1.34
6.1 96 91 19.8 ± 0.10 55.4 ± 2.65 9.7 ± 0.37
18 99 89 19.7 ± 0.40 55.9 ± 3.03 9.6 ± 0.64
56 98 94 20.0 ± 0.18 59.0 ± 2.79 10.3 ± 0.59
165 98 88 20.4 ± 0.32 65.5 ± 3.84 11.3 ± 0.89
469 100 0* - - -
NOEC 469 µg/L 165 µg/L 165 µg/L 165 µg/L 165 µg/L1 The number of live larvae on the day they are transferred from the egg cups to the test vessel (day 5) expressed as a percentage of the number of eggs added at the start of the test (day 0).2 The number of surviving larvae at the end of the test (day 33) expressed as a percentage of the number of eggs added on day 0.* Statistically different from the pooled control.
CONCLUSION: Based on mean measured concentrations, the 33-day NOEC for Sedaxane to early life-stages of fathead minnow (Pimephales promelas) is 165 µg a.i./L, resulting from effects on fry survival.

CLH REPORT FOR SEDAXANE
416
(Authors of vertebrate study, 2008d)
4.4.2 Aquatic invertebrates4.4.2.1 Bätscher (2007c)
Report: Bätscher R (2007c). SYN524464 – Effect on survival and reproduction of Daphnia magna in a semi-static test over three weeks, Report Number B02632, 17 August 2007. RCC Ltd, CH-4452 Itingen, Switzerland. (Syngenta File No. SYN524464/0038)
GUIDELINES: OECD (1984). OECD Guidelines for Testing of Chemicals, No. 211. Daphnia magna Reproduction test. Adopted 21 September 1998.
GLP: Yes
EXECUTIVE SUMMARYThe effect of Sedaxane on the survival and reproduction of Daphnia magna was determined over 21-days. The study was run with a dilution water control, a solvent control and nominal concentrations of 0.025, 0.080, 0.26, 0.82, 2.6 and 8.4 mg ai/L. The 21-day No Observed Effect Concentration (NOEC) for adult (P generation) survival and reproduction was 0.82 mg ai/L, based on nominal concentrations. The 21-day EC50 for reproduction was 1.5 mg ai/L, based on nominal concentrations.
MATERIALS AND METHODSMaterials:
Test Material: Sedaxane Lot/Batch #: SMU6LP006 milledPurity: 95.3%
SYN508210 (trans isomer): 83.0% SYN508211 (cis isomer): 12.3%
Description: Off-white powderStability of test compound:
The test item was assumed to be stable for the test conditions and period of use in the study, pending concurrent batch reanalysis.
Reanalysis/expiry date: Reanalysis date: January 2011
Treatments:Test concentrations:: Culture medium control, solvent control and nominal concentrations of 0.025,
0.080, 0.26, 0.82, 2.6 and 8.4 mg a.i./L.Solvent: N,N-dimethylformamideAnalysis of test concentrations:
Yes (based on measurement of SYN524464 for fresh solutions on days 0, 7 and 16 and for old solutions on days 2, 9 and 19)
Test organismsSpecies: Freshwater crustacean, Daphnia magna Straus 1820, Clone 5Source: Originally supplied by the University of Sheffield, UK in 1992. The Daphnia
are cultured in Elendt M7 medium at the RCC laboratories under standardized conditions according to the test guidelines.
Treatment for disease: NoneFeeding: Freshly grown green alga (Scenedesmus subspicatus) and a suspension of
ground Tetramin® fish food in water were fed three times weekly. The ration supplied to each P generation daphnid on the designated feeding days was ~0.2 mg TOC.
Test designTest vessels: Glass vessels containing 80 mL test medium

CLH REPORT FOR SEDAXANE
417
Test medium: Elendt’s M7 mediumReplication: Ten replicate vessels for each control and test concentration.No of P generation per replicate:
1
No of P generation per treatment:
10
Exposure regime: Semi-staticAeration: NoneDuration: 21 days
Environmental conditionsTest temperature: 20°C pH: 7.6 – 8.1Dissolved oxygen: 8.1 – 9.4 mg/LTotal hardness of dilution water:
250 mg/L CaCO3
Lighting: 16 hours fluorescent light and 8 hours dark with 30 minute dawn and dusk transition periods. Light intensity ranged from 470 - 640 Lux.
Study Design and MethodsExperimental dates: Start 3 April End 5 May 2007.
Application solutions were prepared by dissolving known amounts of the test item in 10 mL of N,N-dimethylformamide (DMF) using intense stirring. The application solutions were then used to prepare the test concentrations. The control consisted of Elendt M7 medium only, while the solvent control contained 100µL DMF/L (the same concentration of DMF as in the test concentrations).
The test was started by adding one P generation animal (less than 24 hours old) to each replicate vessel containing 80 mL of test medium. Ten replicates of the control, solvent control and each test concentration were employed hence 10 daphnids were exposed at each treatment. Live juvenile animals were counted three times each week, starting from day 7. Test vessels were also monitored for the presence of dead adults, dead juveniles and aborted eggs on these days. Three times each week (days 2, 5, 7, 9, 12, 14, 16 and 19) the test medium was renewed and the P generation daphnids transferred to fresh medium.
The pH and concentration of dissolved oxygen were measured in one replicate at the start and end of the test and in the new and old solutions at each medium renewal. At the same time the temperature was measured in one of the control replicates. The room temperature was continually monitored. The appearance of the test medium was visually recorded for the old and new media at the beginning and end of each medium renewal.
The concentrations of Sedaxane in the test solutions were measured in freshly prepared solutions on days 0, 7 and 16 and in the reciprocal old solutions on days 2, 9 and 19. A high performance liquid chromatography mass spectrometry method with UV/visible detection was used. The concentration of Sedaxane was analysed in the nominal test concentrations of 0.82 and 2.6 mg ai/L (21-day NOEC and Lowest Observed Effect Concentration, LOEC). The samples from test concentrations below the NOEC and above the LOEC were not analysed as they were not relevant for the interpretation of the biological results.
RESULTS AND DISCUSSIONAt 0.82 and 2.6 mg ai/L the measured concentrations of the test item in the old and new test media were between 90 and 103% of the nominal values. Therefore, the test item was stable in the test medium over the renewal periods of 48 and 72 hours. Nominal concentrations were used for the calculation and reporting of the results.
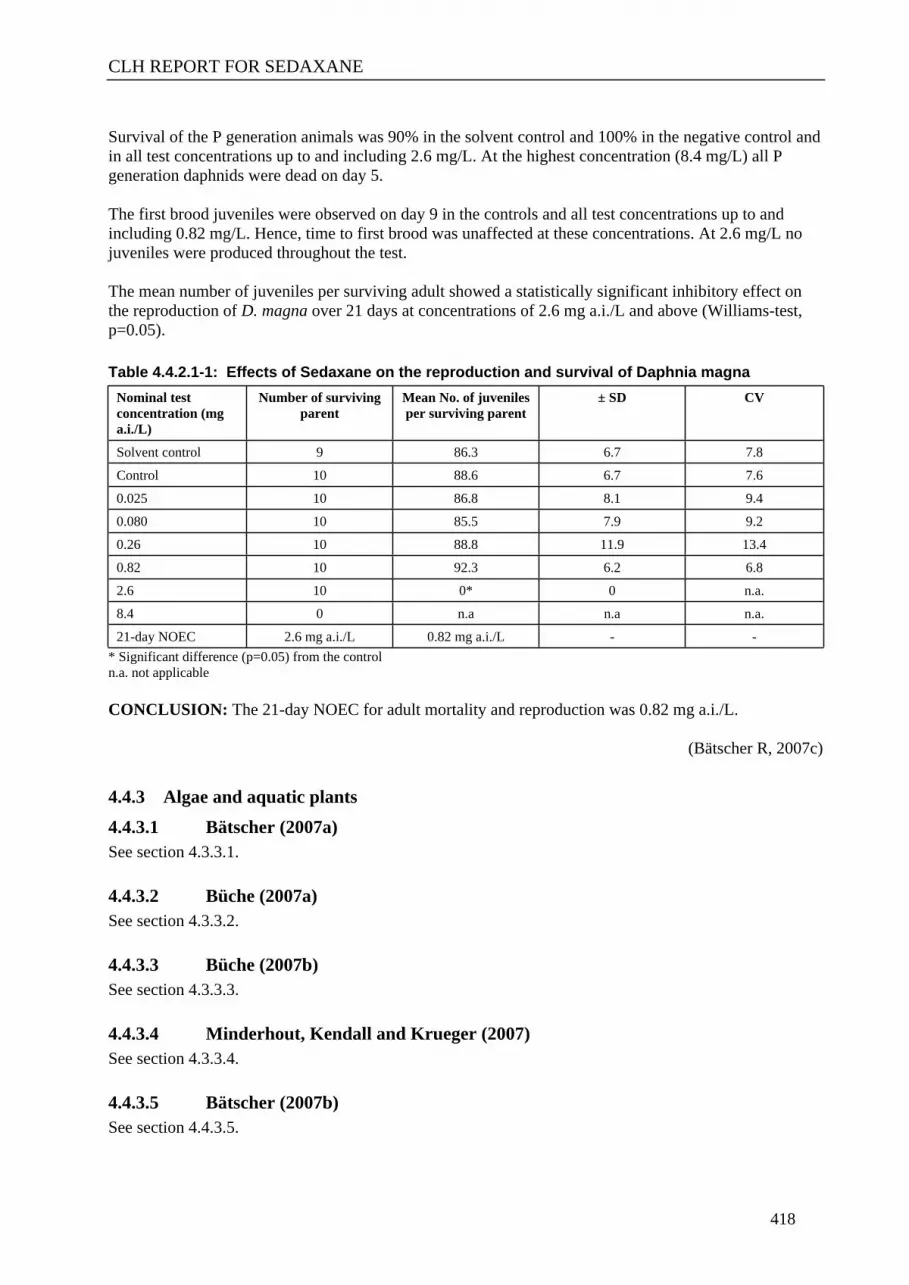
CLH REPORT FOR SEDAXANE
418
Survival of the P generation animals was 90% in the solvent control and 100% in the negative control and in all test concentrations up to and including 2.6 mg/L. At the highest concentration (8.4 mg/L) all P generation daphnids were dead on day 5.
The first brood juveniles were observed on day 9 in the controls and all test concentrations up to and including 0.82 mg/L. Hence, time to first brood was unaffected at these concentrations. At 2.6 mg/L no juveniles were produced throughout the test.
The mean number of juveniles per surviving adult showed a statistically significant inhibitory effect on the reproduction of D. magna over 21 days at concentrations of 2.6 mg a.i./L and above (Williams-test, p=0.05).
Table 4.4.2.1-1: Effects of Sedaxane on the reproduction and survival of Daphnia magnaNominal test concentration (mg a.i./L)
Number of surviving parent
Mean No. of juveniles per surviving parent
± SD CV
Solvent control 9 86.3 6.7 7.8
Control 10 88.6 6.7 7.6
0.025 10 86.8 8.1 9.4
0.080 10 85.5 7.9 9.2
0.26 10 88.8 11.9 13.4
0.82 10 92.3 6.2 6.8
2.6 10 0* 0 n.a.
8.4 0 n.a n.a n.a.
21-day NOEC 2.6 mg a.i./L 0.82 mg a.i./L - -* Significant difference (p=0.05) from the controln.a. not applicable
CONCLUSION: The 21-day NOEC for adult mortality and reproduction was 0.82 mg a.i./L.
(Bätscher R, 2007c)
4.4.3 Algae and aquatic plants4.4.3.1 Bätscher (2007a)See section 4.3.3.1.
4.4.3.2 Büche (2007a)See section 4.3.3.2.
4.4.3.3 Büche (2007b)See section 4.3.3.3.
4.4.3.4 Minderhout, Kendall and Krueger (2007)See section 4.3.3.4.
4.4.3.5 Bätscher (2007b)See section 4.4.3.5.

CLH REPORT FOR SEDAXANE
419
4.4.4 Long-term aquatic hazard (including bioaccumulation potential and degradation)No additional studies.


