Embed Size (px)
Citation preview

CIMR Research Working Paper Series
Working Paper No.
Skills, social insurance, and changes in innovation investment after the onset of
the financial crisis in Europe
by
Andrea Filippetti
Italian Research Council (CNR) Rome, and
Department of Geography, London School of Economics
Frederick Guy
Department of Management, Birkbeck, University of London
Malet St, London WC1E 7HX
10 August 2012

2
Abstract
This paper compares investments in innovation from the early days of the financial
crisis up to mid 2009 using a survey covering more than 5,000 firms across twenty
one European countries. Our interest is in how differences in labour market
institutions and human capital affect a firm’s innovation investment during the
recent financial crisis. We find that continuity of investment in innovation in Europe
during the onset of the financial crisis in 2008-9 was strongest in countries which
have both high earnings replacement rates and high participation in vocational
education and training; countries with just one were more likely to see reduced
innovation, while we find no effect (either positive or negative) from job security.
Key words: varieties of capitalism; labour market institutions; skills; innovation investment; financial
crisis; EU labour market; comparative studies.
JEL codes: J24, J65, O31, O57, P52.

3
1. Introduction
Two persistent questions in the comparative study of capitalism are what role
skilled labour plays in national systems of innovation, and how different forms of
social insurance contribute to the development of skill.
Skilled labour plays a role in innovation by contributing to a firm’s ability to
adopt new technologies, to make incremental process improvements, and to
operate production systems which are flexible in the sense of being able to both
vary and to make incremental improvements to the product. Developing the skills
which contribute to innovation may require risky investments by the employer, the
worker, or both. Investment in a skill is risky for the employer if the worker might
move to another job where the skills are useful; it is risky for the worker if the
market for the skill is thin or volatile – conditions which will attach not only to skills
which are specific to a firm, but also to skills which may be vulnerable to a sudden
loss of market due, say, to technological obsolescence or off-shoring. Skills with this
sort of vulnerability are often specific to a particular industry or technology, and as
shorthand from this point on we will simply call them ‘specific skills’.
Either job security (JS) or unemployment insurance (UI), together with some
provision for re-training, can provide insurance to offset the risk associated with
specific skills (Estevez-Abe, Iversen, and Soskice 2001, [EIS]). A long tradition in
comparative research shows how JS, together with restrictions on worker mobility,
have contributed to skill development and innovation in both Japanese (e.g. Dore
1973; Aoki 1988) and German (e.g. Sorge and Streeck 1988) firms. In recent years,
more interest has been addressed to the contribution of the UI mechanism to skills

4
and innovation, often as part of a package labelled ‘flexicurity’ (e.g. Lorenz 2011).
(Flexicurity takes different forms in different times and places, and the use of the
term itself is perhaps too flexible in policy documents (Viebrock and Clasen 2009);
we mean something like the Danish mix of weak JS, strong short term UI, and
retraining which can be provided independent of employment, through a strong
vocational education and training (VET) system.)
Innovation systems, like labour markets, can be understood as being shaped by
national institutions (Lundvall 1992; Nelson 1993). Hall and Soskice (2001)
maintained that innovation in liberal market economies (LMEs) tends to be more
radical while that in coordinated market economies (CMEs) is more typically
incremental. All of the cases just mentioned – high JS Germany and Japan,
flexicurity Denmark – would be classified, in the terms of Hall and Soskice, as CMEs.
Though the empirical basis for this radical/incremental sorting of national
innovation systems has been questioned (Akkermans, Castaldi, and Los 2009), it
remains worthwhile to ask how national differences in the composition of skills
affects innovation.
The contribution of VET to skill formation, and through skill to innovation, is not
always clear. VET has often been found to be ineffective at delivering useful skills
(World Bank 1991); critics cite the separation between VET providers and
employers (see the discussion in Crouch, Finegold, and Sako 1999) as weakening
both the ability and the incentive to provide up-to-date skills under conditions of
rapid technological change. In addition to the substantive shortcomings this may
reflect, it presents a problem for comparative research: unobserved heterogeneity

5
in the quality of VET may mean that some VET systems produce skills which are
valuable for innovation, while others do not – a difference which will not be evident
in, say, the national VET participation rates published by the World Bank.
The mechanism described by EIS can provide a way around the problem of
unobserved heterogeneity in VET quality: if the skills required for innovation
include specific skills, and if VET outcomes depend on the motivations of the
students (workers), then the ability of VET to deliver the skills required for
innovation will depend on social insurance (either JS or UI). By the same token,
although social insurance may be necessary for the widespread investment in
specific skills, it will not on its own be sufficient – institutions which provide VET will
also be required.
In this paper we address these questions in the context of Europe in the early
months of the financial crisis (late 2008 and early 2009). In the empirical analysis
we employ data at the micro (firm) and macro (country) level. For the former, we
use the Innobarometer Survey 2009 carried out from the European Commission
(2009). This survey is covered more than 5,000 firms across Europe. For the country
level analysis, our data are from the OECD, Eurostat and the World Bank’s World
Development Indicators. We ask how national mixes of UI, VET, and JS affect
decisions by firms to sustain, increase, or reduce investments in innovation after
the onset of the crisis. Controlling for a number of firm-specific characteristics,
including pre-crisis changes in innovation investment by the same firms, and for
country-level changes in GDP, we get country-level indicators of innovation

6
investment during the crisis. We then compare these with relative national levels of
UI, VET and JS.
Our results are consistent with the complementarity of UI and VET: the countries
that sustain innovation well are never weak in both, while almost all of those whose
firms do not sustain innovation during the crisis are weak in either UI or VET (or, in
the case of the UK, both). This is consistent with EIS, and with the flexicurity model.
However, while in EIS JS and UI have similar effects, and in the flexicurity model
strong JS is viewed as a problem, we find no relationship, positive or negative,
between JS and sustained innovation – JS, in this case, is simply irrelevant.
The paper is organized as follows. The Section 2 reviews briefly the theory and
previous findings on the relationship JS, UI, skill formation, innovation, and financial
crisis. Section 3 presents the data. Section 4 presents the empirical model and
results. Section 5 concludes.
2. Social protection, investment in specific skills, innovation, and response to
crisis
We are interested in VET as a source of skills which are industry- or technology
specific. These need to be distinguished from firm-specific skills and general skills,
the categories employed in basic human capital theory. That theory predicts that
employers will pay for firm-specific skills and workers for the general ones. We can
define general skills in either of two ways: a negative definition is simply that the
skill is not firm-specific; a positive one is that the skill is broadly transferable, useful
in numerous industries and occupations. The negative definition is far broader – it

7
includes more skills – not only broadly transferable skills, but also skills which are
useful only within a particular industry (those associated with underground mining
or clothes manufacturing, for instance) or in the use of a particular technology (for
instance, linotype operation, or the ability to customize Linux-based networks and
applications). From an employer’s standpoint, these industry- or technology-
specific skills are fully transferable, and the employer will not pay for training unless
employee mobility is restricted (through contract or through employer collusion),
or there is some assurance that other employers will do comparable training. From
the worker’s standpoint, however, investment in such narrow skills can entail a
considerable risk. As discussed above, this problem can be remedied through some
form of social insurance: if somebody (typically either an employer or the state) can
and does make a credible promise of either continued employment or income
replacement, together with retraining, in the event the skill loses value, then
workers will be willing to spend their time acquiring industry- or technology-specific
skills even if the markets for these skills are very thin or uncertain.
In the absence of credible insurance, skills which are specific will command a risk
premium, at best (at worst, faced by uncertainty and limited borrowing capacity,
workers will simply opt for skills which are truly transferable, or for which demand
appears likely to be stable: sales, teaching, accounting, law...), and employers will
favour production systems and products which depend less on specific skills. The
bias against specificity in the absence of adequate insurance can be seen as
analogous to Williamson’s (1985) analysis of the way incomplete contracts produce
a bias in favour of general purpose, as opposed to transaction specific, assets.

8
EIS observe that, among rich industrial countries, those with relatively high levels
of either JP or UI (or both) have, on average, much higher rates or participation in
VET than countries with low levels of both JP and UI; the countries with low levels
of both forms of protection are the English-speaking countries, which are also what
Hall and Soskice (2001) classify as LMEs. EIS use this observation to support the
argument that income and training insurance – whether offered by the state
through a combination of strong UI and VET, or the employer as a response to
strong JP – encourage investment in specific skills.
The package of policies and institutions known as ‘flexicurity’ is can be
understood as one part of the territory that EIS associate with high VET. Flexicurity
includes high UI, retraining for the unemployed (i.e., off-the-job VET available at
any stage of a worker’s career), but relatively low JS (Kok 2003; Wilthagen and Tros
2004; Council of Europe 2005; Crouch 2010). (The Commission of the European
Communities (2007) specifies ‘moderate’ JS in its definition of flexicurity, but their
starting point is the perceived problem of high JS.) Here, the relationship between
UI and the willingness to invest in skills is consistent with the EIS analysis, although
in most accounts of flexicurity the emphasis on specificity is missing; JS, on the
other hand, is regarded as hindering the efficient allocation of labour, raising
unemployment, fostering labour market dualism, and inhibiting productivity
growth. Flexicurity is, roughly speaking, descriptive of the Nordic, Dutch, and Swiss
economies; the German-style systems (including also Austria and Belgium),
historically high in both UI and JS, can be seen as moving toward flexicurity as they
have reduced JS over the past two decades.

9
While flexicurity provides an attractive policy package, both the positive and the
negative planks of the flexicurity platform have uncertain empirical support. The
overall macroeconomic benefits of flexicurity are contested (see also the discussion
in Schwartz 2001; e.g., Becker 2005; Giugni 2009; Gold 2009), as is its functioning in
times of crisis (Tangian 2010). And, while JS appears to have an adverse effect on
employment levels, the effect is small compared with those caused by variations in
monetary policy (Baccaro and Rei 2007); as with minimum wages (DiNardo, Fortin,
and Lemieux 1996), the aggregate loss of labour income from downward flexibility
may outweigh gains from employment; and incremental reforms (e.g., the
reduction of JS for new hires or certain groups of workers) can produce an
employment quality outcomes worse than either broad JS or employment at will
(Blanchard and Landier 2002). In light of these problems, and in light of the
acknowledged role JS has played in the growth of certain national economies in the
post-World War II period, the curtailment of JS is not something to be pursued
without careful examination.
These functional roles of strong JS can be important even if it is so that flexicurity
– the strong UI/high VET package – is a globally superior solution. Manca et al.
(2010) find “substantial heterogeneity across EU Member States in terms of how
close they are to fulfilling flexicurity ‘requirements’.” Flexicurity is not simply as a
policy package that can be put in place by the passage of legislation: it depends on
institutional functions which may not be present in states that are fiscally or
administratively weak, or which have political systems that do not support inter-
generational bargains. EIS’s argument is that greater investment in specific skills
occurs when there is a credible promise of both income support and retraining in

10
the event of job loss at some unknown future point in a young worker’s career. In
other writings (e.g.Iversen 2005; Cusack, Iversen, and Soskice 2007; Estevez-Abe
2008) the same authors argue that this credibility requires not only institutions
which are seen to be delivering income support and retraining, but also a
‘consensual’ constitutional setup that supports inter-generational bargains.
Elimination of the laws sustaining strong JS, on the other hand, is a policy choice
which in many countries could be effected by a single legislative act. In the absence
of institutions which can sustain and credibly promise the strong UI/high VET
package, a policy decision in favour of flexicurity could result simply in the
elimination of JS, with the promised new form of social insurance and new
incentive for specific training both stillborn.1 Given this difficulty it is worth knowing
just how important is this ‘flexibility’ leg of ‘flexicurity’.
We turn now to innovation. In general, we expect investment in innovation to
decline during a financial crisis, due both to diminished financial resources and to
increased uncertainty: R&D expenditure (one category of investment in innovation)
is pro-cyclical in OECD economies (OECD 2009; WIPO 2010). Yet, the disruptive
effects of crisis may bring opportunities, or simply a perceived imperative to adapt
in order to survive. Deep and long recessions – such as those occasioned by major
financial crises - are often accompanied by major shifts in technological paradigm
and industry structure (Dosi 1982; Perez 2010); Field (2003) finds that the Great
1 . The difficultly of delivering an alternative to JS tells us something about why the defence of JS has been so stubborn: why in countries with strong JS and low UI, ‘reforms’ have protected insiders, not so much curtailing the strength of JS as increasing the proportion of new entrants to the workforce not legally entitled coverage by the JS umbrella, thus institutionalizing labour market dualism. This creates outcomes which – independent of movement on the UI/VET question – may be worse than either universal strong JS or no JS at all (Blanchard and Landier 2002; Bassanini et al. 2009).

11
Depression in the United States – the period 1929-1941 - was for that country also
“the most technologically progressive decade of the [20th] century.”
Studies of innovation have often emphasized the frontiers of technological
advance and the development new processes and products – not least because
data on patent filings and formal R&D expenditures is readily available, while
measures of most other innovation activity are not. In recent decades, however,
data on the innovative activity of firms, more broadly defined, has been gathered
through a number of ongoing surveys. “Innovation” in this context includes the
application and adaptation of technologies new to the firm using them, and non-
technological forms of innovation, in areas such as marketing, design, organization,
business models (OECD 2005). This broad definition of innovation is consistent with
the view, long evidenced in comparative studies, that the skills relevant to
innovation are not only those of scientists and engineers at the top level, but
include what are often classed as “intermediate” skills.
The relationship between innovation, skills, and employment systems can be
seen as one of the central ways in which the innovative activity of firms is shaped,
in both its level and character, by national institutions (Freeman 1987; Lundvall
1992; Nelson 1993). Within the European union, states have maintained (Lorenz
and Lundvall 2006), and even increased (Archibugi and Coco 2005) their
heterogeneity in terms of innovation performance and technological development.
Differences of innovation and technological capabilities make an important
contribution to differences in growth rates (Fagerberg 1994; Castellacci 2008) and

12
are thus a factor in the convergence – or lack of it – between European economies
(Tumpel-Gugerell and Mooslechner 2003; Kutan and Yigit 2007)
JS and UI may have direct effects on firms’ innovation decisions. The skills of the
workforce may also affect these decisions; the stock of skills is in turn affected by
the JS and UI provisions previously in place, and in important respects the system of
skill development and the systems of JS and UI may be mutually determined. At the
risk of simplifying this web of causation, let us trace a few ways in which these
labour market institutions may affect the innovation choices of firms during a
financial crisis.
In liberal economic doctrine, JS is almost certain to retard innovation by
discouraging in a crisis re-allocation of labour and / or by removing incentives for
innovative effort. Yet it is plausible that JS can encourage innovation, if the reduced
threat of job loss encourages employees’ cooperation in productivity improvement,
or if the lock-in motivates employers to innovate in order to find productive uses
for otherwise surplus labour. Levinthal and March (1981), and Nohria and Gulati
(1996), have argued that a certain amount of organizational slack – that is, human
resources and organizational capabilities in excess of operating requirements - is
necessary if firms are to innovate. JS is broadly associated with slack, and is certain
to produce slack in a downturn. During a crisis, the effects (positive or negative) of
JS should be especially strong: sharp changes in demand will require greater
reallocation of labour and availability of labour in excess; the reduced financial
capabilities of firms tighten constraints on their ability to re-allocate labour
internally, but financial market conditions (elevated liquidity preference of private

13
investors; curtailed bank lending) also constrain the ability of the labour market to
re-allocate labour between firms; the elevated threat of job loss may increase effort
or, if job loss appears imminent, may shift workers attention elsewhere.
UI could also affect innovation activity during a downturn, though expected the
direction of the effect is not clear: by lowering the worker’s cost of job loss UI could
reduce incentives for work effort (Gintis and Ishikawa 1987), and innovating
presumably requires effort; on the other hand, income security should reduce
employee resistance to productivity-enhancing innovation.
From the employer’s standpoint, a more highly skilled workforce should be a
more flexible instrument, enhancing the relative value of innovating during a crisis.
Also, if innovation may be undertaken to make use of under-employed workers,
then is should be positively associated with hoarding of skilled workers; whether
such hoarding is more prevalent when skilled workers make up more of the work
force (so that more are worth hoarding) or when they are scarcer, is not clear a
priori.
3. Data sources
3.1 Firm-level data: the Innobarometer Survey
Our firm level data is from the Innobarometer Survey 2009, designed and
collected by the European Commission (2009). In each of the 27 EU Member states,
plus Norway and Switzerland,2 200 enterprises from most manufacturing and
2 In the smallest EU countries, Cyprus, Malta, and Luxembourg, the sample consisted of 70 enterprises and in non-EU countries, Switzerland and Norway, the sample size was 100.

14
private service industries3 with 20 or more employees were sampled. 5,238
telephone interviews were completed between the 1st and 9th of April 2009. The
sample is random, stratified by country, enterprise size (5 size bands) and industry
(2-digit). A detailed description of the survey, sampling and data collection method
can be found in European Commission (2009).
The Innobarometer has been conducted on an annual basis since 2001. Each
year the survey highlights a different issue/theme, which is reflected in additional
questionnaire items. The focus of the 2009 survey was innovation related
expenditures, and the effects of the economic downturn on such expenditures.
The firms surveyed were asked a series of questions about changes in different
aspects of investment in innovation over the period 2006-2008. As explained, the
definition of innovation investment is quite broad. The questions addressed
research and development (distinguishing between that performed in-house, and
that acquired outside); acquisition of know-how; acquisition of machinery; design;
collaboration with customers, with suppliers, with other companies in the same
field, and with universities and research centres; innovation in marketing, and in
organization; patents and design registration; knowledge management practices;
open innovation practices; and whether innovation was driven by cost reduction,
technological opportunities, or market opportunities. Following these came two
summary questions. The first was:
3 Aerospace, defence, construction equipment, apparel, automotive, building fixtures, equipment, business services, chemical products, communications equipment, construction materials, distribution services, energy, entertainment, financial services, fishing products, footwear, furniture, heavy construction services, heavy machinery, hospitality and tourism, information technology, jewellery and precious metals, leather products, lighting and electrical equipment, lumber and wood manufacturers, medical devices, metal manufacturing, oil and gas products and services, paper, (bio)pharmaceuticals, plastics, power generation & transmission, processed food, publishing and printing, sport and child goods, textiles, transportation and logistics, utility.

15
Q3: “Compared to 2006, has the total amount spent on innovation in 2008,
increased, decreased, or stayed the same?”
Immediately following this, respondents were asked:
Q4: “In the last six months has your company taken one of the following actions:
increased total innovation expenditures, decreased […] or maintained […]?”
Although “innovation investment” is not a category that many people would
have clearly in mind most of the time, and is one of which we might ordinarily
expect people to have widely varying interpretations, the fact that Q3 and Q4 come
immediately after a series of more specific questions about the company’s
innovation activities gives us some confidence that respondents would have had a
common understanding of the term.
The definition of innovation implicit in this series of questions is in line with the
definition adopted in the Community Innovation Surveys and similar surveys
elsewhere in the world. While there are obvious drawbacks to using a set of
subjective self-assessments to measure innovation activity, this approach has the
considerable advantage of getting a broad measure of innovation: certain aspects
of innovation activity, such as formal R&D expenditures and patent applications,
can be more precisely and objectively measured, but they capture a narrow and
unrepresentative slice of overall innovation activity, and are heavily concentrated in
a few industries and in larger firms, mostly in the manufacturing sector. With
respect to the question addressed in this paper, R&D/patent measures alone are
problematic because firms typically commit to such projects for extended periods,
and the response over six months is likely to be slight. In contrast, items such as

16
training or design budgets, or new equipment purchases, can be – and often are –
cut quickly. Moreover, the broader measure of innovation encompasses activities
to which employees at all levels contribute, and are therefore more pertinent to
our study.
*************Table 1 about here*********************
10% of firms said they had increased overall investment in the six months
following the onset of the financial crisis, while 24% said they had reduced it and
66% reported no change.
The survey also provides data on changes in the firm’s turnover from 2006-8,
number of employees, proportion of sales exported, and industry classification,
among others (see Appendix Table 1). In our analysis, we use binary variables for
decreased turnover (turn_fall) and firms with more than 250 domestic employees
(LARGE). Pair-wise correlations of firm-level variables are reported in Table 2.
*************Table 2 about here************************
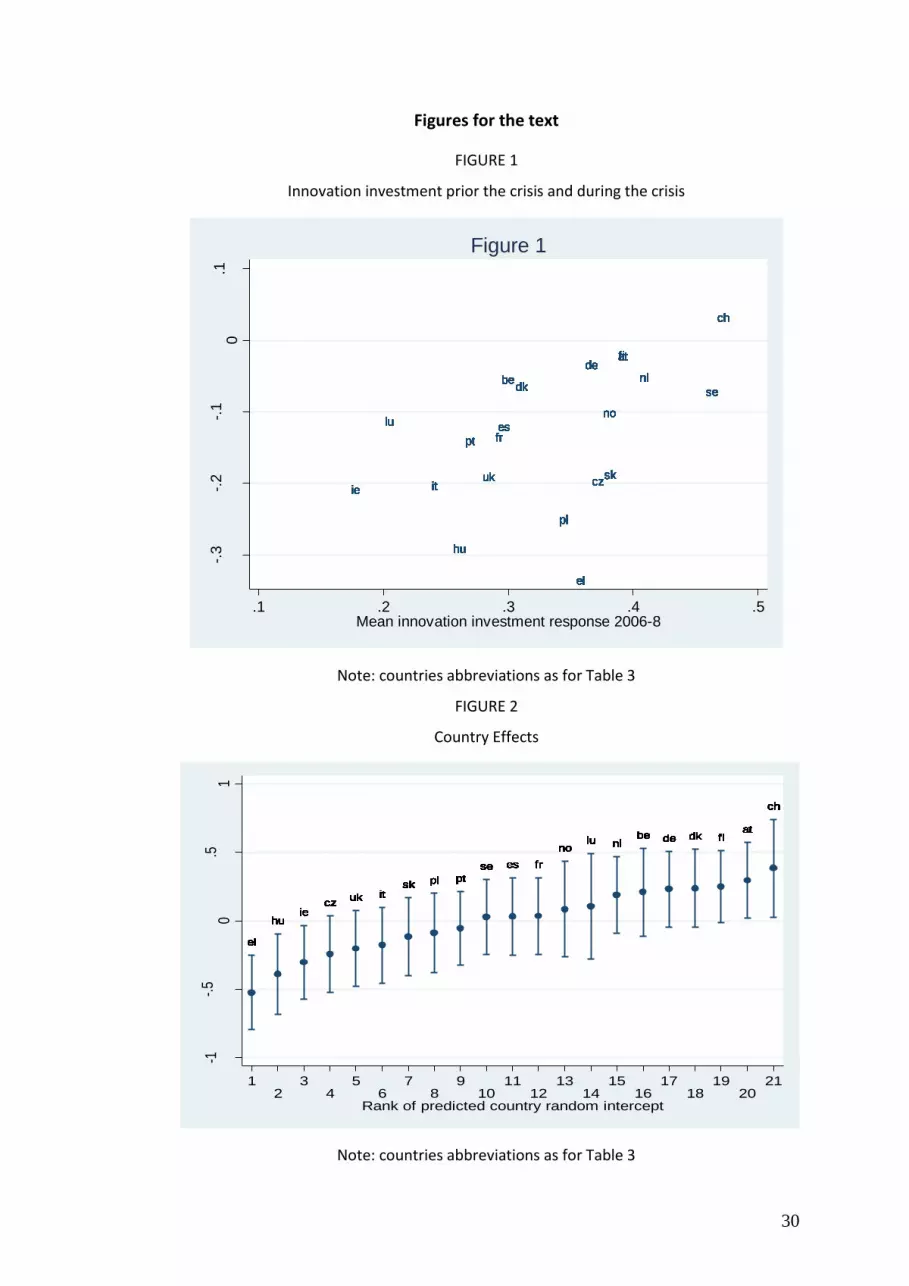
To get a rough picture of how changes in innovation investment differ by
country, we treat the responses as scales running from -1 (decreased spending) to 1
(increased), take the mean by country, and plot them (Figure 1). Overall, the
positive correlation arising between the innovation investment variables over the
two periods the chart suggests the presence of resilience in innovation investment
at the firm level, as found by Geroski and Walters (1995) and by Filippetti and
Archibugi (2011).
****************Figure 1 about here*******************

17
3.2 Country level variables
At the country level, we have variables dealing with macroeconomic aggregates,
labour market institutions and skills, and higher education. For the first, we use the
percentage change in GDP from the first quarter of 2007 to the first quarter of
2008, and similarly for 2008 to 2009.
Our measure of UI is the short-term earnings replacement rate (REPLACE),
defined by the OECD as “net income replacement rates for unemployment benefits
(percentage of earnings)” in the first year after job loss. The short term rate is the
one relevant to both the EIS thesis and the flexicurity model, in that it facilitates re-
training.
Our measure of JS is the OECD Employment Protection Index (PROTECT). This is a
measure of the procedures and costs involved in dismissing individuals or groups of
workers and the procedures involved in hiring workers on fixed-term or temporary
work agency contracts.
VET in our models is vocational and education training defined by the World
Bank World Development Indicator as “Technical/vocational enrolment in ISCED 3
as percentage of total enrolment in ISCED 3”.
For comparison, we include a third group of variables addressing higher
education – an area of education more usually included in innovation studies than
VET is. These include science and engineering doctorates per capita (Eurostat),
science and engineering degrees per capita (Eurostat), and the share of labour force
with tertiary education (World Bank – World Development Indicators).
***************Table 3 about here**********************

18
4. Analysis
Our strategy for analyzing the data is to estimate an ordered logit model on the
firm-level data and macro-economic variables, with country-level random effects.
We then rank the country-level effects and compare them in tables with the tertile
ranks of the country level variables. In principle, the random effects estimated in
the first stage could be modelled as functions of the country-level variables – that
is, an alternate strategy would have been to estimate a two-level model. We do not
do this because, with only twenty-one countries, the statistical properties of the
second stage estimates are not good. This is especially so given that there are
plausible and important hypotheses which could only be tested using both levels
and interactions of country-level variables. This difficulty is commonly encountered
in doing statistical analysis of comparative international data, and in presents a
choice between making heroic statistical assumptions (including the omission of
variables of interest), and resorting to a low-tech tabular or visual presentation
(Bowers and Drake 2005; Kedar and Shively 2005). We opt for the latter.
Our regression model is:
Innovation2008-9i,k = b1*Innovation2006-8i,k + b2*Large_Firmi,k + b3*Turnover_falli,k +
b4*Export_Dependence i,k + b5*GDP0801k + b6*GDP0901k + industry controls + ek + u i,k (1)
where ek is the country random effect. This is estimated in Stata using the GLLAMM
package (Rabe-Hesketh and Skrondal 2004).
Results of this estimation are reported in Table 4. The innovation trajectory in
2006-2008 is a strong predictor of the innovation trajectory in the six months prior

19
to the survey. Reduced turnover during 2006-8 dampens innovation investment in
2009; GDP growth in both 2007-8 and 2008-9 is, to our surprise, negatively
associated with the change in innovation investment during the crisis, but the effect
is not statistically significant; similarly, the circumstances to operate in international
markets (INMKT) and firm size (LARGE) show little effect.
******************Table 4 about here*******************
The country effects from this regression, with their standard errors, are shown in
Figure 2. The countries in which firms showed the strongest innovation
performance during the crisis are all in north-western continental Europe, and are
among what Hall and Soskice (2001) would classify as coordinated market
economies: Switzerland tops the ranking, followed by Austria, Finland, Denmark,
Germany, Belgium and the Netherlands. There are, of course, significant differences
among these countries’ economic institutions, but those seem small compared with
the differences among the countries in the lower tail: starting at the bottom, we
have Greece, Hungary, Ireland, Czech, the UK, Italy, and Slovakia. One might think
that that what the countries performing worst have in common is a particularly bad
experience with the financial crisis, but we have controlled for change in GDP.
****************Figure 2 about here********************
Table 5 shows the country effects alongside each country’s ranking for
unemployment replacement (REPLACE), VET enrolment (VET), and JS (EMPLOY). We
have grouped these variables, so that that 1/3 of the countries with the lowest
rankings for, e.g., REPLACE get a 1 in that column, those in the middle 1/3 get a 2,
and those in the top 1/3 get a 3.

20
************Table 5 about here************************
Two things are striking about this table. One is that all of the countries in the top
1/3 of the table – that is, those with relatively persistent firm-level innovation
during the financial crisis - are in the top 2/3 in terms of both the earnings
replacement rate and VET enrolment. In the bottom half of the table, many
countries rank highly in either earnings replacement or VET enrolment, but only one
(Czech) is strong in both of them; all other countries in the bottom half of the table
are in the bottom 1/3 of either earnings replacement or VET – or in a few cases,
both. One striking thing is the apparent diversity of the countries that performed
badly: rich liberal market economies (the UK and Ireland), countries emerging from
centrally planned economies in central and eastern Europe (all of those in the
sample), and the poorer countries of the EU’s south (Greece and Portugal). What
these countries have in common is that they lack – with the exception of the Czech
Republic - the combination of high replacement rates and high VET participation. A
good earnings replacement safety net together with a strong system of VET are, of
course, key elements of flexicurity.
The second striking thing about the table, however, is that while it shows clearly
that the UI and training elements of flexicurity are, in combination, associated with
a reduced likelihood of cutting expenditures on innovation, there is no clear
relationship between JS and changes in innovation investment: the ‘flexi’ end of
flexicurity appears to be irrelevant in this case. We see, in Table 5, the countries
with the strongest JS grouped together in the middle of the pack, while countries at
both the top and bottom are decidedly mixed in their levels of JS. For the present

21
question, at least, the level of employment security (or its inverse, numerical
flexibility for employers) does not appear to be very important.
In Table 6, we present a similar breakdown for the three higher education
variables. These are of interest both as additional measures of skill in a country’s
workforce, and as indicators of the country’s science base. These are also, of
course, the sort of education variables more commonly associated with innovation
in the academic literature on the subject. The patterns here are not so clear cut.
Science and engineering degrees (the middle column) bear no apparent relation to
the country effect, but most of the countries which rank high in the persistence of
innovation also rank high in science and engineering doctorates, and in tertiary
education generally.
************Table 6 about here************************
5. Discussion and conclusion
Firm-level investment in innovation in Europe during the onset of the financial
crisis in 2008-9, held up best relative to pre-crisis investment in countries with both
high UI and high participation in VET; these were also countries in which high
numbers of people completed doctoral degrees in science and engineering
subjects. We find no relationship, positive or negative, between the resilience of
innovation investment and JS, nor with lower-level science and engineering
degrees. These results must of course be treated with caution, both due to the
short time frame covered by the data (six months into the crisis), and the small

22
number of independent units for country level data. They are, nonetheless, striking
in several respects.
One is the clear association between the persistence of innovation and the
UI/VET combination. For reasons discussed above, it is not surprising that firms with
skilled workforces would be more likely to maintain innovation during a downturn,
than those without skilled workforces. But why should this not show up simply as a
relationship between VET and innovation? If VET produces skill then, given a certain
level of VET participation, why should UI matter? Similarly, there are plausible
reasons why UI might affect innovation during a crisis, but why should this only be
the case when VET participation is high?
We believe that an explanation for the VET/UI pairing may lie in variations in
what VET means in practice. The VET variable measures the proportion of a
relevant age group undertaking vocational education and training at the secondary
and post-secondary levels, but of course the content of this education and training
can mean different things in different circumstances. As noted above, many critics
regard VET as unresponsive to actual labour market needs. The tendency has been
to attribute this problem to the difficulty public education systems have keeping up
with changing workplace technologies; following EIS’s logic, we propose a different
understanding of why VET programmes may fail, based on student motivation.
Where UI is weak, students will devote their efforts to obtaining transferable skills
(or, more cynically, transferable credentials). In EIS’s account, this should lead to a
low rate of VET participation. Our results suggest a different possibility, which is
that while poor social insurance may be associated with low VET participation, it

23
can sometimes instead produce ineffective VET. In the absence of adequate
insurance students may want broadly transferable skills; they may want skills for
relatively safe, stable occupations; they may want a relatively cheap and / or easy
course which leads to a credential of some kind; but what they will surely not want
is to make a substantial investment in specific, risky skills. If VET providers respond
to student demand (or if students get out of VET what they are motivated to get),
VET outcomes will be qualitatively different in settings with and without strong UI:
only the latter will produce a strong supply of skills geared to bear the risk of rapidly
changing technologies and markets.
The apparent unimportance, in our results, of JS, poses a problem for the EIS
analysis, and another much different problem for flexicurity policy. The problem for
EIS is that the symmetry, in their story, between UI and JS, is not borne out in this
case. The problem for flexicurity policy is that the flexibility element appears, at
least in this case, to be irrelevant. As we noted above, the elimination of JS is,
institutionally, the simplest element of flexicurity to implement: eliminating JS and
failing to secure the other elements of flexicurity may accomplish exactly nothing,
while establishing solid UI and VET may make reductions in JS superfluous. In
theory, the irrelevance of JS after UI and VET are taken into account should not be
surprising. JS should be a problem only when a lack of outside options keeps
workers in bad job matches; where outside options are good enough – and the
UI/VET combination can have a lot to do with whether they are good enough – the
strength of JS becomes largely a question of whether workers or employers bear
the costs of separations – that is, a distributional question rather than an
allocational one (Fadda 2011). While we cannot come to a strong conclusion in this

24
respect on the basis of the narrow empirical results reported here, our finding is
consistent with the existing literature in the area; further research on this question
should be a priority.
Finally, while it is not surprising to find - excepting the UK and Ireland – that
countries with large numbers of science and engineering doctorates are relatively
persistent in innovation, it is more surprising that this relationship is notably
stronger than that for overall science and engineering degrees, or for tertiary
education generally. In one sense this is parallel to the apparent importance of VET,
since doctorates like VET tend to be more specific than first university degree; in
another, taken with the VET, it suggests a synergy between production skills and
research.

25
Tables for the text
TABLE 1
Direction of change in total innovation expenditure
q3. compared to 2006, has the total amount spent on innovation in 2008 …
increased 1,399 41.40%
decreased 316 9.40%
stayed the same 1,661 49.20%
Total 3,376 100.00%
q4. in the last six months has your company taken one of the following actions?
increased total amount of innovation expenditures 349 10.30%
decreased total amount of innovation expenditures 805 23.80%
maintained total amount of innovation expenditures at the same level 2,222 65.80%
Total 3,376 100.00%
TABLE 2
Correlation matrix for firm-level variables
Innovation
2008-9 Innovation
2006-8 LARGE turn_fall
Innovation 2008-9 1
Innovation 2006-8 0.245* 1
LARGE -0.013 0.077* 1
turn_fall -0.123* -0.215* -.0787* 1
*: pair-wise correlation significant at .01

26
TABLE 3
Country-level variables
co
un
try
rep
lace
men
t
Emp
loym
ent
pro
tect
ion
ind
ex
VET
S&E
do
cto
rate
S&E
grad
uat
es
Tert
iary
edu
cati
on
GD
P0
80
1
GD
P0
90
1
Switzerland (ch) .97 .16 .77 .82 .66 .78 3 -2.2
Austria (at) .72 .47 1.00 .56 .00 .18 3.4 -5.2
Finland (fi) .90 .48 .58 .75 .41 1.00 2.6 -7.5
Denmark (dk) .99 .30 .56 .22 .62 .82 -.2 -3.4
Germany (de) .74 .55 .63 .49 .11 .47 2.1 -6.4
Belgium (be) .74 .57 .60 .22 .28 .81 2.1 -4.1
Netherland (nl) .97 .48 .82 .19 .36 .75 3.6 -4.5
Luxemburg (lu) 1.00 1.00 .69 . . .57 3.4 -6
Norway (no) .87 .78 .59 .22 .19 .91 .5 1.2
France (fr) .72 .92 .38 .30 1.00 .58 1.7 -3.3
Spain (es) .58 .89 .38 .11 .14 .68 1.9 -3.9
Sweden (se) .82 .45 .67 .79 .20 .78 .9 -6.7
Portugal (pt) .68 .96 .18 1.00 .22 .00 .9 -4.4
Poland (pl) .59 .46 .43 .19 .77 .22 6.5 .9
Slovakia (sk) .45 .28 .90 .20 .07 .04 9.7 -5.7
Italy (it) .15 .46 .68 .20 .26 .00 .3 -6.4
Un. Kingdom (uk)
.64 .00 .00 .51 .75 .80 2 -4.9
Czeck Rep. (cz) .75 .48 .94 .19 .10 .00 2.7 -4.4
Ireland (ie) .84 .14 .17 .30 1.00 .82 -1.4 -9.3
Hungary (hu) .72 .36 .06 .00 .21 .19 1.9 -6.7
Greece (el) .00 .79 .16 .07 .09 .37 3.4 .3
Note: except for the GDP variables, these have been standardized with a maximum of one and
minimum of zero, representing respectively the highest and lowest levels in the sample.

27
TABLE 4
Regression Output
Dependent variable: inno2009
inno2008 0.768***
-0.063
LARGE -0.157
-0.084
INTMKT -0.042
-0.082
gdp0901 -0.027
-0.029
gdp0801 -0.027
-0.033
turn_fall -0.422***
-0.102
industry dummies included
_cut11
Constant -1.160***
-0.247
_cut12
Constant 2.412***
-0.251
coun1
Constant 0.285***
-0.062
R-squared
N 3237
* p<0.05, ** p<0.01, *** p<0.001

28
TABLE 5
Country innovation effects and labour market institutions
country country effect
replacement rate
VET employment
protection
ch 0.385 3 3 1 at 0.297 2 3 2 fi 0.251 3 2 2 dk 0.237 3 2 1 de 0.232 2 2 2 be 0.210 2 2 3 nl 0.191 3 3 2 lu 0.106 3 3 3 no 0.086 3 2 3 fr 0.037 2 1 3 es 0.032 1 1 3 se 0.029 2 2 1 pt -0.055 1 1 3 pl -0.088 1 2 2 sk -0.115 1 3 1 it -0.177 1 3 2 uk -0.202 1 1 1 cz -0.242 2 3 2 ie -0.302 3 1 1 hu -0.389 2 1 1 el -0.523 1 1 3
Note: countries abbreviations as for Table 3

29
TABLE 6 Country Innovation Effects and Tertiary Education
country country effect
S&E doctorate
S&E graduates
Tertiary education
ch 0.39 3 3 2 at 0.30 3 1 1 fi 0.25 3 2 3 dk 0.24 2 3 3 de 0.23 2 1 2 be 0.21 2 2 3 nl 0.19 1 2 2 lu 0.11 . . 2 no 0.09 2 1 3 fr 0.04 2 3 2 es 0.03 1 1 2 se 0.03 3 2 2 pt -0.05 3 2 1 pl -0.09 1 3 1 sk -0.11 1 1 1 it -0.18 1 2 1 uk -0.2 3 3 3 cz -0.24 1 1 1 ie -0.30 2 3 3 hu -0.39 1 2 1 el -0.52 1 1 2
Note: countries abbreviations as for Table 3
30
Figures for the text
FIGURE 1
Innovation investment prior the crisis and during the crisis
be be be be be be be be be be be be be be be be be be be be be be be be be be be be be be be be be be be be be be be be be be be be be be be be be be be be be be be be be be be be be be be be be be be be be be be be be be be be be be be be be be be be be be be be be be be be be be be be be be be be be be be be be be be be be be be be be be be be be be be be be be be be be be be be be
cz cz cz cz cz cz cz cz cz cz cz cz cz cz cz cz cz cz cz cz cz cz cz cz cz cz cz cz cz cz cz cz cz cz cz cz cz cz cz cz cz cz cz cz cz cz cz cz cz cz cz cz cz cz cz cz cz cz cz cz cz cz cz cz cz cz cz cz cz cz cz cz cz cz cz cz cz cz cz cz cz cz cz cz cz cz cz cz cz cz cz cz cz cz cz cz cz cz cz cz cz cz cz cz cz cz cz cz cz cz cz cz cz cz cz cz cz cz cz cz cz cz cz cz cz cz cz cz cz cz cz cz cz cz cz cz cz cz cz cz cz cz cz cz cz cz cz cz cz cz cz cz cz cz cz cz cz cz cz cz cz cz cz cz cz cz cz cz cz cz cz cz cz cz cz cz cz cz
dk dk dk dk dk dk dk dk dk dk dk dk dk dk dk dk dk dk dk dk dk dk dk dk dk dk dk dk dk dk dk dk dk dk dk dk dk dk dk dk dk dk dk dk dk dk dk dk dk dk dk dk dk dk dk dk dk dk dk dk dk dk dk dk dk dk dk dk dk dk dk dk dk dk dk dk dk dk dk dk dk dk dk dk dk dk dk dk dk dk dk dk dk dk dk dk dk dk dk dk dk dk dk dk dk dk dk dk dk dk dk dk dk dk dk dk dk dk dk dk dk dk dk dk dk dk dk dk dk dk dk dk dk dk dk dk dk dk dk dk dk dk dk dk dk dk dk dk dk dk dk dk dk dk dk dk dk dk dk dk dk dk dk dk dk dk dk dk dk dk dk
de de de de de de de de de de de de de de de de de de de de de de de de de de de de de de de de de de de de de de de de de de de de de de de de de de de de de de de de de de de de de de de de de de de de de de de de de de de de de de de de de de de de de de de de de de de de de de de de de de de de de de de de de de de de de de de de de de de de de de de de de de de de de de de de de de de de de de de de de de de de de de de de de de de de de de de de de de de de de de de de de de de de de de de de de de de de de de de de de de
el el el el el el el el el el el el el el el el el el el el el el el el el el el el el el el el el el el el el el el el el el el el el el el el el el el el el el el el el el el el el el el el el el el el el el el el el el el el el el el el el el el el el el el el el el el el el el el el el el el el el el el el el el el el el el el el el el el el el el el el el el el el el el el el el el el el el el el el el el el el el el el el el el el el el el el el el el el el el el el el el el el el el el el el el el el el el
es es es es es es es es es es es es es es es es es es es es es es es es es es es es es es es es es es es es es es es es es es es es es es es es es es es es es es es es es es es es es es es es es es es es es es es es es es es es es es es es es es es es es es es es es es es es es es es es es es es es es es es es es es es es es es es es es es es es es es es es es es es es es es es es es es es es es es es es es es es es es es es es es es es es es es es es es es es es es es es es es es es es es es es es es es es es es es es es es es es es es es es fr fr fr fr fr fr fr fr fr fr fr fr fr fr fr fr fr fr fr fr fr fr fr fr fr fr fr fr fr fr fr fr fr fr fr fr fr fr fr fr fr fr fr fr fr fr fr fr fr fr fr fr fr fr fr fr fr fr fr fr fr fr fr fr fr fr fr fr fr fr fr fr fr fr fr fr fr fr fr fr fr fr fr fr fr fr fr fr fr fr fr fr fr fr fr fr fr fr fr fr fr fr fr fr fr fr fr fr fr fr fr fr fr fr fr fr fr fr fr fr fr fr fr fr fr fr fr fr fr fr fr fr fr fr fr fr fr fr fr fr fr fr fr fr fr fr fr fr fr fr fr fr fr fr fr fr fr fr fr fr fr fr fr
ie ie ie ie ie ie ie ie ie ie ie ie ie ie ie ie ie ie ie ie ie ie ie ie ie ie ie ie ie ie ie ie ie ie ie ie ie ie ie ie ie ie ie ie ie ie ie ie ie ie ie ie ie ie ie ie ie ie ie ie ie ie ie ie ie ie ie ie ie ie ie ie ie ie ie ie ie ie ie ie ie ie ie ie ie ie ie ie ie ie ie ie ie ie ie ie ie ie ie ie ie ie ie ie ie ie ie ie ie ie ie ie ie ie ie ie ie ie ie ie ie ie ie ie ie ie ie ie ie ie ie ie ie ie ie ie ie ie ie ie ie ie ie ie ie ie ie ie ie ie ie ie ie ie ie ie ie ie ie ie ie ie ie ie ie ie ie ie ie ie ie ie ie ie ie ie ie ie ie ie ie ie ie ie ie ie ie ie ie ie ie ie it it it it it it it it it it it it it it it it it it it it it it it it it it it it it it it it it it it it it it it it it it it it it it it it it it it it it it it it it it it it it it it it it it it it it it it it it it it it it it it it it it it it it it it it it it it it it it it it it it it it it it it it it it it it it it it it it it it it it it it it it it it it it it it it it it it it it it it it it it it it it it it it it it it it it it it it it it it it it it it it it it it it it it it it it it it it it it it it it it it it it it
lu lu lu lu lu lu lu lu lu lu lu lu lu lu lu lu lu lu lu lu lu lu lu lu lu lu lu lu lu lu lu lu lu lu lu lu lu lu lu lu lu lu lu lu lu lu lu lu lu lu lu lu lu lu lu lu lu lu lu lu lu lu
hu hu hu hu hu hu hu hu hu hu hu hu hu hu hu hu hu hu hu hu hu hu hu hu hu hu hu hu hu hu hu hu hu hu hu hu hu hu hu hu hu hu hu hu hu hu hu hu hu hu hu hu hu hu hu hu hu hu hu hu hu hu hu hu hu hu hu hu hu hu hu hu hu hu hu hu hu hu hu hu hu hu hu hu hu hu hu hu hu hu hu hu hu hu hu hu hu hu hu hu hu hu hu hu hu hu hu hu hu hu hu hu hu hu hu hu hu hu hu hu hu hu hu hu hu hu hu hu hu hu hu hu hu hu hu hu hu hu hu hu hu
nl nl nl nl nl nl nl nl nl nl nl nl nl nl nl nl nl nl nl nl nl nl nl nl nl nl nl nl nl nl nl nl nl nl nl nl nl nl nl nl nl nl nl nl nl nl nl nl nl nl nl nl nl nl nl nl nl nl nl nl nl nl nl nl nl nl nl nl nl nl nl nl nl nl nl nl nl nl nl nl nl nl nl nl nl nl nl nl nl nl nl nl nl nl nl nl nl nl nl nl nl nl nl nl nl nl nl nl nl nl nl nl nl nl nl nl nl nl nl nl nl nl nl nl nl nl nl nl nl nl nl nl nl nl nl nl nl nl nl nl nl nl nl nl nl nl nl nl nl nl nl nl nl nl nl nl nl nl nl nl nl nl nl nl nl nl nl nl nl nl nl nl nl nl nl nl
at at at at at at at at at at at at at at at at at at at at at at at at at at at at at at at at at at at at at at at at at at at at at at at at at at at at at at at at at at at at at at at at at at at at at at at at at at at at at at at at at at at at at at at at at at at at at at at at at at at at at at at at at at at at at at at at at at at at at at at at at at at at at at at at at at at at at at at at at at at at at at at at at at at at at at at at at at at at at at at at at at at at at at at at at at at at at at at at at at at at at at at at
pl pl pl pl pl pl pl pl pl pl pl pl pl pl pl pl pl pl pl pl pl pl pl pl pl pl pl pl pl pl pl pl pl pl pl pl pl pl pl pl pl pl pl pl pl pl pl pl pl pl pl pl pl pl pl pl pl pl pl pl pl pl pl pl pl pl pl pl pl pl pl pl pl pl pl pl pl pl pl pl pl pl pl pl pl pl pl pl pl pl pl pl pl pl pl pl pl pl pl pl pl pl pl pl pl pl pl pl pl pl pl pl pl pl pl pl pl pl pl pl pl pl pl pl pl pl pl pl pl pl pl pl pl pl pl pl pl pl pl pl pl pl pl pl pl pl pl pl pl pl pl pl pl pl pl pl pl pl pl pl pl pl pl pl pl pl pl pl
pt pt pt pt pt pt pt pt pt pt pt pt pt pt pt pt pt pt pt pt pt pt pt pt pt pt pt pt pt pt pt pt pt pt pt pt pt pt pt pt pt pt pt pt pt pt pt pt pt pt pt pt pt pt pt pt pt pt pt pt pt pt pt pt pt pt pt pt pt pt pt pt pt pt pt pt pt pt pt pt pt pt pt pt pt pt pt pt pt pt pt pt pt pt pt pt pt pt pt pt pt pt pt pt pt pt pt pt pt pt pt pt pt pt pt pt pt pt pt pt pt pt pt pt pt pt pt pt pt pt pt pt pt pt pt pt pt pt pt pt pt pt pt pt pt pt pt pt pt pt pt pt pt pt pt pt pt pt pt pt pt pt pt pt pt pt pt pt pt pt pt pt pt pt pt pt pt pt pt pt pt pt pt pt pt pt
sk sk sk sk sk sk sk sk sk sk sk sk sk sk sk sk sk sk sk sk sk sk sk sk sk sk sk sk sk sk sk sk sk sk sk sk sk sk sk sk sk sk sk sk sk sk sk sk sk sk sk sk sk sk sk sk sk sk sk sk sk sk sk sk sk sk sk sk sk sk sk sk sk sk sk sk sk sk sk sk sk sk sk sk sk sk sk sk sk sk sk sk sk sk sk sk sk sk sk sk sk sk sk sk sk sk sk sk sk sk sk sk sk sk sk sk sk sk sk sk sk sk sk sk sk sk sk sk sk sk sk sk sk sk sk sk sk sk sk sk sk sk sk sk sk sk sk sk sk sk sk sk sk sk sk sk sk sk sk sk sk sk sk sk sk sk sk sk sk sk sk sk sk sk sk sk
fi fi fi fi fi fi fi fi fi fi fi fi fi fi fi fi fi fi fi fi fi fi fi fi fi fi fi fi fi fi fi fi fi fi fi fi fi fi fi fi fi fi fi fi fi fi fi fi fi fi fi fi fi fi fi fi fi fi fi fi fi fi fi fi fi fi fi fi fi fi fi fi fi fi fi fi fi fi fi fi fi fi fi fi fi fi fi fi fi fi fi fi fi fi fi fi fi fi fi fi fi fi fi fi fi fi fi fi fi fi fi fi fi fi fi fi fi fi fi fi fi fi fi fi fi fi fi fi fi fi fi fi fi fi fi fi fi fi fi fi fi fi fi fi fi fi fi fi fi fi fi fi fi fi fi fi fi fi fi fi fi fi fi fi fi fi fi fi fi fi fi fi fi fi fi fi fi fi fi fi fi fi fi fi fi fi fi fi fi fi fi fi fi fi fi fi fi
se se se se se se se se se se se se se se se se se se se se se se se se se se se se se se se se se se se se se se se se se se se se se se se se se se se se se se se se se se se se se se se se se se se se se se se se se se se se se se se se se se se se se se se se se se se se se se se se se se se se se se se se se se se se se se se se se se se se se se se se se se se se se se se se se se se se se se se se se se se se se se se se se se se se se se se se se se se se se se se se se se se se se se se se se se se se se se se se se se se se se se
uk uk uk uk uk uk uk uk uk uk uk uk uk uk uk uk uk uk uk uk uk uk uk uk uk uk uk uk uk uk uk uk uk uk uk uk uk uk uk uk uk uk uk uk uk uk uk uk uk uk uk uk uk uk uk uk uk uk uk uk uk uk uk uk uk uk uk uk uk uk uk uk uk uk uk uk uk uk uk uk uk uk uk uk uk uk uk uk uk uk uk uk uk uk uk uk uk uk uk uk uk uk uk uk uk uk uk uk uk uk uk uk uk uk uk uk uk uk uk uk uk uk uk uk uk uk uk uk uk uk uk uk uk uk uk uk uk uk uk uk uk uk uk uk uk uk uk uk uk uk uk uk uk uk uk uk uk uk uk uk uk uk uk uk uk uk uk uk uk uk uk uk uk
nonononononononononononononononononononononononononononononononononononononononononononononononononononononononononononononononononononononononononononononononononononononononono
chchchchchchchchchchchchchchchchchchchchchchchchchchchchchchchchchchchchchchchchchchchchchchchchchchchchchchchchchchchchchchchchchchchchchchchchchchchchchchchchchchchchchchchchchchchchch
-.3
-.2
-.1
0.1
Mean innovation investm
ent
response 2
008-9
.1 .2 .3 .4 .5Mean innovation investment response 2006-8
Figure 1
Note: countries abbreviations as for Table 3
FIGURE 2
Country Effects
el el el el el el el el el el el el el el el el el el el el el el el el el el el el el el el el el el el el el el el el el el el el el el el el el el el el el el el el el el el el el el el el el el el el el el el el el el el el el el el el el el el el el el el el el el el el el el el el el el el el el el el el el el el el el el el el el el el el el el el el el el el el el el el el el el el el el el el el el el el el el el el el el el el el el el el el el el el el el el el el el el el el el el el el el el el el el
hu hu hu hu hu hu hu hu hu hu hu hu hu hu hu hu hu hu hu hu hu hu hu hu hu hu hu hu hu hu hu hu hu hu hu hu hu hu hu hu hu hu hu hu hu hu hu hu hu hu hu hu hu hu hu hu hu hu hu hu hu hu hu hu hu hu hu hu hu hu hu hu hu hu hu hu hu hu hu hu hu hu hu hu hu hu hu hu hu hu hu hu hu hu hu hu hu hu hu hu hu hu hu hu hu hu hu hu hu hu hu hu hu hu hu hu hu hu hu hu hu hu hu hu hu hu hu hu hu hu hu hu hu hu hu hu hu hu hu hu hu ie ie ie ie ie ie ie ie ie ie ie ie ie ie ie ie ie ie ie ie ie ie ie ie ie ie ie ie ie ie ie ie ie ie ie ie ie ie ie ie ie ie ie ie ie ie ie ie ie ie ie ie ie ie ie ie ie ie ie ie ie ie ie ie ie ie ie ie ie ie ie ie ie ie ie ie ie ie ie ie ie ie ie ie ie ie ie ie ie ie ie ie ie ie ie ie ie ie ie ie ie ie ie ie ie ie ie ie ie ie ie ie ie ie ie ie ie ie ie ie ie ie ie ie ie ie ie ie ie ie ie ie ie ie ie ie ie ie ie ie ie ie ie ie ie ie ie ie ie ie ie ie ie ie ie ie ie ie ie ie ie ie ie ie ie ie ie ie ie ie ie ie ie ie ie ie ie ie ie ie ie ie ie ie ie ie ie ie ie ie ie ie
cz cz cz cz cz cz cz cz cz cz cz cz cz cz cz cz cz cz cz cz cz cz cz cz cz cz cz cz cz cz cz cz cz cz cz cz cz cz cz cz cz cz cz cz cz cz cz cz cz cz cz cz cz cz cz cz cz cz cz cz cz cz cz cz cz cz cz cz cz cz cz cz cz cz cz cz cz cz cz cz cz cz cz cz cz cz cz cz cz cz cz cz cz cz cz cz cz cz cz cz cz cz cz cz cz cz cz cz cz cz cz cz cz cz cz cz cz cz cz cz cz cz cz cz cz cz cz cz cz cz cz cz cz cz cz cz cz cz cz cz cz cz cz cz cz cz cz cz cz cz cz cz cz cz cz cz cz cz cz cz cz cz cz cz cz cz cz cz cz cz cz cz cz cz cz cz cz cz uk uk uk uk uk uk uk uk uk uk uk uk uk uk uk uk uk uk uk uk uk uk uk uk uk uk uk uk uk uk uk uk uk uk uk uk uk uk uk uk uk uk uk uk uk uk uk uk uk uk uk uk uk uk uk uk uk uk uk uk uk uk uk uk uk uk uk uk uk uk uk uk uk uk uk uk uk uk uk uk uk uk uk uk uk uk uk uk uk uk uk uk uk uk uk uk uk uk uk uk uk uk uk uk uk uk uk uk uk uk uk uk uk uk uk uk uk uk uk uk uk uk uk uk uk uk uk uk uk uk uk uk uk uk uk uk uk uk uk uk uk uk uk uk uk uk uk uk uk uk uk uk uk uk uk uk uk uk uk uk uk uk uk uk uk uk uk uk uk uk uk uk uk it it it it it it it it it it it it it it it it it it it it it it it it it it it it it it it it it it it it it it it it it it it it it it it it it it it it it it it it it it it it it it it it it it it it it it it it it it it it it it it it it it it it it it it it it it it it it it it it it it it it it it it it it it it it it it it it it it it it it it it it it it it it it it it it it it it it it it it it it it it it it it it it it it it it it it it it it it it it it it it it it it it it it it it it it it it it it it it it it it it it it it
sk sk sk sk sk sk sk sk sk sk sk sk sk sk sk sk sk sk sk sk sk sk sk sk sk sk sk sk sk sk sk sk sk sk sk sk sk sk sk sk sk sk sk sk sk sk sk sk sk sk sk sk sk sk sk sk sk sk sk sk sk sk sk sk sk sk sk sk sk sk sk sk sk sk sk sk sk sk sk sk sk sk sk sk sk sk sk sk sk sk sk sk sk sk sk sk sk sk sk sk sk sk sk sk sk sk sk sk sk sk sk sk sk sk sk sk sk sk sk sk sk sk sk sk sk sk sk sk sk sk sk sk sk sk sk sk sk sk sk sk sk sk sk sk sk sk sk sk sk sk sk sk sk sk sk sk sk sk sk sk sk sk sk sk sk sk sk sk sk sk sk sk sk sk sk sk pl pl pl pl pl pl pl pl pl pl pl pl pl pl pl pl pl pl pl pl pl pl pl pl pl pl pl pl pl pl pl pl pl pl pl pl pl pl pl pl pl pl pl pl pl pl pl pl pl pl pl pl pl pl pl pl pl pl pl pl pl pl pl pl pl pl pl pl pl pl pl pl pl pl pl pl pl pl pl pl pl pl pl pl pl pl pl pl pl pl pl pl pl pl pl pl pl pl pl pl pl pl pl pl pl pl pl pl pl pl pl pl pl pl pl pl pl pl pl pl pl pl pl pl pl pl pl pl pl pl pl pl pl pl pl pl pl pl pl pl pl pl pl pl pl pl pl pl pl pl pl pl pl pl pl pl pl pl pl pl pl pl pl pl pl pl pl pl pt pt pt pt pt pt pt pt pt pt pt pt pt pt pt pt pt pt pt pt pt pt pt pt pt pt pt pt pt pt pt pt pt pt pt pt pt pt pt pt pt pt pt pt pt pt pt pt pt pt pt pt pt pt pt pt pt pt pt pt pt pt pt pt pt pt pt pt pt pt pt pt pt pt pt pt pt pt pt pt pt pt pt pt pt pt pt pt pt pt pt pt pt pt pt pt pt pt pt pt pt pt pt pt pt pt pt pt pt pt pt pt pt pt pt pt pt pt pt pt pt pt pt pt pt pt pt pt pt pt pt pt pt pt pt pt pt pt pt pt pt pt pt pt pt pt pt pt pt pt pt pt pt pt pt pt pt pt pt pt pt pt pt pt pt pt pt pt pt pt pt pt pt pt pt pt pt pt pt pt pt pt pt pt pt pt
se se se se se se se se se se se se se se se se se se se se se se se se se se se se se se se se se se se se se se se se se se se se se se se se se se se se se se se se se se se se se se se se se se se se se se se se se se se se se se se se se se se se se se se se se se se se se se se se se se se se se se se se se se se se se se se se se se se se se se se se se se se se se se se se se se se se se se se se se se se se se se se se se se se se se se se se se se se se se se se se se se se se se se se se se se se se se se se se se se se se se se es es es es es es es es es es es es es es es es es es es es es es es es es es es es es es es es es es es es es es es es es es es es es es es es es es es es es es es es es es es es es es es es es es es es es es es es es es es es es es es es es es es es es es es es es es es es es es es es es es es es es es es es es es es es es es es es es es es es es es es es es es es es es es es es es es es es es es es es es es es es es es es es es es es es es es es es es es es es es es es es es es es es es es es es es es es es es es es es es es es es es es es fr fr fr fr fr fr fr fr fr fr fr fr fr fr fr fr fr fr fr fr fr fr fr fr fr fr fr fr fr fr fr fr fr fr fr fr fr fr fr fr fr fr fr fr fr fr fr fr fr fr fr fr fr fr fr fr fr fr fr fr fr fr fr fr fr fr fr fr fr fr fr fr fr fr fr fr fr fr fr fr fr fr fr fr fr fr fr fr fr fr fr fr fr fr fr fr fr fr fr fr fr fr fr fr fr fr fr fr fr fr fr fr fr fr fr fr fr fr fr fr fr fr fr fr fr fr fr fr fr fr fr fr fr fr fr fr fr fr fr fr fr fr fr fr fr fr fr fr fr fr fr fr fr fr fr fr fr fr fr fr fr fr fr
nonononononononononononononononononononononononononononononononononononononononononononononononononononononononononononononononononononononononononononononononononononononononono lu lu lu lu lu lu lu lu lu lu lu lu lu lu lu lu lu lu lu lu lu lu lu lu lu lu lu lu lu lu lu lu lu lu lu lu lu lu lu lu lu lu lu lu lu lu lu lu lu lu lu lu lu lu lu lu lu lu lu lu lu lu nl nl nl nl nl nl nl nl nl nl nl nl nl nl nl nl nl nl nl nl nl nl nl nl nl nl nl nl nl nl nl nl nl nl nl nl nl nl nl nl nl nl nl nl nl nl nl nl nl nl nl nl nl nl nl nl nl nl nl nl nl nl nl nl nl nl nl nl nl nl nl nl nl nl nl nl nl nl nl nl nl nl nl nl nl nl nl nl nl nl nl nl nl nl nl nl nl nl nl nl nl nl nl nl nl nl nl nl nl nl nl nl nl nl nl nl nl nl nl nl nl nl nl nl nl nl nl nl nl nl nl nl nl nl nl nl nl nl nl nl nl nl nl nl nl nl nl nl nl nl nl nl nl nl nl nl nl nl nl nl nl nl nl nl nl nl nl nl nl nl nl nl nl nl nl nl
be be be be be be be be be be be be be be be be be be be be be be be be be be be be be be be be be be be be be be be be be be be be be be be be be be be be be be be be be be be be be be be be be be be be be be be be be be be be be be be be be be be be be be be be be be be be be be be be be be be be be be be be be be be be be be be be be be be be be be be be be be be be be be be be be de de de de de de de de de de de de de de de de de de de de de de de de de de de de de de de de de de de de de de de de de de de de de de de de de de de de de de de de de de de de de de de de de de de de de de de de de de de de de de de de de de de de de de de de de de de de de de de de de de de de de de de de de de de de de de de de de de de de de de de de de de de de de de de de de de de de de de de de de de de de de de de de de de de de de de de de de de de de de de de de de de de de de de de de de de de de de de de de de de dk dk dk dk dk dk dk dk dk dk dk dk dk dk dk dk dk dk dk dk dk dk dk dk dk dk dk dk dk dk dk dk dk dk dk dk dk dk dk dk dk dk dk dk dk dk dk dk dk dk dk dk dk dk dk dk dk dk dk dk dk dk dk dk dk dk dk dk dk dk dk dk dk dk dk dk dk dk dk dk dk dk dk dk dk dk dk dk dk dk dk dk dk dk dk dk dk dk dk dk dk dk dk dk dk dk dk dk dk dk dk dk dk dk dk dk dk dk dk dk dk dk dk dk dk dk dk dk dk dk dk dk dk dk dk dk dk dk dk dk dk dk dk dk dk dk dk dk dk dk dk dk dk dk dk dk dk dk dk dk dk dk dk dk dk dk dk dk dk dk dk fi fi fi fi fi fi fi fi fi fi fi fi fi fi fi fi fi fi fi fi fi fi fi fi fi fi fi fi fi fi fi fi fi fi fi fi fi fi fi fi fi fi fi fi fi fi fi fi fi fi fi fi fi fi fi fi fi fi fi fi fi fi fi fi fi fi fi fi fi fi fi fi fi fi fi fi fi fi fi fi fi fi fi fi fi fi fi fi fi fi fi fi fi fi fi fi fi fi fi fi fi fi fi fi fi fi fi fi fi fi fi fi fi fi fi fi fi fi fi fi fi fi fi fi fi fi fi fi fi fi fi fi fi fi fi fi fi fi fi fi fi fi fi fi fi fi fi fi fi fi fi fi fi fi fi fi fi fi fi fi fi fi fi fi fi fi fi fi fi fi fi fi fi fi fi fi fi fi fi fi fi fi fi fi fi fi fi fi fi fi fi fi fi fi fi fi fi at at at at at at at at at at at at at at at at at at at at at at at at at at at at at at at at at at at at at at at at at at at at at at at at at at at at at at at at at at at at at at at at at at at at at at at at at at at at at at at at at at at at at at at at at at at at at at at at at at at at at at at at at at at at at at at at at at at at at at at at at at at at at at at at at at at at at at at at at at at at at at at at at at at at at at at at at at at at at at at at at at at at at at at at at at at at at at at at at at at at at at at at
chchchchchchchchchchchchchchchchchchchchchchchchchchchchchchchchchchchchchchchchchchchchchchchchchchchchchchchchchchchchchchchchchchchchchchchchchchchchchchchchchchchchchchchchchchchchch
-1-.
50
.51
Cou
ntry
ran
dom
inte
rcep
t with
95%
CI
12
34
56
78
910
1112
1314
1516
1718
1920
21
Rank of predicted country random intercept
Note: countries abbreviations as for Table 3

31
Appendix
TABLE 1A
Domestic employment and turnover trend
No. %
d2. how many employees does your company have [in your country]?
20-49 1,330 39.40%
50-249 1,075 31.80%
250-499 634 18.80%
500 or more 337 10.00%
Total 3,376 100.00%
d4. comparing your turnover of 2008 to that of 2006, did the annual turnover
Decreased 561 16.60%
Increased 2,032 60.20%
approximately the same 692 20.50%
dk/na 91 2.70%
Total 3,376 100.00%

32
References
Akkermans, Dirk, Carolina Castaldi, and Bart Los. 2009. Do ‘liberal market economies’ really innovate more radically than ‘coordinated market economies’?: Hall and Soskice reconsidered. Research Policy 38 (1):181-191.
Aoki, Masahiko. 1988. Information, Incentives and Bargaining in the Japanese Economy. New York: Cambridge University Press.
Archibugi, D, and A Coco. 2005. Is Europe becoming the most dynamic knowledge economy in the world? Journal on Common Market Studies 43 (3):433-459.
Baccaro, L., and D. Rei. 2007. Institutional determinants of unemployment in OECD countries: Does the deregulatory view hold water? International Organization 61 (3):527-569.
Bassanini, A., L. Nunziata, D. Venn, J. Boone, and J. Zweimuller. 2009. Job protection legislation and productivity growth in OECD countries. Economic Policy (58):349-402.
Becker, Uwe. 2005. Employment 'Miracles': A Critical Comparison of the Dutch, Scandinavian, Swiss, Australian and Irish Cases versus Germany and the US. Amsterdam: Amsterdam University Press.
Blanchard, O., and A. Landier. 2002. The perverse effects of partial labour market reform: Fixed-term contracts in France. Economic Journal 112 (480):F214-F244.
Bowers, Jake, and Katherine W. Drake. 2005. EDA for HLM: Visualization when Probabilistic Inference Fails. Political Analysis 13 (4):301-326.
Castellacci, F. 2008. Technology Clubs, Technology Gaps and Growth Trajectories. Structural Change and Economic Dynamics 19 (4):301–314.
Commision of the European Communities. 2007. Towards Common Principles of Flexicurity: More and Better Jobs through Flexibility and Security. Brussels: European Commission.
Council of Europe. 2005. Reconciling Labour Flexibility with Social Cohesion. Facing the Challenge, Trends in Social Cohesion Strasbourg: Council of Europe Publishing.
Crouch, C. 2010. Beyond the Flexibility/Security Trade-Off: Reconciling Confident Consumers with Insecure Workers. British Journal of Industrial Relations DOI: 10.1111/j.1467-8543.2010.00825.x.
Crouch, Colin, David Finegold, and Mari Sako. 1999. Are Skills the Answer? The Political Economy of Skill Creation in Advanced Industrial Countries. Oxford: Oxford University Press.
Cusack, Thomas R., Torben Iversen, and David Soskice. 2007. Economic Interests and the Origins of Electoral Systems. American Political Science Review 101 (3):373-391.
DiNardo, John, Nicole M. Fortin, and Thomas Lemieux. 1996. Labor Market Institutions and the Distribution of Wages, 1973-1992: A Semiparametric Approach. Econometrica 64 (5):1001-44.

33
Dore, Ronald. 1973. British factory-Japanese factory: the origins of national diversity in industrial relations. Berkeley: University of California Press.
Dosi, G 1982. Technological Paradigms and Technological Trajectories. Research Policy 11:147-162.
Estevez-Abe, Margarita. 2008. Welfare and Capitalism in Postwar Japan. New York: Cambridge University Press.
Estevez-Abe, Margarita, Torben Iversen, and David Soskice. 2001. Social protection and the formation of skills: a reinterpretation of the welfare state. In Varieties of Capitalism: The Institutional Foundations of Comparative Advantage, edited by P. A. Hall and D. Soskice. Oxford: Oxford University Press.
European Commission. 2009. Innobarometer 2009. Brussels: DG Enterprise and Industry.
Fadda, Sebastiano. 2011. Labour market institutions and the recent crisis: where we come from and where we are going. In International Workshop on Crises, Institutions and Labour Market Performance: Comparing Evidence and Policies. University of Perugia.
Fagerberg, Jan. 1994. Technology and International Differences in Growth Rates. Journal of Economic Literature 32 (3):1147-1175.
Field, Alexander. 2003. The most technologically progressive decade of the century. American Economic Review 93 (4):1399-1413.
Filippetti, Andrea, and Daniele Archibugi. 2011. Innovation in times of crisis: National systems of innovation, structure, and demand. Reseach Policy 40 (2):179-192.
Freeman, C. 1987. Technology Policy and Economic Performance: Lessons from Japan: London Pinter.
Geroski, Paul A., and C F Walters. 1995. Innovative activity over the business cycle. Economic Journal 105 (431):916-928.
Gintis, Herbert, and Tsuneo Ishikawa. 1987. Wages, work intensity, and unemployment. Journal of the Japanese and International Economies 1:195-228.
Giugni, M, ed. 2009. The Politics of Unemployment in Europe. Policy Responses and Collective Action. Ashgate,: Farnham.
Gold, M, ed. 2009. Employment Policy in the European Union. Origins, Themes and Prospects. Houndmills: Palgrave Macmillan.
Hall, Peter A, and David Soskice. 2001. An Introduction to Varieties of Capitalism. In Varieties of Capitalism: The Institutional Foundations of Comparative Advantage, edited by P. A. Hall and D. Soskice. Oxford: Oxford University Press.
Iversen, Torben. 2005. Capitalism, Democracy, and Welfare. New York: Cambridge University Press.
Kedar, Orit, and W. Phillips Shively. 2005. Introduction to the Special Issue. Political Analysis 13 (4):297-300.

34
Kok, W. 2003. The Kok Report: Making a Success of Enlargement. Florence: prepared by the Robert Schuman Centre for Advanced Studies at the European University Institute.
Kutan, A M, and T M Yigit. 2007. European integration, productivity growth and real convergence. European Economic Review 51 (6):1370-1395.
Levinthal, D A, and J G March. 1981. A model of adaptive organizational search. Journal of Economic Behavior and Organization 2:307-333.
Lorenz, Edward. 2011. Do labour markets and educational and training systems matter for innovation outcomes? A multi-level analysis for the EU-27. Science and Public Policy 38 (9):691-702.
Lorenz, Edward, and B A Lundvall, eds. 2006. How Europe's economies learn. Oxford: Oxford University Press.
Lundvall, B. A. 1992. National Systems of Innovation. London: Pinter Publisher.
Manca, A R, M Governatori, and M Masherini. 2010. Towards a set of composite indicators on flexicurity: a comprehensive approach. ISPRA: Joint Research Centre - European Commission.
Nelson, R. 1993. National Systems of Innovation. Oxford: Oxford University Press.
Nohria, Nitin, and R Gulati. 1996. Is slack good for innovation? Academy of Management Journal 39 (5):1245-1264.
OECD. 2005. Oslo Manual. Guidelines For Collecting And Interpreting Innovation Data. Edited by O. Publishing. Paris: Oecd.
———. 2009. Policy Responses to the Economic Crisis: investing in Innovation for Long-Term Growth. Paris: OECD.
Perez, C. 2010. Technological revolutions and techno-economic paradigms. Cambridge Journal of Economics 34 (1):185-202.
Rabe-Hesketh, S, and A Skrondal. 2004. Generalized Latent Variable Modelling. London: Chapman & Hall/CRC.
Schwartz, H M. 2001. The Danish "miracle" - Luck, pluck, or stuck? Comparative Political Studies 34 (2):131-155.
Sorge, Andre, and Wolfgang Streeck. 1988. Industrial Relations and Technical Change: the case for an extended perspective. In New Technology and Industrial Relations, edited by R. Hyman and W. Streeck. Oxford: Blackwell.
Tangian, Andranik. 2010. Not for bad weather: macroanalysis of flexicurity with regard to the crisis. Brussels: European Trade Union Institute.
Tumpel-Gugerell, G, and P Mooslechner, eds. 2003. Economic Convergence and Divergence in Europe. Growth and Regional Develpment in an Enlarged European Union. Cheltenham: Edward Elgar.
Viebrock, Elke, and Jochen Clasen. 2009. Flexicurity and welfare reform: a review. Socio-Economic Review 7 (2):305-331.

35
Williamson, Oliver E. 1985. The Economic Institutions of Capitalism: Firms, Markets, Relational Contracting. New York: Free Press.
Wilthagen, T, and F Tros. 2004. The concept of ‘flexicurity’: a new approach to regulating employment and labour markets” in “flexicurity: conceptual issues and political implementation in Europe”. Transfer 10 (2):166-186.
WIPO. 2010. World Intellectual Property Indicators. Geneva: WIPO.
World Bank. 1991. Vocational and technical education and training: a World Bank Policy Paper. Washington: World Bank.


