Embed Size (px)
Citation preview
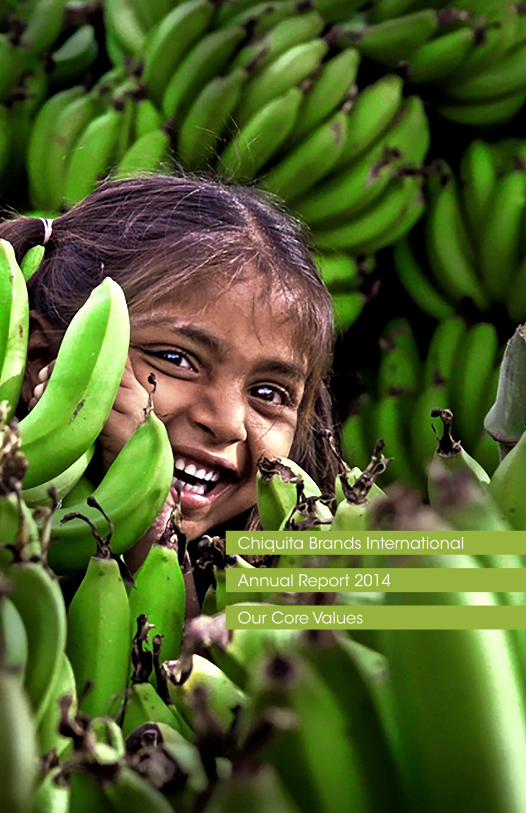
Chiquita Brands International
Annual Report 2014
Our Core Values
Chiquita Brands International, Inc. | 2014
1
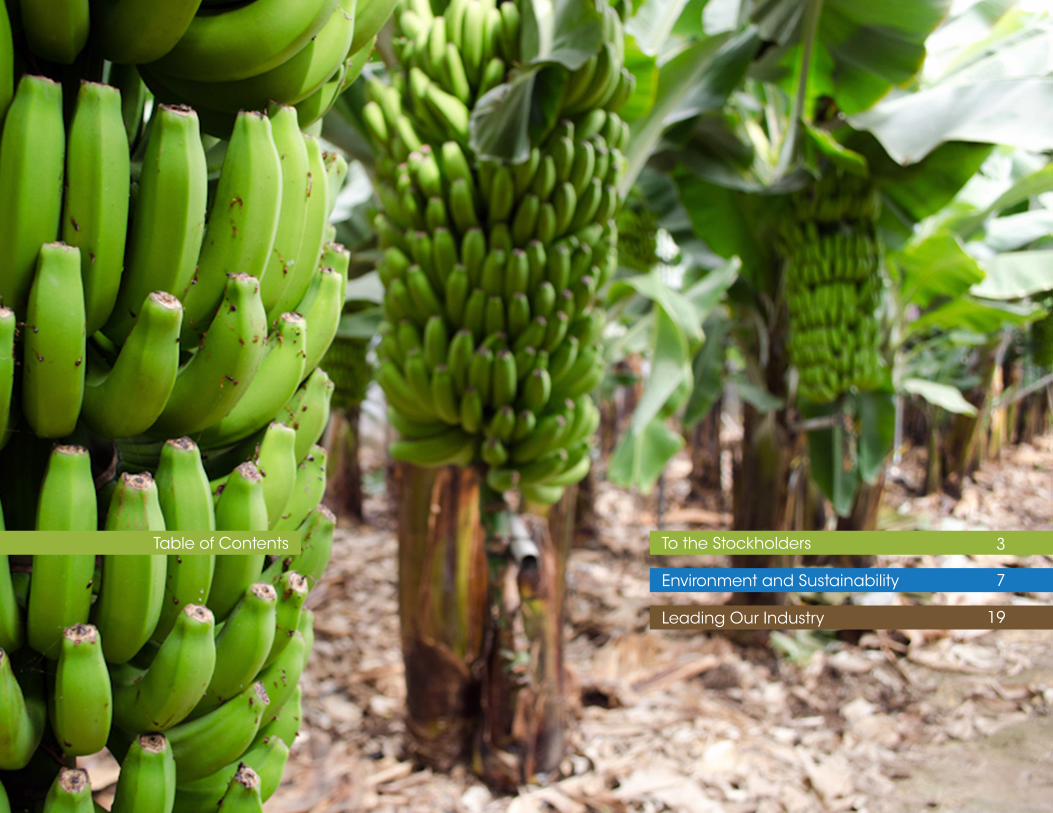
Table of Contents To the Stockholders
Environment and Sustainability
Leading Our Industry
3
7
19
Chiquita Brands International, Inc. | 2014
3
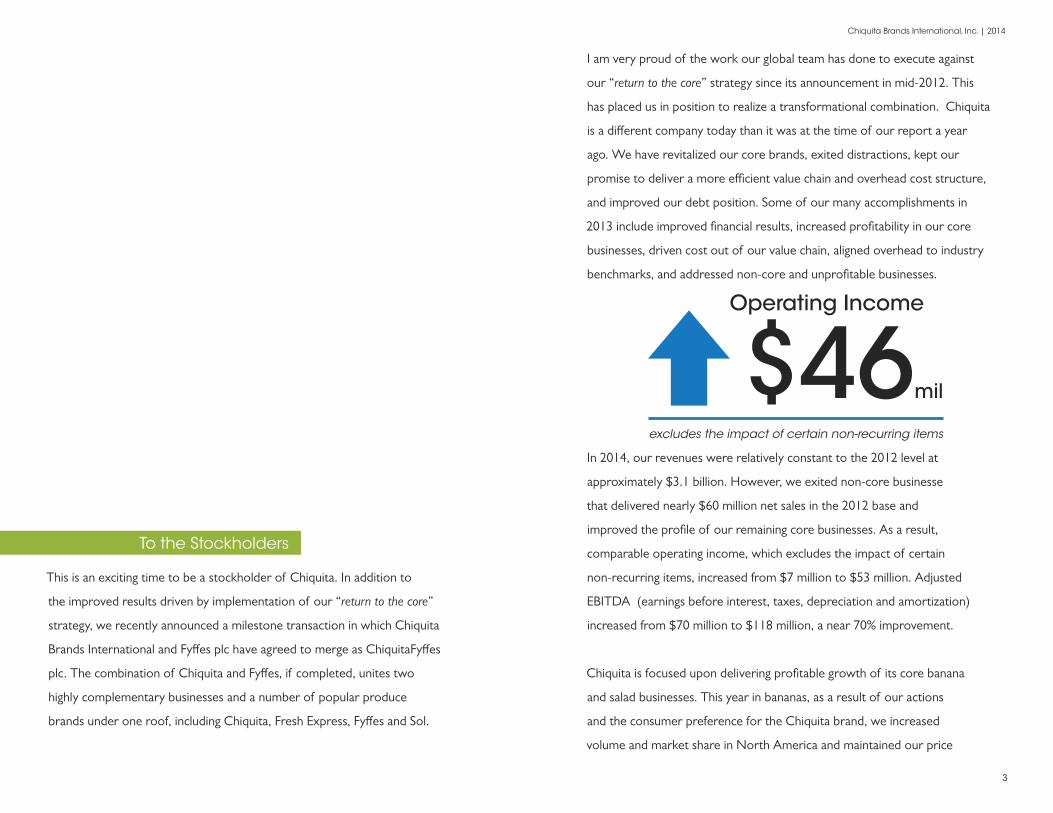
To the Stockholders
This is an exciting time to be a stockholder of Chiquita. In addition to
the improved results driven by implementation of our “return to the core”
strategy, we recently announced a milestone transaction in which Chiquita
Brands International and Fyffes plc have agreed to merge as ChiquitaFyffes
plc. The combination of Chiquita and Fyffes, if completed, unites two
highly complementary businesses and a number of popular produce
brands under one roof, including Chiquita, Fresh Express, Fyffes and Sol.
I am very proud of the work our global team has done to execute against
our “return to the core” strategy since its announcement in mid-2012. This
has placed us in position to realize a transformational combination. Chiquita
is a different company today than it was at the time of our report a year
ago. We have revitalized our core brands, exited distractions, kept our
promise to deliver a more efficient value chain and overhead cost structure,
and improved our debt position. Some of our many accomplishments in
2013 include improved financial results, increased profitability in our core
businesses, driven cost out of our value chain, aligned overhead to industry
benchmarks, and addressed non-core and unprofitable businesses.
In 2014, our revenues were relatively constant to the 2012 level at
approximately $3.1 billion. However, we exited non-core businesse
that delivered nearly $60 million net sales in the 2012 base and
improved the profile of our remaining core businesses. As a result,
comparable operating income, which excludes the impact of certain
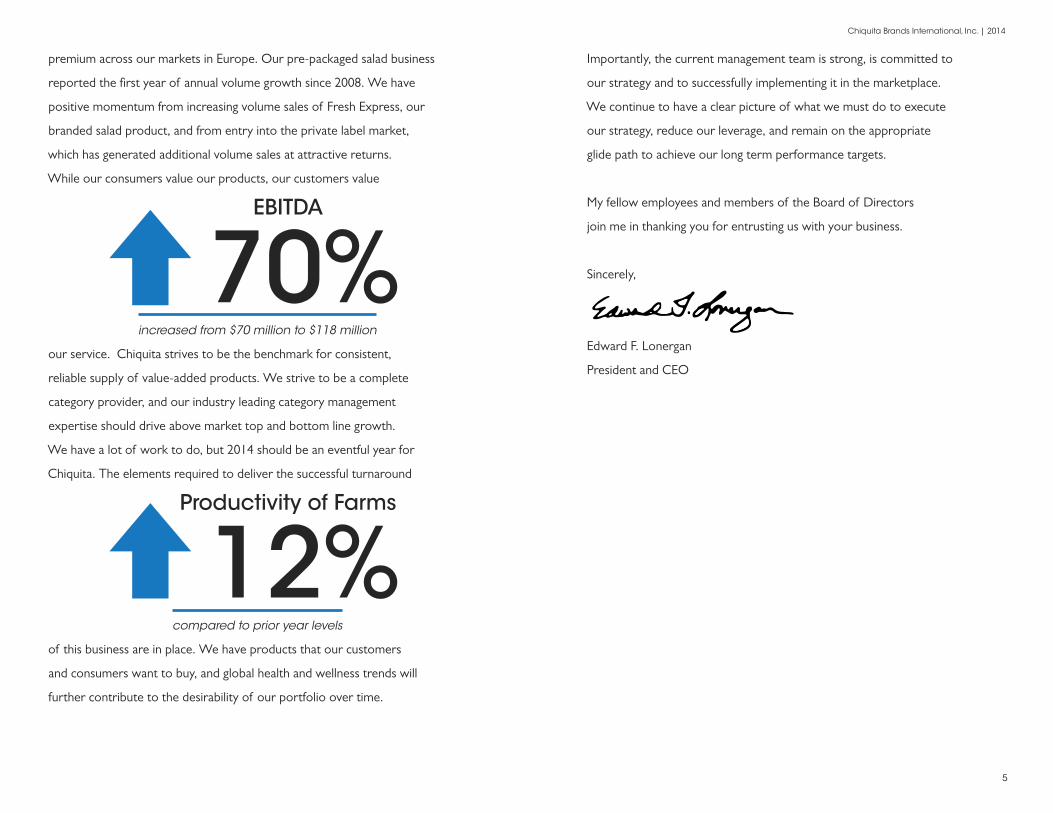
non-recurring items, increased from $7 million to $53 million. Adjusted
EBITDA (earnings before interest, taxes, depreciation and amortization)
increased from $70 million to $118 million, a near 70% improvement.
Chiquita is focused upon delivering profitable growth of its core banana
and salad businesses. This year in bananas, as a result of our actions
and the consumer preference for the Chiquita brand, we increased
volume and market share in North America and maintained our price
$46mil
Operating Income
excludes the impact of certain non-recurring items
Chiquita Brands International, Inc. | 2014
5
premium across our markets in Europe. Our pre-packaged salad business
reported the first year of annual volume growth since 2008. We have
positive momentum from increasing volume sales of Fresh Express, our
branded salad product, and from entry into the private label market,
which has generated additional volume sales at attractive returns.
While our consumers value our products, our customers value
our service. Chiquita strives to be the benchmark for consistent,
reliable supply of value-added products. We strive to be a complete
category provider, and our industry leading category management
expertise should drive above market top and bottom line growth.
We have a lot of work to do, but 2014 should be an eventful year for
Chiquita. The elements required to deliver the successful turnaround
of this business are in place. We have products that our customers
and consumers want to buy, and global health and wellness trends will
further contribute to the desirability of our portfolio over time.
Importantly, the current management team is strong, is committed to
our strategy and to successfully implementing it in the marketplace.
We continue to have a clear picture of what we must do to execute
our strategy, reduce our leverage, and remain on the appropriate
glide path to achieve our long term performance targets.
My fellow employees and members of the Board of Directors
join me in thanking you for entrusting us with your business.
Sincerely,
Edward F. Lonergan
President and CEO
70%EBITDA
increased from $70 million to $118 million
12%Productivity of Farms
compared to prior year levels
Environment and Sustainability Improving Lives
Loving Our Planet
7
Chiquita Brands International, Inc. | 2014
Chiquita Brands International, Inc. | 2014
9
Journey with a Purpose
During the early 1990s, Chiquita began working with the Rainforest
Alliance certification program, and embarked on the journey toward
sustainable agriculture. In 2009, our Corporate Responsibility Steering
Committee initiated a companywide Sustainability initiative with primary
emphasis on greenhouse gas emissions and water, and secondary
focus on materials use and biodiversity. Below we iutline some of the
sustainability work that has since blossomed in many locations.
In February 2012, we celebrated 20 years of collaboration with the
Rainforest Alliance at a public event at the Fruit Logistica fair in Berlin, with
the participation of Tensie Whelan, president of the Rainforest Alliance,
and representatives of the partners in our biodiversity partnerships.
Since 2009, we have, with the expert assistance of MIT
(Massachusetts Institute of Technology), developed the carbon
footprint of Chiquita bananas from field to the retail shelf.
Our European colleagues have also moved ahead in the search for sustainability
solutions. Our team in the Netherlands, designed a new carbon neutral
banana ripening facility, which may well become a model for all such facilities.
We teamed up with WWF International to define the water footprints of
our Fresh Express salads and Chiquita bananas, to identify risks related to
this precious resource and to highlight areas requiring priority attention.
Our Fresh Express packaged salads are primarily grown in the western
United States where fresh water is in short supply. We profile the work
of our agronomists in developing the GAIN™ project to improve
salad farming practices designed to minimize fertilizer and irrigation
water use while maintaining product quality and field yields.
Our North American transportation department has collaborated with
the U.S. government’s SmartWay® initiative for several years to reduce
the environmental impact of our road transportation. Ocean shipping
contributes substantially to the carbon emissions of the banana lifecycle.
Chiquita Brands International, Inc. | 2014
11
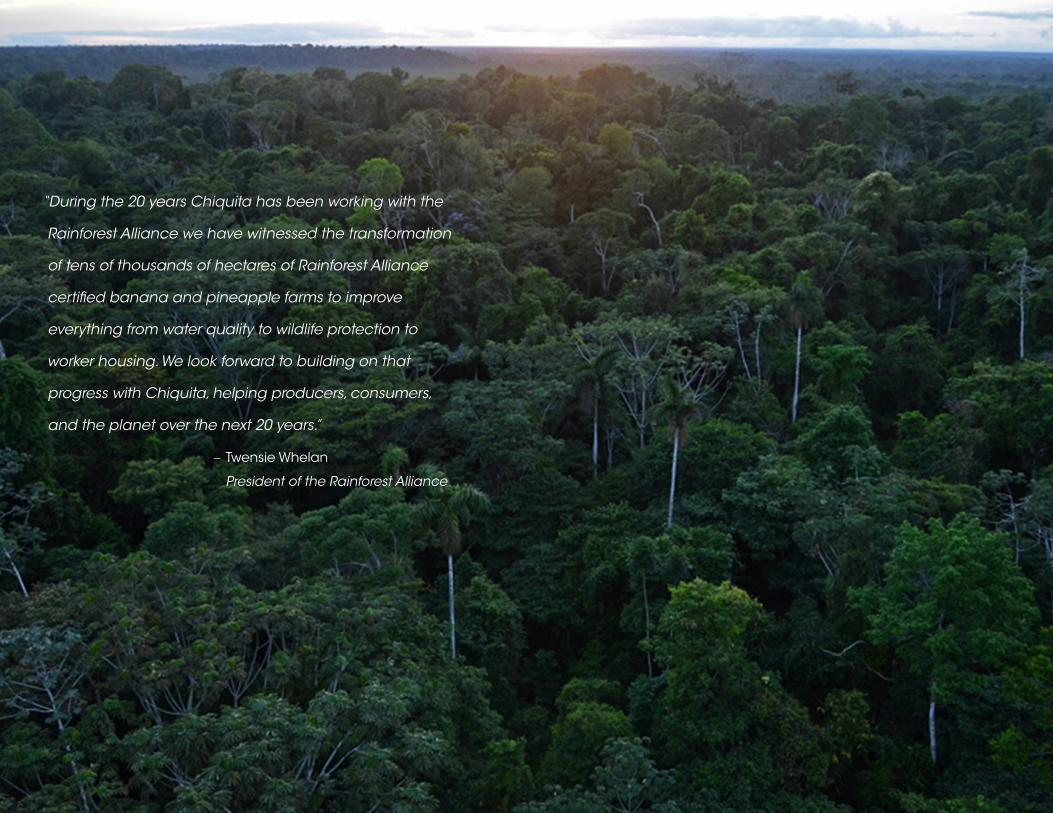
“During the 20 years Chiquita has been working with the
Rainforest Alliance we have witnessed the transformation
of tens of thousands of hectares of Rainforest Alliance
certified banana and pineapple farms to improve
everything from water quality to wildlife protection to
worker housing. We look forward to building on that
progress with Chiquita, helping producers, consumers,
and the planet over the next 20 years.”
– Twensie Whelan
President of the Rainforest Alliance
Chiquita Brands International, Inc. | 2014
13
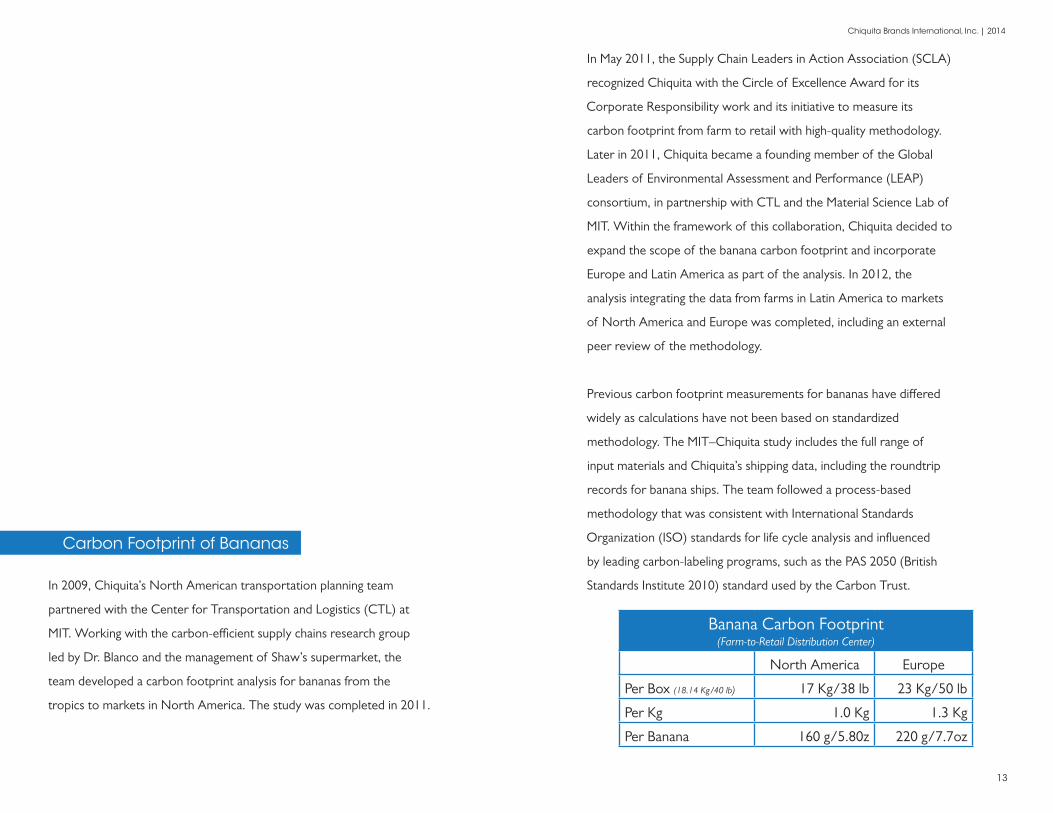
Carbon Footprint of Bananas
In 2009, Chiquita’s North American transportation planning team
partnered with the Center for Transportation and Logistics (CTL) at
MIT. Working with the carbon-efficient supply chains research group
led by Dr. Blanco and the management of Shaw’s supermarket, the
team developed a carbon footprint analysis for bananas from the
tropics to markets in North America. The study was completed in 2011.
In May 2011, the Supply Chain Leaders in Action Association (SCLA)
recognized Chiquita with the Circle of Excellence Award for its
Corporate Responsibility work and its initiative to measure its
carbon footprint from farm to retail with high-quality methodology.
Later in 2011, Chiquita became a founding member of the Global
Leaders of Environmental Assessment and Performance (LEAP)
consortium, in partnership with CTL and the Material Science Lab of
MIT. Within the framework of this collaboration, Chiquita decided to
expand the scope of the banana carbon footprint and incorporate
Europe and Latin America as part of the analysis. In 2012, the
analysis integrating the data from farms in Latin America to markets
of North America and Europe was completed, including an external
peer review of the methodology.
Previous carbon footprint measurements for bananas have differed
widely as calculations have not been based on standardized
methodology. The MIT–Chiquita study includes the full range of
input materials and Chiquita’s shipping data, including the roundtrip
records for banana ships. The team followed a process-based
methodology that was consistent with International Standards
Organization (ISO) standards for life cycle analysis and influenced
by leading carbon-labeling programs, such as the PAS 2050 (British
Standards Institute 2010) standard used by the Carbon Trust.
Banana Carbon Footprint(Farm-to-Retail Distribution Center)
North America Europe
Per Box (18.14 Kg/40 lb) 17 Kg/38 lb 23 Kg/50 lb
Per Kg 1.0 Kg 1.3 Kg
Per Banana 160 g/5.80z 220 g/7.7oz
Chiquita Brands International, Inc. | 2014
15
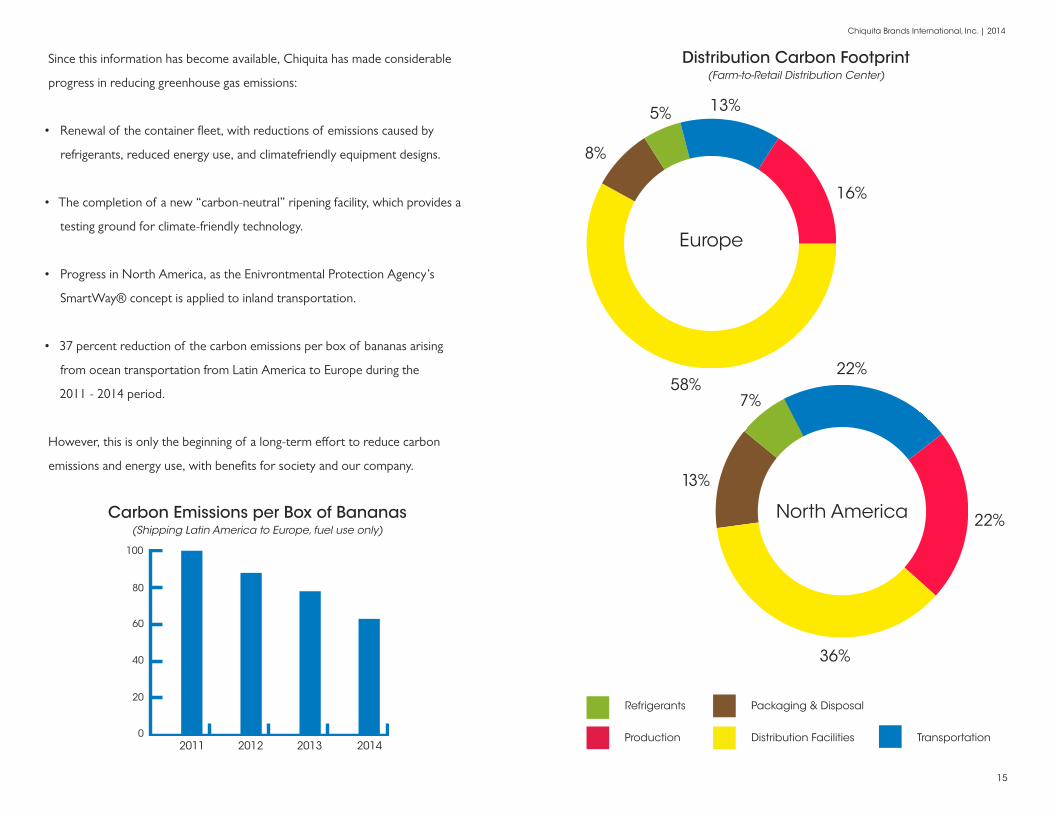
North America
36%
13%
22%
22%
7%
Since this information has become available, Chiquita has made considerable
progress in reducing greenhouse gas emissions:
• Renewal of the container fleet, with reductions of emissions caused by
refrigerants, reduced energy use, and climatefriendly equipment designs.
• The completion of a new “carbon-neutral” ripening facility, which provides a
testing ground for climate-friendly technology.
• Progress in North America, as the Enivrontmental Protection Agency’s
SmartWay® concept is applied to inland transportation.
• 37 percent reduction of the carbon emissions per box of bananas arising
from ocean transportation from Latin America to Europe during the
2011 - 2014 period.
However, this is only the beginning of a long-term effort to reduce carbon
emissions and energy use, with benefits for society and our company.
2014201320122011
20
40
60
80
100
0
Carbon Emissions per Box of Bananas(Shipping Latin America to Europe, fuel use only)
Distribution Carbon Footprint(Farm-to-Retail Distribution Center)
Transportation
Packaging & Disposal
Distribution Facilities Production
Refrigerants
2012
Europe
58%
8%
5% 13%
16%
Chiquita Brands International, Inc. | 2014
17
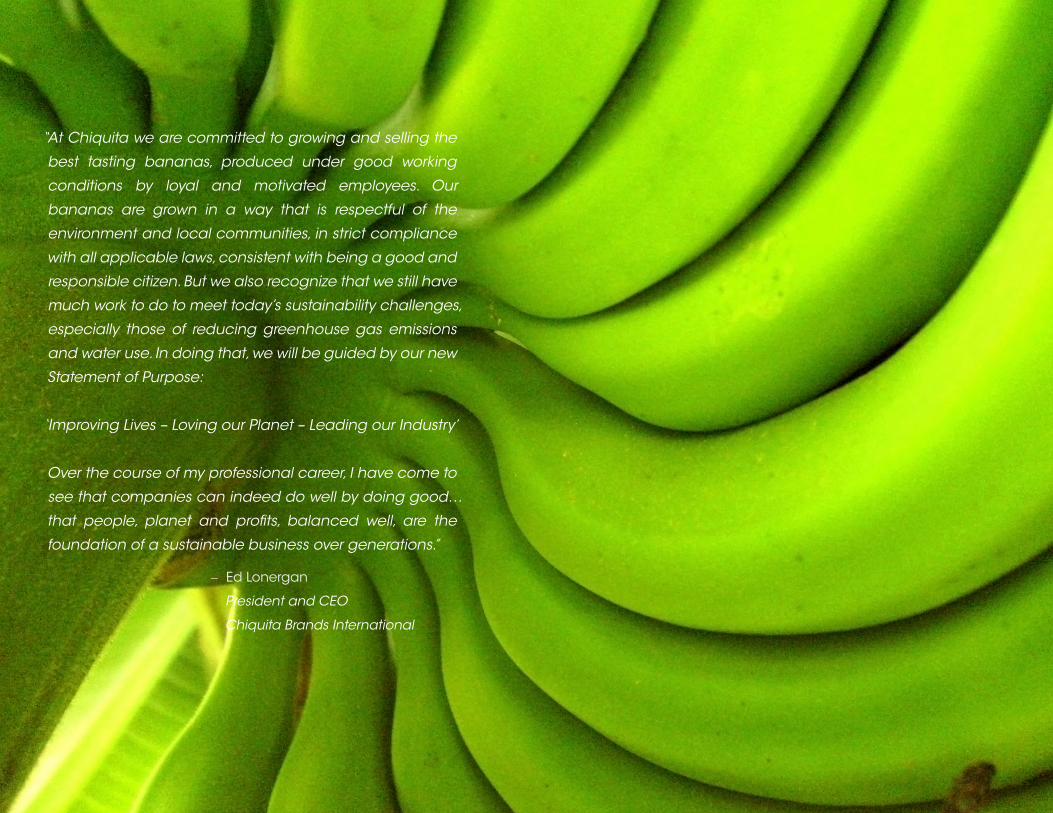
“At Chiquita we are committed to growing and selling the
best tasting bananas, produced under good working
conditions by loyal and motivated employees. Our
bananas are grown in a way that is respectful of the
environment and local communities, in strict compliance
with all applicable laws, consistent with being a good and
responsible citizen. But we also recognize that we still have
much work to do to meet today’s sustainability challenges,
especially those of reducing greenhouse gas emissions
and water use. In doing that, we will be guided by our new
Statement of Purpose:
‘Improving Lives – Loving our Planet – Leading our Industry’
Over the course of my professional career, I have come to
see that companies can indeed do well by doing good…
that people, planet and profits, balanced well, are the
foundation of a sustainable business over generations.”
– Ed Lonergan
President and CEO
Chiquita Brands International
Leading Our Industry
19
Chiquita Brands International, Inc. | 2014
Chiquita Brands International, Inc. | 2014
21
Leading Our Industry
Chiquita Brands International, Inc. (“CBII”) and its subsidiaries (collectively,
“Chiquita,” “the company,” “we” or “us”) operate as a leading international
marketer and distributor of high-quality fresh and value-added produce
which is sold under the premium Chiquita® and Fresh Express® brands and
other trademarks, including private label brands. We are one of the largest
banana distributors in the world and a major supplier of bananas in Europe
and North America. In Europe, we are the brand leader and obtain a price
premium for our Chiquita® bananas, and we hold the number one market
share in U.S. supermarkets and the number two market position in North
America overall for bananas. Our packaged salads are sold under the Fresh
Express brand name, as well as private label offerings, primarily in the United
States.We are pleased with the progress that we have made during 2014, and
our overall year-over-year results continue to improve. The restructuring
initiatives implemented at the end of 2013 have meaningfully reduced our
selling, general and administrative expenses. Our strategic decisions to
focus on our core bananas and salads businesses and to enhance owned
farm and logistics efficiencies have positively impacted our results from
operations. Productivity on our owned banana farms improved substantially
as a primary result of changes in agricultural practices. The additional volume
from our owned farms resulted in lower sourcing costs during this period
by reducing third-party banana purchases during 2014 as compared to 2013,
especially for higher-priced spot purchases in the first half of the year.
We secured 5 million boxes of incremental annualized banana volume in
North America in late 2012 and an additional 2 million annualized boxes
in the first quarter of 2013. These wins drove volume gains in our North
American business in 2013 compared to 2012 and resulted in further
logistics cost savings from scale efficiencies. In Europe, we prioritized
profitability over volume during 2013 resulting in stable local pricing, but
lower volume. Pricing in Europe is mainly based on weekly price quotes
in local currency. Typically, European pricing is significantly stronger in
the first half of the year when supply and demand are more balanced as
compared to the second half of the year, when supply is typically greater
than demand. Overall, both local currency and U.S. dollar pricing in our
Core European banana markets were higher in 2014 compared to 2013.
Chiquita Brands International, Inc. | 2014
23
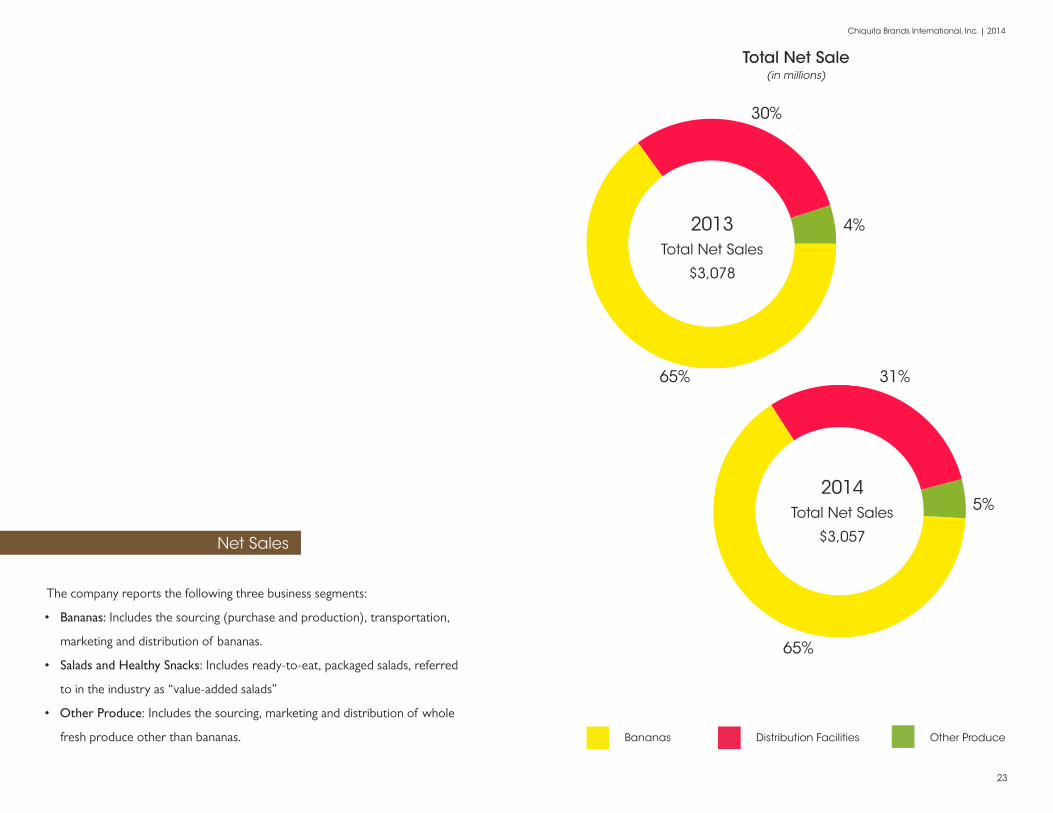
Net Sales
The company reports the following three business segments:
• Bananas: Includes the sourcing (purchase and production), transportation,
marketing and distribution of bananas.
• Salads and Healthy Snacks: Includes ready-to-eat, packaged salads, referred
to in the industry as “value-added salads”
• Other Produce: Includes the sourcing, marketing and distribution of whole
fresh produce other than bananas.
65%
65%
4%
5%
30%
31%
2014 Total Net Sales
$3,057
Total Net Sale(in millions)
2013 Total Net Sales
$3,078
Other ProduceDistribution Facilities Bananas
Chiquita Brands International, Inc. | 2014
25
Net Sales 2014 vs. 2013
Bananas
sales were 0.8% lower primarily as a result of lower volume in Core Europe
(defined below), where we continued to prioritize profitability over volume,
lower volume in the Middle East and lower pricing in North America. These
declines were offset by significant new banana volumes in North America
as a result of customer wins and stable local pricing in Europe during 2013.
Salads and Healthy Snacks
sales were 1.5% higher primarily from increased volume of our retail
value-added salads, as a result of new private label and branded
contract volume and increased velocity with our current customers,
as well as improved pricing in our healthy snacks products. These
improvements were offset by a decrease in sales of our processed
fruit ingredient products and the exit of a European healthy snacking
business that represented approximately $12 million of net sales on
an annual basis and had an insignificant effect on operating income.
Other Produce
sales were lower as a result of discontinuing our North American deciduous
product lines at the end of 2012 partially offset by increased volume
and pricing of pineapples. Our North American deciduous product lines
represented approximately $40 million of net sales on an annual basis.
Operating Income
As a result of the above, as well as the benefits to our selling, general and
administrative expenses from our completed restructuring and relocation
plans, operating income improved on a consolidated basis and in each of
the operating segments. As more fully described below, the 2012 results of
the Salads and Healthy Snacks segment also include a$180 million goodwill
and trademark impairment related to the Fresh Express salads business
and a $32 million loss to fully impair our equity-method investment and
related assets and to record estimates of probable cash obligations to the
Danone JV. The 2012 results of the Bananas segment include $9 million in
allowance for doubtful accounts related to a Middle Eastern customer.
.
Chiquita Brands International, Inc. | 2014
27
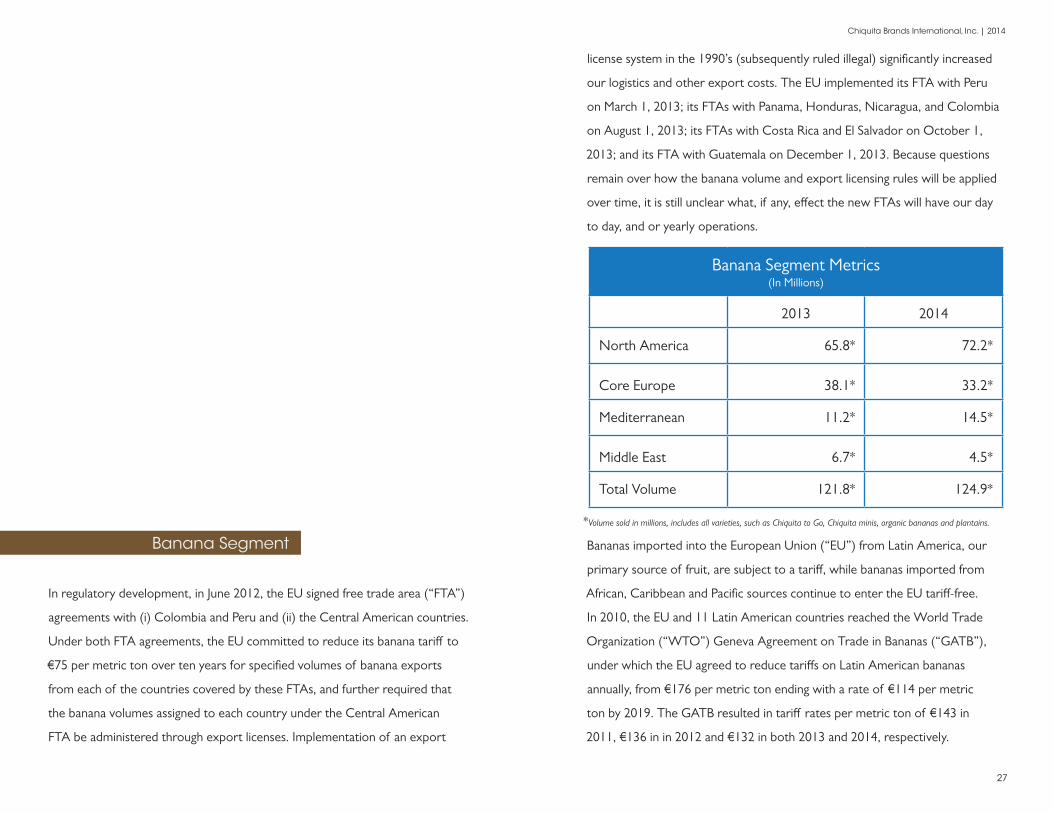
license system in the 1990’s (subsequently ruled illegal) significantly increased
our logistics and other export costs. The EU implemented its FTA with Peru
on March 1, 2013; its FTAs with Panama, Honduras, Nicaragua, and Colombia
on August 1, 2013; its FTAs with Costa Rica and El Salvador on October 1,
2013; and its FTA with Guatemala on December 1, 2013. Because questions
remain over how the banana volume and export licensing rules will be applied
over time, it is still unclear what, if any, effect the new FTAs will have our day
to day, and or yearly operations.
*Volume sold in millions, includes all varieties, such as Chiquita to Go, Chiquita minis, organic bananas and plantains.
Bananas imported into the European Union (“EU”) from Latin America, our
primary source of fruit, are subject to a tariff, while bananas imported from
African, Caribbean and Pacific sources continue to enter the EU tariff-free.
In 2010, the EU and 11 Latin American countries reached the World Trade
Organization (“WTO”) Geneva Agreement on Trade in Bananas (“GATB”),
under which the EU agreed to reduce tariffs on Latin American bananas
annually, from €176 per metric ton ending with a rate of €114 per metric
ton by 2019. The GATB resulted in tariff rates per metric ton of €143 in
2011, €136 in in 2012 and €132 in both 2013 and 2014, respectively.
Banana Segment Metrics (In Millions)
2013 2014
North America 65.8* 72.2*
Core Europe 38.1* 33.2*
Mediterranean 11.2* 14.5*
Middle East 6.7* 4.5*
Total Volume 121.8* 124.9*
Banana Segment
In regulatory development, in June 2012, the EU signed free trade area (“FTA”)
agreements with (i) Colombia and Peru and (ii) the Central American countries.
Under both FTA agreements, the EU committed to reduce its banana tariff to
€75 per metric ton over ten years for specified volumes of banana exports
from each of the countries covered by these FTAs, and further required that
the banana volumes assigned to each country under the Central American
FTA be administered through export licenses. Implementation of an export

Chiquita Brands International, Inc. | 2014
29
Net Sales, Cost of Sales and Operating Income Analysis
(In Millions)
2013 vs. 2012 2014 vs. 2013
Banana Net Sales Comparison Year 2023 1985
Global Pricing 4 (64)
Volume 21 51
Average European Exchange Rates (63) (2)
Banana Net Sales 1985 1970
Our primary markets are in North America and Europe, but we also have sales
in the Middle East and other markets. The majority of our sales in the Middle
East are in Iran under license from the U.S. government that allows sale of
food products to non-sanctioned parties. These sales to Iranian customers are
in U.S. dollars and represent $17 million and $20 million of “Trade receivables,
less allowances” on the Consolidated Balance Sheet as of December 31,
2013 and 2012. Even though the sales in Iran are permitted, the international
sanctions against Iran affected the ability of Iranian customers to pay invoices
within terms because it became difficult for them to obtain U.S. dollars, euros
or other suitable currencies in sufficient quantity on a regular basis. Over the
course of 2012, our receivable balance with these customers increased making
repayment more difficult, and we have established payment plans with each of
these customers to reduce their balances. Certain customers have so far been
able to find acceptable methods of payment to comply with their payment
plans. However, some customers have not, and as a result we recorded a
reserve of $9 million in 2012, with an additional $2 million in 2013 as a
result of further delinquency and other repayment risk. We source bananas
from the Philippines for sale in the Middle East under a committed-volume,
long-term purchase contract with a former joint venture partner through
2016. To mitigate risk, we have reduced the amount of volume being
sent to the Middle East and have developed customers in other Middle
eastern markets, such as Iraq and Saudi Arabia. However, Iran remains
an important market for the company’s Philippine-sourced bananas.
1. Sourcing costs include costs of producing fruit in our owned operations and purchasing fruit from our third party
growers.Logistics costs are significantly affected by fuel prices, including the effect of fuel hedges that were a
benefit of $6 million, $15 million and $47 million in 2013, 2012 and 2011, respectively. Logistics costs are
also significantly affected by shifts in volume from one destination market to another and shifts in transportation
modalities (reefer vessel, 3rd party container lines, container vessel, etc.).
2. Late in 2012, we implemented a new European shipping configuration that resulted in significant reductions in
logistics costs in2013 that continue throughout 2014. These changes reduced our total expected bunker fuel
purchases and the number of ports where bunker fuel is purchased, and accounting standards required us to
recognize $12 million of unrealized fuel hedging gains in 2012 for hedge positions originally intended to hedge
fuel purchases in future periods. Also as a result of the shipping reconfiguration, five chartered cargo ships were
subleased to third parties until the end of 2013, and eight ship charters were not renewed for 2014. In 2013, we
accelerated $6 million of losses on the three sublease arrangements that began in the first quarter of 2013, net
of $2 million of related deferred sale-leaseback gain amortization during the sublease period. We accelerated
$4 million of losses in 2012 on the other two sublease arrangements that began in the fourth quarter of 2012.
(In Millions) 2014 vs. 2013 2013 vs. 2012
Banana Cost of Sales Comparison Year 1748 1715
Volume 66 $20
Sourcing and Logistics Costs 1 (95) 22
Average European Exchange Rates 2 -18
Losses on Ship Sublease 2013 (6) 2
Tariffs (5) (4)
Gains on Asset Sales 2012 2 — 5
Other 2 6
Banana Cost of Sales 1712 1748
Chiquita Brands International, Inc. | 2014
31
Investor Information
KERRII B. ANDERSON
Chairwoman of the Board
Chair of the Nominating & Governance Committee
EDWARD F. LONERGAN
President and Chief Executive Officer
HOWARD W. BARKER, JR.
Chair of the Audit Committee
CLARE M. HASLER-LEWIS
Chair of the Food Safety, Technology and Sustainability Committee
CRAIG E. HUSS
Former Chief Risk Officer
Archer Daniels Midland Company
JEFFREY N. SIMMONS
Chair of the Compensation & Organization Development Committee
STEVEN P. STANBROOK
Chief Operating Officer
RONALD V. WATERS III
Private Investor
CHIQUITA BRANDS INTERNATIONAL, INC.
550 S. Caldwell St
Charlotte, NC 28202 USA
ANNUAL MEETING
May 22, 2014 10 a.m. EDT
550 S. Caldwell Street, 11th Floor
Charlotte, N.C. 28202
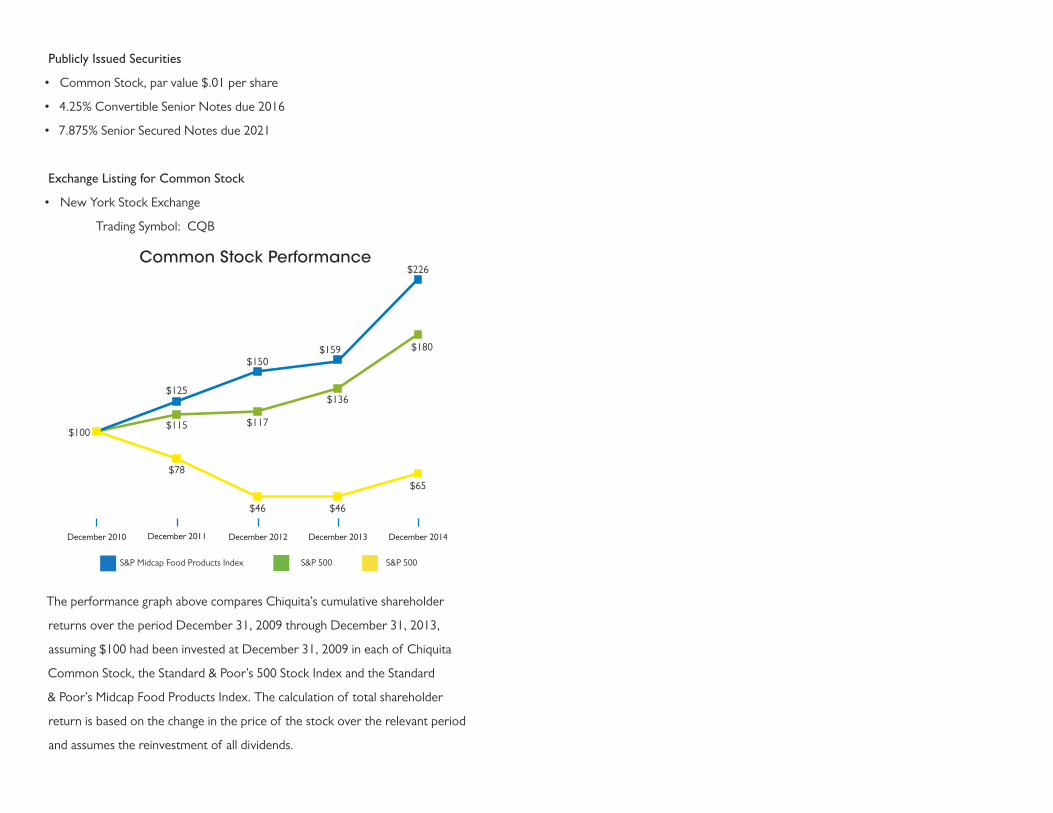
Publicly Issued Securities
• Common Stock, par value $.01 per share
• 4.25% Convertible Senior Notes due 2016
• 7.875% Senior Secured Notes due 2021
Exchange Listing for Common Stock
• New York Stock Exchange
Trading Symbol: CQB
The performance graph above compares Chiquita’s cumulative shareholder
returns over the period December 31, 2009 through December 31, 2013,
assuming $100 had been invested at December 31, 2009 in each of Chiquita
Common Stock, the Standard & Poor’s 500 Stock Index and the Standard
& Poor’s Midcap Food Products Index. The calculation of total shareholder
return is based on the change in the price of the stock over the relevant period
and assumes the reinvestment of all dividends.
December 2010 December 2014December 2013December 2012December 2011
$100
$78
$115
$125
$117
$150
$136
$159 $180
$226
$46 $46
$65
Common Stock Performance
S&P Midcap Food Products Index S&P 500 S&P 500