Embed Size (px)
Citation preview

RESEARCH ARTICLE Open Access
ChIPseqR: analysis of ChIP-seq experimentsPeter Humburg1,2,4*, Chris A Helliwell3, David Bulger1, Glenn Stone2
Abstract
Background: The use of high-throughput sequencing in combination with chromatin immunoprecipitation(ChIP-seq) has enabled the study of genome-wide protein binding at high resolution. While the amount of datagenerated from such experiments is steadily increasing, the methods available for their analysis remain limited.Although several algorithms for the analysis of ChIP-seq data have been published they focus almost exclusively ontranscription factor studies and are usually not well suited for the analysis of other types of experiments.
Results: Here we present ChIPseqR, an algorithm for the analysis of nucleosome positioning and histonemodification ChIP-seq experiments. The performance of this novel method is studied on short read sequencingdata of Arabidopsis thaliana mononucleosomes as well as on simulated data.
Conclusions: ChIPseqR is shown to improve sensitivity and spatial resolution over existing methods whilemaintaining high specificity. Further analysis of predicted nucleosomes reveals characteristic patterns innucleosome sequences and placement.
BackgroundThe recent advent of high-throughput sequencing tech-nologies has enabled genome-wide studies of DNA-binding proteins at high resolution. In such studies theprotein of interest is isolated together with a fragmentof bound DNA, which is then separated from the pro-tein and sequenced. This approach has been used toinvestigate several different proteins including the posi-tioning of nucleosomes [1-4]. For this type of experi-ment DNA is typically digested with micrococcalnuclease (MNase) before isolating nucleosome-sizedDNA fragments (~150 bp) that are then sequenced.This is the application considered here. Each nucleo-some is expected to produce several sequence reads ofapproximately 35 - 100 bp from both strands. This leadsto peaks in read density on either side of the nucleo-some with the extent of the peaks and the distancebetween the two peaks determined by the length ofDNA fragments and binding site. Since the DNA frag-ments produced by an MNase digest of nucleosomes areselected to be similar in length to the actual binding sitethe resulting peaks in read counts are expected to berelatively narrow and peaks on forward and reverse
strand should be separated by a region that correspondsapproximately to the nucleosome bound DNA. Thisregion is expected to be depleted of sequence reads(Figure 1). However, the distance between adjacentnucleosomes is usually short (~30 - 60 bp) and this maylead to overlap between peaks. When analysed at lowresolution this can lead to the detection of extendedenriched regions rather than individual nucleosomes.In a related type of experiment a subset of nucleo-
somes is targeted through chromatin immunoprecipita-tion (ChIP) followed by high-throughput sequencing ofChIP fragments [5,6]. This technique, commonly knownas ChIP-seq, has also been used to investigate the bind-ing of transcription factors [7,8]. Due to the relativelyshort binding site of most transcription factors thesestudies typically produce wider, relatively isolated peaksin read counts compared to those obtained from nucleo-some sequencing.The increasing number of ChIP-seq and nucleosome
positioning studies has led to the development of var-ious approaches to analyse these data. The analysis typi-cally starts by mapping short sequence reads to areference genome, ignoring reads with non-uniquealignments. To identify protein binding sites from thesemapped reads, many commonly used methods generatea strand-independent profile of windowed read countsby recording the total number of reads on both strands
* Correspondence: [email protected] of Statistics, Macquarie University, North Ryde, NSW 2109,AustraliaFull list of author information is available at the end of the article
Humburg et al. BMC Bioinformatics 2011, 12:39http://www.biomedcentral.com/1471-2105/12/39
© 2011 Humburg et al; licensee BioMed Central Ltd. This is an Open Access article distributed under the terms of the CreativeCommons Attribution License (http://creativecommons.org/licenses/by/2.0), which permits unrestricted use, distribution, andreproduction in any medium, provided the original work is properly cited.

that fall into a sliding window, or alternatively the num-ber of overlapping extended reads for each position inthe genome [5,7-11]. In both cases the height of theread count profile corresponds to the total number ofreads in the window, irrespective of strand. The readextension method implicitly uses separate windows forthe two strands, combining the sequence reads in bothwindows into a single read count. Explicitly using twodistinct windows to construct the read count profileallows for the inclusion of information about the lengthof the protein binding site [4]. Peaks in the resultingread count profile are usually assessed for significancebased on total read counts compared to a control sam-ple [7,9], background model [8,10] or permutation ofobserved read counts [5]. The use of hidden Markovmodels (HMMs) [5,11] and kernel density estimators[12,13] has been suggested as an alternative way to iden-tify significant peaks in the read count profile. Althoughthis strand-independent approach to ChIP-seq analysishas been used frequently with apparent success, itignores the fact that DNA binding proteins are expectedto generate a similar number of reads on both strandsadjacent to the binding site.The need for a new approach to ChIP-seq analysis
that incorporates the characteristics of protein bindingsites has been recognised and has led to the develop-ment of new strand-specific methods. Kharchenko et al.[14] suggest three different approaches to utilise strand-specific read counts that outperform established strand-independent methods [7,8]. The SISSRs algorithm ofJothi et al. [15] considers the difference of read countson both strands in a sliding window and locates poten-tial protein binding sites by identifying sign changes inthis net read count. Although these methods were devel-oped with transcription factor analysis in mind, themethods presented in [14] are general enough to beextended to a nucleosome related analysis. The SISSRsalgorithm assumes that binding sites are isolated, i.e.,peaks from neighbouring binding sites do not overlap.
This is unlikely to be true for nucleosomes since theyare expected to be located close to each other, whichrestricts SISSRs to the detection of extended regions ofenrichment. This makes SISSRs unsuitable for the iden-tification of individual nucleosome positions. A similarissue arises with the method proposed by Zang et al.[16]. Although their method was specifically designed toidentify histone modifications from ChIP-seq data itfocuses on the detection of broad regions of enrichmentrather than individual nucleosome positions. Spyrouet al. [17] propose a strand specific HMM analysis ofChIP-seq experiments and demonstrate its utility ontranscription factor and histone modification data.Although Spyrou et al. make a deliberate effort toobtain results at high resolution the HMM frameworklimits the resolution that can be achieved by thismethod, which may be insufficient to distinguishbetween adjacent nucleosomes.When sequencing nucleosomal DNA, either to deter-
mine nucleosome positioning or to identify specific his-tone modifications, it is important to realise that thebinding site is substantially longer than for a typicaltranscription factor. While it may be acceptable toignore the expected gap between peaks on forward andreverse strands when the binding site is small comparedto the window used, as is often the case for transcrip-tion factor binding sites, this is not necessarily true fornucleosomes. Some studies choose the size of the slidingwindow to be the average DNA fragment length [5,8,9]while others choose a smaller window of 100 bp [7,10].It should be noted that these window sizes are substan-tially larger than the transcription factor binding sites inquestion, but similar in length to or shorter thannucleosome-bound DNA. The use of 1 kb windows[5,9,11] or even 1 Mb windows [9] has been suggested.Although the increased window size alleviates the needto model the length of binding sites explicitly, it alsoleads to a notable decrease in resolution.To locate nucleosomes at high resolution we propose
to use an explicit model of protein binding site charac-teristics and of the resulting read patterns. This requiresthe model to be adjusted to the details of the experi-ment under consideration. In particular the impact ofchanges to the protocol used to isolate and purifynucleosomes has to be considered carefully. We demon-strate our approach to the high resolution analysis ofChIP-seq experiments by introducing ChIPseqR, analgorithm designed for the identification of nucleo-somes. This method provides a number of parametersthat allow it to be adjusted to different types of experi-ments but here we focus on the analysis of end-sequenced mononucleosomes after digestion withMNase. ChIPseqR is applied to simulated data on whichit is shown to identify nucleosomes at high resolution
Figure 1 Nucleosome model. Schematic representation of anucleosome (top) and corresponding binding site model (bottom).The signature of a protein binding event with high read densityupstream and downstream of the binding site is partitioned intothree regions. The support regions on the forward and reversestrand are flanking the binding region, capturing the peak in readdensity on the respective strand.
Humburg et al. BMC Bioinformatics 2011, 12:39http://www.biomedcentral.com/1471-2105/12/39
Page 2 of 17

while achieving better sensitivity and specificity thanalternative methods. The favourable performance ofChIPseqR is confirmed through the application to end-sequenced mononucleosomes.
ResultsAlgorithmBackground distribution of sequence readsTo reliably identify nucleosome positions it is necessaryto model the read counts associated with a bindingevent as well as read counts in the absence of proteinbinding. A frequently used assumption is that back-ground sequence reads, which are unrelated to bindingevents, are independently and uniformly distributedthroughout the genome [4,8,15]. This implies that thenumber of these background reads Xbg starting at eachposition of the genome follows a Poisson distributionwith constant rate parameter l. Examination of the readdensity in negative control samples suggests a heteroge-neous distribution of background reads [14]. To allowfor this heterogeneity the use of a background modelthat incorporates changes in read density by assumingthat l follows a gamma distribution has been suggestedby Ji et al. [10].Here we propose a different approach to address this
problem. Instead of estimating the background readdensity for the entire genome at once we estimate thelocal background read density in a window of width2wbg + 1. Consider Ybg(i) ~ Poisson(Λbg(i)), the numberof reads starting at position i. Then the number of back-ground reads in a window centred at position i is
X i Y j ij i w
i w
bg bg bg
bg
bg
Poisson( ) ( ) ~ ( ( ))
(1)
with bg bgbg
bg( ) ( ).i i jj w
w For each position i
the strand specific local background rate can be esti-
mated as ˆ ( ) ( ),bg bgi x i where xbg(i) is the observed
number of sequence reads in window i on the relevantstrand. This background model adapts to locallyobserved read densities without imposing a distributionon l.Confirming the observations made by Kharchenko
et al. [14] we find that the background read densityincludes large peaks that are seemingly unrelated to thepresence of nucleosomes. While the background estima-tion procedure described above adapts to changes in thebackground rate, the presence of large isolated peakswill lead to overestimation of the read rate for the sur-rounding area. A robust estimate of the backgroundread rate is obtained by limiting the change in read
rates between adjacent, non-overlapping, windows. If
ˆ ( )bg bgi w 2 1 is positive we choose the robust esti-
mate bg( )i as the largest value j such that j i ˆ ( )bg
and P X i j i i w[ ( ) | ( ) ( )] ,bg bg bg bg 2 1 for an
appropriately chosen probability l.
Nucleosome modelA nucleosome will produce several DNA fragments inthe sample. During the sequencing process short readsare produced from the 5’-ends of both strands of theDNA fragment population. The start position ofsequence reads generated from this population corre-sponds to the start and end positions of DNA fragmentsin the reference genome. Although these may vary dueto differences in fragment length and relative position ofthe nucleosome within the fragment, all read start siteswill be located in proximity to the nucleosome but notwithin the strech of histone bound DNA itself. Thisleads to a region of increased read density on the for-ward strand upstream of the nucleosome which is mir-rored by a region of increased read density on thereverse strand downstream of the nucleosome. Thenucleosome, located between the two peaks in read den-sity, is relatively depleted of sequence reads. This createsa distinctive pattern that can be partitioned into threeregions: forward support (fwd), binding (bind) andreverse support (rev) region (Figure 1). Note that theforward and reverse support regions only cover therespective strand, allowing for overlapping peaks fromneighbouring binding sites.Consider a binding site of length b = 2wbind + 1 start-
ing at position i containing Xbind(i) sequence reads fromboth strands, a support region on the forward strand oflength s = 2wsup + 1 starting at position i - s containingXfwd(i) forward strand reads and a support region onthe reverse strand of the same length starting at positioni + b containing Xrev(i) reverse strand reads. Here weassume that the read counts in these regions followPoisson distributions, i.e., Xregion(i) ~ Poisson(lregion(i)),where region is one of fwd, bind or rev. Using the sameassumptions as for the background distribution we con-sider Xregion(i) to be the sum of wregion random variablesYregion (j) ~ Poisson(Λregion (i)).Scoring potential nucleosome positionsIf a nucleosome is starting at position i the followingthree relations should hold: lfwd(i) > lbg(i), lbind(i) < lbg(i), lrev(i) > lbg(i). We assess these relations for eachpotential nucleosome position based on a likelihoodratio statistic, Wregion. This statistic is computed foreach of the three regions of the potential nucleosomeposition, comparing the estimated read rate in theregion to the estimated local background rate (see
Humburg et al. BMC Bioinformatics 2011, 12:39http://www.biomedcentral.com/1471-2105/12/39
Page 3 of 17

Methods). If a nucleosome starts at position i one wouldexpect lfwd(i) and lrev(i) to be equal. To account for thisand to avoid inflated values of Wfwd in cases where apeak in read density in the forward support region isnot matched by a comparable peak in the reverse sup-port region, we use the truncated estimate
fwd fwd fwd fwd revand max{ : [ | ] }j j P X j0 (2)
for a suitably chosen g to calculate Wfwd. The trun-
cated estimate rev is defined similarly.
For each of the three regions a score Sregion is calcu-lated. For the two support regions the score Ssup, sup Î{fwd, rev}, is defined as
SW
Wsup
sup sup
sup
,
,
if
otherwise
bg
(3)
and for the binding region as
SW
Wbindbind bind bg
bind
if
otherwise
,
,
(4)
The three region scores for each potential nucleosomeare combined into a single nucleosome score
S i S i S i S i( ) ( ) ( ) ( ). fwd bind rev (5)
Note that this score is only meaningful if there is atleast one read in each of the two support regions and
bg 0 .
Significance testTo assess the significance of nucleosome scores the dis-tribution of S under the null hypothesis that no nucleo-some starts at position i has to be determined. Thenucleosome score for each position in the genome is thesum of the scores for the three regions of the potentialnucleosome position (Equation (5)) and the score foreach region is derived from the likelihood ratio statisticWregion (Equations (3) and (4)). If the null hypothesis istrue W Sregion regionand thus N O ~ ~ ( , ).1
2 1 Thismight suggest the use of S N 0( , )3 to model thedistribution of binding site scores under the nullhypothesis. However, it is important to realise that, evenunder the null hypothesis, Sfwd and Srev are unlikely tobe independent due to the use of truncated rate para-meter estimates, and the asymptotic results may nothold. To avoid misleading p-values that may result fromthe use of an incorrectly specified null distribution wegeneralize the above model to S ~ ( , ),N where isthe sample median of the nucleosome scores and s is
estimated from the observed nucleosome scores. Toobtain a good fit for the null distribution, and thus reli-able p-values, it is necessary to identify a subset ofscores that is representative of the null hypothesis.Observing that the presence of nucleosomes will lead
to larger nucleosome scores we truncate S at the τth and50th percentile, where 0 ≤ τ < 50 is chosen to excludeoutliers in the lower tail while retaining a sufficientlylarge number of observations. This ensures that the vastmajority of scores relating to protein binding eventshave no influence on the parameter estimation whilealso guarding against extreme values in the lower tail,which are observed when calculating nucleosome scoresfor positions that place unusually large numbers ofsequence reads in the binding region. A maximum like-lihood estimate for s is obtained by fitting a truncatedhalf-normal distribution to the selected subset ofnucleosome scores.The p-values for all observed nucleosome scores are
calculated based on the estimated null distribution andcorrected for multiple testing. To control the false dis-covery rate (FDR) we use a Benjamini-Hochberg proce-dure [18]. If the data contain many nucleosomes it maybe beneficial to modify this procedure to account forthe estimated proportion of true null hypotheses. This isdone using the aAFDR approach discussed in [19],where it is shown to be equivalent to the procedure pro-posed by Storey et al. [20].
TestingTo assess the performance of our method we comparedit to a number of other peak-finding methods on simu-lated data. The three methods presented in [14], mirrorstrand peaks (MSP), mirror tag correlation (MTC) andwindow tag density (WTD), were chosen for comparisonbecause they allow for strand specific peaks in readcounts and employ different strategies to handle theexpected gap between peaks. Briefly, WTD calculates abinding score based on the number of forward andreverse strand tags within a window upstream anddownstream of a potential binding site. While this uti-lises the fact that a protein binding event should pro-duce a peak in forward strand read counts upstreamand a peak in reverse strand read counts downstream ofthe binding site, WTD does not require the two peaksto be similar in magnitude nor is the gap between peaksconsidered. MTC is similar to WTD but uses the corre-lation between forward strand and reverse strand readsto introduce a measure of similarity between the twopeaks. Sequence reads close to the centre of the bindingsite are ignored when calculating the correlation coeffi-cient which effectively introduces a gap between the twopeaks. A Gaussian smoothing kernel is used by MSP toestimate local read densities for both strands and
Humburg et al. BMC Bioinformatics 2011, 12:39http://www.biomedcentral.com/1471-2105/12/39
Page 4 of 17
binding sites are required to lie between peaks of com-parable magnitude. The R implementation of thesemethods provides the option to estimate the windowsize from the cross-correlation between the two strands.We found that this does not produce satisfactory resultsfor the nucleosome data under consideration and used a160 bp window instead. Unlike the methods proposedby Kharchenko et al. GeneTrack [13] was specificallydesigned for the detection of nucleosome positions. LikeMSP, GeneTrack uses a Gaussian kernel to smooth readcounts. The algorithm then proceeds to score each peakbased on its height and reports the highest scoring setof non-overlapping peaks. GeneTrack makes no attemptto assess the significance of peaks, which results in ahigh number of nucleosome predictions but is likely tolead to many false positives if the data contains regionsthat are depleted of nucleosomes. To fairly evaluateGeneTrack’s performance relative to methods that con-trol the false discovery rate we choose a cut-off thatleads to a similar number of significant predictions asthe one produced by ChIPseqR. A further peculiarity ofGeneTrack is that nucleosome predictions are centredon the peak in read counts. This results in predictionsthat are shifted by approximately half a nucleosomelength compared to the actual position of the nucleo-some. This inaccuracy was corrected for the purpose ofthis comparison. ChIPseqR was used with a bindingregion of 128 bp, support regions of 17 bp and a back-ground window with w = 1000. These settings werefound to perform well on real data (see Methods) andwere used here for consistency.All methods were applied to simulated data (see
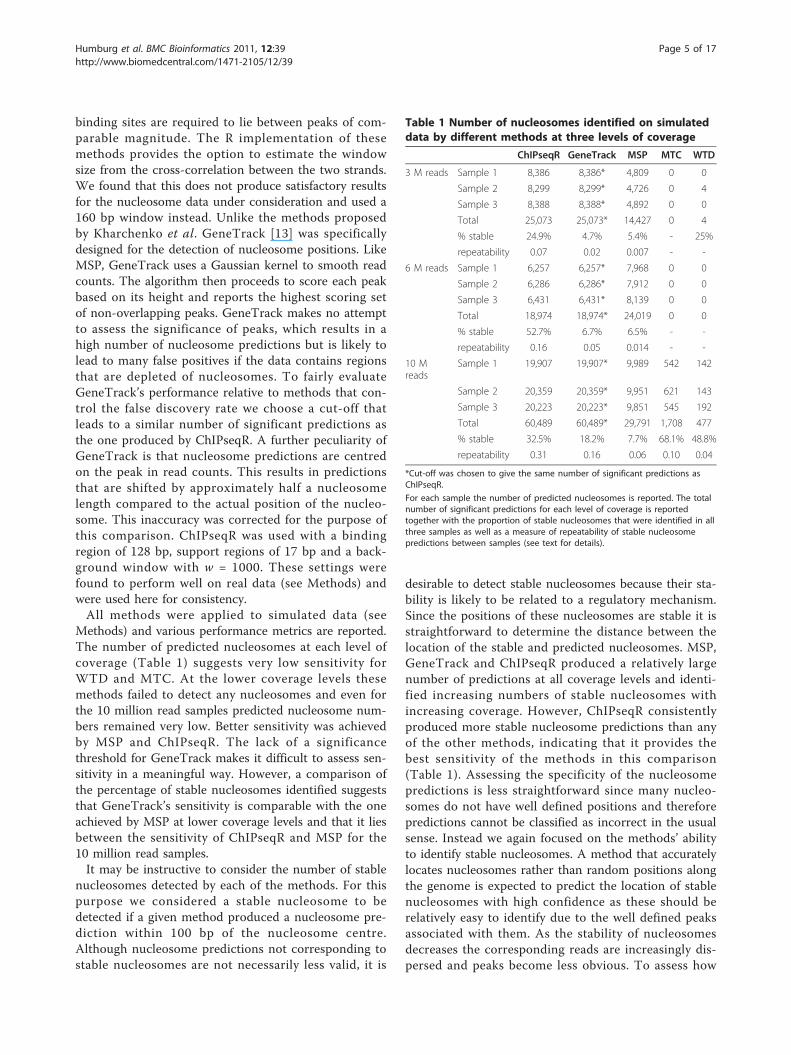
Methods) and various performance metrics are reported.The number of predicted nucleosomes at each level ofcoverage (Table 1) suggests very low sensitivity forWTD and MTC. At the lower coverage levels thesemethods failed to detect any nucleosomes and even forthe 10 million read samples predicted nucleosome num-bers remained very low. Better sensitivity was achievedby MSP and ChIPseqR. The lack of a significancethreshold for GeneTrack makes it difficult to assess sen-sitivity in a meaningful way. However, a comparison ofthe percentage of stable nucleosomes identified suggeststhat GeneTrack’s sensitivity is comparable with the oneachieved by MSP at lower coverage levels and that it liesbetween the sensitivity of ChIPseqR and MSP for the10 million read samples.It may be instructive to consider the number of stable
nucleosomes detected by each of the methods. For thispurpose we considered a stable nucleosome to bedetected if a given method produced a nucleosome pre-diction within 100 bp of the nucleosome centre.Although nucleosome predictions not corresponding tostable nucleosomes are not necessarily less valid, it is
desirable to detect stable nucleosomes because their sta-bility is likely to be related to a regulatory mechanism.Since the positions of these nucleosomes are stable it isstraightforward to determine the distance between thelocation of the stable and predicted nucleosomes. MSP,GeneTrack and ChIPseqR produced a relatively largenumber of predictions at all coverage levels and identi-fied increasing numbers of stable nucleosomes withincreasing coverage. However, ChIPseqR consistentlyproduced more stable nucleosome predictions than anyof the other methods, indicating that it provides thebest sensitivity of the methods in this comparison(Table 1). Assessing the specificity of the nucleosomepredictions is less straightforward since many nucleo-somes do not have well defined positions and thereforepredictions cannot be classified as incorrect in the usualsense. Instead we again focused on the methods’ abilityto identify stable nucleosomes. A method that accuratelylocates nucleosomes rather than random positions alongthe genome is expected to predict the location of stablenucleosomes with high confidence as these should berelatively easy to identify due to the well defined peaksassociated with them. As the stability of nucleosomesdecreases the corresponding reads are increasingly dis-persed and peaks become less obvious. To assess how
Table 1 Number of nucleosomes identified on simulateddata by different methods at three levels of coverage
ChIPseqR GeneTrack MSP MTC WTD
3 M reads Sample 1 8,386 8,386* 4,809 0 0
Sample 2 8,299 8,299* 4,726 0 4
Sample 3 8,388 8,388* 4,892 0 0
Total 25,073 25,073* 14,427 0 4
% stable 24.9% 4.7% 5.4% - 25%
repeatability 0.07 0.02 0.007 - -
6 M reads Sample 1 6,257 6,257* 7,968 0 0
Sample 2 6,286 6,286* 7,912 0 0
Sample 3 6,431 6,431* 8,139 0 0
Total 18,974 18,974* 24,019 0 0
% stable 52.7% 6.7% 6.5% - -
repeatability 0.16 0.05 0.014 - -
10 Mreads
Sample 1 19,907 19,907* 9,989 542 142
Sample 2 20,359 20,359* 9,951 621 143
Sample 3 20,223 20,223* 9,851 545 192
Total 60,489 60,489* 29,791 1,708 477
% stable 32.5% 18.2% 7.7% 68.1% 48.8%
repeatability 0.31 0.16 0.06 0.10 0.04
*Cut-off was chosen to give the same number of significant predictions asChIPseqR.
For each sample the number of predicted nucleosomes is reported. The totalnumber of significant predictions for each level of coverage is reportedtogether with the proportion of stable nucleosomes that were identified in allthree samples as well as a measure of repeatability of stable nucleosomepredictions between samples (see text for details).
Humburg et al. BMC Bioinformatics 2011, 12:39http://www.biomedcentral.com/1471-2105/12/39
Page 5 of 17

well the different methods are able to separate stablenucleosomes from other nucleosomes we considered allnucleosomes predicted from the third 10 M read sampleby each method and rank predictions by score. Figure 2shows the fraction of predicted stable and non-stablenucleosomes considered significant with varying thresh-old. From this it is apparent that ChIPseqR not onlyidentifies more nucleosomes than the other methods, italso is more reliable in terms of locating stable nucleo-somes. Although GeneTrack produces a large numberof nucleosome predictions, stable nucleosomes are notwell distinguished from other nucleosomes.To further investigate how reliably different methods
identify stable nucleosomes we consider the stablenucleosomes identified from different samples at thesame level of coverage (Table 1). For each of the threesamples the stable nucleosomes identified by a givenmethod are recorded such that Xi(j) = 1 when the jth
stable nucleosome was detected in sample i and 0 other-wise. We assess a method’s ability to reliably identify thesame stable nucleosomes from different samples bycomputing the total correlation Ctot(X1, X2, X3) [21]between the three samples. This provides a measure ofthe information shared between the samples, i.e. it willbe maximised if the same set of nucleosomes is identi-fied for each sample. To obtain a measure of repeatabil-ity that is comparable between methods and differentlevels of coverage regardless of the number of identified
nucleosomes, we divide Ctot(X1, X2, X3) by Cmax(X1, X2,X3) which is calculated as the total correlation of a per-mutation of X1, X2, X3 that maximises the number ofrepeated nucleosome detections. This normalises therepeatability such that it lies in [01]. Over 50% of thestable nucleosomes predicted by ChIPseqR from the 10M read samples were successfully identified in all threesamples which corresponds to a repeatability of 0.31.None of the other methods achieved a repeatability ofmore than 0.16. It is worth noting that while MSP pro-duces a relatively large number of predictions they tendto differ substantially between samples, leading to a verylow repeatability.Another important performance measure is the reso-
lution at which predictions are made, i.e., how close pre-dicted nucleosome positions are to actual nucleosomelocations. Peak-finding algorithms like the ones consid-ered here typically involve a smoothing step to elucidatepeaks. This comes at the cost of reducing the resolutionof the raw data. To measure the resolution achieved bythe four methods in this comparison we examined thedistance between predicted stable nucleosomes andthe underlying stable nucleosome positions (Figure 2).The best resolution was achieved by GeneTrack fol-lowed by MTC and ChIPseqR. While WTD appeared toproduce predictions at an acceptable resolution, the lowsensitivity of this method made an accurate assessmentof the resolution difficult. The resolution of MSP was
Figure 2 Specificity and spatial resolution of nucleosome predictions. (A) Fraction of predicted stable and non-stable nucleosomesconsidered significant at varying p-value cut-offs. A method that consistently produces smaller p-values for stable than for non-stablenucleosomes will result in a curve that gets closer to the top left corner than a method for which p-values and the stability of nucleosomes areunrelated. (B) Distance between nucleosome predictions from the third 10 M read sample and the location of stable nucleosomes. For eachmethod observed distances are reported together with standard deviation of distances. A larger standard deviation corresponds to a lowerresolution.
Humburg et al. BMC Bioinformatics 2011, 12:39http://www.biomedcentral.com/1471-2105/12/39
Page 6 of 17

clearly the lowest in this comparison, limiting its useful-ness for localising individual nucleosomes.Characteristics of predicted nucleosome sitesTo further investigate the utility of the proposedmethod we applied it to end sequenced mononucleo-somes from Arabidopsis thaliana. Sequence reads weregenerated through Solexa sequencing of DNA frag-ments. Mononucleosome-sized DNA fragments wereselected for sequencing after MNase digestion.Approximately 8 million uniquely mapped reads wereused for the analysis.The nucleosome model and scoring procedure
described above require the specification of several para-meters. We conducted computational experiments toinvestigate the influence of these parameters on the per-formance of ChIPseqR (see Methods) and chose a back-ground window of 2001 bp, i.e. w = 1000 as well as twoseparate sets of parameters (b = 147, s = 10 and b =128, s = 17) for the length of the binding and supportregions to investigate the properties of nucleosomes pre-dicted from end-sequenced mononucleosome fragments.The first set of parameters only produced about 2,200significant nucleosome predictions while the second setidentified 8,393 nucleosomes. An example of nucleo-some predictions in a selected region of the genome isshown in Figure 3. Characteristics of interest are thedistance between predicted stable nucleosomes, thelocation of stable nucleosomes relative to annotatedgenes and the presence of DNA sequence motifs withinnucleosome sequences.
The distribution of distances between adjacent predic-tions should provide some insights into the distributionof stable nucleosomes throughout the genome. Notethat, while individual nucleosomes along the same chro-mosome cannot overlap within a single cell, the positionof nucleosomes is expected to vary between cells oreven between different copies of a chromosome withinthe same cell to some degree. This may lead to overlap-ping nucleosome predictions if there is sufficient evi-dence to support these alternative positions. Figure 4shows the distribution of distances between adjacentnucleosome predictions for b = 128 and s = 17. Thisdistribution is characterised by a relatively large numberof distances that are shorter than 15 bp followed byonly ten cases with distances between 16 and 150 bp.The majority of distances between nucleosomes are lar-ger than 200 bp. This suggests that some adjacent pre-dictions correspond to adjacent stable nucleosomeswhile others have larger gaps between them. The rela-tively high abundance of overlapping predictions andthe consistently small difference in position betweenthem may represent some uncertainty about the locationof these nucleosomes but also suggests that positionednucleosomes are more likely to exhibit small rather thanlarge changes in position depending on cell state.This observation is consistent with the findings ofAlbert et al. [1] regarding the translational and rota-tional settings of nucleosomes.Previous studies of nucleosomes in various organisms
have found evidence for nucleosome positioning relativeto transcription start sites [1-4]. To investigate whetherthere is evidence of positioning relative to the 5’ and 3’end of annotated genes in the two sets of predictednucleosomes, we aligned the transcription start sites(TSS) and transcription end sites (TES) of all annotatedArabidopsis genes and determined the number of pre-dicted nucleosomes centred at each position within 1 kbof the respective feature (Figure 5). There is clear evi-dence for positioned nucleosomes at both ends of genes.The +1 nucleosome is followed by a series of positionednucleosomes of decreasing stability. The regionupstream of the +1 nucleosome is depleted of nucleo-somes. There is some evidence for nucleosome position-ing upstream of the nucleosome free region (NFR)although this is much weaker than for the +1 nucleo-some. The nucleosome positions predicted with b = 128show some evidence of a nucleosome located in theNFR similar to the -1 nucleosome reported for somegenes in humans [4].It has been suggested based on theoretical considera-
tions as well as empirical findings that stable nucleo-somes are associated with a periodic pattern ofdinucleotides [1,2,22]. To assess whether similar pat-terns play a role in nucleosome positioning in
Figure 3 Predicted nucleosomes. Example of predictednucleosomes from Arabidopsis thaliana dataset with b = 128 and s= 17. Vertical bars indicate read positions on forward (top) andreverse strand (bottom). The nucleosome score computed byChIPseqR is shown as blue line. Blue ellipses indicate nucleosomespredicted by ChIPseqR. GeneTrack predictions are shown as redellipses for comparison. The nucleosome shown in dark bluecorresponds to a high confidence prediction (FDR < 0.05). Lightershades of blue indicate lower confidence predictions.
Humburg et al. BMC Bioinformatics 2011, 12:39http://www.biomedcentral.com/1471-2105/12/39
Page 7 of 17

Arabidopsis and whether they can be detected based onthe stable nucleosomes predicted by our method, weused the over 2200 non-overlapping nucleosome posi-tions identified with b = 147, s = 10 to investigate theproperties of nucleosome sequences. To this end the
position specific frequency of all dinucleotides wasdetermined in a ±500 bp window around the centre ofpredicted nucleosomes (see Methods).Dinucleotide frequencies throughout the predicted
nucleosome sequences differ markedly from genome-wide
Figure 5 Phasing of predicted nucleosomes. Predicted nucleosomes are phased at transcription start and end sites. Predicted nucleosomesunder both parameter sets ((b = 128, s = 17) (top) and (b = 147, s = 10) (bottom)) show clear evidence of phasing at TSS and TES. Vertical barsindicate the number of nucleosomes centred at each position. Red and green lines are smoothed nucleosome counts using smoothing splinesand a moving average respectively.
Figure 4 Distances between adjacent nucleosome predictions. Distribution of distances between adjacent nucleosome predictions for b =128 and s = 17. Many adjacent nucleosome predictions correspond to overlapping nucleosomes, most likely due to variations in nucleosomeposition between cells. The shift in position between overlapping nucleosomes tends to be small with only ten cases where the shift is largerthan 15 bp. Distances larger than 200 bp are not shown.
Humburg et al. BMC Bioinformatics 2011, 12:39http://www.biomedcentral.com/1471-2105/12/39
Page 8 of 17

frequencies while there is little evidence for this outsidethe nucleosome region (Figure 6(A)). Note that the A/Tbias of MNase leads to a notable increase in the frequencyof related dinucleotides in the flanking regions of pre-dicted nucleosomes. Studies in yeast and Drosophila havereported a periodic pattern of A/T and C/G dinucleotidesin nucleosome sequences [1,2]. We observe a similar pat-tern that is dominated by alternating AA/TT and CC/GGdinucleotides (Figure 6(B)). These dinucleotides corre-spond to a subset of previously reported nucleosome-asso-ciated patterns. This may be an indication that suchpatterns vary between species as suggested by Kogan andTrifonov [23]. They also find AA to be the dominant pat-tern associated with periodic dinucleotide signals at genesplice sites in Arabidopsis. The periodic patterns observedin nucleosome binding DNA are accompanied by anincrease in G/C content compared to the genome average(Figure 6(B)), which is consistent with previous observa-tions in yeast [24,25] and humans [26].Verification of predicted nucleosome positionsNine genomic regions containing 13 nucleosome predic-tions with different levels of confidence were selectedfor qPCR verification. Out of the 13 predicted nucleo-somes 11 were verified (see Methods).The DNA abundance profiles obtained through qPCR
show several well defined peaks. Many of these corre-spond to predicted nucleosomes while others appear tosuggest the presence of adjacent nucleosomes that werenot predicted by the initial analysis. To investigate thisfurther we identified peaks in DNA abundance that maycorrespond to positions of additional nucleosomes that
do not overlap predicted nucleosomes and tested themfor significance using the same procedure as above. Thisresults in the detection of additional nucleosomes in 10of 14 potential nucleosome positions. The remainingfour locations are characterised by flat DNA abundanceprofiles and may correspond either to nucleosome freeregions or areas of delocalised “fuzzy” nucleosomes (seeadditional file 1: Figure S1).
ImplementationAn R package implementing the method described hereis freely available from Bioconductor and from theauthors’ web page at http://www.bioinformatics.csiro.au/ChIPseqR together with simulated datasets.
DiscussionUnlike the majority of existing methods for the analysisof ChIP-seq experiments the novel approach presentedhere is suitable for the detection of nucleosome posi-tions. The explicit modelling of nucleosomes increasesthe sensitivity and makes it possible to detect their posi-tions at low coverage levels. Combined with the rela-tively small amount of smoothing required for theanalysis this enables ChIPseqR to reliably identifynucleosomes at high resolution. This is especially impor-tant for the analysis of nucleosome positions and his-tone modifications since this typically requires thesequencing of a much larger proportion of the genomethan would be required for a transcription factor study,which results in lower coverage for the same amount ofsequencing. Furthermore, nucleosome studies aim to
Figure 6 Dinucleotide frequencies in nucleosome sequences. (A) DNA sequences associated with predicted stable nucleosomes show clearevidence of specific dinucleotide patterns. (B) AA/TT and CC/GG/CG/GC dinucleotides show a periodic pattern in nucleosome sequences. Inboth panels open circles correspond to data points while solid curves show a three base pair moving average.
Humburg et al. BMC Bioinformatics 2011, 12:39http://www.biomedcentral.com/1471-2105/12/39
Page 9 of 17

distinguish binding sites that are usually located close toeach other and may vary in location throughout thesample. It is therefore important to identify binding sitesat high resolution and to allow for partially overlappingpeaks in read counts associated with adjacent bindingsites.
High resolution and repeatabilityAlthough all methods compared here use strand specificread counts and all except WTD are able to handleoverlapping peaks from adjacent binding sites onlyChIPseqR achieved good sensitivity and high resolution.The high resolution achieved by ChIPseqR is furtherhighlighted by the detection of periodic dinucleotidepatterns in the DNA sequence of predicted bindingsites. Strong evidence of these patterns was found with-out any further sequence alignment, suggesting that thepredicted positions of stable nucleosomes are highlyaccurate. This result is also indicative of high specificitysince false positives would dilute any sequence motifs. Itshould be noted that all methods in the comparisonwould benefit from a further increase in coverage. Weexpect that differences in performance will diminish ascoverage saturates but achieving sufficient coverage toreach saturation is still costly which makes it desirableto obtain reliable results from low coverage data.Another performance measure of interest is an algo-
rithm’s ability to produce consistent results for repeatedexperiments. This is of particular interest when low cov-erage data is used since this is likely to result in the pre-diction of only a subset of all binding sites. Despite thisone would like to obtain results that do not depend toomuch on the details of a particular sequencing run, i.e.,the analysis should be robust towards moderate changesin read position. This is important to enable researchersto draw reliable conclusions from the analysis that canbe expected to hold when the experiment is repeated.Although all methods in the comparison perform betterthan random, indicating that they all provide a core ofconsistently predicted nucleosomes, ChIPseqR providessubstantially higher repeatability than any other methodat all levels of coverage.
Analysis of mononucleosomesThe favourable performance of ChIPseqR observed inthe comparison on simulated data is confirmed by itsapplication to the mononucleosome dataset. Predictednucleosomes are found close to transcription start andtranscription end sites that are known to be associatedwith stable and phased nucleosomes [1-4], suggestingthat ChIPseqR is well suited for the detection of moder-ately well positioned nucleosomes. This is confirmed bythe results of the qPCR verification of selected nucleo-some predictions. Considering the verification results it
is evident that predicted nucleosomes corresponding topronounced peaks in qPCR measurements, which arelikely to represent stable or phased nucleosomes, wereconfirmed reliably. Closer inspection of the two unveri-fied nucleosome predictions reveals that one of them islocated within 30 bp of a significant peak in DNA abun-dance (Figure 7 and additional file 1: Figure S1). Itseems likely that the location of this nucleosome wouldbe predicted more accurately with increased coverage. Itshould be noted that the peak in qPCR measurementsappears to be wider than expected for a stable nucleo-some and may suggest the presence of an alternativenucleosome position in the sample. The other unverifiednucleosome position is located at what appears to bethe start of a “fuzzy” nucleosome region. This makes itdifficult to assess the exact location with any method.We note that the analysis of the short read data pro-duced three distinct peaks in the binding site scorelocated close to the predicted binding site (see addi-tional file 1: Figure S1). This is consistent with the pre-sence of overlapping nucleosome positions that onewould expect from delocalised nucleosomes.The regions chosen for qPCR verification were
selected to encompass predictions with a range of FDRs.The fact that all low confidence predictions were veri-fied suggests good specificity even for relatively highvalues of the nominal FDR. Consequently the FDR cut-off chosen for the initial analysis may be consideredconservative.
Influence of model parametersWhen discussing the performance of ChIPseqR it isimportant to realise that this depends on a number ofparameters. Apart from the coverage provided by agiven dataset, some of the model parameters will impacton the performance characteristics. Choosing b, thelength of the binding region, close to the actual bindingsite length will result in high resolution and is expectedto improve specificity. However, this will reduce themethod’s ability to detect less stable binding sites, thusreducing sensitivity. Such unstable binding sites can bedetected more reliably if b is reduced while the lengthof the support regions is increased. This increases sensi-tivity but may lead to reduced resolution. It should benoted that the choice of b = 128 that was determined tobe optimal for the data considered here is less than the147 bp that may be expected for a nucleosome. How-ever, this reduced binding region is consistent with thepresence of alternative preferred positions of a stablenucleosome located ±10 bp from a central position thathave been observed previously [27].Another important factor is the estimation of the
background read rate lbg. There are at least two differ-ent approaches to the estimation of this parameter. The
Humburg et al. BMC Bioinformatics 2011, 12:39http://www.biomedcentral.com/1471-2105/12/39
Page 10 of 17

one taken here relies on choosing a large window rela-tive to the binding site which is applied to the samesample that contains the binding sites. The relativelylarge size of the background window results in an aver-age read rate close to a base level even if there are bind-ing sites within the window. However, the presence ofbinding sites will increase the estimated backgroundrate above the actual background, thus producing con-servative binding site scores. An alternative approachwould use a separate control sample to assess the back-ground read rate. This has the potential to producemore accurate results and is generally recommendedbut we note that it may be difficult and costly to obtaingood control samples for this purpose. Even when a sui-table control sample is available the issue of an appro-priate normalisation method for this type of data hasnot been settled (see [28] for a discussion of some pro-blems with current approaches). We therefore consider
the single sample method presented here to be morepractical at the moment, especially for nucleosomesequencing.
ConclusionsThe model proposed here was specifically designed forthe analysis of end sequenced nucleosomes after MNasedigestion. Although several ChIP-seq analysis algorithmsare available for tasks like this they are typically designedfor the analysis of transcription factor binding. Our ana-lysis demonstrates that it is beneficial to take the substan-tial differences between transcription factor binding andnucleosome positioning experiments into account expli-citly. Although some existing methods may be generalenough to handle both transcription factor ChIP-seq andnucleosome sequencing data they will be outperformedby more specialised methods, especially on low coveragedata. Although GeneTrack was designed for the analysis
Figure 7 Results of qPCR verification and amplicon design. Two of the regions chosen for verification are shown with log mean quantitiesof DNA measured on four replicates. The location of verified nucleosomes is indicated by dark green horizontal bars. A nucleosome predictionthat is not supported by qPCR measurements is shown in red with an alternative position suggested by the PCR results indicated in blue. A lightblue bar indicates the location of a nucleosome identified by qPCR that was not predicted by our analysis. Nucleosome scores are shownshaded in grey. Below the location of amplicons used to tile across the selected regions is shown relative to predicted nucleosomes.
Humburg et al. BMC Bioinformatics 2011, 12:39http://www.biomedcentral.com/1471-2105/12/39
Page 11 of 17

of nucleosome experiments and has been used for thispurpose with apparent success [1] it does not take advan-tage of the characteristics of nucleosome experiments.This results in a performance similar to the generalChIP-seq methods.The main advantages of the model presented here are
the high resolution of nucleosome predictions and itsability to operate on low coverage data. This makes itespecially suitable for the analysis of nucleosome posi-tions in situations where it is difficult to obtain highcoverage, i.e. many reads per nucleosome position,because the genome under consideration is large or thesample contains a mixture of many cells (and thereforemany different nucleosome configurations).The most important parameters of our model, b and s,
are closely related to the underlying biology and lengthof DNA fragments used for sequencing. This makesChIPseqR a flexible and versatile method for the analysisof nucleosome positioning and makes it possible to adaptthe method to a range of different experiments. We havedemonstrated its favourable performance in the contextof nucleosome positioning experiments and similar per-formance is expected for other nucleosome relatedexperiments, such as histone modification studies. Moregenerally it should be possible to apply the approachdemonstrated here to other ChIP-seq experiments. Wenote however that the binding site model should beadjusted to accommodate the differences in experimentalprocedures, especially when DNA is fragmented throughsonication rather than MNase digestion.
MethodsSimulated dataData were simulated using the ChIPsim R package(available at http://www.bioinformatics.csiro.au/ChIPsimand from Bioconductor) with default parameters. Briefly,ChIPsim generates a sequence of nucleosome featuresto cover a given genome. Each type of feature has itsown characteristics, corresponding to different chroma-tin structures commonly observed in nucleosome posi-tioning experiments. Here we distinguish between‘stable’, ‘phased’, ‘fuzzy’ and ‘nucleosome free’ regions.The simulation assumes that sequence reads are gener-ated from a population of cells, i.e., nucleosome posi-tions are represented by distributions rather thandiscrete locations.For this study we generated nucleosome features to
cover the Arabidopsis genome. These features include13,758 stable nucleosomes, 16,313 regions of phasednucleosomes covering 82 Mb, 6,360 regions of fuzzynucleosomes covering 32 Mb and 11,293 nucleosomefree regions covering 1.3 Mb. A dataset containing 30million sequence reads, each 36 bp long, was gener-ated from the TAIR 8 assembly of the genome ftp://
ftp.arabidopsis.org/Sequences/wholechromosomes/.From this smaller datasets with three, six and ten mil-lion reads were created with three replicates at eachlevel of coverage. All simulated datasets are availableonline from http://www.bioinformatics.csiro.au/ChIPseqR.
Mononucleosome dataTo generate the mononucleosome fragments for end-sequencing and qPCR verification a lysate was pre-pared by grinding 1 g total seedling material of Arabi-dopsis ecotype Columbia to a fine powder in liquidnitrogen. The ground material was added to 10 mllysis buffer (50 mM HEPES pH7.5, 150 mM NaCl, 1%(v/v) Triton TX-100, 0.1% (w/v) sodium deoxycholate,0.1% (w/v) sodium dodecyl sulphate, 1× Plant Protei-nase Inhibitor mix (Sigma St Louis, MO). 1 ml aliquotsof the lysate were digested with 7.5 to 30 units micro-coccal nuclease (Fermentas, Vilnius, Lithuania) for 15minutes at 37°C, followed by proteinase K treatmentand phenol extraction. DNA fragments were separatedby agarose gel electrophoresis and the fragments in thesize range of mononucleosome cores (~150 bp) wereexcised and purified. The purified mononucleosomecores were then used to generate a library for IlluminaGS sequencing (carried out by Geneworks, Adelaide,Australia) or used for qPCR quantification. The datafrom Illumina GS sequencing are archived at the NCBISequence Read Archive (SRA) under accession numberSRP001458.
Verification of predicted nucleosome positionsNine genomic regions containing a subset of predictednucleosomes were selected for qPCR verification.Regions were chosen to cover predictions with FDRvalues between 0 and 0.2 and large enough to containbetween ten and twelve tiled amplicons. The resultingregions are between 438 bp and 563 bp in length andcontain a total of 13 nucleosome predictions. Of thesepredictions four have p-values between 0 and 0.01,five have p-values between 0.01 and 0.05 and theremaining four predictions have p-values between 0.05and 0.2.A PCR-based strategy was used to verify the nucleo-
some positions predicted from the analysis of thesequence data. A set of predicted nucleosome positionswere selected and short (~80 bp) PCR amplicons weredesigned across each position with each ampliconshifted by ~40 bp relative to the previous one. Theamplicons were designed so that two amplicons shouldfall within the boundaries of each predicted nucleosomeposition. A listing of primer sequences and positions ofamplicons are shown in additional file 2: Table S1, thelocations of predicted nucleosomes covered by
Humburg et al. BMC Bioinformatics 2011, 12:39http://www.biomedcentral.com/1471-2105/12/39
Page 12 of 17

amplicons are given in additional file 3: Table S2. Theposition of amplicons relative to predicted nucleosomesin two regions are shown in Figure 7. A quantitativePCR assay was then used to determine DNA abundancein four replicate mononucleosome isolations comparedto uncut genomic DNA standards. Regions that are con-tained in the mononucleosome fractions should showenrichment in this assay. Similar results were obtainedwhen micrococcal nuclease-digested DNA was assayedwithout purification of the mononucleosome cores (datanot shown). The mean abundance of DNA was mea-sured for each amplicon in four replicates. These mea-surements were converted into a continuous abundanceprofile for each replicate and region by averaging theabundance of different amplicons where they overlap.The resulting profiles were log transformed to accountfor differences in scale between replicates (Figure 7). Todetermine whether a predicted nucleosome position wasconfirmed by the qPCR data the DNA abundance at thecentre of the predicted nucleosome was compared tothe abundance at positions ±80 bp from the centre,which correspond to predicted linker DNA. The differ-ence in abundance was tested for deviation from 0 at asignificance level of 0.01 using a one-sided paired t-test.Predictions associated with significantly higher DNAabundance at the centre of predicted nucleosome coresthan in the corresponding linker region were consideredto be verified. Following this procedure eleven of the 13nucleosome predictions were verified (Table 2).Quantitative PCR AssaysDNA protected from micrococcal nuclease digestion wasquantified using an Applied Biosystems 7900HT real-time PCR machine. PCR conditions were 1× PCR buffer(Platinum Taq buffer, Invitrogen, CA), 3.5 mM MgCl20.2 mM dNTP mix, 0.4 μM oligonucleotide primers,1:20000 (v/v) SybrGreen, 0.025 U/μl Platinum Taq.Nucleosome core samples were quantified against undi-gested genomic DNA standards.
Choosing model parametersThe binding site model and scoring proceduredescribed above require the specification of severalparameters. In this section we discuss possible choicesof parameter values and their impact on the analysis.The parameters of the model itself are the length of
the binding site b, the length of the support region sand the length of the background window w. Themethod used to score potential binding sites intro-duces a number of additional parameters, namely gbgand gsup to specify the cut-off in difference betweenrates for the background and supporting region readrate estimates and the cut-off τ used to exclude out-liers when fitting the null distribution.To obtain a better understanding of how these para-
meters affect the analysis we considered a range of para-meter combinations. The performance of different setsof parameter values was assessed based on the numberof binding sites identified in the mononucleosome dataand accompanying control sample where the latter areassumed to be false positives. We note that the coveragein the control sample is substantially lower than in thetreatment. This may have an impact on the number ofidentified binding sites but we expect the general trendsidentified here to hold for control samples with highercoverage. In the following analysis we used a nominalfalse discovery rate of 0.05 and τ = 0.95. Since the lengthof nucleosome-bound DNA is known to be about 147 bpwe initially chose b = 147 and s = 15. To investigate theeffect of gbg and gsup we predicted binding sites usingvalues of 0.5, 0.9, 0.99 and 1 for each of these parameterswhile the width of the background window was set to1001 bp, 2001 bp and 3001 bp. The number of bindingsites predicted in the treatment and control sample forall parameter combinations were recorded and comparedto determine a set of parameters that provides high speci-ficity and sensitivity. At this stage of the analysis we aremainly concerned with identifying parameter values thatkeep false positive predictions to a minimum while main-taining an acceptable number of predicted binding sitesin the treatment sample, i.e. the focus is on specificity.To assess specificity we considered the ratio between thenumber of predicted binding sites in the control andtreatment. Lower values of this ratio indicate higherspecificity.Results are summarised in Figure 8. The choice of gsup
had the largest effect on specificity with gsup = 0.9 gen-erally outperforming the alternatives. The impact ofother parameters was less pronounced. A backgroundwindow width of 2001 bp appeared to perform slightlybetter than 1001 bp and 3001 bp windows. The choiceof gbg had very little influence on the specificity. Theresults suggest a small increase in specificity for gbg =0.99 and gbg = 0.9 We note that an increasing value ofgbg tends to increase the number of predicted bindingsites while also increasing the influence of unusuallylarge peaks in the data. This may become more appar-ent as the overall coverage increases. Based on theseconsiderations we chose gbg = 0.9. as the conservativealternative.
Table 2 Number of predicted and verified nucleosomesin three significance bands
[0, 0.01) [0.01, 0.05) [0.05, 0.2) total
predictions 4 5 4 13
verified 3 4 4 11
Predicted binding sites with corresponding p-values ranging from 0 to 0.2representing high, medium and low confidence predictions were chosen forverification.
Humburg et al. BMC Bioinformatics 2011, 12:39http://www.biomedcentral.com/1471-2105/12/39
Page 13 of 17

Using the parameter values determined above wethen considered different values for the length of bind-ing and support regions. While the length of DNAbound as part of a nucleosome is well established, itmay be beneficial to use a shorter binding region. Thesample under consideration contains a mixture of cellsfrom various tissue types. With the position of mostnucleosomes expected to vary between tissue types, oreven between cells of the same type, only the moststable nucleosomes will produce a sequence read pat-tern with a binding region of 147 bp. As the stability of
a given nucleosome decreases the resulting pattern willshow a smaller binding region and larger supportregions. We investigated how combinations of b Î {125,. . . , 154} and s Î {5, . . . , 20} affect the number ofnucleosomes detected in treatment and control. Foreach combination of s and b the number of predictednucleosomes in treatment (m) and control (M) wasrecorded, aiming to determine values for b and s thatprovide a favourable trade-off between sensitivity andspecificity. Consider (Mi, mi), the pair of nucleosomecounts produced by the ith parameter set. For each Mi Î
Figure 8 Number of binding sites identified in treatment and control sample using different sets of parameters. (A - C) Box-plots showthe ratios of predicted binding site counts in treatment and control achieved with different parameter choices. Lower values suggest higherspecificity. (D) The number of predicted nucleosomes in the control sample is plotted versus the number of nucleosomes identified from themononucleosome sample. Different colours correspond to different background rate cut-offs while different symbols indicate different cut-offlevels for support region rates.
Humburg et al. BMC Bioinformatics 2011, 12:39http://www.biomedcentral.com/1471-2105/12/39
Page 14 of 17

M we determined mk such that mk is the largest value inm for which Mk ≤ Mi. Then
{( , ) : ( ) arg max[ | ], }( ) ( )M m k i m j M M ik i k i j j i1 480 1 480and (6)
is a set of points representing parameter combinationsthat are optimal in the sense that neither sensitivity norspecificity can be improved without adversely affectingthe other performance measure. While all points in ℱ areoptimal in the above sense, some combinations of para-meter values will be more useful in practice than others.Using b = 128 and s = 17 provides a favourable trade-offbetween the number of nucleosomes identified in treat-ment and control (Figure 9). We note that none of theparameter sets with b = 147 is in ℱ; indeed over 70% ofoptimal parameter combination have 125 ≤ b ≤ 130. Thissuggests that only few nucleosome positions are main-tained throughout the sample. Nucleosome positions pre-dicted in the treatment sample with b = 128, s = 17 and b= 147, s = 10 were selected for further analysis.
Scoring potential nucleosomesTo obtain the statistic for the comparison of read countsin two regions, consider the independent random vari-ables Y0j ~ Poisson(Λ0j) and Y1j ~ Poisson(Λ1j). Wethen obtain two independent random variables X0 andX1 by summing over j:
X Yk kj
j
t
k
k
1
~ ( ),Poisson (7)
where k kjj
tk k
k t 1
with k the average of
the Λkj s, tk = 2wk + 1 and k = 0, 1. If we let
1
0
0 1
1 0
tt
then the probability of observing X0 =
x0 and X1 = x1 is given by
P X x X xt
t x xe e
x x x x t
0 0 1 1 01
0
0
0 1
01 0 1 10
, | ,
! !
11
0t (8)
Thus, the log likelihood is
1 0 0 0 1 0 01
01 1
1
00 1 , ln ln ln ln[ ! !] x x
t
tx x
t
tx x (9)
from which maximum likelihood estimates for j andl0 are obtained as
x t
x t1 0
0 1(10)
0 0 x (11)
Figure 9 Number of nucleosomes identified in treatment and control with varying binding and support regions. (A) The scatter plotshows all combinations of nucleosome predictions in treatment and control obtained for the chosen range of parameter values. Pointscorresponding to maximum number of predicted nucleosomes in the treatment sample for a given number of predicted nucleosomes in thecontrol are marked in green. Results from parameter sets where b = 147 are highlighted in red. Solid points indicate parameter combinationsthat were selected for further analysis. (B) Log ratio of the number of nucleosomes identified in treatment and control for each combination ofbinding and support region length. Parameter combinations corresponding to green points on the left are marked with ×. Green symbolsindicate parameter combinations chosen for further analysis.
Humburg et al. BMC Bioinformatics 2011, 12:39http://www.biomedcentral.com/1471-2105/12/39
Page 15 of 17

If 0 and 1 are known to be equal, i.e. j = 1, we
obtain
0 0 11
01
1
00 11( , ) ln ln ln[ ! !] x x
t
tx
t
tx x (12)
and
tx x
t t00 1
0 1(13)
The likelihood ratio statistic can then be written as
W
x x t x x t
x
2 1
21 0 0
0 0 0 1 1 1
0
{ ( , ) ( , )}
{ (ln ln ) (ln ln )
(
x t t x x1 0 1 0 1)(ln[ ] ln[ ])}
(14)
If 0 and 1 are indeed equal, the asymptotic distri-
bution of W is known to be 12.
Scoring of nucleosome sequence motifsThe observed frequencies of dinucleotides in DNA thatis predicted to be part of the nucleosome core are com-pared to the genome-wide frequencies by calculating aposition specific dinucleotide score Sij (Equation (15)).
So e
eijij j
j
, (15)
where oij is the number of times dinucleotide j isobserved at position i and ej is the number of timesone would expect to see dinucleotide i at any givenposition based on its relative abundance in the gen-ome. Then the statistic Si (Equation (16)) is asymptoti-cally X2 and can be used to determine regions wheredinucleotide frequencies differ significantly from thebackground.
S Si ij
j
2152~ (16)
Additional material
Additional file 1: Results of qPCR verification. The regions chosen forverification are shown with log mean quantities of DNA measured onfour replicates. The location of verified nucleosomes is indicated by darkgreen horizontal bars. Two nucleosome predictions that are notsupported by qPCR measurements are shown in red with an alternativeposition suggested by the PCR results indicated in blue for thenucleosome in region 6. Light blue bars indicate the location ofnucleosomes identified by qPCR that were not predicted by our analysis.
Additional file 2: Primer sequence and location for amplicons usedfor qPCR verification of selected regions.
Additional file 3: Location and p-value of predicted nucleosomesselected for verification.
AcknowledgementsThe authors would like to thank Micheal Buckley for his insightful commentson the manuscript. PH is supported by an E-IPRS scholarship from MacquarieUniversity and a top-up scholarship from CSIRO. Additional funding wasprovided by CSIRO’s Transformational Biology Capability Platform.
Author details1Department of Statistics, Macquarie University, North Ryde, NSW 2109,Australia. 2CSIRO Mathematical and Information Sciences, North Ryde, NSW2113, Australia. 3CSIRO Plant Industry, GPO Box 1600, Canberra 2601,Australia. 4The Wellcome Trust Centre for Human Genetics, Oxford OX3 7BN,UK.
Authors’ contributionsPH developed and implemented the model and carried out the analysis.CAH conceived, designed and carried out the experiment. PH and CAHwrote the manuscript. DB and GS provided supervision to PH. All authorsapproved the final manuscript.
Received: 3 January 2010 Accepted: 31 January 2011Published: 31 January 2011
References1. Albert I, Mavrich TN, Tomsho LP, Qi J, Zanton SJ, Schuster SC, Pugh BF:
Translational and rotational settings of H2A.Z nucleosomes across theSaccharomyces cerevisiae genome. Nature 2007, 446:572-576.
2. Mavrich TN, Jiang C, Ioshikhes IP, Li X, Venters BJ, Zanton SJ, Tomsho LP,Qi J, Glaser RL, Schuster SC, Gilmour DS, Albert I, Pugh BF: Nucleosomeorganization in Drosophila. Nature 2008, 453:358-364.
3. Valouev A, Ichikawa J, Tonthat T, Stuart J, Ranade S, Peckham H, Zeng K,Malek JA, Costa G, Mckernan K, Sidow A, Fire A, Johnson SM: A high-resolution,nucleosome position map of C. elegans reveals a lack of universal sequence-dictated positioning. Genome Research 2008, 18:1051-1063.
4. Schones DE, Cui K, Cuddapah S, Roh TY, Barski A, Wang Z, Wei G, Zhao K:Dynamic Regulation of Nucleosome Positioning in the Human Genome.Cell 2008, 132:887-898.
5. Mikkelsen TS, Ku M, Jaffe DB, Issac B, Lieberman E, Giannoukos G, Alvarez P,Brockman W, Kim TK, Koche RP, Lee W, Mendenhall E, O’Donovan A,Presser A, Russ C, Xie X, Meissner A, Wernig M, Jaenisch R, Nusbaum C,Lander ES, Bernstein BE: Genome-wide maps of chromatin state inpluripotent and lineage-committed cells. Nature 2007, 448:553-560.
6. Barski A, Cuddapah S, Cui K, Roh TY, Schones DE, Wang Z, Zhao K: High-resolution profiling of histone methylations in the human genome. Cell2007, 129:823-837.
7. Johnson DS, Motazavi A, Myers RM, Wold B: Genome-wide mapping of invivo protein-DNA interactions. Science 2007, 316:1497-1502.
8. Robertson G, Hirst M, Bainbridge M, Bilenky M, Zhao Y, Zeng T,Euskirchen G, Bernier B, Varhol R, Delaney A, Thiessen N, Griffith OL, He A,Marra M, Snyder M, Jones S: Genome-wide profiles of STAT1 DNAassociation using chromatin immunoprecipitation and massively parallelsequencing. Nature Methods 2007, 4(8):651-657.
9. Rozowsky J, Euskirchen G, Auerbach RK, Zhang ZD, Gibson T, Bjornson R,Carriero N, Snyder M, Gerstein MB: PeakSeq enables systematic scoring ofChIP-seq experiments relative to controls. Nature Biotechnology 2009,27:66-75.
10. Ji H, Jiang H, Ma W, Johnson DS, Myers RM, Wong WH: An integratedsoftware system for analyzing ChIP-chip and ChIP-seq data. NatureBiotechnology 2008, 26(11):1293-1300.
11. Xu H, Wei CL, Lin F, Sung WK: An HMM approach to genome-wideidentification of differential histone modification sites from ChIP-seqdata. Bioinformatics 2008, 24(20):2344-2349.
Humburg et al. BMC Bioinformatics 2011, 12:39http://www.biomedcentral.com/1471-2105/12/39
Page 16 of 17

12. Boyle AP, Guinney J, Crawford GE, Furey TS: F-Seq: a feature densityestimator for high-throughput sequence tags. Bioinformatics 2008,24(21):2537-2538.
13. Albert I, Wachi S, Jiang C, Pugh BF: GeneTrack: a genomic data processingand visualization framework. Bioinformatics 2008, 24(10):1305-1306.
14. Kharchenko PV, Tolstorukov MY, Park PJ: Design and analysis of ChIP-seqexperiments for DNA-binding proteins. Nature Biotechnology 2008,26(12):1351-1359.
15. Jothi R, Cuddapah S, Barski A, Cui K, Zhao K: Genome-wide identificationof in vivo protein-DNA binding sites from ChIP-Seq data. Nucleic AcidResearch 2008, 36(16):5221-5231.
16. Zang C, Schones DE, Zeng C, Cui K, Zhao K, Peng W: A clusteringapproach for identification of enriched domains from histonemodification ChIP-Seq data. Bioinformatics 2009, 25(15):1952-1958.
17. Spyrou C, Stark R, Lynch A, Tavare S: BayesPeak: Bayesian analysis of ChIP-seq data. BMC Bioinformatics 2009, 10:299+.
18. Benjamini Y, Hochberg Y: Controlling false discovery rate: a practical andpowerful approach to multiple testing. Journal of the Royal StatisticalSociety B 1995, 57:289-300.
19. Yin Y, Soteros CE, Bickis MG: A clarifying comparison of methods forcontrolling the false discovery rate. Journal of Statistical Planning andInference 2008.
20. Storey JD, Taylor JE, Siegmund D: Strong control, conservative pointestimation and simultaneous conservative consistency of false discoveryrates: a unified approach. Journal of the Royal Statistical Society B 2004,66:187-205.
21. Watanabe S: Information Theoretical Analysis of Multivariate Correlation.IBM Journal of Research and Development 1960, 4:66+.
22. Segal E, Mittendorf YF, Chen L, Thåström AC, Field Y, Moore IK, Widom J: Agenomic code for nucleosome positioning. Nature 2006, 442(17):772-778.
23. Kogan S, Trifonov E: Gene splice sites correlate with nucleosomepositions. Gene 2005, 352:57-62.
24. Lee W, Tillo D, Bray N, Morse RH, Davis RW, Hughes TR, Nislow C: A high-resolution atlas of nucleosome occupancy in yeast. Nature Genetics 2007,39(10):1235-1244.
25. Peckham HE, Thurman RE, Fu Y, Stamatoyannopoulos JA, Noble WS,Struhl K, Weng Z: Nucleosome positioning signals in genomic DNA.Genome Research 2007, 17(8):1170-1177.
26. Kharchenko PV, Woo CJ, Tolstorukov MY, Kingston RE, Park PJ: Nucleosomepositioning in human HOX gene clusters. Genome Research 2008,18(10):1554-1561.
27. Jiang C, Pugh BF: Nucleosome positioning and gene regulation:advances through genomics. Nature Reviews Genetics 2009, 10(3):161-172.
28. Taslim C, Wu J, Yan P, Singer G, Parvin J, Huang T, Lin S, Huang K:Comparative study on ChIP-seq data: normalization and binding patterncharacterization. Bioinformatics 2009, 25(18):2334-2340.
doi:10.1186/1471-2105-12-39Cite this article as: Humburg et al.: ChIPseqR: analysis of ChIP-seqexperiments. BMC Bioinformatics 2011 12:39.
Submit your next manuscript to BioMed Centraland take full advantage of:
• Convenient online submission
• Thorough peer review
• No space constraints or color figure charges
• Immediate publication on acceptance
• Inclusion in PubMed, CAS, Scopus and Google Scholar
• Research which is freely available for redistribution
Submit your manuscript at www.biomedcentral.com/submit
Humburg et al. BMC Bioinformatics 2011, 12:39http://www.biomedcentral.com/1471-2105/12/39
Page 17 of 17


