Embed Size (px)
Citation preview
*Corresponding author.
Email: [email protected]
eISSN: 2550-2166 / © 2022 The Authors.
Published by Rynnye Lyan Resources
FU
LL
PA
PE
R Food Research 6 (3) : 324 - 334 (June 2022)
Journal homepage: https://www.myfoodresearch.com
Chemical and microbiological analysis of fermented probiotic watermelon juice
1Lani, M.N., 1MohdMangsor, N.H., 2Sharifudin, S.A., 1Abdullah, W.Z.W., 1MohdIsa, N.S., 1Jamzuri, M.N.S. and 1,*MohdMaidin, N.
1Department of Food Science, Faculty of Fisheries and Food Science, Universiti Malaysia Terengganu,
21030 Kuala Nerus, Terengganu, Malaysia 2Enzyme and Fermentation Technology Programme, Food Science and Technology Research Centre,
MARDI Headquarters, 43400 Serdang, Selangor, Malaysia
Article history:
Received: 4 June 2021
Received in revised form: 29
July 2021
Accepted: 4 November 2021
Available Online: 16 June
2022
Keywords:
Probiotic watermelon juice,
Functional drink,
Fermentation,
Chemical analysis,
Microbiological analysis
DOI: https://doi.org/10.26656/fr.2017.6(3).402
Abstract
Fruit juice is an ideal medium in the production of a probiotic drink. Watermelon fruit is a
suitable medium for the production of probiotic juice due to its nutritional content.
However, its utilisation as a probiotic drink is underutilised. Experiments were conducted
to determine the chemical (pH, Brix, titrable acidity) and microbiological changes (lactic
acid bacteria (LAB) count) during fermentation of probiotic watermelon juice using
different concentrations of Lactobacillus plantarum, Lactobacillus paracasei and
Lactobacillus acidophilus (2%, 5% and 10%) at 30°C for 72 hrs. The results indicated a
significant drop in pH of the probioticated watermelon juice (2%, 5% and 10%) using
various Lactobacilli strains during 24 hrs of fermentation. Interestingly, 2% probioticated
watermelon juice in all their strains of probiotic were higher than 5% and 10%
probioticated watermelon juice. The lactic acid content in probioticated watermelon juice
was reduced significantly throughout 72 hrs of fermentation, but the watermelon juice
without probiotic strains increased only within 24 hrs of fermentation. The LAB count in
probioticated watermelon juice (2%, 5% and 10%) maintained a high population count
(108 to 109 CFU/mL) for all probiotic strains throughout fermentation. Since all
concentrations studied showed similar results in the chemical and microbiological
analyses, 2% concentration is proven to be sufficient for probioticated watermelon juice
regardless of the types of Lactobacillus strains used.
1. Introduction
Watermelon, also known as Citrulus lanatus, is one
of the common crops being familiarly known by people
all around the globe for its distinctive sweetness as
compared to other fruits. As mentioned by Bisognin
(2002), watermelon cultivation and consumption exceed
that of all other Cucurbitaceae plants. Watermelon is a
creeping herbaceous plant that belongs to the family
Cucurbitaceae. Initially, they originated from Southern
Africa (specifically in the southern Kalahari region). The
fruit of the plant contains 93% water, thus giving its
distinctive name “Watermelon” (Ninomiya et al., 2020).
Due to its large number of cultivations, watermelon has
proven its relevance, showing tremendous economic
importance and being widely eaten around the world,
accounting for about 7% of the world's region devoted to
vegetable production, with China producing 67% of the
overall quantity made (Zamuz et al., 2021). Aside from
its large number of consumptions, watermelon is known
for its health benefits. As reported by Dammak et al.
(2019), watermelon is known because of its low-calorie
content, as well as its health benefits, thirst-quenching
capacity, good nutritional value, and antioxidant
properties. Besides, Romdhane et al. (2017) also
reported that watermelon is an excellent source of
mineral salts (Potassium, Sodium, Iron and Magnesium),
vitamins (A, B, C and E), antioxidants such as phenolic
compounds and carotenoids, and few specific amino
acids such as citrulline and arginine.
Food today has many purposes, it satisfies appetite
and provides essential foods for humans, it promotes
physical and mental well-being, it improves fitness, and
it prevents and/or reduces nutrition-related diseases.
Furthermore, in recent years, consumers' perception of
the connection between food and health has sparked a
surge of interest in "healthy foods", this phenomenon
may be due in part to rising healthcare costs, rising life
325 Lani et al. / Food Research 6 (3) (2022) 324 - 334
eISSN: 2550-2166 © 2022 The Authors. Published by Rynnye Lyan Resources
FU
LL
PA
PE
R
expectancy, and older people's desire for a better quality
of life in their later years (Granato et al., 2010). Healthy
food, or can also be known as “functional foods” are
defined as food that, in addition to its dietary benefits,
has additional beneficial effects or functions in the body.
Functional foods include those that contain or are
processed with bioactive compounds like dietary fibre,
oligosaccharides, and active “friendly” bacteria that help
keep intestinal bacterial strains in balance. Probiotics are
part of a new wave of active ingredients that includes
prebiotics, phytonutrients, and lipids, in addition to well-
known functional ingredients like vitamins, minerals,
and micronutrients.
Watermelon juice, for example, has its own set of
advantages due to its high concentration of lycopene,
nutrients, and vitamins A, B, and C. The benefit of
regular consumption of watermelon juice is it will
increase blood concentration of lycopene and beta-
carotene (Edwards et al., 2003). Probiotication of
watermelon juice with various probiotic lactobacilli has
improved the nutritional value of the juice (Sivudu et al.,
2014). In their study, Lactobacillus fermentum and
Lactobacillus casei were found capable to grow well in
watermelon juice without nutrient supplementation. Both
strains produced significantly more titrable acidity
expressed as lactic acid at 30°C of fermentation (Sivudu
et al., 2014).
Lactic acid bacteria, mainly Lactobacilli and
Bifidobacterium have contributed to more than 90% of
probiotic food supplements. Many experiments have
been conducted on the method and development of
probiotic products fermented with probiotic microbes, in
addition to the identification of the health benefits of
probiotic bacteria (Pakbin et al., 2014). These LAB
strains have been reported to suppress the growth of
pathogenic bacteria (Salleh et al., 2014; Salleh et al.,
2021). These bacteria include probiotic properties with
health benefits (Nuraida, 2015; Ahmad et al., 2018).
Fruit and vegetable do not contain any dairy
allergens that are suitable to be consumed by wide
segments of people that can be one of the vehicles for the
delivery and incorporation into the human intestine
(Tuorila and Gardello, 2002). For instance, there is a
genuine enthusiasm for the production of fruit-juice-
based nutritional drinks fortified with probiotic and
prebiotic ingredients. Fruit juices have been proposed as
an ideal vehicle for practical wellness ingredients
because they naturally provide valuable nutrients, have
flavour profiles that appeal to people of all ages, and are
viewed as nutritious and soothing (Tuorila and Gardello,
2002). The fruits and vegetables are high in functional
food ingredients including minerals, vitamins, dietary
fibres, and antioxidants, and they are free of dairy
allergens, which could discourage some people from
eating those (Hasler et al., 2002).
To the best of our knowledge, there is no
comprehensive study on the viability of lactic acid
bacteria (LAB) strains conducted in watermelon juice
during the fermentation process with limited studies on
the physicochemical of fermented watermelon juice.
Therefore, this study aimed to determine the chemical
and microbiological analyses of fermented watermelon
juice using commercial probiotic strains during the
fermentation process.
2. Materials and methods
2.1 Preparation of watermelon juice
Ripe watermelon fruit was purchased from a local
store (Kuala Terengganu) and kept at 4°C prior to use.
The sample was then washed and peeled. The
watermelon juice was prepared using a fruit juicing
machine (National, MJ-68M, Malaysia). The juice
produced was further pasteurized until it reaches the
temperature of 80°C with a holding time of 15 mins
(Mousavi et al., 2011). Pasteurization was done by
cooking the juice on the stove and controlling the
temperature by using a thermometer.
2.2 Preparation of inoculum
Commercial strains of Lactic acid bacteria
(Lactobacillus plantarum, Lactobacillus acidophilus and
Lactobacillus paracasei) were obtained courteously from
the Malaysian Agricultural Research and Development
Institute (MARDI), Serdang, Selangor in the form of
freeze-dried. These cultures were originally purchased
from UAS Labs, Madison, the USA, which is one of the
few fully integrated suppliers of probiotic solutions
(http://www.uaslabs.com). The starters were cultured in
100 mL MRS broth for 24 hrs at 30˚C and transferred
into a 50 mL centrifuge tube before being centrifuged at
8000 rpm, 15 mins, and 4˚C. The pallet collected was
washed with phosphate buffer saline (PBS) with pH 7.3
(Oxoid, UK) and mixed. The mixture was centrifuged
again at 8000 rpm, 15 mins and 4˚C. The mixture was
then washed again with PBS to be used as inoculum.
Before the experiment, the purity of the cultures was
confirmed by streaking them on MRS agar. The same
single colony on MRS Agar indicated that the cultures
were considered pure (Khatoon et al., 2015).
2.3 Optical density
The commercial probiotic cultures (Lactobacillus
plantarum, Lactobacillus acidophilus and Lactobacillus
paracasei) were grown in MRS broth. Fermentation was
done in the incubator shaker (PROTECH, SI-50D,
Lani et al. / Food Research 6 (3) (2022) 324 - 334 326
eISSN: 2550-2166 © 2022 The Authors. Published by Rynnye Lyan Resources
FU
LL
PA
PE
R
Malaysia) for 48 hrs. The reading of the absorbance of
the probiotic cultures was recorded at different time
intervals, i.e. 0, 2, 4, 24, 26, 28, 46, and 48 hrs at 560 nm
using a spectrophotometer (ThermoSpectronic,
GENESYS 20, United States). LAB count was
determined at time intervals of 0, 2-, 4-, 24-, and 26-hrs
using MRS agar (Hoque et al., 2010).
2.4 Fermentation of watermelon juice with lactic acid
bacteria
A fermentation experiment was conducted by using
200 mL transparent glass bottles. A bottle of the sample
containing 100 mL of pasteurised watermelon juice
without probiotics was treated as a control. The other
three bottles containing 100 mL of pasteurized
watermelon juice were inoculated with starter cultures.
The samples of watermelon juice were inoculated with
the same inoculum from each starter culture at three
different concentrations of 2%, 5% and 10% v/v. They
were then incubated at 30°C for 72 hrs. Samples were
taken at 0, 24, 48, and 72 hrs for chemical analysis and
microbiological analysis (Khatoon et al., 2015).
2.5 Chemical analysis
2.5.1 pH analysis
The pH of watermelon juice was measured with a
Benchtop pH meter (WTW series, Inolab, Germany).
The pH was taken at 0, 24, 48, and 72 hrs intervals.
2.5.2 Titrable acidity
Total acidity was expressed as% lactic acid using the
formula below. 10 mL of juice samples were added with
10mL of distilled water and the lactic acid percentage
was determined by titrating the prepared samples with
0.1 N NaOH using phenolphthalein as an indicator until
a light pink colour persists (Akin et al., 2007).
% lactic acid = [(mL of 0.1 M NaOH) × (0.9)] / [sample
volume]
2.5.3 Total Soluble Solid
The total soluble solid of the samples was taken as
degree Brix by using a Refractometer (Milwaukee,
MA871, United States) (Serpen, 2012).
2.6 Microbiological analysis
2.6.1 Determination of LAB count using MRS Agar
Firstly, 10 mL of juice sample was mixed with 90
mL of MRS broth. The sample was incubated for 24 hrs
at 30˚C in a CO2 incubator (Galaxy S, Model: 170-200,
United Kingdom). After 24 hrs, 1.0 mL of sample was
pipetted into a tube containing 9 mL of saline water
(0.85% salt) for appropriate series of serial dilutions.
Then, 0.1 mL of the sample was surface plated on de
Man, Rogosa and Sharpe (MRS) Agar (Oxoid, UK)
plates in triplicates. The plates were then incubated at
30˚C in a CO2 incubator for 24-72 hrs (Khatoon et al.,
2015). Further biochemical tests were carried out for
confirmation of LAB.
2.6.2 Biochemical tests for selected bacteria
2.6.2.1 Gram-staining
Gram staining was conducted by using the standard
procedure (Smith et al., 2005). Briefly, a loopful of
bacteria was transferred aseptically onto a clean glass
slide and was heat fixed using a Bunsen burner. The
smeared area was flooded with crystal violet for 1 min.
Then, it was rinsed with tap water, tilting the slide in
order to rinse all stains. After that, the whole slide was
covered with Lugol’s iodine for 1 min. After 1 min, the
washing step was repeated. With the slide slightly tilted,
the iodine solution was washed off with 95% ethanol and
was treated continuously with alcohol until the washings
were pale violet. The slide was rinsed immediately with
tap water. The smear was then covered with safranin
solution to counterstain for 1 min and was rinsed again
with tap water after 1 min. It was then blotted dry with a
paper towel using firm pressure. The smear was
examined with a compound microscope (Leica, DME,
UK) starting from the low power objective and finally
the immersion lens (Smith et al., 2005).
2.6.2.2 Catalase test
The procedure was done according to Hitchins and
Jinneman, (2011). Briefly, a small amount of colony was
taken from isolates and placed on a slide. A few drops
of hydrogen peroxide (H2O2) reagent were put onto the
sample using a Pasteur pipette. The reaction was
observed for bubbles formation (positive reaction) whilst
no bubbles formation indicated a negative reaction.
2.6.2.3 Oxidase test
A piece of filter paper was prepared and moistens
with tetramethyl-p phenylenediamine, a chromogenic
reducing agent. A small number of bacteria colonies
were rubbed onto the moist paper by using a toothpick.
The presence of dark brown-purple colour showed a
positive result, while no colour change showed a
negative result (Shields and Cathcart, 2013).
2.7 Statistical analysis
All experiments were carried out in triplicate and the
results were expressed as mean ± SD (n = 3). Data
generated from the experiments were analysed for
significance using the one-way analysis of variance,
ANOVA. Statistical analysis was obtained using Minitab
14 statistical software and significant differences
327 Lani et al. / Food Research 6 (3) (2022) 324 - 334
eISSN: 2550-2166 © 2022 The Authors. Published by Rynnye Lyan Resources
FU
LL
PA
PE
R
(p<0.05) between means were determined by Fisher’s
multiple range test.
3. Results and discussion
3.1 Optical density of probiotic lactic acid bacteria
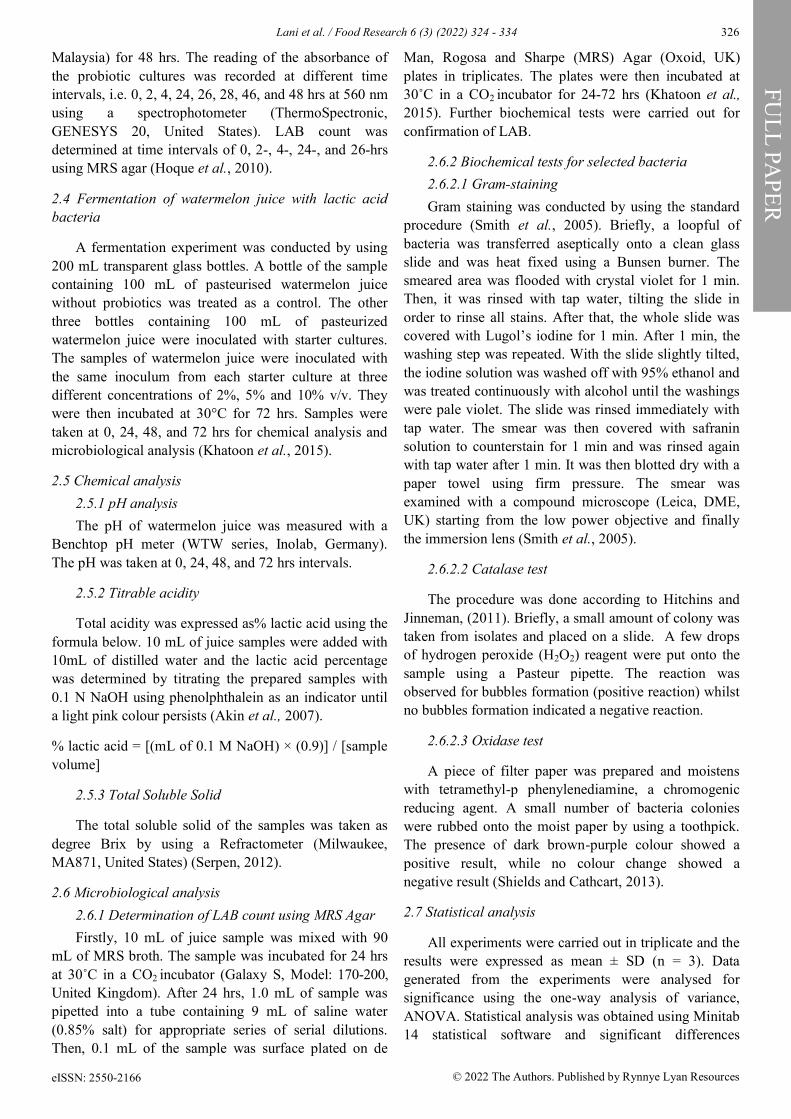
The optical density (560 nm) of 3 commercial
probiotic strains of LAB, grown in MRS broth were
monitored at different time intervals. The purpose of this
experiment was to determine the growth curve of
different strains of LAB. Figure 1 shows the absorbance
of probiotic lactic acid bacteria before inoculating them
into the watermelon juice. MRS broth without any lactic
acid bacteria was prepared as a control.
In Figure 1, it can be seen that the absorbance for the
control sample is 0 for 0 hr until 48 hrs of incubation
time. It was confirmed that without LAB, no growth of
microbes was observed through optical density at 600
nm. For L. plantarum, zero absorbance was observed
while L. paracasei showed less than 0 absorbance values
during the first 4 hrs of incubation. The results then
showed a similar trend for both of the strains whereby an
increase in absorbance to more than 2 was observed at 24
hrs to 28 hrs of incubation time. However, a slight
decrease in absorbance was observed after 46 hrs. For L.
acidophilus, the absorbance was in the range of zero
from 0 h until 28 hrs. An increase in the absorbance to
the value of 1 to 2 was only observed at 46 hrs to 48 hrs
of incubation. Both L. plantarum and L. paracasei,
reached the maximum absorbance at 24 hrs of incubation
in MRS broth while for L. acidophilus, the maximum
absorbance was at 46 hrs.
In order to support the results obtained from optical
density, the total viable count of the LAB was
determined as shown in Table 1. From the results
obtained, it was determined that by comparing the three
strains, L. acidophilus had the slowest growth rate while
L. plantarum and L. paracasei shows similar and
comparable growth rate. The number of viable cells at
maximum absorbance was 2.52×10⁹ CFU/mL and
9.00×10⁷ CFU/mL for L. plantarum and L. paracasei,
respectively (Table 1). From the results, the most
suitable time to inoculate probiotic lactic acid bacteria
into the watermelon juice was after 24 hrs of incubation
time. It has been suggested previously that the ideal cell
count for inoculation is between the range of 107 to 108
CFU/ mL with an absorbance of 0.6-0.8 (Trontel et al.,
2010).
3.2 pH analysis
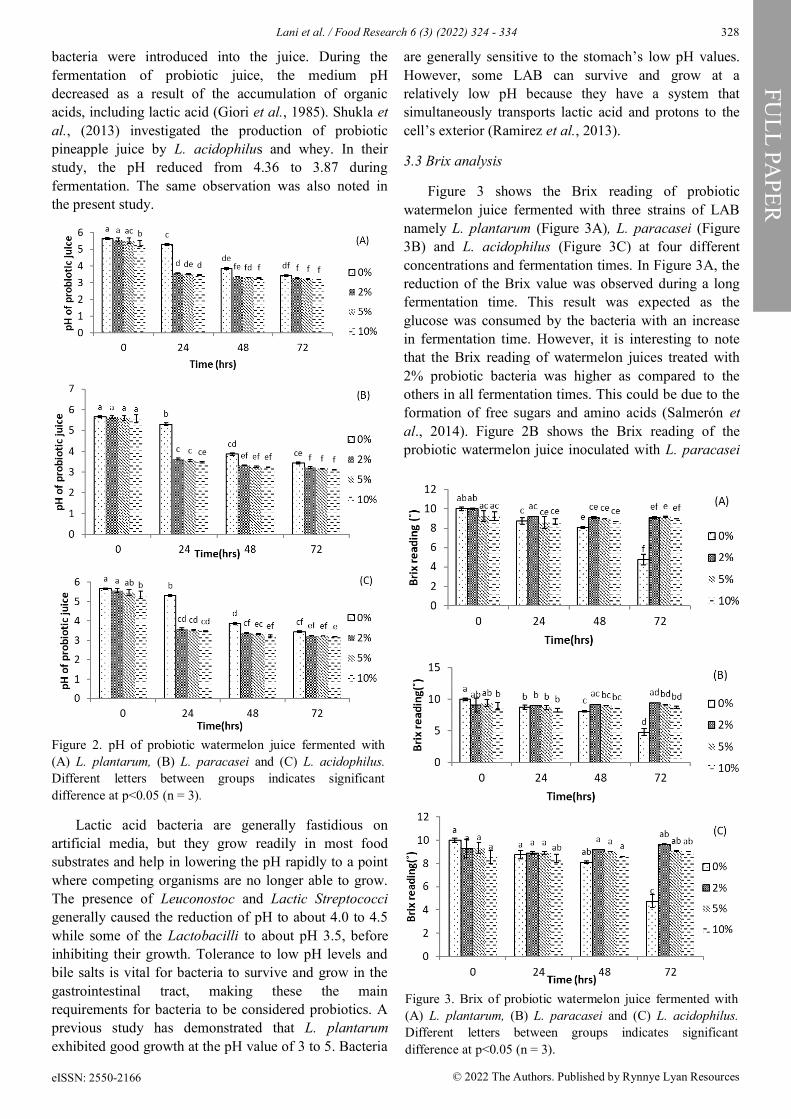
Figure 2 shows the changes in pH value of probiotic
watermelon juice fermented with three strains of LAB
namely L. plantarum (2A), L. paracasei (2B) and L.
acidophilus (2C) with four different concentrations; 0%,
2%, 5% and 10% (w/v) at time of 0 hr, 24 hr, 48 hr, and
72 hr respectively. The control sample had the highest
pH as compared to samples treated with 2%, 5%, and
10% of LAB during the fermentation time. During 0h
fermentation time, there was no significant difference
(p>0.05) of pH between 0%, 2% and 5% concentration
of bacteria used but was only noted at 10%
concentration. No significant difference (p>0.05) was
noted in the pH during 24 hrs of fermentation at 0%
concentration between the three bacteria used, but there
was a significant reduction of pH when the bacteria
concentration increased to 2-10% for all three bacteria
used at the same fermentation time. At 48 hrs
fermentation time, there was no significant difference
(p>0.05) between the control sample with 2% for
samples containing L. plantarum but a difference was
observed between control with samples containing 2%,
5% and 10% of L. paracasei and L. acidophilus. During
the 72 hrs of fermentation time, the pH of the juices
becomes insignificantly different at (p<0.05) for all
concentrations used. The juice’s samples were inoculated
with L. plantarum at 2%, 5% and 10% showing a rapid
decrease in pH at the beginning of the fermentation
process which was from 0 hr to 24 hrs and then slowly
decreases after 24 hrs of fermentation time. The same
trends were also observed in L. paracasei and L.
acidophilus. A rapid decrease in pH at the beginning of
fermentation increases the acidity and hence minimizes
the influence of spoilage bacteria (Karovica et al., 2003).
From the results obtained, the pH of the watermelon
juice was greatly reduced to 3 after 24 hrs up to 72 hrs of
fermentation time when 2%, 5% and 10% of lactic acid
Figure 1. Absorbance at 560 nm for probiotic culture used
Time
(hrs) Control
L.
plantarum L.
acidophilus L. paracasei
0 0 5.72×10⁵ 0 2.40×10⁵ 2 0 5.32×10⁵ 0 3.88×10⁵ 4 0 6.44×10⁶ 7.9×10⁶ 9.00×10⁵
24 0 2.52×10⁹ 8.00×10⁷ 9.00×10⁷ 26 0 1.93×10⁹ 1.00×10⁵ 5.00×10⁸
Table 1. LAB Count (CFU/mL) before inoculated into
watermelon juice
Lani et al. / Food Research 6 (3) (2022) 324 - 334 328
eISSN: 2550-2166 © 2022 The Authors. Published by Rynnye Lyan Resources
FU
LL
PA
PE
R
bacteria were introduced into the juice. During the
fermentation of probiotic juice, the medium pH
decreased as a result of the accumulation of organic
acids, including lactic acid (Giori et al., 1985). Shukla et
al., (2013) investigated the production of probiotic
pineapple juice by L. acidophilus and whey. In their
study, the pH reduced from 4.36 to 3.87 during
fermentation. The same observation was also noted in
the present study.
Lactic acid bacteria are generally fastidious on
artificial media, but they grow readily in most food
substrates and help in lowering the pH rapidly to a point
where competing organisms are no longer able to grow.
The presence of Leuconostoc and Lactic Streptococci
generally caused the reduction of pH to about 4.0 to 4.5
while some of the Lactobacilli to about pH 3.5, before
inhibiting their growth. Tolerance to low pH levels and
bile salts is vital for bacteria to survive and grow in the
gastrointestinal tract, making these the main
requirements for bacteria to be considered probiotics. A
previous study has demonstrated that L. plantarum
exhibited good growth at the pH value of 3 to 5. Bacteria
are generally sensitive to the stomach’s low pH values.
However, some LAB can survive and grow at a
relatively low pH because they have a system that
simultaneously transports lactic acid and protons to the
cell’s exterior (Ramirez et al., 2013).
3.3 Brix analysis
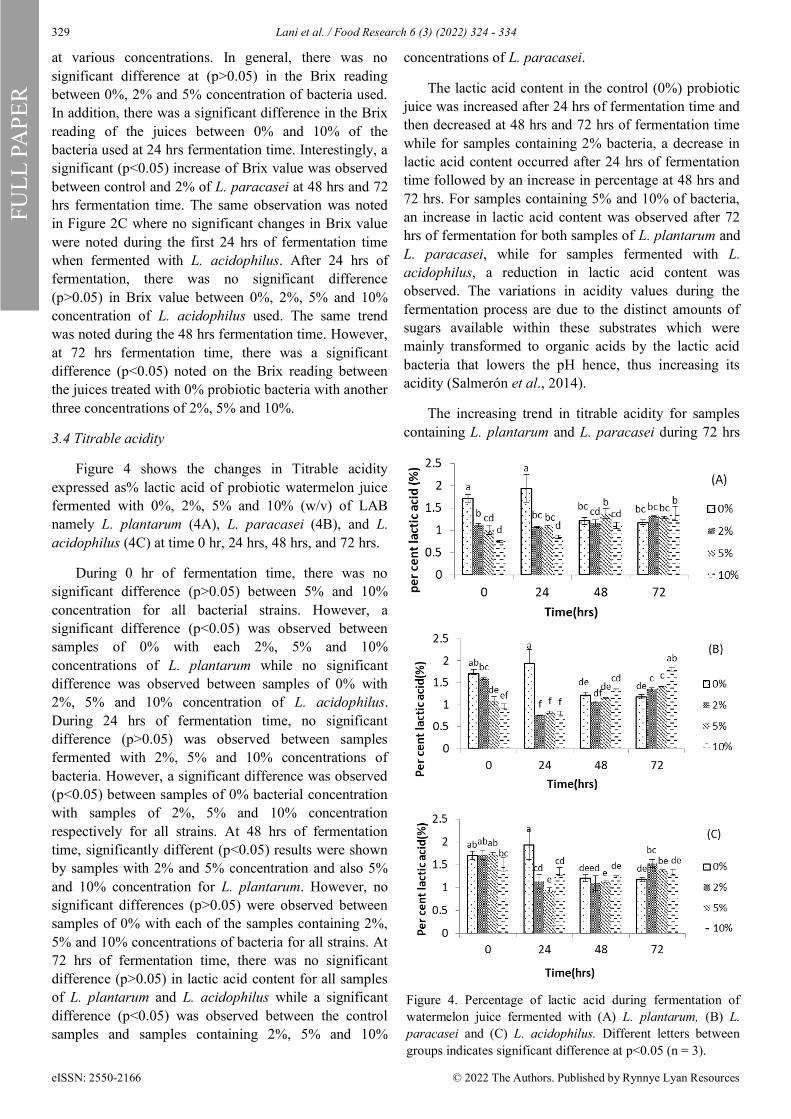
Figure 3 shows the Brix reading of probiotic
watermelon juice fermented with three strains of LAB
namely L. plantarum (Figure 3A), L. paracasei (Figure
3B) and L. acidophilus (Figure 3C) at four different
concentrations and fermentation times. In Figure 3A, the
reduction of the Brix value was observed during a long
fermentation time. This result was expected as the
glucose was consumed by the bacteria with an increase
in fermentation time. However, it is interesting to note
that the Brix reading of watermelon juices treated with
2% probiotic bacteria was higher as compared to the
others in all fermentation times. This could be due to the
formation of free sugars and amino acids (Salmerón et
al., 2014). Figure 2B shows the Brix reading of the
probiotic watermelon juice inoculated with L. paracasei
Figure 2. pH of probiotic watermelon juice fermented with
(A) L. plantarum, (B) L. paracasei and (C) L. acidophilus.
Different letters between groups indicates significant
difference at p<0.05 (n = 3).
Figure 3. Brix of probiotic watermelon juice fermented with
(A) L. plantarum, (B) L. paracasei and (C) L. acidophilus.
Different letters between groups indicates significant
difference at p<0.05 (n = 3).
329 Lani et al. / Food Research 6 (3) (2022) 324 - 334
eISSN: 2550-2166 © 2022 The Authors. Published by Rynnye Lyan Resources
FU
LL
PA
PE
R
at various concentrations. In general, there was no
significant difference at (p>0.05) in the Brix reading
between 0%, 2% and 5% concentration of bacteria used.
In addition, there was a significant difference in the Brix
reading of the juices between 0% and 10% of the
bacteria used at 24 hrs fermentation time. Interestingly, a
significant (p<0.05) increase of Brix value was observed
between control and 2% of L. paracasei at 48 hrs and 72
hrs fermentation time. The same observation was noted
in Figure 2C where no significant changes in Brix value
were noted during the first 24 hrs of fermentation time
when fermented with L. acidophilus. After 24 hrs of
fermentation, there was no significant difference
(p>0.05) in Brix value between 0%, 2%, 5% and 10%
concentration of L. acidophilus used. The same trend
was noted during the 48 hrs fermentation time. However,
at 72 hrs fermentation time, there was a significant
difference (p<0.05) noted on the Brix reading between
the juices treated with 0% probiotic bacteria with another
three concentrations of 2%, 5% and 10%.
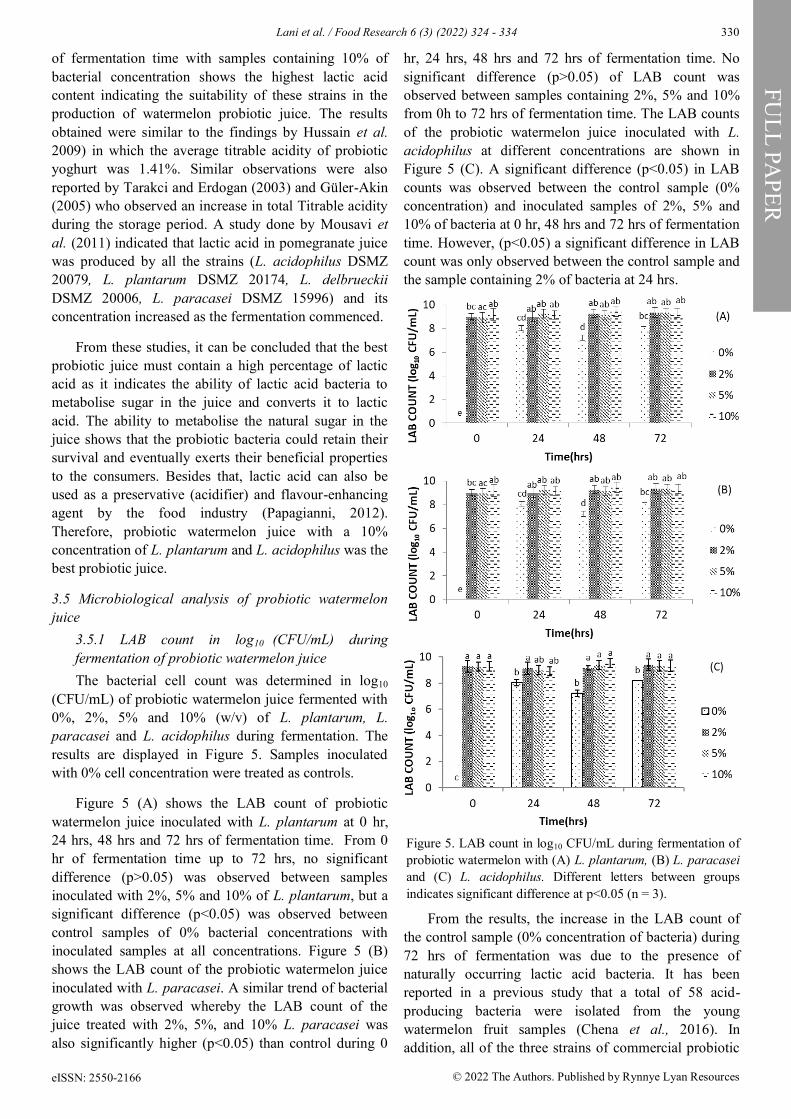
3.4 Titrable acidity
Figure 4 shows the changes in Titrable acidity
expressed as% lactic acid of probiotic watermelon juice
fermented with 0%, 2%, 5% and 10% (w/v) of LAB
namely L. plantarum (4A), L. paracasei (4B), and L.
acidophilus (4C) at time 0 hr, 24 hrs, 48 hrs, and 72 hrs.
During 0 hr of fermentation time, there was no
significant difference (p>0.05) between 5% and 10%
concentration for all bacterial strains. However, a
significant difference (p<0.05) was observed between
samples of 0% with each 2%, 5% and 10%
concentrations of L. plantarum while no significant
difference was observed between samples of 0% with
2%, 5% and 10% concentration of L. acidophilus.
During 24 hrs of fermentation time, no significant
difference (p>0.05) was observed between samples
fermented with 2%, 5% and 10% concentrations of
bacteria. However, a significant difference was observed
(p<0.05) between samples of 0% bacterial concentration
with samples of 2%, 5% and 10% concentration
respectively for all strains. At 48 hrs of fermentation
time, significantly different (p<0.05) results were shown
by samples with 2% and 5% concentration and also 5%
and 10% concentration for L. plantarum. However, no
significant differences (p>0.05) were observed between
samples of 0% with each of the samples containing 2%,
5% and 10% concentrations of bacteria for all strains. At
72 hrs of fermentation time, there was no significant
difference (p>0.05) in lactic acid content for all samples
of L. plantarum and L. acidophilus while a significant
difference (p<0.05) was observed between the control
samples and samples containing 2%, 5% and 10%
concentrations of L. paracasei.
The lactic acid content in the control (0%) probiotic
juice was increased after 24 hrs of fermentation time and
then decreased at 48 hrs and 72 hrs of fermentation time
while for samples containing 2% bacteria, a decrease in
lactic acid content occurred after 24 hrs of fermentation
time followed by an increase in percentage at 48 hrs and
72 hrs. For samples containing 5% and 10% of bacteria,
an increase in lactic acid content was observed after 72
hrs of fermentation for both samples of L. plantarum and
L. paracasei, while for samples fermented with L.
acidophilus, a reduction in lactic acid content was
observed. The variations in acidity values during the
fermentation process are due to the distinct amounts of
sugars available within these substrates which were
mainly transformed to organic acids by the lactic acid
bacteria that lowers the pH hence, thus increasing its
acidity (Salmerón et al., 2014).
The increasing trend in titrable acidity for samples
containing L. plantarum and L. paracasei during 72 hrs
Figure 4. Percentage of lactic acid during fermentation of
watermelon juice fermented with (A) L. plantarum, (B) L.
paracasei and (C) L. acidophilus. Different letters between
groups indicates significant difference at p<0.05 (n = 3).
Lani et al. / Food Research 6 (3) (2022) 324 - 334 330
eISSN: 2550-2166 © 2022 The Authors. Published by Rynnye Lyan Resources
FU
LL
PA
PE
R
of fermentation time with samples containing 10% of
bacterial concentration shows the highest lactic acid
content indicating the suitability of these strains in the
production of watermelon probiotic juice. The results
obtained were similar to the findings by Hussain et al.
2009) in which the average titrable acidity of probiotic
yoghurt was 1.41%. Similar observations were also
reported by Tarakci and Erdogan (2003) and Güler‐Akin
(2005) who observed an increase in total Titrable acidity
during the storage period. A study done by Mousavi et
al. (2011) indicated that lactic acid in pomegranate juice
was produced by all the strains (L. acidophilus DSMZ
20079, L. plantarum DSMZ 20174, L. delbrueckii
DSMZ 20006, L. paracasei DSMZ 15996) and its
concentration increased as the fermentation commenced.
From these studies, it can be concluded that the best
probiotic juice must contain a high percentage of lactic
acid as it indicates the ability of lactic acid bacteria to
metabolise sugar in the juice and converts it to lactic
acid. The ability to metabolise the natural sugar in the
juice shows that the probiotic bacteria could retain their
survival and eventually exerts their beneficial properties
to the consumers. Besides that, lactic acid can also be
used as a preservative (acidifier) and flavour-enhancing
agent by the food industry (Papagianni, 2012).
Therefore, probiotic watermelon juice with a 10%
concentration of L. plantarum and L. acidophilus was the
best probiotic juice.
3.5 Microbiological analysis of probiotic watermelon
juice
3.5.1 LAB count in log10 (CFU/mL) during
fermentation of probiotic watermelon juice
The bacterial cell count was determined in log10
(CFU/mL) of probiotic watermelon juice fermented with
0%, 2%, 5% and 10% (w/v) of L. plantarum, L.
paracasei and L. acidophilus during fermentation. The
results are displayed in Figure 5. Samples inoculated
with 0% cell concentration were treated as controls.
Figure 5 (A) shows the LAB count of probiotic
watermelon juice inoculated with L. plantarum at 0 hr,
24 hrs, 48 hrs and 72 hrs of fermentation time. From 0
hr of fermentation time up to 72 hrs, no significant
difference (p>0.05) was observed between samples
inoculated with 2%, 5% and 10% of L. plantarum, but a
significant difference (p<0.05) was observed between
control samples of 0% bacterial concentrations with
inoculated samples at all concentrations. Figure 5 (B)
shows the LAB count of the probiotic watermelon juice
inoculated with L. paracasei. A similar trend of bacterial
growth was observed whereby the LAB count of the
juice treated with 2%, 5%, and 10% L. paracasei was
also significantly higher (p<0.05) than control during 0
hr, 24 hrs, 48 hrs and 72 hrs of fermentation time. No
significant difference (p>0.05) of LAB count was
observed between samples containing 2%, 5% and 10%
from 0h to 72 hrs of fermentation time. The LAB counts
of the probiotic watermelon juice inoculated with L.
acidophilus at different concentrations are shown in
Figure 5 (C). A significant difference (p<0.05) in LAB
counts was observed between the control sample (0%
concentration) and inoculated samples of 2%, 5% and
10% of bacteria at 0 hr, 48 hrs and 72 hrs of fermentation
time. However, (p<0.05) a significant difference in LAB
count was only observed between the control sample and
the sample containing 2% of bacteria at 24 hrs.
From the results, the increase in the LAB count of
the control sample (0% concentration of bacteria) during
72 hrs of fermentation was due to the presence of
naturally occurring lactic acid bacteria. It has been
reported in a previous study that a total of 58 acid-
producing bacteria were isolated from the young
watermelon fruit samples (Chena et al., 2016). In
addition, all of the three strains of commercial probiotic
Figure 5. LAB count in log10 CFU/mL during fermentation of
probiotic watermelon with (A) L. plantarum, (B) L. paracasei
and (C) L. acidophilus. Different letters between groups
indicates significant difference at p<0.05 (n = 3).
331 Lani et al. / Food Research 6 (3) (2022) 324 - 334
eISSN: 2550-2166 © 2022 The Authors. Published by Rynnye Lyan Resources
FU
LL
PA
PE
R
LAB used (L. plantarum, L. paracasei and L.
acidophilus) have a count of between 8 to 9 log10 CFU/
mL or has the viability between 108 to 109 CFU/mL.
Different levels of probiotic bacteria in Bio-Yogurts
have been recommended and specified, in order to exert
the claimed health effects and are considered as probiotic
products. The National Yogurt Association (NYA) of the
United States specifies that 108 CFU/mL of lactic acid
bacteria at the time of manufacture are required to use
the NYA ‘Live and Active Culture’ logo on the products
containers (Ostlie et al., 2003). In Japan, the Fermented
Milks and Lactic Acid Bacteria Beverages Association
has specified a minimum of 107 CFU/mL of
Bifidobacteria to be present in fresh dairy products as a
standard (Ishibashi et al., 1993). Therefore, maintaining
the probiotic bacteria viability and survivability during
product manufacturing and storage is a very crucial
factor for effective probiotic products.
From the result, three strains of probiotic lactic acid
bacteria tested in this study were suitable to be used for
producing watermelon based probiotic drinks. The
reasons why these cultures were used are because their
effectiveness as probiotic cultures has been measured by
UAS Laboratories before being used in food products
such as clinical studies. According to Collins et al.
(1998), proper in vitro studies should establish the
potential health benefits of probiotics prior to
undertaking in vivo trials. Tests such as acid and bile
tolerance, antimicrobial production and adherence ability
to human intestinal cells should be performed depending
on the proposed health benefits by the UAS
Laboratories. To clarify the identity of a probiotic
present in the food, it was recommended that the
microbial species be stated on the label. If a selection
process has been undertaken at the strain level, the
identity of the strain should also be included, since the
probiotic effect seems to be strain specific. There is a
need to accurately enumerate the probiotic bacteria in
food products in order to include them on the label. The
label should state the viable concentration of each
probiotic present at the end of shelf life (Reid et al.,
2001).
3.6 Biochemical tests for LAB
Table 2 shows the result of a biochemical test for
lactic acid bacteria isolated from the probiotic
watermelon juice during the fermentation process. The
biochemical test was conducted to confirm the presence
of lactic acid bacteria that was introduced into the juice
and to ensure that no contamination occurs during the
analysis.
From Table 2, all of the lactic acid bacteria were
identified as Gram-positive bacteria with a negative
result on the catalase and oxidase test. The control was
the plate with unknown bacteria that was isolated from
the watermelon juice sample. Lactic acid bacteria are
identified as Gram-positive, non-spore-forming rods,
catalase-negative, usually non-motile, do not reduce
nitrate, able to utilize glucose and in the absence of
indole (Sheeladevi and Ramanathan, 2011). The control
and the three strains of L. plantarum, L. paracasei and L.
acidophilus were subjected to Gram staining and they
were examined under a compound microscope. All the
strains including the control sample gave blue-purple
colour with staining; hence they all were Gram-positive
bacteria (Devi et al., 2013). The control (watermelon
juice without probiotic lactic acid bacteria) may have
natural LAB that is an inhabitant in the watermelon
fruits. Based on the previous study, a total of 58 acid-
producing bacteria were isolated from the young
Bacteria Gram-staining Catalase test Oxidase test R1 R2 R1 R2 R1 R2
L. plantarum
0 hrs + + - - - - 24 hrs + + - - - - 48 hrs + + - - - - 72 hrs + + - - - -
L. paracasei
0 hrs + + - - - - 24 hrs + + - - - - 48 hrs + + - - - - 72 hrs + + - - - -
L. acidophilus
0 hrs + + - - - - 24 hrs + + - - - - 48 hrs + + - - - - 72 hrs + + - - - -
Control
0 hrs ND ND ND ND ND ND 24 hrs + + - - - - 48 hrs + + - - - - 72 hrs + + - - - -
Table 2. Results for biochemical tests of probiotic lactic acid bacteria in the watermelon juice
R1 = Replicate 1, R2 = Replicate 2, ND = Not Detected
Lani et al. / Food Research 6 (3) (2022) 324 - 334 332
eISSN: 2550-2166 © 2022 The Authors. Published by Rynnye Lyan Resources
FU
LL
PA
PE
R
watermelon fruit samples. The total 176 isolates were
initially divided into six groups (R1-R6) according to
cell morphology and the results of the 16S rDNA RFLP
analysis. The results identified group R1 isolates as L.
plantarum-related species (Chena et al., 2016).
A catalase test was done to test the ability of the
organism to produce catalase. The oxidation of
flavoproteins invariably results in the formation of
hydrogen peroxide as one major product. In addition, this
oxidation (and other oxygenation) produce small
quantities of an even more toxic radical. In aerobes and
aerotolerant aerobes, the potentially lethal accumulation
of oxygen is prevented by the enzyme superoxide
dismutase which catalyses it to hydrogen peroxide and
oxygen. Catalase lies close to the cell membrane. A
positive result was detected by the formation of air
bubbles and negative results show no air bubbles. The
growth of lactic isolates in the MRS medium was clear.
Their growth was not accompanied by any appearance of
gas bubbles. The total lack of CO2 gas for all strains
tested was an indicator of the homo-fermentative type.
The preliminary test makes it possible to confirm the
genus of the bacteria as Lactobacillus spp. (Holzapfel,
2002).
An Oxidase test was done to detect the presence of
cytochrome C and hence the production of oxidase
enzyme by the given test organism. Positive results on
the oxidase test indicate that the test organism was able
to develop purple colour due to oxidation of the reagent
after the colony was directly applied with the oxidase
reagent. The negative result did not show the purple
colour (Hemraj et al., 2013). The negative results of the
oxidase test confirm the presence of Lactobacillus spp.
4. Conclusion
In conclusion, three different strains of commercial
probiotic lactic acid bacteria, L. plantarum, L. paracasei
and L. acidophilus produced different results in the
chemical analyses and also microbiological analyses.
The pH of all juices samples was significantly changed
during the time of incubation but was not affected by
bacterial concentration. Moreover, no significant
difference (p>0.05) was observed in the Titrable acidity
of the watermelon juice during the time of incubation but
differ with different concentrations of lactic acid bacteria
used. However, no significant difference (p>0.05) were
shown in the Brix reading of the watermelon juice with
the function of both times of incubation and different
concentration of lactic acid bacteria used. In addition, the
duration of incubation time does not significantly affect
(p>0.05) the LAB count of the juices but was affected by
the concentration of the bacteria. Therefore, all three
strains are suitable for the development of probiotic
watermelon juice. In future, the sensorial aspect could be
further studied to confirm the acceptability of this juice.
Conflict of interest
The authors declare no conflict of interest.
Acknowledgements
The authors would like to thank MARDI, Serdang
for the collaboration with UMT. The authors would like
to thank the financial support and assistance of
laboratory staff from the Faculty of Fisheries and Food
Science, UMT.
References
Ahmad, A., Yap, W.B., Kofli, N.T. and Ghazali, A.R.
(2018). Probiotic potentials of Lactobacillus
plantarum isolated from fermented durian
(Tempoyak), a Malaysian traditional condiment.
Food Science and Nutrition, 6(6), 1370-1377. https://
doi.org/10.1002/fsn3.672
Akin, M.B., Akin M.S. and Kyrmacy, Z. (2007). Effects
of inulin and sugar levels on the viability of yoghurt
and probiotic bacteria and the physical and sensory
characteristics in probiotic ice-cream. Food
Chemistry, 104(1), 93–99. https://doi.org/10.1016/
j.foodchem.2006.11.030
Bisognin, D.A. (2002). Origin and evolution of
cultivated cucurbits. Ciência Rural, 32(4), 715–723.
https://doi.org/10.1590/s0103-84782002000400028
Chen, Y.-S., Wu, H.-C., Yu, C.-R., Chen, Z.-Y., Lu, Y.-
C. and Yanagida, F. (2016). Isolation and
characterization of lactic acid bacteria from xi-gua-
mian (fermented watermelon), a traditional
fermented food in Taiwan. Italian Journal of Food
Science, 28(1), 9–14. https://doi.org/10.14674/1120-
1770/ijfs.v451.
Collins, J.K., Thornton, G. and O’Sullivan, G.O. (1998).
Selection of probiotic strains for human applications.
International Dairy Journal, 8(5-6), 487-490. https://
doi.org/10.1016/S0958-6946(98)00073-9
Dammak, M.I., Salem, Y.B., Belaid, A., Mansour, H.B.,
Hammami, S., Le Cerf, D. and Majdoub, H. (2019).
Partial characterization and antitumor activity of a
polysaccharide isolated from watermelon rinds.
International Journal of Biological Macromolecules,
136, 632–641. https://doi.org/10.1016/
j.ijbiomac.2019.06.110
Devi, M., Rebecca, L.J. and Sumathy, S. (2013).
Bactericidal activity of the lactic acid bacteria
Lactobacillus delbreukii. Journal of Chemical and
333 Lani et al. / Food Research 6 (3) (2022) 324 - 334
eISSN: 2550-2166 © 2022 The Authors. Published by Rynnye Lyan Resources
FU
LL
PA
PE
R
Pharmaceutical Research, 5(2), 176-180.
Edwards, A.J., Vinyard, B.T., Wiley, E.R., Brown, E.D.,
Collins, J.K. and Perkins-Veazie, P.A. (2003).
Consumption of watermelon juice increase plasma
concentrations of lycopene and β-carotene in
humans. Nutrition, 133(4), 1043-1050. https://
doi.org/10.1093/jn/133.4.1043
Giori, G., de Valdez, G., Holgado A. and Oliver, G.
(1985). Effect of pH and temperature on the
proteolytic activity of lactic acid bacteria. Journal
Dairy Science, 68, 2160–2164. https://
doi.org/10.3168/jds.S0022-0302(85)81085-7
Granato, D., Branco, G.F., Nazzaro, F., Cruz, A.G. and
Faria, J.A.F. (2010). Functional Food and Nondairy
Probiotic Food Development: Trends, Concepts and
Products. Comprehensive Reviews in Food Science
and Food Safety, 9(3), 292-302. https://
doi.org/10.1111/j.1541-4337.2010.00110.x
Güler‐Akin, M.B. (2005). The effects of different
incubation temperatures on the acetaldehyde content
and viable bacteria counts of bio‐yogurt made from
ewe's milk. International Journal of Dairy
Technology, 58(3), 174-179. https://doi.org/10.1111/
j.1471-0307.2005.00209.x
Hasler, C.M. (2002). Functional foods: Benefits,
concerns and challenges - A position paper from the
American Council on Science and Health. Journal of
Nutrition, 132(12), 3772–3781. https://
doi.org/10.1093/jn/132.12.3772
Hemraj, V., Diksha, S. and Avneet, G. (2013). A review
on commonly used biochemical test for bacteria.
Journal of Life Science, 1(1), 1-7.
Hitchins, A.D. and Jinneman, K. (2011). BAM:
Detection and Enumeration of Listeria
monocytogenes. Retrieved on September 6, 2019
from FDA Website: http://www.fda.gov/Food/Food
Science Research/LaboratoryMethods/
ucm071400.htm.
Holzapfel, W.H. (2002). Appropriate starter culture
technologies for small-scale fermentation in
developing countries. International Journal of Food
Microbiology, 75(3), 197-212. https://
doi.org/10.1016/S0168-1605(01)00707-3
Hussain, I., Rahman, A. and Atkinson, N. (2009).
Quality Comparison of Probiotic and Natural
Yogurt. Pakistan Journal of Nutrition, 8(1), 9-12.
https://doi.org/10.3923/pjn.2009.9.12
Ishibashi, N. and Shimamura, S. (1993). Bifidobacteria:
Research and Development in Japan. Journal of
Food Technology, 47(6) 126, 129–134.
Khatoon, N., Rajinder, K. and Gupta. (2015). Probiotics
Beverages of Sweet Lime and Sugarcane juices and
its Physiochemical, Microbiological and Shelf-life
Studies. Journal of Pharmacognosy and
Phytochemistry, 4(3), 25-34.
Mousavi, Z.E., Mousavi, S.M., Razavi, S.H., Emam-
Djomeh, Z. and Kiani, H. (2011). Fermentation of
pomegranate juice by probiotic lactic acid bacteria.
World Journal of Microbiology and Biotechnology,
27(1), 123–128. https://doi.org/10.1007/s11274-010-
0436-1
Ninomiya, M., Itoh, T., Fujita, S., Hashizume, T. and
Koketsu, M. (2020). Phenolic glycosides from young
fruits of Citrullus lanatus. Phytochemistry Letters,
40(10), 135–138. https://doi.org/10.1016/
j.phytol.2020.09.014
Nuraida, A. (2015). A review: Health promoting lactic
acid bacteria in traditional Indonesian fermented
foods. Food Science and Human Wellness, 4(2), 47-
55. https://doi.org/10.1016/j.fshw.2015.06.001
Ostlie, H., Helland, M.H. and Narvhu, J. (2003). Growth
and metabolism of probiotics in milk. International
Journal of Food Microbiology, 87(1-2), 17-
27. https://doi.org/10.1016/S0168-1605(03)00044-8
Pakbin, B., Razavi, S.H., Mahmoudi, R. and Gajarbeygi,
P. (2014). Producing Probiotic Peach Juice.
Biotechnology and Health Science, 1(3), 1-5. https://
doi.org/10.17795/bhs-24683
Papagianni, M. (2012). Metabolic engineering of lactic
acid bacteria for the production of industrially
important compounds. Computational and Structural
Biotechnology Journal, 3(4), e201210003. https://
doi.org/10.5936/csbj.201210003
Ramirez, C., Wacher, M.L., Eslava, C.A. and
PerezChabela, M.L. (2013). Probiotic
potential of thermotolerant lactic acid bacteria
strains isolated from cooked meat products.
International Food Research Journal, 20(2), 991-
1000.
Reid, G., Zalai, C. and Gardiner, G. (2001). Urogenital
lactobacilli probiotics, reliability and regulatory
issues. Journal Dairy Science, 84(E. Suppl.), E164-
169. https://doi.org/10.3168/jds.S0022-0302(01)
70211-1
Romdhane, M.B., Haddar, A., Ghazala, I., Jeddou, K.B.,
Helbert, C.B. and Ellouz-Chaabouni, S. (2017).
Optimization of polysaccharides extraction from
watermelon rinds: Structure, functional and
biological activities. Food Chemistry, 216(2), 355–
364. https://doi.org/10.1016/j.foodchem.2016.08.056
Salleh, F., Lani, M.N. and Ismail, N. (2014).
Antimicrobial activity of cell-free supernatant of
lactic acid bacteria isolated from fermented durian
flesh against multiple antibiotic resistances,
Lani et al. / Food Research 6 (3) (2022) 324 - 334 334
eISSN: 2550-2166 © 2022 The Authors. Published by Rynnye Lyan Resources
FU
LL
PA
PE
R
Salmonella associated with food poisoning cases in
Malaysia. IOSR Journal of Pharmacy and Biological
Science, 9(6), 60-65. https://doi.org/10.9790/3008-
09646065
Salleh, F., Lani, M.N., Tuan Chilek, T.Z., Kamaruding,
N.A. and Ismail, N. (2021). Lactic acid bacteria
producing sorbic acid and benzoic acid compounds
from fermented durian flesh (Tempoyak) and their
antibacterial activities against foodborne pathogenic
bacteria. Applied Food Biotechnology, 8(2), 121-
132.
Salmerón, I., Thomas, K. and Pandiella,
S.S. (2014). Effect of substrate composition and
inoculum on the fermentation kinetics and flavour
compound profiles of potentially non‐dairy probiotic
formulations. LWT‐Food Science and Technology,
55(1), 240– 247. https://doi.org/10.1016/
j.lwt.2013.07.008
Sheeladevi, A. and Ramanathan, N. (2011). Lactic Acid
Production Using Lactic Acid Bacteria under
Optimized Conditions. International Journal of
Pharmaceutical and Biological Archives, 2(6), 1686-
1691.
Shields, P. and Cathcart, L. (2013). Oxidase Test
Protocol. ASM Microbe Library [online]. Retrieved
on September 9, 2019 from ASM Microbe Library
Website: http://www.microbelibrary.org/library/
laboratory+test/3229 oxidase-test-protocol.
Shukla, M., Kumar Y, Admassu S.H. (2013).
Development of Probiotic Beverage from Whey and
Pineapple Juice. Journal of Food Processing and
Technology, 4(2), 1-4.
Sivudu, S.N. Umamahesh, K. and Reddy, O.V.S. (2014).
Comparative study on Probiotication of mixed
Watermelon and Tomato juice by using Probiotic
strains of Lactobacilli. International Journal of
Current Microbiology and Applied Sciences, 3(11),
977-984.
Smith, A.C. and Hussey, M. (2005). Gram Stain
Protocols. MicrobeLibrary.org. Retrieved December
18, 2016 from: http://www.microbelibrary.org/
asmonly/details.asp?id=1989
Tarakci, Z. and Kucukoner, E. (2003). Physical,
chemical, microbiological and sensory
characteristics of some fruit-flavored yogurt.
Research Journal of Dairy Science, 14(2), 10-14.
Trontel, A., Barsic, V., Slavica, A., Santek, B. and
Novak, S. (2010). Modelling the effect of different
substrates and temperature on the growth and lactic
acid production by Lactobacillus amylovorus DSM
20531T in batch process. Food Technology and
Biotechnology, 48(3), 352–361.
Tuorila, H. and Gardello, A.V. (2002). Consumer
responses to an off-flavor in juice in the presence of
specific health claims. Food Quality and Preference,
13(7–8), 561–569. https://doi.org/10.1016/S0950-
3293(01)00076-3
Zamuz, S., Munekata, P.E.S., Gullón, B., Rocchetti, G.,
Montesano, D. and Lorenzo, J.M. (2021). Citrullus
lanatus as source of bioactive components: An up-to
-date review. Trends in Food Science and
Technology, 111(3), 208–222. https://
doi.org/10.1016/j.tifs.2021.03.002


![Popular ovine and caprine fermented milks [2011]](https://img.dokumen.tips/doc/110x75/6352cae7f036fabe550ada5d/popular-ovine-and-caprine-fermented-milks-2011.jpg)