Embed Size (px)
Citation preview
Seediscussions,stats,andauthorprofilesforthispublicationat:https://www.researchgate.net/publication/298899904
Charge-TransferComplexofp-AminodiphenylaminewithMaleicAnhydride:Spectroscopic,Electrochemical,andPhysicalProperties
ArticleinChemPhysChem·March2016
DOI:10.1002/cphc.201600161
CITATIONS
0
READS
33
4authors,including:
ErhanKaraca
HacettepeUniversity
2PUBLICATIONS6CITATIONS
SEEPROFILE
UğurBozkayaHacettepeUniversity
38PUBLICATIONS357CITATIONS
SEEPROFILE
NuranÖzçiçekPekmez
HacettepeUniversity
45PUBLICATIONS653CITATIONS
SEEPROFILE
Allin-textreferencesunderlinedinbluearelinkedtopublicationsonResearchGate,
lettingyouaccessandreadthemimmediately.
Availablefrom:UğurBozkayaRetrievedon:07September2016
Charge-Transfer Complex of p-Aminodiphenylamine withMaleic Anhydride: Spectroscopic, Electrochemical, andPhysical PropertiesErhan Karaca, Hatice Kaplan Can, Ugur Bozkaya, and Nuran �zÅiÅek Pekmez*[a]
1. Introduction
The concept of “molecular association” has long been recog-nized as important in virtually all fields of chemistry. The con-cept is that of a relatively electron-poor molecule, or acceptor(A), interacting in some way with an electron-rich molecule, ordonor (D). The interaction is such that the binding betweenthe components is weaker than a covalent bond. This defini-tion is sufficiently broad so as to take into consideration bothweak and strong interactions between ionic and unchargedspecies. The literature also abounds with such terms as “molec-ular complexes”, “p complexes”, and “charge-transfer com-plexes” (CTCs), which all refer to some sort of donor–acceptorinteraction [Eq. (1)]:[1]
Aþ DÐ ½A� D� ð1Þ
The interaction between donors and acceptors, describedabove, is generally viewed as an equilibrium at which the equi-librium constant KAD quantifies the strength of the interaction.Charge-transfer interactions are an important consideration inthe preparation of complexed molecules that have potentialuses in many biological[2] and technological applications.[3] Therole of CTCs is important in materials science,[4] and in thestudy of dendrimers,[5] drug action,[6] enzyme catalysis,[7] anti-bacterial agents[8] and DNA binding interactions.[9] Double-
bond electron density calculations help us to understand thep-electron acid–base character of systems yielding such com-plexes. CTC can be also formed through interactions such ashydrogen bonding, ion–dipole interactions, hydrophobic andvan der Waals interactions.
A theory to explain the intermolecular charge-transfer transi-tions in electron acceptor–donor complexes has been pro-posed by Mulliken.[10] Mulliken’s theory considers the complexas a hybrid resonating between a nonpolar structure anda polar one, resulting from the transfer of one electron. InDewar’s theory, the transfer is proposed to take place betweenthe highest occupied molecular orbital (HOMO) of the donorand the lowest unoccupied molecular orbital (LUMO) of the ac-ceptor.[11] In 1949, Benesi and Hildebrand studied iodine–aro-matic hydrocarbon CTCs by using the spectral and thermody-namical properties of the system.[12] Maleic anhydride (MA) isa highly electron-accepting molecule due to its low ionizationpotential and high electron affinity. Hence, a great deal of the-oretical and experimental interest has been generated on non-ionic complexes and MA–hydrocarbon complexes.[13] p-Amino-diphenylamine (PADPA) is an aromatic amine, and is the 4-amino derivative of diphenylamine. It can be used in pigmenttechnology due to its oxidizing potential. PADPA and derivedcompounds have long been used as dye intermediates and aspolymer stabilizers, for example, as antioxidants or antiozon-ants for elastomers. Its skin irritation and sensitization proper-ties are well known.[14] On the basis of only a few studies, theoxidation products of the unsubstituted PADPA can be consid-ered as the dimer of aniline.[15] The formation of a p-dimer ofPADPA can be explained by considering the interactions be-tween benzene rings (p-electrons) and nitrogen electron-do-nating groups.[15, 16] The charge-transfer complexation of PADPA
A new charge-transfer complex and the amide formed by theinteraction between the electron donor of the p-aminodiphe-nylamine and the electron acceptor of maleic anhydride are in-vestigated by spectroscopic methods. The amidation reactionis caused by proton and charge transfer between the maleicanhydride and p-aminodiphenylamine molecules. The Benesi–Hildebrand equation is used to determine the formation con-stant, the molar extinction coefficient and the standard Gibbsfree energy of the complex by using UV/Vis spectroscopy. Toreveal the electronic and spectroscopic properties of these
molecules, theoretical computations are performed on thestructures of maleic anhydride, p-aminodiphenylamine and theconformers of their charge-transfer complex. The charge-trans-fer complex and amidation reaction mechanism are also con-firmed by IR and NMR spectroscopy and HRMS. The nature ofthe maleic anhydride–p-aminodiphenylamine complex is char-acterized by cyclic voltammetry, thermogravimetric analysis,XRD and SEM. Solid microribbons of this complex show higherthermal stability than p-aminodiphenylamine.
[a] E. Karaca, H. Kaplan Can, U. Bozkaya, N. �zÅiÅek PekmezHacettepe UniversityDepartment of Chemistry06800, Beytepe, Ankara (Turkey)E-mail : [email protected]
Supporting Information and the ORCID identification number(s) for theauthor(s) of this article can be found under http://dx.doi.org/10.1002/cphc.201600161.
ChemPhysChem 2016, 17, 1 – 11 � 2016 Wiley-VCH Verlag GmbH & Co. KGaA, Weinheim1 &
These are not the final page numbers! ��These are not the final page numbers! ��
ArticlesDOI: 10.1002/cphc.201600161

is a well-known interaction between a valence bond and mo-lecular orbital.[10] The characterization of novel types of donor–acceptor complexes involves studies on molecules of manytypes of design and preparation. Up to now, the CTC of MAand PADPA has not been studied. The motivation to designthis study was to find changes in the electronic levels of MAand PADPA molecules arising due to electron transfer and todetermine the complex formation constant of the CTC.
The objective of the present work was to prepare the CTCbetween MA (electron acceptor) and PADPA (electron donor).Evidence for CTC formation and the amidation mechanism isfrom 1H NMR and attenuated total reflectance–Fourier trans-form infrared (ATR–FTIR) spectra on the basis of band appear-ance/disappearance and shifts corresponding to MA, PADPAand the MA–PADPA complex. A useful tool is HPLC coupled toelectrospray ionization and quadrupole time-of-flight massspectrometry (HPLC–ESI-QTOF-MS), which is used for determi-nation of molecular weight and fragmentation to support thesuggested mechanism. The formation of a complex within theMA–PADPA system and its related constants—the complex for-mation constant (KAD), the molar extinction coefficient (eAD) andthe standard Gibbs free energy (DGo) of the complex—are de-termined from the well-known linear Benesi–Hildebrand equa-tion using UV/Vis spectroscopy. The MA–PADPA complex wascharacterized by cyclic voltammetry, thermogravimetric analy-sis (TGA), XRD and field emission SEM.
Experimental Section
MA (C4H2O3, MW 98.06 g mol�1, b.p. 197–199 8C, m.p. 60 8C) was ob-tained from Sigma–Aldrich and was purified by recrystallizationtwice from a hot benzene solution. PADPA was obtained fromSigma–Aldrich and recrystallized from hexane. Acetonitrile (HPLCgrade, Sigma–Aldrich) was used without further purification.
1H NMR spectra were collected for solutions using a Bruker400 MHz NMR spectrometer. Tetramethylsilane was used as an in-ternal standard. MA, PADPA and MA–PADPA (1:1) CTC prepared inanhydrous acetonitrile were evaporated to dryness with N2 gasand redissolved with [D6]DMSO at 25 8C.
ATR–FTIR spectra of MA, PADPA and MA–PADPA CTC were mea-sured with a Mattson FTIR spectrophotometer in the 4000–400 cm�1 range; 30 scans were recorded at 4 cm�1 resolution forsolid samples and MA–PADPA CTC was prepared in a 1:1 of MAand PADPA mixture in anhydrous acetonitrile before solventevaporation.
HPLC–ESI-QTOF-MS analysis was performed on an Agilent G6530BAccurate-Mass Q-TOF LC–MS system. Mobile phase was methanoland the flow rate was 0.500 mL min�1. The analysis was performedon a aliquot of sample in acetonitrile (20 mL). All solvents usedwere HPLC gradient grade. MA–PADPA complex formation wasstudied by UV/Vis absorption of acetonitrile solutions of MA–PADPA mixtures of various ratios at room temperature using a UV/Vis/NIR spectrophotometer (PerkinElmer Lambda 750). Cyclic vol-tammetry experiments were performed on a CH Instruments6011D workstation in acetonitrile solution at room temperature.The solutions were purged with N2 gas to remove O2. A three-elec-trode type cell with separate compartments for working electrode(0.0079 cm2 area Pt disc electrode), reference electrode (saturated
Ag/AgCl in acetonitrile + 0.1 m LiBF4) and counter electrode (Ptspiral) were used. TGA measurements were obtained on a Shimad-zu DTG-60H instrument at a heating rate of 10 8C min�1 under a N2
atmosphere at a flow rate of 50 mL min�1. For XRD analysis, an Em-pyrean diffractometer (PANalytical) with CuKa radiation was used.A Nova NanoSEM 650 scanning electron microscope (FEI Technolo-gies Inc.) was used for SEM imaging.
2. Results and Discussion
For the preparation of a CTC, a 5.0 mm solution of PADPA wasmixed with 5.0 mm solution of MA in anhydrous acetonitrile.The color of the resulting solution was observed to suddenlyturn intensely yellow and it was possible to infer that MA andPADPA had formed a complex. The structure of the productwas investigated in 1H NMR, ATR–FTIR and HPLC–ESI-QTOF-MSstudies.
2.1. NMR Studies
Measurement of 1H NMR spectra in [D6]DMSO was performedafter the formation of the complex at room temperature. TheMA–PADPA complex was prepared from a 1:1 mixture ofPADPA and MA in acetonitrile, and after evaporation, a spec-trum of the resulting yellow solid was measured in [D6]DMSO.The 1H NMR spectra of MA, PADPA and the MA–PADPA com-plex are shown in Figure 1. In the spectrum of MA, the protonsof the CH=CH group appear at 7.47 ppm (signal a).[17] The peakat 6.26 ppm (signal b) is assigned to maleic acid (CH=CH)formed from the partial hydrolysis of maleic anhydride.[18] Inthe 1H NMR spectrum of PADPA, the protons of the benzenoidrings are assigned as 6.54 (doublet, protons e), 6.59 (triplet, d),6.76 (doublet, c), 6.82 (doublet, b) and 7.09 ppm (triplet, a),with the ratio of integrated intensity of peaks of 2:1:2:2:2, re-spectively (Figure 1). Primary and secondary amine protonsappear at 4.77 (g) and 7.45 ppm (f), with an integral ratio of2:1, respectively. In the 1H NMR spectrum of PADPA, the signalscorresponding to secondary amine protons were abolisheddue to proton exchange with D2O when [D6]DMSO/D2O wasadded to the sample (Figure S1 in the Supporting Information).In the 1H NMR of the MA–PADPA complex (Figure 1), specificbands were observed: MA–PADPA proton peaks belonging tobenzenoid rings correspond to PADPA, however there is a dif-ference in chemical shift. Observed peaks at 6.54 (e), 6.59 (d)and 7.09 ppm (a) shift downfield to 7.50 (e), 6.80 (d) and7.22 ppm (a), with an integral ratio of 2:1:2, respectively. Peakscorresponding to the benzenoid ring protons at 6.82 (doublet)and 6.76 ppm (doublet) can be observed as overlapped peaksat 7.03 ppm (4 H) in the spectrum of the mixture. Also, theproton of the secondary NH group at 7.45 ppm (f) shifts to8.15 ppm (1 H; f).[19]
Two other peaks arising from the reaction between MA andPADPA were observed. Signals at 6.31 (doublet; h) and6.48 ppm (doublet ; h) with an integral ratio of 1:1 are assignedto the CH=CH protons of the amide. Resulting from the protontransfer to the anhydride carbonyl group of MA, the carboxylicacid is formed and its broad peak is observed at 13.73 ppm (j).
ChemPhysChem 2016, 17, 1 – 11 www.chemphyschem.org � 2016 Wiley-VCH Verlag GmbH & Co. KGaA, Weinheim2&
�� These are not the final page numbers!�� These are not the final page numbers!
Articles

Resulting from the reaction, an amide proton (1 H; NH g) ap-pears at 10.45 ppm accompanied by disappearance of NH2
protons at (2 H; g) at 4.72 ppm. In the 1H NMR spectrum of
MA–PADPA, signals corresponding to COOH and secondary NHprotons disappeared due to their exchange with D2O upon theaddition of DMSO–D2O to the complex (Figure S2).
Figure 1. 1H NMR spectra of MA, PADPA and MA–PADPA adduct in [D6]DMSO at room temperature.
ChemPhysChem 2016, 17, 1 – 11 www.chemphyschem.org � 2016 Wiley-VCH Verlag GmbH & Co. KGaA, Weinheim3 &
These are not the final page numbers! ��These are not the final page numbers! ��
Articles
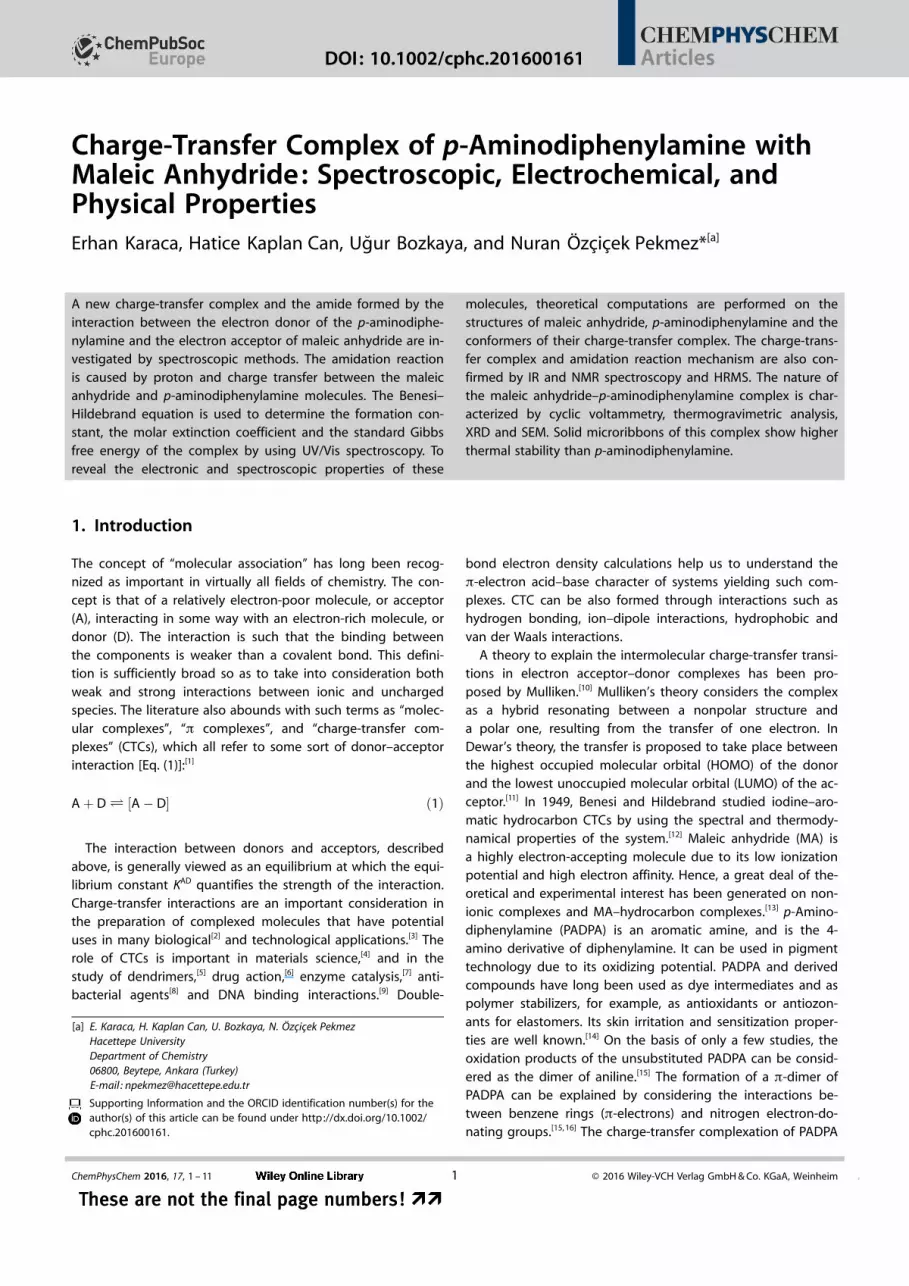
Therefore, the 1H NMR results lead us to conclude that anamidation reaction occurs between MA and PADPA as shownin Scheme 1.
2.2. ATR–FTIR Studies
To follow and characterize the formation of a CTC between MAand PADPA, ATR–FTIR spectroscopy was used. The IR spectra ofMA, PADPA and MA–PADPA system were recorded in the range4000–400 cm�1 in the solid state after evaporation of acetoni-trile. Important bands and peak shifts of the molecules can beseen in Figure 2, Figure S3 and Table 1. The IR spectrum of MA(Figure 2 a) can be assigned thus: OH stretching of partially hy-drolyzed MA at 3590 cm�1; OH (COOH group) stretching of MA(intramolecular H-bonding) at 3123 cm�1; CH stretching bandscentered at 2930 (asymmetric stretch, as) and 2870 cm�1 (sym-metric stretch, s) ; C=O (anhydride moiety) stretching at 1854(as) and 1777 cm�1 (s) ; CH deformation at 1289 cm�1(s) ; C�O�C stretching vibration in anhydride group at 1268, 1239, and1047 cm�1.[20] The IR bands of PADPA (Figure 2 b) were ob-
Scheme 1. Amidation reaction between maleic anhydride (MA) and p-amino-diphenylamine (PADPA).
Figure 2. ATR–FTIR spectra of a) MA, b) PADPA and c) MA–PADPA complex inthe solid state (4000–400 cm�1).
Table 1. ATR–FTIR band assignments of MA, PADPA and MA–PADPA complex.
Band assignments MA PADPA MA–PADPA complex
O�H stretching of MA 3590 – –N�H stretching vibrations secondary amine – 3410 3397N�H stretching in NH2 group – 3318 –N�H stretching in amide of complex – – 3268H-bonded N�H stretching in NH2 group – 3214 –C�H stretching of aromatic system – 3034, 3010 3059O···HO stretching of MA (intramolecular H-bonding) 3123 – –O�H stretching in hydrogen-bonded COOH group – – 3089C�H stretching 2930, 2870 – –C=O stretching 1854, 1777 – –Carboxylic acid C=O stretching – – 1698N�H deformation vibration – 1627, 1278 1631, 1268Aromatic conjugated C=C stretching – 1598 1597Conjugated C=C stretching in complex – 1506Benzenoid ring C=C stretching vibrations – 1487 1496C�O stretching of COOH group in complex – – 1328C�H deformation 1289 – –C�N stretching in aromatic amine – 1256 1241C�O�C stretching vibration in anhydride group 1268–1239 – –C�H in-plane bending vibrations of benzenoid – 1175 1175C�O�C asymmetric stretching vibration 1047 – –C�H out-of-plane – 804 845
ChemPhysChem 2016, 17, 1 – 11 www.chemphyschem.org � 2016 Wiley-VCH Verlag GmbH & Co. KGaA, Weinheim4&
�� These are not the final page numbers!�� These are not the final page numbers!
Articles
served at 3410, 3318 and 3214 cm�1 and these were attributedto the free N�H stretching vibrations of primary and secondaryamino groups, and bands centered at 1627, 1278, and804 cm�1 correspond to the N�H deformation vibration andC�H out-of-plane, respectively (Figure S3 b).[21]
Perhaps the most compelling evidence for a mechanism in-volving proton transfer and CTC formation between the MAand PADPA are the new peaks at 3089 and 1698 cm�1 assignedto OH stretching in hydrogen-bonded COOH and carbonyl C=
O stretching of the COOH group of MA–PADPA adduct, respec-tively. The bands observed at 1496 and 1241 cm�1correspondto benzenoid ring C=C stretching vibrations and the C�Nstretching of the secondary aromatic amine, respectively.[19, 22]
Evidence for a MA–PADPA complex is the NH stretching bandof the amide at 3268 cm�1 (Figure 2 c). This can be explainedby the amidation reaction between MA and the primary aminogroup of the PADPA: ring opening of MA occurs to yield theamide, evidenced by conjugated C=C stretching in adduct at1506 cm�1 and carboxylic acid stretching at 1698 cm�1 (Fig-ure S3 c).[20c] The contribution of various aromatic C�H stretch-ing modes belonging to the benzenoid rings and CH=CH ofthe MA moiety might also be responsible for the band ob-served centered at about 3059 cm�1.[21, 23]
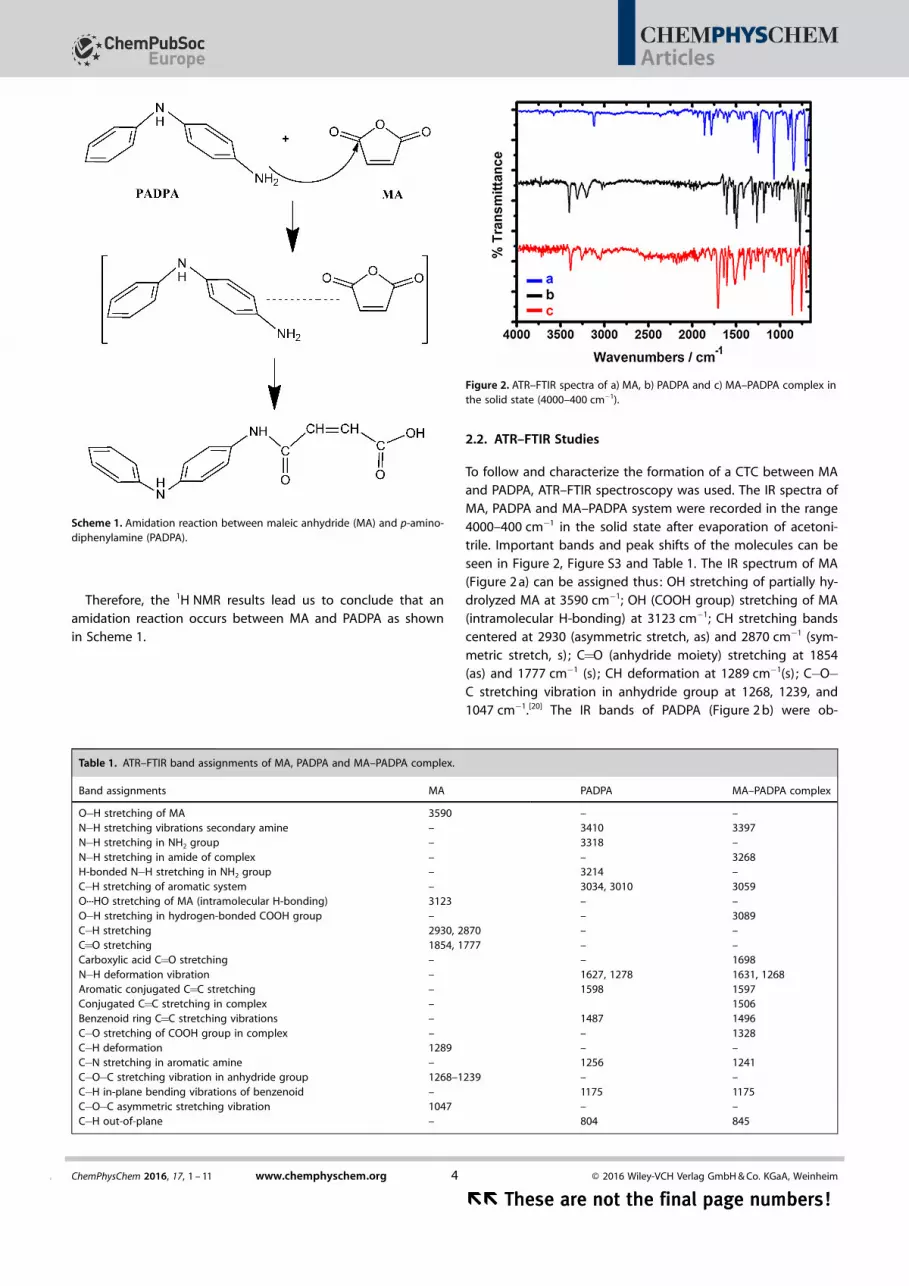
2.3. HPLC–ESI-QTOF-MS Studies
HPLC–ESI-QTOF-MS provided the exact molecular weights andmolecular formulas of MA, PADPA and MA–PADPA complex(Figure 3). The precursor ions of MA, PADPA and MA–PADPAcomplex [M+H]+ at m/z 99.03 (C4H3O3), 185.11 (C12H13N2) and283.11 (C16H15N2O3) were the base peaks in the positive-ion ESIexperiments, respectively.The ions formed by loss of an oxygen
atom from the parent ion at m/z 83.02 and that formed by lossof CO at m/z 54.99 are (C4H3O2) and (C3H3O) for MA, respective-ly.[24] In the mass spectrum of PADPA, peaks at m/z 108.07 and93.06 are due to loss of phenyl and phenylamine, respectively.
From the mass spectrum of the MA–PADPA complex, thefragment ions at m/z 266.10 (C16H14N2O2
+) and 184.10(C12H12N2
+) were attributed to skeleton residues. The mainfragment of the MA–PADPA complex arising from the PADPAmolecules can be seen at m/z 184.10. HPLC–ESI-QTOF-MS evi-dence is supported by ATR–FTIR and 1H NMR spectroscopydata in terms of amidation by a proton-transfer reaction.[25]
2.4. UV/Vis Studies of the MA–PADPA Complex
Figure 4 a shows the UV/Vis spectra at wavelengths between190–600 nm for the MA–PADPA mixture, MA and PADPA atroom temperature in pure acetonitrile. In the MA and PADPAsystem; UV/Vis spectra of mixtures are recorded at variousfeeds (constant [MA], [PADPA]> [MA]).[13c] The results from theUV/Vis spectroscopy of MA and PADPA mixtures at wave-lengths between 300–600 nm are presented in Figure 4 b. Asevidenced from the comparative analysis of the spectra shownin Figure 4 a, the shift of the lmax values and the appearance ofthe new absorption band centered at 370 nm were observed.The formation of the intense yellow color in the solution, theappearance of the new absorption band and the shifts of thebands maximum of MA and PADPA in the UV/Vis spectrum in-dicate the formation of a CTC of MA–PADPA in an acceptor–donor pair. In other words, these differences are assigned tothe p-transition in MA–PADPA and/or a newly formed amidestructure.
Figure 3. HPLC–ESI-QTOF-MS spectra of MA, PADPA and the MA–PADPA complex.
ChemPhysChem 2016, 17, 1 – 11 www.chemphyschem.org � 2016 Wiley-VCH Verlag GmbH & Co. KGaA, Weinheim5 &
These are not the final page numbers! ��These are not the final page numbers! ��
Articles

This charge transfer mechanism can be also confirmed by1H NMR and ATR–FTIR spectroscopy results. From a comparisonof the 1H NMR spectra, the shifted peak corresponding to thesecondary NH proton [8.15 ppm (f)] in the amide product isbroader than that of PADPA [7.45 ppm (f)] . This phenomenoncan be attributed to the intermolecular lone-pair–p interactionbetween the amine group and the aromatic ring (see Theoreti-cal Computations, Section 2.5). Further evidence for the com-plex can be provided with the change in intensity, wavenum-ber and symmetry of the some of the absorption peaks in theATR–FTIR spectra of complex from those of PADPA (Figures 2,Figure S3 and Table 1).
The dominating tendency toward complexation is due tothe CTC of MA and PADPA, which takes part in the reactionprocess as independent molecules; proton transfer also occursfrom PADPA to MA.[26] An equilibrium would therefore exist[Eq. (2)]:
MAþ PADPAÐ CTC ð2Þ
for which the equilibrium constant (KAD) is defined as [Eq. (3)]:
K AD ¼ ½CTC�=ð½MA�½PADPA�Þ ð3Þ
where [CTC], [MA] and [PADPA] are the concentrations of theCTC, MA and PADPA respectively.
The newly formed MA–PADPA absorption band at 370 nmwas monitored for various mixtures of MA and PADPA in aceto-nitrile at room temperature. Upon increasing the concentrationof the donor in the system, the absorption intensity of thespectrum increases (Figure 4 b). The formation of a acceptor–donor complex and the associated KAD and eAD values were in-vestigated by UV/Vis spectroscopy and follows the well-knownBenesi–Hildebrand equation [Eq. (4)]:[12]
A0½ �A¼ 1
K ADeAD D0½ �þ 1
eADð4Þ
where A is the absorbance of the CTC, [Ao] is initial concentra-tion of the electron acceptor, [Do] is the initial concentration ofthe electron donor, KAD is the equilibrium constant of CTC for-mation, and eAD is the CTC molar absorption coefficient. Thegiven method can be used if the donor is in excess, [D] @ [A],that is, [D]� [Do] .
According to the Benesi–Hildebrand equation, the plot of A0½ �A
versus 1D0½ � should be linear with slope and intercept equal to 1/
KADeAD and 1/eAD, respectively (Figure 5). By using this equationsimultaneously, errors in KAD and eAD can be minimized. The ob-tained KAD and eAD values were 285.32 m
�1 and 268 810 m�1 cm,
respectively (R2 = 0.983). Theoretically, K can range from zero(no complex formation) to infinity (complete conversion of theacceptor and donor into the complex). Generally, complexeswith formation constants less than unity are classified as weak,whereas KAD>1 for strong and stable complexes. The forma-tion of the CTC depends upon the polarity of the solvent, thatis, the dielectric constant, which is a measure of the ability ofa molecule to insulate charge from another.[26]
The thermodynamic functions, standard free-energy changeDGo [kcal mol�1] of complexation can be obtained from thewell-known Equation (5):
Figure 4. a) UV/Vis spectra of MA, PADPA and MA–PADPA complex in aceto-nitrile at room temperature; [MA] = [PADPA] = 1.0 � 10�4
m, [MA–PADPA] =
2.0 � 10�4m. b) UV/Vis spectra of mixtures in acetonitrile containing MA
(2.0 � 10�4m) and PADPA at concentrations 8.0 � 10�5, 9.0 � 10�5, 1.0 � 10�4,
1.2 � 10�4, 1.6 � 10�4, 2.0 � 10�4, 2.4 � 10�4, and 2.8 � 10�4m.
Figure 5. Benesi–Hildebrand equation [Eq. (4)] plot, [A0]/A vs. 1/[D0] , of theCTC of MA with PADPA at 25 8C in acetonitrile.
ChemPhysChem 2016, 17, 1 – 11 www.chemphyschem.org � 2016 Wiley-VCH Verlag GmbH & Co. KGaA, Weinheim6&
�� These are not the final page numbers!�� These are not the final page numbers!
Articles
DGo ¼ �RT ln K AD ð5Þ
where R is the ideal gas constant (1.987 cal K�1 mol), T is tem-perature [K], and KAD [m�1] is the complex formation constantat room temperature. The value of DGo for MA and PADPAcomplexation was �3.35 kcal mol�1. The obtained results revealthat CTC formation is spontaneous. There is a good agreementwith the literature values of the constants (KAD, eAD and DGo) ofthe CTC.[27]
2.5. Theoretical Computations
In order to better understand the electronic and spectroscopicproperties of the molecules considered here, we performedtheoretical computations for structures of MA, PADPA and theCTC. Density functional theory (DFT) was used for this purpose.Geometry optimization was performed with the wB97XD func-tional.[28] Vibrational frequencies were computed to character-ize each stationary structure. Pople’s polarized double-z splitvalence basis set with diffuse functions, 6-31 + G(d), wasused.[29–31 All computations were performed using the Gaussi-an 09 program package.[32]
The optimized geometries of MA, PADPA, MA-PADPA andconformers of the CTC at the wB97XD/6-31 + G(d) level are re-ported in Tables S1–S5. The optimized geometries of CTC con-formers are depicted in Figure 6. There is an intramolecular hy-drogen-bond interaction between the carboxyl group of theamide and OH group of the carboxylic acid. The O···H interac-tion distance is 1.621 �, which is typical for H-bonding interac-tions. The intermolecular distances between aromatic rings are3.2–5.0 �, which supports the existence of p–p interactions.[33]
Furthermore, the distance between the nitrogen atom of theamine groups of PADPA segments and aromatic rings is about3.5 �, which indicates lone-pair–p interactions.[34]
Standard reaction enthalpy, entropy and Gibbs free energywere computed for the CTC formation reaction. The theoreticalvalues are DH8=�21.9 kcal mol�1, DS8=�62.5 cal mol�1 K, andDG8=�3.3 kcal mol�1 at room temperature. The computed
value of the standard Gibbs free energy is in good agreementwith the experimental value of �3.35 kcal mol�1. Experimentaland theoretical calculations of the Gibbs free energy revealthat the CTC formation process is spontaneous. Furthermore, italso should be noted that the complex formation process isenthalpically driven. Finally, we note that the computed UV/Visspectra for MA-PADPA and the conformers of the CTC (Fig-ures S4–S6) are in agreement with the experimental spectra.
2.6. Electrochemical Properties
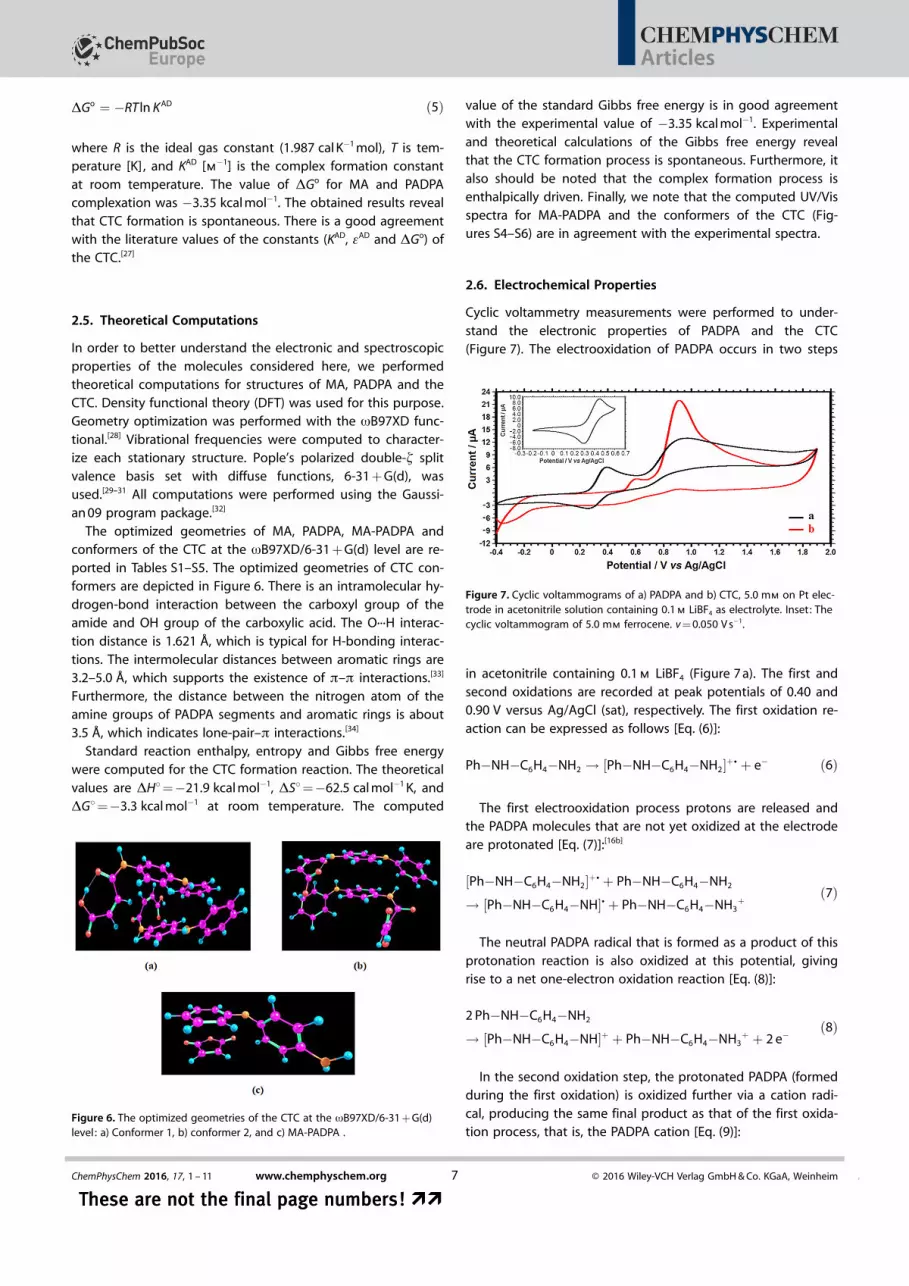
Cyclic voltammetry measurements were performed to under-stand the electronic properties of PADPA and the CTC(Figure 7). The electrooxidation of PADPA occurs in two steps
in acetonitrile containing 0.1 m LiBF4 (Figure 7 a). The first andsecond oxidations are recorded at peak potentials of 0.40 and0.90 V versus Ag/AgCl (sat), respectively. The first oxidation re-action can be expressed as follows [Eq. (6)]:
Ph�NH�C6H4�NH2 ! ½Ph�NH�C6H4�NH2�þ C þ e� ð6Þ
The first electrooxidation process protons are released andthe PADPA molecules that are not yet oxidized at the electrodeare protonated [Eq. (7)]:[16b]
½Ph�NH�C6H4�NH2�þ C þ Ph�NH�C6H4�NH2
! ½Ph�NH�C6H4�NH�C þ Ph�NH�C6H4�NH3þ
ð7Þ
The neutral PADPA radical that is formed as a product of thisprotonation reaction is also oxidized at this potential, givingrise to a net one-electron oxidation reaction [Eq. (8)]:
2 Ph�NH�C6H4�NH2
! ½Ph�NH�C6H4�NH�þ þ Ph�NH�C6H4�NH3þ þ 2 e�
ð8Þ
In the second oxidation step, the protonated PADPA (formedduring the first oxidation) is oxidized further via a cation radi-cal, producing the same final product as that of the first oxida-tion process, that is, the PADPA cation [Eq. (9)]:
Figure 6. The optimized geometries of the CTC at the wB97XD/6-31 + G(d)level : a) Conformer 1, b) conformer 2, and c) MA-PADPA .
Figure 7. Cyclic voltammograms of a) PADPA and b) CTC, 5.0 mm on Pt elec-trode in acetonitrile solution containing 0.1 m LiBF4 as electrolyte. Inset: Thecyclic voltammogram of 5.0 mm ferrocene. v = 0.050 V s�1.
ChemPhysChem 2016, 17, 1 – 11 www.chemphyschem.org � 2016 Wiley-VCH Verlag GmbH & Co. KGaA, Weinheim7 &
These are not the final page numbers! ��These are not the final page numbers! ��
Articles
Ph�NH�C6H4�NH3þ
! ½Ph�NH�C6H4�NH�þ þ 2 Hþ þ 2 e�ð9Þ
The electrochemical behavior of the CTC is similar to that ofPADPA with the exception of the first oxidation potential [shift-ed from 0.40 to 0.60 V vs. Ag/AgCl (sat)] . The shift toward posi-tive potentials might be due to the introduction of the maleicacid moiety to the PADPA molecule through an amidation re-action.
For a CTC in acetonitrile solution, after one electron per mol-ecule was transferred in an exhaustive anodic electrolysis at0.70 V, the solution turned blue-green. Due to this property,the MA–PADPA complex could be also used as an intermediatefor the synthesis of photographic chemicals, and the manufac-ture of dyes such as PADPA.
The HOMO and LUMO energy levels can be calculated byusing the cyclic voltammograms (Figure 7). These cyclic vol-tammetric curves were calibrated using the ferrocene/ferroce-nium (Fc/Fc+) redox couple as an external standard, which wasmeasured under the same condition. The energy level of Fc/Fc+ was assumed to be �4.8 eV in vacuum.[35] The half-wavepotential of the Fc/Fc+ redox couple (E1=2, Fc,Fcþ ) was estimatedfrom E1=2, Fc,Fcþ = (Ea + Ec)/2, where Ea and Ec are the anodic andcathodic peak potentials relative to the Ag/AgCl (sat) referenceelectrode, respectively. The HOMO energy level of the CTC wasestimated according to EHOMO =�(Eox
1/2 + 4.8�E1=2, Fc,Fcþ ) [eV],where Eox
1/2 is the half-wave potential of complex relative tothe Ag/AgCl (sat) reference electrode.[36] Eox
1/2 and E1=2, Fc,Fcþ areobtained from the cyclic voltammograms as 0.55 and 0.38 Vversus Ag/AgCl (sat), respectively. Hence, the EHOMO value is�4.97 eV for the MA–PADPA complex. The LUMO energy levelwas calculated by adding the optical band gap value from therespective HOMO energy level (ELUMO = EHOMO + Eg,opt).
[37] Eg,opt isthe optical band gap, which can be estimated from the onsetof UV/Vis absorption spectra (Eg,opt [eV] = 1240/lonset [nm]).[36, 38]
As a result, the Eg,opt and ELUMO values are 3.35 and �1.62 eV, re-spectively.[37b, 39] Also, the Eg,opt value is 4.43 eV for PADPA. Withthe formation of a new complex, the energy band gap de-creases from 4.43 to 3.35 eV; the computed value is 3.01 eV.The broad energy gap (3.20–4.50 eV) might favor photocatalyt-ic activity.[39, 40]
2.7. Thermal Properties
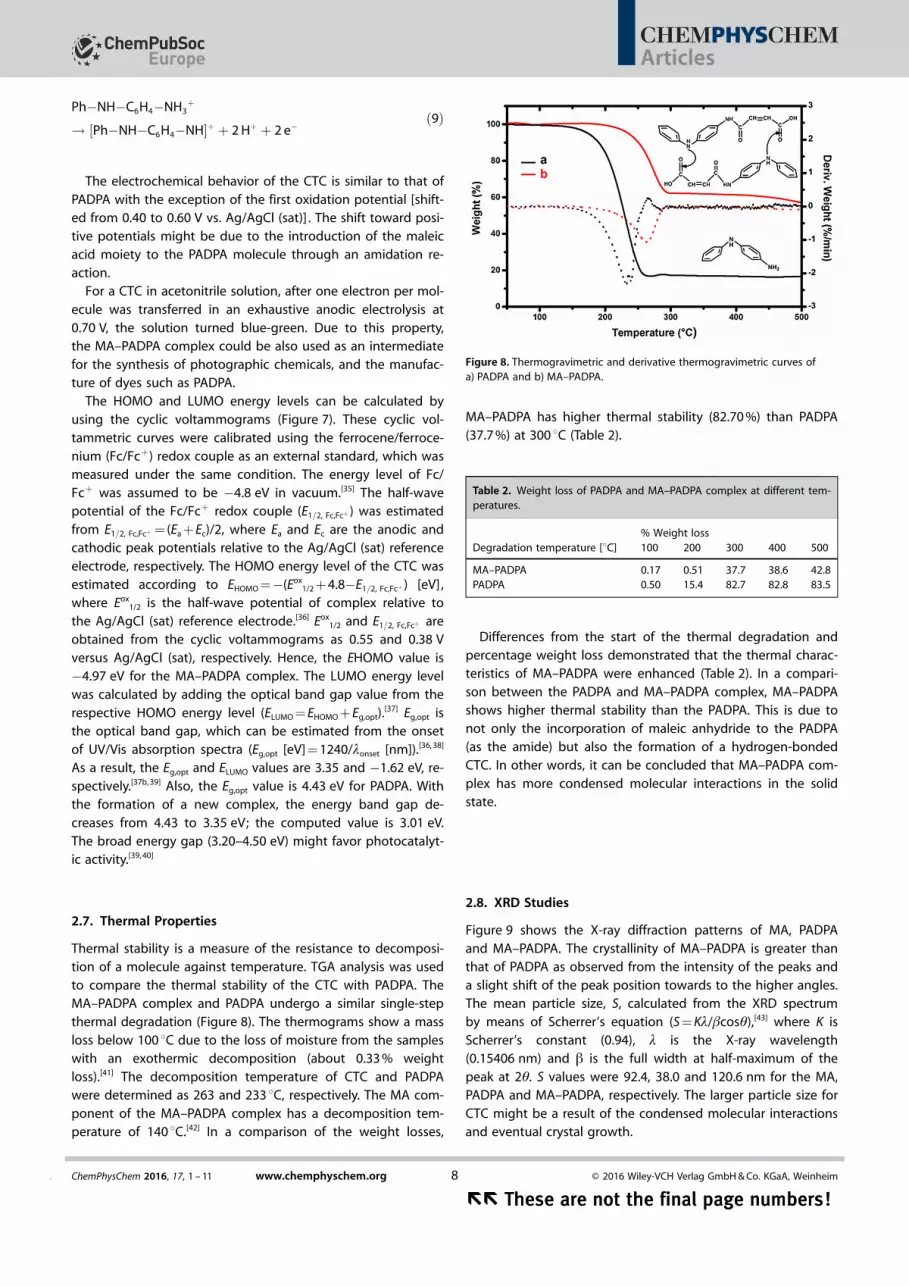
Thermal stability is a measure of the resistance to decomposi-tion of a molecule against temperature. TGA analysis was usedto compare the thermal stability of the CTC with PADPA. TheMA–PADPA complex and PADPA undergo a similar single-stepthermal degradation (Figure 8). The thermograms show a massloss below 100 8C due to the loss of moisture from the sampleswith an exothermic decomposition (about 0.33 % weightloss).[41] The decomposition temperature of CTC and PADPAwere determined as 263 and 233 8C, respectively. The MA com-ponent of the MA–PADPA complex has a decomposition tem-perature of 140 8C.[42] In a comparison of the weight losses,
MA–PADPA has higher thermal stability (82.70 %) than PADPA(37.7 %) at 300 8C (Table 2).
Differences from the start of the thermal degradation andpercentage weight loss demonstrated that the thermal charac-teristics of MA–PADPA were enhanced (Table 2). In a compari-son between the PADPA and MA–PADPA complex, MA–PADPAshows higher thermal stability than the PADPA. This is due tonot only the incorporation of maleic anhydride to the PADPA(as the amide) but also the formation of a hydrogen-bondedCTC. In other words, it can be concluded that MA–PADPA com-plex has more condensed molecular interactions in the solidstate.
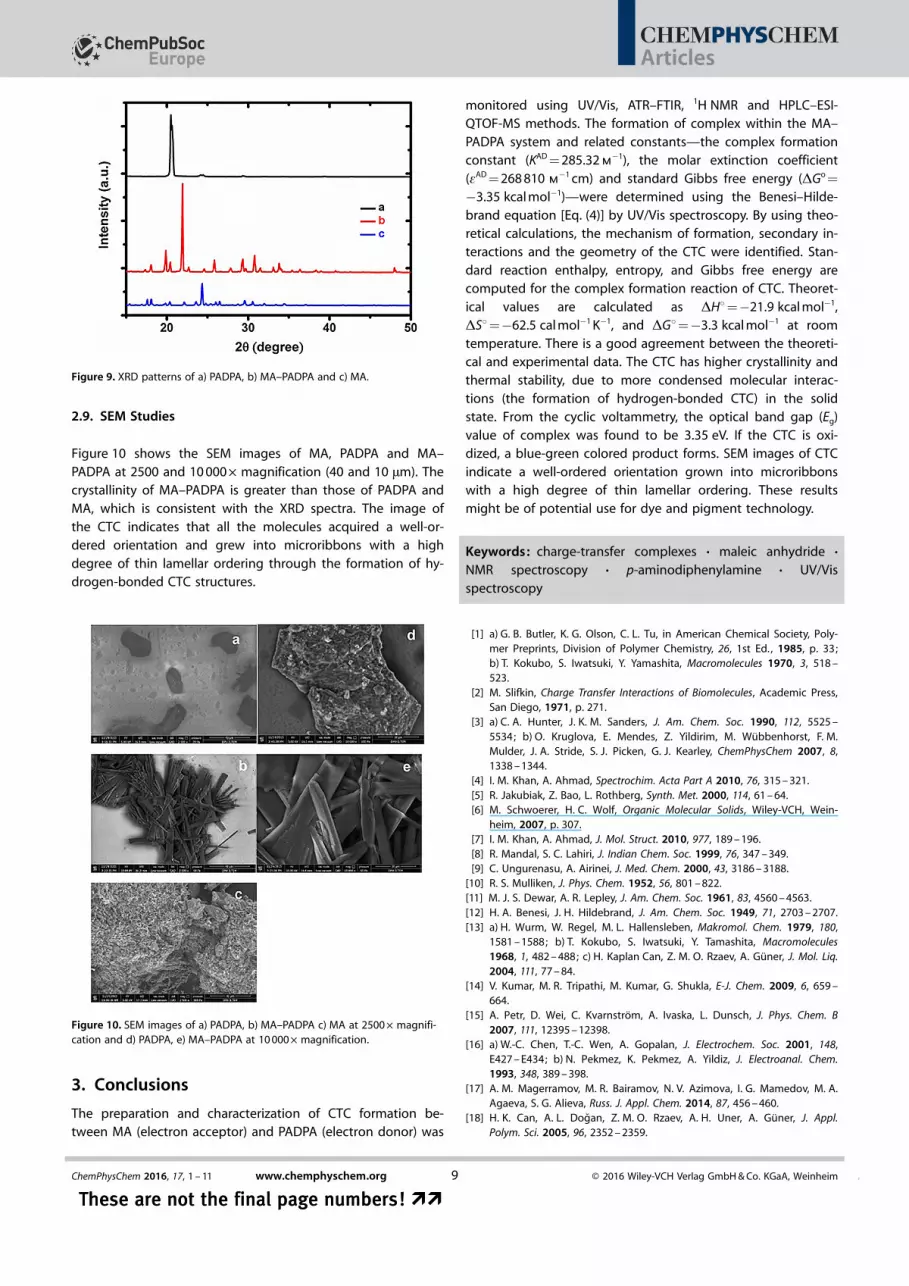
2.8. XRD Studies
Figure 9 shows the X-ray diffraction patterns of MA, PADPAand MA–PADPA. The crystallinity of MA–PADPA is greater thanthat of PADPA as observed from the intensity of the peaks anda slight shift of the peak position towards to the higher angles.The mean particle size, S, calculated from the XRD spectrumby means of Scherrer’s equation (S = Kl/bcosq),[43] where K isScherrer’s constant (0.94), l is the X-ray wavelength(0.15406 nm) and b is the full width at half-maximum of thepeak at 2q. S values were 92.4, 38.0 and 120.6 nm for the MA,PADPA and MA–PADPA, respectively. The larger particle size forCTC might be a result of the condensed molecular interactionsand eventual crystal growth.
Figure 8. Thermogravimetric and derivative thermogravimetric curves ofa) PADPA and b) MA–PADPA.
Table 2. Weight loss of PADPA and MA–PADPA complex at different tem-peratures.
% Weight lossDegradation temperature [8C] 100 200 300 400 500
MA–PADPA 0.17 0.51 37.7 38.6 42.8PADPA 0.50 15.4 82.7 82.8 83.5
ChemPhysChem 2016, 17, 1 – 11 www.chemphyschem.org � 2016 Wiley-VCH Verlag GmbH & Co. KGaA, Weinheim8&
�� These are not the final page numbers!�� These are not the final page numbers!
Articles
2.9. SEM Studies
Figure 10 shows the SEM images of MA, PADPA and MA–PADPA at 2500 and 10 000 � magnification (40 and 10 mm). Thecrystallinity of MA–PADPA is greater than those of PADPA andMA, which is consistent with the XRD spectra. The image ofthe CTC indicates that all the molecules acquired a well-or-dered orientation and grew into microribbons with a highdegree of thin lamellar ordering through the formation of hy-drogen-bonded CTC structures.
3. Conclusions
The preparation and characterization of CTC formation be-tween MA (electron acceptor) and PADPA (electron donor) was
monitored using UV/Vis, ATR–FTIR, 1H NMR and HPLC–ESI-QTOF-MS methods. The formation of complex within the MA–PADPA system and related constants—the complex formationconstant (KAD = 285.32 m
�1), the molar extinction coefficient(eAD = 268 810 m
�1 cm) and standard Gibbs free energy (DGo =
�3.35 kcal mol�1)—were determined using the Benesi–Hilde-brand equation [Eq. (4)] by UV/Vis spectroscopy. By using theo-retical calculations, the mechanism of formation, secondary in-teractions and the geometry of the CTC were identified. Stan-dard reaction enthalpy, entropy, and Gibbs free energy arecomputed for the complex formation reaction of CTC. Theoret-ical values are calculated as DH8=�21.9 kcal mol�1,DS8=�62.5 cal mol�1 K�1, and DG8=�3.3 kcal mol�1 at roomtemperature. There is a good agreement between the theoreti-cal and experimental data. The CTC has higher crystallinity andthermal stability, due to more condensed molecular interac-tions (the formation of hydrogen-bonded CTC) in the solidstate. From the cyclic voltammetry, the optical band gap (Eg)value of complex was found to be 3.35 eV. If the CTC is oxi-dized, a blue-green colored product forms. SEM images of CTCindicate a well-ordered orientation grown into microribbonswith a high degree of thin lamellar ordering. These resultsmight be of potential use for dye and pigment technology.
Keywords: charge-transfer complexes · maleic anhydride ·NMR spectroscopy · p-aminodiphenylamine · UV/Visspectroscopy
[1] a) G. B. Butler, K. G. Olson, C. L. Tu, in American Chemical Society, Poly-mer Preprints, Division of Polymer Chemistry, 26, 1st Ed. , 1985, p. 33;b) T. Kokubo, S. Iwatsuki, Y. Yamashita, Macromolecules 1970, 3, 518 –523.
[2] M. Slifkin, Charge Transfer Interactions of Biomolecules, Academic Press,San Diego, 1971, p. 271.
[3] a) C. A. Hunter, J. K. M. Sanders, J. Am. Chem. Soc. 1990, 112, 5525 –5534; b) O. Kruglova, E. Mendes, Z. Yildirim, M. W�bbenhorst, F. M.Mulder, J. A. Stride, S. J. Picken, G. J. Kearley, ChemPhysChem 2007, 8,1338 – 1344.
[4] I. M. Khan, A. Ahmad, Spectrochim. Acta Part A 2010, 76, 315 – 321.[5] R. Jakubiak, Z. Bao, L. Rothberg, Synth. Met. 2000, 114, 61 – 64.[6] M. Schwoerer, H. C. Wolf, Organic Molecular Solids, Wiley-VCH, Wein-
heim, 2007, p. 307.[7] I. M. Khan, A. Ahmad, J. Mol. Struct. 2010, 977, 189 – 196.[8] R. Mandal, S. C. Lahiri, J. Indian Chem. Soc. 1999, 76, 347 – 349.[9] C. Ungurenasu, A. Airinei, J. Med. Chem. 2000, 43, 3186 – 3188.
[10] R. S. Mulliken, J. Phys. Chem. 1952, 56, 801 – 822.[11] M. J. S. Dewar, A. R. Lepley, J. Am. Chem. Soc. 1961, 83, 4560 – 4563.[12] H. A. Benesi, J. H. Hildebrand, J. Am. Chem. Soc. 1949, 71, 2703 – 2707.[13] a) H. Wurm, W. Regel, M. L. Hallensleben, Makromol. Chem. 1979, 180,
1581 – 1588; b) T. Kokubo, S. Iwatsuki, Y. Tamashita, Macromolecules1968, 1, 482 – 488; c) H. Kaplan Can, Z. M. O. Rzaev, A. G�ner, J. Mol. Liq.2004, 111, 77 – 84.
[14] V. Kumar, M. R. Tripathi, M. Kumar, G. Shukla, E-J. Chem. 2009, 6, 659 –664.
[15] A. Petr, D. Wei, C. Kvarnstrçm, A. Ivaska, L. Dunsch, J. Phys. Chem. B2007, 111, 12395 – 12398.
[16] a) W.-C. Chen, T.-C. Wen, A. Gopalan, J. Electrochem. Soc. 2001, 148,E427 – E434; b) N. Pekmez, K. Pekmez, A. Yildiz, J. Electroanal. Chem.1993, 348, 389 – 398.
[17] A. M. Magerramov, M. R. Bairamov, N. V. Azimova, I. G. Mamedov, M. A.Agaeva, S. G. Alieva, Russ. J. Appl. Chem. 2014, 87, 456 – 460.
[18] H. K. Can, A. L. Dogan, Z. M. O. Rzaev, A. H. Uner, A. G�ner, J. Appl.Polym. Sci. 2005, 96, 2352 – 2359.
Figure 9. XRD patterns of a) PADPA, b) MA–PADPA and c) MA.
Figure 10. SEM images of a) PADPA, b) MA–PADPA c) MA at 2500 � magnifi-cation and d) PADPA, e) MA–PADPA at 10 000 � magnification.
ChemPhysChem 2016, 17, 1 – 11 www.chemphyschem.org � 2016 Wiley-VCH Verlag GmbH & Co. KGaA, Weinheim9 &
These are not the final page numbers! ��These are not the final page numbers! ��
Articles

[19] P. Manisankar, D. Ilangeswaran, Electrochim. Acta 2010, 55, 6546 – 6552.[20] a) Z. M. O. Rzaev, A. G�ner, G. Kibare, H. Kaplan Can, A. Asıcı, Eur. Polym.
J. 2002, 38, 1245 – 1254; b) H. Kaplan Can, O. Sahin, J. Macromol. Sci.Pure Appl. Chem. 2015, 52, 465 – 475; c) Z. M. O. Rzaev, Int. Rev. Chem.Eng. 2011, 3, 153 – 215.
[21] G. Ciric-Marjanovic, M. Trchov�, E. N. Konyushenko, P. Holler, J. Stejskal,J. Phys. Chem. B 2008, 112, 6976 – 6987.
[22] M. Kazayawoko, J. J. Balatinecz, R. T. Woodhams, J. Appl. Polym. Sci.1997, 66, 1163 – 1173.
[23] R. M. Silverstein, G. C. Bassler, T. C. Morrill, Spectrometric Identification ofOrganic Compounds, 4th Ed. , Wiley, New York, 1981, p. 109 – 111.
[24] J. H. Beynon, G. R. Lester, A. E. Williams, J. Phys. Chem. 1959, 63, 1861 –1868.
[25] M. Holcapek, R. Jir�sko, M. L�sa, J. Chromatogr. 2012, 1259, 3 – 15.[26] L. Miyan, I. M. Khan, A. Ahmad, Spectrochim. Acta Part A 2015, 146,
240 – 248.[27] a) M. U. Adikwu, K. C. Ofokansi, A. A. Attama, Chem. Pharm. Bull. 1999,
47, 463 – 466; b) S. I. Peredereeva, I. G. Orlov, I. C. Mikhail, Russ. Chem.Rev. 1975, 44, 295.
[28] J.-D. Chai, M. Head-Gordon, Phys. Chem. Chem. Phys. 2008, 10, 6615 –6620.
[29] a) P. C. Hariharan, J. A. Pople, Theor. Chim. Acta 1973, 28, 213 – 222;b) A. D. McLean, G. S. Chandler, J. Chem. Phys. 1980, 72, 5639 – 5648;c) R. Krishnan, J. S. Binkley, R. Seeger, J. A. Pople, J. Chem. Phys. 1980,72, 650 – 654.
[30] a) R. Bauernschmitt, R. Ahlrichs, Chem. Phys. Lett. 1996, 256, 454 – 464;b) M. E. Casida, C. Jamorski, K. C. Casida, D. R. Salahub, J. Chem. Phys.1998, 108, 4439 – 4449.
[31] a) S. Miertus, E. Scrocco, J. Tomasi, Chem. Phys. 1981, 55, 117 – 129; b) S.Miertus, J. Tomasi, Chem. Phys. 1982, 65, 239 – 245; c) J. L. Pascual-ahuir,E. Silla, I. TuÇon, J. Comput. Chem. 1994, 15, 1127 – 1138.
[32] Gaussian 09 (Revision D.01), M. J. Frisch, G. W. Trucks, H. B. Schlegel,G. E. Scuseria, M. A. Robb, J. R. Cheeseman, G. Scalmani, V. Barone, B.Mennucci, G. A. Petersson, H. Nakatsuji, M. Caricato, X. Li, H. P. Hratch-ian, A. F. Izmaylov, J. Bloino, G. Zheng, J. L. Sonnenberg, M. Hada, M.
Ehara, K. Toyota, R. Fukuda, J. Hasegawa, M. Ishida, T. Nakajima, Y.Honda, O. Kitao, H. Nakai, T. Vreven, J. A. Montgomery, Jr. , J. E. Peralta, F.Ogliaro, M. J. Bearpark, J. Heyd, E. N. Brothers, K. N. Kudin, V. N. Staro-verov, R. Kobayashi, J. Normand, K. Raghavachari, A. P. Rendell, J. C.Burant, S. S. Iyengar, J. Tomasi, M. Cossi, N. Rega, N. J. Millam, M. Klene,J. E. Knox, J. B. Cross, V. Bakken, C. Adamo, J. Jaramillo, R. Gomperts,R. E. Stratmann, O. Yazyev, A. J. Austin, R. Cammi, C. Pomelli, J. W. Och-terski, R. L. Martin, K. Morokuma, V. G. Zakrzewski, G. A. Voth, P. Salvador,J. J. Dannenberg, S. Dapprich, A. D. Daniels, �. Farkas, J. B. Foresman,J. V. Ortiz, J. Cioslowski, D. J. Fox, Gaussian, Inc. , Wallingford, CT, 2009.
[33] M. O. Sinnokrot, C. D. Sherrill, J. Phys. Chem. A 2006, 110, 10656 – 10668.[34] J. Ran, P. Hobza, J. Chem. Theory Comput. 2009, 5, 1180 – 1185.[35] J.-H. Tsai, W.-Y. Lee, W.-C. Chen, C.-Y. Yu, G.-W. Hwang, C. Ting, Chem.
Mater. 2010, 22, 3290 – 3299.[36] C. Lu, H. C. Wu, Y. C. Chiu, W. Y. Lee, W. C. Chen, Macromolecules 2012,
45, 3047 – 3056.[37] a) P. Deng, L. Liu, S. Ren, H. Li, Q. Zhang, Chem. Commun. 2012, 48,
6960 – 6962; b) Q. Zhang, H. Zhuang, J. He, S. Xia, H. Li, N. Li, Q. Xu, J.Lu, J. Mater. Chem. C 2015, 3, 6778 – 6785; c) M. Shakourian-Fard, G.Kamath, S. K. Sankaranarayanan, ChemPhysChem 2015, 16, 3607 – 3617.
[38] Y. Liu, M. S. Liu, A. K.-Y. Jen, Acta Polym. 1999, 50, 105 – 108.[39] B. Yang, S.-K. Kim, H. Xu, Y.-I. Park, H. Zhang, C. Gu, F. Shen, C. Wang, D.
Liu, X. Liu, M. Hanif, S. Tang, W. Li, F. Li, J. Shen, J.-W. Park, Y. Ma, Chem-PhysChem 2008, 9, 2601 – 2609.
[40] J. Wang, R. Li, Z. Zhang, W. Sun, R. Xu, Y. Xie, Z. Xing, X. Zhang, Appl.Catal. A 2008, 334, 227 – 233.
[41] C. Basappa, V. K. R. Reddy, H. M. N. Kotresh, P. K. Musturappa, M. C. De-vendrachari, S. D. Ganesh, J. Heterocycl. Chem. 2015, 52, 1782 – 1791.
[42] X. Zhou, Q. Li, C. Wu, Appl. Organomet. Chem. 2008, 22, 78 – 81.[43] S. K. Meher, P. Justin, G. R. Rao, Nanoscale 2011, 3, 683 – 692.
Manuscript received: February 15, 2016Accepted Article published: March 16, 2016Final Article published: && &&, 2016
ChemPhysChem 2016, 17, 1 – 11 www.chemphyschem.org � 2016 Wiley-VCH Verlag GmbH & Co. KGaA, Weinheim10&
�� These are not the final page numbers!�� These are not the final page numbers!
Articles

ARTICLES
E. Karaca, H. Kaplan Can, U. Bozkaya,N. �zÅiÅek Pekmez*
&& –&&
Charge-Transfer Complex of p-Aminodiphenylamine with MaleicAnhydride: Spectroscopic,Electrochemical, and PhysicalProperties
More complex than you think: The re-action of maleic anhydride with p-ami-nodiphenylamine, and especially theircharge-transfer complex, is investigatedby using 1H NMR, IR and UV/Vis spec-troscopy, HPLC–ESI–QTOF-MS, DFT cal-culations, cyclic voltammetry, thermog-ravimetric analysis, and XRD. SEM showsthe formation of microribbons that havehigher thermal stability than p-aminodi-phenylamine.
ChemPhysChem 2016, 17, 1 – 11 www.chemphyschem.org � 2016 Wiley-VCH Verlag GmbH & Co. KGaA, Weinheim11 &
These are not the final page numbers! ��These are not the final page numbers! ��


