Embed Size (px)
Citation preview
Characterization of chitosan and chitin produced
from silkworm crysalides
Alexandre T. Paulino, Julliana I. Simionato, Juliana C. Garcia, Jorge Nozaki *
Chemistry Department, Maringa State University. Av. Colombo, 5790 CEP, 87020-900 Maringa PR, Brazil
Received 29 October 2004; received in revised form 13 September 2005; accepted 28 October 2005
Available online 5 December 2005
Abstract
Chitin, extracted from silkworm chrysalides, was employed for the production of a high purity and porous chitosan, as observed by scanning
electron microscopy (SEM). Chitin and chitosan produced were characterized by infrared (FTIR), nuclear magnetic resonance (13C-NMR)
spectroscopy, thermal analysis (TGA), differential scanning calorimetry (DSC), and SEM. Two methods of chitin and chitosan extractions were
investigated and compared, and although these were of high purity, the yield of chitin and chitosan were low if compared with the chitin and
chitosan produced from crustacean shells. The yield of chitosan production by chitin deacetylation or degree of deacetylation (DD) was an average
83%. The molecular weight (MW) was determined by viscosimetric methods.
q 2005 Elsevier Ltd. All rights reserved.
Keywords: Silkworm; Chitin; Chitosan; Chrysalides; Spectroscopy
1. Introduction
Chitin is obtained in industrial scale from shrimps and
crustaceans in general (Yanga et al., 2000). However, the
chrysalides of the silkworm are an alternative source of chitin
and, consequently, of chitosan (Zhang et al., 2000). These
chrysalides are the adult form of the larvae responsible for the
production of the silk thread, and the chrysalides itself
constitute a by-product from the silk industry, which is of
low price and easily available. China and Brazil are the
principal exporting countries of cocoons and raw silk (Table 1),
and the Chinese silkworm (Bombyx mori) has been used in
commercial silk production for centuries (Dingle, 2000).
The complete metamorphosis of butterflies, moths, and
some other insects involves four stages: egg, larva (caterpillar),
pupa (chrysalides or cocoon), and adult. In commercial use, it
refers almost entirely to filaments from cocoons produced by
the caterpillar of several moth species of the genus Bombyx,
commonly called silkworms. Silk is a continuous protein
filament around each cocoon, and in the silk production
industry, it is freed by softening the cocoon in water. Table 1
shows the world silk production by country, and China is the
0144-8617/$ - see front matter q 2005 Elsevier Ltd. All rights reserved.
doi:10.1016/j.carbpol.2005.10.032
* Corresponding author. Tel.: C55 442235392; fax: C55 442635784.
E-mail address: [email protected] (J. Nozaki).
main country of silk producers. The Northwest of Parana state
is the main silkworm producers in Brazil, and Parana State is
responsible for 89% of the total Brazilian production.
Chitosan (ß-(1,4)-N-acetyl-D-glucosamine) is a derivative of
chitin after deacetylation, as shown in Fig. 1. Chitosan is a
biodegradable cationic biopolymer and could assist in the
reduction of pollutants in residual waters by adsorption and
chelating with heavy metallic ions, and can also act in the
coagulation of colloidal particles.
In this work, chitin was isolated from chrysalides of
silkworm (B. mori), using a modified process employed for
the extraction of chitin from crustaceans (Acosta et al., 1993).
The products were characterized by infrared spectroscopy
(FTIR), nuclear magnetic resonance spectroscopy
(MAS/13CMNR), thermal analysis (TGA), differential scan-
ning calorimetry (DSC), and scanning electron microscopy
(SEM).
2. Materials and methods
2.1. Reagents
All of the reagents used were of a highly pure grade,
without further purification, and the deionized water was
used for all reagent solution. The standard samples of
chitosan, 86% degree of deacetylation (DD), were purchased
from Aldrich-USA.
Carbohydrate Polymers 64 (2006) 98–103
www.elsevier.com/locate/carbpol
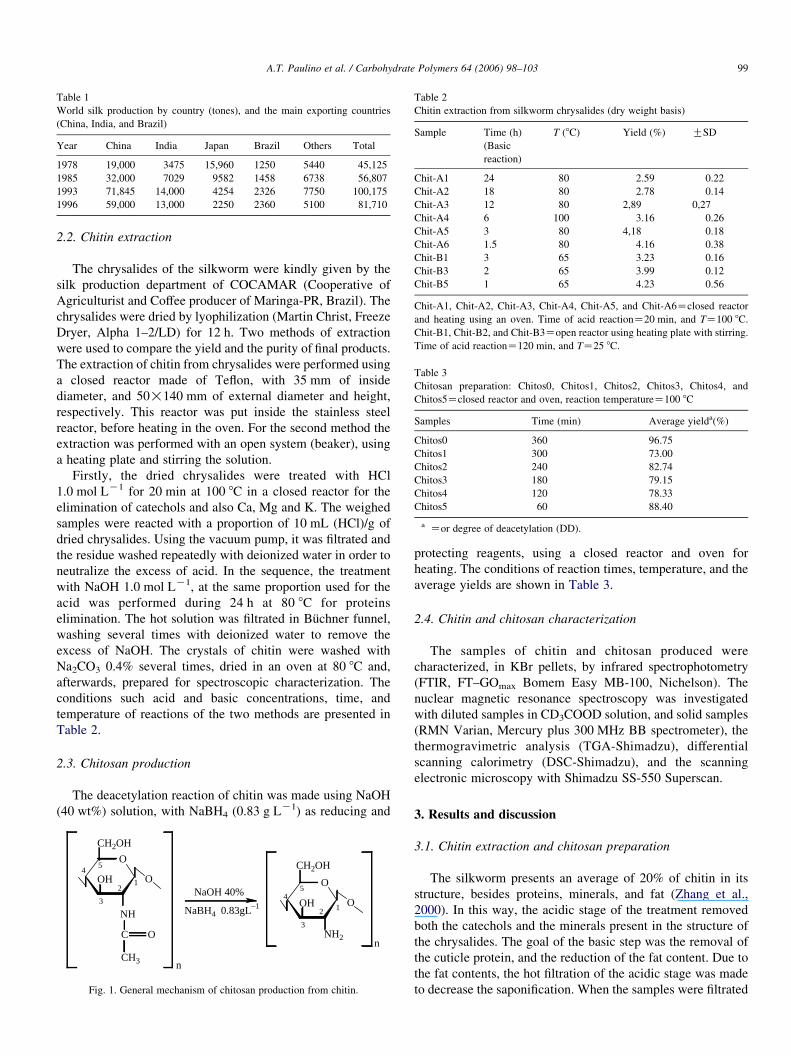
Table 1
World silk production by country (tones), and the main exporting countries
(China, India, and Brazil)
Year China India Japan Brazil Others Total
1978 19,000 3475 15,960 1250 5440 45,125
1985 32,000 7029 9582 1458 6738 56,807
1993 71,845 14,000 4254 2326 7750 100,175
1996 59,000 13,000 2250 2360 5100 81,710
Table 2
Chitin extraction from silkworm chrysalides (dry weight basis)
Sample Time (h) T (8C) Yield (%) GSD
(Basic
reaction)
Chit-A1 24 80 2.59 0.22
Chit-A2 18 80 2.78 0.14
Chit-A3 12 80 2,89 0,27
Chit-A4 6 100 3.16 0.26
Chit-A5 3 80 4,18 0.18
Chit-A6 1.5 80 4.16 0.38
Chit-B1 3 65 3.23 0.16
Chit-B3 2 65 3.99 0.12
Chit-B5 1 65 4.23 0.56
Chit-A1, Chit-A2, Chit-A3, Chit-A4, Chit-A5, and Chit-A6Zclosed reactor
and heating using an oven. Time of acid reactionZ20 min, and TZ100 8C.
Chit-B1, Chit-B2, and Chit-B3Zopen reactor using heating plate with stirring.
Time of acid reactionZ120 min, and TZ25 8C.
Table 3
Chitosan preparation: Chitos0, Chitos1, Chitos2, Chitos3, Chitos4, and
Chitos5Zclosed reactor and oven, reaction temperatureZ100 8C
Samples Time (min) Average yielda(%)
Chitos0 360 96.75
Chitos1 300 73.00
Chitos2 240 82.74
Chitos3 180 79.15
Chitos4 120 78.33
Chitos5 60 88.40
a Zor degree of deacetylation (DD).
A.T. Paulino et al. / Carbohydrate Polymers 64 (2006) 98–103 99
2.2. Chitin extraction
The chrysalides of the silkworm were kindly given by the
silk production department of COCAMAR (Cooperative of
Agriculturist and Coffee producer of Maringa-PR, Brazil). The
chrysalides were dried by lyophilization (Martin Christ, Freeze
Dryer, Alpha 1–2/LD) for 12 h. Two methods of extraction
were used to compare the yield and the purity of final products.
The extraction of chitin from chrysalides were performed using
a closed reactor made of Teflon, with 35 mm of inside
diameter, and 50!140 mm of external diameter and height,
respectively. This reactor was put inside the stainless steel
reactor, before heating in the oven. For the second method the
extraction was performed with an open system (beaker), using
a heating plate and stirring the solution.
Firstly, the dried chrysalides were treated with HCl
1.0 mol LK1 for 20 min at 100 8C in a closed reactor for the
elimination of catechols and also Ca, Mg and K. The weighed
samples were reacted with a proportion of 10 mL (HCl)/g of
dried chrysalides. Using the vacuum pump, it was filtrated and
the residue washed repeatedly with deionized water in order to
neutralize the excess of acid. In the sequence, the treatment
with NaOH 1.0 mol LK1, at the same proportion used for the
acid was performed during 24 h at 80 8C for proteins
elimination. The hot solution was filtrated in Buchner funnel,
washing several times with deionized water to remove the
excess of NaOH. The crystals of chitin were washed with
Na2CO3 0.4% several times, dried in an oven at 80 8C and,
afterwards, prepared for spectroscopic characterization. The
conditions such acid and basic concentrations, time, and
temperature of reactions of the two methods are presented in
Table 2.
2.3. Chitosan production
The deacetylation reaction of chitin was made using NaOH
(40 wt%) solution, with NaBH4 (0.83 g LK1) as reducing and
NH
C O
CH3
O
OH O
CH2OH
12
3
45
n
NaOH 40%
NaBH4 0.83gL–1
54
3
2 1
CH2OH
OOH
O
NH2n
Fig. 1. General mechanism of chitosan production from chitin.
protecting reagents, using a closed reactor and oven for
heating. The conditions of reaction times, temperature, and the
average yields are shown in Table 3.
2.4. Chitin and chitosan characterization
The samples of chitin and chitosan produced were
characterized, in KBr pellets, by infrared spectrophotometry
(FTIR, FT–GOmax Bomem Easy MB-100, Nichelson). The
nuclear magnetic resonance spectroscopy was investigated
with diluted samples in CD3COOD solution, and solid samples
(RMN Varian, Mercury plus 300 MHz BB spectrometer), the
thermogravimetric analysis (TGA-Shimadzu), differential
scanning calorimetry (DSC-Shimadzu), and the scanning
electronic microscopy with Shimadzu SS-550 Superscan.
3. Results and discussion
3.1. Chitin extraction and chitosan preparation
The silkworm presents an average of 20% of chitin in its
structure, besides proteins, minerals, and fat (Zhang et al.,
2000). In this way, the acidic stage of the treatment removed
both the catechols and the minerals present in the structure of
the chrysalides. The goal of the basic step was the removal of
the cuticle protein, and the reduction of the fat content. Due to
the fat contents, the hot filtration of the acidic stage was made
to decrease the saponification. When the samples were filtrated
4000 3000 2000 1000
10
20
30
40
50
60
70
80
90
Chitosan
Chitin
% T
rans
mita
nce
Wave number (cm–1)
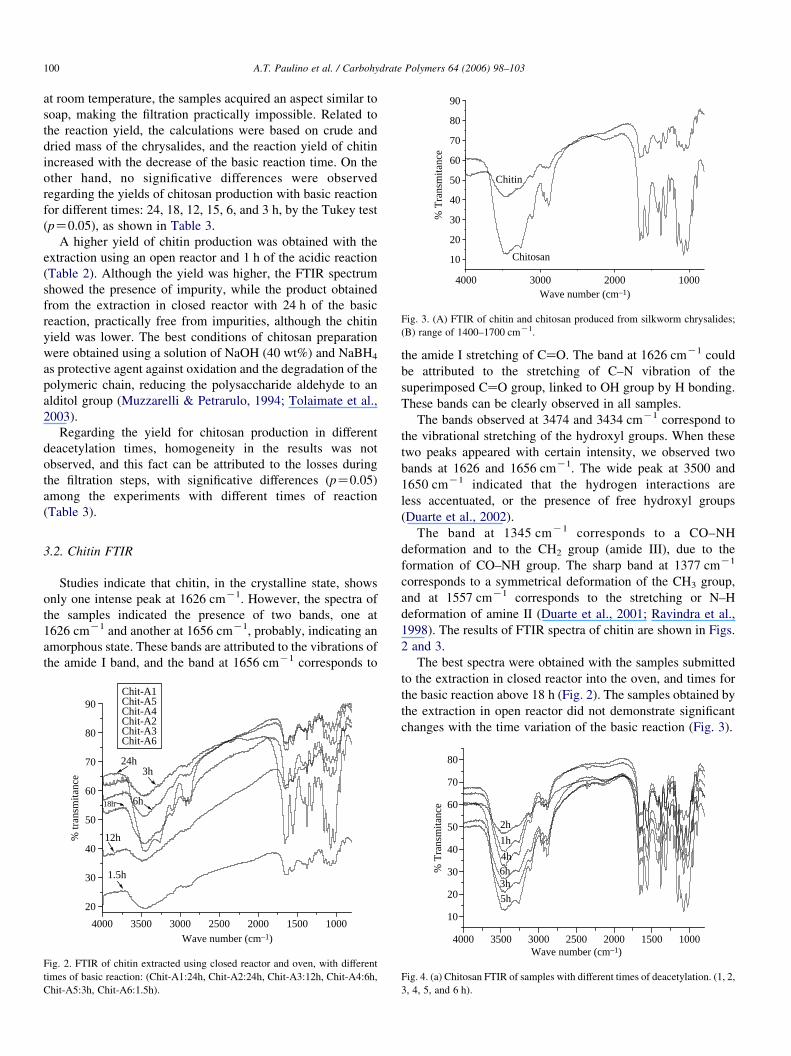
Fig. 3. (A) FTIR of chitin and chitosan produced from silkworm chrysalides;
(B) range of 1400–1700 cmK1.
A.T. Paulino et al. / Carbohydrate Polymers 64 (2006) 98–103100
at room temperature, the samples acquired an aspect similar to
soap, making the filtration practically impossible. Related to
the reaction yield, the calculations were based on crude and
dried mass of the chrysalides, and the reaction yield of chitin
increased with the decrease of the basic reaction time. On the
other hand, no significative differences were observed
regarding the yields of chitosan production with basic reaction
for different times: 24, 18, 12, 15, 6, and 3 h, by the Tukey test
(pZ0.05), as shown in Table 3.
A higher yield of chitin production was obtained with the
extraction using an open reactor and 1 h of the acidic reaction
(Table 2). Although the yield was higher, the FTIR spectrum
showed the presence of impurity, while the product obtained
from the extraction in closed reactor with 24 h of the basic
reaction, practically free from impurities, although the chitin
yield was lower. The best conditions of chitosan preparation
were obtained using a solution of NaOH (40 wt%) and NaBH4
as protective agent against oxidation and the degradation of the
polymeric chain, reducing the polysaccharide aldehyde to an
alditol group (Muzzarelli & Petrarulo, 1994; Tolaimate et al.,
2003).
Regarding the yield for chitosan production in different
deacetylation times, homogeneity in the results was not
observed, and this fact can be attributed to the losses during
the filtration steps, with significative differences (pZ0.05)
among the experiments with different times of reaction
(Table 3).
3.2. Chitin FTIR
Studies indicate that chitin, in the crystalline state, shows
only one intense peak at 1626 cmK1. However, the spectra of
the samples indicated the presence of two bands, one at
1626 cmK1 and another at 1656 cmK1, probably, indicating an
amorphous state. These bands are attributed to the vibrations of
the amide I band, and the band at 1656 cmK1 corresponds to
4000 3500 3000 2500 2000 1500 1000
20
30
40
50
60
70
80
90
1.5h
12h
18h 6h
3h24h
% tr
ansm
itanc
e
Wave number (cm–1)
Chit-A1Chit-A5Chit-A4Chit-A2Chit-A3Chit-A6
Fig. 2. FTIR of chitin extracted using closed reactor and oven, with different
times of basic reaction: (Chit-A1:24h, Chit-A2:24h, Chit-A3:12h, Chit-A4:6h,
Chit-A5:3h, Chit-A6:1.5h).
the amide I stretching of CaO. The band at 1626 cmK1 could
be attributed to the stretching of C–N vibration of the
superimposed CaO group, linked to OH group by H bonding.
These bands can be clearly observed in all samples.
The bands observed at 3474 and 3434 cmK1 correspond to
the vibrational stretching of the hydroxyl groups. When these
two peaks appeared with certain intensity, we observed two
bands at 1626 and 1656 cmK1. The wide peak at 3500 and
1650 cmK1 indicated that the hydrogen interactions are
less accentuated, or the presence of free hydroxyl groups
(Duarte et al., 2002).
The band at 1345 cmK1 corresponds to a CO–NH
deformation and to the CH2 group (amide III), due to the
formation of CO–NH group. The sharp band at 1377 cmK1
corresponds to a symmetrical deformation of the CH3 group,
and at 1557 cmK1 corresponds to the stretching or N–H
deformation of amine II (Duarte et al., 2001; Ravindra et al.,
1998). The results of FTIR spectra of chitin are shown in Figs.
2 and 3.
The best spectra were obtained with the samples submitted
to the extraction in closed reactor into the oven, and times for
the basic reaction above 18 h (Fig. 2). The samples obtained by
the extraction in open reactor did not demonstrate significant
changes with the time variation of the basic reaction (Fig. 3).
4000 3500 3000 2500 2000 1500 1000
10
20
30
40
50
60
70
80
5h
3h6h4h
1h
2h
% T
rans
mita
nce
Wave number (cm–1)
Fig. 4. (a) Chitosan FTIR of samples with different times of deacetylation. (1, 2,
3, 4, 5, and 6 h).
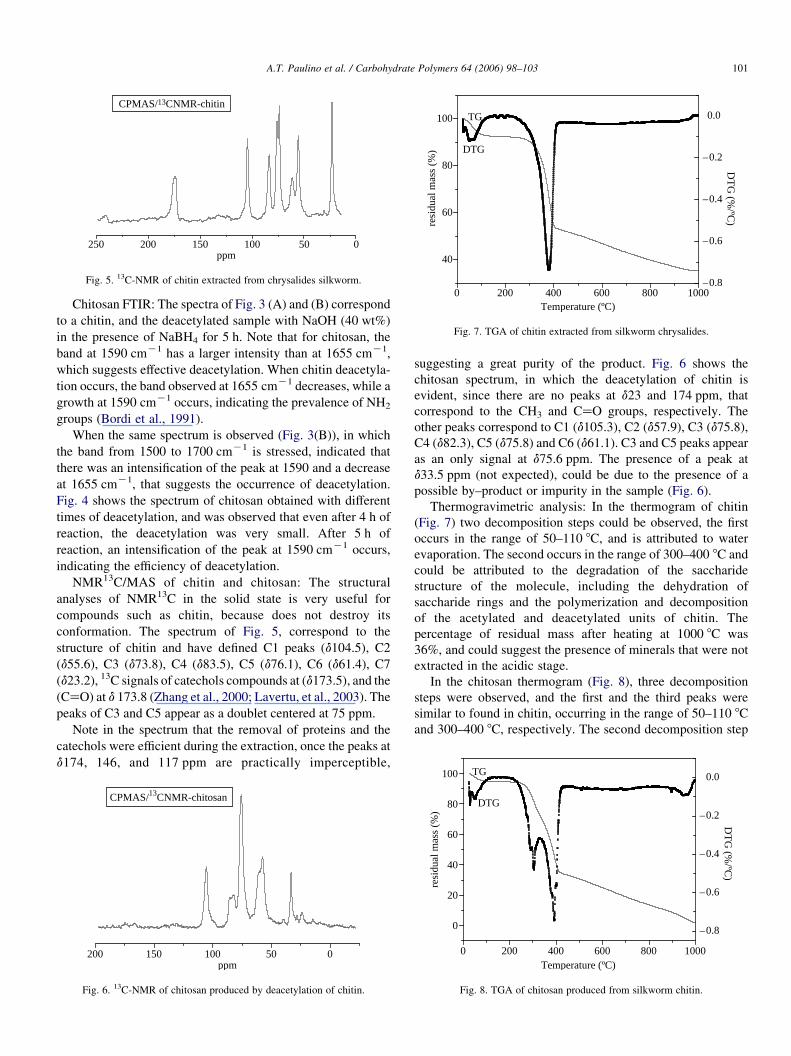
250 200 150 100 50 0ppm
CPMAS/13CNMR-chitin
Fig. 5. 13C-NMR of chitin extracted from chrysalides silkworm.
0 200 400 600 800 1000
40
60
80
100
DTG
TG
Temperature (ºC)
resi
dual
mas
s (%
)
–0.8
–0.6
–0.4
–0.2
0.0
DT
G (%
/ºC)
Fig. 7. TGA of chitin extracted from silkworm chrysalides.
A.T. Paulino et al. / Carbohydrate Polymers 64 (2006) 98–103 101
Chitosan FTIR: The spectra of Fig. 3 (A) and (B) correspond
to a chitin, and the deacetylated sample with NaOH (40 wt%)
in the presence of NaBH4 for 5 h. Note that for chitosan, the
band at 1590 cmK1 has a larger intensity than at 1655 cmK1,
which suggests effective deacetylation. When chitin deacetyla-
tion occurs, the band observed at 1655 cmK1 decreases, while a
growth at 1590 cmK1 occurs, indicating the prevalence of NH2
groups (Bordi et al., 1991).
When the same spectrum is observed (Fig. 3(B)), in which
the band from 1500 to 1700 cmK1 is stressed, indicated that
there was an intensification of the peak at 1590 and a decrease
at 1655 cmK1, that suggests the occurrence of deacetylation.
Fig. 4 shows the spectrum of chitosan obtained with different
times of deacetylation, and was observed that even after 4 h of
reaction, the deacetylation was very small. After 5 h of
reaction, an intensification of the peak at 1590 cmK1 occurs,
indicating the efficiency of deacetylation.
NMR13C/MAS of chitin and chitosan: The structural
analyses of NMR13C in the solid state is very useful for
compounds such as chitin, because does not destroy its
conformation. The spectrum of Fig. 5, correspond to the
structure of chitin and have defined C1 peaks (d104.5), C2
(d55.6), C3 (d73.8), C4 (d83.5), C5 (d76.1), C6 (d61.4), C7
(d23.2), 13C signals of catechols compounds at (d173.5), and the
(CaO) at d 173.8 (Zhang et al., 2000; Lavertu, et al., 2003). The
peaks of C3 and C5 appear as a doublet centered at 75 ppm.
Note in the spectrum that the removal of proteins and the
catechols were efficient during the extraction, once the peaks at
d174, 146, and 117 ppm are practically imperceptible,
200 150 100 50 0ppm
CPMAS/13CNMR-chitosan
Fig. 6. 13C-NMR of chitosan produced by deacetylation of chitin.
suggesting a great purity of the product. Fig. 6 shows the
chitosan spectrum, in which the deacetylation of chitin is
evident, since there are no peaks at d23 and 174 ppm, that
correspond to the CH3 and CaO groups, respectively. The
other peaks correspond to C1 (d105.3), C2 (d57.9), C3 (d75.8),
C4 (d82.3), C5 (d75.8) and C6 (d61.1). C3 and C5 peaks appear
as an only signal at d75.6 ppm. The presence of a peak at
d33.5 ppm (not expected), could be due to the presence of a
possible by–product or impurity in the sample (Fig. 6).
Thermogravimetric analysis: In the thermogram of chitin
(Fig. 7) two decomposition steps could be observed, the first
occurs in the range of 50–110 8C, and is attributed to water
evaporation. The second occurs in the range of 300–400 8C and
could be attributed to the degradation of the saccharide
structure of the molecule, including the dehydration of
saccharide rings and the polymerization and decomposition
of the acetylated and deacetylated units of chitin. The
percentage of residual mass after heating at 1000 8C was
36%, and could suggest the presence of minerals that were not
extracted in the acidic stage.
In the chitosan thermogram (Fig. 8), three decomposition
steps were observed, and the first and the third peaks were
similar to found in chitin, occurring in the range of 50–110 8C
and 300–400 8C, respectively. The second decomposition step
0 200 400 600 800 1000
0
20
40
60
80
100
DTG
TG
DT
G (%
/ºC)
Temperature (ºC)
resi
dual
mas
s (%
)
–0.8
–0.6
–0.4
–0.2
0.0
Fig. 8. TGA of chitosan produced from silkworm chitin.
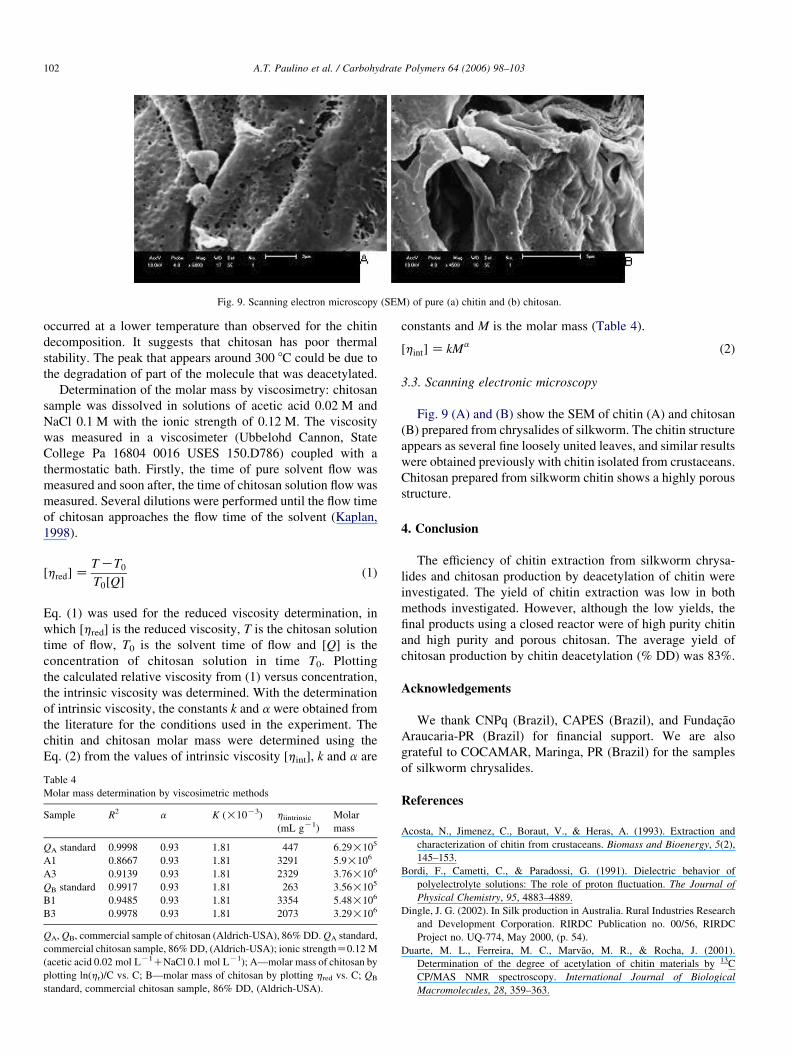
Fig. 9. Scanning electron microscopy (SEM) of pure (a) chitin and (b) chitosan.
A.T. Paulino et al. / Carbohydrate Polymers 64 (2006) 98–103102
occurred at a lower temperature than observed for the chitin
decomposition. It suggests that chitosan has poor thermal
stability. The peak that appears around 300 8C could be due to
the degradation of part of the molecule that was deacetylated.
Determination of the molar mass by viscosimetry: chitosan
sample was dissolved in solutions of acetic acid 0.02 M and
NaCl 0.1 M with the ionic strength of 0.12 M. The viscosity
was measured in a viscosimeter (Ubbelohd Cannon, State
College Pa 16804 0016 USES 150.D786) coupled with a
thermostatic bath. Firstly, the time of pure solvent flow was
measured and soon after, the time of chitosan solution flow was
measured. Several dilutions were performed until the flow time
of chitosan approaches the flow time of the solvent (Kaplan,
1998).
½hred�ZTKT0T0½Q�
(1)
Eq. (1) was used for the reduced viscosity determination, in
which [hred] is the reduced viscosity, T is the chitosan solution
time of flow, T0 is the solvent time of flow and [Q] is the
concentration of chitosan solution in time T0. Plotting
the calculated relative viscosity from (1) versus concentration,
the intrinsic viscosity was determined. With the determination
of intrinsic viscosity, the constants k and a were obtained from
the literature for the conditions used in the experiment. The
chitin and chitosan molar mass were determined using the
Eq. (2) from the values of intrinsic viscosity [hint], k and a are
Table 4
Molar mass determination by viscosimetric methods
Sample R2 a K (!10K3) hiintrinsic(mL gK1)
Molar
mass
QA standard 0.9998 0.93 1.81 447 6.29!105
A1 0.8667 0.93 1.81 3291 5.9!106
A3 0.9139 0.93 1.81 2329 3.76!106
QB standard 0.9917 0.93 1.81 263 3.56!105
B1 0.9485 0.93 1.81 3354 5.48!106
B3 0.9978 0.93 1.81 2073 3.29!106
QA,QB, commercial sample of chitosan (Aldrich-USA), 86% DD.QA standard,
commercial chitosan sample, 86%DD, (Aldrich-USA); ionic strengthZ0.12 M
(acetic acid 0.02 mol LK1CNaCl 0.1 mol LK1); A—molar mass of chitosan by
plotting ln(hr)/C vs. C; B—molar mass of chitosan by plotting hred vs. C; QB
standard, commercial chitosan sample, 86% DD, (Aldrich-USA).
constants and M is the molar mass (Table 4).
½hint�Z kMa (2)
3.3. Scanning electronic microscopy
Fig. 9 (A) and (B) show the SEM of chitin (A) and chitosan
(B) prepared from chrysalides of silkworm. The chitin structure
appears as several fine loosely united leaves, and similar results
were obtained previously with chitin isolated from crustaceans.
Chitosan prepared from silkworm chitin shows a highly porous
structure.
4. Conclusion
The efficiency of chitin extraction from silkworm chrysa-
lides and chitosan production by deacetylation of chitin were
investigated. The yield of chitin extraction was low in both
methods investigated. However, although the low yields, the
final products using a closed reactor were of high purity chitin
and high purity and porous chitosan. The average yield of
chitosan production by chitin deacetylation (% DD) was 83%.
Acknowledgements
We thank CNPq (Brazil), CAPES (Brazil), and Fundacao
Araucaria-PR (Brazil) for financial support. We are also
grateful to COCAMAR, Maringa, PR (Brazil) for the samples
of silkworm chrysalides.
References
Acosta, N., Jimenez, C., Boraut, V., & Heras, A. (1993). Extraction and
characterization of chitin from crustaceans. Biomass and Bioenergy, 5(2),
145–153.
Bordi, F., Cametti, C., & Paradossi, G. (1991). Dielectric behavior of
polyelectrolyte solutions: The role of proton fluctuation. The Journal of
Physical Chemistry, 95, 4883–4889.
Dingle, J. G. (2002). In Silk production in Australia. Rural Industries Research
and Development Corporation. RIRDC Publication no. 00/56, RIRDC
Project no. UQ-774, May 2000, (p. 54).
Duarte, M. L., Ferreira, M. C., Marvao, M. R., & Rocha, J. (2001).
Determination of the degree of acetylation of chitin materials by 13C
CP/MAS NMR spectroscopy. International Journal of Biological
Macromolecules, 28, 359–363.
A.T. Paulino et al. / Carbohydrate Polymers 64 (2006) 98–103 103
Duarte, M. L., Ferreira, M. C., Marvao, M. R., & Rocha, J. (2002). An optimised
method to determine the degree of acetylation of chitin and chitosan by FTIR
spectroscopy. International Journal of Biological Macromolecules, 31, 1–8.
Kaplan, D. L. (Ed.). (1998). Biopolymers from renewable resources (p. 417).
Heidelberg: Springer.
Lavertu, M., Xia, Z., Serregi, A. N., Berrada, M., Rodrigues, A., Wang, D.,
et al. (2003). A validated 1H NMR method for the determination of the
degree of deacetylation of chitosan. Journal of Pharmaceutical and
Biomedical Analysis, 32, 1149–1158.
Muzzarelli, R. A. A., & Petrarulo, M. (1994). Solubility and structure of
N-carboximethyl chitosan. International Journal of Biological Macromol-
ecules, 16(4), 177–180.
Ravindra, R., Krovvidi, K. R., & Khan, A. A. (1998). Solubility parameter of
chitin and chitosan. Carbohydrate Polymers, 36, 121–127.
Tolaimate, A., Desbrieres, J., Rhazi, M., & Alagui, A. (2003). Contribution to
the preparation of chitins and chitosans with controlled physico-chemical
properties. Polymer, 44, 7939–7952.
Yanga, Jen-Kuo, Shihb, Ing-Lung, Tzengc, Yew-Min, & Wang, San-Lang
(2000). Production and purification of protease from a Bacillus subtilis that
can deproteinize crustacean wastes. Enzyme and Microbial Technology, 26,
406–413.
Zhang, M., Haga, A., Sekiguchi, H., & Hirano, S. (2000). Structure of insect
chitin isolated from beetle larva cuticle abd silkworm (Bombix mori) pupa
exuvia. International Journal of Biological Macromolecules, 27, 99–105.


