Embed Size (px)
Citation preview

Chapter 8OPERATIONALDECISION MAKING
By the time you have finished studying this chapter, you should be able to:• decide how to allocate scarce resources;• use various costing techniques to make decisions on the utilisation of scarce resources;• interpret the results of your analysis and advise management on such decisions;• understand the application of the marginal costing/contribution approach to management
decisions;• recognise the importance of risk in the decision-making environment;• recognise the importance of both quantitative and qualitative factors in decision making.
IntroductionSo far in this book we have looked at the basics of management accounting and costingtechniques. This chapter aims to apply these techniques to reach relevant decisions in the‘real’ world. Inevitably in this ‘real’ world of the management accountant we are dealingwith both quantitative and qualitative factors in reaching decisions, although many tradi-tional textbooks tend to concentrate on the financial aspects of any decision. Hence thischapter will also attempt to recognise those factors other than financial ones which playan important part in the managerial decision-making environment. In this context thechapter develops a ‘qualitative’ matrix which aims to provide a frame of reference formanagers to quantify these non-financial factors as a guide to decisions. This frameworkis seen as relevant to both the public and private sector. The chapter also looks at theimportance of an understanding of risk by managers in the decision-making and businesscycle and how to respond to – or better still prepare for – these eventualities. It is alsovitally important that managers are able not only to understand the information theyreceive but also to interpret such information to maximise the benefits of decisions. In theprivate sector, therefore, the general assumption of profit maximisation is taken. For the
Key Learning Objectives
Coombs-08.qxd 3/18/2005 1:09 PM Page 219

public sector such decisions are inevitably more complex due to their social, political andenvironmental context. It is hoped that as the chapter unfolds it will, through the tech-niques described and developed, provide a frame of reference to assist managers in poten-tially complex situations in whatever sector they work.
Marginal Cost and Marginal RevenueAs stated above, in the private sector the goal of companies has been assumed for sim-plicity to be profit maximisation. Other goals are possible such as sales revenue maximi-sation or just growing the sheer size of the company, which may be measured by suchfactors as the number of employees or the number of subsidiaries it controls. Profit max-imisation can be achieved in the short term through perhaps setting high prices for prod-ucts, or in the long term by some form of market penetration exercise. All strategies willbe reflected ultimately in the amount of product to be produced and sold. In the publicsector the emphasis has traditionally been on the cost of services. A greater emphasis todayis being placed on increasing performance through achieving value for money, defined aseconomy, efficiency and effectiveness in the delivery of services. Where possible, however,more emphasis is also being placed on generating extra revenue as public sector budgetscome under increased pressure due to a lack of available resources from general taxation.
In both the public and private sector the concepts of marginal cost and marginal revenueare relevant. Marginal revenue is the increase in unit revenue which corresponds to anincrease in the unit provision of a service or product produced and sold. Marginal cost isthe increase in cost for a unit increase in the service or product produced and sold. If mar-ginal revenue is in excess of marginal cost then increasing the production or supply of aproduct or service will generate a profit on that unit. If marginal cost exceeds marginalrevenue a loss will occur. In the public sector, for those services where no extra revenuecan be generated because they are provided as free goods, we are dealing with the mar-ginal cost of producing one extra unit of service. There will be no marginal revenue asso-ciated with such services and decisions would be made on the marginal benefit achievedfor clients from the extra expense incurred. In the health service, for example, this can bemeasured by the improved quality of life that an operation can bring.
In decision making in the above context it is important to recognise the use of contribu-tion analysis. ‘Contribution’ represents the difference between the selling price for a prod-uct or service and the variable costs of providing that product or service. It goes towardsinitially covering fixed costs, assuming that the selling price exceeds the variable cost.Once fixed costs are covered it is a contribution to profit. It is clear that in order to use thisanalysis we need to disaggregate costs into their variable and fixed components, making anunderstanding of cost behaviour essential. In this context the traditional format of the profitand loss account which essentially concentrates on a functional format – selling and distrib-ution, administration – provides inadequate information for planning, control or decisionmaking. This is because it does not classify costs by their behaviour.
As can be seen from Exhibit 8.1, the contribution approach divides costs into their fixedand variable elements and then deducts this from the sales figure to arrive at the contribution
220 MANAGEMENT ACCOUNTING
Coombs-08.qxd 3/18/2005 1:09 PM Page 220

margin. As stated, it can be seen that this represents the contribution to cover the remainingfixed cost elements of the expenses. The development of such statements is a decision forthe organisation and should be designed so as to facilitate internal planning, control anddecision making. In designing the format of the statement it is also possible that it canfacilitate the appraisal of managerial performance, in particular where there is segmentedreporting of profit and loss data or to emphasise different elements of the budget. It shouldalso be observed that the results achieved are identical whichever approach is adopted. Allthat has been changed is the classification of costs incurred by the business.
Contribution Statement Compared with a FunctionalFinancial Reporting Type Approach
Contribution Approach Functional Approach
£ £
Sales Income 120,000 120,000
Less Variable Expenses
Variable Production 55,000Variable Selling 10,000Variable Administrative 5,000
70,000 Cost of Goods Sold 59,000*Contribution Margin 50,000 Gross Profit (Margin) 61,000
Less Fixed Expenses Less Operating Costs
Fixed Production 4,000 Selling 30,000Fixed Selling 20,000 Administration 20,000Fixed Administration 15,000
39,000 ______
Net Profit 11,000 11,000
*Cost of sales includes both fixed and variable costs
Assumptions of the Marginal Cost Approach
• Fixed costs remain fixed in the short term, irrespective of the level of activity. • Fixed costs are not directly related to specific units.• Variable costs vary directly in proportion to activity levels.• Total costs can be split between fixed and variable elements.
OPERATIONAL DECISION MAKING 221
EXHIBIT8.1
Coombs-08.qxd 3/18/2005 1:09 PM Page 221
Wage costs are treated as variable as gardeners are brought in and paid a daily rate peracre. This is traditional in the industry, although some of the shrubs require higher skilllevels, hence the different variable costs for wages. No problems have been experiencedin the past in acquiring suitable skilled labour at the budgeted rates.
Fixed costs cover management salaries, business rates on the office premises, sellingand distribution costs. Since the business is classified as a farm, agricultural land is notsubject to business rates.
This problem should be tackled in two stages. The first stage is this to identify the con-tribution per shrub per acre, as land is the limiting factor (Table 8.2). As can be seen, thegreatest contribution per acre of land is from the bay trees. Table 8.3 shows the results forthe growing period, taking account of the existing contract with the National Trust. It canbe seen that bay trees provide the greatest contribution per limiting factor and as suchshould be selected to be grown in preference to the other alternatives.
Using Contribution Analysis for Decision Making
As stated in the Introduction, this chapter is concerned with decision making and there-fore this section examines contribution analysis as a relatively simple but powerful tech-nique in a decision-making context for a service industry.
Weeds R Not Us is a garden centre business of long standing operating in the Vale ofEvesham in the Midlands of England. It can sell all it grows, given the rising interest inits activities following the popularity of gardening programmes on radio and television.The objective of the garden centre is to maximise revenues by growing and selling thoseflowers and shrubs which contribute most to that objective. It has a total of 40 acres ofland that it can access.
As well as passing trade from amateur horticulturists, the garden centre supplies astately home belonging to the National Trust. Under the terms of the contract it must sup-ply 420 begonias, 185 fuchsias, 576 dianthuses and 110 bay trees for each of the next fiveyears. Past experience shows that it can sell up to 4500 shrubs of any type, but these fourshrubs are particularly popular and well suited to the soil and English climate.
The garden centre has considerable experience in budgeting, and Table 8.1 shows thebudgeted cost for the next growing season.
222 MANAGEMENT ACCOUNTING
Table 8.1 Budgeted cost for shrub growing
Begonias Fuchsias Dianthuses Bay trees
No. of shrubs per acre 210 185 192 220Selling price each £16 £19 £18 £21Variable costs per acreSeedlings £160 £220 £240 £325Wages £35 £30 £20 £25Fixed cost per annum £65,000
Coombs-08.qxd 3/18/2005 1:09 PM Page 222

In making the decision to concentrate on bay trees, however, the management would needto consider a range of other factors. Gardening is subject to changing fashions as much asany other business. As such they would need to consider market trends so the historic infor-mation for the centre on sales can only provide a guide to the future. Equally, the businessneeds to be aware of the competition in the area, new housing developments coming intothe area or even industrial decline, as all will have a potential impact on sales in what is adiscretionary purchase. It might be possible to negotiate other contracts to ensure that in theevent of a change in consumer demand the centre will continue to flourish. The business isthus not immune from risk, despite having sold all it can produce in the past. In addition,given that it is a gardening business, the weather will have an important influence.
Financial Modelling using Contribution
The objective of financial modelling is to present a representation of business reality. Inessence, the model should allow various assumptions to be made and then varied in orderto carry out sensitivity analysis. In the context of contribution, one of the more basic finan-cial models that maybe employed is that of break-even analysis. This, can be used to sum-marise the effect that sales volume changes can have on an organisation’s revenues, costsand, therefore, profit. Break-even analysis is often considered under the heading cost–volume–profit analysis. The model is frequently used to present the effects on profits of various deci-sions as many individuals prefer a picture as opposed to a mass of figures and, consequently,
OPERATIONAL DECISION MAKING 223
Table 8.2 Contribution per acre
Begonias Fuchsias Dianthuses Bay Trees
Revenue £3360 £3515 £3456 £4620Variable costs £195 £250 £260 £350Contribution £3165 £3265 £3196 £4270
Table 8.3 Maximum contribution and profit available
TotalBegonias Fuchsias Dianthuses Bay Trees £
Sales to National Trust 420 185 576 110Acres required 2 1 3Acres for bay trees 14Contribution per acre £3,165 £3,265 £3,196 £4,270Total contribution £6,330 £3,265 £9,588 £59,780 £78,963Fixed costs £65,000Net profit £13,963
Coombs-08.qxd 3/18/2005 1:09 PM Page 223

find it easier to understand. It should, however, be remembered that many managers use acomplex range of tools and data to forecast profits or losses and their ability to understandshould not be underestimated. In that sense what follows needs to be assessed as part of thecontribution to a holistic managerial decision-making process.
To build an example of this concept we will assume a company is in the business of mak-ing picnic baskets, amongst other products, for sale to the general public and has providedthe information contained in Exhibit 8.2. The exhibit is structured such that we will calculatethe break-even model first and then use the data in the exhibit to construct further analysis.
The Hardy Out Door Company
The Hardy Out Door Company has obtained data on its production of picnic baskets for sale tothe general public. As might be expected, it is a seasonal business. The financial results for thelast financial year were as follows:
Units produced and sold 5,800Selling price £59.00Fixed overheads 81,000
Variable costs per unit
Wages £25.50Materials £10.20Overheads £2.30
A budget has been prepared for the next financial year, showing the following information:
Units to be produced and sold 6,200Selling price £60.00Fixed overheads to rise by £9,000
Variable costs per unit
Wages £26.50Estimated material costs £10.50Overheads to rise by £0.70
Fixed costs are allocated to the part of the premises used to produce the picnic baskets on thebasis of floor area.
The following results were achieved during the three years prior to the last year. Thus thecompany has sales and cost data for the last four years.
Sales are normally made direct to the public, but a well-known retail company has justapproached the firm with an order of 1000 units. They have indicated, however, that they areonly willing to pay a maximum of £54 per basket.
224 MANAGEMENT ACCOUNTING
EXHIBIT8.2
Coombs-08.qxd 3/18/2005 1:09 PM Page 224

Company management has just heard about the technique of break-even analysis(although you first read about it in Chapter 3) and has requested information regarding thebreak-even point and also the production of relevant graphs based on the predicted resultsfor the next financial year. They also want comments on the information provided.
As stated in Chapter 3, the first step in this analysis is to calculate the contribution for thecoming financial year. Contribution equals selling price minus variable costs:
£60.00 − (£26.50 + £10.50 + £3.00) = £20.00
To calculate the break-even figure we divide the fixed costs (£90,000) by the contribution(£20) which gives the break-even point in terms of the sales unit figure as 4500. Thus,once the company sells 4500 units every extra sale is a contribution to profit as fixedcosts have been covered. Once the break-even figure has been achieved any additionalsales represent what is termed the margin of safety. This means that the company hasa ‘comfort’ zone by which sales can decline before it moves into a loss-making situation.It should be pointed out that sales below break-even are not termed ‘the margin ofdanger’, although in the long term all costs must be covered if any company is tosurvive.
Figure 8.1 shows the break-even chart. The relevant range has been assumed to bebetween 2000 units and 6500 units. Outside this range the assumptions of straight-linerelationships might not hold. As can be seen activity levels below 4500 units represent aloss. In contrast, any activity level above 4500 units results in a profit being made.
Figure 8.2 is an alternative presentation to Figure 8.1, with the advantage of placingemphasis on the total contribution, which managers may prefer.
The third alternative method of presenting the information is shown in Figure 8.3. Thisgraph, as the title suggests, stresses the relationship between sales volume and profit or loss.By reference to the graph it can be seen that if sales are equal to zero the total loss incurredis the amount of the fixed costs. The line representing units produced and sold allows us toread off the profit or loss at any point along that line.
These graphs allow managers to interpret what will happen to company profits under dif-ferent market conditions. In addition, assumptions on price and variable cost, for example, canbe varied again to assess the impact that such changes have on the business and the graphsredrawn for visual impact.
The straight lines drawn in these graphs represent accounting assumptions on cost andprice behaviour and, by their nature, these differ from those made by economists. The effect ofmaking accounting assumptions is that the functions are all linear and that, in the case of the
OPERATIONAL DECISION MAKING 225
Last Year – 1 Last year – 2 Last year – 3
Actual sales 6,100 6,500 6,400Selling price (£) 58 55 54Fixed costs (£) 85,260 81,810 79,905Variable costs (£) 278,750 247,000 249,600
Coombs-08.qxd 3/18/2005 1:09 PM Page 225

226 MANAGEMENT ACCOUNTING
500,000
400,000
300,000
200,000
100,000
01000 2000 3000 4000 5000 6000 7000
Costs and revenue (£)
Units produced and sold
Relevant range
Total cost
TotalVariableCosts
Totalfixedcosts
Profit
Loss
Total revenue
Break-evenPoint
Variable costVariable cost
Fixed costsFixed costs
500,000
400,000
300,000
200,000
100,000
01000 2000 3000 4000 5000 6000 7000
Costs and revenue (£)
Units produced and sold
Relevant range
Total cost
Profit
Loss
Total revenue
Break-evenPoint
Figure 8.1 The break-even chart
Figure 8.2 The contribution graph
Coombs-08.qxd 3/18/2005 1:09 PM Page 226

example shown, there is only one break-even point. The break-even chart can also beamended if stepped fixed costs were involved. All that would happen is that at the ‘step-up’point the variable cost line and the sales revenue line would move up by the amount of thestep to form higher parallel lines. This could result in two break-even points, one below thestep and one above the step.
Setting Target Profits
While management will be interested in the break-even figure as the number of units thatneed to be sold to cover costs, they will be more interested in profits that can be earnedfrom the product. To this extent a target profit figure of £10,000 could be input into thecalculation. One way of doing this is to treat the target as the equivalent of extra fixed costs.In this context we would require unit sales of 10,100 to achieve a target profit of £10,000:(Fixed costs (£91,000) + target profit (£10,000))/contribution (£10). Management can nowassess whether this level of sales activity can be achieved.
OPERATIONAL DECISION MAKING 227
+ 100,000
+ 75,000
+ 50,000
0 1000 3000 4000 5000 6000
− 25,000
− 50,000
− 75,000
−100,000
Profit
Break even point
Units producedand sold
Relevant range
Profit
2000
Loss
Loss
Figure 8.3 The profit-volume-graph
Coombs-08.qxd 3/18/2005 1:09 PM Page 227
The Model in Context
Exhibit 8.2 contains additional information to help set the decision in the real world. Ascan be seen, sales have declined from 6400 units four years ago to 6200 units last year,while the company is now estimating sales at 5800 for next year. Is this reasonable as theprice has risen again? The projected break-even is at 4,500. Table 8.4 shows the results forthe last four years and reveals an interesting picture. Unit variable cost is calculated bydividing the total variable cost by the number of units sold.
The analysis begins to reveal a picture of the company as having a rising cost basewhich it is attempting to cover by raising prices. The price rises undertaken have been suf-ficient to compensate for these cost rises and the break-even target has fallen as the con-tribution has risen over the period. Profits have consequently increased. A significantcontribution to this rise was the fall in fixed costs in the last financial year. In the nextfinancial year fixed costs are predicted, however, to rise by 11%.
Sales are in decline so this raises concerns as to whether the target sales figure for next yearwill be achieved, particularly as the price has again been increased. The break-even salesfigure has been around 4000–5000 units for a while and the projection for next year lies inthe middle of this range. The margin of safety at a projection of 5800 units is clearly 1300,and this may provide a sufficient cushion to absorb any lost sales due to the price rise.
Unit variable costs have remained reasonably stable over the period shown. Furtherrises in these costs are forecasted to occur in the next financial year.
The exhibit comments that fixed costs are allocated to picnic baskets on the basis offloor area. This suggests that other products are being made in the workspace available inthe production unit. A reasonable question therefore concerns whether the rise in fixedcosts results from a change in the basis of allocation and whether this is fair. Furtherresearch is needed.
Outside of financial issues the company would need to consider issues such as designas it is possible that a price rise coupled with a dated design could lead to a failure to sellproduct despite a history of acceptable sales levels. This would be considered in the contextof competitor analysis and risk.
228 MANAGEMENT ACCOUNTING
Table 8.4 Analysis of past performance
Last year Last year −− 1 Last year −− 2 Last year −− 3
Actual sales 6,200 6,100 6,500 6,400Income (£) 359,600 353,800 357,500 345,600Fixed cost (£) 81,000 85,260 81,810 79.905Variable costs (£) 235,600 228.750 247,000 249,600Profit/(loss) (£) 43,000 39,790 28,690 16,095Selling price (£) 58 58 55 54Unit variable cost (£) 38 37.50 38 39Contribution (£) 20 20.50 17 15Breakeven units 4,050 4,159 4,812 5,327
Coombs-08.qxd 3/18/2005 1:09 PM Page 228

With regard to the potential new order for 1000 units at £54 each, as variable costs are£40 there is a contribution of £14 towards fixed costs. Serious consideration can thereforebe given to the order as it represents guaranteed sales and improved cash flow (subject tofinancial appraisal of the retail company). The company may also see this order as com-pensating for any further falls in sales given the historical picture.
Assumptions Underpinning Break-Even Analysis
Relevant Range
The accounting model presented is based on the assumption of linearity over the relevantrange. This is the key to understanding the model and the cost/income behaviours repre-sented. It attempts to provide an accurate picture over the range of output and sales thatthe business can realistically achieve in the planning horizon envisaged. In the case ofFigure 8.1 this might be a range of 2000 to 6500 as shown. Outside this range, theassumption of linearity would not hold. It is within this range that the business hasreliable information on cost and cost behaviour.
Fixed Costs
The assumption for fixed costs again is related to the relevant range, here the accountantassumes that over the levels of activity envisaged the costs the business is committed tomeeting are known and can be represented in a linear manner. It is possible to reconstructthe graph without too much difficulty if the fixed costs follow a stepped pattern as out-lined in Chapter 2.
Revenue Line
The total revenue line again is linear. As you will be aware, if you wish to sell more prod-uct the economist would consider supply and demand and suggest price reductions toachieve higher sale volumes. Here the accountant, however, assumes that the business isoperating in a market where the selling price tends to be fixed in the short term. As statedabove, the figures can be redrawn with alternative selling prices (and costs) to present analternative picture to managers. Again, however, within the relevant range the assumptionof linearity for the total revenue line is assumed to hold.
Time Horizon
The assumptions hold over the time horizon envisaged. Typically, as in this example, thistime horizon is one year. If we consider typical fixed costs, property taxes are normallyknown for a year in advance and it is possible to budget reasonably accurately for man-agerial salaries (including any salary increments or pay rises). Operating capacity willalso be known reasonably well in advance as it takes time to plan and commission newproductive capacity. In the longer term, however, there will be a need to change theassumptions on which the model is based.
OPERATIONAL DECISION MAKING 229
Coombs-08.qxd 3/18/2005 1:09 PM Page 229

Cost Split between Fixed and Variable
The model assumes that it is relatively easy to split fixed and variable costs. In practicethis is not as easy as is suggested, but it has to be done as accurately as possible if themodel is to work. Fixed costs are assumed to be unrelated to the level of activity. Thisassumption will normally only hold true in the short term.
Stock is Ignored
The model takes no account of stock. This is, however, acceptable as basically the modelis trying to influence managerial decision making and as such cannot be totally represen-tative of what will actually happen. It is thus just one of the tools for decision making bymanagment.
Single Product/Constant Sales Mix
The illustration used in this section has concentrated on one product. In more complexanalysis it is possible to assume that sales will be in accordance with a preplanned salesmix. This is carried out by measuring sales volume using standard batch sizes based onthis planned mix.
Complexity in the Production Process
Cooper and Kaplan (1987) undertook an analysis in which they suggest that firmsneed to be aware of the complexity of the manufacturing process where multipleproducts are manufactured. They suggest that many so-called fixed costs vary withthe range of items manufactured as opposed to the volume of manufacture. Thus, ascomplexity related costs do not vary significantly, in the short term the emphasis incost–volume–profit techniques will tend to show a growth in short-term profits asnew product variants are introduced. They will, however, potentially cause a rise infixed costs in future periods resulting in long-term disadvantage to the firm. The workof Kaplan is placed in context by Otley (2001) – see the section on further readinglater in the present chapter.
Consumer Behaviour
While reducing the price of a product should in theory generate more revenue, in practiceconsumer behaviour is complex. A reduced price may cause consumers to question qualityeven if there are no grounds to do so. Fashion changes can also dictate the purchase ofgoods. In the case of wicker picnic baskets the market has been adversely affected by thesale of ‘cool boxes’ as they possess better insulating properties.
To conclude this section, Exhibit 8.3 contains an illustration of the core formulas associatedwith break-even analysis.
230 MANAGEMENT ACCOUNTING
Coombs-08.qxd 3/18/2005 1:09 PM Page 230

Break-Even and Related Formulas
Sales − Variable Costs = Fixed Costs + Profit (or −Loss)
Contribution = Selling Price − Variable Costs
Profit/(Loss) = Contribution − Fixed Costs
Break-even (units) =Fixed Costs
Contribution
Break-even (sales value) =Fixed Costs × Sales Units
Contribution
Margin of safety (units) =Profit
Contribution per unit
Margin of safety (sales value) =Profit × Sales
Contribution
Linear ProgrammingThe earlier garden centre example concentrated on one limiting factor, which was land.In order to maximise contribution the land was allocated to production by reference to thecontribution per limiting factor. In practice, decision makers find that there is normallymore than one limiting factor. In the manufacturing process these might be limited to theavailable labour, the available machine hours and the available materials. Effectively, inour garden centre example the limited factor equivalents to the manufacturing processcould be land (materials) and labour.
The technique used to solve these decision dilemmas is termed linear programming,and this section of the chapter explains how the technique can be applied.
Maximise Contribution
A company manufactures two products, X and Y. During the next budget period it is estimatedthat there will be only 4200 direct labour hours available and that the supply of the commonmaterials used by both products is restricted to 3600 units. Machine hours available arelimited to 4000.
OPERATIONAL DECISION MAKING 231
EXHIBIT8.3
EXHIBIT8.4
Coombs-08.qxd 3/18/2005 1:09 PM Page 231
The budget for the next period shows the following standard information per unit of eachproduct:
Product X £ £ Product Y £ £Standard selling price 40 Standard selling price 59less lessMaterials 6 Materials 8Labour 15 Labour 30Variable overhead 4 Variable overhead 4
25 42Contribution 15 17
Product X uses 3 units of material per unit produced, while product Y uses 4 units of materialper unit produced. Material cost is £2 per unit.
Product X uses 3 hours of labour, while product Y uses 6 hours. The labour rate is£5 per hour.
Variable overheads are allocated on the basis of machine hours. The rate is £1 per hour.Product X uses 4 hours of machine time, as does product Y.
The sales department estimates that the organisation can sell an unlimited number of unitsof product Y, but that X is limited to 550 units.
Clearly this is a much more complex problem for the manager operating in this businessenvironment than the garden centre decision maker, and linear programming is needed tosolve it. Solutions can be found both graphically (two products) and by the manipulation ofmathematical formulas (more than two products). Excel can be used to perform the mathe-matics, and the manager must then correctly interpret the results.
As the term linear programming implies, all relationships are assumed to be linear:
• The contribution per unit produced and sold within the relevant range remainsconstant, and therefore are linear.
• Resources utilised are constant whatever the units produced, and are therefore linear• Units produced and resources allocated/available are infinitely divisible.• The objective is to maximise the contribution.• All variables in the equation must be equal to or greater than zero.
To solve the problem we state it mathematically by setting up an objective function.Denoting the contribution by C, we must
maximise C = 15X + 17Y,
subject to:
materials 3X + 4Y ≤ 3600,labour 3X + 6Y ≤ 4200,machine hrs 4X + 4Y ≤ 4000.
232 MANAGEMENT ACCOUNTING
Coombs-08.qxd 3/18/2005 1:09 PM Page 232

Here the constraints have been expressed by relating the quantities of each resource used by eachproduct against the maximum available resource for each of those elements in the productionprocess. Taking materials as an example, the equation 3X + 4Y means that 3 units of material areused to produce product X and 4 units of material used to produce product Y in the final solutionwhen we know the decision as to how many units of each product will be made cannot exceed3600 units of material. A similar logic applies to each of the other constraints.
To satisfy the final assumption outlined earlier, product X must be greater than or equal tozero but, given the maximum we can sell, be no greater than 550. As Y has no upper limit theassumption here is that product Y must be greater than or equal to zero. This assumption ofnon-negativity avoids getting results which are counter-intuitive. This is expressed as
0 ≤ X ≤ 550, Y ≥ 0.
Let us use the graphical method first. Figure 8.4 shows the constraints plotted for thequantities of the two products that can be produced. The only region on the graph which sat-isfies all four constraints is within the area ABCD. This is known as the feasible region. Outside
OPERATIONAL DECISION MAKING 233
Quantityof X
produced
1600
1400
1200
1000
800 A
600
400
200
D200 400 600 800 1000 1200
Quality of Y produced
X = 800
Labour constraint
Materials constraint
Machine hours constraint
B
C
Contribution = £5100
Feasible region
Figure 8.4 Graphical solution to contribution maximisation problem
Coombs-08.qxd 3/18/2005 1:09 PM Page 233

this region it is not possible to satisfy all four constraints. It is still, however, necessary to findwhich production level for X and Y maximises contribution. If we therefore choose a randomcontribution line of £5,100 this would represent 340 units of X or 300 units of Y. As stated,our objective is to maximise contribution so higher-level contributions can be represented bydrawing parallel lines until we reach the boundary of the feasible region. In this example thefarthest we can move from the origin and still satisfy the constraints is at point C. It shouldalso be noted that the materials constraint lies completely outside the boundary of thefeasible region and it is the other three constraints which are crucial in determiningproduction.
Reading from the graph the maximum contribution is achieved at approximately 600 unitsof X and 400 of Y. This is proved below:
contribution at point A is 800 × £15 + 0 × £17 = £12,000;contribution at point B is 800 × £15 + 200 × £17 = £15,400;contribution at point C is 600 × £15 + 400 × £17 = £15,800;contribution at point D is 0 × £15 + 700 × £17 = £11,900.
As indicated by the word ‘approximately’, it is obviously not always possible to measurefrom a graph the exact output at point C, and consequently a more accurate alternative isto solve the simultaneous equations which can be formed from the binding constraints atthat point:
4X + 4Y ≤ 4000, (1)
3X + 6Y ≤ 4200. (2)
Multiply equation (1) by 3 and equation (2) by 2,
12X + 12Y ≤ 12000,6X + 12Y ≤ 8400.
By a process of division 6X equals 3600, so X is 600. By substitution, Y is 400. This is thefinancial calculation result, but it cannot be divorced from the marketing information. Thequestion in this case is that from marketing we believe we can sell an unlimited number ofY and a maximum of 550 for X. While further research may be needed into these claimsthe results, now that we have a potential production plan produced by solving the equation,indicate that the initial market research supports that production plan.
This can be further developed by use of Table 8.5 to show if it is worth attempting toprocure more of the scarce resources. What the table shows is that we have no spare capacityin either labour or machine hours, but spare capacity in materials. If we could remove theseconstraints would it be worth the company paying a premium to do so. If we take labour, theequations would be revised:
4X + 4Y = 4000 (unchanged machine hours),3X + 6Y = 4201 (revised labour constraint).
234 MANAGEMENT ACCOUNTING
Coombs-08.qxd 3/18/2005 1:09 PM Page 234

Therefore the value of an additional unit of labour is £0.66. This is the opportunity cost or shadowprice. The company is thus able to pay up to £0.66 over and above the present cost of labour andstill obtain a contribution towards fixed costs.
Obviously it is not possible to produce and sell 0.67 units of X and 0.33 units of Y. Outputhas to be expressed in whole numbers, but the basis of the calculation can be used to calcu-late the revised optimal output if extra units of labour are available.
Developing this theme, the company is advised that 50 extra units of labour are availableat £5.50 per hour. This is below the opportunity cost by £0.16. The revised equations are now
4X + 4Y = 4000,3X + 6Y = 4250.
X is now 583.33 and Y is 416.67. This makes the total contribution £15,833. At thislevel of production we still satisfy the material constraints as we would use only 3417units of material. Therefore the decision that the company should take is to buy in the extralabour.
Solving, we obtain
X = 599.67 and Y = 400.33.
Therefore the planned production of X should be reduced by 0.33 and Y increased by 0.33.This is termed the marginal rate of substitution. The change in contribution arising fromobtaining one extra element of labour is
OPERATIONAL DECISION MAKING 235
Constraints used Total at optimum Total Spare Shadow
Constraint available (hrs per product) used capacity price?
Labour 4200 1800 X, 2400 Y 4200 0 YesMaterials 3600 1800 X, 1600 Y 3400 200 NoMachines 4000 2400 X, 1600 Y 4000 0 YesMarket 800 600X 600 200 No
Table 8.5 Shadow prices – resource table
Increase in contribution from Y is (0.33 × £17) £5.61Decrease in contribution from X is (0.33 × £15) £4.95Increase in contribution £0.66
Coombs-08.qxd 3/18/2005 1:09 PM Page 235
Ingredient X costs £20 per litre, and Y costs £40 per litre.The maximum that can be stored on site is 100 litres of each ingredient and the objective
of the company is to decide how much of the ingredients should be added to every 5,000litres of the additive to minimise costs.
minimise Z = 20X + 40Y,
Subject to
3X + 8Y ≥ 600,4X + 4Y ≥ 400,3X + 5Y ≥ 450.
Note the equations are now greater than or equal to the minimum requirements. Thelimitations on storage are expressed by the equations:
X < 100,Y < 100.
Finally the non-negative constraint is X, Y ≥ 0.Figure 8.5 shows the graph obtained by plotting the constraints. The feasible region is
bounded by the points P, Q, R, S and T. Drawing in the minimum cost line Z = 20X + 40Yand moving this line inwards towards the origin would give the minimum cost at thenearest point of the feasibility region that the line would touch to the origin. This is point Q
Cost Minimisation
The above example has concentrated on maximising contribution, but managers mayalso be interested in cost minimisation. This is illustrated in the following examplewhich relates to a business manufacturing a fuel additive, Polycon, for tractors toimprove engine performance. Every 10,000 litres of the product requires three elements:600g of A, 400g of B and 450 g of C. In order to obtain these additives, it is necessaryto purchase two ingredients, X and Y, which contain them. This information is set outbelow:
236 MANAGEMENT ACCOUNTING
EXHIBIT8.5
Composition (g) of
X Y
Additive A 3 8Additive B 4 4Additive C 3 5
Coombs-08.qxd 3/18/2005 1:09 PM Page 236

and the minimum cost is 66X + 50Y = £3,300. This could also be solved by using the simulta-neous equations for point Q: solving
3X + 8Y = 600,3X + 5Y = 450.
gives X = 66.67 and Y = 50. Thus if the company is to achieve its decision objective ofminimising the cost of the additives while satisfying all constraints, it would mix 66 units ofX and 50 of Y in each batch of 5000 litres produced.
OPERATIONAL DECISION MAKING 237
Litresof XLitresof X
200200Y = 100Y = 100
175175
150150
125125
PP X = 100X = 100 TT
SS
100100
7575 QQ
Feasible region Feasible region
5050
RR
2525
2525 5050 7575 100100
Litres of YLitres of Y
3X + 8Y = 6003X + 8Y = 600
3X + 5Y = 4503X + 5Y = 450
Z = 20X +40YZ = 20X +40Y
4X + 4Y = 4004X + 4Y = 400
Figure 8.5 Graphical solution to cost minimisation problem
Coombs-08.qxd 3/18/2005 1:09 PM Page 237

Relevant CostingIn making managerial decisions it is essential that managers recognise the importanceof considering only relevant costs and benefits. This section looks at these issues. Itdeals first with financial costs and benefits, and then goes on to develop a technique toenable managers to consider qualitative issues in decision making. In financial terms,the relevant costs and benefits relate to the future cash flows of the organisation whichwould differ as a result of implementing the decision. This type of analysis thusconcentrates on the incremental or differential changes that must be considered. Anycash flows that would remain the same for any alternatives that are being considered areirrelevant.
This section considers four areas:
• ceasing (or shutting down) production of a product or service;• the make or buy decision;• pricing;• special orders.
Cessation of Production of a Product or Service
Managers are frequently required to consider whether a particular product, service orsection is unprofitable and thus should be discontinued. It is particularly important thatmanagers define closely what is meant by ‘unprofitable’. Even if a product or service isseen as making a ‘loss’ if its variable costs are less than its selling price, it is making acontribution towards fixed overhead. Clearly this contribution would be lost if produc-tion or supply ceased. It may also be the case that sales of other products or services maysuffer.
Ceasing Production
Country Limited makes three products (picnic baskets, picnic seats and picnic tables) anduses an absorption costing basis. In addition, you discover that production overheadsof £333,000 consist of £200,000 which are fixed. The variable element for each of thethree products is: picnic baskets, £3,000; picnic seats, £45,000; and tables £85,000.Non-production overhead is entirely fixed. There are no opening and closing stocks as allitems are made to order, with just-in-time management techniques.
The information in Table 8.6 has been extracted from the budget forecast for nextyear. In order to reach the correct decision the above information is recast as shown inTable 8.7.
EXHIBIT8.6
238 MANAGEMENT ACCOUNTING
Coombs-08.qxd 3/18/2005 1:09 PM Page 238

It can be seen that in Table 8.7 the restated budget for picnic baskets neither makes a profitnor contributes towards fixed overheads. It would thus appear that the decision on a profitmaximisation basis would be to close this line. However, we need to give further consideration toa number of points:
• The accuracy of the budget forecast; here we could consult historical data, for example.• The obviously integrated nature of the product mix, as closing picnic baskets may cost
the company sales. They may even be included as a loss leader or even frequently givenaway with the table and chair sets to further encourage sales.
• Are the figures for the variable element of production overhead accurate?• If the decision to close the picnic basket line is to be made, managers need to consider
its contribution to the long-term business plans of the organisation.• As all stock is bought on a just-in-time basis there are no stock holding or stock pricing
costs, but does the budget reflect agreed contract prices with suppliers?
OPERATIONAL DECISION MAKING 239
Picnic baskets Picnic seats Picnic tables Total
Sales (units) 2000 24000 6000 32000£ £ £ £
Sales revenue 31,000 480,000 600,000 1,111,000Direct material – variable 18,000 150,000 80,000 248,000Direct labour – variable 12,000 100,000 90,000 202,000Production overhead 8,000 150,000 175,000 333,000Non-production overhead 15,000 25,000 40,000 80,000Profit (loss) (22,000) 55,000 215,000 248,000
Table 8.6 Country Limited absorption budget statement
Picnic baskets Picnic seats Picnic tables Total(£) (£) (£) (£)
Sales 31,000 480,000 600,000 1,111,000
Variable costsMaterials 18,000 150,000 80,000 248,000Labour 12,000 100,000 90,000 202,000Overheads 3,000 45,000 85,000 133,000
33,000 295,000 255,000 583,000
Contribution (2,000) 185,000 345,000 528,000Fixed costs 280,000Profit 248,000
Table 8.7 Country Limited restated contribution budget statement
Coombs-08.qxd 3/18/2005 1:09 PM Page 239

• The contribution on picnic baskets is only a small negative, so could the price beincreased.
• Are any efficiency gains in the use of labour and materials possible?
The above points concentrate on financial issues only and we will return in the final sectionof this chapter to consider the qualitative issues concerning such decisions.
Make or Buy Decisions
Where a company carries out several processes within the value chain, it is following apolicy of vertical integration by controlling all aspects of production. While this may havea number of advantages for the company in terms of control of the supply process, it maynot necessarily be the most cost-efficient way of managing the business. Thus a decisionto make the part or buy it from an external supplier is naturally termed a make or buy deci-sion. By buying from a supplier, that supplier can potentially maximise the benefits ofeconomies of scale which may also result in better quality and not just lower prices.Obviously there are situations in which a company would never consider subcontractingproduction, for example, where it would put its competitive position at risk either throughdisclosing trade secrets or risking poor quality.
Avoidable and Unavoidable Costs
Tenby Ltd. produces product X, for which the following information is available:
An outside UK-based supplier has indicated that it can supply the 10,000 units required at aprice of £20 per unit. The question for Tenby is what are the avoidable and unavoidable costsof producing product X. These costs are set out in Table 8.8.
As can be seen, the price differential in favour of in-house manufacture is £1.50 per unit –£15,000 for 10,000 units for the budget period. Depreciation is a sunk cost in relation to
240 MANAGEMENT ACCOUNTING
EXHIBIT8.7
Cost category Unit cost (£)
Direct materials 10Direct labour 5Variable overhead 1Section Supervisor 2.5Depreciation 2Fixed overhead 4Total 24.5
Coombs-08.qxd 3/18/2005 1:09 PM Page 240

product X and may be for special machinery to make the product, but it is ignored in thedecision. The fixed overhead represents general overhead apportioned to the productand as such is unavoidable. All other costs are relevant to the decision as they vary withthe production of the product; in the case of the supervisor, this cost can be avoided byredundancy.
If we assume now that the supervisor would be entitled to a redundancy payment of£12,500 on top of the above calculation, then we can see that there is still a cost differentialin favour of manufacture of product X, even if now it is only £2,500. This requires furtherthought, however, in that if in the next budget period the alternative supplier came forwardagain, how would we treat this cost? In this situation the company has already effectivelyused the £12,500 once to make the ‘make’ decision and as such should only count £2,500 asbeing unallocated. Next year (and assuming no other changes) the decision would be to buy.A more sophisticated analysis would incorporate discounted cash-flow analysis, which will bediscussed in Chapter 9.
Finally, in this section opportunity cost needs to be mentioned. It has been assumed in theabove example that the capacity potentially released by a buy decision will be idle. It could,of course, be used to manufacture an alternative product. If this were possible then Tenbywould need to consider the value of the opportunity forgone in reaching its decision. Thishas particular implications for the use of the specialist machinery mentioned above.
Relevant Costing Explored
Relevant costs and revenues are those that will occur in the future and are relevant tospecific decisions. The idea of cost relevance can be illustrated as follows.
A company has 100 components in stock at a manufacturing cost of £100,000, but theprospective customer can no longer afford to pay for them and it has proved impossibleto find an alternative customer for the components. Two alternative uses for the compo-nents have been identified (see Table 8.9):
OPERATIONAL DECISION MAKING 241
Cost Budgeted Avoidable Cost category Unit Cost (£) Per Unit (£)
Make Buy
Direct Materials 10 10Direct labour 5 5Variable overhead 1 1Section supervisor 2.5 2.5Depreciation 2Fixed overhead 4Total Cost 24.5 18.5Purchase Price 20
Table 8.8 Avoidable costs
Coombs-08.qxd 3/18/2005 1:09 PM Page 241

• Convert them into garden gnomes at a cost of £30,000 and then sell them for£50,000, incurring carriage costs of £1000.
• Scrap the components for £5000. Carriage costs will also be £1000.
This approach gathers together all the costs and revenues. However, in terms of thedecision whether to convert or scrap the components, not all of the costs are relevant. Thenon-relevant cost in this case is that of manufacturing: this is a historic or ‘sunk’ cost andhas already been incurred, whichever decision we make. We can remove it from Table 8.9,to give the statement in Table 8.10. As the statement shows, the preferred option is con-version. Conversion will lead to an increase in future net cash flows of £19,000, whereasthey will increase by just £4,500 under the scrap option.
Relevant costs have the following characteristics:
• They are future costs.• They are differential costs (they differ between different alternatives).• They are decision-specific (if you change the decision, the relevant costs will
change).
242 MANAGEMENT ACCOUNTING
Conversion (£) Scrap (£)
Revenue 50,000 5,000Costs
Manufacturing 100,000 100,000Conversion 30,000Carriage 1,000 500
Total costs 131,000 100,500Loss 81,000 96,500
Table 8.9 A conventional approach to identifyingrevenues and costs
Conversion (£) Scrap (£)
Revenue 50,000 5,000Relevant costConversion 30,000Carriage 1,000 500Total relevant costs 31,000 500Net cash flow 19,000 4,500
Table 8.10 Relevant costs and revenues
Coombs-08.qxd 3/18/2005 1:09 PM Page 242

We now examine the application of relevant cost principles in three cost areas: salariesand wages, materials and depreciation.
Salaries and WagesIf there is spare capacity in the workforce, the relevant cost of wages is zero if the work-force is paid whilst spare capacity exists. If there is no spare capacity, the relevant cost oflabour may be represented by the following cases:
• The costs of overtime working when the existing workforce is required to workovertime to complete the project. In this situation the relevant cost is the cost ofovertime working.
• The cost of bringing in new workers to cover for existing workers when this is doneto take work off existing workers to allow them to work on a new project. In thissituation, the relevant cost is the cost of the replacement workers.
• The contribution that is lost when workers are transferred from another project. Thisoccurs when the labour force is fully employed and where workers must be movedaway from one profitable area in order to work on another. In this situation, therelevant cost of labour is its opportunity cost.
MaterialsThe relevant costs of materials depend initially on whether the materials are to be pur-chased or are in stock. If they are to be purchased, then the relevant cost is the futureacquisition cost of the materials.
If they are already in stock, then the book value (or the historic cost of the materials) isirrelevant, as it is a historic or sunk cost. However, materials in stock do have a relevantcost. If the materials are in continuous use within the business, then the relevant cost isequal to the replacement cost of the materials. This is because, if materials are in contin-uous use, once they are used they will be replaced. If, on the other hand, the materials arenot in continuous use – for example, they are obsolete, ordered in error or have becomesurplus to requirements – then their relevant cost is their opportunity cost and this may beestimated as the greater of their net realisable value and their value in alternative use.
The net realisable value is equal to the sales proceeds less the selling costs, for example,carriage. The value in alternative use is the saving obtained by using the material elsewherewithin the company, for example, in place of another material that is currently in use.
The following example demonstrates the application of these principles to the relevantcost of material. A contract requires 1000 kg of material A, 500 kg of material B and 200units of C.
Material A is in continuous use by the company. The company currently has 400 kg instock at a total book value of £2000. Future purchases of material A will cost £5.20 perkilogram.
There are 100 kg of material B in stock, with a total book value of £350 if used on thecontract. Material B will not be replaced. It has no anticipated use other than disposal for£1.20 per kilogram. Its replacement cost is £2.80 per kilogram.
OPERATIONAL DECISION MAKING 243
Coombs-08.qxd 3/18/2005 1:09 PM Page 243
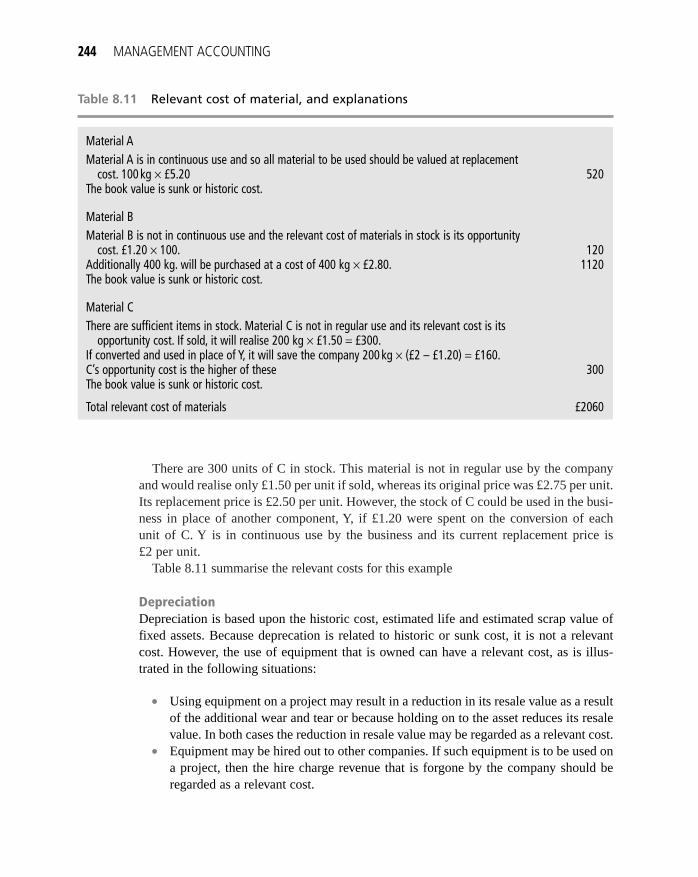
There are 300 units of C in stock. This material is not in regular use by the companyand would realise only £1.50 per unit if sold, whereas its original price was £2.75 per unit.Its replacement price is £2.50 per unit. However, the stock of C could be used in the busi-ness in place of another component, Y, if £1.20 were spent on the conversion of eachunit of C. Y is in continuous use by the business and its current replacement price is£2 per unit.
Table 8.11 summarise the relevant costs for this example
DepreciationDepreciation is based upon the historic cost, estimated life and estimated scrap value offixed assets. Because deprecation is related to historic or sunk cost, it is not a relevantcost. However, the use of equipment that is owned can have a relevant cost, as is illus-trated in the following situations:
• Using equipment on a project may result in a reduction in its resale value as a resultof the additional wear and tear or because holding on to the asset reduces its resalevalue. In both cases the reduction in resale value may be regarded as a relevant cost.
• Equipment may be hired out to other companies. If such equipment is to be used ona project, then the hire charge revenue that is forgone by the company should beregarded as a relevant cost.
244 MANAGEMENT ACCOUNTING
Material AMaterial A is in continuous use and so all material to be used should be valued at replacement
cost. 100 kg × £5.20 520The book value is sunk or historic cost.
Material BMaterial B is not in continuous use and the relevant cost of materials in stock is its opportunity
cost. £1.20 × 100. 120Additionally 400 kg. will be purchased at a cost of 400 kg × £2.80. 1120The book value is sunk or historic cost.
Material CThere are sufficient items in stock. Material C is not in regular use and its relevant cost is its
opportunity cost. If sold, it will realise 200 kg × £1.50 = £300.If converted and used in place of Y, it will save the company 200 kg × (£2 – £1.20) = £160.C’s opportunity cost is the higher of these 300The book value is sunk or historic cost.
Total relevant cost of materials £2060
Table 8.11 Relevant cost of material, and explanations
Coombs-08.qxd 3/18/2005 1:09 PM Page 244
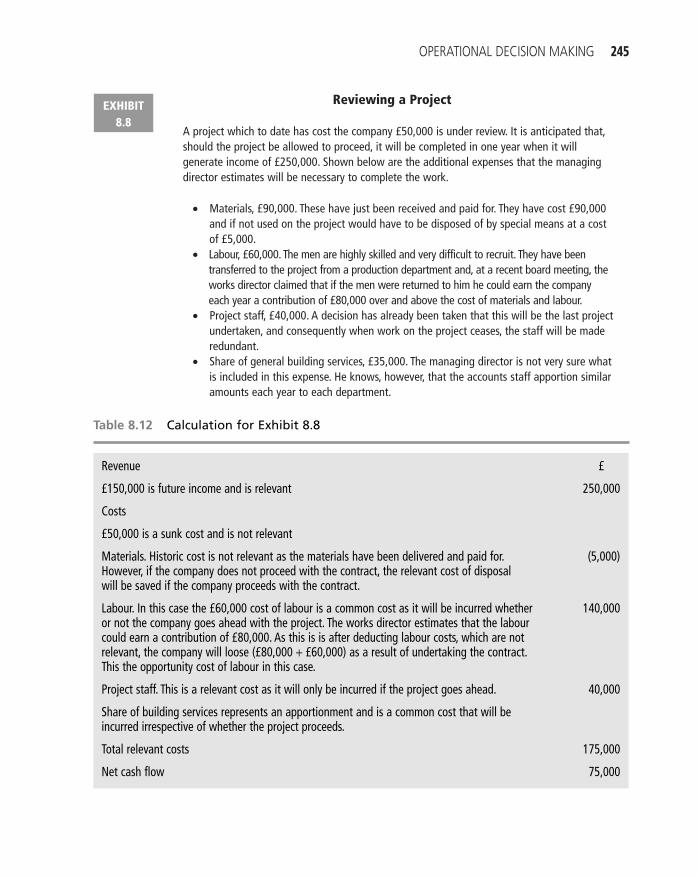
Reviewing a Project
A project which to date has cost the company £50,000 is under review. It is anticipated that,should the project be allowed to proceed, it will be completed in one year when it willgenerate income of £250,000. Shown below are the additional expenses that the managingdirector estimates will be necessary to complete the work.
• Materials, £90,000. These have just been received and paid for. They have cost £90,000and if not used on the project would have to be disposed of by special means at a costof £5,000.
• Labour, £60,000. The men are highly skilled and very difficult to recruit. They have beentransferred to the project from a production department and, at a recent board meeting, theworks director claimed that if the men were returned to him he could earn the companyeach year a contribution of £80,000 over and above the cost of materials and labour.
• Project staff, £40,000. A decision has already been taken that this will be the last projectundertaken, and consequently when work on the project ceases, the staff will be maderedundant.
• Share of general building services, £35,000. The managing director is not very sure whatis included in this expense. He knows, however, that the accounts staff apportion similaramounts each year to each department.
OPERATIONAL DECISION MAKING 245
EXHIBIT8.8
Revenue £
£150,000 is future income and is relevant 250,000
Costs
£50,000 is a sunk cost and is not relevant
Materials. Historic cost is not relevant as the materials have been delivered and paid for. (5,000)However, if the company does not proceed with the contract, the relevant cost of disposalwill be saved if the company proceeds with the contract.
Labour. In this case the £60,000 cost of labour is a common cost as it will be incurred whether 140,000or not the company goes ahead with the project. The works director estimates that the labourcould earn a contribution of £80,000. As this is is after deducting labour costs, which are notrelevant, the company will loose (£80,000 + £60,000) as a result of undertaking the contract.This the opportunity cost of labour in this case.
Project staff. This is a relevant cost as it will only be incurred if the project goes ahead. 40,000
Share of building services represents an apportionment and is a common cost that will beincurred irrespective of whether the project proceeds.
Total relevant costs 175,000
Net cash flow 75,000
Table 8.12 Calculation for Exhibit 8.8
Coombs-08.qxd 3/18/2005 1:09 PM Page 245
Assuming the estimates are accurate, and given that Table 8.12 shows that the net cash flowis positive, the managing director is advised to allow the project to proceed.
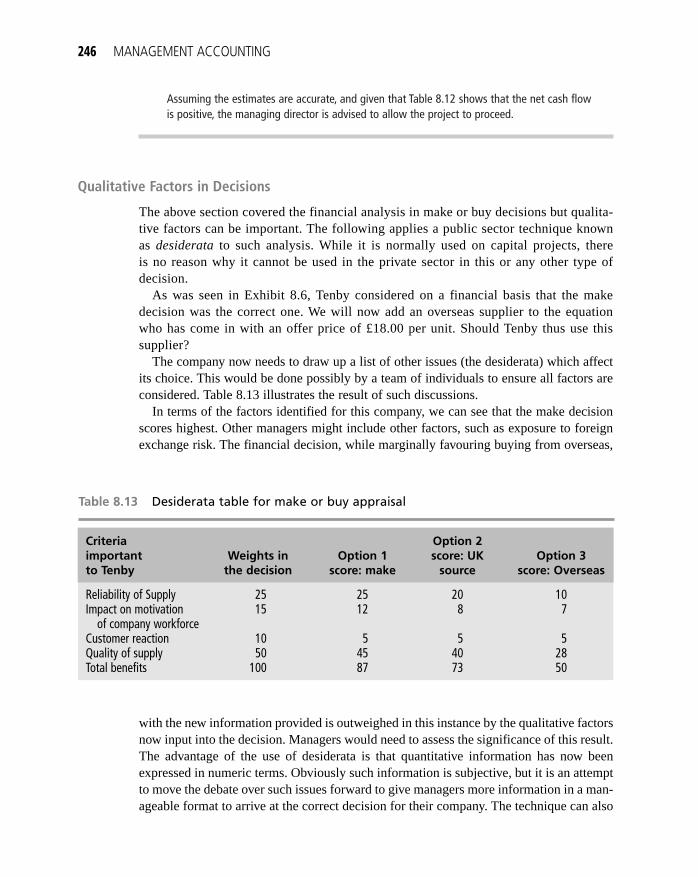
Qualitative Factors in Decisions
The above section covered the financial analysis in make or buy decisions but qualita-tive factors can be important. The following applies a public sector technique knownas desiderata to such analysis. While it is normally used on capital projects, thereis no reason why it cannot be used in the private sector in this or any other type ofdecision.
As was seen in Exhibit 8.6, Tenby considered on a financial basis that the makedecision was the correct one. We will now add an overseas supplier to the equationwho has come in with an offer price of £18.00 per unit. Should Tenby thus use thissupplier?
The company now needs to draw up a list of other issues (the desiderata) which affectits choice. This would be done possibly by a team of individuals to ensure all factors areconsidered. Table 8.13 illustrates the result of such discussions.
In terms of the factors identified for this company, we can see that the make decisionscores highest. Other managers might include other factors, such as exposure to foreignexchange risk. The financial decision, while marginally favouring buying from overseas,
with the new information provided is outweighed in this instance by the qualitative factorsnow input into the decision. Managers would need to assess the significance of this result.The advantage of the use of desiderata is that quantitative information has now beenexpressed in numeric terms. Obviously such information is subjective, but it is an attemptto move the debate over such issues forward to give managers more information in a man-ageable format to arrive at the correct decision for their company. The technique can also
246 MANAGEMENT ACCOUNTING
Table 8.13 Desiderata table for make or buy appraisal
Criteria Option 2 important Weights in Option 1 score: UK Option 3to Tenby the decision score: make source score: Overseas
Reliability of Supply 25 25 20 10Impact on motivation 15 12 8 7
of company workforceCustomer reaction 10 5 5 5Quality of supply 50 45 40 28Total benefits 100 87 73 50
Coombs-08.qxd 3/18/2005 1:09 PM Page 246
be used in a variety of decision-making situations and is further explored in Chapter 9when capital investment decisions are considered.
Pricing Decisions
There are two types of pricing decision, which relate to either internal customers or externalcustomers. In the former case, one division of an organisation charges another for goodsor services provided, and this is known as transfer pricing. In both the public sector andprivate sector such transfer prices may be subject to an internal service level agreementwhich is effectively an internal contract for the supply of goods or services at a set priceand set quality.
Cost Plus Pricing
In simple terms, the pricing decision is about covering costs and earning a mark-up whichrepresents profit. The problem comes in what to include in the costs. One approach couldbe to take prime costs (all direct costs) and add production overheads to give the full pro-duction cost. Full production cost would then form the basis for the addition of the mark-up percentage (say, 25%). By this method the firm has a cushion in the price for anybudget variation, but there is no guarantee that the price at 25% over production costs willcover other non-productive costs such as selling and distribution and give a satisfactorylevel of profit. The alternative is to include non-production costs in calculating the unitcost of output and then to add the mark-up percentage. By this method the companywould hope to reduce the failure to cover all its costs. The final alternative, cost plus,would be to calculate the variable cost per unit of production and then add on a largeprofit mark-up to cover all fixed costs (production and non-production), but this is a high-risk strategy as all fixed costs might not be covered. In addition, whatever price is set, thecompany would need to consider the marketplace and the actions of its competitors as thepercentage mark-up needs to be realistic in terms of achievability.
On page 229 we looked at the issue of a special order and recognised that the companywould accept the order as the price was above unit variable cost. Production and non-production overheads were unaffected by this decision and the order represented cashflow to the company. There is, of course, a danger that other customers could hear of thediscounting on normal selling price and therefore expect similar treatment.
Lowering the price raises the issue of selling below costs and whether this is accept-able in any circumstances. The following suggestions are made:
• A new product is being introduced and the company wishes to create demand so itsets a price below cost in anticipation of raising the price later. There is, of course,a danger that this may not be possible.
• The market is in recession and as such a company needs cash flow. It would, ofcourse, hope to cover variable costs at a minimum as in the short term it can ignorefixed overheads to generate cash flow.
OPERATIONAL DECISION MAKING 247
Coombs-08.qxd 3/18/2005 1:09 PM Page 247

• Product life cycles are important. In the early days of the product, when there is adesire to recover the investment costs, a high price (coupled with a positive con-sumer image) will be set. As the product moves through its life cycle prices may bereduced to continue to sell the product. In this context the decision maker is into lifecycle costing, under which an attempt is made to track budgeted and actual costsand associated revenues through each stage of the product life cycle.
• Predatory pricing (loss leading) may be used to enter a new market and attract salesand potentially customer loyalty.
• Defensive pricing to defend the market from a potential entrant to ensure that themarket is unattractive to that potential entrant.
• To use spare capacity (as with a special order) since fixed costs would be coveredby the normal activities and pricing policy of the company.
Target Costing
Under this system management would set a potential target price based on capturing anenvisaged share of the market. The firm will thus take direct account of market intelli-gence and will build the product (or provide the service) to this target price. The priceobviously builds in a profit percentage, and costs are budgeted to come in below thisfigure. The advantages of this method are as follows:
• The price is set in advance based on specific market intelligence and requiresdetailed consideration of all relevant strategic information.
• Once the price has been established tight budgetary control is vital if planned profitsare to be delivered. Once the price is set managers are forced to find savings if oneparticular element of the budget shows increased costs, otherwise the company’sstrategy is at risk of failure.
• It overcomes the problem of cost-based prices which can ignore the marketplace. Interms of the delivery of a service, for example, it is not unusual for public sectororganisations to simply increase prices by the rate of inflation (usually from 1 April)without any demand analysis. This clearly ignores market information.
Transfer (Internal) Prices
It is quite common for larger organisations to employ an internal market system whereone segment of the entity will trade with another to encourage efficiency. Under thissystem income for one segment is expenditure for another, although when the consoli-dated accounts of the organisation are compiled these transactions will cancel each otherout. It is important that these internal prices are set to optimise the results for the businessas a whole and not to encourage suboptimizing where the goals of a segment are seen asmore important by managers in the segment than the best interests of the company as awhole. The summary of the article by Spicer (1988) at the end of this chapter places trans-fer pricing in an organisational context. The topic is also developed further in Chapter 10.
248 MANAGEMENT ACCOUNTING
Coombs-08.qxd 3/18/2005 1:09 PM Page 248

The objectives of a system of transfer prices should be to:
• report results for each segment which reflect the managerial performance of thesegment or division;
• motivate individual managers to make sound decisions such that their results alsoimprove the results of the company as a whole;
• support segment autonomy while not undermining decision making in the organi-sation as a whole.
There are a number of alternative bases for transfer pricing available including: nego-tiated prices, opportunity cost, total cost, variable cost, and adjusted market price.
In these decisions the role of the management accountant is to supply decision-relevantinformation and to interpret that information. In giving advice on setting transfer prices,whatever price is to be charged will be based around the objectives set out above.
ConclusionsThis chapter has:
• used various costing techniques to make decisions on the utilisation of scarceresources;
• shown how to interpret the results of analysis to advise management on suchdecisions;
• developed an understanding of the application of marginal costing/the contributionapproach to management decisions;
• recognised the importance of risk to the management decision making environment• recognised the importance of both quantitative and qualitative factors in the decision-
making environment.
SummaryHaving read this chapter, you have reviewed the utilisation of scarce resources to max-imise profits within an organisation based on an understanding of the contribution per unitof scarce resource. This was then developed to examine how break-even analysis can con-tribute to a manager’s understanding of business behaviour. The identification of fixedand variable costs via a variety of techniques was considered and decision making exam-ined using a method to quantify qualitative factors. Finally, the chapter looked at pricingboth from an external and internal perspective. It should be remembered that there israrely a single correct answer to the decisions required by managers. What is important isthat the data available are analysed correctly and presented in a form which managers can
OPERATIONAL DECISION MAKING 249
Coombs-08.qxd 3/18/2005 1:09 PM Page 249

use. It is therefore crucial that the management accountant provides that information inthe form required and that managers are aware of their information needs in specific cir-cumstances. This represents a considerable challenge to both parties.
Recommended Further ReadingOtley, D. (2001) ‘Extending the boundaries of management accountingresearch: developing systems for performance management’, BritishAccounting Review, 33(3): 243–261.This paper opens by pointing out that by the mid-1980s the practice of managementaccounting was in decline, with little in the way of new developments for decades.Therefore management accounting was seen as irrelevant to contemporary organisationsand, even worse, its influence seen as counterproductive to good managerial decisionmaking. Otley points out that since 1987, when Johnson and Kaplan’s book RelevanceLost appeared, Johnson appears to have given up on accounting to emphasise ‘softer’areas, while Kaplan has pushed forward the reinvention of management accounting prac-tices. Kaplan’s work is essentially strategic management accounting, through a changein emphasis of the historic context of cost accounting to become forward-looking, to con-centrate on planning, to move from an emphasis on cost to one on value, to stress mar-keting as well as production and recognise external clients and competitors as opposed tothe internal factors. While the author feels that this emphasis perhaps undervalues the con-tribution of previous practice, he goes on to quote a past president of the CharteredInstitute of Management Accountants as claiming this new emphasis releases ‘the man-agement accountant from the factory floor’(Bromwich and Bhimani, 1989).
Otley goes on to look at the so-called second major innovation to come from Kaplan (seeKaplan and Norton, 1996), the ‘balanced scorecard’, which is seen as a framework for per-formance measurement that includes both financial and non-financial elements in thestrategic decision-making process. However, he points out that the literature on the bal-anced scorecard shows a lack of coverage of target setting, resource allocation, reward sys-tems design, and the separation of tactical and strategic feedback, despite diagramscovering these items in the 1996 book. In contrast, the economic value-added techniquedeveloped by Stern Stewart Corporation is seen as putting no ‘explicit’ emphasis on strat-egy either in practice or in theory, but adherence to the principle of generating shareholdervalue is achieved by close attention to each stage of the management process. Performancemeasurement is core to the system, and rewards devised to mitigate inappropriate behav-iour within feedback processes which update targets over time to achieve ‘value added’.Initially these approaches were seen as in conflict, but more recently a more collaborativeapproach seems to be developing, taking the benefits of both ideas. In the context of thepaper by Otley, what is stressed is that management accounting practices have changedradically over the past fifteen years. This is through the linking of financial and non-financialmeasures and presents major challenges to the discipline.
250 MANAGEMENT ACCOUNTING
Coombs-08.qxd 3/18/2005 1:09 PM Page 250

The remainder of the paper goes on to explore issues of how management accountingresearch has adopted to this environment. Otley’s answer is ‘not very well’ in that the dis-cipline seems to have become somewhat sterile, perhaps losing touch with managementpractices. The theme of the paper is the widening role of the management accountant inboth public and private organisations. The call in the paper is to put ‘management’ backinto management accounting; the interest in ‘real’ organisations in understanding anddeveloping their systems of performance management has never been greater. Otleyconcludes by saying that in his opinion management accounting researchers should ‘seizethese opportunities’.
Spicer, B.H. (1988) ‘Towards an organisation theory of the transfer pricingprocess’, Accounting, Organizations and Society, 13(3): 303–22.Spicer’s article builds upon the work of Watson and Baumler (1975) relating to the behav-ioural aspects of transfer pricing (TP).
The classical approach makes assumptions about the firm (e.g. profit maximising) andtries to develop an optimal TP model using an analytical (linear programming) approach.The assumptions, however, limit the wider organisational analysis of the effects of TP,for example on the firm’s various strategies of diversification, management accountingand control. It must be recognised, however, that the benefits of any chosen TP system arecontingent upon the organisational structure of the firm.
The firm, states Spicer, can be seen as a network of transactions whose costs vary withcomplexity. These transactions (both internal and external to the firm) and their associ-ated choices, have associated problems, such as bounded rationality and opportunism.Therefore moral hazard is introduced into exchange relationships (by taking advantage ofasymmetric information).
Spicer refers to Watson and Baumler, who argue that authors on TP have failed to ‘offera coherent theory of decentralisation’ so that the relationship between TP and decentrali-sation is not well thought out. The TP system should try to optimise effective differentia-tion (i.e. segmentation) and integration (i.e. common purpose) of the firm. TP enhancesdifferentiation by pinpointing responsibilities and, via negotiation, can aid in the integra-tion process. Spicer refers to Swieringa and Waterhouse (1982) and Eccles (1985) whocomment that the process of TP (rather than the details) may be useful in furtheringorganisational control. They concluded that the need for (and details of) the TP processwill depend heavily upon the diversification and decentralisation strategies of thecompany – the more a firm is diversified, the less likely it is to have a high level of inter-divisional transfers and the less of a problem TP is.
Spicer argues that two decisions are necessary: the design of the intermediate product(standardised or specialised/unique) and whether to make or buy the intermediate prod-uct. He provides a table examining the dimensions of such decisions and states that thecosts and hazards associated with such decisions are dependent upon the investments inassets necessary, the degree of uncertainty, and the extent (frequency and volume) ofactivity.
OPERATIONAL DECISION MAKING 251
Coombs-08.qxd 3/18/2005 1:09 PM Page 251

Spicer goes on to analyse this further, looking at a particular case where the intermediateproduct is made within the firm and transferred between different profit centres with dif-ferent profit streams. This analysis looks specifically at: the dimensions of intrafirm trans-actions, internal contracting hazards (how they arise and how they can be dealt with), andthe need for adaptation and co-operation (to achieve overall objectives). The analysis dis-cusses these factors at length and also considers the factors involved in deciding thedegree of managerial autonomy in the TP process.
Spicer puts forward nine hypotheses, drawn from the preceding discussion, relating tothe factors likely to affect the mode and process of TP likely to be chosen by an organi-sation. These hypotheses deal with the effects on TP of factors such as: diversificationstrategy; product design; organisational structure; transaction-specific investment; fre-quency and volume of transactions; degree of uncertainty; degree of conflict; the need forarticulation and negotiation; the bases of TP (e.g. cost- or market-based); and degree ofcentral control.
Overall, using a contingency approach, the article attempts to place TP within a widerorganisational context and prepares the ground for further empirical research.
Case Study: The Odd-Job Manufacturing Company
The Odd-Job Manufacturing Company (OJMC) produces toolboxes from plastic andmetal in a single plant. The basic product is made from strong 5 mm plastic with a plas-tic handle and metal hinges and wheels. The company has a good reputation in themarket because the standard toolbox is a high-quality item, has been well-produced andhas sold well for many years.
Two years ago the company decided to expand its product line and produce bespokeboxes for the different retail outlets, usually those that specialise in do-it-yourself supplies.These boxes differ from the standard because they are produced in a range of sizes, theyhave a metal handle and carry the logo of the specific retail outlet. The standard one-sizetoolboxes are simply imprinted with the company’s initials, OJMC.
In order to reduce the labour cost of the speciality toolboxes, much of the assembly workis done by automated machines. These machines are used to a much lesser degree in theproduction of the standard toolbox. With the lower cost of labour, the accounting depart-ment has determined that the speciality toolboxes are less costly to manufacture than thestandard toolboxes. This is shown in the summary data below. Because the bespoke tool-boxes are special-order items, they are priced at a higher level than the standard toolbox.
The managing director of OJMC, T.E.N. Onsaw, exploded when he saw the abovefigures and demanded, ‘Why do we produce the standard item? It seems time to cutback, cut the standard, just produce the special lines and see if we can grow them more.’
The company’s marketing director, Pierre Lasterboard, commented, ‘I agree that thebespoke business is working better and there seems to be plenty of work out there,
252 MANAGEMENT ACCOUNTING
Coombs-08.qxd 3/18/2005 1:09 PM Page 252

Note that the manufacturing overhead is absorbed via direct labour hours and theabsorption rate of £15.69 per hour is obtained from the budgeted manufacturing over-head (£40,012) divided by the budgeted direct labour hours (2550 hours).
Further investigation reveals that standard toolboxes are produced in batches of200 units, whilst speciality toolboxes are produced in batches of 25 units. In conse-quence, in each month the company makes 100 set-ups for the bespoke items and 50set-ups for the standard products. Each machine set-up requires 1 hour for the standardproduct and 2 hours for the bespoke product.
particularly as the competition has not been able to touch our price. Our biggest com-petitor charges £15 for bespoke items.’
However, the finance director, Dee Rill, is not as easily convinced. She observes that,‘Since we introduced the bespoke lines, our annual net profit has fallen by £350,000. Thisbusiness has produced sales but it has also required investment and other costs.’ TheManaging Director responds, ‘Dee, that’s all very well but the unit gross profit figures telltheir own story! Your argument just seems to be suggesting that neither line makes a profit –yet the company makes a profit so we must be doing something right. As chief accoun-tant, Dee, I suggest that you sort this out as soon as possible and let me have somethingdefinitive before we move any further on this issue.’
Dee begins her investigation and first obtains a breakdown of the manufacturing costof each of the company’s product lines as follows:
OPERATIONAL DECISION MAKING 253
Per unit Standard (£) Bespoke (£)
Selling price 9.00 10.00Manufacturing cost 8.94 6.10Gross profit 0.06 3.9
Standard Specials
Units produced each month 10,000 5,500Per unit Per unit
£ £Direct materials 5.00 4.13Direct labour (at £4 per hour) 0.80 0.40Prime cost 5.80 4.53Manufacturing overhead (£15.69 per hour) 3.14 1.57Manufacturing cost 8.94 6.10
Coombs-08.qxd 3/18/2005 1:09 PM Page 253

Complete Dee Rill’s investigation and write a report to the managing director thatexamines the strengths and weaknesses of the existing costing system, examines theconsequences for the company of continuing with it and evaluates an alternative system.You should illustrate how an alternative system should work and explain its significancefor the company’s production and marketing strategies.
Questions1. Submarine Cables makes mobile telephones for underwater use. The budgeted
revenues and costs for the year ended 30 June 2004 are as follows:
Each standard toolbox requires 0.5 hours of machine time but, due to its higher levelof automation, each bespoke toolbox requires 2 hours of machine time.
At the end of the production process all toolboxes are inspected to ensure that qual-ity standards are met. The standard toolbox requires little inspection time as the workerscorrect for any quality problems as they process the units. In total the standard toolboxrequires 300 hours of inspection per month, and the speciality toolbox 500 hours ofinspection time per month.
Dee also has access to results of a consultant’s recent study of monthly overheads. Theconsultant’s report includes the following summary:
254 MANAGEMENT ACCOUNTING
Overhead activity Overhead cost Standard Speciality(cost driver) £ No. of events products products
Purchasing (no. of orders) 3,000 60 48 12Material handling (no. of receipts) 3,750 60 52 8Production orders and set-ups 5,062 150 50 100
(set-up time)Inspection (inspection hours) 4,000 800 300 500Frame assembly (assembly hours) 10,200 2,550 2,000 550Machine-related (machine hours) 14,000 7,000 2,000 5,000Total 40,012
Revenues £600,000Variable costs 420,000Fixed costs 150,000Net profit 30,000
Coombs-08.qxd 3/18/2005 1:09 PM Page 254

Capital employed will be £600,000. Budgeted output for the year ended 30 June 2004 is30,000 units, which represents 60% of output capacity.
The management of the company are concerned about the low level of budgeted profitand return on capital employed. They have asked you to analyse and evaluate the follow-ing independent options for improving performance:
(a) An enquiry has been received from a wholesaler in Kazakhstan who has indi-cated that he is prepared to take 12,000 units at a price of £16 per unit, withSubmarine Cables paying the carriage and customs charges estimated at£2000. Submarine Cables has never previously dealt with this wholesaler orthis distant market.
(b) Reduce selling price by 10%. It is thought that this will increase demand tocapacity. However, it will need to be supported by a new system of sales-men’s commissions; these will be 50 pence per unit sold in 2000/2001.
(c) The managing director believes in setting targets and has announced a profittarget of 10% of capital employed. The managing director wants to knowwhat price increase is necessary to achieve the target with the current levelof sales, and what sales increase is necessary to achieve the target with thecurrent price per unit.
(d) A machine may be leased at a cost of £15,000 per annum. The machine willcause variable costs to fall by 50% per unit; it will also increase current capa-city by 20%.
For each option (a)–(d), determine whether it is financially worthwhile and commenton its non-financial aspects.
2. Didcot is small company that specialises in producing virtual reality (VR)machines for large international entertainment companies. One of these hasoffered Didcot a contract to produce and deliver 1000 identical VR machines overa 26-week period starting on 1 June 2004.
Each machine requires the following materials:
• 2 square metres of Yalloy: Yalloy is in continuous use by the company and 500square metres are currently in stock at a book value of £80 per square metre. Futurepurchases will cost £90 per square metre.
• 1 translucent fitment: 1500 are in stock at a book value of £10 each. However, thistype of fitment will have no other use if not used on this contract, although they maybe sold for scrap at £2 each. It is possible to purchase a new version of the fitmentat £20 per fitment, although the type in stock is adequate for the contract.
• 2 yardarm controllers: there are none in stock. The current purchase price is £50 percontroller.
• 1 piezo control: these will be purchased at £25 each and are specific to VR machinesin the contract.
OPERATIONAL DECISION MAKING 255
Coombs-08.qxd 3/18/2005 1:09 PM Page 255

The following mixture of labour is required:
• Skilled: each VR machine will require 3 hours of skilled labour. Skilled labour iscurrently paid £4.80 per hour and will be fully employed on other work during thenext 26 weeks. In order to fulfil the contract a skilled worker will be taken off otherwork which will be undertaken by a temporary replacement provided by a localagency at £6 per hour.
• Semi-skilled: each machine will require 4 hours of semi-skilled labour. The currentrate for semi-skilled labour is £3.50 per hour and sufficient temporary workers canbe recuited for this work.
In the case of both skilled and semi-skilled employees, national insurance adds a further12% to the cost of employment. This is not payable by Didcot in the case of agencyworkers.
Supervision of the work will be carried out by a senior manager who is currently paid£25,000 per year (with superannuation and national insurance adding a further 20% to thecosts of employment). In order to free her time to undertake this work, an agency willprovide cover at a cost of £500 per week.
Didcot absorbs production overhead by a machine rate that is currently £40 per hour.Of this, £15 is variable and £25 is fixed. Each VR machine will require 2 machine hours.Additionally, fixed overheads directly attributable to the production of VRs are likely toincrease by £15,000 over the period of the contract.
The costs of negotiating and drawing up the contract to supply 1000 VR machines haveamounted to £800.
A price of £520 per machine has been agreed with the entertainment company. Theentertainment company has stipulated within the contract that it will pay only £250 permachine for any that are delivered up to four weeks late. Machines delivered more thanfour weeks late will be delivered free of charge.
(a) Prepare a statement of the relevant costs of the contract and state whether ornot the contract should be undertaken by Didcot. Provide notes to indicatewhy you have selected some costs and rejected others.
(b) Comment on three significant factors that management needs to considerbefore finally agreeing to take the contract.
3. Traffick PLC has been forced to close for two weeks because of supply problems.During that time the company produced no count meters. The company issued apress statement that the supply failure had cost the company £1 million. This figurewas based on the loss of turnover over the two-week period.
The company’s financial accountant has subsequently made a more detailed assessmentof the cost, as follows:
256 MANAGEMENT ACCOUNTING
Coombs-08.qxd 3/18/2005 1:09 PM Page 256

£000 £000
Lost revenue (40,000 units @£25 each) 1000
Standard cost
Costs saved per unit (£)
Materials 1.0 40Direct labour 2.5 100Depreciation 4.0 160Variable overhead 3.0 120Sub-contracting work 1.0 40Fixed overhead 5.0 200 660
Cost of the supply failure 340
The following information is available:
(i) The direct labour was paid 75% of the normal wage during the two-week period,and this amounted to £75,000.
(ii) Depreciation is based on the straight-line method. However, there is a variablecomponent of depreciation amounting to 50 pence per unit produced.
(iii) Fixed overhead is absorbed at the rate of 200% on direct wages.(iv) The maintenance team was able to carry out a major overhaul of one of the
machines during the period of closure. They had to purchase materials costing£5000, but a contractor would normally have performed the overhaul at a cost of£25,000 (including materials). The cost of the maintenance team is includedwithin fixed overheads. The cost of the materials has not yet been recorded.
(v) The sales manager has estimated that because of the closure, there will be unsat-isfied demand amounting to half the production lost. This can be made up by theproduction workforce working overtime during the next month. Overtime is paidat an enhanced rate of 50% above the normal hourly rate.
(a) Examine points (i)–(v) and discuss the relevance of each of these costs tothe identification of the cost of closure.
(b) Produce a statement indicating the net cost of the closure. You will need toexplain the inclusion (or exclusion) of any items that you have not dis-cussed in part (a) of the question.
(c) Outline two potential problems with the use of relevant costing in decisionmaking.
4. Emily Wye is currently working on the production schedules for next month. Herfirm manufactures two types of ceramic grids:
OPERATIONAL DECISION MAKING 257
Coombs-08.qxd 3/18/2005 1:09 PM Page 257

(ii) Both products involve machine work, type A requiring 1 hour and B half an hour.The machine is available for 400 hours per month.
(iii) Next month the company will have available 900 kg of X1. The firm can buy asmuch X2 as it wishes.
(iv) Fixed overheads in the coming month will amount to £1950.
(a) The company wishes to maximise contribution. Set out the objective func-tion and the constraints.
(b) Determine the optimum output of each product next month using the graph-ical approach to linear programming. Calculate the optimum profit for themonth.
(c) Calculate the amount of spare capacity available next month. (d) Discuss three limitations of linear programming.
Jane Lane is the management accountant of a small manufacturing company. Jane normallygets involved in the production scheduling of the firm. She is currently working on thisfor the last three months of 2004, making use of her management accounting and linearprogramming skills.
The company manufactures components for rock climbing, including two types of iceaxe, the X1 and the X2. During the last quarter of 2004, each X1 will have a selling priceof £67 and each X2 a selling price of £78.
Notes:
(i) Labour rates and maximum labour hours available in the next month are:
258 MANAGEMENT ACCOUNTING
Type A Type B£ £
Selling price 60 70Material X1 (at £2 per kg) 3 6Material X2 (at £5 per kg) 10 10Direct labour (grade 1) 12 9Direct labour (grade 2) 10 15Variable overhead 5 7
Grade Hourly rate Max. monthly hours
1 £6 6402 £5 Unlimited
Coombs-08.qxd 3/18/2005 1:09 PM Page 258

In addition, monthly fixed manufacturing overheads are budgeted to be £2000 permonth and fixed non-manufacturing overheads are budgeted to be £5000 for the three-month period.
The company will have the following resources available to it for the last quarter of theyear: 800 metres of STX2, 2000 hours of labour and 1800 machine hours. The firm wishesto supply its retailers with no less than 150 of each type of axe during the final quarter.
(a) The company wishes to maximise contribution. Set out the objective function andthe constraints.
(b) Determine the optimum production of each product over the final quarter using thegraphical approach to linear programming and calculate the optimum net profit forthe final quarter of 2004.
(c) Calculate the shadow price of STX2 and explain how Jane may use it.
The cost of each axe is made up as follows:
OPERATIONAL DECISION MAKING 259
X1 (£) X2 (£)
Materials: STX2 at £12 per metre 15 18Labour: at £4.50 per hour 9 18Variable overhead: at £5 per mc/hr 10 15
Coombs-08.qxd 3/18/2005 1:09 PM Page 259