Embed Size (px)
Citation preview
Chapter 2 The Seventh PH-EITI Report (FY 2019) | 77
• • • • • • • • • • • •
• • • • • • • • • • • • • • • • • • • • • • • •
CHAPTER 2
Data Reconciliation
The Seven h PH-EITI Report (FY 2019)
Chapter 2 The Seventh PH-EITI Report (FY 2019) | 78
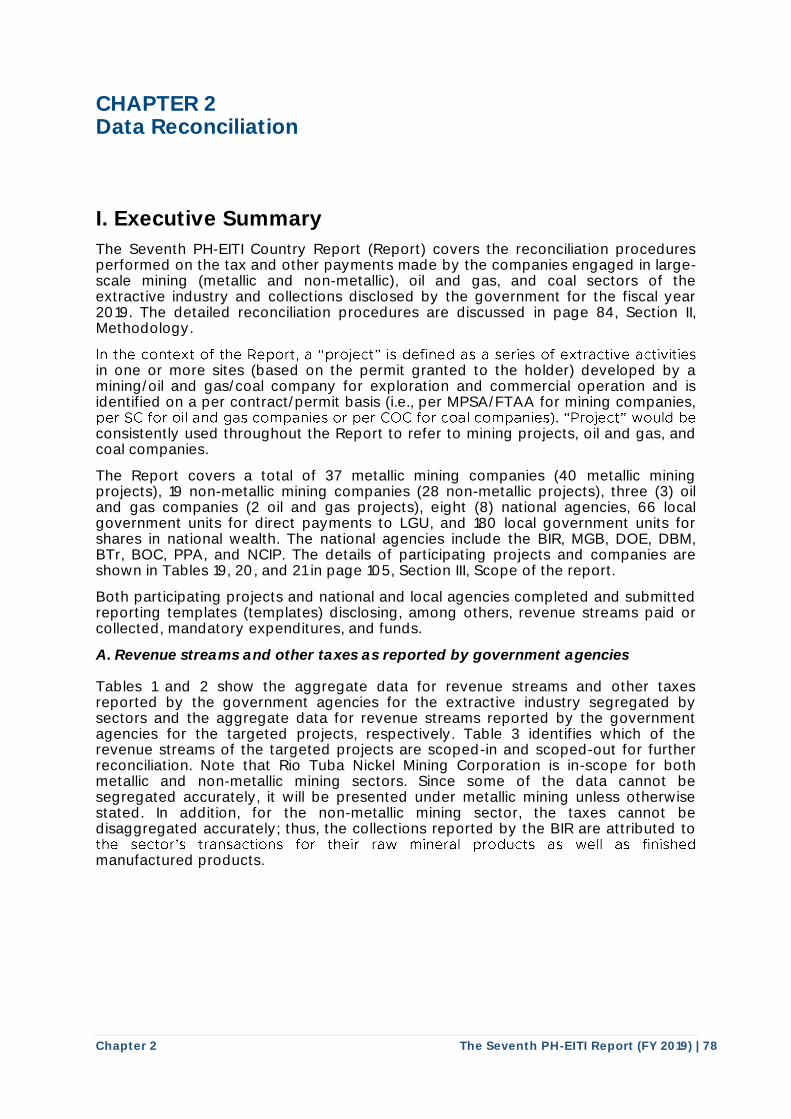
CHAPTER 2 Data Reconciliation I. Executive Summary
The Seventh PH-EITI Country Report (Report) covers the reconciliation procedures performed on the tax and other payments made by the companies engaged in large-scale mining (metallic and non-metallic), oil and gas, and coal sectors of the extractive industry and collections disclosed by the government for the fiscal year 2019. The detailed reconciliation procedures are discussed in page 84, Section II, Methodology.
in one or more sites (based on the permit granted to the holder) developed by a mining/oil and gas/coal company for exploration and commercial operation and is identified on a per contract/permit basis (i.e., per MPSA/FTAA for mining companies,
consistently used throughout the Report to refer to mining projects, oil and gas, and coal companies.
The Report covers a total of 37 metallic mining companies (40 metallic mining projects), 19 non-metallic mining companies (28 non-metallic projects), three (3) oil and gas companies (2 oil and gas projects), eight (8) national agencies, 66 local government units for direct payments to LGU, and 180 local government units for shares in national wealth. The national agencies include the BIR, MGB, DOE, DBM, BTr, BOC, PPA, and NCIP. The details of participating projects and companies are shown in Tables 19, 20, and 21 in page 105, Section III, Scope of the report.
Both participating projects and national and local agencies completed and submitted reporting templates (templates) disclosing, among others, revenue streams paid or collected, mandatory expenditures, and funds.
A. Revenue streams and other taxes as reported by government agencies Tables 1 and 2 show the aggregate data for revenue streams and other taxes reported by the government agencies for the extractive industry segregated by sectors and the aggregate data for revenue streams reported by the government agencies for the targeted projects, respectively. Table 3 identifies which of the revenue streams of the targeted projects are scoped-in and scoped-out for further reconciliation. Note that Rio Tuba Nickel Mining Corporation is in-scope for both metallic and non-metallic mining sectors. Since some of the data cannot be segregated accurately, it will be presented under metallic mining unless otherwise stated. In addition, for the non-metallic mining sector, the taxes cannot be disaggregated accurately; thus, the collections reported by the BIR are attributed to
manufactured products.
In the context of the Report, a "project" is defined as a series of extractive activities
per SC for oil and gas companies or per COC for coal companies). "Project" would be
the sector's transactions for their raw mineral products as well as finished
Chapter 2 The Seventh PH-EITI Report (FY 2019) | 79
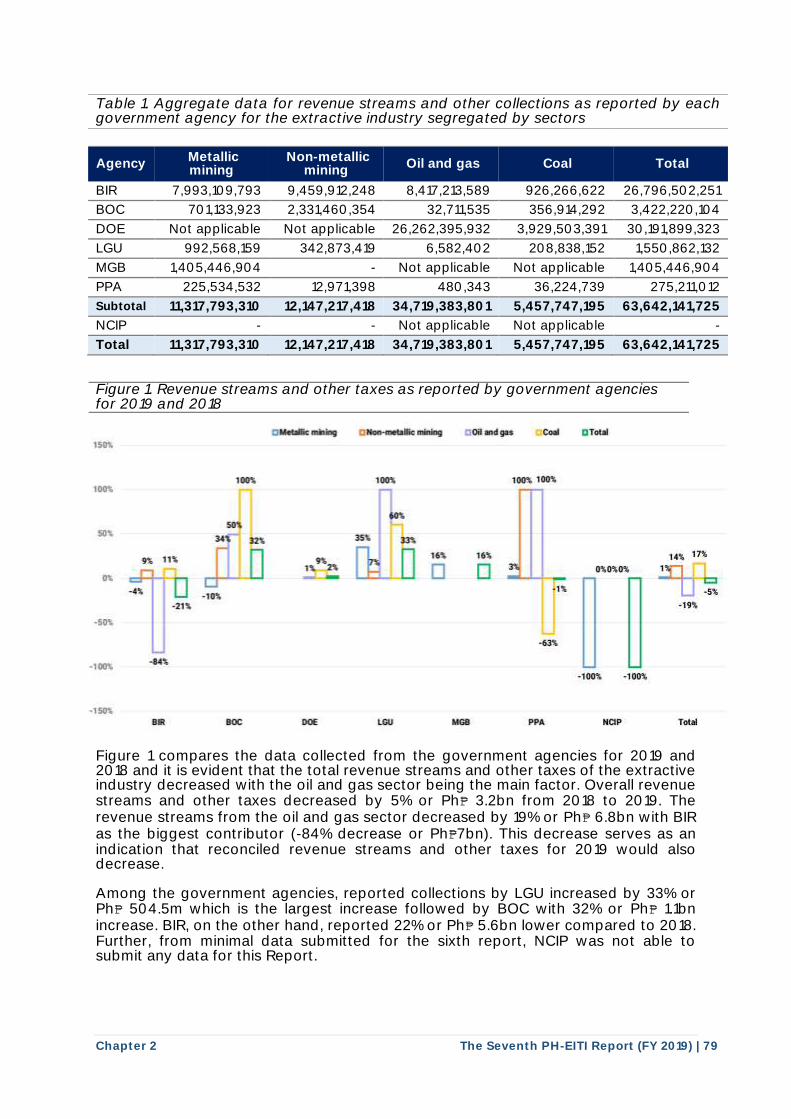
Table 1. Aggregate data for revenue streams and other collections as reported by each government agency for the extractive industry segregated by sectors
Agency Metallic mining
Non-metallic mining
Oil and gas Coal Total
BIR 7,993,109,793 9,459,912,248 8,417,213,589 926,266,622 26,796,502,251
BOC 701,133,923 2,331,460,354 32,711,535 356,914,292 3,422,220,104
DOE Not applicable Not applicable 26,262,395,932 3,929,503,391 30,191,899,323
LGU 992,568,159 342,873,419 6,582,402 208,838,152 1,550,862,132
MGB 1,405,446,904 - Not applicable Not applicable 1,405,446,904
PPA 225,534,532 12,971,398 480,343 36,224,739 275,211,012
Subtotal 11,317,793,310 12,147,217,418 34,719,383,801 5,457,747,195 63,642,141,725
NCIP - - Not applicable Not applicable -
Total 11,317,793,310 12,147,217,418 34,719,383,801 5,457,747,195 63,642,141,725
Figure 1. Revenue streams and other taxes as reported by government agencies for 2019 and 2018 Figure 1 compares the data collected from the government agencies for 2019 and 2018 and it is evident that the total revenue streams and other taxes of the extractive industry decreased with the oil and gas sector being the main factor. Overall revenue streams and other taxes decreased by 5% or Ph₱ 3.2bn from 2018 to 2019. The revenue streams from the oil and gas sector decreased by 19% or Ph₱ 6.8bn with BIR as the biggest contributor (-84% decrease or Ph₱7bn). This decrease serves as an indication that reconciled revenue streams and other taxes for 2019 would also decrease. Among the government agencies, reported collections by LGU increased by 33% or Ph₱ 504.5m which is the largest increase followed by BOC with 32% or Ph₱ 1.1bn increase. BIR, on the other hand, reported 22% or Ph₱ 5.6bn lower compared to 2018. Further, from minimal data submitted for the sixth report, NCIP was not able to submit any data for this Report.
OMeulllc mln"'9 Non·ll'llltalllc mltilng Oilandgu co.I DTOUI 1!,
100\ 100 1Gm'. 100\ 100
0\ 50\
~ u 11~ r 0 16\. 16\ 14\ 17',
'A n 1, 2\
□ □ D 0\ D\
□ b
·4\ 1\ -!,~ ·10\
·21\ -19\
·!iO
~, • I 4◄\
·100 -100\
• 1 Bil BOC OOE LGU MGB PPA NCIP Total
Chapter 2 The Seventh PH-EITI Report (FY 2019) | 80
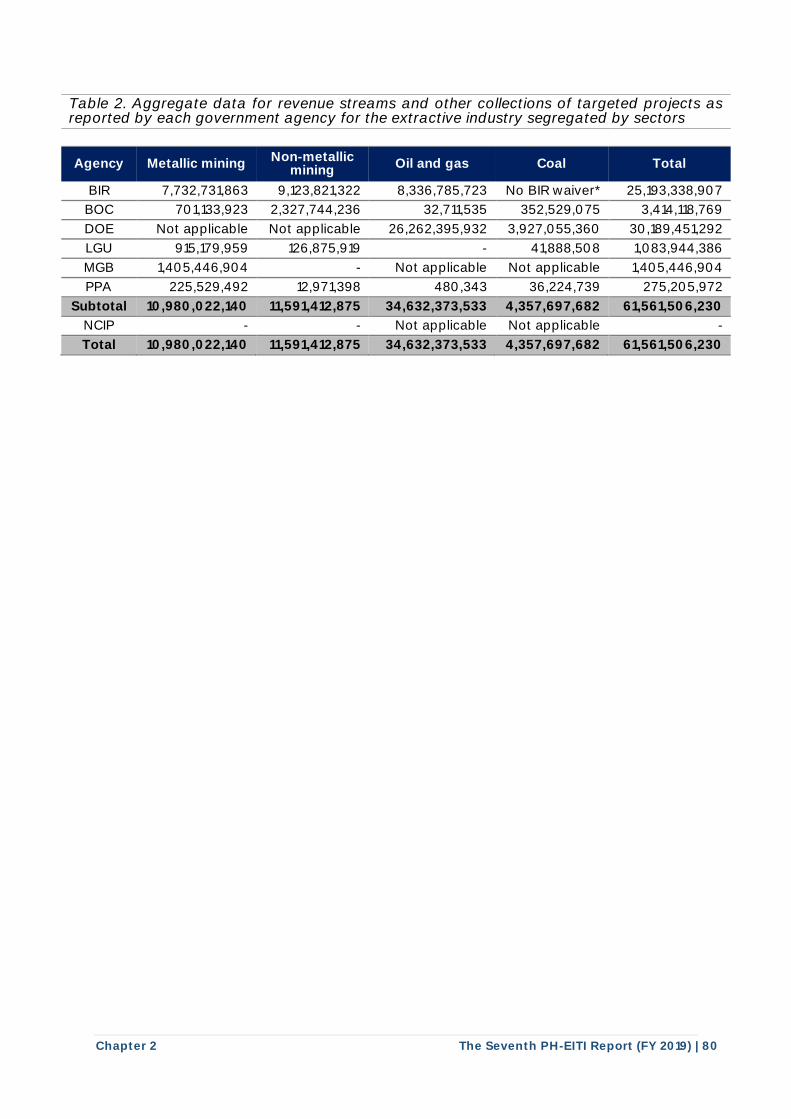
Table 2. Aggregate data for revenue streams and other collections of targeted projects as reported by each government agency for the extractive industry segregated by sectors
Agency Metallic mining Non-metallic
mining Oil and gas Coal Total
BIR 7,732,731,863 9,123,821,322 8,336,785,723 No BIR waiver* 25,193,338,907
BOC 701,133,923 2,327,744,236 32,711,535 352,529,075 3,414,118,769
DOE Not applicable Not applicable 26,262,395,932 3,927,055,360 30,189,451,292
LGU 915,179,959 126,875,919 - 41,888,508 1,083,944,386
MGB 1,405,446,904 - Not applicable Not applicable 1,405,446,904
PPA 225,529,492 12,971,398 480,343 36,224,739 275,205,972
Subtotal 10,980,022,140 11,591,412,875 34,632,373,533 4,357,697,682 61,561,506,230
NCIP - - Not applicable Not applicable -
Total 10,980,022,140 11,591,412,875 34,632,373,533 4,357,697,682 61,561,506,230
Chapter 2 The Seventh PH-EITI Report (FY 2019) | 81
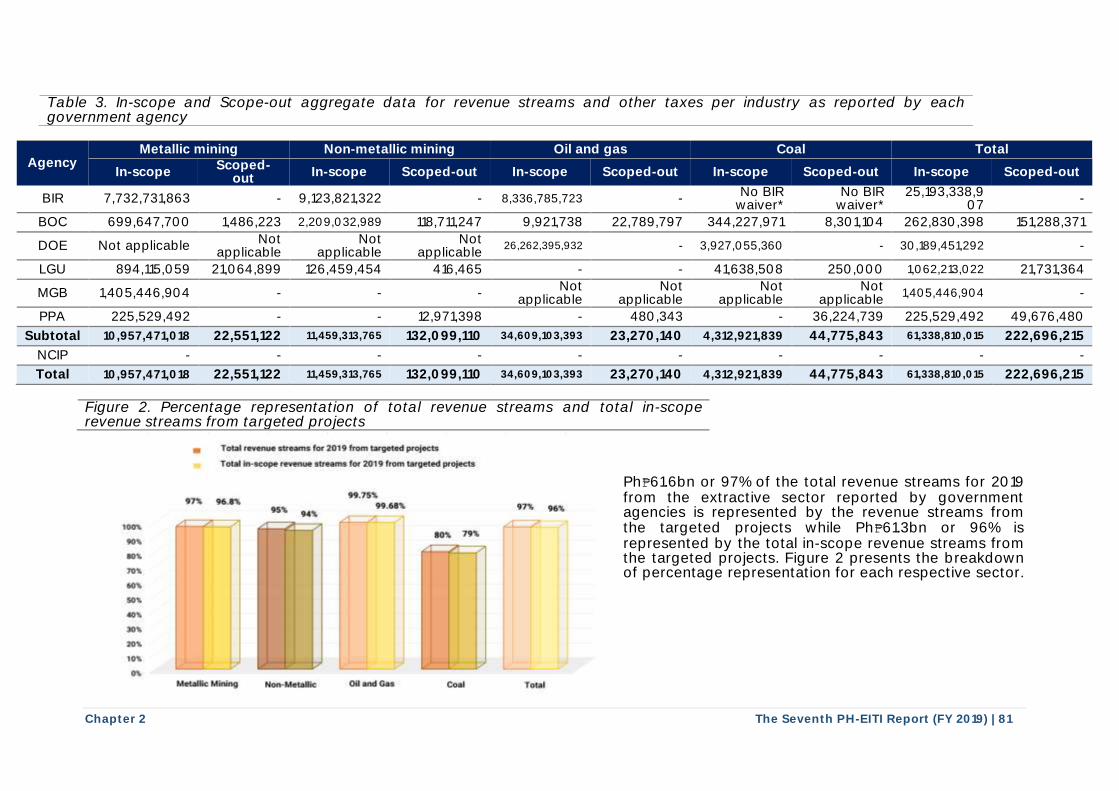
Table 3. In-scope and Scope-out aggregate data for revenue streams and other taxes per industry as reported by each government agency
Agency Metallic mining Non-metallic mining Oil and gas Coal Total
In-scope Scoped-
out In-scope Scoped-out In-scope Scoped-out In-scope Scoped-out In-scope Scoped-out
BIR 7,732,731,863 - 9,123,821,322 - 8,336,785,723 - No BIR waiver*
No BIR waiver*
25,193,338,907
-
BOC 699,647,700 1,486,223 2,209,032,989 118,711,247 9,921,738 22,789,797 344,227,971 8,301,104 262,830,398 151,288,371
DOE Not applicable Not applicable
Not applicable
Not applicable
26,262,395,932 - 3,927,055,360 - 30,189,451,292 -
LGU 894,115,059 21,064,899 126,459,454 416,465 - - 41,638,508 250,000 1,062,213,022 21,731,364
MGB 1,405,446,904 - - - Not
applicable Not
applicable Not
applicable Not
applicable 1,405,446,904 -
PPA 225,529,492 - - 12,971,398 - 480,343 - 36,224,739 225,529,492 49,676,480
Subtotal 10,957,471,018 22,551,122 11,459,313,765 132,099,110 34,609,103,393 23,270,140 4,312,921,839 44,775,843 61,338,810,015 222,696,215
NCIP - - - - - - - - - -
Total 10,957,471,018 22,551,122 11,459,313,765 132,099,110 34,609,103,393 23,270,140 4,312,921,839 44,775,843 61,338,810,015 222,696,215
Figure 2. Percentage representation of total revenue streams and total in-scope revenue streams from targeted projects
Ph₱61.6bn or 97% of the total revenue streams for 2019 from the extractive sector reported by government agencies is represented by the revenue streams from the targeted projects while Ph₱61.3bn or 96% is represented by the total in-scope revenue streams from the targeted projects. Figure 2 presents the breakdown of percentage representation for each respective sector.
100
o .. 8D11.
1 D'll
60 ..
50
.a 0 ..
7D11.
,o ..
Total revenue strums for 2019 from tarvetcd projc,c_ts
• Total ln•acope ,e,,-sueama f« 2.019 lrom wg led projects
95 '11. 99.61'11. U 'II.
- ·✓
7 "
I
•·
I
.__, '_;;J
Metal6c Mir\ing Non,.,Meaillle Oil at1dG s Co I Totlll
Chapter 2 The Seventh PH-EITI Report (FY 2019) | 82
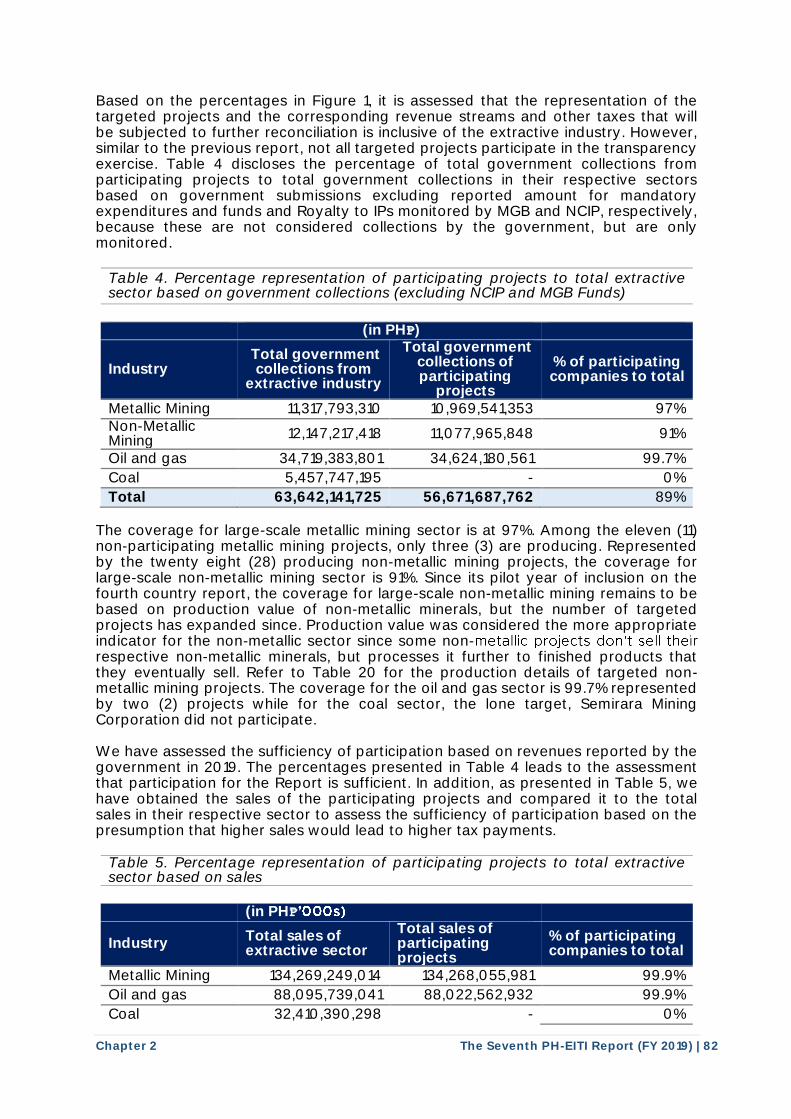
Based on the percentages in Figure 1, it is assessed that the representation of the targeted projects and the corresponding revenue streams and other taxes that will be subjected to further reconciliation is inclusive of the extractive industry. However, similar to the previous report, not all targeted projects participate in the transparency exercise. Table 4 discloses the percentage of total government collections from participating projects to total government collections in their respective sectors based on government submissions excluding reported amount for mandatory expenditures and funds and Royalty to IPs monitored by MGB and NCIP, respectively, because these are not considered collections by the government, but are only monitored.
Table 4. Percentage representation of participating projects to total extractive sector based on government collections (excluding NCIP and MGB Funds)
(in PH₱)
Industry Total government
collections from extractive industry
Total government collections of participating
projects
% of participating companies to total
Metallic Mining 11,317,793,310 10,969,541,353 97% Non-Metallic Mining 12,147,217,418 11,077,965,848 91%
Oil and gas 34,719,383,801 34,624,180,561 99.7%
Coal 5,457,747,195 - 0%
Total 63,642,141,725 56,671,687,762 89% The coverage for large-scale metallic mining sector is at 97%. Among the eleven (11) non-participating metallic mining projects, only three (3) are producing. Represented by the twenty eight (28) producing non-metallic mining projects, the coverage for large-scale non-metallic mining sector is 91%. Since its pilot year of inclusion on the fourth country report, the coverage for large-scale non-metallic mining remains to be based on production value of non-metallic minerals, but the number of targeted projects has expanded since. Production value was considered the more appropriate indicator for the non-metallic sector since some non-respective non-metallic minerals, but processes it further to finished products that they eventually sell. Refer to Table 20 for the production details of targeted non-metallic mining projects. The coverage for the oil and gas sector is 99.7% represented by two (2) projects while for the coal sector, the lone target, Semirara Mining Corporation did not participate. We have assessed the sufficiency of participation based on revenues reported by the government in 2019. The percentages presented in Table 4 leads to the assessment that participation for the Report is sufficient. In addition, as presented in Table 5, we have obtained the sales of the participating projects and compared it to the total sales in their respective sector to assess the sufficiency of participation based on the presumption that higher sales would lead to higher tax payments.
Table 5. Percentage representation of participating projects to total extractive sector based on sales (in PH₱
Industry Total sales of extractive sector
Total sales of participating projects
% of participating companies to total
Metallic Mining 134,269,249,014 134,268,055,981 99.9%
Oil and gas 88,095,739,041 88,022,562,932 99.9%
Coal 32,410,390,298 - 0%
Total
metallic projects don't sell their
'000s)
Chapter 2 The Seventh PH-EITI Report (FY 2019) | 83
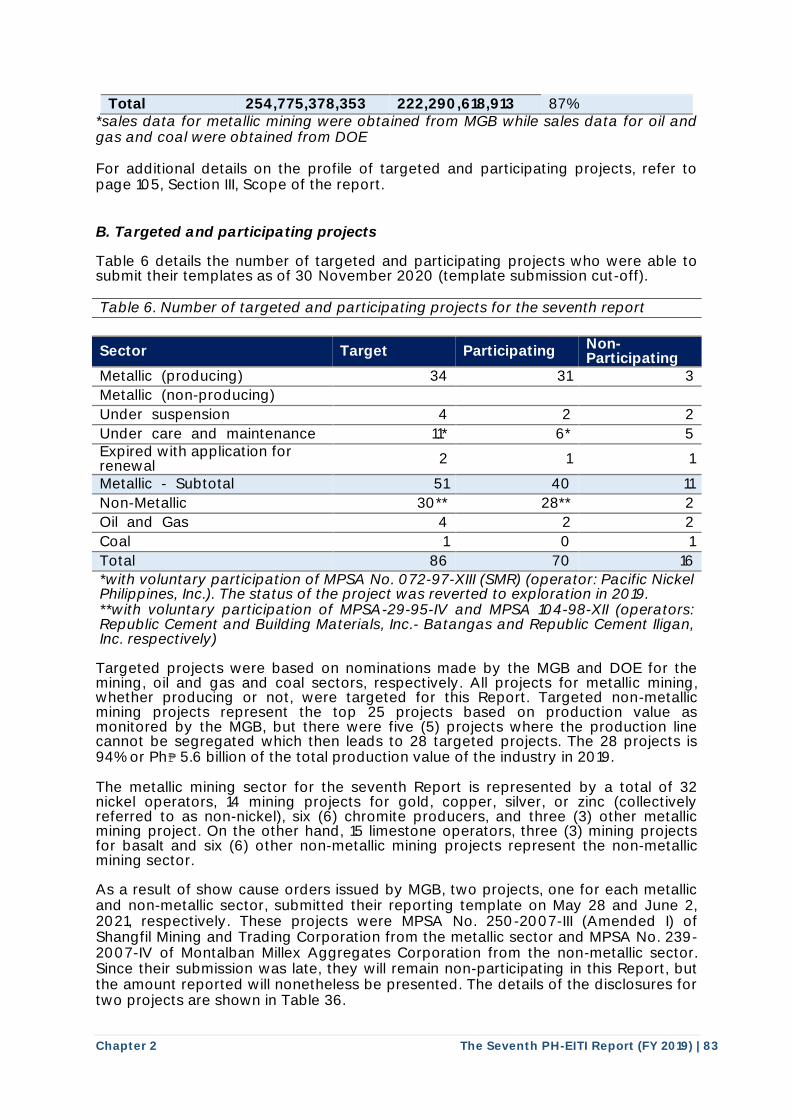
Total 254,775,378,353 222,290,618,913 87% *sales data for metallic mining were obtained from MGB while sales data for oil and gas and coal were obtained from DOE For additional details on the profile of targeted and participating projects, refer to page 105, Section III, Scope of the report. B. Targeted and participating projects Table 6 details the number of targeted and participating projects who were able to submit their templates as of 30 November 2020 (template submission cut-off). Table 6. Number of targeted and participating projects for the seventh report
Sector Target Participating Non-Participating
Metallic (producing) 34 31 3
Metallic (non-producing)
Under suspension 4 2 2
Under care and maintenance 11* 6* 5 Expired with application for renewal 2 1 1
Metallic - Subtotal 51 40 11
Non-Metallic 30** 28** 2
Oil and Gas 4 2 2
Coal 1 0 1
Total 86 70 16
*with voluntary participation of MPSA No. 072-97-XIII (SMR) (operator: Pacific Nickel Philippines, Inc.). The status of the project was reverted to exploration in 2019. **with voluntary participation of MPSA-29-95-IV and MPSA 104-98-XII (operators: Republic Cement and Building Materials, Inc.- Batangas and Republic Cement Iligan, Inc. respectively) Targeted projects were based on nominations made by the MGB and DOE for the mining, oil and gas and coal sectors, respectively. All projects for metallic mining, whether producing or not, were targeted for this Report. Targeted non-metallic mining projects represent the top 25 projects based on production value as monitored by the MGB, but there were five (5) projects where the production line cannot be segregated which then leads to 28 targeted projects. The 28 projects is 94% or Ph₱ 5.6 billion of the total production value of the industry in 2019. The metallic mining sector for the seventh Report is represented by a total of 32 nickel operators, 14 mining projects for gold, copper, silver, or zinc (collectively referred to as non-nickel), six (6) chromite producers, and three (3) other metallic mining project. On the other hand, 15 limestone operators, three (3) mining projects for basalt and six (6) other non-metallic mining projects represent the non-metallic mining sector. As a result of show cause orders issued by MGB, two projects, one for each metallic and non-metallic sector, submitted their reporting template on May 28 and June 2, 2021, respectively. These projects were MPSA No. 250-2007-III (Amended I) of Shangfil Mining and Trading Corporation from the metallic sector and MPSA No. 239-2007-IV of Montalban Millex Aggregates Corporation from the non-metallic sector. Since their submission was late, they will remain non-participating in this Report, but the amount reported will nonetheless be presented. The details of the disclosures for two projects are shown in Table 36.
Chapter 2 The Seventh PH-EITI Report (FY 2019) | 84
For oil and gas sector, producing projects were targeted while the coal sector, Semirara Mining and Power Corporation, the major player and lone target in the sector, remains to be a nonparticipant in the exercise for seven consecutive years despite continued communication and coordination with the company and the DOE, which is the lead government agency overseeing its operations.
In 2014, Semirara Mining and Power Corporation expressed their concern regarding the disclosure of their data on payments to the government which may be used against them in the global market, given the World Trade Organization (WTO)
competitiveness. The company also noted that the incentives they avail might be construed as government subsidy and may cause countries where they export to impose countervailing measures.
A letter signed by the MICC co-chairs, DENR and DOF Secretaries was transmitted in September 2015 to DOE seeking their assistance in requiring Semirara to participate. In January 2016, DOE sent a letter to Semirara encouraging them to participate in the PH-EITI exercise. DAO 2017-07 was issued in 2017 by DENR that mandates mining contractors to participate in the PH-EITI exercise. However, Semirara continuously insists that they are not covered by this administrative order and maintained their position not to participate in the exercise.
Notwithstanding the non-participation of Semirara Mining and Power Corporation, the following information on government share, real property taxes and income taxes weaudited financial statements:
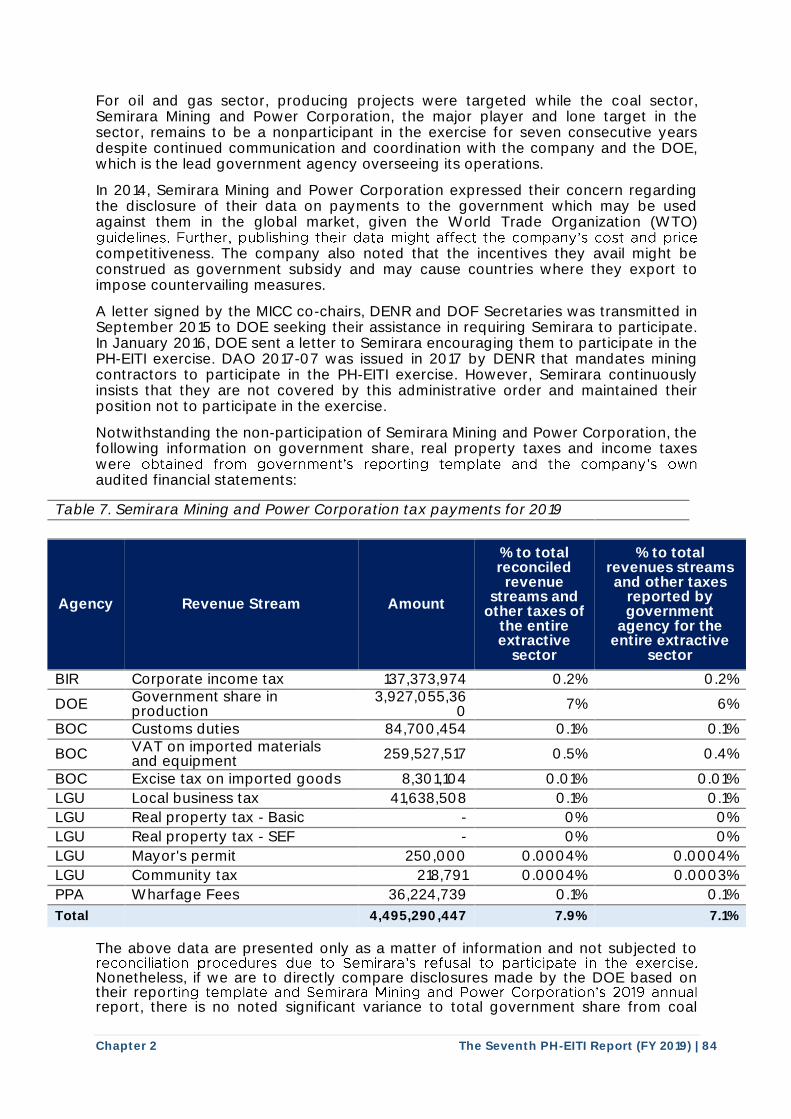
Table 7. Semirara Mining and Power Corporation tax payments for 2019
Agency Revenue Stream Amount
% to total reconciled
revenue streams and
other taxes of the entire extractive
sector
% to total revenues streams and other taxes
reported by government
agency for the entire extractive
sector
BIR Corporate income tax 137,373,974 0.2% 0.2%
DOE Government share in production
3,927,055,360 7% 6%
BOC Customs duties 84,700,454 0.1% 0.1%
BOC VAT on imported materials and equipment 259,527,517 0.5% 0.4%
BOC Excise tax on imported goods 8,301,104 0.01% 0.01%
LGU Local business tax 41,638,508 0.1% 0.1%
LGU Real property tax - Basic - 0% 0%
LGU Real property tax - SEF - 0% 0%
LGU Mayor's permit 250,000 0.0004% 0.0004%
LGU Community tax 218,791 0.0004% 0.0003%
PPA Wharfage Fees 36,224,739 0.1% 0.1%
Total 4,495,290,447 7.9% 7.1%
The above data are presented only as a matter of information and not subjected to
Nonetheless, if we are to directly compare disclosures made by the DOE based on their reporeport, there is no noted significant variance to total government share from coal
guidelines. Further, publishing their data might affect the company's cost and price
re obtained from government's reporting template and the company's own
reconciliation procedures due to Semirara's refusal to participate in the exercise.
rting template and Semirara Mining and Power Corporation's 2019 annual
Chapter 2 The Seventh PH-EITI Report (FY 2019) | 85
production of PH₱3.9bn. The annual report may be accessed through its website at http://www.semiraramining.com. A comparison to the total revenue streams and other taxes of the entire extractive sector reported by government agencies was conducted as presented in Table 7. The total of government collections attributed to Semirara Mining and Power Corporation amounting to PH₱4.5bn represents 20% (2018 - 17%) and 13% (2018 - 9%) of total reconciled revenue streams for mining and oil and gas, respectively, and only 7.9% (2018 5.8%) of the entire extractive sector. Accordingly, we have assessed revenue streams for coal to be immaterial in relation to total extractive sector as a whole and does not affect the comprehensiveness of the Report, however, PH-EITI continues to pursue Semirara as it primarily represents the local coal sector having 99.41% of the total coal production for 2019. Table 8 presents the percentage representation of participating projects based on reported government collections per sector and the extractive industry taken as a whole.
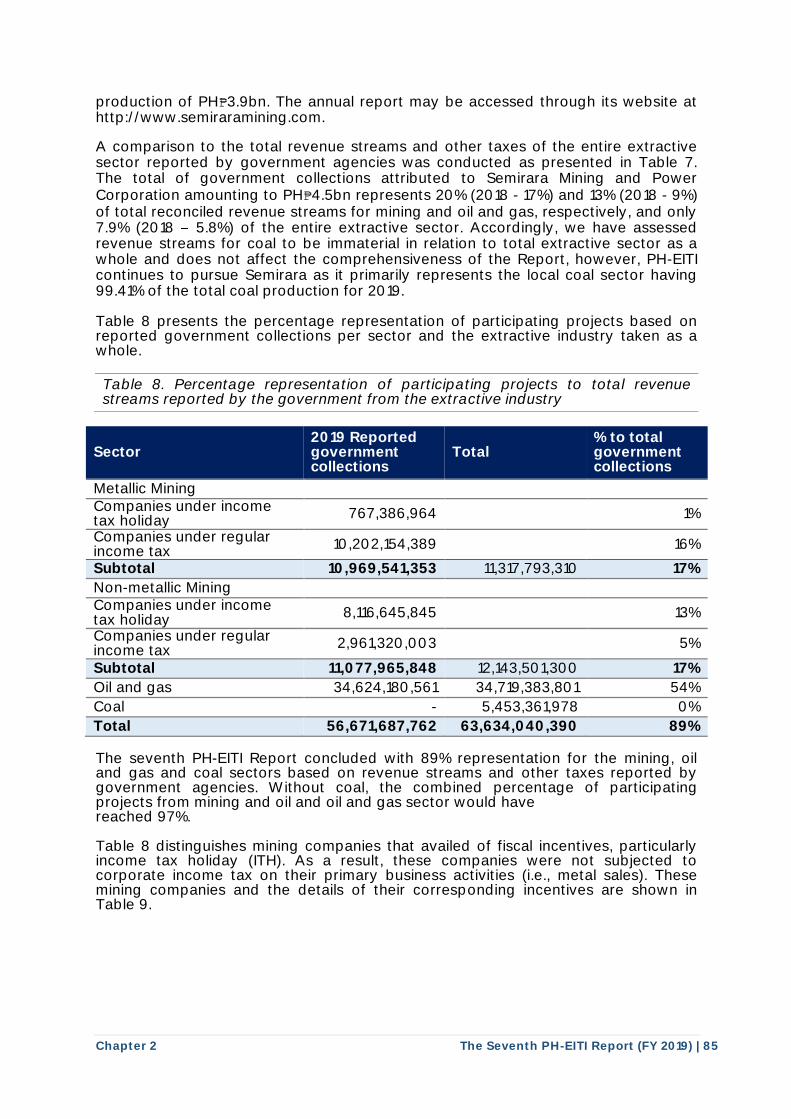
Table 8. Percentage representation of participating projects to total revenue streams reported by the government from the extractive industry
Sector 2019 Reported government collections
Total % to total government collections
Metallic Mining Companies under income tax holiday
767,386,964 1%
Companies under regular income tax 10,202,154,389 16%
Subtotal 10,969,541,353 11,317,793,310 17%
Non-metallic Mining Companies under income tax holiday 8,116,645,845 13%
Companies under regular income tax
2,961,320,003 5%
Subtotal 11,077,965,848 12,143,501,300 17%
Oil and gas 34,624,180,561 34,719,383,801 54%
Coal - 5,453,361,978 0%
Total 56,671,687,762 63,634,040,390 89% The seventh PH-EITI Report concluded with 89% representation for the mining, oil and gas and coal sectors based on revenue streams and other taxes reported by government agencies. Without coal, the combined percentage of participating projects from mining and oil and oil and gas sector would have reached 97%. Table 8 distinguishes mining companies that availed of fiscal incentives, particularly income tax holiday (ITH). As a result, these companies were not subjected to corporate income tax on their primary business activities (i.e., metal sales). These mining companies and the details of their corresponding incentives are shown in Table 9.
Chapter 2 The Seventh PH-EITI Report (FY 2019) | 86
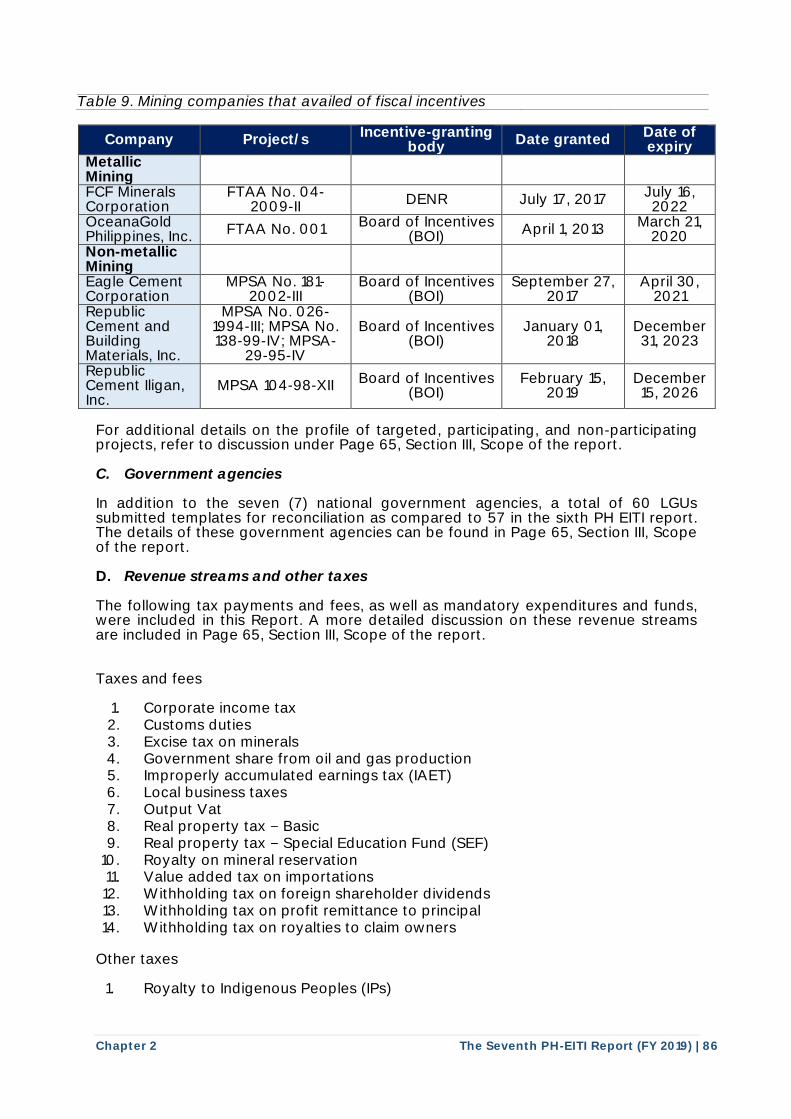
Table 9. Mining companies that availed of fiscal incentives
Company Project/s Incentive-granting
body Date granted Date of expiry
Metallic Mining
FCF Minerals Corporation
FTAA No. 04-2009-II DENR July 17, 2017
July 16, 2022
OceanaGold Philippines, Inc.
FTAA No. 001 Board of Incentives (BOI)
April 1, 2013 March 21, 2020
Non-metallic Mining
Eagle Cement Corporation
MPSA No. 181-2002-III
Board of Incentives (BOI)
September 27, 2017
April 30, 2021
Republic Cement and Building Materials, Inc.
MPSA No. 026-1994-III; MPSA No. 138-99-IV; MPSA-
29-95-IV
Board of Incentives (BOI)
January 01, 2018
December 31, 2023
Republic Cement Iligan, Inc.
MPSA 104-98-XII Board of Incentives (BOI)
February 15, 2019
December 15, 2026
For additional details on the profile of targeted, participating, and non-participating projects, refer to discussion under Page 65, Section III, Scope of the report. C. Government agencies In addition to the seven (7) national government agencies, a total of 60 LGUs submitted templates for reconciliation as compared to 57 in the sixth PH EITI report. The details of these government agencies can be found in Page 65, Section III, Scope of the report. D. Revenue streams and other taxes The following tax payments and fees, as well as mandatory expenditures and funds, were included in this Report. A more detailed discussion on these revenue streams are included in Page 65, Section III, Scope of the report. Taxes and fees
1. Corporate income tax 2. Customs duties 3. Excise tax on minerals 4. Government share from oil and gas production 5. Improperly accumulated earnings tax (IAET) 6. Local business taxes 7. Output Vat 8. Real property tax Basic 9. Real property tax Special Education Fund (SEF)
10. Royalty on mineral reservation 11. Value added tax on importations 12. Withholding tax on foreign shareholder dividends 13. Withholding tax on profit remittance to principal 14. Withholding tax on royalties to claim owners
Other taxes
1. Royalty to Indigenous Peoples (IPs)
Chapter 2 The Seventh PH-EITI Report (FY 2019) | 87
Mandatory expenditures and funds
1. Annual Environmental Protection and Enhancement Program (AEPEP) 2. Annual Safety and Health Program (ASHP) 3. Annual Social Development Management Program (ASDMP) 4. Environmental Trust Fund 5. Final Mine Rehabilitation and Decommissioning Fund 6. Compensation for claims for damages from Mine Waste and Tailing Fees 7. Mine Waste and Tailings Fees (MWTF) 8. Monitoring Trust Fund 9. Rehabilitation Cash Fund
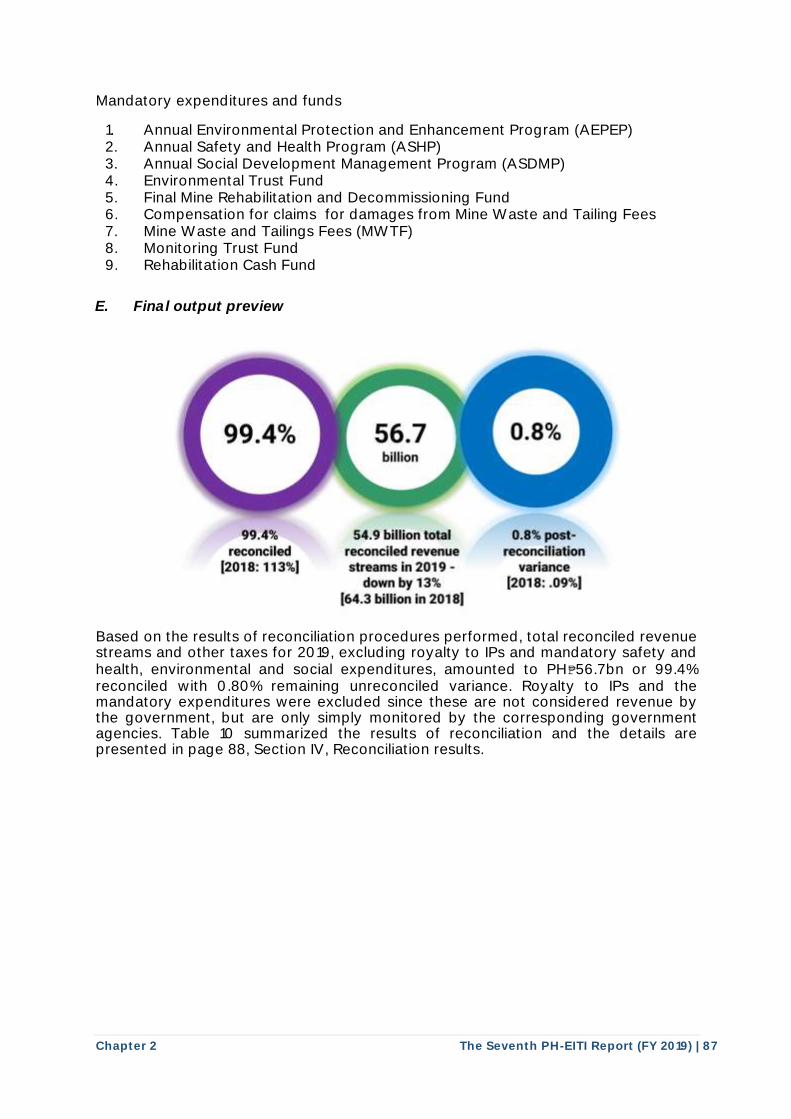
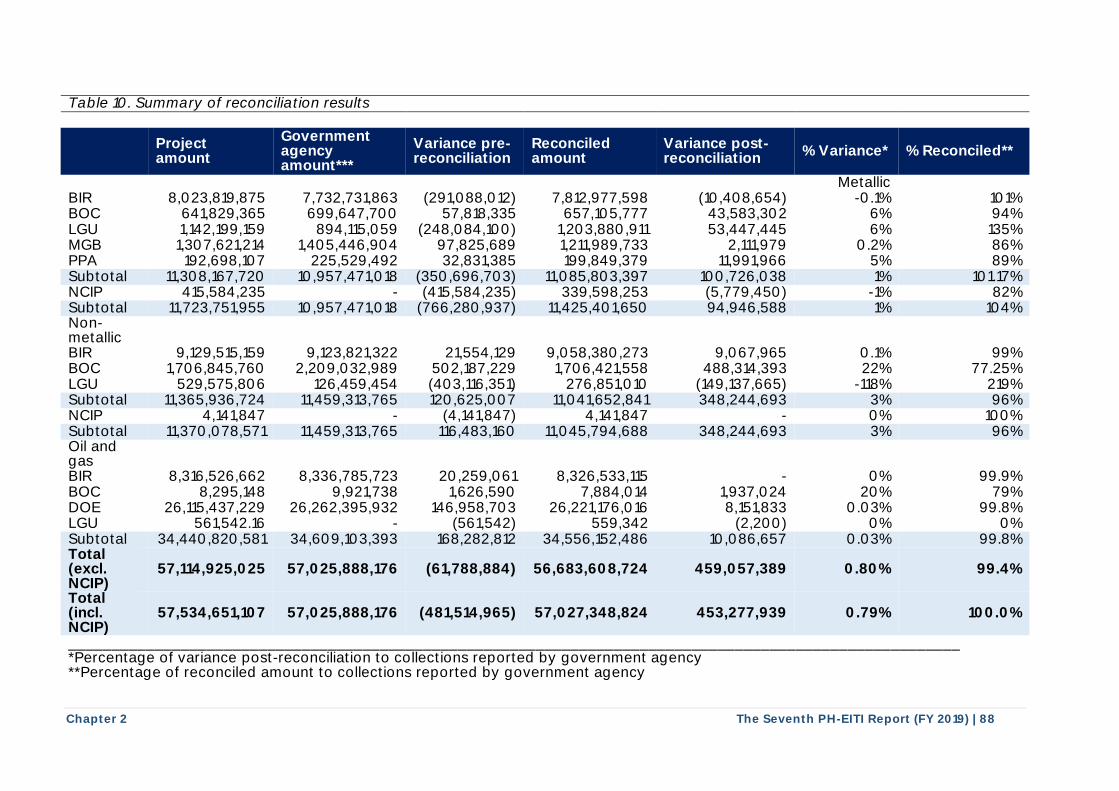
E. Final output preview Based on the results of reconciliation procedures performed, total reconciled revenue streams and other taxes for 2019, excluding royalty to IPs and mandatory safety and health, environmental and social expenditures, amounted to PH₱56.7bn or 99.4% reconciled with 0.80% remaining unreconciled variance. Royalty to IPs and the mandatory expenditures were excluded since these are not considered revenue by the government, but are only simply monitored by the corresponding government agencies. Table 10 summarized the results of reconciliation and the details are presented in page 88, Section IV, Reconciliation results.
99.4% reconciled
12018: 113'1.J
54.9 billion total reconciled revenue streams in 2019 -
downby13% 164.3 billion in 20181
0.8%postreconciliation
variance [2018 ... 09%1
Chapter 2 The Seventh PH-EITI Report (FY 2019) | 88
Table 10. Summary of reconciliation results
Project amount
Government agency amount***
Variance pre-reconciliation
Reconciled amount
Variance post-reconciliation
% Variance* % Reconciled**
Metallic BIR 8,023,819,875 7,732,731,863 (291,088,012) 7,812,977,598 (10,408,654) -0.1% 101% BOC 641,829,365 699,647,700 57,818,335 657,105,777 43,583,302 6% 94% LGU 1,142,199,159 894,115,059 (248,084,100) 1,203,880,911 53,447,445 6% 135% MGB 1,307,621,214 1,405,446,904 97,825,689 1,211,989,733 2,111,979 0.2% 86% PPA 192,698,107 225,529,492 32,831,385 199,849,379 11,991,966 5% 89% Subtotal 11,308,167,720 10,957,471,018 (350,696,703) 11,085,803,397 100,726,038 1% 101.17% NCIP 415,584,235 - (415,584,235) 339,598,253 (5,779,450) -1% 82% Subtotal 11,723,751,955 10,957,471,018 (766,280,937) 11,425,401,650 94,946,588 1% 104% Non-metallic
BIR 9,129,515,159 9,123,821,322 21,554,129 9,058,380,273 9,067,965 0.1% 99% BOC 1,706,845,760 2,209,032,989 502,187,229 1,706,421,558 488,314,393 22% 77.25% LGU 529,575,806 126,459,454 (403,116,351) 276,851,010 (149,137,665) -118% 219% Subtotal 11,365,936,724 11,459,313,765 120,625,007 11,041,652,841 348,244,693 3% 96% NCIP 4,141,847 - (4,141,847) 4,141,847 - 0% 100% Subtotal 11,370,078,571 11,459,313,765 116,483,160 11,045,794,688 348,244,693 3% 96% Oil and gas
BIR 8,316,526,662 8,336,785,723 20,259,061 8,326,533,115 - 0% 99.9% BOC 8,295,148 9,921,738 1,626,590 7,884,014 1,937,024 20% 79% DOE 26,115,437,229 26,262,395,932 146,958,703 26,221,176,016 8,151,833 0.03% 99.8% LGU 561,542.16 - (561,542) 559,342 (2,200) 0% 0% Subtotal 34,440,820,581 34,609,103,393 168,282,812 34,556,152,486 10,086,657 0.03% 99.8% Total (excl. NCIP)
57,114,925,025 57,025,888,176 (61,788,884) 56,683,608,724 459,057,389 0.80% 99.4%
Total (incl. NCIP)
57,534,651,107 57,025,888,176 (481,514,965) 57,027,348,824 453,277,939 0.79% 100.0%
_______________________________________________________________________________________________________ *Percentage of variance post-reconciliation to collections reported by government agency **Percentage of reconciled amount to collections reported by government agency

Chapter 2 The Seventh PH-EITI Report (FY 2019) | 89
***The government agency amounts and variance pre-reconciliation and post-reconciliation includes unilateral disclosures for in-scope revenue streams reported by government agencies for non-participating entities amounting to PH₱10.46m for the metallic mining sector, PH₱498.47m for the non-metallic mining sector and PH₱8.16m for the oil and gas sector. Refer to Section IV, Reconciliation results, of this chapter for the details of unilateral disclosures In this Report, NCIP was not able to submit data and as a result, the percentage reconciled and percentage variance for NCIP was based on the total amount reported by the projects. Supporting documents were obtained from participating projects to arrive at the reconciled amount. This procedure was adopted in recognition of the constraints faced by the NCIP in monitoring royalties which are, by law, paid by projects directly to the concerned IPs who are private parties. IP royalties are, therefore, not considered government revenue, but they are mandatory. While the NCIP is responsible for protecting the rights of the IPs of the Philippines, including their right to receive royalties, it is not a collecting agency. Moreover, it has had to deal with complex and serious challenges in and to its organization, including its budget. Thus, there has been considerable difficulty in getting data on IP royalties from the NCIP, even from its regional offices, most of which do not have ready access to the data themselves. The PH-EITI has put forward and followed up recommendations to help address the gaps in transparency in the NCIP, including developing a monitoring tool and conducting capacity-building activities with the agency and its stakeholders. The efforts continue. Refer to page 333, Section VIII, Recommendations.
Chapter 2 The Seventh PH-EITI Report (FY 2019) | 90
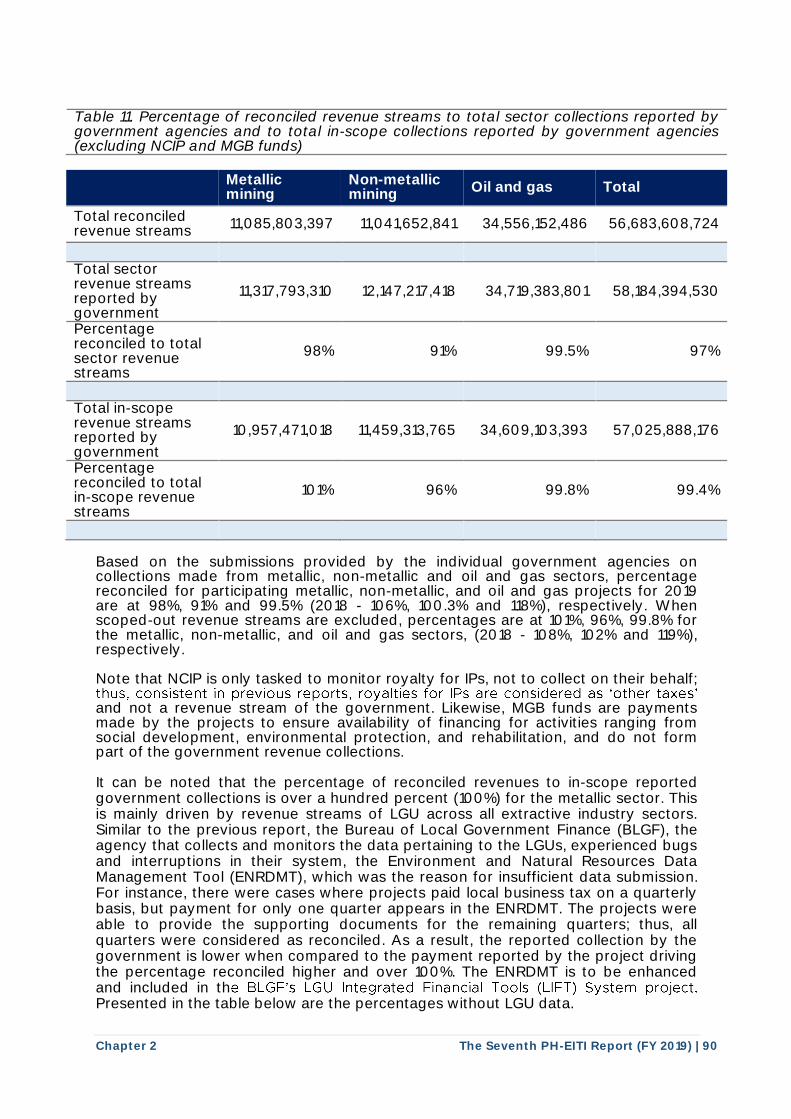
Table 11. Percentage of reconciled revenue streams to total sector collections reported by government agencies and to total in-scope collections reported by government agencies (excluding NCIP and MGB funds)
Metallic mining
Non-metallic mining Oil and gas Total
Total reconciled revenue streams 11,085,803,397 11,041,652,841 34,556,152,486 56,683,608,724
Total sector revenue streams reported by government
11,317,793,310 12,147,217,418 34,719,383,801 58,184,394,530
Percentage reconciled to total sector revenue streams
98% 91% 99.5% 97%
Total in-scope revenue streams reported by government
10,957,471,018 11,459,313,765 34,609,103,393 57,025,888,176
Percentage reconciled to total in-scope revenue streams
101% 96% 99.8% 99.4%
Based on the submissions provided by the individual government agencies on collections made from metallic, non-metallic and oil and gas sectors, percentage reconciled for participating metallic, non-metallic, and oil and gas projects for 2019 are at 98%, 91% and 99.5% (2018 - 106%, 100.3% and 118%), respectively. When scoped-out revenue streams are excluded, percentages are at 101%, 96%, 99.8% for the metallic, non-metallic, and oil and gas sectors, (2018 - 108%, 102% and 119%), respectively. Note that NCIP is only tasked to monitor royalty for IPs, not to collect on their behalf;
and not a revenue stream of the government. Likewise, MGB funds are payments made by the projects to ensure availability of financing for activities ranging from social development, environmental protection, and rehabilitation, and do not form part of the government revenue collections. It can be noted that the percentage of reconciled revenues to in-scope reported government collections is over a hundred percent (100%) for the metallic sector. This is mainly driven by revenue streams of LGU across all extractive industry sectors. Similar to the previous report, the Bureau of Local Government Finance (BLGF), the agency that collects and monitors the data pertaining to the LGUs, experienced bugs and interruptions in their system, the Environment and Natural Resources Data Management Tool (ENRDMT), which was the reason for insufficient data submission. For instance, there were cases where projects paid local business tax on a quarterly basis, but payment for only one quarter appears in the ENRDMT. The projects were able to provide the supporting documents for the remaining quarters; thus, all quarters were considered as reconciled. As a result, the reported collection by the government is lower when compared to the payment reported by the project driving the percentage reconciled higher and over 100%. The ENRDMT is to be enhanced and included in thPresented in the table below are the percentages without LGU data.
thus, consistent in previous reports, royalties for IPs are considered as 'other taxes'
e BLGF's LGU Integrated Financial Tools (LIFT) System project.
Chapter 2 The Seventh PH-EITI Report (FY 2019) | 91
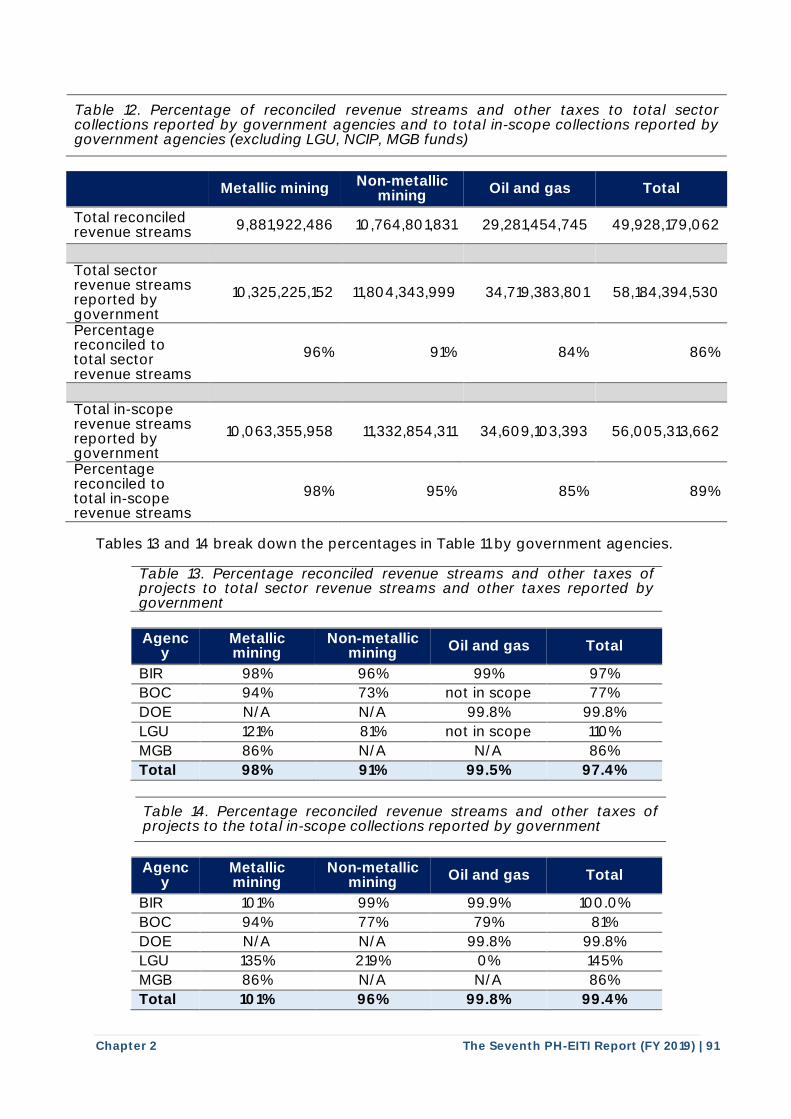
Table 12. Percentage of reconciled revenue streams and other taxes to total sector collections reported by government agencies and to total in-scope collections reported by government agencies (excluding LGU, NCIP, MGB funds)
Metallic mining Non-metallic
mining Oil and gas Total
Total reconciled revenue streams
9,881,922,486 10,764,801,831 29,281,454,745 49,928,179,062
Total sector revenue streams reported by government
10,325,225,152 11,804,343,999 34,719,383,801 58,184,394,530
Percentage reconciled to total sector revenue streams
96% 91% 84% 86%
Total in-scope revenue streams reported by government
10,063,355,958 11,332,854,311 34,609,103,393 56,005,313,662
Percentage reconciled to total in-scope revenue streams
98% 95% 85% 89%
Tables 13 and 14 break down the percentages in Table 11 by government agencies.
Table 13. Percentage reconciled revenue streams and other taxes of projects to total sector revenue streams and other taxes reported by government
Agency
Metallic mining
Non-metallic mining Oil and gas Total
BIR 98% 96% 99% 97%
BOC 94% 73% not in scope 77%
DOE N/A N/A 99.8% 99.8%
LGU 121% 81% not in scope 110%
MGB 86% N/A N/A 86%
Total 98% 91% 99.5% 97.4%
Table 14. Percentage reconciled revenue streams and other taxes of projects to the total in-scope collections reported by government
Agency
Metallic mining
Non-metallic mining Oil and gas Total
BIR 101% 99% 99.9% 100.0%
BOC 94% 77% 79% 81%
DOE N/A N/A 99.8% 99.8%
LGU 135% 219% 0% 145%
MGB 86% N/A N/A 86%
Total 101% 96% 99.8% 99.4%

Chapter 2 The Seventh PH-EITI Report (FY 2019) | 92
Aside from LGU, BIR also posed a percentage reconciled of over 100% for the metallic mining as indicated in Table 14, but are only due to regular causes of variances such as reporting on cash basis instead of accrual basis which the Report requires. Table 15 sets out the details of reconciliation per agency excluding the revenue streams and other taxes of non-participating projects. Table 15. Summary of reconciliation results per agency
Project amount Government agency amount
Variance pre-reconciliation
Reconciled amount
Variance post-
reconciliation
% Reconci
led
% Variance
% Variance to total
government agency amount
BIR 25,465,151,210 25,193,338,907 (244,564,337) 25,197,890,985 3,369,796 100% 0% 0.01% BOC 2,356,970,272 2,418,436,652 61,466,380 2,371,411,349 33,668,944 98% 1% 0.1%
DOE 26,115,437,229 26,254,244,099 138,806,870 26,221,176,016 -
99.9% 0% 0%
LGU 1,671,180,239 1,020,113,328 (651,066,911) 1,481,291,263 (94,997,338) 145% -9% -0.2% MGB 1,307,621,214 1,398,423,135 90,801,921 1,211,989,733 (4,911,789) 87% -0.4% -0.01% PPA 192,680,655 224,245,158 31,564,503 199,849,379 10,725,084 89% 5% 0.02%
Total 57,109,040,820 56,508,801,279 (572,991,575) 56,683,608,724 (52,145,302) 100.3% -0.1% -0.1% NCIP 415,584,235 - (415,584,235) 339,598,253 (5,779,450) 82% -1% -0.01% BIR, DOE, MGB, NCIP and and PPA registered less than .03% unexplained variances to total government reported amounts followed by BOC at 0.1% and LGU at 0.2%. For DOE and MGB, only a few of the participating projects needed to be further reconciled with the
o national offices owing that most mining and oil and gas projects are considered large taxpayers, hence did not require significant level of
ing documents for low value transactions. For BOC, despite early data submission, remaining variance still exists mainly due to non-submission of schedule of a participating project. Although LGU and NCIP have a low percentage of unreconciled variance, it is important to note that the data from LGU is incomplete and NCIP did not submit any data. Since no data was provided by NCIP, the percentage reconciled and percentage variance in Table 15 pertains to percentage reconciled and percentage variance against the amount reported by the projects. Due to the insufficient data from LGU and NCIP, supporting documents were obtained from participating projects to support the amount they have disclosed. Refer to page 213, Section VII, Variances and discrepancies for additional details.
agencies' collection. The immaterial unexplained variance of BIR is primarily attributed to the centralization of reporting t
coordination with their regional or branch offices. PPA 's remaining variance, on the other hand, is due to absence of support
Chapter 2 The Seventh PH-EITI Report (FY 2019) | 93
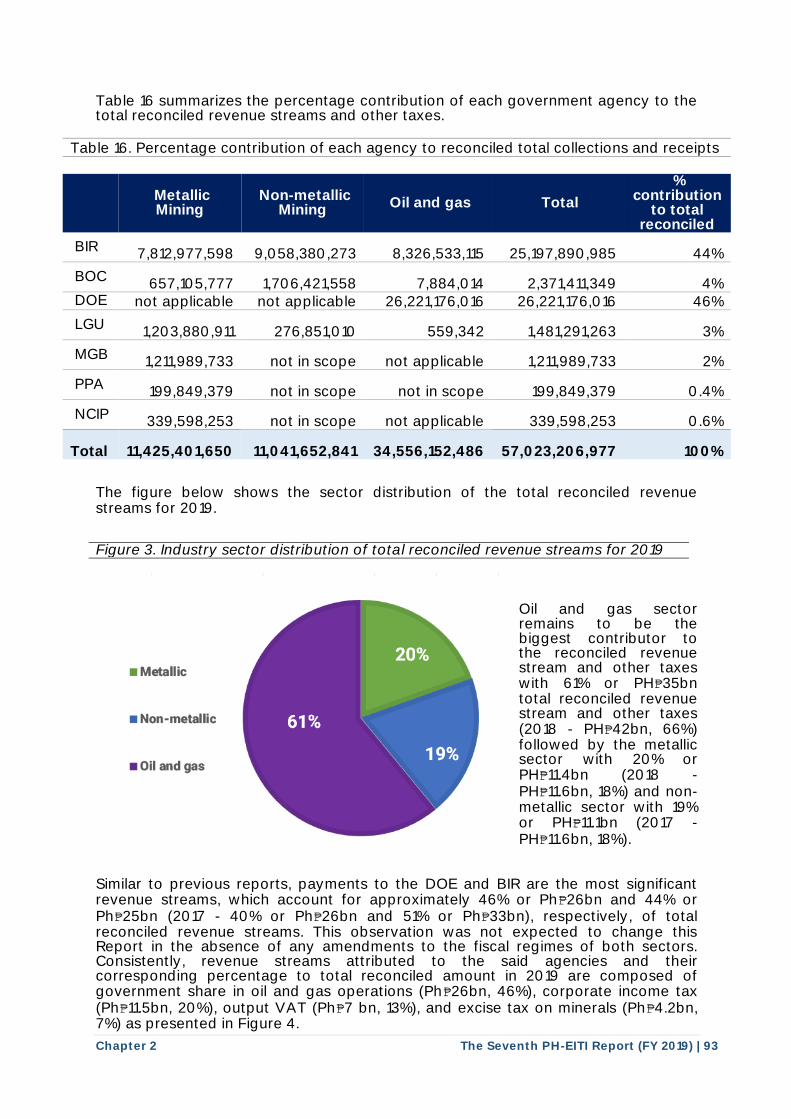
Table 16 summarizes the percentage contribution of each government agency to the total reconciled revenue streams and other taxes.
Table 16. Percentage contribution of each agency to reconciled total collections and receipts
Metallic Mining
Non-metallic Mining Oil and gas Total
% contribution
to total reconciled
BIR 7,812,977,598
9,058,380,273
8,326,533,115 25,197,890,985 44%
BOC 657,105,777
1,706,421,558 7,884,014 2,371,411,349 4%
DOE not applicable not applicable 26,221,176,016 26,221,176,016 46%
LGU
1,203,880,911 276,851,010 559,342 1,481,291,263 3%
MGB
1,211,989,733 not in scope not applicable 1,211,989,733 2%
PPA
199,849,379 not in scope not in scope
199,849,379 0.4%
NCIP
339,598,253 not in scope not applicable
339,598,253 0.6% Total
11,425,401,650
11,041,652,841
34,556,152,486
57,023,206,977 100%
The figure below shows the sector distribution of the total reconciled revenue streams for 2019.
Figure 3. Industry sector distribution of total reconciled revenue streams for 2019
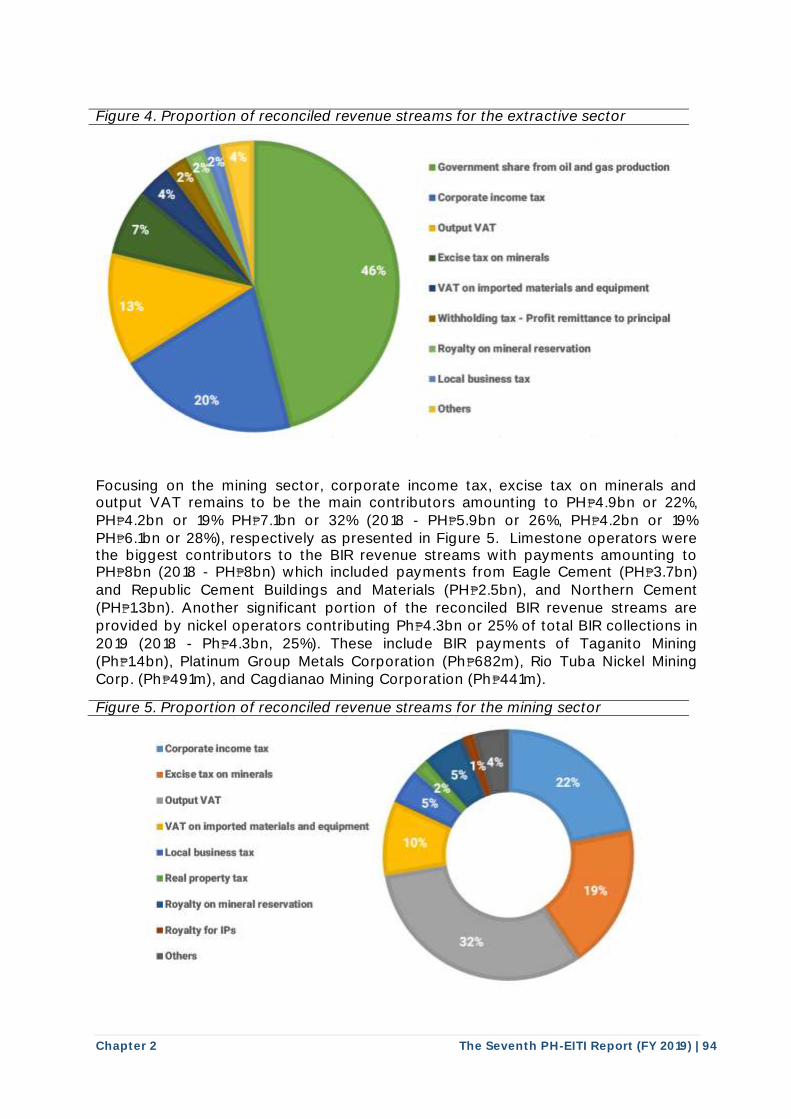
Oil and gas sector remains to be the biggest contributor to the reconciled revenue stream and other taxes with 61% or PH₱35bn total reconciled revenue stream and other taxes (2018 - PH₱42bn, 66%) followed by the metallic sector with 20% or PH₱11.4bn (2018 - PH₱11.6bn, 18%) and non-metallic sector with 19% or PH₱11.1bn (2017 - PH₱11.6bn, 18%).
Similar to previous reports, payments to the DOE and BIR are the most significant revenue streams, which account for approximately 46% or Ph₱26bn and 44% or Ph₱25bn (2017 - 40% or Ph₱26bn and 51% or Ph₱33bn), respectively, of total reconciled revenue streams. This observation was not expected to change this Report in the absence of any amendments to the fiscal regimes of both sectors. Consistently, revenue streams attributed to the said agencies and their corresponding percentage to total reconciled amount in 2019 are composed of government share in oil and gas operations (Ph₱26bn, 46%), corporate income tax (Ph₱11.5bn, 20%), output VAT (Ph₱7 bn, 13%), and excise tax on minerals (Ph₱4.2bn, 7%) as presented in Figure 4.
■ Metallic
■ Non-metallic
■ Oil and gas
Chapter 2 The Seventh PH-EITI Report (FY 2019) | 94
Figure 4. Proportion of reconciled revenue streams for the extractive sector
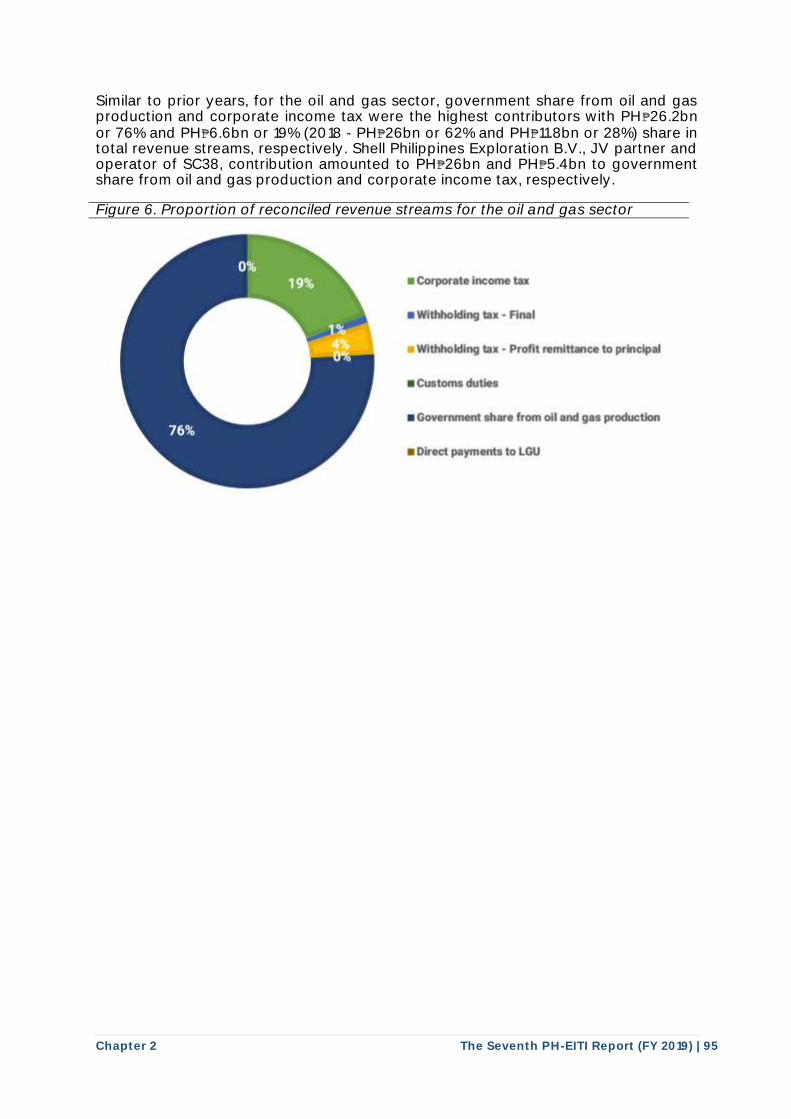
Focusing on the mining sector, corporate income tax, excise tax on minerals and output VAT remains to be the main contributors amounting to PH₱4.9bn or 22%, PH₱4.2bn or 19% PH₱7.1bn or 32% (2018 - PH₱5.9bn or 26%, PH₱4.2bn or 19% PH₱6.1bn or 28%), respectively as presented in Figure 5. Limestone operators were the biggest contributors to the BIR revenue streams with payments amounting to PH₱8bn (2018 - PH₱8bn) which included payments from Eagle Cement (PH₱3.7bn) and Republic Cement Buildings and Materials (PH₱2.5bn), and Northern Cement (PH₱1.3bn). Another significant portion of the reconciled BIR revenue streams are provided by nickel operators contributing Ph₱4.3bn or 25% of total BIR collections in 2019 (2018 - Ph₱4.3bn, 25%). These include BIR payments of Taganito Mining (Ph₱1.4bn), Platinum Group Metals Corporation (Ph₱682m), Rio Tuba Nickel Mining Corp. (Ph₱491m), and Cagdianao Mining Corporation (Ph₱441m).
Figure 5. Proportion of reconciled revenue streams for the mining sector
Corpora lncom• tu
■ Exds tu on m
Output VAT
VATo knported ma
■ Local buadness tu
R I property tu
■ Roy ty on mineral r
Roy ty for IPs
■o
pment
■ Govemm lhar from oil and gas production
■ Cot'por te nco cu
Outpu VAT
■ Elle tax Of'I mineral
■ VATonlmport m rials d9q1,1lp
■ Wlthho ng tax • Profit mJttanco to prln pal
■ Royalty on min ra rfferv on
■ Local bu . taa
0
Chapter 2 The Seventh PH-EITI Report (FY 2019) | 95
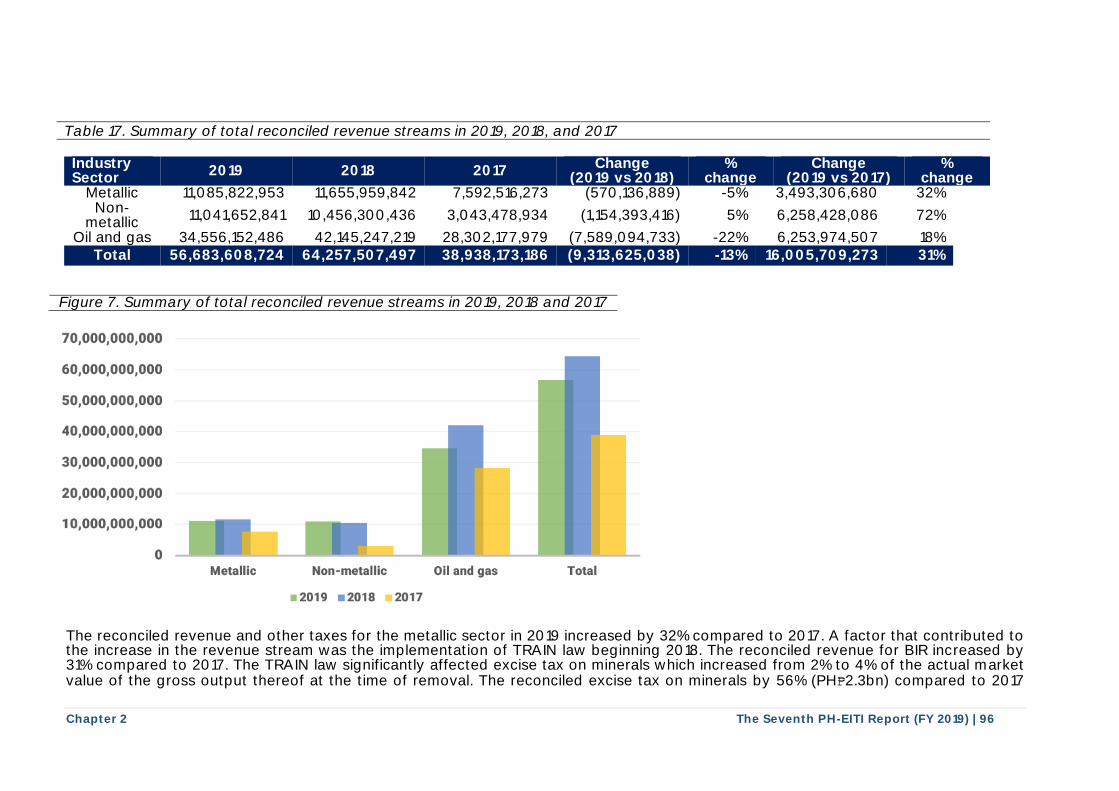
Similar to prior years, for the oil and gas sector, government share from oil and gas production and corporate income tax were the highest contributors with PH₱26.2bn or 76% and PH₱6.6bn or 19% (2018 - PH₱26bn or 62% and PH₱11.8bn or 28%) share in total revenue streams, respectively. Shell Philippines Exploration B.V., JV partner and operator of SC38, contribution amounted to PH₱26bn and PH₱5.4bn to government share from oil and gas production and corporate income tax, respectively. Figure 6. Proportion of reconciled revenue streams for the oil and gas sector
■ Corporate income tu
■ Withhold ng • Final
Wlthholdlng •·Profit m tt.ance to prln p I
■ Gov nm • from oil and g s production
■ Direct paym n to LGU
Chapter 2 The Seventh PH-EITI Report (FY 2019) | 96
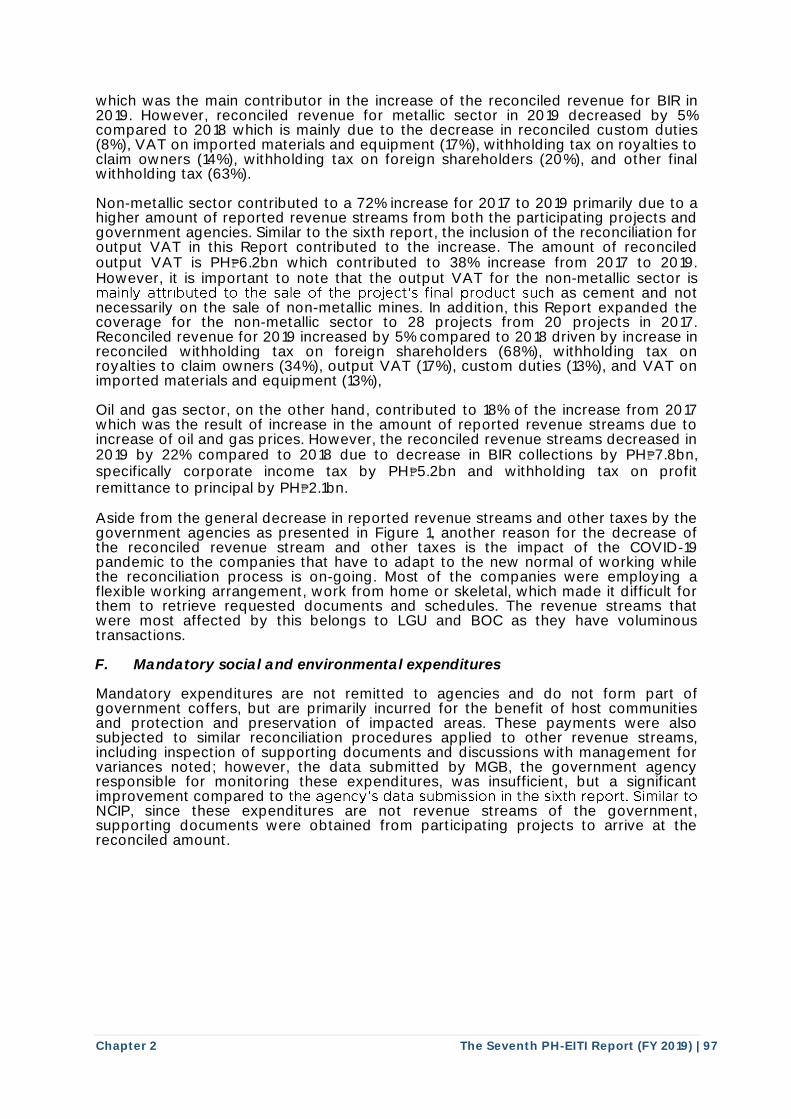
Table 17. Summary of total reconciled revenue streams in 2019, 2018, and 2017 Industry
Sector 2019 2018 2017 Change (2019 vs 2018)
% change
Change (2019 vs 2017)
% change
Metallic 11,085,822,953 11,655,959,842 7,592,516,273 (570,136,889) -5% 3,493,306,680 32% Non-
metallic 11,041,652,841 10,456,300,436 3,043,478,934 (1,154,393,416) 5% 6,258,428,086 72%
Oil and gas 34,556,152,486 42,145,247,219 28,302,177,979 (7,589,094,733) -22% 6,253,974,507 18% Total 56,683,608,724 64,257,507,497 38,938,173,186 (9,313,625,038) -13% 16,005,709,273 31%
Figure 7. Summary of total reconciled revenue streams in 2019, 2018 and 2017
The reconciled revenue and other taxes for the metallic sector in 2019 increased by 32% compared to 2017. A factor that contributed to the increase in the revenue stream was the implementation of TRAIN law beginning 2018. The reconciled revenue for BIR increased by 31% compared to 2017. The TRAIN law significantly affected excise tax on minerals which increased from 2% to 4% of the actual market value of the gross output thereof at the time of removal. The reconciled excise tax on minerals by 56% (PH₱2.3bn) compared to 2017
70,000,000,000
60,000,000,000
50,000,000,000
40,000,000,000
30,000,000,000
20,000,000,000
10,000,000,000
0 Metallic Non-metallic OIi and gas Total
■ 2019 ■ 2018 2017
Chapter 2 The Seventh PH-EITI Report (FY 2019) | 97
which was the main contributor in the increase of the reconciled revenue for BIR in 2019. However, reconciled revenue for metallic sector in 2019 decreased by 5% compared to 2018 which is mainly due to the decrease in reconciled custom duties (8%), VAT on imported materials and equipment (17%), withholding tax on royalties to claim owners (14%), withholding tax on foreign shareholders (20%), and other final withholding tax (63%). Non-metallic sector contributed to a 72% increase for 2017 to 2019 primarily due to a higher amount of reported revenue streams from both the participating projects and government agencies. Similar to the sixth report, the inclusion of the reconciliation for output VAT in this Report contributed to the increase. The amount of reconciled output VAT is PH₱6.2bn which contributed to 38% increase from 2017 to 2019. However, it is important to note that the output VAT for the non-metallic sector is
h as cement and not necessarily on the sale of non-metallic mines. In addition, this Report expanded the coverage for the non-metallic sector to 28 projects from 20 projects in 2017. Reconciled revenue for 2019 increased by 5% compared to 2018 driven by increase in reconciled withholding tax on foreign shareholders (68%), withholding tax on royalties to claim owners (34%), output VAT (17%), custom duties (13%), and VAT on imported materials and equipment (13%), Oil and gas sector, on the other hand, contributed to 18% of the increase from 2017 which was the result of increase in the amount of reported revenue streams due to increase of oil and gas prices. However, the reconciled revenue streams decreased in 2019 by 22% compared to 2018 due to decrease in BIR collections by PH₱7.8bn, specifically corporate income tax by PH₱5.2bn and withholding tax on profit remittance to principal by PH₱2.1bn. Aside from the general decrease in reported revenue streams and other taxes by the government agencies as presented in Figure 1, another reason for the decrease of the reconciled revenue stream and other taxes is the impact of the COVID-19 pandemic to the companies that have to adapt to the new normal of working while the reconciliation process is on-going. Most of the companies were employing a flexible working arrangement, work from home or skeletal, which made it difficult for them to retrieve requested documents and schedules. The revenue streams that were most affected by this belongs to LGU and BOC as they have voluminous transactions. F. Mandatory social and environmental expenditures Mandatory expenditures are not remitted to agencies and do not form part of government coffers, but are primarily incurred for the benefit of host communities and protection and preservation of impacted areas. These payments were also subjected to similar reconciliation procedures applied to other revenue streams, including inspection of supporting documents and discussions with management for variances noted; however, the data submitted by MGB, the government agency responsible for monitoring these expenditures, was insufficient, but a significant improvement compared to NCIP, since these expenditures are not revenue streams of the government, supporting documents were obtained from participating projects to arrive at the reconciled amount.
mainly attributed to the sale of the project's final product sue
the agency's data submission in the sixth report. Similar to
Chapter 2 The Seventh PH-EITI Report (FY 2019) | 98
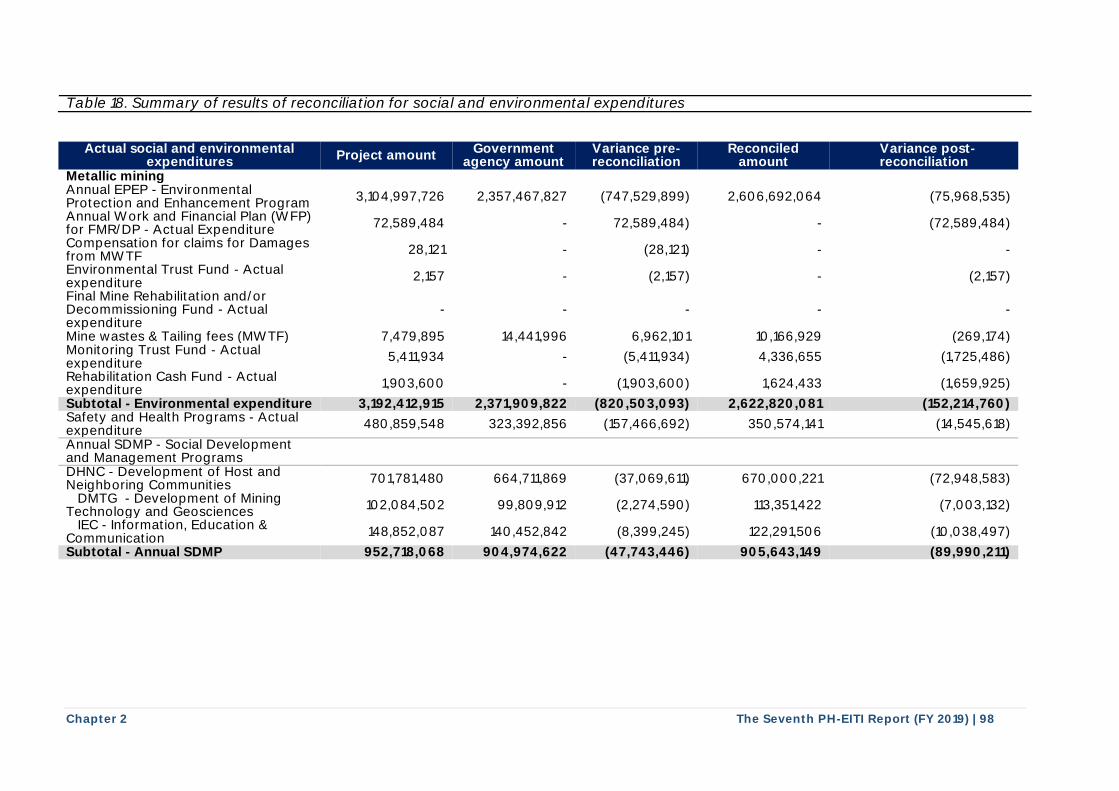
Table 18. Summary of results of reconciliation for social and environmental expenditures
Actual social and environmental expenditures Project amount
Government agency amount
Variance pre-reconciliation
Reconciled amount
Variance post-reconciliation
Metallic mining Annual EPEP - Environmental Protection and Enhancement Program
3,104,997,726 2,357,467,827 (747,529,899) 2,606,692,064 (75,968,535)
Annual Work and Financial Plan (WFP) for FMR/DP - Actual Expenditure 72,589,484 - 72,589,484) - (72,589,484)
Compensation for claims for Damages from MWTF
28,121 - (28,121) - -
Environmental Trust Fund - Actual expenditure
2,157 - (2,157) - (2,157)
Final Mine Rehabilitation and/or Decommissioning Fund - Actual expenditure
- - - - -
Mine wastes & Tailing fees (MWTF) 7,479,895 14,441,996 6,962,101 10,166,929 (269,174) Monitoring Trust Fund - Actual expenditure
5,411,934 - (5,411,934) 4,336,655 (1,725,486)
Rehabilitation Cash Fund - Actual expenditure 1,903,600 - (1,903,600) 1,624,433 (1,659,925)
Subtotal - Environmental expenditure 3,192,412,915 2,371,909,822 (820,503,093) 2,622,820,081 (152,214,760) Safety and Health Programs - Actual expenditure
480,859,548 323,392,856 (157,466,692) 350,574,141 (14,545,618)
Annual SDMP - Social Development and Management Programs
DHNC - Development of Host and Neighboring Communities 701,781,480 664,711,869 (37,069,611) 670,000,221 (72,948,583)
DMTG - Development of Mining Technology and Geosciences
102,084,502 99,809,912 (2,274,590) 113,351,422 (7,003,132)
IEC - Information, Education & Communication
148,852,087 140,452,842 (8,399,245) 122,291,506 (10,038,497)
Subtotal - Annual SDMP 952,718,068 904,974,622 (47,743,446) 905,643,149 (89,990,211)

Chapter 2 The Seventh PH-EITI Report (FY 2019) | 99
Actual social and environmental expenditures Project amount
Government agency amount
Variance pre-reconciliation
Reconciled amount
Variance post-reconciliation
Subtotal - Metallic mining 4,625,990,532 3,600,277,301 (1,025,713,231) 3,879,037,371 (256,750,589) Non-metallic mining Annual EPEP - Environmental Protection and Enhancement Program
241,319,264 203,377,717 (37,941,547) 215,958,411 4,046,773
Annual Work and Financial Plan (WFP) for FMR/DP - Actual Expenditure
7,477,596 - (7,477,596) - (7,477,596)
Compensation for claims for Damages from MWTF - - - - -
Environmental Trust Fund - Actual expenditure
8,136,265 - (8,136,265) - -
Final Mine Rehabilitation and/or Decommissioning Fund - Actual expenditure
- - - - -
Mine wastes & Tailing fees (MWTF) 29,247 18,299 (10,949) 25,300 493 Monitoring Trust Fund - Actual expenditure 723,069 - (723,069) 1,103,549 -
Rehabilitation Cash Fund - Actual expenditure
3,435,257 - (3,435,257) - (3,435,257)
Subtotal - Environmental expenditure 261,120,698 203,396,016 (57,724,683) 217,087,260 (6,865,587) Safety and Health Programs - Actual expenditure
94,387,706 71,962,526 (22,425,181) 68,815,336 (22,482,379)
Annual SDMP - Social Development and Management Programs
DHNC - Development of Host and Neighboring Communities
65,604,738 77,657,289 12,052,552 64,149,403 4,590,968
DMTG - Development of Mining Technology and Geosciences 10,506,381 14,272,413 3,766,031 9,527,021 1,109,022
IEC - Information, Education & Communication
13,801,157 13,883,739 82,582 12,317,041 (410,080)
Subtotal - Annual SDMP 89,912,276 105,813,441 15,901,166 85,993,465 5,289,910 Subtotal - Non-metallic mining 445,420,680 381,171,982 (64,248,698) 371,896,061 (24,058,056) Total 5,071,411,212 3,981,449,283 (1,089,961,929) 4,250,933,432 (280,808,646)
Chapter 2 The Seventh PH-EITI Report (FY 2019) | 100
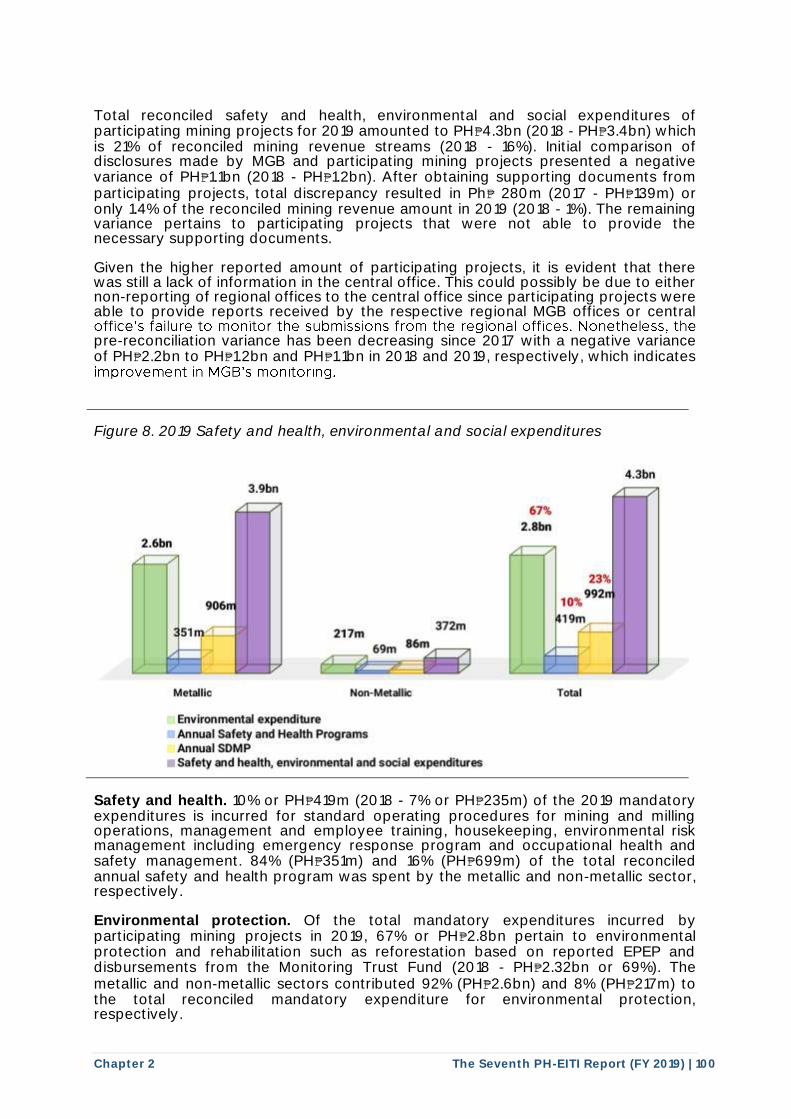
Total reconciled safety and health, environmental and social expenditures of participating mining projects for 2019 amounted to PH₱4.3bn (2018 - PH₱3.4bn) which is 21% of reconciled mining revenue streams (2018 - 16%). Initial comparison of disclosures made by MGB and participating mining projects presented a negative variance of PH₱1.1bn (2018 - PH₱1.2bn). After obtaining supporting documents from participating projects, total discrepancy resulted in Ph₱ 280m (2017 - PH₱139m) or only 1.4% of the reconciled mining revenue amount in 2019 (2018 - 1%). The remaining variance pertains to participating projects that were not able to provide the necessary supporting documents. Given the higher reported amount of participating projects, it is evident that there was still a lack of information in the central office. This could possibly be due to either non-reporting of regional offices to the central office since participating projects were able to provide reports received by the respective regional MGB offices or central
pre-reconciliation variance has been decreasing since 2017 with a negative variance of PH₱2.2bn to PH₱1.2bn and PH₱1.1bn in 2018 and 2019, respectively, which indicates
Figure 8. 2019 Safety and health, environmental and social expenditures
Safety and health. 10% or PH₱419m (2018 - 7% or PH₱235m) of the 2019 mandatory expenditures is incurred for standard operating procedures for mining and milling operations, management and employee training, housekeeping, environmental risk management including emergency response program and occupational health and safety management. 84% (PH₱351m) and 16% (PH₱699m) of the total reconciled annual safety and health program was spent by the metallic and non-metallic sector, respectively. Environmental protection. Of the total mandatory expenditures incurred by participating mining projects in 2019, 67% or PH₱2.8bn pertain to environmental protection and rehabilitation such as reforestation based on reported EPEP and disbursements from the Monitoring Trust Fund (2018 - PH₱2.32bn or 69%). The metallic and non-metallic sectors contributed 92% (PH₱2.6bn) and 8% (PH₱217m) to the total reconciled mandatory expenditure for environmental protection, respectively.
office's failure to monitor the submissions from the regional offices. Nonetheless, the
improvement in MGB's monitoring.
2.6bn
3.9bn
217m
Metallic Non-Metalllo
Environmental expenditure Annual Safety and Health Programs Annual SDMP
372m
Safety and health, environmental and social expenditures
67~ 2.8bn
Total
~ n
--
-
4.3bn / ----;;
I/ I/
Chapter 2 The Seventh PH-EITI Report (FY 2019) | 101
Social development. Total expenditures on social development amounted to PH₱992m or 23% of the total reconciled mandatory expenditures (2018 - PH₱800m or 24%). PH₱ ₱85m or 9% applies to the non-metallic sector. These represent activities undertaken as
h must be equivalent to 1.5% of operating expenses as mandated by existing regulations. Any difference between required and actual expenditures in a given year may be carried forward to the succeeding period as long as it is within the five year program approved by the MGB.
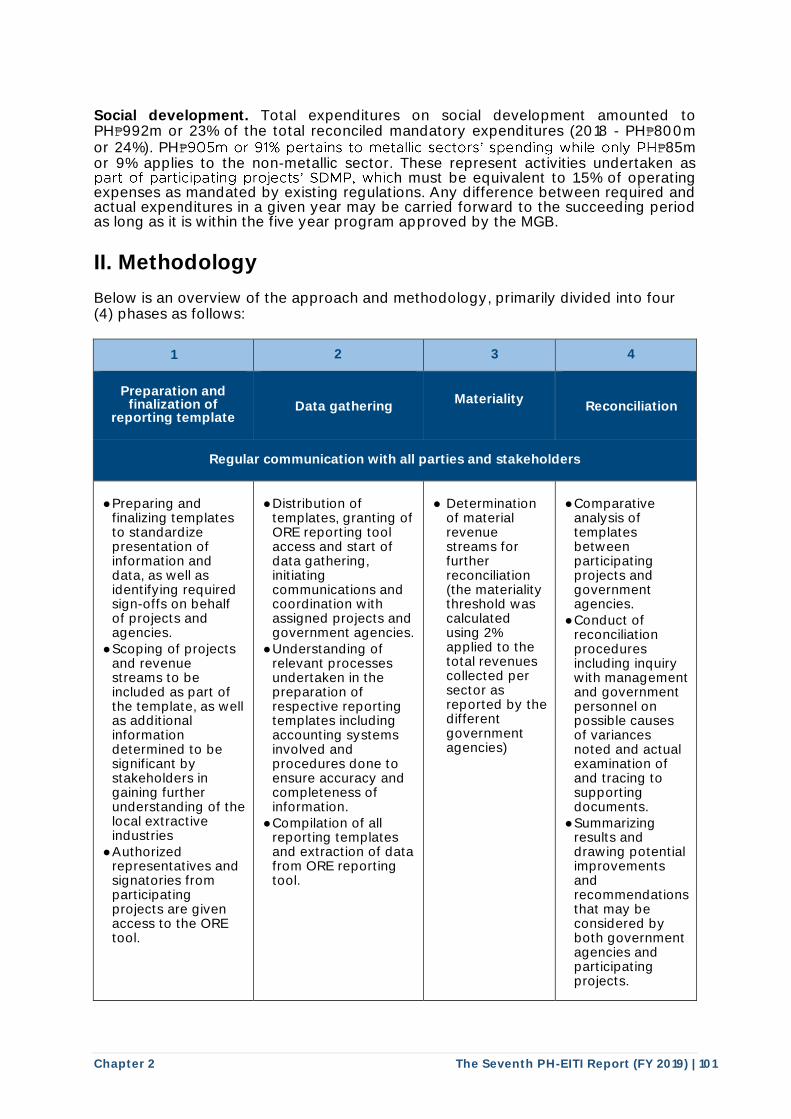
II. Methodology Below is an overview of the approach and methodology, primarily divided into four (4) phases as follows:
1 2 3 4
Preparation and
finalization of reporting template
Data gathering Materiality
Reconciliation
Regular communication with all parties and stakeholders
● Preparing and finalizing templates to standardize presentation of information and data, as well as identifying required sign-offs on behalf of projects and agencies.
● Scoping of projects and revenue streams to be included as part of the template, as well as additional information determined to be significant by stakeholders in gaining further understanding of the local extractive industries
● Authorized representatives and signatories from participating projects are given access to the ORE tool.
● Distribution of
templates, granting of ORE reporting tool access and start of data gathering, initiating communications and coordination with assigned projects and government agencies.
● Understanding of relevant processes undertaken in the preparation of respective reporting templates including accounting systems involved and procedures done to ensure accuracy and completeness of information.
● Compilation of all reporting templates and extraction of data from ORE reporting tool.
● Determination
of material revenue streams for further reconciliation (the materiality threshold was calculated using 2% applied to the total revenues collected per sector as reported by the different government agencies)
● Comparative
analysis of templates between participating projects and government agencies.
● Conduct of reconciliation procedures including inquiry with management and government personnel on possible causes of variances noted and actual examination of and tracing to supporting documents.
● Summarizing results and drawing potential improvements and recommendations that may be considered by both government agencies and participating projects.
905m or 91% pertains to metallic sectors' spending while only PH
part of participating projects ' SDMP, whic
Chapter 2 The Seventh PH-EITI Report (FY 2019) | 102
A. Development of reporting template and data gathering Similar to the previous PH-EITI reports, FY2019 data were gathered based on the reporting templates tailored and approved by MSG. Data submission from reporting projects and some government agencies were made through PH- -approved reporting templates were integrated into the ORE Tool to which reporting projects had access from August 3, 2020 to November 8, 2020 (Please see Annex 1 to 4 for the approved reporting templates for projects and corresponding schedule of payments). Submissions after this date until November 30, 2020 were manually prepared and submitted for reconciliation. ORE was made available to all targeted projects and government agencies particularly the Mines and Geosciences Bureau, Department of Energy, Bureau of Customs, Department of Budget and Management and the National Commission on Indigenous Peoples. The Bureau of Internal Revenue submitted data separately while data submissions from local government units were
Natural Resources Data Management Tool (ENRDMT). The following guidelines were stated in the reporting templates and were explained to reporting projects and government agencies during the ORE Reporting Tool briefing on from June 10 July 22, 2020 and various MSG meetings: ● Disclosures should include all revenue streams attributed to taxable year 2019
irrespective of whether these were settled or paid in other periods, as well as if another fiscal year end is adopted (e.g., 30 June). Accrual basis of accounting should be followed.
● Templates should present total taxes for the year and supporting schedules should include the breakdown with the required level of detail (e.g., per frequency, receiving office) for any variance noted.
● Templates should be signed by the senior management such as President, Chief Finance Officer, or any equivalent personnel for companies of the participating projects, and commissioners or deputies for government agencies.
To establish credibility of the data, the MSG considered availability and accessibility of information including the appropriate level of management who will attest to the accuracy of the data. With these factors in mind, the credibility of data was established through the following: ● Reporting templates were submitted by either the President of the Company for
the respective project and/or Chief Financial Officer, and Department Head for the government agencies via the ORE Tool.
● Traceability of information to the audited financial statements, as applicable. Refer to page 332, Section VII, Audit procedures for the discussion on the audits being performed by an independent third party and COA on the financial statements of the respective companies of the projects and government agencies, respectively.
B. Determination of material revenue streams
The determination of materiality is mainly driven by monetary values and by whether these revenue streams are considered as primary sources of receipts, as confirmed by the collecting government agencies. Consistent with the previous PH-EITI Reports, the determination of materiality level for the seventh PH-EITI Report was done on a per extractive industry sector basis which provided for a uniform monetary threshold and a greater focus on key revenue streams relative to the total revenues per sector. The materiality threshold was calculated using 2% applied to the total revenues collected per sector as reported by the different government agencies. The 2% was benchmarked on the proposed
EITl's Online Reporting in the Extractives (ORE) Tool. The MSG
submitted through the Bureau of Local Government Finance's Environment and
Chapter 2 The Seventh PH-EITI Report (FY 2019) | 103
regulatory threshold to be imposed by the Philippine Securities and Exchange Commission (SEC) on public companies. Presently, the threshold is at 5%, which if applied will result in fewer revenue streams to be covered. Hence, the adoption of a lower threshold was deemed more prudent and will enable greater and expanded scope. In addition, the nature of the payments based on their relevance and significance to communities and operations was also considered. Thus, withholding tax on foreign shareholders, withholding tax on royalties to claim owners, real property taxes, and mandatory expenditures and social funds were included regardless of their amounts. In-scope and Scope-out revenue streams and other taxes for this Report are presented in Table 23. C. Reconciliation Method i. Agreed upon procedures The objectives of the reconciliation process do not extend to an audit and review of the disclosures that were already subjected to the verification of third parties (e.g. independent auditing firms, and COA). Hence, agreed upon procedures (AUP) in accordance with the Philippine Standard on Related Services No. 4400, Engagements to Perform Agreed-upon Procedures regarding Financial Information, was determined to be appropriate. The end result of an AUP is a report on factual findings specifically on variances identified, if any, and reasons thereof, with no assurance expressed or issued. The AUP are as follows: ● Revenue streams above the threshold set were selected and the differences
were calculated. Refer to Determination of materiality subsection of this Section for the details of the in-scope revenue streams.
● Variances between the amounts disclosed by participating projects and the amounts disclosed by the corresponding government agencies were subjected to additional procedures, including direct discussions with management to identify possible reasons and explanations for these differences, as well as tracing sample transactions through the corresponding supporting documents to confirm the validity and accuracy of the disclosures made.
Revenue streams, expenses, and funds that were only disclosed by participating projects but had no corresponding disclosures from the government agencies due to legal restrictions (such as the absence of a confidentiality waiver) and those cases which lack available information (i.e., reports are not readily available at the
through other available supporting documents including tax returns, payment vouchers, invoices and others. ii. Threshold of amount that will be reconciled For each in-scope revenue stream indicated in Table 23, the total variance will be communicated to both the project and government agency to facilitate the compilation of detailed supporting schedules and additional documents (e.g. official receipts, bank statements). Any reconciling item that remained unsupported and unexplainable was declared as variance post reconciliation. Lastly, we also referred to the following documents as additional references: ● FY2019 audited financial statements, if available, as these include relevant
disclosures in compliance with Revenue Regulation No. 15-2010. This regulation
government agency 's central office), were reconciled

Chapter 2 The Seventh PH-EITI Report (FY 2019) | 104
requires the presentation of all applicable taxes made including corporate income, excise and business taxes, duties, and other payments; and
● Annual reports for listed entities that ascertain transparency on community development programs; and other reports gathered by the EITI Secretariat from various agencies for scoping purposes.
D. Provisions for safeguarding confidential information Similar to the previous PH-EITI reports, reconciliation was also limited by the prevailing confidentiality clause under the NIRC, which restricts the BIR to disclose tax payments of companies of the participating projects unless signed waivers are
participating projects were able to submit their corresponding waivers. The first PH-EITI report includes a comprehensive discussion on the concepts of public disclosure, information, and participation. More specifically on confidentiality, the following rules apply to the mining and oil and gas sectors. Figure 9. Rules on confidentiality for the mining sector
submitted (Please see Annex 5 for the waiver template). For this year's exercise , all
CONFIDENTIAL Th(> 1n rmn 10n 1o; con d~t@I du ng ne t rm or the prcje . lnlorm on should no be
I°,ulged 10th public, bu may be us.ed b1 LI'I OE IHAGB Oirector or as author! ed r pres nta ·ves 11t nallY or purpos&s of monltormg. pollcy pleinnlng, an r sc rt .
• lnt(lrmat1on <,IJp ontrnc or-; to 0 asp rt of n
• lnfot lion d u n by th p r I s l ne otl tlons as cool eritl I
NON-CONFIDENTIAL The lnlormallon may be ade va1 bl to nd reproduced by e pJbllc upon wb s.~ o o l
,)f pr t r t O th DE R-M
con fld n ty
• Ernprovm
• qy lty fl La nls
• rv 'i
• al rs. s\lt/1 m1n1og na c.1 ra e mine dlld m d1 tors, c;..
• 0 t-er aa ii a9ree upon by
Chapter 2 The Seventh PH-EITI Report (FY 2019) | 105
III. Scope of the report
A. Targeted projects
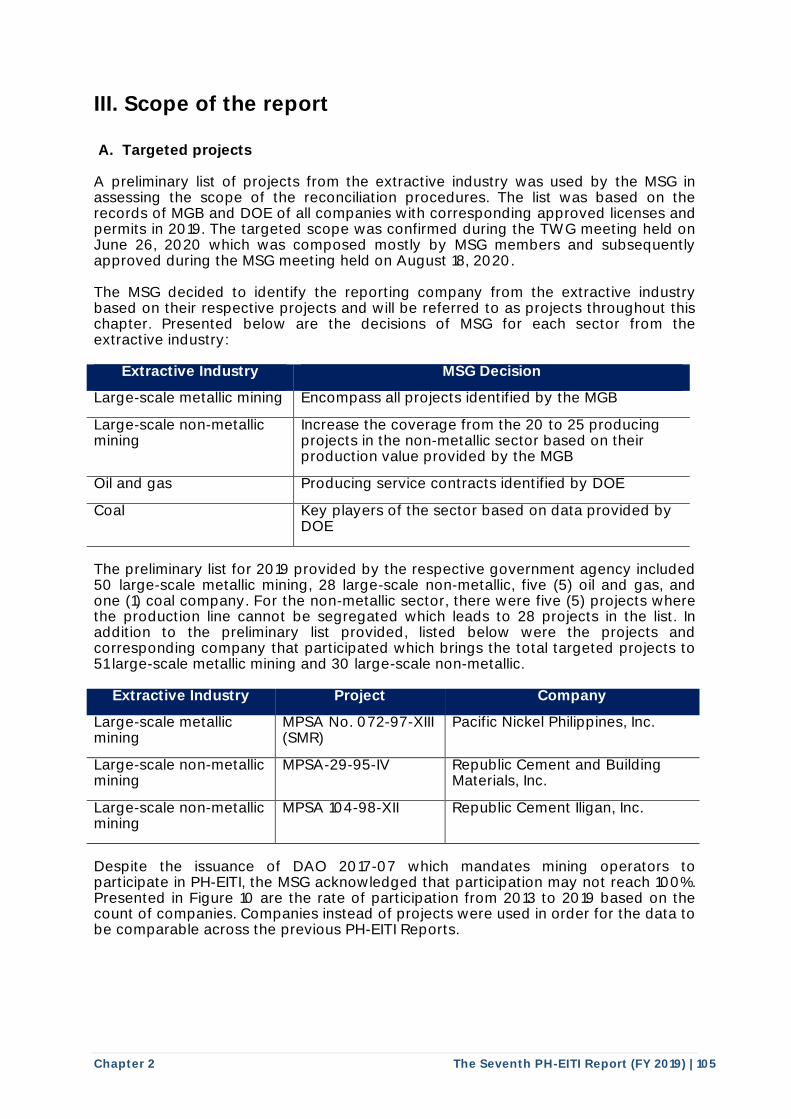
A preliminary list of projects from the extractive industry was used by the MSG in assessing the scope of the reconciliation procedures. The list was based on the records of MGB and DOE of all companies with corresponding approved licenses and permits in 2019. The targeted scope was confirmed during the TWG meeting held on June 26, 2020 which was composed mostly by MSG members and subsequently approved during the MSG meeting held on August 18, 2020. The MSG decided to identify the reporting company from the extractive industry based on their respective projects and will be referred to as projects throughout this chapter. Presented below are the decisions of MSG for each sector from the extractive industry:
Extractive Industry MSG Decision
Large-scale metallic mining Encompass all projects identified by the MGB
Large-scale non-metallic mining
Increase the coverage from the 20 to 25 producing projects in the non-metallic sector based on their production value provided by the MGB
Oil and gas Producing service contracts identified by DOE
Coal Key players of the sector based on data provided by DOE
The preliminary list for 2019 provided by the respective government agency included 50 large-scale metallic mining, 28 large-scale non-metallic, five (5) oil and gas, and one (1) coal company. For the non-metallic sector, there were five (5) projects where the production line cannot be segregated which leads to 28 projects in the list. In addition to the preliminary list provided, listed below were the projects and corresponding company that participated which brings the total targeted projects to 51 large-scale metallic mining and 30 large-scale non-metallic.
Extractive Industry Project Company
Large-scale metallic mining
MPSA No. 072-97-XIII (SMR)
Pacific Nickel Philippines, Inc.
Large-scale non-metallic mining
MPSA-29-95-IV Republic Cement and Building Materials, Inc.
Large-scale non-metallic mining
MPSA 104-98-XII Republic Cement Iligan, Inc.
Despite the issuance of DAO 2017-07 which mandates mining operators to participate in PH-EITI, the MSG acknowledged that participation may not reach 100%. Presented in Figure 10 are the rate of participation from 2013 to 2019 based on the count of companies. Companies instead of projects were used in order for the data to be comparable across the previous PH-EITI Reports.
Chapter 2 The Seventh PH-EITI Report (FY 2019) | 106
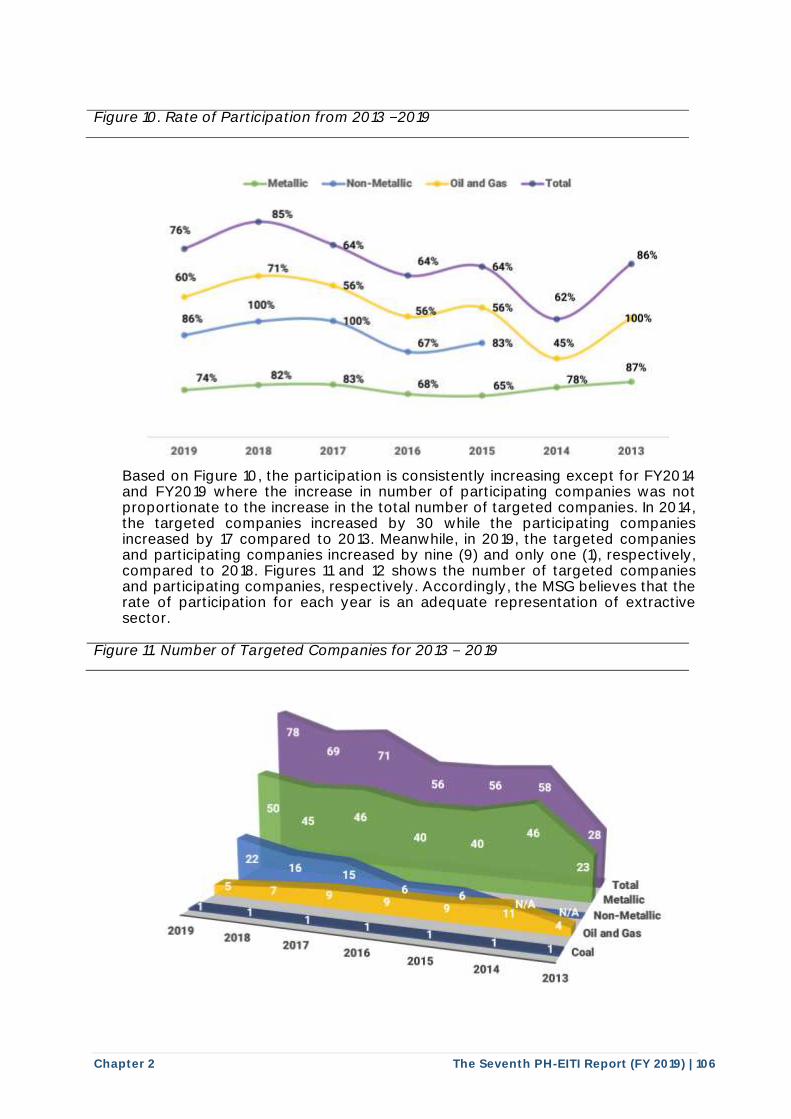
Figure 10. Rate of Participation from 2013 2019
Based on Figure 10, the participation is consistently increasing except for FY2014 and FY2019 where the increase in number of participating companies was not proportionate to the increase in the total number of targeted companies. In 2014, the targeted companies increased by 30 while the participating companies increased by 17 compared to 2013. Meanwhile, in 2019, the targeted companies and participating companies increased by nine (9) and only one (1), respectively, compared to 2018. Figures 11 and 12 shows the number of targeted companies and participating companies, respectively. Accordingly, the MSG believes that the rate of participation for each year is an adequate representation of extractive sector.
Figure 11. Number of Targeted Companies for 2013 2019
2019
MmDJc
85"-
2018
2017
on-MM.al C
83%
2017 2016
2016 2015
0 andG To
83'll, 45.,,
87% 78
2015 2014 2013
Coal
201' 2013
Chapter 2 The Seventh PH-EITI Report (FY 2019) | 107
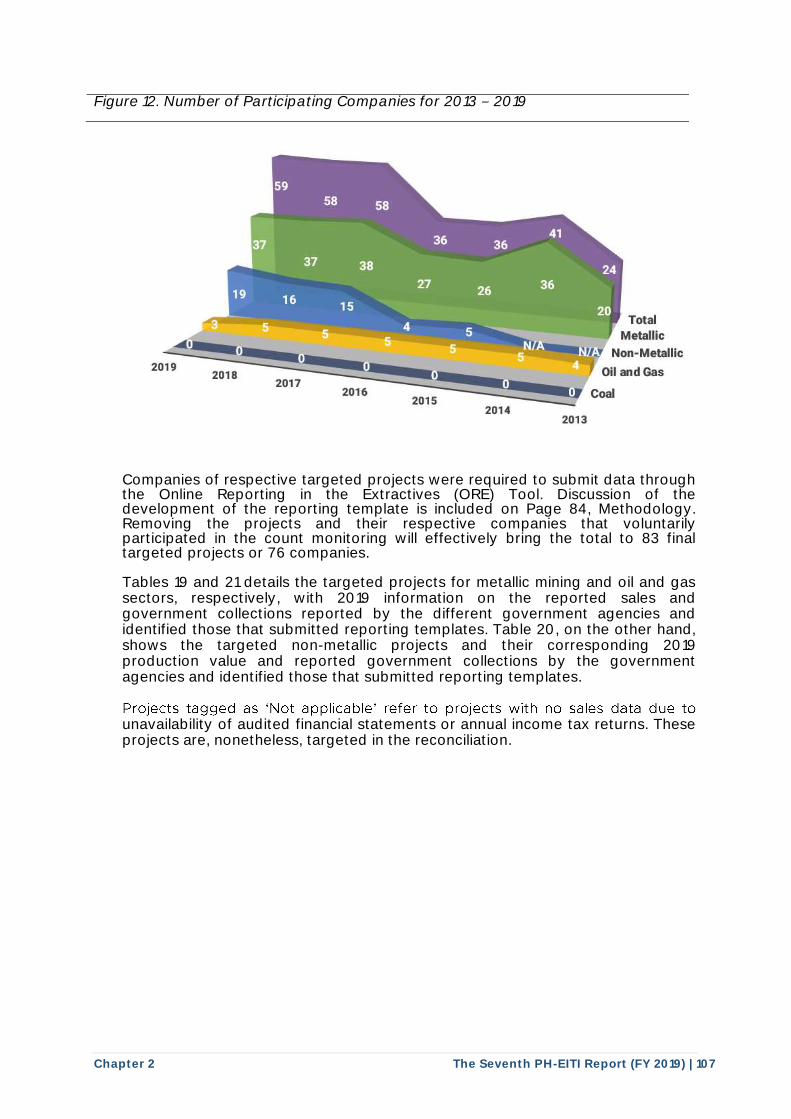
Figure 12. Number of Participating Companies for 2013 2019
Companies of respective targeted projects were required to submit data through the Online Reporting in the Extractives (ORE) Tool. Discussion of the development of the reporting template is included on Page 84, Methodology. Removing the projects and their respective companies that voluntarily participated in the count monitoring will effectively bring the total to 83 final targeted projects or 76 companies. Tables 19 and 21 details the targeted projects for metallic mining and oil and gas sectors, respectively, with 2019 information on the reported sales and government collections reported by the different government agencies and identified those that submitted reporting templates. Table 20, on the other hand, shows the targeted non-metallic projects and their corresponding 2019 production value and reported government collections by the government agencies and identified those that submitted reporting templates.
unavailability of audited financial statements or annual income tax returns. These projects are, nonetheless, targeted in the reconciliation.
2019 2018
2017 2016
2015
2013
Non-Metallic
Oil and Gas
Projects tagged as 'Not applicable' refer to projects with no sales data due to
Chapter 2 The Seventh PH-EITI Report (FY 2019) | 108
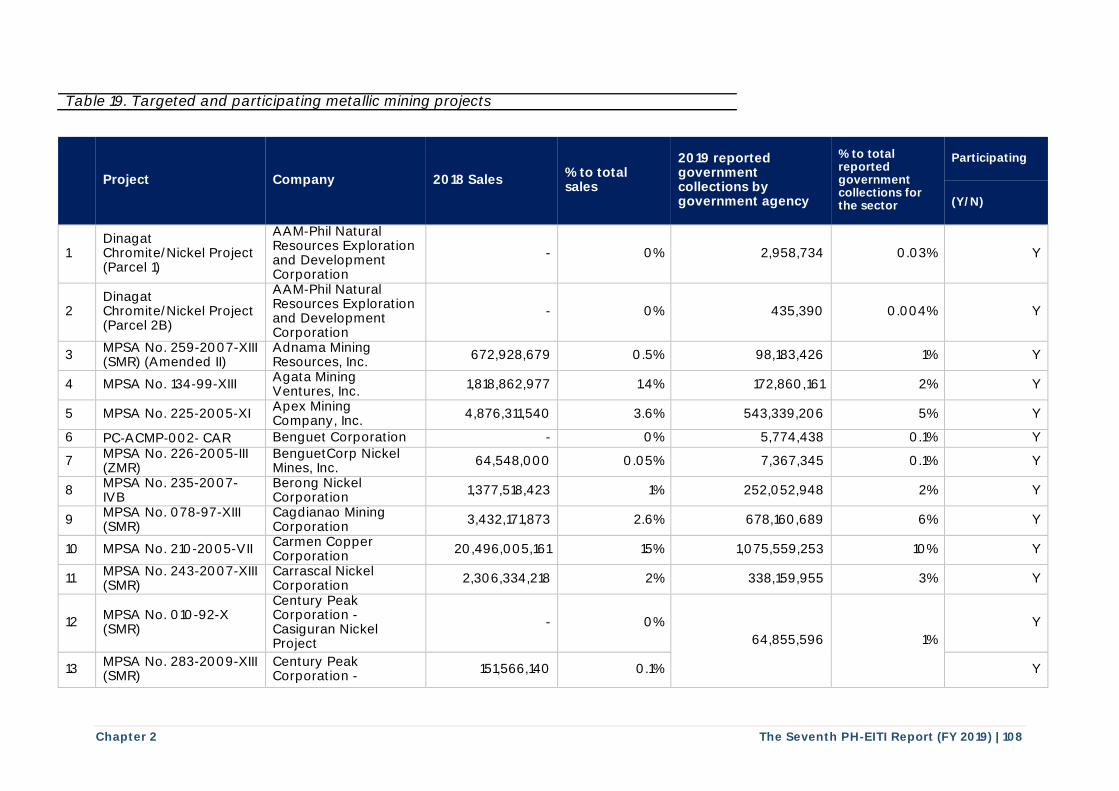
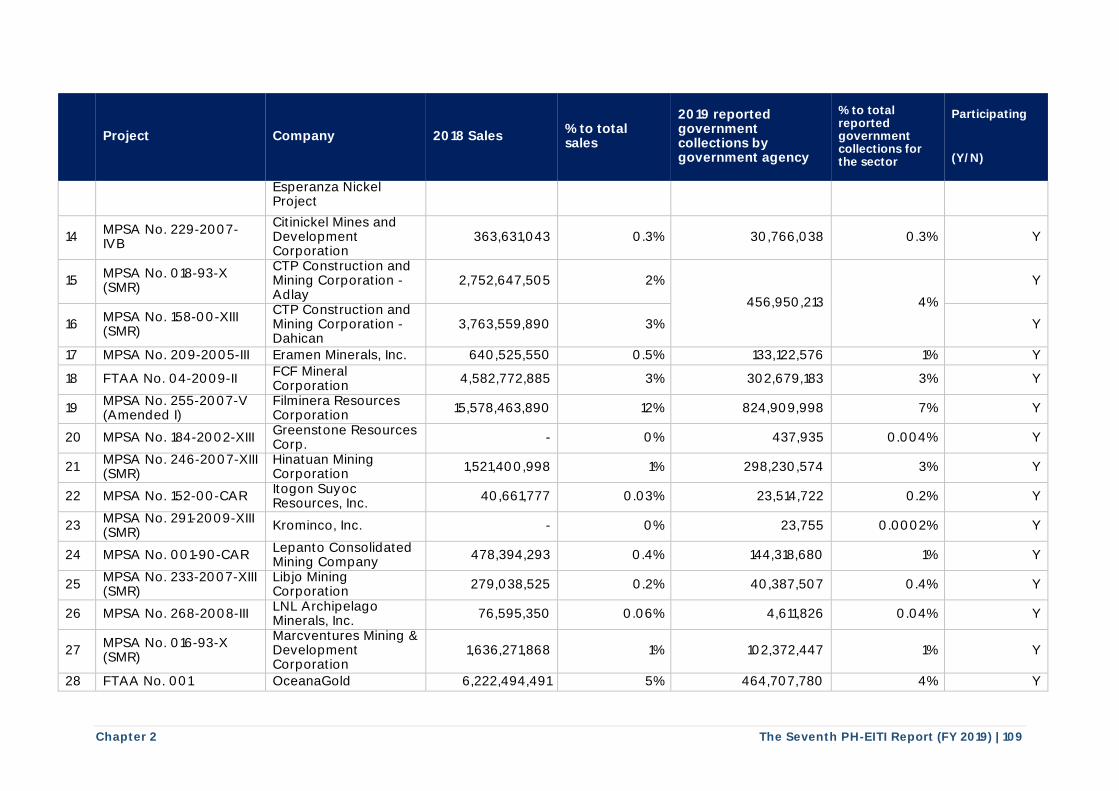
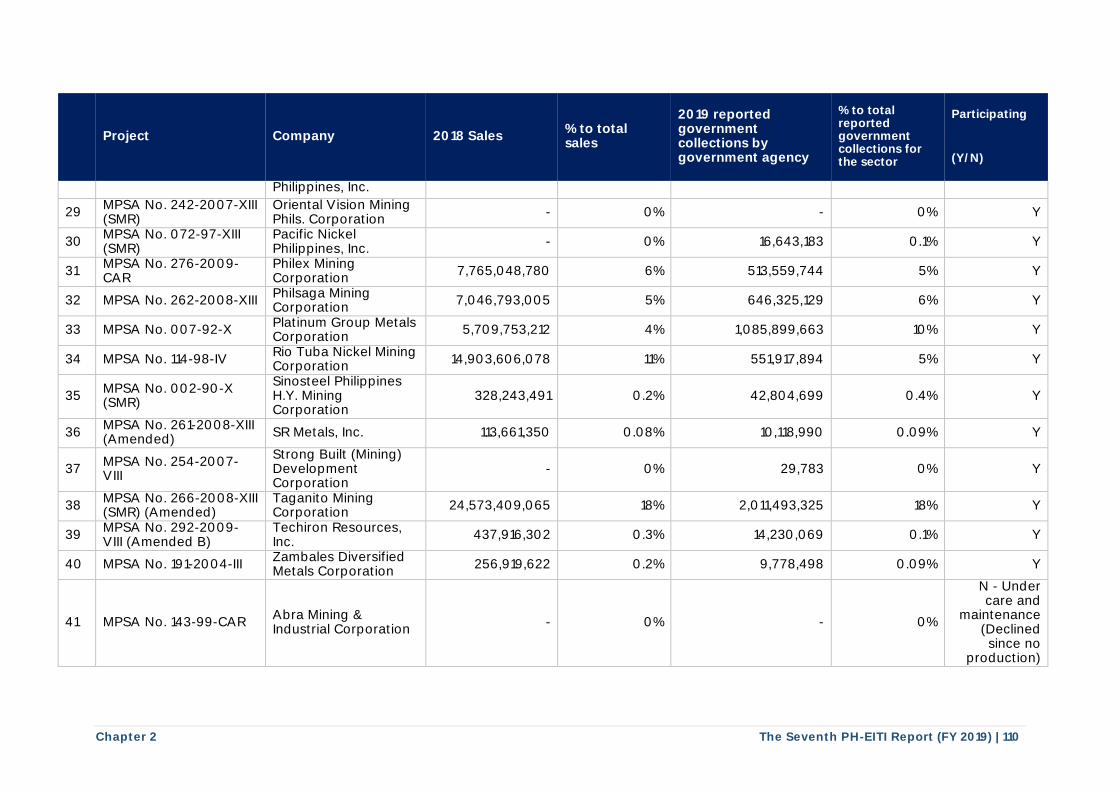
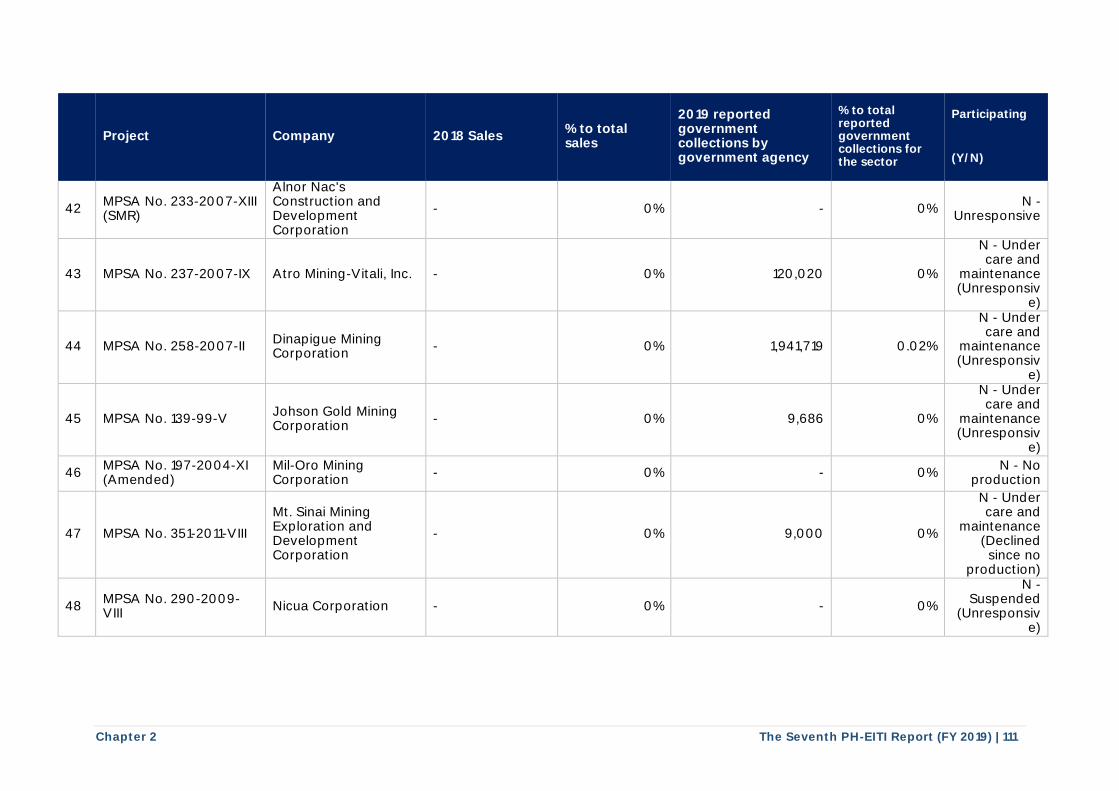
Table 19. Targeted and participating metallic mining projects
Project Company 2018 Sales % to total sales
2019 reported government collections by government agency
% to total reported government collections for the sector
Participating
(Y/N)
1 Dinagat Chromite/Nickel Project (Parcel 1)
AAM-Phil Natural Resources Exploration and Development Corporation
- 0% 2,958,734 0.03% Y
2 Dinagat Chromite/Nickel Project (Parcel 2B)
AAM-Phil Natural Resources Exploration and Development Corporation
- 0% 435,390 0.004% Y
3 MPSA No. 259-2007-XIII (SMR) (Amended II)
Adnama Mining Resources, Inc.
672,928,679 0.5% 98,183,426 1% Y
4 MPSA No. 134-99-XIII Agata Mining Ventures, Inc.
1,818,862,977 1.4% 172,860,161 2% Y
5 MPSA No. 225-2005-XI Apex Mining Company, Inc.
4,876,311,540 3.6% 543,339,206 5% Y
6 PC‐ACMP‐002‐ CAR Benguet Corporation - 0% 5,774,438 0.1% Y
7 MPSA No. 226-2005-III (ZMR)
BenguetCorp Nickel Mines, Inc.
64,548,000 0.05% 7,367,345 0.1% Y
8 MPSA No. 235-2007-IVB
Berong Nickel Corporation
1,377,518,423 1% 252,052,948 2% Y
9 MPSA No. 078-97-XIII (SMR)
Cagdianao Mining Corporation
3,432,171,873 2.6% 678,160,689 6% Y
10 MPSA No. 210-2005-VII Carmen Copper Corporation
20,496,005,161 15% 1,075,559,253 10% Y
11 MPSA No. 243-2007-XIII (SMR)
Carrascal Nickel Corporation
2,306,334,218 2% 338,159,955 3% Y
12 MPSA No. 010-92-X (SMR)
Century Peak Corporation - Casiguran Nickel Project
- 0%
64,855,596 1%
Y
13 MPSA No. 283-2009-XIII (SMR)
Century Peak Corporation -
151,566,140 0.1% Y
Chapter 2 The Seventh PH-EITI Report (FY 2019) | 109
Project Company 2018 Sales % to total sales
2019 reported government collections by government agency
% to total reported government collections for the sector
Participating
(Y/N)
Esperanza Nickel Project
14 MPSA No. 229-2007-IVB
Citinickel Mines and Development Corporation
363,631,043 0.3% 30,766,038 0.3% Y
15 MPSA No. 018-93-X (SMR)
CTP Construction and Mining Corporation - Adlay
2,752,647,505 2%
456,950,213 4%
Y
16 MPSA No. 158-00-XIII (SMR)
CTP Construction and Mining Corporation - Dahican
3,763,559,890 3% Y
17 MPSA No. 209-2005-III Eramen Minerals, Inc. 640,525,550 0.5% 133,122,576 1% Y
18 FTAA No. 04-2009-II FCF Mineral Corporation
4,582,772,885 3% 302,679,183 3% Y
19 MPSA No. 255-2007-V (Amended I)
Filminera Resources Corporation
15,578,463,890 12% 824,909,998 7% Y
20 MPSA No. 184-2002-XIII Greenstone Resources Corp.
- 0% 437,935 0.004% Y
21 MPSA No. 246-2007-XIII (SMR)
Hinatuan Mining Corporation
1,521,400,998 1% 298,230,574 3% Y
22 MPSA No. 152-00-CAR Itogon Suyoc Resources, Inc.
40,661,777 0.03% 23,514,722 0.2% Y
23 MPSA No. 291-2009-XIII (SMR)
Krominco, Inc. - 0% 23,755 0.0002% Y
24 MPSA No. 001-90-CAR Lepanto Consolidated Mining Company
478,394,293 0.4% 144,318,680 1% Y
25 MPSA No. 233-2007-XIII (SMR)
Libjo Mining Corporation
279,038,525 0.2% 40,387,507 0.4% Y
26 MPSA No. 268-2008-III LNL Archipelago Minerals, Inc.
76,595,350 0.06% 4,611,826 0.04% Y
27 MPSA No. 016-93-X (SMR)
Marcventures Mining & Development Corporation
1,636,271,868 1% 102,372,447 1% Y
28 FTAA No. 001 OceanaGold 6,222,494,491 5% 464,707,780 4% Y
Chapter 2 The Seventh PH-EITI Report (FY 2019) | 110
Project Company 2018 Sales % to total sales
2019 reported government collections by government agency
% to total reported government collections for the sector
Participating
(Y/N)
Philippines, Inc.
29 MPSA No. 242-2007-XIII (SMR)
Oriental Vision Mining Phils. Corporation
- 0% - 0% Y
30 MPSA No. 072-97-XIII (SMR)
Pacific Nickel Philippines, Inc.
- 0% 16,643,183 0.1% Y
31 MPSA No. 276-2009-CAR
Philex Mining Corporation
7,765,048,780 6% 513,559,744 5% Y
32 MPSA No. 262-2008-XIII Philsaga Mining Corporation
7,046,793,005 5% 646,325,129 6% Y
33 MPSA No. 007-92-X Platinum Group Metals Corporation
5,709,753,212 4% 1,085,899,663 10% Y
34 MPSA No. 114-98-IV Rio Tuba Nickel Mining Corporation
14,903,606,078 11% 551,917,894 5% Y
35 MPSA No. 002-90-X (SMR)
Sinosteel Philippines H.Y. Mining Corporation
328,243,491 0.2% 42,804,699 0.4% Y
36 MPSA No. 261-2008-XIII (Amended)
SR Metals, Inc. 113,661,350 0.08% 10,118,990 0.09% Y
37 MPSA No. 254-2007-VIII
Strong Built (Mining) Development Corporation
- 0% 29,783 0% Y
38 MPSA No. 266-2008-XIII (SMR) (Amended)
Taganito Mining Corporation
24,573,409,065 18% 2,011,493,325 18% Y
39 MPSA No. 292-2009-VIII (Amended B)
Techiron Resources, Inc.
437,916,302 0.3% 14,230,069 0.1% Y
40 MPSA No. 191-2004-III Zambales Diversified Metals Corporation
256,919,622 0.2% 9,778,498 0.09% Y
41 MPSA No. 143-99-CAR Abra Mining & Industrial Corporation
- 0% - 0%
N - Under care and
maintenance (Declined since no
production)
Chapter 2 The Seventh PH-EITI Report (FY 2019) | 111
Project Company 2018 Sales % to total sales
2019 reported government collections by government agency
% to total reported government collections for the sector
Participating
(Y/N)
42 MPSA No. 233-2007-XIII (SMR)
Alnor Nac's Construction and Development Corporation
- 0% - 0% N -
Unresponsive
43 MPSA No. 237-2007-IX Atro Mining-Vitali, Inc. - 0% 120,020 0%
N - Under care and
maintenance (Unresponsiv
e)
44 MPSA No. 258-2007-II Dinapigue Mining Corporation
- 0% 1,941,719 0.02%
N - Under care and
maintenance (Unresponsiv
e)
45 MPSA No. 139-99-V Johson Gold Mining Corporation
- 0% 9,686 0%
N - Under care and
maintenance (Unresponsiv
e)
46 MPSA No. 197-2004-XI (Amended)
Mil-Oro Mining Corporation
- 0% - 0% N - No
production
47 MPSA No. 351-2011-VIII
Mt. Sinai Mining Exploration and Development Corporation
- 0% 9,000 0%
N - Under care and
maintenance (Declined since no
production)
48 MPSA No. 290-2009-VIII
Nicua Corporation - 0% - 0%
N - Suspended
(Unresponsive)
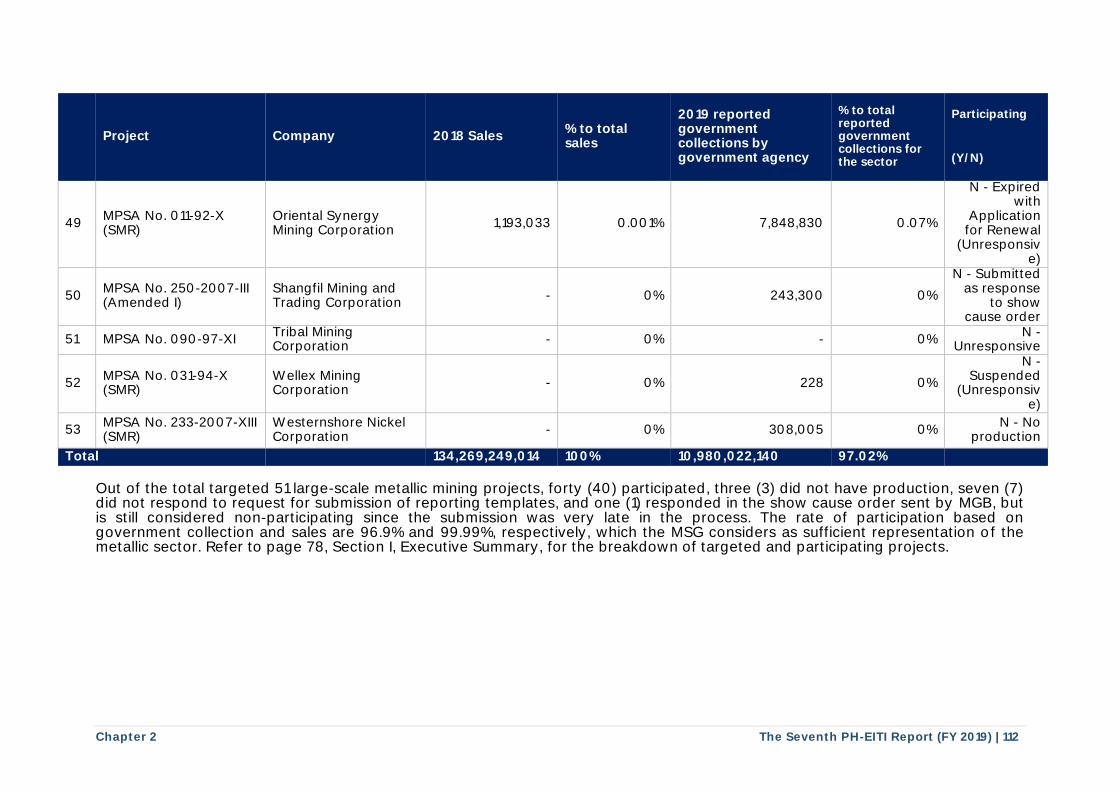
Chapter 2 The Seventh PH-EITI Report (FY 2019) | 112
Project Company 2018 Sales % to total sales
2019 reported government collections by government agency
% to total reported government collections for the sector
Participating
(Y/N)
49 MPSA No. 011-92-X (SMR)
Oriental Synergy Mining Corporation
1,193,033 0.001% 7,848,830 0.07%
N - Expired with
Application for Renewal
(Unresponsive)
50 MPSA No. 250-2007-III (Amended I)
Shangfil Mining and Trading Corporation
- 0% 243,300 0%
N - Submitted as response
to show cause order
51 MPSA No. 090-97-XI Tribal Mining Corporation
- 0% - 0% N -
Unresponsive
52 MPSA No. 031-94-X (SMR)
Wellex Mining Corporation
- 0% 228 0%
N - Suspended
(Unresponsive)
53 MPSA No. 233-2007-XIII (SMR)
Westernshore Nickel Corporation
- 0% 308,005 0% N - No
production
Total 134,269,249,014 100% 10,980,022,140 97.02%
Out of the total targeted 51 large-scale metallic mining projects, forty (40) participated, three (3) did not have production, seven (7) did not respond to request for submission of reporting templates, and one (1) responded in the show cause order sent by MGB, but is still considered non-participating since the submission was very late in the process. The rate of participation based on government collection and sales are 96.9% and 99.99%, respectively, which the MSG considers as sufficient representation of the metallic sector. Refer to page 78, Section I, Executive Summary, for the breakdown of targeted and participating projects.
Chapter 2 The Seventh PH-EITI Report (FY 2019) | 113
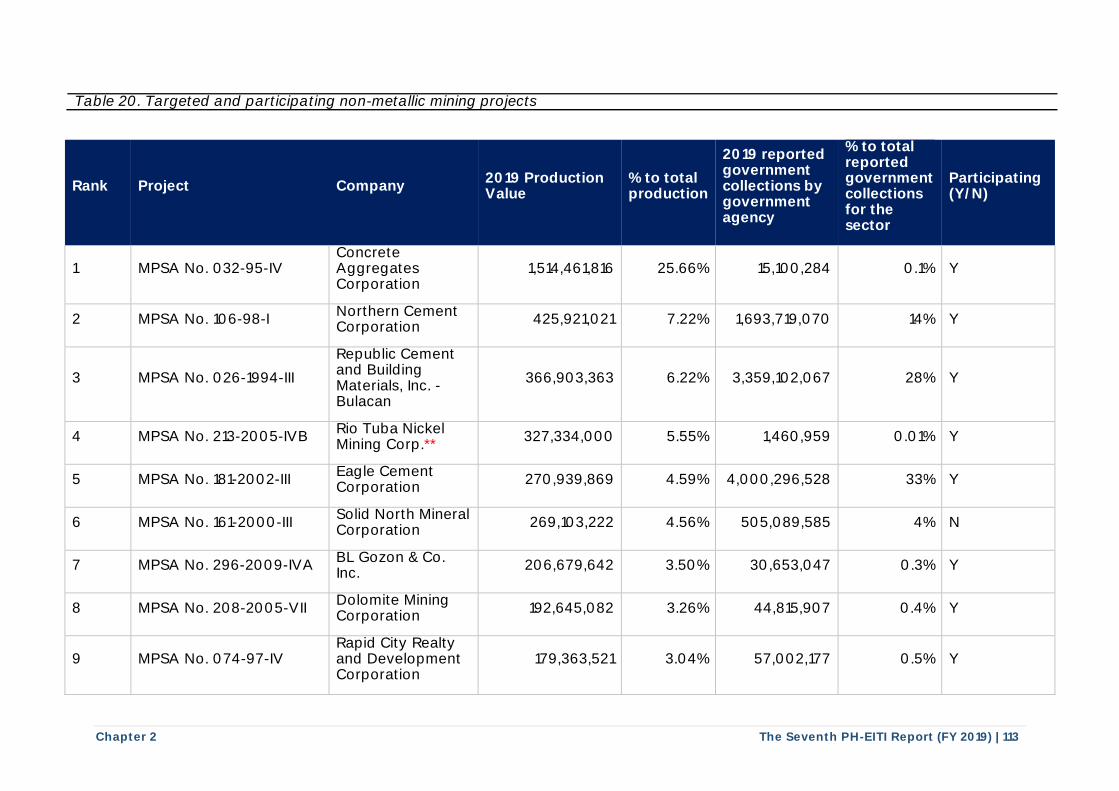
Table 20. Targeted and participating non-metallic mining projects
Rank Project Company 2019 Production Value
% to total production
2019 reported government collections by government agency
% to total reported government collections for the sector
Participating (Y/N)
1 MPSA No. 032-95-IV Concrete Aggregates Corporation
1,514,461,816 25.66% 15,100,284 0.1% Y
2 MPSA No. 106-98-I Northern Cement Corporation
425,921,021 7.22% 1,693,719,070 14% Y
3 MPSA No. 026-1994-III
Republic Cement and Building Materials, Inc. - Bulacan
366,903,363 6.22% 3,359,102,067 28% Y
4 MPSA No. 213-2005-IVB Rio Tuba Nickel Mining Corp.**
327,334,000 5.55% 1,460,959 0.01% Y
5 MPSA No. 181-2002-III Eagle Cement Corporation
270,939,869 4.59% 4,000,296,528 33% Y
6 MPSA No. 161-2000-III Solid North Mineral Corporation
269,103,222 4.56% 505,089,585 4% N
7 MPSA No. 296-2009-IVA BL Gozon & Co. Inc.
206,679,642 3.50% 30,653,047 0.3% Y
8 MPSA No. 208-2005-VII Dolomite Mining Corporation
192,645,082 3.26% 44,815,907 0.4% Y
9 MPSA No. 074-97-IV Rapid City Realty and Development Corporation
179,363,521 3.04% 57,002,177 0.5% Y
Chapter 2 The Seventh PH-EITI Report (FY 2019) | 114
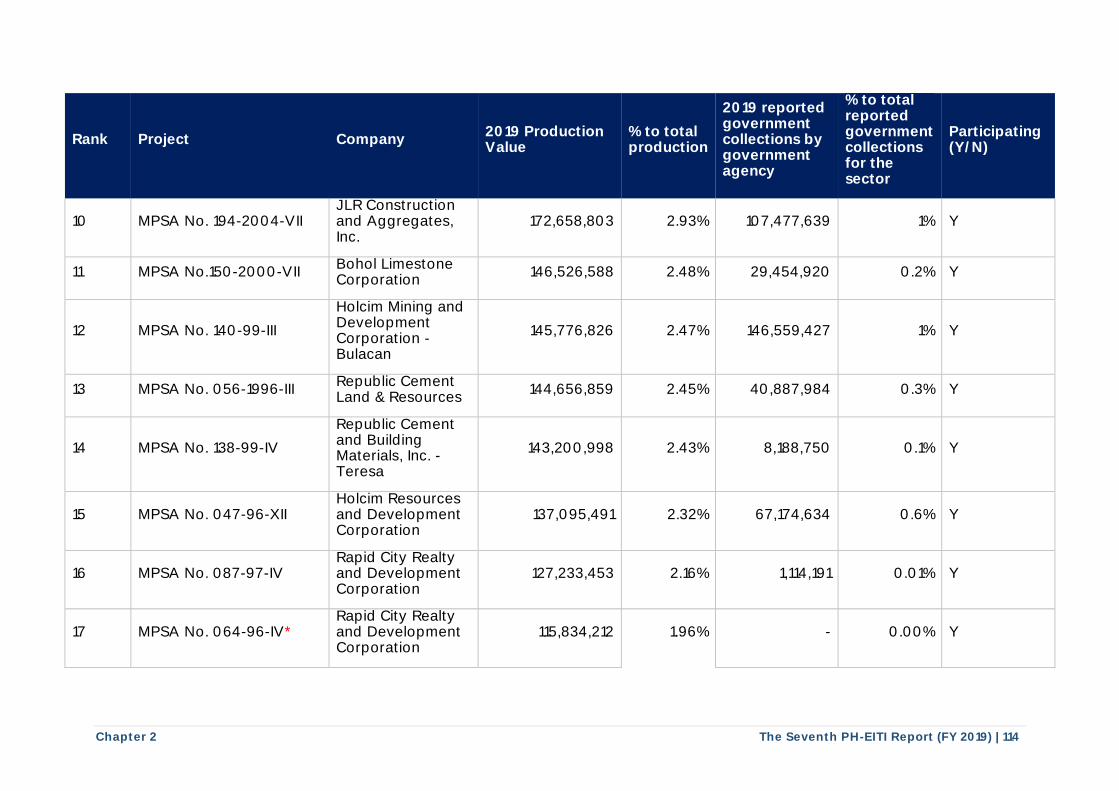
Rank Project Company 2019 Production Value
% to total production
2019 reported government collections by government agency
% to total reported government collections for the sector
Participating (Y/N)
10 MPSA No. 194-2004-VII JLR Construction and Aggregates, Inc.
172,658,803 2.93% 107,477,639 1% Y
11 MPSA No.150-2000-VII Bohol Limestone Corporation
146,526,588 2.48% 29,454,920 0.2% Y
12 MPSA No. 140-99-III
Holcim Mining and Development Corporation - Bulacan
145,776,826 2.47% 146,559,427 1% Y
13 MPSA No. 056-1996-III Republic Cement Land & Resources
144,656,859 2.45% 40,887,984 0.3% Y
14 MPSA No. 138-99-IV
Republic Cement and Building Materials, Inc. - Teresa
143,200,998 2.43% 8,188,750 0.1% Y
15 MPSA No. 047-96-XII Holcim Resources and Development Corporation
137,095,491 2.32% 67,174,634 0.6% Y
16 MPSA No. 087-97-IV Rapid City Realty and Development Corporation
127,233,453 2.16% 1,114,191 0.01% Y
17 MPSA No. 064-96-IV* Rapid City Realty and Development Corporation
115,834,212 1.96% - 0.00% Y
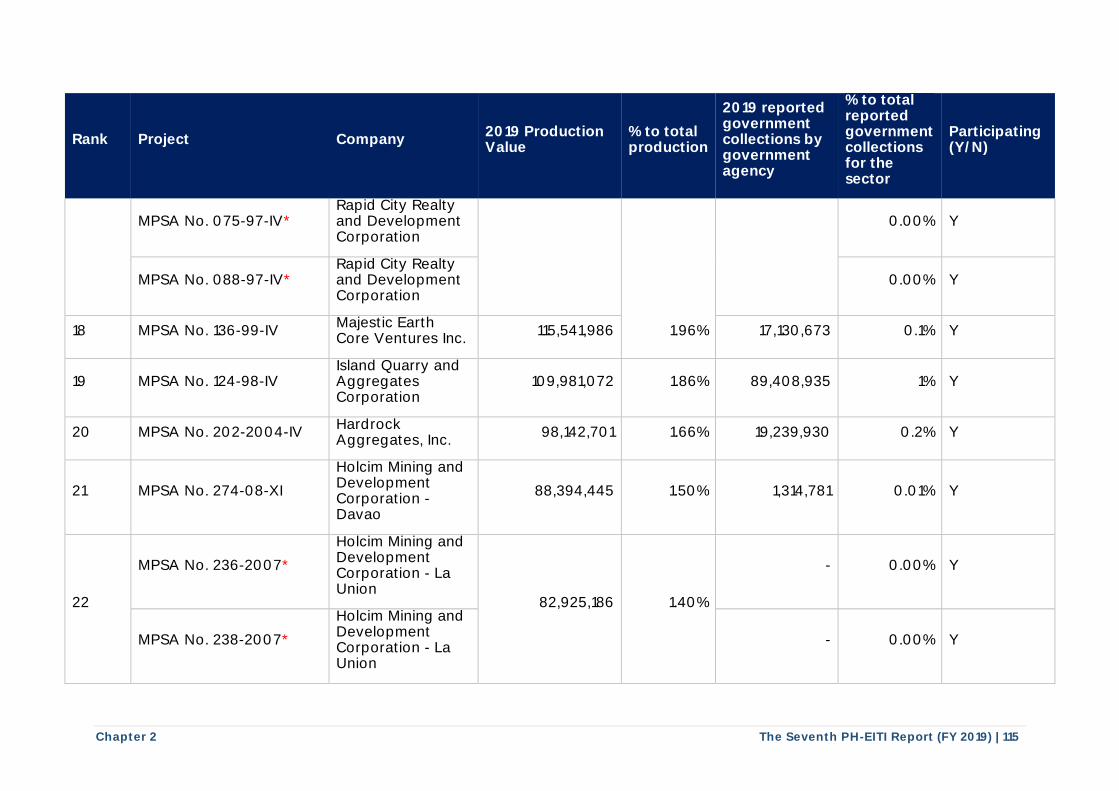
Chapter 2 The Seventh PH-EITI Report (FY 2019) | 115
Rank Project Company 2019 Production Value
% to total production
2019 reported government collections by government agency
% to total reported government collections for the sector
Participating (Y/N)
MPSA No. 075-97-IV* Rapid City Realty and Development Corporation
0.00% Y
MPSA No. 088-97-IV* Rapid City Realty and Development Corporation
0.00% Y
18 MPSA No. 136-99-IV Majestic Earth Core Ventures Inc.
115,541,986 1.96% 17,130,673 0.1% Y
19 MPSA No. 124-98-IV Island Quarry and Aggregates Corporation
109,981,072 1.86% 89,408,935 1% Y
20 MPSA No. 202-2004-IV Hardrock Aggregates, Inc.
98,142,701 1.66% 19,239,930 0.2% Y
21 MPSA No. 274-08-XI
Holcim Mining and Development Corporation - Davao
88,394,445 1.50% 1,314,781 0.01% Y
22
MPSA No. 236-2007*
Holcim Mining and Development Corporation - La Union
82,925,186 1.40%
- 0.00% Y
MPSA No. 238-2007*
Holcim Mining and Development Corporation - La Union
- 0.00% Y
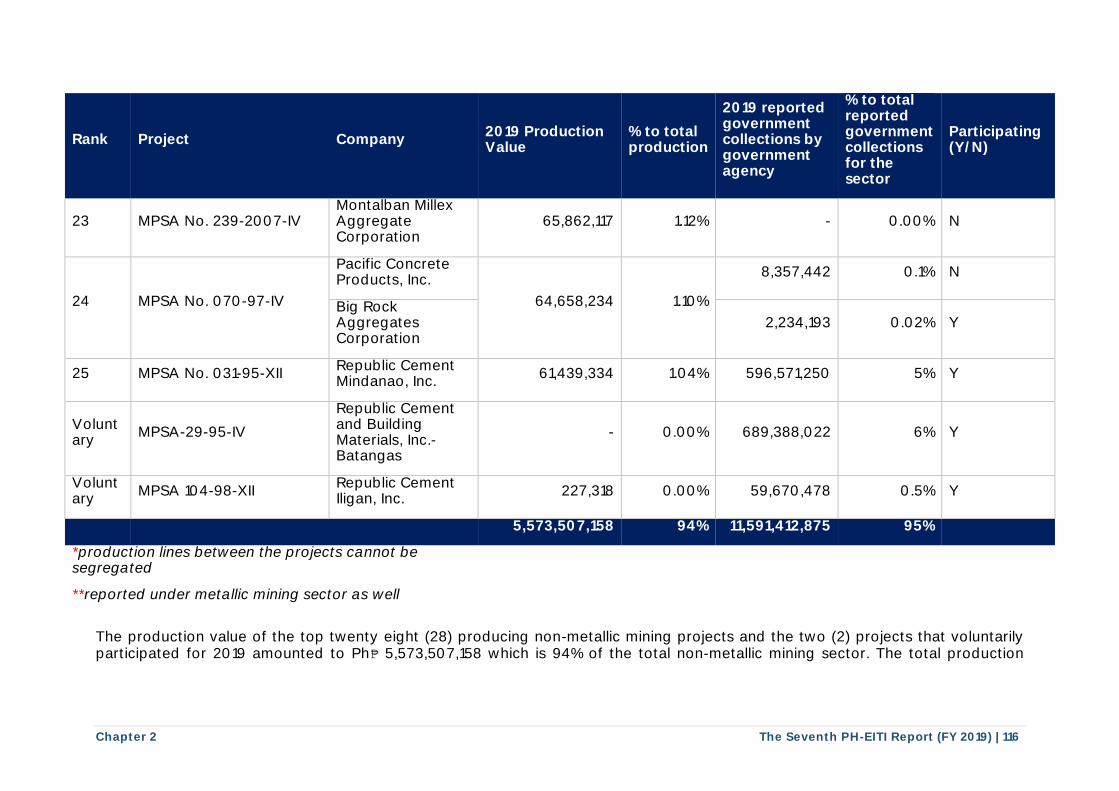
Chapter 2 The Seventh PH-EITI Report (FY 2019) | 116
Rank Project Company 2019 Production Value
% to total production
2019 reported government collections by government agency
% to total reported government collections for the sector
Participating (Y/N)
23 MPSA No. 239-2007-IV Montalban Millex Aggregate Corporation
65,862,117 1.12% - 0.00% N
24 MPSA No. 070-97-IV
Pacific Concrete Products, Inc.
64,658,234 1.10%
8,357,442 0.1% N
Big Rock Aggregates Corporation
2,234,193 0.02% Y
25 MPSA No. 031-95-XII Republic Cement Mindanao, Inc.
61,439,334 1.04% 596,571,250 5% Y
Voluntary
MPSA-29-95-IV
Republic Cement and Building Materials, Inc.- Batangas
- 0.00% 689,388,022 6% Y
Voluntary
MPSA 104-98-XII Republic Cement Iligan, Inc.
227,318 0.00% 59,670,478 0.5% Y
5,573,507,158 94% 11,591,412,875 95%
*production lines between the projects cannot be segregated
**reported under metallic mining sector as well
The production value of the top twenty eight (28) producing non-metallic mining projects and the two (2) projects that voluntarily participated for 2019 amounted to Ph₱ 5,573,507,158 which is 94% of the total non-metallic mining sector. The total production
------ ------------------- --------------- -------------- --------- ------------ ---------- -----------
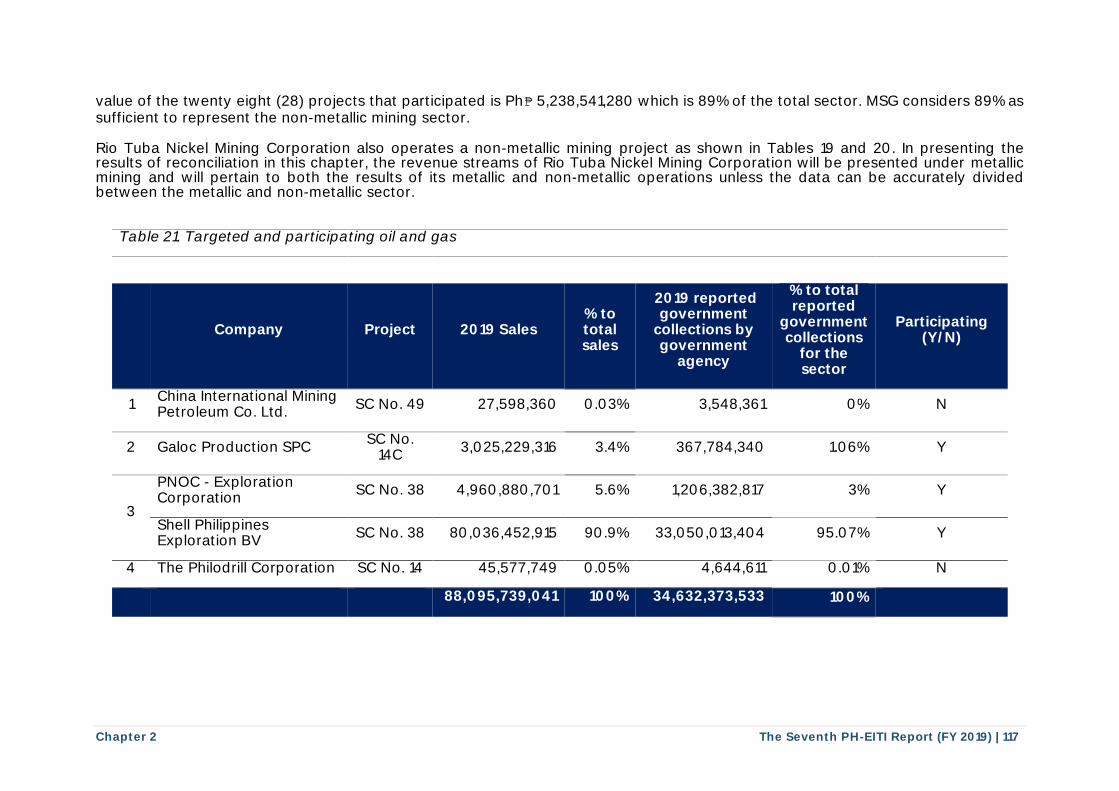
Chapter 2 The Seventh PH-EITI Report (FY 2019) | 117
value of the twenty eight (28) projects that participated is Ph₱ 5,238,541,280 which is 89% of the total sector. MSG considers 89% as sufficient to represent the non-metallic mining sector. Rio Tuba Nickel Mining Corporation also operates a non-metallic mining project as shown in Tables 19 and 20. In presenting the results of reconciliation in this chapter, the revenue streams of Rio Tuba Nickel Mining Corporation will be presented under metallic mining and will pertain to both the results of its metallic and non-metallic operations unless the data can be accurately divided between the metallic and non-metallic sector.
Table 21. Targeted and participating oil and gas
Company Project 2019 Sales % to total sales
2019 reported government
collections by government
agency
% to total reported
government collections
for the sector
Participating (Y/N)
1 China International Mining Petroleum Co. Ltd.
SC No. 49 27,598,360 0.03% 3,548,361 0% N
2 Galoc Production SPC SC No.
14C 3,025,229,316 3.4% 367,784,340 1.06% Y
3
PNOC - Exploration Corporation
SC No. 38 4,960,880,701 5.6% 1,206,382,817 3% Y
Shell Philippines Exploration BV
SC No. 38 80,036,452,915 90.9% 33,050,013,404 95.07% Y
4 The Philodrill Corporation SC No. 14 45,577,749 0.05% 4,644,611 0.01% N
88,095,739,041 100% 34,632,373,533 100%
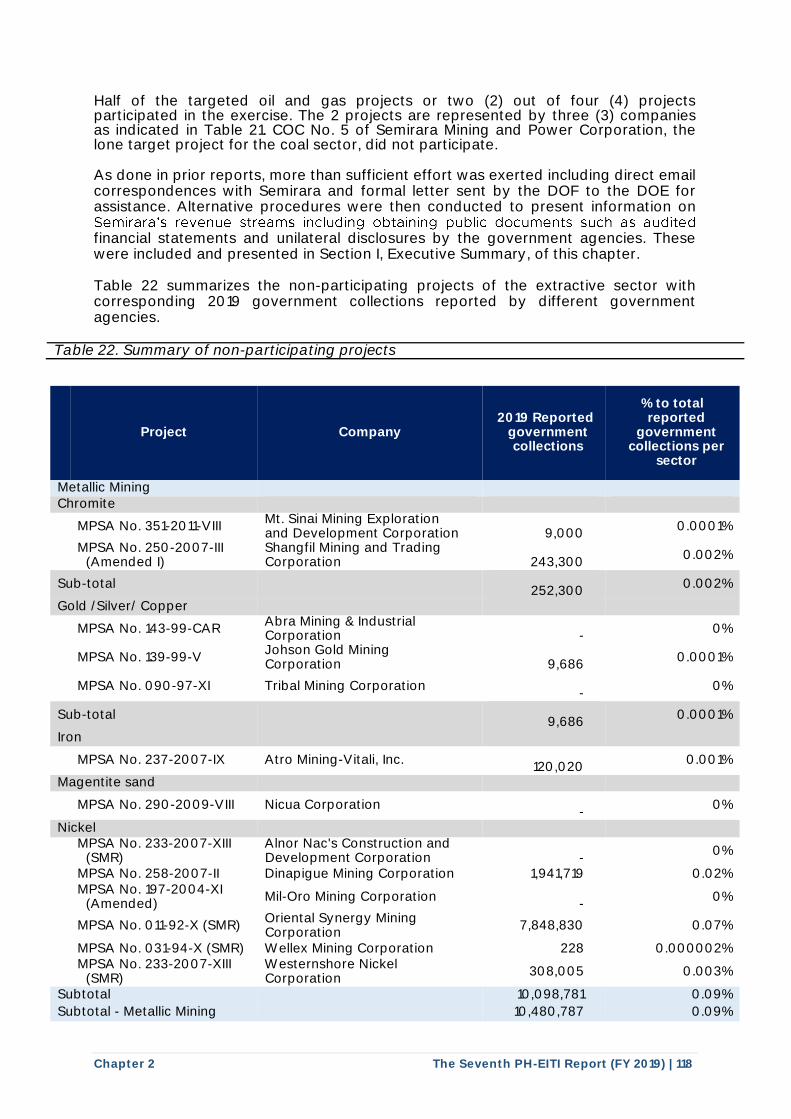
Chapter 2 The Seventh PH-EITI Report (FY 2019) | 118
Half of the targeted oil and gas projects or two (2) out of four (4) projects participated in the exercise. The 2 projects are represented by three (3) companies as indicated in Table 21. COC No. 5 of Semirara Mining and Power Corporation, the lone target project for the coal sector, did not participate. As done in prior reports, more than sufficient effort was exerted including direct email correspondences with Semirara and formal letter sent by the DOF to the DOE for assistance. Alternative procedures were then conducted to present information on
financial statements and unilateral disclosures by the government agencies. These were included and presented in Section I, Executive Summary, of this chapter. Table 22 summarizes the non-participating projects of the extractive sector with corresponding 2019 government collections reported by different government agencies.
Table 22. Summary of non-participating projects
Project Company 2019 Reported
government collections
% to total reported
government collections per
sector
Metallic Mining Chromite
MPSA No. 351-2011-VIII Mt. Sinai Mining Exploration and Development Corporation
9,000
0.0001%
MPSA No. 250-2007-III
(Amended I) Shangfil Mining and Trading Corporation
243,300
0.002%
Sub-total
252,300 0.002%
Gold /Silver/ Copper
MPSA No. 143-99-CAR Abra Mining & Industrial Corporation
-
0%
MPSA No. 139-99-V Johson Gold Mining Corporation
9,686
0.0001%
MPSA No. 090-97-XI Tribal Mining Corporation
- 0%
Sub-total
9,686 0.0001%
Iron
MPSA No. 237-2007-IX Atro Mining-Vitali, Inc.
120,020 0.001%
Magentite sand
MPSA No. 290-2009-VIII Nicua Corporation
- 0%
Nickel
MPSA No. 233-2007-XIII
(SMR) Alnor Nac's Construction and Development Corporation
-
0%
MPSA No. 258-2007-II Dinapigue Mining Corporation 1,941,719 0.02%
MPSA No. 197-2004-XI
(Amended) Mil-Oro Mining Corporation
-
0%
MPSA No. 011-92-X (SMR) Oriental Synergy Mining Corporation
7,848,830 0.07%
MPSA No. 031-94-X (SMR) Wellex Mining Corporation 228 0.000002%
MPSA No. 233-2007-XIII
(SMR) Westernshore Nickel Corporation
308,005 0.003%
Subtotal 10,098,781 0.09%
Subtotal - Metallic Mining 10,480,787 0.09%
Semirara's revenue streams including obtaining public documents such as audited
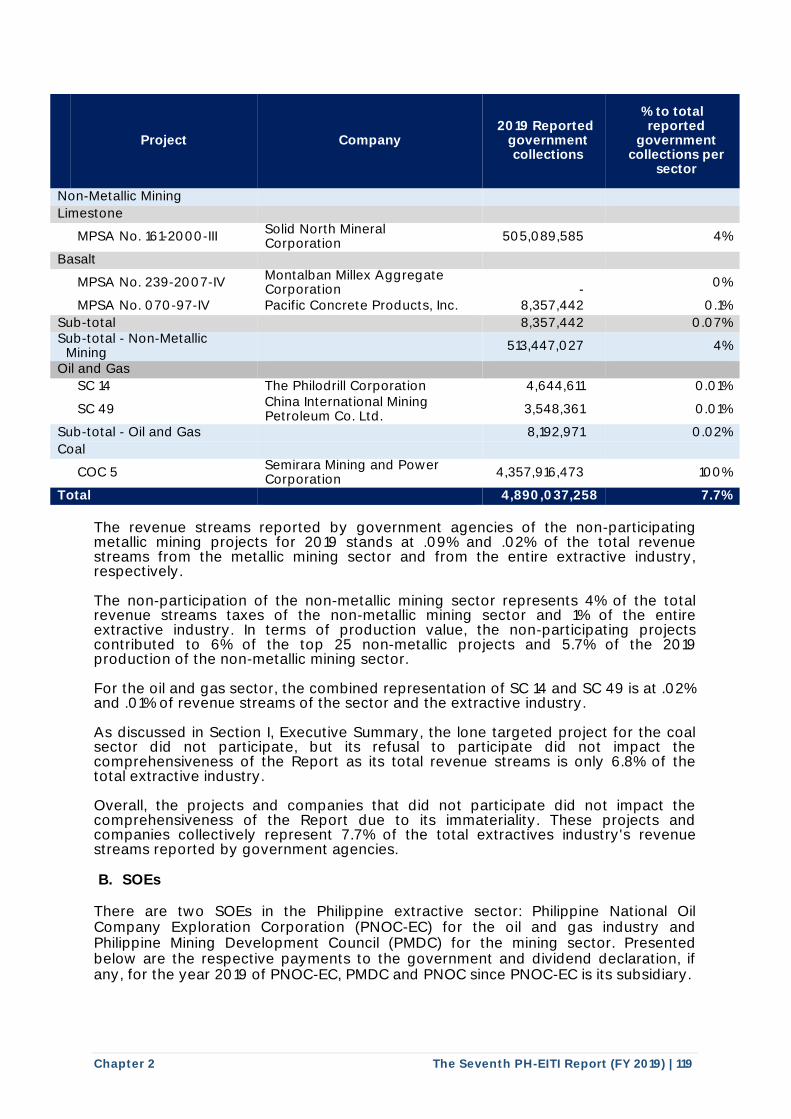
Chapter 2 The Seventh PH-EITI Report (FY 2019) | 119
Project Company 2019 Reported
government collections
% to total reported
government collections per
sector
Non-Metallic Mining
Limestone
MPSA No. 161-2000-III Solid North Mineral Corporation
505,089,585 4%
Basalt
MPSA No. 239-2007-IV Montalban Millex Aggregate Corporation
-
0%
MPSA No. 070-97-IV Pacific Concrete Products, Inc. 8,357,442 0.1%
Sub-total 8,357,442 0.07% Sub-total - Non-Metallic
Mining 513,447,027 4%
Oil and Gas
SC 14 The Philodrill Corporation 4,644,611 0.01%
SC 49 China International Mining Petroleum Co. Ltd.
3,548,361 0.01%
Sub-total - Oil and Gas 8,192,971 0.02%
Coal
COC 5 Semirara Mining and Power Corporation
4,357,916,473 100%
Total 4,890,037,258 7.7%
The revenue streams reported by government agencies of the non-participating metallic mining projects for 2019 stands at .09% and .02% of the total revenue streams from the metallic mining sector and from the entire extractive industry, respectively. The non-participation of the non-metallic mining sector represents 4% of the total revenue streams taxes of the non-metallic mining sector and 1% of the entire extractive industry. In terms of production value, the non-participating projects contributed to 6% of the top 25 non-metallic projects and 5.7% of the 2019 production of the non-metallic mining sector. For the oil and gas sector, the combined representation of SC 14 and SC 49 is at .02% and .01% of revenue streams of the sector and the extractive industry. As discussed in Section I, Executive Summary, the lone targeted project for the coal sector did not participate, but its refusal to participate did not impact the comprehensiveness of the Report as its total revenue streams is only 6.8% of the total extractive industry. Overall, the projects and companies that did not participate did not impact the comprehensiveness of the Report due to its immateriality. These projects and companies collectively represent 7.7% of the total extractives industry's revenue streams reported by government agencies.
B. SOEs
There are two SOEs in the Philippine extractive sector: Philippine National Oil Company Exploration Corporation (PNOC-EC) for the oil and gas industry and Philippine Mining Development Council (PMDC) for the mining sector. Presented below are the respective payments to the government and dividend declaration, if any, for the year 2019 of PNOC-EC, PMDC and PNOC since PNOC-EC is its subsidiary.
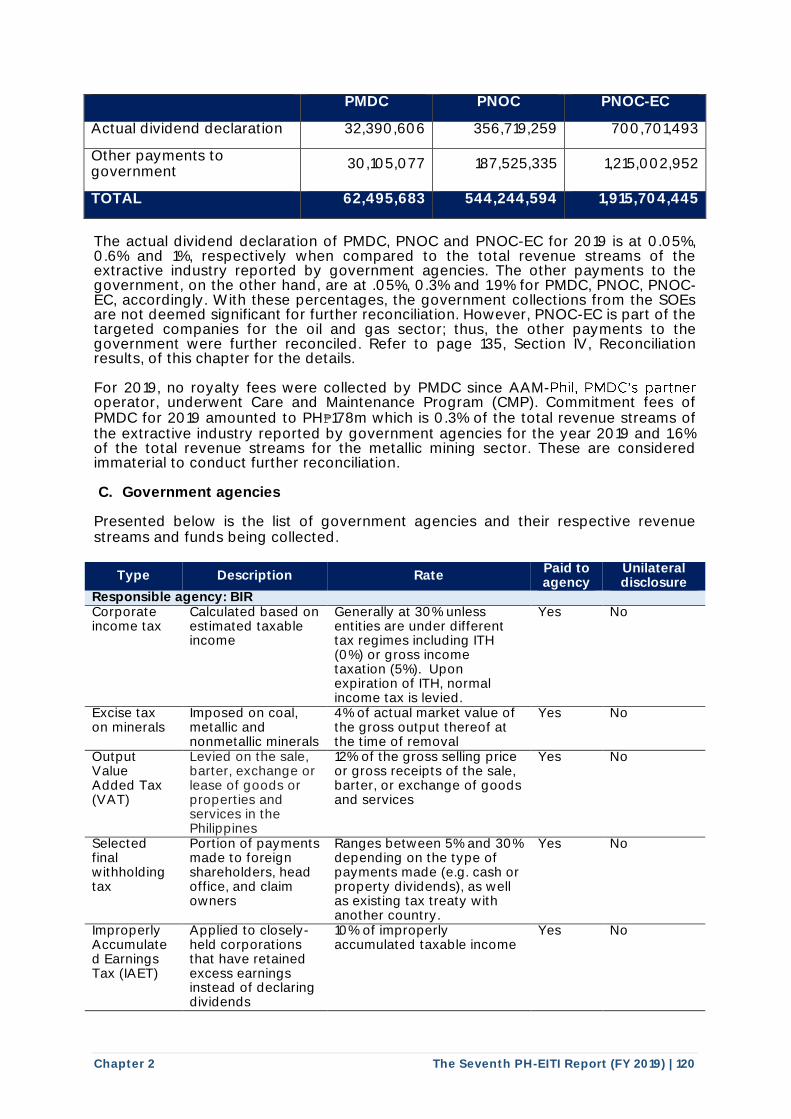
Chapter 2 The Seventh PH-EITI Report (FY 2019) | 120
PMDC PNOC PNOC-EC
Actual dividend declaration 32,390,606 356,719,259 700,701,493
Other payments to government
30,105,077 187,525,335 1,215,002,952
TOTAL 62,495,683 544,244,594 1,915,704,445
The actual dividend declaration of PMDC, PNOC and PNOC-EC for 2019 is at 0.05%, 0.6% and 1%, respectively when compared to the total revenue streams of the extractive industry reported by government agencies. The other payments to the government, on the other hand, are at .05%, 0.3% and 1.9% for PMDC, PNOC, PNOC-EC, accordingly. With these percentages, the government collections from the SOEs are not deemed significant for further reconciliation. However, PNOC-EC is part of the targeted companies for the oil and gas sector; thus, the other payments to the government were further reconciled. Refer to page 135, Section IV, Reconciliation results, of this chapter for the details. For 2019, no royalty fees were collected by PMDC since AAM-operator, underwent Care and Maintenance Program (CMP). Commitment fees of PMDC for 2019 amounted to PH₱178m which is 0.3% of the total revenue streams of the extractive industry reported by government agencies for the year 2019 and 1.6% of the total revenue streams for the metallic mining sector. These are considered immaterial to conduct further reconciliation. C. Government agencies
Presented below is the list of government agencies and their respective revenue streams and funds being collected.
Type Description Rate Paid to agency
Unilateral disclosure
Responsible agency: BIR Corporate income tax
Calculated based on estimated taxable income
Generally at 30% unless entities are under different tax regimes including ITH (0%) or gross income taxation (5%). Upon expiration of ITH, normal income tax is levied.
Yes No
Excise tax on minerals
Imposed on coal, metallic and nonmetallic minerals
4% of actual market value of the gross output thereof at the time of removal
Yes No
Output Value Added Tax (VAT)
Levied on the sale, barter, exchange or lease of goods or properties and services in the Philippines
12% of the gross selling price or gross receipts of the sale, barter, or exchange of goods and services
Yes No
Selected final withholding tax
Portion of payments made to foreign shareholders, head office, and claim owners
Ranges between 5% and 30% depending on the type of payments made (e.g. cash or property dividends), as well as existing tax treaty with another country.
Yes No
Improperly Accumulated Earnings Tax (IAET)
Applied to closely-held corporations that have retained excess earnings instead of declaring dividends
10% of improperly accumulated taxable income
Yes No
Phil, PMDC's partner
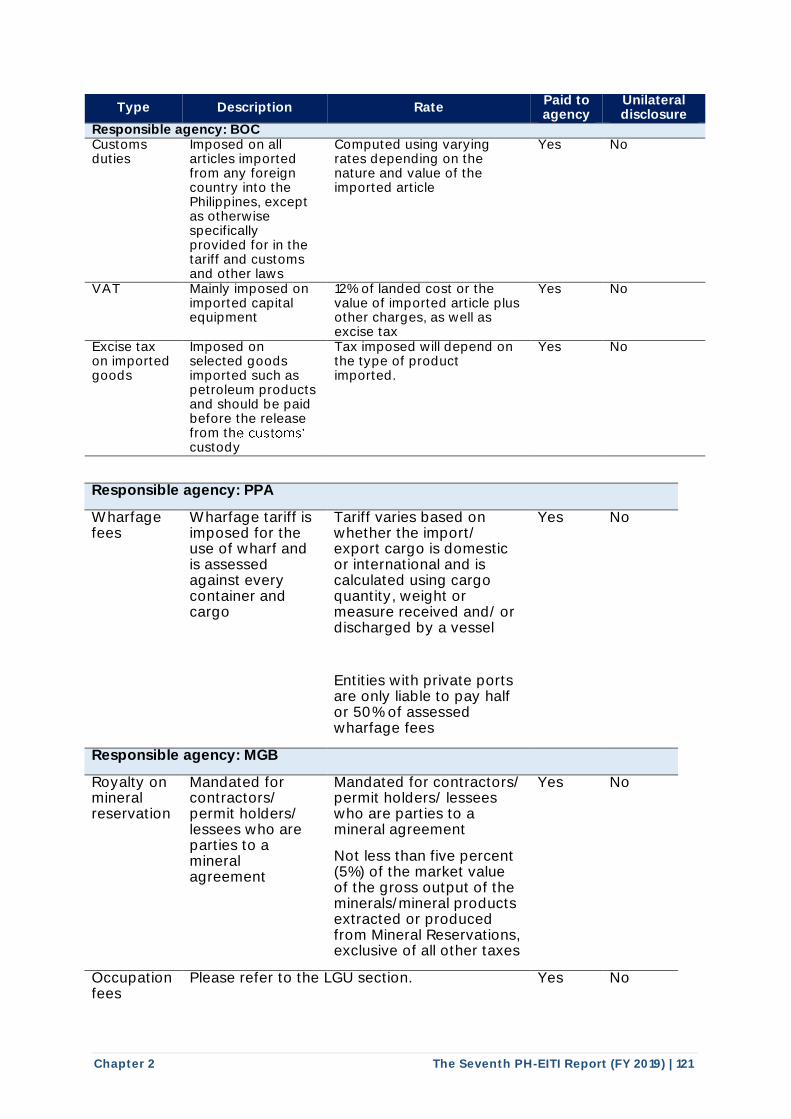
Chapter 2 The Seventh PH-EITI Report (FY 2019) | 121
Type Description Rate Paid to agency
Unilateral disclosure
Responsible agency: BOC Customs duties
Imposed on all articles imported from any foreign country into the Philippines, except as otherwise specifically provided for in the tariff and customs and other laws
Computed using varying rates depending on the nature and value of the imported article
Yes No
VAT Mainly imposed on imported capital equipment
12% of landed cost or the value of imported article plus other charges, as well as excise tax
Yes No
Excise tax on imported goods
Imposed on selected goods imported such as petroleum products and should be paid before the release from thcustody
Tax imposed will depend on the type of product imported.
Yes No
Responsible agency: PPA
Wharfage fees
Wharfage tariff is imposed for the use of wharf and is assessed against every container and cargo
Tariff varies based on whether the import/ export cargo is domestic or international and is calculated using cargo quantity, weight or measure received and/ or discharged by a vessel
Entities with private ports are only liable to pay half or 50% of assessed wharfage fees
Yes No
Responsible agency: MGB
Royalty on mineral reservation
Mandated for contractors/ permit holders/ lessees who are parties to a mineral agreement
Mandated for contractors/ permit holders/ lessees who are parties to a mineral agreement
Not less than five percent (5%) of the market value of the gross output of the minerals/mineral products extracted or produced from Mineral Reservations, exclusive of all other taxes
Yes No
Occupation fees
Please refer to the LGU section. Yes No
e customs'
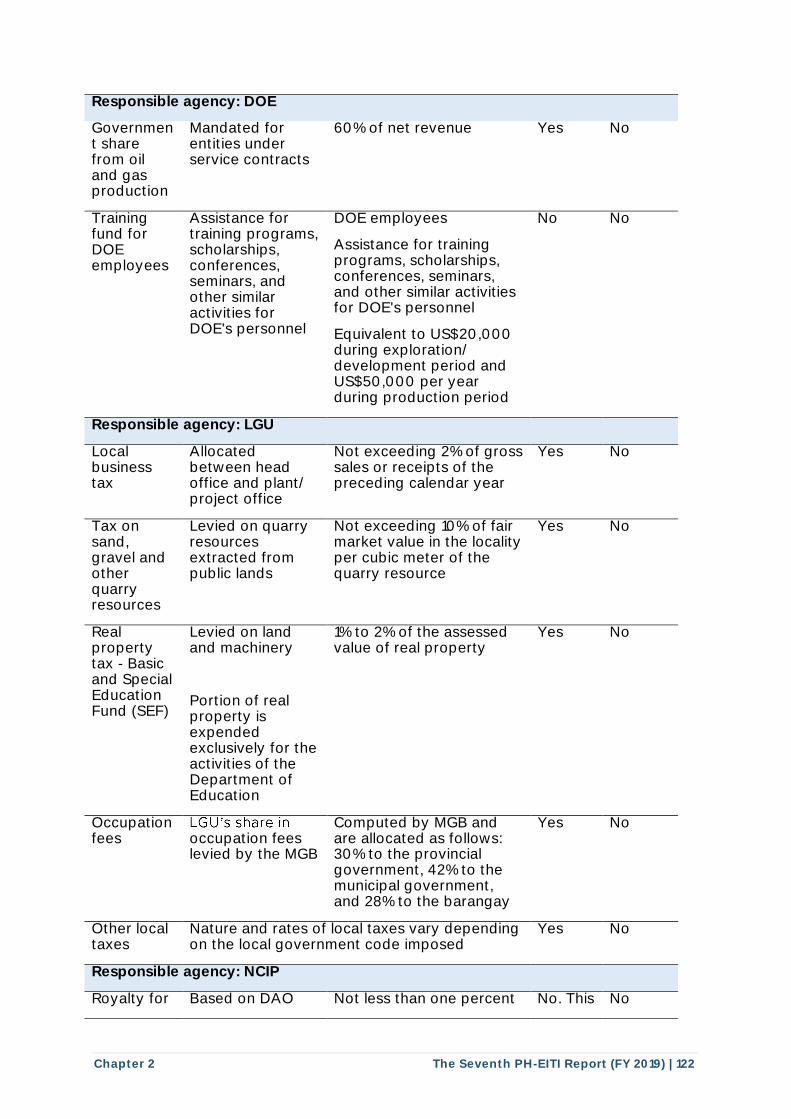
Chapter 2 The Seventh PH-EITI Report (FY 2019) | 122
Responsible agency: DOE
Government share from oil and gas production
Mandated for entities under service contracts
60% of net revenue Yes No
Training fund for DOE employees
Assistance for training programs, scholarships, conferences, seminars, and other similar activities for DOE's personnel
DOE employees
Assistance for training programs, scholarships, conferences, seminars, and other similar activities for DOE's personnel
Equivalent to US$20,000 during exploration/ development period and US$50,000 per year during production period
No No
Responsible agency: LGU
Local business tax
Allocated between head office and plant/ project office
Not exceeding 2% of gross sales or receipts of the preceding calendar year
Yes No
Tax on sand, gravel and other quarry resources
Levied on quarry resources extracted from public lands
Not exceeding 10% of fair market value in the locality per cubic meter of the quarry resource
Yes No
Real property tax - Basic and Special Education Fund (SEF)
Levied on land and machinery
Portion of real property is expended exclusively for the activities of the Department of Education
1% to 2% of the assessed value of real property
Yes No
Occupation fees occupation fees
levied by the MGB
Computed by MGB and are allocated as follows: 30% to the provincial government, 42% to the municipal government, and 28% to the barangay
Yes No
Other local taxes
Nature and rates of local taxes vary depending on the local government code imposed
Yes No
Responsible agency: NCIP
Royalty for Based on DAO Not less than one percent No. This No
LGU's share in
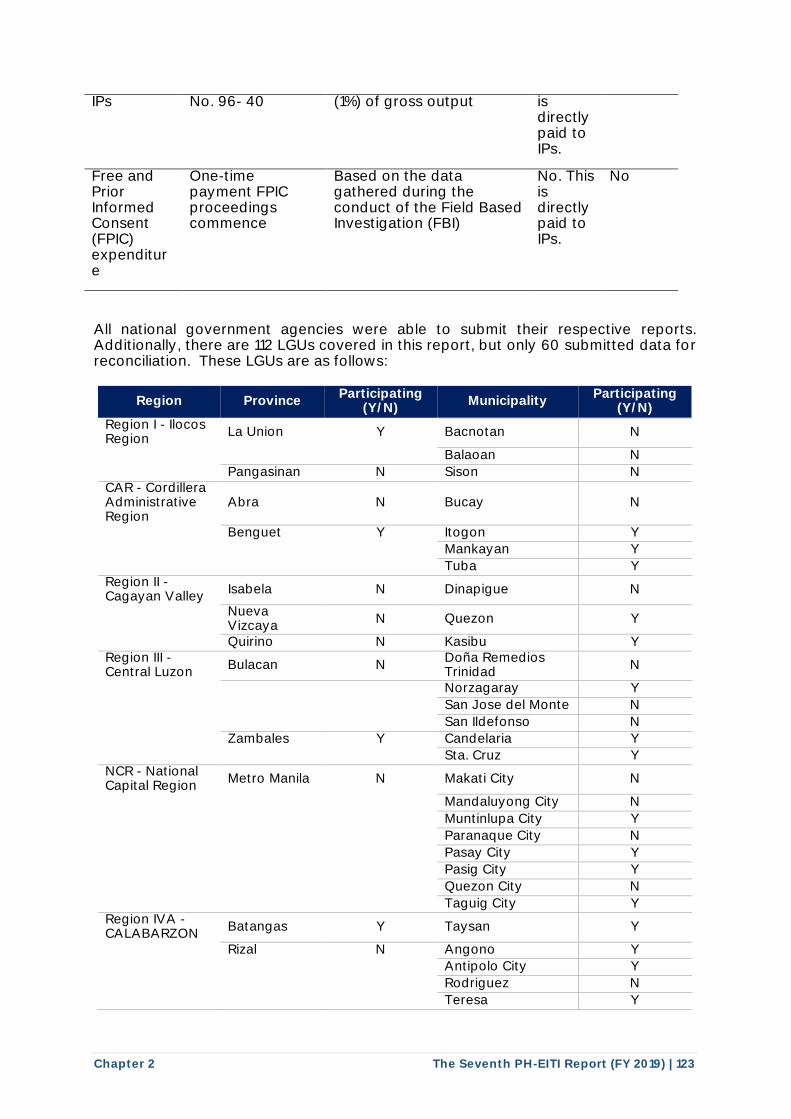
Chapter 2 The Seventh PH-EITI Report (FY 2019) | 123
IPs No. 96- 40 (1%) of gross output is directly paid to IPs.
Free and Prior Informed Consent (FPIC) expenditure
One-time payment FPIC proceedings commence
Based on the data gathered during the conduct of the Field Based Investigation (FBI)
No. This is directly paid to IPs.
No
All national government agencies were able to submit their respective reports. Additionally, there are 112 LGUs covered in this report, but only 60 submitted data for reconciliation. These LGUs are as follows:
Region Province Participating
(Y/N) Municipality
Participating (Y/N)
Region I - Ilocos Region
La Union Y Bacnotan N
Balaoan N
Pangasinan N Sison N CAR - Cordillera Administrative Region
Abra N Bucay N
Benguet Y Itogon Y
Mankayan Y
Tuba Y Region II - Cagayan Valley
Isabela N Dinapigue N
Nueva Vizcaya
N Quezon Y
Quirino N Kasibu Y Region III - Central Luzon
Bulacan N Doña Remedios Trinidad
N
Norzagaray Y
San Jose del Monte N
San Ildefonso N
Zambales Y Candelaria Y
Sta. Cruz Y NCR - National Capital Region
Metro Manila N Makati City N
Mandaluyong City N
Muntinlupa City Y
Paranaque City N
Pasay City Y
Pasig City Y
Quezon City N
Taguig City Y Region IVA - CALABARZON
Batangas Y Taysan Y
Rizal N Angono Y
Antipolo City Y
Rodriguez N
Teresa Y
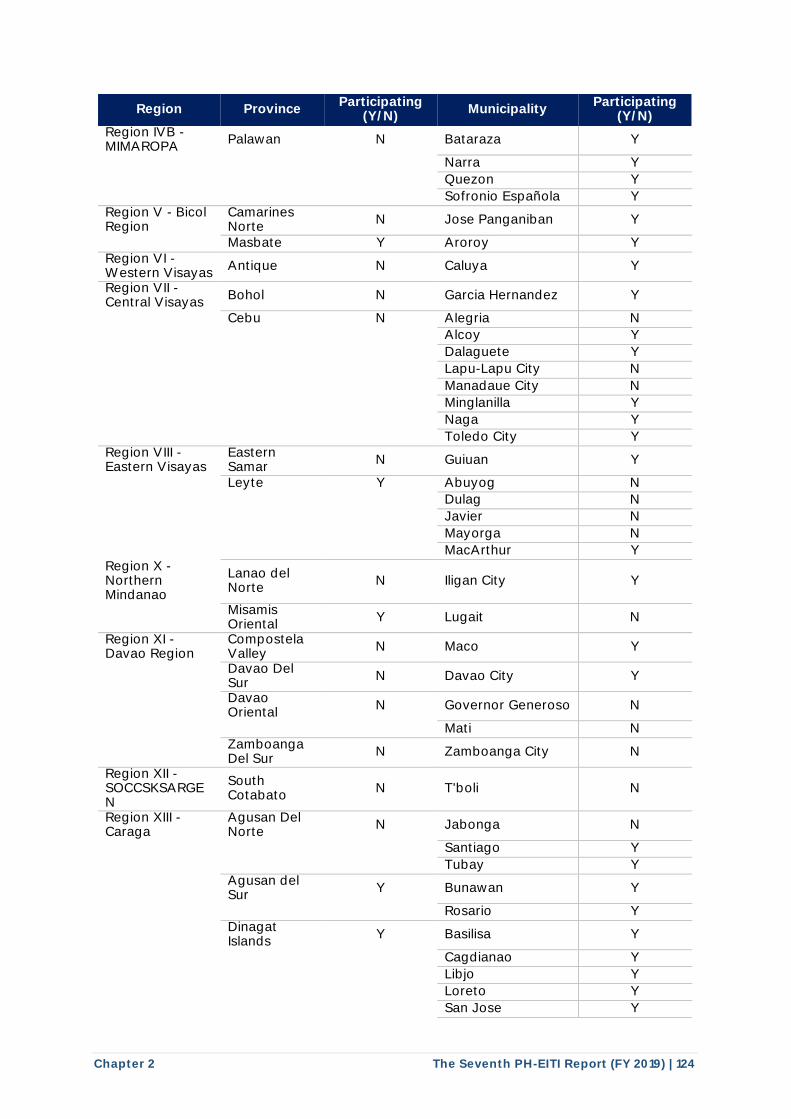
Chapter 2 The Seventh PH-EITI Report (FY 2019) | 124
Region Province Participating
(Y/N) Municipality
Participating (Y/N)
Region IVB - MIMAROPA
Palawan N Bataraza Y
Narra Y
Quezon Y
Sofronio Española Y Region V - Bicol Region
Camarines Norte
N Jose Panganiban Y
Masbate Y Aroroy Y Region VI - Western Visayas
Antique N Caluya Y
Region VII - Central Visayas
Bohol N Garcia Hernandez Y
Cebu N Alegria N
Alcoy Y
Dalaguete Y
Lapu-Lapu City N
Manadaue City N
Minglanilla Y
Naga Y
Toledo City Y Region VIII - Eastern Visayas
Eastern Samar
N Guiuan Y
Leyte Y Abuyog N
Dulag N
Javier N
Mayorga N
MacArthur Y Region X - Northern Mindanao
Lanao del Norte
N Iligan City Y
Misamis Oriental
Y Lugait N
Region XI - Davao Region
Compostela Valley
N Maco Y
Davao Del Sur
N Davao City Y
Davao Oriental
N Governor Generoso N
Mati N
Zamboanga Del Sur
N Zamboanga City N
Region XII - SOCCSKSARGEN
South Cotabato
N T'boli N
Region XIII - Caraga
Agusan Del Norte
N Jabonga N
Santiago Y
Tubay Y
Agusan del Sur
Y Bunawan Y
Rosario Y
Dinagat Islands
Y Basilisa Y
Cagdianao Y
Libjo Y
Loreto Y
San Jose Y
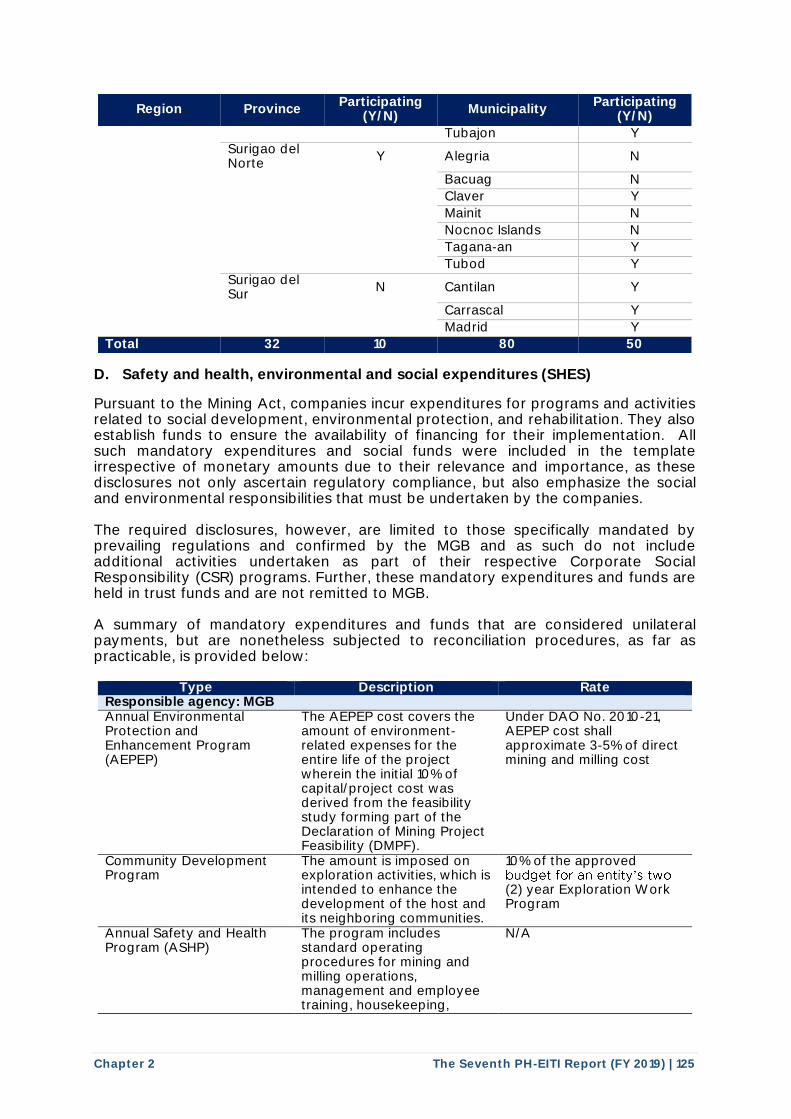
Chapter 2 The Seventh PH-EITI Report (FY 2019) | 125
Region Province Participating
(Y/N) Municipality
Participating (Y/N)
Tubajon Y
Surigao del Norte
Y Alegria N
Bacuag N
Claver Y
Mainit N
Nocnoc Islands N
Tagana-an Y
Tubod Y
Surigao del Sur
N Cantilan Y
Carrascal Y
Madrid Y
Total 32 10 80 50 D. Safety and health, environmental and social expenditures (SHES)
Pursuant to the Mining Act, companies incur expenditures for programs and activities related to social development, environmental protection, and rehabilitation. They also establish funds to ensure the availability of financing for their implementation. All such mandatory expenditures and social funds were included in the template irrespective of monetary amounts due to their relevance and importance, as these disclosures not only ascertain regulatory compliance, but also emphasize the social and environmental responsibilities that must be undertaken by the companies. The required disclosures, however, are limited to those specifically mandated by prevailing regulations and confirmed by the MGB and as such do not include additional activities undertaken as part of their respective Corporate Social Responsibility (CSR) programs. Further, these mandatory expenditures and funds are held in trust funds and are not remitted to MGB. A summary of mandatory expenditures and funds that are considered unilateral payments, but are nonetheless subjected to reconciliation procedures, as far as practicable, is provided below:
Type Description Rate
Responsible agency: MGB Annual Environmental Protection and Enhancement Program (AEPEP)
The AEPEP cost covers the amount of environment-related expenses for the entire life of the project wherein the initial 10% of capital/project cost was derived from the feasibility study forming part of the Declaration of Mining Project Feasibility (DMPF).
Under DAO No. 2010-21, AEPEP cost shall approximate 3-5% of direct mining and milling cost
Community Development Program
The amount is imposed on exploration activities, which is intended to enhance the development of the host and its neighboring communities.
10% of the approved
(2) year Exploration Work Program
Annual Safety and Health Program (ASHP)
The program includes standard operating procedures for mining and milling operations, management and employee training, housekeeping,
N/A
budget for an entity's two
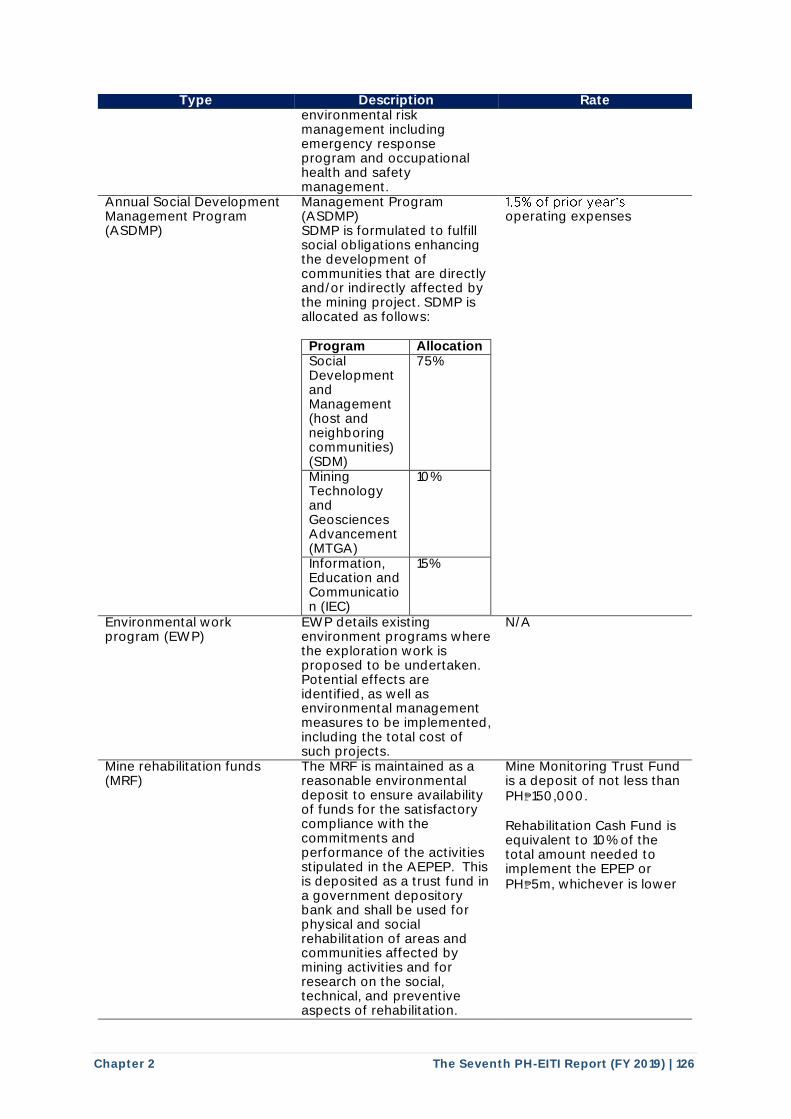
Chapter 2 The Seventh PH-EITI Report (FY 2019) | 126
Type Description Rate environmental risk management including emergency response program and occupational health and safety management.
Annual Social Development Management Program (ASDMP)
Management Program (ASDMP) SDMP is formulated to fulfill social obligations enhancing the development of communities that are directly and/or indirectly affected by the mining project. SDMP is allocated as follows:
Program Allocation Social Development and Management (host and neighboring communities) (SDM)
75%
Mining Technology and Geosciences Advancement (MTGA)
10%
Information, Education and Communication (IEC)
15%
operating expenses
Environmental work program (EWP)
EWP details existing environment programs where the exploration work is proposed to be undertaken. Potential effects are identified, as well as environmental management measures to be implemented, including the total cost of such projects.
N/A
Mine rehabilitation funds (MRF)
The MRF is maintained as a reasonable environmental deposit to ensure availability of funds for the satisfactory compliance with the commitments and performance of the activities stipulated in the AEPEP. This is deposited as a trust fund in a government depository bank and shall be used for physical and social rehabilitation of areas and communities affected by mining activities and for research on the social, technical, and preventive aspects of rehabilitation.
Mine Monitoring Trust Fund is a deposit of not less than PH₱150,000. Rehabilitation Cash Fund is equivalent to 10% of the total amount needed to implement the EPEP or PH₱5m, whichever is lower
1.5% of prior year's
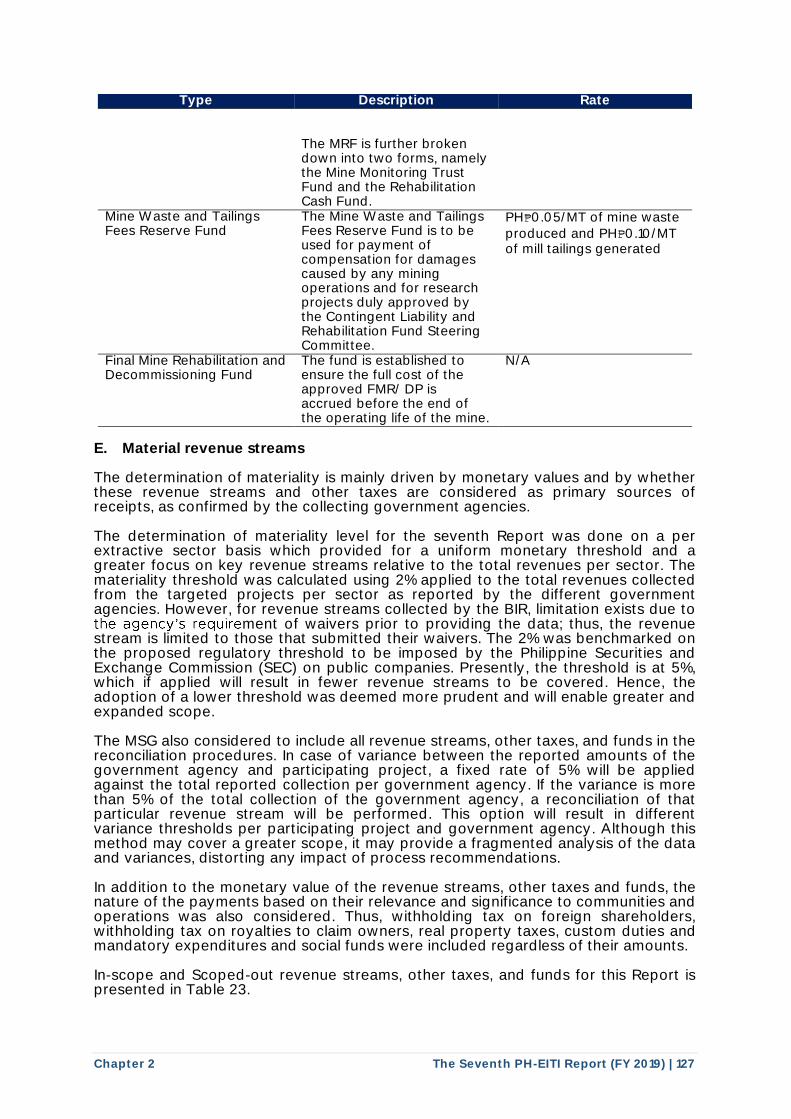
Chapter 2 The Seventh PH-EITI Report (FY 2019) | 127
Type Description Rate The MRF is further broken down into two forms, namely the Mine Monitoring Trust Fund and the Rehabilitation Cash Fund.
Mine Waste and Tailings Fees Reserve Fund
The Mine Waste and Tailings Fees Reserve Fund is to be used for payment of compensation for damages caused by any mining operations and for research projects duly approved by the Contingent Liability and Rehabilitation Fund Steering Committee.
PH₱0.05/MT of mine waste produced and PH₱0.10/MT of mill tailings generated
Final Mine Rehabilitation and Decommissioning Fund
The fund is established to ensure the full cost of the approved FMR/ DP is accrued before the end of the operating life of the mine.
N/A
E. Material revenue streams The determination of materiality is mainly driven by monetary values and by whether these revenue streams and other taxes are considered as primary sources of receipts, as confirmed by the collecting government agencies. The determination of materiality level for the seventh Report was done on a per extractive sector basis which provided for a uniform monetary threshold and a greater focus on key revenue streams relative to the total revenues per sector. The materiality threshold was calculated using 2% applied to the total revenues collected from the targeted projects per sector as reported by the different government agencies. However, for revenue streams collected by the BIR, limitation exists due to
ment of waivers prior to providing the data; thus, the revenue stream is limited to those that submitted their waivers. The 2% was benchmarked on the proposed regulatory threshold to be imposed by the Philippine Securities and Exchange Commission (SEC) on public companies. Presently, the threshold is at 5%, which if applied will result in fewer revenue streams to be covered. Hence, the adoption of a lower threshold was deemed more prudent and will enable greater and expanded scope. The MSG also considered to include all revenue streams, other taxes, and funds in the reconciliation procedures. In case of variance between the reported amounts of the government agency and participating project, a fixed rate of 5% will be applied against the total reported collection per government agency. If the variance is more than 5% of the total collection of the government agency, a reconciliation of that particular revenue stream will be performed. This option will result in different variance thresholds per participating project and government agency. Although this method may cover a greater scope, it may provide a fragmented analysis of the data and variances, distorting any impact of process recommendations. In addition to the monetary value of the revenue streams, other taxes and funds, the nature of the payments based on their relevance and significance to communities and operations was also considered. Thus, withholding tax on foreign shareholders, withholding tax on royalties to claim owners, real property taxes, custom duties and mandatory expenditures and social funds were included regardless of their amounts. In-scope and Scoped-out revenue streams, other taxes, and funds for this Report is presented in Table 23.
the agency's require
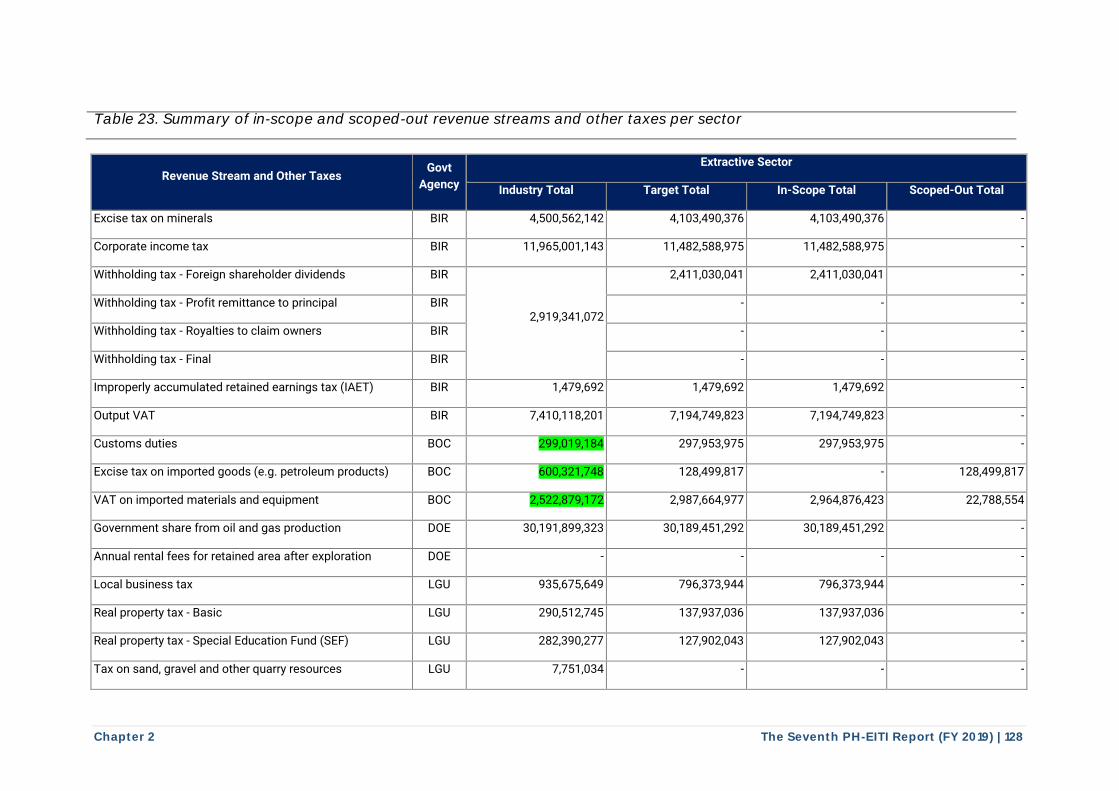
Chapter 2 The Seventh PH-EITI Report (FY 2019) | 128
Table 23. Summary of in-scope and scoped-out revenue streams and other taxes per sector
Revenue Stream and Other Taxes Govt
Agency
Extractive Sector
Industry Total Target Total In-Scope Total Scoped-Out Total
Excise tax on minerals BIR 4,500,562,142 4,103,490,376 4,103,490,376 -
Corporate income tax BIR 11,965,001,143 11,482,588,975 11,482,588,975 -
Withholding tax - Foreign shareholder dividends BIR
2,919,341,072
2,411,030,041 2,411,030,041 -
Withholding tax - Profit remittance to principal BIR - - -
Withholding tax - Royalties to claim owners BIR - - -
Withholding tax - Final BIR - - -
Improperly accumulated retained earnings tax (IAET) BIR 1,479,692 1,479,692 1,479,692 -
Output VAT BIR 7,410,118,201 7,194,749,823 7,194,749,823 -
Customs duties BOC 299,019,184 297,953,975 297,953,975 -
Excise tax on imported goods (e.g. petroleum products) BOC 600,321,748 128,499,817 - 128,499,817
VAT on imported materials and equipment BOC 2,522,879,172 2,987,664,977 2,964,876,423 22,788,554
Government share from oil and gas production DOE 30,191,899,323 30,189,451,292 30,189,451,292 -
Annual rental fees for retained area after exploration DOE - - - -
Local business tax LGU 935,675,649 796,373,944 796,373,944 -
Real property tax - Basic LGU 290,512,745 137,937,036 137,937,036 -
Real property tax - Special Education Fund (SEF) LGU 282,390,277 127,902,043 127,902,043 -
Tax on sand, gravel and other quarry resources LGU 7,751,034 - - -
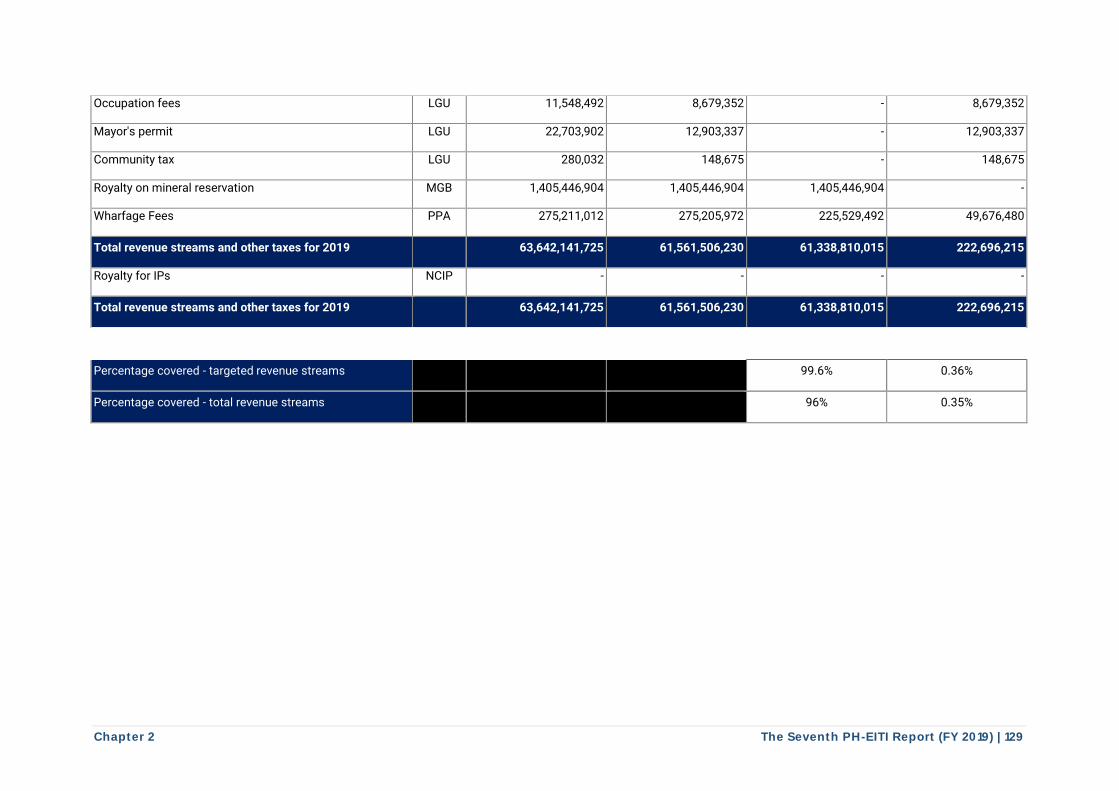
Chapter 2 The Seventh PH-EITI Report (FY 2019) | 129
Occupation fees LGU 11,548,492 8,679,352 - 8,679,352
Mayor's permit LGU 22,703,902 12,903,337 - 12,903,337
Community tax LGU 280,032 148,675 - 148,675
Royalty on mineral reservation MGB 1,405,446,904 1,405,446,904 1,405,446,904 -
Wharfage Fees PPA 275,211,012 275,205,972 225,529,492 49,676,480
Total revenue streams and other taxes for 2019 63,642,141,725 61,561,506,230 61,338,810,015 222,696,215
Royalty for IPs NCIP - - - -
Total revenue streams and other taxes for 2019 63,642,141,725 61,561,506,230 61,338,810,015 222,696,215
Percentage covered - targeted revenue streams 99.6% 0.36%
Percentage covered - total revenue streams 96% 0.35%
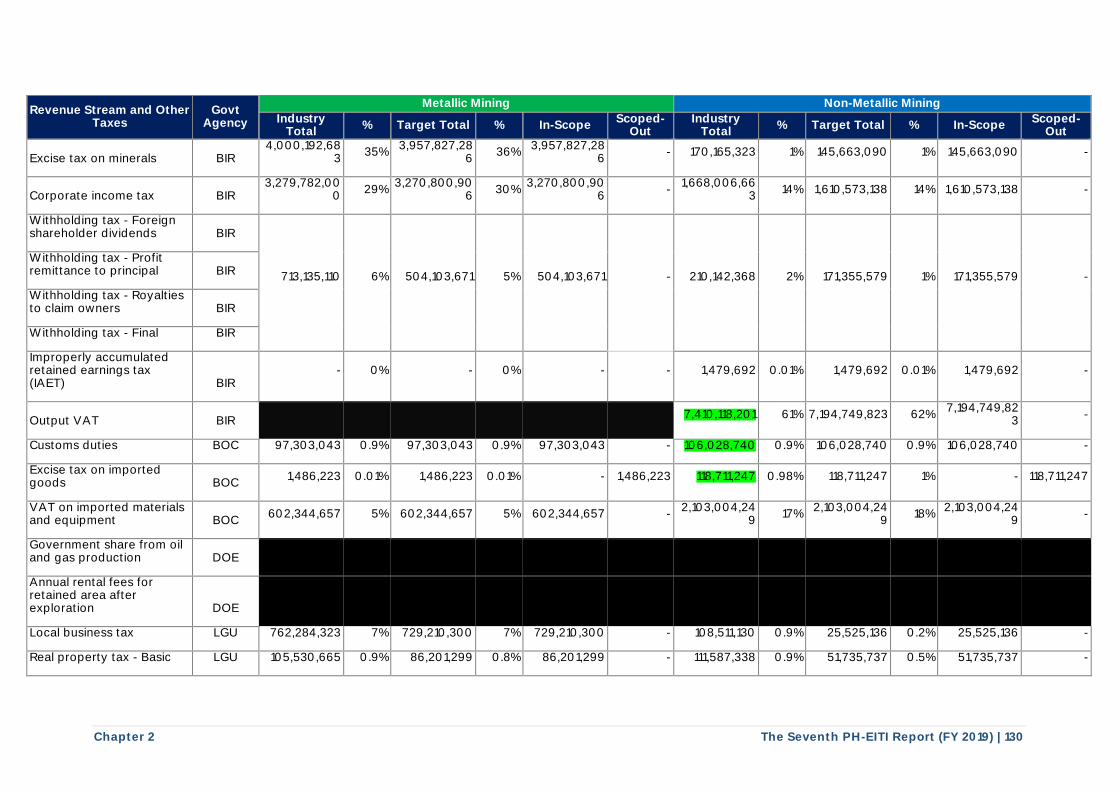
Chapter 2 The Seventh PH-EITI Report (FY 2019) | 130
Revenue Stream and Other Taxes
Govt Agency
Metallic Mining Non-Metallic Mining
Industry Total
% Target Total % In-Scope Scoped-
Out Industry
Total % Target Total % In-Scope
Scoped-Out
Excise tax on minerals BIR 4,000,192,68
3 35%
3,957,827,286
36% 3,957,827,28
6 - 170,165,323 1% 145,663,090 1% 145,663,090 -
Corporate income tax BIR 3,279,782,00
0 29%
3,270,800,906
30% 3,270,800,90
6 -
1,668,006,663
14% 1,610,573,138 14% 1,610,573,138 -
Withholding tax - Foreign shareholder dividends BIR
713,135,110 6% 504,103,671 5% 504,103,671 - 210,142,368 2% 171,355,579 1% 171,355,579 -
Withholding tax - Profit remittance to principal BIR
Withholding tax - Royalties to claim owners BIR
Withholding tax - Final BIR
Improperly accumulated retained earnings tax (IAET) BIR
- 0% - 0% - - 1,479,692 0.01% 1,479,692 0.01% 1,479,692 -
Output VAT BIR 7,410,118,201 61% 7,194,749,823 62%
7,194,749,823
-
Customs duties BOC 97,303,043 0.9% 97,303,043 0.9% 97,303,043 - 106,028,740 0.9% 106,028,740 0.9% 106,028,740 -
Excise tax on imported goods BOC
1,486,223 0.01% 1,486,223 0.01% - 1,486,223 118,711,247 0.98% 118,711,247 1% - 118,711,247
VAT on imported materials and equipment BOC
602,344,657 5% 602,344,657 5% 602,344,657 - 2,103,004,24
9 17%
2,103,004,249
18% 2,103,004,24
9 -
Government share from oil and gas production DOE
Annual rental fees for retained area after exploration DOE
Local business tax LGU 762,284,323 7% 729,210,300 7% 729,210,300 - 108,511,130 0.9% 25,525,136 0.2% 25,525,136 -
Real property tax - Basic LGU 105,530,665 0.9% 86,201,299 0.8% 86,201,299 - 111,587,338 0.9% 51,735,737 0.5% 51,735,737 -
1----------------+--------t--------t-----+--------1-----+----------1----
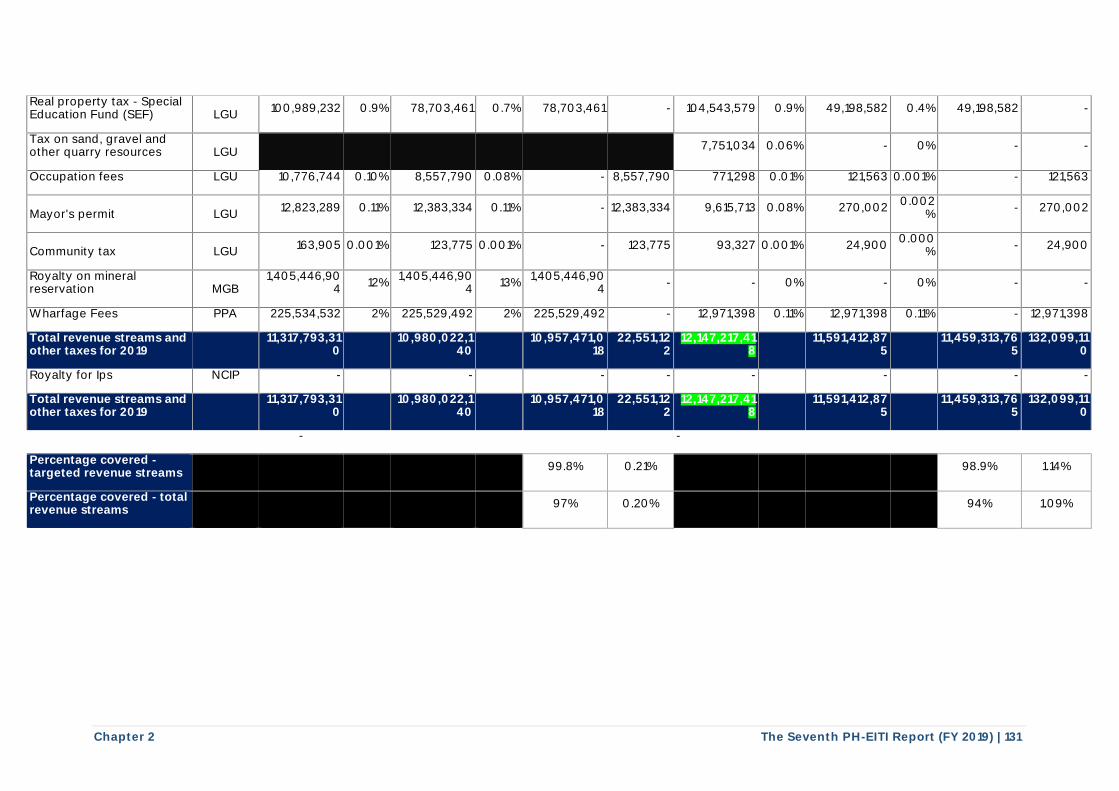
Chapter 2 The Seventh PH-EITI Report (FY 2019) | 131
Real property tax - Special Education Fund (SEF) LGU
100,989,232 0.9% 78,703,461 0.7% 78,703,461 - 104,543,579 0.9% 49,198,582 0.4% 49,198,582 -
Tax on sand, gravel and other quarry resources LGU
7,751,034 0.06% - 0% - -
Occupation fees LGU 10,776,744 0.10% 8,557,790 0.08% - 8,557,790 771,298 0.01% 121,563 0.001% - 121,563
Mayor's permit LGU 12,823,289 0.11% 12,383,334 0.11% - 12,383,334 9,615,713 0.08% 270,002
0.002%
- 270,002
Community tax LGU 163,905 0.001% 123,775 0.001% - 123,775 93,327 0.001% 24,900
0.000%
- 24,900
Royalty on mineral reservation MGB
1,405,446,904
12% 1,405,446,90
4 13%
1,405,446,904
- - 0% - 0% - -
Wharfage Fees PPA 225,534,532 2% 225,529,492 2% 225,529,492 - 12,971,398 0.11% 12,971,398 0.11% - 12,971,398
Total revenue streams and other taxes for 2019
11,317,793,310
10,980,022,1
40
10,957,471,018
22,551,122
12,147,217,418
11,591,412,87
5 11,459,313,76
5 132,099,11
0
Royalty for Ips NCIP - - - - - - - -
Total revenue streams and other taxes for 2019
11,317,793,310
10,980,022,1
40
10,957,471,018
22,551,122
12,147,217,418
11,591,412,87
5 11,459,313,76
5 132,099,11
0
- -
Percentage covered - targeted revenue streams
99.8% 0.21% 98.9% 1.14%
Percentage covered - total revenue streams
97% 0.20% 94% 1.09%
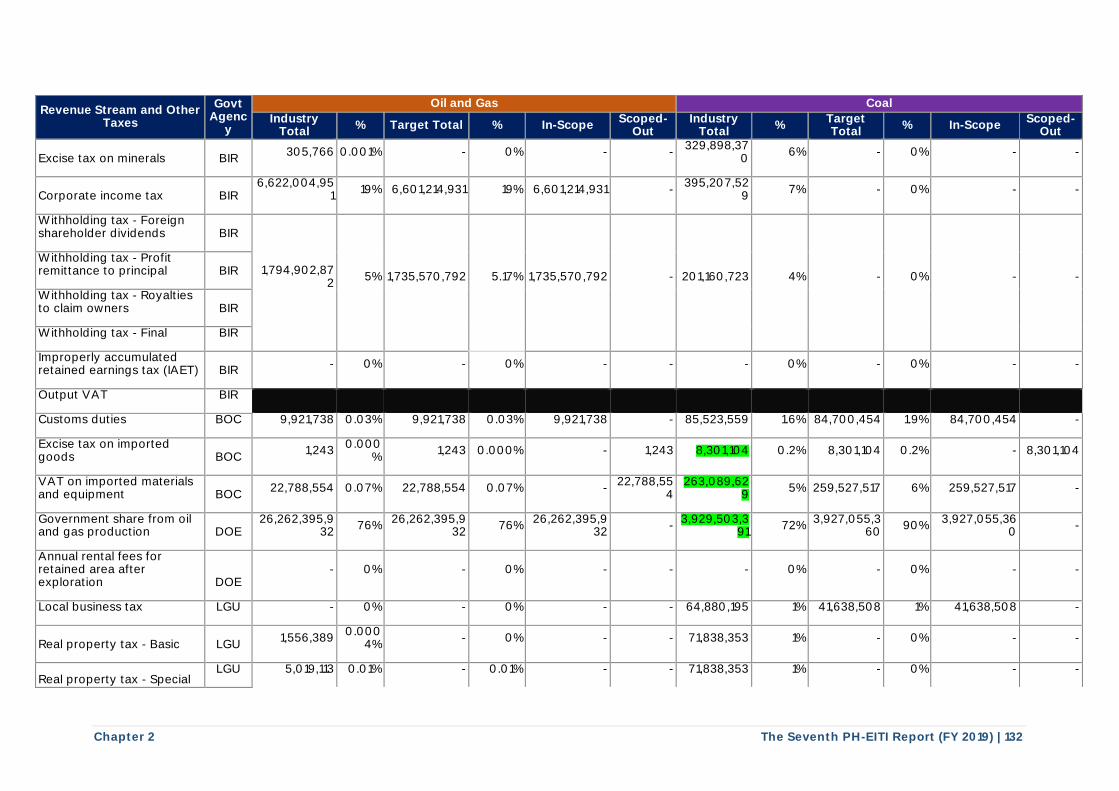
Chapter 2 The Seventh PH-EITI Report (FY 2019) | 132
Revenue Stream and Other Taxes
Govt Agenc
y
Oil and Gas Coal
Industry Total
% Target Total % In-Scope Scoped-
Out Industry
Total %
Target Total
% In-Scope Scoped-
Out
Excise tax on minerals BIR 305,766 0.001% - 0% - -
329,898,370
6% - 0% - -
Corporate income tax BIR 6,622,004,95
1 19% 6,601,214,931 19% 6,601,214,931 -
395,207,529
7% - 0% - -
Withholding tax - Foreign shareholder dividends BIR
1,794,902,872
5% 1,735,570,792 5.17% 1,735,570,792 - 201,160,723 4% - 0% - -
Withholding tax - Profit remittance to principal BIR
Withholding tax - Royalties to claim owners BIR
Withholding tax - Final BIR
Improperly accumulated retained earnings tax (IAET) BIR
- 0% - 0% - - - 0% - 0% - -
Output VAT BIR
Customs duties BOC 9,921,738 0.03% 9,921,738 0.03% 9,921,738 - 85,523,559 1.6% 84,700,454 1.9% 84,700,454 -
Excise tax on imported goods BOC
1,243 0.000
% 1,243 0.000% - 1,243 8,301,104 0.2% 8,301,104 0.2% - 8,301,104
VAT on imported materials and equipment BOC
22,788,554 0.07% 22,788,554 0.07% - 22,788,55
4 263,089,62
9 5% 259,527,517 6% 259,527,517 -
Government share from oil and gas production DOE
26,262,395,932
76% 26,262,395,9
32 76%
26,262,395,932
- 3,929,503,3
91 72%
3,927,055,360
90% 3,927,055,36
0 -
Annual rental fees for retained area after exploration DOE
- 0% - 0% - - - 0% - 0% - -
Local business tax LGU - 0% - 0% - - 64,880,195 1% 41,638,508 1% 41,638,508 -
Real property tax - Basic LGU 1,556,389
0.0004%
- 0% - - 71,838,353 1% - 0% - -
Real property tax - Special LGU 5,019,113 0.01% - 0.01% - - 71,838,353 1% - 0% - -
t----------+----+-------+-----+----------1- - t------+-----+------+---t-----+----+-----t-------t
I
■
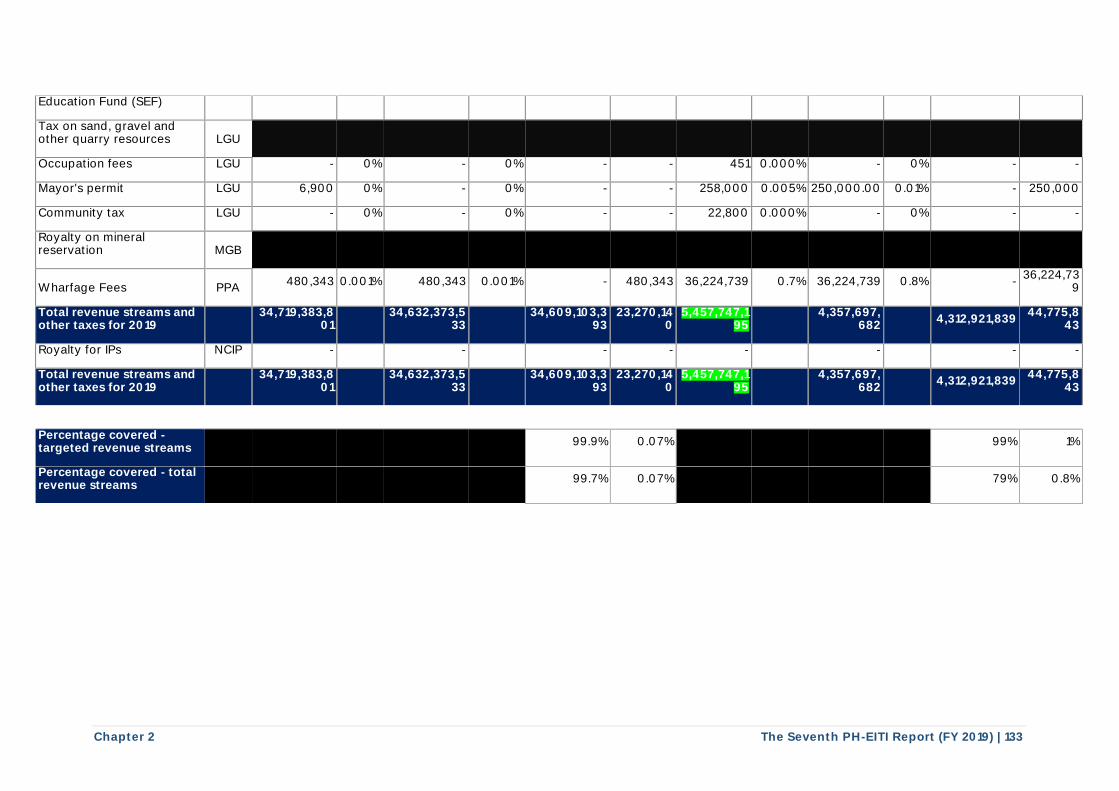
Chapter 2 The Seventh PH-EITI Report (FY 2019) | 133
Education Fund (SEF)
Tax on sand, gravel and other quarry resources LGU
Occupation fees LGU - 0% - 0% - - 451 0.000% - 0% - -
Mayor's permit LGU 6,900 0% - 0% - - 258,000 0.005% 250,000.00 0.01% - 250,000
Community tax LGU - 0% - 0% - - 22,800 0.000% - 0% - -
Royalty on mineral reservation MGB
Wharfage Fees PPA 480,343 0.001% 480,343 0.001% - 480,343 36,224,739 0.7% 36,224,739 0.8% -
36,224,739
Total revenue streams and other taxes for 2019
34,719,383,801
34,632,373,5
33 34,609,103,3
93 23,270,14
0 5,457,747,1
95 4,357,697,
682 4,312,921,839
44,775,843
Royalty for IPs NCIP - - - - - - - -
Total revenue streams and other taxes for 2019
34,719,383,801
34,632,373,5
33 34,609,103,3
93 23,270,14
0 5,457,747,1
95 4,357,697,
682 4,312,921,839
44,775,843
Percentage covered - targeted revenue streams
99.9% 0.07% 99% 1%
Percentage covered - total revenue streams
99.7% 0.07% 79% 0.8%
Chapter 2 The Seventh PH-EITI Report (FY 2019) | 134
The combined in-scope revenue streams across all sectors is 96% of the total revenue streams for 2019 from the extractive industry while scoped-out revenue streams is only 0.35%. Table 24 presents the details for each sector - in-scope revenue streams of the metallic, non-metallic and oil and gas sectors are 97%, 94%, and 99.7% of the total revenue streams of their respective sectors and scoped-out revenue streams are 0.2%, 1.09%, and 0.7%, correspondingly. Any variance arising from the reconciliation procedures for the above in scope revenue streams, other taxes, and funds were subjected to additional procedures. Additional procedures included tracing of transactions between detailed schedules provided by participating projects and government agencies and obtaining the supporting documents. For the coal sector, as discussed in the reporting projects, alternative procedures were conducted to present information on revenue streams and other taxes including obtaining public documents such as audited financial statements and unilateral disclosures by the government agencies. Application, processing, clearance, and issuance fees for exploration permits, mineral agreements, FTAA, and quarry resources, sand and gravel permit/license expected to be incurred before operations and other fees paid to for subsequent services rendered by MGB (i.e. verification, umpiring, surveys and other services) are likewise considered immaterial and scoped out in the reconciliation. In addition, the following revenue streams were also excluded as these were determined to be not applicable to the local mining and oil and gas industry sectors because these are zero-rated or not yet due given the stage of the operation. These may also represent payments made on behalf of other taxpayers (e.g. employees), although still attributed to their operations. These are as follows:
● Fringe benefit and withholding tax on salaries and benefits that are mainly compensation related with remittances made only by entities on behalf of employees.
● Expanded withholding tax is tax imposed on income payments and is creditable against the income tax due of the payee for the taxable period in which the income was earned. It is only a means of approximating and collecting in advance the income tax liability of a payee since income taxes are due and paid on a quarterly and annual basis.
● Government share from FTAA and JV agreements with no company operating under said contractual provisions in 2012. The first FTAA mining project only commenced commercial operations in April 2013.
● Output VAT for metallic mining, oil and gas, and coal are not in scope since revenue transactions of the companies in these industries are zero-rated (e.g. export oriented) or exempt as provided by law (e.g. PD 87).
● Documentary stamp taxes, import processing fees, storage fees, arrastre and stevedoring charges were also excluded because of their minimal value.
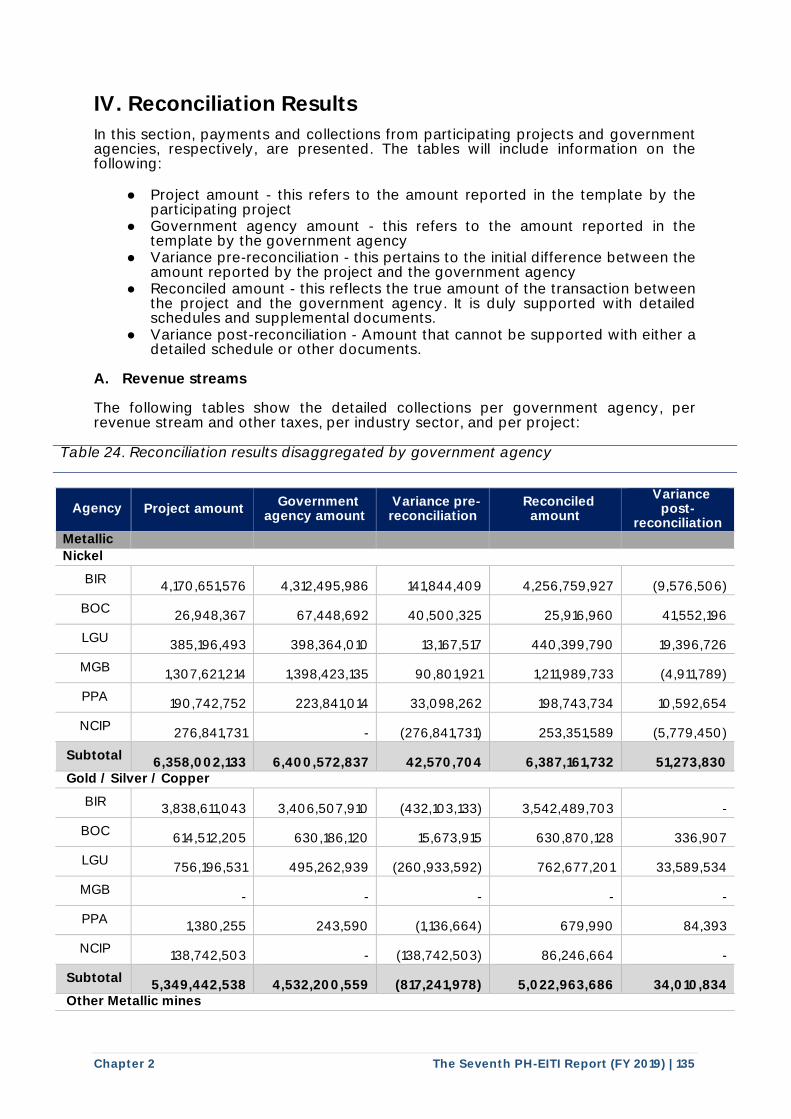
Chapter 2 The Seventh PH-EITI Report (FY 2019) | 135
IV. Reconciliation Results
In this section, payments and collections from participating projects and government agencies, respectively, are presented. The tables will include information on the following:
● Project amount - this refers to the amount reported in the template by the participating project
● Government agency amount - this refers to the amount reported in the template by the government agency
● Variance pre-reconciliation - this pertains to the initial difference between the amount reported by the project and the government agency
● Reconciled amount - this reflects the true amount of the transaction between the project and the government agency. It is duly supported with detailed schedules and supplemental documents.
● Variance post-reconciliation - Amount that cannot be supported with either a detailed schedule or other documents.
A. Revenue streams The following tables show the detailed collections per government agency, per revenue stream and other taxes, per industry sector, and per project:
Table 24. Reconciliation results disaggregated by government agency
Agency Project amount Government
agency amount Variance pre-reconciliation
Reconciled amount
Variance post-
reconciliation Metallic
Nickel
BIR
4,170,651,576
4,312,495,986
141,844,409
4,256,759,927
(9,576,506)
BOC
26,948,367
67,448,692
40,500,325
25,916,960
41,552,196
LGU
385,196,493
398,364,010
13,167,517
440,399,790
19,396,726
MGB
1,307,621,214
1,398,423,135
90,801,921
1,211,989,733
(4,911,789)
PPA
190,742,752
223,841,014
33,098,262
198,743,734
10,592,654
NCIP
276,841,731
-
(276,841,731)
253,351,589
(5,779,450)
Subtotal
6,358,002,133
6,400,572,837
42,570,704
6,387,161,732
51,273,830 Gold / Silver / Copper
BIR
3,838,611,043
3,406,507,910
(432,103,133)
3,542,489,703
-
BOC
614,512,205
630,186,120
15,673,915
630,870,128
336,907
LGU
756,196,531
495,262,939
(260,933,592)
762,677,201
33,589,534
MGB
-
-
-
-
-
PPA
1,380,255
243,590
(1,136,664)
679,990
84,393
NCIP
138,742,503
-
(138,742,503)
86,246,664
-
Subtotal
5,349,442,538
4,532,200,559
(817,241,978)
5,022,963,686
34,010,834 Other Metallic mines
I
I
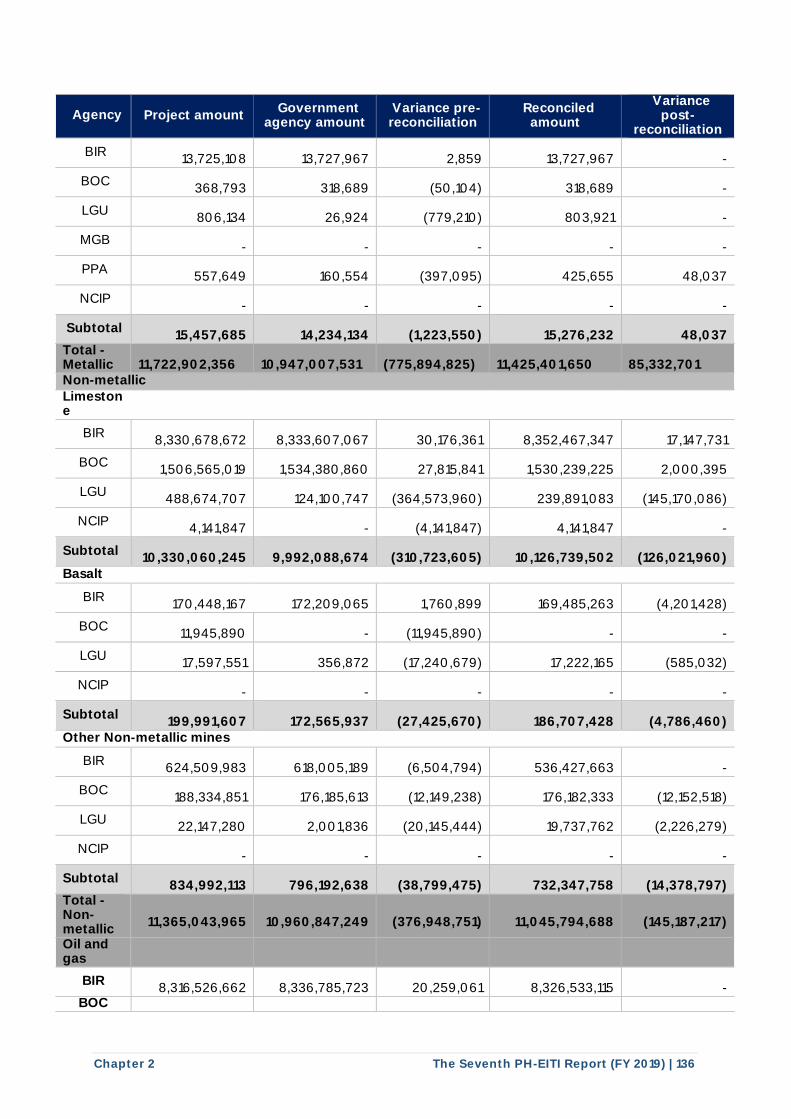
Chapter 2 The Seventh PH-EITI Report (FY 2019) | 136
Agency Project amount Government
agency amount Variance pre-reconciliation
Reconciled amount
Variance post-
reconciliation
BIR
13,725,108
13,727,967
2,859
13,727,967
-
BOC
368,793
318,689
(50,104)
318,689
-
LGU
806,134
26,924
(779,210)
803,921
-
MGB
-
-
-
-
-
PPA
557,649
160,554
(397,095)
425,655
48,037
NCIP
-
-
-
-
-
Subtotal
15,457,685
14,234,134
(1,223,550)
15,276,232
48,037 Total - Metallic
11,722,902,356
10,947,007,531
(775,894,825)
11,425,401,650
85,332,701
Non-metallic Limestone
BIR
8,330,678,672
8,333,607,067
30,176,361
8,352,467,347
17,147,731
BOC
1,506,565,019
1,534,380,860
27,815,841
1,530,239,225
2,000,395
LGU
488,674,707
124,100,747
(364,573,960)
239,891,083
(145,170,086)
NCIP
4,141,847
-
(4,141,847)
4,141,847
-
Subtotal
10,330,060,245
9,992,088,674
(310,723,605)
10,126,739,502
(126,021,960) Basalt
BIR
170,448,167
172,209,065
1,760,899
169,485,263
(4,201,428)
BOC
11,945,890
-
(11,945,890)
-
-
LGU
17,597,551
356,872
(17,240,679)
17,222,165
(585,032)
NCIP
-
-
-
-
-
Subtotal
199,991,607
172,565,937
(27,425,670)
186,707,428
(4,786,460) Other Non-metallic mines
BIR
624,509,983
618,005,189
(6,504,794)
536,427,663
-
BOC
188,334,851
176,185,613
(12,149,238)
176,182,333
(12,152,518)
LGU
22,147,280
2,001,836
(20,145,444)
19,737,762
(2,226,279)
NCIP
-
-
-
-
-
Subtotal
834,992,113
796,192,638
(38,799,475)
732,347,758
(14,378,797) Total - Non-metallic
11,365,043,965
10,960,847,249
(376,948,751)
11,045,794,688
(145,187,217)
Oil and gas
BIR
8,316,526,662
8,336,785,723
20,259,061
8,326,533,115
- BOC
I
I
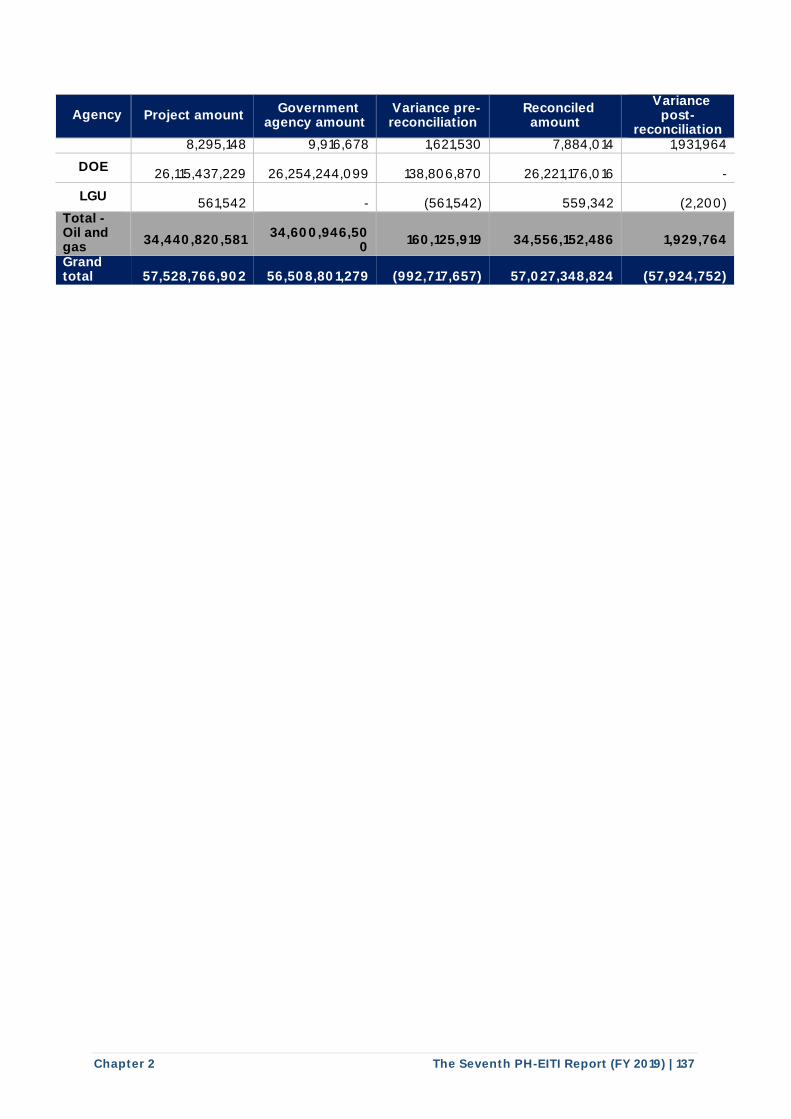
Chapter 2 The Seventh PH-EITI Report (FY 2019) | 137
Agency Project amount Government
agency amount Variance pre-reconciliation
Reconciled amount
Variance post-
reconciliation 8,295,148 9,916,678 1,621,530 7,884,014 1,931,964
DOE
26,115,437,229
26,254,244,099
138,806,870
26,221,176,016
-
LGU
561,542
-
(561,542)
559,342
(2,200) Total - Oil and gas
34,440,820,581
34,600,946,50
0
160,125,919
34,556,152,486
1,929,764
Grand total
57,528,766,902
56,508,801,279
(992,717,657)
57,027,348,824
(57,924,752)
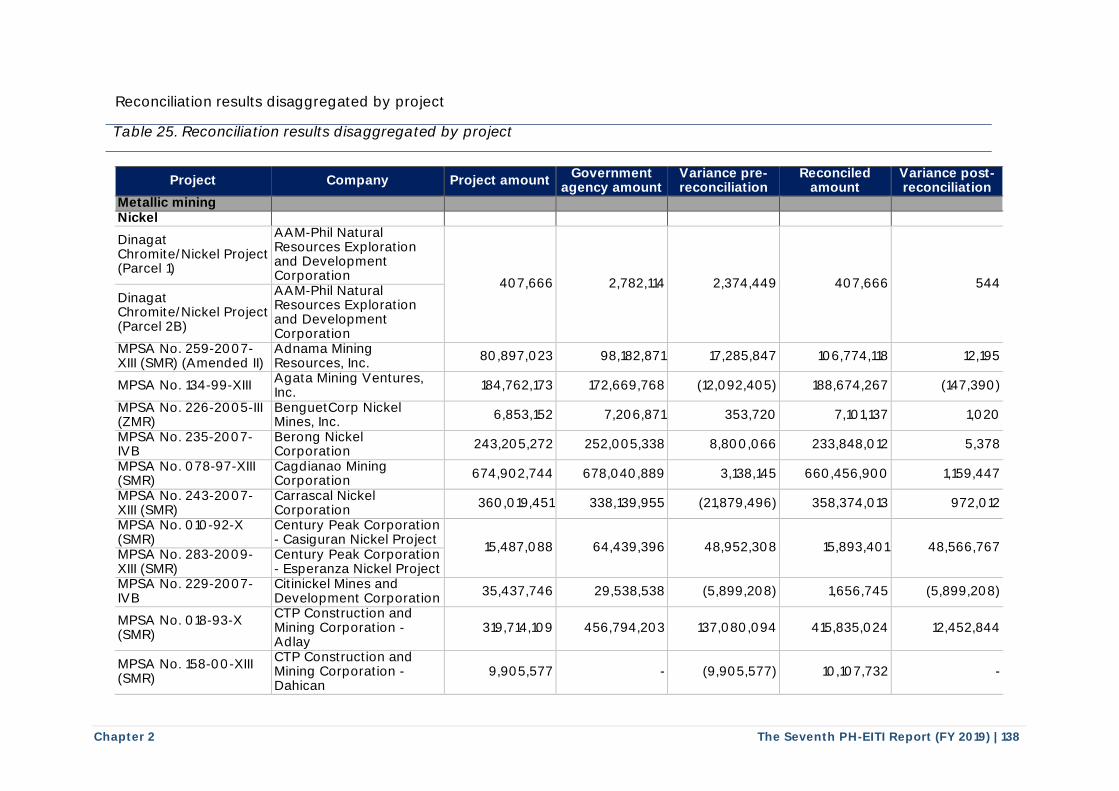
Chapter 2 The Seventh PH-EITI Report (FY 2019) | 138
Reconciliation results disaggregated by project
Table 25. Reconciliation results disaggregated by project
Project Company Project amount Government
agency amount Variance pre-reconciliation
Reconciled amount
Variance post-reconciliation
Metallic mining Nickel
Dinagat Chromite/Nickel Project (Parcel 1)
AAM-Phil Natural Resources Exploration and Development Corporation
407,666 2,782,114 2,374,449 407,666 544 Dinagat Chromite/Nickel Project (Parcel 2B)
AAM-Phil Natural Resources Exploration and Development Corporation
MPSA No. 259-2007-XIII (SMR) (Amended II)
Adnama Mining Resources, Inc.
80,897,023 98,182,871 17,285,847 106,774,118 12,195
MPSA No. 134-99-XIII Agata Mining Ventures, Inc.
184,762,173 172,669,768 (12,092,405) 188,674,267 (147,390)
MPSA No. 226-2005-III (ZMR)
BenguetCorp Nickel Mines, Inc.
6,853,152 7,206,871 353,720 7,101,137 1,020
MPSA No. 235-2007-IVB
Berong Nickel Corporation
243,205,272 252,005,338 8,800,066 233,848,012 5,378
MPSA No. 078-97-XIII (SMR)
Cagdianao Mining Corporation
674,902,744 678,040,889 3,138,145 660,456,900 1,159,447
MPSA No. 243-2007-XIII (SMR)
Carrascal Nickel Corporation
360,019,451 338,139,955 (21,879,496) 358,374,013 972,012
MPSA No. 010-92-X (SMR)
Century Peak Corporation - Casiguran Nickel Project
15,487,088 64,439,396 48,952,308 15,893,401 48,566,767 MPSA No. 283-2009-XIII (SMR)
Century Peak Corporation - Esperanza Nickel Project
MPSA No. 229-2007-IVB
Citinickel Mines and Development Corporation
35,437,746 29,538,538 (5,899,208) 1,656,745 (5,899,208)
MPSA No. 018-93-X (SMR)
CTP Construction and Mining Corporation - Adlay
319,714,109 456,794,203 137,080,094 415,835,024 12,452,844
MPSA No. 158-00-XIII (SMR)
CTP Construction and Mining Corporation - Dahican
9,905,577 - (9,905,577) 10,107,732 -
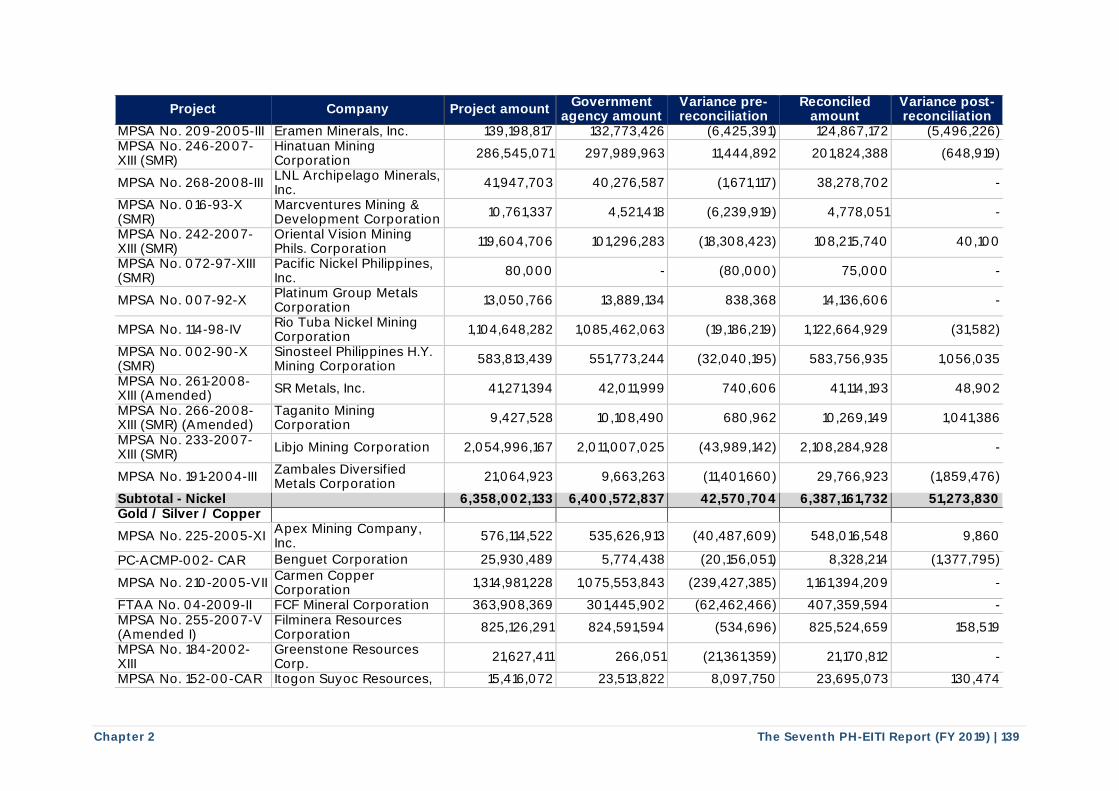
Chapter 2 The Seventh PH-EITI Report (FY 2019) | 139
Project Company Project amount Government
agency amount Variance pre-reconciliation
Reconciled amount
Variance post-reconciliation
MPSA No. 209-2005-III Eramen Minerals, Inc. 139,198,817 132,773,426 (6,425,391) 124,867,172 (5,496,226) MPSA No. 246-2007-XIII (SMR)
Hinatuan Mining Corporation
286,545,071 297,989,963 11,444,892 201,824,388 (648,919)
MPSA No. 268-2008-III LNL Archipelago Minerals, Inc.
41,947,703 40,276,587 (1,671,117) 38,278,702 -
MPSA No. 016-93-X (SMR)
Marcventures Mining & Development Corporation
10,761,337 4,521,418 (6,239,919) 4,778,051 -
MPSA No. 242-2007-XIII (SMR)
Oriental Vision Mining Phils. Corporation
119,604,706 101,296,283 (18,308,423) 108,215,740 40,100
MPSA No. 072-97-XIII (SMR)
Pacific Nickel Philippines, Inc.
80,000 - (80,000) 75,000 -
MPSA No. 007-92-X Platinum Group Metals Corporation
13,050,766 13,889,134 838,368 14,136,606 -
MPSA No. 114-98-IV Rio Tuba Nickel Mining Corporation
1,104,648,282 1,085,462,063 (19,186,219) 1,122,664,929 (31,582)
MPSA No. 002-90-X (SMR)
Sinosteel Philippines H.Y. Mining Corporation
583,813,439 551,773,244 (32,040,195) 583,756,935 1,056,035
MPSA No. 261-2008-XIII (Amended)
SR Metals, Inc. 41,271,394 42,011,999 740,606 41,114,193 48,902
MPSA No. 266-2008-XIII (SMR) (Amended)
Taganito Mining Corporation
9,427,528 10,108,490 680,962 10,269,149 1,041,386
MPSA No. 233-2007-XIII (SMR)
Libjo Mining Corporation 2,054,996,167 2,011,007,025 (43,989,142) 2,108,284,928 -
MPSA No. 191-2004-III Zambales Diversified Metals Corporation
21,064,923 9,663,263 (11,401,660) 29,766,923 (1,859,476)
Subtotal - Nickel 6,358,002,133 6,400,572,837 42,570,704 6,387,161,732 51,273,830 Gold / Silver / Copper
MPSA No. 225-2005-XI Apex Mining Company, Inc.
576,114,522 535,626,913 (40,487,609) 548,016,548 9,860
PC‐ACMP‐002‐ CAR Benguet Corporation 25,930,489 5,774,438 (20,156,051) 8,328,214 (1,377,795)
MPSA No. 210-2005-VII Carmen Copper Corporation
1,314,981,228 1,075,553,843 (239,427,385) 1,161,394,209 -
FTAA No. 04-2009-II FCF Mineral Corporation 363,908,369 301,445,902 (62,462,466) 407,359,594 - MPSA No. 255-2007-V (Amended I)
Filminera Resources Corporation
825,126,291 824,591,594 (534,696) 825,524,659 158,519
MPSA No. 184-2002-XIII
Greenstone Resources Corp.
21,627,411 266,051 (21,361,359) 21,170,812 -
MPSA No. 152-00-CAR Itogon Suyoc Resources, 15,416,072 23,513,822 8,097,750 23,695,073 130,474
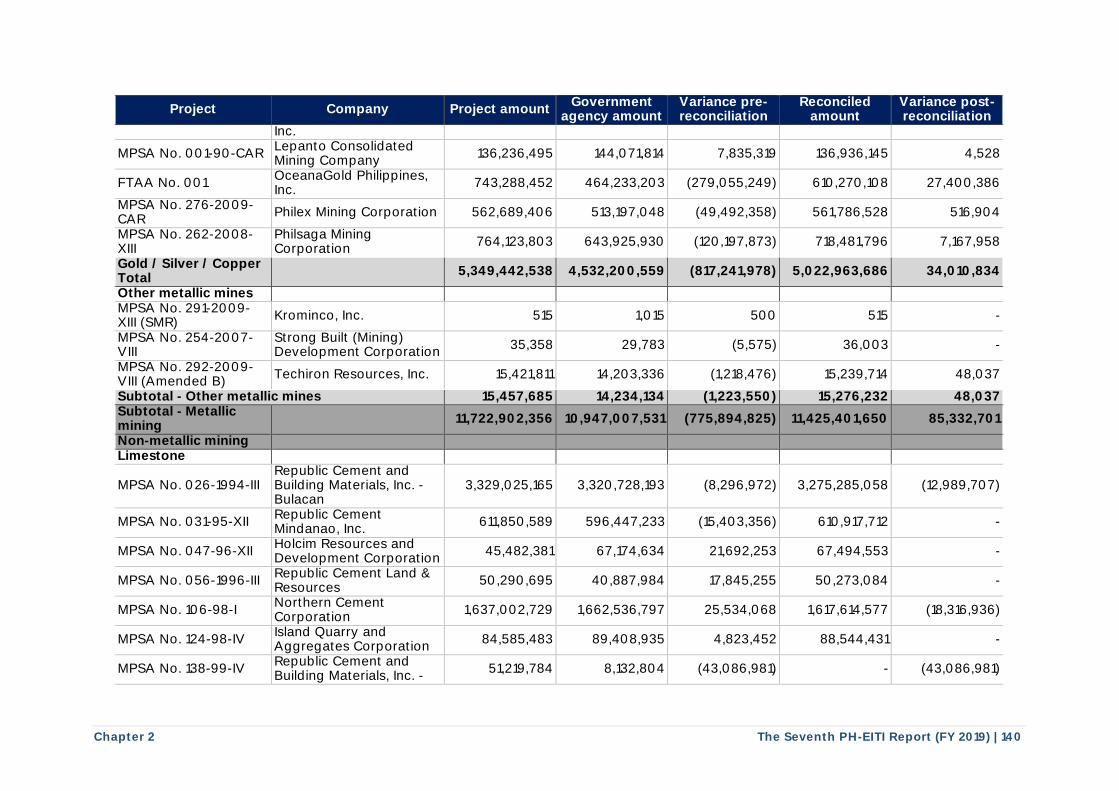
Chapter 2 The Seventh PH-EITI Report (FY 2019) | 140
Project Company Project amount Government
agency amount Variance pre-reconciliation
Reconciled amount
Variance post-reconciliation
Inc.
MPSA No. 001-90-CAR Lepanto Consolidated Mining Company
136,236,495 144,071,814 7,835,319 136,936,145 4,528
FTAA No. 001 OceanaGold Philippines, Inc.
743,288,452 464,233,203 (279,055,249) 610,270,108 27,400,386
MPSA No. 276-2009-CAR
Philex Mining Corporation 562,689,406 513,197,048 (49,492,358) 561,786,528 516,904
MPSA No. 262-2008-XIII
Philsaga Mining Corporation
764,123,803 643,925,930 (120,197,873) 718,481,796 7,167,958
Gold / Silver / Copper Total
5,349,442,538 4,532,200,559 (817,241,978) 5,022,963,686 34,010,834
Other metallic mines MPSA No. 291-2009-XIII (SMR)
Krominco, Inc. 515 1,015 500 515 -
MPSA No. 254-2007-VIII
Strong Built (Mining) Development Corporation
35,358 29,783 (5,575) 36,003 -
MPSA No. 292-2009-VIII (Amended B)
Techiron Resources, Inc. 15,421,811 14,203,336 (1,218,476) 15,239,714 48,037
Subtotal - Other metallic mines 15,457,685 14,234,134 (1,223,550) 15,276,232 48,037 Subtotal - Metallic mining
11,722,902,356 10,947,007,531 (775,894,825) 11,425,401,650 85,332,701
Non-metallic mining Limestone
MPSA No. 026-1994-III Republic Cement and Building Materials, Inc. - Bulacan
3,329,025,165 3,320,728,193 (8,296,972) 3,275,285,058 (12,989,707)
MPSA No. 031-95-XII Republic Cement Mindanao, Inc.
611,850,589 596,447,233 (15,403,356) 610,917,712 -
MPSA No. 047-96-XII Holcim Resources and Development Corporation
45,482,381 67,174,634 21,692,253 67,494,553 -
MPSA No. 056-1996-III Republic Cement Land & Resources
50,290,695 40,887,984 17,845,255 50,273,084 -
MPSA No. 106-98-I Northern Cement Corporation
1,637,002,729 1,662,536,797 25,534,068 1,617,614,577 (18,316,936)
MPSA No. 124-98-IV Island Quarry and Aggregates Corporation
84,585,483 89,408,935 4,823,452 88,544,431 -
MPSA No. 138-99-IV Republic Cement and Building Materials, Inc. -
51,219,784 8,132,804 (43,086,981) - (43,086,981)
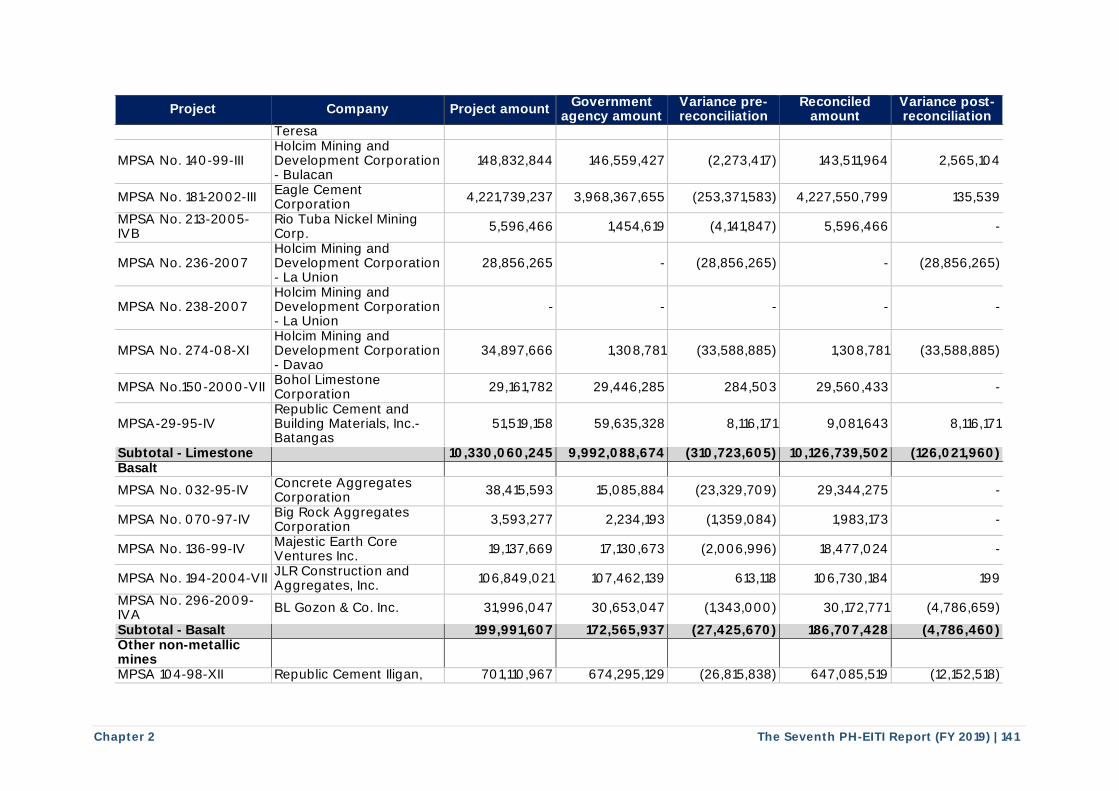
Chapter 2 The Seventh PH-EITI Report (FY 2019) | 141
Project Company Project amount Government
agency amount Variance pre-reconciliation
Reconciled amount
Variance post-reconciliation
Teresa
MPSA No. 140-99-III Holcim Mining and Development Corporation - Bulacan
148,832,844 146,559,427 (2,273,417) 143,511,964 2,565,104
MPSA No. 181-2002-III Eagle Cement Corporation
4,221,739,237 3,968,367,655 (253,371,583) 4,227,550,799 135,539
MPSA No. 213-2005-IVB
Rio Tuba Nickel Mining Corp.
5,596,466 1,454,619 (4,141,847) 5,596,466 -
MPSA No. 236-2007 Holcim Mining and Development Corporation - La Union
28,856,265 - (28,856,265) - (28,856,265)
MPSA No. 238-2007 Holcim Mining and Development Corporation - La Union
- - - - -
MPSA No. 274-08-XI Holcim Mining and Development Corporation - Davao
34,897,666 1,308,781 (33,588,885) 1,308,781 (33,588,885)
MPSA No.150-2000-VII Bohol Limestone Corporation
29,161,782 29,446,285 284,503 29,560,433 -
MPSA-29-95-IV Republic Cement and Building Materials, Inc.- Batangas
51,519,158 59,635,328 8,116,171 9,081,643 8,116,171
Subtotal - Limestone 10,330,060,245 9,992,088,674 (310,723,605) 10,126,739,502 (126,021,960) Basalt
MPSA No. 032-95-IV Concrete Aggregates Corporation
38,415,593 15,085,884 (23,329,709) 29,344,275 -
MPSA No. 070-97-IV Big Rock Aggregates Corporation
3,593,277 2,234,193 (1,359,084) 1,983,173 -
MPSA No. 136-99-IV Majestic Earth Core Ventures Inc.
19,137,669 17,130,673 (2,006,996) 18,477,024 -
MPSA No. 194-2004-VII JLR Construction and Aggregates, Inc.
106,849,021 107,462,139 613,118 106,730,184 199
MPSA No. 296-2009-IVA
BL Gozon & Co. Inc. 31,996,047 30,653,047 (1,343,000) 30,172,771 (4,786,659)
Subtotal - Basalt 199,991,607 172,565,937 (27,425,670) 186,707,428 (4,786,460) Other non-metallic mines
MPSA 104-98-XII Republic Cement Iligan, 701,110,967 674,295,129 (26,815,838) 647,085,519 (12,152,518)
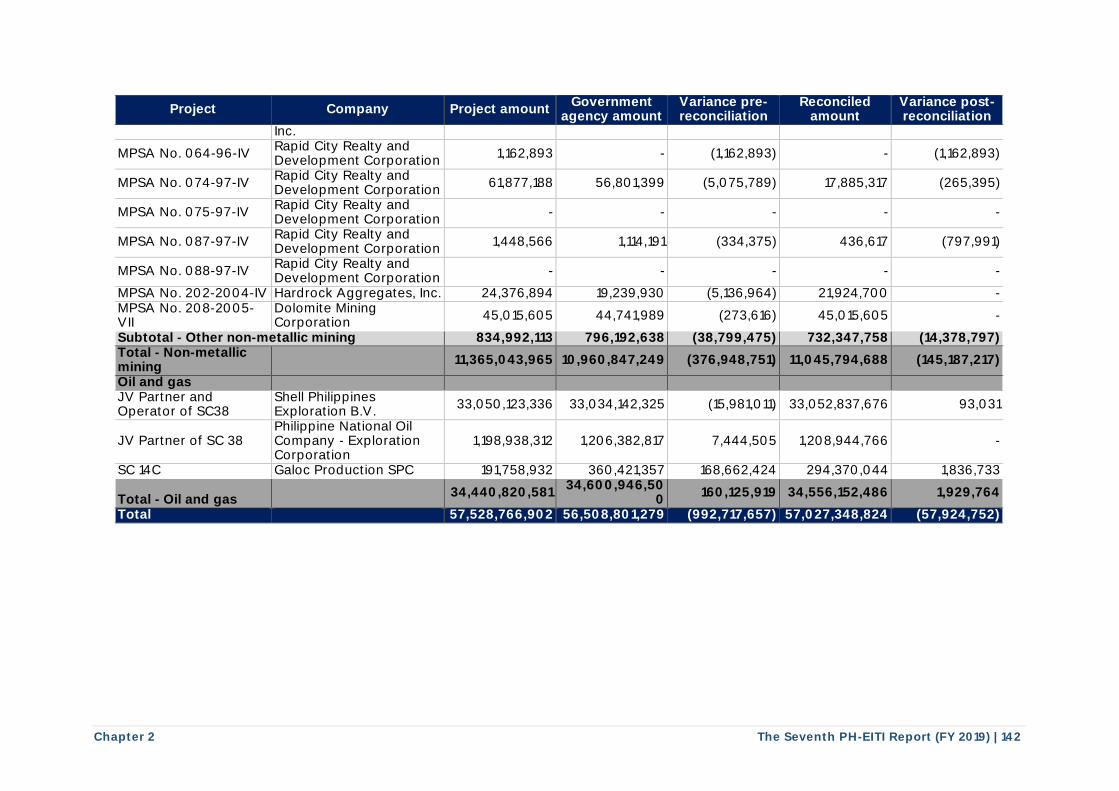
Chapter 2 The Seventh PH-EITI Report (FY 2019) | 142
Project Company Project amount Government
agency amount Variance pre-reconciliation
Reconciled amount
Variance post-reconciliation
Inc.
MPSA No. 064-96-IV Rapid City Realty and Development Corporation
1,162,893 - (1,162,893) - (1,162,893)
MPSA No. 074-97-IV Rapid City Realty and Development Corporation
61,877,188 56,801,399 (5,075,789) 17,885,317 (265,395)
MPSA No. 075-97-IV Rapid City Realty and Development Corporation
- - - - -
MPSA No. 087-97-IV Rapid City Realty and Development Corporation
1,448,566 1,114,191 (334,375) 436,617 (797,991)
MPSA No. 088-97-IV Rapid City Realty and Development Corporation
- - - - -
MPSA No. 202-2004-IV Hardrock Aggregates, Inc. 24,376,894 19,239,930 (5,136,964) 21,924,700 - MPSA No. 208-2005-VII
Dolomite Mining Corporation
45,015,605 44,741,989 (273,616) 45,015,605 -
Subtotal - Other non-metallic mining 834,992,113 796,192,638 (38,799,475) 732,347,758 (14,378,797) Total - Non-metallic mining
11,365,043,965 10,960,847,249 (376,948,751) 11,045,794,688 (145,187,217)
Oil and gas JV Partner and Operator of SC38
Shell Philippines Exploration B.V.
33,050,123,336 33,034,142,325 (15,981,011) 33,052,837,676 93,031
JV Partner of SC 38 Philippine National Oil Company - Exploration Corporation
1,198,938,312 1,206,382,817 7,444,505 1,208,944,766 -
SC 14C Galoc Production SPC 191,758,932 360,421,357 168,662,424 294,370,044 1,836,733
Total - Oil and gas 34,440,820,581
34,600,946,500
160,125,919 34,556,152,486 1,929,764
Total 57,528,766,902 56,508,801,279 (992,717,657) 57,027,348,824 (57,924,752)
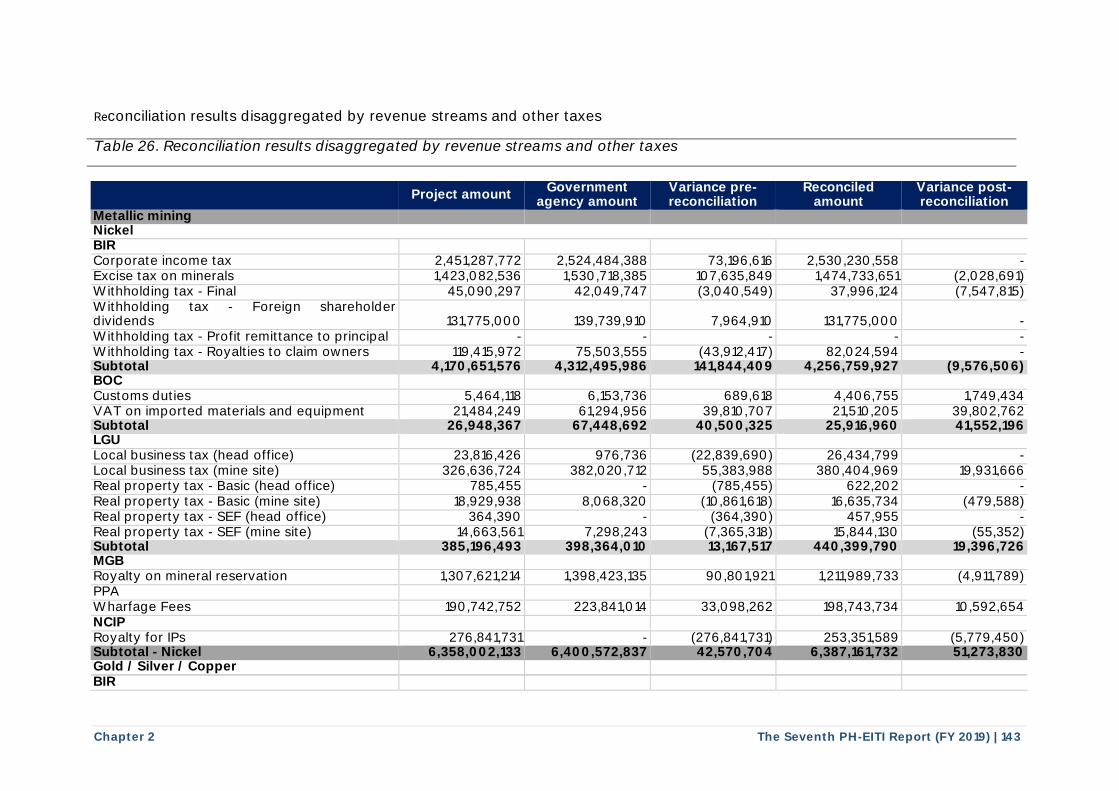
Chapter 2 The Seventh PH-EITI Report (FY 2019) | 143
Reconciliation results disaggregated by revenue streams and other taxes Table 26. Reconciliation results disaggregated by revenue streams and other taxes
Project amount Government
agency amount Variance pre-reconciliation
Reconciled amount
Variance post-reconciliation
Metallic mining Nickel BIR Corporate income tax 2,451,287,772 2,524,484,388 73,196,616 2,530,230,558 - Excise tax on minerals 1,423,082,536 1,530,718,385 107,635,849 1,474,733,651 (2,028,691) Withholding tax - Final 45,090,297 42,049,747 (3,040,549) 37,996,124 (7,547,815) Withholding tax - Foreign shareholder dividends 131,775,000 139,739,910 7,964,910 131,775,000 - Withholding tax - Profit remittance to principal - - - - - Withholding tax - Royalties to claim owners 119,415,972 75,503,555 (43,912,417) 82,024,594 - Subtotal 4,170,651,576 4,312,495,986 141,844,409 4,256,759,927 (9,576,506) BOC Customs duties 5,464,118 6,153,736 689,618 4,406,755 1,749,434 VAT on imported materials and equipment 21,484,249 61,294,956 39,810,707 21,510,205 39,802,762 Subtotal 26,948,367 67,448,692 40,500,325 25,916,960 41,552,196 LGU Local business tax (head office) 23,816,426 976,736 (22,839,690) 26,434,799 - Local business tax (mine site) 326,636,724 382,020,712 55,383,988 380,404,969 19,931,666 Real property tax - Basic (head office) 785,455 - (785,455) 622,202 - Real property tax - Basic (mine site) 18,929,938 8,068,320 (10,861,618) 16,635,734 (479,588) Real property tax - SEF (head office) 364,390 - (364,390) 457,955 - Real property tax - SEF (mine site) 14,663,561 7,298,243 (7,365,318) 15,844,130 (55,352) Subtotal 385,196,493 398,364,010 13,167,517 440,399,790 19,396,726 MGB Royalty on mineral reservation 1,307,621,214 1,398,423,135 90,801,921 1,211,989,733 (4,911,789) PPA Wharfage Fees 190,742,752 223,841,014 33,098,262 198,743,734 10,592,654 NCIP Royalty for IPs 276,841,731 - (276,841,731) 253,351,589 (5,779,450) Subtotal - Nickel 6,358,002,133 6,400,572,837 42,570,704 6,387,161,732 51,273,830 Gold / Silver / Copper BIR
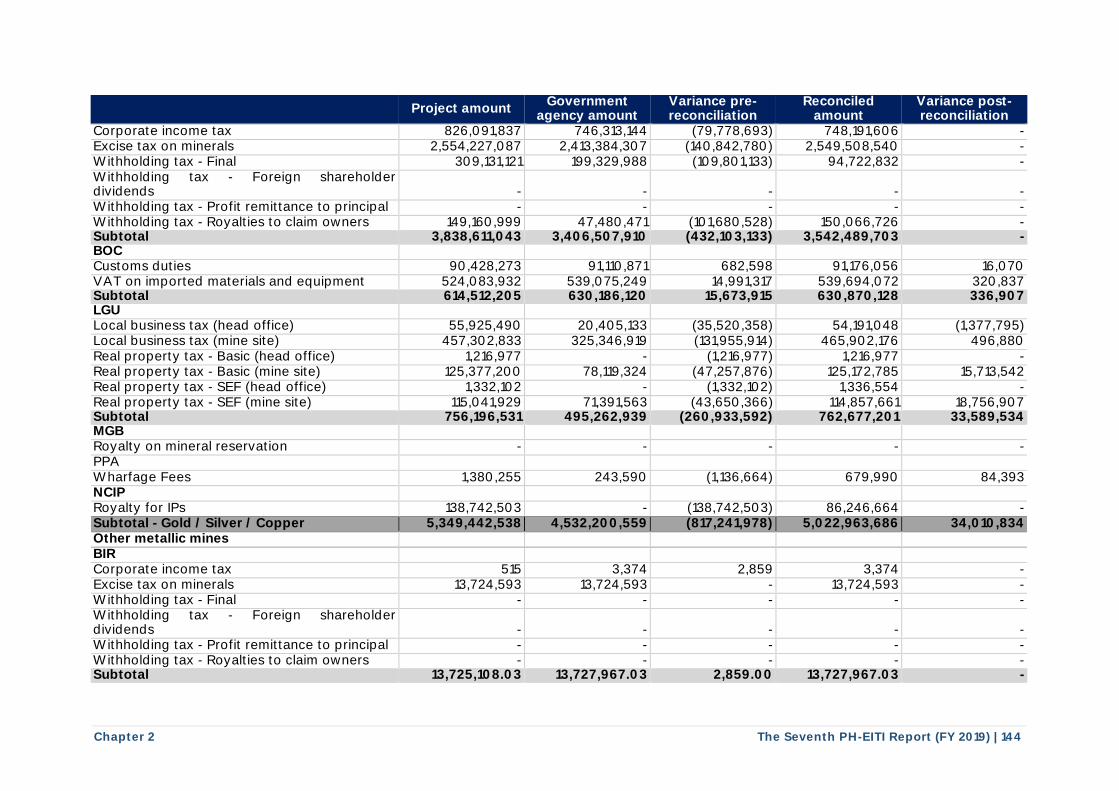
Chapter 2 The Seventh PH-EITI Report (FY 2019) | 144
Project amount Government
agency amount Variance pre-reconciliation
Reconciled amount
Variance post-reconciliation
Corporate income tax 826,091,837 746,313,144 (79,778,693) 748,191,606 - Excise tax on minerals 2,554,227,087 2,413,384,307 (140,842,780) 2,549,508,540 - Withholding tax - Final 309,131,121 199,329,988 (109,801,133) 94,722,832 - Withholding tax - Foreign shareholder dividends - - - - - Withholding tax - Profit remittance to principal - - - - - Withholding tax - Royalties to claim owners 149,160,999 47,480,471 (101,680,528) 150,066,726 - Subtotal 3,838,611,043 3,406,507,910 (432,103,133) 3,542,489,703 - BOC Customs duties 90,428,273 91,110,871 682,598 91,176,056 16,070 VAT on imported materials and equipment 524,083,932 539,075,249 14,991,317 539,694,072 320,837 Subtotal 614,512,205 630,186,120 15,673,915 630,870,128 336,907 LGU Local business tax (head office) 55,925,490 20,405,133 (35,520,358) 54,191,048 (1,377,795) Local business tax (mine site) 457,302,833 325,346,919 (131,955,914) 465,902,176 496,880 Real property tax - Basic (head office) 1,216,977 - (1,216,977) 1,216,977 - Real property tax - Basic (mine site) 125,377,200 78,119,324 (47,257,876) 125,172,785 15,713,542 Real property tax - SEF (head office) 1,332,102 - (1,332,102) 1,336,554 - Real property tax - SEF (mine site) 115,041,929 71,391,563 (43,650,366) 114,857,661 18,756,907 Subtotal 756,196,531 495,262,939 (260,933,592) 762,677,201 33,589,534 MGB Royalty on mineral reservation - - - - - PPA Wharfage Fees 1,380,255 243,590 (1,136,664) 679,990 84,393 NCIP Royalty for IPs 138,742,503 - (138,742,503) 86,246,664 - Subtotal - Gold / Silver / Copper 5,349,442,538 4,532,200,559 (817,241,978) 5,022,963,686 34,010,834 Other metallic mines BIR Corporate income tax 515 3,374 2,859 3,374 - Excise tax on minerals 13,724,593 13,724,593 - 13,724,593 - Withholding tax - Final - - - - - Withholding tax - Foreign shareholder dividends - - - - - Withholding tax - Profit remittance to principal - - - - - Withholding tax - Royalties to claim owners - - - - - Subtotal 13,725,108.03 13,727,967.03 2,859.00 13,727,967.03 -
I I
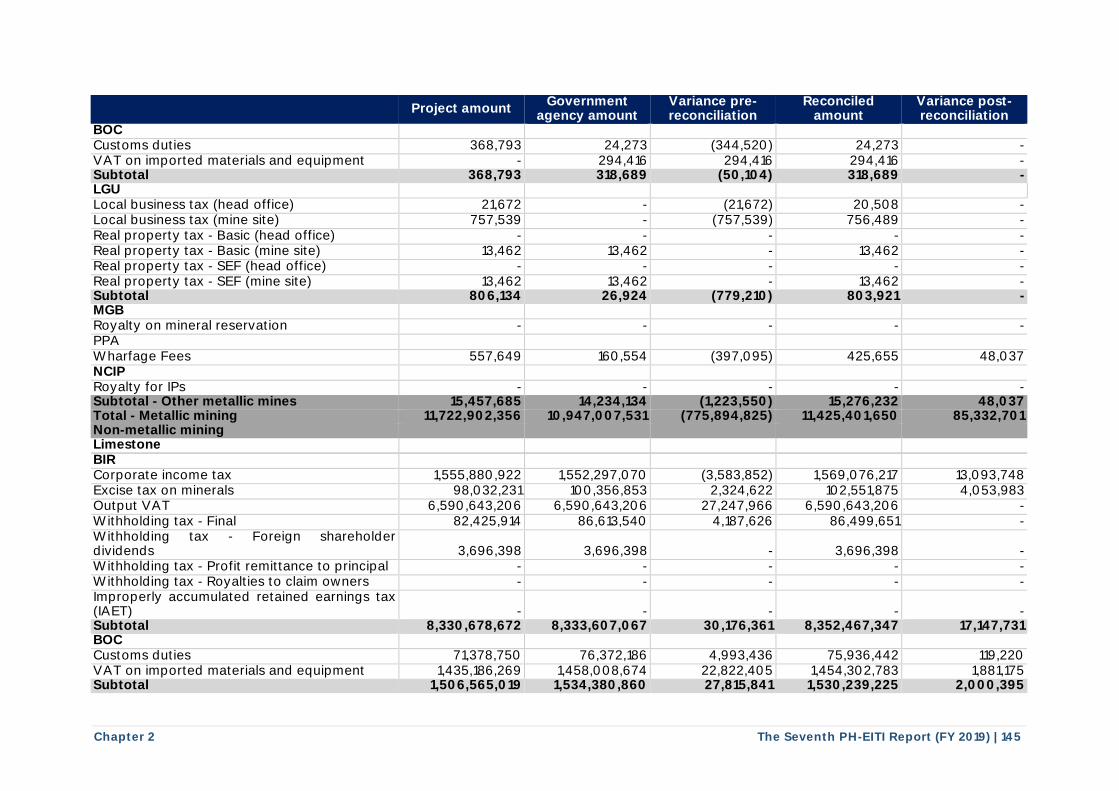
Chapter 2 The Seventh PH-EITI Report (FY 2019) | 145
Project amount Government
agency amount Variance pre-reconciliation
Reconciled amount
Variance post-reconciliation
BOC Customs duties 368,793 24,273 (344,520) 24,273 - VAT on imported materials and equipment - 294,416 294,416 294,416 - Subtotal 368,793 318,689 (50,104) 318,689 - LGU Local business tax (head office) 21,672 - (21,672) 20,508 - Local business tax (mine site) 757,539 - (757,539) 756,489 - Real property tax - Basic (head office) - - - - - Real property tax - Basic (mine site) 13,462 13,462 - 13,462 - Real property tax - SEF (head office) - - - - - Real property tax - SEF (mine site) 13,462 13,462 - 13,462 - Subtotal 806,134 26,924 (779,210) 803,921 - MGB Royalty on mineral reservation - - - - - PPA Wharfage Fees 557,649 160,554 (397,095) 425,655 48,037 NCIP Royalty for IPs - - - - - Subtotal - Other metallic mines 15,457,685 14,234,134 (1,223,550) 15,276,232 48,037 Total - Metallic mining 11,722,902,356 10,947,007,531 (775,894,825) 11,425,401,650 85,332,701 Non-metallic mining Limestone BIR Corporate income tax 1,555,880,922 1,552,297,070 (3,583,852) 1,569,076,217 13,093,748 Excise tax on minerals 98,032,231 100,356,853 2,324,622 102,551,875 4,053,983 Output VAT 6,590,643,206 6,590,643,206 27,247,966 6,590,643,206 - Withholding tax - Final 82,425,914 86,613,540 4,187,626 86,499,651 - Withholding tax - Foreign shareholder dividends 3,696,398 3,696,398 - 3,696,398 - Withholding tax - Profit remittance to principal - - - - - Withholding tax - Royalties to claim owners - - - - - Improperly accumulated retained earnings tax (IAET) - - - - - Subtotal 8,330,678,672 8,333,607,067 30,176,361 8,352,467,347 17,147,731 BOC Customs duties 71,378,750 76,372,186 4,993,436 75,936,442 119,220 VAT on imported materials and equipment 1,435,186,269 1,458,008,674 22,822,405 1,454,302,783 1,881,175 Subtotal 1,506,565,019 1,534,380,860 27,815,841 1,530,239,225 2,000,395

Chapter 2 The Seventh PH-EITI Report (FY 2019) | 146
Project amount Government
agency amount Variance pre-reconciliation
Reconciled amount
Variance post-reconciliation
LGU Local business tax (head office) 30,315,806 - (30,315,806) 18,285,188 (11,822,357) Local business tax (mine site) 75,560,042 23,965,675 (51,594,367) 58,155,060 (9,225,935) Real property tax - Basic (head office) 947 - (947) 885 - Real property tax - Basic (mine site) 196,761,636 51,245,365 (145,516,271) 81,831,399 (67,320,754)
Real property tax SEF (head office) 947 - (947) 885 -
Real property tax - SEF (mine site) 186,035,327 48,889,707 (137,145,621) 81,617,667 (56,801,041) Subtotal 488,674,707 124,100,747 (364,573,960) 239,891,083 (145,170,086) NCIP Royalty for IPs 4,141,847 - (4,141,847) 4,141,847 - Subtotal - Limestone 10,330,060,245 9,992,088,674 (310,723,605) 10,126,739,502 (126,021,960) Basalt BIR Corporate income tax 44,694,101 50,967,516 6,273,415 46,854,904 - Excise tax on minerals 19,464,078 15,750,133 (3,713,945) 19,464,078 - Output VAT 98,595,306 98,595,306 0 95,471,600 - Withholding tax - Final 620,251 3,423,922 2,803,671 620,251 - Withholding tax - Foreign shareholder dividends 2,259,577 126,244 (2,133,333) 2,259,577 (2,133,333) Withholding tax - Profit remittance to principal - - - - - Withholding tax - Royalties to claim owners 4,814,854 1,866,253 (2,948,601) 4,814,854 (2,068,095) Improperly accumulated retained earnings tax (IAET) - 1,479,692 1,479,692 - - Subtotal 170,448,167 172,209,065 1,760,899 169,485,263 (4,201,428) BOC Customs duties 7,795,126 - (7,795,126) - - VAT on imported materials and equipment 4,150,764 - (4,150,764) - - Subtotal 11,945,890 - (11,945,890) - - LGU Local business tax (head office) 1,497,277 - (1,497,277) 934,461 (563,012) Local business tax (mine site) 10,737,746 356,672 (10,381,073) 11,004,243 - Real property tax - Basic (head office) 792,274 - (792,274) 773,878 - Real property tax - Basic (mine site) 2,212,729 100 (2,212,629) 2,201,620 (11,009) Real property tax - SEF (head office) 144,796 - (144,796) 106,343 -
Real property tax - SEF (mine site) 2,212,729 100 (2,212,630) 2,201,620 (11,010) Subtotal 17,597,551 356,872 (17,240,679) 17,222,165 (585,032) Subtotal - Basalt 199,991,607 172,565,937 (27,425,670) 186,707,428 (4,786,460)
-
I I
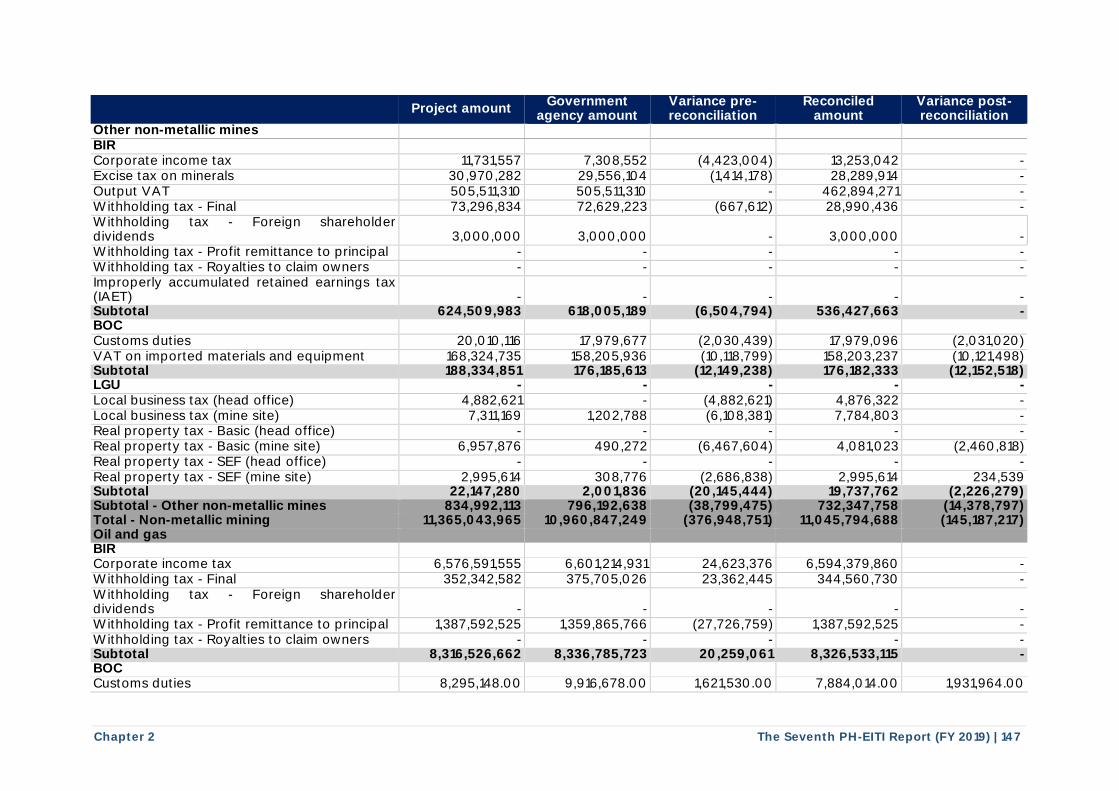
Chapter 2 The Seventh PH-EITI Report (FY 2019) | 147
Project amount Government
agency amount Variance pre-reconciliation
Reconciled amount
Variance post-reconciliation
Other non-metallic mines BIR Corporate income tax 11,731,557 7,308,552 (4,423,004) 13,253,042 - Excise tax on minerals 30,970,282 29,556,104 (1,414,178) 28,289,914 - Output VAT 505,511,310 505,511,310 - 462,894,271 - Withholding tax - Final 73,296,834 72,629,223 (667,612) 28,990,436 - Withholding tax - Foreign shareholder dividends 3,000,000 3,000,000 - 3,000,000 - Withholding tax - Profit remittance to principal - - - - - Withholding tax - Royalties to claim owners - - - - - Improperly accumulated retained earnings tax (IAET) - - - - - Subtotal 624,509,983 618,005,189 (6,504,794) 536,427,663 - BOC Customs duties 20,010,116 17,979,677 (2,030,439) 17,979,096 (2,031,020) VAT on imported materials and equipment 168,324,735 158,205,936 (10,118,799) 158,203,237 (10,121,498) Subtotal 188,334,851 176,185,613 (12,149,238) 176,182,333 (12,152,518) LGU - - - - - Local business tax (head office) 4,882,621 - (4,882,621) 4,876,322 - Local business tax (mine site) 7,311,169 1,202,788 (6,108,381) 7,784,803 - Real property tax - Basic (head office) - - - - - Real property tax - Basic (mine site) 6,957,876 490,272 (6,467,604) 4,081,023 (2,460,818) Real property tax - SEF (head office) - - - - - Real property tax - SEF (mine site) 2,995,614 308,776 (2,686,838) 2,995,614 234,539 Subtotal 22,147,280 2,001,836 (20,145,444) 19,737,762 (2,226,279) Subtotal - Other non-metallic mines 834,992,113 796,192,638 (38,799,475) 732,347,758 (14,378,797) Total - Non-metallic mining 11,365,043,965 10,960,847,249 (376,948,751) 11,045,794,688 (145,187,217) Oil and gas BIR Corporate income tax 6,576,591,555 6,601,214,931 24,623,376 6,594,379,860 - Withholding tax - Final 352,342,582 375,705,026 23,362,445 344,560,730 - Withholding tax - Foreign shareholder dividends - - - - - Withholding tax - Profit remittance to principal 1,387,592,525 1,359,865,766 (27,726,759) 1,387,592,525 - Withholding tax - Royalties to claim owners - - - - - Subtotal 8,316,526,662 8,336,785,723 20,259,061 8,326,533,115 - BOC Customs duties 8,295,148.00 9,916,678.00 1,621,530.00 7,884,014.00 1,931,964.00
I I
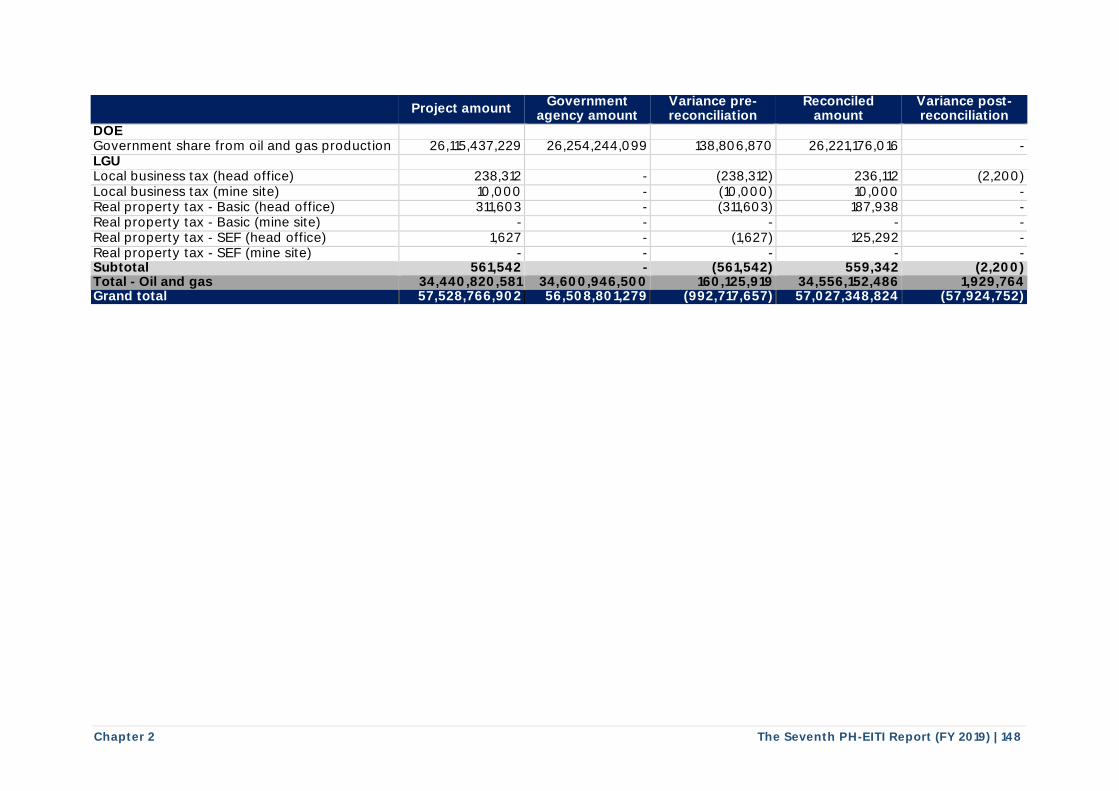
Chapter 2 The Seventh PH-EITI Report (FY 2019) | 148
Project amount Government
agency amount Variance pre-reconciliation
Reconciled amount
Variance post-reconciliation
DOE Government share from oil and gas production 26,115,437,229 26,254,244,099 138,806,870 26,221,176,016 - LGU Local business tax (head office) 238,312 - (238,312) 236,112 (2,200) Local business tax (mine site) 10,000 - (10,000) 10,000 - Real property tax - Basic (head office) 311,603 - (311,603) 187,938 - Real property tax - Basic (mine site) - - - - - Real property tax - SEF (head office) 1,627 - (1,627) 125,292 - Real property tax - SEF (mine site) - - - - - Subtotal 561,542 - (561,542) 559,342 (2,200) Total - Oil and gas 34,440,820,581 34,600,946,500 160,125,919 34,556,152,486 1,929,764 Grand total 57,528,766,902 56,508,801,279 (992,717,657) 57,027,348,824 (57,924,752)
I I I I
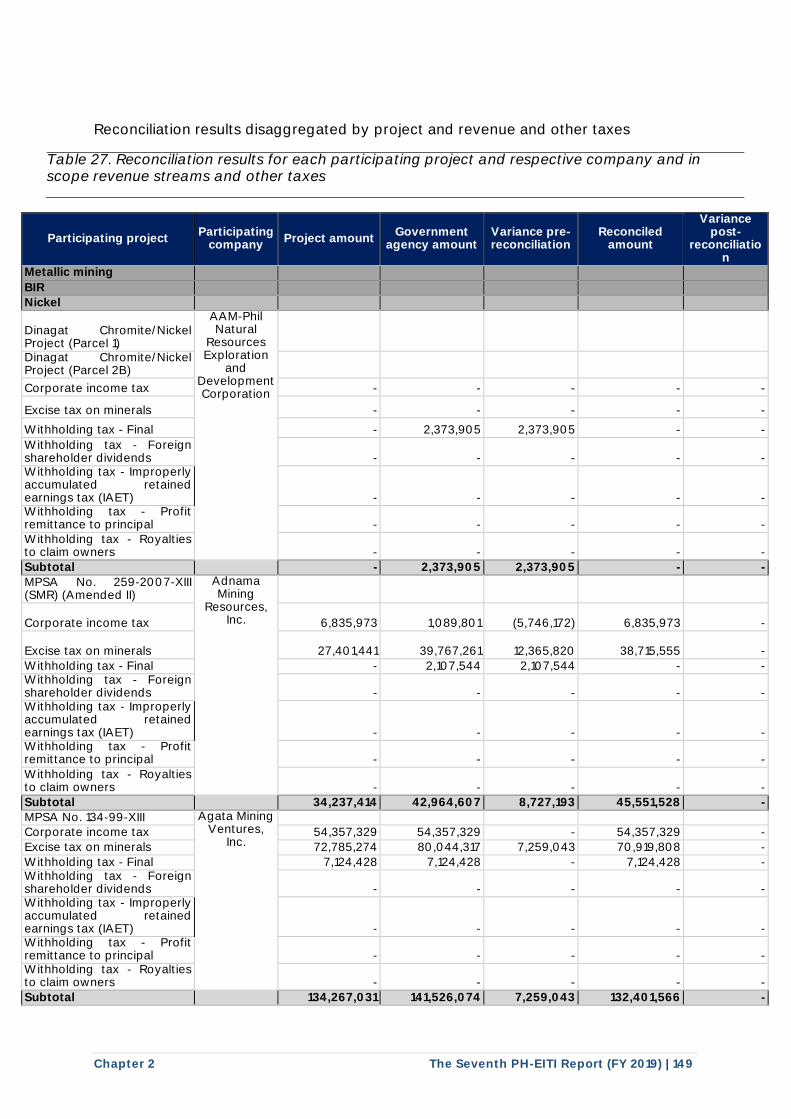
Chapter 2 The Seventh PH-EITI Report (FY 2019) | 149
Reconciliation results disaggregated by project and revenue and other taxes
Table 27. Reconciliation results for each participating project and respective company and in scope revenue streams and other taxes
Participating project Participating
company Project amount
Government agency amount
Variance pre-reconciliation
Reconciled amount
Variance post-
reconciliation
Metallic mining
BIR
Nickel
Dinagat Chromite/Nickel Project (Parcel 1)
AAM-Phil Natural
Resources Exploration
and Development Corporation
Dinagat Chromite/Nickel Project (Parcel 2B)
Corporate income tax - - - - -
Excise tax on minerals - - - - -
Withholding tax - Final - 2,373,905 2,373,905 - -
Withholding tax - Foreign shareholder dividends - - - - - Withholding tax - Improperly accumulated retained earnings tax (IAET) - - - - - Withholding tax - Profit remittance to principal - - - - - Withholding tax - Royalties to claim owners - - - - -
Subtotal - 2,373,905 2,373,905 - -
MPSA No. 259-2007-XIII (SMR) (Amended II)
Adnama Mining
Resources, Inc.
Corporate income tax 6,835,973 1,089,801 (5,746,172) 6,835,973 -
Excise tax on minerals 27,401,441 39,767,261 12,365,820 38,715,555 -
Withholding tax - Final - 2,107,544 2,107,544 - - Withholding tax - Foreign shareholder dividends - - - - - Withholding tax - Improperly accumulated retained earnings tax (IAET) - - - - - Withholding tax - Profit remittance to principal - - - - -
Withholding tax - Royalties to claim owners - - - - -
Subtotal 34,237,414 42,964,607 8,727,193 45,551,528 -
MPSA No. 134-99-XIII Agata Mining Ventures,
Inc.
Corporate income tax 54,357,329 54,357,329 - 54,357,329 -
Excise tax on minerals 72,785,274 80,044,317 7,259,043 70,919,808 -
Withholding tax - Final 7,124,428 7,124,428 - 7,124,428 - Withholding tax - Foreign shareholder dividends - - - - - Withholding tax - Improperly accumulated retained earnings tax (IAET) - - - - - Withholding tax - Profit remittance to principal - - - - - Withholding tax - Royalties to claim owners - - - - -
Subtotal 134,267,031 141,526,074 7,259,043 132,401,566 -
I I I
I I I
I
I I I I I I
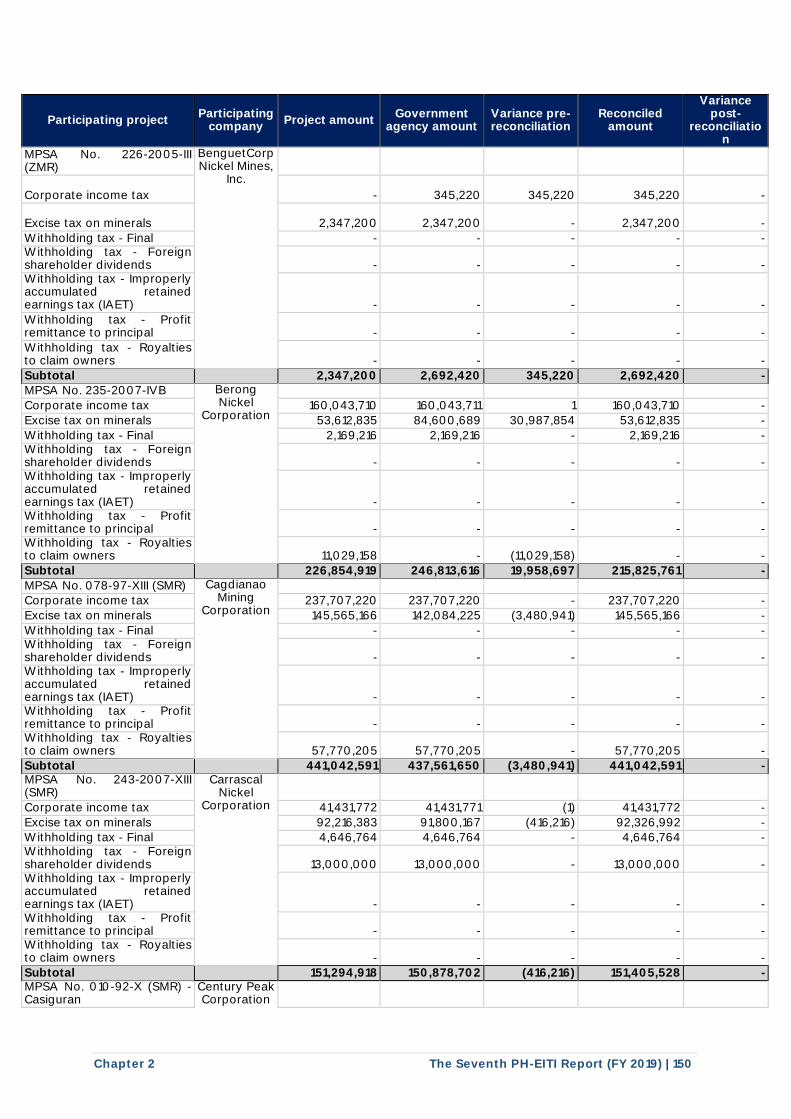
Chapter 2 The Seventh PH-EITI Report (FY 2019) | 150
Participating project Participating
company Project amount
Government agency amount
Variance pre-reconciliation
Reconciled amount
Variance post-
reconciliation
MPSA No. 226-2005-III (ZMR)
BenguetCorp Nickel Mines,
Inc.
Corporate income tax - 345,220 345,220 345,220 -
Excise tax on minerals 2,347,200 2,347,200 - 2,347,200 -
Withholding tax - Final - - - - - Withholding tax - Foreign shareholder dividends - - - - - Withholding tax - Improperly accumulated retained earnings tax (IAET) - - - - -
Withholding tax - Profit remittance to principal - - - - -
Withholding tax - Royalties to claim owners - - - - -
Subtotal 2,347,200 2,692,420 345,220 2,692,420 - MPSA No. 235-2007-IVB Berong
Nickel Corporation
Corporate income tax 160,043,710 160,043,711 1 160,043,710 -
Excise tax on minerals 53,612,835 84,600,689 30,987,854 53,612,835 -
Withholding tax - Final 2,169,216 2,169,216 - 2,169,216 - Withholding tax - Foreign shareholder dividends - - - - - Withholding tax - Improperly accumulated retained earnings tax (IAET) - - - - - Withholding tax - Profit remittance to principal - - - - - Withholding tax - Royalties to claim owners 11,029,158 - (11,029,158) - -
Subtotal 226,854,919 246,813,616 19,958,697 215,825,761 -
MPSA No. 078-97-XIII (SMR) Cagdianao Mining
Corporation
Corporate income tax 237,707,220 237,707,220 - 237,707,220 -
Excise tax on minerals 145,565,166 142,084,225 (3,480,941) 145,565,166 -
Withholding tax - Final - - - - - Withholding tax - Foreign shareholder dividends - - - - - Withholding tax - Improperly accumulated retained earnings tax (IAET) - - - - - Withholding tax - Profit remittance to principal - - - - - Withholding tax - Royalties to claim owners 57,770,205 57,770,205 - 57,770,205 -
Subtotal 441,042,591 437,561,650 (3,480,941) 441,042,591 - MPSA No. 243-2007-XIII (SMR)
Carrascal Nickel
Corporation
Corporate income tax 41,431,772 41,431,771 (1) 41,431,772 -
Excise tax on minerals 92,216,383 91,800,167 (416,216) 92,326,992 - Withholding tax - Final 4,646,764 4,646,764 - 4,646,764 - Withholding tax - Foreign shareholder dividends 13,000,000 13,000,000 - 13,000,000 - Withholding tax - Improperly accumulated retained earnings tax (IAET) - - - - - Withholding tax - Profit remittance to principal - - - - - Withholding tax - Royalties to claim owners - - - - -
Subtotal 151,294,918 150,878,702 (416,216) 151,405,528 - MPSA No. 010-92-X (SMR) - Casiguran
Century Peak Corporation
I I I
I I I
I I
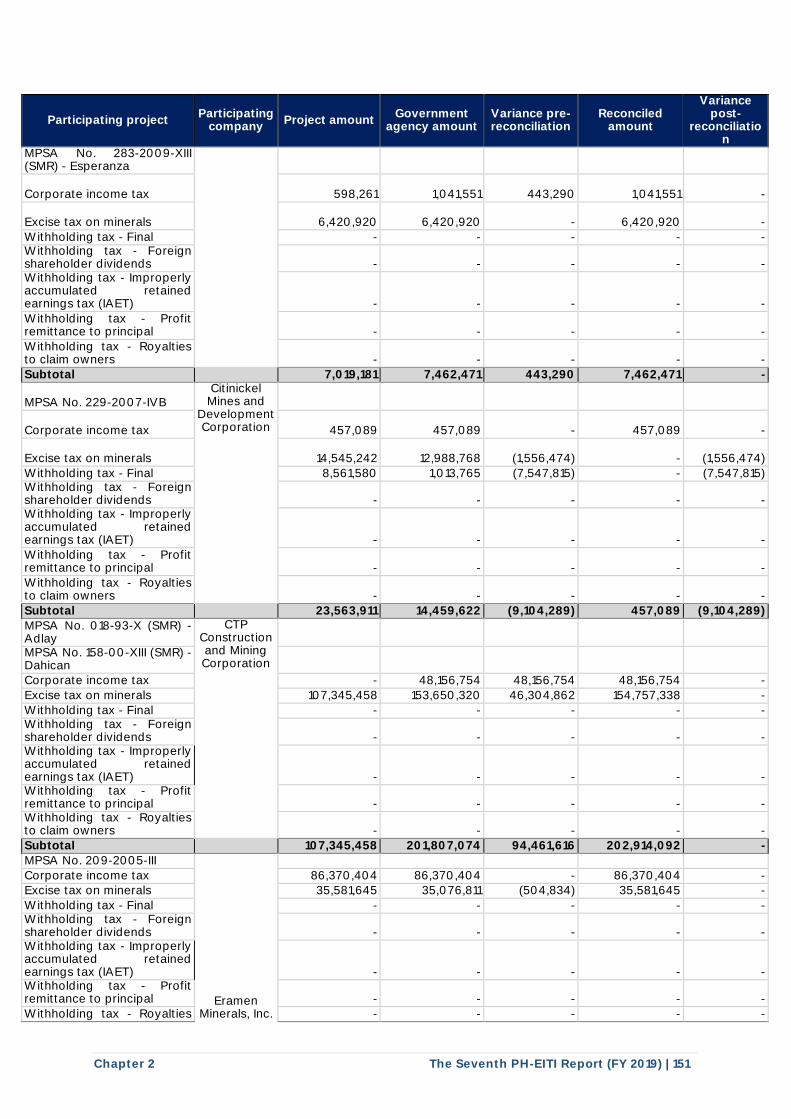
Chapter 2 The Seventh PH-EITI Report (FY 2019) | 151
Participating project Participating
company Project amount
Government agency amount
Variance pre-reconciliation
Reconciled amount
Variance post-
reconciliation
MPSA No. 283-2009-XIII (SMR) - Esperanza
Corporate income tax 598,261 1,041,551 443,290 1,041,551 -
Excise tax on minerals 6,420,920 6,420,920 - 6,420,920 -
Withholding tax - Final - - - - - Withholding tax - Foreign shareholder dividends - - - - - Withholding tax - Improperly accumulated retained earnings tax (IAET) - - - - -
Withholding tax - Profit remittance to principal - - - - -
Withholding tax - Royalties to claim owners - - - - -
Subtotal 7,019,181 7,462,471 443,290 7,462,471 -
MPSA No. 229-2007-IVB Citinickel
Mines and Development Corporation
Corporate income tax 457,089 457,089 - 457,089 -
Excise tax on minerals 14,545,242 12,988,768 (1,556,474) - (1,556,474)
Withholding tax - Final 8,561,580 1,013,765 (7,547,815) - (7,547,815) Withholding tax - Foreign shareholder dividends - - - - - Withholding tax - Improperly accumulated retained earnings tax (IAET) - - - - -
Withholding tax - Profit remittance to principal - - - - -
Withholding tax - Royalties to claim owners - - - - -
Subtotal 23,563,911 14,459,622 (9,104,289) 457,089 (9,104,289)
MPSA No. 018-93-X (SMR) - Adlay
CTP Construction and Mining Corporation
MPSA No. 158-00-XIII (SMR) - Dahican Corporate income tax - 48,156,754 48,156,754 48,156,754 -
Excise tax on minerals 107,345,458 153,650,320 46,304,862 154,757,338 -
Withholding tax - Final - - - - - Withholding tax - Foreign shareholder dividends - - - - - Withholding tax - Improperly accumulated retained earnings tax (IAET) - - - - - Withholding tax - Profit remittance to principal - - - - - Withholding tax - Royalties to claim owners - - - - -
Subtotal 107,345,458 201,807,074 94,461,616 202,914,092 -
MPSA No. 209-2005-III
Eramen Minerals, Inc.
Corporate income tax 86,370,404 86,370,404 - 86,370,404 - Excise tax on minerals 35,581,645 35,076,811 (504,834) 35,581,645 -
Withholding tax - Final - - - - - Withholding tax - Foreign shareholder dividends - - - - - Withholding tax - Improperly accumulated retained earnings tax (IAET) - - - - - Withholding tax - Profit remittance to principal - - - - -
Withholding tax - Royalties - - - - -
I I I
I I I
I I I

Chapter 2 The Seventh PH-EITI Report (FY 2019) | 152
Participating project Participating
company Project amount
Government agency amount
Variance pre-reconciliation
Reconciled amount
Variance post-
reconciliation
to claim owners
Subtotal 121,952,049 121,447,215 (504,834) 121,952,049 - MPSA No. 246-2007-XIII (SMR)
Hinatuan Mining
Corporation
Corporate income tax 101,020,797 101,543,547 522,750 101,543,547 -
Excise tax on minerals 68,435,248 80,934,678 12,499,430 68,435,248 -
Withholding tax - Final - - - - - Withholding tax - Foreign shareholder dividends - - - - - Withholding tax - Improperly accumulated retained earnings tax (IAET) - - - - - Withholding tax - Profit remittance to principal - - - - - Withholding tax - Royalties to claim owners - - - - -
Subtotal 169,456,044 182,478,225 13,022,181 169,978,795 - MPSA No. 233-2007-XIII (SMR)
Libjo Mining Corporation
Corporate income tax 2,173,868 2,173,868 - 2,173,868 -
Excise tax on minerals 12,316,234 12,316,234 - 12,316,234 - Withholding tax - Final 352,049 687,610 335,561 687,610 - Withholding tax - Foreign shareholder dividends - - - - - Withholding tax - Improperly accumulated retained earnings tax (IAET) - - - - - Withholding tax - Profit remittance to principal - - - - - Withholding tax - Royalties to claim owners - - - - -
Subtotal 14,842,151 15,177,712 335,561 15,177,712 -
MPSA No. 268-2008-III
LNL Archipelago Minerals, Inc.
Corporate income tax - - - - -
Excise tax on minerals 3,085,113 2,827,440 (257,673) 3,085,113 -
Withholding tax - Final 827,760 828,760 1,000 827,760 - Withholding tax - Foreign shareholder dividends
- - - - -
Withholding tax - Improperly accumulated retained earnings tax (IAET)
- - - - - Withholding tax - Profit remittance to principal
- - - - -
Withholding tax - Royalties to claim owners
- - - - -
Subtotal 3,912,874 3,656,200 (256,673) 3,912,874 -
MPSA No. 016-93-X (SMR)
Marcventures Mining and Development Corporation
Corporate income tax
12,322,630 12,322,630 - 12,322,630 -
Excise tax on minerals
57,301,364 81,151,531 23,850,167 57,301,364 -
Withholding tax - Final 3,522,598 3,522,598 - 3,522,598 - Withholding tax - Foreign shareholder dividends
- - - - -
Withholding tax - Improperly accumulated retained earnings tax (IAET)
- - - - -
I I I
I I I
I I I
I I I
I
i I
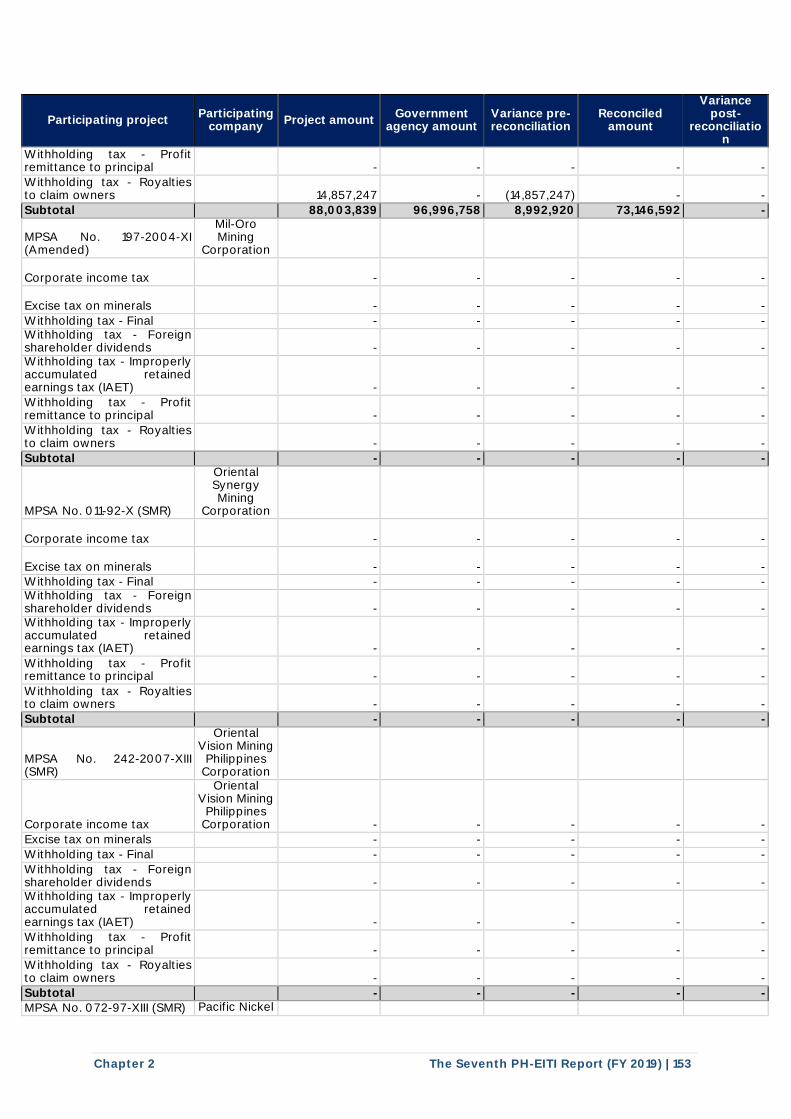
Chapter 2 The Seventh PH-EITI Report (FY 2019) | 153
Participating project Participating
company Project amount
Government agency amount
Variance pre-reconciliation
Reconciled amount
Variance post-
reconciliation
Withholding tax - Profit remittance to principal
- - - - -
Withholding tax - Royalties to claim owners
14,857,247 - (14,857,247) - -
Subtotal 88,003,839 96,996,758 8,992,920 73,146,592 -
MPSA No. 197-2004-XI (Amended)
Mil-Oro Mining
Corporation
Corporate income tax
- - - - -
Excise tax on minerals
- - - - -
Withholding tax - Final - - - - - Withholding tax - Foreign shareholder dividends
- - - - -
Withholding tax - Improperly accumulated retained earnings tax (IAET)
- - - - -
Withholding tax - Profit remittance to principal
- - - - -
Withholding tax - Royalties to claim owners
- - - - -
Subtotal - - - - -
MPSA No. 011-92-X (SMR)
Oriental Synergy Mining
Corporation
Corporate income tax
- - - - -
Excise tax on minerals
- - - - - Withholding tax - Final - - - - - Withholding tax - Foreign shareholder dividends
- - - - -
Withholding tax - Improperly accumulated retained earnings tax (IAET)
- - - - -
Withholding tax - Profit remittance to principal
- - - - -
Withholding tax - Royalties to claim owners
- - - - -
Subtotal - - - - -
MPSA No. 242-2007-XIII (SMR)
Oriental Vision Mining
Philippines Corporation
Corporate income tax
Oriental Vision Mining
Philippines Corporation - - - - -
Excise tax on minerals - - - - -
Withholding tax - Final - - - - -
Withholding tax - Foreign shareholder dividends
- - - - -
Withholding tax - Improperly accumulated retained earnings tax (IAET)
- - - - -
Withholding tax - Profit remittance to principal
- - - - -
Withholding tax - Royalties to claim owners
- - - - -
Subtotal - - - - - MPSA No. 072-97-XIII (SMR) Pacific Nickel
I I
I I
I I
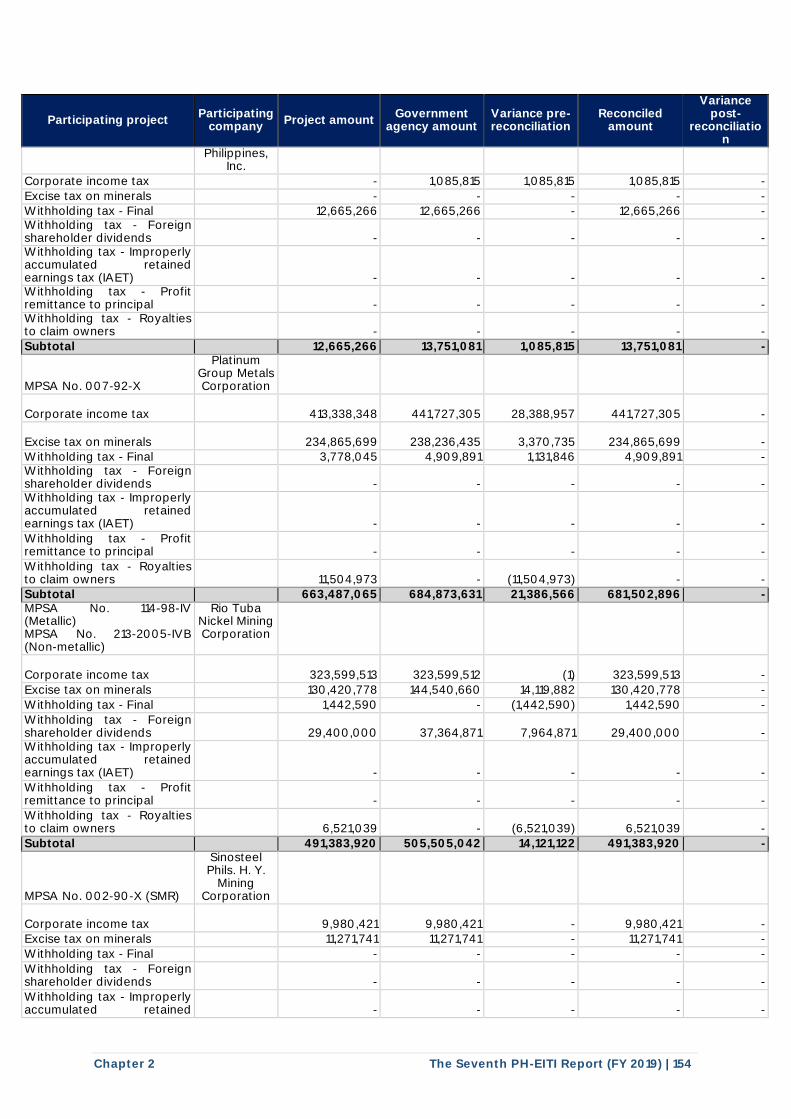
Chapter 2 The Seventh PH-EITI Report (FY 2019) | 154
Participating project Participating
company Project amount
Government agency amount
Variance pre-reconciliation
Reconciled amount
Variance post-
reconciliation
Philippines, Inc.
Corporate income tax - 1,085,815 1,085,815 1,085,815 -
Excise tax on minerals - - - - - Withholding tax - Final 12,665,266 12,665,266 - 12,665,266 - Withholding tax - Foreign shareholder dividends
- - - - -
Withholding tax - Improperly accumulated retained earnings tax (IAET)
- - - - - Withholding tax - Profit remittance to principal
- - - - -
Withholding tax - Royalties to claim owners
- - - - -
Subtotal 12,665,266 13,751,081 1,085,815 13,751,081 -
MPSA No. 007-92-X
Platinum Group Metals Corporation
Corporate income tax
413,338,348 441,727,305 28,388,957 441,727,305 -
Excise tax on minerals
234,865,699 238,236,435 3,370,735 234,865,699 - Withholding tax - Final 3,778,045 4,909,891 1,131,846 4,909,891 - Withholding tax - Foreign shareholder dividends
- - - - -
Withholding tax - Improperly accumulated retained earnings tax (IAET)
- - - - -
Withholding tax - Profit remittance to principal
- - - - -
Withholding tax - Royalties to claim owners
11,504,973 - (11,504,973) - -
Subtotal 663,487,065 684,873,631 21,386,566 681,502,896 - MPSA No. 114-98-IV (Metallic) MPSA No. 213-2005-IVB (Non-metallic)
Rio Tuba Nickel Mining Corporation
Corporate income tax
323,599,513 323,599,512 (1) 323,599,513 -
Excise tax on minerals 130,420,778 144,540,660 14,119,882 130,420,778 -
Withholding tax - Final 1,442,590 - (1,442,590) 1,442,590 -
Withholding tax - Foreign shareholder dividends
29,400,000 37,364,871 7,964,871 29,400,000 -
Withholding tax - Improperly accumulated retained earnings tax (IAET)
- - - - -
Withholding tax - Profit remittance to principal
- - - - -
Withholding tax - Royalties to claim owners
6,521,039 - (6,521,039) 6,521,039 -
Subtotal 491,383,920 505,505,042 14,121,122 491,383,920 -
MPSA No. 002-90-X (SMR)
Sinosteel Phils. H. Y.
Mining Corporation
Corporate income tax
9,980,421 9,980,421 - 9,980,421 - Excise tax on minerals 11,271,741 11,271,741 - 11,271,741 -
Withholding tax - Final - - - - -
Withholding tax - Foreign shareholder dividends
- - - - -
Withholding tax - Improperly accumulated retained
- - - - -
I I
I I
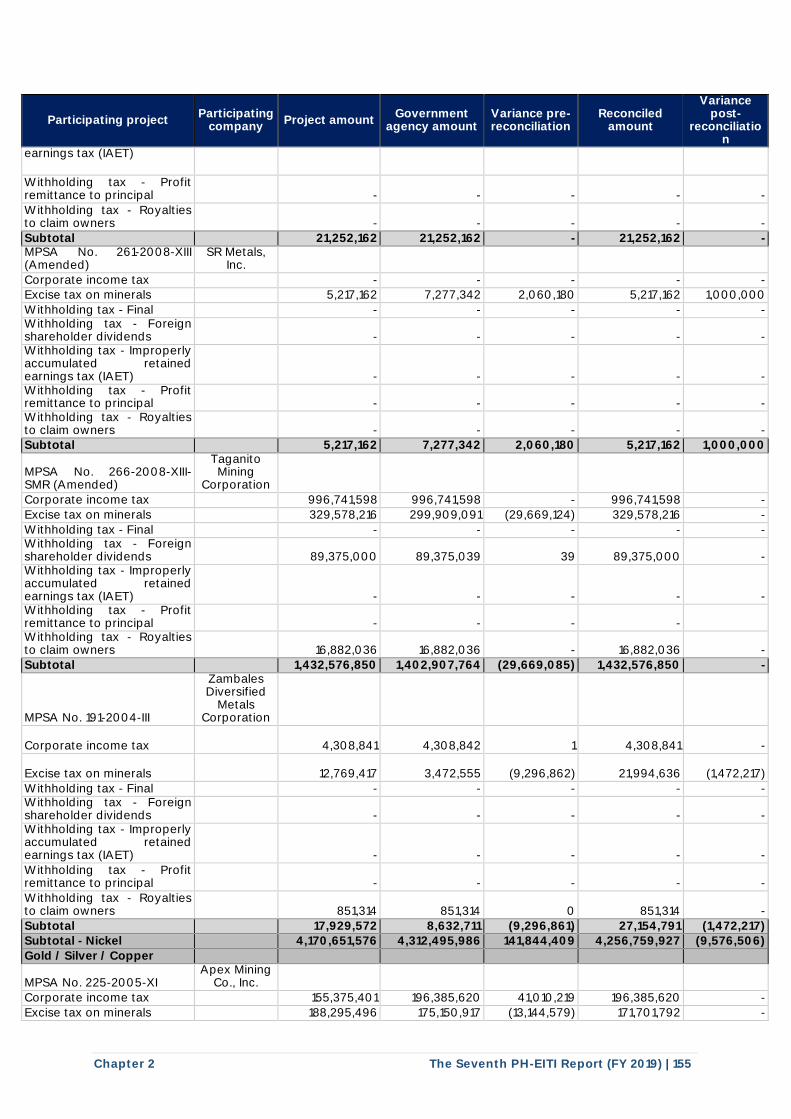
Chapter 2 The Seventh PH-EITI Report (FY 2019) | 155
Participating project Participating
company Project amount
Government agency amount
Variance pre-reconciliation
Reconciled amount
Variance post-
reconciliation
earnings tax (IAET)
Withholding tax - Profit remittance to principal
- - - - -
Withholding tax - Royalties to claim owners
- - - - -
Subtotal 21,252,162 21,252,162 - 21,252,162 - MPSA No. 261-2008-XIII (Amended)
SR Metals, Inc.
Corporate income tax - - - - - Excise tax on minerals 5,217,162 7,277,342 2,060,180 5,217,162 1,000,000
Withholding tax - Final - - - - - Withholding tax - Foreign shareholder dividends
- - - - -
Withholding tax - Improperly accumulated retained earnings tax (IAET)
- - - - - Withholding tax - Profit remittance to principal
- - - - -
Withholding tax - Royalties to claim owners
- - - - -
Subtotal 5,217,162 7,277,342 2,060,180 5,217,162 1,000,000
MPSA No. 266-2008-XIII-SMR (Amended)
Taganito Mining
Corporation
Corporate income tax 996,741,598 996,741,598 - 996,741,598 -
Excise tax on minerals 329,578,216 299,909,091 (29,669,124) 329,578,216 -
Withholding tax - Final - - - - - Withholding tax - Foreign shareholder dividends
89,375,000 89,375,039 39 89,375,000 -
Withholding tax - Improperly accumulated retained earnings tax (IAET)
- - - - - Withholding tax - Profit remittance to principal
- - - -
Withholding tax - Royalties to claim owners
16,882,036 16,882,036 - 16,882,036 -
Subtotal 1,432,576,850 1,402,907,764 (29,669,085) 1,432,576,850 -
MPSA No. 191-2004-III
Zambales Diversified
Metals Corporation
Corporate income tax
4,308,841 4,308,842 1 4,308,841 -
Excise tax on minerals
12,769,417 3,472,555 (9,296,862) 21,994,636 (1,472,217)
Withholding tax - Final - - - - - Withholding tax - Foreign shareholder dividends
- - - - -
Withholding tax - Improperly accumulated retained earnings tax (IAET)
- - - - -
Withholding tax - Profit remittance to principal
- - - - -
Withholding tax - Royalties to claim owners
851,314 851,314 0 851,314 -
Subtotal 17,929,572 8,632,711 (9,296,861) 27,154,791 (1,472,217) Subtotal - Nickel 4,170,651,576 4,312,495,986 141,844,409 4,256,759,927 (9,576,506)
Gold / Silver / Copper
MPSA No. 225-2005-XI Apex Mining
Co., Inc.
Corporate income tax 155,375,401 196,385,620 41,010,219 196,385,620 -
Excise tax on minerals 188,295,496 175,150,917 (13,144,579) 171,701,792 -
I I
I I
I l l l l l :
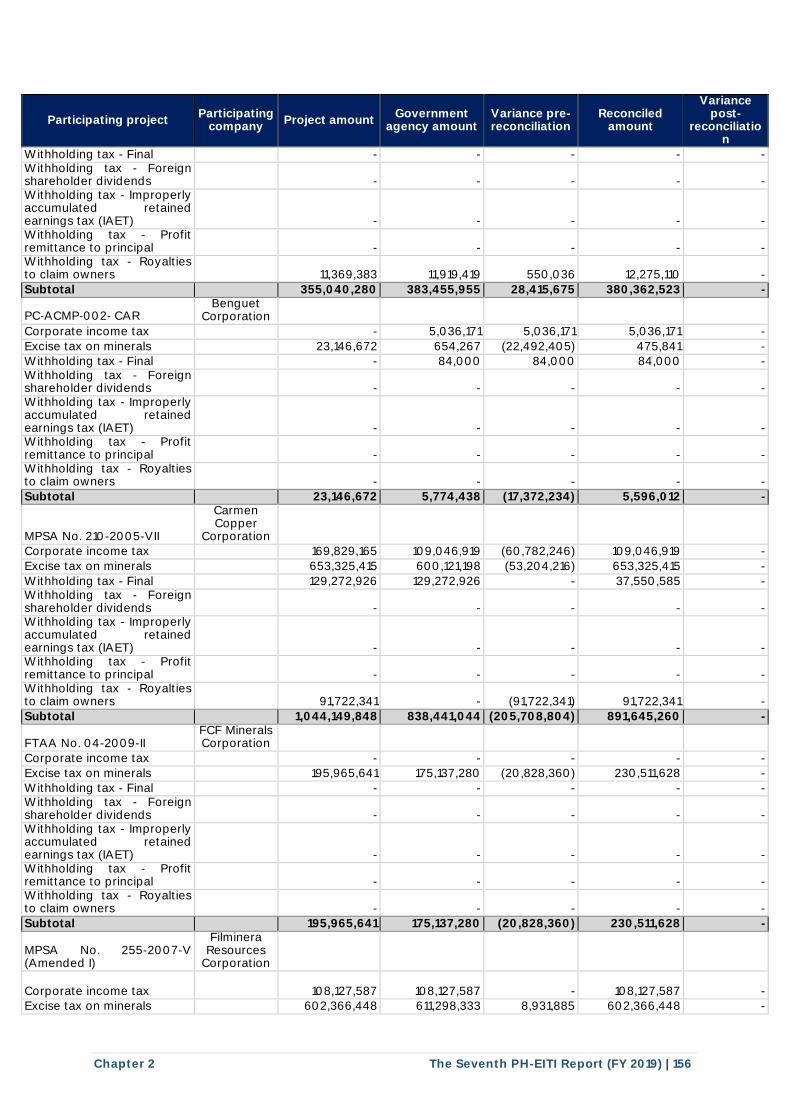
Chapter 2 The Seventh PH-EITI Report (FY 2019) | 156
Participating project Participating
company Project amount
Government agency amount
Variance pre-reconciliation
Reconciled amount
Variance post-
reconciliation
Withholding tax - Final - - - - - Withholding tax - Foreign shareholder dividends
- - - - -
Withholding tax - Improperly accumulated retained earnings tax (IAET)
- - - - - Withholding tax - Profit remittance to principal
- - - - -
Withholding tax - Royalties to claim owners
11,369,383 11,919,419 550,036 12,275,110 -
Subtotal 355,040,280 383,455,955 28,415,675 380,362,523 -
PC‐ACMP‐002‐ CAR Benguet
Corporation
Corporate income tax - 5,036,171 5,036,171 5,036,171 -
Excise tax on minerals 23,146,672 654,267 (22,492,405) 475,841 - Withholding tax - Final - 84,000 84,000 84,000 - Withholding tax - Foreign shareholder dividends
- - - - -
Withholding tax - Improperly accumulated retained earnings tax (IAET)
- - - - - Withholding tax - Profit remittance to principal
- - - - -
Withholding tax - Royalties to claim owners
- - - - -
Subtotal 23,146,672 5,774,438 (17,372,234) 5,596,012 -
MPSA No. 210-2005-VII
Carmen Copper
Corporation Corporate income tax 169,829,165 109,046,919 (60,782,246) 109,046,919 -
Excise tax on minerals 653,325,415 600,121,198 (53,204,216) 653,325,415 -
Withholding tax - Final 129,272,926 129,272,926 - 37,550,585 - Withholding tax - Foreign shareholder dividends
- - - - -
Withholding tax - Improperly accumulated retained earnings tax (IAET)
- - - - - Withholding tax - Profit remittance to principal
- - - - -
Withholding tax - Royalties to claim owners
91,722,341 - (91,722,341) 91,722,341 -
Subtotal 1,044,149,848 838,441,044 (205,708,804) 891,645,260 -
FTAA No. 04-2009-II FCF Minerals Corporation
Corporate income tax - - - - -
Excise tax on minerals 195,965,641 175,137,280 (20,828,360) 230,511,628 - Withholding tax - Final - - - - - Withholding tax - Foreign shareholder dividends
- - - - -
Withholding tax - Improperly accumulated retained earnings tax (IAET)
- - - - - Withholding tax - Profit remittance to principal
- - - - -
Withholding tax - Royalties to claim owners
- - - - -
Subtotal 195,965,641 175,137,280 (20,828,360) 230,511,628 -
MPSA No. 255-2007-V (Amended I)
Filminera Resources
Corporation
Corporate income tax
108,127,587 108,127,587 - 108,127,587 - Excise tax on minerals 602,366,448 611,298,333 8,931,885 602,366,448 -
I I
I I
I I
l l l l l l ·
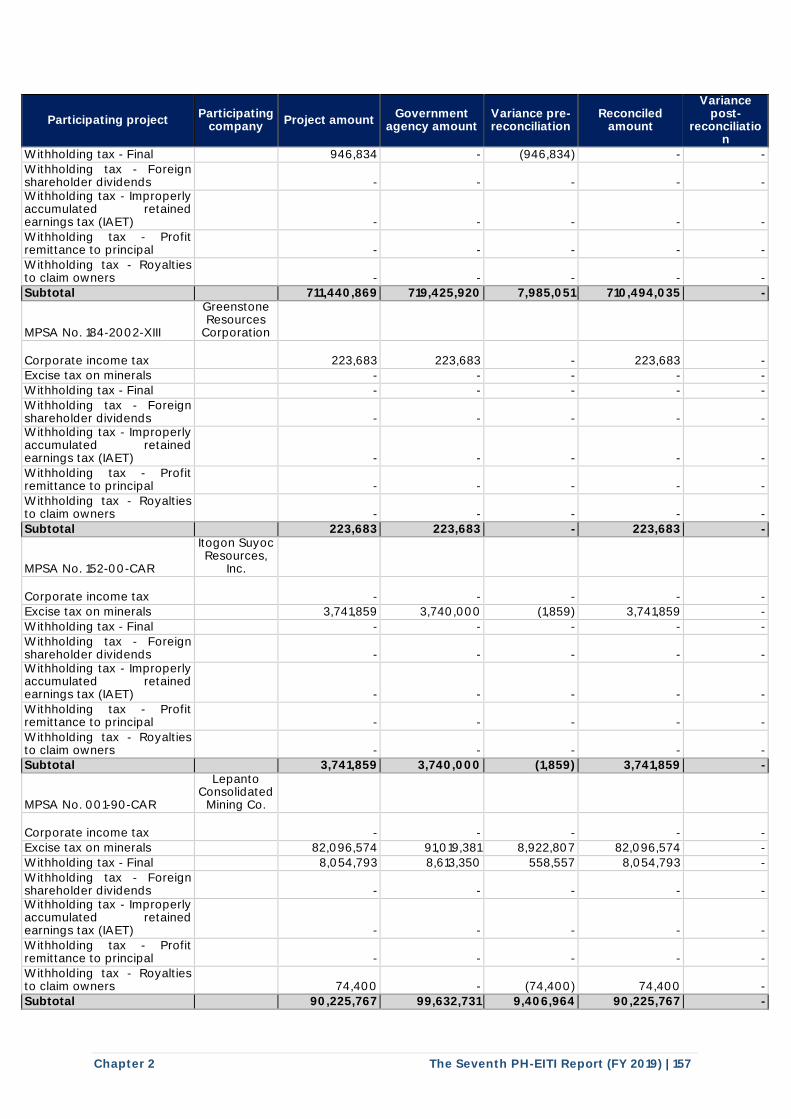
Chapter 2 The Seventh PH-EITI Report (FY 2019) | 157
Participating project Participating
company Project amount
Government agency amount
Variance pre-reconciliation
Reconciled amount
Variance post-
reconciliation
Withholding tax - Final 946,834 - (946,834) - -
Withholding tax - Foreign shareholder dividends
- - - - -
Withholding tax - Improperly accumulated retained earnings tax (IAET)
- - - - -
Withholding tax - Profit remittance to principal
- - - - -
Withholding tax - Royalties to claim owners
- - - - -
Subtotal 711,440,869 719,425,920 7,985,051 710,494,035 -
MPSA No. 184-2002-XIII
Greenstone Resources
Corporation
Corporate income tax
223,683 223,683 - 223,683 - Excise tax on minerals - - - - -
Withholding tax - Final - - - - -
Withholding tax - Foreign shareholder dividends
- - - - -
Withholding tax - Improperly accumulated retained earnings tax (IAET)
- - - - -
Withholding tax - Profit remittance to principal
- - - - -
Withholding tax - Royalties to claim owners
- - - - -
Subtotal 223,683 223,683 - 223,683 -
MPSA No. 152-00-CAR
Itogon Suyoc Resources,
Inc.
Corporate income tax
- - - - -
Excise tax on minerals 3,741,859 3,740,000 (1,859) 3,741,859 -
Withholding tax - Final - - - - -
Withholding tax - Foreign shareholder dividends
- - - - -
Withholding tax - Improperly accumulated retained earnings tax (IAET)
- - - - -
Withholding tax - Profit remittance to principal
- - - - -
Withholding tax - Royalties to claim owners
- - - - -
Subtotal 3,741,859 3,740,000 (1,859) 3,741,859 -
MPSA No. 001-90-CAR
Lepanto Consolidated
Mining Co.
Corporate income tax
- - - - -
Excise tax on minerals 82,096,574 91,019,381 8,922,807 82,096,574 -
Withholding tax - Final 8,054,793 8,613,350 558,557 8,054,793 -
Withholding tax - Foreign shareholder dividends
- - - - -
Withholding tax - Improperly accumulated retained earnings tax (IAET)
- - - - -
Withholding tax - Profit remittance to principal
- - - - -
Withholding tax - Royalties to claim owners
74,400 - (74,400) 74,400 -
Subtotal 90,225,767 99,632,731 9,406,964 90,225,767 -
I I
I I
I I
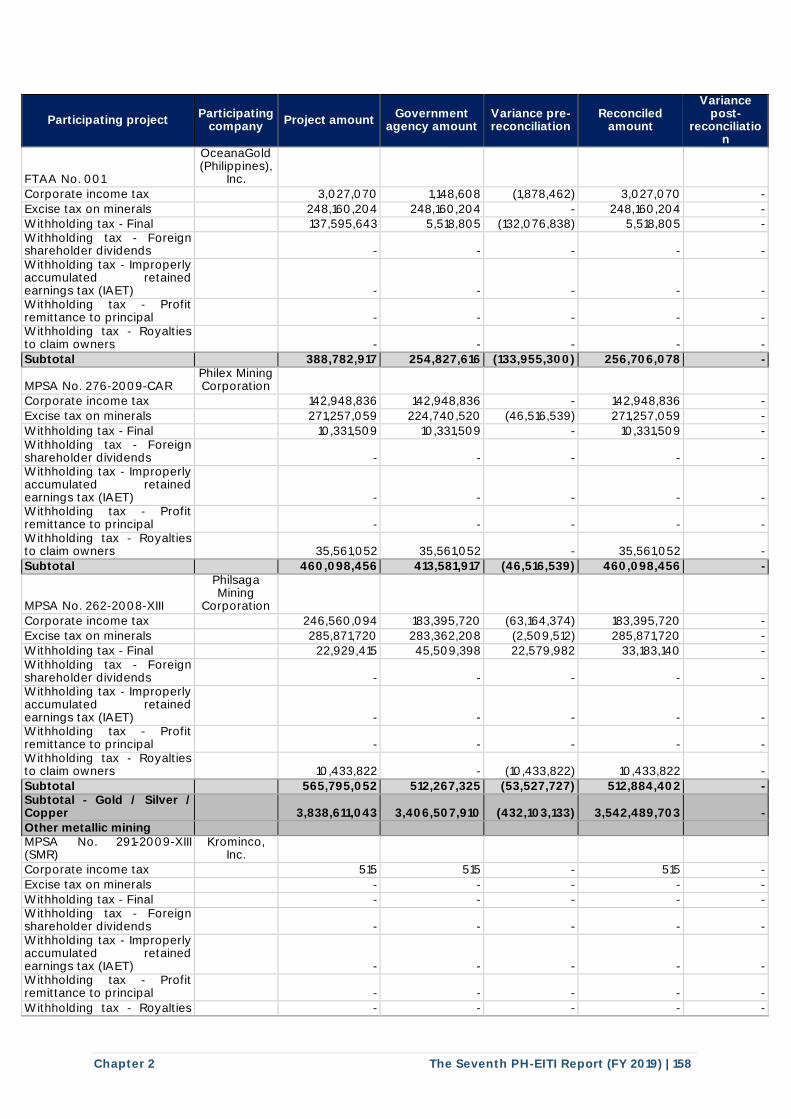
Chapter 2 The Seventh PH-EITI Report (FY 2019) | 158
Participating project Participating
company Project amount
Government agency amount
Variance pre-reconciliation
Reconciled amount
Variance post-
reconciliation
FTAA No. 001
OceanaGold (Philippines),
Inc.
Corporate income tax 3,027,070 1,148,608 (1,878,462) 3,027,070 -
Excise tax on minerals 248,160,204 248,160,204 - 248,160,204 - Withholding tax - Final 137,595,643 5,518,805 (132,076,838) 5,518,805 - Withholding tax - Foreign shareholder dividends
- - - - -
Withholding tax - Improperly accumulated retained earnings tax (IAET)
- - - - - Withholding tax - Profit remittance to principal
- - - - -
Withholding tax - Royalties to claim owners
- - - - -
Subtotal 388,782,917 254,827,616 (133,955,300) 256,706,078 -
MPSA No. 276-2009-CAR Philex Mining Corporation
Corporate income tax 142,948,836 142,948,836 - 142,948,836 -
Excise tax on minerals 271,257,059 224,740,520 (46,516,539) 271,257,059 -
Withholding tax - Final 10,331,509 10,331,509 - 10,331,509 - Withholding tax - Foreign shareholder dividends
- - - - -
Withholding tax - Improperly accumulated retained earnings tax (IAET)
- - - - - Withholding tax - Profit remittance to principal
- - - - -
Withholding tax - Royalties to claim owners
35,561,052 35,561,052 - 35,561,052 -
Subtotal 460,098,456 413,581,917 (46,516,539) 460,098,456 -
MPSA No. 262-2008-XIII
Philsaga Mining
Corporation
Corporate income tax 246,560,094 183,395,720 (63,164,374) 183,395,720 -
Excise tax on minerals 285,871,720 283,362,208 (2,509,512) 285,871,720 - Withholding tax - Final 22,929,415 45,509,398 22,579,982 33,183,140 - Withholding tax - Foreign shareholder dividends
- - - - -
Withholding tax - Improperly accumulated retained earnings tax (IAET)
- - - - - Withholding tax - Profit remittance to principal
- - - - -
Withholding tax - Royalties to claim owners
10,433,822 - (10,433,822) 10,433,822 -
Subtotal 565,795,052 512,267,325 (53,527,727) 512,884,402 - Subtotal - Gold / Silver / Copper 3,838,611,043 3,406,507,910 (432,103,133) 3,542,489,703 - Other metallic mining MPSA No. 291-2009-XIII (SMR)
Krominco, Inc.
Corporate income tax 515 515 - 515 -
Excise tax on minerals - - - - -
Withholding tax - Final - - - - - Withholding tax - Foreign shareholder dividends
- - - - -
Withholding tax - Improperly accumulated retained earnings tax (IAET)
- - - - - Withholding tax - Profit remittance to principal
- - - - -
Withholding tax - Royalties - - - - -
I I
I
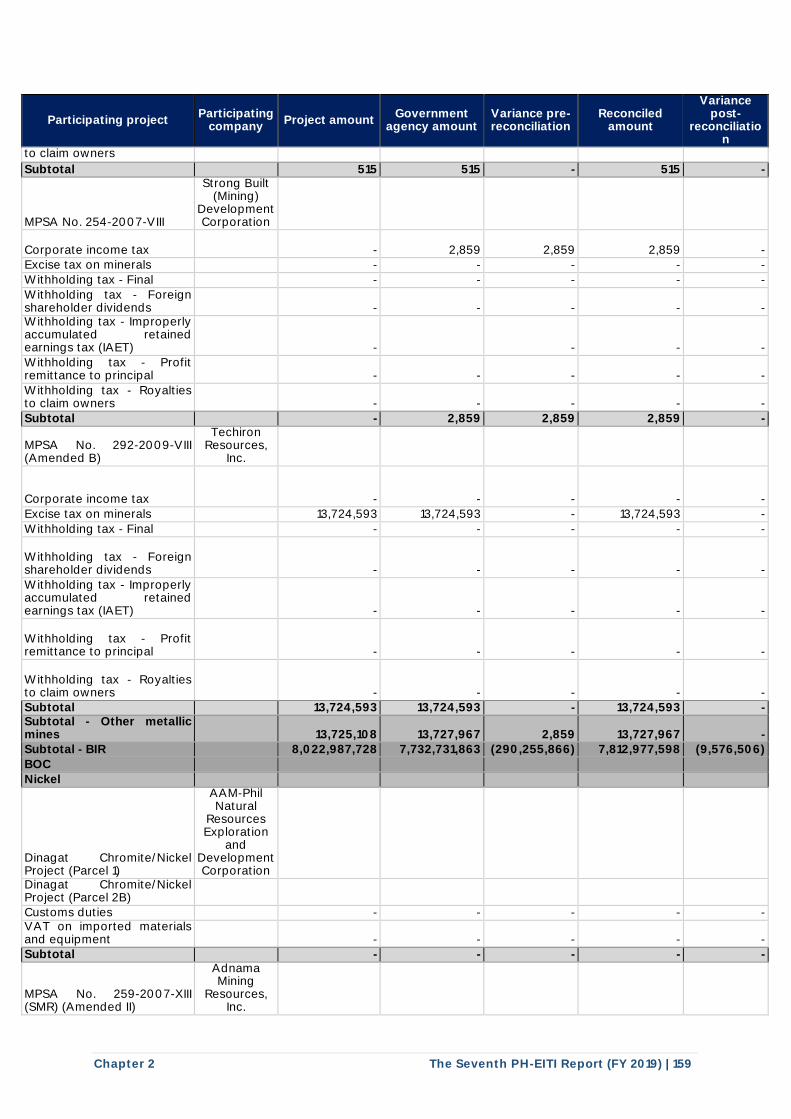
Chapter 2 The Seventh PH-EITI Report (FY 2019) | 159
Participating project Participating
company Project amount
Government agency amount
Variance pre-reconciliation
Reconciled amount
Variance post-
reconciliation
to claim owners
Subtotal 515 515 - 515 -
MPSA No. 254-2007-VIII
Strong Built (Mining)
Development Corporation
Corporate income tax
- 2,859 2,859 2,859 - Excise tax on minerals - - - - -
Withholding tax - Final - - - - -
Withholding tax - Foreign shareholder dividends
- - - - -
Withholding tax - Improperly accumulated retained earnings tax (IAET)
- - - -
Withholding tax - Profit remittance to principal
- - - - -
Withholding tax - Royalties to claim owners
- - - - -
Subtotal - 2,859 2,859 2,859 -
MPSA No. 292-2009-VIII (Amended B)
Techiron Resources,
Inc.
Corporate income tax
- - - - -
Excise tax on minerals 13,724,593 13,724,593 - 13,724,593 -
Withholding tax - Final - - - - -
Withholding tax - Foreign shareholder dividends
- - - - -
Withholding tax - Improperly accumulated retained earnings tax (IAET)
- - - - -
Withholding tax - Profit remittance to principal
- - - - -
Withholding tax - Royalties to claim owners
- - - - - Subtotal 13,724,593 13,724,593 - 13,724,593 - Subtotal - Other metallic mines 13,725,108 13,727,967 2,859 13,727,967 - Subtotal - BIR 8,022,987,728 7,732,731,863 (290,255,866) 7,812,977,598 (9,576,506)
BOC
Nickel
Dinagat Chromite/Nickel Project (Parcel 1)
AAM-Phil Natural
Resources Exploration
and Development Corporation
Dinagat Chromite/Nickel Project (Parcel 2B)
Customs duties - - - - - VAT on imported materials and equipment
- - - - -
Subtotal - - - - -
MPSA No. 259-2007-XIII (SMR) (Amended II)
Adnama Mining
Resources, Inc.
I I
I
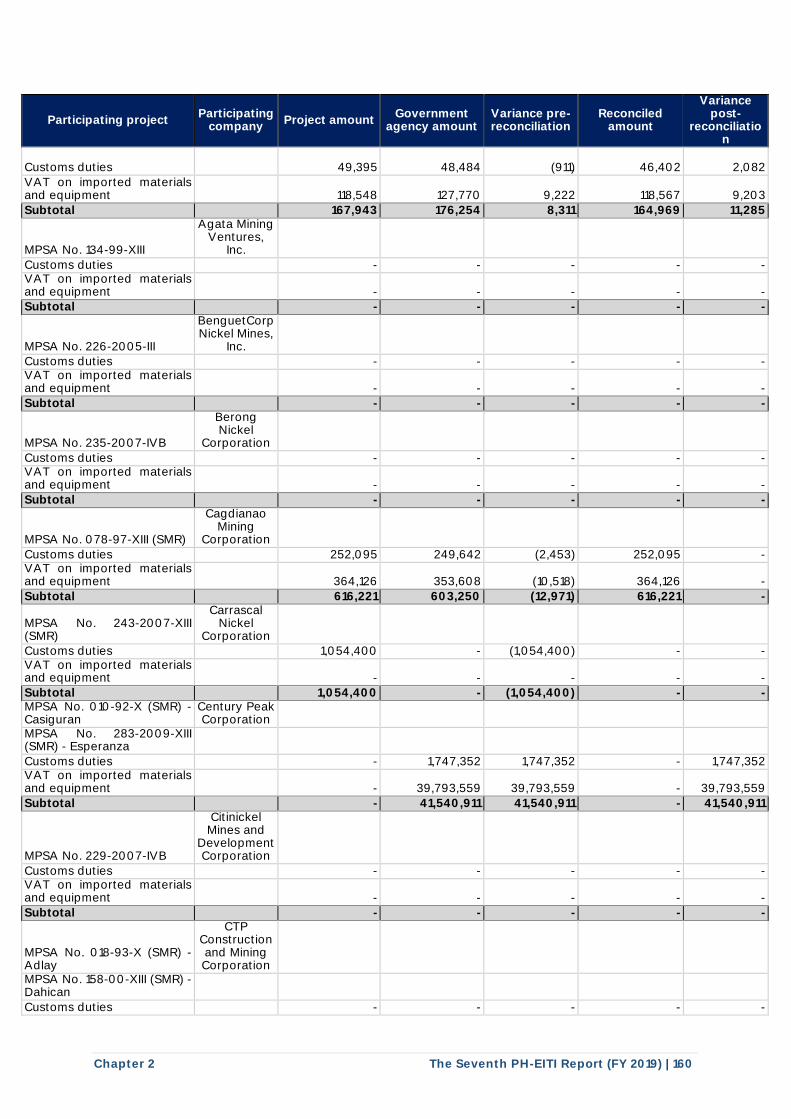
Chapter 2 The Seventh PH-EITI Report (FY 2019) | 160
Participating project Participating
company Project amount
Government agency amount
Variance pre-reconciliation
Reconciled amount
Variance post-
reconciliation
Customs duties
49,395 48,484 (911) 46,402 2,082
VAT on imported materials and equipment
118,548 127,770 9,222 118,567 9,203
Subtotal 167,943 176,254 8,311 164,969 11,285
MPSA No. 134-99-XIII
Agata Mining Ventures,
Inc.
Customs duties - - - - - VAT on imported materials and equipment
- - - - -
Subtotal - - - - -
MPSA No. 226-2005-III
BenguetCorp Nickel Mines,
Inc. Customs duties - - - - - VAT on imported materials and equipment
- - - - -
Subtotal - - - - -
MPSA No. 235-2007-IVB
Berong Nickel
Corporation
Customs duties - - - - - VAT on imported materials and equipment
- - - - -
Subtotal - - - - -
MPSA No. 078-97-XIII (SMR)
Cagdianao Mining
Corporation
Customs duties 252,095 249,642 (2,453) 252,095 - VAT on imported materials and equipment
364,126 353,608 (10,518) 364,126 -
Subtotal 616,221 603,250 (12,971) 616,221 -
MPSA No. 243-2007-XIII (SMR)
Carrascal Nickel
Corporation Customs duties 1,054,400 - (1,054,400) - - VAT on imported materials and equipment
- - - - -
Subtotal 1,054,400 - (1,054,400) - - MPSA No. 010-92-X (SMR) - Casiguran
Century Peak Corporation
MPSA No. 283-2009-XIII (SMR) - Esperanza
Customs duties - 1,747,352 1,747,352 - 1,747,352 VAT on imported materials and equipment
- 39,793,559 39,793,559 - 39,793,559
Subtotal - 41,540,911 41,540,911 - 41,540,911
MPSA No. 229-2007-IVB
Citinickel Mines and
Development Corporation
Customs duties - - - - - VAT on imported materials and equipment
- - - - -
Subtotal - - - - -
MPSA No. 018-93-X (SMR) - Adlay
CTP Construction and Mining Corporation
MPSA No. 158-00-XIII (SMR) - Dahican
Customs duties - - - - -
I I
I I
I I
I I
I I
I I
l l l l l l
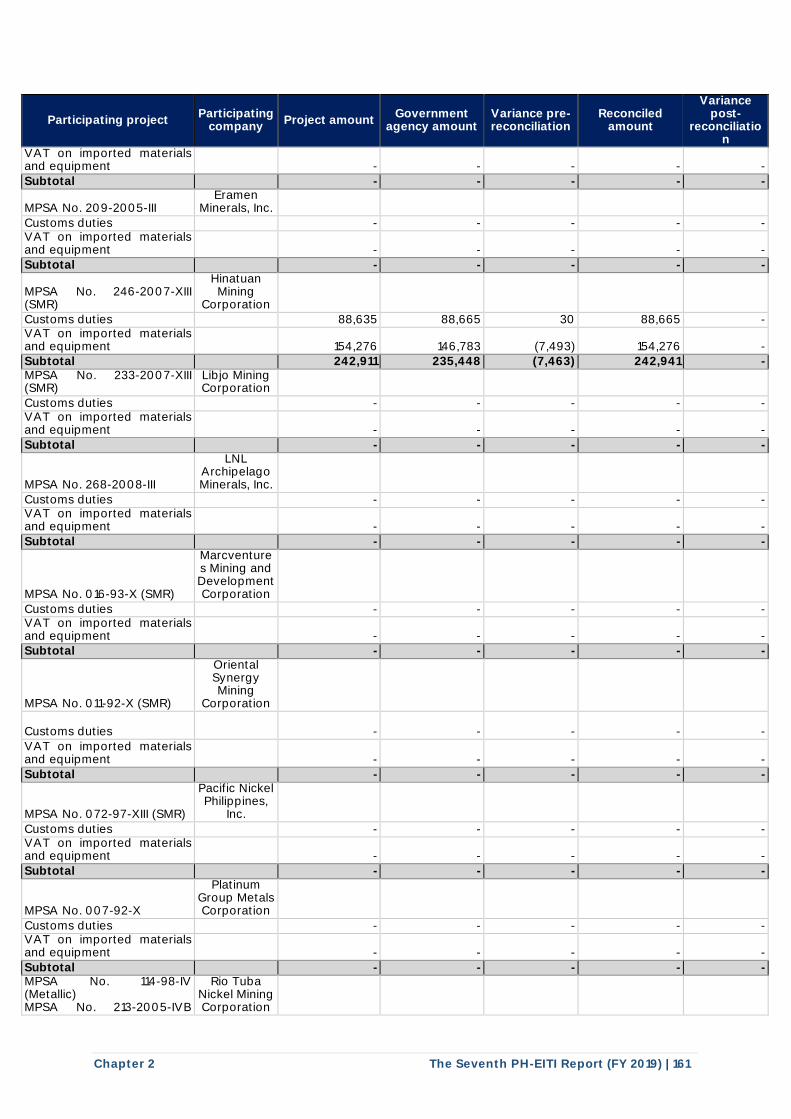
Chapter 2 The Seventh PH-EITI Report (FY 2019) | 161
Participating project Participating
company Project amount
Government agency amount
Variance pre-reconciliation
Reconciled amount
Variance post-
reconciliation
VAT on imported materials and equipment
- - - - -
Subtotal - - - - -
MPSA No. 209-2005-III Eramen
Minerals, Inc.
Customs duties - - - - - VAT on imported materials and equipment - - - - -
Subtotal - - - - -
MPSA No. 246-2007-XIII (SMR)
Hinatuan Mining
Corporation Customs duties 88,635 88,665 30 88,665 - VAT on imported materials and equipment
154,276 146,783 (7,493) 154,276 -
Subtotal 242,911 235,448 (7,463) 242,941 - MPSA No. 233-2007-XIII (SMR)
Libjo Mining Corporation
Customs duties - - - - - VAT on imported materials and equipment
- - - - -
Subtotal - - - - -
MPSA No. 268-2008-III
LNL Archipelago Minerals, Inc.
Customs duties - - - - - VAT on imported materials and equipment
- - - - -
Subtotal - - - - -
MPSA No. 016-93-X (SMR)
Marcventures Mining and Development Corporation
Customs duties - - - - - VAT on imported materials and equipment
- - - - -
Subtotal - - - - -
MPSA No. 011-92-X (SMR)
Oriental Synergy Mining
Corporation
Customs duties
- - - - -
VAT on imported materials and equipment
- - - - -
Subtotal - - - - -
MPSA No. 072-97-XIII (SMR)
Pacific Nickel Philippines,
Inc.
Customs duties - - - - - VAT on imported materials and equipment
- - - - -
Subtotal - - - - -
MPSA No. 007-92-X
Platinum Group Metals Corporation
Customs duties - - - - - VAT on imported materials and equipment
- - - - -
Subtotal - - - - - MPSA No. 114-98-IV (Metallic) MPSA No. 213-2005-IVB
Rio Tuba Nickel Mining Corporation
I I I I I I
I I I I I I I I I I I I
I I I I I I
I I
I I I I I I
I I I I I I I I I I I I
I I I I I I
j j j j j j
I I
I I
I I
I I
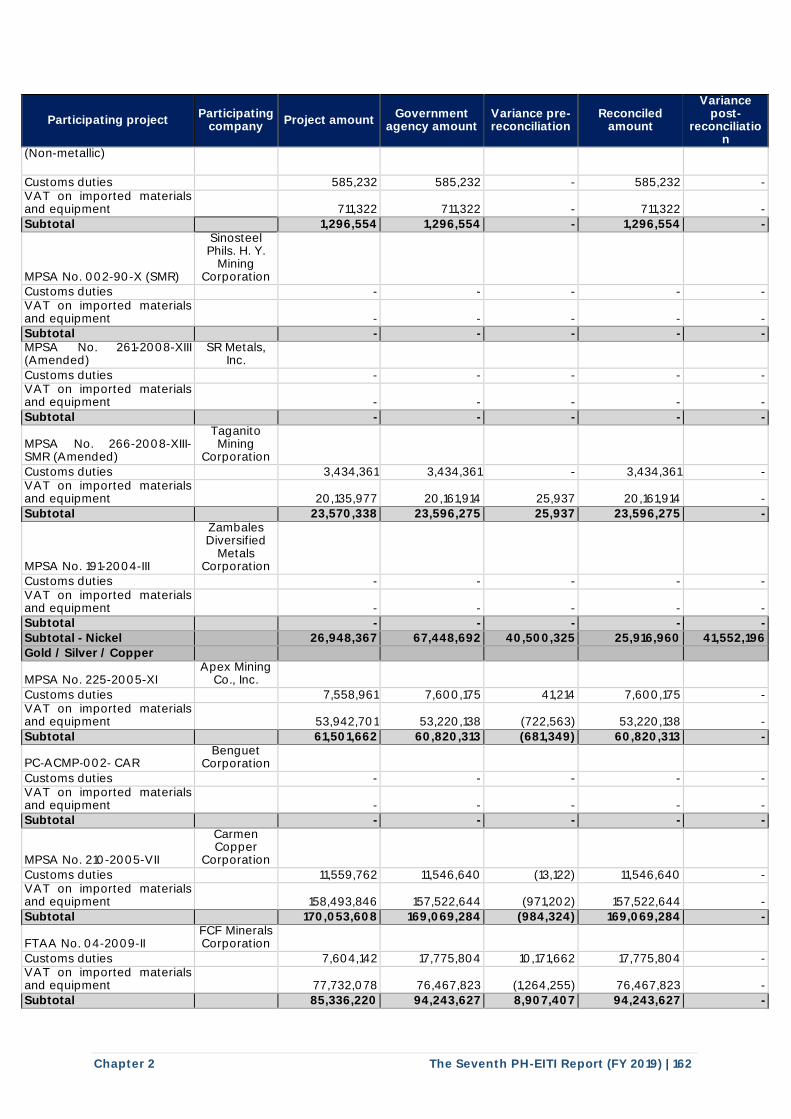
Chapter 2 The Seventh PH-EITI Report (FY 2019) | 162
Participating project Participating
company Project amount
Government agency amount
Variance pre-reconciliation
Reconciled amount
Variance post-
reconciliation
(Non-metallic)
Customs duties 585,232 585,232 - 585,232 - VAT on imported materials and equipment
711,322 711,322 - 711,322 -
Subtotal 1,296,554 1,296,554 - 1,296,554 -
MPSA No. 002-90-X (SMR)
Sinosteel Phils. H. Y.
Mining Corporation
Customs duties - - - - - VAT on imported materials and equipment
- - - - -
Subtotal - - - - - MPSA No. 261-2008-XIII (Amended)
SR Metals, Inc.
Customs duties - - - - - VAT on imported materials and equipment
- - - - -
Subtotal - - - - -
MPSA No. 266-2008-XIII-SMR (Amended)
Taganito Mining
Corporation
Customs duties 3,434,361 3,434,361 - 3,434,361 - VAT on imported materials and equipment
20,135,977 20,161,914 25,937 20,161,914 -
Subtotal 23,570,338 23,596,275 25,937 23,596,275 -
MPSA No. 191-2004-III
Zambales Diversified
Metals Corporation
Customs duties - - - - - VAT on imported materials and equipment
- - - - -
Subtotal - - - - -
Subtotal - Nickel 26,948,367 67,448,692 40,500,325 25,916,960 41,552,196
Gold / Silver / Copper
MPSA No. 225-2005-XI Apex Mining
Co., Inc.
Customs duties 7,558,961 7,600,175 41,214 7,600,175 - VAT on imported materials and equipment 53,942,701 53,220,138 (722,563) 53,220,138 -
Subtotal 61,501,662 60,820,313 (681,349) 60,820,313 -
PC‐ACMP‐002‐ CAR Benguet
Corporation Customs duties - - - - - VAT on imported materials and equipment - - - - - Subtotal - - - - -
MPSA No. 210-2005-VII
Carmen Copper
Corporation
Customs duties 11,559,762 11,546,640 (13,122) 11,546,640 - VAT on imported materials and equipment
158,493,846 157,522,644 (971,202) 157,522,644 -
Subtotal 170,053,608 169,069,284 (984,324) 169,069,284 -
FTAA No. 04-2009-II FCF Minerals Corporation
Customs duties 7,604,142 17,775,804 10,171,662 17,775,804 - VAT on imported materials and equipment
77,732,078 76,467,823 (1,264,255) 76,467,823 -
Subtotal 85,336,220 94,243,627 8,907,407 94,243,627 -
I I
I I I I I I
I I I I I I I I I I I I
I I I I I I
I I
j l l l l l I
I I I I I I
I I I I I I I I I I I I
I I I I I I
I I
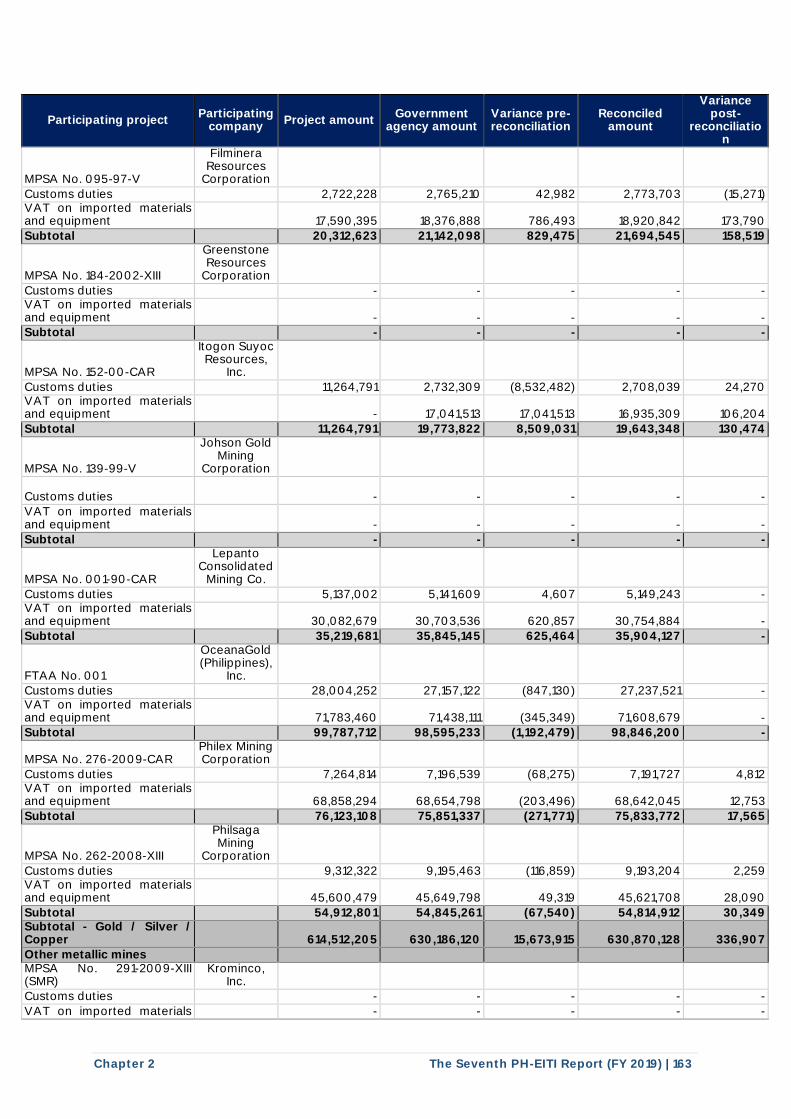
Chapter 2 The Seventh PH-EITI Report (FY 2019) | 163
Participating project Participating
company Project amount
Government agency amount
Variance pre-reconciliation
Reconciled amount
Variance post-
reconciliation
MPSA No. 095-97-V
Filminera Resources
Corporation
Customs duties 2,722,228 2,765,210 42,982 2,773,703 (15,271) VAT on imported materials and equipment
17,590,395 18,376,888 786,493 18,920,842 173,790
Subtotal 20,312,623 21,142,098 829,475 21,694,545 158,519
MPSA No. 184-2002-XIII
Greenstone Resources
Corporation
Customs duties - - - - - VAT on imported materials and equipment
- - - - -
Subtotal - - - - -
MPSA No. 152-00-CAR
Itogon Suyoc Resources,
Inc.
Customs duties 11,264,791 2,732,309 (8,532,482) 2,708,039 24,270 VAT on imported materials and equipment
- 17,041,513 17,041,513 16,935,309 106,204
Subtotal 11,264,791 19,773,822 8,509,031 19,643,348 130,474
MPSA No. 139-99-V
Johson Gold Mining
Corporation
Customs duties
- - - - -
VAT on imported materials and equipment
- - - - -
Subtotal - - - - -
MPSA No. 001-90-CAR
Lepanto Consolidated
Mining Co.
Customs duties 5,137,002 5,141,609 4,607 5,149,243 - VAT on imported materials and equipment
30,082,679 30,703,536 620,857 30,754,884 -
Subtotal 35,219,681 35,845,145 625,464 35,904,127 -
FTAA No. 001
OceanaGold (Philippines),
Inc. Customs duties 28,004,252 27,157,122 (847,130) 27,237,521 - VAT on imported materials and equipment
71,783,460 71,438,111 (345,349) 71,608,679 -
Subtotal 99,787,712 98,595,233 (1,192,479) 98,846,200 -
MPSA No. 276-2009-CAR Philex Mining Corporation
Customs duties 7,264,814 7,196,539 (68,275) 7,191,727 4,812 VAT on imported materials and equipment
68,858,294 68,654,798 (203,496) 68,642,045 12,753
Subtotal 76,123,108 75,851,337 (271,771) 75,833,772 17,565
MPSA No. 262-2008-XIII
Philsaga Mining
Corporation
Customs duties 9,312,322 9,195,463 (116,859) 9,193,204 2,259 VAT on imported materials and equipment
45,600,479 45,649,798 49,319 45,621,708 28,090
Subtotal 54,912,801 54,845,261 (67,540) 54,814,912 30,349 Subtotal - Gold / Silver / Copper 614,512,205 630,186,120 15,673,915 630,870,128 336,907
Other metallic mines MPSA No. 291-2009-XIII (SMR)
Krominco, Inc.
Customs duties - - - - -
VAT on imported materials - - - - -
I I
I I
I I
I I
I I
j j j j j j
I
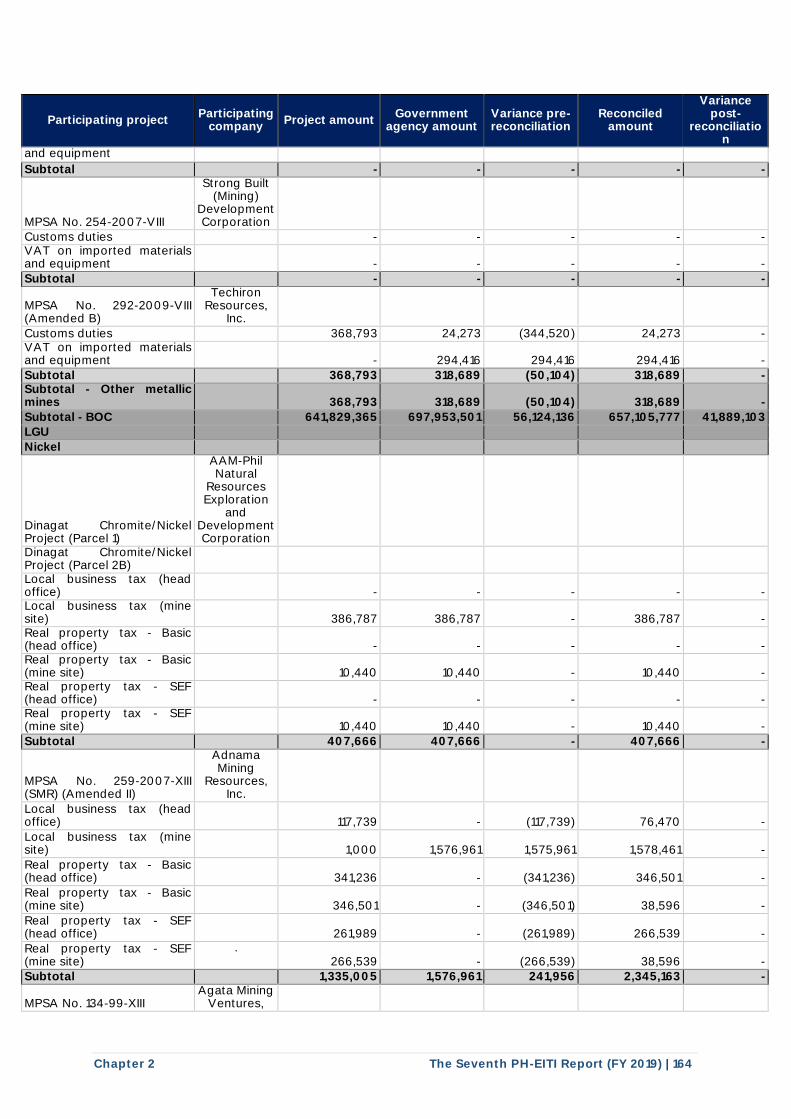
Chapter 2 The Seventh PH-EITI Report (FY 2019) | 164
Participating project Participating
company Project amount
Government agency amount
Variance pre-reconciliation
Reconciled amount
Variance post-
reconciliation
and equipment
Subtotal - - - - -
MPSA No. 254-2007-VIII
Strong Built (Mining)
Development Corporation
Customs duties - - - - - VAT on imported materials and equipment
- - - - -
Subtotal - - - - -
MPSA No. 292-2009-VIII (Amended B)
Techiron Resources,
Inc.
Customs duties 368,793 24,273 (344,520) 24,273 - VAT on imported materials and equipment
- 294,416 294,416 294,416 -
Subtotal 368,793 318,689 (50,104) 318,689 - Subtotal - Other metallic mines 368,793 318,689 (50,104) 318,689 -
Subtotal - BOC 641,829,365 697,953,501 56,124,136 657,105,777 41,889,103 LGU
Nickel
Dinagat Chromite/Nickel Project (Parcel 1)
AAM-Phil Natural
Resources Exploration
and Development Corporation
Dinagat Chromite/Nickel Project (Parcel 2B)
Local business tax (head office)
- - - - -
Local business tax (mine site)
386,787 386,787 - 386,787 -
Real property tax - Basic (head office)
- - - - -
Real property tax - Basic (mine site)
10,440 10,440 - 10,440 -
Real property tax - SEF (head office)
- - - - -
Real property tax - SEF (mine site)
10,440 10,440 - 10,440 -
Subtotal 407,666 407,666 - 407,666 -
MPSA No. 259-2007-XIII (SMR) (Amended II)
Adnama Mining
Resources, Inc.
Local business tax (head office)
117,739 - (117,739) 76,470 -
Local business tax (mine site)
1,000 1,576,961 1,575,961 1,578,461 -
Real property tax - Basic (head office)
341,236 - (341,236) 346,501 -
Real property tax - Basic (mine site)
346,501 - (346,501) 38,596 -
Real property tax - SEF (head office)
261,989 - (261,989) 266,539 -
Real property tax - SEF (mine site)
. 266,539 - (266,539) 38,596 -
Subtotal 1,335,005 1,576,961 241,956 2,345,163 -
MPSA No. 134-99-XIII Agata Mining
Ventures,
I I
I I
I I
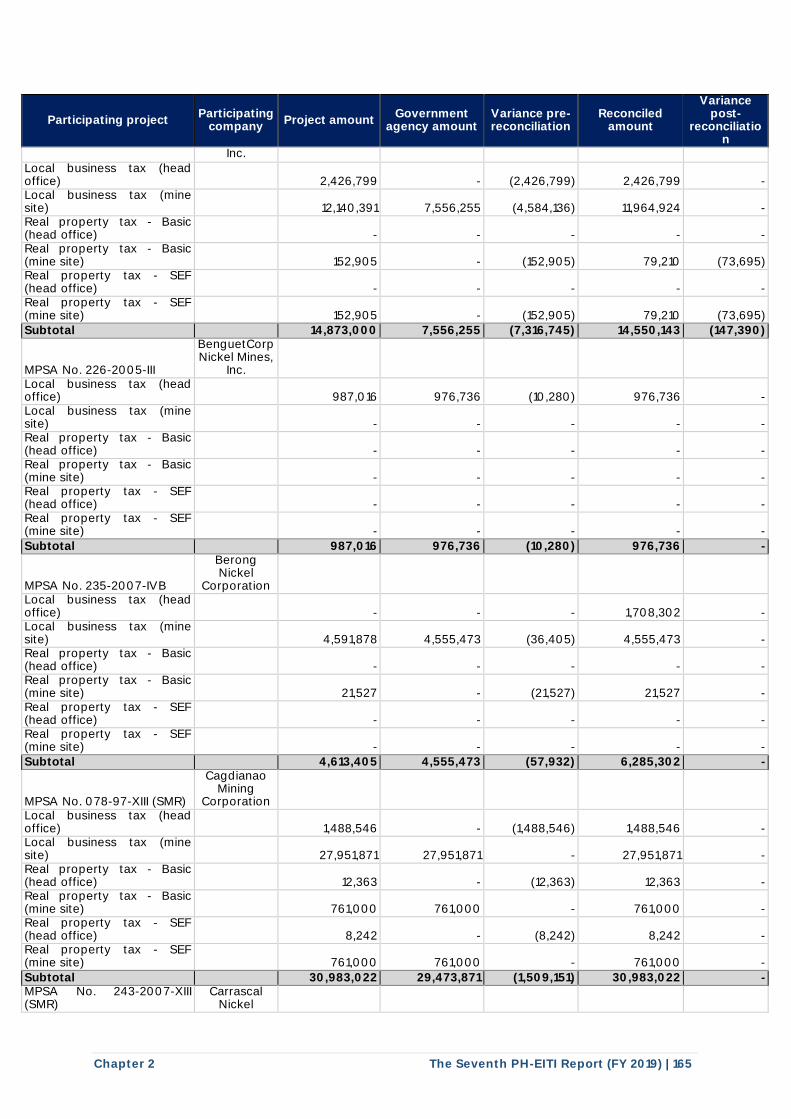
Chapter 2 The Seventh PH-EITI Report (FY 2019) | 165
Participating project Participating
company Project amount
Government agency amount
Variance pre-reconciliation
Reconciled amount
Variance post-
reconciliation
Inc.
Local business tax (head office)
2,426,799 - (2,426,799) 2,426,799 -
Local business tax (mine site)
12,140,391 7,556,255 (4,584,136) 11,964,924 -
Real property tax - Basic (head office)
- - - - -
Real property tax - Basic (mine site)
152,905 - (152,905) 79,210 (73,695)
Real property tax - SEF (head office)
- - - - -
Real property tax - SEF (mine site)
152,905 - (152,905) 79,210 (73,695)
Subtotal 14,873,000 7,556,255 (7,316,745) 14,550,143 (147,390)
MPSA No. 226-2005-III
BenguetCorp Nickel Mines,
Inc. Local business tax (head office)
987,016 976,736 (10,280) 976,736 -
Local business tax (mine site)
- - - - -
Real property tax - Basic (head office)
- - - - -
Real property tax - Basic (mine site)
- - - - -
Real property tax - SEF (head office)
- - - - -
Real property tax - SEF (mine site)
- - - - -
Subtotal 987,016 976,736 (10,280) 976,736 -
MPSA No. 235-2007-IVB
Berong Nickel
Corporation Local business tax (head office)
- - - 1,708,302 -
Local business tax (mine site)
4,591,878 4,555,473 (36,405) 4,555,473 -
Real property tax - Basic (head office)
- - - - -
Real property tax - Basic (mine site)
21,527 - (21,527) 21,527 -
Real property tax - SEF (head office)
- - - - -
Real property tax - SEF (mine site)
- - - - -
Subtotal 4,613,405 4,555,473 (57,932) 6,285,302 -
MPSA No. 078-97-XIII (SMR)
Cagdianao Mining
Corporation Local business tax (head office)
1,488,546 - (1,488,546) 1,488,546 -
Local business tax (mine site)
27,951,871 27,951,871 - 27,951,871 -
Real property tax - Basic (head office)
12,363 - (12,363) 12,363 -
Real property tax - Basic (mine site)
761,000 761,000 - 761,000 -
Real property tax - SEF (head office)
8,242 - (8,242) 8,242 -
Real property tax - SEF (mine site)
761,000 761,000 - 761,000 -
Subtotal 30,983,022 29,473,871 (1,509,151) 30,983,022 - MPSA No. 243-2007-XIII (SMR)
Carrascal Nickel
I I
I I
I I

Chapter 2 The Seventh PH-EITI Report (FY 2019) | 166
Participating project Participating
company Project amount
Government agency amount
Variance pre-reconciliation
Reconciled amount
Variance post-
reconciliation
Corporation
Local business tax (head office)
- - - - -
Local business tax (mine site)
40,953,435 40,933,190 (20,245) 40,933,190 -
Real property tax - Basic (head office)
44,740 - (44,740) 27,336 -
Real property tax - Basic (mine site)
132,313 132,313 - 132,313 -
Real property tax - SEF (head office)
44,740 - (44,740) 18,224 -
Real property tax - SEF (mine site)
132,313 132,313 - 132,313 -
Subtotal 41,307,540 41,197,816 (109,725) 41,243,375 - MPSA No. 010-92-X (SMR) - Casiguran
Century Peak Corporation
MPSA No. 283-2009-XIII (SMR) - Esperanza
Local business tax (head office)
57,750 - (57,750) 57,750 -
Local business tax (mine site)
383,940 7,409,176 7,025,236 383,941 7,025,236
Real property tax - Basic (head office)
- - - - -
Real property tax - Basic (mine site)
36,977 18,343 (18,634) - (18,634)
Real property tax - SEF (head office)
- - - - -
Real property tax - SEF (mine site)
- 18,343 18,343 - 18,343
Subtotal 478,667 7,445,863 6,967,196 441,691 7,024,945
MPSA No. 229-2007-IVB
Citinickel Mines and
Development Corporation
Local business tax (head office)
- - - - -
Local business tax (mine site)
- 12,906,430 12,906,430 12,906,430
Real property tax - Basic (head office)
- - - - -
Real property tax - Basic (mine site)
1,199,657 984,867 (214,790) 984,867 -
Real property tax - SEF (head office)
- - - - -
Real property tax - SEF (mine site)
- 214,790 214,790 214,790 -
Subtotal 1,199,657 14,106,086 12,906,430 1,199,656 12,906,430
MPSA No. 018-93-X (SMR) - Adlay
CTP Construction and Mining Corporation
MPSA No. 158-00-XIII (SMR) - Dahican
Local business tax (head office)
- - - - -
Local business tax (mine site)
26,000,000 26,000,000 - 26,000,000 -
Real property tax - Basic (head office)
- - - - -
Real property tax - Basic (mine site)
256,246 31,156 (225,090) 128,132 -
Real property tax - SEF (head office)
- - - - -
I I
I I
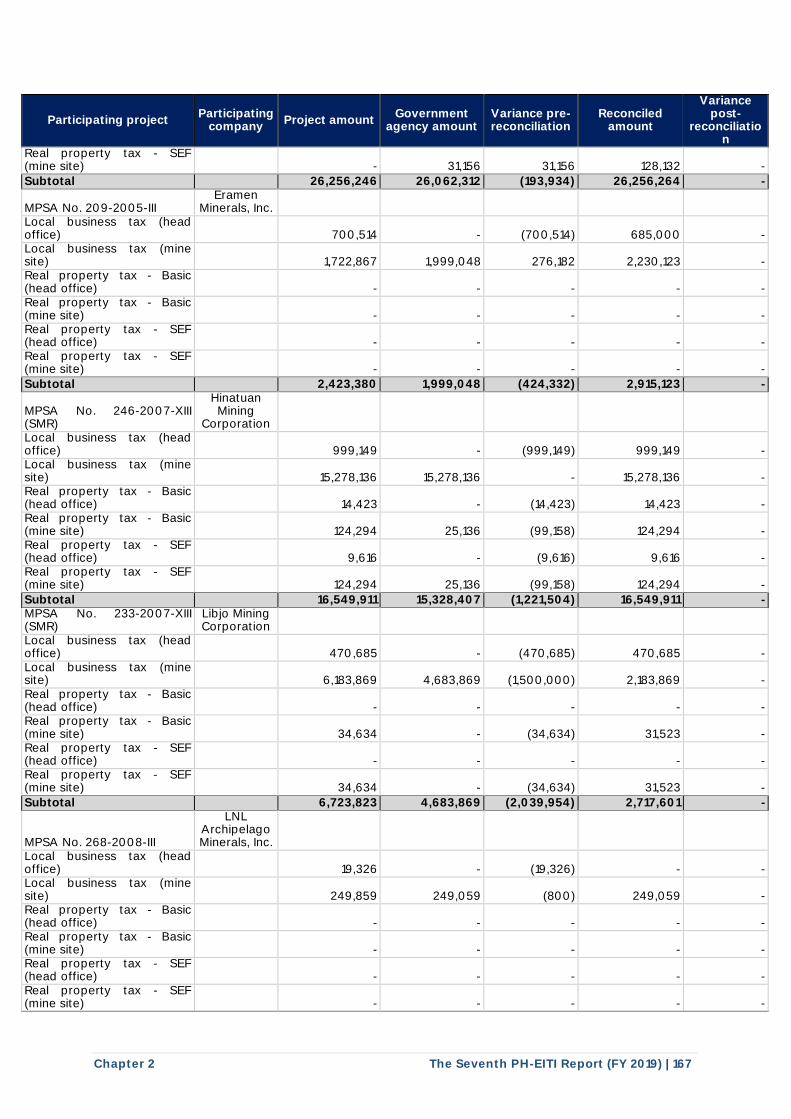
Chapter 2 The Seventh PH-EITI Report (FY 2019) | 167
Participating project Participating
company Project amount
Government agency amount
Variance pre-reconciliation
Reconciled amount
Variance post-
reconciliation
Real property tax - SEF (mine site)
- 31,156 31,156 128,132 -
Subtotal 26,256,246 26,062,312 (193,934) 26,256,264 -
MPSA No. 209-2005-III Eramen
Minerals, Inc. Local business tax (head office) 700,514 - (700,514) 685,000 - Local business tax (mine site) 1,722,867 1,999,048 276,182 2,230,123 - Real property tax - Basic (head office) - - - - - Real property tax - Basic (mine site) - - - - - Real property tax - SEF (head office) - - - - - Real property tax - SEF (mine site) - - - - -
Subtotal 2,423,380 1,999,048 (424,332) 2,915,123 -
MPSA No. 246-2007-XIII (SMR)
Hinatuan Mining
Corporation Local business tax (head office)
999,149 - (999,149) 999,149 -
Local business tax (mine site)
15,278,136 15,278,136 - 15,278,136 -
Real property tax - Basic (head office)
14,423 - (14,423) 14,423 -
Real property tax - Basic (mine site)
124,294 25,136 (99,158) 124,294 -
Real property tax - SEF (head office)
9,616 - (9,616) 9,616 -
Real property tax - SEF (mine site)
124,294 25,136 (99,158) 124,294 -
Subtotal 16,549,911 15,328,407 (1,221,504) 16,549,911 - MPSA No. 233-2007-XIII (SMR)
Libjo Mining Corporation
Local business tax (head office)
470,685 - (470,685) 470,685 -
Local business tax (mine site)
6,183,869 4,683,869 (1,500,000) 2,183,869 -
Real property tax - Basic (head office)
- - - - -
Real property tax - Basic (mine site)
34,634 - (34,634) 31,523 -
Real property tax - SEF (head office)
- - - - -
Real property tax - SEF (mine site)
34,634 - (34,634) 31,523 -
Subtotal 6,723,823 4,683,869 (2,039,954) 2,717,601 -
MPSA No. 268-2008-III
LNL Archipelago Minerals, Inc.
Local business tax (head office)
19,326 - (19,326) - -
Local business tax (mine site)
249,859 249,059 (800) 249,059 -
Real property tax - Basic (head office)
- - - - -
Real property tax - Basic (mine site)
- - - - -
Real property tax - SEF (head office)
- - - - -
Real property tax - SEF (mine site)
- - - - -
I I
I I
I I
I
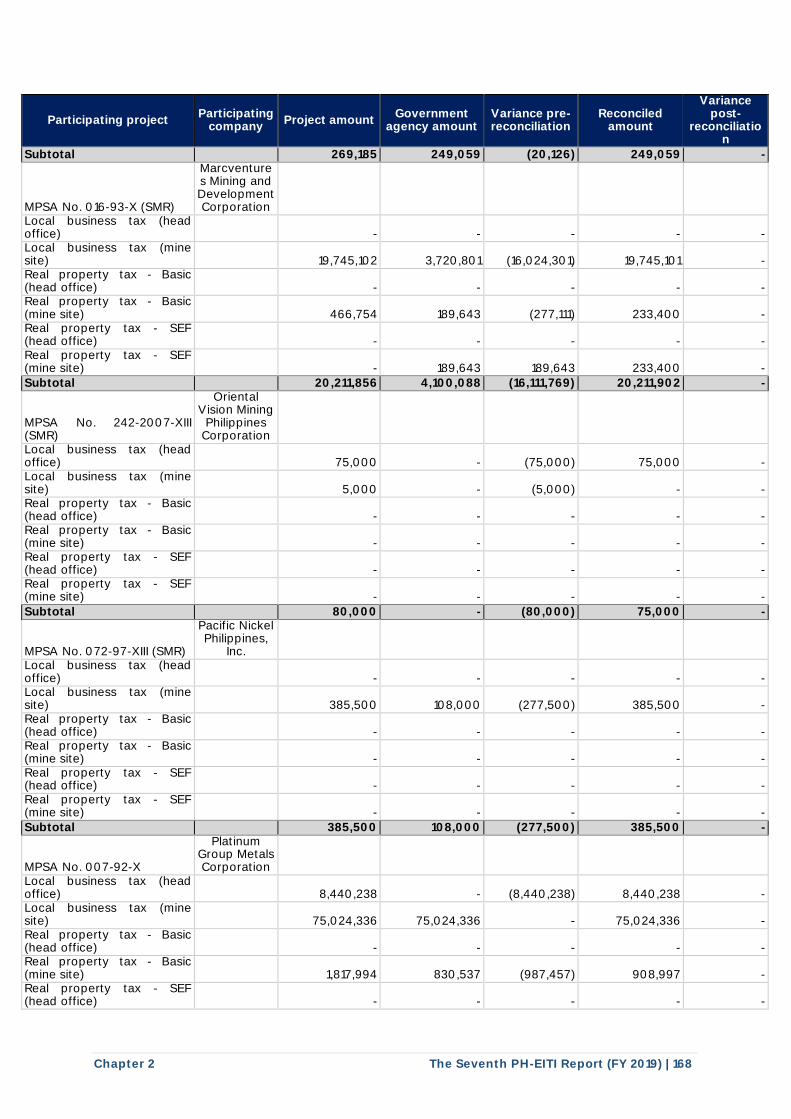
Chapter 2 The Seventh PH-EITI Report (FY 2019) | 168
Participating project Participating
company Project amount
Government agency amount
Variance pre-reconciliation
Reconciled amount
Variance post-
reconciliation
Subtotal 269,185 249,059 (20,126) 249,059 -
MPSA No. 016-93-X (SMR)
Marcventures Mining and Development Corporation
Local business tax (head office)
- - - - -
Local business tax (mine site)
19,745,102 3,720,801 (16,024,301) 19,745,101 -
Real property tax - Basic (head office)
- - - - -
Real property tax - Basic (mine site)
466,754 189,643 (277,111) 233,400 -
Real property tax - SEF (head office)
- - - - -
Real property tax - SEF (mine site)
- 189,643 189,643 233,400 -
Subtotal 20,211,856 4,100,088 (16,111,769) 20,211,902 -
MPSA No. 242-2007-XIII (SMR)
Oriental Vision Mining
Philippines Corporation
Local business tax (head office)
75,000 - (75,000) 75,000 -
Local business tax (mine site)
5,000 - (5,000) - -
Real property tax - Basic (head office)
- - - - -
Real property tax - Basic (mine site)
- - - - -
Real property tax - SEF (head office)
- - - - -
Real property tax - SEF (mine site)
- - - - -
Subtotal 80,000 - (80,000) 75,000 -
MPSA No. 072-97-XIII (SMR)
Pacific Nickel Philippines,
Inc. Local business tax (head office)
- - - - -
Local business tax (mine site)
385,500 108,000 (277,500) 385,500 -
Real property tax - Basic (head office)
- - - - -
Real property tax - Basic (mine site)
- - - - -
Real property tax - SEF (head office)
- - - - -
Real property tax - SEF (mine site)
- - - - -
Subtotal 385,500 108,000 (277,500) 385,500 -
MPSA No. 007-92-X
Platinum Group Metals Corporation
Local business tax (head office)
8,440,238 - (8,440,238) 8,440,238 -
Local business tax (mine site)
75,024,336 75,024,336 - 75,024,336 -
Real property tax - Basic (head office)
- - - - -
Real property tax - Basic (mine site)
1,817,994 830,537 (987,457) 908,997 -
Real property tax - SEF (head office)
- - - - -
I I
I I
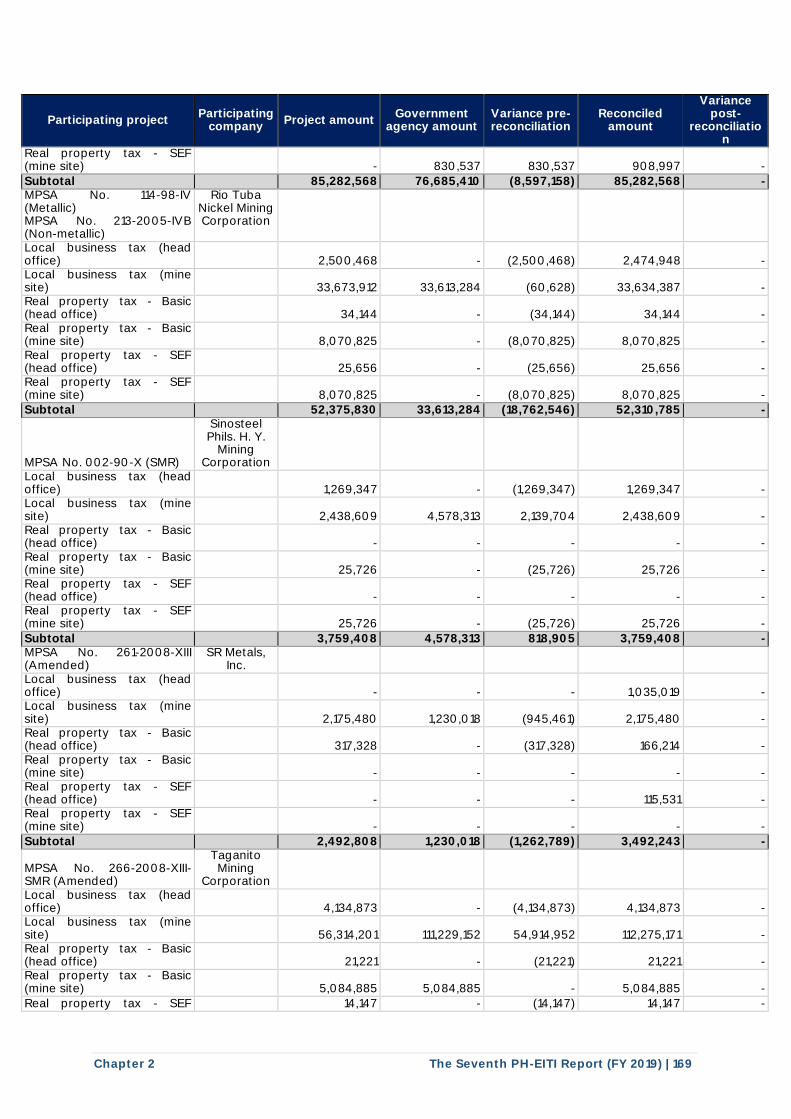
Chapter 2 The Seventh PH-EITI Report (FY 2019) | 169
Participating project Participating
company Project amount
Government agency amount
Variance pre-reconciliation
Reconciled amount
Variance post-
reconciliation
Real property tax - SEF (mine site)
- 830,537 830,537 908,997 -
Subtotal 85,282,568 76,685,410 (8,597,158) 85,282,568 - MPSA No. 114-98-IV (Metallic) MPSA No. 213-2005-IVB (Non-metallic)
Rio Tuba Nickel Mining Corporation
Local business tax (head office)
2,500,468 - (2,500,468) 2,474,948 -
Local business tax (mine site)
33,673,912 33,613,284 (60,628) 33,634,387 -
Real property tax - Basic (head office)
34,144 - (34,144) 34,144 -
Real property tax - Basic (mine site)
8,070,825 - (8,070,825) 8,070,825 -
Real property tax - SEF (head office)
25,656 - (25,656) 25,656 -
Real property tax - SEF (mine site)
8,070,825 - (8,070,825) 8,070,825 -
Subtotal 52,375,830 33,613,284 (18,762,546) 52,310,785 -
MPSA No. 002-90-X (SMR)
Sinosteel Phils. H. Y.
Mining Corporation
Local business tax (head office)
1,269,347 - (1,269,347) 1,269,347 -
Local business tax (mine site)
2,438,609 4,578,313 2,139,704 2,438,609 -
Real property tax - Basic (head office)
- - - - -
Real property tax - Basic (mine site)
25,726 - (25,726) 25,726 -
Real property tax - SEF (head office)
- - - - -
Real property tax - SEF (mine site)
25,726 - (25,726) 25,726 -
Subtotal 3,759,408 4,578,313 818,905 3,759,408 - MPSA No. 261-2008-XIII (Amended)
SR Metals, Inc.
Local business tax (head office) - - - 1,035,019 - Local business tax (mine site) 2,175,480 1,230,018 (945,461) 2,175,480 - Real property tax - Basic (head office) 317,328 - (317,328) 166,214 - Real property tax - Basic (mine site) - - - - - Real property tax - SEF (head office) - - - 115,531 - Real property tax - SEF (mine site) - - - - -
Subtotal 2,492,808 1,230,018 (1,262,789) 3,492,243 -
MPSA No. 266-2008-XIII-SMR (Amended)
Taganito Mining
Corporation Local business tax (head office)
4,134,873 - (4,134,873) 4,134,873 -
Local business tax (mine site)
56,314,201 111,229,152 54,914,952 112,275,171 -
Real property tax - Basic (head office)
21,221 - (21,221) 21,221 -
Real property tax - Basic (mine site)
5,084,885 5,084,885 - 5,084,885 -
Real property tax - SEF 14,147 - (14,147) 14,147 -
I I
I I
I I
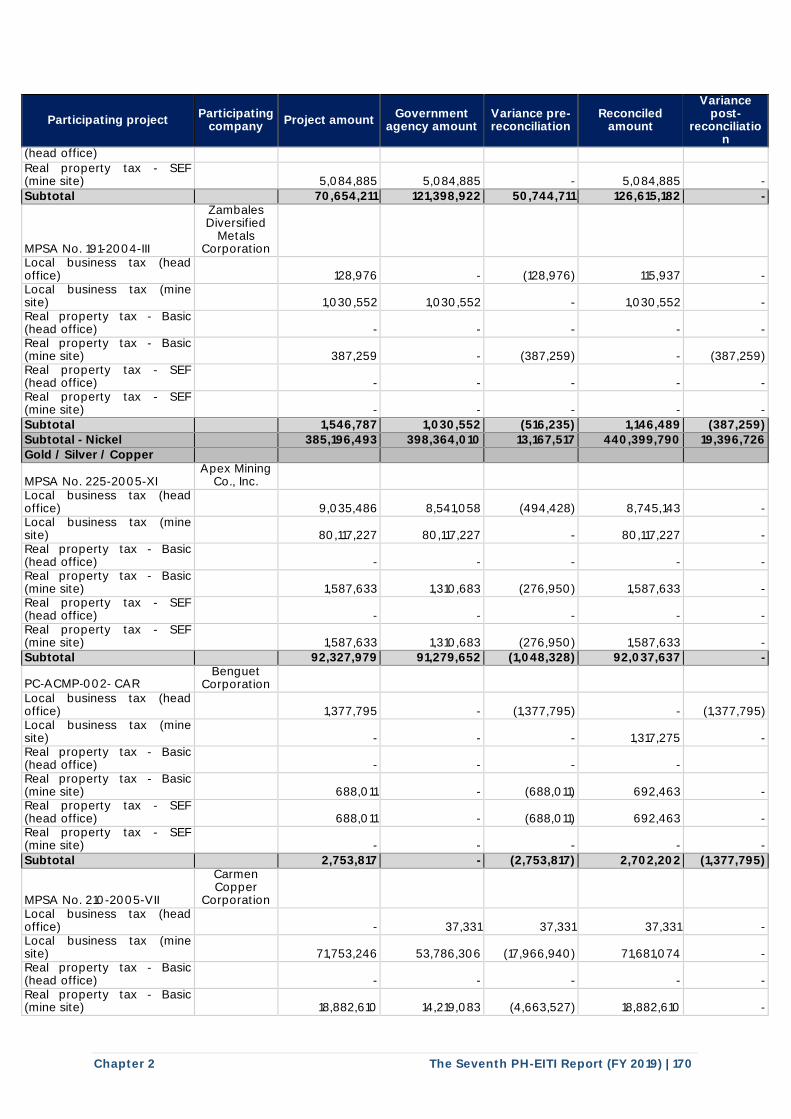
Chapter 2 The Seventh PH-EITI Report (FY 2019) | 170
Participating project Participating
company Project amount
Government agency amount
Variance pre-reconciliation
Reconciled amount
Variance post-
reconciliation
(head office)
Real property tax - SEF (mine site)
5,084,885 5,084,885 - 5,084,885 -
Subtotal 70,654,211 121,398,922 50,744,711 126,615,182 -
MPSA No. 191-2004-III
Zambales Diversified
Metals Corporation
Local business tax (head office)
128,976 - (128,976) 115,937 -
Local business tax (mine site)
1,030,552 1,030,552 - 1,030,552 -
Real property tax - Basic (head office)
- - - - -
Real property tax - Basic (mine site)
387,259 - (387,259) - (387,259)
Real property tax - SEF (head office)
- - - - -
Real property tax - SEF (mine site)
- - - - -
Subtotal 1,546,787 1,030,552 (516,235) 1,146,489 (387,259)
Subtotal - Nickel 385,196,493 398,364,010 13,167,517 440,399,790 19,396,726
Gold / Silver / Copper
MPSA No. 225-2005-XI Apex Mining
Co., Inc. Local business tax (head office) 9,035,486 8,541,058 (494,428) 8,745,143 - Local business tax (mine site) 80,117,227 80,117,227 - 80,117,227 - Real property tax - Basic (head office) - - - - - Real property tax - Basic (mine site) 1,587,633 1,310,683 (276,950) 1,587,633 - Real property tax - SEF (head office) - - - - - Real property tax - SEF (mine site) 1,587,633 1,310,683 (276,950) 1,587,633 - Subtotal 92,327,979 91,279,652 (1,048,328) 92,037,637 -
PC‐ACMP‐002‐ CAR Benguet
Corporation Local business tax (head office) 1,377,795 - (1,377,795) - (1,377,795) Local business tax (mine site) - - - 1,317,275 - Real property tax - Basic (head office) - - - - Real property tax - Basic (mine site) 688,011 - (688,011) 692,463 - Real property tax - SEF (head office) 688,011 - (688,011) 692,463 - Real property tax - SEF (mine site) - - - - -
Subtotal 2,753,817 - (2,753,817) 2,702,202 (1,377,795)
MPSA No. 210-2005-VII
Carmen Copper
Corporation Local business tax (head office)
- 37,331 37,331 37,331 -
Local business tax (mine site)
71,753,246 53,786,306 (17,966,940) 71,681,074 -
Real property tax - Basic (head office)
- - - - -
Real property tax - Basic (mine site)
18,882,610 14,219,083 (4,663,527) 18,882,610 -
I
I I
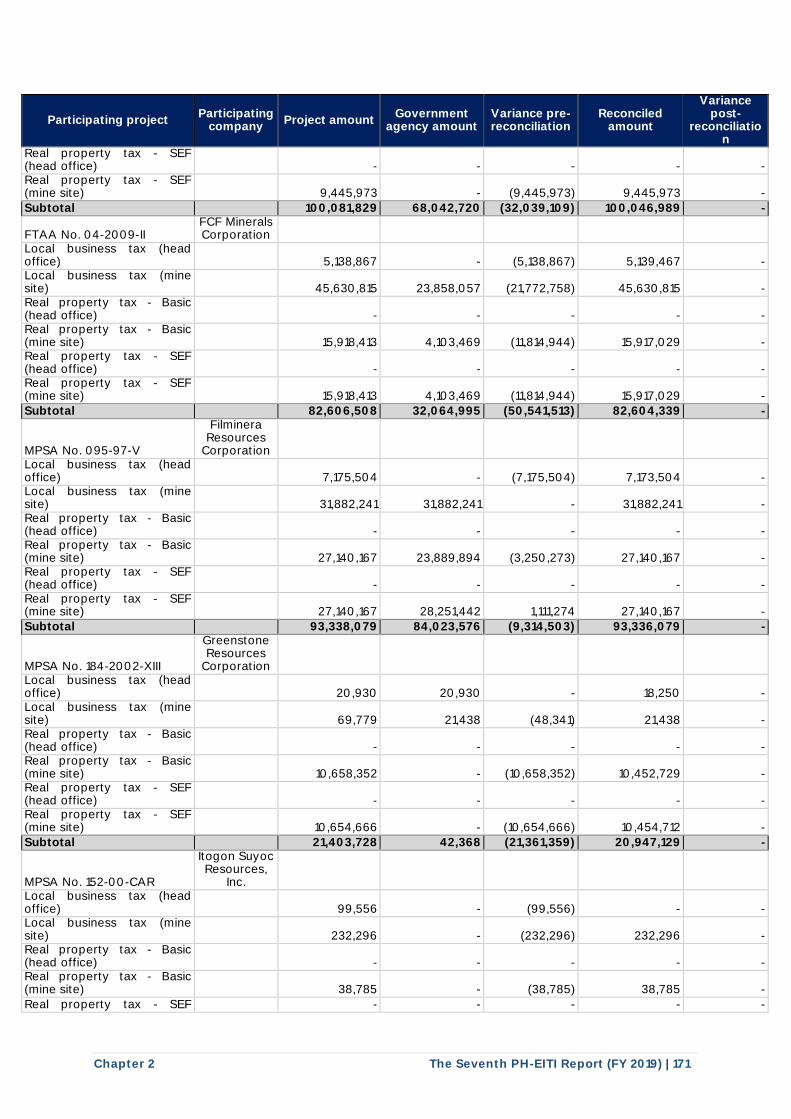
Chapter 2 The Seventh PH-EITI Report (FY 2019) | 171
Participating project Participating
company Project amount
Government agency amount
Variance pre-reconciliation
Reconciled amount
Variance post-
reconciliation
Real property tax - SEF (head office)
- - - - -
Real property tax - SEF (mine site)
9,445,973 - (9,445,973) 9,445,973 -
Subtotal 100,081,829 68,042,720 (32,039,109) 100,046,989 -
FTAA No. 04-2009-II FCF Minerals Corporation
Local business tax (head office)
5,138,867 - (5,138,867) 5,139,467 -
Local business tax (mine site)
45,630,815 23,858,057 (21,772,758) 45,630,815 -
Real property tax - Basic (head office)
- - - - -
Real property tax - Basic (mine site)
15,918,413 4,103,469 (11,814,944) 15,917,029 -
Real property tax - SEF (head office)
- - - - -
Real property tax - SEF (mine site)
15,918,413 4,103,469 (11,814,944) 15,917,029 -
Subtotal 82,606,508 32,064,995 (50,541,513) 82,604,339 -
MPSA No. 095-97-V
Filminera Resources
Corporation Local business tax (head office)
7,175,504 - (7,175,504) 7,173,504 -
Local business tax (mine site)
31,882,241 31,882,241 - 31,882,241 -
Real property tax - Basic (head office)
- - - - -
Real property tax - Basic (mine site)
27,140,167 23,889,894 (3,250,273) 27,140,167 -
Real property tax - SEF (head office)
- - - - -
Real property tax - SEF (mine site)
27,140,167 28,251,442 1,111,274 27,140,167 -
Subtotal 93,338,079 84,023,576 (9,314,503) 93,336,079 -
MPSA No. 184-2002-XIII
Greenstone Resources
Corporation Local business tax (head office)
20,930 20,930 - 18,250 -
Local business tax (mine site)
69,779 21,438 (48,341) 21,438 -
Real property tax - Basic (head office)
- - - - -
Real property tax - Basic (mine site)
10,658,352 - (10,658,352) 10,452,729 -
Real property tax - SEF (head office)
- - - - -
Real property tax - SEF (mine site)
10,654,666 - (10,654,666) 10,454,712 -
Subtotal 21,403,728 42,368 (21,361,359) 20,947,129 -
MPSA No. 152-00-CAR
Itogon Suyoc Resources,
Inc. Local business tax (head office)
99,556 - (99,556) - -
Local business tax (mine site)
232,296 - (232,296) 232,296 -
Real property tax - Basic (head office)
- - - - -
Real property tax - Basic (mine site)
38,785 - (38,785) 38,785 -
Real property tax - SEF - - - - -
I I
I I
I I
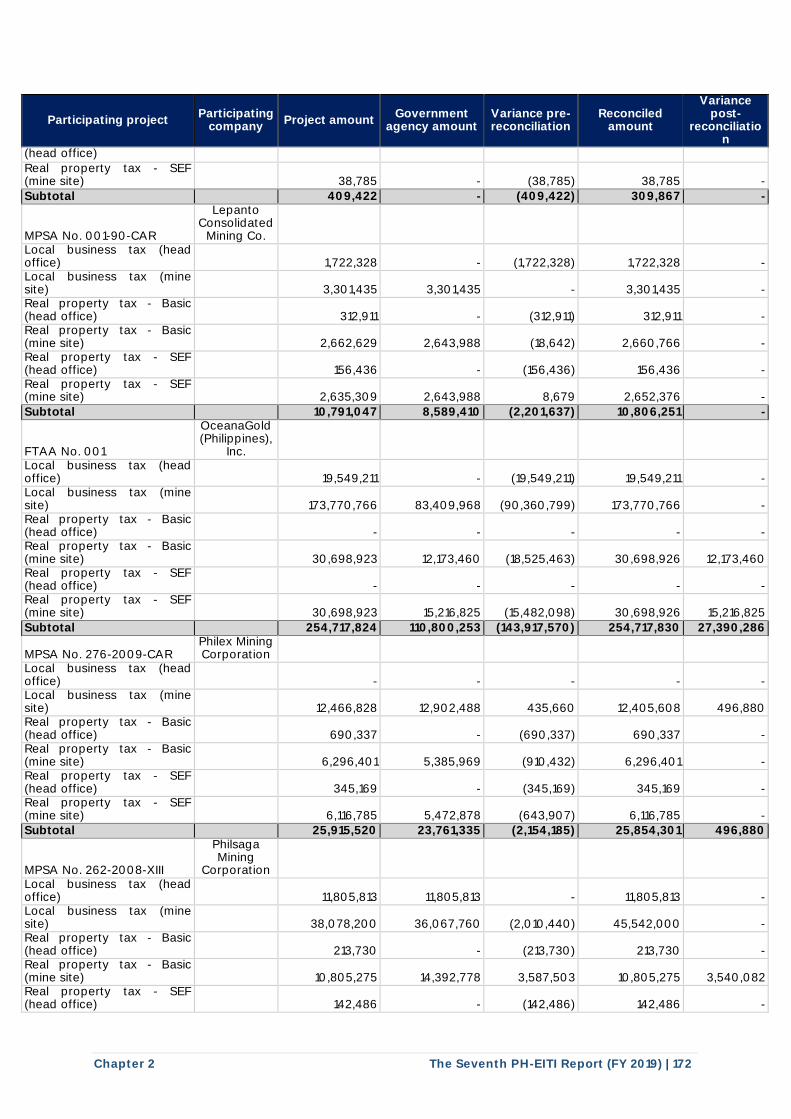
Chapter 2 The Seventh PH-EITI Report (FY 2019) | 172
Participating project Participating
company Project amount
Government agency amount
Variance pre-reconciliation
Reconciled amount
Variance post-
reconciliation
(head office)
Real property tax - SEF (mine site)
38,785 - (38,785) 38,785 -
Subtotal 409,422 - (409,422) 309,867 -
MPSA No. 001-90-CAR
Lepanto Consolidated
Mining Co. Local business tax (head office)
1,722,328 - (1,722,328) 1,722,328 -
Local business tax (mine site)
3,301,435 3,301,435 - 3,301,435 -
Real property tax - Basic (head office)
312,911 - (312,911) 312,911 -
Real property tax - Basic (mine site)
2,662,629 2,643,988 (18,642) 2,660,766 -
Real property tax - SEF (head office)
156,436 - (156,436) 156,436 -
Real property tax - SEF (mine site)
2,635,309 2,643,988 8,679 2,652,376 -
Subtotal 10,791,047 8,589,410 (2,201,637) 10,806,251 -
FTAA No. 001
OceanaGold (Philippines),
Inc. Local business tax (head office)
19,549,211 - (19,549,211) 19,549,211 -
Local business tax (mine site)
173,770,766 83,409,968 (90,360,799) 173,770,766 -
Real property tax - Basic (head office)
- - - - -
Real property tax - Basic (mine site)
30,698,923 12,173,460 (18,525,463) 30,698,926 12,173,460
Real property tax - SEF (head office)
- - - - -
Real property tax - SEF (mine site)
30,698,923 15,216,825 (15,482,098) 30,698,926 15,216,825
Subtotal 254,717,824 110,800,253 (143,917,570) 254,717,830 27,390,286
MPSA No. 276-2009-CAR Philex Mining Corporation
Local business tax (head office)
- - - - -
Local business tax (mine site)
12,466,828 12,902,488 435,660 12,405,608 496,880
Real property tax - Basic (head office)
690,337 - (690,337) 690,337 -
Real property tax - Basic (mine site)
6,296,401 5,385,969 (910,432) 6,296,401 -
Real property tax - SEF (head office)
345,169 - (345,169) 345,169 -
Real property tax - SEF (mine site)
6,116,785 5,472,878 (643,907) 6,116,785 -
Subtotal 25,915,520 23,761,335 (2,154,185) 25,854,301 496,880
MPSA No. 262-2008-XIII
Philsaga Mining
Corporation Local business tax (head office)
11,805,813 11,805,813 - 11,805,813 -
Local business tax (mine site)
38,078,200 36,067,760 (2,010,440) 45,542,000 -
Real property tax - Basic (head office)
213,730 - (213,730) 213,730 -
Real property tax - Basic (mine site)
10,805,275 14,392,778 3,587,503 10,805,275 3,540,082
Real property tax - SEF (head office)
142,486 - (142,486) 142,486 -
I I
I I
I I
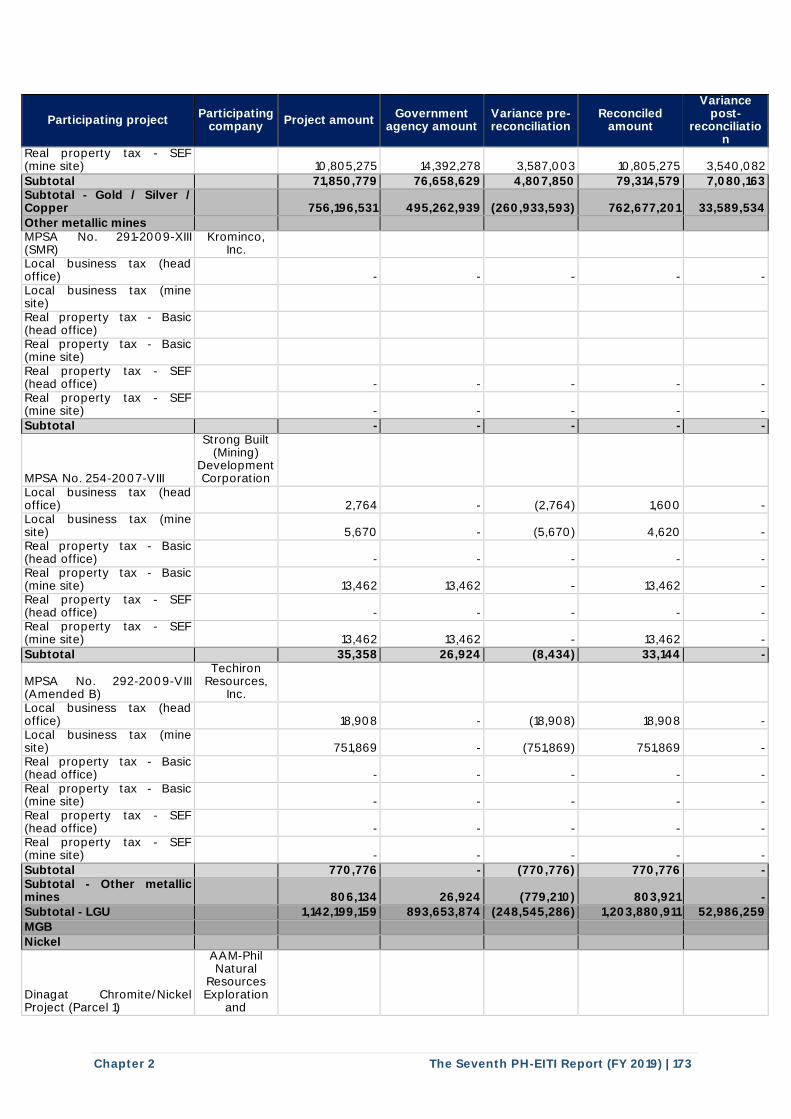
Chapter 2 The Seventh PH-EITI Report (FY 2019) | 173
Participating project Participating
company Project amount
Government agency amount
Variance pre-reconciliation
Reconciled amount
Variance post-
reconciliation
Real property tax - SEF (mine site)
10,805,275 14,392,278 3,587,003 10,805,275 3,540,082
Subtotal 71,850,779 76,658,629 4,807,850 79,314,579 7,080,163 Subtotal - Gold / Silver / Copper 756,196,531 495,262,939 (260,933,593) 762,677,201 33,589,534
Other metallic mines MPSA No. 291-2009-XIII (SMR)
Krominco, Inc.
Local business tax (head office) - - - - - Local business tax (mine site) Real property tax - Basic (head office) Real property tax - Basic (mine site) Real property tax - SEF (head office) - - - - - Real property tax - SEF (mine site) - - - - - Subtotal - - - - -
MPSA No. 254-2007-VIII
Strong Built (Mining)
Development Corporation
Local business tax (head office)
2,764 - (2,764) 1,600 -
Local business tax (mine site)
5,670 - (5,670) 4,620 -
Real property tax - Basic (head office)
- - - - -
Real property tax - Basic (mine site)
13,462 13,462 - 13,462 -
Real property tax - SEF (head office)
- - - - -
Real property tax - SEF (mine site)
13,462 13,462 - 13,462 -
Subtotal 35,358 26,924 (8,434) 33,144 -
MPSA No. 292-2009-VIII (Amended B)
Techiron Resources,
Inc. Local business tax (head office)
18,908 - (18,908) 18,908 -
Local business tax (mine site)
751,869 - (751,869) 751,869 -
Real property tax - Basic (head office)
- - - - -
Real property tax - Basic (mine site)
- - - - -
Real property tax - SEF (head office)
- - - - -
Real property tax - SEF (mine site)
- - - - -
Subtotal 770,776 - (770,776) 770,776 - Subtotal - Other metallic mines 806,134 26,924 (779,210) 803,921 - Subtotal - LGU 1,142,199,159 893,653,874 (248,545,286) 1,203,880,911 52,986,259
MGB
Nickel
Dinagat Chromite/Nickel Project (Parcel 1)
AAM-Phil Natural
Resources Exploration
and
I I
I I
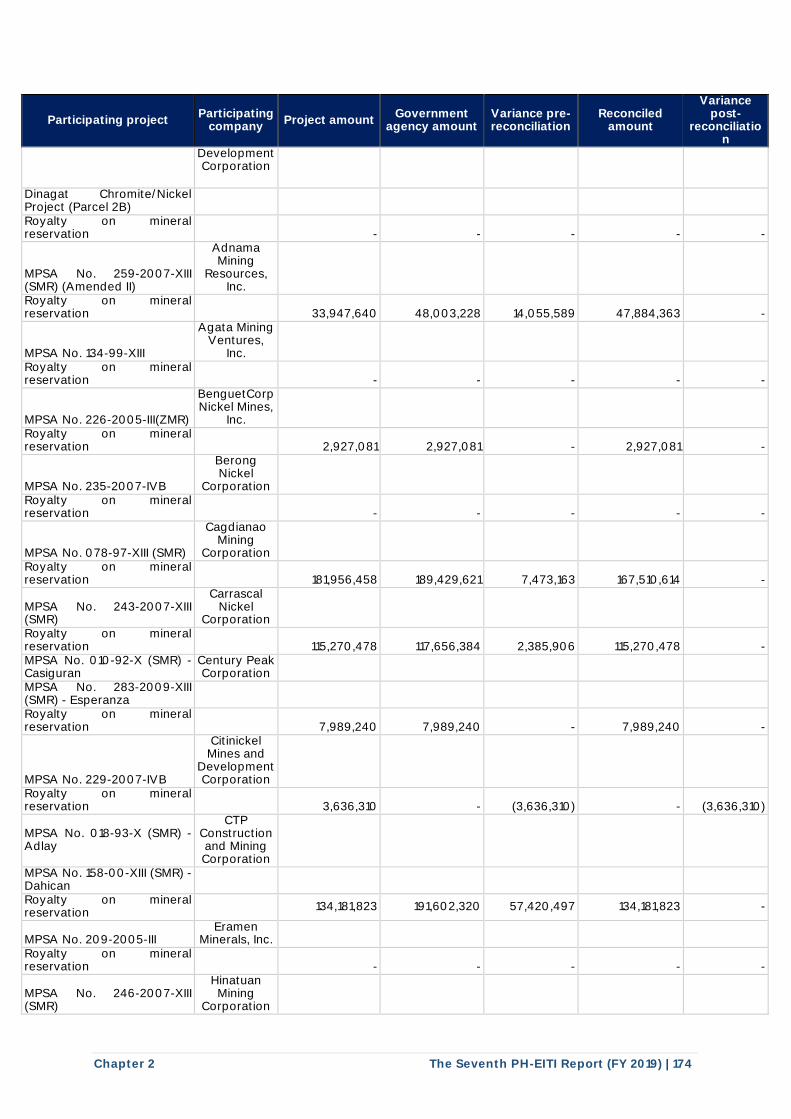
Chapter 2 The Seventh PH-EITI Report (FY 2019) | 174
Participating project Participating
company Project amount
Government agency amount
Variance pre-reconciliation
Reconciled amount
Variance post-
reconciliation
Development Corporation
Dinagat Chromite/Nickel Project (Parcel 2B)
Royalty on mineral reservation
- - - - -
MPSA No. 259-2007-XIII (SMR) (Amended II)
Adnama Mining
Resources, Inc.
Royalty on mineral reservation
33,947,640 48,003,228 14,055,589 47,884,363 -
MPSA No. 134-99-XIII
Agata Mining Ventures,
Inc. Royalty on mineral reservation
- - - - -
MPSA No. 226-2005-III(ZMR)
BenguetCorp Nickel Mines,
Inc. Royalty on mineral reservation
2,927,081 2,927,081 - 2,927,081 -
MPSA No. 235-2007-IVB
Berong Nickel
Corporation Royalty on mineral reservation
- - - - -
MPSA No. 078-97-XIII (SMR)
Cagdianao Mining
Corporation Royalty on mineral reservation
181,956,458 189,429,621 7,473,163 167,510,614 -
MPSA No. 243-2007-XIII (SMR)
Carrascal Nickel
Corporation Royalty on mineral reservation
115,270,478 117,656,384 2,385,906 115,270,478 -
MPSA No. 010-92-X (SMR) - Casiguran
Century Peak Corporation
MPSA No. 283-2009-XIII (SMR) - Esperanza
Royalty on mineral reservation
7,989,240 7,989,240 - 7,989,240 -
MPSA No. 229-2007-IVB
Citinickel Mines and
Development Corporation
Royalty on mineral reservation
3,636,310 - (3,636,310) - (3,636,310)
MPSA No. 018-93-X (SMR) - Adlay
CTP Construction and Mining Corporation
MPSA No. 158-00-XIII (SMR) - Dahican
Royalty on mineral reservation
134,181,823 191,602,320 57,420,497 134,181,823 -
MPSA No. 209-2005-III Eramen
Minerals, Inc. Royalty on mineral reservation - - - - -
MPSA No. 246-2007-XIII (SMR)
Hinatuan Mining
Corporation
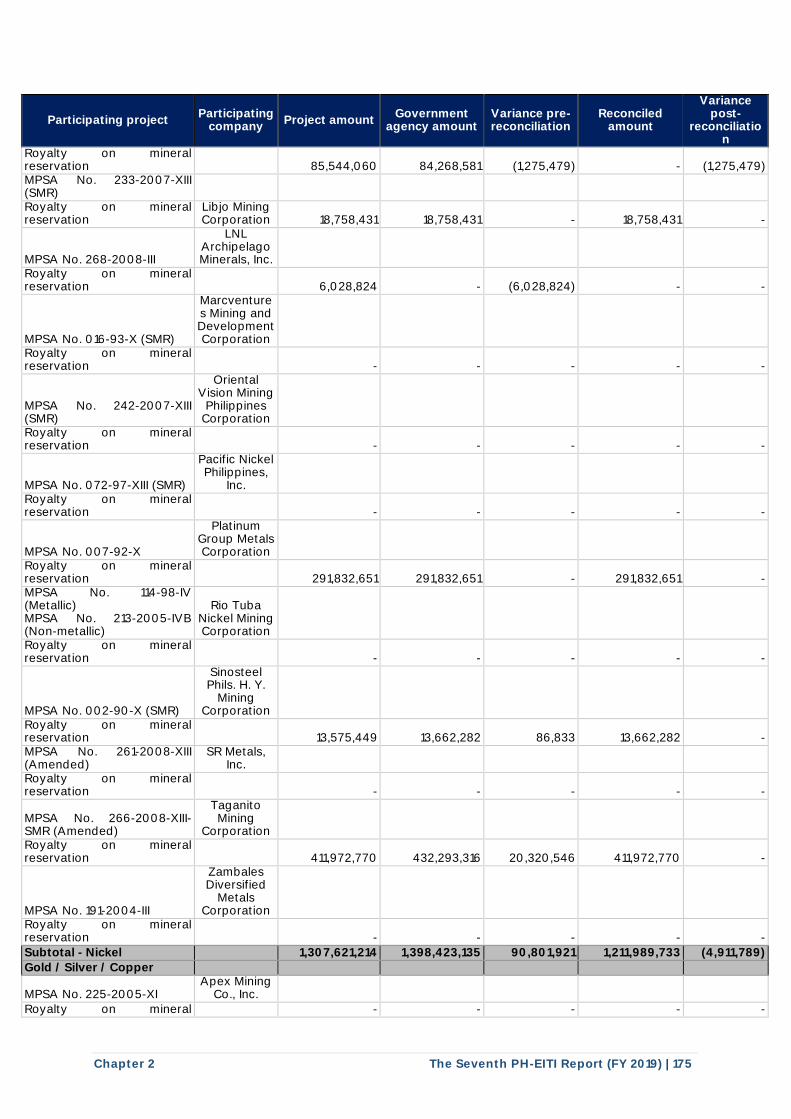
Chapter 2 The Seventh PH-EITI Report (FY 2019) | 175
Participating project Participating
company Project amount
Government agency amount
Variance pre-reconciliation
Reconciled amount
Variance post-
reconciliation
Royalty on mineral reservation
85,544,060 84,268,581 (1,275,479) - (1,275,479)
MPSA No. 233-2007-XIII (SMR) Royalty on mineral reservation
Libjo Mining Corporation 18,758,431 18,758,431 - 18,758,431 -
MPSA No. 268-2008-III
LNL Archipelago Minerals, Inc.
Royalty on mineral reservation
6,028,824 - (6,028,824) - -
MPSA No. 016-93-X (SMR)
Marcventures Mining and Development Corporation
Royalty on mineral reservation
- - - - -
MPSA No. 242-2007-XIII (SMR)
Oriental Vision Mining
Philippines Corporation
Royalty on mineral reservation
- - - - -
MPSA No. 072-97-XIII (SMR)
Pacific Nickel Philippines,
Inc. Royalty on mineral reservation
- - - - -
MPSA No. 007-92-X
Platinum Group Metals Corporation
Royalty on mineral reservation
291,832,651 291,832,651 - 291,832,651 -
MPSA No. 114-98-IV (Metallic) MPSA No. 213-2005-IVB (Non-metallic)
Rio Tuba Nickel Mining Corporation
Royalty on mineral reservation - - - - -
MPSA No. 002-90-X (SMR)
Sinosteel Phils. H. Y.
Mining Corporation
Royalty on mineral reservation
13,575,449 13,662,282 86,833 13,662,282 -
MPSA No. 261-2008-XIII (Amended)
SR Metals, Inc.
Royalty on mineral reservation - - - - -
MPSA No. 266-2008-XIII-SMR (Amended)
Taganito Mining
Corporation Royalty on mineral reservation
411,972,770 432,293,316 20,320,546 411,972,770 -
MPSA No. 191-2004-III
Zambales Diversified
Metals Corporation
Royalty on mineral reservation
- - - - -
Subtotal - Nickel 1,307,621,214 1,398,423,135 90,801,921 1,211,989,733 (4,911,789)
Gold / Silver / Copper
MPSA No. 225-2005-XI Apex Mining
Co., Inc. Royalty on mineral - - - - -
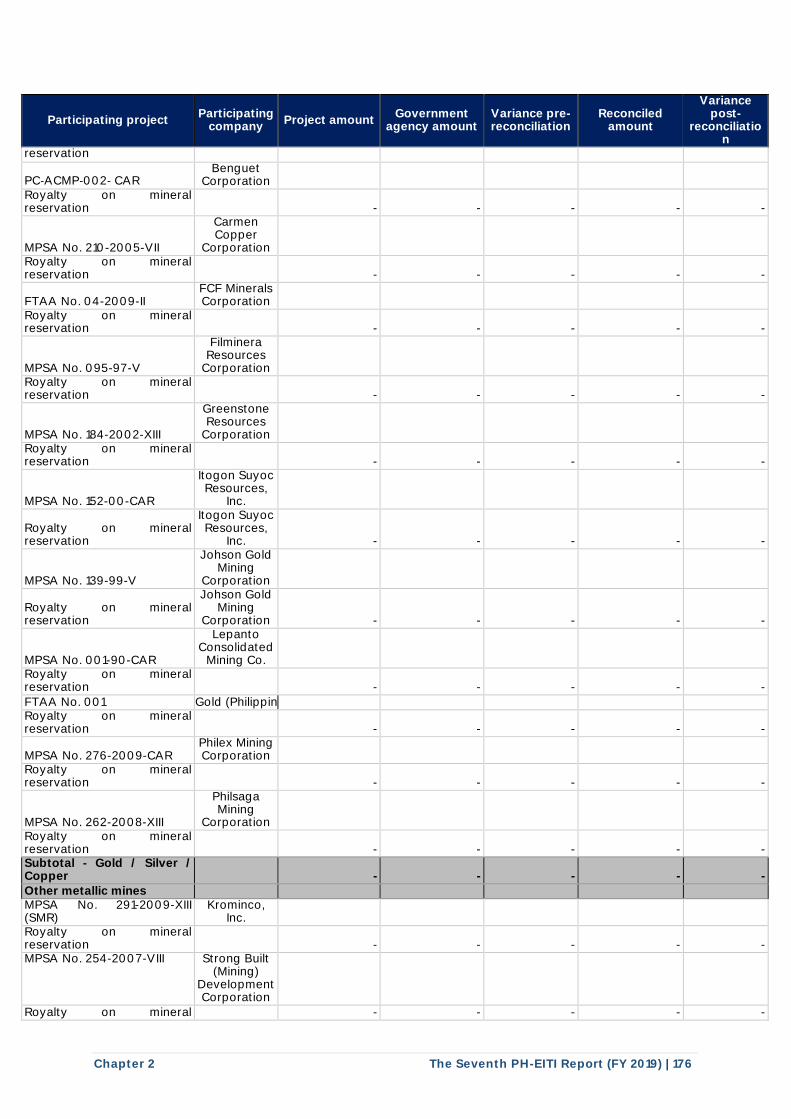
Chapter 2 The Seventh PH-EITI Report (FY 2019) | 176
Participating project Participating
company Project amount
Government agency amount
Variance pre-reconciliation
Reconciled amount
Variance post-
reconciliation
reservation
PC‐ACMP‐002‐ CAR Benguet
Corporation Royalty on mineral reservation - - - - -
MPSA No. 210-2005-VII
Carmen Copper
Corporation Royalty on mineral reservation - - - - -
FTAA No. 04-2009-II FCF Minerals Corporation
Royalty on mineral reservation - - - - -
MPSA No. 095-97-V
Filminera Resources
Corporation Royalty on mineral reservation
- - - - -
MPSA No. 184-2002-XIII
Greenstone Resources
Corporation Royalty on mineral reservation
- - - - -
MPSA No. 152-00-CAR
Itogon Suyoc Resources,
Inc.
Royalty on mineral reservation
Itogon Suyoc Resources,
Inc. - - - - -
MPSA No. 139-99-V
Johson Gold Mining
Corporation
Royalty on mineral reservation
Johson Gold Mining
Corporation - - - - -
MPSA No. 001-90-CAR
Lepanto Consolidated
Mining Co. Royalty on mineral reservation - - - - -
FTAA No. 001 OceanaGold (Philippines), Inc. Royalty on mineral reservation - - - - -
MPSA No. 276-2009-CAR Philex Mining Corporation
Royalty on mineral reservation - - - - -
MPSA No. 262-2008-XIII
Philsaga Mining
Corporation Royalty on mineral reservation - - - - - Subtotal - Gold / Silver / Copper - - - - - Other metallic mines MPSA No. 291-2009-XIII (SMR)
Krominco, Inc.
Royalty on mineral reservation - - - - - MPSA No. 254-2007-VIII Strong Built
(Mining) Development Corporation
Royalty on mineral - - - - -
_________ I __________________ _
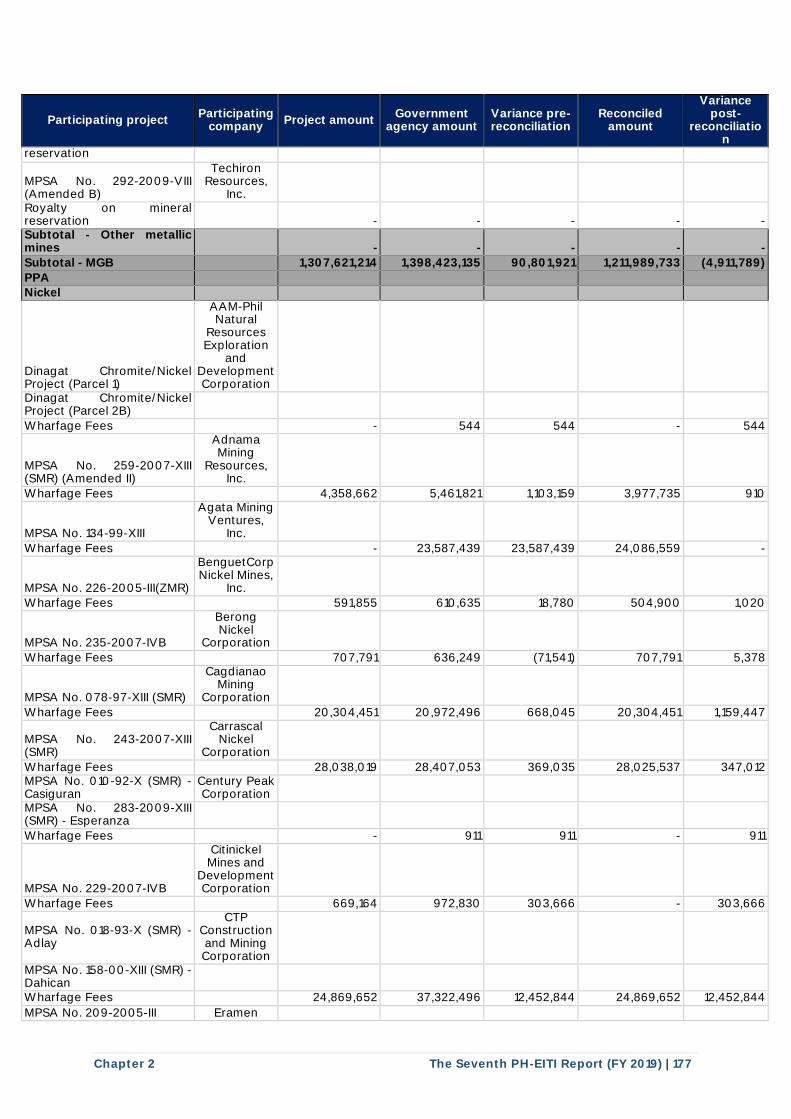
Chapter 2 The Seventh PH-EITI Report (FY 2019) | 177
Participating project Participating
company Project amount
Government agency amount
Variance pre-reconciliation
Reconciled amount
Variance post-
reconciliation
reservation
MPSA No. 292-2009-VIII (Amended B)
Techiron Resources,
Inc. Royalty on mineral reservation - - - - - Subtotal - Other metallic mines - - - - -
Subtotal - MGB 1,307,621,214 1,398,423,135 90,801,921 1,211,989,733 (4,911,789)
PPA Nickel
Dinagat Chromite/Nickel Project (Parcel 1)
AAM-Phil Natural
Resources Exploration
and Development Corporation
Dinagat Chromite/Nickel Project (Parcel 2B)
Wharfage Fees - 544 544 - 544
MPSA No. 259-2007-XIII (SMR) (Amended II)
Adnama Mining
Resources, Inc.
Wharfage Fees 4,358,662 5,461,821 1,103,159 3,977,735 910
MPSA No. 134-99-XIII
Agata Mining Ventures,
Inc.
Wharfage Fees - 23,587,439 23,587,439 24,086,559 -
MPSA No. 226-2005-III(ZMR)
BenguetCorp Nickel Mines,
Inc. Wharfage Fees 591,855 610,635 18,780 504,900 1,020
MPSA No. 235-2007-IVB
Berong Nickel
Corporation
Wharfage Fees 707,791 636,249 (71,541) 707,791 5,378
MPSA No. 078-97-XIII (SMR)
Cagdianao Mining
Corporation
Wharfage Fees 20,304,451 20,972,496 668,045 20,304,451 1,159,447
MPSA No. 243-2007-XIII (SMR)
Carrascal Nickel
Corporation
Wharfage Fees 28,038,019 28,407,053 369,035 28,025,537 347,012 MPSA No. 010-92-X (SMR) - Casiguran
Century Peak Corporation
MPSA No. 283-2009-XIII (SMR) - Esperanza
Wharfage Fees - 911 911 - 911
MPSA No. 229-2007-IVB
Citinickel Mines and
Development Corporation
Wharfage Fees 669,164 972,830 303,666 - 303,666
MPSA No. 018-93-X (SMR) - Adlay
CTP Construction and Mining Corporation
MPSA No. 158-00-XIII (SMR) - Dahican
Wharfage Fees 24,869,652 37,322,496 12,452,844 24,869,652 12,452,844
MPSA No. 209-2005-III Eramen
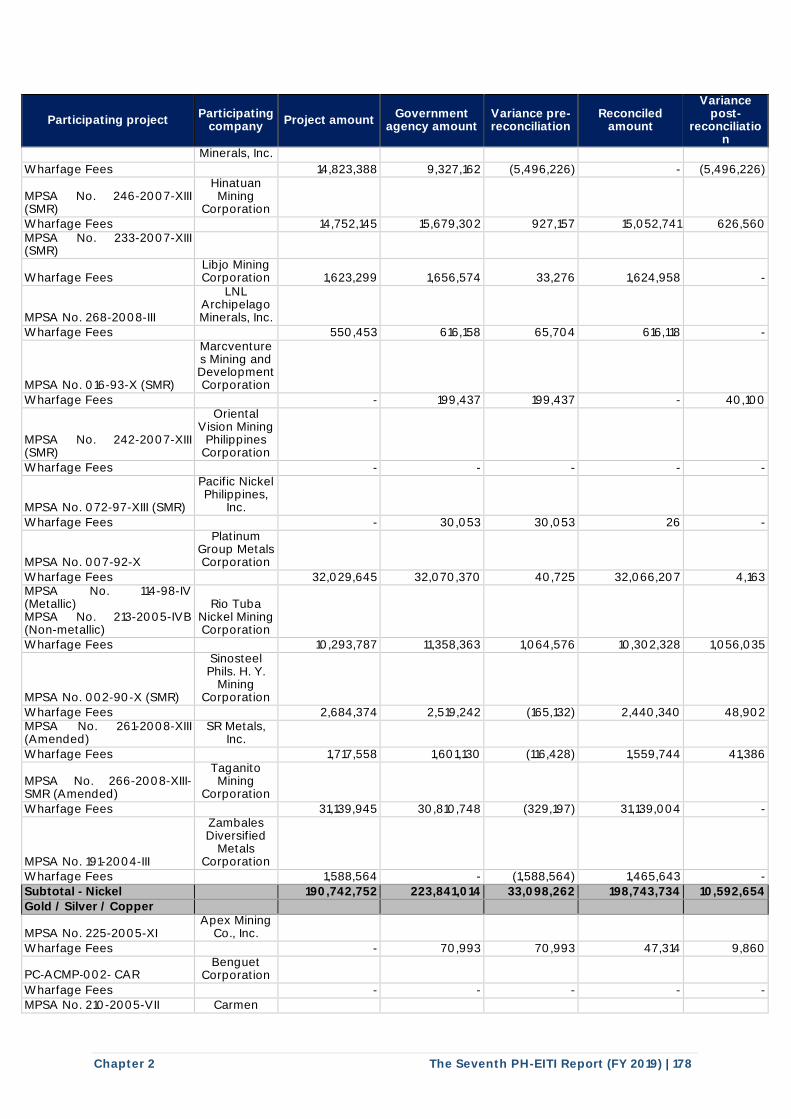
Chapter 2 The Seventh PH-EITI Report (FY 2019) | 178
Participating project Participating
company Project amount
Government agency amount
Variance pre-reconciliation
Reconciled amount
Variance post-
reconciliation
Minerals, Inc.
Wharfage Fees 14,823,388 9,327,162 (5,496,226) - (5,496,226)
MPSA No. 246-2007-XIII (SMR)
Hinatuan Mining
Corporation Wharfage Fees 14,752,145 15,679,302 927,157 15,052,741 626,560 MPSA No. 233-2007-XIII (SMR)
Wharfage Fees Libjo Mining Corporation 1,623,299 1,656,574 33,276 1,624,958 -
MPSA No. 268-2008-III
LNL Archipelago Minerals, Inc.
Wharfage Fees 550,453 616,158 65,704 616,118 -
MPSA No. 016-93-X (SMR)
Marcventures Mining and Development Corporation
Wharfage Fees - 199,437 199,437 - 40,100
MPSA No. 242-2007-XIII (SMR)
Oriental Vision Mining
Philippines Corporation
Wharfage Fees - - - - -
MPSA No. 072-97-XIII (SMR)
Pacific Nickel Philippines,
Inc.
Wharfage Fees - 30,053 30,053 26 -
MPSA No. 007-92-X
Platinum Group Metals Corporation
Wharfage Fees 32,029,645 32,070,370 40,725 32,066,207 4,163 MPSA No. 114-98-IV (Metallic) MPSA No. 213-2005-IVB (Non-metallic)
Rio Tuba Nickel Mining Corporation
Wharfage Fees 10,293,787 11,358,363 1,064,576 10,302,328 1,056,035
MPSA No. 002-90-X (SMR)
Sinosteel Phils. H. Y.
Mining Corporation
Wharfage Fees 2,684,374 2,519,242 (165,132) 2,440,340 48,902 MPSA No. 261-2008-XIII (Amended)
SR Metals, Inc.
Wharfage Fees 1,717,558 1,601,130 (116,428) 1,559,744 41,386
MPSA No. 266-2008-XIII-SMR (Amended)
Taganito Mining
Corporation
Wharfage Fees 31,139,945 30,810,748 (329,197) 31,139,004 -
MPSA No. 191-2004-III
Zambales Diversified
Metals Corporation
Wharfage Fees 1,588,564 - (1,588,564) 1,465,643 -
Subtotal - Nickel 190,742,752 223,841,014 33,098,262 198,743,734 10,592,654
Gold / Silver / Copper
MPSA No. 225-2005-XI Apex Mining
Co., Inc.
Wharfage Fees - 70,993 70,993 47,314 9,860
PC‐ACMP‐002‐ CAR Benguet
Corporation
Wharfage Fees - - - - - MPSA No. 210-2005-VII Carmen
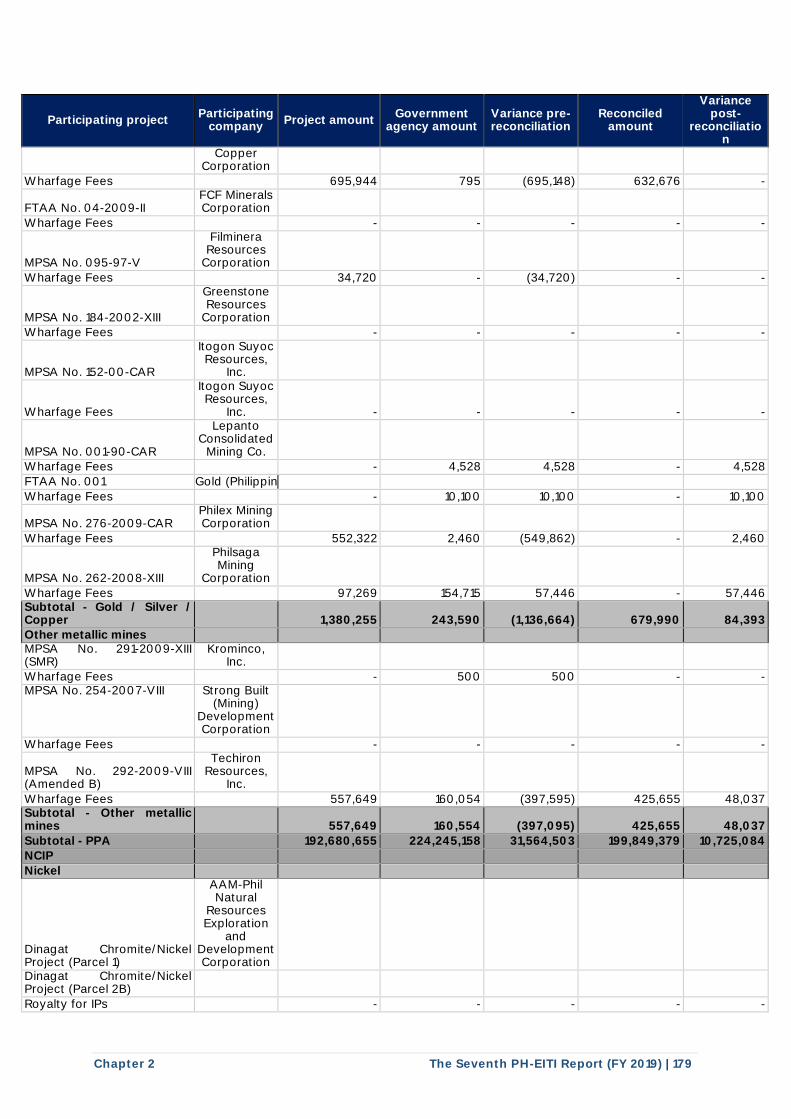
Chapter 2 The Seventh PH-EITI Report (FY 2019) | 179
Participating project Participating
company Project amount
Government agency amount
Variance pre-reconciliation
Reconciled amount
Variance post-
reconciliation
Copper Corporation
Wharfage Fees 695,944 795 (695,148) 632,676 -
FTAA No. 04-2009-II FCF Minerals Corporation
Wharfage Fees - - - - -
MPSA No. 095-97-V
Filminera Resources
Corporation
Wharfage Fees 34,720 - (34,720) - -
MPSA No. 184-2002-XIII
Greenstone Resources
Corporation Wharfage Fees - - - - -
MPSA No. 152-00-CAR
Itogon Suyoc Resources,
Inc.
Wharfage Fees
Itogon Suyoc Resources,
Inc. - - - - -
MPSA No. 001-90-CAR
Lepanto Consolidated
Mining Co. Wharfage Fees - 4,528 4,528 - 4,528
FTAA No. 001 OceanaGold (Philippines), Inc.
Wharfage Fees - 10,100 10,100 - 10,100
MPSA No. 276-2009-CAR Philex Mining Corporation
Wharfage Fees 552,322 2,460 (549,862) - 2,460
MPSA No. 262-2008-XIII
Philsaga Mining
Corporation
Wharfage Fees 97,269 154,715 57,446 - 57,446 Subtotal - Gold / Silver / Copper 1,380,255 243,590 (1,136,664) 679,990 84,393 Other metallic mines MPSA No. 291-2009-XIII (SMR)
Krominco, Inc.
Wharfage Fees - 500 500 - - MPSA No. 254-2007-VIII Strong Built
(Mining) Development Corporation
Wharfage Fees - - - - -
MPSA No. 292-2009-VIII (Amended B)
Techiron Resources,
Inc.
Wharfage Fees 557,649 160,054 (397,595) 425,655 48,037 Subtotal - Other metallic mines 557,649 160,554 (397,095) 425,655 48,037
Subtotal - PPA 192,680,655 224,245,158 31,564,503 199,849,379 10,725,084 NCIP
Nickel
Dinagat Chromite/Nickel Project (Parcel 1)
AAM-Phil Natural
Resources Exploration
and Development Corporation
Dinagat Chromite/Nickel Project (Parcel 2B)
Royalty for IPs - - - - -
___________ I ___________________ _____.
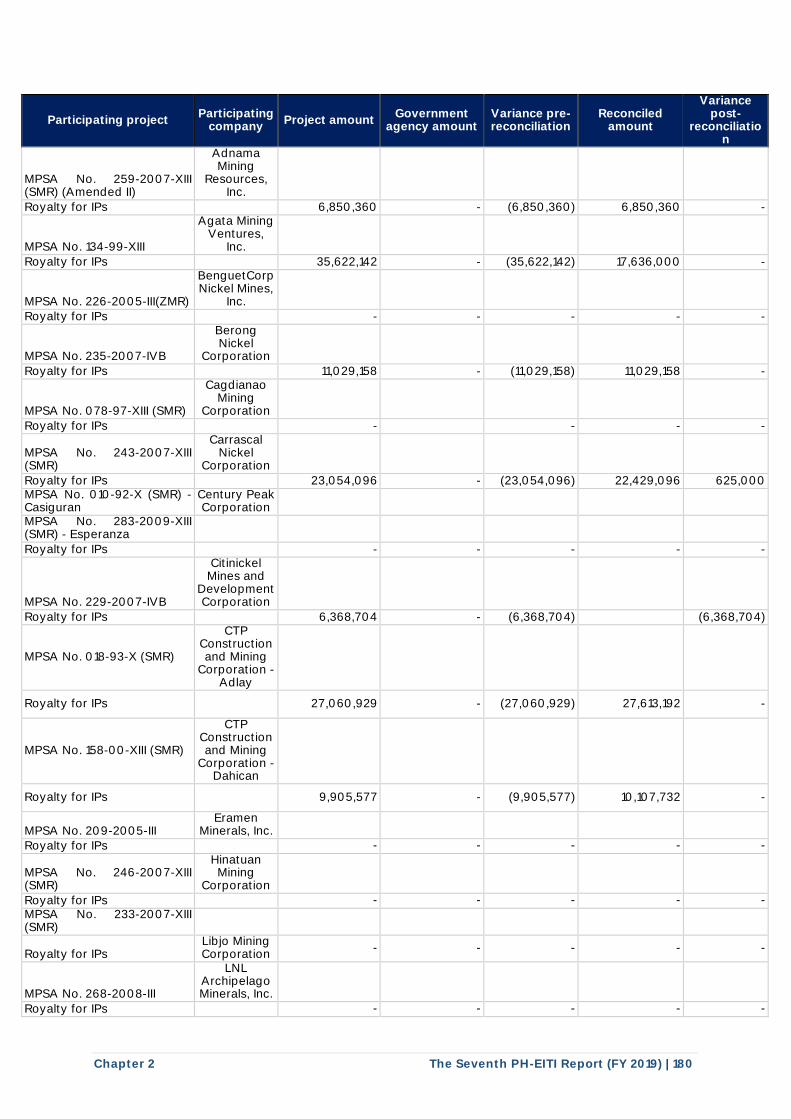
Chapter 2 The Seventh PH-EITI Report (FY 2019) | 180
Participating project Participating
company Project amount
Government agency amount
Variance pre-reconciliation
Reconciled amount
Variance post-
reconciliation
MPSA No. 259-2007-XIII (SMR) (Amended II)
Adnama Mining
Resources, Inc.
Royalty for IPs 6,850,360 - (6,850,360) 6,850,360 -
MPSA No. 134-99-XIII
Agata Mining Ventures,
Inc.
Royalty for IPs 35,622,142 - (35,622,142) 17,636,000 -
MPSA No. 226-2005-III(ZMR)
BenguetCorp Nickel Mines,
Inc. Royalty for IPs - - - - -
MPSA No. 235-2007-IVB
Berong Nickel
Corporation
Royalty for IPs 11,029,158 - (11,029,158) 11,029,158 -
MPSA No. 078-97-XIII (SMR)
Cagdianao Mining
Corporation
Royalty for IPs - - - -
MPSA No. 243-2007-XIII (SMR)
Carrascal Nickel
Corporation
Royalty for IPs 23,054,096 - (23,054,096) 22,429,096 625,000 MPSA No. 010-92-X (SMR) - Casiguran
Century Peak Corporation
MPSA No. 283-2009-XIII (SMR) - Esperanza
Royalty for IPs - - - - -
MPSA No. 229-2007-IVB
Citinickel Mines and
Development Corporation
Royalty for IPs 6,368,704 - (6,368,704) (6,368,704)
MPSA No. 018-93-X (SMR)
CTP Construction and Mining
Corporation - Adlay
Royalty for IPs
27,060,929 - (27,060,929) 27,613,192 -
MPSA No. 158-00-XIII (SMR)
CTP Construction and Mining
Corporation - Dahican
Royalty for IPs
9,905,577 - (9,905,577) 10,107,732 -
MPSA No. 209-2005-III Eramen
Minerals, Inc. Royalty for IPs - - - - -
MPSA No. 246-2007-XIII (SMR)
Hinatuan Mining
Corporation
Royalty for IPs - - - - - MPSA No. 233-2007-XIII (SMR)
Royalty for IPs Libjo Mining Corporation
- - - - -
MPSA No. 268-2008-III
LNL Archipelago Minerals, Inc.
Royalty for IPs - - - - -
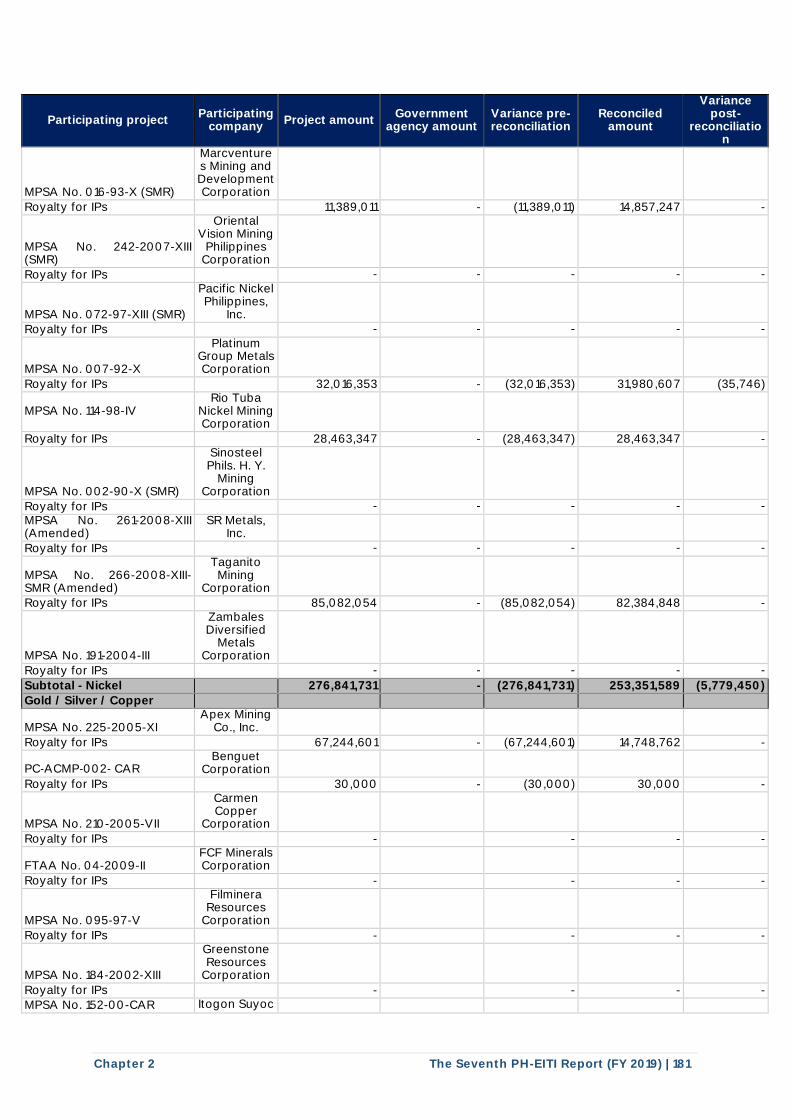
Chapter 2 The Seventh PH-EITI Report (FY 2019) | 181
Participating project Participating
company Project amount
Government agency amount
Variance pre-reconciliation
Reconciled amount
Variance post-
reconciliation
MPSA No. 016-93-X (SMR)
Marcventures Mining and Development Corporation
Royalty for IPs 11,389,011 - (11,389,011) 14,857,247 -
MPSA No. 242-2007-XIII (SMR)
Oriental Vision Mining
Philippines Corporation
Royalty for IPs - - - - -
MPSA No. 072-97-XIII (SMR)
Pacific Nickel Philippines,
Inc. Royalty for IPs - - - - -
MPSA No. 007-92-X
Platinum Group Metals Corporation
Royalty for IPs 32,016,353 - (32,016,353) 31,980,607 (35,746)
MPSA No. 114-98-IV Rio Tuba
Nickel Mining Corporation
Royalty for IPs 28,463,347 - (28,463,347) 28,463,347 -
MPSA No. 002-90-X (SMR)
Sinosteel Phils. H. Y.
Mining Corporation
Royalty for IPs - - - - - MPSA No. 261-2008-XIII (Amended)
SR Metals, Inc.
Royalty for IPs - - - - -
MPSA No. 266-2008-XIII-SMR (Amended)
Taganito Mining
Corporation Royalty for IPs 85,082,054 - (85,082,054) 82,384,848 -
MPSA No. 191-2004-III
Zambales Diversified
Metals Corporation
Royalty for IPs - - - - -
Subtotal - Nickel 276,841,731 - (276,841,731) 253,351,589 (5,779,450)
Gold / Silver / Copper
MPSA No. 225-2005-XI Apex Mining
Co., Inc.
Royalty for IPs 67,244,601 - (67,244,601) 14,748,762 -
PC‐ACMP‐002‐ CAR Benguet
Corporation Royalty for IPs 30,000 - (30,000) 30,000 -
MPSA No. 210-2005-VII
Carmen Copper
Corporation
Royalty for IPs - - - -
FTAA No. 04-2009-II FCF Minerals Corporation
Royalty for IPs - - - -
MPSA No. 095-97-V
Filminera Resources
Corporation
Royalty for IPs - - - -
MPSA No. 184-2002-XIII
Greenstone Resources
Corporation
Royalty for IPs - - - - MPSA No. 152-00-CAR Itogon Suyoc
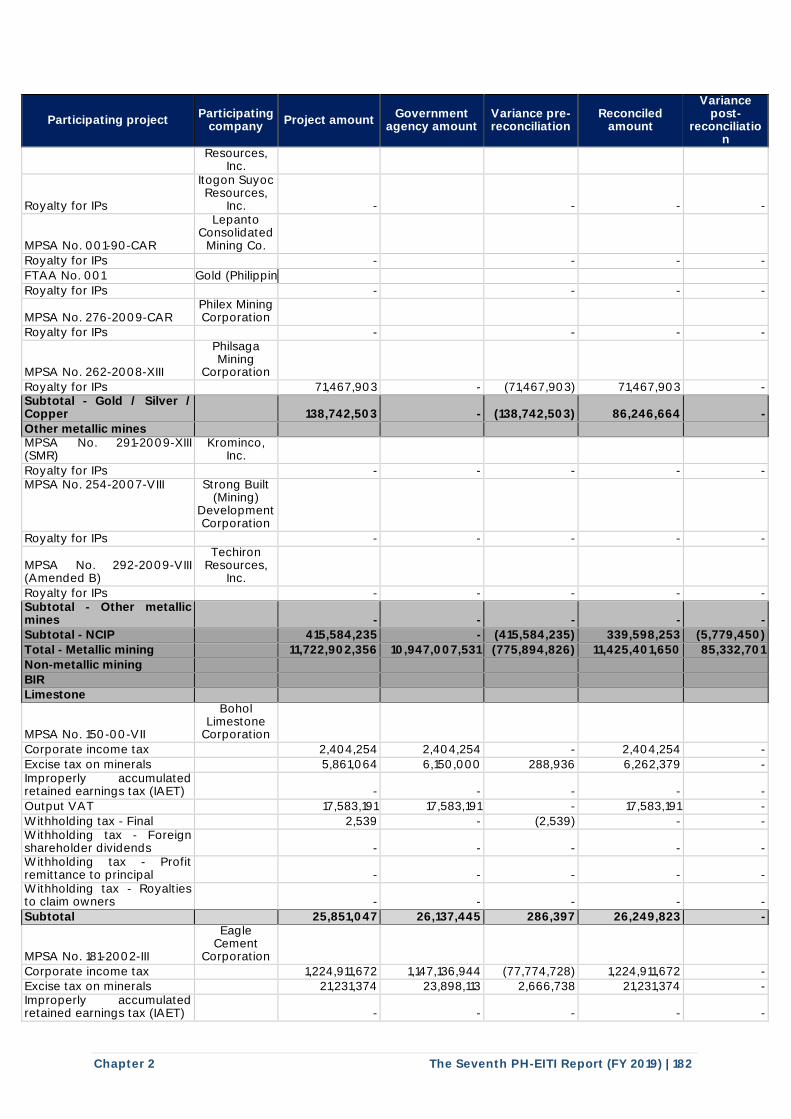
Chapter 2 The Seventh PH-EITI Report (FY 2019) | 182
Participating project Participating
company Project amount
Government agency amount
Variance pre-reconciliation
Reconciled amount
Variance post-
reconciliation
Resources, Inc.
Royalty for IPs
Itogon Suyoc Resources,
Inc. - - - -
MPSA No. 001-90-CAR
Lepanto Consolidated
Mining Co.
Royalty for IPs - - - -
FTAA No. 001 OceanaGold (Philippines), Inc.
Royalty for IPs - - - -
MPSA No. 276-2009-CAR Philex Mining Corporation
Royalty for IPs - - - -
MPSA No. 262-2008-XIII
Philsaga Mining
Corporation
Royalty for IPs 71,467,903 - (71,467,903) 71,467,903 - Subtotal - Gold / Silver / Copper 138,742,503 - (138,742,503) 86,246,664 -
Other metallic mines MPSA No. 291-2009-XIII (SMR)
Krominco, Inc.
Royalty for IPs - - - - - MPSA No. 254-2007-VIII Strong Built
(Mining) Development Corporation
Royalty for IPs - - - - -
MPSA No. 292-2009-VIII (Amended B)
Techiron Resources,
Inc.
Royalty for IPs - - - - - Subtotal - Other metallic mines - - - - - Subtotal - NCIP 415,584,235 - (415,584,235) 339,598,253 (5,779,450)
Total - Metallic mining 11,722,902,356 10,947,007,531 (775,894,826) 11,425,401,650 85,332,701
Non-metallic mining
BIR Limestone
MPSA No. 150-00-VII
Bohol Limestone
Corporation
Corporate income tax 2,404,254 2,404,254 - 2,404,254 -
Excise tax on minerals 5,861,064 6,150,000 288,936 6,262,379 - Improperly accumulated retained earnings tax (IAET) - - - - -
Output VAT 17,583,191 17,583,191 - 17,583,191 -
Withholding tax - Final 2,539 - (2,539) - - Withholding tax - Foreign shareholder dividends - - - - - Withholding tax - Profit remittance to principal - - - - - Withholding tax - Royalties to claim owners - - - - -
Subtotal 25,851,047 26,137,445 286,397 26,249,823 -
MPSA No. 181-2002-III
Eagle Cement
Corporation
Corporate income tax 1,224,911,672 1,147,136,944 (77,774,728) 1,224,911,672 - Excise tax on minerals 21,231,374 23,898,113 2,666,738 21,231,374 - Improperly accumulated retained earnings tax (IAET) - - - - - j t t t t t
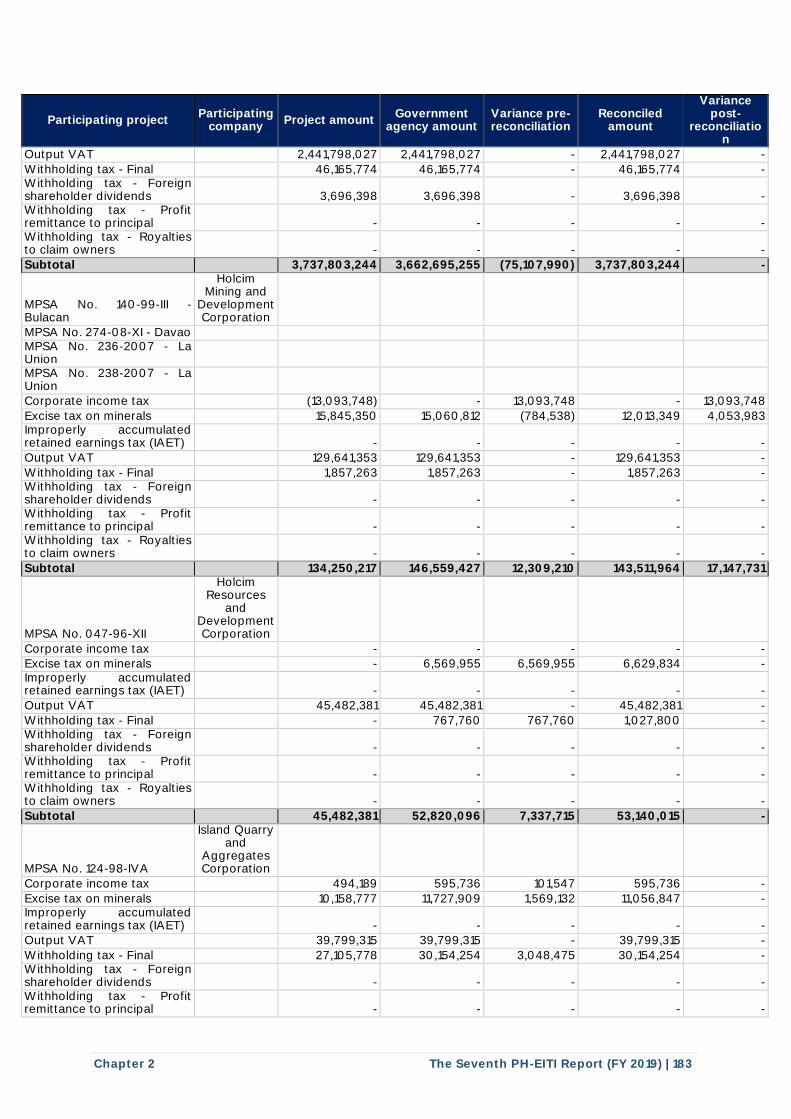
Chapter 2 The Seventh PH-EITI Report (FY 2019) | 183
Participating project Participating
company Project amount
Government agency amount
Variance pre-reconciliation
Reconciled amount
Variance post-
reconciliation
Output VAT 2,441,798,027 2,441,798,027 - 2,441,798,027 -
Withholding tax - Final 46,165,774 46,165,774 - 46,165,774 - Withholding tax - Foreign shareholder dividends 3,696,398 3,696,398 - 3,696,398 - Withholding tax - Profit remittance to principal - - - - - Withholding tax - Royalties to claim owners - - - - -
Subtotal 3,737,803,244 3,662,695,255 (75,107,990) 3,737,803,244 -
MPSA No. 140-99-III - Bulacan
Holcim Mining and
Development Corporation
MPSA No. 274-08-XI - Davao MPSA No. 236-2007 - La Union
MPSA No. 238-2007 - La Union
Corporate income tax (13,093,748) - 13,093,748 - 13,093,748
Excise tax on minerals 15,845,350 15,060,812 (784,538) 12,013,349 4,053,983 Improperly accumulated retained earnings tax (IAET)
- - - - -
Output VAT 129,641,353 129,641,353 - 129,641,353 -
Withholding tax - Final 1,857,263 1,857,263 - 1,857,263 - Withholding tax - Foreign shareholder dividends
- - - - -
Withholding tax - Profit remittance to principal
- - - - -
Withholding tax - Royalties to claim owners
- - - - -
Subtotal 134,250,217 146,559,427 12,309,210 143,511,964 17,147,731
MPSA No. 047-96-XII
Holcim Resources
and Development Corporation
Corporate income tax - - - - - Excise tax on minerals - 6,569,955 6,569,955 6,629,834 - Improperly accumulated retained earnings tax (IAET)
- - - - -
Output VAT 45,482,381 45,482,381 - 45,482,381 -
Withholding tax - Final - 767,760 767,760 1,027,800 - Withholding tax - Foreign shareholder dividends
- - - - -
Withholding tax - Profit remittance to principal
- - - - -
Withholding tax - Royalties to claim owners
- - - - -
Subtotal 45,482,381 52,820,096 7,337,715 53,140,015 -
MPSA No. 124-98-IVA
Island Quarry and
Aggregates Corporation
Corporate income tax 494,189 595,736 101,547 595,736 -
Excise tax on minerals 10,158,777 11,727,909 1,569,132 11,056,847 - Improperly accumulated retained earnings tax (IAET)
- - - - -
Output VAT 39,799,315 39,799,315 - 39,799,315 -
Withholding tax - Final 27,105,778 30,154,254 3,048,475 30,154,254 - Withholding tax - Foreign shareholder dividends
- - - - -
Withholding tax - Profit remittance to principal
- - - - -
I I
I I
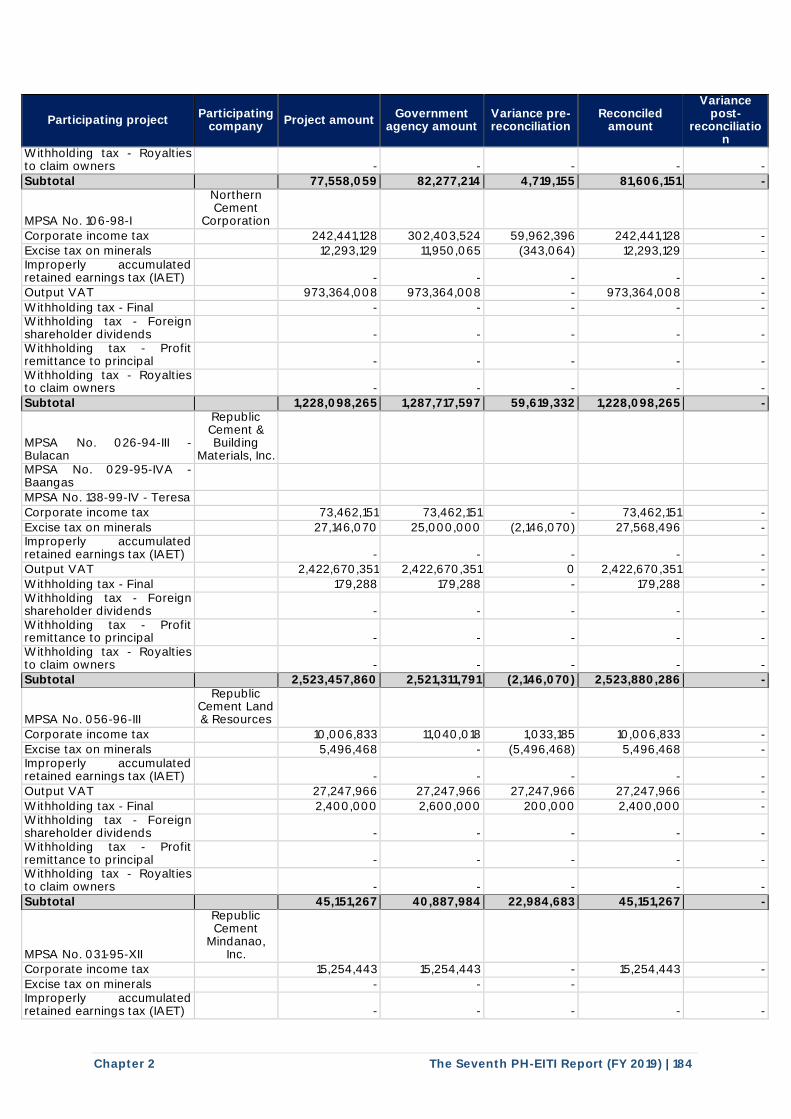
Chapter 2 The Seventh PH-EITI Report (FY 2019) | 184
Participating project Participating
company Project amount
Government agency amount
Variance pre-reconciliation
Reconciled amount
Variance post-
reconciliation
Withholding tax - Royalties to claim owners
- - - - -
Subtotal 77,558,059 82,277,214 4,719,155 81,606,151 -
MPSA No. 106-98-I
Northern Cement
Corporation
Corporate income tax 242,441,128 302,403,524 59,962,396 242,441,128 - Excise tax on minerals 12,293,129 11,950,065 (343,064) 12,293,129 - Improperly accumulated retained earnings tax (IAET)
- - - - -
Output VAT 973,364,008 973,364,008 - 973,364,008 -
Withholding tax - Final - - - - - Withholding tax - Foreign shareholder dividends
- - - - -
Withholding tax - Profit remittance to principal
- - - - -
Withholding tax - Royalties to claim owners
- - - - -
Subtotal 1,228,098,265 1,287,717,597 59,619,332 1,228,098,265 -
MPSA No. 026-94-III - Bulacan
Republic Cement & Building
Materials, Inc. MPSA No. 029-95-IVA - Baangas
MPSA No. 138-99-IV - Teresa
Corporate income tax 73,462,151 73,462,151 - 73,462,151 -
Excise tax on minerals 27,146,070 25,000,000 (2,146,070) 27,568,496 - Improperly accumulated retained earnings tax (IAET)
- - - - -
Output VAT 2,422,670,351 2,422,670,351 0 2,422,670,351 -
Withholding tax - Final 179,288 179,288 - 179,288 - Withholding tax - Foreign shareholder dividends
- - - - -
Withholding tax - Profit remittance to principal
- - - - -
Withholding tax - Royalties to claim owners
- - - - -
Subtotal 2,523,457,860 2,521,311,791 (2,146,070) 2,523,880,286 -
MPSA No. 056-96-III
Republic Cement Land & Resources
Corporate income tax 10,006,833 11,040,018 1,033,185 10,006,833 -
Excise tax on minerals 5,496,468 - (5,496,468) 5,496,468 - Improperly accumulated retained earnings tax (IAET)
- - - - -
Output VAT 27,247,966 27,247,966 27,247,966 27,247,966 -
Withholding tax - Final 2,400,000 2,600,000 200,000 2,400,000 - Withholding tax - Foreign shareholder dividends
- - - - -
Withholding tax - Profit remittance to principal
- - - - -
Withholding tax - Royalties to claim owners
- - - - -
Subtotal 45,151,267 40,887,984 22,984,683 45,151,267 -
MPSA No. 031-95-XII
Republic Cement
Mindanao, Inc.
Corporate income tax 15,254,443 15,254,443 - 15,254,443 -
Excise tax on minerals - - - Improperly accumulated retained earnings tax (IAET)
- - - - -
I I
I I
I I
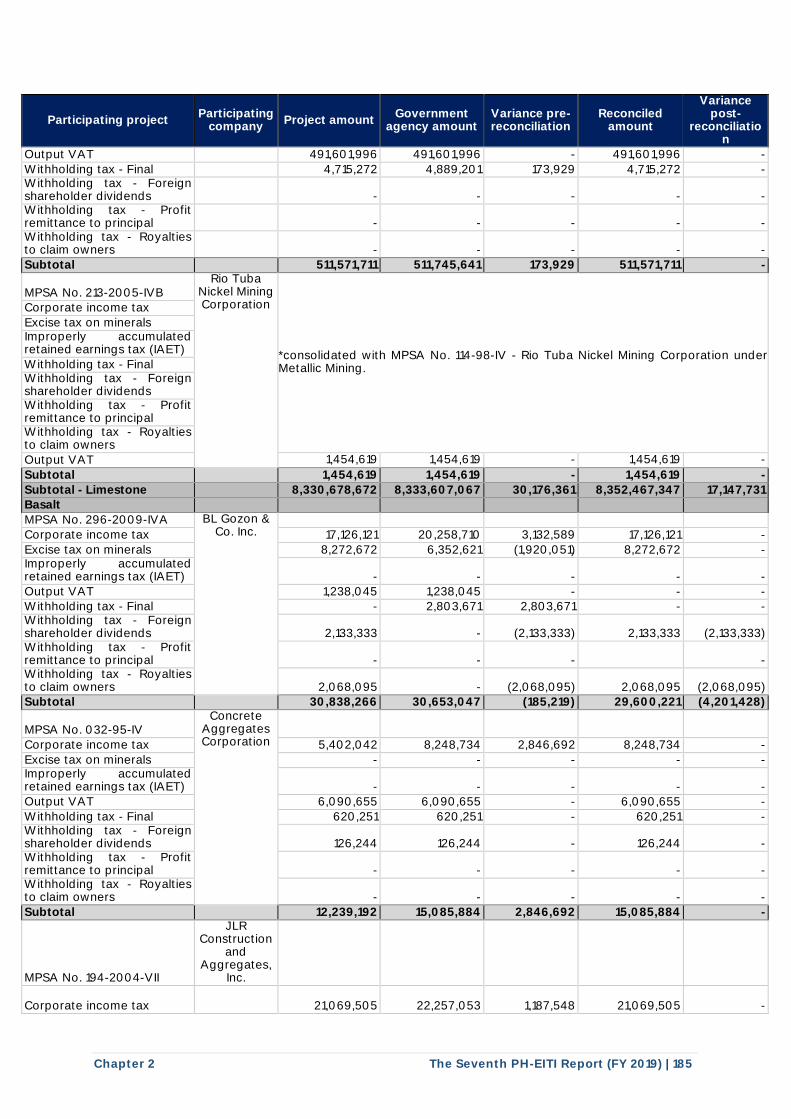
Chapter 2 The Seventh PH-EITI Report (FY 2019) | 185
Participating project Participating
company Project amount
Government agency amount
Variance pre-reconciliation
Reconciled amount
Variance post-
reconciliation
Output VAT 491,601,996 491,601,996 - 491,601,996 -
Withholding tax - Final 4,715,272 4,889,201 173,929 4,715,272 - Withholding tax - Foreign shareholder dividends
- - - - -
Withholding tax - Profit remittance to principal
- - - - -
Withholding tax - Royalties to claim owners
- - - - -
Subtotal 511,571,711 511,745,641 173,929 511,571,711 -
MPSA No. 213-2005-IVB Rio Tuba
Nickel Mining Corporation
*consolidated with MPSA No. 114-98-IV - Rio Tuba Nickel Mining Corporation under Metallic Mining.
Corporate income tax
Excise tax on minerals Improperly accumulated retained earnings tax (IAET)
Withholding tax - Final Withholding tax - Foreign shareholder dividends Withholding tax - Profit remittance to principal Withholding tax - Royalties to claim owners
Output VAT 1,454,619 1,454,619 - 1,454,619 -
Subtotal 1,454,619 1,454,619 - 1,454,619 -
Subtotal - Limestone 8,330,678,672 8,333,607,067 30,176,361 8,352,467,347 17,147,731 Basalt
MPSA No. 296-2009-IVA BL Gozon & Co. Inc.
Corporate income tax 17,126,121 20,258,710 3,132,589 17,126,121 -
Excise tax on minerals 8,272,672 6,352,621 (1,920,051) 8,272,672 - Improperly accumulated retained earnings tax (IAET) - - - - -
Output VAT 1,238,045 1,238,045 - - - Withholding tax - Final - 2,803,671 2,803,671 - - Withholding tax - Foreign shareholder dividends 2,133,333 - (2,133,333) 2,133,333 (2,133,333) Withholding tax - Profit remittance to principal - - - - Withholding tax - Royalties to claim owners 2,068,095 - (2,068,095) 2,068,095 (2,068,095) Subtotal 30,838,266 30,653,047 (185,219) 29,600,221 (4,201,428)
MPSA No. 032-95-IV Concrete
Aggregates Corporation
Corporate income tax 5,402,042 8,248,734 2,846,692 8,248,734 -
Excise tax on minerals - - - - - Improperly accumulated retained earnings tax (IAET) - - - - -
Output VAT 6,090,655 6,090,655 - 6,090,655 -
Withholding tax - Final 620,251 620,251 - 620,251 - Withholding tax - Foreign shareholder dividends 126,244 126,244 - 126,244 - Withholding tax - Profit remittance to principal - - - - - Withholding tax - Royalties to claim owners - - - - -
Subtotal 12,239,192 15,085,884 2,846,692 15,085,884 -
MPSA No. 194-2004-VII
JLR Construction
and Aggregates,
Inc.
Corporate income tax
21,069,505 22,257,053 1,187,548 21,069,505 -
7
I I
I I I
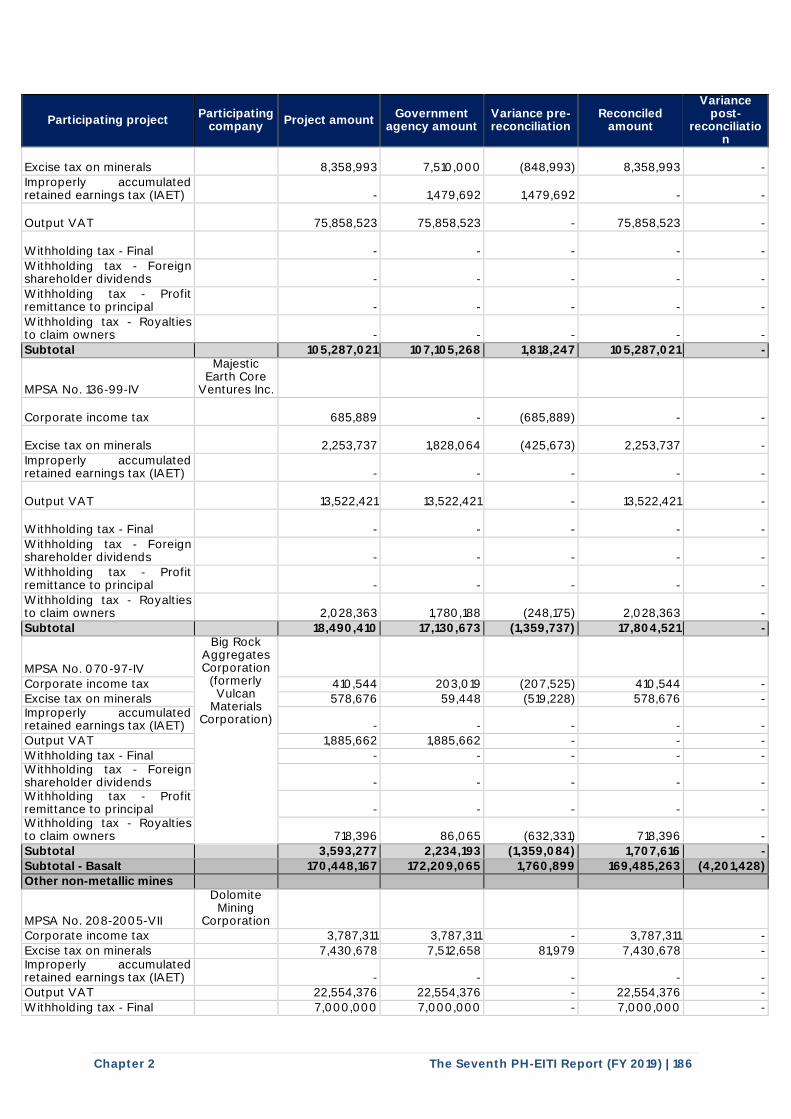
Chapter 2 The Seventh PH-EITI Report (FY 2019) | 186
Participating project Participating
company Project amount
Government agency amount
Variance pre-reconciliation
Reconciled amount
Variance post-
reconciliation
Excise tax on minerals
8,358,993 7,510,000 (848,993) 8,358,993 -
Improperly accumulated retained earnings tax (IAET)
- 1,479,692 1,479,692 - -
Output VAT
75,858,523 75,858,523 - 75,858,523 -
Withholding tax - Final
- - - - -
Withholding tax - Foreign shareholder dividends
- - - - -
Withholding tax - Profit remittance to principal
- - - - -
Withholding tax - Royalties to claim owners
- - - - -
Subtotal 105,287,021 107,105,268 1,818,247 105,287,021 -
MPSA No. 136-99-IV
Majestic Earth Core
Ventures Inc.
Corporate income tax
685,889 - (685,889) - -
Excise tax on minerals
2,253,737 1,828,064 (425,673) 2,253,737 -
Improperly accumulated retained earnings tax (IAET)
- - - - -
Output VAT
13,522,421 13,522,421 - 13,522,421 -
Withholding tax - Final
- - - - -
Withholding tax - Foreign shareholder dividends
- - - - -
Withholding tax - Profit remittance to principal
- - - - -
Withholding tax - Royalties to claim owners
2,028,363 1,780,188 (248,175) 2,028,363 -
Subtotal 18,490,410 17,130,673 (1,359,737) 17,804,521 -
MPSA No. 070-97-IV
Big Rock Aggregates Corporation
(formerly Vulcan
Materials Corporation)
Corporate income tax 410,544 203,019 (207,525) 410,544 - Excise tax on minerals 578,676 59,448 (519,228) 578,676 - Improperly accumulated retained earnings tax (IAET) - - - - -
Output VAT 1,885,662 1,885,662 - - -
Withholding tax - Final - - - - - Withholding tax - Foreign shareholder dividends - - - - - Withholding tax - Profit remittance to principal - - - - - Withholding tax - Royalties to claim owners 718,396 86,065 (632,331) 718,396 -
Subtotal 3,593,277 2,234,193 (1,359,084) 1,707,616 -
Subtotal - Basalt 170,448,167 172,209,065 1,760,899 169,485,263 (4,201,428)
Other non-metallic mines
MPSA No. 208-2005-VII
Dolomite Mining
Corporation Corporate income tax 3,787,311 3,787,311 - 3,787,311 -
Excise tax on minerals 7,430,678 7,512,658 81,979 7,430,678 - Improperly accumulated retained earnings tax (IAET)
- - - - -
Output VAT 22,554,376 22,554,376 - 22,554,376 -
Withholding tax - Final 7,000,000 7,000,000 - 7,000,000 -
I I
I
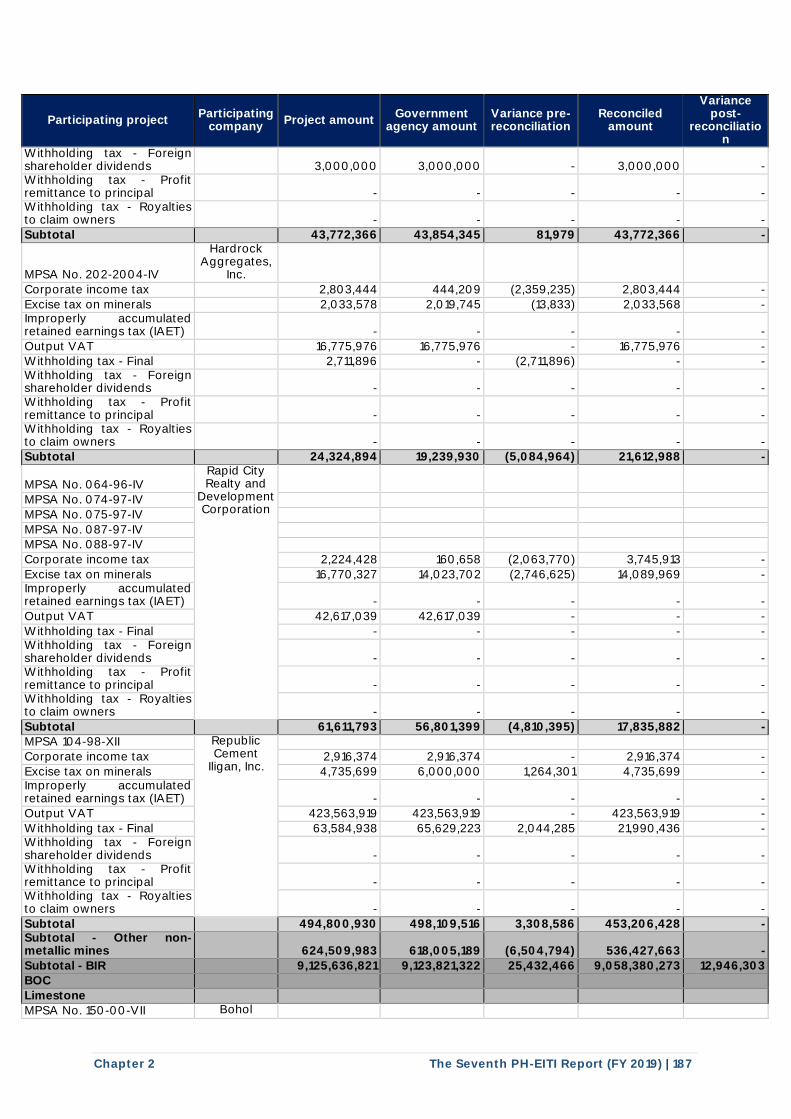
Chapter 2 The Seventh PH-EITI Report (FY 2019) | 187
Participating project Participating
company Project amount
Government agency amount
Variance pre-reconciliation
Reconciled amount
Variance post-
reconciliation
Withholding tax - Foreign shareholder dividends
3,000,000 3,000,000 - 3,000,000 -
Withholding tax - Profit remittance to principal
- - - - -
Withholding tax - Royalties to claim owners
- - - - -
Subtotal 43,772,366 43,854,345 81,979 43,772,366 -
MPSA No. 202-2004-IV
Hardrock Aggregates,
Inc.
Corporate income tax 2,803,444 444,209 (2,359,235) 2,803,444 -
Excise tax on minerals 2,033,578 2,019,745 (13,833) 2,033,568 - Improperly accumulated retained earnings tax (IAET)
- - - - -
Output VAT 16,775,976 16,775,976 - 16,775,976 - Withholding tax - Final 2,711,896 - (2,711,896) - - Withholding tax - Foreign shareholder dividends
- - - - -
Withholding tax - Profit remittance to principal
- - - - -
Withholding tax - Royalties to claim owners
- - - - -
Subtotal 24,324,894 19,239,930 (5,084,964) 21,612,988 -
MPSA No. 064-96-IV Rapid City Realty and
Development Corporation
MPSA No. 074-97-IV
MPSA No. 075-97-IV
MPSA No. 087-97-IV MPSA No. 088-97-IV
Corporate income tax 2,224,428 160,658 (2,063,770) 3,745,913 -
Excise tax on minerals 16,770,327 14,023,702 (2,746,625) 14,089,969 - Improperly accumulated retained earnings tax (IAET) - - - - -
Output VAT 42,617,039 42,617,039 - - -
Withholding tax - Final - - - - - Withholding tax - Foreign shareholder dividends - - - - - Withholding tax - Profit remittance to principal - - - - - Withholding tax - Royalties to claim owners - - - - -
Subtotal 61,611,793 56,801,399 (4,810,395) 17,835,882 - MPSA 104-98-XII Republic
Cement Iligan, Inc.
Corporate income tax 2,916,374 2,916,374 - 2,916,374 -
Excise tax on minerals 4,735,699 6,000,000 1,264,301 4,735,699 - Improperly accumulated retained earnings tax (IAET) - - - - -
Output VAT 423,563,919 423,563,919 - 423,563,919 -
Withholding tax - Final 63,584,938 65,629,223 2,044,285 21,990,436 - Withholding tax - Foreign shareholder dividends - - - - - Withholding tax - Profit remittance to principal - - - - - Withholding tax - Royalties to claim owners - - - - -
Subtotal 494,800,930 498,109,516 3,308,586 453,206,428 - Subtotal - Other non-metallic mines 624,509,983 618,005,189 (6,504,794) 536,427,663 -
Subtotal - BIR 9,125,636,821 9,123,821,322 25,432,466 9,058,380,273 12,946,303 BOC
Limestone
MPSA No. 150-00-VII Bohol
I I
I I I
I
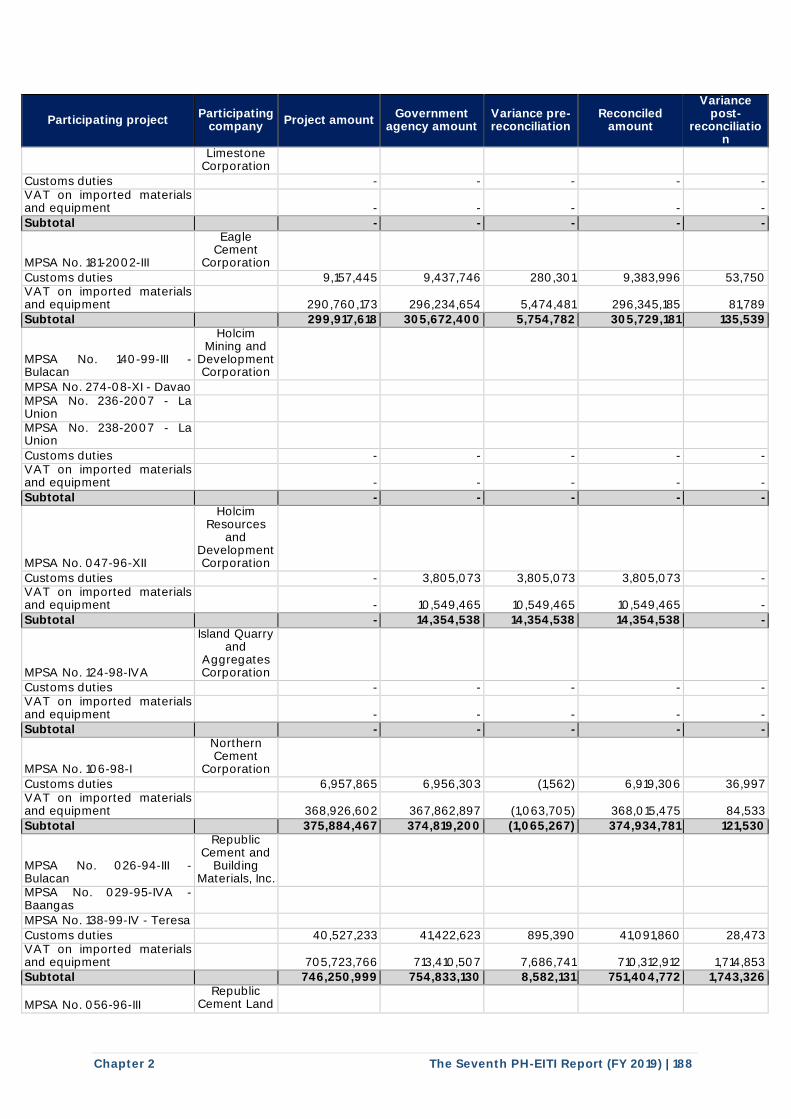
Chapter 2 The Seventh PH-EITI Report (FY 2019) | 188
Participating project Participating
company Project amount
Government agency amount
Variance pre-reconciliation
Reconciled amount
Variance post-
reconciliation
Limestone Corporation
Customs duties - - - - - VAT on imported materials and equipment
- - - - -
Subtotal - - - - -
MPSA No. 181-2002-III
Eagle Cement
Corporation
Customs duties 9,157,445 9,437,746 280,301 9,383,996 53,750 VAT on imported materials and equipment 290,760,173 296,234,654 5,474,481 296,345,185 81,789 Subtotal 299,917,618 305,672,400 5,754,782 305,729,181 135,539
MPSA No. 140-99-III - Bulacan
Holcim Mining and
Development Corporation
MPSA No. 274-08-XI - Davao MPSA No. 236-2007 - La Union
MPSA No. 238-2007 - La Union
Customs duties - - - - - VAT on imported materials and equipment
- - - - -
Subtotal - - - - -
MPSA No. 047-96-XII
Holcim Resources
and Development Corporation
Customs duties - 3,805,073 3,805,073 3,805,073 - VAT on imported materials and equipment
- 10,549,465 10,549,465 10,549,465 -
Subtotal - 14,354,538 14,354,538 14,354,538 -
MPSA No. 124-98-IVA
Island Quarry and
Aggregates Corporation
Customs duties - - - - - VAT on imported materials and equipment
- - - - -
Subtotal - - - - -
MPSA No. 106-98-I
Northern Cement
Corporation
Customs duties 6,957,865 6,956,303 (1,562) 6,919,306 36,997 VAT on imported materials and equipment 368,926,602 367,862,897 (1,063,705) 368,015,475 84,533
Subtotal 375,884,467 374,819,200 (1,065,267) 374,934,781 121,530
MPSA No. 026-94-III - Bulacan
Republic Cement and
Building Materials, Inc.
MPSA No. 029-95-IVA - Baangas
MPSA No. 138-99-IV - Teresa
Customs duties 40,527,233 41,422,623 895,390 41,091,860 28,473 VAT on imported materials and equipment 705,723,766 713,410,507 7,686,741 710,312,912 1,714,853 Subtotal 746,250,999 754,833,130 8,582,131 751,404,772 1,743,326
MPSA No. 056-96-III Republic
Cement Land
I I
I I
I I
I I
I I
I I
1 L L L L 1
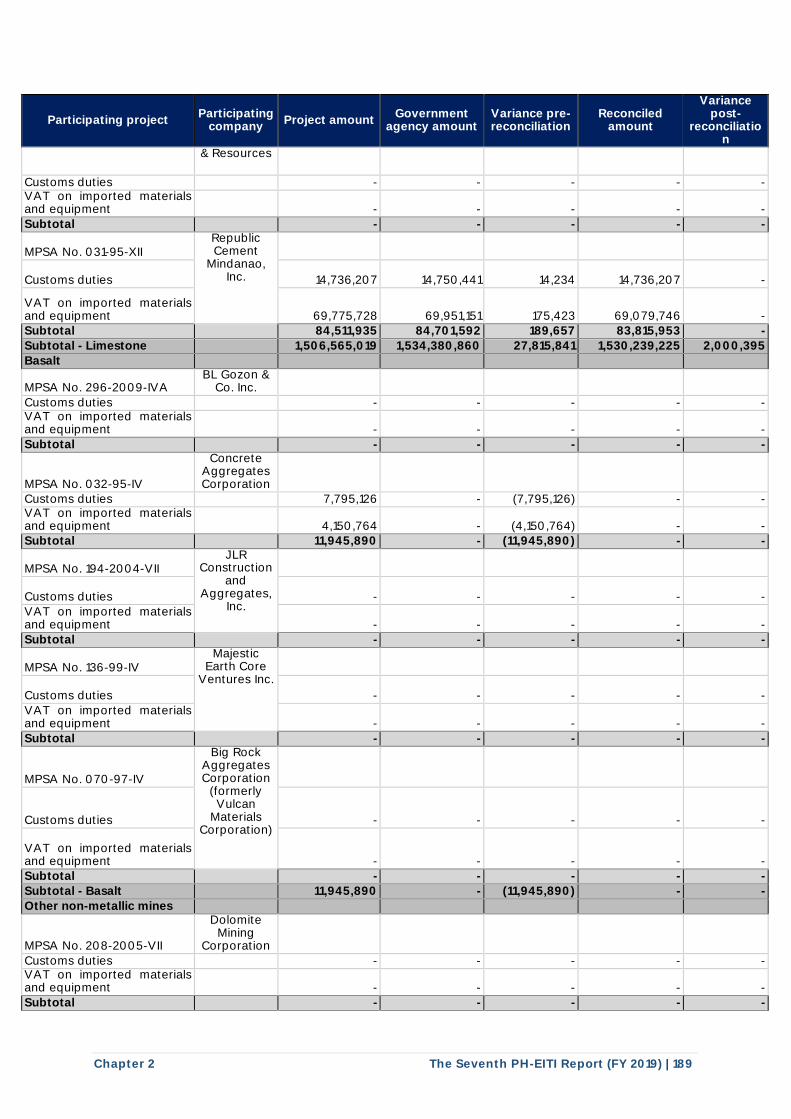
Chapter 2 The Seventh PH-EITI Report (FY 2019) | 189
Participating project Participating
company Project amount
Government agency amount
Variance pre-reconciliation
Reconciled amount
Variance post-
reconciliation
& Resources
Customs duties - - - - - VAT on imported materials and equipment
- - - - -
Subtotal - - - - -
MPSA No. 031-95-XII Republic Cement
Mindanao, Inc.
Customs duties 14,736,207 14,750,441 14,234 14,736,207 -
VAT on imported materials and equipment 69,775,728 69,951,151 175,423 69,079,746 - Subtotal 84,511,935 84,701,592 189,657 83,815,953 -
Subtotal - Limestone 1,506,565,019 1,534,380,860 27,815,841 1,530,239,225 2,000,395
Basalt
MPSA No. 296-2009-IVA BL Gozon &
Co. Inc.
Customs duties - - - - - VAT on imported materials and equipment - - - - -
Subtotal - - - - -
MPSA No. 032-95-IV
Concrete Aggregates Corporation
Customs duties 7,795,126 - (7,795,126) - - VAT on imported materials and equipment
4,150,764 - (4,150,764) - -
Subtotal 11,945,890 - (11,945,890) - -
MPSA No. 194-2004-VII JLR
Construction and
Aggregates, Inc.
Customs duties - - - - -
VAT on imported materials and equipment - - - - -
Subtotal - - - - -
MPSA No. 136-99-IV Majestic
Earth Core Ventures Inc.
Customs duties - - - - -
VAT on imported materials and equipment - - - - -
Subtotal - - - - -
MPSA No. 070-97-IV
Big Rock Aggregates Corporation
(formerly Vulcan
Materials Corporation)
Customs duties - - - - -
VAT on imported materials and equipment - - - - - Subtotal - - - - -
Subtotal - Basalt 11,945,890 - (11,945,890) - -
Other non-metallic mines
MPSA No. 208-2005-VII
Dolomite Mining
Corporation
Customs duties - - - - - VAT on imported materials and equipment - - - - -
Subtotal - - - - -
I I I I I
j l l l l l I
I I
I I I
I
I

Chapter 2 The Seventh PH-EITI Report (FY 2019) | 190
Participating project Participating
company Project amount
Government agency amount
Variance pre-reconciliation
Reconciled amount
Variance post-
reconciliation
MPSA No. 202-2004-IV Hardrock Aggregates,
Inc.
Customs duties - - - - - VAT on imported materials and equipment - - - - - Subtotal - - - - -
MPSA No. 064-96-IV Rapid City Realty and
Development Corporation
MPSA No. 074-97-IV
MPSA No. 075-97-IV
MPSA No. 087-97-IV MPSA No. 088-97-IV
Customs duties - - - - - VAT on imported materials and equipment - - - - -
Subtotal - - - - -
MPSA 104-98-XII Republic Cement
Iligan, Inc.
Customs duties 20,010,116 17,979,677 (2,030,439) 17,979,096 (2,031,020) VAT on imported materials and equipment 168,324,735 158,205,936 (10,118,799) 158,203,237 (10,121,498) Subtotal 188,334,851 176,185,613 (12,149,238) 176,182,333 (12,152,518) Subtotal - Other non-metallic mines 188,334,851 176,185,613 (12,149,238) 176,182,333 (12,152,518) Subtotal - BOC 1,706,845,760 1,710,566,473 3,720,713 1,706,421,558 (10,152,123)
LGU
Limestone
MPSA No. 150-00-VII Bohol Limestone
Corporation
Local business tax (head office) - - - - - Local business tax (mine site) 3,308,840 3,308,840 - 3,308,840 - Real property tax - Basic (head office) 947 - (947) 885 - Real property tax - Basic (mine site) - - - - - Real property tax - SEF (head office) 947 - (947) 885 - Real property tax -SEF (mine site) - - - - -
Subtotal 3,310,735 3,308,840 (1,895) 3,310,610 -
MPSA No. 181-2002-III Eagle Cement
Corporation
Local business tax (head office) 6,800,764 - (6,800,764) 6,800,764 - Local business tax (mine site) 23,607,120 - (23,607,120) 23,607,120 - Real property tax - Basic (head office) - - - - - Real property tax - Basic (mine site) 76,805,245 - (76,805,245) 76,805,245 - Real property tax - SEF (head office) - - - - - Real property tax -SEF (mine site) 76,805,245 - (76,805,245) 76,805,245 - Subtotal 184,018,375 - (184,018,375) 184,018,374 -
MPSA No. 140-99-III - Bulacan
Holcim Mining and
Development Corporation
Local business tax (head office) 3,241,822 - (3,241,822) - (3,241,822) Local business tax (mine site) 1,462,826 - (1,462,826) - (1,462,826) Real property tax - Basic (head office) - - - - - Real property tax - Basic 4,938,989 - (4,938,989) - (4,938,989)
I I I
I I I I I I I I I I
I
I I
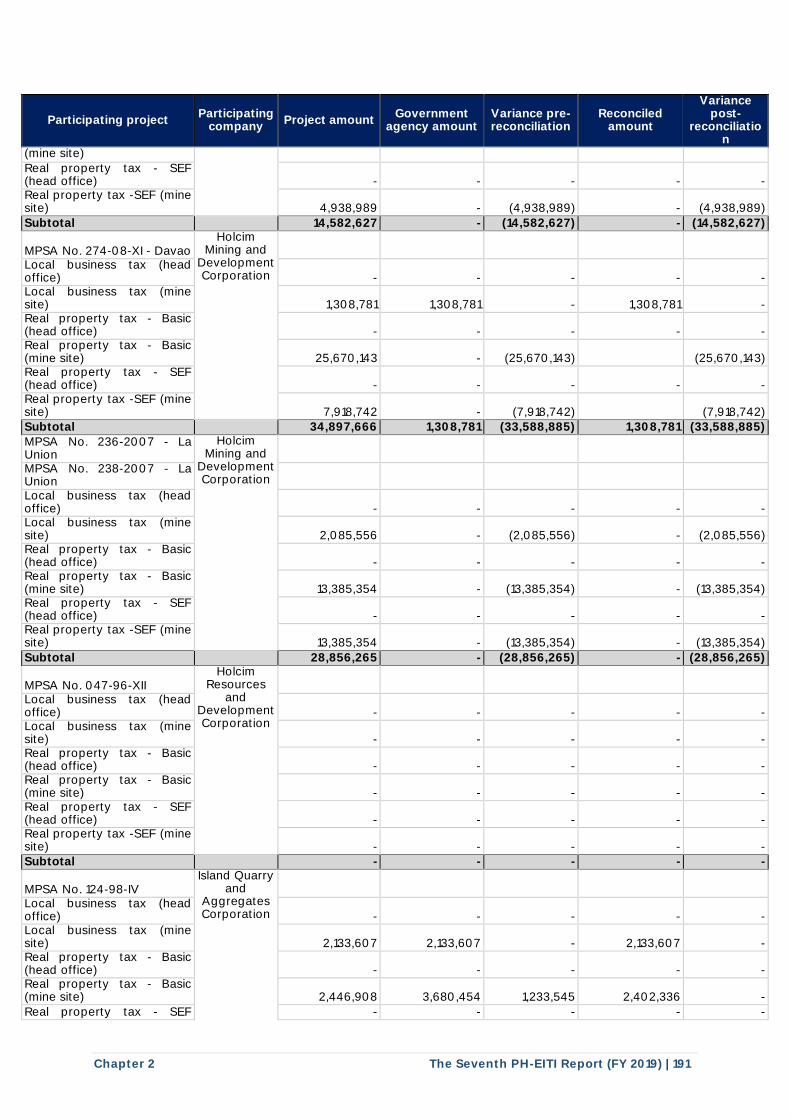
Chapter 2 The Seventh PH-EITI Report (FY 2019) | 191
Participating project Participating
company Project amount
Government agency amount
Variance pre-reconciliation
Reconciled amount
Variance post-
reconciliation
(mine site)
Real property tax - SEF (head office) - - - - - Real property tax -SEF (mine site) 4,938,989 - (4,938,989) - (4,938,989)
Subtotal 14,582,627 - (14,582,627) - (14,582,627)
MPSA No. 274-08-XI - Davao Holcim
Mining and Development Corporation
Local business tax (head office) - - - - - Local business tax (mine site) 1,308,781 1,308,781 - 1,308,781 - Real property tax - Basic (head office) - - - - - Real property tax - Basic (mine site) 25,670,143 - (25,670,143) (25,670,143) Real property tax - SEF (head office) - - - - - Real property tax -SEF (mine site) 7,918,742 - (7,918,742) (7,918,742) Subtotal 34,897,666 1,308,781 (33,588,885) 1,308,781 (33,588,885)
MPSA No. 236-2007 - La Union
Holcim Mining and
Development Corporation
MPSA No. 238-2007 - La Union Local business tax (head office) - - - - - Local business tax (mine site) 2,085,556 - (2,085,556) - (2,085,556) Real property tax - Basic (head office) - - - - - Real property tax - Basic (mine site) 13,385,354 - (13,385,354) - (13,385,354) Real property tax - SEF (head office) - - - - - Real property tax -SEF (mine site) 13,385,354 - (13,385,354) - (13,385,354)
Subtotal 28,856,265 - (28,856,265) - (28,856,265)
MPSA No. 047-96-XII Holcim
Resources and
Development Corporation
Local business tax (head office) - - - - - Local business tax (mine site) - - - - - Real property tax - Basic (head office) - - - - - Real property tax - Basic (mine site) - - - - - Real property tax - SEF (head office) - - - - - Real property tax -SEF (mine site) - - - - - Subtotal - - - - -
MPSA No. 124-98-IV Island Quarry
and Aggregates Corporation
Local business tax (head office) - - - - - Local business tax (mine site) 2,133,607 2,133,607 - 2,133,607 - Real property tax - Basic (head office) - - - - - Real property tax - Basic (mine site) 2,446,908 3,680,454 1,233,545 2,402,336 -
Real property tax - SEF - - - - -
I I I
I I I
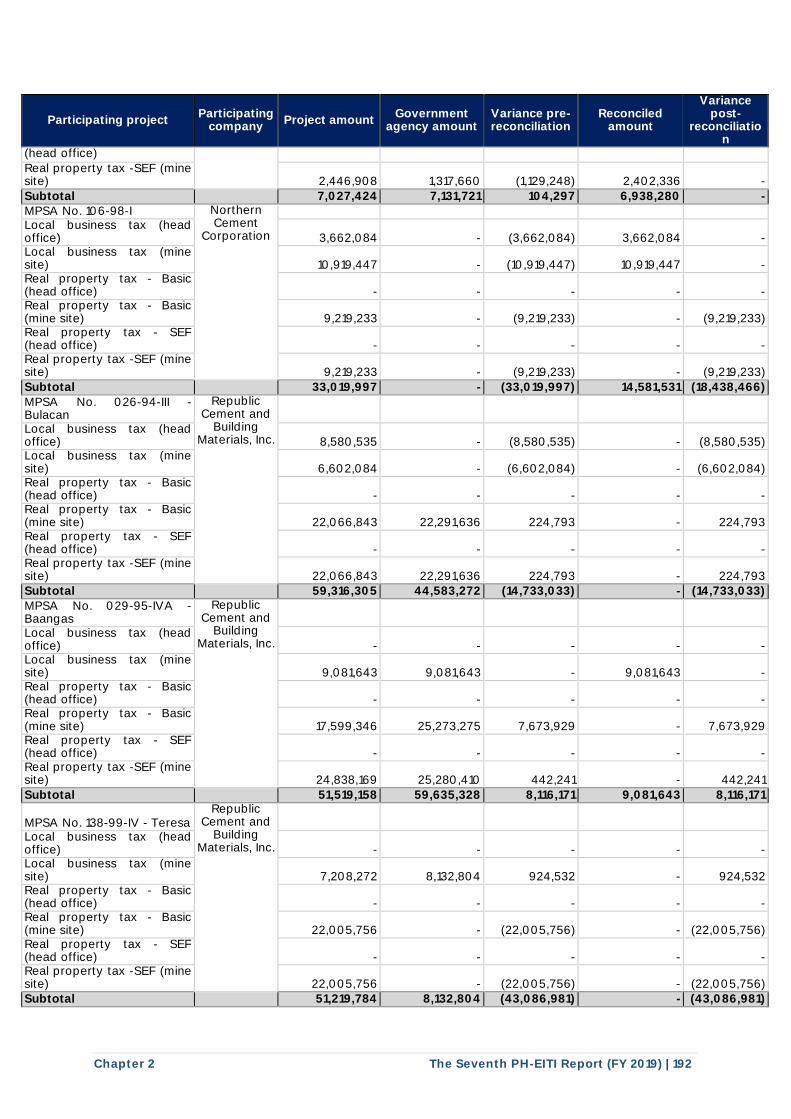
Chapter 2 The Seventh PH-EITI Report (FY 2019) | 192
Participating project Participating
company Project amount
Government agency amount
Variance pre-reconciliation
Reconciled amount
Variance post-
reconciliation
(head office)
Real property tax -SEF (mine site) 2,446,908 1,317,660 (1,129,248) 2,402,336 -
Subtotal 7,027,424 7,131,721 104,297 6,938,280 - MPSA No. 106-98-I Northern
Cement Corporation
Local business tax (head office) 3,662,084 - (3,662,084) 3,662,084 - Local business tax (mine site) 10,919,447 - (10,919,447) 10,919,447 - Real property tax - Basic (head office) - - - - - Real property tax - Basic (mine site) 9,219,233 - (9,219,233) - (9,219,233) Real property tax - SEF (head office) - - - - - Real property tax -SEF (mine site) 9,219,233 - (9,219,233) - (9,219,233)
Subtotal 33,019,997 - (33,019,997) 14,581,531 (18,438,466)
MPSA No. 026-94-III - Bulacan
Republic Cement and
Building Materials, Inc.
Local business tax (head office) 8,580,535 - (8,580,535) - (8,580,535) Local business tax (mine site) 6,602,084 - (6,602,084) - (6,602,084) Real property tax - Basic (head office) - - - - - Real property tax - Basic (mine site) 22,066,843 22,291,636 224,793 - 224,793 Real property tax - SEF (head office) - - - - - Real property tax -SEF (mine site) 22,066,843 22,291,636 224,793 - 224,793 Subtotal 59,316,305 44,583,272 (14,733,033) - (14,733,033)
MPSA No. 029-95-IVA - Baangas
Republic Cement and
Building Materials, Inc.
Local business tax (head office) - - - - - Local business tax (mine site) 9,081,643 9,081,643 - 9,081,643 - Real property tax - Basic (head office) - - - - - Real property tax - Basic (mine site) 17,599,346 25,273,275 7,673,929 - 7,673,929 Real property tax - SEF (head office) - - - - - Real property tax -SEF (mine site) 24,838,169 25,280,410 442,241 - 442,241
Subtotal 51,519,158 59,635,328 8,116,171 9,081,643 8,116,171
MPSA No. 138-99-IV - Teresa Republic
Cement and Building
Materials, Inc.
Local business tax (head office) - - - - - Local business tax (mine site) 7,208,272 8,132,804 924,532 - 924,532 Real property tax - Basic (head office) - - - - - Real property tax - Basic (mine site) 22,005,756 - (22,005,756) - (22,005,756) Real property tax - SEF (head office) - - - - - Real property tax -SEF (mine site) 22,005,756 - (22,005,756) - (22,005,756) Subtotal 51,219,784 8,132,804 (43,086,981) - (43,086,981)
I I I
I I I
I I I
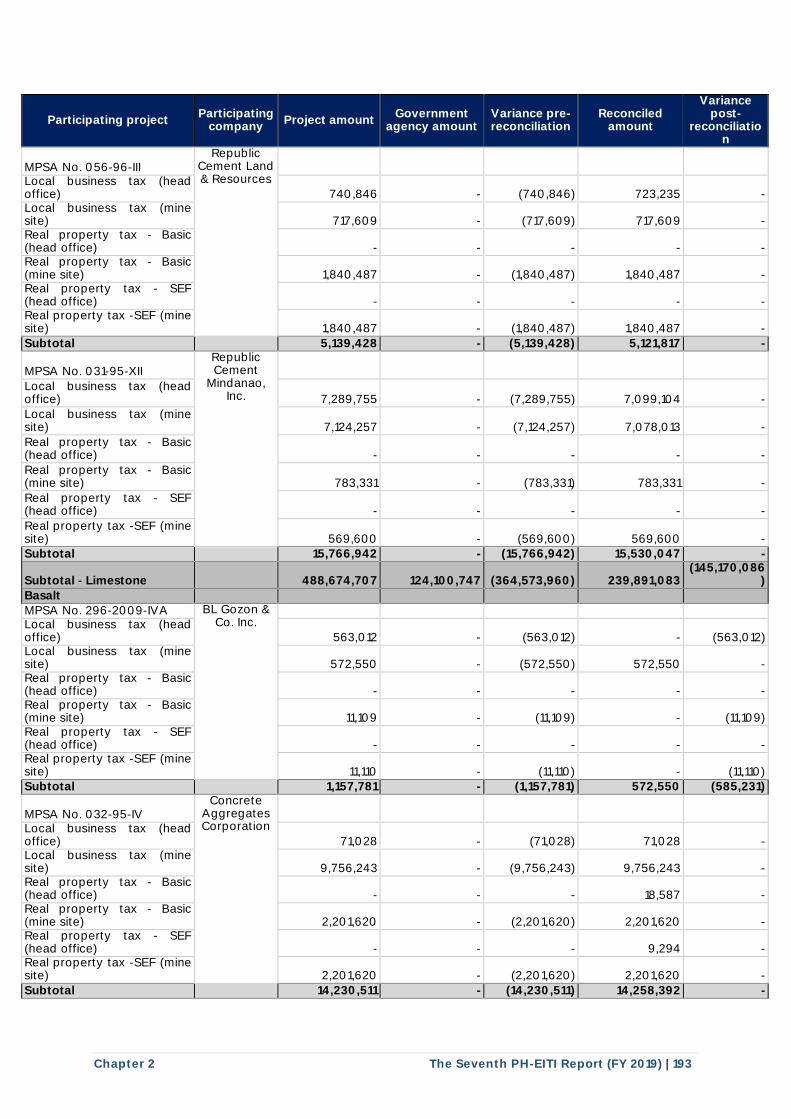
Chapter 2 The Seventh PH-EITI Report (FY 2019) | 193
Participating project Participating
company Project amount
Government agency amount
Variance pre-reconciliation
Reconciled amount
Variance post-
reconciliation
MPSA No. 056-96-III Republic
Cement Land & Resources
Local business tax (head office) 740,846 - (740,846) 723,235 - Local business tax (mine site) 717,609 - (717,609) 717,609 - Real property tax - Basic (head office) - - - - - Real property tax - Basic (mine site) 1,840,487 - (1,840,487) 1,840,487 - Real property tax - SEF (head office) - - - - - Real property tax -SEF (mine site) 1,840,487 - (1,840,487) 1,840,487 -
Subtotal 5,139,428 - (5,139,428) 5,121,817 -
MPSA No. 031-95-XII Republic Cement
Mindanao, Inc.
Local business tax (head office) 7,289,755 - (7,289,755) 7,099,104 -
Local business tax (mine site) 7,124,257 - (7,124,257) 7,078,013 -
Real property tax - Basic (head office) - - - - -
Real property tax - Basic (mine site) 783,331 - (783,331) 783,331 -
Real property tax - SEF (head office) - - - - -
Real property tax -SEF (mine site) 569,600 - (569,600) 569,600 - Subtotal 15,766,942 - (15,766,942) 15,530,047 -
Subtotal - Limestone 488,674,707 124,100,747 (364,573,960) 239,891,083 (145,170,086
)
Basalt
MPSA No. 296-2009-IVA BL Gozon & Co. Inc.
Local business tax (head office) 563,012 - (563,012) - (563,012) Local business tax (mine site) 572,550 - (572,550) 572,550 - Real property tax - Basic (head office) - - - - - Real property tax - Basic (mine site) 11,109 - (11,109) - (11,109) Real property tax - SEF (head office) - - - - - Real property tax -SEF (mine site) 11,110 - (11,110) - (11,110) Subtotal 1,157,781 - (1,157,781) 572,550 (585,231)
MPSA No. 032-95-IV Concrete
Aggregates Corporation
Local business tax (head office) 71,028 - (71,028) 71,028 - Local business tax (mine site) 9,756,243 - (9,756,243) 9,756,243 - Real property tax - Basic (head office) - - - 18,587 - Real property tax - Basic (mine site) 2,201,620 - (2,201,620) 2,201,620 - Real property tax - SEF (head office) - - - 9,294 - Real property tax -SEF (mine site) 2,201,620 - (2,201,620) 2,201,620 -
Subtotal 14,230,511 - (14,230,511) 14,258,392 -
I
I I
I I I
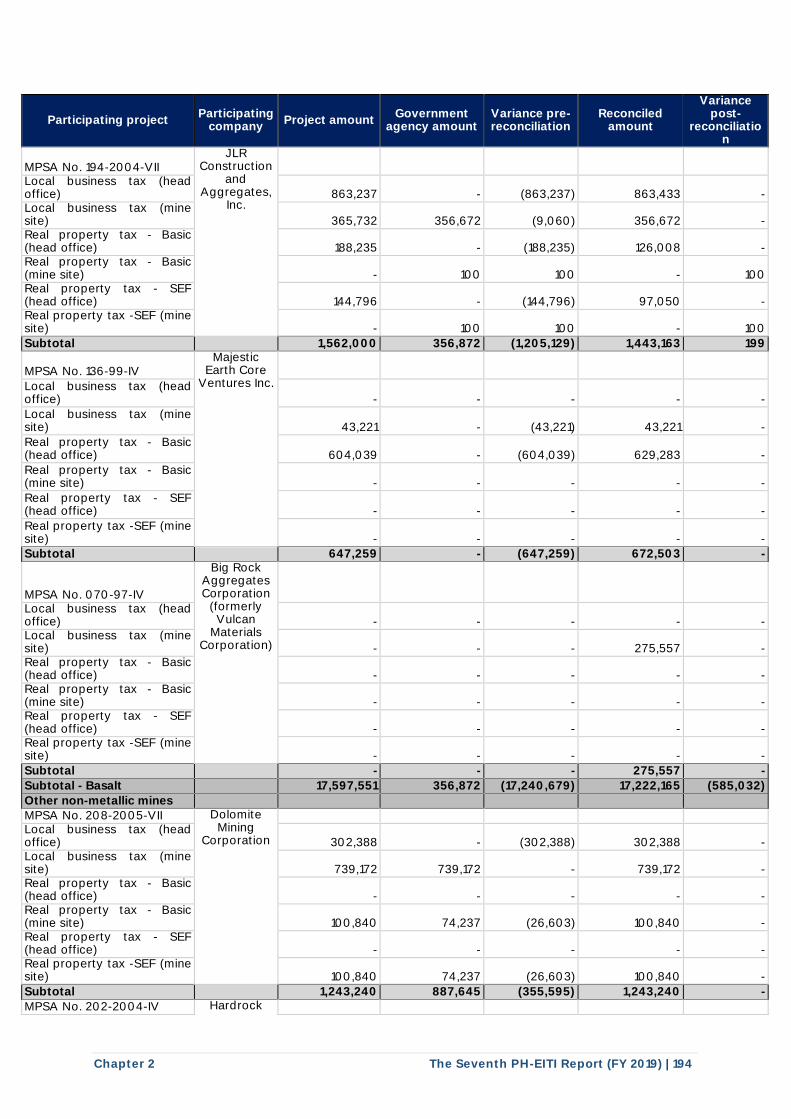
Chapter 2 The Seventh PH-EITI Report (FY 2019) | 194
Participating project Participating
company Project amount
Government agency amount
Variance pre-reconciliation
Reconciled amount
Variance post-
reconciliation
MPSA No. 194-2004-VII JLR
Construction and
Aggregates, Inc.
Local business tax (head office) 863,237 - (863,237) 863,433 - Local business tax (mine site) 365,732 356,672 (9,060) 356,672 - Real property tax - Basic (head office) 188,235 - (188,235) 126,008 - Real property tax - Basic (mine site) - 100 100 - 100 Real property tax - SEF (head office) 144,796 - (144,796) 97,050 - Real property tax -SEF (mine site) - 100 100 - 100
Subtotal 1,562,000 356,872 (1,205,129) 1,443,163 199
MPSA No. 136-99-IV Majestic
Earth Core Ventures Inc.
Local business tax (head office) - - - - -
Local business tax (mine site) 43,221 - (43,221) 43,221 -
Real property tax - Basic (head office) 604,039 - (604,039) 629,283 -
Real property tax - Basic (mine site) - - - - -
Real property tax - SEF (head office) - - - - -
Real property tax -SEF (mine site) - - - - - Subtotal 647,259 - (647,259) 672,503 -
MPSA No. 070-97-IV
Big Rock Aggregates Corporation
(formerly Vulcan
Materials Corporation)
Local business tax (head office) - - - - - Local business tax (mine site) - - - 275,557 - Real property tax - Basic (head office) - - - - - Real property tax - Basic (mine site) - - - - - Real property tax - SEF (head office) - - - - - Real property tax -SEF (mine site) - - - - -
Subtotal - - - 275,557 -
Subtotal - Basalt 17,597,551 356,872 (17,240,679) 17,222,165 (585,032)
Other non-metallic mines MPSA No. 208-2005-VII Dolomite
Mining Corporation
Local business tax (head office) 302,388 - (302,388) 302,388 - Local business tax (mine site) 739,172 739,172 - 739,172 - Real property tax - Basic (head office) - - - - - Real property tax - Basic (mine site) 100,840 74,237 (26,603) 100,840 - Real property tax - SEF (head office) - - - - - Real property tax -SEF (mine site) 100,840 74,237 (26,603) 100,840 -
Subtotal 1,243,240 887,645 (355,595) 1,243,240 -
MPSA No. 202-2004-IV Hardrock
I I I
I
I I
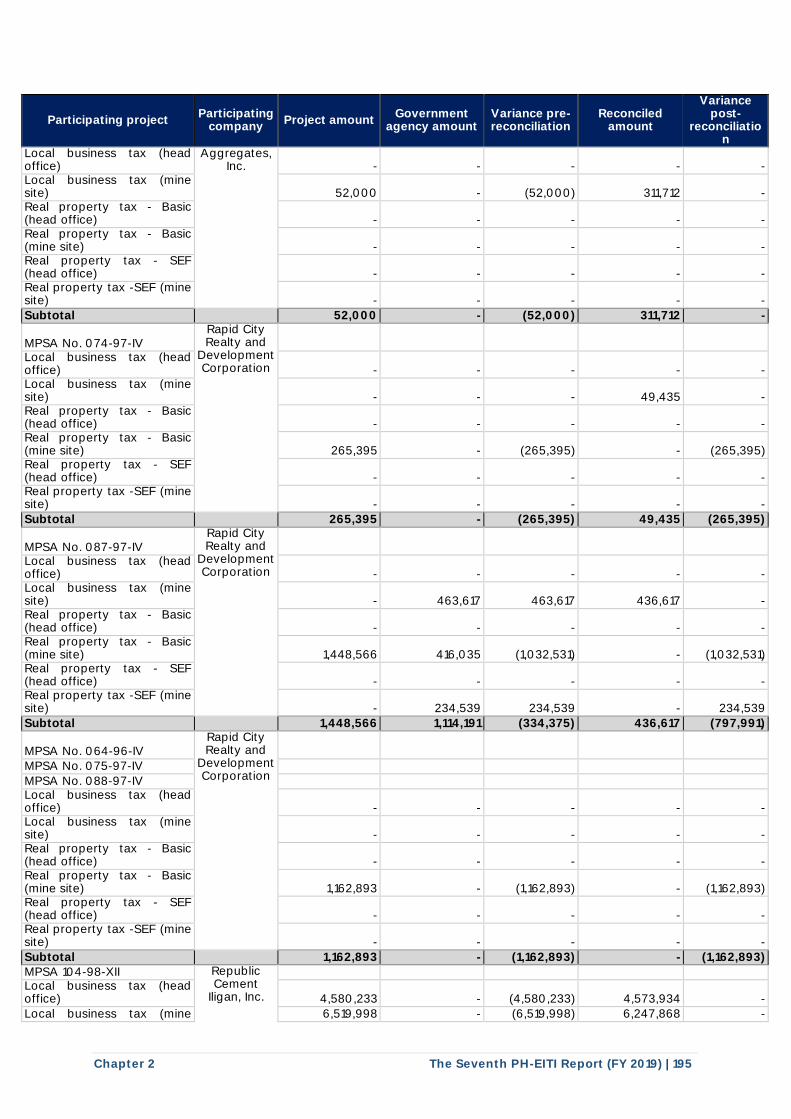
Chapter 2 The Seventh PH-EITI Report (FY 2019) | 195
Participating project Participating
company Project amount
Government agency amount
Variance pre-reconciliation
Reconciled amount
Variance post-
reconciliation
Local business tax (head office)
Aggregates, Inc. - - - - -
Local business tax (mine site) 52,000 - (52,000) 311,712 - Real property tax - Basic (head office) - - - - - Real property tax - Basic (mine site) - - - - - Real property tax - SEF (head office) - - - - - Real property tax -SEF (mine site) - - - - -
Subtotal 52,000 - (52,000) 311,712 -
MPSA No. 074-97-IV Rapid City Realty and
Development Corporation
Local business tax (head office) - - - - - Local business tax (mine site) - - - 49,435 - Real property tax - Basic (head office) - - - - - Real property tax - Basic (mine site) 265,395 - (265,395) - (265,395) Real property tax - SEF (head office) - - - - - Real property tax -SEF (mine site) - - - - -
Subtotal 265,395 - (265,395) 49,435 (265,395)
MPSA No. 087-97-IV Rapid City Realty and
Development Corporation
Local business tax (head office) - - - - - Local business tax (mine site) - 463,617 463,617 436,617 - Real property tax - Basic (head office) - - - - - Real property tax - Basic (mine site) 1,448,566 416,035 (1,032,531) - (1,032,531) Real property tax - SEF (head office) - - - - - Real property tax -SEF (mine site) - 234,539 234,539 - 234,539
Subtotal 1,448,566 1,114,191 (334,375) 436,617 (797,991)
MPSA No. 064-96-IV Rapid City Realty and
Development Corporation
MPSA No. 075-97-IV
MPSA No. 088-97-IV Local business tax (head office) - - - - - Local business tax (mine site) - - - - - Real property tax - Basic (head office) - - - - - Real property tax - Basic (mine site) 1,162,893 - (1,162,893) - (1,162,893) Real property tax - SEF (head office) - - - - - Real property tax -SEF (mine site) - - - - -
Subtotal 1,162,893 - (1,162,893) - (1,162,893) MPSA 104-98-XII Republic
Cement Iligan, Inc.
Local business tax (head office) 4,580,233 - (4,580,233) 4,573,934 -
Local business tax (mine 6,519,998 - (6,519,998) 6,247,868 -
I I I
I I I
I I I
l l l l
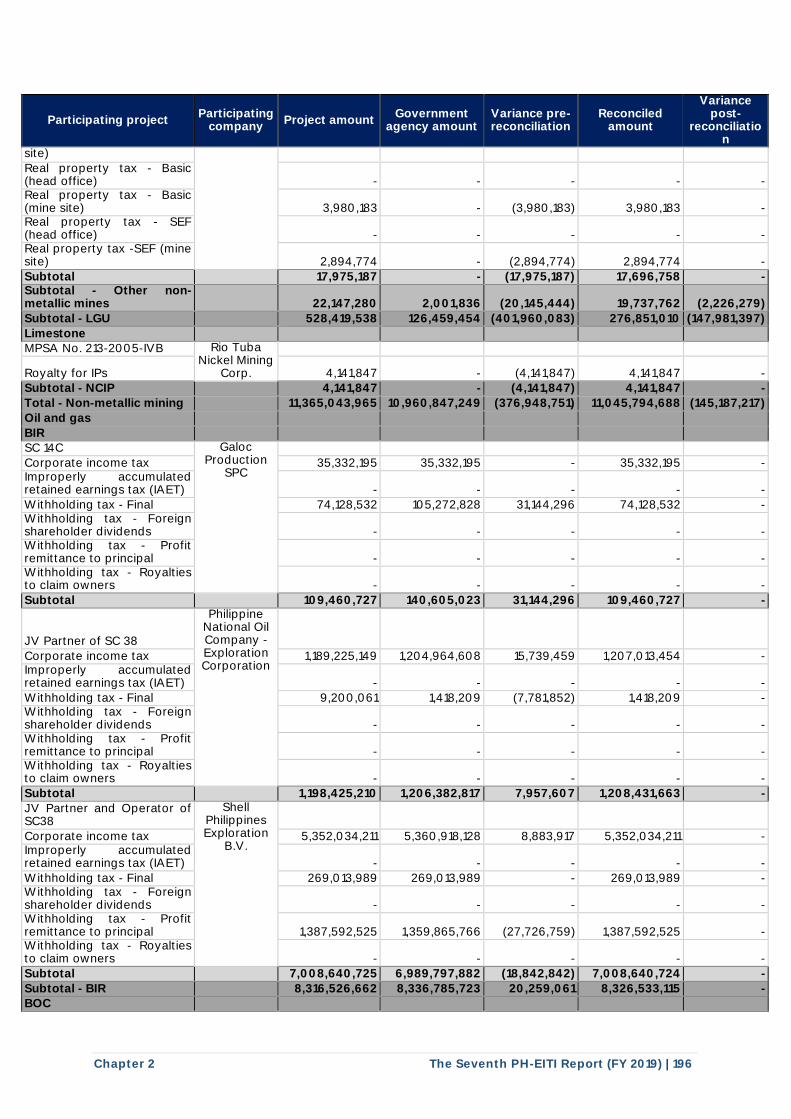
Chapter 2 The Seventh PH-EITI Report (FY 2019) | 196
Participating project Participating
company Project amount
Government agency amount
Variance pre-reconciliation
Reconciled amount
Variance post-
reconciliation
site)
Real property tax - Basic (head office) - - - - - Real property tax - Basic (mine site) 3,980,183 - (3,980,183) 3,980,183 - Real property tax - SEF (head office) - - - - - Real property tax -SEF (mine site) 2,894,774 - (2,894,774) 2,894,774 -
Subtotal 17,975,187 - (17,975,187) 17,696,758 - Subtotal - Other non-metallic mines 22,147,280 2,001,836 (20,145,444) 19,737,762 (2,226,279)
Subtotal - LGU 528,419,538 126,459,454 (401,960,083) 276,851,010 (147,981,397)
Limestone MPSA No. 213-2005-IVB Rio Tuba
Nickel Mining Corp.
Royalty for IPs 4,141,847 - (4,141,847) 4,141,847 - Subtotal - NCIP 4,141,847 - (4,141,847) 4,141,847 -
Total - Non-metallic mining 11,365,043,965 10,960,847,249 (376,948,751) 11,045,794,688 (145,187,217)
Oil and gas
BIR SC 14C Galoc
Production SPC
Corporate income tax 35,332,195 35,332,195 - 35,332,195 - Improperly accumulated retained earnings tax (IAET) - - - - -
Withholding tax - Final 74,128,532 105,272,828 31,144,296 74,128,532 - Withholding tax - Foreign shareholder dividends - - - - - Withholding tax - Profit remittance to principal - - - - - Withholding tax - Royalties to claim owners - - - - -
Subtotal 109,460,727 140,605,023 31,144,296 109,460,727 -
JV Partner of SC 38
Philippine National Oil Company - Exploration Corporation
Corporate income tax 1,189,225,149 1,204,964,608 15,739,459 1,207,013,454 - Improperly accumulated retained earnings tax (IAET) - - - - -
Withholding tax - Final 9,200,061 1,418,209 (7,781,852) 1,418,209 - Withholding tax - Foreign shareholder dividends - - - - - Withholding tax - Profit remittance to principal - - - - - Withholding tax - Royalties to claim owners - - - - -
Subtotal 1,198,425,210 1,206,382,817 7,957,607 1,208,431,663 -
JV Partner and Operator of SC38
Shell Philippines Exploration
B.V.
Corporate income tax 5,352,034,211 5,360,918,128 8,883,917 5,352,034,211 - Improperly accumulated retained earnings tax (IAET) - - - - -
Withholding tax - Final 269,013,989 269,013,989 - 269,013,989 - Withholding tax - Foreign shareholder dividends - - - - - Withholding tax - Profit remittance to principal 1,387,592,525 1,359,865,766 (27,726,759) 1,387,592,525 - Withholding tax - Royalties to claim owners - - - - -
Subtotal 7,008,640,725 6,989,797,882 (18,842,842) 7,008,640,724 -
Subtotal - BIR 8,316,526,662 8,336,785,723 20,259,061 8,326,533,115 - BOC
I I I
I
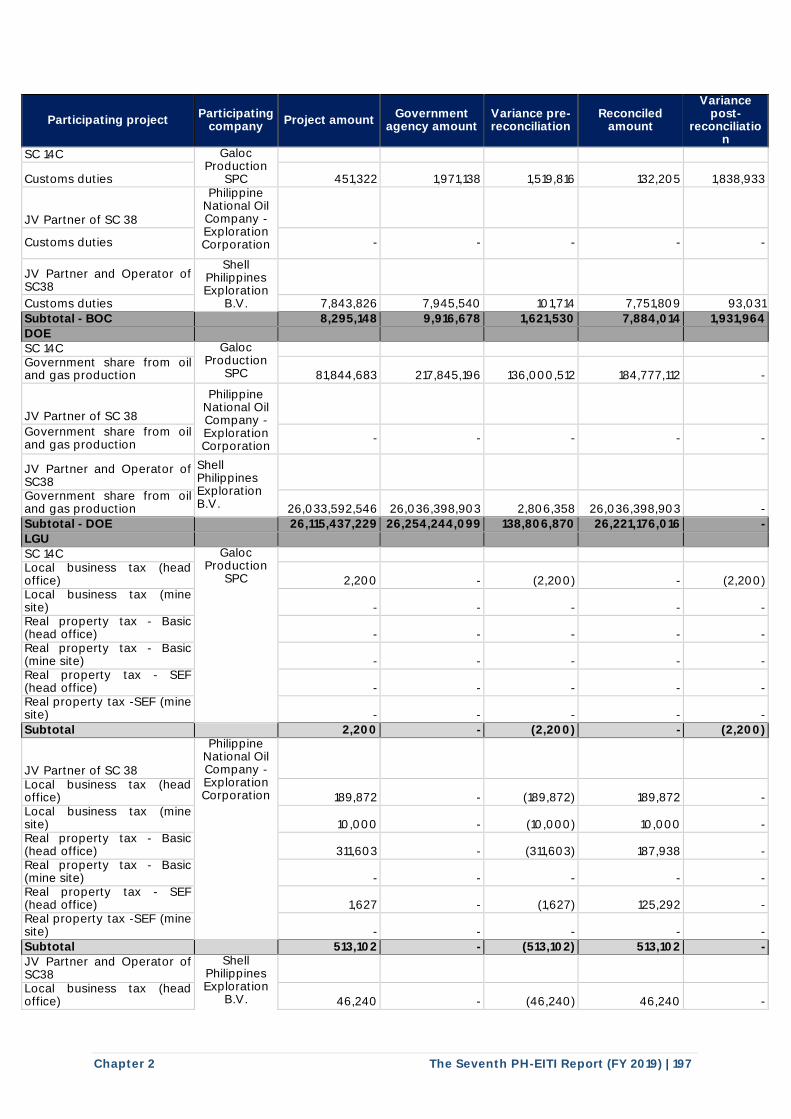
Chapter 2 The Seventh PH-EITI Report (FY 2019) | 197
Participating project Participating
company Project amount
Government agency amount
Variance pre-reconciliation
Reconciled amount
Variance post-
reconciliation
SC 14C Galoc Production
SPC
Customs duties 451,322 1,971,138 1,519,816 132,205 1,838,933
JV Partner of SC 38
Philippine National Oil Company - Exploration Corporation
Customs duties - - - - -
JV Partner and Operator of SC38
Shell Philippines Exploration
B.V.
Customs duties 7,843,826 7,945,540 101,714 7,751,809 93,031
Subtotal - BOC 8,295,148 9,916,678 1,621,530 7,884,014 1,931,964
DOE SC 14C Galoc
Production SPC
Government share from oil and gas production 81,844,683 217,845,196 136,000,512 184,777,112 -
JV Partner of SC 38
Philippine National Oil Company - Exploration Corporation
Government share from oil and gas production
- - - - -
JV Partner and Operator of SC38
Shell Philippines Exploration B.V.
Government share from oil and gas production 26,033,592,546 26,036,398,903 2,806,358 26,036,398,903 -
Subtotal - DOE 26,115,437,229 26,254,244,099 138,806,870 26,221,176,016 -
LGU
SC 14C Galoc Production
SPC
Local business tax (head office) 2,200 - (2,200) - (2,200) Local business tax (mine site) - - - - - Real property tax - Basic (head office) - - - - - Real property tax - Basic (mine site) - - - - - Real property tax - SEF (head office) - - - - - Real property tax -SEF (mine site) - - - - -
Subtotal 2,200 - (2,200) - (2,200)
JV Partner of SC 38
Philippine National Oil Company - Exploration Corporation
Local business tax (head office) 189,872 - (189,872) 189,872 - Local business tax (mine site) 10,000 - (10,000) 10,000 - Real property tax - Basic (head office) 311,603 - (311,603) 187,938 - Real property tax - Basic (mine site) - - - - - Real property tax - SEF (head office) 1,627 - (1,627) 125,292 - Real property tax -SEF (mine site) - - - - -
Subtotal 513,102 - (513,102) 513,102 -
JV Partner and Operator of SC38
Shell Philippines Exploration
B.V.
Local business tax (head office) 46,240 - (46,240) 46,240 -
I I I
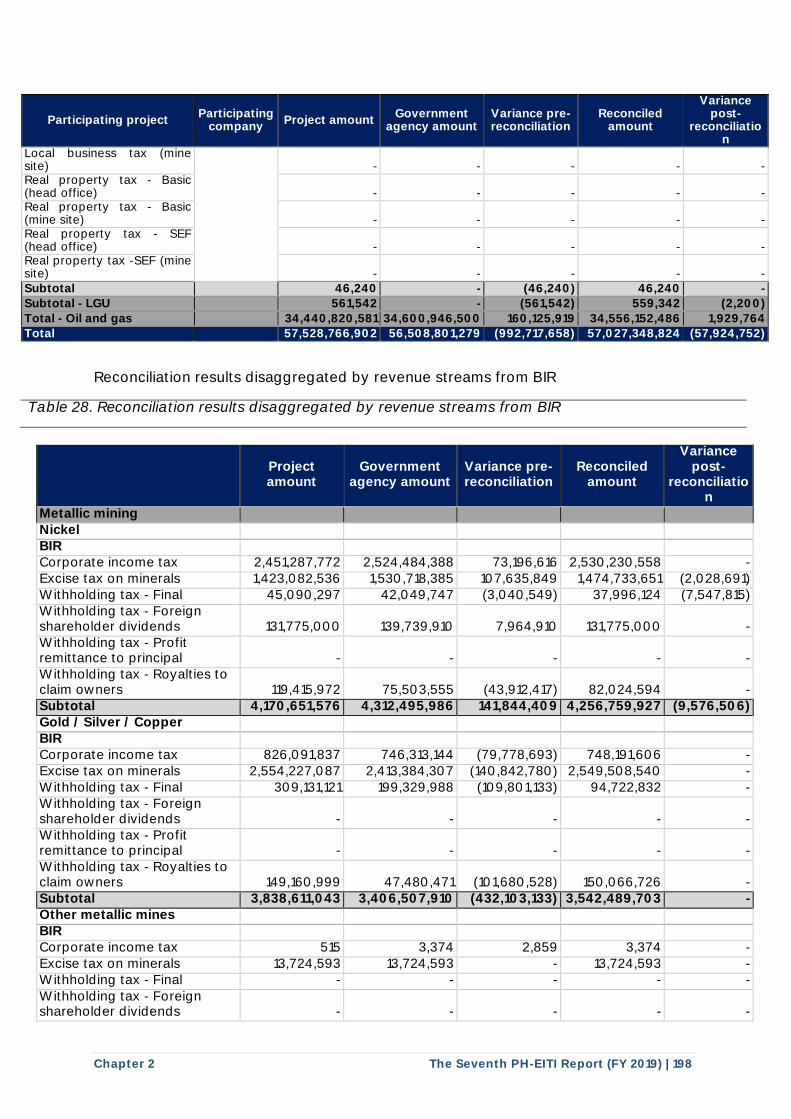
Chapter 2 The Seventh PH-EITI Report (FY 2019) | 198
Participating project Participating
company Project amount
Government agency amount
Variance pre-reconciliation
Reconciled amount
Variance post-
reconciliation
Local business tax (mine site) - - - - - Real property tax - Basic (head office) - - - - - Real property tax - Basic (mine site) - - - - - Real property tax - SEF (head office) - - - - - Real property tax -SEF (mine site) - - - - - Subtotal 46,240 - (46,240) 46,240 -
Subtotal - LGU 561,542 - (561,542) 559,342 (2,200)
Total - Oil and gas 34,440,820,581 34,600,946,500 160,125,919 34,556,152,486 1,929,764
Total 57,528,766,902 56,508,801,279 (992,717,658) 57,027,348,824 (57,924,752)
Reconciliation results disaggregated by revenue streams from BIR
Table 28. Reconciliation results disaggregated by revenue streams from BIR
Project amount
Government agency amount
Variance pre-reconciliation
Reconciled amount
Variance post-
reconciliation
Metallic mining Nickel BIR Corporate income tax 2,451,287,772 2,524,484,388 73,196,616 2,530,230,558 - Excise tax on minerals 1,423,082,536 1,530,718,385 107,635,849 1,474,733,651 (2,028,691) Withholding tax - Final 45,090,297 42,049,747 (3,040,549) 37,996,124 (7,547,815) Withholding tax - Foreign shareholder dividends 131,775,000 139,739,910 7,964,910 131,775,000 - Withholding tax - Profit remittance to principal - - - - - Withholding tax - Royalties to claim owners 119,415,972 75,503,555 (43,912,417) 82,024,594 - Subtotal 4,170,651,576 4,312,495,986 141,844,409 4,256,759,927 (9,576,506) Gold / Silver / Copper BIR Corporate income tax 826,091,837 746,313,144 (79,778,693) 748,191,606 - Excise tax on minerals 2,554,227,087 2,413,384,307 (140,842,780) 2,549,508,540 - Withholding tax - Final 309,131,121 199,329,988 (109,801,133) 94,722,832 - Withholding tax - Foreign shareholder dividends - - - - - Withholding tax - Profit remittance to principal - - - - - Withholding tax - Royalties to claim owners 149,160,999 47,480,471 (101,680,528) 150,066,726 - Subtotal 3,838,611,043 3,406,507,910 (432,103,133) 3,542,489,703 - Other metallic mines BIR Corporate income tax 515 3,374 2,859 3,374 - Excise tax on minerals 13,724,593 13,724,593 - 13,724,593 - Withholding tax - Final - - - - - Withholding tax - Foreign shareholder dividends - - - - -
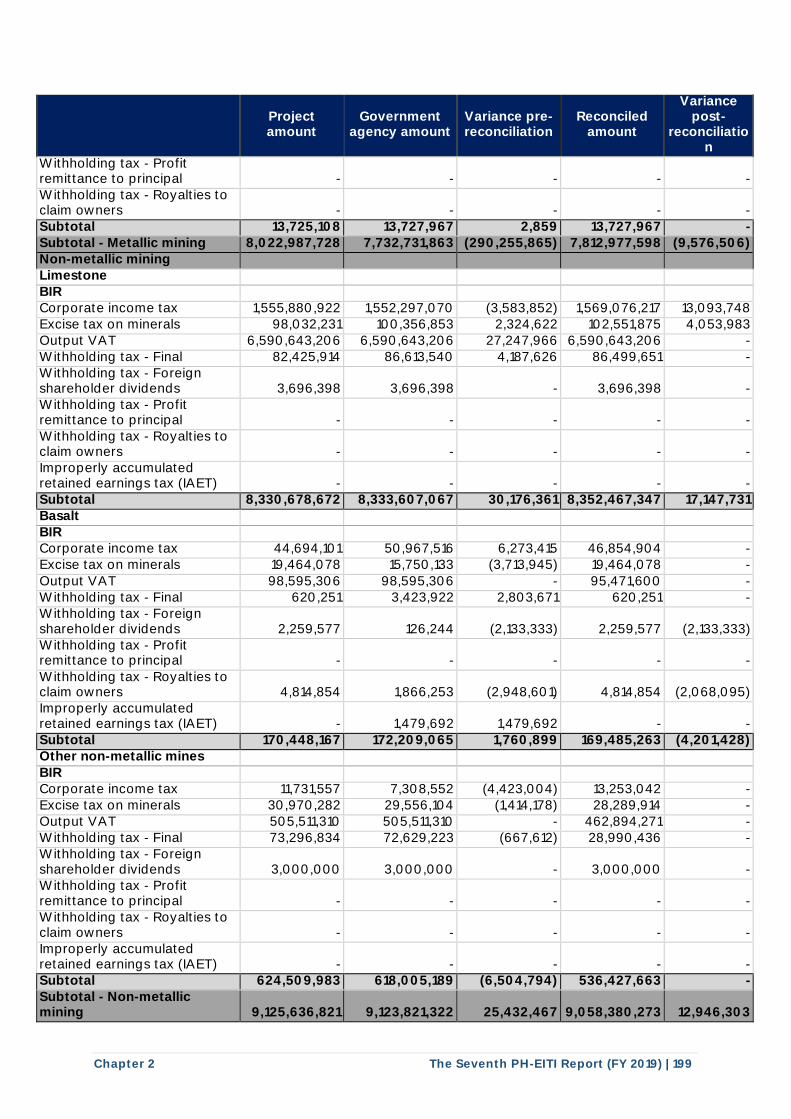
Chapter 2 The Seventh PH-EITI Report (FY 2019) | 199
Project amount
Government agency amount
Variance pre-reconciliation
Reconciled amount
Variance post-
reconciliation
Withholding tax - Profit remittance to principal - - - - - Withholding tax - Royalties to claim owners - - - - - Subtotal 13,725,108 13,727,967 2,859 13,727,967 - Subtotal - Metallic mining 8,022,987,728 7,732,731,863 (290,255,865) 7,812,977,598 (9,576,506) Non-metallic mining Limestone BIR Corporate income tax 1,555,880,922 1,552,297,070 (3,583,852) 1,569,076,217 13,093,748 Excise tax on minerals 98,032,231 100,356,853 2,324,622 102,551,875 4,053,983 Output VAT 6,590,643,206 6,590,643,206 27,247,966 6,590,643,206 - Withholding tax - Final 82,425,914 86,613,540 4,187,626 86,499,651 - Withholding tax - Foreign shareholder dividends 3,696,398 3,696,398 - 3,696,398 - Withholding tax - Profit remittance to principal - - - - - Withholding tax - Royalties to claim owners - - - - - Improperly accumulated retained earnings tax (IAET) - - - - - Subtotal 8,330,678,672 8,333,607,067 30,176,361 8,352,467,347 17,147,731 Basalt BIR Corporate income tax 44,694,101 50,967,516 6,273,415 46,854,904 - Excise tax on minerals 19,464,078 15,750,133 (3,713,945) 19,464,078 - Output VAT 98,595,306 98,595,306 - 95,471,600 - Withholding tax - Final 620,251 3,423,922 2,803,671 620,251 - Withholding tax - Foreign shareholder dividends 2,259,577 126,244 (2,133,333) 2,259,577 (2,133,333) Withholding tax - Profit remittance to principal - - - - - Withholding tax - Royalties to claim owners 4,814,854 1,866,253 (2,948,601) 4,814,854 (2,068,095) Improperly accumulated retained earnings tax (IAET) - 1,479,692 1,479,692 - - Subtotal 170,448,167 172,209,065 1,760,899 169,485,263 (4,201,428) Other non-metallic mines BIR Corporate income tax 11,731,557 7,308,552 (4,423,004) 13,253,042 - Excise tax on minerals 30,970,282 29,556,104 (1,414,178) 28,289,914 - Output VAT 505,511,310 505,511,310 - 462,894,271 - Withholding tax - Final 73,296,834 72,629,223 (667,612) 28,990,436 - Withholding tax - Foreign shareholder dividends 3,000,000 3,000,000 - 3,000,000 - Withholding tax - Profit remittance to principal - - - - - Withholding tax - Royalties to claim owners - - - - - Improperly accumulated retained earnings tax (IAET) - - - - - Subtotal 624,509,983 618,005,189 (6,504,794) 536,427,663 - Subtotal - Non-metallic mining 9,125,636,821 9,123,821,322 25,432,467 9,058,380,273 12,946,303
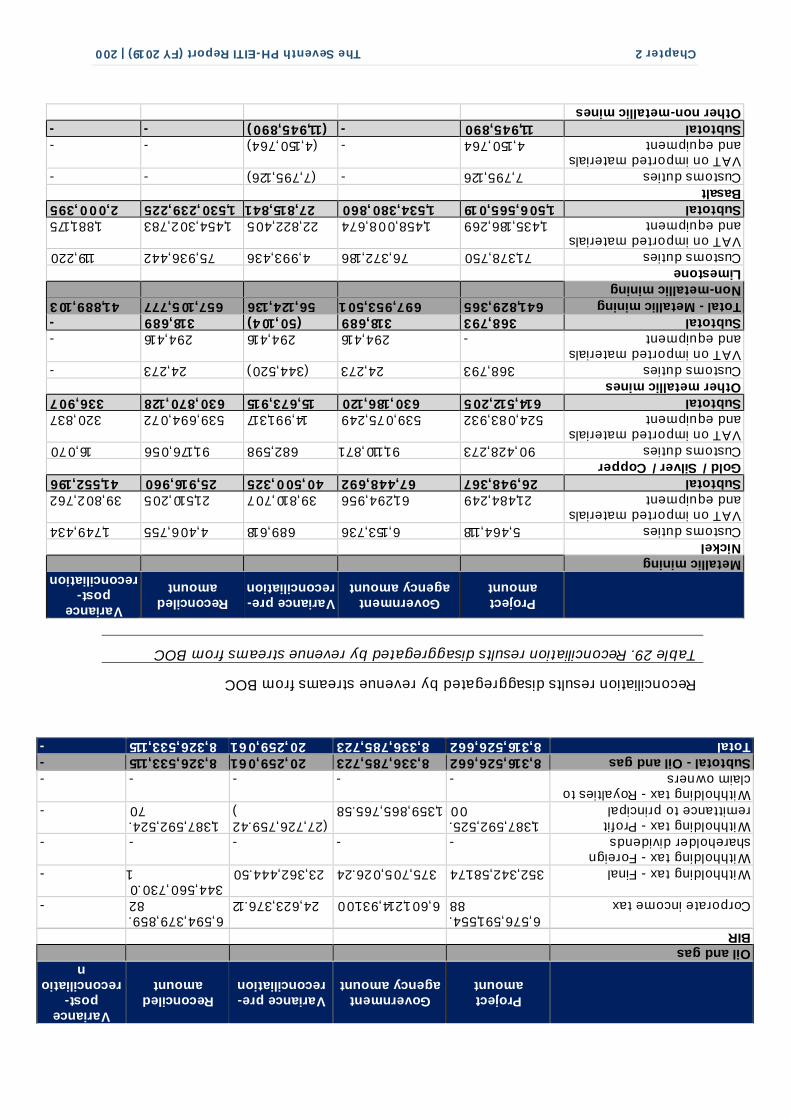
Chapter 2 The Seventh PH-EITI Report (FY 2019) | 200
Project amount
Government agency amount
Variance pre-reconciliation
Reconciled amount
Variance post-
reconciliation
Oil and gas BIR
Corporate income tax 6,576,591,554.
88 6,601,214,931.00 24,623,376.12 6,594,379,859.
82 -
Withholding tax - Final 352,342,581.74 375,705,026.24 23,362,444.50 344,560,730.0
1 - Withholding tax - Foreign shareholder dividends - - - - - Withholding tax - Profit remittance to principal
1,387,592,525.00 1,359,865,765.58
(27,726,759.42)
1,387,592,524.70 -
Withholding tax - Royalties to claim owners - - - - - Subtotal - Oil and gas 8,316,526,662 8,336,785,723 20,259,061 8,326,533,115 - Total 8,316,526,662 8,336,785,723 20,259,061 8,326,533,115 -
Reconciliation results disaggregated by revenue streams from BOC Table 29. Reconciliation results disaggregated by revenue streams from BOC
Project amount
Government agency amount
Variance pre-reconciliation
Reconciled amount
Variance post-
reconciliation Metallic mining Nickel Customs duties 5,464,118 6,153,736 689,618 4,406,755 1,749,434 VAT on imported materials and equipment 21,484,249 61,294,956 39,810,707 21,510,205 39,802,762 Subtotal 26,948,367 67,448,692 40,500,325 25,916,960 41,552,196 Gold / Silver / Copper Customs duties 90,428,273 91,110,871 682,598 91,176,056 16,070 VAT on imported materials and equipment 524,083,932 539,075,249 14,991,317 539,694,072 320,837 Subtotal 614,512,205 630,186,120 15,673,915 630,870,128 336,907 Other metallic mines Customs duties 368,793 24,273 (344,520) 24,273 - VAT on imported materials and equipment - 294,416 294,416 294,416 - Subtotal 368,793 318,689 (50,104) 318,689 - Total - Metallic mining 641,829,365 697,953,501 56,124,136 657,105,777 41,889,103 Non-metallic mining Limestone Customs duties 71,378,750 76,372,186 4,993,436 75,936,442 119,220 VAT on imported materials and equipment 1,435,186,269 1,458,008,674 22,822,405 1,454,302,783 1,881,175 Subtotal 1,506,565,019 1,534,380,860 27,815,841 1,530,239,225 2,000,395 Basalt Customs duties 7,795,126 - (7,795,126) - - VAT on imported materials and equipment 4,150,764 - (4,150,764) - - Subtotal 11,945,890 - (11,945,890) - - Other non-metallic mines l
j
j t t t t
j t t t t
j t t t t
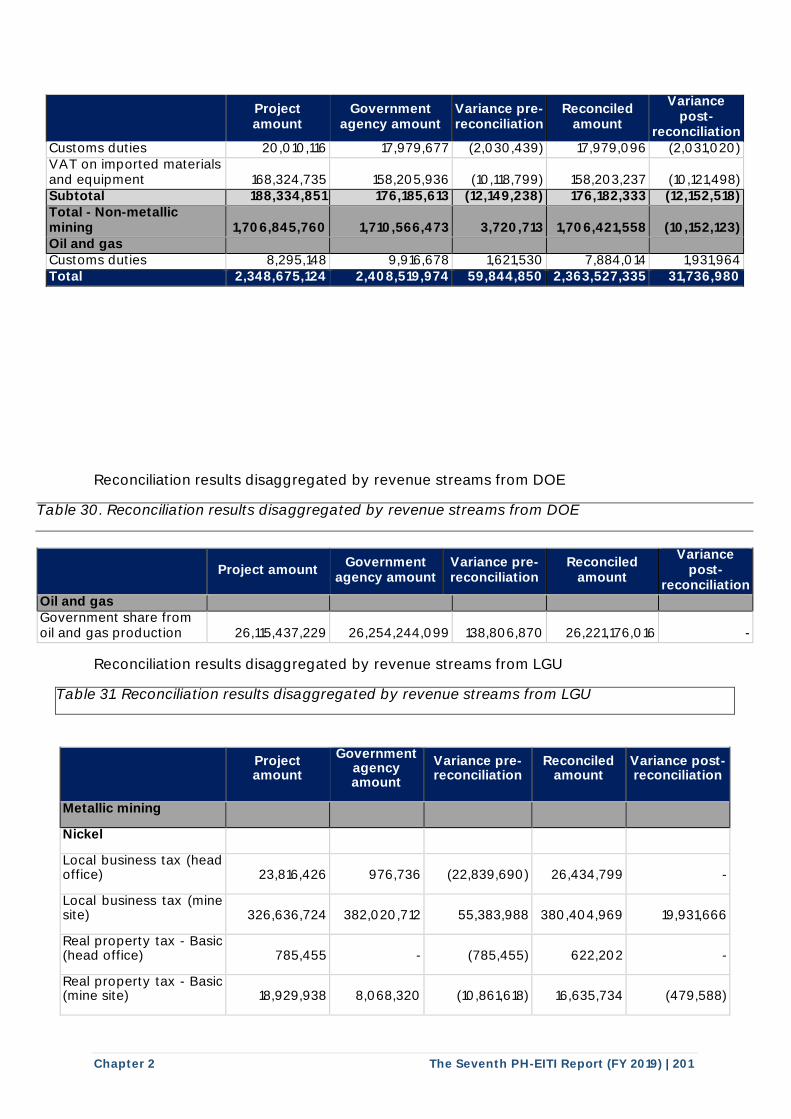
Chapter 2 The Seventh PH-EITI Report (FY 2019) | 201
Project amount
Government agency amount
Variance pre-reconciliation
Reconciled amount
Variance post-
reconciliation Customs duties 20,010,116 17,979,677 (2,030,439) 17,979,096 (2,031,020) VAT on imported materials and equipment 168,324,735 158,205,936 (10,118,799) 158,203,237 (10,121,498) Subtotal 188,334,851 176,185,613 (12,149,238) 176,182,333 (12,152,518) Total - Non-metallic mining 1,706,845,760 1,710,566,473 3,720,713 1,706,421,558 (10,152,123) Oil and gas Customs duties 8,295,148 9,916,678 1,621,530 7,884,014 1,931,964 Total 2,348,675,124 2,408,519,974 59,844,850 2,363,527,335 31,736,980
Reconciliation results disaggregated by revenue streams from DOE
Table 30. Reconciliation results disaggregated by revenue streams from DOE
Project amount Government
agency amount Variance pre-reconciliation
Reconciled amount
Variance post-
reconciliation Oil and gas Government share from oil and gas production 26,115,437,229 26,254,244,099 138,806,870 26,221,176,016 -
Reconciliation results disaggregated by revenue streams from LGU
Table 31. Reconciliation results disaggregated by revenue streams from LGU
Project amount
Government agency amount
Variance pre-reconciliation
Reconciled amount
Variance post-reconciliation
Metallic mining
Nickel
Local business tax (head office) 23,816,426 976,736 (22,839,690) 26,434,799 -
Local business tax (mine site) 326,636,724 382,020,712 55,383,988 380,404,969 19,931,666
Real property tax - Basic (head office) 785,455 - (785,455) 622,202 -
Real property tax - Basic (mine site) 18,929,938 8,068,320 (10,861,618) 16,635,734 (479,588)
-------------
I
1 1 1 1 1
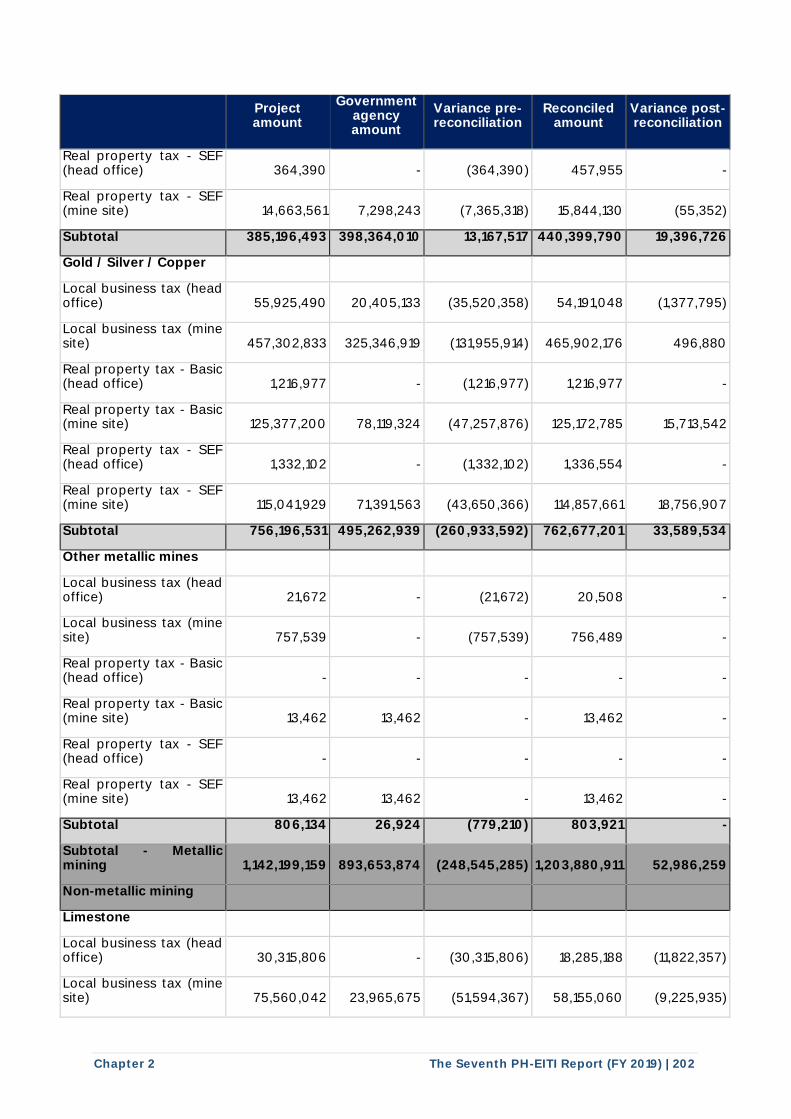
Chapter 2 The Seventh PH-EITI Report (FY 2019) | 202
Project amount
Government agency amount
Variance pre-reconciliation
Reconciled amount
Variance post-reconciliation
Real property tax - SEF (head office) 364,390 - (364,390) 457,955 -
Real property tax - SEF (mine site) 14,663,561 7,298,243 (7,365,318) 15,844,130 (55,352)
Subtotal 385,196,493 398,364,010 13,167,517 440,399,790 19,396,726
Gold / Silver / Copper
Local business tax (head office) 55,925,490 20,405,133 (35,520,358) 54,191,048 (1,377,795)
Local business tax (mine site) 457,302,833 325,346,919 (131,955,914) 465,902,176 496,880
Real property tax - Basic (head office) 1,216,977 - (1,216,977) 1,216,977 -
Real property tax - Basic (mine site) 125,377,200 78,119,324 (47,257,876) 125,172,785 15,713,542
Real property tax - SEF (head office) 1,332,102 - (1,332,102) 1,336,554 -
Real property tax - SEF (mine site) 115,041,929 71,391,563 (43,650,366) 114,857,661 18,756,907
Subtotal 756,196,531 495,262,939 (260,933,592) 762,677,201 33,589,534
Other metallic mines
Local business tax (head office) 21,672 - (21,672) 20,508 -
Local business tax (mine site) 757,539 - (757,539) 756,489 -
Real property tax - Basic (head office) - - - - -
Real property tax - Basic (mine site) 13,462 13,462 - 13,462 -
Real property tax - SEF (head office) - - - - -
Real property tax - SEF (mine site) 13,462 13,462 - 13,462 -
Subtotal 806,134 26,924 (779,210) 803,921 -
Subtotal - Metallic mining 1,142,199,159 893,653,874 (248,545,285) 1,203,880,911 52,986,259
Non-metallic mining
Limestone
Local business tax (head office) 30,315,806 - (30,315,806) 18,285,188 (11,822,357)
Local business tax (mine site) 75,560,042 23,965,675 (51,594,367) 58,155,060 (9,225,935)
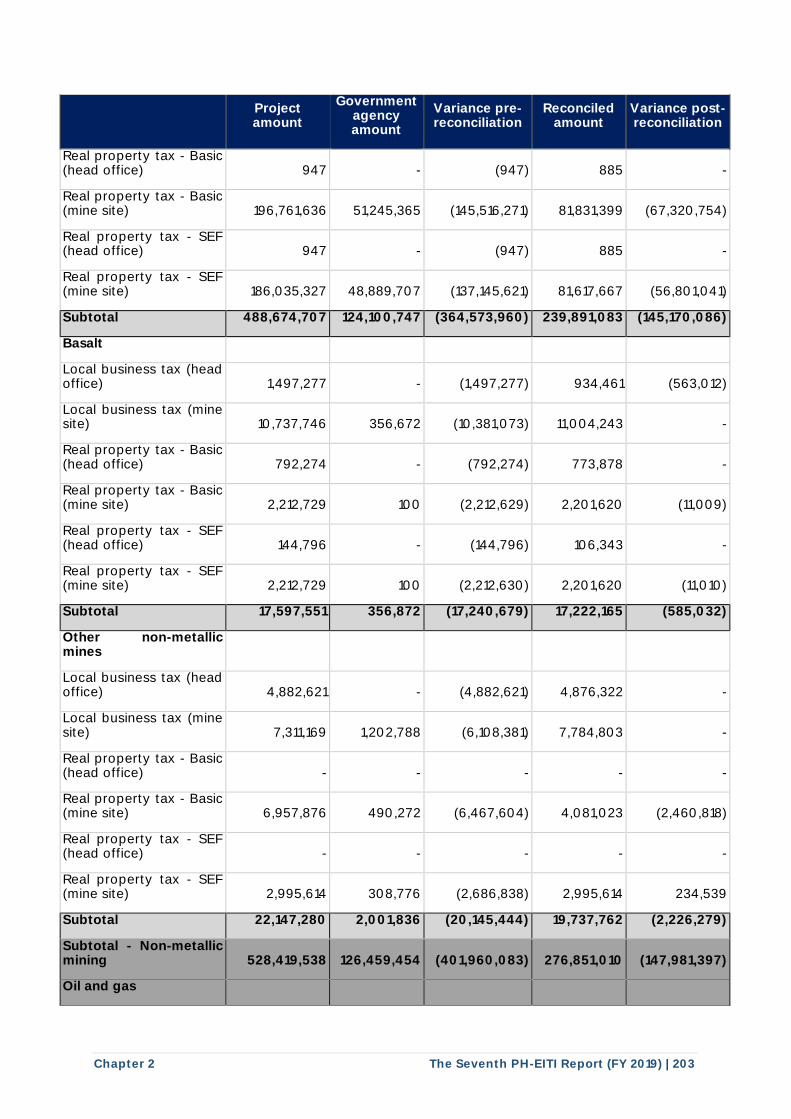
Chapter 2 The Seventh PH-EITI Report (FY 2019) | 203
Project amount
Government agency amount
Variance pre-reconciliation
Reconciled amount
Variance post-reconciliation
Real property tax - Basic (head office) 947 - (947) 885 -
Real property tax - Basic (mine site) 196,761,636 51,245,365 (145,516,271) 81,831,399 (67,320,754)
Real property tax - SEF (head office) 947 - (947) 885 -
Real property tax - SEF (mine site) 186,035,327 48,889,707 (137,145,621) 81,617,667 (56,801,041)
Subtotal 488,674,707 124,100,747 (364,573,960) 239,891,083 (145,170,086)
Basalt
Local business tax (head office) 1,497,277 - (1,497,277) 934,461 (563,012)
Local business tax (mine site) 10,737,746 356,672 (10,381,073) 11,004,243 -
Real property tax - Basic (head office) 792,274 - (792,274) 773,878 -
Real property tax - Basic (mine site) 2,212,729 100 (2,212,629) 2,201,620 (11,009)
Real property tax - SEF (head office) 144,796 - (144,796) 106,343 -
Real property tax - SEF (mine site) 2,212,729 100 (2,212,630) 2,201,620 (11,010)
Subtotal 17,597,551 356,872 (17,240,679) 17,222,165 (585,032)
Other non-metallic mines
Local business tax (head office) 4,882,621 - (4,882,621) 4,876,322 -
Local business tax (mine site) 7,311,169 1,202,788 (6,108,381) 7,784,803 -
Real property tax - Basic (head office) - - - - -
Real property tax - Basic (mine site) 6,957,876 490,272 (6,467,604) 4,081,023 (2,460,818)
Real property tax - SEF (head office) - - - - -
Real property tax - SEF (mine site) 2,995,614 308,776 (2,686,838) 2,995,614 234,539
Subtotal 22,147,280 2,001,836 (20,145,444) 19,737,762 (2,226,279)
Subtotal - Non-metallic mining 528,419,538 126,459,454 (401,960,083) 276,851,010 (147,981,397)
Oil and gas
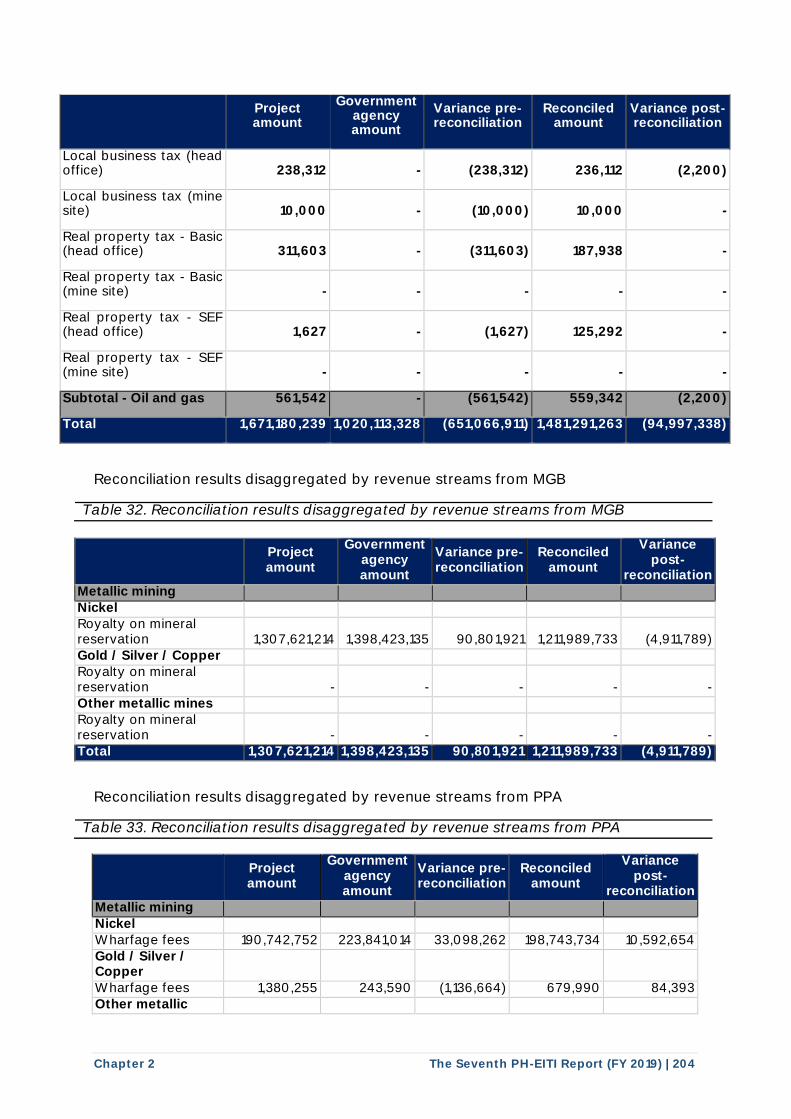
Chapter 2 The Seventh PH-EITI Report (FY 2019) | 204
Project amount
Government agency amount
Variance pre-reconciliation
Reconciled amount
Variance post-reconciliation
Local business tax (head office) 238,312 - (238,312) 236,112 (2,200)
Local business tax (mine site) 10,000 - (10,000) 10,000 -
Real property tax - Basic (head office) 311,603 - (311,603) 187,938 -
Real property tax - Basic (mine site) - - - - -
Real property tax - SEF (head office) 1,627 - (1,627) 125,292 -
Real property tax - SEF (mine site) - - - - -
Subtotal - Oil and gas 561,542 - (561,542) 559,342 (2,200)
Total 1,671,180,239 1,020,113,328 (651,066,911) 1,481,291,263 (94,997,338)
Reconciliation results disaggregated by revenue streams from MGB
Table 32. Reconciliation results disaggregated by revenue streams from MGB
Project amount
Government agency amount
Variance pre-reconciliation
Reconciled amount
Variance post-
reconciliation Metallic mining Nickel Royalty on mineral reservation 1,307,621,214 1,398,423,135 90,801,921 1,211,989,733 (4,911,789) Gold / Silver / Copper Royalty on mineral reservation - - - - - Other metallic mines Royalty on mineral reservation - - - - - Total 1,307,621,214 1,398,423,135 90,801,921 1,211,989,733 (4,911,789)
Reconciliation results disaggregated by revenue streams from PPA
Table 33. Reconciliation results disaggregated by revenue streams from PPA
Project amount
Government agency amount
Variance pre-reconciliation
Reconciled amount
Variance post-
reconciliation Metallic mining Nickel Wharfage fees 190,742,752 223,841,014 33,098,262 198,743,734 10,592,654 Gold / Silver / Copper Wharfage fees 1,380,255 243,590 (1,136,664) 679,990 84,393 Other metallic
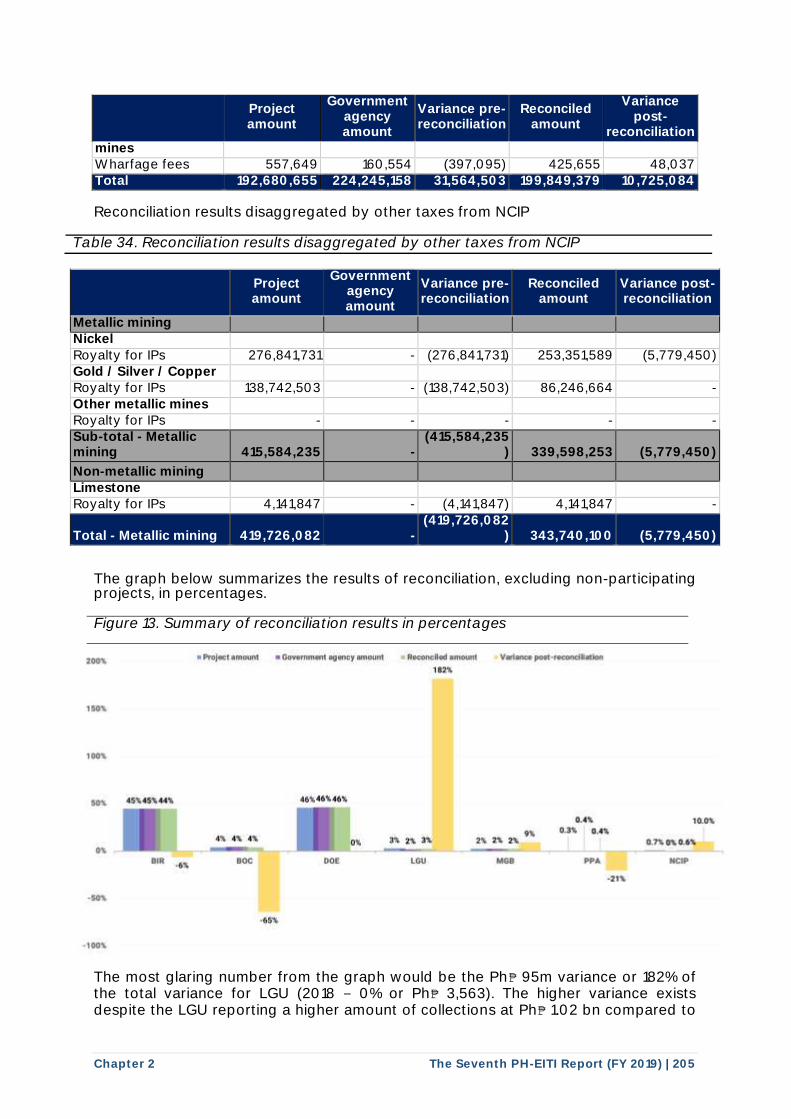
Chapter 2 The Seventh PH-EITI Report (FY 2019) | 205
Project amount
Government agency amount
Variance pre-reconciliation
Reconciled amount
Variance post-
reconciliation mines Wharfage fees 557,649 160,554 (397,095) 425,655 48,037 Total 192,680,655 224,245,158 31,564,503 199,849,379 10,725,084
Reconciliation results disaggregated by other taxes from NCIP
Table 34. Reconciliation results disaggregated by other taxes from NCIP
Project amount
Government agency amount
Variance pre-reconciliation
Reconciled amount
Variance post-reconciliation
Metallic mining Nickel Royalty for IPs 276,841,731 - (276,841,731) 253,351,589 (5,779,450) Gold / Silver / Copper Royalty for IPs 138,742,503 - (138,742,503) 86,246,664 - Other metallic mines Royalty for IPs - - - - - Sub-total - Metallic mining 415,584,235 -
(415,584,235) 339,598,253 (5,779,450)
Non-metallic mining Limestone Royalty for IPs 4,141,847 - (4,141,847) 4,141,847 -
Total - Metallic mining 419,726,082 - (419,726,082
) 343,740,100 (5,779,450)
The graph below summarizes the results of reconciliation, excluding non-participating projects, in percentages. Figure 13. Summary of reconciliation results in percentages
The most glaring number from the graph would be the Ph₱ 95m variance or 182% of the total variance for LGU (2018 0% or Ph₱ 3,563). The higher variance exists despite the LGU reporting a higher amount of collections at Ph₱ 1.02 bn compared to
20
100
tn. 45'445'1.44
IIIR
100
------- ------- ------- -------
! ! !
0.4, 0 ,3 '11 0 .4 '1
0 2'\, 3'I.
IIOC 00£ LGU PPA
!
o.7 no.,
NCIP
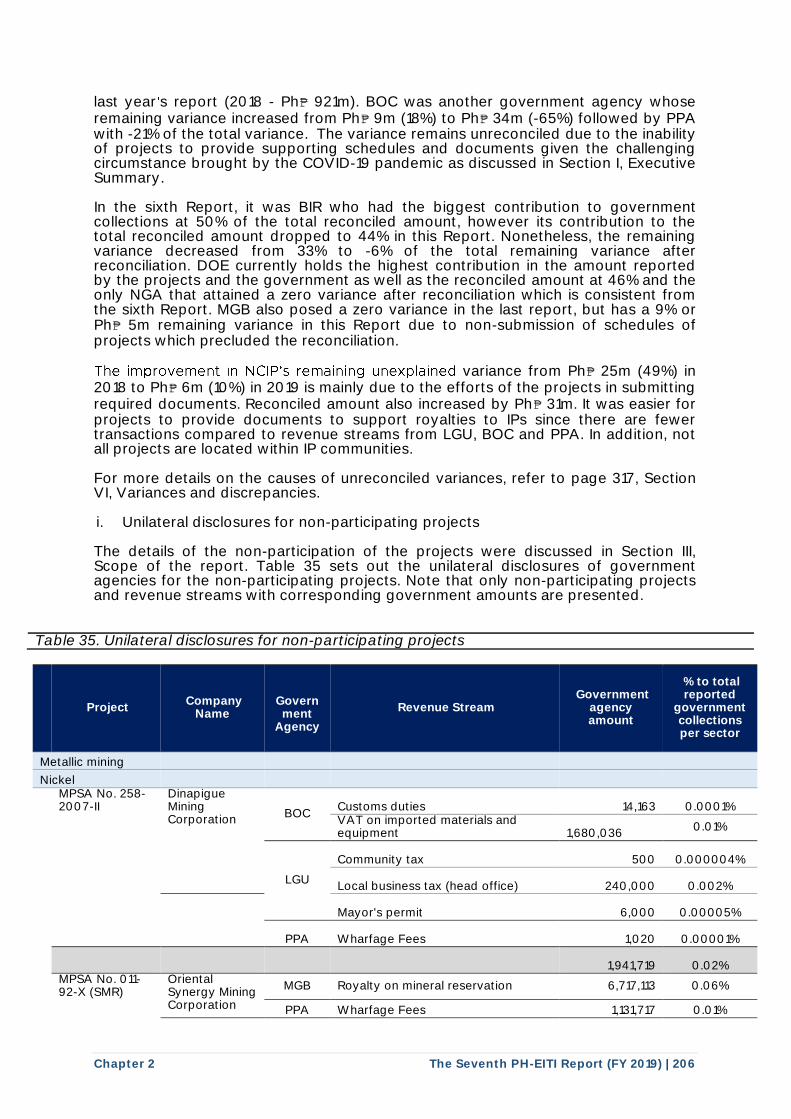
Chapter 2 The Seventh PH-EITI Report (FY 2019) | 206
last year s report (2018 - Ph₱ 921m). BOC was another government agency whose remaining variance increased from Ph₱ 9m (18%) to Ph₱ 34m (-65%) followed by PPA with -21% of the total variance. The variance remains unreconciled due to the inability of projects to provide supporting schedules and documents given the challenging circumstance brought by the COVID-19 pandemic as discussed in Section I, Executive Summary. In the sixth Report, it was BIR who had the biggest contribution to government collections at 50% of the total reconciled amount, however its contribution to the total reconciled amount dropped to 44% in this Report. Nonetheless, the remaining variance decreased from 33% to -6% of the total remaining variance after reconciliation. DOE currently holds the highest contribution in the amount reported by the projects and the government as well as the reconciled amount at 46% and the only NGA that attained a zero variance after reconciliation which is consistent from the sixth Report. MGB also posed a zero variance in the last report, but has a 9% or Ph₱ 5m remaining variance in this Report due to non-submission of schedules of projects which precluded the reconciliation.
variance from Ph₱ 25m (49%) in 2018 to Ph₱ 6m (10%) in 2019 is mainly due to the efforts of the projects in submitting required documents. Reconciled amount also increased by Ph₱ 31m. It was easier for projects to provide documents to support royalties to IPs since there are fewer transactions compared to revenue streams from LGU, BOC and PPA. In addition, not all projects are located within IP communities. For more details on the causes of unreconciled variances, refer to page 317, Section VI, Variances and discrepancies.
i. Unilateral disclosures for non-participating projects
The details of the non-participation of the projects were discussed in Section III, Scope of the report. Table 35 sets out the unilateral disclosures of government agencies for the non-participating projects. Note that only non-participating projects and revenue streams with corresponding government amounts are presented.
Table 35. Unilateral disclosures for non-participating projects
Project Company
Name
Government
Agency
Revenue Stream Government
agency amount
% to total reported
government collections per sector
Metallic mining
Nickel
MPSA No. 258-2007-II
Dinapigue Mining Corporation
BOC Customs duties
14,163 0.0001%
VAT on imported materials and equipment
1,680,036
0.01%
LGU
Community tax
500 0.000004%
Local business tax (head office)
240,000 0.002%
Mayor's permit
6,000 0.00005%
PPA Wharfage Fees
1,020 0.00001%
1,941,719 0.02%
MPSA No. 011-92-X (SMR)
Oriental Synergy Mining Corporation
MGB Royalty on mineral reservation 6,717,113 0.06%
PPA Wharfage Fees 1,131,717 0.01%
The improvement in NCIP's remaining unexplained
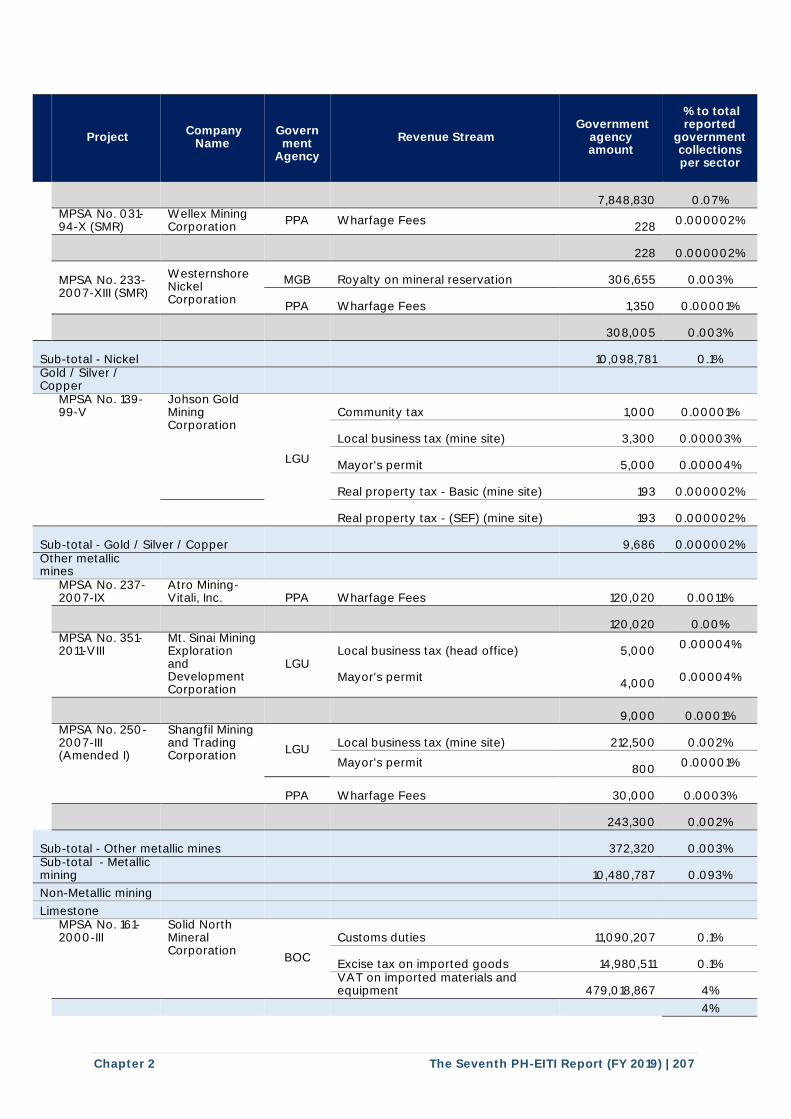
Chapter 2 The Seventh PH-EITI Report (FY 2019) | 207
Project Company
Name
Government
Agency
Revenue Stream Government
agency amount
% to total reported
government collections per sector
7,848,830 0.07%
MPSA No. 031-94-X (SMR)
Wellex Mining Corporation
PPA Wharfage Fees
228 0.000002%
228 0.000002%
MPSA No. 233-2007-XIII (SMR)
Westernshore Nickel Corporation
MGB Royalty on mineral reservation
306,655 0.003%
PPA Wharfage Fees
1,350 0.00001%
308,005 0.003%
Sub-total - Nickel
10,098,781 0.1% Gold / Silver / Copper
MPSA No. 139-99-V
Johson Gold Mining Corporation
LGU
Community tax
1,000 0.00001%
Local business tax (mine site)
3,300 0.00003%
Mayor's permit
5,000 0.00004%
Real property tax - Basic (mine site)
193 0.000002%
Real property tax - (SEF) (mine site)
193 0.000002%
Sub-total - Gold / Silver / Copper
9,686 0.000002% Other metallic mines
MPSA No. 237-2007-IX
Atro Mining-Vitali, Inc. PPA Wharfage Fees
120,020 0.0011%
120,020 0.00%
MPSA No. 351-2011-VIII
Mt. Sinai Mining Exploration and Development Corporation
LGU Local business tax (head office)
5,000
0.00004%
Mayor's permit
4,000
0.00004%
9,000 0.0001%
MPSA No. 250-2007-III (Amended I)
Shangfil Mining and Trading Corporation
LGU Local business tax (mine site)
212,500 0.002%
Mayor's permit
800
0.00001%
PPA Wharfage Fees
30,000 0.0003%
243,300 0.002%
Sub-total - Other metallic mines
372,320 0.003% Sub-total - Metallic mining
10,480,787 0.093%
Non-Metallic mining
Limestone
MPSA No. 161-2000-III
Solid North Mineral Corporation
BOC
Customs duties
11,090,207 0.1%
Excise tax on imported goods
14,980,511 0.1%
VAT on imported materials and equipment
479,018,867 4%
4%

Chapter 2 The Seventh PH-EITI Report (FY 2019) | 208
Project Company
Name
Government
Agency
Revenue Stream Government
agency amount
% to total reported
government collections per sector
505,089,585
Sub-total - Limestone
505,089,585 4%
Basalt
MPSA No. 070-97-IV
Pacific Concrete Products, Inc.
BOC Customs duties
586,670 0.00%
VAT on imported materials and equipment
7,770,772 0.1%
8,357,442 0.1%
Sub-total - Basalt
8,357,442 0.1%
Sub-total - Non-Metallic mining
513,447,027 4%
Oil and gas
SC 14 The Philodrill Corporation
BOC Customs duties
5,060 0.00001%
VAT on imported materials and equipment
36,078 0.0001%
DOE Government share from oil and gas production
4,603,473 0.01%
4,644,611 0.01%
SC 49 China International Mining Petroleum Co. Ltd.
DOE Government share from oil and gas production
3,548,361
0.01%
3,548,361 0.01% Sub-total - Oil and gas
8,192,971 0.02%
Coal
COC 5 Semirara Mining and Power Corporation
DOE Government share in production
3,927,055,360 72%
BOC
Customs duties
84,700,454 2%
VAT on imported materials and equipment
259,527,517 5%
Excise tax on imported goods
8,301,104 0.2%
LGU
Local business tax
41,638,508 1%
Mayor's permit
250,000 0.005%
Community tax
218,791 0.004%
Wharfage Fees
36,224,739 1%
Sub-total - Coal
4,357,916,473 80%
Total
4,890,037,258 7.7% As indicated in Table 35, the non-participation of projects in the metallic mining, non-metallic mining, oil and gas, and coal sectors represents .093%, 4%, .02% and 80%, respectively, of their corresponding sectors. In terms of the entire extractive industry, the non-participation of projects in the metallic mining, non-metallic mining, oil and gas, and coal sectors represents .02%, 0.8%, .01% and 6.8%, respectively. The combined revenue streams of non-participating is at 7.7% of the total revenue
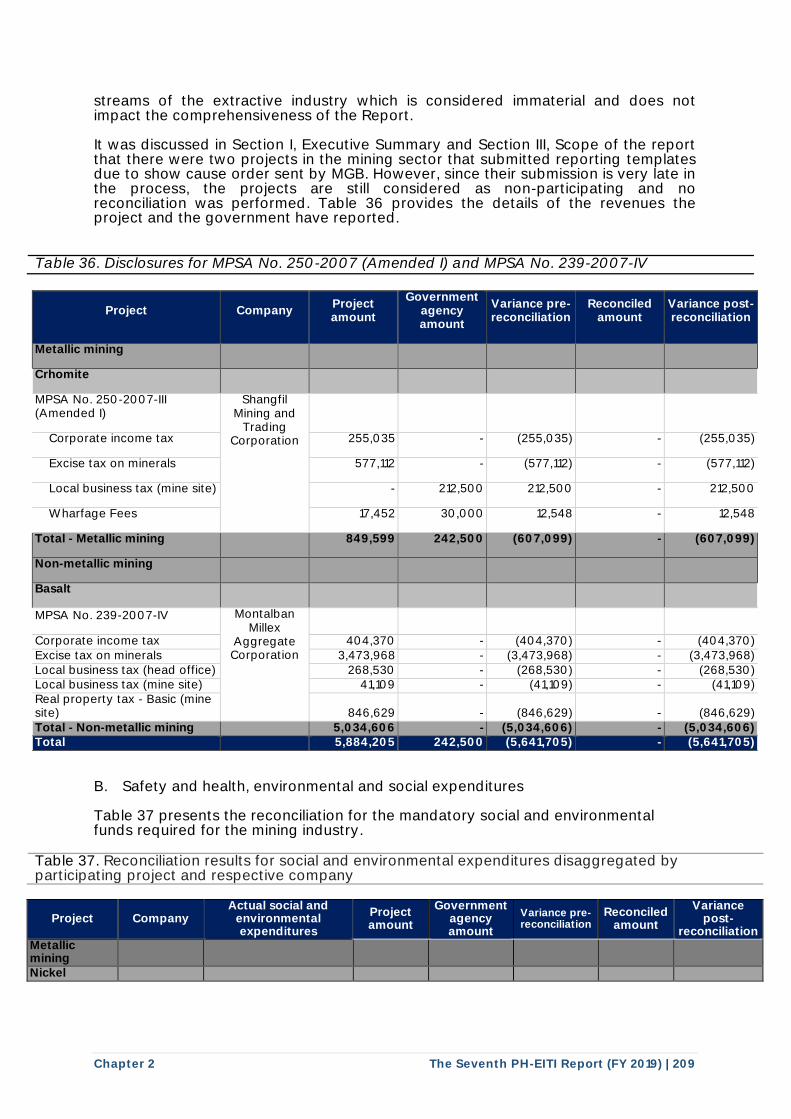
Chapter 2 The Seventh PH-EITI Report (FY 2019) | 209
streams of the extractive industry which is considered immaterial and does not impact the comprehensiveness of the Report. It was discussed in Section I, Executive Summary and Section III, Scope of the report that there were two projects in the mining sector that submitted reporting templates due to show cause order sent by MGB. However, since their submission is very late in the process, the projects are still considered as non-participating and no reconciliation was performed. Table 36 provides the details of the revenues the project and the government have reported.
Table 36. Disclosures for MPSA No. 250-2007 (Amended I) and MPSA No. 239-2007-IV
Project Company Project amount
Government agency amount
Variance pre-reconciliation
Reconciled amount
Variance post-reconciliation
Metallic mining
Crhomite
MPSA No. 250-2007-III (Amended I)
Shangfil Mining and
Trading Corporation
Corporate income tax 255,035 - (255,035) - (255,035)
Excise tax on minerals 577,112 - (577,112) - (577,112)
Local business tax (mine site) - 212,500 212,500 - 212,500
Wharfage Fees 17,452 30,000 12,548 - 12,548
Total - Metallic mining 849,599 242,500 (607,099) - (607,099)
Non-metallic mining
Basalt
MPSA No. 239-2007-IV Montalban Millex
Aggregate Corporation
Corporate income tax 404,370 - (404,370) - (404,370) Excise tax on minerals 3,473,968 - (3,473,968) - (3,473,968) Local business tax (head office) 268,530 - (268,530) - (268,530) Local business tax (mine site) 41,109 - (41,109) - (41,109) Real property tax - Basic (mine site) 846,629 - (846,629) - (846,629) Total - Non-metallic mining 5,034,606 - (5,034,606) - (5,034,606) Total 5,884,205 242,500 (5,641,705) - (5,641,705)
B. Safety and health, environmental and social expenditures Table 37 presents the reconciliation for the mandatory social and environmental funds required for the mining industry.
Table 37. Reconciliation results for social and environmental expenditures disaggregated by participating project and respective company
Project Company Actual social and
environmental expenditures
Project amount
Government agency amount
Variance pre-reconciliation
Reconciled amount
Variance post-
reconciliation Metallic mining
Nickel
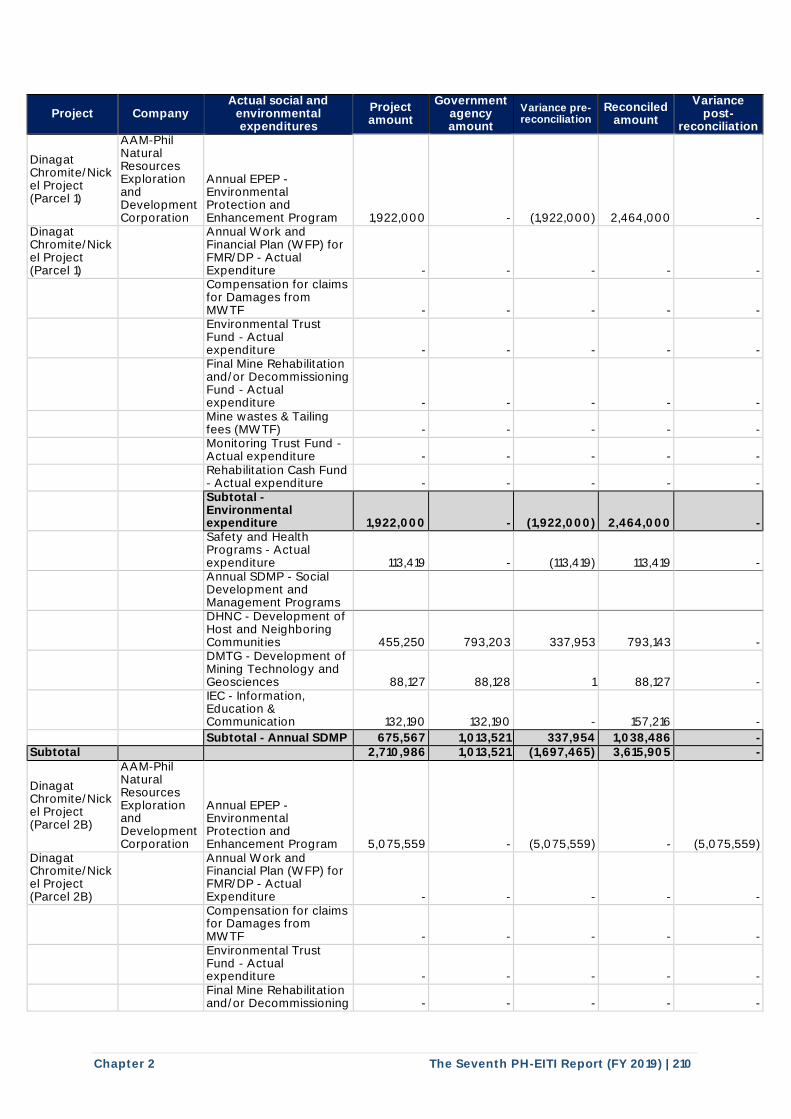
Chapter 2 The Seventh PH-EITI Report (FY 2019) | 210
Project Company Actual social and
environmental expenditures
Project amount
Government agency amount
Variance pre-reconciliation
Reconciled amount
Variance post-
reconciliation
Dinagat Chromite/Nickel Project (Parcel 1)
AAM-Phil Natural Resources Exploration and Development Corporation
Annual EPEP - Environmental Protection and Enhancement Program 1,922,000 - (1,922,000) 2,464,000 -
Dinagat Chromite/Nickel Project (Parcel 1)
Annual Work and Financial Plan (WFP) for FMR/DP - Actual Expenditure - - - - -
Compensation for claims for Damages from MWTF - - - - -
Environmental Trust Fund - Actual expenditure - - - - -
Final Mine Rehabilitation and/or Decommissioning Fund - Actual expenditure - - - - -
Mine wastes & Tailing fees (MWTF) - - - - -
Monitoring Trust Fund - Actual expenditure - - - - -
Rehabilitation Cash Fund - Actual expenditure - - - - -
Subtotal - Environmental expenditure 1,922,000 - (1,922,000) 2,464,000 -
Safety and Health Programs - Actual expenditure 113,419 - (113,419) 113,419 -
Annual SDMP - Social Development and Management Programs
DHNC - Development of Host and Neighboring Communities 455,250 793,203 337,953 793,143 -
DMTG - Development of Mining Technology and Geosciences 88,127 88,128 1 88,127 -
IEC - Information, Education & Communication 132,190 132,190 - 157,216 -
Subtotal - Annual SDMP 675,567 1,013,521 337,954 1,038,486 - Subtotal 2,710,986 1,013,521 (1,697,465) 3,615,905 -
Dinagat Chromite/Nickel Project (Parcel 2B)
AAM-Phil Natural Resources Exploration and Development Corporation
Annual EPEP - Environmental Protection and Enhancement Program 5,075,559 - (5,075,559) - (5,075,559)
Dinagat Chromite/Nickel Project (Parcel 2B)
Annual Work and Financial Plan (WFP) for FMR/DP - Actual Expenditure - - - - -
Compensation for claims for Damages from MWTF - - - - -
Environmental Trust Fund - Actual expenditure - - - - -
Final Mine Rehabilitation and/or Decommissioning - - - - -
I I I I I I I
I I I I
I I I I
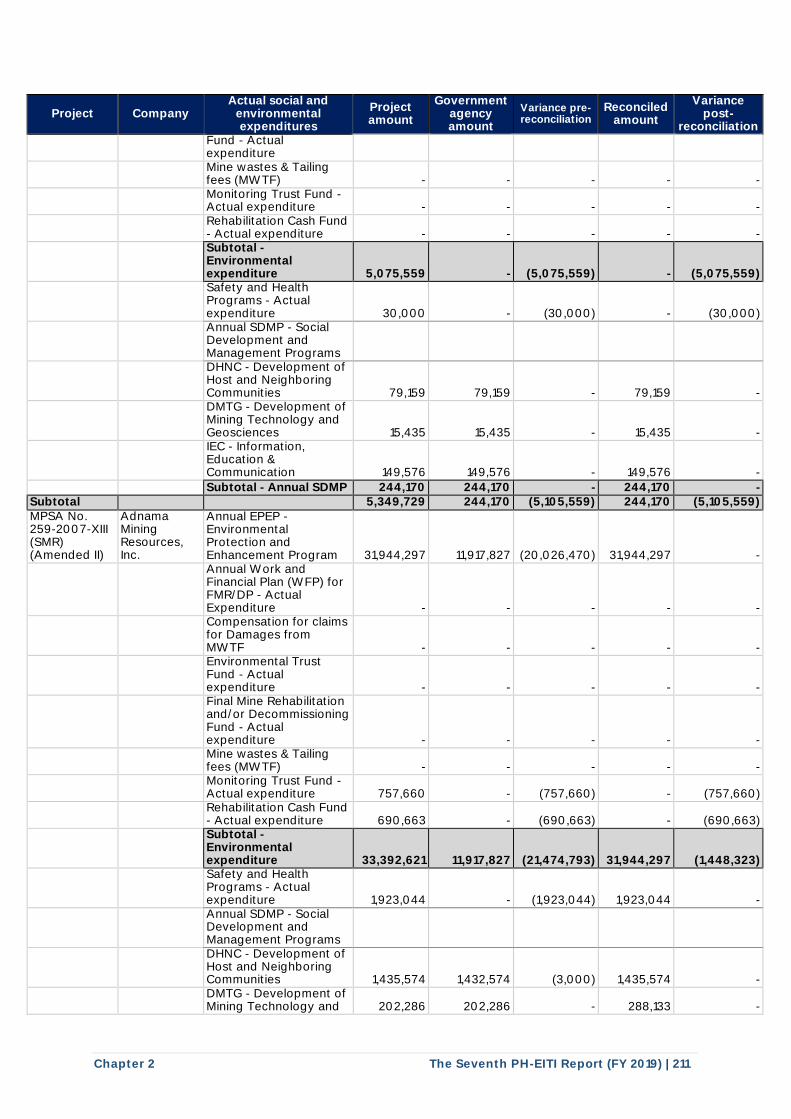
Chapter 2 The Seventh PH-EITI Report (FY 2019) | 211
Project Company Actual social and
environmental expenditures
Project amount
Government agency amount
Variance pre-reconciliation
Reconciled amount
Variance post-
reconciliation Fund - Actual expenditure
Mine wastes & Tailing fees (MWTF) - - - - -
Monitoring Trust Fund - Actual expenditure - - - - -
Rehabilitation Cash Fund - Actual expenditure - - - - -
Subtotal - Environmental expenditure 5,075,559 - (5,075,559) - (5,075,559)
Safety and Health Programs - Actual expenditure 30,000 - (30,000) - (30,000)
Annual SDMP - Social Development and Management Programs
DHNC - Development of Host and Neighboring Communities 79,159 79,159 - 79,159 -
DMTG - Development of Mining Technology and Geosciences 15,435 15,435 - 15,435 -
IEC - Information, Education & Communication 149,576 149,576 - 149,576 -
Subtotal - Annual SDMP 244,170 244,170 - 244,170 - Subtotal 5,349,729 244,170 (5,105,559) 244,170 (5,105,559) MPSA No. 259-2007-XIII (SMR) (Amended II)
Adnama Mining Resources, Inc.
Annual EPEP - Environmental Protection and Enhancement Program 31,944,297 11,917,827 (20,026,470) 31,944,297 -
Annual Work and Financial Plan (WFP) for FMR/DP - Actual Expenditure - - - - -
Compensation for claims for Damages from MWTF - - - - -
Environmental Trust Fund - Actual expenditure - - - - -
Final Mine Rehabilitation and/or Decommissioning Fund - Actual expenditure - - - - -
Mine wastes & Tailing fees (MWTF) - - - - -
Monitoring Trust Fund - Actual expenditure 757,660 - (757,660) - (757,660)
Rehabilitation Cash Fund - Actual expenditure 690,663 - (690,663) - (690,663)
Subtotal - Environmental expenditure 33,392,621 11,917,827 (21,474,793) 31,944,297 (1,448,323)
Safety and Health Programs - Actual expenditure 1,923,044 - (1,923,044) 1,923,044 -
Annual SDMP - Social Development and Management Programs
DHNC - Development of Host and Neighboring Communities 1,435,574 1,432,574 (3,000) 1,435,574 -
DMTG - Development of Mining Technology and 202,286 202,286 - 288,133 -
I I I I I I I
I I I I I
I I I I
I I I I I I I
I I I I
I I I I
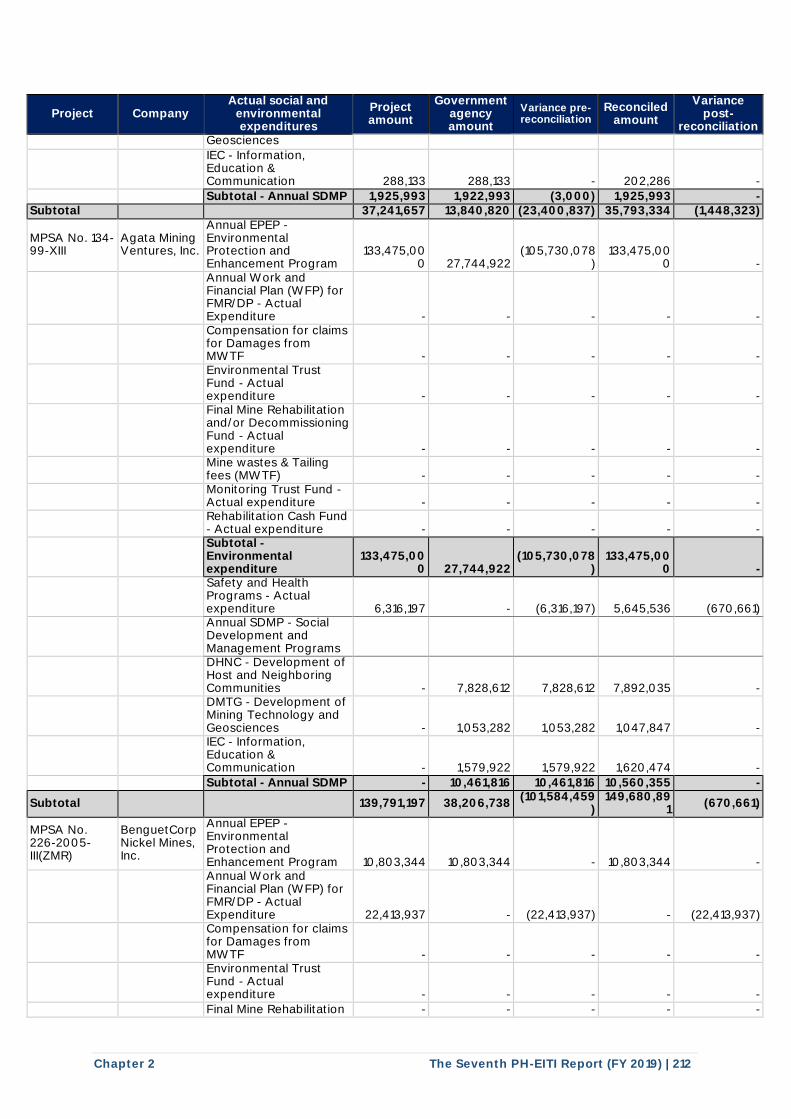
Chapter 2 The Seventh PH-EITI Report (FY 2019) | 212
Project Company Actual social and
environmental expenditures
Project amount
Government agency amount
Variance pre-reconciliation
Reconciled amount
Variance post-
reconciliation Geosciences
IEC - Information, Education & Communication 288,133 288,133 - 202,286 -
Subtotal - Annual SDMP 1,925,993 1,922,993 (3,000) 1,925,993 - Subtotal 37,241,657 13,840,820 (23,400,837) 35,793,334 (1,448,323)
MPSA No. 134-99-XIII
Agata Mining Ventures, Inc.
Annual EPEP - Environmental Protection and Enhancement Program
133,475,000 27,744,922
(105,730,078)
133,475,000 -
Annual Work and Financial Plan (WFP) for FMR/DP - Actual Expenditure - - - - -
Compensation for claims for Damages from MWTF - - - - -
Environmental Trust Fund - Actual expenditure - - - - -
Final Mine Rehabilitation and/or Decommissioning Fund - Actual expenditure - - - - -
Mine wastes & Tailing fees (MWTF) - - - - -
Monitoring Trust Fund - Actual expenditure - - - - -
Rehabilitation Cash Fund - Actual expenditure - - - - -
Subtotal - Environmental expenditure
133,475,000 27,744,922
(105,730,078)
133,475,000 -
Safety and Health Programs - Actual expenditure 6,316,197 - (6,316,197) 5,645,536 (670,661)
Annual SDMP - Social Development and Management Programs
DHNC - Development of Host and Neighboring Communities - 7,828,612 7,828,612 7,892,035 -
DMTG - Development of Mining Technology and Geosciences - 1,053,282 1,053,282 1,047,847 -
IEC - Information, Education & Communication - 1,579,922 1,579,922 1,620,474 -
Subtotal - Annual SDMP - 10,461,816 10,461,816 10,560,355 -
Subtotal 139,791,197 38,206,738 (101,584,459
) 149,680,89
1 (670,661)
MPSA No. 226-2005-III(ZMR)
BenguetCorp Nickel Mines, Inc.
Annual EPEP - Environmental Protection and Enhancement Program 10,803,344 10,803,344 - 10,803,344 -
Annual Work and Financial Plan (WFP) for FMR/DP - Actual Expenditure 22,413,937 - (22,413,937) - (22,413,937)
Compensation for claims for Damages from MWTF - - - - -
Environmental Trust Fund - Actual expenditure - - - - -
Final Mine Rehabilitation - - - - -
. I
I I I I I I I
I I I I
I I I I
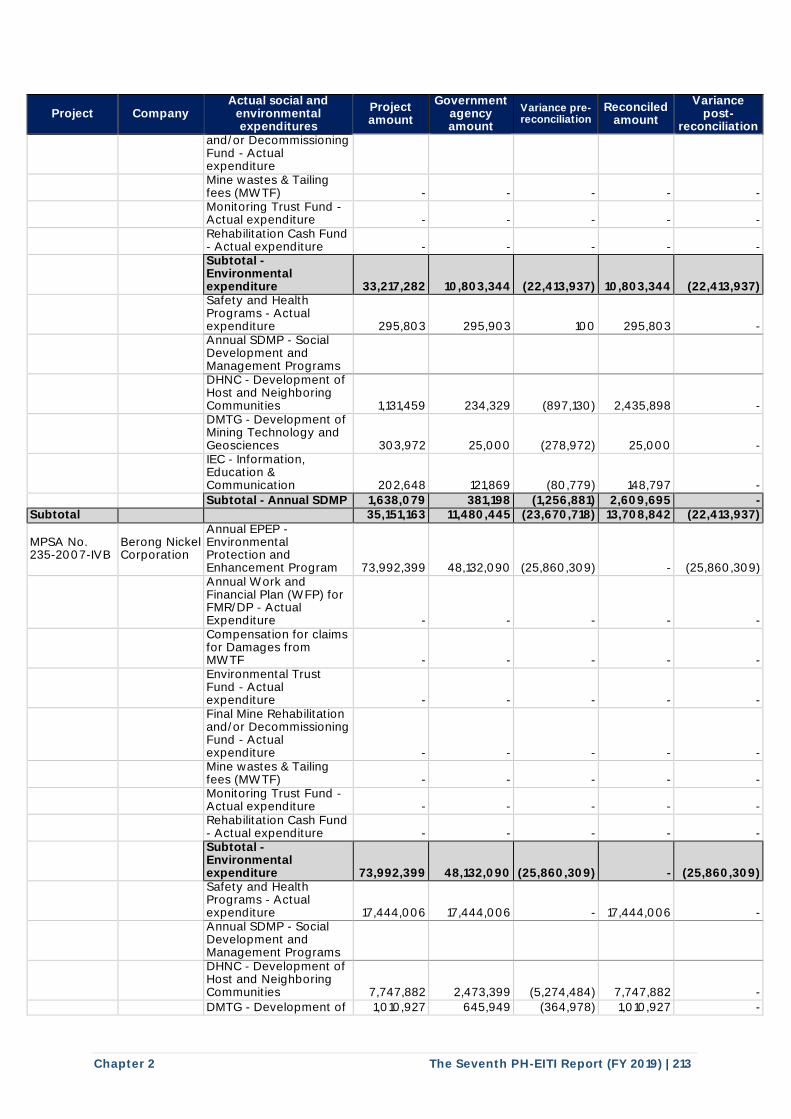
Chapter 2 The Seventh PH-EITI Report (FY 2019) | 213
Project Company Actual social and
environmental expenditures
Project amount
Government agency amount
Variance pre-reconciliation
Reconciled amount
Variance post-
reconciliation and/or Decommissioning Fund - Actual expenditure
Mine wastes & Tailing fees (MWTF) - - - - -
Monitoring Trust Fund - Actual expenditure - - - - -
Rehabilitation Cash Fund - Actual expenditure - - - - -
Subtotal - Environmental expenditure 33,217,282 10,803,344 (22,413,937) 10,803,344 (22,413,937)
Safety and Health Programs - Actual expenditure 295,803 295,903 100 295,803 -
Annual SDMP - Social Development and Management Programs
DHNC - Development of Host and Neighboring Communities 1,131,459 234,329 (897,130) 2,435,898 -
DMTG - Development of Mining Technology and Geosciences 303,972 25,000 (278,972) 25,000 -
IEC - Information, Education & Communication 202,648 121,869 (80,779) 148,797 -
Subtotal - Annual SDMP 1,638,079 381,198 (1,256,881) 2,609,695 - Subtotal 35,151,163 11,480,445 (23,670,718) 13,708,842 (22,413,937)
MPSA No. 235-2007-IVB
Berong Nickel Corporation
Annual EPEP - Environmental Protection and Enhancement Program 73,992,399 48,132,090 (25,860,309) - (25,860,309)
Annual Work and Financial Plan (WFP) for FMR/DP - Actual Expenditure - - - - -
Compensation for claims for Damages from MWTF - - - - -
Environmental Trust Fund - Actual expenditure - - - - -
Final Mine Rehabilitation and/or Decommissioning Fund - Actual expenditure - - - - -
Mine wastes & Tailing fees (MWTF) - - - - -
Monitoring Trust Fund - Actual expenditure - - - - -
Rehabilitation Cash Fund - Actual expenditure - - - - -
Subtotal - Environmental expenditure 73,992,399 48,132,090 (25,860,309) - (25,860,309)
Safety and Health Programs - Actual expenditure 17,444,006 17,444,006 - 17,444,006 -
Annual SDMP - Social Development and Management Programs
DHNC - Development of Host and Neighboring Communities 7,747,882 2,473,399 (5,274,484) 7,747,882 -
DMTG - Development of 1,010,927 645,949 (364,978) 1,010,927 -
I I I I I I I
I I I I
I I I I
I I I I I I I
I I I I
I I I I
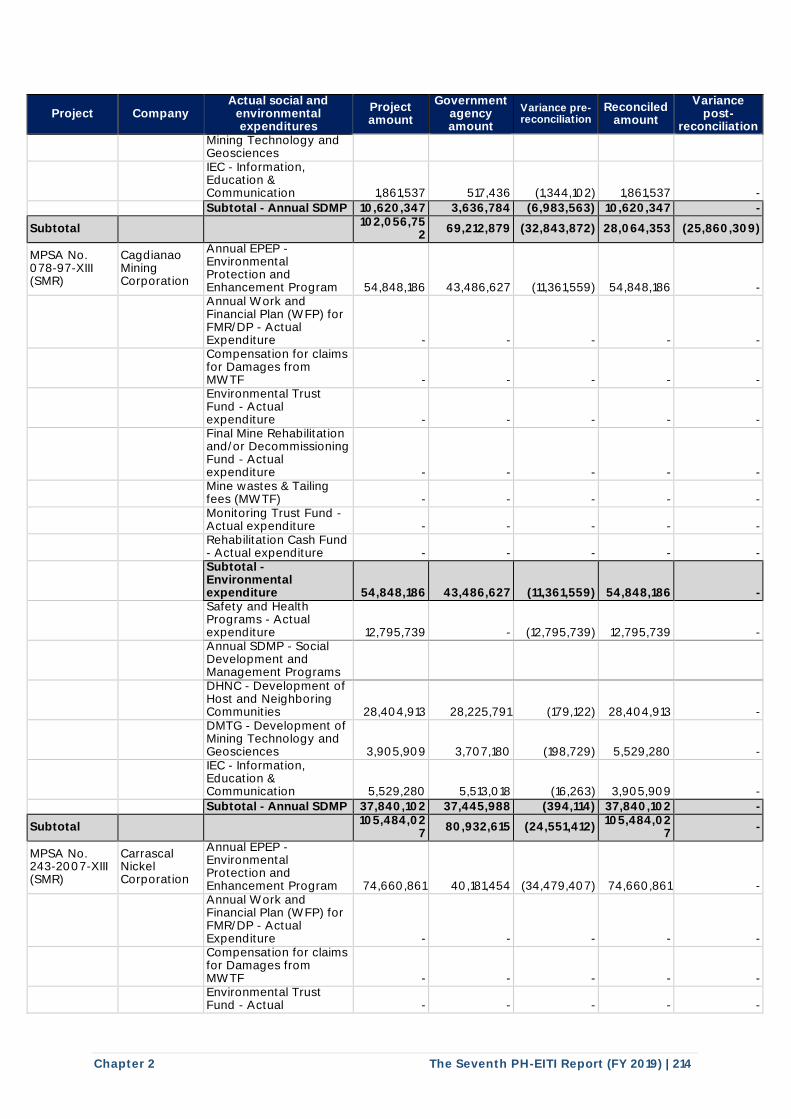
Chapter 2 The Seventh PH-EITI Report (FY 2019) | 214
Project Company Actual social and
environmental expenditures
Project amount
Government agency amount
Variance pre-reconciliation
Reconciled amount
Variance post-
reconciliation Mining Technology and Geosciences
IEC - Information, Education & Communication 1,861,537 517,436 (1,344,102) 1,861,537 -
Subtotal - Annual SDMP 10,620,347 3,636,784 (6,983,563) 10,620,347 -
Subtotal 102,056,75
2 69,212,879 (32,843,872) 28,064,353 (25,860,309)
MPSA No. 078-97-XIII (SMR)
Cagdianao Mining Corporation
Annual EPEP - Environmental Protection and Enhancement Program 54,848,186 43,486,627 (11,361,559) 54,848,186 -
Annual Work and Financial Plan (WFP) for FMR/DP - Actual Expenditure - - - - -
Compensation for claims for Damages from MWTF - - - - -
Environmental Trust Fund - Actual expenditure - - - - -
Final Mine Rehabilitation and/or Decommissioning Fund - Actual expenditure - - - - -
Mine wastes & Tailing fees (MWTF) - - - - -
Monitoring Trust Fund - Actual expenditure - - - - -
Rehabilitation Cash Fund - Actual expenditure - - - - -
Subtotal - Environmental expenditure 54,848,186 43,486,627 (11,361,559) 54,848,186 -
Safety and Health Programs - Actual expenditure 12,795,739 - (12,795,739) 12,795,739 -
Annual SDMP - Social Development and Management Programs
DHNC - Development of Host and Neighboring Communities 28,404,913 28,225,791 (179,122) 28,404,913 -
DMTG - Development of Mining Technology and Geosciences 3,905,909 3,707,180 (198,729) 5,529,280 -
IEC - Information, Education & Communication 5,529,280 5,513,018 (16,263) 3,905,909 -
Subtotal - Annual SDMP 37,840,102 37,445,988 (394,114) 37,840,102 -
Subtotal 105,484,02
7 80,932,615 (24,551,412)
105,484,027
-
MPSA No. 243-2007-XIII (SMR)
Carrascal Nickel Corporation
Annual EPEP - Environmental Protection and Enhancement Program 74,660,861 40,181,454 (34,479,407) 74,660,861 -
Annual Work and Financial Plan (WFP) for FMR/DP - Actual Expenditure - - - - -
Compensation for claims for Damages from MWTF - - - - -
Environmental Trust Fund - Actual - - - - -
I .-----I --------r---------.----------------r---1 ------r---1 -
I I
I I I I I I I
I I I I I
I I I I
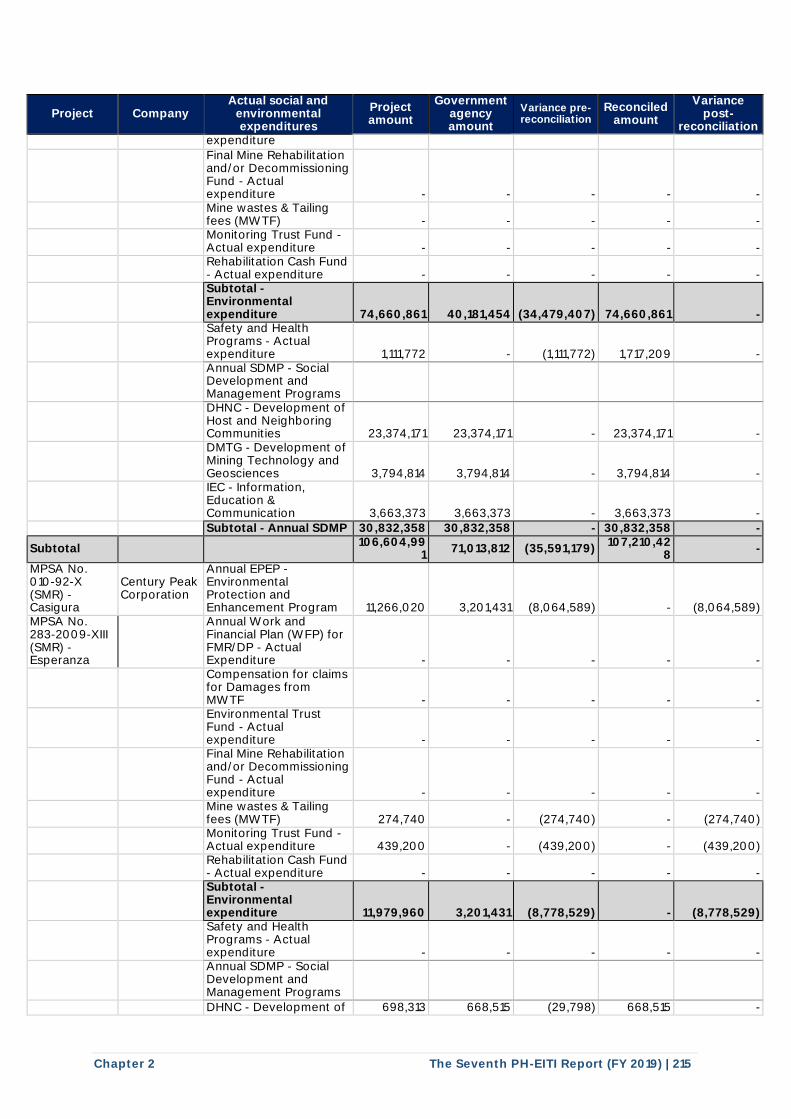
Chapter 2 The Seventh PH-EITI Report (FY 2019) | 215
Project Company Actual social and
environmental expenditures
Project amount
Government agency amount
Variance pre-reconciliation
Reconciled amount
Variance post-
reconciliation expenditure
Final Mine Rehabilitation and/or Decommissioning Fund - Actual expenditure - - - - -
Mine wastes & Tailing fees (MWTF) - - - - -
Monitoring Trust Fund - Actual expenditure - - - - -
Rehabilitation Cash Fund - Actual expenditure - - - - -
Subtotal - Environmental expenditure 74,660,861 40,181,454 (34,479,407) 74,660,861 -
Safety and Health Programs - Actual expenditure 1,111,772 - (1,111,772) 1,717,209 -
Annual SDMP - Social Development and Management Programs
DHNC - Development of Host and Neighboring Communities 23,374,171 23,374,171 - 23,374,171 -
DMTG - Development of Mining Technology and Geosciences 3,794,814 3,794,814 - 3,794,814 -
IEC - Information, Education & Communication 3,663,373 3,663,373 - 3,663,373 -
Subtotal - Annual SDMP 30,832,358 30,832,358 - 30,832,358 -
Subtotal 106,604,99
1 71,013,812 (35,591,179)
107,210,428
-
MPSA No. 010-92-X (SMR) - Casigura
Century Peak Corporation
Annual EPEP - Environmental Protection and Enhancement Program 11,266,020 3,201,431 (8,064,589) - (8,064,589)
MPSA No. 283-2009-XIII (SMR) - Esperanza
Annual Work and Financial Plan (WFP) for FMR/DP - Actual Expenditure - - - - -
Compensation for claims for Damages from MWTF - - - - -
Environmental Trust Fund - Actual expenditure - - - - -
Final Mine Rehabilitation and/or Decommissioning Fund - Actual expenditure - - - - -
Mine wastes & Tailing fees (MWTF) 274,740 - (274,740) - (274,740)
Monitoring Trust Fund - Actual expenditure 439,200 - (439,200) - (439,200)
Rehabilitation Cash Fund - Actual expenditure - - - - -
Subtotal - Environmental expenditure 11,979,960 3,201,431 (8,778,529) - (8,778,529)
Safety and Health Programs - Actual expenditure - - - - -
Annual SDMP - Social Development and Management Programs
DHNC - Development of 698,313 668,515 (29,798) 668,515 -
I I I I I I I
I I I I
I I I I
I I I I I I I
I I I I
I I I I
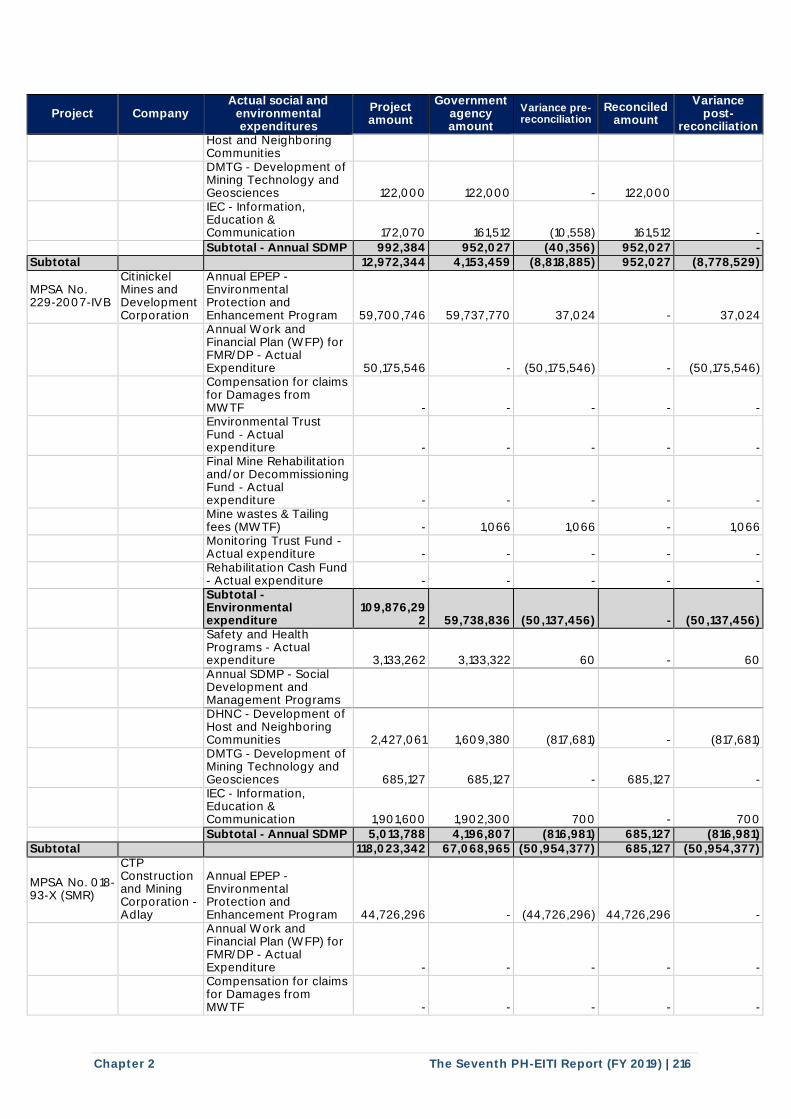
Chapter 2 The Seventh PH-EITI Report (FY 2019) | 216
Project Company Actual social and
environmental expenditures
Project amount
Government agency amount
Variance pre-reconciliation
Reconciled amount
Variance post-
reconciliation Host and Neighboring Communities
DMTG - Development of Mining Technology and Geosciences 122,000 122,000 - 122,000
IEC - Information, Education & Communication 172,070 161,512 (10,558) 161,512 -
Subtotal - Annual SDMP 992,384 952,027 (40,356) 952,027 - Subtotal 12,972,344 4,153,459 (8,818,885) 952,027 (8,778,529)
MPSA No. 229-2007-IVB
Citinickel Mines and Development Corporation
Annual EPEP - Environmental Protection and Enhancement Program 59,700,746 59,737,770 37,024 - 37,024
Annual Work and Financial Plan (WFP) for FMR/DP - Actual Expenditure 50,175,546 - (50,175,546) - (50,175,546)
Compensation for claims for Damages from MWTF - - - - -
Environmental Trust Fund - Actual expenditure - - - - -
Final Mine Rehabilitation and/or Decommissioning Fund - Actual expenditure - - - - -
Mine wastes & Tailing fees (MWTF) - 1,066 1,066 - 1,066
Monitoring Trust Fund - Actual expenditure - - - - -
Rehabilitation Cash Fund - Actual expenditure - - - - -
Subtotal - Environmental expenditure
109,876,292 59,738,836 (50,137,456) - (50,137,456)
Safety and Health Programs - Actual expenditure 3,133,262 3,133,322 60 - 60
Annual SDMP - Social Development and Management Programs
DHNC - Development of Host and Neighboring Communities 2,427,061 1,609,380 (817,681) - (817,681)
DMTG - Development of Mining Technology and Geosciences 685,127 685,127 - 685,127 -
IEC - Information, Education & Communication 1,901,600 1,902,300 700 - 700
Subtotal - Annual SDMP 5,013,788 4,196,807 (816,981) 685,127 (816,981) Subtotal 118,023,342 67,068,965 (50,954,377) 685,127 (50,954,377)
MPSA No. 018-93-X (SMR)
CTP Construction and Mining Corporation - Adlay
Annual EPEP - Environmental Protection and Enhancement Program 44,726,296 - (44,726,296) 44,726,296 -
Annual Work and Financial Plan (WFP) for FMR/DP - Actual Expenditure - - - - -
Compensation for claims for Damages from MWTF - - - - -
I I I I I I I
I I I I I
I I I I

Chapter 2 The Seventh PH-EITI Report (FY 2019) | 217
Project Company Actual social and
environmental expenditures
Project amount
Government agency amount
Variance pre-reconciliation
Reconciled amount
Variance post-
reconciliation
Environmental Trust Fund - Actual expenditure - - - - -
Final Mine Rehabilitation and/or Decommissioning Fund - Actual expenditure - - - - -
Mine wastes & Tailing fees (MWTF) - - - - -
Monitoring Trust Fund - Actual expenditure - - - - -
Rehabilitation Cash Fund - Actual expenditure - - - - -
Subtotal - Environmental expenditure 44,726,296 - (44,726,296) 44,726,296 -
Safety and Health Programs - Actual expenditure 5,537,859 - (5,537,859) 5,537,859 -
Annual SDMP - Social Development and Management Programs
DHNC - Development of Host and Neighboring Communities 17,136,150 6,682,673 (10,453,477) 17,136,150 -
DMTG - Development of Mining Technology and Geosciences 1,262,671 537,976 (724,695) 1,262,671 -
IEC - Information, Education & Communication 1,876,375 642,858 (1,233,517) 1,876,375 -
Subtotal - Annual SDMP 20,275,196 7,863,507 (12,411,689) 20,275,196 - Subtotal 70,539,350 7,863,507 (62,675,843) 70,539,350 -
MPSA No. 158-00-XIII (SMR)
CTP Construction and Mining Corporation - Dahican
Annual EPEP - Environmental Protection and Enhancement Program 14,172,404 - (14,172,404) 14,172,404 -
Annual Work and Financial Plan (WFP) for FMR/DP - Actual Expenditure - - - - -
Compensation for claims for Damages from MWTF - - - - -
Environmental Trust Fund - Actual expenditure - - - - -
Final Mine Rehabilitation and/or Decommissioning Fund - Actual expenditure - - - - -
Mine wastes & Tailing fees (MWTF) - - - - -
Monitoring Trust Fund - Actual expenditure - - - - -
Rehabilitation Cash Fund - Actual expenditure - - - - -
Subtotal - Environmental expenditure 14,172,404 - (14,172,404) 14,172,404 -
Safety and Health Programs - Actual expenditure 3,135,210 - (3,135,210) 3,135,210 -
Annual SDMP - Social Development and
I I I I I I I
I I I I
I I I I
I I I I I I I
I
I I I I I I I I I
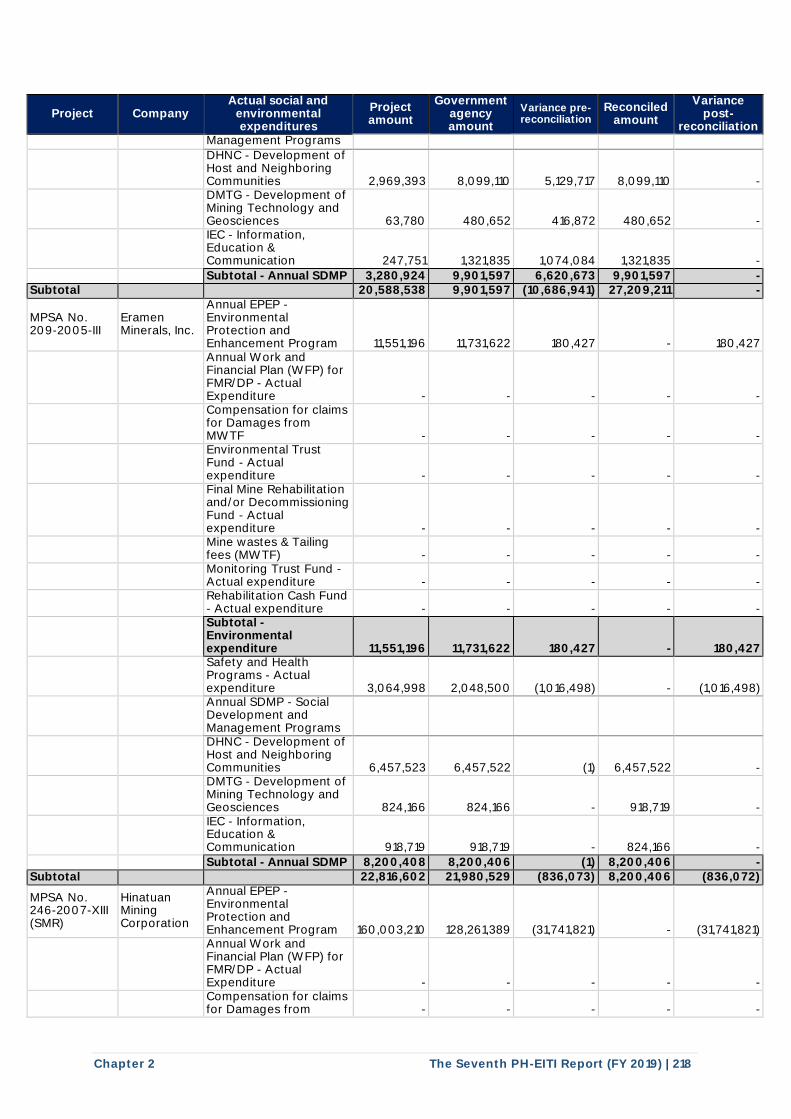
Chapter 2 The Seventh PH-EITI Report (FY 2019) | 218
Project Company Actual social and
environmental expenditures
Project amount
Government agency amount
Variance pre-reconciliation
Reconciled amount
Variance post-
reconciliation Management Programs
DHNC - Development of Host and Neighboring Communities 2,969,393 8,099,110 5,129,717 8,099,110 -
DMTG - Development of Mining Technology and Geosciences 63,780 480,652 416,872 480,652 -
IEC - Information, Education & Communication 247,751 1,321,835 1,074,084 1,321,835 -
Subtotal - Annual SDMP 3,280,924 9,901,597 6,620,673 9,901,597 - Subtotal 20,588,538 9,901,597 (10,686,941) 27,209,211 -
MPSA No. 209-2005-III
Eramen Minerals, Inc.
Annual EPEP - Environmental Protection and Enhancement Program 11,551,196 11,731,622 180,427 - 180,427
Annual Work and Financial Plan (WFP) for FMR/DP - Actual Expenditure - - - - -
Compensation for claims for Damages from MWTF - - - - -
Environmental Trust Fund - Actual expenditure - - - - -
Final Mine Rehabilitation and/or Decommissioning Fund - Actual expenditure - - - - -
Mine wastes & Tailing fees (MWTF) - - - - -
Monitoring Trust Fund - Actual expenditure - - - - -
Rehabilitation Cash Fund - Actual expenditure - - - - -
Subtotal - Environmental expenditure 11,551,196 11,731,622 180,427 - 180,427
Safety and Health Programs - Actual expenditure 3,064,998 2,048,500 (1,016,498) - (1,016,498)
Annual SDMP - Social Development and Management Programs
DHNC - Development of Host and Neighboring Communities 6,457,523 6,457,522 (1) 6,457,522 -
DMTG - Development of Mining Technology and Geosciences 824,166 824,166 - 918,719 -
IEC - Information, Education & Communication 918,719 918,719 - 824,166 -
Subtotal - Annual SDMP 8,200,408 8,200,406 (1) 8,200,406 - Subtotal 22,816,602 21,980,529 (836,073) 8,200,406 (836,072)
MPSA No. 246-2007-XIII (SMR)
Hinatuan Mining Corporation
Annual EPEP - Environmental Protection and Enhancement Program 160,003,210 128,261,389 (31,741,821) - (31,741,821)
Annual Work and Financial Plan (WFP) for FMR/DP - Actual Expenditure - - - - -
Compensation for claims for Damages from - - - - -
I I I I I I I
I I I I
I I I I
I I
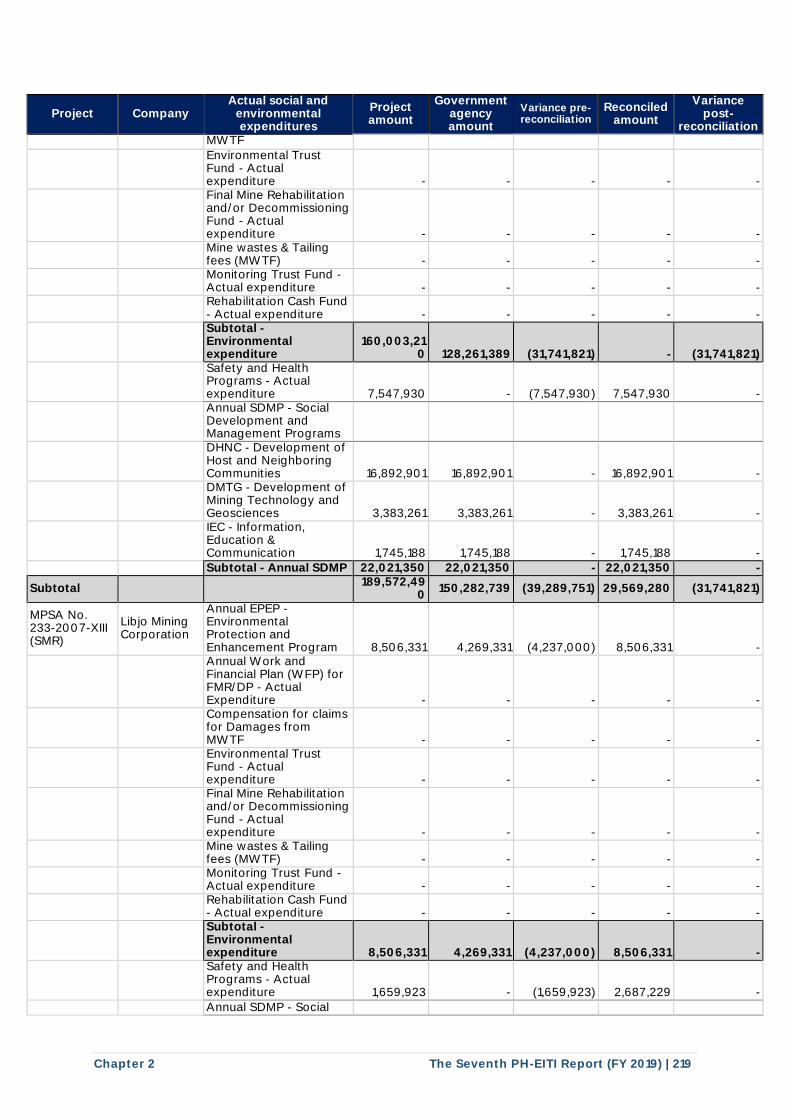
Chapter 2 The Seventh PH-EITI Report (FY 2019) | 219
Project Company Actual social and
environmental expenditures
Project amount
Government agency amount
Variance pre-reconciliation
Reconciled amount
Variance post-
reconciliation MWTF
Environmental Trust Fund - Actual expenditure - - - - -
Final Mine Rehabilitation and/or Decommissioning Fund - Actual expenditure - - - - -
Mine wastes & Tailing fees (MWTF) - - - - -
Monitoring Trust Fund - Actual expenditure - - - - -
Rehabilitation Cash Fund - Actual expenditure - - - - -
Subtotal - Environmental expenditure
160,003,210 128,261,389 (31,741,821) - (31,741,821)
Safety and Health Programs - Actual expenditure 7,547,930 - (7,547,930) 7,547,930 -
Annual SDMP - Social Development and Management Programs
DHNC - Development of Host and Neighboring Communities 16,892,901 16,892,901 - 16,892,901 -
DMTG - Development of Mining Technology and Geosciences 3,383,261 3,383,261 - 3,383,261 -
IEC - Information, Education & Communication 1,745,188 1,745,188 - 1,745,188 -
Subtotal - Annual SDMP 22,021,350 22,021,350 - 22,021,350 -
Subtotal 189,572,49
0 150,282,739 (39,289,751) 29,569,280 (31,741,821)
MPSA No. 233-2007-XIII (SMR)
Libjo Mining Corporation
Annual EPEP - Environmental Protection and Enhancement Program 8,506,331 4,269,331 (4,237,000) 8,506,331 -
Annual Work and Financial Plan (WFP) for FMR/DP - Actual Expenditure - - - - -
Compensation for claims for Damages from MWTF - - - - -
Environmental Trust Fund - Actual expenditure - - - - -
Final Mine Rehabilitation and/or Decommissioning Fund - Actual expenditure - - - - -
Mine wastes & Tailing fees (MWTF) - - - - -
Monitoring Trust Fund - Actual expenditure - - - - -
Rehabilitation Cash Fund - Actual expenditure - - - - -
Subtotal - Environmental expenditure 8,506,331 4,269,331 (4,237,000) 8,506,331 -
Safety and Health Programs - Actual expenditure 1,659,923 - (1,659,923) 2,687,229 -
Annual SDMP - Social
I I I I I I I
I I I I I
I I I I
I I I I I I I
I I I I I I I I I I
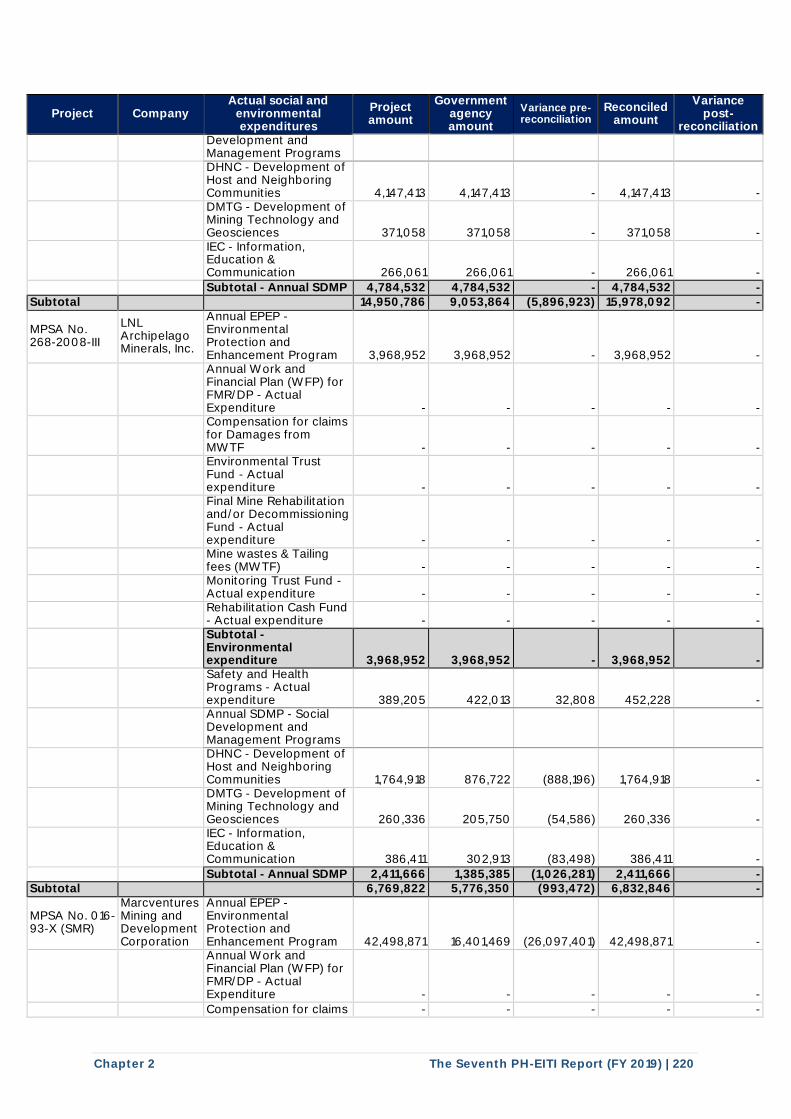
Chapter 2 The Seventh PH-EITI Report (FY 2019) | 220
Project Company Actual social and
environmental expenditures
Project amount
Government agency amount
Variance pre-reconciliation
Reconciled amount
Variance post-
reconciliation Development and Management Programs
DHNC - Development of Host and Neighboring Communities 4,147,413 4,147,413 - 4,147,413 -
DMTG - Development of Mining Technology and Geosciences 371,058 371,058 - 371,058 -
IEC - Information, Education & Communication 266,061 266,061 - 266,061 -
Subtotal - Annual SDMP 4,784,532 4,784,532 - 4,784,532 - Subtotal 14,950,786 9,053,864 (5,896,923) 15,978,092 -
MPSA No. 268-2008-III
LNL Archipelago Minerals, Inc.
Annual EPEP - Environmental Protection and Enhancement Program 3,968,952 3,968,952 - 3,968,952 -
Annual Work and Financial Plan (WFP) for FMR/DP - Actual Expenditure - - - - -
Compensation for claims for Damages from MWTF - - - - -
Environmental Trust Fund - Actual expenditure - - - - -
Final Mine Rehabilitation and/or Decommissioning Fund - Actual expenditure - - - - -
Mine wastes & Tailing fees (MWTF) - - - - -
Monitoring Trust Fund - Actual expenditure - - - - -
Rehabilitation Cash Fund - Actual expenditure - - - - -
Subtotal - Environmental expenditure 3,968,952 3,968,952 - 3,968,952 -
Safety and Health Programs - Actual expenditure 389,205 422,013 32,808 452,228 -
Annual SDMP - Social Development and Management Programs
DHNC - Development of Host and Neighboring Communities 1,764,918 876,722 (888,196) 1,764,918 -
DMTG - Development of Mining Technology and Geosciences 260,336 205,750 (54,586) 260,336 -
IEC - Information, Education & Communication 386,411 302,913 (83,498) 386,411 -
Subtotal - Annual SDMP 2,411,666 1,385,385 (1,026,281) 2,411,666 - Subtotal 6,769,822 5,776,350 (993,472) 6,832,846 -
MPSA No. 016-93-X (SMR)
Marcventures Mining and Development Corporation
Annual EPEP - Environmental Protection and Enhancement Program 42,498,871 16,401,469 (26,097,401) 42,498,871 -
Annual Work and Financial Plan (WFP) for FMR/DP - Actual Expenditure - - - - -
Compensation for claims - - - - -
I I I I
I I I I I I I
I I I I
I I I I
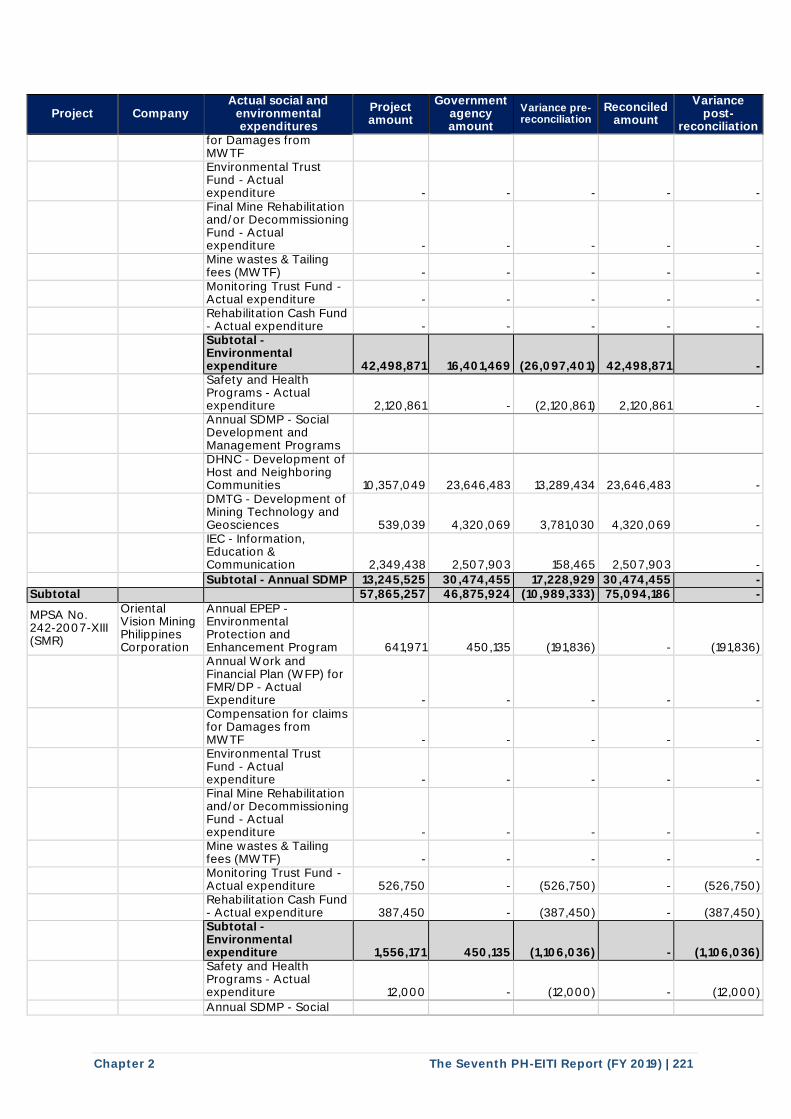
Chapter 2 The Seventh PH-EITI Report (FY 2019) | 221
Project Company Actual social and
environmental expenditures
Project amount
Government agency amount
Variance pre-reconciliation
Reconciled amount
Variance post-
reconciliation for Damages from MWTF
Environmental Trust Fund - Actual expenditure - - - - -
Final Mine Rehabilitation and/or Decommissioning Fund - Actual expenditure - - - - -
Mine wastes & Tailing fees (MWTF) - - - - -
Monitoring Trust Fund - Actual expenditure - - - - -
Rehabilitation Cash Fund - Actual expenditure - - - - -
Subtotal - Environmental expenditure 42,498,871 16,401,469 (26,097,401) 42,498,871 -
Safety and Health Programs - Actual expenditure 2,120,861 - (2,120,861) 2,120,861 -
Annual SDMP - Social Development and Management Programs
DHNC - Development of Host and Neighboring Communities 10,357,049 23,646,483 13,289,434 23,646,483 -
DMTG - Development of Mining Technology and Geosciences 539,039 4,320,069 3,781,030 4,320,069 -
IEC - Information, Education & Communication 2,349,438 2,507,903 158,465 2,507,903 -
Subtotal - Annual SDMP 13,245,525 30,474,455 17,228,929 30,474,455 - Subtotal 57,865,257 46,875,924 (10,989,333) 75,094,186 -
MPSA No. 242-2007-XIII (SMR)
Oriental Vision Mining Philippines Corporation
Annual EPEP - Environmental Protection and Enhancement Program 641,971 450,135 (191,836) - (191,836)
Annual Work and Financial Plan (WFP) for FMR/DP - Actual Expenditure - - - - -
Compensation for claims for Damages from MWTF - - - - -
Environmental Trust Fund - Actual expenditure - - - - -
Final Mine Rehabilitation and/or Decommissioning Fund - Actual expenditure - - - - -
Mine wastes & Tailing fees (MWTF) - - - - -
Monitoring Trust Fund - Actual expenditure 526,750 - (526,750) - (526,750)
Rehabilitation Cash Fund - Actual expenditure 387,450 - (387,450) - (387,450)
Subtotal - Environmental expenditure 1,556,171 450,135 (1,106,036) - (1,106,036)
Safety and Health Programs - Actual expenditure 12,000 - (12,000) - (12,000)
Annual SDMP - Social
I I I I I I I
I I I I
I I I I
I I I I I I I
I I I I I I I I I I
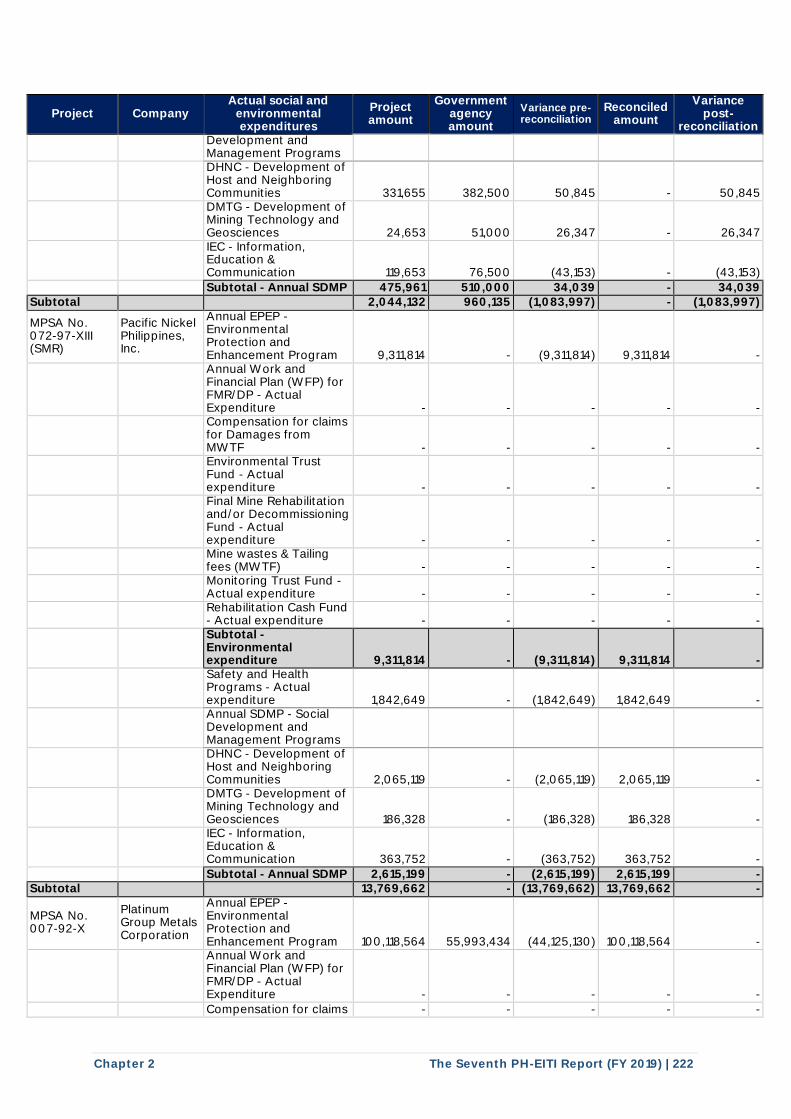
Chapter 2 The Seventh PH-EITI Report (FY 2019) | 222
Project Company Actual social and
environmental expenditures
Project amount
Government agency amount
Variance pre-reconciliation
Reconciled amount
Variance post-
reconciliation Development and Management Programs
DHNC - Development of Host and Neighboring Communities 331,655 382,500 50,845 - 50,845
DMTG - Development of Mining Technology and Geosciences 24,653 51,000 26,347 - 26,347
IEC - Information, Education & Communication 119,653 76,500 (43,153) - (43,153)
Subtotal - Annual SDMP 475,961 510,000 34,039 - 34,039 Subtotal 2,044,132 960,135 (1,083,997) - (1,083,997)
MPSA No. 072-97-XIII (SMR)
Pacific Nickel Philippines, Inc.
Annual EPEP - Environmental Protection and Enhancement Program 9,311,814 - (9,311,814) 9,311,814 -
Annual Work and Financial Plan (WFP) for FMR/DP - Actual Expenditure - - - - -
Compensation for claims for Damages from MWTF - - - - -
Environmental Trust Fund - Actual expenditure - - - - -
Final Mine Rehabilitation and/or Decommissioning Fund - Actual expenditure - - - - -
Mine wastes & Tailing fees (MWTF) - - - - -
Monitoring Trust Fund - Actual expenditure - - - - -
Rehabilitation Cash Fund - Actual expenditure - - - - -
Subtotal - Environmental expenditure 9,311,814 - (9,311,814) 9,311,814 -
Safety and Health Programs - Actual expenditure 1,842,649 - (1,842,649) 1,842,649 -
Annual SDMP - Social Development and Management Programs
DHNC - Development of Host and Neighboring Communities 2,065,119 - (2,065,119) 2,065,119 -
DMTG - Development of Mining Technology and Geosciences 186,328 - (186,328) 186,328 -
IEC - Information, Education & Communication 363,752 - (363,752) 363,752 -
Subtotal - Annual SDMP 2,615,199 - (2,615,199) 2,615,199 - Subtotal 13,769,662 - (13,769,662) 13,769,662 -
MPSA No. 007-92-X
Platinum Group Metals Corporation
Annual EPEP - Environmental Protection and Enhancement Program 100,118,564 55,993,434 (44,125,130) 100,118,564 -
Annual Work and Financial Plan (WFP) for FMR/DP - Actual Expenditure - - - - -
Compensation for claims - - - - -
I I I I
I I I I I I I
I I I I
I I I I
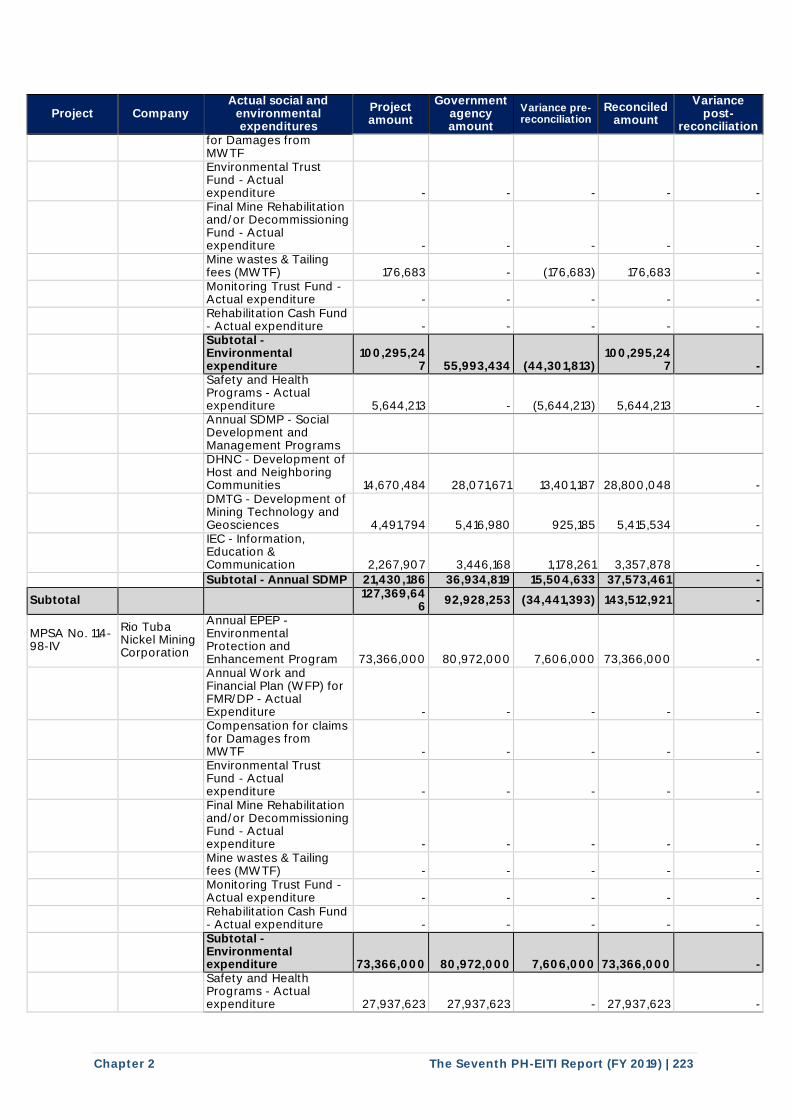
Chapter 2 The Seventh PH-EITI Report (FY 2019) | 223
Project Company Actual social and
environmental expenditures
Project amount
Government agency amount
Variance pre-reconciliation
Reconciled amount
Variance post-
reconciliation for Damages from MWTF
Environmental Trust Fund - Actual expenditure - - - - -
Final Mine Rehabilitation and/or Decommissioning Fund - Actual expenditure - - - - -
Mine wastes & Tailing fees (MWTF) 176,683 - (176,683) 176,683 -
Monitoring Trust Fund - Actual expenditure - - - - -
Rehabilitation Cash Fund - Actual expenditure - - - - -
Subtotal - Environmental expenditure
100,295,247 55,993,434 (44,301,813)
100,295,247 -
Safety and Health Programs - Actual expenditure 5,644,213 - (5,644,213) 5,644,213 -
Annual SDMP - Social Development and Management Programs
DHNC - Development of Host and Neighboring Communities 14,670,484 28,071,671 13,401,187 28,800,048 -
DMTG - Development of Mining Technology and Geosciences 4,491,794 5,416,980 925,185 5,415,534 -
IEC - Information, Education & Communication 2,267,907 3,446,168 1,178,261 3,357,878 -
Subtotal - Annual SDMP 21,430,186 36,934,819 15,504,633 37,573,461 -
Subtotal 127,369,64
6 92,928,253 (34,441,393) 143,512,921 -
MPSA No. 114-98-IV
Rio Tuba Nickel Mining Corporation
Annual EPEP - Environmental Protection and Enhancement Program 73,366,000 80,972,000 7,606,000 73,366,000 -
Annual Work and Financial Plan (WFP) for FMR/DP - Actual Expenditure - - - - -
Compensation for claims for Damages from MWTF - - - - -
Environmental Trust Fund - Actual expenditure - - - - -
Final Mine Rehabilitation and/or Decommissioning Fund - Actual expenditure - - - - -
Mine wastes & Tailing fees (MWTF) - - - - -
Monitoring Trust Fund - Actual expenditure - - - - -
Rehabilitation Cash Fund - Actual expenditure - - - - -
Subtotal - Environmental expenditure 73,366,000 80,972,000 7,606,000 73,366,000 -
Safety and Health Programs - Actual expenditure 27,937,623 27,937,623 - 27,937,623 -
I I I I I I I
I I I I
I I I I
I I I I I I I
I I I I I
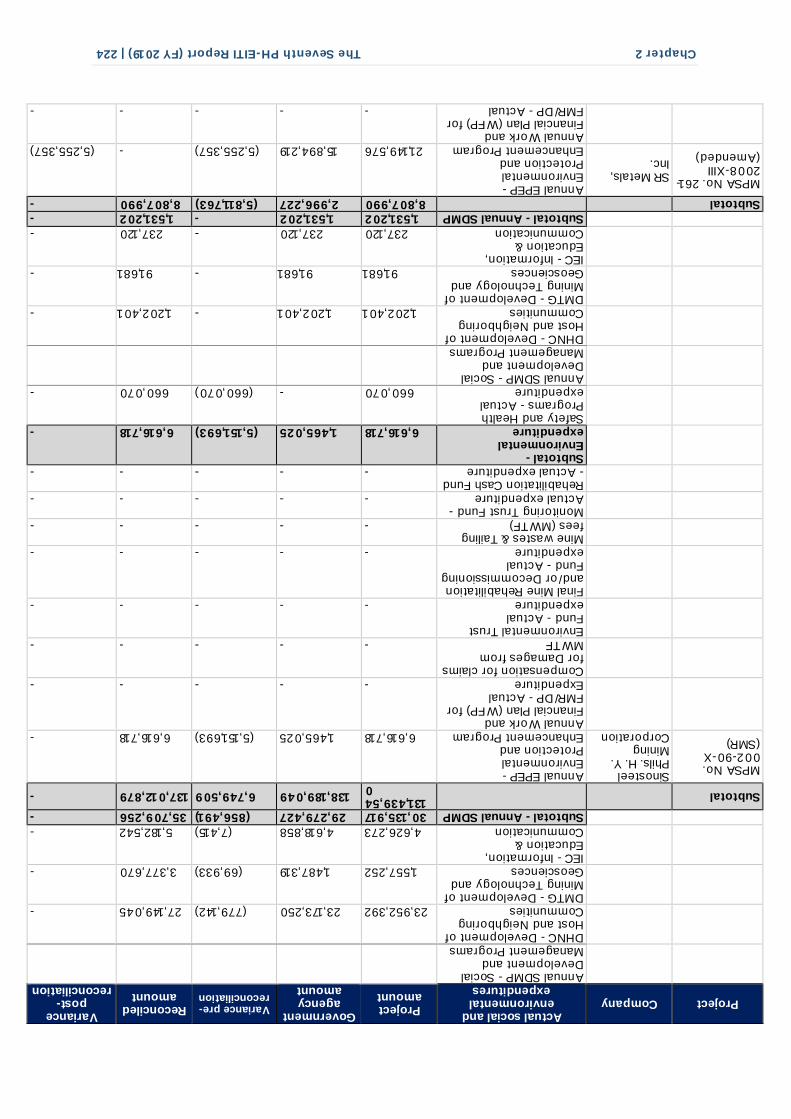
Chapter 2 The Seventh PH-EITI Report (FY 2019) | 224
Project Company Actual social and
environmental expenditures
Project amount
Government agency amount
Variance pre-reconciliation
Reconciled amount
Variance post-
reconciliation
Annual SDMP - Social Development and Management Programs
DHNC - Development of Host and Neighboring Communities 23,952,392 23,173,250 (779,142) 27,149,045 -
DMTG - Development of Mining Technology and Geosciences 1,557,252 1,487,319 (69,933) 3,377,670 -
IEC - Information, Education & Communication 4,626,273 4,618,858 (7,415) 5,182,542 -
Subtotal - Annual SDMP 30,135,917 29,279,427 (856,491) 35,709,256 -
Subtotal 131,439,54
0 138,189,049 6,749,509 137,012,879 -
MPSA No. 002-90-X (SMR)
Sinosteel Phils. H. Y. Mining Corporation
Annual EPEP - Environmental Protection and Enhancement Program 6,616,718 1,465,025 (5,151,693) 6,616,718 -
Annual Work and Financial Plan (WFP) for FMR/DP - Actual Expenditure - - - - -
Compensation for claims for Damages from MWTF - - - - -
Environmental Trust Fund - Actual expenditure - - - - -
Final Mine Rehabilitation and/or Decommissioning Fund - Actual expenditure - - - - -
Mine wastes & Tailing fees (MWTF) - - - - -
Monitoring Trust Fund - Actual expenditure - - - - -
Rehabilitation Cash Fund - Actual expenditure - - - - -
Subtotal - Environmental expenditure 6,616,718 1,465,025 (5,151,693) 6,616,718 -
Safety and Health Programs - Actual expenditure 660,070 - (660,070) 660,070 -
Annual SDMP - Social Development and Management Programs
DHNC - Development of Host and Neighboring Communities 1,202,401 1,202,401 - 1,202,401 -
DMTG - Development of Mining Technology and Geosciences 91,681 91,681 - 91,681 -
IEC - Information, Education & Communication 237,120 237,120 - 237,120 -
Subtotal - Annual SDMP 1,531,202 1,531,202 - 1,531,202 - Subtotal 8,807,990 2,996,227 (5,811,763) 8,807,990 -
MPSA No. 261-2008-XIII (Amended)
SR Metals, Inc.
Annual EPEP - Environmental Protection and Enhancement Program 21,149,576 15,894,219 (5,255,357) - (5,255,357)
Annual Work and Financial Plan (WFP) for FMR/DP - Actual - - - - -
I I I I I I I I I I
I I I I I I I
I I I I I I
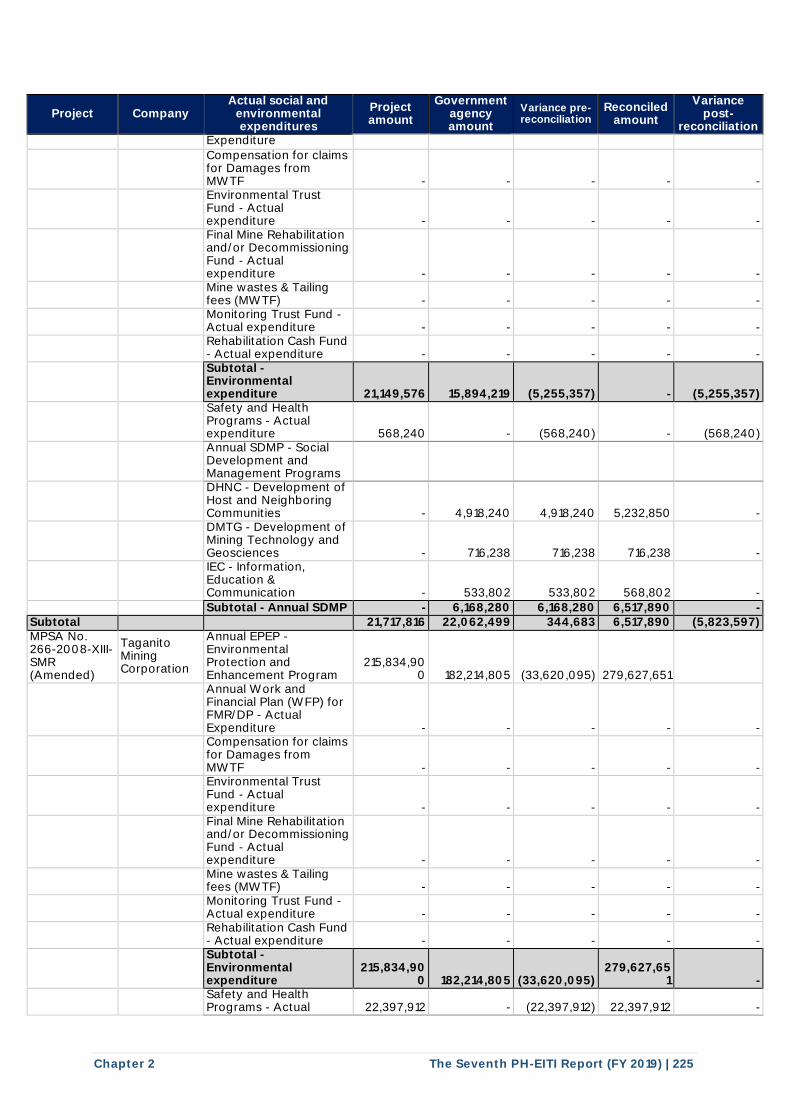
Chapter 2 The Seventh PH-EITI Report (FY 2019) | 225
Project Company Actual social and
environmental expenditures
Project amount
Government agency amount
Variance pre-reconciliation
Reconciled amount
Variance post-
reconciliation Expenditure
Compensation for claims for Damages from MWTF - - - - -
Environmental Trust Fund - Actual expenditure - - - - -
Final Mine Rehabilitation and/or Decommissioning Fund - Actual expenditure - - - - -
Mine wastes & Tailing fees (MWTF) - - - - -
Monitoring Trust Fund - Actual expenditure - - - - -
Rehabilitation Cash Fund - Actual expenditure - - - - -
Subtotal - Environmental expenditure 21,149,576 15,894,219 (5,255,357) - (5,255,357)
Safety and Health Programs - Actual expenditure 568,240 - (568,240) - (568,240)
Annual SDMP - Social Development and Management Programs
DHNC - Development of Host and Neighboring Communities - 4,918,240 4,918,240 5,232,850 -
DMTG - Development of Mining Technology and Geosciences - 716,238 716,238 716,238 -
IEC - Information, Education & Communication - 533,802 533,802 568,802 -
Subtotal - Annual SDMP - 6,168,280 6,168,280 6,517,890 - Subtotal 21,717,816 22,062,499 344,683 6,517,890 (5,823,597) MPSA No. 266-2008-XIII-SMR (Amended)
Taganito Mining Corporation
Annual EPEP - Environmental Protection and Enhancement Program
215,834,900 182,214,805 (33,620,095) 279,627,651
Annual Work and Financial Plan (WFP) for FMR/DP - Actual Expenditure - - - - -
Compensation for claims for Damages from MWTF - - - - -
Environmental Trust Fund - Actual expenditure - - - - -
Final Mine Rehabilitation and/or Decommissioning Fund - Actual expenditure - - - - -
Mine wastes & Tailing fees (MWTF) - - - - -
Monitoring Trust Fund - Actual expenditure - - - - -
Rehabilitation Cash Fund - Actual expenditure - - - - -
Subtotal - Environmental expenditure
215,834,900 182,214,805 (33,620,095)
279,627,651 -
Safety and Health Programs - Actual 22,397,912 - (22,397,912) 22,397,912 -
I I I I I I I
I I I I
I I I I
I I I I I I I I I I I I I
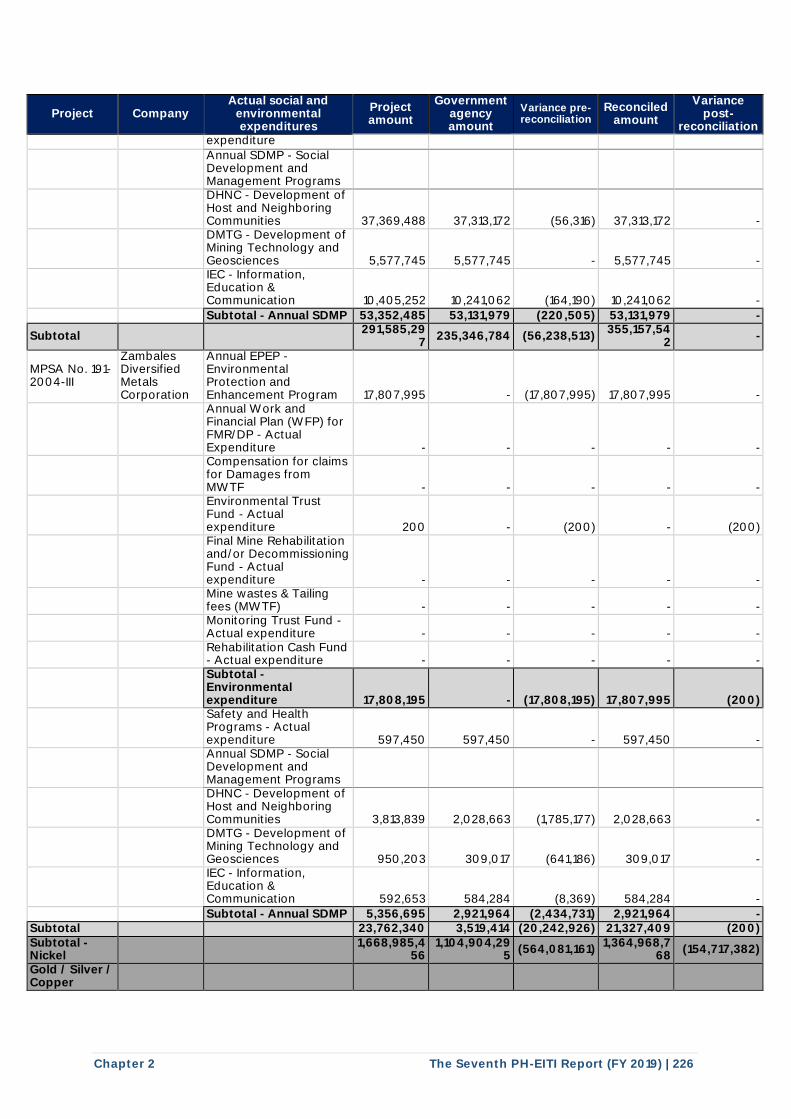
Chapter 2 The Seventh PH-EITI Report (FY 2019) | 226
Project Company Actual social and
environmental expenditures
Project amount
Government agency amount
Variance pre-reconciliation
Reconciled amount
Variance post-
reconciliation expenditure
Annual SDMP - Social Development and Management Programs
DHNC - Development of Host and Neighboring Communities 37,369,488 37,313,172 (56,316) 37,313,172 -
DMTG - Development of Mining Technology and Geosciences 5,577,745 5,577,745 - 5,577,745 -
IEC - Information, Education & Communication 10,405,252 10,241,062 (164,190) 10,241,062 -
Subtotal - Annual SDMP 53,352,485 53,131,979 (220,505) 53,131,979 -
Subtotal 291,585,29
7 235,346,784 (56,238,513)
355,157,542
-
MPSA No. 191-2004-III
Zambales Diversified Metals Corporation
Annual EPEP - Environmental Protection and Enhancement Program 17,807,995 - (17,807,995) 17,807,995 -
Annual Work and Financial Plan (WFP) for FMR/DP - Actual Expenditure - - - - -
Compensation for claims for Damages from MWTF - - - - -
Environmental Trust Fund - Actual expenditure 200 - (200) - (200)
Final Mine Rehabilitation and/or Decommissioning Fund - Actual expenditure - - - - -
Mine wastes & Tailing fees (MWTF) - - - - -
Monitoring Trust Fund - Actual expenditure - - - - -
Rehabilitation Cash Fund - Actual expenditure - - - - -
Subtotal - Environmental expenditure 17,808,195 - (17,808,195) 17,807,995 (200)
Safety and Health Programs - Actual expenditure 597,450 597,450 - 597,450 -
Annual SDMP - Social Development and Management Programs
DHNC - Development of Host and Neighboring Communities 3,813,839 2,028,663 (1,785,177) 2,028,663 -
DMTG - Development of Mining Technology and Geosciences 950,203 309,017 (641,186) 309,017 -
IEC - Information, Education & Communication 592,653 584,284 (8,369) 584,284 -
Subtotal - Annual SDMP 5,356,695 2,921,964 (2,434,731) 2,921,964 - Subtotal 23,762,340 3,519,414 (20,242,926) 21,327,409 (200) Subtotal - Nickel
1,668,985,4
56 1,104,904,29
5 (564,081,161)
1,364,968,768
(154,717,382)
Gold / Silver / Copper
I I I I I I I
I I I I
I I I I
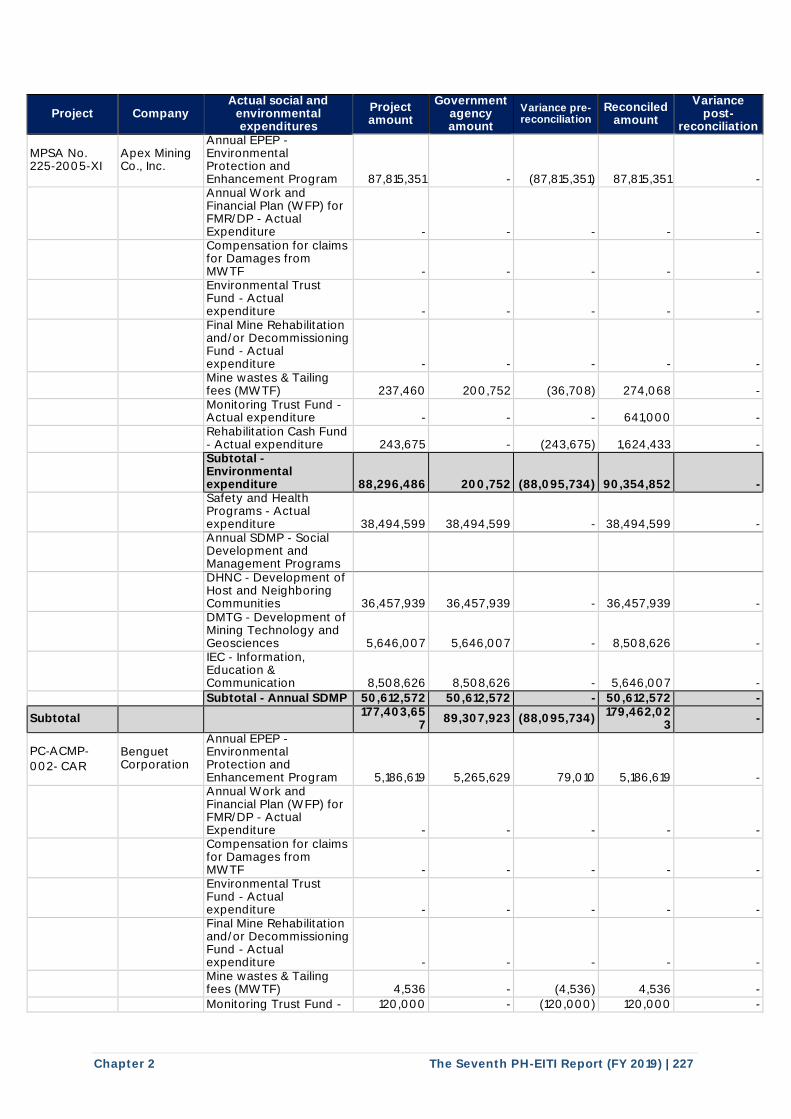
Chapter 2 The Seventh PH-EITI Report (FY 2019) | 227
Project Company Actual social and
environmental expenditures
Project amount
Government agency amount
Variance pre-reconciliation
Reconciled amount
Variance post-
reconciliation
MPSA No. 225-2005-XI
Apex Mining Co., Inc.
Annual EPEP - Environmental Protection and Enhancement Program 87,815,351 - (87,815,351) 87,815,351 -
Annual Work and Financial Plan (WFP) for FMR/DP - Actual Expenditure - - - - -
Compensation for claims for Damages from MWTF - - - - -
Environmental Trust Fund - Actual expenditure - - - - -
Final Mine Rehabilitation and/or Decommissioning Fund - Actual expenditure - - - - -
Mine wastes & Tailing fees (MWTF) 237,460 200,752 (36,708) 274,068 -
Monitoring Trust Fund - Actual expenditure - - - 641,000 -
Rehabilitation Cash Fund - Actual expenditure 243,675 - (243,675) 1,624,433 -
Subtotal - Environmental expenditure 88,296,486 200,752 (88,095,734) 90,354,852 -
Safety and Health Programs - Actual expenditure 38,494,599 38,494,599 - 38,494,599 -
Annual SDMP - Social Development and Management Programs
DHNC - Development of Host and Neighboring Communities 36,457,939 36,457,939 - 36,457,939 -
DMTG - Development of Mining Technology and Geosciences 5,646,007 5,646,007 - 8,508,626 -
IEC - Information, Education & Communication 8,508,626 8,508,626 - 5,646,007 -
Subtotal - Annual SDMP 50,612,572 50,612,572 - 50,612,572 -
Subtotal 177,403,65
7 89,307,923 (88,095,734)
179,462,023
-
PC‐ACMP‐
002‐ CAR Benguet Corporation
Annual EPEP - Environmental Protection and Enhancement Program 5,186,619 5,265,629 79,010 5,186,619 -
Annual Work and Financial Plan (WFP) for FMR/DP - Actual Expenditure - - - - -
Compensation for claims for Damages from MWTF - - - - -
Environmental Trust Fund - Actual expenditure - - - - -
Final Mine Rehabilitation and/or Decommissioning Fund - Actual expenditure - - - - -
Mine wastes & Tailing fees (MWTF) 4,536 - (4,536) 4,536 -
Monitoring Trust Fund - 120,000 - (120,000) 120,000 -
I I I I I I I
I I I I I
I I I I I
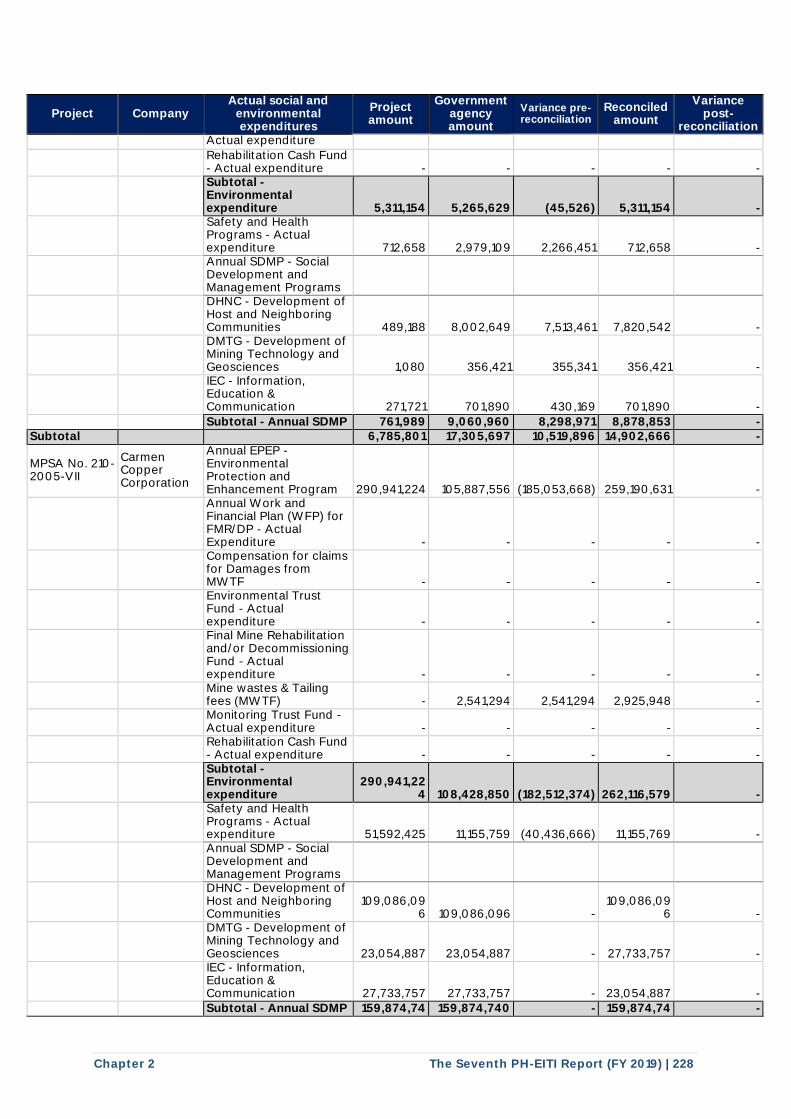
Chapter 2 The Seventh PH-EITI Report (FY 2019) | 228
Project Company Actual social and
environmental expenditures
Project amount
Government agency amount
Variance pre-reconciliation
Reconciled amount
Variance post-
reconciliation Actual expenditure
Rehabilitation Cash Fund - Actual expenditure - - - - -
Subtotal - Environmental expenditure 5,311,154 5,265,629 (45,526) 5,311,154 -
Safety and Health Programs - Actual expenditure 712,658 2,979,109 2,266,451 712,658 -
Annual SDMP - Social Development and Management Programs
DHNC - Development of Host and Neighboring Communities 489,188 8,002,649 7,513,461 7,820,542 -
DMTG - Development of Mining Technology and Geosciences 1,080 356,421 355,341 356,421 -
IEC - Information, Education & Communication 271,721 701,890 430,169 701,890 -
Subtotal - Annual SDMP 761,989 9,060,960 8,298,971 8,878,853 - Subtotal 6,785,801 17,305,697 10,519,896 14,902,666 -
MPSA No. 210-2005-VII
Carmen Copper Corporation
Annual EPEP - Environmental Protection and Enhancement Program 290,941,224 105,887,556 (185,053,668) 259,190,631 -
Annual Work and Financial Plan (WFP) for FMR/DP - Actual Expenditure - - - - -
Compensation for claims for Damages from MWTF - - - - -
Environmental Trust Fund - Actual expenditure - - - - -
Final Mine Rehabilitation and/or Decommissioning Fund - Actual expenditure - - - - -
Mine wastes & Tailing fees (MWTF) - 2,541,294 2,541,294 2,925,948 -
Monitoring Trust Fund - Actual expenditure - - - - -
Rehabilitation Cash Fund - Actual expenditure - - - - -
Subtotal - Environmental expenditure
290,941,224 108,428,850 (182,512,374) 262,116,579 -
Safety and Health Programs - Actual expenditure 51,592,425 11,155,759 (40,436,666) 11,155,769 -
Annual SDMP - Social Development and Management Programs
DHNC - Development of Host and Neighboring Communities
109,086,096 109,086,096 -
109,086,096 -
DMTG - Development of Mining Technology and Geosciences 23,054,887 23,054,887 - 27,733,757 -
IEC - Information, Education & Communication 27,733,757 27,733,757 - 23,054,887 -
Subtotal - Annual SDMP 159,874,74 159,874,740 - 159,874,74 -
I I I I I I I I I I
I I I I I I I
I I I I
I I I I
I I I I I I I
I I I I
I I I I
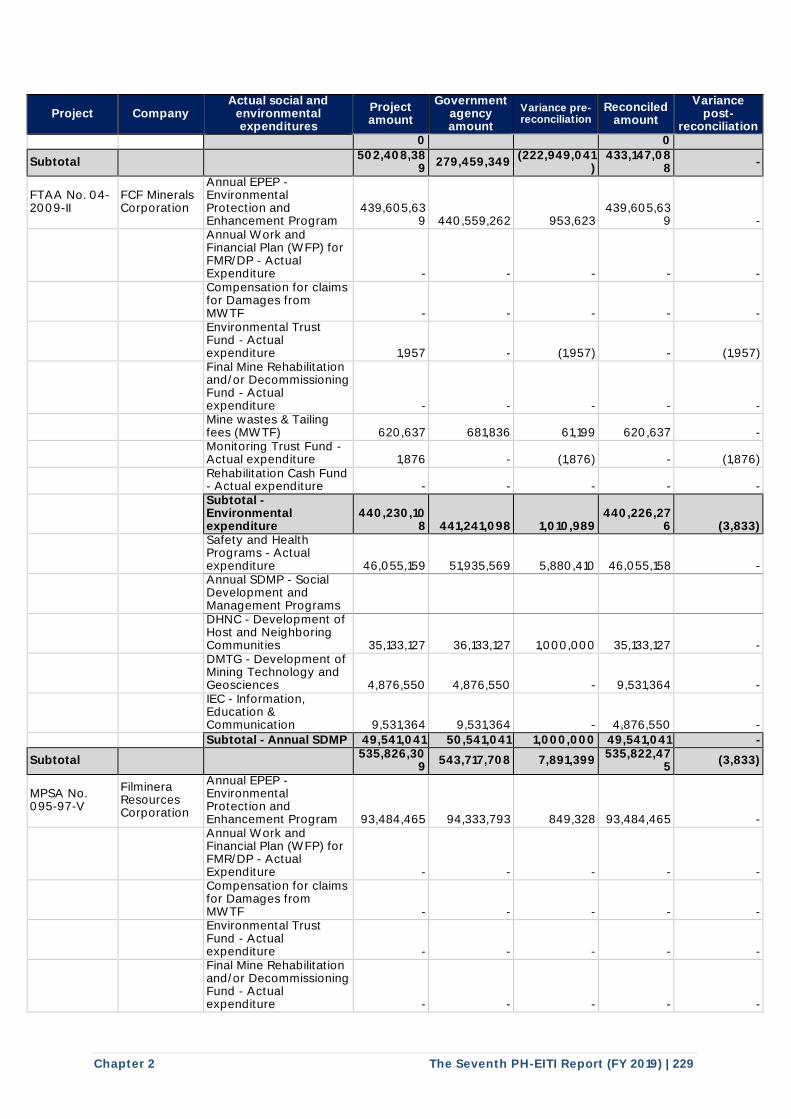
Chapter 2 The Seventh PH-EITI Report (FY 2019) | 229
Project Company Actual social and
environmental expenditures
Project amount
Government agency amount
Variance pre-reconciliation
Reconciled amount
Variance post-
reconciliation 0 0
Subtotal 502,408,38
9 279,459,349
(222,949,041)
433,147,088
-
FTAA No. 04-2009-II
FCF Minerals Corporation
Annual EPEP - Environmental Protection and Enhancement Program
439,605,639 440,559,262 953,623
439,605,639 -
Annual Work and Financial Plan (WFP) for FMR/DP - Actual Expenditure - - - - -
Compensation for claims for Damages from MWTF - - - - -
Environmental Trust Fund - Actual expenditure 1,957 - (1,957) - (1,957)
Final Mine Rehabilitation and/or Decommissioning Fund - Actual expenditure - - - - -
Mine wastes & Tailing fees (MWTF) 620,637 681,836 61,199 620,637 -
Monitoring Trust Fund - Actual expenditure 1,876 - (1,876) - (1,876)
Rehabilitation Cash Fund - Actual expenditure - - - - -
Subtotal - Environmental expenditure
440,230,108 441,241,098 1,010,989
440,226,276 (3,833)
Safety and Health Programs - Actual expenditure 46,055,159 51,935,569 5,880,410 46,055,158 -
Annual SDMP - Social Development and Management Programs
DHNC - Development of Host and Neighboring Communities 35,133,127 36,133,127 1,000,000 35,133,127 -
DMTG - Development of Mining Technology and Geosciences 4,876,550 4,876,550 - 9,531,364 -
IEC - Information, Education & Communication 9,531,364 9,531,364 - 4,876,550 -
Subtotal - Annual SDMP 49,541,041 50,541,041 1,000,000 49,541,041 -
Subtotal 535,826,30
9 543,717,708 7,891,399
535,822,475
(3,833)
MPSA No. 095-97-V
Filminera Resources Corporation
Annual EPEP - Environmental Protection and Enhancement Program 93,484,465 94,333,793 849,328 93,484,465 -
Annual Work and Financial Plan (WFP) for FMR/DP - Actual Expenditure - - - - -
Compensation for claims for Damages from MWTF - - - - -
Environmental Trust Fund - Actual expenditure - - - - -
Final Mine Rehabilitation and/or Decommissioning Fund - Actual expenditure - - - - -
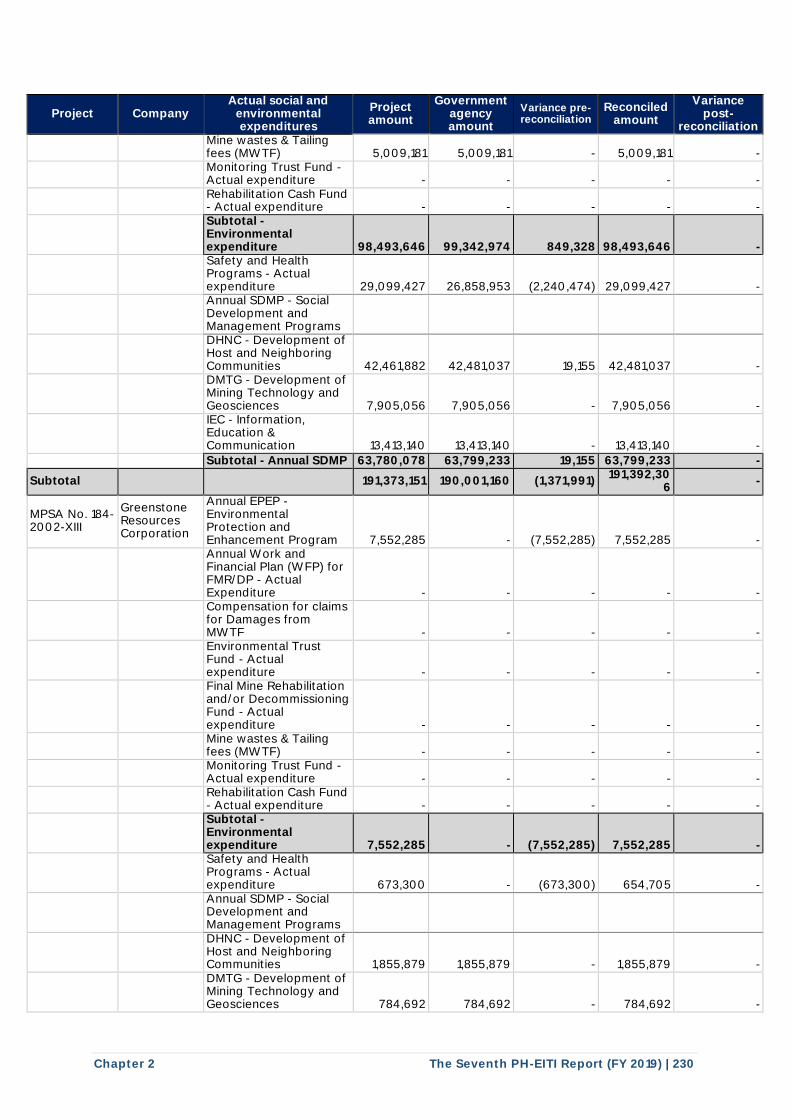
Chapter 2 The Seventh PH-EITI Report (FY 2019) | 230
Project Company Actual social and
environmental expenditures
Project amount
Government agency amount
Variance pre-reconciliation
Reconciled amount
Variance post-
reconciliation
Mine wastes & Tailing fees (MWTF) 5,009,181 5,009,181 - 5,009,181 -
Monitoring Trust Fund - Actual expenditure - - - - -
Rehabilitation Cash Fund - Actual expenditure - - - - -
Subtotal - Environmental expenditure 98,493,646 99,342,974 849,328 98,493,646 -
Safety and Health Programs - Actual expenditure 29,099,427 26,858,953 (2,240,474) 29,099,427 -
Annual SDMP - Social Development and Management Programs
DHNC - Development of Host and Neighboring Communities 42,461,882 42,481,037 19,155 42,481,037 -
DMTG - Development of Mining Technology and Geosciences 7,905,056 7,905,056 - 7,905,056 -
IEC - Information, Education & Communication 13,413,140 13,413,140 - 13,413,140 -
Subtotal - Annual SDMP 63,780,078 63,799,233 19,155 63,799,233 -
Subtotal 191,373,151 190,001,160 (1,371,991) 191,392,30
6 -
MPSA No. 184-2002-XIII
Greenstone Resources Corporation
Annual EPEP - Environmental Protection and Enhancement Program 7,552,285 - (7,552,285) 7,552,285 -
Annual Work and Financial Plan (WFP) for FMR/DP - Actual Expenditure - - - - -
Compensation for claims for Damages from MWTF - - - - -
Environmental Trust Fund - Actual expenditure - - - - -
Final Mine Rehabilitation and/or Decommissioning Fund - Actual expenditure - - - - -
Mine wastes & Tailing fees (MWTF) - - - - -
Monitoring Trust Fund - Actual expenditure - - - - -
Rehabilitation Cash Fund - Actual expenditure - - - - -
Subtotal - Environmental expenditure 7,552,285 - (7,552,285) 7,552,285 -
Safety and Health Programs - Actual expenditure 673,300 - (673,300) 654,705 -
Annual SDMP - Social Development and Management Programs
DHNC - Development of Host and Neighboring Communities 1,855,879 1,855,879 - 1,855,879 -
DMTG - Development of Mining Technology and Geosciences 784,692 784,692 - 784,692 -
I I I I I I I
I I I I I
I I I I
I I I I I I I
I I I I I
I I I I
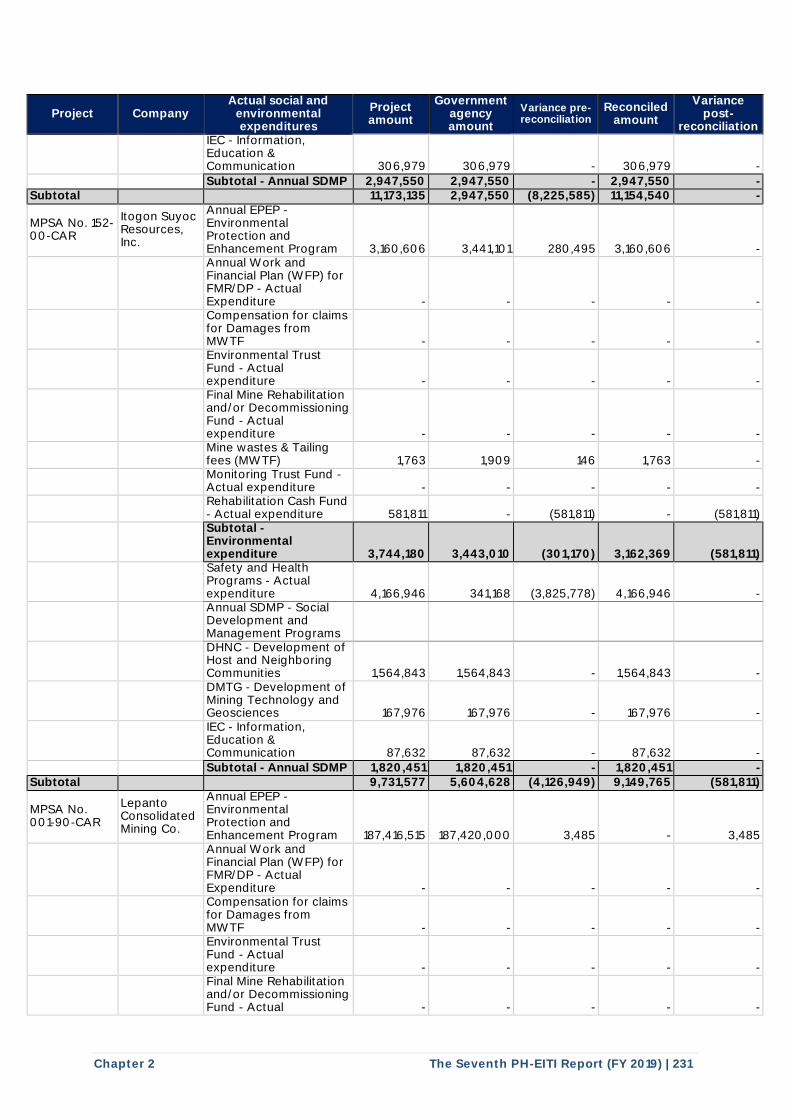
Chapter 2 The Seventh PH-EITI Report (FY 2019) | 231
Project Company Actual social and
environmental expenditures
Project amount
Government agency amount
Variance pre-reconciliation
Reconciled amount
Variance post-
reconciliation
IEC - Information, Education & Communication 306,979 306,979 - 306,979 -
Subtotal - Annual SDMP 2,947,550 2,947,550 - 2,947,550 - Subtotal 11,173,135 2,947,550 (8,225,585) 11,154,540 -
MPSA No. 152-00-CAR
Itogon Suyoc Resources, Inc.
Annual EPEP - Environmental Protection and Enhancement Program 3,160,606 3,441,101 280,495 3,160,606 -
Annual Work and Financial Plan (WFP) for FMR/DP - Actual Expenditure - - - - -
Compensation for claims for Damages from MWTF - - - - -
Environmental Trust Fund - Actual expenditure - - - - -
Final Mine Rehabilitation and/or Decommissioning Fund - Actual expenditure - - - - -
Mine wastes & Tailing fees (MWTF) 1,763 1,909 146 1,763 -
Monitoring Trust Fund - Actual expenditure - - - - -
Rehabilitation Cash Fund - Actual expenditure 581,811 - (581,811) - (581,811)
Subtotal - Environmental expenditure 3,744,180 3,443,010 (301,170) 3,162,369 (581,811)
Safety and Health Programs - Actual expenditure 4,166,946 341,168 (3,825,778) 4,166,946 -
Annual SDMP - Social Development and Management Programs
DHNC - Development of Host and Neighboring Communities 1,564,843 1,564,843 - 1,564,843 -
DMTG - Development of Mining Technology and Geosciences 167,976 167,976 - 167,976 -
IEC - Information, Education & Communication 87,632 87,632 - 87,632 -
Subtotal - Annual SDMP 1,820,451 1,820,451 - 1,820,451 - Subtotal 9,731,577 5,604,628 (4,126,949) 9,149,765 (581,811)
MPSA No. 001-90-CAR
Lepanto Consolidated Mining Co.
Annual EPEP - Environmental Protection and Enhancement Program 187,416,515 187,420,000 3,485 - 3,485
Annual Work and Financial Plan (WFP) for FMR/DP - Actual Expenditure - - - - -
Compensation for claims for Damages from MWTF - - - - -
Environmental Trust Fund - Actual expenditure - - - - -
Final Mine Rehabilitation and/or Decommissioning Fund - Actual - - - - -
I I I I I I I
I I I I
I I I I
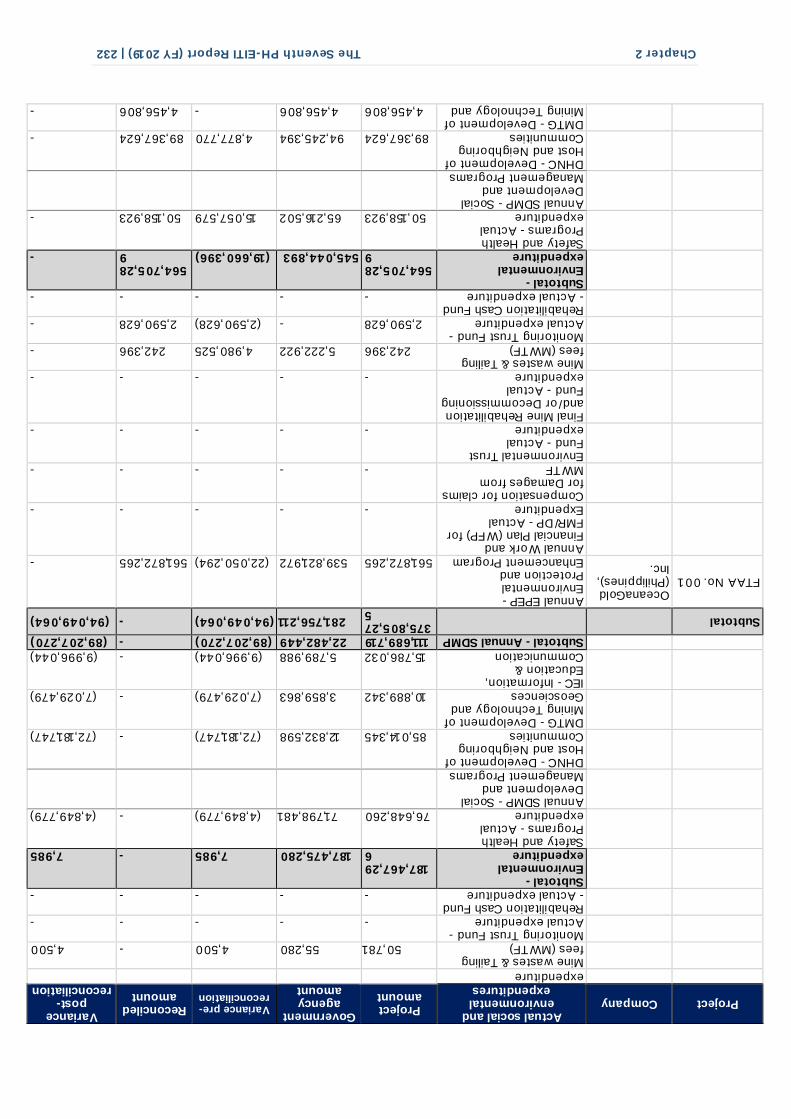
Chapter 2 The Seventh PH-EITI Report (FY 2019) | 232
Project Company Actual social and
environmental expenditures
Project amount
Government agency amount
Variance pre-reconciliation
Reconciled amount
Variance post-
reconciliation expenditure
Mine wastes & Tailing fees (MWTF) 50,781 55,280 4,500 - 4,500
Monitoring Trust Fund - Actual expenditure - - - - -
Rehabilitation Cash Fund - Actual expenditure - - - - -
Subtotal - Environmental expenditure
187,467,296 187,475,280 7,985 - 7,985
Safety and Health Programs - Actual expenditure 76,648,260 71,798,481 (4,849,779) - (4,849,779)
Annual SDMP - Social Development and Management Programs
DHNC - Development of Host and Neighboring Communities 85,014,345 12,832,598 (72,181,747) - (72,181,747)
DMTG - Development of Mining Technology and Geosciences 10,889,342 3,859,863 (7,029,479) - (7,029,479)
IEC - Information, Education & Communication 15,786,032 5,789,988 (9,996,044) - (9,996,044)
Subtotal - Annual SDMP 111,689,719 22,482,449 (89,207,270) - (89,207,270)
Subtotal 375,805,27
5 281,756,211 (94,049,064) - (94,049,064)
FTAA No. 001 OceanaGold (Philippines), Inc.
Annual EPEP - Environmental Protection and Enhancement Program 561,872,265 539,821,972 (22,050,294) 561,872,265 -
Annual Work and Financial Plan (WFP) for FMR/DP - Actual Expenditure - - - - -
Compensation for claims for Damages from MWTF - - - - -
Environmental Trust Fund - Actual expenditure - - - - -
Final Mine Rehabilitation and/or Decommissioning Fund - Actual expenditure - - - - -
Mine wastes & Tailing fees (MWTF) 242,396 5,222,922 4,980,525 242,396 -
Monitoring Trust Fund - Actual expenditure 2,590,628 - (2,590,628) 2,590,628 -
Rehabilitation Cash Fund - Actual expenditure - - - - -
Subtotal - Environmental expenditure
564,705,289 545,044,893 (19,660,396)
564,705,289 -
Safety and Health Programs - Actual expenditure 50,158,923 65,216,502 15,057,579 50,158,923 -
Annual SDMP - Social Development and Management Programs
DHNC - Development of Host and Neighboring Communities 89,367,624 94,245,394 4,877,770 89,367,624 -
DMTG - Development of Mining Technology and 4,456,806 4,456,806 - 4,456,806 -
I I I I I I I I I I I
I I I I I I I
I I I I I I I I I I
I I I I I I I

Chapter 2 The Seventh PH-EITI Report (FY 2019) | 233
Project Company Actual social and
environmental expenditures
Project amount
Government agency amount
Variance pre-reconciliation
Reconciled amount
Variance post-
reconciliation Geosciences
IEC - Information, Education & Communication 18,697,149 18,697,149 - 18,697,149 -
Subtotal - Annual SDMP 112,521,579 117,399,349 4,877,770 112,521,579 -
Subtotal 727,385,79
2 727,660,745 274,953
727,385,792
-
MPSA No. 276-2009-CAR
Philex Mining Corporation
Annual EPEP - Environmental Protection and Enhancement Program 157,575,521 167,015,868 9,440,347 157,575,521 -
Annual Work and Financial Plan (WFP) for FMR/DP - Actual Expenditure - - - - -
Compensation for claims for Damages from MWTF - - - - -
Environmental Trust Fund - Actual expenditure - - - - -
Final Mine Rehabilitation and/or Decommissioning Fund - Actual expenditure - - - - -
Mine wastes & Tailing fees (MWTF) 805,683 727,755 (77,928) 855,683 -
Monitoring Trust Fund - Actual expenditure 576,820 - (576,820) 576,800 -
Rehabilitation Cash Fund - Actual expenditure - - - - -
Subtotal - Environmental expenditure
158,958,024 167,743,624 8,785,599
159,008,004 -
Safety and Health Programs - Actual expenditure 46,660,079 - (46,660,079) 46,660,079 -
Annual SDMP - Social Development and Management Programs
DHNC - Development of Host and Neighboring Communities 71,941,910 71,941,910 - 71,941,910 -
DMTG - Development of Mining Technology and Geosciences 12,958,345 12,958,345 - 12,958,345 -
IEC - Information, Education & Communication 10,360,369 10,360,369 - 10,360,369 -
Subtotal - Annual SDMP 95,260,624 95,260,624 - 95,260,624 -
Subtotal 300,878,72
7 263,004,248 (37,874,480)
300,928,707
-
MPSA No. 262-2008-XIII
Philsaga Mining Corporation
Annual EPEP - Environmental Protection and Enhancement Program 63,895,592 49,372,371 (14,523,220) 63,895,592 -
Annual Work and Financial Plan (WFP) for FMR/DP - Actual Expenditure - - - - -
Compensation for claims for Damages from MWTF 28,121 - (28,121) - -
Environmental Trust Fund - Actual expenditure - - - - -
I I I I I I I
I I I I
I I I I
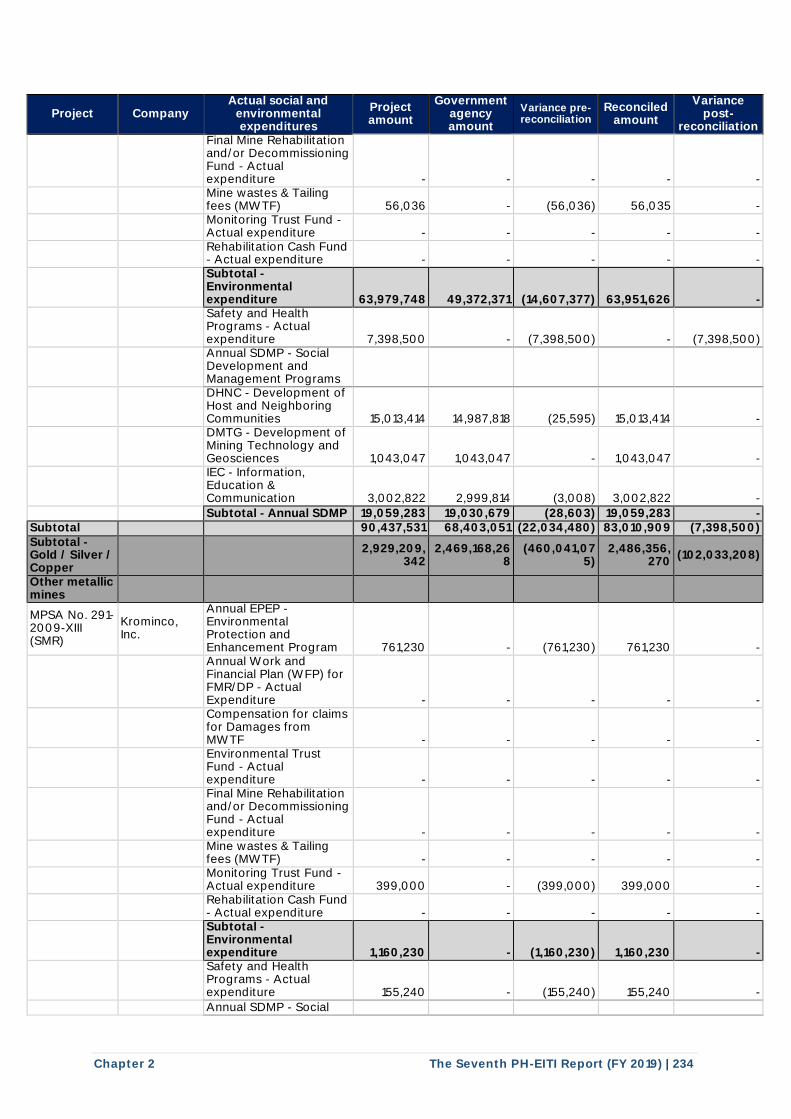
Chapter 2 The Seventh PH-EITI Report (FY 2019) | 234
Project Company Actual social and
environmental expenditures
Project amount
Government agency amount
Variance pre-reconciliation
Reconciled amount
Variance post-
reconciliation
Final Mine Rehabilitation and/or Decommissioning Fund - Actual expenditure - - - - -
Mine wastes & Tailing fees (MWTF) 56,036 - (56,036) 56,035 -
Monitoring Trust Fund - Actual expenditure - - - - -
Rehabilitation Cash Fund - Actual expenditure - - - - -
Subtotal - Environmental expenditure 63,979,748 49,372,371 (14,607,377) 63,951,626 -
Safety and Health Programs - Actual expenditure 7,398,500 - (7,398,500) - (7,398,500)
Annual SDMP - Social Development and Management Programs
DHNC - Development of Host and Neighboring Communities 15,013,414 14,987,818 (25,595) 15,013,414 -
DMTG - Development of Mining Technology and Geosciences 1,043,047 1,043,047 - 1,043,047 -
IEC - Information, Education & Communication 3,002,822 2,999,814 (3,008) 3,002,822 -
Subtotal - Annual SDMP 19,059,283 19,030,679 (28,603) 19,059,283 - Subtotal 90,437,531 68,403,051 (22,034,480) 83,010,909 (7,398,500) Subtotal - Gold / Silver / Copper
2,929,209,
342 2,469,168,26
8 (460,041,07
5) 2,486,356,
270 (102,033,208)
Other metallic mines
MPSA No. 291-2009-XIII (SMR)
Krominco, Inc.
Annual EPEP - Environmental Protection and Enhancement Program 761,230 - (761,230) 761,230 -
Annual Work and Financial Plan (WFP) for FMR/DP - Actual Expenditure - - - - -
Compensation for claims for Damages from MWTF - - - - -
Environmental Trust Fund - Actual expenditure - - - - -
Final Mine Rehabilitation and/or Decommissioning Fund - Actual expenditure - - - - -
Mine wastes & Tailing fees (MWTF) - - - - -
Monitoring Trust Fund - Actual expenditure 399,000 - (399,000) 399,000 -
Rehabilitation Cash Fund - Actual expenditure - - - - -
Subtotal - Environmental expenditure 1,160,230 - (1,160,230) 1,160,230 -
Safety and Health Programs - Actual expenditure 155,240 - (155,240) 155,240 -
Annual SDMP - Social
I I I I I I I
I I I I I
I I I I
I I I I I I I
I I I I I I I I I I
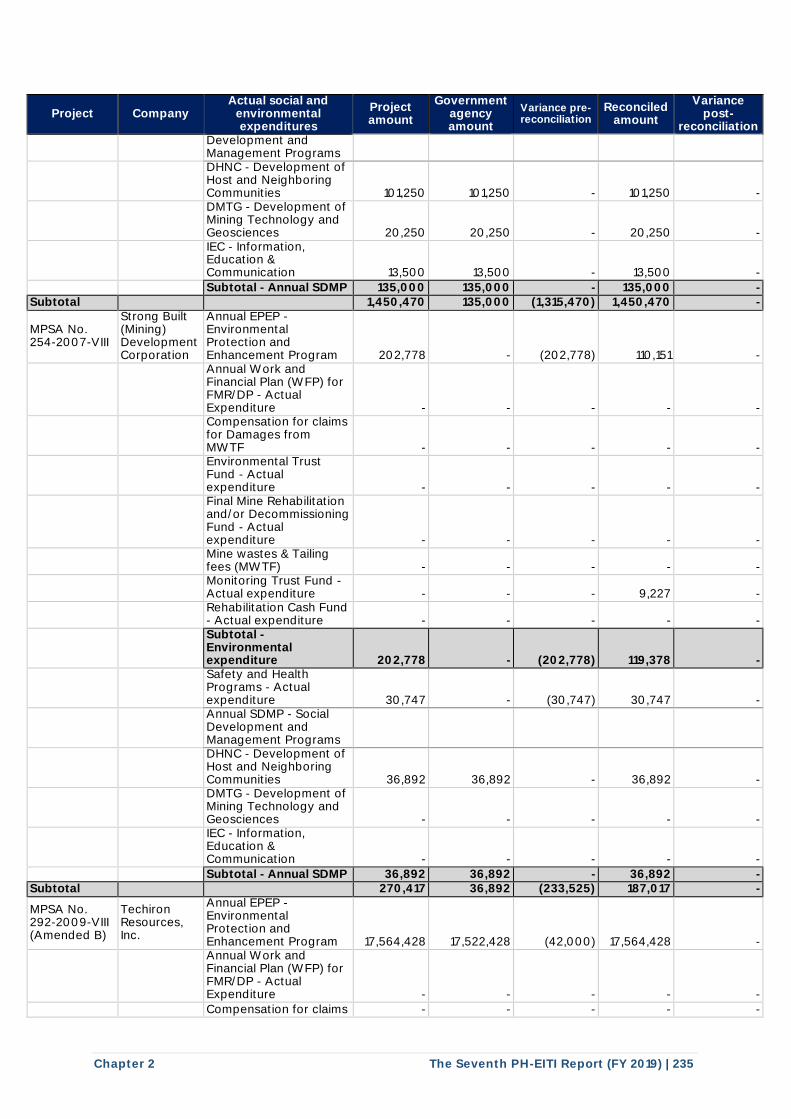
Chapter 2 The Seventh PH-EITI Report (FY 2019) | 235
Project Company Actual social and
environmental expenditures
Project amount
Government agency amount
Variance pre-reconciliation
Reconciled amount
Variance post-
reconciliation Development and Management Programs
DHNC - Development of Host and Neighboring Communities 101,250 101,250 - 101,250 -
DMTG - Development of Mining Technology and Geosciences 20,250 20,250 - 20,250 -
IEC - Information, Education & Communication 13,500 13,500 - 13,500 -
Subtotal - Annual SDMP 135,000 135,000 - 135,000 - Subtotal 1,450,470 135,000 (1,315,470) 1,450,470 -
MPSA No. 254-2007-VIII
Strong Built (Mining) Development Corporation
Annual EPEP - Environmental Protection and Enhancement Program 202,778 - (202,778) 110,151 -
Annual Work and Financial Plan (WFP) for FMR/DP - Actual Expenditure - - - - -
Compensation for claims for Damages from MWTF - - - - -
Environmental Trust Fund - Actual expenditure - - - - -
Final Mine Rehabilitation and/or Decommissioning Fund - Actual expenditure - - - - -
Mine wastes & Tailing fees (MWTF) - - - - -
Monitoring Trust Fund - Actual expenditure - - - 9,227 -
Rehabilitation Cash Fund - Actual expenditure - - - - -
Subtotal - Environmental expenditure 202,778 - (202,778) 119,378 -
Safety and Health Programs - Actual expenditure 30,747 - (30,747) 30,747 -
Annual SDMP - Social Development and Management Programs
DHNC - Development of Host and Neighboring Communities 36,892 36,892 - 36,892 -
DMTG - Development of Mining Technology and Geosciences - - - - -
IEC - Information, Education & Communication - - - - -
Subtotal - Annual SDMP 36,892 36,892 - 36,892 - Subtotal 270,417 36,892 (233,525) 187,017 -
MPSA No. 292-2009-VIII (Amended B)
Techiron Resources, Inc.
Annual EPEP - Environmental Protection and Enhancement Program 17,564,428 17,522,428 (42,000) 17,564,428 -
Annual Work and Financial Plan (WFP) for FMR/DP - Actual Expenditure - - - - -
Compensation for claims - - - - -
I I I I
I I I I I I I
I I I I
I I I I
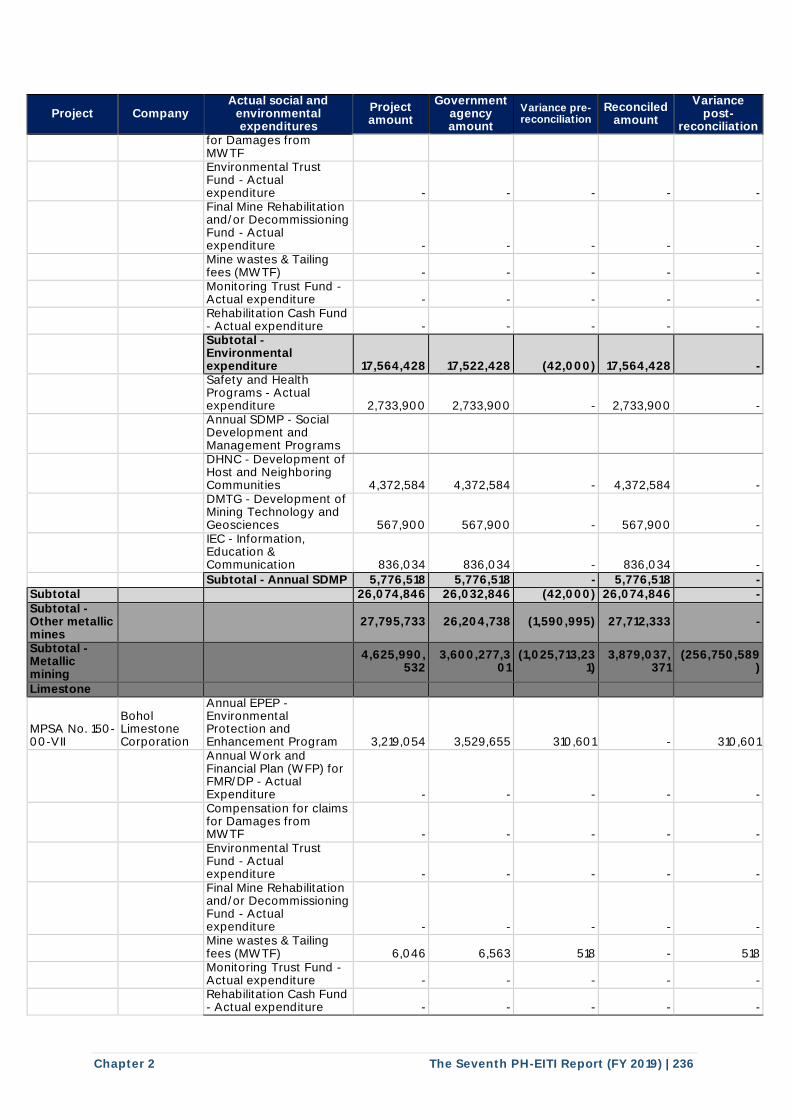
Chapter 2 The Seventh PH-EITI Report (FY 2019) | 236
Project Company Actual social and
environmental expenditures
Project amount
Government agency amount
Variance pre-reconciliation
Reconciled amount
Variance post-
reconciliation for Damages from MWTF
Environmental Trust Fund - Actual expenditure - - - - -
Final Mine Rehabilitation and/or Decommissioning Fund - Actual expenditure - - - - -
Mine wastes & Tailing fees (MWTF) - - - - -
Monitoring Trust Fund - Actual expenditure - - - - -
Rehabilitation Cash Fund - Actual expenditure - - - - -
Subtotal - Environmental expenditure 17,564,428 17,522,428 (42,000) 17,564,428 -
Safety and Health Programs - Actual expenditure 2,733,900 2,733,900 - 2,733,900 -
Annual SDMP - Social Development and Management Programs
DHNC - Development of Host and Neighboring Communities 4,372,584 4,372,584 - 4,372,584 -
DMTG - Development of Mining Technology and Geosciences 567,900 567,900 - 567,900 -
IEC - Information, Education & Communication 836,034 836,034 - 836,034 -
Subtotal - Annual SDMP 5,776,518 5,776,518 - 5,776,518 - Subtotal 26,074,846 26,032,846 (42,000) 26,074,846 - Subtotal - Other metallic mines
27,795,733 26,204,738 (1,590,995) 27,712,333 -
Subtotal - Metallic mining
4,625,990,
532 3,600,277,3
01 (1,025,713,23
1) 3,879,037,
371 (256,750,589
)
Limestone
MPSA No. 150-00-VII
Bohol Limestone Corporation
Annual EPEP - Environmental Protection and Enhancement Program 3,219,054 3,529,655 310,601 - 310,601
Annual Work and Financial Plan (WFP) for FMR/DP - Actual Expenditure - - - - -
Compensation for claims for Damages from MWTF - - - - -
Environmental Trust Fund - Actual expenditure - - - - -
Final Mine Rehabilitation and/or Decommissioning Fund - Actual expenditure - - - - -
Mine wastes & Tailing fees (MWTF) 6,046 6,563 518 - 518
Monitoring Trust Fund - Actual expenditure - - - - -
Rehabilitation Cash Fund - Actual expenditure - - - - -
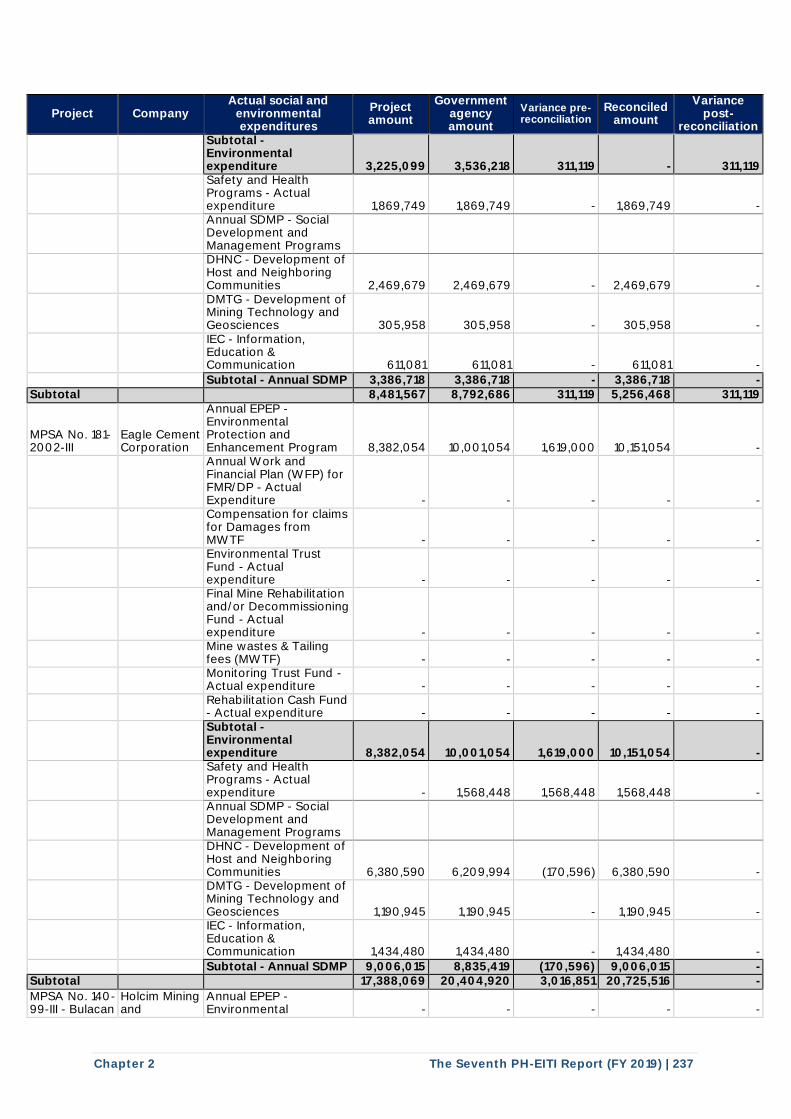
Chapter 2 The Seventh PH-EITI Report (FY 2019) | 237
Project Company Actual social and
environmental expenditures
Project amount
Government agency amount
Variance pre-reconciliation
Reconciled amount
Variance post-
reconciliation
Subtotal - Environmental expenditure 3,225,099 3,536,218 311,119 - 311,119
Safety and Health Programs - Actual expenditure 1,869,749 1,869,749 - 1,869,749 -
Annual SDMP - Social Development and Management Programs
DHNC - Development of Host and Neighboring Communities 2,469,679 2,469,679 - 2,469,679 -
DMTG - Development of Mining Technology and Geosciences 305,958 305,958 - 305,958 -
IEC - Information, Education & Communication 611,081 611,081 - 611,081 -
Subtotal - Annual SDMP 3,386,718 3,386,718 - 3,386,718 - Subtotal 8,481,567 8,792,686 311,119 5,256,468 311,119
MPSA No. 181-2002-III
Eagle Cement Corporation
Annual EPEP - Environmental Protection and Enhancement Program 8,382,054 10,001,054 1,619,000 10,151,054 -
Annual Work and Financial Plan (WFP) for FMR/DP - Actual Expenditure - - - - -
Compensation for claims for Damages from MWTF - - - - -
Environmental Trust Fund - Actual expenditure - - - - -
Final Mine Rehabilitation and/or Decommissioning Fund - Actual expenditure - - - - -
Mine wastes & Tailing fees (MWTF) - - - - -
Monitoring Trust Fund - Actual expenditure - - - - -
Rehabilitation Cash Fund - Actual expenditure - - - - -
Subtotal - Environmental expenditure 8,382,054 10,001,054 1,619,000 10,151,054 -
Safety and Health Programs - Actual expenditure - 1,568,448 1,568,448 1,568,448 -
Annual SDMP - Social Development and Management Programs
DHNC - Development of Host and Neighboring Communities 6,380,590 6,209,994 (170,596) 6,380,590 -
DMTG - Development of Mining Technology and Geosciences 1,190,945 1,190,945 - 1,190,945 -
IEC - Information, Education & Communication 1,434,480 1,434,480 - 1,434,480 -
Subtotal - Annual SDMP 9,006,015 8,835,419 (170,596) 9,006,015 - Subtotal 17,388,069 20,404,920 3,016,851 20,725,516 -
MPSA No. 140-99-III - Bulacan
Holcim Mining and
Annual EPEP - Environmental - - - - -
I I I I
I I I I
I I I I I I I
I I I I
I I I I
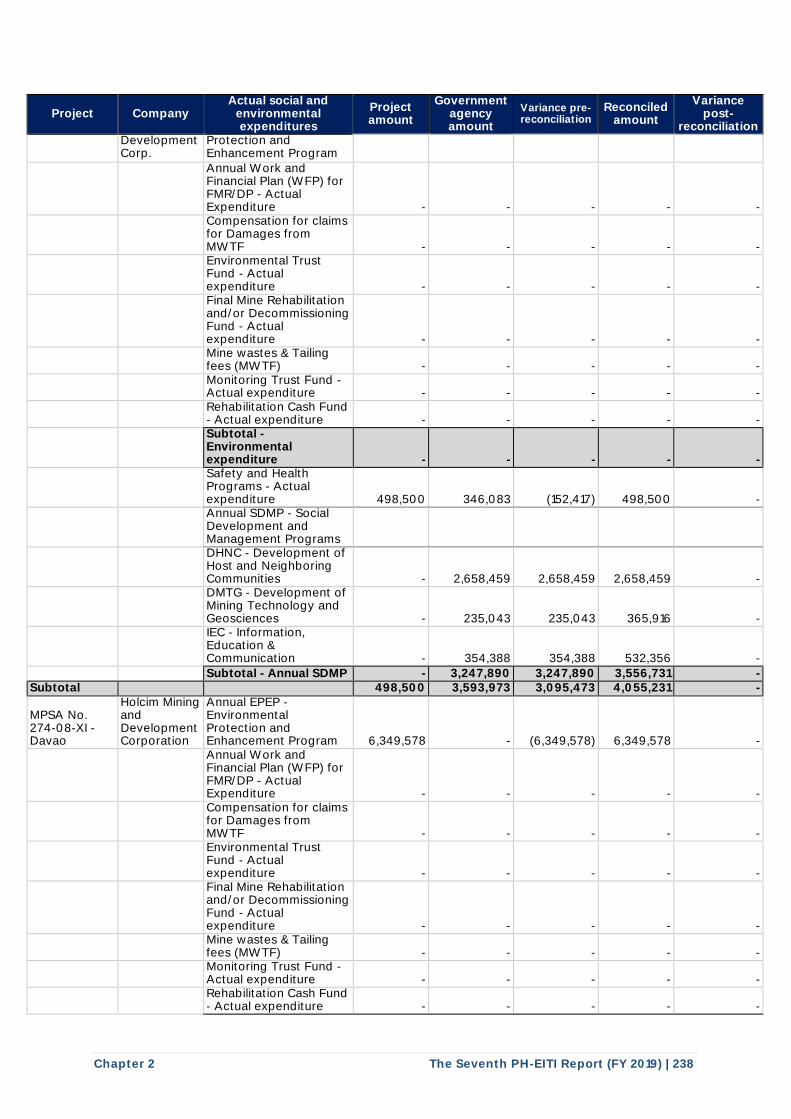
Chapter 2 The Seventh PH-EITI Report (FY 2019) | 238
Project Company Actual social and
environmental expenditures
Project amount
Government agency amount
Variance pre-reconciliation
Reconciled amount
Variance post-
reconciliation Development Corp.
Protection and Enhancement Program
Annual Work and Financial Plan (WFP) for FMR/DP - Actual Expenditure - - - - -
Compensation for claims for Damages from MWTF - - - - -
Environmental Trust Fund - Actual expenditure - - - - -
Final Mine Rehabilitation and/or Decommissioning Fund - Actual expenditure - - - - -
Mine wastes & Tailing fees (MWTF) - - - - -
Monitoring Trust Fund - Actual expenditure - - - - -
Rehabilitation Cash Fund - Actual expenditure - - - - -
Subtotal - Environmental expenditure - - - - -
Safety and Health Programs - Actual expenditure 498,500 346,083 (152,417) 498,500 -
Annual SDMP - Social Development and Management Programs
DHNC - Development of Host and Neighboring Communities - 2,658,459 2,658,459 2,658,459 -
DMTG - Development of Mining Technology and Geosciences - 235,043 235,043 365,916 -
IEC - Information, Education & Communication - 354,388 354,388 532,356 -
Subtotal - Annual SDMP - 3,247,890 3,247,890 3,556,731 - Subtotal 498,500 3,593,973 3,095,473 4,055,231 -
MPSA No. 274-08-XI - Davao
Holcim Mining and Development Corporation
Annual EPEP - Environmental Protection and Enhancement Program 6,349,578 - (6,349,578) 6,349,578 -
Annual Work and Financial Plan (WFP) for FMR/DP - Actual Expenditure - - - - -
Compensation for claims for Damages from MWTF - - - - -
Environmental Trust Fund - Actual expenditure - - - - -
Final Mine Rehabilitation and/or Decommissioning Fund - Actual expenditure - - - - -
Mine wastes & Tailing fees (MWTF) - - - - -
Monitoring Trust Fund - Actual expenditure - - - - -
Rehabilitation Cash Fund - Actual expenditure - - - - -
I I I I I I I
I I I I
I I I I
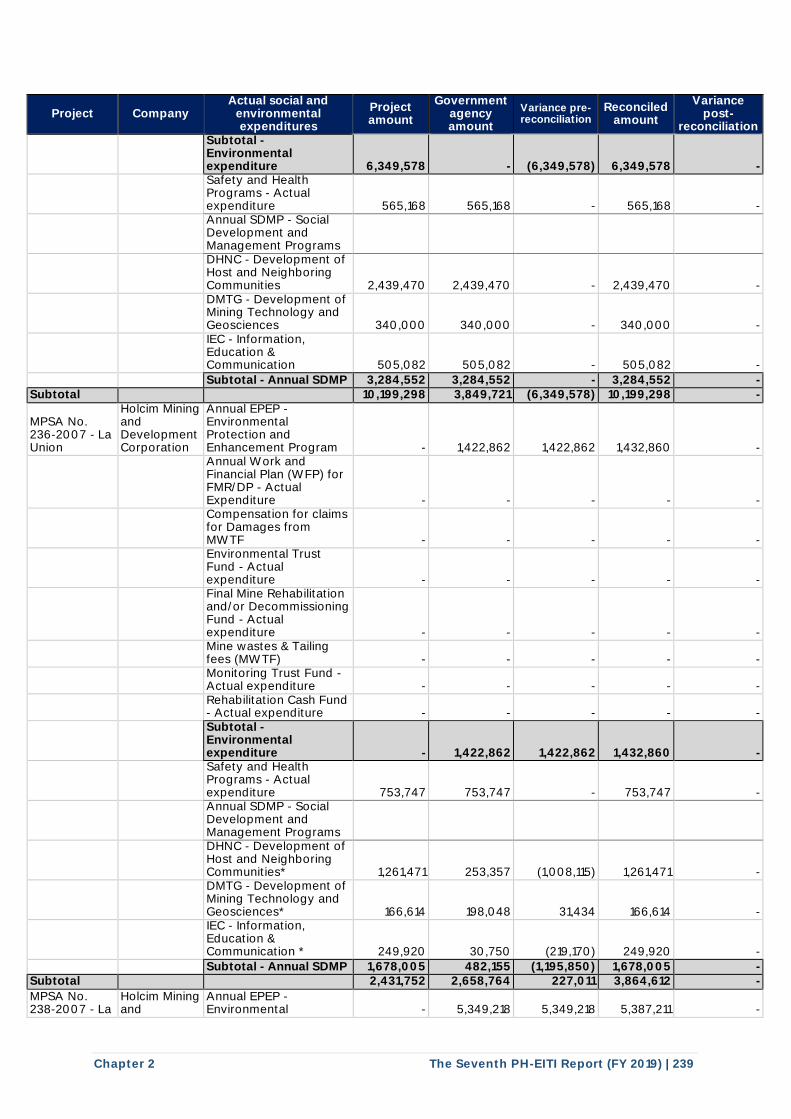
Chapter 2 The Seventh PH-EITI Report (FY 2019) | 239
Project Company Actual social and
environmental expenditures
Project amount
Government agency amount
Variance pre-reconciliation
Reconciled amount
Variance post-
reconciliation
Subtotal - Environmental expenditure 6,349,578 - (6,349,578) 6,349,578 -
Safety and Health Programs - Actual expenditure 565,168 565,168 - 565,168 -
Annual SDMP - Social Development and Management Programs
DHNC - Development of Host and Neighboring Communities 2,439,470 2,439,470 - 2,439,470 -
DMTG - Development of Mining Technology and Geosciences 340,000 340,000 - 340,000 -
IEC - Information, Education & Communication 505,082 505,082 - 505,082 -
Subtotal - Annual SDMP 3,284,552 3,284,552 - 3,284,552 - Subtotal 10,199,298 3,849,721 (6,349,578) 10,199,298 -
MPSA No. 236-2007 - La Union
Holcim Mining and Development Corporation
Annual EPEP - Environmental Protection and Enhancement Program - 1,422,862 1,422,862 1,432,860 -
Annual Work and Financial Plan (WFP) for FMR/DP - Actual Expenditure - - - - -
Compensation for claims for Damages from MWTF - - - - -
Environmental Trust Fund - Actual expenditure - - - - -
Final Mine Rehabilitation and/or Decommissioning Fund - Actual expenditure - - - - -
Mine wastes & Tailing fees (MWTF) - - - - -
Monitoring Trust Fund - Actual expenditure - - - - -
Rehabilitation Cash Fund - Actual expenditure - - - - -
Subtotal - Environmental expenditure - 1,422,862 1,422,862 1,432,860 -
Safety and Health Programs - Actual expenditure 753,747 753,747 - 753,747 -
Annual SDMP - Social Development and Management Programs
DHNC - Development of Host and Neighboring Communities* 1,261,471 253,357 (1,008,115) 1,261,471 -
DMTG - Development of Mining Technology and Geosciences* 166,614 198,048 31,434 166,614 -
IEC - Information, Education & Communication * 249,920 30,750 (219,170) 249,920 -
Subtotal - Annual SDMP 1,678,005 482,155 (1,195,850) 1,678,005 - Subtotal 2,431,752 2,658,764 227,011 3,864,612 -
MPSA No. 238-2007 - La
Holcim Mining and
Annual EPEP - Environmental - 5,349,218 5,349,218 5,387,211 -
I I I I
I I I I
I I I I I I I
I I I I
I I I I
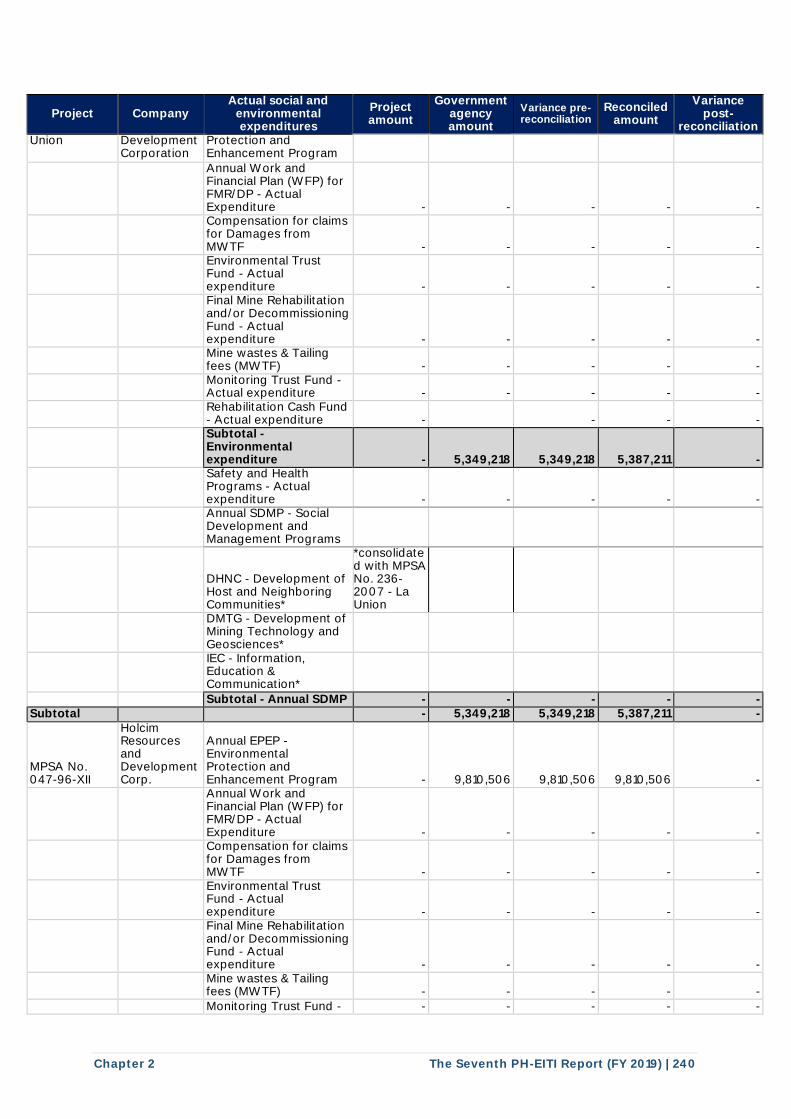
Chapter 2 The Seventh PH-EITI Report (FY 2019) | 240
Project Company Actual social and
environmental expenditures
Project amount
Government agency amount
Variance pre-reconciliation
Reconciled amount
Variance post-
reconciliation Union Development
Corporation Protection and Enhancement Program
Annual Work and Financial Plan (WFP) for FMR/DP - Actual Expenditure - - - - -
Compensation for claims for Damages from MWTF - - - - -
Environmental Trust Fund - Actual expenditure - - - - -
Final Mine Rehabilitation and/or Decommissioning Fund - Actual expenditure - - - - -
Mine wastes & Tailing fees (MWTF) - - - - -
Monitoring Trust Fund - Actual expenditure - - - - -
Rehabilitation Cash Fund - Actual expenditure - - - -
Subtotal - Environmental expenditure - 5,349,218 5,349,218 5,387,211 -
Safety and Health Programs - Actual expenditure - - - - -
Annual SDMP - Social Development and Management Programs
DHNC - Development of Host and Neighboring Communities*
*consolidated with MPSA No. 236-2007 - La Union
DMTG - Development of Mining Technology and Geosciences*
IEC - Information, Education & Communication*
Subtotal - Annual SDMP - - - - - Subtotal - 5,349,218 5,349,218 5,387,211 -
MPSA No. 047-96-XII
Holcim Resources and Development Corp.
Annual EPEP - Environmental Protection and Enhancement Program - 9,810,506 9,810,506 9,810,506 -
Annual Work and Financial Plan (WFP) for FMR/DP - Actual Expenditure - - - - -
Compensation for claims for Damages from MWTF - - - - -
Environmental Trust Fund - Actual expenditure - - - - -
Final Mine Rehabilitation and/or Decommissioning Fund - Actual expenditure - - - - -
Mine wastes & Tailing fees (MWTF) - - - - -
Monitoring Trust Fund - - - - - -
I I I I I I I
I I I I
I I I
I
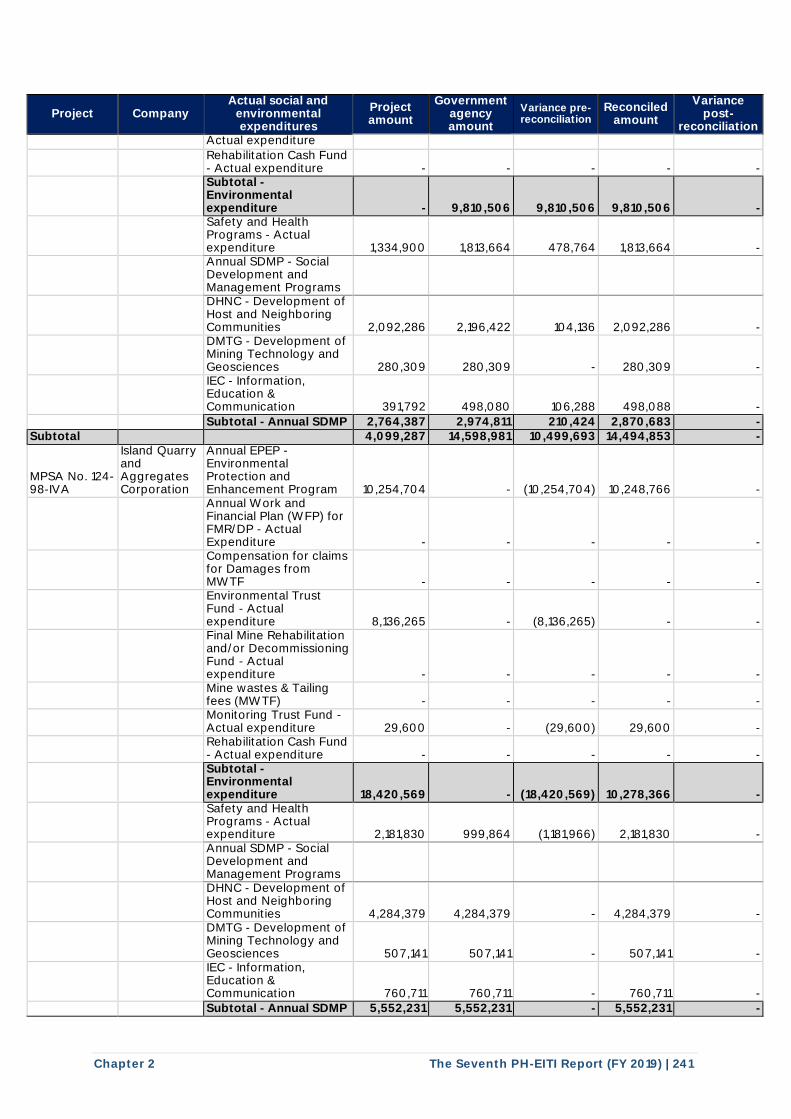
Chapter 2 The Seventh PH-EITI Report (FY 2019) | 241
Project Company Actual social and
environmental expenditures
Project amount
Government agency amount
Variance pre-reconciliation
Reconciled amount
Variance post-
reconciliation Actual expenditure
Rehabilitation Cash Fund - Actual expenditure - - - - -
Subtotal - Environmental expenditure - 9,810,506 9,810,506 9,810,506 -
Safety and Health Programs - Actual expenditure 1,334,900 1,813,664 478,764 1,813,664 -
Annual SDMP - Social Development and Management Programs
DHNC - Development of Host and Neighboring Communities 2,092,286 2,196,422 104,136 2,092,286 -
DMTG - Development of Mining Technology and Geosciences 280,309 280,309 - 280,309 -
IEC - Information, Education & Communication 391,792 498,080 106,288 498,088 -
Subtotal - Annual SDMP 2,764,387 2,974,811 210,424 2,870,683 - Subtotal 4,099,287 14,598,981 10,499,693 14,494,853 -
MPSA No. 124-98-IVA
Island Quarry and Aggregates Corporation
Annual EPEP - Environmental Protection and Enhancement Program 10,254,704 - (10,254,704) 10,248,766 -
Annual Work and Financial Plan (WFP) for FMR/DP - Actual Expenditure - - - - -
Compensation for claims for Damages from MWTF - - - - -
Environmental Trust Fund - Actual expenditure 8,136,265 - (8,136,265) - -
Final Mine Rehabilitation and/or Decommissioning Fund - Actual expenditure - - - - -
Mine wastes & Tailing fees (MWTF) - - - - -
Monitoring Trust Fund - Actual expenditure 29,600 - (29,600) 29,600 -
Rehabilitation Cash Fund - Actual expenditure - - - - -
Subtotal - Environmental expenditure 18,420,569 - (18,420,569) 10,278,366 -
Safety and Health Programs - Actual expenditure 2,181,830 999,864 (1,181,966) 2,181,830 -
Annual SDMP - Social Development and Management Programs
DHNC - Development of Host and Neighboring Communities 4,284,379 4,284,379 - 4,284,379 -
DMTG - Development of Mining Technology and Geosciences 507,141 507,141 - 507,141 -
IEC - Information, Education & Communication 760,711 760,711 - 760,711 -
Subtotal - Annual SDMP 5,552,231 5,552,231 - 5,552,231 -
I I I I I I I I I I
I I I I I I I
I I I I
I I I I
I I I I I I I
I I I I
I I I I
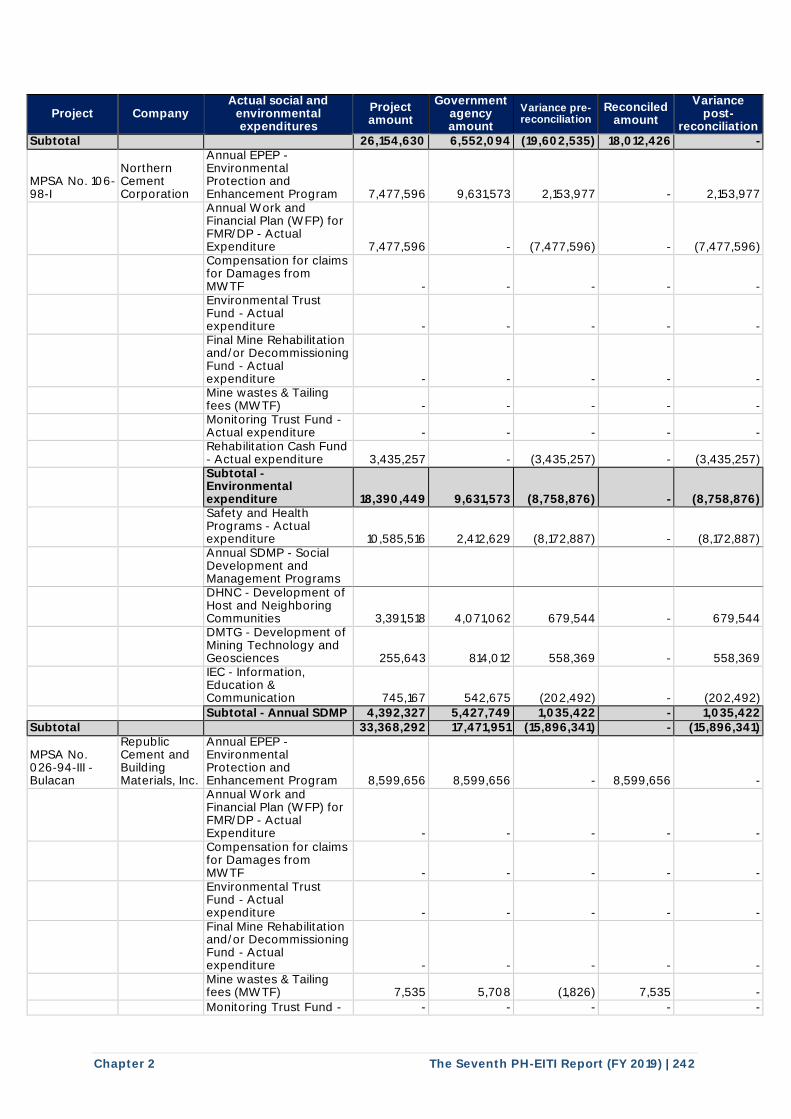
Chapter 2 The Seventh PH-EITI Report (FY 2019) | 242
Project Company Actual social and
environmental expenditures
Project amount
Government agency amount
Variance pre-reconciliation
Reconciled amount
Variance post-
reconciliation Subtotal 26,154,630 6,552,094 (19,602,535) 18,012,426 -
MPSA No. 106-98-I
Northern Cement Corporation
Annual EPEP - Environmental Protection and Enhancement Program 7,477,596 9,631,573 2,153,977 - 2,153,977
Annual Work and Financial Plan (WFP) for FMR/DP - Actual Expenditure 7,477,596 - (7,477,596) - (7,477,596)
Compensation for claims for Damages from MWTF - - - - -
Environmental Trust Fund - Actual expenditure - - - - -
Final Mine Rehabilitation and/or Decommissioning Fund - Actual expenditure - - - - -
Mine wastes & Tailing fees (MWTF) - - - - -
Monitoring Trust Fund - Actual expenditure - - - - -
Rehabilitation Cash Fund - Actual expenditure 3,435,257 - (3,435,257) - (3,435,257)
Subtotal - Environmental expenditure 18,390,449 9,631,573 (8,758,876) - (8,758,876)
Safety and Health Programs - Actual expenditure 10,585,516 2,412,629 (8,172,887) - (8,172,887)
Annual SDMP - Social Development and Management Programs
DHNC - Development of Host and Neighboring Communities 3,391,518 4,071,062 679,544 - 679,544
DMTG - Development of Mining Technology and Geosciences 255,643 814,012 558,369 - 558,369
IEC - Information, Education & Communication 745,167 542,675 (202,492) - (202,492)
Subtotal - Annual SDMP 4,392,327 5,427,749 1,035,422 - 1,035,422 Subtotal 33,368,292 17,471,951 (15,896,341) - (15,896,341)
MPSA No. 026-94-III - Bulacan
Republic Cement and Building Materials, Inc.
Annual EPEP - Environmental Protection and Enhancement Program 8,599,656 8,599,656 - 8,599,656 -
Annual Work and Financial Plan (WFP) for FMR/DP - Actual Expenditure - - - - -
Compensation for claims for Damages from MWTF - - - - -
Environmental Trust Fund - Actual expenditure - - - - -
Final Mine Rehabilitation and/or Decommissioning Fund - Actual expenditure - - - - -
Mine wastes & Tailing fees (MWTF) 7,535 5,708 (1,826) 7,535 -
Monitoring Trust Fund - - - - - -
--------
I I I I I I I
I I I I I
I I I I
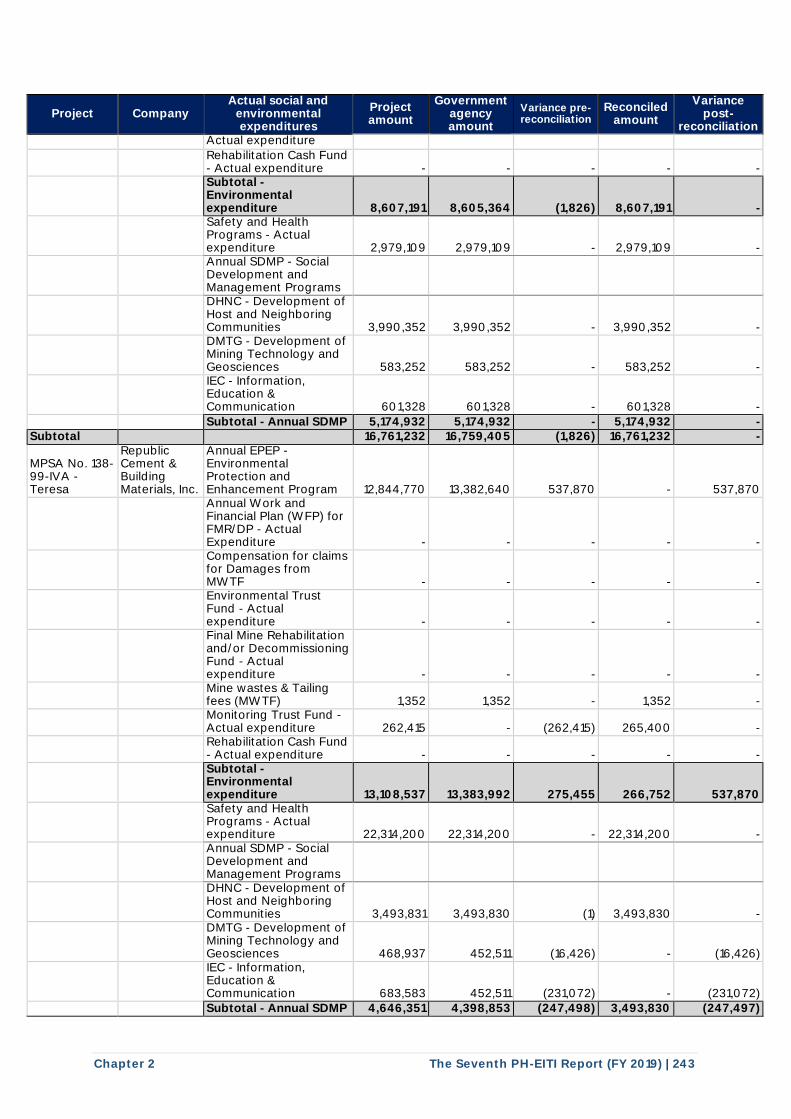
Chapter 2 The Seventh PH-EITI Report (FY 2019) | 243
Project Company Actual social and
environmental expenditures
Project amount
Government agency amount
Variance pre-reconciliation
Reconciled amount
Variance post-
reconciliation Actual expenditure
Rehabilitation Cash Fund - Actual expenditure - - - - -
Subtotal - Environmental expenditure 8,607,191 8,605,364 (1,826) 8,607,191 -
Safety and Health Programs - Actual expenditure 2,979,109 2,979,109 - 2,979,109 -
Annual SDMP - Social Development and Management Programs
DHNC - Development of Host and Neighboring Communities 3,990,352 3,990,352 - 3,990,352 -
DMTG - Development of Mining Technology and Geosciences 583,252 583,252 - 583,252 -
IEC - Information, Education & Communication 601,328 601,328 - 601,328 -
Subtotal - Annual SDMP 5,174,932 5,174,932 - 5,174,932 - Subtotal 16,761,232 16,759,405 (1,826) 16,761,232 -
MPSA No. 138-99-IVA - Teresa
Republic Cement & Building Materials, Inc.
Annual EPEP - Environmental Protection and Enhancement Program 12,844,770 13,382,640 537,870 - 537,870
Annual Work and Financial Plan (WFP) for FMR/DP - Actual Expenditure - - - - -
Compensation for claims for Damages from MWTF - - - - -
Environmental Trust Fund - Actual expenditure - - - - -
Final Mine Rehabilitation and/or Decommissioning Fund - Actual expenditure - - - - -
Mine wastes & Tailing fees (MWTF) 1,352 1,352 - 1,352 -
Monitoring Trust Fund - Actual expenditure 262,415 - (262,415) 265,400 -
Rehabilitation Cash Fund - Actual expenditure - - - - -
Subtotal - Environmental expenditure 13,108,537 13,383,992 275,455 266,752 537,870
Safety and Health Programs - Actual expenditure 22,314,200 22,314,200 - 22,314,200 -
Annual SDMP - Social Development and Management Programs
DHNC - Development of Host and Neighboring Communities 3,493,831 3,493,830 (1) 3,493,830 -
DMTG - Development of Mining Technology and Geosciences 468,937 452,511 (16,426) - (16,426)
IEC - Information, Education & Communication 683,583 452,511 (231,072) - (231,072)
Subtotal - Annual SDMP 4,646,351 4,398,853 (247,498) 3,493,830 (247,497)
I I I I I I I I I I
I I I I I I I
I I I I
I I I I
I I I I I I I
I I I I
I I I I
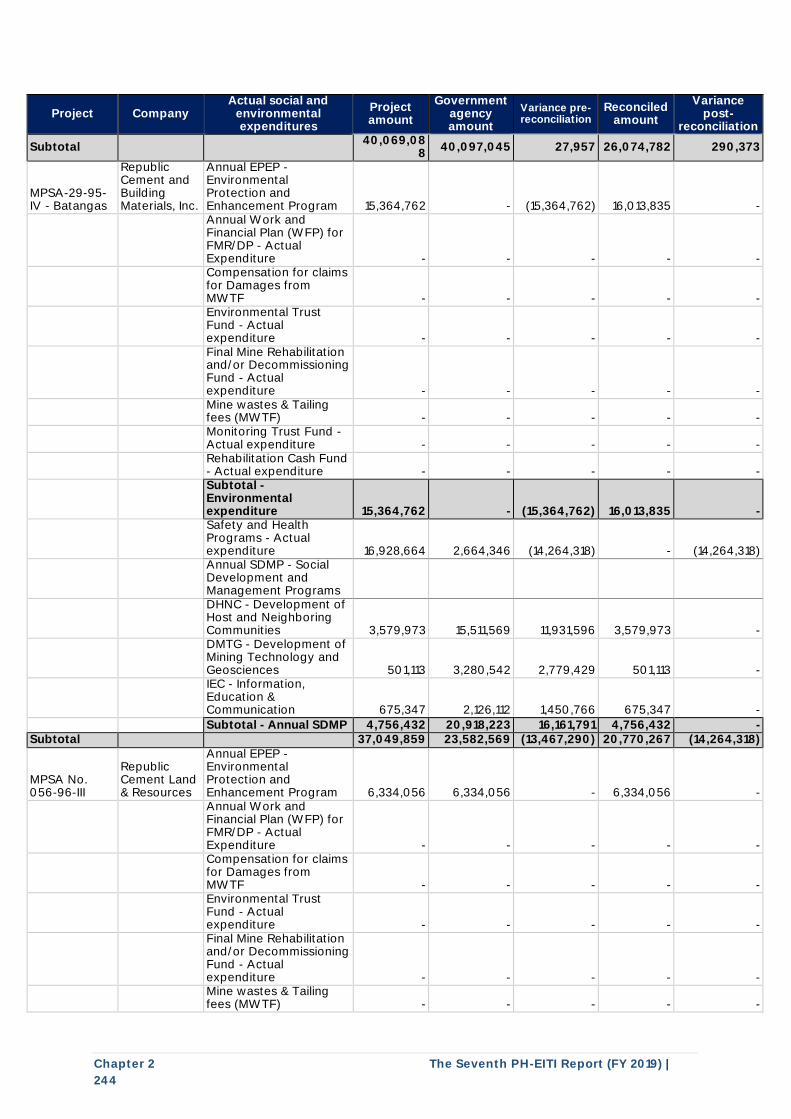
Chapter 2 The Seventh PH-EITI Report (FY 2019) | 244
Project Company Actual social and
environmental expenditures
Project amount
Government agency amount
Variance pre-reconciliation
Reconciled amount
Variance post-
reconciliation
Subtotal
40,069,088
40,097,045 27,957 26,074,782 290,373
MPSA-29-95-IV - Batangas
Republic Cement and Building Materials, Inc.
Annual EPEP - Environmental Protection and Enhancement Program 15,364,762 - (15,364,762) 16,013,835 -
Annual Work and Financial Plan (WFP) for FMR/DP - Actual Expenditure - - - - -
Compensation for claims for Damages from MWTF - - - - -
Environmental Trust Fund - Actual expenditure - - - - -
Final Mine Rehabilitation and/or Decommissioning Fund - Actual expenditure - - - - -
Mine wastes & Tailing fees (MWTF) - - - - -
Monitoring Trust Fund - Actual expenditure - - - - -
Rehabilitation Cash Fund - Actual expenditure - - - - -
Subtotal - Environmental expenditure 15,364,762 - (15,364,762) 16,013,835 -
Safety and Health Programs - Actual expenditure 16,928,664 2,664,346 (14,264,318) - (14,264,318)
Annual SDMP - Social Development and Management Programs
DHNC - Development of Host and Neighboring Communities 3,579,973 15,511,569 11,931,596 3,579,973 -
DMTG - Development of Mining Technology and Geosciences 501,113 3,280,542 2,779,429 501,113 -
IEC - Information, Education & Communication 675,347 2,126,112 1,450,766 675,347 -
Subtotal - Annual SDMP 4,756,432 20,918,223 16,161,791 4,756,432 - Subtotal 37,049,859 23,582,569 (13,467,290) 20,770,267 (14,264,318)
MPSA No. 056-96-III
Republic Cement Land & Resources
Annual EPEP - Environmental Protection and Enhancement Program 6,334,056 6,334,056 - 6,334,056 -
Annual Work and Financial Plan (WFP) for FMR/DP - Actual Expenditure - - - - -
Compensation for claims for Damages from MWTF - - - - -
Environmental Trust Fund - Actual expenditure - - - - -
Final Mine Rehabilitation and/or Decommissioning Fund - Actual expenditure - - - - -
Mine wastes & Tailing fees (MWTF) - - - - -
I I I I I I I
I I I I
I I I I
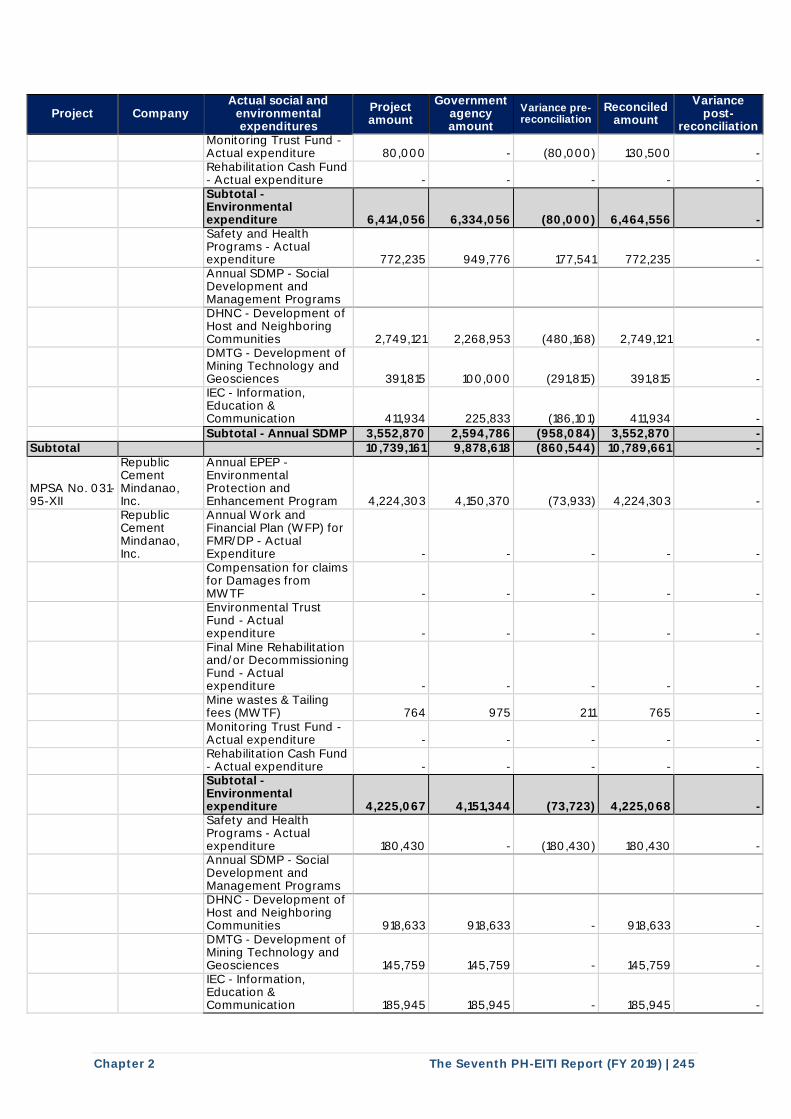
Chapter 2 The Seventh PH-EITI Report (FY 2019) | 245
Project Company Actual social and
environmental expenditures
Project amount
Government agency amount
Variance pre-reconciliation
Reconciled amount
Variance post-
reconciliation
Monitoring Trust Fund - Actual expenditure 80,000 - (80,000) 130,500 -
Rehabilitation Cash Fund - Actual expenditure - - - - -
Subtotal - Environmental expenditure 6,414,056 6,334,056 (80,000) 6,464,556 -
Safety and Health Programs - Actual expenditure 772,235 949,776 177,541 772,235 -
Annual SDMP - Social Development and Management Programs
DHNC - Development of Host and Neighboring Communities 2,749,121 2,268,953 (480,168) 2,749,121 -
DMTG - Development of Mining Technology and Geosciences 391,815 100,000 (291,815) 391,815 -
IEC - Information, Education & Communication 411,934 225,833 (186,101) 411,934 -
Subtotal - Annual SDMP 3,552,870 2,594,786 (958,084) 3,552,870 - Subtotal 10,739,161 9,878,618 (860,544) 10,789,661 -
MPSA No. 031-95-XII
Republic Cement Mindanao, Inc.
Annual EPEP - Environmental Protection and Enhancement Program 4,224,303 4,150,370 (73,933) 4,224,303 -
Republic Cement Mindanao, Inc.
Annual Work and Financial Plan (WFP) for FMR/DP - Actual Expenditure - - - - -
Compensation for claims for Damages from MWTF - - - - -
Environmental Trust Fund - Actual expenditure - - - - -
Final Mine Rehabilitation and/or Decommissioning Fund - Actual expenditure - - - - -
Mine wastes & Tailing fees (MWTF) 764 975 211 765 -
Monitoring Trust Fund - Actual expenditure - - - - -
Rehabilitation Cash Fund - Actual expenditure - - - - -
Subtotal - Environmental expenditure 4,225,067 4,151,344 (73,723) 4,225,068 -
Safety and Health Programs - Actual expenditure 180,430 - (180,430) 180,430 -
Annual SDMP - Social Development and Management Programs
DHNC - Development of Host and Neighboring Communities 918,633 918,633 - 918,633 -
DMTG - Development of Mining Technology and Geosciences 145,759 145,759 - 145,759 -
IEC - Information, Education & Communication 185,945 185,945 - 185,945 -
I I I I I I I I
I I I I I I I
I I I I
I I I I
I I I I I I I
I I I I I
I I I I
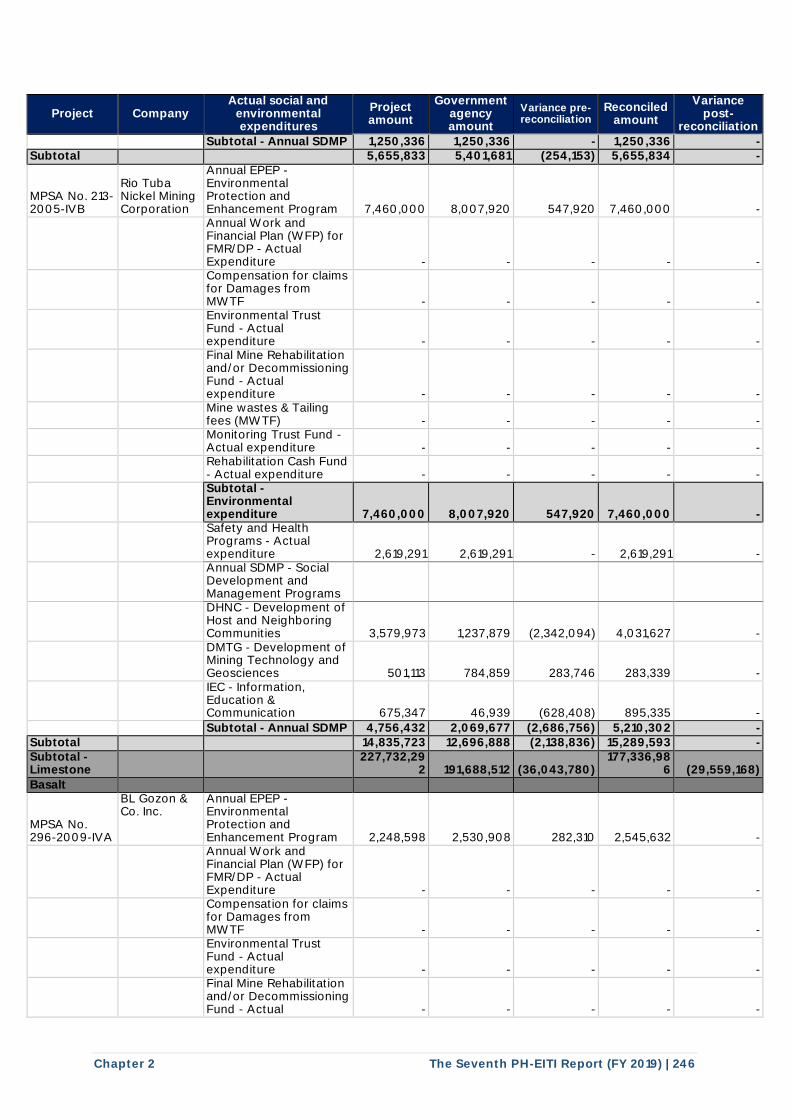
Chapter 2 The Seventh PH-EITI Report (FY 2019) | 246
Project Company Actual social and
environmental expenditures
Project amount
Government agency amount
Variance pre-reconciliation
Reconciled amount
Variance post-
reconciliation
Subtotal - Annual SDMP 1,250,336 1,250,336 - 1,250,336 - Subtotal 5,655,833 5,401,681 (254,153) 5,655,834 -
MPSA No. 213-2005-IVB
Rio Tuba Nickel Mining Corporation
Annual EPEP - Environmental Protection and Enhancement Program 7,460,000 8,007,920 547,920 7,460,000 -
Annual Work and Financial Plan (WFP) for FMR/DP - Actual Expenditure - - - - -
Compensation for claims for Damages from MWTF - - - - -
Environmental Trust Fund - Actual expenditure - - - - -
Final Mine Rehabilitation and/or Decommissioning Fund - Actual expenditure - - - - -
Mine wastes & Tailing fees (MWTF) - - - - -
Monitoring Trust Fund - Actual expenditure - - - - -
Rehabilitation Cash Fund - Actual expenditure - - - - -
Subtotal - Environmental expenditure 7,460,000 8,007,920 547,920 7,460,000 -
Safety and Health Programs - Actual expenditure 2,619,291 2,619,291 - 2,619,291 -
Annual SDMP - Social Development and Management Programs
DHNC - Development of Host and Neighboring Communities 3,579,973 1,237,879 (2,342,094) 4,031,627 -
DMTG - Development of Mining Technology and Geosciences 501,113 784,859 283,746 283,339 -
IEC - Information, Education & Communication 675,347 46,939 (628,408) 895,335 -
Subtotal - Annual SDMP 4,756,432 2,069,677 (2,686,756) 5,210,302 - Subtotal 14,835,723 12,696,888 (2,138,836) 15,289,593 - Subtotal - Limestone
227,732,292 191,688,512 (36,043,780)
177,336,986 (29,559,168)
Basalt
MPSA No. 296-2009-IVA
BL Gozon & Co. Inc.
Annual EPEP - Environmental Protection and Enhancement Program 2,248,598 2,530,908 282,310 2,545,632 -
Annual Work and Financial Plan (WFP) for FMR/DP - Actual Expenditure - - - - -
Compensation for claims for Damages from MWTF - - - - -
Environmental Trust Fund - Actual expenditure - - - - -
Final Mine Rehabilitation and/or Decommissioning Fund - Actual - - - - -
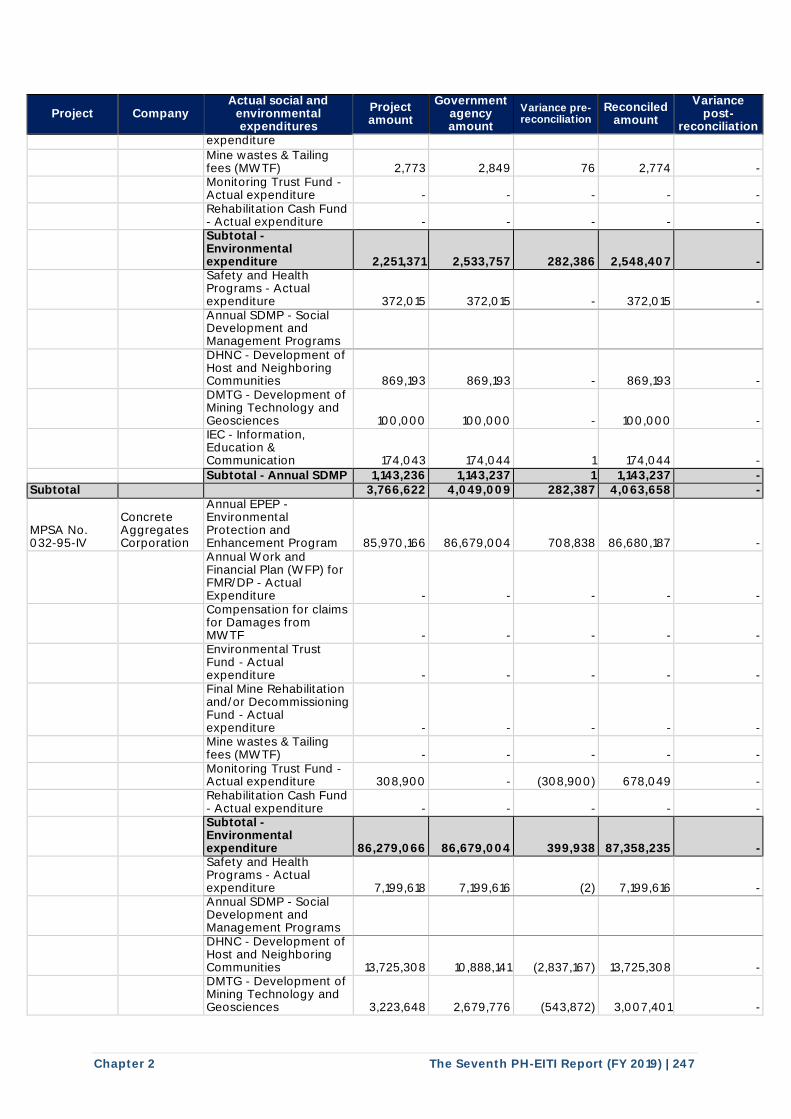
Chapter 2 The Seventh PH-EITI Report (FY 2019) | 247
Project Company Actual social and
environmental expenditures
Project amount
Government agency amount
Variance pre-reconciliation
Reconciled amount
Variance post-
reconciliation expenditure
Mine wastes & Tailing fees (MWTF) 2,773 2,849 76 2,774 -
Monitoring Trust Fund - Actual expenditure - - - - -
Rehabilitation Cash Fund - Actual expenditure - - - - -
Subtotal - Environmental expenditure 2,251,371 2,533,757 282,386 2,548,407 -
Safety and Health Programs - Actual expenditure 372,015 372,015 - 372,015 -
Annual SDMP - Social Development and Management Programs
DHNC - Development of Host and Neighboring Communities 869,193 869,193 - 869,193 -
DMTG - Development of Mining Technology and Geosciences 100,000 100,000 - 100,000 -
IEC - Information, Education & Communication 174,043 174,044 1 174,044 -
Subtotal - Annual SDMP 1,143,236 1,143,237 1 1,143,237 - Subtotal 3,766,622 4,049,009 282,387 4,063,658 -
MPSA No. 032-95-IV
Concrete Aggregates Corporation
Annual EPEP - Environmental Protection and Enhancement Program 85,970,166 86,679,004 708,838 86,680,187 -
Annual Work and Financial Plan (WFP) for FMR/DP - Actual Expenditure - - - - -
Compensation for claims for Damages from MWTF - - - - -
Environmental Trust Fund - Actual expenditure - - - - -
Final Mine Rehabilitation and/or Decommissioning Fund - Actual expenditure - - - - -
Mine wastes & Tailing fees (MWTF) - - - - -
Monitoring Trust Fund - Actual expenditure 308,900 - (308,900) 678,049 -
Rehabilitation Cash Fund - Actual expenditure - - - - -
Subtotal - Environmental expenditure 86,279,066 86,679,004 399,938 87,358,235 -
Safety and Health Programs - Actual expenditure 7,199,618 7,199,616 (2) 7,199,616 -
Annual SDMP - Social Development and Management Programs
DHNC - Development of Host and Neighboring Communities 13,725,308 10,888,141 (2,837,167) 13,725,308 -
DMTG - Development of Mining Technology and Geosciences 3,223,648 2,679,776 (543,872) 3,007,401 -
I I I I I I I
I I I I
I I I I
I I I I I I I
I I I I I
I I I I I
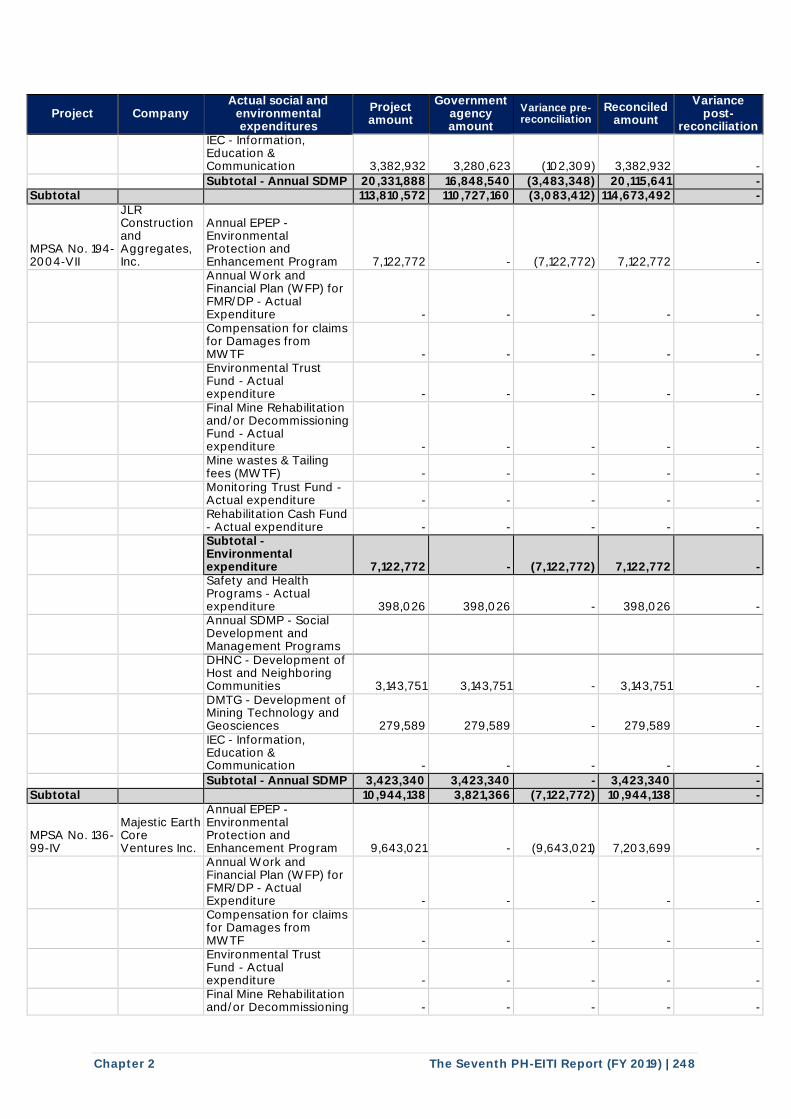
Chapter 2 The Seventh PH-EITI Report (FY 2019) | 248
Project Company Actual social and
environmental expenditures
Project amount
Government agency amount
Variance pre-reconciliation
Reconciled amount
Variance post-
reconciliation
IEC - Information, Education & Communication 3,382,932 3,280,623 (102,309) 3,382,932 -
Subtotal - Annual SDMP 20,331,888 16,848,540 (3,483,348) 20,115,641 - Subtotal 113,810,572 110,727,160 (3,083,412) 114,673,492 -
MPSA No. 194-2004-VII
JLR Construction and Aggregates, Inc.
Annual EPEP - Environmental Protection and Enhancement Program 7,122,772 - (7,122,772) 7,122,772 -
Annual Work and Financial Plan (WFP) for FMR/DP - Actual Expenditure - - - - -
Compensation for claims for Damages from MWTF - - - - -
Environmental Trust Fund - Actual expenditure - - - - -
Final Mine Rehabilitation and/or Decommissioning Fund - Actual expenditure - - - - -
Mine wastes & Tailing fees (MWTF) - - - - -
Monitoring Trust Fund - Actual expenditure - - - - -
Rehabilitation Cash Fund - Actual expenditure - - - - -
Subtotal - Environmental expenditure 7,122,772 - (7,122,772) 7,122,772 -
Safety and Health Programs - Actual expenditure 398,026 398,026 - 398,026 -
Annual SDMP - Social Development and Management Programs
DHNC - Development of Host and Neighboring Communities 3,143,751 3,143,751 - 3,143,751 -
DMTG - Development of Mining Technology and Geosciences 279,589 279,589 - 279,589 -
IEC - Information, Education & Communication - - - - -
Subtotal - Annual SDMP 3,423,340 3,423,340 - 3,423,340 - Subtotal 10,944,138 3,821,366 (7,122,772) 10,944,138 -
MPSA No. 136-99-IV
Majestic Earth Core Ventures Inc.
Annual EPEP - Environmental Protection and Enhancement Program 9,643,021 - (9,643,021) 7,203,699 -
Annual Work and Financial Plan (WFP) for FMR/DP - Actual Expenditure - - - - -
Compensation for claims for Damages from MWTF - - - - -
Environmental Trust Fund - Actual expenditure - - - - -
Final Mine Rehabilitation and/or Decommissioning - - - - -
I I I I I I I
I I I I I
I I I I
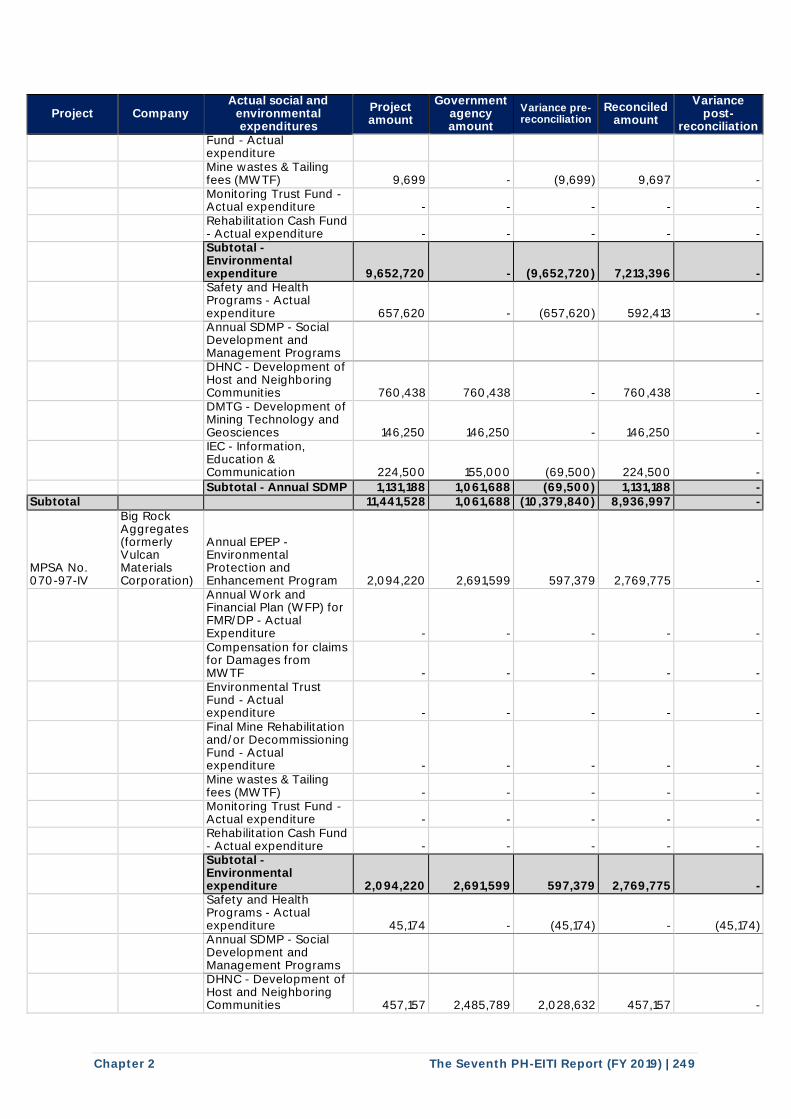
Chapter 2 The Seventh PH-EITI Report (FY 2019) | 249
Project Company Actual social and
environmental expenditures
Project amount
Government agency amount
Variance pre-reconciliation
Reconciled amount
Variance post-
reconciliation Fund - Actual expenditure
Mine wastes & Tailing fees (MWTF) 9,699 - (9,699) 9,697 -
Monitoring Trust Fund - Actual expenditure - - - - -
Rehabilitation Cash Fund - Actual expenditure - - - - -
Subtotal - Environmental expenditure 9,652,720 - (9,652,720) 7,213,396 -
Safety and Health Programs - Actual expenditure 657,620 - (657,620) 592,413 -
Annual SDMP - Social Development and Management Programs
DHNC - Development of Host and Neighboring Communities 760,438 760,438 - 760,438 -
DMTG - Development of Mining Technology and Geosciences 146,250 146,250 - 146,250 -
IEC - Information, Education & Communication 224,500 155,000 (69,500) 224,500 -
Subtotal - Annual SDMP 1,131,188 1,061,688 (69,500) 1,131,188 - Subtotal 11,441,528 1,061,688 (10,379,840) 8,936,997 -
MPSA No. 070-97-IV
Big Rock Aggregates (formerly Vulcan Materials Corporation)
Annual EPEP - Environmental Protection and Enhancement Program 2,094,220 2,691,599 597,379 2,769,775 -
Annual Work and Financial Plan (WFP) for FMR/DP - Actual Expenditure - - - - -
Compensation for claims for Damages from MWTF - - - - -
Environmental Trust Fund - Actual expenditure - - - - -
Final Mine Rehabilitation and/or Decommissioning Fund - Actual expenditure - - - - -
Mine wastes & Tailing fees (MWTF) - - - - -
Monitoring Trust Fund - Actual expenditure - - - - -
Rehabilitation Cash Fund - Actual expenditure - - - - -
Subtotal - Environmental expenditure 2,094,220 2,691,599 597,379 2,769,775 -
Safety and Health Programs - Actual expenditure 45,174 - (45,174) - (45,174)
Annual SDMP - Social Development and Management Programs
DHNC - Development of Host and Neighboring Communities 457,157 2,485,789 2,028,632 457,157 -
I I I I I I I
I I I I I
I I I I
I I I I I I I
I I I I I
I I I I I
l l l l
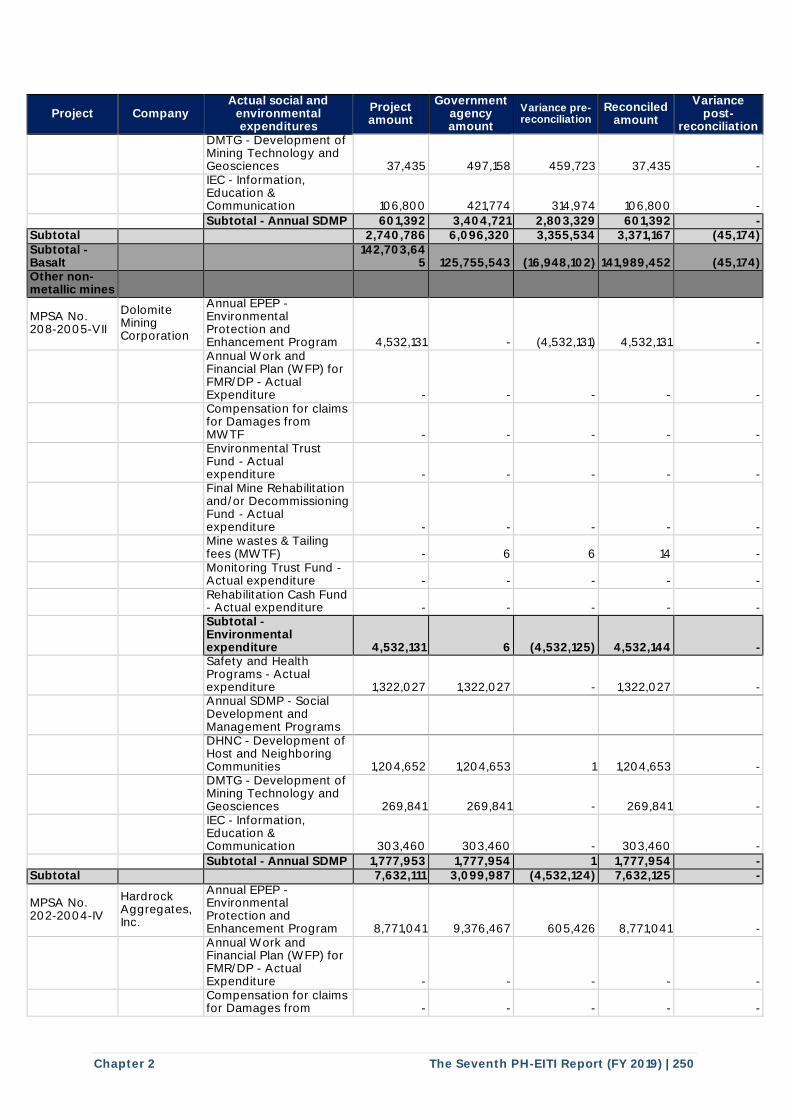
Chapter 2 The Seventh PH-EITI Report (FY 2019) | 250
Project Company Actual social and
environmental expenditures
Project amount
Government agency amount
Variance pre-reconciliation
Reconciled amount
Variance post-
reconciliation
DMTG - Development of Mining Technology and Geosciences 37,435 497,158 459,723 37,435 -
IEC - Information, Education & Communication 106,800 421,774 314,974 106,800 -
Subtotal - Annual SDMP 601,392 3,404,721 2,803,329 601,392 - Subtotal 2,740,786 6,096,320 3,355,534 3,371,167 (45,174) Subtotal - Basalt
142,703,645 125,755,543 (16,948,102) 141,989,452 (45,174)
Other non-metallic mines
MPSA No. 208-2005-VII
Dolomite Mining Corporation
Annual EPEP - Environmental Protection and Enhancement Program 4,532,131 - (4,532,131) 4,532,131 -
Annual Work and Financial Plan (WFP) for FMR/DP - Actual Expenditure - - - - -
Compensation for claims for Damages from MWTF - - - - -
Environmental Trust Fund - Actual expenditure - - - - -
Final Mine Rehabilitation and/or Decommissioning Fund - Actual expenditure - - - - -
Mine wastes & Tailing fees (MWTF) - 6 6 14 -
Monitoring Trust Fund - Actual expenditure - - - - -
Rehabilitation Cash Fund - Actual expenditure - - - - -
Subtotal - Environmental expenditure 4,532,131 6 (4,532,125) 4,532,144 -
Safety and Health Programs - Actual expenditure 1,322,027 1,322,027 - 1,322,027 -
Annual SDMP - Social Development and Management Programs
DHNC - Development of Host and Neighboring Communities 1,204,652 1,204,653 1 1,204,653 -
DMTG - Development of Mining Technology and Geosciences 269,841 269,841 - 269,841 -
IEC - Information, Education & Communication 303,460 303,460 - 303,460 -
Subtotal - Annual SDMP 1,777,953 1,777,954 1 1,777,954 - Subtotal 7,632,111 3,099,987 (4,532,124) 7,632,125 -
MPSA No. 202-2004-IV
Hardrock Aggregates, Inc.
Annual EPEP - Environmental Protection and Enhancement Program 8,771,041 9,376,467 605,426 8,771,041 -
Annual Work and Financial Plan (WFP) for FMR/DP - Actual Expenditure - - - - -
Compensation for claims for Damages from - - - - -
I I I I I I I
I I I I
I I I I

Chapter 2 The Seventh PH-EITI Report (FY 2019) | 251
Project Company Actual social and
environmental expenditures
Project amount
Government agency amount
Variance pre-reconciliation
Reconciled amount
Variance post-
reconciliation MWTF
Environmental Trust Fund - Actual expenditure - - - - -
Final Mine Rehabilitation and/or Decommissioning Fund - Actual expenditure - - - - -
Mine wastes & Tailing fees (MWTF) - 625 625 2,329 -
Monitoring Trust Fund - Actual expenditure - - - - -
Rehabilitation Cash Fund - Actual expenditure - - - - -
Subtotal - Environmental expenditure 8,771,041 9,377,092 606,051 8,773,369 -
Safety and Health Programs - Actual expenditure 912,459 912,350 (109) 912,450 -
Annual SDMP - Social Development and Management Programs
DHNC - Development of Host and Neighboring Communities 589,985 441,428 (148,558) 204,956 -
DMTG - Development of Mining Technology and Geosciences 38,069 100,000 61,931 - -
IEC - Information, Education & Communication 89,372 89,372 - 89,372 -
Subtotal - Annual SDMP 717,426 630,800 (86,627) 294,328 - Subtotal 10,400,926 10,920,242 519,316 9,980,147 -
MPSA No. 074-97-IV
Rapid City Realty and Development Corporation
Annual EPEP - Environmental Protection and Enhancement Program 2,451,120 2,866,120 415,000 - 415,000
Annual Work and Financial Plan (WFP) for FMR/DP - Actual Expenditure - - - - -
Compensation for claims for Damages from MWTF - - - - -
Environmental Trust Fund - Actual expenditure - - - - -
Final Mine Rehabilitation and/or Decommissioning Fund - Actual expenditure - - - - -
Mine wastes & Tailing fees (MWTF) 244 - (244) - (244)
Monitoring Trust Fund - Actual expenditure - - - - -
Rehabilitation Cash Fund - Actual expenditure - - - - -
Subtotal - Environmental expenditure 2,451,364 2,866,120 414,756 - 414,756
Safety and Health Programs - Actual expenditure 440,602 440,602 (0) 440,602 -
Annual SDMP - Social Development and
I I I I I I I
I I I I I
I I I I
I I I I I I I
I I I I I I I I I I
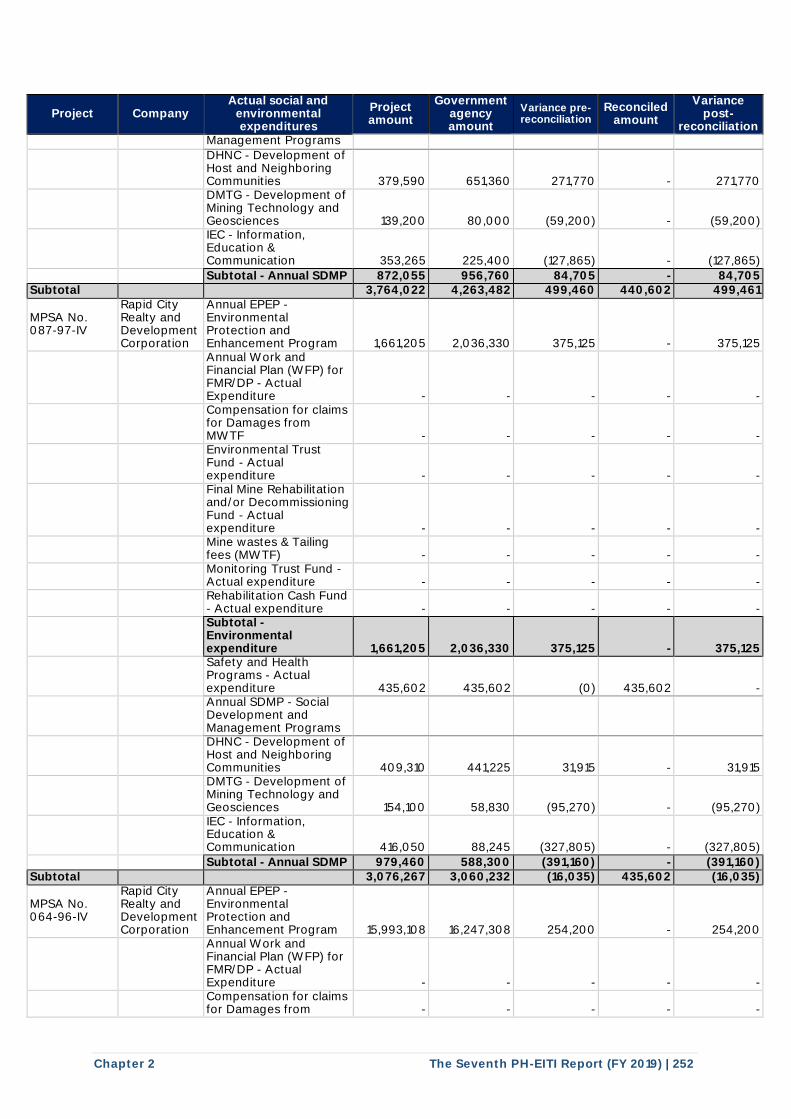
Chapter 2 The Seventh PH-EITI Report (FY 2019) | 252
Project Company Actual social and
environmental expenditures
Project amount
Government agency amount
Variance pre-reconciliation
Reconciled amount
Variance post-
reconciliation Management Programs
DHNC - Development of Host and Neighboring Communities 379,590 651,360 271,770 - 271,770
DMTG - Development of Mining Technology and Geosciences 139,200 80,000 (59,200) - (59,200)
IEC - Information, Education & Communication 353,265 225,400 (127,865) - (127,865)
Subtotal - Annual SDMP 872,055 956,760 84,705 - 84,705 Subtotal 3,764,022 4,263,482 499,460 440,602 499,461
MPSA No. 087-97-IV
Rapid City Realty and Development Corporation
Annual EPEP - Environmental Protection and Enhancement Program 1,661,205 2,036,330 375,125 - 375,125
Annual Work and Financial Plan (WFP) for FMR/DP - Actual Expenditure - - - - -
Compensation for claims for Damages from MWTF - - - - -
Environmental Trust Fund - Actual expenditure - - - - -
Final Mine Rehabilitation and/or Decommissioning Fund - Actual expenditure - - - - -
Mine wastes & Tailing fees (MWTF) - - - - -
Monitoring Trust Fund - Actual expenditure - - - - -
Rehabilitation Cash Fund - Actual expenditure - - - - -
Subtotal - Environmental expenditure 1,661,205 2,036,330 375,125 - 375,125
Safety and Health Programs - Actual expenditure 435,602 435,602 (0) 435,602 -
Annual SDMP - Social Development and Management Programs
DHNC - Development of Host and Neighboring Communities 409,310 441,225 31,915 - 31,915
DMTG - Development of Mining Technology and Geosciences 154,100 58,830 (95,270) - (95,270)
IEC - Information, Education & Communication 416,050 88,245 (327,805) - (327,805)
Subtotal - Annual SDMP 979,460 588,300 (391,160) - (391,160) Subtotal 3,076,267 3,060,232 (16,035) 435,602 (16,035)
MPSA No. 064-96-IV
Rapid City Realty and Development Corporation
Annual EPEP - Environmental Protection and Enhancement Program 15,993,108 16,247,308 254,200 - 254,200
Annual Work and Financial Plan (WFP) for FMR/DP - Actual Expenditure - - - - -
Compensation for claims for Damages from - - - - -
I I I I I I I
I I I I
I I I I
I I
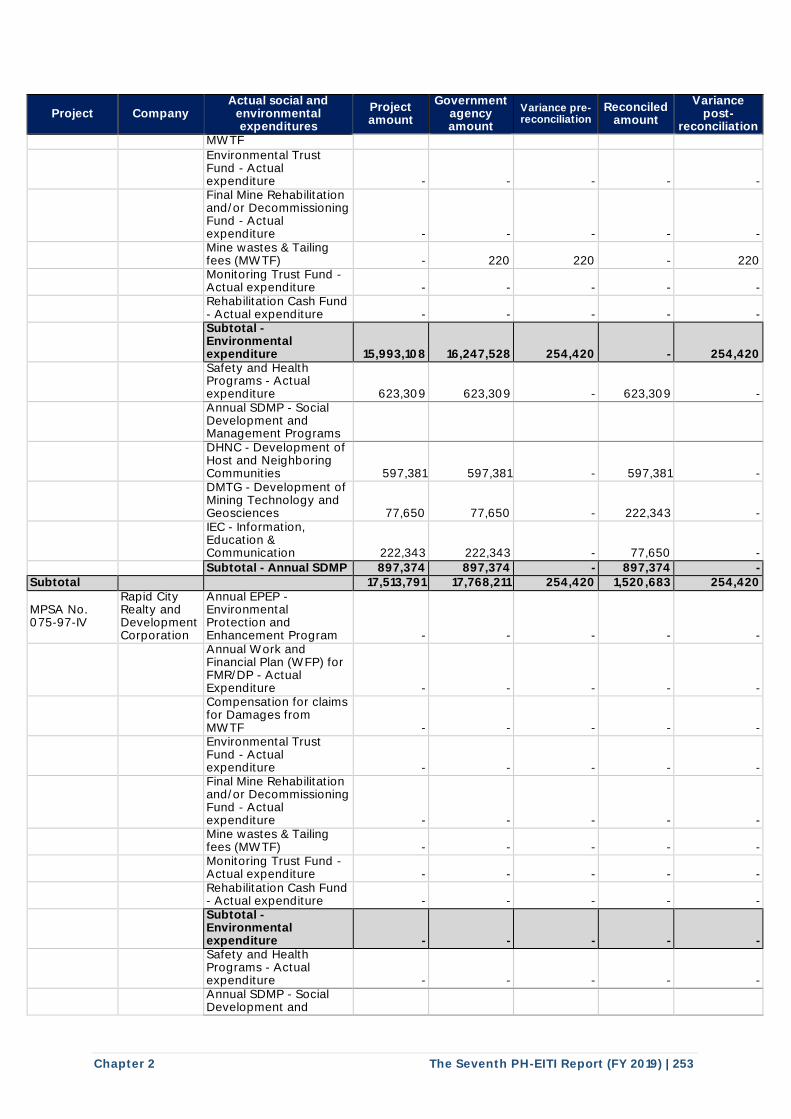
Chapter 2 The Seventh PH-EITI Report (FY 2019) | 253
Project Company Actual social and
environmental expenditures
Project amount
Government agency amount
Variance pre-reconciliation
Reconciled amount
Variance post-
reconciliation MWTF
Environmental Trust Fund - Actual expenditure - - - - -
Final Mine Rehabilitation and/or Decommissioning Fund - Actual expenditure - - - - -
Mine wastes & Tailing fees (MWTF) - 220 220 - 220
Monitoring Trust Fund - Actual expenditure - - - - -
Rehabilitation Cash Fund - Actual expenditure - - - - -
Subtotal - Environmental expenditure 15,993,108 16,247,528 254,420 - 254,420
Safety and Health Programs - Actual expenditure 623,309 623,309 - 623,309 -
Annual SDMP - Social Development and Management Programs
DHNC - Development of Host and Neighboring Communities 597,381 597,381 - 597,381 -
DMTG - Development of Mining Technology and Geosciences 77,650 77,650 - 222,343 -
IEC - Information, Education & Communication 222,343 222,343 - 77,650 -
Subtotal - Annual SDMP 897,374 897,374 - 897,374 - Subtotal 17,513,791 17,768,211 254,420 1,520,683 254,420
MPSA No. 075-97-IV
Rapid City Realty and Development Corporation
Annual EPEP - Environmental Protection and Enhancement Program - - - - -
Annual Work and Financial Plan (WFP) for FMR/DP - Actual Expenditure - - - - -
Compensation for claims for Damages from MWTF - - - - -
Environmental Trust Fund - Actual expenditure - - - - -
Final Mine Rehabilitation and/or Decommissioning Fund - Actual expenditure - - - - -
Mine wastes & Tailing fees (MWTF) - - - - -
Monitoring Trust Fund - Actual expenditure - - - - -
Rehabilitation Cash Fund - Actual expenditure - - - - -
Subtotal - Environmental expenditure - - - - -
Safety and Health Programs - Actual expenditure - - - - -
Annual SDMP - Social Development and
I I I I I I I
I I I I I
I I I I
I I I I I I I
I I I I I I I I I I
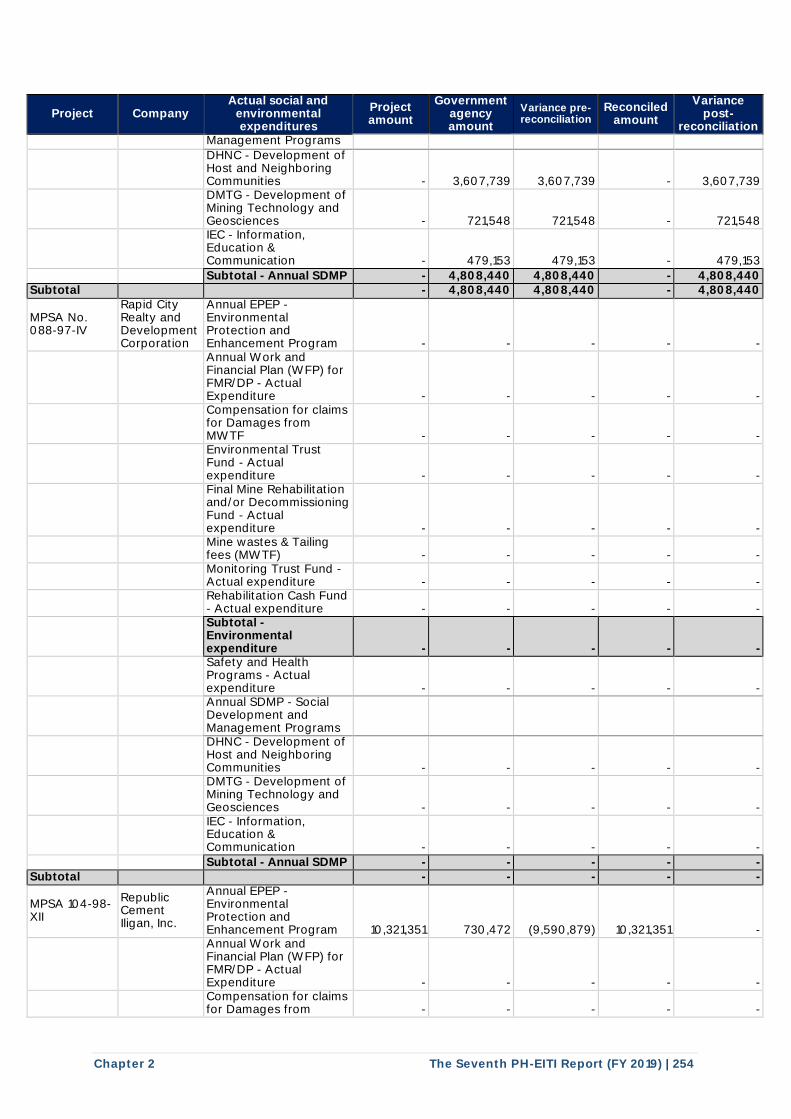
Chapter 2 The Seventh PH-EITI Report (FY 2019) | 254
Project Company Actual social and
environmental expenditures
Project amount
Government agency amount
Variance pre-reconciliation
Reconciled amount
Variance post-
reconciliation Management Programs
DHNC - Development of Host and Neighboring Communities - 3,607,739 3,607,739 - 3,607,739
DMTG - Development of Mining Technology and Geosciences - 721,548 721,548 - 721,548
IEC - Information, Education & Communication - 479,153 479,153 - 479,153
Subtotal - Annual SDMP - 4,808,440 4,808,440 - 4,808,440 Subtotal - 4,808,440 4,808,440 - 4,808,440
MPSA No. 088-97-IV
Rapid City Realty and Development Corporation
Annual EPEP - Environmental Protection and Enhancement Program - - - - -
Annual Work and Financial Plan (WFP) for FMR/DP - Actual Expenditure - - - - -
Compensation for claims for Damages from MWTF - - - - -
Environmental Trust Fund - Actual expenditure - - - - -
Final Mine Rehabilitation and/or Decommissioning Fund - Actual expenditure - - - - -
Mine wastes & Tailing fees (MWTF) - - - - -
Monitoring Trust Fund - Actual expenditure - - - - -
Rehabilitation Cash Fund - Actual expenditure - - - - -
Subtotal - Environmental expenditure - - - - -
Safety and Health Programs - Actual expenditure - - - - -
Annual SDMP - Social Development and Management Programs
DHNC - Development of Host and Neighboring Communities - - - - -
DMTG - Development of Mining Technology and Geosciences - - - - -
IEC - Information, Education & Communication - - - - -
Subtotal - Annual SDMP - - - - - Subtotal - - - - -
MPSA 104-98-XII
Republic Cement Iligan, Inc.
Annual EPEP - Environmental Protection and Enhancement Program 10,321,351 730,472 (9,590,879) 10,321,351 -
Annual Work and Financial Plan (WFP) for FMR/DP - Actual Expenditure - - - - -
Compensation for claims for Damages from - - - - -
I I I I I I I
I I I I
I I I I
I I
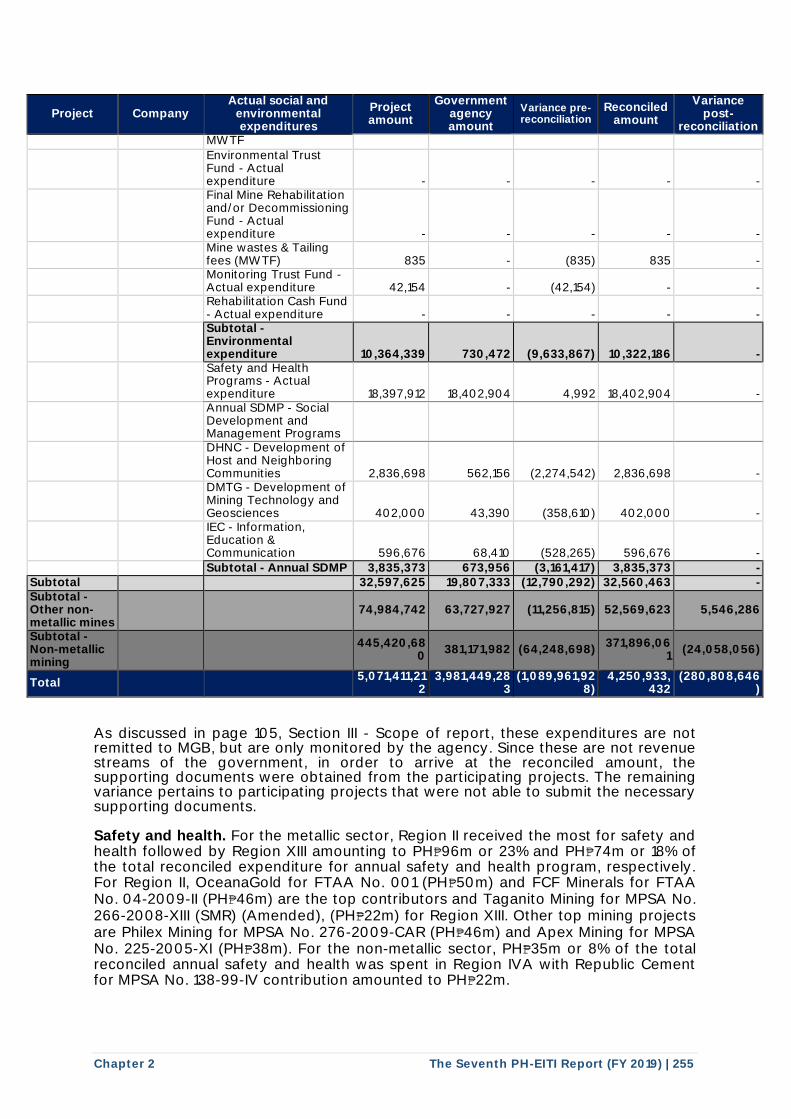
Chapter 2 The Seventh PH-EITI Report (FY 2019) | 255
Project Company Actual social and
environmental expenditures
Project amount
Government agency amount
Variance pre-reconciliation
Reconciled amount
Variance post-
reconciliation MWTF
Environmental Trust Fund - Actual expenditure - - - - -
Final Mine Rehabilitation and/or Decommissioning Fund - Actual expenditure - - - - -
Mine wastes & Tailing fees (MWTF) 835 - (835) 835 -
Monitoring Trust Fund - Actual expenditure 42,154 - (42,154) - -
Rehabilitation Cash Fund - Actual expenditure - - - - -
Subtotal - Environmental expenditure 10,364,339 730,472 (9,633,867) 10,322,186 -
Safety and Health Programs - Actual expenditure 18,397,912 18,402,904 4,992 18,402,904 -
Annual SDMP - Social Development and Management Programs
DHNC - Development of Host and Neighboring Communities 2,836,698 562,156 (2,274,542) 2,836,698 -
DMTG - Development of Mining Technology and Geosciences 402,000 43,390 (358,610) 402,000 -
IEC - Information, Education & Communication 596,676 68,410 (528,265) 596,676 -
Subtotal - Annual SDMP 3,835,373 673,956 (3,161,417) 3,835,373 - Subtotal 32,597,625 19,807,333 (12,790,292) 32,560,463 - Subtotal - Other non-metallic mines
74,984,742 63,727,927 (11,256,815) 52,569,623 5,546,286
Subtotal - Non-metallic mining
445,420,68
0 381,171,982 (64,248,698)
371,896,061
(24,058,056)
Total 5,071,411,21
2 3,981,449,28
3 (1,089,961,92
8) 4,250,933,
432 (280,808,646
)
As discussed in page 105, Section III - Scope of report, these expenditures are not remitted to MGB, but are only monitored by the agency. Since these are not revenue streams of the government, in order to arrive at the reconciled amount, the supporting documents were obtained from the participating projects. The remaining variance pertains to participating projects that were not able to submit the necessary supporting documents. Safety and health. For the metallic sector, Region II received the most for safety and health followed by Region XIII amounting to PH₱96m or 23% and PH₱74m or 18% of the total reconciled expenditure for annual safety and health program, respectively. For Region II, OceanaGold for FTAA No. 001 (PH₱50m) and FCF Minerals for FTAA No. 04-2009-II (PH₱46m) are the top contributors and Taganito Mining for MPSA No. 266-2008-XIII (SMR) (Amended), (PH₱22m) for Region XIII. Other top mining projects are Philex Mining for MPSA No. 276-2009-CAR (PH₱46m) and Apex Mining for MPSA No. 225-2005-XI (PH₱38m). For the non-metallic sector, PH₱35m or 8% of the total reconciled annual safety and health was spent in Region IVA with Republic Cement for MPSA No. 138-99-IV contribution amounted to PH₱22m.
Chapter 2 The Seventh PH-EITI Report (FY 2019) | 256
Environmental protection. Similar to safety and health, for the metallic sector, Region II, received the highest amount of expenditure for environmental protection with PH₱1bn or 35% of the total reconciled mandatory expenditures for environmental protection followed by Region XIII with PH₱876m or 31% of the total reconciled environmental expenditure. Top metallic mining projects and their respective regions are OceanaGold for FTAA No. 001, Region II (PH₱565m), FCF Minerals for FTAA No. 04-2009-II, Region II (PH₱407m), Taganito Mining for MPSA No. 266-2008-XIII (SMR) (Amended), Region XIII (PH₱280m), Carmen Copper for MPSA No. 210-2005-VII, Region VII (PH₱262m), and Philex Mining for MPSA No. 276-2009-CAR, CAR (PH₱159m). The non-metallic sector, on the other hand, spent the most for environmental protection on Region IVA amounting to PH₱119m or 4% of the total reconciled environmental expenditure with Concrete Aggregates for MPSA No. 032-95-IV contributing to PH₱87m or 73% of the total expenditure on Region IVA. Social development. Region XIII received the highest amount of expenditure for social development for the metallic sector amounting to PH₱294m or 30% of the total reconciled social expenditures, followed by Region II with PH₱162m or 16%. Consistent with the prior report, top metallic mining projects and their respective regions were Carmen Copper for MPSA No. 210-2005-VII, Region VII (PH₱159m), OceanaGold for FTAA No. 001, Region II (PH₱113m), and Philex Mining for MPSA No. 276-2009-CAR, CAR (PH₱95m). For the non-metallic sector, Region IVA receives the highest amount of expenditure for social development amounting to PH₱33m or 3.4% followed by Region III with PH₱26m or 2.6% total reconciled social expenditures. Concrete Aggregates for MPSA No. 032-95-IV contributed PH₱20m to Region IVA and Eagle Cement for MPSA No. 181-2002-III contributed PH₱9m to Region III.
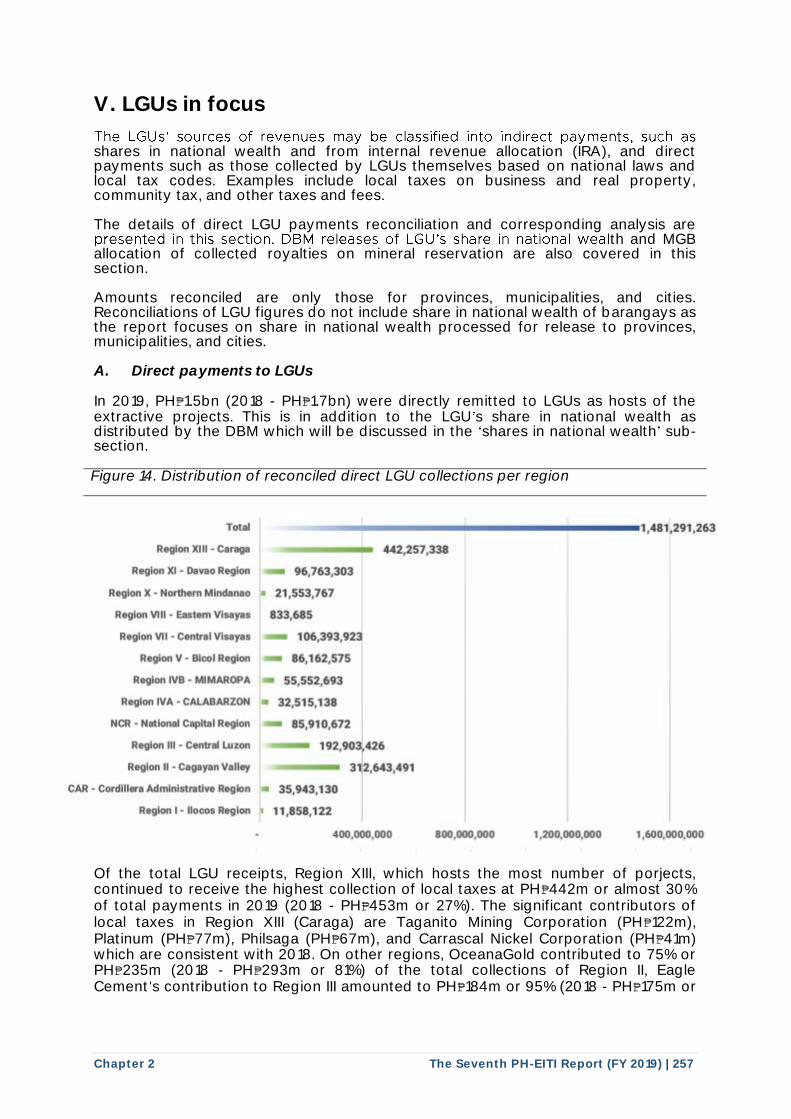
Chapter 2 The Seventh PH-EITI Report (FY 2019) | 257
V. LGUs in focus
shares in national wealth and from internal revenue allocation (IRA), and direct payments such as those collected by LGUs themselves based on national laws and local tax codes. Examples include local taxes on business and real property, community tax, and other taxes and fees. The details of direct LGU payments reconciliation and corresponding analysis are
th and MGB allocation of collected royalties on mineral reservation are also covered in this section. Amounts reconciled are only those for provinces, municipalities, and cities. Reconciliations of LGU figures do not include share in national wealth of barangays as the report focuses on share in national wealth processed for release to provinces, municipalities, and cities. A. Direct payments to LGUs
In 2019, PH₱1.5bn (2018 - PH₱1.7bn) were directly remitted to LGUs as hosts of the extractive projects. This is in addition to the LGU s share in national wealth as distributed by the DBM which will be discussed in the shares in national wealth sub-section. Figure 14. Distribution of reconciled direct LGU collections per region
Of the total LGU receipts, Region XIII, which hosts the most number of porjects, continued to receive the highest collection of local taxes at PH₱442m or almost 30% of total payments in 2019 (2018 - PH₱453m or 27%). The significant contributors of local taxes in Region XIII (Caraga) are Taganito Mining Corporation (PH₱122m), Platinum (PH₱77m), Philsaga (PH₱67m), and Carrascal Nickel Corporation (PH₱41m) which are consistent with 2018. On other regions, OceanaGold contributed to 75% or PH₱235m (2018 - PH₱293m or 81%) of the total collections of Region II, Eagle Cement s contribution to Region III amounted to PH₱184m or 95% (2018 - PH₱175m or
The LGUs ' sources of revenues may be classified into indirect payments, such as
presented in this section. DBM releases of LGU 's share in national weal
Total --======-----------------1,481,291,263
R on X1 It - -M2,157 ,338
Ion 96,763,303
R Ion X - No 21,553,767
R glon VIII - Eastern VI yas 833,685
R onvtl- IVl yas
Regioo V • Bicol Region
A on IVB - MAROPA
~°"'IVA - CAi.ABAAZON
NCR· ltlo I Cap IR on
R99on Ul • C 1111111 Luzon
106,393,923
86,162,575
55,552,693
32,515,138
85,910,672
192,903426
3 2,6-43,491
CAR· CordllleR Adm 35,943,130
R Ion I· loco, R on 11,858,121
400,000,000 800,000,000 1,200,000,000 1,600,000,000

Chapter 2 The Seventh PH-EITI Report (FY 2019) | 258
72%) of the total collection of the region and Carmen Copper payments were 94% or PH₱100m of the total collections of Region VII. The succeeding tables summarized the reconciliation of direct LGU payments mapped to respective regions, provinces, and municipalities/cities, accordingly, including disclosures for non-participating projects.
Table 38. Summary of reconciliation for direct LGU collections disaggregated by municipality/city
Region Province Municipality
/City Project amount
Government agency amount
Variance pre-reconciliation
Reconciled amount
Variance post-reconciliation
Metallic mining
Region I - Ilocos Region La Union San Fernando 938,675 - (938,675) 938,675 - CAR - Cordillera Administrative Region
Benguet Baguio City 12,179 - (12,179) 37,345 -
Itogon 16,125,021 11,543,891 (4,581,130) 16,073,405 (1,377,795)
Mankayan 8,599,373 8,589,410 (9,962) 8,589,410 -
Tuba 11,304,189 12,217,444 913,255 11,242,969 496,880
Subtotal - CAR - Cordillera Administrative Region 36,040,761 32,350,745 (3,690,016) 35,943,130 (880,915)
Region II - Cagayan Valley Nueva Vizcaya
Kasibu 144,807,814 110,800,253 (34,007,560) 144,807,820 27,390,286
Nagtipunan 59,000,000 - (59,000,000) 59,000,000 -
Quezon 77,467,641 32,064,995 (45,402,646) 77,464,872 -
Quirino 31,360,799 - (31,360,799) 31,360,799 -
Subtotal - Region II - Cagayan Valley 312,636,254 142,865,248 (169,771,005) 312,633,491 27,390,286
Region III - Central Luzon Zambales Candelaria 3,129,318 2,823,022 (306,296) 3,054,096 (387,259)
Santa Cruz 1,267,561 1,644,873 377,312 1,432,373 212,500
Subtotal - Region III - Central Luzon 4,396,879 4,467,895 71,016 4,486,470 (174,759) NCR - National Capital Region
Metro Manila Makati City 47,080,219 - (47,080,219) 48,758,569 -
Mandaluyong 1,035,506 - (1,035,506) 1,035,506 -
Muntinlupa City 20,930 20,930 - 18,250 -
Pasay City 32,980 37,331 4,351 70,312 -
Pasig City 9,135,042 8,541,058 (593,983) 8,745,143 -
Quezon City 18,908 - (18,908) 18,908 -
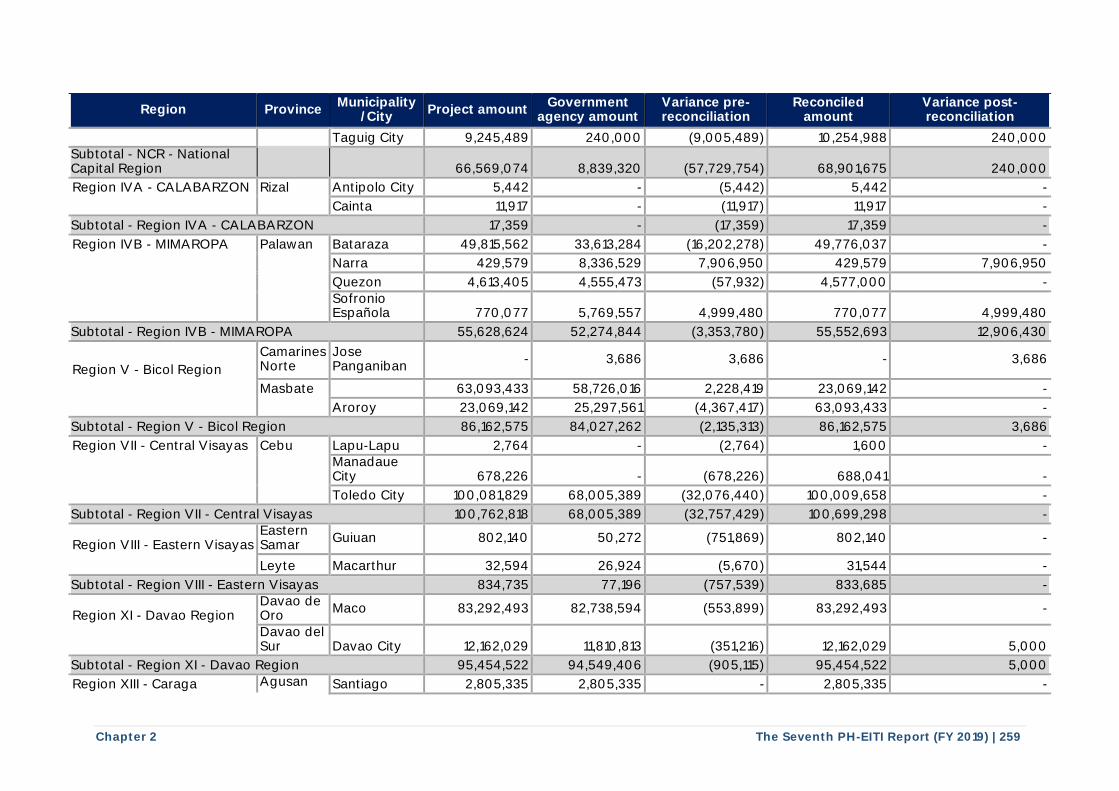
Chapter 2 The Seventh PH-EITI Report (FY 2019) | 259
Region Province Municipality
/City Project amount
Government agency amount
Variance pre-reconciliation
Reconciled amount
Variance post-reconciliation
Taguig City 9,245,489 240,000 (9,005,489) 10,254,988 240,000 Subtotal - NCR - National Capital Region 66,569,074 8,839,320 (57,729,754) 68,901,675 240,000
Region IVA - CALABARZON Rizal Antipolo City 5,442 - (5,442) 5,442 -
Cainta 11,917 - (11,917) 11,917 -
Subtotal - Region IVA - CALABARZON 17,359 - (17,359) 17,359 -
Region IVB - MIMAROPA Palawan Bataraza 49,815,562 33,613,284 (16,202,278) 49,776,037 -
Narra 429,579 8,336,529 7,906,950 429,579 7,906,950
Quezon 4,613,405 4,555,473 (57,932) 4,577,000 -
Sofronio Española 770,077 5,769,557 4,999,480 770,077 4,999,480
Subtotal - Region IVB - MIMAROPA 55,628,624 52,274,844 (3,353,780) 55,552,693 12,906,430
Region V - Bicol Region
Camarines Norte
Jose Panganiban
- 3,686 3,686 - 3,686
Masbate 63,093,433 58,726,016 2,228,419 23,069,142 -
Aroroy 23,069,142 25,297,561 (4,367,417) 63,093,433 -
Subtotal - Region V - Bicol Region 86,162,575 84,027,262 (2,135,313) 86,162,575 3,686
Region VII - Central Visayas Cebu Lapu-Lapu 2,764 - (2,764) 1,600 -
Manadaue City 678,226 - (678,226) 688,041 -
Toledo City 100,081,829 68,005,389 (32,076,440) 100,009,658 -
Subtotal - Region VII - Central Visayas 100,762,818 68,005,389 (32,757,429) 100,699,298 -
Region VIII - Eastern Visayas Eastern Samar
Guiuan 802,140 50,272 (751,869) 802,140 -
Leyte Macarthur 32,594 26,924 (5,670) 31,544 -
Subtotal - Region VIII - Eastern Visayas 834,735 77,196 (757,539) 833,685 -
Region XI - Davao Region Davao de Oro
Maco 83,292,493 82,738,594 (553,899) 83,292,493 -
Davao del Sur Davao City 12,162,029 11,810,813 (351,216) 12,162,029 5,000
Subtotal - Region XI - Davao Region 95,454,522 94,549,406 (905,115) 95,454,522 5,000
Region XIII - Caraga Agusan Santiago 2,805,335 2,805,335 - 2,805,335 -
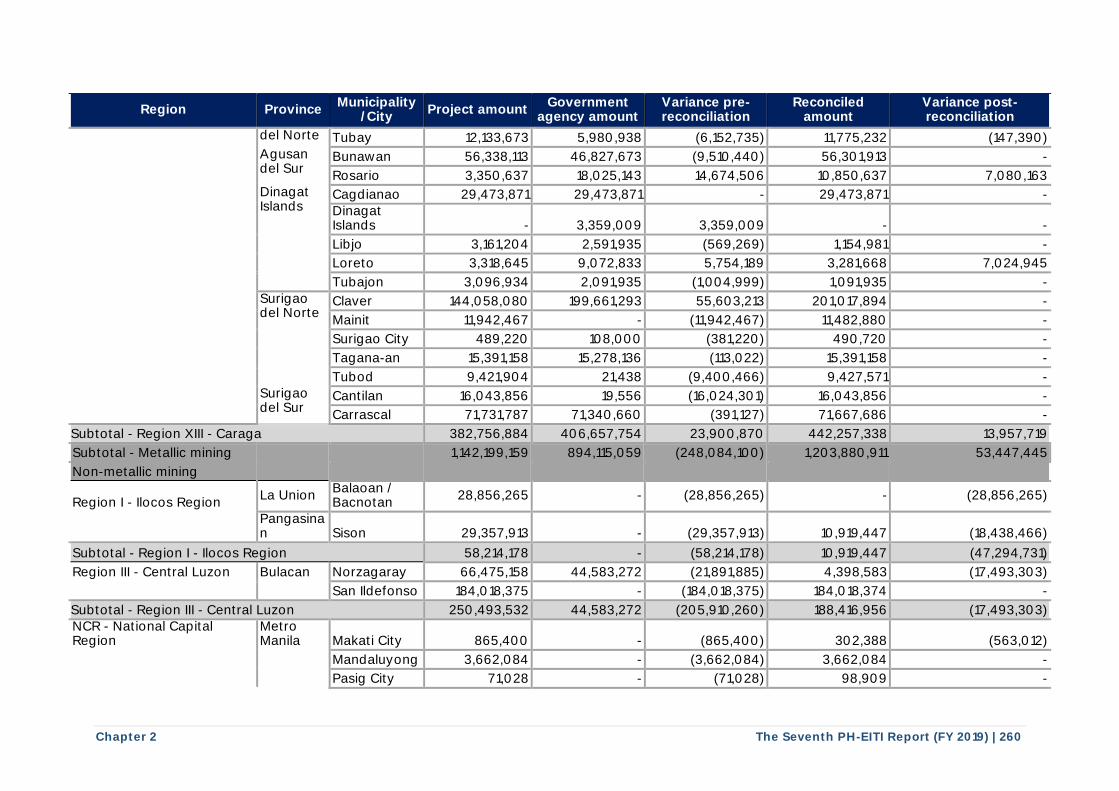
Chapter 2 The Seventh PH-EITI Report (FY 2019) | 260
Region Province Municipality
/City Project amount
Government agency amount
Variance pre-reconciliation
Reconciled amount
Variance post-reconciliation
del Norte Tubay 12,133,673 5,980,938 (6,152,735) 11,775,232 (147,390)
Agusan del Sur
Bunawan 56,338,113 46,827,673 (9,510,440) 56,301,913 -
Rosario 3,350,637 18,025,143 14,674,506 10,850,637 7,080,163
Dinagat Islands
Cagdianao 29,473,871 29,473,871 - 29,473,871 -
Dinagat Islands - 3,359,009 3,359,009 - -
Libjo 3,161,204 2,591,935 (569,269) 1,154,981 -
Loreto 3,318,645 9,072,833 5,754,189 3,281,668 7,024,945
Tubajon 3,096,934 2,091,935 (1,004,999) 1,091,935 -
Surigao del Norte
Claver 144,058,080 199,661,293 55,603,213 201,017,894 -
Mainit 11,942,467 - (11,942,467) 11,482,880 -
Surigao City 489,220 108,000 (381,220) 490,720 -
Tagana-an 15,391,158 15,278,136 (113,022) 15,391,158 -
Tubod 9,421,904 21,438 (9,400,466) 9,427,571 -
Surigao del Sur
Cantilan 16,043,856 19,556 (16,024,301) 16,043,856 -
Carrascal 71,731,787 71,340,660 (391,127) 71,667,686 -
Subtotal - Region XIII - Caraga 382,756,884 406,657,754 23,900,870 442,257,338 13,957,719
Subtotal - Metallic mining 1,142,199,159 894,115,059 (248,084,100) 1,203,880,911 53,447,445
Non-metallic mining
Region I - Ilocos Region La Union
Balaoan / Bacnotan
28,856,265 - (28,856,265) - (28,856,265)
Pangasinan Sison 29,357,913 - (29,357,913) 10,919,447 (18,438,466)
Subtotal - Region I - Ilocos Region 58,214,178 - (58,214,178) 10,919,447 (47,294,731)
Region III - Central Luzon Bulacan Norzagaray 66,475,158 44,583,272 (21,891,885) 4,398,583 (17,493,303)
San Ildefonso 184,018,375 - (184,018,375) 184,018,374 -
Subtotal - Region III - Central Luzon 250,493,532 44,583,272 (205,910,260) 188,416,956 (17,493,303) NCR - National Capital Region
Metro Manila Makati City 865,400 - (865,400) 302,388 (563,012)
Mandaluyong 3,662,084 - (3,662,084) 3,662,084 -
Pasig City 71,028 - (71,028) 98,909 -
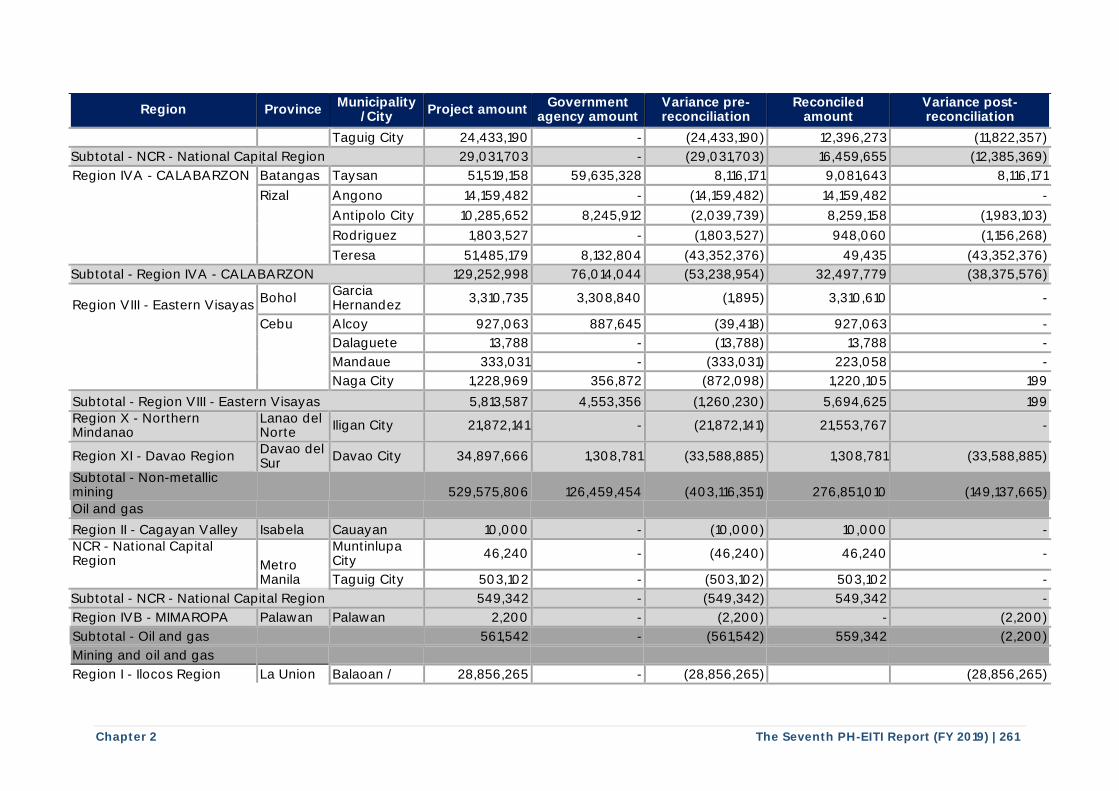
Chapter 2 The Seventh PH-EITI Report (FY 2019) | 261
Region Province Municipality
/City Project amount
Government agency amount
Variance pre-reconciliation
Reconciled amount
Variance post-reconciliation
Taguig City 24,433,190 - (24,433,190) 12,396,273 (11,822,357)
Subtotal - NCR - National Capital Region 29,031,703 - (29,031,703) 16,459,655 (12,385,369)
Region IVA - CALABARZON Batangas Taysan 51,519,158 59,635,328 8,116,171 9,081,643 8,116,171
Rizal Angono 14,159,482 - (14,159,482) 14,159,482 -
Antipolo City 10,285,652 8,245,912 (2,039,739) 8,259,158 (1,983,103)
Rodriguez 1,803,527 - (1,803,527) 948,060 (1,156,268)
Teresa 51,485,179 8,132,804 (43,352,376) 49,435 (43,352,376)
Subtotal - Region IVA - CALABARZON 129,252,998 76,014,044 (53,238,954) 32,497,779 (38,375,576)
Region VIII - Eastern Visayas Bohol
Garcia Hernandez
3,310,735 3,308,840 (1,895) 3,310,610 -
Cebu Alcoy 927,063 887,645 (39,418) 927,063 -
Dalaguete 13,788 - (13,788) 13,788 -
Mandaue 333,031 - (333,031) 223,058 -
Naga City 1,228,969 356,872 (872,098) 1,220,105 199
Subtotal - Region VIII - Eastern Visayas 5,813,587 4,553,356 (1,260,230) 5,694,625 199 Region X - Northern Mindanao
Lanao del Norte
Iligan City 21,872,141 - (21,872,141) 21,553,767 -
Region XI - Davao Region Davao del Sur
Davao City 34,897,666 1,308,781 (33,588,885) 1,308,781 (33,588,885)
Subtotal - Non-metallic mining 529,575,806 126,459,454 (403,116,351) 276,851,010 (149,137,665)
Oil and gas
Region II - Cagayan Valley Isabela Cauayan 10,000 - (10,000) 10,000 - NCR - National Capital Region Metro
Manila
Muntinlupa City
46,240 - (46,240) 46,240 -
Taguig City 503,102 - (503,102) 503,102 -
Subtotal - NCR - National Capital Region 549,342 - (549,342) 549,342 -
Region IVB - MIMAROPA Palawan Palawan 2,200 - (2,200) - (2,200)
Subtotal - Oil and gas 561,542 - (561,542) 559,342 (2,200)
Mining and oil and gas
Region I - Ilocos Region La Union Balaoan / 28,856,265 - (28,856,265) (28,856,265)
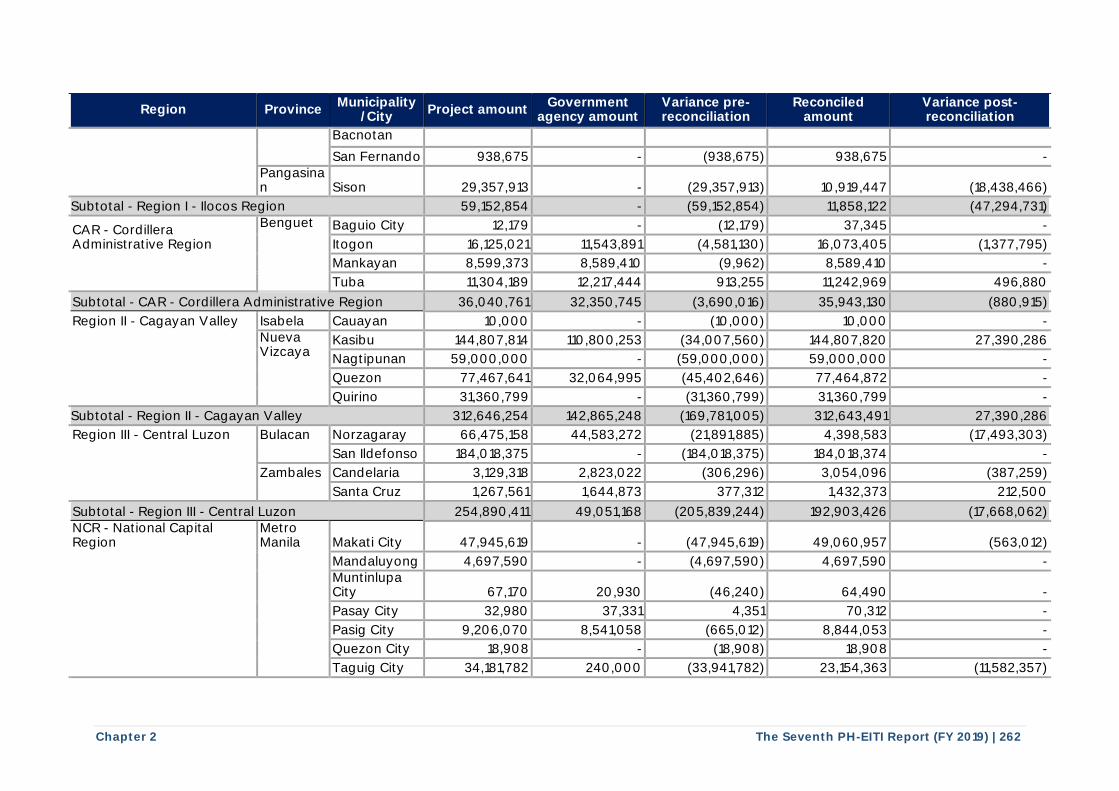
Chapter 2 The Seventh PH-EITI Report (FY 2019) | 262
Region Province Municipality
/City Project amount
Government agency amount
Variance pre-reconciliation
Reconciled amount
Variance post-reconciliation
Bacnotan
San Fernando 938,675 - (938,675) 938,675 -
Pangasinan Sison 29,357,913 - (29,357,913) 10,919,447 (18,438,466)
Subtotal - Region I - Ilocos Region 59,152,854 - (59,152,854) 11,858,122 (47,294,731)
CAR - Cordillera Administrative Region
Benguet Baguio City 12,179 - (12,179) 37,345 -
Itogon 16,125,021 11,543,891 (4,581,130) 16,073,405 (1,377,795)
Mankayan 8,599,373 8,589,410 (9,962) 8,589,410 -
Tuba 11,304,189 12,217,444 913,255 11,242,969 496,880
Subtotal - CAR - Cordillera Administrative Region 36,040,761 32,350,745 (3,690,016) 35,943,130 (880,915)
Region II - Cagayan Valley Isabela Cauayan 10,000 - (10,000) 10,000 -
Nueva Vizcaya
Kasibu 144,807,814 110,800,253 (34,007,560) 144,807,820 27,390,286
Nagtipunan 59,000,000 - (59,000,000) 59,000,000 -
Quezon 77,467,641 32,064,995 (45,402,646) 77,464,872 -
Quirino 31,360,799 - (31,360,799) 31,360,799 -
Subtotal - Region II - Cagayan Valley 312,646,254 142,865,248 (169,781,005) 312,643,491 27,390,286
Region III - Central Luzon Bulacan Norzagaray 66,475,158 44,583,272 (21,891,885) 4,398,583 (17,493,303)
San Ildefonso 184,018,375 - (184,018,375) 184,018,374 -
Zambales Candelaria 3,129,318 2,823,022 (306,296) 3,054,096 (387,259)
Santa Cruz 1,267,561 1,644,873 377,312 1,432,373 212,500
Subtotal - Region III - Central Luzon 254,890,411 49,051,168 (205,839,244) 192,903,426 (17,668,062) NCR - National Capital Region
Metro Manila Makati City 47,945,619 - (47,945,619) 49,060,957 (563,012)
Mandaluyong 4,697,590 - (4,697,590) 4,697,590 -
Muntinlupa City 67,170 20,930 (46,240) 64,490 -
Pasay City 32,980 37,331 4,351 70,312 -
Pasig City 9,206,070 8,541,058 (665,012) 8,844,053 -
Quezon City 18,908 - (18,908) 18,908 -
Taguig City 34,181,782 240,000 (33,941,782) 23,154,363 (11,582,357)
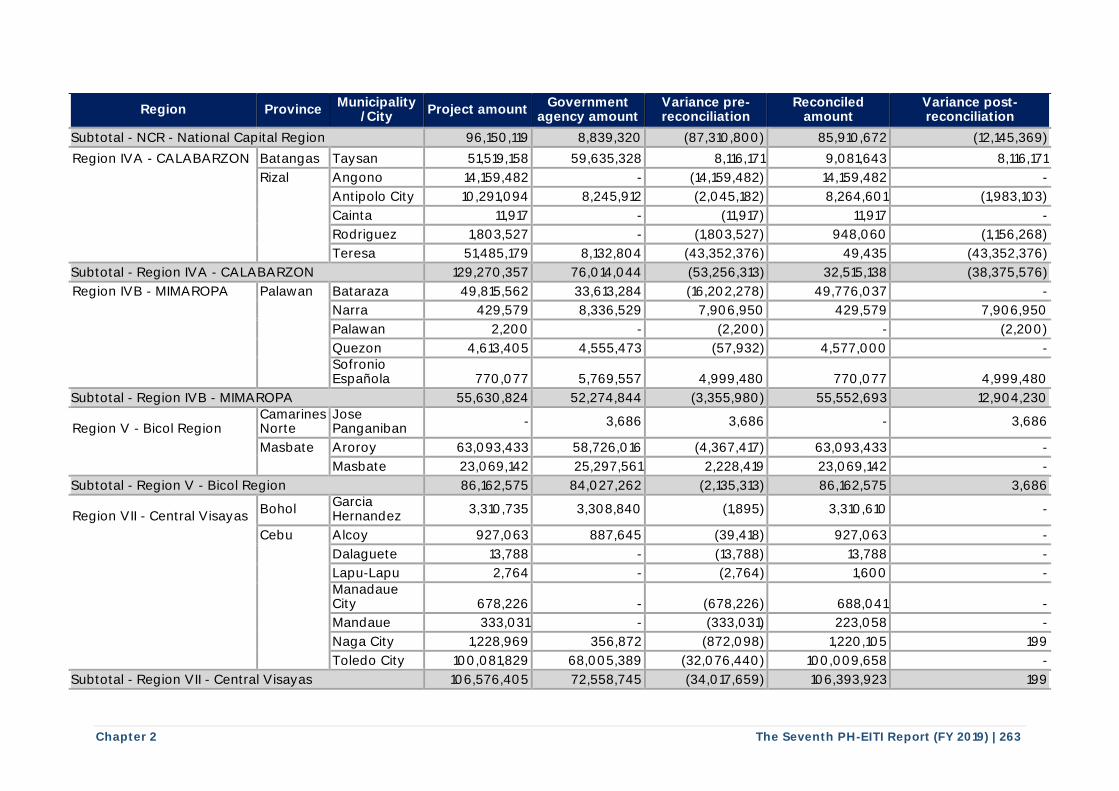
Chapter 2 The Seventh PH-EITI Report (FY 2019) | 263
Region Province Municipality
/City Project amount
Government agency amount
Variance pre-reconciliation
Reconciled amount
Variance post-reconciliation
Subtotal - NCR - National Capital Region 96,150,119 8,839,320 (87,310,800) 85,910,672 (12,145,369)
Region IVA - CALABARZON Batangas Taysan 51,519,158 59,635,328 8,116,171 9,081,643 8,116,171
Rizal Angono 14,159,482 - (14,159,482) 14,159,482 -
Antipolo City 10,291,094 8,245,912 (2,045,182) 8,264,601 (1,983,103)
Cainta 11,917 - (11,917) 11,917 -
Rodriguez 1,803,527 - (1,803,527) 948,060 (1,156,268)
Teresa 51,485,179 8,132,804 (43,352,376) 49,435 (43,352,376)
Subtotal - Region IVA - CALABARZON 129,270,357 76,014,044 (53,256,313) 32,515,138 (38,375,576)
Region IVB - MIMAROPA Palawan Bataraza 49,815,562 33,613,284 (16,202,278) 49,776,037 -
Narra 429,579 8,336,529 7,906,950 429,579 7,906,950
Palawan 2,200 - (2,200) - (2,200)
Quezon 4,613,405 4,555,473 (57,932) 4,577,000 -
Sofronio Española 770,077 5,769,557 4,999,480 770,077 4,999,480
Subtotal - Region IVB - MIMAROPA 55,630,824 52,274,844 (3,355,980) 55,552,693 12,904,230
Region V - Bicol Region Camarines Norte
Jose Panganiban
- 3,686 3,686 - 3,686
Masbate Aroroy 63,093,433 58,726,016 (4,367,417) 63,093,433 -
Masbate 23,069,142 25,297,561 2,228,419 23,069,142 -
Subtotal - Region V - Bicol Region 86,162,575 84,027,262 (2,135,313) 86,162,575 3,686
Region VII - Central Visayas Bohol
Garcia Hernandez
3,310,735 3,308,840 (1,895) 3,310,610 -
Cebu Alcoy 927,063 887,645 (39,418) 927,063 -
Dalaguete 13,788 - (13,788) 13,788 -
Lapu-Lapu 2,764 - (2,764) 1,600 -
Manadaue City 678,226 - (678,226) 688,041 -
Mandaue 333,031 - (333,031) 223,058 -
Naga City 1,228,969 356,872 (872,098) 1,220,105 199
Toledo City 100,081,829 68,005,389 (32,076,440) 100,009,658 -
Subtotal - Region VII - Central Visayas 106,576,405 72,558,745 (34,017,659) 106,393,923 199
I I
I I
I I
I I
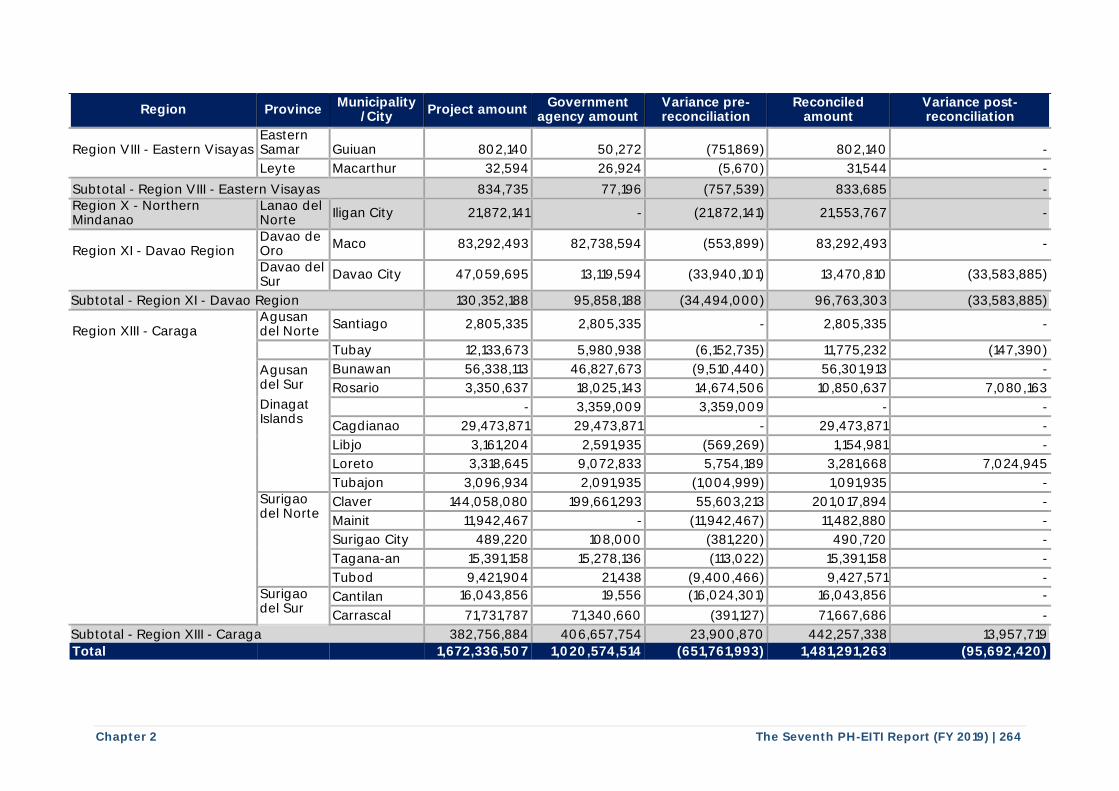
Chapter 2 The Seventh PH-EITI Report (FY 2019) | 264
Region Province Municipality
/City Project amount
Government agency amount
Variance pre-reconciliation
Reconciled amount
Variance post-reconciliation
Region VIII - Eastern Visayas Eastern Samar Guiuan 802,140 50,272 (751,869) 802,140 -
Leyte Macarthur 32,594 26,924 (5,670) 31,544 -
Subtotal - Region VIII - Eastern Visayas 834,735 77,196 (757,539) 833,685 - Region X - Northern Mindanao
Lanao del Norte
Iligan City 21,872,141 - (21,872,141) 21,553,767 -
Region XI - Davao Region Davao de Oro
Maco 83,292,493 82,738,594 (553,899) 83,292,493 -
Davao del Sur
Davao City 47,059,695 13,119,594 (33,940,101) 13,470,810 (33,583,885)
Subtotal - Region XI - Davao Region 130,352,188 95,858,188 (34,494,000) 96,763,303 (33,583,885)
Region XIII - Caraga Agusan del Norte
Santiago 2,805,335 2,805,335 - 2,805,335 -
Tubay 12,133,673 5,980,938 (6,152,735) 11,775,232 (147,390)
Agusan del Sur
Bunawan 56,338,113 46,827,673 (9,510,440) 56,301,913 -
Rosario 3,350,637 18,025,143 14,674,506 10,850,637 7,080,163
Dinagat Islands
- 3,359,009 3,359,009 - -
Cagdianao 29,473,871 29,473,871 - 29,473,871 -
Libjo 3,161,204 2,591,935 (569,269) 1,154,981 -
Loreto 3,318,645 9,072,833 5,754,189 3,281,668 7,024,945
Tubajon 3,096,934 2,091,935 (1,004,999) 1,091,935 -
Surigao del Norte
Claver 144,058,080 199,661,293 55,603,213 201,017,894 -
Mainit 11,942,467 - (11,942,467) 11,482,880 -
Surigao City 489,220 108,000 (381,220) 490,720 -
Tagana-an 15,391,158 15,278,136 (113,022) 15,391,158 -
Tubod 9,421,904 21,438 (9,400,466) 9,427,571 -
Surigao del Sur
Cantilan 16,043,856 19,556 (16,024,301) 16,043,856 -
Carrascal 71,731,787 71,340,660 (391,127) 71,667,686 -
Subtotal - Region XIII - Caraga 382,756,884 406,657,754 23,900,870 442,257,338 13,957,719
Total 1,672,336,507 1,020,574,514 (651,761,993) 1,481,291,263 (95,692,420)
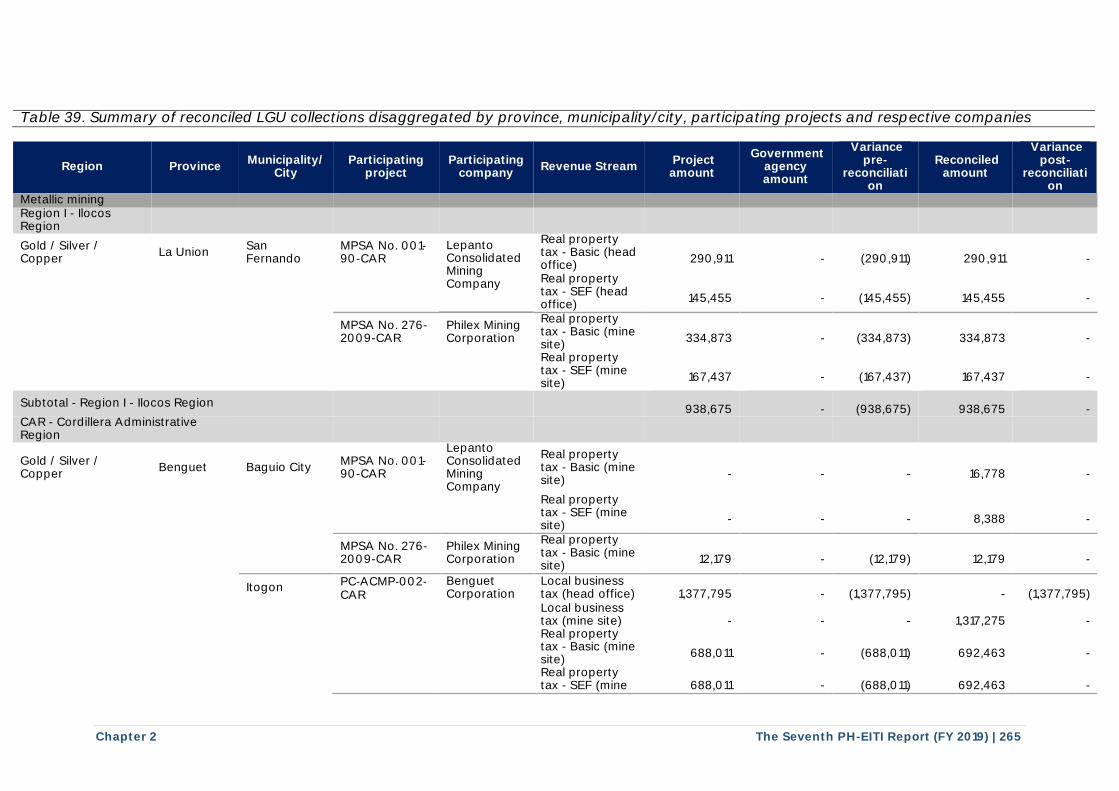
Chapter 2 The Seventh PH-EITI Report (FY 2019) | 265
Table 39. Summary of reconciled LGU collections disaggregated by province, municipality/city, participating projects and respective companies
Region Province Municipality/
City Participating
project Participating
company Revenue Stream
Project amount
Government agency amount
Variance pre-
reconciliation
Reconciled amount
Variance post-
reconciliation
Metallic mining Region I - Ilocos Region
Gold / Silver / Copper
La Union San Fernando
MPSA No. 001-90-CAR
Lepanto Consolidated Mining Company
Real property tax - Basic (head office)
290,911
-
(290,911)
290,911
-
Real property tax - SEF (head office)
145,455
-
(145,455)
145,455
-
MPSA No. 276-2009-CAR
Philex Mining Corporation
Real property tax - Basic (mine site)
334,873
-
(334,873)
334,873
-
Real property tax - SEF (mine site)
167,437
-
(167,437)
167,437
-
Subtotal - Region I - Ilocos Region
938,675
-
(938,675)
938,675
- CAR - Cordillera Administrative Region
Gold / Silver / Copper
Benguet Baguio City MPSA No. 001-90-CAR
Lepanto Consolidated Mining Company
Real property tax - Basic (mine site)
-
-
-
16,778
-
Real property tax - SEF (mine site)
-
-
-
8,388
-
MPSA No. 276-2009-CAR
Philex Mining Corporation
Real property tax - Basic (mine site)
12,179
-
(12,179)
12,179
-
Itogon PC‐ACMP‐002‐ CAR
Benguet Corporation
Local business tax (head office)
1,377,795
-
(1,377,795)
-
(1,377,795)
Local business tax (mine site)
-
-
-
1,317,275
-
Real property tax - Basic (mine site)
688,011
-
(688,011)
692,463
-
Real property tax - SEF (mine
688,011
-
(688,011)
692,463
-
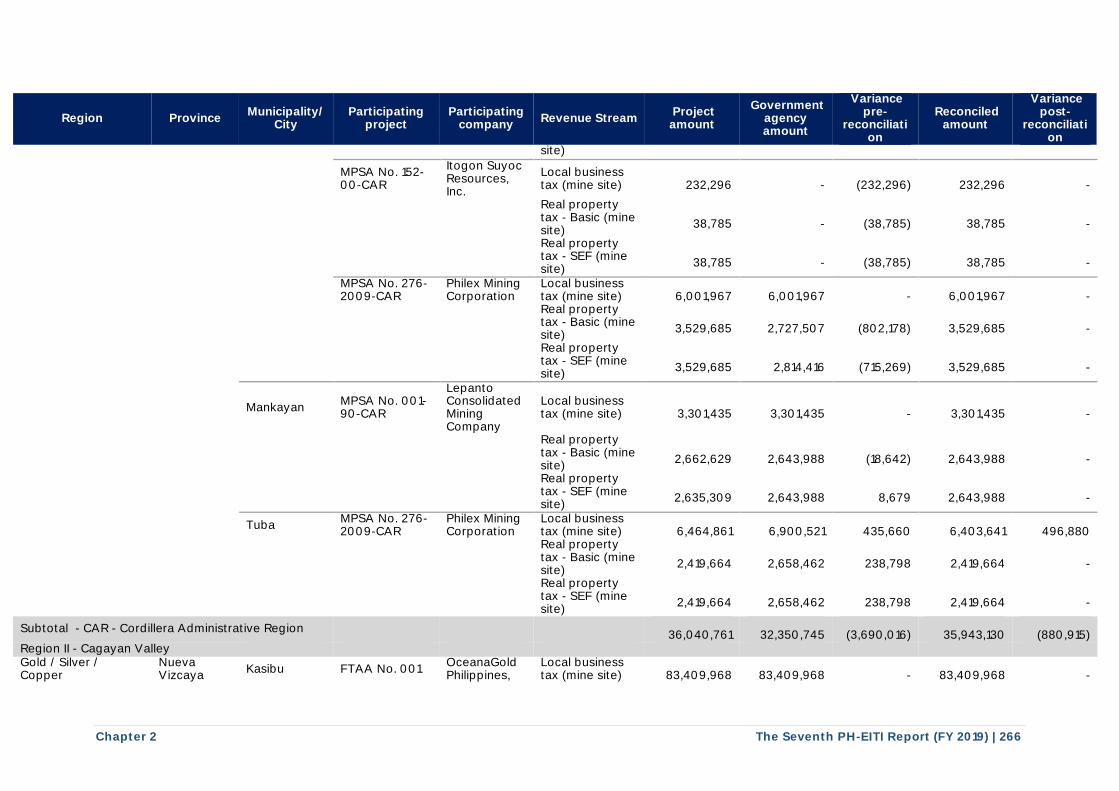
Chapter 2 The Seventh PH-EITI Report (FY 2019) | 266
Region Province Municipality/
City Participating
project Participating
company Revenue Stream
Project amount
Government agency amount
Variance pre-
reconciliation
Reconciled amount
Variance post-
reconciliation
site)
MPSA No. 152-00-CAR
Itogon Suyoc Resources, Inc.
Local business tax (mine site)
232,296
-
(232,296)
232,296
-
Real property tax - Basic (mine site)
38,785
-
(38,785)
38,785
-
Real property tax - SEF (mine site)
38,785
-
(38,785)
38,785
-
MPSA No. 276-2009-CAR
Philex Mining Corporation
Local business tax (mine site)
6,001,967
6,001,967
-
6,001,967
-
Real property tax - Basic (mine site)
3,529,685
2,727,507
(802,178)
3,529,685
-
Real property tax - SEF (mine site)
3,529,685
2,814,416
(715,269)
3,529,685
-
Mankayan MPSA No. 001-90-CAR
Lepanto Consolidated Mining Company
Local business tax (mine site)
3,301,435
3,301,435
-
3,301,435
-
Real property tax - Basic (mine site)
2,662,629
2,643,988
(18,642)
2,643,988
-
Real property tax - SEF (mine site)
2,635,309
2,643,988
8,679
2,643,988
-
Tuba MPSA No. 276-2009-CAR
Philex Mining Corporation
Local business tax (mine site)
6,464,861
6,900,521
435,660
6,403,641
496,880
Real property tax - Basic (mine site)
2,419,664
2,658,462
238,798
2,419,664
-
Real property tax - SEF (mine site)
2,419,664
2,658,462
238,798
2,419,664
-
Subtotal - CAR - Cordillera Administrative Region
36,040,761
32,350,745
(3,690,016)
35,943,130
(880,915) Region II - Cagayan Valley Gold / Silver / Copper
Nueva Vizcaya
Kasibu FTAA No. 001 OceanaGold Philippines,
Local business tax (mine site)
83,409,968
83,409,968
-
83,409,968
-
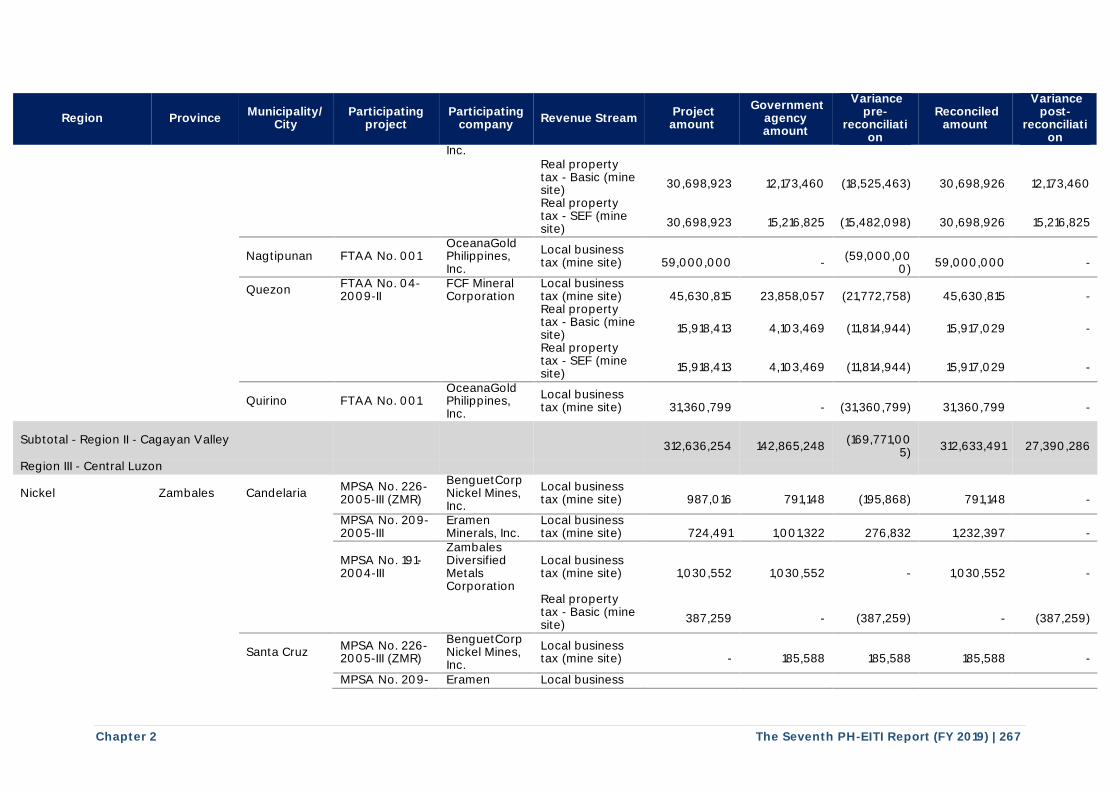
Chapter 2 The Seventh PH-EITI Report (FY 2019) | 267
Region Province Municipality/
City Participating
project Participating
company Revenue Stream
Project amount
Government agency amount
Variance pre-
reconciliation
Reconciled amount
Variance post-
reconciliation
Inc.
Real property tax - Basic (mine site)
30,698,923
12,173,460
(18,525,463)
30,698,926
12,173,460
Real property tax - SEF (mine site)
30,698,923
15,216,825
(15,482,098)
30,698,926
15,216,825
Nagtipunan FTAA No. 001 OceanaGold Philippines, Inc.
Local business tax (mine site)
59,000,000
-
(59,000,00
0)
59,000,000
-
Quezon FTAA No. 04-2009-II
FCF Mineral Corporation
Local business tax (mine site)
45,630,815
23,858,057
(21,772,758)
45,630,815
-
Real property tax - Basic (mine site)
15,918,413
4,103,469
(11,814,944)
15,917,029
-
Real property tax - SEF (mine site)
15,918,413
4,103,469
(11,814,944)
15,917,029
-
Quirino FTAA No. 001 OceanaGold Philippines, Inc.
Local business tax (mine site)
31,360,799
-
(31,360,799)
31,360,799
-
Subtotal - Region II - Cagayan Valley
312,636,254
142,865,248
(169,771,00
5)
312,633,491
27,390,286
Region III - Central Luzon
Nickel Zambales Candelaria MPSA No. 226-2005-III (ZMR)
BenguetCorp Nickel Mines, Inc.
Local business tax (mine site)
987,016
791,148
(195,868)
791,148
-
MPSA No. 209-2005-III
Eramen Minerals, Inc.
Local business tax (mine site)
724,491
1,001,322
276,832
1,232,397
-
MPSA No. 191-2004-III
Zambales Diversified Metals Corporation
Local business tax (mine site)
1,030,552
1,030,552
-
1,030,552
-
Real property tax - Basic (mine site)
387,259
-
(387,259)
-
(387,259)
Santa Cruz MPSA No. 226-2005-III (ZMR)
BenguetCorp Nickel Mines, Inc.
Local business tax (mine site)
-
185,588
185,588
185,588
-
MPSA No. 209- Eramen Local business
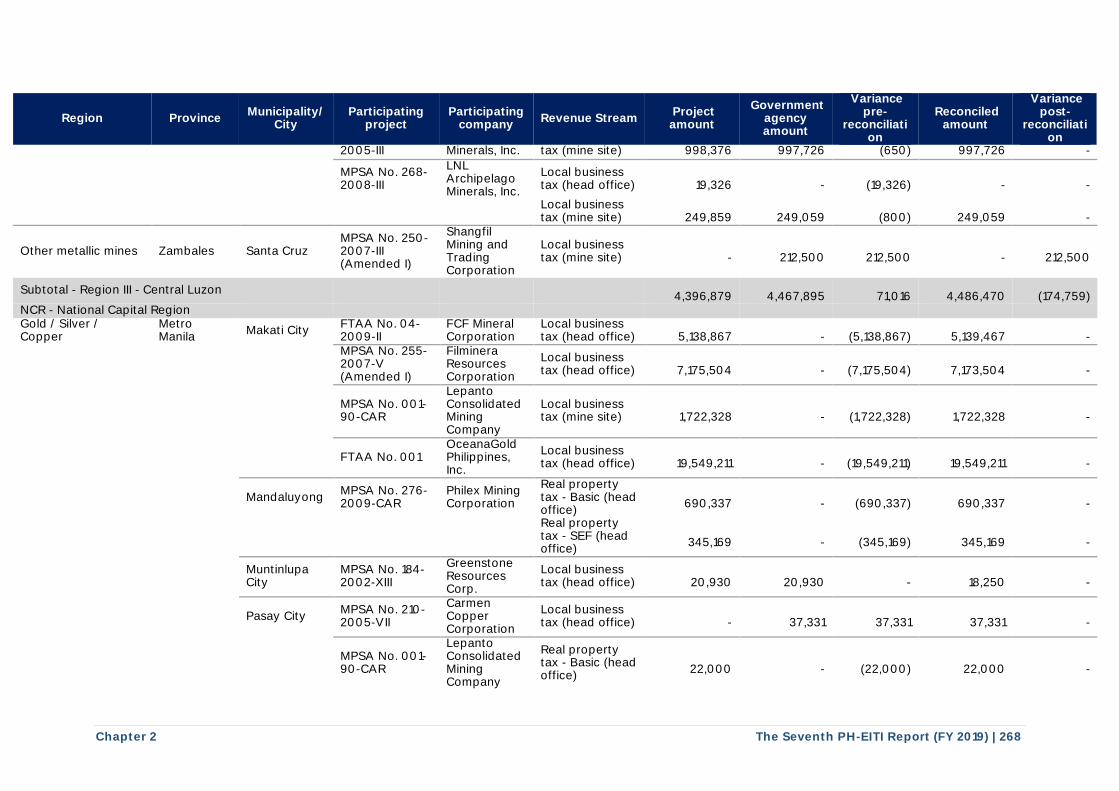
Chapter 2 The Seventh PH-EITI Report (FY 2019) | 268
Region Province Municipality/
City Participating
project Participating
company Revenue Stream
Project amount
Government agency amount
Variance pre-
reconciliation
Reconciled amount
Variance post-
reconciliation
2005-III Minerals, Inc. tax (mine site) 998,376 997,726 (650) 997,726 -
MPSA No. 268-2008-III
LNL Archipelago Minerals, Inc.
Local business tax (head office)
19,326
-
(19,326)
-
-
Local business tax (mine site)
249,859
249,059
(800)
249,059
-
Other metallic mines Zambales Santa Cruz MPSA No. 250-2007-III (Amended I)
Shangfil Mining and Trading Corporation
Local business tax (mine site)
-
212,500
212,500
-
212,500
Subtotal - Region III - Central Luzon
4,396,879
4,467,895
71,016
4,486,470
(174,759) NCR - National Capital Region Gold / Silver / Copper
Metro Manila
Makati City FTAA No. 04-2009-II
FCF Mineral Corporation
Local business tax (head office)
5,138,867
-
(5,138,867)
5,139,467
-
MPSA No. 255-2007-V (Amended I)
Filminera Resources Corporation
Local business tax (head office)
7,175,504
-
(7,175,504)
7,173,504
-
MPSA No. 001-90-CAR
Lepanto Consolidated Mining Company
Local business tax (mine site)
1,722,328
-
(1,722,328)
1,722,328
-
FTAA No. 001 OceanaGold Philippines, Inc.
Local business tax (head office)
19,549,211
-
(19,549,211)
19,549,211
-
Mandaluyong MPSA No. 276-2009-CAR
Philex Mining Corporation
Real property tax - Basic (head office)
690,337
-
(690,337)
690,337
-
Real property tax - SEF (head office)
345,169
-
(345,169)
345,169
-
Muntinlupa City
MPSA No. 184-2002-XIII
Greenstone Resources Corp.
Local business tax (head office)
20,930
20,930
-
18,250
-
Pasay City MPSA No. 210-2005-VII
Carmen Copper Corporation
Local business tax (head office)
-
37,331
37,331
37,331
-
MPSA No. 001-90-CAR
Lepanto Consolidated Mining Company
Real property tax - Basic (head office)
22,000
-
(22,000)
22,000
-
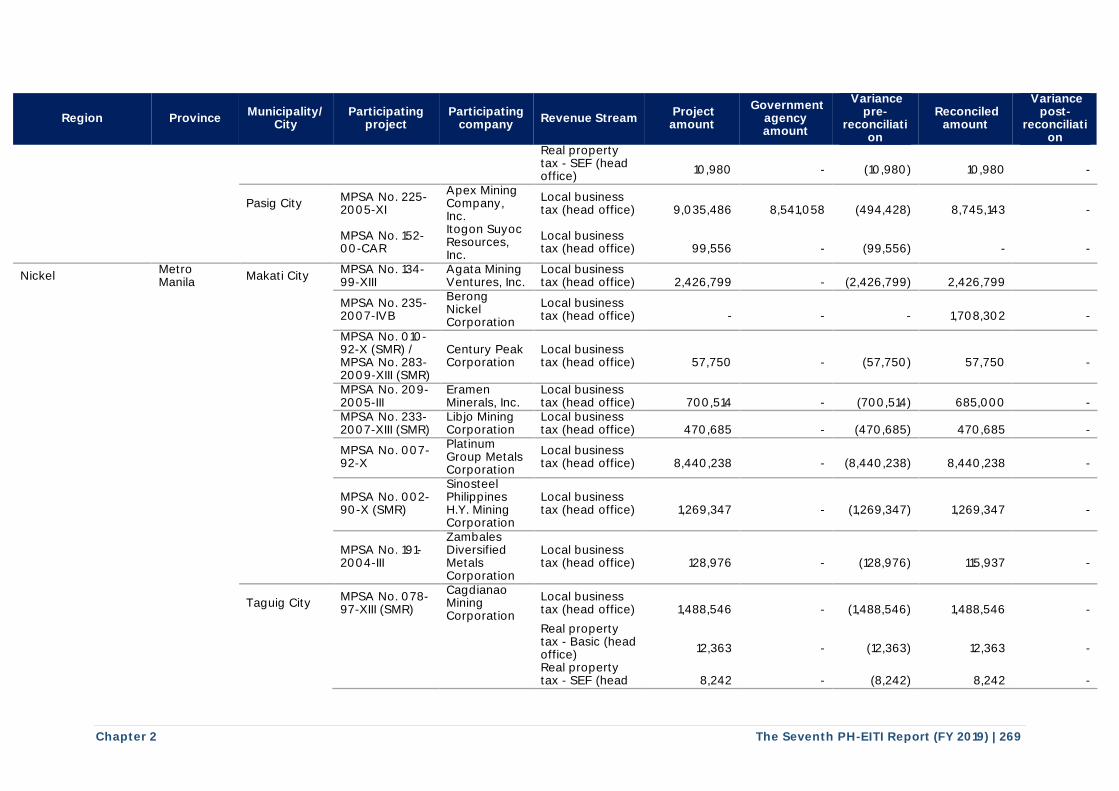
Chapter 2 The Seventh PH-EITI Report (FY 2019) | 269
Region Province Municipality/
City Participating
project Participating
company Revenue Stream
Project amount
Government agency amount
Variance pre-
reconciliation
Reconciled amount
Variance post-
reconciliation
Real property tax - SEF (head office)
10,980
-
(10,980)
10,980
-
Pasig City MPSA No. 225-2005-XI
Apex Mining Company, Inc.
Local business tax (head office)
9,035,486
8,541,058
(494,428)
8,745,143
-
MPSA No. 152-00-CAR
Itogon Suyoc Resources, Inc.
Local business tax (head office)
99,556
-
(99,556)
-
-
Nickel Metro Manila
Makati City MPSA No. 134-99-XIII
Agata Mining Ventures, Inc.
Local business tax (head office)
2,426,799
-
(2,426,799)
2,426,799
MPSA No. 235-2007-IVB
Berong Nickel Corporation
Local business tax (head office)
-
-
-
1,708,302
-
MPSA No. 010-92-X (SMR) / MPSA No. 283-2009-XIII (SMR)
Century Peak Corporation
Local business tax (head office)
57,750
-
(57,750)
57,750
-
MPSA No. 209-2005-III
Eramen Minerals, Inc.
Local business tax (head office)
700,514
-
(700,514)
685,000
-
MPSA No. 233-2007-XIII (SMR)
Libjo Mining Corporation
Local business tax (head office)
470,685
-
(470,685)
470,685
-
MPSA No. 007-92-X
Platinum Group Metals Corporation
Local business tax (head office)
8,440,238
-
(8,440,238)
8,440,238
-
MPSA No. 002-90-X (SMR)
Sinosteel Philippines H.Y. Mining Corporation
Local business tax (head office)
1,269,347
-
(1,269,347)
1,269,347
-
MPSA No. 191-2004-III
Zambales Diversified Metals Corporation
Local business tax (head office)
128,976
-
(128,976)
115,937
-
Taguig City MPSA No. 078-97-XIII (SMR)
Cagdianao Mining Corporation
Local business tax (head office)
1,488,546
-
(1,488,546)
1,488,546
-
Real property tax - Basic (head office)
12,363
-
(12,363)
12,363
-
Real property tax - SEF (head
8,242
-
(8,242)
8,242
-
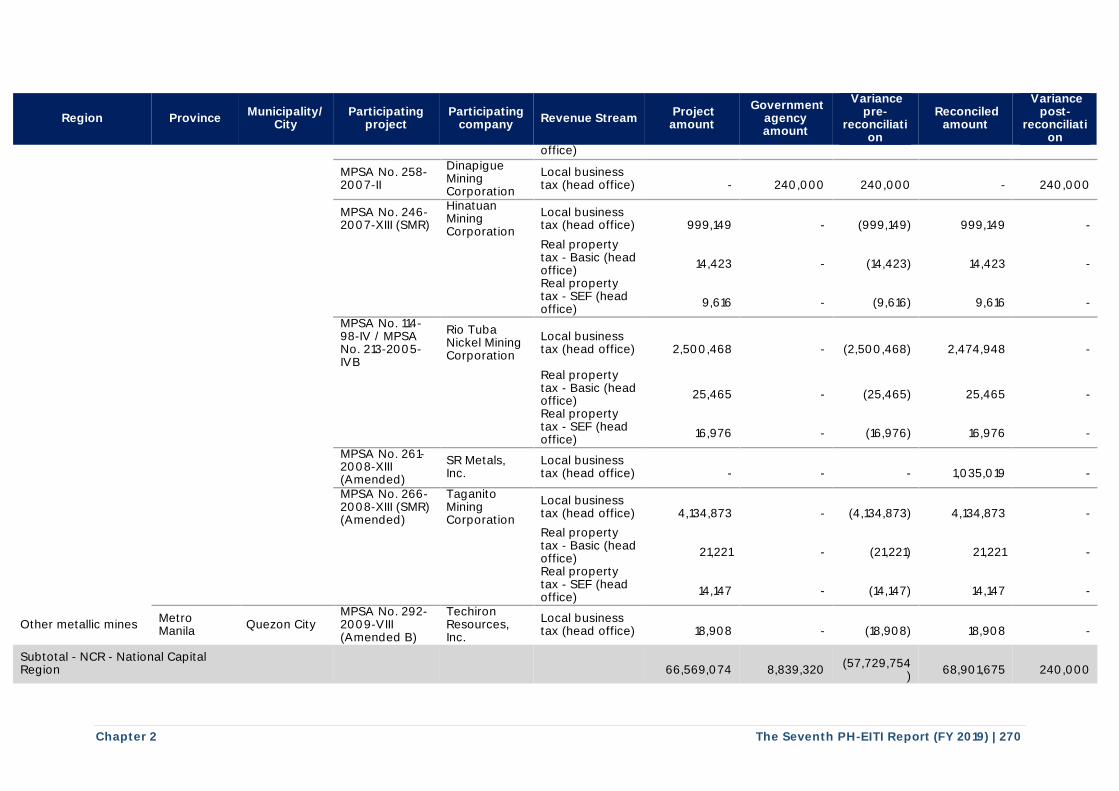
Chapter 2 The Seventh PH-EITI Report (FY 2019) | 270
Region Province Municipality/
City Participating
project Participating
company Revenue Stream
Project amount
Government agency amount
Variance pre-
reconciliation
Reconciled amount
Variance post-
reconciliation
office)
MPSA No. 258-2007-II
Dinapigue Mining Corporation
Local business tax (head office)
-
240,000
240,000
-
240,000
MPSA No. 246-2007-XIII (SMR)
Hinatuan Mining Corporation
Local business tax (head office)
999,149
-
(999,149)
999,149
-
Real property tax - Basic (head office)
14,423
-
(14,423)
14,423
-
Real property tax - SEF (head office)
9,616
-
(9,616)
9,616
-
MPSA No. 114-98-IV / MPSA No. 213-2005-IVB
Rio Tuba Nickel Mining Corporation
Local business tax (head office)
2,500,468
-
(2,500,468)
2,474,948
-
Real property tax - Basic (head office)
25,465
-
(25,465)
25,465
-
Real property tax - SEF (head office)
16,976
-
(16,976)
16,976
-
MPSA No. 261-2008-XIII (Amended)
SR Metals, Inc.
Local business tax (head office)
-
-
-
1,035,019
-
MPSA No. 266-2008-XIII (SMR) (Amended)
Taganito Mining Corporation
Local business tax (head office)
4,134,873
-
(4,134,873)
4,134,873
-
Real property tax - Basic (head office)
21,221
-
(21,221)
21,221
-
Real property tax - SEF (head office)
14,147
-
(14,147)
14,147
-
Other metallic mines Metro Manila
Quezon City MPSA No. 292-2009-VIII (Amended B)
Techiron Resources, Inc.
Local business tax (head office)
18,908
-
(18,908)
18,908
-
Subtotal - NCR - National Capital Region
66,569,074
8,839,320
(57,729,754
)
68,901,675
240,000
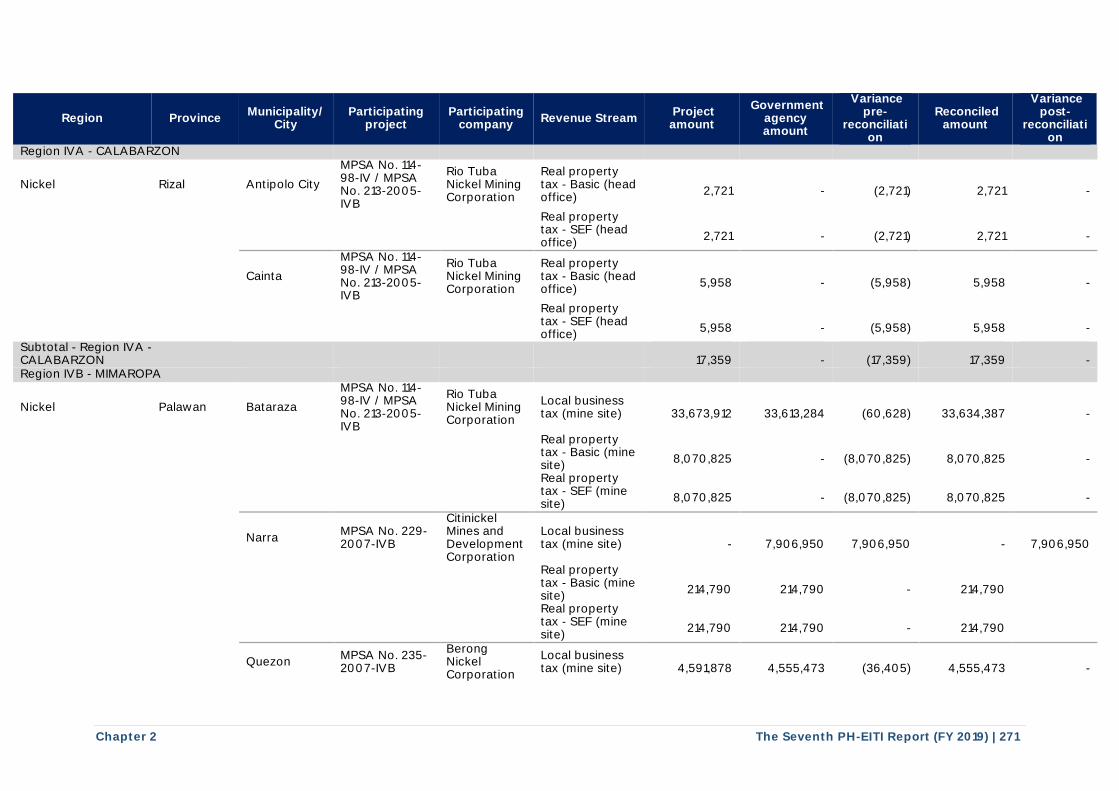
Chapter 2 The Seventh PH-EITI Report (FY 2019) | 271
Region Province Municipality/
City Participating
project Participating
company Revenue Stream
Project amount
Government agency amount
Variance pre-
reconciliation
Reconciled amount
Variance post-
reconciliation
Region IVA - CALABARZON
Nickel Rizal Antipolo City
MPSA No. 114-98-IV / MPSA No. 213-2005-IVB
Rio Tuba Nickel Mining Corporation
Real property tax - Basic (head office)
2,721
-
(2,721)
2,721
-
Real property tax - SEF (head office)
2,721
-
(2,721)
2,721
-
Cainta
MPSA No. 114-98-IV / MPSA No. 213-2005-IVB
Rio Tuba Nickel Mining Corporation
Real property tax - Basic (head office)
5,958
-
(5,958)
5,958
-
Real property tax - SEF (head office)
5,958
-
(5,958)
5,958
-
Subtotal - Region IVA - CALABARZON
17,359
-
(17,359)
17,359
- Region IVB - MIMAROPA
Nickel Palawan Bataraza
MPSA No. 114-98-IV / MPSA No. 213-2005-IVB
Rio Tuba Nickel Mining Corporation
Local business tax (mine site)
33,673,912
33,613,284
(60,628)
33,634,387
-
Real property tax - Basic (mine site)
8,070,825
-
(8,070,825)
8,070,825
-
Real property tax - SEF (mine site)
8,070,825
-
(8,070,825)
8,070,825
-
Narra MPSA No. 229-2007-IVB
Citinickel Mines and Development Corporation
Local business tax (mine site)
-
7,906,950
7,906,950
-
7,906,950
Real property tax - Basic (mine site)
214,790
214,790
-
214,790
Real property tax - SEF (mine site)
214,790
214,790
-
214,790
Quezon MPSA No. 235-2007-IVB
Berong Nickel Corporation
Local business tax (mine site)
4,591,878
4,555,473
(36,405)
4,555,473
-
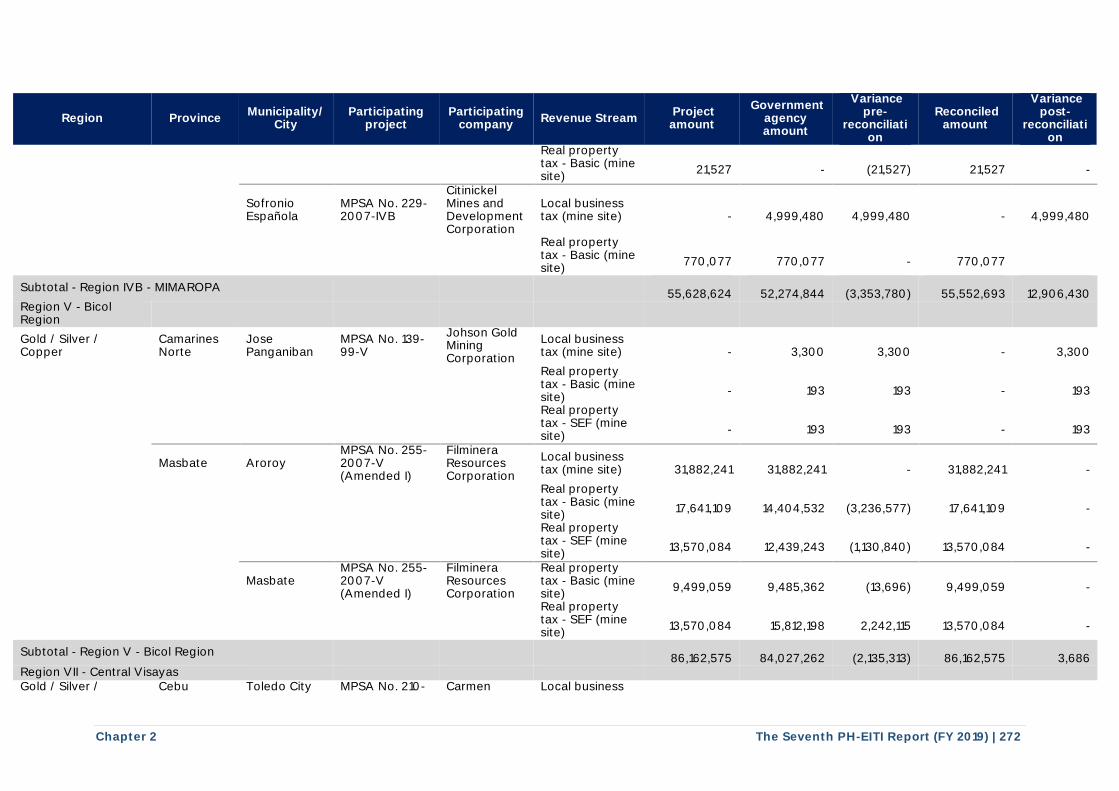
Chapter 2 The Seventh PH-EITI Report (FY 2019) | 272
Region Province Municipality/
City Participating
project Participating
company Revenue Stream
Project amount
Government agency amount
Variance pre-
reconciliation
Reconciled amount
Variance post-
reconciliation
Real property tax - Basic (mine site)
21,527
-
(21,527)
21,527
-
Sofronio Española
MPSA No. 229-2007-IVB
Citinickel Mines and Development Corporation
Local business tax (mine site)
-
4,999,480
4,999,480
-
4,999,480
Real property tax - Basic (mine site)
770,077
770,077
-
770,077
Subtotal - Region IVB - MIMAROPA
55,628,624
52,274,844
(3,353,780)
55,552,693
12,906,430 Region V - Bicol Region
Gold / Silver / Copper
Camarines Norte
Jose Panganiban
MPSA No. 139-99-V
Johson Gold Mining Corporation
Local business tax (mine site)
-
3,300
3,300
-
3,300
Real property tax - Basic (mine site)
-
193
193
-
193
Real property tax - SEF (mine site)
-
193
193
-
193
Masbate Aroroy MPSA No. 255-2007-V (Amended I)
Filminera Resources Corporation
Local business tax (mine site)
31,882,241
31,882,241
-
31,882,241
-
Real property tax - Basic (mine site)
17,641,109
14,404,532
(3,236,577)
17,641,109
-
Real property tax - SEF (mine site)
13,570,084
12,439,243
(1,130,840)
13,570,084
-
Masbate MPSA No. 255-2007-V (Amended I)
Filminera Resources Corporation
Real property tax - Basic (mine site)
9,499,059
9,485,362
(13,696)
9,499,059
-
Real property tax - SEF (mine site)
13,570,084
15,812,198
2,242,115
13,570,084
-
Subtotal - Region V - Bicol Region
86,162,575
84,027,262
(2,135,313)
86,162,575
3,686 Region VII - Central Visayas Gold / Silver / Cebu Toledo City MPSA No. 210- Carmen Local business
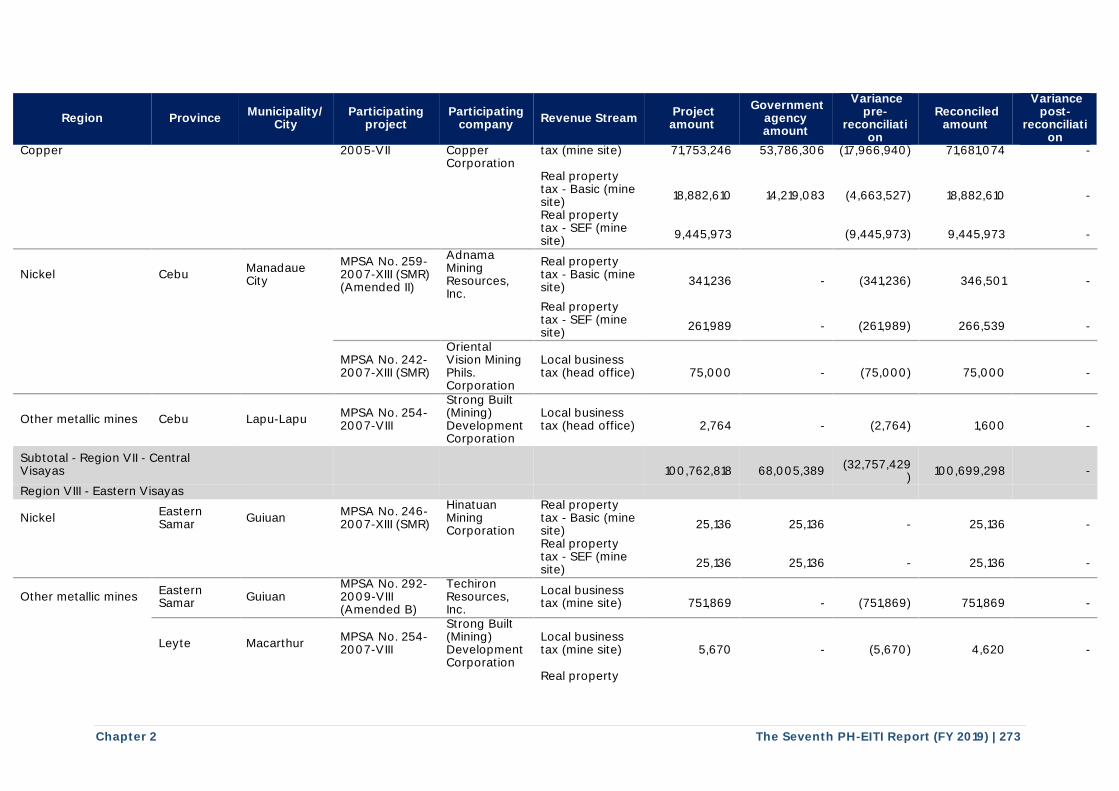
Chapter 2 The Seventh PH-EITI Report (FY 2019) | 273
Region Province Municipality/
City Participating
project Participating
company Revenue Stream
Project amount
Government agency amount
Variance pre-
reconciliation
Reconciled amount
Variance post-
reconciliation
Copper 2005-VII Copper Corporation
tax (mine site) 71,753,246 53,786,306 (17,966,940) 71,681,074 -
Real property tax - Basic (mine site)
18,882,610
14,219,083
(4,663,527)
18,882,610
-
Real property tax - SEF (mine site)
9,445,973
(9,445,973)
9,445,973
-
Nickel Cebu Manadaue City
MPSA No. 259-2007-XIII (SMR) (Amended II)
Adnama Mining Resources, Inc.
Real property tax - Basic (mine site)
341,236
-
(341,236)
346,501
-
Real property tax - SEF (mine site)
261,989
-
(261,989)
266,539
-
MPSA No. 242-2007-XIII (SMR)
Oriental Vision Mining Phils. Corporation
Local business tax (head office)
75,000
-
(75,000)
75,000
-
Other metallic mines Cebu Lapu-Lapu MPSA No. 254-2007-VIII
Strong Built (Mining) Development Corporation
Local business tax (head office)
2,764
-
(2,764)
1,600
-
Subtotal - Region VII - Central Visayas
100,762,818
68,005,389
(32,757,429
)
100,699,298
-
Region VIII - Eastern Visayas
Nickel Eastern Samar
Guiuan MPSA No. 246-2007-XIII (SMR)
Hinatuan Mining Corporation
Real property tax - Basic (mine site)
25,136
25,136
-
25,136
-
Real property tax - SEF (mine site)
25,136
25,136
-
25,136
-
Other metallic mines Eastern Samar
Guiuan MPSA No. 292-2009-VIII (Amended B)
Techiron Resources, Inc.
Local business tax (mine site)
751,869
-
(751,869)
751,869
-
Leyte Macarthur MPSA No. 254-2007-VIII
Strong Built (Mining) Development Corporation
Local business tax (mine site)
5,670
-
(5,670)
4,620
-
Real property
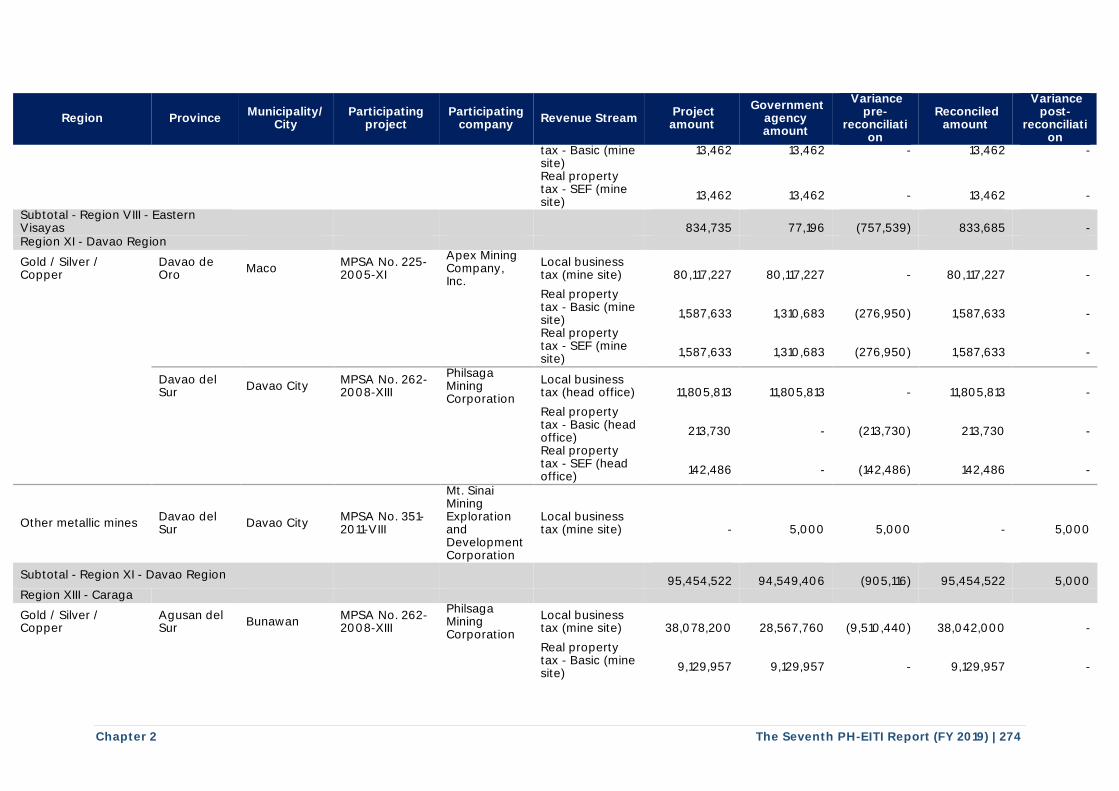
Chapter 2 The Seventh PH-EITI Report (FY 2019) | 274
Region Province Municipality/
City Participating
project Participating
company Revenue Stream
Project amount
Government agency amount
Variance pre-
reconciliation
Reconciled amount
Variance post-
reconciliation
tax - Basic (mine site)
13,462 13,462 - 13,462 -
Real property tax - SEF (mine site)
13,462
13,462
-
13,462
-
Subtotal - Region VIII - Eastern Visayas
834,735
77,196
(757,539)
833,685
- Region XI - Davao Region
Gold / Silver / Copper
Davao de Oro
Maco MPSA No. 225-2005-XI
Apex Mining Company, Inc.
Local business tax (mine site)
80,117,227
80,117,227
-
80,117,227
-
Real property tax - Basic (mine site)
1,587,633
1,310,683
(276,950)
1,587,633
-
Real property tax - SEF (mine site)
1,587,633
1,310,683
(276,950)
1,587,633
-
Davao del Sur
Davao City MPSA No. 262-2008-XIII
Philsaga Mining Corporation
Local business tax (head office)
11,805,813
11,805,813
-
11,805,813
-
Real property tax - Basic (head office)
213,730
-
(213,730)
213,730
-
Real property tax - SEF (head office)
142,486
-
(142,486)
142,486
-
Other metallic mines Davao del Sur
Davao City MPSA No. 351-2011-VIII
Mt. Sinai Mining Exploration and Development Corporation
Local business tax (mine site)
-
5,000
5,000
-
5,000
Subtotal - Region XI - Davao Region
95,454,522
94,549,406
(905,116)
95,454,522
5,000 Region XIII - Caraga
Gold / Silver / Copper
Agusan del Sur
Bunawan MPSA No. 262-2008-XIII
Philsaga Mining Corporation
Local business tax (mine site)
38,078,200
28,567,760
(9,510,440)
38,042,000
-
Real property tax - Basic (mine site)
9,129,957
9,129,957
-
9,129,957
-
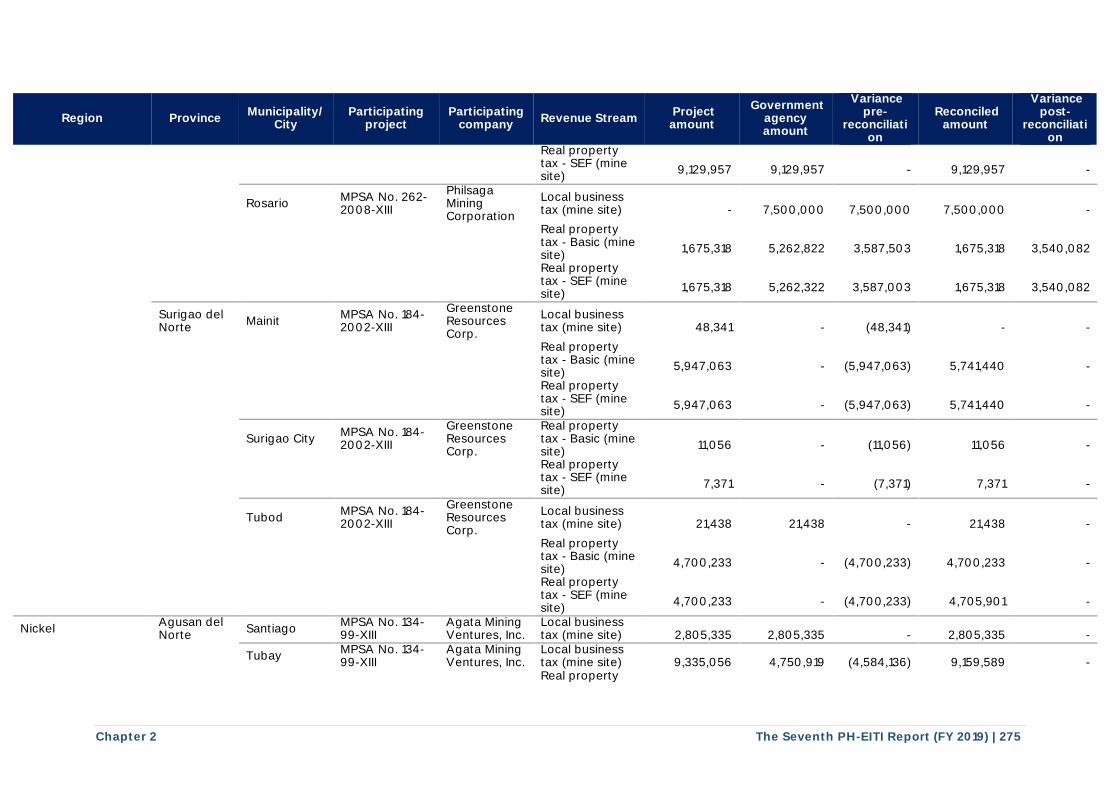
Chapter 2 The Seventh PH-EITI Report (FY 2019) | 275
Region Province Municipality/
City Participating
project Participating
company Revenue Stream
Project amount
Government agency amount
Variance pre-
reconciliation
Reconciled amount
Variance post-
reconciliation
Real property tax - SEF (mine site)
9,129,957
9,129,957
-
9,129,957
-
Rosario MPSA No. 262-2008-XIII
Philsaga Mining Corporation
Local business tax (mine site)
-
7,500,000
7,500,000
7,500,000
-
Real property tax - Basic (mine site)
1,675,318
5,262,822
3,587,503
1,675,318
3,540,082
Real property tax - SEF (mine site)
1,675,318
5,262,322
3,587,003
1,675,318
3,540,082
Surigao del Norte
Mainit MPSA No. 184-2002-XIII
Greenstone Resources Corp.
Local business tax (mine site)
48,341
-
(48,341)
-
-
Real property tax - Basic (mine site)
5,947,063
-
(5,947,063)
5,741,440
-
Real property tax - SEF (mine site)
5,947,063
-
(5,947,063)
5,741,440
-
Surigao City MPSA No. 184-2002-XIII
Greenstone Resources Corp.
Real property tax - Basic (mine site)
11,056
-
(11,056)
11,056
-
Real property tax - SEF (mine site)
7,371
-
(7,371)
7,371
-
Tubod MPSA No. 184-2002-XIII
Greenstone Resources Corp.
Local business tax (mine site)
21,438
21,438
-
21,438
-
Real property tax - Basic (mine site)
4,700,233
-
(4,700,233)
4,700,233
-
Real property tax - SEF (mine site)
4,700,233
-
(4,700,233)
4,705,901
-
Nickel Agusan del Norte
Santiago MPSA No. 134-99-XIII
Agata Mining Ventures, Inc.
Local business tax (mine site)
2,805,335
2,805,335
-
2,805,335
-
Tubay MPSA No. 134-99-XIII
Agata Mining Ventures, Inc.
Local business tax (mine site)
9,335,056
4,750,919
(4,584,136)
9,159,589
-
Real property
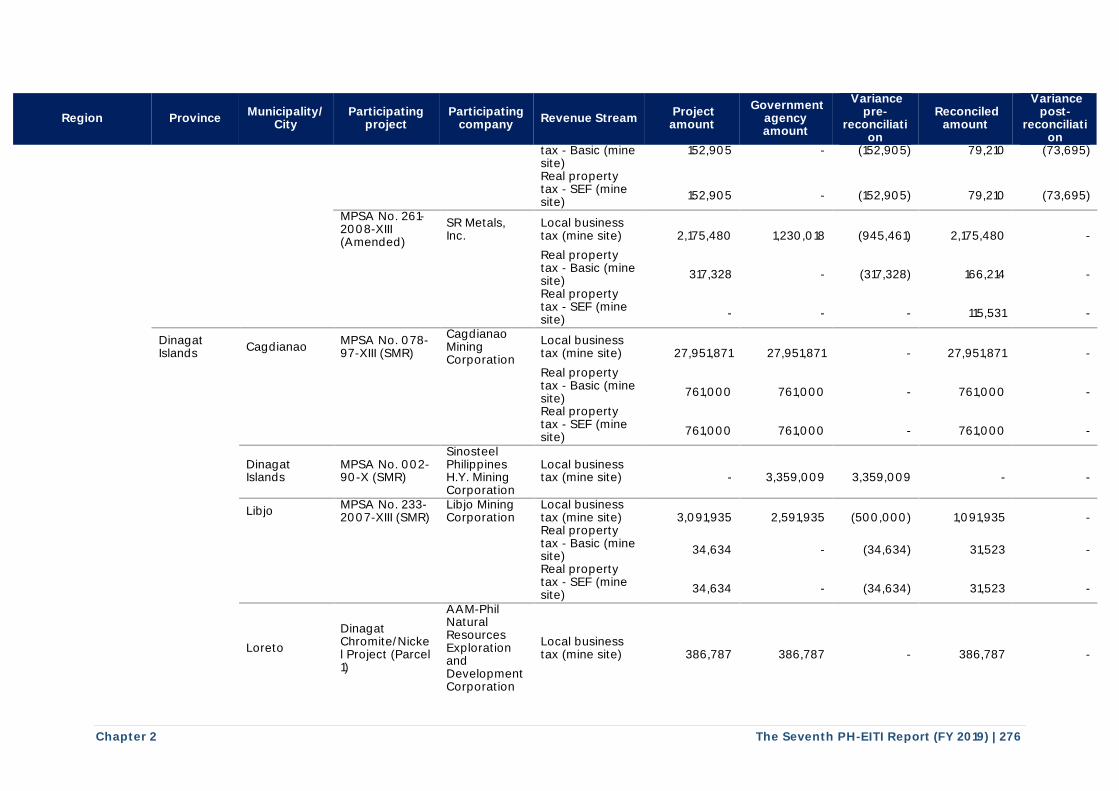
Chapter 2 The Seventh PH-EITI Report (FY 2019) | 276
Region Province Municipality/
City Participating
project Participating
company Revenue Stream
Project amount
Government agency amount
Variance pre-
reconciliation
Reconciled amount
Variance post-
reconciliation
tax - Basic (mine site)
152,905 - (152,905) 79,210 (73,695)
Real property tax - SEF (mine site)
152,905
-
(152,905)
79,210
(73,695)
MPSA No. 261-2008-XIII (Amended)
SR Metals, Inc.
Local business tax (mine site)
2,175,480
1,230,018
(945,461)
2,175,480
-
Real property tax - Basic (mine site)
317,328
-
(317,328)
166,214
-
Real property tax - SEF (mine site)
-
-
-
115,531
-
Dinagat Islands
Cagdianao MPSA No. 078-97-XIII (SMR)
Cagdianao Mining Corporation
Local business tax (mine site)
27,951,871
27,951,871
-
27,951,871
-
Real property tax - Basic (mine site)
761,000
761,000
-
761,000
-
Real property tax - SEF (mine site)
761,000
761,000
-
761,000
-
Dinagat Islands
MPSA No. 002-90-X (SMR)
Sinosteel Philippines H.Y. Mining Corporation
Local business tax (mine site)
-
3,359,009
3,359,009
-
-
Libjo MPSA No. 233-2007-XIII (SMR)
Libjo Mining Corporation
Local business tax (mine site)
3,091,935
2,591,935
(500,000)
1,091,935
-
Real property tax - Basic (mine site)
34,634
-
(34,634)
31,523
-
Real property tax - SEF (mine site)
34,634
-
(34,634)
31,523
-
Loreto
Dinagat Chromite/Nickel Project (Parcel 1)
AAM-Phil Natural Resources Exploration and Development Corporation
Local business tax (mine site)
386,787
386,787
-
386,787
-
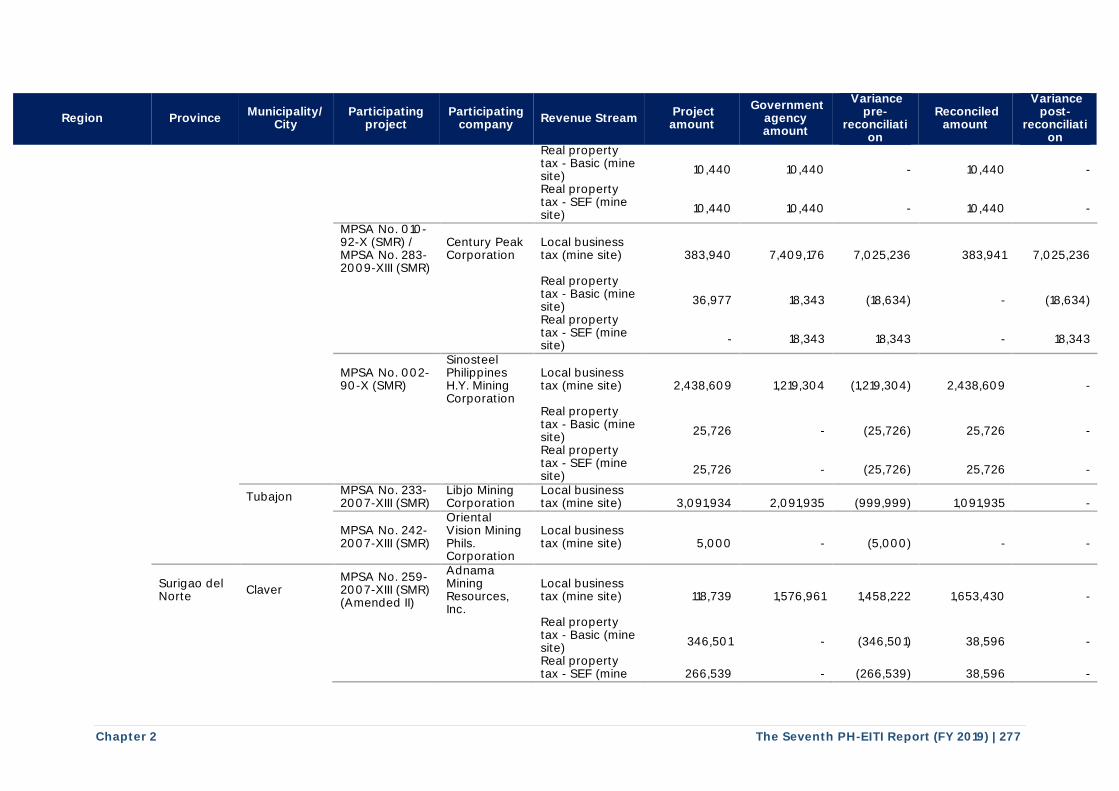
Chapter 2 The Seventh PH-EITI Report (FY 2019) | 277
Region Province Municipality/
City Participating
project Participating
company Revenue Stream
Project amount
Government agency amount
Variance pre-
reconciliation
Reconciled amount
Variance post-
reconciliation
Real property tax - Basic (mine site)
10,440
10,440
-
10,440
-
Real property tax - SEF (mine site)
10,440
10,440
-
10,440
-
MPSA No. 010-92-X (SMR) / MPSA No. 283-2009-XIII (SMR)
Century Peak Corporation
Local business tax (mine site)
383,940
7,409,176
7,025,236
383,941
7,025,236
Real property tax - Basic (mine site)
36,977
18,343
(18,634)
-
(18,634)
Real property tax - SEF (mine site)
-
18,343
18,343
-
18,343
MPSA No. 002-90-X (SMR)
Sinosteel Philippines H.Y. Mining Corporation
Local business tax (mine site)
2,438,609
1,219,304
(1,219,304)
2,438,609
-
Real property tax - Basic (mine site)
25,726
-
(25,726)
25,726
-
Real property tax - SEF (mine site)
25,726
-
(25,726)
25,726
-
Tubajon MPSA No. 233-2007-XIII (SMR)
Libjo Mining Corporation
Local business tax (mine site)
3,091,934
2,091,935
(999,999)
1,091,935
-
MPSA No. 242-2007-XIII (SMR)
Oriental Vision Mining Phils. Corporation
Local business tax (mine site)
5,000
-
(5,000)
-
-
Surigao del Norte
Claver MPSA No. 259-2007-XIII (SMR) (Amended II)
Adnama Mining Resources, Inc.
Local business tax (mine site)
118,739
1,576,961
1,458,222
1,653,430
-
Real property tax - Basic (mine site)
346,501
-
(346,501)
38,596
-
Real property tax - SEF (mine
266,539
-
(266,539)
38,596
-
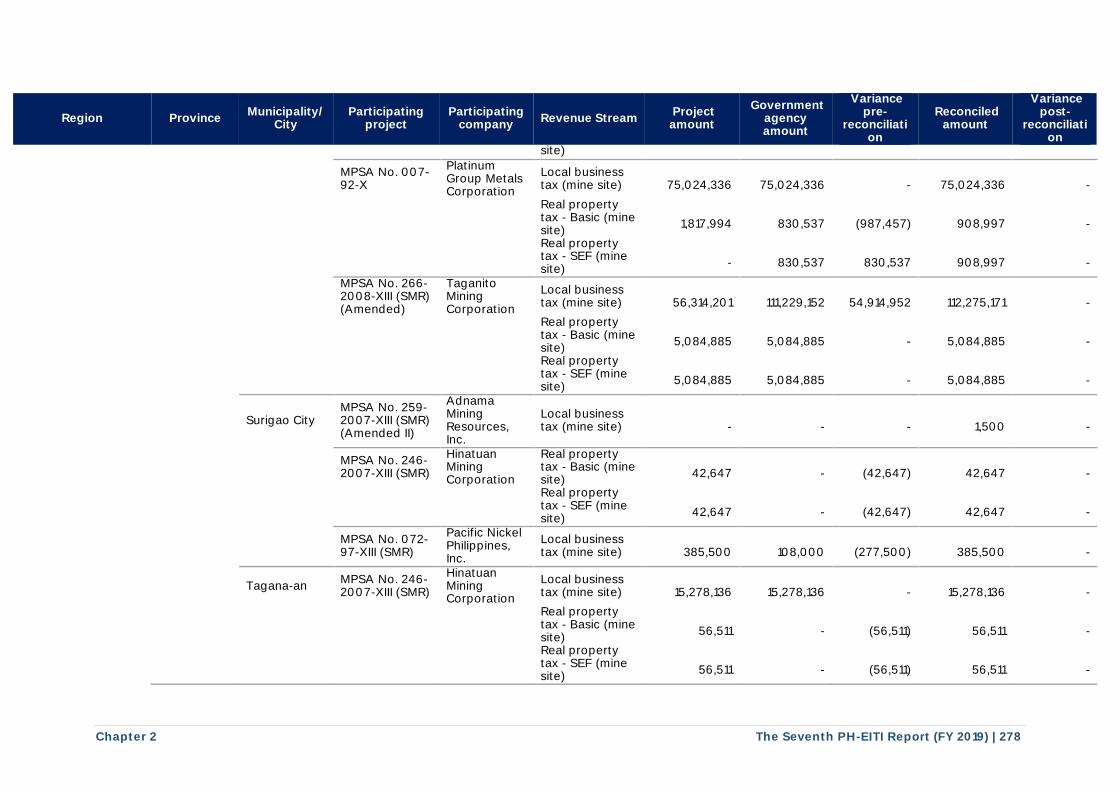
Chapter 2 The Seventh PH-EITI Report (FY 2019) | 278
Region Province Municipality/
City Participating
project Participating
company Revenue Stream
Project amount
Government agency amount
Variance pre-
reconciliation
Reconciled amount
Variance post-
reconciliation
site)
MPSA No. 007-92-X
Platinum Group Metals Corporation
Local business tax (mine site)
75,024,336
75,024,336
-
75,024,336
-
Real property tax - Basic (mine site)
1,817,994
830,537
(987,457)
908,997
-
Real property tax - SEF (mine site)
-
830,537
830,537
908,997
-
MPSA No. 266-2008-XIII (SMR) (Amended)
Taganito Mining Corporation
Local business tax (mine site)
56,314,201
111,229,152
54,914,952
112,275,171
-
Real property tax - Basic (mine site)
5,084,885
5,084,885
-
5,084,885
-
Real property tax - SEF (mine site)
5,084,885
5,084,885
-
5,084,885
-
Surigao City MPSA No. 259-2007-XIII (SMR) (Amended II)
Adnama Mining Resources, Inc.
Local business tax (mine site)
-
-
-
1,500
-
MPSA No. 246-2007-XIII (SMR)
Hinatuan Mining Corporation
Real property tax - Basic (mine site)
42,647
-
(42,647)
42,647
-
Real property tax - SEF (mine site)
42,647
-
(42,647)
42,647
-
MPSA No. 072-97-XIII (SMR)
Pacific Nickel Philippines, Inc.
Local business tax (mine site)
385,500
108,000
(277,500)
385,500
-
Tagana-an MPSA No. 246-2007-XIII (SMR)
Hinatuan Mining Corporation
Local business tax (mine site)
15,278,136
15,278,136
-
15,278,136
-
Real property tax - Basic (mine site)
56,511
-
(56,511)
56,511
-
Real property tax - SEF (mine site)
56,511
-
(56,511)
56,511
-
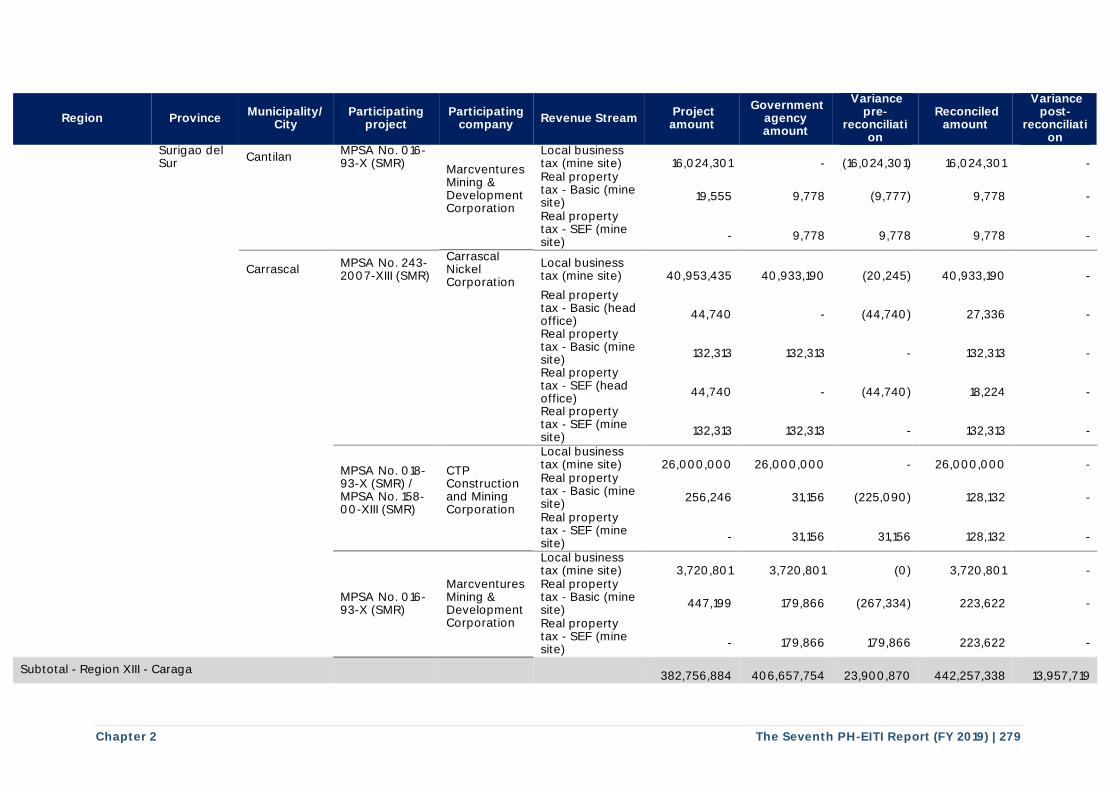
Chapter 2 The Seventh PH-EITI Report (FY 2019) | 279
Region Province Municipality/
City Participating
project Participating
company Revenue Stream
Project amount
Government agency amount
Variance pre-
reconciliation
Reconciled amount
Variance post-
reconciliation
Surigao del Sur
Cantilan MPSA No. 016-93-X (SMR)
Marcventures Mining & Development Corporation
Local business tax (mine site)
16,024,301
-
(16,024,301)
16,024,301
-
Real property tax - Basic (mine site)
19,555
9,778
(9,777)
9,778
-
Real property tax - SEF (mine site)
-
9,778
9,778
9,778
-
Carrascal MPSA No. 243-2007-XIII (SMR)
Carrascal Nickel Corporation
Local business tax (mine site)
40,953,435
40,933,190
(20,245)
40,933,190
-
Real property tax - Basic (head office)
44,740
-
(44,740)
27,336
-
Real property tax - Basic (mine site)
132,313
132,313
-
132,313
-
Real property tax - SEF (head office)
44,740
-
(44,740)
18,224
-
Real property tax - SEF (mine site)
132,313
132,313
-
132,313
-
MPSA No. 018-93-X (SMR) / MPSA No. 158-00-XIII (SMR)
CTP Construction and Mining Corporation
Local business tax (mine site)
26,000,000
26,000,000
-
26,000,000
-
Real property tax - Basic (mine site)
256,246
31,156
(225,090)
128,132
-
Real property tax - SEF (mine site)
-
31,156
31,156
128,132
-
MPSA No. 016-93-X (SMR)
Marcventures Mining & Development Corporation
Local business tax (mine site)
3,720,801
3,720,801
(0)
3,720,801
-
Real property tax - Basic (mine site)
447,199
179,866
(267,334)
223,622
-
Real property tax - SEF (mine site)
-
179,866
179,866
223,622
-
Subtotal - Region XIII - Caraga
382,756,884
406,657,754
23,900,870
442,257,338
13,957,719
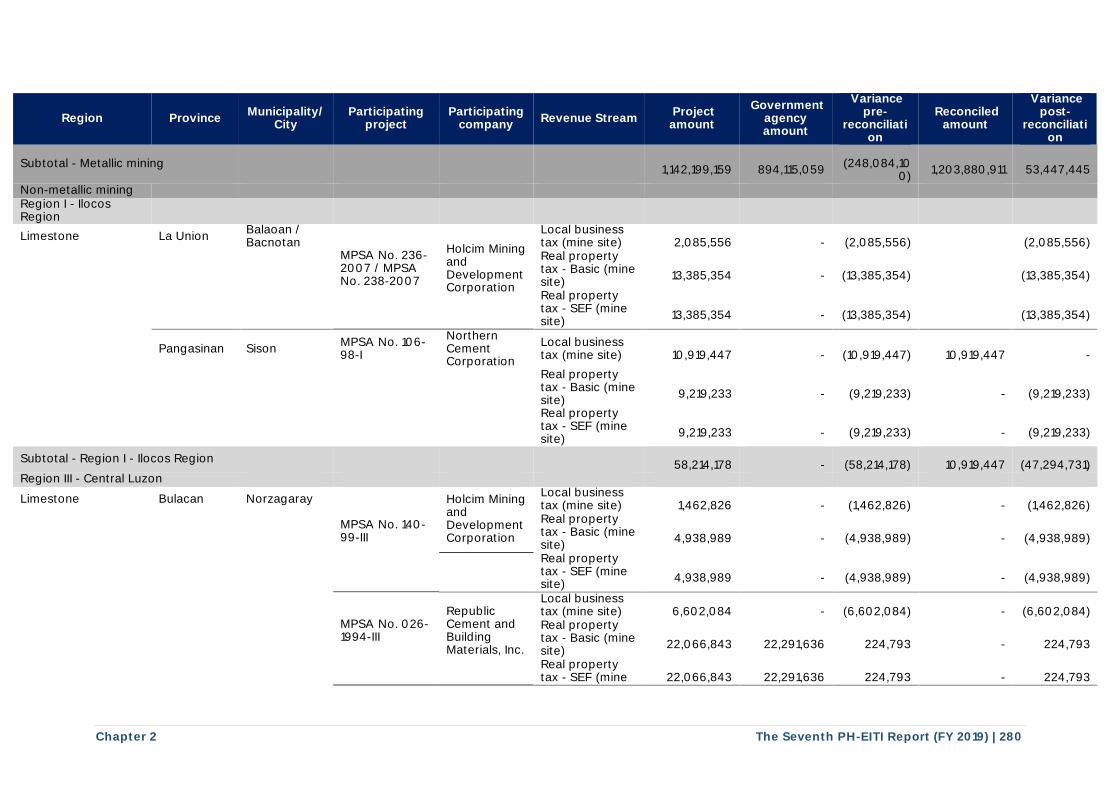
Chapter 2 The Seventh PH-EITI Report (FY 2019) | 280
Region Province Municipality/
City Participating
project Participating
company Revenue Stream
Project amount
Government agency amount
Variance pre-
reconciliation
Reconciled amount
Variance post-
reconciliation
Subtotal - Metallic mining
1,142,199,159
894,115,059
(248,084,10
0)
1,203,880,911
53,447,445
Non-metallic mining Region I - Ilocos Region
Limestone La Union Balaoan / Bacnotan
MPSA No. 236-2007 / MPSA No. 238-2007
Holcim Mining and Development Corporation
Local business tax (mine site)
2,085,556
-
(2,085,556)
(2,085,556)
Real property tax - Basic (mine site)
13,385,354
-
(13,385,354)
(13,385,354)
Real property tax - SEF (mine site)
13,385,354
-
(13,385,354)
(13,385,354)
Pangasinan Sison MPSA No. 106-98-I
Northern Cement Corporation
Local business tax (mine site)
10,919,447
-
(10,919,447)
10,919,447
-
Real property tax - Basic (mine site)
9,219,233
-
(9,219,233)
-
(9,219,233)
Real property tax - SEF (mine site)
9,219,233
-
(9,219,233)
-
(9,219,233)
Subtotal - Region I - Ilocos Region
58,214,178
-
(58,214,178)
10,919,447
(47,294,731) Region III - Central Luzon
Limestone Bulacan Norzagaray
MPSA No. 140-99-III
Holcim Mining and Development Corporation
Local business tax (mine site)
1,462,826
-
(1,462,826)
-
(1,462,826)
Real property tax - Basic (mine site)
4,938,989
-
(4,938,989)
-
(4,938,989)
Real property tax - SEF (mine site)
4,938,989
-
(4,938,989)
-
(4,938,989)
MPSA No. 026-1994-III
Republic Cement and Building Materials, Inc.
Local business tax (mine site)
6,602,084
-
(6,602,084)
-
(6,602,084)
Real property tax - Basic (mine site)
22,066,843
22,291,636
224,793
-
224,793
Real property tax - SEF (mine
22,066,843
22,291,636
224,793
-
224,793
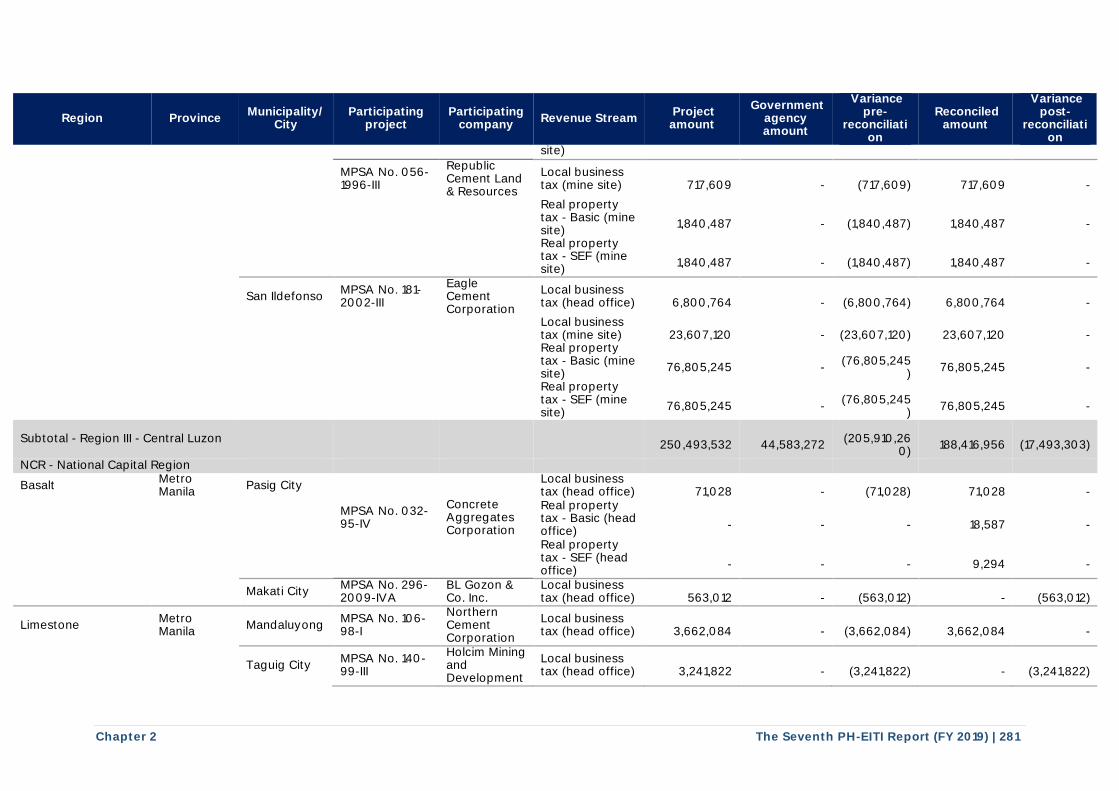
Chapter 2 The Seventh PH-EITI Report (FY 2019) | 281
Region Province Municipality/
City Participating
project Participating
company Revenue Stream
Project amount
Government agency amount
Variance pre-
reconciliation
Reconciled amount
Variance post-
reconciliation
site)
MPSA No. 056-1996-III
Republic Cement Land & Resources
Local business tax (mine site)
717,609
-
(717,609)
717,609
-
Real property tax - Basic (mine site)
1,840,487
-
(1,840,487)
1,840,487
-
Real property tax - SEF (mine site)
1,840,487
-
(1,840,487)
1,840,487
-
San Ildefonso MPSA No. 181-2002-III
Eagle Cement Corporation
Local business tax (head office)
6,800,764
-
(6,800,764)
6,800,764
-
Local business tax (mine site)
23,607,120
-
(23,607,120)
23,607,120
-
Real property tax - Basic (mine site)
76,805,245
-
(76,805,245
)
76,805,245
-
Real property tax - SEF (mine site)
76,805,245
-
(76,805,245
)
76,805,245
-
Subtotal - Region III - Central Luzon
250,493,532
44,583,272
(205,910,26
0)
188,416,956
(17,493,303)
NCR - National Capital Region
Basalt Metro Manila
Pasig City
MPSA No. 032-95-IV
Concrete Aggregates Corporation
Local business tax (head office)
71,028
-
(71,028)
71,028
-
Real property tax - Basic (head office)
-
-
-
18,587
-
Real property tax - SEF (head office)
-
-
-
9,294
-
Makati City MPSA No. 296-2009-IVA
BL Gozon & Co. Inc.
Local business tax (head office)
563,012
-
(563,012)
-
(563,012)
Limestone Metro Manila
Mandaluyong MPSA No. 106-98-I
Northern Cement Corporation
Local business tax (head office)
3,662,084
-
(3,662,084)
3,662,084
-
Taguig City MPSA No. 140-99-III
Holcim Mining and Development
Local business tax (head office)
3,241,822
-
(3,241,822)
-
(3,241,822)
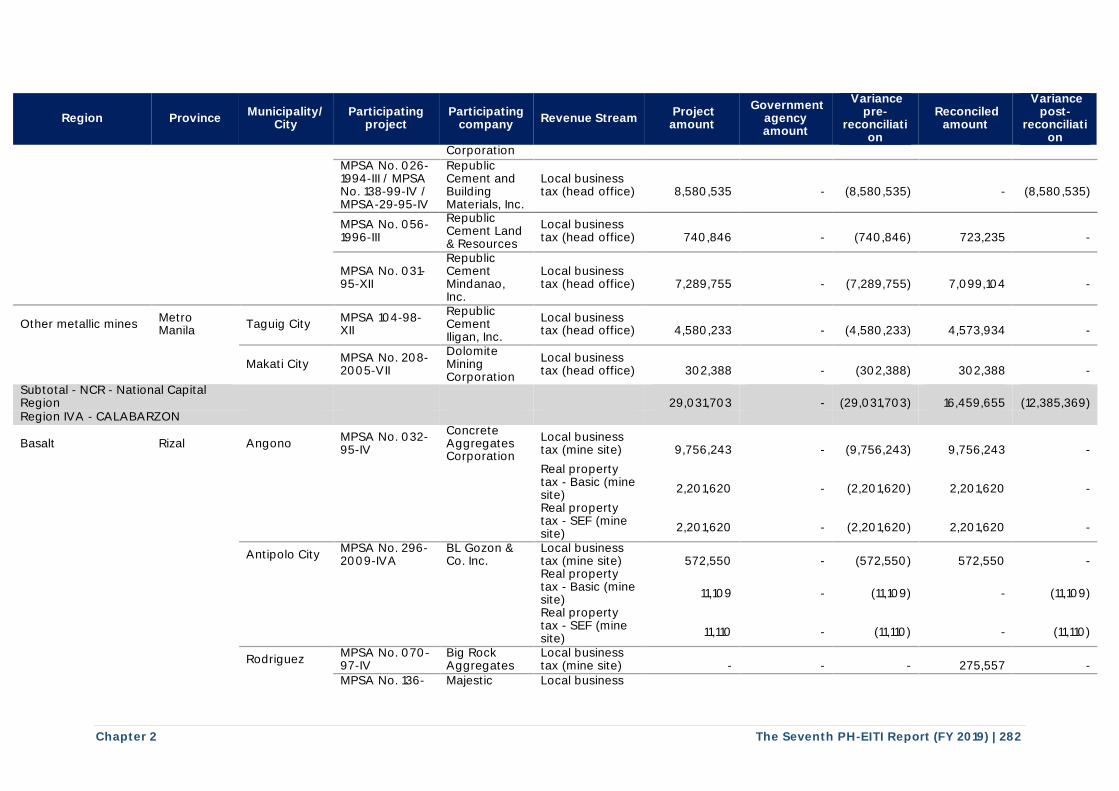
Chapter 2 The Seventh PH-EITI Report (FY 2019) | 282
Region Province Municipality/
City Participating
project Participating
company Revenue Stream
Project amount
Government agency amount
Variance pre-
reconciliation
Reconciled amount
Variance post-
reconciliation
Corporation
MPSA No. 026-1994-III / MPSA No. 138-99-IV / MPSA-29-95-IV
Republic Cement and Building Materials, Inc.
Local business tax (head office)
8,580,535
-
(8,580,535)
-
(8,580,535)
MPSA No. 056-1996-III
Republic Cement Land & Resources
Local business tax (head office)
740,846
-
(740,846)
723,235
-
MPSA No. 031-95-XII
Republic Cement Mindanao, Inc.
Local business tax (head office)
7,289,755
-
(7,289,755)
7,099,104
-
Other metallic mines Metro Manila
Taguig City MPSA 104-98-XII
Republic Cement Iligan, Inc.
Local business tax (head office)
4,580,233
-
(4,580,233)
4,573,934
-
Makati City MPSA No. 208-2005-VII
Dolomite Mining Corporation
Local business tax (head office)
302,388
-
(302,388)
302,388
-
Subtotal - NCR - National Capital Region
29,031,703
-
(29,031,703)
16,459,655
(12,385,369) Region IVA - CALABARZON
Basalt Rizal Angono MPSA No. 032-95-IV
Concrete Aggregates Corporation
Local business tax (mine site)
9,756,243
-
(9,756,243)
9,756,243
-
Real property tax - Basic (mine site)
2,201,620
-
(2,201,620)
2,201,620
-
Real property tax - SEF (mine site)
2,201,620
-
(2,201,620)
2,201,620
-
Antipolo City MPSA No. 296-2009-IVA
BL Gozon & Co. Inc.
Local business tax (mine site)
572,550
-
(572,550)
572,550
-
Real property tax - Basic (mine site)
11,109
-
(11,109)
-
(11,109)
Real property tax - SEF (mine site)
11,110
-
(11,110)
-
(11,110)
Rodriguez MPSA No. 070-97-IV
Big Rock Aggregates
Local business tax (mine site)
-
-
-
275,557
-
MPSA No. 136- Majestic Local business
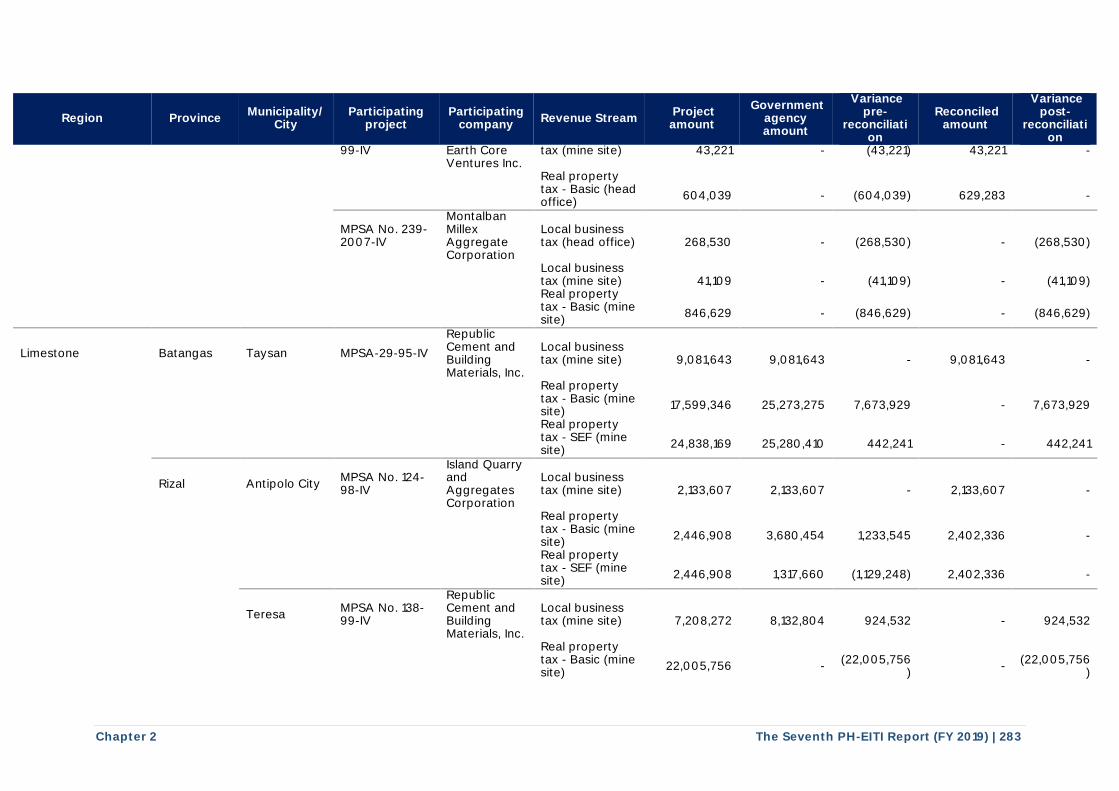
Chapter 2 The Seventh PH-EITI Report (FY 2019) | 283
Region Province Municipality/
City Participating
project Participating
company Revenue Stream
Project amount
Government agency amount
Variance pre-
reconciliation
Reconciled amount
Variance post-
reconciliation
99-IV Earth Core Ventures Inc.
tax (mine site) 43,221 - (43,221) 43,221 -
Real property tax - Basic (head office)
604,039
-
(604,039)
629,283
-
MPSA No. 239-2007-IV
Montalban Millex Aggregate Corporation
Local business tax (head office)
268,530
-
(268,530)
-
(268,530)
Local business tax (mine site)
41,109
-
(41,109)
-
(41,109)
Real property tax - Basic (mine site)
846,629
-
(846,629)
-
(846,629)
Limestone Batangas Taysan MPSA-29-95-IV
Republic Cement and Building Materials, Inc.
Local business tax (mine site)
9,081,643
9,081,643
-
9,081,643
-
Real property tax - Basic (mine site)
17,599,346
25,273,275
7,673,929
-
7,673,929
Real property tax - SEF (mine site)
24,838,169
25,280,410
442,241
-
442,241
Rizal Antipolo City MPSA No. 124-98-IV
Island Quarry and Aggregates Corporation
Local business tax (mine site)
2,133,607
2,133,607
-
2,133,607
-
Real property tax - Basic (mine site)
2,446,908
3,680,454
1,233,545
2,402,336
-
Real property tax - SEF (mine site)
2,446,908
1,317,660
(1,129,248)
2,402,336
-
Teresa MPSA No. 138-99-IV
Republic Cement and Building Materials, Inc.
Local business tax (mine site)
7,208,272
8,132,804
924,532
-
924,532
Real property tax - Basic (mine site)
22,005,756
-
(22,005,756
)
-
(22,005,756
)
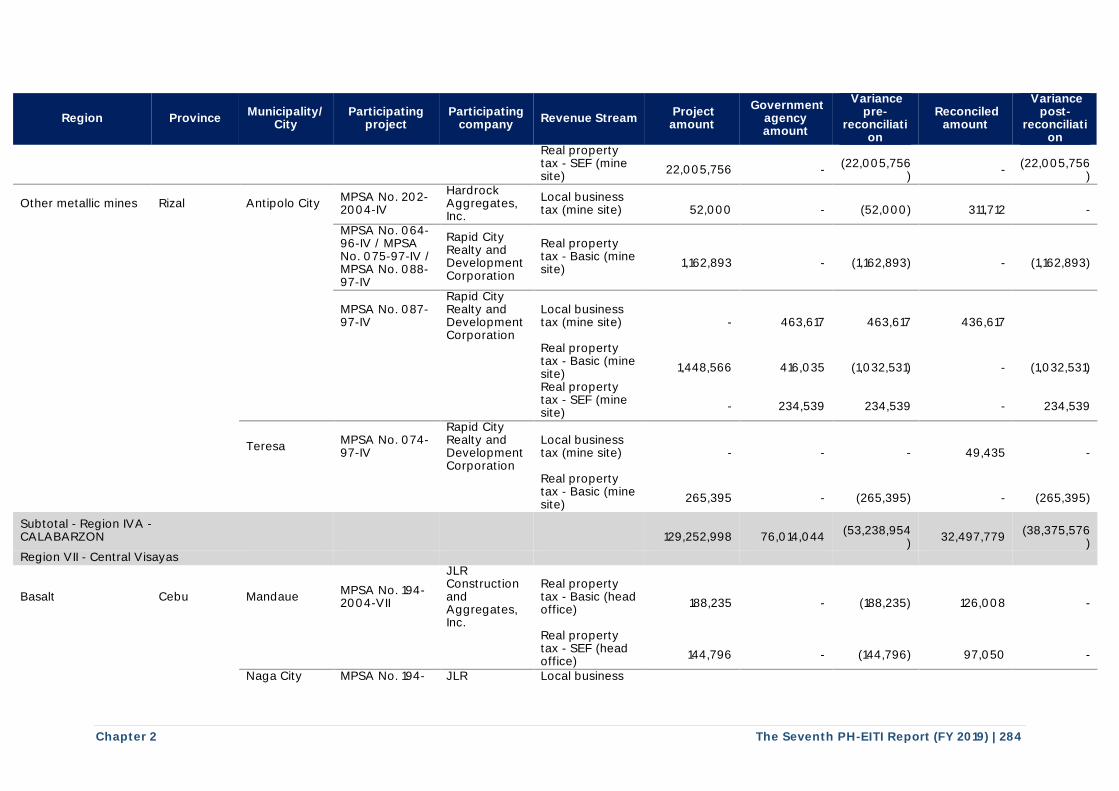
Chapter 2 The Seventh PH-EITI Report (FY 2019) | 284
Region Province Municipality/
City Participating
project Participating
company Revenue Stream
Project amount
Government agency amount
Variance pre-
reconciliation
Reconciled amount
Variance post-
reconciliation
Real property tax - SEF (mine site)
22,005,756
-
(22,005,756
)
-
(22,005,756
)
Other metallic mines Rizal Antipolo City MPSA No. 202-2004-IV
Hardrock Aggregates, Inc.
Local business tax (mine site)
52,000
-
(52,000)
311,712
-
MPSA No. 064-96-IV / MPSA No. 075-97-IV / MPSA No. 088-97-IV
Rapid City Realty and Development Corporation
Real property tax - Basic (mine site)
1,162,893
-
(1,162,893)
-
(1,162,893)
MPSA No. 087-97-IV
Rapid City Realty and Development Corporation
Local business tax (mine site)
-
463,617
463,617
436,617
Real property tax - Basic (mine site)
1,448,566
416,035
(1,032,531)
-
(1,032,531)
Real property tax - SEF (mine site)
-
234,539
234,539
-
234,539
Teresa MPSA No. 074-97-IV
Rapid City Realty and Development Corporation
Local business tax (mine site)
-
-
-
49,435
-
Real property tax - Basic (mine site)
265,395
-
(265,395)
-
(265,395)
Subtotal - Region IVA - CALABARZON
129,252,998
76,014,044
(53,238,954
)
32,497,779
(38,375,576
) Region VII - Central Visayas
Basalt Cebu Mandaue MPSA No. 194-2004-VII
JLR Construction and Aggregates, Inc.
Real property tax - Basic (head office)
188,235
-
(188,235)
126,008
-
Real property tax - SEF (head office)
144,796
-
(144,796)
97,050
-
Naga City MPSA No. 194- JLR Local business
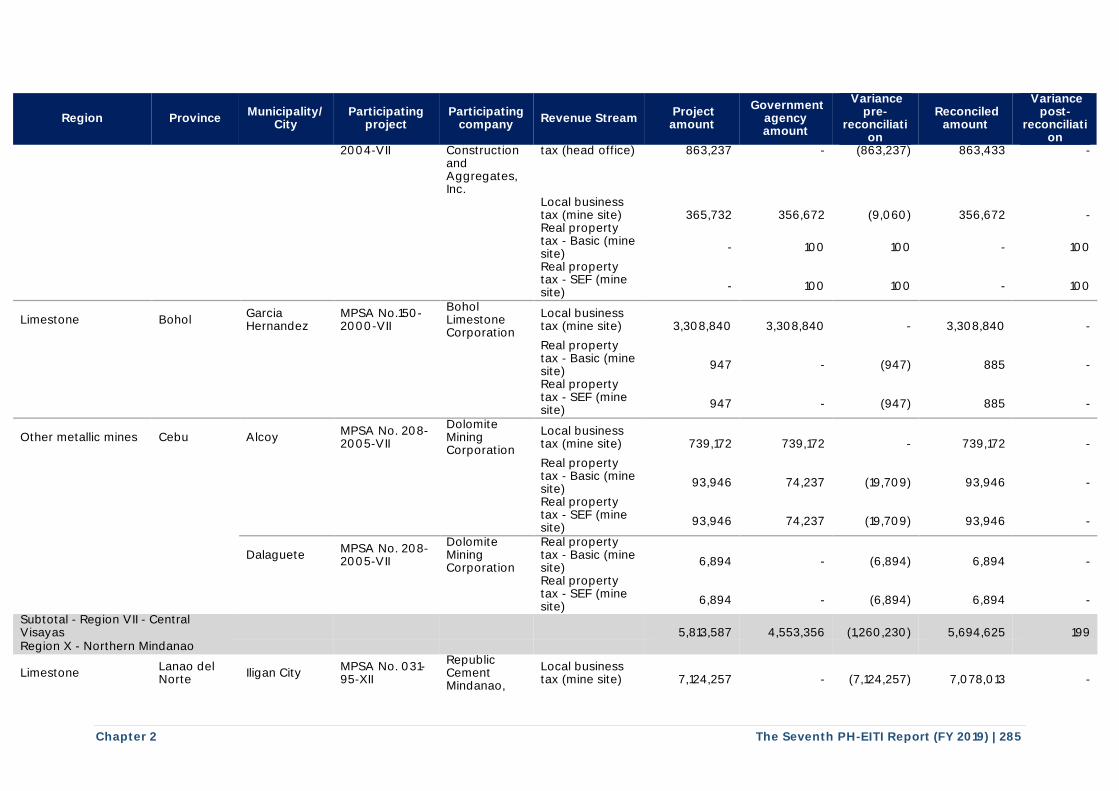
Chapter 2 The Seventh PH-EITI Report (FY 2019) | 285
Region Province Municipality/
City Participating
project Participating
company Revenue Stream
Project amount
Government agency amount
Variance pre-
reconciliation
Reconciled amount
Variance post-
reconciliation
2004-VII Construction and Aggregates, Inc.
tax (head office) 863,237 - (863,237) 863,433 -
Local business tax (mine site)
365,732
356,672
(9,060)
356,672
-
Real property tax - Basic (mine site)
-
100
100
-
100
Real property tax - SEF (mine site)
-
100
100
-
100
Limestone Bohol Garcia Hernandez
MPSA No.150-2000-VII
Bohol Limestone Corporation
Local business tax (mine site)
3,308,840
3,308,840
-
3,308,840
-
Real property tax - Basic (mine site)
947
-
(947)
885
-
Real property tax - SEF (mine site)
947
-
(947)
885
-
Other metallic mines Cebu Alcoy MPSA No. 208-2005-VII
Dolomite Mining Corporation
Local business tax (mine site)
739,172
739,172
-
739,172
-
Real property tax - Basic (mine site)
93,946
74,237
(19,709)
93,946
-
Real property tax - SEF (mine site)
93,946
74,237
(19,709)
93,946
-
Dalaguete MPSA No. 208-2005-VII
Dolomite Mining Corporation
Real property tax - Basic (mine site)
6,894
-
(6,894)
6,894
-
Real property tax - SEF (mine site)
6,894
-
(6,894)
6,894
-
Subtotal - Region VII - Central Visayas
5,813,587
4,553,356
(1,260,230)
5,694,625
199 Region X - Northern Mindanao
Limestone Lanao del Norte
Iligan City MPSA No. 031-95-XII
Republic Cement Mindanao,
Local business tax (mine site)
7,124,257
-
(7,124,257)
7,078,013
-
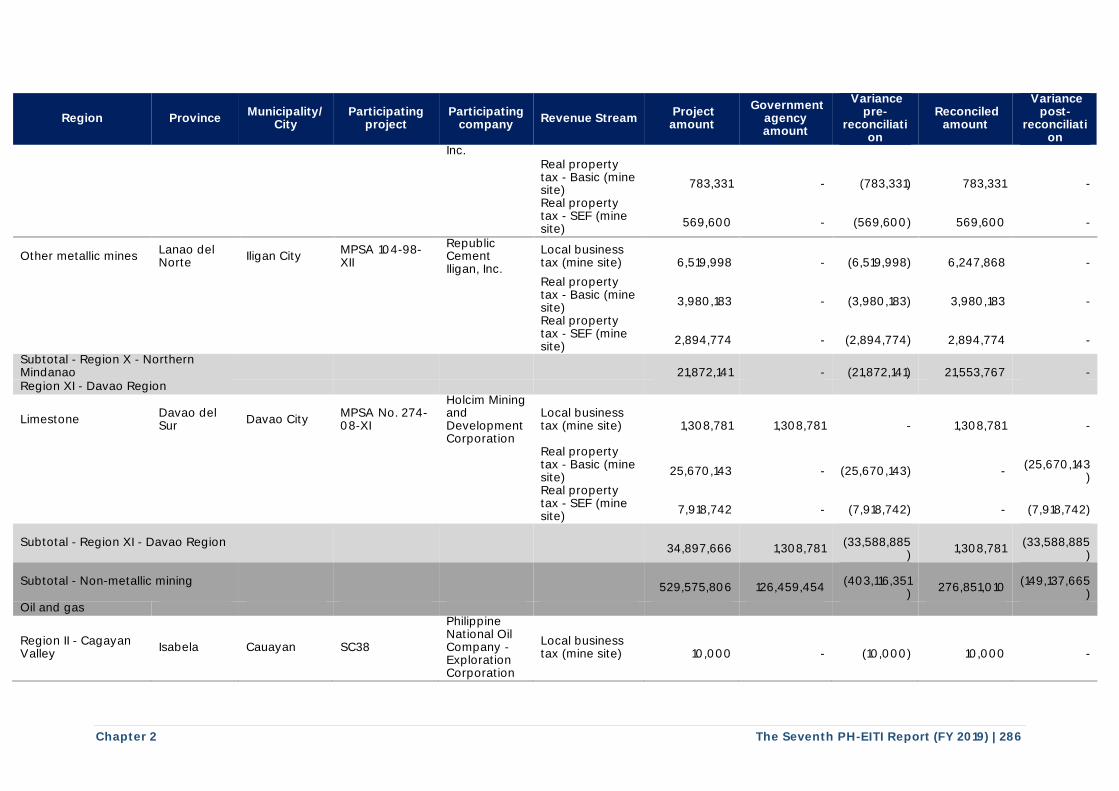
Chapter 2 The Seventh PH-EITI Report (FY 2019) | 286
Region Province Municipality/
City Participating
project Participating
company Revenue Stream
Project amount
Government agency amount
Variance pre-
reconciliation
Reconciled amount
Variance post-
reconciliation
Inc.
Real property tax - Basic (mine site)
783,331
-
(783,331)
783,331
-
Real property tax - SEF (mine site)
569,600
-
(569,600)
569,600
-
Other metallic mines Lanao del Norte
Iligan City MPSA 104-98-XII
Republic Cement Iligan, Inc.
Local business tax (mine site)
6,519,998
-
(6,519,998)
6,247,868
-
Real property tax - Basic (mine site)
3,980,183
-
(3,980,183)
3,980,183
-
Real property tax - SEF (mine site)
2,894,774
-
(2,894,774)
2,894,774
-
Subtotal - Region X - Northern Mindanao
21,872,141
-
(21,872,141)
21,553,767
- Region XI - Davao Region
Limestone Davao del Sur
Davao City MPSA No. 274-08-XI
Holcim Mining and Development Corporation
Local business tax (mine site)
1,308,781
1,308,781
-
1,308,781
-
Real property tax - Basic (mine site)
25,670,143
-
(25,670,143)
-
(25,670,143
)
Real property tax - SEF (mine site)
7,918,742
-
(7,918,742)
-
(7,918,742)
Subtotal - Region XI - Davao Region
34,897,666
1,308,781
(33,588,885
)
1,308,781
(33,588,885
)
Subtotal - Non-metallic mining
529,575,806
126,459,454
(403,116,351
)
276,851,010
(149,137,665
) Oil and gas
Region II - Cagayan Valley
Isabela Cauayan SC38
Philippine National Oil Company - Exploration Corporation
Local business tax (mine site)
10,000
-
(10,000)
10,000
-
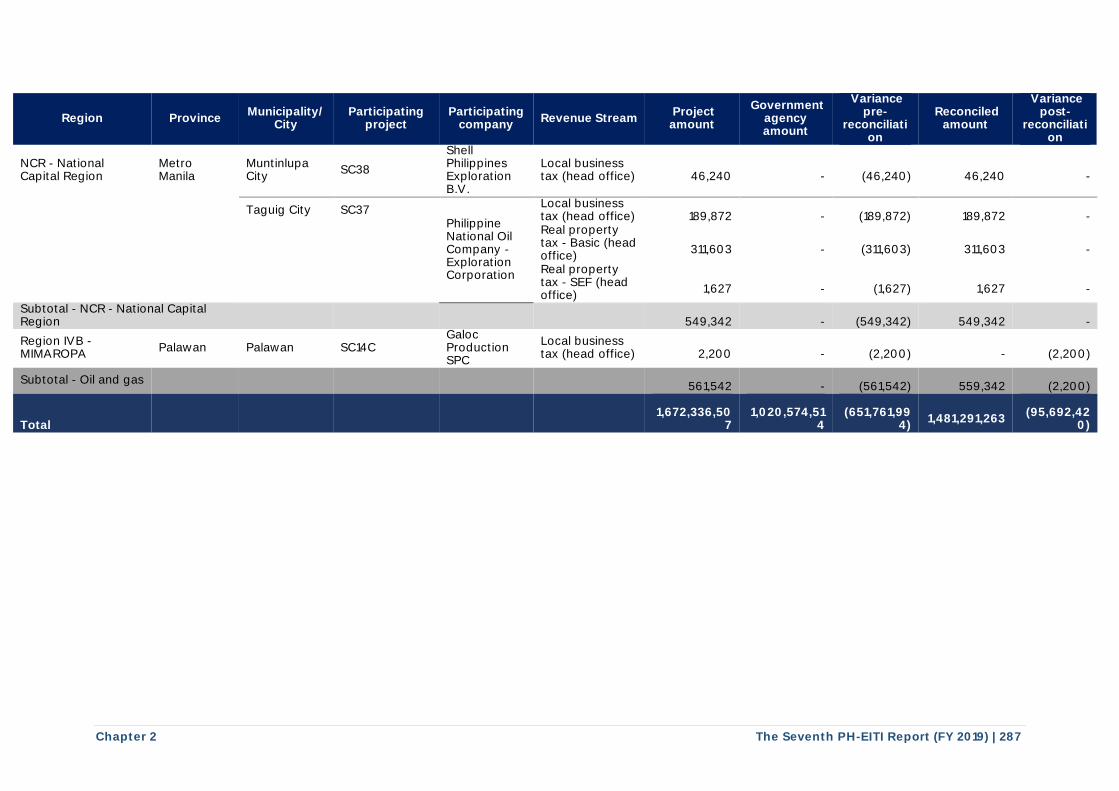
Chapter 2 The Seventh PH-EITI Report (FY 2019) | 287
Region Province Municipality/
City Participating
project Participating
company Revenue Stream
Project amount
Government agency amount
Variance pre-
reconciliation
Reconciled amount
Variance post-
reconciliation
NCR - National Capital Region
Metro Manila
Muntinlupa City
SC38
Shell Philippines Exploration B.V.
Local business tax (head office)
46,240
-
(46,240)
46,240
-
Taguig City SC37 Philippine National Oil Company - Exploration Corporation
Local business tax (head office)
189,872
-
(189,872)
189,872
-
Real property tax - Basic (head office)
311,603
-
(311,603)
311,603
-
Real property tax - SEF (head office)
1,627
-
(1,627)
1,627
-
Subtotal - NCR - National Capital Region
549,342
-
(549,342)
549,342
-
Region IVB - MIMAROPA
Palawan Palawan SC14C Galoc Production SPC
Local business tax (head office)
2,200
-
(2,200)
-
(2,200)
Subtotal - Oil and gas
561,542
-
(561,542)
559,342
(2,200)
Total
1,672,336,50
7
1,020,574,51
4
(651,761,99
4)
1,481,291,263
(95,692,42
0)
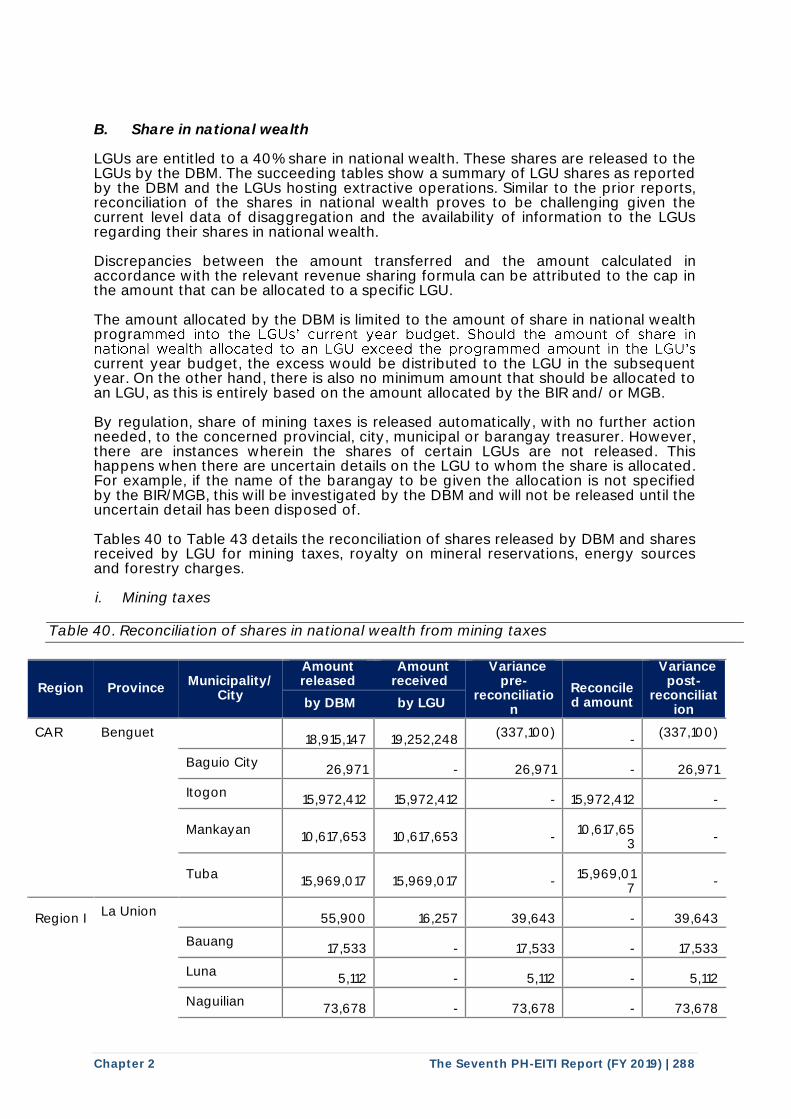
Chapter 2 The Seventh PH-EITI Report (FY 2019) | 288
B. Share in national wealth LGUs are entitled to a 40% share in national wealth. These shares are released to the LGUs by the DBM. The succeeding tables show a summary of LGU shares as reported by the DBM and the LGUs hosting extractive operations. Similar to the prior reports, reconciliation of the shares in national wealth proves to be challenging given the current level data of disaggregation and the availability of information to the LGUs regarding their shares in national wealth. Discrepancies between the amount transferred and the amount calculated in accordance with the relevant revenue sharing formula can be attributed to the cap in the amount that can be allocated to a specific LGU. The amount allocated by the DBM is limited to the amount of share in national wealth progra
current year budget, the excess would be distributed to the LGU in the subsequent year. On the other hand, there is also no minimum amount that should be allocated to an LGU, as this is entirely based on the amount allocated by the BIR and/ or MGB. By regulation, share of mining taxes is released automatically, with no further action needed, to the concerned provincial, city, municipal or barangay treasurer. However, there are instances wherein the shares of certain LGUs are not released. This happens when there are uncertain details on the LGU to whom the share is allocated. For example, if the name of the barangay to be given the allocation is not specified by the BIR/MGB, this will be investigated by the DBM and will not be released until the uncertain detail has been disposed of. Tables 40 to Table 43 details the reconciliation of shares released by DBM and shares received by LGU for mining taxes, royalty on mineral reservations, energy sources and forestry charges.
i. Mining taxes
Table 40. Reconciliation of shares in national wealth from mining taxes
Region Province Municipality/
City
Amount released
Amount received
Variance pre-
reconciliation
Reconciled amount
Variance post-
reconciliation by DBM by LGU
CAR Benguet
18,915,147
19,252,248 (337,100)
-
(337,100)
Baguio City
26,971
-
26,971
-
26,971
Itogon
15,972,412
15,972,412
-
15,972,412
-
Mankayan
10,617,653
10,617,653
-
10,617,65
3
-
Tuba
15,969,017
15,969,017
-
15,969,01
7
-
Region I La Union
55,900
16,257
39,643
-
39,643
Bauang
17,533
-
17,533
-
17,533
Luna
5,112
-
5,112
-
5,112
Naguilian
73,678
-
73,678
-
73,678
mmed into the LGUs' current year budget. Should the amount of share in national wealth allocated to an LGU exceed the programmed amount in the LGU's
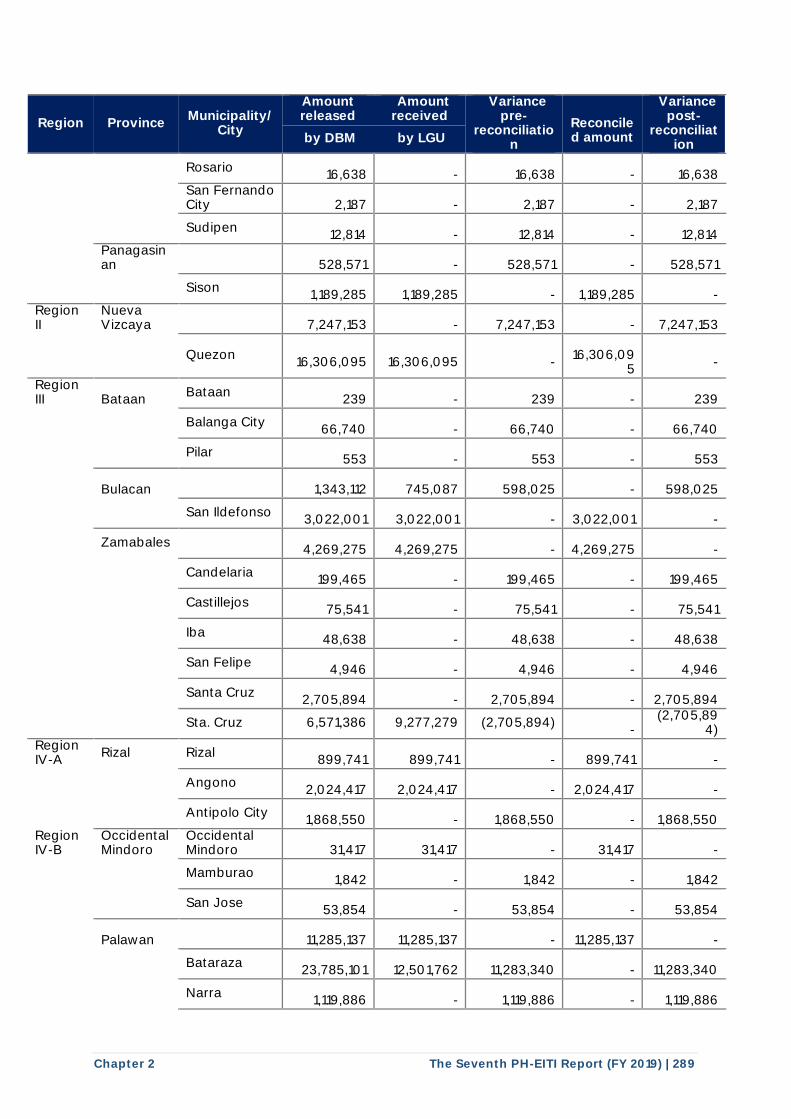
Chapter 2 The Seventh PH-EITI Report (FY 2019) | 289
Region Province Municipality/
City
Amount released
Amount received
Variance pre-
reconciliation
Reconciled amount
Variance post-
reconciliation by DBM by LGU
Rosario
16,638
-
16,638
-
16,638
San Fernando City
2,187
-
2,187
-
2,187
Sudipen
12,814
-
12,814
-
12,814
Panagasinan
528,571
-
528,571
-
528,571
Sison
1,189,285
1,189,285
-
1,189,285
- Region II
Nueva Vizcaya
7,247,153
-
7,247,153
-
7,247,153
Quezon
16,306,095
16,306,095
-
16,306,09
5
-
Region III Bataan
Bataan
239
-
239
-
239
Balanga City
66,740
-
66,740
-
66,740
Pilar
553
-
553
-
553
Bulacan
1,343,112
745,087
598,025
-
598,025
San Ildefonso
3,022,001
3,022,001
-
3,022,001
-
Zamabales
4,269,275
4,269,275
-
4,269,275
-
Candelaria
199,465
-
199,465
-
199,465
Castillejos
75,541
-
75,541
-
75,541
Iba
48,638
-
48,638
-
48,638
San Felipe
4,946
-
4,946
-
4,946
Santa Cruz
2,705,894
-
2,705,894
-
2,705,894
Sta. Cruz 6,571,386 9,277,279 (2,705,894)
- (2,705,89
4) Region IV-A
Rizal Rizal
899,741
899,741
-
899,741
-
Angono
2,024,417
2,024,417
-
2,024,417
-
Antipolo City
1,868,550
-
1,868,550
-
1,868,550 Region IV-B
Occidental Mindoro
Occidental Mindoro
31,417
31,417
-
31,417
-
Mamburao
1,842
-
1,842
-
1,842
San Jose
53,854
-
53,854
-
53,854
Palawan
11,285,137
11,285,137
-
11,285,137
-
Bataraza
23,785,101
12,501,762
11,283,340
-
11,283,340
Narra
1,119,886
-
1,119,886
-
1,119,886
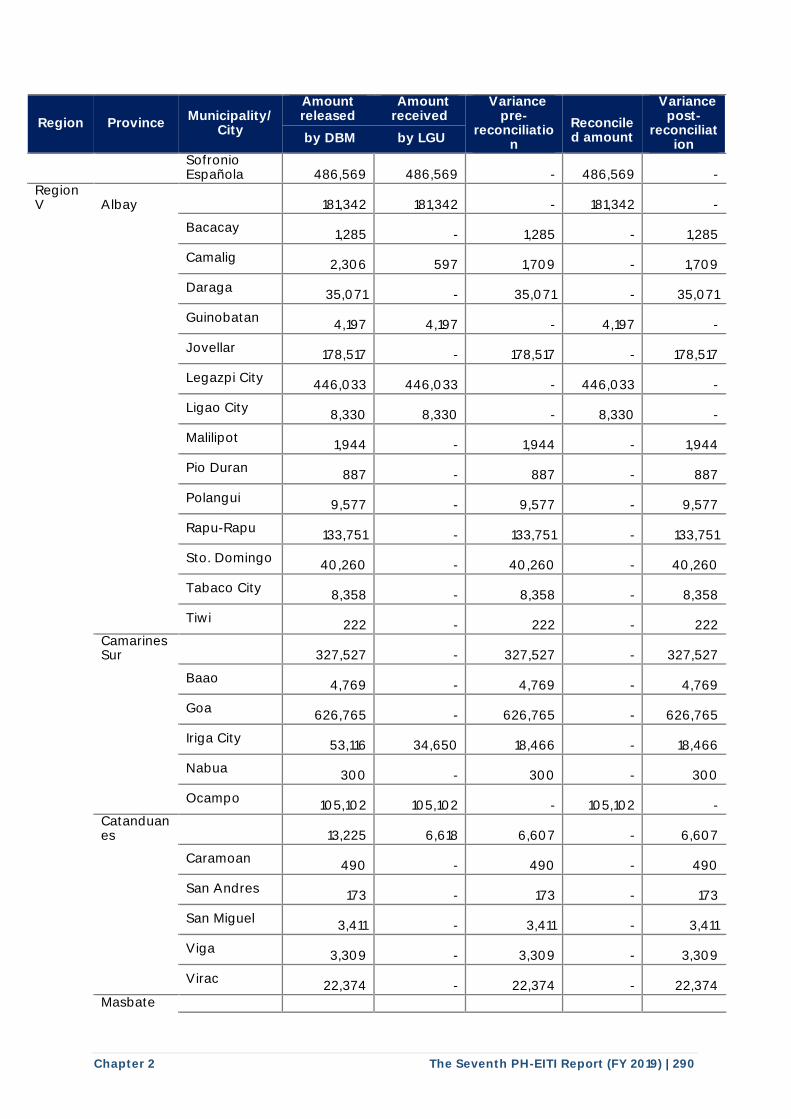
Chapter 2 The Seventh PH-EITI Report (FY 2019) | 290
Region Province Municipality/
City
Amount released
Amount received
Variance pre-
reconciliation
Reconciled amount
Variance post-
reconciliation by DBM by LGU
Sofronio Española
486,569
486,569
-
486,569
-
Region V Albay
181,342
181,342
-
181,342
-
Bacacay
1,285
-
1,285
-
1,285
Camalig
2,306
597
1,709
-
1,709
Daraga
35,071
-
35,071
-
35,071
Guinobatan
4,197
4,197
-
4,197
-
Jovellar
178,517
-
178,517
-
178,517
Legazpi City
446,033
446,033
-
446,033
-
Ligao City
8,330
8,330
-
8,330
-
Malilipot
1,944
-
1,944
-
1,944
Pio Duran
887
-
887
-
887
Polangui
9,577
-
9,577
-
9,577
Rapu-Rapu
133,751
-
133,751
-
133,751
Sto. Domingo
40,260
-
40,260
-
40,260
Tabaco City
8,358
-
8,358
-
8,358
Tiwi
222
-
222
-
222
Camarines Sur
327,527
-
327,527
-
327,527
Baao
4,769
-
4,769
-
4,769
Goa
626,765
-
626,765
-
626,765
Iriga City
53,116
34,650
18,466
-
18,466
Nabua
300
-
300
-
300
Ocampo
105,102
105,102
-
105,102
-
Catanduanes
13,225
6,618
6,607
-
6,607
Caramoan
490
-
490
-
490
San Andres
173
-
173
-
173
San Miguel
3,411
-
3,411
-
3,411
Viga
3,309
-
3,309
-
3,309
Virac
22,374
-
22,374
-
22,374
Masbate
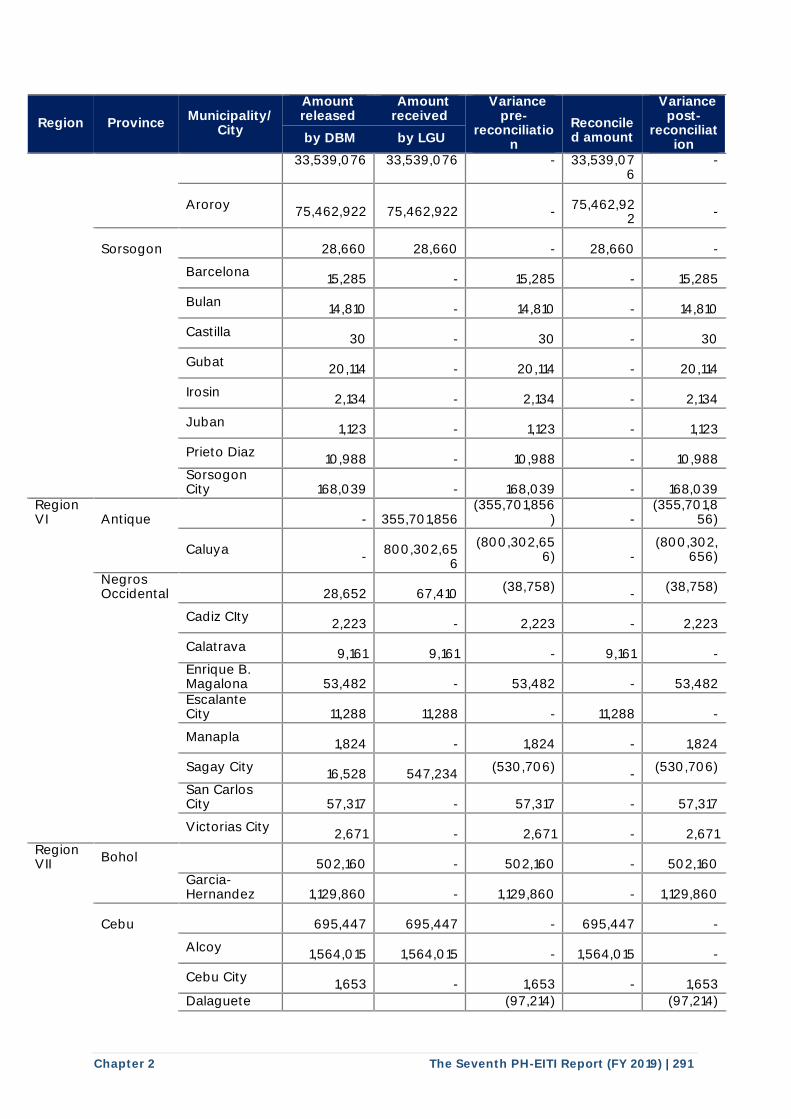
Chapter 2 The Seventh PH-EITI Report (FY 2019) | 291
Region Province Municipality/
City
Amount released
Amount received
Variance pre-
reconciliation
Reconciled amount
Variance post-
reconciliation by DBM by LGU
33,539,076 33,539,076 - 33,539,076
-
Aroroy
75,462,922
75,462,922
-
75,462,92
2
-
Sorsogon
28,660
28,660
-
28,660
-
Barcelona
15,285
-
15,285
-
15,285
Bulan
14,810
-
14,810
-
14,810
Castilla
30
-
30
-
30
Gubat
20,114
-
20,114
-
20,114
Irosin
2,134
-
2,134
-
2,134
Juban
1,123
-
1,123
-
1,123
Prieto Diaz
10,988
-
10,988
-
10,988
Sorsogon City
168,039
-
168,039
-
168,039
Region VI Antique
-
355,701,856 (355,701,856
)
- (355,701,8
56)
Caluya
-
800,302,65
6
(800,302,656)
-
(800,302,656)
Negros Occidental
28,652
67,410 (38,758)
-
(38,758)
Cadiz CIty
2,223
-
2,223
-
2,223
Calatrava
9,161
9,161
-
9,161
-
Enrique B. Magalona
53,482
-
53,482
-
53,482
Escalante City
11,288
11,288
-
11,288
-
Manapla
1,824
-
1,824
-
1,824
Sagay City
16,528
547,234 (530,706)
-
(530,706)
San Carlos City
57,317
-
57,317
-
57,317
Victorias City
2,671
-
2,671
-
2,671 Region VII
Bohol
502,160
-
502,160
-
502,160
Garcia-Hernandez
1,129,860
-
1,129,860
-
1,129,860
Cebu
695,447
695,447
-
695,447
-
Alcoy
1,564,015
1,564,015
-
1,564,015
-
Cebu City
1,653
-
1,653
-
1,653
Dalaguete (97,214) (97,214)
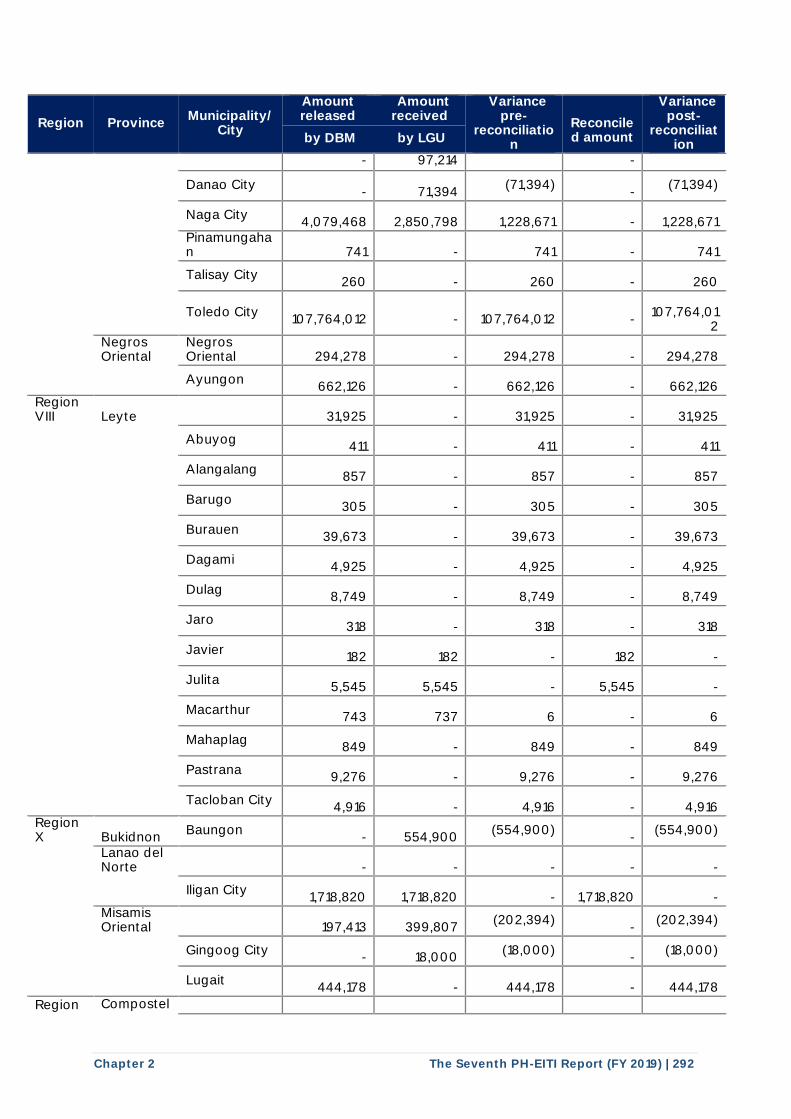
Chapter 2 The Seventh PH-EITI Report (FY 2019) | 292
Region Province Municipality/
City
Amount released
Amount received
Variance pre-
reconciliation
Reconciled amount
Variance post-
reconciliation by DBM by LGU
- 97,214 -
Danao City
-
71,394 (71,394)
-
(71,394)
Naga City
4,079,468
2,850,798
1,228,671
-
1,228,671
Pinamungahan
741
-
741
-
741
Talisay City
260
-
260
-
260
Toledo City
107,764,012
-
107,764,012
-
107,764,01
2
Negros Oriental
Negros Oriental
294,278
-
294,278
-
294,278
Ayungon
662,126
-
662,126
-
662,126 Region VIII Leyte
31,925
-
31,925
-
31,925
Abuyog
411
-
411
-
411
Alangalang
857
-
857
-
857
Barugo
305
-
305
-
305
Burauen
39,673
-
39,673
-
39,673
Dagami
4,925
-
4,925
-
4,925
Dulag
8,749
-
8,749
-
8,749
Jaro
318
-
318
-
318
Javier
182
182
-
182
-
Julita
5,545
5,545
-
5,545
-
Macarthur
743
737
6
-
6
Mahaplag
849
-
849
-
849
Pastrana
9,276
-
9,276
-
9,276
Tacloban City
4,916
-
4,916
-
4,916 Region X Bukidnon
Baungon
-
554,900 (554,900)
-
(554,900)
Lanao del Norte
-
-
-
-
-
Iligan City
1,718,820
1,718,820
-
1,718,820
-
Misamis Oriental
197,413
399,807 (202,394)
-
(202,394)
Gingoog City
-
18,000 (18,000)
-
(18,000)
Lugait
444,178
-
444,178
-
444,178
Region Compostel
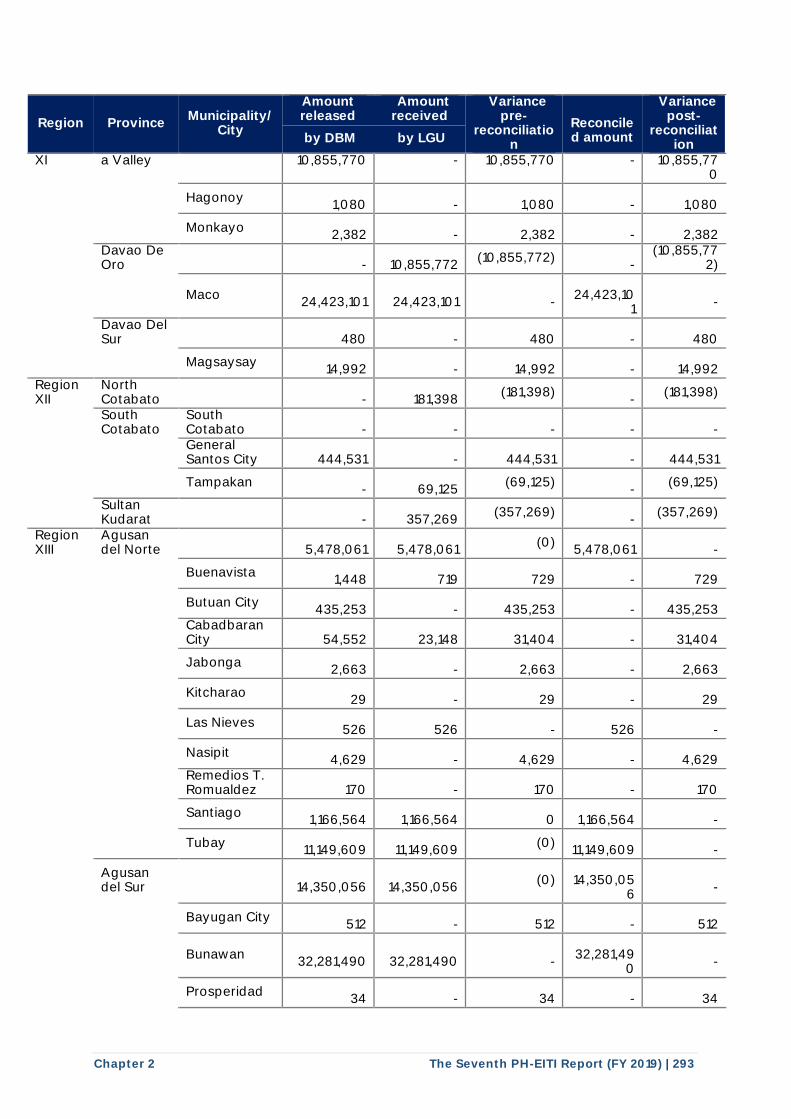
Chapter 2 The Seventh PH-EITI Report (FY 2019) | 293
Region Province Municipality/
City
Amount released
Amount received
Variance pre-
reconciliation
Reconciled amount
Variance post-
reconciliation by DBM by LGU
XI a Valley 10,855,770 - 10,855,770 - 10,855,770
Hagonoy
1,080
-
1,080
-
1,080
Monkayo
2,382
-
2,382
-
2,382
Davao De Oro
-
10,855,772 (10,855,772)
-
(10,855,772)
Maco
24,423,101
24,423,101
-
24,423,10
1
-
Davao Del Sur
480
-
480
-
480
Magsaysay
14,992
-
14,992
-
14,992 Region XII
North Cotabato
-
181,398
(181,398)
- (181,398)
South Cotabato
South Cotabato
-
-
-
-
-
General Santos City
444,531
-
444,531
-
444,531
Tampakan
-
69,125 (69,125)
-
(69,125)
Sultan Kudarat
-
357,269 (357,269)
-
(357,269)
Region XIII
Agusan del Norte
5,478,061
5,478,061 (0)
5,478,061
-
Buenavista
1,448
719
729
-
729
Butuan City
435,253
-
435,253
-
435,253
Cabadbaran City
54,552
23,148
31,404
-
31,404
Jabonga
2,663
-
2,663
-
2,663
Kitcharao
29
-
29
-
29
Las Nieves
526
526
-
526
-
Nasipit
4,629
-
4,629
-
4,629
Remedios T. Romualdez
170
-
170
-
170
Santiago
1,166,564
1,166,564
0
1,166,564
-
Tubay
11,149,609
11,149,609 (0)
11,149,609
-
Agusan del Sur
14,350,056
14,350,056 (0)
14,350,05
6
-
Bayugan City
512
-
512
-
512
Bunawan
32,281,490
32,281,490
-
32,281,49
0
-
Prosperidad
34
-
34
-
34

Chapter 2 The Seventh PH-EITI Report (FY 2019) | 294
Region Province Municipality/
City
Amount released
Amount received
Variance pre-
reconciliation
Reconciled amount
Variance post-
reconciliation by DBM by LGU
Rosario
4,014
-
4,014
-
4,014
San Francisco
630
-
630
-
630
Sta. Josefa
650
-
650
-
650
Trento
808
-
808
-
808
Dinagat Islands
4,925,318
13,370,043 (8,444,724)
-
(8,444,724)
Cagdianao
11,063,404
11,063,404
-
11,063,40
4
-
Loreto
-
2,338,172 (2,338,172)
-
(2,338,172)
Tubajon
18,563
-
18,563
-
18,563
Sarangani
10,755
-
10,755
-
10,755
Alabel
20,762
-
20,762
-
20,762
Glan
127
-
127
-
127
Maasim
3,155
-
3,155
-
3,155
Maitum
155
-
155
-
155
Southern Leyte
9,360
-
9,360
-
9,360
Bontoc
5,627
-
5,627
-
5,627
Hinunangan
15,433
-
15,433
-
15,433
Maasin City
424,050
-
424,050
-
424,050
Surigao del Norte
58,816,143
94,521,852
(35,705,708)
- (35,705,7
08)
Claver
122,548,325
122,548,325
-
122,548,3
25
-
Mainit
713,018
-
713,018
-
713,018
Surigao City
-
40,050 (40,050)
-
(40,050)
Tagana-an
9,074,978
20,021,912 (10,946,934)
-
(10,946,934)
Surigao del Sur
Surigao del Sur
20,042,460
32,019,271
(11,976,810)
- (11,976,810
)
Barobo
-
80,173 (80,173)
-
(80,173)
Cantilan
146,986
146,981
5
-
5
Carrascal 44,869,436 44,869,436
-
44,869,43
6
-
Madrid 79,113 16,170 62,943
-
62,943
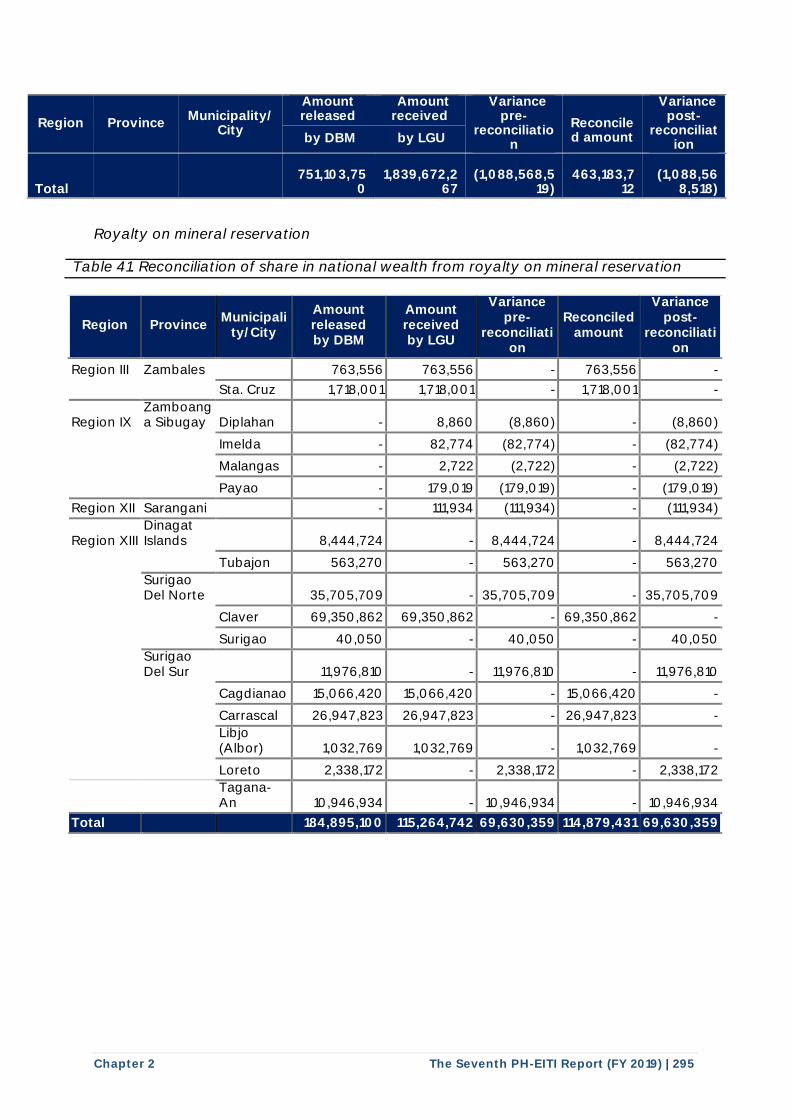
Chapter 2 The Seventh PH-EITI Report (FY 2019) | 295
Region Province Municipality/
City
Amount released
Amount received
Variance pre-
reconciliation
Reconciled amount
Variance post-
reconciliation by DBM by LGU
Total
751,103,75
0
1,839,672,2
67
(1,088,568,5
19)
463,183,7
12
(1,088,56
8,518)
Royalty on mineral reservation
Table 41. Reconciliation of share in national wealth from royalty on mineral reservation
Region Province Municipali
ty/City
Amount released by DBM
Amount received by LGU
Variance pre-
reconciliation
Reconciled amount
Variance post-
reconciliation
Region III Zambales 763,556 763,556 - 763,556 -
Sta. Cruz 1,718,001 1,718,001 - 1,718,001 -
Region IX Zamboanga Sibugay Diplahan - 8,860 (8,860) - (8,860)
Imelda - 82,774 (82,774) - (82,774)
Malangas - 2,722 (2,722) - (2,722)
Payao - 179,019 (179,019) - (179,019)
Region XII Sarangani - 111,934 (111,934) - (111,934)
Region XIII Dinagat Islands 8,444,724 - 8,444,724 - 8,444,724
Tubajon 563,270 - 563,270 - 563,270
Surigao Del Norte 35,705,709 - 35,705,709 - 35,705,709
Claver 69,350,862 69,350,862 - 69,350,862 -
Surigao 40,050 - 40,050 - 40,050
Surigao Del Sur 11,976,810 - 11,976,810 - 11,976,810
Cagdianao 15,066,420 15,066,420 - 15,066,420 -
Carrascal 26,947,823 26,947,823 - 26,947,823 -
Libjo (Albor) 1,032,769 1,032,769 - 1,032,769 -
Loreto 2,338,172 - 2,338,172 - 2,338,172
Tagana-An 10,946,934 - 10,946,934 - 10,946,934
Total 184,895,100 115,264,742 69,630,359 114,879,431 69,630,359
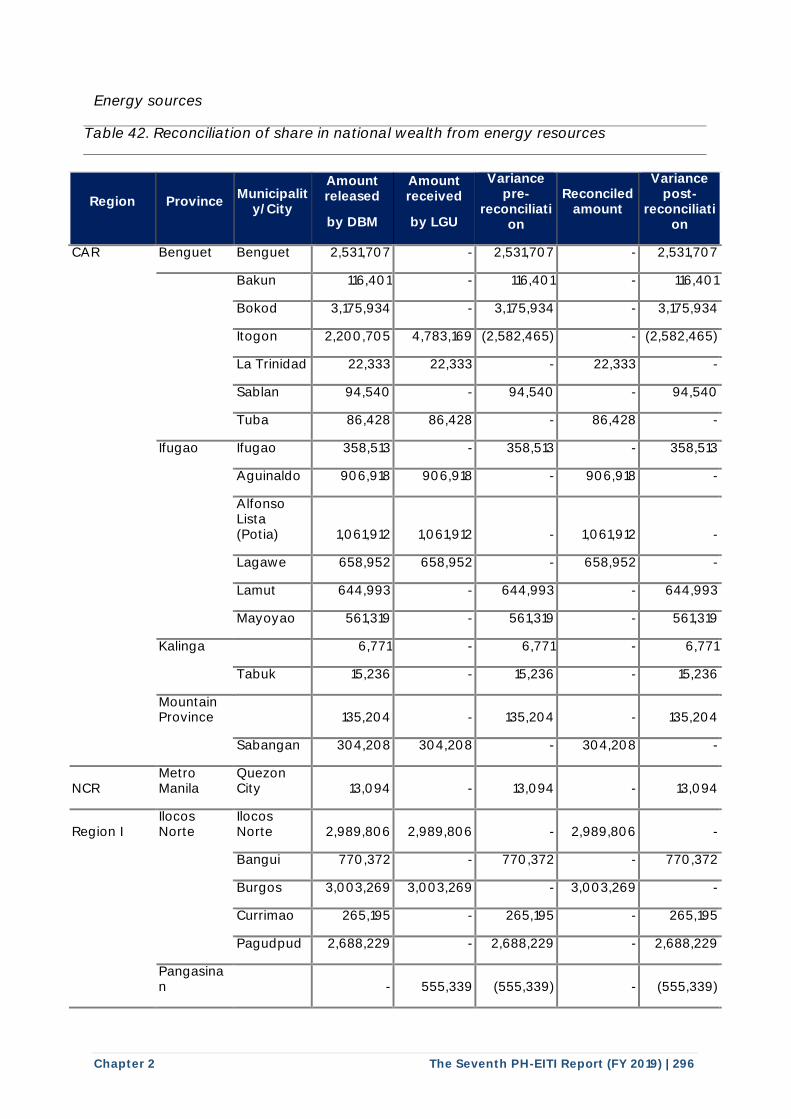
Chapter 2 The Seventh PH-EITI Report (FY 2019) | 296
Energy sources
Table 42. Reconciliation of share in national wealth from energy resources
Region Province Municipalit
y/City
Amount released
by DBM
Amount received
by LGU
Variance pre-
reconciliation
Reconciled amount
Variance post-
reconciliation
CAR Benguet Benguet 2,531,707 - 2,531,707 - 2,531,707
Bakun 116,401 - 116,401 - 116,401
Bokod 3,175,934 - 3,175,934 - 3,175,934
Itogon 2,200,705 4,783,169 (2,582,465) - (2,582,465)
La Trinidad 22,333 22,333 - 22,333 -
Sablan 94,540 - 94,540 - 94,540
Tuba 86,428 86,428 - 86,428 -
Ifugao Ifugao 358,513 - 358,513 - 358,513
Aguinaldo 906,918 906,918 - 906,918 -
Alfonso Lista (Potia) 1,061,912 1,061,912 - 1,061,912 -
Lagawe 658,952 658,952 - 658,952 -
Lamut 644,993 - 644,993 - 644,993
Mayoyao 561,319 - 561,319 - 561,319
Kalinga 6,771 - 6,771 - 6,771
Tabuk 15,236 - 15,236 - 15,236
Mountain Province 135,204 - 135,204 - 135,204
Sabangan 304,208 304,208 - 304,208 -
NCR Metro Manila
Quezon City 13,094 - 13,094 - 13,094
Region I Ilocos Norte
Ilocos Norte 2,989,806 2,989,806 - 2,989,806 -
Bangui 770,372 - 770,372 - 770,372
Burgos 3,003,269 3,003,269 - 3,003,269 -
Currimao 265,195 - 265,195 - 265,195
Pagudpud 2,688,229 - 2,688,229 - 2,688,229
Pangasinan - 555,339 (555,339) - (555,339)

Chapter 2 The Seventh PH-EITI Report (FY 2019) | 297
Region Province Municipalit
y/City
Amount released
by DBM
Amount received
by LGU
Variance pre-
reconciliation
Reconciled amount
Variance post-
reconciliation
Region II Isabela Isabela 2,309,577 2,309,577 - 2,309,577 -
Cordon 998,229 - 998,229 - 998,229
Ramon 1,246,820 - 1,246,820 - 1,246,820
Nueva Vizcaya 744,221 - 744,221 - 744,221
Alfonso Castaneda 101,875 - 101,875 - 101,875
Bagabag 959,854 - 959,854 - 959,854
Diadi 537,408 274,772 262,636 - 262,636
Solano 33,863 - 33,863 - 33,863
Region III Aurora 18,731 18,731 - 18,731 -
Maria Aurora 248,776 - 248,776 - 248,776
Bataan 82,324 - 82,324 - 82,324
Hermosa 185,229 - 185,229 - 185,229
Bulacan 182,044 - 182,044 - 182,044
Daña Remedios Trinidad - 1,859,406 (1,859,406) - (1,859,406)
San Ildefonso 409,598 409,598 - 409,598 -
Nueva Ecija 386,433 - 386,433 - 386,433
Carranglan 295,291 - 295,291 - 295,291
Pantabangan 322,820 334,912 (12,091) - (12,091)
Pampanga Pampanga 129,193 - 129,193 - 129,193
Mabalacat City 290,684 - 290,684 - 290,684
Tarlac 231,346 - 231,346 - 231,346
Tarlac 520,527 - 520,527 - 520,527
Region IV-A Batangas 2,922,629 - 2,922,629 - 2,922,629
Calatagan 922,944 922,944 - 922,944 -
Santo Tomas 5,269,213 5,269,214 - 5,269,213 -
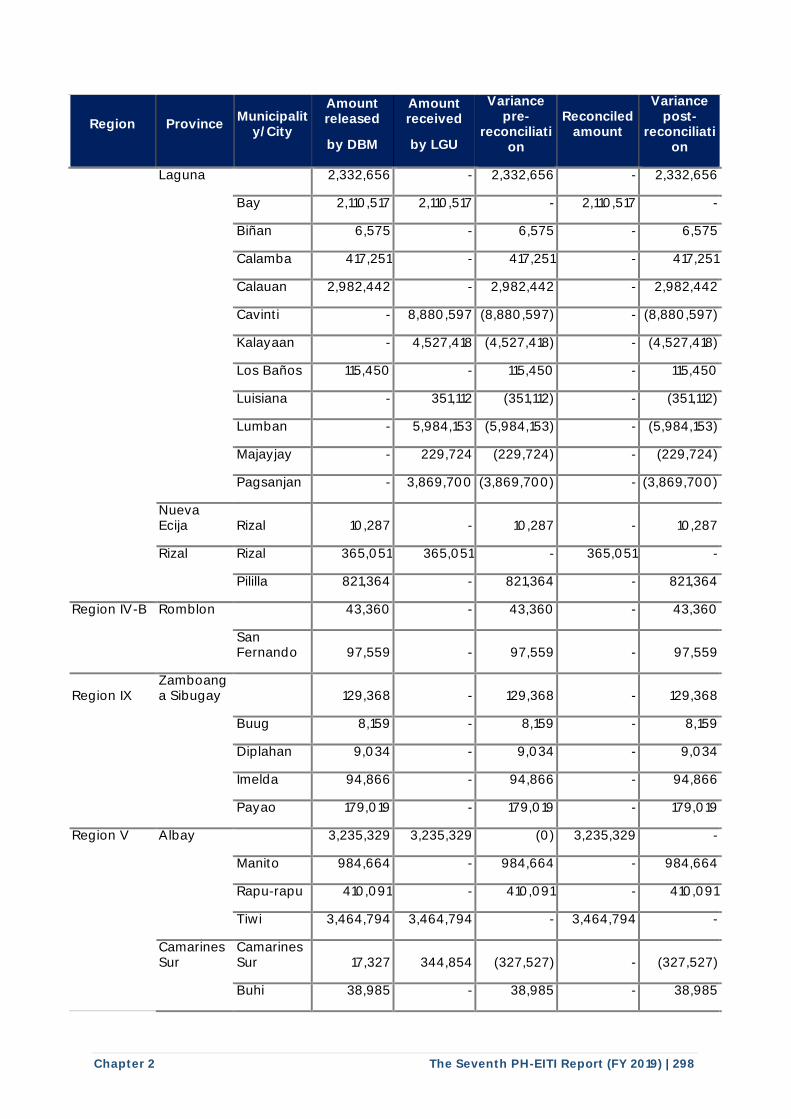
Chapter 2 The Seventh PH-EITI Report (FY 2019) | 298
Region Province Municipalit
y/City
Amount released
by DBM
Amount received
by LGU
Variance pre-
reconciliation
Reconciled amount
Variance post-
reconciliation
Laguna 2,332,656 - 2,332,656 - 2,332,656
Bay 2,110,517 2,110,517 - 2,110,517 -
Biñan 6,575 - 6,575 - 6,575
Calamba 417,251 - 417,251 - 417,251
Calauan 2,982,442 - 2,982,442 - 2,982,442
Cavinti - 8,880,597 (8,880,597) - (8,880,597)
Kalayaan - 4,527,418 (4,527,418) - (4,527,418)
Los Baños 115,450 - 115,450 - 115,450
Luisiana - 351,112 (351,112) - (351,112)
Lumban - 5,984,153 (5,984,153) - (5,984,153)
Majayjay - 229,724 (229,724) - (229,724)
Pagsanjan - 3,869,700 (3,869,700) - (3,869,700)
Nueva Ecija Rizal 10,287 - 10,287 - 10,287
Rizal Rizal 365,051 365,051 - 365,051 -
Pililla 821,364 - 821,364 - 821,364
Region IV-B Romblon 43,360 - 43,360 - 43,360
San Fernando 97,559 - 97,559 - 97,559
Region IX Zamboanga Sibugay 129,368 - 129,368 - 129,368
Buug 8,159 - 8,159 - 8,159
Diplahan 9,034 - 9,034 - 9,034
Imelda 94,866 - 94,866 - 94,866
Payao 179,019 - 179,019 - 179,019
Region V Albay 3,235,329 3,235,329 (0) 3,235,329 -
Manito 984,664 - 984,664 - 984,664
Rapu-rapu 410,091 - 410,091 - 410,091
Tiwi 3,464,794 3,464,794 - 3,464,794 -
Camarines Sur
Camarines Sur 17,327 344,854 (327,527) - (327,527)
Buhi 38,985 - 38,985 - 38,985
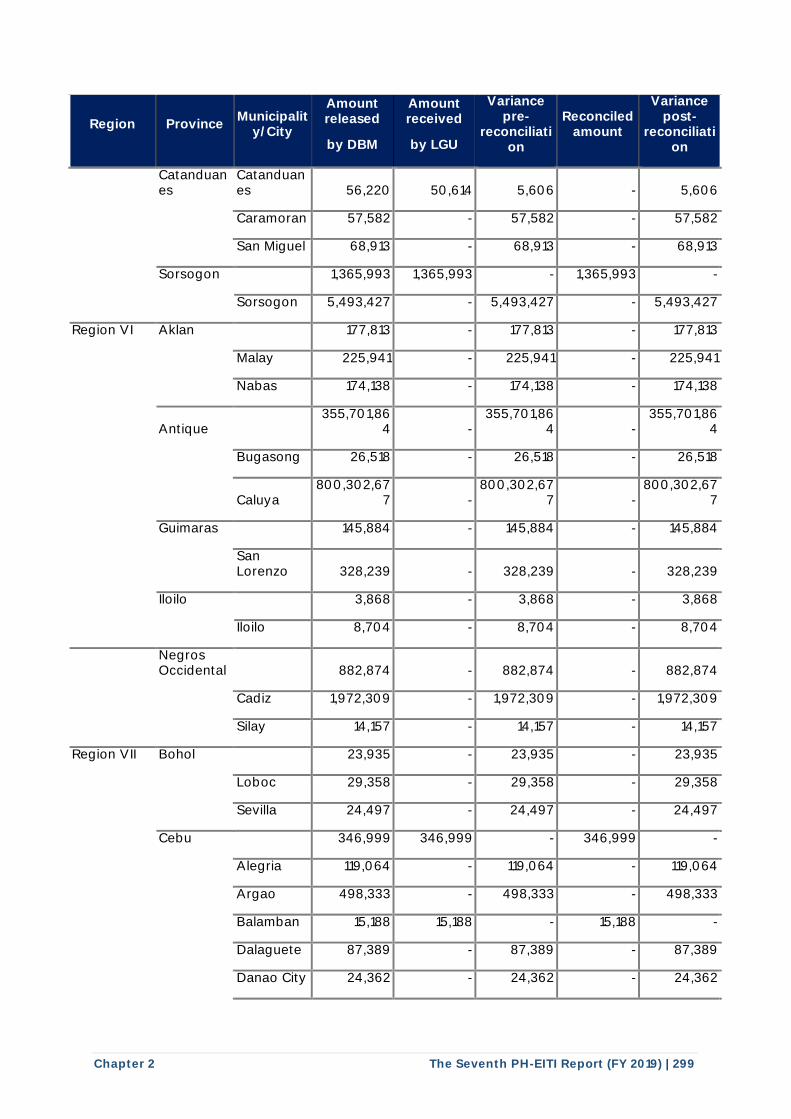
Chapter 2 The Seventh PH-EITI Report (FY 2019) | 299
Region Province Municipalit
y/City
Amount released
by DBM
Amount received
by LGU
Variance pre-
reconciliation
Reconciled amount
Variance post-
reconciliation
Catanduanes
Catanduanes 56,220 50,614 5,606 - 5,606
Caramoran 57,582 - 57,582 - 57,582
San Miguel 68,913 - 68,913 - 68,913
Sorsogon 1,365,993 1,365,993 - 1,365,993 -
Sorsogon 5,493,427 - 5,493,427 - 5,493,427
Region VI Aklan 177,813 - 177,813 - 177,813
Malay 225,941 - 225,941 - 225,941
Nabas 174,138 - 174,138 - 174,138
Antique 355,701,86
4 - 355,701,86
4 - 355,701,86
4
Bugasong 26,518 - 26,518 - 26,518
Caluya 800,302,67
7 - 800,302,67
7 - 800,302,67
7
Guimaras 145,884 - 145,884 - 145,884
San Lorenzo 328,239 - 328,239 - 328,239
Iloilo 3,868 - 3,868 - 3,868
Iloilo 8,704 - 8,704 - 8,704
Negros Occidental 882,874 - 882,874 - 882,874
Cadiz 1,972,309 - 1,972,309 - 1,972,309
Silay 14,157 - 14,157 - 14,157
Region VII Bohol 23,935 - 23,935 - 23,935
Loboc 29,358 - 29,358 - 29,358
Sevilla 24,497 - 24,497 - 24,497
Cebu 346,999 346,999 - 346,999 -
Alegria 119,064 - 119,064 - 119,064
Argao 498,333 - 498,333 - 498,333
Balamban 15,188 15,188 - 15,188 -
Dalaguete 87,389 - 87,389 - 87,389
Danao City 24,362 - 24,362 - 24,362
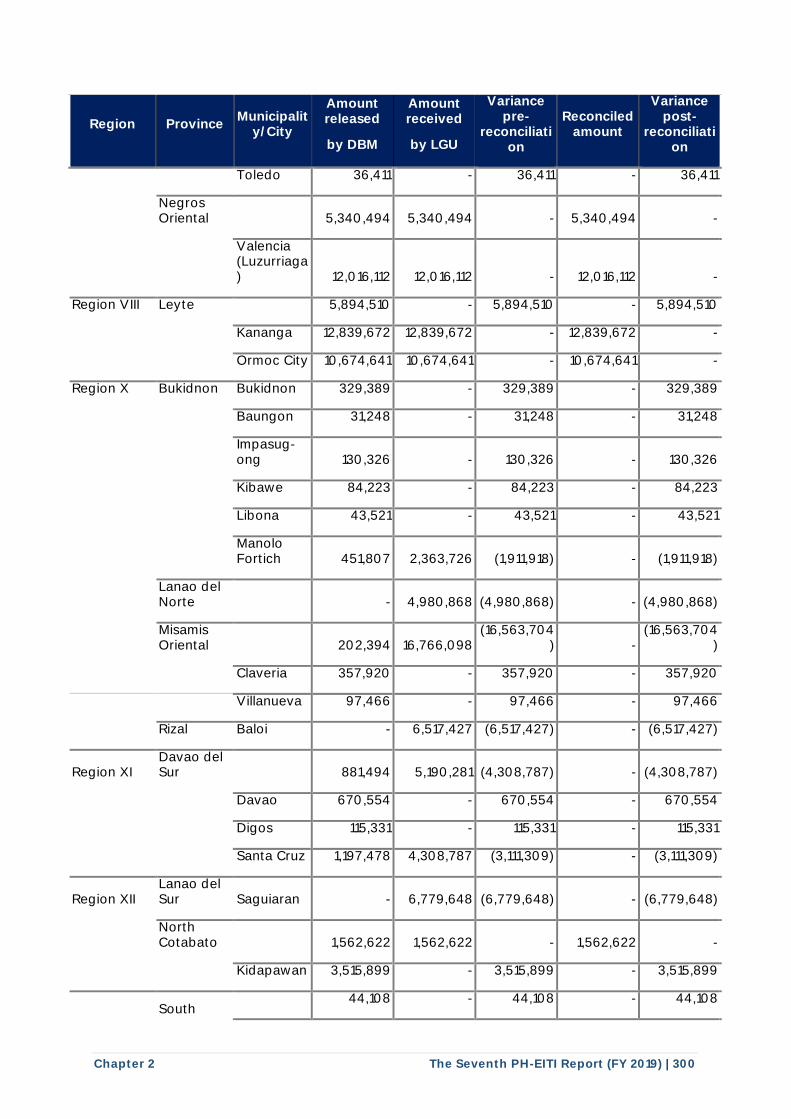
Chapter 2 The Seventh PH-EITI Report (FY 2019) | 300
Region Province Municipalit
y/City
Amount released
by DBM
Amount received
by LGU
Variance pre-
reconciliation
Reconciled amount
Variance post-
reconciliation
Toledo 36,411 - 36,411 - 36,411
Negros Oriental 5,340,494 5,340,494 - 5,340,494 -
Valencia (Luzurriaga) 12,016,112 12,016,112 - 12,016,112 -
Region VIII Leyte 5,894,510 - 5,894,510 - 5,894,510
Kananga 12,839,672 12,839,672 - 12,839,672 -
Ormoc City 10,674,641 10,674,641 - 10,674,641 -
Region X Bukidnon Bukidnon 329,389 - 329,389 - 329,389
Baungon 31,248 - 31,248 - 31,248
Impasug-ong 130,326 - 130,326 - 130,326
Kibawe 84,223 - 84,223 - 84,223
Libona 43,521 - 43,521 - 43,521
Manolo Fortich 451,807 2,363,726 (1,911,918) - (1,911,918)
Lanao del Norte - 4,980,868 (4,980,868) - (4,980,868)
Misamis Oriental 202,394 16,766,098
(16,563,704) -
(16,563,704)
Claveria 357,920 - 357,920 - 357,920
Villanueva 97,466 - 97,466 - 97,466
Rizal Baloi - 6,517,427 (6,517,427) - (6,517,427)
Region XI Davao del Sur 881,494 5,190,281 (4,308,787) - (4,308,787)
Davao 670,554 - 670,554 - 670,554
Digos 115,331 - 115,331 - 115,331
Santa Cruz 1,197,478 4,308,787 (3,111,309) - (3,111,309)
Region XII Lanao del Sur Saguiaran - 6,779,648 (6,779,648) - (6,779,648)
North Cotabato 1,562,622 1,562,622 - 1,562,622 -
Kidapawan 3,515,899 - 3,515,899 - 3,515,899
South
44,108 - 44,108 - 44,108
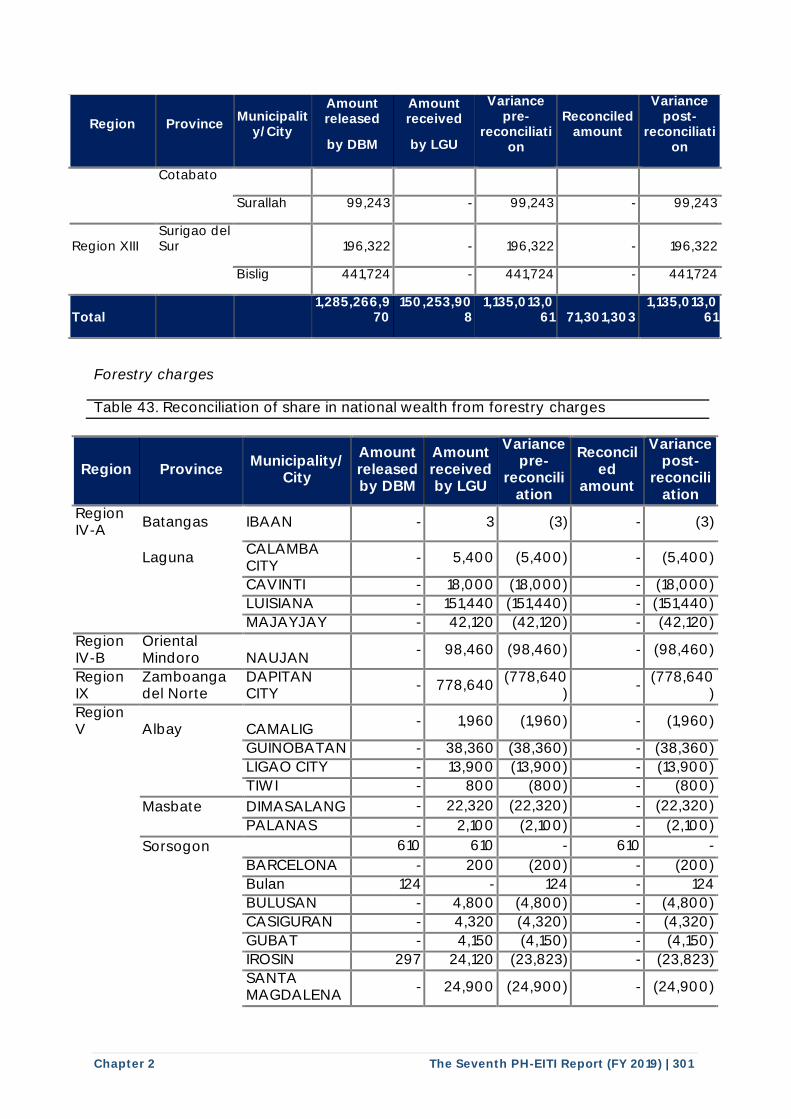
Chapter 2 The Seventh PH-EITI Report (FY 2019) | 301
Region Province Municipalit
y/City
Amount released
by DBM
Amount received
by LGU
Variance pre-
reconciliation
Reconciled amount
Variance post-
reconciliation
Cotabato
Surallah 99,243 - 99,243 - 99,243
Region XIII Surigao del Sur 196,322 - 196,322 - 196,322
Bislig 441,724 - 441,724 - 441,724
Total 1,285,266,9
70 150,253,90
8 1,135,013,0
61 71,301,303 1,135,013,0
61
Forestry charges Table 43. Reconciliation of share in national wealth from forestry charges
Region Province Municipality/
City
Amount released by DBM
Amount received by LGU
Variance pre-
reconciliation
Reconciled
amount
Variance post-
reconciliation
Region IV-A
Batangas IBAAN - 3 (3) - (3)
Laguna CALAMBA CITY
- 5,400 (5,400) - (5,400)
CAVINTI - 18,000 (18,000) - (18,000)
LUISIANA - 151,440 (151,440) - (151,440)
MAJAYJAY - 42,120 (42,120) - (42,120)
Region IV-B
Oriental Mindoro NAUJAN
- 98,460 (98,460) - (98,460)
Region IX
Zamboanga del Norte
DAPITAN CITY
- 778,640 (778,640
) -
(778,640)
Region V Albay CAMALIG
- 1,960 (1,960) - (1,960)
GUINOBATAN - 38,360 (38,360) - (38,360)
LIGAO CITY - 13,900 (13,900) - (13,900)
TIWI - 800 (800) - (800)
Masbate DIMASALANG - 22,320 (22,320) - (22,320)
PALANAS - 2,100 (2,100) - (2,100)
Sorsogon 610 610 - 610 -
BARCELONA - 200 (200) - (200)
Bulan 124 - 124 - 124
BULUSAN - 4,800 (4,800) - (4,800)
CASIGURAN - 4,320 (4,320) - (4,320)
GUBAT - 4,150 (4,150) - (4,150)
IROSIN 297 24,120 (23,823) - (23,823)
SANTA MAGDALENA
- 24,900 (24,900) - (24,900)
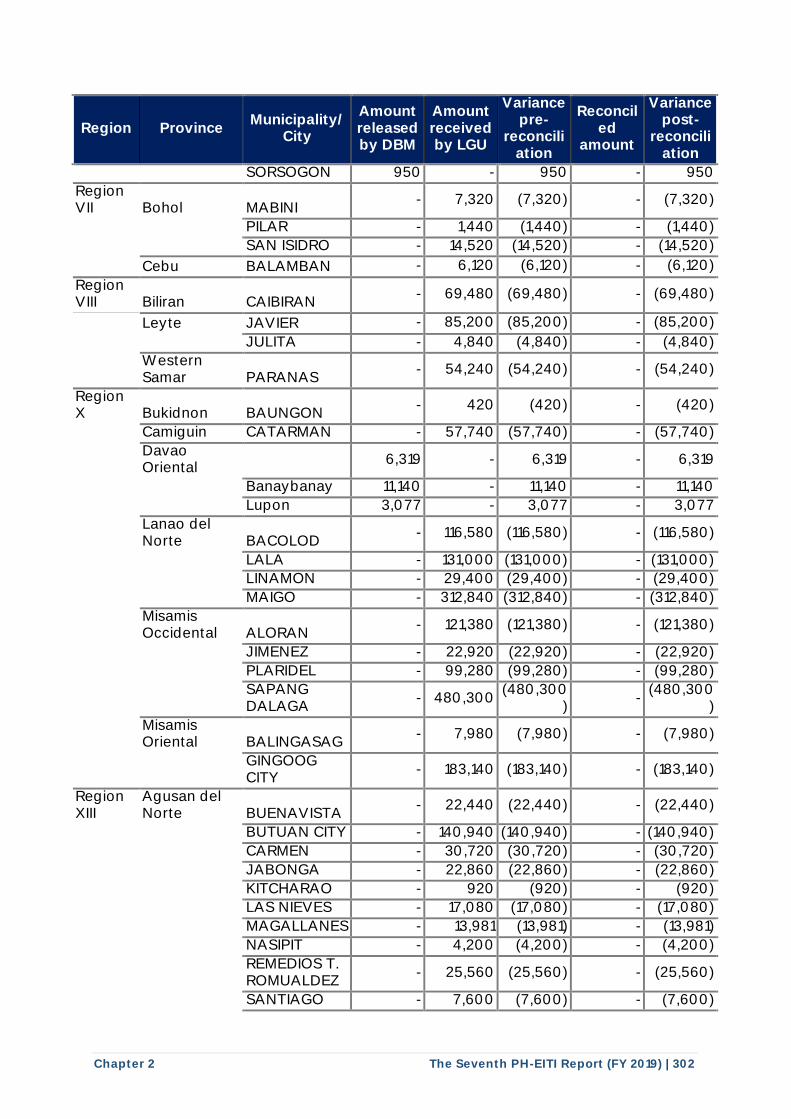
Chapter 2 The Seventh PH-EITI Report (FY 2019) | 302
Region Province Municipality/
City
Amount released by DBM
Amount received by LGU
Variance pre-
reconciliation
Reconciled
amount
Variance post-
reconciliation
SORSOGON 950 - 950 - 950
Region VII Bohol MABINI
- 7,320 (7,320) - (7,320)
PILAR - 1,440 (1,440) - (1,440)
SAN ISIDRO - 14,520 (14,520) - (14,520)
Cebu BALAMBAN - 6,120 (6,120) - (6,120)
Region VIII Biliran CAIBIRAN
- 69,480 (69,480) - (69,480)
Leyte JAVIER - 85,200 (85,200) - (85,200)
JULITA - 4,840 (4,840) - (4,840)
Western Samar PARANAS
- 54,240 (54,240) - (54,240)
Region X Bukidnon BAUNGON
- 420 (420) - (420)
Camiguin CATARMAN - 57,740 (57,740) - (57,740)
Davao Oriental
6,319 - 6,319 - 6,319
Banaybanay 11,140 - 11,140 - 11,140
Lupon 3,077 - 3,077 - 3,077
Lanao del Norte BACOLOD
- 116,580 (116,580) - (116,580)
LALA - 131,000 (131,000) - (131,000)
LINAMON - 29,400 (29,400) - (29,400)
MAIGO - 312,840 (312,840) - (312,840)
Misamis Occidental ALORAN
- 121,380 (121,380) - (121,380)
JIMENEZ - 22,920 (22,920) - (22,920)
PLARIDEL - 99,280 (99,280) - (99,280)
SAPANG DALAGA
- 480,300 (480,300
) -
(480,300)
Misamis Oriental BALINGASAG
- 7,980 (7,980) - (7,980)
GINGOOG CITY
- 183,140 (183,140) - (183,140)
Region XIII
Agusan del Norte BUENAVISTA
- 22,440 (22,440) - (22,440)
BUTUAN CITY - 140,940 (140,940) - (140,940)
CARMEN - 30,720 (30,720) - (30,720)
JABONGA - 22,860 (22,860) - (22,860)
KITCHARAO - 920 (920) - (920)
LAS NIEVES - 17,080 (17,080) - (17,080)
MAGALLANES - 13,981 (13,981) - (13,981)
NASIPIT - 4,200 (4,200) - (4,200)
REMEDIOS T. ROMUALDEZ
- 25,560 (25,560) - (25,560)
SANTIAGO - 7,600 (7,600) - (7,600)
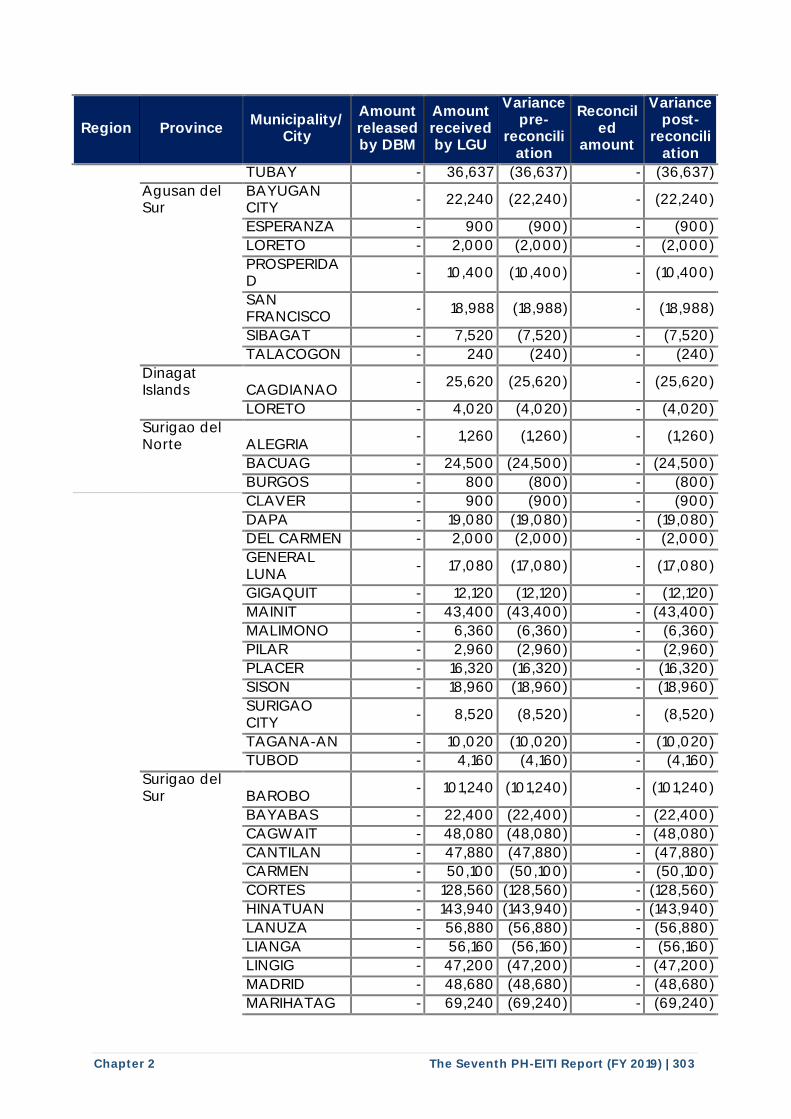
Chapter 2 The Seventh PH-EITI Report (FY 2019) | 303
Region Province Municipality/
City
Amount released by DBM
Amount received by LGU
Variance pre-
reconciliation
Reconciled
amount
Variance post-
reconciliation
TUBAY - 36,637 (36,637) - (36,637)
Agusan del Sur
BAYUGAN CITY
- 22,240 (22,240) - (22,240)
ESPERANZA - 900 (900) - (900)
LORETO - 2,000 (2,000) - (2,000)
PROSPERIDAD
- 10,400 (10,400) - (10,400)
SAN FRANCISCO
- 18,988 (18,988) - (18,988)
SIBAGAT - 7,520 (7,520) - (7,520)
TALACOGON - 240 (240) - (240)
Dinagat Islands CAGDIANAO
- 25,620 (25,620) - (25,620)
LORETO - 4,020 (4,020) - (4,020)
Surigao del Norte ALEGRIA
- 1,260 (1,260) - (1,260)
BACUAG - 24,500 (24,500) - (24,500)
BURGOS - 800 (800) - (800)
CLAVER - 900 (900) - (900)
DAPA - 19,080 (19,080) - (19,080)
DEL CARMEN - 2,000 (2,000) - (2,000)
GENERAL LUNA
- 17,080 (17,080) - (17,080)
GIGAQUIT - 12,120 (12,120) - (12,120)
MAINIT - 43,400 (43,400) - (43,400)
MALIMONO - 6,360 (6,360) - (6,360)
PILAR - 2,960 (2,960) - (2,960)
PLACER - 16,320 (16,320) - (16,320)
SISON - 18,960 (18,960) - (18,960)
SURIGAO CITY
- 8,520 (8,520) - (8,520)
TAGANA-AN - 10,020 (10,020) - (10,020)
TUBOD - 4,160 (4,160) - (4,160)
Surigao del Sur BAROBO
- 101,240 (101,240) - (101,240)
BAYABAS - 22,400 (22,400) - (22,400)
CAGWAIT - 48,080 (48,080) - (48,080)
CANTILAN - 47,880 (47,880) - (47,880)
CARMEN - 50,100 (50,100) - (50,100)
CORTES - 128,560 (128,560) - (128,560)
HINATUAN - 143,940 (143,940) - (143,940)
LANUZA - 56,880 (56,880) - (56,880)
LIANGA - 56,160 (56,160) - (56,160)
LINGIG - 47,200 (47,200) - (47,200)
MADRID - 48,680 (48,680) - (48,680)
MARIHATAG - 69,240 (69,240) - (69,240)
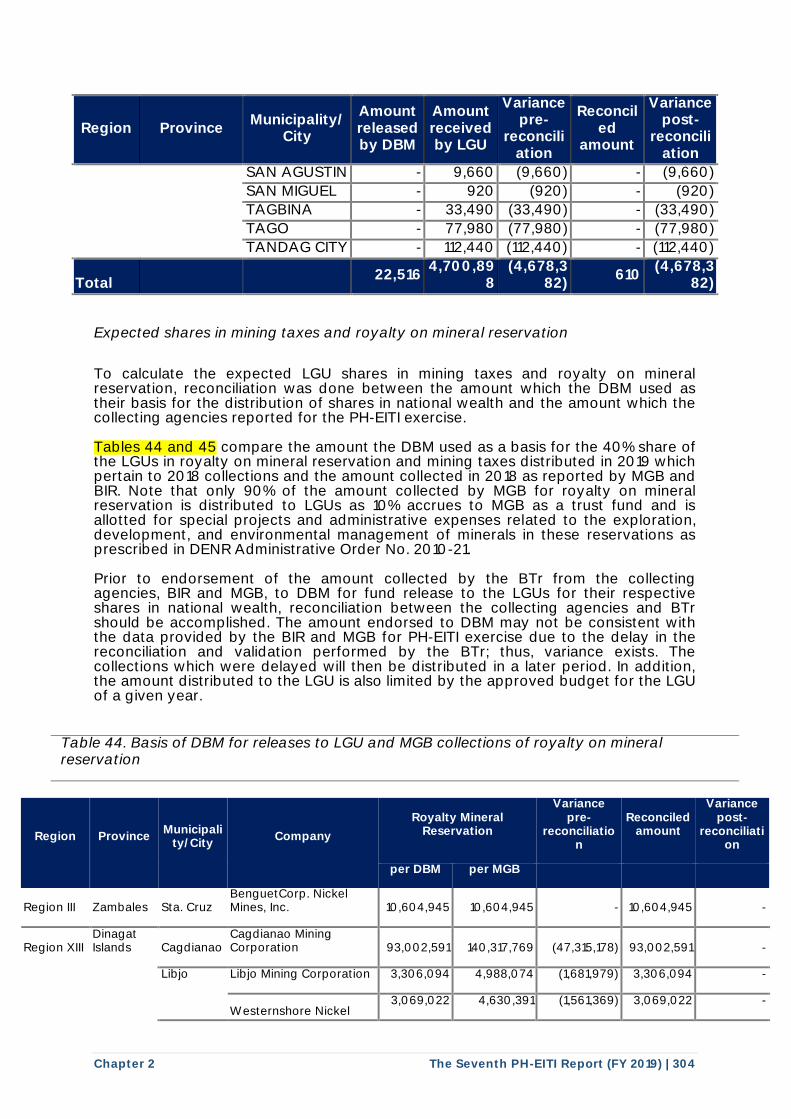
Chapter 2 The Seventh PH-EITI Report (FY 2019) | 304
Region Province Municipality/
City
Amount released by DBM
Amount received by LGU
Variance pre-
reconciliation
Reconciled
amount
Variance post-
reconciliation
SAN AGUSTIN - 9,660 (9,660) - (9,660)
SAN MIGUEL - 920 (920) - (920)
TAGBINA - 33,490 (33,490) - (33,490)
TAGO - 77,980 (77,980) - (77,980)
TANDAG CITY - 112,440 (112,440) - (112,440)
Total 22,516
4,700,898
(4,678,382)
610 (4,678,3
82)
Expected shares in mining taxes and royalty on mineral reservation
To calculate the expected LGU shares in mining taxes and royalty on mineral reservation, reconciliation was done between the amount which the DBM used as their basis for the distribution of shares in national wealth and the amount which the collecting agencies reported for the PH-EITI exercise. Tables 44 and 45 compare the amount the DBM used as a basis for the 40% share of the LGUs in royalty on mineral reservation and mining taxes distributed in 2019 which pertain to 2018 collections and the amount collected in 2018 as reported by MGB and BIR. Note that only 90% of the amount collected by MGB for royalty on mineral reservation is distributed to LGUs as 10% accrues to MGB as a trust fund and is allotted for special projects and administrative expenses related to the exploration, development, and environmental management of minerals in these reservations as prescribed in DENR Administrative Order No. 2010-21. Prior to endorsement of the amount collected by the BTr from the collecting agencies, BIR and MGB, to DBM for fund release to the LGUs for their respective shares in national wealth, reconciliation between the collecting agencies and BTr should be accomplished. The amount endorsed to DBM may not be consistent with the data provided by the BIR and MGB for PH-EITI exercise due to the delay in the reconciliation and validation performed by the BTr; thus, variance exists. The collections which were delayed will then be distributed in a later period. In addition, the amount distributed to the LGU is also limited by the approved budget for the LGU of a given year.
Table 44. Basis of DBM for releases to LGU and MGB collections of royalty on mineral reservation
Region Province Municipali
ty/City Company
Royalty Mineral Reservation
Variance pre-
reconciliation
Reconciled amount
Variance post-
reconciliation
per DBM per MGB
Region III Zambales Sta. Cruz BenguetCorp. Nickel Mines, Inc. 10,604,945 10,604,945 - 10,604,945 -
Region XIII Dinagat Islands Cagdianao
Cagdianao Mining Corporation 93,002,591 140,317,769 (47,315,178) 93,002,591 -
Libjo Libjo Mining Corporation 3,306,094 4,988,074 (1,681,979) 3,306,094 -
Westernshore Nickel
3,069,022 4,630,391 (1,561,369) 3,069,022 -
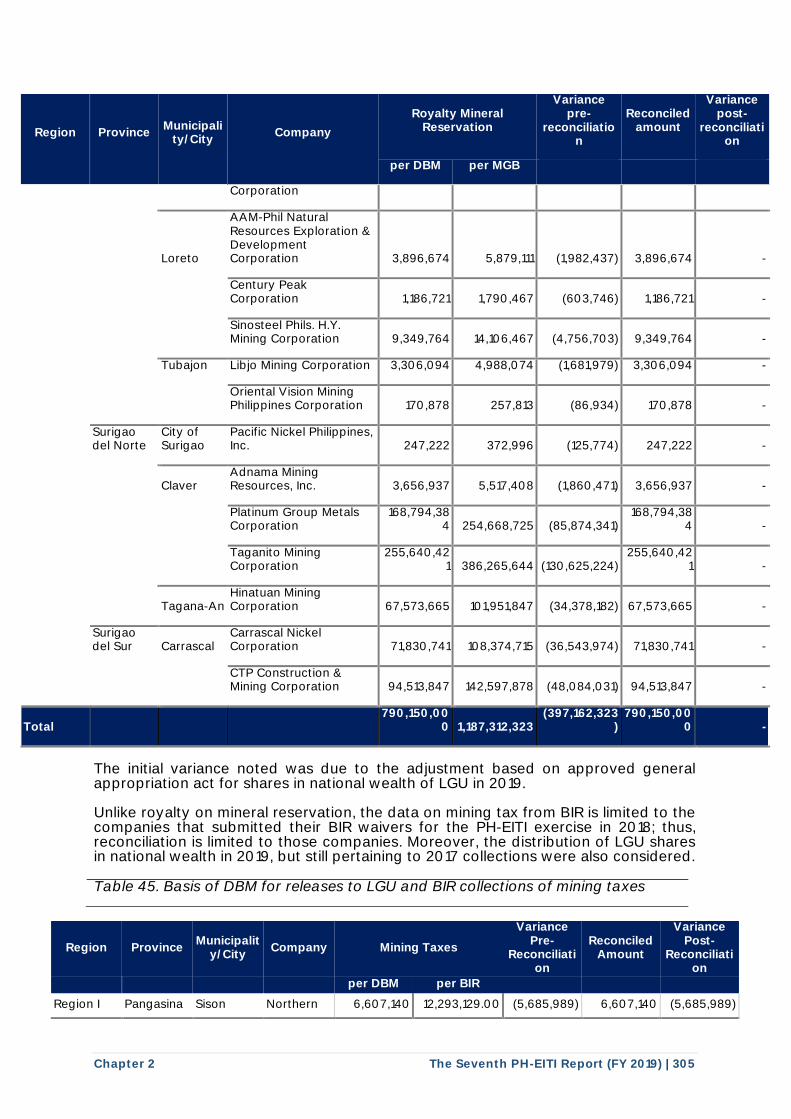
Chapter 2 The Seventh PH-EITI Report (FY 2019) | 305
Region Province Municipali
ty/City Company
Royalty Mineral Reservation
Variance pre-
reconciliation
Reconciled amount
Variance post-
reconciliation
per DBM per MGB
Corporation
Loreto
AAM-Phil Natural Resources Exploration & Development Corporation 3,896,674 5,879,111 (1,982,437) 3,896,674 -
Century Peak Corporation 1,186,721 1,790,467 (603,746) 1,186,721 -
Sinosteel Phils. H.Y. Mining Corporation 9,349,764 14,106,467 (4,756,703) 9,349,764 -
Tubajon Libjo Mining Corporation 3,306,094 4,988,074 (1,681,979) 3,306,094 -
Oriental Vision Mining Philippines Corporation 170,878 257,813 (86,934) 170,878 -
Surigao del Norte
City of Surigao
Pacific Nickel Philippines, Inc. 247,222 372,996 (125,774) 247,222 -
Claver Adnama Mining Resources, Inc. 3,656,937 5,517,408 (1,860,471) 3,656,937 -
Platinum Group Metals Corporation
168,794,384 254,668,725 (85,874,341)
168,794,384 -
Taganito Mining Corporation
255,640,421 386,265,644 (130,625,224)
255,640,421 -
Tagana-An Hinatuan Mining Corporation 67,573,665 101,951,847 (34,378,182) 67,573,665 -
Surigao del Sur Carrascal
Carrascal Nickel Corporation 71,830,741 108,374,715 (36,543,974) 71,830,741 -
CTP Construction & Mining Corporation 94,513,847 142,597,878 (48,084,031) 94,513,847 -
Total 790,150,00
0 1,187,312,323 (397,162,323
) 790,150,00
0 -
The initial variance noted was due to the adjustment based on approved general appropriation act for shares in national wealth of LGU in 2019. Unlike royalty on mineral reservation, the data on mining tax from BIR is limited to the companies that submitted their BIR waivers for the PH-EITI exercise in 2018; thus, reconciliation is limited to those companies. Moreover, the distribution of LGU shares in national wealth in 2019, but still pertaining to 2017 collections were also considered. Table 45. Basis of DBM for releases to LGU and BIR collections of mining taxes
Region Province Municipalit
y/City Company Mining Taxes
Variance Pre-
Reconciliation
Reconciled Amount
Variance Post-
Reconciliation
per DBM per BIR
Region I Pangasina Sison Northern 6,607,140 12,293,129.00 (5,685,989) 6,607,140 (5,685,989)
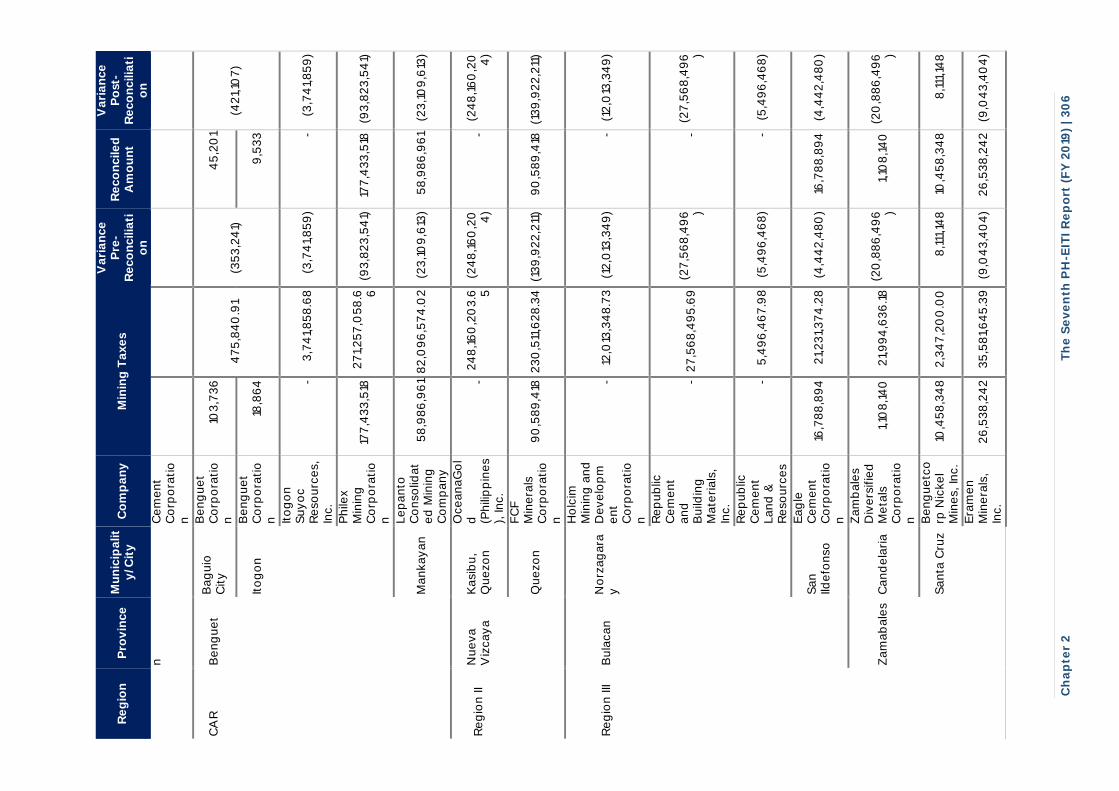
Ch
ap
ter
2
T
he
Se
ve
nth
PH
-EIT
I R
ep
ort
(F
Y 2
019
) | 3
06
Re
gio
n
Pro
vin
ce
M
un
icip
alit
y/C
ity
C
om
pa
ny
M
inin
g T
ax
es
Va
ria
nce
P
re-
Re
co
ncilia
tio
n
Re
co
ncile
d
Am
ou
nt
Va
ria
nce
P
ost-
Re
co
ncilia
tio
n
n
Ce
me
nt
Co
rpo
rati
on
CA
R
Be
ng
ue
t B
ag
uio
C
ity
Be
ng
ue
t C
orp
ora
tio
n
103
,73
6
47
5,8
40
.91
(35
3,2
41)
45
,20
1
(42
1,10
7)
Ito
go
n
Be
ng
ue
t C
orp
ora
tio
n
18,8
64
9
,53
3
Ito
go
n
Su
yo
c
Re
sou
rce
s,
Inc.
- 3
,74
1,8
58
.68
(3
,74
1,8
59
) -
(3,7
41,
85
9)
Ph
ilex
Min
ing
C
orp
ora
tio
n
177
,43
3,5
18
27
1,2
57
,05
8.6 6
(9
3,8
23
,54
1)
177
,43
3,5
18
(93
,82
3,5
41)
M
an
kay
an
Le
pan
to
Co
nso
lidat
ed
Min
ing
C
om
pan
y
58
,98
6,9
61
82
,09
6,5
74
.02
(23
,10
9,6
13)
58
,98
6,9
61
(23
,10
9,6
13)
Re
gio
n II
Nu
eva
Viz
cay
a
Kasi
bu
, Q
ue
zo
n
Oce
an
aG
ol
d
(Ph
ilip
pin
es
), In
c.
- 2
48
,16
0,2
03
.6 5
(24
8,1
60
,20 4)
- (2
48
,16
0,2
0 4)
Qu
ezo
n
FC
F
Min
era
ls
Co
rpo
rati
on
90
,58
9,4
18 2
30
,511
,62
8.3
4
(13
9,9
22
,211
) 9
0,5
89
,418
(1
39
,92
2,2
11)
Re
gio
n III
Bu
lacan
N
orz
ag
ara
y
Ho
lcim
M
inin
g a
nd
D
eve
lop
me
nt
Co
rpo
rati
on
- 12
,013
,34
8.7
3
(12
,013
,34
9)
- (1
2,0
13,3
49
)
Re
pu
blic
C
em
en
t an
d
Bu
ildin
g
Mate
rials
, In
c.
- 2
7,5
68
,49
5.6
9
(27
,56
8,4
96 )
- (2
7,5
68
,49
6 )
Re
pu
blic
C
em
en
t Lan
d &
R
eso
urc
es
- 5
,49
6,4
67
.98
(5
,49
6,4
68
) -
(5,4
96
,46
8)
San
Ild
efo
nso
Eag
le
Ce
me
nt
Co
rpo
rati
on
16,7
88
,89
4
21,
23
1,3
74
.28
(4
,44
2,4
80
) 16
,78
8,8
94
(4
,44
2,4
80
)
Zam
ab
ale
s C
an
de
lari
a
Zam
bale
s D
ive
rsifie
d
Me
tals
C
orp
ora
tio
n
1,10
8,1
40
2
1,9
94
,63
6.1
8
(20
,88
6,4
96 )
1,10
8,1
40
(2
0,8
86
,49
6 )
San
ta C
ruz
Be
ng
ue
tco
rp N
icke
l M
ine
s, In
c.
10,4
58
,34
8
2,3
47
,20
0.0
0
8,1
11,1
48
10
,45
8,3
48
8
,111
,14
8
E
ram
en
M
ine
rals
, In
c.
26
,53
8,2
42
3
5,5
81,
64
5.3
9
(9,0
43,4
04
) 2
6,5
38
,24
2
(9,0
43,4
04
)
•i • ' I I I I I I I I • •
• • • • I I I I I I I • • •
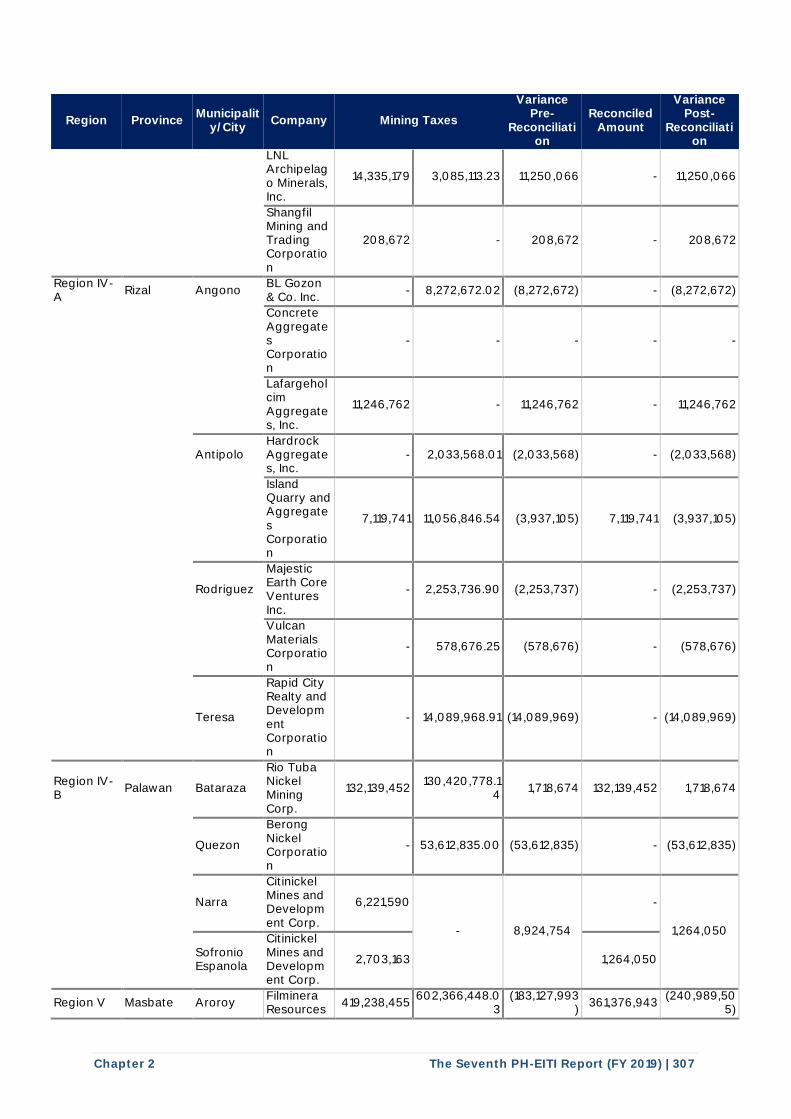
Chapter 2 The Seventh PH-EITI Report (FY 2019) | 307
Region Province Municipalit
y/City Company Mining Taxes
Variance Pre-
Reconciliation
Reconciled Amount
Variance Post-
Reconciliation
LNL Archipelago Minerals, Inc.
14,335,179 3,085,113.23 11,250,066 - 11,250,066
Shangfil Mining and Trading Corporation
208,672 - 208,672 - 208,672
Region IV-A
Rizal Angono BL Gozon & Co. Inc.
- 8,272,672.02 (8,272,672) - (8,272,672)
Concrete Aggregates Corporation
- - - - -
Lafargeholcim Aggregates, Inc.
11,246,762 - 11,246,762 - 11,246,762
Antipolo
Hardrock Aggregates, Inc.
- 2,033,568.01 (2,033,568) - (2,033,568)
Island Quarry and Aggregates Corporation
7,119,741 11,056,846.54 (3,937,105) 7,119,741 (3,937,105)
Rodriguez
Majestic Earth Core Ventures Inc.
- 2,253,736.90 (2,253,737) - (2,253,737)
Vulcan Materials Corporation
- 578,676.25 (578,676) - (578,676)
Teresa
Rapid City Realty and Development Corporation
- 14,089,968.91 (14,089,969) - (14,089,969)
Region IV-B
Palawan Bataraza
Rio Tuba Nickel Mining Corp.
132,139,452 130,420,778.1
4 1,718,674 132,139,452 1,718,674
Quezon
Berong Nickel Corporation
- 53,612,835.00 (53,612,835) - (53,612,835)
Narra
Citinickel Mines and Development Corp.
6,221,590
- 8,924,754
-
1,264,050
Sofronio Espanola
Citinickel Mines and Development Corp.
2,703,163 1,264,050
Region V Masbate Aroroy Filminera Resources
419,238,455 602,366,448.0
3 (183,127,993
) 361,376,943
(240,989,505)
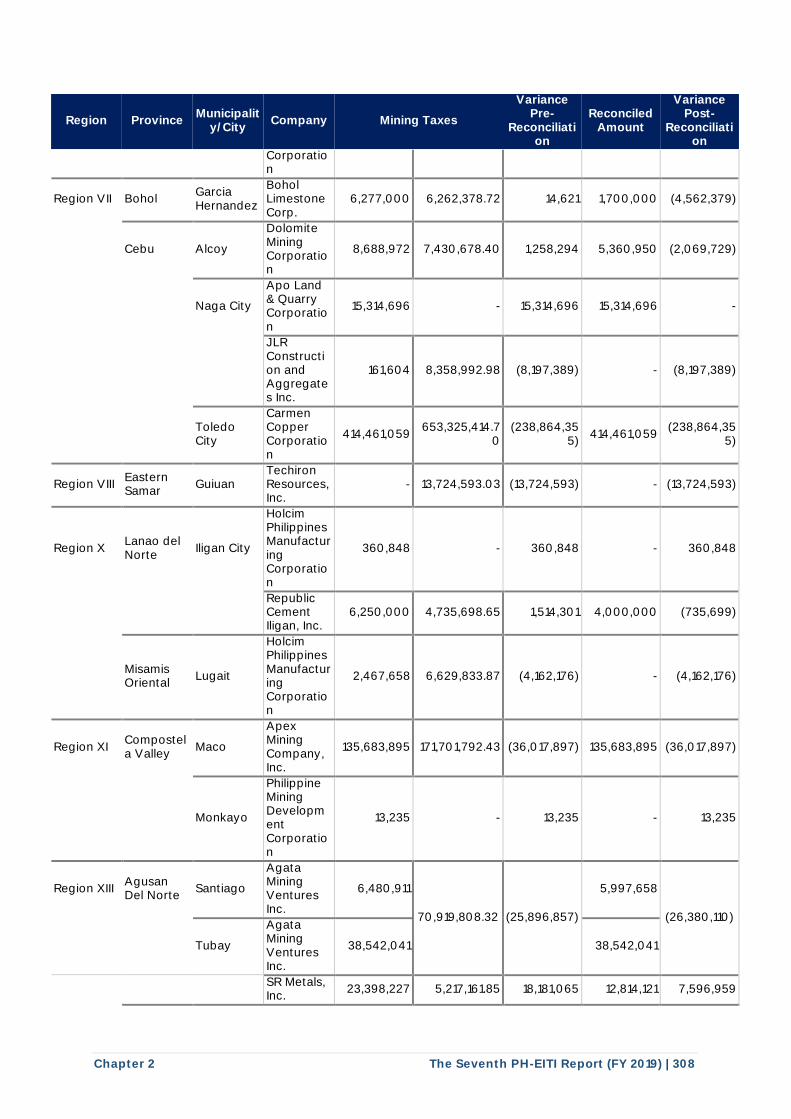
Chapter 2 The Seventh PH-EITI Report (FY 2019) | 308
Region Province Municipalit
y/City Company Mining Taxes
Variance Pre-
Reconciliation
Reconciled Amount
Variance Post-
Reconciliation
Corporation
Region VII Bohol Garcia Hernandez
Bohol Limestone Corp.
6,277,000 6,262,378.72 14,621 1,700,000 (4,562,379)
Cebu Alcoy
Dolomite Mining Corporation
8,688,972 7,430,678.40 1,258,294 5,360,950 (2,069,729)
Naga City
Apo Land & Quarry Corporation
15,314,696 - 15,314,696 15,314,696 -
JLR Construction and Aggregates Inc.
161,604 8,358,992.98 (8,197,389) - (8,197,389)
Toledo City
Carmen Copper Corporation
414,461,059 653,325,414.7
0 (238,864,35
5) 414,461,059
(238,864,355)
Region VIII Eastern Samar
Guiuan Techiron Resources, Inc.
- 13,724,593.03 (13,724,593) - (13,724,593)
Region X Lanao del Norte
Iligan City
Holcim Philippines Manufacturing Corporation
360,848 - 360,848 - 360,848
Republic Cement Iligan, Inc.
6,250,000 4,735,698.65 1,514,301 4,000,000 (735,699)
Misamis Oriental
Lugait
Holcim Philippines Manufacturing Corporation
2,467,658 6,629,833.87 (4,162,176) - (4,162,176)
Region XI Compostela Valley
Maco
Apex Mining Company, Inc.
135,683,895 171,701,792.43 (36,017,897) 135,683,895 (36,017,897)
Monkayo
Philippine Mining Development Corporation
13,235 - 13,235 - 13,235
Region XIII Agusan Del Norte
Santiago
Agata Mining Ventures Inc.
6,480,911
70,919,808.32 (25,896,857)
5,997,658
(26,380,110)
Tubay
Agata Mining Ventures Inc.
38,542,041 38,542,041
SR Metals, Inc.
23,398,227 5,217,161.85 18,181,065 12,814,121 7,596,959 I I
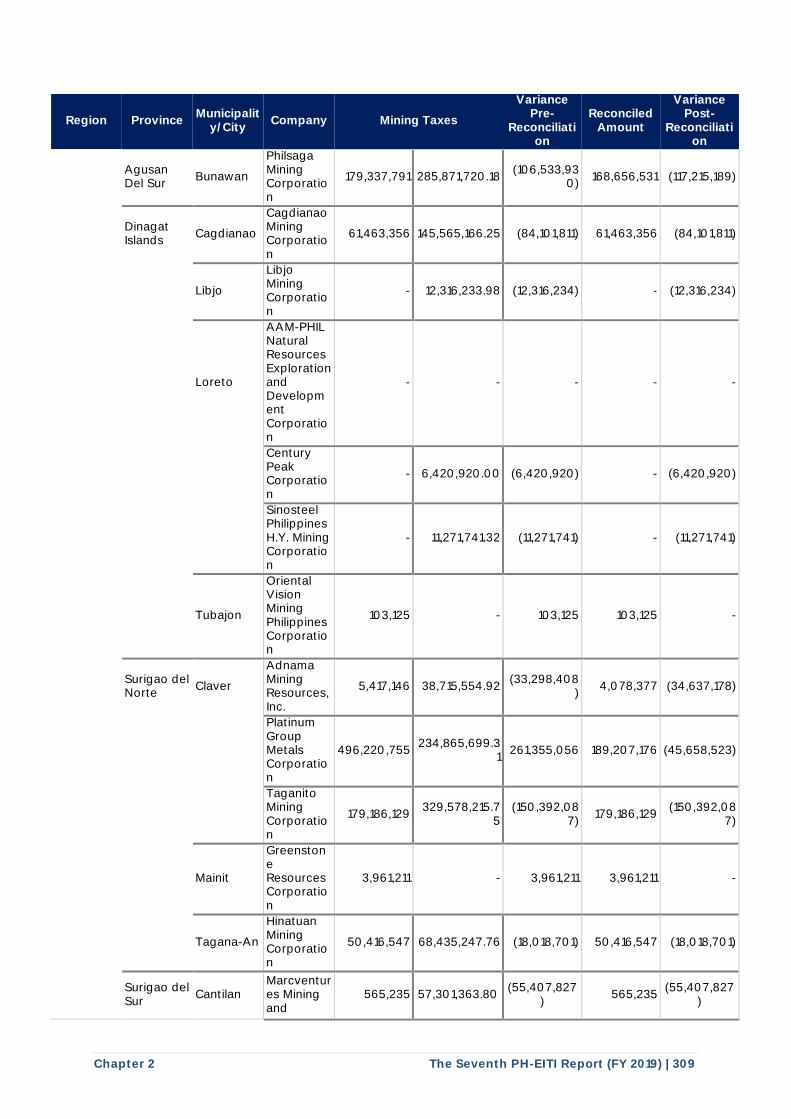
Chapter 2 The Seventh PH-EITI Report (FY 2019) | 309
Region Province Municipalit
y/City Company Mining Taxes
Variance Pre-
Reconciliation
Reconciled Amount
Variance Post-
Reconciliation
Agusan Del Sur
Bunawan
Philsaga Mining Corporation
179,337,791 285,871,720.18 (106,533,93
0) 168,656,531 (117,215,189)
Dinagat Islands
Cagdianao
Cagdianao Mining Corporation
61,463,356 145,565,166.25 (84,101,811) 61,463,356 (84,101,811)
Libjo
Libjo Mining Corporation
- 12,316,233.98 (12,316,234) - (12,316,234)
Loreto
AAM-PHIL Natural Resources Exploration and Development Corporation
- - - - -
Century Peak Corporation
- 6,420,920.00 (6,420,920) - (6,420,920)
Sinosteel Philippines H.Y. Mining Corporation
- 11,271,741.32 (11,271,741) - (11,271,741)
Tubajon
Oriental Vision Mining Philippines Corporation
103,125 - 103,125 103,125 -
Surigao del Norte
Claver
Adnama Mining Resources, Inc.
5,417,146 38,715,554.92 (33,298,408
) 4,078,377 (34,637,178)
Platinum Group Metals Corporation
496,220,755 234,865,699.3
1 261,355,056 189,207,176 (45,658,523)
Taganito Mining Corporation
179,186,129 329,578,215.7
5 (150,392,08
7) 179,186,129
(150,392,087)
Mainit
Greenstone Resources Corporation
3,961,211 - 3,961,211 3,961,211 -
Tagana-An
Hinatuan Mining Corporation
50,416,547 68,435,247.76 (18,018,701) 50,416,547 (18,018,701)
Surigao del Sur
Cantilan Marcventures Mining and
565,235 57,301,363.80 (55,407,827
) 565,235
(55,407,827)
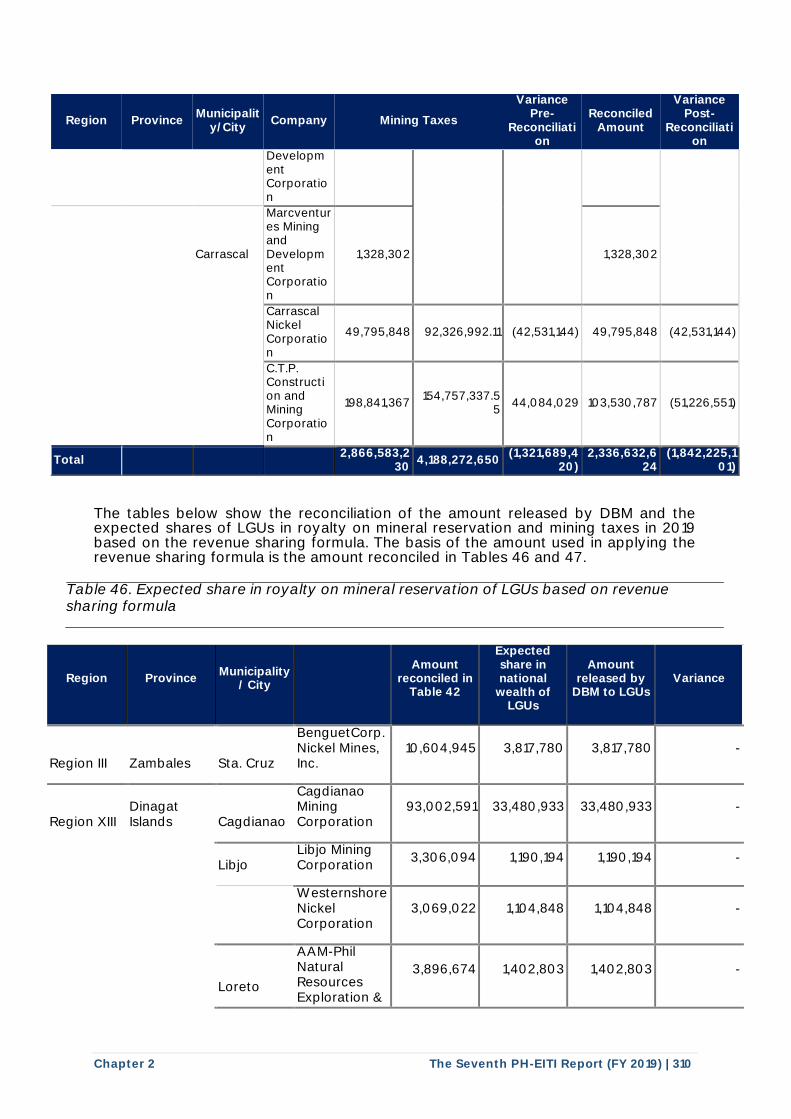
Chapter 2 The Seventh PH-EITI Report (FY 2019) | 310
Region Province Municipalit
y/City Company Mining Taxes
Variance Pre-
Reconciliation
Reconciled Amount
Variance Post-
Reconciliation
Development Corporation
Carrascal
Marcventures Mining and Development Corporation
1,328,302 1,328,302
Carrascal Nickel Corporation
49,795,848 92,326,992.11 (42,531,144) 49,795,848 (42,531,144)
C.T.P. Construction and Mining Corporation
198,841,367 154,757,337.5
5 44,084,029 103,530,787 (51,226,551)
Total 2,866,583,2
30 4,188,272,650
(1,321,689,420)
2,336,632,624
(1,842,225,101)
The tables below show the reconciliation of the amount released by DBM and the expected shares of LGUs in royalty on mineral reservation and mining taxes in 2019 based on the revenue sharing formula. The basis of the amount used in applying the revenue sharing formula is the amount reconciled in Tables 46 and 47.
Table 46. Expected share in royalty on mineral reservation of LGUs based on revenue sharing formula
Region Province Municipality
/ City
Amount
reconciled in Table 42
Expected share in national
wealth of LGUs
Amount released by
DBM to LGUs Variance
Region III Zambales Sta. Cruz
BenguetCorp. Nickel Mines, Inc.
10,604,945 3,817,780 3,817,780 -
Region XIII Dinagat Islands Cagdianao
Cagdianao Mining Corporation
93,002,591 33,480,933 33,480,933 -
Libjo Libjo Mining Corporation
3,306,094 1,190,194 1,190,194 -
Westernshore Nickel Corporation
3,069,022 1,104,848 1,104,848 -
Loreto
AAM-Phil Natural Resources Exploration &
3,896,674 1,402,803 1,402,803 -
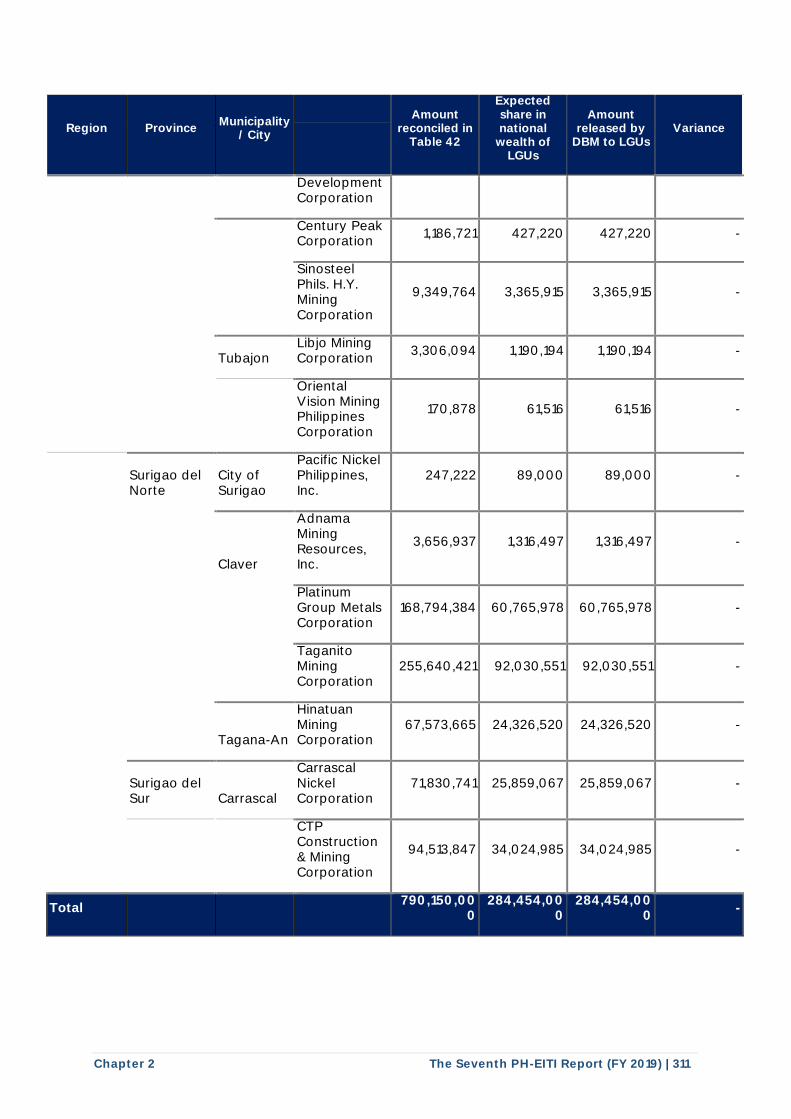
Chapter 2 The Seventh PH-EITI Report (FY 2019) | 311
Region Province Municipality
/ City
Amount
reconciled in Table 42
Expected share in national
wealth of LGUs
Amount released by
DBM to LGUs Variance
Development Corporation
Century Peak Corporation
1,186,721 427,220 427,220 -
Sinosteel Phils. H.Y. Mining Corporation
9,349,764 3,365,915 3,365,915 -
Tubajon Libjo Mining Corporation
3,306,094 1,190,194 1,190,194 -
Oriental Vision Mining Philippines Corporation
170,878 61,516 61,516 -
Surigao del Norte
City of Surigao
Pacific Nickel Philippines, Inc.
247,222 89,000 89,000 -
Claver
Adnama Mining Resources, Inc.
3,656,937 1,316,497 1,316,497 -
Platinum Group Metals Corporation
168,794,384 60,765,978 60,765,978 -
Taganito Mining Corporation
255,640,421 92,030,551 92,030,551 -
Tagana-An
Hinatuan Mining Corporation
67,573,665 24,326,520 24,326,520 -
Surigao del Sur Carrascal
Carrascal Nickel Corporation
71,830,741 25,859,067 25,859,067 -
CTP Construction & Mining Corporation
94,513,847 34,024,985 34,024,985 -
Total 790,150,00
0 284,454,00
0 284,454,00
0 -
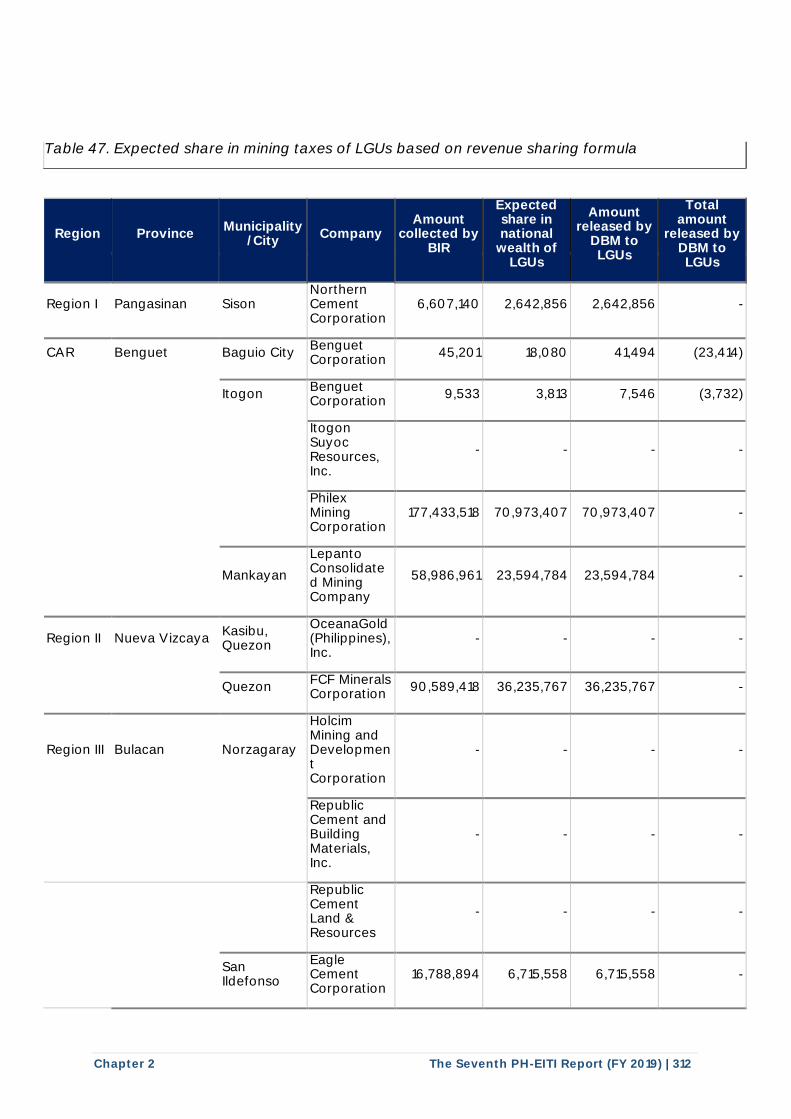
Chapter 2 The Seventh PH-EITI Report (FY 2019) | 312
Table 47. Expected share in mining taxes of LGUs based on revenue sharing formula
Region Province Municipality
/City Company
Amount collected by
BIR
Expected share in national
wealth of LGUs
Amount released by
DBM to LGUs
Total amount
released by DBM to LGUs
Region I Pangasinan Sison Northern Cement Corporation
6,607,140 2,642,856 2,642,856 -
CAR Benguet Baguio City Benguet Corporation
45,201 18,080 41,494 (23,414)
Itogon
Benguet Corporation
9,533 3,813 7,546 (3,732)
Itogon Suyoc Resources, Inc.
- - - -
Philex Mining Corporation
177,433,518 70,973,407 70,973,407 -
Mankayan
Lepanto Consolidated Mining Company
58,986,961 23,594,784 23,594,784 -
Region II Nueva Vizcaya Kasibu, Quezon
OceanaGold (Philippines), Inc.
- - - -
Quezon FCF Minerals Corporation
90,589,418 36,235,767 36,235,767 -
Region III Bulacan Norzagaray
Holcim Mining and Development Corporation
- - - -
Republic Cement and Building Materials, Inc.
- - - -
Republic Cement Land & Resources
- - - -
San Ildefonso
Eagle Cement Corporation
16,788,894 6,715,558 6,715,558 -
I I I
I I
I I
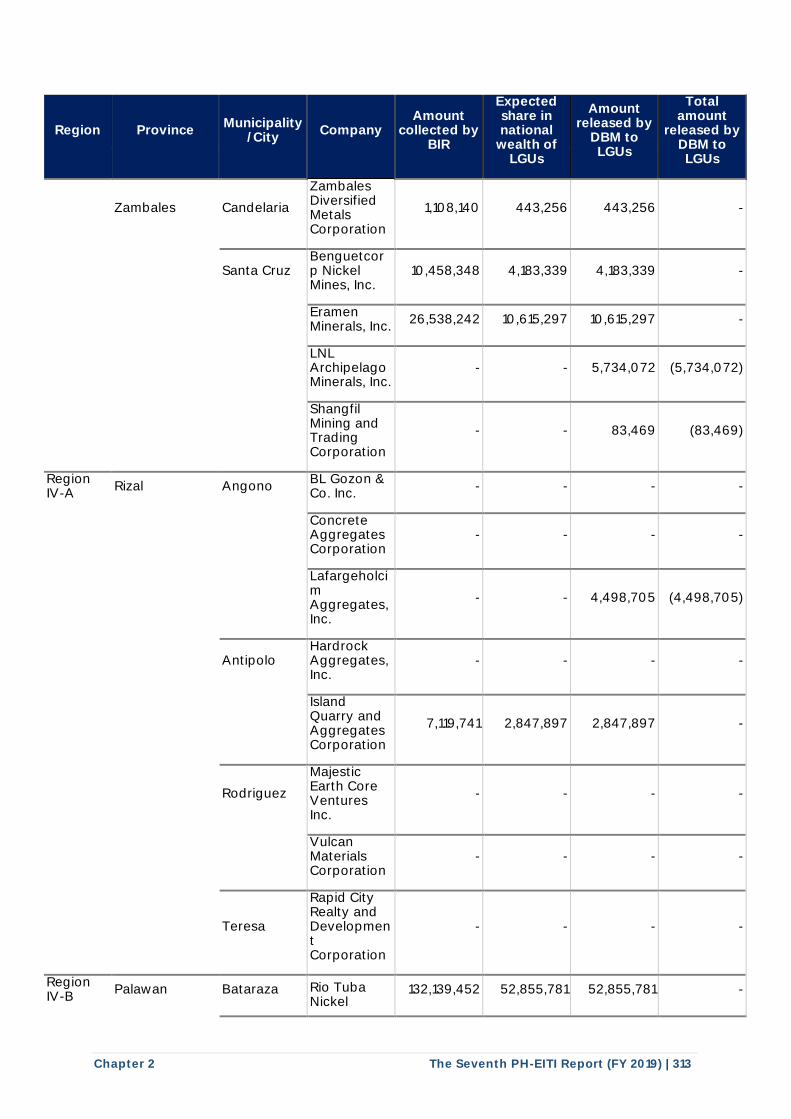
Chapter 2 The Seventh PH-EITI Report (FY 2019) | 313
Region Province Municipality
/City Company
Amount collected by
BIR
Expected share in national
wealth of LGUs
Amount released by
DBM to LGUs
Total amount
released by DBM to LGUs
Zambales Candelaria
Zambales Diversified Metals Corporation
1,108,140 443,256 443,256 -
Santa Cruz
Benguetcorp Nickel Mines, Inc.
10,458,348 4,183,339 4,183,339 -
Eramen Minerals, Inc.
26,538,242 10,615,297 10,615,297 -
LNL Archipelago Minerals, Inc.
- - 5,734,072 (5,734,072)
Shangfil Mining and Trading Corporation
- - 83,469 (83,469)
Region IV-A
Rizal Angono BL Gozon & Co. Inc.
- - - -
Concrete Aggregates Corporation
- - - -
Lafargeholcim Aggregates, Inc.
- - 4,498,705 (4,498,705)
Antipolo
Hardrock Aggregates, Inc.
- - - -
Island Quarry and Aggregates Corporation
7,119,741 2,847,897 2,847,897 -
Rodriguez
Majestic Earth Core Ventures Inc.
- - - -
Vulcan Materials Corporation
- - - -
Teresa
Rapid City Realty and Development Corporation
- - - -
Region IV-B
Palawan Bataraza Rio Tuba Nickel
132,139,452 52,855,781 52,855,781 -
I I I I I
I I
I I
I I I
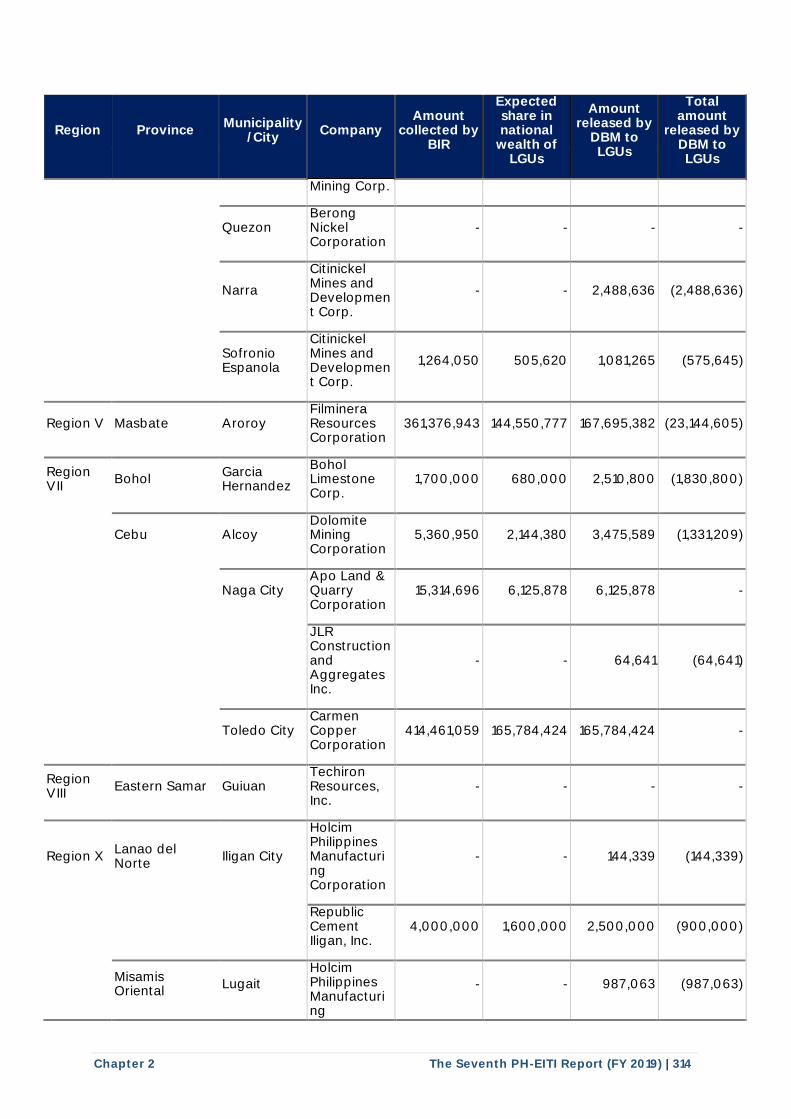
Chapter 2 The Seventh PH-EITI Report (FY 2019) | 314
Region Province Municipality
/City Company
Amount collected by
BIR
Expected share in national
wealth of LGUs
Amount released by
DBM to LGUs
Total amount
released by DBM to LGUs
Mining Corp.
Quezon Berong Nickel Corporation
- - - -
Narra
Citinickel Mines and Development Corp.
- - 2,488,636 (2,488,636)
Sofronio Espanola
Citinickel Mines and Development Corp.
1,264,050 505,620 1,081,265 (575,645)
Region V Masbate Aroroy Filminera Resources Corporation
361,376,943 144,550,777 167,695,382 (23,144,605)
Region VII
Bohol Garcia Hernandez
Bohol Limestone Corp.
1,700,000 680,000 2,510,800 (1,830,800)
Cebu Alcoy
Dolomite Mining Corporation
5,360,950 2,144,380 3,475,589 (1,331,209)
Naga City
Apo Land & Quarry Corporation
15,314,696 6,125,878 6,125,878 -
JLR Construction and Aggregates Inc.
- - 64,641 (64,641)
Toledo City Carmen Copper Corporation
414,461,059 165,784,424 165,784,424 -
Region VIII
Eastern Samar Guiuan Techiron Resources, Inc.
- - - -
Region X Lanao del Norte
Iligan City
Holcim Philippines Manufacturing Corporation
- - 144,339 (144,339)
Republic Cement Iligan, Inc.
4,000,000 1,600,000 2,500,000 (900,000)
Misamis Oriental
Lugait Holcim Philippines Manufacturing
- - 987,063 (987,063)
I I I
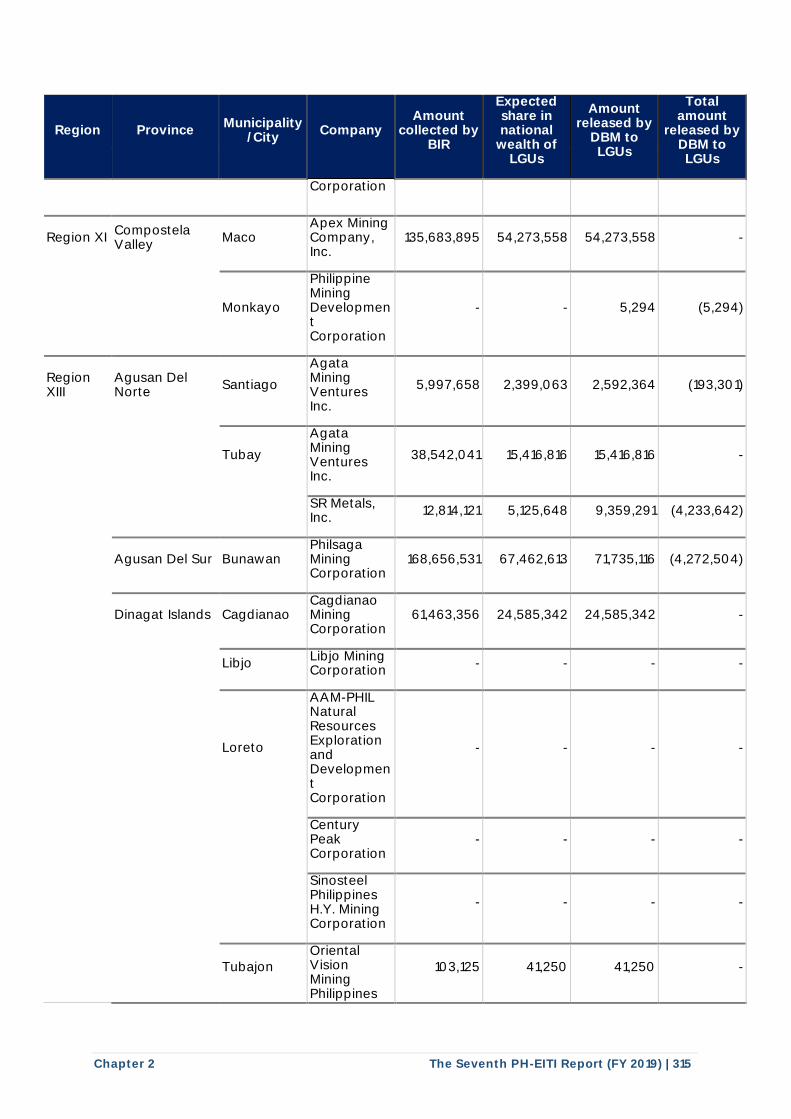
Chapter 2 The Seventh PH-EITI Report (FY 2019) | 315
Region Province Municipality
/City Company
Amount collected by
BIR
Expected share in national
wealth of LGUs
Amount released by
DBM to LGUs
Total amount
released by DBM to LGUs
Corporation
Region XI Compostela Valley
Maco Apex Mining Company, Inc.
135,683,895 54,273,558 54,273,558 -
Monkayo
Philippine Mining Development Corporation
- - 5,294 (5,294)
Region XIII
Agusan Del Norte
Santiago
Agata Mining Ventures Inc.
5,997,658 2,399,063 2,592,364 (193,301)
Tubay
Agata Mining Ventures Inc.
38,542,041 15,416,816 15,416,816 -
SR Metals, Inc.
12,814,121 5,125,648 9,359,291 (4,233,642)
Agusan Del Sur Bunawan
Philsaga Mining Corporation
168,656,531 67,462,613 71,735,116 (4,272,504)
Dinagat Islands Cagdianao
Cagdianao Mining Corporation
61,463,356 24,585,342 24,585,342 -
Libjo
Libjo Mining Corporation
- - - -
Loreto
AAM-PHIL Natural Resources Exploration and Development Corporation
- - - -
Century Peak Corporation
- - - -
Sinosteel Philippines H.Y. Mining Corporation
- - - -
Tubajon
Oriental Vision Mining Philippines
103,125 41,250 41,250 -
I I I
I I I
I
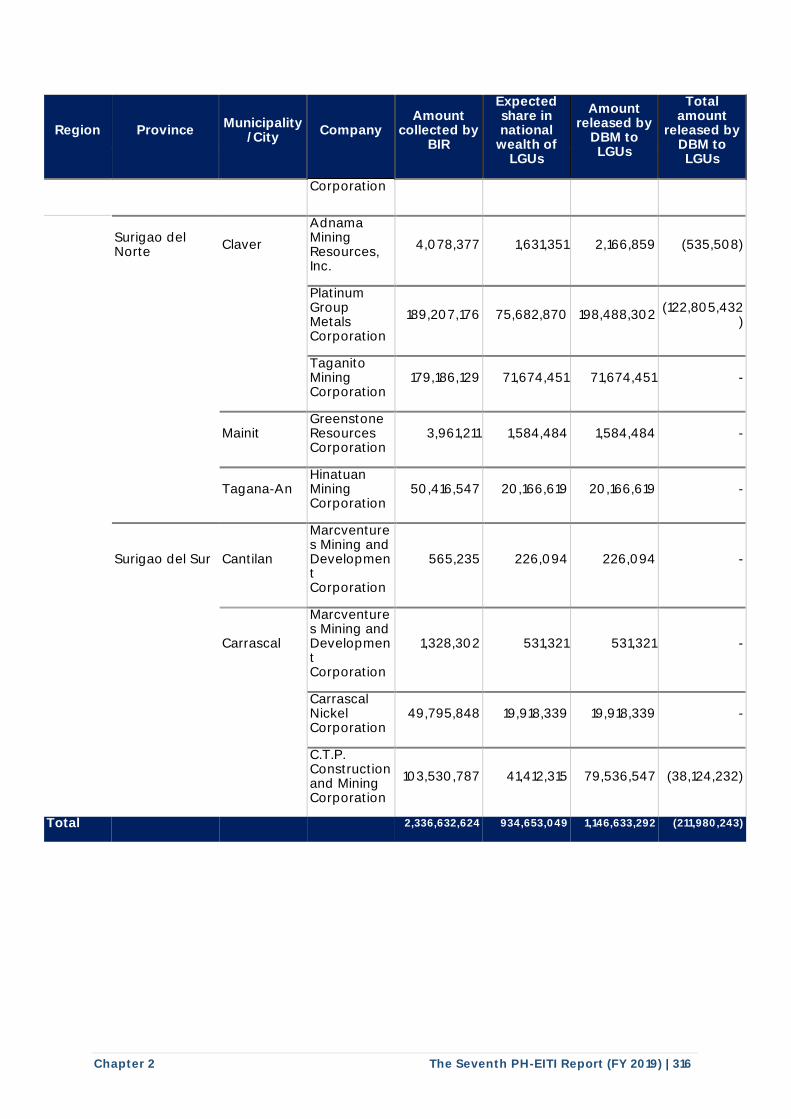
Chapter 2 The Seventh PH-EITI Report (FY 2019) | 316
Region Province Municipality
/City Company
Amount collected by
BIR
Expected share in national
wealth of LGUs
Amount released by
DBM to LGUs
Total amount
released by DBM to LGUs
Corporation
Surigao del Norte
Claver
Adnama Mining Resources, Inc.
4,078,377 1,631,351 2,166,859 (535,508)
Platinum Group Metals Corporation
189,207,176 75,682,870 198,488,302 (122,805,432
)
Taganito Mining Corporation
179,186,129 71,674,451 71,674,451 -
Mainit
Greenstone Resources Corporation
3,961,211 1,584,484 1,584,484 -
Tagana-An
Hinatuan Mining Corporation
50,416,547 20,166,619 20,166,619 -
Surigao del Sur Cantilan
Marcventures Mining and Development Corporation
565,235 226,094 226,094 -
Carrascal
Marcventures Mining and Development Corporation
1,328,302 531,321 531,321 -
Carrascal Nickel Corporation
49,795,848 19,918,339 19,918,339 -
C.T.P. Construction and Mining Corporation
103,530,787 41,412,315 79,536,547 (38,124,232)
Total 2,336,632,624 934,653,049 1,146,633,292 (211,980,243)
I I
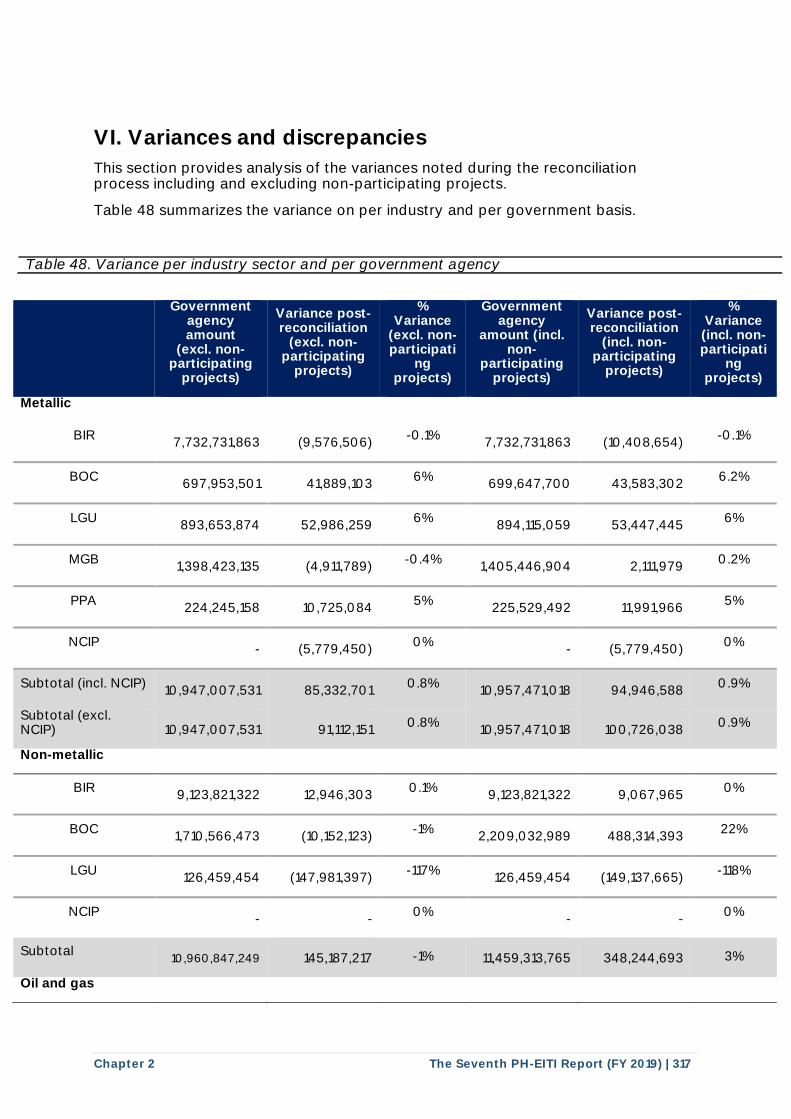
Chapter 2 The Seventh PH-EITI Report (FY 2019) | 317
VI. Variances and discrepancies
This section provides analysis of the variances noted during the reconciliation process including and excluding non-participating projects.
Table 48 summarizes the variance on per industry and per government basis.
Table 48. Variance per industry sector and per government agency
Government agency amount
(excl. non-participating
projects)
Variance post-reconciliation
(excl. non-participating
projects)
% Variance
(excl. non-participati
ng projects)
Government agency
amount (incl. non-
participating projects)
Variance post-reconciliation
(incl. non-participating
projects)
% Variance (incl. non-participati
ng projects)
Metallic
BIR
7,732,731,863
(9,576,506) -0.1%
7,732,731,863
(10,408,654)
-0.1%
BOC
697,953,501
41,889,103 6%
699,647,700
43,583,302
6.2%
LGU
893,653,874
52,986,259 6%
894,115,059
53,447,445
6%
MGB
1,398,423,135
(4,911,789) -0.4%
1,405,446,904
2,111,979
0.2%
PPA
224,245,158
10,725,084 5%
225,529,492
11,991,966
5%
NCIP
-
(5,779,450) 0%
-
(5,779,450)
0%
Subtotal (incl. NCIP)
10,947,007,531
85,332,701 0.8%
10,957,471,018
94,946,588
0.9%
Subtotal (excl. NCIP)
10,947,007,531
91,112,151
0.8%
10,957,471,018
100,726,038 0.9%
Non-metallic
BIR
9,123,821,322
12,946,303 0.1%
9,123,821,322
9,067,965
0%
BOC
1,710,566,473
(10,152,123) -1%
2,209,032,989
488,314,393
22%
LGU
126,459,454
(147,981,397) -117%
126,459,454
(149,137,665)
-118%
NCIP
-
- 0%
-
-
0%
Subtotal 10,960,847,249
145,187,217 -1%
11,459,313,765
348,244,693 3%
Oil and gas
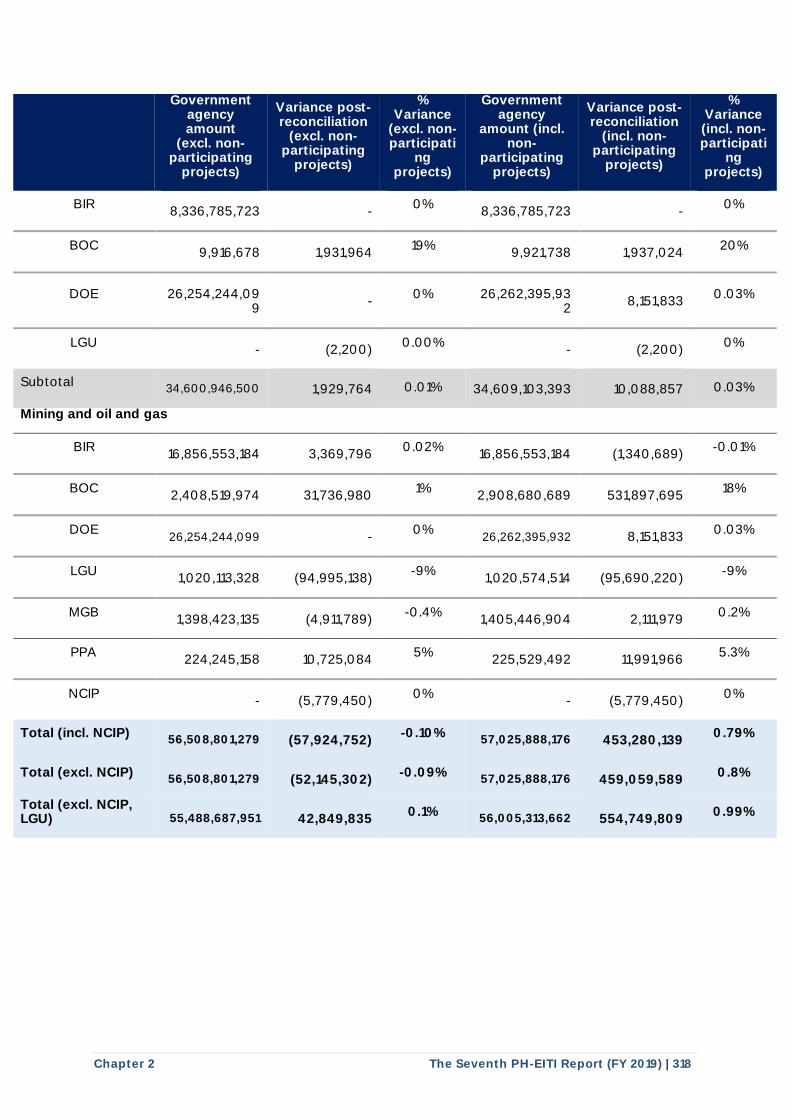
Chapter 2 The Seventh PH-EITI Report (FY 2019) | 318
Government agency amount
(excl. non-participating
projects)
Variance post-reconciliation
(excl. non-participating
projects)
% Variance
(excl. non-participati
ng projects)
Government agency
amount (incl. non-
participating projects)
Variance post-reconciliation
(incl. non-participating
projects)
% Variance (incl. non-participati
ng projects)
BIR
8,336,785,723
- 0%
8,336,785,723
-
0%
BOC
9,916,678
1,931,964 19%
9,921,738
1,937,024
20%
DOE
26,254,244,099
-
0%
26,262,395,932
8,151,833
0.03%
LGU
-
(2,200) 0.00%
-
(2,200)
0%
Subtotal
34,600,946,500
1,929,764 0.01%
34,609,103,393
10,088,857 0.03%
Mining and oil and gas
BIR
16,856,553,184
3,369,796 0.02%
16,856,553,184
(1,340,689)
-0.01%
BOC
2,408,519,974
31,736,980 1%
2,908,680,689
531,897,695
18%
DOE 26,254,244,099
-
0% 26,262,395,932
8,151,833
0.03%
LGU
1,020,113,328
(94,995,138) -9%
1,020,574,514
(95,690,220)
-9%
MGB
1,398,423,135
(4,911,789) -0.4%
1,405,446,904
2,111,979
0.2%
PPA
224,245,158
10,725,084 5%
225,529,492
11,991,966
5.3%
NCIP
-
(5,779,450) 0%
-
(5,779,450)
0%
Total (incl. NCIP)
56,508,801,279
(57,924,752) -0.10%
57,025,888,176
453,280,139
0.79%
Total (excl. NCIP)
56,508,801,279
(52,145,302) -0.09%
57,025,888,176
459,059,589
0.8%
Total (excl. NCIP, LGU)
55,488,687,951
42,849,835
0.1% 56,005,313,662
554,749,809
0.99%
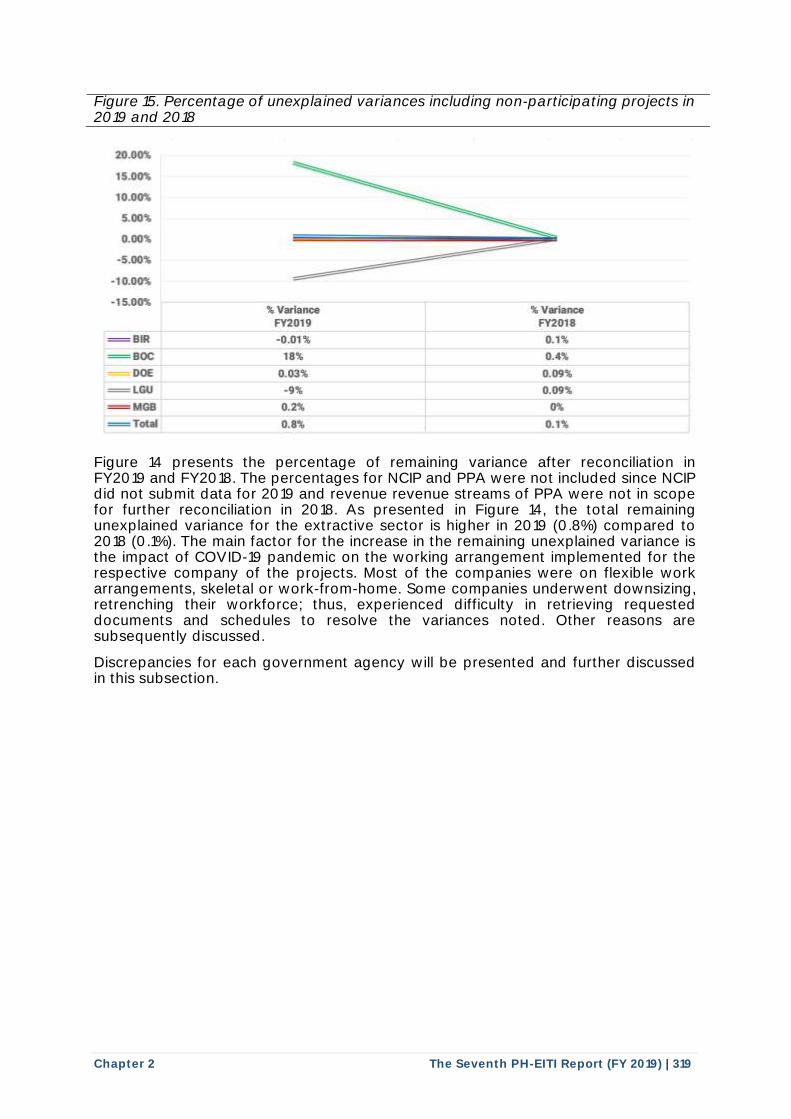
Chapter 2 The Seventh PH-EITI Report (FY 2019) | 319
Figure 15. Percentage of unexplained variances including non-participating projects in 2019 and 2018
Figure 14 presents the percentage of remaining variance after reconciliation in FY2019 and FY2018. The percentages for NCIP and PPA were not included since NCIP did not submit data for 2019 and revenue revenue streams of PPA were not in scope for further reconciliation in 2018. As presented in Figure 14, the total remaining unexplained variance for the extractive sector is higher in 2019 (0.8%) compared to 2018 (0.1%). The main factor for the increase in the remaining unexplained variance is the impact of COVID-19 pandemic on the working arrangement implemented for the respective company of the projects. Most of the companies were on flexible work arrangements, skeletal or work-from-home. Some companies underwent downsizing, retrenching their workforce; thus, experienced difficulty in retrieving requested documents and schedules to resolve the variances noted. Other reasons are subsequently discussed.
Discrepancies for each government agency will be presented and further discussed in this subsection.
2.0.00,.
15.00,.
10.00,.
5 00'.\
0.00 \.
-5.00"
-10.00,.
-15.00,. " Varu111ce
FV2019 - BIR -0.01 ':I o. , ,. = BOC 18'!1. 0.4~
D 0.03" 0.09'
= LGU -9", 0.09 '!1.
- MGB 0.2' o" = Tot 0.8'\ o.,--.
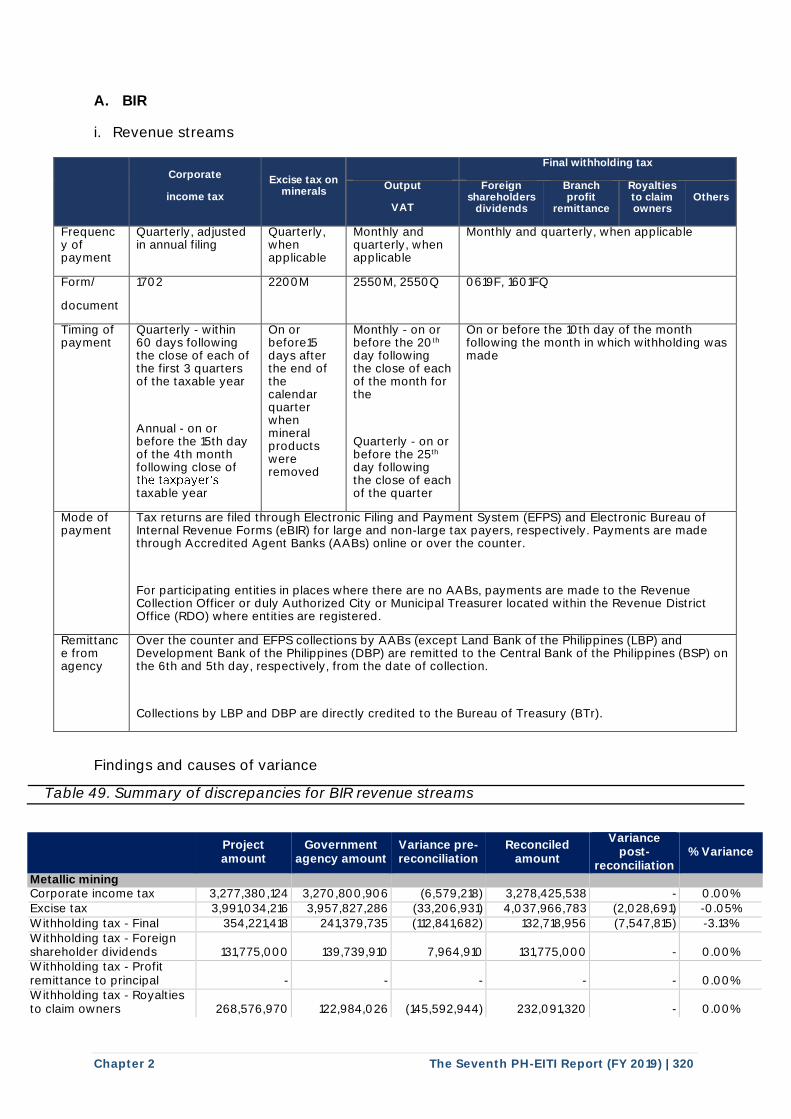
Chapter 2 The Seventh PH-EITI Report (FY 2019) | 320
A. BIR
i. Revenue streams
Corporate
income tax
Excise tax on minerals
Final withholding tax
Output
VAT
Foreign shareholders
dividends
Branch profit
remittance
Royalties to claim owners
Others
Frequency of payment
Quarterly, adjusted in annual filing
Quarterly, when applicable
Monthly and quarterly, when applicable
Monthly and quarterly, when applicable
Form/
document
1702 2200M 2550M, 2550Q 0619F, 1601FQ
Timing of payment
Quarterly - within 60 days following the close of each of the first 3 quarters of the taxable year
Annual - on or before the 15th day of the 4th month following close of
taxable year
On or before15 days after the end of the calendar quarter when mineral products were removed
Monthly - on or before the 20th day following the close of each of the month for the
Quarterly - on or before the 25th day following the close of each of the quarter
On or before the 10th day of the month following the month in which withholding was made
Mode of payment
Tax returns are filed through Electronic Filing and Payment System (EFPS) and Electronic Bureau of Internal Revenue Forms (eBIR) for large and non-large tax payers, respectively. Payments are made through Accredited Agent Banks (AABs) online or over the counter.
For participating entities in places where there are no AABs, payments are made to the Revenue Collection Officer or duly Authorized City or Municipal Treasurer located within the Revenue District Office (RDO) where entities are registered.
Remittance from agency
Over the counter and EFPS collections by AABs (except Land Bank of the Philippines (LBP) and Development Bank of the Philippines (DBP) are remitted to the Central Bank of the Philippines (BSP) on the 6th and 5th day, respectively, from the date of collection.
Collections by LBP and DBP are directly credited to the Bureau of Treasury (BTr).
Findings and causes of variance
Table 49. Summary of discrepancies for BIR revenue streams
Project amount
Government agency amount
Variance pre-reconciliation
Reconciled amount
Variance post-
reconciliation % Variance
Metallic mining Corporate income tax 3,277,380,124 3,270,800,906 (6,579,218) 3,278,425,538 - 0.00% Excise tax 3,991,034,216 3,957,827,286 (33,206,931) 4,037,966,783 (2,028,691) -0.05%
Withholding tax - Final 354,221,418 241,379,735 (112,841,682) 132,718,956 (7,547,815) -3.13% Withholding tax - Foreign shareholder dividends 131,775,000 139,739,910 7,964,910 131,775,000 - 0.00% Withholding tax - Profit remittance to principal - - - - - 0.00% Withholding tax - Royalties to claim owners 268,576,970 122,984,026 (145,592,944) 232,091,320 - 0.00%
the taxpayer 's
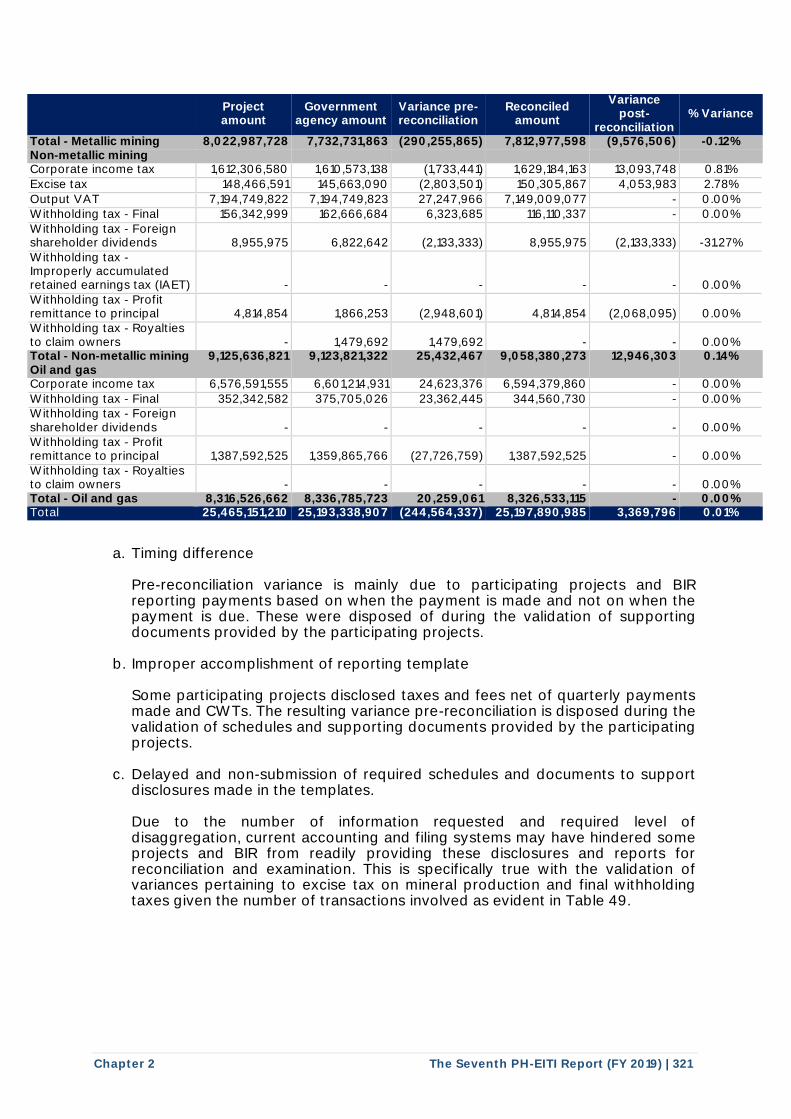
Chapter 2 The Seventh PH-EITI Report (FY 2019) | 321
Project amount
Government agency amount
Variance pre-reconciliation
Reconciled amount
Variance post-
reconciliation % Variance
Total - Metallic mining 8,022,987,728 7,732,731,863 (290,255,865) 7,812,977,598 (9,576,506) -0.12% Non-metallic mining Corporate income tax 1,612,306,580 1,610,573,138 (1,733,441) 1,629,184,163 13,093,748 0.81%
Excise tax 148,466,591 145,663,090 (2,803,501) 150,305,867 4,053,983 2.78%
Output VAT 7,194,749,822 7,194,749,823 27,247,966 7,149,009,077 - 0.00% Withholding tax - Final 156,342,999 162,666,684 6,323,685 116,110,337 - 0.00% Withholding tax - Foreign shareholder dividends 8,955,975 6,822,642 (2,133,333) 8,955,975 (2,133,333) -31.27% Withholding tax - Improperly accumulated retained earnings tax (IAET) - - - - - 0.00% Withholding tax - Profit remittance to principal 4,814,854 1,866,253 (2,948,601) 4,814,854 (2,068,095) 0.00% Withholding tax - Royalties to claim owners - 1,479,692 1,479,692 - - 0.00% Total - Non-metallic mining 9,125,636,821 9,123,821,322 25,432,467 9,058,380,273 12,946,303 0.14% Oil and gas Corporate income tax 6,576,591,555 6,601,214,931 24,623,376 6,594,379,860 - 0.00%
Withholding tax - Final 352,342,582 375,705,026 23,362,445 344,560,730 - 0.00% Withholding tax - Foreign shareholder dividends - - - - - 0.00% Withholding tax - Profit remittance to principal 1,387,592,525 1,359,865,766 (27,726,759) 1,387,592,525 - 0.00% Withholding tax - Royalties to claim owners - - - - - 0.00% Total - Oil and gas 8,316,526,662 8,336,785,723 20,259,061 8,326,533,115 - 0.00% Total 25,465,151,210 25,193,338,907 (244,564,337) 25,197,890,985 3,369,796 0.01%
a. Timing difference Pre-reconciliation variance is mainly due to participating projects and BIR reporting payments based on when the payment is made and not on when the payment is due. These were disposed of during the validation of supporting documents provided by the participating projects.
b. Improper accomplishment of reporting template Some participating projects disclosed taxes and fees net of quarterly payments made and CWTs. The resulting variance pre-reconciliation is disposed during the validation of schedules and supporting documents provided by the participating projects.
c. Delayed and non-submission of required schedules and documents to support disclosures made in the templates. Due to the number of information requested and required level of disaggregation, current accounting and filing systems may have hindered some projects and BIR from readily providing these disclosures and reports for reconciliation and examination. This is specifically true with the validation of variances pertaining to excise tax on mineral production and final withholding taxes given the number of transactions involved as evident in Table 49.
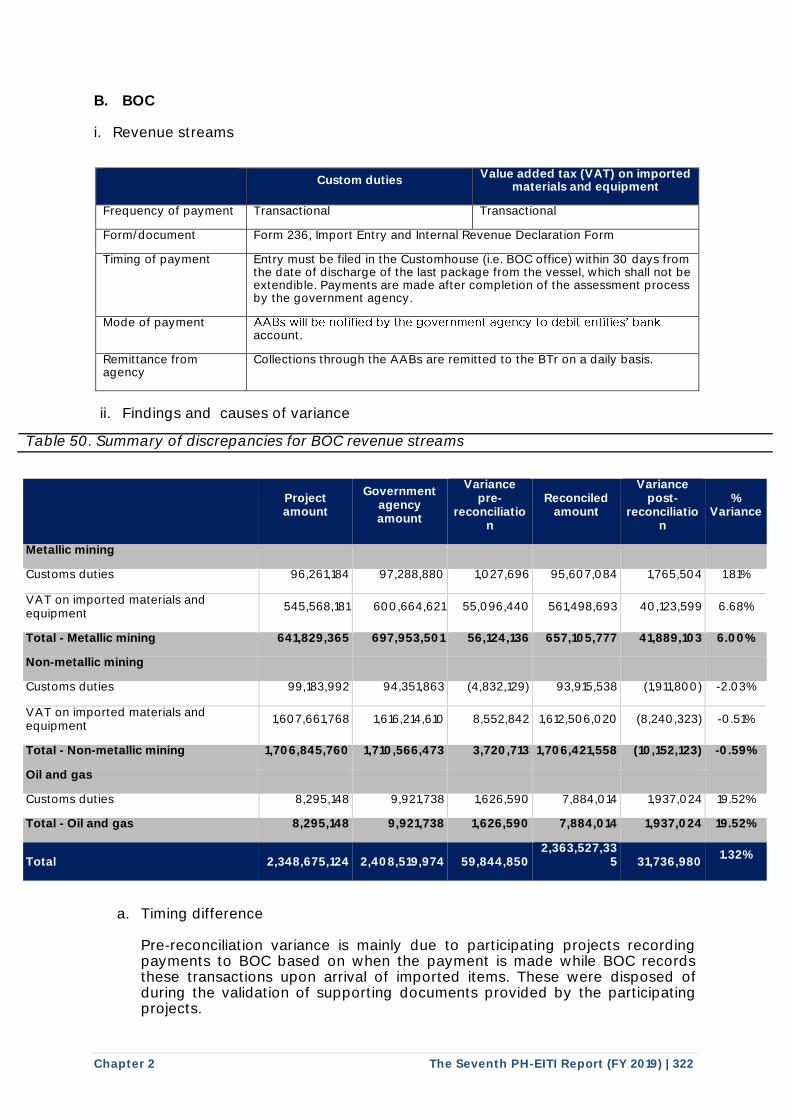
Chapter 2 The Seventh PH-EITI Report (FY 2019) | 322
B. BOC
i. Revenue streams
Custom duties
Value added tax (VAT) on imported materials and equipment
Frequency of payment Transactional Transactional
Form/document Form 236, Import Entry and Internal Revenue Declaration Form
Timing of payment Entry must be filed in the Customhouse (i.e. BOC office) within 30 days from the date of discharge of the last package from the vessel, which shall not be extendible. Payments are made after completion of the assessment process by the government agency.
Mode of payment account.
Remittance from agency
Collections through the AABs are remitted to the BTr on a daily basis.
ii. Findings and causes of variance
Table 50. Summary of discrepancies for BOC revenue streams
Project amount
Government agency amount
Variance pre-
reconciliation
Reconciled amount
Variance post-
reconciliation
% Variance
Metallic mining
Customs duties 96,261,184 97,288,880 1,027,696 95,607,084 1,765,504 1.81%
VAT on imported materials and equipment
545,568,181 600,664,621 55,096,440 561,498,693 40,123,599 6.68%
Total - Metallic mining 641,829,365 697,953,501 56,124,136 657,105,777 41,889,103 6.00%
Non-metallic mining
Customs duties 99,183,992 94,351,863 (4,832,129) 93,915,538 (1,911,800) -2.03%
VAT on imported materials and equipment
1,607,661,768 1,616,214,610 8,552,842 1,612,506,020 (8,240,323) -0.51%
Total - Non-metallic mining 1,706,845,760 1,710,566,473 3,720,713 1,706,421,558 (10,152,123) -0.59%
Oil and gas
Customs duties 8,295,148 9,921,738 1,626,590 7,884,014 1,937,024 19.52%
Total - Oil and gas 8,295,148 9,921,738 1,626,590 7,884,014 1,937,024 19.52%
Total 2,348,675,124 2,408,519,974 59,844,850 2,363,527,33
5 31,736,980 1.32%
a. Timing difference Pre-reconciliation variance is mainly due to participating projects recording payments to BOC based on when the payment is made while BOC records these transactions upon arrival of imported items. These were disposed of during the validation of supporting documents provided by the participating projects.
AABs will be notified by the government agency to debit entities' bank
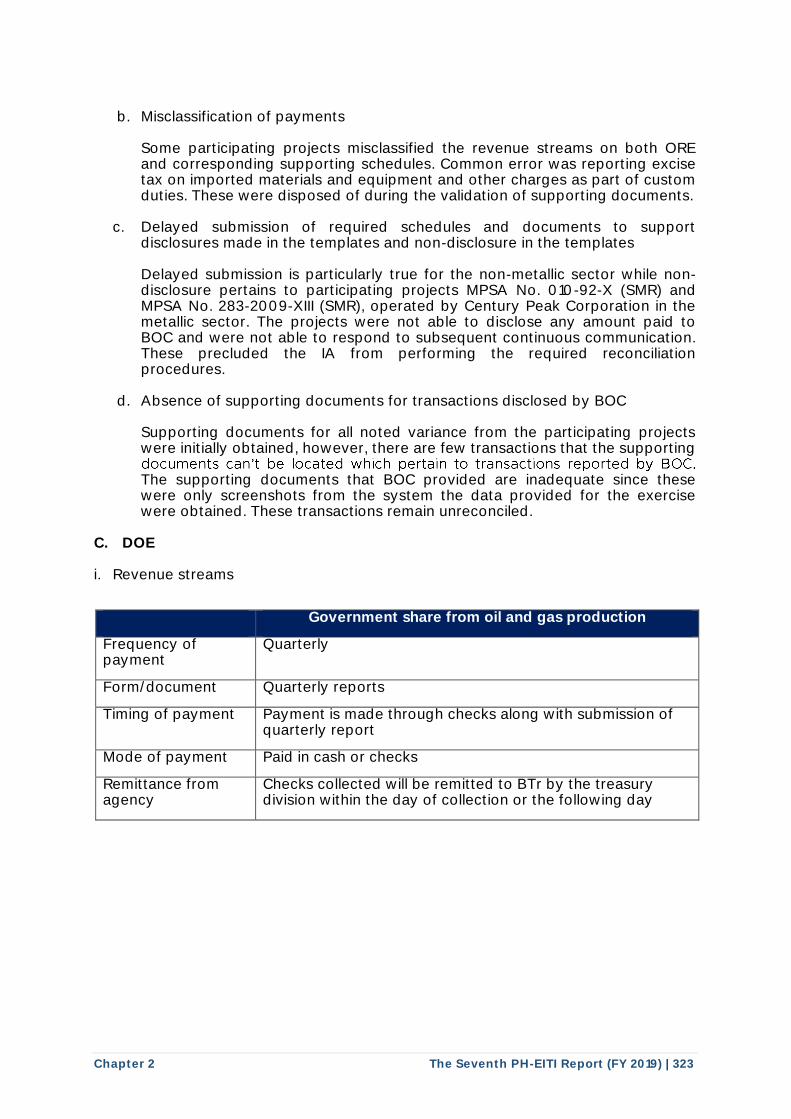
Chapter 2 The Seventh PH-EITI Report (FY 2019) | 323
b. Misclassification of payments
Some participating projects misclassified the revenue streams on both ORE and corresponding supporting schedules. Common error was reporting excise tax on imported materials and equipment and other charges as part of custom duties. These were disposed of during the validation of supporting documents.
c. Delayed submission of required schedules and documents to support disclosures made in the templates and non-disclosure in the templates Delayed submission is particularly true for the non-metallic sector while non-disclosure pertains to participating projects MPSA No. 010-92-X (SMR) and MPSA No. 283-2009-XIII (SMR), operated by Century Peak Corporation in the metallic sector. The projects were not able to disclose any amount paid to BOC and were not able to respond to subsequent continuous communication. These precluded the IA from performing the required reconciliation procedures.
d. Absence of supporting documents for transactions disclosed by BOC Supporting documents for all noted variance from the participating projects were initially obtained, however, there are few transactions that the supporting
The supporting documents that BOC provided are inadequate since these were only screenshots from the system the data provided for the exercise were obtained. These transactions remain unreconciled.
C. DOE
i. Revenue streams
Government share from oil and gas production
Frequency of payment
Quarterly
Form/document Quarterly reports
Timing of payment Payment is made through checks along with submission of quarterly report
Mode of payment Paid in cash or checks
Remittance from agency
Checks collected will be remitted to BTr by the treasury division within the day of collection or the following day
documents can't be located which pertain to transactions reported by BOC.
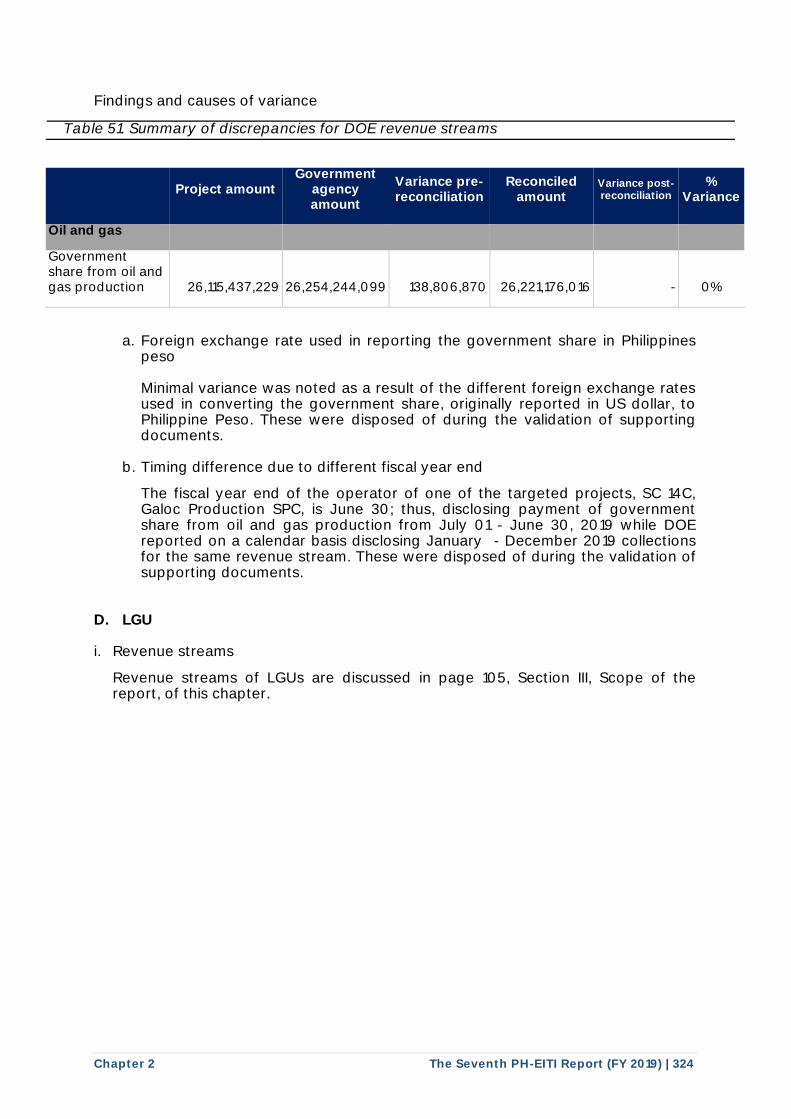
Chapter 2 The Seventh PH-EITI Report (FY 2019) | 324
Findings and causes of variance
Table 51. Summary of discrepancies for DOE revenue streams
Project amount Government
agency amount
Variance pre-reconciliation
Reconciled amount
Variance post-reconciliation
% Variance
Oil and gas
Government share from oil and gas production 26,115,437,229 26,254,244,099 138,806,870 26,221,176,016 - 0%
a. Foreign exchange rate used in reporting the government share in Philippines peso Minimal variance was noted as a result of the different foreign exchange rates used in converting the government share, originally reported in US dollar, to Philippine Peso. These were disposed of during the validation of supporting documents.
b. Timing difference due to different fiscal year end
The fiscal year end of the operator of one of the targeted projects, SC 14C, Galoc Production SPC, is June 30; thus, disclosing payment of government share from oil and gas production from July 01 - June 30, 2019 while DOE reported on a calendar basis disclosing January - December 2019 collections for the same revenue stream. These were disposed of during the validation of supporting documents.
D. LGU
i. Revenue streams
Revenue streams of LGUs are discussed in page 105, Section III, Scope of the report, of this chapter.
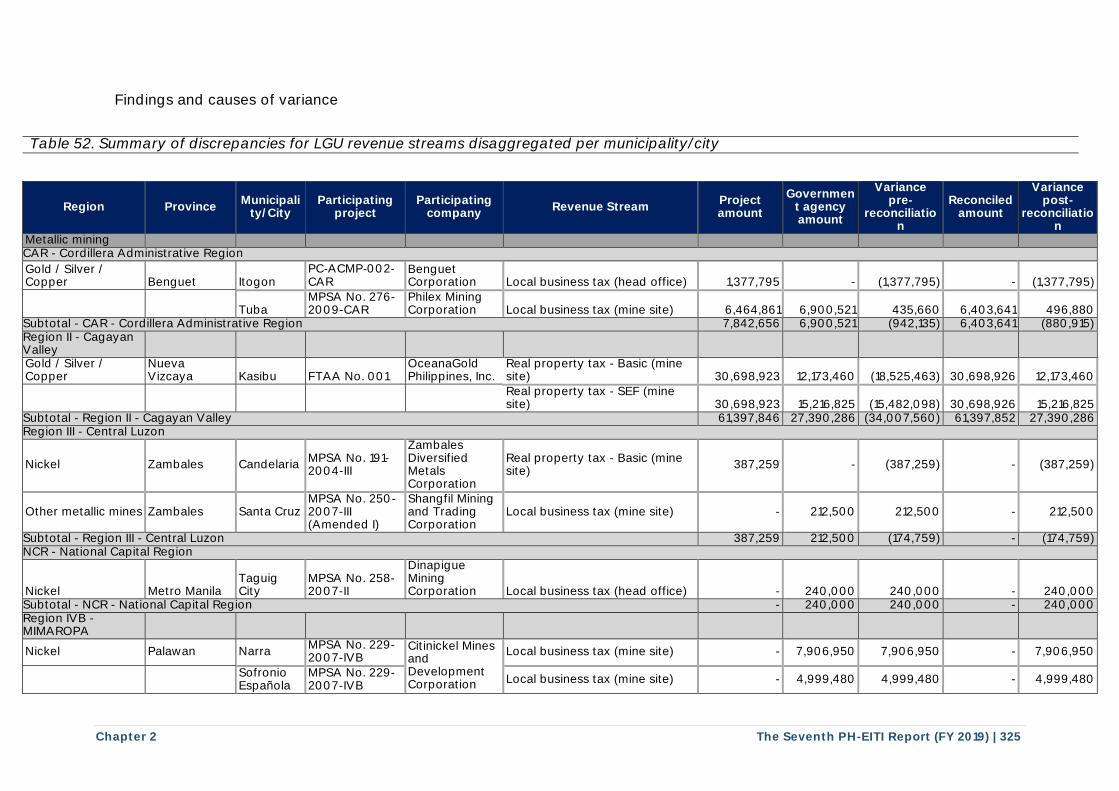
Chapter 2 The Seventh PH-EITI Report (FY 2019) | 325
Findings and causes of variance
Table 52. Summary of discrepancies for LGU revenue streams disaggregated per municipality/city
Region Province Municipali
ty/City Participating
project Participating
company Revenue Stream
Project amount
Government agency amount
Variance pre-
reconciliation
Reconciled amount
Variance post-
reconciliation
Metallic mining CAR - Cordillera Administrative Region
Gold / Silver / Copper Benguet Itogon
PC‐ACMP‐002‐ CAR
Benguet Corporation Local business tax (head office) 1,377,795 - (1,377,795) - (1,377,795)
Tuba MPSA No. 276-2009-CAR
Philex Mining Corporation Local business tax (mine site) 6,464,861 6,900,521 435,660 6,403,641 496,880
Subtotal - CAR - Cordillera Administrative Region 7,842,656 6,900,521 (942,135) 6,403,641 (880,915) Region II - Cagayan Valley Gold / Silver / Copper
Nueva Vizcaya Kasibu FTAA No. 001
OceanaGold Philippines, Inc.
Real property tax - Basic (mine site) 30,698,923 12,173,460 (18,525,463) 30,698,926 12,173,460
Real property tax - SEF (mine site) 30,698,923 15,216,825 (15,482,098) 30,698,926 15,216,825
Subtotal - Region II - Cagayan Valley 61,397,846 27,390,286 (34,007,560) 61,397,852 27,390,286 Region III - Central Luzon
Nickel Zambales Candelaria MPSA No. 191-2004-III
Zambales Diversified Metals Corporation
Real property tax - Basic (mine site)
387,259 - (387,259) - (387,259)
Other metallic mines Zambales Santa Cruz MPSA No. 250-2007-III (Amended I)
Shangfil Mining and Trading Corporation
Local business tax (mine site) - 212,500 212,500 - 212,500
Subtotal - Region III - Central Luzon 387,259 212,500 (174,759) - (174,759) NCR - National Capital Region
Nickel Metro Manila Taguig City
MPSA No. 258-2007-II
Dinapigue Mining Corporation Local business tax (head office) - 240,000 240,000 - 240,000
Subtotal - NCR - National Capital Region - 240,000 240,000 - 240,000 Region IVB - MIMAROPA
Nickel Palawan Narra MPSA No. 229-2007-IVB
Citinickel Mines and Development Corporation
Local business tax (mine site) - 7,906,950 7,906,950 - 7,906,950
Sofronio Española
MPSA No. 229-2007-IVB
Local business tax (mine site) - 4,999,480 4,999,480 - 4,999,480
I I
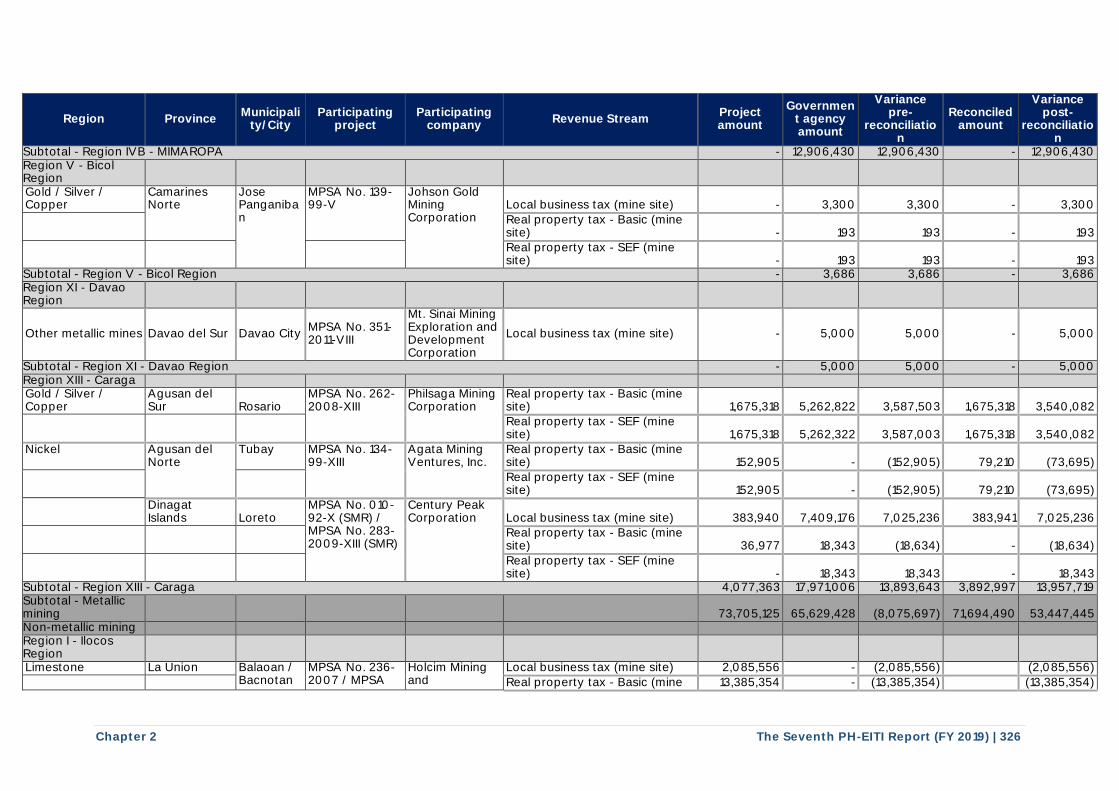
Chapter 2 The Seventh PH-EITI Report (FY 2019) | 326
Region Province Municipali
ty/City Participating
project Participating
company Revenue Stream
Project amount
Government agency amount
Variance pre-
reconciliation
Reconciled amount
Variance post-
reconciliation
Subtotal - Region IVB - MIMAROPA - 12,906,430 12,906,430 - 12,906,430 Region V - Bicol Region Gold / Silver / Copper
Camarines Norte
Jose Panganiban
MPSA No. 139-99-V
Johson Gold Mining Corporation
Local business tax (mine site) - 3,300 3,300 - 3,300
Real property tax - Basic (mine site) - 193 193 - 193
Real property tax - SEF (mine site) - 193 193 - 193
Subtotal - Region V - Bicol Region - 3,686 3,686 - 3,686 Region XI - Davao Region
Other metallic mines Davao del Sur Davao City MPSA No. 351-2011-VIII
Mt. Sinai Mining Exploration and Development Corporation
Local business tax (mine site) - 5,000 5,000 - 5,000
Subtotal - Region XI - Davao Region - 5,000 5,000 - 5,000 Region XIII - Caraga Gold / Silver / Copper
Agusan del Sur Rosario
MPSA No. 262-2008-XIII
Philsaga Mining Corporation
Real property tax - Basic (mine site) 1,675,318 5,262,822 3,587,503 1,675,318 3,540,082
Real property tax - SEF (mine site) 1,675,318 5,262,322 3,587,003 1,675,318 3,540,082
Nickel Agusan del Norte
Tubay MPSA No. 134-99-XIII
Agata Mining Ventures, Inc.
Real property tax - Basic (mine site) 152,905 - (152,905) 79,210 (73,695)
Real property tax - SEF (mine site) 152,905 - (152,905) 79,210 (73,695)
Dinagat Islands Loreto
MPSA No. 010-92-X (SMR) / MPSA No. 283-2009-XIII (SMR)
Century Peak Corporation Local business tax (mine site) 383,940 7,409,176 7,025,236 383,941 7,025,236
Real property tax - Basic (mine site) 36,977 18,343 (18,634) - (18,634)
Real property tax - SEF (mine site) - 18,343 18,343 - 18,343
Subtotal - Region XIII - Caraga 4,077,363 17,971,006 13,893,643 3,892,997 13,957,719 Subtotal - Metallic mining 73,705,125 65,629,428 (8,075,697) 71,694,490 53,447,445 Non-metallic mining Region I - Ilocos Region Limestone La Union Balaoan /
Bacnotan MPSA No. 236-2007 / MPSA
Holcim Mining and
Local business tax (mine site) 2,085,556 - (2,085,556) (2,085,556)
Real property tax - Basic (mine 13,385,354 - (13,385,354) (13,385,354)
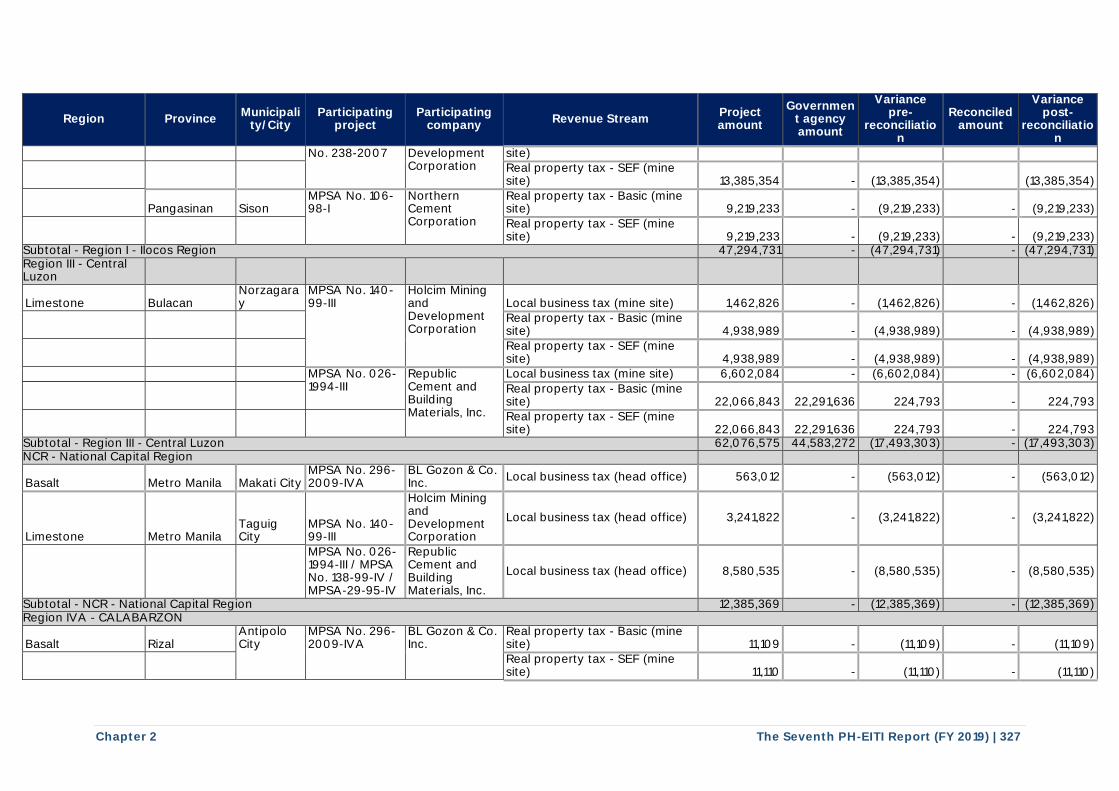
Chapter 2 The Seventh PH-EITI Report (FY 2019) | 327
Region Province Municipali
ty/City Participating
project Participating
company Revenue Stream
Project amount
Government agency amount
Variance pre-
reconciliation
Reconciled amount
Variance post-
reconciliation
No. 238-2007 Development Corporation
site)
Real property tax - SEF (mine site) 13,385,354 - (13,385,354) (13,385,354)
Pangasinan Sison MPSA No. 106-98-I
Northern Cement Corporation
Real property tax - Basic (mine site) 9,219,233 - (9,219,233) - (9,219,233)
Real property tax - SEF (mine site) 9,219,233 - (9,219,233) - (9,219,233)
Subtotal - Region I - Ilocos Region 47,294,731 - (47,294,731) - (47,294,731) Region III - Central Luzon
Limestone Bulacan Norzagaray
MPSA No. 140-99-III
Holcim Mining and Development Corporation
Local business tax (mine site) 1,462,826 - (1,462,826) - (1,462,826)
Real property tax - Basic (mine site) 4,938,989 - (4,938,989) - (4,938,989)
Real property tax - SEF (mine site) 4,938,989 - (4,938,989) - (4,938,989)
MPSA No. 026-1994-III
Republic Cement and Building Materials, Inc.
Local business tax (mine site) 6,602,084 - (6,602,084) - (6,602,084)
Real property tax - Basic (mine site) 22,066,843 22,291,636 224,793 - 224,793
Real property tax - SEF (mine site) 22,066,843 22,291,636 224,793 - 224,793
Subtotal - Region III - Central Luzon 62,076,575 44,583,272 (17,493,303) - (17,493,303) NCR - National Capital Region
Basalt Metro Manila Makati City MPSA No. 296-2009-IVA
BL Gozon & Co. Inc.
Local business tax (head office) 563,012 - (563,012) - (563,012)
Limestone Metro Manila Taguig City
MPSA No. 140-99-III
Holcim Mining and Development Corporation
Local business tax (head office) 3,241,822 - (3,241,822) - (3,241,822)
MPSA No. 026-1994-III / MPSA No. 138-99-IV / MPSA-29-95-IV
Republic Cement and Building Materials, Inc.
Local business tax (head office) 8,580,535 - (8,580,535) - (8,580,535)
Subtotal - NCR - National Capital Region 12,385,369 - (12,385,369) - (12,385,369) Region IVA - CALABARZON
Basalt Rizal Antipolo City
MPSA No. 296-2009-IVA
BL Gozon & Co. Inc.
Real property tax - Basic (mine site) 11,109 - (11,109) - (11,109)
Real property tax - SEF (mine site) 11,110 - (11,110) - (11,110)

Chapter 2 The Seventh PH-EITI Report (FY 2019) | 328
Region Province Municipali
ty/City Participating
project Participating
company Revenue Stream
Project amount
Government agency amount
Variance pre-
reconciliation
Reconciled amount
Variance post-
reconciliation
Rodriguez MPSA No. 239-2007-IV
Montalban Millex Aggregate Corporation
Local business tax (head office) 268,530 - (268,530) - (268,530) Local business tax (mine site) 41,109 - (41,109) - (41,109)
Real property tax - Basic (mine site) 846,629 - (846,629) - (846,629)
Limestone Batangas Taysan MPSA-29-95-IV Republic Cement and Building Materials, Inc.
Real property tax - Basic (mine site) 17,599,346 25,273,275 7,673,929 - 7,673,929
Real property tax - SEF (mine site) 24,838,169 25,280,410 442,241 - 442,241
Rizal Teresa MPSA No. 138-99-IV
Republic Cement and Building Materials, Inc.
Local business tax (mine site) 7,208,272 8,132,804 924,532 - 924,532
Real property tax - Basic (mine site) 22,005,756 - (22,005,756) -
(22,005,756)
Real property tax - SEF (mine site) 22,005,756 - (22,005,756) -
(22,005,756)
Other metallic mines Rizal Antipolo City
MPSA No. 064-96-IV / MPSA No. 075-97-IV / MPSA No. 088-97-IV
Rapid City Realty and Development Corporation
Real property tax - Basic (mine site)
1,162,893 - (1,162,893) - (1,162,893)
MPSA No. 087-97-IV
Rapid City Realty and Development Corporation
Real property tax - Basic (mine site)
1,448,566 416,035 (1,032,531) - (1,032,531)
Real property tax - SEF (mine site)
- 234,539 234,539 - 234,539
Teresa MPSA No. 074-97-IV
Rapid City Realty and Development Corporation
Real property tax - Basic (mine site)
265,395 - (265,395) - (265,395)
Subtotal - Region IVA - CALABARZON 97,712,639 59,337,063 (38,375,576) - (38,375,576) Region VII - Central Visayas
Basalt Cebu Naga City MPSA No. 194-2004-VII
JLR Construction and Aggregates, Inc.
Real property tax - Basic (mine site) - 100 100 - 100
Real property tax - SEF (mine site) - 100 100 - 100
Subtotal - Region VII - Central Visayas - 199 199 - 199 Region XI - Davao Region
Limestone Davao del Sur Davao City MPSA No. 274-08-XI
Holcim Mining and Development Corporation
Real property tax - Basic (mine site) 25,670,143 - (25,670,143) - (25,670,143)
Real property tax - SEF (mine site) 7,918,742 - (7,918,742) - (7,918,742)
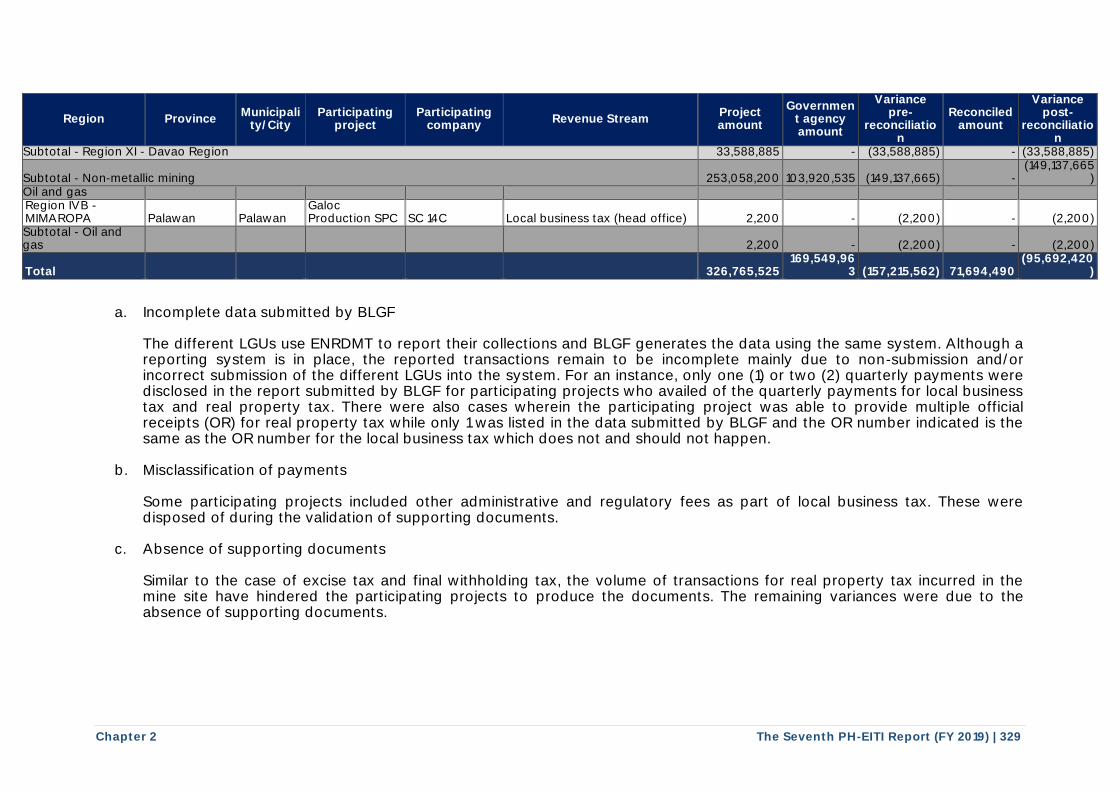
Chapter 2 The Seventh PH-EITI Report (FY 2019) | 329
Region Province Municipali
ty/City Participating
project Participating
company Revenue Stream
Project amount
Government agency amount
Variance pre-
reconciliation
Reconciled amount
Variance post-
reconciliation
Subtotal - Region XI - Davao Region 33,588,885 - (33,588,885) - (33,588,885)
Subtotal - Non-metallic mining 253,058,200 103,920,535 (149,137,665) - (149,137,665
) Oil and gas Region IVB - MIMAROPA Palawan Palawan
Galoc Production SPC SC 14C Local business tax (head office) 2,200 - (2,200) - (2,200)
Subtotal - Oil and gas 2,200 - (2,200) - (2,200)
Total 326,765,525 169,549,96
3 (157,215,562) 71,694,490 (95,692,420
)
a. Incomplete data submitted by BLGF
The different LGUs use ENRDMT to report their collections and BLGF generates the data using the same system. Although a reporting system is in place, the reported transactions remain to be incomplete mainly due to non-submission and/or incorrect submission of the different LGUs into the system. For an instance, only one (1) or two (2) quarterly payments were disclosed in the report submitted by BLGF for participating projects who availed of the quarterly payments for local business tax and real property tax. There were also cases wherein the participating project was able to provide multiple official receipts (OR) for real property tax while only 1 was listed in the data submitted by BLGF and the OR number indicated is the same as the OR number for the local business tax which does not and should not happen.
b. Misclassification of payments
Some participating projects included other administrative and regulatory fees as part of local business tax. These were disposed of during the validation of supporting documents.
c. Absence of supporting documents
Similar to the case of excise tax and final withholding tax, the volume of transactions for real property tax incurred in the mine site have hindered the participating projects to produce the documents. The remaining variances were due to the absence of supporting documents.
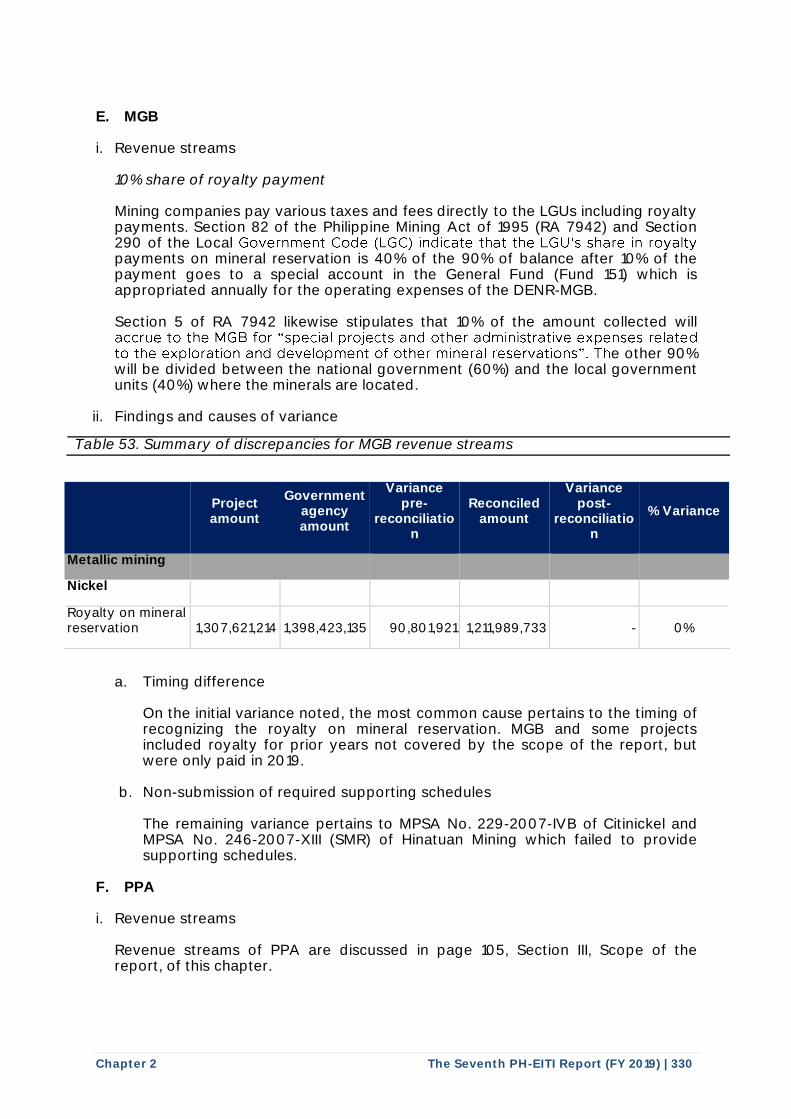
Chapter 2 The Seventh PH-EITI Report (FY 2019) | 330
E. MGB
i. Revenue streams
10% share of royalty payment Mining companies pay various taxes and fees directly to the LGUs including royalty payments. Section 82 of the Philippine Mining Act of 1995 (RA 7942) and Section 290 of the Local payments on mineral reservation is 40% of the 90% of balance after 10% of the payment goes to a special account in the General Fund (Fund 151) which is appropriated annually for the operating expenses of the DENR-MGB. Section 5 of RA 7942 likewise stipulates that 10% of the amount collected will
e other 90% will be divided between the national government (60%) and the local government units (40%) where the minerals are located.
ii. Findings and causes of variance
Table 53. Summary of discrepancies for MGB revenue streams
Project amount
Government agency amount
Variance pre-
reconciliation
Reconciled amount
Variance post-
reconciliation
% Variance
Metallic mining
Nickel
Royalty on mineral reservation 1,307,621,214 1,398,423,135 90,801,921 1,211,989,733 - 0%
a. Timing difference On the initial variance noted, the most common cause pertains to the timing of recognizing the royalty on mineral reservation. MGB and some projects included royalty for prior years not covered by the scope of the report, but were only paid in 2019.
b. Non-submission of required supporting schedules The remaining variance pertains to MPSA No. 229-2007-IVB of Citinickel and MPSA No. 246-2007-XIII (SMR) of Hinatuan Mining which failed to provide supporting schedules.
F. PPA
i. Revenue streams
Revenue streams of PPA are discussed in page 105, Section III, Scope of the report, of this chapter.
Government Code (LGC) indicate that the LGU's share in royalty
accrue to the MGB for "special projects and other administrative expenses related to the exploration and development of other mineral reservations". Th
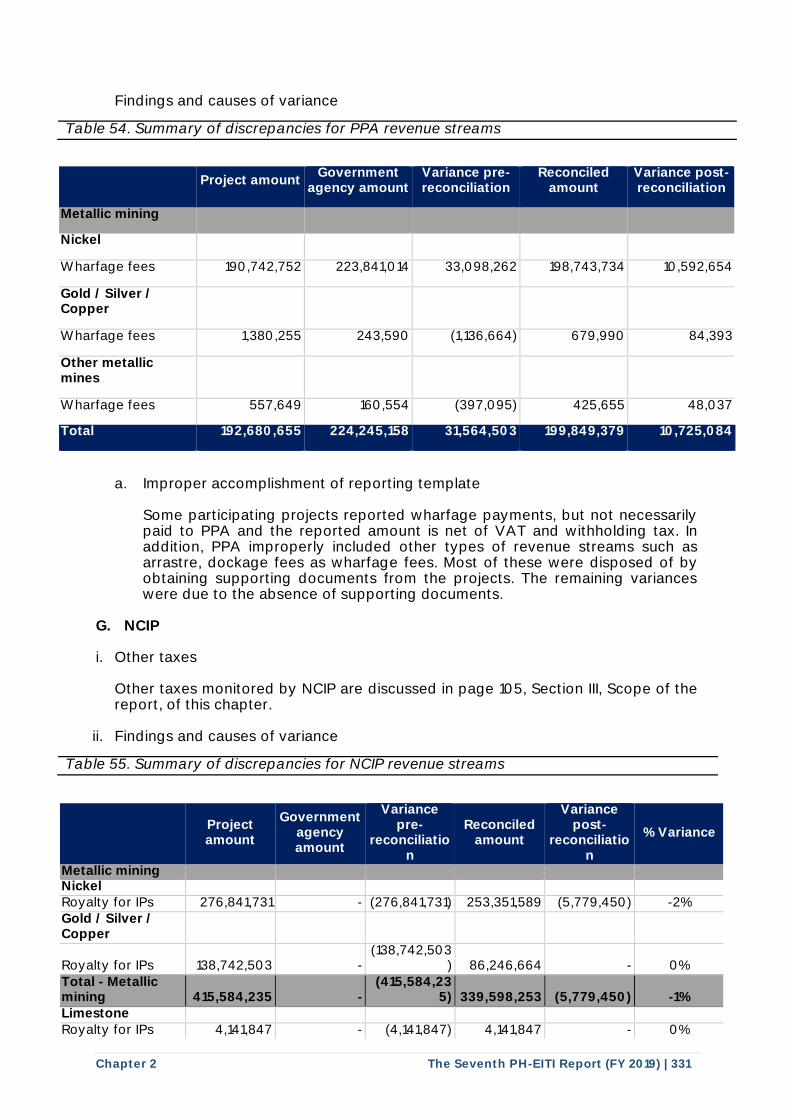
Chapter 2 The Seventh PH-EITI Report (FY 2019) | 331
Findings and causes of variance
Table 54. Summary of discrepancies for PPA revenue streams
Project amount Government
agency amount Variance pre-reconciliation
Reconciled amount
Variance post-reconciliation
Metallic mining
Nickel
Wharfage fees 190,742,752 223,841,014 33,098,262 198,743,734 10,592,654
Gold / Silver / Copper
Wharfage fees 1,380,255 243,590 (1,136,664) 679,990 84,393
Other metallic mines
Wharfage fees 557,649 160,554 (397,095) 425,655 48,037
Total 192,680,655 224,245,158 31,564,503 199,849,379 10,725,084
a. Improper accomplishment of reporting template Some participating projects reported wharfage payments, but not necessarily paid to PPA and the reported amount is net of VAT and withholding tax. In addition, PPA improperly included other types of revenue streams such as arrastre, dockage fees as wharfage fees. Most of these were disposed of by obtaining supporting documents from the projects. The remaining variances were due to the absence of supporting documents.
G. NCIP
i. Other taxes
Other taxes monitored by NCIP are discussed in page 105, Section III, Scope of the report, of this chapter.
ii. Findings and causes of variance
Table 55. Summary of discrepancies for NCIP revenue streams
Project amount
Government agency amount
Variance pre-
reconciliation
Reconciled amount
Variance post-
reconciliation
% Variance
Metallic mining Nickel Royalty for IPs 276,841,731 - (276,841,731) 253,351,589 (5,779,450) -2% Gold / Silver / Copper
Royalty for IPs 138,742,503 - (138,742,503
) 86,246,664 - 0% Total - Metallic mining 415,584,235 -
(415,584,235) 339,598,253 (5,779,450) -1%
Limestone Royalty for IPs 4,141,847 - (4,141,847) 4,141,847 - 0% t t t t
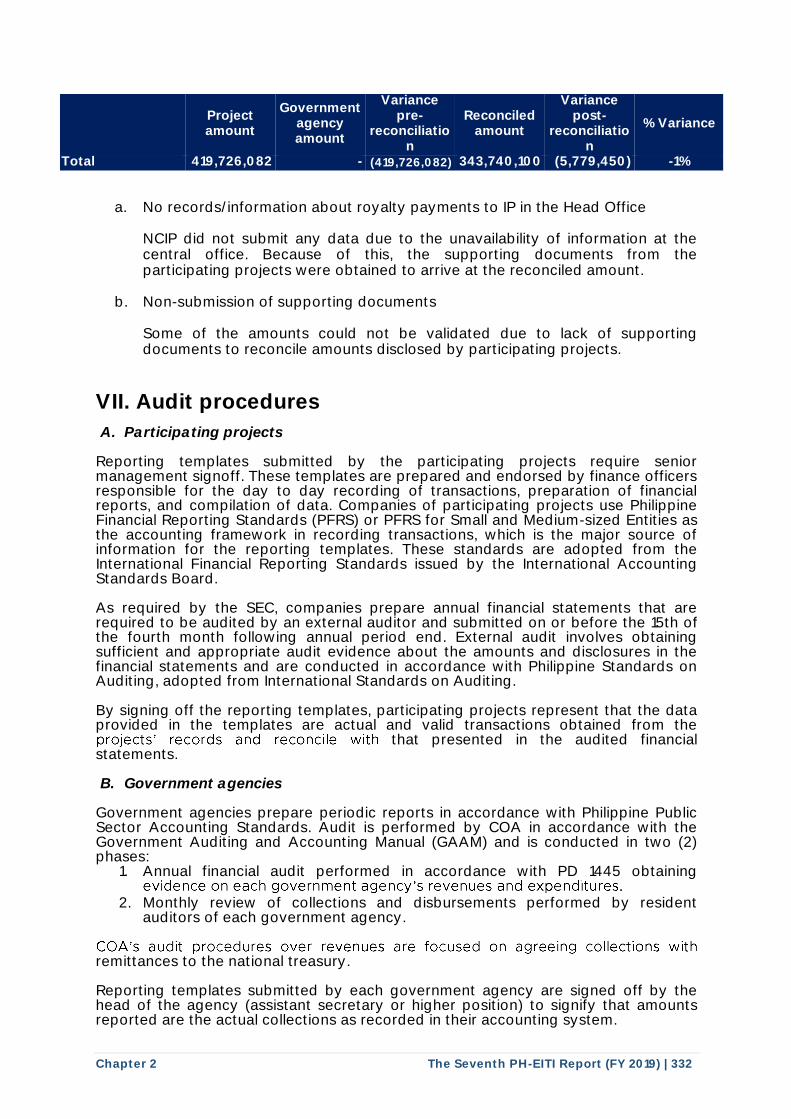
Chapter 2 The Seventh PH-EITI Report (FY 2019) | 332
Project amount
Government agency amount
Variance pre-
reconciliation
Reconciled amount
Variance post-
reconciliation
% Variance
Total 419,726,082 - (419,726,082) 343,740,100 (5,779,450) -1%
a. No records/information about royalty payments to IP in the Head Office
NCIP did not submit any data due to the unavailability of information at the central office. Because of this, the supporting documents from the participating projects were obtained to arrive at the reconciled amount.
b. Non-submission of supporting documents
Some of the amounts could not be validated due to lack of supporting documents to reconcile amounts disclosed by participating projects.
VII. Audit procedures
A. Participating projects Reporting templates submitted by the participating projects require senior management signoff. These templates are prepared and endorsed by finance officers responsible for the day to day recording of transactions, preparation of financial reports, and compilation of data. Companies of participating projects use Philippine Financial Reporting Standards (PFRS) or PFRS for Small and Medium-sized Entities as the accounting framework in recording transactions, which is the major source of information for the reporting templates. These standards are adopted from the International Financial Reporting Standards issued by the International Accounting Standards Board. As required by the SEC, companies prepare annual financial statements that are required to be audited by an external auditor and submitted on or before the 15th of the fourth month following annual period end. External audit involves obtaining sufficient and appropriate audit evidence about the amounts and disclosures in the financial statements and are conducted in accordance with Philippine Standards on Auditing, adopted from International Standards on Auditing. By signing off the reporting templates, participating projects represent that the data provided in the templates are actual and valid transactions obtained from the
that presented in the audited financial statements. B. Government agencies
Government agencies prepare periodic reports in accordance with Philippine Public Sector Accounting Standards. Audit is performed by COA in accordance with the Government Auditing and Accounting Manual (GAAM) and is conducted in two (2) phases:
1. Annual financial audit performed in accordance with PD 1445 obtaining
2. Monthly review of collections and disbursements performed by resident auditors of each government agency.
remittances to the national treasury. Reporting templates submitted by each government agency are signed off by the head of the agency (assistant secretary or higher position) to signify that amounts reported are the actual collections as recorded in their accounting system.
projects ' records and reconcile with
evidence on each government agency's revenues and expenditures.
COA's audit procedures over revenues are focused on agreeing collections with
Chapter 2 The Seventh PH-EITI Report (FY 2019) | 333
Accordingly, reporting templates of all participating projects and government agencies were ascertained to comply with the above procedures; hence deemed reliable and comprehensive with no exceptions identified other than those gaps included as part of recommendations under Section VIII, Recommendations. Recommendations noted in the Report were limited to areas covering administrative functions of each of the government agency that would not impact the reported revenues. It is noteworthy to emphasize that companies of participating projects and government agencies provided quality assurances by certifying the following, as duly stated in the last section of the reporting templates:
1. The signatory is the duly authorized and designated representative of either the project or government agency; and
2. All information disclosed and documents submitted in satisfaction of the EITI initiative are considered authentic and complete, and all statements and information provided therein are true and correct.
There were no identified exceptions or instances of non-compliance on the above.
VIII. Recommendations
The first six (6) PH-EITI Country Reports highlighted areas that required attention and action plans from the MSG and certain government agencies. While there have been steps taken to improve the reporting process and further strengthen the clarity in disclosing revenue collections of the government, there is still room for improvement.
Improving EITI implementation
A. MSG and PH-EITI Secretariat
The succeeding discussions are fundamentally similar to points raised in the sixth PH-EITI Country Report with additional recommendations on the data collection process and ORE reporting.
Data collection. On the onset, a discussion should be conducted with all parties, companies and government agencies, to debrief the events that transpired during the previous report, to obtain updates from recommendations from the previous report, and to discuss the process for the current exercise and changes, if any. It is also important to highlight and reiterate to participating projects and government agency that the EITI implementation follows the accrual basis of reporting which means that government payments due in 2019 although paid in 2018 or 2020 should be included in the reported amounts and payments made in 2019, but due for other year should be excluded. In addition, ensure participating projects to submit detailed supporting schedules for all payments to different government agencies for efficient reconciliation. Further, requests of audited financial statements to the SEC should be made once the targeted projects have already been finalized.
ORE reporting. Timing difference and misclassification of payments were consistent sources of variances for the last 6 and current Report. To help avoid this, basic description of revenue streams and other taxes and the corresponding period should be included.
Data centralization. Constraints due to infrastructure limitations (e.g. none or slow internet bandwidth) have been the primary source of issue on accessibility of data. While satellite and regional offices periodically report to head offices (i.e., NCR/ Metro Manila), delays in the data were the primary cause of variances and delays in the reconciliation procedures. MGB implemented measures (i.e. workshops, direct involvement in the gathering of data from the regional offices) that contributed to the improvement in the reconciled MGB revenue streams. However, MGB continues to struggle when it comes to monitoring for safety and health, social and environmental expenditures. MGB should enforce the regional office to report these expenditures together with their collections. Meanwhile, NCIP continues to struggle with gathering data from regional offices wherein most locations do not have readily available
Chapter 2 The Seventh PH-EITI Report (FY 2019) | 334
information on the royalty for IPs. In lieu of a centralized reporting system, the national office of NCIP should establish formal policies that will require regular reporting of regional offices. The national office of NCIP should institute policies and programs to monitor royalty for IPs paid by mining companies. These policies and procedures should also encompass tracking of the projects and programs paid for by these royalties.
Strict implementation of DAO No. 2017-07. The issuance of the administrative order mandating mining contractors to participate in the PH-EITI project clearly shows the commitment of DENR-MGB to ensure more transparency and accountability from the sector. Immediate release of the implementing rules and regulations of DAO No. 2017-07 will properly guide companies on what constitutes compliance with EITI standards and the corresponding implications for non-participation. Participation of oil and gas and coal sectors. While the oil and gas sector has been consistently well represented in the previous PH-EITI reports, we still recommend that the DOE issue an administrative order similar to DAO No. 2017-07 to further promote accountability and transparency in the sector.
Encouraging other industry players. The composition of the TWG and MSG can be augmented by additional representatives from the industry and other government agencies (i.e. NCIP, BOC, nonmetallic, small scale) to further consider their views in key decisions and resolutions. More importantly, NCIP should be duly represented to ensure that the agency is kept up to speed on the requirements, as well as consider steps taken by other government agencies.
B. Government agencies
Observation/s Recommendation/s
Bureau of Internal Revenue (BIR)
Consistent source of variance for the BIR is timing difference where projects disclose tax due for the covered period regardless of when it was paid (accrual basis) while BIR discloses taxes paid in the covered period (cash basis)
Refer to page 317, Section VI, Variances and discrepancies for details.
Reiterate to the BIR that the basis of reporting is accrual which should encompass taxes due for the covered period regardless of when it was paid.
Bureau of Local Government Finance (BLGF)
In the reconciliation process, it was still observed that the data submitted by BLGF was incomplete. This is mainly due to the several system breakdown of ENRDMT, the main system used by the different LGUs for reporting.
Refer to page 317, Section VI, Variances and discrepancies for details.
Similar to the sixth Report recommendation, DOF, through MSG, could help BLGF in the assessment and improvement of ENDRMT since MSG is set to continuously improve ORE. Aside from the improvement of ENDRMT, focus should also be placed on training the personnel of the different LGUs on how to properly use the ENRDMT and how their work impact the PH-EITI exercise.
Department of Budget and Management (DBM)
During the reconciliation of shares in national wealth, it was observed that some of the names of LGUs were not
Ensure consistency in the names of LGU to avoid LGUs or other stakeholders having to look for two names instead of one in order to obtain the total amount of

Chapter 2 The Seventh PH-EITI Report (FY 2019) | 335
Observation/s Recommendation/s
consistent (eg. Sta. and Santa) shares in national wealth of the specific LGU.
Mines and Geosciences Bureau (MGB)
Since this observation was raised in the Sixth Report, improvement was noted in
health and environmental and expenditures, but significant variance still exists between the reconciled amount and the amount reported by the agency.
MGB central office should set a fixed period (eg. Quarterly) of reporting for its regional offices which should be strictly followed, which will greatly help in easing the burden of lump sum reporting upon the request for the PH-EITI exercise.
National Commission on Indigenous Peoples (NCIP)
For the past 6 reports, NCIP has been consistently struggling in providing disclosures to PH-EITI, but for the current and seventh Report, none were provided.
An urgency should be placed on the implementation of NCIP monitoring tool for IP royalties developed by NCIP and PH-EITI and approved by NCIP Commission En Banc on 26 November 2015 under Commission En Banc Resolution No. 06-033-2015.
the agency's monitoring of safety and