Embed Size (px)
Citation preview
FINAL DRAFT Chapter 16 IPCC WGII Sixth Assessment Report
Do Not Cite, Quote or Distribute 16-1 Total pages: 173
1
Chapter 16: Key Risks Across Sectors and Regions 2 3 Coordinating Lead Authors: Brian O'Neill (USA), Maarten van Aalst (The Netherlands), Zelina Zaiton 4 Ibrahim (Malaysia) 5 6 Lead Authors: Lea Berrang Ford (United Kingdom/Canada), Suruchi Bhadwal (India), Halvard Buhaug 7 (Norway), Delavane Diaz (USA), Katja Frieler (Germany), Matthias Garschagen (Germany), Alexandre 8 Magnan (France), Guy Midgley (South Africa), Alisher Mirzabaev (Uzbekistan/Germany), Adelle Thomas 9 (Bahamas), Rachel Warren (United Kingdom) 10 11 Contributing Authors: Sharina Abdul Halim (Malaysia), Idowu Ajibade (Nigeria/Canada/USA), Philip 12 Antwi-Agyei (Ghana), Richard Betts (United Kingdom), Rachel Bezner Kerr (USA), Joern Birkmann 13 (Germany), Martina Angela Caretta (USA), Tamma Carleton (USA), Connor Cavanagh (Ireland/Norway), 14 Winston Chow (Singapore), Gueladio Cisse (Mauritania/ Switzerland/France), Andrew Constable 15 (Australia), Mark Costello (New Zealand), Jackie Dawson (Canada), Richard Dawson (United Kingdom), 16 Simon Donner (Canada), Sybren Drijfhout (The Netherlands), Virginie K.E. Duvat (France), Kristie Ebi 17 (USA), Tamsin Edwards (United Kingdom), Francois Engelbrecht (South Africa), Alexandra Paige Fischer 18 (USA), Isabel Fletcher (United Kingdom), James Ford (United Kingdom), Eranga Galappaththi (Sri 19 Lanka/Canada), Francois Gemenne (Belgium), Patrick Gonzalez (USA), Neal Haddaway 20 (Sweden/Germany/United Kingdom), Isabel Hagen (Switzerland), Stephane Hallegatte (France/USA), 21 Toshihiro Hasegawa (Japan), Masahiro Hashizume (Japan), Cullen Hendrix (USA), Kevin Hennessy 22 (Australia), Tom Hertel (USA), Jeremy Hess (USA), Helene Hewitt (United Kingdom), Kirstin Holsman 23 (USA), Veronika Huber (Germany/Spain), Christian Huggel (Switzerland), Bramka Jafino (Indonesia/The 24 Netherlands), Kripa Jagannathan (Canada/India/USA), Rhosanna Jenkins (United Kingdom), Chris Jones 25 (United Kingdom), Vhalinavho Khavhagali (South Africa), Elco Koks (The Netherlands), Gerhard Krinner 26 (France), Judy Lawrence (New Zealand), Gonéri Le Cozannet (France), Alexandra Lesnikowski (Canada), 27 Karen Levy (USA), Tabea Lissner (Germany), Rachel Lowe (United Kingdom), Simone Lucatello (Mexico), 28 Yong Luo (China), Brendan Mackey (Australia), Shobha Maharaj (Germany/Trinidad and Tobago), 29 Custodio Matavel (Mozambique/Germany), Timon McPhearson (USA), Veruska Muccione (Switzerland), 30 Aditi Mukherji (India), Didacus Namanya (Uganda), Gerald Nelson (USA), David Obura (Kenya), Jean 31 Ometto (Brazil), Friederike Otto (United Kingdom/Germany), Camille Parmesan (United Kingdom/USA), 32 Patricia Pinho (Brazil/United Kingdom), Franziska Piontek (Germany), Prajal Pradhan (Nepal/Germany), 33 Jeff Price (United Kingdom), Joacim Rocklov (Sweden), Steven Rose (USA), Alexander Ruane (USA), 34 Daniela Schmidt (Germany/United Kingdom), Alcade Segnon (Republic of Benin), Sonia Seneviratne 35 (Switzerland), Olivia Serdeczny (Poland/Germany), Mohammad Aminur Rahman Shah (Bangladesh/United 36 Kingdom), Yuanyuan Shang (China/Australia), Roopam Shukla (India/Germany), AR Siders (USA), 37 Nicholas P. Simpson (Zimbabwe/South Africa), Chandi Singh (India), Asha Sitati (Kenya), Tom Spencer 38 (United Kingdom), Nicola Stevens (South Africa), Emily Theokritoff (Germany), Maria Cristina Tirado-von 39 der Pahlen (Spain/USA), Christopher Trisos (South Africa), Nicola Ulibarri (USA), Mariana Vale (Brazil), 40 Krispa Vasant (India), Ana Vicedo-Carbrera (Spain/Switzerland), Colette Wabnitz (Canada), Anita Wreford 41 (New Zealand), Gary Yohe (USA), Carol Zavaleta (Peru), Xuebin Zhang (Canada), Zhibin Zhang (China) 42 43 Review Editors: Tong Jiang (China), Michael Oppenheimer (USA) 44 45 Chapter Scientist: Rhosanna Jenkins (United Kingdom) 46 47 Date of Draft: 1 October 2021 48 49 Notes: TSU Compiled Version 50 51
52 Table of Contents 53 54 Executive Summary .......................................................................................................................................... 3 55 16.1 Introduction and Framing ....................................................................................................................... 9 56
16.1.1 Objective of the Chapter ................................................................................................................. 9 57
ACCEPTED VERSIO
N
SUBJECT TO FIN
AL EDITS
FINAL DRAFT Chapter 16 IPCC WGII Sixth Assessment Report
Do Not Cite, Quote or Distribute 16-2 Total pages: 173
16.1.2 Risk Framing ................................................................................................................................... 9 1 16.1.3 Storyline of the Chapter, and What’s New Compared to Previous Assessments .......................... 10 2 16.1.4 Drivers of Exposure and Vulnerability ......................................................................................... 13 3
16.2 Synthesis of Observed Impacts .............................................................................................................. 14 4 16.2.1 Definitions ..................................................................................................................................... 15 5 16.2.2 Methods and Data for Impact Attribution Including Recent Advances ........................................ 16 6 16.2.3 Observed Impacts .......................................................................................................................... 17 7
16.3 Synthesis of Observed Adaptation-related Responses ........................................................................ 25 8 16.3.1 Adaptation-related Responses by Natural Systems ....................................................................... 26 9 16.3.2 Adaptation-related Responses by Human Systems ....................................................................... 27 10 16.3.3 Knowledge Gaps in Observed Responses ..................................................................................... 39 11
Cross-Chapter Box INTEREG: Inter-regional Flows of Risks and Responses to Risk ........................... 39 12 16.4 Synthesis of Limits to Adaptation Across Natural and Human Systems .......................................... 44 13
16.4.1 Definitions and Conceptual Advances Since AR5 ......................................................................... 44 14 Box 16.1: Linking Adaptation Constraints, Soft and Hard Limits ............................................................ 45 15
16.4.2 Insights from Regions and Sectors about Limits to Adaptation .................................................... 46 16 16.4.3 Regional and Sectoral Synthesis of Limits to Adaptation ............................................................. 48 17
16.5 Key Risks Across Sectors and Regions ................................................................................................. 55 18 16.5.1 Defining Key Risks ........................................................................................................................ 56 19 16.5.2 Identification and Assessment of Key Risks and Representative Key Risks ................................. 57 20 16.5.3 Variation of Key Risks Across Levels of Global Warming, Exposure and Vulnerability, and 21
Adaptation ............................................................................................................................. 75 22 16.5.4 RKR Interactions ........................................................................................................................... 80 23
16.6 Reasons for Concern Across Scales ...................................................................................................... 89 24 16.6.1 Key Risks and Sustainable Development ...................................................................................... 89 25 16.6.2 Framework and Approach for Assessment of RFCs and Relation to RKRs ................................. 93 26 16.6.3 Global Reasons for Concern ......................................................................................................... 98 27
Cross-Working Group Box ECONOMIC: Estimating Global Economic Impacts from Climate Change28 ................................................................................................................................................................ 111 29 16.6.4 Summary ...................................................................................................................................... 119 30
FAQ16.1: What are key risks in relation to climate change? ................................................................... 121 31 FAQ16.2 How does adaptation help to manage key risks and what are its limits? ................................ 122 32 FAQ16.3: How do climate scientists differentiate between impacts of climate change and changes in 33
natural or human systems that occur for other reasons? ................................................................. 123 34 FAQ16.4: What adaptation-related responses to climate change have already been observed, and do 35
they help reduce climate risk? ............................................................................................................. 124 36 FAQ16.5: How does climate risk vary with temperature? ....................................................................... 125 37 FAQ16.6: What is the role of extreme weather events in the risks we face from climate change? ...... 126 38 References ...................................................................................................................................................... 128 39 40 41
ACCEPTED VERSIO
N
SUBJECT TO FIN
AL EDITS
FINAL DRAFT Chapter 16 IPCC WGII Sixth Assessment Report
Do Not Cite, Quote or Distribute 16-3 Total pages: 173
Executive Summary 1 2 Introduction and framing 3 4 This chapter synthesizes observed climate change impacts (16.2), adaptation-related responses (16.3), limits 5 to adaptation (16.4), and the key risks identified across sectors and regions (16.5). We consider how these 6 risks accrue with increasing global average temperature; how they depend on future development and 7 adaptation efforts; and what this implies for the Sustainable Development Goals and the five main Reasons 8 for Concern about climate change (16.6). 9 10 Observed impacts 11 12 The impacts of changes in climate-related systems have been identified in a wide range of natural, 13 human, and managed systems (very high confidence1). Compared to the last IPCC AR5 there is more 14 evidence for impacts of long-term changes in climate-related systems (including the atmosphere, ocean and 15 cryosphere) on socio-economic indicators and high confidence in the sensitivity of societies to weather 16 conditions. There is also stronger evidence for impacts of long-term climate change on ecosystems, including 17 the observed widespread mortality of warm water corals, far reaching shifts in phenology in marine and 18 terrestrial ecosystems and the expansion of tropical species into the ranges of temperate species, and boreal 19 species moving into Arctic regions (high confidence). {16.2.3, 16.2.3.1} 20 21 Increased rainfall intensity associated with tropical cyclones and rising sea levels have contributed to 22 observed damages in local coastal systems (medium confidence). However, while the impact is expected 23 to be widespread, formal attribution of damages to long term changes in the climate-related systems is still 24 limited by restricted knowledge about changes in exposure and vulnerability and the missing quantification 25 of the contribution of sea level rise to the extent of flooded areas. {16.2.3.3} 26 27 Due to complex interactions with socio-economic conditions, evidence on the impact of long-term 28 climate change on crop prices and malnutrition is largely lacking while the sensitivity of malnutrition to 29 weather conditions has become more evident in some regions, particularly Africa (medium to high 30 confidence). A negative impact of long-term climate change on crop yields has been identified in some 31 regions (e.g., wheat yields in Europe) (medium confidence) while studies are still inconsistent in other 32 regions. {16.2.3.4} 33 34 Climate change has increased observed heat-related mortality (medium confidence) and contributed to 35 the observed latitudinal or altitudinal range expansion of vector- borne diseases into previously colder 36 areas (medium to high confidence) while evidence on the impact of long-term climate change on water-37 borne diseases is largely lacking. Overall, there is extensive observational evidence that extreme ambient 38 temperatures increase human mortality (high confidence) and that the occurrence of water- and vector-borne 39 diseases is sensitive to weather conditions (high confidence). {16.2.3.5, 16.2.3.6, 16.2.3.7} 40 41 Extreme weather events not only cause substantial direct economic damage (high confidence), but also 42 reduce economic growth in the short-term (year of, and year after event) (high confidence) as well as 43 in the long-term (up to 15 years after the event) (medium confidence), with more severe impacts in 44 developing than in industrialized economies (high confidence). Evidence has increased for all of these 45 conclusions; however, evidence for impacts of long-term climate change is still limited. {16.2.3.7} 46 47 Climate variability and extremes are associated with increased prevalence of conflict, with more 48 consistent evidence for low-intensity organized violence than for major armed conflict (medium 49 confidence). Compared to other socio-economic drivers, the link is relatively weak (medium confidence) and 50 conditional on high population size, low socioeconomic development, high political marginalization, and 51 high agricultural dependence (medium confidence). Literature also suggests a larger climate-related influence 52
1 In this Report, the following summary terms are used to describe the available evidence: limited, medium, or robust; and for the degree of agreement: low, medium, or high. A level of confidence is expressed using five qualifiers: very low, low, medium, high, and very high, and typeset in italics, e.g., medium confidence. For a given evidence and agreement statement, different confidence levels can be assigned, but increasing levels of evidence and degrees of agreement are correlated with increasing confidence.
ACCEPTED VERSIO
N
SUBJECT TO FIN
AL EDITS
FINAL DRAFT Chapter 16 IPCC WGII Sixth Assessment Report
Do Not Cite, Quote or Distribute 16-4 Total pages: 173
on the dynamics of conflict than on the likelihood of initial conflict outbreak (low confidence). There is 1 insufficient evidence at present to attribute armed conflict to climate change. {16.2.3.8} 2 3 There is high confidence that anthropogenic climate forcing has had an impact on internal 4 displacement, given the observed impact of anthropogenic climate forcing on the occurrence of 5 weather extremes (high confidence, Table SM16.21) and the strong contribution of weather extremes 6 to observed displacement (high confidence). However, the link between long-term changes in the climate-7 related systems has not been demonstrated systematically and so far there is no attribution of observed trends 8 in displacement to long-term changes in the climate-related systems. Links between weather fluctuations 9 (including extreme events) and human mobility are complex and conditional on socio-economic situations; 10 e.g., poor populations may more often be involuntarily displaced or ‘trapped’ and not be able to migrate. 11 {16.2.3.9} 12 13 Observed adaptation in ecosystems 14 15 While species are increasingly responding to climate change, these responses may not be adaptive or 16 sufficient to cope with the rate of climate changes (high confidence). Responses have been documented in 17 a range of species, including for example changes in the timing of breeding and migration. It is unclear 18 whether these responses reflect long-term evolutionary adaptation or short-term coping mechanisms. 19 Existing assessments indicate that some species’ responses will be insufficient to avert extinction. {16.3.1} 20 21 Observed adaptation-related responses in human systems 22 23 Responses across all sectors and regions reported in the scientific literature are dominated by minor 24 modifications to usual practices or measures for dealing with extreme weather events, whilst evidence 25 of transformative adaptation in human systems is low (high confidence). Responses have accelerated in 26 both developed and developing regions since AR5, with some examples of regression. Despite this, there is 27 negligible evidence in the scientific literature documenting responses that are simultaneously widespread, 28 rapid, and that challenge norms and adaptation limits. {16.3.2.3} 29 30 There is negligible evidence that existing responses are adequate to reduce climate risk (high 31 confidence). There is some evidence of global vulnerability reduction, particularly for mortality and 32 economic losses due to flood risk and extreme heat. (16.3.2.4) Evidence on the effectiveness of specific 33 adaptations remains limited. There is negligible robust evidence to assess the overall adequacy of the global 34 adaptation response to address the scale of climate risk. No studies have systematically assessed the 35 adequacy and effectiveness of adaptation at a global scale, across nations or sectors, or for different levels of 36 warming. {16.3.2.3} 37 38 Adaptation responses are showing co-benefits, for mitigation and other societal goals (high 39 confidence). There is increasing evidence of co-benefits of adaptation responses. Co-benefits are most 40 frequently linked to changes in agricultural practices (e.g., conservation agriculture), land use management 41 (e.g., agroforestry), building technologies (e.g., building efficiency standards), and urban design (e.g., 42 walkable neighbourhoods). {16.3.2.3} 43 44 Evidence of maladaptation is increasing (high confidence), i.e. adaptation that increases climate risk or 45 creates new risks in other systems or for other actors. Globally, maladaptation has been reported most 46 frequently in the context of agriculture and migration in the global south. {16.3.2.6} 47 48 Limits to adaptation across natural and human systems 49 50 There is increasing evidence on limits to adaptation which result from the interaction of adaptation 51 constraints and can be differentiated into soft and hard limits (high confidence). Soft limits may change 52 over time as additional adaptation options become available. Hard limits will not change over time as no 53 additional adaptive actions are possible. Evidence focuses on constraints that may lead to limits at some 54 point of the adaptation process, with less information on how limits may be related to different levels of 55 socio-economic or climatic change (high confidence). {16.4.1, 16.4.2, 16.4.3} 56 57
ACCEPTED VERSIO
N
SUBJECT TO FIN
AL EDITS
FINAL DRAFT Chapter 16 IPCC WGII Sixth Assessment Report
Do Not Cite, Quote or Distribute 16-5 Total pages: 173
Limits to adaptation have been identified for terrestrial and aquatic species and ecosystems, coastal 1 communities, water security, agricultural production, and human health and heat (high confidence). 2 Beginning at 1.5°C, autonomous and evolutionary adaptation responses by terrestrial and aquatic species and 3 ecosystems face hard limits, resulting in biodiversity decline, species extinction and loss of related 4 livelihoods (high confidence). Beginning at 3°C, hard limits are projected for water management measures, 5 leading to decreased water quality and availability, negative impacts on health and wellbeing, economic 6 losses in water and energy dependent sectors and potential migration of communities (medium confidence). 7 Adaptation to address risks of heat stress, heat mortality and reduced capacities for outdoor work for humans 8 face soft and hard limits across regions beginning at 1.5°C, and are particularly relevant for regions with 9 warm climates (high confidence). {16.4.2, 16.4.3} 10 11 Soft limits are currently being experienced by individuals and households along the coast and by 12 small-scale farmers (medium confidence). As sea levels rise and extreme events intensify, coastal 13 communities face soft limits due to financial, institutional and socio-economic constraints reducing the 14 efficacy of coastal protection and accommodation approaches and resulting in loss of life and economic 15 damages (medium confidence). {16.4.2, 16.4.3} 16 17 Hard limits for coastal communities reliant on nature-based coastal protection will be experienced 18 beginning at 1.5°C (medium confidence). Soft and hard limits for agricultural production are related to 19 water availability and the uptake and effectiveness of climate-resilient crops which are constrained by socio-20 economic and political challenges (medium confidence). {16.4.2, 16.4.3} 21 22 Across regions and sectors, the most significant determinants of soft limits are financial, governance, 23 institutional and policy constraints (high confidence). The ability of actors to overcome these socio-24 economic constraints largely influence whether additional adaptation is able to be implemented and prevent 25 soft limits from becoming hard. While the rate, extent and timing of climate hazards largely determine hard 26 limits of biophysical systems, these factors appear to be less influential in determining soft limits for human 27 systems (medium confidence). {16.4.2, 16.4.3} 28 29 Financial constraints are important determinants of limits to adaptation, particularly in low-to-middle 30 income countries (high confidence). Impacts of climate change may increase financial constraints (high 31 confidence) and contribute to soft limits to adaptation being reached (medium confidence). Global and 32 regional evidence shows that climate impacts may limit the availability of financial resources, stunt national 33 economic growth, result in higher levels of losses and damages and thereby increase financial constraints. 34 {16.4.3.2, 16.4.3.3} 35 36 Key risks across climate and development pathways 37 38 Regional and sectoral chapters of this report identified over 130 Key Risks (KRs) that could become 39 severe under particular conditions of climate hazards, exposure, and vulnerability. These key risk are 40 represented in eight so-called Representative Key Risks (RKRs) clusters of key risks relating to low-41 lying coastal systems; terrestrial and ocean ecosystems; critical physical infrastructure, networks and 42 services; living standards; human health; food security; water security; and peace and mobility (high 43 confidence). A key risk is defined as a potentially ‘severe’ risk, i.e. that is relevant to the interpretation of 44 dangerous anthropogenic interference (DAI) with the climate system. Key risks cover scales from the local 45 to the global, are especially prominent in particular regions or systems, and are particularly large for 46 vulnerable subgroups, especially low-income populations, and already at-risk ecosystems (high confidence). 47 The conditions under which RKRs would become severe have been assessed along levels for warming, 48 exposure/vulnerability, and adaptation: for warming, high refers to climate outcomes consistent with RCP8.5 49 or higher, low refers to climate outcomes consistent with RCP2.6 or lower, and medium refers to 50 intermediary climate scenarios; exposure/vulnerability levels are relative to the range of future conditions 51 considered in the literature; for adaptation, high refers to near maximum potential and low refers to the 52 continuation of today’s trends. (6.5.2.1, 16.5.2.2, Table SM16.4). 53 54 For most Representative Key Risks (RKRs), potentially global and systemically pervasive risks 55 become severe in the case of high warming, combined with high exposure/vulnerability, low 56 adaptation, or both (high confidence). Under these conditions there would be severe and pervasive risks to 57
ACCEPTED VERSIO
N
SUBJECT TO FIN
AL EDITS
FINAL DRAFT Chapter 16 IPCC WGII Sixth Assessment Report
Do Not Cite, Quote or Distribute 16-6 Total pages: 173
critical infrastructure and to human health from heat-related mortality (high confidence), to low-lying coastal 1 areas, aggregate economic output, and livelihoods (all medium confidence), of armed conflict (low 2 confidence), and to various aspects of food security (with different levels of confidence). Severe risks 3 interact through cascading effects, potentially causing amplification of RKRs over the course of this century 4 (low evidence, high agreement). {16.5.2.3, 16.5.2.4, 16.5.4, Figure 16.10} 5 For some RKRs, potentially global and systemically pervasive risks would become severe even with 6 medium to low warming (i.e. 1.5-2°C) if exposure/vulnerability is high and/or adaptation is low 7 (medium to high confidence). Under these conditions there would be severe and pervasive risks associated 8 with water scarcity and water-related disasters (high confidence), poverty, involuntary mobility, and insular 9 ecosystems and biodiversity hotspots (all medium confidence). {16.5.2.3, 16.5.2.4} 10 11 All potentially severe risks that apply to particular sectors or groups of people at more specific 12 regional and local levels require high exposure/vulnerability or low adaptation (or both), but do not 13 necessarily require high warming (high confidence). Under these conditions there would be severe, 14 specific risks to low-lying coastal systems, to people and economies from critical infrastructure disruption, 15 economic output in developing countries, livelihoods in climate-sensitive sectors, waterborne diseases 16 especially in children in low- and middle-income countries, water-related impacts on traditional ways of life, 17 and involuntary mobility for example in small islands and low-lying coastal areas (medium to high 18 confidence). {16.5.2.3, 16.5.2.4} 19 20 Some severe impacts are already occurring (high confidence) and will occur in many more systems 21 before mid-century (medium confidence). Tropical and polar low-lying coastal human communities are 22 experiencing severe impacts today (high confidence), and abrupt ecological changes resulting from mass 23 population-level mortality are already observed following climate extreme events. Some systems will 24 experience severe risks before the end of the century (medium confidence), for example critical infrastructure 25 affected by extreme events (medium confidence). Food security for millions of people, particularly low-26 income populations, also faces significant risks with moderate to high warming or high vulnerability, with a 27 growing challenge by 2050 in terms of providing nutritious and affordable diets (high confidence). {16.5.2.3, 28 16.5.3} 29 30 In specific systems already marked by high exposure and vulnerability, high adaptation efforts will 31 not be sufficient to prevent severe risks from occurring under high warming (low evidence, medium 32 agreement). This is particularly the case for some ecosystems and water-related risks (from water scarcity 33 and to indigenous and traditional cultures and ways of life). {16.5.2.3, 16.5.2.4, 16.5.3} 34 35 Interconnectedness and globalization establish pathways for the transmission of climate-related risks 36 across sectors and borders, for instance through trade, finance, food, and ecosystems (high 37 confidence). Examples include semiconductors, global investments, major food crops like wheat, maize and 38 soybean, and transboundary fish stocks. There are knowledge gaps on the need for, effectiveness of, and 39 limits to adaptation to such interregional risks {Cross-Chapter Box INTERREG in this Chapter} 40 41 Key risks increase the challenges in achieving global sustainability goals (high confidence). The greatest 42 challenges will be from risks to water (RKR-G), living standards (RKR-D), coastal socio-ecological systems 43 (RKR-A) and peace and human mobility (RKR-H). The most relevant goals are Zero hunger (SDG2), 44 Sustainable cities and communities (SDG11), Life below water (SDG14), Decent work and economic 45 growth (SDG8), and No poverty (SDG1). Priority areas for regions are indicated by the intersection of 46 hazards, risks and challenges, where, in the near term, challenges to SDGs indicate probable systemic 47 vulnerabilities and issues in responding to climatic hazards. (high confidence) {16.6.1} 48 49 The scale and nature of climate risks is partly determined by the responses to climate change, not only in 50 how they reduce risk, but also how they may create other risks (sometimes inadvertently, and sometimes to 51 others than those who implement the response, in other places, or later in time). 52 53 Solar Radiation Modification (SRM) approaches have potential to offset warming and ameliorate 54 other climate hazards, but their potential to reduce risk or introduce novel risks to people and 55 ecosystems is not well understood (high confidence). SRM effects on climate hazards are highly dependent 56 on deployment scenarios and substantial residual climate change or overcompensating change would occur 57
ACCEPTED VERSIO
N
SUBJECT TO FIN
AL EDITS
FINAL DRAFT Chapter 16 IPCC WGII Sixth Assessment Report
Do Not Cite, Quote or Distribute 16-7 Total pages: 173
at regional scales and seasonal timescales (high confidence). Due in part to limited research, there is low 1 confidence in projected benefits or risks to crop yields, economies, human health, or ecosystems. Large 2 negative impacts are projected from rapid warming for a sudden and sustained termination of SRM in a high-3 CO2 scenario. SRM would not stop CO2 from increasing in the atmosphere or reduce resulting ocean 4 acidification under continued anthropogenic emissions (high confidence). There is high agreement in the 5 literature that for addressing climate change risks SRM is, at best, a supplement to achieving sustained net 6 zero or net negative CO2 emission levels globally. Co-evolution of SRM governance and research provides a 7 chance for responsibly developing SRM technologies with broader public participation and political 8 legitimacy, guarding against potential risks and harms relevant across a full range of scenarios. [Cross-9 Working Group Box SRM} 10 11 Recent global estimates of the economic cost of climate impacts exhibit significant spread and 12 generally increase with global average temperature, as well as vary by other drivers, such as income, 13 population and composition of the economy (high confidence). The wide variation across disparate 14 methodologies does not allow a robust range of damage estimates to be identified with confidence, though 15 the spread of estimates increases with warming in all methodologies, indicating higher risk (in terms of 16 economic costs) at higher temperatures (high confidence). Reconciling methodological variance is a priority 17 for facilitating use of different lines of evidence; however, that some new estimates are higher than the AR5 18 range indicates that global aggregate economic impacts could be higher than previously assessed (low 19 confidence due to the lack of robustness and comparability across methodologies). {Cross-Working Group 20 Box ECONOMIC in Chapter 16} 21 22 Reasons for Concern across scales 23 24 The five major Reasons for Concern (RFCs), describing risks associated with (1) unique and threatened 25 systems, (2) extreme weather events, (3) distribution of impacts, (4) global aggregate impacts, and (5) large-26 scale singular events, were updated using expert elicitation. RFC risk levels were assessed with no or low 27 adaptation, but limits to adaptation are a factor in the identification of very high risk levels. 28 29 Compared to AR5 and SR15, risks increase to high and very high levels at lower global warming levels 30 for all five RFCs (high confidence), and transition ranges are assigned with greater confidence. 31 Transitions from high to very high risk emerge in all five RFCs, compared to just two RFCs in AR5 32 (high confidence). {16.6.3, Figure 16.15} 33 34 ● For unique and threatened systems (RFC1), as before, levels of risk at a given level of warming are 35 higher than for the other RFCs. Risks are already (at current warming of 1.1ºC) in the transition from 36 moderate to high (very high confidence), compared to moderate in AR5 and SR15, based on observed and 37 modelled impacts. The transition to very high risk occurs between 1.2ºC and 2.0ºC warming (high 38 confidence). {16.6.3.1} 39 40 ● For risks from extremes (RFC2), the transition to high risk is between 1.0ºC and 1.5ºC (high 41 confidence) and to very high risk (new in AR6) between 1.8 and 2.5ºC (medium confidence). {16.6.3.2} 42 43 ● For risks disproportionately affecting particularly vulnerable societies and socio-ecological systems, 44 including disadvantaged people and communities in countries at all levels of development (RFC3), current 45 risk is moderate (high confidence) and the transition to high risk is between 1.5–2.0ºC warming (medium 46 confidence). The transition to very high risk occurs at between 2.0–3.5ºC warming (medium confidence). 47 {16.6.3.3} 48 49 ● The risk of global aggregate impacts, including monetary damages, lives affected, species lost or 50 ecosystem degradation at a global scale (RFC4), has begun to transition to moderate risk (medium 51 confidence), with a transition to high risk between 1.5–2.5ºC (medium confidence) and to very high risk (new 52 in AR6) at between 2.5 and 4.5ºC (low confidence). {16.6.3.4} 53 54 ● Present-day risks associated with large-scale singular events (sometimes called tipping points or 55 critical thresholds) (RFC5) are already moderate (high confidence), with a transition to high risk between 56
ACCEPTED VERSIO
N
SUBJECT TO FIN
AL EDITS
FINAL DRAFT Chapter 16 IPCC WGII Sixth Assessment Report
Do Not Cite, Quote or Distribute 16-8 Total pages: 173
1.5–2.5ºC (medium confidence) and to very high risk (new in AR6) between 2.5–4ºC (low confidence). 1 {16.6.3.5} 2 3 Limiting global warming to 1.5ºC would ensure risk levels remain moderate for RFC3, RFC4 and 4 RFC5 (medium confidence) but risk for RFC2 would have transitioned to a high risk at 1.5ºC and 5 RFC1 would be well into the transition to very high risk (high confidence). Remaining below 2ºC 6 warming (but above 1.5ºC) would imply that risk for RFC3 through 5 would be transitioning to high, 7 and risk for RFC1 and RFC2 would be transitioning to very high (high confidence). By 2.5ºC warming, 8 RFC1 will be in very high risk (high confidence) and all other RFCs will have begun their transitions to very 9 high risk (medium confidence for RFC2 and RFC3, low confidence for RFC4 and RFC5). 10 11 RFC1, RFC2 and RFC5 include risks that are irreversible, such as species extinction, coral reef degradation, 12 loss of cultural heritage, or loss of a small island due to sea level rise. Once such risks materialise, as is 13 expected at very high risk levels, the impacts would persist even if global temperatures would subsequently 14 decline to levels associated with lower levels of risk in an ‘overshooting’ scenario (high confidence). 15 {16.6.3} 16 17 18
ACCEPTED VERSIO
N
SUBJECT TO FIN
AL EDITS
FINAL DRAFT Chapter 16 IPCC WGII Sixth Assessment Report
Do Not Cite, Quote or Distribute 16-9 Total pages: 173
16.1 Introduction and Framing 1 2 16.1.1 Objective of the Chapter 3 4 Anthropogenic climate change poses risks to many human and ecological systems. These risks are 5 increasingly visible in our day-to-day lives, including a growing number of disasters that already bear a 6 fingerprint of climate change. There is increasing concern about how these risks will shape the future of our 7 planet – our ecosystems, our well-being and development opportunities. Policy makers are asking what is 8 known about the risks, and what can be done about them. Many people and especially youth around the 9 world are calling for urgency, ambition and action. Companies are wondering how to manage new threats to 10 their bottom line, or how to grasp new opportunities. On top of this growing concern about climate change, 11 the COVID-19 pandemic has exposed vulnerabilities to shocks, significantly aggravated climate-related 12 risks, and posed new questions about how to achieve a green, resilient and inclusive recovery (see Cross-13 Chapter Box COVID in Chapter 7). 14 15 The three synthesis chapters of this report (16, 17 and 18) aim to address these concerns. They synthesize 16 information from across all thematic and regional Chapters of the Working Group (WGII) Sixth Assessment 17 Report (AR6) and the recent IPCC Special Reports on Global Warming of 1.5ºC, on Climate Change and 18 Land, and on Ocean and Cryosphere in a Changing Climate (SR15, SRCCL and SROCC), but also include 19 an independent assessment of the literature, especially literature that cuts across sectors and regions. 20 21 Chapter 16 lays the groundwork by synthesizing the state of knowledge on the observed impacts of climate 22 change (Section 16.2) and ongoing adaptation responses (Section 16.3), the limits to adaptation (Section 23 16.4), and the key risks we should be concerned about, how these risks evolve with global temperature 24 change, and also how they depend on future development and adaptation efforts (Sections 16.5 and 16.6). It 25 thus brings together elements that were assessed in different chapters in previous assessments, especially the 26 Third, Fourth and Fifth Assessment Reports (TAR, AR4, and AR5, respectively). Background on specific 27 methodological aspects of this chapter is provided in Supplementary Material.. 28 29 The strong link between risks, adaptation and development connects this chapter closely to Chapters 17 and 30 18. Chapter 17 assesses decision-making: what do we know about the ways to manage risks in a warming 31 climate (including in the context of the key risks and limits to adaptation identified in this chapter)? Chapter 32 18 puts all of this information into the perspective of climate-resilient development pathways: how can we 33 achieve sustainable development given the additional challenges posed by climate change? 34 35 16.1.2 Risk Framing 36 37 In the IPCC AR6, ‘risk’ is defined as the potential for adverse consequences for human or ecological 38 systems, recognizing the diversity of values and objectives associated with such systems. Relevant adverse 39 consequences include those on lives, livelihoods, health and well-being, economic, social and cultural assets 40 and investments, infrastructure, services (including ecosystem services), ecosystems and species (Chapter 1 41 this volume, SR15). The AR6 definition explicitly notes that ‘risks can arise from potential impacts of 42 climate change as well as human responses to climate change.’ 43 44 The main risks assessed here relate to the potential impacts of climate change. In recent years, the growing 45 visibility of current climate impacts has resulted in a stronger focus on understanding and managing such 46 risk across timescales, rather than just for the longer-term future. Examples include the rapid growth in 47 attribution of specific extreme weather events, the use of scientific evidence of climate change impacts in 48 legal cases, the context of the Paris Agreement’s Article 8 on ‘averting, minimizing and addressing loss and 49 damage’ associated with climate change, but also the stronger links between adaptation and disaster risk 50 reduction, including early warning systems, wider discussions on how to build resilience in the face of a 51 more volatile climate, and attention for limits to adaptation that are already being reached. 52 53 Of course the scale of these risks is also determined by the responses to climate change, mainly in how they 54 reduce risk, but also how they may create risks (sometimes inadvertently, and sometimes to others than those 55 who implement the response, in other places, or later in time). Our focus is on adaptation responses, given 56 that mitigation is covered in WGIII AR6, but we acknowledge certain important interactions, such as 57
ACCEPTED VERSIO
N
SUBJECT TO FIN
AL EDITS
FINAL DRAFT Chapter 16 IPCC WGII Sixth Assessment Report
Do Not Cite, Quote or Distribute 16-10 Total pages: 173
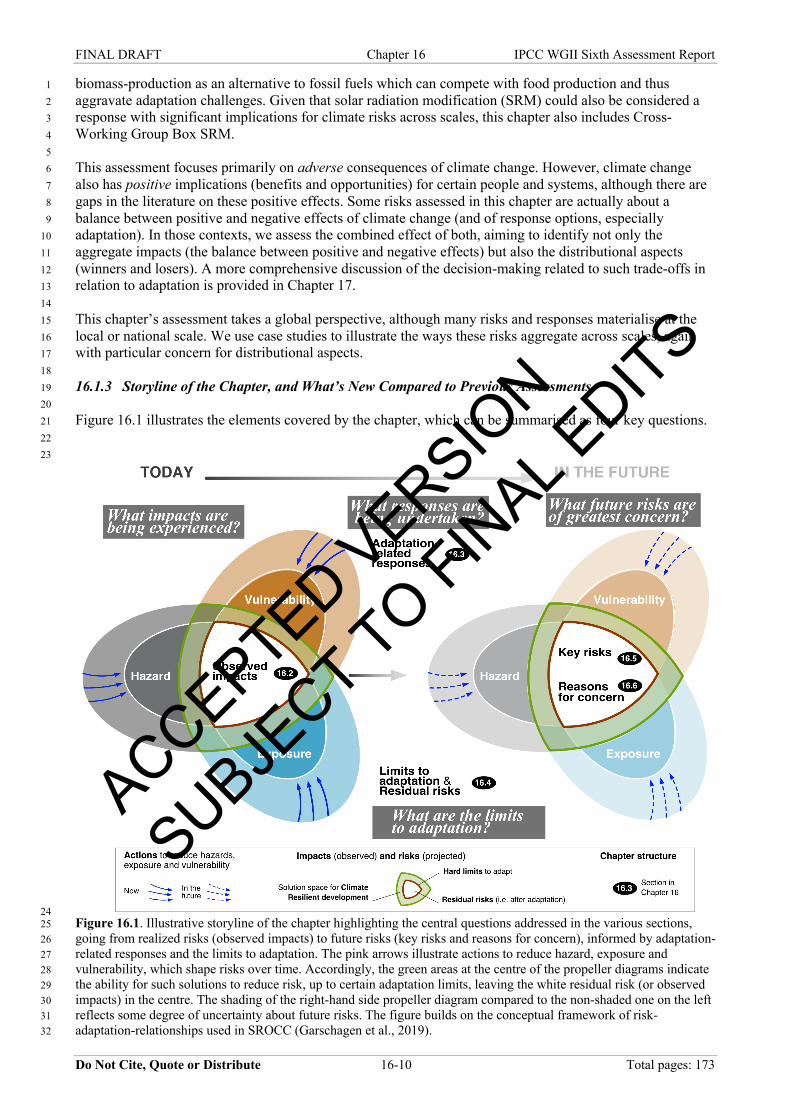
biomass-production as an alternative to fossil fuels which can compete with food production and thus 1 aggravate adaptation challenges. Given that solar radiation modification (SRM) could also be considered a 2 response with significant implications for climate risks across scales, this chapter also includes Cross-3 Working Group Box SRM. 4 5 This assessment focuses primarily on adverse consequences of climate change. However, climate change 6 also has positive implications (benefits and opportunities) for certain people and systems, although there are 7 gaps in the literature on these positive effects. Some risks assessed in this chapter are actually about a 8 balance between positive and negative effects of climate change (and of response options, especially 9 adaptation). In those contexts, we assess the combined effect of both, aiming to identify not only the 10 aggregate impacts (the balance between positive and negative effects) but also the distributional aspects 11 (winners and losers). A more comprehensive discussion of the decision-making related to such trade-offs in 12 relation to adaptation is provided in Chapter 17. 13 14 This chapter’s assessment takes a global perspective, although many risks and responses materialise at the 15 local or national scale. We use case studies to illustrate the ways these risks aggregate across scales, again 16 with particular concern for distributional aspects. 17 18 16.1.3 Storyline of the Chapter, and What’s New Compared to Previous Assessments 19 20 Figure 16.1 illustrates the elements covered by the chapter, which can be summarised as four key questions. 21 22 23
24 Figure 16.1. Illustrative storyline of the chapter highlighting the central questions addressed in the various sections, 25 going from realized risks (observed impacts) to future risks (key risks and reasons for concern), informed by adaptation-26 related responses and the limits to adaptation. The pink arrows illustrate actions to reduce hazard, exposure and 27 vulnerability, which shape risks over time. Accordingly, the green areas at the centre of the propeller diagrams indicate 28 the ability for such solutions to reduce risk, up to certain adaptation limits, leaving the white residual risk (or observed 29 impacts) in the centre. The shading of the right-hand side propeller diagram compared to the non-shaded one on the left 30 reflects some degree of uncertainty about future risks. The figure builds on the conceptual framework of risk-31 adaptation-relationships used in SROCC (Garschagen et al., 2019). 32
ACCEPTED VERSIO
N
SUBJECT TO FIN
AL EDITS
FINAL DRAFT Chapter 16 IPCC WGII Sixth Assessment Report
Do Not Cite, Quote or Distribute 16-11 Total pages: 173
1 2 16.1.3.1 What Impacts are Being Experienced? 3 4 This assessment of climate related impacts that are already taking place is covered in Section 16.2, which 5 aims to differentiate between observed changes in climate hazards (also called ‘climate impact drivers’ in 6 IPCC Working Group I) and the exposure and vulnerability of human and ecological systems. 7 8 Observed impacts of climate change were synthesized in the TAR, AR4 and AR5. The TAR found that 9 recent regional climate changes had already affected many physical and biological systems, with preliminary 10 indications that some human systems had been affected, primarily through floods and droughts. AR4 found 11 likely2 discernible impacts on many physical and biological systems, and more limited evidence for impacts 12 on human environments. AR5 devoted a separate chapter to observed impacts, which found growing 13 evidence of impacts on human and ecological systems on all continents and across oceans (Cramer et al., 14 2014). 15 16 Section 16.2 reports on the expanded literature since then, generally reflecting a growing and more certain 17 impact of climate change on humans and ecological systems. 18 19 16.1.3.2 What Responses are Being Undertaken? 20 21 Section 16.3 provides, for the first time, a comprehensive synthesis of observed adaptation-related responses 22 to the rising risks. 23 24 Such adaptation responses were first covered in the TAR, and further developed in the AR4 and AR5. For 25 instance, AR5 Chapter 15 notes that adaptation to climate change was transitioning from a phase of 26 awareness to the construction of actual strategies and plans in societies (Mimura et al., 2014) but did not 27 include a comprehensive mapping of responses. 28 29 Based on such a comprehensive mapping, Section 16.3 finds growing evidence of adaptation-related 30 responses, although these are dominated by minor modifications to usual practices or measures for dealing 31 with extreme weather events, and there is limited evidence for the extent to which they reduce climate risk. 32 33 16.1.3.3 What are the Limits to Adaptation? 34 35 The literature on limits to adaptation, which is covered in Section 16.4, has strongly evolved since AR5, 36 including links to discussions on Loss and Damage in the UNFCCC. While the SPM of AR4 noted that there 37 was no clear picture of the limits to adaptation, or the cost, AR5 Chapter 16 (Klein et al., 2014) reported 38 increasing insights emerging from the interactions between climate change and biophysical and 39 socioeconomic constraints, and highlighted the fact that limits could be both hard and soft. It also noted that 40 residual losses and damages will occur from climate change despite adaptation and mitigation action. 41 However, AR5 Chapter 16 still found that the empirical evidence needed to identify limits to adaptation of 42 specific sectors, regions, ecosystems, or species that can be avoided with different GHG mitigation pathways 43 was lacking. 44 45 Section 16.4 provides a more comprehensive assessment of limits to adaptation, highlighting again that 46 limits to adaptation are not fixed, but are properties of dynamic socio-ecological systems. They are shaped 47 not only by the magnitude of the climate hazards (e.g., the amount of sea level rise in low lying coasts and 48 islands), and the exposure and vulnerability to those hazards (e.g., people and assets in those areas), but also 49 by physical, infrastructural and social tolerance thresholds and adaptation choices of actors in societies (e.g., 50 the decision to migrate from locations strongly impacted by climate change). The evolution of such socio-51
2 In this Report, the following terms have been used to indicate the assessed likelihood of an outcome or a result: Virtually certain 99–100% probability, Very likely 90–100%, Likely 66–100%, About as likely as not 33–66%, Unlikely 0–33%, Very unlikely 0–10%, and Exceptionally unlikely 0–1%. Additional terms (Extremely likely: 95–100%, More likely than not >50–100%, and Extremely unlikely 0–5%) may also be used when appropriate. Assessed likelihood is typeset in italics, e.g., very likely). This Report also uses the term ‘likely range’ to indicate that the assessed likelihood of an outcome lies within the 17-83% probability range.
ACCEPTED VERSIO
N
SUBJECT TO FIN
AL EDITS
FINAL DRAFT Chapter 16 IPCC WGII Sixth Assessment Report
Do Not Cite, Quote or Distribute 16-12 Total pages: 173
economic systems over time, including their interaction with the changing physical climate, determines the 1 evolution of limits to adaptation. 2 3 16.1.3.4 What Future Risks are of Greatest Concern? 4 5 The fourth and final element of the chapter is the question about the risks we face, and which ones we should 6 be most concerned about. This is addressed in Section 16.5 and 16.6. 7 8 Section 16.5.1 presents a full discussion of ‘key risks’, synthesized from across all chapters, defined as those 9 risks that are potentially severe and therefore especially relevant to the interpretation of ‘dangerous 10 anthropogenic interference with the climate system’ in the terminology of UNFCCC Article 2. 11 12 In 2015 the Paris Agreement established the goal of ‘holding the increase in the global average temperature 13 to well below 2°C above pre-industrial levels and pursuing efforts to limit the temperature increase to 1.5°C 14 above pre-industrial levels’. However, assessment of key risks across a range of future warming levels 15 remains a high priority for several reasons: (1) understanding risks at higher levels of warming can help 16 prepare for them, should efforts to limit warming be unsuccessful (UNEP, 2017); (2) understanding risks at 17 higher levels can inform the benefits of limiting warming to lower levels; (3) in addition, there is continued 18 debate about whether warming limits should be at or rather somewhere below 2ºC (in particular at 1.5ºC); 19 and (4) there is a more explicit recognition that key risks can result not only from increased warming, but 20 also from changes in the exposure and vulnerability of society, and from a lack of ambitious adaptation 21 efforts. So relatively limited warming does not automatically imply that key risks will not occur. In assessing 22 key risks, we have applied four criteria: magnitude of adverse consequences, likelihood of adverse 23 consequences, temporal characteristics of the risk, and ability to respond. Of course, this is an aggregated 24 approach to what is dangerous; it should be noted that in practice, ‘dangerous’ will occur at a myriad of 25 temperature levels depending on who or what is at risk (and their circumstances), geographic scale and time 26 scale. 27 28 A new element is that we particularly look at a set of eight ‘representative key risks’ that exemplify the 29 underlying set of key risks identified in the earlier chapters: risk to the integrity of low-lying coastal socio-30 ecological systems, risk to terrestrial and ocean ecosystems, risk to critical physical infrastructure and 31 networks, risk to living standards (including economic impacts, poverty and inequality), risk to human 32 health, risk to food security, risk to water security, and risk to peace and mobility (Section 16.5.2.3). 33 Another increased focus relates to the issue of compound risks. This includes risks associated with 34 compound hazards (WGI AR6 Chapter 11, Seneviratne et al., 2021), but also implications for future risk 35 when repeated impacts erode vulnerability, as well as through transboundary effects (including effects both 36 from one system to a neighbouring one, as well as from one system to a distant one), also discussed in the 37 cross-chapter box on interregional risks and adaptation (Cross-Chapter Box INTEREG in this Chapter). 38 39 Section 16.6 maps the representative key risks in Section 16.5 to the Sustainable Development Goals, noting 40 both direct and indirect implications for Climate Resilient Development as assessed in Chapter 18. 41 42 Finally, section 16.6 presents an updated assessment of the so-called ‘Reasons for Concern’ (RFC): risks 43 related to unique and threatened systems, extreme events, distribution of impacts, aggregate impacts 44 (including the cross-chapter box on the global economic impacts of climate change and the social cost of 45 carbon, Cross-Working Group Box ECONOMIC) and the risk of irreversible and abrupt transitions. 46 47 The AR4 and AR5 each also evaluated the most important climate risks, framed firstly in terms of the state 48 of knowledge relevant to Article 2 of the UNFCCC. The TAR first synthesized this knowledge in five RFCs. 49 AR4 identified a set of ‘key vulnerabilities’, and provided an update of the RFCs. AR5 further refined a new 50 risk framework developed in SREX, and used it to assess ‘key risks’ and provide another update of the 51 overarching Reasons for Concern, drawing as well on Cramer et al. (2014) assessment of observed changes. 52 53 Our risk assessment also further builds on risk assessments from the Special Reports that are part of the AR6 54 cycle, i.e. SR15; SRCCL, and SROCC. While since AR4 the RFC assessment framework has remained 55 largely consistent, refinements in methodology have included the consideration of different risks, the role of 56 adaptation, use of confidence statements, more formalized protocols and standardized metrics (Zommers et 57
ACCEPTED VERSIO
N
SUBJECT TO FIN
AL EDITS
FINAL DRAFT Chapter 16 IPCC WGII Sixth Assessment Report
Do Not Cite, Quote or Distribute 16-13 Total pages: 173
al., 2020). In subsequent assessment cycles, the risk level at a given temperature has generally increased, 1 reflecting accumulating scientific evidence (Zommers et al., 2020). 2 3 16.1.4 Drivers of Exposure and Vulnerability 4 5 While this chapter focuses on climate-related impacts, risks and responses, these all take place against a 6 backdrop of trends in exposure and vulnerability driven by demographics, socio-economic development 7 (including inequalities) and ecosystem degradation. Other global trends that are shaping climate risks include 8 technological innovation, shifts in global power relations, and resource scarcity (Retief et al., 2016). Note 9 that these global trends may increase but also reduce exposure and/or vulnerability, for instance when 10 growing incomes, savings and social protection systems increase resilience in the face of shocks and stresses. 11 Drivers and future trends in vulnerability and exposure – next to climate-induced changes in natural hazards 12 – therefore need to be considered in comprehensive risk assessments and eventually adaptation solutions, but 13 empirical research suggests that they remain to be underemphasized in current national adaptation planning 14 (Garschagen et al., 2021a). 15 16 While these risk drivers are often listed separately, they are often closely interconnected, including between 17 human and ecological systems, and increasingly also through climate risks and responses (e.g., Simpson et 18 al., 2021). Climate impacts increasingly affect these drivers, and may compete with financial resources that 19 could otherwise be applied for development, mitigation, adaptation and resilience building, also affecting 20 inequalities (e.g., Taconet et al., 2020). 21 22 16.1.4.1 Demographics 23 24 Population growth (or decline) can result in increasing (or decreasing) pressure on natural resources (e.g., 25 soils, water and fish stocks) (IPBES, 2019), and can result in the expansion of densely populated areas 26 (Cardona et al., 2012; Day et al., 2016). A majority of the population in the coming decades will be in urban 27 areas. While urbanization can have many benefits that reduce vulnerability, such as employment 28 opportunities and increased income, better access to healthcare and education, and improved infrastructure, 29 unsustainable urbanisation patterns can create challenges for resource availability, exacerbate pollution 30 levels (Rode et al., 2015), and increase exposure to some risks. For example, ~10% of the global population 31 live in Low Elevation Coastal Zones (in 2000; areas <10 m of elevation) (McGranahan et al., 2007; 32 Neumann et al., 2015), which is expected to increase by 5% to 13.6% by 2100 depending on the population 33 scenario (Neumann et al., 2015; Jones and O’Neill, 2016). Building assets and infrastructure in naturally 34 risk-prone areas are also projected to increase (Magnan et al., 2019), which may also lead to environmental 35 degradation that can further aggravate risk, e.g., destruction of wetlands that buffer against floods (Schuerch 36 et al., 2018; Oppenheimer et al., 2019). Demographic trends, coupled with changes in income, can also result 37 in increasing demands for land, food, water and energy, and therefore to major changes in land use and cover 38 change (Arneth, 2019). The observed and projected population decline in some rural areas also has 39 implications for vulnerability and exposure. In addition, demographic changes such as aging may increase 40 vulnerability to some climate hazards, including heat stress (Byers et al., 2018; Rohat et al., 2019a; Rohat et 41 al., 2019b). 42 43 16.1.4.2 Biodiversity and Ecosystems 44 45 Rapidly accelerating trends in human impacts on global ecosystems and biodiversity, especially in the past 5 46 decades, have resulted precipitous declines in the numbers of many wild species on land and in the ocean, 47 transformation of the terrestrial land surface for agricultural production, and the pervasive spread of alien 48 and invasive species (IPBES, 2019). As a result, the capacity of ecosystems to support human society is 49 thought to be coming under threat. For instance, the fraction of all primary production being appropriated for 50 human use has doubled over the course of the 20th Century (to about 25% in 2005), although it has grown at 51 a slower rate than human population (Krausmann et al., 2013). Future projections significantly depend on 52 bioenergy production, signalling one of the feedbacks between responses to climate change and climate 53 risks. 54 55 16.1.4.3 Poverty Trends and Socioeconomic Inequalities Within and Across Societies 56 57
ACCEPTED VERSIO
N
SUBJECT TO FIN
AL EDITS
FINAL DRAFT Chapter 16 IPCC WGII Sixth Assessment Report
Do Not Cite, Quote or Distribute 16-14 Total pages: 173
Poverty contributes to exposure and vulnerability by limiting access of individuals, households and 1 communities to economic resources and restraining adaptive capacities (e.g., for food and energy supply, or 2 for financing adaptation responses) (Hallegatte and Rozenberg, 2017). Over the past decades, until the 3 COVID-19 pandemic, global poverty rates have declined rapidly. Between 1981 and 2015, the share of 4 global population living in extreme poverty (under the international poverty line of US$1.90 per day) 5 declined from 42% to 10%, leaving 736 million people in extreme poverty, concentrated in South Asia and 6 Sub-Saharan Africa (World Bank, 2018). This general reduction in poverty across the world is accompanied 7 by a decrease in vulnerability to many types of climate change impacts (medium confidence). However, the 8 COVID-19 pandemic has significantly increased extreme poverty by about 100 million people in 2020, with 9 disproportionate economic impacts on the poorest, most fragile and smaller countries (World Bank, 2021) 10 and significant implications for vulnerability to climate change (see also Cross-Chapter Box COVID in 11 Chapter 7). 12 13 The majority of the population in poverty are smallholder farmers and pastoralists, whose livelihoods 14 critically depend on climate-sensitive natural ecosystems, e.g., through semi-subsistence agriculture where 15 food consumption is primarily dependent on households’ own food production (Mbow et al., 2019). A 16 significant share of this population is affected by armed conflict, which deters economic development and 17 growth and increases local dependence on subsistence agriculture (Serneels and Verpoorten, 2015; 18 Braithwaite et al., 2016; Tollefsen, 2017), and aggravating humanitarian challenges (e.g., ICRC, 2020). 19 Extreme weather events, particularly droughts, can result in poverty traps keeping people poor or making 20 them poorer, resulting in widening inequalities within and across countries. 21 22 Climate risks are also strongly related to other inequalities, often but not always intersecting with poverty. 23 AR5 found with very high confidence that differences in vulnerability and exposure arise from 24 multidimensional inequalities, often produced by uneven development processes. These inequalities relate to 25 geographic location, as well as economic, political and socio-cultural aspects, such as wealth, education, 26 race/ethnicity, religion, gender, age, class/caste, disability, and health status (Oppenheimer et al., 2014). 27 Since AR5, a number of studies have confirmed and refined this assessment, especially also regarding socio-28 economic inequality and poverty (Hallegatte et al., 2016; Hallegatte and Rozenberg, 2017; Pelling and 29 Garschagen, 2019; Hallegatte et al., 2020). Poor people more often live in exposed areas such as wastelands 30 or riverbanks (Garschagen and Romero-Lankao, 2015; Winsemius et al., 2018). Also, poor people lose more 31 of their total wealth to climatic hazards, receive less post-shock support from their often-times equally poor 32 social networks, and are often not covered by social protection schemes (Leichenko and Silva, 2014; 33 Hallegatte et al., 2016). Countries with high inequality tend to have above-average levels of exposure and 34 vulnerability to climate hazards (BEH UNU-EHS, 2016). Many socio-economic models used in climate 35 research have been found to have a limited ability to capture and represent the poor at a larger scale (Rao et 36 al., 2019; Rufat et al., 2019). However, an analysis of 92 countries found that relative income losses and 37 other climate change impacts were disproportionately high among the poorest (Hallegatte and Rozenberg, 38 2017, see Section 16.2.6). There have also been advances in detecting and attributing the impacts of climate 39 change and vulnerability at household scale and specifically on women’s agency and adaptive capacity (Rao 40 et al., 2019). The distribution of impacts and responses (adaptation and mitigation) affects inequality, not just 41 between countries, but also within countries (e.g., Tol, 2020) and between different people within societies. 42 Distribution has so far largely been thought of in a geographical sense, but identifying those most at risk 43 requires an additional focus on the social distribution of impacts, responses, as well as of resilience, as 44 influenced for instance by differential social protection coverage (Tenzing, 2020). 45 46 Many climate responses interact with all of these global risk drivers. Some raise additional equity concerns 47 about marginalising those most vulnerable and exacerbating social conflicts (Oppenheimer et al., 2019), 48 leading to wider questions about the governance of climate risks (and impacts) across scales. Hence, our 49 assessment of impacts, responses, and risks is complemented by the assessment of governance and the 50 enabling environment for risk management in Chapter 17, and of climate-resilient development in Chapter 51 18. 52 53 54 16.2 Synthesis of Observed Impacts 55 56
ACCEPTED VERSIO
N
SUBJECT TO FIN
AL EDITS
FINAL DRAFT Chapter 16 IPCC WGII Sixth Assessment Report
Do Not Cite, Quote or Distribute 16-15 Total pages: 173
This section synthesizes the observed impacts of changes in climate-related systems (see Section 16.2.1) on 1 different natural, human, and managed systems (outlined in Chapters 2-8) and regions (outlined in Chapters 2 9-15). To stay as specific as possible given the required level of aggregation, we decided in favour of a 3 summary along specific prominent indicators such as ‘crop yields’ or ‘areas burned by wildfires’ instead of 4 an assessment across broad categories such as ‘food production’ which could include a broad range of 5 measures ranging from climate induced changes in growing seasons to growing seasons to impacts on 6 livestock and fisheries etc. or ‘wildfires’ which could also cover impacts on the frequency, intensity, timing, 7 or emissions and health impacts of wildfires. However, this decision for specificity certainly implies a 8 decision against comprehensiveness. In addition, the level of specificity has to be adjusted given the 9 literature basis which is quite broad regarding crop yields but still limited and less harmonized regarding 10 indicators when it comes to e.g., conflicts. A broader discussion can be found in the sectoral or regional 11 chapters that all cover ‘observed impacts’ individually. Section 16.2.1 provides key definitions, followed by 12 recent advances in available methods and data for climate impact attribution (Section 16.2.2), and the 13 assessment of observed impacts (Section 16.2.3). It is important to note that the assessment is primarily 14 based on peer-reviewed literature, i.e. it is limited to the regions and phenomena for which such studies are 15 available. So ‘no assessment’ in a certain region does not apply the considered type of impact did not occur 16 in this region. 17 18 16.2.1 Definitions 19 20 The section adopts the general definition of detection as ‘demonstration that a considered system has 21 changed without providing reasons for the change’ and attribution as identifying the causes of the observed 22 change or a specific event (see Glossary). 23 24 Based on these general definitions and following the approach applied in WGII AR5 Chapter 18 (Cramer et 25 al., 2014), we define an observed impact as the difference between the observed state of a natural, human, 26 or managed system and a counterfactual baseline that characterizes the system’s state in the absence of 27 changes in the climate-related systems defined here as climate system including the ocean and the 28 cryosphere as physical or chemical systems. 29 30 The difference between the observed and the counterfactual baseline state is considered the change in the 31 natural, human, or managed system that is attributed to the changes in the climate-related systems (impact 32 attribution).The counterfactual baseline may be stationary or may change over time, for example due to 33 direct human influences such as changes in land use patterns, agricultural or water management affecting 34 exposure and vulnerability to climate related hazards (see Section 16.2.3 for methods on how to construct the 35 counterfactual). 36 37 In line with the AR5 definition, ‘changes in climate-related systems’ here refer to any long-term trend, 38 irrespective of the underlying causes; thus, an observed impact is not necessarily an observed impact of 39 anthropogenic climate forcing. For example, in this section sea level rise is defined as relative sea level rise 40 measured against a land-based reference frame (tide gauge measurements), meaning that it is driven not only 41 by thermal expansion and loss of land ice influenced by anthropogenic climate forcing, but also by vertical 42 land movements. As attribution of coastal damages to sea level rise does not distinguish between these 43 components it does not imply attribution to anthropogenic forcing. Where the literature does allow 44 attribution of changes in natural, human or managed systems to anthropogenic climate forcing (‘joint 45 attribution’, Rosenzweig et al., 2007), this is highlighted in the assessment. Often the attribution of changes 46 in the natural, human or managed systems to anthropogenic forcing can be done in a two-step approach 47 where i) an observed change in a climate-related system is attributed to anthropogenic climate forcing 48 (‘climate attribution’) and ii) changes in natural, human, or managed systems are attributed to this change in 49 the climate-related system (‘impact attribution’). 50 51 For climate attribution the main challenge is the separation of externally human forced changes in the 52 climate-related systems from their internal variability while for impact attribution it often is the separation of 53 the effects of other external forcings (i.e., direct human influences or natural disturbances) from the impacts 54 of the changes in the climate-related systems. Direct influences not related to changes in the climate-related 55 systems could e.g., be pollution and land use changes amplifying biodiversity losses, intensification of 56 fishing reducing fish stocks, and increasing protection reducing losses due to river floods. The direct human 57
ACCEPTED VERSIO
N
SUBJECT TO FIN
AL EDITS
FINAL DRAFT Chapter 16 IPCC WGII Sixth Assessment Report
Do Not Cite, Quote or Distribute 16-16 Total pages: 173
or natural influences may counter the impacts of climate change (e.g., climate change may have reduced 1 flood hazards but exposure may have increased as people have moved to flood-prone areas, resulting in no 2 change in observed damages). Given the definition of impact attribution, that means that there may be an 3 observed impact of climate change without the detection of a change in the natural, human or managed 4 system. This is different from ‘climate attribution’ where detection and attribution are consecutive steps. 5 6 Changes in climate related systems can certainly also affect natural, human and managed systems through 7 indirect effects on land use, pollution or exposure. However, these indirect effects are barely addressed in 8 existing studies. 9 10 In addition to impact attribution, there is research on the identification of natural, human, or managed 11 systems’ response to short-term (typically daily, monthly or annual) weather fluctuations or individual 12 extreme weather events. As different from impact attribution we separately define: 13 14 ‘Identification of weather sensitivity’ refers to the attribution of the response of a system to fluctuations in 15 weather and short-term changes in the climate-related systems including individual extreme weather events 16 (e.g., a heatwave or storm surge). 17 18 Typical questions addressed include: ‘How much of the observed variability of crop yields is due to 19 variations in weather conditions compared to contributions from management changes?’ (e.g., Ray et al., 20 2015; Müller et al., 2017) and ‘Can weather fluctuations explain part of the observed variability in annual 21 national economic growth rates?’ (e.g., Burke et al., 2015). Identification of weather sensitivity may also 22 address the effects of individual climate extremes, for example asking, ‘Was the observed outbreak of 23 cholera triggered by an associated flood event?’ (e.g., Rinaldo et al., 2012; Moore et al., 2017b). It is 24 important to note that sensitivity could be described in diverse ways and that for example the fraction of the 25 observed variability in a system explained by weather variability differs from the strength of the systems’ 26 response to a specific change in a weather variable. Nevertheless, all these different measures are integrated 27 in the ‘identification of weather sensitivity’ assessment where ‘sensitivity’ should not be considered a 28 quantitative one dimensional mathematical measure. 29 30 In this chapter we explicitly distinguish between assessment statements related to ‘climate attribution’ (listed 31 in Table SM16.21), ‘impact attribution’ (listed in Table SM16.22), and ‘identification of weather sensitivity’ 32 (listed in Table SM16.23). The identification of ‘weather sensitivity’ does not necessarily imply that there 33 also is an impact of long-term climate change on the considered system. However, if the probability or 34 intensity of an extreme weather event has increased due to anthropogenic forcing (‘climate attribution’) 35 (NASEM, 2016; WGI AR6 Chapter 11 Seneviratne et al., 2021) and the event is also identified as an 36 important driver of an observed fluctuation in a natural, human or managed system (‘identification of 37 weather sensitivity’), then the observed fluctuation is considered (partly) attributed to long-term climate 38 change (‘impact attribution’) and even to anthropogenic forcing. 39 40 16.2.2 Methods and Data for Impact Attribution Including Recent Advances 41 42 By definition the counterfactual baseline required for impact attribution cannot be observed. However, it 43 may be approximated by impact model simulations forced by a stationary climate e.g. derived by de-trending 44 the observed climate (Diffenbaugh et al., 2017; Mengel et al., 2021) while other relevant drivers (e.g., land 45 use changes or application of pesticides) of changes in the system of interest (e.g., a bird population) evolve 46 according to historical conditions. To attribute to anthropogenic climate forcing, the anthropogenic trends in 47 climate are estimated from a range of different climate models and subtracted from the observed climate e.g., 48 Abatzoglou and Williams (2016) for changes in the extent of forest fires or Diffenbaugh and Burke (2019) 49 for effects on economic inequality) or the ‘no anthropogenic climate forcing’ baseline is directly derived 50 from a large ensemble of climate model simulations not accounting for anthropogenic forcings e.g., 51 Kirchmeier‐Young et al. (2019b) for the extent of forest fires). In any case it has to be demonstrated that the 52 applied impact models are able to explain the observed changes in natural, human or managed systems by 53 e.g., reproducing the observations when forced by observed changes in climate-related systems and other 54 relevant drivers. 55 56
ACCEPTED VERSIO
N
SUBJECT TO FIN
AL EDITS
FINAL DRAFT Chapter 16 IPCC WGII Sixth Assessment Report
Do Not Cite, Quote or Distribute 16-17 Total pages: 173
In a situation where an influence of other direct human drivers can be excluded (e.g., by restriction to remote 1 areas not affected by direct human interventions), the ‘no climate-change’ baseline can also be approximated 2 by data from early observational periods with no or minor levels of climate change. In particular, the 3 contribution of climate change to the observed changes in ecosystems is often also determined by a ‘multiple 4 lines of evidence’ approach where the baseline is not formally quantified but the observed changes are 5 identified as a signal of climate change compared to a no-climate change situation based on process 6 understanding from e.g. paleo data and laboratory or field experiments in combination with individual long 7 term observational records and the large scale spatial or temporal pattern of observed changes that can hardly 8 be explained by alternative drivers (Parmesan et al., 2013). 9 10 To date, explicit accounting for direct human or natural influences is often hampered by an incomplete 11 understanding of the processes and limited observational data. There are, however, first studies 12 demonstrating the potential of detailed process-based or empirical modelling that explicitly account for 13 known variations in direct human or natural drivers and separate their effects from the ones induced by 14 changes in the climate-related systems. Examples are Butler et al. (2018) for the separation of growing 15 season adjustments from within growing season climate effects on US crop yields; Wang and Hijmans 16 (2019), separating effects of shifts in land use from climate effects; Jongman et al. (2015); Formetta and 17 Feyen (2019), and Tanoue et al. (2016) for the separation of changes in exposure and vulnerability from 18 climate effects on river floods; Kirchmeier‐Young et al. (2019b) for wildfire attribution; Venter et al. (2018) 19 for the attribution of ecosystem structural changes to climate change versus other disturbances. 20 21 There also has been significant progress in the compilation of fragmented and distributed observational data 22 (e.g., Cohen et al. (2018) for phenological ecosystem changes, Poloczanska et al. (2013) for distributional 23 shifts in marine ecosystems, the new global fire atlas (Andela et al., 2019) including information about 24 individual fire size, duration, speed and direction), as well as regional downscaling (e.g., Ray et al. (2015)) 25 allowing for the identification of an overall picture of the impacts of progressing climate change. Given the 26 ever increasing body of literature on observed changes in natural, human, and managed systems there also is 27 a first machine learning approach for an automated identification for relevant literature that could 28 complement or support expert assessments as the one provided here (Callaghan et al., 2021). 29 30 16.2.3 Observed Impacts 31 32 In this section we synthesize observed impacts across a range of ecosystems, sectors, and regions. Figure 33 16.2 summarizes the attribution of observed (regional) changes in natural, human or managed systems 34 (orange symbols and confidence ratings), the quantification of weather sensitivity of those systems (blue 35 symbols and confidence ratings), and the attribution of underlying changes in the climate-related systems to 36 anthropogenic forcing (grey symbols and confidence ratings). The Figure can be read as a summary and 37 Table of content for the underlying Tables 16.B.1 on climate attribution, 16.B.2 on impact attribution, and 38 16.B.3 on identification of weather sensitivity that provide the more detailed explanations behind each 39 regional or global assessment, including all references. The synthesis was generated in collaboration with 40 ‘detection and attribution contact persons’ from the individual chapters that each includes its own assessment 41 of observed impacts, and contributing authors on individual topics. The synthesis of ‘climate attribution’ 42 studies in Table SM16.21 was particularly informed by the WGI assessment. 43 44 If Figure 16.2 only provides an assessment of attributed impacts on a given system (e.g., Phenology shifts in 45 terrestrial ecosystems) but does not include an associated ‘identification of weather sensitivity’ that does not 46 mean that the system is not sensitive to weather fluctuations. The focus of our assessment was on ‘impacts 47 attribution’ and we only provide an assessment of ‘weather sensitivities’ if the literature has turned out to 48 provide only limited evidence on impacts of long-term climate change but rather addressed the system’s 49 responses to short term weather fluctuations. 50 51 16.2.3.1 Ecosystems 52 53 The collapse or transformation of ecosystems is one of the most abrupt potential tipping points associated 54 with climate change. Climate change has started to induce such tipping points with the first examples 55 including mass mortality in coral reef ecosystems (e.g., Donner et al., 2017; Hughes et al., 2018; Hughes et 56 al., 2019) (high confidence), and changes in vegetation cover triggered by wildfires with climate change 57
ACCEPTED VERSIO
N
SUBJECT TO FIN
AL EDITS
FINAL DRAFT Chapter 16 IPCC WGII Sixth Assessment Report
Do Not Cite, Quote or Distribute 16-18 Total pages: 173
suppressing the recovery of the former cover (Tepley et al., 2017; Davis et al., 2019) (low confidence 1 because of the still limited number of studies). Another example of an abrupt change in an ecosystem 2 triggered by a climate extreme is the shift from kelp- to urchin-dominated communities along parts of the 3 Western North America coast due a marine heatwave (Rogers-Bennett and Catton, 2019; McPherson et al., 4 2021, see ‘Marine ecosystems - Kelp forest’, Table SM16.22) where anthropogenic climate forcing has been 5 shown to have increased the probability for an event of that duration by at least a factor of 33 (Laufkötter et 6 al., 2020). Many terrestrial ecosystems on all continents show evidence of significant structural 7 transformation, including woody thickening and ‘greening’ in more water-limited ecosystems, with a 8 significant role played by rising atmospheric CO2 fertilization in these trends (high confidence) (Fang et al., 9 2017; Stevens et al., 2017; Burrell et al., 2020). Climate change is identified as a major driver of increases in 10 burned areas in the Western US (high confidence, see ‘Terrestrial ecosystems - Burned areas’, Table 11 SM16.22). 12 13 There is also a clear footprint of climate change on species distribution, with appreciable proportions of 14 tropical species expanding into the ranges of temperate species, and boreal species moving into Arctic 15 regions (high confidence, see ‘Marine ecosystems - Range reduction and shift’ and ‘Terrestrial ecosystems - 16 Range reduction and shift’, Table SM16.22). Climate change has also shifted the phenology of animals and 17 plants on land and in the ocean (high confidence, see ‘Marine ecosystems - Phenology shift’ and ‘Terrestrial 18 ecosystems - Phenology shifts’, Table SM16.22). Both processes have led to emerging hybridisation, 19 competition, temporal or spatial mismatches in predator-prey, guest-host relationships, and invasion of alien 20 plant pests or pathogens (Edwards and Richardson, 2004; Bebber et al., 2013; Parmesan et al., 2013; Millon 21 et al., 2014; Thackeray et al., 2016). 22 23 16.2.3.2 Water Distribution - River Flooding and Reduction in Water Availability 24 25 Observed trends in high river flows strongly vary across regions but also with the considered time period 26 (Gudmundsson et al., 2019; Gudmundsson et al., 2021) as influenced by climate oscillations such as the El 27 Niño–Southern Oscillation (Ward et al., 2014). On global scale the spatial pattern of observed trends is 28 largely explained by observed changes in climate conditions as demonstrated by multi-model hydrological 29 simulations forced by observed weather while the considered direct human influences only play a minor role 30 on global scale (Gudmundsson et al., 2021, see ‘Water distribution - Flood hazards’, Table SM16.22). The 31
annual total number of reported fatalities from flooding shows a positive trend (1.5% per year from 1960-32
2013, Tanoue et al., 2016) which appears to be primarily driven by changes in exposure dampened by a 33 reduction in vulnerability while climate induced increases in affected areas only show a weak positive trend 34 on global scale (see ‘Water distribution - Flood induced fatalities’, Table SM16.22). However, the signal of 35 climate change in flood induced fatalities may be lost in the regional aggregation where effects of increasing 36 and decreasing hazards may cancel out. Thus, a climate driven increase in flood induced damages becomes 37 detectable in continental subregions with increasing discharge while the signal of climate change may not be 38 detectable without disaggregation (Sauer et al., 2021, see ‘Water distribution: Flood-induced economic 39
damages’, Table 16.2), see ‘Water distribution: Flood-induced economic damages’, Table 16.2). Compared 40 to river floods the analysis of impacts of long-term changes in the climate related systems on the reduction in 41 water availability is much more fragmented and reduced to individual case studies regarding associated 42
societal impacts (see ‘Water distribution - Reductions in water availability + induced damages and fatalities’, 43 Table SM16.22). At the same time weather fluctuations have led to reductions in water availability with 44 severe societal consequences and high numbers of drought-induced fatalities and damages in particular in 45 Africa and Asia (see ‘Water distribution - Reductions in water availability + induced damages and fatalities, 46 Table SM16.23) and impacts on malnutrition (see ‘Food system - Malnutrition, Table SM16.23). Although 47 anthropogenic climate forcing has increased droughts’ intensity or probability in many regions of the world 48 (medium confidence), (‘Atmosphere - Droughts, Table SM16.21), the existing knowledge has not yet been 49 systematically linked to attribute long-term trends in malnutrition, fatalities, and damages induced by 50 reduced water availability to anthropogenic climate forcing or long-term climate change. For impacts of 51 individual attributable drought events see Table 4.5 of Chapter 4 and ‘Water distribution - Reductions in 52 water availability + induced damages and fatalities, Table SM16.23. 53 54 16.2.3.3 Coastal Systems 55 56
ACCEPTED VERSIO
N
SUBJECT TO FIN
AL EDITS
FINAL DRAFT Chapter 16 IPCC WGII Sixth Assessment Report
Do Not Cite, Quote or Distribute 16-19 Total pages: 173
With their enormous destructive power tropical cyclones represent a major risk for coastal systems (see 1 ‘Coastal systems - Damages’, Table SM16.23). Despite its relevance, confidence in the influence of 2 anthropogenic climate forcing on the strength and occurrence probability of tropical storms themselves is 3 still low (see ‘Coastal systems: Tropical cyclones’, Table SM16.21). However, anthropogenic climate 4 forcing has become the dominant driver of sea level rise (high confidence) (see ‘Coastal systems - Mean and 5 extreme sea levels’, Table SM16.21) and has increased the risk of coastal flooding, including inundation 6 induced by tropical cyclones. In addition, anthropogenic climate forcing has increased the amount of rainfall 7 associated with tropical cyclones (high confidence) (Risser and Wehner, 2017; Van Oldenborgh et al., 2017; 8 Wang et al., 2018) for hurricane Harvey in 2017 (Patricola and Wehner, 2018) and for hurricanes Katrina in 9 2005, Irma in 2017, and Maria in 2017 (see ‘Atmosphere - Heavy precipitation’, Table SM16.21). Assuming 10 that the extreme rainfall is a major driver of the total damages induced by the tropical cyclone, the 11 contribution of anthropogenic climate forcing to the occurrence probability of the observed rainfall (fraction 12 of attributable risk) can also be considered the fraction of attributable risk of the hurricane-induced damages 13 or fatalities (Frame et al., 2020; Clarke et al., 2021, see ‘Coastal systems - Damages’, Table SM16.22). 14 However, first studies do not only quantify the change in occurrence probabilities but translate the actual 15 change in climate-related systems into the additional area affected by flooding in a process-based way 16 (Strauss et al. (2021), contribution of anthropogenic SLR to damages induced by hurricane Sandy; Wehner 17 and Sampson (2021), contribution increased precipitation to damages induced by hurricane Harvey) and 18 attribute a considerable part of the observed damage to anthropogenic climate forcing. In addition, disruption 19 of local economic activity in Annapolis, Maryland and loss of areas and settlements in Micronesia and 20 Solomon Islands have been attributed to relative sea level rise (Nunn et al., 2017; Albert et al., 2018; Hino et 21 al., 2019) while permafrost thawing and sea ice retreat are additional drivers of observed coastal damages in 22 Alaska (Albert et al., 2016; Smith and Sattineni, 2016; Fang et al., 2017). 23 24 16.2.3.4 Food System 25 26 Crop yields respond to weather variations but also to increasing atmospheric CO2, changes in management 27 (e.g., fertilizer input, changes in varieties), diseases, and pests. However, the weather signal is clearly 28 detectable in national and subnational annual yield statistics in main production regions (see ‘Food system - 29 Crop yields’, Table SM16.23). Over the last decades crop yields have increased nearly everywhere mainly 30 due to technological progress (e.g., Lobell and Field, 2007 (global); Butler et al., 2018 (US); Hoffman et al., 31 2018 (Sub-Saharan Africa); Agnolucci and De Lipsis, 2019 (Europe)) with only minor areas not 32 experiencing improvements in maize, wheat, rice, and soy yields. However meanwhile, stagnation or decline 33 in yields is also observed on parts of the harvested areas (high confidence) (~20% to 40% of harvested areas 34 of maize, wheat, rice and soy with wheat being most affected) (Ray et al., 2012; Iizumi et al., 2018). 35 Evidence on the contribution of climate change to recent trends is still limited (see ‘Food system - Crop 36 yields’, Table SM16.22). Current global-scale process-based simulations forced by simulated historical and 37 pre-industrial climate miss an evaluation to what degree simulations reproduce observed yields (Iizumi et al., 38 2018). Global scale empirical approaches do not explicitly account for extreme weather events but growing 39 season average temperatures and precipitation (e.g., Lobell et al., 2011; Ray et al., 2019). In addition, studies 40 are constrained by only fragmented information about changes in agricultural management such as growing 41 season adjustments. Some of these limitations have be overcome in regional studies indicating a climate 42 induced increase (28% of observed trend since 1981) in maize yields in the US (Butler et al., 2018 based on 43 a detailed accounting of impacts of extreme temperatures and growing season adjustments) and a climate 44 induced decrease in millet and sorghum yields (10–20% for millet and 5–15% for sorghum in 2000-2009 45 compared to pre-industrial conditions) in Africa and a negative effect of historical climate change on 46 potential wheat yields (27% reduction from 1990 to 2015) in Australia (Hochman et al., 2017; Sultan et al., 47 2019) based on detailed process-based modelling including a dedicated evaluation against observed yield 48 fluctuations). However, these findings need additional support by independent studies while results are 49 relatively convergent that climate change has been an important driver of the recent declines in wheat yields 50 in Europe (medium confidence) (Moore and Lobell, 2015; Agnolucci and De Lipsis, 2019; Ray et al., 2019). 51 52 Due to complex interactions with socio-economic conditions, climate-induced trends in crop yields and 53 production do not directly transmit to crop prices, availability of food, or nutrition status. This complexity, in 54 addition to the limited availability of long-term data, has so far impeded the detection and attribution of a 55 long-term impact of climate change on associated food security indicators. However, in a few cases, 56 observed crop prices (e.g., domestic grain price in Russia and Africa, Götz et al., 2016; Mawejje, 2016; 57
ACCEPTED VERSIO
N
SUBJECT TO FIN
AL EDITS
FINAL DRAFT Chapter 16 IPCC WGII Sixth Assessment Report
Do Not Cite, Quote or Distribute 16-20 Total pages: 173
Baffes et al., 2019) are shown to be sensitive to fluctuations in local weather through its impact on 1 production (see ‘Food system - Food prices’, Table SM16.23). In addition, there is growing evidence that 2 climate extremes (in particular droughts) have led to malnutrition (in particular stunting of children) in the 3 historical period (medium confidence, see ‘Food system - Malnutrition’, Table SM16.23) but without an 4 attribution of changes to long-term climate change. 5 6 16.2.3.5 Temperature-related Mortality 7 8 There is nearly universal evidence that non-optimal ambient temperatures increase mortality (high 9 confidence), with notable heterogeneity only in the shape of the temperature-mortality relationship across 10 geographical regions but often sharply growing relative risks at the outer 5% of the local historical 11 temperature distributions (Gasparrini et al., 2015; Guo et al., 2018; Carleton et al., 2020; Zhao et al., 2021, 12 see ‘Other societal impacts - Heat-related mortality’, Table SM16.23). Significant advances have been made 13 since AR5 regarding the study of temperature-related excess mortality in previously under-researched 14 regions, such as developing countries and (sub-)tropical climates e.g. Africa (South-East Asia: Dang et al., 15 2016; Ingole et al., 2017; Mazdiyasni et al., 2017; Wichmann, 2017; e.g., Scovronick et al., 2018; Alahmad 16 et al., 2019; the Middle East: Gholampour et al., 2019; and Latin America: Péres et al., 2020). Progress has 17 also been made with regard to temporal changes in temperature-related excess mortality and underlying 18 population vulnerability over time. Heat-attributable mortality fractions have declined over time in most 19 countries due to general improvements in health care systems, increasing prevalence of residential air 20 conditioning, and behavioural changes. These factors, which determine the susceptibility of the population to 21 heat, have predominated over the influence of temperature change (see ‘Other societal impacts - Heat-related 22 mortality’, Table SM16.22, De’Donato et al., 2015; Arbuthnott et al., 2016; Vicedo-Cabrera et al., 2018a). 23 Important exceptions exist, e.g., where unprecedented heat waves have occurred recently. No conclusive 24 evidence emerges regarding recent temporal trends in excess mortality attributable to cold exposure (Vicedo-25 Cabrera et al., 2018b). Quantitative detection and attribution studies of temperature-related mortality are still 26 rare. One study (Vicedo-Cabrera et al.), using data from 43 countries, found that 37% (range 20.5–76.3%) of 27 average warm-season heat-related mortality during recent decades can be attributed to anthropogenic climate 28 change (medium confidence, see ‘Other societal impacts - Heat-related mortality’, Table SM16.22). Studying 29 excess mortality associated with past heat waves, such as the 2003 or 2018 events in Europe, even higher 30 proportions of deaths attributable to anthropogenic climate change have been reported for France and the UK 31 (Mitchell et al., 2016; Clarke et al., 2021). Formal attribution studies encompassing cold-related mortality 32 are quasi non-existent. The very few studies from Europe and Australia (Christidis et al., 2010; Åström et al., 33 2013; Bennett et al., 2014) find weak impacts of climate change on cold-associated excess mortality, with 34 contradictory outcomes both towards higher and lower risks (low confidence, see ‘Other societal impacts - 35 Heat-related mortality’, Table SM16.22). 36 37 16.2.3.6 Water-borne Diseases 38 39 Infectious diseases with water-associated transmission pathways constitute a large burden of disease 40 globally. Since AR5 the evidence has strengthened that waterborne diseases, and especially gastrointestinal 41 infections, are highly to moderately sensitive to weather variability (medium confidence, see ‘Water 42 distribution - Water-borne diseases’, Table SM16.23). Increased temperature and high precipitation, with 43 associated flooding events, have been shown to generally increase the risk of diarrhoeal diseases. There are 44 however a number of studies that describe important exceptions and modifications to this general 45 observation. While high temperatures favour bacterial diarrhoeal diseases, virally transmitted diarrhoea is on 46 the contrary mostly associated with low temperatures (Carlton et al., 2016; Chua et al., 2021). Socio-47 economic determinants, such as the existence of single household water supplies (Herrador et al., 2015) or 48 combined sewer overflows (Jagai et al., 2017), have been shown to critically increase the risk of 49 gastrointestinal infections linked to heavy rainfall in high-income countries. Also, for both low- and high-50 income countries it has been found that gastrointestinal diseases increase following a heavy rainfall event 51 only if preceded by a dry period (Carlton et al., 2014; Setty et al., 2018). Yet, so far there is no consistent 52 evidence on the role of droughts in favouring waterborne disease transmission (Levy et al., 2016). As 53 exemplified by the large cholera outbreak following the 2010 earthquake in Haiti, the existence of 54 functioning sanitation systems is critical for preventing waterborne disease outbreaks, while climatic factors 55 (especially rainfall) are important in driving the transmission dynamics once the outbreak has started 56 (Rinaldo et al., 2012). Other socio-economic factors, such as human mobility and water management project 57
ACCEPTED VERSIO
N
SUBJECT TO FIN
AL EDITS
FINAL DRAFT Chapter 16 IPCC WGII Sixth Assessment Report
Do Not Cite, Quote or Distribute 16-21 Total pages: 173
(e.g., dam constructions) also modify the strength of the association between climatic factors and waterborne 1 diseases, as shown by recent studies in Africa (Perez-Saez et al., 2015; Finger et al., 2016). 2 3 Whereas the weather sensitivity of waterborne diseases is well-established for all world regions (see ‘Water 4 distribution - Water-borne diseases’, Table SM16.23), studies attempting to attribute recent trends in 5 waterborne disease to climate change are non-existent, except for investigations on the distribution of marine 6 Vibrio bacteria and associated disease outbreaks in the coastal North Atlantic and the Baltic Sea regions 7 (Baker-Austin et al., 2013; Baker-Austin et al., 2016; Vezzulli et al., 2016; Ebi et al., 2017). These 8 investigations provide evidence that increases in sea surface temperatures over recent decades as well as 9 during recent summer heat waves are linked to increased concentrations of Vibrio bacteria in coastal waters 10 and an associated rise in environmentally acquired Vibrio infections in humans. 11 12 16.2.3.7 Vector-borne Diseases 13 14 Vector-borne diseases constitute a large burden of infectious diseases worldwide and are highly sensitive to 15 fluctuations of weather conditions including extreme events. Thus, both extreme rainfall and droughts have 16 increased infections (high confidence, see documentation of cases in ‘Other societal impacts - Vector-borne 17 diseases’, Table SM16.23). For example, in Sudan, anomalous high rainfall increased Anopheles mosquito 18 breeding sites, leading to malaria outbreaks (Elsanousi et al., 2018) while in Barbados and Brazil, drought 19 conditions in urban areas have enhanced dengue incidence due to changes in water storage behaviour 20 creating breeding sites for Aedes mosquitoes around human dwellings (Lowe et al., 2018; Lowe et al., 21 2021)). In the Caribbean and Pacific island nations, weather extremes, such as storms and flooding have led 22 to outbreaks of dengue due to disruption to water and sanitation services, leading to increased exposure to 23 Aedes mosquito breeding sites (Descloux et al., 2012; Sharp et al., 2014; Uwishema et al., 2021). In South 24 and Central America, and Asia, dengue incidence has been shown to sensitive to variations in temperature 25 and the monsoon season in addition to variations induced by urbanization and population mobility (high 26 confidence (South and Central America); medium confidence (Asia); see ‘Other societal impacts - Vector-27 borne diseases’, Table SM16.23). 28 29 The attribution of changes in disease incidence to long-term climate change is often limited by relatively 30 short reporting periods often only covering 10-15 years. Most studies then attribute trends in the occurrence 31 of vector-borne diseases to the trends in climate across the same observational period and do not refer to an 32 early ‘no climate change’ baseline climate. This means that they also capture trends induced by longer term 33 climate oscillations. Nevertheless, we list them in Table SM16.22 on ‘impact attribution’ to clearly 34 distinguish them from the analysis of interannual fluctuations. The overall consistency of their findings 35 across regions and time windows indicates that climate change is an important driver of the observed 36 latitudinal or altitudinal range expansions of vector-borne diseases into previously colder areas (medium to 37 high confidence, see ‘Other societal impacts - Vector-borne diseases’, Table SM16.22). In highland areas of 38 Africa and South America, epidemic outbreaks of malaria have become more frequent due to warming trends 39 that allow Anopheles mosquitoes to persist at higher elevations (Pascual et al., 2006; Siraj et al., 2014). In the 40 US, ticks that transmit Lyme disease have expanded their range northwards due to warmer temperatures 41 (high confidence, (Kugeler et al., 2015; McPherson et al., 2017; Lin et al., 2019; Couper et al., 2020, see 42 ‘Other societal impacts - Vector-borne diseases’, Table SM16.22). In Southern Europe, climate suitability 43 for Aedes mosquitoes, which transmit dengue and chikungunya, and Culex mosquitoes, which transmit West 44 Nile virus, has also increased and contributed to unprecedented outbreaks including the 2018 West Nile fever 45 outbreak (medium confidence) (Medlock et al., 2013; Paz et al., 2013; Roiz et al., 2015; ECDC, 2018, see 46 ‘Other societal impacts - Vector-borne diseases’, Table SM16.22). 47 48 16.2.3.8 Economic Impacts 49 50 Since the AR5, there has been significant progress regarding the identification of economic responses to 51 weather fluctuations: Evidence has increased that extreme weather events such as tropical cyclones, 52 droughts, and severe fluvial floods have not only caused substantial immediate direct economic damage 53 (high confidence, see ‘Coastal Systems - Damages, Table SM16.23, ‘Water distribution - Reductions in 54 water availability + induced damages and fatalities, Table SM16.23, and ‘Water distribution - Flood-induced 55 economic damages, Table SM16.22), but have also reduced economic growth in the short-term (year of, and 56 year after event) (Strobl, 2011; Strobl, 2012; Fomby et al., 2013; Felbermayr and Gröschl, 2014, Loyaza et 57
ACCEPTED VERSIO
N
SUBJECT TO FIN
AL EDITS
FINAL DRAFT Chapter 16 IPCC WGII Sixth Assessment Report
Do Not Cite, Quote or Distribute 16-22 Total pages: 173
al. 2012) (high confidence) as well as long-term (up to 10-15 years after event) (medium confidence) (Hsiang 1 and Jina, 2014; Berlemann and Wenzel, 2016; Berlemann and Wenzel, 2018; Krichene et al., 2020; Tanoue 2 et al., 2020, see ‘Other societal impacts - Macroeconomic output’, Table SM16.23). Short- and long-term 3 reductions of economic growth by extreme weather events affect both, developing and industrialized 4 countries, but have been shown to be more severe in developing than in industrialized economies thereby 5 increasing inequality between countries (high confidence, see ‘Other societal impacts - Between country 6 inequality’, Table SM16.23). Further, extreme weather events have increased within-country inequality since 7 poorer people are more exposed and suffer relatively higher well-being losses than richer parts of the 8 population (medium confidence, see ‘Other societal impacts - Between country inequality’, Table SM16.23). 9 Going beyond extreme weather events, economic production depends non-linearly on temperature 10 fluctuations: below a certain threshold temperature, economic production increases with temperature 11 whereas it decreases above a certain threshold temperature (high confidence) (Burke et al., 2015; Pretis et al., 12 2018; Kalkuhl and Wenz, 2020; Kotz et al., 2021). 13 14 So far, there are few individual studies attributing observed economic damages to long term climate change 15 except for damages induced by river flooding, droughts, and tropical cyclones (see ‘Coastal systems - 16 Damages’, ‘Water distribution - Flood induced damages’, and ‘Water distribution - Reduction in water 17 availability + induced damages and fatalities’, Table SM16.22) extremes to anthropogenic forcing. In 18 addition, the empirical findings on the sensitivity of macroeconomic development to weather fluctuations 19 and extreme weather events have been used to estimate the cumulative effect of historical warming on long 20 term economic development (see ‘Other societal impacts - Macroeconomic output’, Table SM16.22): 21 anthropogenic climate change is estimated to have reduced GDP growth over the last 50 years with 22 substantially larger negative effects on developing countries and in some cases positive effects on colder 23 industrialized countries (low confidence) (Diffenbaugh and Burke, 2019). Globally, between-country 24 inequality has decreased over the last 50 years. Climate change is estimated to have substantially slowed 25 down this trend, i.e., increased inequality compared to a counterfactual no climate change baseline (low 26 confidence) (Diffenbaugh and Burke, 2019). On a regional level, decreasing rainfall trends in Sub-Saharan 27 Africa (SSA) may have increased the GDP per capita gap between SSA and other developing countries (low 28 confidence) (Barrios et al., 2010). Overall, more research is needed on the impact channels through which 29 extreme weather events and weather variability can hinder economic development, especially in the long-30 term. 31 32 16.2.3.9 Social Conflict 33 34 There are few studies directly attributing changes in conflict risk to climate change in the modern era (van 35 Weezel, 2020), preventing a confident assessment of the effect of long-term changes in the climate-related 36 systems on armed conflict (see ‘Other societal impacts - Social conflict’, Table SM16.22). However, a 37 sizeable literature links the prevalence of armed conflict within countries to within- and between-year 38 variations in rainfall, temperature or drought exposure; often via reduced-form econometric analysis or 39 statistical models that control for important non-climatic factors, such as agricultural dependence, level of 40 economic development, state capacity, and ethnopolitical marginalization (see ‘Other societal impacts - 41 Social conflict’ in Table SM16.23). Overall, there is more consistent evidence that climate variability has 42 influenced low-intensity organized violence than major civil wars (Detges, 2017; Nordkvelle et al., 2017; 43 Linke et al., 2018). Likewise, there is more consistent evidence that climate variability has affected dynamics 44 of conflict, such as continuation, severity, and frequency of violent conflict events, than the likelihood of 45 initial conflict outbreak (Yeeles, 2015; Eastin, 2016; Von Uexkull et al., 2016, Section 7.2.7). Moreover, 46 research suggests with medium confidence (medium evidence, medium agreement) that weather effects on 47 armed conflict have been most prominent in contexts marked by a large population, low socioeconomic 48 development, high political marginalization, and high agricultural dependence (Theisen, 2017; Koubi, 2019; 49 Buhaug et al., 2020; Ide et al., 2020). 50 51 Some studies also seek to evaluate potential indirect links between climate and weather anomalies and 52 prevalence of armed conflict via food price shocks or forced migration. While there is robust evidence that 53 the likelihood of social unrest in the developing world generally increases in response to rapid growth in 54 food prices (Bellemare, 2015; Rudolfsen, 2018), the magnitude of the climate effect on unrest via food prices 55 is less well established (Martin-Shields and Stojetz, 2019). Similarly, research shows with high confidence 56 that climate variability and extremes have affected human mobility (see ‘Other societal impacts - 57
ACCEPTED VERSIO
N
SUBJECT TO FIN
AL EDITS
FINAL DRAFT Chapter 16 IPCC WGII Sixth Assessment Report
Do Not Cite, Quote or Distribute 16-23 Total pages: 173
Displacement and migration’, Table SM16.23), but there is low agreement and limited evidence that 1 weather-induced migration has increased the likelihood of armed conflict (Section 7.2, Brzoska and Fröhlich, 2 2016; Kelley et al., 2017; Selby et al., 2017; Abel, 2019). Research on weather-related effects on interstate 3 security generally conclude that periods of transboundary water scarcity are more likely to facilitate 4 increased international cooperation than conflict (Bernauer and Böhmelt, 2020). 5 6 In general, the historical influence of climate on conflict is judged to be small when compared to dominant 7 conflict drivers (Mach et al., 2019). Much of this research is limited to (parts of) Sub-Saharan Africa, which 8 raises some concerns about selection bias and generalizability of results (Adams et al., 2018). 9 10 16.2.3.10 Displacement and Migration 11 12 Given the complexity of human migration processes and decisions (e.g., Boas et al., 2019, Cattaneo et al., 13 2019) and the paucity of long-term, reliable and internally consistent observational data on displacement 14 (IDMC, 2019; IDMC, 2020) and migration (Laczko, 2016) the contribution of long-term changes in climate 15 related systems to observed human displacement or migration patterns has not been quantified so far, except 16 for individual examples for displacement induced by inland flooding where the heavy precipitation has been 17 attributed to anthropogenic climate forcing and coastal flooding (see ‘Other societal impacts - Displacement 18 and migration’, Table SM16.22; CCP2). 19 20 However, new evidence has emerged since the AR5 that further documents widespread effects of weather 21 fluctuations and extreme events on migration (see ‘Other societal impacts- Displacement and migration’ in 22 Table SM16.23). Numerous studies find significant links between temperature or precipitation anomalies, or 23 extreme weather events such as storms or floods, and internal as well as international migration (Coniglio 24 and Pesce, 2015; Cattaneo and Peri, 2016; Nawrotzki and DeWaard, 2016; Beine and Parsons, 2017for 25 international migration; and IDMC, 2019 for internal displacement). Internal displacement of millions of 26 people every year is triggered by natural hazards, mainly floods and storms (IDMC, 2019). The effects of 27 weather fluctuations and extremes on migration are considered more important for temporary mobility and 28 displacement than permanent migration, and more influential on short-distance movement, including 29 urbanization, than international migration (McLeman, 2014; Hauer et al., 2020; Hoffmann et al., 2020, 30 Section 7.2.6). Importantly, these links are conditional on the socio-economic situation in the origin; e.g., 31 poor populations may be ‘trapped’ and not be able to migrate in the face of adverse climate or weather 32 conditions (Black et al., 2013; Adams, 2016). Many studies have also explored the channels through which 33 climate or weather influence migration, and have identified incomes in the agricultural sector as one of the 34 main channels (Nawrotzki et al., 2015; Viswanathan and Kavi Kumar, 2015; Cai et al., 2016a). In particular, 35 declines in agricultural incomes and employment due to changed weather variability may foster increased 36 rural-urban movement; and the resulting pressures on urban wages in turn fosters international migration 37 (Marchiori et al., 2012; Maurel and Tuccio, 2016). Another possible but controversial channel is violent 38 conflict, which may be fostered (though not exclusively caused) by adverse climate conditions such as 39 drought, and in turn lead to people seeking refugee status, although evidence of such an indirect effect is 40 weak (Brzoska and Fröhlich, 2016; Abel et al., 2019; Schutte et al., 2021). 41 42 16.2.3.11 Case study on climate change and the outbreak of the Syrian civil war 43 44 Separating between climatic and non-climatic factors in impact attribution is often challenging, as 45 highlighted by the debate surrounding the causes of the Syrian civil war. During the years 2006–2010, the 46 Fertile Crescent region in Eastern Mediterranean and Western Asia was hit by the worst drought on 47 meteorological record, compounding a consistent drying of the region over the past half century (Trigo et al., 48 2010; Hoerling et al., 2012; Mathbout et al., 2018, SR15 BOX 3.2). The magnitude of the multiyear drought 49 is estimated to have become two to three times more likely as a result of increased CO2 forcing (Kelley et al., 50 2015). The drought had a devastating impact on agricultural production in the northeast of Syria. In 2007–51 2008 alone, average crop yields dropped by 32% in irrigated areas and as much as 79% in rain-fed areas (De 52 Châtel, 2014), and herders in the northeast lost around 85% of their livestock (Werrell et al., 2015). 53 Successive years with little or no income eventually forced people to leave their farms in great numbers and 54 seek employment in less affected parts of the country, adding to existing pressures on housing, labour 55 market, and public goods provision (Gleick, 2014; Kelley et al., 2015). In March 2011, by which time the 56
ACCEPTED VERSIO
N
SUBJECT TO FIN
AL EDITS
FINAL DRAFT Chapter 16 IPCC WGII Sixth Assessment Report
Do Not Cite, Quote or Distribute 16-24 Total pages: 173
‘Arab Spring’ uprisings had gained momentum and spread across much of the region, anti-regime protests 1 broke out in Syria, first in the southern city of Dara’a and then in Damascus and throughout the country. 2 3 Yet, the attribution of the Syrian civil war to climate change has triggered a heated debate. A number of 4 studies argue that the principal drivers of the drought-induced economic collapse were political rather than 5 environmental in nature, shaped by adverse economic reforms and unsustainable agricultural policies, 6 promoting water-intensive irrigation schemes for cotton cultivation and implementing abrupt subsidy cuts at 7 the peak of the drought, implying that many poor farmers no longer could afford fertilizers or fuel to power 8 irrigation pumps (Barnes, 2009; De Châtel, 2014; Eklund and Thompson, 2017; Selby et al., 2017). Thus, the 9 2006–10 drought did not precipitate similar devastating socioeconomic impacts on agrarian communities 10 across the borders in Turkey, Iraq or Jordan, although environmental conditions were comparable (Trigo et 11 al., 2010; Eklund and Thompson, 2017; Feitelson and Tubi, 2017). 12 13 However, the relevant attribution question is not whether the same drought would produce the same 14 consequences under different political and socio-economic conditions but rather, given the same political and 15 socio-economic context, how would the outcomes have differed in the absence of the climate event? 16 Research still provides very limited insights into whether and how the escalation process would have 17 evolved differently in a counterfactual no-climate change world. 18 19 Thus, the role of the drought in augmenting pre-existing internal migration, and the role of the distress 20 migration in accentuating demographic, economic, and social pressures in receiving areas, remain contested. 21 Estimates of the number of people who abandoned their farms in response to the drought range from less 22 than 40–60,000 families (Selby et al., 2017) to more than 1.5 million displaced (Gleick, 2014). However, the 23 numbers have to be seen in the context of prevailing population growth, significant rural-urban migration, 24 and the preceding inflow of around 1.5 million refugees from neighbouring Iraq (De Châtel, 2014; 25 Hoffmann, 2016). In addition, research suggests that the migrants played a peripheral role in the initial social 26 mobilization in March 2011 (Fröhlich, 2016). 27 28 While it is undisputed that the drought caused direct economic losses, its overall additional impact on the 29 Syrian economy, relative to other prevalent drivers of economic misery, including rampant unemployment, 30 increasing inequalities, declining rural productivity, and loss of oil revenues (Aïta, 2009; Landis, 2012; De 31 Châtel, 2014; Selby, 2019) has not been quantified. 32 33 In addition, the protesters’ demands centred around contentious political rather than economic issues, 34 including release of political prisoners, ending of torture and indiscriminate violence by security forces, and 35 abolishment of the near 50-year old state of emergency (Selby et al., 2017; Ash and Obradovich, 2020). The 36 mobilization in Syria in the spring of 2011 also made explicit references to events across the Middle East and 37 North African region. Analyses of regional and social media and networks show high level of interaction 38 across the Arab world, and the initial Syrian uprising adopted a mobilization model and rhetorical frames 39 similar to those developed in Tunisia and Egypt (Leenders, 2013; 2014). However, the Syrian uprising stands 40 out in how it was met with overwhelming violent force by the police and security forces, which changed the 41 character of the resistance and opened up for militarization of non-state actors that further escalated the 42 conflict (Heydemann, 2013; Leenders, 2013; Bramsen, 2020). 43 44 In summary, the drought itself is shown to be attributable to greenhouse gas emissions. The agricultural 45 losses and internal migration from rural to urban areas can be directly linked to the drought and in this way 46 are partly attributable to greenhouse gas emissions, although there are no studies comparing the observed 47 losses and number of people displaced to a counterfactual situation of a weaker drought in a ‘no climate 48 change’ situation. Current research does not provide enough evidence to attribute the civil war to climate 49 change. In contrast, it is likely that social uprisings would have occurred even without the drought. 50 51 52
ACCEPTED VERSIO
N
SUBJECT TO FIN
AL EDITS
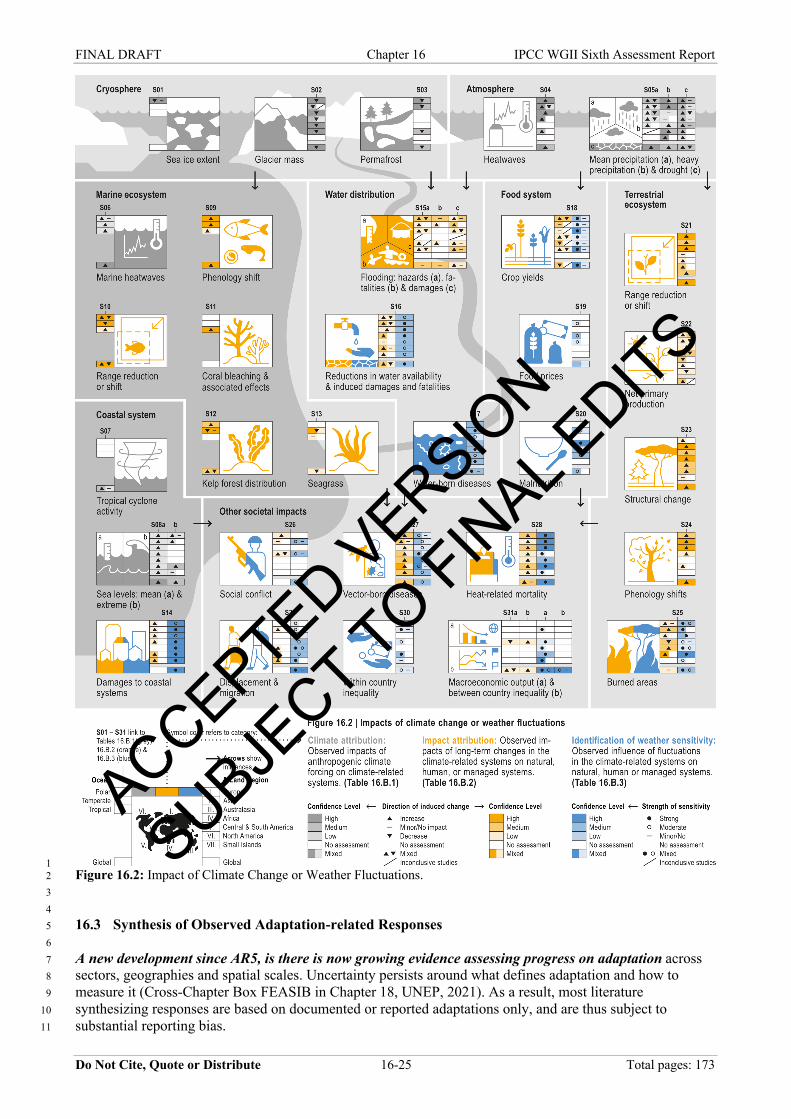
FINAL DRAFT Chapter 16 IPCC WGII Sixth Assessment Report
Do Not Cite, Quote or Distribute 16-25 Total pages: 173
1 Figure 16.2: Impact of Climate Change or Weather Fluctuations. 2 3 4 16.3 Synthesis of Observed Adaptation-related Responses 5 6 A new development since AR5, is there is now growing evidence assessing progress on adaptation across 7 sectors, geographies and spatial scales. Uncertainty persists around what defines adaptation and how to 8 measure it (Cross-Chapter Box FEASIB in Chapter 18, UNEP, 2021). As a result, most literature 9 synthesizing responses are based on documented or reported adaptations only, and are thus subject to 10 substantial reporting bias. 11
ACCEPTED VERSIO
N
SUBJECT TO FIN
AL EDITS
FINAL DRAFT Chapter 16 IPCC WGII Sixth Assessment Report
Do Not Cite, Quote or Distribute 16-26 Total pages: 173
1 We document implemented adaptation-related responses that could directly reduce risk. Adaptation as a 2 process is more broadly covered in Chapter 17 (Section 17.4.2), including risk management, decision-3 making, planning, feasibility (see Cross-Chapter Box FEASIB in Chapter 18), legislation and learning. Here, 4 we focus on a subset of adaptation activities: adaptation-related responses of species, ecosystems, and human 5 societies that have been implemented, observed, and could directly reduce risk. We consider all adaptation-6 related responses to assumed, perceived, or expected climate risk, regardless of whether or not impacts or 7 risks have been formally attributed to climate change. 8 9 We use the term ‘adaptation-related responses’, recognising that not all responses reduce risk. While 10 ‘adaptation’ implies risk reduction, we use the broader term ‘responses’ to reflect that responses may 11 decrease risk, but in some cases may increase risk. 12 13 It is not currently possible to conduct a comprehensive global assessment of effectiveness, adequacy, or the 14 contribution of adaptation-related responses to changing risk due to an absence of robust empirical literature. 15 This constrains assessment of adaptation progress and gaps in the context of over-shoot scenarios. Given 16 limited evidence to inform comprehensive global assessment of effectiveness and adequacy, we assess 17 evidence that adaptation responses in human systems indicate transformational change. Chapter 17 considers 18 adaptation planning and governance, including adaptation solutions, success, and feasibility assessment 19 (Cross-Chapter Box FEASIB in Chapter 18), discussed further in Box 16.1 (also see Cross-Chapter Box 20 PROGRESS in Chapter 17). 21 22 In natural ecosystems or species, detectable changes can be considered as ‘impact’ or ‘response’. The 23 distinction between ‘observed impacts’ (16.2) and ‘observed responses’ (16.3) is not always clear. For 24 example, autonomous distributional shifts in wild species induced by increasing temperatures (an observed 25 impact) may reduce risk to the species (an autonomous adaptation response), but this process can be 26 enhanced or supported by human intervention such as intentional changes in land use. Observed autonomous 27 changes in natural ecosystems or species unsupported by human intervention are treated as impacts (see 28 Section 16.2). 29 30 Adaptation-related responses are frequently motivated by a combination of climatic and non-climatic drivers, 31 and interact with other transitions to affect risk. For societal responses, it is difficult to say whether they are 32 triggered by observed or anticipated changes in climate, by non-climatic drivers, or a combination of all 33 three. In the case of observed impacts, assessment typically focuses on detection and attribution vis à vis a 34 counterfactual of no climate change. While there has been some effort to attribute reduced climate risk to 35 adaptation-related responses (Toloo et al., 2013a; Toloo et al., 2013b; Hess et al., 2018; Weinberger et al., 36 2018), in many cases this has not been feasible given difficulties in defining adaptation and empirically 37 disentangling the contribution of intersecting social transitions and changing risks. Literature on adaptation-38 related response frequently draws on theories-of-change to assess the likely contribution of adaptations to 39 changes in risk, including maladaptation and co-benefits. 40 41 16.3.1 Adaptation-related Responses by Natural Systems 42 43 There is growing evidence of shifts in species distributions and ecosystem structure and functioning in 44 response to climate change (Chapter 2). While many species are increasingly responding to climate change, 45 there is limited evidence that these responses will be fully adaptive, and for many species the rate of 46 response appears insufficient to keep pace with the rate of climate change under mid- and high-range 47 emissions scenarios (medium confidence). There is relatively limited, but growing, empirical data to 48 document adaptation of natural systems in the absence of human interventions. For example, Scheffers et al. 49 (2016) reviewed climate responses across diverse species, reporting widespread and extensive observed 50 changes in organisms (genetics, physiology, morphology), populations (phenology, abundance and 51 dynamics), species (distributions), and ecosystems. A systematic review by Franks et al. (2014) synthesized 52 evidence from 38 empirical studies of changes in terrestrial plant populations, finding evidence to support a 53 mix of plastic and evolutionary responses. Boutin and Lane (2014) similarly reviewed adaptive responses in 54 mammals, finding most species’ responses due to phenotypic plasticity. Charmantier and Gienapp (2014) 55 reviewed responses to climate change among birds, finding emerging evidence that birds from a range of 56 taxa show advancement in their timing of migration and breeding in response to warming. Aragão et al. 57
ACCEPTED VERSIO
N
SUBJECT TO FIN
AL EDITS
FINAL DRAFT Chapter 16 IPCC WGII Sixth Assessment Report
Do Not Cite, Quote or Distribute 16-27 Total pages: 173
(2018) reviewed adaptation responses in marine systems, including 12 studies of live marine mammals. They 1 observed widespread evidence of shifting distributions and timing of biological events (Chapter 2, Chapter 3, 2 and Cross-Chapter Paper 1 on Biodiversity Hotspots). 3 4 Some ecosystems and species’ responses may be insufficient to keep pace with rates of climate change. It 5 is difficult to distinguish whether adaptations are due to genotypic change or to phenotypic plasticity. Long-6 term natural adaptations will require the former, but the latter may provide short-term coping mechanisms to 7 ‘buy time’ to respond to climate changes or lay foundations for evolutionary adaptation. There is mixed 8 evidence regarding evolutionary versus plastic responses, with relatively limited evidence of longer-term 9 evolutionary responses of species that can be associated with climate change. Similarly, it is difficult to 10 assess whether responses are indeed potentially adaptive (e.g., coping, shifting, migrating) or simply 11 reflective of impacts (e.g., stress, damage). Among mammal responses reviewed by Boutin and Lane (2014), 12 for example, only 4 of 12 studies found some evidence that responses were adaptive. Even where adaptive 13 responses are occurring, they may not be sufficient to keep pace with the rate of climate change. found, for 14 example, that among the twelve studies in their review that directly assessed the sufficiency of responses to 15 keep pace with the rate of climate change, eight concluded that responses would be insufficient to avert 16 extinction. 17 18 16.3.2 Adaptation-related Responses by Human Systems 19 20 The literature that seeks to assess adaptation progress is growing at the global (Berrang-Ford et al., 2021a), 21 regional (Bowen and Ebi, 2015; England et al., 2018; Robinson, 2018a; Wirehn, 2018; Olazabal et al., 2019; 22 Thomas et al., 2019a; Biesbroek et al., 2020; Canosa et al., 2020; Robinson, 2020b), national (Hegger et al., 23 2017; Lesnikowski et al., 2019a; Lesnikowski et al., 2019b), and municipal (Araos et al., 2016; Reckien et 24 al., 2018; Reckien et al., 2019; Lesnikowski et al., 2020; Singh et al., 2021) levels, using National 25 Communications (Gagnon-Lebrun and Agrawala, 2007; Lesnikowski et al., 2015; Muchuru and Nhamo, 26 2017), local climate change action plans (Regmi et al., 2016b; Regmi et al., 2016a; Reckien et al., 2018; 27 Reckien et al., 2019), adaptation project proposals, and reported adaptations in the peer reviewed literature. 28 There remains persistent publication bias in the evidence base on adaptation given the difficulty of 29 integrating diverse knowledge sources (see Section 16.3.3). To better assess how adaptation is occurring in 30 human systems, we draw on this literature base and characterize evidence of adaptation across regions and 31 sectors in terms of five key questions (Table 16.4, Ford et al., 2013; Biagini et al., 2014; Ford et al., 2015a; 32 Bednar and Henstra, 2018; Reckien et al., 2018; Tompkins et al., 2018): What types of hazards are 33 motivating adaptation-related responses? Who is responding? What types of responses are being 34 documented? What evidence is available on adaptation effectiveness, adequacy, and risk reduction? To 35 characterize evidence that adaptation responses indicate transformation, we use a typology based on four 36 dimensions of climate adaptation: scope, depth, and speed, and consideration of limits to adaptation (Section 37 16.4, Termeer et al., 2017; Berrang-Ford et al., 2021a). 38 39 16.3.2.1 What Hazards are Motivating Adaptation-related Responses? 40 41 Drought and precipitation variability are the most prevalent hazards in the adaptation literature, particularly 42 in the context of food and livelihood security. Adaptation frequently occurs in response to specific rapid or 43 slow-onset physical events that can have adverse impacts on people. In some cases, people adapt in 44 anticipation of climate change in general or to take advantage of new opportunities created by hazards (e.g., 45 increased navigability due to melting sea ice). There is evidence that prior experience with hazards increases 46 adaptation response (Barreca et al., 2015). Following drought and precipitation variability, the next specific 47 hazards that are most frequently documented in the global adaptation literature are heat and flooding. Heat, 48 while less salient, appears to be a driver of adaptation across all regions and sectors (Stone Jr et al., 2014; 49 Hintz et al., 2018; Nunfam et al., 2018). Drought, extreme precipitation, and inland flooding are commonly 50 reported in the context of water and sanitation (Bauer and Steurer, 2015; Lindsay, 2018; Kirchhoff and 51 Watson, 2019; Hunter et al., 2020; Simpson et al., 2020). Flooding is frequently reported as a key hazard for 52 adaptation in cities, followed by drought, precipitation variability, heat, and sea level rise (Broto and 53 Bulkeley, 2013; Araos et al., 2016; Georgeson et al., 2016; Mees, 2017; Reckien et al., 2018; Hunter et al., 54 2020). 55 56 57
ACCEPTED VERSIO
N
SUBJECT TO FIN
AL EDITS
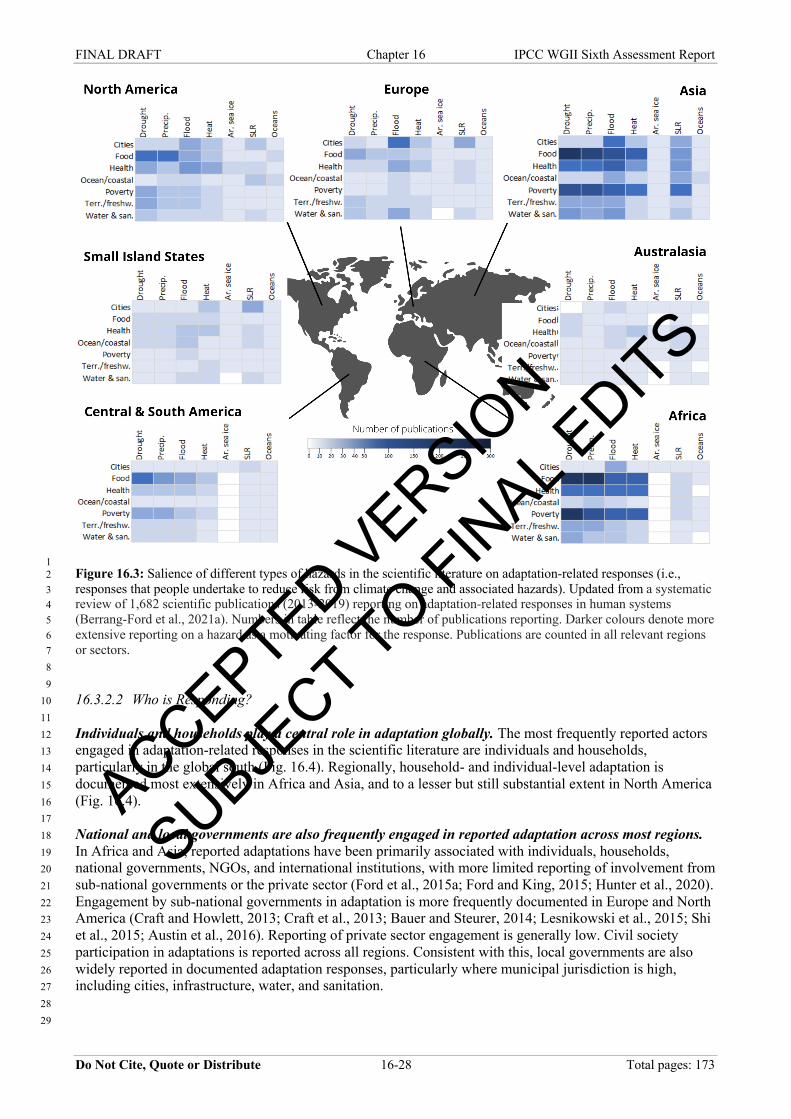
FINAL DRAFT Chapter 16 IPCC WGII Sixth Assessment Report
Do Not Cite, Quote or Distribute 16-28 Total pages: 173
1 Figure 16.3: Salience of different types of hazards in the scientific literature on adaptation-related responses (i.e., 2 responses that people undertake to reduce risk from climate change and associated hazards). Updated from a systematic 3 review of 1,682 scientific publications (2013-2019) reporting on adaptation-related responses in human systems 4 (Berrang-Ford et al., 2021a). Numbers in table reflect the number of publications reporting. Darker colours denote more 5 extensive reporting on a hazard as a motivating factor for the response. Publications are counted in all relevant regions 6 or sectors. 7 8 9 16.3.2.2 Who is Responding? 10 11 Individuals and households play a central role in adaptation globally. The most frequently reported actors 12 engaged in adaptation-related responses in the scientific literature are individuals and households, 13 particularly in the global south (Fig. 16.4). Regionally, household- and individual-level adaptation is 14 documented most extensively in Africa and Asia, and to a lesser but still substantial extent in North America 15 (Fig. 16.4). 16 17 National and local governments are also frequently engaged in reported adaptation across most regions. 18 In Africa and Asia, reported adaptations have been primarily associated with individuals, households, 19 national governments, NGOs, and international institutions, with more limited reporting of involvement from 20 sub-national governments or the private sector (Ford et al., 2015a; Ford and King, 2015; Hunter et al., 2020). 21 Engagement by sub-national governments in adaptation is more frequently documented in Europe and North 22 America (Craft and Howlett, 2013; Craft et al., 2013; Bauer and Steurer, 2014; Lesnikowski et al., 2015; Shi 23 et al., 2015; Austin et al., 2016). Reporting of private sector engagement is generally low. Civil society 24 participation in adaptations is reported across all regions. Consistent with this, local governments are also 25 widely reported in documented adaptation responses, particularly where municipal jurisdiction is high, 26 including cities, infrastructure, water, and sanitation. 27 28 29
ACCEPTED VERSIO
N
SUBJECT TO FIN
AL EDITS
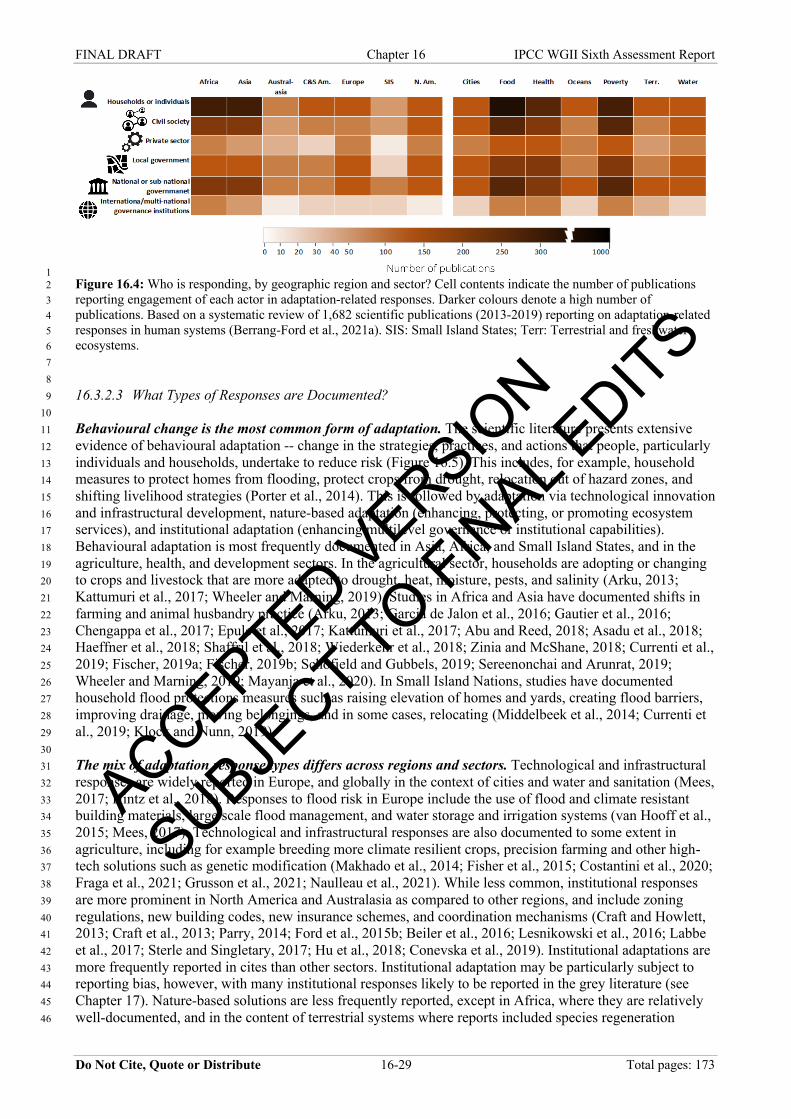
FINAL DRAFT Chapter 16 IPCC WGII Sixth Assessment Report
Do Not Cite, Quote or Distribute 16-29 Total pages: 173
1 Figure 16.4: Who is responding, by geographic region and sector? Cell contents indicate the number of publications 2 reporting engagement of each actor in adaptation-related responses. Darker colours denote a high number of 3 publications. Based on a systematic review of 1,682 scientific publications (2013-2019) reporting on adaptation-related 4 responses in human systems (Berrang-Ford et al., 2021a). SIS: Small Island States; Terr: Terrestrial and freshwater 5 ecosystems. 6 7 8 16.3.2.3 What Types of Responses are Documented? 9 10 Behavioural change is the most common form of adaptation. The scientific literature presents extensive 11 evidence of behavioural adaptation -- change in the strategies, practices, and actions that people, particularly 12 individuals and households, undertake to reduce risk (Figure 16.5). This includes, for example, household 13 measures to protect homes from flooding, protect crops from drought, relocation out of hazard zones, and 14 shifting livelihood strategies (Porter et al., 2014). This is followed by adaptation via technological innovation 15 and infrastructural development, nature-based adaptation (enhancing, protecting, or promoting ecosystem 16 services), and institutional adaptation (enhancing multilevel governance or institutional capabilities). 17 Behavioural adaptation is most frequently documented in Asia, Africa, and Small Island States, and in the 18 agriculture, health, and development sectors. In the agricultural sector, households are adopting or changing 19 to crops and livestock that are more adapted to drought, heat, moisture, pests, and salinity (Arku, 2013; 20 Kattumuri et al., 2017; Wheeler and Marning, 2019). Studies in Africa and Asia have documented shifts in 21 farming and animal husbandry practice (Arku, 2013; Garcia de Jalon et al., 2016; Gautier et al., 2016; 22 Chengappa et al., 2017; Epule et al., 2017; Kattumuri et al., 2017; Abu and Reed, 2018; Asadu et al., 2018; 23 Haeffner et al., 2018; Shaffril et al., 2018; Wiederkehr et al., 2018; Zinia and McShane, 2018; Currenti et al., 24 2019; Fischer, 2019a; Fischer, 2019b; Schofield and Gubbels, 2019; Sereenonchai and Arunrat, 2019; 25 Wheeler and Marning, 2019; Mayanja et al., 2020). In Small Island Nations, studies have documented 26 household flood protections measures such as raising elevation of homes and yards, creating flood barriers, 27 improving drainage, moving belongings, and in some cases, relocating (Middelbeek et al., 2014; Currenti et 28 al., 2019; Klock and Nunn, 2019). 29 30 The mix of adaptation response types differs across regions and sectors. Technological and infrastructural 31 responses are widely reported in Europe, and globally in the context of cities and water and sanitation (Mees, 32 2017; Hintz et al., 2018). Responses to flood risk in Europe include the use of flood and climate resistant 33 building materials, large scale flood management, and water storage and irrigation systems (van Hooff et al., 34 2015; Mees, 2017). Technological and infrastructural responses are also documented to some extent in 35 agriculture, including for example breeding more climate resilient crops, precision farming and other high-36 tech solutions such as genetic modification (Makhado et al., 2014; Fisher et al., 2015; Costantini et al., 2020; 37 Fraga et al., 2021; Grusson et al., 2021; Naulleau et al., 2021). While less common, institutional responses 38 are more prominent in North America and Australasia as compared to other regions, and include zoning 39 regulations, new building codes, new insurance schemes, and coordination mechanisms (Craft and Howlett, 40 2013; Craft et al., 2013; Parry, 2014; Ford et al., 2015b; Beiler et al., 2016; Lesnikowski et al., 2016; Labbe 41 et al., 2017; Sterle and Singletary, 2017; Hu et al., 2018; Conevska et al., 2019). Institutional adaptations are 42 more frequently reported in cites than other sectors. Institutional adaptation may be particularly subject to 43 reporting bias, however, with many institutional responses likely to be reported in the grey literature (see 44 Chapter 17). Nature-based solutions are less frequently reported, except in Africa, where they are relatively 45 well-documented, and in the content of terrestrial systems where reports included species regeneration 46
ACCEPTED VERSIO
N
SUBJECT TO FIN
AL EDITS
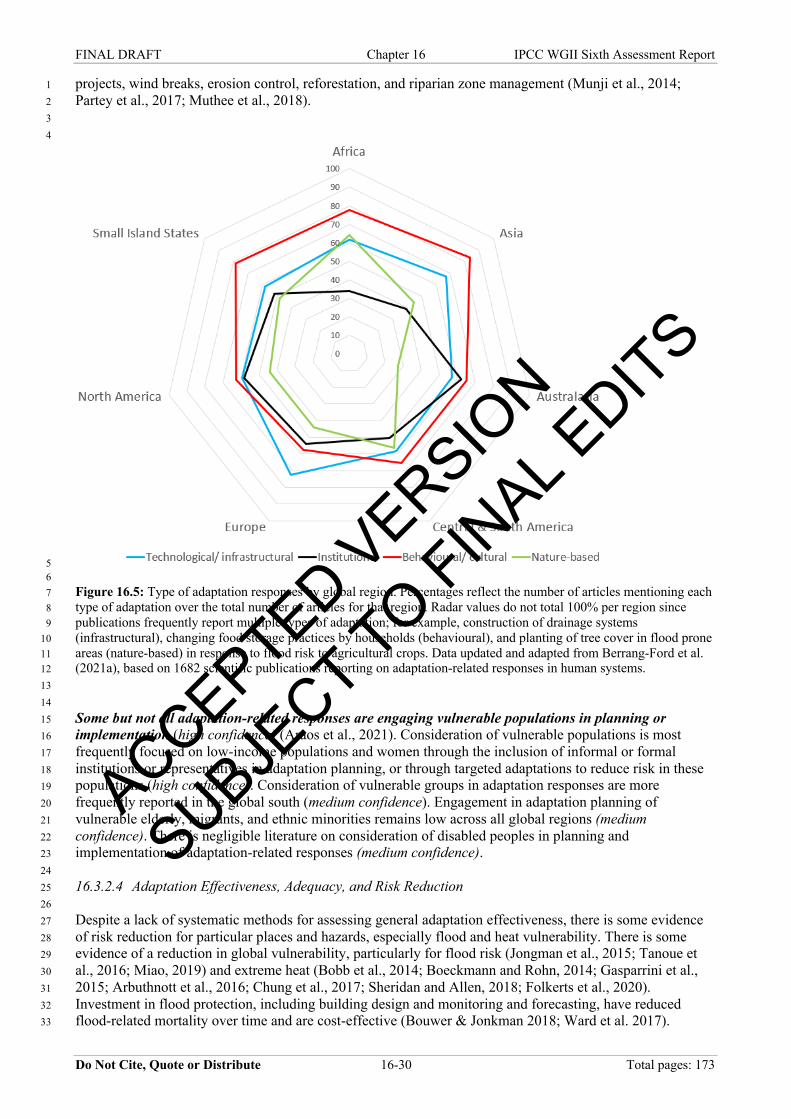
FINAL DRAFT Chapter 16 IPCC WGII Sixth Assessment Report
Do Not Cite, Quote or Distribute 16-30 Total pages: 173
projects, wind breaks, erosion control, reforestation, and riparian zone management (Munji et al., 2014; 1 Partey et al., 2017; Muthee et al., 2018). 2 3 4
5 6 Figure 16.5: Type of adaptation responses by global region. Percentages reflect the number of articles mentioning each 7 type of adaptation over the total number of articles for that region. Radar values do not total 100% per region since 8 publications frequently report multiple types of adaptation; for example, construction of drainage systems 9 (infrastructural), changing food storage practices by households (behavioural), and planting of tree cover in flood prone 10 areas (nature-based) in response to flood risk to agricultural crops. Data updated and adapted from Berrang-Ford et al. 11 (2021a), based on 1682 scientific publications reporting on adaptation-related responses in human systems. 12 13 14 Some but not all adaptation-related responses are engaging vulnerable populations in planning or 15 implementation (high confidence) (Araos et al., 2021). Consideration of vulnerable populations is most 16 frequently focused on low-income populations and women through the inclusion of informal or formal 17 institutions or representatives in adaptation planning, or through targeted adaptations to reduce risk in these 18 populations (high confidence). Consideration of vulnerable groups in adaptation responses are more 19 frequently reported in the global south (medium confidence). Engagement in adaptation planning of 20 vulnerable elderly, migrants, and ethnic minorities remains low across all global regions (medium 21 confidence). There is negligible literature on consideration of disabled peoples in planning and 22 implementation of adaptation-related responses (medium confidence). 23 24 16.3.2.4 Adaptation Effectiveness, Adequacy, and Risk Reduction 25 26 Despite a lack of systematic methods for assessing general adaptation effectiveness, there is some evidence 27 of risk reduction for particular places and hazards, especially flood and heat vulnerability. There is some 28 evidence of a reduction in global vulnerability, particularly for flood risk (Jongman et al., 2015; Tanoue et 29 al., 2016; Miao, 2019) and extreme heat (Bobb et al., 2014; Boeckmann and Rohn, 2014; Gasparrini et al., 30 2015; Arbuthnott et al., 2016; Chung et al., 2017; Sheridan and Allen, 2018; Folkerts et al., 2020). 31 Investment in flood protection, including building design and monitoring and forecasting, have reduced 32 flood-related mortality over time and are cost-effective (Bouwer & Jonkman 2018; Ward et al. 2017). 33
ACCEPTED VERSIO
N
SUBJECT TO FIN
AL EDITS
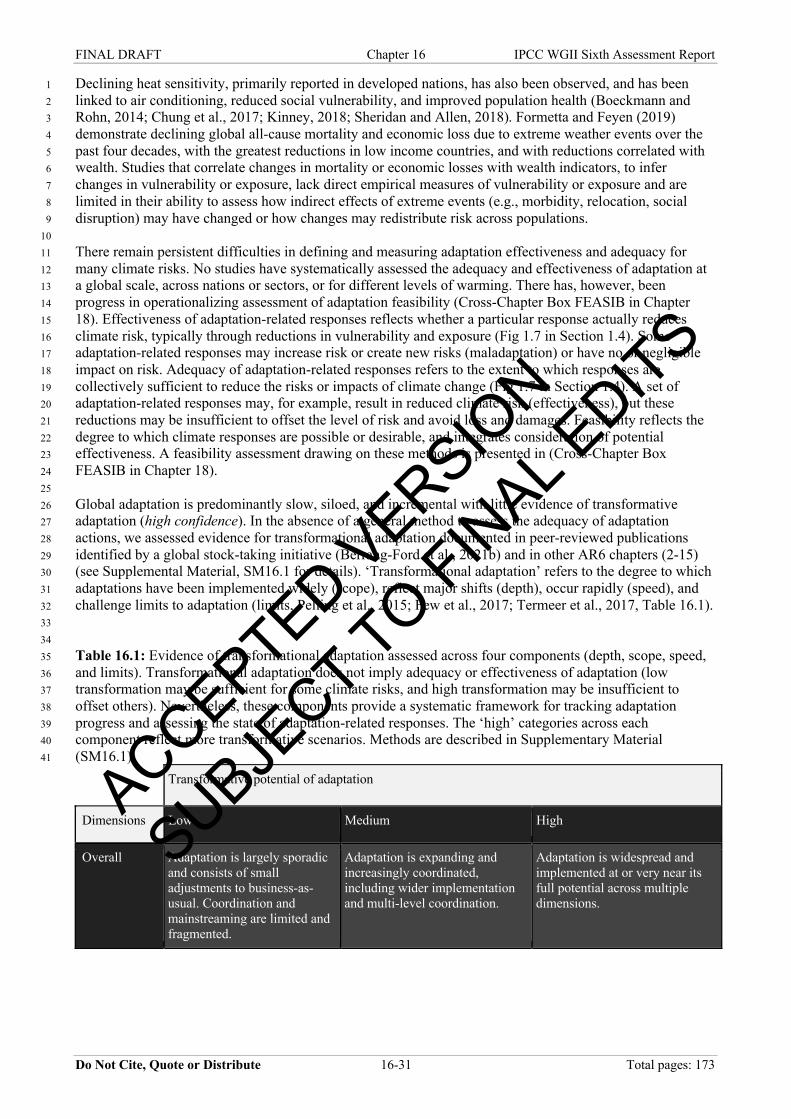
FINAL DRAFT Chapter 16 IPCC WGII Sixth Assessment Report
Do Not Cite, Quote or Distribute 16-31 Total pages: 173
Declining heat sensitivity, primarily reported in developed nations, has also been observed, and has been 1 linked to air conditioning, reduced social vulnerability, and improved population health (Boeckmann and 2 Rohn, 2014; Chung et al., 2017; Kinney, 2018; Sheridan and Allen, 2018). Formetta and Feyen (2019) 3 demonstrate declining global all-cause mortality and economic loss due to extreme weather events over the 4 past four decades, with the greatest reductions in low income countries, and with reductions correlated with 5 wealth. Studies that correlate changes in mortality or economic losses with wealth indicators, to infer 6 changes in vulnerability or exposure, lack direct empirical measures of vulnerability or exposure and are 7 limited in their ability to assess how indirect effects of extreme events (e.g., morbidity, relocation, social 8 disruption) may have changed or how changes may redistribute risk across populations. 9 10 There remain persistent difficulties in defining and measuring adaptation effectiveness and adequacy for 11 many climate risks. No studies have systematically assessed the adequacy and effectiveness of adaptation at 12 a global scale, across nations or sectors, or for different levels of warming. There has, however, been 13 progress in operationalizing assessment of adaptation feasibility (Cross-Chapter Box FEASIB in Chapter 14 18). Effectiveness of adaptation-related responses reflects whether a particular response actually reduces 15 climate risk, typically through reductions in vulnerability and exposure (Fig 1.7 in Section 1.4). Some 16 adaptation-related responses may increase risk or create new risks (maladaptation) or have no or negligible 17 impact on risk. Adequacy of adaptation-related responses refers to the extent to which responses are 18 collectively sufficient to reduce the risks or impacts of climate change (Fig 1.7 in Section 1.4). A set of 19 adaptation-related responses may, for example, result in reduced climate risk (effectiveness), but these 20 reductions may be insufficient to offset the level of risk and avoid loss and damages. Feasibility reflects the 21 degree to which climate responses are possible or desirable, and integrates consideration of potential 22 effectiveness. A feasibility assessment drawing on these methods is presented in (Cross-Chapter Box 23 FEASIB in Chapter 18). 24 25 Global adaptation is predominantly slow, siloed, and incremental with little evidence of transformative 26 adaptation (high confidence). In the absence of a general method to assess the adequacy of adaptation 27 actions, we assessed evidence for transformational adaptation documented in peer-reviewed publications 28 identified by a global stock-taking initiative (Berrang-Ford et al., 2021b) and in other AR6 chapters (2-15) 29 (see Supplemental Material, SM16.1 for details). ‘Transformational adaptation’ refers to the degree to which 30 adaptations have been implemented widely (scope), reflect major shifts (depth), occur rapidly (speed), and 31 challenge limits to adaptation (limits, Pelling et al., 2015; Few et al., 2017; Termeer et al., 2017, Table 16.1). 32 33 34 Table 16.1: Evidence of transformational adaptation assessed across four components (depth, scope, speed, 35 and limits). Transformational adaptation does not imply adequacy or effectiveness of adaptation (low 36 transformation may be sufficient for some climate risks, and high transformation may be insufficient to 37 offset others). Nevertheless, these components provide a systematic framework for tracking adaptation 38 progress and assessing the state of adaptation-related responses. The ‘high’ categories across each 39 component reflect more transformative scenarios. Methods are described in Supplementary Material 40 (SM16.1). 41
Transformative potential of adaptation
Dimensions Low Medium High
Overall Adaptation is largely sporadic and consists of small adjustments to business-as-usual. Coordination and mainstreaming are limited and fragmented.
Adaptation is expanding and increasingly coordinated, including wider implementation and multi-level coordination.
Adaptation is widespread and implemented at or very near its full potential across multiple dimensions.
ACCEPTED VERSIO
N
SUBJECT TO FIN
AL EDITS
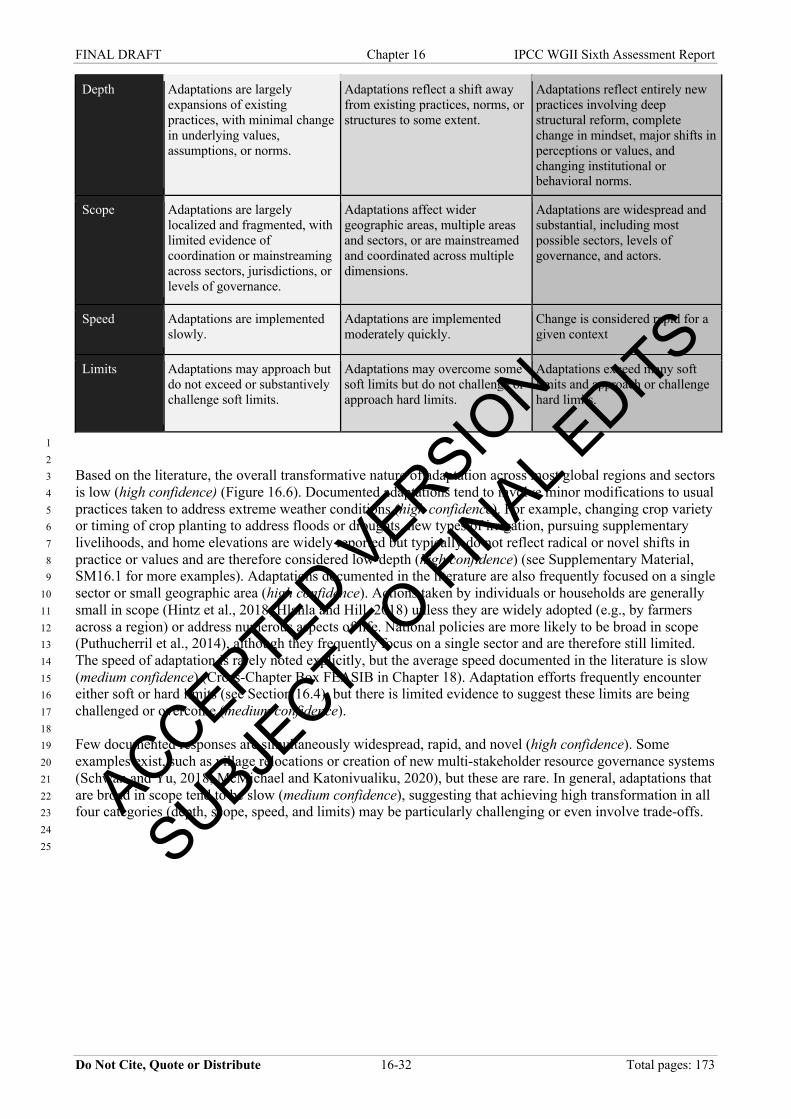
FINAL DRAFT Chapter 16 IPCC WGII Sixth Assessment Report
Do Not Cite, Quote or Distribute 16-32 Total pages: 173
Depth Adaptations are largely expansions of existing practices, with minimal change in underlying values, assumptions, or norms.
Adaptations reflect a shift away from existing practices, norms, or structures to some extent.
Adaptations reflect entirely new practices involving deep structural reform, complete change in mindset, major shifts in perceptions or values, and changing institutional or behavioral norms.
Scope Adaptations are largely localized and fragmented, with limited evidence of coordination or mainstreaming across sectors, jurisdictions, or levels of governance.
Adaptations affect wider geographic areas, multiple areas and sectors, or are mainstreamed and coordinated across multiple dimensions.
Adaptations are widespread and substantial, including most possible sectors, levels of governance, and actors.
Speed Adaptations are implemented slowly.
Adaptations are implemented moderately quickly.
Change is considered rapid for a given context
Limits Adaptations may approach but do not exceed or substantively challenge soft limits.
Adaptations may overcome some soft limits but do not challenge or approach hard limits.
Adaptations exceed many soft limits and approach or challenge hard limits.
1 2 Based on the literature, the overall transformative nature of adaptation across most global regions and sectors 3 is low (high confidence) (Figure 16.6). Documented adaptations tend to involve minor modifications to usual 4 practices taken to address extreme weather conditions (high confidence). For example, changing crop variety 5 or timing of crop planting to address floods or droughts, new types of irrigation, pursuing supplementary 6 livelihoods, and home elevations are widely reported but typically do not reflect radical or novel shifts in 7 practice or values and are therefore considered low-depth (high confidence) (see Supplementary Material, 8 SM16.1 for more examples). Adaptations documented in the literature are also frequently focused on a single 9 sector or small geographic area (high confidence). Actions taken by individuals or households are generally 10 small in scope (Hintz et al., 2018; Hlahla and Hill, 2018) unless they are widely adopted (e.g., by farmers 11 across a region) or address numerous aspects of life. National policies are more likely to be broad in scope 12 (Puthucherril et al., 2014), although they frequently focus on a single sector and are therefore still limited. 13 The speed of adaptation is rarely noted explicitly, but the average speed documented in the literature is slow 14 (medium confidence) (Cross-Chapter Box FEASIB in Chapter 18). Adaptation efforts frequently encounter 15 either soft or hard limits (see Section 16.4), but there is limited evidence to suggest these limits are being 16 challenged or overcome (medium confidence). 17 18 Few documented responses are simultaneously widespread, rapid, and novel (high confidence). Some 19 examples exist, such as village relocations or creation of new multi-stakeholder resource governance systems 20 (Schwan and Yu, 2018; McMichael and Katonivualiku, 2020), but these are rare. In general, adaptations that 21 are broad in scope tend to be slow (medium confidence), suggesting that achieving high transformation in all 22 four categories (depth, scope, speed, and limits) may be particularly challenging or even involve trade-offs. 23 24 25
ACCEPTED VERSIO
N
SUBJECT TO FIN
AL EDITS
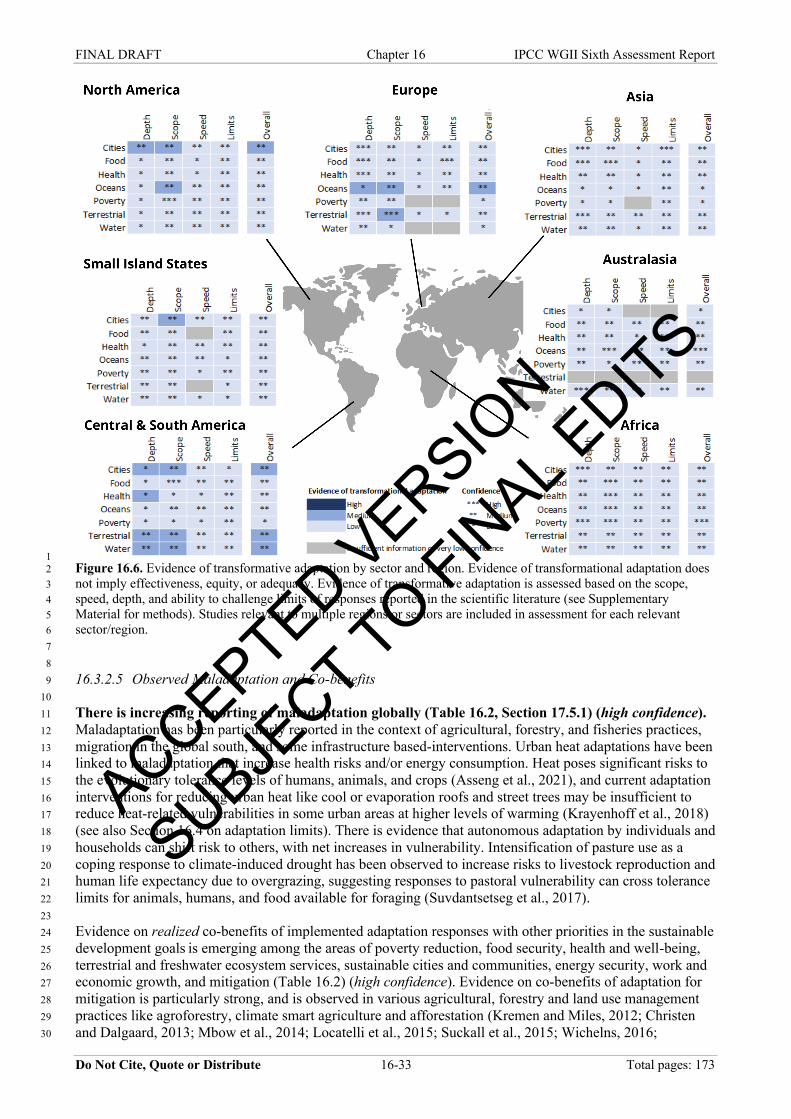
FINAL DRAFT Chapter 16 IPCC WGII Sixth Assessment Report
Do Not Cite, Quote or Distribute 16-33 Total pages: 173
1 Figure 16.6. Evidence of transformative adaptation by sector and region. Evidence of transformational adaptation does 2 not imply effectiveness, equity, or adequacy. Evidence of transformative adaptation is assessed based on the scope, 3 speed, depth, and ability to challenge limits of responses reported in the scientific literature (see Supplementary 4 Material for methods). Studies relevant to multiple regions or sectors are included in assessment for each relevant 5 sector/region. 6 7 8 16.3.2.5 Observed Maladaptation and Co-benefits 9 10 There is increasing reporting of maladaptation globally (Table 16.2, Section 17.5.1) (high confidence). 11 Maladaptation has been particularly reported in the context of agricultural, forestry, and fisheries practices, 12 migration in the global south, and some infrastructure based-interventions. Urban heat adaptations have been 13 linked to maladaptation that increase health risks and/or energy consumption. Heat poses significant risks to 14 the evolutionary tolerance levels of humans, animals, and crops (Asseng et al., 2021), and current adaptation 15 interventions for reducing urban heat like cool or evaporation roofs and street trees may be insufficient to 16 reduce heat-related vulnerabilities in some urban areas at higher levels of warming (Krayenhoff et al., 2018) 17 (see also Section 16.4 on adaptation limits). There is evidence that autonomous adaptation by individuals and 18 households can shift risk to others, with net increases in vulnerability. Intensification of pasture use as a 19 coping response to climate-induced drought has been observed to increase risks to livestock reproduction and 20 human life expectancy due to overgrazing, suggesting responses to pastoral vulnerability can cross tolerance 21 limits for animals, humans, and food available for foraging (Suvdantsetseg et al., 2017). 22 23 Evidence on realized co-benefits of implemented adaptation responses with other priorities in the sustainable 24 development goals is emerging among the areas of poverty reduction, food security, health and well-being, 25 terrestrial and freshwater ecosystem services, sustainable cities and communities, energy security, work and 26 economic growth, and mitigation (Table 16.2) (high confidence). Evidence on co-benefits of adaptation for 27 mitigation is particularly strong, and is observed in various agricultural, forestry and land use management 28 practices like agroforestry, climate smart agriculture and afforestation (Kremen and Miles, 2012; Christen 29 and Dalgaard, 2013; Mbow et al., 2014; Locatelli et al., 2015; Suckall et al., 2015; Wichelns, 2016; 30
ACCEPTED VERSIO
N
SUBJECT TO FIN
AL EDITS
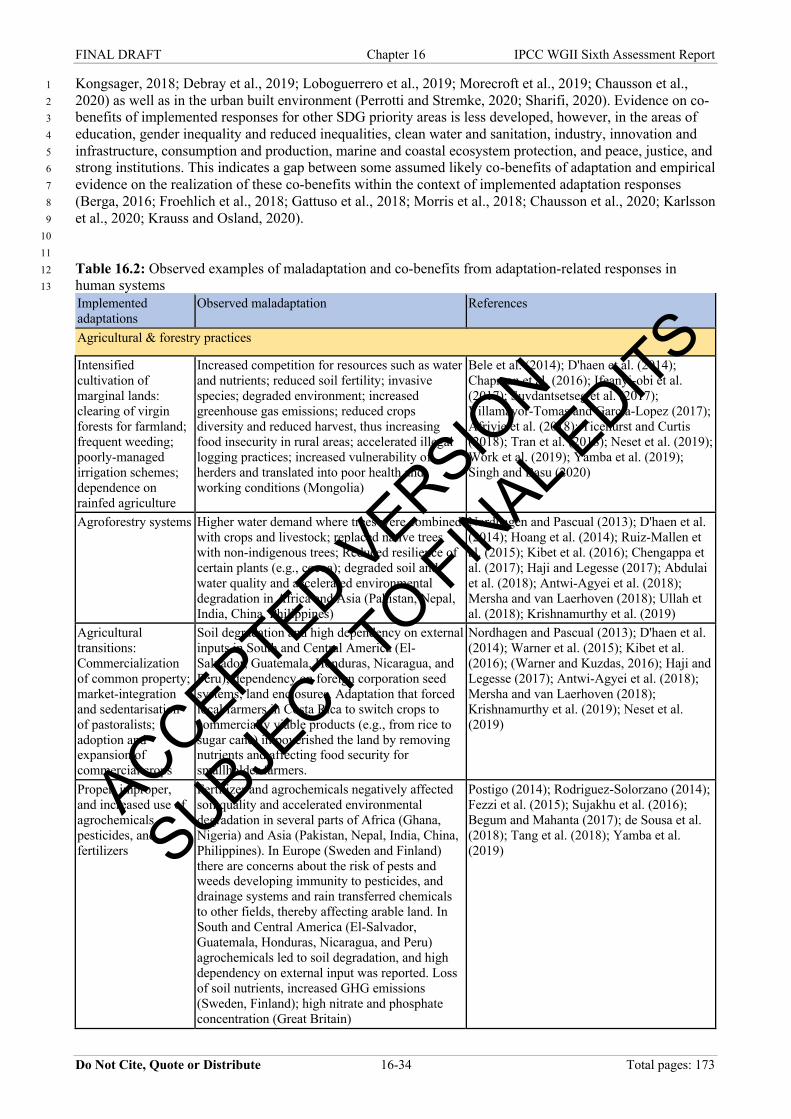
FINAL DRAFT Chapter 16 IPCC WGII Sixth Assessment Report
Do Not Cite, Quote or Distribute 16-34 Total pages: 173
Kongsager, 2018; Debray et al., 2019; Loboguerrero et al., 2019; Morecroft et al., 2019; Chausson et al., 1 2020) as well as in the urban built environment (Perrotti and Stremke, 2020; Sharifi, 2020). Evidence on co-2 benefits of implemented responses for other SDG priority areas is less developed, however, in the areas of 3 education, gender inequality and reduced inequalities, clean water and sanitation, industry, innovation and 4 infrastructure, consumption and production, marine and coastal ecosystem protection, and peace, justice, and 5 strong institutions. This indicates a gap between some assumed likely co-benefits of adaptation and empirical 6 evidence on the realization of these co-benefits within the context of implemented adaptation responses 7 (Berga, 2016; Froehlich et al., 2018; Gattuso et al., 2018; Morris et al., 2018; Chausson et al., 2020; Karlsson 8 et al., 2020; Krauss and Osland, 2020). 9 10 11 Table 16.2: Observed examples of maladaptation and co-benefits from adaptation-related responses in 12 human systems 13
Implemented adaptations
Observed maladaptation References
Agricultural & forestry practices
Intensified cultivation of marginal lands: clearing of virgin forests for farmland; frequent weeding; poorly-managed irrigation schemes; dependence on rainfed agriculture
Increased competition for resources such as water and nutrients; reduced soil fertility; invasive species; degraded environment; increased greenhouse gas emissions; reduced crops diversity and reduced harvest, thus increasing food insecurity in rural areas; accelerated illegal logging practices; increased vulnerability of herders and translated into poor health and working conditions (Mongolia)
Bele et al. (2014); D'haen et al. (2014); Chapman et al. (2016); Ifeanyi-obi et al. (2017); Suvdantsetseg et al. (2017); Villamayor-Tomas and Garcia-Lopez (2017); Afriyie et al. (2018); Ticehurst and Curtis (2018); Tran et al. (2018); Neset et al. (2019); Work et al. (2019); Yamba et al. (2019); Singh and Basu (2020)
Agroforestry systems Higher water demand where trees were combined with crops and livestock; replaced native trees with non-indigenous trees; Reduced resilience of certain plants (e.g., cocoa); degraded soil and water quality and accelerated environmental degradation in Africa and Asia (Pakistan, Nepal, India, China, Philippines)
Nordhagen and Pascual (2013); D'haen et al. (2014); Hoang et al. (2014); Ruiz-Mallen et al. (2015); Kibet et al. (2016); Chengappa et al. (2017); Haji and Legesse (2017); Abdulai et al. (2018); Antwi-Agyei et al. (2018); Mersha and van Laerhoven (2018); Ullah et al. (2018); Krishnamurthy et al. (2019)
Agricultural transitions: Commercialization of common property; market-integration and sedentarisation of pastoralists; adoption and expansion of commercial crops
Soil degradation and high dependency on external inputs in South and Central America (El-Salvador, Guatemala, Honduras, Nicaragua, and Peru); dependency on foreign corporation seed systems; land enclosures. Adaptation that forced local farmers in Costa Rica to switch crops to commercially viable products (e.g., from rice to sugar cane) impoverished the land by removing nutrients and affecting food security for smallholder farmers.
Nordhagen and Pascual (2013); D'haen et al. (2014); Warner et al. (2015); Kibet et al. (2016); (Warner and Kuzdas, 2016); Haji and Legesse (2017); Antwi-Agyei et al. (2018); Mersha and van Laerhoven (2018); Krishnamurthy et al. (2019); Neset et al. (2019)
Proper, improper, and increased use of agrochemicals, pesticides, and fertilizers
Fertilizer and agrochemicals negatively affected soil quality and accelerated environmental degradation in several parts of Africa (Ghana, Nigeria) and Asia (Pakistan, Nepal, India, China, Philippines). In Europe (Sweden and Finland) there are concerns about the risk of pests and weeds developing immunity to pesticides, and drainage systems and rain transferred chemicals to other fields, thereby affecting arable land. In South and Central America (El-Salvador, Guatemala, Honduras, Nicaragua, and Peru) agrochemicals led to soil degradation, and high dependency on external input was reported. Loss of soil nutrients, increased GHG emissions (Sweden, Finland); high nitrate and phosphate concentration (Great Britain)
Postigo (2014); Rodriguez-Solorzano (2014); Fezzi et al. (2015); Sujakhu et al. (2016); Begum and Mahanta (2017); de Sousa et al. (2018); Tang et al. (2018); Yamba et al. (2019)
ACCEPTED VERSIO
N
SUBJECT TO FIN
AL EDITS
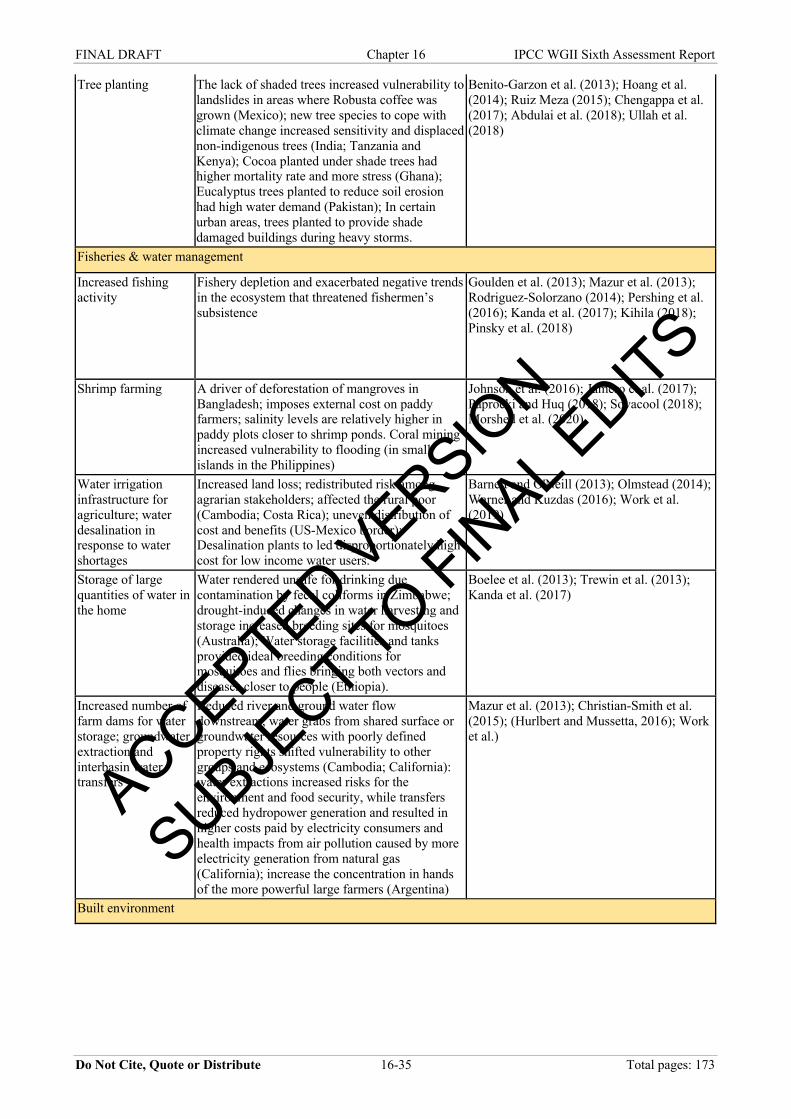
FINAL DRAFT Chapter 16 IPCC WGII Sixth Assessment Report
Do Not Cite, Quote or Distribute 16-35 Total pages: 173
Tree planting The lack of shaded trees increased vulnerability to landslides in areas where Robusta coffee was grown (Mexico); new tree species to cope with climate change increased sensitivity and displaced non-indigenous trees (India; Tanzania and Kenya); Cocoa planted under shade trees had higher mortality rate and more stress (Ghana); Eucalyptus trees planted to reduce soil erosion had high water demand (Pakistan); In certain urban areas, trees planted to provide shade damaged buildings during heavy storms.
Benito-Garzon et al. (2013); Hoang et al. (2014); Ruiz Meza (2015); Chengappa et al. (2017); Abdulai et al. (2018); Ullah et al. (2018)
Fisheries & water management
Increased fishing activity
Fishery depletion and exacerbated negative trends in the ecosystem that threatened fishermen’s subsistence
Goulden et al. (2013); Mazur et al. (2013); Rodriguez-Solorzano (2014); Pershing et al. (2016); Kanda et al. (2017); Kihila (2018); Pinsky et al. (2018)
Shrimp farming A driver of deforestation of mangroves in Bangladesh; imposes external cost on paddy farmers; salinity levels are relatively higher in paddy plots closer to shrimp ponds. Coral mining increased vulnerability to flooding (in small islands in the Philippines)
Johnson et al. (2016); Jamero et al. (2017); Paprocki and Huq (2018); Sovacool (2018); Morshed et al. (2020)
Water irrigation infrastructure for agriculture; water desalination in response to water shortages
Increased land loss; redistributed risk among agrarian stakeholders; affected the rural poor (Cambodia; Costa Rica); uneven distribution of cost and benefits (US-Mexico border); Desalination plants to led disproportionately high cost for low income water users.
Barnett and O'Neill (2013); Olmstead (2014); Warner and Kuzdas (2016); Work et al. (2019)
Storage of large quantities of water in the home
Water rendered unsafe for drinking due contamination by fecal coliforms in Zimbabwe; drought-induced changes in water harvesting and storage increased breeding sites for mosquitoes (Australia); Water storage facilities and tanks provided ideal breeding conditions for mosquitoes and flies bringing both vectors and diseases closer to people (Ethiopia).
Boelee et al. (2013); Trewin et al. (2013); Kanda et al. (2017)
Increased number of farm dams for water storage; groundwater extraction and interbasin water transfers
Reduced river and ground water flow downstream; water grabs from shared surface or groundwater resources with poorly defined property rights shifted vulnerability to other groups and ecosystems (Cambodia; California): water extractions increased risks for the environment and food security, while transfers reduced hydropower generation and resulted in higher costs paid by electricity consumers and health impacts from air pollution caused by more electricity generation from natural gas (California); increase the concentration in hands of the more powerful large farmers (Argentina)
Mazur et al. (2013); Christian-Smith et al. (2015); (Hurlbert and Mussetta, 2016); Work et al.)
Built environment
ACCEPTED VERSIO
N
SUBJECT TO FIN
AL EDITS
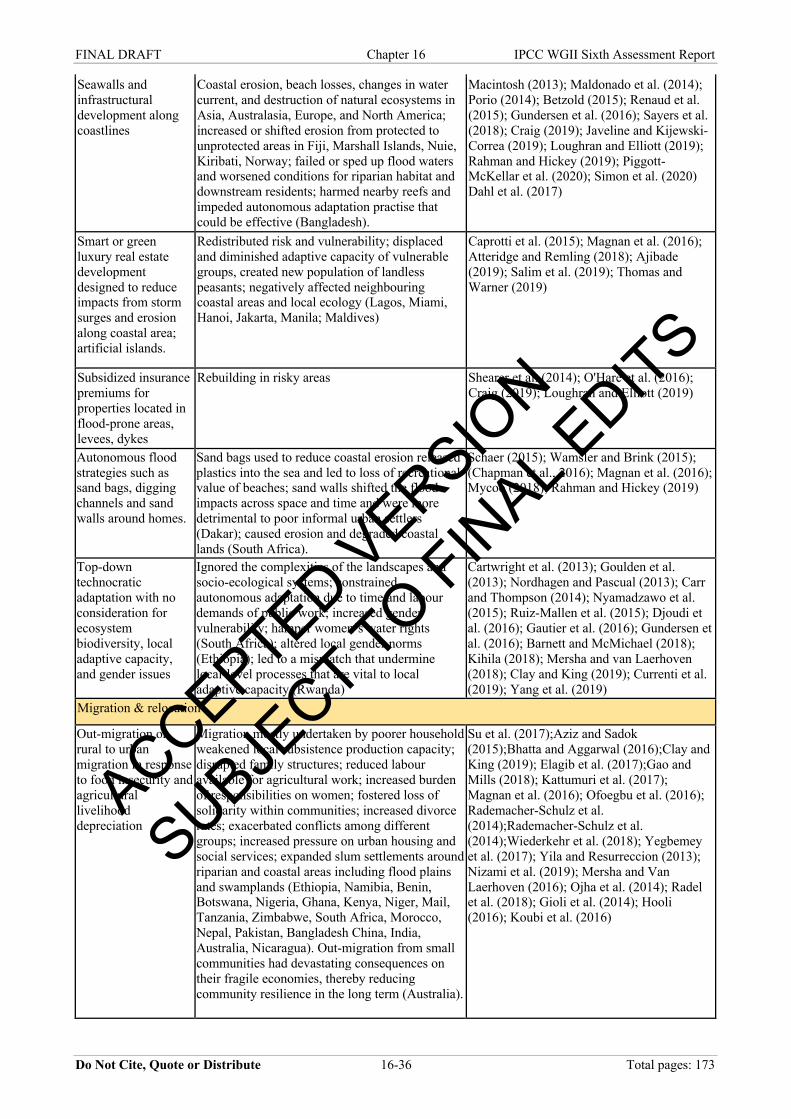
FINAL DRAFT Chapter 16 IPCC WGII Sixth Assessment Report
Do Not Cite, Quote or Distribute 16-36 Total pages: 173
Seawalls and infrastructural development along coastlines
Coastal erosion, beach losses, changes in water current, and destruction of natural ecosystems in Asia, Australasia, Europe, and North America; increased or shifted erosion from protected to unprotected areas in Fiji, Marshall Islands, Nuie, Kiribati, Norway; failed or sped up flood waters and worsened conditions for riparian habitat and downstream residents; harmed nearby reefs and impeded autonomous adaptation practise that could be effective (Bangladesh).
Macintosh (2013); Maldonado et al. (2014); Porio (2014); Betzold (2015); Renaud et al. (2015); Gundersen et al. (2016); Sayers et al. (2018); Craig (2019); Javeline and Kijewski-Correa (2019); Loughran and Elliott (2019); Rahman and Hickey (2019); Piggott-McKellar et al. (2020); Simon et al. (2020) Dahl et al. (2017)
Smart or green luxury real estate development designed to reduce impacts from storm surges and erosion along coastal area; artificial islands.
Redistributed risk and vulnerability; displaced and diminished adaptive capacity of vulnerable groups, created new population of landless peasants; negatively affected neighbouring coastal areas and local ecology (Lagos, Miami, Hanoi, Jakarta, Manila; Maldives)
Caprotti et al. (2015); Magnan et al. (2016); Atteridge and Remling (2018); Ajibade (2019); Salim et al. (2019); Thomas and Warner (2019)
Subsidized insurance premiums for properties located in flood-prone areas, levees, dykes
Rebuilding in risky areas Shearer et al. (2014); O'Hare et al. (2016); Craig (2019); Loughran and Elliott (2019)
Autonomous flood strategies such as sand bags, digging channels and sand walls around homes.
Sand bags used to reduce coastal erosion released plastics into the sea and led to loss of recreational value of beaches; sand walls shifted the flood impacts across space and time and were more detrimental to poor informal urban settlers (Dakar); caused erosion and degraded coastal lands (South Africa).
Schaer (2015); Wamsler and Brink (2015); (Chapman et al., 2016); Magnan et al. (2016); Mycoo (2018); Rahman and Hickey (2019)
Top-down technocratic adaptation with no consideration for ecosystem biodiversity, local adaptive capacity, and gender issues
Ignored the complexities of the landscapes and socio-ecological systems; constrained autonomous adaptation due to time and labour demands of public work; increased gender vulnerability; hamper women’s water rights (South Africa); altered local gender norms (Ethiopia); led to a mismatch that undermine local-level processes that are vital to local adaptive capacity (Rwanda)
Cartwright et al. (2013); Goulden et al. (2013); Nordhagen and Pascual (2013); Carr and Thompson (2014); Nyamadzawo et al. (2015); Ruiz-Mallen et al. (2015); Djoudi et al. (2016); Gautier et al. (2016); Gundersen et al. (2016); Barnett and McMichael (2018); Kihila (2018); Mersha and van Laerhoven (2018); Clay and King (2019); Currenti et al. (2019); Yang et al. (2019)
Migration & relocation
Out-migration or rural to urban migration in response to food insecurity and agricultural livelihood depreciation
Migration mostly undertaken by poorer household weakened local subsistence production capacity; disrupted family structures; reduced labour available for agricultural work; increased burden of responsibilities on women; fostered loss of solidarity within communities; increased divorce rates; exacerbated conflicts among different groups; increased pressure on urban housing and social services; expanded slum settlements around riparian and coastal areas including flood plains and swamplands (Ethiopia, Namibia, Benin, Botswana, Nigeria, Ghana, Kenya, Niger, Mail, Tanzania, Zimbabwe, South Africa, Morocco, Nepal, Pakistan, Bangladesh China, India, Australia, Nicaragua). Out-migration from small communities had devastating consequences on their fragile economies, thereby reducing community resilience in the long term (Australia).
Su et al. (2017);Aziz and Sadok (2015);Bhatta and Aggarwal (2016);Clay and King (2019); Elagib et al. (2017);Gao and Mills (2018); Kattumuri et al. (2017); Magnan et al. (2016); Ofoegbu et al. (2016); Rademacher-Schulz et al. (2014);Rademacher-Schulz et al. (2014);Wiederkehr et al. (2018); Yegbemey et al. (2017); Yila and Resurreccion (2013); Nizami et al. (2019); Mersha and Van Laerhoven (2016); Ojha et al. (2014); Radel et al. (2018); Gioli et al. (2014); Hooli (2016); Koubi et al. (2016)
ACCEPTED VERSIO
N
SUBJECT TO FIN
AL EDITS
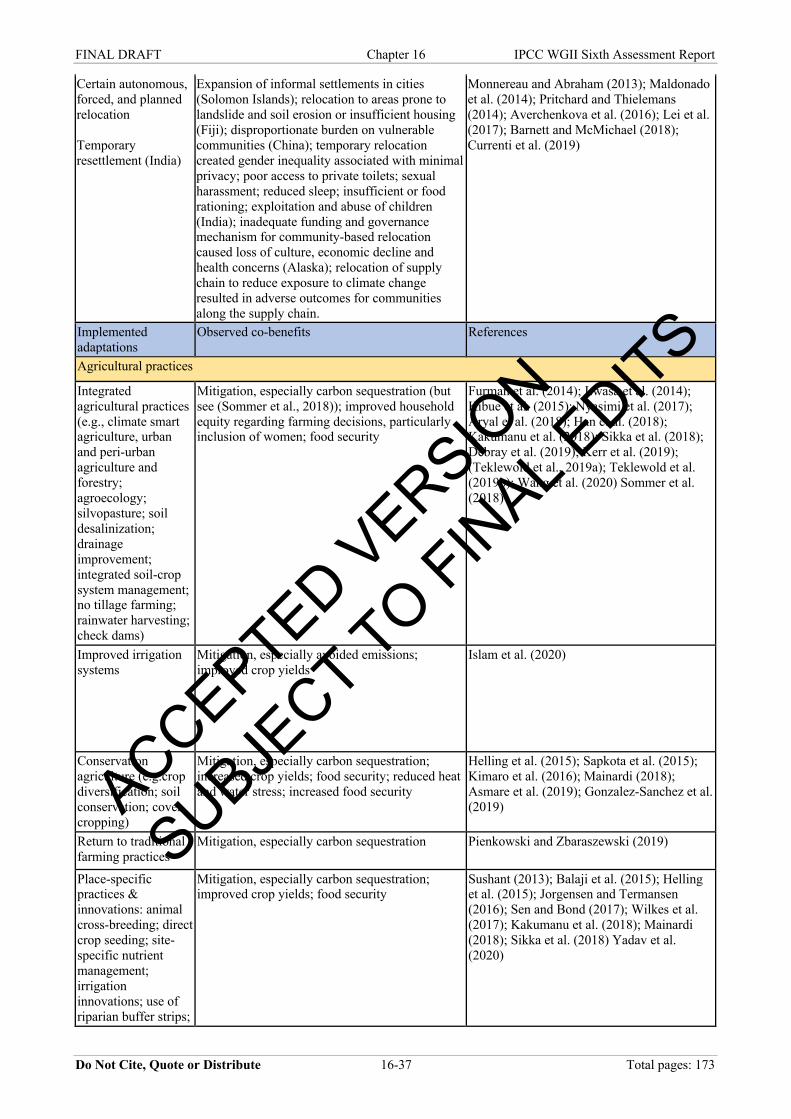
FINAL DRAFT Chapter 16 IPCC WGII Sixth Assessment Report
Do Not Cite, Quote or Distribute 16-37 Total pages: 173
Certain autonomous, forced, and planned relocation Temporary resettlement (India)
Expansion of informal settlements in cities (Solomon Islands); relocation to areas prone to landslide and soil erosion or insufficient housing (Fiji); disproportionate burden on vulnerable communities (China); temporary relocation created gender inequality associated with minimal privacy; poor access to private toilets; sexual harassment; reduced sleep; insufficient or food rationing; exploitation and abuse of children (India); inadequate funding and governance mechanism for community-based relocation caused loss of culture, economic decline and health concerns (Alaska); relocation of supply chain to reduce exposure to climate change resulted in adverse outcomes for communities along the supply chain.
Monnereau and Abraham (2013); Maldonado et al. (2014); Pritchard and Thielemans (2014); Averchenkova et al. (2016); Lei et al. (2017); Barnett and McMichael (2018); Currenti et al. (2019)
Implemented adaptations
Observed co-benefits References
Agricultural practices
Integrated agricultural practices (e.g., climate smart agriculture, urban and peri-urban agriculture and forestry; agroecology; silvopasture; soil desalinization; drainage improvement; integrated soil-crop system management; no tillage farming; rainwater harvesting; check dams)
Mitigation, especially carbon sequestration (but see (Sommer et al., 2018)); improved household equity regarding farming decisions, particularly inclusion of women; food security
Furman et al. (2014); Lwasa et al. (2014); Kibue et al. (2015); Nyasimi et al. (2017); Aryal et al. (2018); Han et al. (2018); Kakumanu et al. (2018); Sikka et al. (2018); Debray et al. (2019); Kerr et al. (2019); (Teklewold et al., 2019a); Teklewold et al. (2019b); Wang et al. (2020) Sommer et al. (2018)
Improved irrigation systems
Mitigation, especially avoided emissions; improved crop yields
Islam et al. (2020)
Conservation agriculture (e.g.crop diversification; soil conservation; cover cropping)
Mitigation, especially carbon sequestration; increased crop yields; food security; reduced heat and water stress; increased food security
Helling et al. (2015); Sapkota et al. (2015); Kimaro et al. (2016); Mainardi (2018); Asmare et al. (2019); Gonzalez-Sanchez et al. (2019)
Return to traditional farming practices
Mitigation, especially carbon sequestration Pienkowski and Zbaraszewski (2019)
Place-specific practices & innovations: animal cross-breeding; direct crop seeding; site-specific nutrient management; irrigation innovations; use of riparian buffer strips;
Mitigation, especially carbon sequestration; improved crop yields; food security
Sushant (2013); Balaji et al. (2015); Helling et al. (2015); Jorgensen and Termansen (2016); Sen and Bond (2017); Wilkes et al. (2017); Kakumanu et al. (2018); Mainardi (2018); Sikka et al. (2018) Yadav et al. (2020)
ACCEPTED VERSIO
N
SUBJECT TO FIN
AL EDITS
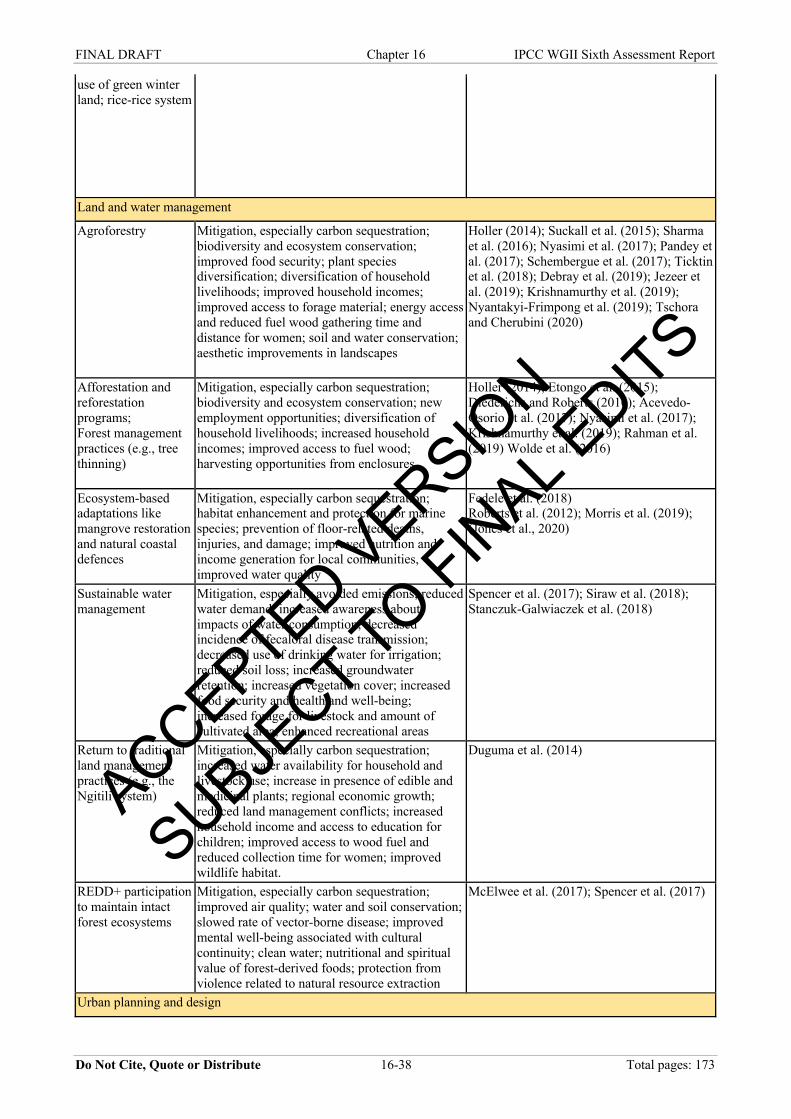
FINAL DRAFT Chapter 16 IPCC WGII Sixth Assessment Report
Do Not Cite, Quote or Distribute 16-38 Total pages: 173
use of green winter land; rice-rice system
Land and water management
Agroforestry
Mitigation, especially carbon sequestration; biodiversity and ecosystem conservation; improved food security; plant species diversification; diversification of household livelihoods; improved household incomes; improved access to forage material; energy access and reduced fuel wood gathering time and distance for women; soil and water conservation; aesthetic improvements in landscapes
Holler (2014); Suckall et al. (2015); Sharma et al. (2016); Nyasimi et al. (2017); Pandey et al. (2017); Schembergue et al. (2017); Ticktin et al. (2018); Debray et al. (2019); Jezeer et al. (2019); Krishnamurthy et al. (2019); Nyantakyi-Frimpong et al. (2019); Tschora and Cherubini (2020)
Afforestation and reforestation programs; Forest management practices (e.g., tree thinning)
Mitigation, especially carbon sequestration; biodiversity and ecosystem conservation; new employment opportunities; diversification of household livelihoods; increased household incomes; improved access to fuel wood; harvesting opportunities from enclosures
Holler (2014); Etongo et al. (2015); Diederichs and Roberts (2016); Acevedo-Osorio et al. (2017); Nyasimi et al. (2017); Krishnamurthy et al. (2019); Rahman et al. (2019) Wolde et al. (2016)
Ecosystem-based adaptations like mangrove restoration and natural coastal defences
Mitigation, especially carbon sequestration; habitat enhancement and protection for marine species; prevention of floor-related deaths, injuries, and damage; improved nutrition and income generation for local communities, improved water quality
Fedele et al. (2018) Roberts et al. (2012); Morris et al. (2019); (Jones et al., 2020)
Sustainable water management
Mitigation, especially avoided emissions; reduced water demand; increased awareness about impacts of water consumption; decreased incidence of fecaloral disease transmission; decreased use of drinking water for irrigation; reduced soil loss; increased groundwater retention; increased vegetation cover; increased food security and health and well-being; increased forage for livestock and amount of cultivated area; enhanced recreational areas
Spencer et al. (2017); Siraw et al. (2018); Stanczuk-Galwiaczek et al. (2018)
Return to traditional land management practices (e.g., the Ngitili system)
Mitigation, especially carbon sequestration; increased water availability for household and livestock use; increase in presence of edible and medicinal plants; regional economic growth; reduced land management conflicts; increased household income and access to education for children; improved access to wood fuel and reduced collection time for women; improved wildlife habitat.
Duguma et al. (2014)
REDD+ participation to maintain intact forest ecosystems
Mitigation, especially carbon sequestration; improved air quality; water and soil conservation; slowed rate of vector-borne disease; improved mental well-being associated with cultural continuity; clean water; nutritional and spiritual value of forest-derived foods; protection from violence related to natural resource extraction
McElwee et al. (2017); Spencer et al. (2017)
Urban planning and design
ACCEPTED VERSIO
N
SUBJECT TO FIN
AL EDITS
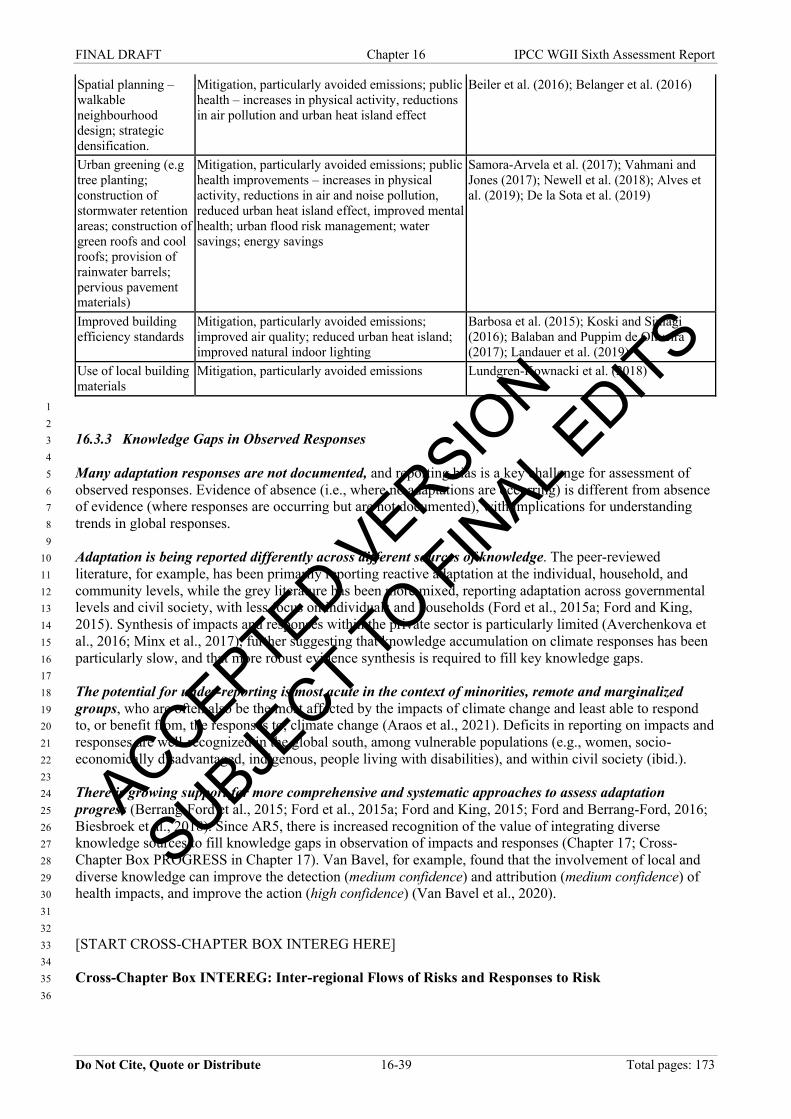
FINAL DRAFT Chapter 16 IPCC WGII Sixth Assessment Report
Do Not Cite, Quote or Distribute 16-39 Total pages: 173
Spatial planning – walkable neighbourhood design; strategic densification.
Mitigation, particularly avoided emissions; public health – increases in physical activity, reductions in air pollution and urban heat island effect
Beiler et al. (2016); Belanger et al. (2016)
Urban greening (e.g tree planting; construction of stormwater retention areas; construction of green roofs and cool roofs; provision of rainwater barrels; pervious pavement materials)
Mitigation, particularly avoided emissions; public health improvements – increases in physical activity, reductions in air and noise pollution, reduced urban heat island effect, improved mental health; urban flood risk management; water savings; energy savings
Samora-Arvela et al. (2017); Vahmani and Jones (2017); Newell et al. (2018); Alves et al. (2019); De la Sota et al. (2019)
Improved building efficiency standards
Mitigation, particularly avoided emissions; improved air quality; reduced urban heat island; improved natural indoor lighting
Barbosa et al. (2015); Koski and Siulagi (2016); Balaban and Puppim de Oliveira (2017); Landauer et al. (2019)
Use of local building materials
Mitigation, particularly avoided emissions Lundgren-Kownacki et al. (2018)
1 2 16.3.3 Knowledge Gaps in Observed Responses 3 4 Many adaptation responses are not documented, and reporting bias is a key challenge for assessment of 5 observed responses. Evidence of absence (i.e., where no adaptations are occurring) is different from absence 6 of evidence (where responses are occurring but are not documented), with implications for understanding 7 trends in global responses. 8 9 Adaptation is being reported differently across different sources of knowledge. The peer-reviewed 10 literature, for example, has been primarily reporting reactive adaptation at the individual, household, and 11 community levels, while the grey literature has been more mixed, reporting adaptation across governmental 12 levels and civil society, with less focus on individuals and households (Ford et al., 2015a; Ford and King, 13 2015). Synthesis of impacts and responses within the private sector is particularly limited (Averchenkova et 14 al., 2016; Minx et al., 2017), further suggesting that knowledge accumulation on climate responses has been 15 particularly slow, and that more robust evidence synthesis is required to fill key knowledge gaps. 16 17 The potential for under-reporting is most acute in the context of minorities, remote and marginalized 18 groups, who are often also be the most affected by the impacts of climate change and least able to respond 19 to, or benefit from, the responses to, climate change (Araos et al., 2021). Deficits in reporting on impacts and 20 responses are well-recognized in the global south, among vulnerable populations (e.g., women, socio-21 economically disadvantaged, indigenous, people living with disabilities), and within civil society (ibid.). 22 23 There is growing support for more comprehensive and systematic approaches to assess adaptation 24 progress (Berrang-Ford et al., 2015; Ford et al., 2015a; Ford and King, 2015; Ford and Berrang-Ford, 2016; 25 Biesbroek et al., 2018). Since AR5, there is increased recognition of the value of integrating diverse 26 knowledge sources to fill knowledge gaps in observation of impacts and responses (Chapter 17; Cross-27 Chapter Box PROGRESS in Chapter 17). Van Bavel, for example, found that the involvement of local and 28 diverse knowledge can improve the detection (medium confidence) and attribution (medium confidence) of 29 health impacts, and improve the action (high confidence) (Van Bavel et al., 2020). 30 31 32 [START CROSS-CHAPTER BOX INTEREG HERE] 33 34 Cross-Chapter Box INTEREG: Inter-regional Flows of Risks and Responses to Risk 35 36
ACCEPTED VERSIO
N
SUBJECT TO FIN
AL EDITS
FINAL DRAFT Chapter 16 IPCC WGII Sixth Assessment Report
Do Not Cite, Quote or Distribute 16-40 Total pages: 173
Authors: Birgit Bednar-Friedl (Austria, Chapter 13), Christopher Trisos (South Africa, Chapter 9), Laura 1 Astigarraga (Uruguay, Chapter 12), Magnus Benzie (Sweden/United Kingdom), Aditi Mukherji (India, 2 Chapter 4), Maarten Van Aalst (The Netherlands, Chapter 16) 3 4 Introduction 5 6 Our world today is characterized by a high degree of interconnectedness and globalization which establish 7 pathways for the transmission of climate-related risks across sectors and borders (high confidence) 8 (Challinor et al., 2018; Hedlund et al., 2018). While AR5 has pointed to this connection of risks across 9 regions as ‘cross-regional phenomena’ (Hewitson et al., 2014), only a few countries so far have integrated 10 interregional aspects into their climate change risks assessments (Liverman, 2016; Surminski et al., 2016; 11 Adams et al., 2020) and adaptation is still framed as a predominantly national or local issue (Dzebo and 12 Stripple, 2015; Benzie and Persson, 2019). 13 14 Interregional risks from climate change - also called cross-border, transboundary, transnational or indirect 15 risks - are risks that are transmitted across borders (e.g., transboundary water use) and/or via teleconnections 16 (e.g., supply chains, global food markets) (Moser and Hart, 2015). The risks can result from impacts, 17 including compound or concurrent impacts, that cascade across several tiers, in ways that either diminish or 18 escalate risk within international systems (Carter et al., 2021). Risk transmission may occur through trade 19 and finance networks, flows of people (Cross-Chapter Box MIGRATE in Chapter 7), biophysical flows 20 (natural resources such as water) and ecosystem connections. But not only risks are transmitted across 21 borders and systems, but also the adaptation response may reduce risks at the origin of the risk, along the 22 transmission channel or at the recipient of the risk (Carter et al., 2021). This Cross-Chapter Box discusses 23 four interregional risk channels (trade, finance, food, and ecosystems) and how adaptation can govern these 24 risks. 25 26 27
ACCEPTED VERSIO
N
SUBJECT TO FIN
AL EDITS
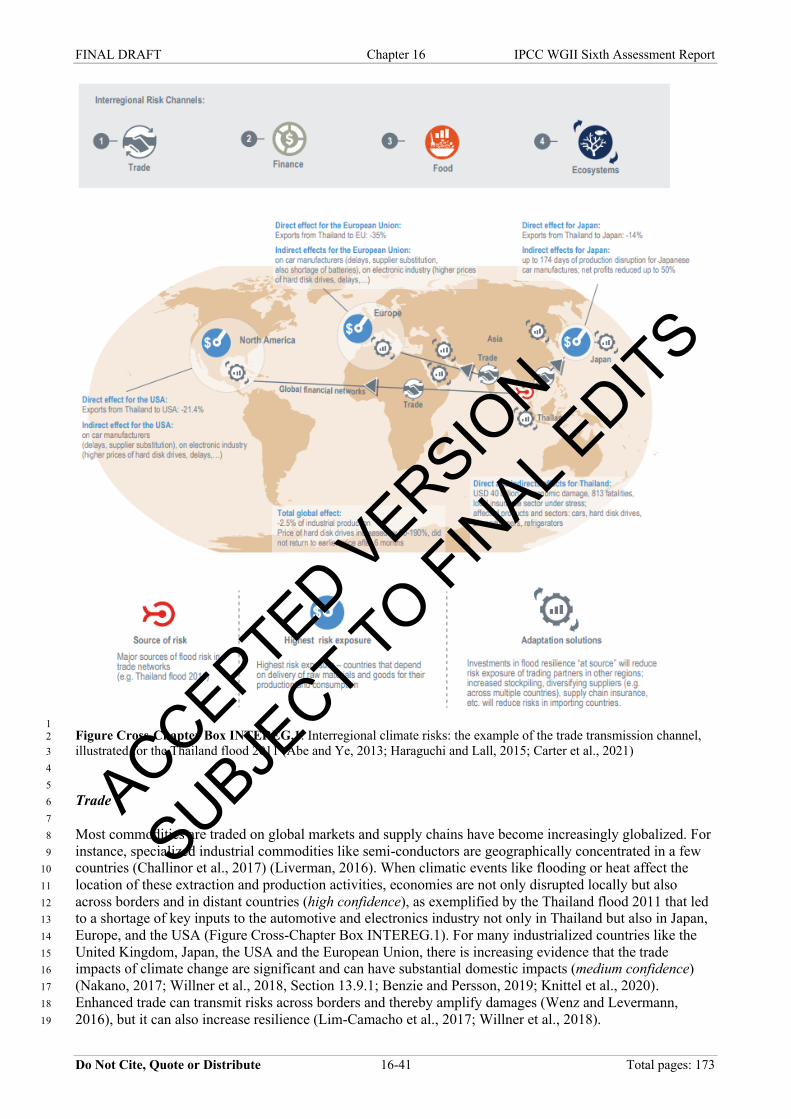
FINAL DRAFT Chapter 16 IPCC WGII Sixth Assessment Report
Do Not Cite, Quote or Distribute 16-41 Total pages: 173
1 Figure Cross-Chapter Box INTEREG.1: Interregional climate risks: the example of the trade transmission channel, 2 illustrated for the Thailand flood 2011 (Abe and Ye, 2013; Haraguchi and Lall, 2015; Carter et al., 2021) 3 4 5 Trade 6 7 Most commodities are traded on global markets and supply chains have become increasingly globalized. For 8 instance, specialized industrial commodities like semi-conductors are geographically concentrated in a few 9 countries (Challinor et al., 2017) (Liverman, 2016). When climatic events like flooding or heat affect the 10 location of these extraction and production activities, economies are not only disrupted locally but also 11 across borders and in distant countries (high confidence), as exemplified by the Thailand flood 2011 that led 12 to a shortage of key inputs to the automotive and electronics industry not only in Thailand but also in Japan, 13 Europe, and the USA (Figure Cross-Chapter Box INTEREG.1). For many industrialized countries like the 14 United Kingdom, Japan, the USA and the European Union, there is increasing evidence that the trade 15 impacts of climate change are significant and can have substantial domestic impacts (medium confidence) 16 (Nakano, 2017; Willner et al., 2018, Section 13.9.1; Benzie and Persson, 2019; Knittel et al., 2020). 17 Enhanced trade can transmit risks across borders and thereby amplify damages (Wenz and Levermann, 18 2016), but it can also increase resilience (Lim-Camacho et al., 2017; Willner et al., 2018). 19
ACCEPTED VERSIO
N
SUBJECT TO FIN
AL EDITS
FINAL DRAFT Chapter 16 IPCC WGII Sixth Assessment Report
Do Not Cite, Quote or Distribute 16-42 Total pages: 173
1 Finance 2 3 Climate risks can also spread through global financial markets (Mandel et al., 2021). For the case of coastal 4 and riverine flooding with low adaptation 2080 (RCP 8.5-SSP5), the financial system is projected to amplify 5 direct losses by a factor of 2 (global average), but reach up to a factor of 10 for countries that are central 6 financial hubs (Mandel et al., 2021, Figure 13.28). Indirect impacts may also arise through indirect effects on 7 foreign direct investment, remittance flows, and official development assistance (Hedlund et al., 2018). 8 9 Food 10 11 The global supply of agricultural products is concentrated to a few main breadbaskets (Bren d’Amour et al., 12 2016; Gaupp et al., 2020, Chapter 5). For instance, Central and South America is one of the regions with the 13 highest potential to increase food supplies to more densely populated regions in Asia, Middle East and 14 Europe (Chapter 12). The exports of agricultural commodities (coffee, bananas, sugar, soybean, corn, 15 sugarcane, beef livestock) have gained importance in the past two decades as international trade and 16 globalization of markets have shaped the global agri-food system (Chapter 5). 17 18 The export of major food crops like wheat, maize and soybeans from many of the world’s water scarce areas 19 – Middle East, North Africa, parts of South Asia, North China Plains, south-west USA, Australia – to 20 relatively water abundant parts of the world carries a high virtual water content (the net volume of water 21 embedded in trade) (high confidence) (Hoekstra and Mekonnen, 2012; Dalin et al., 2017; Zhao et al., 2019, 22 Chapter 4). Both importing and exporting countries are exposed to transboundary risk transmission through 23 climate change impacts on distant water resources (Sartori et al., 2017; Zhao et al., 2019; Ercin et al., 2021). 24 Climate change is projected to exacerbate risk and add new vulnerabilities for risk transmission (medium 25 confidence). Rising atmospheric CO2 concentration is projected to decrease water efficiency of growing 26 maize and temperate cereal crops in parts of USA, East and Mediterranean Europe, South Africa, Argentina, 27 Australia and South East Asia with important implications for future trade in food grains (Fader et al., 2010). 28 By 2050 (SRES B2 scenario) virtual water importing countries in Africa and the Middle East may be 29 exposed to imported water stress as they rely on imports of food grains from countries which have 30 unsustainable water use (Sartori et al., 2017). Until 2100, virtual trade in irrigation water is projected to 31 almost triple (for SSP2-RCP6.5 scenarios) and the direction of virtual water flows is projected to reverse 32 with the currently exporting regions like South Asia becoming importers of virtual water (Graham et al., 33 2020). An additional 10-120% trade flow from water abundant regions to water scarce regions will be 34 needed to sustain environmental flow requirements on a global scale by end of the century (Pastor et al., 35 2019). Exports of agricultural commodities contribute to deforestation, over-exploitation of natural resources 36 and pollution, affecting the natural capital base and ecosystem services (Agarwala and Coyle, 2020; Rabin et 37 al., 2020, Section 12.5.4). 38 39 Species and ecosystems 40 41 The spatial distributions of species on land and in the oceans are shifting due to climate change, with these 42 changes projected to accelerate at higher levels of global warming (Pecl et al., 2017). These ‘species on the 43 move’ have large effects on ecosystems and human well-being, and present challenges for governance (Pecl 44 et al., 2017). For example, the number of transboundary fish stocks are projected to increase as key fisheries 45 species are displaced by ocean warming (Pinsky et al., 2018). Conflict over shifting mackerel fisheries has 46 already occurred between European countries (Spijkers and Boonstra, 2017), because few regulatory bodies 47 have clear policies on shifting stocks; this leaves species open to unsustainable exploitation in new waters in 48 the absence of regularly updated catch allocations to reflect changing stock distributions (Caddell, 2018). 49 50 Human health will also be affected as vector-borne diseases such as malaria and dengue shift geographic 51 distributions (Caminade et al., 2014). There is also evidence that many warm-adapted invasive species, such 52 as invasive freshwater cyanobacterium, have spread to higher latitudes due to climate change (Chapter 2). 53 54 Adaptation to interregional climate risks 55 56
ACCEPTED VERSIO
N
SUBJECT TO FIN
AL EDITS
FINAL DRAFT Chapter 16 IPCC WGII Sixth Assessment Report
Do Not Cite, Quote or Distribute 16-43 Total pages: 173
Adaptation responses to reduce interregional risks can be implemented at a range of scales: at the point of the 1 initial climate change impact (e.g. assistance for recovery after an extreme event, development of resilient 2 infrastructure, climate-smart technologies for agriculture); at or along the pathway via which impacts are 3 transmitted to the eventual recipient (e.g. trade diversification, re-routing of transport); in the recipient 4 country (e.g. increasing storage to buffer supply disruptions), or by third parties (e.g. adaptation finance, 5 technology transfer) (Bren d’Amour et al., 2016; Carter et al., 2021; Talebian et al., 2021). A knowledge gap 6 exits on the need for, effectiveness of, and limits to adaptation under different socio-economic and land-use 7 futures. 8 9 Due to regional and global interdependencies, climate resilience has a global, multi-level public good 10 character (Banda, 2018). The benefits of adaptation are therefore shared beyond the places where adaptation 11 is initially implemented. Conversely, adaptation may be successful at a local level whilst redistributing 12 vulnerability elsewhere or even driving or exacerbating risks in other places (Atteridge and Remling, 2018). 13 International cooperation is therefore needed to ensure that inter-regional effects are considered in adaptation 14 and that adaptation efforts are coordinated to avoid maladaptation. However, regional and global scale 15 governance of adaptation is only just beginning to emerge (Persson, 2019). 16 17 The UNFCCC Paris Agreement frames adaptation as a ‘global challenge’ (Article 7.2) and establishes the 18 global goal on adaptation (Article 7.1), which provides space for dialogue between Parties on the global 19 scale challenge of adaptation and the need for renewed political and financial investment in adaptation, 20 including to address interregional effects (Benzie et al., 2018). 21 22 National Adaptation Plans (NAPs) can evolve to consider inter-regional effects as well as domestic ones 23 (Liverman, 2016; Surminski et al., 2016; European Environment, 2020). Regional and international 24 coordination of NAPs, coupled with building capacities and addressing existing knowledge gaps at the 25 country level, can help to ensure that resources are oriented towards reducing interregional risks and building 26 systemic resilience to climate change globally (Booth et al., 2020; Wijenayake et al., 2020). 27 28 Given the important role of private actors in managing interregional climate risks (Goldstein et al., 2019; 29 Tenggren et al., 2019), efforts will be needed to align public and private strategies for managing 30 interregional climate risks to avoid maladaptation and ensure just and equitable adaptation at different scales 31 (Talebian et al., 2021). 32 33 [END CROSS-CHAPTER BOX INTEREG HERE] 34 35 36 A new development since AR5, there is now growing evidence assessing progress on adaptation across 37 sectors, geographies and spatial scales. Uncertainty persists around what defines adaptation and how to 38 measure it (Cross-Chapter Box FEASIB in Chapter 18, UNEP, 2021). As a result, most literature 39 synthesizing responses are based on documented or reported adaptations only, and are thus subject to 40 substantial reporting bias. 41 42 We document implemented adaptation-related responses that could directly reduce risk. Adaptation as a 43 process is more broadly covered in Chapter 17 (Section 17.4.2), including risk management, decision-44 making, planning, feasibility (see Cross-Chapter Box FEASIB in Chapter 18), legislation and learning. Here, 45 we focus on a subset of adaptation activities: adaptation-related responses of species, ecosystems, and human 46 societies that have been implemented, observed, and could directly reduce risk. We consider all adaptation-47 related responses to assumed, perceived, or expected climate risk, regardless of whether or not impacts or 48 risks have been formally attributed to climate change. 49 50 We use the term ‘adaptation-related responses’, recognising that not all responses reduce risk. While 51 ‘adaptation’ implies risk reduction, we use the broader term ‘responses’ to reflect that responses may 52 decrease risk, but in some cases may increase risk. 53 54 Given limited evidence to inform comprehensive global assessment of effectiveness and adequacy, we assess 55 evidence that adaptation responses in human systems indicate transformational change. Chapter 17 considers 56 adaptation planning and governance, including adaptation solutions, success, and feasibility assessment 57
ACCEPTED VERSIO
N
SUBJECT TO FIN
AL EDITS
FINAL DRAFT Chapter 16 IPCC WGII Sixth Assessment Report
Do Not Cite, Quote or Distribute 16-44 Total pages: 173
(Cross-Chapter Box FEASIB in Chapter 18). It is not currently possible to conduct a comprehensive global 1 assessment of effectiveness, adequacy, or the contribution of adaptation-related responses to changing risk 2 due to an absence of robust empirical literature (discussed further in Cross-Chapter Box PROGRESS in 3 Chapter 17). 4 5 In natural ecosystems or species, detectable changes can be considered as ‘impact’ or ‘response’. The 6 distinction between ‘observed impacts’ (16.2) and ‘observed responses’ (16.3) is not always clear. For 7 example, autonomous distributional shifts in wild species induced by increasing temperatures (an observed 8 impact) may reduce risk to the species (an autonomous adaptation response), but this process can be 9 enhanced or supported by human intervention such as intentional changes in land use. Observed autonomous 10 changes in natural ecosystems or species unsupported by human intervention are treated as impacts (see 11 Section 16.2). 12 13 Adaptation-related responses are frequently motivated by a combination of climatic and non-climatic drivers, 14 and interact with other transitions to affect risk. For societal responses, it is difficult to say whether they are 15 triggered by observed or anticipated changes in climate, by non-climatic drivers, or as is the case in many 16 societal responses, a combination of all three. In the case of impacts, assessment typically focuses on 17 detection and attribution vis a vis a counterfactual of no climate change. While there has been some effort to 18 attribute reduced climate risk to adaptation-related responses (Toloo et al., 2013a; Toloo et al., 2013b; Hess 19 et al., 2018; Weinberger et al., 2018), in many cases this has not been feasible given difficulties in defining 20 adaptation and empirically disentangling the contribution of intersecting social transitions and changing 21 risks. Literature on adaptation-related response frequently draws on theories-of-change to assess the likely 22 contribution of adaptations to changes in risk, including maladaptation and co-benefits. 23 24 25 16.4 Synthesis of Limits to Adaptation Across Natural and Human Systems 26 27 This section builds on previous IPCC Reports (i.e., AR5, SR15, SROCC, SRCCL) to advance concepts and 28 emphasize remaining gaps in understanding about limits to adaptation. We provide case studies to illustrate 29 these concepts and synthesize regional and sectoral limits to adaptation across natural and human systems 30 that informs key risks (Section 16.5) and Reasons for Concern (Section 16.6). We also identify residual risks 31 - risks that remain after efforts to reduce hazards, vulnerability, and/or exposure - associated with limits to 32 adaptation. 33 34 16.4.1 Definitions and Conceptual Advances Since AR5 35 36 16.4.1.1 Limits to Adaptation since AR5 37 38 AR5 introduced the concept of limits to adaptation and provided a functional definition that has been used in 39 subsequent Special Reports (SR15, SROCC, SRCCL) and is also used for AR6 (see also Chapter 1). 40 41 A limit is defined as the point at which an actor’s objectives or system’s needs cannot be secured from 42 intolerable risks through adaptive actions (Klein et al., 2014). Tolerable risks are those where adaptation 43 needed to keep risk within reasonable levels is possible, while intolerable risks are those where practicable or 44 affordable adaptation options to avoid unreasonable risks are unavailable. This highlights that limits to 45 adaptation are socially constructed and based on values that determine levels of reasonable or unreasonable 46 risk as well as on available adaptation options, which vary greatly across and within societies. 47 48 Limits are categorized as being either ‘soft’ or ‘hard’. Soft limits may change over time as additional 49 adaptation options that are practicable or affordable become available. Hard limits will not change over time 50 as no additional adaptive actions are possible. When a limit is exceeded, then intolerable risk may 51 materialize and the actor’s objectives or system’s needs may be either abandoned or transformed (Figure 52 Box16.1.1). 53 54 For human systems, soft and hard limits are largely distinguished by whether or not constraints to adaptation 55 are able to be overcome. Constraints to adaptation (also called barriers) are factors that make it harder to plan 56 and implement adaptation actions – such as limited financial resources, ineffective institutional arrangements 57
ACCEPTED VERSIO
N
SUBJECT TO FIN
AL EDITS
FINAL DRAFT Chapter 16 IPCC WGII Sixth Assessment Report
Do Not Cite, Quote or Distribute 16-45 Total pages: 173
or insufficient human capacity. Soft limits are mostly associated with human systems, due in part to the role 1 of human agency in addressing constraints. For natural systems, the magnitude and rate of climate change 2 and capacity of adaptation to such change largely determine the type of limit. Hard limits are largely 3 associated with natural systems and are mostly due to inability to adapt to biophysical changes. 4 5 Using this understanding of limits, subsequent Special Reports have assessed relevant literature (Mechler et 6 al., 2020). SR15 identifies several regions, sectors and ecosystems – including coral reefs, biodiversity, 7 human health, coastal livelihoods, small island developing states, and the Arctic – that are projected to 8 experience limits at either 1.5ºC or 2ºC. SRCCL states that land degradation due to climate change may 9 result in limits to adaptation being reached in coastal regions and areas affected by thawing permafrost. 10 SROCC details that risks of climate-related changes in the ocean and cryosphere may result in limits for 11 ecosystems and vulnerable communities in coral reef environments, urban atoll islands and low-lying Arctic 12 locations before the end of this century in case of high emissions scenarios. 13 14 A key area of advancement since AR5 is how incremental and transformational adaptation relate to limits to 15 adaptation. Incremental adaptation maintains ‘the essence and integrity of a system or process at a given 16 scale’ while transformational adaptation ‘changes the fundamental attributes of a social-ecological system’ 17 (Matthews, 2018). Both incremental and transformational adaptation may expand the adaptive possibilities 18 for a system, providing additional adaptation options after a system reaches a soft limit (Felgenhauer, 2015; 19 Pelling et al., 2015; Termeer et al., 2017, see also Chapter 1 and 17; Alston et al., 2018; Panda, 2018; 20 Mechler and Deubelli, 2021). However, it is critical to note that adaptation, whether incremental or 21 transformational, must support securing an actor’s objectives or system’s needs from intolerable risks. Once 22 objectives or needs have been abandoned or transformed, a limit to adaptation has occurred. However, 23 objectives or needs may change over time as values of a society change (Taebi et al., 2020), thus adding 24 further complexity to assessing limits to adaptation. 25 26 16.4.1.2 Residual risk since AR5 27 28 The term ‘residual risk’ was not assessed in detail in AR5 and was used interchangeably with other terms 29 including ‘residual impacts’, ‘residual loss and damage’ and ‘residual damage’. SR15 includes discussion of 30 residual risks without an explicit definition and relates these to loss and damage and limits to adaptation, 31 concluding that residual risks rise as global temperatures increase from 1.5°C to 2°C. SRCCL refers to 32 residual risks arising from limits to adaptation related to land management. Such residual risk can emerge 33 from irreversible forms of land degradation, such as coastal erosion when land completely disappears, 34 collapse of infrastructure due to thawing of permafrost, and extreme forms of soil erosion. SROCC advanced 35 the conceptualization of residual risk and integrated it within the risk framework, defining residual risk as the 36 risk that remains after actions have been taken to reduce hazards, exposure and/or vulnerability. Residual 37 risk is therefore generally higher where adaptation failure, insufficient adaptation or limits to adaptation 38 occur. We use the SROCC definition of residual risk for our assessment in the following sections and 39 identify residual risks that are associated with limits to adaptation. 40 41 42 [START BOX 16.1 HERE] 43 44 Box 16.1: Linking Adaptation Constraints, Soft and Hard Limits 45 46 McNamara et al. (2017) provides an example of community-scaled adaptation that highlights how 47 constraints affect limits, the relationship between soft and hard limits, and the potential need to abandon or 48 transform objectives. In Boigu Island, Australia, community members are already adapting to perceived 49 climate change hazards - including sea level rise and coastal erosion - to secure their objective of sustaining 50 livelihoods and way of life in their current location. Existing seawall and drainage systems provide 51 inadequate protection from flooding during high tides, leading residents to elevate their houses to prevent 52 damages. However, these adaptation measures have proved to be insufficient. Standing saltwater for 53 extended periods of time after floods has resulted in losses and damages – including erosion of 54 infrastructure, increased soil salinity, and heightened public health concerns. Additional adaptation efforts 55 are constrained by scarcity of elevated land which inhibits movement of infrastructure within the community 56 and lack of financial, technical and human assets to improve coastal protection measures. 57
ACCEPTED VERSIO
N
SUBJECT TO FIN
AL EDITS
FINAL DRAFT Chapter 16 IPCC WGII Sixth Assessment Report
Do Not Cite, Quote or Distribute 16-46 Total pages: 173
1 These constraints are leading to a soft limit to adaptation – where risks would become unreasonable as sea 2 levels continue to rise and practicable and affordable adaptation options are limited to currently available 3 approaches. This soft limit could be overcome through addressing constraints and allowing further 4 adaptation to take place, such as providing financial, technical and human resources for more effective 5 coastal protection and drainage systems that would reduce flooding. However, if the effectiveness of these 6 new adaptation measures decreases as sea levels rise further and if constraints are not able to be overcome, 7 another soft limit may be reached. Eventually, if constraints are not addressed, no further adaptation 8 measures are implemented and climate hazards intensify, the area could become uninhabitable. This would 9 then be a hard limit for adaptation – there would be no adaptation options available that would allow the 10 community to sustain livelihoods and way of life in its present location. This hard limit to adaptation may 11 necessitate abandoning the objective of remaining in the community. The objective of the community may 12 then transform to sustaining their livelihoods in a less vulnerable location which would necessitate 13 relocation. However, such transformation of the community’s objectives may be hindered by the expressed 14 resistance of residents to migrate, due to their strong sense of place. 15 16 [END BOX 16.1 HERE] 17 18 19 16.4.2 Insights from Regions and Sectors about Limits to Adaptation 20 21 Here we provide example case studies to highlight constraints that may lead to soft limits, potential 22 incremental and transformational adaptation options that may overcome soft limits, evidence of hard limits 23 and residual risks. 24 25 16.4.2.1 Small Island Developing States (SIDS) 26 27 An expanding volume of empirical research highlights existing adaptation constraints that may lead to soft 28 limits in SIDS. Investigation of national communications among 19 SIDS found that financial constraints, 29 institutional challenges and poor resource endowments were the most-frequently reported as inhibiting 30 adaptation for a range of climate impacts (Robinson, 2018b). Governance, financial and information 31 constraints such as unclear property rights and lack of donor flexibility have led to hasty implementation of 32 adaptation projects in Kiribati, whereas in Vanuatu and the Solomon Islands, limited awareness of rural 33 adaptation needs and weak linkages between central governance and local communities have resulted in an 34 urban bias in resource allocation (Kuruppu and Willie, 2015). Limited availability and use of information 35 and technology also present constraints to adaptation – many SIDS suffer from lack of data and established 36 routines to identify loss and damage, and the combination of poor monitoring of slow-onset changes and 37 influence of non-climatic determinants of observed impacts challenges attribution (Thomas and Benjamin, 38 2018). The fact that climate information is often available only in the English language represents another 39 common constraint for island communities (Betzold, 2015). Although indigenous and local knowledge 40 systems can provide important experience-based input to adaptation policies (Miyan et al., 2017), socio-41 cultural values and traditions such as attachment to place, religious beliefs and traditions can also constrain 42 adaptation in island communities, particularly for more transformational forms of adaptation (Ha’apio et al., 43 2018; Oakes, 2019). 44 45 Soft limits to adaptation for coastal flooding and erosion are already being experienced in Samoa due largely 46 to financial, physical and technological constraints (Crichton and Esteban, 2018). While sea walls have been 47 erected to minimize coastal erosion, these defences need regular upgrading and replacement as high swells, 48 tropical cyclones and constant wave action erode their effectiveness. The high costs of installing, upgrading 49 and enlarging such infrastructure has led to sea walls only being used in specific locations, leaving 50 communities that are beyond the extent of these measures exposed to inundation and erosion. Native tree 51 replanting has also been implemented but coastal flooding and erosion persist as large swells lead to high 52 failure rates of replanting efforts. Across SIDS, adaptation to coastal flooding and erosion in particular is 53 increasingly facing soft limits due to high costs, unavailability of technological options and limited physical 54 space or environmental suitability for hard engineering or ecosystem-based approaches (Mackey and Ware, 55 2018; Nalau et al., 2018). 56 57
ACCEPTED VERSIO
N
SUBJECT TO FIN
AL EDITS
FINAL DRAFT Chapter 16 IPCC WGII Sixth Assessment Report
Do Not Cite, Quote or Distribute 16-47 Total pages: 173
Retreat and relocation constitute transformative adaptation options, although evidence of permanent 1 community-scale relocation in response to climate change remains limited at present (Kelman, 2015; 2 McNamara and Des Combes, 2015). Material and emotional cost of emigration as well as loss of homeland, 3 nationhood, and other intangible assets and values imply that relocation is generally considered a last resort 4 (Jamero et al., 2017) and may mean abandoning objectives of remaining in existing locations, hence 5 exceeding adaptation limits. 6 7 Hard limits in SIDS are mostly due to adaptation being unable to prevent intolerable risks from escalating 8 climate hazards such as sea-level rise and related risks of flooding and surges, severe tropical cyclones, and 9 contamination of groundwater. Emerging evidence suggests that shortage of water and land degradation have 10 already contributed to migration of multiple island communities in the Pacific (Handmer and Nalau, 2019). 11 12 Residual risks for SIDS include loss of marine and terrestrial biodiversity and ecosystem services, increased 13 food and water insecurity, destruction of settlements and infrastructure, loss of cultural resources and 14 heritage, collapse of economies and livelihoods and reduced habitability of islands (Section 3.5.1, Section 15 15.3). 16 17 16.4.2.2 Agriculture in Asia 18 19 Lack of financial resources is found to be a significant constraint that contributes to soft limits to adaptation 20 in agriculture across Asia. Although smallholder farmers are currently adapting to climate impacts, lack of 21 finance and access to credit prevents upscaling of adaptive responses and has led to losses (Bauer, 2013; 22 Patnaik and Narayanan, 2015; Bhatta and Aggarwal, 2016; Loria, 2016). Other constraints further contribute 23 to soft limits including governance and associated institutional factors such as ineffective agricultural 24 policies and organizational capacities (Tun Oo et al., 2017), information and technology challenges such as 25 limited availability and access to technologies on the ground (Singh et al., 2018), socio-cultural factors such 26 as the social acceptability of adaptation measures that are affected by gender (Huyer, 2016; Ravera et al., 27 2016), and limited human capacity (Masud et al., 2017). A wide range of pests and pathogens are predicted 28 to become problematic to regional food crop production as average global temperatures rise (Deutsch et al., 29 2018) increasing crop loss across Asia for which farmers are already experiencing a variety of adaptation 30 constraints including financial, economic and technological challenges (Sada et al., 2014; Tun Oo et al., 31 2017; Fahad and Wang, 2018). Extreme heat waves are projected in the densely populated agricultural 32 regions of South Asia leading to increased risk of heat stress for farmers and resultant constraints on their 33 ability to implement adaptive actions (Im et al., 2017). However, socio-economic constraints appear to have 34 a higher influence on soft limits to adaptation in agriculture than biophysical constraints (Thomas et al., 35 2021). For example, an examination of farmers’ adaptation to climate change in Turkey found that 36 constraints related to access to climate information and access to credit will likely limit the yield benefits of 37 incremental adaptation (Karapinar and Özertan, 2020). In Nepal, conservation policies restrict traditional 38 grazing inside national parks, which promotes intensive agriculture and limits other cropping systems that 39 have been implemented as climate change adaptation (Aryal et al., 2014). 40 41 In Bangladesh, small and landless farm households are already approaching soft limits in adapting to 42 riverbank erosion (Alam et al., 2018). While wealthier farming households can implement a range of 43 adaptation responses including changing planting times and cultivating different crops, poorer households 44 have limited access to financial institutions and credit to implement such measures. Their adaptation 45 responses of shifting to homestead gardening and animal rearing are insufficient to maintain their livelihoods 46 and these households are more likely to engage in off-farm work or migrate. 47 48 (Palao et al., 2019) identify the possible need for transformational adaptation in Asian-Pacific agricultural 49 practices due to changes in biophysical parameters as global average temperatures rise. In this context, 50 transformational adaptation would consist of changing farming locations to different provinces or different 51 elevations for the production of specific crops or introducing new farming systems. Nearly 50% of maize in 52 the region along with 18% of potato and 8% of rice crops would need to either be shifted in location or use 53 new cropping systems, with the most significant transformation being needed in China, India, Myanmar and 54 the Philippines. For maize suitability by 2030, seven provinces in the east and northeast of China are 55 projected to experience over 50% reduction in suitability and two northern states in India may experience 56
ACCEPTED VERSIO
N
SUBJECT TO FIN
AL EDITS
FINAL DRAFT Chapter 16 IPCC WGII Sixth Assessment Report
Do Not Cite, Quote or Distribute 16-48 Total pages: 173
70% reduction in suitability. Cassava and sweet potato may play a critical role in food resilience in these 1 areas, as these crops are more resilient to climate change (Prain and Naziri, 2019). 2 3 In terms of hard limits, the rate and extent of climate change is critical as agriculture is climate-dependent 4 and sensitive to changes in climate parameters. Poudel and Duex (2017) document that over 70% of the 5 springs used as water sources in Nepalese mountain agricultural communities had a decreased flow and 6 approximately 12% had dried up over the past decade. While there are some adaptation measures to address 7 reduced water availability – e.g., the introduction of water-saving irrigation technology among Beijing 8 farmers to alleviate water scarcity in metropolitan suburbs (Zhang et al., 2019) – these actions still depend on 9 some level of water availability. If climate hazards intensify to the point where water supply cannot meet 10 agricultural demands, hard limits to adaptation will occur. 11 12 Residual risks associated with agriculture in Asia include declines in fisheries, aquaculture and crop 13 production, particularly in South and Southeast Asia (Section 10.3.5), increased food insecurity (Section 14 10.4.5), reductions of farmers’ incomes by up to 25% (Section 10.4.5), loss of production areas (Section 15 10.4.5) and reduced physical work capacity for farmers - between 5-15% decline in south-southwest Asia 16 and China under RCP8.5 (Section 5.12.4). 17 18 16.4.2.3 Livelihoods in Africa 19 20 For livelihoods dependent on small-scale rain-fed agriculture in Africa, climate hazards include floods and 21 droughts. However, governance, financial and information/awareness/technology challenges are identified as 22 the most significant constraints leading to soft limits, followed by social and human capacity constraints 23 (Thomas et al., 2021). Finance and land tenure constraints restrict Ghanaian farmers when considering 24 adaptation responses due to climate variability (Guodaar et al., 2017). Similarly, in East Africa, farmers with 25 small pieces of land have limited economic profitability, making it difficult to invest in drought and/or flood 26 management measures (Gbegbelegbe et al., 2018). 27 28 Increasing droughts and floods require costlier adaptation responses to reduce risks, such as using drought-29 tolerant species (Berhanu and Beyene, 2015) and coping strategies for flood-prone households (Schaer, 30 2015; Musyoki et al., 2016), resulting in soft limits for poorer households who cannot afford these responses. 31 In Namibia weak governance and poor integration of information, such as disregarding knowledge of urban 32 and rural residents in flood management strategies, has resulted in soft limits to adaptation, leading to 33 temporary or permanent relocation of communities (Hooli, 2016). Shortage of land – namely high population 34 pressure and small per capita land holding – leads to continuous cultivation and results in poor soil fertility. 35 This low productivity is further aggravated by erratic rainfall causing soft limits as farmers cannot produce 36 enough and must depend on food aid (Asfaw et al., 2019). 37 38 Relocation due to flooding is discussed as a transformation adaptation action taken in Botswana where the 39 government decided to permanently relocate hundreds of residents to a nearby dryland area (Shinn et al., 40 2014). Some residents permanently relocated whereas others only temporarily relocated against the 41 government’s instructions. Such relocation processes must attend to micro-politics and risks of existing 42 systemic issues of inequality and vulnerability. 43 44 In terms of hard limits, land scarcity poses a hard limit when implementing organic cotton production, an 45 adaptation response supporting sustainable livelihoods (Kloos and Renaud, 2014). 46 47 Residual risks associated with livelihoods in Africa include poorer households becoming trapped in cycles of 48 poverty (Section 9.9.3), increased rates of rural-urban migration (Section 9.8.4), decline of traditional 49 livelihoods such as in agriculture (Section 9.9.3, Section 9.11.3.1) and fisheries (Section 9.11.1.2) and loss of 50 traditional practices and cultural heritage (Section 9.9.2). 51 52 16.4.3 Regional and Sectoral Synthesis of Limits to Adaptation 53 54 16.4.3.1 Evidence on Limits to Adaptation 55 56
ACCEPTED VERSIO
N
SUBJECT TO FIN
AL EDITS
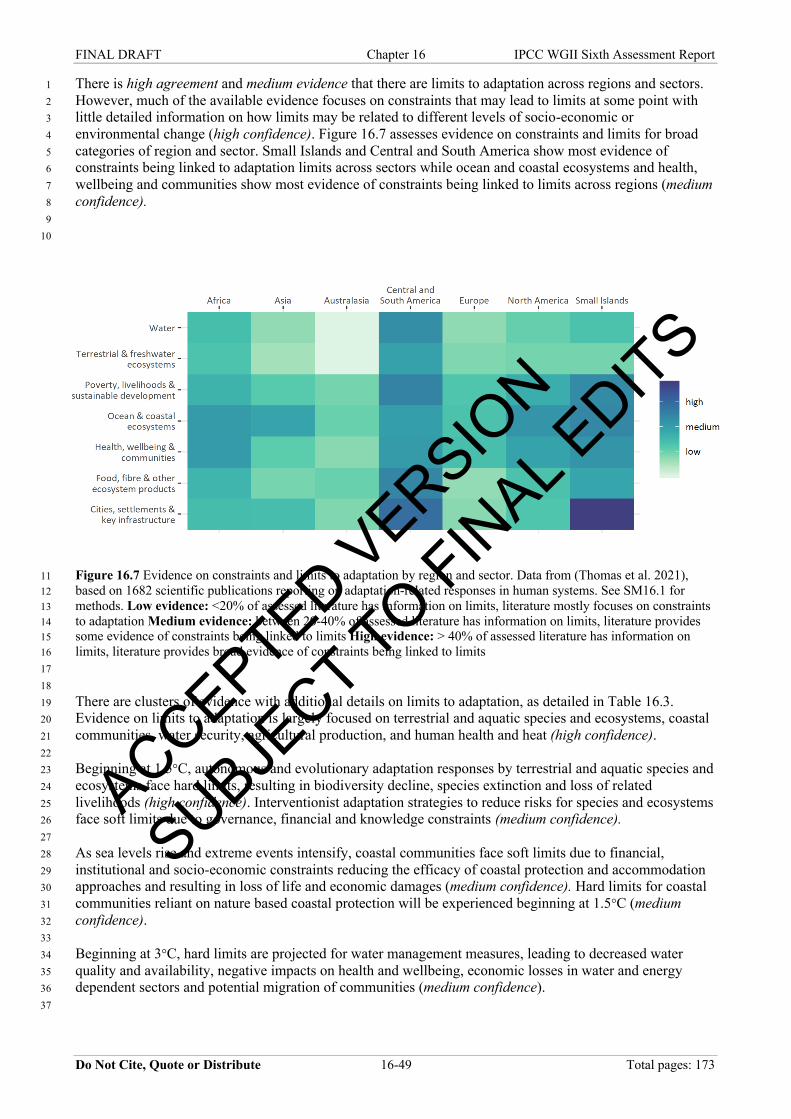
FINAL DRAFT Chapter 16 IPCC WGII Sixth Assessment Report
Do Not Cite, Quote or Distribute 16-49 Total pages: 173
There is high agreement and medium evidence that there are limits to adaptation across regions and sectors. 1 However, much of the available evidence focuses on constraints that may lead to limits at some point with 2 little detailed information on how limits may be related to different levels of socio-economic or 3 environmental change (high confidence). Figure 16.7 assesses evidence on constraints and limits for broad 4 categories of region and sector. Small Islands and Central and South America show most evidence of 5 constraints being linked to adaptation limits across sectors while ocean and coastal ecosystems and health, 6 wellbeing and communities show most evidence of constraints being linked to limits across regions (medium 7 confidence). 8 9 10
Figure 16.7 Evidence on constraints and limits to adaptation by region and sector. Data from (Thomas et al. 2021), 11 based on 1682 scientific publications reporting on adaptation-related responses in human systems. See SM16.1 for 12 methods. Low evidence: <20% of assessed literature has information on limits, literature mostly focuses on constraints 13 to adaptation Medium evidence: between 20-40% of assessed literature has information on limits, literature provides 14 some evidence of constraints being linked to limits High evidence: > 40% of assessed literature has information on 15 limits, literature provides broad evidence of constraints being linked to limits 16 17 18 There are clusters of evidence with additional details on limits to adaptation, as detailed in Table 16.3. 19 Evidence on limits to adaptation is largely focused on terrestrial and aquatic species and ecosystems, coastal 20 communities, water security, agricultural production, and human health and heat (high confidence). 21 22 Beginning at 1.5°C, autonomous and evolutionary adaptation responses by terrestrial and aquatic species and 23 ecosystems face hard limits, resulting in biodiversity decline, species extinction and loss of related 24 livelihoods (high confidence). Interventionist adaptation strategies to reduce risks for species and ecosystems 25 face soft limits due to governance, financial and knowledge constraints (medium confidence). 26 27 As sea levels rise and extreme events intensify, coastal communities face soft limits due to financial, 28 institutional and socio-economic constraints reducing the efficacy of coastal protection and accommodation 29 approaches and resulting in loss of life and economic damages (medium confidence). Hard limits for coastal 30 communities reliant on nature based coastal protection will be experienced beginning at 1.5°C (medium 31 confidence). 32 33 Beginning at 3°C, hard limits are projected for water management measures, leading to decreased water 34 quality and availability, negative impacts on health and wellbeing, economic losses in water and energy 35 dependent sectors and potential migration of communities (medium confidence). 36 37
ACCEPTED VERSIO
N
SUBJECT TO FIN
AL EDITS
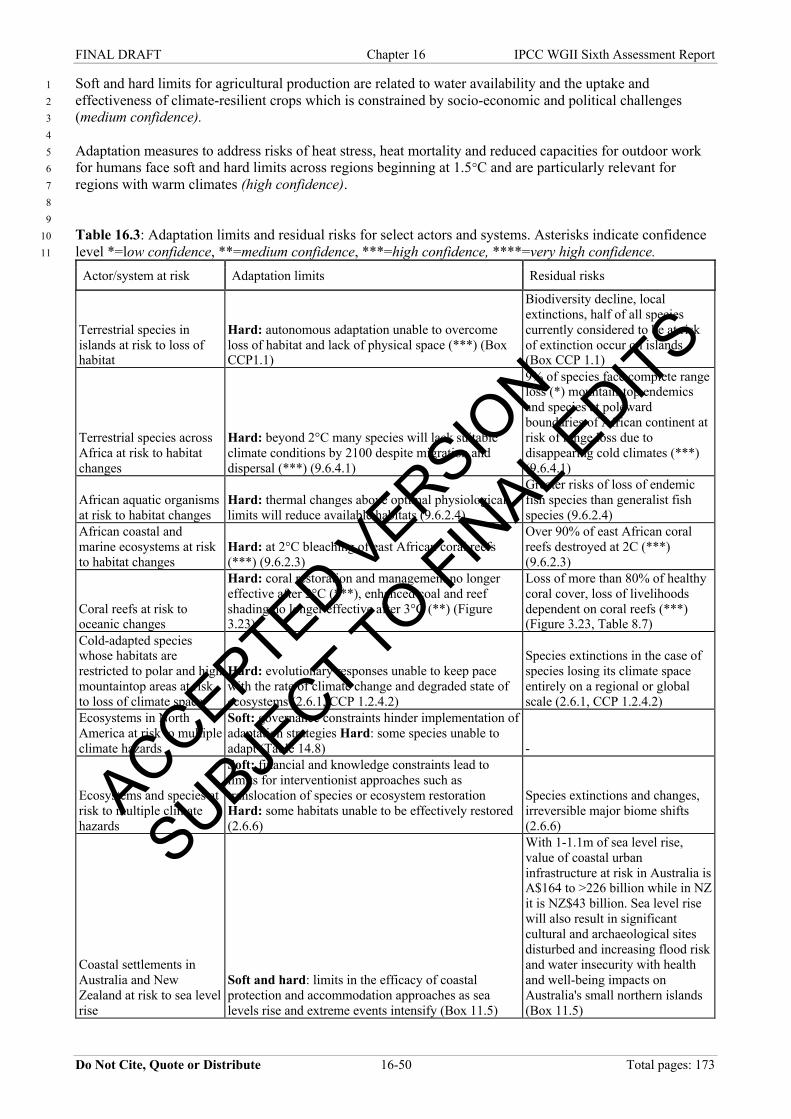
FINAL DRAFT Chapter 16 IPCC WGII Sixth Assessment Report
Do Not Cite, Quote or Distribute 16-50 Total pages: 173
Soft and hard limits for agricultural production are related to water availability and the uptake and 1 effectiveness of climate-resilient crops which is constrained by socio-economic and political challenges 2 (medium confidence). 3 4 Adaptation measures to address risks of heat stress, heat mortality and reduced capacities for outdoor work 5 for humans face soft and hard limits across regions beginning at 1.5°C and are particularly relevant for 6 regions with warm climates (high confidence). 7 8 9 Table 16.3: Adaptation limits and residual risks for select actors and systems. Asterisks indicate confidence 10 level *=low confidence, **=medium confidence, ***=high confidence, ****=very high confidence. 11
Actor/system at risk Adaptation limits Residual risks
Terrestrial species in islands at risk to loss of habitat
Hard: autonomous adaptation unable to overcome loss of habitat and lack of physical space (***) (Box CCP1.1)
Biodiversity decline, local extinctions, half of all species currently considered to be at risk of extinction occur on islands (Box CCP 1.1)
Terrestrial species across Africa at risk to habitat changes
Hard: beyond 2°C many species will lack suitable climate conditions by 2100 despite migration and dispersal (***) (9.6.4.1)
9% of species face complete range loss (*) mountain-top endemics and species at poleward boundaries of African continent at risk of range loss due to disappearing cold climates (***) (9.6.4.1)
African aquatic organisms at risk to habitat changes
Hard: thermal changes above optimal physiological limits will reduce available habitats (9.6.2.4)
Greater risks of loss of endemic fish species than generalist fish species (9.6.2.4)
African coastal and marine ecosystems at risk to habitat changes
Hard: at 2°C bleaching of east African coral reefs (***) (9.6.2.3)
Over 90% of east African coral reefs destroyed at 2C (***) (9.6.2.3)
Coral reefs at risk to oceanic changes
Hard: coral restoration and management no longer effective after 2°C (***), enhanced coal and reef shading no longer effective after 3°C (**) (Figure 3.23)
Loss of more than 80% of healthy coral cover, loss of livelihoods dependent on coral reefs (***) (Figure 3.23, Table 8.7)
Cold-adapted species whose habitats are restricted to polar and high mountaintop areas at risk to loss of climate space
Hard: evolutionary responses unable to keep pace with the rate of climate change and degraded state of ecosystems (2.6.1, CCP 1.2.4.2)
Species extinctions in the case of species losing its climate space entirely on a regional or global scale (2.6.1, CCP 1.2.4.2)
Ecosystems in North America at risk to multiple climate hazards
Soft: governance constraints hinder implementation of adaptation strategies Hard: some species unable to adapt (Table 14.8) -
Ecosystems and species at risk to multiple climate hazards
Soft: financial and knowledge constraints lead to limits for interventionist approaches such as translocation of species or ecosystem restoration Hard: some habitats unable to be effectively restored (2.6.6)
Species extinctions and changes, irreversible major biome shifts (2.6.6)
Coastal settlements in Australia and New Zealand at risk to sea level rise
Soft and hard: limits in the efficacy of coastal protection and accommodation approaches as sea levels rise and extreme events intensify (Box 11.5)
With 1-1.1m of sea level rise, value of coastal urban infrastructure at risk in Australia is A$164 to >226 billion while in NZ it is NZ$43 billion. Sea level rise will also result in significant cultural and archaeological sites disturbed and increasing flood risk and water insecurity with health and well-being impacts on Australia's small northern islands (Box 11.5)
ACCEPTED VERSIO
N
SUBJECT TO FIN
AL EDITS
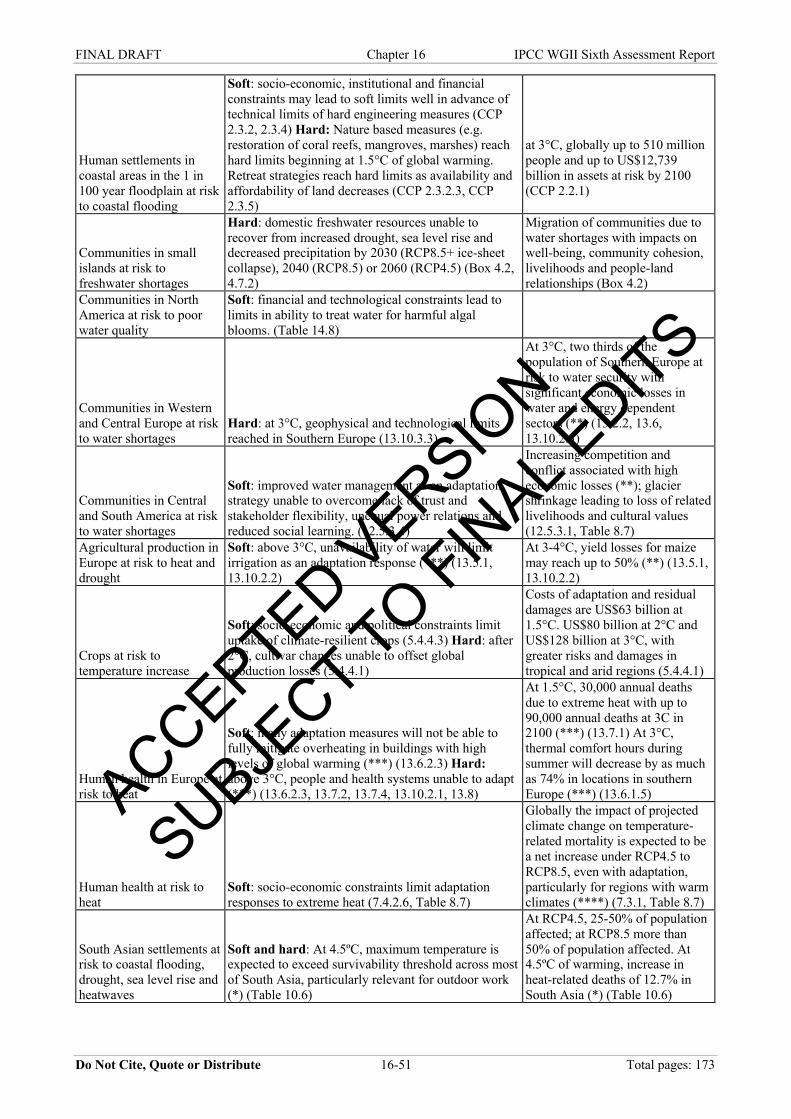
FINAL DRAFT Chapter 16 IPCC WGII Sixth Assessment Report
Do Not Cite, Quote or Distribute 16-51 Total pages: 173
Human settlements in coastal areas in the 1 in 100 year floodplain at risk to coastal flooding
Soft: socio-economic, institutional and financial constraints may lead to soft limits well in advance of technical limits of hard engineering measures (CCP 2.3.2, 2.3.4) Hard: Nature based measures (e.g. restoration of coral reefs, mangroves, marshes) reach hard limits beginning at 1.5°C of global warming. Retreat strategies reach hard limits as availability and affordability of land decreases (CCP 2.3.2.3, CCP 2.3.5)
at 3°C, globally up to 510 million people and up to US$12,739 billion in assets at risk by 2100 (CCP 2.2.1)
Communities in small islands at risk to freshwater shortages
Hard: domestic freshwater resources unable to recover from increased drought, sea level rise and decreased precipitation by 2030 (RCP8.5+ ice-sheet collapse), 2040 (RCP8.5) or 2060 (RCP4.5) (Box 4.2, 4.7.2)
Migration of communities due to water shortages with impacts on well-being, community cohesion, livelihoods and people-land relationships (Box 4.2)
Communities in North America at risk to poor water quality
Soft: financial and technological constraints lead to limits in ability to treat water for harmful algal blooms. (Table 14.8)
Communities in Western and Central Europe at risk to water shortages
Hard: at 3°C, geophysical and technological limits reached in Southern Europe (13.10.3.3)
At 3°C, two thirds of the population of Southern Europe at risk to water security with significant economic losses in water and energy dependent sectors (**) (13.2.2, 13.6, 13.10.2.3)
Communities in Central and South America at risk to water shortages
Soft: improved water management as an adaptation strategy unable to overcome lack of trust and stakeholder flexibility, unequal power relations and reduced social learning. (12.5.3.4)
Increasing competition and conflict associated with high economic losses (**); glacier shrinkage leading to loss of related livelihoods and cultural values (12.5.3.1, Table 8.7)
Agricultural production in Europe at risk to heat and drought
Soft: above 3°C, unavailability of water will limit irrigation as an adaptation response (***) (13.5.1, 13.10.2.2)
At 3-4°C, yield losses for maize may reach up to 50% (**) (13.5.1, 13.10.2.2)
Crops at risk to temperature increase
Soft: socio-economic and political constraints limit uptake of climate-resilient crops (5.4.4.3) Hard: after 2°C, cultivar changes unable to offset global production losses (5.4.4.1)
Costs of adaptation and residual damages are US$63 billion at 1.5°C. US$80 billion at 2°C and US$128 billion at 3°C, with greater risks and damages in tropical and arid regions (5.4.4.1)
Human health in Europe at risk to heat
Soft: many adaptation measures will not be able to fully mitigate overheating in buildings with high levels of global warming (***) (13.6.2.3) Hard: above 3°C, people and health systems unable to adapt (***) (13.6.2.3, 13.7.2, 13.7.4, 13.10.2.1, 13.8)
At 1.5°C, 30,000 annual deaths due to extreme heat with up to 90,000 annual deaths at 3C in 2100 (***) (13.7.1) At 3°C, thermal comfort hours during summer will decrease by as much as 74% in locations in southern Europe (***) (13.6.1.5)
Human health at risk to heat
Soft: socio-economic constraints limit adaptation responses to extreme heat (7.4.2.6, Table 8.7)
Globally the impact of projected climate change on temperature-related mortality is expected to be a net increase under RCP4.5 to RCP8.5, even with adaptation, particularly for regions with warm climates (****) (7.3.1, Table 8.7)
South Asian settlements at risk to coastal flooding, drought, sea level rise and heatwaves
Soft and hard: At 4.5ºC, maximum temperature is expected to exceed survivability threshold across most of South Asia, particularly relevant for outdoor work (*) (Table 10.6)
At RCP4.5, 25-50% of population affected; at RCP8.5 more than 50% of population affected. At 4.5ºC of warming, increase in heat-related deaths of 12.7% in South Asia (*) (Table 10.6)
ACCEPTED VERSIO
N
SUBJECT TO FIN
AL EDITS
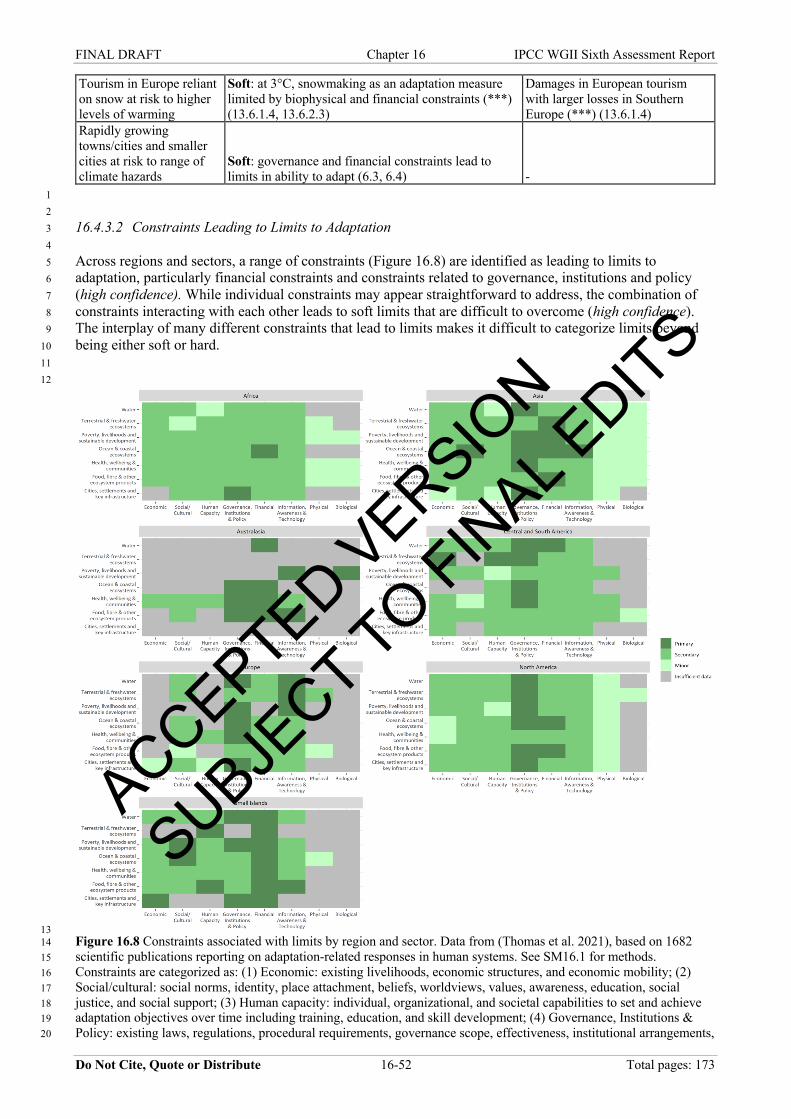
FINAL DRAFT Chapter 16 IPCC WGII Sixth Assessment Report
Do Not Cite, Quote or Distribute 16-52 Total pages: 173
Tourism in Europe reliant on snow at risk to higher levels of warming
Soft: at 3°C, snowmaking as an adaptation measure limited by biophysical and financial constraints (***) (13.6.1.4, 13.6.2.3)
Damages in European tourism with larger losses in Southern Europe (***) (13.6.1.4)
Rapidly growing towns/cities and smaller cities at risk to range of climate hazards
Soft: governance and financial constraints lead to limits in ability to adapt (6.3, 6.4) -
1 2 16.4.3.2 Constraints Leading to Limits to Adaptation 3 4 Across regions and sectors, a range of constraints (Figure 16.8) are identified as leading to limits to 5 adaptation, particularly financial constraints and constraints related to governance, institutions and policy 6 (high confidence). While individual constraints may appear straightforward to address, the combination of 7 constraints interacting with each other leads to soft limits that are difficult to overcome (high confidence). 8 The interplay of many different constraints that lead to limits makes it difficult to categorize limits beyond 9 being either soft or hard. 10 11 12
13 Figure 16.8 Constraints associated with limits by region and sector. Data from (Thomas et al. 2021), based on 1682 14 scientific publications reporting on adaptation-related responses in human systems. See SM16.1 for methods. 15 Constraints are categorized as: (1) Economic: existing livelihoods, economic structures, and economic mobility; (2) 16 Social/cultural: social norms, identity, place attachment, beliefs, worldviews, values, awareness, education, social 17 justice, and social support; (3) Human capacity: individual, organizational, and societal capabilities to set and achieve 18 adaptation objectives over time including training, education, and skill development; (4) Governance, Institutions & 19 Policy: existing laws, regulations, procedural requirements, governance scope, effectiveness, institutional arrangements, 20
ACCEPTED VERSIO
N
SUBJECT TO FIN
AL EDITS
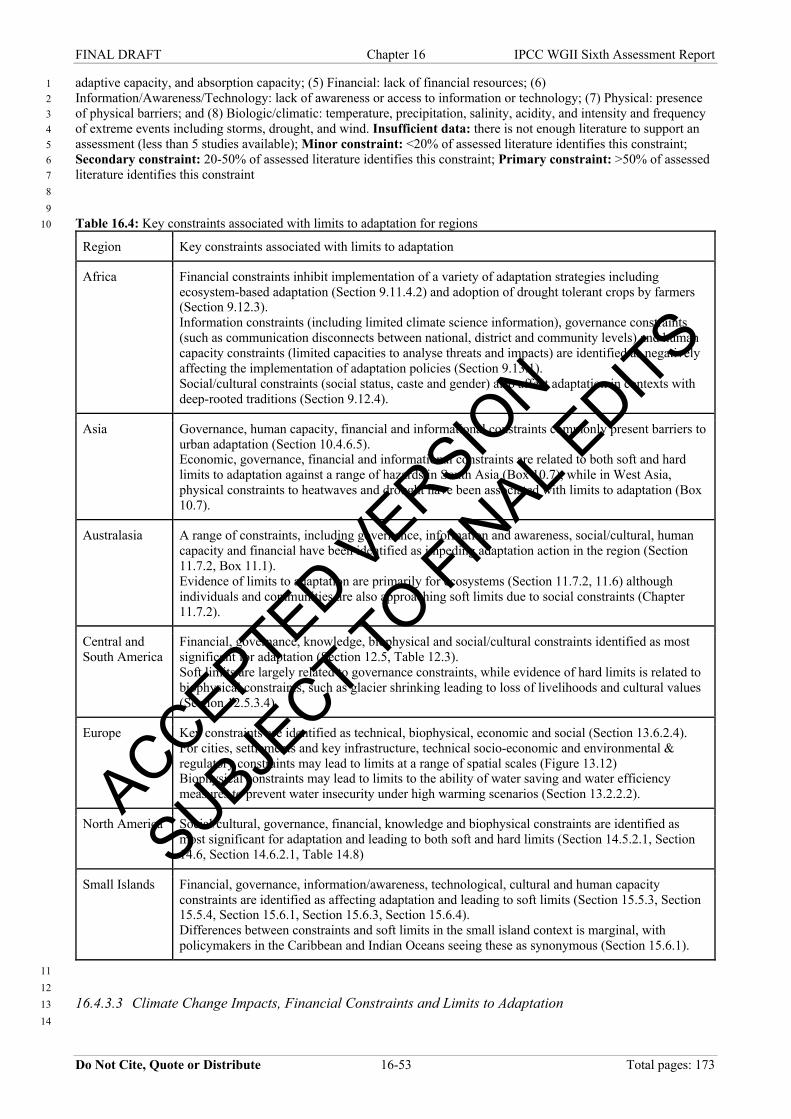
FINAL DRAFT Chapter 16 IPCC WGII Sixth Assessment Report
Do Not Cite, Quote or Distribute 16-53 Total pages: 173
adaptive capacity, and absorption capacity; (5) Financial: lack of financial resources; (6) 1 Information/Awareness/Technology: lack of awareness or access to information or technology; (7) Physical: presence 2 of physical barriers; and (8) Biologic/climatic: temperature, precipitation, salinity, acidity, and intensity and frequency 3 of extreme events including storms, drought, and wind. Insufficient data: there is not enough literature to support an 4 assessment (less than 5 studies available); Minor constraint: <20% of assessed literature identifies this constraint; 5 Secondary constraint: 20-50% of assessed literature identifies this constraint; Primary constraint: >50% of assessed 6 literature identifies this constraint 7 8 9 Table 16.4: Key constraints associated with limits to adaptation for regions 10
Region Key constraints associated with limits to adaptation
Africa Financial constraints inhibit implementation of a variety of adaptation strategies including ecosystem-based adaptation (Section 9.11.4.2) and adoption of drought tolerant crops by farmers (Section 9.12.3). Information constraints (including limited climate science information), governance constraints (such as communication disconnects between national, district and community levels) and human capacity constraints (limited capacities to analyse threats and impacts) are identified as negatively affecting the implementation of adaptation policies (Section 9.13.1). Social/cultural constraints (social status, caste and gender) also affect adaptation in contexts with deep-rooted traditions (Section 9.12.4).
Asia Governance, human capacity, financial and informational constraints commonly present barriers to urban adaptation (Section 10.4.6.5). Economic, governance, financial and informational constraints are related to both soft and hard limits to adaptation against a range of hazards in South Asia (Box 10.7), while in West Asia, physical constraints to heatwaves and drought have been associated with limits to adaptation (Box 10.7).
Australasia A range of constraints, including governance, information and awareness, social/cultural, human capacity and financial have been identified as impeding adaptation action in the region (Section 11.7.2, Box 11.1). Evidence of limits to adaptation are primarily for ecosystems (Section 11.7.2, 11.6) although individuals and communities are also approaching soft limits due to social constraints (Chapter 11.7.2).
Central and South America
Financial, governance, knowledge, biophysical and social/cultural constraints identified as most significant for adaptation (Section 12.5, Table 12.3). Soft limits are largely related to governance constraints, while evidence of hard limits is related to biophysical constraints, such as glacier shrinking leading to loss of livelihoods and cultural values (Section 12.5.3.4).
Europe Key constraints are identified as technical, biophysical, economic and social (Section 13.6.2.4). For cities, settlements and key infrastructure, technical socio-economic and environmental & regulatory constraints may lead to limits at a range of spatial scales (Figure 13.12) Biophysical constraints may lead to limits to the ability of water saving and water efficiency measures to prevent water insecurity under high warming scenarios (Section 13.2.2.2).
North America Social/cultural, governance, financial, knowledge and biophysical constraints are identified as most significant for adaptation and leading to both soft and hard limits (Section 14.5.2.1, Section 14.6, Section 14.6.2.1, Table 14.8)
Small Islands Financial, governance, information/awareness, technological, cultural and human capacity constraints are identified as affecting adaptation and leading to soft limits (Section 15.5.3, Section 15.5.4, Section 15.6.1, Section 15.6.3, Section 15.6.4). Differences between constraints and soft limits in the small island context is marginal, with policymakers in the Caribbean and Indian Oceans seeing these as synonymous (Section 15.6.1).
11 12 16.4.3.3 Climate Change Impacts, Financial Constraints and Limits to Adaptation 13 14
ACCEPTED VERSIO
N
SUBJECT TO FIN
AL EDITS
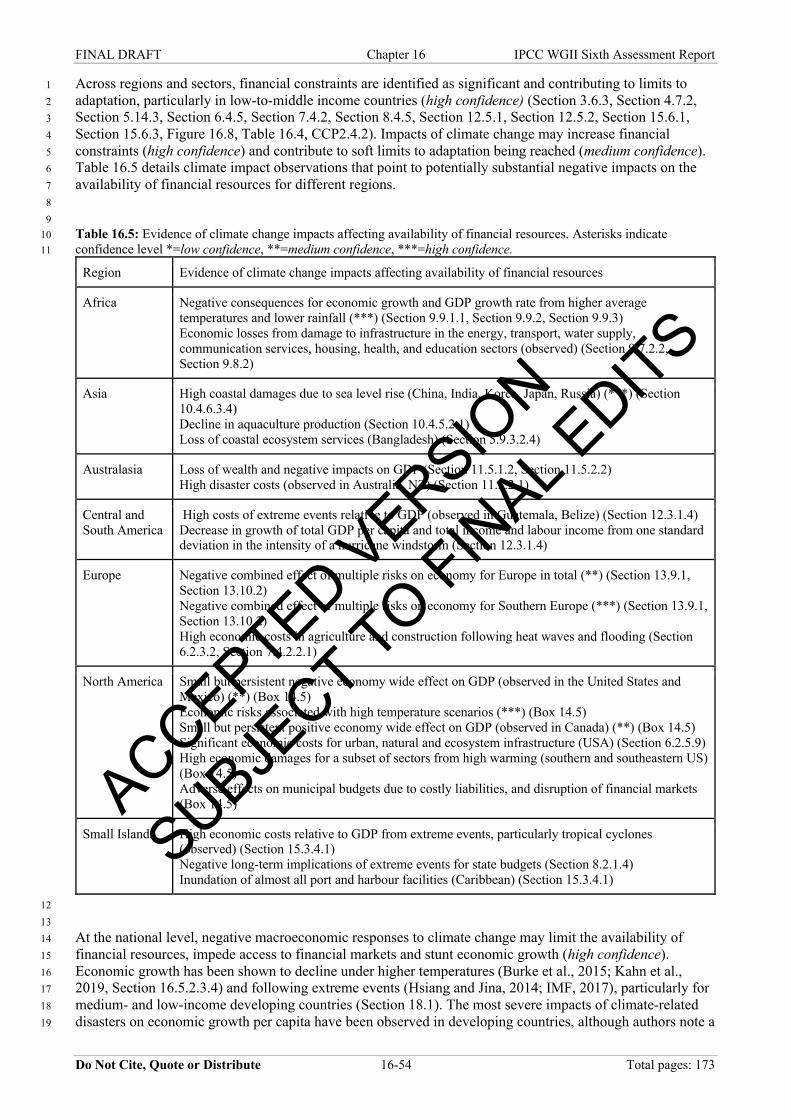
FINAL DRAFT Chapter 16 IPCC WGII Sixth Assessment Report
Do Not Cite, Quote or Distribute 16-54 Total pages: 173
Across regions and sectors, financial constraints are identified as significant and contributing to limits to 1 adaptation, particularly in low-to-middle income countries (high confidence) (Section 3.6.3, Section 4.7.2, 2 Section 5.14.3, Section 6.4.5, Section 7.4.2, Section 8.4.5, Section 12.5.1, Section 12.5.2, Section 15.6.1, 3 Section 15.6.3, Figure 16.8, Table 16.4, CCP2.4.2). Impacts of climate change may increase financial 4 constraints (high confidence) and contribute to soft limits to adaptation being reached (medium confidence). 5 Table 16.5 details climate impact observations that point to potentially substantial negative impacts on the 6 availability of financial resources for different regions. 7 8 9 Table 16.5: Evidence of climate change impacts affecting availability of financial resources. Asterisks indicate 10 confidence level *=low confidence, **=medium confidence, ***=high confidence. 11
Region Evidence of climate change impacts affecting availability of financial resources
Africa Negative consequences for economic growth and GDP growth rate from higher average temperatures and lower rainfall (***) (Section 9.9.1.1, Section 9.9.2, Section 9.9.3) Economic losses from damage to infrastructure in the energy, transport, water supply, communication services, housing, health, and education sectors (observed) (Section 9.7.2.2, Section 9.8.2)
Asia High coastal damages due to sea level rise (China, India, Korea, Japan, Russia) (***) (Section 10.4.6.3.4) Decline in aquaculture production (Section 10.4.5.2.1) Loss of coastal ecosystem services (Bangladesh) (Section 5.9.3.2.4)
Australasia Loss of wealth and negative impacts on GDP (Section 11.5.1.2, Section 11.5.2.2) High disaster costs (observed in Australia, NZ) (Section 11.5.2.1)
Central and South America
High costs of extreme events relative to GDP (observed in Guatemala, Belize) (Section 12.3.1.4) Decrease in growth of total GDP per capita and total income and labour income from one standard deviation in the intensity of a hurricane windstorm (Section 12.3.1.4)
Europe Negative combined effect of multiple risks on economy for Europe in total (**) (Section 13.9.1, Section 13.10.2) Negative combined effect of multiple risks on economy for Southern Europe (***) (Section 13.9.1, Section 13.10.2) High economic costs in agriculture and construction following heat waves and flooding (Section 6.2.3.2, Section 7.4.2.2.1)
North America Small but persistent negative economy wide effect on GDP (observed in the United States and Mexico) (**) (Box 14.5) Economic risks associated with high temperature scenarios (***) (Box 14.5) Small but persistent positive economy wide effect on GDP (observed in Canada) (**) (Box 14.5) Significant economic costs for urban, natural and ecosystem infrastructure (USA) (Section 6.2.5.9) High economic damages for a subset of sectors from high warming (southern and southeastern US) (Box 14.5) Adverse effects on municipal budgets due to costly liabilities, and disruption of financial markets (Box 14.5)
Small Islands High economic costs relative to GDP from extreme events, particularly tropical cyclones (observed) (Section 15.3.4.1) Negative long-term implications of extreme events for state budgets (Section 8.2.1.4) Inundation of almost all port and harbour facilities (Caribbean) (Section 15.3.4.1)
12 13 At the national level, negative macroeconomic responses to climate change may limit the availability of 14 financial resources, impede access to financial markets and stunt economic growth (high confidence). 15 Economic growth has been shown to decline under higher temperatures (Burke et al., 2015; Kahn et al., 16 2019, Section 16.5.2.3.4) and following extreme events (Hsiang and Jina, 2014; IMF, 2017), particularly for 17 medium- and low-income developing countries (Section 18.1). The most severe impacts of climate-related 18 disasters on economic growth per capita have been observed in developing countries, although authors note a 19
ACCEPTED VERSIO
N
SUBJECT TO FIN
AL EDITS
FINAL DRAFT Chapter 16 IPCC WGII Sixth Assessment Report
Do Not Cite, Quote or Distribute 16-55 Total pages: 173
publication bias in the reporting of negative effects (Klomp and Valckx, 2014). Substantial immediate output 1 losses and reduced economic growth due to extreme events have been observed both in the short- and long-2 term (Section 16.2.3). Estimates of the duration of negative effects of climate-related disasters differ, with 3 some analyses suggesting that on average economies recover after two years (Klomp, 2016) and others 4 finding negative effects of cyclones to persist 15 – 20 years following an event (Hsiang and Jina, 2014; IMF, 5 2017). Rising climate vulnerability has also been shown to increase the cost of debt (Kling et al., 2018). 6 Rising climatic risks negatively affect developing countries’ ability to access financial markets (Cevik and 7 Jalles, 2020) and their disclosure may result in capital flight (Cross-Chapter Box FINANCE in Chapter 17). 8 Overall, the direct and indirect economic effects of climate change represent a major risk to financial system 9 stability (Section 11.5.2). These risks and effects may further limit the availability of financial resources 10 needed to overcome constraints, in particular for developing countries. 11 12 Sectoral studies indicate that climate impacts will result in higher levels of losses and damages and decreases 13 in income, thereby increasing financial constraints (medium confidence). Yield losses for major agricultural 14 crops are expected in nearly all world regions (Figure 5.7). Decreases in estimated marine fish catch 15 potential and large economic impacts from ocean acidification are expected globally, leading to the risk of 16 revenue loss (Section 5.8.3). Losses of primary productivity and farmed species of shellfish are expected in 17 tropical and subtropical regions (Section 5.9.3.2.2). Economic losses have been observed in the power 18 generation sector and transport infrastructure (Section 10.4.6.3.8), including economic losses from floods in 19 urban areas (Section 4.2.4.5). However, some positive sectoral climate change impacts have been identified 20 for the timber and forestry sector (Section 5.6.2), for primary productivity and farmed species of shellfish in 21 high-latitude regions (Section 5.9.3.2.2) and agriculture in high-latitude regions (Section 5.4.1.1). 22 23 At the household or community level, climate impacts may increase financial constraints (high confidence). 24 Impacts on agriculture and food prices could force between 3 to 16 million people into extreme poverty 25 (Hallegatte and Rozenberg, 2017). Within-country inequality is expected to increase following extreme 26 weather events (Section 16.2.3.6 and Chapter 8). Households affected by climate-related extreme events may 27 be faced with continuous reconstruction efforts following extreme events (Adelekan and Fregene, 2015) or 28 declines in critical livelihood resources in the agriculture, fisheries and tourism sectors (Forster et al., 2014, 29 Section 3.5.1). Further erosion of livelihood security of vulnerable households creates the risk of poverty 30 traps, particularly for rural and urban landless (Section 8.2.1, Section 8.3.3.1), for example in Malawi and 31 Ethiopia (Section 9.9.3). Levels of labour productivity and economic outputs are projected to decrease as 32 temperatures rise particularly in urban areas (Section 6.2.3.1). At the same time, higher utilities demand 33 under higher urban temperatures exert additional economic stresses on urban residents and households. 34 Substantial, negative impacts on the livelihoods of over 180 million people are expected from changes to 35 African grassland productivity (Section 5.5.3.1). In Western Uzbekistan, farmers´ incomes are at risk of 36 declining (Section 10.4.5.3). For Small Island Developing States, loss of livelihoods is expected due to 37 negative climatic impacts on coastal environments and resources (Section 3.5.1). Negative effects on 38 households from extreme events can also persist in the long-term and in multiple dimensions. Exposure to 39 disasters during the first year of life significantly reduces the number of years of schooling, increases the 40 chances of being unemployed as an adult and living in a multidimensionally poor household (González et al., 41 2021). 42 43 44 16.5 Key Risks Across Sectors and Regions 45 46 This section builds on the analogous chapter in AR5 (Oppenheimer et al., 2014) to refine the definition of 47 climate-related key risks (KRs) and criteria for identifying them (16.5.1), and describe a broad range of key 48 risks by sector and region as identified by the authors of WGII AR6 (Section 16.5.2, SM16.4). Based on this, 49 eight clusters of key risks (i.e., Representative Key Risks, RKRs) are identified and assessed in terms of the 50 conditions under which they would become severe. In addition, the section assesses variation in KRs and 51 RKRs by the level of global average warming, socio-economic development pathways, and levels of 52 adaptation, and illustrates the implications from resulting dynamics in all risk dimensions (hazard, exposure, 53 vulnerability) along a case study of densely populated river deltas (Section 16.5.3). Last, interactions among 54 RKRs are discussed (Section 16.5.4). 55 56
ACCEPTED VERSIO
N
SUBJECT TO FIN
AL EDITS
FINAL DRAFT Chapter 16 IPCC WGII Sixth Assessment Report
Do Not Cite, Quote or Distribute 16-56 Total pages: 173
16.5.1 Defining Key Risks 1 2 A key risk is defined as a potentially severe risk and therefore especially relevant to the interpretation of 3 dangerous anthropogenic interference (DAI) with the climate system, the prevention of which is the ultimate 4 objective of the UNFCCC as stated in its Article 2 (Oppenheimer et al., 2014). Key risks are therefore a 5 relevant lens for the interpretation of this policy framing. The severity of a risk is a context-specific 6 judgment based on a number of criteria discussed below. KRs are ‘potentially’ severe because, while some 7 could already reflect dangerous interference now, more typically they may become severe over time due to 8 changes in the nature of hazards (or, more broadly, climatic impact-drivers (or, more broadly, climatic 9 impact-drivers, IPCC, 2021a) and/or of the exposure/vulnerability of societies or ecosystems to those 10 hazards. They also may become severe due to the adverse consequences of adaptation or mitigation 11 responses to the risk (on the former see Section 17.5.1; the latter is not assessed separately here, except as it 12 contributes to risks from climate hazards). Dangerous interferences in this chapter are considered over the 13 course of the 21st century. 14 15 KRs may be defined for a wide variety of systems at a range of scales. The broadest definition is for the 16 global human system or planetary ecological system, but KRs may also apply to regions, specific sectors or 17 communities, or to parts of a system rather than to the system as a whole. For example, the population at the 18 lower end of the wealth distribution is often impacted by climate change much more severely than the rest of 19 the population (Leichenko and Silva, 2014; Hallegatte and Rozenberg, 2017; Hallegatte et al., 2017; Pelling 20 and Garschagen, 2019). 21 22 KRs are determined not just by the nature of hazards, exposure, vulnerability, and response options, but also 23 by values, which determine the importance of a risk. Importance is understood here as the degree of 24 relevance to interpreting DAI at a given system’s level or scale, and was an explicit criterion for identifying 25 key vulnerabilities and risks in AR5 (Oppenheimer et al., 2014). Because values can vary across individuals, 26 communities, or cultures, as well as over time, what constitutes a KR can vary widely from the perspective 27 of each of these groups, or across individuals. For example, ecosystems providing indirect services and 28 cultural assets such as historic buildings and archaeological sites may be considered very important to 29 preserve by some people but not by others; and some types of infrastructure, such as a commuter rail, may be 30 important to the well-being of some households but less so to others. Therefore, Chapter 16 authors do not 31 make their own judgements about the importance of particular risks. Instead, we highlight importance as an 32 overarching factor but identify and evaluate KRs based on four other criteria for what may be considered 33 potentially severe. 34 35 Magnitude of adverse consequences. Magnitude measures the degree to which particular dimensions of a 36 system are affected, should the risk materialize. Magnitude can include the size or extent of the system, the 37 pervasiveness of the consequences across the system (geographically or in terms of affected population), as 38 well as the degree of consequences. Consequences can be measured by a wide range of characteristics. For 39 example, risks to food security can be measured as uncertain consequences for food consumption, access, or 40 prices. The magnitude of these consequences would be the degree of change in these measures induced by 41 climate change and accounting for the interaction with exposure and vulnerability. In addition to 42 pervasiveness and degree of change, several other aspects can contribute to a judgement of magnitude, 43 although they refer to concepts that are difficult to capture and highly context-specific: 44 Irreversibility of consequences. Consequences that are irreversible, at least over long timescales, would be 45 considered a higher risk than those that are temporary. For example, changes to the prevailing ecosystem in a 46 given location may not be reversible on the decade to century scale. 47 Potential for impact thresholds or tipping points. Higher risks are posed by the potential for exceeding a 48 threshold beyond which the magnitude or rate of an impact substantially increases. 49 Potential for cascading effects beyond system boundaries. Higher risks are posed by those with the potential 50 to generate downstream cascading effects to other ecosystems, sectors or population groups within the 51 affected system and/or to another system, whether neighbouring or distant (Cross-Chapter Box INTEREG in 52 this Chapter). 53 54 Likelihood of adverse consequences. A higher probability of high-magnitude consequences poses a larger 55 risk a priori, whatever the scale considered. This probability may not be quantifiable, and it may be 56 conditional on assumptions about the hazard, exposure, or vulnerability associated with the risk. 57
ACCEPTED VERSIO
N
SUBJECT TO FIN
AL EDITS
FINAL DRAFT Chapter 16 IPCC WGII Sixth Assessment Report
Do Not Cite, Quote or Distribute 16-57 Total pages: 173
1 Temporal characteristics of the risk. Risks that occur sooner, or that increase more rapidly over time, 2 present greater challenges to natural and societal adaptation. A persistent risk (due to the persistence of the 3 hazard, exposure, and vulnerability) may also pose a higher threat than a temporary risk due, for example, to 4 a short-term increase in the vulnerability of a population (e.g., due to conflict or an economic downturn). 5 6 Ability to respond to the risk. Risks are more severe if the affected ecosystems or societies have limited 7 ability to reduce hazards (e.g., for human systems, through mitigation, ecosystem management and possibly 8 solar radiation management); to reduce exposure or vulnerability through various human or ecological 9 adaptation options; or to cope with or respond to the consequences, should they occur. 10 11 The relative influence of these different criteria is case-specific and left to author judgment in the 12 identification of KRs (groups of authors in regional and sectoral chapters, see Supplementary Material Table 13 SM16.10) and the assessment of representative key risks (author teams, see Supplementary Material Table 14 SM16.10). But in general, the more criteria are met, the higher is the risk 15 16 16.5.2 Identification and Assessment of Key Risks and Representative Key Risks 17 18 16.5.2.1 Identification of Key Risks (KR) 19 20 The authors of the sectoral and regional chapters and Cross Chapter Papers of the WGII AR6 Report 21 identified more than 130 key risks (Table SM16..4). Authors were asked to rely on the above definition and 22 criteria to identify risks that could potentially become severe according to changes in the associated hazards, 23 the study systems’ exposure and/or vulnerability; and important adaptation strategies that could reduce these 24 risks (see 16.B.2 for methodology). Wherever possible, identification is based on literature that includes 25 projected future conditions for all three components of risk and adaptation. Where literature was insufficient, 26 potential severity is based on current vulnerability and exposure to climate hazards and the expectation that 27 hazards will increase in frequency and/or intensity in the future. This approach is more limited in that it does 28 not consider future changes in exposure and vulnerability nor in adaptation, but has the benefit of being 29 grounded in observed experience. 30 31 Table SM16.4 indicates that climate change presents a wide range of risks across scales, sectors and regions 32 that could become severe under particular conditions of hazards, exposure, and vulnerability, which may or 33 may not occur. Some illustrations of the extent and diversity of KRs are provided here, and more detailed 34 assessment can be found in the Chapters referenced in the table. 35 36 Global scale KRs include threats to biodiversity in oceans, coastal regions, and on land, particularly in 37 biodiversity hotspots, as well as other ecological risks such as geographic shifts in vegetation, tree mortality, 38 reduction in populations, and reduction in growth (such as for shellfish). These ecological risks include 39 cascading impacts on livelihoods and food security. Global-scale risks also include risks to people, property, 40 and infrastructure from river flooding and extreme heat (particularly in urban areas), risks to fisheries (with 41 implications for living standards and food security), and some health risks from food-borne diseases as well 42 as psychopathologies. 43 44 Many KRs are especially prominent in particular regions or systems, or for particular subgroups of the 45 population. For example, coastal systems and small islands are a nexus of many KRs, including those to 46 ecosystems and their services, especially coral reefs; people (health, livelihoods); and assets, including 47 infrastructure. Risks to socio-ecological systems in polar regions are also identified as KRs, as are ecological 48 risks to the Amazon forest in South America and savannahs in Africa. For some regions risks from wildfire 49 are of particular concern, including in Australasia and North America. Vector-borne diseases are a particular 50 concern in Africa and Asia. Loss of cultural heritage is identified as a KR in Small Islands, Mountain 51 Regions, Africa, Australasia, and North America. 52 53 For many risks, low-income populations are particularly vulnerable to KRs. Climate-related impacts on 54 malnutrition and other forms of food insecurity will be larger for this group, along with small-holder farming 55 households and indigenous communities reliant on agriculture, and for women, children, the elderly, and the 56 socially isolated (Section 5.12). KRs in coastal communities are expected to affect low income populations 57
ACCEPTED VERSIO
N
SUBJECT TO FIN
AL EDITS
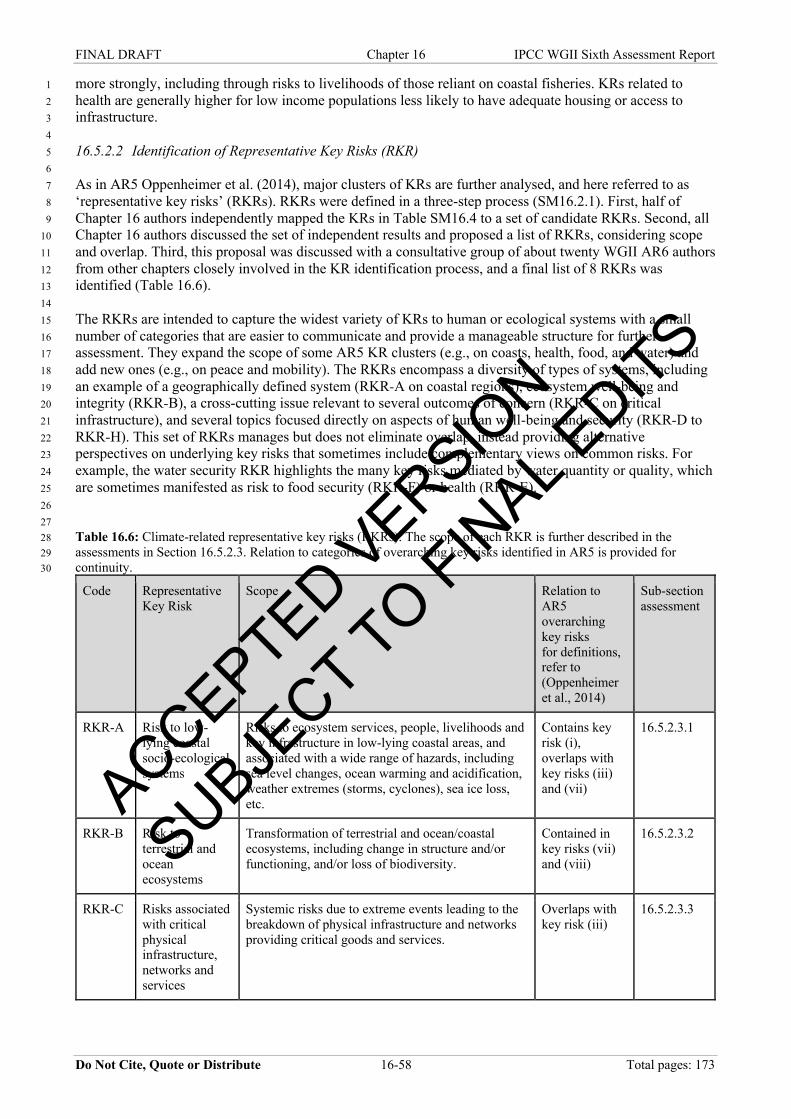
FINAL DRAFT Chapter 16 IPCC WGII Sixth Assessment Report
Do Not Cite, Quote or Distribute 16-58 Total pages: 173
more strongly, including through risks to livelihoods of those reliant on coastal fisheries. KRs related to 1 health are generally higher for low income populations less likely to have adequate housing or access to 2 infrastructure. 3 4 16.5.2.2 Identification of Representative Key Risks (RKR) 5 6 As in AR5 Oppenheimer et al. (2014), major clusters of KRs are further analysed, and here referred to as 7 ‘representative key risks’ (RKRs). RKRs were defined in a three-step process (SM16.2.1). First, half of 8 Chapter 16 authors independently mapped the KRs in Table SM16.4 to a set of candidate RKRs. Second, all 9 Chapter 16 authors discussed the set of independent results and proposed a list of RKRs, considering scope 10 and overlap. Third, this proposal was discussed with a consultative group of about twenty WGII AR6 authors 11 from other chapters closely involved in the KR identification process, and a final list of 8 RKRs was 12 identified (Table 16.6). 13 14 The RKRs are intended to capture the widest variety of KRs to human or ecological systems with a small 15 number of categories that are easier to communicate and provide a manageable structure for further 16 assessment. They expand the scope of some AR5 KR clusters (e.g., on coasts, health, food, and water) and 17 add new ones (e.g., on peace and mobility). The RKRs encompass a diversity of types of systems, including 18 an example of a geographically defined system (RKR-A on coastal regions), ecosystem well-being and 19 integrity (RKR-B), a cross-cutting issue relevant to several outcomes of concern (RKR-C on critical 20 infrastructure), and several topics focused directly on aspects of human well-being and security (RKR-D to 21 RKR-H). This set of RKRs manages but does not eliminate overlap, instead providing alternative 22 perspectives on underlying key risks that sometimes include complementary views on common risks. For 23 example, the water security RKR highlights the many key risks mediated by water quantity or quality, which 24 are sometimes manifested as risk to food security (RKR-F) or health (RKR-E). 25 26 27 Table 16.6: Climate-related representative key risks (RKRs). The scope of each RKR is further described in the 28 assessments in Section 16.5.2.3. Relation to categories of overarching key risks identified in AR5 is provided for 29 continuity. 30
Code Representative Key Risk
Scope Relation to AR5 overarching key risks for definitions, refer to (Oppenheimer et al., 2014)
Sub-section assessment
RKR-A Risk to low-lying coastal socio-ecological systems
Risks to ecosystem services, people, livelihoods and key infrastructure in low-lying coastal areas, and associated with a wide range of hazards, including sea level changes, ocean warming and acidification, weather extremes (storms, cyclones), sea ice loss, etc.
Contains key risk (i), overlaps with key risks (iii) and (vii)
16.5.2.3.1
RKR-B Risk to terrestrial and ocean ecosystems
Transformation of terrestrial and ocean/coastal ecosystems, including change in structure and/or functioning, and/or loss of biodiversity.
Contained in key risks (vii) and (viii)
16.5.2.3.2
RKR-C Risks associated with critical physical infrastructure, networks and services
Systemic risks due to extreme events leading to the breakdown of physical infrastructure and networks providing critical goods and services.
Overlaps with key risk (iii)
16.5.2.3.3
ACCEPTED VERSIO
N
SUBJECT TO FIN
AL EDITS
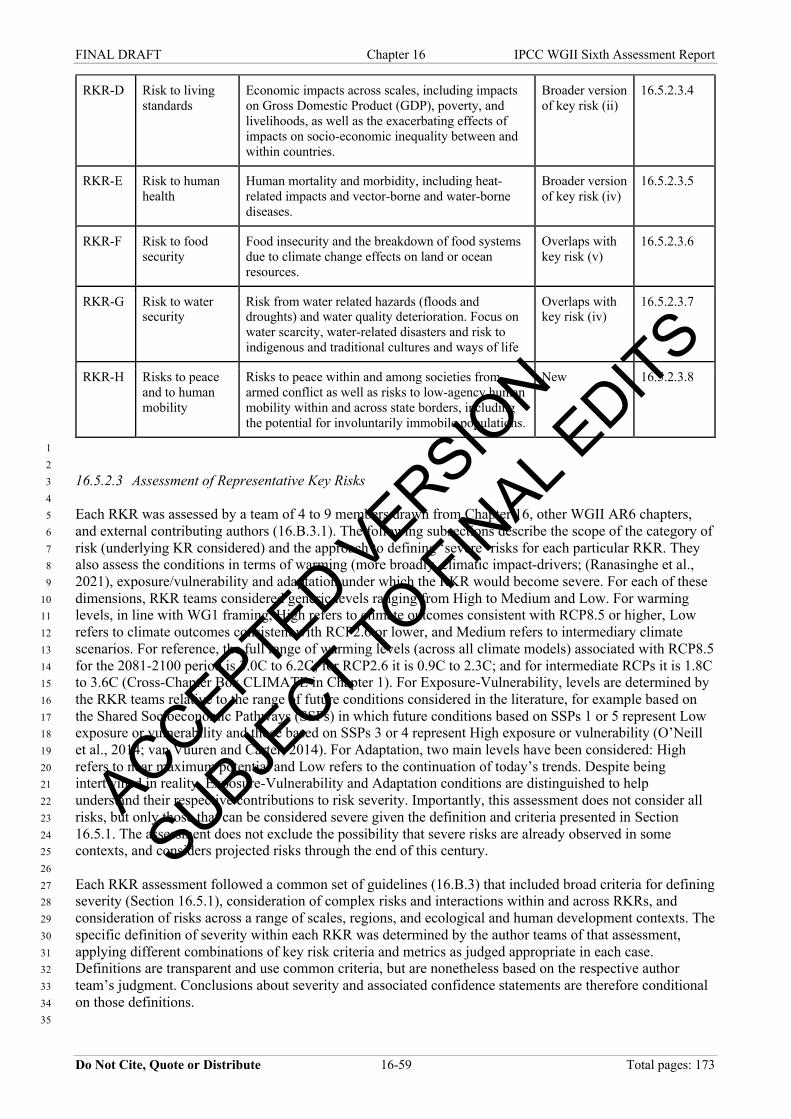
FINAL DRAFT Chapter 16 IPCC WGII Sixth Assessment Report
Do Not Cite, Quote or Distribute 16-59 Total pages: 173
RKR-D Risk to living standards
Economic impacts across scales, including impacts on Gross Domestic Product (GDP), poverty, and livelihoods, as well as the exacerbating effects of impacts on socio-economic inequality between and within countries.
Broader version of key risk (ii)
16.5.2.3.4
RKR-E Risk to human health
Human mortality and morbidity, including heat-related impacts and vector-borne and water-borne diseases.
Broader version of key risk (iv)
16.5.2.3.5
RKR-F Risk to food security
Food insecurity and the breakdown of food systems due to climate change effects on land or ocean resources.
Overlaps with key risk (v)
16.5.2.3.6
RKR-G Risk to water security
Risk from water related hazards (floods and droughts) and water quality deterioration. Focus on water scarcity, water-related disasters and risk to indigenous and traditional cultures and ways of life
Overlaps with key risk (iv)
16.5.2.3.7
RKR-H Risks to peace and to human mobility
Risks to peace within and among societies from armed conflict as well as risks to low-agency human mobility within and across state borders, including the potential for involuntarily immobile populations.
New 16.5.2.3.8
1 2 16.5.2.3 Assessment of Representative Key Risks 3 4 Each RKR was assessed by a team of 4 to 9 members drawn from Chapter 16, other WGII AR6 chapters, 5 and external contributing authors (16.B.3.1). The following subsections describe the scope of the category of 6 risk (underlying KR considered) and the approach to defining ‘severe’ risks for each particular RKR. They 7 also assess the conditions in terms of warming (more broadly, climatic impact-drivers; (Ranasinghe et al., 8 2021), exposure/vulnerability and adaptation under which the RKR would become severe. For each of these 9 dimensions, RKR teams considered generic levels ranging from High to Medium and Low. For warming 10 levels, in line with WG1 framing, High refers to climate outcomes consistent with RCP8.5 or higher, Low 11 refers to climate outcomes consistent with RCP2.6 or lower, and Medium refers to intermediary climate 12 scenarios. For reference, the full range of warming levels (across all climate models) associated with RCP8.5 13 for the 2081-2100 period is 3.0C to 6.2C; for RCP2.6 it is 0.9C to 2.3C; and for intermediate RCPs it is 1.8C 14 to 3.6C (Cross-Chapter Box CLIMATE in Chapter 1). For Exposure-Vulnerability, levels are determined by 15 the RKR teams relative to the range of future conditions considered in the literature, for example based on 16 the Shared Socioeconomic Pathways (SSPs) in which future conditions based on SSPs 1 or 5 represent Low 17 exposure or vulnerability and those based on SSPs 3 or 4 represent High exposure or vulnerability (O’Neill 18 et al., 2014; van Vuuren and Carter, 2014). For Adaptation, two main levels have been considered: High 19 refers to near maximum potential and Low refers to the continuation of today’s trends. Despite being 20 intertwined in reality, Exposure-Vulnerability and Adaptation conditions are distinguished to help 21 understand their respective contributions to risk severity. Importantly, this assessment does not consider all 22 risks, but only those that can be considered severe given the definition and criteria presented in Section 23 16.5.1. The assessment does not exclude the possibility that severe risks are already observed in some 24 contexts, and considers projected risks through the end of this century. 25 26 Each RKR assessment followed a common set of guidelines (16.B.3) that included broad criteria for defining 27 severity (Section 16.5.1), consideration of complex risks and interactions within and across RKRs, and 28 consideration of risks across a range of scales, regions, and ecological and human development contexts. The 29 specific definition of severity within each RKR was determined by the author teams of that assessment, 30 applying different combinations of key risk criteria and metrics as judged appropriate in each case. 31 Definitions are transparent and use common criteria, but are nonetheless based on the respective author 32 team’s judgment. Conclusions about severity and associated confidence statements are therefore conditional 33 on those definitions. 34 35
ACCEPTED VERSIO
N
SUBJECT TO FIN
AL EDITS
FINAL DRAFT Chapter 16 IPCC WGII Sixth Assessment Report
Do Not Cite, Quote or Distribute 16-60 Total pages: 173
Assessments are based on different types of evidence depending on the nature of the literature. In some 1 cases, quantitative projections of potential impacts are available. In others and as for KR identification, the 2 potential for severe risk is inferred from high levels of current vulnerability and the expectation that the 3 relevant climate hazards (CIDs) will increase in frequency or intensity in the future. 4 5 16.5.2.3.1 Risk to the integrity of low-lying coastal socio-ecological systems (RKR-A) 6 RKR-A considers climate change-related risks to low-lying coasts including their physical, ecological and 7 human components. Low-lying systems are those occupying land below 10 m of elevation that is contiguous 8 and hydrologically connected to the sea (McGranahan et al., 2007). The assessment builds on Key Risks 9 identified in chapters 3 and 15, Cross Chapter Paper 2 as well as in the SROCC (Magnan et al., 2019; 10 Oppenheimer et al., 2019). It highlights risks to (i) natural coastal protection and habitats; (ii) lives, 11 livelihoods, culture and well-being; and (iii) critical physical infrastructure; it therefore overlaps with several 12 other RKRs (Fig. 16.10 and 16.11) but within a coastal focus. It encompasses all latitudes and considers 13 multiple sources of climate hazards, including sea-level rise (SLR), ocean warming and acidification, 14 permafrost thaw, and sea-ice loss and changes in weather extremes. 15 16 Severe risks to low-lying coasts involve irreversible long-term loss of land, critical ecosystem services, 17 livelihoods, well-being or culture in relation to increasing combined drivers, including climate hazards and 18 exposure and vulnerability conditions. The definition depends on the local context because of variation in the 19 perception of tolerable risks and the limits to adaptation (Handmer and Nalau, 2019). Accordingly, a 20 qualitative range of consequences is presented here, in place of a quantitative global severe risk threshold. 21 22 The literature suggests that severe risks generally occur at the nexus of high levels and rates of 23 anthropogenic-driven change in climate hazards (16.2.3.2), concentrations of people and tangible and 24 intangible assets, non-climate hazards such as sediment mining and ecosystem degradation (3.4.2.1), and the 25 reaching of adaptation limits (16.4) (medium evidence, high agreement). In some Arctic communities and in 26 communities reliant on warm-water coral reefs, even 1.5-2ºC warming will lead to severe risks from loss of 27 ecosystem services (3.4.2.2; CCP6) (high confidence). Loss of land is already underway globally due to 28 accelerating coastal erosion and will be amplified by increased sea-level extremes and permanent flooding 29 (high confidence; Oppenheimer et al. 2019, Ranasinghe et al. 2021). Observed impacts of and projected 30 increases in high intensity extreme events (Ranasinghe et al. 2021) also provide evidence for severe risk to 31 occur on livelihoods, infrastructure and well-being (Section 16.5.2.3.3) by mid-century (high confidence). 32 Consequently, the combination of high warming, continued coastal development and low adaptation levels 33 will challenge the habitability of many low-lying coastal communities in both developing and developed 34 countries over the course of this century (low evidence, high agreement) (Duvat et al., 2021; Horton et al., 35 2021). In some contexts, climate risks are already considered severe (medium evidence, medium agreement), 36 and in others, even lower warming will induce severe risks to habitability, which will not necessarily be 37 offset by ambitious adaptation (low evidence, medium agreement). 38 39 (i) Natural coastal protection and habitats — Severe risks from the loss of shoreline protection from 40 reductions in wave attenuation (Beck et al., 2018, Section 3.5.5.1; Section 3.5.4.5) and sediment delivery 41 (3.4.2.5; 15.3.3) are already observed in some coastal systems (Section 16.2.3.1) and occur broadly even 42 with 1.5ºC of global warming (Hoegh-Guldberg et al., 2018a; Bindoff et al., 2019, Section 3.4.2). These 43 impacts are the consequence of warming and SLR on coastal ecosystems. 44 45 Warm-water coral reefs are at risk of widespread loss of structural complexity and reef accretion by 2050 46 under 1.5°C global warming (Section 3.4.2.1) (high confidence). Kelp forests may experience shifts in 47 community structure (Arafeh-Dalmau et al., 2019; Rogers-Bennett and Catton, 2019; Smale, 2020; Smith et 48 al., 2021) with >2°C of global warming especially at lower latitudes (Section 3.4.2.2) (high confidence). In 49 addition, depending on the local tide and sediment conditions, SLR associated with >1.5°C of global 50 warming (SSP1-2.6; 3.4.2.5) is sufficient to initiate shifts to alternate states in some seagrass and coastal 51 wetland systems (van Belzen et al., 2017; El-Hacen et al., 2018, Section 3.4.2.5, Cross-Chapter Box SLR in 52 Chapter 3), and submergence of some mangrove forests (3.4.2.5). A striking example of risks becoming 53 severe at higher levels of warming is the one of coral islands with low elevation (Section 15.3.4, Box 15.1): 54 the risk of loss of habitability transitions from Moderate-to-High under RCP2.6 for most island types (urban 55 and rural) to High-to-Very High under RCP8.5 (Duvat et al., 2021), even under a high adaptation scenario 56
ACCEPTED VERSIO
N
SUBJECT TO FIN
AL EDITS
FINAL DRAFT Chapter 16 IPCC WGII Sixth Assessment Report
Do Not Cite, Quote or Distribute 16-61 Total pages: 173
(Oppenheimer et al., 2019), partly due to declining sediment supply (Perry et al., 2018) and increased annual 1 flooding (Giardino et al., 2018; Storlazzi et al., 2018). 2 3 More broadly, about 28,000 km2 of land have been lost globally since the 1980s due to anthropogenic 4 factors (e.g., coastal structures, disruption of sediment fluxes) and coastal hazards (Mentaschi et al., 2018), 5 and an additional loss of 6000-17,000 km2 is estimated by the end of the century due to coastal erosion alone 6 associated with SLR in combination with other drivers (Hinkel et al., 2013). 7 8 (ii) Impacts to lives, livelihoods, culture and well-being — In the absence of effective adaptation, changing 9 extreme and slow-onset hazards combined with anthropogenic drivers (e.g., increased population pressure at 10 the coast between +5% and +13.6% by 2100 compared to today, Jones and O’Neill, 2016) will lead to loss of 11 lives, livelihoods, health, well-being, and/or culture (McGregor et al., 2016; Pinnegar et al., 2019; Pugatch, 12 2019; Schneider and Asch, 2020; Thomas and Benjamin, 2020; McNamara et al., 2021) (high confidence). 13 Catastrophic examples that may foreshadow the future include Hurricane Sandy in 2012 (Strauss et al., 14 2021)and super Typhoon Haiyan in 2013 (>6,000 deaths and inequities in access to safe housing; Trenberth 15 et al. 2015) (6.2.2, 6.3.5.1). Although there is no unique definition of ‘intolerable’ loss, risks are generally 16 expected to become severe over this century (Tschakert et al., 2017; Dannenberg et al., 2019; Tschakert et 17 al., 2019). Globally, with High warming, 90 to 380 million more people will be exposed to annual flood 18 levels by the mid- and end-century, respectively, compared to 250 million people today (Kulp and Strauss, 19 2019; Kirezci et al., 2020), with potential implications on forced displacement or migration (Oppenheimer et 20 al., 2019; Wrathall et al., 2019; Hauer et al., 2020; Lincke and Hinkel, 2021, Section 16.5.2.3.9). Some of the 21 largest fish-producing and fish-dependent ecoregions have already experienced losses of up to 35% in 22 marine fisheries productivity due to warming (Free et al., 2019), and about 11% of the global population will 23 face increasing nutritional risks if current trajectories continue (Golden et al., 2016). While difficult to 24 measure, current climate-driven losses to (indigenous) knowledge, traditions (Tschakert et al., 2019; Pearson 25 et al., 2021) and well-being (Ebi et al., 2017; Cunsolo and Ellis, 2018; Jaakkola et al., 2018) indicate such 26 risk as already severe in some regions (low evidence, medium agreement), jeopardizing communities’ 27 realization of their rights to food, health and culture. In the Arctic, climate-driven changes to ice and weather 28 regimes have substantially affected traditional coastal-based hunting and fishing activities (Fawcett et al., 29 2018; Galappaththi et al., 2019; Huntington et al., 2020; Nuttall, 2020, CCP6), and where permafrost thaw, 30 SLR and coastal erosion are contributing to threatening cultural sites (Hollesen et al., 2018; Fenger‐Nielsen 31 et al., 2020). 32 33 (iii) Critical physical infrastructure — Severe risks are also illustrated through damages that lead to possibly 34 long-lasting disruption of key services like transportation as well as energy generation and distribution in 35 coastal areas (Section 16.5.2.3.3) under all RCPs (CCP2.2.3) and if no additional adaptation (medium 36 confidence). Critical transport infrastructure is already suffering from structural failures in polar regions, for 37 instance, due to permafrost thaw and increased erosion associated with ocean warming, storm surge flooding 38 and loss of sea ice (Melvin et al., 2017; Fang et al., 2018, Section 14.5.2.8, Section 16.2.3.2, CCP6). One 39 hundred airports are projected to be below mean sea-level in 2100 with 2°C of warming (i.e., 0.62 m SLR, 40 Yesudian and Dawson, 2021), including in small islands (Monioudi et al., 2018; Storlazzi et al., 2018) and 41 megacities. Projections show San Francisco International Airport, for instance, to be inundated by 2100 42 under the upper likely range of SLR in RCP8.5 (also considering subsidence trends, Shirzaei and Bürgmann, 43 2018). On the energy side, it is estimated that with 1.8m SLR, for example, four out of 13 US nuclear power 44 plant facilities will become exposed to storm surges and three others will be surrounded or submerged by 45 seawater (Jordaan et al., 2019; Jenkins et al., 2020). 46 47 16.5.2.3.2 Risk to terrestrial and ocean ecosystems (RKR-B) 48 This risk refers to transformations of terrestrial and ocean/coastal ecosystems that would include significant 49 changes in structure and/or functioning, and/or loss of a substantial fraction of species richness (commonly 50 used to indicate loss of biodiversity). These are sourced mainly from Chapters 2 and 3, CCP1, and reference 51 the 1.5C report, Chapter 4 from WGII AR5, and Chapter 4 from WGII AR4 Reports. 52 53 Severe adverse impacts on biodiversity include significant risk of species extinction (e.g., loss of a 54 substantial fraction (one tenth or more) of species from a local to global scale), mass population mortality 55 (>50% of individuals or colonies killed), ecological disruption (order-of-magnitude increases or abrupt 56 reductions of population numbers or biomass), shifts in ecosystem structure and function (order-of 57
ACCEPTED VERSIO
N
SUBJECT TO FIN
AL EDITS
FINAL DRAFT Chapter 16 IPCC WGII Sixth Assessment Report
Do Not Cite, Quote or Distribute 16-62 Total pages: 173
magnitude increases or abrupt decreases in cover and/or biomass of novel growth forms or functional types), 1 and/or a socio-economically material increase in environmental risk (e.g., destruction by wildfire) or socio-2 economically material decline in goods and services (e.g., carbon stock losses, loss of grazing, loss of 3 pollination). Metrics relevant to Sustainable Development Goals are also germane. 4 5 A substantial proportion of biodiversity is at risk of being lost below 2ºC of global warming (Chapter 2), due 6 to range reductions and loss globally, with this risk amplified roughly three times in insular ecosystems and 7 biodiversity hotspots, due to the increased vulnerability of endemic species (Manes et al., 2021). High 8 latitude, high altitude, insular, freshwater, and coral reef ecosystems and biodiversity hotspots (Chapter 2, 9 Cross-Chapter Paper 1 on Biodiversity Hotspots) are at appreciable risk of substantial biodiversity loss due 10 to climate change even under Low warming (high confidence). These systems comprise a large fraction of 11 unique and endemic biodiversity, with species impacts often exacerbated by multiple drivers of global 12 change (Chapter 2, Chapter 3). Roughly one third of all known plant species are extremely rare, vulnerable 13 to climate impacts, and clustered in areas of higher projected rates of anthropogenic climate change (Enquist 14 et al., 2019). Much evidence shows increased risk of the loss of 10% or more of terrestrial biodiversity with 15 increasing anthropogenic climate change (Urban, 2015; Smith et al., 2018) (medium confidence), likely with 16 2ºC warming above pre-industrial level (Chapter 2), with consequent degradation of terrestrial, freshwater, 17 and ocean ecosystems (Oliver et al., 2015) and adverse impacts on ecosystem services (Pecl et al., 2017) and 18 dependent human livelihoods (Dube et al., 2016). Adverse impacts on biodiversity may show lagged 19 responses (Essl et al., 2015), and loss of a substantial fraction of species could occur abruptly, 20 simultaneously across multiple taxa, below 4ºC of global warming (Trisos et al., 2020). 21 22 Mass population-level mortality (>50% of individuals or colonies killed) and resulting abrupt ecological 23 changes can be caused by simple or compound climate extreme events, such as exceedance of upper thermal 24 limits by vulnerable terrestrial species (Fey et al., 2015), who also note reduced mass mortality trends due to 25 extreme low thermal events); marine heatwaves that can cause mortality, enhance invasive alien species 26 establishment, and damage coastal ecological communities and small-scale fisheries (high confidence) 27 (Section 3.4.2.7); and increased frequency and extent of wildfires that threaten populations dependent on 28 habitat availability (like Koala Bears, Lam et al., 2020). Abrupt ecological changes are widespread and 29 increasing in frequency (Turner et al., 2020), and include tree mortality due to insect infestation exacerbated 30 by drought, and ecosystem transformation due to wildfire (Vogt et al., 2020). Freshwater ecosystems and 31 their biodiversity are at high risk of biodiversity loss and turnover due to climate change (precipitation 32 change and warming, including warming of water bodies), due to high sensitivity of processes and life 33 histories to thermal conditions and water quality (Chapter 2) (high confidence). In marine systems, 34 heatwaves cause damages in coastal systems, including extensive coral bleaching and mortality (very high 35 confidence) (Section 3.4.2.1), mass mortality of invertebrate species (low to high confidence, depending on 36 system) (Sections 3.4.2.2, Section 3.4.2.5, Section 3.4.4.1), and abrupt mortality of kelp-forest (high 37 confidence) (Section 3.4.2.3) and seagrass-meadow habitat (high confidence) (Section 3.4.4.2). The 38 biodiversity of polar seas shows strong impacts of climate change on phenological timing of plankton 39 activity, Arctic fish species range contractions and species community change (Table 16.2) (high 40 confidence). Extreme weather events and storm surges exacerbated by climate change have severe and 41 sudden adverse impacts on coastal systems, including loss of seagrass meadows and mangrove forests (high 42 confidence) (see Section 3.4.2.7, Section 3.4.2.8, Cross-Chapter Box EXTREMES in Chapter 2). 43 44 Ecological disruption (order-of-magnitude increases or abrupt reductions of population numbers or biomass) 45 can occur due to unprecedented inter-species interactions with unpredictable outcomes in ‘novel ecosystems’ 46 (Chapter 2) as species shift geographic ranges idiosyncratically in response to climatic drivers (Table 16.2). 47 Idiosyncratic geographic shifts are now observed in an appreciable fraction of species studied (Chapter 2, 48 Table 16.2). Commensal or parasitic diseases may infect immunologically naive hosts (e.g., chytrid fungus 49 in amphibians). Atypical disturbance regimes may be enhanced, for example, with the spread of flammable 50 plant species (e.g., du Toit et al., 2015), exacerbated by introduced species (e.g., Martin et al., 2015), thus 51 significantly increasing risk of loss and damage to infrastructure and livelihoods, ecological degradation, and 52 challenging existing management approaches. 53 54 Landscape- and larger-scale shifts in ecosystem structure and function (order-of magnitude increases or 55 abrupt decreases in cover and/or biomass of novel growth forms or functional types) are occurring in non-56 equilibrium ecosystems (systems which exist in multiple states, often disturbance-controlled) in response to 57
ACCEPTED VERSIO
N
SUBJECT TO FIN
AL EDITS
FINAL DRAFT Chapter 16 IPCC WGII Sixth Assessment Report
Do Not Cite, Quote or Distribute 16-63 Total pages: 173
changing disturbance regime, climate and rising CO2 (high confidence) Woody plant encroachment has been 1 occurring in multiple ecosystems, including sub-tropical and tropical fire driven grassland and savanna 2 systems, upland grassland systems, arid grasslands and shrublands (high confidence), leading to large scale 3 biodiversity changes, albedo changes, and impacts on water delivery, grazing services and human livelihoods 4 (medium confidence). Expansion of grasses (alien and native) into xeric shrublands is occurring causing 5 increasing fire prevalence in previous fire free vegetation (CCP3). In tropical forests repeated droughts and 6 recurrence of large-scale anthropogenic fires increase forest degradation, loss of biodiversity and ecosystem 7 functioning (high confidence) (Anderson et al., 2018b; Longo et al., 2020). Accelerated growth rates and 8 mortality of tropical trees is also adversely affecting tropical ecosystem functioning (McDowell et al., 2018; 9 Aleixo et al., 2019). Projected changes in ecosystem functioning, such as via wildfire (Section 2.5.5.2), tree 10 mortality (Section 2.5.5.3) and woody encroachment under climate change (Chapter 2) would alter 11 hydrological processes, with adverse implications for water yields and water supplies (Sankey et al., 2017; 12 Robinne et al., 2018; Rodrigues et al., 2019; Uzun et al., 2020). 13 14 The loss of a substantial fraction of biodiversity globally, abrupt impacts like significant local biodiversity 15 loss and mass population mortality events, and ecological disruption due to novel species interactions have 16 been observed or are projected at global warming levels below 2ºC (Chapter 2 Table 2.S.4, Cross Chapter 17 Box: EXTREMES in Chapter 2, Section 2.4.4.3.1, Section 2.4.2.3.3) (medium confidence). Simple and 18 compound impacts of extreme climate events are already causing significant loss and damage in vulnerable 19 ecosystems, including through the facilitation of important global change drivers of ecological disruption and 20 homogenisation like invasive species (high confidence). Severe impacts on human livelihoods and 21 infrastructure, and valuable ecosystem services are all projected to accompany these changes. Adaptation 22 potential for many of these risks is low due to the projected rate and magnitude of change, and to the 23 requirement of significant amounts of land for terrestrial ecosystems (Hannah et al., 2020). Biodiversity 24 conservation efforts may be hampered due to climate change impacts on the effectiveness of protected areas, 25 with high sensitivity of effectiveness to forcing scenario (medium confidence). In addition, climate-related 26 risks to ecosystems pose challenges to ecosystem-based adaptation responses (‘nature-based solutions’) 27 (Section 2.1.3) (medium confidence). 28 29 16.5.2.3.3 Risk to critical physical infrastructure and networks (RKR-C) 30 RKR-C includes risks associated with the breakdown of physical infrastructure and networks which provide 31 goods and services considered critical to the functioning of societies. It encompasses infrastructure systems 32 for energy, water, transportation, telecommunications, health care and emergency response, as well as 33 compound, cascading and cross-boundary risks resulting from infrastructure interdependencies (Birkmann et 34 al., 2016; Fekete, 2019). Critical infrastructures such as transport or energy supply also play a central role in 35 coping with climate risks, especially in acute disaster situations in which the services of transport 36 infrastructure, communication technologies or electricity are particularly needed, despite the fact that these 37 very systems are themselves exposed to disaster impacts (Garschagen et al., 2016; Pescaroli et al., 2018). 38 The major hazards driving such risks are acute extreme events such as cyclones, floods, droughts or fires 39 (high confidence), but cumulative and chronic hazards such as sea level rise (SLR) are also considered. 40 41 RKR-C is considered severe when the functioning of critical infrastructure cannot be secured and maintained 42 against climate change impacts, resulting in the frequent and widespread breakdown of service delivery and 43 eventually a significant rise of detrimental impacts on people (lives, livelihoods and well-being), the 44 economy (including averted growth) or environment (disruption and loss of ecosystems) above historically 45 observed levels. Severity in this RKR is assessed on two levels for (i) direct impacts of climate change on 46 infrastructure assets and networks (e.g., amount of port infrastructure damaged or destroyed by SLR, 47 flooding and storms) on which most of the literature focuses, as well as (ii) indirect and cascading 48 downstream impacts to people, economy and environment (Markolf et al., 2019; Pyatkova et al., 2019; 49 Chester et al., 2020), for which attribution is more difficult and uncertainties tend to be much higher. 50 Overall, the literature with quantified assessments of climate change infrastructure risks remains to be less 51 extensive than for many other risks, particularly with regards to assessments focusing on the Global South. 52 While climate-related changes in hazards are widely considered in the literature, changes in future exposure 53 and vulnerability conditions are often not treated explicitly. In addition, the severity of infrastructure risks 54 also depends on future trends in the capacity to maintain, repair and rebuild infrastructure and adapt it to new 55 hazard intensities (medium evidence, high agreement). These are mostly not quantified in a forward-looking 56
ACCEPTED VERSIO
N
SUBJECT TO FIN
AL EDITS
FINAL DRAFT Chapter 16 IPCC WGII Sixth Assessment Report
Do Not Cite, Quote or Distribute 16-64 Total pages: 173
manner in the literature; however, damage projections (see below) indicate a rapidly rising demand for 1 investment, straining the financial capacity of countries (medium evidence, high agreement). 2 3 (i) Risks related to direct impacts on critical infrastructure would become severe with high warming, current 4 infrastructure development regimes and minimal adaptation (high confidence), and in some contexts even 5 with low warming, current vulnerability and no additional adaptation (medium confidence), with severity 6 defined as infrastructure damage and required maintenance costs exceeding multiple times the current levels. 7 Transport and energy infrastructure in coasts, polar systems and along rivers are projected to face a 8 particularly steep rise in risk, resulting in severe risk even under medium warming (high confidence). Risk in 9 relation to the increasing intensity and frequency of extreme events might become severe before the middle 10 of the century (medium confidence). Damages from multiple climate hazards to transport, energy, industry 11 and social infrastructure in Europe could increase tenfold by the 2080s, from 3.4 € billion annually to date, 12 and 15-fold for transport infrastructure, under Medium warming (A1B, ~3°C by 2100) and with current 13 adaptation levels, even if no further extension of the infrastructure in exposed areas is considered (Forzieri et 14 al., 2018). Under High warming (RCP8.5) in 2100, the percent of roads in the United States that require 15 rehabilitation due to high temperatures and precipitation is expected to increase to 23–33%, relative to 14% 16 in 2100 when no climate change is considered (Mallick et al., 2018). Projections of climate-induced changes 17 in exposure are an incomplete measure of risk but in the absence of other metrics can serve as a proxy for the 18 potential for severe impacts. In the circumpolar Arctic, 14.8% of critical infrastructure assets would be 19 affected by climate change under RCP8.5 by 2050, with lifecycle replacement costs projected to increase by 20 27.7% if infrastructure is to be preserved at current adaptation levels (Suter et al., 2019). Under RCP8.5, the 21 number of ports under high risk will increase from 3.8% in the present day to 14.4% by 2100, as a result of 22 increased coastal flooding and overtopping due to sea level rise, as well as the heat stress impacts of higher 23 temperatures (Izaguirre et al., 2021). In the UK under High warming (4ºC), the number of clean and 24 wastewater treatment sites located in the 1 in 75-year floodplain will increase by a third relative to today by 25 the 2080s under current vulnerability and adaptation levels (Dawson et al., 2018). A global assessment of 26 changing climate and water resources for electricity generation finds considerable reductions in usable 27 hydropower and thermoelectric capacity by 2050 for a range of warming scenarios from Low to High, with 28 absolute declines on average for most (61–74%) of the world’s hydropower resources and monthly 29 maximum reductions above 30% of usable capacity for over two-thirds of 1,427 thermoelectric power plants 30 worldwide (Van Vliet et al., 2016). Many studies find large technical potential for coordinated adaptation-31 mitigation policies in the electricity sector to avoid a significant portion of projected climate change impacts 32 (e.g., a two-thirds reduction, and in some cases fully offset) (Ciscar and Dowling, 2014; Van Vliet et al., 33 2016; Gerlak et al., 2018; Allen-Dumas et al., 2019). 34 35 (ii) Studies quantifying the indirect impacts of infrastructure failure on lives, livelihoods and economies are 36 still rare but emerging, suggesting that risks would become severe in many contexts globally with high 37 warming, current vulnerability and no additional adaptation (medium confidence). Severity in this context is 38 defined as the potential to disrupt the lives, livelihoods and well-being of a significantly increased proportion 39 of the population and to significantly forestall economic growth and development potential. Global risks to 40 air travel from SLR, expressed in terms of expected annual route disruptions, could increase by a factor of 41 between 17 and 69 by 2100 under the 1.5 ◦C and the 95th percentile value of the RCP8.5 SLR scenario, 42 respectively (Yesudian and Dawson, 2021). By 2050, up to 185,000 airline passengers per year may be 43 grounded due to extreme heat (48°C) if no additional adaptation is taken, roughly 23 times more than today 44 (McKinsey Global Institute, 2020). In Africa, under RCP8.5 and without additional adaptation a 250% 45 increase in disruption time of the transport network is expected by 2050 due to extreme temperatures, a 76% 46 increase due to precipitation, and 1400% increase due to flooding (Cervigni et al., 2015). On the Dawlish 47 railway section (UK), the number of days with line restrictions are set to increase by up to 1170%, to as 48 many as 84–120 per year by 2100 due to 0.8m SLR with High warming (Dawson et al., 2016). Next to the 49 limited number of projections or scenarios of indirect impacts, additional inferences from studies focusing on 50 past and current impacts can be drawn. Already today, climate-related impacts on transport and energy 51 infrastructure reach far beyond the direct impacts on physical infrastructure, triggering indirect impacts on, 52 for example, health and income (medium confidence). A case study of future flood hazard in Europe found 53 that the indirect impact of a power outage on the local economy is six to eight times greater than the direct 54 flood damage and asset repair costs, due to the interruption of daily economic activity (Karagiannis et al., 55 2019). In low and middle-income countries, the annual costs from infrastructure disruptions reach up to 300 56 billion USD for firms and 90 billion USD for private households, with natural hazards such as floods being 57
ACCEPTED VERSIO
N
SUBJECT TO FIN
AL EDITS
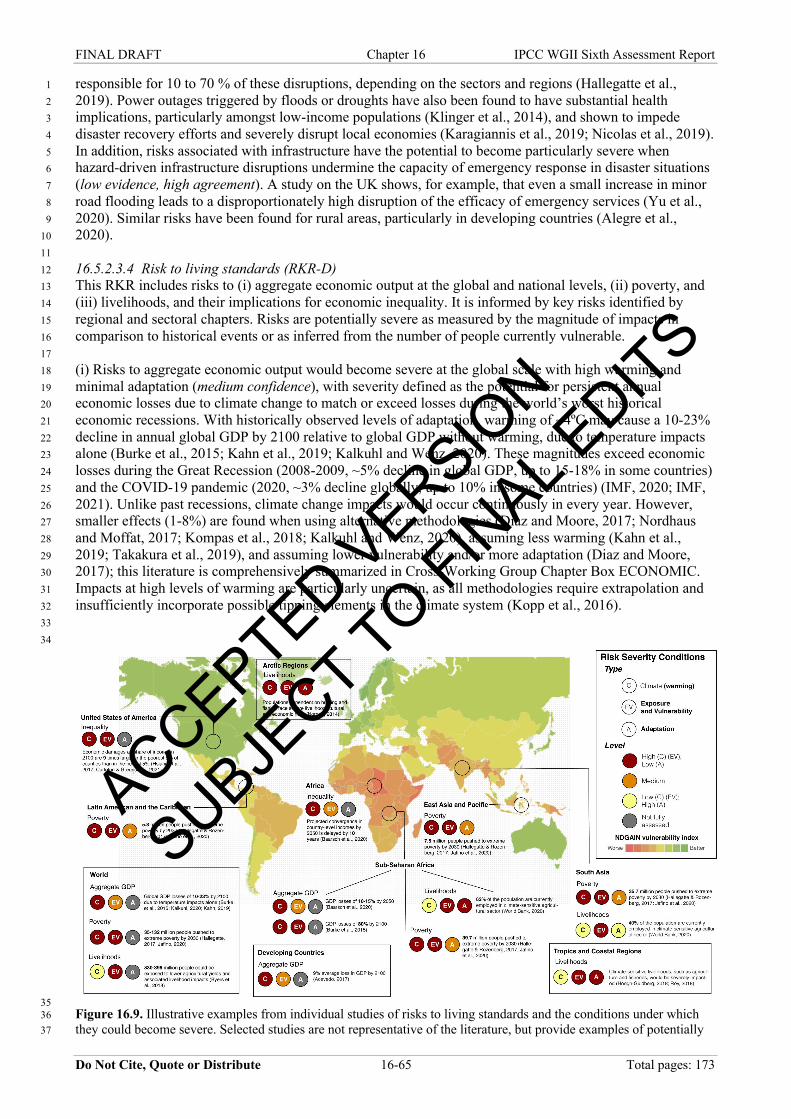
FINAL DRAFT Chapter 16 IPCC WGII Sixth Assessment Report
Do Not Cite, Quote or Distribute 16-65 Total pages: 173
responsible for 10 to 70 % of these disruptions, depending on the sectors and regions (Hallegatte et al., 1 2019). Power outages triggered by floods or droughts have also been found to have substantial health 2 implications, particularly amongst low-income populations (Klinger et al., 2014), and shown to impede 3 disaster recovery efforts and severely disrupt local economies (Karagiannis et al., 2019; Nicolas et al., 2019). 4 In addition, risks associated with infrastructure have the potential to become particularly severe when 5 hazard-driven infrastructure disruptions undermine the capacity of emergency response in disaster situations 6 (low evidence, high agreement). A study on the UK shows, for example, that even a small increase in minor 7 road flooding leads to a disproportionately high disruption of the efficacy of emergency services (Yu et al., 8 2020). Similar risks have been found for rural areas, particularly in developing countries (Alegre et al., 9 2020). 10 11 16.5.2.3.4 Risk to living standards (RKR-D) 12 This RKR includes risks to (i) aggregate economic output at the global and national levels, (ii) poverty, and 13 (iii) livelihoods, and their implications for economic inequality. It is informed by key risks identified by 14 regional and sectoral chapters. Risks are potentially severe as measured by the magnitude of impacts in 15 comparison to historical events or as inferred from the number of people currently vulnerable. 16 17 (i) Risks to aggregate economic output would become severe at the global scale with high warming and 18 minimal adaptation (medium confidence), with severity defined as the potential for persistent annual 19 economic losses due to climate change to match or exceed losses during the world’s worst historical 20 economic recessions. With historically observed levels of adaptation, warming of ~4ºC may cause a 10-23% 21 decline in annual global GDP by 2100 relative to global GDP without warming, due to temperature impacts 22 alone (Burke et al., 2015; Kahn et al., 2019; Kalkuhl and Wenz, 2020). These magnitudes exceed economic 23 losses during the Great Recession (2008-2009, ~5% decline in global GDP, up to 15-18% in some countries) 24 and the COVID-19 pandemic (2020, ~3% decline globally, up to 10% in some countries) (IMF, 2020; IMF, 25 2021). Unlike past recessions, climate change impacts would occur continuously in every year. However, 26 smaller effects (1-8%) are found when using alternative methodologies (Diaz and Moore, 2017; Nordhaus 27 and Moffat, 2017; Kompas et al., 2018; Kalkuhl and Wenz, 2020), assuming less warming (Kahn et al., 28 2019; Takakura et al., 2019), and assuming lower vulnerability and/or more adaptation (Diaz and Moore, 29 2017); this literature is comprehensively summarized in Cross-Working Group Chapter Box ECONOMIC. 30 Impacts at high levels of warming are particularly uncertain, as all methodologies require extrapolation and 31 insufficiently incorporate possible tipping elements in the climate system (Kopp et al., 2016). 32 33 34
35 Figure 16.9. Illustrative examples from individual studies of risks to living standards and the conditions under which 36 they could become severe. Selected studies are not representative of the literature, but provide examples of potentially 37
ACCEPTED VERSIO
N
SUBJECT TO FIN
AL EDITS
FINAL DRAFT Chapter 16 IPCC WGII Sixth Assessment Report
Do Not Cite, Quote or Distribute 16-66 Total pages: 173
severe risks to aggregate economic output, poverty, and livelihoods. High, medium, and low levels of warming, 1 exposure/vulnerability, and adaptation are defined as in Figure 16.10. 2 3 4 Annual economic output losses in developing countries could exceed the worst country-level losses during 5 historical economic recessions (medium confidence). Assuming global warming of ~4ºC by 2100, historical 6 adaptation levels, and high vulnerability, losses across sub-Saharan Africa may reach 12% of GDP by 2050 7 (Baarsch et al., 2020) and 80% by 2100 (Burke et al., 2015), and ~9% on average across developing 8 countries by 2100 (Acevedo et al., 2017). The largest estimates are debated and depend on assumptions 9 about development trends, adaptive capacity, and whether temperature impacts the level or growth rate of 10 economic activity (Kalkuhl and Wenz, 2020). Severe risks are more likely in (typically hotter) developing 11 countries because of nonlinearities in the relationship between economic damages and temperature (Burke et 12 al., 2015; Acevedo et al., 2017). These risks are highest in scenarios and countries with: a large portion of the 13 workforce employed in highly exposed industries (Acevedo et al., 2017); a high concentration of population 14 and economic activity on coastlines (Hsiang and Jina, 2014; Acevedo et al., 2017); and an increase in the 15 frequency or intensity of disasters triggered by natural hazards (Berlemann and Wenzel, 2018; Botzen et al., 16 2019). Whether baseline economic growth may help avoid severe future risks is highly uncertain (Dell et al., 17 2012; Burke et al., 2015; Acevedo et al., 2017; Deryugina and Hsiang, 2017). 18 19 (ii) Under medium warming pathways, climate change risks to poverty would become severe if vulnerability 20 is high and adaptation is low (limited evidence, high agreement). We define poverty in terms of absolute 21 consumption levels and define severity as tens to hundreds of millions of additional people in poverty 22 relative to the number without change (globally) or an absolute increase in the number of people living in 23 poverty compared to today (nationally or locally). This global impact is comparable to the effect of the 2007 24 food price shock (De Hoyos and Medvedev, 2009) and the 2020 COVID-19 pandemic (World Bank, 2020) 25 and can be compared to about 700 million in poverty in 2017, down from 1.9 billion in 1990 (World Bank, 26 2020). 27 28 In a high-vulnerability development pathway, climate change in 2030 could push 35-132 million people into 29 extreme poverty, in addition to the people already in poverty assuming climate is unchanged (disregarding 30 impacts from natural variability; Hallegatte and Rozenberg, 2017; Jafino et al., 2020). In a low warming 31 pathway, risks from mitigation costs could also be severe if no progressive redistribution from carbon pricing 32 revenues is applied (Soergel et al., 2021). At the national level there is limited evidence of climate change 33 causing an absolute increase in poverty (e.g., absolute increase of ~1-2%/yr through 2040, Montaud et al., 34 2017). Potentially severe risks to poverty are also supported by (1) the observed impacts of past disasters 35 (Winsemius et al., 2018; Hallegatte et al., 2020; Rentschler and Melda, 2020) and previous crises such as 36 food price shocks (Ivanic and Martin, 2008) or current diseases (WHO, 2018) on poor people and on 37 poverty; (2) the expectation that these events will become more intense or frequent in some regions (WGI 38 Chapter 12, Ranasinghe et al., 2021); and (3) population growth and the low adaptive and coping capacities 39 of the poor (Leichenko and Silva, 2014; Huynh and Stringer, 2018; Thomas et al., 2020). This literature 40 provides indirect evidence that climate change will keep many people poor and may cause more than tens of 41 millions to fall into poverty (low evidence, high agreement). 42 43 (iii) Climate change poses severe risks to livelihoods at low levels of warming, high exposure/vulnerability, 44 and low adaptation in climate-sensitive regions, ecosystems, and economic sectors (high confidence), where 45 severity refers to the disruption of livelihoods for tens to hundreds of millions of additional people (Arnell 46 and Lloyd-Hughes, 2014; Liu et al., 2018). More widespread severe risks would occur at high levels of 47 warming (with high exposure/vulnerability and low adaptation) where there is additional potential for one or 48 more social or ecological tipping points to be triggered (Cai et al., 2015; Cai et al., 2016b; Kopp et al., 2016; 49 Steffen et al., 2018; Lenton et al., 2019), and for severe impacts on livelihoods to cascade from relatively 50 more climate-sensitive to relatively less climate-sensitive sectors and regions (medium confidence) 51 (Lawrence et al., 2020). Severity assessment is based on the current magnitude of exposure and vulnerability 52 across multiple social and ecological systems, projected future exposure and vulnerability, and the rate at 53 which hazard frequency or intensity is expected to increase (Otto et al., 2017; Roy et al., 2018; Li et al., 54 2019, Section 8.5). Without effective adaptation measures, regions with high dependence on climate-55 sensitive livelihoods – particularly agriculture and fisheries in the tropics and coastal regions – would be 56 severely impacted even at low levels of warming (high confidence) (Hoegh-Guldberg et al., 2018b; Roy et 57
ACCEPTED VERSIO
N
SUBJECT TO FIN
AL EDITS
FINAL DRAFT Chapter 16 IPCC WGII Sixth Assessment Report
Do Not Cite, Quote or Distribute 16-67 Total pages: 173
al., 2018). For example, it is estimated that 330–396 million people could be exposed to lower agricultural 1 yields and associated livelihood impacts at warming between 1.5 and 2ºC (Byers et al., 2018). Risks to the 2 200 million people with livelihoods derived from small-scale fisheries would also be severe, given 3 sensitivity to ocean warming, acidification, and coral reef loss occurring beyond 1.5ºC (Cheung et al., 2018b; 4 Froehlich et al., 2018; Free et al., 2019; Barnard et al., 2021). Livelihoods in highly exposed locations, such 5 as small-island developing states, low-lying coastal areas, arid or semi-arid regions, the Arctic, and urban 6 informal settlements or slums, are particularly vulnerable (Ford et al., 2015c; Hagenlocher et al., 2018; 7 Ahmadalipour et al., 2019; Tamura et al., 2019). Within populations, the poor, women, children, the elderly, 8 and indigenous populations are especially vulnerable due to a combination of factors including gendered 9 divisions of paid and/or unpaid labour, as well as barriers in access to information, skills, services, or 10 resources (Bose, 2017; Thomas et al., 2019b; Anderson and Singh, 2020; Adzawla and Baumüller, 11 2021)(high confidence). Future structural transformation could moderate risk severity by improving adaptive 12 capacity, creating livelihoods in less climate-sensitive sectors, or by enabling sustainable migration to less 13 climate-sensitive locations (Henderson et al., 2017; Roy et al., 2018). However, successful risk moderation 14 would depend upon simultaneous avoidance of both climate change-related and mitigation-related (Doelman 15 et al., 2019; Fujimori et al., 2019; Doelman et al., 2020) or maladaptation-related risks (Magnan et al., 2016; 16 Benveniste et al., 2020; Schipper, 2020). 17 18 Climate change also could increase income inequality between countries (high confidence) as well as within 19 them (medium evidence, high agreement) that result from and exacerbate impacts on aggregate economic 20 activity, poverty, and livelihoods. Increasing inequality implies larger impacts on the least well-off, threatens 21 their ability to respond to climate hazards, compromises basic principles of fairness and established global 22 development goals, and potentially threatens the functioning of society and long-term progress (Roe and 23 Siegel, 2011; Cingano, 2014; van der Weide and Milanovic, 2018). There is evidence that warming has 24 slowed down the convergence in between-country income in recent decades (Diffenbaugh and Burke, 2019). 25 Future impacts may halt or even reverse this trend during this century due to high sensitivity of developing 26 economies (Burke et al., 2015; Pretis et al., 2018; Baarsch et al., 2020), although projections depend as much 27 or more on future socioeconomic development pathways and mitigation policies as on warming levels 28 (Takakura et al., 2019; Harding et al., 2020; Taconet et al., 2020). Within countries, studies that find adverse 29 impacts on low-income groups imply an increase in inequality (Hallegatte and Rozenberg, 2017; Hsiang et 30 al., 2017), although evidence for long-term climate impacts on within-country inequality at global scale 31 remains limited. 32 33 16.5.2.3.5 Risk to human health (RKR-E) 34 This RKR includes (i) mortality from heat, and morbidity and mortality from (ii) vector-borne diseases and 35 (iii) waterborne diseases. It builds on KRs identified primarily in Chapter 7 and health risks in regional 36 chapters. 37 38 A severe risk to health is the potential for a widespread, substantial worsening of health conditions due to 39 climate change. We measure severity in terms of the magnitude of mortality and morbidity. We consider a 40 severe mortality impact to be a sustained increase in the crude mortality rate (CMR) of more than about 2-4 41 deaths per 10,000 people per year, or 2-5% over the current background rate. This range of increase is 42 consistent with current mortality impacts with substantial global effects, including traffic fatalities (CMR of 43 1.6/10,000/yr, IHME) and the COVID-19 pandemic (4/10,000/yr, as of April, 2021, expressed as an 44 annualized rate (Ritchie, Hannah et al., 2021). We use these global rates as thresholds in all cases, 45 recognizing that they reflect substantial variation across regions and sub-populations (other points of 46 comparison are included in Table SM16.13). Morbidity impacts are measured in numbers of disease cases or 47 hospital admissions. We find that severe health impacts are projected to occur for particular sub-populations 48 and regions where vulnerability is currently high and is assumed to persist into the future; we focus our 49 assessment on these cases. In other cases, literature is either inadequate or does not support severe outcomes. 50 51 (i) Risks of heat-related mortality would become severe at global and regional scales with high levels of 52 warming and vulnerability (high confidence). Under these conditions (SSP3-8.5), accounting for adaptation, 53 heat mortality would increase the global CMR by up to 2-7/10,000/yr by 2100 (Carleton et al., 2020). For 54 example, the US would experience a CMR increase of 2-4/10,000/yr by the end of the century (medium 55 vulnerability without adaptation, and recent vulnerability with adaptation, respectively) (Weinberger et al., 56 2017; Shindell et al., 2020). Also assuming no adaptation and recent vulnerability, every population of the 57
ACCEPTED VERSIO
N
SUBJECT TO FIN
AL EDITS
FINAL DRAFT Chapter 16 IPCC WGII Sixth Assessment Report
Do Not Cite, Quote or Distribute 16-68 Total pages: 173
world would experience an increase of 2-10 percentage points in the proportion of deaths attributable to heat 1 by the end of the century (RCP8.5). Harmful conditions for health are expected to increase in frequency and 2 intensity over all land areas along with the rising temperatures in the coming decades (Pal and Eltahir, 2016; 3 Russo et al., 2017; Ranasinghe et al., 2021; Saeed et al., 2021; Schwingshackl et al., 2021). Projections of 4 exposure are an incomplete measure of risk but suggest the potential for severe impacts. For example, the 5 percent of global population exposed to deadly heat stress would increase from today's 30% to 48-74% by 6 the end of the century depending on level of warming and population distribution (Mora et al., 2017). 7 Projected impacts are larger if exposure and/or vulnerability increases due to ageing of the population or 8 increased inequality (Weinberger et al., 2017; Chen et al., 2020a; IPCC, 2021a) and with limited adaptation 9 capacity (e.g., poor infrastructure, limited air conditioning, few medical and public health resources) (Table 10 SM16.4) (Carleton et al., 2020). Higher risks are also expected in urban areas due to hazard amplification 11 (i.e., urban heat island effect) and in highly dense settlements with other environmental hazards such as air 12 pollution (Zhao et al., 2018; Sera et al., 2019). 13 14 (ii) Risks of vector-borne disease would become severe with high warming and current vulnerability, 15 concentrated in children and in sensitive regions (medium confidence). Severity is defined by regionally 16 substantial numbers of additional malaria deaths, disease cases, and episodic hospitalisation demands (for 17 dengue). 18 19 With high warming, the CMR for malaria among children under the age of one year could increase by 5.2-20 10.1/10,000/yr in Africa under current vulnerability levels. This estimate assumes a net increase of 70-130 21 million more people exposed to potential disease transmission due to climate change in a high warming 22 scenario (RCP8.5, end of century)(Caminade et al., 2014; Colón-González et al., 2018; Ryan et al., 2020), 23 representing a 14-27% increase in the current population at risk (Ryan et al., 2020), and assumes children 24 under 1 year of age are facing the same crude mortality in the future as for the African region today (Table 25 SM16.13). The largest increase is observed in Eastern Africa, where the population exposed could nearly 26 double by 2080 (Ryan et al., 2020) without accounting for population growth, driven mainly by changes 27 among previously unexposed populations at higher altitude areas (Colón-González et al., 2018). Actual 28 future disease burden of malaria will be highly sensitive to regional socio-economic development and the 29 effectiveness of malaria intervention programs. 30 31 For dengue, with high warming and current levels of vulnerability there could be as many as a doubling of 32 cases and hospital admissions per year globally, relative to today, driven by both warming and population 33 growth. These estimates are derived by assuming similar relative incidence rates as today (Shepard et al., 34 2016) combined with projections of a more than doubling of the population exposed to potential disease 35 transmission by the end of the century in a high warming scenario (RCP8.5), although much of this increase 36 is driven by population growth (Colón-González et al., 2018; Monaghan et al., 2018; Messina et al., 2019). 37 There are around 3 billion people exposed to dengue today. 38 39 (iii) Climate change would lead to severe risks of morbidity and mortality caused by waterborne diseases, 40 particularly for diarrhoea in children in many lower- and middle-income countries (LMICs) and where 41 vulnerability remains high (medium confidence). The global CMR for diarrhoea is 1.98 for all ages, but 42 varies by region and age group, reaching as high as 53 for <1 year olds in Africa (Institute for Health Metrics 43 and Evaluation (IHME), 2021) . In these vulnerable populations even a small percentage increase can lead to 44 substantial additional morbidity and mortality. For example, assuming no change in vulnerability or 45 population, an increase in diarrhoea mortality of only 5% over 2019 baseline rates would create a severe risk 46 (CMR of 2.0) for children under the age of 1 in the WHO Africa (AFRO) region. This percent increase due 47 to climate change is plausible since diarrhoea incidence increases of 7% (95% confidence interval 3-10%) 48 are associated with a 1ºC increase in ambient temperature (WHO, 2014; Carlton et al., 2016), and diarrhoea 49 is positively associated with heavy rainfall and flooding events (Levy et al., 2016), expected in some regions 50 (WGI). Assuming vulnerability remains the same as today, mortality and morbidity rates would increase 51 equivalently. 52 53 However, risks will be highly dependent on development trajectories, given that waterborne disease 54 transmission is exacerbated by lack of clean drinking water and sanitation systems, inadequate food safety 55 and hygiene conditions, lack of flood and drought protections, and interactions with other risks such as 56 cholera outbreaks, food insecurity, and infrastructure damage. Climate change threatens the progress that has 57
ACCEPTED VERSIO
N
SUBJECT TO FIN
AL EDITS
FINAL DRAFT Chapter 16 IPCC WGII Sixth Assessment Report
Do Not Cite, Quote or Distribute 16-69 Total pages: 173
been made toward reducing the burden of diarrhea. For example, in Sub-Saharan Africa, while overall 1 diarrhea rates are expected to continue to decline (GBD 2016 Diarrhoeal Disease Collaborators, 2018), 2 warming in 2030 (relative to the late 20th century) is projected to lead to diarrheal deaths in children under 3 15 equivalent to a CMR increase of 0.56/10,000/yr (based on population projections for the region and age 4 group (UN, 2020)) (WHO, 2014). In China, by 2030 climate change could delay progress toward reducing 5 waterborne disease burden by 8-85 months (Hodges et al., 2014).This RKR includes (i) mortality from heat, 6 and morbidity and mortality from (ii) vector-borne diseases and (iii) waterborne diseases. It builds on KRs 7 identified primarily in Chapter 7 and health risks in regional chapters. 8 9 16.5.2.3.6 Risk to food security (RKR-F) 10 Climate change affects food security primarily through impacts on food production, including crops, 11 livestock, and fisheries, as well as disruptions in food supply chains, linked to global warming, drought, 12 flooding, precipitation variability and weather extremes (Myers et al., 2017; FAO et al., 2018; Mbow et al., 13 2019). This RKR builds on Key Risks identified primarily in the Food, Fibre, and other Ecosystem Products 14 Chapter, some sectoral (Health), and regional (Africa, Australasia, Central and South America, North 15 America) chapters, as well as SR15, SRCCL and SROCC. 16 17 The severity of the risk to food security is defined here using a combination of criteria including the 18 magnitude and likelihood of adverse consequences, affecting 10s to 100s of millions of people, timing of the 19 risk and ability to respond to the risk. In this assessment, we use the number of undernourished people as a 20 proxy outcome of these dimensions and their multiple interactions. 21 22 Climate change will pose severe risks in terms of increasing the number of undernourished people, affecting 23 tens to hundreds of million people under High vulnerability and High warming, particularly among low-24 income populations in developing countries (high confidence). Extreme weather events will increase risks of 25 undernutrition even on a regional scale, via spikes in food price and reduced income (high confidence) (FAO 26 et al., 2018, Hickey and Unwin, 2020; Mbow et al., 2019). The timing of these impacts and our ability to 27 respond to them vary based on the level of GHG emissions and Shared Socioeconomic Pathways (SSP). 28 Under a low vulnerability development pathway (SSP1), climate change starts posing a moderate risk to food 29 security above 1ºC of global warming (i.e., impacts become detectable and attributable to climate-related 30 factors), while beyond 2.5ºC the risk becomes high (widespread impacts on larger numbers or proportion of 31 population or area, but with the potential to adapt or recover) (Hurlbert et al., 2019). Under high 32 vulnerability-high warming scenario (i.e., SSP3-RCP6.0), up to 183 million additional people are projected 33 to become undernourished in low income countries due to climate change by 2050 (Mbow et al., 2019). 34 Climate-related changes in food availability and diet quality are estimated to result in a crude mortality rate 35 of about 54 deaths per million people with about 2ºC warming by 2050 (SSP2, RCP8.5), most of them 36 projected to occur in South and East Asia (67-231 deaths per million depending on the country) (Springmann 37 et al., 2016). In a medium vulnerability-high warming scenario (SSP2, RCP6.0), Hasegawa et al. (2018) 38 projects that the number of undernourished people increases by 24 million in 2050, compared to outcomes 39 without climate change and accounting for the CO2-fertilization effect. This number increases by around 78 40 million in a low warming scenario (RCP2.6) accounting for the impacts of both climate change and 41 mitigation policies. Caveats to these modelling studies are that most models (crop models in particular) are 42 designed for long-term change in climate but not suited to project the impacts of short-term extreme events. 43 The inclusion of adaptation measures into modeling estimates remains selective and partial. 44 45 Climate change risks of micronutrient deficiency will become severe in high vulnerability development 46 pathways and in the absence of societal adaptation, leading to hundreds of millions of additional people 47 lacking key nutrients for atmospheric CO2 levels above 500 ppm (high confidence) (Myers et al., 2017; 48 Nelson et al., 2018; Mbow et al., 2019). For example, concentration of many micronutrients (e.g., 49 phosphorus, potassium, calcium, sulphur, magnesium, iron, zinc, copper, and manganese) can decrease by 5-50 10% under atmospheric CO2 concentrations of 690 ppm (3.5ºC warming). The decline in zinc content is 51 projected to lead to an additional 150-220 million people affected by zinc deficiency with increases in 52 existing deficiencies in more than 1 billion people (Myers et al., 2017). Similarly, decrease in protein and 53 micronutrient content in rice due to a higher CO2 concentration (568 to 590 ppm) can lead to 600 million 54 people with rice as a staple at risk of micronutrient deficiency by 2050 (Zhu et al., 2018). Additionally, the 55 impact on protein content of increased CO2 concentration (> 500 ppm) can lead an additional 150 million 56
ACCEPTED VERSIO
N
SUBJECT TO FIN
AL EDITS
FINAL DRAFT Chapter 16 IPCC WGII Sixth Assessment Report
Do Not Cite, Quote or Distribute 16-70 Total pages: 173
people with protein deficiency by 2050 (within the total of 1.4 billion people with protein deficiency) in 1 comparison to the scenario without increased CO2 concentration (Medek et al., 2017). 2 3 16.5.2.3.7 Risk to water security (RKR-G) 4 Water security encompasses multiple dimensions: water for sanitation and hygiene, food production, 5 economic activities, ecosystems, water-induced disasters, and use of water for cultural purposes (Chapter 4; 6 Box 4.1; Section 4.6.1). Water security risks are a combination of water-related hazards such as floods, 7 droughts, and water quality deterioration, and exposure of vulnerable groups exposed to too little, too much, 8 or contaminated water. Reasons for these can include both environmental conditions and issues of safety and 9 access influenced by effectiveness of water governance (Sadoff et al., 2020). These are manifest through loss 10 of lives, property, livelihoods and culture, and impacts on human health and nutrition, ecosystems and water-11 related conflicts which in turn can drive forced human displacement. 12 13 This RKR focuses on three types of risks with the potential to become severe: those associated with water 14 scarcity, those driven by water-related disasters, and those impacting indigenous and traditional cultures and 15 ways of life. Risk to water security constitutes a potentially severe risk because climate change could impact 16 the hydrologic cycle in ways that would lead to substantial consequences for the health, livelihoods, 17 property, and cultures of large numbers of people. For those associated with water scarcity, ‘severe’ refers to 18 magnitude (number of people in areas where water scarcity falls below recognised thresholds for adequate 19 water supply per capita), along with the likelihood of unforeseen increases in water scarcity that outpace the 20 ability to prepare for the increased risk by putting in place new large-scale infrastructure within the required 21 timescale. For those associated with extreme events, ‘severe’ refers to magnitude (numbers of people 22 affected, including deaths, physical health impacts including disease, mental health impacts, loss of 23 livelihoods, loss of or damage to property) and timing (for example, events coinciding with other stresses, 24 e.g., a pandemic occurring at a time when local infrastructures are weakened by an extreme weather event). 25 Important water-related extreme events include river flooding caused by heavy and/or prolonged rainfall, 26 glacial lake outburst floods, and droughts. For those impacting cultures, ‘severe’ refers to the loss of key 27 aspects of traditional ways of life. This includes consequences of the above two key risks. 28 29 Risks associated with water scarcity have the potential to become severe based on projections of large 30 numbers of people becoming exposed to low levels of water availability per person, where ‘water 31 availability’ includes fresh water in the landscape, including soil moisture and streamflows, available for all 32 uses including agriculture as a dominant sector. Approximately 1.6 billion people currently experience 33 ‘chronic’ water scarcity, defined as the availability of less than 1000 m3 of renewable sources of fresh water 34 per person per year (Gosling and Arnell, 2016). In this context, we define a severe outcome as an additional 35 1 billion people experiencing ‘chronic’ water scarcity, relating to all uses of water, representing an increase 36 of a magnitude comparable with current levels. The global number of people experiencing chronic water 37 scarcity is projected to increase by approximately 800 million to 3 billion for 2°C global warming, and up to 38 approximately 4 billion for 4°C global warming, considering the effects of climate change alone, with 39 present-day population (Gosling and Arnell, 2016). Severe outcomes are projected to occur even with no 40 changes in exposure: present-day exposure is defined here as ‘medium’ since either an increase or decrease 41 in exposure could be possible. Vulnerability is not quantified in the literature assessed here, so in this 42 assessment it is considered that severe outcomes could occur with present-day levels of vulnerability, again 43 defined here as ‘medium’. Particularly severe outcomes (i.e., the high end of these ranges) are driven by 44 regional patterns of climate change bringing severe reductions in precipitation and/or high levels of 45 evapotranspiration in the most highly-populated regions, leading to very substantial reductions in water 46 availability compared to demand. There is strong consensus across models that water scarcity is projected to 47 increase across substantial parts of the world even though projections disagree on which specific areas would 48 see this impact. Moreover, a projected decrease in water scarcity in some regions does not prevent the 49 increase in water scarcity in other regions becoming severe. Hence there is high confidence that risks to 50 water scarcity have the potential to become severe due to climate change. Consequences of water scarcity 51 include potential competition and conflicts between water users (Vanham et al., 2018), damaging 52 livelihoods, hindering socio-economic development, and reducing human well-being, for example through 53 malnutrition resulting from inadequate water supplies leading to long-term health impacts such as child 54 stunting (Cooper et al., 2019). The avoidance of these consequences at high levels of water scarcity would 55 require transformational adaptations including large-scale interventions such as dams and water transfer 56 infrastructure (Greve et al., 2018). Since these require many years or even decades for planning and 57
ACCEPTED VERSIO
N
SUBJECT TO FIN
AL EDITS
FINAL DRAFT Chapter 16 IPCC WGII Sixth Assessment Report
Do Not Cite, Quote or Distribute 16-71 Total pages: 173
construction, and are also costly and irreversible and can potentially lead to lock-in and maladaptation, the 1 potential for inadequate policy decisions made in the context of high uncertainties in regional climate 2 changes brings the risk of a shortfall in adaptation. Around 2050, at approximately 2°C global warming, the 3 risk of a substantial adaptation shortfall and hence severe outcomes for water scarcity have a relatively high 4 likelihood across large parts of the southern USA and Mexico, northern Africa, parts of the Middle-East, 5 northern China, and southern Australia, as well as many parts of Northwest India and Pakistan (Greve et al., 6 2018). 7 8 Risks associated with water-related extreme events and disasters have the potential to become severe based 9 on projections of large numbers of people or high values of assets being affected. The risks to people from 10 disasters can often only be quantified in terms of the hazard and exposure (the number of people affected), 11 rather than the full consequences such as number of deaths, injuries or other health outcomes, as these often 12 depend on complex or unpredictable factors such the effectiveness of emergency and humanitarian responses 13 or the access to healthcare. With approximately 50 million people per year currently affected by flooding 14 (Alfieri et al., 2017), we define severe outcomes as more than 100 million people affected by flooding. At 15 2°C global warming, between approximately 50 million and 150 million people are projected to be affected 16 by flooding, with figures rising to 110 million to 330 million at 4°C global warming. These projections 17 assume present-day population and no additional adaptation, so no changes in exposure. Increased flood risk 18 is projected by the WHO to lead to an additional 48,000 deaths of children under 5 years due to diarrhoea by 19 2030, with Sub-Saharan Africa impacted the most (WHO, 2014). Other consequences of floods that already 20 occur include deaths by drowning, loss of access to fresh water, vector-borne diseases, mental health 21 impacts, loss of livelihoods, and loss of or damage to property. Many of these consequences depend on the 22 vulnerability of individuals, households or communities to flooding impacts, for example through the 23 presence or absence of measures to safeguard health and livelihoods, such as through infrastructure services, 24 insurance or community support. The risks associated with these consequences could increase if there were 25 no local adaptations to counter the effect of increased levels of hazard by reducing exposure and/or 26 vulnerability. Climate-related changes to extreme events that would lead to these severe outcomes: increased 27 frequency and/or magnitude of river floods of flash floods due to heavy or long-lasting precipitation, rapid 28 snowmelt, or catastrophic failure of glacial lake moraine dams. These climate conditions are projected to 29 increase with global warming. 30 31 Risks to cultural uses of water can become severe if there are permanent loss of aspects of communities’ 32 cultures due to changes in water, including loss of areas of ice or snow with spiritual meanings, loss of 33 culturally-important places of access to such places, and loss of culturally-important subsistence practices 34 including by indigenous people (Chapter 4). This includes mountain regions where changes in the 35 cryosphere are having profound impacts (CCP5). In these cases, severe outcomes would be defined locally 36 rather than globally. Communities that lost a dominant environmental characteristic deeply associated with 37 its cultural identity would be considered to be severely impacted. For example, due to the central role that 38 travel on sea ice plays in the life of Inuit communities, providing freedom and mental wellbeing, loss of sea 39 ice can be argued to represent environmental dispossession of these communities (Durkalec et al., 2015). 40 Traditional ways of life are therefore threatened and resulting changes would be transformative rather than 41 adaptive. Similarly, changes in streamflow affecting the availability of species for traditional hunting can 42 also negatively impact indigenous communities (Norton-Smith et al.). Such changes are already being seen 43 at current levels of warming, but studies remain somewhat limited in number, so this assessment is assigned 44 medium confidence due to medium evidence and medium agreement. WG1 conclude that it is virtually 45 certain that further warming will lead to further reductions in Northern Hemisphere snow cover and mass 46 loss in individual glacier regions is projected to be between approximately 30% and 100% by 2100 under 47 high-warming scenarios (Chapter 4). Streamflows are projected to change in most major river basins 48 worldwide by several tens of percent at 4°C global warming (Chapter 4). 49 50 There is strong potential for increases in water scarcity, flooding, loss of snow and ice and changes in water 51 bodies to lead to severe outcomes such as deaths from water-related diseases, drowning and starvation, long-52 term health impacts arising from malnutrition and diseases, loss of property, loss of existence or access to 53 places of cultural significance, loss of livelihoods and loss of aspects of culture especially for indigenous 54 people with traditional lifestyles. The numbers of people affected are projected to range from hundreds of 55 millions to several billion, depending on the level of global warming and socio-economic futures. A key 56 aspect of the risk is the high uncertainty in future regional precipitation changes in many regions of high 57
ACCEPTED VERSIO
N
SUBJECT TO FIN
AL EDITS
FINAL DRAFT Chapter 16 IPCC WGII Sixth Assessment Report
Do Not Cite, Quote or Distribute 16-72 Total pages: 173
vulnerability, including the potential for large and highly-impactful changes, for which it may not be 1 possible to provide adaptation measures before they become needed, leading to a high likelihood of 2 adaptation deficits. 3 4 16.5.2.3.8 Risks to peace and to human mobility (RKR-H) 5 This RKR includes risks to peace within and among societies from armed conflict as well as risks to human 6 mobility, epitomized by involuntary migration and displacement within and across state borders and 7 involuntary immobility. Breakdown of peace and the inability of people to choose to move or stay challenge 8 core elements of human security (Adger et al., 2014). Risks to peace also inform the agency and viability of 9 mobility decisions. However, evidence does not indicate that human mobility constitutes a general risk to 10 peace. 11 12 Breakdown of peace, materialized as overt or covert violence across social and spatial scales, constitutes a 13 key risk because of its potential to cause widespread loss of life, livelihood, and wellbeing. Such impacts are 14 considered severe if they result in at least 1,000 excess battle-related deaths in a country in a year. This 15 threshold is consistent with the conventional definition of war (Pettersson and Öberg, 2020). However, 16 because armed conflict routinely causes significant material destruction, triggers mass displacement, 17 threatens health and food security, and undermines economic activity and living standards (Baumann and 18 Kuemmerle, 2016; FAO et al., 2017; de Waal, 2018), risks to peace can be considered severe also when 19 conflict has cascading effects on other aspects of wellbeing and amplifies vulnerability to other RKRs. 20 Beyond the magnitude of such impacts, the rapidity with which armed conflict can escalate and the 21 challenges of ending violence once it has broken out imply potentially very limited time and ability to 22 respond for populations at risk. 23 24 Mobility is a universal strategy for pursuing wellbeing and managing household risks (Section 7.2.6; Cross-25 Chapter Box MIGRATE in Chapter 7,UN, 2018) and, where it occurs in a safe and orderly fashion, can 26 reduce social inequality and facilitate sustainable development (Franco Gavonel et al., 2021). Involuntary 27 mobility constitutes a key risk because it implies reduced human agency with high potential for significant 28 economic losses and non-material costs, an unequal gender burden, and amplified vulnerability to other 29 RKRs (Schwerdtle et al., 2018; Adger et al., 2020; Maharjan et al., 2020; Piggott-McKellar et al., 2020). 30 Climate change also may erode or overwhelm human capacity to use mobility as a coping strategy, 31 producing involuntarily immobile populations (Adams, 2016). A severe impact is when a large share of an 32 affected population is forcibly displaced or prevented from moving, relative to normal mobility patterns, at 33 local to global scale. However, because mobility may be a favourable mechanism for reducing risk or an 34 adverse outcome of risk, depending on the circumstances under which it occurs, it is not possible to specify a 35 simple quantitative threshold for when impacts become severe. 36 37 Complex causal pathways and lack of long-term projection studies presently prevent making confident 38 quantitative judgments about how risks to peace and human mobility will materialize in response to specific 39 warming levels, development pathways, and adaptation scenarios. Literature concludes with medium 40 confidence that risks to peace will increase with warming, with the largest impacts expected in weather-41 sensitive communities with low resilience to climate extremes and high prevalence of underlying risk factors 42 (Theisen, 2017; Busby, 2018; Koubi, 2019; von Uexkull and Buhaug, 2021). However, climate-driven 43 impacts on societies will depend critically on future political and socioeconomic development trajectories 44 (limited evidence, high agreement), suggesting that risks due to climate change are relevant primarily for 45 highly vulnerable populations and for pessimistic development scenarios. Overall risks to peace may decline 46 despite warming if non-climatic determinants are reduced sufficiently in the future. 47 48 Regular human mobility will continue regardless of climate change but mobility-related risks will increase 49 with warming, notably in densely populated hazard-prone regions, in small islands and low-lying coastal 50 zones, and among populations with limited coping capacity (RKR-A; CCP2 2.2.2; Chapter 7) (high 51 confidence). Such risks can become severe even with limited levels of warming for populations with low 52 adaptive capacity and whose settlements and livelihoods are critically sensitive to environmental conditions 53 (medium evidence, high agreement). Likewise, risk of involuntary immobility could become severe for 54 highly vulnerable populations with limited resources, even with moderate levels of warming (limited 55 evidence, high agreement). Critically, population growth and shifting exposure will interact with warming to 56 shape these risks (Davis et al., 2018; Hauer et al., 2020; Robinson, 2020a). Although climate-driven human 57
ACCEPTED VERSIO
N
SUBJECT TO FIN
AL EDITS
FINAL DRAFT Chapter 16 IPCC WGII Sixth Assessment Report
Do Not Cite, Quote or Distribute 16-73 Total pages: 173
mobility generally does not increase risks to peace (medium confidence), armed conflict is a major driver of 1 forced displacement (high confidence). 2 3 Expert elicitation estimates that 4°C warming above pre-industrial levels will have severe and widespread 4 effects on armed conflict with 26% probability, assuming no change from present levels in non-climatic 5 drivers (Mach et al., 2019). That judgment refers to impacts that exceed the threshold for severity considered 6 here, suggesting that global warming of 4°C would produce severe risks to peace under present societal 7 conditions (low confidence). Future risks to peace will remain strongly influenced by socioeconomic 8 development (Hegre et al., 2016). A study of Sub-Saharan Africa that accounts for both temperature and 9 socioeconomic changes, 2015–65, concludes that determinants other than rising temperatures, notably 10 quality of governance, will remain most influential in shaping overall levels of violence even in the high-11 warming RCP8.5 scenario (Witmer et al., 2017). 12 13 A larger empirical literature offers indirect evidence that climate change may produce severe risks to peace 14 within this century by demonstrating how climate variability and extremes affect contemporary conflict 15 dynamics, especially in contexts marked by low economic development, high economic dependence on 16 climate-sensitive activities, high or increasing social marginalization, and fragile governance (medium 17 confidence) (Chapter 7.2.7; Chapter 16.2, Schleussner et al., 2016a; Von Uexkull et al., 2016; Busby, 2018; 18 Harari and Ferrara, 2018; Ide et al., 2020; Scartozzi, 2020). 19 20 Climatic risks interact with economic, political, and social drivers to create risks to human mobility both 21 directly (through the threat of physical harm and destruction of property and infrastructure) and indirectly 22 (via adverse impacts on livelihood and wellbeing). Extreme weather events are leading causes of forced 23 displacement (Cross-Chapter Box MIGRATE in Chapter 7, IDMC, 2020). Projected increases in the 24 frequency and severity of extreme events (AR6 WGI Chapter 12, Ranasinghe et al., 2021) in combination 25 with future population growth in hazard-prone regions (e.g., Merkens et al., 2016) suggest that risks to 26 mobility will increase in response to future global warming (Robalino et al., 2015; Davis et al., 2018; Rigaud 27 et al., 2018). For example, moving from RCP2.6 to RCP8.5 (entailing ⁓0.5°C additional global warming by 28 2050) is projected to increase internal migration by 2050 from 51 [31-72] million to 118 [92-143] million 29 people across South Asia, Latin America, and Africa (Rigaud et al., 2018), although those estimates are 30 principally comprised of migrants, whose decisions are also informed by non-climatic drivers, rather than 31 involuntarily displaced people. Global levels of flood displacement are estimated to increase by 50% with 32 each 1°C warming (Kam et al., 2021). Should future warming reduce adaptation options for vulnerable 33 populations (Chapter 16.4), a consequence may be higher levels of involuntary migration and immobility 34 (Grecequet et al., 2017; Otto et al., 2017). There is little evidence that climate-driven mobility negatively 35 affects peace (Brzoska and Fröhlich, 2016; Burrows and Kinney, 2016; Freeman, 2017; Petrova, 2021). 36 37 There is high agreement that even moderate levels of future SLR will severely amplify involuntary migration 38 and displacement in small islands and densely populated low-lying coastal areas in the absence of 39 appropriate adaptive responses (high confidence) (Hauer, 2017; IPCC, 2019b; Hauer et al., 2020; McMichael 40 et al., 2020, Section 15.3.4; Section 16.4). In some contexts climate change also may accelerate migration 41 toward high-exposure coastal areas (Bell et al., 2021). Under a high emissions RCP8.5 scenario (global 42 median 0.7m SLR by 2100), the number of people exposed to annual coastal flooding may more than double 43 by 2100 compared to present numbers (Kulp and Strauss, 2019). In USA alone, SLR of 0.9 m could 44 potentially put 4.2 million people at risk of inundation by the end of this century (Hauer, 2017). However, 45 numbers of people exposed to SLR does not evenly translate to forcibly displaced populations (Hauer et al., 46 2020). Ascertaining how many people will move forcibly or as adaptive response to SLR is inherently 47 challenging because of the complex and highly individual nature of migration decisions (Black et al., 2013; 48 Boas et al., 2019; Piguet, 2019; Bell et al., 2021). Implications of climate change for risks to human mobility 49 across borders are even harder to quantify and highly uncertain, due to unknown developments in legal and 50 political conditions that govern international migration (McLeman, 2019; Wrathall et al., 2019). 51 52 16.5.2.4 Synthesis of the Assessment of Representative Key Risks 53 54 Figure 16.10 provides a synthesis of the RKRs and the conditions that lead to severe risks over the course of 55 the 21st century, as assessed in Sections 16.5.2.3.1 to 16.5.2.3.8 (see Supplementary Table SM16.12 for 56 further description). It identifies sets of conditions -- defined by levels of warming, exposure/vulnerability, 57
ACCEPTED VERSIO
N
SUBJECT TO FIN
AL EDITS
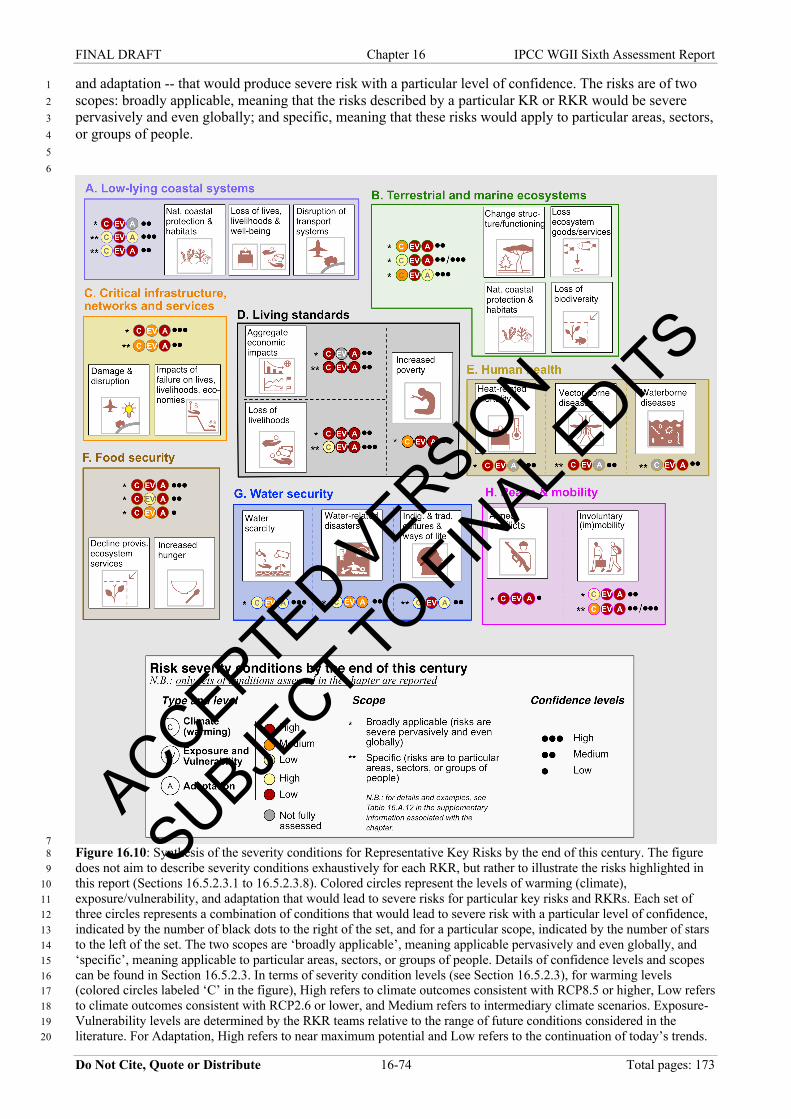
FINAL DRAFT Chapter 16 IPCC WGII Sixth Assessment Report
Do Not Cite, Quote or Distribute 16-74 Total pages: 173
and adaptation -- that would produce severe risk with a particular level of confidence. The risks are of two 1 scopes: broadly applicable, meaning that the risks described by a particular KR or RKR would be severe 2 pervasively and even globally; and specific, meaning that these risks would apply to particular areas, sectors, 3 or groups of people. 4 5 6
7 Figure 16.10: Synthesis of the severity conditions for Representative Key Risks by the end of this century. The figure 8 does not aim to describe severity conditions exhaustively for each RKR, but rather to illustrate the risks highlighted in 9 this report (Sections 16.5.2.3.1 to 16.5.2.3.8). Colored circles represent the levels of warming (climate), 10 exposure/vulnerability, and adaptation that would lead to severe risks for particular key risks and RKRs. Each set of 11 three circles represents a combination of conditions that would lead to severe risk with a particular level of confidence, 12 indicated by the number of black dots to the right of the set, and for a particular scope, indicated by the number of stars 13 to the left of the set. The two scopes are ‘broadly applicable’, meaning applicable pervasively and even globally, and 14 ‘specific’, meaning applicable to particular areas, sectors, or groups of people. Details of confidence levels and scopes 15 can be found in Section 16.5.2.3. In terms of severity condition levels (see Section 16.5.2.3), for warming levels 16 (colored circles labeled ‘C’ in the figure), High refers to climate outcomes consistent with RCP8.5 or higher, Low refers 17 to climate outcomes consistent with RCP2.6 or lower, and Medium refers to intermediary climate scenarios. Exposure-18 Vulnerability levels are determined by the RKR teams relative to the range of future conditions considered in the 19 literature. For Adaptation, High refers to near maximum potential and Low refers to the continuation of today’s trends. 20
ACCEPTED VERSIO
N
SUBJECT TO FIN
AL EDITS
FINAL DRAFT Chapter 16 IPCC WGII Sixth Assessment Report
Do Not Cite, Quote or Distribute 16-75 Total pages: 173
Despite being intertwined in reality, Exposure-Vulnerability and Adaptation conditions are distinguished to help 1 understand their respective contributions to risk severity. 2 3 4 Five main messages arise from this synthesis: 5 6 Severe risk is rarely driven by a single determinant (warming, exposure/vulnerability, adaptation), but rather 7 by a combination of conditions that jointly produce the level of pervasiveness of consequences, 8 irreversibility, thresholds, cascading effects, likelihood of consequences, temporal characteristics of risk and 9 the systems’ ability to respond (medium to high confidence). In other words, climate risk is not a matter of 10 changing climatic impact drivers (CIDs) only, but of the confrontation between changing CIDs and changing 11 socio-ecological conditions. 12 13 In most of the RKRs, severe risk for broadly applicable situations requires high levels of warming or 14 exposure/vulnerability, or low adaptation. In many cases, it is associated with several of these conditions 15 occurring simultaneously (e.g., high warming and high vulnerability). Examples include low-lying coastal 16 areas (RKR-A; medium confidence), loss of livelihoods (RKR-D; medium confidence) or armed conflicts 17 (RKR-H; low confidence). 18 19 High warming and exposure/vulnerability combined with low adaptation is however not necessarily required 20 to lead to severe risk, and various other sets of conditions can lead to such an outcome. For example: 21 Without high levels of warming — This is especially the case for terrestrial and marine ecosystems (RKR-B) 22 and water security (RKR-G) for which even medium to low levels of warming will generate severe risk, 23 depending on the processes considered (e.g., mass population-level mortality and ecological disruption for 24 ecosystems). This is also the case when more specific situations are considered, for example in the case of 25 (in)voluntary mobility of vulnerable populations with limited resources (RKR-H), and for some critical 26 infrastructure in already highly exposed and vulnerable contexts (RKR-C). 27 With high levels of adaptation — High levels of adaptation will not necessarily avoid severe risk, as is 28 illustrated by the cases of coral-dependent and arctic coastal communities (RKR-A), some terrestrial and 29 marine ecosystems (RKR-B), and water scarcity and the cultural uses of water (RKR-G). 30 31 All RKR assessments indicate that risks are higher in high vulnerability development pathways, and in some 32 cases high vulnerability can occur in high income societies. Examples include the possibility of increasing 33 coastal settlement and the location of critical infrastructure in highly exposed locations (RKR-A, RKR-C) 34 including to floods (RKR-G) and risks to terrestrial and marine ecosystems (RKR-B). The assessment 35 therefore show that depending on socioeconomic trends especially in terms of equity, social justice and 36 income sustainability, as well as on the ability to shift towards more climate resilient economic and 37 settlement systems (e.g., at the coast), higher income societies also are at serious risk of being substantially 38 affected in the decades-to-century to come. 39 40 In terms of the time frames, most of the RKRs conclude that severe risks to many dimensions (ecosystems, 41 health, etc.) are expected to occur by the end of the 21st century and across the globe. Some RKRs however 42 highlight that severe risk could occur far earlier, e.g. as soon as a warming level of 1.5°C or 2°C is reached, 43 which means potentially well before mid-century (IPCC, 2021a). In some cases, risks are already considered 44 severe, for example after major climatic events such as tropical storms (RKR-A). 45 46 16.5.3 Variation of Key Risks Across Levels of Global Warming, Exposure and Vulnerability, and 47
Adaptation 48 49 This section builds on Sections 16.5.1 and 16.5.2 as well as on additional literature to illustrate how 50 consequences associated with KRs and RKRs are projected to vary with three types of determinants: global 51 average warming level, as a proxy for associated changes in climate hazards (climatic impact-drivers, CIDs, 52 Ranasinghe et al., 2021); socio-economic development pathway, as a means of capturing alternative future 53 exposure and vulnerability conditions; and level of adaptation to reflect the extent to which successful 54 adaptation is implemented. While these three dimensions are partly intertwined – e.g., warming and 55 adaptation scenarios are constrained by development pathways (Chapter 18) – this section assesses the 56 influence of each dimension separately (Section 16.5.3.2 to Section 16.5.3.4) to highlight how sensitivity 57
ACCEPTED VERSIO
N
SUBJECT TO FIN
AL EDITS
FINAL DRAFT Chapter 16 IPCC WGII Sixth Assessment Report
Do Not Cite, Quote or Distribute 16-76 Total pages: 173
varies across these dimensions for different KRs and RKRs. We then bring the dimensions together in an 1 illustrative example (large deltas; Section 16.5.3.5). 2 3 16.5.3.1 Warming Level, Including Risks Avoided by Mitigation 4 5 Studies illustrating sensitivity to warming level typically do so by contrasting projected impacts for the same 6 socioeconomic conditions but different climate pathways or temperature levels, often based on 7 Representative Concentration Pathways (RCPs) (van Vuuren and Carter, 2014). We refer to future climate 8 conditions either based on their global average warming level or as a ‘high warming’ scenario (based on 9 RCP8.5), medium warming (RCP4.5 or RCP6.0), or low warming (RCP2.6 or 1.5ºC scenarios). Because 10 some of these scenarios assume no or minimal mitigation (RCP8.5, RCP6.0) while others do (RCP4.5, 11 RCP2.6), differences in outcomes between them reflect risks avoided by mitigation (assuming consistent 12 socioeconomic assumptions). 13 14 Some ecological risks (Chapter 2) are particularly sensitive to warming. For example, warm-water coral 15 reefs are already experiencing High risk levels and are expected to face Very High risks under 1.5ºC of 16 global warming (Hoegh-Guldberg et al., 2018a; Bindoff et al., 2019). Some societal risks, such as human 17 mortality due to extreme heat, also are sensitive to warming. A medium warming scenario (relative to high 18 warming) reduces projected global average mortality due to heat from seven deaths per 10,000 people per 19 year (7/10,000/yr) by 2100 to ~1/10,000/yr, assuming high vulnerability societal conditions (Carleton et al., 20 2020). At the national level, without considering adaptation, reductions in a broader measure of mortality are 21 projected across a range of countries including Colombia, the Philippines, and several in Europe (Guo et al., 22 2018), and exposure of the US population to high mortality heatwaves is reduced by nearly half (Anderson et 23 al., 2018a). Without considering changes in exposure or vulnerability, warming of 1.5-2ºC (compared to 4-24 5ºC) reduces global mortality impacts from an increase of 2.1-13.0% to 0.1-2.2% (Gasparrini et al., 2017; 25 Vicedo-Cabrera et al., 2018a) and impacts in China from up to 4/10,000/yr (Weinberger et al., 2017) to 0.3-26 0.5/10,000/yr (Wang and Hijmans, 2019). 27 28 A low warming scenario (relative to high warming) reduces aggregate economic impacts from around 7% of 29 global GDP to less than 1% (Takakura et al., 2019), and changes impacts on the number of people suffering 30 from hunger from an increase (by 7-55 million) to a decrease (by up to 6 million) (Janssens et al., 2020). 31 Low versus high warming also reduces the coastal population at risk of flooding due to SLR from tripling by 32 2100 (relative to today) to doubling (Kulp and Strauss, 2019, Section 16.5.2.3.2). The SROCC estimates that 33 SLR risks are reduced from Moderate-to-High to Moderate for large tropical agricultural deltas and resource-34 rich megacities, and from High and Very high to Moderate-to-High for Arctic human communities and 35 Urban atoll islands, respectively (Oppenheimer et al., 2019). 36 37 Higher levels of warming are projected to also generate higher income inequality between countries (e.g., 38 Pretis et al., 2018; Takakura et al., 2019) as well as within them (Hallegatte et al., 2016) even though other 39 drivers will be more important (Section 16.5.2.3.5). Similarly, climate and weather events are expected to 40 play an increasing role in shaping risks to peace (medium agreement, low evidence) and migration (high 41 agreement, medium evidence) in the future, but uncertainty is high due to complex causal pathways and non-42 climate factors likely dominate outcomes (Section 16.5.2.3.9). There is high agreement that future SLR will 43 amplify levels of forced migration from small islands and low-lying coastal areas in the absence of 44 appropriate adaptive responses (Oppenheimer et al., 2019). 45 46 A synthesis of risk assessments in the recent IPCC Special Reports (Magnan et al., 2021) concludes that an 47 integrated measure of today's global climate risk level will increase by the end of this century by two- to 48 four-fold under a low and high warming, respectively (based on aggregated scores developed in the study). 49 An additional comparison of risk levels under +1.5 °C and +2 °C suggests that every additional 0.5 °C of 50 global warming will increase the risk level by about a third. 51 52 16.5.3.2 Exposure and Vulnerability Trends 53 54 Development pathways describe plausible alternative futures of societal change and are critical to future 55 risks because they affect outcomes of concern both through non-climate and climate-related channels (very 56 high confidence). 57
ACCEPTED VERSIO
N
SUBJECT TO FIN
AL EDITS
FINAL DRAFT Chapter 16 IPCC WGII Sixth Assessment Report
Do Not Cite, Quote or Distribute 16-77 Total pages: 173
1 Studies illustrating sensitivity to development pathways typically do so by contrasting projected impacts for 2 the same climate pathway or temperature level but different levels of socioeconomic exposure and 3 vulnerability, for example based on Shared Socioeconomic Pathways (SSPs) (O’Neill et al., 2014; Van 4 Vuuren et al., 2014). Or, they infer sensitivity to future development pathways based on differences in 5 impacts across current populations with different levels of exposure or vulnerability. We refer to future 6 conditions based on SSPs 1 or 5 as ‘low exposure’ or ‘low vulnerability’ conditions, and those based on 7 SSPs 3 or 4 as ‘high exposure’ or ‘high vulnerability’ conditions (O’Neill et al., 2014; van Vuuren and 8 Carter, 2014). 9 10 A wide range of climate change impacts depend strongly on development pathway (high confidence), A low 11 (relative to high) exposure future, determined by limited population growth and urbanization, results in about 12 30% fewer people exposed to extreme heat globally (Jones et al., 2018b) and about 50% fewer in Africa 13 (Rohat et al., 2019a), similar to the effect of a medium vs. high level of global warming. Low exposure 14 conditions also reduce the fraction of the population in Europe at very high risk of heat stress from 39% to 15 11% (Rohat et al., 2019b). Demographic differences lead to a reduction in the global population exposed to 16 mosquitos acting as viral disease vectors by more than half (Monaghan et al., 2018) and exposure to wildfire 17 risk by nearly half (Knorr et al., 2016). 18 19 Studies are increasingly going beyond exposure to incorporate future vulnerability, finding that it is often the 20 dominant determinant of risk (high confidence). A low (relative to high) vulnerability future reduces the risk 21 to global poverty by an order of magnitude, robustly across approaches that account for macroeconomic 22 growth, structural change in the economy, inequality, and access to infrastructure services (Hallegatte and 23 Rozenberg, 2017), or for the exposure of vulnerable populations to multi-sector climate-related risks (Byers 24 et al., 2018). A low (relative to high) vulnerability future also reduces the global mean number of 25 temperature-attributable deaths in 2080-2095 due to enteric infections by an order of magnitude (from 26 >80,000 to <7000; (Chua et al., 2021)). Low future socioeconomic vulnerability to flooding reduces global 27 fatalities and economic losses by 69-96% (Jongman et al., 2015). Low vulnerability as measured by 28 indicators including per capita GDP, education, governance, water demand, and storage potential reduces 29 water insecurity by a factor of three (Koutroulis et al., 2019). A scenario with reduced barriers to trade 30 reduces the number of people at risk of hunger due to climate change by 64% (Janssens et al., 2020). 31 Structural transformation of the economy (shift of the workforce from highly exposed sectors such as 32 agriculture and fishing to less exposed sectors such as services) lowers GDP impact projections by 25-30% 33 in today’s developing countries by 2100 (Acevedo et al., 2017). 34 35 The IPCC SRCCL supports the importance of societal conditions to climate-related risk (Hurlbert et al., 36 2019), concluding that risks of water scarcity in drylands (i.e., desertification), land degradation and food 37 insecurity are close to High3 beginning at 1.5ºC under high vulnerability conditions (SSP3), but remain close 38 to Moderate up to slightly above 2ºC for low vulnerability conditions (SSP1). Specifically, risk of water 39 scarcity in drylands (i.e., desertification) at 1.5ºC warming is reduced in low vulnerability (relative to high 40 vulnerability) conditions from High to Medium. Similarly, under a 2ºC warming, risk is reduced from High 41 to Moderate for food security and High to Moderate-to-High for land degradation. 42 43 While climate change will increase risk to society and ecosystems, future exposure and vulnerability 44 conditions will also greatly impact outcomes of concern directly. Global economic damages to coastal assets 45 from tropical cyclones are projected to increase by more than 300% due to coastal development alone, a 46 much larger effect than projected climate change impacts through 2100 even in RCP8.5 (Gettelman et al., 47 2018). Similarly, global crop prices are more than three times more sensitive to alternative assumptions 48 about changes in production technologies and demand than to alternative climate outcomes (Ren et al., 49 2016). Future water scarcity is driven mainly by both demographic change and socioeconomic changes 50 affecting water demand and management. A measure of between-country inequality (Gini coefficient) would 51 decline by more than 50% this century in low vulnerability conditions, but would double in a high 52 vulnerability future (Crespo Cuaresma, 2017), outweighing the effect of climate (Taconet et al., 2020). 53
3 The IPCC distinguishes between four qualitative risk levels, from Undetectable (risks that are undetected), to Moderate (detectable with at least medium confidence), High (significant and widespread) and Very high (very high probability of severe risks and significant irreversibility or persistence of impacts).
ACCEPTED VERSIO
N
SUBJECT TO FIN
AL EDITS
FINAL DRAFT Chapter 16 IPCC WGII Sixth Assessment Report
Do Not Cite, Quote or Distribute 16-78 Total pages: 173
Similarly, the global prevalence of armed conflict will roughly double this century in a high vulnerability 1 future, whereas it will drop by half in a low vulnerability future (Hegre et al., 2016). In Sub-Saharan Africa, 2 assumptions about governance and political rights are estimated to be far more important to the future risk of 3 violent conflict than climate change (Witmer et al., 2017). 4 5 16.5.3.3 Climate Adaptation Scenarios 6 7 One approach to understand adaptation benefits for risk reduction is to contrast projected impacts for the 8 same climate and development conditions but different levels of adaptation. For example, global-scale 9 coastal protection studies considering both RCPs and SSPs suggest that under a given RCP, the total flooded 10 area may be reduced by 40% by using 1-m height dykes, compared to a no-adaptation baseline (Tamura et 11 al., 2019). The global cost of SLR over the 21st century can be lowered by factor of two to four if local cost-12 benefit decisions consider migration an adaptation option, in addition to hard protection (Lincke and Hinkel, 13 2021). Under a low warming scenario, it is estimated that adaptation (i.e. changes in crop variety and 14 planting dates) could reduce the total number of people at risk of hunger globally by about 4%, and by about 15 10% in a high warming scenario Hasegawa et al. (2014). Impacts on heat-related mortality would be cut 16 from 10 to 7 deaths per 10,000 people per year in 2100 by adaptation actions beyond those assumed to be 17 driven by income growth (Carleton et al., 2020). In a regional example, proactive adaptation efforts on 18 infrastructure (especially roads, runways, buildings, and airports) in Alaska, USA, could reduce damage-19 related expenditure by 45% under medium or high warming (Melvin et al., 2017). 20 21 Another approach infers the potential future effectiveness of adaptation based on current sensitivity of 22 impacts to interventions. For example, the future disease burden of malaria is likely to be highly dependent 23 on the future development of health services, deployment of malaria programs and adaptation. Investments 24 in water and sanitation infrastructure are also recognized to have the potential to reduce severe risks of 25 waterborne disease, although these improvements likely need to provide transformative change (Cumming et 26 al., 2019). The potential for severe risks may also be substantially reduced through the development of 27 vaccines for specific enteric diseases (Riddle et al., 2018), although most current vaccines target viral 28 pathogens, incidence for which tends to be inversely correlated with ambient temperature (Carlton et al., 29 2016). In addition, international migration as well as forced movement of people across borders will be 30 influenced by developments in legal and political conditions (McLeman, 2019; Wrathall et al., 2019), but the 31 fact that these developments are unknown strongly limits any forecasts on the magnitude of adaptation 32 benefits (Section 16.5.2.3.9). 33 34 Last, there is growing concern that even ambitious adaptation efforts will not eliminate residual risks from 35 climate change (Section 16.4.2). A synthesis of risk assessments in the recent IPCC Special Reports 36 (Magnan et al., 2021) concludes that high societal adaptation is expected to reduce the aggregated score –the 37 proxy used in the study– of global risk from anthropogenic climate change by about 40% under all RCPs by 38 the end of the century, compared to risk levels projected without adaptation. It however also shows that even 39 for the lowest warming scenario a residual risk one-third greater than today’s risk level would still remain 40 (with a doubling of today’s aggregated score under the high emission scenario). 41 42 16.5.3.4 Illustration: Risk and Adaptation Pathways in Densely Populated and Agricultural Deltas 43 44 Large deltas, which are very dynamic risk hotspots of global importance and interest (Wigginton, 2015; Hill 45 et al., 2020; Nicholls et al., 2020), serve well to illustrate how risk pathways develop over time, determined 46 by climatic as well as non-climatic risk drivers as well as by adaptation. Deltas occupy less than 0.5% of the 47 global land area but host over 5% of the global population (Dunn et al., 2019) and contribute major fractions 48 of food production in many world regions (Kuenzer et al., 2020). Future risk in these areas is heavily driven 49 by climate change but also greatly depends on past, current and future socio-economic changes which 50 influence future trends in exposure, vulnerability and adaptive capacity of natural and human systems (high 51 confidence) (Oppenheimer et al., 2019). From a risk perspective, trends over the past decades have been 52 unfavourable for many deltas, as most of them have experienced a simultaneous intensification of hazards, 53 rise in exposure and stagnation or only limited reduction in vulnerability, particularly in low income 54 countries (high confidence) (Day et al., 2016; Tessler et al., 2016; Loucks, 2019; Oppenheimer et al., 2019; 55 Hill et al., 2020). 56 57
ACCEPTED VERSIO
N
SUBJECT TO FIN
AL EDITS

FINAL DRAFT Chapter 16 IPCC WGII Sixth Assessment Report
Do Not Cite, Quote or Distribute 16-79 Total pages: 173
16.5.3.4.1 Hazard trends in deltas 1 Deltas face multiple interacting hazards, many of which over the past decades have been intensified by local 2 and regional anthropogenic developments (e.g., the construction of dams, groundwater extraction, or 3 agricultural irrigation practices) and most of which are expected to be exacerbated by climate change (high 4 confidence) (Giosan et al., 2014; Tessler et al., 2015; Tessler et al., 2016; Arto et al., 2019; Oppenheimer et 5 al., 2019). The most important hazards include sea level rise (SLR), inundation, salinity intrusion, cyclones, 6 storms and erosion, many of which occur in combination. The potential for flooding and inundation depends 7 on the relative sea level rise (RSLR) which results from global and regional SLR as well as local subsidence 8 within the deltas. Subsidence caused by natural and human drivers (mainly compaction and groundwater 9 extraction) is currently the most important cause for RSLR in many deltas and can exceed the rate of 10 climate-induced SLR by an order of magnitude (Oppenheimer et al., 2019). But in higher warming scenarios 11 the relative importance of climate-driven SLR is expected to increase over time (Oppenheimer et al., 2019). 12 In a global study covering 47 major deltas and assessing future trends of sediment delivery across four RCPs, 13 three SSPs (1,2,3) and a projection of future dam construction, Dunn et al. (2019) find most deltas (33 out of 14 the 47) will experience a mean decline of 38% in sediment flux by the end of the century when considering 15 the average of the scenarios. Nienhuis et al. (2020) find in a global assessment that some deltas have gained 16 land through increased sediment load (e.g., through deforestation), but recent land gains are unlikely to be 17 sustained if SLR continues to accelerate. According to the latest assessments, it is virtually certain that 18 global mean sea level will continue to rise over the 21st century, with sea level rise by 2100 likely to reach 19 0.28-0.55 m in a an SSP1-1.9 and 0.63-1.01 m in an SSP5-8.5 scenario relative to 1995-2014 (IPCC, 2021a). 20 The combined effects of local subsidence and GMSL rise result in a significant increase in the potential for 21 inundation of low-lying deltas across all RCPs, with some variation according to regional sea level change 22 rates, without significant further adaptation measures (very high confidence). 23 24 In terms of salt-water intrusion and salinization, global comparative studies are still lacking but the general 25 processes are well understood (e.g., White and Kaplan, 2017)) and research on individual deltas is on the 26 rise. In the Mekong Delta of Vietnam, one of the main rice producing deltas globally, salinity intrusion has 27 been observed to extend around 15 km inland during the rainy season and around 50 km during the dry 28 season (Gugliotta et al., 2017), resulting in rice yield losses of up to 4 tons per hectare per year (Khat et al., 29 2018). SLR, along with the expansion of dams and dry season irrigation upstream, is expected to further 30 increase the salinity intrusion into the delta. This creates additional risk for food production as rice and other 31 crops might be pushed beyond their adaptation limits in terms of salt tolerance, potentially affecting many of 32 the 282,000 agriculture-based livelihoods in the Mekong Delta and increasing the pressure for cost-intensive 33 adaptation (Smajgl et al., 2015). Genua-Olmedo et al. (2016) find for the Ebro that in high scenario (RCP8.5, 34 and SLR of almost 1m by 2100), SLR-induced salinity intrusion will lead to almost a doubling of salinity 35 levels and a decrease of mean rice productivity by over 20% in a high SLR scenario with almost 1 meter of 36 SLR by the end of the century. 37 38 16.5.3.4.2 Exposure trends in deltas 39 Next to the trends in hazards, future exposure of and in deltas is shaped particularly by the increase of 40 population and infrastructure and the intensification of land use. Over the recent years, the population has 41 been rising in major deltas, roughly along with overall national population trends (Szabo et al., 2016). In 42 2017, 339 million people lived in deltas with a high exposure to flooding, cyclones and other coastal hazards 43 (Edmonds et al., 2020). Over 40% of the global population exposed to flooding from tropical cyclones lived 44 in deltas, more than 90% of which in developing countries and emerging economies (ibid.). Looking into the 45 future, population in low elevation coastal zones is expected to increase by 2050 across all SSPs with 46 diverging developments in the second half of the century, and at the end of the century will reach well over 1 47 billion people in SSP3 (Jones and O’Neill, 2016; Merkens et al., 2016). A major part of this population is 48 expected to reside in deltas with large cities or mega-urban agglomerations such as the Pearl River Delta, 49 China. One of the first studies using the SSP-RCP framework on the delta scale suggests a strong increase in 50 intensive agricultural land by the middle of the century in three SSPs (2, 3, 5) in the Volta Delta, Ghana, 51 whilst the Mahanadi, India, and the Ganges-Brahmaputra-Meghna do not show a significant further increase 52 (Kebede et al., 2018). Hence, the amount of population and infrastructure as well as agricultural land is 53 expected to rise further under certain SSPs, further increasing the exposure to future climate hazards. 54 55
ACCEPTED VERSIO
N
SUBJECT TO FIN
AL EDITS
FINAL DRAFT Chapter 16 IPCC WGII Sixth Assessment Report
Do Not Cite, Quote or Distribute 16-80 Total pages: 173
16.5.3.4.3 Vulnerability trends in deltas 1 Deltas are characterized by multifaceted vulnerabilities of their environment and human populations. Over 2 200 indicators are being used in the literature to characterize and analyse vulnerability in deltas, spanning 3 social, ecological and economic aspects (Sebesvari et al., 2016). However, only a few studies model or 4 dynamically assess trends in vulnerability, particularly for the future, at global scale, or take a comparative 5 approach. But overall, a global trend assessment suggests that social vulnerability to climate hazards has 6 been improving over the past years in all world regions hosting major deltas apart from Oceania, yet with 7 emerging economies and developing countries in Africa showing less improvement than the Americas, Asia 8 and Europe (Feldmeyer et al., 2017). An analysis of 48 major deltas finds that vulnerability therefore is a less 9 dominant source of future increase in risk than exposure (Haasnoot et al., 2012). However, case study 10 research from individual deltas suggests that delta populations, particularly those with agriculture-based 11 livelihoods, have seen more limited vulnerability reduction due in particular to the impacts of environmental 12 hazards, stress and disasters (high confidence). In the Mekong Delta, for instance, the strong economic 13 growth since the beginning of Vietnam’s reform process has not led to a reduction of vulnerability across the 14 board for all socio-economic groups (Garschagen, 2015). Rather, issues such as widespread landlessness or 15 continued poverty have maintained and, in some respect, increased social vulnerability. 16 17 16.5.4 RKR Interactions 18
19 Multiple feedbacks between individual risks exist that have the potential to create cascades (WEF, 2018; 20 Weyer, 2019 p. 680; Simpson et al., 2021) and then to amplify systemic risks and impacts far beyond the 21 level of individual RKRs (medium confidence). Scientific research however remains limited on whether such 22 interactions would result in increasing or decreasing the initial impact(s), and hence risk severity across 23 systems. Given the scope of this chapter on increasing risk severity, here we focus on assessing RKR 24 interactions that lead to increasing risk. Drawing directly on RKR assessments (16.5.2.3.2 to 16.5.2.3.9), this 25 section cites those assessments rather than primary literature. The arrows in Figure 16.11 are derived from a 26 qualitative analysis by three authors of Chapter 16 of the material provided by chapters on KRs and RKR 27 assessments (Section 16.5.2.3), and do not result from any systematic and quantitative approach as done in 28 some recent studies (e.g., WEF, 2018; Yokohata et al., 2019). 29 30 Interactions at the RKR level (Figure 16.11, Panel A) – Climate change will combine with pre-existing 31 socioeconomic and ecological conditions (grey blocks on the left hand-side of Panel A in Figure 16.10) to 32 generate direct and second-order effects (black plain arrows) both on the structure and/or functioning of 33 ecosystems (RKR-B) and on some natural processes such as the hydrologic cycle (RKR-G) for example. 34 This then translates into implications not only for biodiversity, but also for natural resources that support 35 livelihoods, which will in turn affect food security (especially food availability; RKR-F), water security 36 (especially access to adequate quantities of acceptable quality water; RKR-G) and the living standards of 37 already vulnerable groups and aggregate economic outputs at the global level (RKR-D). Climatic impact 38 drivers (CID; IPCC, 2021a) will also directly affect infrastructure that are critical to ensure some basic 39 conditions for economies to function (RKR-C), e.g., through transportation within and outside the country, 40 energy production and international trade. Such disturbances to socioecological systems and economies pose 41 climate-related risks to human health (RKR-E) as well as to peace and mobility (RKR-H). Indeed, while 42 health is concerned with direct influence of climate change, e.g., through hotter air temperatures impacting 43 morbidity and mortality or the spatial distribution of disease vectors such as mosquitos, it is also at risk of 44 being stressed by direct and secondary climate impacts on living standards, food security and water security 45 (RKR-D, RKR-F, RKR-G, respectively). Increased poverty, increased hunger and limited access to drinkable 46 water are well-known drivers of poor health conditions. The role of impact cascades is even more prominent 47 in the case of peace and mobility (RKR-H), even though the scientific literature does not conclude on any 48 clear and direct climate influence on armed conflict and human migration. Rather, climate-induced 49 degradation of natural resources that are vital for subsistence agriculture and fisheries, transformational and 50 long-term consequences on livelihoods (e.g., new risks, increasing precarious living conditions, gendered 51 inequity, etc.), as well as erosion of social capital due to exacerbated tension within and between 52 communities, are considered among the main drivers of armed conflicts and forced displacement, therefore 53 highlighting links with water security (RKR-G) and living standards (RKR-D), for example. 54 55 RKR assessments also suggest that some feedback effects are at work (arrows moving from the right to the 56 left in Panel A) that contribute to the potentially long-lasting effects of climate risks. RKR-H assessment for 57
ACCEPTED VERSIO
N
SUBJECT TO FIN
AL EDITS
FINAL DRAFT Chapter 16 IPCC WGII Sixth Assessment Report
Do Not Cite, Quote or Distribute 16-81 Total pages: 173
example states that there is robust evidence that major armed conflicts routinely trigger mass displacement, 1 threaten health and food security, and undermine economic activity and livelihoods, often with lasting 2 negative consequences for living standards and socioeconomic development, therefore linking back to risks 3 to living standards (RKR-D), human health (RKR-E) and food security (RKR-F). 4 5 Interactions at the KR level (Figure 16.11, Panel B) – Panel B illustrates risk connections at the Key Risk 6 level (Section 16.5.2.1) and as described in RKR assessments (Section 16.5.2.3). To only take one example 7 here, risk to livelihoods and economies is influenced by the loss of ecosystem services (RKR-B) and the loss 8 or breakdown of critical infrastructures (RKR-C), as well as it influences risks to human lives and health 9 (RKR-E), food and water security (RKR-F, RKR-G), poverty (RKR-D) and peace and mobility (RKR-H). 10 As a third-order sequence, RKR assessments show that increased risk to peace and mobility affects lives and 11 health as well as food security, which in turn threaten livelihoods and economies. 12 13 The above suggests that some vicious cycle effects play a central role in explaining impact processes. 14 Cascading effects can indeed lead to cumulative risks that partly feed various drivers of the emergence of 15 severe risks (Section 16.5.1), such as the acceleration of ecosystem degradation, or the reaching of thresholds 16 and irreversible states in human systems at a decade-to-century time horizon (e.g., when permanent 17 inundation questions the habitability of some low-lying coasts; RKR-A). The extent and duration of risk 18 cascades are however expected to substantially vary depending on warming levels and development 19 pathways, both separately (Section 16.5.3) and when combined (Section 16.6.1 and 16.6.2) (Fig. 16.10). 20 21 In addition, RKR assessments converge to suggest that regions that are already experiencing climate change 22 impacts will experience severe impact cascades first (e.g., RKR-F), because they are in areas (i) that face 23 development constraints and associated challenges such as poverty, inequity and social discrimination for 24 example, and (ii) where climate change projections are the most intense for the next decades. That is 25 especially a concern for Africa (RKR-F, RKR-G), Asia and Latin America (Chapters 9, 10 and 12). RKR-E 26 concludes for example that the likelihood of severe risks to human health is especially high for highly 27 susceptible populations, particularly the poor and otherwise marginalized. RKR assessments however 28 emphasize that middle- and high-income regions are also to be considered at serious risk because climate 29 change is accelerating at the global level (IPCC, 2021a), and because critical dimensions are exposed to 30 severe risks such as major transportation (e.g., international airports) and energy (e.g., nuclear power plants) 31 infrastructure for instance (RKR-C), and because of the interconnectedness of economies. 32 33 Finally, all RKR assessments suggest that enhanced adaptation has the potential to contain such feedback 34 effects and cascading processes more broadly, and reduce the duration of the impacts on the system as a 35 whole. There are however knowledge gaps on such a potential, as well as on the nature of impact cascades 36 (positive, negative, neutral, mixed). 37 38 39
ACCEPTED VERSIO
N
SUBJECT TO FIN
AL EDITS
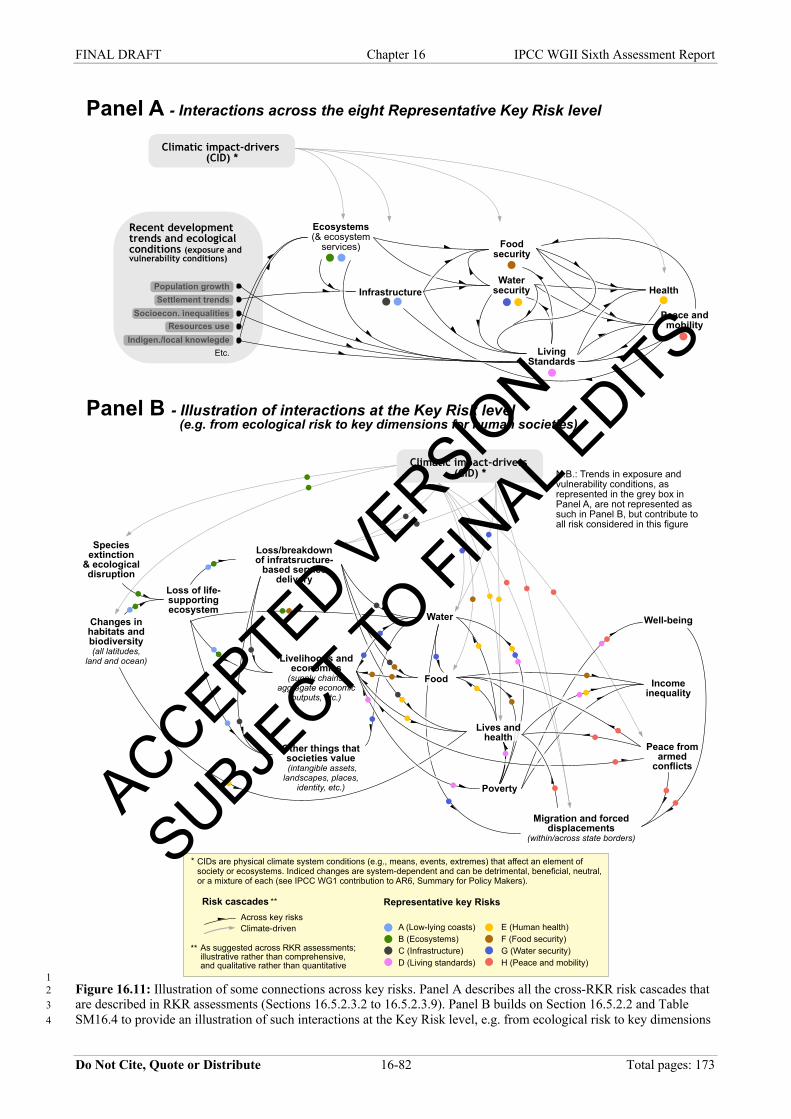
FINAL DRAFT Chapter 16 IPCC WGII Sixth Assessment Report
Do Not Cite, Quote or Distribute 16-82 Total pages: 173
1 Figure 16.11: Illustration of some connections across key risks. Panel A describes all the cross-RKR risk cascades that 2 are described in RKR assessments (Sections 16.5.2.3.2 to 16.5.2.3.9). Panel B builds on Section 16.5.2.2 and Table 3 SM16.4 to provide an illustration of such interactions at the Key Risk level, e.g. from ecological risk to key dimensions 4
N.B.: Trends in exposure andvulnerability conditions, asrepresented in the grey box inPanel A, are not represented assuch in Panel B, but contribute toall risk considered in this figure
Resources useIndigen./local knowlegde
Socioecon. inequalitiesSettlement trends
Etc.
Population growth Infrastructure
Foodsecurity
Watersecurity Health
Peace andmobility
LivingStandards
Ecosystems(& ecosystemservices)
Panel A - Interactions across the eight Representative Key Risk level
Recent developmenttrends and ecologicalconditions (exposure andvulnerability conditions)
Climatic impact-drivers(CID) *
Panel B - Illustration of interactions at the Key Risk level(e.g. from ecological risk to key dimensions for human societies)
Lives andhealth
Loss of life-supportingecosystem
Speciesextinction& ecologicaldisruption
Changes inhabitats andbiodiversity(all latitudes,
land and ocean)
Loss/breakdownof infratsructure-based service
delivery
Livelihoods andeconomies(supply chains,
aggregate economicoutputs, etc.)
Migration and forceddisplacements
(within/across state borders)
Well-being
Incomeinequality
Peace fromarmedconflicts
Water
Food
Poverty
Other things thatsocieties value(intangible assets,landscapes, places,
identity, etc.)
Climatic impact-drivers(CID) *
E (Human health)F (Food security)G (Water security)H (Peace and mobility)
A (Low-lying coasts)B (Ecosystems)C (Infrastructure)D (Living standards)
Risk cascadesAcross key risksClimate-driven
Representative key Risks
As suggested across RKR assessments;illustrative rather than comprehensive,and qualitative rather than quantitative
**
*
**
CIDs are physical climate system conditions (e.g., means, events, extremes) that affect an element ofsociety or ecosystems. Indiced changes are system-dependent and can be detrimental, beneficial, neutral,or a mixture of each (see IPCC WG1 contribution to AR6, Summary for Policy Makers).
ACCEPTED VERSIO
N
SUBJECT TO FIN
AL EDITS
FINAL DRAFT Chapter 16 IPCC WGII Sixth Assessment Report
Do Not Cite, Quote or Distribute 16-83 Total pages: 173
for human societies. The arrows are representative of interactions as qualitatively identified in this chapter; they do not 1 result from any quantitative modelling exercise. 2 3 4 [START CROSS-WORKING GROUP BOX SRM HERE] 5
6 Cross-Working Group Box SRM: Solar Radiation Modification 7
8
Authors: Christopher H. Trisos (South Africa), Oliver Geden (Germany), Sonia I. Seneviratne (Switzerland), 9 Masahiro Sugiyama (Japan), Maarten van Aalst (The Netherlands), Govindasamy Bala (India), Katharine J. 10 Mach (USA), Veronika Ginzburg (Russia), Heleen de Coninck (The Netherlands), Anthony Patt 11 (Switzerland) 12 13 Proposed Solar Radiation Modification Schemes 14 15 This cross-working group box assesses Solar Radiation Modification (SRM) proposals, their potential 16 contribution to reducing or increasing climate risk, as well as other risks they may pose (categorised as risks 17 from responses to climate change in the IPCC AR6 risk definition in 1.2.1.1), and related perception, ethics 18 and governance questions. 19 20 SRM refers to proposals to increase the reflection of shortwave radiation (sunlight) back to space to 21 counteract anthropogenic warming and some of its harmful impacts (de Coninck et al., 2018) (Cross-chapter 22 Box 10; WG1 Chapter 4 and Chapter 5). A number of SRM options have been proposed, including: 23 Stratospheric Aerosol Interventions (SAI), Marine Cloud Brightening (MCB), Ground-Based Albedo 24 Modifications (GBAM), and Ocean Albedo Change (OAC). Although not strictly a form of SRM, Cirrus 25 Cloud Thinning (CCT) has been proposed to cool the planet by increasing the escape of longwave thermal 26 radiation to space and is included here for consistency with previous assessments (de Coninck et al., 2018). 27 SAI is the most-researched proposal. Modeling studies show SRM could reduce surface temperatures and 28 potentially ameliorate some climate change risks (with more confidence for SAI than other options), but 29 SRM could also introduce a range of new risks. 30 31 There is high agreement in the literature that for addressing climate change risks SRM cannot be the main 32 policy response to climate change and is, at best, a supplement to achieving sustained net zero or net 33 negative CO2 emission levels globally (de Coninck et al., 2018; MacMartin et al., 2018; Buck et al., 2020; 34 National Academies of Sciences and Medicine, 2021b). SRM contrasts with climate change mitigation 35 activities, such as emission reductions and CDR, as it introduces a ‘mask’ to the climate change problem by 36 altering the Earth’s radiation budget, rather than attempting to address the root cause of the problem, which 37 is the increase in GHGs in the atmosphere. In addition, the effects of proposed SRM options would only last 38 as long as a deployment is maintained— e.g. requiring ca. yearly injection of aerosols in the case of SAI as 39 the lifetime of aerosols in the stratosphere is 1-3 years (Niemeier et al., 2011) or continuous spraying of sea 40 salt in the case of MCB as the lifetime of sea salt aerosols in the atmosphere is only about 10 days—which 41 contrasts with the long lifetime of CO2 and its climate effects, with global warming resulting from CO2 42 emissions likely remaining at a similar level for a hundred years or more (MacDougall et al., 2020) and long-43 term climate effects of emitted CO2 remaining for several hundreds to thousands of years (Solomon et al., 44 2009). 45 46 Which scenarios? 47 48 The choice of SRM deployment scenarios and reference scenarios is crucial in assessment of SRM risks and 49 its effectiveness in attenuating climate change risks (Keith and MacMartin, 2015; Honegger et al., 2021). 50 Most climate model simulations have used scenarios with highly stylized large SRM forcing to fully 51 counteract large amounts of warming in order to enhance the signal-to-noise ratio of climate responses to 52 SRM (Kravitz et al., 2015; Sugiyama et al., 2018a; Tilmes et al., 2018; Krishna-Pillai et al., 2019). 53 54 The effects of SRM fundamentally depend on a variety of choices about deployment (Sugiyama et al., 55 2018b), including: its position in the portfolio of human responses to climate change (e.g., the magnitude of 56 SRM used against the background radiative forcing), governance of research and potential deployment 57
ACCEPTED VERSIO
N
SUBJECT TO FIN
AL EDITS
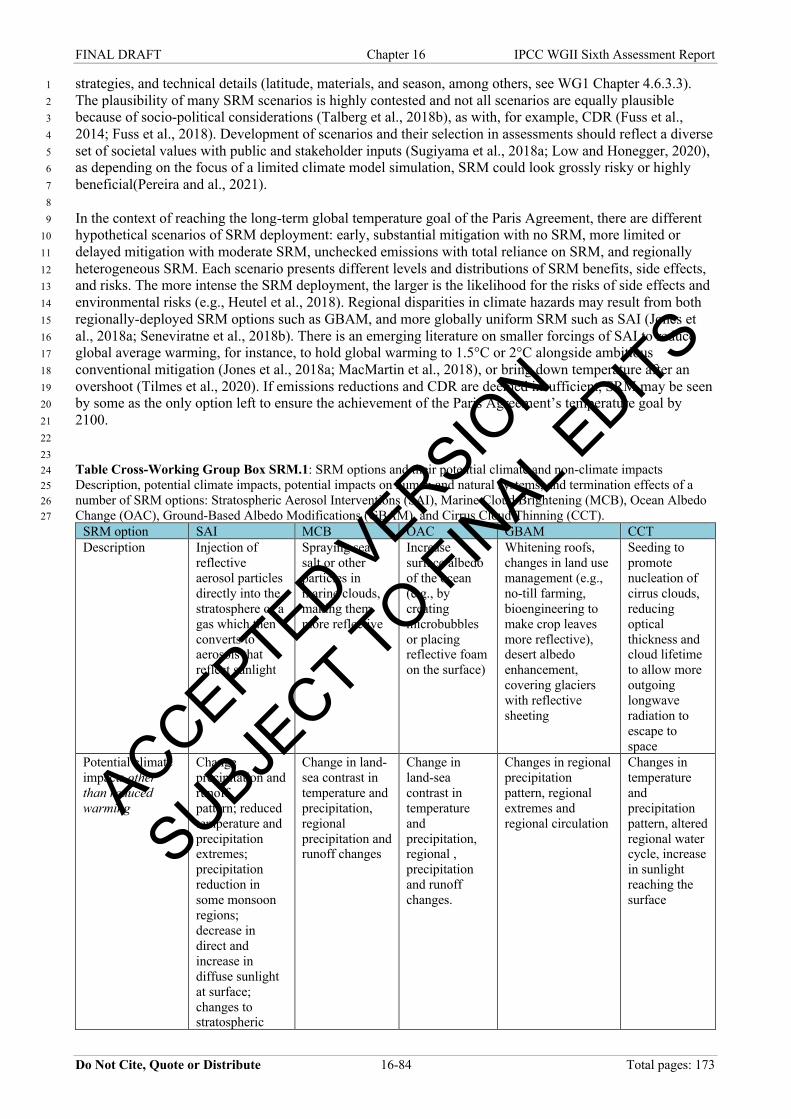
FINAL DRAFT Chapter 16 IPCC WGII Sixth Assessment Report
Do Not Cite, Quote or Distribute 16-84 Total pages: 173
strategies, and technical details (latitude, materials, and season, among others, see WG1 Chapter 4.6.3.3). 1 The plausibility of many SRM scenarios is highly contested and not all scenarios are equally plausible 2 because of socio-political considerations (Talberg et al., 2018b), as with, for example, CDR (Fuss et al., 3 2014; Fuss et al., 2018). Development of scenarios and their selection in assessments should reflect a diverse 4 set of societal values with public and stakeholder inputs (Sugiyama et al., 2018a; Low and Honegger, 2020), 5 as depending on the focus of a limited climate model simulation, SRM could look grossly risky or highly 6 beneficial(Pereira and al., 2021). 7 8 In the context of reaching the long-term global temperature goal of the Paris Agreement, there are different 9 hypothetical scenarios of SRM deployment: early, substantial mitigation with no SRM, more limited or 10 delayed mitigation with moderate SRM, unchecked emissions with total reliance on SRM, and regionally 11 heterogeneous SRM. Each scenario presents different levels and distributions of SRM benefits, side effects, 12 and risks. The more intense the SRM deployment, the larger is the likelihood for the risks of side effects and 13 environmental risks (e.g., Heutel et al., 2018). Regional disparities in climate hazards may result from both 14 regionally-deployed SRM options such as GBAM, and more globally uniform SRM such as SAI (Jones et 15 al., 2018a; Seneviratne et al., 2018b). There is an emerging literature on smaller forcings of SAI to reduce 16 global average warming, for instance, to hold global warming to 1.5°C or 2°C alongside ambitious 17 conventional mitigation (Jones et al., 2018a; MacMartin et al., 2018), or bring down temperature after an 18 overshoot (Tilmes et al., 2020). If emissions reductions and CDR are deemed insufficient, SRM may be seen 19 by some as the only option left to ensure the achievement of the Paris Agreement’s temperature goal by 20 2100. 21 22 23 Table Cross-Working Group Box SRM.1: SRM options and their potential climate and non-climate impacts 24 Description, potential climate impacts, potential impacts on human and natural systems, and termination effects of a 25 number of SRM options: Stratospheric Aerosol Interventions (SAI), Marine Cloud Brightening (MCB), Ocean Albedo 26 Change (OAC), Ground-Based Albedo Modifications (GBAM), and Cirrus Cloud Thinning (CCT). 27
SRM option SAI MCB OAC GBAM CCT Description Injection of
reflective aerosol particles directly into the stratosphere or a gas which then converts to aerosols that reflect sunlight
Spraying sea salt or other particles in marine clouds, making them more reflective
Increase surface albedo of the ocean (e.g., by creating microbubbles or placing reflective foam on the surface)
Whitening roofs, changes in land use management (e.g., no-till farming, bioengineering to make crop leaves more reflective), desert albedo enhancement, covering glaciers with reflective sheeting
Seeding to promote nucleation of cirrus clouds, reducing optical thickness and cloud lifetime to allow more outgoing longwave radiation to escape to space
Potential climate impacts other than reduced warming
Change precipitation and runoff pattern; reduced temperature and precipitation extremes; precipitation reduction in some monsoon regions; decrease in direct and increase in diffuse sunlight at surface; changes to stratospheric
Change in land-sea contrast in temperature and precipitation, regional precipitation and runoff changes
Change in land-sea contrast in temperature and precipitation, regional , precipitation and runoff changes.
Changes in regional precipitation pattern, regional extremes and regional circulation
Changes in temperature and precipitation pattern, altered regional water cycle, increase in sunlight reaching the surface
ACCEPTED VERSIO
N
SUBJECT TO FIN
AL EDITS
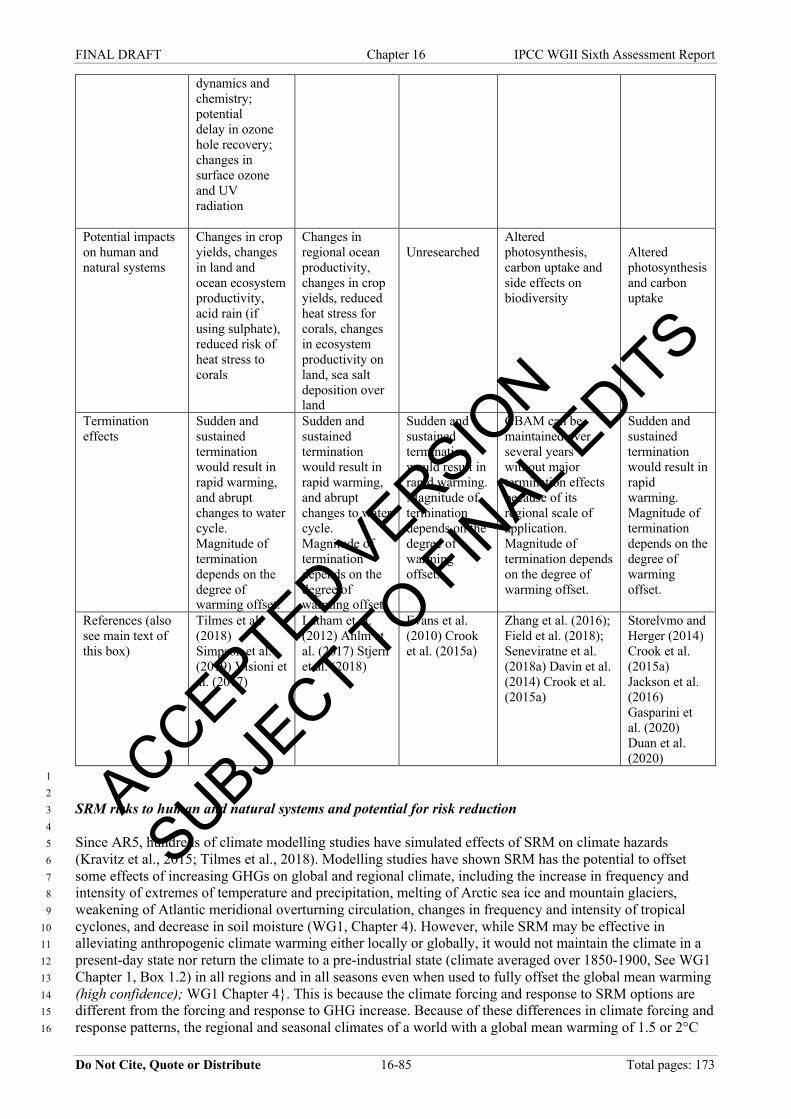
FINAL DRAFT Chapter 16 IPCC WGII Sixth Assessment Report
Do Not Cite, Quote or Distribute 16-85 Total pages: 173
dynamics and chemistry; potential delay in ozone hole recovery; changes in surface ozone and UV radiation
Potential impacts on human and natural systems
Changes in crop yields, changes in land and ocean ecosystem productivity, acid rain (if using sulphate), reduced risk of heat stress to corals
Changes in regional ocean productivity, changes in crop yields, reduced heat stress for corals, changes in ecosystem productivity on land, sea salt deposition over land
Unresearched
Altered photosynthesis, carbon uptake and side effects on biodiversity
Altered photosynthesis and carbon uptake
Termination effects
Sudden and sustained termination would result in rapid warming, and abrupt changes to water cycle. Magnitude of termination depends on the degree of warming offset.
Sudden and sustained termination would result in rapid warming, and abrupt changes to water cycle. Magnitude of termination depends on the degree of warming offset.
Sudden and sustained termination would result in rapid warming. Magnitude of termination depends on the degree of warming offset.
GBAM can be maintained over several years without major termination effects because of its regional scale of application. Magnitude of termination depends on the degree of warming offset.
Sudden and sustained termination would result in rapid warming. Magnitude of termination depends on the degree of warming offset.
References (also see main text of this box)
Tilmes et al. (2018) Simpson et al. (2019) Visioni et al. (2017)
Latham et al. (2012) Ahlm et al. (2017) Stjern et al. (2018)
Evans et al. (2010) Crook et al. (2015a)
Zhang et al. (2016); Field et al. (2018); Seneviratne et al. (2018a) Davin et al. (2014) Crook et al. (2015a)
Storelvmo and Herger (2014) Crook et al. (2015a) Jackson et al. (2016) Gasparini et al. (2020) Duan et al. (2020)
1 2 SRM risks to human and natural systems and potential for risk reduction 3 4 Since AR5, hundreds of climate modelling studies have simulated effects of SRM on climate hazards 5 (Kravitz et al., 2015; Tilmes et al., 2018). Modelling studies have shown SRM has the potential to offset 6 some effects of increasing GHGs on global and regional climate, including the increase in frequency and 7 intensity of extremes of temperature and precipitation, melting of Arctic sea ice and mountain glaciers, 8 weakening of Atlantic meridional overturning circulation, changes in frequency and intensity of tropical 9 cyclones, and decrease in soil moisture (WG1, Chapter 4). However, while SRM may be effective in 10 alleviating anthropogenic climate warming either locally or globally, it would not maintain the climate in a 11 present-day state nor return the climate to a pre-industrial state (climate averaged over 1850-1900, See WG1 12 Chapter 1, Box 1.2) in all regions and in all seasons even when used to fully offset the global mean warming 13 (high confidence); WG1 Chapter 4}. This is because the climate forcing and response to SRM options are 14 different from the forcing and response to GHG increase. Because of these differences in climate forcing and 15 response patterns, the regional and seasonal climates of a world with a global mean warming of 1.5 or 2°C 16
ACCEPTED VERSIO
N
SUBJECT TO FIN
AL EDITS
FINAL DRAFT Chapter 16 IPCC WGII Sixth Assessment Report
Do Not Cite, Quote or Distribute 16-86 Total pages: 173
achieved via SRM would be different from a world with similar global mean warming but achieved through 1 mitigation MacMartin et al. JGR2019}. At the regional scale and seasonal timescale there could be 2 considerable residual climate change and/or overcompensating change (e.g., more cooling, wetting or drying 3 than just what’s needed to offset warming, drying or wetting due to anthropogenic greenhouse gas 4 emissions), and there is low confidence in understanding of the climate response to SRM at the regional 5 scale (WG1, Chapter 4). 6 7 SAI implemented to partially offset warming (e.g., offsetting half of global warming) may have potential to 8 ameliorate hazards in multiple regions and reduce negative residual change, such as drying compared to 9 present-day climate, that are associated with fully offsetting global mean warming (Irvine and Keith, 2020), 10 but may also increase flood and drought risk in Europe compared to unmitigated warming (Jones et al., 11 2021). Recent modelling studies suggest it is conceptually possible to meet multiple climate objectives 12 through optimally designed SRM strategies (WG1, Chapter 4). Nevertheless, large uncertainties still exist for 13 climate processes associated with SRM options (e.g. aerosol-cloud-radiation interaction) (WG1, Chapter 4) 14 (Kravitz and MacMartin, 2020). 15 16 Compared with climate hazards, many fewer studies have examined SRM risks—the potential adverse 17 consequences to people and ecosystems from the combination of climate hazards, exposure and 18 vulnerability—or the potential for SRM to reduce risk (Curry et al., 2014; Irvine et al., 2017). Risk analyses 19 have often used inputs from climate models forced with stylized representations of SRM, such as dimming 20 the sun. Fewer have used inputs from climate models that explicitly simulated injection of gases or aerosols 21 into the atmosphere, which include more complex cloud-radiative feedbacks. Most studies have used 22 scenarios where SAI is deployed to hold average global temperature constant despite high emissions. 23 24 There is low confidence and large uncertainty in projected impacts of SRM on crop yields due in part to a 25 limited number of studies. Because SRM would result in only a slight reduction in CO2 concentrations 26 relative to the emission scenario without SRM (Chapter 5, WG1), the CO2 fertilization effect on plant 27 productivity is nearly the same in emissions scenarios with and without SRM. Nevertheless, changes in 28 climate due to SRM are likely to have some impacts on crop yields. A single study indicates MCB may 29 reduce crop failure rates compared to climate change from a doubling of CO2 pre-industrial concentrations 30 (Parkes et al., 2015). Models suggest SAI cooling would reduce crop productivity at higher latitudes 31 compared to a scenario without SRM by reducing the growing season length, but benefit crop productivity in 32 lower latitudes by reducing heat stress (Pongratz et al., 2012; Xia et al., 2014; Zhan et al., 2019). Crop 33 productivity is also projected to be reduced where SAI reduces rainfall relative to the scenario without SRM, 34 including a case where reduced Asian summer monsoon rainfall causes a reduction in groundnut yields (Xia 35 et al., 2014; Yang et al., 2016). SAI will increase the fraction of diffuse sunlight, which is projected to 36 increase photosynthesis in forested canopy, but will reduce the direct and total available sunlight, which 37 tends to reduce photosynthesis. As total sunlight is reduced, there is a net reduction in crop photosynthesis 38 with the result that any benefits to crops from avoided heat stress may be offset by reduced photosynthesis, 39 as indicated by a single statistical modeling study (Proctor et al., 2018). SAI would reduce average surface 40 ozone concentration (Xia et al., 2017) mainly as a result of aerosol-induced reduction in stratospheric ozone 41 in polar regions, resulting in reduced downward transport of ozone to the troposphere (Pitari et al., 2014; 42 Tilmes et al., 2018). The reduction in stratospheric ozone also allows more UV radiation to reach the surface. 43 The reduction in surface ozone, together with an increase in surface UV radiation, would have important 44 implications for crop yields but there is low confidence in our understanding of the net impact. 45 46 Few studies have assessed potential SRM impacts on human health and wellbeing. SAI using sulfate aerosols 47 is projected to deplete the ozone layer, increasing mortality from skin cancer, and SAI could increase 48 particulate matter due to offsetting warming, reduced precipitation and deposition of SAI aerosols, which 49 would increase mortality, but SAI also reduces surface-level ozone exposure, which would reduce mortality 50 from air pollution, with net changes in mortality uncertain and depending on aerosol type and deployment 51 scenario (Effiong and Neitzel, 2016; Eastham et al., 2018; Dai et al., 2020). However, these effects may be 52 small compared to changes in risk from infectious disease (e.g., mosquito-borne illnesses) or food security 53 due to SRM influences on climate (Carlson et al., 2020). Using volcanic eruptions as a natural analog, a 54 sudden implementation of SAI that forced the ENSO system may increase risk of severe cholera outbreaks in 55 Bengal (Trisos et al., 2018; Pinke et al., 2019). Considering only mean annual temperature and precipitation, 56 SAI that stabilizes global temperature at its present-day level is projected to reduce income inequality 57
ACCEPTED VERSIO
N
SUBJECT TO FIN
AL EDITS
FINAL DRAFT Chapter 16 IPCC WGII Sixth Assessment Report
Do Not Cite, Quote or Distribute 16-87 Total pages: 173
between countries compared to the highest warming pathway (RCP8.5) (Harding et al., 2020). Some 1 integrated assessment model scenarios have included SAI (Arino et al., 2016; Emmerling and Tavoni, 2018; 2 Heutel et al., 2018; Helwegen et al., 2019; Rickels et al., 2020) showing the indirect costs and benefits to 3 welfare dominate, since the direct economic cost of SAI itself is expected to be relatively low (Moriyama et 4 al., 2017; Smith and Wagner, 2018). There is a general lack of research on the wide scope of potential risk or 5 risk reduction to human health, wellbeing and sustainable development from SRM and on their distribution 6 across countries and vulnerable groups (Carlson et al., 2020; Honegger et al., 2021). 7 8 SRM may also introduce novel risks for international collaboration and peace. Conflicting temperature 9 preferences between countries may lead to counter-geoengineering measures such as deliberate release of 10 warming agents or destruction of deployment equipment (Parker et al., 2018). Game-theoretic models and 11 laboratory experiments indicate a powerful actor or group with a higher preference for SRM may use SAI to 12 cool the planet beyond what is socially optimal, imposing welfare losses on others although this cooling does 13 not necessarily imply excluded countries would be worse off relative to a world of unmitigated warming 14 (Ricke et al., 2013; Weitzman, 2015; Abatayo et al., 2020). In this context counter-geoengineering may 15 promote international cooperation or lead to large welfare losses (Heyen et al., 2019; Abatayo et al., 2020). 16 17 Cooling caused by SRM would increase the global land and ocean CO2 sinks (medium confidence), but this 18 would not stop CO2 from increasing in the atmosphere or affect the resulting ocean acidification under 19 continued anthropogenic emissions (high confidence) (WG1 Chapter 5). 20 21 Few studies have assessed potential SRM impacts on ecosystems. SAI and MCB may reduce risk of coral 22 reef bleaching compared to global warming with no SAI (Latham et al., 2013; Kwiatkowski et al., 2015), but 23 risks to marine life from ocean acidification would remain, because SRM proposals do not reduce elevated 24 levels of anthropogenic atmospheric CO2 concentrations. MCB could cause changes in marine net primary 25 productivity by reducing light availability in deployment regions, with important fishing regions off the west 26 coast of South America showing both large increases and decreases in productivity (Partanen et al., 2016; 27 Keller, 2018). 28 29 There is large uncertainty in terrestrial ecosystem responses to SRM. By decoupling increases in atmospheric 30 greenhouse gas concentrations and temperature, SAI could generate substantial impacts on large-scale 31 biogeochemical cycles, with feedbacks to regional and global climate variability and change (Zarnetske et 32 al., 2021). Compared to a high CO2 world without SRM, global-scale SRM simulations indicate reducing 33 heat stress in low latitudes would increase plant productivity, but cooling would also slow down the process 34 of nitrogen mineralization which could decrease plant productivity (Glienke et al., 2015; Duan et al., 2020). 35 In high latitude and polar regions SRM may limit vegetation growth compared to a high CO2 world without 36 SRM, but net primary productivity may still be higher than pre-industrial climate (Glienke et al., 2015). 37 Tropical forests cycle more carbon and water than other terrestrial biomes but large areas of the tropics may 38 tip between savanna and tropical forest depending on rainfall and fire (Beer et al., 2010; Staver et al., 2011). 39 Thus, SAI-induced reductions in precipitation in Amazonia and central Africa are expected to change the 40 biogeography of tropical ecosystems in ways different both from present-day climate and global warming 41 without SAI (Simpson et al., 2019; Zarnetske et al., 2021). This would have potentially large consequences 42 for ecosystem services (Chapter 2 and Chapter 9). When designing and evaluating SAI scenarios, biome-43 specific responses need to be considered if SAI approaches are to benefit rather than harm ecosystems. 44 Regional precipitation change and sea salt deposition over land from MCB may increase or decrease primary 45 productivity in tropical rainforests (Muri et al., 2015). SRM that fully offsets warming could reduce the 46 dispersal velocity required for species to track shifting temperature niches whereas partially offsetting 47 warming with SAI would not reduce this risk unless rates of warming were also reduced (Trisos et al., 2018; 48 Dagon and Schrag, 2019). SAI may reduce high fire risk weather in Australia, Europe and parts of the 49 Americas, compared to global warming without SAI (Burton et al., 2018). Yet SAI using sulfur injection 50 could shift the spatial distribution of acid-induced aluminum soil toxicity into relatively undisturbed 51 ecosystems in Europe and North America (Visioni et al., 2020). For the same amount of global mean 52 cooling, SAI, MCB, and CCT would have different effects on gross and net primary productivity because of 53 different spatial patterns of temperature, available sunlight, and hydrological cycle changes (Duan et al., 54 2020). Large-scale modification of land surfaces for GBAM may have strong trade-offs with biodiversity 55 and other ecosystem services, including food security (Seneviratne et al., 2018a). Although existing studies 56
ACCEPTED VERSIO
N
SUBJECT TO FIN
AL EDITS
FINAL DRAFT Chapter 16 IPCC WGII Sixth Assessment Report
Do Not Cite, Quote or Distribute 16-88 Total pages: 173
indicate SRM will have widespread impacts on ecosystems, risks and potential for risk reduction for marine 1 and terrestrial ecosystems and biodiversity remain largely unknown. 2 3 A sudden and sustained termination of SRM in a high CO2 emissions scenario would cause rapid climate 4 change (high confidence; WG1 Chapter 4). More scenario analysis is needed on the potential likelihood of 5 sudden termination (Kosugi, 2013; Irvine and Keith, 2020). A gradual phase-out of SRM combined with 6 emission reduction and CDR could avoid these termination effects (medium confidence) (MacMartin et al., 7 2014; Keith and MacMartin, 2015; Tilmes et al., 2016). Several studies find that large and extremely rapid 8 warming and abrupt changes to the water cycle would occur within a decade if a sudden termination of SAI 9 occurred (McCusker et al., 2014; Crook et al., 2015b). The size of this ‘termination shock’ is proportional to 10 the amount of radiative forcing being masked by SAI. A sudden termination of SAI could place many 11 thousands of species at risk of extinction, because the resulting rapid warming would be too fast for species 12 to track the changing climate (Trisos et al., 2018). 13 14 Public perceptions of SRM 15 16 Studies on the public perception of SRM have used multiple methods: questionnaire surveys, workshops, and 17 focus group interviews (Burns et al., 2016; Cummings et al., 2017). Most studies have been limited to 18 Western societies with some exceptions. Studies have repeatedly found that respondents are largely unaware 19 of SRM (Merk et al., 2015). In the context of this general lack of familiarity, the publics prefer carbon 20 dioxide removal (CDR) to SRM (Pidgeon et al., 2012), are very cautious about SRM deployment because of 21 potential environmental side effects and governance concerns, and mostly reject deployment for the 22 foreseeable future. Studies also suggest conditional and reluctant support for research, including proposed 23 field experiments, with conditions of proper governance (Sugiyama et al., 2020). Recent studies show that 24 the perception varies with the intensity of deliberation (Merk et al., 2019), and that the public distinguishes 25 different funding sources (Nelson et al., 2021). Limited studies for developing countries show a tendency for 26 respondents to be more open to SRM (Visschers et al., 2017; Sugiyama et al., 2020), perhaps because they 27 experience climate change more directly (Carr and Yung, 2018). In some Anglophone countries, a small 28 portion of the public believes in chemtrail conspiracy theories, which are easily found in social media 29 (Tingley and Wagner, 2017; Allgaier, 2019). Since researchers rarely distinguish different SRM options in 30 engagement studies, there remains uncertainty in public perception. 31 32 Ethics 33 34 There is broad literature on ethical considerations around SRM, mainly stemming from philosophy or 35 political theory, and mainly focused on SAI (Flegal et al., 2019). There is concern that publicly debating, 36 researching and potentially deploying SAI could involve a ‘moral hazard’, with potential to obstruct ongoing 37 and future mitigation efforts (Morrow, 2014; Baatz, 2016; McLaren, 2016), while empirical evidence is 38 limited and mostly at the individual, not societal, level (Burns et al., 2016; Merk et al., 2016; Merk et al., 39 2019). There is low agreement whether research and outdoors experimentation will create a ‘slippery slope’ 40 toward eventual deployment, leading to a lock-in to long-term SRM, or can be effectively regulated at a later 41 stage to avoid undesirable outcomes (Hulme, 2014; Parker, 2014; Callies, 2019; McKinnon, 2019). 42 Regarding potential deployment of SRM, procedural, distributive and recognitional conceptions of justice 43 are being explored, (Svoboda and Irvine, 2014; Svoboda, 2017; Preston and Carr, 2018; Hourdequin, 2019). 44 With the SRM research community’s increasing focus on distributional impacts of SAI, researchers have 45 started more explicitly considering inequality in participation and inclusion of vulnerable countries and 46 marginalized social groups (Flegal and Gupta, 2018; Whyte, 2018; Táíwò and Talati, 2021), including 47 considering stopping research (Stephens and Surprise, 2020; National Academies of Sciences and Medicine, 48 2021a). There is recognition that SRM research has been conducted predominantly by a relatively small 49 number of experts in the Global North, and that more can be done to enable participation from diverse 50 peoples and geographies in setting research agendas and research governance priorities, and undertaking 51 research, with initial efforts to this effect (e.g., Rahman et al., 2018), noting unequal power relations in 52 participation could influence SRM research governance and potential implications for policy (Whyte, 2018; 53 Táíwò and Talati, 2021) (Winickoff et al., 2015; Frumhoff and Stephens, 2018; Biermann and Möller, 2019; 54 McLaren and Corry, 2021; National Academies of Sciences and Medicine, 2021b) 55 56 Governance of research and of deployment 57
ACCEPTED VERSIO
N
SUBJECT TO FIN
AL EDITS
FINAL DRAFT Chapter 16 IPCC WGII Sixth Assessment Report
Do Not Cite, Quote or Distribute 16-89 Total pages: 173
1 Currently, there is no dedicated, formal international SRM governance for research, development, 2 demonstration, or deployment (see WG3 Chapter 14). Some multilateral agreements—such as the UN 3 Convention on Biological Diversity or the Vienna Convention on the Protection of the Ozone Layer—4 indirectly and partially cover SRM, but none is comprehensive and the lack of robust and formal SRM 5 governance poses risks (Ricke et al., 2013; Talberg et al., 2018a; Reynolds, 2019a). While governance 6 objectives range broadly, from prohibition to enabling research and potentially deployment (Sugiyama et al., 7 2018b; Gupta et al., 2020), there is agreement that SRM governance should cover all interacting stages of 8 research through to any potential, eventual deployment with rules, institutions, and norms (Reynolds, 9 2019b). Accordingly, governance arrangements are co-evolving with respective SRM technologies across 10 the interacting stages of research, development, demonstration, and—potentially—deployment (Rayner et 11 al., 2013; Parker, 2014; Parson, 2014). Stakeholders are developing governance already in outdoors research; 12 for example, for MCB and OAC experiments on the Great Barrier Reef (McDonald et al., 2019). Co-13 evolution of governance and SRM research provides a chance for responsibly developing SRM technologies 14 with broader public participation and political legitimacy, guarding against potential risks and harms relevant 15 across a full range of scenarios, and ensuring that SRM is considered only as a part of a broader portfolio of 16 responses to climate change (Stilgoe, 2015; Nicholson et al., 2018). For SAI, large-scale outdoor 17 experiments even with low radiative forcing could be transboundary and those with deployment-scale 18 radiative forcing may not be distinguished from deployment, such that (MacMartin and Kravitz, 2019) argue 19 for continued reliance on modeling until a decision on whether and how to deploy is made, with modeling 20 helping governance development. For further discussion of SRM governance see Chapter 14, WG3. 21 22 [END CROSS-WORKING GROUP BOX SRM HERE] 23 24 25 16.6 Reasons for Concern Across Scales 26 27 This section builds on Section 16.5 which identifies and assesses key risks (KRs) and representative key 28 risks (RKRs), including conditions contributing to their severity (i.e., Figure 16.10), in two ways. First, we 29 consider those risks in the context of the global goal for sustainable development which can be impacted, as 30 expressed in the United Nations 2030 Agenda for Sustainable Development and the Sustainable 31 Development Goals (SDGs). This discussion supports further assessment in Chapter 18 on sustainable 32 system transitions and climate resilient development pathways. Second, the potential global consequences 33 are then elaborated in an updated assessment of five globally aggregated categories of risk, designated as 34 Reasons for Concern (RFCs), that evaluates risk accrual by global warming level. 35 36 16.6.1 Key Risks and Sustainable Development 37 38 The United Nations 2030 Agenda for Sustainable Development, and the Sustainable Development Goals 39 (SDGs) (UN, 2015), since 2015, have become an important vision for the United Nations member countries 40 (Chimhowu, 2019) as well as for corporations to contribute towards sustainable growth (UNDP et al., 2016; 41 Ike et al., 2019; van der Waal and Thijssens, 2020). Climate change risks, as embodied in the RKR and 42 RFCs, can affect attainment of the SDGs and have consequences for lives and livelihoods (related to SDGs 43 1, 4, 8 and 9), health and well-being (related to SDGs 2, 3 and 6), ecosystems and species (related to SDGs 44 6, 14 and 15), economic (related to SDGs 1, 8 and 12), social and cultural assets (related to SDGs 5, 10, 11, 45 16 and 17), services including ecosystem services (related to SDGs 6, 7, 11, 12, 14 and 15), and 46 infrastructure (related to SDGs 6, 7, 9, 11 and 12). This section assesses the level of linkages between key 47 risks with sustainable development, in terms of the SDG targets and indicators. This informs on the key risks 48 which are most relevant to consider with respect to the attainment of the SDGs. 49 50 16.6.1.1 Links Between Key Risks and SDGs 51 52 Within the AR6 cycle, the three IPCC Special Reports have all considered the relationships between climate 53 change impacts and actions and the SDGs. SR15 discussed priorities for sustainable development in relation 54 to climate adaptation efforts (Section 5.3.1, SR15); synergies and trade-offs of climate adaptation measures 55 (Section 5.3.2, SR15); and the effect of adaptation pathways towards a 1.5ºC warmer world (Section 5.3.3 56 SR15). The SRCCL considered impacts of desertification on SDGs 1 (no poverty), 2 (zero hunger), 13 57
ACCEPTED VERSIO
N
SUBJECT TO FIN
AL EDITS
FINAL DRAFT Chapter 16 IPCC WGII Sixth Assessment Report
Do Not Cite, Quote or Distribute 16-90 Total pages: 173
(climate), 15 (life on land), and 5 (gender) (IPCC, 2019a, Figure 3.9). Trade-offs and synergies between 1 SDGs 2 (zero hunger) and 13 (climate action) at the global level were recognised (IPCC, 2019a, Section 2 5.6.6, Figure 5.16). Various integrated response options, interventions and investments were also evaluated 3 within the SDG framework (IPCC, 2019a, Section 6.4.3). The SROCC (Chapter 5) concluded that climate 4 change impacts on the ocean, overall, will negatively affect achieving the SDGs with 14 (life below water) 5 being most relevant (Singh et al., 2019). 6 7 Many linkages between SDG 13 (climate action) and other SDGs have been identified (very high 8 confidence), (Blanc, 2015; Kelman, 2015; Northrop et al., 2016; Hammill and Price-Kelly, 2017; ICSU, 9 2017; Mugambiwa and Tirivangasi, 2017; Dzebo et al., 2018; Major et al., 2018; Nilsson et al., 2018; 10 Sanchez Rodriguez et al., 2018). In addition, interactions between different climate change actions and 11 SDGs, and interactions among SDGs themselves, have also been assessed (Nilsson et al., 2016; IPCC, 2018; 12 McCollum et al., 2018; Fuso-Nerini et al., 2019; IPCC, 2019b; Cernev and Fenner, 2020). The Cross-13 Chapter Box GENDER in Chapter 18 assessment indicates the importance of gender considerations in 14 achieving success and benefits in adaptation efforts. Aligning climate change adaptation to the SDGs could 15 bring potential co-benefits, increased efficiency in funding, and reduce the gap between adaptation planning 16 and implementation (very high confidence) (IPCC, 2018; Sanchez Rodriguez et al., 2018; IPCC, 2019b; 17 IPCC, 2019a). 18 19 Progress towards meeting the SDGs has been recognized to be able to reduce global disparities and support 20 more climate resilient development pathways (IPCC WGII AR5, Chapter 13, p. 818; discussed further in 21 Chapter 18). Nevertheless, we are still lagging in achieving the 2030 Goals (OECD, 2019; Sachs et al., 22 2021), and this affects societal vulnerability, readiness and risk response capacities (IPCC, 2019a, Chapters 23 6, 7, Chapters 6 and 8, this report). We assess the risk literature for linkages between key risks (grouped by 24 RKRs) and the indicators of the SDGs (UN, 2015) using text analysis (details in Supplementary Material 25 SM16.5) to identify the potential level of effect of different risks on the SDGs. Some 940 documents were 26 analysed. The SDG status is associated with projected climate hazards, also called climatic impact-drivers 27 (CID) (Ranasinghe et al., 2021) (panel a), and RKRs (panel c), summarising hazard and exposure with 28 vulnerability aspects, as expressed by challenges in achieving the SDGs (panel d), on a regional level (Figure 29 16.12). 30 31 32
ACCEPTED VERSIO
N
SUBJECT TO FIN
AL EDITS
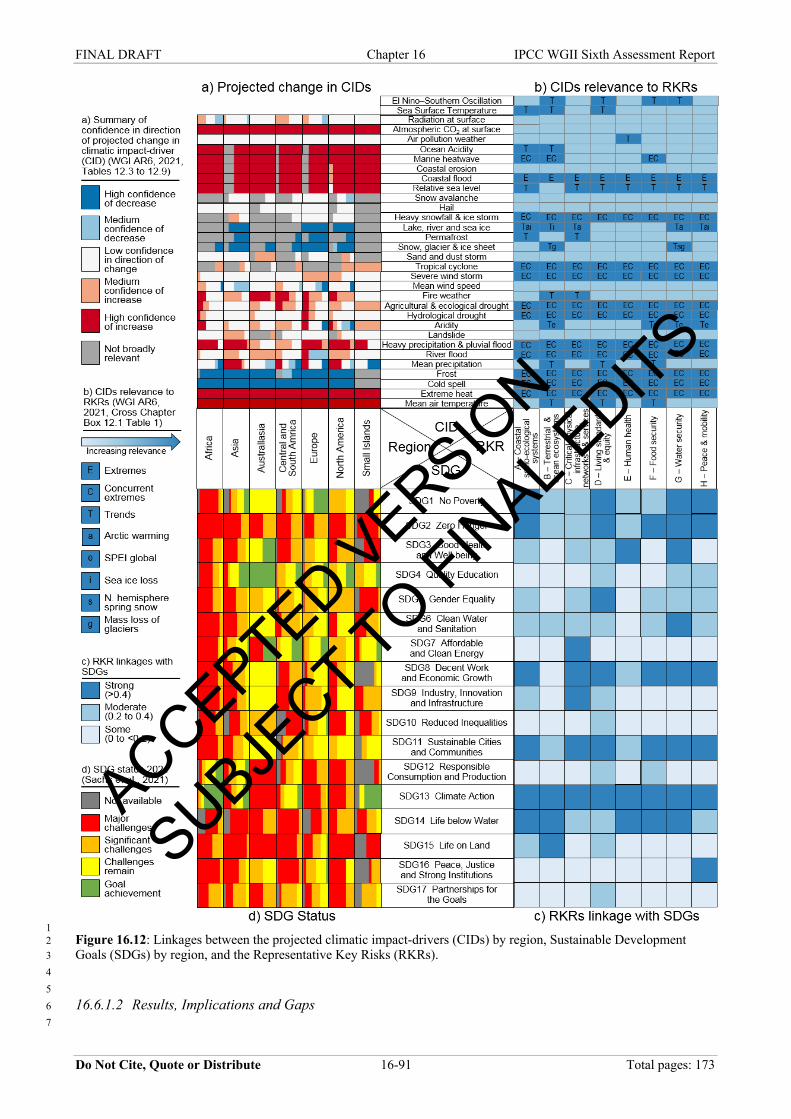
FINAL DRAFT Chapter 16 IPCC WGII Sixth Assessment Report
Do Not Cite, Quote or Distribute 16-91 Total pages: 173
1 Figure 16.12: Linkages between the projected climatic impact-drivers (CIDs) by region, Sustainable Development 2 Goals (SDGs) by region, and the Representative Key Risks (RKRs). 3 4 5 16.6.1.2 Results, Implications and Gaps 6 7
ACCEPTED VERSIO
N
SUBJECT TO FIN
AL EDITS
FINAL DRAFT Chapter 16 IPCC WGII Sixth Assessment Report
Do Not Cite, Quote or Distribute 16-92 Total pages: 173
Linkages between the 17 SDGs and the eight RKRs (Figure 16.15 bottom left panel) are mapped to the 1 regional SDG status (Figure 16.15 bottom right panel) and related to the climate hazards (CIDs) (Figure 2 16.15 top left panel). Interconnections between climate hazards (CIDs) and RKRs are complicated by the 3 possibility of concurrent weather events, extremes and longer term trends. Risks are compounded by existing 4 vulnerabilities (Iwama et al., 2016; Thomas et al., 2019b; Birkmann et al., 2021) and cascading 5 consequences (Pescaroli and Alexander, 2015; Pescaroli and Alexander, 2018; Yokohata et al., 2019) (see 6 for example Sections 3.4.3.5, 5.12, 6.2.6, 7.2.2.2) as well as interactions. The level of challenges faced in 7 attaining the SDGs is one metric for assessing vulnerability and lack of capacity to manage risks (Cernev and 8 Fenner, 2020). Other metrics are also available (Parker et al., 2019; Garschagen et al., 2021b; Birkmann et 9 al., 2022). From Figure 16.12, aside from SDG13 (climate action), the strongest connections and risk 10 challenges are with zero hunger (SDG2), sustainable cities and communities (SDG11), life below water 11 (SDG14), decent work and economic growth (SDG8), no poverty (SDG1), clean water and sanitation 12 (SDG6) and good health and well-being (SDG3) (high confidence). Other SDGs have strong linkages with 13 specific RKRs, for example, terrestrial and marine ecosystems with Life on land (SDG15); infrastructure 14 (RKR-C) with Industry, innovation and infrastructure (SDG9) and Affordable and clean energy (SDG7); 15 living standards (RKR-D) with Gender equality (SDG5); and peace and mobility (RKR-H) with Peace, 16 justice and strong institutions (SDG 16) (high confidence). 17 18 On a global scale, priority areas for regions can be evaluated from the intersection of climate hazards, risks 19 and the level of challenges in SDG attainment (Moyer and Hedden, 2020; Sachs et al., 2021). The greatest 20 linkages and effects on the SDGs will be due to risks to water (RKR-G), living standards (RKR-D), coastal 21 socio-ecological systems (RKR-A) and Peace and human mobility (RKR-H) (high confidence) (details in 22 Supplementary Material SM16.5). 23 24 In particular, coastal socio-ecological systems (RKR-A), living standards (RKR-D), food security (RKR-F), 25 water security (RKR-G) and peace and mobility (RKR-H), have strong linkages with SDG 2 (zero hunger), 26 for which there are significant to major challenges for all regions (high confidence). Almost all the RKRs are 27 strongly linked to SDGs 8 (decent work and economic growth), and 11 (sustainable cities and communities) 28 (high confidence), where regions such as Africa, Asia, and Central and South America face significant to 29 major challenges in attaining targets. All regions also face major to significant challenges affecting SDGs 14 30 (life below water) and 15 (life on land), which relate to terrestrial and ocean ecosystems (RKR-B) (high 31 confidence). 32 33 The analysis of RKR linkages to SDGs is also useful in identifying gaps and susceptibilities, especially for 34 developing future climate resilient development targets. This aspect is discussed further in Chapter 18. Gaps 35 may arise as SDG targets and indicators are not specifically focused on systems affected by climate change 36 risks or impacts. For example, in the SRCCL Section 7.1.2 Hurlbert et al. (2019), noted the absence of an 37 explicit goal for conserving fresh-water ecosystems and ecosystem services in the SDGs. Such gaps (Tasaki 38 and Kameyama, 2015; Guppy et al., 2019) are inevitable as the current SDG targets and indicators focus on 39 overall sustainable development. As another example, projected increases in frequency and intensity of hot 40 temperature extremes are likely to result in increased heat-related illness and mortality, yet heat extremes are 41 not called out as an SDG indicator under SDGs 3 (good health and well-being) nor 13 (climate action). The 42 gaps on climate-related metrics for impacts on health are just beginning to be evaluated (Lloyd and Hales, 43 2019, see also Section 7.1.6). The current SDG 13 (climate action) targets also do not specifically track the 44 possibility of differential impacts on society from disasters and extreme weather events (RFC2). For 45 example, the first indicator (13.1.1.1), ‘Number of deaths, missing persons and directly affected persons 46 attributed to disasters per 100,000 population’, does not include any requirement for disaggregated data, 47 unlike several other socio-economic and population SDG indicators, making it difficult to track the different 48 effects that climate-related disasters are expected to have on men, women, and children across different 49 segments of society, relevant for distributional impacts (RFC3) (see also Section 8.3, Cross-Chapter Box 50 GENDER in Chapter 18). The risk consequences identified and discussed in each RKR (Section 16.5.2) 51 provide useful entry points for identifying indicators and metrics for monitoring and evaluating specific 52 impacts of key climate change risks. In addition, the sector and region chapters have considered various 53 adaptation responses relevant to the SDGs (see for example, Sections 3.6, 4.7.5, 5.13.3, 8.2.1.6, 10.6.1, 54 13.11.4, 14.6.3) with relevant metrics for evaluation. 55 56
ACCEPTED VERSIO
N
SUBJECT TO FIN
AL EDITS
FINAL DRAFT Chapter 16 IPCC WGII Sixth Assessment Report
Do Not Cite, Quote or Distribute 16-93 Total pages: 173
In summary, key risks, and the consequences arising from them, are directly linked to and will affect specific 1 indicators of the SDGs (high confidence). They also will be indirectly linked to, and thus affect, the SDGs 2 overall, due to the interactions between the key risks (Section 16.5) and between the SDGs themselves (very 3 high confidence). These results support previous findings that climate change impacts pose a risk to 4 achieving sustainability (Ansuategi et al., 2015; Chirambo, 2016; ICSU, 2017; Pradhan et al., 2017; Gomez-5 Echeverri, 2018; IPCC, 2018; IPCC, 2019b; IPCC, 2019a; Cernev and Fenner, 2020). Not all observed or 6 expected consequences arising from the key risks are fully captured by the SDG indicators, and nor were 7 they designed to be. Therefore, for monitoring and assessing the climate risk impacts, it is useful to consider 8 specific, climate change impact indicators and metrics (Enenkel et al., 2020) to capture any realised impacts. 9 10 In the near term, the strength of connection between the RKRs and the SDGs, with respect to existing SDG 11 challenges, indicate probable systemic vulnerabilities and issues in responding to climatic hazards (UN-12 IATFFD, 2019; Leal Filho et al., 2020; Weaver et al., 2020; Tiedemann et al., 2021) (high confidence). In 13 the medium to long term (associated with global warming levels of between 2°C and 2.7°C under SSP2-45 14 scenario), if such vulnerabilities and challenges cannot be substantially reduced, the hazards and risks 15 resulting from the projected climate hazards (CIDs) (Figure 16.12b, c) will further stress systems relevant for 16 sustainable development, based on current experience of the COVID-19 pandemic (UN-IATFFD, 2021, see 17 also Cross-Chapter Box COVID in Chapter 7; Section 8.2, Section 8.3) (medium confidence, based on 18 medium evidence, high agreement). 19 20 The potential impacts of the various climate hazards, the occurrence of extreme events, and the projected 21 trends of climate hazards, give rise to complex risks for ecological and human systems, which are 22 compounded by the exposure, vulnerability and sustainability challenges faced in different regions of the 23 world. The potential global consequences are elaborated in the next section which describes the framework 24 and approach for the assessment of the five Reasons for Concern. 25 26 16.6.2 Framework and Approach for Assessment of RFCs and Relation to RKRs 27 28 The ‘Reasons for Concern’ (RFC) framework communicates scientific understanding about accrual of risk in 29 relation to varying levels of warming for five broad categories: risk associated with (1) unique and 30 threatened systems, (2) extreme weather events, (3) distribution of impacts, (4) global aggregate impacts, and 31 (5) large-scale singular events (Smith et al., 2001; Mastrandrea and Schneider, 2004; Schneider and 32 Mastrandrea, 2005). The RFC framework was first developed during the Third Assessment Report (Smith et 33 al., 2001) along with a visual representation of these risks as ‘burning embers’ figures, and this assessment 34 framework has been further developed and updated in subsequent IPCC reports including AR5 (IPCC, 2014; 35 Oppenheimer et al., 2014) and the recent IPCC Special Reports (SR15 2018; SRCCL 2019; SROCC 2019). 36 37 Relationship between RKRs and RFCs 38 RFCs reflect risks aggregated globally that together inform the interpretation of dangerous anthropogenic 39 interference with the climate system. The five RFC categories are maintained as previously defined for 40 consistency with earlier assessments. Compared to the synthesis of risk across RKRs in Section 16.5, we 41 note that the RKRs and RFCs are complementary methods that aggregate individual risks into different but 42 interconnected categories (Figure 16.13). 43 44 45
ACCEPTED VERSIO
N
SUBJECT TO FIN
AL EDITS
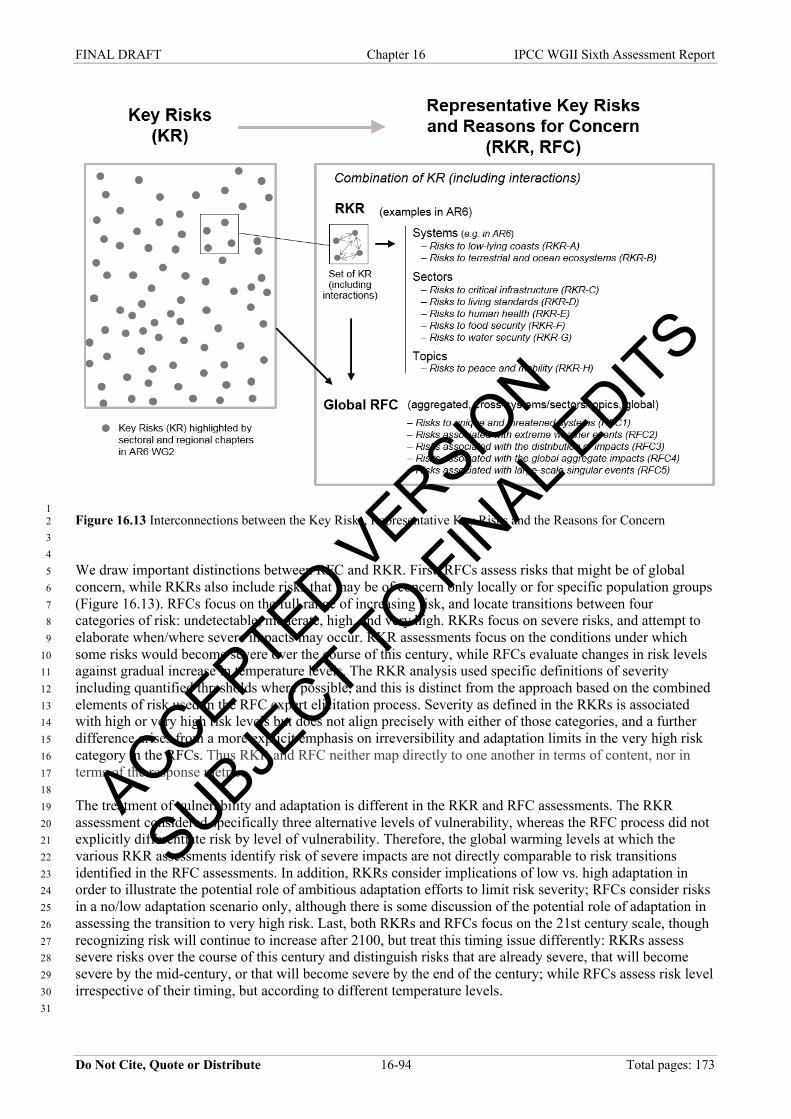
FINAL DRAFT Chapter 16 IPCC WGII Sixth Assessment Report
Do Not Cite, Quote or Distribute 16-94 Total pages: 173
1 Figure 16.13 Interconnections between the Key Risks, Representative Key Risks and the Reasons for Concern 2 3 4 We draw important distinctions between RFC and RKR. First, RFCs assess risks that might be of global 5 concern, while RKRs also include risks that may be of concern only locally or for specific population groups 6 (Figure 16.13). RFCs focus on the full range of increasing risk, and locate transitions between four 7 categories of risk: undetectable, moderate, high, and very high. RKRs focus on severe risks, and attempt to 8 elaborate when/where severe impacts may occur. RKR assessments focus on the conditions under which 9 some risks would become severe over the course of this century, while RFCs evaluate changes in risk levels 10 against gradual increase in temperature levels. The RKR analysis used specific definitions of severity 11 including quantified thresholds where possible, and this is distinct from the approach based on the combined 12 elements of risk used in the RFC expert elicitation process. Severity as defined in the RKRs is associated 13 with high or very high risk levels but does not align precisely with either of those categories, and a further 14 difference arises from a more explicit emphasis on irreversibility and adaptation limits in the very high risk 15 category in the RFCs. Thus RKR and RFC neither map directly to one another in terms of content, nor in 16 terms of the response metric. 17 18 The treatment of vulnerability and adaptation is different in the RKR and RFC assessments. The RKR 19 assessment considered specifically three alternative levels of vulnerability, whereas the RFC process did not 20 explicitly differentiate risk by level of vulnerability. Therefore, the global warming levels at which the 21 various RKR assessments identify risk of severe impacts are not directly comparable to risk transitions 22 identified in the RFC assessments. In addition, RKRs consider implications of low vs. high adaptation in 23 order to illustrate the potential role of ambitious adaptation efforts to limit risk severity; RFCs consider risks 24 in a no/low adaptation scenario only, although there is some discussion of the potential role of adaptation in 25 assessing the transition to very high risk. Last, both RKRs and RFCs focus on the 21st century scale, though 26 recognizing risk will continue to increase after 2100, but treat this timing issue differently: RKRs assess 27 severe risks over the course of this century and distinguish risks that are already severe, that will become 28 severe by the mid-century, or that will become severe by the end of the century; while RFCs assess risk level 29 irrespective of their timing, but according to different temperature levels. 30 31
ACCEPTED VERSIO
N
SUBJECT TO FIN
AL EDITS
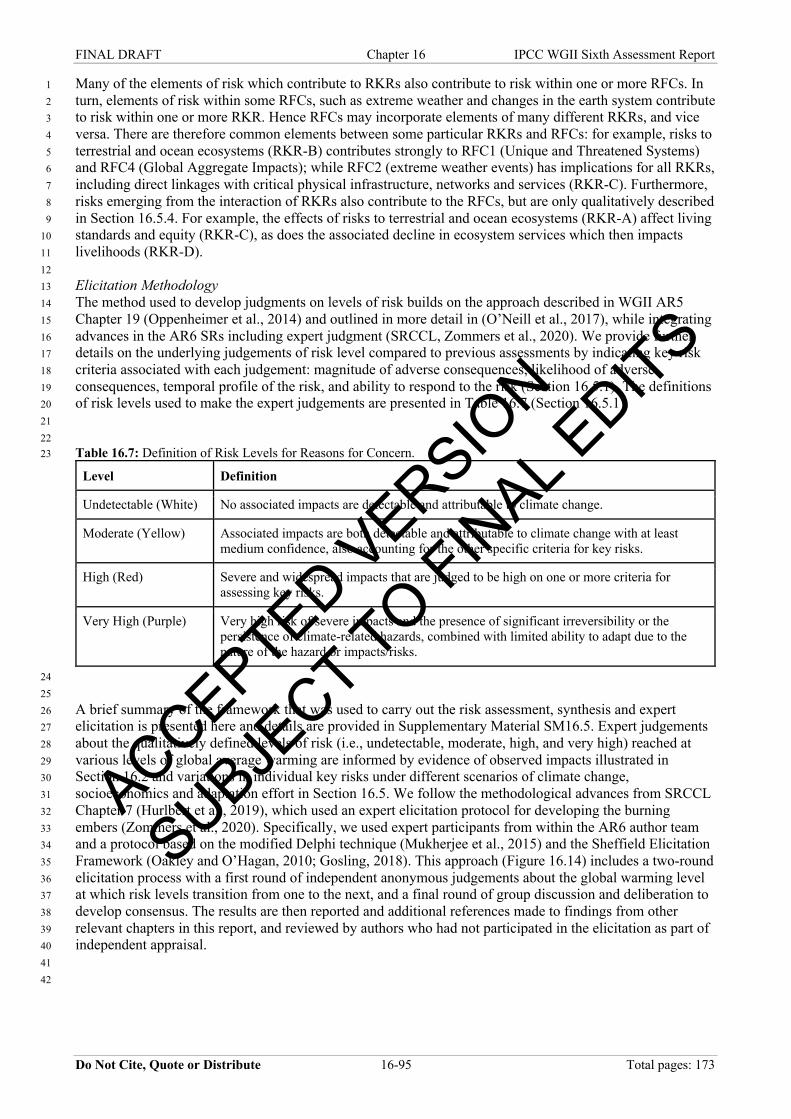
FINAL DRAFT Chapter 16 IPCC WGII Sixth Assessment Report
Do Not Cite, Quote or Distribute 16-95 Total pages: 173
Many of the elements of risk which contribute to RKRs also contribute to risk within one or more RFCs. In 1 turn, elements of risk within some RFCs, such as extreme weather and changes in the earth system contribute 2 to risk within one or more RKR. Hence RFCs may incorporate elements of many different RKRs, and vice 3 versa. There are therefore common elements between some particular RKRs and RFCs: for example, risks to 4 terrestrial and ocean ecosystems (RKR-B) contributes strongly to RFC1 (Unique and Threatened Systems) 5 and RFC4 (Global Aggregate Impacts); while RFC2 (extreme weather events) has implications for all RKRs, 6 including direct linkages with critical physical infrastructure, networks and services (RKR-C). Furthermore, 7 risks emerging from the interaction of RKRs also contribute to the RFCs, but are only qualitatively described 8 in Section 16.5.4. For example, the effects of risks to terrestrial and ocean ecosystems (RKR-A) affect living 9 standards and equity (RKR-C), as does the associated decline in ecosystem services which then impacts 10 livelihoods (RKR-D). 11 12 Elicitation Methodology 13 The method used to develop judgments on levels of risk builds on the approach described in WGII AR5 14 Chapter 19 (Oppenheimer et al., 2014) and outlined in more detail in (O’Neill et al., 2017), while integrating 15 advances in the AR6 SRs including expert judgment (SRCCL, Zommers et al., 2020). We provide further 16 details on the underlying judgements of risk level compared to previous assessments by indicating key risk 17 criteria associated with each judgement: magnitude of adverse consequences, likelihood of adverse 18 consequences, temporal profile of the risk, and ability to respond to the risk (Section 16.5.1). The definitions 19 of risk levels used to make the expert judgements are presented in Table 16.7 (Section 16.5.1). 20 21 22 Table 16.7: Definition of Risk Levels for Reasons for Concern. 23
Level Definition
Undetectable (White) No associated impacts are detectable and attributable to climate change.
Moderate (Yellow) Associated impacts are both detectable and attributable to climate change with at least medium confidence, also accounting for the other specific criteria for key risks.
High (Red) Severe and widespread impacts that are judged to be high on one or more criteria for assessing key risks.
Very High (Purple) Very high risk of severe impacts and the presence of significant irreversibility or the persistence of climate-related hazards, combined with limited ability to adapt due to the nature of the hazard or impacts/risks.
24 25 A brief summary of the framework that was used to carry out the risk assessment, synthesis and expert 26 elicitation is presented here and details are provided in Supplementary Material SM16.5. Expert judgements 27 about the qualitatively defined levels of risk (i.e., undetectable, moderate, high, and very high) reached at 28 various levels of global average warming are informed by evidence of observed impacts illustrated in 29 Section 16.2 and variations in individual key risks under different scenarios of climate change, 30 socioeconomics and adaptation effort in Section 16.5. We follow the methodological advances from SRCCL 31 Chapter 7 (Hurlbert et al., 2019), which used an expert elicitation protocol for developing the burning 32 embers (Zommers et al., 2020). Specifically, we used expert participants from within the AR6 author team 33 and a protocol based on the modified Delphi technique (Mukherjee et al., 2015) and the Sheffield Elicitation 34 Framework (Oakley and O’Hagan, 2010; Gosling, 2018). This approach (Figure 16.14) includes a two-round 35 elicitation process with a first round of independent anonymous judgements about the global warming level 36 at which risk levels transition from one to the next, and a final round of group discussion and deliberation to 37 develop consensus. The results are then reported and additional references made to findings from other 38 relevant chapters in this report, and reviewed by authors who had not participated in the elicitation as part of 39 independent appraisal. 40 41 42
ACCEPTED VERSIO
N
SUBJECT TO FIN
AL EDITS
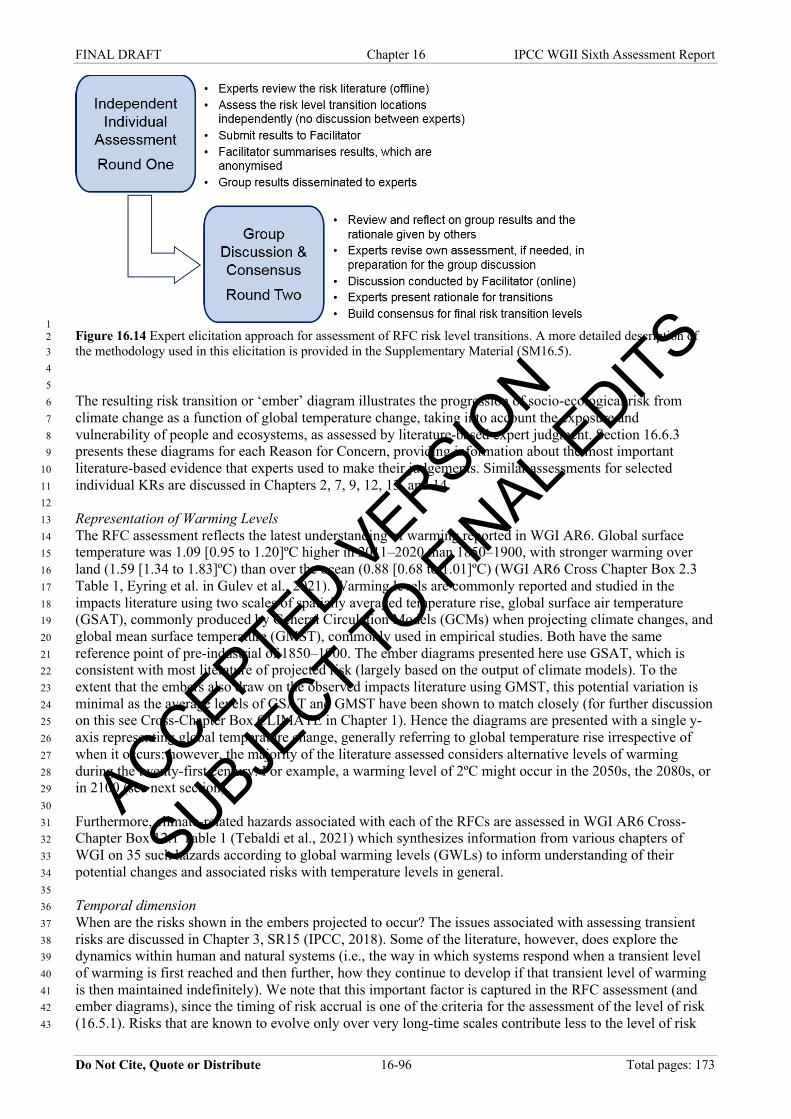
FINAL DRAFT Chapter 16 IPCC WGII Sixth Assessment Report
Do Not Cite, Quote or Distribute 16-96 Total pages: 173
1 Figure 16.14 Expert elicitation approach for assessment of RFC risk level transitions. A more detailed description of 2 the methodology used in this elicitation is provided in the Supplementary Material (SM16.5). 3 4 5 The resulting risk transition or ‘ember’ diagram illustrates the progression of socio-ecological risk from 6 climate change as a function of global temperature change, taking into account the exposure and 7 vulnerability of people and ecosystems, as assessed by literature-based expert judgment. Section 16.6.3 8 presents these diagrams for each Reason for Concern, providing information about the most important 9 literature-based evidence that experts used to make their judgements. Similar assessments for selected 10 individual KRs are discussed in Chapters 2, 7, 9, 12, 13, and 14. 11 12 Representation of Warming Levels 13 The RFC assessment reflects the latest understanding of warming reported in WGI AR6. Global surface 14 temperature was 1.09 [0.95 to 1.20]ºC higher in 2011–2020 than 1850–1900, with stronger warming over 15 land (1.59 [1.34 to 1.83]ºC) than over the ocean (0.88 [0.68 to 1.01]ºC) (WGI AR6 Cross Chapter Box 2.3 16 Table 1, Eyring et al. in Gulev et al., 2021). Warming levels are commonly reported and studied in the 17 impacts literature using two scales of spatially averaged temperature rise, global surface air temperature 18 (GSAT), commonly produced by General Circulation Models (GCMs) when projecting climate changes, and 19 global mean surface temperature (GMST), commonly used in empirical studies. Both have the same 20 reference point of pre-industrial of 1850–1900. The ember diagrams presented here use GSAT, which is 21 consistent with most literature of projected risk (largely based on the output of climate models). To the 22 extent that the embers also draw on the observed impacts literature using GMST, this potential variation is 23 minimal as the average levels of GSAT and GMST have been shown to match closely (for further discussion 24 on this see Cross-Chapter Box CLIMATE in Chapter 1). Hence the diagrams are presented with a single y-25 axis representing global temperature change, generally referring to global temperature rise irrespective of 26 when it occurs: however, the majority of the literature assessed considers alternative levels of warming 27 during the twenty-first century. For example, a warming level of 2ºC might occur in the 2050s, the 2080s, or 28 in 2100 (see next section). 29 30 Furthermore, climate-related hazards associated with each of the RFCs are assessed in WGI AR6 Cross-31 Chapter Box 12.1 Table 1 (Tebaldi et al., 2021) which synthesizes information from various chapters of 32 WGI on 35 such hazards according to global warming levels (GWLs) to inform understanding of their 33 potential changes and associated risks with temperature levels in general. 34 35 Temporal dimension 36 When are the risks shown in the embers projected to occur? The issues associated with assessing transient 37 risks are discussed in Chapter 3, SR15 (IPCC, 2018). Some of the literature, however, does explore the 38 dynamics within human and natural systems (i.e., the way in which systems respond when a transient level 39 of warming is first reached and then further, how they continue to develop if that transient level of warming 40 is then maintained indefinitely). We note that this important factor is captured in the RFC assessment (and 41 ember diagrams), since the timing of risk accrual is one of the criteria for the assessment of the level of risk 42 (16.5.1). Risks that are known to evolve only over very long-time scales contribute less to the level of risk 43
ACCEPTED VERSIO
N
SUBJECT TO FIN
AL EDITS
FINAL DRAFT Chapter 16 IPCC WGII Sixth Assessment Report
Do Not Cite, Quote or Distribute 16-97 Total pages: 173
than those which are known to occur rapidly. This is because sea level rise also depends on the dynamics of 1 global warming, including the rate of change of radiative forcing, and time lags of several decades, including 2 between atmospheric and ocean warming, and in reaching equilibrium sea level state (Oppenheimer et al., 3 2019; Fox-Kemper et al., 2021). However, longer-term risks that would arise if those transient temperatures 4 were maintained are also included, and this is particularly important in RFC5 (large scale singular events). 5 Note that risks that take place over a very long timescale are considered to be of lower concern than more 6 imminent risks. However, changes of very large magnitude can still be very important even if far away in 7 time, especially if these changes are irreversible (or reversible only on extremely long time scales) (see 8 Section 16.5.1). 9 10 Although the embers do not indicate the decade in which certain risks are projected to occur, clearly this 11 depends strongly on the level of mitigation action as well as the degree of adaptation. Hence, the ember 12 diagram (Figure 16. 14) is shown alongside a graphic illustrating possible global temperature time series 13 emerging from alternative future scenarios assessed by WGI AR6 which imply different levels of mitigation 14 effort. For example, in a scenario with a high level of mitigation effort (SSP1-1.9) reaching net zero 15 emissions in the 2050s, it is extremely likely that global warming remains below 2°C and more than 50% 16 likely that it will remain below 1.6°C (AR6 WGI 4.3.1.1, Meinshausen et al., 2020). On the other hand, a 17 level of 2°C warming is extremely likely to be exceeded during the 21st century under the three scenarios 18 assessed by WGI AR6 in which greenhouse gas emissions do not fall below current levels before mid-19 century (i.e., SSP2-4.5, SSP3-7.0, SSP-8.5) (WGI AR6 4.3.1.1, Lee et al., 2021). WGI AR6 has assessed that 20 ‘global surface temperature averaged over 2081–2100 is very likely to be higher by 1.0°C–1.8°C under the 21 lowest CO2 emission scenario considered in this report (SSP1-1.9) and by 3.3°C–5.7°C under the highest 22 CO2 emission scenario (SSP5-8.5)’. However, almost all scenarios assessed by IPCC AR6 WGI reach 1.5°C 23 global warming level in the early 2030s (WGI AR6 SPM, IPCC, 2021a). 24 25 Temperature overshoot 26 The concept of temperature overshoot, defined as ‘exceedance of a specified global warming level followed 27 by a decline to or below that level during a specified period of time’ is a relevant consideration for this RFC 28 risk assessment; however, the effect of overshoot has not explicitly been considered in the burning ember 29 assessment due to the limited literature basis. However, despite the lack of directly assessed overshoot 30 scenarios, the current literature provides several salient examples of irreversible changes that are projected to 31 occur once global temperatures reach a particular level. For example, coral reefs are unable to survive 32 repeated bleaching events that are too close together, leading to irreversible loss of the reefs even if 33 bleaching were to cease (see Section 16.6.3.1 RFC1). Species extinction is irreversible, and Chapter 2 34 assesses that at ~1.6°C, >10% of species are projected to become endangered as compared with >20% at 35 ~2.1°C (median) representing high and very high biodiversity risk, respectively (medium confidence) 36 (Section 2.5.4). Similarly, WGI AR6 finds that ‘Over the 21st century and beyond, abrupt and irreversible 37 regional changes in the water cycle, including changes in seasonal precipitation, streamflow and aridity, 38 cannot be excluded’. Thus, information about irreversibility provides information about the potential 39 outcome of temperature overshoot scenarios. Other types of losses, such as loss of human or species life, are 40 irreversible even if the loss process ceases in the future. The less resilient a system is, the more likely it is to 41 suffer irreversible damage during a temperature overshoot; the more resilient it is, the more likely it is to be 42 able to withstand the overshoot or recover afterwards. Very high levels of risk, as assessed here in the 43 Reasons for Concern, are associated with a wide range of criteria for risk assessment including 44 irreversibility. Whilst not all very high risks are irreversible, in general risks reaching a very high level 45 include a component of irreversible risks that would persist during and after an overshooting of a given 46 temperature level. 47 48 Risks associated with socioeconomic development, mitigation and mal-adaptation 49 The ember diagrams in Figure 16.14 capture only the risks arising from exposure of vulnerable socio-50 ecological systems to climatic hazards across a range of socioeconomic futures. They do not capture any risk 51 component arising solely from changes in population or level of development. Importantly, they also do not 52 capture additional risks that may arise from the human response to climate change, including climate change 53 mitigation or unintended negative consequences of adaptation-related responses (i.e., maladaptation) 54 (Section 17.5.1). Such risks are discussed in SRCCL Chapter 7, for example, adverse effects of the very 55 large-scale use of land and water for primary bioenergy production on food production and biodiversity 56 (Hurlbert et al., 2019). Contributions of mitigation or maladaptation to risk can be important, however, and 57
ACCEPTED VERSIO
N
SUBJECT TO FIN
AL EDITS
FINAL DRAFT Chapter 16 IPCC WGII Sixth Assessment Report
Do Not Cite, Quote or Distribute 16-98 Total pages: 173
are discussed further in the context of specific RFCs in Section 16.6.3. In general, such components of risk 1 are difficult to quantify, and can be minimised by good design of climate change mitigation and adaptation. 2 Thus, the effect is excluded from the ember diagrams to allow a more clear representation of the accrual of 3 climate change risk with global warming. 4 5 Emergent Risk 6 AR5 Oppenheimer et al. (2014) defined ‘emergent risk’ as a risk that arises from the interaction of 7 phenomena in a complex system. While emergent risk is a relevant consideration for this RFC risk 8 assessment, this type of risk has not been explicitly accounted for in the burning ember assessment due to the 9 limited literature basis. Unlike known or identified risks, emergent risks are characterized by the uncertainty 10 of consequences and/or probabilities of occurrence. The International Risk Governance Council (IRGC) 11 suggests three categories of emergent risks: 1) high uncertainty and a lack of knowledge about potential 12 impacts and interactions with risk-absorbing systems; 2) increasing complexity, emergent interactions and 13 systemic dependencies that can lead to non-linear impacts and surprises; and 3) changes in context (for 14 example social and behavioural trends, organisational settings, regulations, natural environments) that may 15 alter the nature, probability and magnitude of expected impacts. Feedback processes between climatic 16 change, human interventions involving mitigation and adaptation actions, and processes in natural systems 17 can be classified as emergent risks if they pose a threat to human security. 18 19 16.6.3 Global Reasons for Concern 20 21 In this section we present the results of the expert elicitation in the form of the burning embers diagram, 22 alongside a description of the recent literature and scientific evidence for each of the RFCs in turn. The 23 consensus transition values are illustrated in Figure 16.14, an updated version of the burning embers diagram 24 that describes the additional risk due to climate change for each RFC when a temperature level is reached 25 and then sustained or exceeded. (Table SM16.18 in Supplementary Material SM16.6 presents the consensus 26 values of the transition range and median estimate in terms of global warming level by risk level for each of 27 the five RFC embers). The shading of each ember provides a qualitative indication of the increase in risk 28 with temperature, and we retain the color scheme employed in the most recent versions of this figure, where 29 white, yellow, red, and purple indicate undetectable, moderate, high and very high additional risk, 30 respectively. These transitions were assessed under conditions of low to no adaptation compared to today, in 31 accordance with definitions provided in 16.3 (i.e., adaptation consists of fragmented, localized, incremental 32 adjustments to existing practices), though the effect of adaptation on risk for individual RFCs and related 33 literature is discussed further below. 34 35 The following subsections present the expert assessment and judgments made during the elicitation process 36 to identify consensus transition values for each RFC. The description of these transitions is further extended 37 with additional references to findings from underlying chapters in this report, and reviewed by Chapter 16 38 authors as part of independent appraisal. No changes were made to the transition values assessed through the 39 expert elicitation. 40 41 42 ACCEPTED V
ERSION
SUBJECT TO FIN
AL EDITS
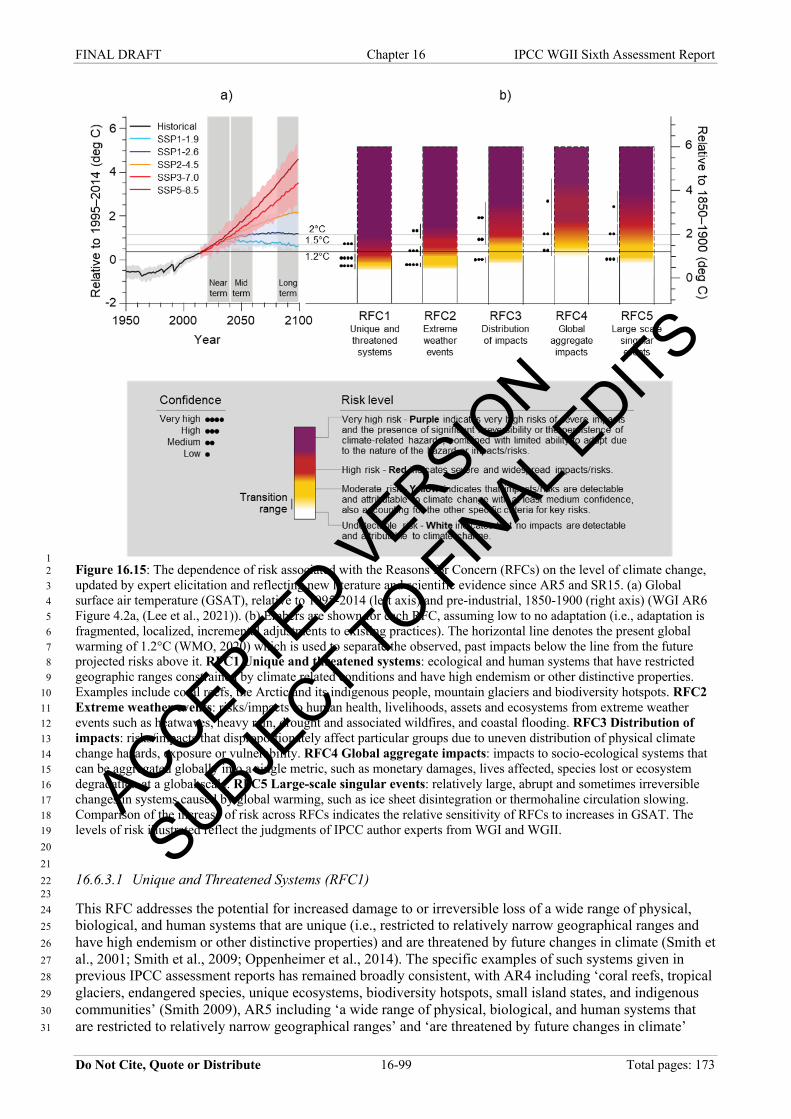
FINAL DRAFT Chapter 16 IPCC WGII Sixth Assessment Report
Do Not Cite, Quote or Distribute 16-99 Total pages: 173
1 Figure 16.15: The dependence of risk associated with the Reasons for Concern (RFCs) on the level of climate change, 2 updated by expert elicitation and reflecting new literature and scientific evidence since AR5 and SR15. (a) Global 3 surface air temperature (GSAT), relative to 1995-2014 (left axis) and pre-industrial, 1850-1900 (right axis) (WGI AR6 4 Figure 4.2a, (Lee et al., 2021)). (b) Embers are shown for each RFC, assuming low to no adaptation (i.e., adaptation is 5 fragmented, localized, incremental adjustments to existing practices). The horizontal line denotes the present global 6 warming of 1.2°C (WMO, 2020) which is used to separate the observed, past impacts below the line from the future 7 projected risks above it. RFC1 Unique and threatened systems: ecological and human systems that have restricted 8 geographic ranges constrained by climate related conditions and have high endemism or other distinctive properties. 9 Examples include coral reefs, the Arctic and its indigenous people, mountain glaciers and biodiversity hotspots. RFC2 10 Extreme weather events: risks/impacts to human health, livelihoods, assets and ecosystems from extreme weather 11 events such as heatwaves, heavy rain, drought and associated wildfires, and coastal flooding. RFC3 Distribution of 12 impacts: risks/impacts that disproportionately affect particular groups due to uneven distribution of physical climate 13 change hazards, exposure or vulnerability. RFC4 Global aggregate impacts: impacts to socio-ecological systems that 14 can be aggregated globally into a single metric, such as monetary damages, lives affected, species lost or ecosystem 15 degradation at a global scale. RFC5 Large-scale singular events: relatively large, abrupt and sometimes irreversible 16 changes in systems caused by global warming, such as ice sheet disintegration or thermohaline circulation slowing. 17 Comparison of the increase of risk across RFCs indicates the relative sensitivity of RFCs to increases in GSAT. The 18 levels of risk illustrated reflect the judgments of IPCC author experts from WGI and WGII. 19 20 21 16.6.3.1 Unique and Threatened Systems (RFC1) 22 23 This RFC addresses the potential for increased damage to or irreversible loss of a wide range of physical, 24 biological, and human systems that are unique (i.e., restricted to relatively narrow geographical ranges and 25 have high endemism or other distinctive properties) and are threatened by future changes in climate (Smith et 26 al., 2001; Smith et al., 2009; Oppenheimer et al., 2014). The specific examples of such systems given in 27 previous IPCC assessment reports has remained broadly consistent, with AR4 including ‘coral reefs, tropical 28 glaciers, endangered species, unique ecosystems, biodiversity hotspots, small island states, and indigenous 29 communities’ (Smith 2009), AR5 including ‘a wide range of physical, biological, and human systems that 30 are restricted to relatively narrow geographical ranges’ and ‘are threatened by future changes in climate’ 31
ACCEPTED VERSIO
N
SUBJECT TO FIN
AL EDITS
FINAL DRAFT Chapter 16 IPCC WGII Sixth Assessment Report
Do Not Cite, Quote or Distribute 16-100 Total pages: 173
(Smith et al., 2001), while SR15 Chapter 3 included ‘ecological and human systems that have restricted 1 geographic ranges constrained by climate related conditions and have high endemism or other distinctive 2 properties. Examples include coral reefs, the Arctic and its indigenous people, mountain glaciers and 3 biodiversity hotspots’. In this cycle, we retain the definition used in SR15 as most explicit and inclusive of 4 the previous definitions. 5 6 AR5 (Oppenheimer et al., 2014) assessed the transition from undetectable to moderate risk for RFC1 to lie 7 below recent global temperatures (1986-2005, which at the time was considered to correspond to a global 8 warming level of 0.6°C above pre-industrial levels; AR6 WGI now considers this time period of 1986-2005 9 to correspond to a global warming or approximately 0.7°C). At that time, there was at least medium 10 confidence in attribution of a major role for climate change for impacts on at least one each of ecosystems, 11 physical systems, and human systems within this RFC. SR15 Section 3.5.2.1 (Hoegh-Guldberg et al., 12 2018b), concurred with high confidence that the transition to moderate risk had already occurred before the 13 time of writing. 14 15 The transitions here are informed by these assessments, along with the assessment in Chapter 2 on species 16 high extinction risk and on ecosystem transitions. It also draws substantially from information in Cross-17 Chapter Paper 1 and Table SM16.22 on risks to unique and threatened biological systems. Some unique and 18 threatened systems, such as coral reefs and sea-ice dependent ecosystems, were already showing attributable 19 impacts with high confidence (see table 16.1, Cross-Chapter Paper 1 and Chapter 2) based on data collected 20 in the mid to latter 20th century, when global warming of 0.5°C above pre-industrial levels had taken place, 21 as noted already in AR3. In this AR6 assessment, the temperature range for the transition from undetectable 22 to moderate risk is still located at a median value of 0.5°C above pre-industrial levels, with very high 23 confidence. Since impacts were first detected in coral reef systems in the 1980s when warming of ~0.4°C of 24 global warming had occurred (SR15 Chapter 3), this provides the temperature at which the transition begins. 25 The September Arctic sea ice volume has declined by 55-65% between 1979 and 2010 (AR6 WGI, Schweiger et 26 al., 2019) as global warming increased from around 0.36°C in 1979 to around 0.9°C in 2010. These provide 27 evidence of a start to the transition from undetectable to moderate risk at 0.4°C above pre-industrial levels. 28 Recent evidence of observed impacts on mountaintop ecosystems, sea ice dependent species, and of range 29 shifts in multiple ecosystems during 1990-2000, which AR6 WGI now assesses as corresponding to a global 30 warming of 0.69°C (see WGI AR6 Cross-Chapter Box 2.3, Figure 1, Gulev et al., 2021) provides evidence 31 for an upper limit to this transition of 0.7°C with very high confidence. Overall, the transition is located at a 32 median of 0.5°C with lower and upper limits of 0.4 and 0.7°C respectively with very high confidence. 33 34 AR5 assessed the transition from moderate to high risk to lie around 1°C above 1986–2005 levels (which 35 corresponded at that time to 1.6°C above pre-industrial levels but has been reassessed by AR6 WGI to 36 correspond to 1.7°C) to reflect projected ‘increasing risk to unique and threatened systems, including Arctic 37 sea ice and coral reefs, as well as threatened species as temperature increases over this range.’ SR15 38 relocated the transition slightly from 1.6°C to 1.5°C, owing to increased literature projecting the effects of 39 climate change upon Arctic sea ice and new literature assessing projected impacts of climate change on 40 biodiversity at 1.5°C warming. 41 42 In this AR6 assessment, the transition from moderate to high is based on the high level of observed impacts, 43 and the areas projected to begin undergoing major transformations by 1.5ºC (see CCP1, Chapter 2 and 44 SR15). A substantial number of unique and threatened systems are assessed to be in a high risk state owing 45 to the influence of anthropogenic climate change by the 2000-2010 period, when global warming had 46 reached approximately 0.85ºC (range 0.7-1ºC) (see WGI AR6 Cross-Chapter Box 2.3, Gulev et al., 2021) 47 using the 1995-2014 figure as a proxy for 2000-2010). 48 49 The most prominent example of a system assessed to be already in a high risk state is that of coral reefs, 50 which are already degrading rapidly. Observed impacts on coral reefs increased significantly during 2014-51 2017 (Table 16.2, corresponding to a global warming of about 0.9ºC). This includes mass bleaching in the 52 Indian Ocean in 1998, 2010, 2015 and 2016 when bleaching intensity exceeded 20% in surveyed locations in 53 the western Indian Ocean, eastern Indian Ocean and western Indonesia. In the tropical Pacific Ocean, 54 climate-driven mass bleaching was reported in all countries in the region, with most bleaching reports 55 coinciding with 2014-2017 marine heatwaves. 50% of coral within shallow-water reefs of the northern and 56 central two-thirds of the Great Barrier Reef were killed in 2015/16. Subsequent coral recruitment in 2018 57
ACCEPTED VERSIO
N
SUBJECT TO FIN
AL EDITS
FINAL DRAFT Chapter 16 IPCC WGII Sixth Assessment Report
Do Not Cite, Quote or Distribute 16-101 Total pages: 173
was reduced to only 11% of the long-term average, representing an unprecedented shift in the ecology of the 1 northern and middle sections of the reef system to a highly degraded state. A second key example are sea ice 2 dependent systems in the Arctic. During August-October of 2010-2019, corresponding to a global warming of 3 about 0.9°C, average Arctic sea-ice area has declined in area by 25% relative to 1979-1988 (high confidence, AR6 4 WGI, Figure 9.13). September Arctic sea ice volume has declined by about 72 % between 1979 and 2016, with 5 the latter deemed a conservative estimate (AR6 WGI, Schweiger et al., 2019). 6 7 Other important examples of observed impacts on unique ecosystems that indicate that risks are already at a 8 high level (Table SM16.22) include mass tree mortalities, now well recorded in multiple unique forest and 9 woodland ecosystems around the world. Sections 2.4.3.3 and 2.4.5 report that between 1945 and 2007, 10 drought-induced tree mortality (sometimes associated with insect damage and wildfire) has caused the 11 mortality of up to 20% of trees in western North America, the African Sahel, and North Africa, linked to a 12 warming of 0.3-0.9ºC above pre-industrial levels, and is implicated in more than 100 other cases of drought-13 induced tree mortality in Africa, Asia, Australia, Europe, and North and South America (high confidence). 14 Species in biodiversity hotspots already show changes in response to climate change (CCP1, high 15 confidence). Román-Palacios and Wiens (2020) attribute local extinctions of several taxonomic groups 16 between the latter 20th century and 2003-2012, (corresponding to warming of less than 0.85ºC) to climate-17 change related temperature extremes for up to 44% (0-75%) of species. Widespread declines of up to 35% in 18 the species richness of the unique pollinator group, bumble bees, between 1901 - 1974 and 2000 - 2014 are 19 also attributed to climate change, via increasing exceedance of their thermal tolerance limits across Europe 20 and North America (Soroye et al., 2020). The first extinctions attributed to climate change have been now 21 detected with the present 1.2ºC warming including that of the Bramble Cays Melomys (Melomys rubicola), a 22 sub-species of the lemuroid ringtail possum (Hemibelideus lemuroides), and golden toad (Incilius 23 periglenes) (Chapter 2). An increasing frequency or unprecedented occurrence of mass animal mortality due 24 to climate-change enhanced heat waves have also been observed in recent years on more than one continent, 25 including temperature vulnerable terrestrial birds and mammals in South Africa and Australia (Ratnayake et 26 al., 2019; McKechnie et al., 2021). There have also been 90% declines in sea ice dependent species such as 27 sea lions and penguins in the Antarctic (Table 16.2). A strong effect of climate change on the observed 28 contraction of ranges of polar fish species and strong expansion of ranges of arcto-boreal or boreal fish was 29 observed between 2004 and 2012 Frainer et al. (2017). Even if current human driven habitat loss is excluded, 30 many hotspots are projected to cease to be refugia (i.e., to remain climatically suitable for >75% of the 31 species they contain which have been modelled), at 1.0-1.5ºC (Cross-Chapter Paper 1). 32 33 Based on observed and modelled impacts to unique and threatened systems, including in particular coral 34 reefs, sea ice dependent systems, and biodiversity hotspots, AR6 assesses that the transition to high risks for 35 RFC1 have already occurred at a median level of 0.9ºC, with a lower bound at 0.7ºC and an upper bound at 36 the present day level of global warming of 1.2ºC (WMO, 2020) (very high confidence). 37 38 Identification of the transition to very high risk is associated by definition with the reaching of limits to 39 natural and/or societal adaptation. Adaptation which occurs naturally is already included in the risk 40 assessment, but experts also discussed the effect of additional human-planned adaptation in reducing risk 41 levels in RFC1. This additional adaptation could help species to survive in situ despite a changing climate 42 (for example by reducing current anthropogenic stresses such as over harvesting), or facilitate the ability of 43 species to shift geographic range in response to changes in climate, and the potential benefits of nature-based 44 solutions and restoration (see Cross-Chapter Box NATURAL and Section 2.6.5.1 in Chapter 2). 45 46 When considering planned adaptation, the main option often considered in terrestrial ecosystems is the 47 expansion of the protected area network, which is broadly beneficial in increasing the resilience of 48 ecosystems to climate change (e.g., Hannah et al., 2020). However, this action is not effective if the unique 49 and threatened systems in question reach a hard limit to adaptation (as in the case of the loss of Arctic 50 summer sea ice, the submergence of a small island, the contraction and elimination of a species’ climatic 51 niche from a mountaintop, or the degradation of a coral reef) (Section 16.4). Furthermore, adaptation 52 benefits deriving from restoration rapidly diminish with increasing temperature (Cross-Chapter Paper 1). 53 One study quantifies how land management (in terms of protecting existing ecosystems or restoring lost 54 ones) might reduce extinctions in biodiversity hotspots or globally significant terrestrial biodiversity areas 55 more generally (Warren et al., 2018b). Whilst the latter suggests that substantial benefits can result globally 56 in terrestrial systems, allowing less unique systems to persist at higher levels of warming but only under a 57
ACCEPTED VERSIO
N
SUBJECT TO FIN
AL EDITS
FINAL DRAFT Chapter 16 IPCC WGII Sixth Assessment Report
Do Not Cite, Quote or Distribute 16-102 Total pages: 173
high adaptation scenario in which globally applied terrestrial ecosystem restoration and protected area 1 expansion takes place, this is less likely for many of the unique and threatened terrestrial systems which are 2 more vulnerable than the globally significant biodiversity areas treated in that study (which excludes coral 3 reefs and Arctic sea ice dependent systems). Such high levels of adaptation globally are likely infeasible 4 owing to competition for land use with food production (Pörtner et al., 2021). Novel targeted adaptation 5 interventions for coral reefs such as artificial upwelling and local radiation management show some promise 6 for reducing the adverse effects of thermal stress and resulting coral bleaching Condie et al. (2021), but are 7 far from implementation (Sawall et al., 2020; Kleypas et al., 2021). Larger benefits in this RFC could 8 theoretically accrue only if adaptation action became ubiquitous and extensive, which experts considered 9 infeasible at the scales required. Small island communities are confronted by socio-ecological limits to 10 adaptation well before 2100, especially those reliant on coral reef systems for their livelihoods, even for a 11 low emissions pathway (Chapter 3) (high confidence). At warming levels beyond 1.5°C, the potential to 12 reach biophysical limits to adaptation due to limited water resources are reported for Small Islands (medium 13 confidence) and unique systems dependent on glaciers and snowmelt (Chapter 4) (medium confidence). 14 15 AR5 assessed with high confidence that the transition from high to very high risks for RFC1 to lie around 16 2°C above 1986–2005 levels (then considered to correspond to 2.6°C above pre-industrial levels) to reflect 17 the very high risk to species and ecosystems projected to occur beyond that level as well as limited ability to 18 adapt to impacts on coral reef systems and in Arctic sea ice-dependent systems. Using the additional 19 literature which became available on projected risks to Arctic sea ice, biodiversity and ecosystems at 1.5°C 20 vs 2°C warming above pre-industrial levels, SR15 assessed that the transition from high to very high risks in 21 RFC1 lay between 1.5°C and 2°C above pre-industrial levels. 22 23 In AR6, risks are considered to start to transition from high to very high risks above 1.2°C warming (present 24 day, WMO, 2020), with a median value of 1.5°C, owing in particular to the observation of a present day 25 onset of ecosystem degradation in coral reefs, which are projected in the SR15 report ‘to decline by a further 26 70–90% at 1.5ºC (very high confidence)’ . The literature for projected increases in risk to other unique and 27 threatened systems and their limited ability to adapt above 2ºC warming is substantial and robust and the 28 confidence level in very high risk remains high. At 2ºC, 18% of 34,000 insects are projected to lose >50% 29 climatically determined geographic range, as compared with 6% at 1.5ºC (Warren et al., 2018a). The risk of 30 species extinction increases with warming in all climate change projections, for all native species studied in 31 biodiversity hotspots (Cross-Chapter Paper 1, high confidence), being roughly threefold greater for endemic 32 than more widespread species for global warming of 3°C above pre industrial levels than 1.5°C) (Manes et 33 al., 2021, Cross-Chapter Paper 1) (medium confidence). The Arctic is projected to be practically ice free in 34 September in some years for global warming of between 1.5 and 2ºC (WGI AR6 Section 9.3.1.1, Fox-35 Kemper et al., 2021), undermining the persistence of ice dependent species such as polar bears, ringed seals 36 and walrus (Meredith et al., 2019), and adversely affecting indigenous communities. Warming of 1.5ºC is 37 also assessed (Chapter 3) to reduce the habitability of small islands, due to the combined impacts of several 38 key risks (high confidence). Hence the transition from high to very high risk in these systems is assessed to 39 occur with high confidence beginning at 1.2ºC, passing through a median value of 1.5°C, and completing 40 (i.e. reaching its upper bound) at 2ºC warming. 41 42 16.6.3.2 Extreme Weather Events (RFC2) 43 44 This RFC addresses the risks to human health, livelihoods, assets and ecosystems from extreme weather 45 events such as heatwaves, heavy rain, drought and associated wildfires, and coastal flooding (Hoegh-46 Guldberg et al., 2018b). Previous assessments of this RFC have focused mainly on changes to the hazard 47 component of the risk, using the projected increase in hazard as an indicator of higher risk. However, in AR6 48 an expanding (although still smaller) body of evidence now allows also incorporation of the exposure and/or 49 vulnerability components of risk and, to a limited extent, their trends. 50 51 AR5 identified a transition from undetectable to moderate risk below ‘recent’ temperatures (i.e., during 52 1986-2005, which then corresponded to a global warming of 0.6ºC above pre-industrial levels). SR15 53 Section 3.5.2.2 (Hoegh-Guldberg et al., 2018b), concluded that differences of 0.5ºC in global warming led to 54 detectable changes in extreme weather and climate events on the global scale and for large regions. IPCC 55 WGI AR6 Chapter 11 confirms this assessment and concludes that ‘new evidence strengthens the conclusion 56 from SR15 that even relatively small incremental increases in global warming (+0.5°C) cause statistically 57
ACCEPTED VERSIO
N
SUBJECT TO FIN
AL EDITS
FINAL DRAFT Chapter 16 IPCC WGII Sixth Assessment Report
Do Not Cite, Quote or Distribute 16-103 Total pages: 173
significant changes in extremes on the global scale and for large regions’. Substantial literature is available 1 for comparisons at +1.5ºC vs +2ºC of global warming, but the conclusions are assessed to also apply at lower 2 global warming levels and smaller increments of global warming given the identified linearity of regional 3 responses of several extremes in relation to global warming(Seneviratne et al., 2016; Wartenburger et al., 4 2017; Tebaldi and Knutti, 2018) and the identification of emergence of global signals in climate extremes for 5 global warming levels as small as 0.1°C (Seneviratne and Hauser, 2020, WGI AR6, Chapter 11, Figure 11.8; 6 WGI Cross-Chapter Box 12.1). Further analyses are consistent with this assessment, based on model 7 simulations (Fischer and Knutti, 2015; Schleussner et al., 2017; Kirchmeier‐Young et al., 2019a; Seneviratne 8 and Hauser, 2020) and observational evidence (Zwiers et al., 2011; Dunn et al., 2020). A global warming of 9 +0.5ºC above pre-industrial conditions corresponds approximately to climate conditions in the 1980s 10 (Chapter 2, Figure 2.11), a time frame at which detectable changes in some extremes were established at the 11 global scale based on observations (Dunn et al., 2020). Heat-related mortality has also been assessed to have 12 increased considerably because of climate change (Ebi et al., 2021; Vicedo-Cabrera et al., 2021). The onset, 13 and also median location of the transitions of risk (Figure 16.15) from undetectable to moderate, is therefore 14 considered to be 0.5ºC. Further strong new evidence shows that changes in extremes emerged during the 15 1990s and 2000s (Dunn et al., 2020) by which time +0.7ºC of global warming had taken place (IPCC SR15, 16 Chapter 1; WGI AR6, Chapter 2). In AR5 Section 19.6.3.3 (Oppenheimer et al., 2014), a transition to 17 moderate risk was assessed to have taken place at the then ‘recent’ global warming level of 0.6ºC, with high 18 confidence. Owing to the increase in evidence, there is now very high confidence that the median value of 19 the transition from undetectable to moderate risk is at 0.5ºC and led by heat extremes, with the lower 20 estimate set at 0.5°C as well, and upper estimate at 0.7°C. 21 22 Further evidence of more recent observed changes in extreme weather and climate events, and their potential 23 for associated adverse consequences across many aspects of society and ecosystems, has continued to accrue 24 (WGI AR6 Chapter 11; WGI AR6 Chapter 12). Since a necessary condition for ‘moderate’ levels of risk is 25 the detection and attribution of observed impacts, the following text provides an overview of some salient 26 examples of this evidence. In particular, WGI AR6 Chapter 11 (Seneviratne et al., 2021) concludes that some 27 recent hot extreme events that happened in the past decade (2010s) would have been extremely unlikely to 28 occur without human influence on the climate system. Global warming in that decade reached approximately 29 1.09°C on average (IPCC WGI AR6 Chapter 2). 30 31 Assessment of a high level of risk requires a higher level of magnitude, severity and spatial extent of the 32 risks. Events prior to that already had substantial impacts such as the 2003 European heatwave (IPCC SREX 33 Chapter 9). Examples of impactful events in the early 2010s (at ca. 0.95°C of global warming, (WGI AR6 34 Chapter 2, Gulev et al., 2021) include the 2010 Russian heatwave (Barriopedro et al., 2011) and the 2010 35 Amazon drought (Lewis et al., 2011). Later impactful events include, among others, the 2013 heatwave in 36 eastern China (Sun et al., 2014), the 2017 tropical cyclone Harvey (Risser and Wehner, 2017; Van 37 Oldenborgh et al., 2017), and the 2018 concurrent north hemisphere heatwaves in Europe, North America 38 and Asia (Vogel et al., 2019). Very recent events with severe and unprecedented impacts attributed to 39 anthropogenic climate change indicate that thresholds to high risks may already have been crossed at recent 40 levels of global warming (ca. 1.1°C-1.2°C) including the Siberian fires and the 2019 Australian bushfires 41 that were linked to extreme heat and drought conditions (Van Oldenborgh et al., 2017) and extreme 42 precipitation linked to increased storm activity in the US (Van Oldenborgh et al., 2017). Severe and 43 unprecedented impacts occurred with current low levels of adaptation (16.2.3.4). The global-scale risk of 44 wildfire considerably degrading ecosystems and increasing illnesses and death of people has been assessed to 45 transition from undetectable to moderate over the range 0.6 to 0.9°C with high confidence (Chapter 2, Table 46 2.S.4, Figure 2.11). 47 48 In addition, long-term trends in various types of extremes are now detectable (WGI AR6 Chapter 11, 49 Seneviratne et al., 2021). This includes increases in hot extremes over most land regions (virtually certain), 50 increases in heavy precipitation at the global scale and over most regions with sufficient observations (high 51 confidence), and increases in agricultural and ecological droughts in some regions (medium confidence) 52 (WGI AR6 Chapter 11). There has also been overall a likely increase in the probability of compound events, 53 such as an increase in concurrent heatwaves and droughts (high confidence) (WGI AR6 Chapter 11). There 54 is medium confidence that weather conditions that promote wildfires (fire weather) have become more 55 probable in southern Europe, northern Eurasia, the US, and Australia over the last century (WGI AR6 56 Chapter 11; SRCCL Chapter 2, Jolly et al., 2015; Abatzoglou and Williams, 2016). Furthermore, food 57
ACCEPTED VERSIO
N
SUBJECT TO FIN
AL EDITS
FINAL DRAFT Chapter 16 IPCC WGII Sixth Assessment Report
Do Not Cite, Quote or Distribute 16-104 Total pages: 173
security and livelihoods are being affected by short-term food shortages caused by climate extremes (5.12.1; 1 Chapter 16, Food Security RKR) which have affected the productivity of all agricultural and fishery sectors 2 (high confidence). The frequency of sudden food production losses has increased since at least mid-20th 3 century on land and sea (medium evidence, high agreement). Droughts, floods, and marine heatwaves 4 contribute to reduced food availability and increased food prices, threatening food security, nutrition, and 5 livelihoods of millions (high confidence). Changes in sea surface temperatures drive simultaneous variation 6 in climate extremes increasing the risk of multi-breadbasket failures (Cai et al., 2014; Perry et al., 2017). 7 Droughts induced by the 2015-2016 El Niño, partially attributable to human influences (medium confidence), 8
caused acute food insecurity in various regions, including eastern and southern Africa and the dry corridor of 9 Central America (high confidence). Human-induced climate change warming also worsened the 2007 10 drought in southern Africa, causing food shortages, price spikes, and acute food insecurity in Lesotho 11 (Verschuur et al., 2021). In the fisheries and aquaculture sector, marine heat waves are estimated to have 12 doubled in frequency between 1982 and 2016, as well as increasing in intensity and length, with 13 consequences for fish mortality (Ch 5) (Smale et al., 2019; Laufkötter et al., 2020). In the northeast Pacific, a 14 recent 5-year warm period impacted the migration, distribution, and abundance of key fish resources (high 15 confidence). At 1ºC warming the number of people affected by six categories of extreme events was found to 16 have already increased by a factor of 2.3 relative to preindustrial (Lange et al., 2020). 17 18 The general picture is one of annual or more frequent occurrences of severe extremes with widespread 19 impacts (as also reflected in section 16.2), and of multiple extremes, meeting the criteria for the ‘severe and 20 widespread’ nature of risks that is required for classification at a ‘high’ level of risk. This is consistent with 21 AR5 Chapter 19 (Oppenheimer et al., 2014), and gives high confidence that the lower threshold for entering 22 high risks associated with extreme weather events is +1ºC, and that the best estimate is that this transition 23 already occurred now that global warming has reached its present-day level of ca. 1.2ºC (WMO, 2020), 24 slightly above the 1.09°C average conditions in the 2010s, i.e. 2011-2020 (IPCC WGI AR6 Chapter 2, Gulev 25 et al., 2021). 26 27 A range of literature projects further substantial increases in several extreme event types with a global 28 warming of +1.5ºC, notably hot extremes in most regions, heavy precipitation in several regions, and 29 drought in some regions (IPCC SR15; WGI AR6 , Chapter 11). In particular, heavy precipitation and 30 associated flooding are projected to intensify and be more frequent in most regions in Africa and Asia (high 31 confidence), North America (medium to high confidence depending on the region), and Europe (medium 32 confidence). Also, more frequent and/or severe agricultural and ecological droughts are projected in a few 33 regions in all continents except Asia, compared to 1850–1900 (medium confidence); increases in 34 meteorological droughts are also projected in a few regions (medium confidence). Increases at 1.5°C of 35 global warming are projected in marine heatwaves (Laufkötter et al., 2020) and the occurrence of fire 36 weather (IPCC, 2019a). Heat-related mortality is assessed to increase from moderate to high levels of risk 37 under about 1.5ºC warming under SSP3, a socioeconomic scenario with large challenges to adaptation (Ebi 38 et al., 2021) especially in urban centres (Chapter 6). An additional 350 million people living in urban areas 39 are estimated would be exposed to water scarcity from severe droughts at 1.5°C warming (Section 6.1; 40 Section 6.2.2; CCP2 Coastal Cities). In summary, there is high confidence that the best estimate for the 41 transition from moderate to high risk is 1.2°C of global warming, with 1°C as lower estimate and 1.5°C as 42 upper estimate. The latter would be set to 1.3°C for an assessment at medium confidence. 43 44 As in RFC1, one of the criteria for identification of very high risks is limits to adaptation. Though the 45 literature explicitly considering societal adaptation to extreme weather events is limited, there is evidence 46 that investments in hydro-meteorological information, early warning systems and anticipatory forecast-based 47 finance are a cost-effective way to prevent some of the most adverse effects of extreme events (Coughlan de 48 Perez et al., 2016; Fakhruddin and Schick, 2019; Merz et al., 2020). Despite a lack of systematic methods for 49 assessing general adaptation effectiveness, there is some evidence of risk reduction for particular places and 50 hazards, especially flood and heat vulnerability (16.3.2.4) including investment in flood protection, building 51 design and monitoring and forecasting, air conditioning, reduced social vulnerability, and improved 52 population health. One study finds declining global mortality and economic loss due to extreme weather 53 events over the past four decades Formetta and Feyen (2019) especially in low income countries. Using 54 SSP2 as a proxy for expanded adaptation, Ebi et al. (2021) assesses that the transition to high risk for heat-55 related mortality increases to 1.8ºC (compared to 1.5ºC with less adaptation under SSP3). There is evidence 56 of adaptation avoiding heat-related mortality at low levels of global warming, using early warning and 57
ACCEPTED VERSIO
N
SUBJECT TO FIN
AL EDITS
FINAL DRAFT Chapter 16 IPCC WGII Sixth Assessment Report
Do Not Cite, Quote or Distribute 16-105 Total pages: 173
response systems and sustainable alterations of the thermal environment at the individual, building, urban, 1 and landscape levels (Jay et al., 2021). Despite the evidence that adaptation can reduce risks of heat stress, 2 the impact of projected climate change on temperature-related mortality is expected to be a net increase 3 under a wide range of climate change scenarios, even with adaptation (Ch 7, high confidence). Much of the 4 adaptation literature focuses on coping with long-term gradual climate change and largely does not take into 5 account the increased difficulty of adapting to climate extremes and general higher variability in climate that 6 is projected to occur in the future. However, expanding and more coordinated adaptation, including wider 7 implementation and multi-level coordination, has the potential to reduce the risks to crops from heatwaves at 8 intermediate (but not high) levels of warming.(IPCC AR5 Ch7, Ahmed et al., 2018; Ahmed et al., 2019, 9 Section 16.3.2.2; EEA, 2019; Raza et al., 2019; Tripathi and Sindhi, 2020). 10 11 The transition from high to very high risk for the RFC2 was not assessed in the AR5 or in SR15. Some new 12 evidence suggests, however, that very high risks associated with weather and climate extremes would be 13 reached at higher levels of global warming. In particular, changes in several hazards would be more 14 widespread and pronounced at 2°C compared to 1.5°C global warming, including increases in multiple and 15 concurrent extremes (IPCC WGI AR6 SPM; IPCC WGI AR6 Chapter 11, IPCC WGI AR6 Chapter 12). On 16 average over land, high temperature events that would have occurred once in 50 years in the absence of 17 anthropogenic climate change are projected to become 13.9 times more likely with 2ºC warming, and 39.2 18 times more likely with 4ºC warming (IPCC AR6 WGI SPM Figure 6, IPCC, 2021b) indicating a non-linear 19 increase with warming. Ch 2 has assessed that risk of wildfire transitions from moderate to high over the 20 range 1.5ºC to 2.5ºC warming (medium confidence, Table 2.S.4, Figure 2.11). The intensity of heavy 21 precipitation events increase overall by about 7% for each additional degree of global warming (IPCC AR6 22 WGI SPM), while their frequency increases non-linearly. Events that would have occurred once every 10 23 years in a climate without human influence are projected to become 1.7 times more likely with 2ºC warming, 24 and 2.7 times more likely with 4ºC warming (IPCC AR6 WGI SPM Figure 6). Several AR6 regions are 25 projected to be affected by increases in agricultural and ecological droughts at 2°C of global warming, 26 including W. North-America, C. North-America, N. Central-America, S. Central-America, Caribbean, N. 27 South-America, N.E. South-America, South-American-Monsoon, S.W. South-America, S. South-America, 28 West & Central-Europe, Mediterranean, W. Southern-Africa, E. Southern-Africa, Madagascar, E. Australia, 29 and S. Australia (IPCC WGI AR6, Chapter 11, Seneviratne et al., 2021). This is a substantially larger 30 number compared to projections at 1.5°C (IPCC WGI AR6, Chapter 11, Seneviratne et al., 2021). In these 31 drying regions, events that would have occurred once every 10 years in a climate without human influence 32 are projected to happen 2.4 times more frequently at 2°C of global warming (IPCC WGI AR6 SPM Figure 33 6). Urban land exposed to floods and droughts is very likely to have more than doubled between 2000 and 34 2030, and the risk of flooding accelerates after 2050 (Ch 4). At 2ºC of global warming, there are also 35 significant projected increases in fluvial flood frequency and resultant risks associated with higher 36 populations exposed to these flood risks (Alfieri et al., 2017; Dottori et al., 2018) projected. 37 38 Heat-related mortality is assessed to increase from high to very high by 3°C under SSP3, a socioeconomic 39 scenario with large challenges to adaptation (Ebi et al., 2021). SRCCL assessed that very high risks would be 40 reached in association with wildfire above 3ºC of global warming (IPCC, 2019a). Chapter 2 has assessed that 41 risk of fire weather itself transitions from high to very high over the range 3ºC to 4.5ºC warming (medium 42 confidence, Table 2.S.4, Figure 2.11). Matthews et al. (2017) show that at 1.5ºC of global warming, about 43 40% of all megacities would be affected at least 1 day per year with a heat index above 40.6ºC (i.e., with 44 40.6ºC ‘feels-like’ temperatures, accounting for moisture effects). This number would reach about 65% of 45 megacities at 2.7ºC and close to 80% at 4ºC. In addition, there is evidence for a higher risk of concurrent 46 heat extremes at different locations with increasing global warming (Vogel et al., 2019), meaning that 47 several cities could be affected by deadly heatwaves simultaneously. Laufkötter et al. (2020) found that 48 marine heatwave events would become annual to decadal events under 3ºC of global warming, with 49 consequences for aquaculture (Chapter 5). Gaupp et al. (2019) conclude that risks of simultaneous crop 50 failure across worldwide breadbasket regions, due to changes in maximum temperatures in the crop-growth 51 relevant season or cumulative precipitation in relevant time frames, increase disproportionately between 52 1.5ºC and 2ºC of global warming. Populations exposed to extreme weather and climate events may consume 53 inadequate or insufficient food, leading to malnutrition and increasing the risk of disease (Ch 5, high 54 confidence). Hence, there is the potential for very high risks associated with changes in climate extremes for 55 food security in the low adaptation case, already above 2ºC of global warming. Finally, studies suggest that 56 regional thresholds for climate extremes could be reached at 2ºC of global warming, for instance in the 57
ACCEPTED VERSIO
N
SUBJECT TO FIN
AL EDITS
FINAL DRAFT Chapter 16 IPCC WGII Sixth Assessment Report
Do Not Cite, Quote or Distribute 16-106 Total pages: 173
Mediterranean (Guiot and Cramer, 2016). Samaniego et al. (2018) conclude that soil moisture droughts in 1 that region would become 2–3 times longer than at the end of the 20th century at 2ºC, and 3–4 times longer 2 (125 days long per year) at 3ºC of global warming. There is clear evidence of very high risk at 3ºC global 3 warming for wildfires, marine heatwaves, and heatwaves in megacities (the latter being set at 2.7ºC). 4 5 Based on the available evidence, we assess that there is medium confidence that the transition to very high 6 risk would happen at a median value 2ºC of global warming, considering the increased risk for breadbasket 7 failure and irreversible impacts associated with changes in extremes at this warming level (e.g. damages to 8 ecosystems, health impacts, severe coastal storms), but that due to the disproportionate increases in risk 9 between 1.5 and 2ºC this transition begins already at 1.8ºC. The higher range for this transition is set with 10 medium confidence at 2.5ºC in this low/no adaptation scenario, owing to the further projected non-linear 11 increases in risks associated with high temperature events above 2ºC (WGI AR6 Figure SPM.6,, IPCC, 12 2021b; Cross-Chapter Box12.1, Ranasinghe et al., 2021), and also the limits to adaptation associated with 13 dealing with a rapid escalation of extreme weather events globally during this century; extreme events are 14 particularly difficult to adapt to and thus more often exceed hard limits to adaptation, particularly in natural 15 ecosystem settings (Section 16.4). 16 17 16.6.3.3 Distribution of Impacts (RFC3) 18 19 RFC3 reflects how key risks are distributed unevenly across regions and different population groups, due to 20 the non-uniform spatial distributions of physical climate change hazards, exposure, and vulnerability across 21 regions. It addresses how risks disproportionately affect particularly vulnerable societies and socio-22 ecological systems, including disadvantaged people and communities in countries at all levels of 23 development. AR5 concluded that low-latitude and less developed areas generally face greater risk than 24 higher latitude and more developed countries, including for food- and health-related risks. This conclusion 25 remains valid and is now supported by greater evidence across a range of sectors and geographic regions. 26 27 Note that the assessment here is largely based on the national and regional distribution of impacts, rather 28 than sub-national distribution or explicit consideration of vulnerable elements of society. Climate risks are 29 also strongly related to inequalities, often but not always intersecting with poverty (16.1), geographic 30 location, political and socio-cultural aspects. Thus, countries with high inequality tend to be more vulnerable, 31 and more exposed, to climate hazards (16.1). Whilst the literature assessed here tends to be insufficiently 32 granular to resolve local inequalities, it does confirm the AR5 finding that low-latitude and less developed 33 areas generally face greater risk. 34 35 AR6 continues to highlight the uneven regional distribution of projected climate change risks. Biodiversity 36 loss is projected to affect a greater number of regions with increasing warming, and to be highest in northern 37 South America, southern Africa, most of Australia, and northern high latitudes (Section 2.5.1.3, medium 38 confidence). Climate change is projected to increase the number of people at risk of hunger in mid-century, 39 concentrated in Sub-Saharan Africa, South Asia and Central America (Chapter 5, high confidence), 40 increasing undernutrition, stunting, and related childhood mortality particularly in Africa and Asia and 41 disproportionately affecting children and pregnant women (Chapter 7, high confidence) strongly mediated by 42 socio-economic factors (Section 7.2.4.4, 7.3.1, very high confidence). Strong geographical differences in 43 heat-related mortality are projected to emerge later this century, mainly driven by growth in regions with 44 tropical and subtropical climates (Section 7.3.1, very high confidence) 45 46 In AR5 and SR15, the transition from undetectable to moderate risk was located below what were at the time 47 ‘recent’ temperatures of between 0.5 to 0.8°C above pre-industrial levels, with medium to high confidence, 48 based on evidence of distributional impacts on crop production and water resources. New literature has 49 continued to confirm this transition has already taken place including more recent observed impacts for 50 regions and groups within the food and water sectors, strongly linked to Representative Key Risks for 51 Health, Water and Food Security (Section 16.2; 16.5; 5.4.1, 5.5.1, 5.8.1 and 5.12; Chapter 7). 52 In AR6, moderate risks have already been assessed to have occurred in Africa for economic growth and 53 reduced inequality, biodiversity and ecosystems, mortality and morbidity due to heat extremes and infectious 54 disease, and food production in fisheries and crop production (Figure 9.6). In Europe moderate risks to heat 55 stress, mortality and morbidity have already been reached, as well as for water scarcity in some regions 56 (Figure 13.30, Figure 13.33). In Australasia, moderate risks are assessed as present already for heat related 57
ACCEPTED VERSIO
N
SUBJECT TO FIN
AL EDITS
FINAL DRAFT Chapter 16 IPCC WGII Sixth Assessment Report
Do Not Cite, Quote or Distribute 16-107 Total pages: 173
mortality risk as well as cascading effects on cities and settlements; and also very high risks already present 1 in coral reef systems, and high risks to kelp forests and alpine biodiversity (Figure 11.7). In North America, 2 moderate risks have already been reached for freshwater scarcity, water quality (Figure 14.4), agriculture, 3 forestry, tourism, transport, energy & mining and construction (Figure 14.10). 4 5 For this assessment, the transition to moderate risk was assessed to have occurred between 0.7°C and 1.0°C 6 of warming with high confidence, demonstrating that a moderate level of risk exists at present. The 0.2°C 7 increase in this temperature range as compared with AR5 reflects the fact that AR6 WGI has assessed that 8 the level of global warming reached by 1986-2005 was 0.52-0.82°C (as opposed to 0.55-0.67°C in previous 9 assessments), and also reflects the opportunity for observations to be have made of the observed 10 consequences of the additional rise in temperature that has taken place since the literature underpinning the 11 AR5 assessment was published. 12 13 In AR5, the transition from moderate to high risk was assessed to occur between 1.6°C and 2.6°C above the 14 pre-industrial levels with medium confidence. In SR15, new literature on projected risks allowed this range 15 to be narrowed to 1.5–2°C. There is now substantial literature providing robust evidence of larger regional 16 risks at 2°C warming than 1.5°C and in a range of systems, including crop production (with risks of 17 simultaneous crop failure) (Thiault et al.; Gaupp et al., 2019), aquaculture and fisheries (Cheung et al., 18 2018b; Froehlich et al., 2018; Stewart‐Sinclair et al., 2020), nutrition-related health (Springmann et al., 2016; 19 Lloyd et al., 2018; Sulser et al., 2021), and exposure to stressors such as drought, floods (Alfieri et al., 2017; 20 Hirabayashi et al., 2021) and extreme heat (Dosio et al., 2018; Harrington et al., 2018; Sun et al., 2019). One 21 study (Gaupp et al., 2019) found that the risk of simultaneous crop failure in maize is estimated to increase 22 from 6% to 40% at 1.5 °C relative to the historical baseline climate. In particular, further research on 23 projected regional yield declines of wheat and maize between 1.5ºC and 2ºC, especially in Africa, has 24 accrued Asseng et al. (2015), including in Ethiopia (Abera et al., 2018) with associated economic effects 25 (Wang et al., 2019). Optimum maize production areas in E Asia are projected to reduce in area by 38% for 26 global warming of 1.5–2.0°C (He et al., 2019). A study of Jamaica also estimated that warming of less than 27 1.5°C will have an overall negative impact on crop suitability and a general reduction in the range of crops, 28 but above 1.5°C, irreversible changes to Jamaica’s agriculture sector were projected (Rhiney et al., 2018). 29 30 Projections of increasing flood risk associated with global warming of 1.5 and 2°C continue to highlight 31 regional disparities, with larger than average increases projected in Asia and Africa (Hirabayashi et al., 32 2021), including in China, India and Bangladesh (Alfieri et al., 2017). Similarly, nearly 80% of the 8-80 33 million additional people projected to be at risk of hunger owing to climate change are located in Africa and 34 Asia (Springmann et al., 2016; Lloyd and Oreskes, 2018; Nelson et al., 2018). Schleussner et al. (2016b) 35 analysed hotspots of multi-sectoral risks with 1.5°C and especially 2°C warming, highlighted projected crop 36 yield reductions in West Africa, South-East Asia, as well as Central and northern South America; a reduction 37 in water availability in the Mediterranean; and widespread bleaching of tropical coral reefs. 38 39 High risks to crop production are assessed to occur in Africa ~1.5-2ºC warming (Figure 9.6), to agriculture 40 in North America for ~1.5ºC warming (Figure 14.10), and ~ 2.8ºC Europe (Figure 13.30). High risks of 41 mortality and morbidity due to heat extremes and infectious disease are assessed to be reached in Africa with 42 ~1.5ºC warming (Figure 9.6); heat stress, mortality and morbidity in Europe is assessed to reach a high level 43 of risk at ~2ºC (Figure 13.30). Heat related mortality risk transitions to a high level by ~1.5-2ºC warming in 44 Australasia while cascading effects on cities reach high risk with ~1.2ºC warming (Figure 11.7). Risks to 45 water scarcity, forestry, tourism and transportation in N America are projected to reach high levels with ~2ºC 46 warming (Figure 14.4, Figure 14.10). 47 48 Two complementary multi-sectoral analyses indicates that South Asia and Africa become hotspots of multi-49 sectoral climate change risk, largely due to changes in water related indicators which also affect crop 50 production (Arnell et al., 2018; Byers et al., 2018). For instance, Byers et al. (2018) found that the doubling 51 in global exposure to multi-sector risks that accrues as warming increases from 1.5 to 2°C is concentrated in 52 Asian and African regions (especially East Africa), which together account for 85-95% of the global 53 exposure. 54 Considering this evidence, for this assessment, the temperature range for the transition from moderate to 55 high risk is located between 1.5°C to 2°C above pre-industrial levels, with high confidence in the lower 56
ACCEPTED VERSIO
N
SUBJECT TO FIN
AL EDITS
FINAL DRAFT Chapter 16 IPCC WGII Sixth Assessment Report
Do Not Cite, Quote or Distribute 16-108 Total pages: 173
bound of 1.5°C, but medium confidence in the upper bound of 2°C, because simulation studies do not 1 account for climate variability and therefore risks could be higher. 2 3 Very high risk implies limited ability to adapt. Adaptation potential not only differs across sectors and 4 regions, but also occurs on different timescales depending on the nature and implementation level of the 5 adaptation option under consideration and the system in which it is to be deployed. The costs of adaptation 6 actions that would be needed to offset projected climate change impacts for major crop production are 7 projected to rise once global warming reaches 1.5 °C (Iizumi et al., 2020). It has been estimated that the 8 number of additional people at risk of hunger with 2.0 °C global warming could be reduced from 40 million 9 to 30 million by raising the level of adaptation action (Baldos and Hertel, 2014) but beyond this level of 10 warming residual impacts are projected to escalate (Iizumi et al., 2020). Chapter 5 assessed the potential of 11 existing farm management practices to reduce yield losses, finding an average 8% loss reduction in mid-12 century and 11% by end-century (Section 5.4.4.1), which is insufficient to offset the negative impacts from 13 climate change, particularly in currently warmer regions (5.4.3.2). The literature indicates that globally, crop 14 production may be sustained below 2.0 °C warming with adaptation, but negative impacts will prevail at 2.0 15 °C warming and above in currently warm regions (Section 5.4.4.1). Importantly, residual damage (that which 16 cannot be avoided despite adaptation) is projected to rise around 2.0 °C global warming (Iizumi et al., 2020). 17 Evidence of constraints and limits for food, fiber and other ecosystem products for the different regions is 18 evident for the various regions (16.4.3.1) indicating limited ability to adapt. Adaptation costs are also higher 19 relative to GDP in low-income countries, for example for the building of sea-dikes (Brown et al., 2021). 20 21 In previous reports, the transition from high to very high risk for the distribution of impacts was not assessed 22 due to limited available literature, but there is now sufficient evidence to do so. A range of literature 23 quantifies the increasing regional probability of drought as compared to the present day, with projected 24 increases in the area exposed to drought (Carrão et al., 2018; Pokhrel et al., 2021), as well as the duration 25 (Naumann et al., 2018) and frequency of droughts with higher warming levels. Naumann et al. (2018) 26 showed that, for drying areas, drought durations are projected to rise from 2 months/°C below 1.5 °C to 4.2 27 months/°C near 3°C warming. Most of Africa, Australia, southern Europe, southern and central United 28 States, Central America, the Caribbean, north-west China, and parts of Southern America are projected to 29 experience more frequent droughts. Adverse effects of climate change on food production are projected to 30 become much more severe (Section 5.4.3.2) when global temperatures rise more than 2ºC globally but there 31 are predicted to be much more negative impacts experienced sooner on food security in low- to mid-latitudes 32 (Richardson et al., 2018a) (Sections 5.4.1). For instance, climate change by 2050 is projected to increase the 33
number of people at risk of hunger by between 8 and 80 million with 2–3°C warming compared to no climate 34 change conditions (Baldos and Hertel, 2014; Hasegawa et al., 2018; Nelson et al., 2018; Janssens et al., 2020). In 35 addition to effects upon crop yield, agricultural labour productivity, and food access, and food-related health are 36 projected to be negatively impacted by 2–3°C warming (Springmann et al., 2016; de Lima et al., 2021). 37 Regionally, substantial regional disparity in risks to food production is projected to persist at these higher 38 levels of warming. Risks for heat-related morbidity and mortality, ozone-related mortality, malaria, dengue, 39 Lyme disease, and West Nile fever are projected to increase regionally and globally (Chapter 7) with 40 potential infestation areas for disease-carrying vectors in multiple geographic regions that could be five times 41 higher at 4ºC than at 2ºC (Liu-Helmersson et al., 2019). 42 43 Very high risks to crop production are assessed to occur in Africa above ~2.5ºC warming (Figure 9.6) and 44 below 4ºC in Europe (Figure 13.30). Very high risks of mortality and morbidity due to heat extremes and 45 infectious disease are assessed to occur in Africa with 2.5ºC warming (Figure 9.6); heat stress, mortality and 46 morbidity in Europe is assessed to reach a very high level of risk at ~3.2ºC (Figure 13.30). Heat related 47 mortality risk and cascading effects on cities both transitions to a very high level by ~2.5C warming in 48 Australasia (Figure 11.7). Risks to water scarcity in N America are projected to reach very high levels with 49 3.5C warming (Figure 14.4). Hence this assessment concludes with medium confidence that a transition from 50 high to very high risks, in terms of distribution of impacts, begins at 2ºC global warming, with a full 51 transition to very high risks completed by 3.5ºC. However, it should be noted that many studies upon which 52 this assessment has been based have not taken into account the impacts of extreme weather events and 53 oscillations in sea surface temperatures hence risks at a given level of global warming might be 54 underestimated in the literature. 55 56
ACCEPTED VERSIO
N
SUBJECT TO FIN
AL EDITS
FINAL DRAFT Chapter 16 IPCC WGII Sixth Assessment Report
Do Not Cite, Quote or Distribute 16-109 Total pages: 173
16.6.3.4 Global Aggregate Impacts (RFC4) 1 2 This RFC considers impacts to socio-ecological systems that can be aggregated globally into a single metric, 3 such as monetary damages, lives affected, species lost or ecosystem degradation at a global scale 4 (Oppenheimer et al., 2014; O’Neill et al., 2017). RFC4 shares underlying key risk components with other 5 RFCs (e.g., RFC1 and RFC2, see O’Neill et al., 2017) and thus draws on a similar literature as those 6 assessments; however, this RFC focuses on impacts that reach levels of concern at the global level and also 7 weighs the composite effect of risk elements ranging from economic to biodiversity. 8 9 In AR5 Section 19.6.3.5 (Oppenheimer et al., 2014), the transition from undetectable to moderate risk was 10 assessed between 1.6 and 2.6ºC above pre-industrial levels (i.e., 1ºC and 2ºC above the 1986-2005 level) 11 based on impacts to both Earth’s biodiversity and the overall global economy with medium confidence. The 12 risk transition between moderate and high risk was set around 3.6ºC above pre-industrial levels (i.e., 3ºC 13 above the 1986-2005 level), based on literature finding extensive species vulnerability and biodiversity 14 damage with associated loss of ecosystem goods and services at 3.5ºC (Foden et al., 2013; Warren et al., 15 2013). In SR15 Section 3.5.2.4 (Hoegh-Guldberg et al., 2018b), economic literature on potential socio-16 economic threshold events as well as empirical studies of global economic damages, combined with new 17 evidence on biome shifts, extinction risk, species range loss (especially noting the integral role of insects in 18 ecosystem function), and ecosystem degradation, were assessed and the upper bound of the transition to 19 moderate risk was lowered to 1.5ºC warming above pre-industrial levels, and the transition from moderate 20 and high risk was lowered to between 1.5ºC and 2.5ºC (medium confidence). The boundary between high 21 risk and very high risk was not assessed in either of these reports because the temperature threshold was 22 beyond the scope of the assessment in the case of SR15 and due to the limited literature available for this 23 highest transition in AR5. 24 25 Since AR5, many new global estimates of the aggregate, economy-wide risks of climate change have been 26 produced, though, as was the case in AR5, these continue to exhibit a low level of agreement, including for 27 today’s level of global warming, due primarily to differences in methods. Cross-Working Group Box 28 ECONOMIC in this chapter includes a more thorough discussion of advancements and limitations of global 29 economic impact estimates and methodologies, finding significant variation in estimates that increases with 30 warming, indicating higher risk in terms of economic costs at higher temperatures (high confidence). Climate 31 change has been found to exacerbate poverty through declines in agricultural productivity, changes in 32 agricultural prices and extreme weather events (Hertel and Lobell, 2014; Hallegatte and Rozenberg, 2017). 33 In terms of biodiversity risks, the literature indicates that losses in terrestrial and marine ecosystems increase 34 substantially between 1.5ºC and 2ºC of warming (Hoegh-Guldberg et al., 2018b). Since SR15, further 35 evidence of degradation of biodiversity and ecosystem services and ocean acidification at the global 36 aggregate level has continued to accrue due to climate change (see Chapter 2). 37 38 For this RFC, the transition from undetectable to moderate risk to global aggregate impacts is assessed with 39 medium confidence to occur between 1.0ºC (start of transition) and 1.5ºC (completion of transition) with a 40 median judgment of transition at 1.3ºC, based on evidence of a combination of economic consequences, 41 widespread impacts to climate-sensitive livelihoods, changes in biomes and loss of terrestrial and marine 42 biodiversity. The start of the transition from undetectable to moderate risk is located at recent temperatures 43 based on observed impacts to biodiversity (16.2.3.1). Experts noted aggregate impacts on biodiversity are 44 detectable, with damages that have had global significance (e.g., drought, pine bark beetles, coral reef 45 ecosystems). Consistent with the start of this transition at 1ºC, a similar elicitation conducted in Chapter 2 46 assessed that risks to biodiversity globally have already transitioned to a moderate level with 1ºC warming; 47 whilst risks of widespread tree mortality are already moderate with 0.9ºC warming and finds that moderate 48 risks of ecosystem structure change began with warming of 0.5ºC (Table 2.S.4, Figure 2.11). Human-49 induced warming has slowed growth of agricultural productivity over the past 50 years in mid- and low-50 latitudes (Chapter 5; Hurlbert et al., 2019). Although there is not yet strong evidence of attributable loss of 51 life and livelihoods at the global level (16.5.2.3.4, 16.5.2.3.5), experts found that regional evidence of such 52 observed impacts were still relevant to defining the beginning of the transition (e.g., Table SM16.22, Chapter 53 9). Informing the median value and upper bound of the transition to moderate risk, empirical studies and 54 scenario analyses have found that regions with high dependence on climate-sensitive livelihoods like 55 agriculture, fisheries and forestry would be severely impacted even at low levels of warming under 56 conditions of low adaptation (RKR-D, Lobell et al., 2011; Hoegh-Guldberg et al., 2018b). 57
ACCEPTED VERSIO
N
SUBJECT TO FIN
AL EDITS
FINAL DRAFT Chapter 16 IPCC WGII Sixth Assessment Report
Do Not Cite, Quote or Distribute 16-110 Total pages: 173
1 The transition to high risk is assessed with medium confidence to occur between 1.5ºC (start of transition) 2 and 2.5ºC (completion of transition) with a median judgment of transition at 2.0ºC. Though economic 3 estimates exhibit wide variation and low agreement at warming levels above 1.5ºC, many estimates are 4 nonlinear with marginal economic impacts increasing with temperature (see Cross-Working Group Box 5 ECONOMIC in this Chapter). At 1.5ºC warming, most aggregate global impacts to Gross Domestic Product 6 are negative across different estimation methods, including bottom-up estimation (e.g., Takakura et al., 7 2019), meta-analysis (e.g., Howard and Sterner, 2017) and empirical estimations (e.g., Pretis et al., 2018; 8 Kalkuhl and Wenz, 2020). At 2°C Watts et al. (2021) estimate a relative decrease in effective labour by 10%, 9 which would have profound economic consequences. Byers et al. (2018) found that global exposure to multi-10 sector risks approximately doubles between 1.5°C and 2°C, whilst the percentage of the global population 11 exposed to flooding is projected to rise by 24% with 1.5°C warming and by 30% with 2.0°C warning 12 (Hirabayashi et al., 2021). 13 14 Section 16.5.2.3.4 (RKR-D, underlying key risk on poverty) reports that under medium warming pathways, 15 climate change risks to poverty would become severe if vulnerability is high and adaptation is low (limited 16 evidence, high agreement). At and beyond 1.5ºC, approximately 200 million people with livelihoods derived 17 from small-scale fisheries would face severe risk, given sensitivity to ocean warming, acidification, and coral 18 reef loss (Cheung et al., 2018a; Froehlich et al., 2018; Free et al., 2019). Warming between 1.5 and 2ºC 19 could expose 330–396 million people to lower agricultural yields and associated livelihood impacts (Byers et 20 al., 2018; Hoegh-Guldberg et al., 2018a), due to a high dependency of climate-sensitive livelihoods to 21 agriculture globally (World Bank, 2020). Models project that climate change will increase the number of 22 people at risk of hunger in 2050 by 8-80 million people globally, with the range depending on the level of 23 warming (1.5–2.9ºC) and SSPs (Nelson et al., 2018; Mbow et al., 2019; Janssens et al., 2020). Higher 24 atmospheric concentrations of carbon dioxide reduce the nutritional quality of wheat, rice, and other major 25 crops, potentially affecting millions of people at a doubling of carbon dioxide relative to pre-industrial (very 26 high confidence) (Section 7.3.1). Global ocean animal biomass is projected to decrease on average by 5% per 27 1°C increase, hence a 2.5C level of warming is associated with ~13% decline in ocean animal biomass, 28
which would considerably reduce marine food provisioning, fisheries distribution and revenue value, with 29 further consequences for ecosystem functioning (Chapter 5, medium confidence). 30 31 Losses in terrestrial and marine biodiversity increase substantially beyond 1.5ºC of warming (Hoegh-32 Guldberg et al., 2018b). Section 16.5.2.3.2 (RKR-B, risks to terrestrial and marine ecosystems) finds that 33 substantial biodiversity loss globally, abrupt local ecosystem mortality impacts, and ecological species 34 disruption are all projected at global warming levels below 3ºC, with insular systems and biodiversity 35 hotspots at risk below 2ºC (medium confidence). Insects play a critical role in providing vital ecosystem 36 services that underpin human systems, with major losses of their climatically determined geographic range at 37 2°C warming implying adverse effects on ecosystem functioning. Consistent with the transitions presented 38 here, a similar burning ember developed in Chapter 2 assessed a transition from moderate to high risks 39 globally for marine and terrestrial biodiversity (e.g., widespread death of trees, damages to ecosystems, and 40 reduced provision of ecosystem services, and structural change, including biome shifts) beginning between 41 1.0 and 2.0ºC warming (Table 2.S.4, Figure 2.11). 42 43 Though explicit treatment of adaptation is limited in the RFC4 impacts literature (i.e., studies that compare 44 risks for specific adaptation scenarios in terms of globally aggregated impacts with quantified findings), 45 there is evidence of the potential for investments in improved hydro-meteorological information and early 46 warning systems to avoid some of the most adverse social and economic impacts from extreme weather 47 events in both developed and developing countries, with benefits at a globally significant level (Hallegatte, 48 2012). Studies of adaptation in the agriculture sector (e.g., changing crop variety, timing of crop planting, 49 new types of irrigation, etc.) and infrastructure (e.g., coastal protection, hardening of critical infrastructure, 50 flood and climate resistant building materials and water storage) show large potential benefits in terms of 51 reduced impacts to lives and livelihoods (van Hooff et al., 2015; Mees, 2017). At higher warming levels, 52 however, potential adaptations to address biodiversity loss are expected to be limited due to the projected 53 rate and magnitude of change as well as the resources required (Hannah et al., 2020). 54 55 The transition to very high risks is assessed to occur between a range of 2.5–4.5ºC with medium confidence 56 over the range, and low confidence assessed over a narrowed ‘best estimate’ range of 2.7–3.7ºC. The lower 57
ACCEPTED VERSIO
N
SUBJECT TO FIN
AL EDITS
FINAL DRAFT Chapter 16 IPCC WGII Sixth Assessment Report
Do Not Cite, Quote or Distribute 16-111 Total pages: 173
end of the range reflects the loss of an increasingly large fraction of biodiversity globally. Chapter 2 has 1 assessed a transition from high to very high risks globally for biodiversity (marine and terrestrial) completing 2 at ~2.5ºC warming, noting widespread death of trees, damages to ecosystems, and reduced provision of 3 ecosystem services over the temperature range 2.5ºC–4.5ºC (Table 2.S.4, Figure 2.11); and similarly a 4 transition from high to very high risks of ecosystem structure change (including biome shifts) between 3ºC 5 and 5ºC warming (Table 2.S.4, Figure 2.11). A global study of 115,000 common species projects 6 climatically determined geographic range losses of over 50% in 49% of insects, 44% of plants and 26% of 7 vertebrates with global warming of 3.2ºC, implying an associated effect on provisional and regulating 8 ecosystem services that support human wellbeing, including pollination and detrivory (Warren et al., 2018a). 9 The risk of abrupt impacts on ecosystems as multiple species approach tolerance limits simultaneously is 10 projected to threaten up to 15% of ecological communities with 4ºC of warming (Trisos et al., 2020). Under 11 a 4ºC warming scenario, models project global annual damages associated with sea level rise of $31,000 12 billion per year in 2100 (Brown et al., 2021) 13 14 In terms of global economic impact, while an emerging economic literature is addressing many gaps and 15 critiques of previous damage estimates for high warming (e.g., Jensen and Traeger, 2014; Burke et al., 2015; 16 Lontzek et al., 2015; Moore and Diaz, 2015; Lemoine and Traeger, 2016; Moore et al., 2017a; Cai and 17 Lontzek; Takakura et al., 2019, discussed further in Cross-Working Group Box ECONOMIC; Carleton et al., 18 2020; Méjean et al., 2020; Rode et al., 2021), there remains wide variation across disparate methodologies, 19 though the spread of estimates increases with warming in all methodologies, indicating higher risk in terms 20 of economic costs at higher temperatures (high confidence). Section 16.5.2.3.4 (RKR-D) finds that risks to 21 aggregate economic output would become severe at the global scale at high warming (~4.4ºC) and minimal 22 adaptation (medium confidence), defining severity as ‘the potential for persistent annual economic losses due 23 to climate change to match or exceed losses during the world’s worst historical economic recessions’. 24 Furthermore, climate change impacts on income inequality could compound risks to living standards (high 25 confidence, 16.5.2.3.4). Chapter 4 finds that at 4°C, 4 billion people are projected to be exposed to physical 26 water scarcity (medium confidence). 27 28 29 [START CROSS-WORKING GROUP BOX ECONOMIC HERE] 30 31 Cross-Working Group Box ECONOMIC: Estimating Global Economic Impacts from Climate Change 32 33 Authors: Steven Rose (USA), Delavane Diaz (USA), Tamma Carleton (USA), Laurent Drouet (Italy), Celine Guivarch 34 (France), Aurélie Méjean (France), Franziska Piontek (Germany) 35 36 This Cross-Working Group Box assesses literature estimating the potential global aggregate economic costs 37 of climate change and the social cost of carbon (SCC), where the former are sometimes referred to as 38 estimates of global ‘climate damages’ and the latter are estimates of the potential monetized impacts to 39 society of an additional metric ton of carbon dioxide emitted to the atmosphere. These measures include the 40 economic costs of climate change that could be felt in market sectors such as agriculture, energy services, 41 labour productivity, and coastal resources, as well as non-market impacts such as other types of human 42 health risks (including mortality effects) and ecosystems. Global economic impacts estimates can inform 43 decisions about global climate management strategy, while SCC estimates can inform globally incremental 44 emissions decisions. In practice, economic damage estimates have been used to explore economically 45 efficient (‘economically optimal’) global emissions pathways (e.g.’, Nordhaus and Moffat, 2017), while 46 SCCs have been used to inform federal and state-level policy assessment in some countries (Greenstone et 47 al., 2013; Rose and Bistline, 2016), but the type of SCC and application matter (Rose, 2017). This literature 48 has been assessed in previous WGII reports (e.g.., Arent et al., 2014) and this box serves this need for this 49 report. The assessment in this box was performed jointly across WGII and WGIII, building on the foundation 50 of WGII AR6 Chapter 16’s ‘Risk to living standards’ assessment (Section 16.5.2.3.4), which includes 51 consideration of severe risks to global aggregate economic output, and WGIII AR6 Chapter 3’s assessment 52 of the benefits of mitigation. It also informs Chapter 16’s global aggregate impacts Reason for Concern and 53 supports Chapter 18’s assessment of global emissions transitions, risk management, and climate-resilient 54 development. In keeping with the broad risk framing presented in Chapter 1 of this report, other lines of 55 evidence regarding climate risks, beyond monetary estimates, should be considered in decision-making, 56 including key risks and Reasons for Concern. 57
ACCEPTED VERSIO
N
SUBJECT TO FIN
AL EDITS
FINAL DRAFT Chapter 16 IPCC WGII Sixth Assessment Report
Do Not Cite, Quote or Distribute 16-112 Total pages: 173
1 Methods for estimating global economic costs of climate impacts 2 3 There are several broad approaches to estimating climate damages, including biophysical process models, 4 structural economic models, statistical methods (also called empirical or econometric) and hybrid 5 approaches, with each methodology having strengths and weaknesses. Process models simulate physical, 6 natural science, and/or engineering processes and their response to climate variables, that are then monetized 7 (e.g., Anthoff and Tol, 2014; Sieg et al., 2019; Narita et al., 2020). Process approaches have the advantage of 8 being explicit and interpretable, though they can be computationally intensive; may omit relevant impact 9 channels, interactions, and market dynamics affecting valuation; and, often lack a rigorous empirical basis 10 for calibration (Fisher-Vanden et al.). Structural economic modelling represents climate impacts on inputs, 11 production, household consumption, aggregate investment, and markets for economic sectors and regional 12 economies (e.g., Reilly et al., 2007; Roson and Van der Mensbrugghe, 2012; Anthoff and Tol, 2014; Dellink 13 et al., 2019; Takakura et al., 2019), often using computable general equilibrium (CGE) frameworks. 14 Structural models can evaluate how market and non-market impacts might enter and transmit through 15 economies, and adaptation responses within input and output markets, consumer and investment choices, and 16 inter-regional trade (e.g., Darwin and Tol, 2001; Dellink et al., 2019; Takakura et al., 2019). Statistical 17 methods estimate economic impacts in a given sector (e.g., Auffhammer, 2018) or in aggregate (e.g., Dell et 18 al., 2014; Burke et al., 2015; Hsiang et al., 2017; Pretis et al., 2018; Kahn et al., 2019), inferred from 19 observed changes in economic factors, weather, and climate, with responses and net results constrained by 20 available data. Since AR5, hybrid approaches have taken different forms to integrate process, statistical 21 and/or structural methods, and represent a potentially promising means of leveraging the strengths of 22 different approaches (e.g., Moore and Diaz, 2015; and Hsiang et al., 2017; Moore et al., 2017a; Ricke et al., 23 2018; Yumashev et al., 2019; Chen et al., 2020b). There is also a small literature that uses expert elicitation 24 to gather subjective assessments of climate risks and potential economic impacts (Nordhaus, 1994; IPCC, 25 2019a; Pindyck, 2019). 26 27 In addition to differences in methods, there are also differences in scope – geographic, sectoral, and 28 temporal. Global estimates are frequently based on an aggregation of independent sector and/or regional 29 modelling and estimates; however, there are examples of estimates from global modelling that simulate 30 multiple types of climate impacts and their potential interactions within a single, coherent framework (e.g., 31 Roson and Van der Mensbrugghe, 2012; Dellink et al., 2019; Takakura et al., 2019). Differences in scope 32 also represent strengths and weaknesses between the methodologies, with narrower scope allowing for more 33 detailed assessment, but missing potential interactions with the scope not covered (e.g., other geographic 34 areas, sectors, markets, or periods of time). 35 36 Comprehensive economic estimates are challenging to produce for many reasons, including complex 37 interactions among physical, natural, and social systems; pervasive climate, socio-economic, and system 38 response uncertainties; and the heterogeneous nature of climate impacts that vary across space and time. 39 Critiques and commentaries of global estimation methods (Pindyck, 2013; Stern, 2013; van den Bergh and 40 Botzen, 2015; Cropper et al., 2017; Diaz and Moore, 2017; Pindyck, 2017; Rose et al., 2017; Stoerk et al., 41 2018; DeFries et al., 2019; Pezzey, 2019; Calel et al., 2020; Warner et al., 2020; EPRI, 2021; Grubb et al., 42 2021; Newell et al., 2021) include, among other things, concerns about statistical methods estimating 43 weather but not climate relationships, making out-of-sample extrapolations, and model specification 44 uncertainty, concerns about the observational grounding of structural modelling, overall concerns about the 45 lack of adaptation consideration, as well as representation and evaluation of potential large-scale singular 46 events such as ice sheet destabilisation or biodiversity destruction, some questioning the ability to generate 47 robust estimates (i.e., estimates insensitive to reasonable alternative inputs and specifications), and general 48 concerns about methodological details, transparency, and justification. 49 50 Additional methodological challenges to address (see, for instance, EPRI, 2021; Piontek et al., 2021) include 51 how to capture and represent uncertainty and variability in potential damage responses for a given climate 52 and societal condition, combine estimates from different methods and sources (including aggregating 53 independent sectoral and regional results), assess sensitivity and evaluate robustness of estimates (including 54 sensitivity to model specification), capture interactions and spillovers between regions and sectors, estimate 55 societal welfare implications (versus GDP changes) of market and non-market impacts, consider 56 distributional effects, represent micro and macro adaptation processes (and adaptation costs), specify 57
ACCEPTED VERSIO
N
SUBJECT TO FIN
AL EDITS
FINAL DRAFT Chapter 16 IPCC WGII Sixth Assessment Report
Do Not Cite, Quote or Distribute 16-113 Total pages: 173
nongradual damages and non-linearities, and improve understanding of potential long-run economic growth 1 effects. Note that, the treatment of time preference, risk aversion, and equity considerations have important 2 welfare implications for the aggregation of both potential economic impacts and climate change mitigation 3 costs. 4 5 In addition to updated and new methods and estimates, newer literature has explored nongradual damages, 6 such as climatic and socioeconomic tipping points (Lontzek et al., 2015; Méjean et al., 2020), potential 7 damage to economic growth (e.g., Burke et al., 2015; Moore and Diaz, 2015), valuing uncertainty in 8 potential damages (Jensen and Traeger, 2014; Lemoine and Traeger, 2016; Cai and Lontzek), and 9 representing adaptation (Takakura et al., 2019; Carleton et al., 2020; Rode et al., 2021). Going forward, to 10 help advance science and decisions, a key research priority is to understand and evaluate methodological 11 strengths and weaknesses in damage estimation, and reconcile the differences affecting comparability in such 12 a way that it informs use of the different lines of evidence. This will require greater transparency and 13 assessment of details and assumptions in individual methods, communication and evaluation of alternatives 14 for specifying or calibrating climate damage functional representations with respect to climate and non-15 climate drivers and potential non-linearities, including evaluating data sufficiency for levels within and 16 beyond observations and for characterizing physical system dynamics, and evaluating the sensitivity of 17 results to model specification and input parameter choices (Cropper et al., 2017). Improving the robustness 18 of economic impact estimates is an active area of research. Below we describe the latest estimates. 19 20 Global estimates of the economic costs of climate impacts 21 22 Since AR5, many new estimates of the global economic costs of climate change have been produced. Figure 23 Cross-Working Group Box ECONOMIC.1 shows a wide spread of estimates, with growing variance at 24 higher levels of warming, both within and across methodology types (i.e., statistical, structural, or meta-25 analysis). Meta-analysis is used here to refer to studies that treat other studies’ estimates as data points in an 26 attempt to derive a synthesized functional form. 27 28 Global aggregate economic impact estimates (Figure Cross-Working Group Box ECONOMIC.1) are 29 generally found to increase with global average temperature change, as well as vary by other drivers, such as 30 income and population and the composition of the economy. Most estimates are nonlinear with higher 31 marginal economic impacts at higher temperature, although some recover declining marginal economic 32 impacts and functional forms cannot be determined for all studies. The drivers of non-linearity found in 33 economic impact estimates, and the differences in non-linearity across estimates (e.g., convex versus 34 concave, degree of curvature), are not well understood, with methodology construction, assumptions, and 35 data all potential factors. Relative to AR5, there have been more estimates and greater variation in estimates, 36 including some recent estimates significantly higher than the range reported in AR5. For most of the studies 37 shown in Figure Cross-Working Group Box ECONOMIC.1, the visible variation within a study represents 38 alternative socioeconomic projections and climate modelling, not economic impacts response uncertainty for 39 a given socioeconomic and climate condition. Response uncertainty could be significant as indicated by 40 some of the results shown in the figure (e.g., Burke et al., 2015; Rose et al., 2017), but methodological 41 differences in how uncertainty is characterized (model specification, errors, and confidence intervals versus 42 distributions of results) limits comparability and assessment. Note that modeling factors between global 43 temperature change and the economic impact calculation, such as regional temperature pattern assumptions 44 or assumed sea level rise dynamics, can also impact calculated estimates (e.g., Warren et al, 2021 PAGE09 45 estimates versus those in Rose et al, 2017, Chen et al, 2020 PAGE-ICE estimates versus Burke et al, 2015). 46 47 From Figure Cross-Working Group Box ECONOMIC.1, we find a large span of damage estimates, even 48 without considering uncertainty/confidence in damage responses, including for today's level of warming 49 (about 1˚C). There is also evidence that some regions benefit from low levels of warming, leading to net 50 benefits globally at these temperatures. The size of the span of estimates grows with global warming level, 51 with variation across statistical estimates larger than variation in structural estimates. The structural and meta 52 analyses estimates appear to be in closer agreement, but that outcome is contingent on the meta analyses data 53 considerations and approach. Meta analyses to date have not assessed the alternative methods and dealt with 54 the lack of comparability between methods. 55 56 57
ACCEPTED VERSIO
N
SUBJECT TO FIN
AL EDITS
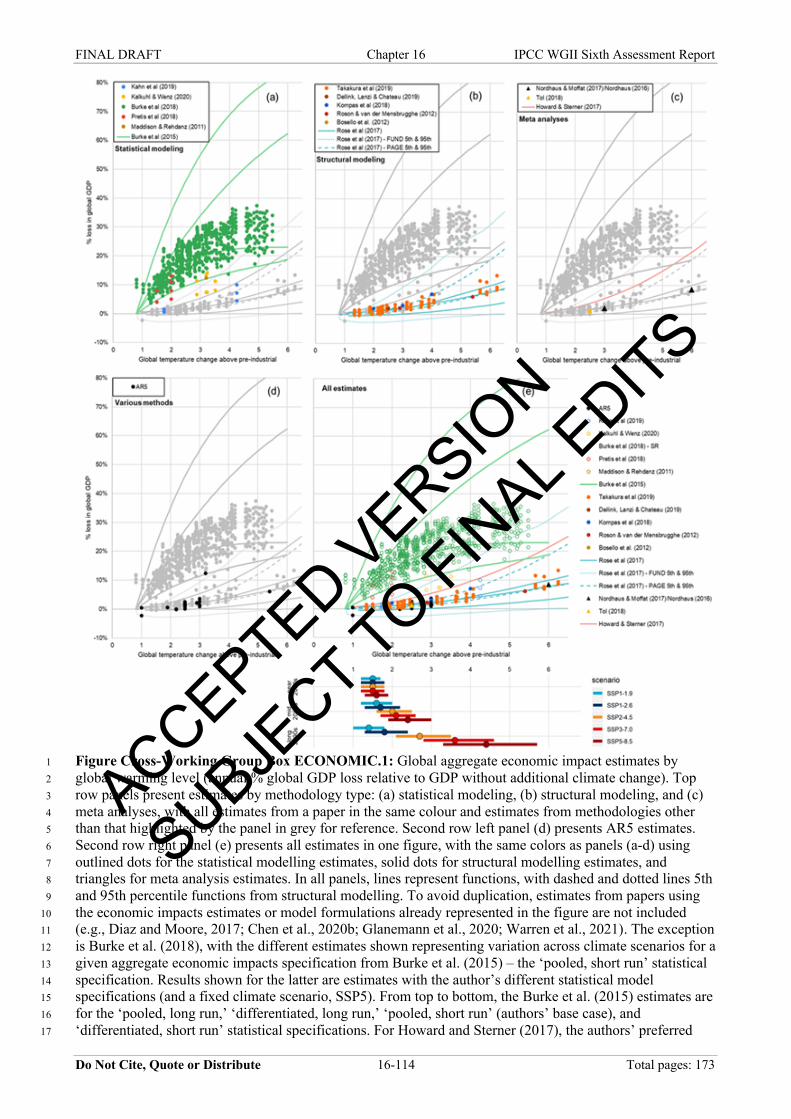
FINAL DRAFT Chapter 16 IPCC WGII Sixth Assessment Report
Do Not Cite, Quote or Distribute 16-114 Total pages: 173
Figure Cross-Working Group Box ECONOMIC.1: Global aggregate economic impact estimates by 1 global warming level (annual % global GDP loss relative to GDP without additional climate change). Top 2 row panels present estimates by methodology type: (a) statistical modeling, (b) structural modeling, and (c) 3 meta analyses, with all estimates from a paper in the same colour and estimates from methodologies other 4 than that highlighted by the panel in grey for reference. Second row left panel (d) presents AR5 estimates. 5 Second row right panel (e) presents all estimates in one figure, with the same colors as panels (a-d) using 6 outlined dots for the statistical modelling estimates, solid dots for structural modelling estimates, and 7 triangles for meta analysis estimates. In all panels, lines represent functions, with dashed and dotted lines 5th 8 and 95th percentile functions from structural modelling. To avoid duplication, estimates from papers using 9 the economic impacts estimates or model formulations already represented in the figure are not included 10 (e.g., Diaz and Moore, 2017; Chen et al., 2020b; Glanemann et al., 2020; Warren et al., 2021). The exception 11 is Burke et al. (2018), with the different estimates shown representing variation across climate scenarios for a 12 given aggregate economic impacts specification from Burke et al. (2015) – the ‘pooled, short run’ statistical 13 specification. Results shown for the latter are estimates with the author’s different statistical model 14 specifications (and a fixed climate scenario, SSP5). From top to bottom, the Burke et al. (2015) estimates are 15 for the ‘pooled, long run,’ ‘differentiated, long run,’ ‘pooled, short run’ (authors’ base case), and 16 ‘differentiated, short run’ statistical specifications. For Howard and Sterner (2017), the authors’ preferred 17
ACCEPTED VERSIO
N
SUBJECT TO FIN
AL EDITS
FINAL DRAFT Chapter 16 IPCC WGII Sixth Assessment Report
Do Not Cite, Quote or Distribute 16-115 Total pages: 173
function is shown. Overall, estimates shown in the figure can correspond to different future years, reflecting 1 different socioeconomic conditions and climate pathways to a global warming level. Global average 2 temperature change bars relative to the period 1850-1900 are shown below the economic cost estimates to 3 provide context to potential future warming. Shown are the WGI AR6 assessed best estimates and 90% 4 intervals for the illustrative emissions scenarios considered for the near term 2021-2040, mid-term 2041-5 2060, and long term 2081–2100. 6 7 8 Differences in methodology type and scope complicate comparison, assessment, and synthesis (Cropper et 9 al., 2017; Diaz and Moore, 2017; EPRI, 2021; Piontek et al., 2021). In particular, structural economic 10 modelling and empirical aggregate output modelling are fundamentally different, which has been identified 11 as an issue affecting the comparability of results (Cropper et al., 2017). The different methodologies affect 12 outcomes, with global aggregate estimates based on statistical methodologies typically higher than those 13 from structural modelling (Figure Cross-Working Group Box ECONOMIC.1). This is, in part, due to the 14 relationships in observational data captured by statistical modelling, assumed persistence of impacts in 15 statistical modelling, broader adaptation responses in structural modelling, and differences in the 16 representation of future societies and how they might evolve, respond, and interact. Within statistical 17 modelling, results are also found to be very sensitive to the statistical model specification (e.g., Burke et al., 18 2015; Newell et al., 2021). Within structural modelling, differences in representations of biophysical changes 19 and economic structural dynamics contribute to differences across structural estimates (e.g., Rose et al., 20 2017). 21 22 The wide range of estimates, and the lack of comparability between methodologies, does not allow for 23 identification of a robust range of estimates with confidence (high confidence). Evaluating and reconciling 24 differences in methodologies is a research priority for facilitating use of the different lines of evidence (high 25 confidence). However, the existence of higher estimates than AR5 indicate that global aggregate economic 26 impacts could be higher than previously estimated (low confidence due to the lack of comparability across 27 methodologies and robustness of estimates). 28 29 While Figure Cross-Working Group Box ECONOMIC.1 summarizes global aggregate estimates, the 30 literature exhibits significant heterogeneity in regional economic impacts that are also sensitive to 31 methodology, model specification, and societal assumptions (with, for instance, larger estimates due to the 32 assumed size of society, but offsetting adaptive capacity improvements and adaptation responses). Regional 33 results illustrate the potential for overall net benefits in more temperate regions at lower levels of warming 34 with potential lower energy demand and comparative advantages in agricultural markets; however, at higher 35 levels of warming net losses are estimated. In addition, economic impacts for poorer households and poorer 36 countries represent a smaller share in aggregate quantifications expressed in GDP terms than their influence 37 on well-being or welfare (Byers et al., 2018; Hallegatte et al., 2020). 38 39 Social cost of carbon methods and estimates 40 41 The global economic impact estimates discussed in the previous section serve as a key input into the 42 calculation of the value of potential net damages caused by a marginal ton of carbon dioxide emissions, or 43 the SCC. To compute an SCC, damage estimates are commonly combined in a multi-century modelling 44 framework with socioeconomic and emissions projections, a physical model of the climate, including a sea-45 level rise component, and assumptions about the discount rate, with current frameworks having highly 46 stylized representations of these components. Though we do not present quantitative estimates here, due to 47 the challenge of comparability, for economic impacts methodologies (as discussed above) as well as other 48 SCC estimation elements, large variations in SCC estimates are found in the literature assessed due to, 49 among other things, differences in modelling component representations, input and parameter assumptions, 50 considerations of uncertainty, and discounting, inflation, and emissions year (e.g., Tol, 2009; Tol, 2018; 51 Pezzey, 2019; Iese et al., 2021). There are also different ‘variants’ of SCC estimates that differ conceptually, 52 and in magnitude, depending on the reference condition for evaluating the impact of a marginal metric ton--53 is it being evaluated relative to a no-climate-policy baseline, an economically efficient pathway that weighs 54 the benefits and costs of emissions mitigation, or a pathway based on a particular climate policy or goal such 55 as 2°C or a concentration target (Rose et al., 2017)? The variant of SCC has implications for its applicability 56 to different policy contexts (Rose and Bistline, 2016). 57
ACCEPTED VERSIO
N
SUBJECT TO FIN
AL EDITS
FINAL DRAFT Chapter 16 IPCC WGII Sixth Assessment Report
Do Not Cite, Quote or Distribute 16-116 Total pages: 173
1 In addition to the economic impacts methodological challenges discussed above with respect to aggregate 2 economic impact estimates, the additional components needed for SCC calculations give rise to a new set of 3 technical issues and critiques, including incorporation of uncertainties in the components beyond climate 4 damages, links between components, and discounting (van den Bergh and Botzen, 2015; Cropper et al., 5 2017; Diaz and Moore, 2017; Pindyck, 2017; Rose et al., 2017; EPRI, 2021). For component-specific 6 discussions and assessment, see Cropper et al. (2017), Rose et al. (2017), and EPRI (2021). 7 8 Substantial progress has been made in recent years to better reflect complexities in the global economy, the 9 climate system, and their interaction. For example, recent studies have explored damages to natural capital 10 (Bastien-Olvera and Moore, 2021), the influence of imperfect substitutability between environmental 11 services and market goods (Sterner and Persson, 2008; Weitzman, 2012; Drupp and Hänsel, 2021), the 12 implications of heterogeneous climate change impacts across income groups (Dennig et al., 2015; EPRI, 13 2021; Errickson et al., 2021), the potential for persistent climate impacts to economic growth instead of 14 effects on levels of economic output (Dietz and Stern, 2015; Moore and Diaz, 2015; Ricke et al., 2018; 15 Kikstra et al., 2021; Newell et al., 2021), valuing the risks of climate tipping points (Cai and Lontzek, 2019; 16 Rising et al., 2020), valuing uncertainty under risk aversion (Jensen and Traeger, 2014; Lemoine and 17 Traeger, 2016), and modelling a distinction between intertemporal inequality aversion and risk aversion in 18 the social welfare utility function (Crost and Traeger, 2013; Jensen and Traeger, 2014; Daniel et al., 2015). 19 These new studies have, in general, raised estimates of the SCC (Crost and Traeger, 2013; Jensen and 20 Traeger, 2014; Gerlagh and Michielsen, 2015; Moore and Diaz, 2015; Faulwasser et al., 2018; Guivarch and 21 Pottier, 2018; Budolfson et al., 2019; Cai and Lontzek, 2019; Dietz and Venmans, 2019; Kalkuhl and Wenz, 22 2020), in some cases by an order of magnitude (Ricke et al., 2018). However, challenges persist in terms of 23 moving from conceptual to practical application, such as pinning down parameter specifications, modelling 24 specific mechanisms for impacts, and more fully representing adaptation. 25 26 Despite these scientific advances, SCC estimates vary widely in the literature. Technical issues with past and 27 current modelling (e.g.’, Pezzey, 2019; Pindyck, 2019; EPRI, 2021) and the challenge of comparability 28 across methodologies imply that many estimates are not robust (high confidence). Also, as a result, the issue 29 of directional bias of past estimates remains unsettled. Better representation of uncertainty in methods can 30 improve robustness, while detailed methodology assessment and comparison will help define the relative 31 biases of methods (high confidence). 32 33 Application to decision-making 34 35 The literature has also assessed the application of aggregate economic impact cost and SCC estimates (Rose 36 and Bistline, 2016; Rose et al., 2017; Kaufman et al., 2020) and identified conceptual and technical issues 37 that need to be considered when using results to inform policy decisions. These issues include: accounting 38 for endogenous marginal benefits and socioeconomic conditions in evaluating policies with non-incremental 39 global emissions implications; consistency in assumptions and treatment of uncertainty across benefit and 40 cost calculations; fully accounting for the streams of both mitigation costs and benefits over time; avoiding 41 inefficiently valuing or pricing emissions more than once across policies and jurisdictions; and accounting 42 for emissions leakage to capture net climate implications. Furthermore, concerns about the robustness of 43 estimates have led some to recommend considering alternatives, such as using marginal mitigation cost 44 estimates based on modelling of policy goals instead of the SCC (e.g., Rose, 2012; Pezzey, 2019; Kaufman 45 et al., 2020), although this comes with its own set of assumptions and technical challenges. 46 47 [END CROSS-WORKING GROUP BOX ECONOMIC HERE] 48 49 50 16.6.3.5 Large-scale Singular Events (RFC5) 51 52 This RFC, large-scale singular events (sometimes called tipping points or critical thresholds), considers 53 abrupt, drastic, and sometimes irreversible changes in physical, ecological, or social systems in response to 54 smooth variations in driving forces (accompanied by natural variability) (Oppenheimer et al., 2014; O’Neill 55 et al., 2017). SR15 Section 3.5.2.5 presented four examples, including the cryosphere (West Antarctic ice 56 sheet, Greenland ice sheet), thermohaline circulation (slowdown of the Atlantic Meridional Overturning 57
ACCEPTED VERSIO
N
SUBJECT TO FIN
AL EDITS
FINAL DRAFT Chapter 16 IPCC WGII Sixth Assessment Report
Do Not Cite, Quote or Distribute 16-117 Total pages: 173
Circulation), the El Niño–Southern Oscillation (ENSO) as a global mode of climate variability, and the role 1 of the Southern Ocean in the global carbon cycle (Hoegh-Guldberg et al., 2018b). Whilst most of the 2 literature assessed here focuses on the resultant changes to climate-related hazards such as sea level rise, in 3 this assessment evidence about the implications of accelerated sea level rise for human and natural systems is 4 also considered. If sea level rise is accelerated by ice sheet melt, the associated impacts are projected to 5 occur decades earlier than otherwise, directly affecting coastal systems including cities and settlements by 6 the sea (CCP2) and wetlands (Chapter 2). The associated disruption to ports is projected to severely 7 compromise global supply chains and maritime trade with local-global geo-political and economic 8 consequences. In order to compensate for this acceleration, adaptation would need to occur much faster and 9 at a much greater scale than otherwise, or indeed than has previously been observed (CCP2). The costs of 10 accommodating port growth and adapting to sea level rise amount to USD22-768 billion before 2050 11 globally (medium evidence, high agreement) (see Section 2.1; Section 2.2; Cross-Chapter Box SLR in 12 Chapter 3). 13 14 In AR5 Section 19.6.3.6 (Oppenheimer et al., 2014), the boundary between undetectable and moderate risk is 15 set at levels between 0.6 and 1.6ºC above pre-industrial levels (i.e., 0ºC and 1ºC above the 1986-2005 level) 16 with high confidence, based on emerging early warning signals of regime shifts in Arctic and warm water 17 coral reef systems. The risk transition boundary between moderate and high risk was set between 1.6 and 18 3.6ºC above pre-industrial levels (i.e., 1ºC and 3ºC above the 1986-2005 level), with medium confidence 19 based on projections of ice sheet loss, with faster increase between 1ºC and 2ºC than between 2ºC and 3ºC. 20 The literature available at the time did not allow AR5 to assess the boundary between high and very high 21 risk. 22 23 In SR15 Section 3.5.2.5 (Hoegh-Guldberg et al., 2018b), new assessments of the potential collapse of the 24 West Antarctic ice sheet (WAIS) initiated by marine ice sheet instability (MISI) resulted in lowering the 25 upper end of the transition from undetectable and moderate risk from 1.6ºC to 1ºC warming above pre-26 industrial levels, and lowering the upper end of the transition from moderate to high risk to 2.5ºC. Although 27 SR15 did not produce embers beyond 2.5ºC, authors reported that the transition to very high risk was 28 assessed at lying above 5ºC in light of growing literature on ice sheet contributions to sea level rise. 29 30 AR6 provides new evidence that relates to the location of the transition from undetectable to moderate risk. 31 At the time of SR15, observations were suggesting that MISI might already be taking place in some parts of 32 the WAIS while AR5 supported assessment of an additional MISI contribution to sea-level rise of several 33 additional tenths of a metre over the next two centuries. Since SR15, new observations (WGI AR6 Section 34 9.4.2.1, Fox-Kemper et al., 2021) support the assessment of enhanced grounding line retreat and subsequent 35 mass loss through basal melt in various parts of Antarctica, and year 2100 sea-level projections for the 36 RCP8.5 scenario have increased by 10-12 cm owing to ice dynamics. However, the onset of MISI is driven 37 by ocean warming in specific locations (ice cavities beneath floating ice shelves) and the relation between 38 these ocean temperatures and global mean temperature is indirect and ambiguous. In addition, MISI implies 39 a self-sustaining instability in the absence of further forcing. Because forcing is still increasing, it cannot be 40 unambiguously assessed whether MISI is driving the observed retreat of grounding lines in the WAIS, or 41 whether this retreat is a purely forced response (and would stop if the warming stops), or is just a 42 manifestation of natural variability in upwelling of warmer waters on the Antarctic continental shelves and, 43 as a result is just a temporary effect. Consistent with SROCC, AR6 states with medium confidence that 44 sustained mass losses of several major glaciers in the Amundsen Sea Embayment (ASE) are compatible with 45 the onset of MISI, but that whether unstable WAIS retreat already has begun or is imminent remains a 46 critical uncertainty. 47 48 Whether associated with MISI or not, WGI AR6 (Fox-Kemper et al., 2021) now assesses with very high 49 confidence that mass loss from both the Antarctic (whether associated with MISI or not) and Greenland Ice 50 Sheets, is more than seven times higher over the period 2010-2016 than over the period 1992-1999 for 51 Greenland and four times higher for the same time-intervals for Antarctica. Given their multi-century 52 commitments to global sea level rise this reinforces the assessment of estimating the boundary between 53 undetectable and moderate risks for ice sheets to lie between 0.7ºC (the level of global warming in the 1990s 54 when melting began to accelerate) and 1ºC (as in SR15), with a median at 0.9ºC. 55 56
ACCEPTED VERSIO
N
SUBJECT TO FIN
AL EDITS
FINAL DRAFT Chapter 16 IPCC WGII Sixth Assessment Report
Do Not Cite, Quote or Distribute 16-118 Total pages: 173
In the Amazon forest, increases in tree mortality and a decline in the carbon sink are already reported 1 (Brienen et al., 2015; Hubau et al., 2020) and old-growth Amazon rainforest may have become a net carbon 2 source for the period 2010-2019 (Qin et al., 2021). Estimates which include land-use emissions indicate the 3 region may have become a net carbon source (Gatti et al., 2021). Fire activity is an important driver and both 4 bigger fires (Lizundia-Loiola et al., 2020) and longer fire season (Jolly et al., 2015) have been reported in 5 South America, although this is strongly linked to land-use and land-use change as well as climate (Kelley et 6 al., 2021), and indeed land use change may be a stronger driver of potential loss of the Amazon forest than 7 climate change. The risk of climate-change related loss of the Amazon forest is assessed already above 8 ‘undetectable’ – but has only emerged over the last few years, when global warming had reached 1ºC, and is 9 linked to land-use as well as GSAT levels. Chapter 2 has assessed ecosystem carbon loss from tipping points 10 in tropical forest and loss of Arctic permafrost, and finds a transition to moderate risk over the range 0.6 to 11 0.9C (medium confidence). Specifically, WGII AR6 Table 2.S.4 finds that ‘Primary tropical forest comprised 12 a net source of carbon to the atmosphere, 2001-2019 (emissions 0.6 Gt y-1, net 0.1 Gt y-1) (Harris et al., 13 2021). Anthropogenic climate change has thawed Arctic permafrost (Guo et al., 2020), carbon emissions 1.7 14 ± 0.8 Gt y-1, 2003-2017 (Natali et al., 2019)‘. This also supports the upper limit for this transition lying at 15 1ºC. 16 17 The potential global loss of an entire ecosystem type, coral reefs, is also considered a large-scale singular 18 event. In the 1990’s when global warming was around 0.7ºC large scale coral reef bleaching also became 19 apparent (16.2.3.1), also supporting the lower boundary for this transition in respect of coral reefs. 20 21 Overall, given the above evidence on ice sheets, Amazon forest, and coral reefs, the transition from 22 undetectable to moderate risk is therefore assessed to occur between 0.7ºC and 1ºC warming with a median 23 of 0.9ºC with high confidence. 24 25 The transition from moderate to high risk is informed by an assessment of risks at higher levels of warming 26 than present. Nearly all climate models do show warmer temperatures around Antarctica in conjunction with 27 rising global mean temperature and all ice sheet models do show sustained mass loss from the WAIS after 28 temperature increase halts (thus implying MISI takes place) at various levels between 1.5ºC and 5ºC, and an 29 increasing fraction of ice sheet models shows additional sustained mass loss from the East Antarctic Ice 30 Sheet (EAIS) for peak warming between 2ºC and 4ºC, and all ice sheet models show mass loss for peak 31 warming higher than 4ºC. Therefore, we assess an increasing link between MISI, WAIS collapse and 32 Antarctic mass loss, for increasing temperature levels (high confidence). 33 34 There is high confidence in the existence of threshold behaviour of the Greenland Ice Sheet in a warmer 35 climate (WGI AR6 Ch 9, Fox-Kemper et al., 2021), however there is low agreement on the nature of the 36 thresholds and the associated tipping points. Similarly the likelihood for accelerated and irreversible mass 37 loss from Antarctica increases with increasing temperatures but thresholds cannot yet be unambiguously 38 identified. By the year 2100, sea-level projections (AR6 WG1 SPM Fig SPM 8) now range from 0.57 m 39 (0.37-0.85) for the SSP1-1.9 scenario to 1.35 m (1.02-1.89) for the SS5-8.5 scenario and become 1.99 m for 40 the latter scenario (1.02-4.83) in case of low-likelihood, high-impact outcomes resulting from ice sheet 41 instability, for which there is limited evidence. It should be noted that inclusion of such low-likelihood, high-42 impact outcomes dominated by not-well understood processes affecting ice dynamics on the large icecaps of 43 Greenland, and in particular Antarctica, would also enhance the sea-level projections for other scenarios, but 44 to a lesser extent for increasingly weaker forcing. No quantitative assessment of their effect in other 45 scenarios than SSP5-8.5 yet exists as such simulations with ice-sheet models have not been carried out, or 46 only in a very limited amount. 47 48
It should be noted that ice sheets may take many centuries to respond, implying that risk levels increase over 49 time for the same warming level. Therefore we base judgments about risk transitions related to ice sheets 50 primarily on their implications for 2000-year commitments to sea level rise from sustained mass loss from 51 both ice sheets as projected by various ice sheet models, reaching 2.3-3.1 m at 1.5°C peak warming and 2-6 52 m at 2.0°C peak warming (WGI AR6 TS, Box TS.4 Figure 1, (Arias et al., 2021)). This is an important 53 feature of the approach to this RFC (i.e., it is not primarily focused on implications for the next 100-200 54 years). In addition, since the AR5, there is new evidence about the Last Interglacial (LIG), when global mean 55 temperature was about 0.5-1.5°C above the pre-industrial era. AR6 assesses that it is virtually certain that 56 sea-level was higher than today at that time, likely by 5–10 m (medium confidence) (B.5.4 WGI AR6 57
ACCEPTED VERSIO
N
SUBJECT TO FIN
AL EDITS
FINAL DRAFT Chapter 16 IPCC WGII Sixth Assessment Report
Do Not Cite, Quote or Distribute 16-119 Total pages: 173
SPM,(IPCC, 2021a)). Mid-Pliocene temperatures of 2.5°C (about 3 million years ago when global 1 temperatures were 2.5°C–4°C higher) also provide evidence as an upper limit for the transition to high risk 2 associated with long-term equilibrium sea-level rise of 5-25 m (WGI AR6 SPM B.5.4). In 2300 projected 3 sea-level rise in an RCP8.5 or SSP5-8.5 scenario (consistent with a peak warming range of 4ºC-6ºC, varies 4 between 1.7-6.8 and 2.2-5.9m respectively (WGI AR6 TS Box TS.4, Arias et al., 2021)), and when 5 accounting for Marine Ice Cliff Instability taking place on Antarctica these numbers may increase to a range 6 of 9.5-16.2 m (WGI AR6 TS Box TS.4, Arias et al., 2021) ). 7 8 CMIP6 climate models project drying in the Amazon – especially in June-July-August, irrespective of future 9 forcing scenario, but which increases with GSAT/higher scenarios (Lee et al., 2021). For higher GSAT 10 levels Burton et al. (2021) explore different forcing scenarios and found, regardless of scenario, burned area 11 increases markedly with GSAT. New understanding of the role of vegetation stomata will act to exacerbate 12 this drying (Richardson et al., 2018b). A transition to high risk of savannization for the Amazon alone was 13 assessed to lie between 1.5 and 3ºC with a median value at 2.0ºC. A mean temperature increase of 2ºC could 14 reduce Arctic permafrost area ~15% by 2100 (Comyn-Platt et al., 2018). Chapter 2 has assessed ecosystem 15 carbon loss from tipping points in tropical forest and loss of Arctic permafrost, and finds a transition from 16 moderate to high risk over the range 1.5 to 3ºC with a median of 2ºC (medium confidence, Table 2.S.4, 17 Figure 2.11). Its assessment of the transition from high to very high risk is located over the range 3ºC - 5ºC 18 (low confidence, Table 2.S.4, Figure 2.11) based on the potential for Amazon forest dieback between 4-5ºC 19 temperature increase above the pre-industrial period (Salazar and Nobre, 2010). 20 21 One of the criteria for locating a transition to very high risk is a limited ability to adapt. In natural systems 22 limiting warming to 1.5°C rather than 2°C would enhance the ability of coastal wetlands to adapt naturally to 23 sea level rise, since natural sedimentation rates more likely keep up with sea level rise (SR15, Hoegh-24 Guldberg 2018). In human systems, there is medium confidence that technical limits will be reached for hard 25 protection to SLR beyond 2100 under high emissions scenarios, with limits associated with socio-economic 26 and governance issues reached before 2100 (CCP2). 27 28 We therefore estimate the boundary between moderate and high risk to lie between 1.5ºC and 2.5ºC, with a 29 median at 2.0ºC, with medium confidence based on projections for melting ice sheets and drying in the 30 Amazon. We also estimate the boundary between high and very high risk to lie between 2.5ºC and 4ºC, but 31 with low confidence due to uncertainties in the projections of sea level rise at higher levels of warming and 32 differences between levels of warming at which very high risks were assessed in different systems. 33 34 16.6.4 Summary 35 36 The updated Reasons for Concern (RFC) show that transitions between levels of risk are now assessed to 37 occur at lower levels of global warming than in previous assessments (high confidence), levels of confidence 38 in assigning transitions have generally increased, evidence on the potential for adaptation to adequately 39 address risks at different warming levels remains limited, and transitions from high to very high levels of risk 40 have been assessed for all five RFCs, compared to just two RFCs in AR5, together showing how literature 41 published since AR5 is informing us on our future climate risks. 42 43
● In particular, risks to unique and threatened systems (RFC1) are now assessed to be already at a high 44 level today, as compared with a moderate level in previous assessments, and transition to a very high 45 level is assessed to occur beginning at 1.2ºC, passing through a median value of 1.5°C, and 46 completing the transition at 2.0ºC warming (high confidence). 47 48
● Risks associated with extreme weather events (RFC2) are assessed to have begun to transition to a 49 high level already when global warming reached 1ºC, with that transition projected to complete for a 50 warming of 1.5ºC (high confidence). Newly in AR6, a transition between high and very high levels 51 of risk was assessed to lie at 2.0ºC warming for RFC2 (range 1.8- 2.5ºC). 52 53
● For risks associated with the distribution of impacts (RFC3), there is now high confidence that a 54 transition to moderate risk has already occurred, and the transition to high risk is now projected to 55
occur between 1.5–2.0ºC warming with medium confidence. Furthermore, a transition from high to 56
ACCEPTED VERSIO
N
SUBJECT TO FIN
AL EDITS
FINAL DRAFT Chapter 16 IPCC WGII Sixth Assessment Report
Do Not Cite, Quote or Distribute 16-120 Total pages: 173
very high risk is provided for the first time in this AR6 assessment, between 2.0–3.5ºC warming 1 (medium confidence). 2 3
● Global aggregate impacts (RFC4) are assessed to have begun to transition to a moderate level 4 already when global warming reached 1ºC, and are projected to transition to a high level with 5 warming of 1.5 - 2.5ºC (median 2ºC) with medium confidence. An assessment of a transition to very 6 high risk is provided for the first time in AR6, over the range 2.5 to 4.5ºC with low confidence. 7 8
● Risks associated with large-scale singular events are assessed to have already completed 9 transitioning to moderate with 1ºC warming (high confidence), with a transition to high risk between 10
1.5–2.5ºC [median 2ºC] (medium confidence). An assessment of a transition to very high risk is 11
provided for the first time in AR6, over the range 2.5–4.5ºC with low confidence. 12 13 In summary, risks to unique and threatened systems (RFC1) are higher at recent and projected levels of 14 warming than assessed previously (very high confidence); risks associated with extreme weather events 15 (RFC2) are assessed comparably to AR5 and SR15 at recent and low levels of warming, but notably much 16 higher at projected warming above 1.8°C (medium confidence); risks associated with distribution of impacts 17 (RFC3) and global aggregate impacts (RFC4) are similar to SR15 and higher than AR5 above 2°C (medium 18 confidence); and those associated with large-scale singular events (RFC5) are similar to SR15 and higher at 19 both recent and projected warming than AR5 (medium confidence). 20 21 Limiting global warming to 1.5ºC would ensure risk levels remain moderate for RFC3, RFC4 and RFC5 22 (medium confidence) but risk for RFC2 would have transitioned to a high risk at 1.5ºC and RFC1 would be 23 well into the transition to very high risk (high confidence). Remaining below 2ºC warming (but above 1.5ºC) 24 would imply that risk for RFC3 through 5 would be transitioning to high, and risk for RFC1 and RFC2 25 would be transitioning to very high (high confidence). By 2.5ºC warming, RFC1 will be in very high risk 26 (high confidence) and all other RFCs will have begun their transitions to very high risk (medium confidence 27 for RFC2 and RFC3, low confidence for RFC4 and RFC5). These highest levels of risk are associated with 28 an irreversible component, such that some impacts would persist even were global temperatures to 29 subsequently decline in an ‘overshooting’ scenario. 30 31 Lack of evidence on the potential for adaptation to adequately reduce risk is a critical gap in our ability to 32 assess global risk transitions at the RFC level, but not only. In some cases, such as RFC1, the widespread 33 nature and rapid speed of the escalating risks, in combination with limited ability to adapt means that 34 transitions to high risk may occur despite medium or even high levels of adaptation. Risks that are largely 35 natural and not widely mediated by human vulnerability, are thus less likely to have risk transitions that shift 36 under higher societal adaptation. Risk transitions that are mediated through human systems, such as 37 distribution impacts, for example, are more likely to shift in response to adaptation as impacts are strongly 38 mediated through vulnerability within human systems, but such a shift is difficult to quantify given 39 knowledge gaps in the literature (Section 16.3). However, in some circumstances, expanded global 40 adaptation could slow some of these transitions (low confidence); in the case of RFC2, RFC3 and RFC4, the 41 literature suggests that coordinated global adaptation could increase the global temperature at which risks 42 transition from moderate to high, for example the prevention of mortality associated with heat stress within 43 RFC2. 44 45 A higher level of adaptation, applied globally and effectively, could have larger benefits for several RFC, 46 either postponing the onset of a high level of risk until a higher level of warming is reached (and allowing 47 time for mitigation efforts) or allowing a system to survive a temporary overshoot of a lower temperature 48 threshold. Adaptations are likely to have significant potential to reduce risks (Magnan et al., 2021) in 49 particular for risks mediated through human systems. However, there is limited evidence available to assess 50 the extent to which current or potential adaptations are or would be adequate in reducing climate risks at 51 different levels of warming, and adaptation implications for risk transitions will be highly localized. 52 Pathways and opportunities for risk management and adaptation actions with transformational potential are 53 discussed in Chapter 17, together with enabling factors, governance frameworks, financing, success factors, 54 and monitoring and evaluation discussed in Chapter 18, supporting sustainable system transitions and 55 leading to options for climate resilient development pathways. 56 57
ACCEPTED VERSIO
N
SUBJECT TO FIN
AL EDITS
FINAL DRAFT Chapter 16 IPCC WGII Sixth Assessment Report
Do Not Cite, Quote or Distribute 16-121 Total pages: 173
1 [START FAQ16.1 HERE] 2 3 FAQ16.1: What are key risks in relation to climate change? 4 5 A few clusters of key risks can be identified which have the potential to become particularly severe and pose 6 significant challenges for adaptation worldwide. These risks, therefore, deserve special attention. They 7 include risks to important resources such as food and water, risks to critical infrastructures, economies, 8 health and peace, as well as risks to threatened ecosystems and coastal areas. 9 10 The IPCC defines key risks related to climate change as potentially severe risks that are relevant to the 11 primary goal of the United Nations Framework Convention on Climate Change treaty to avoid ‘dangerous 12 human interference with the climate system’, and whatever the scale considered (global to local). What 13 constitutes ‘dangerous’ or ‘severe’ risks is partly a value judgment and can therefore vary widely across 14 people, communities, or countries. However, the severity of risks also depends on criteria like the magnitude, 15 irreversibility, timing, likelihood of the impacts they describe, as well as the adaptive capacity of the affected 16 systems (species or societies). The Working Group II authors use these criteria in various ways to identify 17 those risks that could become especially large in the future due to the interaction of physical changes to the 18 climate system with vulnerable populations and ecosystems exposed to them. For example, some natural 19 systems may be at risk of collapsing, as is the case for warm water coral reefs by mid-century, even if global 20 warming is limited to +1.5°C. For human systems, severe risks can include increasing restriction of water 21 resources that are already being observed; mortality or economic damages that are large compared to 22 historical crises; or impacts on coastal systems from sea level rise and storms that could make some locations 23 uninhabitable. 24 25 More than 130 key risks across sectors and regions have been identified by the chapters of this report, which 26 have then been clustered into a set of 8 overarching risks, called representative key risks, which can occur 27 from global to local scales but are of potential significance for a wide diversity of regions and systems 28 globally. As shown in figure FAQ16.1, the representative key risks include risks to (1) low-lying coastal 29 areas, (2) terrestrial and marine ecosystems, (3) critical infrastructures and networks, (4) living standards, (5) 30 human health, (6) food security, (7) water security and (8) peace and mobility. 31 32 These representative key risks are expected to increase in the coming decades and will depend strongly not 33 only on how much climate change occurs, but also on how the exposure and vulnerability of society changes, 34 as well as on the extent to which adaptation efforts will be effective enough to substantially reduce the 35 magnitude of severe risks. The report finds that risks are highest when high warming combines with 36 development pathways with continued high levels of poverty and inequality, poor health systems, lack of 37 capacity to invest in infrastructure, and other characteristics making societies highly vulnerable. Some 38 regions already have high levels of exposure and vulnerability, such as in many developing countries as well 39 as communities in small islands, Arctic areas and high mountains; in these regions, even low levels of 40 warming will contribute to severe risks in the coming decades. Some risks in industrialized countries could 41 also become severe over the course of this century, for example if climate change affects critical 42 infrastructure such as transport hubs, power plants, or financial centres. In some cases such as coral reef 43 environments and areas already severely affected by intense extreme events (e.g. recent typhoons or 44 wildfires), for example, climate risks are already considered severe. 45 46 47
ACCEPTED VERSIO
N
SUBJECT TO FIN
AL EDITS
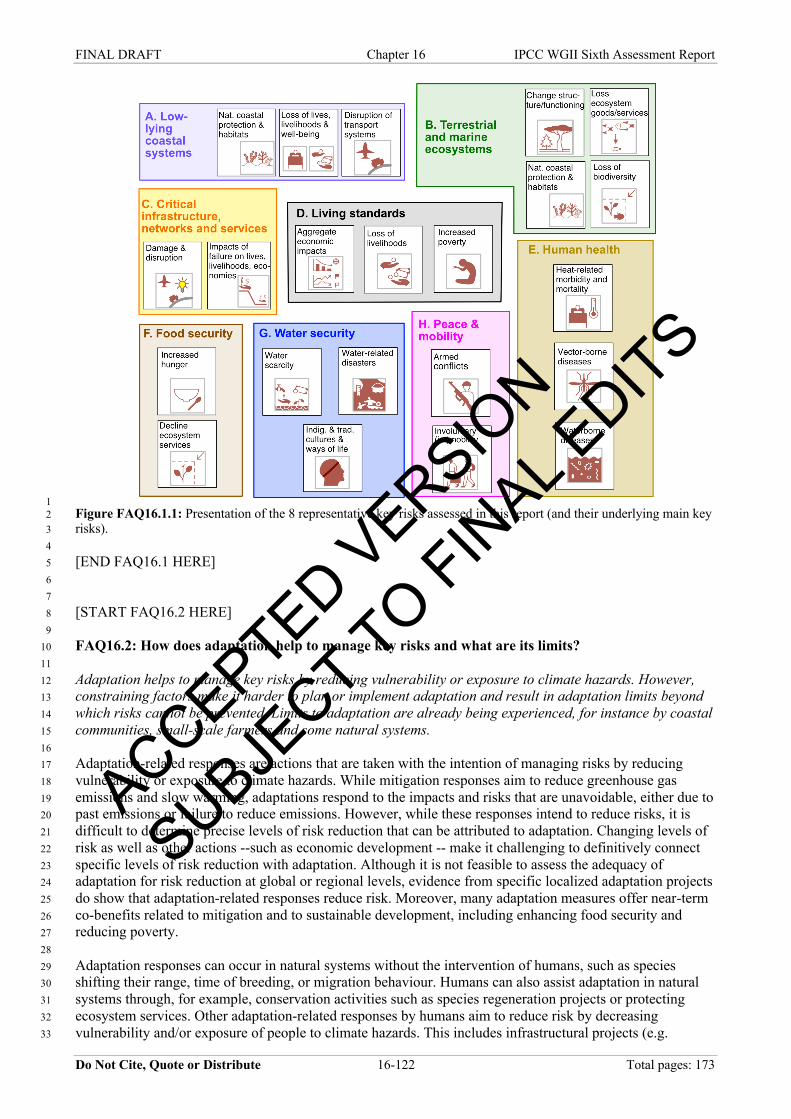
FINAL DRAFT Chapter 16 IPCC WGII Sixth Assessment Report
Do Not Cite, Quote or Distribute 16-122 Total pages: 173
1 Figure FAQ16.1.1: Presentation of the 8 representative key risks assessed in this report (and their underlying main key 2 risks). 3 4 [END FAQ16.1 HERE] 5 6 7 [START FAQ16.2 HERE] 8 9 FAQ16.2: How does adaptation help to manage key risks and what are its limits? 10 11 Adaptation helps to manage key risks by reducing vulnerability or exposure to climate hazards. However, 12 constraining factors make it harder to plan or implement adaptation and result in adaptation limits beyond 13 which risks cannot be prevented. Limits to adaptation are already being experienced, for instance by coastal 14 communities, small-scale farmers and some natural systems. 15 16 Adaptation-related responses are actions that are taken with the intention of managing risks by reducing 17 vulnerability or exposure to climate hazards. While mitigation responses aim to reduce greenhouse gas 18 emissions and slow warming, adaptations respond to the impacts and risks that are unavoidable, either due to 19 past emissions or failure to reduce emissions. However, while these responses intend to reduce risks, it is 20 difficult to determine precise levels of risk reduction that can be attributed to adaptation. Changing levels of 21 risk as well as other actions --such as economic development -- make it challenging to definitively connect 22 specific levels of risk reduction with adaptation. Although it is not feasible to assess the adequacy of 23 adaptation for risk reduction at global or regional levels, evidence from specific localized adaptation projects 24 do show that adaptation-related responses reduce risk. Moreover, many adaptation measures offer near-term 25 co-benefits related to mitigation and to sustainable development, including enhancing food security and 26 reducing poverty. 27 28 Adaptation responses can occur in natural systems without the intervention of humans, such as species 29 shifting their range, time of breeding, or migration behaviour. Humans can also assist adaptation in natural 30 systems through, for example, conservation activities such as species regeneration projects or protecting 31 ecosystem services. Other adaptation-related responses by humans aim to reduce risk by decreasing 32 vulnerability and/or exposure of people to climate hazards. This includes infrastructural projects (e.g. 33
ACCEPTED VERSIO
N
SUBJECT TO FIN
AL EDITS
FINAL DRAFT Chapter 16 IPCC WGII Sixth Assessment Report
Do Not Cite, Quote or Distribute 16-123 Total pages: 173
upgrading water systems to improve flood control), technological innovation (e.g. early warning systems for 1 extreme events), behavioural change (e.g. shift to new crop types or livelihood strategies), cultural shifts 2 (e.g. changing perspectives on urban greenspace, or increased recognition of Indigendous Knowledge and 3 Local Knowledge), and institutional governance (e.g. adaptation planning, funding, and legislation). 4 5 While adaptation is important to reduce risk, adaptation cannot prevent all climate impacts from occurring. 6 Adaptation has soft and hard limits, points at which adaptive actions are unable to prevent risks. Soft limits 7 can change over time as additional adaptation options become available, while hard limits will not change as 8 there are no additional adaptive actions that are possible. Soft limits occur largely due to constraints-- factors 9 that make it harder to plan and implement adaptation, such as lack of financial resources or insufficient 10 human capacity. Across regions and sectors, the most challenging constraints to adaptation are financial and 11 those related to governance, institutions and policy measures. Limited funding and ineffective governance 12 structures make it difficult to plan and implement adaptation-related responses which can lead to insufficient 13 adaptation to prevent risks. Small-scale farmers and coastal communities are already facing soft limits to 14 adaptation as measures that they have put in place are not enough to prevent loss. If constraints that are 15 limiting adaptation are addressed, then additional adaptation can take place and these soft limits can be 16 overcome. Evidence on limits to adaptation is largely focused on terrestrial and aquatic species and 17 ecosystems, coastal communities, water security, agricultural production, and human health and heat. 18 19 Adaptation is critical for responding to unavoidable climate risks. Greater warming will mean more and 20 more severe impacts requiring a high level of adaptation which may face greater constraints and reach soft 21 and hard limits. At high levels of warming, it may not be possible to adapt to some severe impacts. 22 23 24 [END FAQ16.2 HERE] 25 26 27 [START FAQ16.3 HERE] 28 29 FAQ16.3: How do climate scientists differentiate between impacts of climate change and changes in 30
natural or human systems that occur for other reasons? 31 32 We can already observe many impacts of climate change today. The large body of climatic impact data and 33 research confirms this. To decide whether an observed change in a natural or human system is at least 34 partly an impact of climate change we systematically compare the observed situation to a theoretical 35 situation without observed levels of climate change. This is detection and attribution research. 36 37 Global mean temperature has already risen by more than 1°C and that also means that the impacts of climate 38 change become more visible. Many natural and human systems are sensitive to weather conditions. Crop 39 yields, river floods and associated damages, ecosystems such as coral reefs, or the extent of wildfires are 40 affected by temperatures and precipitation changes. Other factors also come into play. So for example, crop 41 yields around the world have increased over the last decades because of increasing fertilizer input, improved 42 management and varieties. How do we detect the effect of climate change itself on these systems, when the 43 other factors are excluded? This question is central for impact attribution. ‘Impact of climate change’ is 44 defined as the difference between the observed state of the system (e.g., level of crop yields, damage induced 45 by a river flood, coral bleaching) and the state of the system assuming the same observed levels of non-46 climate related drivers (e.g. fertilizer input, land use patterns, or settlement structures) but no climate change. 47 So: 48 ‘Impact of climate change’ is defined as the difference between the observed state of the system and the state 49 of the system assuming the same observed levels of non-climate related drivers but no climate change. For 50 example, we can compare the level of crop yields, damage induced by a river flood, and coral bleaching with 51 differences in fertilizer input, land use patterns, or settlement structures, without climate change and with 52 climate change occurring. 53 54 While this definition is quite clear, there certainly is the problem that in real life, we do not have a ‘no 55 climate change world’ to compare with. We use model simulations where the influence of climate change 56 can be eliminated to estimate what might have happened without climate change. In a situation where the 57
ACCEPTED VERSIO
N
SUBJECT TO FIN
AL EDITS
FINAL DRAFT Chapter 16 IPCC WGII Sixth Assessment Report
Do Not Cite, Quote or Distribute 16-124 Total pages: 173
influence of other non-climate related drivers is known to be minor (e.g., in very remote locations) the non-1 climate change situation can also be approximated by observation from an early period where climate change 2 was still minor. Often a combination of different approaches increases our confidence in the quantification of 3 the impact of climate change. 4 5 Impacts of climate change have been identified in a wide range of natural, human, and managed systems. For 6 example, climate change is the major driver of observed widespread shifts in the timing of events in the 7 annual cycle of marine and terrestrial species, the extent of areas burned by wildfires is increased by climate 8 change in certain regions, it has increased heat-related mortality and had an impact on the expansion of 9 vector-borne diseases. 10 In some other cases research has made considerable progress in identifying the sensitivity of certain 11 processes to weather conditions without yet attributing observed changes to long-term climate change. Two 12 examples of weather sensitivity without attribution are observed crop price fluctuations and waterborne 13 diseases. 14 15 Finally it is important to note that ‘attribution to climate change’ does not necessarily mean ‘attribution to 16 anthropogenic climate change’. Instead, according to the IPCC definition, climate change means any long 17 term change in the climate system no matter where it comes from. 18 19 [END FAQ16.3 HERE] 20 21 22 [START FAQ16.4 HERE] 23 24 FAQ16.4: What adaptation-related responses to climate change have already been observed, and do 25
they help reduce climate risk? 26 27 Adaptation-related responses are the actions taken with the intention of managing risks by reducing 28 vulnerability or exposure to climate hazards. Responses are increasing and expanding across global regions 29 and sectors, although there is still a lot of opportunity for improvement. Examining the adequacy and 30 effectiveness of the responses is important to guide, planning, implementation and expansion. 31 32 The most frequently reported adaptation-related responses are behavioural changes made by individuals and 33 households in response to drought, flooding, and rainfall variability in Africa and Asia. Governments are 34 increasingly undertaking planning, and implementing policy and legislation, including for example new 35 zoning regulations and building codes, coordination mechanisms, disaster and emergency planning, or 36 extension services to support farmer uptake of drought tolerant crops. Local governments are particularly 37 active in adaptation-related responses, particularly in protecting infrastructure and services, such as water 38 and sanitation. Across all regions, adaptation-related responses are strongly linked to food security, with 39 poverty alleviation a key strategy in the Global South. 40 41 Overall, however, the extent of adaptation-related responses globally is low. On average, responses tend to 42 be local, incremental, fragmented, and consistent with business-as-usual practices. There are no global 43 regions or sectors where the overall adaptation-related response has been rapid, widespread, substantial, and 44 has overcome or challenged key barriers. The extent of adaptation thus remains low globally, with 45 significant potential for increased scope, depth, speed, and the challenging of adaptation limits. Examples of 46 low extent adaptations include shifts by subsistence farmers in crop variety or timing, household flood 47 barriers to protect houses and gardens, and harvesting of water for home and farm use. In contrast, high 48 extent adaptation means that responses are widespread, coordinated, involve major shifts from normal 49 practices, are rapid, and challenge existing constraints to adaptation. Examples of high extent adaptations 50 include planned relocation of populations away from increasingly flood-prone areas, and widely 51 implemented social support to communities to prevent migration or displacement due to climate hazards. 52 53 Increasing the extent of adaptation-related responses will require more widespread implementation and 54 coordination, more novel and radical shifts from business-as-usual practices, more rapid transitions, and 55 challenging or surmounting limits -- key barriers -- to adaptation. This might include, for example, best-56 practice programmes implemented in a few communities being expanded to a larger region or country, 57
ACCEPTED VERSIO
N
SUBJECT TO FIN
AL EDITS
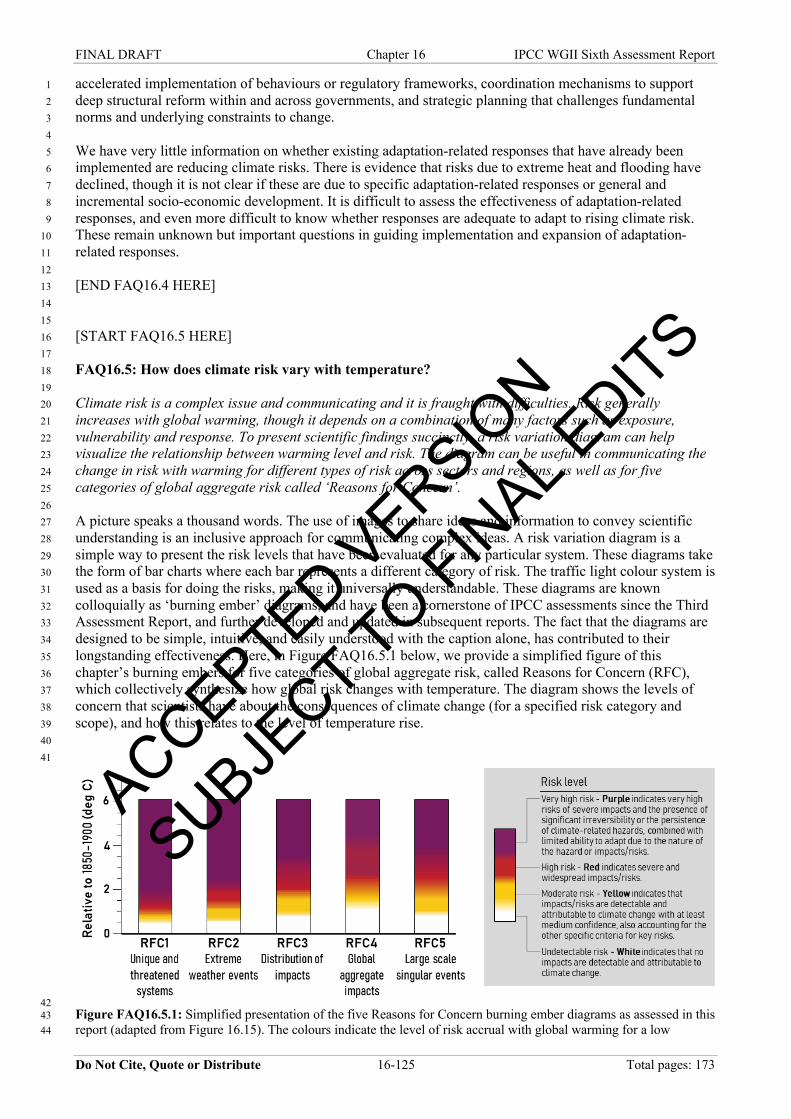
FINAL DRAFT Chapter 16 IPCC WGII Sixth Assessment Report
Do Not Cite, Quote or Distribute 16-125 Total pages: 173
accelerated implementation of behaviours or regulatory frameworks, coordination mechanisms to support 1 deep structural reform within and across governments, and strategic planning that challenges fundamental 2 norms and underlying constraints to change. 3 4 We have very little information on whether existing adaptation-related responses that have already been 5 implemented are reducing climate risks. There is evidence that risks due to extreme heat and flooding have 6 declined, though it is not clear if these are due to specific adaptation-related responses or general and 7 incremental socio-economic development. It is difficult to assess the effectiveness of adaptation-related 8 responses, and even more difficult to know whether responses are adequate to adapt to rising climate risk. 9 These remain unknown but important questions in guiding implementation and expansion of adaptation-10 related responses. 11 12 [END FAQ16.4 HERE] 13 14 15 [START FAQ16.5 HERE] 16 17 FAQ16.5: How does climate risk vary with temperature? 18 19 Climate risk is a complex issue and communicating and it is fraught with difficulties. Risk generally 20 increases with global warming, though it depends on a combination of many factors such as exposure, 21 vulnerability and response. To present scientific findings succinctly, a risk variation diagram can help 22 visualize the relationship between warming level and risk. The diagram can be useful in communicating the 23 change in risk with warming for different types of risk across sectors and regions, as well as for five 24 categories of global aggregate risk called ‘Reasons for Concern’. 25 26 A picture speaks a thousand words. The use of images to share ideas and information to convey scientific 27 understanding is an inclusive approach for communicating complex ideas. A risk variation diagram is a 28 simple way to present the risk levels that have been evaluated for any particular system. These diagrams take 29 the form of bar charts where each bar represents a different category of risk. The traffic light colour system is 30 used as a basis for doing the risks, making it universally understandable. These diagrams are known 31 colloquially as ‘burning ember’ diagrams, and have been a cornerstone of IPCC assessments since the Third 32 Assessment Report, and further developed and updated in subsequent reports. The fact that the diagrams are 33 designed to be simple, intuitive, and easily understood with the caption alone, has contributed to their 34 longstanding effectiveness. Here, in Figure FAQ16.5.1 below, we provide a simplified figure of this 35 chapter’s burning embers for five categories of global aggregate risk, called Reasons for Concern (RFC), 36 which collectively synthesize how global risk changes with temperature. The diagram shows the levels of 37 concern that scientists have about the consequences of climate change (for a specified risk category and 38 scope), and how this relates to the level of temperature rise. 39 40 41
42 Figure FAQ16.5.1: Simplified presentation of the five Reasons for Concern burning ember diagrams as assessed in this 43 report (adapted from Figure 16.15). The colours indicate the level of risk accrual with global warming for a low 44
ACCEPTED VERSIO
N
SUBJECT TO FIN
AL EDITS
FINAL DRAFT Chapter 16 IPCC WGII Sixth Assessment Report
Do Not Cite, Quote or Distribute 16-126 Total pages: 173
adaptation scenario. RFC1 Unique and threatened systems: ecological and human systems that have restricted 1 geographic ranges constrained by climate related conditions and have high endemism or other distinctive properties. 2 Examples include coral reefs, the Arctic and its indigenous people, mountain glaciers and biodiversity hotspots. RFC2 3 Extreme weather events: risks/impacts to human health, livelihoods, assets and ecosystems from extreme weather 4 events such as heatwaves, heavy rain, drought and associated wildfires, and coastal flooding. RFC3 Distribution of 5 impacts: risks/impacts that disproportionately affect particular groups due to uneven distribution of physical climate 6 change hazards, exposure or vulnerability. RFC4 Global aggregate impacts: impacts to socio-ecological systems that 7 can be aggregated globally into a single metric, such as monetary damages, lives affected, species lost or ecosystem 8 degradation at a global scale. RFC5 Large-scale singular events: relatively large, abrupt and sometimes irreversible 9 changes in systems caused by global warming, such as ice sheet disintegration or thermohaline circulation slowing. 10 11 12 In this diagram, the risk variation bars or embers are shown with temperature on the y-axis, and the base of 13 the ember corresponds to a baseline temperature. Typically this baseline temperature is that before global 14 warming started (i.e., average temperatures for the pre-industrial period of 1850 to 1900). This area of the 15 ember appears white, which indicates no to negligible impacts due to climate change. Moving up the ember 16 bar, changing colours show the increase in risk as the earth warms globally in terms of degrees Celsius – 17 yellow for moderate risk, red for high risk, and purple for very high risk. Definitions of the risk levels are 18 presented in Figure FAQ16.5.1 The risk transitions are informed by the latest literature and scientific 19 evidence, and developed through consultation and development of consensus among experts. The bars depict 20 an averaged assessment across the world which has the disadvantage of hiding regional variation. For 21 example, some locations or regions could face high risk even when the global risk level is moderate. 22 23 When the embers for different risk categories are placed next to each other, it is possible to compare risk 24 levels at different levels of global warming. For example, at 1ºC warming all embers appear yellow or white, 25 so it is possible to say that keeping global warming below that particular temperature would help ensure risks 26 remain moderate for all five categories of concern assessed. In contrast, at 2ºC warming, risk levels have 27 transitioned to high for all categories assessed, and even reach a very high level of risk in the case of unique 28 and threatened systems. 29 30 [END FAQ16.5 HERE] 31 32 33 [START FAQ16.6 HERE] 34 35 FAQ16.6: What is the role of extreme weather events in the risks we face from climate change? 36
37 Climate change has often been perceived as a slow and gradual process but by now it is abundantly clear 38 that many of its impacts arise through shocks, such as extreme weather events. Many places are facing more 39 frequent and intense extremes, and also more surprises. The impact of such shocks is shaped by exposure 40 and vulnerability, where we live, and how we are prepared for and able to cope with shocks and surprises. 41 42 The rising risk of extreme events is one of the major reasons for concern about climate change. It is clear that 43 this risk has already increased today. Many recent disasters already have a fingerprint of climate change. 44
45
There are large differences in such risks from country to country, place to place, and person to person. This 46 is of course partly due to differences in hazards such as heatwaves, floods, droughts, storms, storm surges, 47 etc., and the way those hazards are influenced by climate change. However, an even more important aspect is 48 people’s exposure and vulnerability: do these hazards occur in places where people live and work, and how 49 badly do they affect people’s lives and livelihoods? Some groups are especially vulnerable, for instance 50 elderly in the case of heatwaves, or people with disabilities in the case of floods. In general, poor and 51 marginalised people tend to be much more affected than rich people, partly because they have less reserves 52 and support systems that help them to prepare for, cope with and recover from a shock. On the other hand, 53 absolute economic losses are generally higher in richer places, simply because more assets are at risk there. 54
55 Many problems caused by extreme weather do not just appear because of one weather extreme, but due to a 56 combination of several events. For instance, dryness may increase the risk of a subsequent heatwave. But the 57 increased risk may also cascade through human systems, for instance when several consecutive disasters 58
ACCEPTED VERSIO
N
SUBJECT TO FIN
AL EDITS
FINAL DRAFT Chapter 16 IPCC WGII Sixth Assessment Report
Do Not Cite, Quote or Distribute 16-127 Total pages: 173
erode people’s savings, or when a heatwave reduces the ability of power plants to produce electricity, which 1 subsequently affects availability of electricity to turn on air conditioning to cope with the heat. Many shocks 2 also have impacts beyond the place where they occur, for instance when a failed harvest affects food prices 3 elsewhere. Climate risks can also be aggravated by other shocks, such as in the case of COVID-19, which 4 not only had a direct health impact, but also affected livelihoods around the world and left many people 5 much more vulnerable to weather extremes. 6 7 Understanding the risks we face can help in planning for the future. This may be a combination of short-term 8 preparation, such as early warning systems, and longer-term strategies to reduce vulnerability, for instance 9 through urban planning, as well as reducing greenhouse gases to avoid longer-term increases in risk. Many 10 interventions to increase people’s resilience are effective in the face of a range of shocks. For instance, social 11 safety nets can help mitigate the impact of a drought on farmers’ livelihoods, but also of the economic 12 impacts of COVID-19. 13
14
Climate-related shocks are threats to society, but they can also offer opportunities for learning and change. 15 Recent disasters can motivate action during a short window of opportunity when awareness of the risks is 16 higher and policy attention is focused on solutions to adapt and reduce risk. However, those windows tend to 17 be short, and attention is often directed at the event that was recently experienced, rather than resilience in 18 the face of a wider range of risks. 19 20 [END FAQ 16.6 HERE] 21 22 23 24
ACCEPTED VERSIO
N
SUBJECT TO FIN
AL EDITS
FINAL DRAFT Chapter 16 IPCC WGII Sixth Assessment Report
Do Not Cite, Quote or Distribute 16-128 Total pages: 173
References 1 2 Abatayo, A. L. et al., 2020: Solar geoengineering may lead to excessive cooling and high strategic uncertainty, 13393-3
13398 pp. 4 Abatzoglou, J. T. and A. P. Williams, 2016: Impact of anthropogenic climate change on wildfire across western US 5
forests. Proceedings of the National Academy of Sciences, 113(42), 11770-11775. 6 Abdulai, I. et al., 2018: Cocoa agroforestry is less resilient to sub-optimal and extreme climate than cocoa in full sun. 7
GLOBAL CHANGE BIOLOGY, 24(1), 273-286, doi:10.1111/gcb.13885. 8 Abe, M. and L. Ye, 2013: Building Resilient Supply Chains against Natural Disasters: The Cases of Japan and 9
Thailand. Global Business Review, 14(4), 567-586, doi:10.1177/0972150913501606. 10 Abel, G. J., 2019: Estimates of Global Bilateral Migration Flows by Gender between 1960 and 2015. International 11
Migration Review, 0(0), doi:10.1111/imre.12327. 12 Abel, G. J., M. Brottrager, J. C. Cuaresma and R. Muttarak, 2019: Climate, conflict and forced migration. Global 13
Environmental Change, 54, 239-249. 14 Abera, K., O. Crespo, J. Seid and F. Mequanent, 2018: Simulating the impact of climate change on maize production in 15
Ethiopia, East Africa. Environmental Systems Research, 7(1), 1-12. 16 Abu, R. and M. G. Reed, 2018: Adaptation through bricolage: Indigenous responses to long-term social-ecological 17
change in the Saskatchewan River Delta, Canada. Canadian Geographer-Geographe Canadien, 62(4), 437-451, 18 doi:10.1111/cag.12469. 19
Acevedo-Osorio, Á., A. A. Leiton, M. V. L. Durán and K. L. F. Quiroga, 2017: Sustentability and climate variability: 20 Participatory agroecologycal actions to adaptation and socio-ecological reesilience in the colombian high-andean 21 region. Revista Luna Azul, 44, 6-26, doi:10.17151/luaz.2017.44.2. 22
Acevedo, S. et al., 2017: The Effects of Weather Shocks on Economic Activity: How Can Low-Income Countries Cope. 23 World Economic Outlook. 24
Adams, C., T. Ide, J. Barnett and A. Detges, 2018: Sampling bias in climate–conflict research. Nature Climate Change, 25 doi:10.1038/s41558-018-0068-2. 26
Adams, H., 2016: Why populations persist: mobility, place attachment and climate change. Population and 27 Environment, 37(4), 429-448, doi:10.1007/s11111-015-0246-3. 28
Adams, K. et al., 2020: Climate-Resilient Trade and Production: The Transboundary Effects of Climate Change and 29 Their Implications for EU Member States. SEI, ODI, IDDRI. 30
Adelekan, I. and T. Fregene, 2015: Vulnerability of artisanal fishing communities to flood risks in coastal southwest 31 Nigeria. Climate and Development, 7(4), 322-338, doi:10.1080/17565529.2014.951011. 32
Adger, W. N. et al., 2020: Urbanization, Migration, and Adaptation to Climate Change. One Earth, 3(4), 396-399, 33 doi:10.1016/j.oneear.2020.09.016. 34
Adger, W. N. et al., 2014: Human Security. In: Climate Change 2014: Impacts, Adaptation, and Vulnerability. Part A: 35 Global and Sectoral Aspects. Contribution of Working Group II to the Fifth Assessment Report of the 36 Intergovernmental Panel on Climate Change [Field, C. B., V. R. Barros, D. J. Dokken, K. J. Mach, M. D. 37 Mastrandrea, T. E. Bilir, M. Chatterjee, K. L. Ebi, Y. O. Estrada, R. C. Genova, B. Girma, E. S. Kissel, A. N. 38 Levy, S. MacCracken, P. R. Mastrandrea and L. L. White (eds.)]. Cambridge University Press, Cambridge, United 39 Kingdom and New York, NY, USA, pp. 755-791. ISBN 9781107058071. 40
Adzawla, W. and H. Baumüller, 2021: Effects of livelihood diversification on gendered climate vulnerability in 41 Northern Ghana. Environment, Development and Sustainability, 23(1), 923-946, doi:10.1007/s10668-020-00614-42 3. 43
Afriyie, K., J. K. Ganle and E. Santos, 2018: ‘The floods came and we lost everything': weather extremes and 44 households' asset vulnerability and adaptation in rural Ghana. Climate and Development, 10(3), 259-274, 45 doi:10.1080/17565529.2017.1291403. 46
Agarwala, M. and D. Coyle, 2020: Natural capital in climate models. Nature Sustainability, doi:10.1038/s41893-020-47 00618-x. 48
Agnolucci, P. and V. De Lipsis, 2019: Long-run trend in agricultural yield and climatic factors in Europe. Climatic 49 Change, 1-21. 50
Ahlm, L. et al., 2017: Marine cloud brightening–as effective without clouds. Atmospheric Chemistry and Physics, 51 17(21), 13071-13087. 52
Ahmadalipour, A., H. Moradkhani and M. Kumar, 2019: Mortality risk from heat stress expected to hit poorest nations 53 the hardest. Climatic Change, 152(3), 569-579, doi:10.1007/s10584-018-2348-2. 54
Ahmed, F. et al., 2018: Tipping points in adaptation to urban flooding under climate change and urban growth: The case 55 of the Dhaka megacity. Land Use Policy, 79, 496-506. 56
Ahmed, I. et al., 2019: Climate change impacts and adaptation strategies for agronomic crops. In: Climate change and 57 agriculture. IntechOpen, pp. 1-14. 58
Aïta, S., 2009: Labour Markets Performance and Migration Flows in SYRIA. Robert Schuman Centre for Advanced 59 Studies. 60
Ajibade, I., 2019: Planned retreat in Global South megacities: disentangling policy, practice, and environmental justice. 61 Climatic Change, 157(2), 299-317, doi:10.1007/s10584-019-02535-1. 62
ACCEPTED VERSIO
N
SUBJECT TO FIN
AL EDITS
FINAL DRAFT Chapter 16 IPCC WGII Sixth Assessment Report
Do Not Cite, Quote or Distribute 16-129 Total pages: 173
Alahmad, B., A. Shakarchi, M. Alseaidan and M. Fox, 2019: The effects of temperature on short-term mortality risk in 1 Kuwait: A time-series analysis. Environmental research, 171, 278-284. 2
Alam, G. M. M., K. Alam, S. Mushtaq and W. L. Filho, 2018: How do climate change and associated hazards impact 3 on the resilience of riparian rural communities in Bangladesh? Policy implications for livelihood development. 4 Environmental Science & Policy, 84, 7-18, doi:10.1016/j.envsci.2018.02.012. 5
Albert, S. et al., 2018: Heading for the hills: climate-driven community relocations in the Solomon Islands and Alaska 6 provide insight for a 1.5 C future. Regional environmental change, 18(8), 2261-2272. 7
Albert, S. et al., 2016: Interactions between sea-level rise and wave exposure on reef island dynamics in the Solomon 8 Islands. Environmental Research Letters, 11(5), 054011. 9
Alegre, X. E., Z. Stanton-Geddes, S. Aliyev and V. Bun, 2020: Analyzing Flooding Impacts on Rural Access to 10 Hospitals and Other Critical Services in Rural Cambodia Using Geo-Spatial Information and Network Analysis. 11 25. 12
Aleixo, I. et al., 2019: Amazonian rainforest tree mortality driven by climate and functional traits. Nature Climate 13 Change, 9(5), 384-388, doi:10.1038/s41558-019-0458-0. 14
Alfieri, L. et al., 2017: Global projections of river flood risk in a warmer world: RIVER FLOOD RISK IN A 15 WARMER WORLD. Earth's Future, 5(2), 171-182, doi:10.1002/2016EF000485. 16
Allen-Dumas, M. R., G. L. Toole and V. C. Tidwell, 2019: An Interdisciplinary Approach to Assessing Vulnerability of 17 US Midwest to Drought and Heat Waves. 17(2), 5. 18
Allgaier, J., 2019: Science and environmental communication on YouTube: strategically distorted communications in 19 online videos on climate change and climate engineering. Frontiers in Communication, 4, 36. 20
Alston, M., J. Clarke and K. Whittenbury, 2018: Limits to adaptation: Reducing irrigation water in the Murray-Darling 21 Basin dairy communities. Journal of Rural Studies, 58, 93-102, doi:10.1016/j.jrurstud.2017.12.026. 22
Alves, A. et al., 2019: Assessing the Co-Benefits of green-blue-grey infrastructure for sustainable urban flood risk 23 management. Journal Of Environmental Management, 239, 244-254, doi:10.1016/j.jenvman.2019.03.036. 24
Andela, N. et al., 2019: The Global Fire Atlas of individual fire size, duration, speed and direction. Earth System 25 Science Data, 11, 529-552, doi:10.5194/essd-11-529-2019. 26
Anderson, G. B., K. W. Oleson, B. Jones and R. D. Peng, 2018a: Projected trends in high-mortality heatwaves under 27 different scenarios of climate, population, and adaptation in 82 US communities. Climatic Change, 146(3), 455-28 470, doi:10.1007/s10584-016-1779-x. 29
Anderson, L. O. et al., 2018b: Vulnerability of Amazonian forests to repeated droughts. Philosophical Transactions of 30 the Royal Society B: Biological Sciences, 373(1760), 20170411, doi:10.1098/rstb.2017.0411. 31
Anderson, T. and H. Singh, 2020: Participatory methodologies enable communities to assess climate-induced loss and 32 damage. APN Science Bulletin, 10(1), doi:10.30852/sb.2020.1241. 33
Ansuategi, A. et al., 2015: The impact of climate change on the achievement of the post-2015 sustainable development 34 goals. Climate and Development Knowledge Network (CDKN), 76 pp. (accessed 2020-09-16 14:59:27). 35
Anthoff, D. and R. Tol, 2014: FUND-Climate Framework for Uncertainty, Negotiation and Distribution. Available at 36 www. fund-model. org. Accessed October, 26, 2015. 37
Antwi-Agyei, P., A. J. Dougill, L. C. Stringer and S. N. A. Codjoe, 2018: Adaptation opportunities and maladaptive 38 outcomes in climate vulnerability hotspots of northern Ghana. Climate Risk Management, 19, 83-93, 39 doi:10.1016/j.crm.2017.11.003. 40
Arafeh-Dalmau, N. et al., 2019: Extreme Marine Heatwaves Alter Kelp Forest Community Near Its Equatorward 41 Distribution Limit. Frontiers in Marine Science, 6, 499, doi:10.3389/fmars.2019.00499. 42
Aragão, L. E. O. C. et al., 2018: 21st Century drought-related fires counteract the decline of Amazon deforestation 43 carbon emissions. Nature Communications, 9(1), 536, doi:10.1038/s41467-017-02771-y. 44
Araos, M. et al., 2016: Climate change adaptation planning in large cities: A systematic global assessment. 45 Environmental Science & Policy, 66, 375-382, doi:10.1016/j.envsci.2016.06.009. 46
Araos, M., K. Jagannathan and e. al., 2021: The role of equity in adaptation: a systematic global review. Nature 47 Sustainability, doi:10.2139/ssrn.3782859. 48
Arbuthnott, K., S. Hajat, C. Heaviside and S. Vardoulakis, 2016: Changes in population susceptibility to heat and cold 49 over time: assessing adaptation to climate change. Environmental Health, 15(1), doi:10.1186/s12940-016-0102-7. 50
Arent, D. J. et al., 2014: Key economic sectors and services. In: Climate Change 2014: Impacts, Adaptation, and 51 Vulnerability. Part A: Global and Sectoral Aspects. Contribution of Working Group II to the Fifth Assessment 52 Report of the Intergovernmental Panel of Climate Change [Field, C. B., V. R. Barros, D. J. Dokken, K. J. Mach, 53 M. D. Mastrandrea, T. E. Bilir, M. Chatterjee, K. L. Ebi, Y. O. Estrada, R. C. Genova, B. Girma, E. S. Kissel, A. 54 N. Levy, S. MacCracken, P. R. Mastrandrea and L. L. White (eds.)]. Cambridge University Press, Cambridge, 55 United Kingdom and New York, NY, USA, pp. 659-708. 56
Arias, P. A. et al., 2021: Technical Summary. In: Climate Change 2021: The Physical Science Basis. Contribution of 57 Working Group I to the Sixth Assessment Report of the Intergovernmental Panel on Climate Change [Masson-58 Delmotte, V., P. Zhai, A. Pirani, S. L. Connors, C. Péan, S. Berger, N. Caud, Y. Chen, L. Goldfarb, M. I. Gomis, 59 M. Huang, K. Leitzell, E. Lonnoy, J. B. R. Matthews, T. K. Maycock, T. Waterfield, O. Yelekçi, R. Yu and B. 60 Zhou (eds.)]. Cambridge University Press. 61
Arino, Y. et al., 2016: Estimating option values of solar radiation management assuming that climate sensitivity is 62 uncertain. Proc. Natl. Acad. Sci. U. S. A., 113(21), 5886-5891, doi:10.1073/pnas.1520795113. 63
ACCEPTED VERSIO
N
SUBJECT TO FIN
AL EDITS
FINAL DRAFT Chapter 16 IPCC WGII Sixth Assessment Report
Do Not Cite, Quote or Distribute 16-130 Total pages: 173
Arku, F. S., 2013: Local creativity for adapting to climate change among rural farmers in the semi-arid region of Ghana. 1 International Journal of Climate Change Strategies and Management, 5(4), 418-430, doi:10.1108/IJCCSM-08-2 2012-0049. 3
Arnell, N. W. and B. Lloyd-Hughes, 2014: The global-scale impacts of climate change on water resources and flooding 4 under new climate and socio-economic scenarios. Climatic Change, 122(1), 127-140, doi:10.1007/s10584-013-5 0948-4. 6
Arnell, N. W., J. A. Lowe, B. Lloyd-Hughes and T. J. Osborn, 2018: The impacts avoided with a 1.5 °C climate target: 7 a global and regional assessment. Climatic Change, 147(1), 61-76, doi:10.1007/s10584-017-2115-9. 8
Arneth, A., 2019: Climate Change and Land: An IPCC Special Report on Climate Change, Desertification, Land 9 Degradation, Sustainable Land Management, Food Security, and Greenhouse Gas Fluxes in Terrestrial 10 Ecosystems. IPPC. 11
Arto, I. et al., 2019: The socioeconomic future of deltas in a changing environment. Science of The Total Environment, 12 648, 1284-1296, doi:10.1016/j.scitotenv.2018.08.139. 13
Aryal, J. P. et al., 2018: Adoption of multiple climate-smart agricultural practices in the Gangetic plains of Bihar, India. 14 International Journal of Climate Change Strategies and Management, 10(3), 407-427, doi:10.1108/IJCCSM-02-15 2017-0025. 16
Aryal, S., T. N. Maraseni and G. Cockfield, 2014: Sustainability of transhumance grazing systems under socio-17 economic threats in Langtang, Nepal. Journal of Mountain Science, 11(4), 1023-1034, doi:10.1007/s11629-013-18 2684-7. 19
Asadu, A. N., R. Ozioko, I and M. U. Dimelu, 2018: Climate Change Information Source and Indigenous Adaptation 20 Strategies of Cucumber Farmers in Enugu State, Nigeria. Journal of Agricultural Extension, 22(2), 136-146, 21 doi:10.4314/jae.v22i2.12. 22
Asfaw, A., B. Simane, A. Bantider and A. Hassen, 2019: Determinants in the adoption of climate change adaptation 23 strategies: evidence from rainfed-dependent smallholder farmers in north-central Ethiopia (Woleka sub-basin). 24 Environment, Development and Sustainability, 21(5), 2535-2565. 25
Ash, K. and N. Obradovich, 2020: Climatic Stress, Internal Migration, and Syrian Civil War Onset. Journal of Conflict 26 Resolution, 64(1), 3-31, doi:10.1177/0022002719864140. 27
Asmare, F., H. Teklewold and A. Mekonnen, 2019: The effect of climate change adaptation strategy on farm 28 households welfare in the Nile basin of Ethiopia Is there synergy or trade-offs? International Journal of Climate 29 Change Strategies and Management, 11(4), 518-535, doi:10.1108/IJCCSM-10-2017-0192. 30
Asseng, S. et al., 2015: Rising temperatures reduce global wheat production. Nature climate change, 5(2), 143-147. 31 Asseng, S., D. Spaenkuch, I. M. Hernandez-Ochoa and J. Laporta, 2021: The upper temperature thresholds of life. 32
Lancet Planetary Health, 5(6), E378-E385. 33 Åström, D. O., B. Forsberg, K. L. Ebi and J. Rocklöv, 2013: Attributing mortality from extreme temperatures to climate 34
change in Stockholm, Sweden. Nature climate change, 3(12), 1050-1054. 35 Atteridge, A. and E. Remling, 2018: Is adaptation reducing vulnerability or redistributing it? WIREs Climate Change, 36
9(1), e500, doi:10.1002/wcc.500. 37 Auffhammer, M., 2018: Climate adaptive response estimation: Short and long run impacts of climate change on 38
residential electricity and natural gas consumption using big data. National Bureau of Economic Research. 39 Austin, S. E. et al., 2016: Public Health Adaptation to Climate Change in OECD Countries. International Journal of 40
Environmental Research and Public Health, 13(9), doi:10.3390/ijerph13090889. 41 Averchenkova, A. et al., 2016: Multinational and large national corporations and climate adaptation: are we asking the 42
right questions? A review of current knowledge and a new research perspective. Wiley Interdisciplinary Reviews-43 Climate Change, 7(4), 517-536, doi:10.1002/wcc.402. 44
Aziz, L. and W. Sadok, 2015: Strategies used by the saffron producers of Taliouine (Morocco) to adapt to climate 45 change. Revue De Geographie Alpine-Journal of Alpine Research, 103(2), doi:10.4000/rga.2902. 46
Baarsch, F. et al., 2020: The impact of climate change on incomes and convergence in Africa. World Development, 126, 47 104699, doi:10.1016/j.worlddev.2019.104699. 48
Baatz, C., 2016: Can We Have It Both Ways? On Potential Trade-Offs Between Mitigation and Solar Radiation 49 Management. Environ. Values, 25(1), 29-49, doi:10.3197/096327115X14497392134847. 50
Baffes, J., V. Kshirsagar and D. Mitchell, 2019: What Drives Local Food Prices? Evidence from the Tanzanian Maize 51 Market. The World Bank Economic Review, 33(1), 160-184, doi:10.1093/wber/lhx008. 52
Baker-Austin, C. et al., 2016: Heat wave–associated vibriosis, Sweden and Finland, 2014. Emerging infectious 53 diseases, 22(7), 1216. 54
Baker-Austin, C. et al., 2013: Emerging Vibrio risk at high latitudes in response to ocean warming. Nature Climate 55 Change, 3(1), 73-77. 56
Balaban, O. and J. A. Puppim de Oliveira, 2017: Sustainable buildings for healthier cities: assessing the co-benefits of 57 green buildings in Japan. Journal of Cleaner Production, 163(S), S68-S78, doi:10.1016/j.jclepro.2016.01.086. 58
Balaji, V., S. Ganapuram and C. Devakumar, 2015: Communication and capacity building to advance adaptation 59 strategies in agriculture in the context of climate change in India. Decision, 42(2, SI), 147-158, 60 doi:10.1007/s40622-015-0086-0. 61
ACCEPTED VERSIO
N
SUBJECT TO FIN
AL EDITS
FINAL DRAFT Chapter 16 IPCC WGII Sixth Assessment Report
Do Not Cite, Quote or Distribute 16-131 Total pages: 173
Baldos, U. L. C. and T. W. Hertel, 2014: Global food security in 2050: the role of agricultural productivity and climate 1 change. Australian Journal of Agricultural and Resource Economics, 58(4), 554-570, doi:10.1111/1467-2 8489.12048. 3
Banda, M. L., 2018: Global Adaptation Law: Optimizing Legal Design for Multi-Level Public Goods after the Paris 4 Agreement. Social Science Research Network, Rochester, NY. Available at: 5 https://papers.ssrn.com/abstract=3134172 6
https://papers.ssrn.com/sol3/papers.cfm?abstract_id=3134172 (accessed 2020/11/04/15:55:44). 7 Barbosa, R., R. Vicente and R. Santos, 2015: Climate change and thermal comfort in Southern Europe housing: A case 8
study from Lisbon. Building and Environment, 92, 440-451, doi:10.1016/j.buildenv.2015.05.019. 9 Barnard, P. L. et al., 2021: Multiple climate change-driven tipping points for coastal systems. Scientific Reports, 11(1), 10
15560, doi:10.1038/s41598-021-94942-7. 11 Barnes, J., 2009: Managing the Waters of Baՙth Country: The Politics of Water Scarcity in Syria. Geopolitics, 14(3), 12
510-530, doi:10.1080/14650040802694117. 13 Barnett, J. and C. McMichael, 2018: The effects of climate change on the geography and timing of human mobility. 14
POPULATION AND ENVIRONMENT, 39(4, SI), 339-356, doi:10.1007/s11111-018-0295-5. 15 Barnett, J. and S. J. O'Neill, 2013: Minimising the risk of maladaptation: a framework for analysis. In: Climate 16
Adaptation Futures. Wiley, pp. 87-93. 17 Barreca, A. et al., 2015: Convergence in Adaptation to Climate Change: Evidence from High Temperatures and 18
Mortality, 1900-2004. American Economic Review, 105(5), 247-251, doi:10.1257/aer.p20151028. 19 Barriopedro, D. et al., 2011: The hot summer of 2010: redrawing the temperature record map of Europe. Science, 20
332(6026), 220-224. 21 Barrios, S., L. Bertinelli and E. Strobl, 2010: Trends in rainfall and economic growth in Africa: A neglected cause of 22
the african growth tragedy. Review of Economics and Statistics, 92(2), 350-366, doi:10.1162/rest.2010.11212. 23 Bastien-Olvera, B. A. and F. C. Moore, 2021: Use and non-use value of nature and the social cost of carbon. Nature 24
Sustainability, 4(2), 101-108. 25 Bauer, A. and R. Steurer, 2014: Multi-level governance of climate change adaptation through regional partnerships in 26
Canada and England. GEOFORUM, 51, 121-129, doi:10.1016/j.geoforum.2013.10.006. 27 Bauer, A. and R. Steurer, 2015: National Adaptation Strategies, what else? Comparing adaptation mainstreaming in 28
German and Dutch water management. Regional Environmental Change, 15(2), 341-352, doi:10.1007/s10113-29 014-0655-3. 30
Bauer, K., 2013: Are preventive and coping measures enough to avoid loss and damage from flooding in Udayapur 31 district, Nepal? International Journal of Global Warming, 5(4), 433, doi:10.1504/IJGW.2013.057292. 32
Baumann, M. and T. Kuemmerle, 2016: The impacts of warfare and armed conflict on land systems. Journal of Land 33 Use Science, 11(6), 672-688, doi:10.1080/1747423X.2016.1241317. 34
Bebber, D. P., M. A. T. Ramotowski and S. J. Gurr, 2013: Crop pests and pathogens move polewards in a warming 35 world. Nature Climate Change, 3(11), 985-988, doi:10.1038/nclimate1990. 36
Beck, M. W. et al., 2018: The global flood protection savings provided by coral reefs. Nature Communications, 9(1), 37 2186, doi:10.1038/s41467-018-04568-z. 38
Bednar, D. and D. Henstra, 2018: Applying a Typology of Governance Modes to Climate Change Adaptation. 39 POLITICS AND GOVERNANCE, 6(3), 147-158, doi:10.17645/pag.v6i3.1432. 40
Beer, C. et al., 2010: Terrestrial Gross Carbon Dioxide Uptake: Global Distribution and Covariation with Climate, 834-41 838 pp. 42
Begum, A. and R. Mahanta, 2017: Adaptation to climate change and factors affecting it in Assam. Indian Journal of 43 Agricultural Economics, 72(3), 446-455. 44
BEH UNU-EHS, 2016: World Risk Report. United Nations University Institute for Environment and Human Security 45 (UNU-EHS) Bündnis Entwicklung Hilft (BEH). 46
Beiler, M. O., L. Marroquin and S. McNeil, 2016: State-of-the-practice assessment of climate change adaptation 47 practices across metropolitan planning organizations pre- and post-Hurricane Sandy. TRANSPORTATION 48 RESEARCH PART A-POLICY AND PRACTICE, 88, 163-174, doi:10.1016/j.tra.2016.04.003. 49
Beine, M. and C. R. Parsons, 2017: Climatic Factors as Determinants of International Migration: Redux. CESifo Econ. 50 Stud., 63(4), 386-402, doi:10.1093/cesifo/ifx017. 51
Belanger, D. et al., 2016: A multilevel analysis to explain self-reported adverse health effects and adaptation to urban 52 heat: a cross-sectional survey in the deprived areas of 9 Canadian cities. BMC PUBLIC HEALTH, 16, 53 doi:10.1186/s12889-016-2749-y. 54
Bele, M. Y., D. J. Sonwa and A. M. Tiani, 2014: Local Communities Vulnerability to Climate Change and Adaptation 55 Strategies in Bukavu in DR Congo. Journal Of Environment & Development, 23(3), 331-357, 56 doi:10.1177/1070496514536395. 57
Bell, A. R. et al., 2021: Migration towards Bangladesh coastlines projected to increase with sea-level rise through 2100. 58 Environmental Research Letters, 16(2), 024045, doi:10.1088/1748-9326/abdc5b. 59
Bellemare, M. F., 2015: Rising Food Prices, Food Price Volatility, and Social Unrest. American Journal of Agricultural 60 Economics, 97(1), 1-21, doi:10.1093/ajae/aau038. 61
ACCEPTED VERSIO
N
SUBJECT TO FIN
AL EDITS
FINAL DRAFT Chapter 16 IPCC WGII Sixth Assessment Report
Do Not Cite, Quote or Distribute 16-132 Total pages: 173
Benito-Garzon, M., H. D. Minh, N. Frascaria-Lacoste and J. Fernandez-Manjarres, 2013: Habitat Restoration and 1 Climate Change: Dealing with Climate Variability, Incomplete Data, and Management Decisions with Tree 2 Translocations. Restoration Ecology, 21(5), 530-536, doi:10.1111/rec.12032. 3
Bennett, C. M., K. B. Dear and A. J. McMichael, 2014: Shifts in the seasonal distribution of deaths in Australia, 1968–4 2007. International journal of biometeorology, 58(5), 835-842. 5
Benveniste, H., M. Oppenheimer and M. Fleurbaey, 2020: Effect of border policy on exposure and vulnerability to 6 climate change. Proceedings of the National Academy of Sciences, 117(43), 26692, 7 doi:10.1073/pnas.2007597117. 8
Benzie, M. et al., 2018: Meeting the global challenge of adaptation by addressing transboundary climate risk: A joint 9 collaboration between SEI, IDDRI, and ODI. Stockholm Environment Institute, Stockholm, Sweden, 10 pp. 10 Available at: https://www.sei.org/publications/transboundary-climate-risk/. 11
Benzie, M. and Å. Persson, 2019: Governing borderless climate risks: moving beyond the territorial framing of 12 adaptation. International Environmental Agreements: Politics, Law and Economics, 19(4-5), 369-393, 13 doi:10.1007/s10784-019-09441-y. 14
Berga, L., 2016: The Role of Hydropower in Climate Change Mitigation and Adaptation: A Review. Engineering, 2(3), 15 313-318, doi:10.1016/j.eng.2016.03.004. 16
Berhanu, W. and F. Beyene, 2015: Climate Variability and Household Adaptation Strategies in Southern Ethiopia. 17 Sustainability, 7(6), 6353-6375, doi:10.3390/su7066353. 18
Berlemann, M. and D. Wenzel, 2016: Long-term Growth Effects of Natural Disasters. Economics bulletin: EB. 19 Berlemann, M. and D. Wenzel, 2018: Hurricanes, economic growth and transmission channels: Empirical evidence for 20
countries on differing levels of development. World Development, 105, 231-247. 21 Bernauer, T. and T. Böhmelt, 2020: International conflict and cooperation over freshwater resources. Nature 22
Sustainability, 1-7. 23 Berrang-Ford, L., T. Pearce and J. D. Ford, 2015: Systematic review approaches for climate change adaptation research. 24
REGIONAL ENVIRONMENTAL CHANGE, 15(5, SI), 755-769, doi:10.1007/s10113-014-0708-7. 25 Berrang-Ford, L. et al., 2021a: Mapping evidence of human adaptation to climate change. Nature Climate Change, 26
doi:10.21203/rs.3.rs-100873/v1. 27 Berrang-Ford, L. et al., 2021b: A systematic global stocktake of evidence on human adaptation to climate change. 28
Nature Climate Change, doi:10.21203/rs.3.rs-100873/v1. 29 Betzold, C., 2015: Adapting to climate change in small island developing states. Climatic Change, 133(3), 481-489, 30
doi:10.1007/s10584-015-1408-0. 31 Bhatta, G. D. and P. K. Aggarwal, 2016: Coping with weather adversity and adaptation to climatic variability: a cross-32
country study of smallholder farmers in South Asia. Climate and Development, 8(2), 145-157, 33 doi:10.1080/17565529.2015.1016883. 34
Biagini, B. et al., 2014: A typology of adaptation actions: A global look at climate adaptation actions financed through 35 the Global Environment Facility. GLOBAL ENVIRONMENTAL CHANGE-HUMAN AND POLICY 36 DIMENSIONS, 25, 97-108, doi:10.1016/j.gloenvcha.2014.01.003. 37
Biermann, F. and I. Möller, 2019: Rich man’s solution? Climate engineering discourses and the marginalization of the 38 Global South. International Environmental Agreements: Politics, Law and Economics, 19(2), 151-167. 39
Biesbroek, R., S. Badloe and I. N. Athanasiadis, 2020: Machine learning for research on climate change adaptation 40 policy integration: an exploratory UK case study. Regional Environmental Change, 20(3), doi:10.1007/s10113-41 020-01677-8. 42
Biesbroek, R. et al., 2018: Data, concepts and methods for large-n comparative climate change adaptation policy 43 research: A systematic literature review. WILEY INTERDISCIPLINARY REVIEWS-CLIMATE CHANGE, 9(6), 44 doi:10.1002/wcc.548. 45
Bindoff, N. L. et al., 2019: Changing Ocean, Marine Ecosystems, and Dependent Communities. In: IPCC Special 46 Report on the Ocean and Cryosphere in a Changing Climate [Pörtner, H. O., D. C. Roberts, V. Masson-Delmotte, 47 P. Zhai, M. Tignor, E. Poloczanska, K. Mintenbeck, A. Alegría, M. Nicolai, A. Okem, J. Petzold, B. Rama and N. 48 M. Weyer (eds.)], pp. In press. 49
Birkmann, J. et al., 2021: Regional clusters of vulnerability show the need for transboundary cooperation. 50 Environmental Research Letters. 51
Birkmann, J. et al., 2022: Understanding human vulnerability to climate change: A global perspective on index 52 validation for adaptation planning. Science of the Total Environment, 803, doi:10.1016/j.scitotenv.2021.150065. 53
Birkmann, J. et al., 2016: Extreme Events, Critical Infrastructures, Human Vulnerability and Strategic Planning: 54 Emerging Research Issues. Journal of Extreme Events, 03(04), 1650017, doi:10.1142/S2345737616500172. 55
Black, R. et al., 2013: Migration, immobility and displacement outcomes following extreme events. Environmental 56 Science & Policy, 27, S32-S43, doi:10.1016/j.envsci.2012.09.001. 57
Blanc, D. L., 2015: Towards integration at last? The sustainable development goals as a network of targets. UN/DESA 58 Working Papers, 141, 19. 59
Boas, I. et al., 2019: Climate migration myths. Nature Climate Change, 9(12), 901-903. 60 Bobb, J. F., R. D. Peng, M. L. Bell and F. Dominici, 2014: Heat-Related Mortality and Adaptation to Heat in the United 61
States. ENVIRONMENTAL HEALTH PERSPECTIVES, 122(8), 811-816, doi:10.1289/ehp.1307392. 62
ACCEPTED VERSIO
N
SUBJECT TO FIN
AL EDITS
FINAL DRAFT Chapter 16 IPCC WGII Sixth Assessment Report
Do Not Cite, Quote or Distribute 16-133 Total pages: 173
Boeckmann, M. and I. Rohn, 2014: Is planned adaptation to heat reducing heat-related mortality and illness? A 1 systematic review. BMC PUBLIC HEALTH, 14, doi:10.1186/1471-2458-14-1112. 2
Boelee, E. et al., 2013: Options for water storage and rainwater harvesting to improve health and resilience against 3 climate change in Africa. Regional Environmental Change, 13(3, SI), 509-519, doi:10.1007/s10113-012-0287-4. 4
Booth, L. et al., 2020: Simulating synergies between Climate Change Adaptation and Disaster Risk Reduction 5 stakeholders to improve management of transboundary disasters in Europe. International Journal of Disaster Risk 6 Reduction, 49, 101668, doi:10.1016/j.ijdrr.2020.101668. 7
Bose, P., 2017: Climate adaptation: marginal populations in the vulnerable regions. Climate and Development, 9(6), 8 575-578, doi:10.1080/17565529.2017.1318747. 9
Botzen, W. W., O. Deschenes and M. Sanders, 2019: The economic impacts of natural disasters: A review of models 10 and empirical studies. Review of Environmental Economics and Policy, 13(2), 167-188. 11
Boutin, S. and J. E. Lane, 2014: Climate change and mammals: evolutionary versus plastic responses. 12 EVOLUTIONARY APPLICATIONS, 7(1, SI), 29-41, doi:10.1111/eva.12121. 13
Bowen, K. J. and K. L. Ebi, 2015: Governing the health risks of climate change: towards multi-sector responses. 14 CURRENT OPINION IN ENVIRONMENTAL SUSTAINABILITY, 12, 80-85, doi:10.1016/j.cosust.2014.12.001. 15
Braithwaite, A., N. Dasandi and D. Hudson, 2016: Does poverty cause conflict? Isolating the causal origins of the 16 conflict trap. Conflict Management and Peace Science, 33(1), 45-66, doi:10.1177/0738894214559673. 17
Bramsen, I., 2020: From civil resistance to civil war: Nonstrategic mechanisms of militarization in the Syrian uprising. 18 Peace & Change, 45(2), 256-286. 19
Bren d’Amour, C. et al., 2016: Teleconnected food supply shocks. Environmental Research Letters, 11(3), 035007, 20 doi:10.1088/1748-9326/11/3/035007. 21
Brienen, R. J. W. et al., 2015: Long-term decline of the Amazon carbon sink. Nature, 519(7543), 344-348, 22 doi:10.1038/nature14283. 23
Broto, V. C. and H. Bulkeley, 2013: A survey of urban climate change experiments in 100 cities. GLOBAL 24 ENVIRONMENTAL CHANGE-HUMAN AND POLICY DIMENSIONS, 23(1), 92-102, 25 doi:10.1016/j.gloenvcha.2012.07.005. 26
Brown, S. et al., 2021: Global costs of protecting against sea-level rise at 1.5 to 4.0 °C. Climatic Change, 167(1), 4, 27 doi:10.1007/s10584-021-03130-z. 28
Brzoska, M. and C. Fröhlich, 2016: Climate change, migration and violent conflict: vulnerabilities, pathways and 29 adaptation strategies. Migration and Development, 5(2), 190-210. 30
Buck, H. J. et al., 2020: Evaluating the efficacy and equity of environmental stopgap measures. Nature Sustainability, 31 3(7), 499-504, doi:10.1038/s41893-020-0497-6. 32
Budolfson, M. et al., 2019: Optimal climate policy and the future of world economic development. The World Bank 33 Economic Review, 33(1), 21-40. 34
Buhaug, H., M. Croicu, H. Fjelde and N. von Uexkull, 2020: A conditional model of local income shock and civil 35 conflict. The Journal of Politics, doi:10.1086/709671. 36
Burke, M., W. M. Davis and N. S. Diffenbaugh, 2018: Large potential reduction in economic damages under UN 37 mitigation targets. Nature, 557(7706), 549-553, doi:10.1038/s41586-018-0071-9. 38
Burke, M., S. M. Hsiang and E. Miguel, 2015: Global non-linear effect of temperature on economic production. Nature, 39 527(7577), 235-239, doi:10.1038/nature15725. 40
Burns, E. T. et al., 2016: What do people think when they think about solar geoengineering? A review of empirical 41 social science literature, and prospects for future research. Earth's Future, 4(11), 536-542. 42
Burrell, A., J. Evans and M. De Kauwe, 2020: Anthropogenic climate change has driven over 5 million km 2 of 43 drylands towards desertification. Nature communications, 11(1), 1-11. 44
Burrows, K. and P. Kinney, 2016: Exploring the Climate Change, Migration and Conflict Nexus. International Journal 45 of Environmental Research and Public Health, 13(4), 443, doi:10.3390/ijerph13040443. 46
Burton, C., R. A. Betts, C. D. Jones and K. Williams, 2018: Will fire danger be reduced by using Solar Radiation 47 Management to limit global warming to 1.5 C compared to 2.0 C? Geophys. Res. Lett., 45(8), 3644-3652. 48
Burton, C. et al., 2021: South American fires and their impacts on ecosystems increase with continued emissions. 49 Climate Resilience and Sustainability, n/a(n/a), e8, doi:https://doi.org/10.1002/cli2.8. 50
Busby, J. W., 2018: Taking Stock: the Field of Climate and Security. Current Climate Change Reports, 4(4), 338-346, 51 doi:10.1007/s40641-018-0116-z. 52
Butler, E. E., N. D. Mueller and P. Huybers, 2018: Peculiarly pleasant weather for US maize. Proceedings of the 53 National Academy of Sciences, 115(47), 11935-11940, doi:10.1073/pnas.1808035115. 54
Byers, E. et al., 2018: Global exposure and vulnerability to multi-sector development and climate change hotspots. 55 Environmental Research Letters, 13(5), 055012, doi:10.1088/1748-9326/aabf45. 56
Caddell, R., 2018: Precautionary Management and the Development of Future Fishing Opportunities: The International 57 Regulation of New and Exploratory Fisheries. Int. J. Mar. Coast. Law, 33(1), 199-260, doi:10.1163/15718085-58 13310013. 59
Cai, R., S. Feng, M. Oppenheimer and M. Pytlikova, 2016a: Climate variability and international migration: The 60 importance of the agricultural linkage. Journal of Environmental Economics and Management, 79, 135-151. 61
Cai, W. et al., 2014: Increasing frequency of extreme El Niño events due to greenhouse warming. Nature Climate 62 Change, 4(2), 111-116, doi:10.1038/nclimate2100. 63
ACCEPTED VERSIO
N
SUBJECT TO FIN
AL EDITS
FINAL DRAFT Chapter 16 IPCC WGII Sixth Assessment Report
Do Not Cite, Quote or Distribute 16-134 Total pages: 173
Cai, Y. et al., 2015: Environmental tipping points significantly affect the cost− benefit assessment of climate policies. 1 Proceedings of the National Academy of Sciences, 112(15), 4606-4611. 2
Cai, Y., T. M. Lenton and T. S. Lontzek, 2016b: Risk of multiple interacting tipping points should encourage rapid CO 3 2 emission reduction. Nature Climate Change, 6(5), 520-525. 4
Cai, Y. and T. S. Lontzek, 2019: The social cost of carbon with economic and climate risks. Journal of Political 5 Economy, 127(6), 2684-2734. 6
Calel, R., S. C. Chapman, D. A. Stainforth and N. W. Watkins, 2020: Temperature variability implies greater economic 7 damages from climate change. Nature communications, 11(1), 1-5. 8
Callaghan, M. et al., 2021: Machine learning-based evidence and attribution mapping of 100,000 climate impact 9 studies. 10
Callies, D. E., 2019: The Slippery Slope Argument against Geoengineering Research. J. Appl. Philos., 36(4), 675-687, 11 doi:10.1111/japp.12345. 12
Caminade, C. et al., 2014: Impact of climate change on global malaria distribution. Proceedings of the National 13 Academy of Sciences, 111(9), 3286-3291. 14
Canosa, I., V et al., 2020: Progress in climate change adaptation in the Arctic. ENVIRONMENTAL RESEARCH 15 LETTERS, 15(9), doi:10.1088/1748-9326/ab9be1. 16
Caprotti, F., C. Springer and N. Harmer, 2015: ‘Eco' For Whom? Envisioning Eco-urbanism in the Sino-Singapore 17 Tianjin Eco-city, China. International Journal of Urban and Regional Research, 39(3), 495-517, 18 doi:10.1111/1468-2427.12233. 19
Cardona, O.-D. et al., 2012: Determinants of Risk: Exposure and Vulnerability. In: Managing the Risks of Extreme 20 Events and Disasters to Advance Climate Change Adaptation [Field, C. B., V. Barros, T. F. Stocker and Q. Dahe 21 (eds.)]. Cambridge University Press, Cambridge, pp. 65-108. ISBN 978-1-139-17724-5. 22
Carleton, T. A. et al., 2020: Valuing the global mortality consequences of climate change accounting for adaptation 23 costs and benefits. National Bureau of Economic Research. 24
Carlson, C. J. et al., 2020: Solar geoengineering could redistribute malaria risk in developing countries. medRxiv. 25 Carlton, E. J. et al., 2014: Heavy rainfall events and diarrhea incidence: the role of social and environmental factors. 26
American journal of epidemiology, 179(3), 344-352. 27 Carlton, E. J. et al., 2016: A systematic review and meta-analysis of ambient temperature and diarrhoeal diseases. 28
International Journal of Epidemiology, 45(1), 117-130, doi:10.1093/ije/dyv296. 29 Carr, E. R. and M. C. Thompson, 2014: Gender and Climate Change Adaptation in Agrarian Settings: Current 30
Thinking, New Directions, and Research Frontiers. Geography Compass, 8(3), 182-197, doi:10.1111/gec3.12121. 31 Carr, W. A. and L. Yung, 2018: Perceptions of climate engineering in the South Pacific, Sub-Saharan Africa, and North 32
American Arctic. Clim. Change, 147(1-2), 119-132. 33 Carrão, H., G. Naumann and P. Barbosa, 2018: Global projections of drought hazard in a warming climate: a prime for 34
disaster risk management. Climate Dynamics, 50(5), 2137-2155, doi:10.1007/s00382-017-3740-8. 35 Carter, T. R. et al., 2021: A conceptual framework for cross-border impacts of climate change. Global Environmental 36
Change, 69, 102307, doi:10.1016/j.gloenvcha.2021.102307. 37 Cartwright, A. et al., 2013: Economics of climate change adaptation at the local scale under conditions of uncertainty 38
and resource constraints: the case of Durban, South Africa. ENVIRONMENT AND URBANIZATION, 25(1), 139-39 156, doi:10.1177/0956247813477814. 40
Cattaneo, C. et al., 2019: Human Migration in the Era of Climate Change. Review of Environmental Economics and 41 Policy, 13(2), 189-206, doi:10.1093/reep/rez008. 42
Cattaneo, C. and G. Peri, 2016: The migration response to increasing temperatures. Journal of Development Economics, 43 122, 127-146. 44
Cernev, T. and R. Fenner, 2020: The importance of achieving foundational Sustainable Development Goals in reducing 45 global risk. Futures, 115, 102492, doi:10.1016/j.futures.2019.102492. 46
Cervigni, R., R. Liden, J. E. Neumann and K. M. Strzepek, 2015: Enhancing the Climate Resilience of Africa's 47 Infrastructure : The Power and Water Sectors. World Bank Publications. 48
Cevik, S. and J. Jalles, 2020: Feeling the Heat: Climate Shocks and Credit Ratings. 49 Challinor, A. J., W. N. Adger and T. G. Benton, 2017: Climate risks across borders and scales. Nature Climate Change, 50
7(9), 621-623, doi:10.1038/nclimate3380. 51 Challinor, A. J. et al., 2018: Transmission of climate risks across sectors and borders. Philosophical Transactions of the 52
Royal Society A: Mathematical, Physical and Engineering Sciences, 376(2121), 20170301, 53 doi:10.1098/rsta.2017.0301. 54
Chapman, A. D. et al., 2016: Adaptation and development trade-offs: fluvial sediment deposition and the sustainability 55 of rice-cropping in An Giang Province, Mekong Delta. CLIMATIC CHANGE, 137(3-4), 593-608, 56 doi:10.1007/s10584-016-1684-3. 57
Charmantier, A. and P. Gienapp, 2014: Climate change and timing of avian breeding and migration: evolutionary versus 58 plastic changes. EVOLUTIONARY APPLICATIONS, 7(1, SI), 15-28, doi:10.1111/eva.12126. 59
Chausson, A. et al., 2020: Mapping the effectiveness of nature-based solutions for climate change adaptation. Global 60 Change Biology, 26(11), 6134-6155, doi:10.1111/gcb.15310. 61
ACCEPTED VERSIO
N
SUBJECT TO FIN
AL EDITS
FINAL DRAFT Chapter 16 IPCC WGII Sixth Assessment Report
Do Not Cite, Quote or Distribute 16-135 Total pages: 173
Chen, K., A. M. Vicedo-Cabrera and R. Dubrow, 2020a: Projections of Ambient Temperature-and Air Pollution-1 Related Mortality Burden Under Combined Climate Change and Population Aging Scenarios: a Review. Current 2 environmental health reports, 1-13. 3
Chen, Y., A. Liu and X. Cheng, 2020b: Quantifying economic impacts of climate change under nine future emission 4 scenarios within CMIP6. Science of The Total Environment, 703, 134950. 5
Chengappa, P. G., C. M. Devika and C. S. Rudragouda, 2017: Climate variability and mitigation: perceptions and 6 strategies adopted by traditional coffee growers in India. CLIMATE AND DEVELOPMENT, 9(7), 593-604, 7 doi:10.1080/17565529.2017.1318740. 8
Chester, M. V., B. S. Underwood and C. Samaras, 2020: Keeping infrastructure reliable under climate uncertainty. 9 Nature Climate Change, 10(6), 488-490, doi:10.1038/s41558-020-0741-0. 10
Cheung, W. W. L., J. Bruggeman and M. Butenschön, 2018a: Chapter 4: Projected changes in global and national 11 potential marine fisheries catch under climate change scenarios in the twenty-first century. In: Impacts of climate 12 change on fisheries and aquaculture: synthesis of current knowledge, adaptation and mitigation options [Barange, 13 M., T. Bahri, M. C. M. Beveridge, K. L. Cochrane, S. Funge-Smith and F. Poulain (eds.)]. Food and Agriculture 14 Organization of the United Nations, Rome, pp. 63-86. ISBN 78-92-5-130607-9. 15
Cheung, W. W. L., M. C. Jones, G. Reygondeau and T. L. Frölicher, 2018b: Opportunities for climate-risk reduction 16 through effective fisheries management. Global Change Biology, 24(11), 5149-5163, doi:10.1111/gcb.14390. 17
Chimhowu, A. O., Hulme, D., Munro, L.T., 2019: The ‘New’ national development planning and global development 18 goals: Processes and partnerships. World Development, 120, 76-89, doi:10.1016/j.worlddev.2019.03.013. 19
Chirambo, D., 2016: Moving past the rhetoric: Policy considerations that can make Sino-African relations to improve 20 Africa's climate change resilience and the attainment of the sustainable development goals. Advances in Climate 21 Change Research, 7(4), 253-263, doi:10.1016/j.accre.2016.11.002. 22
Christen, B. and T. Dalgaard, 2013: Buffers for biomass production in temperate European agriculture: A review and 23 synthesis on function, ecosystem services and implementation. Biomass & Bioenergy, 55, 53-67, 24 doi:10.1016/j.biombioe.2012.09.053. 25
Christian-Smith, J., M. C. Levy and P. H. Gleick, 2015: Maladaptation to drought: a case report from California, USA. 26 SUSTAINABILITY SCIENCE, 10(3), 491-501, doi:10.1007/s11625-014-0269-1. 27
Christidis, N., G. C. Donaldson and P. A. Stott, 2010: Causes for the recent changes in cold-and heat-related mortality 28 in England and Wales. Climatic Change, 102(3-4), 539-553. 29
Chua, P. L. C. et al., 2021: Global projections of temperature-attributable mortality due to enteric infections: a 30 modelling study. The Lancet Planetary Health, 5(7), e436-e445, doi:10.1016/S2542-5196(21)00152-2. 31
Chung, Y. et al., 2017: Temporal Changes in Mortality Related to Extreme Temperatures for 15 Cities in Northeast 32 Asia: Adaptation to Heat and Maladaptation to Cold. AMERICAN JOURNAL OF EPIDEMIOLOGY, 185(10), 33 907-913, doi:10.1093/aje/kww199. 34
Cingano, F., 2014: Trends in Income Inequality and its Impact on Economic Growth. (accessed 2020-09-03 11:39:16). 35 Ciscar, J.-C. and P. Dowling, 2014: Integrated assessment of climate impacts and adaptation in the energy sector. 36
Energy Economics, 46, 531-538, doi:10.1016/j.eneco.2014.07.003. 37 Clarke, B. J., F. E. L. Otto and R. G. Jones, 2021: Inventories of extreme weather events and impacts: Implications for 38
loss and damage from and adaptation to climate extremes, 100285 pp. 39 Clay, N. and B. King, 2019: Smallholders' uneven capacities to adapt to climate change amid Africa's `green 40
revolution': Case study of Rwanda's crop intensification program. WORLD DEVELOPMENT, 116, 1-14, 41 doi:10.1016/j.worlddev.2018.11.022. 42
Cohen, J. M., M. J. Lajeunesse and J. R. Rohr, 2018: A global synthesis of animal phenological responses to climate 43 change. Nature Climate Change, 8(3), 224-228, doi:10.1038/s41558-018-0067-3. 44
Colón-González, F. J. et al., 2018: Limiting global-mean temperature increase to 1.5–2 °C could reduce the incidence 45 and spatial spread of dengue fever in Latin America. Proceedings of the National Academy of Sciences, 115(24), 46 6243-6248, doi:10.1073/pnas.1718945115. 47
Comyn-Platt, E. et al., 2018: Carbon budgets for 1.5 and 2 °C targets lowered by natural wetland and permafrost 48 feedbacks. Nature Geoscience, 11(8), 568-573, doi:10.1038/s41561-018-0174-9. 49
Condie, S. A. et al., 2021: Large-scale interventions may delay decline of the Great Barrier Reef. Royal Society Open 50 Science, 8(4), 201296, doi:doi:10.1098/rsos.201296. 51
Conevska, A., J. Ford, A. Lesnikowski and S. Harper, 2019: Adaptation financing for projects focused on food systems 52 through the UNFCCC. CLIMATE POLICY, 19(1), 43-58, doi:10.1080/14693062.2018.1466682. 53
Coniglio, N. D. and G. Pesce, 2015: Climate variability and international migration: An empirical analysis. Environ. 54 Dev. Econ., 20(4), 434-468, doi:10.1017/S1355770X14000722. 55
Cooper, M. W. et al., 2019: Mapping the effects of drought on child stunting. Proceedings of the National Academy of 56 Sciences, 116(35), 17219-17224, doi:10.1073/pnas.1905228116. 57
Costantini, E. A. C. et al., 2020: Local adaptation strategies to increase or maintain soil organic carbon content under 58 arable farming in Europe: Inspirational ideas for setting operational groups within the European innovation 59 partnership. JOURNAL OF RURAL STUDIES, 79, 102-115, doi:10.1016/j.jrurstud.2020.08.005. 60
Coughlan de Perez, E. et al., 2016: Action-based flood forecasting for triggering humanitarian action. Hydrology and 61 Earth System Sciences, 20(9), 3549-3560. 62
ACCEPTED VERSIO
N
SUBJECT TO FIN
AL EDITS
FINAL DRAFT Chapter 16 IPCC WGII Sixth Assessment Report
Do Not Cite, Quote or Distribute 16-136 Total pages: 173
Couper, L. I., A. J. MacDonald and E. A. Mordecai, 2020: Impact of prior and projected climate change on US Lyme 1 disease incidence. bioRxiv, 2020.2001.2031.929380, doi:10.1101/2020.01.31.929380. 2
Craft, J. and M. Howlett, 2013: Policy Capacity and the Ability to Adapt to Climate Change: Canadian and U.S. Case 3 Studies. REVIEW OF POLICY RESEARCH, 30(1, SI), 1-18, doi:10.1111/ropr.12000. 4
Craft, J., M. Howlett, M. Crawford and K. McNutt, 2013: Assessing Policy Capacity for Climate Change Adaptation: 5 Governance Arrangements, Resource Deployments, and Analytical Skills in Canadian Infrastructure Policy 6 Making. REVIEW OF POLICY RESEARCH, 30(1, SI), 42-65, doi:10.1111/ropr.12002. 7
Craig, R. K., 2019: Coastal adaptation, government-subsidized insurance, and perverse incentives to stay. CLIMATIC 8 CHANGE, 152(2, SI), 215-226, doi:10.1007/s10584-018-2203-5. 9
Cramer, W. et al., 2014: Detection and Attribution of Observed Impacts. In: Climate Change 2014: Impacts, 10 Adaptation, and Vulnerability. Part A: Global and Sectoral Aspects. Contribution of Working Group II to the 11 Fifth Assessment Report of the Intergovernmental Panel on Climate Change [Field, C. B., V. R. Barros, D. J. 12 Dokken, K. J. Mach, M. D. Mastrandrea, T. E. Bilir, M. Chatterjee, K. L. Ebi, Y. O. Estrada, R. C. Genova, B. 13 Girma, E. S. Kissel, A. N. Levy, S. MacCracken, P. R. Mastrandrea and L. L. White (eds.)]. Cambridge 14 University Press, Cambridge, United Kingdom and New York, NY, USA, pp. 979-1037. ISBN 9781107058071. 15
Crespo Cuaresma, J., 2017: Income projections for climate change research: A framework based on human capital 16 dynamics. Global Environmental Change, 42, 226-236, doi:10.1016/j.gloenvcha.2015.02.012. 17
Crichton, R. and M. Esteban, 2018: Limits to Coastal Adaptation in Samoa: Insights and Experiences. In: Limits to 18 Climate Change Adaptation [Leal Filho, W. and J. Nalau (eds.)]. Springer International Publishing, Cham, pp. 19 283-300. ISBN 978-3-319-64598-8 978-3-319-64599-5. 20
Crook, J., L. Jackson, S. Osprey and P. Forster, 2015a: A comparison of temperature and precipitation responses to 21 different Earth radiation management geoengineering schemes. Journal of Geophysical Research: Atmospheres, 22 120(18), 9352-9373. 23
Crook, J. A., L. S. Jackson, S. M. Osprey and P. M. Forster, 2015b: A comparison of temperature and precipitation 24 responses to different Earth radiation management geoengineering schemes. J. Geophys. Res. D: Atmos., 120(18), 25 9352-9373, doi:10.1002/2015JD023269. 26
Cropper, M. et al., 2017: Valuing climate damages: updating estimation of the social cost of carbon dioxide. URL 27 https://www. nap. edu/catalog/24651/valuing-climate-damagesupdating-estimation-of-the-social-cost-of. 28
Crost, B. and C. P. Traeger, 2013: Optimal climate policy: uncertainty versus Monte Carlo. Economics Letters, 120(3), 29 552-558. 30
Cumming, O. et al., 2019: The implications of three major new trials for the effect of water, sanitation and hygiene on 31 childhood diarrhea and stunting: a consensus statement. BMC Medicine, 17(1), 173, doi:10.1186/s12916-019-32 1410-x. 33
Cummings, C. L., S. H. Lin and B. D. Trump, 2017: Public perceptions of climate geoengineering: a systematic review 34 of the literature. Clim. Res., 73(3), 247-264, doi:10.3354/cr01475. 35
Cunsolo, A. and N. R. Ellis, 2018: Ecological grief as a mental health response to climate change-related loss. Nature 36 Climate Change, 8(4), 275-281, doi:10.1038/s41558-018-0092-2. 37
Currenti, R. et al., 2019: Adaptation to Climate Change in an Interior Pacific Island Village: a Case Study of 38 Nawairuku, Ra, Fiji. HUMAN ECOLOGY, 47(1), 65-80, doi:10.1007/s10745-019-0049-8. 39
Curry, C. L. et al., 2014: A multimodel examination of climate extremes in an idealized geoengineering experiment. J. 40 Geophys. Res. D: Atmos., 119(7), 3900-3923, doi:10.1002/2013JD020648. 41
D'haen, S. A. L., J. O. Nielsen and E. F. Lambin, 2014: Beyond local climate: rainfall variability as a determinant of 42 household nonfarm activities in contemporary rural Burkina Faso. CLIMATE AND DEVELOPMENT, 6(2), 144-43 165, doi:10.1080/17565529.2013.867246. 44
Dagon, K. and D. P. Schrag, 2019: Quantifying the effects of solar geoengineering on vegetation, 235-251 pp. 45 Dahl, K. A. et al., 2017: Effective inundation of continental United States communities with 21st century sea level rise. 46
Elementa: Science of the Anthropocene, 5. 47 Dai, Z., D. K. Weisenstein, F. N. Keutsch and D. W. Keith, 2020: Experimental reaction rates constrain estimates of 48
ozone response to calcium carbonate geoengineering. Communications Earth & Environment, 1(1), 1-9. 49 Dalin, C., Y. Wada, T. Kastner and M. J. Puma, 2017: Groundwater depletion embedded in international food trade. 50
Nature, 543(7647), 700-704, doi:10.1038/nature21403. 51 Dang, T. N. et al., 2016: Characterizing the relationship between temperature and mortality in tropical and subtropical 52
cities: a distributed lag non-linear model analysis in Hue, Viet Nam, 2009–2013. Global health action, 9(1), 53 28738. 54
Daniel, K. D., R. B. Litterman and G. Wagner, 2015: Applying Asset Pricing Theory to Calibrate the Price of Climate 55 Risk: A Declining Optimal Price for Carbon Emissions. Columbia Graduate School of Business working paper. 56
Dannenberg, A. L., H. Frumkin, J. J. Hess and K. L. Ebi, 2019: Managed retreat as a strategy for climate change 57 adaptation in small communities: public health implications. Climatic Change, 153(1-2), 1-14, 58 doi:10.1007/s10584-019-02382-0. 59
Darwin, R. F. and R. S. Tol, 2001: Estimates of the economic effects of sea level rise. Environmental and Resource 60 Economics, 19(2), 113-129. 61
Davin, E. L. et al., 2014: Preferential cooling of hot extremes from cropland albedo management. Proceedings of the 62 National Academy of Sciences, 111(27), 9757-9761. 63
ACCEPTED VERSIO
N
SUBJECT TO FIN
AL EDITS
FINAL DRAFT Chapter 16 IPCC WGII Sixth Assessment Report
Do Not Cite, Quote or Distribute 16-137 Total pages: 173
Davis, K. F., A. Bhattachan, P. D’Odorico and S. Suweis, 2018: A universal model for predicting human migration 1 under climate change: examining future sea level rise in Bangladesh. Environmental Research Letters, 13(6), 2 064030, doi:10.1088/1748-9326/aac4d4. 3
Davis, K. T. et al., 2019: Wildfires and climate change push low-elevation forests across a critical climate threshold for 4 tree regeneration. Proceedings of the National Academy of Sciences, 116(13), 6193-6198, 5 doi:10.1073/pnas.1815107116. 6
Dawson, D., J. Shaw and W. Roland Gehrels, 2016: Sea-level rise impacts on transport infrastructure: The notorious 7 case of the coastal railway line at Dawlish, England. Journal of Transport Geography, 51, 97-109, 8 doi:10.1016/j.jtrangeo.2015.11.009. 9
Dawson, R. J. et al., 2018: A systems framework for national assessment of climate risks to infrastructure. 10 Philosophical Transactions of the Royal Society A: Mathematical, Physical and Engineering Sciences, 376(2121), 11 20170298, doi:10.1098/rsta.2017.0298. 12
Day, J. W. et al., 2016: Approaches to defining deltaic sustainability in the 21st century. Estuarine, Coastal and Shelf 13 Science, 183, 275-291, doi:10.1016/j.ecss.2016.06.018. 14
De Châtel, F., 2014: The role of drought and climate change in the Syrian uprising: Untangling the triggers of the 15 revolution. Middle Eastern Studies, 50(4), 521-535. 16
de Coninck, H. et al., 2018: Strengthening and Implementing the Global Response. In: Global Warming of 1.5°C. An 17 IPCC Special Report on the impacts of global warming of 1.5°C above pre-industrial levels and related global 18 greenhouse gas emission pathways, in the context of strengthening the global response to the threat of climate 19 change, sustainable development, and efforts to eradicate poverty [Masson-Delmotte, V., P. Zhai, H. O. Pörtner, 20 D. Roberts, J. Skea, P. R. Shukla, A. Pirani, W. Moufouma-Okia, C. Péan, R. Pidcock, S. Connors, J. B. R. 21 Matthews, Y. Chen, X. Zhou, M. I. Gomis, E. Lonnoy, T. Maycock, M. Tignor and T. Waterfield (eds.)], pp. In 22 press. ISBN 9789291691517. 23
De Hoyos, R. E. and D. Medvedev, 2009: Poverty effects of higher food prices: a global perspective. The World Bank. 24 De la Sota, C., V. J. Ruffato-Ferreira, L. Ruiz-Garcia and S. Alvarez, 2019: Urban green infrastructure as a strategy of 25
climate change mitigation. A case study in northern Spain. URBAN FORESTRY & URBAN GREENING, 40(SI), 26 145-151, doi:10.1016/j.ufug.2018.09.004. 27
de Lima, C. Z. et al., 2021: Heat stress on agricultural workers exacerbates crop impacts of climate change. 28 Environmental Research Letters, 16(4), 044020, doi:10.1088/1748-9326/abeb9f. 29
de Sousa, K. et al., 2018: How climate awareness influences farmers' adaptation decisions in Central America? 30 JOURNAL OF RURAL STUDIES, 64, 11-19, doi:10.1016/j.jrurstud.2018.09.018. 31
de Waal, A., 2018: The end of famine? Prospects for the elimination of mass starvation by political action. Political 32 Geography, 62, 184-195, doi:10.1016/j.polgeo.2017.09.004. 33
De’Donato, F. K. et al., 2015: Changes in the effect of heat on mortality in the last 20 years in nine European cities. 34 Results from the PHASE project. International journal of environmental research and public health, 12(12), 35 15567-15583. 36
Debray, V. et al., 2019: Agroecological practices for climate change adaptation in semiarid and subhumid Africa. 37 AGROECOLOGY AND SUSTAINABLE FOOD SYSTEMS, 43(4), 429-456, doi:10.1080/21683565.2018.1509166. 38
DeFries, R. S. et al., 2019: The missing economic risks in assessments of climate change impacts. 39 Dell, M., B. F. Jones and B. A. Olken, 2012: Temperature Shocks and Economic Growth: Evidence from the Last Half 40
Century. American Economic Journal: Macroeconomics, 4(3), 66-95, doi:10.1257/mac.4.3.66. 41 Dell, M., B. F. Jones and B. A. Olken, 2014: What do we learn from the weather? The new climate-economy literature. 42
Journal of Economic Literature, 52(3), 740-798. 43 Dellink, R., E. Lanzi and J. Chateau, 2019: The sectoral and regional economic consequences of climate change to 44
2060. Environmental and Resource Economics, 72(2), 309-363. 45 Dennig, F. et al., 2015: Inequality, climate impacts on the future poor, and carbon prices. Proceedings of the National 46
Academy of Sciences, 112(52), 15827-15832. 47 Deryugina, T. and S. Hsiang, 2017: The marginal product of climate. National Bureau of Economic Research. 48 Descloux, E. et al., 2012: Climate-Based Models for Understanding and Forecasting Dengue Epidemics, e1470 pp. 49 Detges, A., 2017: Droughts, state-citizen relations and support for political violence in Sub-Saharan Africa: A micro-50
level analysis. Political Geography, 61, 88-98, doi:10.1016/j.polgeo.2017.07.005. 51 Deutsch, C. A. et al., 2018: Increase in crop losses to insect pests in a warming climate. Science, 361(6405), 916-919, 52
doi:10.1126/science.aat3466. 53 Diaz, D. and F. Moore, 2017: Quantifying the economic risks of climate change. Nature Climate Change, 7(11), 774-54
782, doi:10.1038/nclimate3411. 55 Diederichs, N. and D. Roberts, 2016: Climate protection in mega-event greening: the 2010 FIFA World Cup and 56
COP17/CMP7 experiences in Durban, South Africa. CLIMATE AND DEVELOPMENT, 8(4), 376-384, 57 doi:10.1080/17565529.2015.1085361. 58
Dietz, S. and N. Stern, 2015: Endogenous growth, convexity of damage and climate risk: how Nordhaus' framework 59 supports deep cuts in carbon emissions. The Economic Journal, 125(583), 574-620. 60
Dietz, S. and F. Venmans, 2019: Cumulative carbon emissions and economic policy: in search of general principles. 61 Journal of Environmental Economics and Management, 96, 108-129. 62
ACCEPTED VERSIO
N
SUBJECT TO FIN
AL EDITS
FINAL DRAFT Chapter 16 IPCC WGII Sixth Assessment Report
Do Not Cite, Quote or Distribute 16-138 Total pages: 173
Diffenbaugh, N. S. and M. Burke, 2019: Global warming has increased global economic inequality. Proceedings of the 1 National Academy of Sciences, 116(20), 9808-9813. 2
Diffenbaugh, N. S. et al., 2017: Quantifying the influence of global warming on unprecedented extreme climate events. 3 Proceedings of the National Academy of Sciences, 114(19), 4881-4886. 4
Djoudi, H. et al., 2016: Beyond dichotomies: Gender and intersecting inequalities in climate change studies. AMBIO, 5 45(3, SI), S248-S262, doi:10.1007/s13280-016-0825-2. 6
Doelman, J. C., E. Stehfest, A. Tabeau and H. van Meijl, 2019: Making the Paris agreement climate targets consistent 7 with food security objectives. Global Food Security, 23, 93-103, doi:10.1016/j.gfs.2019.04.003. 8
Doelman, J. C. et al., 2020: Afforestation for climate change mitigation: Potentials, risks and trade-offs. Global Change 9 Biology, 26(3), 1576-1591, doi:10.1111/gcb.14887. 10
Donner, S. D., G. J. M. Rickbeil and S. F. Heron, 2017: A new, high-resolution global mass coral bleaching database. 11 PLOS ONE, 12(4), e0175490, doi:10.1371/journal.pone.0175490. 12
Dosio, A., L. Mentaschi, E. M. Fischer and K. Wyser, 2018: Extreme heat waves under 1.5 °C and 2 °C global 13 warming. Environmental Research Letters, 13(5), 054006, doi:10.1088/1748-9326/aab827. 14
Dottori, F. et al., 2018: Increased human and economic losses from river flooding with anthropogenic warming. Nature 15 Climate Change, 8(9), 781-786, doi:10.1038/s41558-018-0257-z. 16
Drupp, M. A. and M. C. Hänsel, 2021: Relative prices and climate policy: How the scarcity of nonmarket goods drives 17 policy evaluation. American Economic Journal: Economic Policy, 13(1), 168-201. 18
du Toit, J. C. O., T. G. O'Connor and L. Van den Berg, 2015: Photographic evidence of fire-induced shifts from dwarf-19 shrub- to grass-dominated vegetation in Nama-Karoo. South African Journal of Botany, 101, 148-152, 20 doi:10.1016/j.sajb.2015.06.002. 21
Duan, L., L. Cao, G. Bala and K. Caldeira, 2020: A Model‐Based Investigation of Terrestrial Plant Carbon Uptake 22 Response to Four Radiation Modification Approaches. J. Geophys. Res. D: Atmos., 125(9), 413, 23 doi:10.1029/2019JD031883. 24
Dube, T., P. Moyo, M. Ncube and D. Nyathi, 2016: The Impact of Climate Change on Agro-Ecological Based 25 Livelihoods in Africa: A Review. Journal of Sustainable Development, 9(1), 256, doi:10.5539/jsd.v9n1p256. 26
Duguma, L. A., P. A. Minang and M. van Noordwijk, 2014: Climate Change Mitigation and Adaptation in the Land 27 Use Sector: From Complementarity to Synergy. ENVIRONMENTAL MANAGEMENT, 54(3), 420-432, 28 doi:10.1007/s00267-014-0331-x. 29
Dunn, F. E. et al., 2019: Projections of declining fluvial sediment delivery to major deltas worldwide in response to 30 climate change and anthropogenic stress. Environmental Research Letters, 14(8), 084034, doi:10.1088/1748-31 9326/ab304e. 32
Dunn, R. J. et al., 2020: Development of an updated global land in situ‐based data set of temperature and precipitation 33 extremes: HadEX3. Journal of Geophysical Research: Atmospheres, 125(16), e2019JD032263. 34
Durkalec, A., C. Furgal, M. W. Skinner and T. Sheldon, 2015: Climate change influences on environment as a 35 determinant of Indigenous health: Relationships to place, sea ice, and health in an Inuit community. Social Science 36 & Medicine, 136-137, 17-26, doi:10.1016/j.socscimed.2015.04.026. 37
Duvat, V. K. E. et al., 2021: Risks to future atoll habitability from climate‐driven environmental changes. WIREs 38 Climate Change, doi:10.1002/wcc.700. 39
Dzebo, A., H. Janetschek, C. Brandi and G. Iacobuta, 2018: The Sustainable Development Goals viewed through a 40 climate lens. 4. 41
Dzebo, A. and J. Stripple, 2015: Transnational adaptation governance: An emerging fourth era of adaptation. Global 42 Environmental Change, 35, 423-435, doi:10.1016/j.gloenvcha.2015.10.006. 43
Eastham, S. D., D. W. Keith and S. R. H. Barrett, 2018: Mortality tradeoff between air quality and skin cancer from 44 changes in stratospheric ozone, 034035 pp. 45
Eastin, J., 2016: Fuel to the fire: Natural disasters and the duration of civil conflict. International Interactions, 42(2), 46 322-349. 47
Ebi, K. L. et al., 2021: Burning embers: synthesis of the health risks of climate change. Environmental Research 48 Letters, 16(4), 044042, doi:10.1088/1748-9326/abeadd. 49
Ebi, K. L., N. H. Ogden, J. C. Semenza and A. Woodward, 2017: Detecting and attributing health burdens to climate 50 change. Environmental health perspectives, 125(8), 085004. 51
ECDC, 2021: West Nile virus transmission season 2018: Increase in cases, European Centre for Disease Prevention and 52 Control. Available at: https://www.ecdc.europa.eu/en/west-nile-virus-transmission-season-2018-increase-cases. 53
Edmonds, D. A., R. L. Caldwell, E. S. Brondizio and S. M. O. Siani, 2020: Coastal flooding will disproportionately 54 impact people on river deltas, 4741 pp. 55
Edwards, M. and A. J. Richardson, 2004: Impact of climate change on marine pelagic phenology and trophic mismatch. 56 Nature, 430(7002), 881-884, doi:10.1038/nature02808. 57
EEA, 2019: Climate change adaptation in the agriculture sector in Europe. European Environment Agency, 58 Copenhagen, Denmark. Available at: https://www.eea.europa.eu/publications/cc-adaptation-59 agriculture/at_download/file. 60
Effiong, U. and R. L. Neitzel, 2016: Assessing the direct occupational and public health impacts of solar radiation 61 management with stratospheric aerosols. Environmental Health, 15(1), 1-9. 62
ACCEPTED VERSIO
N
SUBJECT TO FIN
AL EDITS
FINAL DRAFT Chapter 16 IPCC WGII Sixth Assessment Report
Do Not Cite, Quote or Distribute 16-139 Total pages: 173
Eklund, L. and D. Thompson, 2017: Differences in resource management affects drought vulnerability across the 1 borders between Iraq, Syria, and Turkey. Ecology and Society, 22(4), art9, doi:10.5751/ES-09179-220409. 2
El-Hacen, E.-H. M. et al., 2018: Evidence for ‘critical slowing down’ in seagrass: a stress gradient experiment at the 3 southern limit of its range. Scientific Reports, 8(1), 17263, doi:10.1038/s41598-018-34977-5. 4
Elagib, N. A., A. A. Musa and H. M. Sulieman (eds.), Socio-hydrological Framework of Farmer-Drought Feedback: 5 Darfur as a Case Study. 2017, 461-479 pp. ISBN 978-3-319-51856-5 978-3-319-51855-8. 6
Elsanousi, Y. E. A., A. S. Elmahi, I. Pereira and M. Debacker, 2018: Impact of the 2013 floods on the incidence of 7 malaria in Almanagil locality, Gezira State, Sudan. PLoS currents, 10. 8
Emmerling, J. and M. Tavoni, 2018: Exploration of the interactions between mitigation and solar radiation management 9 in cooperative and non-cooperative international governance settings. Glob. Environ. Change, 53, 244-251, 10 doi:10.1016/j.gloenvcha.2018.10.006. 11
Enenkel, M. et al., 2020: Why predict climate hazards if we need to understand impacts? Putting humans back into the 12 drought equation. Climatic Change, 1-16. 13
England, M. I. et al., 2018: Climate change adaptation and cross-sectoral policy coherence in southern Africa. 14 REGIONAL ENVIRONMENTAL CHANGE, 18(7, SI), 2059-2071, doi:10.1007/s10113-018-1283-0. 15
Enquist, B. J. et al., 2019: The commonness of rarity: Global and future distribution of rarity across land plants. Science 16 advances, 5(11), eaaz0414. 17
EPRI, 2021: Repairing the Social Cost of Carbon Framework: Immediate and One Year Steps for Scientifically 18 Reliable Estimates and Use. EPRI, Palo Alto, CA. Available at: 19 https://www.epri.com/research/products/000000003002020523. 20
Epule, T. E., J. D. Ford, S. Lwasa and L. Lepage, 2017: Climate change adaptation in the Sahel. Environmental Science 21 and Policy, 75, 121-137, doi:10.1016/j.envsci.2017.05.018. 22
Ercin, E., T. I. E. Veldkamp and J. Hunink, 2021: Cross-border climate vulnerabilities of the European Union to 23 drought. Nature Communications, 12(1), 3322, doi:10.1038/s41467-021-23584-0. 24
Errickson, F. C. et al., 2021: Equity is more important for the social cost of methane than climate uncertainty. Nature, 25 592(7855), 564-570. 26
Essl, F. et al., 2015: Delayed biodiversity change: no time to waste. Trends in Ecology & Evolution, 30(7), 375-378, 27 doi:10.1016/j.tree.2015.05.002. 28
Etongo, D., I. N. S. Djenontin, M. Kanninen and K. Fobissie, 2015: Smallholders' Tree Planting Activity in the Ziro 29 Province, Southern Burkina Faso: Impacts on Livelihood and Policy Implications. FORESTS, 6(8), 2655-2677, 30 doi:10.3390/f6082655. 31
European Environment, A., 2020: Monitoring and evaluation of national adaptation policies throughout the policy 32 cycle. Publications Office, LU. 33
Evans, J. et al., 2010: Can oceanic foams limit global warming? Climate Research, 42(2), 155-160. 34 Fader, M. et al., 2010: Virtual water content of temperate cereals and maize: Present and potential future patterns. 35
Journal of Hydrology, 384(3), 218-231, doi:10.1016/j.jhydrol.2009.12.011. 36 Fahad, S. and J. Wang, 2018: Farmers’ risk perception, vulnerability, and adaptation to climate change in rural Pakistan. 37
Land Use Policy, 79, 301-309, doi:10.1016/j.landusepol.2018.08.018. 38 Fakhruddin, B. S. and L. Schick, 2019: Benefits of economic assessment of cyclone early warning systems-A case 39
study on Cyclone Evan in Samoa. Progress in Disaster Science, 2, 100034. 40 Fang, X. et al., 2017: Isolating and quantifying the effects of climate and CO2 changes (1980–2014) on the net primary 41
productivity in arid and semiarid China. Forests, 8(3), 60. 42 Fang, Z., P. T. Freeman, C. B. Field and K. J. Mach, 2018: Reduced sea ice protection period increases storm exposure 43
in Kivalina, Alaska. Arctic Science, 4(4), 525-537, doi:10.1139/as-2017-0024. 44 FAO et al., 2017: The State of Food Security and Nutrition in the World 2017. FAO, Rome. 45 FAO et al., 2018: The State of Food Security and Nutrition in the World: Building climate resilience for food security 46
and nutrition., Food and Agriculture Organization of the United Nations, Rome. ISBN 978-92-5-130571-3. 47 Faulwasser, T., C. M. Kellett and S. R. Weller, 2018: MPC-DICE: An open-source Matlab implementation of receding 48
horizon solutions to DICE. IFAC-PapersOnLine, 51(5), 120-125. 49 Fawcett, D. et al., 2018: Inuit adaptability to changing environmental conditions over an 11-year period in Ulukhaktok, 50
Northwest Territories. Polar Record, 54(2), 119-132, doi:10.1017/S003224741800027X. 51 Fedele, G., B. Locatelli, H. Djoudi and M. J. Colloff, 2018: Reducing risks by transforming landscapes: Cross-scale 52
effects of land-use changes on ecosystem services. PLOS ONE, 13(4), doi:10.1371/journal.pone.0195895. 53 Feitelson, E. and A. Tubi, 2017: A main driver or an intermediate variable? Climate change, water and security in the 54
Middle East. Global Environmental Change, 44, 39-48, doi:10.1016/j.gloenvcha.2017.03.001. 55 Fekete, A., 2019: Critical infrastructure and flood resilience: Cascading effects beyond water. Wiley Interdisciplinary 56
Reviews-Water, 6(5), e1370, doi:10.1002/wat2.1370. 57 Felbermayr, G. and J. Gröschl, 2014: Naturally negative: The growth effects of natural disasters. Journal of 58
development economics, 111, 92-106. 59 Feldmeyer, D., J. Birkmann and T. Welle, 2017: Development of Human Vulnerability 2012–2017. Journal of Extreme 60
Events, 04(04), 1850005, doi:10.1142/S2345737618500057. 61 Felgenhauer, T., 2015: Addressing the limits to adaptation across four damage–response systems. Environmental 62
Science & Policy, 50, 214-224, doi:10.1016/j.envsci.2015.03.003. 63
ACCEPTED VERSIO
N
SUBJECT TO FIN
AL EDITS
FINAL DRAFT Chapter 16 IPCC WGII Sixth Assessment Report
Do Not Cite, Quote or Distribute 16-140 Total pages: 173
Fenger‐Nielsen, R. et al., 2020: Arctic archaeological sites threatened by climate change: A regional multi‐threat 1 assessment of sites in south‐west Greenland. Archaeometry, arcm.12593, doi:10.1111/arcm.12593. 2
Few, R. et al., 2017: Transformation, adaptation and development: relating concepts to practice. PALGRAVE 3 COMMUNICATIONS, 3, doi:10.1057/palcomms.2017.92. 4
Fey, S. B. et al., 2015: Recent shifts in the occurrence, cause, and magnitude of animal mass mortality events. 5 Proceedings of the National Academy of Sciences, 112(4), 1083-1088, doi:10.1073/pnas.1414894112. 6
Fezzi, C., A. R. Harwood, A. A. Lovett and I. J. Bateman, 2015: The environmental impact of climate change 7 adaptation on land use and water quality (vol 5, pg 255, 2015). NATURE CLIMATE CHANGE, 5(3). 8
Field, L. et al., 2018: Increasing Arctic sea ice albedo using localized reversible geoengineering. Earth's Future, 6(6), 9 882-901. 10
Finger, F. et al., 2016: Mobile phone data highlights the role of mass gatherings in the spreading of cholera outbreaks. 11 Proceedings of the National Academy of Sciences, 113(23), 6421-6426. 12
Fischer, A. P., 2019a: Adapting and coping with climate change in temperate forests. GLOBAL ENVIRONMENTAL 13 CHANGE-HUMAN AND POLICY DIMENSIONS, 54, 160-171, doi:10.1016/j.gloenvcha.2018.10.011. 14
Fischer, A. P., 2019b: Characterizing behavioral adaptation to climate change in temperate forests. LANDSCAPE AND 15 URBAN PLANNING, 188, 72-79, doi:10.1016/j.landurbplan.2018.09.024. 16
Fischer, E. M. and R. Knutti, 2015: Anthropogenic contribution to global occurrence of heavy-precipitation and high-17 temperature extremes. Nature Climate Change, 5(6), 560-564. 18
Fisher-Vanden, K., D. Popp and I. S. Wing, 2014: Introduction to the special issue on climate adaptation: improving the 19 connection between empirical research and integrated assessment models. Energy Economics, 46, 495-499. 20
Fisher, M. et al., 2015: Drought tolerant maize for farmer adaptation to drought in sub-Saharan Africa: Determinants of 21 adoption in eastern and southern Africa. CLIMATIC CHANGE, 133(2), 283-299, doi:10.1007/s10584-015-1459-2. 22
Flegal, J. A. and A. Gupta, 2018: Evoking equity as a rationale for solar geoengineering research? Scrutinizing 23 emerging expert visions of equity. International Environmental Agreements: Politics, Law and Economics, 18(1), 24 45-61, doi:10.1007/s10784-017-9377-6. 25
Flegal, J. A., A.-M. Hubert, D. R. Morrow and J. B. Moreno-Cruz, 2019: Solar Geoengineering: Social Science, Legal, 26 Ethical, and Economic Frameworks. Annu. Rev. Environ. Resour., 44(1), 399-423, doi:10.1146/annurev-environ-27 102017-030032. 28
Foden, W. B. et al., 2013: Identifying the world's most climate change vulnerable species: a systematic trait-based 29 assessment of all birds, amphibians and corals. PloS one, 8(6), e65427. 30
Folkerts, M. A. et al., 2020: Long Term Adaptation to Heat Stress: Shifts in the Minimum Mortality Temperature in the 31 Netherlands. FRONTIERS IN PHYSIOLOGY, 11, doi:10.3389/fphys.2020.00225. 32
Fomby, T., Y. Ikeda and N. V. Loayza, 2013: The Growth Aftermath of Natural Disasters. Journal of Applied 33 Econometrics, 28(3), 412-434, doi:10.1002/jae.1273. 34
Ford, J. D. and L. Berrang-Ford, 2016: The 4Cs of adaptation tracking: consistency, comparability, comprehensiveness, 35 coherency. MITIGATION AND ADAPTATION STRATEGIES FOR GLOBAL CHANGE, 21(6), 839-859, 36 doi:10.1007/s11027-014-9627-7. 37
Ford, J. D. et al., 2015a: Adaptation tracking for a post-2015 climate agreement. NATURE CLIMATE CHANGE, 5(11), 38 967-969, doi:10.1038/nclimate2744. 39
Ford, J. D. et al., 2015b: The status of climate change adaptation in Africa and Asia. REGIONAL ENVIRONMENTAL 40 CHANGE, 15(5, SI), 801-814, doi:10.1007/s10113-014-0648-2. 41
Ford, J. D. et al., 2013: How to Track Adaptation to Climate Change: A Typology of Approaches for National-Level 42 Application. ECOLOGY AND SOCIETY, 18(3), doi:10.5751/ES-05732-180340. 43
Ford, J. D. and D. King, 2015: Coverage and framing of climate change adaptation in the media: A review of influential 44 North American newspapers during 1993-2013. ENVIRONMENTAL SCIENCE & POLICY, 48, 137-146, 45 doi:10.1016/j.envsci.2014.12.003. 46
Ford, J. D., G. McDowell and T. Pearce, 2015c: The adaptation challenge in the Arctic. Nature Climate Change, 5(12), 47 1046-1053. 48
Formetta, G. and L. Feyen, 2019: Empirical evidence of declining global vulnerability to climate-related hazards. 49 Global Environmental Change, 57, 101920. 50
Forster, J., I. R. Lake, A. R. Watkinson and J. A. Gill, 2014: Marine dependent livelihoods and resilience to 51 environmental change: A case study of Anguilla. Marine Policy, 45, 204-212, doi:10.1016/j.marpol.2013.10.017. 52
Forzieri, G. et al., 2018: Escalating impacts of climate extremes on critical infrastructures in Europe. Global 53 Environmental Change-Human and Policy Dimensions, 48, 97-107, doi:10.1016/j.gloenvcha.2017.11.007. 54
Fox-Kemper, B. et al., 2021: Ocean, Cryosphere and Sea Level Change. In: Climate Change 2021: The Physical 55 Science Basis. Contribution of Working Group I to the Sixth Assessment Report of the Intergovernmental Panel on 56 Climate Change [Masson-Delmotte, V., P. Zhai, A. Pirani, S. L. Connors, C. Péan, S. Berger, N. Caud, Y. Chen, 57 L. Goldfarb, M. I. Gomis, M. Huang, K. Leitzell, E. Lonnoy, J. B. R. Matthews, T. K. Maycock, T. Waterfield, O. 58 Yelekçi, R. Yu and B. Zhou (eds.)]. Cambridge University Press. 59
Fraga, H., M. Moriondo, L. Leolini and J. A. Santos, 2021: Mediterranean Olive Orchards under Climate Change: A 60 Review of Future Impacts and Adaptation Strategies. AGRONOMY-BASEL, 11(1), 61 doi:10.3390/agronomy11010056. 62
ACCEPTED VERSIO
N
SUBJECT TO FIN
AL EDITS
FINAL DRAFT Chapter 16 IPCC WGII Sixth Assessment Report
Do Not Cite, Quote or Distribute 16-141 Total pages: 173
Frainer, A. et al., 2017: Climate-driven changes in functional biogeography of Arctic marine fish communities. 1 Proceedings of the National Academy of Sciences, 114(46), 12202-12207, doi:10.1073/pnas.1706080114. 2
Frame, D. J., M. F. Wehner, I. Noy and S. M. Rosier, 2020: The economic costs of Hurricane Harvey attributable to 3 climate change. Climatic Change, 160(2), 271-281. 4
Franco Gavonel, M. et al., 2021: The migration-sustainability paradox: transformations in mobile worlds. Current 5 Opinion in Environmental Sustainability, 49, 98-109, doi:10.1016/j.cosust.2021.03.013. 6
Franks, S. J., J. J. Weber and S. N. Aitken, 2014: Evolutionary and plastic responses to climate change in terrestrial 7 plant populations. EVOLUTIONARY APPLICATIONS, 7(1, SI), 123-139, doi:10.1111/eva.12112. 8
Free, C. M. et al., 2019: Impacts of historical warming on marine fisheries production. Science, 363(6430), 979-983, 9 doi:10.1126/science.aau1758. 10
Freeman, L., 2017: Environmental Change, Migration, and Conflict in Africa: A Critical Examination of the 11 Interconnections. The Journal of Environment & Development, 26(4), 351-374, doi:10.1177/1070496517727325. 12
Froehlich, H. E., R. R. Gentry and B. S. Halpern, 2018: Global change in marine aquaculture production potential under 13 climate change. Nature Ecology & Evolution, 2(11), 1745-1750. 14
Fröhlich, C. J., 2016: Climate migrants as protestors? Dispelling misconceptions about global environmental change in 15 pre-revolutionary Syria. Contemporary Levant, 1(1), 38-50, doi:10.1080/20581831.2016.1149355. 16
Frumhoff, P. C. and J. C. Stephens, 2018: Towards legitimacy of the solar geoengineering research enterprise. 17 Philosophical transactions of the royal society A: mathematical, Physical and Engineering Sciences, 376(2119), 18 20160459. 19
Fujimori, S. et al., 2019: A multi-model assessment of food security implications of climate change mitigation. Nature 20 Sustainability, 2(5), 386-396, doi:10.1038/s41893-019-0286-2. 21
Furman, C., C. Roncoli, D. R. Nelson and G. Hoogenboom, 2014: Growing food, growing a movement: climate 22 adaptation and civic agriculture in the southeastern United States. AGRICULTURE AND HUMAN VALUES, 23 31(1), 69-82, doi:10.1007/s10460-013-9458-2. 24
Fuso-Nerini, F. et al., 2019: Connecting climate action with other Sustainable Development Goals. Nature 25 Sustainability, 2(8), 674-680, doi:10.1038/s41893-019-0334-y. 26
Fuss, S. et al., 2014: Betting on negative emissions, 850-853 pp. 27 Fuss, S. et al., 2018: Negative emissions—Part 2: Costs, potentials and side effects, 063002 pp. 28 Gagnon-Lebrun, F. and S. Agrawala, 2007: Implementing adaptation in developed countries: an analysis of progress 29
and trends. CLIMATE POLICY, 7(5), 392-408. 30 Galappaththi, E. K., J. D. Ford, E. M. Bennett and F. Berkes, 2019: Climate change and community fisheries in the 31
arctic: A case study from Pangnirtung, Canada. Journal of Environmental Management, 250, 109534, 32 doi:10.1016/j.jenvman.2019.109534. 33
Gao, J. and B. F. Mills, 2018: Weather Shocks, Coping Strategies, and Consumption Dynamics in Rural Ethiopia. 34 WORLD DEVELOPMENT, 101, 268-283, doi:10.1016/j.worlddev.2017.09.002. 35
Garcia de Jalon, S., A. Iglesias and A. P. Barnes, 2016: Drivers of farm-level adaptation to climate change in Africa: an 36 evaluation by a composite index of potential adoption. MITIGATION AND ADAPTATION STRATEGIES FOR 37 GLOBAL CHANGE, 21(5), 779-798, doi:10.1007/s11027-014-9626-8. 38
Garschagen, M., 2015: Risky Change? Vietnam's Urban Flood Risk Governance between Climate Dynamics and 39 Transformation. Pacific Affairs, 88(3), 599-621, doi:10.5509/2015883599. 40
Garschagen, M. et al., 2019: Key concepts of risk, adaptation, resilience and transformation. In: IPCC Special Report 41 on the Ocean and Cryosphere in a Changing Climate, pp. 87-90. 42
Garschagen, M. et al., 2021a: The consideration of future risk trends in national adaptation planning: conceptual gaps 43 and empirical lessons. Climate Risk Management. 44
Garschagen, M., D. Doshi, J. Reith and M. Hagenlocher, 2021b: Global patterns of disaster and climate risk – An 45 analysis of the consistency of leading index based assessments and their results Climatic Change. 46
Garschagen, M., M. Hagenlocher, second, R. Sabelfeld and Y. J. Lee, 2016: Infrastructure as a risk factor. In: World 47 Risk Report 2016: Focus on Logistics and Infrastructure. Bündnis Entwicklung Hilft & United Nations 48 University, pp. 14-22. ISBN 978-3-946785-02-6. 49
Garschagen, M. and P. Romero-Lankao, 2015: Exploring the relationships between urbanization trends and climate 50 change vulnerability. Climatic Change, 133(1), 37-52, doi:10.1007/s10584-013-0812-6. 51
Gasparini, B., Z. McGraw, T. Storelvmo and U. Lohmann, 2020: To what extent can cirrus cloud seeding counteract 52 global warming? Environmental Research Letters, 15(5), 054002. 53
Gasparrini, A. et al., 2015: Mortality risk attributable to high and low ambient temperature: a multicountry 54 observational study. The Lancet, 386(9991), 369-375, doi:10.1016/S0140-6736(14)62114-0. 55
Gasparrini, A. et al., 2017: Projections of temperature-related excess mortality under climate change scenarios. The 56 Lancet Planetary Health, 1(9), e360-e367. 57
Gatti, L. V. et al., 2021: Amazonia as a carbon source linked to deforestation and climate change. Nature, 595(7867), 58 388-393, doi:10.1038/s41586-021-03629-6. 59
Gattuso, J.-P. et al., 2018: Ocean solutions to address climate change and its effects on marine ecosystems. Frontiers in 60 Marine Science, 5, 337. 61
Gaupp, F., J. Hall, S. Hochrainer-Stigler and S. Dadson, 2020: Changing risks of simultaneous global breadbasket 62 failure. Nature Climate Change, 10(1), 54-57, doi:10.1038/s41558-019-0600-z. 63
ACCEPTED VERSIO
N
SUBJECT TO FIN
AL EDITS
FINAL DRAFT Chapter 16 IPCC WGII Sixth Assessment Report
Do Not Cite, Quote or Distribute 16-142 Total pages: 173
Gaupp, F., J. Hall, D. Mitchell and S. Dadson, 2019: Increasing risks of multiple breadbasket failure under 1.5 and 2 C 1 global warming. Agricultural Systems, 175, 34-45. 2
Gautier, D., D. Denis and B. Locatelli, 2016: Impacts of drought and responses of rural populations in West Africa: a 3 systematic review. WILEY INTERDISCIPLINARY REVIEWS-CLIMATE CHANGE, 7(5), 666-681, 4 doi:10.1002/wcc.411. 5
Gbegbelegbe, S. et al., 2018: Smallholder farmers in eastern Africa and climate change: a review of risks and adaptation 6 options with implications for future adaptation programmes. CLIMATE AND DEVELOPMENT, 10(4), 289-306, 7 doi:10.1080/17565529.2017.1374236. 8
Genua-Olmedo, A., C. Alcaraz, N. Caiola and C. Ibáñez, 2016: Sea level rise impacts on rice production: The Ebro 9 Delta as an example. Science of The Total Environment, 571, 1200-1210, doi:10.1016/j.scitotenv.2016.07.136. 10
Georgeson, L., M. Maslin, M. Poessinouw and S. Howard, 2016: Adaptation responses to climate change differ 11 between global megacities. NATURE CLIMATE CHANGE, 6(6), 584+, doi:10.1038/NCLIMATE2944. 12
Gerlagh, R. and T. O. Michielsen, 2015: Moving targets—cost-effective climate policy under scientific uncertainty. 13 Climatic change, 132(4), 519-529. 14
Gerlak, A. K. et al., 2018: Climate risk management and the electricity sector. Climate Risk Management, 19, 12-22, 15 doi:10.1016/j.crm.2017.12.003. 16
Gettelman, A. et al., 2018: Projections of future tropical cyclone damage with a high-resolution global climate model. 17 Climatic Change, 146(3-4), 575-585. 18
Gholampour, R., M. Darand and A. H. Halabian, 2019: Impacts of cold and hot temperatures on mortality rate in 19 Isfahan, Iran. Journal of Thermal Biology, 86, 102453. 20
Giardino, A., K. Nederhoff and M. Vousdoukas, 2018: Coastal hazard risk assessment for small islands: assessing the 21 impact of climate change and disaster reduction measures on Ebeye (Marshall Islands). Regional Environmental 22 Change, 18(8), 2237-2248, doi:10.1007/s10113-018-1353-3. 23
Gioli, G., T. Khan, S. Bisht and J. Scheffran, 2014: Migration as an Adaptation Strategy and its Gendered Implications 24 A Case Study From the Upper Indus Basin. MOUNTAIN RESEARCH AND DEVELOPMENT, 34(3, SI), 255-265, 25 doi:10.1659/MRD-JOURNAL-D-13-00089.1. 26
Giosan, L., J. Syvitski, S. Constantinescu and J. Day, 2014: Climate change: Protect the world's deltas. Nature, 27 516(7529), 31-33, doi:10.1038/516031a. 28
Glanemann, N., S. N. Willner and A. Levermann, 2020: Paris Climate Agreement passes the cost-benefit test. Nature 29 communications, 11(1), 1-11. 30
Gleick, P. H., 2014: Water, Drought, Climate Change, and Conflict in Syria. Weather, Climate, and Society, 6(3), 331-31 340, doi:10.1175/WCAS-D-13-00059.1. 32
Glienke, S., P. J. Irvine and M. G. Lawrence, 2015: The impact of geoengineering on vegetation in experiment G1 of 33 the GeoMIP. J. Geophys. Res. D: Atmos., 120(19), 10-196. 34
Golden, C. D. et al., 2016: Nutrition: Fall in fish catch threatens human health. Nature News, 534(7607), 317, 35 doi:10.1038/534317a. 36
Goldstein, A., W. R. Turner, J. Gladstone and D. G. Hole, 2019: The private sector’s climate change risk and adaptation 37 blind spots. Nature Climate Change, 9(1), 18-25, doi:10.1038/s41558-018-0340-5. 38
Gomez-Echeverri, L., 2018: Climate and development: enhancing impact through stronger linkages in the 39 implementation of the Paris Agreement and the Sustainable Development Goals (SDGs). Philosophical 40 Transactions of the Royal Society A: Mathematical, Physical and Engineering Sciences, 376(2119), 20160444. 41
Gonzalez-Sanchez, E. J. et al., 2019: Meta-analysis on carbon sequestration through Conservation Agriculture in Africa. 42 SOIL & TILLAGE RESEARCH, 190, 22-30, doi:10.1016/j.still.2019.02.020. 43
González, F. A. I., M. E. Santos and S. London, 2021: Persistent effects of natural disasters on human development: 44 quasi-experimental evidence for Argentina. Environment, Development and Sustainability, 23(7), 10432-10454, 45 doi:10.1007/s10668-020-01064-7. 46
Gosling, J. P., 2018: SHELF: The Sheffield Elicitation Framework. In: Elicitation [Dias, L. C., A. Morton and J. 47 Quigley (eds.)]. Springer International Publishing, Cham, pp. 61-93. ISBN 978-3-319-65051-7 978-3-319-65052-48 4. 49
Gosling, S. N. and N. W. Arnell, 2016: A global assessment of the impact of climate change on water scarcity. Climatic 50 Change, 134(3), 371-385, doi:10.1007/s10584-013-0853-x. 51
Götz, L., I. Djuric and O. Nivievskyi, 2016: Regional price effects of extreme weather events and wheat export controls 52 in Russia and Ukraine. Journal of Agricultural Economics, 67(3), 741-763. 53
Goulden, M. C., W. N. Adger, E. H. Allison and D. Conway, 2013: Limits to Resilience from Livelihood 54 Diversification and Social Capital in Lake Social-Ecological Systems. ANNALS OF THE ASSOCIATION OF 55 AMERICAN GEOGRAPHERS, 103(4), 906-924, doi:10.1080/00045608.2013.765771. 56
Graham, N. T. et al., 2020: Future changes in the trading of virtual water. Nature Communications, 11(1), 1-7, 57 doi:10.1038/s41467-020-17400-4. 58
Grecequet, M., J. DeWaard, J. J. Hellmann and G. J. Abel, 2017: Climate Vulnerability and Human Migration in Global 59 Perspective. Sustainability, 9(5), 720, doi:10.3390/su9050720. 60
Greenstone, M., E. Kopits and A. Wolverton, 2013: Developing a social cost of carbon for us regulatory analysis: A 61 methodology and interpretation. 7, 23-46, doi:10.1093/reep/res015. 62
ACCEPTED VERSIO
N
SUBJECT TO FIN
AL EDITS
FINAL DRAFT Chapter 16 IPCC WGII Sixth Assessment Report
Do Not Cite, Quote or Distribute 16-143 Total pages: 173
Greve, P. et al., 2018: Global assessment of water challenges under uncertainty in water scarcity projections. Nature 1 Sustainability, 1(9), 486-494, doi:10.1038/s41893-018-0134-9. 2
Grubb, M., C. Wieners and P. Yang, 2021: Modeling myths: On DICE and dynamic realism in integrated assessment 3 models of climate change mitigation. Wiley Interdisciplinary Reviews: Climate Change, 12(3), e698. 4
Grusson, Y., I. Wesstrom and A. Joel, 2021: Impact of climate change on Swedish agriculture: Growing season rain 5 deficit and irrigation need. AGRICULTURAL WATER MANAGEMENT, 251, doi:10.1016/j.agwat.2021.106858. 6
Gudmundsson, L. et al., 2021: Globally observed trends in mean and extreme river flow attributed to climate change. 7 Science, 371(6534), 1159-1162, doi:10.1126/science.aba3996. 8
Gudmundsson, L. et al., 2019: Observed trends in global indicators of mean and extreme streamflow. Geophysical 9 Research Letters, 46(2), 756-766. 10
Gugliotta, M. et al., 2017: Process regime, salinity, morphological, and sedimentary trends along the fluvial to marine 11 transition zone of the mixed-energy Mekong River delta, Vietnam. Continental Shelf Research, 147, 7-26, 12 doi:10.1016/j.csr.2017.03.001. 13
Guiot, J. and W. Cramer, 2016: Climate change: The 2015 Paris Agreement thresholds and Mediterranean basin 14 ecosystems. Science, 354(6311), 465-468. 15
Guivarch, C. and A. Pottier, 2018: Climate damage on production or on growth: what impact on the social cost of 16 carbon? Environmental Modeling & Assessment, 23(2), 117-130. 17
Gulev, S. K. et al., 2021: Changing State of the Climate System. In: Climate Change 2021: The Physical Science Basis. 18 Contribution of Working Group I to the Sixth Assessment Report of the Intergovernmental Panel on Climate 19 Change [Masson-Delmotte, V., P. Zhai, A. Pirani, S. L. Connors, C. Péan, S. Berger, N. Caud, Y. Chen, L. 20 Goldfarb, M. I. Gomis, M. Huang, K. Leitzell, E. Lonnoy, J. B. R. Matthews, T. K. Maycock, T. Waterfield, O. 21 Yelekçi, R. Yu and B. Zhou (eds.)]. Cambridge University Press. 22
Gundersen, V., B. P. Kaltenborn and D. R. Williams, 2016: A bridge over troubled water: A contextual analysis of 23 social vulnerability to climate change in a riverine landscape in south-east Norway. NORSK GEOGRAFISK 24 TIDSSKRIFT-NORWEGIAN JOURNAL OF GEOGRAPHY, 70(4), 216-229, 25 doi:10.1080/00291951.2016.1194317. 26
Guo, D. et al., 2020: Attribution of historical near-surface permafrost degradation to anthropogenic greenhouse gas 27 warming. Environmental Research Letters, 15(8), 084040, doi:10.1088/1748-9326/ab926f. 28
Guo, Y. et al., 2018: Quantifying excess deaths related to heatwaves under climate change scenarios: A multicountry 29 time series modelling study. PLOS Medicine, 15(7), e1002629, doi:10.1371/journal.pmed.1002629. 30
Guodaar, L., A. Beni and P. Benebere, 2017: Using a mixed-method approach to explore the spatiality of adaptation 31 practices of tomato farmers to climate variability in the Offinso North District, Ghana. Cogent Social Sciences, 32 3(1), doi:10.1080/23311886.2016.1273747. 33
Guppy, L., P. Mehta and M. Qadir, 2019: Sustainable development goal 6: two gaps in the race for indicators. 34 Sustainability Science, 14(2), 501-513, doi:10.1007/s11625-018-0649-z. 35
Gupta, A. et al., 2020: Anticipatory governance of solar geoengineering: conflicting visions of the future and their links 36 to governance proposals. Curr Opin Environ Sustain, 45, 10-19, doi:10.1016/j.cosust.2020.06.004. 37
Ha’apio, M. O., M. Wairiu, R. Gonzalez and K. Morrison, 2018: Transformation of rural communities: lessons from a 38 local self-initiative for building resilience in the Solomon Islands. Local Environment, 23(3), 352-365. 39
Haasnoot, M. et al., 2012: Exploring pathways for sustainable water management in river deltas in a changing 40 environment. Climatic Change, 115(3-4), 795-819, doi:10.1007/s10584-012-0444-2. 41
Haeffner, M., J. A. Baggio and K. Galvin, 2018: Investigating environmental migration and other rural drought 42 adaptation strategies in Baja California Sur, Mexico. REGIONAL ENVIRONMENTAL CHANGE, 18(5, SI), 1495-43 1507, doi:10.1007/s10113-018-1281-2. 44
Hagenlocher, M., F. G. Renaud, S. Haas and Z. Sebesvari, 2018: Vulnerability and risk of deltaic social-ecological 45 systems exposed to multiple hazards. Science of The Total Environment, 631-632, 71-80, 46 doi:10.1016/j.scitotenv.2018.03.013. 47
Haji, J. and B. Legesse, 2017: Impact of sedentarization program on the livelihood and food security of Ethiopian 48 pastoralists. JOURNAL OF ARID ENVIRONMENTS, 136, 45-53, doi:10.1016/j.jaridenv.2016.10.007. 49
Hallegatte, S., 2012: A cost effective solution to reduce disaster losses in developing countries: hydro-meteorological 50 services, early warning, and evacuation. World Bank policy research working paper,(6058). 51
Hallegatte, S. et al., 2016: Shock Waves: Managing the Impacts of Climate Change on Poverty. The World Bank. ISBN 52 978-1-4648-0673-5 978-1-4648-0674-2. 53
Hallegatte, S., J. Rentschler and J. Rozenberg, 2019: Lifelines: The Resilient Infrastructure Opportunity. The World 54 Bank. ISBN 978-1-4648-1430-3 978-1-4648-1431-0. 55
Hallegatte, S. and J. Rozenberg, 2017: Climate change through a poverty lens. Nature Climate Change, 7(4), 250-256, 56 doi:10.1038/nclimate3253. 57
Hallegatte, S., A. Vogt-Schilb, M. Bangalore and J. Rozenberg, 2017: Unbreakable. Building the Resilience of the Poor 58 in the Face of Natural Disasters. 59
Hallegatte, S. et al., 2020: From Poverty to Disaster and Back: a Review of the Literature. Economics of Disasters and 60 Climate Change, 4(1), 223-247, doi:10.1007/s41885-020-00060-5. 61
Hammill, A. and H. Price-Kelly, 2017: Using NDCs, NAPs and the SDGs to Advance Climate-Resilient Development. 62 NDC Partnership, 10. 63
ACCEPTED VERSIO
N
SUBJECT TO FIN
AL EDITS
FINAL DRAFT Chapter 16 IPCC WGII Sixth Assessment Report
Do Not Cite, Quote or Distribute 16-144 Total pages: 173
Han, Q. et al., 2018: Phenological variation decreased carbon uptake in European forests during 1999–2013. Forest 1 Ecology and Management, 427, 45-51, doi:10.1016/j.foreco.2018.05.062. 2
Handmer, J. and J. Nalau, 2019: Understanding Loss and Damage in Pacific Small Island Developing States. In: Loss 3 and Damage from Climate Change: Concepts, Methods and Policy Options [Mechler, R., L. M. Bouwer, T. 4 Schinko, S. Surminski and J. Linnerooth-Bayer (eds.)]. Springer International Publishing, Cham, pp. 365-381. 5 ISBN 978-3-319-72026-5. 6
Hannah, L. et al., 2020: 30% land conservation and climate action reduces tropical extinction risk by more than 50%. 7 Ecography. 8
Haraguchi, M. and U. Lall, 2015: Flood risks and impacts: A case study of Thailand’s floods in 2011 and research 9 questions for supply chain decision making. International Journal of Disaster Risk Reduction, 14, 256-272, 10 doi:10.1016/j.ijdrr.2014.09.005. 11
Harari, M. and E. L. Ferrara, 2018: Conflict, Climate, and Cells: A Disaggregated Analysis. The Review of Economics 12 and Statistics, 100(4), 594-608, doi:10.1162/rest_a_00730. 13
Harding, A. R. et al., 2020: Climate econometric models indicate solar geoengineering would reduce inter-country 14 income inequality. Nat. Commun., 11(1), 227, doi:10.1038/s41467-019-13957-x. 15
Harrington, L. J., D. Frame, A. D. King and F. E. L. Otto, 2018: How Uneven Are Changes to Impact-Relevant Climate 16 Hazards in a 1.5 °C World and Beyond? Geophysical Research Letters, 45(13), 6672-6680, 17 doi:10.1029/2018GL078888. 18
Harris, N. L. et al., 2021: Global maps of twenty-first century forest carbon fluxes. Nature Climate Change, 11(3), 234-19 240, doi:10.1038/s41558-020-00976-6. 20
Hasegawa, T. et al., 2018: Risk of increased food insecurity under stringent global climate change mitigation policy. 21 Nature Climate Change, 8(8), 699-703, doi:10.1038/s41558-018-0230-x. 22
Hasegawa, T. et al., 2014: Climate Change Impact and Adaptation Assessment on Food Consumption Utilizing a New 23 Scenario Framework. Environmental Science & Technology, 48(1), 438-445, doi:10.1021/es4034149. 24
Hauer, M. E., 2017: Migration induced by sea-level rise could reshape the US population landscape. Nature Climate 25 Change, 7, 321–325 doi:10.1038/nclimate3271. 26
Hauer, M. E. et al., 2020: Sea-level rise and human migration. Nature Reviews Earth & Environment, 1(1), 28-39, 27 doi:10.1038/s43017-019-0002-9. 28
He, Q., G. Zhou, X. Lü and M. Zhou, 2019: Climatic suitability and spatial distribution for summer maize cultivation in 29 China at 1.5 and 2.0° C global warming. Science Bulletin, 64(10), 690-697. 30
Hedlund, J., S. Fick, H. Carlsen and M. Benzie, 2018: Quantifying transnational climate impact exposure: New 31 perspectives on the global distribution of climate risk. Global Environmental Change, 52, 75-85, 32 doi:10.1016/j.gloenvcha.2018.04.006. 33
Hegger, D. L. T., H. L. P. Mees, P. P. J. Driessen and H. A. C. Runhaar, 2017: The Roles of Residents in Climate 34 Adaptation: A systematic review in the case of the Netherlands. ENVIRONMENTAL POLICY AND 35 GOVERNANCE, 27(4), 336-350, doi:10.1002/eet.1766. 36
Hegre, H. et al., 2016: Forecasting civil conflict along the shared socioeconomic pathways. Environmental Research 37 Letters, 11(5), 054002, doi:10.1088/1748-9326/11/5/054002. 38
Helling, A. P., D. S. Conner, S. N. Heiss and L. S. Berlin, 2015: Economic Analysis of Climate Change Best 39 Management Practices in Vermont Agriculture. AGRICULTURE-BASEL, 5(3), 879-900, 40 doi:10.3390/agriculture5030879. 41
Helwegen, K. G., C. E. Wieners, J. E. Frank and H. A. Dijkstra, 2019: Complementing 42 CO&lt;sub&gt;2&lt;/sub&gt; emission reduction by solar radiation management might 43 strongly enhance future welfare, 453-472 pp. 44
Henderson, J. V., A. Storeygard and U. Deichmann, 2017: Has climate change driven urbanization in Africa? Journal of 45 development economics, 124, 60-82. 46
Herrador, B. R. G. et al., 2015: Analytical studies assessing the association between extreme precipitation or 47 temperature and drinking water-related waterborne infections: a review. Environmental Health, 14(1), 29. 48
Hertel, T. W. and D. B. Lobell, 2014: Agricultural adaptation to climate change in rich and poor countries: Current 49 modeling practice and potential for empirical contributions. Energy Economics, 46, 562-575, 50 doi:10.1016/j.eneco.2014.04.014. 51
Hess, J. J. et al., 2018: Building Resilience to Climate Change: Pilot Evaluation of the Impact of India's First Heat 52 Action Plan on All-Cause Mortality. JOURNAL OF ENVIRONMENTAL AND PUBLIC HEALTH, 2018, 53 doi:10.1155/2018/7973519. 54
Heutel, G., J. Moreno-Cruz and S. Shayegh, 2018: Solar geoengineering, uncertainty, and the price of carbon, 24-41 pp. 55 Hewitson, B. et al., 2014: Regional Context. In: Climate Change 2014: Impacts, Adaptation, and Vulnerability. Part B: 56
Regional Aspects: Working Group II Contribution to the Fifth Assessment Report of the Intergovernmental Panel 57 on Climate Change [Barros, V. R., C. B. Field, D. J. Dokken, M. D. Mastrandrea, K. J. Mach, T. E. Bilir, M. 58 Chatterjee, K. L. Ebi, Y. O. Estrada, R. C. Genova, B. Girma, E. S. Kissel, A. N. Levy, S. MacCracken, P. R. 59 Mastrandrea and L. L. White (eds.)]. Cambridge University Press, Cambridge, United Kingdom and New York, 60 NY, USA, pp. 1133-1197. ISBN 9781107058163. 61
Heydemann, S., 2013: Tracking the ‘Arab Spring’: Syria and the Future of Authoritarianism. Journal of Democracy, 62 24(4), 59-73, doi:10.1353/jod.2013.0067. 63
ACCEPTED VERSIO
N
SUBJECT TO FIN
AL EDITS
FINAL DRAFT Chapter 16 IPCC WGII Sixth Assessment Report
Do Not Cite, Quote or Distribute 16-145 Total pages: 173
Heyen, D., J. Horton and J. Moreno-Cruz, 2019: Strategic implications of counter-geoengineering: Clash or 1 cooperation? Journal of Environmental Economics and Management, 95, 153-177. 2
Hill, C. et al., 2020: Hotspots of Present and Future Risk Within Deltas: Hazards, Exposure and Vulnerability. In: 3 Deltas in the Anthropocene [Nicholls, R. J., W. N. Adger, C. W. Hutton and S. E. Hanson (eds.)]. Springer 4 International Publishing, Cham, pp. 127-151. ISBN 978-3-030-23516-1 978-3-030-23517-8. 5
Hinkel, J., D. P. van Vuuren, R. J. Nicholls and R. J. T. Klein, 2013: The effects of adaptation and mitigation on coastal 6 flood impacts during the 21st century. An application of the DIVA and IMAGE models. Climatic Change, 117(4), 7 783-794, doi:10.1007/s10584-012-0564-8. 8
Hino, M. et al., 2019: High-tide flooding disrupts local economic activity. Science Advances, 5(2), eaau2736, 9 doi:10.1126/sciadv.aau2736. 10
Hintz, M. J., C. Luederitz, D. J. Lang and H. von Wehrden, 2018: Facing the heat: A systematic literature review 11 exploring the transferability of solutions to cope with urban heat waves. URBAN CLIMATE, 24, 714-727, 12 doi:10.1016/j.uclim.2017.08.011. 13
Hirabayashi, Y. et al., 2021: Global exposure to flooding from the new CMIP6 climate model projections. Scientific 14 reports, 11(1), 3740, doi:10.1038/s41598-021-83279-w. 15
Hlahla, S. and T. R. Hill, 2018: Responses to Climate Variability in Urban Poor Communities in Pietermaritzburg, 16 KwaZulu-Natal, South Africa. SAGE OPEN, 8(3), doi:10.1177/2158244018800914. 17
Hoang, M. H. et al., 2014: Farmer portfolios, strategic diversity management and climate-change adaptation - 18 implications for policy in Vietnam and Kenya. CLIMATE AND DEVELOPMENT, 6(3), 216-225, 19 doi:10.1080/17565529.2013.857588. 20
Hochman, Z., D. L. Gobbett and H. Horan, 2017: Climate trends account for stalled wheat yields in Australia since 21 1990. Global Change Biology, 23(5), 2071-2081. 22
Hodges, M. et al., 2014: Delays in reducing waterborne and water-related infectious diseases in China under climate 23 change. Nature climate change, 4(12), 1109-1115. 24
Hoegh-Guldberg, O. et al., 2018a: Cross-Chapter Box 6: Food Security. In: Global Warming of 1.5°C. An IPCC Special 25 Report on the impacts of global warming of 1.5°C above pre-industrial levels and related global greenhouse gas 26 emission pathways, in the context of strengthening the global response to the threat of climate change, sustainable 27 development, and efforts to eradicate poverty [Masson-Delmotte, V., P. Zhai, H. O. Pörtner, D. Roberts, J. Skea, 28 P. R. Shukla, A. Pirani, W. Moufouma-Okia, C. Péan, R. Pidcock, S. Connors, J. B. R. Matthews, Y. Chen, X. 29 Zhou, M. I. Gomis, E. Lonnoy, T. Maycock, M. Tignor and T. Waterfield (eds.)], pp. In press. ISBN 30 9789291691517. 31
Hoegh-Guldberg, O. et al., 2018b: Impacts of 1.5°C Global Warming on Natural and Human Systems. In: Global 32 Warming of 1.5°C. An IPCC Special Report on the impacts of global warming of 1.5°C above pre-industrial levels 33 and related global greenhouse gas emission pathways, in the context of strengthening the global response to the 34 threat of climate change, sustainable development, and efforts to eradicate poverty [Masson-Delmotte, V., P. 35 Zhai, H. O. Pörtner, D. Roberts, J. Skea, P. R. Shukla, A. Pirani, W. Moufouma-Okia, C. Péan, R. Pidcock, S. 36 Connors, J. B. R. Matthews, Y. Chen, X. Zhou, M. I. Gomis, E. Lonnoy, T. Maycock, M. Tignor and T. 37 Waterfield (eds.)], pp. In press. ISBN 9789291691517. 38
Hoekstra, A. Y. and M. M. Mekonnen, 2012: The water footprint of humanity. Proceedings of the National Academy of 39 Sciences, 109(9), 3232-3237, doi:10.1073/pnas.1109936109. 40
Hoerling, M. et al., 2012: On the Increased Frequency of Mediterranean Drought. Journal of Climate, 25(6), 2146-41 2161, doi:10.1175/JCLI-D-11-00296.1. 42
Hoffman, A. L., A. R. Kemanian and C. E. Forest, 2018: Analysis of climate signals in the crop yield record of sub‐43 Saharan Africa. Global change biology, 24(1), 143-157. 44
Hoffmann, R. et al., 2020: A meta-analysis of country-level studies on environmental change and migration. Nature 45 Climate Change, 10(10), 904-912, doi:10.1038/s41558-020-0898-6. 46
Hoffmann, S., 2016: INTERNATIONAL HUMANITARIAN AGENCIES AND IRAQI MIGRATION IN 47 PRECONFLICT SYRIA. International Journal of Middle East Studies, 48(2), 339-355, 48 doi:10.1017/S0020743816000076. 49
Holler, J., 2014: Is Sustainable Adaptation Possible? Determinants of Adaptation on Mount Kilimanjaro. 50 PROFESSIONAL GEOGRAPHER, 66(4), 526-537, doi:10.1080/00330124.2014.922015. 51
Hollesen, J. et al., 2018: Climate change and the deteriorating archaeological and environmental archives of the Arctic. 52 Antiquity, 92(363), 573-586, doi:10.15184/aqy.2018.8. 53
Honegger, M., A. Michaelowa and J. Pan, 2021: Potential implications of solar radiation modification for achievement 54 of the Sustainable Development Goals, 21 pp. 55
Hooli, L. J., 2016: Resilience of the poorest: coping strategies and indigenous knowledge of living with the floods in 56 Northern Namibia. REGIONAL ENVIRONMENTAL CHANGE, 16(3, SI), 695-707, doi:10.1007/s10113-015-57 0782-5. 58
Horton, R. M., A. de Sherbinin, D. Wrathall and M. Oppenheimer, 2021: Assessing human habitability and migration. 59 Science, 372(6548), 1279-1283, doi:10.1126/science.abi8603. 60
Hourdequin, M., 2019: Geoengineering justice: the role of recognition. Science, Technology, & Human Values, 44(3), 61 448-477. 62
ACCEPTED VERSIO
N
SUBJECT TO FIN
AL EDITS
FINAL DRAFT Chapter 16 IPCC WGII Sixth Assessment Report
Do Not Cite, Quote or Distribute 16-146 Total pages: 173
Howard, P. H. and T. Sterner, 2017: Few and not so far between: a meta-analysis of climate damage estimates. 1 Environmental and Resource Economics, 68(1), 197-225. 2
Hsiang, S. et al., 2017: Estimating economic damage from climate change in the United States. Science, 356(6345), 3 1362-1369. 4
Hsiang, S. M. and A. S. Jina, 2014: The Causal Effect of Environmental Catastrophe on Long-Run Economic Growth: 5 Evidence From 6,700 Cyclones. National Bureau of Economic Research. Available at: 6 http://www.nber.org/papers/w20352 (accessed 2019/09/26/). 7
Hu, Q. et al., 2018: An examination of midwestern US cities' preparedness for climate change and extreme hazards. 8 NATURAL HAZARDS, 94(2), 777-800, doi:10.1007/s11069-018-3420-y. 9
Hubau, W. et al., 2020: Asynchronous carbon sink saturation in African and Amazonian tropical forests. Nature, 10 579(7797), 80-87. 11
Hughes, T. P. et al., 2019: Global warming impairs stock–recruitment dynamics of corals. Nature, 568, 387-390, 12 doi:10.1038/s41586-019-1081-y. 13
Hughes, T. P., J. T. Kerry and T. Simpson, 2018: Large-scale bleaching of corals on the Great Barrier Reef. Ecology, 14 99(2), 501, doi:10.1002/ecy.2092. 15
Hulme, M., 2014: Can Science Fix Climate Change?: A Case Against Climate Engineering. John Wiley & Sons, 144 16 pp. ISBN 9780745685267. 17
Hunter, N. B., M. A. North, D. C. Roberts and R. Slotow, 2020: A systematic map of responses to climate impacts in 18 urban Africa. ENVIRONMENTAL RESEARCH LETTERS, 15(10), doi:10.1088/1748-9326/ab9d00. 19
Huntington, H. P. et al., 2020: Evidence suggests potential transformation of the Pacific Arctic ecosystem is underway. 20 Nature Climate Change, 10(4), 342-348, doi:10.1038/s41558-020-0695-2. 21
Hurlbert, M. et al., 2019: Risk management and decision making in relation to sustainable development. In: Climate 22 Change and Land: An IPCC special report on climate change, desertification, land degradation, sustainable land 23 management, food security, and greenhouse gas fluxes in terrestrial ecosystems. 24
Hurlbert, M. and P. Mussetta, 2016: Creating resilient water governance for irrigated producers in Mendoza, Argentina. 25 ENVIRONMENTAL SCIENCE & POLICY, 58, 83-94, doi:10.1016/j.envsci.2016.01.004. 26
Huyer, S., 2016: Closing the Gender Gap in Agriculture. Gender, Technology and Development, 20(2), 105-116, 27 doi:10.1177/0971852416643872. 28
Huynh, L. T. M. and L. C. Stringer, 2018: Multi-scale assessment of social vulnerability to climate change: An 29 empirical study in coastal Vietnam. Climate Risk Management, 20, 165-180. 30
ICRC, 2020: When rain turns to dust. Understanding and responding to the combined impact of armed conflicts and the 31 climate and environment crisis on people's lives. ICRC, Geneva, 64 pp. 32
ICSU, 2017: A guide to SDG interactions: from science to implementation. International Council for Science (ICSU) 33 (accessed 2019-04-05 08:25:52). 34
Ide, T., M. Brzoska, J. F. Donges and C.-F. Schleussner, 2020: Multi-method evidence for when and how climate-35 related disasters contribute to armed conflict risk. Global Environmental Change, 62, 102063, 36 doi:10.1016/j.gloenvcha.2020.102063. 37
IDMC, 2019: Global Report on Internal Displacement. Internal Displacement Monitoring Centre, Norwegian Refugee 38 Council (NRC). Available at: http://www.internal-39 displacement.org/sites/default/files/publications/documents/2019-IDMC-GRID.pdf. 40
IDMC, 2020: Global Report on Internal Displacement 2020. Internal Displacement Monitoring Centre, Geneva, 41 Switzerland. 42
Iese, V. et al., 2021: Impacts of COVID-19 on agriculture and food systems in Pacific Island countries (PICs): Evidence 43 from communities in Fiji and Solomon Islands. Agricultural Systems, 190, 103099, 44 doi:10.1016/j.agsy.2021.103099. 45
Ifeanyi-obi, C. C., A. O. Togun, R. Lamboll and S. Arokoyu, 2017: Socio-Economic Determinants of Cocoyam 46 Farmer's Strategies for Climate Change Adaptation in Southeast Nigeria. JOURNAL OF AGRICULTURAL 47 EXTENSION, 21(2), 91-104, doi:10.4314/jae.v21i2.8. 48
Iizumi, T. et al., 2018: Uncertainties of potentials and recent changes in global yields of major crops resulting from 49 census- and satellite-based yield datasets at multiple resolutions. PLOS ONE, 13(9), e0203809, 50 doi:10.1371/journal.pone.0203809. 51
Iizumi, T. et al., 2020: Climate change adaptation cost and residual damage to global crop production. Climate 52 Research, 80(3), 203-218. 53
Ike, M., J. D. Donovan, C. Topple and E. K. Masli, 2019: The process of selecting and prioritising corporate 54 sustainability issues: Insights for achieving the Sustainable Development Goals. Journal of Cleaner Production, 55 236, 117661, doi:10.1016/j.jclepro.2019.117661. 56
Im, E.-S., J. S. Pal and E. A. B. Eltahir, 2017: Deadly heat waves projected in the densely populated agricultural regions 57 of South Asia. Science Advances, 3(8), e1603322, doi:10.1126/sciadv.1603322. 58
IMF, 2017: Seeking sustainable growth: short-term recovery, long-term challenges [Währungsfonds, I. (ed.)]. World 59 economic outlook, International Monetary Fund, Washington, DC, 284 pp. ISBN 978-1-4843-1249-0 978-1-4843-60 2114-0 978-1-4843-2112-6 978-1-4843-2111-9. 61
IMF, 2020: World Economic Outlook Update, June 2020. International Monetary Fund (IMF): Washington. 62 IMF, 2021: World Economic Outlook Update July 2021. International Monetary Fund. 63
ACCEPTED VERSIO
N
SUBJECT TO FIN
AL EDITS
FINAL DRAFT Chapter 16 IPCC WGII Sixth Assessment Report
Do Not Cite, Quote or Distribute 16-147 Total pages: 173
Ingole, V. et al., 2017: Socioenvironmental factors associated with heat and cold-related mortality in Vadu HDSS, 1 western India: a population-based case-crossover study. International journal of biometeorology, 61(10), 1797-2 1804. 3
IPBES, 2019: Summary for policymakers of the global assessment report on biodiversity and ecosystem services. 37 pp. 4 Available at: https://www.ipbes.net/system/tdf/ipbes_7_10_add-1-_advance_0.pdf?file=1&type=node&id=35245. 5
IPCC, 2014: Summary for Policymakers. In: Climate Change 2014: Synthesis Report. Contribution of Working Groups 6 I, II and III to the Fifth Assessment Report of the Intergovernmental Panel on Climate Change [Core Writing, T., 7 R. K. Pachauri and L. A. Meyer (eds.)]. IPCC, Geneva, Switzerland, pp. 2-31. 8
IPCC, 2018: Global Warming of 1.5°C. An IPCC Special Report on the impacts of global warming of 1.5°C above pre-9 industrial levels and related global greenhouse gas emission pathways, in the context of strengthening the global 10 response to the threat of climate change, sustainable development, and efforts to eradicate poverty [Masson-11 Delmotte, V. (ed.)]. In press pp. ISBN 9789291691517. 12
IPCC, 2019a: Climate Change and Land: an IPCC special report on climate change, desertification, land degradation, 13 sustainable land management, food security, and greenhouse gas fluxes in terrestrial ecosystems [Shukla, P. R. 14 (ed.)]. In press pp. 15
IPCC, 2019b: IPCC Special Report on the Ocean and Cryosphere in a Changing Climate [Pörtner, H. O. (ed.)]. In press 16 pp. 17
IPCC, 2021a: Summary for Policymakers. In: Climate Change 2021: The Physical Science Basis. Contribution of 18 Working Group I to the Sixth Assessment Report of the Intergovernmental Panel on Climate Change. Cambridge 19 University Press. 20
IPCC, 2021b: Summary for Policymakers. In: Climate Change 2021: The Physical Science Basis. Contribution of 21 Working Group I to the Sixth Assessment Report of the Intergovernmental Panel on Climate Change [Masson-22 Delmotte, V., P. Zhai, A. Pirani, S. L. Connors, C. Péan, S. Berger, N. Caud, Y. Chen, L. Goldfarb, M. I. Gomis, 23 M. Huang, K. Leitzell, E. Lonnoy, J. B. R. Matthews, T. K. Maycock, T. Waterfield, O. Yelekçi, R. Yu and B. 24 Zhou (eds.)]. Cambridge University Press. 25
Irvine, P. J. and D. W. Keith, 2020: Halving warming with stratospheric aerosol geoengineering moderates policy-26 relevant climate hazards, 044011 pp. 27
Irvine, P. J. et al., 2017: Towards a comprehensive climate impacts assessment of solar geoengineering. Earth's Future, 28 5(1), 93-106. 29
Islam, S. F.-u. et al., 2020: Mitigation of greenhouse gas emissions and reduced irrigation water use in rice production 30 through water-saving irrigation scheduling, reduced tillage and fertiliser application strategies. Science of the 31 Total Environment, 739, 140215. 32
Ivanic, M. and W. Martin, 2008: Implications of higher global food prices for poverty in low-income countries. The 33 World Bank. 34
Iwama, A. Y. et al., 2016: Risk, vulnerability and adaptation to climate change: An interdisciplinary approach. 35 Ambiente & Sociedade, 19, 93-116. 36
Izaguirre, C. et al., 2021: Climate change risk to global port operations. Nature Climate Change, 11(1), 14-20. 37 Jaakkola, J. J. K., S. Juntunen and K. Näkkäläjärvi, 2018: The Holistic Effects of Climate Change on the Culture, Well-38
Being, and Health of the Saami, the Only Indigenous People in the European Union, 401-417 pp. 39 Jackson, L., J. Crook and P. Forster, 2016: An intensified hydrological cycle in the simulation of geoengineering by 40
cirrus cloud thinning using ice crystal fall speed changes. Journal of Geophysical Research: Atmospheres, 41 121(12), 6822-6840. 42
Jafino, B. A., B. Walsh, J. Rozenberg and S. Hallegatte, 2020: Revised Estimates of the Impact of Climate Change on 43 Extreme Poverty by 2030. 44
Jagai, J. S. et al., 2017: Sanitary sewer overflows and emergency room visits for gastrointestinal illness: analysis of 45 Massachusetts data, 2006–2007. Environmental health perspectives, 125(11), 117007. 46
Jamero, M. L. et al., 2017: Small-island communities in the Philippines prefer local measures to relocation in response 47 to sea-level rise. Nature Climate Change, 7(8), 581-586, doi:10.1038/nclimate3344. 48
Janssens, C. et al., 2020: Global hunger and climate change adaptation through international trade. Nature Climate 49 Change, 10(9), 829-835. 50
Javeline, D. and T. Kijewski-Correa, 2019: Coastal homeowners in a changing climate. CLIMATIC CHANGE, 152(2, 51 SI), 259-274, doi:10.1007/s10584-018-2257-4. 52
Jay, O. et al., 2021: Reducing the health effects of hot weather and heat extremes: from personal cooling strategies to 53 green cities. The Lancet, 398(10301), 709-724, doi:10.1016/S0140-6736(21)01209-5. 54
Jenkins, L. M., R. Alvarez and S. M. Jordaan, 2020: Unmanaged climate risks to spent fuel from U.S. nuclear power 55 plants: The case of sea-level rise. Energy Policy, 137, 111106, doi:10.1016/j.enpol.2019.111106. 56
Jensen, S. and C. P. Traeger, 2014: Optimal climate change mitigation under long-term growth uncertainty: Stochastic 57 integrated assessment and analytic findings. European Economic Review, 69, 104-125. 58
Jezeer, R. E. et al., 2019: Influence of livelihood assets, experienced shocks and perceived risks on smallholder coffee 59 farming practices in Peru JOURNAL OF ENVIRONMENTAL MANAGEMENT, 242, 496-506, 60 doi:10.1016/j.jenvman.2019.04.101. 61
ACCEPTED VERSIO
N
SUBJECT TO FIN
AL EDITS
FINAL DRAFT Chapter 16 IPCC WGII Sixth Assessment Report
Do Not Cite, Quote or Distribute 16-148 Total pages: 173
Johnson, F. A. et al., 2016: Is shrimp farming a successful adaptation to salinity intrusion? A geospatial associative 1 analysis of poverty in the populous Ganges-Brahmaputra-Meghna Delta of Bangladesh. SUSTAINABILITY 2 SCIENCE, 11(3), 423-439, doi:10.1007/s11625-016-0356-6. 3
Jolly, W. M. et al., 2015: Climate-induced variations in global wildfire danger from 1979 to 2013. Nature 4 Communications, 6(1), 1-11, doi:10.1038/ncomms8537. 5
Jones, A. et al., 2021: North Atlantic Oscillation response in GeoMIP experiments G6solar and G6sulfur: why detailed 6 modelling is needed for understanding regional implications of solar radiation management. Atmospheric 7 Chemistry and Physics, 21(2), 1287-1304. 8
Jones, A. C. et al., 2018a: Regional Climate Impacts of Stabilizing Global Warming at 1.5 K Using Solar 9 Geoengineering, 230-251 pp. 10
Jones, B. and B. C. O’Neill, 2016: Spatially explicit global population scenarios consistent with the Shared 11 Socioeconomic Pathways. Environmental Research Letters, 11(8), 084003, doi:10.1088/1748-9326/11/8/084003. 12
Jones, B. et al., 2018b: Avoiding population exposure to heat-related extremes: demographic change vs climate change. 13 Climatic Change, 146(3), 423-437, doi:10.1007/s10584-017-2133-7. 14
Jones, H. P. et al., 2020: Global hotspots for coastal ecosystem-based adaptation. PLOS ONE, 15(5), 15 doi:10.1371/journal.pone.0233005. 16
Jongman, B. et al., 2015: Declining vulnerability to river floods and the global benefits of adaptation. Proceedings of 17 the National Academy of Sciences, 112(18), E2271-E2280. 18
Jordaan, S. M., A. Siddiqi, W. Kakenmaster and A. C. Hill, 2019: The Climate Vulnerabilities of Global Nuclear 19 Power. Global Environmental Politics, 19(4), 3-13, doi:10.1162/glep_a_00527. 20
Jorgensen, S. L. and M. Termansen, 2016: Linking climate change perceptions to adaptation and mitigation action. 21 CLIMATIC CHANGE, 138(1-2), 283-296, doi:10.1007/s10584-016-1718-x. 22
Kahn, M. et al., 2019: Long-Term Macroeconomic Effects of Climate Change: A Cross-Country Analysis. 23 INTERNATIONAL MONETARY FUND. ISBN 978-1-5135-1459-8. 24
Kakumanu, K. R. et al., 2018: BUILDING FARM-LEVEL CAPACITIES IN IRRIGATION WATER 25 MANAGEMENT TO ADAPT TO CLIMATE CHANGE. IRRIGATION AND DRAINAGE, 67(1, SI), 43-54, 26 doi:10.1002/ird.2143. 27
Kalkuhl, M. and L. Wenz, 2020: The impact of climate conditions on economic production. Evidence from a global 28 panel of regions. Journal of Environmental Economics and Management, 103, 102360. 29
Kam, P. M. et al., 2021: Global warming and population change both heighten future risk of human displacement due to 30 river floods. Environmental Research Letters, 16(4), 044026, doi:10.1088/1748-9326/abd26c. 31
Kanda, A., M. Murongazvombo and F. Ncube, 2017: Adapting household water use in rural Zimbabwe. International 32 Journal of Environmental Studies, 74(3), 471-485, doi:10.1080/00207233.2017.1319622. 33
Karagiannis, G. M. et al., 2019: Climate change and critical infrastructure – floods. 43. 34 Karapinar, B. and G. Özertan, 2020: Yield implications of date and cultivar adaptation to wheat phenological shifts: a 35
survey of farmers in Turkey. Climatic Change, 158(3-4), 453-472, doi:10.1007/s10584-019-02532-4. 36 Karlsson, M., E. Alfredsson and N. Westling, 2020: Climate policy co-benefits: a review. Climate Policy, 20(3), 292-37
316, doi:10.1080/14693062.2020.1724070. 38 Kattumuri, R., D. Ravindranath and T. Esteves, 2017: Local adaptation strategies in semi-arid regions: study of two 39
villages in Karnataka, India. CLIMATE AND DEVELOPMENT, 9(1), 36-49, 40 doi:10.1080/17565529.2015.1067179. 41
Kaufman, N. et al., 2020: A near-term to net zero alternative to the social cost of carbon for setting carbon prices. 42 Nature Climate Change, 1-5. 43
Kebede, A. S. et al., 2018: Applying the global RCP–SSP–SPA scenario framework at sub-national scale: A multi-scale 44 and participatory scenario approach. Science of the Total Environment, 635, 659-672. 45
Keith, D. W. and D. G. MacMartin, 2015: A temporary, moderate and responsive scenario for solar geoengineering. 46 Nat. Clim. Chang., 5(3), 201-206, doi:10.1038/nclimate2493. 47
Keller, D. P., 2018: Marine Climate Engineering. In: Handbook on Marine Environment Protection : Science, Impacts 48 and Sustainable Management [Salomon, M. and T. Markus (eds.)]. Springer International Publishing, Cham, pp. 49 261-276. ISBN 9783319601564. 50
Kelley, C. et al., 2017: Commentary on the Syria case: Climate as a contributing factor. Political Geography, 60(1), 51 245-247. 52
Kelley, C. P. et al., 2015: Climate change in the Fertile Crescent and implications of the recent Syrian drought. 53 Proceedings of the national Academy of Sciences, 112(11), 3241-3246. 54
Kelley, D. I. et al., 2021: Technical note: Low meteorological influence found in 2019 Amazonia fires. Biogeosciences, 55 18(3), 787-804, doi:10.5194/bg-18-787-2021. 56
Kelman, I., 2015: Difficult decisions: Migration from Small Island Developing States under climate change. Earth's 57 Future, 3(4), 133-142, doi:10.1002/2014EF000278. 58
Kerr, R. B. et al., 2019: Participatory agroecological research on climate change adaptation improves smallholder 59 farmer household food security and dietary diversity in Malawi. AGRICULTURE ECOSYSTEMS & 60 ENVIRONMENT, 279, 109-121, doi:10.1016/j.agee.2019.04.004. 61
Khat, H. V., N. H. Dang and M. Yabe, 2018: Impact of salinity intrusion on rice productivity in the Vietnamese 62 Mekong Delta. Journal of the Faculty of Agriculture, Kyushu UniversityEconomics, 63(1), 6. 63
ACCEPTED VERSIO
N
SUBJECT TO FIN
AL EDITS
FINAL DRAFT Chapter 16 IPCC WGII Sixth Assessment Report
Do Not Cite, Quote or Distribute 16-149 Total pages: 173
Kibet, S., M. Nyangito, L. MacOpiyo and D. Kenfack, 2016: Tracing innovation pathways in the management of 1 natural and social capital on Laikipia Maasai Group Ranches, Kenya. PASTORALISM-RESEARCH POLICY AND 2 PRACTICE, 6, doi:10.1186/s13570-016-0063-z. 3
Kibue, G. W. et al., 2015: Assessment of climate change awareness and agronomic practices in an agricultural region of 4 Henan Province, China. ENVIRONMENT DEVELOPMENT AND SUSTAINABILITY, 17(3), 379-391, 5 doi:10.1007/s10668-014-9546-5. 6
Kihila, J. M., 2018: Indigenous coping and adaptation strategies to climate change of local communities in Tanzania: a 7 review. CLIMATE AND DEVELOPMENT, 10(5), 406-416, doi:10.1080/17565529.2017.1318739. 8
Kikstra, J. et al., 2021: The social cost of carbon dioxide under climate-economy feedbacks and temperature variability. 9 Preprint at https://www. researchgate. 10 net/publication/350443280_The_social_cost_of_carbon_dioxide_under_climate-11 economy_feedbacks_and_temperature_variability. 12
Kimaro, A. A. et al., 2016: Is conservation agriculture `climate-smart' for maize farmers in the highlands of Tanzania? 13 NUTRIENT CYCLING IN AGROECOSYSTEMS, 105(3, SI), 217-228, doi:10.1007/s10705-015-9711-8. 14
Kinney, P. L., 2018: Temporal trends in heat-related mortality: Implications for future projections. Atmosphere, 9(10), 15 doi:10.3390/atmos9100409. 16
Kirchhoff, C. J. and P. L. Watson, 2019: Are Wastewater Systems Adapting to Climate Change? JOURNAL OF THE 17 AMERICAN WATER RESOURCES ASSOCIATION, 55(4), 869-880, doi:10.1111/1752-1688.12748. 18
Kirchmeier‐Young, M., H. Wan, X. Zhang and S. I. Seneviratne, 2019a: Importance of framing for extreme event 19 attribution: The role of spatial and temporal scales. Earth's Future, 7(10), 1192-1204. 20
Kirchmeier‐Young, M. C. et al., 2019b: Attribution of the Influence of Human‐Induced Climate Change on an Extreme 21 Fire Season. Earth's Future, 7(7), 2-10. 22
Kirezci, E. et al., 2020: Projections of global-scale extreme sea levels and resulting episodic coastal flooding over the 23 21st Century. Scientific Reports, 10(1), 11629, doi:10.1038/s41598-020-67736-6. 24
Klein, R. J. T. et al., 2014: Adaptation Opportunities, Constraints, and Limits. In: Climate Change 2014: Impacts, 25 Adaptation, and Vulnerability. Part A: Global and Sectoral Aspects. Contribution of Working Group II to the 26 Fifth Assessment Report of the Intergovernmental Panel on Climate Change [Field, C. B., V. R. Barros, D. J. 27 Dokken, K. J. Mach, M. D. Mastrandrea, T. E. Bilir, M. Chatterjee, K. L. Ebi, Y. O. Estrada, R. C. Genova, B. 28 Girma, E. S. Kissel, A. N. Levy, S. MacCracken, P. R. Mastrandrea and L. L. White (eds.)]. Cambridge 29 University Press, Cambridge, United Kingdom and New York, NY, USA, pp. 899-943. ISBN 9781107058071. 30
Kleypas, J. et al., 2021: Designing a blueprint for coral reef survival. Biological Conservation, 257, 109107, 31 doi:10.1016/j.biocon.2021.109107. 32
Kling, G., Y. Lo, V. Murinde and U. Volz, 2018: Climate Vulnerability and the Cost of Debt. SSRN Electronic Journal, 33 doi:10.2139/ssrn.3198093. 34
Klinger, C., O. Landeg and V. Murray, 2014: Power Outages, Extreme Events and Health: a Systematic Review of the 35 Literature from 2011-2012. PLoS Currents, doi:10.1371/currents.dis.04eb1dc5e73dd1377e05a10e9edde673. 36
Klock, C. and P. D. Nunn, 2019: Adaptation to Climate Change in Small Island Developing States: A Systematic 37 Literature Review of Academic Research. JOURNAL OF ENVIRONMENT & DEVELOPMENT, 28(2), 196-218, 38 doi:10.1177/1070496519835895. 39
Klomp, J., 2016: Economic development and natural disasters: A satellite data analysis. Global Environmental Change, 40 36, 67-88, doi:10.1016/j.gloenvcha.2015.11.001. 41
Klomp, J. and K. Valckx, 2014: Natural disasters and economic growth: A meta-analysis. Global Environmental 42 Change, 26, 183-195, doi:10.1016/j.gloenvcha.2014.02.006. 43
Kloos, J. and F. G. Renaud, 2014: Organic Cotton Production as an Adaptation Option in North-West Benin. Outlook 44 on Agriculture, 43(2), 91-100, doi:10.5367/oa.2014.0166. 45
Knittel, N. et al., 2020: A global analysis of heat-related labour productivity losses under climate change—implications 46 for Germany’s foreign trade. Climatic Change, 160(2), 251-269, doi:10.1007/s10584-020-02661-1. 47
Knorr, W., A. Arneth and L. Jiang, 2016: Demographic controls of future global fire risk. Nature Climate Change, 6(8), 48 781-785. 49
Kompas, T., V. H. Pham and T. N. Che, 2018: The effects of climate change on GDP by country and the global 50 economic gains from complying with the Paris climate accord. Earth's Future, 6(8), 1153-1173. 51
Kongsager, R., 2018: Linking Climate Change Adaptation and Mitigation: A Review with Evidence from the Land-Use 52 Sectors. Land, 7(4), doi:10.3390/land7040158. 53
Kopp, R. E., R. L. Shwom, G. Wagner and J. Yuan, 2016: Tipping elements and climate–economic shocks: Pathways 54 toward integrated assessment. Earth's Future, 4(8), 346-372. 55
Koski, C. and A. Siulagi, 2016: Environmental Harm or Natural Hazard? Problem Identification and Adaptation in US 56 Municipal Climate Action Plans. REVIEW OF POLICY RESEARCH, 33(3), 270-290, doi:10.1111/ropr.12173. 57
Kosugi, T., 2013: Fail-safe solar radiation management geoengineering. Mitigation and Adaptation Strategies for 58 Global Change, 18(8), 1141-1166. 59
Kotz, M. et al., 2021: Day-to-day temperature variability reduces economic growth, 319-325 pp. 60 Koubi, V., 2019: Climate Change and Conflict. Annual Review of Political Science, 22(1), null, doi:10.1146/annurev-61
polisci-050317-070830. 62
ACCEPTED VERSIO
N
SUBJECT TO FIN
AL EDITS
FINAL DRAFT Chapter 16 IPCC WGII Sixth Assessment Report
Do Not Cite, Quote or Distribute 16-150 Total pages: 173
Koubi, V., G. Spilker, L. Schaffer and T. Bohmelt, 2016: The role of environmental perceptions in migration decision-1 making: evidence from both migrants and non-migrants in five developing countries. POPULATION AND 2 ENVIRONMENT, 38(2), 134-163, doi:10.1007/s11111-016-0258-7. 3
Koutroulis, A. G. et al., 2019: Global water availability under high-end climate change: A vulnerability based 4 assessment. Global and Planetary Change, 175, 52-63, doi:10.1016/j.gloplacha.2019.01.013. 5
Krausmann, F. et al., 2013: Global human appropriation of net primary production doubled in the 20th century. 6 Proceedings of the National Academy of Sciences, 110(25), 10324, doi:10.1073/pnas.1211349110. 7
Krauss, K. W. and M. J. Osland, 2020: Tropical cyclones and the organization of mangrove forests: a review. Annals of 8 Botany, 125(2), 213-234, doi:10.1093/aob/mcz161. 9
Kravitz, B. and D. G. MacMartin, 2020: Uncertainty and the basis for confidence in solar geoengineering research, 64-10 75 pp. 11
Kravitz, B. et al., 2015: The geoengineering model intercomparison project phase 6 (GeoMIP6): Simulation design and 12 preliminary results. Geoscientific Model Development, 8(10), 3379-3392. 13
Krayenhoff, E. S. et al., 2018: Diurnal interaction between urban expansion, climate change and adaptation in US cities. 14 NATURE CLIMATE CHANGE, 8(12), 1097+, doi:10.1038/s41558-018-0320-9. 15
Kremen, C. and A. Miles, 2012: Ecosystem Services in Biologically Diversified versus Conventional Farming Systems: 16 Benefits, Externalities, and Trade-Offs. Ecology and Society, 17(4), doi:10.5751/es-05035-170440. 17
Krichene, H. et al., 2020: The Impacts of Tropical Cyclones and Fluvial Floods on Economic Growth–Empirical 18 Evidence on Transmission Channels at Different Levels of Development. Available at SSRN 3594081. 19
Krishna-Pillai, S.-P. K. et al., 2019: Climate system response to stratospheric sulfate aerosols: sensitivity to altitude of 20 aerosol layer. Earth System Dynamics, 10(4), 885-900. 21
Krishnamurthy, L., P. Krishna Krishnamurthy, I. Rajagopal and A. Peralta Solares, 2019: Can agroforestry systems 22 thrive in the drylands? Characteristics of successful agroforestry systems in the arid and semi-arid regions of Latin 23 America. AGROFORESTRY SYSTEMS, 93(2), 503-513, doi:10.1007/s10457-017-0143-0. 24
Kuenzer, C. et al., 2020: Profiling resilience and adaptation in mega deltas: A comparative assessment of the Mekong, 25 Yellow, Yangtze, and Rhine deltas. Ocean & Coastal Management, 198, 105362. 26
Kugeler, K. F., G. M. Farley, J. D. Forrester and P. S. Mead, 2015: Geographic Distribution and Expansion of Human 27 Lyme Disease, United States.(1080-6059 (Electronic)). 28
Kulp, S. A. and B. H. Strauss, 2019: New elevation data triple estimates of global vulnerability to sea-level rise and 29 coastal flooding. Nature Communications, 10(1), 4844, doi:10.1038/s41467-019-12808-z. 30
Kuruppu, N. and R. Willie, 2015: Barriers to reducing climate enhanced disaster risks in Least Developed Country-31 Small Islands through anticipatory adaptation. Weather and Climate Extremes, 7, 72-83, 32 doi:10.1016/j.wace.2014.06.001. 33
Kwiatkowski, L. et al., 2015: Coral bleaching under unconventional scenarios of climate warming and ocean 34 acidification. Nat. Clim. Chang., 5(8), 777-781, doi:10.1038/nclimate2655. 35
Labbe, J., J. D. Ford, M. Araos and M. Flynn, 2017: The government-led climate change adaptation landscape in 36 Nunavut, Canada. ENVIRONMENTAL REVIEWS, 25(1), 12-25, doi:10.1139/er-2016-0032. 37
Laczko, F., 2016: Improving Data on International Migration and Development: Towards a global action plan. 38 Improving Data on International Migration-towards Agenda, 2030, 1-12. 39
Lam, S. S., C. Waugh, W. Peng and C. Sonne, 2020: Wildfire puts koalas at risk of extinction. Science, 367(6479), 750-40 750, doi:10.1126/science.aba8372. 41
Landauer, M., S. Juhola and J. Klein, 2019: The role of scale in integrating climate change adaptation and mitigation in 42 cities. JOURNAL OF ENVIRONMENTAL PLANNING AND MANAGEMENT, 62(5), 741-765, 43 doi:10.1080/09640568.2018.1430022. 44
Landis, J., 2012: The Syrian Uprising of 2011: Why the Asad Regime Is Likely to Survive to 2013. Middle East Policy, 45 19(1), 72-84, doi:10.1111/j.1475-4967.2012.00524.x. 46
Lange, S. et al., 2020: Projecting exposure to extreme climate impact events across six event categories and three spatial 47 scales. Earth's Future, 8(12), e2020EF001616. 48
Latham, J. et al., 2012: Marine cloud brightening. Philosophical Transactions of the Royal Society A: Mathematical, 49 Physical and Engineering Sciences, 370(1974), 4217-4262. 50
Latham, J. et al., 2013: Can marine cloud brightening reduce coral bleaching? Atmos. Sci. Lett., 14(4), 214-219, 51 doi:10.1002/asl2.442. 52
Laufkötter, C., J. Zscheischler and T. L. Frölicher, 2020: High-impact marine heatwaves attributable to human-induced 53 global warming. Science, 369(6511), 1621-1625. 54
Lawrence, J., P. Blackett and N. A. Cradock-Henry, 2020: Cascading climate change impacts and implications. Climate 55 Risk Management, 29, 100234, doi:10.1016/j.crm.2020.100234. 56
Leal Filho, W. et al., 2020: Partnerships for the Goals. Encyclopedia of the UN Sustainable Development Goals., 57 Springer 58
Cham. 59 Lee, J. Y. et al., 2021: Future Global Climate: Scenario-Based Projections and Near-Term Information. In: Climate 60
Change 2021: The Physical Science Basis. Contribution of Working Group I to the Sixth Assessment Report of the 61 Intergovernmental Panel on Climate Change [Masson-Delmotte, V., P. Zhai, A. Pirani, S. L. Connors, C. Péan, S. 62
ACCEPTED VERSIO
N
SUBJECT TO FIN
AL EDITS
FINAL DRAFT Chapter 16 IPCC WGII Sixth Assessment Report
Do Not Cite, Quote or Distribute 16-151 Total pages: 173
Berger, N. Caud, Y. Chen, L. Goldfarb, M. I. Gomis, M. Huang, K. Leitzell, E. Lonnoy, J. B. R. Matthews, T. K. 1 Maycock, T. Waterfield, O. Yelekçi, R. Yu and B. Zhou (eds.)]. Cambridge University Press. 2
Leenders, R., 2013: Social Movement Theory and the Onset of the Popular Uprising in Syria. Arab Studies Quarterly, 3 35(3), 273, doi:10.13169/arabstudquar.35.3.0273. 4
Lei, Y. et al., 2017: Using government resettlement projects as a sustainable adaptation strategy for climate change. 5 Sustainability (Switzerland), 9(8), doi:10.3390/su9081373. 6
Leichenko, R. and J. A. Silva, 2014: Climate change and poverty: vulnerability, impacts, and alleviation strategies: 7 Climate change and poverty. Wiley Interdisciplinary Reviews: Climate Change, 5(4), 539-556, 8 doi:10.1002/wcc.287. 9
Lemoine, D. and C. P. Traeger, 2016: Economics of tipping the climate dominoes. doi:10.1038/nclimate2902. 10 Lenton, T. M. et al., 2019: Climate tipping points—too risky to bet against. Nature Publishing Group. 11 Lesnikowski, A. et al., 2019a: Frontiers in data analytics for adaptation research: Topic modeling. WILEY 12
INTERDISCIPLINARY REVIEWS-CLIMATE CHANGE, 10(3), doi:10.1002/wcc.576. 13 Lesnikowski, A., R. Biesbroek, J. D. Ford and L. Berrang-Ford, 2020: Policy implementation styles and local 14
governments: the case of climate change adaptation. ENVIRONMENTAL POLITICS, 15 doi:10.1080/09644016.2020.1814045. 16
Lesnikowski, A. et al., 2016: National-level progress on adaptation. NATURE CLIMATE CHANGE, 6(3), 261+, 17 doi:10.1038/NCLIMATE2863. 18
Lesnikowski, A., J. D. Ford, R. Biesbroek and L. Berrang-Ford, 2019b: A policy mixes approach to conceptualizing 19 and measuring climate change adaptation policy. CLIMATIC CHANGE, 156(4), 447-469, doi:10.1007/s10584-20 019-02533-3. 21
Lesnikowski, A. C. et al., 2015: How are we adapting to climate change? A global assessment. MITIGATION AND 22 ADAPTATION STRATEGIES FOR GLOBAL CHANGE, 20(2), 277-293, doi:10.1007/s11027-013-9491-x. 23
Levy, K., A. P. Woster, R. S. Goldstein and E. J. Carlton, 2016: Untangling the Impacts of Climate Change on 24 Waterborne Diseases: a Systematic Review of Relationships between Diarrheal Diseases and Temperature, 25 Rainfall, Flooding, and Drought. Environmental Science & Technology, 50(10), 4905-4922, 26 doi:10.1021/acs.est.5b06186. 27
Lewis, S. L. et al., 2011: The 2010 amazon drought. Science, 331(6017), 554-554. 28 Li, Y. et al., 2019: Excessive rainfall leads to maize yield loss of a comparable magnitude to extreme drought in the 29
United States. Global Change Biology, 25(7), 2325-2337, doi:10.1111/gcb.14628. 30 Lim-Camacho, L. et al., 2017: Complex resource supply chains display higher resilience to simulated climate shocks. 31
Global Environmental Change, 46, 126-138, doi:10.1016/j.gloenvcha.2017.08.011. 32 Lin, S. et al., 2019: The effects of multiyear and seasonal weather factors on incidence of Lyme disease and its vector in 33
New York State, 1182-1188 pp. 34 Lincke, D. and J. Hinkel, 2021: Coastal Migration due to 21st Century Sea-Level Rise. Earth's Future, 9(5), 35
e2020EF001965, doi:10.1029/2020EF001965. 36 Lindsay, A., 2018: Social learning as an adaptive measure to prepare for climate change impacts on water provision in 37
Peru. JOURNAL OF ENVIRONMENTAL STUDIES AND SCIENCES, 8(4), 477-487, doi:10.1007/s13412-017-38 0464-3. 39
Linke, A. M. et al., 2018: Drought, Local Institutional Contexts, and Support for Violence in Kenya. Journal of Conflict 40 Resolution, 62(7), 1544-1578, doi:10.1177/0022002717698018. 41
Liu-Helmersson, J., J. Rocklöv, M. Sewe and Å. Brännström, 2019: Climate change may enable Aedes aegypti 42 infestation in major European cities by 2100. Environmental research, 172, 693-699. 43
Liu, W. et al., 2018: Global drought and severe drought-affected populations in 1.5 and 2 °C warmer worlds. 44 Earth Syst. Dynam., 9(1), 267-283, doi:10.5194/esd-9-267-2018. 45
Liverman, D., 2016: U.S. National climate assessment gaps and research needs: overview, the economy and the 46 international context. Climatic Change, 135(1), 173-186, doi:10.1007/s10584-015-1464-5. 47
Lizundia-Loiola, J., M. L. Pettinari and E. Chuvieco, 2020: Temporal Anomalies in Burned Area Trends: Satellite 48 Estimations of the Amazonian 2019 Fire Crisis. Remote Sensing, 12(1), doi:10.3390/rs12010151. 49
Lloyd, E. and N. Oreskes, 2018: Climate change attribution: When is it appropriate to accept new methods? Earth's 50 Future, 1(6(3)), 311-325. 51
Lloyd, S. J. et al., 2018: A Global-Level Model of the Potential Impacts of Climate Change on Child Stunting via 52 Income and Food Price in 2030. Environmental Health Perspectives, 126(9), 097007, doi:10.1289/EHP2916. 53
Lloyd, S. J. and S. Hales, 2019: Challenges and gaps in assessing impacts of climate change on health in rural areas. 54 Expert Group Meeting on ‘Eradicating Rural Poverty to Implement the 2030 Agenda for Sustainable 55 Development’, UN DESA EGM on ‘Eradicating Rural Poverty to implement the 2030 Agenda for Sustainable 56 Development, Addis Abba, Ethiopia, 33 pp. (accessed 2020-10-31). 57
Lobell, D. B. and C. B. Field, 2007: Global scale climate–crop yield relationships and the impacts of recent warming. 58 Environmental research letters, 2(1), 014002. 59
Lobell, D. B., W. Schlenker and J. Costa-Roberts, 2011: Climate trends and global crop production since 1980. Science, 60 333(6042), 616-620. 61
Loboguerrero, A. M. et al., 2019: Food and Earth Systems: Priorities for Climate Change Adaptation and Mitigation for 62 Agriculture and Food Systems. Sustainability, 11(5), doi:10.3390/su11051372. 63
ACCEPTED VERSIO
N
SUBJECT TO FIN
AL EDITS
FINAL DRAFT Chapter 16 IPCC WGII Sixth Assessment Report
Do Not Cite, Quote or Distribute 16-152 Total pages: 173
Locatelli, B., C. Pavageau, E. Pramova and M. Di Gregorio, 2015: Integrating climate change mitigation and adaptation 1 in agriculture and forestry: opportunities and trade-offs. Wiley Interdisciplinary Reviews-Climate Change, 6(6), 2 585-598, doi:10.1002/wcc.357. 3
Longo, M. et al., Impacts of Degradation on Water, Energy, and Carbon Cycling of the Amazon Tropical Forests 4 (accessed 2020-10-18 20:47:44). 5
Lontzek, T. S., Y. Cai, K. L. Judd and T. M. Lenton, 2015: Stochastic integrated assessment of climate tipping points 6 indicates the need for strict climate policy. 3-6, doi:10.1038/nclimate2570. 7
Loria, N., 2016: Farmers’ Response and Adaptation Strategies to Climate Change in Low-Hills of Himachal Pradesh in 8 India. Nature Environment and Pollution Technology An International Quarterly Scientific Journal, 15(3), 895-9 901. 10
Loucks, D. P., 2019: Developed river deltas: are they sustainable? Environmental Research Letters, 14(11), 113004, 11 doi:10.1088/1748-9326/ab4165. 12
Loughran, K. and J. R. Elliott, 2019: Residential buyouts as environmental mobility: examining where homeowners 13 move to illuminate social inequities in climate adaptation. POPULATION AND ENVIRONMENT, 41(1), 52-70, 14 doi:10.1007/s11111-019-00324-7. 15
Low, S. and M. Honegger, 2020: A Precautionary Assessment of Systemic Projections and Promises From Sunlight 16 Reflection and Carbon Removal Modeling, risa.13565 pp. 17
Lowe, R. et al., 2018: Nonlinear and delayed impacts of climate on dengue risk in Barbados: A modelling study, 18 e1002613 pp. 19
Lowe, R. et al., 2021: Combined effects of hydrometeorological hazards and urbanisation on dengue risk in Brazil: a 20 spatiotemporal modelling study, e209-e219 pp. 21
Lundgren-Kownacki, K. et al., 2018: Climate change-induced heat risks for migrant populations working at brick kilns 22 in India: a transdisciplinary approach. INTERNATIONAL JOURNAL OF BIOMETEOROLOGY, 62(3), 347-358, 23 doi:10.1007/s00484-017-1476-0. 24
Lwasa, S. et al., 2014: Urban and peri-urban agriculture and forestry: Transcending poverty alleviation to climate 25 change mitigation and adaptation. Urban Climate, 7, 92-106, doi:10.1016/j.uclim.2013.10.007. 26
Lynch, M., 2014: The Arab uprisings explained: new contentious politics in the Middle East [Lynch, M. (ed.)]. 27 Columbia studies in Middle East politics, Columbia Univ. Press, New York, NY, 340 pp. ISBN 978-0-231-15885-28 5 978-0-231-15884-8 978-0-231-53749-0. 29
MacDougall, A. H. et al., 2020: Is there warming in the pipeline? A multi-model analysis of the Zero Emissions 30 Commitment from CO&lt;sub&gt;2&lt;/sub&gt;, 2987-3016 pp. 31
Mach, K. J. et al., 2019: Climate as a risk factor for armed conflict. Nature, 571(7764), 193-197, doi:10.1038/s41586-32 019-1300-6. 33
Macintosh, A., 2013: Coastal climate hazards and urban planning: how planning responses can lead to maladaptation. 34 MITIGATION AND ADAPTATION STRATEGIES FOR GLOBAL CHANGE, 18(7), 1035-1055, 35 doi:10.1007/s11027-012-9406-2. 36
Mackey, B. and D. Ware, 2018: Limits to Capital Works Adaptation in the Coastal Zones and Islands: Lessons for the 37 Pacific. In: Limits to Climate Change Adaptation [Leal Filho, W. and J. Nalau (eds.)]. Springer International 38 Publishing, Cham, pp. 301-323. ISBN 978-3-319-64598-8 978-3-319-64599-5. 39
MacMartin, D. G., K. Caldeira and D. W. Keith, 2014: Solar geoengineering to limit the rate of temperature change. 40 Philosophical Transactions of the Royal Society A: Mathematical, Physical and Engineering Sciences, 372(2031), 41 20140134. 42
MacMartin, D. G. and B. Kravitz, 2019: Mission-driven research for stratospheric aerosol geoengineering. Proceedings 43 of the National Academy of Sciences, 116(4), 1089-1094. 44
MacMartin, D. G., K. L. Ricke and D. W. Keith, 2018: Solar geoengineering as part of an overall strategy for meeting 45 the 1.5°C Paris target, 20160454 pp. 46
Magnan, A. K. et al., 2019: Integrative Cross-Chapter Box on Low-Lying Islands and Coasts. In: IPCC Special Report 47 on the Ocean and Cryosphere in a Changing Climate [Pörtner, H. O., D. C. Roberts, V. Masson-Delmotte, P. 48 Zhai, M. Tignor, E. Poloczanska, K. Mintenbeck, A. Alegría, M. Nicolai, A. Okem, J. Petzold, B. Rama and N. 49 M. Weyer (eds.)], pp. In press. 50
Magnan, A. K. et al., 2021: Global climate risk. Nature Climate Change, doi:10.1038/s41558-021-01156-w. 51 Magnan, A. K. et al., 2016: Addressing the risk of maladaptation to climate change. WILEY INTERDISCIPLINARY 52
REVIEWS-CLIMATE CHANGE, 7(5), 646-665, doi:10.1002/wcc.409. 53 Maharjan, A. et al., 2020: Migration and Household Adaptation in Climate-Sensitive Hotspots in South Asia. Current 54
Climate Change Reports, 6(1), 1-16, doi:10.1007/s40641-020-00153-z. 55 Mainardi, S., 2018: Location factors and spatial dependence in household perceptions and adaptations to climate 56
change: A case in the upper Blue Nile Basin. AGREKON, 57(1), 1-27, doi:10.1080/03031853.2017.1409128. 57 Major, D. C., M. Lehmann and J. Fitton, 2018: Linking the management of climate change adaptation in small coastal 58
towns and cities to the Sustainable Development Goals. Ocean & Coastal Management, 163, 205-208, 59 doi:10.1016/j.ocecoaman.2018.06.010. 60
Makhado, R. A., A. T. Saidi and P. P. Tshikhudo, 2014: Optimising drought adaptation by small-scale farmers in 61 southern Africa through integration of indigenous and technologically-driven practices. African Journal of 62 Science, Technology, Innovation and Development, 6(4), 265-273, doi:10.1080/20421338.2014.945391. 63
ACCEPTED VERSIO
N
SUBJECT TO FIN
AL EDITS
FINAL DRAFT Chapter 16 IPCC WGII Sixth Assessment Report
Do Not Cite, Quote or Distribute 16-153 Total pages: 173
Maldonado, J. K. et al., 2014: The impact of climate change on tribal communities in the US: displacement, relocation, 1 and human rights. In: Climate Change and Indigenous Peoples in the United States: Impacts, Experiences and 2 Actions [Maldonado, J. K., B. Colombi and R. Pandya (eds.)]. Springer International Publishing, Cham, pp. 93-3 106. ISBN 978-3-319-05266-3. 4
Mallick, R. B. et al., 2018: Understanding the impact of climate change on pavements with CMIP5, system dynamics 5 and simulation. International Journal of Pavement Engineering, 19(8), 697-705, 6 doi:10.1080/10298436.2016.1199880. 7
Mandel, A. et al., 2021: Risks on global financial stability induced by climate change: the case of flood risks. Climatic 8 Change, 166(1-2), 4, doi:10.1007/s10584-021-03092-2. 9
Manes, S. et al., 2021: Endemism increases species' climate change risk in areas of global biodiversity importance. 10 Biological Conservation, 257, 109070. 11
Marchiori, L., J. F. Maystadt and I. Schumacher, 2012: The impact of weather anomalies on migration in sub-Saharan 12 Africa. Journal of Environmental Economics and Management, 63(3), 355-374, doi:10.1016/j.jeem.2012.02.001. 13
Markolf, S. A. et al., 2019: Transportation resilience to climate change and extreme weather events - Beyond risk and 14 robustness. Transport Policy, 74, 174-186, doi:10.1016/j.tranpol.2018.11.003. 15
Martin-Shields, C. P. and W. Stojetz, 2019: Food security and conflict: Empirical challenges and future opportunities 16 for research and policy making on food security and conflict. World Development, 119, 150-164, 17 doi:10.1016/j.worlddev.2018.07.011. 18
Martin, T. G. et al., 2015: Buffel grass and climate change: a framework for projecting invasive species distributions 19 when data are scarce. Biological Invasions, 17(11), 3197-3210, doi:10.1007/s10530-015-0945-9. 20
Mastrandrea, M. D. and S. H. Schneider, 2004: Probabilistic Integrated Assessment of ‘Dangerous’ Climate Change. 21 Science, 304(5670), 571-575, doi:10.1126/science.1094147. 22
Masud, M. M. et al., 2017: Adaptation barriers and strategies towards climate change: Challenges in the agricultural 23 sector. Journal of Cleaner Production, 156, 698-706, doi:10.1016/j.jclepro.2017.04.060. 24
Mathbout, S. et al., 2018: Spatial and temporal analysis of drought variability at several time scales in Syria during 25 1961–2012. Atmospheric Research, 200, 153-168. 26
Matthews, J. B. R., 2018: Annex I: Glossary. In: Global Warming of 1.5°C. An IPCC Special Report on the impacts of 27 global warming of 1.5°C above pre-industrial levels and related global greenhouse gas emission pathways, in the 28 context of strengthening the global response to the threat of climate change, sustainable development, and efforts 29 to eradicate poverty. 30
Matthews, T. K., R. L. Wilby and C. Murphy, 2017: Communicating the deadly consequences of global warming for 31 human heat stress. Proceedings of the National Academy of Sciences, 114(15), 3861-3866. 32
Maurel, M. and M. Tuccio, 2016: Climate Instability, Urbanisation and International Migration, 735-752 pp. 33 Mawejje, J., 2016: Food prices, energy and climate shocks in Uganda. Agricultural and Food Economics, 4(1), 34
doi:10.1186/s40100-016-0049-6. 35 Mayanja, M. N., C. Rubaire-Akiiki, J. Morton and J. D. Kabasa, 2020: Pastoral community coping and adaptation 36
strategies to manage household food insecurity consequent to climatic hazards in the cattle corridor of Uganda. 37 CLIMATE AND DEVELOPMENT, 12(2), 110-119, doi:10.1080/17565529.2019.1605283. 38
Mazdiyasni, O. et al., 2017: Increasing probability of mortality during Indian heat waves. Science Advances, 3(6), 39 e1700066, doi:10.1126/sciadv.1700066. 40
Mazur, N., A. Curtis and M. Rogers, 2013: Do You See What I See? Rural Landholders' Belief in Climate Change. 41 SOCIETY & NATURAL RESOURCES, 26(1), 75-85, doi:10.1080/08941920.2012.686650. 42
Mbow, C. et al., 2019: Food Security. In: An IPCC special report on climate change, desertification, land degradation, 43 sustainable land management, food security, and greenhouse gas fluxes in terrestrial ecosystems. 44
Mbow, C. et al., 2014: Achieving mitigation and adaptation to climate change through sustainable agroforestry 45 practices in Africa. Current Opinion in Environmental Sustainability, 6, 8-14, doi:10.1016/j.cosust.2013.09.002. 46
McCollum, D. L. et al., 2018: Connecting the sustainable development goals by their energy inter-linkages. 47 Environmental Research Letters, 13(3), 033006, doi:10.1088/1748-9326/aaafe3. 48
McCusker, K. E., K. C. Armour, C. M. Bitz and D. S. Battisti, 2014: Rapid and extensive warming following cessation 49 of solar radiation management. Environ. Res. Lett., 9(2), 024005, doi:10.1088/1748-9326/9/2/024005. 50
McDonald, J., J. McGee, K. Brent and W. Burns, 2019: Governing geoengineering research for the Great Barrier Reef. 51 Clim. Policy, 19(7), 801-811, doi:10.1080/14693062.2019.1592742. 52
McDowell, N. et al., 2018: Drivers and mechanisms of tree mortality in moist tropical forests. New Phytologist, 219(3), 53 851-869. 54
McElwee, P. et al., 2017: Using REDD plus Policy to Facilitate Climate Adaptation at the Local Level: Synergies and 55 Challenges in Vietnam. FORESTS, 8(1), doi:10.3390/f8010011. 56
McGranahan, G., D. Balk and B. Anderson, 2007: The rising tide: assessing the risks of climate change and human 57 settlements in low elevation coastal zones. Environment and Urbanization, 19(1), 17-37, 58 doi:10.1177/0956247807076960. 59
McGregor, A., M. Taylor, R. M. Bourke and V. Lebot, 2016: Vulnerability of staple food crops to climate change. 79. 60 McKechnie, A. E., I. A. Rushworth, F. Myburgh and S. J. Cunningham, 2021: Mortality among birds and bats during 61
an extreme heat event in eastern South Africa. Austral Ecology, 46(4), 687-691, doi:10.1111/aec.13025. 62
ACCEPTED VERSIO
N
SUBJECT TO FIN
AL EDITS
FINAL DRAFT Chapter 16 IPCC WGII Sixth Assessment Report
Do Not Cite, Quote or Distribute 16-154 Total pages: 173
McKinnon, C., 2019: Sleepwalking into lock-in? Avoiding wrongs to future people in the governance of solar radiation 1 management research. Environmental Politics, 28(3), 441-459. 2
McKinsey Global Institute, 2020: Will infrastructure bend or break under climate stress. Climate risk and response: 3 Physical hazards and socioeconomic impacts, McKinsey Global Institute, 26 pp. (accessed 2021-08-23 07:29:13). 4
McLaren, D., 2016: Mitigation deterrence and the ‘moral hazard’ of solar radiation management. Earth's Future, 4(12), 5 596-602. 6
McLaren, D. and O. Corry, 2021: The politics and governance of research into solar geoengineering. Wiley 7 Interdisciplinary Reviews: Climate Change, 12(3), e707. 8
McLeman, R., 2014: Climate and Human Migration Past Experiences, Future Challenges. 9 McLeman, R., 2019: International migration and climate adaptation in an era of hardening borders. Nature Climate 10
Change, 9(12), 911-918, doi:10.1038/s41558-019-0634-2. 11 McMichael, C., S. Dasgupta, S. Ayeb-Karlsson and I. Kelman, 2020: A review of estimating population exposure to 12
sea-level rise and the relevance for migration. Environmental Research Letters, 15(12), 123005, 13 doi:10.1088/1748-9326/abb398. 14
McMichael, C. and M. Katonivualiku, 2020: Thick temporalities of planned relocation in Fiji. GEOFORUM, 108, 286-15 294, doi:10.1016/j.geoforum.2019.06.012. 16
McNamara, K. E. and H. J. Des Combes, 2015: Planning for Community Relocations Due to Climate Change in Fiji. 17 International Journal of Disaster Risk Science, 6(3), 315-319, doi:10.1007/s13753-015-0065-2. 18
McNamara, K. E., R. Westoby and A. Chandra, 2021: Exploring climate-driven non-economic loss and damage in the 19 Pacific Islands. Current Opinion in Environmental Sustainability, 50, 1-11, doi:10.1016/j.cosust.2020.07.004. 20
McNamara, K. E., R. Westoby and S. G. Smithers, 2017: Identification of limits and barriers to climate change 21 adaptation: case study of two islands in Torres Strait, Australia. Geographical Research, 55(4), 438-455, 22 doi:10.1111/1745-5871.12242. 23
McPherson, M. et al., 2017: Expansion of the Lyme Disease Vector Ixodes Scapularis in Canada Inferred from CMIP5 24 Climate Projections.(1552-9924 (Electronic)). 25
McPherson, M. L. et al., 2021: Large-scale shift in the structure of a kelp forest ecosystem co-occurs with an epizootic 26 and marine heatwave, 298 pp. 27
Mechler, R. and T. M. Deubelli, 2021: Finance for Loss and Damage: a comprehensive risk analytical approach, 185-28 196 pp. 29
Mechler, R. et al., 2020: Loss and Damage and limits to adaptation: recent IPCC insights and implications for climate 30 science and policy. Sustainability Science, 15(4), 1245-1251, doi:10.1007/s11625-020-00807-9. 31
Medek, D., J. Schwartz and S. Myers, 2017: Estimated Effects of Future Atmospheric CO2 Concentrations on Protein 32 Intake and the Risk of Protein Deficiency by Country and Region. Environmental Health Perspectives, 125(8), 33 087002, doi:10.1289/EHP41. 34
Medlock, J. M. et al., 2013: Driving forces for changes in geographical distribution of Ixodes ricinus ticks in Europe. 35 Parasites & Vectors, 6(1), 1, doi:10.1186/1756-3305-6-1. 36
Mees, H., 2017: Local governments in the driving seat? A comparative analysis of public and private responsibilities for 37 adaptation to climate change in European and North-American cities. JOURNAL OF ENVIRONMENTAL POLICY 38 & PLANNING, 19(4), 374-390, doi:10.1080/1523908X.2016.1223540. 39
Meinshausen, M. et al., 2020: The shared socio-economic pathway (SSP) greenhouse gas concentrations and their 40 extensions to 2500. Geosci. Model Dev., 13(8), 3571-3605, doi:10.5194/gmd-13-3571-2020. 41
Méjean, A., A. Pottier, M. Fleurbaey and S. Zuber, 2020: Catastrophic climate change, population ethics and 42 intergenerational equity. Climatic Change, 163(2), 873-890. 43
Melvin, A. M. et al., 2017: Climate change damages to Alaska public infrastructure and the economics of proactive 44 adaptation. Proceedings of the National Academy of Sciences, 114(2), E122-E131, doi:10.1073/pnas.1611056113. 45
Mengel, M., S. Treu, S. Lange and K. Frieler, 2021: ATTRICI v1.1 – counterfactual climate for impact attribution, 46 5269-5284 pp. 47
Mentaschi, L. et al., 2018: Global long-term observations of coastal erosion and accretion. Scientific Reports, 8(1), 48 12876, doi:10.1038/s41598-018-30904-w. 49
Meredith, M. et al., 2019: Polar Regions. In: IPCC Special Report on the Ocean and Cryosphere in a Changing Climate 50 [Pörtner, H. O., D. C. Roberts, V. Masson-Delmotte, P. Zhai, M. Tignor, E. Poloczanska, K. Mintenbeck, A. 51 Alegría, M. Nicolai, A. Okem, J. Petzold, B. Rama and N. M. Weyer (eds.)], pp. In press. 52
Merk, C. et al., 2015: Exploring public perceptions of stratospheric sulfate injection. Clim. Change, 130(2), 299-312. 53 Merk, C., G. Pönitzsch and K. Rehdanz, 2016: Knowledge about aerosol injection does not reduce individual mitigation 54
efforts. Environmental Research Letters, 11(5), 054009. 55 Merk, C., G. Pönitzsch and K. Rehdanz, 2019: Do climate engineering experts display moral-hazard behaviour? 56
Climate Policy, 19(2), 231-243. 57 Merkens, J.-L., L. Reimann, J. Hinkel and A. T. Vafeidis, 2016: Gridded population projections for the coastal zone 58
under the Shared Socioeconomic Pathways. Global and Planetary Change, 145, 57-66, 59 doi:10.1016/j.gloplacha.2016.08.009. 60
Mersha, A. A. and F. Van Laerhoven, 2016: A gender approach to understanding the differentiated impact of barriers to 61 adaptation: responses to climate change in rural Ethiopia. Regional Environmental Change, 16(6), 1701-1713, 62 doi:10.1007/s10113-015-0921-z. 63
ACCEPTED VERSIO
N
SUBJECT TO FIN
AL EDITS
FINAL DRAFT Chapter 16 IPCC WGII Sixth Assessment Report
Do Not Cite, Quote or Distribute 16-155 Total pages: 173
Mersha, A. A. and F. van Laerhoven, 2018: The interplay between planned and autonomous adaptation in response to 1 climate change: Insights from rural Ethiopia. WORLD DEVELOPMENT, 107, 87-97, 2 doi:10.1016/j.worlddev.2018.03.001. 3
Merz, B. et al., 2020: Impact forecasting to support emergency management of natural hazards. Reviews of geophysics, 4 58(4), e2020RG000704. 5
Messina, J. P. et al., 2019: The current and future global distribution and population at risk of dengue. Nature 6 microbiology, 4(9), 1508-1515. 7
Miao, Q., 2019: Are We Adapting to Floods? Evidence from Global Flooding Fatalities. Risk Analysis, 39(6), 1298-8 1313, doi:10.1111/risa.13245. 9
Middelbeek, L., K. Kolle and H. Verrest, 2014: Built to last? Local climate change adaptation and governance in the 10 Caribbean - The case of an informal urban settlement in Trinidad and Tobago. Urban Climate, 8, 138-154, 11 doi:10.1016/j.uclim.2013.12.003. 12
Millon, A. et al., 2014: Dampening prey cycle overrides the impact of climate change on predator population dynamics: 13 a long-term demographic study on tawny owls. Global Change Biology, 20(6), 1770-1781, 14 doi:10.1111/gcb.12546. 15
Mimura, N. et al., 2014: Adaptation Planning and Implementation. In: Climate Change 2014: Impacts, Adaptation, and 16 Vulnerability. Part A: Global and Sectoral Aspects. Contribution of Working Group II to the Fifth Assessment 17 Report of the Intergovernmental Panel on Climate Change [Field, C. B., V. R. Barros, D. J. Dokken, K. J. Mach, 18 M. D. Mastrandrea, T. E. Bilir, M. Chatterjee, K. L. Ebi, Y. O. Estrada, R. C. Genova, B. Girma, E. S. Kissel, A. 19 N. Levy, S. MacCracken, P. R. Mastrandrea and L. L. White (eds.)]. Cambridge University Press, Cambridge, 20 United Kingdom and New York, NY, USA, pp. 869-898. ISBN 9781107058071. 21
Minx, J. C. et al., 2017: Learning about climate change solutions in the IPCC and beyond. Environmental Science & 22 Policy, 77, 252-259, doi:10.1016/j.envsci.2017.05.014. 23
Mitchell, D. et al., 2016: Attributing human mortality during extreme heat waves to anthropogenic climate change. 24 Environmental Research Letters, 11(7), 074006. 25
Miyan, M. A. et al., 2017: Barriers, needs and potential solutions to reducing vulnerability to global environment 26 change for least developed countries in the Asia-Pacific Region. APN Science Bulletin, 7(1), 27 doi:10.30852/sb.2017.108. 28
Monaghan, A. J. et al., 2018: The potential impacts of 21st century climatic and population changes on human exposure 29 to the virus vector mosquito Aedes aegypti. Climatic change, 146(3-4), 487-500. 30
Monioudi, I. Ν. et al., 2018: Climate change impacts on critical international transportation assets of Caribbean Small 31 Island Developing States (SIDS): the case of Jamaica and Saint Lucia. Regional Environmental Change, 18(8), 32 2211-2225, doi:10.1007/s10113-018-1360-4. 33
Monnereau, I. and S. Abraham, 2013: Limits to autonomous adaptation in response to coastal erosion in Kosrae, 34 Micronesia. INTERNATIONAL JOURNAL OF GLOBAL WARMING, 5(4, SI), 416-432, 35 doi:10.1504/IJGW.2013.057283. 36
Montaud, J.-M., N. Pecastaing and M. Tankari, 2017: Potential socio-economic implications of future climate change 37 and variability for Nigerien agriculture: A countrywide dynamic CGE-Microsimulation analysis. Economic 38 Modelling, 63, 128-142, doi:10.1016/j.econmod.2017.02.005. 39
Moore, F. C., U. Baldos, T. Hertel and D. Diaz, 2017a: New science of climate change impacts on agriculture implies 40 higher social cost of carbon. Nature communications, 8(1), 1-9. 41
Moore, F. C. and D. B. Diaz, 2015: Temperature impacts on economic growth warrant stringent mitigation policy. 42 Nature Climate Change, 5(2), 127. 43
Moore, F. C. and D. B. Lobell, 2015: The fingerprint of climate trends on European crop yields. Proceedings of the 44 National Academy of Sciences, 112(9), 2670-2675, doi:10.1073/pnas.1409606112. 45
Moore, S. M. et al., 2017b: El Niño and the shifting geography of cholera in Africa. Proceedings of the National 46 Academy of Sciences, 114(17), 4436-4441. 47
Mora, C. et al., 2017: Global risk of deadly heat. Nature Climate Change, 7(7), 501-506, doi:10.1038/nclimate3322. 48 Morecroft, M. D. et al., 2019: Measuring the success of climate change adaptation and mitigation in terrestrial 49
ecosystems. SCIENCE, 366(6471), 1329+, doi:10.1126/science.aaw9256. 50 Moriyama, R. et al., 2017: The cost of stratospheric climate engineering revisited. Mitigation and Adaptation Strategies 51
for Global Change, 22(8), 1207-1228. 52 Morris, R. L., T. M. Konlechner, M. Ghisalberti and S. E. Swearer, 2018: From grey to green: Efficacy of eco-53
engineering solutions for nature-based coastal defence. Global Change Biology, 24(5), 1827-1842, 54 doi:10.1111/gcb.14063. 55
Morris, R. L. et al., 2019: Developing a nature-based coastal defence strategy for Australia. AUSTRALIAN JOURNAL 56 OF CIVIL ENGINEERING, 17(2), 167-176, doi:10.1080/14488353.2019.1661062. 57
Morrow, D. R., 2014: Ethical aspects of the mitigation obstruction argument against climate engineering research. 58 Philos. Trans. A Math. Phys. Eng. Sci., 372(2031), doi:10.1098/rsta.2014.0062. 59
Morshed, M. M., M. S. Islam, H. Das Lohano and P. Shyamsundar, 2020: Production externalities of shrimp 60 aquaculture on paddy farming in coastal Bangladesh. AGRICULTURAL WATER MANAGEMENT, 238, 61 doi:10.1016/j.agwat.2020.106213. 62
ACCEPTED VERSIO
N
SUBJECT TO FIN
AL EDITS
FINAL DRAFT Chapter 16 IPCC WGII Sixth Assessment Report
Do Not Cite, Quote or Distribute 16-156 Total pages: 173
Moser, S. C. and J. A. F. Hart, 2015: The long arm of climate change: societal teleconnections and the future of climate 1 change impacts studies. Climatic Change, 129(1-2), 13-26, doi:10.1007/s10584-015-1328-z. 2
Moyer, J. D. and S. Hedden, 2020: Are we on the right path to achieve the sustainable development goals? World 3 Development, 127, 104749, doi:10.1016/j.worlddev.2019.104749. 4
Muchuru, S. and G. Nhamo, 2017: Climate change and the African livestock sector Emerging adaptation measures from 5 UNFCCC national communications. INTERNATIONAL JOURNAL OF CLIMATE CHANGE STRATEGIES AND 6 MANAGEMENT, 9(2), 241-260, doi:10.1108/IJCCSM-07-2016-0093. 7
Mugambiwa, S. S. and H. M. Tirivangasi, 2017: Climate change: A threat towards achieving ‘Sustainable Development 8 Goal number two’ (end hunger, achieve food security and improved nutrition and promote sustainable agriculture) 9 in South Africa. Jàmbá: Journal of Disaster Risk Studies, 9(1), doi:10.4102/jamba.v9i1.350. 10
Mukherjee, N. et al., 2015: The Delphi technique in ecology and biological conservation: applications and guidelines. 11 Methods in Ecology and Evolution, 6(9), 1097-1109, doi:10.1111/2041-210X.12387. 12
Müller, C. et al., 2017: Global gridded crop model evaluation: benchmarking, skills, deficiencies and implications. 13 Geoscientific Model Development, 10(4), 1403-1422, doi:10.5194/gmd-10-1403-2017. 14
Munji, C. A., M. Y. Bele, M. E. Idinoba and D. J. Sonwa, 2014: Floods and mangrove forests, friends or foes? 15 Perceptions of relationships and risks in Cameroon coastal mangroves. ESTUARINE COASTAL AND SHELF 16 SCIENCE, 140, 67-75, doi:10.1016/j.ecss.2013.11.017. 17
Muri, H., U. Niemeier and J. E. Kristjánsson, 2015: Tropical rainforest response to marine sky brightening climate 18 engineering. Geophys. Res. Lett., 42(8), 2951-2960. 19
Musyoki, A., R. Thifhulufhelwi and F. M. Murungweni, 2016: The impact of and responses to flooding in Thulamela 20 Municipality, Limpopo Province, South Africa. Jàmbá: Journal of Disaster Risk Studies, 8(2), 10 pages, 21 doi:10.4102/jamba.v8i2.166. 22
Muthee, K. W., C. Mbow, G. M. Macharia and W. Leal-Filho, 2018: Ecosystem services in adaptation projects in West 23 Africa. INTERNATIONAL JOURNAL OF CLIMATE CHANGE STRATEGIES AND MANAGEMENT, 10(4, SI), 24 533-550, doi:10.1108/IJCCSM-06-2017-0140. 25
Mycoo, M. A., 2018: Beyond 1.5 °C: vulnerabilities and adaptation strategies for Caribbean Small Island Developing 26 States. Regional Environmental Change, 18(8), 2341-2353, doi:10.1007/s10113-017-1248-8. 27
Myers, S. S. et al., 2017: Climate Change and Global Food Systems: Potential Impacts on Food Security and 28 Undernutrition. Annual Review of Public Health, 38(1), 259-277, doi:10.1146/annurev-publhealth-031816-29 044356. 30
Nakano, K., 2017: Screening of climatic impacts on a country’s international supply chains: Japan as a case study. 31 Mitigation and Adaptation Strategies for Global Change, 22(4), 651-667, doi:10.1007/s11027-015-9692-6. 32
Nalau, J., S. Becken and B. Mackey, 2018: Ecosystem-based Adaptation: A review of the constraints. Environmental 33 Science & Policy, 89, 357-364, doi:10.1016/j.envsci.2018.08.014. 34
Narita, D., H.-O. Poertner and K. Rehdanz, 2020: Accounting for risk transitions of ocean ecosystems under climate 35 change: an economic justification for more ambitious policy responses. Climatic Change, 162(1), 1-11. 36
NASEM, 2016: Attribution of Extreme Weather Events in the Context of Climate Change. The National Academies 37 Press, National Academies of Sciences Medicine and Engineering, Washington, DC. 38
Natali, S. M. et al., 2019: Large loss of CO2 in winter observed across the northern permafrost region. Nature Climate 39 Change, 9(11), 852-857, doi:10.1038/s41558-019-0592-8. 40
National Academies of Sciences, E. and Medicine, 2021a: Reflecting Sunlight: Recommendations for Solar 41 Geoengineering Research and Research Governance. The National Academies Press, Washington, DC, 328 pp. 42 ISBN 978-0-309-67605-2. 43
National Academies of Sciences, E. and Medicine, 2021b: Reflecting sunlight: Recommendations for solar 44 geoengineering research and research governance. 45
Naulleau, A., C. Gary, L. Prevot and L. Hossard, 2021: Evaluating Strategies for Adaptation to Climate Change in 46 Grapevine Production-A Systematic Review. FRONTIERS IN PLANT SCIENCE, 11, 47 doi:10.3389/fpls.2020.607859. 48
Naumann, G. et al., 2018: Global Changes in Drought Conditions Under Different Levels of Warming. Geophysical 49 Research Letters, 45(7), 3285-3296, doi:10.1002/2017GL076521. 50
Nawrotzki, R. J. and J. DeWaard, 2016: Climate shocks and the timing of migration from Mexico. Population and 51 Environment, 38(1), 72-100, doi:10.1007/s11111-016-0255-x. 52
Nawrotzki, R. J., L. M. Hunter, D. M. Runfola and F. Riosmena, 2015: Climate change as a migration driver from rural 53 and urban Mexico. Environmental Research Letters, 10(11), 114023. 54
Nelson, G. et al., 2018: Income growth and climate change effects on global nutrition security to mid-century. Nature 55 Sustainability, 1(12), 773-781, doi:10.1038/s41893-018-0192-z. 56
Nelson, J. P., L. Kaplan and D. Tomblin, 2021: Assessing solar geoengineering research funders: Insights from two US 57 public deliberations. The Anthropocene Review, 8(1), 37-55. 58
Neset, T.-S. et al., 2019: Maladaptation in Nordic agriculture. CLIMATE RISK MANAGEMENT, 23, 78-87, 59 doi:10.1016/j.crm.2018.12.003. 60
Neumann, B., A. T. Vafeidis, J. Zimmermann and R. J. Nicholls, 2015: Future Coastal Population Growth and 61 Exposure to Sea-Level Rise and Coastal Flooding - A Global Assessment. PLOS ONE, 10(3), e0118571, 62 doi:10.1371/journal.pone.0118571. 63
ACCEPTED VERSIO
N
SUBJECT TO FIN
AL EDITS
FINAL DRAFT Chapter 16 IPCC WGII Sixth Assessment Report
Do Not Cite, Quote or Distribute 16-157 Total pages: 173
Newell, R., A. Dale and M. Roseland, 2018: Climate action co-benefits and integrated community planning: 1 Uncovering the synergies and trade-offs. International Journal of Climate Change: Impacts and Responses, 10(4), 2 1-23, doi:10.18848/1835-7156. 3
Newell, R. G., B. C. Prest and S. E. Sexton, 2021: The GDP-temperature relationship: implications for climate change 4 damages. Journal of Environmental Economics and Management, 108, 102445. 5
Nicholls, R. J., W. N. Adger, C. W. Hutton and S. E. Hanson, 2020: Deltas in the Anthropocene. Springer Nature. 6 Nicholson, S., S. Jinnah and A. Gillespie, 2018: Solar radiation management: a proposal for immediate polycentric 7
governance. Clim. Policy, 18(3), 322-334, doi:10.1080/14693062.2017.1400944. 8 Nicolas, C. et al., 2019: Stronger Power: Improving Power Sector Resilience to Natural Hazards. World Bank. 9 Niemeier, U., H. Schmidt and C. Timmreck, 2011: The dependency of geoengineered sulfate aerosol on the emission 10
strategy, 189-194 pp. 11 Nienhuis, J. H. et al., 2020: Global-scale human impact on delta morphology has led to net land area gain. Nature, 12
577(7791), 514-518, doi:10.1038/s41586-019-1905-9. 13 Nilsson, M. et al., 2018: Mapping interactions between the sustainable development goals: lessons learned and ways 14
forward. Sustainability science, 13(6), 1489-1503. 15 Nilsson, M., D. Griggs and M. Visbeck, 2016: Map the interactions between Sustainable Development Goals. 3. 16 Nizami, A., J. Ali and M. Zulfiqar, 2019: Climate change, hydro-meteorological hazards and adaptation for sustainable 17
livelihood in Chitral Pakistan. Sarhad Journal of Agriculture, 35(2), 432-441, 18 doi:10.17582/journal.sja/2019/35.2.432.441. 19
Nordhagen, S. and U. Pascual, 2013: The Impact of Climate Shocks on Seed Purchase Decisions in Malawi: 20 Implications for Climate Change Adaptation. WORLD DEVELOPMENT, 43, 238-251, 21 doi:10.1016/j.worlddev.2012.08.002. 22
Nordhaus, W. D., 1994: Expert opinion on climatic change. 23 Nordhaus, W. D. and A. Moffat, 2017: A survey of global impacts of climate change: replication, survey methods, and 24
a statistical analysis. National Bureau of Economic Research. 25 Nordkvelle, J., S. A. Rustad and M. Salmivalli, 2017: Identifying the effect of climate variability on communal conflict 26
through randomization. Climatic Change, 141(4), 627-639, doi:10.1007/s10584-017-1914-3. 27 Northrop, E. et al., 2016: Examining the alignment between the intended nationally determined contributions and 28
sustainable development goals. World Resources Institute. 29 Norton-Smith, K., K. Lynn, K. Chief and K. Cozzetto, Climate Change and Indigenous Peoples: A Synthesis of Current 30
Impacts and Experiences. 142. 31 Nunfam, V. F. et al., 2018: Social impacts of occupational heat stress and adaptation strategies of workers: A narrative 32
synthesis of the literature. SCIENCE OF THE TOTAL ENVIRONMENT, 643, 1542-1552, 33 doi:10.1016/j.scitotenv.2018.06.255. 34
Nunn, P. D., A. Kohler and R. Kumar, 2017: Identifying and assessing evidence for recent shoreline change attributable 35 to uncommonly rapid sea-level rise in Pohnpei, Federated States of Micronesia, Northwest Pacific Ocean. Journal 36 of Coastal Conservation, 21, 719-730, doi:10.1007/s11852-017-0531-7. 37
Nuttall, M., 2020: Water, ice, and climate change in northwest Greenland. WIREs Water, 7(3), doi:10.1002/wat2.1433. 38 Nyamadzawo, G. et al., 2015: Optimizing dambo (seasonal wetland) cultivation for climate change adaptation and 39
sustainable crop production in the smallholder farming areas of Zimbabwe. INTERNATIONAL JOURNAL OF 40 AGRICULTURAL SUSTAINABILITY, 13(1), 23-39, doi:10.1080/14735903.2013.863450. 41
Nyantakyi-Frimpong, H., P. Matous and M. E. Isaac, 2019: Smallholder farmers' social networks and resource-42 conserving agriculture in Ghana: a multicase comparison using exponential random graph models. ECOLOGY 43 AND SOCIETY, 24(1), doi:10.5751/ES-10623-240105. 44
Nyasimi, M. et al., 2017: Adoption and Dissemination Pathways for Climate-Smart Agriculture Technologies and 45 Practices for Climate-Resilient Livelihoods in Lushoto, Northeast Tanzania. CLIMATE, 5(3), 46 doi:10.3390/cli5030063. 47
O'Hare, P., I. White and A. Connelly, 2016: Insurance as maladaptation: Resilience and the ‘business as usual' paradox. 48 ENVIRONMENT AND PLANNING C-GOVERNMENT AND POLICY, 34(6), 1175-1193, 49 doi:10.1177/0263774X15602022. 50
O’Neill, B. et al., 2014: A new scenario framework for climate change research: the concept of shared socioeconomic 51 pathways. Climatic change, 122(3), 387-400. 52
O’Neill, B. et al., 2017: IPCC reasons for concern regarding climate change risks. Nature Climate Change, 7(1), 28-37, 53 doi:10.1038/nclimate3179. 54
Oakes, R., 2019: Culture, climate change and mobility decisions in Pacific Small Island Developing States. Population 55 and Environment, 40(4), 480-503, doi:10.1007/s11111-019-00321-w. 56
Oakley, J. and A. O’Hagan, 2010: SHELF: the Sheffield elicitation framework (version 2.0). School of Mathematics 57 and Statistics, University of Sheffield, UK. Available at: http://tonyohagan.co.uk/shelf/. 58
OECD, 2019: Measuring Distance to the SDG Targets 2019: An Assessment of Where OECD Countries Stand, . OECD 59 Publishing, Paris. 60
Ofoegbu, C., P. W. Chirwa, J. Francis and F. D. Babalola, 2016: Assessing forest-based rural communities' adaptive 61 capacity and coping strategies for climate variability and change: The case of Vhembe district in south Africa. 62 ENVIRONMENTAL DEVELOPMENT, 18, 36-51, doi:10.1016/j.envdev.2016.03.001. 63
ACCEPTED VERSIO
N
SUBJECT TO FIN
AL EDITS
FINAL DRAFT Chapter 16 IPCC WGII Sixth Assessment Report
Do Not Cite, Quote or Distribute 16-158 Total pages: 173
Ojha, H. R. et al., 2014: Is South Asian Agriculture Adapting to Climate Change? Evidence from the Indo-Gangetic 1 Plains. AGROECOLOGY AND SUSTAINABLE FOOD SYSTEMS, 38(5), 505-531, 2 doi:10.1080/21683565.2013.841607. 3
Olazabal, M. et al., 2019: A cross-scale worldwide analysis of coastal adaptation planning. ENVIRONMENTAL 4 RESEARCH LETTERS, 14(12), doi:10.1088/1748-9326/ab5532. 5
Oliver, T. H. et al., 2015: Declining resilience of ecosystem functions under biodiversity loss. Nature Communications, 6 6(1), 10122, doi:10.1038/ncomms10122. 7
Olmstead, S. M., 2014: Climate change adaptation and water resource management: A review of the literature. 8 ENERGY ECONOMICS, 46(SI), 500-509, doi:10.1016/j.eneco.2013.09.005. 9
Oppenheimer, M. et al., 2014: Emergent Risks and Key Vulnerabilities. In: Climate Change 2014: Impacts, Adaptation, 10 and Vulnerability. Part A: Global and Sectoral Aspects. Contribution of Working Group II to the Fifth Assessment 11 Report of the Intergovernmental Panel on Climate Change [Field, C. B., V. R. Barros, D. J. Dokken, K. J. Mach, 12 M. D. Mastrandrea, T. E. Bilir, M. Chatterjee, K. L. Ebi, Y. O. Estrada, R. C. Genova, B. Girma, E. S. Kissel, A. 13 N. Levy, S. MacCracken, P. R. Mastrandrea and L. L. White (eds.)]. Cambridge University Press, Cambridge, 14 United Kingdom and New York, NY, USA, pp. 1039-1099. ISBN 9781107058071. 15
Oppenheimer, M. et al., 2019: Sea Level Rise and Implications for Low-Lying Islands, Coasts and Communities. In: 16 IPCC Special Report on the Ocean and Cryosphere in a Changing Climate [Pörtner, H. O., D. C. Roberts, V. 17 Masson-Delmotte, P. Zhai, M. Tignor, E. Poloczanska, K. Mintenbeck, A. Alegría, M. Nicolai, A. Okem, J. 18 Petzold, B. Rama and N. M. Weyer (eds.)], pp. In press. 19
Otto, I. M. et al., 2017: Social vulnerability to climate change: a review of concepts and evidence. Regional 20 Environmental Change, 17(6), 1651-1662, doi:10.1007/s10113-017-1105-9. 21
Pal, J. S. and E. A. B. Eltahir, 2016: Future temperature in southwest Asia projected to exceed a threshold for human 22 adaptability. Nature Climate Change, 6(2), 197-200, doi:10.1038/nclimate2833. 23
Palao, L. K., D. Naziri, J. G. Balanza and D. M. Campilan, 2019: Transformational adaptation of key root and tuber 24 crops in Asia: Assessing crop suitability amidst climate change by species distribution modelling. International 25 Potato Center (accessed 2020-10-14 01:08:35). 26
Panda, A., 2018: Transformational adaptation of agricultural systems to climate change. Wiley Interdisciplinary 27 Reviews: Climate Change, 9(4), e520, doi:10.1002/wcc.520. 28
Pandey, R. et al., 2017: Agroecology as a Climate Change Adaptation Strategy for Smallholders of Tehri-Garhwal in 29 the Indian Himalayan Region. SMALL-SCALE FORESTRY, 16(1), 53-63, doi:10.1007/s11842-016-9342-1. 30
Paprocki, K. and S. Huq, 2018: Shrimp and coastal adaptation: on the politics of climate justice. CLIMATE AND 31 DEVELOPMENT, 10(1), 1-3, doi:10.1080/17565529.2017.1301871. 32
Parker, A., 2014: Governing solar geoengineering research as it leaves the laboratory. Philosophical Transactions of the 33 Royal Society A: Mathematical, Physical and Engineering Sciences, 372(2031), 20140173. 34
Parker, A., J. B. Horton and D. W. Keith, 2018: Stopping Solar Geoengineering Through Technical Means: A 35 Preliminary Assessment of Counter‐Geoengineering, 1058-1065 pp. 36
Parker, L., C. Bourgoin, A. Martinez-Valle and P. Läderach, 2019: Vulnerability of the agricultural sector to climate 37 change: The development of a pan-tropical Climate Risk Vulnerability Assessment to inform sub-national 38 decision making. PLOS ONE, 14(3), e0213641, doi:10.1371/journal.pone.0213641. 39
Parkes, B., A. Challinor and K. Nicklin, 2015: Crop failure rates in a geoengineered climate: impact of climate change 40 and marine cloud brightening. Environ. Res. Lett., 10(8), 084003, doi:10.1088/1748-9326/10/8/084003. 41
Parmesan, C. et al., 2013: Beyond climate change attribution in conservation and ecological research. Ecology Letters, 42 16(s1), 58-71, doi:10.1111/ele.12098. 43
Parry, J., 2014: The UK response to the challenge of climate change. PROCEEDINGS OF THE INSTITUTION OF 44 CIVIL ENGINEERS-MUNICIPAL ENGINEER, 167(2), 63-76, doi:10.1680/muen.13.00032. 45
Parson, E. A., 2014: Climate engineering in global climate governance: Implications for participation and linkage. TEL, 46 3, 89. 47
Partanen, A.-I., D. P. Keller, H. Korhonen and H. D. Matthews, 2016: Impacts of sea spray geoengineering on ocean 48 biogeochemistry. Geophys. Res. Lett., 43(14), 7600-7608. 49
Partey, S. T., R. B. Zougmore, M. Ouedraogo and N. V. Thevathasan, 2017: Why Promote Improved Fallows as a 50 Climate-Smart Agroforestry Technology in Sub-Saharan Africa? SUSTAINABILITY, 9(11), 51 doi:10.3390/su9111887. 52
Pascual, M. et al., 2006: Malaria resurgence in the East African highlands: Temperature trends revisited. Proceedings of 53 the National Academy of Sciences, 103(15), 5829, doi:10.1073/pnas.0508929103. 54
Pastor, A. V. et al., 2019: The global nexus of food–trade–water sustaining environmental flows by 2050. Nature 55 Sustainability, 2(6), 499-507, doi:10.1038/s41893-019-0287-1. 56
Patnaik, U. and K. Narayanan, 2015: How effective are coping mechanisms in securing livelihoods against climatic 57 aberrations?: Evidences from rural India. International Journal of Climate Change Strategies and Management, 58 7(3), 359-374, doi:10.1108/IJCCSM-07-2014-0085. 59
Patricola, C. M. and M. F. Wehner, 2018: Anthropogenic influences on major tropical cyclone events. Nature, 60 563(7731), 339-346. 61
Paz, S. et al., 2013: Permissive Summer Temperatures of the 2010 European West Nile Fever Upsurge. PLOS ONE, 62 8(2), e56398, doi:10.1371/journal.pone.0056398. 63
ACCEPTED VERSIO
N
SUBJECT TO FIN
AL EDITS
FINAL DRAFT Chapter 16 IPCC WGII Sixth Assessment Report
Do Not Cite, Quote or Distribute 16-159 Total pages: 173
Pearson, J., G. Jackson and K. E. McNamara, 2021: Climate-driven losses to Indigenous and local knowledge and 1 cultural heritage. The Anthropocene Review, 205301962110054, doi:10.1177/20530196211005482. 2
Pecl, G. T. et al., 2017: Biodiversity redistribution under climate change: Impacts on ecosystems and human well-being. 3 Science, 355(6332), eaai9214, doi:10.1126/science.aai9214. 4
Pelling, M. and M. Garschagen, 2019: Put equity first in climate adaptation. Nature, 569(7756), 327-329, 5 doi:10.1038/d41586-019-01497-9. 6
Pelling, M., K. O’Brien and D. Matyas, 2015: Adaptation and transformation. Climatic Change, 133(1), 113-127, 7 doi:10.1007/s10584-014-1303-0. 8
Pereira, L. and e. al., 2021: From Fairplay to Climate Wars: Making climate change scenarios more dynamic, creative 9 and integrative. Ecology and Society. 10
Péres, W. E., A. F. Ribeiro, A. Russo and B. Nunes, 2020: The Association between Air Temperature and Mortality in 11 Two Brazilian Health Regions. Climate, 8(1), 16. 12
Perez-Saez, J. et al., 2015: A theoretical analysis of the geography of schistosomiasis in Burkina Faso highlights the 13 roles of human mobility and water resources development in disease transmission. PLoS Negl Trop Dis, 9(10), 14 e0004127. 15
Perrotti, D. and S. Stremke, 2020: Can urban metabolism models advance green infrastructure planning? Insights from 16 ecosystem services research. Environment and Planning B-Urban Analytics and City Science, 47(4), 678-694, 17 doi:10.1177/2399808318797131. 18
Perry, C. T. et al., 2018: Loss of coral reef growth capacity to track future increases in sea level. Nature, 558(7710), 19 396-400, doi:10.1038/s41586-018-0194-z. 20
Perry, S. J., S. McGregor, A. S. Gupta and M. H. England, 2017: Future Changes to El Niño–Southern Oscillation 21 Temperature and Precipitation Teleconnections. Geophysical Research Letters, 44(20), 10,608-610,616, 22 doi:10.1002/2017GL074509. 23
Pershing, A. J. et al., 2016: Response to Comments on ‘Slow adaptation in the face of rapid warming leads to collapse 24 of the Gulf of Maine cod fishery’. SCIENCE, 352(6284), doi:10.1126/science.aae0463. 25
Persson, Å., 2019: Global adaptation governance: An emerging but contested domain. WIREs Climate Change, 10(6), 26 e618, doi:10.1002/wcc.618. 27
Pescaroli, G. and D. Alexander, 2015: A definition of cascading disasters and cascading effects: Going beyond the 28 ‘toppling dominos’ metaphor. Planet@ risk, 3(1), 58-67. 29
Pescaroli, G. and D. Alexander, 2018: Understanding Compound, Interconnected, Interacting, and Cascading Risks: A 30 Holistic Framework. Risk Analysis, 38(11), 2245-2257, doi:10.1111/risa.13128. 31
Pescaroli, G., M. Nones, L. Galbusera and D. Alexander, 2018: Understanding and mitigating cascading crises in the 32 global interconnected system. International Journal of Disaster Risk Reduction, 30, 159-163, 33 doi:10.1016/j.ijdrr.2018.07.004. 34
Petrova, K., 2021: Natural hazards, internal migration and protests in Bangladesh. Journal of Peace Research, 58(1), 35 33-49, doi:10.1177/0022343320973741. 36
Pettersson, T. and M. Öberg, 2020: Organized violence, 1989–2019. Journal of Peace Research, 57(4), 597-613, 37 doi:10.1177/0022343320934986. 38
Pezzey, J. C., 2019: Why the social cost of carbon will always be disputed. Wiley Interdisciplinary Reviews: Climate 39 Change, 10(1), e558. 40
Pidgeon, N. et al., 2012: Exploring early public responses to geoengineering. Philos. Trans. A Math. Phys. Eng. Sci., 41 370(1974), 4176-4196, doi:10.1098/rsta.2012.0099. 42
Pienkowski, D. and W. Zbaraszewski, 2019: THE CONCEPT OF CLIMATE RESILIENT ECONOMY FROM THE 43 PERSPECTIVE OF LOCAL COMMUNITIES. EKONOMIA I SRODOWISKO-ECONOMICS AND 44 ENVIRONMENT, 1(68), 204-213. 45
Piggott-McKellar, A. E., P. D. Nunn, K. E. McNamara and S. T. Sekinini, 2020: Dam(n) Seawalls: A Case of Climate 46 Change Maladaptation in Fiji. Climate Change Management, 69 pp. 47
Piguet, E., 2019: Climatic Statelessness: Risk Assessment and Policy Options. Population and Development Review, 48 45(4), 865-883, doi:10.1111/padr.12295. 49
Pindyck, R. S., 2013: Climate Change Policy: What Do the Models Tell Us? 51, 860-872, doi:10.1257/jel.51.3.860. 50 Pindyck, R. S., 2017: The use and misuse of models for climate policy. Review of Environmental Economics and 51
Policy, 11(1), 100-114. 52 Pindyck, R. S., 2019: The social cost of carbon revisited. Journal of Environmental Economics and Management, 94, 53
140-160. 54 Pinke, Z., S. Pow and Z. Kern, 2019: Volcanic mega-eruptions may trigger major cholera outbreaks, 151-162 pp. 55 Pinnegar, J. K. et al., 2019: Assessing vulnerability and adaptive capacity of the fisheries sector in Dominica: long-term 56
climate change and catastrophic hurricanes. ICES Journal of Marine Science, fsz052, doi:10.1093/icesjms/fsz052. 57 Pinsky, M. L. et al., 2018: Preparing ocean governance for species on the move. Science, 360(6394), 1189-1191, 58
doi:10.1126/science.aat2360. 59 Piontek, F. et al., 2021: Integrated perspective on translating biophysical to economic impacts of climate change. 60
Nature Climate Change, 1-10. 61
ACCEPTED VERSIO
N
SUBJECT TO FIN
AL EDITS
FINAL DRAFT Chapter 16 IPCC WGII Sixth Assessment Report
Do Not Cite, Quote or Distribute 16-160 Total pages: 173
Pitari, G. et al., 2014: Stratospheric ozone response to sulfate geoengineering: Results from the Geoengineering Model 1 Intercomparison Project (GeoMIP). Journal of Geophysical Research: Atmospheres, 119(5), 2629-2653, 2 doi:https://doi.org/10.1002/2013JD020566. 3
Pokhrel, Y. et al., 2021: Global terrestrial water storage and drought severity under climate change. Nature Climate 4 Change, 11(3), 226-233, doi:10.1038/s41558-020-00972-w. 5
Poloczanska, E. S. et al., 2013: Global imprint of climate change on marine life. Nature Climate Change, 3, 919, 6 doi:10.1038/nclimate1958 7
https://www.nature.com/articles/nclimate1958#supplementary-information. 8 Pongratz, J., D. B. Lobell, L. Cao and K. Caldeira, 2012: Crop yields in a geoengineered climate. Nat. Clim. Chang., 9
2(2), 101-105, doi:10.1038/nclimate1373. 10 Porio, E., 2014: Climate Change Vulnerability and Adaptation in Metro Manila Challenging Governance and Human 11
Security of Urban Poor Communities. ASIAN JOURNAL OF SOCIAL SCIENCE, 42(1-2), 75-102, 12 doi:10.1163/15685314-04201006. 13
Porter, J. J., S. Dessai and E. L. Tompkins, 2014: What do we know about UK household adaptation to climate change? 14 A systematic review. Climatic Change, 127(2), 371-379, doi:10.1007/s10584-014-1252-7. 15
Pörtner, H. O. et al., 2021: IPBES-IPCC co-sponsored workshop report on biodiversity and climate change. IPBES and 16 IPCC. 17
Postigo, J. C., 2014: PERCEPTION AND RESILIENCE OF ANDEAN POPULATIONS FACING CLIMATE 18 CHANGE. JOURNAL OF ETHNOBIOLOGY, 34(3, SI), 383-400, doi:10.2993/0278-0771-34.3.383. 19
Poudel, D. D. and T. W. Duex, 2017: Vanishing Springs in Nepalese Mountains: Assessment of Water Sources, 20 Farmers' Perceptions, and Climate Change Adaptation. Mountain Research and Development, 37(1), 35, 21 doi:10.1659/MRD-JOURNAL-D-16-00039.1. 22
Pradhan, P. et al., 2017: A Systematic Study of Sustainable Development Goal (SDG) Interactions. Earth's Future, 23 5(11), 1169-1179, doi:10.1002/2017EF000632. 24
Prain, G. and D. Naziri, 2019: The role of root and tuber crops in strengthening agri‐food system resilience in Asia. A 25 literature review and selective stakeholder assessment., International Potato Center (accessed 2020-10-14 26 01:11:39). 27
Preston, C. and W. Carr, 2018: Recognitional Justice, Climate Engineering, and the Care Approach. Ethics, Policy & 28 Environment, 21(3), 308-323, doi:10.1080/21550085.2018.1562527. 29
Pretis, F. et al., 2018: Uncertain impacts on economic growth when stabilizing global temperatures at 1.5°C or 2°C 30 warming. Philosophical Transactions of the Royal Society A: Mathematical, Physical and Engineering Sciences, 31 376(2119), 20160460, doi:10.1098/rsta.2016.0460. 32
Pritchard, B. and R. Thielemans, 2014: 'Rising Waters Don't Lift All Boats': a sustainable livelihood analysis of 33 recursive cycles of vulnerability and maladaptation to flood risk in rural Bihar, India. Australian Geographer, 34 45(3), 325-339, doi:10.1080/00049182.2014.930001. 35
Proctor, J. et al., 2018: Estimating global agricultural effects of geoengineering using volcanic eruptions. Nature, 36 560(7719), 480-483, doi:10.1038/s41586-018-0417-3. 37
Pugatch, T., 2019: Tropical storms and mortality under climate change. World Development, 117, 172-182, 38 doi:10.1016/j.worlddev.2019.01.009. 39
Puthucherril, T. G., S. Evans and M. Doelle, 2014: The role of the unfccc Regime in ensuring effective adaptation in 40 developing countries: Lessons from Bangladesh. Climate Law, 4(3-4), 327-352, doi:10.1163/18786561-00404007. 41
Pyatkova, K. et al., 2019: Assessing the knock-on effects of flooding on road transportation. Journal of Environmental 42 Management, 244, 48-60, doi:10.1016/j.jenvman.2019.05.013. 43
Qin, Y. et al., 2021: Carbon loss from forest degradation exceeds that from deforestation in the Brazilian Amazon. 44 Nature Climate Change, 11(5), 442-448, doi:10.1038/s41558-021-01026-5. 45
Rabin, S. S. et al., 2020: Impacts of future agricultural change on ecosystem service indicators. Earth System Dynamics, 46 11(2), 357-376, doi:10.5194/esd-11-357-2020. 47
Radel, C., B. Schmook, L. Carte and S. Mardero, 2018: Toward a Political Ecology of Migration: Land, Labor 48 Migration, and Climate Change in Northwestern Nicaragua. WORLD DEVELOPMENT, 108, 263-273, 49 doi:10.1016/j.worlddev.2017.04.023. 50
Rademacher-Schulz, C., B. Schraven and E. S. Mahama, 2014: Time matters: shifting seasonal migration in Northern 51 Ghana in response to rainfall variability and food insecurity. CLIMATE AND DEVELOPMENT, 6(1, SI), 46-52, 52 doi:10.1080/17565529.2013.830955. 53
Rahman, A. A., P. Artaxo, A. Asrat and A. Parker, 2018: Developing countries must lead on solar geoengineering 54 research. Nature publishing group. 55
Rahman, H. M. T. and G. M. Hickey, 2019: What Does Autonomous Adaptation to Climate Change Have to Teach 56 Public Policy and Planning About Avoiding the Risks of Maladaptation in Bangladesh? FRONTIERS IN 57 ENVIRONMENTAL SCIENCE, 7, doi:10.3389/fenvs.2019.00002. 58
Rahman, S., M. S. Islam, M. N. H. Khan and M. Touhiduzzaman, 2019: Climate change adaptation and disaster risk 59 reduction (DRR) through coastal afforestation in South-Central Coast of Bangladesh. MANAGEMENT OF 60 ENVIRONMENTAL QUALITY, 30(3), 498-517, doi:10.1108/MEQ-01-2018-0021. 61
Ranasinghe, R. et al., 2021: Climate Change Information for Regional Impact and for Risk Assessment. In: Climate 62 Change 2021: The Physical Science Basis. Contribution of Working Group I to the Sixth Assessment Report of the 63
ACCEPTED VERSIO
N
SUBJECT TO FIN
AL EDITS
FINAL DRAFT Chapter 16 IPCC WGII Sixth Assessment Report
Do Not Cite, Quote or Distribute 16-161 Total pages: 173
Intergovernmental Panel on Climate Change [Masson-Delmotte, V., P. Zhai, A. Pirani, S. L. Connors, C. Péan, S. 1 Berger, N. Caud, Y. Chen, L. Goldfarb, M. I. Gomis, M. Huang, K. Leitzell, E. Lonnoy, J. B. R. Matthews, T. K. 2 Maycock, T. Waterfield, O. Yelekçi, R. Yu and B. Zhou (eds.)]. Cambridge University Press. 3
Rao, N. D., P. Sauer, M. Gidden and K. Riahi, 2019: Income inequality projections for the Shared Socioeconomic 4 Pathways (SSPs). Futures, 105, 27-39, doi:10.1016/j.futures.2018.07.001. 5
Ratnayake, H. U. et al., 2019: Forecasting wildlife die-offs from extreme heat events. Animal Conservation, 22(4), 386-6 395, doi:10.1111/acv.12476. 7
Ravera, F., B. Martín-López, U. Pascual and A. Drucker, 2016: The diversity of gendered adaptation strategies to 8 climate change of Indian farmers: A feminist intersectional approach. Ambio, 45(S3), 335-351, 9 doi:10.1007/s13280-016-0833-2. 10
Ray, D. K., J. S. Gerber, G. K. MacDonald and P. C. West, 2015: Climate variation explains a third of global crop yield 11 variability. Nature Communications, 6(1), 5989, doi:10.1038/ncomms6989. 12
Ray, D. K. et al., 2012: Recent patterns of crop yield growth and stagnation. Nature Communications, 3(1), 1-7, 13 doi:10.1038/ncomms2296. 14
Ray, D. K. et al., 2019: Climate change has likely already affected global food production. PloS one, 14(5), e0217148. 15 Rayner, S. et al., 2013: The oxford principles. Clim. Change, 121(3), 499-512. 16 Raza, A. et al., 2019: Impact of Climate Change on Crops Adaptation and Strategies to Tackle Its Outcome: A Review. 17
Plants, 8(2), doi:10.3390/plants8020034. 18 Reckien, D. et al., 2018: How are cities planning to respond to climate change? Assessment of local climate plans from 19
885 cities in the EU-28. JOURNAL OF CLEANER PRODUCTION, 191, 207-219, 20 doi:10.1016/j.jclepro.2018.03.220. 21
Reckien, D. et al., 2019: Dedicated versus mainstreaming approaches in local climate plans in Europe. RENEWABLE & 22 SUSTAINABLE ENERGY REVIEWS, 112, 948-959, doi:10.1016/j.rser.2019.05.014. 23
Regmi, B. R., C. Star and W. Leal Filho, 2016a: Effectiveness of the Local Adaptation Plan of Action to support 24 climate change adaptation in Nepal. MITIGATION AND ADAPTATION STRATEGIES FOR GLOBAL CHANGE, 25 21(3), 461-478, doi:10.1007/s11027-014-9610-3. 26
Regmi, B. R., C. Star and W. Leal Filho, 2016b: An overview of the opportunities and challenges of promoting climate 27 change adaptation at the local level: a case study from a community adaptation planning in Nepal. CLIMATIC 28 CHANGE, 138(3-4), 537-550, doi:10.1007/s10584-016-1765-3. 29
Reilly, J. et al., 2007: Global economic effects of changes in crops, pasture, and forests due to changing climate, carbon 30 dioxide, and ozone. Energy Policy, 35(11), 5370-5383. 31
Ren, J., J. B. Campbell and Y. Shao, 2016: Spatial and temporal dimensions of agricultural land use changes, 2001–32 2012, East-Central Iowa. Agricultural Systems, 148, 149-158. 33
Renaud, F. G. et al., 2015: Resilience and shifts in agro-ecosystems facing increasing sea-level rise and salinity 34 intrusion in Ben Tre Province, Mekong Delta. CLIMATIC CHANGE, 133(1), 69-84, doi:10.1007/s10584-014-35 1113-4. 36
Rentschler, J. and S. Melda, 2020: People in Harm's Way : Flood Exposure and Poverty in 189 Countries. World Bank, 37 Washington, DC. Available at: https://openknowledge.worldbank.org/handle/10986/34655. 38
Retief, F. et al., 2016: Global megatrends and their implications for environmental assessment practice. Environmental 39 Impact Assessment Review, 61, 52-60, doi:10.1016/j.eiar.2016.07.002. 40
Reynolds, J. L., 2019a: The Governance of Solar Geoengineering: Managing Climate Change in the Anthropocene. 41 Cambridge University Press, 250 pp. ISBN 9781107161955. 42
Reynolds, J. L., 2019b: Solar geoengineering to reduce climate change: a review of governance proposals. Proceedings 43 of the Royal Society A, 475(2229), 20190255. 44
Rhiney, K., A. Eitzinger, A. D. Farrell and S. D. Prager, 2018: Assessing the implications of a 1.5 °C temperature limit 45 for the Jamaican agriculture sector. Regional Environmental Change, 18(8), 2313-2327, doi:10.1007/s10113-018-46 1409-4. 47
Richardson, K. J. et al., 2018a: Food security outcomes under a changing climate: impacts of mitigation and adaptation 48 on vulnerability to food insecurity. Climatic Change, 147(1), 327-341, doi:10.1007/s10584-018-2137-y. 49
Richardson, T. B. et al., 2018b: Carbon Dioxide Physiological Forcing Dominates Projected Eastern Amazonian 50 Drying. Geophysical Research Letters, 45(6), 2815-2825, doi:https://doi.org/10.1002/2017GL076520. 51
Ricke, K., L. Drouet, K. Caldeira and M. Tavoni, 2018: Country-level social cost of carbon. Nature Climate Change, 52 8(10), 895-900. 53
Ricke, K. L., J. B. Moreno-Cruz and K. Caldeira, 2013: Strategic incentives for climate geoengineering coalitions to 54 exclude broad participation. Environmental Research Letters, 8(1), 014021. 55
Rickels, W. et al., 2020: Who turns the global thermostat and by how much? Energy Economics, 91, 104852. 56 Riddle, M. S., W. H. Chen, C. D. Kirkwood and C. A. MacLennan, 2018: Update on vaccines for enteric pathogens. 57
Clinical Microbiology and Infection, 24(10), 1039-1045, doi:10.1016/j.cmi.2018.06.023. 58 Rigaud, K. K. et al., 2018: Groundswell: Preparing for Internal Climate Migration. World Bank, Washington, DC. 59
Available at: 60 https://www.google.com/url?q=https://openknowledge.worldbank.org/bitstream/handle/10986/29461/WBG_Clim61 ateChange_Final.pdf&sa=D&ust=1569585643138000&usg=AFQjCNHkSEpG_vTFA5JsgrR4F3mEZK8ELQ. 62
ACCEPTED VERSIO
N
SUBJECT TO FIN
AL EDITS
FINAL DRAFT Chapter 16 IPCC WGII Sixth Assessment Report
Do Not Cite, Quote or Distribute 16-162 Total pages: 173
Rinaldo, A. et al., 2012: Reassessment of the 2010–2011 Haiti cholera outbreak and rainfall-driven multiseason 1 projections. Proceedings of the National Academy of Sciences, 109(17), 6602-6607. 2
Rising, J., S. Dietz, T. Stoerk and G. Wagner (eds.), Tipping Points in the Climate System and the Economics of 3 Climate Change. EGU General Assembly Conference Abstracts, 2959 pp. 4
Risser, M. D. and M. F. Wehner, 2017: Attributable human‐induced changes in the likelihood and magnitude of the 5 observed extreme precipitation during Hurricane Harvey. Geophysical Research Letters, 44(24), 12,457-412,464. 6
Robalino, J., J. Jimenez and A. Chacón, 2015: The Effect of Hydro-Meteorological Emergencies on Internal Migration. 7 World Development, 67, 438-448, doi:10.1016/j.worlddev.2014.10.031. 8
Roberts, D. et al., 2012: Exploring ecosystem-based adaptation in Durban, South Africa: ‘learning-by-doing’ at the 9 local government coal face. ENVIRONMENT AND URBANIZATION, 24(1), 167-195, 10 doi:10.1177/0956247811431412. 11
Robinne, F.-N. et al., 2018: A spatial evaluation of global wildfire-water risks to human and natural systems. Science of 12 The Total Environment, 610-611, 1193-1206, doi:10.1016/j.scitotenv.2017.08.112. 13
Robinson, S.-a., 2018a: Adapting to climate change at the national level in Caribbean small island developing states. 14 Island Studies Journal, 13(1), 79-100, doi:10.24043/isj.59. 15
Robinson, S.-a., 2018b: Climate Change Adaptation Limits in Small Island Developing States. In: Limits to Climate 16 Change Adaptation [Leal Filho, W. and J. Nalau (eds.)]. Springer International Publishing, Cham, pp. 263-281. 17 ISBN 978-3-319-64599-5. 18
Robinson, S.-a., 2020a: Climate change adaptation in SIDS: A systematic review of the literature pre and post the IPCC 19 Fifth Assessment Report. WILEY INTERDISCIPLINARY REVIEWS-CLIMATE CHANGE, 11(4), 20 doi:10.1002/wcc.653. 21
Robinson, S.-a., 2020b: A richness index for baselining climate change adaptations in small island developing states. 22 Environmental and Sustainability Indicators, 8, 100065, doi:10.1016/j.indic.2020.100065. 23
Rode, A. et al., 2021: Estimating a Social Cost of Carbon for Global Energy Consumption. Nature. 24 Rode, K. D., C. T. Robbins, L. Nelson and S. C. Amstrup, 2015: Can polar bears use terrestrial foods to offset lost ice-25
based hunting opportunities? Frontiers in Ecology and the Environment, 13(3), 138-145, doi:10.1890/140202. 26 Rodrigues, E. L., C. M. Jacobi and J. E. C. Figueira, 2019: Wildfires and their impact on the water supply of a large 27
neotropical metropolis: A simulation approach. Science of The Total Environment, 651, 1261-1271, 28 doi:10.1016/j.scitotenv.2018.09.289. 29
Rodriguez-Solorzano, C., 2014: Unintended outcomes of farmers' adaptation to climate variability: deforestation and 30 conservation in Calakmul and Maya biosphere reserves. ECOLOGY AND SOCIETY, 19(2), doi:10.5751/ES-31 06509-190253. 32
Roe, M. J. and J. I. Siegel, 2011: Political instability: Effects on financial development, roots in the severity of 33 economic inequality. Journal of Comparative Economics, 39(3), 279-309, doi:10.1016/j.jce.2011.02.001. 34
Rogers-Bennett, L. and C. A. Catton, 2019: Marine heat wave and multiple stressors tip bull kelp forest to sea urchin 35 barrens. Scientific Reports, 9(1), 15050, doi:10.1038/s41598-019-51114-y. 36
Rohat, G. et al., 2019a: Projections of Human Exposure to Dangerous Heat in African Cities Under Multiple 37 Socioeconomic and Climate Scenarios. Earth's Future, 2018EF001020, doi:10.1029/2018EF001020. 38
Rohat, G. et al., 2019b: Influence of changes in socioeconomic and climatic conditions on future heat-related health 39 challenges in Europe. Global and Planetary Change, 172, 45-59, doi:10.1016/j.gloplacha.2018.09.013. 40
Roiz, D. et al., 2015: Autochthonous Chikungunya Transmission and Extreme Climate Events in Southern France. 41 PLOS Neglected Tropical Diseases, 9(6), e0003854, doi:10.1371/journal.pntd.0003854. 42
Román-Palacios, C. and J. J. Wiens, 2020: Recent responses to climate change reveal the drivers of species extinction 43 and survival. Proceedings of the National Academy of Sciences, 117(8), 4211-4217. 44
Rose, S., 2017: Carbon Pricing and the Social Cost of Carbon. EPRI, Palo Alto, CA. Available at: 45 https://www.epri.com/research/products/000000003002011391. 46
Rose, S. and J. Bistline, 2016: Applying the social cost of carbon: technical considerations. EPRI Report# 3002004659. 47 Palo Alto, CA. 48
Rose, S. K., 2012: The role of the social cost of carbon in policy. Wiley Interdisciplinary Reviews: Climate Change, 49 3(2), 195-212. 50
Rose, S. K., D. B. Diaz and G. J. Blanford, 2017: Understanding the social cost of carbon: a model diagnostic and inter-51 comparison study. Climate Change Economics, 8(02), 1750009. 52
Rosenzweig, C. et al., 2007: Assessment of observed changes and responses in natural and managed systems. In: 53 Climate Change 2007: Impacts, Adaptation and Vulnerability. Contribution of Working Group II to the Fourth 54 Assessment Report of the Intergovernmental Panel on Climate Change [Parry, M. L., O. F. Canziani, J. P. 55 Palutikof, P. J. van der Linden and C. E. Hanson (eds.)]. Cambridge University Press, Cambridge, United 56 Kingdom. ISBN 9780521880107. 57
Roson, R. and D. Van der Mensbrugghe, 2012: Climate change and economic growth: impacts and interactions. 58 International Journal of Sustainable Economy, 4(3), 270-285. 59
Roy, J. et al., 2018: Sustainable development, poverty eradication and reducing inequalities. In: Global Warming of 60 1.5°C. An IPCC Special Report on the impacts of global warming of 1.5°C above pre-industrial levels and related 61 global greenhouse gas emission pathways, in the context of strengthening the global response to the threat of 62 climate change, sustainable development, and efforts to eradicate poverty [Masson-Delmotte, V., P. Zhai, H. O. 63
ACCEPTED VERSIO
N
SUBJECT TO FIN
AL EDITS
FINAL DRAFT Chapter 16 IPCC WGII Sixth Assessment Report
Do Not Cite, Quote or Distribute 16-163 Total pages: 173
Pörtner, D. Roberts, J. Skea, P. R. Shukla, A. Pirani, W. Moufouma-Okia, C. Péan, R. Pidcock, S. Connors, J. B. 1 R. Matthews, Y. Chen, X. Zhou, M. I. Gomis, E. Lonnoy, T. Maycock, M. Tignor and T. Waterfield (eds.)]. In 2 Press. 3
Rudolfsen, I., 2018: Food insecurity and domestic instability: a review of the literature. Terrorism and Political 4 Violence, 0(0), 1-28, doi:10.1080/09546553.2017.1418334. 5
Rufat, S., E. Tate, C. T. Emrich and F. Antolini, 2019: How Valid Are Social Vulnerability Models? Annals of the 6 American Association of Geographers, 109(4), 1131-1153, doi:10.1080/24694452.2018.1535887. 7
Ruiz-Mallen, I. et al., 2015: How do biosphere reserves influence local vulnerability and adaptation? Evidence from 8 Latin America. GLOBAL ENVIRONMENTAL CHANGE-HUMAN AND POLICY DIMENSIONS, 33, 97-108, 9 doi:10.1016/j.gloenvcha.2015.05.002. 10
Ruiz Meza, L. E., 2015: Adaptive capacity of small-scale coffee farmers to climate change impacts in the Soconusco 11 region of Chiapas, Mexico. CLIMATE AND DEVELOPMENT, 7(2), 100-109, 12 doi:10.1080/17565529.2014.900472. 13
Russo, S., J. Sillmann and A. Sterl, 2017: Humid heat waves at different warming levels. Scientific reports, 7(1), 1-7. 14 Ryan, S. J., C. A. Lippi and F. Zermoglio, 2020: Shifting transmission risk for malaria in Africa with climate change: a 15
framework for planning and intervention. Malaria Journal, 19, 1-14. 16 Sachs, J. et al., 2021: Sustainable Development Report 2021, 1 ed., Cambridge University Press. ISBN 978-1-00-17
910655-9 978-1-00-909891-5 978-1-00-910289-6. 18 Sada, R., A. Shrestha, A. Kumar Shukla and L. Anna Melsen, 2014: People's experience and facts of changing climate: 19
impacts and responses. International Journal of Climate Change Strategies and Management, 6(1), 47-62, 20 doi:10.1108/IJCCSM-04-2013-0047. 21
Sadoff, C., D. Grey and E. Borgomeo, 2020: Water security. Oxford Research Encyclopedia of Environmental Science. 22 Saeed, F., C. F. Schleussner and M. Ashfaq, 2021: Deadly heat stress to become commonplace across South Asia 23
already at 1.5 C of global warming. Geophysical Research Letters, 48(7), e2020GL091191. 24 Salazar, L. F. and C. A. Nobre, 2010: Climate change and thresholds of biome shifts in Amazonia. Geophysical 25
Research Letters, 37(17), doi:10.1029/2010GL043538. 26 Salim, W., K. Bettinger and M. Fisher, 2019: Maladaptation on the Waterfront: Jakarta's Growth Coalition and the 27
Great Garuda. ENVIRONMENT AND URBANIZATION ASIA, 10(1), 63-80, doi:10.1177/0975425318821809. 28 Samaniego, L. et al., 2018: Anthropogenic warming exacerbates European soil moisture droughts. Nature Climate 29
Change, 8(5), 421-426. 30 Samora-Arvela, A. et al., 2017: GREEN INFRASTRUCTURE, CLIMATE CHANGE AND SPATIAL PLANNING: 31
LEARNING LESSONS ACROSS BORDERS. JOURNAL OF SPATIAL AND ORGANIZATIONAL DYNAMICS, 32 5(3), 176-188. 33
Sanchez Rodriguez, R., D. Ürge-Vorsatz and A. S. Barau, 2018: Sustainable Development Goals and climate change 34 adaptation in cities. Nature Climate Change, 8(3), 181-183, doi:10.1038/s41558-018-0098-9. 35
Sankey, J. B. et al., 2017: Climate, wildfire, and erosion ensemble foretells more sediment in western USA watersheds. 36 Geophysical Research Letters, 44(17), 8884-8892, doi:10.1002/2017GL073979. 37
Sapkota, T. B. et al., 2015: Climate change adaptation, greenhouse gas mitigation and economic profitability of 38 conservation agriculture: Some examples from cereal systems of Indo-Gangetic Plains. JOURNAL OF 39 INTEGRATIVE AGRICULTURE, 14(8), 1524-1533, doi:10.1016/S2095-3119(15)61093-0. 40
Sartori, M., S. Schiavo, A. Fracasso and M. Riccaboni, 2017: Modeling the future evolution of the virtual water trade 41 network: A combination of network and gravity models. Advances in Water Resources, 110, 538-548, 42 doi:10.1016/j.advwatres.2017.05.005. 43
Sauer, I. J. et al., 2021: Climate signals in river flood damages emerge under sound regional disaggregation. Nature 44 Communications, 12(1), 2128, doi:10.1038/s41467-021-22153-9. 45
Sawall, Y. et al., 2020: Discrete pulses of cooler deep water can decelerate coral bleaching during thermal stress: 46 implications for artificial upwelling during heat stress events. Frontiers in Marine Science, 7, 720. 47
Sayers, P., E. C. Penning-Rowsell and M. Horritt, 2018: Flood vulnerability, risk, and social disadvantage: current and 48 future patterns in the UK. REGIONAL ENVIRONMENTAL CHANGE, 18(2, SI), 339-352, doi:10.1007/s10113-49 017-1252-z. 50
Scartozzi, C. M., 2020: Reframing Climate-Induced Socio-Environmental Conflicts: A Systematic Review. 51 International Studies Review,(viaa064), doi:10.1093/isr/viaa064. 52
Schaer, C., 2015: Condemned to live with one’s feet in water?: A case study of community based strategies and urban 53 maladaptation in flood prone Pikine/Dakar, Senegal. International Journal of Climate Change Strategies and 54 Management, 7(4), 534-551, doi:10.1108/IJCCSM-03-2014-0038. 55
Scheffers, B. R. et al., 2016: The broad footprint of climate change from genes to biomes to people. SCIENCE, 56 354(6313), doi:10.1126/science.aaf7671. 57
Schembergue, A. et al., 2017: Sistemas agroflorestais como estrategia de adaptação aos desafios das mudanças 58 climáticas no Brasil. Revista de Economia e Sociologia Rural, 55(1), 9-30, doi:10.1590/1234-56781806-59 94790550101. 60
Schipper, E. L. F., 2020: Maladaptation: When Adaptation to Climate Change Goes Very Wrong. One Earth, 3(4), 409-61 414, doi:10.1016/j.oneear.2020.09.014. 62
ACCEPTED VERSIO
N
SUBJECT TO FIN
AL EDITS
FINAL DRAFT Chapter 16 IPCC WGII Sixth Assessment Report
Do Not Cite, Quote or Distribute 16-164 Total pages: 173
Schleussner, C.-F., J. F. Donges, R. V. Donner and H. J. Schellnhuber, 2016a: Armed-conflict risks enhanced by 1 climate-related disasters in ethnically fractionalized countries. Proceedings of the National Academy of Sciences, 2 113(33), 9216-9221, doi:10.1073/pnas.1601611113. 3
Schleussner, C.-F., P. Pfleiderer and E. M. Fischer, 2017: In the observational record half a degree matters. Nature 4 Climate Change, 7(7), 460. 5
Schleussner, C. F. et al., 2016b: Differential climate impacts for policy-relevant limits to global warming: the case of 6 1.5 °C and 2 °C. Earth Syst. Dynam., 7(2), 327-351, doi:10.5194/esd-7-327-2016. 7
Schneider, P. and F. Asch, 2020: Rice production and food security in Asian Mega deltas—A review on characteristics, 8 vulnerabilities and agricultural adaptation options to cope with climate change. Journal of Agronomy and Crop 9 Science, 206(4), 491-503, doi:10.1111/jac.12415. 10
Schneider, S. H. and M. D. Mastrandrea, 2005: Probabilistic assessment of ‘dangerous’ climate change and emissions 11 pathways. Proceedings of the National Academy of Sciences of the United States of America, 102(44), 15728-12 15735, doi:10.1073/pnas.0506356102. 13
Schofield, D. and F. Gubbels, 2019: Informing notions of climate change adaptation: a case study of everyday gendered 14 realities of climate change adaptation in an informal settlement in Dar es Salaam. ENVIRONMENT AND 15 URBANIZATION, 31(1), 93-114, doi:10.1177/0956247819830074. 16
Schuerch, M. et al., 2018: Future response of global coastal wetlands to sea-level rise. Nature, 561(7722), 231-234, 17 doi:10.1038/s41586-018-0476-5. 18
Schutte, S., J. Vestby, J. Carling and H. Buhaug, 2021: Climatic conditions are weak predictors of asylum migration. 19 Nature Communications, 12(1), 2067, doi:10.1038/s41467-021-22255-4. 20
Schwan, S. and X. Yu, 2018: Social protection as a strategy to address climate-induced migration. INTERNATIONAL 21 JOURNAL OF CLIMATE CHANGE STRATEGIES AND MANAGEMENT, 10(1, SI), 43-64, 22 doi:10.1108/IJCCSM-01-2017-0019. 23
Schweiger, A. J., K. R. Wood and J. Zhang, 2019: Arctic Sea Ice Volume Variability over 1901?2010: A Model-Based 24 Reconstruction. Journal of Climate, 32(15), 4731-4752, doi:10.1175/jcli-d-19-0008.1. 25
Schwerdtle, P., K. Bowen and C. McMichael, 2018: The health impacts of climate-related migration. BMC Medicine, 26 16(1), 1, doi:10.1186/s12916-017-0981-7. 27
Schwingshackl, C. et al., 2021: Heat Stress Indicators in CMIP6: Estimating Future Trends and Exceedances of Impact‐28 Relevant Thresholds. Earth's Future, 9(3), e2020EF001885. 29
Scovronick, N. et al., 2018: The association between ambient temperature and mortality in South Africa: A time-series 30 analysis. Environmental research, 161, 229-235. 31
Sebesvari, Z. et al., 2016: A review of vulnerability indicators for deltaic social–ecological systems. Sustainability 32 Science, 11(4), 575-590, doi:10.1007/s11625-016-0366-4. 33
Selby, J., 2019: Climate change and the Syrian civil war, Part II: The Jazira’s agrarian crisis. Geoforum, 101, 260-274, 34 doi:10.1016/j.geoforum.2018.06.010. 35
Selby, J., O. S. Dahi, C. Fröhlich and M. Hulme, 2017: Climate change and the Syrian civil war revisited. Political 36 Geography, 60, 232-244. 37
Sen, L. T. H. and J. Bond, 2017: Agricultural adaptation to flood in lowland rice production areas of Central Vietnam: 38 understanding the `regenerated rice' ratoon system. CLIMATE AND DEVELOPMENT, 9(3), 274-285, 39 doi:10.1080/17565529.2016.1149440. 40
Seneviratne, S. I. et al., 2016: Allowable CO 2 emissions based on regional and impact-related climate targets. Nature, 41 529(7587), 477-483. 42
Seneviratne, S. I. and M. Hauser, 2020: Regional Climate Sensitivity of Climate Extremes in CMIP6 Versus CMIP5 43 Multimodel Ensembles. Earth's future, 8(9), e2019EF001474. 44
Seneviratne, S. I. et al., 2018a: Land radiative management as contributor to regional-scale climate adaptation and 45 mitigation. Nat. Geosci., 11(2), 88-96, doi:10.1038/s41561-017-0057-5. 46
Seneviratne, S. I. et al., 2018b: Land radiative management as contributor to regional-scale climate adaptation and 47 mitigation, 88-96 pp. 48
Seneviratne, S. I. et al., 2021: Weather and Climate Extreme Events in a Changing Climate. In: Climate Change 2021: 49 The Physical Science Basis. Contribution of Working Group I to the Sixth Assessment Report of the 50 Intergovernmental Panel on Climate Change [Masson-Delmotte, V., P. Zhai, A. Pirani, S. L. Connors, C. Péan, S. 51 Berger, N. Caud, Y. Chen, L. Goldfarb, M. I. Gomis, M. Huang, K. Leitzell, E. Lonnoy, J. B. R. Matthews, T. K. 52 Maycock, T. Waterfield, O. Yelekçi, R. Yu and B. Zhou (eds.)]. Cambridge University Press. 53
Sera, F. et al., 2019: How urban characteristics affect vulnerability to heat and cold: a multi-country analysis. 54 International journal of epidemiology, 48(4), 1101-1112. 55
Sereenonchai, S. and N. Arunrat, 2019: Fisher's Decisions to Adopt Adaptation Strategies and Expectations for Their 56 Children to Pursue the Same Profession in Chumphon Province, Thailand. CLIMATE, 7(2), 57 doi:10.3390/cli7020034. 58
Serneels, P. and M. Verpoorten, 2015: The Impact of Armed Conflict on Economic Performance: Evidence from 59 Rwanda. Journal of Conflict Resolution, 59(4), 555-592, doi:10.1177/0022002713515409. 60
Setty, K. E. et al., 2018: Time series study of weather, water quality, and acute gastroenteritis at Water Safety Plan 61 implementation sites in France and Spain. Int J Hyg Environ Health, 221(4), 714-726, 62 doi:10.1016/j.ijheh.2018.04.001. 63
ACCEPTED VERSIO
N
SUBJECT TO FIN
AL EDITS
FINAL DRAFT Chapter 16 IPCC WGII Sixth Assessment Report
Do Not Cite, Quote or Distribute 16-165 Total pages: 173
Shaffril, H. A. M., S. E. Krauss and S. F. Samsuddin, 2018: A systematic review on Asian's farmers' adaptation 1 practices towards climate change. Science Of The Total Environment, 644, 683-695, 2 doi:10.1016/j.scitotenv.2018.06.349. 3
Sharifi, A., 2020: Trade-offs and conflicts between urban climate change mitigation and adaptation measures: A 4 literature review. Journal of Cleaner Production, 122813. 5
Sharma, N. et al., 2016: Bioenergy from agroforestry can lead to improved food security, climate change, soil quality, 6 and rural development. FOOD AND ENERGY SECURITY, 5(3), 165-183, doi:10.1002/fes3.87. 7
Sharp, T. M. et al., 2014: Characteristics of a Dengue Outbreak in a Remote Pacific Island Chain – Republic of the 8 Marshall Islands, 2011–2012, e108445 pp. 9
Shearer, H., J. Dodson, E. Coiacetto and P. Taygfeld, 2014: Capacities of private developers in urban climate change 10 adaptation. In: Applied Studies in Climate Adaptation, pp. 422-428. 11
Shepard, D. S., E. A. Undurraga, Y. A. Halasa and J. D. Stanaway, 2016: The global economic burden of dengue: a 12 systematic analysis. The Lancet infectious diseases, 16(8), 935-941. 13
Sheridan, S. C. and M. J. Allen, 2018: Temporal trends in human vulnerability to excessive heat. ENVIRONMENTAL 14 RESEARCH LETTERS, 13(4), doi:10.1088/1748-9326/aab214. 15
Shi, L., E. Chu and J. Debats, 2015: Explaining Progress in Climate Adaptation Planning Across 156 US 16 Municipalities. JOURNAL OF THE AMERICAN PLANNING ASSOCIATION, 81(3), 191-202, 17 doi:10.1080/01944363.2015.1074526. 18
Shindell, D. et al., 2020: The effects of heat exposure on human mortality throughout the United States. GeoHealth, 19 4(4), e2019GH000234. 20
Shinn, J. E., B. King, K. R. Young and K. A. Crews, 2014: Variable adaptations: Micro-politics of environmental 21 displacement in the Okavango Delta, Botswana. Geoforum, 57, 21-29, doi:10.1016/j.geoforum.2014.08.006. 22
Shirzaei, M. and R. Bürgmann, 2018: Global climate change and local land subsidence exacerbate inundation risk to the 23 San Francisco Bay Area. Science Advances, 4(3), eaap9234, doi:10.1126/sciadv.aap9234. 24
Sieg, T., K. Vogel, B. Merz and H. Kreibich, 2019: Seamless estimation of hydrometeorological risk across spatial 25 scales. Earth's Future, 7(5), 574-581. 26
Sikka, A. K., A. Islam and K. V. Rao, 2018: CLIMATE-SMART LAND AND WATER MANAGEMENT FOR 27 SUSTAINABLE AGRICULTURE. IRRIGATION AND DRAINAGE, 67(1, SI), 72-81, doi:10.1002/ird.2162. 28
Simon, K., G. Diprose and A. C. Thomas, 2020: Community-led initiatives for climate adaptation and mitigation. 29 KOTUITUI-NEW ZEALAND JOURNAL OF SOCIAL SCIENCES ONLINE, 15(1), 93-105, 30 doi:10.1080/1177083X.2019.1652659. 31
Simpson, I. R. et al., 2019: The Regional Hydroclimate Response to Stratospheric Sulfate Geoengineering and the Role 32 of Stratospheric Heating, 12587-12616 pp. 33
Simpson, N. P. et al., 2021: A framework for complex climate change risk assessment. One Earth, 4(4), 489-501, 34 doi:10.1016/j.oneear.2021.03.005. 35
Simpson, N. P., C. D. Shearing and B. Dupont, 2020: Gated Adaptation during the Cape Town Drought: Mentalities, 36 Transitions and Pathways to Partial Nodes of Water Security. SOCIETY & NATURAL RESOURCES, 33(8), 1041-37 1049, doi:10.1080/08941920.2020.1712756. 38
Singh, C. and R. Basu, 2020: Moving in and out of vulnerability: Interrogating migration as an adaptation strategy 39 along a rural–urban continuum in India. The Geographical Journal, 186(1), 87-102, doi:10.1111/geoj.12328. 40
Singh, C., M. Madhavan, J. Arvind and A. Bazaz, 2021: Climate change adaptation in Indian cities: a review of existing 41 actions and spaces for triple wins. Urban Climate. 42
Singh, G. G. et al., 2019: Climate impacts on the ocean are making the Sustainable Development Goals a moving target 43 travelling away from us. People and Nature, 1(3), 317-330, doi:10.1002/pan3.26. 44
Singh, N. P., B. Anand and M. A. Khan, 2018: Micro-level perception to climate change and adaptation issues: A 45 prelude to mainstreaming climate adaptation into developmental landscape in India. Natural Hazards, 92(3), 46 1287-1304, doi:10.1007/s11069-018-3250-y. 47
Siraj, A. S. et al., 2014: Altitudinal Changes in Malaria Incidence in Highlands of Ethiopia and Colombia. Science, 343, 48 1154-1158, doi:10.1126/science.1244325. 49
Siraw, Z., M. A. Degefu and W. Bewket, 2018: The role of community-based watershed development in reducing 50 farmers' vulnerability to climate change and variability in the northwestern highlands of Ethiopia. LOCAL 51 ENVIRONMENT, 23(12), 1190-1206, doi:10.1080/13549839.2018.1541344. 52
Smajgl, A. et al., 2015: Responding to rising sea levels in the Mekong Delta. Nature Climate Change, 5(2), 167-174, 53 doi:10.1038/nclimate2469. 54
Smale, D. A., 2020: Impacts of ocean warming on kelp forest ecosystems. New Phytologist, 225(4), 1447-1454. 55 Smale, D. A. et al., 2019: Marine heatwaves threaten global biodiversity and the provision of ecosystem services. 56
Nature Climate Change, 9(4), 306-312, doi:10.1038/s41558-019-0412-1. 57 Smith, J. B. et al., 2001: Vulnerability to climate change and reasons for concern: a synthesis. Climate change, 913-967. 58 Smith, J. B. et al., 2009: Assessing dangerous climate change through an update of the Intergovernmental Panel on 59
Climate Change (IPCC) ‘Reasons for Concern’. Proceedings of the national Academy of Sciences, 106(11), 4133-60 4137. 61
Smith, N. and A. Sattineni, 2016: Effect of erosion in Alaskan coastal villages. 52nd Associated Schools of 62 Construction, Provo, Utah. 63
ACCEPTED VERSIO
N
SUBJECT TO FIN
AL EDITS
FINAL DRAFT Chapter 16 IPCC WGII Sixth Assessment Report
Do Not Cite, Quote or Distribute 16-166 Total pages: 173
Smith, P. et al., 2018: Impacts on terrestrial biodiversity of moving from a 2°C to a 1.5°C target. Philosophical 1 Transactions of the Royal Society A: Mathematical, Physical and Engineering Sciences, 376(2119), 20160456, 2 doi:10.1098/rsta.2016.0456. 3
Smith, S. M. et al., 2021: Tropicalization and kelp loss shift trophic composition and lead to more winners than losers in 4 fish communities. Global Change Biology, 27(11), 2537-2548, doi:10.1111/gcb.15592. 5
Smith, W. and G. Wagner, 2018: Stratospheric aerosol injection tactics and costs in the first 15 years of deployment. 6 Environ. Res. Lett., 13(12), 124001, doi:10.1088/1748-9326/aae98d. 7
Solomon, S., G.-K. Plattner, R. Knutti and P. Friedlingstein, 2009: Irreversible climate change due to carbon dioxide 8 emissions, 1704-1709 pp. 9
Sommer, R., B. K. Paul, J. Mukalama and J. Kihara, 2018: Reducing losses but failing to sequester carbon in soils – the 10 case of Conservation Agriculture and Integrated Soil Fertility Management in the humid tropical agro-ecosystem 11 of Western Kenya. Agriculture, Ecosystems & Environment, 254, 82-91, doi:10.1016/j.agee.2017.11.004. 12
Soroye, P., T. Newbold and J. Kerr, 2020: Climate change contributes to widespread declines among bumble bees 13 across continents. Science, 367(6478), 685-688. 14
Sovacool, B. K., 2018: Bamboo Beating Bandits: Conflict, Inequality, and Vulnerability in the Political Ecology of 15 Climate Change Adaptation in Bangladesh. WORLD DEVELOPMENT, 102, 183-194, 16 doi:10.1016/j.worlddev.2017.10.014. 17
Spencer, B. et al., 2017: Case studies in co-benefits approaches to climate change mitigation and adaptation. JOURNAL 18 OF ENVIRONMENTAL PLANNING AND MANAGEMENT, 60(4), 647-667, 19 doi:10.1080/09640568.2016.1168287. 20
Spijkers, J. and W. J. Boonstra, 2017: Environmental change and social conflict: the northeast Atlantic mackerel 21 dispute. Regional Environmental Change, 17(6), 1835-1851, doi:10.1007/s10113-017-1150-4. 22
Springmann, M. et al., 2016: Global and regional health effects of future food production under climate change: a 23 modelling study. The Lancet, 387(10031), 1937-1946, doi:10.1016/S0140-6736(15)01156-3. 24
Stanczuk-Galwiaczek, M., K. Sobolewska-Mikulska, H. Ritzema and J. M. van Loon-Steensma, 2018: Integration of 25 water management and land consolidation in rural areas to adapt to climate change: Experiences from Poland and 26 the Netherlands. LAND USE POLICY, 77, 498-511, doi:10.1016/j.landusepol.2018.06.005. 27
Staver, A. C., S. Archibald and S. A. Levin, 2011: The Global Extent and Determinants of Savanna and Forest as 28 Alternative Biome States, 230-232 pp. 29
Steffen, W. et al., 2018: Trajectories of the Earth System in the Anthropocene. Proceedings of the National Academy of 30 Sciences, 115(33), 8252, doi:10.1073/pnas.1810141115. 31
Stephens, J. C. and K. Surprise, 2020: The hidden injustices of advancing solar geoengineering research. Global 32 Sustainability, 3. 33
Sterle, K. and L. Singletary, 2017: Adapting to Variable Water Supply in the Truckee-Carson River System, Western 34 USA. WATER, 9(10), doi:10.3390/w9100768. 35
Stern, N., 2013: The structure of economic modeling of the potential impacts of climate change: grafting gross 36 underestimation of risk onto already narrow science models. 51, 838-859, doi:10.1257/jel.51.3.838. 37
Sterner, T. and U. M. Persson, 2008: An even sterner review: Introducing relative prices into the discounting debate. 2, 38 61-76, doi:10.1093/reep/rem024. 39
Stevens, N., C. E. R. Lehmann, B. P. Murphy and G. Durigan, 2017: Savanna woody encroachment is widespread 40 across three continents. Global Change Biology, 23(1), 235-244, doi:10.1111/gcb.13409. 41
Stewart‐Sinclair, P. J., K. S. Last, B. L. Payne and T. A. Wilding, 2020: A global assessment of the vulnerability of 42 shellfish aquaculture to climate change and ocean acidification. Ecology and Evolution, 10(7), 3518-3534, 43 doi:10.1002/ece3.6149. 44
Stilgoe, J., 2015: Experiment Earth: Responsible innovation in geoengineering. Routledge, 240 pp. ISBN 45 9781317909149. 46
Stjern, C. W. et al., 2018: Response to marine cloud brightening in a multi-model ensemble. Atmospheric Chemistry 47 and Physics, 18(2), 621-634. 48
Stoerk, T., G. Wagner and R. E. Ward, 2018: Policy brief—Recommendations for improving the treatment of risk and 49 uncertainty in economic estimates of climate impacts in the sixth Intergovernmental Panel on Climate Change 50 assessment report. Review of Environmental Economics and Policy, 12(2), 371-376. 51
Stone Jr, B. et al., 2014: Avoided Heat-Related Mortality through Climate Adaptation Strategies in Three US Cities. 52 PLOS ONE, 9(6), e100852, doi:10.1371/journal.pone.0100852. 53
Storelvmo, T. and N. Herger, 2014: Cirrus cloud susceptibility to the injection of ice nuclei in the upper troposphere. 54 Journal of Geophysical Research: Atmospheres, 119(5), 2375-2389. 55
Storlazzi, C. D. et al., 2018: Most atolls will be uninhabitable by the mid-21st century because of sea-level rise 56 exacerbating wave-driven flooding. Science Advances, 4(4), eaap9741, doi:10.1126/sciadv.aap9741. 57
Strauss, B. et al., 2021: Economic Damages from Hurricane Sandy Attributable to Sea Level Rise Caused by 58 Anthropogenic Climate Change. Nature Communications, 12(1), 15. 59
Strobl, E., 2011: The economic growth impact of hurricanes: Evidence from U.S. coastal counties. The Review of 60 Economics and Statistics, 93 (2), 575-589, doi:10.1162/REST_a_00082. 61
ACCEPTED VERSIO
N
SUBJECT TO FIN
AL EDITS
FINAL DRAFT Chapter 16 IPCC WGII Sixth Assessment Report
Do Not Cite, Quote or Distribute 16-167 Total pages: 173
Strobl, E., 2012: The economic growth impact of natural disasters in developing countries: Evidence from hurricane 1 strikes in the Central American and Caribbean regions. Journal of Development Economics, 97(1), 130-141, 2 doi:10.1016/j.jdeveco.2010.12.002. 3
Su, Y. et al., 2017: Gendered Responses to Drought in Yunnan Province, China. MOUNTAIN RESEARCH AND 4 DEVELOPMENT, 37(1), 24-34, doi:10.1659/MRD-JOURNAL-D-15-00041.1. 5
Suckall, N., L. C. Stringer and E. L. Tompkins, 2015: Presenting Triple-Wins? Assessing Projects That Deliver 6 Adaptation, Mitigation and Development Co-benefits in Rural Sub-Saharan Africa. AMBIO, 44(1), 34-41, 7 doi:10.1007/s13280-014-0520-0. 8
Sugiyama, M. et al., 2018a: Next steps in geoengineering scenario research: limited deployment scenarios and beyond. 9 Clim. Policy, 18(6), 681-689, doi:10.1080/14693062.2017.1323721. 10
Sugiyama, M., S. Asayama and T. Kosugi, 2020: The North–South Divide on Public Perceptions of Stratospheric 11 Aerosol Geoengineering?: A Survey in Six Asia-Pacific Countries. Environmentalist. 12
Sugiyama, M., A. Ishii, S. Asayama and T. Kosugi, 2018b: Solar Geoengineering Governance. In: Oxford Research 13 Encyclopedia of Climate Science. oxfordre.com. 14
Sujakhu, N. M. et al., 2016: Farmers' Perceptions of and Adaptations to Changing Climate in the Melamchi Valley of 15 Nepal. MOUNTAIN RESEARCH AND DEVELOPMENT, 36(1), 15-30, doi:10.1659/MRD-JOURNAL-D-15-16 00032.1. 17
Sulser, T. B. et al., 2021: Disability-adjusted life years due to chronic and hidden hunger under food system evolution 18 with climate change and adaptation to 2050. The American Journal of Clinical Nutrition, 114(2), 550-563, 19 doi:10.1093/ajcn/nqab101. 20
Sultan, B., D. Defrance and T. Iizumi, 2019: Evidence of crop production losses in West Africa due to historical global 21 warming in two crop models. Scientific reports, 9(1), 1-15. 22
Sun, Q. et al., 2019: Global heat stress on health, wildfires, and agricultural crops under different levels of climate 23 warming. Environment International, 128, 125-136, doi:10.1016/j.envint.2019.04.025. 24
Sun, Y. et al., 2014: Rapid increase in the risk of extreme summer heat in Eastern China. Nature Climate Change, 25 4(12), 1082-1085, doi:10.1038/nclimate2410. 26
Surminski, S. et al., 2016: UK Climate Change Risk Assessment Evidence Report: Chapter 6, Business and Industry. 27 London. 28
Sushant, 2013: Impact of Climate Change in Eastern Madhya Pradesh, India. TROPICAL CONSERVATION SCIENCE, 29 6(3, SI), 338-364, doi:10.1177/194008291300600304. 30
Suter, L., D. Streletskiy and N. Shiklomanov, 2019: Assessment of the cost of climate change impacts on critical 31 infrastructure in the circumpolar Arctic. Polar Geography, 42(4), 267-286, doi:10.1080/1088937X.2019.1686082. 32
Suvdantsetseg, B. et al., 2017: Assessment of pastoral vulnerability and its impacts on socio-economy of herding 33 community and formulation of adaptation options. APN Science Bulletin, 10(1), doi:10.30852/sb.2020.1107. 34
Svoboda, T., 2017: The ethics of climate engineering: solar radiation management and non-ideal justice. Routledge. 35 ISBN 1315468530. 36
Svoboda, T. and P. Irvine, 2014: Ethical and Technical Challenges in Compensating for Harm Due to Solar Radiation 37 Management Geoengineering. Ethics, Policy & Environment, 17(2), 157-174, 38 doi:10.1080/21550085.2014.927962. 39
Szabo, S. et al., 2016: Population dynamics, delta vulnerability and environmental change: comparison of the Mekong, 40 Ganges–Brahmaputra and Amazon delta regions. Sustainability Science, 11(4), 539-554, doi:10.1007/s11625-016-41 0372-6. 42
Taconet, N., A. Méjean and C. Guivarch, 2020: Influence of climate change impacts and mitigation costs on inequality 43 between countries. Climatic Change, doi:10.1007/s10584-019-02637-w. 44
Taebi, B., J. H. Kwakkel and C. Kermisch, 2020: Governing climate risks in the face of normative uncertainties. WIREs 45 Climate Change, 11(5), doi:10.1002/wcc.666. 46
Táíwò, O. O. and S. Talati, 2021: Who Are the Engineers? Solar Geoengineering Research and Justice. Global 47 Environmental Politics, 1-7. 48
Takakura, J. y. et al., 2019: Dependence of economic impacts of climate change on anthropogenically directed 49 pathways. Nature Climate Change, 9(10), 737-741, doi:10.1038/s41558-019-0578-6. 50
Talberg, A., P. Christoff, S. Thomas and D. Karoly, 2018a: Geoengineering governance-by-default: an earth system 51 governance perspective. International Environmental Agreements: Politics, Law and Economics, 18(2), 229-253. 52
Talberg, A., S. Thomas, P. Christoff and D. Karoly, 2018b: How geoengineering scenarios frame assumptions and 53 create expectations. Sustainability Sci., 13(4), 1093-1104. 54
Talebian, S. et al., 2021: Assessing future cross-border climate impacts using shared socioeconomic pathways. Climate 55 Risk Management, 32, 100311, doi:10.1016/j.crm.2021.100311. 56
Tamura, M., N. Kumano, M. Yotsukuri and H. Yokoki, 2019: Global assessment of the effectiveness of adaptation in 57 coastal areas based on RCP/SSP scenarios. Climatic Change, 152(3-4), 363-377, doi:10.1007/s10584-018-2356-2. 58
Tang, L. et al., 2018: Induce or reduce? The crowding-in effects of farmers' perceptions of climate risk on chemical use 59 in China. CLIMATE RISK MANAGEMENT, 20, 27-37, doi:10.1016/j.crm.2018.02.001. 60
Tanoue, M., Y. Hirabayashi and H. Ikeuchi, 2016: Global-scale river flood vulnerability in the last 50 years. Scientific 61 reports, 6, 36021. 62
ACCEPTED VERSIO
N
SUBJECT TO FIN
AL EDITS
FINAL DRAFT Chapter 16 IPCC WGII Sixth Assessment Report
Do Not Cite, Quote or Distribute 16-168 Total pages: 173
Tanoue, M. et al., 2020: Estimation of direct and indirect economic losses caused by a flood with long‐lasting 1 inundation: Application to the 2011 Thailand flood. Water Resources Research, 56(5), e2019WR026092. 2
Tasaki, T. and Y. Kameyama, 2015: Sustainability Indicators: Are We Measuring What We Ought to Measure? Global 3 Environmental Research, 19, 147-154. 4
Tebaldi, C. et al., 2021: Cross-Chapter Box 12.1: Projections by warming levels of hazards relevant to the assessment 5 of Representative Key Risks and Reasons for Concern. In: Climate Change 2021: The Physical Science Basis. 6 Contribution of Working Group I to the Sixth Assessment Report of the Intergovernmental Panel on Climate 7 Change [Masson-Delmotte, V., P. Zhai, A. Pirani, S. L. Connors, C. Péan, S. Berger, N. Caud, Y. Chen, L. 8 Goldfarb, M. I. Gomis, M. Huang, K. Leitzell, E. Lonnoy, J. B. R. Matthews, T. K. Maycock, T. Waterfield, O. 9 Yelekçi, R. Yu and B. Zhou (eds.)]. 10
Tebaldi, C. and R. Knutti, 2018: Evaluating the accuracy of climate change pattern emulation for low warming targets. 11 Environmental Research Letters, 13(5), 055006. 12
Teklewold, H., T. Gebrehiwot and M. Bezabih, 2019a: Climate smart agricultural practices and gender differentiated 13 nutrition outcome: An empirical evidence from Ethiopia. WORLD DEVELOPMENT, 122, 38-53, 14 doi:10.1016/j.worlddev.2019.05.010. 15
Teklewold, H., A. Mekonnen and G. Kohlin, 2019b: Climate change adaptation: a study of multiple climate-smart 16 practices in the Nile Basin of Ethiopia. CLIMATE AND DEVELOPMENT, 11(2), 180-192, 17 doi:10.1080/17565529.2018.1442801. 18
Tenggren, S. et al., 2019: Climate risk in a globalized world: empirical findings from supply chains in the Swedish 19 manufacturing sector. Journal of Environmental Planning and Management, 18, 20 doi:10.1080/09640568.2019.1660626. 21
Tenzing, J. D., 2020: Integrating social protection and climate change adaptation: A review. WIREs Climate Change, 22 11(2), e626, doi:10.1002/wcc.626. 23
Tepley, A. J., J. R. Thompson, H. E. Epstein and K. J. Anderson-Teixeira, 2017: Vulnerability to forest loss through 24 altered postfire recovery dynamics in a warming climate in the Klamath Mountains. Global Change Biology, 25 23(10), 4117-4132, doi:10.1111/gcb.13704. 26
Termeer, C. J. A. M., A. Dewulf and G. R. Biesbroek, 2017: Transformational change: governance interventions for 27 climate change adaptation from a continuous change perspective. JOURNAL OF ENVIRONMENTAL PLANNING 28 AND MANAGEMENT, 60(4), 558-576, doi:10.1080/09640568.2016.1168288. 29
Tessler, Z. D. et al., 2016: A global empirical typology of anthropogenic drivers of environmental change in deltas. 30 Sustainability Science, 11(4), 525-537, doi:10.1007/s11625-016-0357-5. 31
Tessler, Z. D. et al., 2015: Profiling risk and sustainability in coastal deltas of the world. Science, 349(6248), 638-643, 32 doi:10.1126/science.aab3574. 33
Thackeray, S. J. et al., 2016: Phenological sensitivity to climate across taxa and trophic levels. Nature, 535(7611), 241-34 245, doi:10.1038/nature18608. 35
Theisen, O. M., 2017: Climate Change and Violence: Insights from Political Science. Current Climate Change Reports, 36 3(4), 210-221, doi:10.1007/s40641-017-0079-5. 37
Thiault, L. A.-O. et al., Escaping the perfect storm of simultaneous climate change impacts on agriculture and marine 38 fisheries.(2375-2548 (Electronic)). 39
Thomas, A. et al., 2020: Climate Change and Small Island Developing States. Annual Review of Environment and 40 Resources, 45. 41
Thomas, A. and L. Benjamin, 2018: Management of loss and damage in small island developing states: implications for 42 a 1.5 °C or warmer world. Regional Environmental Change, 18(8), 2369-2378, doi:10.1007/s10113-017-1184-7. 43
Thomas, A. and L. Benjamin, 2020: Non-economic loss and damage: Lessons from displacement in the Caribbean. 44 Climate Policy, 20(6), 715-728. 45
Thomas, A. et al., 2019a: Climate change adaptation planning in practice: insights from the Caribbean. REGIONAL 46 ENVIRONMENTAL CHANGE, 19(7, SI), 2013-2025, doi:10.1007/s10113-019-01540-5. 47
Thomas, A. et al., 2021: Global evidence constraints and limits to human adaptation. Regional Environmental Change, 48 21, doi:doi.org/10.1007/s10113-021-01808-9. 49
Thomas, K. et al., 2019b: Explaining differential vulnerability to climate change: A social science review. WIREs 50 Climate Change, 10(2), e565, doi:10.1002/wcc.565. 51
Thomas, K. A. and B. P. Warner, 2019: Weaponizing vulnerability to climate change. GLOBAL ENVIRONMENTAL 52 CHANGE-HUMAN AND POLICY DIMENSIONS, 57, doi:10.1016/j.gloenvcha.2019.101928. 53
Ticehurst, J. L. and A. L. Curtis, 2018: The intention of irrigators to adopt water use efficient measures: case studies in 54 the north and south of the Murray-Darling Basin. AUSTRALASIAN JOURNAL OF WATER RESOURCES, 22(2), 55 149-161, doi:10.1080/13241583.2018.1486267. 56
Ticktin, T. et al., 2018: Linkages between measures of biodiversity and community resilience in Pacific Island 57 agroforests. CONSERVATION BIOLOGY, 32(5), 1085-1095, doi:10.1111/cobi.13152. 58
Tiedemann, J. et al., 2021: Meeting the Sustainable Development Goals in Small Developing States with Climate 59 Vulnerabilities: Cost and Financing. IMF Working Paper, International Monetary Fund, Washington, DC. 60
Tilmes, S. et al., 2020: Reaching 1.5 and 2.0 °C global surface temperature targets using stratospheric aerosol 61 geoengineering, 579-601 pp. 62
ACCEPTED VERSIO
N
SUBJECT TO FIN
AL EDITS
FINAL DRAFT Chapter 16 IPCC WGII Sixth Assessment Report
Do Not Cite, Quote or Distribute 16-169 Total pages: 173
Tilmes, S. et al., 2018: CESM1 (WACCM) stratospheric aerosol geoengineering large ensemble project. Bull. Am. 1 Meteorol. Soc., 99(11), 2361-2371. 2
Tilmes, S., B. M. Sanderson and B. C. O'Neill, 2016: Climate impacts of geoengineering in a delayed mitigation 3 scenario. Geophysical Research Letters, 43(15), 8222-8229. 4
Tingley, D. and G. Wagner, 2017: Solar geoengineering and the chemtrails conspiracy on social media. Palgrave 5 Communications, 3(1), 1-7. 6
Tol, R. S., 2009: The economic effects of climate change. Journal of economic perspectives, 23(2), 29-51. 7 Tol, R. S. J., 2018: The Economic Impacts of Climate Change. Review of Environmental Economics and Policy, 12(1), 8
4-25, doi:10.1093/reep/rex027. 9 Tol, R. S. J., 2020: The distributional impact of climate change. Annals of the New York Academy of Sciences, 10
doi:10.1111/nyas.14497. 11 Tollefsen, A. F., 2017: Experienced poverty and local conflict violence. Conflict Management and Peace Science, 12
0738894217741618, doi:10.1177/0738894217741618. 13 Toloo, G. et al., 2013a: Evaluating the effectiveness of heat warning systems: systematic review of epidemiological 14
evidence. INTERNATIONAL JOURNAL OF PUBLIC HEALTH, 58(5), 667-681, doi:10.1007/s00038-013-0465-2. 15 Toloo, G. S. et al., 2013b: Are heat warning systems effective? ENVIRONMENTAL HEALTH, 12, doi:10.1186/1476-16
069X-12-27. 17 Tompkins, E. L., K. Vincent, R. J. Nicholls and N. Suckall, 2018: Documenting the state of adaptation for the global 18
stocktake of the Paris Agreement. Wiley Interdisciplinary Reviews-Climate Change, 9(5), e545, 19 doi:10.1002/wcc.545. 20
Tran, D. D. et al., 2018: Questioning triple rice intensification on the Vietnamese mekong delta floodplains: An 21 environmental and economic analysis of current land-use trends and alternatives. Journal of Environmental 22 Management, 217, 429-441, doi:10.1016/j.jenvman.2018.03.116. 23
Trewin, B. J., B. H. Kay, J. M. Darbro and T. P. Hurst, 2013: Increased container-breeding mosquito risk owing to 24 drought-induced changes in water harvesting and storage in Brisbane, Australia. International Health, 5(4), 251-25 258, doi:10.1093/inthealth/iht023. 26
Trigo, R. M., C. M. Gouveia and D. Barriopedro, 2010: The intense 2007–2009 drought in the Fertile Crescent: Impacts 27 and associated atmospheric circulation. Agricultural and Forest Meteorology, 150(9), 1245-1257, 28 doi:10.1016/j.agrformet.2010.05.006. 29
Tripathi, A. K. and S. Sindhi, 2020: Droughts, Heatwaves and Agricultural Adaptation. Review of Rural Affairs, 55(26-30 27). 31
Trisos, C. H. et al., 2018: Potentially dangerous consequences for biodiversity of solar geoengineering implementation 32 and termination. Nat Ecol Evol, 2(3), 475-482, doi:10.1038/s41559-017-0431-0. 33
Trisos, C. H., C. Merow and A. L. Pigot, 2020: The projected timing of abrupt ecological disruption from climate 34 change. Nature, 580(7804), 496-501, doi:10.1038/s41586-020-2189-9. 35
Tschakert, P. et al., 2017: Climate change and loss, as if people mattered: values, places, and experiences. Wiley 36 Interdisciplinary Reviews: Climate Change, 8(5), e476, doi:10.1002/wcc.476. 37
Tschakert, P. et al., 2019: One thousand ways to experience loss: A systematic analysis of climate-related intangible 38 harm from around the world. Global Environmental Change, 55, 58-72, doi:10.1016/j.gloenvcha.2018.11.006. 39
Tschora, H. and F. Cherubini, 2020: Co-benefits and trade-offs of agroforestry for climate change mitigation and other 40 sustainability goals in West Africa. Global Ecology and Conservation, 22, doi:10.1016/j.gecco.2020.e00919. 41
Tun Oo, A., G. Van Huylenbroeck and S. Speelman, 2017: Determining factors for the application of climate change 42 adaptation strategies among farmers in Magwe District, dry zone region of Myanmar. International Journal of 43 Climate Change Strategies and Management, 9(1), 36-55, doi:10.1108/IJCCSM-09-2015-0134. 44
Turner, M. G. et al., 2020: Climate change, ecosystems and abrupt change: science priorities. Philosophical 45 Transactions of the Royal Society B, doi:10.1098/rstb.2019.0105. 46
Ullah, W. et al., 2018: Understanding climate change vulnerability, adaptation and risk perceptions at household level 47 in Khyber Pakhtunkhwa, Pakistan. INTERNATIONAL JOURNAL OF CLIMATE CHANGE STRATEGIES AND 48 MANAGEMENT, 10(3), 359-378, doi:10.1108/IJCCSM-02-2017-0038. 49
UN-IATFFD, 2019: Financing for Sustainable Development Report 2019. United Nations, New York. Available at: 50 https://developmentfinance.un.org/fsdr2019. 51
UN-IATFFD, 2021: Financing for Sustainable Development Report 2021., United Nations, New York. Available at: 52 https://developmentfinance.un.org/fsdr2021. 53
UN, 2015: Transforming Our World: The 2030 Agenda for Sustainable Development. Resolution, United Nations, New 54 York, 35 pp. 55
UN, 2018: Global Compact for Safe, Orderly and Regular Migration. United Nations General Assembly. Available at: 56 https://undocs.org/A/CONF.231/3. 57
UNDP, WEF, CCSI and SDSN, 2016: Mapping_Mining_SDGs_An_Atlas_Executive_Summary_FINAL.pdf. World 58 Economic Forum, 74 pp. (accessed 2020-09-16 14:44:19). 59
UNEP, 2017: The Adaptation Gap Report 2017: Towards Global Assessment :: Our Planet. 60 UNEP, 2021: The Adaptation Gap Report 2021. 61 Urban, M. C., 2015: Accelerating extinction risk from climate change. Science, 348(6234), 571-573, 62
doi:10.1126/science.aaa4984. 63
ACCEPTED VERSIO
N
SUBJECT TO FIN
AL EDITS
FINAL DRAFT Chapter 16 IPCC WGII Sixth Assessment Report
Do Not Cite, Quote or Distribute 16-170 Total pages: 173
Uwishema, O. et al., 2021: Dengue fever outbreak in Cook Island: A rising concern, efforts, challenges, and future 1 recommendations, jmv.27223 pp. 2
Uzun, H. et al., 2020: Effect of prescribed fires on the export of dissolved organic matter, precursors of disinfection by-3 products, and water treatability. Water Research, 187, 116385, doi:10.1016/j.watres.2020.116385. 4
Vahmani, P. and A. D. Jones, 2017: Water conservation benefits of urban heat mitigation. Nature Communications, 8, 5 doi:10.1038/s41467-017-01346-1. 6
Van Bavel, B. et al., 2020: Contributions of scale: What we stand to gain from including local communities and experts 7 in climate and health monitoring and surveillance systems. Environmental Research Letters, 15(8), 8 doi:doi.org/10.1088/1748-9326/ab875e. 9
van Belzen, J. et al., 2017: Vegetation recovery in tidal marshes reveals critical slowing down under increased 10 inundation. Nature Communications, 8(1), 15811, doi:10.1038/ncomms15811. 11
van den Bergh, J. C. and W. Botzen, 2015: Monetary valuation of the social cost of CO2 emissions: a critical survey. 12 Ecological Economics, 114, 33-46. 13
van der Waal, J. W. H. and T. Thijssens, 2020: Corporate involvement in Sustainable Development Goals: Exploring 14 the territory. Journal of Cleaner Production, 252, 119625, doi:10.1016/j.jclepro.2019.119625. 15
van der Weide, R. and B. Milanovic, 2018: Inequality is Bad for Growth of the Poor (but Not for That of the Rich). The 16 World Bank Economic Review, 32(3), 507-530, doi:10.1093/wber/lhy023. 17
van Hooff, T., B. Blocken, J. L. M. Hensen and H. J. P. Timmermans, 2015: On the predicted effectiveness of climate 18 adaptation measures for residential buildings (Reprinted from vol 82, pg 300-316, 2014). BUILDING AND 19 ENVIRONMENT, 83(SI), 142-158, doi:10.1016/j.buildenv.2014.10.006. 20
Van Oldenborgh, G. J. et al., 2017: Attribution of extreme rainfall from Hurricane Harvey, August 2017. Environmental 21 Research Letters, 12(12), 124009. 22
Van Vliet, M. T., D. Wiberg, S. Leduc and K. Riahi, 2016: Power-generation system vulnerability and adaptation to 23 changes in climate and water resources. Nature Climate Change, 6(4), 375-380. 24
van Vuuren, D. P. and T. R. Carter, 2014: Climate and socio-economic scenarios for climate change research and 25 assessment: reconciling the new with the old. Climatic Change, 122(3), 415-429, doi:10.1007/s10584-013-0974-2. 26
Van Vuuren, D. P. et al., 2014: A new scenario framework for climate change research: scenario matrix architecture. 27 Climatic Change, 122(3), 373-386. 28
van Weezel, S., 2020: Local warming and violent armed conflict in Africa. World Development, 126, 104708, 29 doi:10.1016/j.worlddev.2019.104708. 30
Vanham, D. et al., 2018: Physical water scarcity metrics for monitoring progress towards SDG target 6.4: An evaluation 31 of indicator 6.4.2 ‘Level of water stress’. Science of The Total Environment, 613-614, 218-232, 32 doi:10.1016/j.scitotenv.2017.09.056. 33
Venter, Z., M. Cramer and H.-J. Hawkins, 2018: Drivers of woody plant encroachment over Africa. Nature 34 communications, 9(1), 1-7. 35
Verschuur, J., S. Li, P. Wolski and F. E. L. Otto, 2021: Climate change as a driver of food insecurity in the 2007 36 Lesotho-South Africa drought. Scientific Reports, 11(1), 3852, doi:10.1038/s41598-021-83375-x. 37
Vezzulli, L. et al., 2016: Climate influence on Vibrio and associated human diseases during the past half-century in the 38 coastal North Atlantic. Proceedings of the National Academy of Sciences, 113(34), E5062-E5071. 39
Vicedo-Cabrera, A. M. et al., 2018a: Temperature-related mortality impacts under and beyond Paris Agreement climate 40 change scenarios. Climatic Change, 150(3), 391-402, doi:10.1007/s10584-018-2274-3. 41
Vicedo-Cabrera, A. M. et al., 2021: The burden of heat-related mortality attributable to recent human-induced climate 42 change. Nature Climate Change, 11(6), 492-500, doi:10.1038/s41558-021-01058-x. 43
Vicedo-Cabrera, A. M. et al., 2018b: A multi-country analysis on potential adaptive mechanisms to cold and heat in a 44 changing climate. Environment international, 111, 239-246. 45
Villamayor-Tomas, S. and G. Garcia-Lopez, 2017: The influence of community-based resource management 46 institutions on adaptation capacity: A large-n study of farmer responses to climate and global market disturbances. 47 GLOBAL ENVIRONMENTAL CHANGE-HUMAN AND POLICY DIMENSIONS, 47, 153-166, 48 doi:10.1016/j.gloenvcha.2017.10.002. 49
Visioni, D., G. Pitari and V. Aquila, 2017: Sulfate geoengineering: a review of the factors controlling the needed 50 injection of sulfur dioxide. Atmospheric Chemistry and Physics, 17(6), 3879-3889. 51
Visioni, D. et al., 2020: What goes up must come down: impacts of deposition in a sulfate geoengineering scenario. 52 Environ. Res. Lett., 15(9), 094063, doi:10.1088/1748-9326/ab94eb. 53
Visschers, V. H. M., J. Shi, M. Siegrist and J. Arvai, 2017: Beliefs and values explain international differences in 54 perception of solar radiation management: insights from a cross-country survey. Clim. Change, 142(3-4), 531-55 544. 56
Viswanathan, B. and K. S. Kavi Kumar, 2015: Weather, agriculture and rural migration: evidence from state and district 57 level migration in India. Environment and Development Economics, 20(04), 469-492, 58 doi:10.1017/S1355770X1500008X. 59
Vogel, M. M. et al., 2019: Concurrent 2018 hot extremes across Northern Hemisphere due to human‐induced climate 60 change. Earth's future, 7(7), 692-703. 61
ACCEPTED VERSIO
N
SUBJECT TO FIN
AL EDITS
FINAL DRAFT Chapter 16 IPCC WGII Sixth Assessment Report
Do Not Cite, Quote or Distribute 16-171 Total pages: 173
Vogt, J. T. et al., 2020: Interactions between weather-related disturbance and forest insects and diseases in the Southern 1 United States. Gen. Tech. Rep. SRS–255. Asheville, NC: U.S. Department of Agriculture Forest Service, Southern 2 Research Station., 255, 1-37, doi:10.2737/SRS-GTR-255. 3
von Uexkull, N. and H. Buhaug, 2021: Security implications of climate change: A decade of scientific progress. Journal 4 of Peace Research, 58(1), 3-17, doi:10.1177/0022343320984210. 5
Von Uexkull, N., M. Croicu, H. Fjelde and H. Buhaug, 2016: Civil conflict sensitivity to growing-season drought. 6 Proceedings of the National Academy of Sciences, 113(44), 12391-12396. 7
Wamsler, C. and E. Brink, 2015: The role of individual adaptive practices for sustainable adaptation. International 8 Journal of Disaster Resilience in the Built Environment, 6(1), 6-29, doi:10.1108/IJDRBE-09-2014-0070. 9
Wang, H. and R. J. Hijmans, 2019: Climate change and geographic shifts in rice production in China. Environmental 10 Research Communications, 1(1), 011008, doi:10.1088/2515-7620/ab0856. 11
Wang, S. S. et al., 2018: Quantitative attribution of climate effects on Hurricane Harvey’s extreme rainfall in Texas. 12 Environmental Research Letters, 13(5), 054014. 13
Wang, X. et al., 2020: Cutting carbon footprints of vegetable production with integrated soil - crop system 14 management: A case study of greenhouse pepper production. Journal of Cleaner Production, 254, 15 doi:10.1016/j.jclepro.2020.120158. 16
Wang, Y. et al., 2019: Tens of thousands additional deaths annually in cities of China between 1.5 °C and 2.0 °C 17 warming. Nature Communications, 10(1), 3376, doi:10.1038/s41467-019-11283-w. 18
Ward, P. J. et al., 2014: Strong influence of El Nino Southern Oscillation on flood risk around the world. Proceedings 19 of the National Academy of Sciences, 111, 15659-15664, doi:10.1073/pnas.1409822111. 20
Warner, B. P. and C. Kuzdas, 2016: Manufactured global-change risk pathways in industrial-based agrarian 21 development. Climate and Development, 8(5), 385-396, doi:10.1080/17565529.2015.1085359. 22
Warner, B. P., C. Kuzdas, M. G. Yglesias and D. L. Childers, 2015: Limits to adaptation to interacting global change 23 risks among smallholder rice farmers in Northwest Costa Rica. Global Environmental Change, 30, 101-112, 24 doi:10.1016/j.gloenvcha.2014.11.002. 25
Warner, K., Z. Zommers and A. Wreford, 2020: The real economic dimensions of climate change. Journal of Extreme 26 Events, 7(03), 2131001. 27
Warren, R. et al., 2021: Global and regional aggregate damages associated with global warming of 1.5 to 4°C above 28 pre-industrial levels. 29
Warren, R. et al., 2018a: The projected effect on insects, vertebrates, and plants of limiting global warming to 1.5°C 30 rather than 2°C. Science, 360(6390), 791-795, doi:10.1126/science.aar3646. 31
Warren, R. et al., 2018b: The implications of the United Nations Paris Agreement on climate change for globally 32 significant biodiversity areas. Climatic Change, 147(3), 395-409, doi:10.1007/s10584-018-2158-6. 33
Warren, R. et al., 2013: Quantifying the benefit of early climate change mitigation in avoiding biodiversity loss. Nature 34 Climate Change, 3(7), 678-682. 35
Wartenburger, R. et al., 2017: Changes in regional climate extremes as a function of global mean temperature: an 36 interactive plotting framework. Geoscientific Model Development, 10(9), 3609-3634. 37
Watts, N. et al., 2021: The 2020 report of The Lancet Countdown on health and climate change: responding to 38 converging crises. The Lancet, 397(10269), 129-170, doi:10.1016/S0140-6736(20)32290-X. 39
Weaver, M., H. Tan and K. Crossan, 2020: Systems and Systemic Approaches for Attaining the SDGs Across 40 Partnerships. In: Partnerships for the Goals [Leal Filho, W., A. M. Azul, L. Brandli, A. Lange Salvia and T. Wall 41 (eds.)]. Springer International Publishing, Cham, pp. 1-14. ISBN 978-3-319-71067-9. 42
WEF, 2018: The Global Risks Report 2018. World Economic Forum (13th edition). 43 Wehner, M. and C. Sampson, 2021: Attributable human-induced changes in the magnitude of flooding in the Houston, 44
Texas region during Hurricane Harvey. Climatic Change, 166(1), 20, doi:10.1007/s10584-021-03114-z. 45 Weinberger, K. R. et al., 2017: Projected temperature-related deaths in ten large U.S. metropolitan areas under different 46
climate change scenarios. Environment International, 107, 196-204, doi:10.1016/j.envint.2017.07.006. 47 Weinberger, K. R., A. Zanobetti, J. Schwartz and G. A. Wellenius, 2018: Effectiveness of National Weather Service 48
heat alerts in preventing mortality in 20 US cities. ENVIRONMENT INTERNATIONAL, 116, 30-38, 49 doi:10.1016/j.envint.2018.03.028. 50
Weitzman, M. L., 2012: GHG targets as insurance against catastrophic climate damages. Journal of Public Economic 51 Theory, 14(2), 221-244. 52
Weitzman, M. L., 2015: A Voting Architecture for the Governance of Free-Driver Externalities, with Application to 53 Geoengineering, 1049-1068 pp. 54
Wenz, L. and A. Levermann, 2016: Enhanced economic connectivity to foster heat stress–related losses. Science 55 Advances, 2(6), e1501026, doi:10.1126/sciadv.1501026. 56
Werrell, C. E., F. Femia and T. Sternberg, 2015: Did We See It Coming?: State Fragility, Climate Vulnerability, and the 57 Uprisings in Syria and Egypt. SAIS Review of International Affairs, 35(1), 29-46, doi:10.1353/sais.2015.0002. 58
Weyer, N. M., 2019: Annex I: Glossary. In: Special Report on the Ocean and Cryosphere in a Changing Climate. 59 Wheeler, S. A. and A. Marning, 2019: Turning water into wine: Exploring water security perceptions and adaptation 60
behaviour amongst conventional, organic and biodynamic grape growers. LAND USE POLICY, 82, 528-537, 61 doi:10.1016/j.landusepol.2018.12.034. 62
ACCEPTED VERSIO
N
SUBJECT TO FIN
AL EDITS
FINAL DRAFT Chapter 16 IPCC WGII Sixth Assessment Report
Do Not Cite, Quote or Distribute 16-172 Total pages: 173
White, E. and D. Kaplan, 2017: Restore or retreat? saltwater intrusion and water management in coastal wetlands, 1 e01258 pp. 2
WHO, 2014: Quantitative risk assessment of the effects of climate change on selected causes of death, 2030s and 3 2050s. 4
WHO, 2018: The state of food security and nutrition in the world 2018: building climate resilience for food security 5 and nutrition. Food & Agriculture Org., World Health Organization. ISBN 9251305714. 6
Whyte, K. P., 2018: Indigeneity in geoengineering discourses: Some considerations. Ethics, Policy & Environment, 7 21(3), 289-307. 8
Wichelns, D., 2016: Managing Water and Soils to Achieve Adaptation and Reduce Methane Emissions and Arsenic 9 Contamination in Asian Rice Production. Water, 8(4), doi:10.3390/w8040141. 10
Wichmann, J., 2017: Heat effects of ambient apparent temperature on all-cause mortality in Cape Town, Durban and 11 Johannesburg, South Africa: 2006–2010. Science of the Total Environment, 587, 266-272. 12
Wiederkehr, C., M. Beckmann and K. Hermans, 2018: Environmental change, adaptation strategies and the relevance of 13 migration in Sub-Saharan drylands. ENVIRONMENTAL RESEARCH LETTERS, 13(11), doi:10.1088/1748-14 9326/aae6de. 15
Wigginton, N. S., 2015: Deltas are growing centers of risk. Science, 349(6248), i-599, 16 doi:10.1126/science.349.6248.598-i. 17
Wijenayake, V., D. Mombauer, P. M. Singh and M. Nadiruzzaman, 2020: Policy gaps and needs analysis for the 18 implementation of NDCs on adaptation and loss and damage in Bangladesh, Nepal, and Sri Lanka. APN Science 19 Bulletin, 10(1), doi:10.30852/sb.2020.1283. 20
Wilkes, A. et al., 2017: Is cross-breeding with indigenous sheep breeds an option for climate-smart agriculture? SMALL 21 RUMINANT RESEARCH, 147, 83-88, doi:10.1016/j.smallrumres.2016.12.036. 22
Willner, S. N., C. Otto and A. Levermann, 2018: Global economic response to river floods. Nature Climate Change, 23 8(7), 594-598, doi:10.1038/s41558-018-0173-2. 24
Winickoff, D. E., J. A. Flegal and A. Asrat, 2015: Engaging the Global South on climate engineering research. Nature 25 Climate Change, 5(7), 627-634. 26
Winsemius, H. C. et al., 2018: Disaster risk, climate change, and poverty: assessing the global exposure of poor people 27 to floods and droughts. Environment and Development Economics, 23(3), 328-348, 28 doi:10.1017/S1355770X17000444. 29
Wirehn, L., 2018: Nordic agriculture under climate change: A systematic review of challenges, opportunities and 30 adaptation strategies for crop production. LAND USE POLICY, 77, 63-74, doi:10.1016/j.landusepol.2018.04.059. 31
Witmer, F. D. et al., 2017: Subnational violent conflict forecasts for sub-Saharan Africa, 2015–65, using climate-32 sensitive models. Journal of Peace Research, 54(2), 175-192, doi:10.1177/0022343316682064. 33
WMO, 2020: State of the Global Climate 2020 PROVISIONAL REPORT. World Meteorological Organization. 34 Available at: https://library.wmo.int/doc_num.php?explnum_id=10444. 35
Wolde, B. et al., 2016: Determinants of enrollment in public incentive programs for forest management and their effect 36 on future programs for woody bioenergy: evidence from Virginia and Texas. Canadian Journal of Forest 37 Research, 46(6), 775-782. 38
Work, C., V. Rong, D. Song and A. Scheidel, 2019: Maladaptation and development as usual? Investigating climate 39 change mitigation and adaptation projects in Cambodia. CLIMATE POLICY, 19(1), S47-S62, 40 doi:10.1080/14693062.2018.1527677. 41
World Bank, Income share held by lowest 20%, data.worldbank.org. 42 World Bank, 2020: Employment in agriculture (% of total employment) (modeled ILO estimate) - World, Sub-Saharan 43
Africa, South Asia, European Union, East Asia & Pacific, Latin America & Caribbean. 44 World Bank, 2021: Global Economic Prospects, June 2021. World Bank, Washington DC. 45 Wrathall, D. J. et al., 2019: Meeting the looming policy challenge of sea-level change and human migration. Nature 46
Climate Change, 9(12), 898-901, doi:10.1038/s41558-019-0640-4. 47 Xia, L., P. J. Nowack, S. Tilmes and A. Robock, 2017: Impacts of stratospheric sulfate geoengineering on tropospheric 48
ozone. Atmos. Chem. Phys., 17(19), 11913-11928, doi:10.5194/acp-17-11913-2017. 49 Xia, L. et al., 2014: Solar radiation management impacts on agriculture in China: A case study in the Geoengineering 50
Model Intercomparison Project (GeoMIP). J. Geophys. Res. D: Atmos., 119(14), 8695-8711, 51 doi:10.1002/2013JD020630. 52
Yadav, G. et al., 2020: A framework to achieve sustainability in manufacturing organisations of developing economies 53 using industry 4.0 technologies’ enablers. Computers in Industry, 122, 103280, 54 doi:10.1016/j.compind.2020.103280. 55
Yamba, S., D. O. Appiah and L. P. Siaw, 2019: Smallholder farmers' perceptions and adaptive response to climate 56 variability and climate change in southern rural Ghana. COGENT SOCIAL SCIENCES, 5(1), 57 doi:10.1080/23311886.2019.1646626. 58
Yang, H. et al., 2016: Potential negative consequences of geoengineering on crop production: A study of Indian 59 groundnut. Geophys. Res. Lett., 43(22), 11786-11795, doi:10.1002/2016GL071209. 60
Yang, J., V. Owusu, E. Andriesse and A. D. Ablo, 2019: In-Situ Adaptation and Coastal Vulnerabilities in Ghana and 61 Tanzania. JOURNAL OF ENVIRONMENT & DEVELOPMENT, 28(3), 282-308, 62 doi:10.1177/1070496519852992. 63
ACCEPTED VERSIO
N
SUBJECT TO FIN
AL EDITS

FINAL DRAFT Chapter 16 IPCC WGII Sixth Assessment Report
Do Not Cite, Quote or Distribute 16-173 Total pages: 173
Yeeles, A., 2015: Weathering unrest: The ecology of urban social disturbances in Africa and Asia. Journal of Peace 1 Research, 52(2), 158-170. 2
Yegbemey, R. N., E. O. Yegbemey and J. A. Yabi, 2017: Sustainability analysis of observed climate change adaptation 3 strategies in maize farming in Benin, West Africa. OUTLOOK ON AGRICULTURE, 46(1), 20-27, 4 doi:10.1177/0030727016689638. 5
Yesudian, A. N. and R. J. Dawson, 2021: Global analysis of sea level rise risk to airports. Climate Risk Management, 6 31, 100266, doi:10.1016/j.crm.2020.100266. 7
Yila, J. O. and B. P. Resurreccion, 2013: Determinants of smallholder farmers' adaptation strategies to climate change 8 in the semi arid Nguru Local Government Area, Northeastern Nigeria. Management of Environmental Quality: An 9 International Journal, 24(3), 341-364, doi:10.1108/14777831311322659. 10
Yokohata, T. et al., 2019: Visualizing the Interconnections Among Climate Risks. Earth's Future, 7(2), 85-100, 11 doi:10.1029/2018EF000945. 12
Yu, D. et al., 2020: Disruption of emergency response to vulnerable populations during floods. Nature Sustainability, 1-13 9, doi:10.1038/s41893-020-0516-7. 14
Yumashev, D. et al., 2019: Climate policy implications of nonlinear decline of Arctic land permafrost and other 15 cryosphere elements. Nature communications, 10(1), 1-11. 16
Zarnetske, P. L. et al., 2021: Potential ecological impacts of climate intervention by reflecting sunlight to cool Earth, 17 e1921854118 pp. 18
Zhan, P. et al., 2019: Impacts of Sulfate Geoengineering on Rice Yield in China: Results From a Multimodel Ensemble. 19 Earth's Future, 7(4), 395-410, doi:10.1029/2018EF001094. 20
Zhang, B., Z. Fu, J. Wang and L. Zhang, 2019: Farmers’ adoption of water-saving irrigation technology alleviates water 21 scarcity in metropolis suburbs: A case study of Beijing, China. Agricultural Water Management, 212, 349-357, 22 doi:10.1016/j.agwat.2018.09.021. 23
Zhang, J., K. Zhang, J. Liu and G. Ban-Weiss, 2016: Revisiting the climate impacts of cool roofs around the globe 24 using an Earth system model. Environmental Research Letters, 11(8), 084014. 25
Zhao, H. et al., 2019: Virtual water scarcity risk to global trade under climate change. Journal of Cleaner Production, 26 230, 1013-1026, doi:10.1016/j.jclepro.2019.05.114. 27
Zhao, L. et al., 2018: Interactions between urban heat islands and heat waves. Environmental research letters, 13(3), 28 034003. 29
Zhao, Q. et al., 2021: Global, regional, and national burden of mortality associated with non-optimal ambient 30 temperatures from 2000 to 2019: a three-stage modelling study, e415-e425 pp. 31
Zhu, C. et al., 2018: Carbon dioxide (CO 2 ) levels this century will alter the protein, micronutrients, and vitamin 32 content of rice grains with potential health consequences for the poorest rice-dependent countries. Science 33 Advances, 4(5), eaaq1012, doi:10.1126/sciadv.aaq1012. 34
Zinia, N. J. and P. McShane, 2018: Ecosystem services management: An evaluation of green adaptations for urban 35 development in Dhaka, Bangladesh. LANDSCAPE AND URBAN PLANNING, 173, 23-32, 36 doi:10.1016/j.landurbplan.2018.01.008. 37
Zommers, Z. et al., 2020: Burning embers: towards more transparent and robust climate-change risk assessments. 38 Nature Reviews Earth & Environment, 1(10), 516-529, doi:10.1038/s43017-020-0088-0. 39
Zwiers, F. W., X. Zhang and Y. Feng, 2011: Anthropogenic influence on long return period daily temperature extremes 40 at regional scales. Journal of Climate, 24(3), 881-892. 41
42
ACCEPTED VERSIO
N
SUBJECT TO FIN
AL EDITS


