Embed Size (px)
Citation preview
356
Chapter 10: General Discussion Despite the increasing use of rTMS in therapeutic and investigative studies in humans,
the mechanisms underlying the therapeutic effects still require elucidation to provide
increased and longer-lasting benefits to patients. An ideal approach for the study of
the effects of rTMS is to use non-invasive magnetic resonance-based techniques,
which have the added advantage of being techniques that can be utilised in both
preclinical and clinical studies. This thesis aimed to characterise the effects of LI-rTMS
on brain function, chemistry and structure using MRI in both healthy rats and a rat
model of depression and link these results to behaviour and gut microbiome
composition. I have also investigated how altering the frequency and duration of the
stimulation affects short- and long-term outcomes, which may suggest how to improve
personalised rTMS protocols by optimising the treatment effects.
10.1. Effect of LI-rTMS in healthy animals
10.1.1. Immediate effects of one LI-rTMS session
Although clinical applications of rTMS most commonly involve high intensity fields that
trigger action potentials, my thesis adds to the growing body of evidence that rTMS at
low intensity (LI-rTMS) can modulate neurons and induce brain plasticity via other
mechanisms (Tang et al., 2015). In Chapter 4, I added knowledge about how these
cellular and molecular changes can affect brain circuits. I showed that a single session
of LI-rTMS in rats has frequency-specific effects on functional links within the RSNs
(Table 10.1). In-vitro studies have also reported frequency-specific TMS-induced
changes and have shown that a single session of stimulation can increase intracellular
calcium (Grehl et al., 2015) and brain derived neurotrophic factor (BDNF) levels

357
(Makowiecki et al., 2014), downregulate expression of genes related to calcium
signalling, inflammatory molecules and neural plasticity (Clarke et al., 2021), deplete
selected tricarboxylic acid cycle metabolites (Hong et al., 2018) and alter neuronal
excitability (Tang et al., 2016a). These mechanisms may be involved in inducing the
immediate changes in functional connectivity observed in Chapter 4. Importantly, the
changes observed in Chapter 4 were similar to those described in humans following
rTMS, showing that use of combined LI-rTMS/MRI in rodents can be a useful
translational model to inform and guide clinical application of rTMS.
10.1.2. Immediate and long-term effects of repeated LI-rTMS delivery
In Chapters 5 and 8, I have taken advantage of the capacity of longitudinal study design
to look at progression of rTMS effects over time. Non-invasive MRI provided us with
the unique opportunity to acquire repeated measurements within the same animals,
which added a new dimension to understanding the long-term frequency-specific
effects of LI-rTMS. I have shown that daily stimulation over a period of two weeks
results in significant changes in functional connectivity, neurometabolite levels and
dMRI measures of brain microstructure and that these changes outlast the duration of
stimulation (Table 10.1). Overall, the changes following 10 Hz LI-rTMS were larger and
detected earlier than following 1 Hz LI-rTMS. This is in line with in-vitro studies
reporting greater gene-expression changes and higher levels of intracellular calcium
following a single session of 10 Hz stimulation compared to 1 Hz stimulation, with 10
Hz stimulation altering expression of the majority of significantly regulated calcium-
related genes (Grehl et al., 2015; Clarke et al., 2021).
358
Interestingly, while I found an increase in neurotransmitters glutamate and GABA after
seven days of stimulation, Poh et al. (2019) did not detect changes in
neurotransmitters dopamine and serotonin, and their metabolite concentrations in
either cortical or subcortical regions following a single session of 10 Hz LI-rTMS. This is
in contrast to previous studies reporting significant increases in extracellular dopamine
following a single session of high-frequency rTMS delivered at high intensities (Keck et
al., 2002; Kanno et al., 2004). This may indicate that the effects of rTMS on
neurotransmitters are cumulative and if delivered at low intensities, the rTMS-induced
changes may not be detectable following a single stimulation session. In line with
previous human studies showing increased excitability following 10 Hz rTMS and
evidence from animal studies that 10 Hz stimulation induces LTP, I found that daily
stimulation with 10 Hz LI-rTMS potentiated functional connectivity in the RSNs and
these findings are generally consistent with human MRI studies using HI-rTMS
(Schneider et al., 2010; Salomons et al., 2014; Wang et al., 2014; Chou et al., 2015;
Dunlop et al., 2016; Peters et al., 2016). These prior studies suggest that the increase in
functional connectivity observed here might be related to an increase in activity within
the somatosensory cortex, striatum, and thalamus induced by the excitatory
stimulation paradigm.
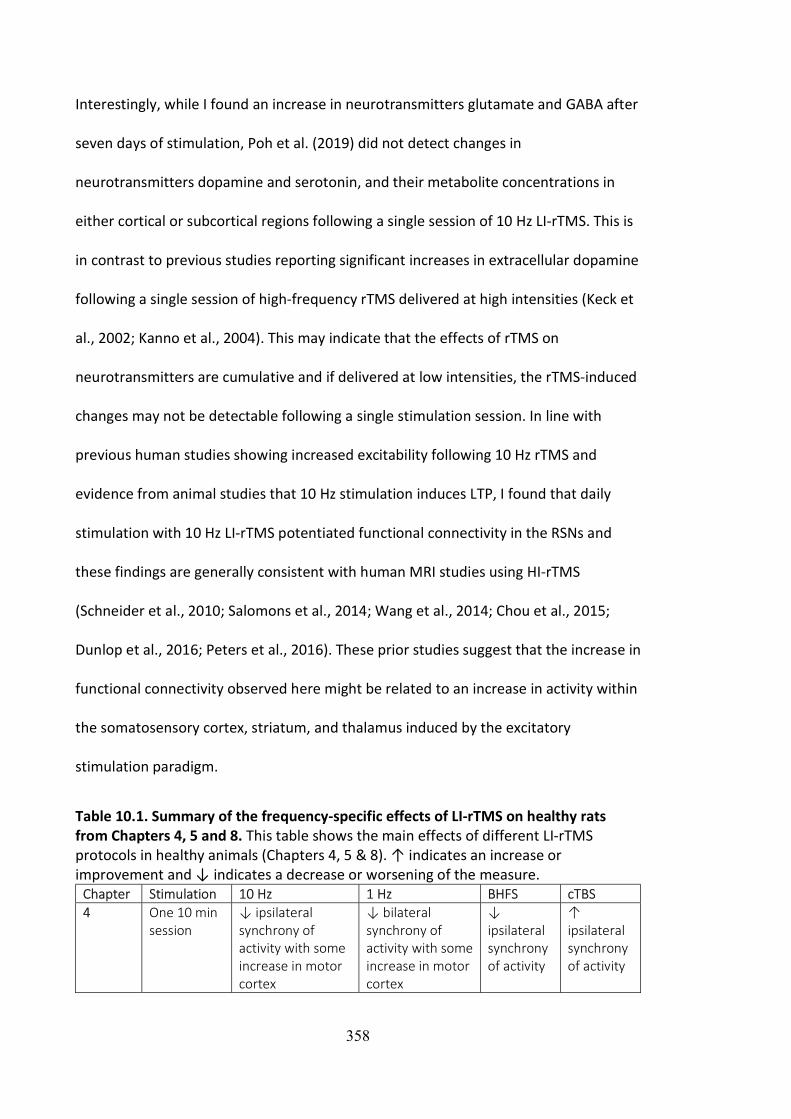
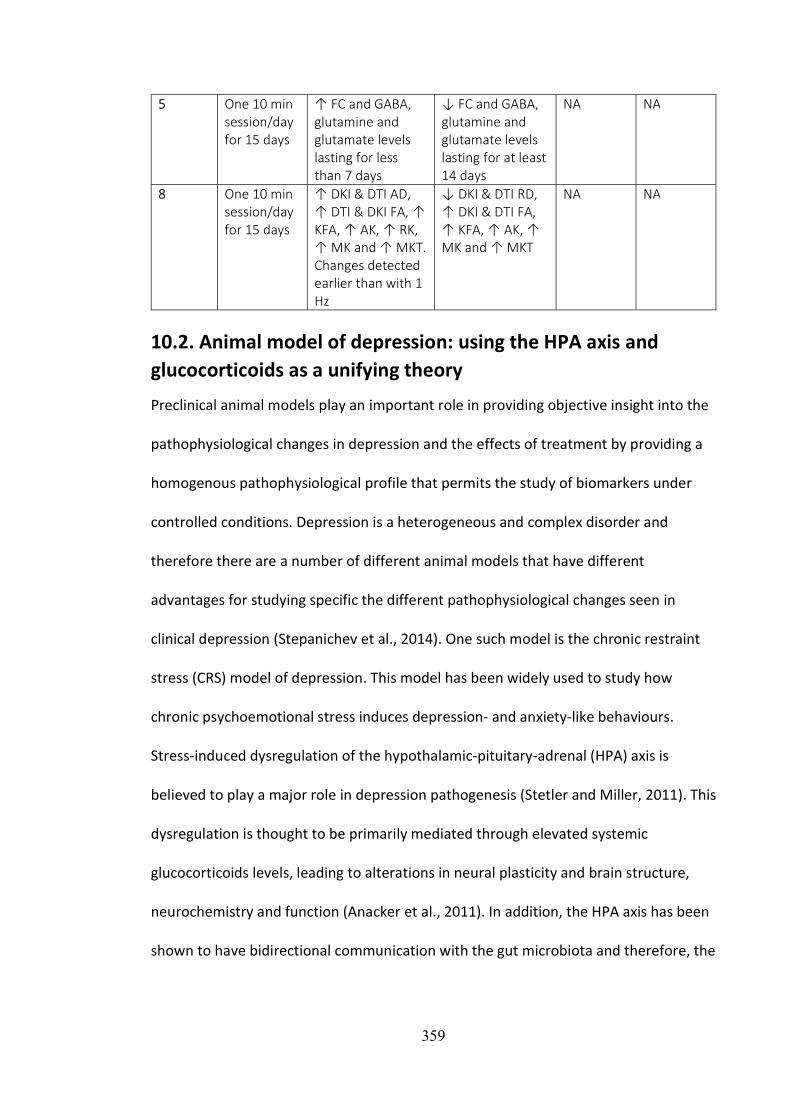
Table 10.1. Summary of the frequency-specific effects of LI-rTMS on healthy rats from Chapters 4, 5 and 8. This table shows the main effects of different LI-rTMS protocols in healthy animals (Chapters 4, 5 & 8). ↑ indicates an increase or improvement and ↓ indicates a decrease or worsening of the measure.
Chapter Stimulation 10 Hz 1 Hz BHFS cTBS 4 One 10 min
session ↓ ipsilateral synchrony of activity with some increase in motor cortex
↓ bilateral synchrony of activity with some increase in motor cortex
↓ ipsilateral synchrony of activity
↑ ipsilateral synchrony of activity
359
5 One 10 min session/day for 15 days
↑ FC and GABA, glutamine and glutamate levels lasting for less than 7 days
↓ FC and GABA, glutamine and glutamate levels lasting for at least 14 days
NA NA
8 One 10 min session/day for 15 days
↑ DKI & DTI AD, ↑ DTI & DKI FA, ↑ KFA, ↑ AK, ↑ RK, ↑ MK and ↑ MKT. Changes detected earlier than with 1 Hz
↓ DKI & DTI RD, ↑ DKI & DTI FA, ↑ KFA, ↑ AK, ↑ MK and ↑ MKT
NA NA
10.2. Animal model of depression: using the HPA axis and glucocorticoids as a unifying theory
Preclinical animal models play an important role in providing objective insight into the
pathophysiological changes in depression and the effects of treatment by providing a
homogenous pathophysiological profile that permits the study of biomarkers under
controlled conditions. Depression is a heterogeneous and complex disorder and
therefore there are a number of different animal models that have different
advantages for studying specific the different pathophysiological changes seen in
clinical depression (Stepanichev et al., 2014). One such model is the chronic restraint
stress (CRS) model of depression. This model has been widely used to study how
chronic psychoemotional stress induces depression- and anxiety-like behaviours.
Stress-induced dysregulation of the hypothalamic-pituitary-adrenal (HPA) axis is
believed to play a major role in depression pathogenesis (Stetler and Miller, 2011). This
dysregulation is thought to be primarily mediated through elevated systemic
glucocorticoids levels, leading to alterations in neural plasticity and brain structure,
neurochemistry and function (Anacker et al., 2011). In addition, the HPA axis has been
shown to have bidirectional communication with the gut microbiota and therefore, the
360
gut–brain axis may also play a role in development and/or maintenance of depression
(Foster and McVey Neufeld, 2013).
Despite that glucocorticoid levels were not measured in Chapter 6-9 and therefore
HPA axis dysregulation cannot be confirmed, I will use this potential mechanism to
unify the results of these chapters involving the depression model. Multimodal MRI
(rs-fMRI, MRS, anatomical imaging) in Chapter 6, advanced dMRI measures in Chapter
8 and gut microbiome data in Chapter 9 showed that many of the structural, chemical,
functional, and gut microbial abnormalities common to depression (Zhuo et al., 2019;
Capuco et al., 2020; Kang and Cho, 2020) are also present in rats following CRS (see
Table 10.2 for summary of the effects of CRS in rats). The decrease in white matter
fibre density and cross-section, hippocampal atrophy, decreased glutamate and
glutamine levels in the sensorimotor cortex, increased abundance of several gut
bacteria, and hyperconnectivity between limbic regions (hippocampus, thalamus and
cingulate cortex) observed in these chapters may be related to overactivation of the
HPA axis and elevated systemic glucocorticoids levels.
361
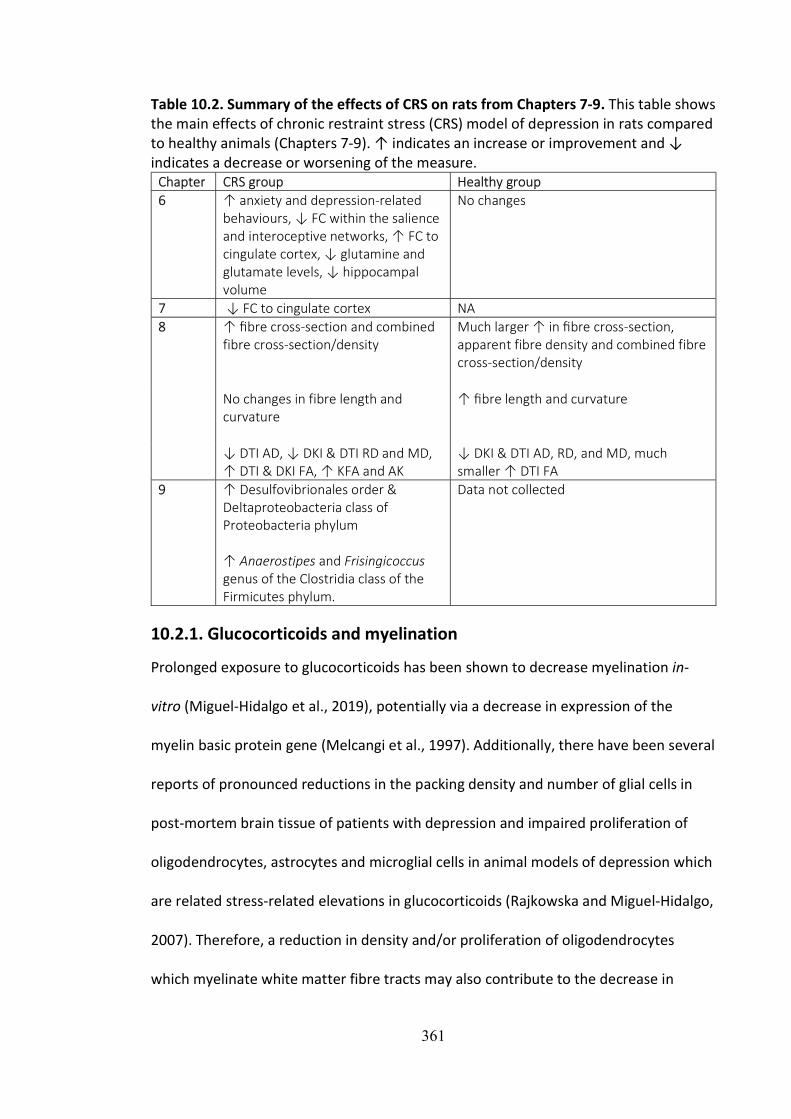
Table 10.2. Summary of the effects of CRS on rats from Chapters 7-9. This table shows the main effects of chronic restraint stress (CRS) model of depression in rats compared to healthy animals (Chapters 7-9). ↑ indicates an increase or improvement and ↓ indicates a decrease or worsening of the measure.
Chapter CRS group Healthy group 6 ↑ anxiety and depression-related
behaviours, ↓ FC within the salience and interoceptive networks, ↑ FC to cingulate cortex, ↓ glutamine and glutamate levels, ↓ hippocampal volume
No changes
7 ↓ FC to cingulate cortex NA 8 ↑ fibre cross-section and combined
fibre cross-section/density Much larger ↑ in fibre cross-section, apparent fibre density and combined fibre cross-section/density
No changes in fibre length and curvature
↑ fibre length and curvature
↓ DTI AD, ↓ DKI & DTI RD and MD, ↑ DTI & DKI FA, ↑ KFA and AK
↓ DKI & DTI AD, RD, and MD, much smaller ↑ DTI FA
9 ↑ Desulfovibrionales order & Deltaproteobacteria class of Proteobacteria phylum ↑ Anaerostipes and Frisingicoccus genus of the Clostridia class of the Firmicutes phylum.
Data not collected
10.2.1. Glucocorticoids and myelination
Prolonged exposure to glucocorticoids has been shown to decrease myelination in-
vitro (Miguel-Hidalgo et al., 2019), potentially via a decrease in expression of the
myelin basic protein gene (Melcangi et al., 1997). Additionally, there have been several
reports of pronounced reductions in the packing density and number of glial cells in
post-mortem brain tissue of patients with depression and impaired proliferation of
oligodendrocytes, astrocytes and microglial cells in animal models of depression which
are related stress-related elevations in glucocorticoids (Rajkowska and Miguel-Hidalgo,
2007). Therefore, a reduction in density and/or proliferation of oligodendrocytes
which myelinate white matter fibre tracts may also contribute to the decrease in
362
myelination seen in depression. Moreover, given that the white matter is largely
comprised of myelinated and unmyelinated axons and glial cells, the decrease in white
matter volume observed in humans with depression and in animal models of
depression (Rajkowska and Miguel-Hidalgo, 2007) and the decrease in apparent fibre
density and fibre cross-section observed in Chapter 8 may be related to the reduction
in myelination and packing density and number of glial cells.
10.2.2. Glucocorticoids and the hippocampus
Due to the high concentration of glucocorticoid receptors in the hippocampus in
conjunction with its integral role in social interactions, emotional and cognitive
processing, and the feedback control of the HPA axis, the hippocampus has been one
of the most extensively studied brain regions in depression (Nolan et al., 2020).
Elevated levels of glucocorticoids in depression have been hypothesised to be related
to damage to the hippocampus, both in terms of reduced neurogenesis and cell
proliferation and survival (Kino, 2015). Both bilateral or unilateral hippocampal
volumes have been shown to be significantly reduced by approximately 8% relative to
healthy controls (Nolan et al., 2020).
However, the mechanism by which increased glucocorticoid leads to hippocampal
atrophy in depression is still unclear. Chronic glucocorticoid exposure has been shown
to increase extracellular glutamate levels by inhibiting glutamate uptake, potentially
via reduced density and/or proliferation of oligodendrocytes (Rajkowska and Miguel-
Hidalgo, 2007) and increasing the basal release of glutamate in several limbic and
cortical areas, including the hippocampus, amygdala and prefrontal cortex (Popoli et
al., 2011; Sandi, 2011). Excess glutamatergic excitotoxicity can lead to neuronal death
363
and hence atrophy in associated brain regions via intra-cellular calcium-driven
cytoskeletal degeneration and oxidative stress (Duman, 2009).
On the other hand, long-term exposure to glucocorticoids can down-regulate BDNF
expression (Numakawa et al., 2009; Nowacka and Obuchowicz, 2013). Decreased
serum and brain BDNF levels have been consistently reported in animal models of
stress and depression and in patients with depression (Gervasoni et al., 2005; Duman,
2009). A decrease in BDNF concentrations leads to suppression of BDNF-induced
glutamate release and therefore an overall decrease in glutamate levels (Yang et al.,
2020). At lower BDNF concentrations, hippocampal neurogenesis is inhibited and
dendritic outgrowth impaired, which may lead to hippocampal atrophy (Kumamaru et
al., 2008). However, immunostaining of the brain tissue of animals in Chapters 6-7 did
not show any evidence of reduced neurogenesis in the hippocampus following
restraint (Figure J.1B). Therefore, hippocampal atrophy observed in the restrained
animals in Chapter 6 is likely to result from reduced cell proliferation and survival
instead. Interestingly, probiotic treatment has been shown to reduce stress-induced
corticosterone and anxiety- and depression-related behaviour (Bravo et al., 2011) and
increase hippocampal BDNF expression back to normal levels (Bercik et al., 2010),
suggesting a direct link between the health status of the gut microbiome and the
hippocampus. In line with these studies, when correlational analyses were performed
between the microbiome and MRI data in Chapter 9, we found that the changes in gut
microbial composition were significantly correlated with glutamate levels,
hippocampal volume and brain functional connectivity. This correlation could be
364
related to a decrease in BDNF expression due to increased glucocorticoids in CRS
animals.
Investigation of the relationships between hippocampal activity and HPA axis
responsivity has been made possible via measurements of cortisol levels during stress
paradigms in fMRI studies. For example, Root et al. (2009) reported that increased
cortisol levels were correlated to increased activity in the hippocampus and decreased
activity in the prefrontal cortex. Previous studies have consistently provided evidence
supporting fronto-limbic network dysregulation, specifically hyperactivation of several
limbic regions in response to negative stimuli in depression (Delvecchio et al., 2012;
Dichter et al., 2015). In accordance with these studies, in Chapter 6, significant
hyperconnectivity between limbic regions including the hippocampus, thalamus and
cingulate cortex was observed.
10.3. Effect of LI-rTMS on animal model of depression
An important aspect of the underlying mechanism of rTMS could be related to its
effect on the HPA axis in restoring and/or preventing the pathological processes
described in section 10.2 (Keck, 2003). In Chapters 7-9, LI-rTMS was shown to have a
protective effect on the brain functional connectivity, neurometabolite levels,
hippocampal volume, white matter structure and myelination and gut microbiome
(Table 10.3). Restoration of the HPA axis activity via the mechanisms described below
may underly the effects of LI-rTMS observed in our MRI studies and in human MRI
studies showing similar results (Peng et al., 2018).
Table 10.3. Summary of the effects of LI-rTMS on CRS rats from Chapters 7-9. This table shows the main effects of an accelerated protocol of LI-rTMS in a chronic restraint stress (CRS) model of depression (Chapters 7-9). Animals received three 10

365
min sessions per day (spaced 1 hour apart) for 5 days a week for 2 weeks. ↑ indicates an increase or improvement and ↓ indicates a decrease or worsening of the measure.
Chapter Main effects of accelerated 10 Hz LI-rTMS
7 ↑ FC back to baseline levels Prevents anxiety-related changes in hippocampal volume ↓ GABA and ↑glutamate
8 ↑ fibre cross-section ↓ DKI & DTI RD, ↑ DKI & DTI FA, ↑ KFA, ↑ MK, ↑ MKT, ↓ DKI & DTI MD ↑ MBP staining
9 Prevents ↓ Acidaminococcales order, Acidaminococcaceae family, Phascolarctobacterium genus, Fusicatenibacter genus and Negativicutes class compared to depression control group ↑ Roseburia genus from the Clostridia class in active group but ↓ in depression control group
The potential effect of rTMS on the HPA axis has been investigated in several clinical
and preclinical studies measuring cortisol levels before and after rTMS treatment
(Schutter and van Honk, 2010). However, the effects of rTMS on the HPA axis is
variable (Schutter and van Honk, 2010; Meille et al., 2016). For example, Pridmore
(1999) observed normalisation of HPA axis hyperactivity in depressed patients after
multiple sessions of HF-rTMS while Zwanzger et al. (2003) did not observe any rTMS-
induced changes in HPA-axis activity. Nevertheless, these studies were not sham-
controlled and there were no comparisons made between baseline cortisol levels in
healthy and depressed patients. Additionally, even though HPA axis dysregulation has
been implicated in MDD, MDD has a heterogeneous nature and not all patients
present with HPA axis overactivity or elevated cortisol levels. The large individual
heterogeneity of HPA axis dysregulation in MDD may explain why the effects of rTMS
treatment are mixed and often not significant in small studies. For instance, in contrast
with the smaller studies mentioned above, a decrease in HPA axis activity was reported
by a large double-blind, randomised controlled trial in depressed patients who
underwent multiple active rTMS sessions (Mingli et al., 2009).
366
However, the causality of the effects of rTMS in depression and on the HPA axis is still
largely unknown. HPA axis activity may decrease as a result of loss of depression
following successful treatment or rTMS may be having a direct effect on the HPA axis
(Figure 10.1). In a sham-controlled study, salivary cortisol concentrations decreased
after one active HF-rTMS session (Baeken et al., 2009). Given that cortisol
concentration decreased immediately after a single rTMS session, that rTMS can have
a direct effect on cortisol levels is possible. A decrease in glucocorticoid levels induced
by rTMS may then prevent the glucocorticoid-mediated suppression of BDNF levels,
leading to an increase in BDNF (Figure 10.1). Indeed, in an animal model of depression,
animals showed a significant increase in cortisol and a significant decrease in BDNF
levels following induction of depression-like behaviours and these changes were
reversed by rTMS treatment (Feng et al., 2012).
rTMS may also be affecting other factors in the brain which in turn lead to a change in
glucocorticoid levels. For example, evidence from animal research shows decreased
levels of adrenocorticotropic hormone following rTMS treatment (Keck et al., 2000).
This hormone is known to stimulate the production and release of glucocorticoids
(cortisol in primates including humans, and corticosterone in rodents) and therefore, a
decrease in adrenocorticotropic hormone levels would in turn lead to a decrease in
glucocorticoid levels. rTMS has also been shown to directly increase BDNF mRNA and
protein levels in rats (Müller et al., 2000; Gersner et al., 2011). Interestingly, injection
of exogenous BDNF has been shown to modify HPA axis function (Givalois et al., 2004;
Naert et al., 2006) and have anti-depressant-like effects in animals (Siuciak et al., 1997;
Shirayama et al., 2002; Hoshaw et al., 2005).
367
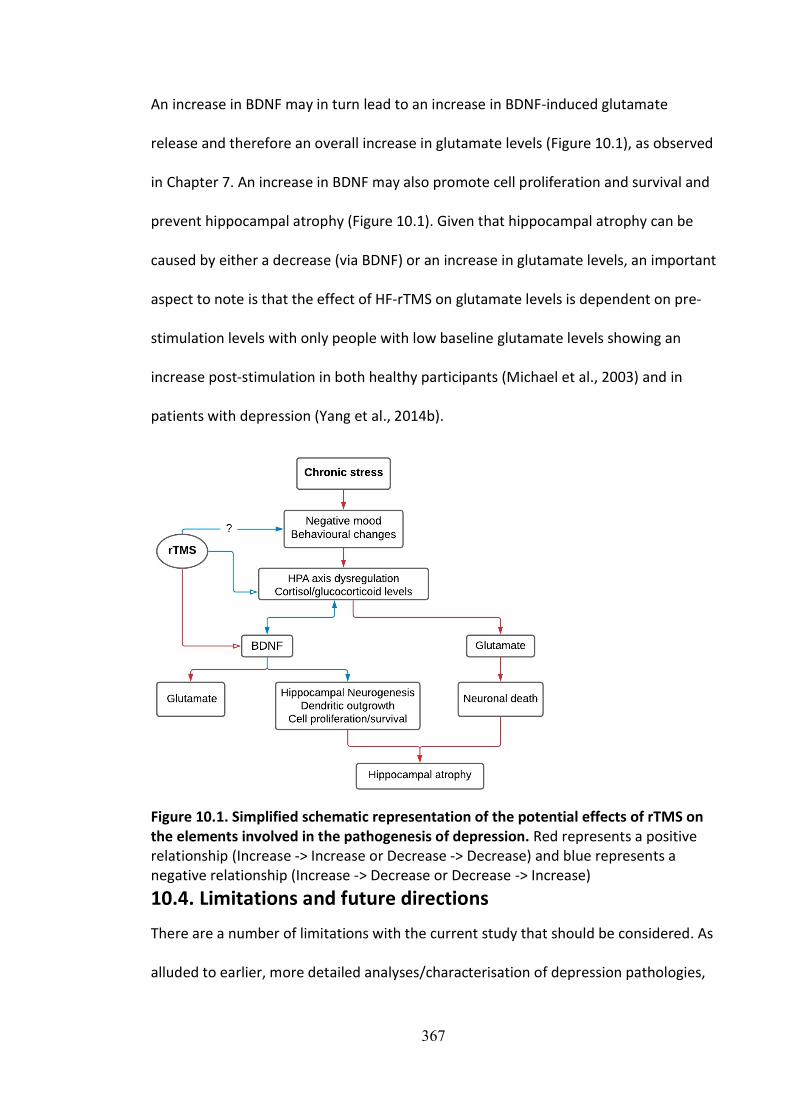
An increase in BDNF may in turn lead to an increase in BDNF-induced glutamate
release and therefore an overall increase in glutamate levels (Figure 10.1), as observed
in Chapter 7. An increase in BDNF may also promote cell proliferation and survival and
prevent hippocampal atrophy (Figure 10.1). Given that hippocampal atrophy can be
caused by either a decrease (via BDNF) or an increase in glutamate levels, an important
aspect to note is that the effect of HF-rTMS on glutamate levels is dependent on pre-
stimulation levels with only people with low baseline glutamate levels showing an
increase post-stimulation in both healthy participants (Michael et al., 2003) and in
patients with depression (Yang et al., 2014b).
Figure 10.1. Simplified schematic representation of the potential effects of rTMS on the elements involved in the pathogenesis of depression. Red represents a positive relationship (Increase -> Increase or Decrease -> Decrease) and blue represents a negative relationship (Increase -> Decrease or Decrease -> Increase)
10.4. Limitations and future directions
There are a number of limitations with the current study that should be considered. As
alluded to earlier, more detailed analyses/characterisation of depression pathologies,

368
as well as the effects of rTMS on those changes, must be completed. For example, the
presence of changes in neurotrophic factors and neuroinflammatory indices, and
whether these changes are correlated with depression-like behaviours and rTMS
treatment were not investigated in this study but is a common feature of human
depression (Hacimusalar and Eşel, 2018). Blood samples may be taken at the different
timepoints to track how BDNF and corticosterone levels change following CRS and
following LI-rTMS treatment. Additionally, our analyses of neurometabolic
abnormalities were limited to the ipsilateral sensorimotor cortex, and future studies
would benefit from examining these outcomes in other structures such as the
hippocampus and those in the contralateral hemisphere. Similarly, our analyses of
volumetric changes were limited to the hippocampus due to its relatively large size,
and future studies should acquire higher resolution anatomical images to allow for the
examination of volumetric changes in other brain regions, including the cingulate
cortex and amygdala. The inclusion of additional post-stimulation timepoints would
also be informative. For example, a more chronic post-stimulation timepoint (e.g., 3-12
months) might determine whether the rTMS-induced changes observed at two weeks
post-cessation of stimulation in this study is maintained compared to control animals.
Chronic post-stimulation timepoints can help determine the duration of rTMS effects
and hence, help validate potential prolongation of effects through maintenance rTMS
sessions weeks or months after the first set of treatment. Given that the brain changes
observed in this animal model more closely reflects changes in depressed humans with
high anxiety levels, inclusion of other tests for anxiety-like behaviours such as the open
field test and novelty suppressed feeding would have allowed us to better characterise
the progression of and recovery from behavioural changes induced by CRS (Belovicova
369
et al., 2017). Although future discussion and research into the specificity and/or
classification of the depression and anxiety-like changes in animal models of
depression (including the CRS model studied here) and the chronic effects of rTMS in
depression and other neuropsychiatric conditions are required, the findings presented
here indicate that the CRS model shows pathologies that resemble those occurring in
depression and that rTMS can help reverse these changes.
Of pertinence, while the current study focused on the effects of rTMS in the context of
depression, rTMS has also been approved for the treatment of other conditions such
as migraines (Lipton et al., 2010) and obsessive-compulsive disorder (Carmi et al.,
2019) and has shown therapeutic potential in a range of neuropsychiatric conditions
such as Parkinson’s disease (Jiang et al., 2020), stroke (Smith and Stinear, 2016;
Fisicaro et al., 2019) and Alzheimer’s disease (Bagattini et al., 2020). Thus, the
underlying mechanisms of action of rTMS in depression may have implications in other
brain disorders. For example, like depression, environmental stressors, stress
responses and hence the HPA axis activity are central to the pathogenesis of
posttraumatic stress disorder (D’Elia et al., 2021) and anxiety disorders as well (Tafet
and Nemeroff, 2020). Therefore, rTMS treatment may be leading to improvement in
symptoms (Yan et al., 2017; Rodrigues et al., 2019) via similar mechanisms.
370
10.5. Conclusion
In conclusion, in this study LI-rTMS was delivered to healthy rats and to a CRS model of
depression and assessed for the immediate and long-term (two weeks post-
stimulation cessation) changes in brain function, chemistry and structure using non-
invasive multimodal MRI methods and gut microbiome using faecal 16S rRNA
sequencing. In healthy animals, we found evidence of changes in functional
connectivity, neurometabolite levels and several dMRI measures related to white
matter microstructure which were specific to the frequency of stimulation. Overall, 10
Hz LI-rTMS induced larger changes and were detected earlier than following 1 Hz LI-
rTMS. Prior to investigating the effect of 10 Hz LI-rTMS in the CRS model, I examined
the effects of CRS on the behaviour, gut microbiome, and brain of the animals
compared to healthy controls. We observed increased depression- and anxiety-like
behaviours, gut microbiome dysbiosis, dysfunctional connectivity in several RSNs,
neurometabolite imbalance, hippocampal atrophy, microstructural disruption in the
white matter and demyelination of the corpus callosum after CRS in rats. Importantly,
these abnormalities reflect the pathological changes reported in human depression.
Interestingly, several of these changes were restored using LI-rTMS. While future
studies are required to further characterise the underlying mechanisms of these
changes, our initial results provide evidence that CRS is a relevant model for the study
of depression and LI-rTMS can result in progressive long-term neuroplastic changes
which are beneficial in depression. An improved basic understanding of mechanism
will help tailor personalised treatment protocols to suit specific individuals and
therefore, increase the therapeutic efficacy of this treatment.
371
References Abe M, Fukuyama H, Mima T (2014) Water diffusion reveals networks that modulate
multiregional morphological plasticity after repetitive brain stimulation. Proceedings of the National Academy of Sciences 111:4608–4613.
Abraham G, O'Brien S (2002) Repetitive transcranial magnetic stimulation is useful for maintenance treatment. Can J Psychiatry 47:386.
Abraham WC (2008) Metaplasticity: tuning synapses and networks for plasticity. Nat Rev Neurosci 9:387.
Agans R, Rigsbee L, Kenche H, Michail S, Khamis HJ, Paliy O (2011) Distal gut microbiota of adolescent children is different from that of adults. FEMS Microbiol Ecol 77:404–412.
Ait Chait Y, Mottawea W, Tompkins TA, Hammami R (2020) Unravelling the antimicrobial action of antidepressants on gut commensal microbes. Sci Rep 10:17878.
Albanese D, Fontana P, De Filippo C, Cavalieri D, Donati C (2015) MICCA: a complete and accurate software for taxonomic profiling of metagenomic data. Sci Rep 5:9743.
Alemu JL, Elberling F, Azam B, Pakkenberg B, Olesen MV (2019) Electroconvulsive treatment prevents chronic restraint stress-induced atrophy of the hippocampal formation-A stereological study. Brain Behav 9:e01195-.
Allen EA, Pasley BN, Duong T, Freeman RD (2007) Transcranial magnetic stimulation elicits coupled neural and hemodynamic consequences. Science 317:1918–1921.
Ampuero E, Luarte A, Santibañez M, Varas-Godoy M, Toledo J, Diaz-Veliz G, Cavada G, Rubio FJ, Wyneken U (2015a) Two Chronic Stress Models Based on Movement Restriction in Rats Respond Selectively to Antidepressant Drugs: Aldolase C As a Potential Biomarker. Int J Neuropsychopharmacol 18:pyv038-pyv038.
Ampuero E, Luarte A, Santibañez M, Varas-Godoy M, Toledo J, Diaz-Veliz G, Cavada G, Rubio FJ, Wyneken U (2015b) Two chronic stress models based on movement restriction in rats respond selectively to antidepressant drugs: Aldolase C as a potential biomarker. Int J Neuropsychopharmacol 18:pyv038.
Anacker C, Zunszain PA, Carvalho LA, Pariante CM (2011) The glucocorticoid receptor: Pivot of depression and of antidepressant treatment? Psychoneuroendocrinology 36:415–425.
Anderson RJ, Hoy KE, Daskalakis ZJ, Fitzgerald PB (2016) Repetitive transcranial magnetic stimulation for treatment resistant depression: Re-establishing connections. Clin Neurophysiol 127:3394–3405.
Andoh J, Zatorre RJ (2012) Mapping the after-effects of theta burst stimulation on the human auditory cortex with functional imaging. J Vis Exp:e3985.
Andoh J, Matsushita R, Zatorre RJ, Andoh J, Matsushita R, Zatorre RJ (2015) Asymmetric interhemispheric transfer in the auditory network: Evidence from TMS, resting-state fMRI, and diffusion imaging. J Neurosci 35:14602–14611.
Angst J, Gamma A, Benazzi F, Ajdacic V, Rössler W (2009) Does psychomotor agitation in major depressive episodes indicate bipolarity? Eur Arch Psychiatry Clin Neurosci 259:55-63.
Arias-Carrion O (2008) Basic mechanisms of rTMS: Implications in Parkinson's disease. Int Arch Med 1:2.
Arnone D, Mumuni AN, Jauhar S, Condon B, Cavanagh J (2015) Indirect evidence of selective glial involvement in glutamate-based mechanisms of mood regulation in depression:
372
Meta-analysis of absolute prefrontal neuro-metabolic concentrations. Eur Neuropsychopharmacol 25:1109–1117.
Artifon M, Schestatsky P, Griebler N, Tossi GM, Beraldo LM, Pietta-Dias C (2020) Effects of transcranial direct current stimulation on the gut microbiome: A case report. Brain Stimulation: Basic, Translational, and Clinical Research in Neuromodulation 13:1451–1452.
Aydin-Abidin S, Moliadze V, Eysel UT, Funke K (2006) Effects of repetitive TMS on visually evoked potentials and EEG in the anaesthetized cat: dependence on stimulus frequency and train duration. J Physiol 574:443–455.
Baeken C, De Raedt R, Santermans L, Zeeuws D, Vanderhasselt MA, Meers M, Vanderbruggen N (2010a) HF-rTMS treatment decreases psychomotor retardation in medication-resistant melancholic depression. Prog Neuro-Psychopharmacol Biol Psychiatry 34:684–687.
Baeken C, De Raedt R, Van Schuerbeek P, Vanderhasselt M-A, De Mey J, Bossuyt A, Luypaert R (2010b) Right prefrontal HF-rTMS attenuates right amygdala processing of negatively valenced emotional stimuli in healthy females. Behav Brain Res 214:450–455.
Baeken C, De Raedt R, Leyman L, Schiettecatte J, Kaufman L, Poppe K, Vanderhasselt MA, Anckaert E, Bossuyt A (2009) The impact of one HF-rTMS session on mood and salivary cortisol in treatment resistant unipolar melancholic depressed patients. J Affect Disord 113:100–108.
Bagattini C, Zanni M, Barocco F, Caffarra P, Brignani D, Miniussi C, Defanti CA (2020) Enhancing cognitive training effects in Alzheimer’s disease: rTMS as an add-on treatment. Brain Stimul 13:1655–1664.
Bajic D, Craig MM, Borsook D, Becerra L (2016) Probing intrinsic resting-state networks in the infant rat brain. Front Behav Neurosci 10:192.
Bandeira F, Lent R, Herculano-Houzel S (2009) Changing numbers of neuronal and non-neuronal cells underlie postnatal brain growth in the rat. Proceedings of the National Academy of Sciences 106:14108.
Banerjee J, Sorrell ME, Celnik PA, Pelled G (2017) Immediate effects of repetitive magnetic stimulation on single cortical pyramidal neurons. PLoS One 12:e0170528.
Banich MT, Belger A (1990) Interhemispheric interaction: How do the hemispheres divide and conquer a task? Cortex 26:77–94.
Barandouzi ZA, Starkweather AR, Henderson WA, Gyamfi A, Cong XS (2020) Altered composition of gut microbiota in depression: A systematic review. Front Psychiatry 11.
Barch DM, Tillman R, Kelly D, Whalen D, Gilbert K, Luby JL (2019) Hippocampal volume and depression among young children. Psychiat Res: Neuroim 288:21–28.
Barker AT, Freeston I (2007) Transcranial magnetic stimulation. Scholarpedia J 2:2936.
Barres BA, Raff MC (1993) Proliferation of oligodendrocyte precursor cells depends on electrical activity in axons. Nature 361:258–260.
Bastiaanssen TFS, Gururajan A, van de Wouw M, Moloney GM, Ritz NL, Long-Smith CM, Wiley NC, Murphy AB, Lyte JM, Fouhy F, Stanton C, Claesson MJ, Dinan TG, Cryan JF (2021) Volatility as a concept to understand the impact of stress on the microbiome. Psychoneuroendocrinology 124:105047.

373
Bear TLK, Dalziel JE, Coad J, Roy NC, Butts CA, Gopal PK (2020) The role of the gut microbiota in dietary interventions for depression and anxiety. Adv Nutr 11:890–907.
Becerra L, Pendse G, Chang P-C, Bishop J, Borsook D (2011) Robust reproducible resting state networks in the awake rodent brain. PLoS One 6:e25701.
Beckmann CF, Jenkinson M, Smith SM (2003) General multilevel linear modeling for group analysis in fMRI. NeuroImage 20:1052–1063.
Beckmann CF, DeLuca M, Devlin JT, Smith SM (2005) Investigations into resting-state connectivity using independent component analysis. Philos Trans R Soc Lond B Biol Sci 360:1001–1013.
Beckmann CF, Mackay CE, Filippini N, Smith SM (2009) Group comparison of resting-state fMRI data using multi-subject ICA and dual regression. NeuroImage 47:S148.
Behzadi Y, Restom K, Liau J, Liu TT (2007) A component based noise correction method (CompCor) for BOLD and perfusion based fMRI. NeuroImage 37:90–101.
Belovicova K, Bogi E, Csatlosova K, Dubovicky M (2017) Animal tests for anxiety-like and depression-like behavior in rats. Interdiscip Toxicol 10:40–43.
Ben-Shachar D, Belmaker RH, Grisaru N, Klein E (1997) Transcranial magnetic stimulation induces alterations in brain monoamines. J Neural Transm 104:191–197.
Benali A, Trippe J, Weiler E, Mix A, Petrasch-Parwez E, Girzalsky W, Eysel UT, Erdmann R, Funke K (2011) Theta-burst transcranial magnetic stimulation alters cortical inhibition. J Neurosci 31:1193–1203.
Bercik P, Verdu EF, Foster JA, Macri J, Potter M, Huang X, Malinowski P, Jackson W, Blennerhassett P, Neufeld KA, Lu J, Khan WI, Corthesy–Theulaz I, Cherbut C, Bergonzelli GE, Collins SM (2010) Chronic gastrointestinal inflammation induces anxiety-like behavior and alters central nervous system biochemistry in mice. Gastroenterology 139:2102–2112.
Berk M, Williams LJ, Jacka FN, O’Neil A, Pasco JA, Moylan S, Allen NB, Stuart AL, Hayley AC, Byrne ML, Maes M (2013) So depression is an inflammatory disease, but where does the inflammation come from? BMC Med 11:200.
Bestmann S, Baudewig J, Siebner HR, Rothwell JC, Frahm J (2004) Functional MRI of the immediate impact of transcranial magnetic stimulation on cortical and subcortical motor circuits. Eur J Neurosci 19:1950–1962.
Bidgood Jr WD, Horii SC, Prior FW, Van Syckle DE (1997) Understanding and using DICOM, the data interchange standard for biomedical imaging. J Am Med Inf Assoc 4:199–212.
Bilek E, Schäfer A, Ochs E, Esslinger C, Zangl M, Plichta MM, Braun U, Kirsch P, Schulze TG, Rietschel M, Meyer-Lindenberg A, Tost H (2013) Application of high-frequency repetitive transcranial magnetic stimulation to the DLPFC alters human prefrontal–hippocampal functional interaction. J Neurosci 33:7050–7056.
Binney RJ, Lambon Ralph MA (2015) Using a combination of fMRI and anterior temporal lobe rTMS to measure intrinsic and induced activation changes across the semantic cognition network. Neuropsychologia 76:170–181.
Birur B, Kraguljac NV, Shelton RC, Lahti AC (2017) Brain structure, function, and neurochemistry in schizophrenia and bipolar disorder—A systematic review of the magnetic resonance neuroimaging literature. NPJ Schizophrenia 3:15.

374
Biswal B, Yetkin FZ, Haughton VM, Hyde JS (1995) Functional connectivity in the motor cortex of resting human brain using echo-planar MRI. Magn Reson Med 34:537–541.
Block W, Träber F, von Widdern O, Metten M, Schild H, Maier W, Zobel A, Jessen F (2009) Proton MR spectroscopy of the hippocampus at 3 T in patients with unipolar major depressive disorder: correlates and predictors of treatment response. Int J Neuropsychopharmacol 12:415–422.
Blood AJ, Iosifescu DV, Makris N, Perlis RH, Kennedy DN, Dougherty DD, Kim BW, Lee MJ, Wu S, Lee S, Calhoun J, Hodge SM, Fava M, Rosen BR, Smoller JW, Gasic GP, Breiter HC, Phenotype Genotype Project on A, Mood D (2010) Microstructural abnormalities in subcortical reward circuitry of subjects with major depressive disorder. PLoS One 5:e13945.
Bluhm RL, Miller J, Lanius RA, Osuch EA, Boksman K, Neufeld RWJ, Théberge J, Schaefer B, Williamson P (2007) Spontaneous low-frequency fluctuations in the BOLD signal in Schizophrenic patients: anomalies in the default network. Schizophr Bull 33:1004–1012.
Blumberger DM, Vila-Rodriguez F, Thorpe KE, Feffer K, Noda Y, Giacobbe P, Knyahnytska Y, Kennedy SH, Lam RW, Daskalakis ZJ, Downar J (2018) Effectiveness of theta burst versus high-frequency repetitive transcranial magnetic stimulation in patients with depression (THREE-D): a randomised non-inferiority trial. The Lancet 391:1683–1692.
Bogdanova OV, Kanekar S, D'Anci KE, Renshaw PF (2013) Factors influencing behavior in the forced swim test. Physiol Behav 118:227–239.
Boggio PS, Rocha M, Oliveira MO, Fecteau S, Cohen RB, Campanhã C, Ferreira-Santos E, Meleiro A, Corchs F, Zaghi S, Pascual-Leone A, Fregni F (2010) Noninvasive brain stimulation with high-frequency and low-intensity repetitive transcranial magnetic stimulation treatment for posttraumatic stress disorder. J Clin Psychiatry 71:992–999.
Bohning DE, Shastri A, Nahas Z, Lorberbaum JP, Andersen SW, Dannels WR, Haxthausen E-U, Vincent DJ, George MS (1998) Echoplanar BOLD fMRI of brain activation induced by concurrent transcranial magnetic stimulation. Invest Radiol 33:336–340.
Bohning DE, Shastri A, McConnell KA, Nahas Z, Lorberbaum JP, Roberts DR, Teneback C, Vincent DJ, George MS (1999) A combined TMS/fMRI study of intensity-dependent TMS over motor cortex. Biol Psychiatry 45:385–394.
Bol C, Danhof M, Stanski DR, Mandema JW (1997) Pharmacokinetic-pharmacodynamic characterization of the cardiovascular, hypnotic, EEG and ventilatory responses to dexmedetomidine in the rat. J Pharmacol Exp Ther 283:1051–1058.
Borovikova LV, Ivanova S, Zhang M, Yang H, Botchkina GI, Watkins LR, Wang H, Abumrad N, Eaton JW, Tracey KJ (2000) Vagus nerve stimulation attenuates the systemic inflammatory response to endotoxin. Nature 405:458–462.
Borre YE, O’Keeffe GW, Clarke G, Stanton C, Dinan TG, Cryan JF (2014) Microbiota and neurodevelopmental windows: implications for brain disorders. Trends Mol Med 20:509–518.
Bramham CR (2008) Local protein synthesis, actin dynamics, and LTP consolidation. Curr Opin Neurobiol 18:524-531.
Bravo JA, Díaz-Veliz G, Mora S, Ulloa JL, Berthoud VM, Morales P, Arancibia S, Fiedler JL (2009) Desipramine prevents stress-induced changes in depressive-like behavior and hippocampal markers of neuroprotection. Behav Pharmacol 20:273–285.

375
Bravo JA, Forsythe P, Chew MV, Escaravage E, Savignac HM, Dinan TG, Bienenstock J, Cryan JF (2011) Ingestion of Lactobacillus strain regulates emotional behavior and central GABA receptor expression in a mouse via the vagus nerve. Proc Natl Acad Sci U S A 108:16050–16055.
Breden Crouse EL (2012) Transcranial magnetic stimulation for major depressive disorder: What a pharmacist should know. Mental Health Clinician 2:152–155.
Breit S, Kupferberg A, Rogler G, Hasler G (2018) Vagus nerve as modulator of the brain–gut axis in psychiatric and inflammatory disorders. Front Psychiatry 9.
Bright MG, Murphy K (2015) Is fMRI “noise” really noise? Resting state nuisance regressors remove variance with network structure. NeuroImage 114:158–169.
Brown ES, Hughes CW, McColl R, Peshock R, King KS, Rush AJ (2014) Association of depressive symptoms with hippocampal volume in 1936 adults. Neuropsychopharmacology 39:770–779.
Brusa L, Ponzo V, Mastropasqua C, Picazio S, Bonnì S, Di Lorenzo F, Iani C, Stefani A, Stanzione P, Caltagirone C, Bozzali M, Koch G (2014) Theta burst stimulation modulates cerebellar-cortical connectivity in patients with progressive supranuclear palsy. Brain Stimul 7:29–35.
Brust V, Schindler PM, Lewejohann L (2015) Lifetime development of behavioural phenotype in the house mouse (Mus musculus). Frontiers in Zoology 12:S17.
Brydges NM, Whalley HC, Jansen MA, Merrifield GD, Wood ER, Lawrie SM, Wynne S-M, Day M, Fleetwood-Walker S, Steele D, Marshall I, Hall J, Holmes MC (2013) Imaging conditioned fear circuitry using awake rodent fMRI. PLoS One 8:e54197.
Brynildsen JK, Hsu L-M, Ross TJ, Stein EA, Yang Y, Lu H (2017) Physiological characterization of a robust survival rodent fMRI method. Magn Reson Imaging 35:54–60.
Bukhari Q, Schroeter A, Cole DM, Rudin M (2017a) Resting state fMRI in mice reveals anesthesia specific signatures of brain functional networks and their interactions. Front Neural Circuits 11:5.
Bukhari Q, Schroeter A, Cole DM, Rudin M (2017b) Resting state fMRI in mice reveals anesthesia specific signatures of brain functional networks and their interactions. Front Neural Circuits 11.
Buyukdura JS, McClintock SM, Croarkin PE (2011) Psychomotor retardation in depression: biological underpinnings, measurement, and treatment. Prog Neuropsychopharmacol Biol Psychiatry 35:395–409.
Caballero-Gaudes C, Reynolds RC (2017) Methods for cleaning the BOLD fMRI signal. NeuroImage 154:128–149.
Caglayan AB, Beker MC, Caglayan B, Yalcin E, Caglayan A, Yulug B, Hanoglu L, Kutlu S, Doeppner TR, Hermann DM, Kilic E (2019) Acute and post-acute neuromodulation induces stroke recovery by promoting survival signaling, neurogenesis, and pyramidal tract plasticity. Front Cell Neurosci 13.
Calhoun VD, de Lacy N (2017) Ten key observations on the analysis of resting-state functional MR imaging data using independent component analysis. Neuroimaging Clin N Am 27:561–579.
Calhoun VD, Adali T, Pearlson GD, Pekar JJ (2001) A method for making group inferences from functional MRI data using independent component analysis. Hum Brain Mapp 14:140–151.

376
Callahan LM, Ross SM, Jones ML, Musk GC (2014) Mortality associated with using medetomidine and ketamine for general anesthesia in pregnant and nonpregnant Wistar rats. Lab Animal 43:208–214.
Campbell S, Macqueen G (2004) The role of the hippocampus in the pathophysiology of major depression. J Psychiatry Neurosci 29:417–426.
Capuco A, Urits I, Hasoon J, Chun R, Gerald B, Wang JK, Kassem H, Ngo AL, Abd-Elsayed A, Simopoulos T, Kaye AD, Viswanath O (2020) Current perspectives on gut microbiome dysbiosis and depression. Adv Ther 37:1328–1346.
Cárdenas-Morales L, Nowak DA, Kammer T, Wolf RC, Schönfeldt-Lecuona C (2010) Mechanisms and applications of theta-burst rTMS on the human motor cortex. Brain Topogr 22:294–306.
Carmi L, Tendler A, Bystritsky A, Hollander E, Blumberger DM, Daskalakis J, Ward H, Lapidus K, Goodman W, Casuto L, Feifel D, Barnea-Ygael N, Roth Y, Zangen A, Zohar J (2019) Efficacy and safety of deep transcranial magnetic stimulation for obsessive-compulsive disorder: A prospective multicenter randomized double-blind placebo-controlled trial. Am J Psychiatry 176:931–938.
Cerqueira JJ, Mailliet F, Almeida OFX, Jay TM, Sousa N (2007) The prefrontal cortex as a key target of the maladaptive response to stress. J Neurosci 27:2781–2787.
Chang J, Yu R (2018) Alternations in functional connectivity of amygdalar subregions under acute social stress. Neurobiology of Stress 9:264–270.
Chang WH, Kim Y-H, Yoo W-K, Goo K-H, Park C-h, Kim ST, Pascual-Leone A (2012) rTMS with motor training modulates cortico-basal ganglia-thalamocortical circuits in stroke patients. Restor Neurol Neurosci 30:179–189.
Chen G, Hu X, Li L, Huang X, Lui S, Kuang W, Ai H, Bi F, Gu Z, Gong Q (2016) Disorganization of white matter architecture in major depressive disorder: a meta-analysis of diffusion tensor imaging with tract-based spatial statistics. Sci Rep 6:21825.
Chen HJ, Zhang L, Ke J, Qi R, Xu Q, Zhong Y, Pan M, Li J, Lu GM, Chen F (2018) Altered resting-state dorsal anterior cingulate cortex functional connectivity in patients with post-traumatic stress disorder. Aust N Z J Psychiatry 53:68–79.
Cheng S, Han B, Ding M, Wen Y, Ma M, Zhang L, Qi X, Cheng B, Li P, Kafle OP, Liang X, Liu L, Du Y, Zhao Y, Zhang F (2020) Identifying psychiatric disorder-associated gut microbiota using microbiota-related gene set enrichment analysis. Briefings in Bioinformatics 21:1016–1022.
Cheng Y-q, Xu J, Chai P, Li H-j, Luo C-r, Yang T, Li L, Shan B-c, Xu X-f, Xu L (2010) Brain volume alteration and the correlations with the clinical characteristics in drug-naïve first-episode MDD patients: A voxel-based morphometry study. Neurosci Lett 480:30–34.
Cherkassky VL, Kana RK, Keller TA, Just MA (2006) Functional connectivity in a baseline resting-state network in autism. Neuroreport 17:1687–1690.
Chiba S, Numakawa T, Ninomiya M, Richards MC, Wakabayashi C, Kunugi H (2012) Chronic restraint stress causes anxiety- and depression-like behaviors, downregulates glucocorticoid receptor expression, and attenuates glutamate release induced by brain-derived neurotrophic factor in the prefrontal cortex. Prog Neuro-Psychopharmacol Biol Psychiatry 39:112–119.
Chinna Meyyappan A, Forth E, Wallace CJK, Milev R (2020) Effect of fecal microbiota transplant on symptoms of psychiatric disorders: a systematic review. BMC Psychiatry 20:299.
377
Cho SI, Nam YS, Chu LY, Lee JH, Bang JS, Kim HR, Kim H-C, Lee YJ, Kim H-D, Sul JD, Kim D, Chung YH, Jeong JH (2012) Extremely low-frequency magnetic fields modulate nitric oxide signaling in rat brain. Bioelectromagnetics 33:568–574.
Chou Y-h, You H, Wang H, Zhao Y-P, Hou B, Chen N-k, Feng F (2015) Effect of repetitive transcranial magnetic stimulation on fMRI resting-state connectivity in multiple system atrophy. Brain Connect 5:451–459.
Chuang K-H, Lee H-L, Li Z, Chang W-T, Nasrallah FA, Yeow LY, Kaur K (2019) Evaluation of nuisance removal for functional MRI of rodent brain. NeuroImage 188:694–709.
Chung SW, Hill AT, Rogasch NC, Hoy KE, Fitzgerald PB (2016) Use of theta-burst stimulation in changing excitability of motor cortex: A systematic review and meta-analysis. Neurosci Biobehav Rev 63:43–64.
Ciric R, Wolf DH, Power JD, Roalf DR, Baum GL, Ruparel K, Shinohara RT, Elliott MA, Eickhoff SB, Davatzikos C, Gur RC, Gur RE, Bassett DS, Satterthwaite TD (2017) Benchmarking of participant-level confound regression strategies for the control of motion artifact in studies of functional connectivity. NeuroImage 154:174–187.
Clapp M, Aurora N, Herrera L, Bhatia M, Wilen E, Wakefield S (2017) Gut microbiota’s effect on mental health: The gut-brain axis. Clinics and Practice 7.
Clark C, Cole J, Winter C, Williams K, Grammer G (2015) A review of transcranial magnetic stimulation as a treatment for post-traumatic stress disorder. Curr Psychiatry Rep 17:1–9.
Clarke D, Penrose MA, Harvey AR, Rodger J, Bates KA (2017) Low intensity rTMS has sex-dependent effects on the local response of glia following a penetrating cortical stab injury. Exp Neurol 295:233–242.
Clarke D, Beros J, Bates KA, Harvey AR, Tang AD, Rodger J (2021) Low intensity repetitive magnetic stimulation reduces expression of genes related to inflammation and calcium signalling in cultured mouse cortical astrocytes. Brain Stimul 14:183–191.
Cohen D, Cuffin BN (1991) Developing a more focal magnetic stimulation. Part 1. Some basic principles. J Clin Neurophysiol 8:102–111.
Cole DM, Smith SM, Beckmann CF (2010) Advances and pitfalls in the analysis and interpretation of resting-state fMRI data. Front Syst Neurosci 4:8.
Cole J, Costafreda SG, McGuffin P, Fu CHY (2011) Hippocampal atrophy in first episode depression: A meta-analysis of magnetic resonance imaging studies. J Affect Disord 134:483–487.
Collins SM, Bercik P (2009) The relationship between intestinal microbiota and the central nervous system in normal gastrointestinal function and disease. Gastroenterology 136:2003–2014.
Collins SM, Surette M, Bercik P (2012) The interplay between the intestinal microbiota and the brain. Nature Reviews Microbiology 10:735–742.
Coloigner J, Batail J-M, Commowick O, Corouge I, Robert G, Barillot C, Drapier D (2019) White matter abnormalities in depression: A categorical and phenotypic diffusion MRI study. NeuroImage Clinical 22:101710.
Conchou F, Loubinoux I, Castel-Lacanal E, Le Tinnier A, Gerdelat-Mas A, Faure-Marie N, Gros H, Thalamas C, Calvas F, Berry I, Chollet F, Simonetta Moreau M (2009) Neural substrates of low-frequency repetitive transcranial magnetic stimulation during movement in

378
healthy subjects and acute stroke patients. A PET study. Hum Brain Mapp 30:2542–2557.
Connolly CG, Wu J, Ho TC, Hoeft F, Wolkowitz O, Eisendrath S, Frank G, Hendren R, Max JE, Paulus MP, Tapert SF, Banerjee D, Simmons AN, Yang TT (2013) Resting-state functional connectivity of subgenual anterior cingulate cortex in depressed adolescents. Biol Psychiatry 74:898-907.
Cordero-Grande L, Christiaens D, Hutter J, Price AN, Hajnal JV (2019) Complex diffusion-weighted image estimation via matrix recovery under general noise models. NeuroImage 200:391–404.
Cordes D, Haughton VM, Arfanakis K, Wendt GJ, Turski PA, Moritz CH, Quigley MA, Meyerand ME (2000) Mapping functionally related regions of brain with functional connectivity MR imaging. Am J Neuroradiol 21:1636–1644.
Coretti L, Paparo L, Riccio MP, Amato F, Cuomo M, Natale A, Borrelli L, Corrado G, Comegna M, Buommino E, Castaldo G, Bravaccio C, Chiariotti L, Berni Canani R, Lembo F (2018) Gut microbiota features in young children with autism spectrum disorders. Front Microbiol 9:3146.
Correa-sales C, Rabin BC, Maze M (1992) A hypnotic response to dexmedetomidine, an alpha 2 agonist, is mediated in the locus coeruleus in rats. Anesthesiology 76:948–952.
Corti M, Patten C, Triggs W (2012) Repetitive transcranial magnetic stimulation of motor cortex after stroke: A focused review. Am J Phys Med Rehabil 91:254–270.
Craddock C, Sikka S, Cheung B, Khanuja R, Ghosh SS, Yan C, Li Q, Lurie D, Vogelstein J, Burns R, Colcombe S, Mennes M, Kelly C, Di Martino A, Castellanos FX, Milham M (2013) Towards automated analysis of connectomes: The configurable pipeline for the analysis of connectomes (C-PAC). Front Neuroinform.
Cristancho P, Cristancho M, Baltuch G, Thase M, O'Reardon J (2011) Effectiveness and safety of vagus nerve stimulation for severe treatment-resistant major depression in clinical practice after FDA approval: Outcomes at 1 year. J Clin Psychiatry 72:1376–1382.
Croarkin PE, Nakonezny PA, Wall CA, Murphy LL, Sampson SM, Frye MA, Port JD (2016) Transcranial magnetic stimulation potentiates glutamatergic neurotransmission in depressed adolescents. Psychiatry research Neuroimaging 247:25–33.
Crovesy L, Masterson D, Rosado EL (2020) Profile of the gut microbiota of adults with obesity: a systematic review. Eur J Clin Nutr 74:1251–1262.
Cruz-Pereira JS, Rea K, Nolan YM, O'Leary OF, Dinan TG, Cryan JF (2020) Depression's unholy trinity: Dysregulated stress, immunity, and the microbiome. Annu Rev Psychol 71:49–78.
Cryan JF, Mombereau C (2004) In search of a depressed mouse: utility of models for studying depression-related behavior in genetically modified mice. Mol Psychiatry 9:326-357.
Cryan JF, Valentino RJ, Lucki I (2005) Assessing substrates underlying the behavioral effects of antidepressants using the modified rat forced swimming test. Neurosci Biobehav Rev 29:547–569.
Cullen CL, Senesi M, Tang AD, Clutterbuck MT, Auderset L, O'Rourke ME, Rodger J, Young KM (2019) Low-intensity transcranial magnetic stimulation promotes the survival and maturation of newborn oligodendrocytes in the adult mouse brain. Glia 67:1462–1477.
Cullen CL, Pepper RE, Clutterbuck MT, Pitman KA, Oorschot V, Auderset L, Tang AD, Ramm G, Emery B, Rodger J, Jolivet RB, Young KM (2021) Periaxonal and nodal plasticities

379
modulate action potential conduction in the adult mouse brain. Cell Reports 34:108641.
D’Elia ATD, Juruena MF, Coimbra BM, Mello MF, Mello AF (2021) Posttraumatic stress disorder (PTSD) and depression severity in sexually assaulted women: hypothalamic-pituitary-adrenal (HPA) axis alterations. BMC Psychiatry 21:174.
Daniel S, Balalian AA, Whyatt RM, Liu X, Rauh V, Herbstman J, Factor-Litvak P (2020) Perinatal phthalates exposure decreases fine-motor functions in 11-year-old girls: Results from weighted Quantile sum regression. Environ Int 136:105424.
Davey CG, Harrison BJ, Yücel M, Allen NB (2012) Regionally specific alterations in functional connectivity of the anterior cingulate cortex in major depressive disorder. Psychol Med 42:2071–2081.
Davis SW, Dennis NA, Buchler NG, White LE, Madden DJ, Cabeza R (2009) Assessing the effects of age on long white matter tracts using diffusion tensor tractography. NeuroImage 46:530–541.
De Gois S, Schäfer MKH, Defamie N, Chen C, Ricci A, Weihe E, Varoqui H, Erickson JD (2005) Homeostatic scaling of vesicular glutamate and GABA transporter expression in rat neocortical circuits. J Neurosci 25:7121–7133.
De Sarro GB, Ascioti C, Froio F, Libri V, Nistico G (1987) Evidence that locus coeruleus is the site where clonidine and drugs acting at alpha 1- and alpha 2-adrenoceptors affect sleep and arousal mechanisms. Br J Pharmacol 90:675–685.
Delvecchio G, Fossati P, Boyer P, Brambilla P, Falkai P, Gruber O, Hietala J, Lawrie SM, Martinot J-L, McIntosh AM, Meisenzahl E, Frangou S (2012) Common and distinct neural correlates of emotional processing in Bipolar Disorder and Major Depressive Disorder: A voxel-based meta-analysis of functional magnetic resonance imaging studies. Eur Neuropsychopharmacol 22:100–113.
Deng Z-D, Lisanby SH, Peterchev AV (2014) Coil design considerations for deep transcranial magnetic stimulation. Clin Neurophysiol 125:1202–1212.
Dhollander T, Mito R, Raffelt D, Connelly A (2019) Improved white matter response function estimation for 3-tissue constrained spherical deconvolution. In: 27th International Society of Magnetic Resonance in Medicine, p 555. Montréal, Québec, Canada.
Dichter GS, Gibbs D, Smoski MJ (2015) A systematic review of relations between resting-state functional-MRI and treatment response in major depressive disorder. J Affect Disord 172:8–17.
Dlabac-de Lange JJ, Liemburg EJ, Bais L, van de Poel-Mustafayeva AT, de Lange-de Klerk ESM, Knegtering H, Aleman A (2017) Effect of bilateral prefrontal rTMS on left prefrontal NAA and Glx Levels in schizophrenia patients with predominant negative symptoms: An exploratory study. Brain Stimul 10:59–64.
Dlabač-de Lange JJ, Knegtering R, Aleman A (2010) Repetitive transcranial magnetic stimulation for negative symptoms of schizophrenia: Review and meta-analysis. J Clin Psychiatry 71:411–418.
Dobberthien BJ, Tessier AG, Yahya A (2018) Improved resolution of glutamate, glutamine and γ-aminobutyric acid with optimized point-resolved spectroscopy sequence timings for their simultaneous quantification at 9.4 T. NMR Biomed 31:e3851.
Dohoo SE (1990) Isoflurane as an inhalational anesthetic agent in clinical practice. Canadian Veterinary Journal-Revue Veterinaire Canadienne 31:847–850.
380
Dordević D, Jančíková S, Vítězová M, Kushkevych I (2021) Hydrogen sulfide toxicity in the gut environment: Meta-analysis of sulfate-reducing and lactic acid bacteria in inflammatory processes. Journal of Advanced Research 27:55–69.
Douglas GM, Maffei VJ, Zaneveld JR, Yurgel SN, Brown JR, Taylor CM, Huttenhower C, Langille MGI (2020) PICRUSt2 for prediction of metagenome functions. Nat Biotechnol 38:685–688.
Downar J, Dunlop K, Schultze LL, Mansouri F, Vila-Rodriguez F, Giacobbe P, Kennedy SH, Daskalakis ZJ, Blumberger DM (2015) Resting-state functional connectivity to subgenual cingulate cortex differentially predicts treatment response for 10 Hz versus intermittent theta-burst rTMS in major depression. Brain Stimul 8:396.
Doze VA, Chen BX, Maze M (1989) Dexmedetomidine produces a hypnotic-anesthetic action in rats via activation of central alpha-2 adrenoceptors. Anesthesiology 71:75–79.
Dranovsky A, Hen R (2006) Hippocampal neurogenesis: Regulation by stress and sntidepressants. Biol Psychiatry 59:1136–1143.
Drevets WC, Savitz J, Trimble M (2008) The subgenual anterior cingulate cortex in mood disorders. CNS spectrums 13:663–681.
Drysdale AT et al. (2017) Resting-state connectivity biomarkers define neurophysiological subtypes of depression. Nat Med 23:28–38.
Dubin MJ, Mao X, Banerjee S, Goodman Z, Lapidus KAB, Kang G, Liston C, Shungu DC (2016) Elevated prefrontal cortex GABA in patients with major depressive disorder after TMS treatment measured with proton magnetic resonance spectroscopy. J Psychiatry Neurosci 41:E37–E45.
Dufor T, Grehl S, Tang AD, Doulazmi M, Traoré M, Debray N, Dubacq C, Deng ZD, Mariani J, Lohof AM, Sherrard RM (2019) Neural circuit repair by low-intensity magnetic stimulation requires cellular magnetoreceptors and specific stimulation patterns. Science Advances 5:eaav9847.
Duman RS (2009) Neuronal damage and protection in the pathophysiology and treatment of psychiatric illness: stress and depression. Dialogues Clin Neurosci 11:239–255.
Dunlop K, Woodside B, Olmsted M, Colton P, Giacobbe P, Downar J (2016) Reductions in cortico-striatal hyperconnectivity accompany successful treatment of obsessive-compulsive disorder with dorsomedial prefrontal rTMS. Neuropsychopharmacology 41:1395–1403.
Dunlop K, Peters SK, Giacobbe P, Daskalakis ZJ, Lam RW, Kennedy SH, Vila-Rodriquez F, Blumberger DM, Downar J (2017) Cortico-cortical and cortico-striatal resting-state functional connectivity differentially predicts response to 10 Hz rTMS and intermittent TBS to the DLPFC. Brain Stimul 10:464.
Eche j, Mondino m, Haesebaert f, Saoud m, Poulet e, Brunelin J (2012) Low- vs high-frequency repetitive transcranial magnetic stimulation as an add-on treatment for refractory depression. Front Psychiatry 3:13.
Edwards MJ, Talleli P, Rothwell JC (2008) Clinical applications of transcranial magnetic stimulation in patients with movement disorders. Lancet Neurol 7:827–840.
Eger EI (1984) The pharmacology of isoflurane. Br J Anaesth 56:S71–S99.
Eid RS, Gobinath AR, Galea LAM (2019) Sex differences in depression: Insights from clinical and preclinical studies. Prog Neurobiol 176:86–102.

381
Eldaief MC, Halko MA, Buckner RL, Pascual-Leone A (2011) Transcranial magnetic stimulation modulates the brain's intrinsic activity in a frequency-dependent manner. Proc Natl Acad Sci U S A 108:21229–21234.
Enomoto H, Ugawa Y, Hanajima R, Yuasa K, Mochizuki H, Terao Y, Shiio Y, Furubayashi T, Iwata NK, Kanazawa I (2001) Decreased sensory cortical excitability after 1 Hz rTMS over the ipsilateral primary motor cortex. Clin Neurophysiol 112:2154–2158.
Ernst T, Kreis R, Ross BD (1993) Absolute quantitation of water and metabolites in the human brain. I. Compartments and water. J Magn Reson B 102:1–8.
Esslinger C, Schüler N, Sauer C, Gass D, Mier D, Braun U, Ochs E, Schulze TG, Rietschel M, Kirsch P, Meyer-Lindenberg A (2014) Induction and quantification of prefrontal cortical network plasticity using 5 Hz rTMS and fMRI. Hum Brain Mapp 35:140–151.
Ewing KK, Mohammed HO, Scarlett JM, Short CE (1993) Reduction of isoflurane anesthetic requirement by medetomidine and its restoration by atipamezole in dogs. Am J Vet Res 54:294–299.
Falangola MF, Guilfoyle DN, Tabesh A, Hui ES, Nie X, Jensen JH, Gerum SV, Hu C, LaFrancois J, Collins HR, Helpern JA (2014) Histological correlation of diffusional kurtosis and white matter modeling metrics in cuprizone-induced corpus callosum demyelination. NMR Biomed 27:948–957.
Fang P, Zeng L-L, Shen H, Wang L, Li B, Liu L, Hu D (2012) Increased cortical-limbic anatomical network connectivity in major depression revealed by diffusion tensor imaging. PLoS One 7:e45972.
Faraday M (1840) Experimental researches in electricity. London: Taylor.
Feng J, Zhang Q, Zhang C, Wen Z, Zhou X (2019) The Effect of sequential bilateral low-frequency rTMS over dorsolateral prefrontal cortex on serum level of BDNF and GABA in patients with primary insomnia. Brain Behav 9:e01206.
Feng S-f, Shi T-y, Fan Y, Wang W-n, Chen Y-c, Tan Q-r (2012) Long-lasting effects of chronic rTMS to treat chronic rodent model of depression. Behav Brain Res 232:245–251.
Ferrulli A, Drago L, Gandini S, Massarini S, Bellerba F, Senesi P, Terruzzi I, Luzi L (2021) Deep transcranial magnetic stimulation affects gut microbiota composition in obesity: Results of randomized clinical trial. Int J Mol Sci 22.
Filippini N, Nickerson LD, Beckmann CF, Ebmeier KP, Frisoni GB, Matthews PM, Smith SM, Mackay CE (2012) Age-related adaptations of brain function during a memory task are also present at rest. NeuroImage 59:3821–3828.
Filippini N, MacIntosh BJ, Hough MG, Goodwin GM, Frisoni GB, Smith SM, Matthews PM, Beckmann CF, Mackay CE, Mahley RW (2009) Distinct patterns of brain activity in young carriers of the APOE-epsilon4 allele. Proc Natl Acad Sci U S A 106:7209–7214.
Fisicaro F, Lanza G, Grasso AA, Pennisi G, Bella R, Paulus W, Pennisi M (2019) Repetitive transcranial magnetic stimulation in stroke rehabilitation: review of the current evidence and pitfalls. Ther Adv Neurol Disord 12:1756286419878317.
Fitzgerald PB, Fountain S, Daskalakis ZJ (2006) A comprehensive review of the effects of rTMS on motor cortical excitability and inhibition. Clin Neurophysiol 117:2584–2596.
Fitzgerald PB, Hoy KE, Elliot D, Susan McQueen RN, Wambeek LE, Daskalakis ZJ (2018) Accelerated repetitive transcranial magnetic stimulation in the treatment of depression. Neuropsychopharmacology 43:1565–1572.
382
Fitzgerald PB, Hoy K, McQueen S, Maller JJ, Herring S, Segrave R, Bailey M, Been G, Kulkarni J, Daskalakis ZJ (2009) A randomized trial of rTMS targeted with MRI based neuro-navigation in treatment-resistant depression. Neuropsychopharmacology 34:1255–1262.
Foster JA, McVey Neufeld K-A (2013) Gut–brain axis: how the microbiome influences anxiety and depression. Trends Neurosci 36:305–312.
Fox MD, Halko MA, Eldaief MC, Pascual-Leone A (2012a) Measuring and manipulating brain connectivity with resting state functional connectivity magnetic resonance imaging (fcMRI) and transcranial magnetic stimulation (TMS). NeuroImage 62:2232–2243.
Fox MD, Buckner RL, White MP, Greicius MD, Pascual-Leone A (2012b) Efficacy of TMS targets for depression is related to intrinsic functional connectivity with the subgenual cingulate. Biol Psychiatry 72:595–603.
Fransson P, Skiold B, Engstrom M, Hallberg B, Mosskin M, Aden U, Lagercrantz H, Blennow M (2009) Spontaneous brain activity in the newborn brain during natural sleep: An fMRI study in infants born at full term. Pediatr Res 66:301–305.
Fregni F, Boggio PS, Valle AC, Rocha RR, Duarte J, Ferreira MJL, Wagner T, Fecteau S, Rigonatti SP, Riberto M, Freedman SD, Pascual-Leone A (2006) A sham-controlled trial of a 5-day course of repetitive transcranial magnetic stimulation of the unaffected hemisphere in stroke patients. Stroke 37:2115–2122.
Fu Y, Rusznák Z, Herculano-Houzel S, Watson C, Paxinos G (2013) Cellular composition characterizing postnatal development and maturation of the mouse brain and spinal cord. Brain Structure and Function 218:1337–1354.
Fujiki M, Steward O (1997) High frequency transcranial magnetic stimulation mimics the effects of ECS in upregulating astroglial gene expression in the murine CNS. Mol Brain Res 44:301–308.
Fukuda M, Vazquez AL, Zong X, Kim S-G (2013) Effects of the a2-adrenergic receptor agonist dexmedetomidine on neural, vascular and BOLD fMRI responses in the somatosensory cortex. Eur J Neurosci 37:80–95.
Funke K, Benali A (2010) Cortical cellular actions of transcranial magnetic stimulation. Restor Neurol Neurosci 28:399–417.
Funke K, Benali A (2011) Modulation of cortical inhibition by rTMS - findings obtained from animal models. J Physiol 589:4423–4435.
Furman DJ, Hamilton JP, Gotlib IH (2011) Frontostriatal functional connectivity in major depressive disorder. Biol Mood Anxiety Disord 1:11.
Gajamange S, Raffelt D, Dhollander T, Lui E, van der Walt A, Kilpatrick T, Fielding J, Connelly A, Kolbe S (2018) Fibre-specific white matter changes in multiple sclerosis patients with optic neuritis. NeuroImage: Clinical 17:60–68.
Galhardoni R, Correia GS, Araujo H, Yeng LT, Fernandes DT, Kaziyama HH, Marcolin MA, Bouhassira D, Teixeira MJ, de Andrade DC (2015) Repetitive transcranial magnetic stimulation in chronic pain: A review of the literature. Arch Phys Med Rehabil 96:S156–172.
Galley JD, Nelson MC, Yu Z, Dowd SE, Walter J, Kumar PS, Lyte M, Bailey MT (2014) Exposure to a social stressor disrupts the community structure of the colonic mucosa-associated microbiota. BMC Microbiol 14:189.

383
Gao F, Wang S, Guo Y, Wang J, Lou M, Wu J, Ding M, Tian M, Zhang H (2010) Protective effects of repetitive transcranial magnetic stimulation in a rat model of transient cerebral ischaemia: a microPET study. Eur J Nucl Med Mol Imag 37:954–961.
Gao X, Lin H, Revanna K, Dong Q (2017a) A Bayesian taxonomic classification method for 16S rRNA gene sequences with improved species-level accuracy. BMC Bioinformatics 18:247.
Gao Y-R, Ma Y, Zhang Q, Winder AT, Liang Z, Antinori L, Drew PJ, Zhang N (2017b) Time to wake up: Studying neurovascular coupling and brain-wide circuit function in the un-anesthetized animal. NeuroImage 153:382–398.
Garcia-Toro M, Mayol A, Arnillas H, Capllonch I, Ibarra O, Crespı M, Micó J, Lafau O, Lafuente L (2001) Modest adjunctive benefit with transcranial magnetic stimulation in medication-resistant depression. J Affect Disord 64:271–275.
Gasparovic C, Song T, Devier D, Bockholt HJ, Caprihan A, Mullins PG, Posse S, Jung RE, Morrison LA (2006) Use of tissue water as a concentration reference for proton spectroscopic imaging. Magn Reson Med 55:1219–1226.
Gaud N, Kumar A, Matta M, Kole P, Sridhar S, Mandlekar S, Holenarsipur VK (2017) Single jugular vein cannulated rats may not be suitable for intravenous pharmacokinetic screening of high logP compounds. Eur J Pharm Sci 99:272–278.
Gaynes BN, Lloyd SW, Lux L, Gartlehner G, Hansen RA, Brode S, Jonas DE, Swinson Evans T, Viswanathan M, Lohr KN (2014) Repetitive transcranial magnetic stimulation for treatment-resistant depression: A systematic review and meta-analysis. J Clin Psychiatry 75:477–489.
Gellai M (1990) Modulation of vasopressin antidiuretic action by renal alpha 2-adrenoceptors. Am J Physiol 259:F1–F8.
George MS, Wassermann EM, Williams WA, Callahan A, Ketter TA, Basser P, Hallett M, Post RM (1995) Daily repetitive transcranial magnetic stimulation (rTMS) improves mood in depression. Neuroreport 6:1853–1856.
George MS, Nahas Z, Molloy M, Speer AM, Oliver NC, Li XB, Arana GW, Risch SC, Ballenger JC (2000) A controlled trial of daily left prefrontal cortex TMS for treating depression. Biol Psychiatry 48:962-970.
George MS, Raman R, Benedek DM, Pelic CG, Grammer GG, Stokes KT, Schmidt M, Spiegel C, DeAlmeida N, Beaver KL, Borckardt JJ, Sun X, Jain S, Stein MB (2014) A two-site pilot randomized 3 day trial of high dose left prefrontal repetitive transcranial magnetic stimulation (rTMS) for suicidal inpatients. Brain Stimul 7:421–431.
Gersner R, Kravetz E, Feil J, Pell G, Zangen A (2011) Long-term effects of repetitive transcranial magnetic stimulation on markers for neuroplasticity: differential outcomes in anesthetized and awake animals. J Neurosci 31:7521–7526.
Gervasoni N, Aubry JM, Bondolfi G, Osiek C, Schwald M, Bertschy G, Karege F (2005) Partial normalization of serum brain-derived neurotrophic factor in remitted patients after a major depressive episode. Neuropsychobiology 51:234–238.
Gilbert JA, Blaser MJ, Caporaso JG, Jansson JK, Lynch SV, Knight R (2018) Current understanding of the human microbiome. Nat Med 24:392–400.
Givalois L, Naert G, Rage F, Ixart G, Arancibia S, Tapia-Arancibia L (2004) A single brain-derived neurotrophic factor injection modifies hypothalamo–pituitary–adrenocortical axis activity in adult male rats. Mol Cell Neurosci 27:280–295.

384
Glasser MF, Coalson TS, Bijsterbosch JD, Harrison SJ, Harms MP, Anticevic A, Van Essen DC, Smith SM (2018) Using temporal ICA to selectively remove global noise while preserving global signal in functional MRI data. NeuroImage 181:692–717.
Glielmi CB, Butler AJ, Niyazov DM, Darling WG, Epstein CM, Alberts JL, Hu XP (2014) Assessing low-frequency repetitive transcranial magnetic stimulation with functional magnetic resonance imaging: A case series. Physiother Res Int 19:117–125.
Goense J, Merkle H, Logothetis NK (2012) High-resolution fMRI reveals laminar differences in neurovascular coupling between positive and negative BOLD responses. Neuron 76:629–639.
Gomez RS, Guatimosim C (2003) Mechanism of action of volatile anesthetics: Involvement of intracellular calcium signaling. Curr Drug Targets CNS Neurol Disord 2:123–129.
Gonzalez-Garcia N, Armony JL, Soto J, Trejo D, Alegria MA, Drucker-Colin R (2011) Effects of rTMS on Parkinson's disease: A longitudinal fMRI study. J Neurol 258:1268–1280.
Gorges M, Roselli F, Müller H-P, Ludolph AC, Rasche V, Kassubek J (2017) Functional connectivity mapping in the animal model: Principles and applications of resting-state fMRI. Front Neurol 8:200.
Gozzi A, Schwarz AJ (2016) Large-scale functional connectivity networks in the rodent brain. NeuroImage 127:496–509.
Grandjean J, Schroeter A, Batata I, Rudin M (2014) Optimization of anesthesia protocol for resting-state fMRI in mice based on differential effects of anesthetics on functional connectivity patterns. NeuroImage 102:838–847.
Grandjean J et al. (2019) Common functional networks in the mouse brain revealed by multi-centre resting-state fMRI analysis. bioRxiv.
Green RM, Pascual-Leone A, Wasserman EMC (1997) Ethical Guidelines for rTMS Research. IRB 19:1–7.
Grefkes C, Nowak DA, Wang LE, Dafotakis M, Eickhoff SB, Fink GR, Grefkes C, Nowak DA, Wang LE, Dafotakis M, Eickhoff SB, Fink GR (2010) Modulating cortical connectivity in stroke patients by rTMS assessed with fMRI and dynamic causal modeling. NeuroImage 50:233–242.
Grehl S, Viola HM, Fuller-Carter PI, Carter KW, Dunlop SA, Hool LC, Sherrard RM, Rodger J (2015) Cellular and molecular changes to cortical neurons following low intensity repetitive magnetic stimulation at different frequencies. Brain Stimul 8:114–123.
Greicius MD, Krasnow B, Reiss AL, Menon V (2003) Functional connectivity in the resting brain: a network analysis of the default mode hypothesis. Proc Natl Acad Sci U S A 100:253–258.
Greicius MD, Srivastava G, Reiss AL, Menon V, Raichle ME (2004) Default-mode network activity distinguishes Alzheimer's disease from healthy aging: Evidence from functional MRI. Proc Natl Acad Sci U S A 101:4637–4642.
Greicius MD, Flores BH, Menon V, Glover GH, Solvason HB, Kenna H, Reiss AL, Schatzberg AF (2007) Resting-state functional connectivity in major depression: Abnormally increased contributions from subgenual cingulate cortex and thalamus. Biol Psychiatry 62:429–437.
Griffanti L, Rolinski M, Szewczyk-Krolikowski K, Menke RA, Filippini N, Zamboni G, Jenkinson M, Hu MTM, Mackay CE (2016) Challenges in the reproducibility of clinical studies with resting state fMRI: An example in early Parkinson's disease. NeuroImage 124:704–713.

385
Griffanti L, Salimi-Khorshidi G, Beckmann CF, Auerbach EJ, Douaud G, Sexton CE, Zsoldos E, Ebmeier KP, Filippini N, Mackay CE, Moeller S, Xu J, Yacoub E, Baselli G, Ugurbil K, Miller KL, Smith SM (2014) ICA-based artefact and accelerated fMRI acquisition for improved Resting State Network imaging. NeuroImage 95:232–247.
Guglielmetti C, Veraart J, Roelant E, Mai Z, Daans J, Van Audekerke J, Naeyaert M, Vanhoutte G, Delgado Y Palacios R, Praet J, Fieremans E, Ponsaerts P, Sijbers J, Van der Linden A, Verhoye M (2016) Diffusion kurtosis imaging probes cortical alterations and white matter pathology following cuprizone induced demyelination and spontaneous remyelination. NeuroImage 125:363–377.
Guo T, Cao X, Xia L (2008) Repetitive transcranial magnetic stimulation causes significant changes of chemical substances in the brain of rabbits with experimental intracerebral hemorrhage. Front Med China 2:406–409.
Hacimusalar Y, Eşel E (2018) Suggested biomarkers for major depressive disorder. Noro psikiyatri arsivi 55:280–290.
Hahn A, Stein P, Windischberger C, Weissenbacher A, Spindelegger C, Moser E, Kasper S, Lanzenberger R (2011) Reduced resting-state functional connectivity between amygdala and orbitofrontal cortex in social anxiety disorder. NeuroImage 56:881–889.
Hakansson A, Molin G (2011) Gut Microbiota and Inflammation. Nutrients 3.
Hamada M, Terao Y, Hanajima R, Shirota Y, Nakatani-Enomoto S, Furubayashi T, Matsumoto H, Ugawa Y (2008) Bidirectional long-term motor cortical plasticity and metaplasticity induced by quadripulse transcranial magnetic stimulation. J Physiol 586:3927–3947.
Hamilton C, Ma Y, Zhang N (2017) Global reduction of information exchange during anesthetic-induced unconsciousness. Brain Struct Funct 222:3205–3216.
Hampson M, Hoffman RE (2010) Transcranial magnetic stimulation and connectivity mapping: Tools for studying the neural bases of brain disorders. Front Syst Neurosci 4:40.
Haneef Z, Lenartowicz A, Yeh HJ, Engel J, Jr., Stern JM (2014) Network analysis of the default mode network using functional connectivity MRI in Temporal Lobe Epilepsy. Journal of Visualized Experiments: JoVE:e51442–e51442.
Haney MM, Ericsson AC, Lever TE (2018) Effects of intraoperative vagal nerve stimulation on the gastrointestinal microbiome in a mouse model of amyotrophic lateral sclerosis. Comp Med 68:452–460.
Hannah R, Rothwell JC (2017) Pulse duration as well as current direction determines the specificity of transcranial magnetic stimulation of motor cortex during contraction. Brain Stimul 10:106–115.
Hansen B, Jespersen SN (2016) Kurtosis fractional anisotropy, its contrast and estimation by proxy. Sci Rep 6:23999.
Hansen PEB, Videbech P, Sturlason R, Clemmensen K, Jensen HM, Vestergaard P (2004) Repetitive transcranial magnetic stimulation as add-on antidepressant treatment. The applicability of the method in a clinical setting. Nordic Journal of Psychiatry 58:455–457.
Harris NG, Verley DR, Gutman BA, Sutton RL (2016) Bi-directional changes in fractional anisotropy after experiment TBI: Disorganization and reorganization? NeuroImage 133:129–143.

386
Harshaw C (2015) Interoceptive dysfunction: toward an integrated framework for understanding somatic and affective disturbance in depression. Psychol Bull 141:311–363.
Hasler G, van der Veen JW, Tumonis T, Meyers N, Shen J, Drevets WC (2007a) Reduced prefrontal glutamate/glutamine and γ-aminobutyric acid levels in major depression determined using proton magnetic resonance spectroscopy. Arch Gen Psychiatry 64:193–200.
Hasler G, van der Veen JW, Tumonis T, Meyers N, Shen J, Drevets WC (2007b) Reduced prefrontal glutamate/glutamine and γ-aminobutyric acid levels in major depression determined using proton magnetic resonance spectroscopy. JAMA Psychiatry 64:193–200.
Hayasaka S, Nakamura M, Noda Y, Izuno T, Saeki T, Iwanari H, Hirayasu Y (2017) Lateralized hippocampal volume increase following high-frequency left prefrontal repetitive transcranial magnetic stimulation in patients with major depression. Psychiatry Clin Neurosci 71:747–758.
Heath A, Lindberg DR, Makowiecki K, Gray A, Asp AJ, Rodger J, Choi D-S, Croarkin PE (2018) Medium- and high-intensity rTMS reduces psychomotor agitation with distinct neurobiologic mechanisms. Transl Psychiatry 8:126.
Helm K, Viol K, Weiger TM, Tass PA, Grefkes C, Del Monte D, Schiepek G (2018) Neuronal connectivity in major depressive disorder: a systematic review. Neuropsychiatr Dis Treat 14:2715–2737.
Hemanth Kumar BS, Mishra SK, Rana P, Singh S, Khushu S (2012) Neurodegenerative evidences during early onset of depression in CMS rats as detected by proton magnetic resonance spectroscopy at 7T. Behav Brain Res 232:53–59.
Hemanth Kumar BS, Mishra SK, Trivedi R, Singh S, Rana P, Khushu S (2014) Demyelinating evidences in CMS rat model of depression: A DTI study at 7T. Neuroscience 275:12–21.
Henckens MJAG, van der Marel K, van der Toorn A, Pillai AG, Fernández G, Dijkhuizen RM, Joëls M (2015) Stress-induced alterations in large-scale functional networks of the rodent brain. NeuroImage 105:312–322.
Herring BE, Nicoll RA (2016) Long-term potentiation: From CaMKII to AMPA receptor trafficking. Annu Rev Physiol 78:351–365.
Hibicke M, Graham MA, Hayslett RL (2017a) Adult female rats exposed to adolescent chronic restraint stress (aCRS) display robust depressive-like behavior, cognitive impairment, and an unexpected correlation with serum BDNF. The FASEB Journal 31:989.984.
Hibicke M, Graham MA, Hayslett RL (2017b) Adolescent chronic restraint stress (aCRS) elicits robust depressive-like behavior in freely cycling, adult female rats without increasing anxiety-like behaviors. Exp Clin Psychopharmacol 25:74–83.
Hilbert K, Lueken U, Beesdo-Baum K (2014) Neural structures, functioning and connectivity in Generalized Anxiety Disorder and interaction with neuroendocrine systems: A systematic review. J Affect Disord 158:114–126.
Hillman EMC (2014) Coupling mechanism and significance of the BOLD Signal: A status report. In: Annual Review of Neuroscience, Vol 37 (Hyman SE, ed), pp 161–181.
Himmerich H, Patsalos O, Lichtblau N, Ibrahim MAA, Dalton B (2019) Cytokine research in depression: Principles, challenges, and open questions. Front Psychiatry 10.
387
Ho J, Tumkaya T, Aryal S, Choi H, Claridge-Chang A (2019) Moving beyond P values: data analysis with estimation graphics. Nat Methods 16:565–566.
Hoeppner J, Padberg F, Domes G, Zinke A, Herpertz SC, Großheinrich N, Herwig U (2010) Influence of repetitive transcranial magnetic stimulation on psychomotor symptoms in major depression. Eur Arch Psychiatry Clin Neurosci 260:197–202.
Holingue C, Budavari AC, Rodriguez KM, Zisman CR, Windheim G, Fallin MD (2020) Sex differences in the gut-brain axis: Implications for mental health. Curr Psychiatry Rep 22:83.
Holtzheimer PE, 3rd, McDonald WM, Mufti M, Kelley ME, Quinn S, Corso G, Epstein CM (2010) Accelerated repetitive transcranial magnetic stimulation for treatment-resistant depression. Depress Anxiety 27:960–963.
Hone-Blanchet A, Mondino M, Fecteau S (2017) Repetitive transcranial magnetic stimulation reduces anxiety symptoms, drug cravings, and elevates 1H-MRS brain metabolites: A case report. Brain Stimul 10:856–858.
Hong I, Garrett A, Maker G, Mullaney I, Rodger J, Etherington SJ (2018) Repetitive low intensity magnetic field stimulation in a neuronal cell line: a metabolomics study. PeerJ 6:e4501.
Hopman HJ, Neggers SFW, Lam LCW, Mak ADP, Chan SSM (2017) Preliminary results: resting-state fMRI correlations between left dorsolateral prefrontal cortex and subgenual cingulate and the relationship with repetitive transcranial magnetic stimulation treatment response. Brain Stimul 10:403.
Horvath JC, Mathews J, Demitrack MA, Pascual-Leone A (2010) The NeuroStar TMS device: conducting the FDA approved protocol for treatment of depression. Journal of visualized experiments : JoVE:2345.
Hoshaw BA, Malberg JE, Lucki I (2005) Central administration of IGF-I and BDNF leads to long-lasting antidepressant-like effects. Brain Res 1037:204–208.
Houdayer E, Degardin A, Cassim F, Bocquillon P, Derambure P, Devanne H (2008) The effects of low- and high-frequency repetitive TMS on the input/output properties of the human corticospinal pathway. Exp Brain Res 187:207–217.
Hsu L-M, Liang X, Gu H, Brynildsen JK, Stark JA, Ash JA, Lin C-P, Lu H, Rapp P, Stein EA, Yang Y (2016) Constituents and functional implications of the rat default mode network. Proc Natl Acad Sci U S A 113:e4541–4547.
Huang G, Mouraux A (2015) MEP latencies predict the neuromodulatory effect of cTBS delivered to the ipsilateral and contralateral sensorimotor cortex. PLoS One 10:e0133893.
Huang S-M, Wu Y-L, Peng S-L, Peng H-H, Huang T-Y, Ho K-C, Wang F-N (2016) Inter-strain differences in default mode network: A resting state fMRI study on spontaneously hypertensive rat and Wistar Kyoto rat. Sci Rep 6:21697.
Huang Y-Z, Rothwell JC (2004) The effect of short-duration bursts of high-frequency, low-intensity transcranial magnetic stimulation on the human motor cortex. Clin Neurophysiol 115:1069–1075.
Huang Y-Z, Edwards MJ, Rounis E, Bhatia KP, Rothwell JC (2005) Theta burst stimulation of the human motor cortex. Neuron 45:201–206.
Huang Y, Shi X, Li Z, Shen Y, Shi X, Wang L, Li G, Yuan Y, Wang J, Zhang Y, Zhao L, Zhang M, Kang Y, Liang Y (2018) Possible association of Firmicutes in the gut microbiota of patients with major depressive disorder. Neuropsychiatr Dis Treat 14:3329–3337.
388
Huber L, Handwerker DA, Jangraw DC, Chen G, Hall A, Stüber C, Gonzalez-Castillo J, Ivanov D, Marrett S, Guidi M, Goense J, Poser BA, Bandettini PA (2017) High-resolution CBV-fMRI allows mapping of laminar activity and connectivity of cortical input and output in human M1. Neuron 96:1253–1263.e1257.
Hunter RG, Seligsohn Ma, Rubin TG, Griffiths BB, Ozdemir Y, Pfaff DW, Datson NA, McEwen BS (2016) Stress and corticosteroids regulate rat hippocampal mitochondrial DNA gene expression via the glucocorticoid receptor. Proceedings of the National Academy of Sciences 113:9099–9104.
Hutchison RM, Mirsattari SM, Jones CK, Gati JS, Leung LS (2010) Functional networks in the anesthetized rat brain revealed by independent component analysis of resting-state fMRI. J Neurophysiol 103:3398–3406.
Iacoboni M (2008) The role of premotor cortex in speech perception: Evidence from fMRI and rTMS. J Physiol 102:31–34.
Iida H, Ohata H, Iida M, Watanabe Y, Dohi S (1998) Isoflurane and sevoflurane induce vasodilation of cerebral vessels via ATP-sensitive K+ channel activation. Anesthesiology 89:954–960.
Ilamkar KR (2014) Psychomotor retardation, attention deficit and executive dysfunctional in young non-hospitalised un-medicated non-psychotic unipolar depression patients. Journal of clinical and diagnostic research 8:124–126.
Ilmoniemi RJ, Kičić D (2010) Methodology for combined TMS and EEG. Brain Topogr 22:233–248.
Iraji A, Calhoun VD, Wiseman NM, Davoodi-Bojd E, Avanaki MRN, Haacke EM, Kou Z (2016) The connectivity domain: Analyzing resting state fMRI data using feature-based data-driven and model-based methods. NeuroImage 134:494–507.
Islam R, Kaffman A (2021) White-matter repair as a novel therapeutic target for early adversity. Front Neurosci 15.
Iwanami T, Maeshima H, Baba H, Satomura E, Namekawa Y, Shimano T, Suzuki T, Arai H (2015) Psychomotor agitation in major depressive disorder is a predictive factor of mood-switching. J Affect Disord 170:185–189.
Jaafari N, Rachid F, Rotge J-Y, Polosan M, El-Hage W, Belin D, Vibert N, Pelissolo A (2012) Safety and efficacy of repetitive transcranial magnetic stimulation in the treatment of obsessive-compulsive disorder: A review. World J Biol Psychiatry 13:164–177.
Jacobs J (2014) Hippocampal theta oscillations are slower in humans than in rodents: implications for models of spatial navigation and memory. Philosophical Transactions of the Royal Society B: Biological Sciences 369:20130304.
Janicak PG, Nahas Z, Lisanby SH, Solvason HB, Sampson SM, McDonald WM, Marangell LB, Rosenquist P, McCall WV, Kimball J, O’Reardon JP, Loo C, Husain MH, Krystal A, Gilmer W, Dowd SM, Demitrack MA, Schatzberg AF (2010) Durability of clinical benefit with transcranial magnetic stimulation (TMS) in the treatment of pharmacoresistant major depression: assessment of relapse during a 6-month, multisite, open-label study. Brain Stimul 3:187–199.
Jansen JM, van Wingen G, van den Brink W, Goudriaan AE (2015) Resting state connectivity in alcohol dependent patients and the effect of repetitive transcranial magnetic stimulation. Eur Neuropsychopharmacol 25:2230–2239.
389
Jenkinson M, Smith S (2001) A global optimisation method for robust affine registration of brain images. Med Image Anal 5:143–156.
Jenkinson M, Bannister P, Brady M, Smith S (2002) Improved optimization for the robust and accurate linear registration and motion correction of brain images. NeuroImage 17:825–841.
Jenkinson M, Beckmann CF, Smith SM, Woolrich MW, Behrens TEJ (2012) FSL. NeuroImage 62:782–790.
Jeurissen B, Tournier J-D, Dhollander T, Connelly A, Sijbers J (2014) Multi-tissue constrained spherical deconvolution for improved analysis of multi-shell diffusion MRI data. NeuroImage 103:411–426.
Ji R-R, Schlaepfer TE, Aizenman CD, Epstein CM, Qiu D, Huang JC, Rupp F (1998) Repetitive transcranial magnetic stimulation activates specific regions in rat brain. Proc Natl Acad Sci U S A 95:15635–15640.
Jiang H, Ling Z, Zhang Y, Mao H, Ma Z, Yin Y, Wang W, Tang W, Tan Z, Shi J, Li L, Ruan B (2015) Altered fecal microbiota composition in patients with major depressive disorder. Brain, Behav, Immun 48:186–194.
Jiang Y, Guo Z, McClure MA, He L, Mu Q (2020) Effect of rTMS on Parkinson’s cognitive function: a systematic review and meta-analysis. BMC Neurol 20:377.
Joel SE, Caffo BS, van Zijl PCM, Pekar JJ (2011) On the relationship between seed-based and ICA-based measures of functional connectivity. Magn Reson Med 66:644–657.
Jonckers E, Van Audekerke J, De Visscher G, Van der Linden A, Verhoye M (2011) Functional connectivity fMRI of the rodent brain: Comparison of functional connectivity networks in rat and mouse. PLoS One 6:e18876.
Jonckers E, Shah D, Hamaide J, Verhoye M, Van der Linden A (2015) The power of using functional fMRI on small rodents to study brain pharmacology and disease. Front Pharmacol 6:231.
Jonckers E, Delgado y Palacios R, Shah D, Guglielmetti C, Verhoye M, Van der Linden A (2014) Different anesthesia regimes modulate the functional connectivity outcome in mice. Magn Reson Med 72:1103–1112.
Kaiser RH, Andrews-Hanna JR, Wager TD, Pizzagalli DA (2015) Large-scale network dysfunction in major depressive disorder: A meta-analysis of resting-state functional connectivity. JAMA psychiatry 72:603–611.
Kaiser T, Herzog P, Voderholzer U, Brakemeier E-L (2021) Unraveling the comorbidity of depression and anxiety in a large inpatient sample: Network analysis to examine bridge symptoms. Depress Anxiety 38:307–317.
Kamiya K, Okada N, Sawada K, Watanabe Y, Irie R, Hanaoka S, Suzuki Y, Koike S, Mori H, Kunimatsu A, Hori M, Aoki S, Kasai K, Abe O (2018) Diffusional kurtosis imaging and white matter microstructure modeling in a clinical study of major depressive disorder. NMR Biomed 31:e3938.
Kanda T, Hikasa Y (2008) Effects of medetomidine and midazolam alone or in combination on the metabolic and neurohormonal responses in healthy cats. Canadian Journal of Veterinary Research-Revue Canadienne De Recherche Veterinaire 72:332–339.
Kang S-G, Cho S-E (2020) Neuroimaging biomarkers for predicting treatment response and recurrence of major depressive disorder. Int J Mol Sci 21:2148.
390
Kanno M, Matsumoto M, Togashi H, Yoshioka M, Mano Y (2004) Effects of acute repetitive transcranial magnetic stimulation on dopamine release in the rat dorsolateral striatum. J Neurol Sci 217:73–81.
Kannurpatti SS, Biswal BB, Kim YR, Rosen BR (2008) Spatio-temporal characteristics of low-frequency BOLD signal fluctuations in isoflurane-anesthetized rat brain. NeuroImage 40:1738–1747.
Keck ME (2003) rTMS as treatment strategy in psychiatric disorders – neurobiological concepts. In: Supplements to Clinical Neurophysiology (Paulus W, Tergau F, Nitsche MA, Rothwell JG, Ziemann U, Hallett M, eds), pp 100–116: Elsevier.
Keck ME, Welt T, Müller MB, Erhardt A, Ohl F, Toschi N, Holsboer F, Sillaber I (2002) Repetitive transcranial magnetic stimulation increases the release of dopamine in the mesolimbic and mesostriatal system. Neuropharmacology 43:101–109.
Keck ME, Engelmann M, Müller MB, Henniger MSH, Hermann B, Rupprecht R, Neumann ID, Toschi N, Landgraf R, Post A (2000) Repetitive transcranial magnetic stimulation induces active coping strategies and attenuates the neuroendocrine stress response in rats. J Psychiatr Res 34:265–276.
Kedzior KK, Reitz SK, Azorina V, Loo C (2015) Durability of the antidepressant effect of the high-frequency repetitive transcranial magnetic stimulation (rTMS) In the absence of maintenance treatment in major depression: a systematic review and meta-analysis of 16 double-blind, randomized, sham-controlled trials. Depress Anxiety 32:193–203.
Kellner E, Dhital B, Kiselev VG, Reisert M (2016) Gibbs-ringing artifact removal based on local subvoxel-shifts. Magn Reson Med 76:1574–1581.
Kelly AMC, Uddin LQ, Biswal BB, Castellanos FX, Milham MP (2008) Competition between functional brain networks mediates behavioral variability. NeuroImage 39:527–537.
Kelly JR, Kennedy PJ, Cryan JF, Dinan TG, Clarke G, Hyland NP (2015) Breaking down the barriers: the gut microbiome, intestinal permeability and stress-related psychiatric disorders. Front Cell Neurosci 9:392.
Kelly JR, Borre Y, O' Brien C, Patterson E, El Aidy S, Deane J, Kennedy PJ, Beers S, Scott K, Moloney G, Hoban AE, Scott L, Fitzgerald P, Ross P, Stanton C, Clarke G, Cryan JF, Dinan TG (2016) Transferring the blues: Depression-associated gut microbiota induces neurobehavioural changes in the rat. J Psychiatr Res 82:109–118.
Kelly RE, Wang Z, Alexopoulos GS, Gunning FM, Murphy CF, Morimoto SS, Kanellopoulos D, Jia Z, Lim KO, Hoptman MJ (2010) Hybrid ICA-seed-based methods for fMRI functional connectivity assessment: A feasibility study. International Journal of Biomedical Imaging 2010:868976.
Kempton MJ, Salvador Z, Munafò MR, Geddes JR, Simmons A, Frangou S, Williams SCR (2011) Structural neuroimaging studies in major depressive disorder: Meta-analysis and comparison with bipolar disorder. Arch Gen Psychiatry 68:675–690.
Kenkel WM, Yee JR, Moore K, Madularu D, Kulkarni P, Gamber K, Nedelman M, Ferris CF (2016) Functional magnetic resonance imaging in awake transgenic fragile X rats: evidence of dysregulation in reward processing in the mesolimbic/habenular neural circuit. Transl Psychiatry 6:e763.
Kennedy DP, Redcay E, Courchesne E (2006) Failing to deactivate: Resting functional abnormalities in autism. Proc Natl Acad Sci U S A 103:8275–8280.
391
Kennis M, Rademaker AR, van Rooij SJH, Kahn RS, Geuze E (2015) Resting state functional connectivity of the anterior cingulate cortex in veterans with and without post-traumatic stress disorder. Hum Brain Mapp 36:99-109.
Khan AR, Chuhutin A, Wiborg O, Kroenke CD, Nyengaard JR, Hansen B, Jespersen SN (2016) Biophysical modeling of high field diffusion MRI demonstrates micro-structural aberration in chronic mild stress rat brain. NeuroImage 142:421–430.
Kim MJ, Loucks RA, Palmer AL, Brown AC, Solomon KM, Marchante AN, Whalen PJ (2011) The structural and functional connectivity of the amygdala: from normal emotion to pathological anxiety. Behav Brain Res 223:403–410.
Kimbrell TA, Little JT, Dunn RT, Frye MA, Greenberg BD, Wassermann EM, Repella JD, Danielson AL, Willis MW, Benson BE, Speer AM, Osuch E, George MS, Post RM (1999) Frequency dependence of antidepressant response to left prefrontal repetitive transcranial magnetic stimulation (rTMS) as a function of baseline cerebral glucose metabolism. Biol Psychiatry 46:1603–1613.
Kino T (2015) Stress, glucocorticoid hormones, and hippocampal neural progenitor cells: implications to mood disorders. Front Physiol 6.
Kint LT, Seewoo BJ, Hyndman TH, Clarke MW, Edwards SH, Rodger J, Feindel KW, Musk GC (2020) The pharmacokinetics of medetomidine administered subcutaneously during isoflurane anaesthesia in Sprague-Dawley rats. Animals 10:1050.
Kistsen V, Evstigneev V, Dubovik BU, Vladimir (2016) The effects of repetitive transcranial magnetic stimulation on picrotoxin-induced convulsions in mice. Adv Clin Exp Med 25:317–325.
Kjonigsen LJ, Lillehaug S, Bjaalie JG, Witter MP, Leergaard TB (2015) Waxholm Space atlas of the rat brain hippocampal region: Three-dimensional delineations based on magnetic resonance and diffusion tensor imaging. NeuroImage 108:441–449.
Klär AA, Ballmaier M, Leopold K, Häke I, Schaefer M, Brühl R, Schubert F, Gallinat J (2010) Interaction of hippocampal volume and N-acetylaspartate concentration deficits in schizophrenia: A combined MRI and 1H-MRS study. NeuroImage 53:51–57.
Klomjai W, Katz R, Lackmy-Vallée A (2015) Basic principles of transcranial magnetic stimulation (TMS) and repetitive TMS (rTMS). Ann Phys Rehabil Med 58:208–213.
Kochar B, Barnes EL, Long MD, Cushing KC, Galanko J, Martin CF, Raffals LE, Sandler RS (2018) Depression is associated with more aggressive inflammatory bowel disease. The American journal of gastroenterology 113:80–85.
Köhler S, Paus T, Buckner RL, Milner B (2004) Effects of left inferior prefrontal stimulation on episodic memory formation: A two-stage fMRI—rTMS study. J Cognit Neurosci 16:178–188.
Kole MHP, Fuchs E, Ziemann U, Paulus W, Ebert U (1999) Changes in 5-HT1A and NMDA binding sites by a single rapid transcranial magnetic stimulation procedure in rats. Brain Res 826:309–312.
Komssi S, Kähkönen S, Ilmoniemi RJ (2004) The effect of stimulus intensity on brain responses evoked by transcranial magnetic stimulation. Hum Brain Mapp 21:154–164.
Korgaonkar MS, Ram K, Williams LM, Gatt JM, Grieve SM (2014) Establishing the resting state default mode network derived from functional magnetic resonance imaging tasks as an endophenotype: A twins study. Hum Brain Mapp 35:3893–3902.

392
Kozel FA, Tian F, Dhamne S, Croarkin PE, McClintock SM, Elliott A, Mapes KS, Husain MM, Liu H (2009) Using simultaneous repetitive transcranial magnetic stimulation/functional near infrared spectroscopy (rTMS/fNIRS) to measure brain activation and connectivity. NeuroImage 47:1177–1184.
Kozel FA, Johnson KA, Nahas Z, Nakonezny PA, Morgan PS, Anderson BS, Kose S, Li X, Lim KO, Trivedi MH, George MS (2011) Fractional anisotropy changes after several weeks of daily left high-frequency repetitive transcranial magnetic stimulation of the prefrontal cortex to treat major depression. J ECT 27:5–10.
Krishnan V, Nestler EJ (2011) Animal models of depression: molecular perspectives. Curr Top Behav Neurosci 7:121–147.
Kristsen V, Evstigneev V, Bulaev I, Sakovich R, Dubovik B (2013) Neurometabolic effect of repetitive transcranial magnetic stimulation in epileptic brain: A sham-controlled proton magnetic resonance spectroscopy study. J Neurol Sci 333:e3.
Kumamaru E, Numakawa T, Adachi N, Yagasaki Y, Izumi A, Niyaz M, Kudo M, Kunugi H (2008) Glucocorticoid prevents brain-derived neurotrophic factor-mediated maturation of synaptic function in developing hippocampal neurons through reduction in the activity of mitogen-activated protein kinase. Molecular endocrinology (Baltimore, Md) 22:546–558.
Kunugi H (2021) Gut microbiota and pathophysiology of depressive disorder. Ann Nutr Metab 77 Suppl 2:11–20.
Lahmame A, del Arco C, Pazos A, Yritia M, Armario A (1997) Are Wistar-Kyoto rats a genetic animal model of depression resistant to antidepressants? Eur J Pharmacol 337:115–123.
Laine MA, Sokolowska E, Dudek M, Callan S-A, Hyytiä P, Hovatta I (2017) Brain activation induced by chronic psychosocial stress in mice. Sci Rep 7:15061.
Lan MJ, Chhetry BT, Liston C, Mann JJ, Dubin M (2016) Transcranial magnetic stimulation of left dorsolateral prefrontal cortex induces brain morphological changes in regions associated with a treatment resistant major depressive episode: An exploratory analysis. Brain Stimul 9:577–583.
Larson J, Wong D, Lynch G (1986) Patterned stimulation at the theta frequency is optimal for the induction of hippocampal long-term potentiation. Brain Res 368:347–350.
Lee L, Siebner H, Bestmann S (2006) Rapid modulation of distributed brain activity by transcranial magnetic stimulation of human motor cortex. Behav Neurol 17:135–148.
Lee MH, Smyser CD, Shimony JS (2013a) Resting state fMRI: A review of methods and clinical applications. Am J Neuroradiol 34:1866–1872.
Lee MH, Miller-Thomas MM, Benzinger TL, Marcus DS, Hacker CD, Leuthardt EC, Shimony JS (2016) Clinical resting-state fMRI in the preoperative setting: Are we ready for prime time? Topics in Magnetic Resonance Imaging: TMRI 25:11–18.
Lee T, Jarome T, Li S-J, Kim JJ, Helmstetter FJ (2009) Chronic stress selectively reduces hippocampal volume in rats: a longitudinal magnetic resonance imaging study. Neuroreport 20:1554–1558.
Lee Y, Son H, Kim G, Kim S, Lee DH, Roh GS, Kang SS, Cho GJ, Choi WS, Kim HJ (2013b) Glutamine deficiency in the prefrontal cortex increases depressive-like behaviours in male mice. J Psychiatry Neurosci 38:183–191.
393
Lefaucheur J-P (2008) Principles of therapeutic use of transcranial and epidural cortical stimulation. Clin Neurophysiol 119:2179–2184.
Lefaucheur J-P (2009) Methods of therapeutic cortical stimulation. Clin Neurophysiol 39:1–14.
Lehmann ML, Weigel TK, Elkahloun AG, Herkenham M (2017) Chronic social defeat reduces myelination in the mouse medial prefrontal cortex. Sci Rep 7:46548.
Lemke KA (2007) Pharmacology-anticholinergics and sedatives. In: Lumb and Jones' Veterinary Anesthesia and Analgesia, pp 218–219. Ames, IA, USA: Blackwell Publishing.
Lener MS, Niciu MJ, Ballard ED, Park M, Park LT, Nugent AC, Zarate CA, Jr. (2017) Glutamate and gamma-aminobutyric acid systems in the pathophysiology of major depression and antidepressant response to ketamine. Biol Psychiatry 81:886–897.
Lenz M, Vlachos A (2016) Releasing the cortical brake by non-invasive electromagnetic stimulation? rTMS induces LTD of GABAergic neurotransmission. Front Neural Circuits 10:96.
Lenz M, Galanis C, Müller-Dahlhaus F, Opitz A, Wierenga CJ, Szabó G, Ziemann U, Deller T, Funke K, Vlachos A (2016) Repetitive magnetic stimulation induces plasticity of inhibitory synapses. Nature communications 7:10020.
Lerman C, Gu H, Loughead J, Ruparel K, Yang Y, Stein EA (2014) Large-scale brain network coupling predicts acute nicotine abstinence effects on craving and cognitive function. JAMA Psychiatry 71:523–530.
Lewis G (2018) Transcranial magnetic stimulation for depression. The Lancet 391:1639–1640.
Ley RE, Hamady M, Lozupone C, Turnbaugh PJ, Ramey RR, Bircher JS, Schlegel ML, Tucker TA, Schrenzel MD, Knight R, Gordon JI (2008) Evolution of mammals and their gut microbes. Science 320:1647–1651.
Li J, Park E, Zhong LR, Chen L (2019) Homeostatic synaptic plasticity as a metaplasticity mechanism — A molecular and cellular perspective. Curr Opin Neurobiol 54:44–53.
Li J, Zhang X-W, Zuo Z-T, Lu J, Meng C-L, Fang H-Y, Xue R, Fan Y, Guan Y-Z, Zhang W-H (2016) Cerebral functional reorganization in ischemic stroke after repetitive transcranial magnetic stimulation: An fMRI study. CNS Neurosci Ther 22:952–960.
Li J, Yang R, Xia K, Wang T, Nie B, Gao K, Chen J, Zhao H, Li Y, Wang W (2018) Effects of stress on behavior and resting-state fMRI in rats and evaluation of Telmisartan therapy in a stress-induced depression model. BMC Psychiatry 18:337.
Li Q, Brus-Ramer M, Martin JH, McDonald JW (2010) Electrical stimulation of the medullary pyramid promotes proliferation and differentiation of oligodendrocyte progenitor cells in the corticospinal tract of the adult rat. Neurosci Lett 479:128–133.
Li X, Nahas Z, Anderson B, Kozel FA, George MS (2004) Can left prefrontal rTMS be used as a maintenance treatment for bipolar depression? Depress Anxiety 20:98–100.
Li X, Hartwell KJ, Owens M, Lematty T, Borckardt JJ, Hanlon CA, Brady KT, George MS (2013) Repetitive transcranial magnetic stimulation of the dorsolateral prefrontal cortex reduces nicotine cue craving. Biol Psychiatry 73:714–720.
Liang Z, King J, Zhang N (2012) Intrinsic organization of the anesthetized brain. J Neurosci 32:10183–10191.
Lin H, Peddada SD (2020) Analysis of compositions of microbiomes with bias correction. Nature Communications 11:3514.
394
Lipton RB, Pearlman SH (2010) Transcranial magnetic simulation in the treatment of migraine. Neurotherapeutics 7:204–212.
Lipton RB, Dodick DW, Silberstein SD, Saper JR, Aurora SK, Pearlman SH, Fischell RE, Ruppel PL, Goadsby PJ (2010) Single-pulse transcranial magnetic stimulation for acute treatment of migraine with aura: a randomised, double-blind, parallel-group, sham-controlled trial. The Lancet Neurology 9:373–380.
Liston C, Chen AC, Zebley BD, Drysdale AT, Gordon R, Leuchter B, Voss HU, Casey BJ, Etkin A, Dubin MJ (2014) Default mode network mechanisms of transcranial magnetic stimulation in depression. Biol Psychiatry 76:517–526.
Liu J, Dietz K, DeLoyht JM, Pedre X, Kelkar D, Kaur J, Vialou V, Lobo MK, Dietz DM, Nestler EJ, Dupree J, Casaccia P (2012) Impaired adult myelination in the prefrontal cortex of socially isolated mice. Nat Neurosci 15:1621–1623.
Liu L, Zhou X, Zhang Y, Liu Y, Yang L, Pu J, Zhu D, Zhou C, Xie P (2016) The identification of metabolic disturbances in the prefrontal cortex of the chronic restraint stress rat model of depression. Behav Brain Res 305:148–156.
Liu M-Y, Yin C-Y, Zhu L-J, Zhu X-H, Xu C, Luo C-X, Chen H, Zhu D-Y, Zhou Q-G (2018) Sucrose preference test for measurement of stress-induced anhedonia in mice. Nat Protoc 13:1686–1698.
Ljubisavljevic MR, Javid A, Oommen J, Parekh K, Nagelkerke N, Shehab S, Adrian TE (2015) The effects of different repetitive transcranial magnetic stimulation (rTMS) protocols on cortical gene expression in a rat model of cerebral ischemic-reperfusion injury. PLoS One 10:e0139892.
Loo CK, Mitchell PB, McFarquhar TF, Malhi GS, Sachdev PS (2007) A sham-controlled trial of the efficacy and safety of twice-daily rTMS in major depression. Psychol Med 37:341–349.
López-Rubalcava C, Lucki I (2000) Strain differences in the behavioral effects of antidepressant drugs in the rat forced swimming test. Neuropsychopharmacology 22:191–199.
Lowe MJ, Phillips MD, Lurito JT, Mattson D, Dzemidzic M, Mathews VP (2002) Multiple sclerosis: low-frequency temporal blood oxygen level-dependent fluctuations indicate reduced functional connectivity initial results. Radiology 224:184–192.
Lu B (2003) BDNF and activity-dependent synaptic modulation. Learn Mem 10:86–98.
Lu H, Zou Q, Gu H, Raichle ME, Stein EA, Yang Y (2012) Rat brains also have a default mode network. Proc Natl Acad Sci U S A 109:3979–3984.
Lu H, Kobilo T, Robertson C, Tong S, Celnik P, Pelled G (2015) Transcranial magnetic stimulation facilitates neurorehabilitation after pediatric traumatic brain injury. Sci Rep 5:14769-14769.
Lu H, Scholl CA, Zuo Y, Demny S, Rea W, Stein EA, Yang Y (2010) Registering and analyzing rat fMRI data in the stereotaxic framework by exploiting intrinsic anatomical features. Magn Reson Imaging 28:146–152.
Lu H, Zuo Y, Gu H, Waltz JA, Zhan W, Scholl CA, Rea W, Yang Y, Stein EA (2007) Synchronized delta oscillations correlate with the resting-state functional MRI signal. Proc Natl Acad Sci U S A 104:18265–18269.
Luborzewski A, Schubert F, Seifert F, Danker-Hopfe H, Brakemeier E-L, Schlattmann P, Anghelescu I, Colla M, Bajbouj M (2007) Metabolic alterations in the dorsolateral

395
prefrontal cortex after treatment with high-frequency repetitive transcranial magnetic stimulation in patients with unipolar major depression. J Psychiatr Res 41:606–615.
Ludders JW (1992) Advantages and guidelines for using isoflurane. Veterinary Clinics of North America-Small Animal Practice 22:328–331.
Lukić I, Getselter D, Ziv O, Oron O, Reuveni E, Koren O, Elliott E (2019) Antidepressants affect gut microbiota and Ruminococcus flavefaciens is able to abolish their effects on depressive-like behavior. Transl Psychiatry 9:133.
Luykx JJ, Laban KG, van den Heuvel MP, Boks MPM, Mandl RCW, Kahn RS, Bakker SC (2012) Region and state specific glutamate downregulation in major depressive disorder: A meta-analysis of 1H-MRS findings. Neurosci Biobehav Rev 36:198–205.
Lv H, Wang Z, Tong E, Williams LM, Zaharchuk G, Zeineh M, Goldstein-Piekarski AN, Ball TM, Liao C, Wintermark M (2018) Resting-state functional MRI: Everything that nonexperts have always wanted to know. Am J Neuroradiol 39:1390–1399.
Lyden H, Espinoza RT, Pirnia T, Clark K, Joshi SH, Leaver AM, Woods RP, Narr KL (2014) Electroconvulsive therapy mediates neuroplasticity of white matter microstructure in major depression. Transl Psychiatry 4:e380.
MacDonald KD, Brett B, Barth DS (1996) Inter- and intra-hemispheric spatiotemporal organization of spontaneous electrocortical oscillations. J Neurophysiol 76:423–437.
Machado S, Arias-Carrion O, Paes F, Uehara E, Velasques B, Teixeira S, Santos AD, Queiroz C, Junior J, Ribeiro P, Nardi AE (2011) Effects of repetitive transcranial magnetic stimulation on dystonia: An overview. Am J Neuroscience 2:5–16.
Macrı S, Adriani W, Chiarotti F, Laviola G (2002) Risk taking during exploration of a plus-maze is greater in adolescent than in juvenile or adult mice. Anim Behav 64:541–546.
Madore MR, Poh E, Bollard SJ, Rivera J, Taylor J, Cheng J, Booth E, Nable M, Heath A, Yesavage J, Rodger J, McNerney MW (2021) Moving back in the brain to drive the field forward: Targeting neurostimulation to different brain regions in animal models of depression and neurodegeneration. J Neurosci Methods 360:109261.
Maeda F, Keenan JP, Tormos JM, Topka H, Pascual-Leone A (2000) Interindividual variability of the modulatory effects of repetitive transcranial magnetic stimulation on cortical excitability. Exp Brain Res 133:425–430.
Maes M, Kubera M, Leunis J-C (2008) The gut-brain barrier in major depression: Intestinal mucosal dysfunction with an increased translocation of LPS from gram negative enterobacteria (leaky gut) plays a role in the inflammatory pathophysiology of depression. Neuro Endocrinol Lett 29:117–124.
Magalhães R, Bourgin J, Boumezbeur F, Marques P, Bottlaender M, Poupon C, Djemaï B, Duchesnay E, Mériaux S, Sousa N, Jay TM, Cachia A (2017) White matter changes in microstructure associated with a maladaptive response to stress in rats. Transl Psychiatry 7:e1009.
Magalhães R, Barrière DA, Novais A, Marques F, Marques P, Cerqueira J, Sousa JC, Cachia A, Boumezbeur F, Bottlaender M, Jay TM, Mériaux S, Sousa N (2018) The dynamics of stress: A longitudinal MRI study of rat brain structure and connectome. Mol Psychiatry 23:1998–2006.
Magalhães R, Novais A, Barrière DA, Marques P, Marques F, Sousa JC, Cerqueira JJ, Cachia A, Jay TM, Bottlaender M, Sousa N, Mériaux S, Boumezbeur F (2019) A resting-state
396
functional MR imaging and spectroscopy study of the dorsal hippocampus in the chronic unpredictable stress rat model. J Neurosci 39:3640.
Magne F, Gotteland M, Gauthier L, Zazueta A, Pesoa S, Navarrete P, Balamurugan R (2020) The Firmicutes/Bacteroidetes ratio: A relevant marker of gut dysbiosis in obese patients? Nutrients 12.
Makowiecki K, Harvey AR, Sherrard RM, Rodger J (2014) Low-intensity repetitive transcranial magnetic stimulation improves abnormal visual cortical circuit topography and upregulates BDNF in mice. J Neurosci 34:10780–10792.
Makris AP, Karianaki M, Tsamis KI, Paschou SA (2021) The role of the gut-brain axis in depression: endocrine, neural, and immune pathways. Hormones 20:1–12.
Malhotra A, Sepehrizadeh T, Dhollander T, Wright D, Castillo-Melendez M, Sutherland AE, Pham Y, Ditchfield M, Polglase GR, de Veer M, Jenkin G, Pannek K, Shishegar R, Miller SL (2019) Advanced MRI analysis to detect white matter brain injury in growth restricted newborn lambs. NeuroImage Clinical 24:101991.
Manoliu A, Meng C, Brandl F, Doll A, Tahmasian M, Scherr M, Schwerthöffer D, Zimmer C, Förstl H, Bäuml J, Riedl V, Wohlschläger AM, Sorg C (2014) Insular dysfunction within the salience network is associated with severity of symptoms and aberrant inter-network connectivity in major depressive disorder. Front Hum Neurosci 7:930.
Mansur CG, Fregni F, Boggio PS, Riberto M, Gallucci-Neto J, Santos CM, Wagner T, Rigonatti SP, Marcolin MA, Pascual-Leone A (2005) A sham stimulation-controlled trial of rTMS of the unaffected hemisphere in stroke patients. Neurology 64:1802–1804.
Marcotte K, Perlbarg V, Marrelec G, Benali H, Ansaldo AI (2013) Default-mode network functional connectivity in aphasia: therapy-induced neuroplasticity. Brain Lang 124:45–55.
Mariat D, Firmesse O, Levenez F, Guimarăes VD, Sokol H, Doré J, Corthier G, Furet JP (2009) The Firmicutes/Bacteroidetes ratio of the human microbiota changes with age. BMC Microbiol 9:123.
Marrelec G, Fransson P (2011) Assessing the influence of different ROI selection strategies on functional connectivity analyses of fMRI data acquired during steady-state conditions. PLoS One 6:e14788–e14788.
Marrocco J, Reynaert M-L, Gatta E, Gabriel C, Mocaër E, Di Prisco S, Merega E, Pittaluga A, Nicoletti F, Maccari S, Morley-Fletcher S, Mairesse J (2014) The effects of antidepressant treatment in prenatally stressed rats support the glutamatergic hypothesis of stress-related disorders. J Neurosci 34:2015.
Martiny K, Lunde M, Bech P (2010) Transcranial low voltage pulsed electromagnetic fields in patients with treatment-resistant depression. Biol Psychiatry 68:163–169.
Masamoto K, Kanno I (2012a) Anesthesia and the quantitative evaluation of neurovascular coupling. J Cereb Blood Flow Metab 32:1233–1247.
Masamoto K, Kanno I (2012b) Anesthesia and the quantitative evaluation of neurovascular coupling. J Cereb Blood Flow Metab 32:1233–1247.
Masamoto K, Fukuda M, Vazquez A, Kim S-G (2009) Dose-dependent effect of isoflurane on neurovascular coupling in rat cerebral cortex. Eur J Neurosci 30:242–250.
Masamoto K, Kim T, Fukuda M, Wang P, Kim S-G (2007) Relationship between neural, vascular, and BOLD signals in isoflurane-anesthetized rat somatosensory cortex. Cereb Cortex 17:942–950.
397
Masini CV, Holmes PV, Freeman KG, Maki AC, Edwards GL (2004) Dopamine overflow is increased in olfactory bulbectomized rats: an in vivo microdialysis study. Physiol Behav 81:111–119.
Mayer EA (2011) Gut feelings: the emerging biology of gut–brain communication. Nature Reviews Neuroscience 12:453–466.
Mazze RI, Rice SA, Baden JM (1985) Halothane, isoflurane, and enflurane MAC in pregnant and nonpregnant female and male mice and rats. Anesthesiology 62:339–341.
McGirr A, Van den Eynde F, Tovar-Perdomo S, Fleck MPA, Berlim MT (2015) Effectiveness and acceptability of accelerated repetitive transcranial magnetic stimulation (rTMS) for treatment-resistant major depressive disorder: An open label trial. J Affect Disord 173:216–220.
McGovern AS, Hamlin AS, Winter G (2019) A review of the antimicrobial side of antidepressants and its putative implications on the gut microbiome. Aust N Z J Psychiatry 53:1151–1166.
McIntosh AL, Gormley S, Tozzi L, Frodl T, Harkin A (2017) Recent advances in translational magnetic resonance imaging in animal models of stress and depression. Front Cell Neurosci 11:150.
McKinnon MC, Yucel K, Nazarov A, MacQueen GM (2009) A meta-analysis examining clinical predictors of hippocampal volume in patients with major depressive disorder. J Psychiatry Neurosci 34:41–54.
McMurdie PJ, Holmes S (2013) phyloseq: An R package for reproducible interactive analysis and graphics of microbiome census data. PLoS One 8:e61217.
McRobbie DW, Moore EA, Graves MJ, Prince MR (2007) MRI: from picture to proton. Cambridge: Cambridge University Press.
Meille V, Verges B, Lalanne L, Jonval L, Duvillard L, Chavet-Gelinier J-C, Bonin B, Trojak B (2016) Effects of transcranial magnetic stimulation on the hypothalamic-pituitary axis in depression: Results of a pilot study. J Neuropsychiatry Clin Neurosci 29:70–73.
Melcangi RC, Magnaghi V, Cavarretta I, Riva MA, Martini L (1997) Corticosteroid effects on gene expression of myelin basic protein in oligodendrocytes and of glial fibrillary acidic protein in type 1 astrocytes. J Neuroendocrinol 9:729–733.
Mengler L, Khmelinskii A, Diedenhofen M, Po C, Staring M, Lelieveldt BPF, Hoehn M (2014) Brain maturation of the adolescent rat cortex and striatum: Changes in volume and myelination. NeuroImage 84:35–44.
Mescher M, Merkle H, Kirsch J, Garwood M, Gruetter R (1998) Simultaneous in vivo spectral editing and water suppression. NMR Biomed 11:266–272.
Michael N, Gösling M, Reutemann M, Kersting A, Heindel W, Arolt V, Pfleiderer B (2003) Metabolic changes after repetitive transcranial magnetic stimulation (rTMS) of the left prefrontal cortex: a sham-controlled proton magnetic resonance spectroscopy (1H MRS) study of healthy brain. Eur J Neurosci 17:2462–2468.
Miguel-Hidalgo JJ, Carter K, Deloach PH, Sanders L, Pang Y (2019) Glucocorticoid-induced reductions of myelination and connexin 43 in mixed central nervous system cell cultures are prevented by Mifepristone. Neuroscience 411:255–269.
Mikkelsen M et al. (2017) Big GABA: Edited MR spectroscopy at 24 research sites. NeuroImage 159:32–45.
398
Mikkelsen M et al. (2019) Big GABA II: Water-referenced edited MR spectroscopy at 25 research sites. NeuroImage 191:537–548.
Mikl M, Mareček R, Hluštík P, Pavlicová M, Drastich A, Chlebus P, Brázdil M, Krupa P (2008) Effects of spatial smoothing on fMRI group inferences. Magn Reson Imaging 26:490–503.
Min Y-S, Park JW, Jin SU, Jang KE, Lee B-J, Lee HJ, Lee J, Lee Y-S, Chang Y, Jung T-D (2016) Neuromodulatory effects of offline low-frequency repetitive transcranial magnetic stimulation of the motor cortex: A functional magnetic resonance imaging study. Sci Rep 6:36058.
Minatoya M, Kishi R (2021) A review of recent studies on Bisphenol A and phthalate exposures and child neurodevelopment. Int J Env Res Public Health 18:3585.
Mingli H, Zhengtian G, Xinyi W, Xiaoping T (2009) Effects of repetitive transcranial magnetic stimulation on hypothalamic-pituitary-adrenal axis of patients with depression. Journal of Medical Colleges of PLA 24:337–345.
Mirarab S, Nguyen N, Guo S, Wang L-S, Kim J, Warnow T (2014) PASTA: Ultra-large multiple sequence alignment for nucleotide and amino-acid sequences. J Comput Biol 22:377–386.
Mirski MAZ, Rossell LA, McPherson RW, Traystman RJ (1994) Dexmedetomidine decreases seizure threshold in a rat model of experimental generalized epilepsy. Anesthesiology 81:1422–1428.
Mirza Y, Tang J, Russell A, Banerjee SP, Bhandari R, Ivey J, Rose M, Moore GJ, Rosenberg DR (2004) Reduced anterior cingulate cortex glutamatergic concentrations in childhood major depression. J Am Acad Child Adolesc Psychiatry 43:341–348.
Mishra A, Majumdar S, Wang F, Wilson GH, 3rd, Gore JC, Chen LM (2019) Functional connectivity with cortical depth assessed by resting state fMRI of subregions of S1 in squirrel monkeys. Hum Brain Mapp 40:329–339.
Mitaki S, Onoda K, Abe S, Oguro H, Yamaguchi S (2016) The effectiveness of repetitive transcranial magnetic stimulation for poststroke apathy is associated with improved interhemispheric functional connectivity. J Stroke Cerebrovasc Dis 25:e219–221.
Miyazaki Y, Adachi T, Kurata J, Utsumi J, Shichino T, Segawa H (1999) Dexmedetomidine reduces seizure threshold during enflurane anaesthesia in cats. Br J Anaesth 82:935–937.
Modirrousta M, Meek BP, Wikstrom SL (2018) Efficacy of twice-daily vs once-daily sessions of repetitive transcranial magnetic stimulation in the treatment of major depressive disorder: a retrospective study. Neuropsychiatr Dis Treat 14:309–316.
Morellini N, Grehl S, Tang A, Rodger J, Mariani J, Lohof AM, Sherrard RM (2015) What does low-intensity rTMS do to the cerebellum? The Cerebellum 14:23-26.
Moriguchi S, Takamiya A, Noda Y, Horita N, Wada M, Tsugawa S, Plitman E, Sano Y, Tarumi R, ElSalhy M, Katayama N, Ogyu K, Miyazaki T, Kishimoto T, Graff-Guerrero A, Meyer JH, Blumberger DM, Daskalakis ZJ, Mimura M, Nakajima S (2019) Glutamatergic neurometabolite levels in major depressive disorder: a systematic review and meta-analysis of proton magnetic resonance spectroscopy studies. Mol Psychiatry 24:952–964.
Mottaghy FM, Gangitano M, Horkan C, Chen Y, Pascual-Leone A, Schlaug G (2003) Repetitive TMS temporarily alters brain diffusion. Neurology 60:1539–1541.
399
Mueller JK, Grigsby EM, Prevosto V, Petraglia FW, III, Rao H, Deng Z-D, Peterchev AV, Sommer MA, Egner T, Platt ML, Grill WM (2014) Simultaneous transcranial magnetic stimulation and single-neuron recording in alert non-human primates. Nat Neurosci 17:1130–1136.
Mueller K, Jech R, Hoskovcová M, Ulmanová O, Urgošík D, Vymazal J, Růžička E (2017) General and selective brain connectivity alterations in essential tremor: A resting state fMRI study. NeuroImage: Clinical 16:468–476.
Mulders PC, van Eijndhoven PF, Schene AH, Beckmann CF, Tendolkar I (2015) Resting-state functional connectivity in major depressive disorder: A review. Neurosci Biobehav Rev 56:330–344.
Mulders WHAM, Vooys V, Makowiecki K, Tang AD, Rodger J (2016) The effects of repetitive transcranial magnetic stimulation in an animal model of tinnitus. Sci Rep 6:38234.
Muller-Dahlhaus F, Vlachos A (2013) Unraveling the cellular and molecular mechanisms of repetitive magnetic stimulation. Front Mol Neurosci 6:50.
Müller MB, Toschi N, Kresse AE, Post A, Keck ME (2000) Long-term repetitive transcranial magnetic stimulation increases the expression of brain-derived neurotrophic factor and cholecystokinin mRNA, but not neuropeptide tyrosine mRNA in specific areas of rat brain. Neuropsychopharmacology 23:205–215.
Muller PA, Dhamne SC, Vahabzadeh-Hagh AM, Pascual-Leone A, Jensen FE, Rotenberg A (2014) Suppression of motor cortical excitability in anesthetized rats by low frequency repetitive transcranial magnetic stimulation. PLoS One 9:e91065.
Murphy K, Fox MD (2017) Towards a consensus regarding global signal regression for resting state functional connectivity MRI. NeuroImage 154:169–173.
Murphy K, Birn RM, Handwerker DA, Jones TB, Bandettini PA (2009) The impact of global signal regression on resting state correlations: are anti-correlated networks introduced? NeuroImage 44:893–905.
Naert G, Ixart G, Tapia-Arancibia L, Givalois L (2006) Continuous i.c.v. infusion of brain-derived neurotrophic factor modifies hypothalamic–pituitary–adrenal axis activity, locomotor activity and body temperature rhythms in adult male rats. Neuroscience 139:779–789.
Nagy SA, Vranesics A, Varga Z, Csabai D, Bruszt N, Bali ZK, Perlaki G, Hernádi I, Berente Z, Miseta A, Dóczi T, Czéh B (2020) Stress-induced microstructural alterations correlate with the cognitive performance of rats: A Longitudinal in vivo diffusion tensor imaging study. Front Neurosci 14:474.
Naseribafrouei A, Hestad K, Avershina E, Sekelja M, Linløkken A, Wilson R, Rudi K (2014) Correlation between the human fecal microbiota and depression. Neurogastroenterol Motil 26:1155–1162.
National Health and Medical Research Council (2013) Australian code of practice for the care and use of animals for scientific purposes, 8th ed. 2013 Edition. Canberra, Australia: National Health and Medical Research Council.
Natividad JMM, Verdu EF (2013) Modulation of intestinal barrier by intestinal microbiota: Pathological and therapeutic implications. Pharmacol Res 69:42–51.
Neely C, Lane C, Torres J, Flinn J (2018) The effect of gentle handling on depressive-like behavior in adult male mice: Considerations for human and rodent interactions in the laboratory. Behav Neurol 2018:2976014.
400
Neha, Gandhi TK (2016) Resting state fMRI analysis using seed based and ICA methods. In: 3rd International Conference on Computing for Sustainable Global Development (INDIACom), pp 2551–2554. India.
Nettekoven C, Volz LJ, Kutscha M, Pool E-M, Rehme AK, Eickhoff SB, Fink GR, Grefkes C (2014) Dose-dependent effects of theta burst rTMS on cortical excitability and resting-state connectivity of the human motor system. J Neurosci 34:6849–6859.
Nichols TE, Holmes AP (2002) Nonparametric permutation tests for functional neuroimaging: A primer with examples. Hum Brain Mapp 15:1–25.
Nickerson LD, Smith SM, Öngür D, Beckmann CF (2017) Using dual regression to investigate network shape and amplitude in functional connectivity analyses. Front Neurosci 11:115.
Nicoll RA (2017) A Brief History of Long-Term Potentiation. Neuron 93:281–290.
Niehaus L, Hoffmann KT, Grosse P, Röricht S, Meyer BU (2000) MRI study of human brain exposed to high-dose repetitive magnetic stimulation of visual cortex. Neurology 54:256.
Nierat M-C, Hudson AL, Chaskalovic J, Similowski T, Laviolette L (2015) Repetitive transcranial magnetic stimulation over the supplementary motor area modifies breathing pattern in response to inspiratory loading in normal humans. Front Physiol 6:273.
Niimi M, Hashimoto K, Kakuda W, Miyano S, Momosaki R, Ishima T, Abo M (2016) Role of brain-derived neurotrophic factor in beneficial effects of repetitive transcranial magnetic stimulation for upper limb hemiparesis after stroke. PLoS One 11:e0152241.
Nikouline VV, Linkenkaer-Hansen K, Huttunen J, Ilmoniemi RJ (2001) Interhemispheric phase synchrony and amplitude correlation of spontaneous beta oscillations in human subjects: A magnetoencephalographic study. Neuroreport 12:2487–2491.
Nobuhara K, Okugawa G, Minami T, Takase K, Yoshida T, Yagyu T, Tajika A, Sugimoto T, Tamagaki C, Ikeda K, Sawada S, Kinoshita T (2004) Effects of electroconvulsive therapy on frontal white matter in late-life depression: A diffusion tensor imaging study. Neuropsychobiology 50:48–53.
Nolan M, Roman E, Nasa A, Levins KJ, O’Hanlon E, O’Keane V, Willian Roddy D (2020) Hippocampal and amygdalar volume changes in major depressive disorder: A targeted review and focus on stress. Chronic Stress 4:2470547020944553.
Nowacka M, Obuchowicz E (2013) BDNF and VEGF in the pathogenesis of stress-induced affective diseases: an insight from experimental studies. Pharmacol Rep 65:535–546.
Numakawa T, Kumamaru E, Adachi N, Yagasaki Y, Izumi A, Kunugi H (2009) Glucocorticoid receptor interaction with TrkB promotes BDNF-triggered PLC-γ signaling for glutamate release via a glutamate transporter. Proceedings of the National Academy of Sciences 106:647–652.
Nuñez JL, Nelson J, Pych JC, Kim JHY, Juraska JM (2000) Myelination in the splenium of the corpus callosum in adult male and female rats. Dev Brain Res 120:87–90.
O'Reardon JP, Blumner KH, Peshek AD, Pradilla RR, Pimiento PC (2005) Long-term maintenance therapy for major depressive disorder with rTMS. J Clin Psychiatry 66:1524–1528.
O'Shea J, Johansen-Berg H, Trief D, Göbel S, Rushworth MFS (2007) Functionally specific reorganization in human premotor cortex. Neuron 54:479–490.

401
O’Reardon JP, Solvason HB, Janicak PG, Sampson S, Isenberg KE, Nahas Z, McDonald WM, Avery D, Fitzgerald PB, Loo C, Demitrack MA, George MS, Sackeim HA (2007) Efficacy and safety of transcranial magnetic stimulation in the acute treatment of major depression: A multisite randomized controlled trial. Biol Psychiatry 62:1208–1216.
Ohata H, Iida H, Dohi S, Watanabe Y (1999a) Intravenous dexmedetomidine inhibits cerebrovascular dilation induced by isoflurane and sevoflurane in dogs. Anesth Analg 89:370–377.
Ohata H, Iida H, Dohi S, Watanabe Y (1999b) Intravenous dexmedetomidine inhibits cerebrovascular dilation induced by isoflurane and sevoflurane in dogs. Anesth Analg 89:370–377.
Ontario H (2016) Repetitive transcranial Mmgnetic stimulation for treatment-resistant depression: A systematic review and meta-analysis of randomized controlled trials. Ontario health technology assessment series 16:1–66.
Opitz A, Windhoff M, Heidemann RM, Turner R, Thielscher A (2011) How the brain tissue shapes the electric field induced by transcranial magnetic stimulation. NeuroImage 58:849–859.
Ota M, Noda T, Sato N, Hattori K, Hori H, Sasayama D, Teraishi T, Nagashima A, Obu S, Higuchi T, Kunugi H (2015) White matter abnormalities in major depressive disorder with melancholic and atypical features: A diffusion tensor imaging study. Psychiatry Clin Neurosci 69:360–368.
Ouyang W, Hemmings HC (2005) Depression by isoflurane of the action potential and underlying voltage-gated ion currents in isolated rat neurohypophysial nerve terminals. J Pharmacol Exp Ther 312:801–808.
Paasonen J, Stenroos P, Salo RA, Kiviniemi V, Gröhn O (2018) Functional connectivity under six anesthesia protocols and the awake condition in rat brain. NeuroImage 172:9–20.
Paddleford RR (1988) Manual of small animal anesthesia. New York, USA: Churchill Livingstone.
Pan W-J, Billings JCW, Grooms JK, Shakil S, Keilholz SD (2015) Considerations for resting state functional MRI and functional connectivity studies in rodents. Front Neurosci 9:269.
Pannek K, Mathias JL, Bigler ED, Brown G, Taylor JD, Rose SE (2011) The average pathlength map: A diffusion MRI tractography-derived index for studying brain pathology. NeuroImage 55:133–141.
Papp EA, Leergaard TB, Calabrese E, Johnson GA, Bjaalie JG (2014) Waxholm Space atlas of the Sprague Dawley rat brain. NeuroImage 97:374–386.
Parikh HI, Koparde VN, Bradley SP, Buck GA, Sheth NU (2016) MeFiT: merging and filtering tool for illumina paired-end reads for 16S rRNA amplicon sequencing. BMC Bioinformatics 17:491.
Parkes L, Fulcher B, Yücel M, Fornito A (2018) An evaluation of the efficacy, reliability, and sensitivity of motion correction strategies for resting-state functional MRI. NeuroImage 171:415–436.
Pashut T, Wolfus S, Friedman A, Lavidor M, Bar-Gad I, Yeshurun Y, Korngreen A (2011) Mechanisms of magnetic stimulation of central nervous system neurons. PLoS Comp Biol 7:e1002022–e1002022.
Patterson SL, Abel T, Deuel TAS, Martin KC, Rose JC, Kandel ER (1996) Recombinant BDNF rescues deficits in basal synaptic transmission and hippocampal LTP in BDNF knockout mice. Neuron 16:1137–1145.
402
Paulus MP, Stein MB (2010) Interoception in anxiety and depression. Brain Struct Funct 214:451–463.
Pauly JM, Le Roux P, Nishimura DG, Macovski A (1991) Parameter relations for the Shinnar-Le Roux selective excitation pulse design algorithm [NMR imaging]. IEEE Trans Med Imaging 10:53–65.
Paus T, Jech R, Thompson CJ, Comeau R, Peters T, Evans AC (1997) Transcranial magnetic stimulation during positron emission tomography: A new method for studying connectivity of the human cerebral cortex. J Neurosci 17:3178–3184.
Pawela CP, Biswal BB, Hudetz AG, Schulte ML, Li R, Jones SR, Cho YR, Matloub HS, Hyde JS (2009) A protocol for use of medetomidine anesthesia in rats for extended studies using task-induced BOLD contrast and resting-state functional connectivity. NeuroImage 46:1137–1147.
Pawela CP, Biswal BB, Cho YR, Kao DS, Li R, Jones SR, Schulte ML, Matloub HS, Hudetz AG, Hyde JS (2008) Resting-state functional connectivity of the rat brain. Magn Reson Med 59:1021–1029.
Paxinos G, Watson C (1998) The rat brain in stereotaxic coordinates, 4th Edition. London: Academic Press, Ltd.
Paxinos G, Watson C, Calabrese E, Badea A, Johnson GA (2015) MRI/DTI Atlas of The Rat Brain. San Diego: Academic Press.
Pell GS, Roth Y, Zangen A (2011) Modulation of cortical excitability induced by repetitive transcranial magnetic stimulation: influence of timing and geometrical parameters and underlying mechanisms. Prog Neurobiol 93:59–98.
Pelled G (2011) MRI of neuronal plasticity in rodent models. In: Magnetic resonance neuroimaging: Methods and protocols (Modo M, Bulte JWM, eds), pp 567–578. Totowa, NJ: Humana Press.
Peng H, Zheng H, Li L, Liu J, Zhang Y, Shan B, Zhang L, Yin Y, Liu J, Li W, Zhou J, Li Z, Yang H, Zhang Z (2012) High-frequency rTMS treatment increases white matter FA in the left middle frontal gyrus in young patients with treatment-resistant depression. J Affect Disord 136:249–257.
Peng Z, Zhou C, Xue S, Bai J, Yu S, Li X, Wang H, Tan Q (2018) Mechanism of repetitive transcranial magnetic stimulation for depression. Shanghai archives of psychiatry 30:84–92.
Pereira LS, Müller VT, da Mota Gomes M, Rotenberg A, Fregni F (2016) Safety of repetitive transcranial magnetic stimulation in patients with epilepsy: A systematic review. Epilepsy Behav 57:167–176.
Perera T, George MS, Grammer G, Janicak PG, Pascual-Leone A, Wirecki TS (2016) The clinical TMS society consensus review and treatment recommendations for TMS therapy for Major Depressive Disorder. Brain Stimul 9:336–346.
Perez-Burgos A, Wang B, Mao Y-K, Mistry B, Neufeld K-AM, Bienenstock J, Kunze W (2012) Psychoactive bacteria Lactobacillus rhamnosus (JB-1) elicits rapid frequency facilitation in vagal afferents. American Journal of Physiology-Gastrointestinal and Liver Physiology 304:G211–G220.
Peters SK, Dunlop K, Downar J (2016) Cortico-striatal-thalamic loop circuits of the salience network: A central pathway in psychiatric disease and treatment. Front Syst Neurosci 10:104.
403
Pfleiderer B, Michael N, Erfurth A, Ohrmann P, Hohmann U, Wolgast M, Fiebich M, Arolt V, Heindel W (2003) Effective electroconvulsive therapy reverses glutamate/glutamine deficit in the left anterior cingulum of unipolar depressed patients. Psychiat Res: Neuroim 122:185-192.
Pineda JA (2008) Sensorimotor cortex as a critical component of an 'extended' mirror neuron system: Does it solve the development, correspondence, and control problems in mirroring? Behavioral and brain functions : BBF 4:47.
Pirttimaki T, Salo RA, Shatillo A, Kettunen MI, Paasonen J, Sierra A, Jokivarsi K, Leinonen V, Andrade P, Quittek S, Pitkanen A, Grohn O (2016) Implantable RF-coil with multiple electrodes for long-term EEG-fMRI monitoring in rodents. J Neurosci Methods 274:154–163.
Poh EZ, Harvey AR, Makowiecki K, Rodger J (2018) Online LI-rTMS during a visual learning task: Differential impacts on visual circuit and behavioral plasticity in adult Ephrin-A2A5(-/-) mice. eNeuro 5:ENEURO.0163-0117.2018.
Poh EZ, Hahne D, Moretti J, Harvey AR, Clarke MW, Rodger J (2019) Simultaneous quantification of dopamine, serotonin, their metabolites and amino acids by LC-MS/MS in mouse brain following repetitive transcranial magnetic stimulation. Neurochem Int 131:104546.
Popa T, Morris LS, Hunt R, Deng ZD, Shitara H, Baek K, Hallett M, Voon V (2017) Low-frequency transcranial magnetic stimulation of the mesio-frontal cortex modulates its connectivity with basal ganglia. Brain Stimul 10:488.
Popa T, Russo M, Vidailhet M, Roze E, Lehéricy S, Bonnet C, Apartis E, Legrand AP, Marais L, Meunier S, Gallea C (2013) Cerebellar rTMS stimulation may induce prolonged clinical benefits in essential tremor, and subjacent changes in functional connectivity: An open label trial. Brain Stimul 6:175–179.
Popoli M, Yan Z, McEwen BS, Sanacora G (2011) The stressed synapse: the impact of stress and glucocorticoids on glutamate transmission. Nature reviews Neuroscience 13:22–37.
Portella MJ, de Diego-Adeliño J, Gómez-Ansón B, Morgan-Ferrando R, Vives Y, Puigdemont D, Pérez-Egea R, Ruscalleda J, Enric Á, Pérez V (2011) Ventromedial prefrontal spectroscopic abnormalities over the course of depression: A comparison among first episode, remitted recurrent and chronic patients. J Psychiatr Res 45:427–434.
Price MN, Dehal PS, Arkin AP (2010) FastTree 2 – Approximately maximum-likelihood trees for large alignments. PLoS One 5:e9490.
Price RB, Shungu DC, Mao X, Nestadt P, Kelly C, Collins KA, Murrough JW, Charney DS, Mathew SJ (2009) Amino acid neurotransmitters assessed by proton magnetic resonance spectroscopy: relationship to treatment resistance in major depressive disorder. Biol Psychiatry 65:792–800.
Pridmore S (1999) Rapid transcranial magnetic stimulation and normalization of the dexamethasone suppression test. Psychiatry Clin Neurosci 53:33–37.
Pridmore S, Belmaker R (1999) Transcranial magnetic stimulation in the treatment of psychiatric disorders. Psychiatry Clin Neurosci 53:541–548.
Prielipp RC, Wall MH, Tobin JR, Groban L, Cannon MA, Fahey FH, Gage HD, Stump DA, James RL, Bennett J, Butterworth J (2002) Dexmedetomidine-induced sedation in volunteers decreases regional and global cerebral blood flow. Anesth Analg 95:1052–1059.
404
Pritchard LM, Van Kempen TA, Zimmerberg B (2013) Behavioral effects of repeated handling differ in rats reared in social isolation and environmental enrichment. Neurosci Lett 536:47–51.
Provencher SW (2001) Automatic quantitation of localized in vivo 1H spectra with LCModel. NMR Biomed 14:260–264.
Provencher SW (2019) LCModel and LCMgui User’s Manual. In, pp 1–184.
Pruim RHR, Mennes M, Buitelaar JK, Beckmann CF (2015) Evaluation of ICA-AROMA and alternative strategies for motion artifact removal in resting state fMRI. NeuroImage 112:278.
Puts NAJ, Edden RAE (2012) In vivo magnetic resonance spectroscopy of GABA: A methodological review. Progress in Nuclear Magnetic Resonance Spectroscopy 60:29–41.
Pypendop BH, Verstegen JP (1998) Hemodynamic effects of medetomidine in the dog: A dose titration study. Vet Surg 27:612–622.
Qiao J, Jin G, Lei L, Wang L, Du Y, Wang X (2016) The positive effects of high-frequency right dorsolateral prefrontal cortex repetitive transcranial magnetic stimulation on memory, correlated with increases in brain metabolites detected by proton magnetic resonance spectroscopy in recently detoxified alcohol-dependent patients. Neuropsychiatr Dis Treat 12:2273–2278.
Radjabzadeh D, Boer CG, Beth SA, van der Wal P, Kiefte-De Jong JC, Jansen MAE, Konstantinov SR, Peppelenbosch MP, Hays JP, Jaddoe VWV, Ikram MA, Rivadeneira F, van Meurs JBJ, Uitterlinden AG, Medina-Gomez C, Moll HA, Kraaij R (2020) Diversity, compositional and functional differences between gut microbiota of children and adults. Sci Rep 10:1040.
Radman T, Ramos RL, Brumberg JC, Bikson M (2009) Role of cortical cell type and morphology in subthreshold and suprathreshold uniform electric field stimulation in vitro. Brain Stimul 2:215–228.
Raffelt D, Tournier JD, Fripp J, Crozier S, Connelly A, Salvado O (2011) Symmetric diffeomorphic registration of fibre orientation distributions. NeuroImage 56:1171–1180.
Raffelt D, Tournier JD, Rose S, Ridgway GR, Henderson R, Crozier S, Salvado O, Connelly A (2012) Apparent Fibre Density: A novel measure for the analysis of diffusion-weighted magnetic resonance images. NeuroImage 59:3976–3994.
Raffelt DA, Tournier JD, Smith RE, Vaughan DN, Jackson G, Ridgway GR, Connelly A (2017) Investigating white matter fibre density and morphology using fixel-based analysis. NeuroImage 144:58–73.
Raffelt DA, Smith RE, Ridgway GR, Tournier JD, Vaughan DN, Rose S, Henderson R, Connelly A (2015) Connectivity-based fixel enhancement: Whole-brain statistical analysis of diffusion MRI measures in the presence of crossing fibres. NeuroImage 117:40–55.
Rai N, Premji A, Tommerdahl M, Nelson AJ (2012) Continuous theta-burst rTMS over primary somatosensory cortex modulates tactile perception on the hand. Clin Neurophysiol 123:1226–1233.
Raichle ME, MacLeod AM, Snyder AZ, Powers WJ, Gusnard DA, Shulman GL (2001) A default mode of brain function. Proc Natl Acad Sci U S A 98:676–682.
Rajkowska G, Miguel-Hidalgo JJ (2007) Gliogenesis and glial pathology in depression. CNS Neurol Disord Drug Targets 6:219–233.
405
Rampelli S, Soverini M, D’Amico F, Barone M, Tavella T, Monti D, Capri M, Astolfi A, Brigidi P, Biagi E, Franceschi C, Turroni S, Candela M, David Lawrence A (2020) Shotgun metagenomics of gut microbiota in humans with up to extreme longevity and the increasing role of xenobiotic degradation. mSystems 5:e00124-00120.
Rao U, Chen L-A, Bidesi AS, Shad MU, Thomas MA, Hammen CL (2010) Hippocampal changes associated with early-life adversity and vulnerability to depression. Biol Psychiatry 67:357–364.
Ressler KJ, Mayberg HS (2007) Targeting abnormal neural circuits in mood and anxiety disorders: from the laboratory to the clinic. Nat Neurosci 10:1116–1124.
Ridding MC, Rothwell JC (2007) Is there a future for therapeutic use of transcranial magnetic stimulation? Nature Reviews Neuroscience 8:559–567.
Ridding MC, Ziemann U (2010) Determinants of the induction of cortical plasticity by non-invasive brain stimulation in healthy subjects. J Physiol 588:2291–2304.
Rittweger N, Ishorst T, Barmashenko G, Aliane V, Winter C, Funke K (2021) Effects of iTBS-rTMS on the behavioral phenotype of a rat model of maternal immune activation. Front Behav Neurosci 15.
Rocher C, Spedding M, Munoz C, Jay TM (2004) Acute stress-induced changes in hippocampal/prefrontal circuits in rats: Effects of antidepressants. Cereb Cortex 14:224–229.
Rodger J, Sherrard RM (2015) Optimising repetitive transcranial magnetic stimulation for neural circuit repair following traumatic brain injury. Neural Regen Res 10:357–359.
Rodger J, Mo C, Wilks T, Dunlop SA, Sherrard RM (2012) Transcranial pulsed magnetic field stimulation facilitates reorganization of abnormal neural circuits and corrects behavioral deficits without disrupting normal connectivity. FASEB J 26:1593–1606.
Rodrigues PA, Zaninotto AL, Neville IS, Hayashi CY, Brunoni AR, Teixeira MJ, Paiva WS (2019) Transcranial magnetic stimulation for the treatment of anxiety disorder. Neuropsychiatr Dis Treat 15:2743–2761.
Rolls ET, Cheng W, Gong W, Qiu J, Zhou C, Zhang J, Lv W, Ruan H, Wei D, Cheng K, Meng J, Xie P, Feng J (2018) Functional connectivity of the anterior cingulate cortex in depression and in health. Cereb Cortex 29:3617–3630.
Root JC, Tuescher O, Cunningham-Bussel A, Pan H, Epstein J, Altemus M, Cloitre M, Goldstein M, Silverman M, Furman D, Ledoux J, McEwen B, Stern E, Silbersweig D (2009) Frontolimbic function and cortisol reactivity in response to emotional stimuli. Neuroreport 20:429–434.
Rorden C, Karnath H-O, Bonilha L (2007) Improving lesion-symptom mapping. J Cognit Neurosci 19:1081–1088.
Rosazza C, Minati L, Ghielmetti F, Mandelli ML, Bruzzone MG (2012) Functional connectivity during resting-state functional MR imaging: Study of the correspondence between independent component analysis and region-of-interest-based methods. Am J Neuroradiol 33:180–187.
Rossi S, Hallett M, Rossini PM, Pascual-Leone A, Safety of TMSCG (2009) Safety, ethical considerations, and application guidelines for the use of transcranial magnetic stimulation in clinical practice and research. Clinical neurophysiology : official journal of the International Federation of Clinical Neurophysiology 120:2008–2039.
406
Rossini PM, Barker AT, Berardelli A, Caramia MD, Caruso G, Cracco RQ, Dimitrijević MR, Hallett M, Katayama Y, Lücking CH (1994) Non-invasive electrical and magnetic stimulation of the brain, spinal cord and roots: Basic principles and procedures for routine clinical application. Report of an IFCN committee. Electroencephalogr Clin Neurophysiol 91:79–92.
Rotenberg A, Muller PA, Vahabzadeh-Hagh AM, Navarro X, López-Vales R, Pascual-Leone A, Jensen F (2010) Lateralization of forelimb motor evoked potentials by transcranial magnetic stimulation in rats. Clin Neurophysiol 121:104–108.
Rowland LM, Edden RAE, Kontson K, Zhu H, Barker PB, Hong LE (2013) GABA predicts inhibition of frequency-specific oscillations in schizophrenia. J Neuropsychiatry Clin Neurosci 25:83–87.
RStudio Team (2018) RStudio: Integrated Development for R. In, 3.6.1 Edition. Boston, MA: RStudio, Inc.
Rubenstein JLR, Merzenich MM (2003) Model of autism: increased ratio of excitation/inhibition in key neural systems. Genes, Brain and Behav 2:255–267.
Rytty R, Nikkinen J, Paavola L, Abou Elseoud A, Moilanen V, Visuri A, Tervonen O, Renton AE, Traynor BJ, Kiviniemi V, Remes AM (2013) GroupICA dual regression analysis of resting state networks in a behavioral variant of frontotemporal dementia. Front Hum Neurosci 7:461.
Sacchet MD, Gotlib IH (2017) Myelination of the brain in major depressive disorder: An in vivo quantitative magnetic resonance imaging study. Sci Rep 7:2200.
Sack AT, Hubl D, Prvulovic D, Formisano E, Jandl M, Zanella FE, Maurer K, Goebel R, Dierks T, Linden DEJ (2002) The experimental combination of rTMS and fMRI reveals the functional relevance of parietal cortex for visuospatial functions. Brain Res Cogn Brain Res 13:85–93.
Salimi-Khorshidi G, Smith SM, Griffanti L, Douaud G, Beckmann CF, Glasser MF (2014) Automatic denoising of functional MRI data: Combining independent component analysis and hierarchical fusion of classifiers. NeuroImage 90:449–468.
Salinas FS, Narayana S, Zhang W, Fox PT, Szabó CÁ (2013) Repetitive transcranial magnetic stimulation elicits rate-dependent brain network responses in non-human primates. Brain Stimul 6:777–787.
Salomons TV, Dunlop K, Kennedy SH, Flint A, Geraci J, Giacobbe P, Downar J (2014) Resting-state cortico-thalamic-striatal connectivity predicts response to dorsomedial prefrontal rTMS in major depressive disorder. Neuropsychopharmacology 39:488–498.
Salonen JS (1989) Pharmacokinetics of medetomidine. Acta Vet Scand:49–54.
Sanacora G, Treccani G, Popoli M (2012) Towards a glutamate hypothesis of depression: An emerging frontier of neuropsychopharmacology for mood disorders. Neuropharmacology 62:63–77.
Sandi C (2011) Glucocorticoids act on glutamatergic pathways to affect memory processes. Trends Neurosci 34:165–176.
Savola JM (1989) Cardiovascular actions of medetomidine and their reversal by atipamezole. Acta Vet Scand:39–47.
Sbardella E, Petsas N, Tona F, Pantano P (2015) Resting-state fMRI in MS: General concepts and brief overview of its application. BioMed Research International 2015:1–8.

407
Schindelin J, Arganda-Carreras I, Frise E, Kaynig V, Longair M, Pietzsch T, Preibisch S, Rueden C, Saalfeld S, Schmid B, Tinevez J-Y, White DJ, Hartenstein V, Eliceiri K, Tomancak P, Cardona A (2012) Fiji: an open-source platform for biological-image analysis. Nat Methods 9:676–682.
Schirmer E, Schuster S, Machnik P (2021) Bisphenols exert detrimental effects on neuronal signaling in mature vertebrate brains. Communications Biology 4:465.
Schmeling WT, Kampine JP, Roerig DL, Warltier DC (1991) The effects of the stereoisomers of the alpha 2-adrenergic agonist medetomidine on systemic and coronary hemodynamics in conscious dogs. Anesthesiology 75:499–511.
Schmitt U, Hiemke C (1998) Strain differences in open-field and elevated plus-maze behavior of rats without and with pretest handling. Pharmacol Biochem Behav 59:807–811.
Schneider SA, Pleger B, Draganski B, Cordivari C, Rothwell JC, Bhatia KP, Dolan RJ (2010) Modulatory effects of 5Hz rTMS over the primary somatosensory cortex in focal dystonia—An fMRI-TMS study. Mov Disord 25:76–83.
Schultz AP, Chhatwal JP, Huijbers W, Hedden T, van Dijk KRA, McLaren DG, Ward AM, Wigman S, Sperling RA (2014) Template based rotation: A method for functional connectivity analysis with a priori templates. NeuroImage 102:620–636.
Schutter DJLG, van Honk J (2010) An endocrine perspective on the role of steroid hormones in the antidepressant treatment efficacy of transcranial magnetic stimulation. Psychoneuroendocrinology 35:171–178.
Seeley WW, Crawford RK, Zhou J, Miller BL, Greicius MD (2009) Neurodegenerative diseases target large-scale human brain networks. Neuron 62:42–52.
Seewoo B, Feindel K, Etherington S, Hennessy L, Croarkin P, Rodger J (2019a) M85. Validation of the chronic restraint stress model of depression in rats and investigation of standard vs accelerated rTMS treatment. Neuropsychopharmacology 44:122–123.
Seewoo BJ, Etherington SJ, Rodger J (2019b) Transcranial Magnetic Stimulation. In: eLS, pp 1-8: John Wiley & Sons, Ltd.
Seewoo BJ, Joos AC, Feindel KW (2021a) An analytical workflow for seed-based correlation and independent component analysis in interventional resting-state fMRI studies. Neurosci Res 165:26–37.
Seewoo BJ, Etherington SJ, Feindel KW, Rodger J (2018a) Combined rTMS/fMRI studies: An overlooked resource in animal models. Front Neurosci 12:180.
Seewoo BJ, Feindel KW, Etherington SJ, Rodger J (2018b) Resting-state fMRI study of brain activation using low-intensity repetitive transcranial magnetic stimulation in rats. Sci Rep 8:6706.
Seewoo BJ, Feindel KW, Etherington SJ, Rodger J (2019c) Frequency-specific effects of low-intensity rTMS can persist for up to 2 weeks post-stimulation: A longitudinal rs-fMRI/MRS study in rats. Brain Stimul 12:1526–1536.
Seewoo BJ, Hennessy LA, Feindel KW, Etherington SJ, Croarkin PE, Rodger J (2020a) Validation of chronic restraint stress model in young adult rats for the study of depression using longitudinal multimodal MR imaging. eneuro 7:ENEURO.0113-0120.2020.
Seewoo BJ, Hennessy LA, Feindel KW, Etherington SJ, Croarkin PE, Rodger J (2020b) Validation of chronic restraint stress model in rats for the study of depression using longitudinal multimodal MR imaging. bioRxiv.
408
Seewoo BJ, Feindel KW, Won Y, Joos AC, Figliomeni A, Hennessy LA, Rodger J (2021b) White matter changes following chronic restraint stress and neuromodulation: A diffusion magnetic resonance imaging study in young male rats. Biological Psychiatry: Global Open Science.
Sergejeva M, Papp EA, Bakker R, Gaudnek MA, Okamura-Oho Y, Boline J, Bjaalie JG, Hess A (2015) Anatomical landmarks for registration of experimental image data to volumetric rodent brain atlasing templates. J Neurosci Methods 240:161–169.
Serra F, Gordon-Smith K, Perry A, Fraser C, Di Florio A, Craddock N, Jones I, Jones L (2019) Agitated depression in bipolar disorder. Bipolar Disorders 21:547–555.
Shao J, Meng C, Tahmasian M, Brandl F, Yang Q, Luo G, Luo C, Yao D, Gao L, Riedl V, Wohlschläger A, Sorg C (2018) Common and distinct changes of default mode and salience network in schizophrenia and major depression. Brain Imaging Behav 12:1708–1719.
Shao Y, Yan G, Xuan Y, Peng H, Huang Q-J, Wu R, Xu H (2015) Chronic social isolation decreases glutamate and glutamine levels and induces oxidative stress in the rat hippocampus. Behav Brain Res 282:201–208.
Sheline YI (2011) Depression and the hippocampus: Cause or effect? Biol Psychiatry 70:308–309.
Sheline YI, Barch DM, Price JL, Rundle MM, Vaishnavi SN, Snyder AZ, Mintun MA, Wang S, Coalson RS, Raichle ME (2009) The default mode network and self-referential processes in depression. Proc Natl Acad Sci U S A 106:1942.
Sherrard RM, Morellini N, Jourdan N, El-Esawi M, Arthaut L-D, Niessner C, Rouyer F, Klarsfeld A, Doulazmi M, Witczak J, d'Harlingue A, Mariani J, McLure I, Martino CF, Ahmad M (2018) Low-intensity electromagnetic fields induce human cryptochrome to modulate intracellular reactive oxygen species. PLoS Biol 16:e2006229.
Shin SS, Krishnan V, Stokes W, Robertson C, Celnik P, Chen Y, Song X, Lu H, Liu P, Pelled G (2018) Transcranial magnetic stimulation and environmental enrichment enhances cortical excitability and functional outcomes after traumatic brain injury. Brain Stimul 11:1306–1313.
Shinnar M, Leigh JS (1989) The application of spinors to pulse synthesis and analysis. Magn Reson Med 12:93–98.
Shinnar M, Bolinger L, Leigh JS (1989a) The synthesis of soft pulses with a specified frequency-response. Magn Reson Med 12:88–92.
Shinnar M, Bolinger L, Leigh JS (1989b) The use of finite impulse-response filters in pulse design. Magn Reson Med 12:81–87.
Shinnar M, Eleff S, Subramanian H, Leigh JS (1989c) The synthesis of pulse sequences yielding arbitrary magnetization vectors. Magn Reson Med 12:74–80.
Shirayama Y, Chen AC, Nakagawa S, Russell DS, Duman RS (2002) Brain-derived neurotrophic factor produces antidepressant effects in behavioral models of depression. J Neurosci 22:3251–3261.
Shizukuishi T, Abe O, Aoki S (2013) Diffusion tensor imaging analysis for psychiatric disorders. Magn Reson Med Sci 12:153–159.
Shoji H, Takao K, Hattori S, Miyakawa T (2016) Age-related changes in behavior in C57BL/6J mice from young adulthood to middle age. Mol Brain 9:11.
409
Shreiner AB, Kao JY, Young VB (2015) The gut microbiome in health and in disease. Current opinion in gastroenterology 31:69–75.
Sierakowiak A, Monnot C, Aski SN, Uppman M, Li T-Q, Damberg P, Brené S (2015) Default mode network, motor network, dorsal and ventral basal ganglia networks in the rat brain: Comparison to human networks using resting state-fMRI. PLoS One 10:e0120345.
Simpson CA, Diaz-Arteche C, Eliby D, Schwartz OS, Simmons JG, Cowan CSM (2021) The gut microbiota in anxiety and depression – A systematic review. Clin Psychol Rev 83:101943.
Sinclair MD (2003) A review of the physiological effects of alpha(2)-agonists related to the clinical use of medetomidine in small animal practice. Canadian Veterinary Journal-Revue Veterinaire Canadienne 44:885–897.
Sirmpilatze N, Baudewig J, Boretius S (2019) Temporal stability of fMRI in medetomidine-anesthetized rats. Sci Rep 9.
Siuciak JA, Lewis DR, Wiegand SJ, Lindsay RM (1997) Antidepressant-like effect of brain-derived neurotrophic factor (BDNF). Pharmacol Biochem Behav 56:131–137.
Sjöström PJ, Rancz EA, Roth A, Häusser M (2008) Dendritic excitability and synaptic plasticity. Physiol Rev 88:769–840.
Slattery DA, Cryan JF (2012) Using the rat forced swim test to assess antidepressant-like activity in rodents. Nat Protoc 7:1009.
Slykerman RF, Thompson J, Waldie KE, Murphy R, Wall C, Mitchell EA (2017) Antibiotics in the first year of life and subsequent neurocognitive outcomes. Acta Paediatr 106:87–94.
Smith DV, Utevsky AV, Bland AR, Clement N, Clithero JA, Harsch AEW, McKell Carter R, Huettel SA (2014) Characterizing individual differences in functional connectivity using dual-regression and seed-based approaches. NeuroImage 95:1–12.
Smith M-C, Stinear CM (2016) Transcranial magnetic stimulation (TMS) in stroke: Ready for clinical practice? J Clin Neurosci 31:10-14.
Smith RE, Tournier J-D, Calamante F, Connelly A (2013) SIFT: Spherical-deconvolution informed filtering of tractograms. NeuroImage 67:298–312.
Smith SM, Nichols TE (2009) Threshold-free cluster enhancement: Addressing problems of smoothing, threshold dependence and localisation in cluster inference. NeuroImage 44:83–98.
Smith SM, Jenkinson M, Johansen-Berg H, Rueckert D, Nichols TE, Mackay CE, Watkins KE, Ciccarelli O, Cader MZ, Matthews PM, Behrens TEJ (2006) Tract-based spatial statistics: Voxelwise analysis of multi-subject diffusion data. NeuroImage 31:1487–1505.
Sohn WS, Yoo K, Lee Y-B, Seo SW, Na DL, Jeong Y (2015) Influence of ROI selection on resting state functional connectivity: An individualized approach for resting state fMRI analysis. Front Neurosci 9:280.
Soleimani R, Jalali MM, Hasandokht T (2015) Therapeutic impact of repetitive transcranial magnetic stimulation (rTMS) on tinnitus: A systematic review and meta-analysis. Eur Arch Otorhinolaryngol 273:1663–1675.
Sommers MG, Pikkemaat JA, Booij LHDJ, Heerschap A (2002) Improved anesthesia protocols for fMlU studies in rats: the use of medetomidine for stable, reversible sedation. In:

410
Proceedings of the International Society for Magnetic Resonance in Medicine. Honolulu, Hawaii, USA.
Song X, Panych LP, Chen N-K (2016) Data-driven and predefined ROI-based quantification of long-term resting-state fMRI reproducibility. Brain Connect 6:136–151.
Sonmez AI, Camsari DD, Nandakumar AL, Voort JLV, Kung S, Lewis CP, Croarkin PE (2019) Accelerated TMS for Depression: A systematic review and meta-analysis. Psychiatry Res 273:770–781.
Speer AM, Kimbrell TA, Wassermann EM, D. Repella J, Willis MW, Herscovitch P, Post RM (2000) Opposite effects of high and low frequency rTMS on regional brain activity in depressed patients. Biol Psychiatry 48:1133–1141.
Steinberg EE, Christoffel DJ, Deisseroth K, Malenka RC (2015) Illuminating circuitry relevant to psychiatric disorders with optogenetics. Curr Opin Neurobiol 30:9–16.
Stenberg D (1989) Physiological role of alpha 2-adrenoceptors in the regulation of vigilance and pain: effect of medetomidine. Acta Vet Scand:21–28.
Stepanichev M, Dygalo NN, Grigoryan G, Shishkina GT, Gulyaeva N (2014) Rodent models of depression: Neurotrophic and neuroinflammatory biomarkers. BioMed Research International 2014:932757.
Stephani C, Paulus W, Sommer M (2016) The effect of current flow direction on motor hot spot allocation by transcranial magnetic stimulation. Physiological Reports 4:e12666.
Stetler C, Miller GE (2011) Depression and hypothalamic-pituitary-adrenal activation: A quantitative summary of four decades of research. Psychosom Med 73:114–126.
Stojanov S, Berlec A, Štrukelj B (2020) The influence of probiotics on the Firmicutes/Bacteroidetes ratio in the treatment of obesity and inflammatory bowel disease. Microorganisms 8:1715.
Stone EA, Quartermain D (1997) Greater behavioral effects of stress in immature as compared to mature male mice. Physiol Behav 63:143–145.
Storelli L, Pagani E, Preziosa P, Filippi M, Rocca MA (2020) Measurement of white matter fiber-bundle cross-section in multiple sclerosis using diffusion-weighted imaging. Multiple Sclerosis Journal 27:818–826.
Sugar J, Witter MP, van Strien NM, Cappaert NLM (2011) The retrosplenial cortex: intrinsic connectivity and connections with the (para)hippocampal region in the rat. An interactive connectome. Front Neuroinform 5:7.
Sun Y, Zhang M, Chen C-C, Gillilland M, 3rd, Sun X, El-Zaatari M, Huffnagle GB, Young VB, Zhang J, Hong S-C, Chang Y-M, Gumucio DL, Owyang C, Kao JY (2013) Stress-induced corticotropin-releasing hormone-mediated NLRP6 inflammasome inhibition and transmissible enteritis in mice. Gastroenterology 144:1478-1487.
Sutherland MT, McHugh MJ, Pariyadath V, Stein EA (2012) Resting state functional connectivity in addiction: Lessons learned and a road ahead. NeuroImage 62:2281–2295.
Suvrathan A, Tomar A, Chattarji S (2010) Effects of chronic and acute stress on rat behaviour in the forced-swim test. Stress 13:533–540.
Sykes M, Matheson NA, Brownjohn PW, Tang AD, Rodger J, Shemmell JBH, Reynolds JNJ (2016) Differences in motor evoked potentials induced in rats by transcranial magnetic stimulation under two separate anesthetics: Implications for plasticity studies. Front Neural Circuits 10:80.
411
Szewczyk-Krolikowski K, Menke RAL, Rolinski M, Duff E, Salimi-Khorshidi G, Filippini N, Zamboni G, Hu MTM, Mackay CE (2014) Functional connectivity in the basal ganglia network differentiates PD patients from controls. Neurology 83:208–214.
Tabesh A, Jensen JH, Ardekani BA, Helpern JA (2011) Estimation of tensors and tensor-derived measures in diffusional kurtosis imaging. Magn Reson Med 65:823–836.
Tafet GE, Nemeroff CB (2020) Pharmacological treatment of anxiety disorders: The role of the HPA axis. Front Psychiatry 11:443.
Taïb S, Arbus C, Sauvaget A, Sporer M, Schmitt L, Yrondi A (2018) How does repetitive transcranial magnetic stimulation influence the brain in depressive disorders?: A review of neuroimaging magnetic resonance imaging studies. J ECT 34:79–86.
Takeuchi N, Chuma T, Matsuo Y, Watanabe I, Ikoma K (2005) Repetitive transcranial magnetic stimulation of contralesional primary motor cortex improves hand function after stroke. Stroke 36:2681–2686.
Talukder MH, Hikasa Y (2009) Diuretic effects of medetomidine compared with xylazine in healthy dogs. Canadian Journal of Veterinary Research-Revue Canadienne De Recherche Veterinaire 73:224-236.
Tambalo S, Peruzzotti-Jametti L, Rigolio R, Fiorini S, Bontempi P, Mallucci G, Balzarotti B, Marmiroli P, Sbarbati A, Cavaletti G, Pluchino S, Marzola P (2015) Functional magnetic resonance imaging of rats with experimental autoimmune encephalomyelitis reveals brain cortex remodeling. J Neurosci 35:10088–10100.
Tan T, Xie J, Liu T, Chen X, Zheng X, Tong Z, Tian X (2013) Low-frequency (1Hz) repetitive transcranial magnetic stimulation (rTMS) reverses Aβ1–42-mediated memory deficits in rats. Exp Gerontol 48:786–794.
Tang A, Thickbroom G, Rodger J (2015) Repetitive transcranial magnetic stimulation of the brain: Mechanisms from animal and experimental models. Neuroscientist 23:82–94.
Tang AD, Hong I, Boddington LJ, Garrett AR, Etherington S, Reynolds JNJ, Rodger J (2016a) Low-intensity repetitive magnetic stimulation lowers action potential threshold and increases spike firing in layer 5 pyramidal neurons in vitro. Neuroscience 335:64–71.
Tang AD, Bennett W, Hadrill C, Collins J, Fulopova B, Wills K, Bindoff A, Puri R, Garry MI, Hinder MR, Summers JJ, Rodger J, Canty AJ (2018) Low intensity repetitive transcranial magnetic stimulation modulates skilled motor learning in adult mice. Sci Rep 8:4016.
Tang AD, Lowe AS, Garrett AR, Woodward R, Bennett W, Canty AJ, Garry MI, Hinder MR, Summers JJ, Gersner R, Rotenberg A, Thickbroom G, Walton J, Rodger J (2016b) Construction and evaluation of rodent-specific rTMS coils. Front Neural Circuits 10:47.
Théberge J, Al-Semaan Y, Williamson PC, Menon RS, Neufeld RWJ, Rajakumar N, Schaefer B, Densmore M, Drost DJ (2003) Glutamate and glutamine in the anterior cingulate and thalamus of medicated patients with chronic Schizophrenia and healthy comparison subjects measured with 4.0-T proton MRS. Am J Psychiatry 160:2231–2233.
Thielscher A, Kammer T (2004) Electric field properties of two commercial figure-8 coils in TMS: calculation of focality and efficiency. Clin Neurophysiol 115:1697–1708.
Thut G, Pascual-Leone A (2010) A Review of Combined TMS-EEG Studies to Characterize Lasting Effects of Repetitive TMS and Assess Their Usefulness in Cognitive and Clinical Neuroscience. Brain Topogr 22:219–232.
412
Tian P, Wang G, Zhao J, Zhang H, Chen W (2019) Bifidobacterium with the role of 5-hydroxytryptophan synthesis regulation alleviates the symptom of depression and related microbiota dysbiosis. J Nutr Biochem 66:43–51.
Tillisch K, Labus J, Kilpatrick L, Jiang Z, Stains J, Ebrat B, Guyonnet D, Legrain–Raspaud S, Trotin B, Naliboff B, Mayer EA (2013) Consumption of fermented milk product with probiotic modulates brain activity. Gastroenterology 144:1394–1401.e1394.
Tournier J-D, Calamante F, Connelly A (2010) Improved probabilistic streamlines tractography by 2nd order integration over fibre orientation distributions. In: Proceedings of the International Society for Magnetic Resonance in Medicine.
Tournier JD, Calamante F, Gadian DG, Connelly A (2004) Direct estimation of the fiber orientation density function from diffusion-weighted MRI data using spherical deconvolution. NeuroImage 23:1176–1185.
Tournier JD, Smith R, Raffelt D, Tabbara R, Dhollander T, Pietsch M, Christiaens D, Jeurissen B, Yeh C-H, Connelly A (2019) MRtrix3: A fast, flexible and open software framework for medical image processing and visualisation. NeuroImage 202:116137.
Toutain PL, Bousquet-Melou A (2004a) Volumes of distribution. J Vet Pharmacol Ther 27:441–453.
Toutain PL, Bousquet-Melou A (2004b) Plasma clearance. J Vet Pharmacol Ther 27:415–425.
Toutain PL, Bousquet-Melou A (2004c) Bioavailability and its assessment. J Vet Pharmacol Ther 27:455–466.
Tremblay R, Lee S, Rudy B (2016) GABAergic interneurons in the neocortex: From cellular properties to circuits. Neuron 91:260–292.
Tremblay S, Beaulé V, Proulx S, de Beaumont L, Marjanska M, Doyon J, Pascual-Leone A, Lassonde M, Théoret H (2013) Relationship between transcranial magnetic stimulation measures of intracortical inhibition and spectroscopy measures of GABA and glutamate+glutamine. J Neurophysiol 109:1343–1349.
Trippe J, Mix A, Aydin-Abidin S, Funke K, Benali A (2009) Theta burst and conventional low-frequency rTMS differentially affect GABAergic neurotransmission in the rat cortex. Exp Brain Res 199:411–421.
Tustison NJ, Avants BB, Cook PA, Zheng Y, Egan A, Yushkevich PA, Gee JC (2010) N4ITK: improved N3 bias correction. IEEE Trans Med Imaging 29:1310–1320.
Tymofiyeva O, Connolly CG, Ho TC, Sacchet MD, Henje Blom E, LeWinn KZ, Xu D, Yang TT (2017) DTI-based connectome analysis of adolescents with major depressive disorder reveals hypoconnectivity of the right caudate. J Affect Disord 207:18–25.
Ulloa JL, Castañeda P, Berríos C, Díaz-Veliz G, Mora S, Bravo JA, Araneda K, Menares C, Morales P, Fiedler JL (2010) Comparison of the antidepressant sertraline on differential depression-like behaviors elicited by restraint stress and repeated corticosterone administration. Pharmacol Biochem Behav 97:213–221.
Ulluwishewa D, Anderson RC, McNabb WC, Moughan PJ, Wells JM, Roy NC (2011) Regulation of tight junction permeability by intestinal bacteria and dietary components. The Journal of Nutrition 141:769–776.
Vacca M, Celano G, Calabrese FM, Portincasa P, Gobbetti M, De Angelis M (2020) The controversial role of human gut Lachnospiraceae. Microorganisms 8:573.

413
Vahabzadeh-Hagh AM, Muller PA, Gersner R, Zangen A, Rotenberg A (2012) Translational neuromodulation: approximating human transcranial magnetic stimulation protocols in rats. Neuromodulation: Technology at the Neural Interface 15:296–305.
Valchev N, Ćurčić-Blake B, Renken RJ, Avenanti A, Keysers C, Gazzola V, Maurits NM (2015) cTBS delivered to the left somatosensory cortex changes its functional connectivity during rest. NeuroImage 114:386–397.
Valero-Cabre A, Wattiez N, Monfort M, François C, Rivaud-Péchoux S, Gaymard B, Pouget P (2012) Frontal non-invasive neurostimulation modulates antisaccade preparation in non-human primates. PLoS One 7:e38674.
Valero-Cabré A, Payne B, Pascual-Leone A (2007) Opposite impact on 14 C-2-deoxyglucose brain metabolism following patterns of high and low frequency repetitive transcranial magnetic stimulation in the posterior parietal cortex. Exp Brain Res 176:603–615.
Valles-Colomer M, Falony G, Darzi Y, Tigchelaar EF, Wang J, Tito RY, Schiweck C, Kurilshikov A, Joossens M, Wijmenga C, Claes S, Van Oudenhove L, Zhernakova A, Vieira-Silva S, Raes J (2019) The neuroactive potential of the human gut microbiota in quality of life and depression. Nature Microbiology 4:623–632.
van Alst TM, Wachsmuth L, Datunashvili M, Albers F, Just N, Budde T, Faber C (2019) Anesthesia differentially modulates neuronal and vascular contributions to the BOLD signal. NeuroImage 195:89–103.
Van den Heuvel MP, Hulshoff Pol HE (2010) Exploring the brain network: A review on resting-state fMRI functional connectivity. Eur Neuropsychopharmacol 20:519–534.
Van der Werf YD, Sanz-Arigita EJ, Menning S, van den Heuvel OA (2010a) Modulating spontaneous brain activity using repetitive transcranial magnetic stimulation. BMC Neurosci 11:145.
van der Werf YD, Sanz-Arigita EJ, Menning S, van den Heuvel OA (2010b) Modulating spontaneous brain activity using repetitive transcranial magnetic stimulation. BMC Neurosci 11:145.
van Velzen LS et al. (2020) White matter disturbances in major depressive disorder: a coordinated analysis across 20 international cohorts in the ENIGMA MDD working group. Mol Psychiatry 25:1511–1525.
Veraart J, Fieremans E, Novikov DS (2016a) Diffusion MRI noise mapping using random matrix theory. Magn Reson Med 76:1582–1593.
Veraart J, Novikov DS, Christiaens D, Ades-Aron B, Sijbers J, Fieremans E (2016b) Denoising of diffusion MRI using random matrix theory. NeuroImage 142:394–406.
Videbech P, Ravnkilde B (2004) Hippocampal volume and depression: A meta-analysis of MRI studies. Am J Psychiatry 161:1957–1966.
Vidoni ED, Acerra NE, Dao E, Meehan SK, Boyd LA (2010) Role of the primary somatosensory cortex in motor learning: An rTMS study. Neurobiol Learn Mem 93:532–539.
Vincent JL, Patel GH, Fox MD, Snyder AZ, Baker JT, Van Essen DC, Zempel JM, Snyder LH, Corbetta M, Raichle ME (2007) Intrinsic functional architecture in the anaesthetized monkey brain. Nature 447:83–86.
Virtanen R, Savola JM, Saano V, Nyman L (1988) Characterization of the selectivity, specificity and potency of medetomidine as an alpha 2-adrenoceptor agonist. Eur J Pharmacol 150:9–14.

414
Vlachos A, Müller-Dahlhaus F, Rosskopp J, Lenz M, Ziemann U, Deller T (2012) Repetitive magnetic stimulation induces functional and structural plasticity of excitatory postsynapses in mouse organotypic hippocampal slice cultures. J Neurosci 32:17514–17523.
Volz LJ, Benali A, Mix A, Neubacher U, Funke K (2013) Dose-dependence of changes in cortical protein expression induced with repeated transcranial magnetic theta-burst stimulation in the rat. Brain Stimul 6:598–606.
Vyas A, Mitra R, Shankaranarayana Rao BS, Chattarji S (2002) Chronic stress induces contrasting patterns of dendritic remodeling in hippocampal and amygdaloid neurons. J Neurosci 22:6810–6818.
Waites AB, Briellmann RS, Saling MM, Abbott DF, Jackson GD (2006) Functional connectivity networks are disrupted in left temporal lobe epilepsy. Ann Neurol 59:335–343.
Walf AA, Frye CA (2007) The use of the elevated plus maze as an assay of anxiety-related behavior in rodents. Nat Protoc 2:322–328.
Walsh V (1998) Brain mapping: Faradization of the mind. Curr Biol 8:R8–11.
Walter M, Henning A, Grimm S, Schulte RF, Beck J, Dydak U, Schnepf B, Boeker H, Boesiger P, Northoff G (2009) The relationship between aberrant neuronal activation in the pregenual anterior cingulate, altered glutamatergic metabolism, and anhedonia in major depression. JAMA Psychiatry 66:478–486.
Wang D, Noda Y, Tsunekawa H, Zhou Y, Miyazaki M, Senzaki K, Nabeshima T (2007) Behavioural and neurochemical features of olfactory bulbectomized rats resembling depression with comorbid anxiety. Behav Brain Res 178:262–273.
Wang H-N, Wang X-X, Zhang R-G, Wang Y, Cai M, Zhang Y-H, Sun R-Z, Guo L, Qiao Y-T, Liu J-C, He H, Wang Z-H, Wan Y-C, Tan Q-R, Zhang Z-J (2017a) Clustered repetitive transcranial magnetic stimulation for the prevention of depressive relapse/recurrence: a randomized controlled trial. Transl Psychiatry 7:1292.
Wang JX, Rogers LM, Gross EZ, Ryals AJ, Dokucu ME, Brandstatt KL, Hermiller MS, Voss JL (2014) Targeted enhancement of cortical-hippocampal brain networks and associative memory. Science 345:1054–1057.
Wang L, Hermens DF, Hickie IB, Lagopoulos J (2012) A systematic review of resting-state functional-MRI studies in major depression. J Affect Disord 142:6–12.
Wang Q, Timberlake MA, 2nd, Prall K, Dwivedi Y (2017b) The recent progress in animal models of depression. Prog Neuropsychopharmacol Biol Psychiatry 77:99–109.
Wang T, Huang X, Huang P, Li D, Lv F, Zhang Y, Zhou L, Yang D, Xie P (2013) Early-Stage psychotherapy produces elevated frontal white matter integrity in adult major depressive disorder. PLoS One 8:e63081.
Wassermann EM (1998) Risk and safety of repetitive transcranial magnetic stimulation: report and suggested guidelines from the International Workshop on the Safety of Repetitive Transcranial Magnetic Stimulation, June 5-7, 1996. Electroencephalogr Clin Neurophysiol 108:1–16.
Wassermann EM, Lisanby SH (2001) Therapeutic application of repetitive transcranial magnetic stimulation: A review. Clin Neurophysiol 112:1367–1377.
Wassermann EM, Zimmermann T (2012) Transcranial magnetic brain stimulation: Therapeutic promises and scientific gaps. Pharmacol Ther 133:98–107.
415
Watrous AJ, Lee DJ, Izadi A, Gurkoff GG, Shahlaie K, Ekstrom AD (2013) A comparative study of human and rat hippocampal low frequency oscillations during spatial navigation. Hippocampus 23:656–661.
Weber R, Ramos-Cabrer P, Wiedermann D, van Camp N, Hoehn M (2006) A fully noninvasive and robust experimental protocol for longitudinal fMRI studies in the rat. NeuroImage 29:1303–1310.
Welniak–Kaminska M, Fiedorowicz M, Orzel J, Bogorodzki P, Modlinska K, Stryjek R, Chrzanowska A, Pisula W, Grieb P (2019) Volumes of brain structures in captive wild-type and laboratory rats: 7T magnetic resonance in vivo automatic atlas-based study. PLoS One 14:e0215348.
Whitfield-Gabrieli S, Nieto-Castanon A (2012) Conn: A functional connectivity toolbox for correlated and anticorrelated brain networks. Brain Connect 2:125–141.
Whitfield-Gabrieli S, Thermenos HW, Milanovic S, Tsuang MT, Faraone SV, McCarley RW, Shenton ME, Green AI, Nieto-Castanon A, LaViolette P, Wojcik J, John DEG, Seidman LJ, Raichle ME (2009) Hyperactivity and hyperconnectivity of the default network in Schizophrenia and in first-degree relatives of persons with Schizophrenia. Proc Natl Acad Sci U S A 106:1279–1284.
Williams KA, Mehta NS, Redei EE, Wang L, Procissi D (2014) Aberrant resting-state functional connectivity in a genetic rat model of depression. Psychiat Res: Neuroim 222:111–113.
Williams KA, Magnuson M, Majeed W, LaConte SM, Peltier SJ, Hu X, Keilholz SD (2010) Comparison of α-chloralose, medetomidine and isoflurane anesthesia for functional connectivity mapping in the rat. Magn Reson Imaging 28:995–1003.
Willner P, Towell A, Sampson D, Sophokleous S, Muscat R (1987) Reduction of sucrose preference by chronic unpredictable mild stress, and its restoration by a tricyclic antidepressant. Psychopharmacology 93:358–364.
Wilson MT, St George L (2016) Repetitive transcranial magnetic stimulation: A call for better data. Front Neural Circuits 10:57.
Winkler AM, Ridgway GR, Webster MA, Smith SM, Nichols TE (2014) Permutation inference for the general linear model. NeuroImage 92:381–397.
Wood T (2018) QUIT: QUantitative Imaging Tools. J Open Source Softw 3:656.
Woolrich M (2008) Robust group analysis using outlier inference. NeuroImage 41:286–301.
Woolrich MW, Ripley BD, Brady M, Smith SM (2001) Temporal autocorrelation in univariate linear modeling of fMRI data. NeuroImage 14:1370–1386.
Woolrich MW, Behrens TEJ, Beckmann CF, Jenkinson M, Smith SM (2004) Multilevel linear modelling for FMRI group analysis using Bayesian inference. NeuroImage 21:1732–1747.
Worsley KJ (2001a) Statistical analysis of activation images. In: Functional MRI: An introduction to methods (Jezzard P, Matthews PM, Smith SM, eds), pp 251–270. Oxford: Oxford University Press.
Worsley KJ (2001b) Statistical analysis of activation images. In: Functional MRI: An Introduction to Methods (Jezzard P, Matthews PM, Smith SM, eds). Oxford: Oxford University Press.
Wright DK, Johnston LA, Kershaw J, Ordidge R, O'Brien TJ, Shultz SR (2017) Changes in apparent fiber density and track-weighted imaging netrics in white matter following experimental traumatic brain injury. J Neurotrauma 34:2109–2118.
416
Wu EX, Cheung MM (2010) MR diffusion kurtosis imaging for neural tissue characterization. NMR Biomed 23:836–848.
Wu L, Caprihan A, Bustillo J, Mayer A, Calhoun V (2018) An approach to directly link ICA and seed-based functional connectivity: Application to schizophrenia. NeuroImage 179:448–470.
Xia G, Gajwani P, Muzina DJ, Kemp DE, Gao K, Ganocy SJ, Calabrese JR (2008) Treatment-emergent mania in unipolar and bipolar depression: Focus on repetitive transcranial magnetic stimulation. Int J Neuropsychopharmacol 11:119–130.
Xu J, Dydak U, Harezlak J, Nixon J, Dzemidzic M, Gunn AD, Karne HS, Anand A (2013a) Neurochemical abnormalities in unmedicated bipolar depression and mania: a 2D 1H MRS investigation. Psychiatry Res 213:235–241.
Xu S, Ji Y, Chen X, Yang Y, Gullapalli RP, Masri R (2013b) In vivo high-resolution localized 1H MR spectroscopy in the awake rat brain at 7 T. Magn Reson Med 69:937–943.
Xue S-W, Guo Y, Peng W, Zhang J, Chang D, Zang Y-F, Wang Z (2017) Increased low-frequency resting-state brain activity by high-frequency repetitive TMS on the left dorsolateral prefrontal cortex. Front Psychol 8:2266.
Yaksh TL (1985) Pharmacology of spinal adrenergic systems which modulate spinal nociceptive processing. Pharmacol Biochem Behav 22:845–858.
Yan T, Xie Q, Zheng Z, Zou K, Wang L (2017) Different frequency repetitive transcranial magnetic stimulation (rTMS) for posttraumatic stress disorder (PTSD): A systematic review and meta-analysis. J Psychiatr Res 89:125–135.
Yang H-l, Li M-M, Zhou M-F, Xu H-S, Huan F, Liu N, Gao R, Wang J, Zhang N, Jiang L (2021) Links between gut dysbiosis and neurotransmitter disturbance in chronic restraint stress-induced depressive behaviours: The role of inflammation. Inflammation.
Yang H-Y, Liu Y, Xie J-C, Liu N-N, Tian X (2015) Effects of repetitive transcranial magnetic stimulation on synaptic plasticity and apoptosis in vascular dementia rats. Behav Brain Res 281:149–155.
Yang H, Shi O, Jin Y, Henrich-Noack P, Qiao H, Cai C, Tao H, Tian X, Yang H, Shi O, Jin Y, Henrich-Noack P, Qiao H, Cai C, Tao H, Tian X (2014a) Functional protection of learning and memory abilities in rats with vascular dementia. Restor Neurol Neurosci 32:689–700.
Yang K, Xie G, Zhang Z, Wang C, Li W, Zhou W, Tang Y (2007) Levels of serum interleukin (IL)-6, IL-1β, tumour necrosis factor-α and leptin and their correlation in depression. Aust N Z J Psychiatry 41:266-273.
Yang T, Nie Z, Shu H, Kuang Y, Chen X, Cheng J, Yu S, Liu H (2020) The role of BDNF on neural plasticity in depression. Front Cell Neurosci 14.
Yang X-R, Kirton A, Wilkes TC, Pradhan S, Liu I, Jaworska N, Damji O, Keess J, Langevin LM, Rajapakse T, Lebel RM, Sembo M, Fife M, MacMaster FP (2014b) Glutamate alterations associated with transcranial magnetic stimulation in youth depression: A case series. J ECT 30:242–247.
Yildiz-Yesiloglu A, Ankerst DP (2006) Review of 1H magnetic resonance spectroscopy findings in major depressive disorder: A meta-analysis. Psychiat Res: Neuroim 147:1–25.
Yin Z, Chang M, Wei S, Jiang X, Zhou Y, Cui L, Lv J, Wang F, Tang Y (2018) Decreased functional connectivity in insular subregions in depressive episodes of bipolar disorder and major depressive disorder. Front Neurosci 12.
417
Yizhar O, Fenno LE, Prigge M, Schneider F, Davidson TJ, O'Shea DJ, Sohal VS, Goshen I, Finkelstein J, Paz JT, Stehfest K, Fudim R, Ramakrishnan C, Huguenard JR, Hegemann P, Deisseroth K (2011) Neocortical excitation/inhibition balance in information processing and social dysfunction. Nature 477:171–178.
Yu Y, Lee C, Kim J, Hwang S (2005) Group-specific primer and probe sets to detect methanogenic communities using quantitative real-time polymerase chain reaction. Biotechnol Bioeng 89:670–679.
Yuan H, Shou G, Gleghorn D, Ding L, Cha Y-H (2017) Resting state functional connectivity signature of treatment effects of repetitive transcranial magnetic stimulation in mal de debarquement syndrome. Brain Connect 7:617–626.
Yüksel C, Öngür D (2010) Magnetic resonance spectroscopy studies of glutamate-related abnormalities in mood disorders. Biol Psychiatry 68:785–794.
Yushkevich PA, Piven J, Hazlett HC, Smith RG, Ho S, Gee JC, Gerig G (2006) User-guided 3D active contour segmentation of anatomical structures: Significantly improved efficiency and reliability. NeuroImage 31:1116–1128.
Zalsman G, Weller A, Shbiro L, Barzilay R, Gutman A, Weizman A, Mann JJ, Wasserman J, Wasserman D (2017) Fibre tract analysis using diffusion tensor imaging reveals aberrant connectivity in a rat model of depression. World J Biol Psychiatry 18:615–623.
Zamboni G, Wilcock GK, Douaud G, Drazich E, McCulloch E, Filippini N, Tracey I, Brooks JCW, Smith SM, Jenkinson M, Mackay CE (2013) Resting functional connectivity reveals residual functional activity in Alzheimer’s disease. Biol Psychiatry 74:375–383.
Zangen A, Hyodo K (2002) Transcranial magnetic stimulation induces increases in extracellular levels of dopamine and glutamate in the nucleus accumbens. Neuroreport 13:2401–2405.
Zarrinpar A, Deldin P, Kosslyn SM (2006) Effects of depression on sensory/motor vs. central processing in visual mental imagery. Cognition and Emotion 20:737–758.
Zbozinek TD, Rose RD, Wolitzky-Taylor KB, Sherbourne C, Sullivan G, Stein MB, Roy-Byrne PP, Craske MG (2012) Diagnostic overlap of generalized anxiety disorder and major depressive disorder in a primary care sample. Depress Anxiety 29:1065–1071.
Zerbi V, Grandjean J, Rudin M, Wenderoth N (2015) Mapping the mouse brain with rs-fMRI: An optimized pipeline for functional network identification. NeuroImage 123:11–21.
Zhang H, Yushkevich PA, Alexander DC, Gee JC (2006) Deformable registration of diffusion tensor MR images with explicit orientation optimization. Med Image Anal 10:764–785.
Zhang H, Avants BB, Yushkevich PA, Woo JH, Wang S, McCluskey LF, Elman LB, Melhem ER, Gee JC (2007) High-dimensional spatial normalization of diffusion tensor images improves the detection of white matter differences: An example study using amyotrophic lateral sclerosis. IEEE Trans Med Imaging 26:1585–1597.
Zhang J, Abiose O, Katsumi Y, Touroutoglou A, Dickerson BC, Barrett LF (2019) Intrinsic functional connectivity is organized as three interdependent gradients. Sci Rep 9:15976.
Zhang N, Xing M, Wang Y, Tao H, Cheng Y (2015) Repetitive transcranial magnetic stimulation enhances spatial learning and synaptic plasticity via the VEGF and BDNF–NMDAR pathways in a rat model of vascular dementia. Neuroscience 311:284–291.
418
Zhang S-s, Wu W, Liu Z-p, Huang G-z, Guo S-g, Yang J-m (2014) Altered regional homogeneity in experimentally induced low back pain: a resting-state fMRI study. J Neuroeng Rehabil 11:115–115.
Zhang W, Qu W, Wang H, Yan H (2021) Antidepressants fluoxetine and amitriptyline induce alterations in intestinal microbiota and gut microbiome function in rats exposed to chronic unpredictable mild stress. Transl Psychiatry 11:131.
Zhao F, Zhao T, Zhou L, Wu Q, Hu X (2008) BOLD study of stimulation-induced neural activity and resting-state connectivity in medetomidine-sedated rat. NeuroImage 39:248–260.
Zhao L, Wang Y, Jia Y, Zhong S, Sun Y, Zhou Z, Zhang Z, Huang L (2016) Cerebellar microstructural abnormalities in bipolar depression and unipolar depression: A diffusion kurtosis and perfusion imaging study. J Affect Disord 195:21–31.
Zheng C, Quan M, Zhang T (2012) Decreased thalamo-cortical connectivity by alteration of neural information flow in theta oscillation in depression-model rats. J Comput Neurosci 33:547–558.
Zheng H, Jia F, Guo G, Quan D, Li G, Wu H, Zhang B, Fan C, He X, Huang H (2015) Abnormal anterior cingulate N-acetylaspartate and executive functioning in treatment-resistant depression after rTMS therapy. Int J Neuropsychopharmacol 18:pyv059.
Zheng H, Zhang L, Li L, Liu P, Gao J, Liu X, Zou J, Zhang Y, Liu J, Zhang Z, Li Z, Men W (2010) High-frequency rTMS treatment increases left prefrontal myo-inositol in young patients with treatment-resistant depression. Prog Neuro-Psychopharmacol Biol Psychiatry 34:1189–1195.
Zheng P, Zeng B, Zhou C, Liu M, Fang Z, Xu X, Zeng L, Chen J, Fan S, Du X, Zhang X, Yang D, Yang Y, Meng H, Li W, Melgiri ND, Licinio J, Wei H, Xie P (2016) Gut microbiome remodeling induces depressive-like behaviors through a pathway mediated by the host’s metabolism. Mol Psychiatry 21:786–796.
Zhu C, Song K, Shen Z, Quan Y, Tan B, Luo W, Wu S, Tang K, Yang Z, Wang X (2018) Roseburia intestinalis inhibits interleukin‑17 excretion and promotes regulatory T cells differentiation in colitis. Mol Med Rep 17:7567–7574.
Zhu X, Wang X, Xiao J, Liao J, Zhong M, Wang W, Yao S (2012) Evidence of a dissociation pattern in resting-state default mode network connectivity in first-episode, treatment-naive major depression patients. Biol Psychiatry 71:611–617.
Zhuo C, Li G, Lin X, Jiang D, Xu Y, Tian H, Wang W, Song X (2019) The rise and fall of MRI studies in major depressive disorder. Transl Psychiatry 9:335.
Zuurbier CJ, Keijzers PJM, Koeman A, Van Wezel HB, Hollmann MW (2008) Anesthesia's effects on plasma glucose and insulin and cardiac hexokinase at similar hemodynamics and without major surgical stress in fed rats. Anesth Analg 106:135–142.
Zwanzger P, Baghai TC, Padberg F, Ella R, Minov C, Mikhaiel P, Schüle C, Thoma H, Rupprecht R (2003) The combined dexamethasone-CRH test before and after repetitive transcranial magnetic stimulation (rTMS) in major depression. Psychoneuroendocrinology 28:376–385.
419
Appendices
Appendix A
Seewoo, B.J., Etherington, S.J., Feindel, K.W. & Rodger, J., 2018. Combined rTMS/fMRI studies:
An overlooked resource in animal models. Frontiers in Neuroscience. 12, 180. doi:
10.3389/fnins.2018.00180
Appendix B
Seewoo, B.J., Etherington, S.J. & Rodger, J., 2019. Transcranial Magnetic Stimulation. eLS. John
Wiley & Sons, Ltd, pp. 1–8. doi: 10.1002/9780470015902.a0028620
Appendix C
Kint, L.T., Seewoo, B.J., Hyndman, T.H., Clarke, M.W., Edwards, S.H., Rodger, J., Feindel, K.W. &
Musk, G.C., 2020. The pharmacokinetics of medetomidine administered subcutaneously during
isoflurane anaesthesia in Sprague-Dawley rats. Animals. 10, 1050. doi: 10.3390/ani10061050
Appendix D
Seewoo, B.J., Joos, A.C. & Feindel, K.W., 2020. An analytical workflow for seed-based
correlation and independent component analysis in interventional resting-state state fMRI
studies. 165: 26–37. Neuroscience Research. doi: 10.1016/j.neures.2020.05.006
Appendix E
Seewoo, B.J., Feindel, K.W., Etherington, S.J. & Rodger, J., 2018. Resting-state fMRI study of
brain activation using low-intensity repetitive transcranial magnetic stimulation in rats.
Scientific Reports. 8, 6706. doi: 10.1038/s41598-018-24951-6
420
Appendix F
Seewoo, B.J., Feindel, K.W., Etherington, S.J. & Rodger, J., 2019. Frequency-specific effects of
low-intensity rTMS can persist for up to 2 weeks post-stimulation: A longitudinal rs-fMRI/MRS
study in rats. Brain Stimulation. 12, 1526–1536. doi: 10.1016/j.brs.2019.06.028
Appendix G
Seewoo, B.J., Hennessy, L.A., Feindel, K.W., Etherington, S.J., Croarkin, P.E. & Rodger, J., 2020.
Validation of chronic restraint stress model in young adult rats for the study of depression
using longitudinal multimodal MR imaging. eneuro. 7. doi: 10.1523/eneuro.0113-20.2020
Appendix H
Seewoo, B., Feindel, K., Etherington, S., Hennessy, L., Croarkin, P., Rodger, J., 2019. M85.
Validation of the chronic restraint stress model of depression in rats and investigation of
standard vs accelerated rTMS treatment. Neuropsychopharmacology. 44:122–123. doi:
10.1038/s41386-019-0545-y
Appendix I
Seewoo, B.J., Hennessy, L.A., Jaeschke-Angi, L.A., Mackie, L.A., Etherington, S.J., Dunlop, S.A.,
Croarkin, P.E. & Rodger, J., 2021. A preclinical study of standard versus accelerated transcranial
magnetic stimulation for depression in adolescents. Journal of Child and Adolescent
Psychopharmacology, in press. doi: 10.1089/cap.2021.0100
421
Appendix J
Seewoo, B.J., Feindel, K.W., Won, Y., Joos, A.C., Figliomeni, A., Hennessy, L.A. &
Rodger, J., 2021. White matter changes following chronic restraint stress and
neuromodulation: a diffusion magnetic resonance imaging study in young male rats.
Biological Psychiatry Global Open Science, in press. doi: 10.1016/j.bpsgos.2021.08.006
Appendix K
Extra analyses

REVIEWpublished: 23 March 2018
doi: 10.3389/fnins.2018.00180
Frontiers in Neuroscience | www.frontiersin.org 1 March 2018 | Volume 12 | Article 180
Edited by:
Takashi Hanakawa,
National Center of Neurology and
Psychiatry (Japan), Japan
Reviewed by:
Mitsunari Abe,
Fukushima Medical University, Japan
Ken-Ichiro Tsutsui,
Tohoku University, Japan
*Correspondence:
Jennifer Rodger
Specialty section:
This article was submitted to
Neural Technology,
a section of the journal
Frontiers in Neuroscience
Received: 19 October 2017
Accepted: 06 March 2018
Published: 23 March 2018
Citation:
Seewoo BJ, Etherington SJ,
Feindel KW and Rodger J (2018)
Combined rTMS/fMRI Studies: An
Overlooked Resource in Animal
Models. Front. Neurosci. 12:180.
doi: 10.3389/fnins.2018.00180
Combined rTMS/fMRI Studies: AnOverlooked Resource in AnimalModelsBhedita J. Seewoo 1,2, Sarah J. Etherington 3, Kirk W. Feindel 2,4 and Jennifer Rodger 1,5*
1 Experimental and Regenerative Neurosciences, School of Biological Sciences, The University of Western Australia, Perth,
WA, Australia, 2Centre for Microscopy, Characterization and Analysis, Research Infrastructure Centers, The University of
Western Australia, Perth, WA, Australia, 3 School of Veterinary and Life Sciences, Murdoch University, Perth, WA, Australia,4 School of Biomedical Sciences, University of Western Australia, Perth, WA, Australia, 5 Brain Plasticity Group, Perron
Institute for Neurological and Translational Research, Perth, WA, Australia
Repetitive transcranial magnetic stimulation (rTMS) is a non-invasive neuromodulation
technique, which has brain network-level effects in healthy individuals and is also used to
treat many neurological and psychiatric conditions in which brain connectivity is believed
to be abnormal. Despite the fact that rTMS is being used in a clinical setting and
animal studies are increasingly identifying potential cellular and molecular mechanisms,
little is known about how these mechanisms relate to clinical changes. This knowledge
gap is amplified by non-overlapping approaches used in preclinical and clinical rTMS
studies: preclinical studies are mostly invasive, using cellular and molecular approaches,
while clinical studies are non-invasive, including functional magnetic resonance imaging
(fMRI), TMS electroencephalography (EEG), positron emission tomography (PET), and
behavioral measures. A non-invasive method is therefore needed in rodents to link our
understanding of cellular and molecular changes to functional connectivity changes
that are clinically relevant. fMRI is the technique of choice for examining both short
and long term functional connectivity changes in large-scale networks and is becoming
increasingly popular in animal research because of its high translatability, but, to date,
there have been no reports of animal rTMS studies using this technique. This review
summarizes the main studies combining different rTMS protocols with fMRI in humans,
in both healthy and patient populations, providing a foundation for the design of
equivalent studies in animals. We discuss the challenges of combining these two
methods in animals and highlight considerations important for acquiring clinically-relevant
information from combined rTMS/fMRI studies in animals. We believe that combining
rTMS and fMRI in animal models will generate new knowledge in the following ways:
functional connectivity changes can be explored in greater detail through complementary
invasive procedures, clarifying mechanism and improving the therapeutic application
of rTMS, as well as improving interpretation of fMRI data. And, in a more general
context, a robust comparative approach will refine the use of animal models of specific
neuropsychiatric conditions.
Keywords: translational studies, non-invasive animal models, neuromodulation, rTMS, fMRI, resting-state,
functional connectivity
Appendix A
422

Seewoo et al. Combined rTMS/fMRI Studies
INTRODUCTION
An exciting approach for the treatment of neuropsychiatricconditions is to use neuronal activity itself to encourage repairand improve brain function. This method can be used asan adjuvant with other interventions and might prove to bemore effective and specific than a pharmacological approach,which often has side-effects and might not induce lastingchanges. Several lines of evidence suggest that dysfunctionalconnectivity within specific neural networks may underpinmany neurological and psychiatric conditions (Seeley et al.,2009; van den Heuvel and Hulshoff Pol, 2010). Transcranialmagnetic stimulation (TMS) is a non-invasive neuromodulationtechnique that uses magnetic fields to induce electrical currentsin the brain, thereby modulating neuronal activity, and networks(Barker and Freeston, 2007; Wassermann and Zimmermann,2012). TMS works according to the principle of electromagneticinduction: pulses of current flowing through a TMS coil generatea controllable, pulsatile magnetic field that passes into thebrain unimpeded by skin, muscle or skull (basic principlesdescribed in Walsh, 1998). This time-dependent magnetic fieldinduces transient electrical currents within the brain. TMS isable to stimulate the human brain and deep peripheral nerveswithout causing pain because current is not induced in the skin,i.e., pain fiber nerve endings are not activated. This lack ofdiscomfort enables the technique to be used readily on patientsand volunteers for research and therapeutic purposes (Barker andFreeston, 2007).
Repetitive transcranial magnetic stimulation (rTMS) deliverstrains of closely spaced pulses to the brain to induce transientmodulation of neural excitability and brain function. Althoughtransient, the modulation can outlast the stimulation periodleading to long-term changes in synaptic plasticity and behavior(for review, see Lenz and Vlachos, 2016). George et al. (1995)were the first to use rTMS as a treatment for depression andits efficacy in medication-resistant patients has been validatedby numerous clinical trials (Gaynes et al., 2014). In 2008, anrTMS device developed by Neuronetics was approved by theFood and Drug Administration in the United States for thetreatment of patients with major depressive disorder who areresistant to at least one antidepressant drug (O’Reardon et al.,2007). rTMS has since been shown to have therapeutic potentialfor a range of psychiatric disorders, including unipolar (Xia et al.,2008; Gaynes et al., 2014) and bipolar depression (Xia et al.,2008), schizophrenia (Dlabac-de Lange et al., 2010), obsessive-compulsive disorder (Jaafari et al., 2012), and post-traumaticstress disorder (Clark et al., 2015) as well as in neurologicalconditions such as Parkinson’s disease (Arias-Carrión, 2008),dystonia (Machado et al., 2011), tinnitus (Soleimani et al., 2015),epilepsy (Pereira et al., 2016), and stroke (Corti et al., 2012).rTMS has also shown promising results in the treatment ofpain syndromes such as migraine (Lipton and Pearlman, 2010)and chronic pain (Galhardoni et al., 2015). However, there issignificant inter- and intra-individual variability in the after-effects induced by rTMS and increasing evidence suggests thatsubject-related variables such as gender, age, exercise, diet, use ofneuropharmacological drugs, the state of the subject, and genetic
backgroundmight affect the stimulation-induced effects of rTMSin both healthy individuals and patient populations (for review,see Ridding and Ziemann, 2010). To improve the safety andefficacy of rTMS in a clinical setting, a better understanding ofhow rTMS affects the brain is required (Müller-Dahlhaus andVlachos, 2013).
Animal models have been useful in elucidating some of themechanisms of rTMS as they allow us to perform invasive studiesof molecular and genetic changes that are not ethically possible inhumans. These studies have been reviewed extensively elsewhere(e.g., Tang et al., 2015; Lenz andVlachos, 2016). However, to alignthe different experimental approaches used in preclinical animalstudies (invasive: cellular andmolecular outcomes) and in humanstudies (non-invasive: e.g., TMS and motor-evoked potentials,MEPs; electroencephalography, EEG; optical imaging, positronemission tomography, PET; functional magnetic resonanceimaging, fMRI, behavior) is difficult. Although MEPs (electricalsignals induced in muscles following cortical stimulation), whichare currently the most common outcome measure used inhumans, can also be measured in animals (Rotenberg et al., 2010;Sykes et al., 2016), this approach lacks sensitivity and can beapplied only to motor cortical areas. The vast majority of TMSresearch and clinical treatments target non-motor regions suchas the prefrontal or sensory cortex (e.g., Schneider et al., 2010;Liston et al., 2014; Jansen et al., 2015; Valchev et al., 2015), witheffects that extend to deeper regions that are not accessible toMEPs (e.g., Komssi et al., 2004). Similarly, EEG (e.g., Komssiet al., 2004; Benali et al., 2011) and optical imaging (e.g., Allenet al., 2007; Kozel et al., 2009) have restricted depth of recordingand can detect rTMS-induced functional changes only in themost superficial regions of the brain.
The ability to measure whole-brain functional connectivitybefore and after rTMS is important because rTMS can inducewidespread changes both in cortical and subcortical networks.Currently, PET and fMRI are the only techniques capableof measuring functional effects of rTMS in the whole brain.Combined rTMS/PET have been used in humans (e.g., Paus et al.,1997; Kimbrell et al., 1999; Speer et al., 2000; Mintun et al.,2001; Conchou et al., 2009) and animal models (e.g., Gao et al.,2010; Salinas et al., 2013). However, a major disadvantage ofPET with regards to safety is the use of radiotracers, exposingsubjects to ionizing radiation. A single PET scan using a standardradiotracer dose leads to radiation exposure up to an order ofmagnitude greater than that received annually from backgroundradiation. Therefore, longitudinal rTMS/PET studies requiringrepeated measurements are not ethically feasible. fMRI, on theother hand, does not require the use of ionizing radiation andtherefore, is a safe imaging tool appropriate for repeated long-term experiments.
Therefore, in this review, we suggest that fMRI will be apowerful tool amenable to visualizing and comparing rTMS-induced short and long term neural connectivity changesthroughout the brain at high spatio-temporal resolutions inboth humans and animals. This method could potentiallyhelp unravel the physiological processes underlying the rTMS-induced changes in the cortex and in functionally connectedbrain regions. Comparison of rTMS effects in human and
Frontiers in Neuroscience | www.frontiersin.org 2 March 2018 | Volume 12 | Article 180
423
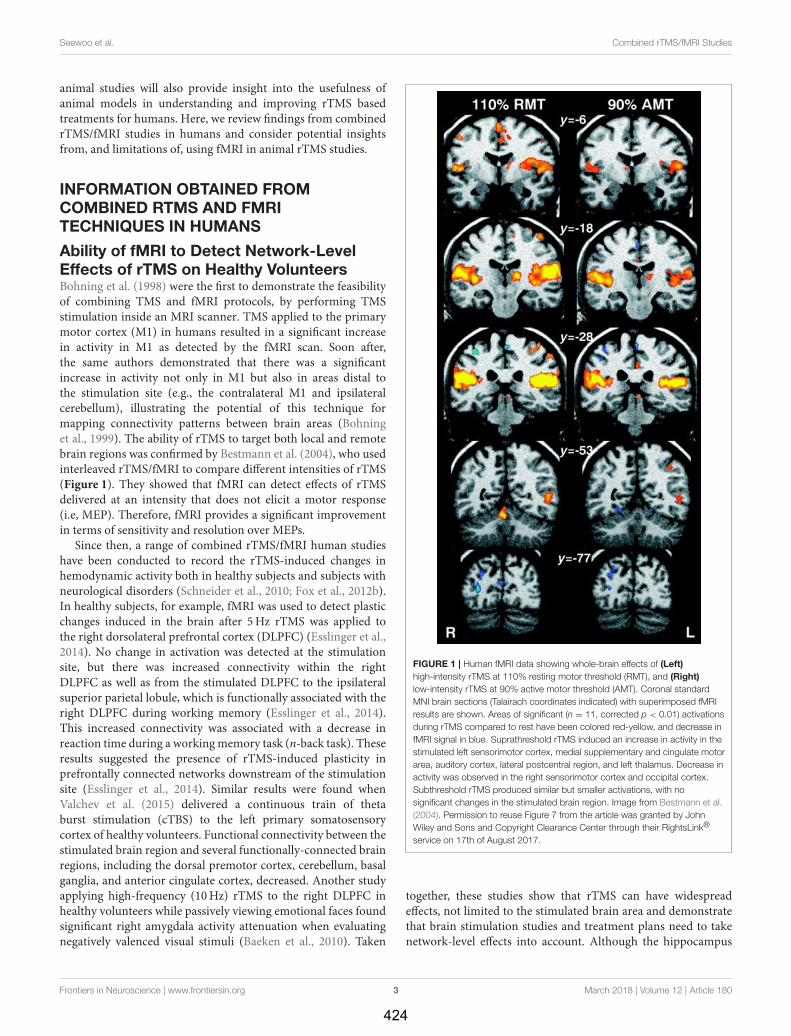
Seewoo et al. Combined rTMS/fMRI Studies
animal studies will also provide insight into the usefulness ofanimal models in understanding and improving rTMS basedtreatments for humans. Here, we review findings from combinedrTMS/fMRI studies in humans and consider potential insightsfrom, and limitations of, using fMRI in animal rTMS studies.
INFORMATION OBTAINED FROMCOMBINED RTMS AND FMRITECHNIQUES IN HUMANS
Ability of fMRI to Detect Network-LevelEffects of rTMS on Healthy VolunteersBohning et al. (1998) were the first to demonstrate the feasibilityof combining TMS and fMRI protocols, by performing TMSstimulation inside an MRI scanner. TMS applied to the primarymotor cortex (M1) in humans resulted in a significant increasein activity in M1 as detected by the fMRI scan. Soon after,the same authors demonstrated that there was a significantincrease in activity not only in M1 but also in areas distal tothe stimulation site (e.g., the contralateral M1 and ipsilateralcerebellum), illustrating the potential of this technique formapping connectivity patterns between brain areas (Bohninget al., 1999). The ability of rTMS to target both local and remotebrain regions was confirmed by Bestmann et al. (2004), who usedinterleaved rTMS/fMRI to compare different intensities of rTMS(Figure 1). They showed that fMRI can detect effects of rTMSdelivered at an intensity that does not elicit a motor response(i.e, MEP). Therefore, fMRI provides a significant improvementin terms of sensitivity and resolution over MEPs.
Since then, a range of combined rTMS/fMRI human studieshave been conducted to record the rTMS-induced changes inhemodynamic activity both in healthy subjects and subjects withneurological disorders (Schneider et al., 2010; Fox et al., 2012b).In healthy subjects, for example, fMRI was used to detect plasticchanges induced in the brain after 5Hz rTMS was applied tothe right dorsolateral prefrontal cortex (DLPFC) (Esslinger et al.,2014). No change in activation was detected at the stimulationsite, but there was increased connectivity within the rightDLPFC as well as from the stimulated DLPFC to the ipsilateralsuperior parietal lobule, which is functionally associated with theright DLPFC during working memory (Esslinger et al., 2014).This increased connectivity was associated with a decrease inreaction time during a workingmemory task (n-back task). Theseresults suggested the presence of rTMS-induced plasticity inprefrontally connected networks downstream of the stimulationsite (Esslinger et al., 2014). Similar results were found whenValchev et al. (2015) delivered a continuous train of thetaburst stimulation (cTBS) to the left primary somatosensorycortex of healthy volunteers. Functional connectivity between thestimulated brain region and several functionally-connected brainregions, including the dorsal premotor cortex, cerebellum, basalganglia, and anterior cingulate cortex, decreased. Another studyapplying high-frequency (10Hz) rTMS to the right DLPFC inhealthy volunteers while passively viewing emotional faces foundsignificant right amygdala activity attenuation when evaluatingnegatively valenced visual stimuli (Baeken et al., 2010). Taken
FIGURE 1 | Human fMRI data showing whole-brain effects of (Left)
high-intensity rTMS at 110% resting motor threshold (RMT), and (Right)
low-intensity rTMS at 90% active motor threshold (AMT). Coronal standard
MNI brain sections (Talairach coordinates indicated) with superimposed fMRI
results are shown. Areas of significant (n = 11, corrected p < 0.01) activations
during rTMS compared to rest have been colored red-yellow, and decrease in
fMRI signal in blue. Suprathreshold rTMS induced an increase in activity in the
stimulated left sensorimotor cortex, medial supplementary and cingulate motor
area, auditory cortex, lateral postcentral region, and left thalamus. Decrease in
activity was observed in the right sensorimotor cortex and occipital cortex.
Subthreshold rTMS produced similar but smaller activations, with no
significant changes in the stimulated brain region. Image from Bestmann et al.
(2004). Permission to reuse Figure 7 from the article was granted by John
Wiley and Sons and Copyright Clearance Center through their RightsLink®
service on 17th of August 2017.
together, these studies show that rTMS can have widespreadeffects, not limited to the stimulated brain area and demonstratethat brain stimulation studies and treatment plans need to takenetwork-level effects into account. Although the hippocampus
Frontiers in Neuroscience | www.frontiersin.org 3 March 2018 | Volume 12 | Article 180
424

Seewoo et al. Combined rTMS/fMRI Studies
as a deep brain structure is unlikely to be directly modulated byrTMS, which affects only superficial regions immediately beneaththe coil, an ipsilateral change in the hippocampus was detectedfollowing multiple-session high-frequency (20Hz) stimulation tothe left lateral parietal cortex of healthy adults (Wang et al., 2014).Increased functional connectivity was observed and this changewas correlated with improved associative memory performance.The effects of rTMS on these brain regions (e.g., cerebellum,basal ganglia, cingulate cortex, amygdala, hippocampus) areinteresting because they have therapeutic implications which willbe summarized in section Potential Applications of CombinedrTMS/fMRI Studies in Human Diseases, along with moredetailed effects of rTMS on functional connectivity in the intactnormal state vs. diseased states.
Activation Patterns in Healthy vs. DiseasedStates in HumansWhile fMRI detects changes in brain activity during an activetask, resting-state fMRI (rs-fMRI) provides information aboutconnectivity between brain regions at rest, i.e., when no specificstimulus or task is presented. Rs-fMRI detects brain regionswhose patterns of spontaneous blood oxygen level dependent(BOLD) contrast fluctuations are temporally correlated when thesubject is at rest. These brain regions with coherent spontaneousfluctuations in activity form an organized network called theresting-state network (Biswal et al., 1995). The default modenetwork (DMN), a resting-state network with a synchronizedactivity pattern, shows highest activation when the subject is atrest and is deactivated in goal-oriented tasks (Raichle et al., 2001).The DMN has been associated with cognitive performance andis thought to play an important role in neuroplasticity throughthe consolidation and maintenance of brain functions (Marcotteet al., 2013). For example, a higher resting-state activity withinthe DMN is hypothesized to favor network efficiency (Kellyet al., 2008), while decreased connectivity between the frontaland posterior DMN brain regions is associated with functionaldeficits (Davis et al., 2009). Consistent with these hypotheses,patients with neurological and psychiatric disorders show DMNdysregulation compared with healthy individuals (for review,see van den Heuvel and Hulshoff Pol, 2010). Disruptions infunctional connectivity between brain regions forming part of theDMNhave been implicated, inter alia, in patients with conditionslike Alzheimer’s disease (Greicius et al., 2004), multiple sclerosis(Lowe et al., 2002; Sbardella et al., 2015), autism (Cherkasskyet al., 2006; Kennedy et al., 2006), epilepsy (Waites et al., 2006),depression (Greicius et al., 2007), schizophrenia (Bluhm et al.,2007; Whitfield-Gabrieli et al., 2009), aphasia (Marcotte et al.,2013), and addiction (Sutherland et al., 2012; Lerman et al., 2014).
Given that the pathophysiology of many psychiatric andneurological disorders is believed to be related to altered neuralconnectivity and network dynamics, interleaved rTMS/fMRIprotocols provide an opportunity to investigate altered patternsof neural activity in these disorders (for review, see Hampson andHoffman, 2010). The activation patterns in healthy individualsand patients with neurological or psychiatric conditions canbe compared after an rTMS session to determine how these
patterns are disrupted in the disease state (Hampson andHoffman, 2010). For example, Schneider et al. (2010) examinedthe effect of 5Hz rTMS on the primary somatosensory cortexin patients with dystonia (a condition associated with impairedsomatosensory ability) and healthy controls based on their abilityto discriminate between two stimulation frequencies applied tothe right index finger before and after the rTMS session. An fMRIscan was carried out together with the tactile discrimination task.Without rTMS application, patients showed relative overactivityin the basal ganglia compared to healthy controls (Figure 2A).rTMS led to an improved performance in this task in healthycontrols but not in the patients. There was increased activitydetected in the stimulated primary somatosensory cortex andbilateral premotor cortex in both groups (Figures 2B,C) butfMRI detected an increase in activity in the basal gangliain healthy subjects only (Figure 2D), suggesting an abnormalfunctional connectivity in the cortico-basal network in dystonia.The authors hypothesized that this could be related to alteredsensory circuits and sensorimotor integration in patients withdystonia.
Interestingly, rTMS has been shown to modulate functionalconnectivity in humans, but the direction (increase or decreasein activity) and extent of this modulation depend on the rTMSprotocol used, as we review below (Fox et al., 2012b; more recentarticles: Popa et al., 2013; Glielmi et al., 2014; Jansen et al.,2015; Li et al., 2016). Using fMRI, increases and decreases infunctional activity have been found depending on the stimulatedbrain region and the frequency of rTMS, allowing insight intohow rTMS affects complex brain circuits (Bohning et al., 1999;Kimbrell et al., 1999).
rTMS PROTOCOLS AND THEIR SPECIFICEFFECTS IN HUMANS
Simple Stimulation ProtocolsThere is considerable evidence from MEP and animal studiesthat that low-frequency (<5Hz) rTMS has long-term synapticdepression (LTD) like effects and thereby decreases brainexcitability (Klomjai et al., 2015; Wilson and St George, 2016).The inhibitory effect of low-frequency rTMS has been confirmedin studies of the DMN. For example, van der Werf et al.(2010) applied 1Hz rTMS for two sessions over the leftDLPFC of healthy volunteers. The rTMS sessions appeared todecrease resting-state network activity within the DMN, withthe reductions happening in the temporal lobes, distant fromthe stimulated region. More specifically, they found that thehippocampus had reduced activation bilaterally following theapplication of low-frequency rTMS. They hypothesized that thischange in neuronal activity of the hippocampus could arise froma change in cortical excitability or the transcallosal spread ofrTMS effects inducing bilateral inhibition. The inhibitory effectof low-frequency rTMS was also confirmed in a resting-stateconnectivity study between motor regions in healthy individuals(Glielmi et al., 2014). Interestingly, 1Hz, an inhibitory frequency,is thought to decrease the activity of inhibitory neurones in thestimulated hemisphere, causing a reduction in the inhibitory
Frontiers in Neuroscience | www.frontiersin.org 4 March 2018 | Volume 12 | Article 180
425

Seewoo et al. Combined rTMS/fMRI Studies
FIGURE 2 | Evidence of functional connectivity abnormalities in patients with dystonia and changes following rTMS. (A) Connectivity maps of patients vs. controls
during the sham condition showing bilaterally greater activity in the ventromedial pallidum of patients compared to healthy controls. Effects of rTMS (real versus sham
condition) on neuronal activity during sensory discrimination task in dystonia patients (B) and controls (C). Both patients with dystonia (B) and healthy controls
(C) show relatively greater activity ipsilaterally in the left premotor cortex (PMC) and the left sensorimotor cortex (S1) following after real-rTMS compared to sham
stimulation. In addition, there is activation of the ventromedial pallidum bilaterally in healthy controls, but not in patients with dystonia. (D) Interaction (group ×
condition) during rTMS in patients with dystonia compared to controls. Compared to controls, dystonia patients show reduced activity in the left oribtofrontal cortext
(OFC) and the ventromedial pallidum bilaterally after real-rTMS compared to sham stimulation (D). Image from Schneider et al. (2010). Permission to reuse Figures 3
and 4 from the article was granted by John Wiley and Sons and Copyright Clearance Center through their RightsLink® service on 13th of February 2018.
interhemispheric drive, which in turn leads to an increase inexcitability of the contralateral hemisphere. For example, O’Sheaet al. (2007) found that even when 1Hz stimulation over the leftdorsal premotor cortex had no effect on behavior, there was acompensatory increase in activity in the right dorsal premotorcortex and connected medial premotor areas. This contralateraleffect of 1Hz rTMS has been utilized to treat patients withstroke by applying low-frequency stimulation to the unaffectedhemisphere to decrease transcallosal inhibition of the lesionedhemisphere and consequently improve motor function in such
patients. An rTMS/fMRI study by Grefkes et al. (2010) recruitedpatients with mild to moderate unilateral hand weakness aftera first-ever subcortical ischemic stroke in the middle cerebralartery. Each subject underwent a baseline fMRI scan, a post-sham stimulation scan, and a post 1Hz stimulation scan. rTMSapplied over contralesional M1 significantly improved the motorperformance of the paretic hand, and the improvement insymptomswas correlated with the functional connectivity results.The fMRI data showed a decrease in negative transcallosalinfluences from the contralesional M1 and an increase in
Frontiers in Neuroscience | www.frontiersin.org 5 March 2018 | Volume 12 | Article 180
426
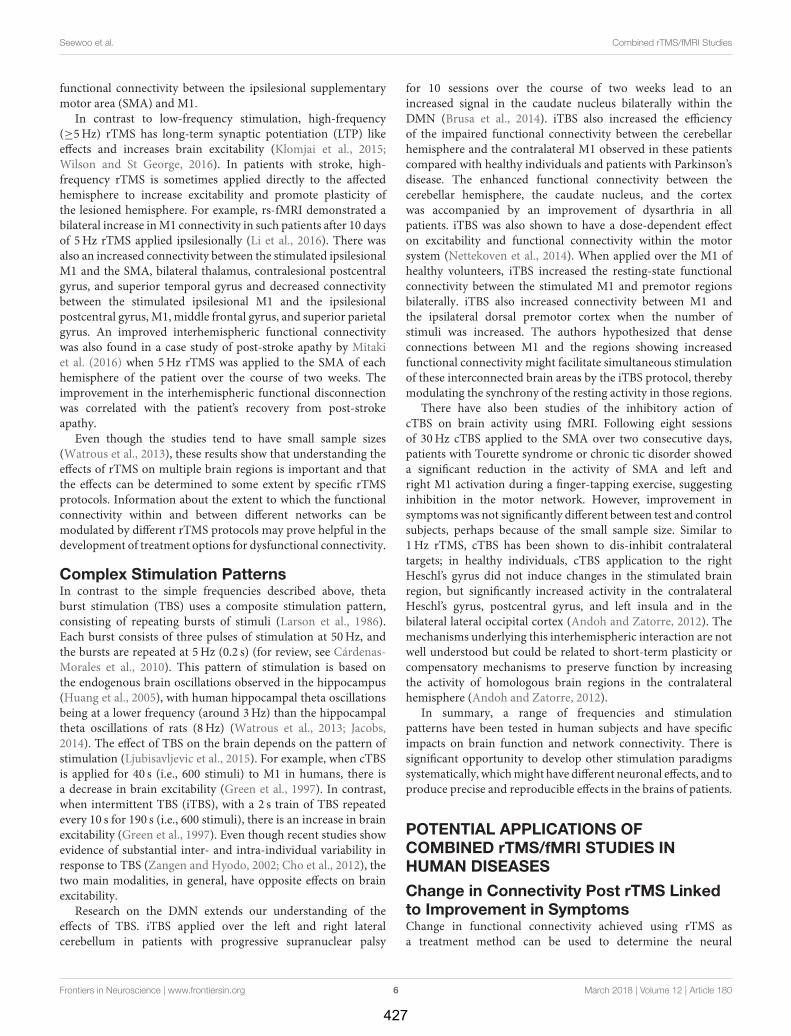
Seewoo et al. Combined rTMS/fMRI Studies
functional connectivity between the ipsilesional supplementarymotor area (SMA) and M1.
In contrast to low-frequency stimulation, high-frequency(≥5Hz) rTMS has long-term synaptic potentiation (LTP) likeeffects and increases brain excitability (Klomjai et al., 2015;Wilson and St George, 2016). In patients with stroke, high-frequency rTMS is sometimes applied directly to the affectedhemisphere to increase excitability and promote plasticity ofthe lesioned hemisphere. For example, rs-fMRI demonstrated abilateral increase inM1 connectivity in such patients after 10 daysof 5Hz rTMS applied ipsilesionally (Li et al., 2016). There wasalso an increased connectivity between the stimulated ipsilesionalM1 and the SMA, bilateral thalamus, contralesional postcentralgyrus, and superior temporal gyrus and decreased connectivitybetween the stimulated ipsilesional M1 and the ipsilesionalpostcentral gyrus, M1, middle frontal gyrus, and superior parietalgyrus. An improved interhemispheric functional connectivitywas also found in a case study of post-stroke apathy by Mitakiet al. (2016) when 5Hz rTMS was applied to the SMA of eachhemisphere of the patient over the course of two weeks. Theimprovement in the interhemispheric functional disconnectionwas correlated with the patient’s recovery from post-strokeapathy.
Even though the studies tend to have small sample sizes(Watrous et al., 2013), these results show that understanding theeffects of rTMS on multiple brain regions is important and thatthe effects can be determined to some extent by specific rTMSprotocols. Information about the extent to which the functionalconnectivity within and between different networks can bemodulated by different rTMS protocols may prove helpful in thedevelopment of treatment options for dysfunctional connectivity.
Complex Stimulation PatternsIn contrast to the simple frequencies described above, thetaburst stimulation (TBS) uses a composite stimulation pattern,consisting of repeating bursts of stimuli (Larson et al., 1986).Each burst consists of three pulses of stimulation at 50Hz, andthe bursts are repeated at 5Hz (0.2 s) (for review, see Cárdenas-Morales et al., 2010). This pattern of stimulation is based onthe endogenous brain oscillations observed in the hippocampus(Huang et al., 2005), with human hippocampal theta oscillationsbeing at a lower frequency (around 3Hz) than the hippocampaltheta oscillations of rats (8Hz) (Watrous et al., 2013; Jacobs,2014). The effect of TBS on the brain depends on the pattern ofstimulation (Ljubisavljevic et al., 2015). For example, when cTBSis applied for 40 s (i.e., 600 stimuli) to M1 in humans, there isa decrease in brain excitability (Green et al., 1997). In contrast,when intermittent TBS (iTBS), with a 2 s train of TBS repeatedevery 10 s for 190 s (i.e., 600 stimuli), there is an increase in brainexcitability (Green et al., 1997). Even though recent studies showevidence of substantial inter- and intra-individual variability inresponse to TBS (Zangen and Hyodo, 2002; Cho et al., 2012), thetwo main modalities, in general, have opposite effects on brainexcitability.
Research on the DMN extends our understanding of theeffects of TBS. iTBS applied over the left and right lateralcerebellum in patients with progressive supranuclear palsy
for 10 sessions over the course of two weeks lead to anincreased signal in the caudate nucleus bilaterally within theDMN (Brusa et al., 2014). iTBS also increased the efficiencyof the impaired functional connectivity between the cerebellarhemisphere and the contralateral M1 observed in these patientscompared with healthy individuals and patients with Parkinson’sdisease. The enhanced functional connectivity between thecerebellar hemisphere, the caudate nucleus, and the cortexwas accompanied by an improvement of dysarthria in allpatients. iTBS was also shown to have a dose-dependent effecton excitability and functional connectivity within the motorsystem (Nettekoven et al., 2014). When applied over the M1 ofhealthy volunteers, iTBS increased the resting-state functionalconnectivity between the stimulated M1 and premotor regionsbilaterally. iTBS also increased connectivity between M1 andthe ipsilateral dorsal premotor cortex when the number ofstimuli was increased. The authors hypothesized that denseconnections between M1 and the regions showing increasedfunctional connectivity might facilitate simultaneous stimulationof these interconnected brain areas by the iTBS protocol, therebymodulating the synchrony of the resting activity in those regions.
There have also been studies of the inhibitory action ofcTBS on brain activity using fMRI. Following eight sessionsof 30Hz cTBS applied to the SMA over two consecutive days,patients with Tourette syndrome or chronic tic disorder showeda significant reduction in the activity of SMA and left andright M1 activation during a finger-tapping exercise, suggestinginhibition in the motor network. However, improvement insymptoms was not significantly different between test and controlsubjects, perhaps because of the small sample size. Similar to1Hz rTMS, cTBS has been shown to dis-inhibit contralateraltargets; in healthy individuals, cTBS application to the rightHeschl’s gyrus did not induce changes in the stimulated brainregion, but significantly increased activity in the contralateralHeschl’s gyrus, postcentral gyrus, and left insula and in thebilateral lateral occipital cortex (Andoh and Zatorre, 2012). Themechanisms underlying this interhemispheric interaction are notwell understood but could be related to short-term plasticity orcompensatory mechanisms to preserve function by increasingthe activity of homologous brain regions in the contralateralhemisphere (Andoh and Zatorre, 2012).
In summary, a range of frequencies and stimulationpatterns have been tested in human subjects and have specificimpacts on brain function and network connectivity. There issignificant opportunity to develop other stimulation paradigmssystematically, whichmight have different neuronal effects, and toproduce precise and reproducible effects in the brains of patients.
POTENTIAL APPLICATIONS OFCOMBINED rTMS/fMRI STUDIES INHUMAN DISEASES
Change in Connectivity Post rTMS Linkedto Improvement in SymptomsChange in functional connectivity achieved using rTMS asa treatment method can be used to determine the neural
Frontiers in Neuroscience | www.frontiersin.org 6 March 2018 | Volume 12 | Article 180
427
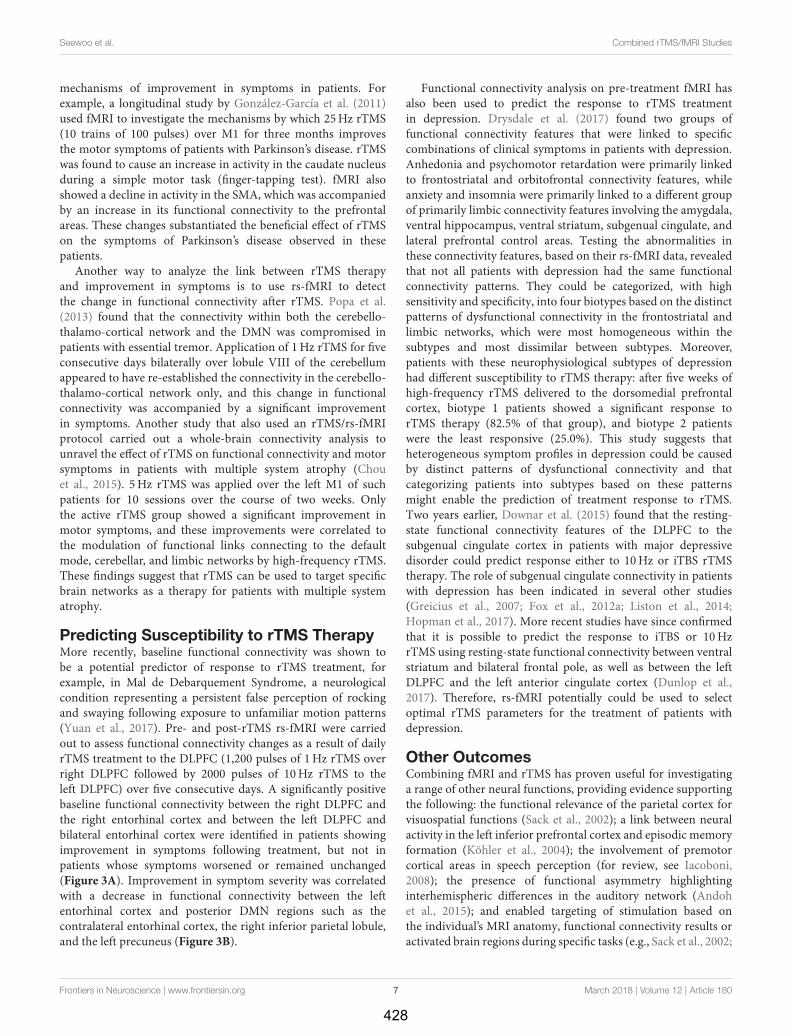
Seewoo et al. Combined rTMS/fMRI Studies
mechanisms of improvement in symptoms in patients. Forexample, a longitudinal study by González-García et al. (2011)used fMRI to investigate the mechanisms by which 25Hz rTMS(10 trains of 100 pulses) over M1 for three months improvesthe motor symptoms of patients with Parkinson’s disease. rTMSwas found to cause an increase in activity in the caudate nucleusduring a simple motor task (finger-tapping test). fMRI alsoshowed a decline in activity in the SMA, which was accompaniedby an increase in its functional connectivity to the prefrontalareas. These changes substantiated the beneficial effect of rTMSon the symptoms of Parkinson’s disease observed in thesepatients.
Another way to analyze the link between rTMS therapyand improvement in symptoms is to use rs-fMRI to detectthe change in functional connectivity after rTMS. Popa et al.(2013) found that the connectivity within both the cerebello-thalamo-cortical network and the DMN was compromised inpatients with essential tremor. Application of 1Hz rTMS for fiveconsecutive days bilaterally over lobule VIII of the cerebellumappeared to have re-established the connectivity in the cerebello-thalamo-cortical network only, and this change in functionalconnectivity was accompanied by a significant improvementin symptoms. Another study that also used an rTMS/rs-fMRIprotocol carried out a whole-brain connectivity analysis tounravel the effect of rTMS on functional connectivity and motorsymptoms in patients with multiple system atrophy (Chouet al., 2015). 5Hz rTMS was applied over the left M1 of suchpatients for 10 sessions over the course of two weeks. Onlythe active rTMS group showed a significant improvement inmotor symptoms, and these improvements were correlated tothe modulation of functional links connecting to the defaultmode, cerebellar, and limbic networks by high-frequency rTMS.These findings suggest that rTMS can be used to target specificbrain networks as a therapy for patients with multiple systematrophy.
Predicting Susceptibility to rTMS TherapyMore recently, baseline functional connectivity was shown tobe a potential predictor of response to rTMS treatment, forexample, in Mal de Debarquement Syndrome, a neurologicalcondition representing a persistent false perception of rockingand swaying following exposure to unfamiliar motion patterns(Yuan et al., 2017). Pre- and post-rTMS rs-fMRI were carriedout to assess functional connectivity changes as a result of dailyrTMS treatment to the DLPFC (1,200 pulses of 1Hz rTMS overright DLPFC followed by 2000 pulses of 10Hz rTMS to theleft DLPFC) over five consecutive days. A significantly positivebaseline functional connectivity between the right DLPFC andthe right entorhinal cortex and between the left DLPFC andbilateral entorhinal cortex were identified in patients showingimprovement in symptoms following treatment, but not inpatients whose symptoms worsened or remained unchanged(Figure 3A). Improvement in symptom severity was correlatedwith a decrease in functional connectivity between the leftentorhinal cortex and posterior DMN regions such as thecontralateral entorhinal cortex, the right inferior parietal lobule,and the left precuneus (Figure 3B).
Functional connectivity analysis on pre-treatment fMRI hasalso been used to predict the response to rTMS treatmentin depression. Drysdale et al. (2017) found two groups offunctional connectivity features that were linked to specificcombinations of clinical symptoms in patients with depression.Anhedonia and psychomotor retardation were primarily linkedto frontostriatal and orbitofrontal connectivity features, whileanxiety and insomnia were primarily linked to a different groupof primarily limbic connectivity features involving the amygdala,ventral hippocampus, ventral striatum, subgenual cingulate, andlateral prefrontal control areas. Testing the abnormalities inthese connectivity features, based on their rs-fMRI data, revealedthat not all patients with depression had the same functionalconnectivity patterns. They could be categorized, with highsensitivity and specificity, into four biotypes based on the distinctpatterns of dysfunctional connectivity in the frontostriatal andlimbic networks, which were most homogeneous within thesubtypes and most dissimilar between subtypes. Moreover,patients with these neurophysiological subtypes of depressionhad different susceptibility to rTMS therapy: after five weeks ofhigh-frequency rTMS delivered to the dorsomedial prefrontalcortex, biotype 1 patients showed a significant response torTMS therapy (82.5% of that group), and biotype 2 patientswere the least responsive (25.0%). This study suggests thatheterogeneous symptom profiles in depression could be causedby distinct patterns of dysfunctional connectivity and thatcategorizing patients into subtypes based on these patternsmight enable the prediction of treatment response to rTMS.Two years earlier, Downar et al. (2015) found that the resting-state functional connectivity features of the DLPFC to thesubgenual cingulate cortex in patients with major depressivedisorder could predict response either to 10Hz or iTBS rTMStherapy. The role of subgenual cingulate connectivity in patientswith depression has been indicated in several other studies(Greicius et al., 2007; Fox et al., 2012a; Liston et al., 2014;Hopman et al., 2017). More recent studies have since confirmedthat it is possible to predict the response to iTBS or 10HzrTMS using resting-state functional connectivity between ventralstriatum and bilateral frontal pole, as well as between the leftDLPFC and the left anterior cingulate cortex (Dunlop et al.,2017). Therefore, rs-fMRI potentially could be used to selectoptimal rTMS parameters for the treatment of patients withdepression.
Other OutcomesCombining fMRI and rTMS has proven useful for investigatinga range of other neural functions, providing evidence supportingthe following: the functional relevance of the parietal cortex forvisuospatial functions (Sack et al., 2002); a link between neuralactivity in the left inferior prefrontal cortex and episodic memoryformation (Köhler et al., 2004); the involvement of premotorcortical areas in speech perception (for review, see Iacoboni,2008); the presence of functional asymmetry highlightinginterhemispheric differences in the auditory network (Andohet al., 2015); and enabled targeting of stimulation based onthe individual’s MRI anatomy, functional connectivity results oractivated brain regions during specific tasks (e.g., Sack et al., 2002;
Frontiers in Neuroscience | www.frontiersin.org 7 March 2018 | Volume 12 | Article 180
428

Seewoo et al. Combined rTMS/fMRI Studies
FIGURE 3 | Evidence of correlation between behavioral improvements and functional connectivity before and after rTMS treatment. (A) Correlation between baseline
entorhinal cortex–dorsolateral prefrontal cortex (DLPFC) functional connectivity and treatment response. Higher baseline functional connectivity exhibited by both right
entorhinal cortex–right DLPFC connectivity (top) and left entorhinal cortex–left DLPFC connectivity (bottom) is associated with a greater magnitude of symptom
reduction (change < 0) after rTMS. (B) Directional effect of functional connectivity changes between the left entorhinal cortex and the right entorhinal cortex (top), right
inferior parietal lobule (middle), and the left precuneus (bottom). Functional connectivity between these regions decreased in patients showing improvement in
symptoms (positive responders) compared with patients whose symptoms remained unchanged (neutral responders) or worsened (negative responders). *,**Indicate
significant changes for p < 0.05 and p < 0.01, respectively. Image from Yuan et al. (2017), an open access article distributed under the terms of the Creative
Commons Attribution License, which permits unrestricted use, distribution, and reproduction in any medium, provided the original work is properly cited.
Fitzgerald et al., 2009; Eldaief et al., 2011; Binney and LambonRalph, 2015; Nierat et al., 2015; Valchev et al., 2015).
NEED FOR ANIMAL rTMS/fMRI STUDIES
The induction of plasticity as described in previous sectionshas been the driving force behind clinical studies of rTMS as apotential treatment of neurological and psychiatric conditions.However, even in neurologically normal subjects, the variabilityin response to rTMS is high (Maeda et al., 2000). Increasingevidence suggests that rTMS may not induce reliable andreproducible effects, therefore limiting the current therapeuticusefulness of this technology (for review, see Ridding andZiemann, 2010). Animal models give us the opportunity tomitigate the confounding effects of variability in studies bycontrolling for gender, age, diet, drugs, genetic background, andthe time at which experiments are carried out. The relativeimportance of these contributing factors can then be identifiedusing animal studies (e.g., state-dependent variability explored inPasley et al., 2009).
Interleaving rTMS and fMRI has opened doors to manypossibilities in the clinical setting. However, there have been noreports of animal studies using those same techniques. fMRI
in rodent research is becoming increasingly popular because ofits high translatability. Moreover, rodent rs-fMRI studies haveconfirmed that rodents possess a DMN similar to humans despitethe distinct evolutionary paths of rodent and primate brains(Figure 4; Lu et al., 2012). Because rodents are widely used aspreclinical models of neuropsychiatric disease (e.g., Tan et al.,2013; Yang et al., 2014, 2015; Zhang et al., 2015; Kistsen et al.,2016), a thorough understanding of how rTMS affects the rodentneural networks is of particular importance for both interpretingrodent fMRI data and translating findings from humans toanimals and back again.
Future Experiments: Linking FunctionalConnectivity Changes Post rTMS toGenetic/Molecular ChangesAnimal models provide a unique opportunity to combinetechniques: changes in functional connectivity between spatiallyseparated brain regions caused by long-term modulation ofnetwork dynamics by rTMS, can be studied in parallel withchanges in behavioral measures, and followed by invasiveprocedures to detect cellular and molecular changes, all withinthe same animal. As shown in human rTMS/fMRI studies, the
Frontiers in Neuroscience | www.frontiersin.org 8 March 2018 | Volume 12 | Article 180
429

Seewoo et al. Combined rTMS/fMRI Studies
FIGURE 4 | Evidence of translatability of fMRI studies: similar brain regions forming part of the default mode network (DMN) in the rat (Paxino’s atlas coordinates
indicated) and human (Talairach coordinates indicated) brains. Connectivity maps are shown in the coronal (A), axial (B), and sagittal (C) planes. Significant clusters for
rat DMN (left) include: 1, orbital cortex; 2, prelimbic cortex (PrL); 3, cingulate cortex (CG1, CG2); 4, auditory/temporal association cortex (Au1, AuD, AuV, TeA); 5,
posterior parietal cortex; 6, retrosplenial cortex (corresponding to the posterior cingulate cortex in humans); 7, hippocampus (CA1). The sagittal plane (medial–lateral:
+0.4mm) also shows: FrA, frontal association cortex; MO, medial orbital cortex; RSG/RSD, granular/dysgranular retrosplenial cortex. Color bar indicates t scores
(n = 16, t > 5.6, corrected p < 0.05). Significant clusters for human DMN (right) include: 1, orbital frontal cortex; 2/3, medial prefrontal cortex/anterior cingulate cortex;
4, lateral temporal cortex; 5, inferior parietal lobe; 6, posterior cingulate cortex; 7, hippocampus/parahippocampal cortex. Color bar indicates z scores (n = 39,
z > 2.1, corrected p < 0.05). Image adapted from Lu et al. (2012), an open access article under the creative commons license and can be republished without the
need to apply for permission provided the material is cited correctly and is republished under the same license.
functional connectivity effects of rTMS are distributed acrossthe whole brain (Figure 1). But, even when in-depth studies ofthe molecular mechanisms are carried out (e.g., quantification ofgene expresssion inmultiple brain regions using low-density PCRarrays by Ljubisavljevic et al., 2015), how these molecular changesfrom animal studies underpin functional connectivity changesdescribed in humans remains unclear. Future studies should aimto identify brain regions affected by the stimulation in animalsusing fMRI and then rTMS mechanisms further elucidated inthe same individuals, for example by measuring changes in geneexpression in the corresponding brain regions postmortem. Suchcorrelational approaches will provide a compelling view of howrTMS affects the brain at systems levels.
Future Experiments: Linking FunctionalConnectivity Changes Post rTMS toStructural ChangesThe induction of brain plasticity has been the driving forcebehind clinical studies of rTMS as a potential treatment
of neurological and psychiatric conditions. A more detailedunderstanding of how rTMS treatment leads to long-termmodulation of network dynamics will be essential for theinterpretation of neuropsychological and cognitive effects ofrTMS in a clinical context. Combined rTMS/fMRI studies inanimals can be used in longitudinal studies to investigate thelong-term effects of rTMS. For example, fMRI can be used tomeasure cumulative effects of repeated rTMS delivery, followingwhich fluorescent dye tracers can be injected into brain toanatomically label neuronal pathways of interest identified byfMRI. Conducting neuronal tract tracing after an fMRI studycould elucidate whether long-term treatment with rTMS caneventually elicit changes in fiber tracts in the brain. Analyzingfunctional connectivity and anatomical connectivity within thesame animals will provide information about how observedfunctional changes correlate with the structural changes detectedat a cellular level. Although there is a general trend towardfunctional and structural connectivity being strongly associated,there are some mismatches within the DMN whereby regionsshowing high correlation have low fiber connectivity (Hsu et al.,
Frontiers in Neuroscience | www.frontiersin.org 9 March 2018 | Volume 12 | Article 180
430

Seewoo et al. Combined rTMS/fMRI Studies
2016). Therefore, future studies to investigate whether the effectof rTMS on functional connectivity is related to fiber connectivityare warranted.
Future Experiments: Combined rTMS/fMRIStudies Using Animal ModelsAn important recent development in animal research hasbeen the use of rs-fMRI for the characterization of modelsof neuropsychiatric disorders. Studies have revealed abnormalfunctional connectivity patterns in animal models due topharmacological modulations or genetic manipulations whichmimic connection abnormalities observed in correspondinghuman disorders (Jonckers et al., 2015; Gozzi and Schwarz,2016; Gorges et al., 2017). These animal models represent apowerful tool to understand the neurobiological basis of thereported ability of rTMS to assist in remediating functionaldysconnectivity observed in human disorders. First, fMRIcan be used to identify the abnormal functional connectivityin an animal model specific to a neurological disorder.For example, the Wistar-Kyoto rat, an accepted model fordepression which has shown resistance to acute antidepressanttreatment (Lahmame et al., 1997; López-Rubalcava and Lucki,2000), also shows functional connectivity anomalies betweenhippocampus, cortical, and sub-cortical regions (Williams et al.,2014), as has been observed in humans with major depressivedisorder. Future studies can investigate the effects of rTMSon such animal models. Functional connectivity changes post-rTMS treatment can then be linked to improvement insymptoms (through behavioral tests such as the forced swimtest commonly used in depression studies) as well as to anyinduced molecular and cellular changes (through postmortemanalysis). Therefore, extending the use of combined rTMS/fMRItechniques in various types of neurological and psychiatricconditions using appropriate animal models is a promisingavenue for understanding the fundamental properties of thefunctional re-organization in these conditions in a unique way.
While the use of combined rTMS/fMRI techniques in rodentresearch has great potential because of its high translatability,there are challenges as we review below.
CHALLENGES ASSOCIATED WITHrTMS/fMRI STUDIES IN ANIMALS
Choice of Animal Model and Developmentof rTMS CoilsA wide range of animal models have been used with the aimof understanding the underlying mechanisms and optimizingthe therapeutic applications of rTMS: rats (Tan et al., 2013;Yang et al., 2015; Zhang et al., 2015), mice (Kistsen et al.,2016), guinea pigs (Mulders et al., 2016), rabbits (Guo et al.,2008), felines (Allen et al., 2007; Valero-Cabré et al., 2007),and in a very limited way, non-human primates (Valero-Cabreet al., 2012; Salinas et al., 2013; Mueller et al., 2014). Theseanimal models have contributed considerably to our currentunderstanding of the non-invasive neuromodulatory effects ofrTMS (reviewed in Tang et al., 2015). However, the variation
in brain structure and the smaller sized brains of non-humananimals present a fundamental challenge in the application ofrTMS and interpretation of its effects.
Non-human primates are clearly the closest to humans interms of brain structure and size and have the advantage thatthey can be taught behavioral tasks similar to those used inhuman rTMS studies. However, the high cost of using non-human primates limit opportunities for invasive studies in largenumbers of animals. Rodents, on the other hand, although theyare the most commonly used laboratory animals, have importantdifferences in brain structure compared to humans. Their smoothcortex possesses a very different geometry to the highly foldedhuman cortex and this is an important consideration becausethe characteristics of the electric field induced by rTMS arepredicted to be influenced by the orientation of the tissue relativeto the coil (Opitz et al., 2011). In addition to differences inbrain structure, the small size of the rodent brain presents aserious challenge. In humans, rTMS is most commonly deliveredusing a coil shaped like a “figure-of-eight” (Figure 5). Thisconfiguration provides a stimulation hotspot at the intersectionof the loops that can be positioned over the target brain regionto provide focal stimulation. Adjacent brain areas also receivestimulation but at much lower intensity. In most animal models,even the smallest commercially available rTMS coil results ina different ratio between head size and coil size from that inhumans, reducing stimulation focality and efficiency (Rodgerand Sherrard, 2015). For example, using a standard, human-sized “figure-of-eight” coil in mice stimulates the entire brainand often an appreciable portion of the body (Figure 5). Thediscrepancy in size, therefore, precludes easy interpretation andtranslation of animal results into clinical applications. Manyrodent studies are therefore compromised by the use of large,human-scale coils to deliver rTMS (e.g., Yang et al., 2014, 2015;Zhang et al., 2015), and some groups have used miniaturizedrTMS coils in order to more closely mimic focal human rTMSin rodents. For example, custom-made 8mm diameter roundcoils have been used to stimulate one hemisphere in both miceand rats (Rodger et al., 2012; Makowiecki et al., 2014), withthe induced current fully contained within the brain, increasingthe efficiency of induction. However, there is a heat dissipationproblem when using small round coils (Cohen and Cuffin, 1991;Wassermann and Zimmermann, 2012), limiting the intensity ofthemagnetic field to levels roughly 10–100 times lower than thosecommonly applied in humans (low-intensity; LI-rTMS) (Rodgerand Sherrard, 2015).
Despite the existing inability to deliver the same magneticfield parameters in humans and in animals with small brains(Rodger and Sherrard, 2015), beneficial effects are seen in animalmodels of neurological disease using human rTMS coils (e.g., Tanet al., 2013; Yang et al., 2015; Zhang et al., 2015; Kistsen et al.,2016) and small LI-rTMS coils (Makowiecki et al., 2014; Clarkeet al., 2017), suggesting that both approaches have therapeuticpotential. Because fMRI can detect both high and low-intensityrTMS effects in the brain, this technique will be useful inestablishing a direct comparison of different intensity magneticfield effects in human and animal brains. This information isimperative if we are to define the best clinical protocols for rTMS.
Frontiers in Neuroscience | www.frontiersin.org 10 March 2018 | Volume 12 | Article 180
431
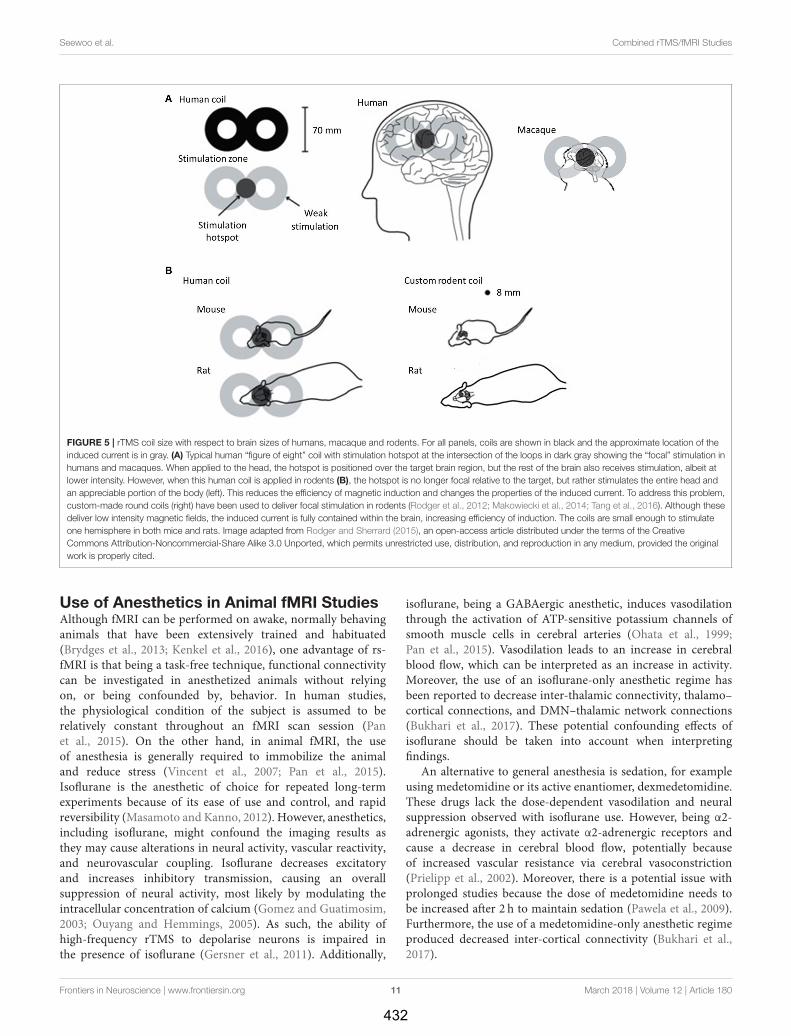
Seewoo et al. Combined rTMS/fMRI Studies
FIGURE 5 | rTMS coil size with respect to brain sizes of humans, macaque and rodents. For all panels, coils are shown in black and the approximate location of the
induced current is in gray. (A) Typical human “figure of eight” coil with stimulation hotspot at the intersection of the loops in dark gray showing the “focal” stimulation in
humans and macaques. When applied to the head, the hotspot is positioned over the target brain region, but the rest of the brain also receives stimulation, albeit at
lower intensity. However, when this human coil is applied in rodents (B), the hotspot is no longer focal relative to the target, but rather stimulates the entire head and
an appreciable portion of the body (left). This reduces the efficiency of magnetic induction and changes the properties of the induced current. To address this problem,
custom-made round coils (right) have been used to deliver focal stimulation in rodents (Rodger et al., 2012; Makowiecki et al., 2014; Tang et al., 2016). Although these
deliver low intensity magnetic fields, the induced current is fully contained within the brain, increasing efficiency of induction. The coils are small enough to stimulate
one hemisphere in both mice and rats. Image adapted from Rodger and Sherrard (2015), an open-access article distributed under the terms of the Creative
Commons Attribution-Noncommercial-Share Alike 3.0 Unported, which permits unrestricted use, distribution, and reproduction in any medium, provided the original
work is properly cited.
Use of Anesthetics in Animal fMRI StudiesAlthough fMRI can be performed on awake, normally behavinganimals that have been extensively trained and habituated(Brydges et al., 2013; Kenkel et al., 2016), one advantage of rs-fMRI is that being a task-free technique, functional connectivitycan be investigated in anesthetized animals without relyingon, or being confounded by, behavior. In human studies,the physiological condition of the subject is assumed to berelatively constant throughout an fMRI scan session (Panet al., 2015). On the other hand, in animal fMRI, the useof anesthesia is generally required to immobilize the animaland reduce stress (Vincent et al., 2007; Pan et al., 2015).Isoflurane is the anesthetic of choice for repeated long-termexperiments because of its ease of use and control, and rapidreversibility (Masamoto and Kanno, 2012). However, anesthetics,including isoflurane, might confound the imaging results asthey may cause alterations in neural activity, vascular reactivity,and neurovascular coupling. Isoflurane decreases excitatoryand increases inhibitory transmission, causing an overallsuppression of neural activity, most likely by modulating theintracellular concentration of calcium (Gomez and Guatimosim,2003; Ouyang and Hemmings, 2005). As such, the ability ofhigh-frequency rTMS to depolarise neurons is impaired inthe presence of isoflurane (Gersner et al., 2011). Additionally,
isoflurane, being a GABAergic anesthetic, induces vasodilationthrough the activation of ATP-sensitive potassium channels ofsmooth muscle cells in cerebral arteries (Ohata et al., 1999;Pan et al., 2015). Vasodilation leads to an increase in cerebralblood flow, which can be interpreted as an increase in activity.Moreover, the use of an isoflurane-only anesthetic regime hasbeen reported to decrease inter-thalamic connectivity, thalamo–cortical connections, and DMN–thalamic network connections(Bukhari et al., 2017). These potential confounding effects ofisoflurane should be taken into account when interpretingfindings.
An alternative to general anesthesia is sedation, for exampleusing medetomidine or its active enantiomer, dexmedetomidine.These drugs lack the dose-dependent vasodilation and neuralsuppression observed with isoflurane use. However, being α2-adrenergic agonists, they activate α2-adrenergic receptors andcause a decrease in cerebral blood flow, potentially becauseof increased vascular resistance via cerebral vasoconstriction(Prielipp et al., 2002). Moreover, there is a potential issue withprolonged studies because the dose of medetomidine needs tobe increased after 2 h to maintain sedation (Pawela et al., 2009).Furthermore, the use of a medetomidine-only anesthetic regimeproduced decreased inter-cortical connectivity (Bukhari et al.,2017).
Frontiers in Neuroscience | www.frontiersin.org 11 March 2018 | Volume 12 | Article 180
432

Seewoo et al. Combined rTMS/fMRI Studies
Interestingly, using a combination of low-dose isofluraneand medetomidine appears to mitigate some of these factors.This anesthetic combination not only allows stable sedation forover four hours (Lu et al., 2012) but also maintains stronginter-cortical and cortical-subcortical connectivity (Grandjeanet al., 2014; Bukhari et al., 2017). The BOLD signal wasdetermined to be maximally stable approximately 90min afterthe initiation of medetomidine infusion, suggesting that fMRIdata should be collected at this time (Lu et al., 2012). Moreover,data were reproducible from repeated fMRI experiments onthe same animal one week apart (Lu et al., 2012). The highreproducibility and minimal impact on network connectivityof the medetomidine/isoflurane combination anesthesia makeit a preferred anesthetic regime for prolonged and longitudinalrs-fMRI studies in rodents.
Rs-fMRI Studies in Rodents—Challengesin Data AnalysisAs with human data, rodent rs-fMRI data need to undergoextensive pre-processing prior to analysis. Rodent studieshave used a variety of software packages such as StatisticalParametric Mapping (SPM) (e.g., Jonckers et al., 2011), Analysisof Functional NeuroImages (AFNI) (e.g., Hsu et al., 2016),BrainVoyager (e.g., Hutchison et al., 2010), and Functional MRIof the Brain (FMRIB) Software Library (FSL) (e.g., Tambalo et al.,2015), which were designed for human fMRI data. Therefore,modifications to the data format and pre-processing steps areoften necessary to undertake analysis of rodent brain data. Forexample, the field of view can be altered by up-scaling the voxelsizes by a factor of 10 to be closer to the size of a human brain(Tambalo et al., 2015). Likewise, because of the smaller size ofthe rodent brain, higher spatial smoothing may be required inanimal fMRI data to increase the signal-to-noise ratio withoutreducing valid activation. Temporal band-pass filtering can alsobe used to reduce hardware noise, low-frequency signal drifts,and some artifacts caused by cardiac rhythm and respiration, aswell as thermal noise (for review, see Pan et al., 2015). Recently,Zerbi et al. (2015) described the use of single-session independentcomponent analysis (ICA) in the FSL for significantly improvedartifact reduction in rs-fMRI rodent data. This method removessignals from common sources, for example breathing, whichcan be isolated into separate components and removed as noisefrom the data. Additionally, because of the difference in theshape of human and animal brains, skull-stripping—a fully-automated step in human fMRI data pre-processing required toprevent extra-brain matter from interfering with the results—isstill largely performed through manual segmentation in animalstudies (Sierakowiak et al., 2015; Zerbi et al., 2015). Beforeanalysis, normalization to map functional networks onto acommon space is necessary to allow for comparison acrosssubjects or groups. However, because not all rodent strains havean available standard template or atlas for co-registration, somestudies acquire and use high-resolution structural images orgroup-averaged images as a common space (Sierakowiak et al.,2015; Zerbi et al., 2015).
Two of the popular methods for rs-fMRI data are seed-basedconnectivity analysis (e.g., Hutchison et al., 2010; Sierakowiaket al., 2015; Huang et al., 2016) and ICA (e.g., Hutchison et al.,
2010; Jonckers et al., 2011; Lu et al., 2012; Zerbi et al., 2015;Hsu et al., 2016). Seed-based correlation, used in the earliestfunctional connectivity studies, is a hypothesis-driven approach,which is particularly attractive for area-based hypotheses-drivenrs-fMRI studies in rodents. The temporal correlation of all voxelswithin the brain is analyzed relative to user-defined seed voxelor small region of interest (Joel et al., 2011). However, seed-points can differ in their location between studies, which affectsthe connectivity patterns considerably and renders comparisonsbetween studies difficult. In addition, this method is not suitablefor exploratory analyses. In contrast, the use of data-drivenICA enables identification of networks of functional connectivitywithin the entire brain without a priori knowledge, and thusis a less biased approach (Cole et al., 2010). Moreover, thisapproach might improve reproducibility because there is no(arbitrary) seed selection (Rosazza et al., 2012). However, theresults might depend on the number of components used.Despite the rodent DMN producing similar spatial patterns andbeing robust irrespective of the number of components (Luet al., 2012), the number of components chosen can impacton the ease of analysis. For example, Jonckers et al. (2011)and Hsu et al. (2016) chose 15-components in ICA over ICAsrepeated with a higher number of components to avoid splittingof the DMN or splitting of some brain regions into differentcomponents. Therefore, despite ICA becoming increasinglypopular for the analysis of rodent rs-fMRI data, challengesremain as there is no set protocol for selecting the number ofcomponents.
SUMMARY
Considered together, the human studies discussed in this reviewdemonstrate the broad relevance and significance of the resultsfrom combined rTMS/fMRI protocols. Results from humanstudies to date inter alia have permitted the characterizationof corrupted networks in diseased states, as well as intriguingglimpses into how alterations in functional connectivity patternsafter rTMS are correlated with improvements in symptoms.There is also exciting evidence that functional connectivity can beused to predict responses to rTMS treatment with high reliability.
Although methodological challenges remain in the use ofbrain imaging techniques in rodents, we anticipate that the useof fMRI to study rTMS in animal models will not only permitmore detailed characterizations of how different rTMS protocolsaffect network dynamics and connectivity but will also elucidatehow these changes reflect the manifestation of symptoms inpreclinical models. Linking these functional changes to themolecular and cellular changes currently known in rodents willprovide new insights into the fundamental mechanisms of brainplasticity and how to use rTMS therapeutically.
AUTHOR CONTRIBUTIONS
BJS: Wrote and edited the manuscript; SE: Provided feedback,structured and edited the manuscript; KWF: Provided feedback,structured and edited the manuscript; JR: Conceived the idea andapproach of the review, structured and edited the manuscript.
Frontiers in Neuroscience | www.frontiersin.org 12 March 2018 | Volume 12 | Article 180
433
Seewoo et al. Combined rTMS/fMRI Studies
ACKNOWLEDGMENTS
BJS is supported by a Forrest Research Foundation Scholarship,an International Postgraduate Research Scholarship, and a
University Postgraduate Award. KWF is an Australian NationalImaging Facility Fellow, a facility funded by the University,State, and Commonwealth Governments. JR was supported byan NHMRC Senior Research Fellowship.
REFERENCES
Allen, E. A., Pasley, B. N., Duong, T., and Freeman, R. D. (2007). Transcranialmagnetic stimulation elicits coupled neural and hemodynamic consequences.Science 317, 1918–1921. doi: 10.1126/science.1146426
Andoh, J., Matsushita, R., Zatorre, R. J. (2015). Asymmetric interhemispherictransfer in the auditory network: evidence from TMS, resting-state fMRI, and diffusion imaging. J. Neurosci. 35, 14602–14611.doi: 10.1523/JNEUROSCI.2333-15.2015
Andoh, J., and Zatorre, R. J. (2012). Mapping the after-effects of theta burststimulation on the human auditory cortex with functional imaging. J. Vis. Exp.67:e3985. doi: 10.3791/3985
Arias-Carrión, O. (2008). Basic mechanisms of rTMS: implications in Parkinson’sdisease. Int. Arch. Med. 1:2. doi: 10.1186/1755-7682-1-2
Baeken, C., De Raedt, R., Van Schuerbeek, P., Vanderhasselt, M. A., De Mey, J.,Bossuyt, A., et al. (2010). Right prefrontal HF-rTMS attenuates right amygdalaprocessing of negatively valenced emotional stimuli in healthy females. Behav.Brain Res. 214, 450–455. doi: 10.1016/j.bbr.2010.06.029
Barker, A. T., and Freeston, I. (2007). Transcranial magnetic stimulation.Scholarpedia J. 2:2936. doi: 10.4249/scholarpedia.2936
Benali, A., Trippe, J., Weiler, E., Mix, A., Petrasch-Parwez, E., Girzalsky,W., et al. (2011). Theta-burst transcranial magnetic stimulation alterscortical inhibition. J. Neurosci. 31, 1193–1203. doi: 10.1523/JNEUROSCI.1379-10.2011
Bestmann, S., Baudewig, J., Siebner, H. R., Rothwell, J. C., and Frahm, J. (2004).Functional MRI of the immediate impact of transcranial magnetic stimulationon cortical and subcortical motor circuits. Eur. J. Neurosci. 19, 1950–1962.doi: 10.1111/j.1460-9568.2004.03277.x
Binney, R. J., and Ralph, M. A. (2015). Using a combination of fMRI andanterior temporal lobe rTMS to measure intrinsic and induced activationchanges across the semantic cognition network. Neuropsychologia 76, 170–181.doi: 10.1016/j.neuropsychologia.2014.11.009
Biswal, B., Yetkin, F. Z., Haughton, V. M., and Hyde, J. S. (1995). Functionalconnectivity in the motor cortex of resting human brain using echo-planarMRI.Magn. Reson. Med. 34, 537–541. doi: 10.1002/mrm.1910340409
Bluhm, R. L., Miller, J., Lanius, R. A., Osuch, E. A., Boksman, K., Neufeld, R. W.,et al. (2007). Spontaneous low-frequency fluctuations in the BOLD signal inSchizophrenic patients: anomalies in the default network. Schizophr. Bull. 33,1004–1012. doi: 10.1093/schbul/sbm052
Bohning, D. E., Shastri, A., McConnell, K. A., Nahas, Z., Lorberbaum,J. P., Roberts, D. R., et al. (1999). A combined TMS/fMRI study ofintensity-dependent TMS over motor cortex. Biol. Psychiatry 45, 385–394.doi: 10.1016/S0006-3223(98)00368-0
Bohning, D. E., Shastri, A., Nahas, Z., Lorberbaum, J. P., Andersen, S. W., Dannels,W. R., et al. (1998). Echoplanar BOLD fMRI of brain activation inducedby concurrent transcranial magnetic stimulation. Invest. Radiol. 33, 336–340.doi: 10.1097/00004424-199806000-00004
Brusa, L., Ponzo, V., Mastropasqua, C., Picazio, S., Bonnì, S., Di Lorenzo, F.,et al. (2014). Theta burst stimulation modulates cerebellar-cortical connectivityin patients with progressive supranuclear palsy. Brain Stimul. 7, 29–35.doi: 10.1016/j.brs.2013.07.003
Brydges, N. M., Whalley, H. C., Jansen, M. A., Merrifield, G. D., Wood, E. R.,Lawrie, S. M., et al. (2013). Imaging conditioned fear circuitry using awakerodent fMRI. PLoS ONE 8:e54197. doi: 10.1371/journal.pone.0054197
Bukhari, Q., Schroeter, A., Cole, D. M., and Rudin, M. (2017). Resting state fMRIin mice reveals anesthesia specific signatures of brain functional networks andtheir interactions. Front. Neural Circuits 11:5. doi: 10.3389/fncir.2017.00005
Cárdenas-Morales, L., Nowak, D. A., Kammer, T., Wolf, R. C., andSchönfeldt-Lecuona, C. (2010). Mechanisms and applications oftheta-burst rTMS on the human motor cortex. Brain Topogr. 22, 294–306.doi: 10.1007/s10548-009-0084-7
Cherkassky, V. L., Kana, R. K., Keller, T. A., and Just, M. A. (2006). Functionalconnectivity in a baseline resting-state network in autism. Neuroreport 17,1687–1690. doi: 10.1097/01.wnr.0000239956.45448.4c
Cho, S. I., Nam, Y. S., Chu, L. Y., Lee, J. H., Bang, J. S., Kim, H. R., et al. (2012).Extremely low-frequency magnetic fields modulate nitric oxide signaling in ratbrain. Bioelectromagnetics 33, 568–574. doi: 10.1002/bem.21715
Chou, Y. H., You, H., Wang, H., Zhao, Y. P., Hou, B., Chen, N. K., et al.(2015). Effect of repetitive transcranial magnetic stimulation on fMRI resting-state connectivity in multiple system atrophy. Brain Connect. 5, 451–459.doi: 10.1089/brain.2014.0325
Clark, C., Cole, J., Winter, C., Williams, K., and Grammer, G. (2015). A reviewof transcranial magnetic stimulation as a treatment for post-traumatic stressdisorder. Curr. Psychiatry Rep. 17, 1–9. doi: 10.1007/s11920-015-0621-x
Clarke, D., Penrose, M. A., Harvey, A. R., Rodger, J., and Bates, K. A. (2017).Low intensity rTMS has sex-dependent effects on the local response ofglia following a penetrating cortical stab injury. Exp. Neurol. 295, 233–242.doi: 10.1016/j.expneurol.2017.06.019
Cohen, D., and Cuffin, B. N. (1991). Developing a more focal magneticstimulation. Part 1. Some basic principles. J. Clin. Neurophysiol. 8, 102–111.doi: 10.1097/00004691-199101000-00013
Cole, D. M., Smith, S. M., and Beckmann, C. F. (2010). Advances and pitfalls in theanalysis and interpretation of resting-state fMRI data. Front. Syst. Neurosci. 4:8.doi: 10.3389/fnsys.2010.00008
Conchou, F., Loubinoux, I., Castel-Lacanal, E., Le Tinnier, A., Gerdelat-Mas, A.,Faure-Marie, N., et al. (2009). Neural substrates of low-frequency repetitivetranscranial magnetic stimulation during movement in healthy subjects andacute stroke patients. A PET study. Hum. Brain Mapp. 30, 2542–2557.doi: 10.1002/hbm.20690
Corti, M., Patten, C., and Triggs, W. (2012). Repetitive transcranial magneticstimulation of motor cortex after stroke: a focused review. Am. J. Phys. Med.
Rehabil. 91, 254–270. doi: 10.1097/PHM.0b013e318228bf0cDavis, S. W., Dennis, N. A., Buchler, N. G., White, L. E., Madden, D.
J., and Cabeza, R. (2009). Assessing the effects of age on long whitematter tracts using diffusion tensor tractography. Neuroimage 46, 530–541.doi: 10.1016/j.neuroimage.2009.01.068
Dlabac-de Lange, J. J., Knegtering, R., and Aleman, A. (2010).Repetitive transcranial magnetic stimulation for negative symptoms ofschizophrenia: review and meta-analysis. J. Clin. Psychiatry 71, 411–418.doi: 10.4088/JCP.08r04808yel
Downar, J., Dunlop, K., Schultze, L. L., Mansouri, F., Vila-Rodriguez, F.,Giacobbe, P., et al. (2015). Resting-state functional connectivity to subgenualcingulate cortex differentially predicts treatment response for 10Hz versusintermittent theta-burst rTMS in major depression. Brain Stimul. 8:396.doi: 10.1016/j.brs.2015.01.265
Drysdale, A. T., Grosenick, L., Downar, J., Dunlop, K., Mansouri, F., Meng, Y.,et al. (2017). Resting-state connectivity biomarkers define neurophysiologicalsubtypes of depression. Nat. Med. 23, 28–38. doi: 10.1038/nm.4246
Dunlop, K., Peters, S. K., Giacobbe, P., Daskalakis, Z. J., Lam, R. W., Kennedy,S. H., et al. (2017). Cortico-cortical and cortico-striatal resting-state functionalconnectivity differentially predicts response to 10Hz rTMS and intermittentTBS to the DLPFC. Brain Stimul. 10:464. doi: 10.1016/j.brs.2017.01.360
Eldaief, M. C., Halko, M. A., Buckner, R. L., and Pascual-Leone, A. (2011).Transcranial magnetic stimulation modulates the brain’s intrinsic activity in afrequency-dependent manner. Proc. Natl. Acad. Sci. U.S.A. 108, 21229–21234.doi: 10.1073/pnas.1113103109
Esslinger, C., Schüler, N., Sauer, C., Gass, D., Mier, D., Braun, U., et al. (2014).Induction and quantification of prefrontal cortical network plasticity using5Hz rTMS and fMRI. Hum. Brain Mapp. 35, 140–151. doi: 10.1002/hbm.22165
Fitzgerald, P. B., Hoy, K., McQueen, S., Maller, J. J., Herring, S., Segrave, R., et al.(2009). A randomized trial of rTMS targeted with MRI based neuro-navigation
Frontiers in Neuroscience | www.frontiersin.org 13 March 2018 | Volume 12 | Article 180
434

Seewoo et al. Combined rTMS/fMRI Studies
in treatment-resistant depression. Neuropsychopharmacology 34, 1255–1262.doi: 10.1038/npp.2008.233
Fox, M. D., Buckner, R. L., White, M. P., Greicius, M. D., and Pascual-Leone,A. (2012a). Efficacy of TMS targets for depression is related to intrinsicfunctional connectivity with the subgenual cingulate. Biol. Psychiatry 72,595–603. doi: 10.1016/j.biopsych.2012.04.028
Fox, M. D., Halko, M. A., Eldaief, M. C., and Pascual-Leone, A. (2012b). Measuringand manipulating brain connectivity with resting state functional connectivitymagnetic resonance imaging (fcMRI) and transcranial magnetic stimulation(TMS). Neuroimage 62, 2232–2243. doi: 10.1016/j.neuroimage.2012.03.035
Galhardoni, R., Correia, G. S., Araujo, H., Yeng, L. T., Fernandes, D. T., Kaziyama,H. H., et al. (2015). Repetitive transcranial magnetic stimulation in chronicpain: a review of the literature. Arch. Phys. Med. Rehabil. 96, S156–S172.doi: 10.1016/j.apmr.2014.11.010
Gao, F., Wang, S., Guo, Y., Wang, J., Lou, M., Wu, J., et al. (2010). Protectiveeffects of repetitive transcranial magnetic stimulation in a rat model of transientcerebral ischaemia: a microPET study. Eur. J. Nucl. Med. Mol. Imaging 37,954–961. doi: 10.1007/s00259-009-1342-3
Gaynes, B. N., Lloyd, S. W., Lux, L., Gartlehner, G., Hansen, R. A., Brode,S., et al. (2014). Repetitive transcranial magnetic stimulation for treatment-resistant depression: a systematic review and meta-analysis. J. Clin. Psychiatry75, 477–489. doi: 10.4088/JCP.13r08815
George, M. S., Wassermann, E. M., Williams, W. A., Callahan, A., Ketter,T. A., Basser, P., et al. (1995). Daily repetitive transcranial magneticstimulation (rTMS) improves mood in depression. Neuroreport 6, 1853–1856.doi: 10.1097/00001756-199510020-00008
Gersner, R., Kravetz, E., Feil, J., Pell, G., and Zangen, A. (2011). Long-term effectsof repetitive transcranial magnetic stimulation on markers for neuroplasticity:differential outcomes in anesthetized and awake animals. J. Neurosci. 31,7521–7526. doi: 10.1523/JNEUROSCI.6751-10.2011
Glielmi, C. B., Butler, A. J., Niyazov, D. M., Darling, W. G., Epstein, C. M.,Alberts, J. L., et al. (2014). Assessing low-frequency repetitive transcranialmagnetic stimulation with functional magnetic resonance imaging: a caseseries. Physiother. Res. Int. 19, 117–125. doi: 10.1002/pri.518
Gomez, R. S., and Guatimosim, C. (2003). Mechanism of action of volatileanesthetics: involvement of intracellular calcium signaling. Curr. Drug TargetsCNS Neurol Disord. 2, 123–129. doi: 10.2174/1568007033482940
González-García, N., Armony, J. L., Soto, J., Trejo, D., Alegria, M. A., and Drucker-Colin, R. (2011). Effects of rTMS on Parkinson’s disease: a longitudinal fMRIstudy. J. Neurol. 258, 1268–1280. doi: 10.1007/s00415-011-5923-2
Gorges, M., Roselli, F., Müller, H. P., Ludolph, A. C., Rasche, V., andKassubek, J. (2017). Functional connectivity mapping in the animal model:principles and applications of resting-state fMRI. Front. Neurol. 8:200.doi: 10.3389/fneur.2017.00200
Gozzi, A., and Schwarz, A. J. (2016). Large-scale functionalconnectivity networks in the rodent brain. Neuroimage 127, 496–509.doi: 10.1016/j.neuroimage.2015.12.017
Grandjean, J., Schroeter, A., Batata, I., and Rudin, M. (2014). Optimization ofanesthesia protocol for resting-state fMRI in mice based on differential effectsof anesthetics on functional connectivity patterns. Neuroimage 102, 838–847.doi: 10.1016/j.neuroimage.2014.08.043
Green, R. M., Pascual-Leone, A., and Wasserman, E. M. (1997). Ethical guidelinesfor rTMS research. IRB Ethics Hum. Res. 19, 1–7. doi: 10.2307/3563539
Grefkes, C., Nowak, D. A., Wang, L. E., Dafotakis, M., Eickhoff, S. B., Fink, G.R., et al. (2010). Modulating cortical connectivity in stroke patients by rTMSassessed with fMRI and dynamic causal modeling. Neuroimage 50, 233–242.doi: 10.1016/j.neuroimage.2009.12.029
Greicius, M. D., Flores, B. H., Menon, V., Glover, G. H., Solvason, H. B., Kenna,H., et al. (2007). Resting-state functional connectivity in major depression:abnormally increased contributions from subgenual cingulate cortex andthalamus. Biol. Psychiatry 62, 429–437. doi: 10.1016/j.biopsych.2006.09.020
Greicius, M. D., Srivastava, G., Reiss, A. L., and Menon, V. (2004). Default-mode network activity distinguishes Alzheimer’s disease from healthy aging:evidence from functional MRI. Proc. Natl. Acad. Sci. U.S.A. 101, 4637–4642.doi: 10.1073/pnas.0308627101
Guo, T., Cao, X., and Xia, L. (2008). Repetitive transcranial magnetic stimulationcauses significant changes of chemical substances in the brain of rabbits
with experimental intracerebral hemorrhage. Front. Med. China 2, 406–409.doi: 10.1007/s11684-008-0078-y
Hampson, M., and Hoffman, R. E. (2010). Transcranial magnetic stimulation andconnectivity mapping: tools for studying the neural bases of brain disorders.Front. Syst. Neurosci. 4:40. doi: 10.3389/fnsys.2010.00040
Hopman, H. J., Neggers, S. F. W., Lam, L. C. W., Mak, A. D., and Chan, S. S.M. (2017). Preliminary results: resting-state fMRI correlations between leftdorsolateral prefrontal cortex and subgenual cingulate and the relationship withrepetitive transcranial magnetic stimulation treatment response. Brain Stimul.
10:403. doi: 10.1016/j.brs.2017.01.197Hsu, L. M., Liang, X., Gu, H., Brynildsen, J. K., Stark, J. A., Ash, J. A., et al. (2016).
Constituents and functional implications of the rat default mode network.Proc. Natl. Acad. Sci. U.S.A. 113, e4541–e4547. doi: 10.1073/pnas.1601485113
Huang, S. M., Wu, Y. L., Peng, S. L., Peng, H. H., Huang, T. Y., Ho, K. C.,et al. (2016). Inter-strain differences in default mode network: a resting statefMRI study on spontaneously hypertensive rat and Wistar Kyoto rat. Sci. Rep.6:21697. doi: 10.1038/srep21697
Huang, Y. Z., Edwards, M. J., Rounis, E., Bhatia, K. P., and Rothwell, J. C. (2005).Theta burst stimulation of the human motor cortex. Neuron 45, 201–206.doi: 10.1016/j.neuron.2004.12.033
Hutchison, R. M., Mirsattari, S. M., Jones, C. K., Gati, J. S., and Leung, L. S. (2010).Functional networks in the anesthetized rat brain revealed by independentcomponent analysis of resting-state fMRI. J. Neurophysiol. 103, 3398–3406.doi: 10.1152/jn.00141.2010
Iacoboni, M. (2008). The role of premotor cortex in speechperception: evidence from fMRI and rTMS. J. Physiol. 102, 31–34.doi: 10.1016/j.jphysparis.2008.03.003
Jaafari, N., Rachid, F., Rotge, J. Y., Polosan, M., El-Hage, W., Belin, D., et al.(2012). Safety and efficacy of repetitive transcranial magnetic stimulation in thetreatment of obsessive-compulsive disorder: a review.World J. Biol. Psychiatry
13, 164–177. doi: 10.3109/15622975.2011.575177Jacobs, J. (2014). Hippocampal theta oscillations are slower in humans than in
rodents: implications for models of spatial navigation and memory. Philos.Trans. R. Soc. B Biol. Sci. 369:20130304. doi: 10.1098/rstb.2013.0304
Jansen, J. M., van Wingen, G., van den Brink, W., and Goudriaan, A. E. (2015).Resting state connectivity in alcohol dependent patients and the effect ofrepetitive transcranial magnetic stimulation. Eur. Neuropsychopharmacol. 25,2230–2239. doi: 10.1016/j.euroneuro.2015.09.019
Joel, S. E., Caffo, B. S., van Zijl, P. C., and Pekar, J. J. (2011). On the relationshipbetween seed-based and ICA-based measures of functional connectivity.Magn.
Reson. Med. 66, 644–657. doi: 10.1002/mrm.22818Jonckers, E., Shah, D., Hamaide, J., Verhoye, M., and Van der Linden,
A. (2015). The power of using functional fMRI on small rodentsto study brain pharmacology and disease. Front. Pharmacol. 6:231.doi: 10.3389/fphar.2015.00231
Jonckers, E., Van Audekerke, J., De Visscher, G., Van der Linden, A., and Verhoye,M. (2011). Functional connectivity fMRI of the rodent brain: comparisonof functional connectivity networks in rat and mouse. PLoS ONE 6:e18876.doi: 10.1371/journal.pone.0018876
Kelly, A. M., Uddin, L. Q., Biswal, B. B., Castellanos, F. X., and Milham, M. P.(2008). Competition between functional brain networks mediates behavioralvariability. Neuroimage 39, 527–537. doi: 10.1016/j.neuroimage.2007.08.008
Kenkel, W. M., Yee, J. R., Moore, K., Madularu, D., Kulkarni, P., Gamber,K., et al. (2016). Functional magnetic resonance imaging in awaketransgenic fragile X rats: evidence of dysregulation in reward processingin the mesolimbic/habenular neural circuit. Transl. Psychiatry 6:e763.doi: 10.1038/tp.2016.15
Kennedy, D. P., Redcay, E., and Courchesne, E. (2006). Failing to deactivate:resting functional abnormalities in autism. Proc. Natl. Acad. Sci. U.S.A. 103,8275–8280. doi: 10.1073/pnas.0600674103
Kimbrell, T. A., Little, J. T., Dunn, R. T., Frye, M. A., Greenberg, B. D.,Wassermann, E. M., et al. (1999). Frequency dependence of antidepressantresponse to left prefrontal repetitive transcranial magnetic stimulation (rTMS)as a function of baseline cerebral glucose metabolism. Biol. Psychiatry 46,1603–1613. doi: 10.1016/S0006-3223(99)00195-X
Frontiers in Neuroscience | www.frontiersin.org 14 March 2018 | Volume 12 | Article 180
435
Seewoo et al. Combined rTMS/fMRI Studies
Kistsen, V., Evstigneev, V., Dubovik, B., and Ulashchik, V. (2016). Theeffects of repetitive transcranial magnetic stimulation on picrotoxin-induced convulsions in mice. Adv. Clin. Exp. Med. 25, 317–325.doi: 10.17219/acem/36597
Klomjai, W., Katz, R., and Lackmy-Vallée, A. (2015). Basic principles oftranscranial magnetic stimulation (TMS) and repetitive TMS (rTMS). Ann.Phys. Rehabil. Med. 58, 208–213. doi: 10.1016/j.rehab.2015.05.005
Köhler, S., Paus, T., Buckner, R. L., and Milner, B. (2004). Effects of left inferiorprefrontal stimulation on episodic memory formation: a two-stage fMRI—rTMS study. J. Cogn. Neurosci. 16, 178–188. doi: 10.1162/089892904322984490
Komssi, S., Kähkönen, S., and Ilmoniemi, R. J. (2004). The effect of stimulusintensity on brain responses evoked by transcranial magnetic stimulation.Hum. Brain Mapp. 21, 154–164. doi: 10.1002/hbm.10159
Kozel, F. A., Tian, F., Dhamne, S., Croarkin, P. E., McClintock, S. M., Elliott,A., et al. (2009). Using simultaneous repetitive transcranial magneticstimulation/functional near infrared spectroscopy (rTMS/fNIRS) tomeasure brain activation and connectivity. Neuroimage 47, 1177–1184.doi: 10.1016/j.neuroimage.2009.05.016
Lahmame, A., del Arco, C., Pazos, A., Yritia, M., and Armario, A.(1997). Are Wistar-Kyoto rats a genetic animal model of depressionresistant to antidepressants? Eur. J. Pharmacol. 337, 115–123.doi: 10.1016/S0014-2999(97)01276-4
Larson, J., Wong, D., and Lynch, G. (1986). Patterned stimulation at the thetafrequency is optimal for the induction of hippocampal long-term potentiation.Brain Res. 368, 347–350. doi: 10.1016/0006-8993(86)90579-2
Lenz, M., and Vlachos, A. (2016). Releasing the cortical brake by non-invasive electromagnetic stimulation? rTMS induces LTD of GABAergicneurotransmission. Front. Neural Circuits 10:96. doi: 10.3389/fncir.2016.00096
Lerman, C., Gu, H., Loughead, J., Ruparel, K., Yang, Y., and Stein, E. A.(2014). Large-scale brain network coupling predicts acute nicotine abstinenceeffects on craving and cognitive function. JAMA Psychiatry 71, 523–530.doi: 10.1001/jamapsychiatry.2013.4091
Li, J., Zhang, X. W., Zuo, Z. T., Lu, J., Meng, C. L., Fang, H. Y., et al.(2016). Cerebral functional reorganization in ischemic stroke after repetitivetranscranial magnetic stimulation: an fMRI study. CNS Neurosci. Ther. 22,952–960. doi: 10.1111/cns.12593
Lipton, R. B., and Pearlman, S. H. (2010). Transcranial magneticsimulation in the treatment of migraine. Neurotherapeutics 7, 204–212.doi: 10.1016/j.nurt.2010.03.002
Liston, C., Chen, A. C., Zebley, B. D., Drysdale, A. T., Gordon, R., Leuchter,B., et al. (2014). Default mode network mechanisms of transcranialmagnetic stimulation in depression. Biol. Psychiatry 76, 517–526.doi: 10.1016/j.biopsych.2014.01.023
Ljubisavljevic, M. R., Javid, A., Oommen, J., Parekh, K., Nagelkerke, N.,Shehab, S., et al. (2015). The effects of different repetitive transcranialmagnetic stimulation (rTMS) protocols on cortical gene expression in arat model of cerebral ischemic-reperfusion injury. PLoS ONE 10:e0139892.doi: 10.1371/journal.pone.0139892
López-Rubalcava, C., and Lucki, I. (2000). Strain differences in thebehavioral effects of antidepressant drugs in the rat forced swimmingtest. Neuropsychopharmacology 22, 191–199. doi: 10.1016/S0893-133X(99)00100-1
Lowe,M. J., Phillips, M. D., Lurito, J. T., Mattson, D., Dzemidzic, M., andMathews,V. P. (2002). Multiple sclerosis: low-frequency temporal blood oxygen level-dependent fluctuations indicate reduced functional connectivity initial results.Radiology 224, 184–192. doi: 10.1148/radiol.2241011005
Lu, H., Zou, Q., Gu, H., Raichle, M. E., Stein, E. A., and Yang, Y. (2012). Rat brainsalso have a default mode network. Proc. Natl. Acad. Sci. U.S.A. 109, 3979–3984.doi: 10.1073/pnas.1200506109
Machado, S., Arias-Carrion, O., Paes, F., Uehara, E., Velasques, B., Teixeira, S., et al.(2011). Effects of repetitive transcranial magnetic stimulation on dystonia: anoverview. Am. J. Neurosci. 2, 5–16. doi: 10.3844/amjnsp.2011.5.16
Maeda, F., Keenan, J. P., Tormos, J. M., Topka, H., and Pascual-Leone, A. (2000).Interindividual variability of the modulatory effects of repetitive transcranialmagnetic stimulation on cortical excitability. Exp. Brain Res. 133, 425–430.doi: 10.1007/s002210000432
Makowiecki, K., Harvey, A. R., Sherrard, R. M., and Rodger, J. (2014). Low-intensity repetitive transcranial magnetic stimulation improves abnormal visual
cortical circuit topography and upregulates BDNF in mice. J. Neurosci. 34,10780–10792. doi: 10.1523/JNEUROSCI.0723-14.2014
Marcotte, K., Perlbarg, V., Marrelec, G., Benali, H., and Ansaldo, A. I. (2013).Default-mode network functional connectivity in aphasia: therapy-inducedneuroplasticity. Brain Lang. 124, 45–55. doi: 10.1016/j.bandl.2012.11.004
Masamoto, K., and Kanno, I. (2012). Anesthesia and the quantitative evaluationof neurovascular coupling. J. Cereb. Blood Flow Metab. 32, 1233–1247.doi: 10.1038/jcbfm.2012.50
Mintun, M. A., Lundstrom, B. N., Snyder, A. Z., Vlassenko, A. G., Shulman, G.L., and Raichle, M. E. (2001). Blood flow and oxygen delivery to human brainduring functional activity: Theoretical modeling and experimental data. Proc.Natl. Acad. Sci. U.S.A. 98, 6859–6864. doi: 10.1073/pnas.111164398
Mitaki, S., Onoda, K., Abe, S., Oguro, H., and Yamaguchi, S. (2016).The effectiveness of repetitive transcranial magnetic stimulationfor poststroke apathy is associated with improved interhemisphericfunctional connectivity. J. Stroke Cerebrovasc. Dis. 25, e219–221.doi: 10.1016/j.jstrokecerebrovasdis.2016.05.014
Mueller, J. K., Grigsby, E. M., Prevosto, V., Petraglia, F. W. III, Rao, H., Deng, Z.D., et al. (2014). Simultaneous transcranial magnetic stimulation and single-neuron recording in alert non-human primates. Nat. Neurosci. 17, 1130–1136.doi: 10.1038/nn.3751
Mulders, W. H., Vooys, V., Makowiecki, K., Tang, A. D., and Rodger, J. (2016).The effects of repetitive transcranial magnetic stimulation in an animal modelof tinnitus. Sci. Rep. 6:38234. doi: 10.1038/srep38234
Müller-Dahlhaus, F., andVlachos, A. (2013). Unraveling the cellular andmolecularmechanisms of repetitive magnetic stimulation. Front. Mol. Neurosci. 6:50.doi: 10.3389/fnmol.2013.00050
Nettekoven, C., Volz, L. J., Kutscha, M., Pool, E. M., Rehme, A. K., Eickhoff, S. B.,et al. (2014). Dose-dependent effects of theta burst rTMS on cortical excitabilityand resting-state connectivity of the human motor system. J. Neurosci. 34,6849–6859. doi: 10.1523/JNEUROSCI.4993-13.2014
Nierat, M. C., Hudson, A. L., Chaskalovic, J., Similowski, T., and Laviolette, L.(2015). Repetitive transcranial magnetic stimulation over the supplementarymotor area modifies breathing pattern in response to inspiratory loading innormal humans. Front. Physiol. 6:273. doi: 10.3389/fphys.2015.00273
O’Reardon, J. P., Solvason, H. B., Janicak, P. G., Sampson, S., Isenberg, K. E., Nahas,Z., et al. (2007). Efficacy and safety of transcranial magnetic stimulation in theacute treatment of major depression: a multisite randomized controlled trial.Biol. Psychiatry 62, 1208–1216. doi: 10.1016/j.biopsych.2007.01.018
Ohata, H., Iida, H., Dohi, S., and Watanabe, Y. (1999). Intravenousdexmedetomidine inhibits cerebrovascular dilation induced byisoflurane and sevoflurane in dogs. Anesth. Analg. 89, 370–377.doi: 10.1213/00000539-199908000-00023
Opitz, A., Windhoff, M., Heidemann, R. M., Turner, R., and Thielscher, A. (2011).How the brain tissue shapes the electric field induced by transcranial magneticstimulation. Neuroimage 58, 849–859. doi: 10.1016/j.neuroimage.2011.06.069
O’Shea, J., Johansen-Berg, H., Trief, D., Göbel, S., and Rushworth, M. F. S. (2007).Functionally specific reorganization in human premotor cortex. Neuron 54,479–490. doi: 10.1016/j.neuron.2007.04.021
Ouyang, W., and Hemmings, H. C. (2005). Depression by isoflurane of theaction potential and underlying voltage-gated ion currents in isolated ratneurohypophysial nerve terminals. J. Pharmacol. Exp. Ther. 312, 801–808.doi: 10.1124/jpet.104.074609
Pan, W. J., Billings, J. C. W., Grooms, J. K., Shakil, S., and Keilholz, S. D. (2015).Considerations for resting state functional MRI and functional connectivitystudies in rodents. Front. Neurosci. 9:269. doi: 10.3389/fnins.2015.00269
Pasley, B. N., Allen, E. A., and Freeman, R. D. (2009). State-dependent variabilityof neuronal responses to transcranial magnetic stimulation of the visual cortex.Neuron 62, 291–303. doi: 10.1016/j.neuron.2009.03.012
Paus, T., Jech, R., Thompson, C. J., Comeau, R., Peters, T., and Evans, A. C. (1997).Transcranial magnetic stimulation during positron emission tomography: anewmethod for studying connectivity of the human cerebral cortex. J. Neurosci.17, 3178–3184.
Pawela, C. P., Biswal, B. B., Hudetz, A. G., Schulte, M. L., Li, R., Jones,S. R., et al. (2009). A protocol for use of medetomidine anesthesiain rats for extended studies using task-induced BOLD contrast andresting-state functional connectivity. Neuroimage 46, 1137–1147.doi: 10.1016/j.neuroimage.2009.03.004
Frontiers in Neuroscience | www.frontiersin.org 15 March 2018 | Volume 12 | Article 180
436
Seewoo et al. Combined rTMS/fMRI Studies
Pereira, L. S., Müller, V. T., da Mota Gomes, M., Rotenberg, A., and Fregni,F. (2016). Safety of repetitive transcranial magnetic stimulation in patientswith epilepsy: a systematic review. Epilepsy Behav. 57(Pt A), 167–176.doi: 10.1016/j.yebeh.2016.01.015
Popa, T., Russo, M., Vidailhet, M., Roze, E., Lehéricy, S., Bonnet, C., et al. (2013).Cerebellar rTMS stimulationmay induce prolonged clinical benefits in essentialtremor, and subjacent changes in functional connectivity: an open label trial.Brain Stimul. 6, 175–179. doi: 10.1016/j.brs.2012.04.009
Prielipp, R. C., Wall, M. H., Tobin, J. R., Groban, L., Cannon, M. A., Fahey, F.H., et al. (2002). Dexmedetomidine-induced sedation in volunteers decreasesregional and global cerebral blood flow. Anesth. Analg. 95, 1052–1059.doi: 10.1213/00000539-200210000-00048
Raichle, M. E., MacLeod, A. M., Snyder, A. Z., Powers, W. J., Gusnard, D. A., andShulman, G. L. (2001). A default mode of brain function. Proc. Natl. Acad. Sci.U.S.A. 98, 676–682. doi: 10.1073/pnas.98.2.676
Ridding, M. C., and Ziemann, U. (2010). Determinants of the induction of corticalplasticity by non-invasive brain stimulation in healthy subjects. J. Physiol. 588,2291–2304. doi: 10.1113/jphysiol.2010.190314
Rodger, J., Mo, C., Wilks, T., Dunlop, S. A., and Sherrard, R. M. (2012).Transcranial pulsed magnetic field stimulation facilitates reorganization ofabnormal neural circuits and corrects behavioral deficits without disruptingnormal connectivity. FASEB J. 26, 1593–1606. doi: 10.1096/fj.11-194878
Rodger, J., and Sherrard, R. M. (2015). Optimising repetitive transcranial magneticstimulation for neural circuit repair following traumatic brain injury. Neural.Regener. Res. 10, 357–359. doi: 10.4103/1673-5374.153676
Rosazza, C., Minati, L., Ghielmetti, F., Mandelli, M. L., and Bruzzone, M. G.(2012). Functional connectivity during resting-state functional MR imaging:study of the correspondence between independent component analysisand region-of-interest-based methods. Am. J. Neuroradiol. 33, 180–187.doi: 10.3174/ajnr.A2733
Rotenberg, A., Muller, P. A., Vahabzadeh-Hagh, A. M., Navarro, X., López-Vales,R., Pascual-Leone, A., et al. (2010). Lateralization of forelimb motor evokedpotentials by transcranial magnetic stimulation in rats. Clin. Neurophysiol. 121,104–108. doi: 10.1016/j.clinph.2009.09.008
Sack, A. T., Hubl, D., Prvulovic, D., Formisano, E., Jandl, M., Zanella, F. E.,et al. (2002). The experimental combination of rTMS and fMRI reveals thefunctional relevance of parietal cortex for visuospatial functions. Cogn. BrainRes. 13, 85–93. doi: 10.1016/S0926-6410(01)00087-8
Salinas, F. S., Narayana, S., Zhang, W., Fox, P. T., and Szabó, C. Á. (2013).Repetitive transcranial magnetic stimulation elicits rate-dependent brainnetwork responses in non-human primates. Brain Stimul. 6, 777–787.doi: 10.1016/j.brs.2013.03.002
Sbardella, E., Petsas, N., Tona, F., and Pantano, P. (2015). Resting-state fMRI inMS: general concepts and brief overview of its application. Biomed Res. Int.
2015, 1–8. doi: 10.1155/2015/212693Schneider, S. A., Pleger, B., Draganski, B., Cordivari, C., Rothwell, J. C., Bhatia,
K. P., et al. (2010). Modulatory effects of 5Hz rTMS over the primarysomatosensory cortex in focal dystonia—An fMRI-TMS study. Mov. Disord.
25, 76–83. doi: 10.1002/mds.22825Seeley, W. W., Crawford, R. K., Zhou, J., Miller, B. L., and Greicius, M. D. (2009).
Neurodegenerative diseases target large-scale human brain networks. Neuron62, 42–52. doi: 10.1016/j.neuron.2009.03.024
Sierakowiak, A., Monnot, C., Aski, S. N., Uppman, M., Li, T. Q., Damberg,P., et al. (2015). Default mode network, motor network, dorsal and ventralbasal ganglia networks in the rat brain: comparison to human networksusing resting state-fMRI. PLoS ONE 10:e0120345. doi: 10.1371/journal.pone.0120345
Soleimani, R., Jalali, M. M., and Hasandokht, T. (2015). Therapeutic impact ofrepetitive transcranial magnetic stimulation (rTMS) on tinnitus: a systematicreview and meta-analysis. Eur. Arch. Oto Rhino Laryngol. 273, 1663–1675.doi: 10.1007/s00405-015-3642-5
Speer, A. M., Kimbrell, T. A., Wassermann, E. M. D., Repella, J., Willis, M. W.,Herscovitch, P., et al. (2000). Opposite effects of high and low frequency rTMSon regional brain activity in depressed patients. Biol. Psychiatry 48, 1133–1141.doi: 10.1016/S0006-3223(00)01065-9
Sutherland, M. T., McHugh, M. J., Pariyadath, V., and Stein, E. A. (2012). Restingstate functional connectivity in addiction: lessons learned and a road ahead.Neuroimage 62, 2281–2295. doi: 10.1016/j.neuroimage.2012.01.117
Sykes, M., Matheson, N. A., Brownjohn, P. W., Tang, A. D., Rodger, J., Shemmell,J. B. H., et al. (2016). Differences in motor evoked potentials induced in rats bytranscranial magnetic stimulation under two separate anesthetics: implicationsfor plasticity studies. Front. Neural Circuits 10:80. doi: 10.3389/fncir.2016.00080
Tambalo, S., Peruzzotti-Jametti, L., Rigolio, R., Fiorini, S., Bontempi, P., Mallucci,G., et al. (2015). Functional magnetic resonance imaging of rats withexperimental autoimmune encephalomyelitis reveals brain cortex remodeling.J. Neurosci. 35, 10088–10100. doi: 10.1523/JNEUROSCI.0540-15.2015
Tan, T., Xie, J., Liu, T., Chen, X., Zheng, X., Tong, Z., et al. (2013). Low-frequency (1Hz) repetitive transcranial magnetic stimulation (rTMS) reversesAβ1–42-mediated memory deficits in rats. Exp. Gerontol. 48, 786–794.doi: 10.1016/j.exger.2013.05.001
Tang, A. D., Lowe, A. S., Garrett, A. R., Woodward, R., Bennett, W., Canty, A. J.,et al. (2016). Construction and evaluation of rodent-specific rTMS coils. Front.Neural Circuits 10:47. doi: 10.3389/fncir.2016.00047
Tang, A., Thickbroom, G., and Rodger, J. (2015). Repetitive transcranial magneticstimulation of the brain: mechanisms from animal and experimental models.Neuroscientist 23, 82–94. doi: 10.1177/1073858415618897
Valchev, N., Curcic-Blake, B., Renken, R. J., Avenanti, A., Keysers, C.,Gazzola, V., et al. (2015). cTBS delivered to the left somatosensory cortexchanges its functional connectivity during rest. Neuroimage 114, 386–397.doi: 10.1016/j.neuroimage.2015.04.017
Valero-Cabré, A., Payne, B., and Pascual-Leone, A. (2007). Opposite impact on14 C-2-deoxyglucose brain metabolism following patterns of high and lowfrequency repetitive transcranial magnetic stimulation in the posterior parietalcortex. Exper. Brain Res. 176, 603–615. doi: 10.1007/s00221-006-0639-8
Valero-Cabre, A., Wattiez, N., Monfort, M., François, C., Rivaud-Péchoux, S.,Gaymard, B., et al. (2012). Frontal non-invasive neurostimulation modulatesantisaccade preparation in non-human primates. PLoS ONE 7:e38674.doi: 10.1371/journal.pone.0038674
van den Heuvel, M. P., and Hulshoff Pol, H. E. (2010). Exploring thebrain network: a review on resting-state fMRI functional connectivity. Eur.Neuropsychopharmacol. 20, 519–534. doi: 10.1016/j.euroneuro.2010.03.008
van der Werf, Y. D., Sanz-Arigita, E. J., Menning, S., and van den Heuvel, O.A. (2010). Modulating spontaneous brain activity using repetitive transcranialmagnetic stimulation. BMC Neurosci. 11:145. doi: 10.1186/1471-2202-11-145
Vincent, J. L., Patel, G. H., Fox, M. D., Snyder, A. Z., Baker, J. T., Van Essen, D.C., et al. (2007). Intrinsic functional architecture in the anaesthetized monkeybrain. Nature 447, 83–86. doi: 10.1038/nature05758
Waites, A. B., Briellmann, R. S., Saling, M. M., Abbott, D. F., and Jackson, G. D.(2006). Functional connectivity networks are disrupted in left temporal lobeepilepsy. Ann. Neurol. 59, 335–343. doi: 10.1002/ana.20733
Walsh, V. (1998). Brain mapping: faradization of the mind. Curr. Biol. 8, R8–R11.doi: 10.1016/S0960-9822(98)70098-3
Wang, J. X., Rogers, L. M., Gross, E. Z., Ryals, A. J., Dokucu, M. E., Brandstatt, K.L., et al. (2014). Targeted enhancement of cortical-hippocampal brain networksand associative memory. Science 345, 1054–1057. doi: 10.1126/science.1252900
Wassermann, E. M., and Zimmermann, T. (2012). Transcranial magnetic brainstimulation: therapeutic promises and scientific gaps. Pharmacol. Ther. 133,98–107. doi: 10.1016/j.pharmthera.2011.09.003
Watrous, A. J., Lee, D. J., Izadi, A., Gurkoff, G. G., Shahlaie, K., and Ekstrom,A. D. (2013). A comparative study of human and rat hippocampal lowfrequency oscillations during spatial navigation. Hippocampus 23, 656–661.doi: 10.1002/hipo.22124
Whitfield-Gabrieli, S., Thermenos, H. W., Milanovic, S., Tsuang, M. T., Faraone,S. V., McCarley, R. W., et al. (2009). Hyperactivity and hyperconnectivityof the default network in Schizophrenia and in first-degree relatives ofpersons with Schizophrenia. Proc. Natl. Acad. Sci. U.S.A. 106, 1279–1284.doi: 10.1073/pnas.0809141106
Williams, K. A., Mehta, N. S., Redei, E. E., Wang, L., and Procissi,D. (2014). Aberrant resting-state functional connectivity in agenetic rat model of depression. Psychiatry Res. 222, 111–113.doi: 10.1016/j.pscychresns.2014.02.001
Wilson, M. T., and St George, L. (2016). Repetitive transcranial magneticstimulation: a call for better data. Front. Neural Circuits 10:57.doi: 10.3389/fncir.2016.00057
Xia, G., Gajwani, P., Muzina, D. J., Kemp, D. E., Gao, K., Ganocy, S. J., et al.(2008). Treatment-emergent mania in unipolar and bipolar depression: focus
Frontiers in Neuroscience | www.frontiersin.org 16 March 2018 | Volume 12 | Article 180
437
Seewoo et al. Combined rTMS/fMRI Studies
on repetitive transcranial magnetic stimulation. Int. J. Neuropsychopharmacol.
11, 119–130. doi: 10.1017/S1461145707007699Yang, H., Shi, O., Jin, Y., Henrich-Noack, P., Qiao, H., Cai, C., et al. (2014).
Functional protection of learning and memory abilities in rats with vasculardementia. Restor. Neurol. Neurosci. 32, 689–700. doi: 10.3233/RNN-140409
Yang, H. Y., Liu, Y., Xie, J. C., Liu, N. N., and Tian, X. (2015). Effectsof repetitive transcranial magnetic stimulation on synaptic plasticity andapoptosis in vascular dementia rats. Behav. Brain Res. 281, 149–155.doi: 10.1016/j.bbr.2014.12.037
Yuan, H., Shou, G., Gleghorn, D., Ding, L., and Cha, Y. H. (2017). Resting statefunctional connectivity signature of treatment effects of repetitive transcranialmagnetic stimulation in mal de debarquement syndrome. Brain Connect. 7,617–626. doi: 10.1089/brain.2017.0514
Zangen, A., and Hyodo, K. (2002). Transcranial magnetic stimulationinduces increases in extracellular levels of dopamine andglutamate in the nucleus accumbens. Neuroreport 13, 2401–2405.doi: 10.1097/00001756-200212200-00005
Zerbi, V., Grandjean, J., Rudin, M., and Wenderoth, N. (2015). Mapping themouse brain with rs-fMRI: an optimized pipeline for functional network
identification. Neuroimage 123, 11–21. doi: 10.1016/j.neuroimage.2015.07.090
Zhang, N., Xing, M., Wang, Y., Tao, H., and Cheng, Y. (2015). Repetitivetranscranial magnetic stimulation enhances spatial learning andsynaptic plasticity via the VEGF and BDNF–NMDAR pathwaysin a rat model of vascular dementia. Neuroscience 311, 284–291.doi: 10.1016/j.neuroscience.2015.10.038
Conflict of Interest Statement: The authors declare that the research wasconducted in the absence of any commercial or financial relationships that couldbe construed as a potential conflict of interest.
Copyright © 2018 Seewoo, Etherington, Feindel and Rodger. This is an open-access
article distributed under the terms of the Creative Commons Attribution License (CC
BY). The use, distribution or reproduction in other forums is permitted, provided
the original author(s) and the copyright owner are credited and that the original
publication in this journal is cited, in accordance with accepted academic practice.
No use, distribution or reproduction is permitted which does not comply with these
terms.
Frontiers in Neuroscience | www.frontiersin.org 17 March 2018 | Volume 12 | Article 180
438
�
� �
�
Transcranial MagneticStimulationBhedita J Seewoo, The University of Western Australia, Perth, Western Australia,
Australia
Sarah J Etherington, Murdoch University, Perth, Western Australia, Australia
Jennifer Rodger, The University of Western Australia, Perth, Western Australia,
Australia
Advanced article
Article Contents• Introduction
• The Principle Underlying TMS
• TMS Protocols
• Monitoring the Effects of TMS
• Clinical Applications of TMS
• Biological Mechanisms of TMS
• Conclusion
Online posting date: 17th April 2019
Transcranial magnetic stimulation (TMS) is gainingincreasing prominence as a non-invasive neu-romodulation technique for the treatment ofneurological and psychiatric conditions. Repet-itive transcranial magnetic stimulation (rTMS)has therapeutic potential for a range of psychi-atric disorders (e.g. depression, schizophrenia) aswell as neurological disorders such as Parkinson’sdisease. The approach has advantages over phar-macological or electroconvulsive therapy due to itspainlessness and limited side effects. The magni-tude, duration and direction (increase or decrease)of TMS-induced changes in brain excitability varydepending on the strength and timing of stim-ulation and the interaction of stimulation coilgeometry with brain structures. The outcomes ofTMS stimulation can also depend on the character-istics (e.g. age, exercise status) of the individualbeing treated. Despite increasing clinical useof rTMS, the cellular and network mechanismsunderlying the clinical application of rTMS remainelusive and will need to be better understood toenable optimisation of clinical outcomes.
Introduction
Transcranial magnetic stimulation (TMS) involves exposure ofhuman brain to a variable magnetic field. TMS is used to inducea current in the brain, where it can cause neurons to fire bychanging their electrical environment (Wassermann and Zimmer-mann, 2012). This technique has advantages over direct electri-cal stimulation of nerves by application of external current (e.g.
eLS subject area: Neuroscience
How to cite:Seewoo, Bhedita J; Etherington, Sarah J; and Rodger, Jennifer(April 2019) Transcranial Magnetic Stimulation. In: eLS. JohnWiley & Sons, Ltd: Chichester.DOI: 10.1002/9780470015902.a0028620
electroconvulsive therapy, ECT), which has been widely usedin the treatment of several psychiatric conditions (Barker andFreeston, 2007; Fujiki and Steward, 1997). Unlike ECT, whichinvolves delivery of electrical signals via implanted electrodes,TMS is entirely non-invasive and does not require use of anaes-thesia. TMS is able to stimulate the human brain and deep periph-eral nerves without causing pain as there is no induced currentthat passes through the skin, where most of the pain fibre nerveendings are located (Barker and Freeston, 2007). TMS also veryrarely causes seizures compared to other techniques for electricalor pharmacological modulation of brain function (Wassermannand Zimmermann, 2012). This safety and lack of discomfortenable the technique to be readily used on patients and volunteersfor therapeutic and research purposes. TMS can modulate brainfunction both locally (directly under the stimulating coil) and indistant brain regions by driving existing neural networks (Bohn-ing et al., 1999). See also: Transcutaneous Electrical NerveSimulation (TENS)
The Principle Underlying TMS
Faraday’s law of electromagnetic induction states that movingmagnetic fields can induce a transient electrical current in anearby conductor (Faraday, 1840). TMS applies this principle toinduce electrical currents in adult human brains (Walsh, 1998).A wound coil is placed on the scalp of the subject over theregion of interest (Figure 1). The magnetic field, induced by thecurrent flowing through the TMS coil, passes into the brain andinduces currents within the brain, stimulating neuronal activityand affecting brain function (Walsh, 1998). The magnetic fieldspass freely into the brain, unimpeded by skin, muscle or skullbecause magnetic fields are not blocked by non-magnetic objects(unlike electricity, which cannot flow through non-conductingmaterials).
TMS Protocols
Early TMS devices emitted only a single, brief magnetic pulseand were generally used to deliver a strong stimulus that triggeredaction potential firing in a pathway and elicited a peripheralresponse (e.g. muscle contraction). Modern devices can generate
eLS © 2019, John Wiley & Sons, Ltd. www.els.net 1
Appendix B
439
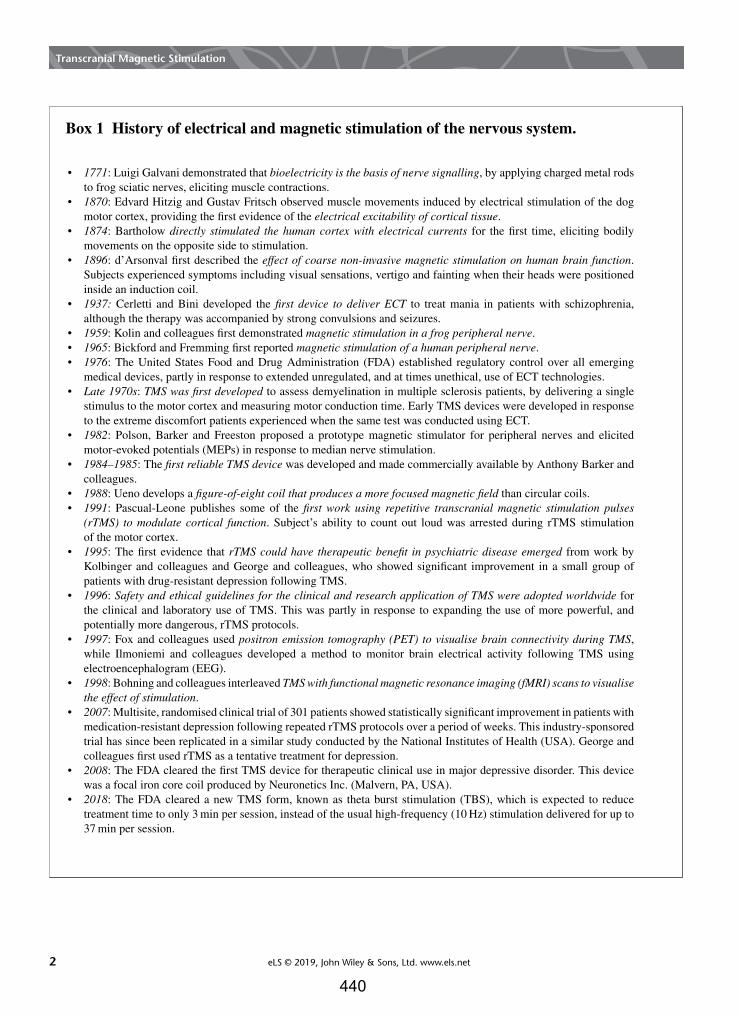
�
� �
�
Transcranial Magnetic Stimulation
Box 1 History of electrical and magnetic stimulation of the nervous system.
• 1771: Luigi Galvani demonstrated that bioelectricity is the basis of nerve signalling, by applying charged metal rodsto frog sciatic nerves, eliciting muscle contractions.
• 1870: Edvard Hitzig and Gustav Fritsch observed muscle movements induced by electrical stimulation of the dogmotor cortex, providing the first evidence of the electrical excitability of cortical tissue.
• 1874: Bartholow directly stimulated the human cortex with electrical currents for the first time, eliciting bodilymovements on the opposite side to stimulation.
• 1896: d’Arsonval first described the effect of coarse non-invasive magnetic stimulation on human brain function.Subjects experienced symptoms including visual sensations, vertigo and fainting when their heads were positionedinside an induction coil.
• 1937: Cerletti and Bini developed the first device to deliver ECT to treat mania in patients with schizophrenia,although the therapy was accompanied by strong convulsions and seizures.
• 1959: Kolin and colleagues first demonstrated magnetic stimulation in a frog peripheral nerve.• 1965: Bickford and Fremming first reported magnetic stimulation of a human peripheral nerve.• 1976: The United States Food and Drug Administration (FDA) established regulatory control over all emerging
medical devices, partly in response to extended unregulated, and at times unethical, use of ECT technologies.• Late 1970s: TMS was first developed to assess demyelination in multiple sclerosis patients, by delivering a single
stimulus to the motor cortex and measuring motor conduction time. Early TMS devices were developed in responseto the extreme discomfort patients experienced when the same test was conducted using ECT.
• 1982: Polson, Barker and Freeston proposed a prototype magnetic stimulator for peripheral nerves and elicitedmotor-evoked potentials (MEPs) in response to median nerve stimulation.
• 1984–1985: The first reliable TMS device was developed and made commercially available by Anthony Barker andcolleagues.
• 1988: Ueno develops a figure-of-eight coil that produces a more focused magnetic field than circular coils.• 1991: Pascual-Leone publishes some of the first work using repetitive transcranial magnetic stimulation pulses
(rTMS) to modulate cortical function. Subject’s ability to count out loud was arrested during rTMS stimulationof the motor cortex.
• 1995: The first evidence that rTMS could have therapeutic benefit in psychiatric disease emerged from work byKolbinger and colleagues and George and colleagues, who showed significant improvement in a small group ofpatients with drug-resistant depression following TMS.
• 1996: Safety and ethical guidelines for the clinical and research application of TMS were adopted worldwide forthe clinical and laboratory use of TMS. This was partly in response to expanding the use of more powerful, andpotentially more dangerous, rTMS protocols.
• 1997: Fox and colleagues used positron emission tomography (PET) to visualise brain connectivity during TMS,while Ilmoniemi and colleagues developed a method to monitor brain electrical activity following TMS usingelectroencephalogram (EEG).
• 1998: Bohning and colleagues interleaved TMS with functional magnetic resonance imaging (fMRI) scans to visualisethe effect of stimulation.
• 2007: Multisite, randomised clinical trial of 301 patients showed statistically significant improvement in patients withmedication-resistant depression following repeated rTMS protocols over a period of weeks. This industry-sponsoredtrial has since been replicated in a similar study conducted by the National Institutes of Health (USA). George andcolleagues first used rTMS as a tentative treatment for depression.
• 2008: The FDA cleared the first TMS device for therapeutic clinical use in major depressive disorder. This devicewas a focal iron core coil produced by Neuronetics Inc. (Malvern, PA, USA).
• 2018: The FDA cleared a new TMS form, known as theta burst stimulation (TBS), which is expected to reducetreatment time to only 3 min per session, instead of the usual high-frequency (10 Hz) stimulation delivered for up to37 min per session.
2 eLS © 2019, John Wiley & Sons, Ltd. www.els.net
440
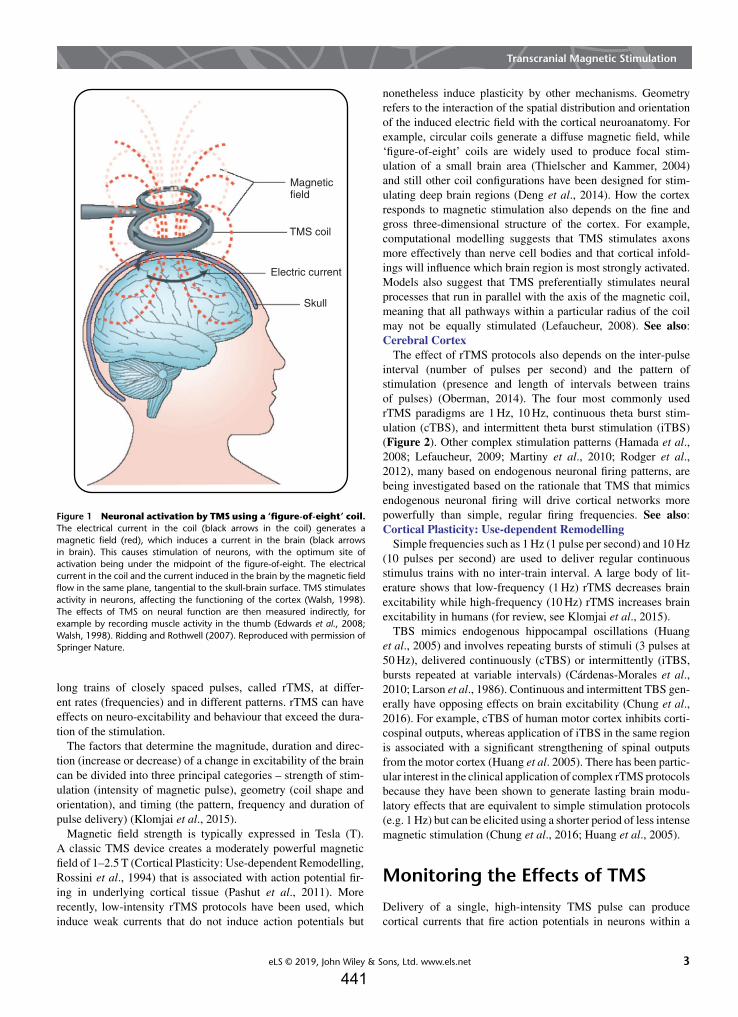
�
� �
�
Transcranial Magnetic Stimulation
Magneticfield
Electric current
Skull
TMS coil
Figure 1 Neuronal activation by TMS using a ‘figure-of-eight’ coil.The electrical current in the coil (black arrows in the coil) generates amagnetic field (red), which induces a current in the brain (black arrowsin brain). This causes stimulation of neurons, with the optimum site ofactivation being under the midpoint of the figure-of-eight. The electricalcurrent in the coil and the current induced in the brain by the magnetic fieldflow in the same plane, tangential to the skull-brain surface. TMS stimulatesactivity in neurons, affecting the functioning of the cortex (Walsh, 1998).The effects of TMS on neural function are then measured indirectly, forexample by recording muscle activity in the thumb (Edwards et al., 2008;Walsh, 1998). Ridding and Rothwell (2007). Reproduced with permission ofSpringer Nature.
long trains of closely spaced pulses, called rTMS, at differ-ent rates (frequencies) and in different patterns. rTMS can haveeffects on neuro-excitability and behaviour that exceed the dura-tion of the stimulation.
The factors that determine the magnitude, duration and direc-tion (increase or decrease) of a change in excitability of the braincan be divided into three principal categories – strength of stim-ulation (intensity of magnetic pulse), geometry (coil shape andorientation), and timing (the pattern, frequency and duration ofpulse delivery) (Klomjai et al., 2015).
Magnetic field strength is typically expressed in Tesla (T).A classic TMS device creates a moderately powerful magneticfield of 1–2.5 T (Cortical Plasticity: Use-dependent Remodelling,Rossini et al., 1994) that is associated with action potential fir-ing in underlying cortical tissue (Pashut et al., 2011). Morerecently, low-intensity rTMS protocols have been used, whichinduce weak currents that do not induce action potentials but
nonetheless induce plasticity by other mechanisms. Geometryrefers to the interaction of the spatial distribution and orientationof the induced electric field with the cortical neuroanatomy. Forexample, circular coils generate a diffuse magnetic field, while‘figure-of-eight’ coils are widely used to produce focal stim-ulation of a small brain area (Thielscher and Kammer, 2004)and still other coil configurations have been designed for stim-ulating deep brain regions (Deng et al., 2014). How the cortexresponds to magnetic stimulation also depends on the fine andgross three-dimensional structure of the cortex. For example,computational modelling suggests that TMS stimulates axonsmore effectively than nerve cell bodies and that cortical infold-ings will influence which brain region is most strongly activated.Models also suggest that TMS preferentially stimulates neuralprocesses that run in parallel with the axis of the magnetic coil,meaning that all pathways within a particular radius of the coilmay not be equally stimulated (Lefaucheur, 2008). See also:Cerebral Cortex
The effect of rTMS protocols also depends on the inter-pulseinterval (number of pulses per second) and the pattern ofstimulation (presence and length of intervals between trainsof pulses) (Oberman, 2014). The four most commonly usedrTMS paradigms are 1 Hz, 10 Hz, continuous theta burst stim-ulation (cTBS), and intermittent theta burst stimulation (iTBS)(Figure 2). Other complex stimulation patterns (Hamada et al.,2008; Lefaucheur, 2009; Martiny et al., 2010; Rodger et al.,2012), many based on endogenous neuronal firing patterns, arebeing investigated based on the rationale that TMS that mimicsendogenous neuronal firing will drive cortical networks morepowerfully than simple, regular firing frequencies. See also:Cortical Plasticity: Use-dependent Remodelling
Simple frequencies such as 1 Hz (1 pulse per second) and 10 Hz(10 pulses per second) are used to deliver regular continuousstimulus trains with no inter-train interval. A large body of lit-erature shows that low-frequency (1 Hz) rTMS decreases brainexcitability while high-frequency (10 Hz) rTMS increases brainexcitability in humans (for review, see Klomjai et al., 2015).
TBS mimics endogenous hippocampal oscillations (Huanget al., 2005) and involves repeating bursts of stimuli (3 pulses at50 Hz), delivered continuously (cTBS) or intermittently (iTBS,bursts repeated at variable intervals) (Cárdenas-Morales et al.,2010; Larson et al., 1986). Continuous and intermittent TBS gen-erally have opposing effects on brain excitability (Chung et al.,2016). For example, cTBS of human motor cortex inhibits corti-cospinal outputs, whereas application of iTBS in the same regionis associated with a significant strengthening of spinal outputsfrom the motor cortex (Huang et al. 2005). There has been partic-ular interest in the clinical application of complex rTMS protocolsbecause they have been shown to generate lasting brain modu-latory effects that are equivalent to simple stimulation protocols(e.g. 1 Hz) but can be elicited using a shorter period of less intensemagnetic stimulation (Chung et al., 2016; Huang et al., 2005).
Monitoring the Effects of TMS
Delivery of a single, high-intensity TMS pulse can producecortical currents that fire action potentials in neurons within a
eLS © 2019, John Wiley & Sons, Ltd. www.els.net 3
441
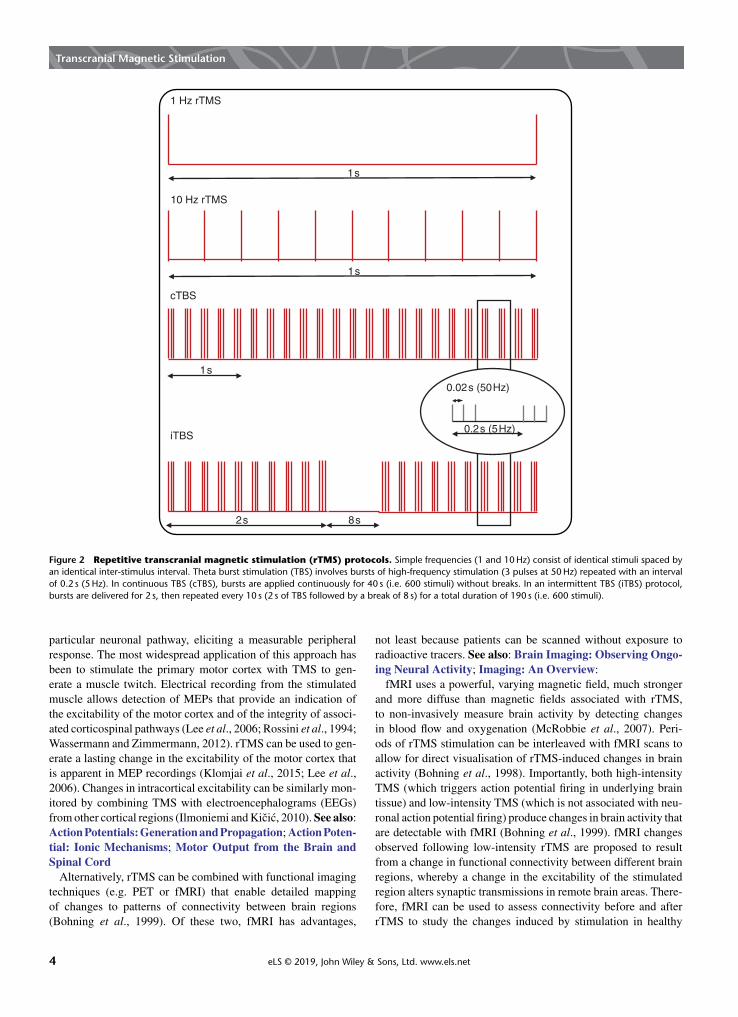
�
� �
�
Transcranial Magnetic Stimulation
1s
1s
1s
2s 8s
0.02s (50Hz)
0.2s (5Hz)
1 Hz rTMS
10 Hz rTMS
cTBS
iTBS
Figure 2 Repetitive transcranial magnetic stimulation (rTMS) protocols. Simple frequencies (1 and 10 Hz) consist of identical stimuli spaced byan identical inter-stimulus interval. Theta burst stimulation (TBS) involves bursts of high-frequency stimulation (3 pulses at 50 Hz) repeated with an intervalof 0.2 s (5 Hz). In continuous TBS (cTBS), bursts are applied continuously for 40 s (i.e. 600 stimuli) without breaks. In an intermittent TBS (iTBS) protocol,bursts are delivered for 2 s, then repeated every 10 s (2 s of TBS followed by a break of 8 s) for a total duration of 190 s (i.e. 600 stimuli).
particular neuronal pathway, eliciting a measurable peripheralresponse. The most widespread application of this approach hasbeen to stimulate the primary motor cortex with TMS to gen-erate a muscle twitch. Electrical recording from the stimulatedmuscle allows detection of MEPs that provide an indication ofthe excitability of the motor cortex and of the integrity of associ-ated corticospinal pathways (Lee et al., 2006; Rossini et al., 1994;Wassermann and Zimmermann, 2012). rTMS can be used to gen-erate a lasting change in the excitability of the motor cortex thatis apparent in MEP recordings (Klomjai et al., 2015; Lee et al.,2006). Changes in intracortical excitability can be similarly mon-itored by combining TMS with electroencephalograms (EEGs)from other cortical regions (Ilmoniemi and Kicic, 2010). See also:Action Potentials: Generation and Propagation; Action Poten-tial: Ionic Mechanisms; Motor Output from the Brain andSpinal Cord
Alternatively, rTMS can be combined with functional imagingtechniques (e.g. PET or fMRI) that enable detailed mappingof changes to patterns of connectivity between brain regions(Bohning et al., 1999). Of these two, fMRI has advantages,
not least because patients can be scanned without exposure toradioactive tracers. See also: Brain Imaging: Observing Ongo-ing Neural Activity; Imaging: An Overview:
fMRI uses a powerful, varying magnetic field, much strongerand more diffuse than magnetic fields associated with rTMS,to non-invasively measure brain activity by detecting changesin blood flow and oxygenation (McRobbie et al., 2007). Peri-ods of rTMS stimulation can be interleaved with fMRI scans toallow for direct visualisation of rTMS-induced changes in brainactivity (Bohning et al., 1998). Importantly, both high-intensityTMS (which triggers action potential firing in underlying braintissue) and low-intensity TMS (which is not associated with neu-ronal action potential firing) produce changes in brain activity thatare detectable with fMRI (Bohning et al., 1999). fMRI changesobserved following low-intensity rTMS are proposed to resultfrom a change in functional connectivity between different brainregions, whereby a change in the excitability of the stimulatedregion alters synaptic transmissions in remote brain areas. There-fore, fMRI can be used to assess connectivity before and afterrTMS to study the changes induced by stimulation in healthy
4 eLS © 2019, John Wiley & Sons, Ltd. www.els.net
�
� �
�
Transcranial Magnetic Stimulation
subjects and subjects with neurological diseases (Fox et al., 2012;Schneider et al., 2010; Seewoo et al., 2018). See also: MagneticResonance Imaging
Given that the pathophysiology of many psychiatric and neuro-logical disorders is believed to be related to altered neural connec-tivity and network dynamics, interleaved fMRI/rTMS protocolsprovide an opportunity to investigate altered patterns of neuralactivity in these disorders (for review, see Hampson and Hoffman,2010). The activation patterns in healthy individuals and patientswith neurological or psychiatric conditions can be compared afteran rTMS session in order to determine how those patterns are dis-rupted in the diseased state. For example, low-frequency rTMS ofthe somatosensory cortex improved the tactile discrimination ofhealthy controls but did not improve the performance of patientswith dystonia (a condition associated with impaired somatosen-sory ability) (Schneider et al., 2010). rTMS increased relevantcortical activity in both groups, but only healthy subjects showedan increase in activation of task-associated subcortical structures,suggesting altered sensory circuits and sensorimotor integrationin dystonia patients. The change in connectivity within the brainbrought about by the use of rTMS as a treatment method canbe used to determine the neural pathways involved in symptomimprovement in patients.
Clinical Applications of TMS
Individual high-intensity TMS pulses are now used routinely ina diagnostic capacity to assess the integrity of spinal and corticalpathways. For example, TMS-induced MEPs (describe above) aredifferently affected by diseases where the predominant pathologyis demyelination (e.g. multiple sclerosis) compared with condi-tions associated with loss of axons or neurons. Monitoring ofcortical pathways with TMS can also be used to guide and opti-mise the outcome of brain surgery. The tolerability of TMS forpatients has been an important driver of its expanded use in thesecontexts. See also: Myelin and Action Potential Propagation
More complex, and potentially more powerful, clinical appli-cations of TMS are revealed with sustained stimulation of thebrain during rTMS. rTMS can promote reorganisation of abnor-mal or damaged neural circuits in animals (Makowiecki et al.,2014) and cause long-term behavioural changes in patients withpsychiatric and neurological disorders (Pridmore and Belmaker,1999). The weight of scientific evidence now supports the use ofrTMS as a treatment for major depression and neuropathic pain(Moisset et al., 2015), and there is growing evidence for its effi-cacy in treating some of the symptoms of stroke (Corti et al.,2012) and Parkinson’s disease (Arias-Carrion, 2008). In 2008, anrTMS device produced by Neuronetics Inc. (Malvern, PA, USA)was approved by the Food and Drug Administration in the UnitedStates for the treatment of patients with major depressive disorderwho are resistant to at least one antidepressant drug (O’Reardonet al., 2007). Other rTMS devices (Magventure, Magstim) havesince been approved. See also: Depression
However, behind this relatively short list of conditions wherethere is convincing evidence for rTMS as an effective treatment,there is a much longer list of conditions where rTMS protocolshave been trialled with mixed or conflicting results. For example,
the overall size of the treatment effect of rTMS is small in patientswith schizophrenia (see review Dlabac-de Lange et al., 2010).The effect size is smaller (and in some studies nonsignificant)when low-frequency rTMS is used compared to high-frequencyrTMS, although negative effects (greater effect in sham stimula-tion group than rTMS group) have also been reported when usinghigh-frequency rTMS.
In part, this reflects the relatively recent emergence of TMS asa therapeutic option and the fact that its safety and tolerabilitymeant that it was very rapidly adopted as a clinical tool, withoutthe underpinning biological research that precedes the clinical useof many medical treatments. However, these conflicting resultsalso reflect genuine challenges associated with the technique. Inparticular, the potential diversity of rTMS protocols (in termsof stimulus intensity, duration, pattern, site of application andothers) means that direct comparisons between studies are oftenimpossible. In addition, the outcomes of rTMS treatment, likemany treatments for complex neurological and psychiatric dis-orders, depend very much on the characteristics of the individualbeing treated. There is increasing evidence that the effects of TMSstimulation vary depending on biological sex and genetic profile,as well as with time-varying factors such as age, diet, and exercisestatus, even in healthy individuals (for review, see Ridding andZiemann, 2010). Responses in patient populations are furthercomplicated by interactions between rTMS therapeutic outcomesand other treatments (e.g. pharmacological) that patients may beundergoing at the same time (Breden Crouse, 2012).
To unravel these sources of variability, to maximise the safetyof rTMS therapies, and to optimise their effectiveness, require abetter scientific understanding of the mechanisms by which TMSaffects the brain (Muller-Dahlhaus and Vlachos, 2013; Seewooet al., 2018).
Biological Mechanisms of TMS
Even though rTMS is being used extensively in a clinicalcontext and clinical trials are abundant, not much is knownabout the brain and cellular mechanisms underlying its efficacy(Muller-Dahlhaus and Vlachos, 2013). Certainly, the intenseneuronal activity generated by rTMS stimulation can alter nervecell function by influencing gene expression (Pridmore andBelmaker, 1999). Importantly, these lasting changes in geneexpression are not restricted to the site of magnetic stimulationbut can be expressed in remote brain regions, possibly in responseto the spread of electrical activity via brain networks (Fujiki andSteward, 1997; Ji et al., 1998). In addition to these distributedchanges in gene expression, rTMS can alter the expression ofsecreted proteins, such as the growth factor BDNF (brain-derivedneurotrophic factor), that could further distribute rTMS-inducedchange within the brain (Ljubisavljevic et al., 2015). Changes ingene expression induced by rTMS depend on the frequency andpattern of stimulation and are associated with improved recov-ery from brain injury in animals (Ljubisavljevic et al., 2015;Pridmore and Belmaker, 1999). Thus, there is evidence thatusing different rTMS paradigms has the potential to selectivelystimulate gene expression in healthy and dysfunctional brainnetworks.
eLS © 2019, John Wiley & Sons, Ltd. www.els.net 5
443
�
� �
�
Transcranial Magnetic Stimulation
An area of particular interest to scientists unravelling thebiological mechanisms of rTMS has been the similaritiesbetween processes activated by rTMS and those involved informs of long-term synaptic plasticity, long-term potentiation(LTP) and long-term depression (LTD). LTP and LTD generatelasting change (strengthening and weakening respectively) inthe strength of a particular synaptic connection depending onthe pattern of activity at that synapse (Klomjai et al., 2015).LTP, in particular, has been extensively investigated in the hip-pocampus as the cellular mechanism for learning and memory(Nicoll, 2017) See also: Long-term Potentiation; Long-termDepression and Depotentiation
There are various parallels between processes that are welldocumented in synaptic plasticity research and those reportedin association with rTMS. For example, high-frequency synap-tic activation generally induces LTP (synaptic strengthening),whereas low-frequency stimulation is more commonly asso-ciated with LTD (synaptic weakening). A similar trend forhigh-frequency stimulation to excite and low-frequency stim-ulation to inhibit neural networks has been reported in rTMSresearch, as discussed above.
There is also some overlap in the molecular players involvedin LTP and in the response to rTMS. For example, LTP dependson modulation of NMDA and AMPA receptors (Herring andNicoll, 2016). A persistent increase in the number of hip-pocampal NMDA receptors has been documented in responseto high-intensity, high-frequency rTMS (Gersner et al., 2011;Kole et al., 1999). Lasting modulation of AMPA receptor GluR1subunits, increasing the calcium permeability of the receptor, hasalso been documented following high-frequency, high-intensityrTMS stimulation (Gersner et al., 2011). The upregulation ofBDNF reported following rTMS (described above and see alsoGersner et al., 2011; Rodger et al., 2012) also features in themolecular mechanism for LTP (Bramham, 2008; Lu, 2003;Patterson et al., 1996). See also: Glutamatergic Synapses:Molecular Organisation
However, the synapse-specificity of LTP is one of its corefeatures, and in this area, synaptic plasticity research divergessomewhat from TMS research. At most synapses, LTP occursonly if two connected neurons are synchronously activated. Anoffset in activation of mere milliseconds can transition plasticityfrom LTP to LTD at a given synapse. It is certainly conceivablethat repeated, TMS-induced activity could induce LTP by syn-chronously activating particular synapses in the brain. It is lessclear how that LTP might influence the spread of activity througha complex neural network, where strengthening of one synapsecan simultaneously promote strengthening and weakening of oth-ers and when the stimulus is being applied in a very diffusemanner compared to the targeted stimulation of synaptic pairs ofneurons in synaptic plasticity research. TMS studies have docu-mented complex effects of both high- and low-frequency stimu-lation that cannot be simply characterised as either potentiatingor depressing (Houdayer et al., 2008), likely reflecting distributedimpacts on excitatory and inhibitory cortical pathways. Translat-ing this complexity to produce optimised, predictable outcomesfor patients remains a challenge in the field. See also: SynapticIntegration
Conclusion
Modulation of brain function using rTMS is still an emergingtherapeutic option. The very favourable side effect profile ofrTMS and its demonstrated efficacy for a small number of con-ditions to date (e.g. major depression, neuropathic pain) providesupport for expanding its usage. However, effective delivery ofrTMS as a therapy will require a better scientific understandingof how rTMS affects the brain, at a cellular and a circuit level.In particular, how therapeutic parameters (strength, pattern andduration of stimulation) combine with patient factors (e.g. sex,fatigue, concomitant use of pharmacological therapy) to deter-mine therapeutic outcomes will be important in optimising theclinical application of rTMS.
Glossary
Action potential A brief, large amplitude deviation in theelectrical potential of a nerve cell that can propagate over longdistances and transmit signals within neural networks.
Functional connectivity An integrated relationship betweenspatially separated brain regions with similar patterns ofactivation, regardless of physical connections.
Long-term depression A long-lasting (usually hours or longer)decrease in the strength of a synapse in response to particularpatterns of activity, often sustained low-frequency stimulation.
Long-term potentiation A long-lasting increase in the strengthof a synapse in response to particular patterns of synapticactivity, believed to underpin information storage in the brain.
Magnetic field The area over which a magnet exerts a force,which can be generated by a magnetic material or by amoving electrical charge.
Synapse A point of communication between two consecutivenerve cells in a neural network that is subject to modulationby internal (e.g. nerve cell activity) and external (e.g.pharmacological) factors.
References
Arias-Carrion O (2008) Basic mechanisms of rTMS: implications inParkinson’s disease. International Archives of Medicine 1 (1): 2.
Barker AT and Freeston I (2007) Transcranial magnetic stimulation.Scholarpedia journal 2 (10): 2936.
Bohning DE, Shastri A, Nahas Z, et al. (1998) Echoplanar BOLDfMRI of brain activation induced by concurrent transcranial mag-netic stimulation. Investigative Radiology 33 (6): 336–340.
Bohning DE, Shastri A, McConnell KA, et al. (1999) A combinedTMS/fMRI study of intensity-dependent TMS over motor cortex.Biological Psychiatry 45 (4): 385–394.
Bramham CR (2008) Local protein synthesis, actin dynamics, andLTP consolidation. Current Opinion in Neurobiology 18 (5):524–531.
Breden Crouse EL (2012) Transcranial magnetic stimulation formajor depressive disorder: what a pharmacist should know. MentalHealth Clinician 2 (6): 152–155.
Cárdenas-Morales L, Nowak DA, Kammer T, et al. (2010) Mecha-nisms and applications of theta-burst rTMS on the human motorcortex. Brain Topography 22 (4): 294–306.
6 eLS © 2019, John Wiley & Sons, Ltd. www.els.net
444

�
� �
�
Transcranial Magnetic Stimulation
Chung SW, Hill AT, Rogasch NC, et al. (2016) Use of theta-burststimulation in changing excitability of motor cortex: a systematicreview and meta-analysis. Neuroscience & Biobehavioral Reviews63: 43–64.
Corti M, Patten C and Triggs W (2012) Repetitive transcranial mag-netic stimulation of motor cortex after stroke: a focused review.American Journal of Physical Medicine and Rehabilitation 91 (3):254–270.
Deng Z-D, Lisanby SH and Peterchev AV (2014) Coil design con-siderations for deep transcranial magnetic stimulation. ClinicalNeurophysiology 125 (6): 1202–1212.
Dlabac-de Lange JJ, Knegtering R and Aleman A (2010) Repeti-tive transcranial magnetic stimulation for negative symptoms ofschizophrenia: review and meta-analysis. Journal of Clinical Psy-chiatry 71 (4): 411–418.
Edwards MJ, Talleli P and Rothwell JC (2008) Clinical applicationsof transcranial magnetic stimulation in patients with movementdisorders. Lancet Neurology 7 (9): 827–840.
Faraday M (1840) Experimental Researches in Electricity. London:Taylor.
Fox MD, Halko MA, Eldaief MC, et al. (2012) Measuring and manip-ulating brain connectivity with resting state functional connectivitymagnetic resonance imaging (fcMRI) and transcranial magneticstimulation (TMS). NeuroImage 62 (4): 2232–2243.
Fujiki M and Steward O (1997) High frequency transcranial magneticstimulation mimics the effects of ECS in upregulating astroglialgene expression in the murine CNS. Molecular Brain Research 44(2): 301–308.
Gersner R, Kravetz E, Feil J, et al. (2011) Long-term effects of repeti-tive transcranial magnetic stimulation on markers for neuroplastic-ity: differential outcomes in anesthetized and awake animals. TheJournal of Neuroscience 31 (20): 7521–7526.
Hamada M, Terao Y, Hanajima R, et al. (2008) Bidirectionallong-term motor cortical plasticity and metaplasticity inducedby quadripulse transcranial magnetic stimulation. The Journal ofPhysiology 586 (16): 3927–3947.
Hampson M and Hoffman RE (2010) Transcranial magnetic stimula-tion and connectivity mapping: tools for studying the neural basesof brain disorders. Frontiers in Systems Neuroscience 4: 40.
Herring BE and Nicoll RA (2016) Long-term potentiation: FromCaMKII to AMPA receptor trafficking. Annual Review of Physi-ology 78 (1): 351–365.
Houdayer E, Degardin A, Cassim F, et al. (2008) The effects of low-and high-frequency repetitive TMS on the input/output propertiesof the human corticospinal pathway. Experimental Brain Research187 (2): 207–217.
Huang Y-Z, Edwards MJ, Rounis E, et al. (2005) Theta burst stimu-lation of the human motor cortex. Neuron 45 (2): 201–206.
Ilmoniemi RJ and Kicic D (2010) Methodology for combined TMSand EEG. Brain Topography 22 (4): 233–248.
Ji R-R, Schlaepfer TE, Aizenman CD, et al. (1998) Repetitive tran-scranial magnetic stimulation activates specific regions in rat brain.Proceedings of the National Academy of Sciences of the UnitedStates of America 95 (26): 15635–15640.
Klomjai W, Katz R and Lackmy-Vallée A (2015) Basic principlesof transcranial magnetic stimulation (TMS) and repetitive TMS(rTMS). Annals of Physical and Rehabilitation Medicine 58 (4):208–213.
Kole MHP, Fuchs E, Ziemann U, et al. (1999) Changes in 5-HT1Aand NMDA binding sites by a single rapid transcranial magneticstimulation procedure in rats. Brain Research 826 (2): 309–312.
Larson J, Wong D and Lynch G (1986) Patterned stimulation atthe theta frequency is optimal for the induction of hippocampallong-term potentiation. Brain Research 368 (2): 347–350.
Lee L, Siebner H and Bestmann S (2006) Rapid modulation ofdistributed brain activity by transcranial magnetic stimulation ofhuman motor cortex. Behavioural Neurology 17 (3–4): 135–148.
Lefaucheur J-P (2008) Principles of therapeutic use of transcranialand epidural cortical stimulation. Clinical Neurophysiology 119(10): 2179–2184.
Lefaucheur J-P (2009) Methods of therapeutic cortical stimulation.Clinical Neurophysiology 39 (1): 1–14.
Ljubisavljevic MR, Javid A, Oommen J, et al. (2015) The effectsof different repetitive transcranial magnetic stimulation (rTMS)protocols on cortical gene expression in a rat model of cerebralischemic-reperfusion injury. PloS One 10 (10): e0139892.
Lu B (2003) BDNF and activity-dependent synaptic modulation.Learning and Memory 10 (2): 86–98.
Makowiecki K, Harvey AR, Sherrard RM, et al. (2014) Low-intensityrepetitive transcranial magnetic stimulation improves abnormalvisual cortical circuit topography and upregulates BDNF in mice.Journal of Neuroscience 34 (32): 10780–10792.
Martiny K, Lunde M and Bech P (2010) Transcranial low voltagepulsed electromagnetic fields in patients with treatment-resistantdepression. Biological Psychiatry 68 (2): 163–169.
McRobbie DW, Moore EA, Graves MJ, et al. (2007) MRI: FromPicture to Proton. Cambridge: Cambridge University Press.
Moisset X, Andrade DC and Bouhassira D (2015) From pulses to painrelief: an update on the mechanisms of rTMS-induced analgesiceffects. European Journal of Pain 20 (5): 689–700.
Muller-Dahlhaus F and Vlachos A (2013) Unraveling the cellularand molecular mechanisms of repetitive magnetic stimulation.Frontiers in Molecular Neuroscience 6: 50.
Nicoll RA (2017) A brief history of long-term potentiation. Neuron93 (2): 281–290.
Oberman L (2014) Repetitive transcranial magnetic stimulation(rTMS) protocols. Neuromethods 89: 129–139.
O’Reardon JP, Solvason HB, Janicak PG, et al. (2007) Efficacy andsafety of transcranial magnetic stimulation in the acute treatmentof major depression: A multisite randomized controlled trial. Bio-logical Psychiatry 62 (11): 1208–1216.
Pashut T, Wolfus S, Friedman A, et al. (2011) Mechanisms ofmagnetic stimulation of central nervous system neurons. PLoSComputational Biology 7 (3): e1002022–e1002022.
Patterson SL, Abel T, Deuel TAS, et al. (1996) Recombinant BDNFrescues deficits in basal synaptic transmission and hippocampalLTP in BDNF knockout mice. Neuron 16 (6): 1137–1145.
Pridmore S and Belmaker R (1999) Transcranial magnetic stimu-lation in the treatment of psychiatric disorders. Psychiatry andClinical Neurosciences 53 (5): 541–548.
Ridding MC and Rothwell JC (2007) Is there a future for therapeuticuse of transcranial magnetic stimulation? Nature Reviews Neuro-science 8 (7): 559–567.
Ridding MC and Ziemann U (2010) Determinants of the inductionof cortical plasticity by non-invasive brain stimulation in healthysubjects. The Journal of Physiology 588 (13): 2291–2304.
Rodger J, Mo C, Wilks T, et al. (2012) Transcranial pulsed mag-netic field stimulation facilitates reorganization of abnormal neuralcircuits and corrects behavioral deficits without disrupting normalconnectivity. FASEB Journal 26 (4): 1593–1606.
Rossini PM, Barker AT, Berardelli A, et al. (1994) Non-invasiveelectrical and magnetic stimulation of the brain, spinal cord and
eLS © 2019, John Wiley & Sons, Ltd. www.els.net 7
445
�
� �
�
Transcranial Magnetic Stimulation
roots: basic principles and procedures for routine clinical applica-tion. Report of an IFCN committee. Electroencephalography andClinical Neurophysiology 91 (2): 79–92.
Schneider SA, Pleger B, Draganski B, et al. (2010) Modulatoryeffects of 5Hz rTMS over the primary somatosensory cortex infocal dystonia – an fMRI-TMS study. Movement Disorders 25 (1):76–83.
Seewoo BJ, Etherington SJ, Feindel KW, et al. (2018) CombinedrTMS/fMRI studies: an overlooked resource in animal models.Frontiers in Neuroscience 12: 180.
Thielscher A and Kammer T (2004) Electric field properties of twocommercial figure-8 coils in TMS: calculation of focality andefficiency. Clinical Neurophysiology 115 (7): 1697–1708.
Walsh V (1998) Brain mapping: Faradization of the mind. CurrentBiology 8 (1): R8–R11.
Wassermann EM and Zimmermann T (2012) Transcranial magneticbrain stimulation: therapeutic promises and scientific gaps. Phar-macology and Therapeutics 133 (1): 98–107.
Further Reading
Funk RHW and Monsees TK (2006) Effects of electromagnetic fieldson cells: physiological and therapeutical approaches and molecularmechanisms of interaction. Cells Tissues Organs 182 (2): 59–78.
Lefaucheur J-P, André-Obadia N, Antal A, et al. (2014)Evidence-based guidelines on the therapeutic use of repetitive tran-scranial magnetic stimulation (rTMS). Clinical Neurophysiology125 (11): 2150–2206.
Nordmann GC, Hochstoeger T and Keays DA (2017)Magnetoreception—a sense without a receptor. PLoS Biology 15(10): e2003234.
Pell GS, Roth Y and Zangen A (2011) Modulation of corticalexcitability induced by repetitive transcranial magnetic stimula-tion: influence of timing and geometrical parameters and under-lying mechanisms. Progress in Neurobiology 93 (1): 59–98.
Tang A, Thickbroom G and Rodger J (2015) Repetitive transcranialmagnetic stimulation of the brain: mechanisms from animal andexperimental models. The Neuroscientist 23 (1): 82–94.
Vidal-Dourado M, Conforto AB, Caboclo LOSF, et al. (2013) Mag-netic fields in non-invasive brain stimulation. The Neuroscientist20 (2): 112–121.
8 eLS © 2019, John Wiley & Sons, Ltd. www.els.net
446

animals
Article
The Pharmacokinetics of MedetomidineAdministered Subcutaneously duringIsoflurane Anaesthesia in Sprague-Dawley Rats
Leila T. Kint 1, Bhedita J. Seewoo 2,3,4 , Timothy H. Hyndman 5 , Michael W. Clarke 6,Scott H. Edwards 7, Jennifer Rodger 3,4, Kirk W. Feindel 2,8 and Gabrielle C. Musk 1,9,*
1 Faculty of Health and Medical Sciences, The University of Western Australia, Perth 6009, Australia;[email protected]
2 Centre for Microscopy, Characterisation and Analysis, Research Infrastructure Centres, TheUniversity of Western Australia, Perth 6009, Australia; [email protected] (B.J.S.);[email protected] (K.W.F.)
3 Experimental and Regenerative Neurosciences, School of Biological Sciences,The University of Western Australia, Perth 6009, Australia; [email protected]
4 Brain Plasticity Group, Perron Institute for Neurological and Translational Science, Perth 6009, Australia5 School of Veterinary Medicine, Murdoch University, Perth 6150, Australia; [email protected] Metabolomics Australia, Centre for Microscopy, Characterisation and Analysis,
The University of Western Australia, Perth 6009, Australia; [email protected] School of Animal Veterinary Sciences, Charles Sturt University, Wagga Wagga 2650, Australia;
[email protected] School of Biomedical Sciences, the University of Western Australia, Perth 6009, Australia9 Animal Care Services, the University of Western Australia, Perth 6009, Australia* Correspondence: [email protected]
Received: 28 May 2020; Accepted: 17 June 2020; Published: 18 June 2020�����������������
Simple Summary: Rodents, including rats, are used as animal models for research investigatingneurological diseases in humans. To enable this research the animals are anaesthetized to facilitateimaging of the brain, but the anaesthetic drugs impact the results of the research. To minimize thevariation between studies anaesthetic protocols should be similar. A common anaesthetic regime isthe combination of two drugs (medetomidine and isoflurane); however, there is much variation inthe doses of these drugs and the way in which they are administered. To provide some evidence tofacilitate the standardization of anaesthetic protocols this study was performed to elucidate the detailsof what the body does to these drugs when they are administered in a certain way. Three groups of ratswere studied to determine the desired dose of medetomidine when isoflurane is used at a low dose(approximately 0.5%). The results of the study are an evidence-based suggestion for medetomidineand isoflurane anaesthesia during functional magnetic resonance imaging (fMRI) studies.
Abstract: Anaesthetic protocols involving the combined use of a sedative agent, medetomidine,and an anaesthetic agent, isoflurane, are increasingly being used in functional magnetic resonanceimaging (fMRI) studies of the rodent brain. Despite the popularity of this combination, a standardisedprotocol for the combined use of medetomidine and isoflurane has not been established, resulting ininconsistencies in the reported use of these drugs. This study investigated the pharmacokinetic detailrequired to standardise the use of medetomidine and isoflurane in rat brain fMRI studies. Using massspectrometry, serum concentrations of medetomidine were determined in Sprague-Dawley ratsduring medetomidine and isoflurane anaesthesia. The serum concentration of medetomidine foradministration with 0.5% (vapouriser setting) isoflurane was found to be 14.4 ng/mL (±3.0 ng/mL).The data suggests that a steady state serum concentration of medetomidine when administeredwith 0.5% (vapouriser setting) isoflurane can be achieved with an initial subcutaneous (SC)dose of 0.12 mg/kg of medetomidine followed by a 0.08 mg/kg/h SC infusion of medetomidine.
Animals 2020, 10, 1050; doi:10.3390/ani10061050 www.mdpi.com/journal/animals
Appendix C
447

Animals 2020, 10, 1050 2 of 14
Consideration of these results for future studies will facilitate standardisation of medetomidine andisoflurane anaesthetic protocols during fMRI data acquisition.
Keywords: functional MRI; rat anaesthesia; refinement
1. Introduction
Anaesthetic protocols using a combination of medetomidine and isoflurane, are increasingly beingused in functional magnetic resonance imaging (fMRI) studies of the rodent brain [1–10]. The use ofmedetomidine for these studies was first reported in 2002 [9], whilst the use of low dose isoflurane(<0.5% vapouriser setting) in conjunction with medetomidine as an anaesthetic regime was firstreported in 2012 [3,4,8].
Medetomidine is an α2-adrenoceptor agonist that causes sedation, hypertension, bradycardia,respiratory depression, hyperglycaemia, diuresis, muscle relaxation and analgesia [11–26]. The potencyand receptor selectivity of medetomidine has led to its widespread use in veterinary anaesthesia,mostly in dogs and cats [27]. Medetomidine causes sedation through the activation of centralα2-adrenoceptors in the locus coeruleus, which prevents excitatory neurotransmitter release inthe central nervous system and thereby depresses cortical arousal [13–15]. Vascular side effects ofmedetomidine occur due to the activation of peripheral α2-adrenoceptors, which causes a transient andmarked increase in systemic vascular resistance [17,18]. This vasoconstriction is followed by a decreasein vascular tone due to suppression of central nervous system-mediated sympathetic stimulation onblood vessels.
Isoflurane is a GABAergic fluorinated ether that causes anaesthesia, respiratory depression,bronchodilation, vasodilation, hypotension and muscle relaxation [28,29]. Isoflurane is commonly usedfor clinical and veterinary anaesthesia due to its rapid onset of action, short recovery time, safety andtitratability [29–31]. The minimum alveolar concentration of isoflurane in adult Sprague-Dawley rats is1.46 ± 0.06% [32].
The benefit of combining medetomidine with isoflurane specifically for fMRI studies has beendescribed. When >0.1% isoflurane is administered with medetomidine, the epileptic activity caused bymedetomidine is suppressed [4,21,22]. Furthermore, the drug combination allows for maintenance of asteady state of anaesthesia for >4 h, with consistent fMRI data [3]. In contrast, when medetomidineis administered alone via a constant rate infusion (subcutaneous (SC) or intravenous (IV)), it is notpossible to maintain a steady state of sedation for >3 h. It has been reported that medetomidineadministered alone can only be used in fMRI experiments >3 h if the initial infusion dose is increasedthree-fold after 90 min, or if medetomidine is specifically administered using an initial IV injectionof at least 0.05 mg/kg medetomidine followed by a subsequent continuous SC or IV infusion of atleast 0.1 mg/kg/h medetomidine, whereby the initial dose cannot be omitted, and the dose cannot bedecreased [1,33].
Despite the increasing popularity of this combination of medetomidine and isoflurane,a standardised anaesthetic protocol for their combined use for rodent brain fMRI studies has not beenestablished [4,34]. Various protocols are described with variable doses of both medetomidine andisoflurane, different routes of administration of medetomidine, and variation in the time of fMRI datacollection relative to the time of medetomidine administration [3,4,6,7,34–36]. For example, in sevenrodent fMRI studies employing medetomidine and isoflurane anaesthesia, the dose of isofluranefor maintenance of anaesthesia varied from 0.25–1.4% [3,4]. Furthermore, reported loading dosesfor medetomidine range from 0.03 to 0.15 mg/kg and the subsequent infusion doses range from0.03 to 0.1 mg/kg/h [35,36]. In addition, the initial injection was administered via the intravenous (IV),intramuscular, intraperitoneal or subcutaneous (SC) routes and the infusion via the IV, intramuscularor SC routes. The time of fMRI data collection after the initial administration of medetomidine ranged
448

Animals 2020, 10, 1050 3 of 14
from 15 min to 90 min [3,7,36]. This variation in the use of medetomidine and isoflurane in rodentbrain fMRI studies may be attributed to a lack of comprehensive data on the pharmacokinetics andpharmacodynamics of medetomidine in rodents. Importantly, the serum concentration of medetomidinewhen administered with low dose isoflurane for rodent brain fMRI studies is unknown. Thus,the rationale for the administration of medetomidine alongside isoflurane for rodent brain fMRI studiesis largely derived empirically [1–9]. However, there is now evidence that both resting-state and evokedblood-oxygen-level-dependent (BOLD) fMRI signals are altered by the type of anaesthetic drug(s) usedand their dose [37–44]. Thus, the many aforementioned inconsistencies in the use of medetomidineand isoflurane may be hindering the interpretation, generalisation, meta-analysis and reproducibilityof rodent brain fMRI studies.
Medetomidine substantially reduces the dose of isoflurane required to achieve stable anaesthesia,therefore minimising anaesthetic-induced distortions of BOLD fMRI signals. When dogs areadministered a dose of 0.03 mg/kg IV medetomidine, there is a reduction of the minimum alveolarconcentration of isoflurane by 47.2% [45]. Furthermore, when rodents are anaesthetised with a combinedmedetomidine and isoflurane dose of 0.06 mg/kg/h IV and 0.5–0.6%, respectively, they exhibit levelsof anaesthesia comparable to rodents treated either medetomidine 0.1 mg/kg/h IV or isoflurane1.3% [34]. Reducing the dose requirement of each drug is beneficial, as high doses of each drugin isolation are associated with significant drug-specific distortions of BOLD fMRI signals [34].This artefact occurs because BOLD fMRI studies rely on the coupling between local blood flow andlocal neuronal activity (known as neurovascular coupling) to infer and therefore measure neuralactivity [44,46,47]. BOLD signals in anaesthetised rodents are considered an accurate measure of neuralactivity when they produce an image reflective of brain activity in the awake rodent. Conversely, BOLDsignals are considered inaccurate when they produce an image reflective of fMRI-induced-stress oranaesthetic-induced changes in the BOLD effect [34,48]. Recent evidence suggests that BOLD fMRIsignals obtained during medetomidine and isoflurane anaesthesia can be used to accurately measurerodent brain activity [34]. This attribute can be partially explained by the synergistic effects of thedrugs on preserving neurovascular coupling [3,35]. When administered alone, medetomidine altersthe BOLD effect by causing cerebral vasoconstriction, bradycardia, decreased cerebral blood flow andaltered astrocyte activity [4,35,49]. In contrast, when isoflurane is administered alone, it alters the BOLDeffect by inducing vasodilation in cerebral vasculature [1,50]. Accordingly, when medetomidine andisoflurane are administered together, medetomidine appears to attenuate isoflurane-induced cerebralvasodilation, leading to better preservation of neurovascular coupling [51].
To better utilise medetomidine and isoflurane anaesthesia in rodent fMRI studies, their useshould be standardised. To this end, the pharmacokinetic profile of medetomidine during combinedmedetomidine and isoflurane anaesthesia needs to be elucidated, and the serum concentrationof medetomidine in this context needs to be identified. The aim of this study was to describethe pharmacokinetics of medetomidine during isoflurane anaesthesia and determine the serumconcentration of medetomidine when administered with 0.5% (vapouriser setting) isoflurane, so thatan evidence-based dosing regimen of medetomidine could be determined for rat brain fMRI studies.
2. Materials and Methods
The study was approved by the University of Western Australia’s Animal Ethics Committee(RA/3/100/1599) and conducted in accordance with the Australian code for the care and use of animalsfor scientific purposes, 8th edition [52]. The rats were housed in an AAALAC (Association for theAssessment and Accreditation of Laboratory Animal Care) facility.
2.1. Animals
Twenty-four male, eight-week-old, Sprague-Dawley rats (Rattus norvegicus) were imported fromthe Animal Resources Centre (Canning Vale, WA, Australia) as specific pathogen free rats. Rats weretransported in groups to the animal care facility and held for at least three days prior to the study.
449
Animals 2020, 10, 1050 4 of 14
The rats were housed in a temperature-controlled environment on a 12 h light-dark cycle with foodand water ad libitum at M-block in QEII Medical Centre (Nedlands, WA, Australia). The cages wereindividually ventilated with minimum dimensions of 38.8 cm wide, 40.6 cm long and 21 cm highon coarse aspen bedding. The rats were housed in pairs, fed a commercial rat diet (Specialty FeedsMeat Free Rat and Mouse Diet, Glen Forrest, Australia) that was autoclaved prior to introductioninto the animal facility and were provided with acidified drinking water (pH 2.5–3). Food was notwithheld prior to anaesthesia. On the day of the procedure, the rats were transferred to the Centre forMicroscopy Characterisation and Analysis (University of Western Australia, Nedlands, Australia).
2.2. Experimental Procedure
The rats were randomly allocated to three experimental groups: Group T for determination ofthe target serum concentration of medetomidine when administered with low dose isoflurane forrodent brain fMRI studies (n = 8); Groups IV and SC for determination of the SC bioavailability ofmedetomidine during isoflurane anaesthesia (n = 8 each).
On the days of the procedures, the rats were anaesthetised with isoflurane (Isothesia™,Henry Schein Animal Health, 2000, Australia) in an induction chamber (4% isoflurane in 100%medical oxygen, 2 L/min). Once adequately anaesthetised (recumbent, no response to toe pinch)the rats were transferred onto the experimental benchtop and positioned for delivery of isofluranethroughout the experiment (0.5–2% isoflurane vapouriser setting in 100% medical oxygen, 1.5 L/min,Darvall Zero Dead Space face mask circuit, Advanced Anaesthesia Specialists) under a heat lamp.Physiological monitoring included body temperature, respiratory rate, heart rate, electrocardiography(PC-SAM Small Animal Monitor, SA Instruments Inc., 1030 System), exhaled isoflurane and CO2
(data not shown) (ISATM Sidestream Gas Analyzer, Masimo Sweden AB and PHASEIN and LightningMulti-Parameter Monitor Vetronic Services Ltd., Newton Abbot, UK) and blood glucose concentration(Accu-Chek Guide, Roche, Mannheim, Germany). These variables were recorded every 5 min. A singlerat was studied at any one time, during the hours of 8 a.m. and 6 p.m.
Medetomidine (1 mg/mL, Ilium Medetomidine Injection, Troy Laboratories Pty. Limited,Glendenning, Australia) was administered according to the treatment group. In Group T, rats wereadministered an initial dose of medetomidine of 0.05 mg/kg SC over 1 s via a 29 G insulin syringe(BD Ultra-Fine Insulin Syringe, Becton Dickinson Pty Ltd., Macquarie University Research Park NorthRyde, Australia), immediately followed by a continuous medetomidine infusion of 0.15 mg/kg/h SC,administered via a 25 G butterfly catheter connected to a single syringe infusion pump (Legato 100Syringe Pump, KD Scientific Inc., Holliston, MA, USA). This protocol was developed empiricallyand used in our laboratory [10]. In the IV and SC groups, rats were manually administered a singledose of either IV (through a catheter placed in a lateral tail vein) or SC (under the skin over a flank)medetomidine at 0.05 mg/kg. The concentration of isoflurane was immediately reduced to 0.5% afteradministration of the initial dose of medetomidine and then subsequently altered to maintain anadequate depth of anaesthesia as assessed by response to toe pinch, heart rate and respiratory rate.
For serial blood sampling, a catheter was placed in the lateral tail vein (22 G, 1 IN, BD AngiocathIV Catheter, BD Australia, Seven Hills, NSW, Australia), secured with surgical tape and flushed withheparinised saline (5 IU/mL). In Group T, blood samples were collected 60 and 90 min after the initialdose of medetomidine. The conditions during anaesthesia were consistent with those observed inprevious studies performed in this laboratory and were considered suitable for identification of thetarget concentration of medetomidine. In the IV group, blood was collected before medetomidineadministration and 2, 5, 10, 20, 30, 60, 120 and 180 min afterwards. In the SC group, blood wascollected before medetomidine administration and 10, 20, 30, 40, 50, 60, 120, 180 and 240 minafterwards. Following collection of the final sample, but before recovery from anaesthesia, the ratswere euthanised via an intraperitoneal or IV injection of pentobarbitone (160 mg/kg, Lethabarb, Jurox,Rutherford, Australia).
450

Animals 2020, 10, 1050 5 of 14
2.3. Blood Sampling
Approximately 0.5 mL of blood was collected at each timepoint by inserting a 23 G butterflycatheter (SV*23BLK, Terumo Australia Pty Ltd., Macquarie Park, NSW, Australia) into the injection portof the tail vein catheter. The initial saline-diluted drops of blood were discarded before sample collection.A glucometer was used to immediately measure the blood glucose concentration (Accu-Chek Guide,Roche, BellaVista, Australia). After each sample, the catheter was flushed with 0.5 mL of heparinisedsaline (5 IU/mL) to prevent clot formation in the catheter and replace blood volume. In the event thatsufficient blood could not be collected from the catheter, blood was drawn percutaneously from thelateral saphenous veins, medial saphenous veins or femoral arteries through a butterfly catheter.
All blood samples were collected in 3 mL Eppendorf tubes and allowed to clot at room temperaturefor 10 min before refrigeration. Refrigerated samples were centrifuged within 4 h of collectionusing an Eppendorf MiniSpin plus centrifugation at 2000× g for 10 min. Approximately 0.2 mL ofserum supernatant from each sample was collected and transferred into new 3 mL Eppendorf tubes.These serum samples were then frozen at −80 ◦C.
2.4. Serum Analysis
The analyses were performed at Metabolomics Australia (University of Western Australia,Nedlands, Australia). Medetomidine concentrations of the serum samples were analysed using a liquidchromatography-tandem mass spectroscopy (LC-MS/MS) technique. The internal standard duringanalysis was medetomidine-13C,d3 hydrochloride (Sapphire Bioscience, Redfern, Australia).
To process the serum for analysis, 20 µL of serum were added to 50 µL of working internalstandard (50 ng/mL labelled medetomidine-13C,d3 in 50:50 methanol:water plus 0.1% formic acid) andvortexed for 10 s. The mixture was then vortexed with 1 mL ethyl acetate for 120 s, after which theywere centrifuged at 3000 rpm for 5 min. Then, 900 µL solvent were evaporated to dryness for 30 min at40 ◦C before being reconstituted in 70 µL of 50:50 methanol:water.
Processed serum extracts of 2 µL were run on an Agilent 6460 LC-MS/MS in 2D mode using isotopedilution to adjust for instrument response. Solvent A was LC-MS/MS grade water (Thermo Optima)with 0.1% formic acid (Merck). Solvent B was LC-MS/MS grade methanol (B & J) and 0.1% formicacid (Merck). Column one was an Agilent 2.1 × 50 mm 2.6 µm C18 Poroschell and column two was aPhenomenex Kinetex 3 × 150 mm 2.6 µm Biphenyl phase. The flow rate was set at 0.5 mL/min and agradient was run from 50% B to 80% B in 10 min. The column was washed with 98% B and then returnedto 50% B by 7 min. Compounds were heart cut from column one to column two between 0.4–0.9 min.Medetomidine and medetomidine-13C,d3 were monitored with transitions 201 > 95 and 204.1 > 98,respectively, with a collision energy of 15. Assay calibration was achieved by spiking drug free matrixmatched rat plasma to create a calibration curve, with the r2 typically >0.9999. Assay precision wasassessed during the project by extracting 4 samples in triplicate and the intra-assay CV ranged from2.1–5.7%. The limit of quantitation for the assay was 0.1 ng/mL.
2.5. Pharmacokinetic and Pharmacodynamic Calculations
The maximum serum concentration (Cmax) of medetomidine following SC administration wasthe highest measured concentration for each animal. The time at Cmax (tmax) was also determined.The elimination rate constant (λz) was calculated as the negative slope of the semilogarithmic plot ofeach animal created from the terminal three time points (t = 120, 180 and 240 min). The eliminationhalf-life (t1/2β) was calculated as ln(2)/λz. The area under the serum concentration time curve (AUC0→∞)was estimated by the trapezoidal rule extrapolated to infinite time. Standard formulae were used tocalculate the total body clearance (Cl = dose/AUC) [53] and volume of distribution at pseudo-equilibrium(Vdarea = Cl/λz) [54].
The target serum concentration of medetomidine (Ctarget) was obtained from the rats in Group Tand was taken as the mean serum concentration of MED at t = 60 and 90 min. The loading dose (LD)
451
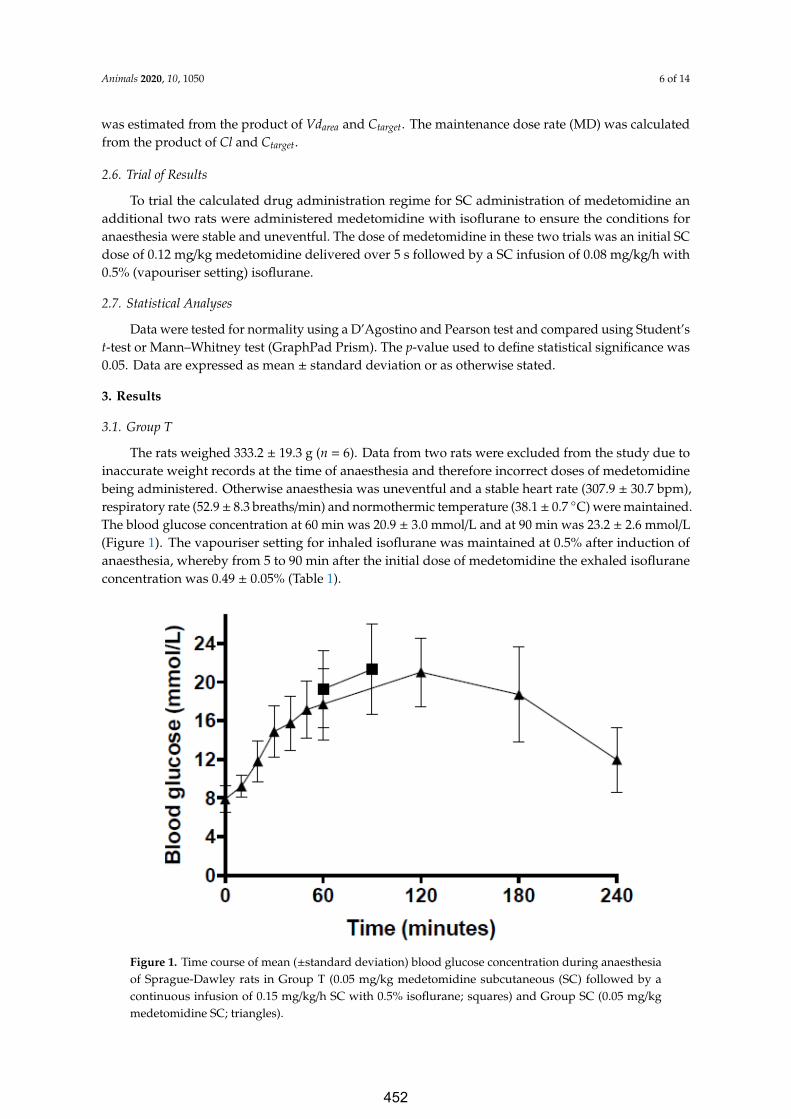
Animals 2020, 10, 1050 6 of 14
was estimated from the product of Vdarea and Ctarget. The maintenance dose rate (MD) was calculatedfrom the product of Cl and Ctarget.
2.6. Trial of Results
To trial the calculated drug administration regime for SC administration of medetomidine anadditional two rats were administered medetomidine with isoflurane to ensure the conditions foranaesthesia were stable and uneventful. The dose of medetomidine in these two trials was an initial SCdose of 0.12 mg/kg medetomidine delivered over 5 s followed by a SC infusion of 0.08 mg/kg/h with0.5% (vapouriser setting) isoflurane.
2.7. Statistical Analyses
Data were tested for normality using a D’Agostino and Pearson test and compared using Student’st-test or Mann–Whitney test (GraphPad Prism). The p-value used to define statistical significance was0.05. Data are expressed as mean ± standard deviation or as otherwise stated.
3. Results
3.1. Group T
The rats weighed 333.2 ± 19.3 g (n = 6). Data from two rats were excluded from the study due toinaccurate weight records at the time of anaesthesia and therefore incorrect doses of medetomidinebeing administered. Otherwise anaesthesia was uneventful and a stable heart rate (307.9 ± 30.7 bpm),respiratory rate (52.9± 8.3 breaths/min) and normothermic temperature (38.1± 0.7 ◦C) were maintained.The blood glucose concentration at 60 min was 20.9 ± 3.0 mmol/L and at 90 min was 23.2 ± 2.6 mmol/L(Figure 1). The vapouriser setting for inhaled isoflurane was maintained at 0.5% after induction ofanaesthesia, whereby from 5 to 90 min after the initial dose of medetomidine the exhaled isofluraneconcentration was 0.49 ± 0.05% (Table 1).
Animals 2020, 10, x 6 of 14
2.6. Trial of Results
To trial the calculated drug administration regime for SC administration of medetomidine an additional two rats were administered medetomidine with isoflurane to ensure the conditions for anaesthesia were stable and uneventful. The dose of medetomidine in these two trials was an initial SC dose of 0.12 mg/kg medetomidine delivered over 5 s followed by a SC infusion of 0.08 mg/kg/h with 0.5% (vapouriser setting) isoflurane.
2.7. Statistical Analyses
Data were tested for normality using a D’Agostino and Pearson test and compared using Student’s t-test or Mann–Whitney test (GraphPad Prism). The p-value used to define statistical significance was 0.05. Data are expressed as mean ± standard deviation or as otherwise stated.
3. Results
3.1. Group T
The rats weighed 333.2 ± 19.3 g (n = 6). Data from two rats were excluded from the study due to inaccurate weight records at the time of anaesthesia and therefore incorrect doses of medetomidine being administered. Otherwise anaesthesia was uneventful and a stable heart rate (307.9 ± 30.7 bpm), respiratory rate (52.9 ± 8.3 breaths/min) and normothermic temperature (38.1 ± 0.7 °C) were maintained. The blood glucose concentration at 60 min was 20.9 ± 3.0 mmol/L and at 90 min was 23.2 ± 2.6 mmol/L (Figure 1). The vapouriser setting for inhaled isoflurane was maintained at 0.5% after induction of anaesthesia, whereby from 5 to 90 min after the initial dose of medetomidine the exhaled isoflurane concentration was 0.49 ± 0.05% (Table 1).
Figure 1. Time course of mean (±standard deviation) blood glucose concentration during anaesthesia of Sprague-Dawley rats in Group T (0.05 mg/kg medetomidine subcutaneous (SC) followed by a continuous infusion of 0.15 mg/kg/h SC with 0.5% isoflurane; squares) and Group SC (0.05 mg/kg medetomidine SC; triangles).
Figure 1. Time course of mean (±standard deviation) blood glucose concentration during anaesthesiaof Sprague-Dawley rats in Group T (0.05 mg/kg medetomidine subcutaneous (SC) followed by acontinuous infusion of 0.15 mg/kg/h SC with 0.5% isoflurane; squares) and Group SC (0.05 mg/kgmedetomidine SC; triangles).
452
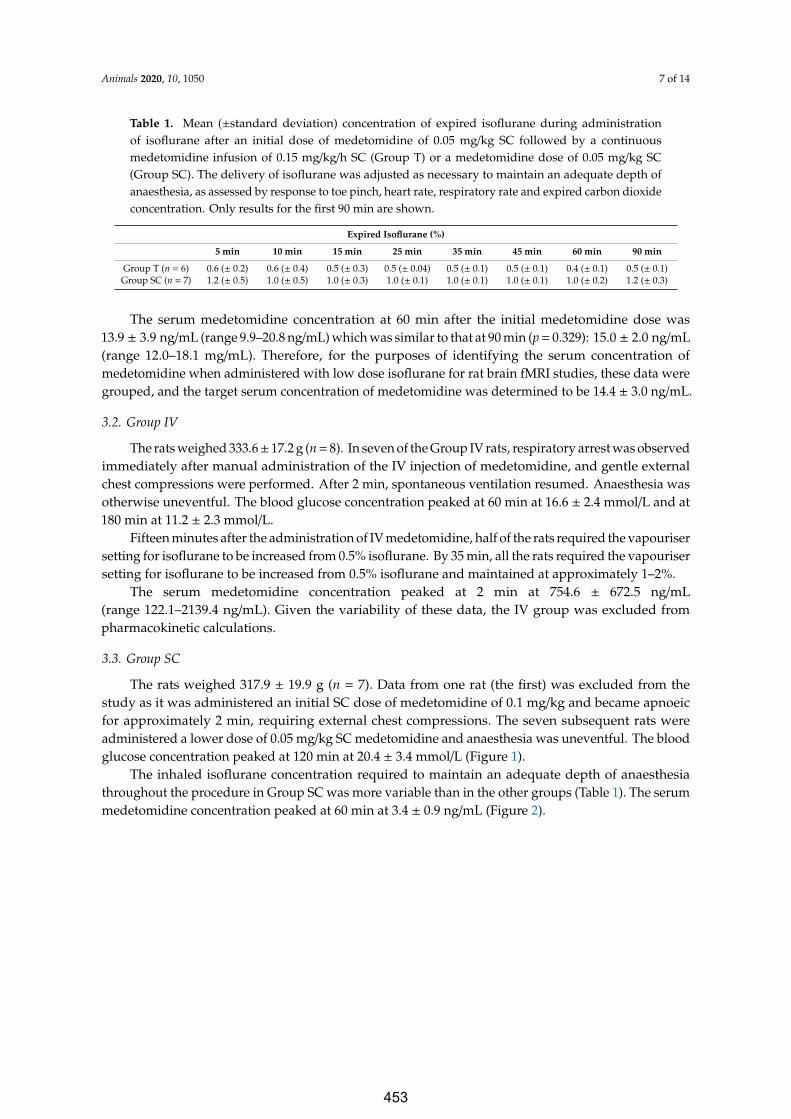
Animals 2020, 10, 1050 7 of 14
Table 1. Mean (±standard deviation) concentration of expired isoflurane during administrationof isoflurane after an initial dose of medetomidine of 0.05 mg/kg SC followed by a continuousmedetomidine infusion of 0.15 mg/kg/h SC (Group T) or a medetomidine dose of 0.05 mg/kg SC(Group SC). The delivery of isoflurane was adjusted as necessary to maintain an adequate depth ofanaesthesia, as assessed by response to toe pinch, heart rate, respiratory rate and expired carbon dioxideconcentration. Only results for the first 90 min are shown.
Expired Isoflurane (%)
5 min 10 min 15 min 25 min 35 min 45 min 60 min 90 min
Group T (n = 6) 0.6 (± 0.2) 0.6 (± 0.4) 0.5 (± 0.3) 0.5 (± 0.04) 0.5 (± 0.1) 0.5 (± 0.1) 0.4 (± 0.1) 0.5 (± 0.1)Group SC (n = 7) 1.2 (± 0.5) 1.0 (± 0.5) 1.0 (± 0.3) 1.0 (± 0.1) 1.0 (± 0.1) 1.0 (± 0.1) 1.0 (± 0.2) 1.2 (± 0.3)
The serum medetomidine concentration at 60 min after the initial medetomidine dose was13.9 ± 3.9 ng/mL (range 9.9–20.8 ng/mL) which was similar to that at 90 min (p = 0.329): 15.0 ± 2.0 ng/mL(range 12.0–18.1 mg/mL). Therefore, for the purposes of identifying the serum concentration ofmedetomidine when administered with low dose isoflurane for rat brain fMRI studies, these data weregrouped, and the target serum concentration of medetomidine was determined to be 14.4 ± 3.0 ng/mL.
3.2. Group IV
The rats weighed 333.6± 17.2 g (n = 8). In seven of the Group IV rats, respiratory arrest was observedimmediately after manual administration of the IV injection of medetomidine, and gentle externalchest compressions were performed. After 2 min, spontaneous ventilation resumed. Anaesthesia wasotherwise uneventful. The blood glucose concentration peaked at 60 min at 16.6 ± 2.4 mmol/L and at180 min at 11.2 ± 2.3 mmol/L.
Fifteen minutes after the administration of IV medetomidine, half of the rats required the vapourisersetting for isoflurane to be increased from 0.5% isoflurane. By 35 min, all the rats required the vapourisersetting for isoflurane to be increased from 0.5% isoflurane and maintained at approximately 1–2%.
The serum medetomidine concentration peaked at 2 min at 754.6 ± 672.5 ng/mL(range 122.1–2139.4 ng/mL). Given the variability of these data, the IV group was excluded frompharmacokinetic calculations.
3.3. Group SC
The rats weighed 317.9 ± 19.9 g (n = 7). Data from one rat (the first) was excluded from thestudy as it was administered an initial SC dose of medetomidine of 0.1 mg/kg and became apnoeicfor approximately 2 min, requiring external chest compressions. The seven subsequent rats wereadministered a lower dose of 0.05 mg/kg SC medetomidine and anaesthesia was uneventful. The bloodglucose concentration peaked at 120 min at 20.4 ± 3.4 mmol/L (Figure 1).
The inhaled isoflurane concentration required to maintain an adequate depth of anaesthesiathroughout the procedure in Group SC was more variable than in the other groups (Table 1). The serummedetomidine concentration peaked at 60 min at 3.4 ± 0.9 ng/mL (Figure 2).
453
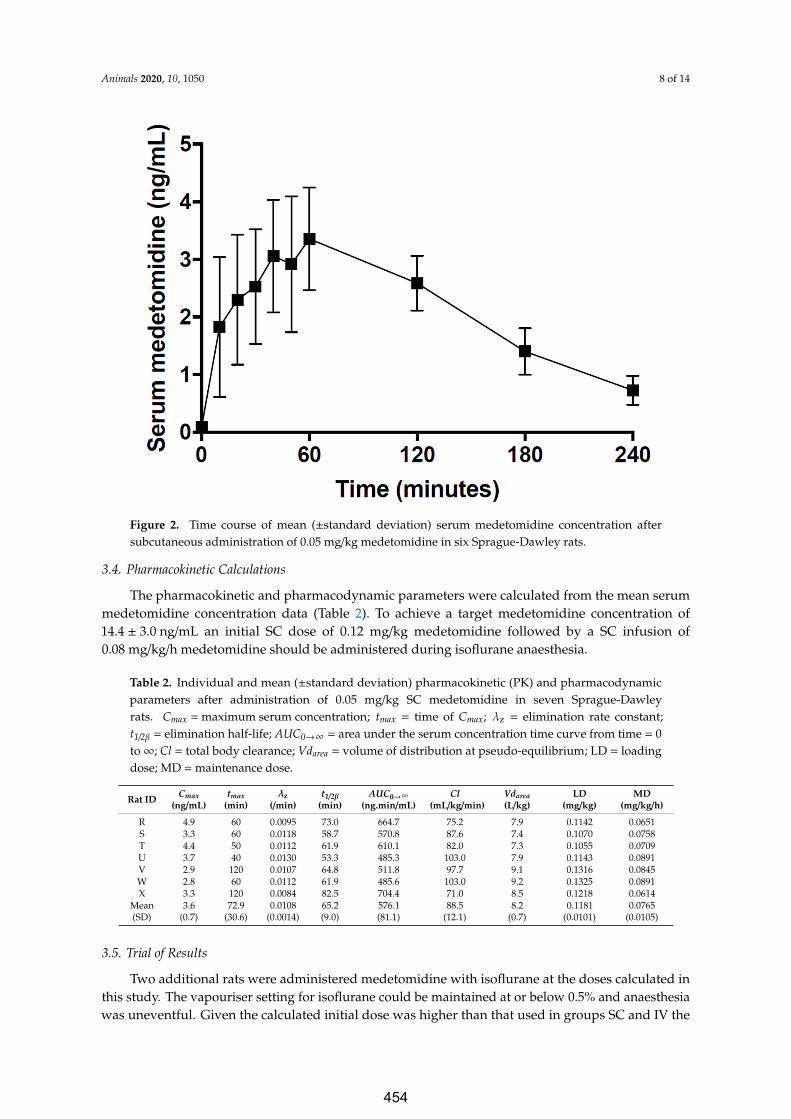
Animals 2020, 10, 1050 8 of 14
Animals 2020, 10, x 8 of 14
Figure 2. Time course of mean (±standard deviation) serum medetomidine concentration after subcutaneous administration of 0.05 mg/kg medetomidine in six Sprague-Dawley rats.
3.4. Pharmacokinetic Calculations
The pharmacokinetic and pharmacodynamic parameters were calculated from the mean serum medetomidine concentration data (Table 2). To achieve a target medetomidine concentration of 14.4 ± 3.0 ng/mL an initial SC dose of 0.12 mg/kg medetomidine followed by a SC infusion of 0.08 mg/kg/h medetomidine should be administered during isoflurane anaesthesia.
Table 2. Individual and mean (±standard deviation) pharmacokinetic (PK) and pharmacodynamic parameters after administration of 0.05 mg/kg SC medetomidine in seven Sprague-Dawley rats. Cmax = maximum serum concentration; tmax = time of Cmax; λz = elimination rate constant; t1/2β = elimination half-life; AUC0→∞ = area under the serum concentration time curve from time = 0 to ∞; Cl = total body clearance; Vdarea = volume of distribution at pseudo-equilibrium; LD = loading dose; MD = maintenance dose.
Rat ID Cmax
(ng/mL) tmax
(min) λz
(/min) t1/2β
(min) AUC0→∞
(ng.min/mL) Cl
(mL/kg/min) Vdarea (L/kg)
LD (mg/kg)
MD (mg/kg/h)
R 4.9 60 0.0095 73.0 664.7 75.2 7.9 0.1142 0.0651 S 3.3 60 0.0118 58.7 570.8 87.6 7.4 0.1070 0.0758 T 4.4 50 0.0112 61.9 610.1 82.0 7.3 0.1055 0.0709 U 3.7 40 0.0130 53.3 485.3 103.0 7.9 0.1143 0.0891 V 2.9 120 0.0107 64.8 511.8 97.7 9.1 0.1316 0.0845 W 2.8 60 0.0112 61.9 485.6 103.0 9.2 0.1325 0.0891 X 3.3 120 0.0084 82.5 704.4 71.0 8.5 0.1218 0.0614
Mean (SD)
3.6 (0.7) 72.9
(30.6) 0.0108
(0.0014) 65.2 (9.0)
576.1 (81.1)
88.5 (12.1)
8.2 (0.7)
0.1181 (0.0101)
0.0765 (0.0105)
Figure 2. Time course of mean (±standard deviation) serum medetomidine concentration aftersubcutaneous administration of 0.05 mg/kg medetomidine in six Sprague-Dawley rats.
3.4. Pharmacokinetic Calculations
The pharmacokinetic and pharmacodynamic parameters were calculated from the mean serummedetomidine concentration data (Table 2). To achieve a target medetomidine concentration of14.4 ± 3.0 ng/mL an initial SC dose of 0.12 mg/kg medetomidine followed by a SC infusion of0.08 mg/kg/h medetomidine should be administered during isoflurane anaesthesia.
Table 2. Individual and mean (±standard deviation) pharmacokinetic (PK) and pharmacodynamicparameters after administration of 0.05 mg/kg SC medetomidine in seven Sprague-Dawleyrats. Cmax = maximum serum concentration; tmax = time of Cmax; λz = elimination rate constant;t1/2β = elimination half-life; AUC0→∞ = area under the serum concentration time curve from time = 0to∞; Cl = total body clearance; Vdarea = volume of distribution at pseudo-equilibrium; LD = loadingdose; MD = maintenance dose.
Rat ID Cmax(ng/mL)
tmax(min)
λz(/min)
t1/2β(min)
AUC0→∞(ng.min/mL)
Cl(mL/kg/min)
Vdarea(L/kg)
LD(mg/kg)
MD(mg/kg/h)
R 4.9 60 0.0095 73.0 664.7 75.2 7.9 0.1142 0.0651S 3.3 60 0.0118 58.7 570.8 87.6 7.4 0.1070 0.0758T 4.4 50 0.0112 61.9 610.1 82.0 7.3 0.1055 0.0709U 3.7 40 0.0130 53.3 485.3 103.0 7.9 0.1143 0.0891V 2.9 120 0.0107 64.8 511.8 97.7 9.1 0.1316 0.0845W 2.8 60 0.0112 61.9 485.6 103.0 9.2 0.1325 0.0891X 3.3 120 0.0084 82.5 704.4 71.0 8.5 0.1218 0.0614
Mean(SD)
3.6(0.7)
72.9(30.6)
0.0108(0.0014)
65.2(9.0)
576.1(81.1)
88.5(12.1)
8.2(0.7)
0.1181(0.0101)
0.0765(0.0105)
3.5. Trial of Results
Two additional rats were administered medetomidine with isoflurane at the doses calculated inthis study. The vapouriser setting for isoflurane could be maintained at or below 0.5% and anaesthesiawas uneventful. Given the calculated initial dose was higher than that used in groups SC and IV the
454

Animals 2020, 10, 1050 9 of 14
initial dose was administered over five seconds to mitigate the risk of apnoea (as observed in the IVgroup and the first rat in the SC group that was administered 1.0 mg/kg SC). Apnoea did not occurwhen the initial dose was delivered over five seconds.
4. Discussion
The present study shows that steady state serum concentrations of medetomidine will be achievedin male Sprague-Dawley rats if an initial SC dose of medetomidine of 0.12 mg/kg is administeredin combination with continuous 0.5% (vapouriser setting) isoflurane, followed by a SC infusion ofmedetomidine at 0.08 mg/kg/h. This regime appears to provide suitable conditions for anaesthesiawhen the initial dose is delivered over five seconds. This result is within the range of doses reported inthe literature [34,35].
The Group T result was used as the target serum concentration of medetomidine when administeredwith 0.5% (vapouriser setting) isoflurane. The anaesthetic protocol in this group was based onconsultation with researchers using combined medetomidine and isoflurane anaesthesia in ongoingresting-state rodent fMRI studies. Given the apparent empirical success of the protocol in achievingstrong and reproducible fMRI signals [10], rats under this protocol were hypothesised to achieve asteady state concentration of medetomidine. Data from rats in Group SC were used to determinethe SC bioavailability of medetomidine during combined medetomidine and isoflurane anaesthesia.Collectively, the data from the two groups were used to inform the SC administration of medetomidinein rodents with low dose isoflurane.
The intention was to use data from both the IV and SC groups to perform pharmacokineticcalculations. However, the data from Group IV were excluded from the analysis due to considerablevariation in this data set. We attribute the variation to the use of a single cannula for both IV drugadministration and subsequent serial blood sampling. Issues arising from the use of a single cannulahave been investigated and described by Gaud et al. [55]. They report that the use of a single cannulais not suitable for pharmacokinetic studies. Some compounds will experience non-specific bindingto the cannula that may contaminate the first few blood samples taken from the cannula and lead tooverestimation of serum concentrations [55]. Manually flushing the cannula with heparinised saline canhelp dislodge bound medetomidine, therefore reducing serum concentration overestimation. However,the flushing can also cause increased variation in measured serum medetomidine concentration dueto the random error associated with repeated hand-operated techniques. This oversight likely led toinaccurate serum concentrations in the Group IV and hence exclusion of these data.
The Group T data suggest that a steady state serum medetomidine concentration of14.4 ± 3.0 ng/mL is suitable for rats undergoing brain fMRI with 0.5% (vapouriser setting) isoflurane.This combination of drugs creates conditions suitable for prolonged anaesthesia (hours) without majoranaesthetic-specific distortion of BOLD fMRI signals [10]. Future studies could consider using variousdoses of medetomidine and isoflurane to better define the therapeutic range for these drugs in thecontext of optimising the quality of fMRI images.
In the present study, the elimination half-life of medetomidine in rats was calculated to be65.2 (±9.0) min. Similar values were calculated by Bol et al. (56.2 and 57.4 min) in a study ofdexmedetomidine that was administered to Harlan-Sprague-Dawley male rats by two different IVinfusion protocols [11]. In our study, and the work by Bol et al., drug concentrations were analysedfor 210–240 min, and in neither study did blood medetomidine nor dexmedetomidine concentrationsbecome undetectable. In contrast, a slower elimination half-life (1.6 h) was reported by Salonen et al.after tritium (3H)-labelled medetomidine was administered SC to male and female Sprague-Dawley rats.Furthermore, Salonen et al. detected plasma radioactivity at five and eight hours after administrationof 3H- medetomidine [56]. The persistence of medetomidine at these time points (five and eight hours)may suggest that in our four-hour study, and in the study by Bol et al., the elimination rate constantwas overestimated and therefore the elimination half-life was underestimated. This parameter could
455
Animals 2020, 10, 1050 10 of 14
be explored in future studies by quantifying blood medetomidine (or dexmedetomidine) levels forseveral hours after administration.
The first rat in Group SC was administered a rapid initial dose (<one second, delivered manually)of 0.1 mg/kg SC medetomidine and became apnoeic for approximately two minutes. This responsewas not previously observed when the initial SC medetomidine dose was mechanically delivered inone second. Thus, the decision was made to alter the initial SC dose in Group SC from 0.1 mg/kg to0.05 mg/kg for the remaining seven rats in that group. Although rats in Group IV also became apnoeicafter administration of medetomidine, the dose in this group was not altered. The rationale to notalter the dose in Group IV was that transient apnoea could be managed with manual external chestcompressions with the rat in sternal recumbency. To mitigate the risk of apnoea, the initial dose couldbe delivered over a longer time period; so during the trial of the calculated initial and infusion dose,the initial dose was administered over five seconds by the infusion pump. The conditions duringanaesthesia were stable and uneventful.
Measurement of blood glucose concentrations was performed opportunistically and was not theprimary aim of the project. Nevertheless, hyperglycaemia developed in all the rats in this study andalthough this side effect of medetomidine is described in rats its impact on experimental outcomesis not clear [57]. The mechanism of hyperglycaemia is a combination of anti-ADH (antidiuretichormone) effects and alterations in insulin sensitivity, resulting in an osmotic diuresis [58]. This sideeffect of administration of medetomidine should be considered when designing anaesthetic regimensfor research.
There are a number of limitations to this study which must be considered when interpreting theresults. Only male, eight-week-old, Sprague-Dawley rats were used in this small study. This cohortlimits the direct applicability of the results to female rats, other rat strains and mice. The age of the ratsin this study is also a limitation of the model as adult animals may have a different pharmacokineticprofile for medetomidine. Future studies could expand the applicability of these results by investigatingthe pharmacokinetics of medetomidine in female rats, pregnant rats, obese rats, different ages andstrains of rats and mice. In addition, the pharmacokinetic calculations could only be performed withserum concentrations of medetomidine that were obtained following SC administration. The datafrom Group IV was unfortunately excluded. Nevertheless, the data from Group SC were utilized inisolation, which meant that during the sampling period, the serum concentrations of medetomidinewere assumed to be in pseudo-equilibrium. Thus, calculating the volume of distribution using thearea method (Vdarea) was appropriate [59]. The loading dose should be calculated using the volume ofdistribution calculated at steady state (Vdss). Given Vdarea is usually only larger than Vdss by a smallamount, our calculated loading dose is likely to still be a reliable estimate. Furthermore, single dosesof medetomidine and isoflurane were evaluated in this study as the aim was to determine a targetconcentration of medetomidine based upon empirical evidence of using these doses. Future workshould consider the evaluation of alternative doses and their impact on fMRI outputs. Finally, the targetdose as determined by Group T was based on the premise that quality fMRI images were acquired(in previous work in the lab) with the empirical protocol. Correlation of our conclusions with the qualityof fMRI images has not been performed.
For studies where multiple imaging sessions are scheduled and the animals recover fromanaesthesia, the administration of atipamezole is prudent. This drug antagonises medetomidine andis routinely administered in the laboratory in which this study was performed when rats recoverfrom anaesthesia.
The benefit of combined medetomidine and isoflurane anaesthetic protocols in rodent brainfMRI studies may be compromised by inconsistencies in these anaesthetic protocols between studies.Anaesthetics alter BOLD fMRI signals and these inconsistencies hinder the interpretation, generalisation,meta-analysis and reproducibility of rodent brain fMRI studies. Future brain fMRI studies shouldconsider an evidence-based approach to the use of medetomidine and isoflurane anaesthetic protocolsto standardise the regime between studies.
456
Animals 2020, 10, 1050 11 of 14
5. Conclusions
The data suggest that a serum medetomidine concentration of 14.4 ± 3.0 ng/mL is suitable for ratsundergoing brain fMRI with 0.5% (vapouriser setting) isoflurane.
Author Contributions: Conceptualization, G.C.M., K.W.F. and J.R.; methodology, G.C.M., T.H.H., K.W.F. andJ.R.; data collection, L.T.K., B.J.S. and G.C.M.; pharmacokinetic analysis, T.H.H. and S.H.E.; medetomidinequantification, M.W.C.; data curation, L.T.K., B.J.S. and G.C.M.; writing—original draft preparation, L.T.K., G.C.M.and B.J.S.; writing—review and editing, all authors. All authors have read and agreed to the published version ofthe manuscript.
Funding: This research was funded by the University of Western Australia internal research funds held byK.W.F.; K.W.F. is an Australian National Imaging Facility Fellow, a facility funded by the University, State andCommonwealth Governments. L.T.K. is supported by a University of Western Australia Winthrop Scholarship.B.J.S. is supported by a Forrest Research Foundation Scholarship, an International Postgraduate ResearchScholarship, and a University Postgraduate Award. J.R. is supported by a Senior Research Fellowship fromMultiple Sclerosis Western Australia and the Perron Institute for Neurological and Translational Science.
Acknowledgments: The authors thank Andrea Holme for her assistance with the serum collection process,Sandy Goodin and the team at M Block Animal Care Services for their assistance with animal care andpre-procedural monitoring. The authors acknowledge the facilities, scientific assistance and technical assistance ofthe National Imaging Facility, a National Collaborative Research Infrastructure Strategy (NCRIS) capability, at theCentre for Microscopy, Characterisation and Analysis, University of Western Australia.
Conflicts of Interest: The authors declare no conflicts of interest. The funders had no role in the design of thestudy; in the collection, analyses, or interpretation of data; in the writing of the manuscript, or in the decision topublish the results.
References
1. Pawela, C.P.; Biswal, B.B.; Hudetz, A.G.; Schulte, M.L.; Li, R.; Jones, S.R.; Cho, Y.R.; Matloub, H.S.; Hyde, J.S.A protocol for use of medetomidine anesthesia in rats for extended studies using task-induced BOLD contrastand resting-state functional connectivity. NeuroImage 2009, 46, 1137–1147. [CrossRef] [PubMed]
2. Jonckers, E.; Van Audekerke, J.; De Visscher, G.; Vander Linden, A.; Verhoye, M. Functional connectivityfMRI of the rodent brain: Comparison of functional connectivity networks in rat and mouse. PLoS ONE2011, 6, e18876. [CrossRef]
3. Lu, H.; Zou, Q.; Gu, H.; Raichle, M.E.; Stein, E.A.; Yang, Y. Rat brains also have a default mode network.Proc. Natl. Acad. Sci. USA 2012, 109, 3979–3984. [CrossRef] [PubMed]
4. Fukuda, M.; Vazquez, A.L.; Zong, X.; Kim, S.-G. Effects of the α(2)-adrenergic receptor agonistdexmedetomidine on neurovascular responses in somatosensory cortex. Eur. J. Neurosci. 2013, 37,80–95. [CrossRef] [PubMed]
5. Sierakowiak, A.; Monnot, C.; Aski, S.N.; Uppman, M.; Li, T.-Q.; Dambert, P.; Brene, S. Default mode network,motor network, dorsal and ventral basal ganglia networks in the rat brain: Comparison to human networksusing resting State-fMRI. PLoS ONE 2015, 10, e0120345. [CrossRef]
6. Zerbi, V.; Grandjean, J.; Rudin, M.; Wenderoth, N. Mapping the mouse brain with rs-fMRI: An optimizedpipeline for functional network identification. Neuroimage 2015, 123, 11–21. [CrossRef]
7. Hsu, L.M.; Liang, X.; Gu, H.; Brynildsen, J.K.; Stark, J.A.; Ash, J.A.; Lin., C.P.; Lu, H.; Rapp, P.R.; Stein, E.A.; et al.Constituents and functional implications of the rat default mode network. Proc. Natl. Acad. Sci. USA 2016,113, E4541–E4547. [CrossRef]
8. Weber, R.; Ramos-Cabrer, P.; Wiedermann, D.; van Camp, N.; Hoehn, M. A fully noninvasive and robustexperimental protocol for longitudinal fMRI studies in the rat. Neuroimage 2006, 29, 1303–1310. [CrossRef]
9. Sommers, M.G.; Pikkemaat, J.A.; Booij, L.H.D.J.; Heerschap, A. Improved Anesthesia Protocols for fMlUStudies in Rats: The Use of Medetomidine For Stable, Reversible Sedation. 2002. Available online:https://cds.ismrm.org/ismrm-2002/PDF2/0393.PDF (accessed on 20 May 2020).
10. Seewoo, B.J.; Feindel, K.W.; Etherington, S.J.; Rodger, J. Frequency-specific effects of low-intensity rTMS canpersist for up to 2 weeks post-stimulation: A longitudinal rs-fMRI/MRS study in rats. Brain Stimul. 2019.[CrossRef]
457

Animals 2020, 10, 1050 12 of 14
11. Bol, C.; Danhof, M.; Stanski, D.R.; Mandema, J.W. Pharmacokinetic-pharmacodynamic characterization ofthe cardiovascular, hypnotic, EEG and ventilatory responses to dexmedetomidine in the rat. J. Pharm. Exp.1997, 283, 1051–1058.
12. Sinclair, M.D. A review of the physiological effects of α(2)-agonists related to the clinical use of medetomidinein small animal practice. Can. Vet. J. 2003, 44, 885–897. [PubMed]
13. Doze, V.A.; Chen, B.X.; Maze, M. Dexmedetomidine produces a hypnotic-anesthetic action in rats viaactivation of central alpha-2 adrenoceptors. Anesthesiology 1989, 71, 75–79. [CrossRef] [PubMed]
14. Correa-Sales, C.; Rabin, B.C.; Maze, M. A hypnotic response to dexmedetomidine, an alpha 2 agonist, ismediated in the locus coeruleus in rats. Anesthesiology 1992, 76, 948–952. [CrossRef] [PubMed]
15. De Sarro, G.B.; Ascioti, C.; Froio, F.; Liberi, V.; Nistico, G. Evidence that locus coeruleus is the site whereclonidine and drugs acting at alpha 1- and alpha 2-adrenoceptors affect sleep and arousal mechanisms.Br. J. Pharm. 1987, 90, 675–685. [CrossRef] [PubMed]
16. Pypendop, B.H.; Verstegen, J.P. Hemodynamic effects of medetomidine in the dog: A dose titration study.Vet. Surg. Vs 1998, 27, 612–622. [CrossRef] [PubMed]
17. Savola, J.M. Cardiovascular actions of medetomidine and their reversal by atipamezole. Acta Vet. Scand. Suppl.1989, 85, 39–47.
18. Schmeling, W.T.; Kampine, J.P.; Roerig, D.L.; Warltier, D.C. The effects of the stereoisomers of thealpha 2-adrenergic agonist medetomidine on systemic and coronary hemodynamics in conscious dogs.Anesthesiology 1991, 75, 499–511. [CrossRef]
19. Yaksh, T.L. Pharmacology of spinal adrenergic systems which modulate spinal nociceptive processing.Pharm. Biochem. Behav. 1985, 22, 845–858. [CrossRef]
20. Stenberg, D. Physiological role of alpha 2-adrenoceptors in the regulation of vigilance and pain: Effect ofmedetomidine. Acta Vet. Scand. Suppl. 1989, 85, 21–28. [PubMed]
21. Mirski, M.A.; Rossell, L.A.; McPherson, R.W.; Traystman, R.J. Dexmedetomidine decreases seizure thresholdin a rat model of experimental generalized epilepsy. Anesthesiology 1994, 81, 1422–1428. [CrossRef] [PubMed]
22. Miyazaki, Y.; Adachi, T.; Kurata, J.; Utsumi, J.; Shichino, T.; Segawa, H. Dexmedetomidine reduces seizurethreshold during enflurane anaesthesia in cats. Br. J. Anaesth. 1999, 82, 935–937. [CrossRef] [PubMed]
23. Gellai, M. Modulation of vasopressin antidiuretic action by renal alpha 2-adrenoceptors. Am. J. Physiol. 1990,259, F1–F8. [CrossRef]
24. Talukder, M.H.; Hikasa, Y. Diuretic effects of medetomidine compared with xylazine in healthy dogs. Can. J.Vet. Res. Rev. Can. De Rech. Vet. 2009, 73, 224–236.
25. Kanda, T.; Hikasa, Y. Effects of medetomidine and midazolam alone or in combination on the metabolic andneurohormonal responses in healthy cats. Can. J. Vet. Res. Rev. Can. De Rech. Vet. 2008, 72, 332–339.
26. Zuurbier, C.J.; Keijzers, P.J.; Koeman, A.; Van Wezel, H.B.; Hollmann, M.W. Anesthesia’s effects on plasmaglucose and insulin and cardiac hexokinase at similar hemodynamics and without major surgical stress infed rats. Anesth. Analg. 2008, 106, 135–142. [CrossRef]
27. Virtanen, R.; Savola, J.M.; Saano, V.; Nyman, L. Characterization of the selectivity, specificity and potency ofmedetomidine as an alpha 2-adrenoceptor agonist. Eur. J. Pharm. 1988, 150, 9–14. [CrossRef]
28. Eger, E.I., 2nd. The pharmacology of isoflurane. Br. J. Anaesth. 1984, 56 (Suppl. 1), 71s–99s.29. Dohoo, S.E. Isoflurane as an inhalational anesthetic agent in clinical practice. Can. Vet. J. = La Rev. Vet. Can.
1990, 31, 847–850.30. Paddleford, R.R. Manual of Small Animal Anesthesia; Churchill Livingstone: New York, NY, USA, 1988.31. Ludders, J.W. Advantages and Guidelines for Using Isoflurane. Vet. Clin. North Am. Small Anim. Pr. 1992,
22, 328–331. [CrossRef]32. Mazze, R.I.; Rice, S.A.; Baden, J.M. Halothane, isoflurane, and enflurane MAC in pregnant and nonpregnant
female and male mice and rats. Anesthesiology 1985, 62, 339–341. [CrossRef]33. Paasonen, J.; Stenroos, P.; Salo, R.A.; Kiviniemi, V.; Grohn, O. Functional connectivity under six anesthesia
protocols and the awake condition in rat brain. Neuroimage 2018, 172, 9–20. [CrossRef] [PubMed]34. Brynildsen, J.K.; Hsu, L.-M.; Ross, T.J.; Stein, E.A.; Yang, Y.; Lu, H. Physiological characterization of a robust
survival rodent fMRI method. Magn. Reson. Imaging 2017, 35, 54–60. [CrossRef]
458
Animals 2020, 10, 1050 13 of 14
35. Pirttimaki, T.; Salo, R.A.; Shatillo, A.; Kettunen, M.I.; Paasonen, J.; Sierra, A.; Jokivarsi, K.; Leinonen, V.;Andrade, P.; Quittek, S.; et al. Implantable RF-coil with multiple electrodes for long-term EEG-fMRImonitoring in rodents. J. Neurosci. Methods 2016, 274, 154–163. [CrossRef] [PubMed]
36. Grandjean, J.; Schroeter, A.; Batata, I.; Rudin, M. Optimization of anesthesia protocol for resting-state fMRIin mice based on differential effects of anesthetics on functional connectivity patterns. Neuroimage 2014, 102,838–847. [CrossRef] [PubMed]
37. Jonckers, E.; Delgado y Palacios, R.; Shah, D.; Guglielmetti, C.; Verhoye, M.; Van der Linden, A.Different anesthesia regimes modulate the functional connectivity outcome in mice. Magn. Reson. Med. 2014,72, 1103–1112. [CrossRef] [PubMed]
38. Hamilton, C.; Ma, Y.; Zhang, N. Global reduction of information exchange during anesthetic-inducedunconsciousness. Brain Struct. Funct. 2017, 222, 3205–3216. [CrossRef]
39. Masamoto, K.; Fukuda, M.; Vazquez, A.; Kim, S.G. Dose-dependent effect of isoflurane on neurovascularcoupling in rat cerebral cortex. Eur. J. Neurosci. 2009, 30, 242–250. [CrossRef]
40. Masamoto, K.; Kim, T.; Fukuda, M.; Wang, P.; Kim, S.G. Relationship between neural, vascular, and BOLDsignals in isoflurane-anesthetized rat somatosensory cortex. Cerebral Cortex (New York, NY: 1991) 2007, 17,942–950. [CrossRef] [PubMed]
41. Bukhari, Q.; Schroeter, A.; Cole, D.M.; Rudin, M. Resting State fMRI in Mice Reveals Anesthesia SpecificSignatures of Brain Functional Networks and Their Interactions. Front. Neural Circuits 2017, 11. [CrossRef][PubMed]
42. Van Alst, T.M.; Wachsmuth, L.; Datunashvili, M.; Albers, F.; Just, N.; Budde, T.; Faber, C.Anesthesia differentially modulates neuronal and vascular contributions to the BOLD signal. NeuroImage2019, 195, 89–103. [CrossRef] [PubMed]
43. Masamoto, K.; Kanno, I. Anesthesia and the Quantitative Evaluation of Neurovascular Coupling. J. Cereb.Blood Flow Metab. 2012, 32, 1233–1247. [CrossRef] [PubMed]
44. Sirmpilatze, N.; Baudewig, J.; Boretius, S. Temporal stability of fMRI in medetomidine-anesthetized rats.bioRxiv 2019, 667659. [CrossRef] [PubMed]
45. Ewing, K.K.; Mohammed, H.O.; Scarlett, J.M.; Short, C.E. Reduction of isoflurane anesthetic requirement bymedetomidine and its restoration by atipamezole in dogs. Am. J. Vet. Res. 1993, 54, 294–299. [PubMed]
46. Gao, Y.-R.; Ma, Y.; Zhang, Q.; Winder, W.T.; Liang, Z.; Antinori, L.; drew, P.J.; Zhang, N. Time to wake up:Studying neurovascular coupling and brain-wide circuit function in the un-anesthetized animal. NeuroImage2017, 153, 382–398. [CrossRef]
47. Hillman, E.M.C. Coupling Mechanism and Significance of the BOLD Signal: A Status Report.Annu. Rev. Neurosci. 2014, 37, 161–181. [CrossRef] [PubMed]
48. Chuang, K.-H.; Lee, H.-L.; Li, Z.; Chang, W.; Nasrallah, F.A.; Yeowd, L.Y.; Singhd, K.K.D.R. Evaluation ofnuisance removal for functional MRI of rodent brain. NeuroImage 2019, 188, 694–709. [CrossRef] [PubMed]
49. Prielipp, R.C.; Wall, M.H.; Tobin, J.R.; Groban, L.; Cannon, M.A.; Fahey, F.H.; Gage, H.D.; Stump, D.A.;James, R.L.; Bennett, J.; et al. Dexmedetomidine-induced sedation in volunteers decreases regional andglobal cerebral blood flow. Anesth. Analg. 2002, 95, 1052–1059.
50. Iida, H.; Ohata, H.; Iida, M.; Watanabe, Y.; Dohi, S. Isoflurane and sevoflurane induce vasodilation of cerebralvessels via ATP-sensitive K+ channel activation. Anesthesiology 1998, 89, 954–960. [CrossRef] [PubMed]
51. Ohata, H.; Iida, H.; Dohi, S.; Watanabe, Y. Intravenous dexmedetomidine inhibits cerebrovascular dilationinduced by isoflurane and sevoflurane in dogs. Anesth. Analg. 1999, 89, 370–377. [PubMed]
52. National Health and Medical Research Council. Australian Code for the Care and Use of Animals for ScientificPurposes, 8th ed.; National Health and Medical Research Council: Canberra, Australia, 2013.
53. Toutain, P.L.; Bousquet-Melou, A. Plasma clearance. J. Vet. Pharm. 2004, 27, 415–425. [CrossRef] [PubMed]54. Toutain, P.L.; Bousquet-Melou, A. Bioavailability and its assessment. J. Vet. Pharm. 2004, 27, 455–466.
[CrossRef] [PubMed]55. Gaud, N.; Kumar, A.; Matta, M.; Kole, P.; Sridhar, S.; Mandlekar, S.; Holenarsipur, V.K. Single jugular vein
cannulated rats may not be suitable for intravenous pharmacokinetic screening of high logP compounds.Eur. J. Pharm. Sci. 2017, 99, 272–278. [CrossRef] [PubMed]
56. Salonen, J.S. Pharmacokinetics of medetomidine. Acta Vet. Scand. Suppl. 1989, 85, 49–54.
459
Animals 2020, 10, 1050 14 of 14
57. Callahan, L.M.; Ross, S.M.; Jones, M.L.; Musk, G.C. Mortality associated with using medetomidine andketamine for general anesthesia in pregnant and nonpregnant Wistar rats. Lab Anim. 2014, 43, 208–214.[CrossRef] [PubMed]
58. Lemke, K.A. Pharmacology-Anticholinergics and Sedatives. In Lumb and Jones’ Veterinary Anesthesia andAnalgesia 4th Edition; Tranquilli, W.J., Thurmon, J.C., Grimm, K.A., Eds.; Blackwell Publishing: Ames, IA, USA,2007; pp. 218–219.
59. Toutain, P.L.; Bousquet-Melou, A. Volumes of distribution. J. Vet. Pharm. 2004, 27, 441–453. [CrossRef]
© 2020 by the authors. Licensee MDPI, Basel, Switzerland. This article is an open accessarticle distributed under the terms and conditions of the Creative Commons Attribution(CC BY) license (http://creativecommons.org/licenses/by/4.0/).
460

Neuroscience Research 165 (2021) 26–37
Contents lists available at ScienceDirect
Neuroscience Research
journa l homepage: www.e lsev ier .com/ locate /neures
An analytical workflow for seed-based correlation and independentcomponent analysis in interventional resting-state fMRI studies
Bhedita J. Seewooa,b,c, Alexander C. Joosc, Kirk W. Feindelc,d,∗
a Experimental and Regenerative Neurosciences, School of Biological Sciences, The University of Western Australia, Perth, WA, Australiab Brain Plasticity Group, Perron Institute for Neurological and Translational Science, WA, Australiac Centre for Microscopy, Characterisation and Analysis, Research Infrastructure Centres, The University of Western Australia, Perth, WA, Australiad School of Biomedical Sciences, The University of Western Australia, Perth, WA, Australia
a r t i c l e i n f o
Article history:Received 20 March 2020Received in revised form 8 May 2020Accepted 18 May 2020Available online 25 May 2020
Keywords:resting-state networksFSLICASCAfunctional magnetic resonance imagingdenoising
a b s t r a c t
Resting-state functional MRI (rs-fMRI) is a task-free method of detecting spatially distinct brain regionswith correlated activity, which form organised networks known as resting-state networks (RSNs). The twomost widely used methods for analysing RSN connectivity are seed-based correlation analysis (SCA) andindependent component analysis (ICA) but there is no established workflow of the optimal combinationof analytical steps and how to execute them. Rodent rs-fMRI data from our previous longitudinal brainstimulation studies were used to investigate these two methods using FSL. Specifically, we examined: (1)RSN identification and group comparisons in ICA, (2) ICA-based denoising compared to nuisance signalregression in SCA, and (3) seed selection in SCA. In ICA, using a baseline-only template resulted in greaterfunctional connectivity within RSNs and more sensitive detection of group differences than when anaverage pre/post stimulation template was used. In SCA, the use of an ICA-based denoising method inthe preprocessing of rs-fMRI data and the use of seeds from individual functional connectivity maps inrunning group comparisons increased the sensitivity of detecting group differences by preventing thereduction in signals of interest. Accordingly, when analysing animal and human rs-fMRI data, we inferthat the use of baseline-only templates in ICA and ICA-based denoising and individualised seeds in SCAwill improve the reliability of results and comparability across rs-fMRI studies.
© 2020 Elsevier B.V. and Japan Neuroscience Society. All rights reserved.
1. Introduction
Functional magnetic resonance imaging (fMRI) is a power-ful tool for brain research and has great potential in diagnosingand tracking the treatment of neurological disorders. fMRI pri-marily uses the blood-oxygen-level-dependent, or BOLD, contrastas an indirect measurement of brain activity. Functional con-nectivity, which refers to the strongly correlated time signal ofspatially remote brain regions, can be observed both during theexecution of a task or at rest, that is, in the absence of a spe-cific task or stimulus. A functional brain network observed atrest is called a resting-state network (RSN) and the associatedimaging technique is resting-state fMRI (rs-fMRI). Patients withneurological and psychiatric disorders such as Alzheimer’s disease,Parkinson’s disease and depression have been found to exhibit
∗ Corresponding author at: MRI and BioImaging Facilities, Centre for Microscopy,Characterisation and Analysis M519, The University of Western Australia, 35 StirlingHighway, Perth WA 6009, Australia.
E-mail address: [email protected] (K.W. Feindel).
abnormal connectivity within their RSNs compared to healthyindividuals (Seeley et al., 2009, Lee et al., 2013, Gorges et al.,2017).
Using rs-fMRI has several important advantages. Firstly, multi-ple RSNs can be studied simultaneously and RSNs can be detectedin subjects who are not able to or are not trained to perform aspecific task (Lee et al., 2016). The absence of a task also makes rs-fMRI studies less laborious in terms of the imaging procedure (Leeet al., 2016). Additionally, RSNs are quite consistent among mam-malian species, which allows for an easier translation of resultsfrom animal studies to clinical applications (Becerra et al., 2011,Gorges et al., 2017, Pawela et al., 2008). Furthermore, RSNs are alsolargely similar between awake and anaesthetised states, which isespecially important in paediatric and animal studies for preven-tion of motion artefacts (Paasonen et al., 2018, Liang et al., 2012,Seewoo et al., 2018a). However, despite the usefulness of rs-fMRIin a clinical and preclinical setting, analysis steps to obtain signifi-cant and reliable results from the noisy raw data are extensive andcomplex and there are numerous different analysis pipelines in theliterature.
https://doi.org/10.1016/j.neures.2020.05.0060168-0102/© 2020 Elsevier B.V. and Japan Neuroscience Society. All rights reserved.
Appendix D
461
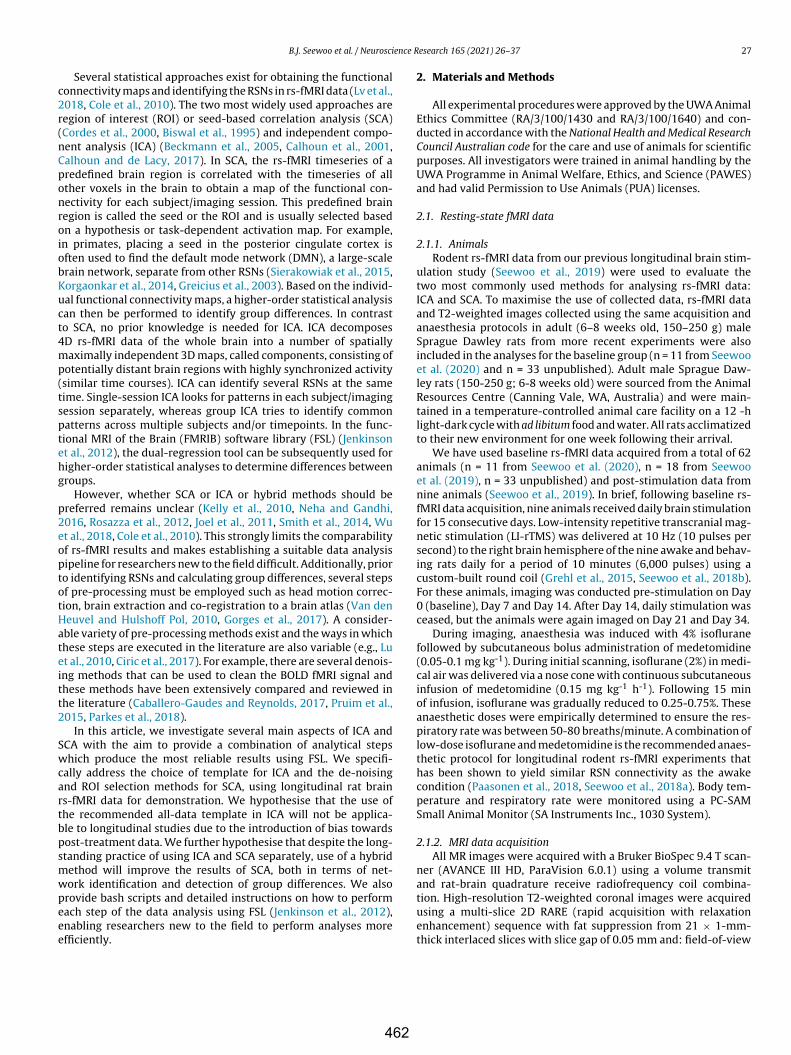
B.J. Seewoo et al. / Neuroscience Research 165 (2021) 26–37 27
Several statistical approaches exist for obtaining the functionalconnectivity maps and identifying the RSNs in rs-fMRI data (Lv et al.,2018, Cole et al., 2010). The two most widely used approaches areregion of interest (ROI) or seed-based correlation analysis (SCA)(Cordes et al., 2000, Biswal et al., 1995) and independent compo-nent analysis (ICA) (Beckmann et al., 2005, Calhoun et al., 2001,Calhoun and de Lacy, 2017). In SCA, the rs-fMRI timeseries of apredefined brain region is correlated with the timeseries of allother voxels in the brain to obtain a map of the functional con-nectivity for each subject/imaging session. This predefined brainregion is called the seed or the ROI and is usually selected basedon a hypothesis or task-dependent activation map. For example,in primates, placing a seed in the posterior cingulate cortex isoften used to find the default mode network (DMN), a large-scalebrain network, separate from other RSNs (Sierakowiak et al., 2015,Korgaonkar et al., 2014, Greicius et al., 2003). Based on the individ-ual functional connectivity maps, a higher-order statistical analysiscan then be performed to identify group differences. In contrastto SCA, no prior knowledge is needed for ICA. ICA decomposes4D rs-fMRI data of the whole brain into a number of spatiallymaximally independent 3D maps, called components, consisting ofpotentially distant brain regions with highly synchronized activity(similar time courses). ICA can identify several RSNs at the sametime. Single-session ICA looks for patterns in each subject/imagingsession separately, whereas group ICA tries to identify commonpatterns across multiple subjects and/or timepoints. In the func-tional MRI of the Brain (FMRIB) software library (FSL) (Jenkinsonet al., 2012), the dual-regression tool can be subsequently used forhigher-order statistical analyses to determine differences betweengroups.
However, whether SCA or ICA or hybrid methods should bepreferred remains unclear (Kelly et al., 2010, Neha and Gandhi,2016, Rosazza et al., 2012, Joel et al., 2011, Smith et al., 2014, Wuet al., 2018, Cole et al., 2010). This strongly limits the comparabilityof rs-fMRI results and makes establishing a suitable data analysispipeline for researchers new to the field difficult. Additionally, priorto identifying RSNs and calculating group differences, several stepsof pre-processing must be employed such as head motion correc-tion, brain extraction and co-registration to a brain atlas (Van denHeuvel and Hulshoff Pol, 2010, Gorges et al., 2017). A consider-able variety of pre-processing methods exist and the ways in whichthese steps are executed in the literature are also variable (e.g., Luet al., 2010, Ciric et al., 2017). For example, there are several denois-ing methods that can be used to clean the BOLD fMRI signal andthese methods have been extensively compared and reviewed inthe literature (Caballero-Gaudes and Reynolds, 2017, Pruim et al.,2015, Parkes et al., 2018).
In this article, we investigate several main aspects of ICA andSCA with the aim to provide a combination of analytical stepswhich produce the most reliable results using FSL. We specifi-cally address the choice of template for ICA and the de-noisingand ROI selection methods for SCA, using longitudinal rat brainrs-fMRI data for demonstration. We hypothesise that the use ofthe recommended all-data template in ICA will not be applica-ble to longitudinal studies due to the introduction of bias towardspost-treatment data. We further hypothesise that despite the long-standing practice of using ICA and SCA separately, use of a hybridmethod will improve the results of SCA, both in terms of net-work identification and detection of group differences. We alsoprovide bash scripts and detailed instructions on how to performeach step of the data analysis using FSL (Jenkinson et al., 2012),enabling researchers new to the field to perform analyses moreefficiently.
2. Materials and Methods
All experimental procedures were approved by the UWA AnimalEthics Committee (RA/3/100/1430 and RA/3/100/1640) and con-ducted in accordance with the National Health and Medical ResearchCouncil Australian code for the care and use of animals for scientificpurposes. All investigators were trained in animal handling by theUWA Programme in Animal Welfare, Ethics, and Science (PAWES)and had valid Permission to Use Animals (PUA) licenses.
2.1. Resting-state fMRI data
2.1.1. AnimalsRodent rs-fMRI data from our previous longitudinal brain stim-
ulation study (Seewoo et al., 2019) were used to evaluate thetwo most commonly used methods for analysing rs-fMRI data:ICA and SCA. To maximise the use of collected data, rs-fMRI dataand T2-weighted images collected using the same acquisition andanaesthesia protocols in adult (6–8 weeks old, 150–250 g) maleSprague Dawley rats from more recent experiments were alsoincluded in the analyses for the baseline group (n = 11 from Seewooet al. (2020) and n = 33 unpublished). Adult male Sprague Daw-ley rats (150-250 g; 6-8 weeks old) were sourced from the AnimalResources Centre (Canning Vale, WA, Australia) and were main-tained in a temperature-controlled animal care facility on a 12 -hlight-dark cycle with ad libitum food and water. All rats acclimatizedto their new environment for one week following their arrival.
We have used baseline rs-fMRI data acquired from a total of 62animals (n = 11 from Seewoo et al. (2020), n = 18 from Seewooet al. (2019), n = 33 unpublished) and post-stimulation data fromnine animals (Seewoo et al., 2019). In brief, following baseline rs-fMRI data acquisition, nine animals received daily brain stimulationfor 15 consecutive days. Low-intensity repetitive transcranial mag-netic stimulation (LI-rTMS) was delivered at 10 Hz (10 pulses persecond) to the right brain hemisphere of the nine awake and behav-ing rats daily for a period of 10 minutes (6,000 pulses) using acustom-built round coil (Grehl et al., 2015, Seewoo et al., 2018b).For these animals, imaging was conducted pre-stimulation on Day0 (baseline), Day 7 and Day 14. After Day 14, daily stimulation wasceased, but the animals were again imaged on Day 21 and Day 34.
During imaging, anaesthesia was induced with 4% isofluranefollowed by subcutaneous bolus administration of medetomidine(0.05-0.1 mg kg-1). During initial scanning, isoflurane (2%) in medi-cal air was delivered via a nose cone with continuous subcutaneousinfusion of medetomidine (0.15 mg kg-1 h-1). Following 15 minof infusion, isoflurane was gradually reduced to 0.25-0.75%. Theseanaesthetic doses were empirically determined to ensure the res-piratory rate was between 50-80 breaths/minute. A combination oflow-dose isoflurane and medetomidine is the recommended anaes-thetic protocol for longitudinal rodent rs-fMRI experiments thathas been shown to yield similar RSN connectivity as the awakecondition (Paasonen et al., 2018, Seewoo et al., 2018a). Body tem-perature and respiratory rate were monitored using a PC-SAMSmall Animal Monitor (SA Instruments Inc., 1030 System).
2.1.2. MRI data acquisitionAll MR images were acquired with a Bruker BioSpec 9.4 T scan-
ner (AVANCE III HD, ParaVision 6.0.1) using a volume transmitand rat-brain quadrature receive radiofrequency coil combina-tion. High-resolution T2-weighted coronal images were acquiredusing a multi-slice 2D RARE (rapid acquisition with relaxationenhancement) sequence with fat suppression from 21 × 1-mm-thick interlaced slices with slice gap of 0.05 mm and: field-of-view
462
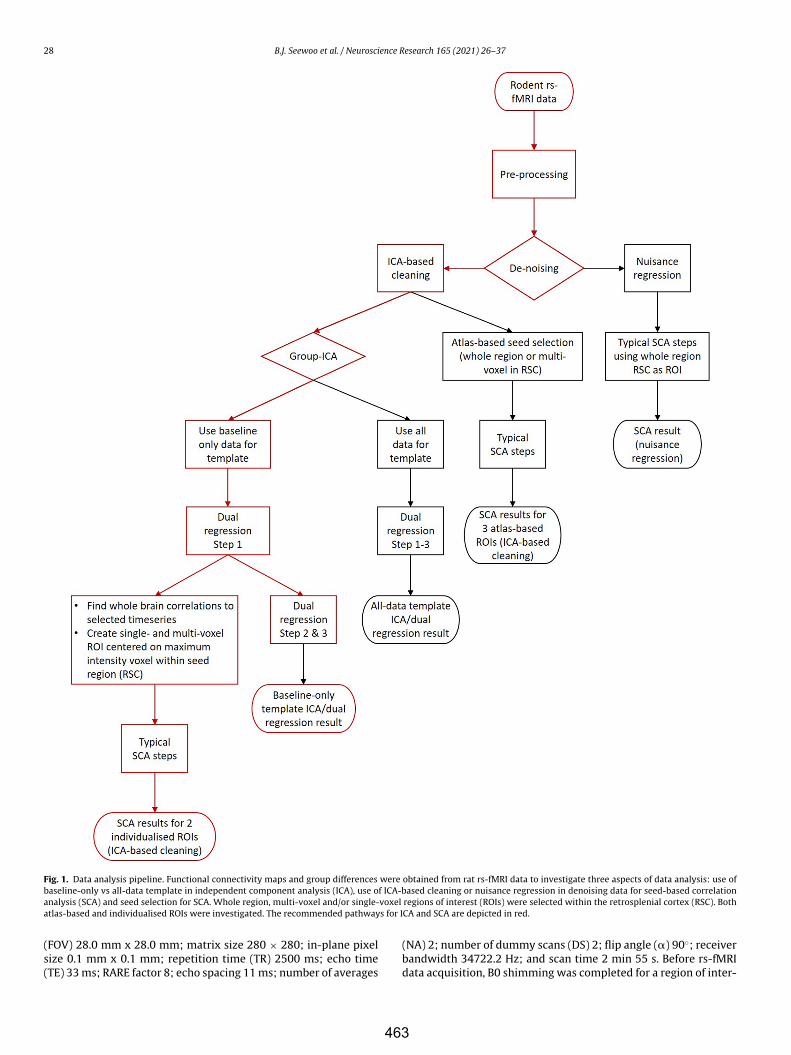
28 B.J. Seewoo et al. / Neuroscience Research 165 (2021) 26–37
Fig. 1. Data analysis pipeline. Functional connectivity maps and group differences were obtained from rat rs-fMRI data to investigate three aspects of data analysis: use ofbaseline-only vs all-data template in independent component analysis (ICA), use of ICA-based cleaning or nuisance regression in denoising data for seed-based correlationanalysis (SCA) and seed selection for SCA. Whole region, multi-voxel and/or single-voxel regions of interest (ROIs) were selected within the retrosplenial cortex (RSC). Bothatlas-based and individualised ROIs were investigated. The recommended pathways for ICA and SCA are depicted in red.
(FOV) 28.0 mm x 28.0 mm; matrix size 280 × 280; in-plane pixelsize 0.1 mm x 0.1 mm; repetition time (TR) 2500 ms; echo time(TE) 33 ms; RARE factor 8; echo spacing 11 ms; number of averages
(NA) 2; number of dummy scans (DS) 2; flip angle (�) 90◦; receiverbandwidth 34722.2 Hz; and scan time 2 min 55 s. Before rs-fMRIdata acquisition, B0 shimming was completed for a region of inter-
463
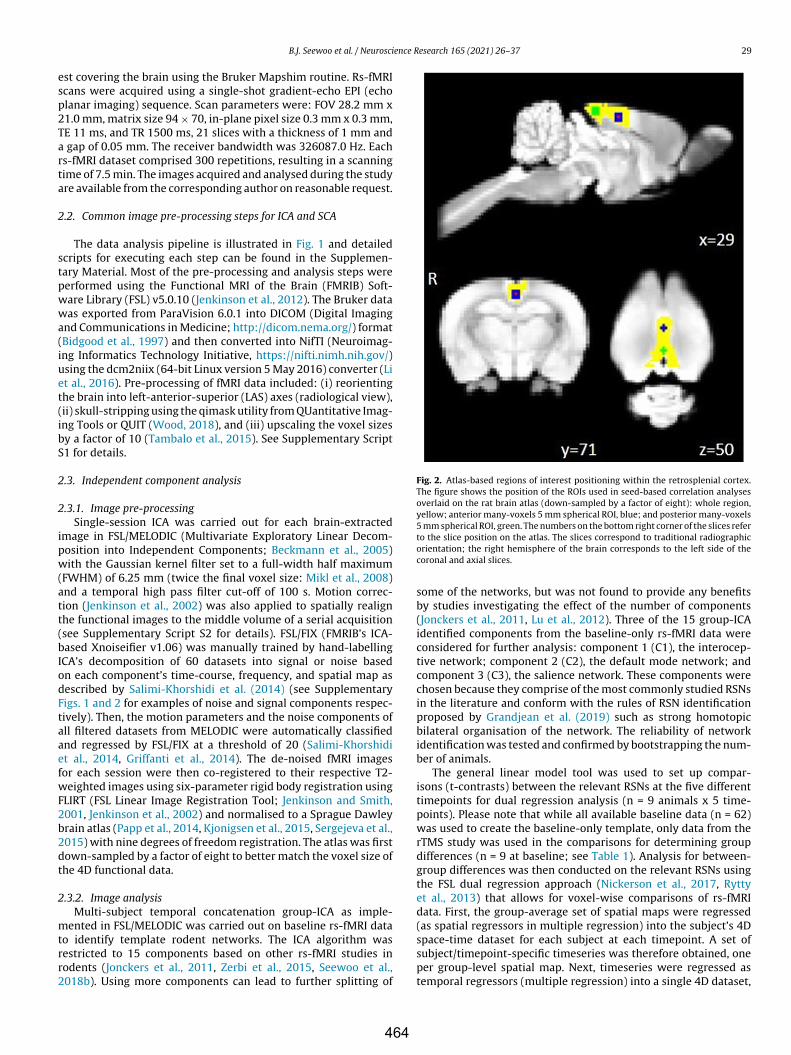
B.J. Seewoo et al. / Neuroscience Research 165 (2021) 26–37 29
est covering the brain using the Bruker Mapshim routine. Rs-fMRIscans were acquired using a single-shot gradient-echo EPI (echoplanar imaging) sequence. Scan parameters were: FOV 28.2 mm x21.0 mm, matrix size 94 × 70, in-plane pixel size 0.3 mm x 0.3 mm,TE 11 ms, and TR 1500 ms, 21 slices with a thickness of 1 mm anda gap of 0.05 mm. The receiver bandwidth was 326087.0 Hz. Eachrs-fMRI dataset comprised 300 repetitions, resulting in a scanningtime of 7.5 min. The images acquired and analysed during the studyare available from the corresponding author on reasonable request.
2.2. Common image pre-processing steps for ICA and SCA
The data analysis pipeline is illustrated in Fig. 1 and detailedscripts for executing each step can be found in the Supplemen-tary Material. Most of the pre-processing and analysis steps wereperformed using the Functional MRI of the Brain (FMRIB) Soft-ware Library (FSL) v5.0.10 (Jenkinson et al., 2012). The Bruker datawas exported from ParaVision 6.0.1 into DICOM (Digital Imagingand Communications in Medicine; http://dicom.nema.org/) format(Bidgood et al., 1997) and then converted into NifTI (Neuroimag-ing Informatics Technology Initiative, https://nifti.nimh.nih.gov/)using the dcm2niix (64-bit Linux version 5 May 2016) converter (Liet al., 2016). Pre-processing of fMRI data included: (i) reorientingthe brain into left-anterior-superior (LAS) axes (radiological view),(ii) skull-stripping using the qimask utility from QUantitative Imag-ing Tools or QUIT (Wood, 2018), and (iii) upscaling the voxel sizesby a factor of 10 (Tambalo et al., 2015). See Supplementary ScriptS1 for details.
2.3. Independent component analysis
2.3.1. Image pre-processingSingle-session ICA was carried out for each brain-extracted
image in FSL/MELODIC (Multivariate Exploratory Linear Decom-position into Independent Components; Beckmann et al., 2005)with the Gaussian kernel filter set to a full-width half maximum(FWHM) of 6.25 mm (twice the final voxel size: Mikl et al., 2008)and a temporal high pass filter cut-off of 100 s. Motion correc-tion (Jenkinson et al., 2002) was also applied to spatially realignthe functional images to the middle volume of a serial acquisition(see Supplementary Script S2 for details). FSL/FIX (FMRIB’s ICA-based Xnoiseifier v1.06) was manually trained by hand-labellingICA’s decomposition of 60 datasets into signal or noise basedon each component’s time-course, frequency, and spatial map asdescribed by Salimi-Khorshidi et al. (2014) (see SupplementaryFigs. 1 and 2 for examples of noise and signal components respec-tively). Then, the motion parameters and the noise components ofall filtered datasets from MELODIC were automatically classifiedand regressed by FSL/FIX at a threshold of 20 (Salimi-Khorshidiet al., 2014, Griffanti et al., 2014). The de-noised fMRI imagesfor each session were then co-registered to their respective T2-weighted images using six-parameter rigid body registration usingFLIRT (FSL Linear Image Registration Tool; Jenkinson and Smith,2001, Jenkinson et al., 2002) and normalised to a Sprague Dawleybrain atlas (Papp et al., 2014, Kjonigsen et al., 2015, Sergejeva et al.,2015) with nine degrees of freedom registration. The atlas was firstdown-sampled by a factor of eight to better match the voxel size ofthe 4D functional data.
2.3.2. Image analysisMulti-subject temporal concatenation group-ICA as imple-
mented in FSL/MELODIC was carried out on baseline rs-fMRI datato identify template rodent networks. The ICA algorithm wasrestricted to 15 components based on other rs-fMRI studies inrodents (Jonckers et al., 2011, Zerbi et al., 2015, Seewoo et al.,2018b). Using more components can lead to further splitting of
Fig. 2. Atlas-based regions of interest positioning within the retrosplenial cortex.The figure shows the position of the ROIs used in seed-based correlation analysesoverlaid on the rat brain atlas (down-sampled by a factor of eight): whole region,yellow; anterior many-voxels 5 mm spherical ROI, blue; and posterior many-voxels5 mm spherical ROI, green. The numbers on the bottom right corner of the slices referto the slice position on the atlas. The slices correspond to traditional radiographicorientation; the right hemisphere of the brain corresponds to the left side of thecoronal and axial slices.
some of the networks, but was not found to provide any benefitsby studies investigating the effect of the number of components(Jonckers et al., 2011, Lu et al., 2012). Three of the 15 group-ICAidentified components from the baseline-only rs-fMRI data wereconsidered for further analysis: component 1 (C1), the interocep-tive network; component 2 (C2), the default mode network; andcomponent 3 (C3), the salience network. These components werechosen because they comprise of the most commonly studied RSNsin the literature and conform with the rules of RSN identificationproposed by Grandjean et al. (2019) such as strong homotopicbilateral organisation of the network. The reliability of networkidentification was tested and confirmed by bootstrapping the num-ber of animals.
The general linear model tool was used to set up compar-isons (t-contrasts) between the relevant RSNs at the five differenttimepoints for dual regression analysis (n = 9 animals x 5 time-points). Please note that while all available baseline data (n = 62)was used to create the baseline-only template, only data from therTMS study was used in the comparisons for determining groupdifferences (n = 9 at baseline; see Table 1). Analysis for between-group differences was then conducted on the relevant RSNs usingthe FSL dual regression approach (Nickerson et al., 2017, Ryttyet al., 2013) that allows for voxel-wise comparisons of rs-fMRIdata. First, the group-average set of spatial maps were regressed(as spatial regressors in multiple regression) into the subject’s 4Dspace-time dataset for each subject at each timepoint. A set ofsubject/timepoint-specific timeseries was therefore obtained, oneper group-level spatial map. Next, timeseries were regressed astemporal regressors (multiple regression) into a single 4D dataset,
464

30 B.J. Seewoo et al. / Neuroscience Research 165 (2021) 26–37
Table 1ICA templates and group comparisons.
Template type Data used for making template Data used in dual regression
Baseline-only template n = 11 from Seewoo et al. (2020), n = 18 from Seewooet al. (2019) and n = 33 unpublished
Day 0 (n = 9), Day 7 (n = 9), Day 14 (n = 9), Day 21 (n =9) and Day 34 (n = 9)
All-data template Day 0 (n = 9), Day 7 (n = 9), Day 14 (n = 9), Day 21 (n =9) and Day 34 (n = 9)
Day 0 (n = 9), Day 7 (n = 9), Day 14 (n = 9), Day 21 (n =9) and Day 34 (n = 9)
Balanced template Day 0 (n = 9) and Day 7 (n = 9) Day 0 (n = 9) and Day 7 (n = 9)Balanced template Day 0 (n = 9) and Day 14 (n = 9) Day 0 (n = 9) and Day 14 (n = 9)Balanced template Day 14 (n = 9) and Day 21 (n = 9) Day 14 (n = 9) and Day 21 (n = 9)Balanced template Day 14 (n = 9) and Day 34 (n = 9) Day 14 (n = 9) and Day 24 (n = 9)
resulting in a set of subject/timepoint-specific spatial maps, whichwere subject-level representations of these components at eachtimepoint (Beckmann et al., 2009). We then tested for groupdifferences using FSL’s randomise nonparametric permutation-testing tool, with 5000 permutations, using a threshold-free clusterenhanced (TFCE) technique and family-wise error (FWE) correctionto control for multiple (spatial) comparisons. The resulting statisti-cal maps were thresholded to p < 0.00625 to account for the eightdifferent longitudinal comparisons using the conservative Bonfer-roni correction. These eight comparisons between the five differenttime points were chosen based on the design of the longitudinalstudy. A threshold of 30 adjacent voxels was used for the clustersize. Cluster size thresholds reported in the literature mostly varybetween 10 and 50 (e.g., Zhang et al., 2014, Mueller et al., 2017).
The group-ICA algorithm was re-run on all longitudinal rs-fMRIdata (n = 9 animals x 5 timepoints) to identify the RSNs (seeTable 1). The components from this all-data template were visu-ally compared to the previous baseline-only template. The qualityof RSN identification was assessed based on similarity to rodentRSNs reported in the literature (Zerbi et al., 2015, Lu et al., 2012,Grandjean et al., 2019, Bajic et al., 2016). The group differencesfound based on the all-data template were then quantitativelycompared to the results of the baseline-only template. For thiscomparison, only the interoceptive network (C1) was used, sincethe default mode network (C2) in the all-data template overlappedwith another network, and for the salience network (C3), no sig-nificant changes were found in the previous publication (Seewooet al., 2019). Since the visual comparison of identified RSNs is some-what subjective, the quantitative comparison of group differencesis a more meaningful approach for assessing the quality of differentanalysis pipelines.
In addition to baseline-only and all-data templates, the group-ICA algorithm was also used to create balanced templates of fourdifferent combinations of timepoints: Day 0/Day 7, Day 0/Day 14,Day 14/Day 21 and Day 14/Day 34 (see Table 1). This allowed testingof group differences based on balanced templates as well, as is oftendone in studies with pre-post treatment or healthy-pathologicaldesign (e.g., Filippini et al., 2009, Filippini et al., 2012, Zamboni et al.,2013).
2.4. Seed-based correlation analysis
2.4.1. DenoisingData processing for SCA was carried out using FSL/FEAT (FMRI
Expert Analysis Tool) Version 6.00, largely according to the stepsdescribed in Haneef et al. (2014). The data were denoised usingtwo methods: nuisance regression (see Supplementary Script S3for details) and ICA-based cleaning as described above (Supplemen-tary Script S4). Please note that there are other denoising methodsimplemented in different fMRI data analysis software such as thepopular CompCor method in CONN (Whitfield-Gabrieli and Nieto-Castanon, 2012) and C-PAC (Craddock et al. 2013) packages whichis an extension of the nuisance regression model using principalcomponents derived from WM and CSF (Behzadi et al., 2007). These
methods will not be investigated in this study because they arenot implemented within FSL and an aim of this study is to providea streamlined data analysis pipeline for rodent fMRI data withinFSL. For nuisance regression, the following pre-statistics process-ing was applied in the first-level FEAT analysis: motion correctionusing MCFLIRT (Jenkinson et al., 2002), grand-mean intensity nor-malisation of the entire 4D dataset by a single multiplicative factor,and high-pass temporal filtering (Gaussian-weighted least-squaresstraight line fitting, with sigma = 5000.0 s). Registration to highresolution structural and standard space images was carried outusing FLIRT (Jenkinson and Smith, 2001, Jenkinson et al., 2002). Toremove potential contributions of physiological noise, timeseriesextracted from individual white matter and cerebral spinal fluidmasks were regressed out, along with head motion parametersusing FILM (FMRIB’s Improved Linear Model) with local autocor-relation correction (Woolrich et al., 2001). Spatial smoothing usinga Gaussian kernel of FWHM 6.25 mm and high-pass temporal fil-tering (Gaussian-weighted least-squares straight line fitting, withsigma = 50.0 s) were also applied in this step.
2.4.2. ROI selectionThe retrosplenial cortex (RSC) was chosen as the brain region
for seeding to obtain the rat DMN because the RSC robustly elic-its DMN maps and is not lateralized (Huang et al., 2016, Lu et al.,2012). The RSC region is one of the major hubs of the DMN inrodents, which corresponds to the posterior cingulate cortex in pri-mates (Sugar et al., 2011). To determine the effects of ROI size andplacement on the calculated resting-state connectivity, five ROIswere selected within this region within the ICA- cleaned data: threefrom the atlas (Fig. 2) and two from individual ICA functional con-nectivity as described by Sohn and colleagues (Sohn et al., 2015).Individualised ROIs were based on the voxel (within the RSC) withmaximum correlation to each individual animal’s C1 timeseries asidentified by ICA (see Supplementary Script S5 for details). The fol-lowing ROIs were used: whole RSC (RSCW); anterior many-voxels5 mm spherical ROI (RSCAMV) centred at x = 29, y = 71, and z = 49;posterior many-voxels 5 mm spherical ROI (RSCPMV) centred at x= 29, y = 62, and z = 51; individualised many-voxels 5 mm spheri-cal ROI (individualised RSCMV); and individualised single-voxel ROI(individualised RSCSV).
2.4.3. Image analysis for identifying RSNs and detecting groupdifferences
After ROI selection, the data were demeaned and the averagetime courses of the ROIs were used in a first-level FEAT analysis togenerate whole-brain correlation maps.
Higher-level analysis was carried out using OLS (ordinary leastsquares) simple mixed effects (Woolrich et al., 2004, Beckmannet al., 2003, Woolrich, 2008). Z (Gaussianised T/F) statistic imageswere automatically thresholded non-parametrically using clustersdetermined by z > 2 and a (corrected) cluster significance thresholdof p = 0.05 (Worsley, 2001).
To study the effect of de-noising methods and ROI selection onRSN identification, average whole-brain correlation maps were cal-
465

B.J. Seewoo et al. / Neuroscience Research 165 (2021) 26–37 31
culated using only the baseline data of the 62 rats. The results werecompared visually. To study the sensitivity of de-noising meth-ods and different ROI selections for detecting group differences,higher-level analysis was also carried out using the longitudinaldata only (n = 9 per timepoint). Like for ICA, the conservativeBonferroni correction was used to correct for multiple compar-isons (eight contrasts, p < 0.00625) and accordingly, all statisticalmaps were thresholded to z > 2.5. The results were compared visu-ally and quantitatively. For the quantitative comparisons, a clusterthreshold of 30 adjacent voxels was applied. As an indicator of thesensitivity for detecting group differences, the number of signif-icant clusters, total number of significant voxels and maximumz-score in each of the comparisons were used.
3. Results
3.1. Choice of template for independent component analysis
3.1.1. Identification of RSNsHomologous networks were identified when group-ICA was
performed on baseline-only rs-fMRI data and on all rs-fMRIdata (i.e., pre and post stimulation). When comparing the tem-plates qualitatively (Fig. 3), baseline-only networks exhibited morewidespread overall connectivity in terms of the spatial distributionof the RSNs and stronger functional connectivity (higher z-scores)between brain regions within those networks, especially within thedefault mode network, as compared to the all-data networks.
3.1.2. Sensitivity of dual regression to group differencesDual regression analysis was carried out using C1 of the
baseline-only template and the homologous component found inthe all-data template and in each of the four balanced templates. Nosignificant group differences were found in the all-data or balancedtemplates using the strict Bonferroni correction and a threshold forthe cluster size of 30 voxels. With the baseline-only template, sig-nificant clusters were found for Day 14 > Day 21 (1 cluster of 109voxels) and for Day 14 > Day 34 (1 cluster of 71 voxels). There-fore, the use of baseline-only template RSNs resulted in increasedsensitivity of the dual regression tool in detecting between-groupdifferences.
3.2. Considerations for using seed-based correlation analysis
3.2.1. Effect of de-noising method and ROI selection for RSNidentification
The effect of two de-noising methods, nuisance regression andICA-based cleaning, was investigated for SCA of the whole retros-plenial cortex (RSCW) seed from baseline data of 62 rats. While onlythe interoceptive network (C1-equivalent) was identified in thenuisance regressed data (Fig. 4B), both the interoceptive network(C1-equivalent) and default mode network (C2-equivalent) wereidentified in ICA-cleaned data (Fig. 4C). Overall, the connectivityobtained after ICA-based cleaning was higher and more widespreadthan after nuisance regression.
The connectivity maps resulting from the different ROI selec-tions using the ICA-cleaned data are shown in Fig. 4D-G. In general,both the interoceptive and default mode networks were success-fully identified using all seeds. However, the RSCPMV seeded mapexhibited relatively little functional connectivity overall, especiallyfurther away from the ROI between slices at y = 70 and y = 88where the corresponding ICA networks show most connectivity. Ofall results, the RSCW seeded map exhibited the highest and mostwidespread connectivity. The two maps obtained using the indi-vidualized ROIs showed almost identical functional connectivity
patterns and together with the RSCAMV seeded map, they were mostsimilar to the ICA C1 and C2 networks.
3.2.2. Sensitivity of methods for detecting group differencesThe quantitative results of the group comparisons using dif-
ferent de-noising methods and ROI selections are presented inTable 2. SCA of the whole region ROI (RSCW) based on nuisanceregressed de-noising detected few significant differences betweenthe groups. Among the ICA-cleaned atlas-based SCA methods, theanterior multi-region ROI (RSCAMV) achieved better sensitivityto group differences than the whole region ROI (RSCW) and theposterior multi-region ROI (RSCPMV). The two individualised SCAapproaches performed similarly and were the only methods thatfound significant differences for all eight tests.
To get an idea of the spatial distribution of significant voxels,example slices for the two comparisons with the highest numberof significant voxels are shown in Fig. 5. The results based on thenuisance regressed data are left out since they do not contain anysignificant voxels in the slices shown here. The maps for the twoindividualised SCA approaches are very similar and the significantvoxels in the atlas-based results are largely located in the sameregions as the voxels in the individualised SCA maps.
4. Discussion
We investigated the two most widely used methods foranalysing rs-fMRI data (ICA and SCA) to provide an optimumcombination of analytical steps which produce the most reliableresults. We demonstrate that the results of ICA are affected bythe choice of network templates. An average pre-post treatmenttemplate obtained using all data in ICA rendered the identifica-tion of the DMN difficult and the dual regression tool less sensitiveto stimulation-induced changes within the RSNs compared tobaseline-only templates. When denoising rs-fMRI data for SCA,ICA-based cleaning was superior to the traditionally used nuisanceregression method both in terms of the quality of the RSNs gener-ated and in the detection of group differences. These data indicatethat nuisance regression may reduce signals of interest in additionto noise signals. Additionally, the use of individualised ROIs insteadof atlas-based ROIs considerably increased the sensitivity of SCAto the identification of RSNs and detection of group differences.Hence, we suggest the use of a healthy or pre-treatment templatein ICA and the use of ICA-based denoising and individualised ROIsin SCA. We did not directly compare ICA and SCA since these twoapproaches are conceptually different and use distinct statisticalmethods for the higher-level analysis.
4.1. Choice of RSN template for dual regression analysis
Several recent studies have suggested the use of a set of healthytemplate networks for dual regression (Nickerson et al., 2017, Ryttyet al., 2013, Griffanti et al., 2016), while others recommend to havean equal number of subjects for pre and post treatment or healthycontrols and patients for a “balanced” template when using an all-data template method (e.g., Filippini et al., 2009, Filippini et al.,2012, Zamboni et al., 2013). We visually compared the qualityof three of the most commonly studied RSNs (interoceptive net-work, DMN and salience network) and when only baseline datawas used, we found that the strength of functional connectivitybetween brain regions within those networks was considerablystronger, especially within the DMN, as compared to the all-datanetworks. Using a baseline-only template also resulted in bettersensitivity for group differences compared to the all-data template.This might be due to the all-data template being strongly biasedtowards post-stimulation networks.
466

32 B.J. Seewoo et al. / Neuroscience Research 165 (2021) 26–37
Fig. 3. Resting-state networks resulting from group-ICA. The figure illustrates coronal slices of RSNs identified in rs-fMRI scans of 6-8 weeks old male Sprague Dawleyrats. The components were classified as follows: C1, interoceptive network; C2, default mode network; and C3, salience network. The spatial colour-coded z-maps of thesecomponents are overlaid on the rat brain atlas (down-sampled by a factor of eight) and the number on the bottom right corner of each slice refers to the slice position on theatlas. The same slices are shown for RSNs of baseline rs-fMRI scans (n = 62) and of all pre and post treatment data (n = 45). The RSN maps are represented as z-scores (lowerthreshold at z > 4, except for all-data C2 where z > 2), with a higher z-score (yellow) representing a greater correlation between the time course of that voxel and the meantime course of the component. The slices correspond to traditional radiographic orientation; the right hemisphere of the brain corresponds to the left side of the image.
The use of a balanced number of healthy controls and patientsin the template creates an average healthy-pathological tem-plate. However, an unbiased average all-data template cannotbe obtained in longitudinal studies like the present one dueto repeated measurements, or in cases where there are severalpathological RSN subtypes (e.g., in depression as identified byDrysdale et al., 2017). To use an unbiased template in dual regres-sion in these cases, a different average template can be usedfor each comparison. Nevertheless, previous studies have shownthat dual regression is better able to detect differences from a“healthy” brain rather than from an average template (e.g., Griffantiet al., 2016). Our results obtained using balanced templates offour different combinations of timepoints confirm this finding.Therefore, we recommend the use of a pre-treatment or healthytemplate, both for longitudinal studies and for studies with pre-post treatment/healthy-pathological design.
Template networks could also be sourced from group-ICA ofan independent set of subjects, such as an out-of-sample func-tional atlas (Szewczyk-Krolikowski et al., 2014, Schultz et al., 2014).
However, we do not recommend the use of a functional atlas forrodent studies as the atlas may be devoid of information related tostudy-specific variations contained in group-ICA components of theoriginal data. Such study-specific variations could be the type anddose of anaesthetic used, both of which alter the relative localisa-tion and strength of connectivity within specific networks and eventhe presence of some RSNs (Masamoto and Kanno, 2012, Paasonenet al., 2018, Grandjean et al., 2014, Williams et al., 2010). In thepresent study, the use of a study-specific template is not expected tointroduce significant anaesthetic-related variation because all fMRIdata used here were acquired under the same anaesthetic protocol.
4.2. Considerations for using seed-based correlation analysis
The results of this study strongly suggest that functional connec-tivity maps obtained after ICA-based cleaning exhibit higher andmore widespread overall connectivity than maps obtained afternuisance regression. Furthermore, the nuisance regression in SCAseems to lead to lower sensitivity in the detection of group dif-
467
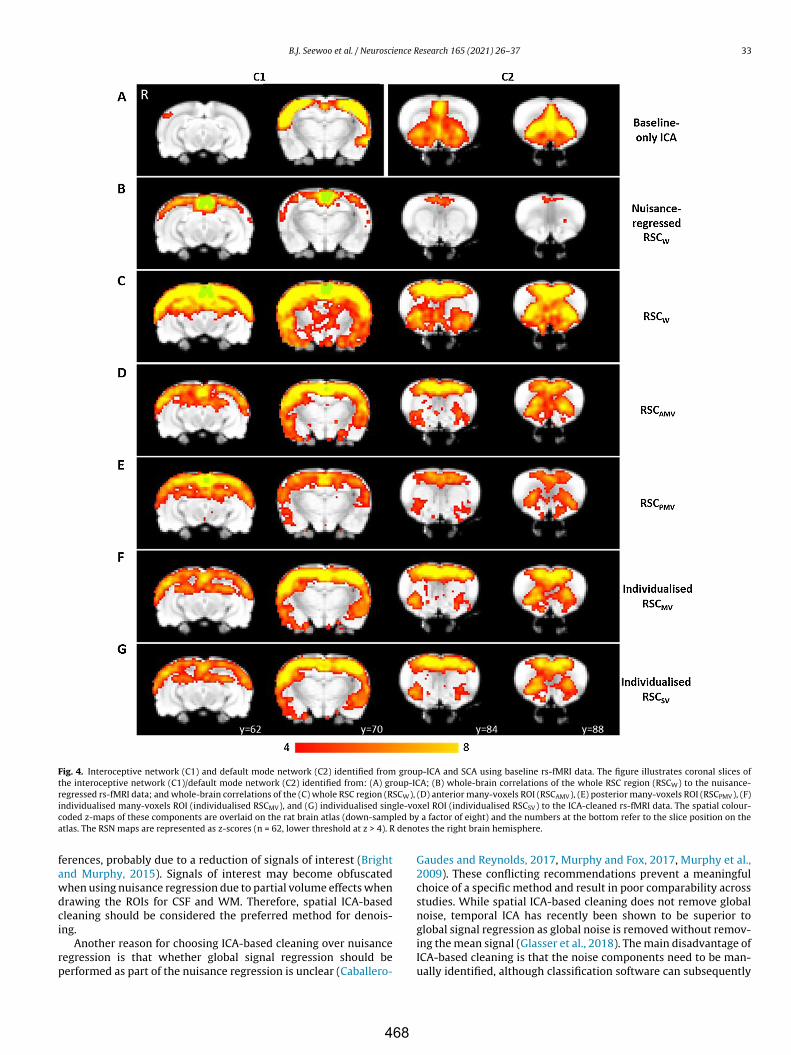
B.J. Seewoo et al. / Neuroscience Research 165 (2021) 26–37 33
Fig. 4. Interoceptive network (C1) and default mode network (C2) identified from group-ICA and SCA using baseline rs-fMRI data. The figure illustrates coronal slices ofthe interoceptive network (C1)/default mode network (C2) identified from: (A) group-ICA; (B) whole-brain correlations of the whole RSC region (RSCW) to the nuisance-regressed rs-fMRI data; and whole-brain correlations of the (C) whole RSC region (RSCW), (D) anterior many-voxels ROI (RSCAMV), (E) posterior many-voxels ROI (RSCPMV), (F)individualised many-voxels ROI (individualised RSCMV), and (G) individualised single-voxel ROI (individualised RSCSV) to the ICA-cleaned rs-fMRI data. The spatial colour-coded z-maps of these components are overlaid on the rat brain atlas (down-sampled by a factor of eight) and the numbers at the bottom refer to the slice position on theatlas. The RSN maps are represented as z-scores (n = 62, lower threshold at z > 4). R denotes the right brain hemisphere.
ferences, probably due to a reduction of signals of interest (Brightand Murphy, 2015). Signals of interest may become obfuscatedwhen using nuisance regression due to partial volume effects whendrawing the ROIs for CSF and WM. Therefore, spatial ICA-basedcleaning should be considered the preferred method for denois-ing.
Another reason for choosing ICA-based cleaning over nuisanceregression is that whether global signal regression should beperformed as part of the nuisance regression is unclear (Caballero-
Gaudes and Reynolds, 2017, Murphy and Fox, 2017, Murphy et al.,2009). These conflicting recommendations prevent a meaningfulchoice of a specific method and result in poor comparability acrossstudies. While spatial ICA-based cleaning does not remove globalnoise, temporal ICA has recently been shown to be superior toglobal signal regression as global noise is removed without remov-ing the mean signal (Glasser et al., 2018). The main disadvantage ofICA-based cleaning is that the noise components need to be man-ually identified, although classification software can subsequently
468
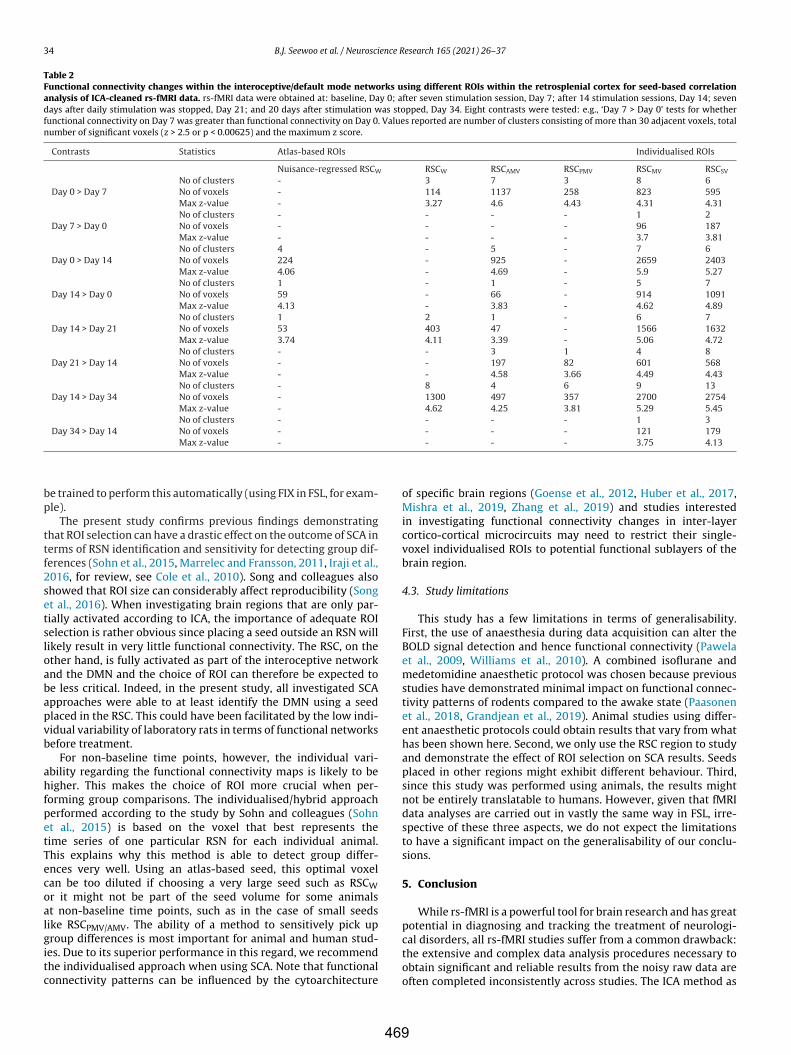
34 B.J. Seewoo et al. / Neuroscience Research 165 (2021) 26–37
Table 2Functional connectivity changes within the interoceptive/default mode networks using different ROIs within the retrosplenial cortex for seed-based correlationanalysis of ICA-cleaned rs-fMRI data. rs-fMRI data were obtained at: baseline, Day 0; after seven stimulation session, Day 7; after 14 stimulation sessions, Day 14; sevendays after daily stimulation was stopped, Day 21; and 20 days after stimulation was stopped, Day 34. Eight contrasts were tested: e.g., ‘Day 7 > Day 0’ tests for whetherfunctional connectivity on Day 7 was greater than functional connectivity on Day 0. Values reported are number of clusters consisting of more than 30 adjacent voxels, totalnumber of significant voxels (z > 2.5 or p < 0.00625) and the maximum z score.
Contrasts Statistics Atlas-based ROIs Individualised ROIs
Nuisance-regressed RSCW RSCW RSCAMV RSCPMV RSCMV RSCSV
Day 0 > Day 7No of clusters - 3 7 3 8 6No of voxels - 114 1137 258 823 595Max z-value - 3.27 4.6 4.43 4.31 4.31
Day 7 > Day 0No of clusters - - - - 1 2No of voxels - - - - 96 187Max z-value - - - - 3.7 3.81
Day 0 > Day 14No of clusters 4 - 5 - 7 6No of voxels 224 - 925 - 2659 2403Max z-value 4.06 - 4.69 - 5.9 5.27
Day 14 > Day 0No of clusters 1 - 1 - 5 7No of voxels 59 - 66 - 914 1091Max z-value 4.13 - 3.83 - 4.62 4.89
Day 14 > Day 21No of clusters 1 2 1 - 6 7No of voxels 53 403 47 - 1566 1632Max z-value 3.74 4.11 3.39 - 5.06 4.72
Day 21 > Day 14No of clusters - - 3 1 4 8No of voxels - - 197 82 601 568Max z-value - - 4.58 3.66 4.49 4.43
Day 14 > Day 34No of clusters - 8 4 6 9 13No of voxels - 1300 497 357 2700 2754Max z-value - 4.62 4.25 3.81 5.29 5.45
Day 34 > Day 14No of clusters - - - - 1 3No of voxels - - - - 121 179Max z-value - - - - 3.75 4.13
be trained to perform this automatically (using FIX in FSL, for exam-ple).
The present study confirms previous findings demonstratingthat ROI selection can have a drastic effect on the outcome of SCA interms of RSN identification and sensitivity for detecting group dif-ferences (Sohn et al., 2015, Marrelec and Fransson, 2011, Iraji et al.,2016, for review, see Cole et al., 2010). Song and colleagues alsoshowed that ROI size can considerably affect reproducibility (Songet al., 2016). When investigating brain regions that are only par-tially activated according to ICA, the importance of adequate ROIselection is rather obvious since placing a seed outside an RSN willlikely result in very little functional connectivity. The RSC, on theother hand, is fully activated as part of the interoceptive networkand the DMN and the choice of ROI can therefore be expected tobe less critical. Indeed, in the present study, all investigated SCAapproaches were able to at least identify the DMN using a seedplaced in the RSC. This could have been facilitated by the low indi-vidual variability of laboratory rats in terms of functional networksbefore treatment.
For non-baseline time points, however, the individual vari-ability regarding the functional connectivity maps is likely to behigher. This makes the choice of ROI more crucial when per-forming group comparisons. The individualised/hybrid approachperformed according to the study by Sohn and colleagues (Sohnet al., 2015) is based on the voxel that best represents thetime series of one particular RSN for each individual animal.This explains why this method is able to detect group differ-ences very well. Using an atlas-based seed, this optimal voxelcan be too diluted if choosing a very large seed such as RSCWor it might not be part of the seed volume for some animalsat non-baseline time points, such as in the case of small seedslike RSCPMV/AMV. The ability of a method to sensitively pick upgroup differences is most important for animal and human stud-ies. Due to its superior performance in this regard, we recommendthe individualised approach when using SCA. Note that functionalconnectivity patterns can be influenced by the cytoarchitecture
of specific brain regions (Goense et al., 2012, Huber et al., 2017,Mishra et al., 2019, Zhang et al., 2019) and studies interestedin investigating functional connectivity changes in inter-layercortico-cortical microcircuits may need to restrict their single-voxel individualised ROIs to potential functional sublayers of thebrain region.
4.3. Study limitations
This study has a few limitations in terms of generalisability.First, the use of anaesthesia during data acquisition can alter theBOLD signal detection and hence functional connectivity (Pawelaet al., 2009, Williams et al., 2010). A combined isoflurane andmedetomidine anaesthetic protocol was chosen because previousstudies have demonstrated minimal impact on functional connec-tivity patterns of rodents compared to the awake state (Paasonenet al., 2018, Grandjean et al., 2019). Animal studies using differ-ent anaesthetic protocols could obtain results that vary from whathas been shown here. Second, we only use the RSC region to studyand demonstrate the effect of ROI selection on SCA results. Seedsplaced in other regions might exhibit different behaviour. Third,since this study was performed using animals, the results mightnot be entirely translatable to humans. However, given that fMRIdata analyses are carried out in vastly the same way in FSL, irre-spective of these three aspects, we do not expect the limitationsto have a significant impact on the generalisability of our conclu-sions.
5. Conclusion
While rs-fMRI is a powerful tool for brain research and has greatpotential in diagnosing and tracking the treatment of neurologi-cal disorders, all rs-fMRI studies suffer from a common drawback:the extensive and complex data analysis procedures necessary toobtain significant and reliable results from the noisy raw data areoften completed inconsistently across studies. The ICA method as
469
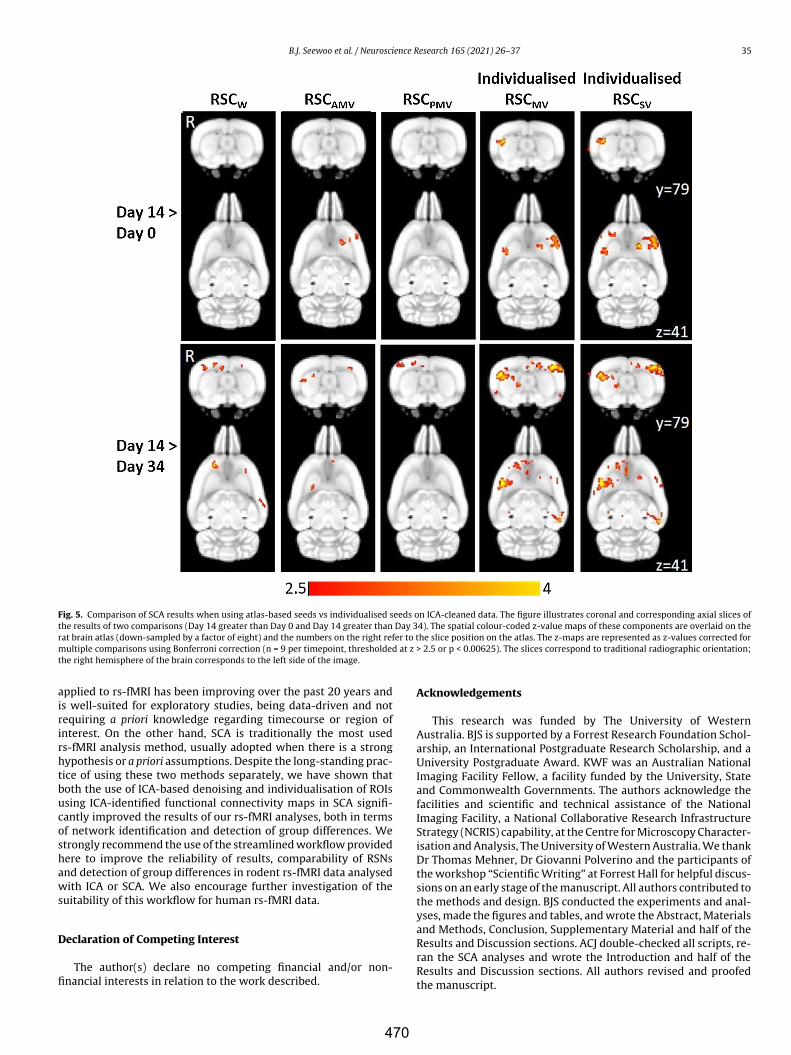
B.J. Seewoo et al. / Neuroscience Research 165 (2021) 26–37 35
Fig. 5. Comparison of SCA results when using atlas-based seeds vs individualised seeds on ICA-cleaned data. The figure illustrates coronal and corresponding axial slices ofthe results of two comparisons (Day 14 greater than Day 0 and Day 14 greater than Day 34). The spatial colour-coded z-value maps of these components are overlaid on therat brain atlas (down-sampled by a factor of eight) and the numbers on the right refer to the slice position on the atlas. The z-maps are represented as z-values corrected formultiple comparisons using Bonferroni correction (n = 9 per timepoint, thresholded at z > 2.5 or p < 0.00625). The slices correspond to traditional radiographic orientation;the right hemisphere of the brain corresponds to the left side of the image.
applied to rs-fMRI has been improving over the past 20 years andis well-suited for exploratory studies, being data-driven and notrequiring a priori knowledge regarding timecourse or region ofinterest. On the other hand, SCA is traditionally the most usedrs-fMRI analysis method, usually adopted when there is a stronghypothesis or a priori assumptions. Despite the long-standing prac-tice of using these two methods separately, we have shown thatboth the use of ICA-based denoising and individualisation of ROIsusing ICA-identified functional connectivity maps in SCA signifi-cantly improved the results of our rs-fMRI analyses, both in termsof network identification and detection of group differences. Westrongly recommend the use of the streamlined workflow providedhere to improve the reliability of results, comparability of RSNsand detection of group differences in rodent rs-fMRI data analysedwith ICA or SCA. We also encourage further investigation of thesuitability of this workflow for human rs-fMRI data.
Declaration of Competing Interest
The author(s) declare no competing financial and/or non-financial interests in relation to the work described.
Acknowledgements
This research was funded by The University of WesternAustralia. BJS is supported by a Forrest Research Foundation Schol-arship, an International Postgraduate Research Scholarship, and aUniversity Postgraduate Award. KWF was an Australian NationalImaging Facility Fellow, a facility funded by the University, Stateand Commonwealth Governments. The authors acknowledge thefacilities and scientific and technical assistance of the NationalImaging Facility, a National Collaborative Research InfrastructureStrategy (NCRIS) capability, at the Centre for Microscopy Character-isation and Analysis, The University of Western Australia. We thankDr Thomas Mehner, Dr Giovanni Polverino and the participants ofthe workshop “Scientific Writing” at Forrest Hall for helpful discus-sions on an early stage of the manuscript. All authors contributed tothe methods and design. BJS conducted the experiments and anal-yses, made the figures and tables, and wrote the Abstract, Materialsand Methods, Conclusion, Supplementary Material and half of theResults and Discussion sections. ACJ double-checked all scripts, re-ran the SCA analyses and wrote the Introduction and half of theResults and Discussion sections. All authors revised and proofedthe manuscript.
470
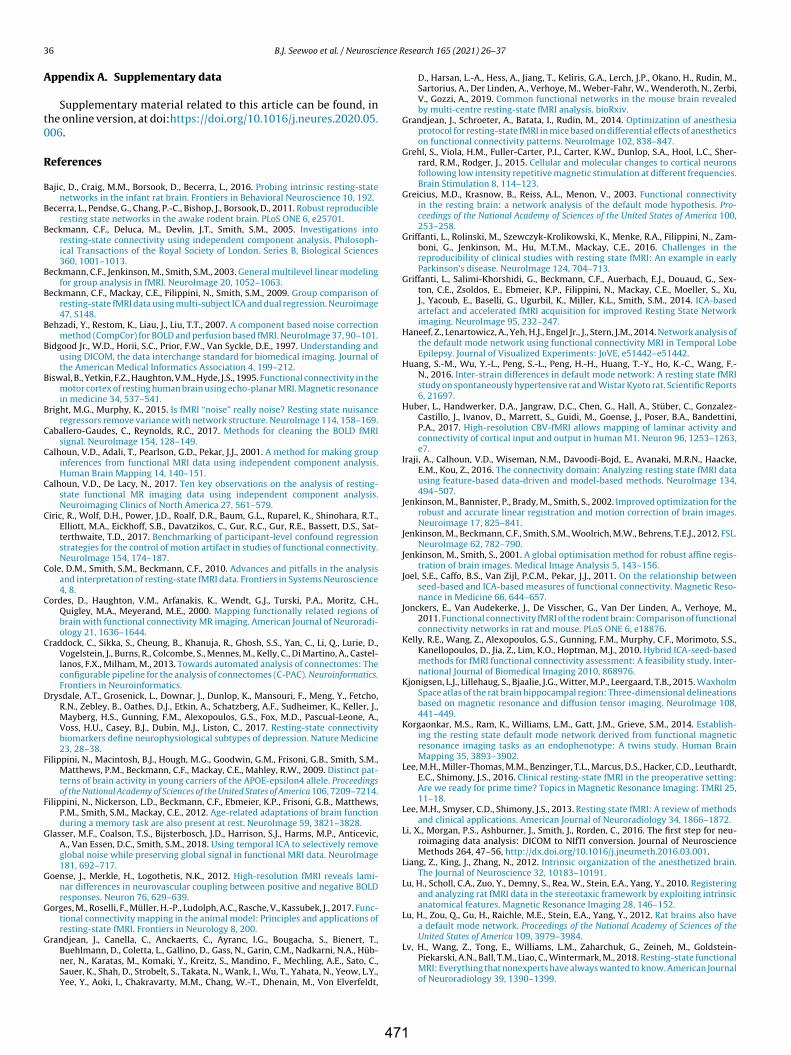
36 B.J. Seewoo et al. / Neuroscience Research 165 (2021) 26–37
Appendix A. Supplementary data
Supplementary material related to this article can be found, inthe online version, at doi:https://doi.org/10.1016/j.neures.2020.05.006.
References
Bajic, D., Craig, M.M., Borsook, D., Becerra, L., 2016. Probing intrinsic resting-statenetworks in the infant rat brain. Frontiers in Behavioral Neuroscience 10, 192.
Becerra, L., Pendse, G., Chang, P.-C., Bishop, J., Borsook, D., 2011. Robust reproducibleresting state networks in the awake rodent brain. PLoS ONE 6, e25701.
Beckmann, C.F., Deluca, M., Devlin, J.T., Smith, S.M., 2005. Investigations intoresting-state connectivity using independent component analysis. Philosoph-ical Transactions of the Royal Society of London. Series B, Biological Sciences360, 1001–1013.
Beckmann, C.F., Jenkinson, M., Smith, S.M., 2003. General multilevel linear modelingfor group analysis in fMRI. NeuroImage 20, 1052–1063.
Beckmann, C.F., Mackay, C.E., Filippini, N., Smith, S.M., 2009. Group comparison ofresting-state fMRI data using multi-subject ICA and dual regression. Neuroimage47, S148.
Behzadi, Y., Restom, K., Liau, J., Liu, T.T., 2007. A component based noise correctionmethod (CompCor) for BOLD and perfusion based fMRI. NeuroImage 37, 90–101.
Bidgood Jr., W.D., Horii, S.C., Prior, F.W., Van Syckle, D.E., 1997. Understanding andusing DICOM, the data interchange standard for biomedical imaging. Journal ofthe American Medical Informatics Association 4, 199–212.
Biswal, B., Yetkin, F.Z., Haughton, V.M., Hyde, J.S., 1995. Functional connectivity in themotor cortex of resting human brain using echo-planar MRI. Magnetic resonancein medicine 34, 537–541.
Bright, M.G., Murphy, K., 2015. Is fMRI “noise” really noise? Resting state nuisanceregressors remove variance with network structure. NeuroImage 114, 158–169.
Caballero-Gaudes, C., Reynolds, R.C., 2017. Methods for cleaning the BOLD fMRIsignal. NeuroImage 154, 128–149.
Calhoun, V.D., Adali, T., Pearlson, G.D., Pekar, J.J., 2001. A method for making groupinferences from functional MRI data using independent component analysis.Human Brain Mapping 14, 140–151.
Calhoun, V.D., De Lacy, N., 2017. Ten key observations on the analysis of resting-state functional MR imaging data using independent component analysis.Neuroimaging Clinics of North America 27, 561–579.
Ciric, R., Wolf, D.H., Power, J.D., Roalf, D.R., Baum, G.L., Ruparel, K., Shinohara, R.T.,Elliott, M.A., Eickhoff, S.B., Davatzikos, C., Gur, R.C., Gur, R.E., Bassett, D.S., Sat-terthwaite, T.D., 2017. Benchmarking of participant-level confound regressionstrategies for the control of motion artifact in studies of functional connectivity.NeuroImage 154, 174–187.
Cole, D.M., Smith, S.M., Beckmann, C.F., 2010. Advances and pitfalls in the analysisand interpretation of resting-state fMRI data. Frontiers in Systems Neuroscience4, 8.
Cordes, D., Haughton, V.M., Arfanakis, K., Wendt, G.J., Turski, P.A., Moritz, C.H.,Quigley, M.A., Meyerand, M.E., 2000. Mapping functionally related regions ofbrain with functional connectivity MR imaging. American Journal of Neuroradi-ology 21, 1636–1644.
Craddock, C., Sikka, S., Cheung, B., Khanuja, R., Ghosh, S.S., Yan, C., Li, Q., Lurie, D.,Vogelstein, J., Burns, R., Colcombe, S., Mennes, M., Kelly, C., Di Martino, A., Castel-lanos, F.X., Milham, M., 2013. Towards automated analysis of connectomes: Theconfigurable pipeline for the analysis of connectomes (C-PAC). Neuroinformatics.Frontiers in Neuroinformatics.
Drysdale, A.T., Grosenick, L., Downar, J., Dunlop, K., Mansouri, F., Meng, Y., Fetcho,R.N., Zebley, B., Oathes, D.J., Etkin, A., Schatzberg, A.F., Sudheimer, K., Keller, J.,Mayberg, H.S., Gunning, F.M., Alexopoulos, G.S., Fox, M.D., Pascual-Leone, A.,Voss, H.U., Casey, B.J., Dubin, M.J., Liston, C., 2017. Resting-state connectivitybiomarkers define neurophysiological subtypes of depression. Nature Medicine23, 28–38.
Filippini, N., Macintosh, B.J., Hough, M.G., Goodwin, G.M., Frisoni, G.B., Smith, S.M.,Matthews, P.M., Beckmann, C.F., Mackay, C.E., Mahley, R.W., 2009. Distinct pat-terns of brain activity in young carriers of the APOE-epsilon4 allele. Proceedingsof the National Academy of Sciences of the United States of America 106, 7209–7214.
Filippini, N., Nickerson, L.D., Beckmann, C.F., Ebmeier, K.P., Frisoni, G.B., Matthews,P.M., Smith, S.M., Mackay, C.E., 2012. Age-related adaptations of brain functionduring a memory task are also present at rest. NeuroImage 59, 3821–3828.
Glasser, M.F., Coalson, T.S., Bijsterbosch, J.D., Harrison, S.J., Harms, M.P., Anticevic,A., Van Essen, D.C., Smith, S.M., 2018. Using temporal ICA to selectively removeglobal noise while preserving global signal in functional MRI data. NeuroImage181, 692–717.
Goense, J., Merkle, H., Logothetis, N.K., 2012. High-resolution fMRI reveals lami-nar differences in neurovascular coupling between positive and negative BOLDresponses. Neuron 76, 629–639.
Gorges, M., Roselli, F., Müller, H.-P., Ludolph, A.C., Rasche, V., Kassubek, J., 2017. Func-tional connectivity mapping in the animal model: Principles and applications ofresting-state fMRI. Frontiers in Neurology 8, 200.
Grandjean, J., Canella, C., Anckaerts, C., Ayranc, I.G., Bougacha, S., Bienert, T.,Buehlmann, D., Coletta, L., Gallino, D., Gass, N., Garin, C.M., Nadkarni, N.A., Hüb-ner, N., Karatas, M., Komaki, Y., Kreitz, S., Mandino, F., Mechling, A.E., Sato, C.,Sauer, K., Shah, D., Strobelt, S., Takata, N., Wank, I., Wu, T., Yahata, N., Yeow, L.Y.,Yee, Y., Aoki, I., Chakravarty, M.M., Chang, W.-T., Dhenain, M., Von Elverfeldt,
D., Harsan, L.-A., Hess, A., Jiang, T., Keliris, G.A., Lerch, J.P., Okano, H., Rudin, M.,Sartorius, A., Der Linden, A., Verhoye, M., Weber-Fahr, W., Wenderoth, N., Zerbi,V., Gozzi, A., 2019. Common functional networks in the mouse brain revealedby multi-centre resting-state fMRI analysis. bioRxiv.
Grandjean, J., Schroeter, A., Batata, I., Rudin, M., 2014. Optimization of anesthesiaprotocol for resting-state fMRI in mice based on differential effects of anestheticson functional connectivity patterns. NeuroImage 102, 838–847.
Grehl, S., Viola, H.M., Fuller-Carter, P.I., Carter, K.W., Dunlop, S.A., Hool, L.C., Sher-rard, R.M., Rodger, J., 2015. Cellular and molecular changes to cortical neuronsfollowing low intensity repetitive magnetic stimulation at different frequencies.Brain Stimulation 8, 114–123.
Greicius, M.D., Krasnow, B., Reiss, A.L., Menon, V., 2003. Functional connectivityin the resting brain: a network analysis of the default mode hypothesis. Pro-ceedings of the National Academy of Sciences of the United States of America 100,253–258.
Griffanti, L., Rolinski, M., Szewczyk-Krolikowski, K., Menke, R.A., Filippini, N., Zam-boni, G., Jenkinson, M., Hu, M.T.M., Mackay, C.E., 2016. Challenges in thereproducibility of clinical studies with resting state fMRI: An example in earlyParkinson’s disease. NeuroImage 124, 704–713.
Griffanti, L., Salimi-Khorshidi, G., Beckmann, C.F., Auerbach, E.J., Douaud, G., Sex-ton, C.E., Zsoldos, E., Ebmeier, K.P., Filippini, N., Mackay, C.E., Moeller, S., Xu,J., Yacoub, E., Baselli, G., Ugurbil, K., Miller, K.L., Smith, S.M., 2014. ICA-basedartefact and accelerated fMRI acquisition for improved Resting State Networkimaging. NeuroImage 95, 232–247.
Haneef, Z., Lenartowicz, A., Yeh, H.J., Engel Jr., J., Stern, J.M., 2014. Network analysis ofthe default mode network using functional connectivity MRI in Temporal LobeEpilepsy. Journal of Visualized Experiments: JoVE, e51442–e51442.
Huang, S.-M., Wu, Y.-L., Peng, S.-L., Peng, H.-H., Huang, T.-Y., Ho, K.-C., Wang, F.-N., 2016. Inter-strain differences in default mode network: A resting state fMRIstudy on spontaneously hypertensive rat and Wistar Kyoto rat. Scientific Reports6, 21697.
Huber, L., Handwerker, D.A., Jangraw, D.C., Chen, G., Hall, A., Stüber, C., Gonzalez-Castillo, J., Ivanov, D., Marrett, S., Guidi, M., Goense, J., Poser, B.A., Bandettini,P.A., 2017. High-resolution CBV-fMRI allows mapping of laminar activity andconnectivity of cortical input and output in human M1. Neuron 96, 1253–1263,e7.
Iraji, A., Calhoun, V.D., Wiseman, N.M., Davoodi-Bojd, E., Avanaki, M.R.N., Haacke,E.M., Kou, Z., 2016. The connectivity domain: Analyzing resting state fMRI datausing feature-based data-driven and model-based methods. NeuroImage 134,494–507.
Jenkinson, M., Bannister, P., Brady, M., Smith, S., 2002. Improved optimization for therobust and accurate linear registration and motion correction of brain images.Neuroimage 17, 825–841.
Jenkinson, M., Beckmann, C.F., Smith, S.M., Woolrich, M.W., Behrens, T.E.J., 2012. FSL.NeuroImage 62, 782–790.
Jenkinson, M., Smith, S., 2001. A global optimisation method for robust affine regis-tration of brain images. Medical Image Analysis 5, 143–156.
Joel, S.E., Caffo, B.S., Van Zijl, P.C.M., Pekar, J.J., 2011. On the relationship betweenseed-based and ICA-based measures of functional connectivity. Magnetic Reso-nance in Medicine 66, 644–657.
Jonckers, E., Van Audekerke, J., De Visscher, G., Van Der Linden, A., Verhoye, M.,2011. Functional connectivity fMRI of the rodent brain: Comparison of functionalconnectivity networks in rat and mouse. PLoS ONE 6, e18876.
Kelly, R.E., Wang, Z., Alexopoulos, G.S., Gunning, F.M., Murphy, C.F., Morimoto, S.S.,Kanellopoulos, D., Jia, Z., Lim, K.O., Hoptman, M.J., 2010. Hybrid ICA-seed-basedmethods for fMRI functional connectivity assessment: A feasibility study. Inter-national Journal of Biomedical Imaging 2010, 868976.
Kjonigsen, L.J., Lillehaug, S., Bjaalie, J.G., Witter, M.P., Leergaard, T.B., 2015. WaxholmSpace atlas of the rat brain hippocampal region: Three-dimensional delineationsbased on magnetic resonance and diffusion tensor imaging. NeuroImage 108,441–449.
Korgaonkar, M.S., Ram, K., Williams, L.M., Gatt, J.M., Grieve, S.M., 2014. Establish-ing the resting state default mode network derived from functional magneticresonance imaging tasks as an endophenotype: A twins study. Human BrainMapping 35, 3893–3902.
Lee, M.H., Miller-Thomas, M.M., Benzinger, T.L., Marcus, D.S., Hacker, C.D., Leuthardt,E.C., Shimony, J.S., 2016. Clinical resting-state fMRI in the preoperative setting:Are we ready for prime time? Topics in Magnetic Resonance Imaging: TMRI 25,11–18.
Lee, M.H., Smyser, C.D., Shimony, J.S., 2013. Resting state fMRI: A review of methodsand clinical applications. American Journal of Neuroradiology 34, 1866–1872.
Li, X., Morgan, P.S., Ashburner, J., Smith, J., Rorden, C., 2016. The first step for neu-roimaging data analysis: DICOM to NIfTI conversion. Journal of NeuroscienceMethods 264, 47–56, http://dx.doi.org/10.1016/j.jneumeth.2016.03.001.
Liang, Z., King, J., Zhang, N., 2012. Intrinsic organization of the anesthetized brain.The Journal of Neuroscience 32, 10183–10191.
Lu, H., Scholl, C.A., Zuo, Y., Demny, S., Rea, W., Stein, E.A., Yang, Y., 2010. Registeringand analyzing rat fMRI data in the stereotaxic framework by exploiting intrinsicanatomical features. Magnetic Resonance Imaging 28, 146–152.
Lu, H., Zou, Q., Gu, H., Raichle, M.E., Stein, E.A., Yang, Y., 2012. Rat brains also havea default mode network. Proceedings of the National Academy of Sciences of theUnited States of America 109, 3979–3984.
Lv, H., Wang, Z., Tong, E., Williams, L.M., Zaharchuk, G., Zeineh, M., Goldstein-Piekarski, A.N., Ball, T.M., Liao, C., Wintermark, M., 2018. Resting-state functionalMRI: Everything that nonexperts have always wanted to know. American Journalof Neuroradiology 39, 1390–1399.
471
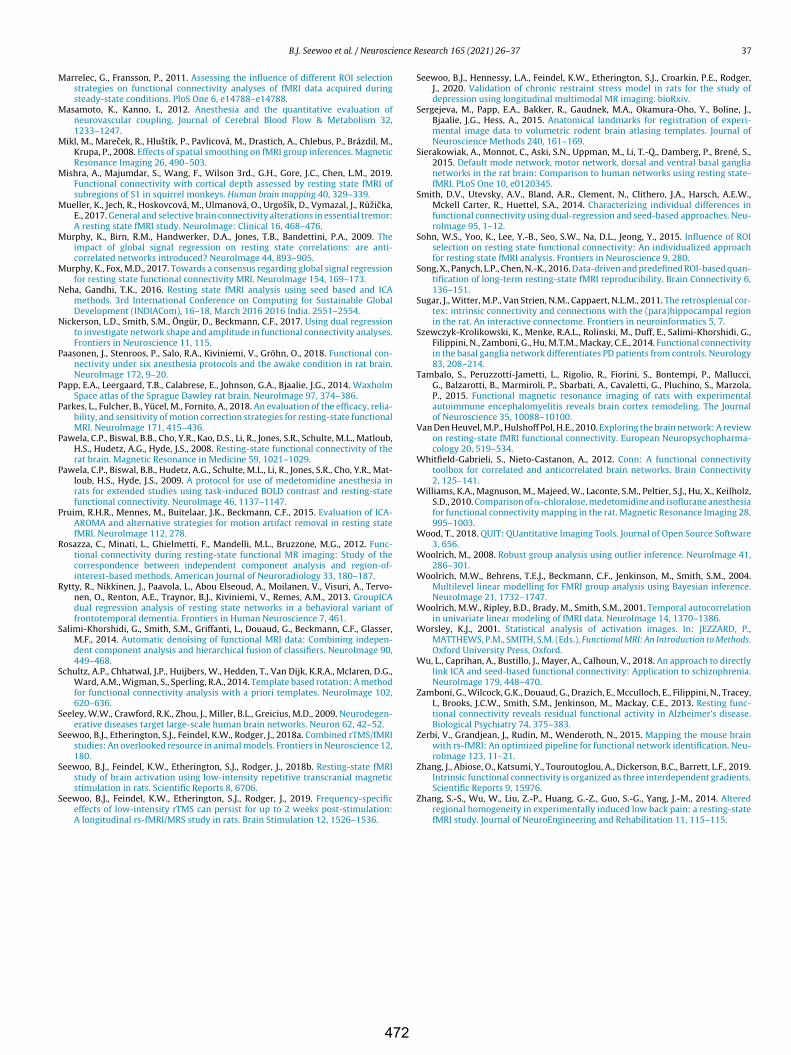
B.J. Seewoo et al. / Neuroscience Research 165 (2021) 26–37 37
Marrelec, G., Fransson, P., 2011. Assessing the influence of different ROI selectionstrategies on functional connectivity analyses of fMRI data acquired duringsteady-state conditions. PloS One 6, e14788–e14788.
Masamoto, K., Kanno, I., 2012. Anesthesia and the quantitative evaluation ofneurovascular coupling. Journal of Cerebral Blood Flow & Metabolism 32,1233–1247.
Mikl, M., Marecek, R., Hlustík, P., Pavlicová, M., Drastich, A., Chlebus, P., Brázdil, M.,Krupa, P., 2008. Effects of spatial smoothing on fMRI group inferences. MagneticResonance Imaging 26, 490–503.
Mishra, A., Majumdar, S., Wang, F., Wilson 3rd., G.H., Gore, J.C., Chen, L.M., 2019.Functional connectivity with cortical depth assessed by resting state fMRI ofsubregions of S1 in squirrel monkeys. Human brain mapping 40, 329–339.
Mueller, K., Jech, R., Hoskovcová, M., Ulmanová, O., Urgosík, D., Vymazal, J., Ruzicka,E., 2017. General and selective brain connectivity alterations in essential tremor:A resting state fMRI study. NeuroImage: Clinical 16, 468–476.
Murphy, K., Birn, R.M., Handwerker, D.A., Jones, T.B., Bandettini, P.A., 2009. Theimpact of global signal regression on resting state correlations: are anti-correlated networks introduced? NeuroImage 44, 893–905.
Murphy, K., Fox, M.D., 2017. Towards a consensus regarding global signal regressionfor resting state functional connectivity MRI. NeuroImage 154, 169–173.
Neha, Gandhi, T.K., 2016. Resting state fMRI analysis using seed based and ICAmethods. 3rd International Conference on Computing for Sustainable GlobalDevelopment (INDIACom), 16–18, March 2016 2016 India. 2551–2554.
Nickerson, L.D., Smith, S.M., Öngür, D., Beckmann, C.F., 2017. Using dual regressionto investigate network shape and amplitude in functional connectivity analyses.Frontiers in Neuroscience 11, 115.
Paasonen, J., Stenroos, P., Salo, R.A., Kiviniemi, V., Gröhn, O., 2018. Functional con-nectivity under six anesthesia protocols and the awake condition in rat brain.NeuroImage 172, 9–20.
Papp, E.A., Leergaard, T.B., Calabrese, E., Johnson, G.A., Bjaalie, J.G., 2014. WaxholmSpace atlas of the Sprague Dawley rat brain. NeuroImage 97, 374–386.
Parkes, L., Fulcher, B., Yücel, M., Fornito, A., 2018. An evaluation of the efficacy, relia-bility, and sensitivity of motion correction strategies for resting-state functionalMRI. NeuroImage 171, 415–436.
Pawela, C.P., Biswal, B.B., Cho, Y.R., Kao, D.S., Li, R., Jones, S.R., Schulte, M.L., Matloub,H.S., Hudetz, A.G., Hyde, J.S., 2008. Resting-state functional connectivity of therat brain. Magnetic Resonance in Medicine 59, 1021–1029.
Pawela, C.P., Biswal, B.B., Hudetz, A.G., Schulte, M.L., Li, R., Jones, S.R., Cho, Y.R., Mat-loub, H.S., Hyde, J.S., 2009. A protocol for use of medetomidine anesthesia inrats for extended studies using task-induced BOLD contrast and resting-statefunctional connectivity. NeuroImage 46, 1137–1147.
Pruim, R.H.R., Mennes, M., Buitelaar, J.K., Beckmann, C.F., 2015. Evaluation of ICA-AROMA and alternative strategies for motion artifact removal in resting statefMRI. NeuroImage 112, 278.
Rosazza, C., Minati, L., Ghielmetti, F., Mandelli, M.L., Bruzzone, M.G., 2012. Func-tional connectivity during resting-state functional MR imaging: Study of thecorrespondence between independent component analysis and region-of-interest-based methods. American Journal of Neuroradiology 33, 180–187.
Rytty, R., Nikkinen, J., Paavola, L., Abou Elseoud, A., Moilanen, V., Visuri, A., Tervo-nen, O., Renton, A.E., Traynor, B.J., Kiviniemi, V., Remes, A.M., 2013. GroupICAdual regression analysis of resting state networks in a behavioral variant offrontotemporal dementia. Frontiers in Human Neuroscience 7, 461.
Salimi-Khorshidi, G., Smith, S.M., Griffanti, L., Douaud, G., Beckmann, C.F., Glasser,M.F., 2014. Automatic denoising of functional MRI data: Combining indepen-dent component analysis and hierarchical fusion of classifiers. NeuroImage 90,449–468.
Schultz, A.P., Chhatwal, J.P., Huijbers, W., Hedden, T., Van Dijk, K.R.A., Mclaren, D.G.,Ward, A.M., Wigman, S., Sperling, R.A., 2014. Template based rotation: A methodfor functional connectivity analysis with a priori templates. NeuroImage 102,620–636.
Seeley, W.W., Crawford, R.K., Zhou, J., Miller, B.L., Greicius, M.D., 2009. Neurodegen-erative diseases target large-scale human brain networks. Neuron 62, 42–52.
Seewoo, B.J., Etherington, S.J., Feindel, K.W., Rodger, J., 2018a. Combined rTMS/fMRIstudies: An overlooked resource in animal models. Frontiers in Neuroscience 12,180.
Seewoo, B.J., Feindel, K.W., Etherington, S.J., Rodger, J., 2018b. Resting-state fMRIstudy of brain activation using low-intensity repetitive transcranial magneticstimulation in rats. Scientific Reports 8, 6706.
Seewoo, B.J., Feindel, K.W., Etherington, S.J., Rodger, J., 2019. Frequency-specificeffects of low-intensity rTMS can persist for up to 2 weeks post-stimulation:A longitudinal rs-fMRI/MRS study in rats. Brain Stimulation 12, 1526–1536.
Seewoo, B.J., Hennessy, L.A., Feindel, K.W., Etherington, S.J., Croarkin, P.E., Rodger,J., 2020. Validation of chronic restraint stress model in rats for the study ofdepression using longitudinal multimodal MR imaging. bioRxiv.
Sergejeva, M., Papp, E.A., Bakker, R., Gaudnek, M.A., Okamura-Oho, Y., Boline, J.,Bjaalie, J.G., Hess, A., 2015. Anatomical landmarks for registration of experi-mental image data to volumetric rodent brain atlasing templates. Journal ofNeuroscience Methods 240, 161–169.
Sierakowiak, A., Monnot, C., Aski, S.N., Uppman, M., Li, T.-Q., Damberg, P., Brené, S.,2015. Default mode network, motor network, dorsal and ventral basal ganglianetworks in the rat brain: Comparison to human networks using resting state-fMRI. PLoS One 10, e0120345.
Smith, D.V., Utevsky, A.V., Bland, A.R., Clement, N., Clithero, J.A., Harsch, A.E.W.,Mckell Carter, R., Huettel, S.A., 2014. Characterizing individual differences infunctional connectivity using dual-regression and seed-based approaches. Neu-roImage 95, 1–12.
Sohn, W.S., Yoo, K., Lee, Y.-B., Seo, S.W., Na, D.L., Jeong, Y., 2015. Influence of ROIselection on resting state functional connectivity: An individualized approachfor resting state fMRI analysis. Frontiers in Neuroscience 9, 280.
Song, X., Panych, L.P., Chen, N.-K., 2016. Data-driven and predefined ROI-based quan-tification of long-term resting-state fMRI reproducibility. Brain Connectivity 6,136–151.
Sugar, J., Witter, M.P., Van Strien, N.M., Cappaert, N.L.M., 2011. The retrosplenial cor-tex: intrinsic connectivity and connections with the (para)hippocampal regionin the rat. An interactive connectome. Frontiers in neuroinformatics 5, 7.
Szewczyk-Krolikowski, K., Menke, R.A.L., Rolinski, M., Duff, E., Salimi-Khorshidi, G.,Filippini, N., Zamboni, G., Hu, M.T.M., Mackay, C.E., 2014. Functional connectivityin the basal ganglia network differentiates PD patients from controls. Neurology83, 208–214.
Tambalo, S., Peruzzotti-Jametti, L., Rigolio, R., Fiorini, S., Bontempi, P., Mallucci,G., Balzarotti, B., Marmiroli, P., Sbarbati, A., Cavaletti, G., Pluchino, S., Marzola,P., 2015. Functional magnetic resonance imaging of rats with experimentalautoimmune encephalomyelitis reveals brain cortex remodeling. The Journalof Neuroscience 35, 10088–10100.
Van Den Heuvel, M.P., Hulshoff Pol, H.E., 2010. Exploring the brain network: A reviewon resting-state fMRI functional connectivity. European Neuropsychopharma-cology 20, 519–534.
Whitfield-Gabrieli, S., Nieto-Castanon, A., 2012. Conn: A functional connectivitytoolbox for correlated and anticorrelated brain networks. Brain Connectivity2, 125–141.
Williams, K.A., Magnuson, M., Majeed, W., Laconte, S.M., Peltier, S.J., Hu, X., Keilholz,S.D., 2010. Comparison of �-chloralose, medetomidine and isoflurane anesthesiafor functional connectivity mapping in the rat. Magnetic Resonance Imaging 28,995–1003.
Wood, T., 2018. QUIT: QUantitative Imaging Tools. Journal of Open Source Software3, 656.
Woolrich, M., 2008. Robust group analysis using outlier inference. NeuroImage 41,286–301.
Woolrich, M.W., Behrens, T.E.J., Beckmann, C.F., Jenkinson, M., Smith, S.M., 2004.Multilevel linear modelling for FMRI group analysis using Bayesian inference.NeuroImage 21, 1732–1747.
Woolrich, M.W., Ripley, B.D., Brady, M., Smith, S.M., 2001. Temporal autocorrelationin univariate linear modeling of fMRI data. NeuroImage 14, 1370–1386.
Worsley, K.J., 2001. Statistical analysis of activation images. In: JEZZARD, P.,MATTHEWS, P.M., SMITH, S.M. (Eds.), Functional MRI: An Introduction to Methods.Oxford University Press, Oxford.
Wu, L., Caprihan, A., Bustillo, J., Mayer, A., Calhoun, V., 2018. An approach to directlylink ICA and seed-based functional connectivity: Application to schizophrenia.NeuroImage 179, 448–470.
Zamboni, G., Wilcock, G.K., Douaud, G., Drazich, E., Mcculloch, E., Filippini, N., Tracey,I., Brooks, J.C.W., Smith, S.M., Jenkinson, M., Mackay, C.E., 2013. Resting func-tional connectivity reveals residual functional activity in Alzheimer’s disease.Biological Psychiatry 74, 375–383.
Zerbi, V., Grandjean, J., Rudin, M., Wenderoth, N., 2015. Mapping the mouse brainwith rs-fMRI: An optimized pipeline for functional network identification. Neu-roImage 123, 11–21.
Zhang, J., Abiose, O., Katsumi, Y., Touroutoglou, A., Dickerson, B.C., Barrett, L.F., 2019.Intrinsic functional connectivity is organized as three interdependent gradients.Scientific Reports 9, 15976.
Zhang, S.-S., Wu, W., Liu, Z.-P., Huang, G.-Z., Guo, S.-G., Yang, J.-M., 2014. Alteredregional homogeneity in experimentally induced low back pain: a resting-statefMRI study. Journal of NeuroEngineering and Rehabilitation 11, 115–115.
472
An analytical workflow for seed-based
correlation and independent component analysis
in interventional resting-state fMRI studies
Bhedita J Seewoo1,2,3, Alexander C Joos3, Kirk W
Feindel3,4*
1 Experimental and Regenerative Neurosciences, School of Biological Sciences, The University of Western Australia, Perth, WA, Australia 2 Brain Plasticity Group, Perron Institute for Neurological and Translational Research, WA, Australia 3 Centre for Microscopy, Characterisation and Analysis, Research Infrastructure Centres, The University of Western Australia, Perth, WA, Australia 4 School of Biomedical Sciences, The University of Western Australia, Perth, WA, Australia
* Corresponding author:Dr Kirk Wayne FeindelMRI and BioImaging FacilitiesCentre for Microscopy, Characterisation and Analysis M519The University of Western Australia,35 Stirling Highway, Crawley WA 6009Email: [email protected]
473
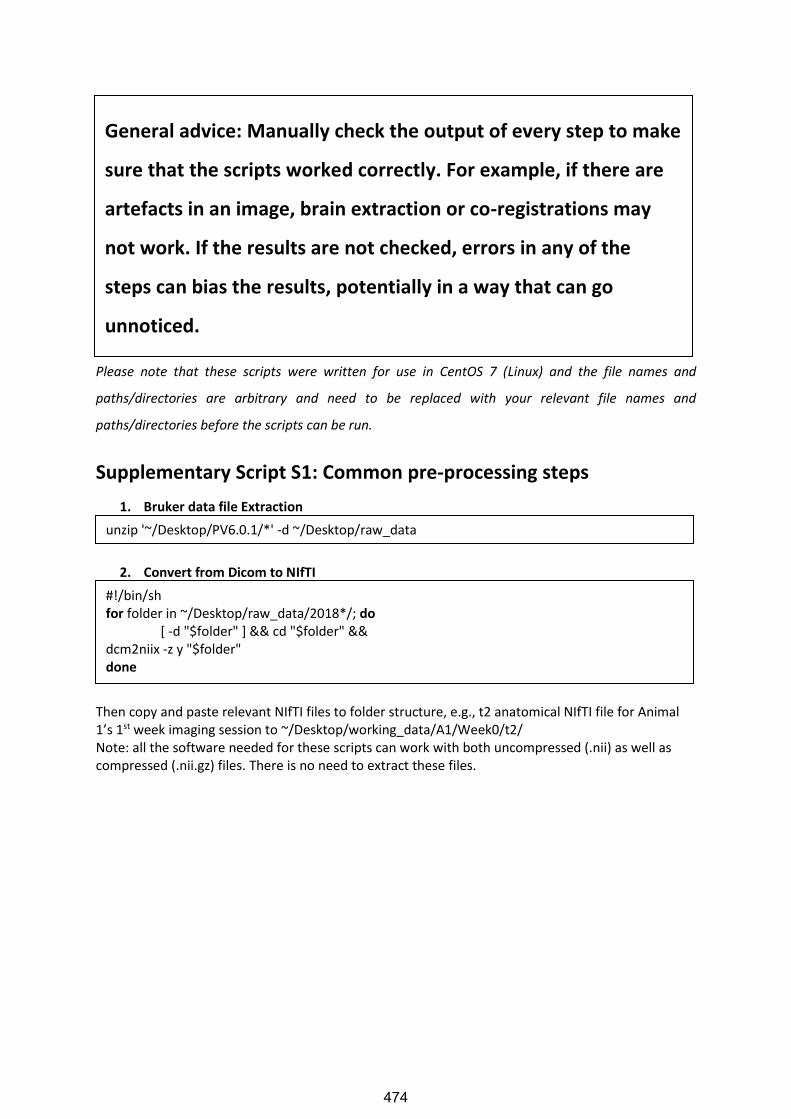
Please note that these scripts were written for use in CentOS 7 (Linux) and the file names and
paths/directories are arbitrary and need to be replaced with your relevant file names and
paths/directories before the scripts can be run.
Supplementary Script S1: Common pre-processing steps
1. Bruker data file Extraction
2. Convert from Dicom to NIfTI
Then copy and paste relevant NIfTI files to folder structure, e.g., t2 anatomical NIfTI file for Animal 1’s 1st week imaging session to ~/Desktop/working_data/A1/Week0/t2/ Note: all the software needed for these scripts can work with both uncompressed (.nii) as well as compressed (.nii.gz) files. There is no need to extract these files.
unzip '~/Desktop/PV6.0.1/*' -d ~/Desktop/raw_data
#!/bin/sh for folder in ~/Desktop/raw_data/2018*/; do [ -d "$folder" ] && cd "$folder" && dcm2niix -z y "$folder" done
General advice: Manually check the output of every step to make
sure that the scripts worked correctly. For example, if there are
artefacts in an image, brain extraction or co-registrations may
not work. If the results are not checked, errors in any of the
steps can bias the results, potentially in a way that can go
unnoticed.
474
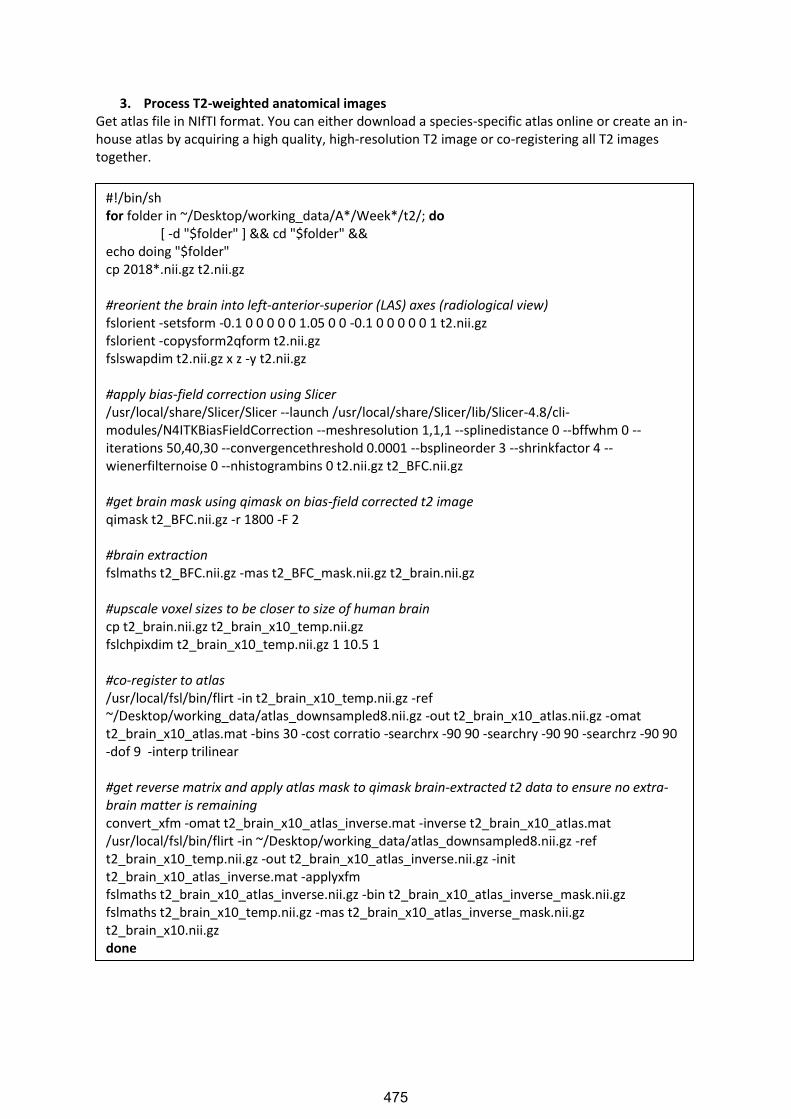
3. Process T2-weighted anatomical images Get atlas file in NIfTI format. You can either download a species-specific atlas online or create an in-house atlas by acquiring a high quality, high-resolution T2 image or co-registering all T2 images together.
#!/bin/sh for folder in ~/Desktop/working_data/A*/Week*/t2/; do [ -d "$folder" ] && cd "$folder" && echo doing "$folder" cp 2018*.nii.gz t2.nii.gz #reorient the brain into left-anterior-superior (LAS) axes (radiological view) fslorient -setsform -0.1 0 0 0 0 0 1.05 0 0 -0.1 0 0 0 0 0 1 t2.nii.gz fslorient -copysform2qform t2.nii.gz fslswapdim t2.nii.gz x z -y t2.nii.gz #apply bias-field correction using Slicer /usr/local/share/Slicer/Slicer --launch /usr/local/share/Slicer/lib/Slicer-4.8/cli-modules/N4ITKBiasFieldCorrection --meshresolution 1,1,1 --splinedistance 0 --bffwhm 0 --iterations 50,40,30 --convergencethreshold 0.0001 --bsplineorder 3 --shrinkfactor 4 --wienerfilternoise 0 --nhistogrambins 0 t2.nii.gz t2_BFC.nii.gz #get brain mask using qimask on bias-field corrected t2 image qimask t2_BFC.nii.gz -r 1800 -F 2 #brain extraction fslmaths t2_BFC.nii.gz -mas t2_BFC_mask.nii.gz t2_brain.nii.gz #upscale voxel sizes to be closer to size of human brain cp t2_brain.nii.gz t2_brain_x10_temp.nii.gz fslchpixdim t2_brain_x10_temp.nii.gz 1 10.5 1 #co-register to atlas /usr/local/fsl/bin/flirt -in t2_brain_x10_temp.nii.gz -ref ~/Desktop/working_data/atlas_downsampled8.nii.gz -out t2_brain_x10_atlas.nii.gz -omat t2_brain_x10_atlas.mat -bins 30 -cost corratio -searchrx -90 90 -searchry -90 90 -searchrz -90 90 -dof 9 -interp trilinear #get reverse matrix and apply atlas mask to qimask brain-extracted t2 data to ensure no extra-brain matter is remaining convert_xfm -omat t2_brain_x10_atlas_inverse.mat -inverse t2_brain_x10_atlas.mat /usr/local/fsl/bin/flirt -in ~/Desktop/working_data/atlas_downsampled8.nii.gz -ref t2_brain_x10_temp.nii.gz -out t2_brain_x10_atlas_inverse.nii.gz -init t2_brain_x10_atlas_inverse.mat -applyxfm fslmaths t2_brain_x10_atlas_inverse.nii.gz -bin t2_brain_x10_atlas_inverse_mask.nii.gz fslmaths t2_brain_x10_temp.nii.gz -mas t2_brain_x10_atlas_inverse_mask.nii.gz t2_brain_x10.nii.gz done
475
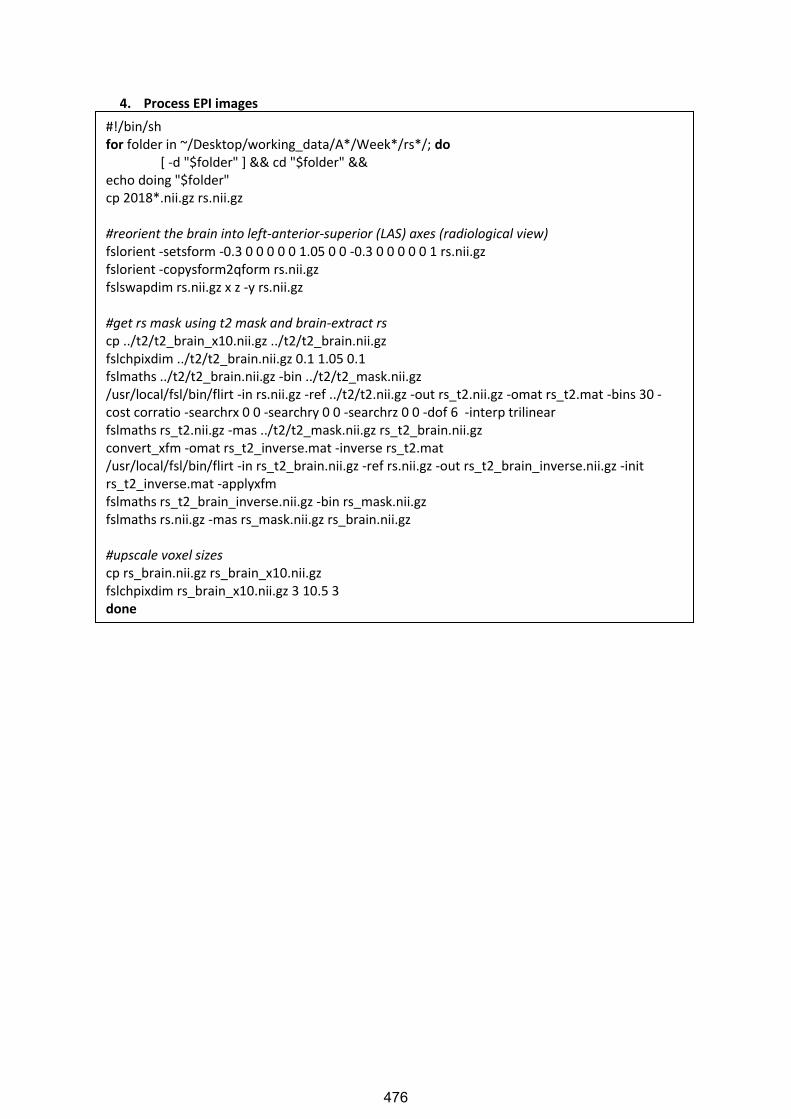
4. Process EPI images
#!/bin/sh for folder in ~/Desktop/working_data/A*/Week*/rs*/; do [ -d "$folder" ] && cd "$folder" && echo doing "$folder" cp 2018*.nii.gz rs.nii.gz #reorient the brain into left-anterior-superior (LAS) axes (radiological view) fslorient -setsform -0.3 0 0 0 0 0 1.05 0 0 -0.3 0 0 0 0 0 1 rs.nii.gz fslorient -copysform2qform rs.nii.gz fslswapdim rs.nii.gz x z -y rs.nii.gz #get rs mask using t2 mask and brain-extract rs cp ../t2/t2_brain_x10.nii.gz ../t2/t2_brain.nii.gz fslchpixdim ../t2/t2_brain.nii.gz 0.1 1.05 0.1 fslmaths ../t2/t2_brain.nii.gz -bin ../t2/t2_mask.nii.gz /usr/local/fsl/bin/flirt -in rs.nii.gz -ref ../t2/t2.nii.gz -out rs_t2.nii.gz -omat rs_t2.mat -bins 30 -cost corratio -searchrx 0 0 -searchry 0 0 -searchrz 0 0 -dof 6 -interp trilinear fslmaths rs_t2.nii.gz -mas ../t2/t2_mask.nii.gz rs_t2_brain.nii.gz convert_xfm -omat rs_t2_inverse.mat -inverse rs_t2.mat /usr/local/fsl/bin/flirt -in rs_t2_brain.nii.gz -ref rs.nii.gz -out rs_t2_brain_inverse.nii.gz -init rs_t2_inverse.mat -applyxfm fslmaths rs_t2_brain_inverse.nii.gz -bin rs_mask.nii.gz fslmaths rs.nii.gz -mas rs_mask.nii.gz rs_brain.nii.gz #upscale voxel sizes cp rs_brain.nii.gz rs_brain_x10.nii.gz fslchpixdim rs_brain_x10.nii.gz 3 10.5 3 done
476
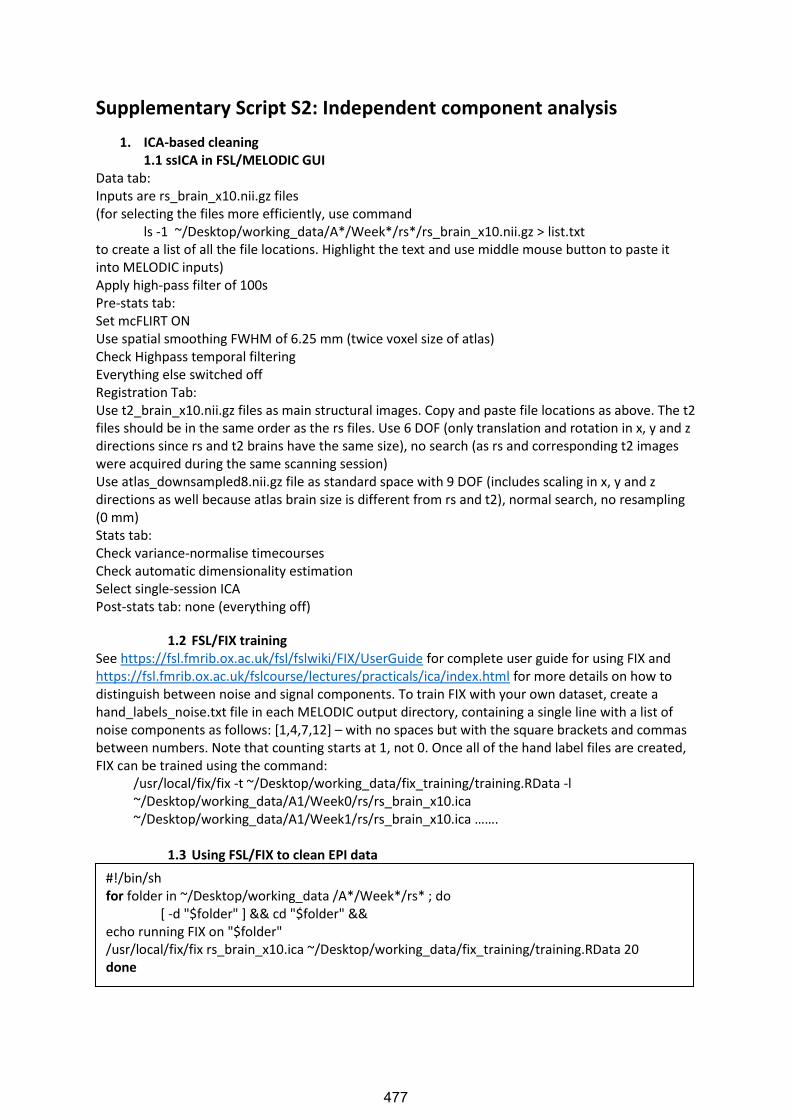
Supplementary Script S2: Independent component analysis
1. ICA-based cleaning 1.1 ssICA in FSL/MELODIC GUI
Data tab: Inputs are rs_brain_x10.nii.gz files (for selecting the files more efficiently, use command
ls -1 ~/Desktop/working_data/A*/Week*/rs*/rs_brain_x10.nii.gz > list.txt to create a list of all the file locations. Highlight the text and use middle mouse button to paste it into MELODIC inputs) Apply high-pass filter of 100s Pre-stats tab: Set mcFLIRT ON Use spatial smoothing FWHM of 6.25 mm (twice voxel size of atlas) Check Highpass temporal filtering Everything else switched off Registration Tab: Use t2_brain_x10.nii.gz files as main structural images. Copy and paste file locations as above. The t2 files should be in the same order as the rs files. Use 6 DOF (only translation and rotation in x, y and z directions since rs and t2 brains have the same size), no search (as rs and corresponding t2 images were acquired during the same scanning session) Use atlas_downsampled8.nii.gz file as standard space with 9 DOF (includes scaling in x, y and z directions as well because atlas brain size is different from rs and t2), normal search, no resampling (0 mm) Stats tab: Check variance-normalise timecourses Check automatic dimensionality estimation Select single-session ICA Post-stats tab: none (everything off)
1.2 FSL/FIX training See https://fsl.fmrib.ox.ac.uk/fsl/fslwiki/FIX/UserGuide for complete user guide for using FIX and https://fsl.fmrib.ox.ac.uk/fslcourse/lectures/practicals/ica/index.html for more details on how to distinguish between noise and signal components. To train FIX with your own dataset, create a hand_labels_noise.txt file in each MELODIC output directory, containing a single line with a list of noise components as follows: [1,4,7,12] – with no spaces but with the square brackets and commas between numbers. Note that counting starts at 1, not 0. Once all of the hand label files are created, FIX can be trained using the command:
/usr/local/fix/fix -t ~/Desktop/working_data/fix_training/training.RData -l ~/Desktop/working_data/A1/Week0/rs/rs_brain_x10.ica ~/Desktop/working_data/A1/Week1/rs/rs_brain_x10.ica …….
1.3 Using FSL/FIX to clean EPI data
#!/bin/sh for folder in ~/Desktop/working_data /A*/Week*/rs* ; do [ -d "$folder" ] && cd "$folder" && echo running FIX on "$folder" /usr/local/fix/fix rs_brain_x10.ica ~/Desktop/working_data/fix_training/training.RData 20 done
477
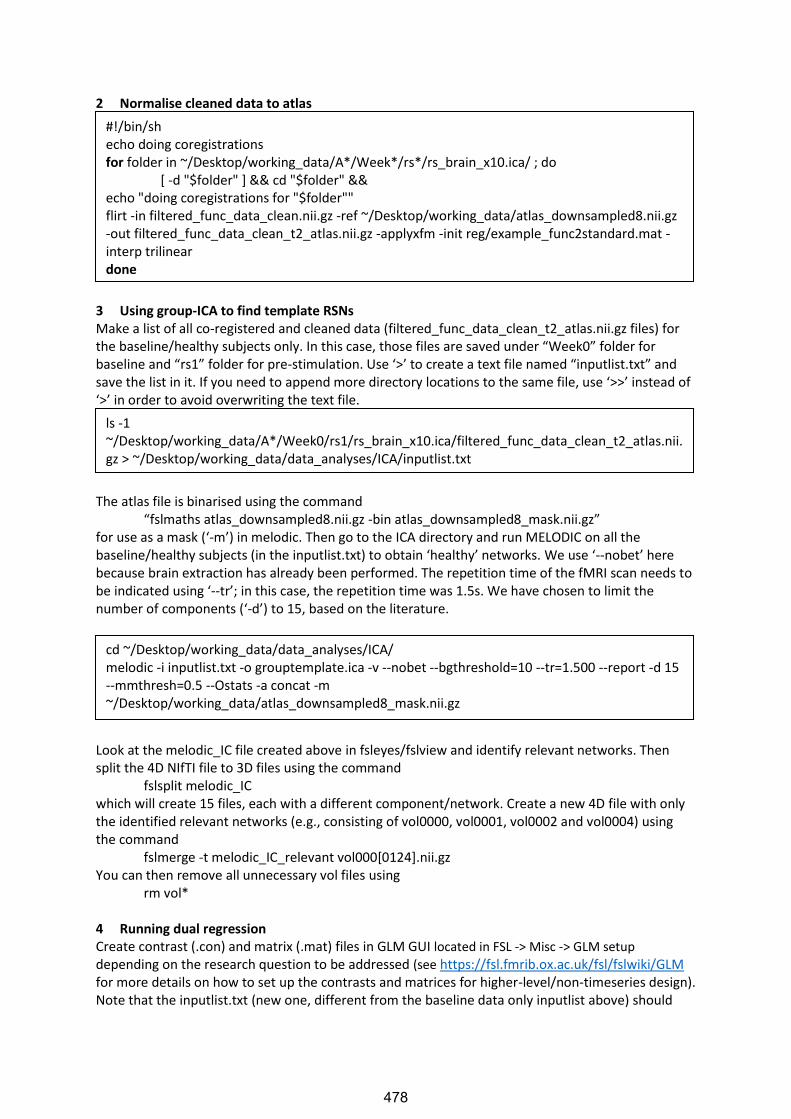
2 Normalise cleaned data to atlas
3 Using group-ICA to find template RSNs Make a list of all co-registered and cleaned data (filtered_func_data_clean_t2_atlas.nii.gz files) for the baseline/healthy subjects only. In this case, those files are saved under “Week0” folder for baseline and “rs1” folder for pre-stimulation. Use ‘>’ to create a text file named “inputlist.txt” and save the list in it. If you need to append more directory locations to the same file, use ‘>>’ instead of ‘>’ in order to avoid overwriting the text file.
The atlas file is binarised using the command
“fslmaths atlas_downsampled8.nii.gz -bin atlas_downsampled8_mask.nii.gz” for use as a mask (‘-m’) in melodic. Then go to the ICA directory and run MELODIC on all the baseline/healthy subjects (in the inputlist.txt) to obtain ‘healthy’ networks. We use ‘--nobet’ here because brain extraction has already been performed. The repetition time of the fMRI scan needs to be indicated using ‘--tr’; in this case, the repetition time was 1.5s. We have chosen to limit the number of components (‘-d’) to 15, based on the literature.
Look at the melodic_IC file created above in fsleyes/fslview and identify relevant networks. Then split the 4D NIfTI file to 3D files using the command
fslsplit melodic_IC which will create 15 files, each with a different component/network. Create a new 4D file with only the identified relevant networks (e.g., consisting of vol0000, vol0001, vol0002 and vol0004) using the command
fslmerge -t melodic_IC_relevant vol000[0124].nii.gz You can then remove all unnecessary vol files using
rm vol* 4 Running dual regression Create contrast (.con) and matrix (.mat) files in GLM GUI located in FSL -> Misc -> GLM setup
depending on the research question to be addressed (see https://fsl.fmrib.ox.ac.uk/fsl/fslwiki/GLM for more details on how to set up the contrasts and matrices for higher-level/non-timeseries design). Note that the inputlist.txt (new one, different from the baseline data only inputlist above) should
#!/bin/sh echo doing coregistrations for folder in ~/Desktop/working_data/A*/Week*/rs*/rs_brain_x10.ica/ ; do [ -d "$folder" ] && cd "$folder" && echo "doing coregistrations for "$folder"" flirt -in filtered_func_data_clean.nii.gz -ref ~/Desktop/working_data/atlas_downsampled8.nii.gz -out filtered_func_data_clean_t2_atlas.nii.gz -applyxfm -init reg/example_func2standard.mat -interp trilinear done
ls -1 ~/Desktop/working_data/A*/Week0/rs1/rs_brain_x10.ica/filtered_func_data_clean_t2_atlas.nii.gz > ~/Desktop/working_data/data_analyses/ICA/inputlist.txt
cd ~/Desktop/working_data/data_analyses/ICA/ melodic -i inputlist.txt -o grouptemplate.ica -v --nobet --bgthreshold=10 --tr=1.500 --report -d 15 --mmthresh=0.5 --Ostats -a concat -m ~/Desktop/working_data/atlas_downsampled8_mask.nii.gz
478

contain a complete list of all your filtered_func_data_clean_t2_atlas.nii.gz data to be analysed in the specific order in which they are inserted into GLM.
dual_regression melodic_IC_relevant 1 *.mat *.con 5000 dual_regression `cat inputlist.txt` 5 Finding statistically significant dual regression values The script below creates an excel file of statistically significant results (P<0.05, or 1-P>0.95) with first three columns giving the coordinates of the maximum intensity voxel (‘-x’), next two give the minimum and maximum intensity (‘-R’), next two the volume/number of significant voxels (‘-V’), next the name of the file (which component and contrast) and lastly the contrast name that you insert. #input the contrast name instead of ‘first_contrast’, ‘second_contrast’ etc.
6 Getting z values from specific masks (e.g., thalamus) This script gives the mean z-score within the mask (e.g., thalamus) for each independent component as a separate column in the excel file.
#!/bin/sh for file in ~/Desktop/working_data/data_analyses/ICA/grouptemplate.ica/dual_regression/*_tfce_corrp* ; do i=$(fslstats "$file" -k ~/Desktop/working_data/atlas_downsampled8_mask.nii.gz -R) if [ ${i##*0 0.} -gt 950000 ] then stats=$(fslstats "$file" -k ~/Desktop/working_data/atlas_downsampled8_mask.nii.gz -x -R -l 0.95 -V) case $file in *tstat1.nii.gz) echo -e $stats ${file##*stage3_} first_contrast > ~/Desktop/working_data/data_analyses/ICA/grouptemplate.ica/stats.xls ;; *tstat2.nii.gz) echo -e $stats ${file##*stage3_} second_contrast >> ~/Desktop/working_data/data_analyses/ICA/grouptemplate.ica/stats.xls ;; *tstat3.nii.gz) echo -e $stats ${file##*stage3_} third_contrast >> ~/Desktop/working_data/data_analyses/ICA/grouptemplate.ica/stats.xls ;; esac fi done
#!/bin/sh for file in ~/Desktop/working_data/data_analyses/ICA/grouptemplate.ica/dual_regression/*_Z.nii.gz ; do for masks in ~/Desktop/working_data/zscore_extraction/*.nii.gz ; do stats=$(fslstats -t "$file" -k "$masks" -M) echo -e $stats ${masks##*zscore_extraction/} ${file##*stage2_} >> ~/Desktop/working_data/data_analyses/ICA/grouptemplate.ica/dual_regression/zvalues.xls done done
479
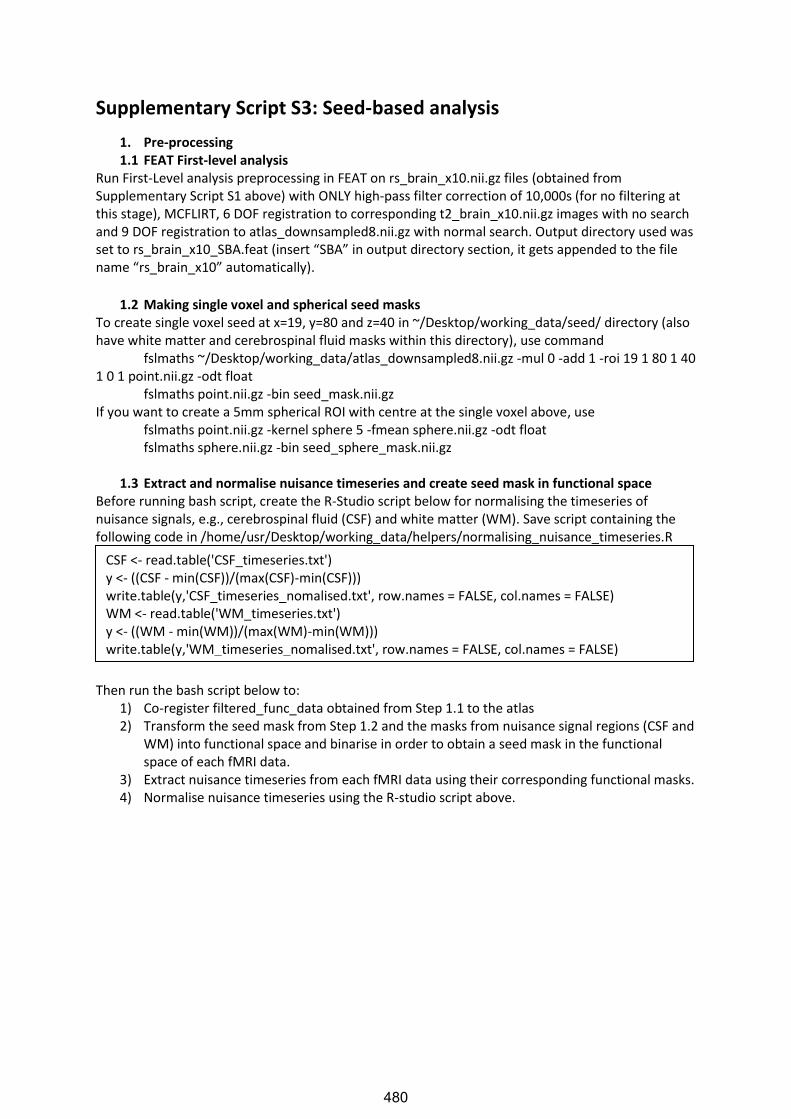
Supplementary Script S3: Seed-based analysis
1. Pre-processing 1.1 FEAT First-level analysis
Run First-Level analysis preprocessing in FEAT on rs_brain_x10.nii.gz files (obtained from Supplementary Script S1 above) with ONLY high-pass filter correction of 10,000s (for no filtering at this stage), MCFLIRT, 6 DOF registration to corresponding t2_brain_x10.nii.gz images with no search and 9 DOF registration to atlas_downsampled8.nii.gz with normal search. Output directory used was set to rs_brain_x10_SBA.feat (insert “SBA” in output directory section, it gets appended to the file name “rs_brain_x10” automatically).
1.2 Making single voxel and spherical seed masks
To create single voxel seed at x=19, y=80 and z=40 in ~/Desktop/working_data/seed/ directory (also have white matter and cerebrospinal fluid masks within this directory), use command
fslmaths ~/Desktop/working_data/atlas_downsampled8.nii.gz -mul 0 -add 1 -roi 19 1 80 1 40 1 0 1 point.nii.gz -odt float
fslmaths point.nii.gz -bin seed_mask.nii.gz If you want to create a 5mm spherical ROI with centre at the single voxel above, use
fslmaths point.nii.gz -kernel sphere 5 -fmean sphere.nii.gz -odt float fslmaths sphere.nii.gz -bin seed_sphere_mask.nii.gz
1.3 Extract and normalise nuisance timeseries and create seed mask in functional space
Before running bash script, create the R-Studio script below for normalising the timeseries of nuisance signals, e.g., cerebrospinal fluid (CSF) and white matter (WM). Save script containing the following code in /home/usr/Desktop/working_data/helpers/normalising_nuisance_timeseries.R
Then run the bash script below to:
1) Co-register filtered_func_data obtained from Step 1.1 to the atlas 2) Transform the seed mask from Step 1.2 and the masks from nuisance signal regions (CSF and
WM) into functional space and binarise in order to obtain a seed mask in the functional space of each fMRI data.
3) Extract nuisance timeseries from each fMRI data using their corresponding functional masks. 4) Normalise nuisance timeseries using the R-studio script above.
CSF <- read.table('CSF_timeseries.txt') y <- ((CSF - min(CSF))/(max(CSF)-min(CSF))) write.table(y,'CSF_timeseries_nomalised.txt', row.names = FALSE, col.names = FALSE) WM <- read.table('WM_timeseries.txt') y <- ((WM - min(WM))/(max(WM)-min(WM))) write.table(y,'WM_timeseries_nomalised.txt', row.names = FALSE, col.names = FALSE)
480
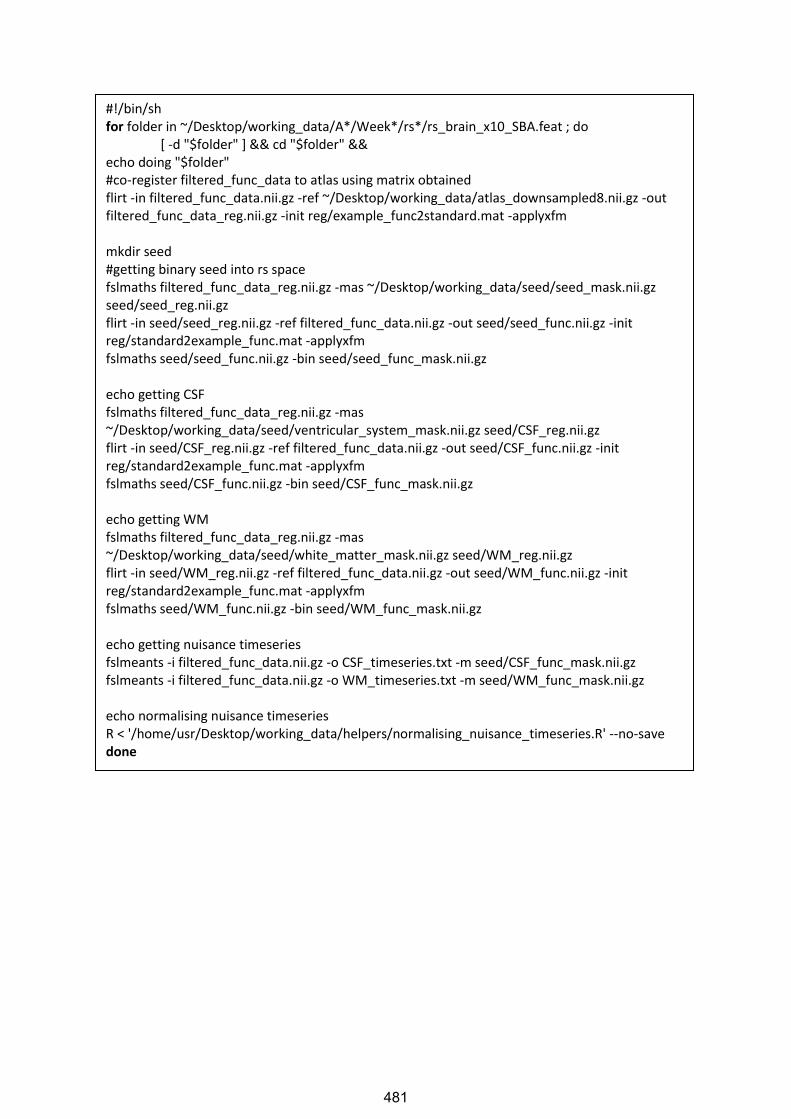
#!/bin/sh for folder in ~/Desktop/working_data/A*/Week*/rs*/rs_brain_x10_SBA.feat ; do [ -d "$folder" ] && cd "$folder" && echo doing "$folder" #co-register filtered_func_data to atlas using matrix obtained flirt -in filtered_func_data.nii.gz -ref ~/Desktop/working_data/atlas_downsampled8.nii.gz -out filtered_func_data_reg.nii.gz -init reg/example_func2standard.mat -applyxfm mkdir seed #getting binary seed into rs space fslmaths filtered_func_data_reg.nii.gz -mas ~/Desktop/working_data/seed/seed_mask.nii.gz seed/seed_reg.nii.gz flirt -in seed/seed_reg.nii.gz -ref filtered_func_data.nii.gz -out seed/seed_func.nii.gz -init reg/standard2example_func.mat -applyxfm fslmaths seed/seed_func.nii.gz -bin seed/seed_func_mask.nii.gz echo getting CSF fslmaths filtered_func_data_reg.nii.gz -mas ~/Desktop/working_data/seed/ventricular_system_mask.nii.gz seed/CSF_reg.nii.gz flirt -in seed/CSF_reg.nii.gz -ref filtered_func_data.nii.gz -out seed/CSF_func.nii.gz -init reg/standard2example_func.mat -applyxfm fslmaths seed/CSF_func.nii.gz -bin seed/CSF_func_mask.nii.gz echo getting WM fslmaths filtered_func_data_reg.nii.gz -mas ~/Desktop/working_data/seed/white_matter_mask.nii.gz seed/WM_reg.nii.gz flirt -in seed/WM_reg.nii.gz -ref filtered_func_data.nii.gz -out seed/WM_func.nii.gz -init reg/standard2example_func.mat -applyxfm fslmaths seed/WM_func.nii.gz -bin seed/WM_func_mask.nii.gz echo getting nuisance timeseries fslmeants -i filtered_func_data.nii.gz -o CSF_timeseries.txt -m seed/CSF_func_mask.nii.gz fslmeants -i filtered_func_data.nii.gz -o WM_timeseries.txt -m seed/WM_func_mask.nii.gz echo normalising nuisance timeseries R < '/home/usr/Desktop/working_data/helpers/normalising_nuisance_timeseries.R' --no-save done
481

1.4 Nuisance regression in FEAT Set up full First-Level analysis in FEAT on ONE of the filtered_func_data.nii.gz files from above (e.g., /home/usr/Desktop/working_data/A1/Week1/rs1/rs_brain_x10_SBA.feat) with high-pass filter correction of 100s and smoothing of 6.25 and no registrations. In stats tab, use FILM prewhitening. Under full model setup, add 3 evs: 1) add motion correction file (.par file in mc folder) under basic shape-custom (one entry per volume). Select no convolution, add temporal derivative and apply temporal filtering. 2) add normalised CSF timeseries (.txt file), no convolution, add temporal derivative 3) add normalised WM timeseries (.txt file), no convolution, add temporal derivative. Set output folder as e.g., /home/usr/Desktop/working_data/A1/Week1/rs1/rs_brain_x10_SBA.feat /nuisance_regression.feat. Select ‘None’ under Post-stats. Save this FEAT settings as ~/Desktop/working_data/helpers/SBA/nuisance_regression.fsf. Use the .fsf file above to run the loop script below on all filtered_func_data.nii.gz files, replacing the input file directory with the new directory and run FEAT:
2. Whole-brain correlations to seed for each animal/session 2.1 Create R-studio script for normalising seed timeseries
Create the R-Studio script below for normalising the seed timeseries. Save script containing the following code in /home/usr/Desktop/working_data/helpers/normalising_roi_timeseries.R
2.2 Set up single-animal single-session whole-brain seed correlation in FEAT
Select First-Level Analysis with Stats only. Input: res4d_lpf_demeaned_scaled.nii.gz (this file will be created in the bash script below); highpass filter 10,000s (no filter); insert whole path to output directory (as the input) with “seed.feat” appended. Under stats tab, unselect FILM prewhitening Under ‘Full Model Setup’, add seed EV seed_res4d_timeseries_nomalised.txt (this file will be created in the bash script below) with Basic shape custom; no convolution, add temporal derivative, apply temporal filtering. Post-stats tab: cluster-based, z=2. Note that the fisher z transform of COPE images are automatically carried out by FEAT. save as ~/Desktop/working_data/helpers/ss_SBA.fsf
#!/bin/sh for folder in /home/usr/Desktop/working_data/A*/Week*/rs*/rs_brain_x10_SBA.feat ; do [ -d "$folder" ] && cd "$folder" && echo doing "$folder" cp ~/Desktop/working_data/helpers/SBA/nuisance_regression.fsf ./ sed -i -e “s|/home/usr/Desktop/working_data/A1/Week1/rs1/rs_brain_x10_SBA.feat|”$folder”|g” nuisance_regression.fsf echo doing nuisance regression /usr/local/fsl/bin/feat nuisance_regression.fsf ; done
roi <- read.table('seed_res4d_timeseries.txt') y <- ((roi - min(roi))/(max(roi)-min(roi))) write.table(y,'seed_res4d_timeseries_nomalised.txt', row.names = FALSE, col.names = FALSE)
482

2.3 Get seed timeseries and normalise Then run the bash script below to:
1) Convert residual file “res4d.nii.gz” obtained from Step 1.4 to 4D data 2) Apply a low-pass filter, demean and scale the 4D residual file 3) Extract seed timeseries from the output above using seed masks in individual functional
spaces 4) Normalise the seed timeseries obtained 5) Run FEAT on all data using .fsf recipe file saved in Step 2.2.
#!/bin/sh for folder in /home/usr/Desktop/working_data/A*/Week*/rs*/rs_brain_x10_SBA.feat/nuisance_regression.feat ; do [ -d "$folder" ] && cd "$folder" && echo doing "$folder" cd stats #convert residual file to 4D data cp res4d.nii.gz temp_res4d_tr.nii.gz fslchpixdim temp_res4d_tr.nii.gz 3 10.5 3 1.5 #apply a low-pass filter of 0.1 Hz fslmaths temp_res4d_tr.nii.gz -bptf -1 3.33333333333 res4d_lpf.nii.gz #demean and scale residual file fslmaths res4d_lpf.nii.gz -Tmean tempMean fslmaths res4d_lpf.nii.gz -Tstd tempstd fslmaths res4d_lpf.nii.gz -sub tempMean -div tempstd -add 100 res4d_lpf_demeaned_scaled.nii.gz rm temp* echo getting timeseries fslmeants -i res4d_lpf_demeaned_scaled.nii.gz -o ../seed_res4d_timeseries.txt -m ../../seed/seed_func_mask.nii.gz cd ../ echo normalising roi timeseries R < '/home/usr/Desktop/working_data/helpers/normalising_roi_timeseries.R' --no-save cp ~/Desktop/working_data/helpers/ss_SBA.fsf ./ sed -i -e "s|/home/usr/working_data/A1/Week0/rs1/rs_brain_x10_SBA.feat/nuisance_regression.feat|"$folder"|g" ss_SBA.fsf echo doing single-session SBA /usr/local/fsl/bin/feat ss_SBA.fsf ; done
483
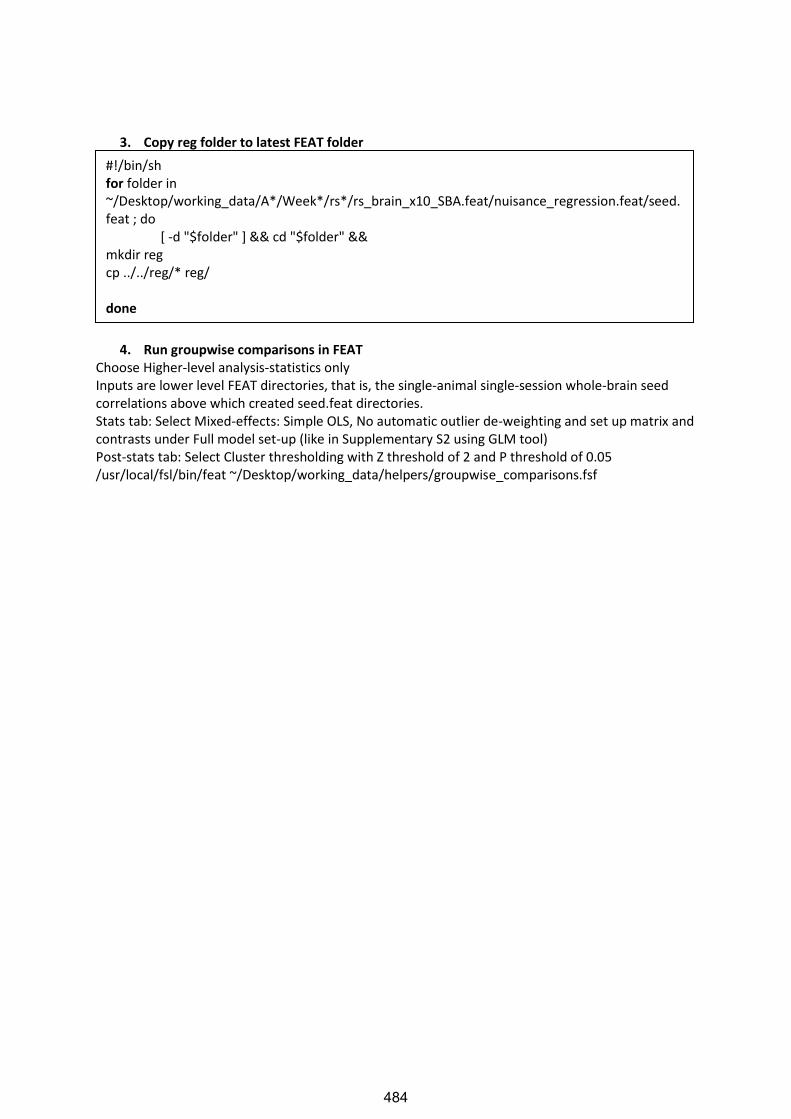
3. Copy reg folder to latest FEAT folder
4. Run groupwise comparisons in FEAT Choose Higher-level analysis-statistics only Inputs are lower level FEAT directories, that is, the single-animal single-session whole-brain seed correlations above which created seed.feat directories. Stats tab: Select Mixed-effects: Simple OLS, No automatic outlier de-weighting and set up matrix and contrasts under Full model set-up (like in Supplementary S2 using GLM tool) Post-stats tab: Select Cluster thresholding with Z threshold of 2 and P threshold of 0.05 /usr/local/fsl/bin/feat ~/Desktop/working_data/helpers/groupwise_comparisons.fsf
#!/bin/sh for folder in ~/Desktop/working_data/A*/Week*/rs*/rs_brain_x10_SBA.feat/nuisance_regression.feat/seed.feat ; do [ -d "$folder" ] && cd "$folder" && mkdir reg cp ../../reg/* reg/ done
484

Supplementary Script S4: Seed-based analysis using ICA-cleaned
data
1. Extract seed timeseries and find whole-brain correlations to seed 1.1 Get seed
1.2 Get time series
1.3 Whole brain correlations to seed Set up FEAT for doing single-animal single-session whole-brain seed correlation Select First-Level Analysis with Stats only. Input: filtered_func_data_clean.nii.gz from the rs_brain_x10.ica folder; insert whole path to output directory; highpass filter 10,000s; under stats tab, unselect FILM prewhitening and add seed EV under ‘Full Model Setup’ with Basic shape custom: seed_timeseries.txt; no convolution, add temporal derivative, apply temporal filtering; Post-stats tab: cluster-based z=2. Save as ICA_cleaned_SBA.fsf
#!/bin/sh for folder in /home/usr/Desktop/working_data/A*/Week*/rs*/rs_brain_x10.ica/ ; do [ -d "$folder" ] && cd "$folder" && echo “getting seed for "$folder"” #use binary seed mask (in atlas space) to mask filtered_func_data_clean_t2_atlas.nii.gz to obtain functional data within seed region in atlas space fslmaths filtered_func_data_clean_t2_atlas.nii.gz -mas seed_mask.nii.gz seed_func_reg.nii.gz # back project seed from above into functional space flirt -in seed_func_reg.nii.gz -ref filtered_func_data_clean.nii.gz -out seed_func.nii.gz -init reg/standard2example_func.mat -applyxfm fslmaths seed_func.nii.gz -bin seed_func_mask.nii.gz done
#!/bin/sh for folder in /home/usr/Desktop/working_data/A*/Week*/rs*/rs_brain_x10.ica/ ; do [ -d "$folder" ] && cd "$folder" && fslmeants -i filtered_func_data_clean.nii.gz -o seed_timeseries.txt -m seed_func_mask.nii.gz done
485

2. Group-wise comparisons Copy reg folder into the FEAT directory and then run group-wise comparisons (Step 3 and 4 from Supplementary Script S3)
#!/bin/sh for folder in /home/usr/Desktop/working_data/A*/Week*/rs*/rs_brain_x10.ica/ ; do [ -d "$folder" ] && cd "$folder" && echo “running FEAT on "$folder"” # Copy feat fsf file to each directory and replace directory to $folder cp ~/Desktop/working_data/helpers/ICA_cleaned_SBA.fsf ./ sed -i -e "s|/home/usr/Desktop/working_data/A1/Week0/rs1/rs_brain_x10.ica|"$folder"|g" ICA_cleaned_SBA.fsf echo running feat /usr/local/fsl/bin/feat ICA_cleaned_SBA.fsf ; done
486
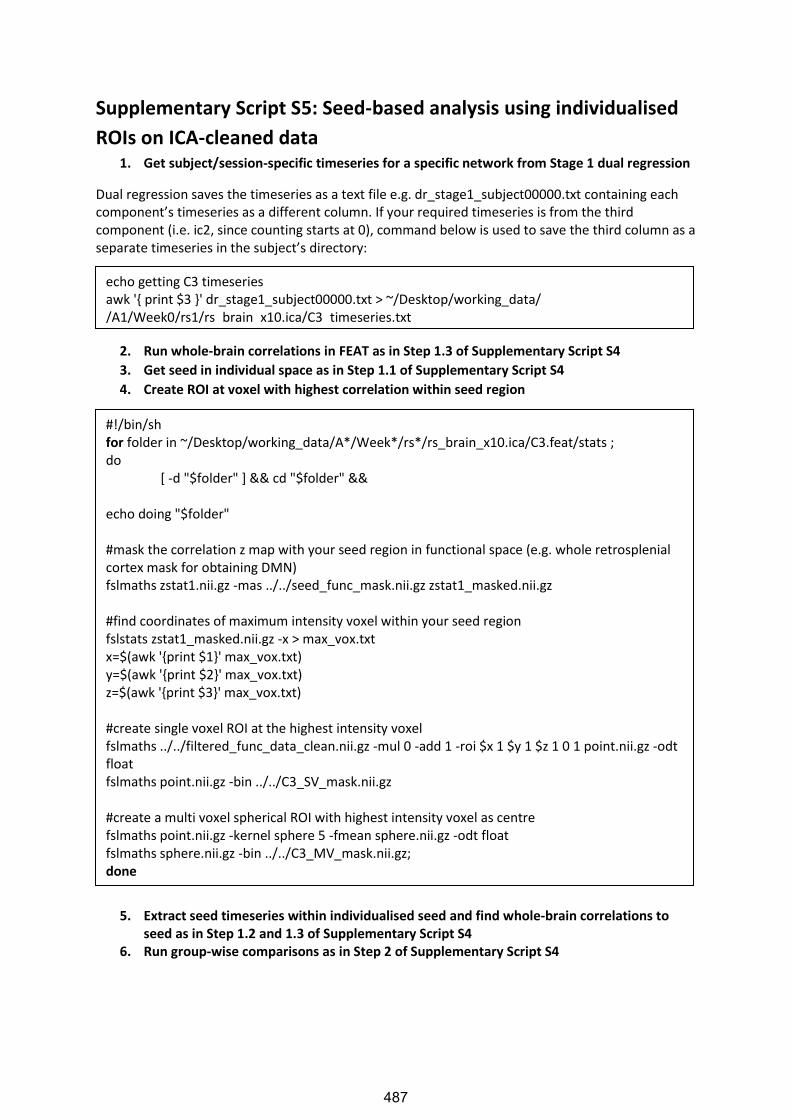
Supplementary Script S5: Seed-based analysis using individualised
ROIs on ICA-cleaned data 1. Get subject/session-specific timeseries for a specific network from Stage 1 dual regression
Dual regression saves the timeseries as a text file e.g. dr_stage1_subject00000.txt containing each component’s timeseries as a different column. If your required timeseries is from the third component (i.e. ic2, since counting starts at 0), command below is used to save the third column as a separate timeseries in the subject’s directory:
2. Run whole-brain correlations in FEAT as in Step 1.3 of Supplementary Script S4
3. Get seed in individual space as in Step 1.1 of Supplementary Script S4
4. Create ROI at voxel with highest correlation within seed region
5. Extract seed timeseries within individualised seed and find whole-brain correlations to seed as in Step 1.2 and 1.3 of Supplementary Script S4
6. Run group-wise comparisons as in Step 2 of Supplementary Script S4
echo getting C3 timeseries awk '{ print $3 }' dr_stage1_subject00000.txt > ~/Desktop/working_data/ /A1/Week0/rs1/rs_brain_x10.ica/C3_timeseries.txt
#!/bin/sh for folder in ~/Desktop/working_data/A*/Week*/rs*/rs_brain_x10.ica/C3.feat/stats ; do [ -d "$folder" ] && cd "$folder" && echo doing "$folder" #mask the correlation z map with your seed region in functional space (e.g. whole retrosplenial cortex mask for obtaining DMN) fslmaths zstat1.nii.gz -mas ../../seed_func_mask.nii.gz zstat1_masked.nii.gz #find coordinates of maximum intensity voxel within your seed region fslstats zstat1_masked.nii.gz -x > max_vox.txt x=$(awk '{print $1}' max_vox.txt) y=$(awk '{print $2}' max_vox.txt) z=$(awk '{print $3}' max_vox.txt) #create single voxel ROI at the highest intensity voxel fslmaths ../../filtered_func_data_clean.nii.gz -mul 0 -add 1 -roi $x 1 $y 1 $z 1 0 1 point.nii.gz -odt float fslmaths point.nii.gz -bin ../../C3_SV_mask.nii.gz #create a multi voxel spherical ROI with highest intensity voxel as centre fslmaths point.nii.gz -kernel sphere 5 -fmean sphere.nii.gz -odt float fslmaths sphere.nii.gz -bin ../../C3_MV_mask.nii.gz; done
487
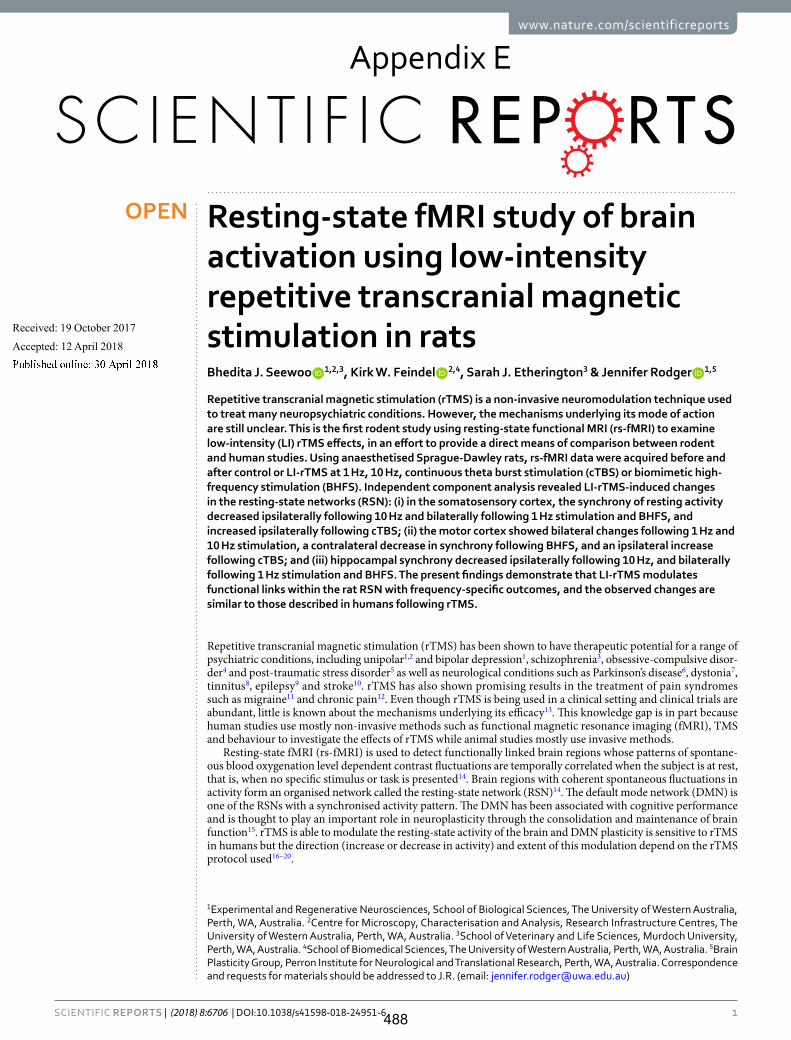
1SCIENTIfIC REpoRTS | (2018) 8:6706 | DOI:10.1038/s41598-018-24951-6
www.nature.com/scientificreports
Resting-state fMRI study of brain activation using low-intensity repetitive transcranial magnetic stimulation in ratsBhedita J. Seewoo 1,2,3, Kirk W. Feindel 2,4, Sarah J. Etherington3 & Jennifer Rodger 1,5
Repetitive transcranial magnetic stimulation (rTMS) is a non-invasive neuromodulation technique used to treat many neuropsychiatric conditions. However, the mechanisms underlying its mode of action are still unclear. This is the first rodent study using resting-state functional MRI (rs-fMRI) to examine low-intensity (LI) rTMS effects, in an effort to provide a direct means of comparison between rodent and human studies. Using anaesthetised Sprague-Dawley rats, rs-fMRI data were acquired before and after control or LI-rTMS at 1 Hz, 10 Hz, continuous theta burst stimulation (cTBS) or biomimetic high-frequency stimulation (BHFS). Independent component analysis revealed LI-rTMS-induced changes in the resting-state networks (RSN): (i) in the somatosensory cortex, the synchrony of resting activity decreased ipsilaterally following 10 Hz and bilaterally following 1 Hz stimulation and BHFS, and increased ipsilaterally following cTBS; (ii) the motor cortex showed bilateral changes following 1 Hz and 10 Hz stimulation, a contralateral decrease in synchrony following BHFS, and an ipsilateral increase following cTBS; and (iii) hippocampal synchrony decreased ipsilaterally following 10 Hz, and bilaterally following 1 Hz stimulation and BHFS. The present findings demonstrate that LI-rTMS modulates functional links within the rat RSN with frequency-specific outcomes, and the observed changes are similar to those described in humans following rTMS.
Repetitive transcranial magnetic stimulation (rTMS) has been shown to have therapeutic potential for a range of psychiatric conditions, including unipolar1,2 and bipolar depression1, schizophrenia3, obsessive-compulsive disor-der4 and post-traumatic stress disorder5 as well as neurological conditions such as Parkinson’s disease6, dystonia7, tinnitus8, epilepsy9 and stroke10. rTMS has also shown promising results in the treatment of pain syndromes such as migraine11 and chronic pain12. Even though rTMS is being used in a clinical setting and clinical trials are abundant, little is known about the mechanisms underlying its efficacy13. This knowledge gap is in part because human studies use mostly non-invasive methods such as functional magnetic resonance imaging (fMRI), TMS and behaviour to investigate the effects of rTMS while animal studies mostly use invasive methods.
Resting-state fMRI (rs-fMRI) is used to detect functionally linked brain regions whose patterns of spontane-ous blood oxygenation level dependent contrast fluctuations are temporally correlated when the subject is at rest, that is, when no specific stimulus or task is presented14. Brain regions with coherent spontaneous fluctuations in activity form an organised network called the resting-state network (RSN)14. The default mode network (DMN) is one of the RSNs with a synchronised activity pattern. The DMN has been associated with cognitive performance and is thought to play an important role in neuroplasticity through the consolidation and maintenance of brain function15. rTMS is able to modulate the resting-state activity of the brain and DMN plasticity is sensitive to rTMS in humans but the direction (increase or decrease in activity) and extent of this modulation depend on the rTMS protocol used16–20.
1Experimental and Regenerative Neurosciences, School of Biological Sciences, The University of Western Australia, Perth, WA, Australia. 2Centre for Microscopy, Characterisation and Analysis, Research Infrastructure Centres, The University of Western Australia, Perth, WA, Australia. 3School of Veterinary and Life Sciences, Murdoch University, Perth, WA, Australia. 4School of Biomedical Sciences, The University of Western Australia, Perth, WA, Australia. 5Brain Plasticity Group, Perron Institute for Neurological and Translational Research, Perth, WA, Australia. Correspondence and requests for materials should be addressed to J.R. (email: [email protected])
Received: 19 October 2017
Accepted: 12 April 2018
Published: xx xx xxxx
OPEN
Appendix E
488
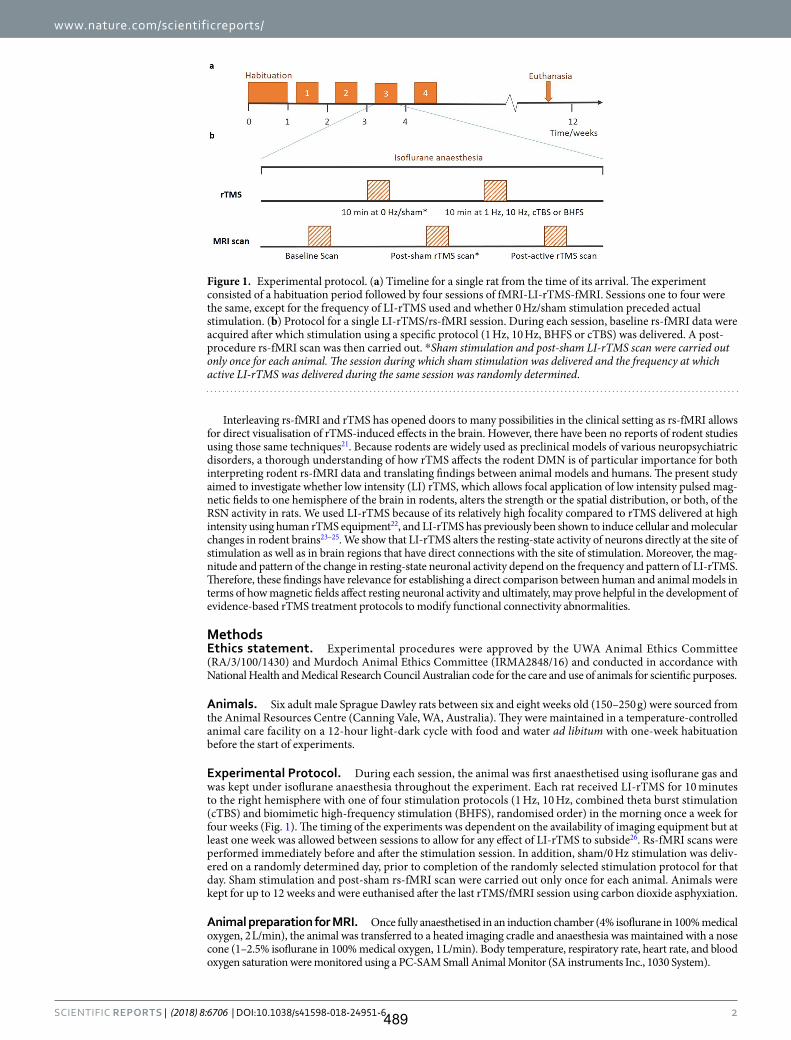
www.nature.com/scientificreports/
2SCIENTIfIC REpoRTS | (2018) 8:6706 | DOI:10.1038/s41598-018-24951-6
Interleaving rs-fMRI and rTMS has opened doors to many possibilities in the clinical setting as rs-fMRI allows for direct visualisation of rTMS-induced effects in the brain. However, there have been no reports of rodent studies using those same techniques21. Because rodents are widely used as preclinical models of various neuropsychiatric disorders, a thorough understanding of how rTMS affects the rodent DMN is of particular importance for both interpreting rodent rs-fMRI data and translating findings between animal models and humans. The present study aimed to investigate whether low intensity (LI) rTMS, which allows focal application of low intensity pulsed mag-netic fields to one hemisphere of the brain in rodents, alters the strength or the spatial distribution, or both, of the RSN activity in rats. We used LI-rTMS because of its relatively high focality compared to rTMS delivered at high intensity using human rTMS equipment22, and LI-rTMS has previously been shown to induce cellular and molecular changes in rodent brains23–25. We show that LI-rTMS alters the resting-state activity of neurons directly at the site of stimulation as well as in brain regions that have direct connections with the site of stimulation. Moreover, the mag-nitude and pattern of the change in resting-state neuronal activity depend on the frequency and pattern of LI-rTMS. Therefore, these findings have relevance for establishing a direct comparison between human and animal models in terms of how magnetic fields affect resting neuronal activity and ultimately, may prove helpful in the development of evidence-based rTMS treatment protocols to modify functional connectivity abnormalities.
MethodsEthics statement. Experimental procedures were approved by the UWA Animal Ethics Committee (RA/3/100/1430) and Murdoch Animal Ethics Committee (IRMA2848/16) and conducted in accordance with National Health and Medical Research Council Australian code for the care and use of animals for scientific purposes.
Animals. Six adult male Sprague Dawley rats between six and eight weeks old (150–250 g) were sourced from the Animal Resources Centre (Canning Vale, WA, Australia). They were maintained in a temperature-controlled animal care facility on a 12-hour light-dark cycle with food and water ad libitum with one-week habituation before the start of experiments.
Experimental Protocol. During each session, the animal was first anaesthetised using isoflurane gas and was kept under isoflurane anaesthesia throughout the experiment. Each rat received LI-rTMS for 10 minutes to the right hemisphere with one of four stimulation protocols (1 Hz, 10 Hz, combined theta burst stimulation (cTBS) and biomimetic high-frequency stimulation (BHFS), randomised order) in the morning once a week for four weeks (Fig. 1). The timing of the experiments was dependent on the availability of imaging equipment but at least one week was allowed between sessions to allow for any effect of LI-rTMS to subside26. Rs-fMRI scans were performed immediately before and after the stimulation session. In addition, sham/0 Hz stimulation was deliv-ered on a randomly determined day, prior to completion of the randomly selected stimulation protocol for that day. Sham stimulation and post-sham rs-fMRI scan were carried out only once for each animal. Animals were kept for up to 12 weeks and were euthanised after the last rTMS/fMRI session using carbon dioxide asphyxiation.
Animal preparation for MRI. Once fully anaesthetised in an induction chamber (4% isoflurane in 100% medical oxygen, 2 L/min), the animal was transferred to a heated imaging cradle and anaesthesia was maintained with a nose cone (1–2.5% isoflurane in 100% medical oxygen, 1 L/min). Body temperature, respiratory rate, heart rate, and blood oxygen saturation were monitored using a PC-SAM Small Animal Monitor (SA instruments Inc., 1030 System).
Figure 1. Experimental protocol. (a) Timeline for a single rat from the time of its arrival. The experiment consisted of a habituation period followed by four sessions of fMRI-LI-rTMS-fMRI. Sessions one to four were the same, except for the frequency of LI-rTMS used and whether 0 Hz/sham stimulation preceded actual stimulation. (b) Protocol for a single LI-rTMS/rs-fMRI session. During each session, baseline rs-fMRI data were acquired after which stimulation using a specific protocol (1 Hz, 10 Hz, BHFS or cTBS) was delivered. A post-procedure rs-fMRI scan was then carried out. *Sham stimulation and post-sham LI-rTMS scan were carried out only once for each animal. The session during which sham stimulation was delivered and the frequency at which active LI-rTMS was delivered during the same session was randomly determined.
489
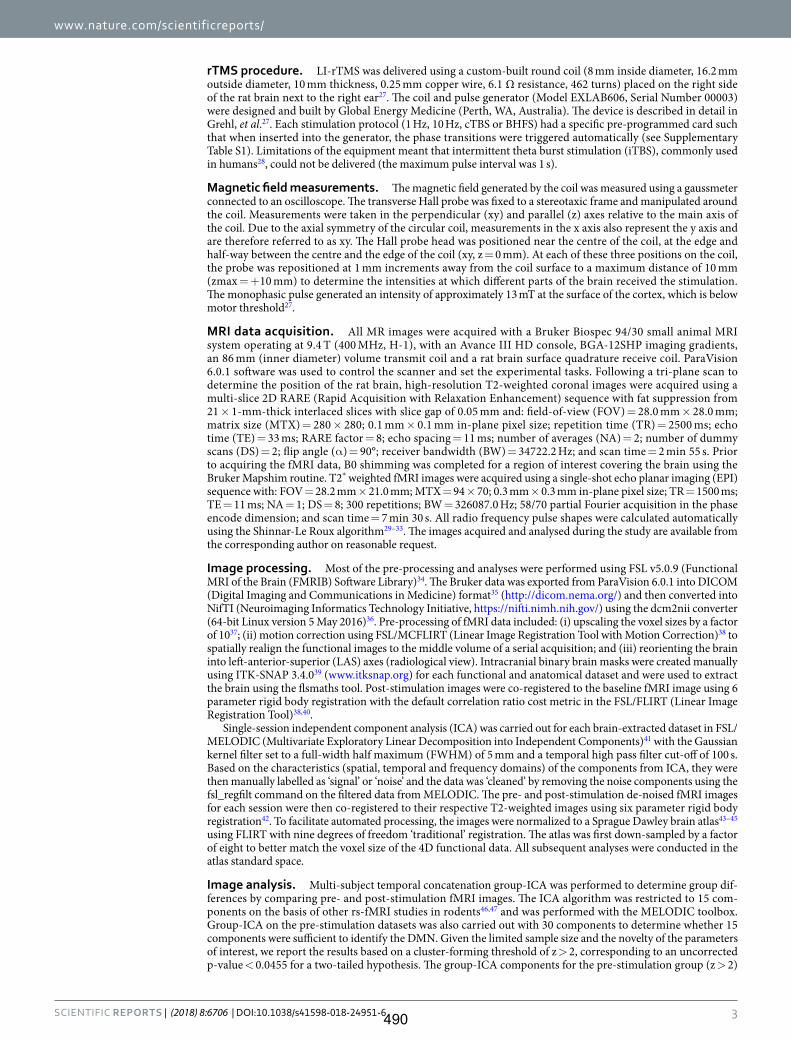
www.nature.com/scientificreports/
3SCIENTIfIC REpoRTS | (2018) 8:6706 | DOI:10.1038/s41598-018-24951-6
rTMS procedure. LI-rTMS was delivered using a custom-built round coil (8 mm inside diameter, 16.2 mm outside diameter, 10 mm thickness, 0.25 mm copper wire, 6.1 Ω resistance, 462 turns) placed on the right side of the rat brain next to the right ear27. The coil and pulse generator (Model EXLAB606, Serial Number 00003) were designed and built by Global Energy Medicine (Perth, WA, Australia). The device is described in detail in Grehl, et al.27. Each stimulation protocol (1 Hz, 10 Hz, cTBS or BHFS) had a specific pre-programmed card such that when inserted into the generator, the phase transitions were triggered automatically (see Supplementary Table S1). Limitations of the equipment meant that intermittent theta burst stimulation (iTBS), commonly used in humans28, could not be delivered (the maximum pulse interval was 1 s).
Magnetic field measurements. The magnetic field generated by the coil was measured using a gaussmeter connected to an oscilloscope. The transverse Hall probe was fixed to a stereotaxic frame and manipulated around the coil. Measurements were taken in the perpendicular (xy) and parallel (z) axes relative to the main axis of the coil. Due to the axial symmetry of the circular coil, measurements in the x axis also represent the y axis and are therefore referred to as xy. The Hall probe head was positioned near the centre of the coil, at the edge and half-way between the centre and the edge of the coil (xy, z = 0 mm). At each of these three positions on the coil, the probe was repositioned at 1 mm increments away from the coil surface to a maximum distance of 10 mm (zmax = +10 mm) to determine the intensities at which different parts of the brain received the stimulation. The monophasic pulse generated an intensity of approximately 13 mT at the surface of the cortex, which is below motor threshold27.
MRI data acquisition. All MR images were acquired with a Bruker Biospec 94/30 small animal MRI system operating at 9.4 T (400 MHz, H-1), with an Avance III HD console, BGA-12SHP imaging gradients, an 86 mm (inner diameter) volume transmit coil and a rat brain surface quadrature receive coil. ParaVision 6.0.1 software was used to control the scanner and set the experimental tasks. Following a tri-plane scan to determine the position of the rat brain, high-resolution T2-weighted coronal images were acquired using a multi-slice 2D RARE (Rapid Acquisition with Relaxation Enhancement) sequence with fat suppression from 21 × 1-mm-thick interlaced slices with slice gap of 0.05 mm and: field-of-view (FOV) = 28.0 mm × 28.0 mm; matrix size (MTX) = 280 × 280; 0.1 mm × 0.1 mm in-plane pixel size; repetition time (TR) = 2500 ms; echo time (TE) = 33 ms; RARE factor = 8; echo spacing = 11 ms; number of averages (NA) = 2; number of dummy scans (DS) = 2; flip angle (α) = 90°; receiver bandwidth (BW) = 34722.2 Hz; and scan time = 2 min 55 s. Prior to acquiring the fMRI data, B0 shimming was completed for a region of interest covering the brain using the Bruker Mapshim routine. T2* weighted fMRI images were acquired using a single-shot echo planar imaging (EPI) sequence with: FOV = 28.2 mm × 21.0 mm; MTX = 94 × 70; 0.3 mm × 0.3 mm in-plane pixel size; TR = 1500 ms; TE = 11 ms; NA = 1; DS = 8; 300 repetitions; BW = 326087.0 Hz; 58/70 partial Fourier acquisition in the phase encode dimension; and scan time = 7 min 30 s. All radio frequency pulse shapes were calculated automatically using the Shinnar-Le Roux algorithm29–33. The images acquired and analysed during the study are available from the corresponding author on reasonable request.
Image processing. Most of the pre-processing and analyses were performed using FSL v5.0.9 (Functional MRI of the Brain (FMRIB) Software Library)34. The Bruker data was exported from ParaVision 6.0.1 into DICOM (Digital Imaging and Communications in Medicine) format35 (http://dicom.nema.org/) and then converted into NifTI (Neuroimaging Informatics Technology Initiative, https://nifti.nimh.nih.gov/) using the dcm2nii converter (64-bit Linux version 5 May 2016)36. Pre-processing of fMRI data included: (i) upscaling the voxel sizes by a factor of 1037; (ii) motion correction using FSL/MCFLIRT (Linear Image Registration Tool with Motion Correction)38 to spatially realign the functional images to the middle volume of a serial acquisition; and (iii) reorienting the brain into left-anterior-superior (LAS) axes (radiological view). Intracranial binary brain masks were created manually using ITK-SNAP 3.4.039 (www.itksnap.org) for each functional and anatomical dataset and were used to extract the brain using the flsmaths tool. Post-stimulation images were co-registered to the baseline fMRI image using 6 parameter rigid body registration with the default correlation ratio cost metric in the FSL/FLIRT (Linear Image Registration Tool)38,40.
Single-session independent component analysis (ICA) was carried out for each brain-extracted dataset in FSL/MELODIC (Multivariate Exploratory Linear Decomposition into Independent Components)41 with the Gaussian kernel filter set to a full-width half maximum (FWHM) of 5 mm and a temporal high pass filter cut-off of 100 s. Based on the characteristics (spatial, temporal and frequency domains) of the components from ICA, they were then manually labelled as ‘signal’ or ‘noise’ and the data was ‘cleaned’ by removing the noise components using the fsl_regfilt command on the filtered data from MELODIC. The pre- and post-stimulation de-noised fMRI images for each session were then co-registered to their respective T2-weighted images using six parameter rigid body registration42. To facilitate automated processing, the images were normalized to a Sprague Dawley brain atlas43–45 using FLIRT with nine degrees of freedom ‘traditional’ registration. The atlas was first down-sampled by a factor of eight to better match the voxel size of the 4D functional data. All subsequent analyses were conducted in the atlas standard space.
Image analysis. Multi-subject temporal concatenation group-ICA was performed to determine group dif-ferences by comparing pre- and post-stimulation fMRI images. The ICA algorithm was restricted to 15 com-ponents on the basis of other rs-fMRI studies in rodents46,47 and was performed with the MELODIC toolbox. Group-ICA on the pre-stimulation datasets was also carried out with 30 components to determine whether 15 components were sufficient to identify the DMN. Given the limited sample size and the novelty of the parameters of interest, we report the results based on a cluster-forming threshold of z > 2, corresponding to an uncorrected p-value < 0.0455 for a two-tailed hypothesis. The group-ICA components for the pre-stimulation group (z > 2)
490

www.nature.com/scientificreports/
4SCIENTIfIC REpoRTS | (2018) 8:6706 | DOI:10.1038/s41598-018-24951-6
were visually inspected, and the DMN identified (Fig. 2) based on the spatial patterns in reference to known ana-tomical and functional locations using a rat brain atlas48. After identifying the DMN (Fig. 3), pre- and post-rTMS homologous ICA components were visually compared to determine the effect of LI-rTMS on the DMN.
As data was acquired for each animal at four different timepoints, the reproducibility of the group-ICA results over time and between subjects was also investigated. The pre-stimulation datasets were thresholded to a z-score higher than 2, binarised and then summed to give cumulative reproducibility maps for each subject (Fig. 4). The regions where the voxels have a z-score of 2 or higher for one, two, three or four sessions are shown in different colours.
Results and DiscussionRs-fMRI studies in rodents have previously shown that rodents possess a DMN similar to humans despite the dis-tinct evolutionary paths between rodent and primate brains49. In this study, we compared spontaneous activity in the brain at rest before and after the animals received active or sham LI-rTMS over the right hemisphere. The RSN in the rat brain was inferred based on synchronous fluctuations of the haemodynamic signals identified by ICA of pre-stimulation rs-fMRI data. ICA of post-stimulation rs-fMRI data showed that 10 Hz stimulation, BHFS and cTBS caused mostly ipsilateral changes in synchrony of resting activity while 1 Hz stimulation resulted in bilateral changes in synchrony, with the contralateral changes being more prominent than ipsilateral changes. When com-pared with results from rTMS/fMRI studies in humans, our findings suggest that repetitive transcranial magnetic stimulation, whether in the form of conventional high intensity rTMS in humans, or the lower intensity version LI-rTMS used here in rats, has similar effects on human and rat resting brain activity. Therefore, LI-rTMS/fMRI studies in animal models may be useful in refining clinical protocols for humans.
Identification of resting-state brain networks. The pre-stimulation group data were analysed using the group-ICA algorithm, and the resting-state networks were identified (Fig. 2). The components obtained from MELODIC were overlaid on the rat brain template to which they were originally co-registered and the distribution of the synchronised voxels was investigated using the digital brain atlas labels. Based on visual inspection of the spa-tial map for each of the 15 components and the consistency of the spatial distribution with known neuroanatomical regions from the brain atlas, six non-artefactual circuits could be identified, which formed part of the putative DMN (Fig. 3). The remaining nine components were classified as noise (see examples in Supplementary Fig. S1).
Figure 2. Independent component maps of pre-stimulation rs-fMRI group overlaid on 3D-rendered standard Sprague Dawley brain atlas. The figure shows the superior view (top left), anterior view (top right) and lateral view (bottom) of the chosen six non-artefactual independent components from the group-ICA. The spatial colour-coded z-maps of these components are overlaid on the brain atlas (down-sampled by a factor of eight). A higher z-score (bright red) represents a higher correlation between the time course of that voxel and the mean time course of the components. Colour bar indicates z-scores (n = 24, thresholded at z > 2, uncorrected p-value < 0.0455 for a two-tailed hypothesis).
491

www.nature.com/scientificreports/
5SCIENTIfIC REpoRTS | (2018) 8:6706 | DOI:10.1038/s41598-018-24951-6
The DMN in rats has previously been described as consisting of the orbital cortex47,49–52, cingulate cor-tex46,47,49–52, auditory cortex49,51,52, somatosensory cortex51, striatum/caudate putamen51, retrosplenial cor-tex47,49–51, temporal association cortex47,49,52, prelimbic cortex47,50,52, parasubiculum47, entorhinal cortex47, hippocampus49,51,52 and visual cortex49,52. Figure 3 provides the ICA components with clusters corresponding to these regions. The motor cortex and inferior colliculus, which form part of the RSN46 have also been identified.
In the pre-stimulation group, the ICA components forming the RSN showed bilateral symmetry in resting activity (Fig. 2). However, four of the chosen non-artefactual ICA components (Fig. 3) had spatially asymmetrical correlations between homologous brain regions. In some components, the homologous brain region was com-pletely absent (no correlation at that particular time point) while in some components, the spatial extent of the clusters was larger in one hemisphere. The ‘dominant’ hemisphere with increased ipsilateral cluster size was the same between sessions and across all animals (Fig. 4). Coherent neuronal oscillations or spontaneous rhythmic activity are believed to show which brain regions are coupled for joint processing for a specific function, and the resulting hemodynamic responses are interpreted as functional connectivity between these areas53. MacDonald, et al.54 measured the oscillations of the auditory and somatosensory cortex in anaesthetised rats and found that the oscillations in the somatosensory cortex were stronger in one hemisphere. Other similar behavioural and
Figure 3. Thresholded independent component spatial maps showing the resting-state network in the pre-stimulation rs-fMRI group-ICA dataset. The figure shows six independent components from the group-ICA, three coronal slices and three coronal slices with their corresponding axial slices. The spatial colour-coded z-maps of these components are overlaid on the brain atlas (down-sampled by a factor of eight). A higher z-score (yellow) represents a higher correlation between the time course of that voxel and the mean time course of this component. Significant clusters within the components include various brain regions: 1, orbital cortex; 2, cingulate cortex; 3, auditory cortex; 4, somatosensory cortex; 5, striatum/caudate putamen; 6, retrosplenial cortex; 7, temporal association cortex; 8, prelimbic cortex; 9, parasubiculum; 10, entorhinal cortex; 11, hippocampus; 12, visual cortex; 13, inferior colliculus; 14, motor cortex. R denotes right hemisphere. x, y, z refer to the coordinates in standard Sprague Dawley template space. Colour bar indicates z-scores (n = 24, thresholded at z > 2, uncorrected p-value < 0.0455 for a two-tailed hypothesis).
492
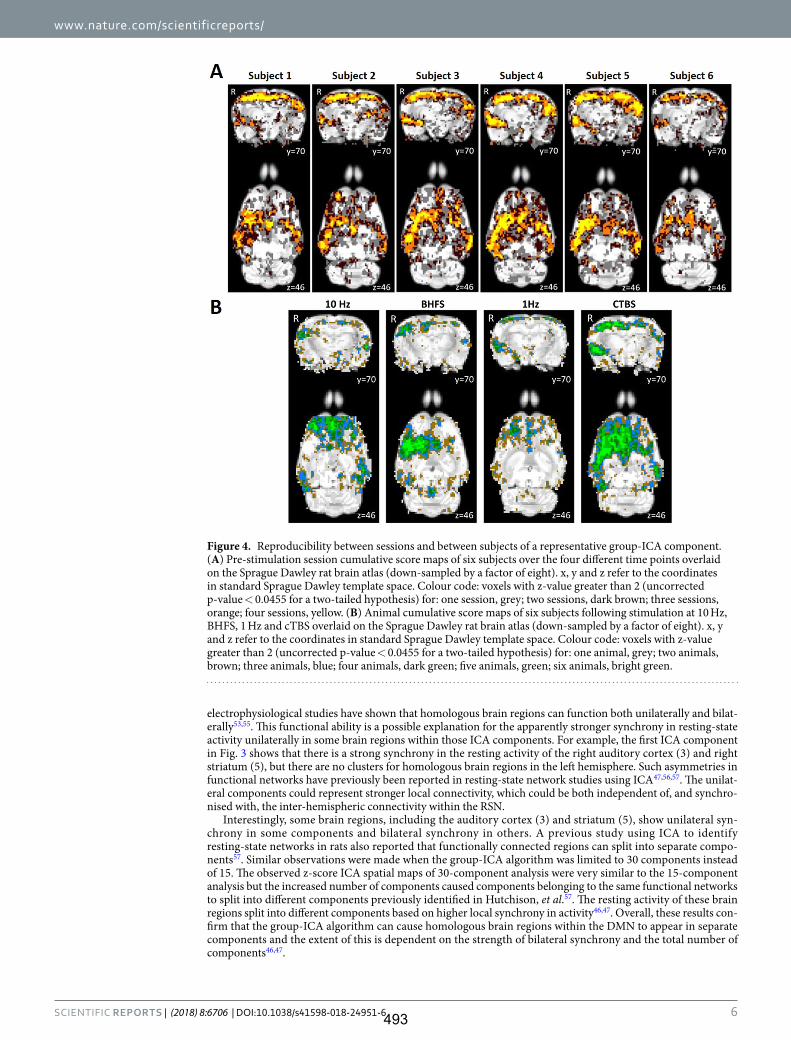
www.nature.com/scientificreports/
6SCIENTIfIC REpoRTS | (2018) 8:6706 | DOI:10.1038/s41598-018-24951-6
electrophysiological studies have shown that homologous brain regions can function both unilaterally and bilat-erally53,55. This functional ability is a possible explanation for the apparently stronger synchrony in resting-state activity unilaterally in some brain regions within those ICA components. For example, the first ICA component in Fig. 3 shows that there is a strong synchrony in the resting activity of the right auditory cortex (3) and right striatum (5), but there are no clusters for homologous brain regions in the left hemisphere. Such asymmetries in functional networks have previously been reported in resting-state network studies using ICA47,56,57. The unilat-eral components could represent stronger local connectivity, which could be both independent of, and synchro-nised with, the inter-hemispheric connectivity within the RSN.
Interestingly, some brain regions, including the auditory cortex (3) and striatum (5), show unilateral syn-chrony in some components and bilateral synchrony in others. A previous study using ICA to identify resting-state networks in rats also reported that functionally connected regions can split into separate compo-nents57. Similar observations were made when the group-ICA algorithm was limited to 30 components instead of 15. The observed z-score ICA spatial maps of 30-component analysis were very similar to the 15-component analysis but the increased number of components caused components belonging to the same functional networks to split into different components previously identified in Hutchison, et al.57. The resting activity of these brain regions split into different components based on higher local synchrony in activity46,47. Overall, these results con-firm that the group-ICA algorithm can cause homologous brain regions within the DMN to appear in separate components and the extent of this is dependent on the strength of bilateral synchrony and the total number of components46,47.
Figure 4. Reproducibility between sessions and between subjects of a representative group-ICA component. (A) Pre-stimulation session cumulative score maps of six subjects over the four different time points overlaid on the Sprague Dawley rat brain atlas (down-sampled by a factor of eight). x, y and z refer to the coordinates in standard Sprague Dawley template space. Colour code: voxels with z-value greater than 2 (uncorrected p-value < 0.0455 for a two-tailed hypothesis) for: one session, grey; two sessions, dark brown; three sessions, orange; four sessions, yellow. (B) Animal cumulative score maps of six subjects following stimulation at 10 Hz, BHFS, 1 Hz and cTBS overlaid on the Sprague Dawley rat brain atlas (down-sampled by a factor of eight). x, y and z refer to the coordinates in standard Sprague Dawley template space. Colour code: voxels with z-value greater than 2 (uncorrected p-value < 0.0455 for a two-tailed hypothesis) for: one animal, grey; two animals, brown; three animals, blue; four animals, dark green; five animals, green; six animals, bright green.
493
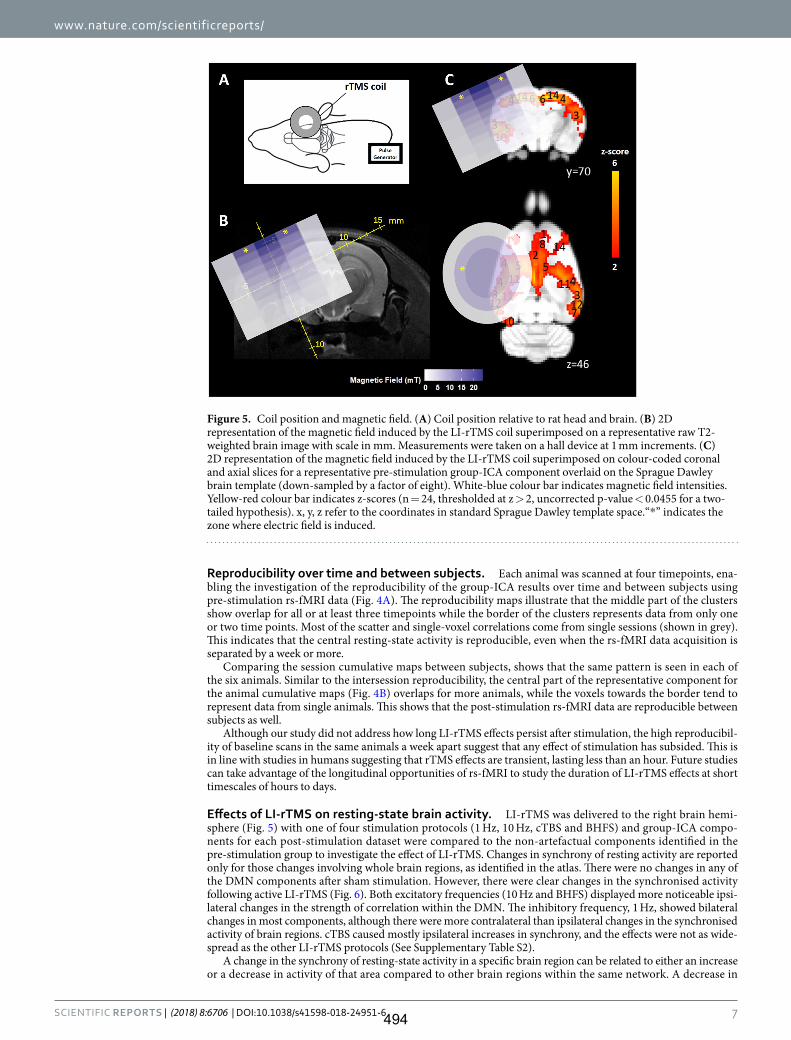
www.nature.com/scientificreports/
7SCIENTIfIC REpoRTS | (2018) 8:6706 | DOI:10.1038/s41598-018-24951-6
Reproducibility over time and between subjects. Each animal was scanned at four timepoints, ena-bling the investigation of the reproducibility of the group-ICA results over time and between subjects using pre-stimulation rs-fMRI data (Fig. 4A). The reproducibility maps illustrate that the middle part of the clusters show overlap for all or at least three timepoints while the border of the clusters represents data from only one or two time points. Most of the scatter and single-voxel correlations come from single sessions (shown in grey). This indicates that the central resting-state activity is reproducible, even when the rs-fMRI data acquisition is separated by a week or more.
Comparing the session cumulative maps between subjects, shows that the same pattern is seen in each of the six animals. Similar to the intersession reproducibility, the central part of the representative component for the animal cumulative maps (Fig. 4B) overlaps for more animals, while the voxels towards the border tend to represent data from single animals. This shows that the post-stimulation rs-fMRI data are reproducible between subjects as well.
Although our study did not address how long LI-rTMS effects persist after stimulation, the high reproducibil-ity of baseline scans in the same animals a week apart suggest that any effect of stimulation has subsided. This is in line with studies in humans suggesting that rTMS effects are transient, lasting less than an hour. Future studies can take advantage of the longitudinal opportunities of rs-fMRI to study the duration of LI-rTMS effects at short timescales of hours to days.
Effects of LI-rTMS on resting-state brain activity. LI-rTMS was delivered to the right brain hemi-sphere (Fig. 5) with one of four stimulation protocols (1 Hz, 10 Hz, cTBS and BHFS) and group-ICA compo-nents for each post-stimulation dataset were compared to the non-artefactual components identified in the pre-stimulation group to investigate the effect of LI-rTMS. Changes in synchrony of resting activity are reported only for those changes involving whole brain regions, as identified in the atlas. There were no changes in any of the DMN components after sham stimulation. However, there were clear changes in the synchronised activity following active LI-rTMS (Fig. 6). Both excitatory frequencies (10 Hz and BHFS) displayed more noticeable ipsi-lateral changes in the strength of correlation within the DMN. The inhibitory frequency, 1 Hz, showed bilateral changes in most components, although there were more contralateral than ipsilateral changes in the synchronised activity of brain regions. cTBS caused mostly ipsilateral increases in synchrony, and the effects were not as wide-spread as the other LI-rTMS protocols (See Supplementary Table S2).
A change in the synchrony of resting-state activity in a specific brain region can be related to either an increase or a decrease in activity of that area compared to other brain regions within the same network. A decrease in
Figure 5. Coil position and magnetic field. (A) Coil position relative to rat head and brain. (B) 2D representation of the magnetic field induced by the LI-rTMS coil superimposed on a representative raw T2-weighted brain image with scale in mm. Measurements were taken on a hall device at 1 mm increments. (C) 2D representation of the magnetic field induced by the LI-rTMS coil superimposed on colour-coded coronal and axial slices for a representative pre-stimulation group-ICA component overlaid on the Sprague Dawley brain template (down-sampled by a factor of eight). White-blue colour bar indicates magnetic field intensities. Yellow-red colour bar indicates z-scores (n = 24, thresholded at z > 2, uncorrected p-value < 0.0455 for a two-tailed hypothesis). x, y, z refer to the coordinates in standard Sprague Dawley template space.“*” indicates the zone where electric field is induced.
494
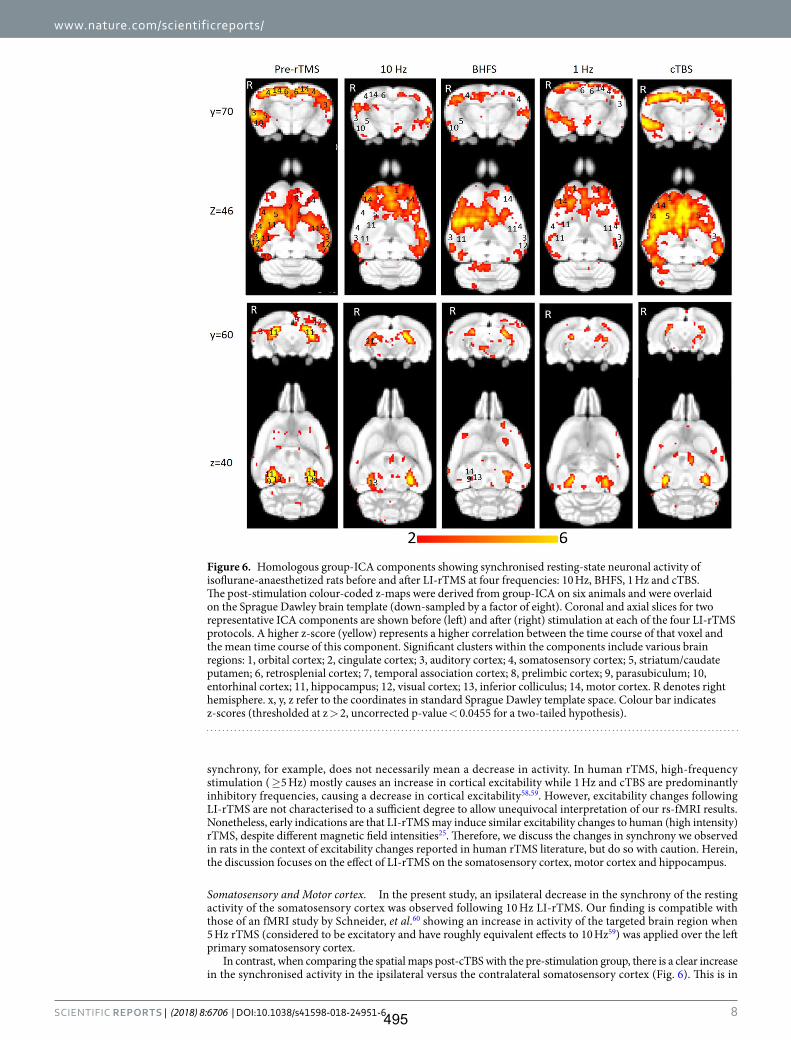
www.nature.com/scientificreports/
8SCIENTIfIC REpoRTS | (2018) 8:6706 | DOI:10.1038/s41598-018-24951-6
synchrony, for example, does not necessarily mean a decrease in activity. In human rTMS, high-frequency stimulation ( ≥5 Hz) mostly causes an increase in cortical excitability while 1 Hz and cTBS are predominantly inhibitory frequencies, causing a decrease in cortical excitability58,59. However, excitability changes following LI-rTMS are not characterised to a sufficient degree to allow unequivocal interpretation of our rs-fMRI results. Nonetheless, early indications are that LI-rTMS may induce similar excitability changes to human (high intensity) rTMS, despite different magnetic field intensities25. Therefore, we discuss the changes in synchrony we observed in rats in the context of excitability changes reported in human rTMS literature, but do so with caution. Herein, the discussion focuses on the effect of LI-rTMS on the somatosensory cortex, motor cortex and hippocampus.
Somatosensory and Motor cortex. In the present study, an ipsilateral decrease in the synchrony of the resting activity of the somatosensory cortex was observed following 10 Hz LI-rTMS. Our finding is compatible with those of an fMRI study by Schneider, et al.60 showing an increase in activity of the targeted brain region when 5 Hz rTMS (considered to be excitatory and have roughly equivalent effects to 10 Hz59) was applied over the left primary somatosensory cortex.
In contrast, when comparing the spatial maps post-cTBS with the pre-stimulation group, there is a clear increase in the synchronised activity in the ipsilateral versus the contralateral somatosensory cortex (Fig. 6). This is in
Figure 6. Homologous group-ICA components showing synchronised resting-state neuronal activity of isoflurane-anaesthetized rats before and after LI-rTMS at four frequencies: 10 Hz, BHFS, 1 Hz and cTBS. The post-stimulation colour-coded z-maps were derived from group-ICA on six animals and were overlaid on the Sprague Dawley brain template (down-sampled by a factor of eight). Coronal and axial slices for two representative ICA components are shown before (left) and after (right) stimulation at each of the four LI-rTMS protocols. A higher z-score (yellow) represents a higher correlation between the time course of that voxel and the mean time course of this component. Significant clusters within the components include various brain regions: 1, orbital cortex; 2, cingulate cortex; 3, auditory cortex; 4, somatosensory cortex; 5, striatum/caudate putamen; 6, retrosplenial cortex; 7, temporal association cortex; 8, prelimbic cortex; 9, parasubiculum; 10, entorhinal cortex; 11, hippocampus; 12, visual cortex; 13, inferior colliculus; 14, motor cortex. R denotes right hemisphere. x, y, z refer to the coordinates in standard Sprague Dawley template space. Colour bar indicates z-scores (thresholded at z > 2, uncorrected p-value < 0.0455 for a two-tailed hypothesis).
495
www.nature.com/scientificreports/
9SCIENTIfIC REpoRTS | (2018) 8:6706 | DOI:10.1038/s41598-018-24951-6
agreement with a study by Rai, et al.61 evaluating the effect of cTBS over the left somatosensory cortex by measuring the change in tactile acuity of the contralateral hand. They noted a decrease in neural activity within the stimulated cortex after cTBS application, which may indicate that cTBS can reduce sensory processing in the ipsilateral cortex. The increase in synchrony of resting-state activity in the present results and the localised decrease in activity in the ipsilateral somatosensory cortex following cTBS in Rai’s study appear to reflect similar trends, suggesting that cTBS effects on the somatosensory cortex may be restricted to the stimulated hemisphere and not spread bilaterally.
The effects of 1 Hz LI-rTMS are more variable across studies and may differ more between rodent LI-rTMS and human rTMS. While reports in humans suggest a purely uni-hemispheric effect of rTMS, the present results show bilateral and even contralateral outcomes following LI-rTMS. Enomoto, et al.62 examined the changes in excitability of the sensory cortex following rTMS by measuring changes in the somatosensory evoked potentials and found that 1 Hz rTMS over the left primary motor cortex suppressed the activity of only the ipsilateral sensory cortex. Similarly, Vidoni, et al.63 studied the impact of 1 Hz rTMS over left primary somatosensory cortex by observing cutaneous somatosensation and found that while the right hand was significantly impaired, the ipsilateral left hand was unaf-fected. In contrast, we found that the synchrony of the resting activity of the somatosensory cortex was decreased bilaterally following 1 Hz stimulation. Although we cannot rule out a lack of focality in the present study relative to human studies, some components nonetheless showed an exclusively contralateral decrease in synchrony, while those with bilateral decrease showed a stronger ipsilateral decrease in the synchrony of resting activity within the same component, suggesting that changes induced by 1 Hz rTMS are likely to be complex.
There is also evidence that 1 Hz rTMS in other brain regions has effects on the contralateral hemisphere, which is congruent with some of the results herein on synchrony of resting activity. 1 Hz, being an inhibitory frequency, is thought to decrease the activity of inhibitory neurones in the stimulated hemisphere, causing a reduction in the inhibitory interhemispheric drive, which in turn leads to an increase in excitability of the contralateral hemisphere. This effect of 1 Hz rTMS has been exploited in treating stroke patients by applying low-frequency stimulation to the unaffected hemisphere to decrease transcallosal inhibition of the lesioned hemisphere and consequently improve motor function64–66. That the motor cortex in both hemispheres experiences a change in neuronal excitability following 1 Hz rTMS on one hemisphere may explain the bilateral changes in synchrony observed in the present study. Interestingly, applying high-frequency rTMS to the lesioned hemisphere can have a similar effect by improving ipsilesional hemispheric excitability and hence improving motor rehabilitation. In a stroke study, 5 Hz (high-frequency) rTMS was applied ipsilesionally, and a bilateral increase in motor connec-tivity was found20. In accordance with this study, we also found a bilateral increase in the synchrony of resting activity in the motor cortex following 10 Hz stimulation.
Previous human studies have found that there are bilateral changes in the motor cortex activity following cTBS stimulatiom67,68. However, in the present study, only an ipsilateral increase in the synchronised activity of the motor cortex was observed following cTBS LI-rTMS to the right hemisphere of the rat brain. Although one can argue that there were also contralateral changes in synchrony of resting-state activity following cTBS (Fig. 6), these changes have not been reported because they did not encompass entire brain regions, as identified in the atlas, and similar spurious changes were found in the sham data. The intrinsic differences between the methods used to detect changes in correlation and activity or the limitations in imaging measurements like EPI distortions could be the cause of this inconsistency.
Hippocampus. While the proximal changes in the DMN may reflect direct stimulation of those brain regions, the very low intensity of the magnetic field applied in LI-rTMS (Fig. 5) means that any change in the activity of the hippocampus would likely be indirect and due to the modulation of functionally connected regions. We detected an ipsilateral decrease in the synchronised activity of the hippocampus following 10 Hz stimulation. This result is supported by Wang, et al.69 who applied high-frequency (20 Hz) stimulation to the left lateral parietal cortex of healthy adults to non-invasively enhance the targeted cortical-hippocampal networks and study their role in associative memory. An ipsilateral change in the hippocampus was detected following multiple-session stimula-tion and the increased functional connectivity was correlated with improved associative memory performance. Hence, the present results display a correlation profile that is coherent with what is known about the effect of high-frequency rTMS on the hippocampus in the literature.
After 1 Hz stimulation, we found a bilateral decrease in the synchrony of hippocampal activity relative to other brain regions. Van der Werf, et al.70 also determined that the hippocampus had reduced activation bilaterally following the application of low-frequency rTMS over the left dorsolateral prefrontal cortex. They hypothesised that this change was not due to direct stimulation because the changes in neural activity were observed distally relative to the site of stimulation. Consistent with this finding, the change in the synchronised activity of the hippocampus observed in the resting-state network in the present study could, therefore, be due to the change in cortical excitability or the transcallosal spread of LI-rTMS effects inducing bilateral inhibition as discussed above for motor and somatosensory cortices.
BHFS is a relatively new pattern of stimulation and use in humans has yet to be reported. As such, there is little information about the effects of BHFS in the literature. Studies using BHFS LI-rTMS in mice have shown increased structural plasticity of visual pathway topography in the midbrain, thalamus and cortex23,24 and altered density of GFAP astrocytes in a mouse model of brain injury71, possibly via intracellular calcium increases and changes in gene expression27. However, how these cellular and molecular changes might relate to resting-state network changes remains unclear. In the present study, like 1 Hz stimulation, BHFS had a bilateral effect on the synchronised activity in the somatosensory cortex and the hippocampus. Motor cortex resting activity following BHFS LI-rTMS showed a contralateral decrease in the synchrony compared to other brain regions, a different effect than observed with the other three LI-rTMS protocols. Further studies in animals and humans are war-ranted in effort to investigate the effects of BHFS on the resting-state networks.
496

www.nature.com/scientificreports/
1 0SCIENTIfIC REpoRTS | (2018) 8:6706 | DOI:10.1038/s41598-018-24951-6
Use of anaesthetics in rs-fMRI and rTMS studies in rodents. Combined rTMS/rs-fMRI studies allow direct comparison between human and animal investigations, but these comparisons are complicated by the use of anaesthesia in animals. In human studies, the physiological condition of the subject can be assumed to be relatively constant throughout an rs-fMRI scan session72. In contrast, in animal rs-fMRI, the use of anaesthesia is required to immobilise the animal and reduce stress72,73.
However, the effects of anaesthetics may confound both imaging and rTMS experiments, as these neuroactive substances may cause alterations in neural activity, vascular reactivity and neurovascular coupling. Nonetheless, the DMN has been shown to persist irrespective of the depth and type of anaesthetics used73–76, and many rTMS studies using other (non-fMRI) methodologies have employed the use of anaesthetics (e.g., ketamine, pentobar-bital, midazolam, isoflurane, propofol, and urethane) and have demonstrated the induction of neuronal plasticity in these anesthetised animals77–79, albeit with some impact of anaesthesia on rTMS outcomes78,79. Urethane, in particular, is commonly used in rTMS rodent electrophysiology studies because of its minimal effects on cortical excitability, its ability to preserve spinal reflexes and its capacity to maintain a stable resting motor threshold over an extended period78,80. However, urethane has mutagenic, carcinogenic, and hepatotoxic properties, which limit its use to acute and terminal experimental investigations. Longitudinal experiments in animals, such as those described here, therefore require alternative anaesthetic options.
In the present study, we have used isoflurane, even though studies indicate some concerns with its use in the context of both rTMS and fMRI imaging. Isoflurane may affect the intracellular concentration of calcium81, potentially modulating presynaptic transmission and/or postsynaptic excitability. Isoflurane also decreases excit-atory and increases inhibitory transmission, causing an overall suppression of neural activity81,82. As such, in the presence of isoflurane, the ability of high-frequency rTMS to depolarise is impaired79. Additionally, isoflurane, being a GABAergic anaesthetic, induces vasodilation83, particularly in deep anaesthesia, through the activa-tion of ATP-sensitive potassium channels of smooth muscle cells in cerebral arteries72. Vasodilation leads to an increase in cerebral blood flow, which may be interpreted as an increase in activity. Despite these confounding factors, isoflurane is the anaesthetic of choice for repeated long-term experiments because of its ease of use and control, and rapid reversibility84. Isoflurane level can be kept within a specified range (1–2.5% in the present study) within and between experiment sessions. The concentration of isoflurane can also be adjusted (within the specified range: 1–2.5%) based on the monitoring to keep the physiological parameters from fluctuating outside the desired range. The lack of change in synchronised resting activity observed after sham stimulation in our study provides confidence that the experimental conditions were stable over time and within and between indi-viduals. Moreover, the reproducibility maps (Figs. 4A and B) show that the correlation at the centre of a cluster was always greater than a z-score of 2 irrespective of the timepoint and animal, suggesting that our results have biological significance.
Conclusion. To date, all reported studies on the effects of rTMS on the structure and function of the DMN have been conducted in humans. To the best of our knowledge, the present study is the first to show evidence of alterations in the resting-state networks caused by LI-rTMS in a pre-clinical model and most of the observed changes are consistent with those described in the human rTMS literature. Nonetheless, the precise mechanisms generating these changes in resting neuronal activity remain to be elucidated. Furthermore, rTMS and LI-rTMS may have similar impact on the DMN of humans and animals, despite sig-nificant differences in intensity and focality of stimulation. To better understand the mechanisms underlying the reported clinical benefits of rTMS in different neurological and psychiatric conditions, relevant animal models could be used to link the LI-rTMS-induced changes in resting brain activity to changes in symptoms (through behavioural tests). Subsequent invasive techniques such as molecular studies can then be used to explore those effects in greater detail and provide information about how observed functional changes reflect those detected at a molecular and cellular level. This study provides a framework to use brain imag-ing to explore how LI-rTMS affects rodent resting brain activity, promoting evidence-based translation to human treatments.
References 1. Xia, G. et al. Treatment-emergent mania in unipolar and bipolar depression: Focus on repetitive transcranial magnetic stimulation.
Int. J. Neuropsychopharmacol. 11, 119–130, https://doi.org/10.1017/S1461145707007699 (2008). 2. Gaynes, B. N. et al. Repetitive transcranial magnetic stimulation for treatment-resistant depression: A systematic review and meta-
analysis. J. Clin. Psychiatry 75, 477–489, https://doi.org/10.4088/JCP.13r08815 (2014). 3. Dlabač-de Lange, J. J., Knegtering, R. & Aleman, A. Repetitive transcranial magnetic stimulation for negative symptoms of
schizophrenia: Review and meta-analysis. J. Clin. Psychiatry 71, 411–418, https://doi.org/10.4088/JCP.08r04808yel (2010). 4. Jaafari, N. et al. Safety and efficacy of repetitive transcranial magnetic stimulation in the treatment of obsessive-compulsive disorder:
A review. World J. Biol. Psychiatry 13, 164–177, https://doi.org/10.3109/15622975.2011.575177 (2012). 5. Clark, C., Cole, J., Winter, C., Williams, K. & Grammer, G. A review of transcranial magnetic stimulation as a treatment for post-
traumatic stress disorder. Curr. Psychiatry Rep. 17, 1–9, https://doi.org/10.1007/s11920-015-0621-x (2015). 6. Arias-Carrion, O. Basic mechanisms of rTMS: Implications in Parkinson’s disease. Int. Arch. Med. 1, 2, https://doi.org/10.1186/1755-
7682-1-2 (2008). 7. Machado, S. et al. Effects of repetitive transcranial magnetic stimulation on dystonia: An overview. Am. J. Neuroscience 2, 5–16,
https://doi.org/10.3844/amjnsp.2011.5.16 (2011). 8. Soleimani, R., Jalali, M. M. & Hasandokht, T. Therapeutic impact of repetitive transcranial magnetic stimulation (rTMS) on tinnitus:
A systematic review and meta-analysis. Eur. Arch. Otorhinolaryngol. 273, 1663–1675, https://doi.org/10.1007/s00405-015-3642-5 (2015).
9. Pereira, L. S., Müller, V. T., da Mota Gomes, M., Rotenberg, A. & Fregni, F. Safety of repetitive transcranial magnetic stimulation in patients with epilepsy: A systematic review. Epilepsy Behav. 57, 167–176, https://doi.org/10.1016/j.yebeh.2016.01.015 (2016).
10. Corti, M., Patten, C. & Triggs, W. Repetitive transcranial magnetic stimulation of motor cortex after stroke: A focused review. Am. J. Phys. Med. Rehabil. 91, 254–270, https://doi.org/10.1097/PHM.0b013e318228bf0c (2012).
497
www.nature.com/scientificreports/
1 1SCIENTIfIC REpoRTS | (2018) 8:6706 | DOI:10.1038/s41598-018-24951-6
11. Lipton, R. B. & Pearlman, S. H. Transcranial magnetic simulation in the treatment of migraine. Neurotherapeutics 7, 204–212, https://doi.org/10.1016/j.nurt.2010.03.002 (2010).
12. Galhardoni, R. et al. Repetitive transcranial magnetic stimulation in chronic pain: A review of the literature. Arch. Phys. Med. Rehabil. 96, S156–172, https://doi.org/10.1016/j.apmr.2014.11.010 (2015).
13. Wassermann, E. M. & Lisanby, S. H. Therapeutic application of repetitive transcranial magnetic stimulation: A review. Clin. Neurophysiol. 112, 1367–1377, https://doi.org/10.1016/S1388-2457(01)00585-5 (2001).
14. Biswal, B., Yetkin, F. Z., Haughton, V. M. & Hyde, J. S. Functional connectivity in the motor cortex of resting human brain using echo-planar MRI. Magn. Reson. Med. 34, 537–541, https://doi.org/10.1002/mrm.1910340409 (1995).
15. Marcotte, K., Perlbarg, V., Marrelec, G., Benali, H. & Ansaldo, A. I. Default-mode network functional connectivity in aphasia: therapy-induced neuroplasticity. Brain Lang. 124, 45–55, https://doi.org/10.1016/j.bandl.2012.11.004 (2013).
16. Fox, M. D., Halko, M. A., Eldaief, M. C. & Pascual-Leone, A. Measuring and manipulating brain connectivity with resting state functional connectivity magnetic resonance imaging (fcMRI) and transcranial magnetic stimulation (TMS). NeuroImage 62, 2232–2243, https://doi.org/10.1016/j.neuroimage.2012.03.035 (2012).
17. Popa, T. et al. Cerebellar rTMS stimulation may induce prolonged clinical benefits in essential tremor, and subjacent changes in functional connectivity: An open label trial. Brain Stimul. 6, 175–179, https://doi.org/10.1016/j.brs.2012.04.009 (2013).
18. Glielmi, C. B. et al. Assessing low-frequency repetitive transcranial magnetic stimulation with functional magnetic resonance imaging: A case series. Physiother. Res. Int. 19, 117–125, https://doi.org/10.1002/pri.518 (2014).
19. Jansen, J. M., van Wingen, G., van den Brink, W. & Goudriaan, A. E. Resting state connectivity in alcohol dependent patients and the effect of repetitive transcranial magnetic stimulation. Eur. Neuropsychopharmacol. 25, 2230–2239, https://doi.org/10.1016/j.euroneuro.2015.09.019 (2015).
20. Li, J. et al. Cerebral functional reorganization in ischemic stroke after repetitive transcranial magnetic stimulation: An fMRI study. CNS Neurosci. Ther. 22, 952–960, https://doi.org/10.1111/cns.12593 (2016).
21. Seewoo, B. J., Etherington, S. J., Feindel, K. W. & Rodger, J. Combined rTMS/fMRI studies: An overlooked resource in animal models. Front. Neurosci. 12, 180, https://doi.org/10.3389/fnins.2018.00180 (2018).
22. Tang, A. D. et al. Construction and evaluation of rodent-specific rTMS coils. Front. Neural Circuits 10, 47, https://doi.org/10.3389/fncir.2016.00047 (2016).
23. Rodger, J., Mo, C., Wilks, T., Dunlop, S. A. & Sherrard, R. M. Transcranial pulsed magnetic field stimulation facilitates reorganization of abnormal neural circuits and corrects behavioral deficits without disrupting normal connectivity. FASEB J. 26, 1593–1606, https://doi.org/10.1096/fj.11-194878 (2012).
24. Makowiecki, K., Harvey, A. R., Sherrard, R. M. & Rodger, J. Low-intensity repetitive transcranial magnetic stimulation improves abnormal visual cortical circuit topography and upregulates BDNF in mice. J. Neurosci. 34, 10780–10792, https://doi.org/10.1523/jneurosci.0723-14.2014 (2014).
25. Tang, A. D. et al. Low-intensity repetitive magnetic stimulation lowers action potential threshold and increases spike firing in layer 5 pyramidal neurons in vitro. Neuroscience 335, 64–71, https://doi.org/10.1016/j.neuroscience.2016.08.030 (2016).
26. Li, X. et al. Repetitive transcranial magnetic stimulation of the dorsolateral prefrontal cortex reduces nicotine cue craving. Biol. Psychiatry 73, 714–720, https://doi.org/10.1016/j.biopsych.2013.01.003 (2013).
27. Grehl, S. et al. Cellular and molecular changes to cortical neurons following low intensity repetitive magnetic stimulation at different frequencies. Brain Stimul. 8, 114–123, https://doi.org/10.1016/j.brs.2014.09.012 (2015).
28. Cárdenas-Morales, L., Nowak, D. A., Kammer, T., Wolf, R. C. & Schönfeldt-Lecuona, C. Mechanisms and applications of theta-burst rTMS on the human motor cortex. Brain Topogr. 22, 294–306, https://doi.org/10.1007/s10548-009-0084-7 (2010).
29. Shinnar, M., Bolinger, L. & Leigh, J. S. The synthesis of soft pulses with a specified frequency-response. Magn. Reson. Med. 12, 88–92, https://doi.org/10.1002/mrm.1910120111 (1989).
30. Shinnar, M., Bolinger, L. & Leigh, J. S. The use of finite impulse-response filters in pulse design. Magn. Reson. Med. 12, 81–87, https://doi.org/10.1002/mrm.1910120110 (1989).
31. Shinnar, M., Eleff, S., Subramanian, H. & Leigh, J. S. The synthesis of pulse sequences yielding arbitrary magnetization vectors. Magn. Reson. Med. 12, 74–80, https://doi.org/10.1002/mrm.1910120109 (1989).
32. Shinnar, M. & Leigh, J. S. The application of spinors to pulse synthesis and analysis. Magn. Reson. Med. 12, 93–98, https://doi.org/10.1002/mrm.1910120112 (1989).
33. Pauly, J. M., Le Roux, P., Nishimura, D. G. & Macovski, A. Parameter relations for the Shinnar-Le Roux selective excitation pulse design algorithm [NMR imaging]. IEEE Trans. Med. Imaging 10, 53–65, https://doi.org/10.1109/42.75611 (1991).
34. Jenkinson, M., Beckmann, C. F., Smith, S. M., Woolrich, M. W. & Behrens, T. E. J. FSL. NeuroImage 62, 782–790, https://doi.org/10.1016/j.neuroimage.2011.09.015 (2012).
35. Bidgood, W. D. Jr., Horii, S. C., Prior, F. W. & Van Syckle, D. E. Understanding and using DICOM, the data interchange standard for biomedical imaging. J. Am. Med. Inf. Assoc. 4, 199–212, https://doi.org/10.1136/jamia.1997.0040199 (1997).
36. Rorden, C., Karnath, H.-O. & Bonilha, L. Improving lesion-symptom mapping. J. Cognit. Neurosci. 19, 1081–1088, https://doi.org/10.1162/jocn.2007.19.7.1081 (2007).
37. Tambalo, S. et al. Functional magnetic resonance imaging of rats with experimental autoimmune encephalomyelitis reveals brain cortex remodeling. J. Neurosci. 35, 10088–10100, https://doi.org/10.1523/jneurosci.0540-15.2015 (2015).
38. Jenkinson, M., Bannister, P., Brady, M. & Smith, S. Improved optimization for the robust and accurate linear registration and motion correction of brain images. NeuroImage 17, 825–841, https://doi.org/10.1006/nimg.2002.1132 (2002).
39. Yushkevich, P. A. et al. User-guided 3D active contour segmentation of anatomical structures: Significantly improved efficiency and reliability. NeuroImage 31, 1116–1128, https://doi.org/10.1016/j.neuroimage.2006.01.015 (2006).
40. Jenkinson, M. & Smith, S. A global optimisation method for robust affine registration of brain images. Med. Image Anal. 5, 143–156, https://doi.org/10.1016/S1361-8415(01)00036-6 (2001).
41. Beckmann, C. F., DeLuca, M., Devlin, J. T. & Smith, S. M. Investigations into resting-state connectivity using independent component analysis. Philos. Trans. R. Soc. Lond., B, Biol. Sci. 360, 1001–1013, https://doi.org/10.1098/rstb.2005.1634 (2005).
42. Lu, H. et al. Registering and analyzing rat fMRI data in the stereotaxic framework by exploiting intrinsic anatomical features. Magn. Reson. Imaging 28, 146–152, https://doi.org/10.1016/j.mri.2009.05.019 (2010).
43. Papp, E. A., Leergaard, T. B., Calabrese, E., Johnson, G. A. & Bjaalie, J. G. Waxholm Space atlas of the Sprague Dawley rat brain. NeuroImage 97, 374–386, https://doi.org/10.1016/j.neuroimage.2014.04.001 (2014).
44. Kjonigsen, L. J., Lillehaug, S., Bjaalie, J. G., Witter, M. P. & Leergaard, T. B. Waxholm Space atlas of the rat brain hippocampal region: Three-dimensional delineations based on magnetic resonance and diffusion tensor imaging. NeuroImage 108, 441–449, https://doi.org/10.1016/j.neuroimage.2014.12.080 (2015).
45. Sergejeva, M. et al. Anatomical landmarks for registration of experimental image data to volumetric rodent brain atlasing templates. J. Neurosci. Methods 240, 161–169, https://doi.org/10.1016/j.jneumeth.2014.11.005 (2015).
46. Jonckers, E., Van Audekerke, J., De Visscher, G., Van der Linden, A. & Verhoye, M. Functional connectivity fMRI of the rodent brain: comparison of functional connectivity networks in rat and mouse. PLoS One 6, e18876, https://doi.org/10.1371/journal.pone.0018876 (2011).
47. Zerbi, V., Grandjean, J., Rudin, M. & Wenderoth, N. Mapping the mouse brain with rs-fMRI: An optimized pipeline for functional network identification. NeuroImage 123, 11–21, https://doi.org/10.1016/j.neuroimage.2015.07.090 (2015).
48. Paxinos, G. & Watson, C. The rat brain in stereotaxic coordinates. 4th edn, (Academic Press, Ltd, 1998).
498
www.nature.com/scientificreports/
1 2SCIENTIfIC REpoRTS | (2018) 8:6706 | DOI:10.1038/s41598-018-24951-6
49. Lu, H. et al. Rat brains also have a default mode network. Proc. Natl. Acad. Sci. USA 109, 3979–3984, https://doi.org/10.1073/pnas.1200506109 (2012).
50. Sierakowiak, A. et al. Default mode network, motor network, dorsal and ventral basal ganglia networks in the rat brain: Comparison to human networks using resting state-fMRI. PLoS One 10, e0120345, https://doi.org/10.1371/journal.pone.0120345 (2015).
51. Huang, S.-M. et al. Inter-strain differences in default mode network: A resting state fMRI study on spontaneously hypertensive rat and Wistar Kyoto rat. Sci. Rep. 6, 21697, https://doi.org/10.1038/srep21697 (2016).
52. Hsu, L.-M. et al. Constituents and functional implications of the rat default mode network. Proc. Natl. Acad. Sci. USA 113, e4541–4547, https://doi.org/10.1073/pnas.1601485113 (2016).
53. Nikouline, V. V., Linkenkaer-Hansen, K., Huttunen, J. & Ilmoniemi, R. J. Interhemispheric phase synchrony and amplitude correlation of spontaneous beta oscillations in human subjects: A magnetoencephalographic study. Neuroreport 12, 2487–2491, https://doi.org/10.1097/00001756-200108080-00040 (2001).
54. MacDonald, K. D., Brett, B. & Barth, D. S. Inter- and intra-hemispheric spatiotemporal organization of spontaneous electrocortical oscillations. J. Neurophysiol. 76, 423–437 (1996).
55. Banich, M. T. & Belger, A. Interhemispheric interaction: How do the hemispheres divide and conquer a task? Cortex 26, 77–94, https://doi.org/10.1016/S0010-9452(13)80076-7 (1990).
56. Fransson, P. et al. Spontaneous brain activity in the newborn brain during natural sleep: An fMRI study in infants born at full term. Pediatr. Res. 66, 301–305, https://doi.org/10.1203/PDR.0b013e3181b1bd84 (2009).
57. Hutchison, R. M., Mirsattari, S. M., Jones, C. K., Gati, J. S. & Leung, L. S. Functional networks in the anesthetized rat brain revealed by independent component analysis of resting-state fMRI. J. Neurophysiol. 103, 3398–3406, https://doi.org/10.1152/jn.00141.2010 (2010).
58. Klomjai, W., Katz, R. & Lackmy-Vallée, A. Basic principles of transcranial magnetic stimulation (TMS) and repetitive TMS (rTMS). Ann. Phys. Rehabil. Med. 58, 208–213, https://doi.org/10.1016/j.rehab.2015.05.005 (2015).
59. Wilson, M. T. & St George, L. Repetitive transcranial magnetic stimulation: A call for better data. Front. Neural Circuits 10, 57, https://doi.org/10.3389/fncir.2016.00057 (2016).
60. Schneider, S. A. et al. Modulatory effects of 5Hz rTMS over the primary somatosensory cortex in focal dystonia—An fMRI-TMS study. Mov. Disord. 25, 76–83, https://doi.org/10.1002/mds.22825 (2010).
61. Rai, N., Premji, A., Tommerdahl, M. & Nelson, A. J. Continuous theta-burst rTMS over primary somatosensory cortex modulates tactile perception on the hand. Clin. Neurophysiol. 123, 1226–1233, https://doi.org/10.1016/j.clinph.2011.09.026 (2012).
62. Enomoto, H. et al. Decreased sensory cortical excitability after 1 Hz rTMS over the ipsilateral primary motor cortex. Clin. Neurophysiol. 112, 2154–2158, https://doi.org/10.1016/S1388-2457(01)00667-8 (2001).
63. Vidoni, E. D., Acerra, N. E., Dao, E., Meehan, S. K. & Boyd, L. A. Role of the primary somatosensory cortex in motor learning: An rTMS study. Neurobiol. Learn. Mem. 93, 532–539, https://doi.org/10.1016/j.nlm.2010.01.011 (2010).
64. Takeuchi, N., Chuma, T., Matsuo, Y., Watanabe, I. & Ikoma, K. Repetitive transcranial magnetic stimulation of contralesional primary motor cortex improves hand function after stroke. Stroke 36, 2681–2686, https://doi.org/10.1161/01.STR.0000189658.51972.34 (2005).
65. Mansur, C. G. et al. A sham stimulation-controlled trial of rTMS of the unaffected hemisphere in stroke patients. Neurology 64, 1802–1804, https://doi.org/10.1212/01.WNL.0000161839.38079.92 (2005).
66. Fregni, F. et al. A sham-controlled trial of a 5-day course of repetitive transcranial magnetic stimulation of the unaffected hemisphere in stroke patients. Stroke 37, 2115–2122, https://doi.org/10.1161/01.STR.0000231390.58967.6b (2006).
67. Huang, Y.-Z., Edwards, M. J., Rounis, E., Bhatia, K. P. & Rothwell, J. C. Theta burst stimulation of the human motor cortex. Neuron 45, 201–206, https://doi.org/10.1016/j.neuron.2004.12.033 (2005).
68. Huang, G. & Mouraux, A. MEP latencies predict the neuromodulatory effect of cTBS delivered to the ipsilateral and contralateral sensorimotor cortex. PLoS One 10, e0133893, https://doi.org/10.1371/journal.pone.0133893 (2015).
69. Wang, J. X. et al. Targeted enhancement of cortical-hippocampal brain networks and associative memory. Science 345, 1054–1057, https://doi.org/10.1126/science.1252900 (2014).
70. Van der Werf, Y. D., Sanz-Arigita, E. J., Menning, S. & van den Heuvel, O. A. Modulating spontaneous brain activity using repetitive transcranial magnetic stimulation. BMC Neurosci. 11, 145, https://doi.org/10.1186/1471-2202-11-145 (2010).
71. Clarke, D., Penrose, M. A., Harvey, A. R., Rodger, J. & Bates, K. A. Low intensity rTMS has sex-dependent effects on the local response of glia following a penetrating cortical stab injury. Exp. Neurol. 295, 233–242, https://doi.org/10.1016/j.expneurol.2017.06.019 (2017).
72. Pan, W.-J., Billings, J. C. W., Grooms, J. K., Shakil, S. & Keilholz, S. D. Considerations for resting state functional MRI and functional connectivity studies in rodents. Front. Neurosci. 9, 269, https://doi.org/10.3389/fnins.2015.00269 (2015).
73. Vincent, J. L. et al. Intrinsic functional architecture in the anaesthetized monkey brain. Nature 447, 83–86, https://doi.org/10.1038/nature05758 (2007).
74. Lu, H. et al. Synchronized delta oscillations correlate with the resting-state functional MRI signal. Proc. Natl. Acad. Sci. USA 104, 18265–18269, https://doi.org/10.1073/pnas.0705791104 (2007).
75. Kannurpatti, S. S., Biswal, B. B., Kim, Y. R. & Rosen, B. R. Spatio-temporal characteristics of low-frequency BOLD signal fluctuations in isoflurane-anesthetized rat brain. NeuroImage 40, 1738–1747, https://doi.org/10.1016/j.neuroimage.2007.05.061 (2008).
76. Zhao, F., Zhao, T., Zhou, L., Wu, Q. & Hu, X. BOLD study of stimulation-induced neural activity and resting-state connectivity in medetomidine-sedated rat. NeuroImage 39, 248–260, https://doi.org/10.1016/j.neuroimage.2007.07.063 (2008).
77. Tang, A., Thickbroom, G. & Rodger, J. Repetitive transcranial magnetic stimulation of the brain: Mechanisms from animal and experimental models. Neuroscientist 23, 82–94, https://doi.org/10.1177/1073858415618897 (2015).
78. Sykes, M. et al. Differences in motor evoked potentials induced in rats by transcranial magnetic stimulation under two separate anesthetics: Implications for plasticity studies. Front. Neural Circuits 10, 80, https://doi.org/10.3389/fncir.2016.00080 (2016).
79. Gersner, R., Kravetz, E., Feil, J., Pell, G. & Zangen, A. Long-term effects of repetitive transcranial magnetic stimulation on markers for neuroplasticity: differential outcomes in anesthetized and awake animals. J. Neurosci. 31, 7521–7526, https://doi.org/10.1523/jneurosci.6751-10.2011 (2011).
80. Vahabzadeh-Hagh, A. M., Muller, P. A., Gersner, R., Zangen, A. & Rotenberg, A. Translational neuromodulation: approximating human transcranial magnetic stimulation protocols in rats. Neuromodulation 15, 296–305, https://doi.org/10.1111/j.1525-1403.2012.00482.x (2012).
81. Gomez, R. S. & Guatimosim, C. Mechanism of action of volatile anesthetics: Involvement of intracellular calcium signaling. Curr. Drug Targets CNS Neurol. Disord. 2, 123–129, https://doi.org/10.2174/1568007033482940 (2003).
82. Ouyang, W. & Hemmings, H. C. Depression by isoflurane of the action potential and underlying voltage-gated ion currents in isolated rat neurohypophysial nerve terminals. J. Pharmacol. Exp. Ther. 312, 801–808, https://doi.org/10.1124/jpet.104.074609 (2005).
83. Ohata, H., Iida, H., Dohi, S. & Watanabe, Y. Intravenous dexmedetomidine inhibits cerebrovascular dilation induced by isoflurane and sevoflurane in dogs. Anesth. Analg. 89, 370–377, https://doi.org/10.1213/00000539-199908000-00023 (1999).
84. Masamoto, K. & Kanno, I. Anesthesia and the quantitative evaluation of neurovascular coupling. J. Cereb. Blood Flow Metab. 32, 1233–1247, https://doi.org/10.1038/jcbfm.2012.50 (2012).
499

www.nature.com/scientificreports/
13SCIENTIfIC REpoRTS | (2018) 8:6706 | DOI:10.1038/s41598-018-24951-6
AcknowledgementsThe authors thank Clare Auckland and Marissa Penrose-Menz for their technical assistance and Dr Andrew Mehnert for his help with the co-registration and analysis of the fMRI data. The authors acknowledge the facilities, and the scientific and technical assistance of the National Imaging Facility at the Centre for Microscopy, Characterisation & Analysis, The University of Western Australia, a facility funded by the University, State and Commonwealth Governments. This research was funded by The University of Western Australia. B.J.S. is supported by a Forrest Research Foundation Scholarship, an International Postgraduate Research Scholarship, and a University Postgraduate Award. K.W.F. is an Australian National Imaging Facility Fellow. J.R. was supported by an NHMRC Senior Research Fellowship.
Author ContributionsAll authors contributed to the experimental background and design. B.J.S. conducted the experiments, analysed the results and wrote the first version of the manuscript as part of her Honours thesis. K.W.F. provided troubleshooting and methodological advice on acquiring and analysing the imaging data. All authors revised and proofed the manuscript.
Additional InformationSupplementary information accompanies this paper at https://doi.org/10.1038/s41598-018-24951-6.Competing Interests: The authors declare no competing interests.Publisher's note: Springer Nature remains neutral with regard to jurisdictional claims in published maps and institutional affiliations.
Open Access This article is licensed under a Creative Commons Attribution 4.0 International License, which permits use, sharing, adaptation, distribution and reproduction in any medium or
format, as long as you give appropriate credit to the original author(s) and the source, provide a link to the Cre-ative Commons license, and indicate if changes were made. The images or other third party material in this article are included in the article’s Creative Commons license, unless indicated otherwise in a credit line to the material. If material is not included in the article’s Creative Commons license and your intended use is not per-mitted by statutory regulation or exceeds the permitted use, you will need to obtain permission directly from the copyright holder. To view a copy of this license, visit http://creativecommons.org/licenses/by/4.0/. © The Author(s) 2018
500
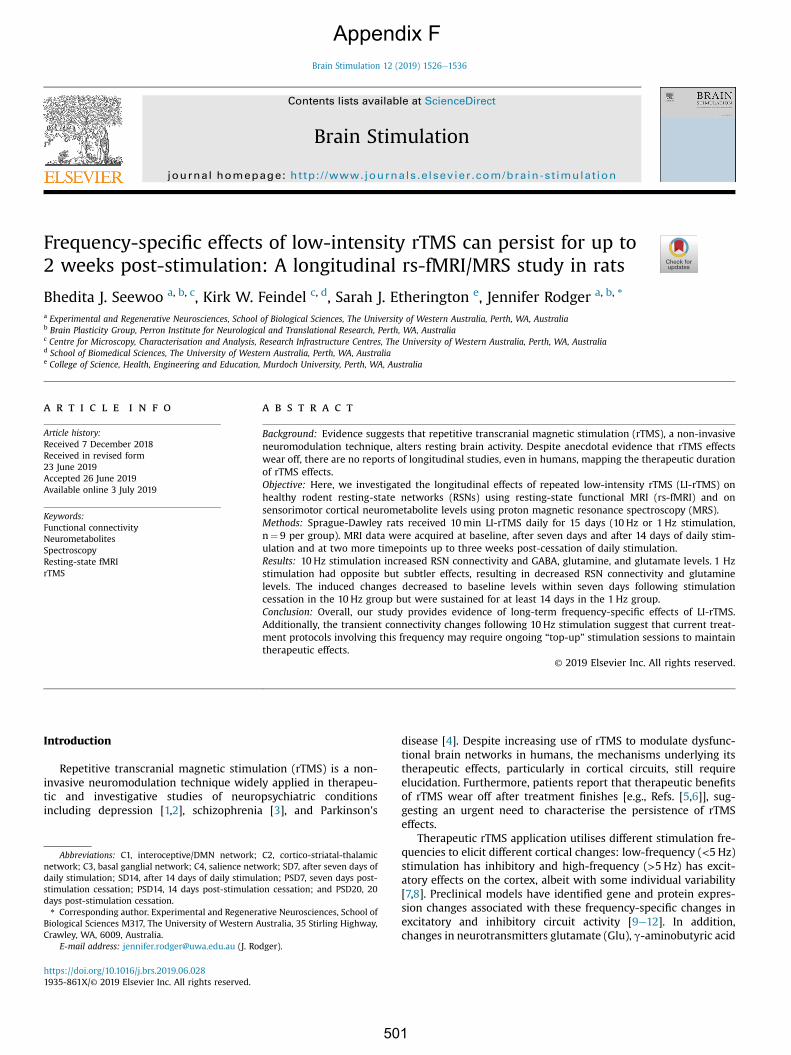
Frequency-specific effects of low-intensity rTMS can persist for up to2 weeks post-stimulation: A longitudinal rs-fMRI/MRS study in rats
Bhedita J. Seewoo a, b, c, Kirk W. Feindel c, d, Sarah J. Etherington e, Jennifer Rodger a, b, *
a Experimental and Regenerative Neurosciences, School of Biological Sciences, The University of Western Australia, Perth, WA, Australiab Brain Plasticity Group, Perron Institute for Neurological and Translational Research, Perth, WA, Australiac Centre for Microscopy, Characterisation and Analysis, Research Infrastructure Centres, The University of Western Australia, Perth, WA, Australiad School of Biomedical Sciences, The University of Western Australia, Perth, WA, Australiae College of Science, Health, Engineering and Education, Murdoch University, Perth, WA, Australia
a r t i c l e i n f o
Article history:Received 7 December 2018Received in revised form23 June 2019Accepted 26 June 2019Available online 3 July 2019
Keywords:Functional connectivityNeurometabolitesSpectroscopyResting-state fMRIrTMS
a b s t r a c t
Background: Evidence suggests that repetitive transcranial magnetic stimulation (rTMS), a non-invasiveneuromodulation technique, alters resting brain activity. Despite anecdotal evidence that rTMS effectswear off, there are no reports of longitudinal studies, even in humans, mapping the therapeutic durationof rTMS effects.Objective: Here, we investigated the longitudinal effects of repeated low-intensity rTMS (LI-rTMS) onhealthy rodent resting-state networks (RSNs) using resting-state functional MRI (rs-fMRI) and onsensorimotor cortical neurometabolite levels using proton magnetic resonance spectroscopy (MRS).Methods: Sprague-Dawley rats received 10min LI-rTMS daily for 15 days (10 Hz or 1 Hz stimulation,n¼ 9 per group). MRI data were acquired at baseline, after seven days and after 14 days of daily stim-ulation and at two more timepoints up to three weeks post-cessation of daily stimulation.Results: 10 Hz stimulation increased RSN connectivity and GABA, glutamine, and glutamate levels. 1 Hzstimulation had opposite but subtler effects, resulting in decreased RSN connectivity and glutaminelevels. The induced changes decreased to baseline levels within seven days following stimulationcessation in the 10 Hz group but were sustained for at least 14 days in the 1 Hz group.Conclusion: Overall, our study provides evidence of long-term frequency-specific effects of LI-rTMS.Additionally, the transient connectivity changes following 10 Hz stimulation suggest that current treat-ment protocols involving this frequency may require ongoing “top-up” stimulation sessions to maintaintherapeutic effects.
© 2019 Elsevier Inc. All rights reserved.
Introduction
Repetitive transcranial magnetic stimulation (rTMS) is a non-invasive neuromodulation technique widely applied in therapeu-tic and investigative studies of neuropsychiatric conditionsincluding depression [1,2], schizophrenia [3], and Parkinson's
disease [4]. Despite increasing use of rTMS to modulate dysfunc-tional brain networks in humans, the mechanisms underlying itstherapeutic effects, particularly in cortical circuits, still requireelucidation. Furthermore, patients report that therapeutic benefitsof rTMS wear off after treatment finishes [e.g., Refs. [5,6]], sug-gesting an urgent need to characterise the persistence of rTMSeffects.
Therapeutic rTMS application utilises different stimulation fre-quencies to elicit different cortical changes: low-frequency (<5Hz)stimulation has inhibitory and high-frequency (>5 Hz) has excit-atory effects on the cortex, albeit with some individual variability[7,8]. Preclinical models have identified gene and protein expres-sion changes associated with these frequency-specific changes inexcitatory and inhibitory circuit activity [9e12]. In addition,changes in neurotransmitters glutamate (Glu), g-aminobutyric acid
Abbreviations: C1, interoceptive/DMN network; C2, cortico-striatal-thalamicnetwork; C3, basal ganglial network; C4, salience network; SD7, after seven days ofdaily stimulation; SD14, after 14 days of daily stimulation; PSD7, seven days post-stimulation cessation; PSD14, 14 days post-stimulation cessation; and PSD20, 20days post-stimulation cessation.* Corresponding author. Experimental and Regenerative Neurosciences, School of
Biological Sciences M317, The University of Western Australia, 35 Stirling Highway,Crawley, WA, 6009, Australia.
E-mail address: [email protected] (J. Rodger).
Contents lists available at ScienceDirect
Brain Stimulation
journal homepage: http: / /www.journals .e lsevier .com/brain-st imulat ion
https://doi.org/10.1016/j.brs.2019.06.0281935-861X/© 2019 Elsevier Inc. All rights reserved.
Brain Stimulation 12 (2019) 1526e1536
Appendix F
501
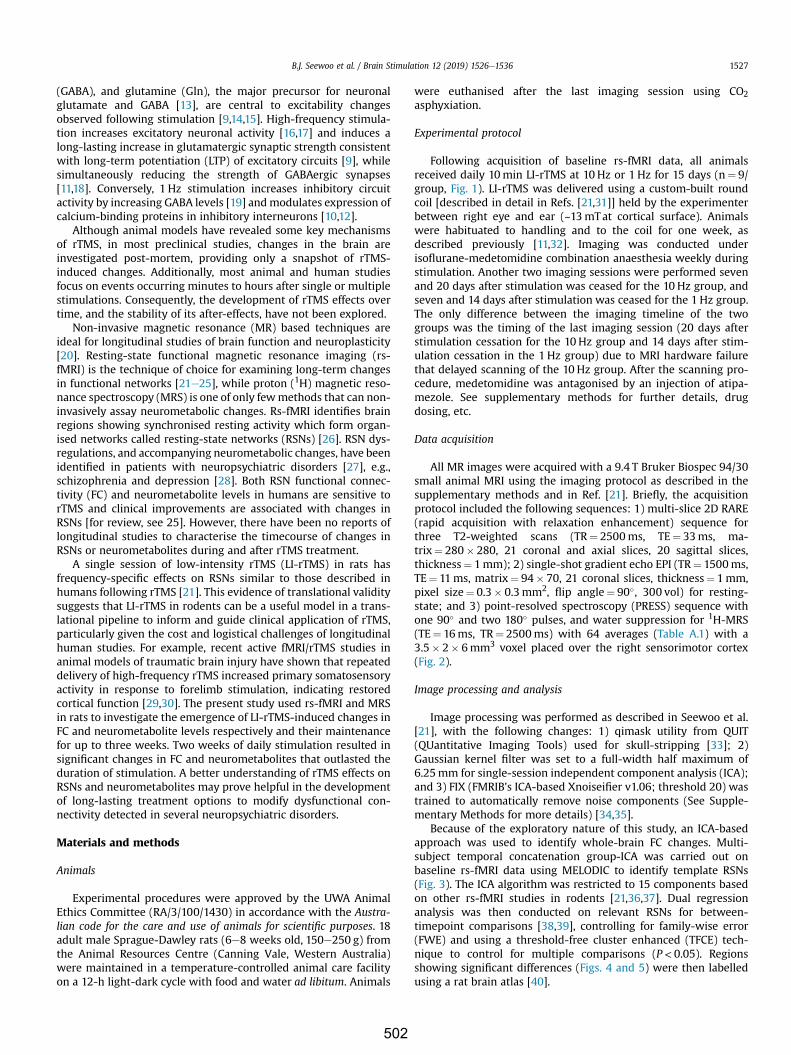
(GABA), and glutamine (Gln), the major precursor for neuronalglutamate and GABA [13], are central to excitability changesobserved following stimulation [9,14,15]. High-frequency stimula-tion increases excitatory neuronal activity [16,17] and induces along-lasting increase in glutamatergic synaptic strength consistentwith long-term potentiation (LTP) of excitatory circuits [9], whilesimultaneously reducing the strength of GABAergic synapses[11,18]. Conversely, 1 Hz stimulation increases inhibitory circuitactivity by increasing GABA levels [19] andmodulates expression ofcalcium-binding proteins in inhibitory interneurons [10,12].
Although animal models have revealed some key mechanismsof rTMS, in most preclinical studies, changes in the brain areinvestigated post-mortem, providing only a snapshot of rTMS-induced changes. Additionally, most animal and human studiesfocus on events occurring minutes to hours after single or multiplestimulations. Consequently, the development of rTMS effects overtime, and the stability of its after-effects, have not been explored.
Non-invasive magnetic resonance (MR) based techniques areideal for longitudinal studies of brain function and neuroplasticity[20]. Resting-state functional magnetic resonance imaging (rs-fMRI) is the technique of choice for examining long-term changesin functional networks [21e25], while proton (1H) magnetic reso-nance spectroscopy (MRS) is one of only fewmethods that can non-invasively assay neurometabolic changes. Rs-fMRI identifies brainregions showing synchronised resting activity which form organ-ised networks called resting-state networks (RSNs) [26]. RSN dys-regulations, and accompanying neurometabolic changes, have beenidentified in patients with neuropsychiatric disorders [27], e.g.,schizophrenia and depression [28]. Both RSN functional connec-tivity (FC) and neurometabolite levels in humans are sensitive torTMS and clinical improvements are associated with changes inRSNs [for review, see 25]. However, there have been no reports oflongitudinal studies to characterise the timecourse of changes inRSNs or neurometabolites during and after rTMS treatment.
A single session of low-intensity rTMS (LI-rTMS) in rats hasfrequency-specific effects on RSNs similar to those described inhumans following rTMS [21]. This evidence of translational validitysuggests that LI-rTMS in rodents can be a useful model in a trans-lational pipeline to inform and guide clinical application of rTMS,particularly given the cost and logistical challenges of longitudinalhuman studies. For example, recent active fMRI/rTMS studies inanimal models of traumatic brain injury have shown that repeateddelivery of high-frequency rTMS increased primary somatosensoryactivity in response to forelimb stimulation, indicating restoredcortical function [29,30]. The present study used rs-fMRI and MRSin rats to investigate the emergence of LI-rTMS-induced changes inFC and neurometabolite levels respectively and their maintenancefor up to three weeks. Two weeks of daily stimulation resulted insignificant changes in FC and neurometabolites that outlasted theduration of stimulation. A better understanding of rTMS effects onRSNs and neurometabolites may prove helpful in the developmentof long-lasting treatment options to modify dysfunctional con-nectivity detected in several neuropsychiatric disorders.
Materials and methods
Animals
Experimental procedures were approved by the UWA AnimalEthics Committee (RA/3/100/1430) in accordance with the Austra-lian code for the care and use of animals for scientific purposes. 18adult male Sprague-Dawley rats (6e8 weeks old, 150e250 g) fromthe Animal Resources Centre (Canning Vale, Western Australia)were maintained in a temperature-controlled animal care facilityon a 12-h light-dark cycle with food and water ad libitum. Animals
were euthanised after the last imaging session using CO2asphyxiation.
Experimental protocol
Following acquisition of baseline rs-fMRI data, all animalsreceived daily 10min LI-rTMS at 10 Hz or 1 Hz for 15 days (n¼ 9/group, Fig. 1). LI-rTMS was delivered using a custom-built roundcoil [described in detail in Refs. [21,31]] held by the experimenterbetween right eye and ear (~13mTat cortical surface). Animalswere habituated to handling and to the coil for one week, asdescribed previously [11,32]. Imaging was conducted underisoflurane-medetomidine combination anaesthesia weekly duringstimulation. Another two imaging sessions were performed sevenand 20 days after stimulation was ceased for the 10 Hz group, andseven and 14 days after stimulation was ceased for the 1 Hz group.The only difference between the imaging timeline of the twogroups was the timing of the last imaging session (20 days afterstimulation cessation for the 10Hz group and 14 days after stim-ulation cessation in the 1 Hz group) due to MRI hardware failurethat delayed scanning of the 10 Hz group. After the scanning pro-cedure, medetomidine was antagonised by an injection of atipa-mezole. See supplementary methods for further details, drugdosing, etc.
Data acquisition
All MR images were acquired with a 9.4 T Bruker Biospec 94/30small animal MRI using the imaging protocol as described in thesupplementary methods and in Ref. [21]. Briefly, the acquisitionprotocol included the following sequences: 1) multi-slice 2D RARE(rapid acquisition with relaxation enhancement) sequence forthree T2-weighted scans (TR¼ 2500ms, TE¼ 33ms, ma-trix¼ 280� 280, 21 coronal and axial slices, 20 sagittal slices,thickness¼ 1mm); 2) single-shot gradient echo EPI (TR¼ 1500ms,TE¼ 11ms, matrix¼ 94� 70, 21 coronal slices, thickness¼ 1mm,pixel size¼ 0.3� 0.3mm2, flip angle¼ 90�, 300 vol) for resting-state; and 3) point-resolved spectroscopy (PRESS) sequence withone 90� and two 180� pulses, and water suppression for 1H-MRS(TE¼ 16ms, TR¼ 2500ms) with 64 averages (Table A.1) with a3.5� 2� 6mm3 voxel placed over the right sensorimotor cortex(Fig. 2).
Image processing and analysis
Image processing was performed as described in Seewoo et al.[21], with the following changes: 1) qimask utility from QUIT(QUantitative Imaging Tools) used for skull-stripping [33]; 2)Gaussian kernel filter was set to a full-width half maximum of6.25mm for single-session independent component analysis (ICA);and 3) FIX (FMRIB's ICA-based Xnoiseifier v1.06; threshold 20) wastrained to automatically remove noise components (See Supple-mentary Methods for more details) [34,35].
Because of the exploratory nature of this study, an ICA-basedapproach was used to identify whole-brain FC changes. Multi-subject temporal concatenation group-ICA was carried out onbaseline rs-fMRI data using MELODIC to identify template RSNs(Fig. 3). The ICA algorithm was restricted to 15 components basedon other rs-fMRI studies in rodents [21,36,37]. Dual regressionanalysis was then conducted on relevant RSNs for between-timepoint comparisons [38,39], controlling for family-wise error(FWE) and using a threshold-free cluster enhanced (TFCE) tech-nique to control for multiple comparisons (P< 0.05). Regionsshowing significant differences (Figs. 4 and 5) were then labelledusing a rat brain atlas [40].
B.J. Seewoo et al. / Brain Stimulation 12 (2019) 1526e1536 1527
502

MRS data analysis and presentation
MRS data was analysed in LCModel (“Linear Combination ofModel spectra” version 6.3-1L) [41] using a simulated basis setprovided by the software vendor. Individual metabolite concen-trations were computed using the unsuppressed reference watersignal for each individual scan. The Cram�er-Rao lower bounds(CRLBs) were calculated by LCModel and reported as the percent-age of the estimated concentrations to determine reliability of themetabolite estimates (see Table A.2 for quantification details). Themetabolites of interest were GABA and Glu, the major neuro-transmitters in the brain, Gln, a neurotransmitter precursor, andcombined glutamate-glutamine (Glx). All results presented for themetabolite concentrations are expressed as Tau ratios (metaboliteconcentration/Tau concentration) because (i) Tau peak could beidentified with high reliability by LCModel (CRLB< 10%), and (ii) to
Fig. 1. Timeline of an experiment for one rat. A. The experiment consisted of an initial one-week period of habituation upon arrival of the animal, after which the rats had fivesessions of MRI scans, each separated by at least one week. Day 0 was the first imaging session for acquiring baseline resting-state activity and neurometabolite levels. For the firsttwo weeks, animals were stimulated daily for 10min at 10 Hz (6000 pulses) or 1 Hz (600 pulses). Stimulation was ceased after 15 days of stimulation (after Day 14), but the animalswere still imaged on Day 21 (all animals), Day 28 (1 Hz animals) and Day 34 (10 Hz animals). These five imaging timepoints will be referred to as: baseline, after seven (SD7) and 14days (SD14) of daily stimulation and either 20 days (10 Hz group) or 14 days (1 Hz group) after stimulation cessation (PSD20 or PSD14 respectively). B. Protocol for a single scansession. During each session, the animal was under a combination of isoflurane and medetomidine anaesthesia throughout the experiment. Each session consisted of the acquisitionof a localising scan, an anatomical scan, a B0 map, a localised shim, an MRS scan, whole brain shim, and an rs-fMRI scan.
Fig. 2. Volume of interest (VOI) positioning. The figure shows the position of theMRS voxel (size of 3.5mm� 2mm� 6mm) on the right sensorimotor cortex (ipsi-lateral to LI-rTMS delivery) on T2-weighted images for proton nuclear magneticresonance spectroscopy.
Fig. 3. Template resting-state networks from baseline rs-fMRI scans. The figure illustrates coronal and corresponding axial slices of four RSNs (C1eC4) that were identified in thebaseline rs-fMRI scans of 6-7-week-old male Sprague Dawley rats under isoflurane-medetomidine combination anaesthesia. The four components were classified as follows: C1,interoceptive/DMN network; C2, cortico-striatal-thalamic network; C3, basal ganglial network; and C4, salience network. The spatial colour-coded z-maps of these components areoverlaid on the rat brain atlas (down-sampled by a factor of eight) and the numbers on the bottom right corner of each slice refer to the position on the atlas. The RSN maps arerepresented as z-scores (n¼ 22, thresholded at z> 3), with a higher z-score (yellow) representing a greater correlation between the time course of that voxel and the mean timecourse of the component. R denotes right hemisphere. Significant clusters within the components include various brain regions: 1, striatum/caudate putamen; 2, somatosensorycortex; 3, thalamus; 4, hippocampus; 5, motor cortex; 6, auditory cortex; 7, retrosplenial cortex; 8, insular cortex; 9, cingulate cortex; 10, entorhinal cortex; 11, inferior colliculus; 12,association cortex. (For interpretation of the references to colour in this figure legend, the reader is referred to the Web version of this article.)
B.J. Seewoo et al. / Brain Stimulation 12 (2019) 1526e15361528
503
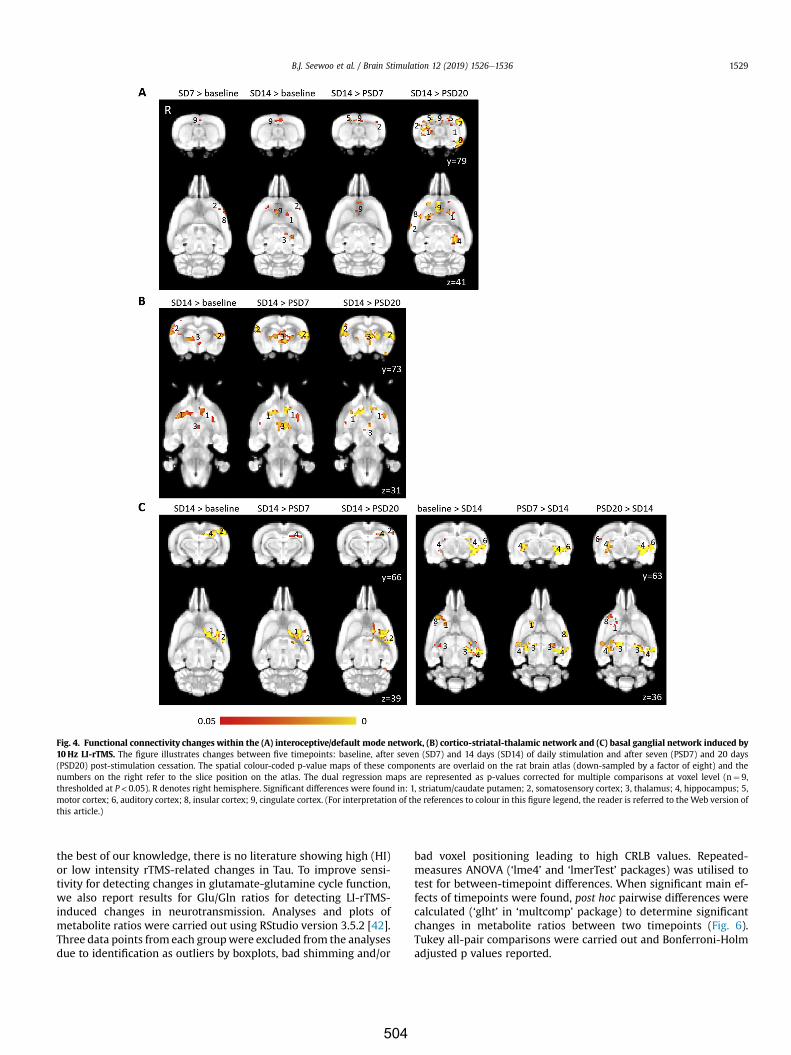
the best of our knowledge, there is no literature showing high (HI)or low intensity rTMS-related changes in Tau. To improve sensi-tivity for detecting changes in glutamate-glutamine cycle function,we also report results for Glu/Gln ratios for detecting LI-rTMS-induced changes in neurotransmission. Analyses and plots ofmetabolite ratios were carried out using RStudio version 3.5.2 [42].Three data points from each groupwere excluded from the analysesdue to identification as outliers by boxplots, bad shimming and/or
bad voxel positioning leading to high CRLB values. Repeated-measures ANOVA (‘lme4’ and ‘lmerTest’ packages) was utilised totest for between-timepoint differences. When significant main ef-fects of timepoints were found, post hoc pairwise differences werecalculated (‘glht’ in ‘multcomp’ package) to determine significantchanges in metabolite ratios between two timepoints (Fig. 6).Tukey all-pair comparisons were carried out and Bonferroni-Holmadjusted p values reported.
Fig. 4. Functional connectivity changes within the (A) interoceptive/default mode network, (B) cortico-striatal-thalamic network and (C) basal ganglial network induced by10 Hz LI-rTMS. The figure illustrates changes between five timepoints: baseline, after seven (SD7) and 14 days (SD14) of daily stimulation and after seven (PSD7) and 20 days(PSD20) post-stimulation cessation. The spatial colour-coded p-value maps of these components are overlaid on the rat brain atlas (down-sampled by a factor of eight) and thenumbers on the right refer to the slice position on the atlas. The dual regression maps are represented as p-values corrected for multiple comparisons at voxel level (n¼ 9,thresholded at P < 0.05). R denotes right hemisphere. Significant differences were found in: 1, striatum/caudate putamen; 2, somatosensory cortex; 3, thalamus; 4, hippocampus; 5,motor cortex; 6, auditory cortex; 8, insular cortex; 9, cingulate cortex. (For interpretation of the references to colour in this figure legend, the reader is referred to the Web version ofthis article.)
B.J. Seewoo et al. / Brain Stimulation 12 (2019) 1526e1536 1529
504
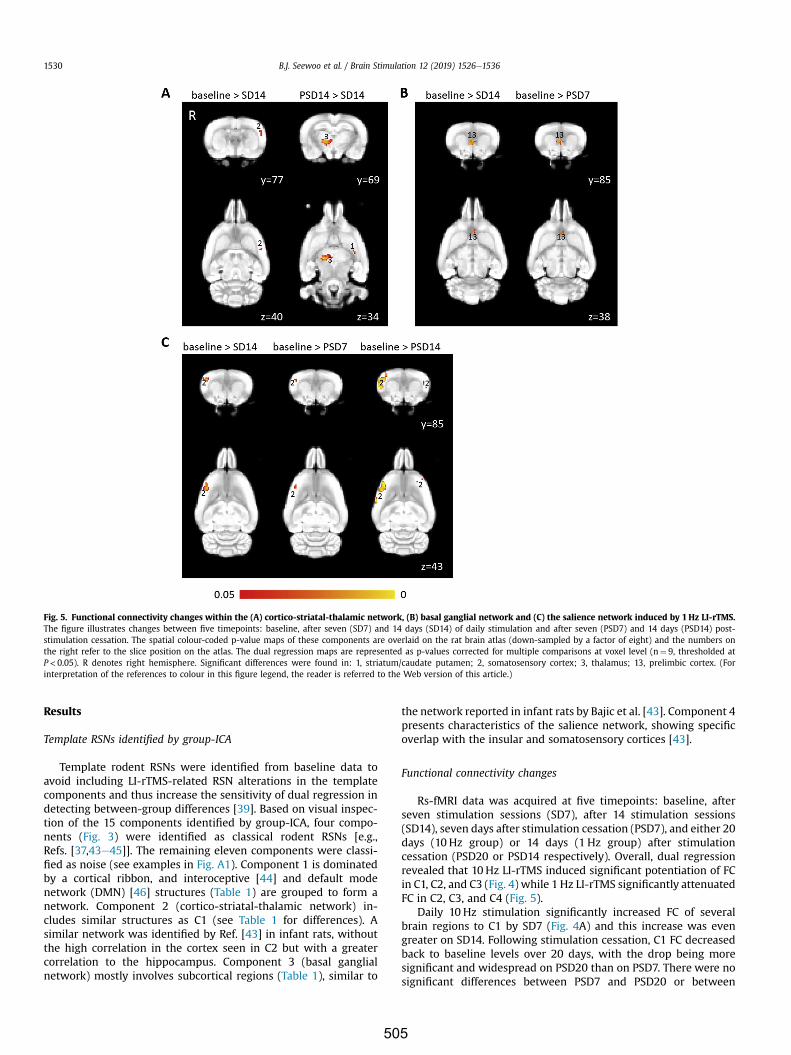
Results
Template RSNs identified by group-ICA
Template rodent RSNs were identified from baseline data toavoid including LI-rTMS-related RSN alterations in the templatecomponents and thus increase the sensitivity of dual regression indetecting between-group differences [39]. Based on visual inspec-tion of the 15 components identified by group-ICA, four compo-nents (Fig. 3) were identified as classical rodent RSNs [e.g.,Refs. [37,43e45]]. The remaining eleven components were classi-fied as noise (see examples in Fig. A1). Component 1 is dominatedby a cortical ribbon, and interoceptive [44] and default modenetwork (DMN) [46] structures (Table 1) are grouped to form anetwork. Component 2 (cortico-striatal-thalamic network) in-cludes similar structures as C1 (see Table 1 for differences). Asimilar network was identified by Ref. [43] in infant rats, withoutthe high correlation in the cortex seen in C2 but with a greatercorrelation to the hippocampus. Component 3 (basal ganglialnetwork) mostly involves subcortical regions (Table 1), similar to
the network reported in infant rats by Bajic et al. [43]. Component 4presents characteristics of the salience network, showing specificoverlap with the insular and somatosensory cortices [43].
Functional connectivity changes
Rs-fMRI data was acquired at five timepoints: baseline, afterseven stimulation sessions (SD7), after 14 stimulation sessions(SD14), seven days after stimulation cessation (PSD7), and either 20days (10 Hz group) or 14 days (1 Hz group) after stimulationcessation (PSD20 or PSD14 respectively). Overall, dual regressionrevealed that 10 Hz LI-rTMS induced significant potentiation of FCin C1, C2, and C3 (Fig. 4) while 1 Hz LI-rTMS significantly attenuatedFC in C2, C3, and C4 (Fig. 5).
Daily 10 Hz stimulation significantly increased FC of severalbrain regions to C1 by SD7 (Fig. 4A) and this increase was evengreater on SD14. Following stimulation cessation, C1 FC decreasedback to baseline levels over 20 days, with the drop being moresignificant and widespread on PSD20 than on PSD7. There were nosignificant differences between PSD7 and PSD20 or between
Fig. 5. Functional connectivity changes within the (A) cortico-striatal-thalamic network, (B) basal ganglial network and (C) the salience network induced by 1Hz LI-rTMS.The figure illustrates changes between five timepoints: baseline, after seven (SD7) and 14 days (SD14) of daily stimulation and after seven (PSD7) and 14 days (PSD14) post-stimulation cessation. The spatial colour-coded p-value maps of these components are overlaid on the rat brain atlas (down-sampled by a factor of eight) and the numbers onthe right refer to the slice position on the atlas. The dual regression maps are represented as p-values corrected for multiple comparisons at voxel level (n¼ 9, thresholded atP< 0.05). R denotes right hemisphere. Significant differences were found in: 1, striatum/caudate putamen; 2, somatosensory cortex; 3, thalamus; 13, prelimbic cortex. (Forinterpretation of the references to colour in this figure legend, the reader is referred to the Web version of this article.)
B.J. Seewoo et al. / Brain Stimulation 12 (2019) 1526e15361530
505
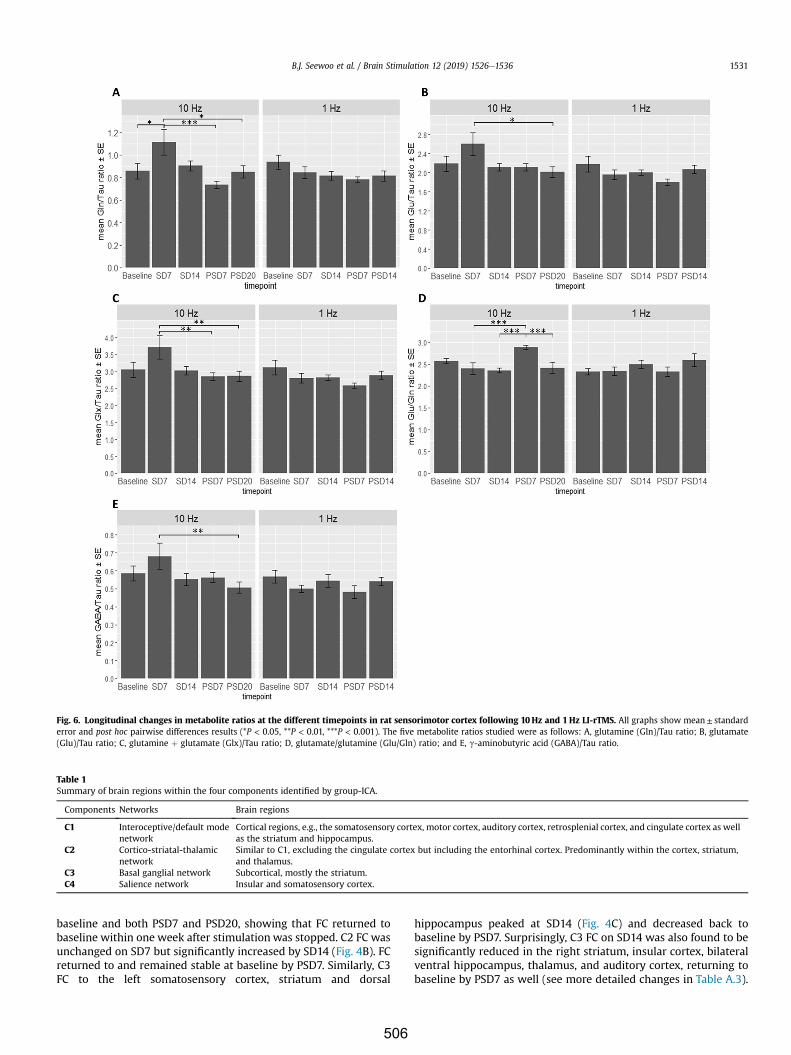
baseline and both PSD7 and PSD20, showing that FC returned tobaseline within one week after stimulation was stopped. C2 FC wasunchanged on SD7 but significantly increased by SD14 (Fig. 4B). FCreturned to and remained stable at baseline by PSD7. Similarly, C3FC to the left somatosensory cortex, striatum and dorsal
hippocampus peaked at SD14 (Fig. 4C) and decreased back tobaseline by PSD7. Surprisingly, C3 FC on SD14 was also found to besignificantly reduced in the right striatum, insular cortex, bilateralventral hippocampus, thalamus, and auditory cortex, returning tobaseline by PSD7 as well (see more detailed changes in Table A.3).
Fig. 6. Longitudinal changes in metabolite ratios at the different timepoints in rat sensorimotor cortex following 10Hz and 1 Hz LI-rTMS. All graphs show mean± standarderror and post hoc pairwise differences results (*P < 0.05, **P < 0.01, ***P < 0.001). The five metabolite ratios studied were as follows: A, glutamine (Gln)/Tau ratio; B, glutamate(Glu)/Tau ratio; C, glutamine þ glutamate (Glx)/Tau ratio; D, glutamate/glutamine (Glu/Gln) ratio; and E, g-aminobutyric acid (GABA)/Tau ratio.
Table 1Summary of brain regions within the four components identified by group-ICA.
Components Networks Brain regions
C1 Interoceptive/default modenetwork
Cortical regions, e.g., the somatosensory cortex, motor cortex, auditory cortex, retrosplenial cortex, and cingulate cortex as wellas the striatum and hippocampus.
C2 Cortico-striatal-thalamicnetwork
Similar to C1, excluding the cingulate cortex but including the entorhinal cortex. Predominantly within the cortex, striatum,and thalamus.
C3 Basal ganglial network Subcortical, mostly the striatum.C4 Salience network Insular and somatosensory cortex.
B.J. Seewoo et al. / Brain Stimulation 12 (2019) 1526e1536 1531
506
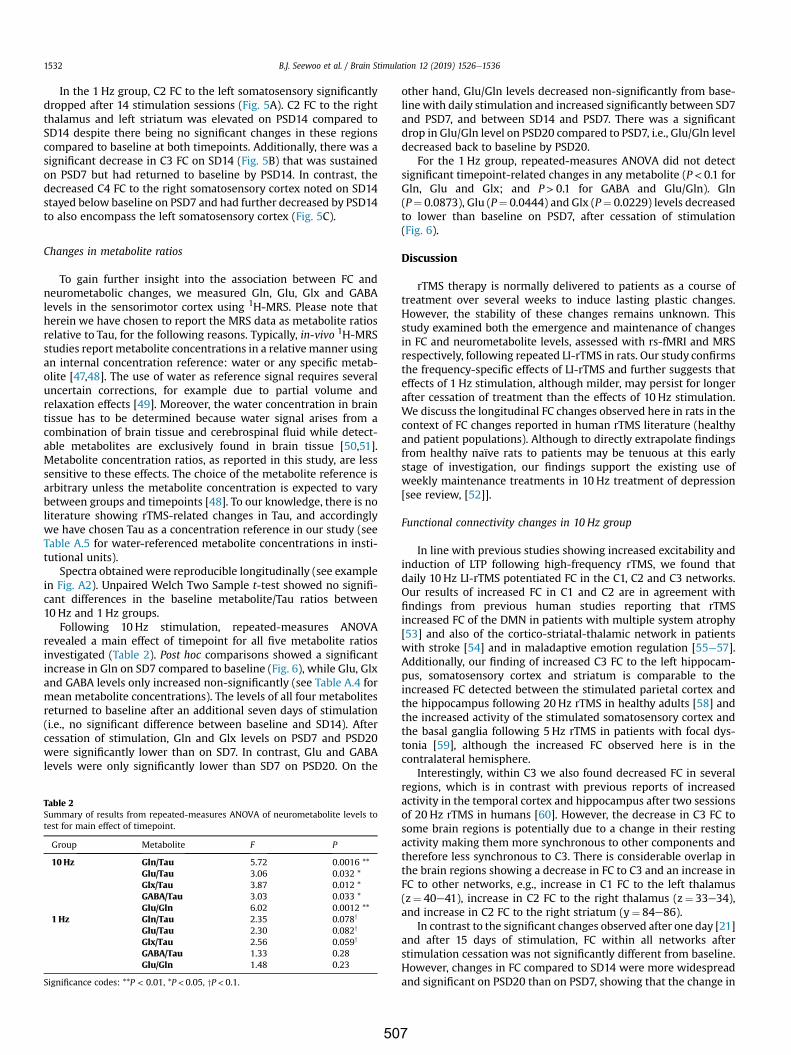
In the 1 Hz group, C2 FC to the left somatosensory significantlydropped after 14 stimulation sessions (Fig. 5A). C2 FC to the rightthalamus and left striatum was elevated on PSD14 compared toSD14 despite there being no significant changes in these regionscompared to baseline at both timepoints. Additionally, there was asignificant decrease in C3 FC on SD14 (Fig. 5B) that was sustainedon PSD7 but had returned to baseline by PSD14. In contrast, thedecreased C4 FC to the right somatosensory cortex noted on SD14stayed below baseline on PSD7 and had further decreased by PSD14to also encompass the left somatosensory cortex (Fig. 5C).
Changes in metabolite ratios
To gain further insight into the association between FC andneurometabolic changes, we measured Gln, Glu, Glx and GABAlevels in the sensorimotor cortex using 1H-MRS. Please note thatherein we have chosen to report the MRS data as metabolite ratiosrelative to Tau, for the following reasons. Typically, in-vivo 1H-MRSstudies report metabolite concentrations in a relative manner usingan internal concentration reference: water or any specific metab-olite [47,48]. The use of water as reference signal requires severaluncertain corrections, for example due to partial volume andrelaxation effects [49]. Moreover, the water concentration in braintissue has to be determined because water signal arises from acombination of brain tissue and cerebrospinal fluid while detect-able metabolites are exclusively found in brain tissue [50,51].Metabolite concentration ratios, as reported in this study, are lesssensitive to these effects. The choice of the metabolite reference isarbitrary unless the metabolite concentration is expected to varybetween groups and timepoints [48]. To our knowledge, there is noliterature showing rTMS-related changes in Tau, and accordinglywe have chosen Tau as a concentration reference in our study (seeTable A.5 for water-referenced metabolite concentrations in insti-tutional units).
Spectra obtained were reproducible longitudinally (see examplein Fig. A2). Unpaired Welch Two Sample t-test showed no signifi-cant differences in the baseline metabolite/Tau ratios between10 Hz and 1Hz groups.
Following 10Hz stimulation, repeated-measures ANOVArevealed a main effect of timepoint for all five metabolite ratiosinvestigated (Table 2). Post hoc comparisons showed a significantincrease in Gln on SD7 compared to baseline (Fig. 6), while Glu, Glxand GABA levels only increased non-significantly (see Table A.4 formean metabolite concentrations). The levels of all four metabolitesreturned to baseline after an additional seven days of stimulation(i.e., no significant difference between baseline and SD14). Aftercessation of stimulation, Gln and Glx levels on PSD7 and PSD20were significantly lower than on SD7. In contrast, Glu and GABAlevels were only significantly lower than SD7 on PSD20. On the
other hand, Glu/Gln levels decreased non-significantly from base-linewith daily stimulation and increased significantly between SD7and PSD7, and between SD14 and PSD7. There was a significantdrop in Glu/Gln level on PSD20 compared to PSD7, i.e., Glu/Gln leveldecreased back to baseline by PSD20.
For the 1 Hz group, repeated-measures ANOVA did not detectsignificant timepoint-related changes in any metabolite (P< 0.1 forGln, Glu and Glx; and P> 0.1 for GABA and Glu/Gln). Gln(P¼ 0.0873), Glu (P¼ 0.0444) and Glx (P¼ 0.0229) levels decreasedto lower than baseline on PSD7, after cessation of stimulation(Fig. 6).
Discussion
rTMS therapy is normally delivered to patients as a course oftreatment over several weeks to induce lasting plastic changes.However, the stability of these changes remains unknown. Thisstudy examined both the emergence and maintenance of changesin FC and neurometabolite levels, assessed with rs-fMRI and MRSrespectively, following repeated LI-rTMS in rats. Our study confirmsthe frequency-specific effects of LI-rTMS and further suggests thateffects of 1 Hz stimulation, although milder, may persist for longerafter cessation of treatment than the effects of 10 Hz stimulation.We discuss the longitudinal FC changes observed here in rats in thecontext of FC changes reported in human rTMS literature (healthyand patient populations). Although to directly extrapolate findingsfrom healthy naïve rats to patients may be tenuous at this earlystage of investigation, our findings support the existing use ofweekly maintenance treatments in 10 Hz treatment of depression[see review, [52]].
Functional connectivity changes in 10 Hz group
In line with previous studies showing increased excitability andinduction of LTP following high-frequency rTMS, we found thatdaily 10 Hz LI-rTMS potentiated FC in the C1, C2 and C3 networks.Our results of increased FC in C1 and C2 are in agreement withfindings from previous human studies reporting that rTMSincreased FC of the DMN in patients with multiple system atrophy[53] and also of the cortico-striatal-thalamic network in patientswith stroke [54] and in maladaptive emotion regulation [55e57].Additionally, our finding of increased C3 FC to the left hippocam-pus, somatosensory cortex and striatum is comparable to theincreased FC detected between the stimulated parietal cortex andthe hippocampus following 20 Hz rTMS in healthy adults [58] andthe increased activity of the stimulated somatosensory cortex andthe basal ganglia following 5Hz rTMS in patients with focal dys-tonia [59], although the increased FC observed here is in thecontralateral hemisphere.
Interestingly, within C3 we also found decreased FC in severalregions, which is in contrast with previous reports of increasedactivity in the temporal cortex and hippocampus after two sessionsof 20 Hz rTMS in humans [60]. However, the decrease in C3 FC tosome brain regions is potentially due to a change in their restingactivity making them more synchronous to other components andtherefore less synchronous to C3. There is considerable overlap inthe brain regions showing a decrease in FC to C3 and an increase inFC to other networks, e.g., increase in C1 FC to the left thalamus(z¼ 40e41), increase in C2 FC to the right thalamus (z¼ 33e34),and increase in C2 FC to the right striatum (y¼ 84e86).
In contrast to the significant changes observed after one day [21]and after 15 days of stimulation, FC within all networks afterstimulation cessation was not significantly different from baseline.However, changes in FC compared to SD14 were more widespreadand significant on PSD20 than on PSD7, showing that the change in
Table 2Summary of results from repeated-measures ANOVA of neurometabolite levels totest for main effect of timepoint.
Group Metabolite F P
10Hz Gln/Tau 5.72 0.0016 **Glu/Tau 3.06 0.032 *Glx/Tau 3.87 0.012 *GABA/Tau 3.03 0.033 *Glu/Gln 6.02 0.0012 **
1Hz Gln/Tau 2.35 0.078y
Glu/Tau 2.30 0.082y
Glx/Tau 2.56 0.059y
GABA/Tau 1.33 0.28Glu/Gln 1.48 0.23
Significance codes: **P < 0.01, *P< 0.05, yP< 0.1.
B.J. Seewoo et al. / Brain Stimulation 12 (2019) 1526e15361532
507
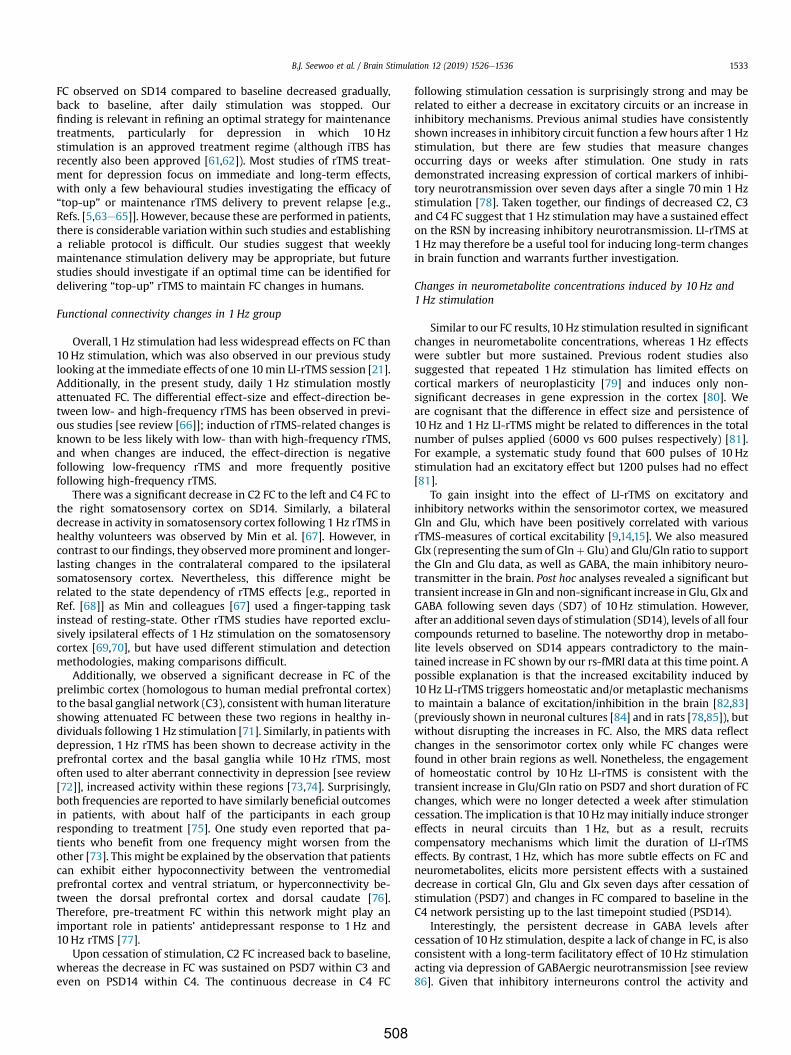
FC observed on SD14 compared to baseline decreased gradually,back to baseline, after daily stimulation was stopped. Ourfinding is relevant in refining an optimal strategy for maintenancetreatments, particularly for depression in which 10 Hzstimulation is an approved treatment regime (although iTBS hasrecently also been approved [61,62]). Most studies of rTMS treat-ment for depression focus on immediate and long-term effects,with only a few behavioural studies investigating the efficacy of“top-up” or maintenance rTMS delivery to prevent relapse [e.g.,Refs. [5,63e65]]. However, because these are performed in patients,there is considerable variationwithin such studies and establishinga reliable protocol is difficult. Our studies suggest that weeklymaintenance stimulation delivery may be appropriate, but futurestudies should investigate if an optimal time can be identified fordelivering “top-up” rTMS to maintain FC changes in humans.
Functional connectivity changes in 1 Hz group
Overall, 1 Hz stimulation had less widespread effects on FC than10Hz stimulation, which was also observed in our previous studylooking at the immediate effects of one 10min LI-rTMS session [21].Additionally, in the present study, daily 1 Hz stimulation mostlyattenuated FC. The differential effect-size and effect-direction be-tween low- and high-frequency rTMS has been observed in previ-ous studies [see review [66]]; induction of rTMS-related changes isknown to be less likely with low- than with high-frequency rTMS,and when changes are induced, the effect-direction is negativefollowing low-frequency rTMS and more frequently positivefollowing high-frequency rTMS.
There was a significant decrease in C2 FC to the left and C4 FC tothe right somatosensory cortex on SD14. Similarly, a bilateraldecrease in activity in somatosensory cortex following 1 Hz rTMS inhealthy volunteers was observed by Min et al. [67]. However, incontrast to our findings, they observedmore prominent and longer-lasting changes in the contralateral compared to the ipsilateralsomatosensory cortex. Nevertheless, this difference might berelated to the state dependency of rTMS effects [e.g., reported inRef. [68]] as Min and colleagues [67] used a finger-tapping taskinstead of resting-state. Other rTMS studies have reported exclu-sively ipsilateral effects of 1 Hz stimulation on the somatosensorycortex [69,70], but have used different stimulation and detectionmethodologies, making comparisons difficult.
Additionally, we observed a significant decrease in FC of theprelimbic cortex (homologous to human medial prefrontal cortex)to the basal ganglial network (C3), consistent with human literatureshowing attenuated FC between these two regions in healthy in-dividuals following 1 Hz stimulation [71]. Similarly, in patients withdepression, 1 Hz rTMS has been shown to decrease activity in theprefrontal cortex and the basal ganglia while 10 Hz rTMS, mostoften used to alter aberrant connectivity in depression [see review[72]], increased activity within these regions [73,74]. Surprisingly,both frequencies are reported to have similarly beneficial outcomesin patients, with about half of the participants in each groupresponding to treatment [75]. One study even reported that pa-tients who benefit from one frequency might worsen from theother [73]. This might be explained by the observation that patientscan exhibit either hypoconnectivity between the ventromedialprefrontal cortex and ventral striatum, or hyperconnectivity be-tween the dorsal prefrontal cortex and dorsal caudate [76].Therefore, pre-treatment FC within this network might play animportant role in patients’ antidepressant response to 1 Hz and10Hz rTMS [77].
Upon cessation of stimulation, C2 FC increased back to baseline,whereas the decrease in FC was sustained on PSD7 within C3 andeven on PSD14 within C4. The continuous decrease in C4 FC
following stimulation cessation is surprisingly strong and may berelated to either a decrease in excitatory circuits or an increase ininhibitory mechanisms. Previous animal studies have consistentlyshown increases in inhibitory circuit function a few hours after 1 Hzstimulation, but there are few studies that measure changesoccurring days or weeks after stimulation. One study in ratsdemonstrated increasing expression of cortical markers of inhibi-tory neurotransmission over seven days after a single 70min 1 Hzstimulation [78]. Taken together, our findings of decreased C2, C3and C4 FC suggest that 1 Hz stimulationmay have a sustained effecton the RSN by increasing inhibitory neurotransmission. LI-rTMS at1 Hz may therefore be a useful tool for inducing long-term changesin brain function and warrants further investigation.
Changes in neurometabolite concentrations induced by 10 Hz and1 Hz stimulation
Similar to our FC results,10 Hz stimulation resulted in significantchanges in neurometabolite concentrations, whereas 1 Hz effectswere subtler but more sustained. Previous rodent studies alsosuggested that repeated 1Hz stimulation has limited effects oncortical markers of neuroplasticity [79] and induces only non-significant decreases in gene expression in the cortex [80]. Weare cognisant that the difference in effect size and persistence of10 Hz and 1Hz LI-rTMS might be related to differences in the totalnumber of pulses applied (6000 vs 600 pulses respectively) [81].For example, a systematic study found that 600 pulses of 10 Hzstimulation had an excitatory effect but 1200 pulses had no effect[81].
To gain insight into the effect of LI-rTMS on excitatory andinhibitory networks within the sensorimotor cortex, we measuredGln and Glu, which have been positively correlated with variousrTMS-measures of cortical excitability [9,14,15]. We also measuredGlx (representing the sumof GlnþGlu) and Glu/Gln ratio to supportthe Gln and Glu data, as well as GABA, the main inhibitory neuro-transmitter in the brain. Post hoc analyses revealed a significant buttransient increase in Gln and non-significant increase in Glu, Glx andGABA following seven days (SD7) of 10Hz stimulation. However,after an additional seven days of stimulation (SD14), levels of all fourcompounds returned to baseline. The noteworthy drop in metabo-lite levels observed on SD14 appears contradictory to the main-tained increase in FC shown by our rs-fMRI data at this time point. Apossible explanation is that the increased excitability induced by10Hz LI-rTMS triggers homeostatic and/or metaplastic mechanismsto maintain a balance of excitation/inhibition in the brain [82,83](previously shown in neuronal cultures [84] and in rats [78,85]), butwithout disrupting the increases in FC. Also, the MRS data reflectchanges in the sensorimotor cortex only while FC changes werefound in other brain regions as well. Nonetheless, the engagementof homeostatic control by 10Hz LI-rTMS is consistent with thetransient increase in Glu/Gln ratio on PSD7 and short duration of FCchanges, which were no longer detected a week after stimulationcessation. The implication is that 10Hzmay initially induce strongereffects in neural circuits than 1Hz, but as a result, recruitscompensatory mechanisms which limit the duration of LI-rTMSeffects. By contrast, 1 Hz, which has more subtle effects on FC andneurometabolites, elicits more persistent effects with a sustaineddecrease in cortical Gln, Glu and Glx seven days after cessation ofstimulation (PSD7) and changes in FC compared to baseline in theC4 network persisting up to the last timepoint studied (PSD14).
Interestingly, the persistent decrease in GABA levels aftercessation of 10 Hz stimulation, despite a lack of change in FC, is alsoconsistent with a long-term facilitatory effect of 10 Hz stimulationacting via depression of GABAergic neurotransmission [see review86]. Given that inhibitory interneurons control the activity and
B.J. Seewoo et al. / Brain Stimulation 12 (2019) 1526e1536 1533
508
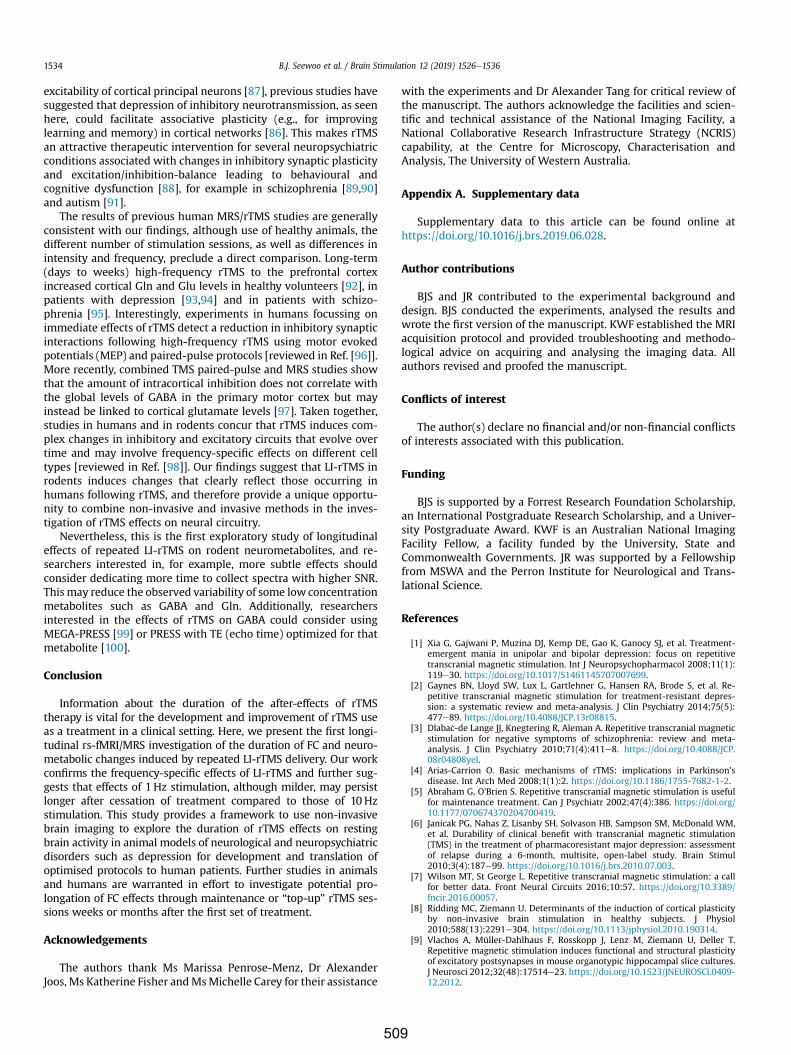
excitability of cortical principal neurons [87], previous studies havesuggested that depression of inhibitory neurotransmission, as seenhere, could facilitate associative plasticity (e.g., for improvinglearning and memory) in cortical networks [86]. This makes rTMSan attractive therapeutic intervention for several neuropsychiatricconditions associated with changes in inhibitory synaptic plasticityand excitation/inhibition-balance leading to behavioural andcognitive dysfunction [88], for example in schizophrenia [89,90]and autism [91].
The results of previous human MRS/rTMS studies are generallyconsistent with our findings, although use of healthy animals, thedifferent number of stimulation sessions, as well as differences inintensity and frequency, preclude a direct comparison. Long-term(days to weeks) high-frequency rTMS to the prefrontal cortexincreased cortical Gln and Glu levels in healthy volunteers [92], inpatients with depression [93,94] and in patients with schizo-phrenia [95]. Interestingly, experiments in humans focussing onimmediate effects of rTMS detect a reduction in inhibitory synapticinteractions following high-frequency rTMS using motor evokedpotentials (MEP) and paired-pulse protocols [reviewed in Ref. [96]].More recently, combined TMS paired-pulse and MRS studies showthat the amount of intracortical inhibition does not correlate withthe global levels of GABA in the primary motor cortex but mayinstead be linked to cortical glutamate levels [97]. Taken together,studies in humans and in rodents concur that rTMS induces com-plex changes in inhibitory and excitatory circuits that evolve overtime and may involve frequency-specific effects on different celltypes [reviewed in Ref. [98]]. Our findings suggest that LI-rTMS inrodents induces changes that clearly reflect those occurring inhumans following rTMS, and therefore provide a unique opportu-nity to combine non-invasive and invasive methods in the inves-tigation of rTMS effects on neural circuitry.
Nevertheless, this is the first exploratory study of longitudinaleffects of repeated LI-rTMS on rodent neurometabolites, and re-searchers interested in, for example, more subtle effects shouldconsider dedicating more time to collect spectra with higher SNR.This may reduce the observed variability of some low concentrationmetabolites such as GABA and Gln. Additionally, researchersinterested in the effects of rTMS on GABA could consider usingMEGA-PRESS [99] or PRESS with TE (echo time) optimized for thatmetabolite [100].
Conclusion
Information about the duration of the after-effects of rTMStherapy is vital for the development and improvement of rTMS useas a treatment in a clinical setting. Here, we present the first longi-tudinal rs-fMRI/MRS investigation of the duration of FC and neuro-metabolic changes induced by repeated LI-rTMS delivery. Our workconfirms the frequency-specific effects of LI-rTMS and further sug-gests that effects of 1 Hz stimulation, although milder, may persistlonger after cessation of treatment compared to those of 10Hzstimulation. This study provides a framework to use non-invasivebrain imaging to explore the duration of rTMS effects on restingbrain activity in animal models of neurological and neuropsychiatricdisorders such as depression for development and translation ofoptimised protocols to human patients. Further studies in animalsand humans are warranted in effort to investigate potential pro-longation of FC effects through maintenance or “top-up” rTMS ses-sions weeks or months after the first set of treatment.
Acknowledgements
The authors thank Ms Marissa Penrose-Menz, Dr AlexanderJoos, Ms Katherine Fisher andMsMichelle Carey for their assistance
with the experiments and Dr Alexander Tang for critical review ofthe manuscript. The authors acknowledge the facilities and scien-tific and technical assistance of the National Imaging Facility, aNational Collaborative Research Infrastructure Strategy (NCRIS)capability, at the Centre for Microscopy, Characterisation andAnalysis, The University of Western Australia.
Appendix A. Supplementary data
Supplementary data to this article can be found online athttps://doi.org/10.1016/j.brs.2019.06.028.
Author contributions
BJS and JR contributed to the experimental background anddesign. BJS conducted the experiments, analysed the results andwrote the first version of the manuscript. KWF established the MRIacquisition protocol and provided troubleshooting and methodo-logical advice on acquiring and analysing the imaging data. Allauthors revised and proofed the manuscript.
Conflicts of interest
The author(s) declare no financial and/or non-financial conflictsof interests associated with this publication.
Funding
BJS is supported by a Forrest Research Foundation Scholarship,an International Postgraduate Research Scholarship, and a Univer-sity Postgraduate Award. KWF is an Australian National ImagingFacility Fellow, a facility funded by the University, State andCommonwealth Governments. JR was supported by a Fellowshipfrom MSWA and the Perron Institute for Neurological and Trans-lational Science.
References
[1] Xia G, Gajwani P, Muzina DJ, Kemp DE, Gao K, Ganocy SJ, et al. Treatment-emergent mania in unipolar and bipolar depression: focus on repetitivetranscranial magnetic stimulation. Int J Neuropsychopharmacol 2008;11(1):119e30. https://doi.org/10.1017/S1461145707007699.
[2] Gaynes BN, Lloyd SW, Lux L, Gartlehner G, Hansen RA, Brode S, et al. Re-petitive transcranial magnetic stimulation for treatment-resistant depres-sion: a systematic review and meta-analysis. J Clin Psychiatry 2014;75(5):477e89. https://doi.org/10.4088/JCP.13r08815.
[3] Dlaba�c-de Lange JJ, Knegtering R, Aleman A. Repetitive transcranial magneticstimulation for negative symptoms of schizophrenia: review and meta-analysis. J Clin Psychiatry 2010;71(4):411e8. https://doi.org/10.4088/JCP.08r04808yel.
[4] Arias-Carrion O. Basic mechanisms of rTMS: implications in Parkinson'sdisease. Int Arch Med 2008;1(1):2. https://doi.org/10.1186/1755-7682-1-2.
[5] Abraham G, O'Brien S. Repetitive transcranial magnetic stimulation is usefulfor maintenance treatment. Can J Psychiatr 2002;47(4):386. https://doi.org/10.1177/070674370204700419.
[6] Janicak PG, Nahas Z, Lisanby SH, Solvason HB, Sampson SM, McDonald WM,et al. Durability of clinical benefit with transcranial magnetic stimulation(TMS) in the treatment of pharmacoresistant major depression: assessmentof relapse during a 6-month, multisite, open-label study. Brain Stimul2010;3(4):187e99. https://doi.org/10.1016/j.brs.2010.07.003.
[7] Wilson MT, St George L. Repetitive transcranial magnetic stimulation: a callfor better data. Front Neural Circuits 2016;10:57. https://doi.org/10.3389/fncir.2016.00057.
[8] Ridding MC, Ziemann U. Determinants of the induction of cortical plasticityby non-invasive brain stimulation in healthy subjects. J Physiol2010;588(13):2291e304. https://doi.org/10.1113/jphysiol.2010.190314.
[9] Vlachos A, Müller-Dahlhaus F, Rosskopp J, Lenz M, Ziemann U, Deller T.Repetitive magnetic stimulation induces functional and structural plasticityof excitatory postsynapses in mouse organotypic hippocampal slice cultures.J Neurosci 2012;32(48):17514e23. https://doi.org/10.1523/JNEUROSCI.0409-12.2012.
B.J. Seewoo et al. / Brain Stimulation 12 (2019) 1526e15361534
509

[10] Funke K, Benali A. Modulation of cortical inhibition by rTMS - findings ob-tained from animal models. J Physiol 2011;589(Pt 18):4423e35. https://doi.org/10.1113/jphysiol.2011.206573.
[11] Makowiecki K, Harvey AR, Sherrard RM, Rodger J. Low-intensity repetitivetranscranial magnetic stimulation improves abnormal visual cortical circuittopography and upregulates BDNF in mice. J Neurosci 2014;34(32):10780e92. https://doi.org/10.1523/jneurosci.0723-14.2014.
[12] Mulders WHAM, Vooys V, Makowiecki K, Tang AD, Rodger J. The effects ofrepetitive transcranial magnetic stimulation in an animal model of tinnitus.Sci Rep 2016;6:38234. https://doi.org/10.1038/srep38234.
[13] Yüksel C, €Ongür D. Magnetic resonance spectroscopy studies of glutamate-related abnormalities in mood disorders. Biol Psychiatry 2010;68(9):785e94. https://doi.org/10.1016/j.biopsych.2010.06.016.
[14] Zangen A, Hyodo K. Transcranial magnetic stimulation induces increases inextracellular levels of dopamine and glutamate in the nucleus accumbens.Neuroreport 2002;13(18):2401e5. https://doi.org/10.1097/00001756-200212200-00005.
[15] Tang A, Thickbroom G, Rodger J. Repetitive transcranial magnetic stimulationof the brain: mechanisms from animal and experimental models. Neuro-scientist 2015;23(1):82e94. https://doi.org/10.1177/1073858415618897.
[16] Tang AD, Hong I, Boddington LJ, Garrett AR, Etherington S, Reynolds JNJ, et al.Low-intensity repetitive magnetic stimulation lowers action potentialthreshold and increases spike firing in layer 5 pyramidal neurons in vitro.Neuroscience 2016;335:64e71. https://doi.org/10.1016/j.neuroscience.2016.08.030.
[17] Banerjee J, Sorrell ME, Celnik PA, Pelled G. Immediate effects of repetitivemagnetic stimulation on single cortical pyramidal neurons. PLoS One2017;12(1):e0170528. https://doi.org/10.1371/journal.pone.0170528.
[18] Lenz M, Galanis C, Müller-Dahlhaus F, Opitz A, Wierenga CJ, Szab�o G, et al.Repetitive magnetic stimulation induces plasticity of inhibitory synapses.Nat Commun 2016;7:10020. https://doi.org/10.1038/ncomms10020.
[19] Feng J, Zhang Q, Zhang C, Wen Z, Zhou X. The Effect of sequential bilaterallow-frequency rTMS over dorsolateral prefrontal cortex on serum level ofBDNF and GABA in patients with primary insomnia. Brain Behav. 2019;9(2):e01206. https://doi.org/10.1002/brb3.1206.
[20] Pelled G. MRI of neuronal plasticity in rodent models. In: Modo M,Bulte JWM, editors. Magnetic resonance neuroimaging: methods and pro-tocols. Methods in molecular biology, vol. 711. Totowa, NJ: Humana Press;2011. p. 567e78.
[21] Seewoo BJ, Feindel KW, Etherington SJ, Rodger J. Resting-state fMRI study ofbrain activation using low-intensity repetitive transcranial magnetic stimu-lation in rats. Sci Rep 2018;8(1):6706. https://doi.org/10.1038/s41598-018-24951-6.
[22] Gorges M, Roselli F, Müller H-P, Ludolph AC, Rasche V, Kassubek J. Functionalconnectivity mapping in the animal model: principles and applications ofresting-state fMRI. Front Neurol 2017;8:200. https://doi.org/10.3389/fneur.2017.00200.
[23] Gozzi A, Schwarz AJ. Large-scale functional connectivity networks in therodent brain. Neuroimage 2016;127:496e509. https://doi.org/10.1016/j.neuroimage.2015.12.017.
[24] Jonckers E, Shah D, Hamaide J, Verhoye M, Van der Linden A. The power ofusing functional fMRI on small rodents to study brain pharmacology anddisease. Front Pharmacol 2015;6:231. https://doi.org/10.3389/fphar.2015.00231.
[25] Seewoo BJ, Etherington SJ, Feindel KW, Rodger J. Combined rTMS/fMRIstudies: an overlooked resource in animal models. Front Neurosci 2018;12:180. https://doi.org/10.3389/fnins.2018.00180.
[26] Biswal B, Yetkin FZ, Haughton VM, Hyde JS. Functional connectivity in themotor cortex of resting human brain using echo-planar MRI. Magn ResonMed 1995;34(4):537e41. https://doi.org/10.1002/mrm.1910340409.
[27] Van den Heuvel MP, Hulshoff Pol HE. Exploring the brain network: a reviewon resting-state fMRI functional connectivity. Eur Neuropsychopharmacol2010;20(8):519e34. https://doi.org/10.1016/j.euroneuro.2010.03.008.
[28] Birur B, Kraguljac NV, Shelton RC, Lahti AC. Brain structure, function, andneurochemistry in schizophrenia and bipolar disorderda systematic reviewof the magnetic resonance neuroimaging literature. NPJ Schizophr2017;3(1):15. https://doi.org/10.1038/s41537-017-0013-9.
[29] Shin SS, Krishnan V, Stokes W, Robertson C, Celnik P, Chen Y, et al. Trans-cranial magnetic stimulation and environmental enrichment enhancescortical excitability and functional outcomes after traumatic brain injury.Brain Stimul 2018;11(6):1306e13. https://doi.org/10.1016/j.brs.2018.07.050.
[30] Lu H, Kobilo T, Robertson C, Tong S, Celnik P, Pelled G. Transcranial magneticstimulation facilitates neurorehabilitation after pediatric traumatic braininjury. Sci Rep 2015;5:14769. https://doi.org/10.1038/srep14769.
[31] Grehl S, Viola HM, Fuller-Carter PI, Carter KW, Dunlop SA, Hool LC, et al.Cellular and molecular changes to cortical neurons following low intensityrepetitive magnetic stimulation at different frequencies. Brain Stimul2015;8(1):114e23. https://doi.org/10.1016/j.brs.2014.09.012.
[32] Rodger J, Mo C, Wilks T, Dunlop SA, Sherrard RM. Transcranial pulsedmagnetic field stimulation facilitates reorganization of abnormal neuralcircuits and corrects behavioral deficits without disrupting normal connec-tivity. FASEB J 2012;26(4):1593e606. https://doi.org/10.1096/fj.11-194878.
[33] Wood T. QUIT: QUantitative imaging tools. J Open Source Softw 2018;3(26):656. https://doi.org/10.21105/joss.00656.
[34] Salimi-Khorshidi G, Smith SM, Griffanti L, Douaud G, Beckmann CF,Glasser MF. Automatic denoising of functional MRI data: combining inde-pendent component analysis and hierarchical fusion of classifiers. Neuro-image 2014;90:449e68. https://doi.org/10.1016/j.neuroimage.2013.11.046.
[35] Griffanti L, Salimi-Khorshidi G, Beckmann CF, Auerbach EJ, Douaud G,Sexton CE, et al. ICA-based artefact and accelerated fMRI acquisition forimproved Resting State Network imaging. Neuroimage 2014;95:232e47.https://doi.org/10.1016/j.neuroimage.2014.03.034.
[36] Jonckers E, Van Audekerke J, De Visscher G, Van der Linden A, Verhoye M.Functional connectivity fMRI of the rodent brain: comparison of functionalconnectivity networks in rat and mouse. PLoS One 2011;6(4):e18876.https://doi.org/10.1371/journal.pone.0018876.
[37] Zerbi V, Grandjean J, Rudin M, Wenderoth N. Mapping the mouse brain withrs-fMRI: an optimized pipeline for functional network identification. Neu-roimage 2015;123:11e21. https://doi.org/10.1016/j.neuroimage.2015.07.090.
[38] Nickerson LD, Smith SM, €Ongür D, Beckmann CF. Using dual regression toinvestigate network shape and amplitude in functional connectivity ana-lyses. Front Neurosci 2017;11:115. https://doi.org/10.3389/fnins.2017.00115.
[39] Rytty R, Nikkinen J, Paavola L, Abou Elseoud A, Moilanen V, Visuri A, et al.GroupICA dual regression analysis of resting state networks in a behavioralvariant of frontotemporal dementia. Front Hum Neurosci 2013;7:461.https://doi.org/10.3389/fnhum.2013.00461.
[40] Paxinos G, Watson C. The rat brain in stereotaxic coordinates. fourth ed.London: Academic Press, Ltd; 1998.
[41] Provencher SW. Automatic quantitation of localized in vivo 1H spectra withLCModel. NMR Biomed 2001;14(4):260e4. https://doi.org/10.1002/nbm.698.
[42] RStudio Team. RStudio: integrated development for R. 3.5. 1 ed. Boston, MA:RStudio, Inc.; 2016.
[43] Bajic D, Craig MM, Borsook D, Becerra L. Probing intrinsic resting-statenetworks in the infant rat brain. Front Behav Neurosci 2016;10:192.https://doi.org/10.3389/fnbeh.2016.00192.
[44] Becerra L, Pendse G, Chang P-C, Bishop J, Borsook D. Robust reproducibleresting state networks in the awake rodent brain. PLoS One 2011;6(10):e25701. https://doi.org/10.1371/journal.pone.0025701.
[45] Hsu L-M, Liang X, Gu H, Brynildsen JK, Stark JA, Ash JA, et al. Constituents andfunctional implications of the rat default mode network. Proc Natl Acad Sci US A 2016;113(31). e4541e7, https://doi.org/10.1073/pnas.1601485113.
[46] Lu H, Zou Q, Gu H, Raichle ME, Stein EA, Yang Y. Rat brains also have a defaultmode network. Proc Natl Acad Sci U S A 2012;109(10):3979e84. https://doi.org/10.1073/pnas.1200506109.
[47] Mikkelsen M, Barker PB, Bhattacharyya PK, Brix MK, Buur PF, Cecil KM, et al.Big GABA: edited MR spectroscopy at 24 research sites. Neuroimage2017;159:32e45. https://doi.org/10.1016/j.neuroimage.2017.07.021.
[48] Mikkelsen M, Rimbault DL, Barker PB, Bhattacharyya PK, Brix MK, Buur PF,et al. Big GABA II: water-referenced edited MR spectroscopy at 25 researchsites. Neuroimage 2019;191:537e48. https://doi.org/10.1016/j.neuroimage.2019.02.059.
[49] Provencher SW. LCModel and LCMgui user's manual. 2019. p. 1e184.[50] Ernst T, Kreis R, Ross BD. Absolute quantitation of water and metabolites in
the human brain. I. Compartments and water. J Magn Reson B 1993;102(1):1e8. https://doi.org/10.1006/jmrb.1993.1055.
[51] Gasparovic C, Song T, Devier D, Bockholt HJ, Caprihan A, Mullins PG, et al. Useof tissue water as a concentration reference for proton spectroscopic imag-ing. Magn Reson Med 2006;55(6):1219e26. https://doi.org/10.1002/mrm.20901.
[52] Perera T, George MS, Grammer G, Janicak PG, Pascual-Leone A, Wirecki TS.The clinical TMS society consensus review and treatment recommendationsfor TMS therapy for Major Depressive Disorder. Brain Stimul 2016;9(3):336e46. https://doi.org/10.1016/j.brs.2016.03.010.
[53] Chou Y-h, You H, Wang H, Zhao Y-P, Hou B, Chen N-k, et al. Effect of re-petitive transcranial magnetic stimulation on fMRI resting-state connectivityin multiple system atrophy. Brain Connect 2015;5(7):451e9. https://doi.org/10.1089/brain.2014.0325.
[54] Chang WH, Kim Y-H, Yoo W-K, Goo K-H, Park C-h, Kim ST, et al. rTMS withmotor training modulates cortico-basal ganglia-thalamocortical circuits instroke patients. Restor Neurol Neurosci 2012;30(3):179e89. https://doi.org/10.3233/rnn-2012-110162.
[55] Peters SK, Dunlop K, Downar J. Cortico-striatal-thalamic loop circuits ofthe salience network: a central pathway in psychiatric disease and treat-ment. Front Syst Neurosci 2016;10:104. https://doi.org/10.3389/fnsys.2016.00104.
[56] Dunlop K, Woodside B, Olmsted M, Colton P, Giacobbe P, Downar J. Re-ductions in cortico-striatal hyperconnectivity accompany successful treat-ment of obsessive-compulsive disorder with dorsomedial prefrontal rTMS.Neuropsychopharmacology 2016;41(5):1395e403. https://doi.org/10.1038/npp.2015.292.
[57] Salomons TV, Dunlop K, Kennedy SH, Flint A, Geraci J, Giacobbe P, et al.Resting-state cortico-thalamic-striatal connectivity predicts response todorsomedial prefrontal rTMS in major depressive disorder. Neuro-psychopharmacology 2014;39(2):488e98. https://doi.org/10.1038/npp.2013.222.
[58] Wang JX, Rogers LM, Gross EZ, Ryals AJ, Dokucu ME, Brandstatt KL, et al.Targeted enhancement of cortical-hippocampal brain networks and
B.J. Seewoo et al. / Brain Stimulation 12 (2019) 1526e1536 1535
510
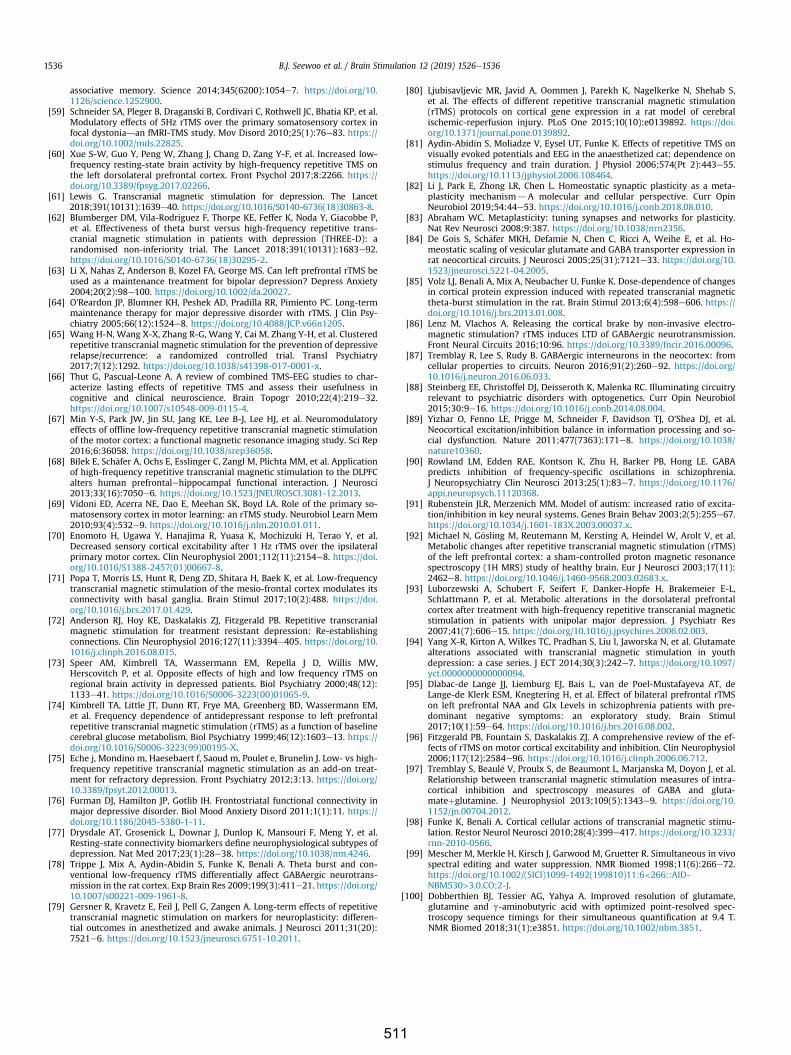
associative memory. Science 2014;345(6200):1054e7. https://doi.org/10.1126/science.1252900.
[59] Schneider SA, Pleger B, Draganski B, Cordivari C, Rothwell JC, Bhatia KP, et al.Modulatory effects of 5Hz rTMS over the primary somatosensory cortex infocal dystoniadan fMRI-TMS study. Mov Disord 2010;25(1):76e83. https://doi.org/10.1002/mds.22825.
[60] Xue S-W, Guo Y, Peng W, Zhang J, Chang D, Zang Y-F, et al. Increased low-frequency resting-state brain activity by high-frequency repetitive TMS onthe left dorsolateral prefrontal cortex. Front Psychol 2017;8:2266. https://doi.org/10.3389/fpsyg.2017.02266.
[61] Lewis G. Transcranial magnetic stimulation for depression. The Lancet2018;391(10131):1639e40. https://doi.org/10.1016/S0140-6736(18)30863-8.
[62] Blumberger DM, Vila-Rodriguez F, Thorpe KE, Feffer K, Noda Y, Giacobbe P,et al. Effectiveness of theta burst versus high-frequency repetitive trans-cranial magnetic stimulation in patients with depression (THREE-D): arandomised non-inferiority trial. The Lancet 2018;391(10131):1683e92.https://doi.org/10.1016/S0140-6736(18)30295-2.
[63] Li X, Nahas Z, Anderson B, Kozel FA, George MS. Can left prefrontal rTMS beused as a maintenance treatment for bipolar depression? Depress Anxiety2004;20(2):98e100. https://doi.org/10.1002/da.20027.
[64] O'Reardon JP, Blumner KH, Peshek AD, Pradilla RR, Pimiento PC. Long-termmaintenance therapy for major depressive disorder with rTMS. J Clin Psy-chiatry 2005;66(12):1524e8. https://doi.org/10.4088/JCP.v66n1205.
[65] Wang H-N, Wang X-X, Zhang R-G, Wang Y, Cai M, Zhang Y-H, et al. Clusteredrepetitive transcranial magnetic stimulation for the prevention of depressiverelapse/recurrence: a randomized controlled trial. Transl Psychiatry2017;7(12):1292. https://doi.org/10.1038/s41398-017-0001-x.
[66] Thut G, Pascual-Leone A. A review of combined TMS-EEG studies to char-acterize lasting effects of repetitive TMS and assess their usefulness incognitive and clinical neuroscience. Brain Topogr 2010;22(4):219e32.https://doi.org/10.1007/s10548-009-0115-4.
[67] Min Y-S, Park JW, Jin SU, Jang KE, Lee B-J, Lee HJ, et al. Neuromodulatoryeffects of offline low-frequency repetitive transcranial magnetic stimulationof the motor cortex: a functional magnetic resonance imaging study. Sci Rep2016;6:36058. https://doi.org/10.1038/srep36058.
[68] Bilek E, Sch€afer A, Ochs E, Esslinger C, Zangl M, Plichta MM, et al. Applicationof high-frequency repetitive transcranial magnetic stimulation to the DLPFCalters human prefrontalehippocampal functional interaction. J Neurosci2013;33(16):7050e6. https://doi.org/10.1523/JNEUROSCI.3081-12.2013.
[69] Vidoni ED, Acerra NE, Dao E, Meehan SK, Boyd LA. Role of the primary so-matosensory cortex in motor learning: an rTMS study. Neurobiol Learn Mem2010;93(4):532e9. https://doi.org/10.1016/j.nlm.2010.01.011.
[70] Enomoto H, Ugawa Y, Hanajima R, Yuasa K, Mochizuki H, Terao Y, et al.Decreased sensory cortical excitability after 1 Hz rTMS over the ipsilateralprimary motor cortex. Clin Neurophysiol 2001;112(11):2154e8. https://doi.org/10.1016/S1388-2457(01)00667-8.
[71] Popa T, Morris LS, Hunt R, Deng ZD, Shitara H, Baek K, et al. Low-frequencytranscranial magnetic stimulation of the mesio-frontal cortex modulates itsconnectivity with basal ganglia. Brain Stimul 2017;10(2):488. https://doi.org/10.1016/j.brs.2017.01.429.
[72] Anderson RJ, Hoy KE, Daskalakis ZJ, Fitzgerald PB. Repetitive transcranialmagnetic stimulation for treatment resistant depression: Re-establishingconnections. Clin Neurophysiol 2016;127(11):3394e405. https://doi.org/10.1016/j.clinph.2016.08.015.
[73] Speer AM, Kimbrell TA, Wassermann EM, Repella J D, Willis MW,Herscovitch P, et al. Opposite effects of high and low frequency rTMS onregional brain activity in depressed patients. Biol Psychiatry 2000;48(12):1133e41. https://doi.org/10.1016/S0006-3223(00)01065-9.
[74] Kimbrell TA, Little JT, Dunn RT, Frye MA, Greenberg BD, Wassermann EM,et al. Frequency dependence of antidepressant response to left prefrontalrepetitive transcranial magnetic stimulation (rTMS) as a function of baselinecerebral glucose metabolism. Biol Psychiatry 1999;46(12):1603e13. https://doi.org/10.1016/S0006-3223(99)00195-X.
[75] Eche j, Mondino m, Haesebaert f, Saoud m, Poulet e, Brunelin J. Low- vs high-frequency repetitive transcranial magnetic stimulation as an add-on treat-ment for refractory depression. Front Psychiatry 2012;3:13. https://doi.org/10.3389/fpsyt.2012.00013.
[76] Furman DJ, Hamilton JP, Gotlib IH. Frontostriatal functional connectivity inmajor depressive disorder. Biol Mood Anxiety Disord 2011;1(1):11. https://doi.org/10.1186/2045-5380-1-11.
[77] Drysdale AT, Grosenick L, Downar J, Dunlop K, Mansouri F, Meng Y, et al.Resting-state connectivity biomarkers define neurophysiological subtypes ofdepression. Nat Med 2017;23(1):28e38. https://doi.org/10.1038/nm.4246.
[78] Trippe J, Mix A, Aydin-Abidin S, Funke K, Benali A. Theta burst and con-ventional low-frequency rTMS differentially affect GABAergic neurotrans-mission in the rat cortex. Exp Brain Res 2009;199(3):411e21. https://doi.org/10.1007/s00221-009-1961-8.
[79] Gersner R, Kravetz E, Feil J, Pell G, Zangen A. Long-term effects of repetitivetranscranial magnetic stimulation on markers for neuroplasticity: differen-tial outcomes in anesthetized and awake animals. J Neurosci 2011;31(20):7521e6. https://doi.org/10.1523/jneurosci.6751-10.2011.
[80] Ljubisavljevic MR, Javid A, Oommen J, Parekh K, Nagelkerke N, Shehab S,et al. The effects of different repetitive transcranial magnetic stimulation(rTMS) protocols on cortical gene expression in a rat model of cerebralischemic-reperfusion injury. PLoS One 2015;10(10):e0139892. https://doi.org/10.1371/journal.pone.0139892.
[81] Aydin-Abidin S, Moliadze V, Eysel UT, Funke K. Effects of repetitive TMS onvisually evoked potentials and EEG in the anaesthetized cat: dependence onstimulus frequency and train duration. J Physiol 2006;574(Pt 2):443e55.https://doi.org/10.1113/jphysiol.2006.108464.
[82] Li J, Park E, Zhong LR, Chen L. Homeostatic synaptic plasticity as a meta-plasticity mechanismdA molecular and cellular perspective. Curr OpinNeurobiol 2019;54:44e53. https://doi.org/10.1016/j.conb.2018.08.010.
[83] Abraham WC. Metaplasticity: tuning synapses and networks for plasticity.Nat Rev Neurosci 2008;9:387. https://doi.org/10.1038/nrn2356.
[84] De Gois S, Sch€afer MKH, Defamie N, Chen C, Ricci A, Weihe E, et al. Ho-meostatic scaling of vesicular glutamate and GABA transporter expression inrat neocortical circuits. J Neurosci 2005;25(31):7121e33. https://doi.org/10.1523/jneurosci.5221-04.2005.
[85] Volz LJ, Benali A, Mix A, Neubacher U, Funke K. Dose-dependence of changesin cortical protein expression induced with repeated transcranial magnetictheta-burst stimulation in the rat. Brain Stimul 2013;6(4):598e606. https://doi.org/10.1016/j.brs.2013.01.008.
[86] Lenz M, Vlachos A. Releasing the cortical brake by non-invasive electro-magnetic stimulation? rTMS induces LTD of GABAergic neurotransmission.Front Neural Circuits 2016;10:96. https://doi.org/10.3389/fncir.2016.00096.
[87] Tremblay R, Lee S, Rudy B. GABAergic interneurons in the neocortex: fromcellular properties to circuits. Neuron 2016;91(2):260e92. https://doi.org/10.1016/j.neuron.2016.06.033.
[88] Steinberg EE, Christoffel DJ, Deisseroth K, Malenka RC. Illuminating circuitryrelevant to psychiatric disorders with optogenetics. Curr Opin Neurobiol2015;30:9e16. https://doi.org/10.1016/j.conb.2014.08.004.
[89] Yizhar O, Fenno LE, Prigge M, Schneider F, Davidson TJ, O'Shea DJ, et al.Neocortical excitation/inhibition balance in information processing and so-cial dysfunction. Nature 2011;477(7363):171e8. https://doi.org/10.1038/nature10360.
[90] Rowland LM, Edden RAE, Kontson K, Zhu H, Barker PB, Hong LE. GABApredicts inhibition of frequency-specific oscillations in schizophrenia.J Neuropsychiatry Clin Neurosci 2013;25(1):83e7. https://doi.org/10.1176/appi.neuropsych.11120368.
[91] Rubenstein JLR, Merzenich MM. Model of autism: increased ratio of excita-tion/inhibition in key neural systems. Genes Brain Behav 2003;2(5):255e67.https://doi.org/10.1034/j.1601-183X.2003.00037.x.
[92] Michael N, G€osling M, Reutemann M, Kersting A, Heindel W, Arolt V, et al.Metabolic changes after repetitive transcranial magnetic stimulation (rTMS)of the left prefrontal cortex: a sham-controlled proton magnetic resonancespectroscopy (1H MRS) study of healthy brain. Eur J Neurosci 2003;17(11):2462e8. https://doi.org/10.1046/j.1460-9568.2003.02683.x.
[93] Luborzewski A, Schubert F, Seifert F, Danker-Hopfe H, Brakemeier E-L,Schlattmann P, et al. Metabolic alterations in the dorsolateral prefrontalcortex after treatment with high-frequency repetitive transcranial magneticstimulation in patients with unipolar major depression. J Psychiatr Res2007;41(7):606e15. https://doi.org/10.1016/j.jpsychires.2006.02.003.
[94] Yang X-R, Kirton A, Wilkes TC, Pradhan S, Liu I, Jaworska N, et al. Glutamatealterations associated with transcranial magnetic stimulation in youthdepression: a case series. J ECT 2014;30(3):242e7. https://doi.org/10.1097/yct.0000000000000094.
[95] Dlabac-de Lange JJ, Liemburg EJ, Bais L, van de Poel-Mustafayeva AT, deLange-de Klerk ESM, Knegtering H, et al. Effect of bilateral prefrontal rTMSon left prefrontal NAA and Glx Levels in schizophrenia patients with pre-dominant negative symptoms: an exploratory study. Brain Stimul2017;10(1):59e64. https://doi.org/10.1016/j.brs.2016.08.002.
[96] Fitzgerald PB, Fountain S, Daskalakis ZJ. A comprehensive review of the ef-fects of rTMS on motor cortical excitability and inhibition. Clin Neurophysiol2006;117(12):2584e96. https://doi.org/10.1016/j.clinph.2006.06.712.
[97] Tremblay S, Beaul�e V, Proulx S, de Beaumont L, Marjanska M, Doyon J, et al.Relationship between transcranial magnetic stimulation measures of intra-cortical inhibition and spectroscopy measures of GABA and gluta-mateþglutamine. J Neurophysiol 2013;109(5):1343e9. https://doi.org/10.1152/jn.00704.2012.
[98] Funke K, Benali A. Cortical cellular actions of transcranial magnetic stimu-lation. Restor Neurol Neurosci 2010;28(4):399e417. https://doi.org/10.3233/rnn-2010-0566.
[99] Mescher M, Merkle H, Kirsch J, Garwood M, Gruetter R. Simultaneous in vivospectral editing and water suppression. NMR Biomed 1998;11(6):266e72.https://doi.org/10.1002/(SICI)1099-1492(199810)11:6<266::AID-NBM530>3.0.CO;2-J.
[100] Dobberthien BJ, Tessier AG, Yahya A. Improved resolution of glutamate,glutamine and g-aminobutyric acid with optimized point-resolved spec-troscopy sequence timings for their simultaneous quantification at 9.4 T.NMR Biomed 2018;31(1):e3851. https://doi.org/10.1002/nbm.3851.
B.J. Seewoo et al. / Brain Stimulation 12 (2019) 1526e15361536
511
Disorders of the Nervous System
Validation of Chronic Restraint Stress Model inYoung Adult Rats for the Study of Depression UsingLongitudinal Multimodal MR ImagingBhedita J. Seewoo,1,2,3 Lauren A. Hennessy,1,2 Kirk W. Feindel,3,4 Sarah J. Etherington,5
Paul E. Croarkin,6 and Jennifer Rodger1,2
https://doi.org/10.1523/ENEURO.0113-20.2020
1Experimental and Regenerative Neurosciences, School of Biological Sciences, The University of Western Australia,6009 Western Australia, Australia, 2Brain Plasticity Group, Perron Institute for Neurological and Translational Science,6009 Western Australia, Australia, 3Centre for Microscopy, Characterisation & Analysis, Research InfrastructureCentres, The University of Western Australia, 6009 Western Australia, Australia, 4School of Biomedical Sciences, TheUniversity of Western Australia, 6009 Western Australia, Australia, 5College of Science, Health, Engineering andEducation, Murdoch University, Perth, 6150 Western Australia, Australia, and 6Mayo Clinic Depression Center,Department of Psychiatry and Psychology, Mayo Clinic, Rochester, MN 55905
Abstract
Prior research suggests that the neurobiological underpinnings of depression include aberrant brain functional con-nectivity, neurometabolite levels, and hippocampal volume. Chronic restraint stress (CRS) depression model in ratshas been shown to elicit behavioral, gene expression, protein, functional connectivity, and hippocampal volumechanges similar to those in human depression. However, no study to date has examined the association betweenbehavioral changes and brain changes within the same animals. This study specifically addressed the correlationbetween the outcomes of behavioral tests and multiple 9.4 T magnetic resonance imaging (MRI) modalities in theCRS model using data collected longitudinally in the same animals. CRS involved placing young adult maleSprague Dawley rats in individual transparent tubes for 2.5 h daily over 13d. Elevated plus maze (EPM) and forcedswim tests (FSTs) confirmed the presence of anxiety-like and depression-like behaviors, respectively, postrestraint.Resting-state functional MRI (rs-fMRI) data revealed hypoconnectivity within the salience and interoceptive net-works and hyperconnectivity of several brain regions to the cingulate cortex. Proton magnetic resonance spectros-copy revealed decreased sensorimotor cortical glutamate (Glu), glutamine (Gln), and combined Glu-Gln (Glx) levels.Volumetric analysis of T2-weighted images revealed decreased hippocampal volume. Importantly, these changesparallel those found in human depression, suggesting that the CRS rodent model has utility for translational studiesand novel intervention development for depression.
Key words: animal model; chronic restraint stress; depression; hippocampus; resting-state fMRI; spectroscopy
Significance Statement
Peripheral biomarker studies suggest that chronic restraint stress (CRS) is a valid rodent model of depression, withanimals exhibiting similar gene expression and protein changes, aberrant brain functional connectivity, and re-duced hippocampal volume found in human depression. However, the present study is the first to demonstrate hy-perconnectivity and hypoconnectivity, hippocampal atrophy, and decreased sensorimotor cortical glutamate (Glu)and glutamine (Gln) levels in the same young adult male rats postrestraint and the correlation of these measureswith changes in behavior. Importantly, these changes are similar to anomalies found in humans with depression,which also correlate with patient symptoms. Present findings reinforce the usefulness of the CRSmodel for trans-lational studies, intervention development, andmultimodal molecular and imaging studies.
July/August 2020, 7(4) ENEURO.0113-20.2020 1–22
Research Article: New ResearchAppendix G
512

IntroductionMajor depressive disorder is a debilitating neuropsychiat-
ric disease with significant morbidity and mortality. The di-agnosis of depression in humans is based on persistentnegative mood, clinical symptoms, and behavioral changes.However, diagnosing depression based solely on clinicalfeatures leads to suboptimal outcomes in research studiesand clinical practice. Considerable effort has been focusedon addressing the biological heterogeneity of depressionwith biomarkers, including the use of magnetic resonanceimaging (MRI) techniques. For example, the cingulate cor-tex, a critical node of the default mode network (DMN), isone of the most extensively investigated brain regions in thecontext of mood disorders in MRI studies because of its rolein the modulation of emotional behavior (Drevets et al.,2008; Davey et al., 2012; Rolls et al., 2019). Resting-statefunctional MRI (rs-fMRI) studies of depression demonstratefunctional connectivity changes in the DMN, along withother resting-state networks (RSNs) such as the saliencenetwork and the interoceptive network which are involved inprocessing emotions and sensory stimuli and regulating theinternal state (Paulus and Stein, 2010; Mulders et al., 2015).These alterations in functional connectivity within RSNs areassociated with neurometabolite [e.g., glutamine (Gln); glu-tamate (Glu); GABA] imbalances in depression, measurednon-invasively using proton magnetic resonance spectros-copy (1H-MRS; Lener et al., 2017). Additionally, human MRIstudies reproducibly detect reduced hippocampal volumesin patients with depression compared with age-matchedhealthy controls (Videbech and Ravnkilde, 2004).
Although significant progress has been made in under-standing the mechanisms underpinning major depressivedisorder, the causality of neuroimaging findings is difficultto infer. For example, the state versus trait nature ofhuman imaging findings are often uncertain and difficultto study (Sheline, 2011; Brown et al., 2014). In contrast,temporal relationships between biological findings anddepression-like behaviors can be studied in animal mod-els. Moreover, MRI-based techniques can be used to in-vestigate the same biological changes in humans andanimals, allowing direct comparison of validated outcomemeasures. Furthermore, combining repeated behavioral andMRI measures within the same animals allows the explora-tion of correlation between those measures. Therefore, ani-mal models are an indispensable tool for studying etiology,progress, and treatment of depression.Chronic restraint stress (CRS) in Sprague Dawley rats
has been shown to elicit behavioral, gene expression,protein, brain functional connectivity, and hippocampalvolume changes similar to those in patients with depres-sion. However, no study to date has examined the associ-ation between multimodal MRI measures and behavioralchanges within the same animals in the CRS model of de-pression (Lee et al., 2009; Henckens et al., 2015; Wang etal., 2017). This model involves restraining animals’ move-ments for at least 2 h/d for several days (Wang et al.,2017); the continuous and predictable stress is designedto mimic everyday human stress, such as daily repetitionof a stressful job and familial stresses. Our study aimed tobring previous MRI findings in CRS animals together andinvestigate the relationship between neurobiological andbehavioral changes in the CRS rat model by performingmultimodal MRI (rs-fMRI, 1H-MRS, and structural MRI)and behavioral tests on the same young adult male ratsbefore and after induction of the model.
Materials and MethodsEthics statementExperimental procedures were approved by The
University of Western Australia (UWA) Animal EthicsCommittee (RA/3/100/1640) and conducted in accord-ance with the National Health and Medical ResearchCouncil Australian code for the care and use of animalsfor scientific purposes. All investigators were trained inanimal handling by the UWA Programme in AnimalWelfare, Ethics, and Science (PAWES) and had validPermission to Use Animals (PUA) licenses.
AnimalsYoung adult male Sprague Dawley rats (n=33; 150–
200 g; six to sevenweeks old) from the local AnimalResources Centre were housed in pair under temperature-controlled conditions on a 12/12 h light/dark cycle. Foodand water were freely provided, except during the CRS pro-cedure and fasting before the sucrose preference test (SPT).All rats acclimatized to their new environment for one weekfollowing their arrival. Behavioral tests and MRI scans wereconducted at baseline and after the final restraint procedure.
Received March 23, 2020; accepted July 3, 2020; First published July 15,2020.The authors declare no competing financial interests.Author contributions: B.J.S. and J.R. designed research; B.J.S. and L.A.H.
performed research; B.J.S., L.A.H., K.W.F., and P.E.C. analyzed data; B.J.S.,L.A.H., K.W.F., S.J.E., P.E.C., and J.R. wrote the paper.This work was supported by The University of Western Australia. B.J.S. is
supported by a Forrest Research Foundation Scholarship, an InternationalPostgraduate Research Scholarship, and a University Postgraduate Award. L.A.H.is supported by the Commonwealth Government’s Australian GovernmentResearch Training Program Fees Offset. K.W.F. was an Australian National ImagingFacility Fellow, a facility funded by the University, State and CommonwealthGovernments. P.E.C. was supported by the National Institute of Mental HealthGrant R01 MH113700. J.R. was supported by a Fellowship from MSWA and thePerron Institute for Neurological and Translational Science.Acknowledgements: We thank Marissa Penrose-Menz, Kerry Leggett,
Elizabeth Jaeschke-Angi, Leah Mackie, Kaylene Schutz, Yasmin Arena-Foster,and Yashvi Bhatt and Parth Patel for their assistance with the experiments andthe team at M-Block Animal Care Services, especially Sandra Goodin and StefanDavis, for their assistance with animal care and provision of some essentialmaterials for the behavioral experiments. We also thank the reviewers and thereviewing editor whose comments have greatly improved this manuscript and thefacilities and scientific and technical assistance of the National Imaging Facility, aNational Collaborative Research Infrastructure Strategy (NCRIS) capability, at theCentre for Microscopy Characterisation and Analysis, The University of WesternAustralia.Correspondence should be addressed to Jennifer Rodger at jennifer.
[email protected]://doi.org/10.1523/ENEURO.0113-20.2020
Copyright © 2020 Seewoo et al.
This is an open-access article distributed under the terms of the CreativeCommons Attribution 4.0 International license, which permits unrestricted use,distribution and reproduction in any medium provided that the original work isproperly attributed.
Research Article: New Research 2 of 22
July/August 2020, 7(4) ENEURO.0113-20.2020 eNeuro.org
513

A control group of (n=8) animals underwent all proceduresexcept CRS.
CRS procedureThe CRS procedure was conducted on a bench located
on the opposite side of the large animal holding room fac-ing the wall. Each session was conducted between 12:30and 3:30 P.M. in effort to avoid effects associated withthe circadian rhythm. In brief, rats were weighed andplaced in a transparent tube (size of the tube dependingon weight of animal, see Table 1) for 2.5 h/d for 13 con-secutive days as performed on Sprague Dawley rats inprevious studies (Bravo et al., 2009; Ulloa et al., 2010;Stepanichev et al., 2014). The length of each restraint wasadjusted to limit limb movements using tail gates.Following CRS, rats were returned to their home cages.Healthy control animals were not restrained and remainedin their home cages.
Behavioral testsElevated plus maze (EPM) and forced swim tests (FSTs)
were used to confirm increased anxiety-related behaviorsand learned-helplessness induced by the CRS paradigmin rats as previously described in several preclinical stud-ies (Suvrathan et al., 2010; Ulloa et al., 2010; Chiba et al.,2012; Bogdanova et al., 2013). Behavioral tests were con-ducted over a period of 3 d (Fig. 1). On the first day, theanimals were subjected to EPM test (Walf and Frye,2007). After EPM, the animals were habituated to singlehousing and 1% sucrose solution as described below anddeprived of food and water overnight. The next day, theSPT (Willner et al., 1987) was conducted and on the thirdday, the animals underwent the FST (Slattery and Cryan,2012). All behavioral testing occurred between 8:30 and11 A.M. The full behavioral dataset can be obtained fromthe corresponding author on request.
EPMEPM was conducted as detailed in Walf and Frye
(2007). The apparatus consisted of two open arms (with-out walls or railing) and two closed arms, crossed in themiddle perpendicularly to each other, and a center area(10 � 10 cm). Each arm was 50 cm long and 10 cm wide,and the enclosed arms had 40-cm high walls. Each arm ofthe maze was attached to sturdy legs, such that it waselevated 60 cm off the floor. The maze was placed in away to ensure similar levels of illumination on both openand closed arms. One animal was tested at a time andafter each trial, all arms and the center area were wipedwith 70% ethanol to remove olfactory cues. The animalwas placed in the center of the maze facing the sameopen arm, away from the experimenter. The animal wasallowed to move freely in the maze for 5min and thewhole procedure was video recorded from ;120 cmabove the platform using a GoPro HERO7. The experi-menters stayed in the room during the procedure, but un-necessary movements and noise were minimized.EPM data were analyzed manually by researchers
blinded to experimental group and timepoint. The number
of entries and time spent in closed and open arms weremeasured. Additionally, the number and duration of rear-ing and grooming were also measured to investigate anxi-ety-related behaviors (Walf and Frye, 2007). The numberof entries and time spent in the center of the maze and be-haviors such as head shaking, head dips and stretchingwere not considered. One animal fell off the open arm dur-ing baseline testing and was re-placed onto the maze tocontinue the whole 5-min testing, but the data were ex-cluded from the analyses (Walf and Frye, 2007).
SPTImmediately following EPM, animals were habituated to
single housing and to sucrose solution (Fig. 1). Animals wereplaced in individual cages with ad libitum access to foodpellets and two 600-ml bottles, one bottle containing fresh1% sucrose solution [D-(1)-Sucrose, AnalaR NORMAPURanalytical reagent, VWR International BVBA] and the othercontaining tap water. The animals were trained to thiscondition for 8 h. Rats were given a free choice betweenthe two bottles and the position of the bottles wasswitched 4 h after the start of single housing to preventside preference in drinking behavior. Overnight food andwater deprivation was applied at the end of the 8-h habit-uation for up to 16 h.The next day, SPT was performed according to a previ-
ous study with some modifications (Willner et al., 1987).Water and sucrose solution bottles were weighed, la-beled, and placed in corresponding cages. The positionof the bottles was switched 30min after the start of theSPT. Thirtyminutes later, the bottles were removed andre-weighed, and the animals were re-housed in their
Table 1: Weight of animals and size of restraints
Body weightof animal (g)
Diameter ofrestraint (cm)
Maximum lengthof restraint (cm)
,255 5 19255–300 5 23.300 6 21
Figure 1. Experimental timeline. The experiment consisted ofan initial one-week period of habituation on arrival of the ani-mals, after which the rats underwent EPM test (day 1).Following EPM, animals were habituated to single housing andsucrose solution for 8 h and deprived of food and water over-night (days 1–2). SPT was conducted the next day (day 2), fol-lowed by a preswim test. FST was conducted on day 3 andMRI on day 4. The animals then underwent CRS for 2.5 h dailyfor 13 consecutive days. The day after the end of CRS, animalsunderwent behavioral tests (days 18–20) and MRI (day 21) inthe same order without a preswim test.
Research Article: New Research 3 of 22
July/August 2020, 7(4) ENEURO.0113-20.2020 eNeuro.org
514

original cages. Sucrose preference was calculated as apercentage of the total amount of liquid ingested (sucrosepreference = sucrose consumption (g)/[sucrose con-sumption (g)1 water consumption (g)]).
FSTFST was conducted as detailed in Slattery and Cryan
(2012). Briefly, 20-l white opaque plastic buckets (41cmhigh, 28cm wide) were filled up to a depth of 30cm withwater at 23–25°C. At this depth, the rats could not touch thebottom of the bucket with their tails or hind limbs. Up to fourbuckets were used at a time, and the buckets were emptied,cleaned, and refilled between animals. At baseline, 24 h be-fore the FST session (on SPT day), rats were exposed to apreswim test for 10min by placing them in the water-filledbuckets (Slattery and Cryan, 2012). The next day, and at theend of the restraint period, rats underwent 6min of FST (Fig.1) and the procedure was video recorded from ;50cmabove the buckets using a GoPro HERO7.FST data were analyzed manually by researchers
blinded to experimental group and timepoint using a time-sampling technique (Slattery and Cryan, 2012). The first5min of the video recording was split into 5-s intervals,and the predominant behavior in each 5-s period wasrated. The following escape behaviors were scored: (1)swimming, with horizontal movements throughout thebucket including crossing into another quadrant and div-ing; (2) climbing, with upward movements of the forepawsalong the side of bucket; (3) immobility, with minimalmovements necessary to keep their head above water;and (4) latency, defined as the time taken to exhibit thefirst immobility behavior. Grooming, head shaking andnumber of fecal boli were not considered. Trials duringwhich the animals managed to escape more than once orwere floating horizontally for the duration of the test (withmost of their body being completely dry at the end) wereexcluded from the analyses.
MRI data acquisitionAnimal preparationMRI data were acquired the day after the FST. Because
of the well-documented effect of anesthesia on RSNs, acombined medetomidine-isoflurane anesthetic protocolwas chosen because it produces similar RSN connectivityas in the awake condition (Paasonen et al., 2018), main-tains strong intercortical and cortical-subcortical connec-tivity (Grandjean et al., 2014; Bukhari et al., 2017) andprovides stable sedation for over 4 h and reproducibledata from repeated fMRI experiments on the same animalone week apart (Lu et al., 2012). The rat was preanaesthe-tized using isoflurane (Isothesia, Henry Schein MedicalAnimal Health) in an induction chamber (4% isoflurane inmedical air, 2 l/min). Once fully anaesthetized, the animalwas transferred to a heated imaging cradle and anesthe-sia was maintained with a nose cone (2% isoflurane inmedical air, 1 l/min). Body temperature and respiratoryrate were monitored using a PC-SAM Small AnimalMonitor (SA Instruments Inc., 1030 System). An MR-com-patible computer feedback heating blanket was used for
maintaining animal body temperature at 37°C (6 0.5°C). A25G butterfly catheter (SVp25BLK, Terumo Australia PtyLtd) was implanted subcutaneously in the left flank of theanimal to deliver a 0.05–0.1mg/kg bolus injection andcontinuous infusion of medetomidine (1mg/ml, IliumMedetomidine Injection, Troy Laboratories Pty. Limited)at 0.15mg/kg/h using a single syringe infusion pump(Legato 100 Syringe Pump, KD Scientific Inc.). Once theanimal’s breathing rate dropped to 50breaths/min, iso-flurane was gradually reduced to 0.5–0.75%. These anes-thetic doses were empirically determined to ensure therespiratory rate of the animals was between 50 and80breaths/min. rs-fMRI scans were started only after theisoflurane concentration had been reduced for at least15min, and the physiology of the animal was stable dur-ing that time. After the MRI procedure, medetomidine wasantagonized by an injection of 0.1mg/kg atipamezole(5.0mg/ml, Ilium Atipamezole Injection, Troy LaboratoriesPty. Limited) using a 29-G insulin syringe (BD Ultra-FineInsulin Syringe, Becton Dickinson Pty Ltd).
MRI acquisition parametersAll MR images were acquired with a Bruker Biospec 94/
30 small animal MRI system operating at 9.4 T (400MHz,H-1), with an Avance III HD console, BGA-12SHP imaginggradients, a 72-mm (inner diameter) volume transmit coiland a rat brain surface quadrature receive coil using theimaging protocol as detailed in Seewoo et al. (2018, 2019).The acquisition protocol included the following sequences:(1) multislice 2D RARE (rapid acquisition with relaxation en-hancement) sequence for three T2-weighted anatomicscans (TR=2500ms, TE=33ms, matrix=280� 280, pixelsize=0.1� 0.1 mm2, 21 coronal and axial slices, 20 sagittalslices, thickness=1 mm); (2) single-shot gradient-echoechoplanar imaging (TR=1500ms, TE=11ms, matrix=94� 70, pixel size=0.3� 0.3 mm2, 21 coronal slices,thickness=1 mm, flip angle=90°, 300 volumes, automaticghost correction order=1, receiver bandwidth=300kHz)for resting-state; and (3) point-resolved spectroscopy(PRESS) sequence with one 90° and two 180° pulses andwater suppression for 1H-MRS (TE=16ms, TR=2500ms)with 64 averages with a 3.5� 2� 6 mm3 voxel placed over
Figure 2. Voxel position for proton magnetic resonance spec-troscopy. The figure shows the position of the voxel of interest(size of 3.5 � 2 � 6 mm) on the left sensorimotor cortex on T2-weighted images for proton magnetic resonance spectroscopy.R denotes right hemisphere.
Research Article: New Research 4 of 22
July/August 2020, 7(4) ENEURO.0113-20.2020 eNeuro.org
515
the left sensorimotor cortex (Fig. 2). The sensorimotor cor-tex was chosen because: (1) it is a key brain region involvedin psychomotor retardation (Zarrinpar et al., 2006; Pineda,2008), an important but poorly understood clinical featureof depression (Buyukdura et al., 2011; Ilamkar, 2014); (2)brain stimulation has been reported to decrease the severityof psychomotor retardation in patients with depression(Buyukdura et al., 2011) and increase Glu and Gln levels inthe sensorimotor cortex of healthy Sprague Dawley rats(Seewoo et al., 2019); (3) rostral regions such as the senso-rimotor cortex have higher signal-to-noise ratio (SNR) whenusing a surface coil (Xu et al., 2013b); and (4) larger voxelsizes can be used without white matter contamination,leading to higher SNR and greater reliability and reproduci-bility of measured metabolite concentrations. 1H-MRS datawere acquired from the left cortex only to facilitate compari-sons with human depression studies, which mostly exam-ine neurometabolite changes in the left hemisphere(Moriguchi et al., 2019).
Analysis stepsBehavioral dataEPM and FST videos were scored blind by two trained
observers to establish the most reliable measures. Basedon their low interindividual scorer variability (,12%), ex-ploration (into and within closed and open arms sepa-rately), grooming and rearing for EPM, and swimming andclimbing (separately and combined as “total activity”), im-mobility, and latency to first immobility behavior for FSTwere selected for statistical analysis. Sucrose preference(%) was calculated as sucrose consumption (g)/[sucroseconsumption (g)1 water consumption (g)].
rs-fMRI dataTo maximize the use of collected data, rs-fMRI data
and T2-weighted images collected using the same acqui-sition and anesthesia protocols from a previous study(Seewoo et al., 2019) in adult (six to eight weeks old, 150–250 g) male Sprague Dawley rats were also included inthe analyses for the baseline timepoint (Table 2). Theseanimals did not undergo any behavioral testing or inter-vention before the acquisition of MRI data. All rs-fMRIdata were preprocessed and analyzed in the same way.Preprocessing of data included: (1) export into DICOMformat from ParaVision 6.0.1 (Bidgood et al., 1997); (2)conversion into NifTI using the dcm2niix converter (64-bitLinux version May 5, 2016; Rorden et al., 2007); (3) reor-ienting the brain into left-anterior-superior (LAS) axes (ra-diologic view); and (4) skull-stripping using the qimaskutility from QUIT (QUantitative Imaging Tools; Wood,2018). The voxel sizes were then upscaled by a factor of10 (Tambalo et al., 2015).All further preprocessing and analyses were performed
using FSL v5.0.10 [Functional MRI of the Brain (FMRIB)Software Library; Jenkinson et al., 2012] using the methodsdescribed in Seewoo et al. (2020). Single-session independ-ent component analysis (ICA) as implemented in FSL/MELODIC (Multivariate Exploratory Linear Decompositioninto Independent Components; Beckmann et al., 2005) wasused to de-noise the data (detailed in Seewoo et al., 2018).
The de-noised rs-fMRI images were then co-registered totheir respective T2-weighted coronal images using six-pa-rameter rigid body registration using FSL/FLIRT (LinearImage Registration Tool; Jenkinson and Smith, 2001;Jenkinson et al., 2002) and normalized to a Sprague Dawleybrain atlas (Papp et al., 2014; Kjonigsen et al., 2015;Sergejeva et al., 2015) with nine degrees of freedom “tradi-tional” registration. The atlas was first down-sampled by afactor of eight to better match the voxel size of the 4D func-tional data. All subsequent analyses were conducted in theatlas standard space.Multisubject temporal concatenation group-ICA and
FSL dual regression analysis were used to determinegroup differences (baseline, n=33; restraint, n=15), con-trolling for family-wise error (FWE) and using a threshold-free cluster enhanced (TFCE) technique to control for mul-tiple comparisons. The resulting statistical maps werethresholded to p, 0.05.To investigate the correlation between strong depres-
sion-like behaviors on functional connectivity, dual re-gression was also conducted using a subset of animals inthe restraint group. FST measures (immobility, swimmingand climbing scores, and latency time) were extracted forthe 15 animals scanned following restraint and sorted inorder of greatest change in each FST measure. Animalswere scored according to their position on the list (1–15).Nine of 15 animals had consistently high scores and wereused in the analysis as they exhibited the greatest changein overall behavioral outcomes in FST.For seed-based analysis, the atlas mask for cingulate
cortex was transformed to each individual animal’s func-tional space. The region of interest (ROI) masks (within theindividual functional space) were used to extract the timecourse from the ICA de-noised data. The time courseswere used in a first-level FSL/FEAT (FMRI Expert AnalysisTool version 6.00) analysis to generate a whole-braincorrelation map. Higher-level analysis was conductedusing ordinary least squares (OLS) simple mixed-effects(Beckmann et al., 2003; Woolrich et al., 2004; Woolrich,2008) in atlas space (baseline, n=33; restraint, n=15). Z(Gaussianized T/F) statistic images were thresholdednon-parametrically using clusters determined by Z. 2and a (corrected) cluster significance threshold of p=0.05(Worsley, 2001).1H-MRS
1H-MRS data were analyzed in LCModel (LinearCombination of Model spectra, version 6.3-1L; Provencher,2001) using a set of simulated basis set provided by thesoftware vendor. For data quality control, the linewidth (fullwidth at half-maximum; FWHM) for each scan was calcu-lated for the N-acetylaspartate1N-acetyl-aspartyl-gluta-mate (NAA 1 NAAG) resonance at 2.01ppm, and theintensity of this resonance relative to the residual intensitywas obtained (SNR). Mean (6SE) FWHM and SNR were10.6 (60.4) Hz and 12.1 (60.4) Hz, respectively, for thebaseline group (n=17), and 14.6 (60.8) Hz and 9.8 (60.3)Hz, respectively, for the restraint group (n=17). Individualmetabolite concentrations were computed using the unsup-pressed reference water signal for each individual scan.Cramér-Rao lower bound (CRLB) values were calculated by
Research Article: New Research 5 of 22
July/August 2020, 7(4) ENEURO.0113-20.2020 eNeuro.org
516

Table 2: Statistical table indicating the results of all analyses
No Fig. Descriptionp Statistics Power
EPM test
aa 3A Open arm # CRS group (n = 24/timepoint) Paired median difference= –1.0
p = 0.0
–1.0, –1.0
baseline = 0.88 6 0.18
restraint = 0.32 6 0.13
ab Healthy group (n = 8/timepoint) Paired median difference= –1.0
p = 0.246
–1.0, –1.0
baseline = 1.75 6 0.62
restraint = 0.38 6 0.26
ac Open arm time CRS group (n = 24/timepoint) Paired median difference= –1.5
p = 0.15
–8.0, 0.0
baseline = 5.79 6 1.43 s
restraint = 2.52 6 1.15 s
ad Healthy group (n = 6/timepoint) Paired median difference= –3.0
p = 0.38
–24.0, 0.0
baseline = 6.83 6 3.89 s
restraint = 2.63 6 2.01 s
ae 3B Closed arm # CRS group (n = 24/timepoint) Paired Cohen’s d = 0.462
p = 0.0282
–0.0122, 0.856
baseline = 5.63 6 0.66
restraint = 7.20 6 0.74
af Healthy group (n = 8/timepoint) Paired Cohen’s d = 0.114
p = 0.639
–0.647, 0.51
baseline = 8.00 6 1.72
restraint = 8.63 6 2.13
ag Closed arm time CRS group (n = 24/timepoint) Paired Cohen’s d = 0.212
p = 0.47
–0.415, 0.777
baseline = 220.83 6 9.06 s
restraint = 230.60 6 7.81 s
ah Healthy group (n = 8/timepoint) Paired Cohen’s d = 0.056
p = 0.888
–0.848, 0.851
baseline = 221.75 6 12.82 s
restraint = 224.13 6 16.89 s
ai 3C Grooming # CRS group (n = 24/timepoint) Paired Cohen’s d = –0.921
p = 0.001
–1.41, –0.357
baseline = 4.63 6 0.64
restraint = 2.28 6 0.31
aj Healthy group (n = 8/timepoint) Paired Cohen’s d = 0.232
p = 0.464
–0.511, 1.17
baseline = 3.00 6 1.10
restraint = 3.63 6 0.78
ak Grooming time CRS group (n = 23/timepoint) Paired Cohen’s d = –0.642
p = 0.0016
–1.09, –0.185
baseline = 24.70 6 3.93 s
restraint = 14.48 6 3.30 s
al Healthy group (n = 8/timepoint) Paired Cohen’s d = –0.326
p = 0.411
–1.11, 0.352
baseline = 24.63 6 9.89 s
restraint = 17.75 6 3.70 s
am 3D Rearing # CRS group (n = 23/timepoint) Paired Cohen’s d = –0.2
p = 0.422
–0.732, 0.327
baseline = 17.79 6 0.86
restraint = 16.92 6 1.14
an Healthy group (n = 7/timepoint) Paired Cohen’s d = 0.533
p = 0.19
–0.852, 1.13
baseline = 16.14 6 1.52
restraint = 17.38 6 1.82
ao Rearing time CRS group (n = 24/timepoint) Paired Cohen’s d = 0.187
p = 0.501
–0.364, 0.73
baseline = 41.38 6 1.72 s
restraint = 44.36 6 3.36 s
ap Healthy group (n = 8/timepoint) Paired Cohen’s d = 0.117
p = 0.618
–0.639, 0.552
baseline = 41.88 6 5.43 s
restraint = 43.38 6 3.42 s
SPT
aq CRS group (n = 25/timepoint) Paired Cohen’s d = 0.289
p = 0.312
–0.294, 0.889
baseline = 0.63 6 0.03
restraint = 0.69 6 0.04
ar Healthy group (n = 5/timepoint) Paired Cohen’s d = –0.191
p = 0.807
–1.52, 0.831
baseline = 0.81 6 0.03
restraint = 0.78 6 0.07
(Continued)
Research Article: New Research 6 of 22
July/August 2020, 7(4) ENEURO.0113-20.2020 eNeuro.org
517

Table 2: Continued
No Fig. Descriptionp Statistics Power
FST
as 4A Total
activity
CRS group (n = 19/timepoint) Paired Cohen’s d = –0.62
p = 0.0414
–1.19, –0.0902
baseline = 42 6 2
restraint = 37 6 1
at Healthy group (n = 8/timepoint) Paired Cohen’s d = –0.726
p = 0.22
–1.91, 0.489
baseline = 45 6 3
restraint = 40 6 2
au 4B Swimming CRS group (n = 19/timepoint) Paired Cohen’s d = 0.0269
p = 0.896
–0.526, 0.489
baseline = 26 6 2
restraint = 26 6 2
av Healthy group (n = 8/timepoint) Paired Cohen’s d = 0.0
p = 0.969
–1.54, 1.17
baseline = 30 6 3
restraint = 30 6 4
aw Climbing CRS group (n = 19/timepoint) Paired Cohen’s d = –0.696
p = 0.021
–1.22, –0.202
baseline = 16 6 2
restraint = 11 6 1
ax Healthy group (n = 8/timepoint) Paired Cohen’s d = –0.8
p = 0.12
–1.92, 0.327
baseline = 15 6 2
restraint = 10 6 2
ay 4C Immobility CRS group (n = 19/timepoint) Paired Cohen’s d = 0.611
p = 0.0438
0.0902, 1.19
baseline = 18 6 2
restraint = 23 6 1
az Healthy group (n = 8/timepoint) Paired Cohen’s d = 0.726
p = 0.22
0.0902, 1.19
baseline = 15 6 3
restraint = 20 6 2
ba Latency CRS group (n = 19/timepoint) Paired Cohen’s d = –1.34
p = 0.0006
–2.03, –0.578
baseline = 119 6 9 s
restraint = 71 6 7 s
bb Healthy group (n = 8/timepoint) Paired Cohen’s d = –0.0967
p = 0.92
–1.59, 1.21
baseline = 101 6 32
restraint = 95 6 16
rs-fMRI
bc 5A,B ICA/dual regression CRS group with all restraint data [baseline: n = 11 from current cohort and n = 22
from Seewoo et al. (2019); restraint: n = 15]
Dual regression
p , 0.05
bd CRS group with restraint data based on FST findings [baseline: n = 11 from current
cohort and n = 22 from Seewoo et al. (2019); restraint: n = 9]
Dual regression
p , 0.05
be 5C Salience network
CRS group (baseline: n = 9 from current cohort; restraint: n = 15)
Unpaired Cohen’s d = –2.33
p = 0.0
–3.2, –1.29
baseline = 36 6 3
restraint = 19 6 1
bf Salience network
Healthy group (baseline: n = 5 from current cohort; restraint: n = 8)
Unpaired Cohen’s d = –0.208
p = 0.718
–1.68, 0.93
baseline = 29 6 5
restraint = 27 6 4
bg 5D Interoceptive network
CRS group (baseline: n = 9 from current cohort; restraint: n = 15)
Unpaired Cohen’s d = –1.38
p = 0.0032
–2.13, –0.574
baseline = 39 6 5
restraint = 23 6 2
bh Interoceptive network
Healthy group (baseline: n = 5 from current cohort; restraint: n = 8)
Unpaired Cohen’s d = –0.539
p = 0.374
–1.47, 0.685
baseline = 27 6 2
restraint = 22 6 4
bi 6A Seed-based analysis CRS group with all restraint data [baseline: n = 11 from current cohort and n = 22
from Seewoo et al. (2019); restraint: n = 15]
Higher-level FEAT
p , 0.05, z . 2
bj 6B CRS group (baseline: n = 9 from current cohort; restraint: n = 15) Unpaired Cohen’s d = 1.51
p = 0.0018
0.712, 2.18
baseline = 0.13 6 0.02
restraint = 0.29 6 0.03
bk Healthy group (baseline: n = 5 from current cohort; restraint: n = 8) Unpaired Cohen’s d = 0.752
p = 0.214
–0.318, 1.74
baseline = 0.15 6 0.03
restraint = 0.24 6 0.05
(Continued)
Research Article: New Research 7 of 22
July/August 2020, 7(4) ENEURO.0113-20.2020 eNeuro.org
518

Table 2: Continued
No Fig. Descriptionp Statistics Power
Proton magnetic resonance spectroscopy
bl 7C Gln CRS group (n = 17/timepoint) Paired Cohen’s d = –0.538
p = 0.027
–1.19, –0.0217
baseline: 0.53 6 0.01
restraint: 0.50 6 0.01
bm Healthy group (n = 8/timepoint) Paired Cohen’s d = 0.743
p = 0.174
–0.127, 1.95
baseline = 0.50 6 0.02
restraint = 0.54 6 0.02
bn 7D Glu CRS group (n = 17/timepoint) Paired Cohen’s d = –0.711
p = 0.0706
–1.46, 0.134
baseline: 1.41 6 0.02
restraint: 1.35 6 0.02
bo Healthy group (n = 6/timepoint) Paired Cohen’s d = –1.1
p = 0.121
–2.15, –0.122
baseline = 1.48 6 0.04
restraint = 1.37 6 0.04
bp 7E Gln 1 Glu
(Glx)
CRS group (n = 17/timepoint) Paired Cohen’s d = –0.84
p = 0.0186
–1.49, –0.115
baseline: 1.94 6 0.02
restraint: 1.85 6 0.03
bq Healthy group (n = 7/timepoint) Paired Cohen’s d = –0.41
p = 0.529
–1.83, 1.12
baseline = 1.97 6 0.04
restraint = 1.92 6 0.05
br GABA CRS group (n = 16/timepoint) Paired Cohen’s d = –0.137
p = 0.74
–0.959, 0.632
baseline: 0.35 6 0.01
restraint: 0.34 6 0.01
bs Healthy group (n = 8/timepoint) Paired Cohen’s d = –0.558
p = 0.378
–1.82, 0.926
baseline = 0.37 6 0.02
restraint = 0.34 6 0.02
bt Gln/Glu CRS group (n = 17/timepoint) Paired Cohen’s d = –0.171
p = 0.552
–0.767, 0.275
baseline = 0.38 6 0.01
restraint = 0.37 6 0.01
bu Healthy group (n = 6/timepoint) Paired Cohen’s d = 1.15
p = 0.0632
0.45, 2.51
baseline = 0.35 6 0.02
restraint = 0.41 6 0.02
Animal weight and whole-brain volume
bv 8A Spearman’s rank correlation rho because baseline weights were not normally distributed [n = 33 from
current cohort, n = 41 from Seewoo et al. (2019) and our unpublished data]
S = 28632
p = 7.909e-08
r = 0.58
Mean whole-brain volume to
weight ratio = 6.64 6 0.16
mm3/g
Hippocampal volume
bw 8B CRS group (n = 18/timepoint) Paired Cohen’s d = –0.811
p = 0.0032
–1.33, –0.318
baseline: 5.88 6 0.01
restraint: 5.85 6 0.01
bx Healthy group (n = 8/timepoint) Paired Cohen’s d = –0.409
p = 0.327
–1.64, 0.467
baseline = 5.87 6 0.01
restraint = 5.85 6 0.02
Correlations
by 9A Latency and salience network functional connectivity (not normal; Spearman’s rank correlation
rho; n = 35)
R = 0.180
S = 5853.7
p = 0.3004
padj = 0.4440
bz 9B Latency and interoceptive network functional connectivity (not normal; Spearman’s rank correlation
rho; n = 35)
R = 0.312
S = 4909.9
p = 0.0678
padj = 0.3627
ca 9C Salience and interoceptive network functional connectivity (not normal; Spearman’s rank correlation
rho; n = 37)
R = 0.595
S = 3414
p = 0.0001
padj = 0.0017
cb 9D Latency and cingulate cortex functional connectivity (not normal; Spearman’s rank correlation
rho; n = 35)
R = –0.484
S = 10597
p = 0.0032
padj = 0.0320
(Continued)
Research Article: New Research 8 of 22
July/August 2020, 7(4) ENEURO.0113-20.2020 eNeuro.org
519
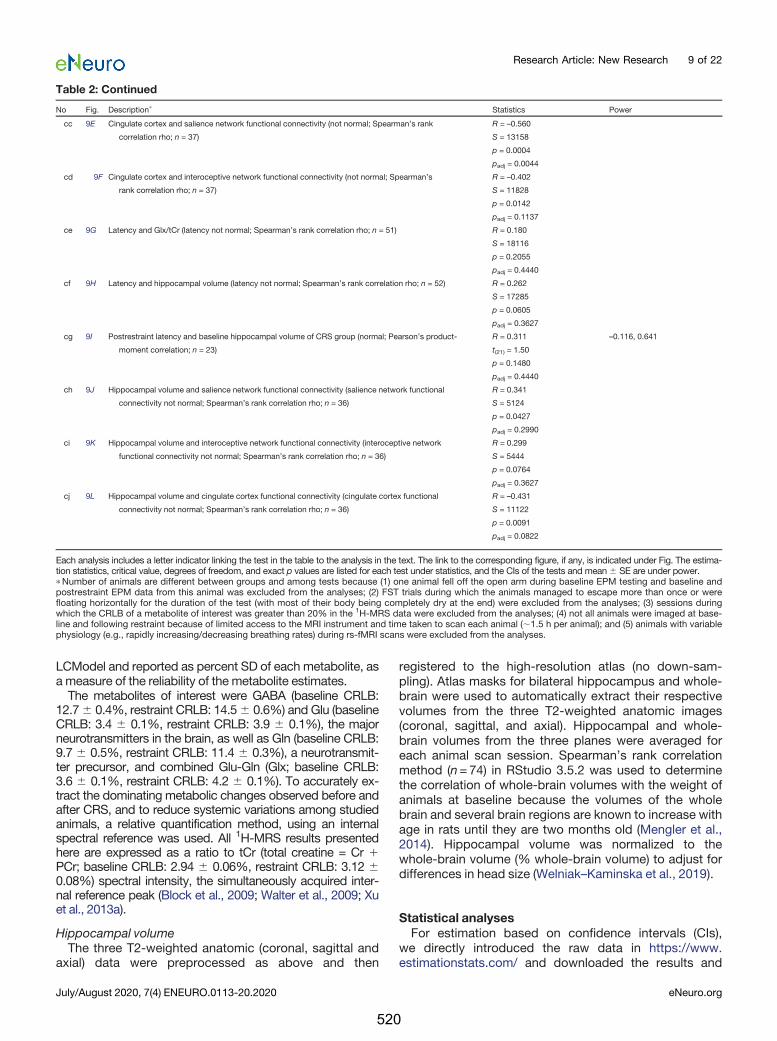
LCModel and reported as percent SD of each metabolite, asa measure of the reliability of the metabolite estimates.The metabolites of interest were GABA (baseline CRLB:
12.76 0.4%, restraint CRLB: 14.56 0.6%) and Glu (baselineCRLB: 3.4 6 0.1%, restraint CRLB: 3.9 6 0.1%), the majorneurotransmitters in the brain, as well as Gln (baseline CRLB:9.7 6 0.5%, restraint CRLB: 11.4 6 0.3%), a neurotransmit-ter precursor, and combined Glu-Gln (Glx; baseline CRLB:3.6 6 0.1%, restraint CRLB: 4.2 6 0.1%). To accurately ex-tract the dominating metabolic changes observed before andafter CRS, and to reduce systemic variations among studiedanimals, a relative quantification method, using an internalspectral reference was used. All 1H-MRS results presentedhere are expressed as a ratio to tCr (total creatine = Cr 1PCr; baseline CRLB: 2.94 6 0.06%, restraint CRLB: 3.12 60.08%) spectral intensity, the simultaneously acquired inter-nal reference peak (Block et al., 2009; Walter et al., 2009; Xuet al., 2013a).
Hippocampal volumeThe three T2-weighted anatomic (coronal, sagittal and
axial) data were preprocessed as above and then
registered to the high-resolution atlas (no down-sam-pling). Atlas masks for bilateral hippocampus and whole-brain were used to automatically extract their respectivevolumes from the three T2-weighted anatomic images(coronal, sagittal, and axial). Hippocampal and whole-brain volumes from the three planes were averaged foreach animal scan session. Spearman’s rank correlationmethod (n=74) in RStudio 3.5.2 was used to determinethe correlation of whole-brain volumes with the weight ofanimals at baseline because the volumes of the wholebrain and several brain regions are known to increase withage in rats until they are two months old (Mengler et al.,2014). Hippocampal volume was normalized to thewhole-brain volume (% whole-brain volume) to adjust fordifferences in head size (Welniak–Kaminska et al., 2019).
Statistical analysesFor estimation based on confidence intervals (CIs),
we directly introduced the raw data in https://www.estimationstats.com/ and downloaded the results and
Table 2: Continued
No Fig. Descriptionp Statistics Power
cc 9E Cingulate cortex and salience network functional connectivity (not normal; Spearman’s rank
correlation rho; n = 37)
R = –0.560
S = 13158
p = 0.0004
padj = 0.0044
cd 9F Cingulate cortex and interoceptive network functional connectivity (not normal; Spearman’s
rank correlation rho; n = 37)
R = –0.402
S = 11828
p = 0.0142
padj = 0.1137
ce 9G Latency and Glx/tCr (latency not normal; Spearman’s rank correlation rho; n = 51) R = 0.180
S = 18116
p = 0.2055
padj = 0.4440
cf 9H Latency and hippocampal volume (latency not normal; Spearman’s rank correlation rho; n = 52) R = 0.262
S = 17285
p = 0.0605
padj = 0.3627
cg 9I Postrestraint latency and baseline hippocampal volume of CRS group (normal; Pearson’s product-
moment correlation; n = 23)
R = 0.311
t(21) = 1.50
p = 0.1480
padj = 0.4440
–0.116, 0.641
ch 9J Hippocampal volume and salience network functional connectivity (salience network functional
connectivity not normal; Spearman’s rank correlation rho; n = 36)
R = 0.341
S = 5124
p = 0.0427
padj = 0.2990
ci 9K Hippocampal volume and interoceptive network functional connectivity (interoceptive network
functional connectivity not normal; Spearman’s rank correlation rho; n = 36)
R = 0.299
S = 5444
p = 0.0764
padj = 0.3627
cj 9L Hippocampal volume and cingulate cortex functional connectivity (cingulate cortex functional
connectivity not normal; Spearman’s rank correlation rho; n = 36)
R = –0.431
S = 11122
p = 0.0091
padj = 0.0822
Each analysis includes a letter indicator linking the test in the table to the analysis in the text. The link to the corresponding figure, if any, is indicated under Fig. The estima-tion statistics, critical value, degrees of freedom, and exact p values are listed for each test under statistics, and the CIs of the tests and mean6 SE are under power.pNumber of animals are different between groups and among tests because (1) one animal fell off the open arm during baseline EPM testing and baseline andpostrestraint EPM data from this animal was excluded from the analyses; (2) FST trials during which the animals managed to escape more than once or werefloating horizontally for the duration of the test (with most of their body being completely dry at the end) were excluded from the analyses; (3) sessions duringwhich the CRLB of a metabolite of interest was greater than 20% in the 1H-MRS data were excluded from the analyses; (4) not all animals were imaged at base-line and following restraint because of limited access to the MRI instrument and time taken to scan each animal (;1.5 h per animal); and (5) animals with variablephysiology (e.g., rapidly increasing/decreasing breathing rates) during rs-fMRI scans were excluded from the analyses.
Research Article: New Research 9 of 22
July/August 2020, 7(4) ENEURO.0113-20.2020 eNeuro.org
520
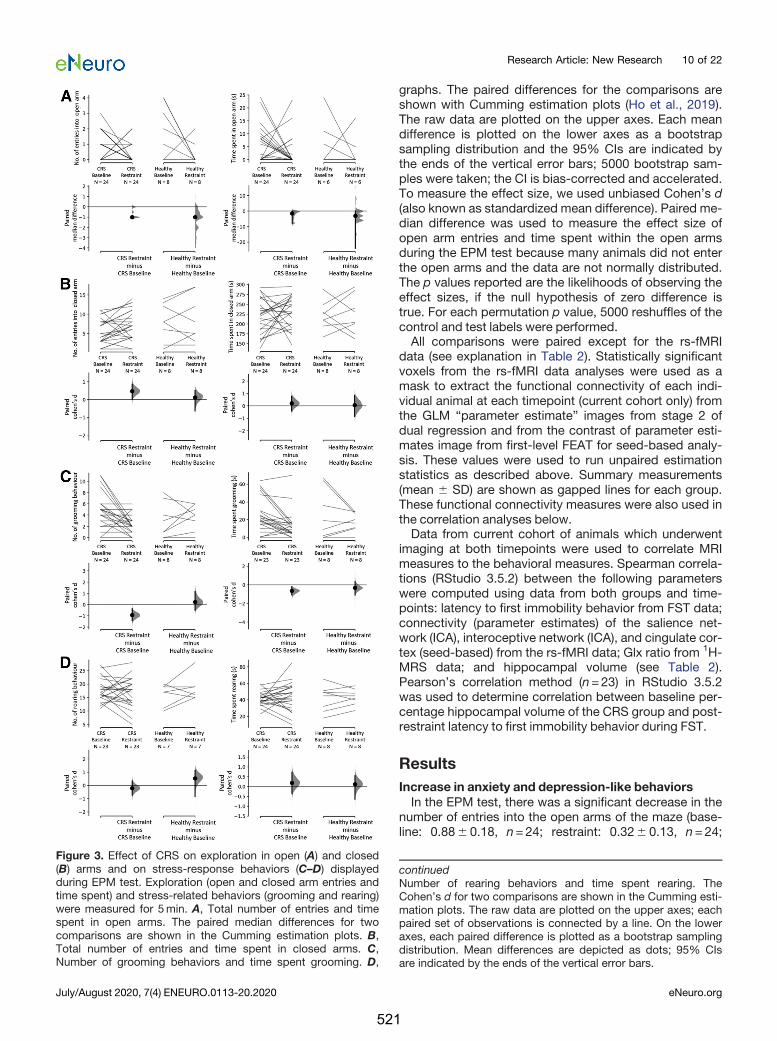
graphs. The paired differences for the comparisons areshown with Cumming estimation plots (Ho et al., 2019).The raw data are plotted on the upper axes. Each meandifference is plotted on the lower axes as a bootstrapsampling distribution and the 95% CIs are indicated bythe ends of the vertical error bars; 5000 bootstrap sam-ples were taken; the CI is bias-corrected and accelerated.To measure the effect size, we used unbiased Cohen’s d(also known as standardized mean difference). Paired me-dian difference was used to measure the effect size ofopen arm entries and time spent within the open armsduring the EPM test because many animals did not enterthe open arms and the data are not normally distributed.The p values reported are the likelihoods of observing theeffect sizes, if the null hypothesis of zero difference istrue. For each permutation p value, 5000 reshuffles of thecontrol and test labels were performed.All comparisons were paired except for the rs-fMRI
data (see explanation in Table 2). Statistically significantvoxels from the rs-fMRI data analyses were used as amask to extract the functional connectivity of each indi-vidual animal at each timepoint (current cohort only) fromthe GLM “parameter estimate” images from stage 2 ofdual regression and from the contrast of parameter esti-mates image from first-level FEAT for seed-based analy-sis. These values were used to run unpaired estimationstatistics as described above. Summary measurements(mean 6 SD) are shown as gapped lines for each group.These functional connectivity measures were also used inthe correlation analyses below.Data from current cohort of animals which underwent
imaging at both timepoints were used to correlate MRImeasures to the behavioral measures. Spearman correla-tions (RStudio 3.5.2) between the following parameterswere computed using data from both groups and time-points: latency to first immobility behavior from FST data;connectivity (parameter estimates) of the salience net-work (ICA), interoceptive network (ICA), and cingulate cor-tex (seed-based) from the rs-fMRI data; Glx ratio from 1H-MRS data; and hippocampal volume (see Table 2).Pearson’s correlation method (n=23) in RStudio 3.5.2was used to determine correlation between baseline per-centage hippocampal volume of the CRS group and post-restraint latency to first immobility behavior during FST.
ResultsIncrease in anxiety and depression-like behaviorsIn the EPM test, there was a significant decrease in the
number of entries into the open arms of the maze (base-line: 0.886 0.18, n=24; restraint: 0.326 0.13, n=24;
Figure 3. Effect of CRS on exploration in open (A) and closed(B) arms and on stress-response behaviors (C–D) displayedduring EPM test. Exploration (open and closed arm entries andtime spent) and stress-related behaviors (grooming and rearing)were measured for 5min. A, Total number of entries and timespent in open arms. The paired median differences for twocomparisons are shown in the Cumming estimation plots. B,Total number of entries and time spent in closed arms. C,Number of grooming behaviors and time spent grooming. D,
continuedNumber of rearing behaviors and time spent rearing. TheCohen’s d for two comparisons are shown in the Cumming esti-mation plots. The raw data are plotted on the upper axes; eachpaired set of observations is connected by a line. On the loweraxes, each paired difference is plotted as a bootstrap samplingdistribution. Mean differences are depicted as dots; 95% CIsare indicated by the ends of the vertical error bars.
Research Article: New Research 10 of 22
July/August 2020, 7(4) ENEURO.0113-20.2020 eNeuro.org
521
mediandiff = �1.0, p=0.0aa) and a significant increase inthe number of entries in the closed arms of the maze(baseline: 5.636 0.66, n=24; restraint: 7.2060.74,n=24; Cohen’s d =0.212, p=0.0282ae) following CRS.Note that there is considerable uncertainty about themagnitude of the effect of the restraint procedure onclosed arms entries, with the CI stretching down towardnegligible effects (95% CI[�0.0122, 0.856]; Fig. 3B).There were no significant differences for time spent ex-ploring the open arms or the closed arms (Fig. 3A,Bac,ag).There was also a significant decrease in the number oftimes the animals demonstrated grooming behaviors(baseline: 4.636 0.64, n=24; restraint: 2.2860.31,n=24; Cohen’s d = �0.921, p=0.001ai; Fig. 3C) and thetotal time spent grooming (baseline: 24.706 3.93 s,n=23; restraint: 14.486 3.30 s, n=23; Cohen’s d =�0.642, p=0.0016ak; Fig. 3C). However, the number oftimes rats exhibited rearing behaviors remained similarbetween the two timepoints, as did total time spent rear-ing (Fig. 3D; Table 2am,ao). Healthy control animals whichdid not undergo the CRS procedure did not show anychanges in any of the EPM measures between the twotimepoints (Fig. 3; Table 2aa-ap).There was no average change observed in the SPT data
for both animals which underwent 13d of restraint (base-line: 0.636 0.03, n=25; restraint: 0.696 0.04, n=25;95% CI[�0.294, 0.889]; Cohen’s d=0.289; p=0.312aq)and healthy control animals (baseline: 0.816 0.03, n=5;restraint: 0.786 0.07, n=5; 95% CI[�1.52, 0.831];Cohen’s d = �0.191, p=0.807 ar). Note that the CIs arelarge, and therefore, moderate effects in either directioncannot be ruled out.For the FST, animals in both groups had similar scores
for immobility and climbing behaviors at baseline, display-ing total active behaviors (climbing plus swimming) for;72% of the time (Fig. 4A; Table 2). After restraint, totalactivity decreased significantly compared with baseline(baseline: 426 2, n=19; restraint: 376 1, n=19; Cohen’sd = �0.62, p=0.0414as; Fig. 4A). When scores for bothactive behaviors were split, the decrease in climbing be-haviors following restraint was statistically significant(baseline: 166 2, n=19; restraint: 116 1, n=19; Cohen’sd = �0.696, p=0.021aw), but not for swimming (baseline:266 2, n=19; restraint: 266 2, n=19; Cohen’s d=0.0269,p=0.896au; Fig. 4B). Additionally, immobility increased(baseline: 1862, n=19; restraint: 236 1, n=19; Cohen’sd=0.611, p=0.0438ay) and latency to first immobility behav-ior decreased (baseline: 1196 9 s, n=19; restraint: 716 7 s,n=19; Cohen’s d = �1.34, p=0.0006ba; Fig. 4C). Healthycontrol animals which did not undergo the CRS proceduredid not show changes in any of the FST measures betweenthe two timepoints (Fig. 4; Table 2as-bb).
Changes in resting-state functional connectivityThe interoceptive (Becerra et al., 2011; Seewoo et al.,
2019) and salience (Bajic et al., 2016; Seewoo et al., 2019)networks were identified from baseline rs-fMRI dataand used in dual regression analysis for detecting func-tional connectivity differences induced by CRS (Fig. 5).Dual regression analysis revealed a large decrease in
connectivity of the bilateral somatosensory cortex to thesalience network (baseline: 3663, n=9; restraint: 196 1,n=15; unpaired Cohen’s d = �2.33, p=0.0bc,be; Fig. 5A,C) and of the right somatosensory cortex to the interocep-tive network (baseline: 396 5, n=9; restraint: 236 2,n=15; unpaired Cohen’s d = �1.38, p=0.0032bc,bg; Fig.5B,D). As a supplementary analysis, dual regression wasconducted using a subset of the restraint group, whichconsisted of the nine animals exhibiting the greatestchange in FST behavioral outcomes. A greater number ofsignificant voxels with p, 0.05bd (both networks) andlower p values for changes in the salience network wereobtained in the same brain regions (Fig. 5A,B; Table 3).Additionally, dual regression detected a significant de-crease in connectivity of the right motor cortex and bilat-eral insular cortex to the salience network (Fig. 5A).When rs-fMRI data of all animals were analyzed using a
seed-based analysis, a significantly greater functionalconnectivity of several brain regions to the cingulate cor-tex was detected in the restraint group (baseline:0.1360.02, n=9; restraint: 0.296 0.03, n=15; unpairedCohen’s d=1.51, p=0.0018bj; Fig. 6B). Specifically, hy-perconnectivity was detected in the right retrosplenialcortex, visual cortex, and inferior colliculus and in the bi-lateral thalamus, superior colliculus, dentate gyrus, andcornu ammonis 3 (CA3; Fig. 6Abi). Healthy control animalswhich did not undergo the CRS procedure did not showany change in functional connectivity between the twotimepoints (Figs. 5C,D, 6B; Table 2bf,bh,bk).
Changes in neurometabolite levels as detected by 1H-MRSThe concentrations of the neurotransmitters GABA and
Glu, the neurotransmitter precursor Gln, and Glx weremeasured before and after CRS and were computed rela-tive to tCr. Following restraint, rats had lower levels of Gln(baseline: 0.536 0.01, n=17; restraint: 0.506 0.01, n =17; Cohen’s d = �0.538, p=0.027bl), Glu (baseline:1.4160.02, n=17; restraint: 1.356 0.02, n=17; Cohen’sd = �0.711, p=0.071bn), and Glx (baseline: 1.946 0.02,n=17; restraint: 1.8560.03, n=17; Cohen’s d = �0.84,p=0.0186 bp) in the sensorimotor cortex (Fig. 7C–E). Notethat there is considerable uncertainty about the magni-tude of the effect of the restraint procedure on Glu levels,with the CI stretching up toward negligible effects (95%CI[�1.46, 0.134]; Fig. 7D). There was no change in GABA/tCr (baseline: 0.3560.01, n=16; restraint: 0.346 0.01,n=16br) and Gln/Glu (baseline: 0.386 0.01, n=17; re-straint: 0.376 0.01, n=17bt). Healthy control animalswhich did not undergo the CRS procedure did not showany change in neurometabolite levels between the twotimepoints (Fig. 7C-E; Table 2bl-bu).
Change in hippocampal volumeSpearman’s rank correlation method revealed a significant
correlation of whole-brain volumes with the weight of the ani-mals at baseline (S=28632, R=0.58, p=7.909e�8bv; Fig.8A), with the mean whole-brain volume to body weight ratioof the Sprague Dawley rats being 6.646 0.16 mm3/g.
Research Article: New Research 11 of 22
July/August 2020, 7(4) ENEURO.0113-20.2020 eNeuro.org
522
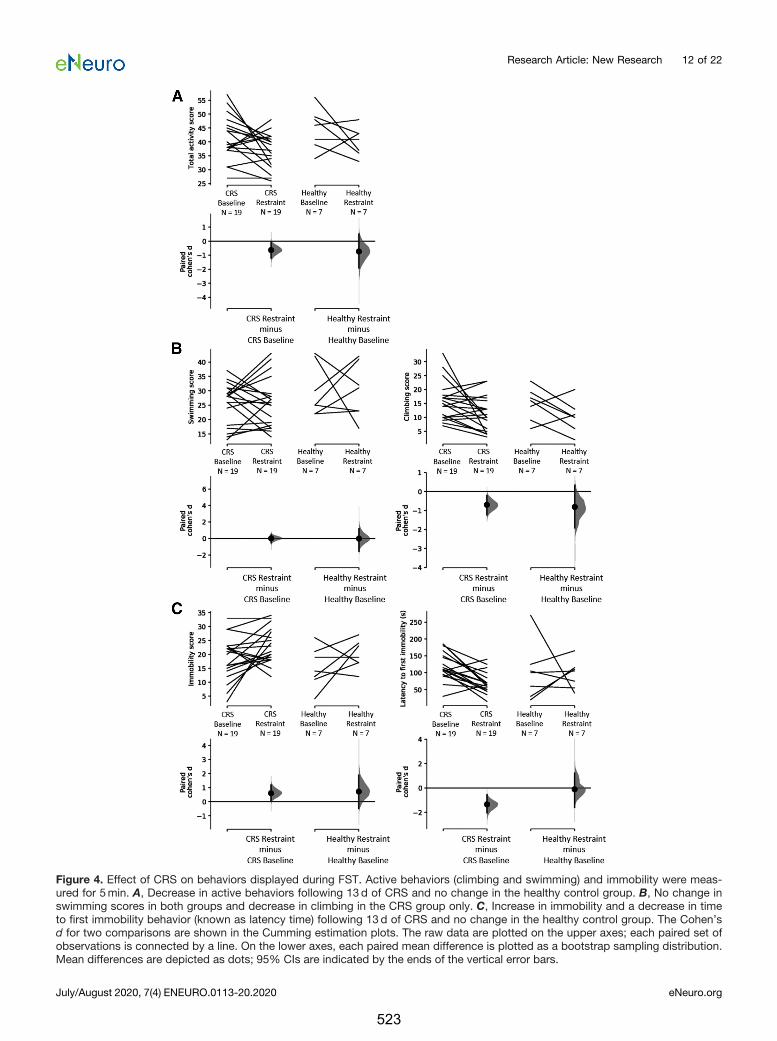
Figure 4. Effect of CRS on behaviors displayed during FST. Active behaviors (climbing and swimming) and immobility were meas-ured for 5min. A, Decrease in active behaviors following 13d of CRS and no change in the healthy control group. B, No change inswimming scores in both groups and decrease in climbing in the CRS group only. C, Increase in immobility and a decrease in timeto first immobility behavior (known as latency time) following 13d of CRS and no change in the healthy control group. The Cohen’sd for two comparisons are shown in the Cumming estimation plots. The raw data are plotted on the upper axes; each paired set ofobservations is connected by a line. On the lower axes, each paired mean difference is plotted as a bootstrap sampling distribution.Mean differences are depicted as dots; 95% CIs are indicated by the ends of the vertical error bars.
Research Article: New Research 12 of 22
July/August 2020, 7(4) ENEURO.0113-20.2020 eNeuro.org
523
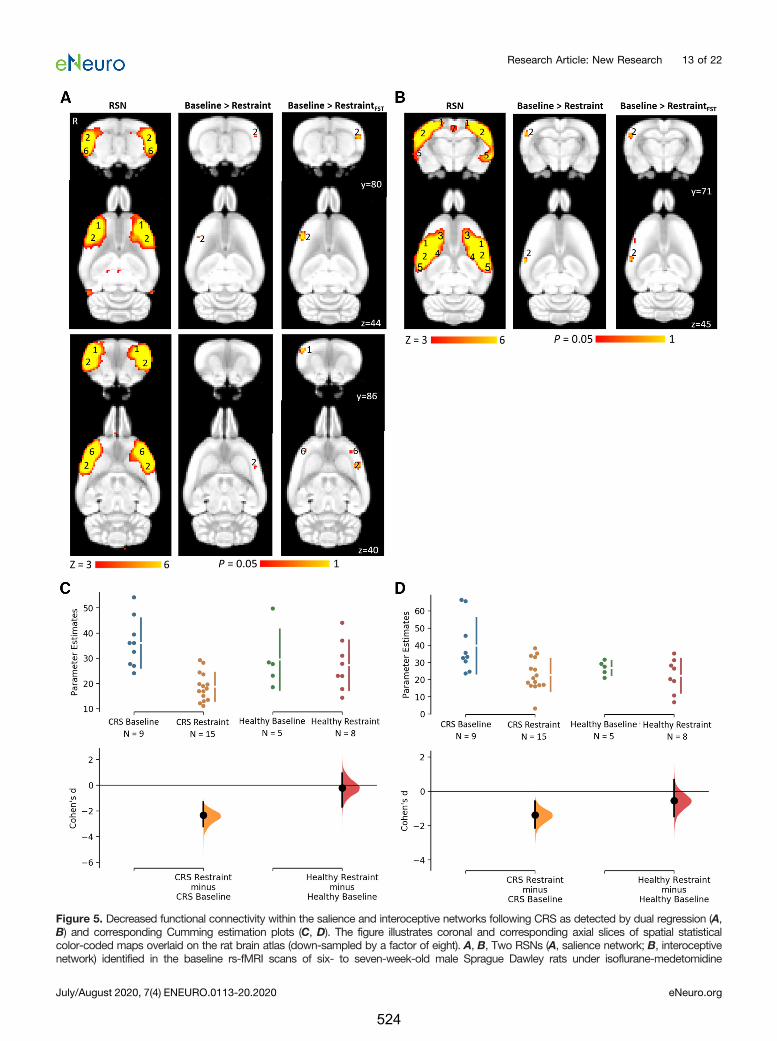
Figure 5. Decreased functional connectivity within the salience and interoceptive networks following CRS as detected by dual regression (A,B) and corresponding Cumming estimation plots (C, D). The figure illustrates coronal and corresponding axial slices of spatial statisticalcolor-coded maps overlaid on the rat brain atlas (down-sampled by a factor of eight). A, B, Two RSNs (A, salience network; B, interoceptivenetwork) identified in the baseline rs-fMRI scans of six- to seven-week-old male Sprague Dawley rats under isoflurane-medetomidine
Research Article: New Research 13 of 22
July/August 2020, 7(4) ENEURO.0113-20.2020 eNeuro.org
524
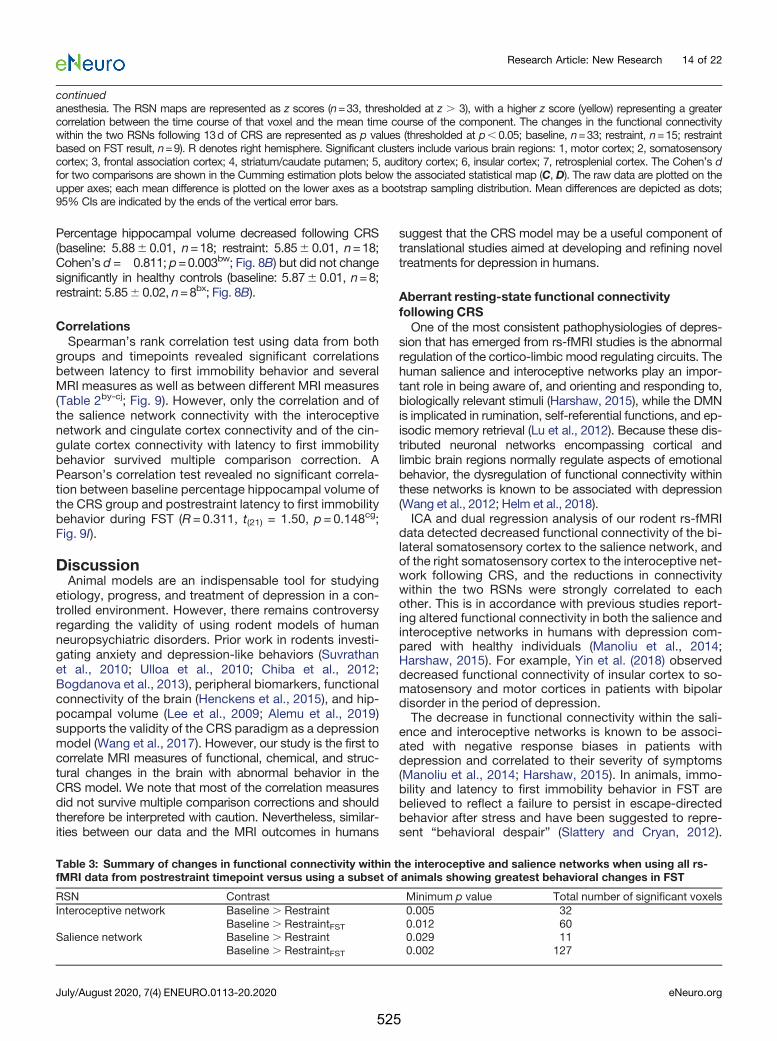
Percentage hippocampal volume decreased following CRS(baseline: 5.886 0.01, n=18; restraint: 5.856 0.01, n=18;Cohen’s d =�0.811; p=0.003bw; Fig. 8B) but did not changesignificantly in healthy controls (baseline: 5.876 0.01, n=8;restraint: 5.856 0.02, n=8bx; Fig. 8B).
CorrelationsSpearman’s rank correlation test using data from both
groups and timepoints revealed significant correlationsbetween latency to first immobility behavior and severalMRI measures as well as between different MRI measures(Table 2by-cj; Fig. 9). However, only the correlation and ofthe salience network connectivity with the interoceptivenetwork and cingulate cortex connectivity and of the cin-gulate cortex connectivity with latency to first immobilitybehavior survived multiple comparison correction. APearson’s correlation test revealed no significant correla-tion between baseline percentage hippocampal volume ofthe CRS group and postrestraint latency to first immobilitybehavior during FST (R=0.311, t(21) = 1.50, p=0.148cg;Fig. 9I).
DiscussionAnimal models are an indispensable tool for studying
etiology, progress, and treatment of depression in a con-trolled environment. However, there remains controversyregarding the validity of using rodent models of humanneuropsychiatric disorders. Prior work in rodents investi-gating anxiety and depression-like behaviors (Suvrathanet al., 2010; Ulloa et al., 2010; Chiba et al., 2012;Bogdanova et al., 2013), peripheral biomarkers, functionalconnectivity of the brain (Henckens et al., 2015), and hip-pocampal volume (Lee et al., 2009; Alemu et al., 2019)supports the validity of the CRS paradigm as a depressionmodel (Wang et al., 2017). However, our study is the first tocorrelate MRI measures of functional, chemical, and struc-tural changes in the brain with abnormal behavior in theCRS model. We note that most of the correlation measuresdid not survive multiple comparison corrections and shouldtherefore be interpreted with caution. Nevertheless, similar-ities between our data and the MRI outcomes in humans
suggest that the CRS model may be a useful component oftranslational studies aimed at developing and refining noveltreatments for depression in humans.
Aberrant resting-state functional connectivityfollowing CRSOne of the most consistent pathophysiologies of depres-
sion that has emerged from rs-fMRI studies is the abnormalregulation of the cortico-limbic mood regulating circuits. Thehuman salience and interoceptive networks play an impor-tant role in being aware of, and orienting and responding to,biologically relevant stimuli (Harshaw, 2015), while the DMNis implicated in rumination, self-referential functions, and ep-isodic memory retrieval (Lu et al., 2012). Because these dis-tributed neuronal networks encompassing cortical andlimbic brain regions normally regulate aspects of emotionalbehavior, the dysregulation of functional connectivity withinthese networks is known to be associated with depression(Wang et al., 2012; Helm et al., 2018).ICA and dual regression analysis of our rodent rs-fMRI
data detected decreased functional connectivity of the bi-lateral somatosensory cortex to the salience network, andof the right somatosensory cortex to the interoceptive net-work following CRS, and the reductions in connectivitywithin the two RSNs were strongly correlated to eachother. This is in accordance with previous studies report-ing altered functional connectivity in both the salience andinteroceptive networks in humans with depression com-pared with healthy individuals (Manoliu et al., 2014;Harshaw, 2015). For example, Yin et al. (2018) observeddecreased functional connectivity of insular cortex to so-matosensory and motor cortices in patients with bipolardisorder in the period of depression.The decrease in functional connectivity within the sali-
ence and interoceptive networks is known to be associ-ated with negative response biases in patients withdepression and correlated to their severity of symptoms(Manoliu et al., 2014; Harshaw, 2015). In animals, immo-bility and latency to first immobility behavior in FST arebelieved to reflect a failure to persist in escape-directedbehavior after stress and have been suggested to repre-sent “behavioral despair” (Slattery and Cryan, 2012).
Table 3: Summary of changes in functional connectivity within the interoceptive and salience networks when using all rs-fMRI data from postrestraint timepoint versus using a subset of animals showing greatest behavioral changes in FST
RSN Contrast Minimum p value Total number of significant voxelsInteroceptive network Baseline . Restraint 0.005 32
Baseline . RestraintFST 0.012 60Salience network Baseline . Restraint 0.029 11
Baseline . RestraintFST 0.002 127
continuedanesthesia. The RSN maps are represented as z scores (n=33, thresholded at z . 3), with a higher z score (yellow) representing a greatercorrelation between the time course of that voxel and the mean time course of the component. The changes in the functional connectivitywithin the two RSNs following 13d of CRS are represented as p values (thresholded at p, 0.05; baseline, n=33; restraint, n=15; restraintbased on FST result, n=9). R denotes right hemisphere. Significant clusters include various brain regions: 1, motor cortex; 2, somatosensorycortex; 3, frontal association cortex; 4, striatum/caudate putamen; 5, auditory cortex; 6, insular cortex; 7, retrosplenial cortex. The Cohen’s dfor two comparisons are shown in the Cumming estimation plots below the associated statistical map (C, D). The raw data are plotted on theupper axes; each mean difference is plotted on the lower axes as a bootstrap sampling distribution. Mean differences are depicted as dots;95% CIs are indicated by the ends of the vertical error bars.
Research Article: New Research 14 of 22
July/August 2020, 7(4) ENEURO.0113-20.2020 eNeuro.org
525
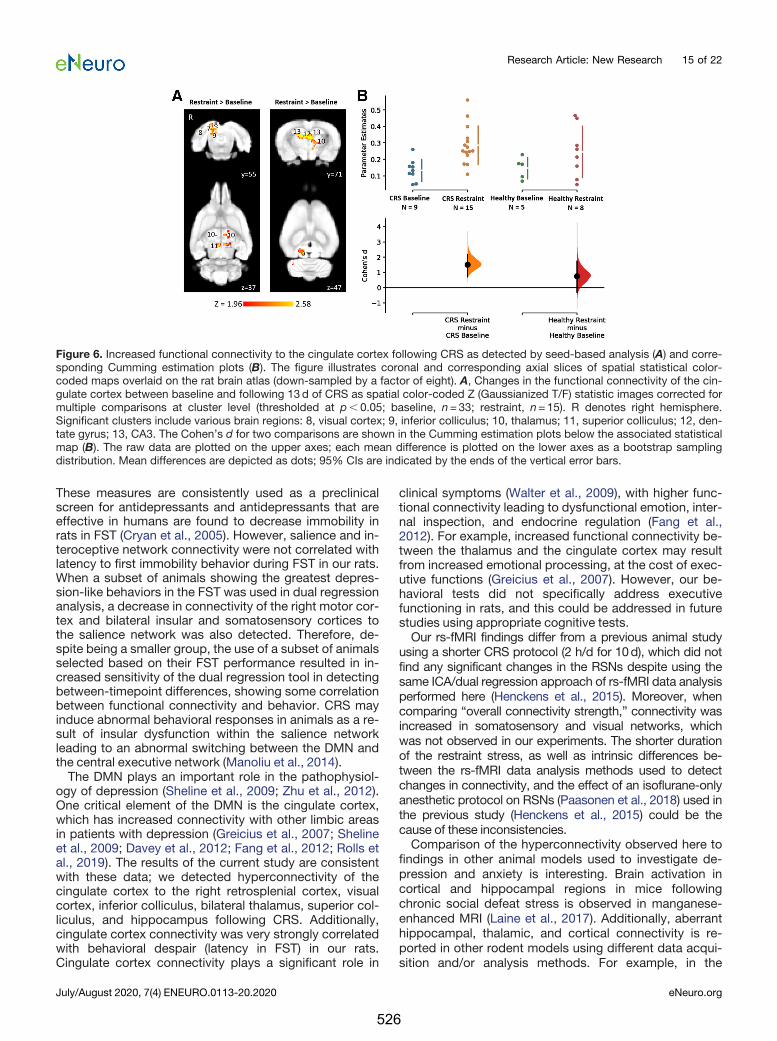
These measures are consistently used as a preclinicalscreen for antidepressants and antidepressants that areeffective in humans are found to decrease immobility inrats in FST (Cryan et al., 2005). However, salience and in-teroceptive network connectivity were not correlated withlatency to first immobility behavior during FST in our rats.When a subset of animals showing the greatest depres-sion-like behaviors in the FST was used in dual regressionanalysis, a decrease in connectivity of the right motor cor-tex and bilateral insular and somatosensory cortices tothe salience network was also detected. Therefore, de-spite being a smaller group, the use of a subset of animalsselected based on their FST performance resulted in in-creased sensitivity of the dual regression tool in detectingbetween-timepoint differences, showing some correlationbetween functional connectivity and behavior. CRS mayinduce abnormal behavioral responses in animals as a re-sult of insular dysfunction within the salience networkleading to an abnormal switching between the DMN andthe central executive network (Manoliu et al., 2014).The DMN plays an important role in the pathophysiol-
ogy of depression (Sheline et al., 2009; Zhu et al., 2012).One critical element of the DMN is the cingulate cortex,which has increased connectivity with other limbic areasin patients with depression (Greicius et al., 2007; Shelineet al., 2009; Davey et al., 2012; Fang et al., 2012; Rolls etal., 2019). The results of the current study are consistentwith these data; we detected hyperconnectivity of thecingulate cortex to the right retrosplenial cortex, visualcortex, inferior colliculus, bilateral thalamus, superior col-liculus, and hippocampus following CRS. Additionally,cingulate cortex connectivity was very strongly correlatedwith behavioral despair (latency in FST) in our rats.Cingulate cortex connectivity plays a significant role in
clinical symptoms (Walter et al., 2009), with higher func-tional connectivity leading to dysfunctional emotion, inter-nal inspection, and endocrine regulation (Fang et al.,2012). For example, increased functional connectivity be-tween the thalamus and the cingulate cortex may resultfrom increased emotional processing, at the cost of exec-utive functions (Greicius et al., 2007). However, our be-havioral tests did not specifically address executivefunctioning in rats, and this could be addressed in futurestudies using appropriate cognitive tests.Our rs-fMRI findings differ from a previous animal study
using a shorter CRS protocol (2 h/d for 10d), which did notfind any significant changes in the RSNs despite using thesame ICA/dual regression approach of rs-fMRI data analysisperformed here (Henckens et al., 2015). Moreover, whencomparing “overall connectivity strength,” connectivity wasincreased in somatosensory and visual networks, whichwas not observed in our experiments. The shorter durationof the restraint stress, as well as intrinsic differences be-tween the rs-fMRI data analysis methods used to detectchanges in connectivity, and the effect of an isoflurane-onlyanesthetic protocol on RSNs (Paasonen et al., 2018) used inthe previous study (Henckens et al., 2015) could be thecause of these inconsistencies.Comparison of the hyperconnectivity observed here to
findings in other animal models used to investigate de-pression and anxiety is interesting. Brain activation incortical and hippocampal regions in mice followingchronic social defeat stress is observed in manganese-enhanced MRI (Laine et al., 2017). Additionally, aberranthippocampal, thalamic, and cortical connectivity is re-ported in other rodent models using different data acqui-sition and/or analysis methods. For example, in the
Figure 6. Increased functional connectivity to the cingulate cortex following CRS as detected by seed-based analysis (A) and corre-sponding Cumming estimation plots (B). The figure illustrates coronal and corresponding axial slices of spatial statistical color-coded maps overlaid on the rat brain atlas (down-sampled by a factor of eight). A, Changes in the functional connectivity of the cin-gulate cortex between baseline and following 13d of CRS as spatial color-coded Z (Gaussianized T/F) statistic images corrected formultiple comparisons at cluster level (thresholded at p, 0.05; baseline, n=33; restraint, n=15). R denotes right hemisphere.Significant clusters include various brain regions: 8, visual cortex; 9, inferior colliculus; 10, thalamus; 11, superior colliculus; 12, den-tate gyrus; 13, CA3. The Cohen’s d for two comparisons are shown in the Cumming estimation plots below the associated statisticalmap (B). The raw data are plotted on the upper axes; each mean difference is plotted on the lower axes as a bootstrap samplingdistribution. Mean differences are depicted as dots; 95% CIs are indicated by the ends of the vertical error bars.
Research Article: New Research 15 of 22
July/August 2020, 7(4) ENEURO.0113-20.2020 eNeuro.org
526
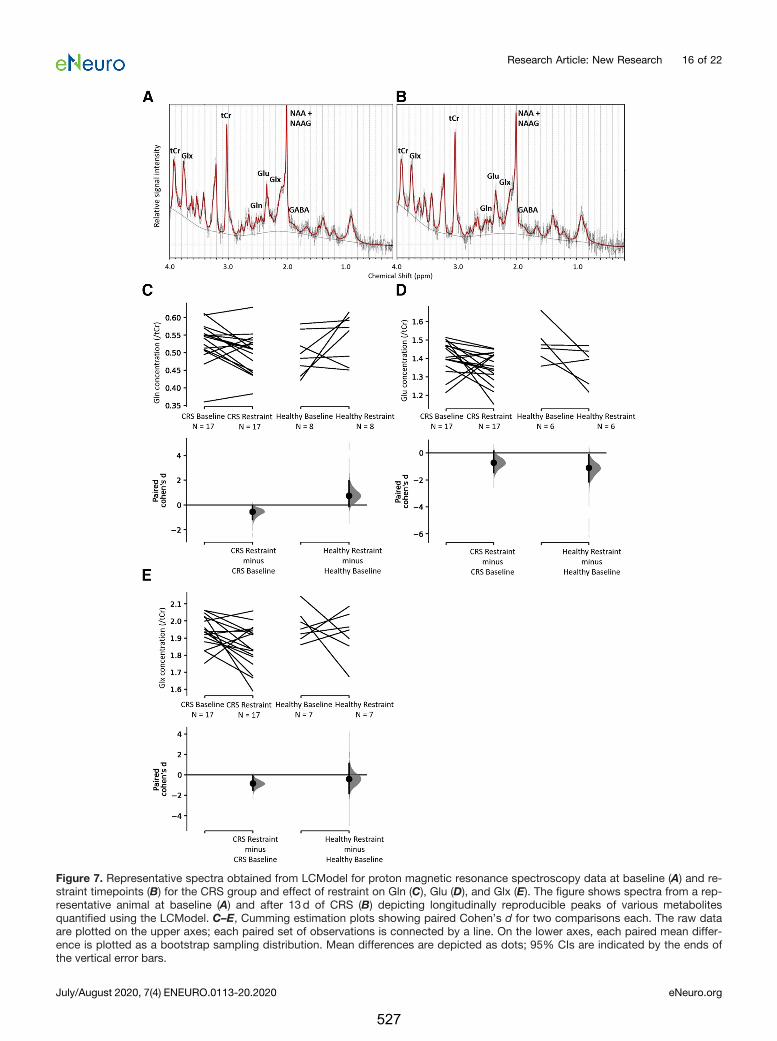
Figure 7. Representative spectra obtained from LCModel for proton magnetic resonance spectroscopy data at baseline (A) and re-straint timepoints (B) for the CRS group and effect of restraint on Gln (C), Glu (D), and Glx (E). The figure shows spectra from a rep-resentative animal at baseline (A) and after 13d of CRS (B) depicting longitudinally reproducible peaks of various metabolitesquantified using the LCModel. C–E, Cumming estimation plots showing paired Cohen’s d for two comparisons each. The raw dataare plotted on the upper axes; each paired set of observations is connected by a line. On the lower axes, each paired mean differ-ence is plotted as a bootstrap sampling distribution. Mean differences are depicted as dots; 95% CIs are indicated by the ends ofthe vertical error bars.
Research Article: New Research 16 of 22
July/August 2020, 7(4) ENEURO.0113-20.2020 eNeuro.org
527
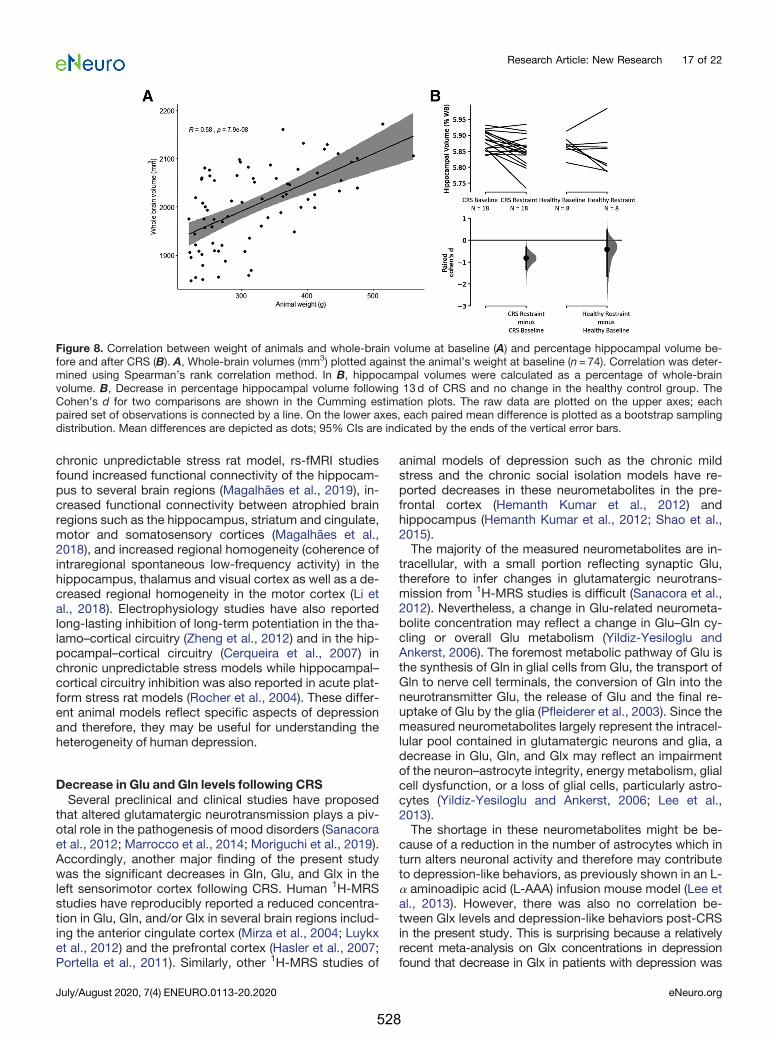
chronic unpredictable stress rat model, rs-fMRI studiesfound increased functional connectivity of the hippocam-pus to several brain regions (Magalhães et al., 2019), in-creased functional connectivity between atrophied brainregions such as the hippocampus, striatum and cingulate,motor and somatosensory cortices (Magalhães et al.,2018), and increased regional homogeneity (coherence ofintraregional spontaneous low-frequency activity) in thehippocampus, thalamus and visual cortex as well as a de-creased regional homogeneity in the motor cortex (Li etal., 2018). Electrophysiology studies have also reportedlong-lasting inhibition of long-term potentiation in the tha-lamo–cortical circuitry (Zheng et al., 2012) and in the hip-pocampal–cortical circuitry (Cerqueira et al., 2007) inchronic unpredictable stress models while hippocampal–cortical circuitry inhibition was also reported in acute plat-form stress rat models (Rocher et al., 2004). These differ-ent animal models reflect specific aspects of depressionand therefore, they may be useful for understanding theheterogeneity of human depression.
Decrease in Glu and Gln levels following CRSSeveral preclinical and clinical studies have proposed
that altered glutamatergic neurotransmission plays a piv-otal role in the pathogenesis of mood disorders (Sanacoraet al., 2012; Marrocco et al., 2014; Moriguchi et al., 2019).Accordingly, another major finding of the present studywas the significant decreases in Gln, Glu, and Glx in theleft sensorimotor cortex following CRS. Human 1H-MRSstudies have reproducibly reported a reduced concentra-tion in Glu, Gln, and/or Glx in several brain regions includ-ing the anterior cingulate cortex (Mirza et al., 2004; Luykxet al., 2012) and the prefrontal cortex (Hasler et al., 2007;Portella et al., 2011). Similarly, other 1H-MRS studies of
animal models of depression such as the chronic mildstress and the chronic social isolation models have re-ported decreases in these neurometabolites in the pre-frontal cortex (Hemanth Kumar et al., 2012) andhippocampus (Hemanth Kumar et al., 2012; Shao et al.,2015).The majority of the measured neurometabolites are in-
tracellular, with a small portion reflecting synaptic Glu,therefore to infer changes in glutamatergic neurotrans-mission from 1H-MRS studies is difficult (Sanacora et al.,2012). Nevertheless, a change in Glu-related neurometa-bolite concentration may reflect a change in Glu–Gln cy-cling or overall Glu metabolism (Yildiz-Yesiloglu andAnkerst, 2006). The foremost metabolic pathway of Glu isthe synthesis of Gln in glial cells from Glu, the transport ofGln to nerve cell terminals, the conversion of Gln into theneurotransmitter Glu, the release of Glu and the final re-uptake of Glu by the glia (Pfleiderer et al., 2003). Since themeasured neurometabolites largely represent the intracel-lular pool contained in glutamatergic neurons and glia, adecrease in Glu, Gln, and Glx may reflect an impairmentof the neuron–astrocyte integrity, energy metabolism, glialcell dysfunction, or a loss of glial cells, particularly astro-cytes (Yildiz-Yesiloglu and Ankerst, 2006; Lee et al.,2013).The shortage in these neurometabolites might be be-
cause of a reduction in the number of astrocytes which inturn alters neuronal activity and therefore may contributeto depression-like behaviors, as previously shown in an L-a aminoadipic acid (L-AAA) infusion mouse model (Lee etal., 2013). However, there was also no correlation be-tween Glx levels and depression-like behaviors post-CRSin the present study. This is surprising because a relativelyrecent meta-analysis on Glx concentrations in depressionfound that decrease in Glx in patients with depression was
Figure 8. Correlation between weight of animals and whole-brain volume at baseline (A) and percentage hippocampal volume be-fore and after CRS (B). A, Whole-brain volumes (mm3) plotted against the animal’s weight at baseline (n=74). Correlation was deter-mined using Spearman’s rank correlation method. In B, hippocampal volumes were calculated as a percentage of whole-brainvolume. B, Decrease in percentage hippocampal volume following 13d of CRS and no change in the healthy control group. TheCohen’s d for two comparisons are shown in the Cumming estimation plots. The raw data are plotted on the upper axes; eachpaired set of observations is connected by a line. On the lower axes, each paired mean difference is plotted as a bootstrap samplingdistribution. Mean differences are depicted as dots; 95% CIs are indicated by the ends of the vertical error bars.
Research Article: New Research 17 of 22
July/August 2020, 7(4) ENEURO.0113-20.2020 eNeuro.org
528
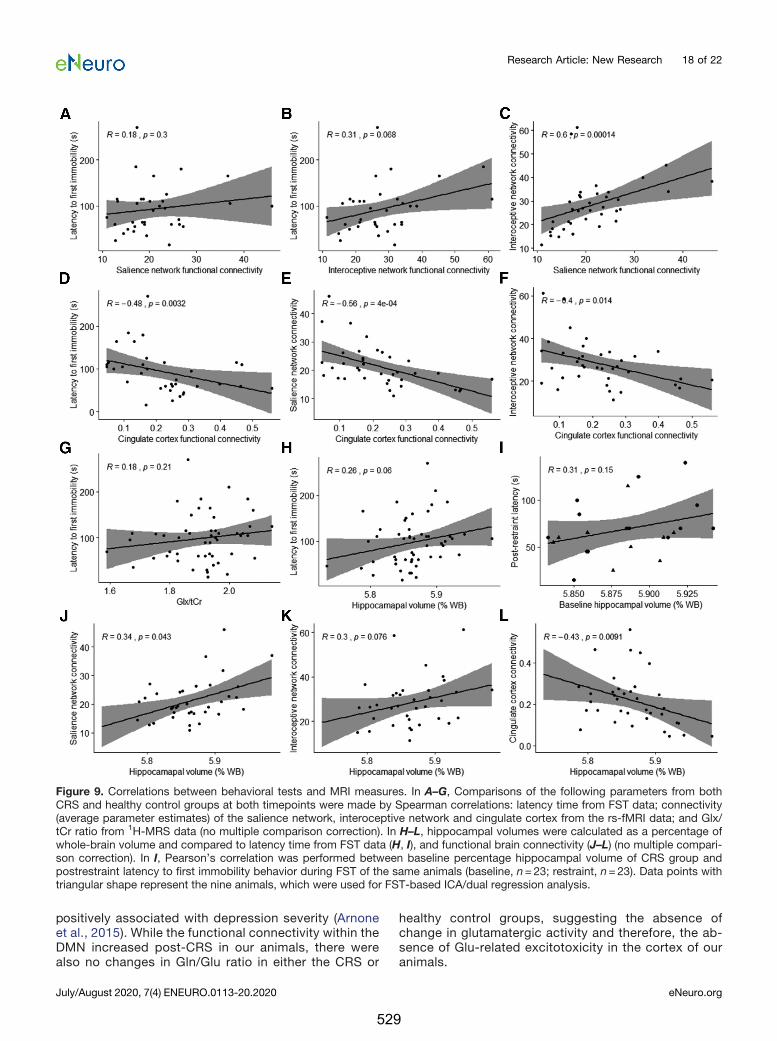
positively associated with depression severity (Arnoneet al., 2015). While the functional connectivity within theDMN increased post-CRS in our animals, there werealso no changes in Gln/Glu ratio in either the CRS or
healthy control groups, suggesting the absence ofchange in glutamatergic activity and therefore, the ab-sence of Glu-related excitotoxicity in the cortex of ouranimals.
Figure 9. Correlations between behavioral tests and MRI measures. In A–G, Comparisons of the following parameters from bothCRS and healthy control groups at both timepoints were made by Spearman correlations: latency time from FST data; connectivity(average parameter estimates) of the salience network, interoceptive network and cingulate cortex from the rs-fMRI data; and Glx/tCr ratio from 1H-MRS data (no multiple comparison correction). In H–L, hippocampal volumes were calculated as a percentage ofwhole-brain volume and compared to latency time from FST data (H, I), and functional brain connectivity (J–L) (no multiple compari-son correction). In I, Pearson’s correlation was performed between baseline percentage hippocampal volume of CRS group andpostrestraint latency to first immobility behavior during FST of the same animals (baseline, n=23; restraint, n=23). Data points withtriangular shape represent the nine animals, which were used for FST-based ICA/dual regression analysis.
Research Article: New Research 18 of 22
July/August 2020, 7(4) ENEURO.0113-20.2020 eNeuro.org
529
Decrease in hippocampal volumeThere are several convergent lines of evidence from
both preclinical and clinical studies that implicate the hip-pocampus in the pathogenesis of depression (Campbelland Macqueen, 2004). The hippocampus is a key brain re-gion within the limbic system and plays a determinant rolein emotional regulation. As mentioned above, the hippo-campus is one of several regions, including the prefrontalcortex, the cingulate cortex, and the thalamus that havebeen identified to be part of the DMN showing abnormallyhigher functional connectivity in patients with depressioncompared with healthy individuals (Sheline et al., 2009).Additionally, the hippocampus is known to be a highlystress-sensitive structure as increased levels of glucocorti-coids in stressful situations are known to disrupt hippocam-pal neurogenesis, which may lead to hippocampal atrophy(Dranovsky and Hen, 2006). A reduction in hippocampal vol-ume has been consistently associated with depression inhumans (McKinnon et al., 2009). However, the stage atwhich hippocampal atrophy begins in human depression isunclear and so is the direction of causality.There are two main hypotheses regarding how depres-
sion is associated with hippocampal atrophy. First, hippo-campal volume reduction, probably as a result of early lifeadversity, poverty, and stress, might predispose peopleto depression. This hypothesis seems consistent withsmaller hippocampal volumes already present in first de-pressive episodes (Cole et al., 2011) and in young children(Barch et al., 2019) and adolescents (Rao et al., 2010) withdepression. The second hypothesis, known as the neuro-toxicity hypothesis, suggests that cumulative exposure todisrupted emotion regulation, stress reactivity, glucocorti-coids, and antidepressant medications as a result of de-pression increases neuronal susceptibility to insults andtherefore leads to hippocampal deficits (Sheline, 2011).This hypothesis is consistent with hippocampal atrophybeing more pronounced among individuals with recurrentepisodes and in chronic depression (McKinnon et al.,2009; Cheng et al., 2010; Brown et al., 2014).The longitudinal nature of the present study precludes
the first hypothesis in CRS animals. While hippocampalvolume was weakly correlated with latency overall, therewas no correlation between baseline hippocampal vol-ume and post-CRS latency. This shows that baseline hip-pocampal volume did not predict severity of symptoms inthis CRS model. Therefore, this study supports the neuro-toxicity hypothesis and further suggests that the reduc-tion in hippocampal volume might happen at a very earlystage in depression, i.e., within only three weeks in thisanimal model. Additionally, hippocampal volume was cor-related to functional connectivity of the salience network,interoceptive network, and cingulate cortex, which sug-gests the presence of a common pathway for the mecha-nism of depression.
Study limitationsOur study has four main limitations. First, only young
adult male rats were used in this study, although CRS hasbeen shown to successfully induce depression-like be-haviors in freely cycling adolescent female rats (Hibicke et
al., 2017a,b). Future studies could expand the applicabil-ity of present results by investigating brain changes fol-lowing CRS in female rats and in older rats. Second, theSPT did not detect anhedonia in our animals following re-straint, despite anhedonia being a well-documented ef-fect of CRS (Chiba et al., 2012; Ampuero et al., 2015; Liuet al., 2016). Use of non-acidified water and longer habitu-ation and/or test times as performed in these studies maybe required. Third, MRI data were acquired under anes-thesia, which could potentially alter the blood oxygenlevel-dependent (BOLD) signal detection. However, func-tional connectivity patterns of animals anaesthetizedusing a combination of low-dose isoflurane and medeto-midine have good correspondence with those of awakerats (Paasonen et al., 2018) with strong intercortical andcortical-subcortical functional connectivity (Grandjean etal., 2014; Bukhari et al., 2017) and are reproducible (Lu etal., 2012). Moreover, 1H-MRS data were acquired only inthe left sensorimotor cortex. Future studies can investi-gate neurometabolite changes in bilateral sensorimotorcortex as well as in other brain regions such as the basalganglia, hippocampus, anterior cingulate cortex, and oc-cipital cortex, which are extensively investigated in 1H-MRS studies of human depression. Neurometabolite andstructural changes could be confirmed using invasivemethods following CRS. Finally, the pharmacological orinterventional validity of the present neuroimaging find-ings is unknown. Future work should examine the utility ofthese findings as preclinical target engagement bio-markers with pharmacological and neuromodulatory in-terventions. If this proves to be the case, this animalmodel has potential utility for high throughput dose find-ing studies of neurotherapeutics and novel interventions.
ConclusionThe present study is the first to demonstrate significant
changes in functional connectivity, neurometabolite lev-els, and hippocampal volume in the same young adultmale rats post-CRS and the correlation of these measureswith changes in behavior provide insight into the neuro-biological changes that may underpin patient symptoms.Cumulative exposure to stress might increases neuronaland astrocytic death leading to hippocampal atrophy anda shortage in Glu and Gln, which in turn alters neuronalactivity and therefore contribute to learned helplessness.Overall, the substantial concordance of the present find-ings with the literature of human depression presents aunique opportunity for the integration of behavioral, cellu-lar and molecular changes detected in this depressionmodel with changes in MRI measures of brain function,chemistry and structure that may be translated to futurestudies of the human disorder, especially when testingthe effects of new drug treatments or therapies.
References
Alemu JL, Elberling F, Azam B, Pakkenberg B, Olesen MV (2019)Electroconvulsive treatment prevents chronic restraint stress-in-duced atrophy of the hippocampal formation-a stereologicalstudy. Brain Behav 9:e01195.
Research Article: New Research 19 of 22
July/August 2020, 7(4) ENEURO.0113-20.2020 eNeuro.org
530
Ampuero E, Luarte A, Santibañez M, Varas-Godoy M, Toledo J,Diaz-Veliz G, Cavada G, Rubio FJ, Wyneken U (2015) Two chronicstress models based on movement restriction in rats respond se-lectively to antidepressant drugs: aldolase C as a potential bio-marker. Int J Neuropsychopharmacol 18:pyv038.
Arnone D, Mumuni AN, Jauhar S, Condon B, Cavanagh J (2015) Indirectevidence of selective glial involvement in glutamate-based mecha-nisms of mood regulation in depression: meta-analysis of absolute pre-frontal neuro-metabolic concentrations. Eur Neuropsychopharmacol25:1109–1117.
Bajic D, Craig MM, Borsook D, Becerra L (2016) Probing intrinsicresting-state networks in the infant rat brain. Front Behav Neurosci10:192.
Barch DM, Tillman R, Kelly D, Whalen D, Gilbert K, Luby JL (2019)Hippocampal volume and depression among young children.Psychiatry Res Neuroimaging 288:21–28.
Becerra L, Pendse G, Chang P-C, Bishop J, Borsook D (2011)Robust reproducible resting state networks in the awake rodentbrain. PLoS One 6:e25701.
Beckmann CF, Jenkinson M, Smith SM (2003) General multilevel lin-ear modeling for group analysis in fMRI. Neuroimage 20:1052–1063.
Beckmann CF, DeLuca M, Devlin JT, Smith SM (2005) Investigationsinto resting-state connectivity using independent component anal-ysis. Philos Trans R Soc Lond B Biol Sci 360:1001–1013.
Bidgood WD Jr, Horii SC, Prior FW, Van Syckle DE (1997)Understanding and using DICOM, the data interchange standardfor biomedical imaging. J AmMed Inform Assoc 4:199–212.
Block W, Träber F, von Widdern O, Metten M, Schild H, Maier W,Zobel A, Jessen F (2009) Proton MR spectroscopy of the hippo-campus at 3 T in patients with unipolar major depressive disorder:correlates and predictors of treatment response. Int JNeuropsychopharmacol 12:415–422.
Bogdanova OV, Kanekar S, D’Anci KE, Renshaw PF (2013) Factorsinfluencing behavior in the forced swim test. Physiol Behav118:227–239.
Bravo JA, Díaz-Veliz G, Mora S, Ulloa JL, Berthoud VM, Morales P,Arancibia S, Fiedler JL (2009) Desipramine prevents stress-in-duced changes in depressive-like behavior and hippocampalmarkers of neuroprotection. Behav Pharmacol 20:273–285.
Brown ES, Hughes CW, McColl R, Peshock R, King KS, Rush AJ(2014) Association of depressive symptoms with hippocampal vol-ume in 1936 adults. Neuropsychopharmacology 39:770–779.
Bukhari Q, Schroeter A, Cole DM, Rudin M (2017) Resting state fMRIin mice reveals anesthesia specific signatures of brain functionalnetworks and their interactions. Front Neural Circuits 11:5.
Buyukdura JS, McClintock SM, Croarkin PE (2011) Psychomotor re-tardation in depression: biological underpinnings, measurement,and treatment. Prog Neuropsychopharmacol Biol Psychiatry35:395–409.
Campbell S, Macqueen G (2004) The role of the hippocampus in thepathophysiology of major depression. J Psychiatry Neurosci29:417–426.
Cerqueira JJ, Mailliet F, Almeida OFX, Jay TM, Sousa N (2007) Theprefrontal cortex as a key target of the maladaptive response tostress. J Neurosci 27:2781–2787.
Cheng YQ, Xu J, Chai P, Li HJ, Luo CR, Yang T, Li L, Shan BC, XuXF, Xu L (2010) Brain volume alteration and the correlations withthe clinical characteristics in drug-naïve first-episode MDD pa-tients: a voxel-based morphometry study. Neurosci Lett 480:30–34.
Chiba S, Numakawa T, Ninomiya M, Richards MC, Wakabayashi C,Kunugi H (2012) Chronic restraint stress causes anxiety- and de-pression-like behaviors, downregulates glucocorticoid receptorexpression, and attenuates glutamate release induced by brain-derived neurotrophic factor in the prefrontal cortex. ProgNeuropsychopharmacol Biol Psychiatry 39:112–119.
Cole J, Costafreda SG, McGuffin P, Fu CHY (2011) Hippocampal at-rophy in first episode depression: a meta-analysis of magnetic res-onance imaging studies. J Affect Disord 134:483–487.
Cryan JF, Valentino RJ, Lucki I (2005) Assessing substrates underly-ing the behavioral effects of antidepressants using the modified ratforced swimming test. Neurosci Biobehav Rev 29:547–569.
Davey CG, Harrison BJ, Yücel M, Allen NB (2012) Regionally specificalterations in functional connectivity of the anterior cingulate cor-tex in major depressive disorder. Psychol Med 42:2071–2081.
Dranovsky A, Hen R (2006) Hippocampal neurogenesis: regulationby stress and antidepressants. Biol Psychiatry 59:1136–1143.
Drevets WC, Savitz J, Trimble M (2008) The subgenual anterior cin-gulate cortex in mood disorders. CNS Spectr 13:663–681.
Fang P, Zeng L-L, Shen H, Wang L, Li B, Liu L, Hu D (2012)Increased cortical-limbic anatomical network connectivity in majordepression revealed by diffusion tensor imaging. PLoS One 7:e45972.
Grandjean J, Schroeter A, Batata I, Rudin M (2014) Optimization ofanesthesia protocol for resting-state fMRI in mice based on differ-ential effects of anesthetics on functional connectivity patterns.Neuroimage 102:838–847.
Greicius MD, Flores BH, Menon V, Glover GH, Solvason HB, KennaH, Reiss AL, Schatzberg AF (2007) Resting-state functional con-nectivity in major depression: abnormally increased contributionsfrom subgenual cingulate cortex and thalamus. Biol Psychiatry62:429–437.
Harshaw C (2015) Interoceptive dysfunction: toward an integratedframework for understanding somatic and affective disturbance indepression. Psychol Bull 141:311–363.
Hasler G, van der Veen JW, Tumonis T, Meyers N, Shen J, DrevetsWC (2007) Reduced prefrontal glutamate/glutamine and g-amino-butyric acid levels in major depression determined using protonmagnetic resonance spectroscopy. Arch Gen Psychiatry 64:193–200.
Helm K, Viol K, Weiger TM, Tass PA, Grefkes C, Del Monte D,Schiepek G (2018) Neuronal connectivity in major depressive dis-order: a systematic review. Neuropsychiatr Dis Treat 14:2715–2737.
Hemanth Kumar BS, Mishra SK, Rana P, Singh S, Khushu S (2012)Neurodegenerative evidences during early onset of depression inCMS rats as detected by proton magnetic resonance spectros-copy at 7 T. Behav Brain Res 232:53–59.
Henckens M, van der Marel K, van der Toorn A, Pillai AG, FernándezG, Dijkhuizen RM, Joëls M (2015) Stress-induced alterations inlarge-scale functional networks of the rodent brain. Neuroimage105:312–322.
Hibicke M, Graham MA, Hayslett RL (2017a) Adolescent chronic re-straint stress (aCRS) elicits robust depressive-like behavior infreely cycling, adult female rats without increasing anxiety-like be-haviors. Exp Clin Psychopharmacol 25:74–83.
Hibicke M, Graham MA, Hayslett RL (2017b) Adult female rats ex-posed to adolescent chronic restraint stress (aCRS) display robustdepressive-like behavior, cognitive impairment, and an unex-pected correlation with serum BDNF. FASEB J 31:989–984.
Ho J, Tumkaya T, Aryal S, Choi H, Claridge-Chang A (2019) Movingbeyond P values: data analysis with estimation graphics. NatMethods 16:565–566.
Ilamkar KR (2014) Psychomotor retardation, attention deficit and ex-ecutive dysfunctional in young non-hospitalised un-medicatednon-psychotic unipolar depression patients. J Clin Diagn Res8:124–126.
Jenkinson M, Smith S (2001) A global optimisation method for robustaffine registration of brain images. Med Image Anal 5:143–156.
Jenkinson M, Bannister P, Brady M, Smith S (2002) Improved optimi-zation for the robust and accurate linear registration and motioncorrection of brain images. Neuroimage 17:825–841.
Jenkinson M, Beckmann CF, Smith SM, Woolrich MW, Behrens TEJ(2012) FSL. Neuroimage 62:782–790.
Kjonigsen LJ, Lillehaug S, Bjaalie JG, Witter MP, Leergaard TB(2015) Waxholm Space atlas of the rat brain hippocampal region:three-dimensional delineations based on magnetic resonance anddiffusion tensor imaging. Neuroimage 108:441–449.
Research Article: New Research 20 of 22
July/August 2020, 7(4) ENEURO.0113-20.2020 eNeuro.org
531
Laine MA, Sokolowska E, Dudek M, Callan S-A, Hyytiä P, Hovatta I(2017) Brain activation induced by chronic psychosocial stress inmice. Sci Rep 7:15061.
Lee T, Jarome T, Li S-J, Kim JJ, Helmstetter FJ (2009) Chronic stressselectively reduces hippocampal volume in rats: a longitudinalmagnetic resonance imaging study. Neuroreport 20:1554–1558.
Lee Y, Son H, Kim G, Kim S, Lee DH, Roh GS, Kang SS, Cho GJ,Choi WS, Kim HJ (2013) Glutamine deficiency in the prefrontal cor-tex increases depressive-like behaviours in male mice. JPsychiatry Neurosci 38:183–191.
Lener MS, Niciu MJ, Ballard ED, Park M, Park LT, Nugent AC, ZarateCA Jr (2017) Glutamate and gamma-aminobutyric acid systems inthe pathophysiology of major depression and antidepressant re-sponse to ketamine. Biol Psychiatry 81:886–897.
Li J, Yang R, Xia K, Wang T, Nie B, Gao K, Chen J, Zhao H, Li Y,Wang W (2018) Effects of stress on behavior and resting-statefMRI in rats and evaluation of Telmisartan therapy in a stress-in-duced depression model. BMC Psychiatry 18:337.
Liu L, Zhou X, Zhang Y, Liu Y, Yang L, Pu J, Zhu D, Zhou C, Xie P(2016) The identification of metabolic disturbances in the prefron-tal cortex of the chronic restraint stress rat model of depression.Behav Brain Res 305:148–156.
Lu H, Zou Q, Gu H, Raichle ME, Stein EA, Yang Y (2012) Rat brainsalso have a default mode network. Proc Natl Acad Sci USA109:3979–3984.
Luykx JJ, Laban KG, van den Heuvel MP, Boks MPM, Mandl RCW,Kahn RS, Bakker SC (2012) Region and state specific glutamatedownregulation in major depressive disorder: a meta-analysis of(1)H-MRS findings. Neurosci Biobehav Rev 36:198–205.
Magalhães R, Barrière DA, Novais A, Marques F, Marques P,Cerqueira J, Sousa JC, Cachia A, Boumezbeur F, Bottlaender M,Jay TM, Mériaux S, Sousa N (2018) The dynamics of stress: a lon-gitudinal MRI study of rat brain structure and connectome. MolPsychiatry 23:1998–2006.
Magalhães R, Novais A, Barrière DA, Marques P, Marques F, SousaJC, Cerqueira JJ, Cachia A, Jay TM, Bottlaender M, Sousa N,Mériaux S, Boumezbeur F (2019) A resting-state functional MRimaging and spectroscopy study of the dorsal hippocampus in thechronic unpredictable stress rat model. J Neurosci 39:3640–3650.
Manoliu A, Meng C, Brandl F, Doll A, Tahmasian M, Scherr M,Schwerthöffer D, Zimmer C, Förstl H, Bäuml J, Riedl V,Wohlschläger AM, Sorg C (2014) Insular dysfunction within the sa-lience network is associated with severity of symptoms and aber-rant inter-network connectivity in major depressive disorder. FrontHum Neurosci 7:930.
Marrocco J, Reynaert M-L, Gatta E, Gabriel C, Mocaër E, Di PriscoS, Merega E, Pittaluga A, Nicoletti F, Maccari S, Morley-Fletcher S,Mairesse J (2014) The effects of antidepressant treatment in pre-natally stressed rats support the glutamatergic hypothesis ofstress-related disorders. J Neurosci 34:2015–2024.
McKinnon MC, Yucel K, Nazarov A, MacQueen GM (2009) A meta-analysis examining clinical predictors of hippocampal volume inpatients with major depressive disorder. J Psychiatry Neurosci34:41–54.
Mengler L, Khmelinskii A, Diedenhofen M, Po C, Staring M,Lelieveldt BPF, Hoehn M (2014) Brain maturation of the adolescentrat cortex and striatum: changes in volume and myelination.Neuroimage 84:35–44.
Mirza Y, Tang J, Russell A, Banerjee SP, Bhandari R, Ivey J, Rose M,Moore GJ, Rosenberg DR (2004) Reduced anterior cingulate cor-tex glutamatergic concentrations in childhood major depression. JAm Acad Child Adolesc Psychiatry 43:341–348.
Moriguchi S, Takamiya A, Noda Y, Horita N, Wada M, Tsugawa S,Plitman E, Sano Y, Tarumi R, ElSalhy M, Katayama N, Ogyu K,Miyazaki T, Kishimoto T, Graff-Guerrero A, Meyer JH, BlumbergerDM, Daskalakis ZJ, Mimura M, Nakajima S (2019) Glutamatergicneurometabolite levels in major depressive disorder: a systematicreview and meta-analysis of proton magnetic resonance spectros-copy studies. Mol Psychiatry 24:952–964.
Mulders PC, van Eijndhoven PF, Schene AH, Beckmann CF,Tendolkar I (2015) Resting-state functional connectivity in majordepressive disorder: a review. Neurosci Biobehav Rev 56:330–344.
Paasonen J, Stenroos P, Salo RA, Kiviniemi V, Gröhn O (2018)Functional connectivity under six anesthesia protocols and theawake condition in rat brain. Neuroimage 172:9–20.
Papp EA, Leergaard TB, Calabrese E, Johnson GA, Bjaalie JG (2014)Waxholm Space atlas of the Sprague Dawley rat brain.Neuroimage 97:374–386.
Paulus MP, Stein MB (2010) Interoception in anxiety and depression.Brain Struct Funct 214:451–463.
Pfleiderer B, Michael N, Erfurth A, Ohrmann P, Hohmann U, WolgastM, Fiebich M, Arolt V, Heindel W (2003) Effective electroconvulsivetherapy reverses glutamate/glutamine deficit in the left anteriorcingulum of unipolar depressed patients. Psychiat Res Neuroim122:185–192.
Pineda JA (2008) Sensorimotor cortex as a critical component of an’extended’ mirror neuron system: does it solve the development,correspondence, and control problems in mirroring? Behav BrainFunct 4:47.
Portella MJ, de Diego-Adeliño J, Gómez-Ansón B, Morgan-FerrandoR, Vives Y, Puigdemont D, Pérez-Egea R, Ruscalleda J, Enric Á,Pérez V (2011) Ventromedial prefrontal spectroscopic abnormal-ities over the course of depression: a comparison among first epi-sode, remitted recurrent and chronic patients. J Psychiatr Res45:427–434.
Provencher SW (2001) Automatic quantitation of localized in vivo 1Hspectra with LCModel. NMR Biomed 14:260–264.
Rao U, Chen L-A, Bidesi AS, Shad MU, Thomas MA, Hammen CL(2010) Hippocampal changes associated with early-life adversityand vulnerability to depression. Biol Psychiatry 67:357–364.
Rocher C, Spedding M, Munoz C, Jay TM (2004) Acute stress-in-duced changes in hippocampal/prefrontal circuits in rats: effectsof antidepressants. Cereb Cortex 14:224–229.
Rolls ET, Cheng W, Gong W, Qiu J, Zhou C, Zhang J, Lv W, Ruan H,Wei D, Cheng K, Meng J, Xie P, Feng J (2019) Functional connec-tivity of the anterior cingulate cortex in depression and in health.Cereb Cortex 29:3617–3630.
Rorden C, Karnath H-O, Bonilha L (2007) Improving lesion-symptommapping. J Cogn Neurosci 19:1081–1088.
Sanacora G, Treccani G, Popoli M (2012) Towards a glutamate hy-pothesis of depression: an emerging frontier of neuropsychophar-macology for mood disorders. Neuropharmacology 62:63–77.
Seewoo BJ, Feindel KW, Etherington SJ, Rodger J (2018) Resting-state fMRI study of brain activation using low-intensity repetitivetranscranial magnetic stimulation in rats. Sci Rep 8:6706.
Seewoo BJ, Feindel KW, Etherington SJ, Rodger J (2019)Frequency-specific effects of low-intensity rTMS can persist for upto 2 weeks post-stimulation: a longitudinal rs-fMRI/MRS study inrats. Brain Stimul 12:1526–1536.
Seewoo BJ, Joos AC, Feindel KW (2020) An analytical workflow forseed-based correlation and independent component analysis ininterventional resting-state fMRI studies. Neurosci Res, in press.
Sergejeva M, Papp EA, Bakker R, Gaudnek MA, Okamura-Oho Y,Boline J, Bjaalie JG, Hess A (2015) Anatomical landmarks for regis-tration of experimental image data to volumetric rodent brain atlas-ing templates. J Neurosci Methods 240:161–169.
Shao Y, Yan G, Xuan Y, Peng H, Huang Q-J, Wu R, Xu H (2015)Chronic social isolation decreases glutamate and glutamine levelsand induces oxidative stress in the rat hippocampus. Behav BrainRes 282:201–208.
Sheline YI (2011) Depression and the hippocampus: cause or effect?Biol Psychiatry 70:308–309.
Sheline YI, Barch DM, Price JL, Rundle MM, Vaishnavi SN, SnyderAZ, Mintun MA, Wang S, Coalson RS, Raichle ME (2009) The de-fault mode network and self-referential processes in depression.Proc Natl Acad Sci USA 106:1942–1947.
Slattery DA, Cryan JF (2012) Using the rat forced swim test to assessantidepressant-like activity in rodents. Nat Protoc 7:1009–1014.
Research Article: New Research 21 of 22
July/August 2020, 7(4) ENEURO.0113-20.2020 eNeuro.org
532

Stepanichev M, Dygalo NN, Grigoryan G, Shishkina GT, Gulyaeva N(2014) Rodent models of depression: neurotrophic and neuroin-flammatory biomarkers. Biomed Res Int 2014:932757.
Suvrathan A, Tomar A, Chattarji S (2010) Effects of chronic andacute stress on rat behaviour in the forced-swim test. Stress13:533–540.
Tambalo S, Peruzzotti-Jametti L, Rigolio R, Fiorini S, Bontempi P,Mallucci G, Balzarotti B, Marmiroli P, Sbarbati A, Cavaletti G,Pluchino S, Marzola P (2015) Functional magnetic resonanceimaging of rats with experimental autoimmune encephalomyelitisreveals brain cortex remodeling. J Neurosci 35:10088–10100.
Ulloa JL, Castañeda P, Berríos C, Díaz-Veliz G, Mora S, Bravo JA,Araneda K, Menares C, Morales P, Fiedler JL (2010) Comparisonof the antidepressant sertraline on differential depression-like be-haviors elicited by restraint stress and repeated corticosterone ad-ministration. Pharmacol Biochem Behav 97:213–221.
Videbech P, Ravnkilde B (2004) Hippocampal volume and depres-sion: a meta-analysis of MRI studies. Am J Psychiatry 161:1957–1966.
Walf AA, Frye CA (2007) The use of the elevated plus maze as an assayof anxiety-related behavior in rodents. Nat Protoc 2:322–328.
Walter M, Henning A, Grimm S, Schulte RF, Beck J, Dydak U,Schnepf B, Boeker H, Boesiger P, Northoff G (2009) The relation-ship between aberrant neuronal activation in the pregenual ante-rior cingulate, altered glutamatergic metabolism, and anhedonia inmajor depression. Arch Gen Psychiatry 66:478–486.
Wang L, Hermens DF, Hickie IB, Lagopoulos J (2012) A systematicreview of resting-state functional-MRI studies in major depression.J Affect Disord 142:6–12.
Wang Q, Timberlake MA 2nd, Prall K, Dwivedi Y (2017) The recent pro-gress in animal models of depression. Prog NeuropsychopharmacolBiol Psychiatry 77:99–109.
Welniak–Kaminska M, Fiedorowicz M, Orzel J, Bogorodzki P,Modlinska K, Stryjek R, Chrzanowska A, Pisula W, Grieb P (2019)Volumes of brain structures in captive wild-type and laboratoryrats: 7T magnetic resonance in vivo automatic atlas-based study.PLoS One 14:e0215348.
Willner P, Towell A, Sampson D, Sophokleous S, Muscat R (1987)Reduction of sucrose preference by chronic unpredictable mildstress, and its restoration by a tricyclic antidepressant.Psychopharmacology (Berl) 93:358–364.
Wood T (2018) QUIT: quantitative imaging tools. J Open SourceSoftw 3:656.
Woolrich M (2008) Robust group analysis using outlier inference.Neuroimage 41:286–301.
Woolrich MW, Behrens TEJ, Beckmann CF, Jenkinson M, Smith SM(2004) Multilevel linear modelling for FMRI group analysis usingBayesian inference. Neuroimage 21:1732–1747.
Worsley KJ (2001) Statistical analysis of activation images. In:Functional MRI: an introduction to methods (Jezzard P, MatthewsPM, Smith SM, eds), pp 251–270. Oxford: Oxford University Press.
Xu J, Dydak U, Harezlak J, Nixon J, Dzemidzic M, Gunn AD, KarneHS, Anand A (2013a) Neurochemical abnormalities in unmedicatedbipolar depression and mania: a 2D 1H MRS investigation.Psychiatry Res 213:235–241.
Xu S, Ji Y, Chen X, Yang Y, Gullapalli RP, Masri R (2013b) In vivohigh-resolution localized (1) H MR spectroscopy in the awake ratbrain at 7 T. Magn Reson Med 69:937–943.
Yildiz-Yesiloglu A, Ankerst DP (2006) Review of 1H magnetic reso-nance spectroscopy findings in major depressive disorder: ameta-analysis. Psychiatry Res 147:1–25.
Yin Z, Chang M, Wei S, Jiang X, Zhou Y, Cui L, Lv J, Wang F, Tang Y(2018) Decreased functional connectivity in insular subregions indepressive episodes of bipolar disorder and major depressive dis-order. Front Neurosci 12:842.
Zarrinpar A, Deldin P, Kosslyn SM (2006) Effects of depression onsensory/motor vs. central processing in visual mental imagery.Cogn Emot 20:737–758.
Zheng C, Quan M, Zhang T (2012) Decreased thalamo-cortical con-nectivity by alteration of neural information flow in theta oscillationin depression-model rats. J Comput Neurosci 33:547–558.
Zhu X, Wang X, Xiao J, Liao J, Zhong M, Wang W, Yao S (2012)Evidence of a dissociation pattern in resting-state default modenetwork connectivity in first-episode, treatment-naive major de-pression patients. Biol Psychiatry 71:611–617.
Research Article: New Research 22 of 22
July/August 2020, 7(4) ENEURO.0113-20.2020 eNeuro.org
533
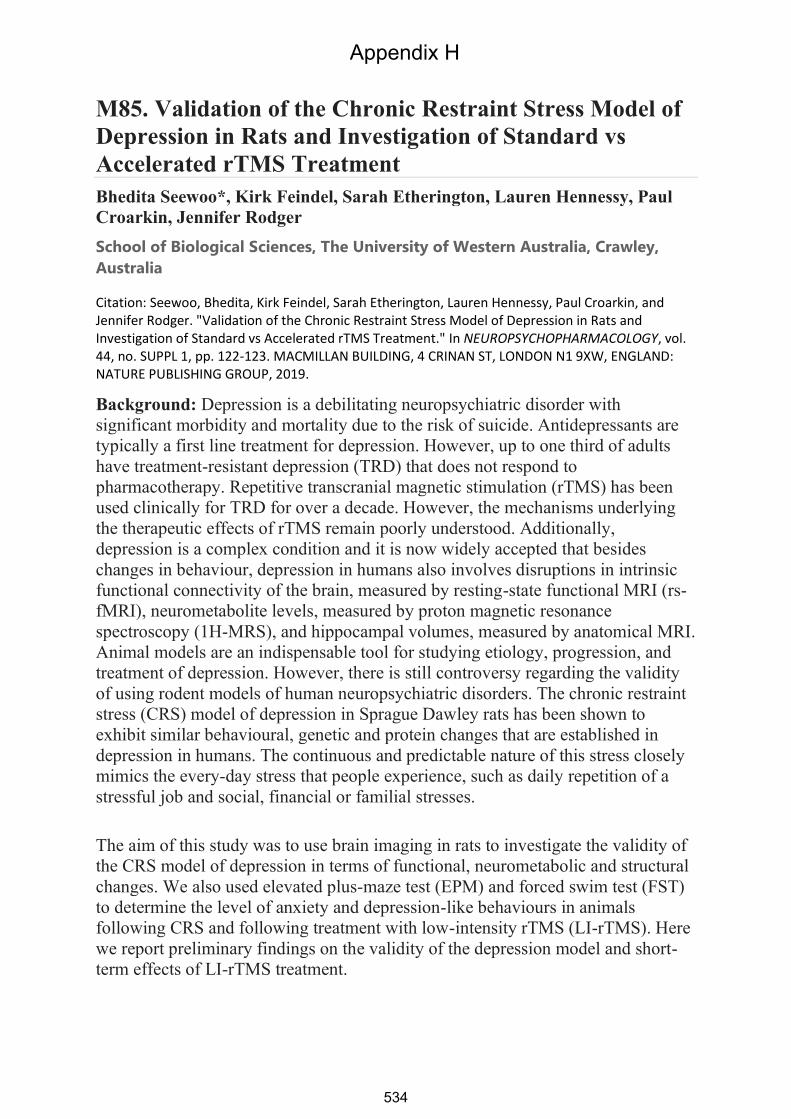
M85. Validation of the Chronic Restraint Stress Model of
Depression in Rats and Investigation of Standard vs
Accelerated rTMS Treatment
Bhedita Seewoo*, Kirk Feindel, Sarah Etherington, Lauren Hennessy, Paul
Croarkin, Jennifer Rodger
School of Biological Sciences, The University of Western Australia, Crawley,
Australia
Citation: Seewoo, Bhedita, Kirk Feindel, Sarah Etherington, Lauren Hennessy, Paul Croarkin, and Jennifer Rodger. "Validation of the Chronic Restraint Stress Model of Depression in Rats and Investigation of Standard vs Accelerated rTMS Treatment." In NEUROPSYCHOPHARMACOLOGY, vol. 44, no. SUPPL 1, pp. 122-123. MACMILLAN BUILDING, 4 CRINAN ST, LONDON N1 9XW, ENGLAND: NATURE PUBLISHING GROUP, 2019.
Background: Depression is a debilitating neuropsychiatric disorder with
significant morbidity and mortality due to the risk of suicide. Antidepressants are
typically a first line treatment for depression. However, up to one third of adults
have treatment-resistant depression (TRD) that does not respond to
pharmacotherapy. Repetitive transcranial magnetic stimulation (rTMS) has been
used clinically for TRD for over a decade. However, the mechanisms underlying
the therapeutic effects of rTMS remain poorly understood. Additionally,
depression is a complex condition and it is now widely accepted that besides
changes in behaviour, depression in humans also involves disruptions in intrinsic
functional connectivity of the brain, measured by resting-state functional MRI (rs-
fMRI), neurometabolite levels, measured by proton magnetic resonance
spectroscopy (1H-MRS), and hippocampal volumes, measured by anatomical MRI.
Animal models are an indispensable tool for studying etiology, progression, and
treatment of depression. However, there is still controversy regarding the validity
of using rodent models of human neuropsychiatric disorders. The chronic restraint
stress (CRS) model of depression in Sprague Dawley rats has been shown to
exhibit similar behavioural, genetic and protein changes that are established in
depression in humans. The continuous and predictable nature of this stress closely
mimics the every-day stress that people experience, such as daily repetition of a
stressful job and social, financial or familial stresses.
The aim of this study was to use brain imaging in rats to investigate the validity of
the CRS model of depression in terms of functional, neurometabolic and structural
changes. We also used elevated plus-maze test (EPM) and forced swim test (FST)
to determine the level of anxiety and depression-like behaviours in animals
following CRS and following treatment with low-intensity rTMS (LI-rTMS). Here
we report preliminary findings on the validity of the depression model and short-
term effects of LI-rTMS treatment.
Appendix H
534
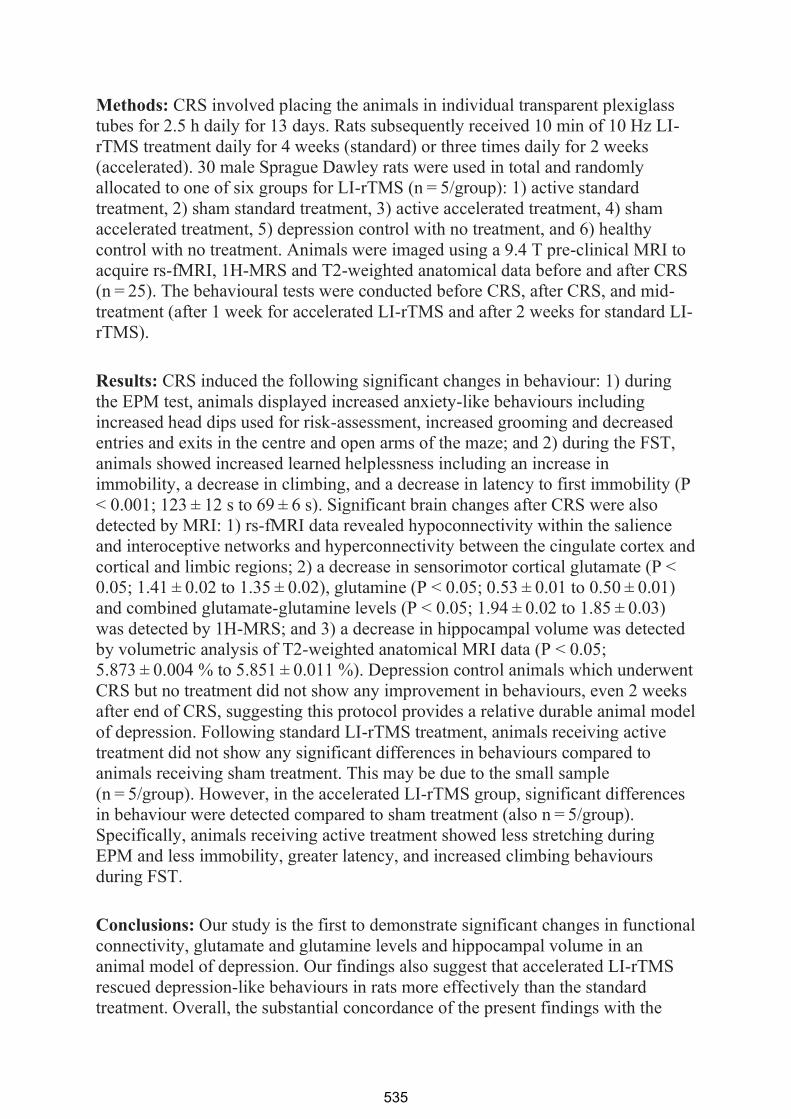
Methods: CRS involved placing the animals in individual transparent plexiglass
tubes for 2.5 h daily for 13 days. Rats subsequently received 10 min of 10 Hz LI-
rTMS treatment daily for 4 weeks (standard) or three times daily for 2 weeks
(accelerated). 30 male Sprague Dawley rats were used in total and randomly
allocated to one of six groups for LI-rTMS (n = 5/group): 1) active standard
treatment, 2) sham standard treatment, 3) active accelerated treatment, 4) sham
accelerated treatment, 5) depression control with no treatment, and 6) healthy
control with no treatment. Animals were imaged using a 9.4 T pre-clinical MRI to
acquire rs-fMRI, 1H-MRS and T2-weighted anatomical data before and after CRS
(n = 25). The behavioural tests were conducted before CRS, after CRS, and mid-
treatment (after 1 week for accelerated LI-rTMS and after 2 weeks for standard LI-
rTMS).
Results: CRS induced the following significant changes in behaviour: 1) during
the EPM test, animals displayed increased anxiety-like behaviours including
increased head dips used for risk-assessment, increased grooming and decreased
entries and exits in the centre and open arms of the maze; and 2) during the FST,
animals showed increased learned helplessness including an increase in
immobility, a decrease in climbing, and a decrease in latency to first immobility (P
< 0.001; 123 ± 12 s to 69 ± 6 s). Significant brain changes after CRS were also
detected by MRI: 1) rs-fMRI data revealed hypoconnectivity within the salience
and interoceptive networks and hyperconnectivity between the cingulate cortex and
cortical and limbic regions; 2) a decrease in sensorimotor cortical glutamate (P <
0.05; 1.41 ± 0.02 to 1.35 ± 0.02), glutamine (P < 0.05; 0.53 ± 0.01 to 0.50 ± 0.01)
and combined glutamate-glutamine levels (P < 0.05; 1.94 ± 0.02 to 1.85 ± 0.03)
was detected by 1H-MRS; and 3) a decrease in hippocampal volume was detected
by volumetric analysis of T2-weighted anatomical MRI data (P < 0.05;
5.873 ± 0.004 % to 5.851 ± 0.011 %). Depression control animals which underwent
CRS but no treatment did not show any improvement in behaviours, even 2 weeks
after end of CRS, suggesting this protocol provides a relative durable animal model
of depression. Following standard LI-rTMS treatment, animals receiving active
treatment did not show any significant differences in behaviours compared to
animals receiving sham treatment. This may be due to the small sample
(n = 5/group). However, in the accelerated LI-rTMS group, significant differences
in behaviour were detected compared to sham treatment (also n = 5/group).
Specifically, animals receiving active treatment showed less stretching during
EPM and less immobility, greater latency, and increased climbing behaviours
during FST.
Conclusions: Our study is the first to demonstrate significant changes in functional
connectivity, glutamate and glutamine levels and hippocampal volume in an
animal model of depression. Our findings also suggest that accelerated LI-rTMS
rescued depression-like behaviours in rats more effectively than the standard
treatment. Overall, the substantial concordance of the present findings with the
535

human literature presents a unique opportunity for the integration of behavioural
and molecular changes in CRS model of depression in rats with changes in
functional connectivity, neurometabolite levels and hippocampal volume that may
be translated to the human disorder and therefore improve treatment strategies.
Keywords: Depression, Animal Model, Translational Research, Proton Magnetic
Resonance Spectroscopy, Resting-State Functional MRI
Disclosure: Nothing to disclose.
536
Open camera or QR reader andscan code to access this article
and other resources online.
A Preclinical Study of Standard Versus AcceleratedTranscranial Magnetic Stimulation
for Depression in Adolescents
Bhedita J. Seewoo, PhD,1–3,i Lauren A. Hennessy, MSc,1,2 Liz A. Jaeschke, BSc,1 Leah A. Mackie, BSc,1
Sarah J. Etherington, PhD,4 Sarah A. Dunlop, PhD,1,5 Paul E. Croarkin, DO, MS,6,ii and Jennifer Rodger, PhD1,2
Abstract
Objective: Ongoing studies are focused on adapting transcranial magnetic stimulation (TMS) for the treatment of major
depressive disorder in adolescent humans. Most protocols in adolescent humans to date have delivered daily 10 Hz prefrontal
stimulation with mixed results. Novel TMS dosing strategies such as accelerated TMS have recently been considered. There
are knowledge gaps related to the potential clinical and pragmatic advantages of accelerated TMS. This pilot study compared
the behavioral effects of a standard daily and accelerated low-intensity TMS (LI-TMS) protocol in an adolescent murine
model of depression.
Methods: Male adolescent Sprague Dawley rats were placed in transparent plexiglass tubes for 2.5 hours daily for 13 days as
part of a study to validate the chronic restraint stress (CRS) protocol. Rats subsequently received 10 minutes of active or sham
10 Hz LI-TMS daily for 2 weeks (standard) or three times daily for 1 week (accelerated). Behavior was assessed using the
elevated plus maze and forced swim test (FST). Hippocampal neurogenesis was assessed by injection of the thymidine
analogue 5-ethynyl-2¢-deoxyuridine at the end of LI-TMS treatment (2 weeks standard, 1 week accelerated), followed by
postmortem histological analysis.
Results: There were no significant differences in behavioral outcomes among animals receiving once-daily sham or active LI-
TMS treatment. However, animals treated with accelerated LI-TMS demonstrated significant improvements in behavioral
outcomes compared with sham treatment. Specifically, animals receiving active accelerated treatment showed greater latency
to the first immobility behavior ( p < 0.05; active: 130 – 46 seconds; sham: 54 – 39 seconds) and increased climbing behaviors
( p < 0.05; active: 16 – 5; sham: 9 – 5) during FST. There were no changes in hippocampal neurogenesis nor any evidence of
cell death in histological sections.
Conclusions: An accelerated LI-TMS protocol outperformed the standard (once-daily) protocol in adolescent male animals
with depression-like behaviors induced by CRS and was not accompanied by any toxicity or tolerability concerns. These
preliminary findings support the speculation that novel TMS dosing strategies should be studied in adolescent humans and
will inform future clinical protocols.
Keywords: TMS, chronic stress, animal model, depression, behavior
1Experimental and Regenerative Neurosciences, School of Biological Sciences, The University of Western Australia, Perth, Western Australia, Australia.2Brain Plasticity Group, Perron Institute for Neurological and Translational Science, Perth, Western Australia, Australia.3Centre for Microscopy, Characterisation and Analysis, Research Infrastructure Centres, The University of Western Australia, Perth, Western
Australia, Australia.4Medical, Molecular and Forensic Sciences, Murdoch University, Perth, Western Australia, Australia.5Minderoo Foundation, Perth, Western Australia, Australia.6Department of Psychiatry and Psychology, Mayo Clinic, Rochester, Minnesota, USA.iORCID ID (https://orcid.org/0000-0003-4679-4857).
iiORCID ID (https://orcid.org/0000-0001-6843-6503).Funding: P.E.C. was supported by the National Institute of Mental Health under award numbers R01MH113700 and R01MH124655. The content is
solely the responsibility of the authors and does not necessarily represent the official views of the Mayo Clinic, the National Institutes of Health, or theNational Institute of Mental Health.
JOURNAL OF CHILD AND ADOLESCENT PSYCHOPHARMACOLOGYVolume XX, Number XX, 2021ª Mary Ann Liebert, Inc.Pp. 1–7DOI: 10.1089/cap.2021.0100
1
Dow
nloa
ded
by U
NIV
ER
SIT
Y O
F W
EST
ER
N A
UST
RA
LIA
fro
m w
ww
.lieb
ertp
ub.c
om a
t 01/
09/2
2. F
or p
erso
nal u
se o
nly.
Appendix I
537
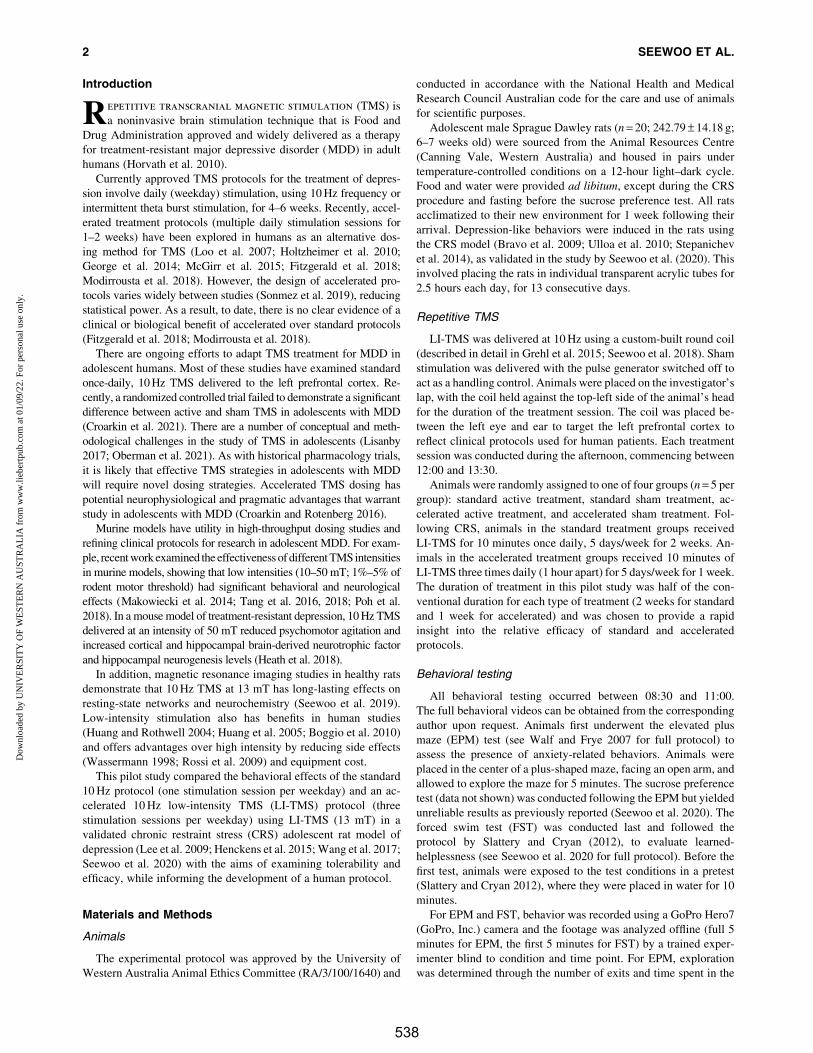
Introduction
Repetitive transcranial magnetic stimulation (TMS) is
a noninvasive brain stimulation technique that is Food and
Drug Administration approved and widely delivered as a therapy
for treatment-resistant major depressive disorder (MDD) in adult
humans (Horvath et al. 2010).
Currently approved TMS protocols for the treatment of depres-
sion involve daily (weekday) stimulation, using 10 Hz frequency or
intermittent theta burst stimulation, for 4–6 weeks. Recently, accel-
erated treatment protocols (multiple daily stimulation sessions for
1–2 weeks) have been explored in humans as an alternative dos-
ing method for TMS (Loo et al. 2007; Holtzheimer et al. 2010;
George et al. 2014; McGirr et al. 2015; Fitzgerald et al. 2018;
Modirrousta et al. 2018). However, the design of accelerated pro-
tocols varies widely between studies (Sonmez et al. 2019), reducing
statistical power. As a result, to date, there is no clear evidence of a
clinical or biological benefit of accelerated over standard protocols
(Fitzgerald et al. 2018; Modirrousta et al. 2018).
There are ongoing efforts to adapt TMS treatment for MDD in
adolescent humans. Most of these studies have examined standard
once-daily, 10 Hz TMS delivered to the left prefrontal cortex. Re-
cently, a randomized controlled trial failed to demonstrate a significant
difference between active and sham TMS in adolescents with MDD
(Croarkin et al. 2021). There are a number of conceptual and meth-
odological challenges in the study of TMS in adolescents (Lisanby
2017; Oberman et al. 2021). As with historical pharmacology trials,
it is likely that effective TMS strategies in adolescents with MDD
will require novel dosing strategies. Accelerated TMS dosing has
potential neurophysiological and pragmatic advantages that warrant
study in adolescents with MDD (Croarkin and Rotenberg 2016).
Murine models have utility in high-throughput dosing studies and
refining clinical protocols for research in adolescent MDD. For exam-
ple, recent work examined the effectiveness of different TMS intensities
in murine models, showing that low intensities (10–50 mT; 1%–5% of
rodent motor threshold) had significant behavioral and neurological
effects (Makowiecki et al. 2014; Tang et al. 2016, 2018; Poh et al.
2018). In a mouse model of treatment-resistant depression, 10 Hz TMS
delivered at an intensity of 50 mT reduced psychomotor agitation and
increased cortical and hippocampal brain-derived neurotrophic factor
and hippocampal neurogenesis levels (Heath et al. 2018).
In addition, magnetic resonance imaging studies in healthy rats
demonstrate that 10 Hz TMS at 13 mT has long-lasting effects on
resting-state networks and neurochemistry (Seewoo et al. 2019).
Low-intensity stimulation also has benefits in human studies
(Huang and Rothwell 2004; Huang et al. 2005; Boggio et al. 2010)
and offers advantages over high intensity by reducing side effects
(Wassermann 1998; Rossi et al. 2009) and equipment cost.
This pilot study compared the behavioral effects of the standard
10 Hz protocol (one stimulation session per weekday) and an ac-
celerated 10 Hz low-intensity TMS (LI-TMS) protocol (three
stimulation sessions per weekday) using LI-TMS (13 mT) in a
validated chronic restraint stress (CRS) adolescent rat model of
depression (Lee et al. 2009; Henckens et al. 2015; Wang et al. 2017;
Seewoo et al. 2020) with the aims of examining tolerability and
efficacy, while informing the development of a human protocol.
Materials and Methods
Animals
The experimental protocol was approved by the University of
Western Australia Animal Ethics Committee (RA/3/100/1640) and
conducted in accordance with the National Health and Medical
Research Council Australian code for the care and use of animals
for scientific purposes.
Adolescent male Sprague Dawley rats (n = 20; 242.79 – 14.18 g;
6–7 weeks old) were sourced from the Animal Resources Centre
(Canning Vale, Western Australia) and housed in pairs under
temperature-controlled conditions on a 12-hour light–dark cycle.
Food and water were provided ad libitum, except during the CRS
procedure and fasting before the sucrose preference test. All rats
acclimatized to their new environment for 1 week following their
arrival. Depression-like behaviors were induced in the rats using
the CRS model (Bravo et al. 2009; Ulloa et al. 2010; Stepanichev
et al. 2014), as validated in the study by Seewoo et al. (2020). This
involved placing the rats in individual transparent acrylic tubes for
2.5 hours each day, for 13 consecutive days.
Repetitive TMS
LI-TMS was delivered at 10 Hz using a custom-built round coil
(described in detail in Grehl et al. 2015; Seewoo et al. 2018). Sham
stimulation was delivered with the pulse generator switched off to
act as a handling control. Animals were placed on the investigator’s
lap, with the coil held against the top-left side of the animal’s head
for the duration of the treatment session. The coil was placed be-
tween the left eye and ear to target the left prefrontal cortex to
reflect clinical protocols used for human patients. Each treatment
session was conducted during the afternoon, commencing between
12:00 and 13:30.
Animals were randomly assigned to one of four groups (n = 5 per
group): standard active treatment, standard sham treatment, ac-
celerated active treatment, and accelerated sham treatment. Fol-
lowing CRS, animals in the standard treatment groups received
LI-TMS for 10 minutes once daily, 5 days/week for 2 weeks. An-
imals in the accelerated treatment groups received 10 minutes of
LI-TMS three times daily (1 hour apart) for 5 days/week for 1 week.
The duration of treatment in this pilot study was half of the con-
ventional duration for each type of treatment (2 weeks for standard
and 1 week for accelerated) and was chosen to provide a rapid
insight into the relative efficacy of standard and accelerated
protocols.
Behavioral testing
All behavioral testing occurred between 08:30 and 11:00.
The full behavioral videos can be obtained from the corresponding
author upon request. Animals first underwent the elevated plus
maze (EPM) test (see Walf and Frye 2007 for full protocol) to
assess the presence of anxiety-related behaviors. Animals were
placed in the center of a plus-shaped maze, facing an open arm, and
allowed to explore the maze for 5 minutes. The sucrose preference
test (data not shown) was conducted following the EPM but yielded
unreliable results as previously reported (Seewoo et al. 2020). The
forced swim test (FST) was conducted last and followed the
protocol by Slattery and Cryan (2012), to evaluate learned-
helplessness (see Seewoo et al. 2020 for full protocol). Before the
first test, animals were exposed to the test conditions in a pretest
(Slattery and Cryan 2012), where they were placed in water for 10
minutes.
For EPM and FST, behavior was recorded using a GoPro Hero7
(GoPro, Inc.) camera and the footage was analyzed offline (full 5
minutes for EPM, the first 5 minutes for FST) by a trained exper-
imenter blind to condition and time point. For EPM, exploration
was determined through the number of exits and time spent in the
2 SEEWOO ET AL.
Dow
nloa
ded
by U
NIV
ER
SIT
Y O
F W
EST
ER
N A
UST
RA
LIA
fro
m w
ww
.lieb
ertp
ub.c
om a
t 01/
09/2
2. F
or p
erso
nal u
se o
nly.
538

open and closed arms. Number of occurrences and time spent ex-
hibiting rearing and grooming behaviors were also measured to
quantify stress responses. For FST, the video was split into 5 second
segments. Each segment was analyzed to determine the predomi-
nant behavior. Behaviors were classified as climbing, swimming, or
immobility behaviors. Latency to the first segment with predomi-
nant immobility was also determined.
Histological study of neurogenesis
On the last day of LI-TMS delivery, rats received intraperitoneal
injections of the thymidine analogue 5-ethynyl-2¢-deoxyuridine
(EdU, two doses of 50 mg/kg, 8 hours apart). Animals receiving
daily LI-TMS were euthanized 2 weeks after the last LI-TMS
session, whereas animals receiving the accelerated LI-TMS were
euthanized 1 week after the last LI-TMS session. Rats were ad-
ministered an overdose of sodium pentobarbitone (>160 mg/kg i.p.)
and transcardially perfused with 200 mL of 4% paraformaldehyde
in 0.2 M phosphate buffer.
Brains were extracted, postfixed in 4% paraformaldehyde, and
transferred to 30% sucrose in PBS 48 hours before cryosectioning
into 40 lm coronal sections. Six sections were chosen per brain
for immunohistochemical staining at Bregma: -2.80, -3.60, -4.30,
-5.20, -5.60, and -6.04 mm (Paxinos et al. 2015). The brain sections
were triple stained for EdU, neuronal nuclei (NeuN), and Hoechst to
label dividing cells (EdU), neurons (NeuN), and all cell nuclei, thus
allowing us to specifically identify the newly born cells during
LI-TMS that had differentiated into neurons (Supplementary Data).
FIG. 1. Comparisons of depression-related behaviors during forced swim test between the active and sham groups of the accelerated(A) and standard (B) LI-TMS protocols. The figure shows total count of behaviors and total time taken to exhibit the first immobilitycount (seconds) following the accelerated protocol (A) and standard protocol (B) during the forced swim test. Raw data are plotted onthe top section of the estimation plot, with unpaired mean difference for the comparisons on the bottom. The bootstrap sampleddistributions are shown via bolded vertical lines, with the center circle indicating the average mean difference, and nonbolded endsrepresenting error bars for the 95% CIs. l--p < 0.1, *p < 0.05. CIs, confidence intervals; LI-TMS, low-intensity TMS; TMS, transcranialmagnetic stimulation.
STANDARD VS. ACCELERATED TMS 3
Dow
nloa
ded
by U
NIV
ER
SIT
Y O
F W
EST
ER
N A
UST
RA
LIA
fro
m w
ww
.lieb
ertp
ub.c
om a
t 01/
09/2
2. F
or p
erso
nal u
se o
nly.
539
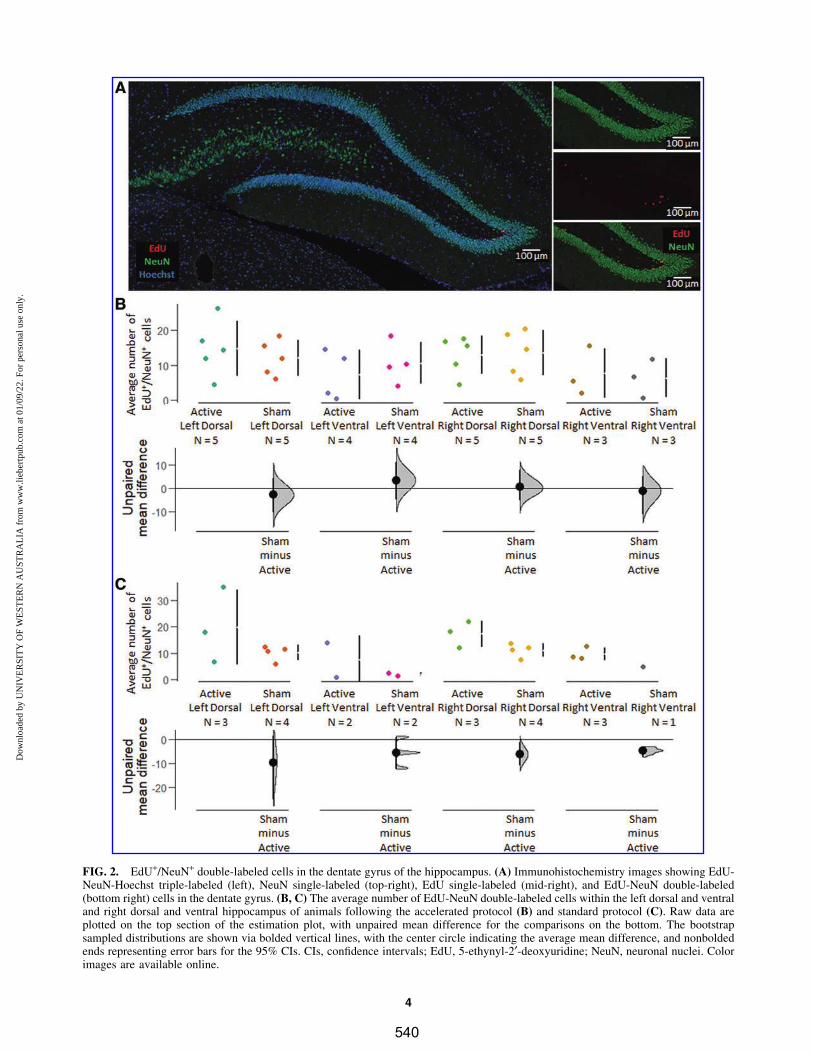
FIG. 2. EdU+/NeuN+ double-labeled cells in the dentate gyrus of the hippocampus. (A) Immunohistochemistry images showing EdU-NeuN-Hoechst triple-labeled (left), NeuN single-labeled (top-right), EdU single-labeled (mid-right), and EdU-NeuN double-labeled(bottom right) cells in the dentate gyrus. (B, C) The average number of EdU-NeuN double-labeled cells within the left dorsal and ventraland right dorsal and ventral hippocampus of animals following the accelerated protocol (B) and standard protocol (C). Raw data areplotted on the top section of the estimation plot, with unpaired mean difference for the comparisons on the bottom. The bootstrapsampled distributions are shown via bolded vertical lines, with the center circle indicating the average mean difference, and nonboldedends representing error bars for the 95% CIs. CIs, confidence intervals; EdU, 5-ethynyl-2¢-deoxyuridine; NeuN, neuronal nuclei. Colorimages are available online.
4
Dow
nloa
ded
by U
NIV
ER
SIT
Y O
F W
EST
ER
N A
UST
RA
LIA
fro
m w
ww
.lieb
ertp
ub.c
om a
t 01/
09/2
2. F
or p
erso
nal u
se o
nly.
540
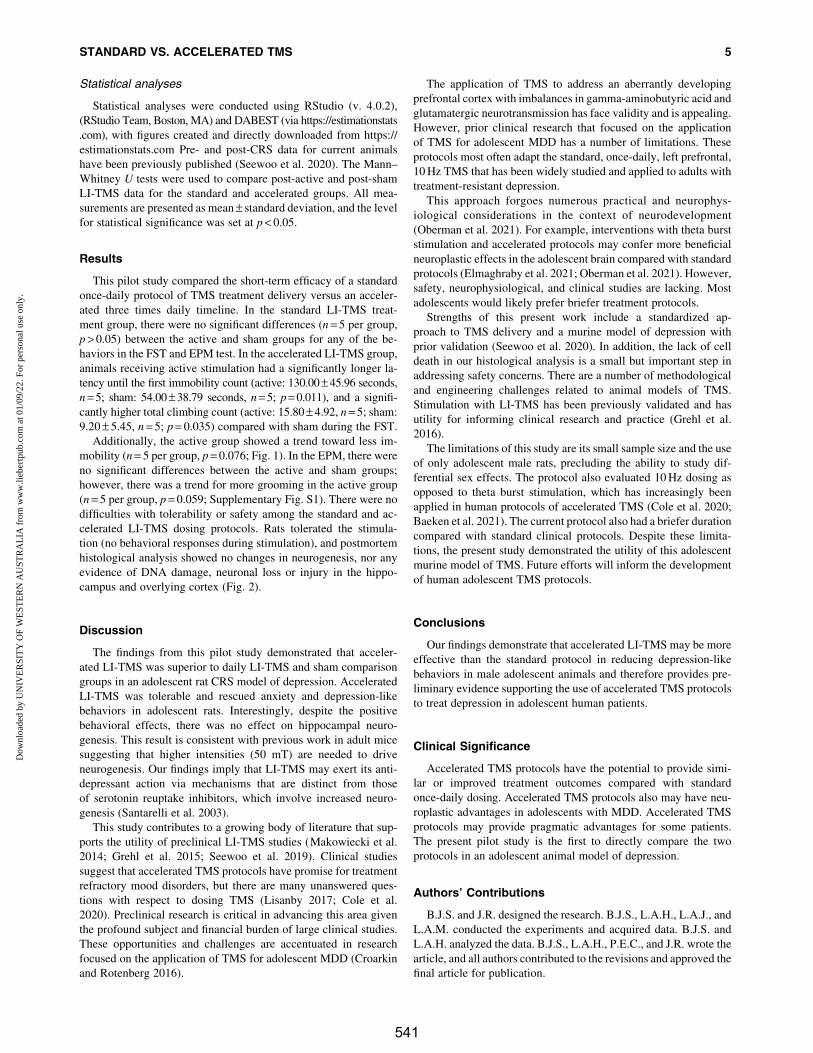
Statistical analyses
Statistical analyses were conducted using RStudio (v. 4.0.2),
(RStudio Team, Boston, MA) and DABEST (via https://estimationstats
.com), with figures created and directly downloaded from https://
estimationstats.com Pre- and post-CRS data for current animals
have been previously published (Seewoo et al. 2020). The Mann–
Whitney U tests were used to compare post-active and post-sham
LI-TMS data for the standard and accelerated groups. All mea-
surements are presented as mean – standard deviation, and the level
for statistical significance was set at p < 0.05.
Results
This pilot study compared the short-term efficacy of a standard
once-daily protocol of TMS treatment delivery versus an acceler-
ated three times daily timeline. In the standard LI-TMS treat-
ment group, there were no significant differences (n = 5 per group,
p > 0.05) between the active and sham groups for any of the be-
haviors in the FST and EPM test. In the accelerated LI-TMS group,
animals receiving active stimulation had a significantly longer la-
tency until the first immobility count (active: 130.00 – 45.96 seconds,
n = 5; sham: 54.00 – 38.79 seconds, n = 5; p = 0.011), and a signifi-
cantly higher total climbing count (active: 15.80 – 4.92, n = 5; sham:
9.20 – 5.45, n = 5; p = 0.035) compared with sham during the FST.
Additionally, the active group showed a trend toward less im-
mobility (n = 5 per group, p = 0.076; Fig. 1). In the EPM, there were
no significant differences between the active and sham groups;
however, there was a trend for more grooming in the active group
(n = 5 per group, p = 0.059; Supplementary Fig. S1). There were no
difficulties with tolerability or safety among the standard and ac-
celerated LI-TMS dosing protocols. Rats tolerated the stimula-
tion (no behavioral responses during stimulation), and postmortem
histological analysis showed no changes in neurogenesis, nor any
evidence of DNA damage, neuronal loss or injury in the hippo-
campus and overlying cortex (Fig. 2).
Discussion
The findings from this pilot study demonstrated that acceler-
ated LI-TMS was superior to daily LI-TMS and sham comparison
groups in an adolescent rat CRS model of depression. Accelerated
LI-TMS was tolerable and rescued anxiety and depression-like
behaviors in adolescent rats. Interestingly, despite the positive
behavioral effects, there was no effect on hippocampal neuro-
genesis. This result is consistent with previous work in adult mice
suggesting that higher intensities (50 mT) are needed to drive
neurogenesis. Our findings imply that LI-TMS may exert its anti-
depressant action via mechanisms that are distinct from those
of serotonin reuptake inhibitors, which involve increased neuro-
genesis (Santarelli et al. 2003).
This study contributes to a growing body of literature that sup-
ports the utility of preclinical LI-TMS studies (Makowiecki et al.
2014; Grehl et al. 2015; Seewoo et al. 2019). Clinical studies
suggest that accelerated TMS protocols have promise for treatment
refractory mood disorders, but there are many unanswered ques-
tions with respect to dosing TMS (Lisanby 2017; Cole et al.
2020). Preclinical research is critical in advancing this area given
the profound subject and financial burden of large clinical studies.
These opportunities and challenges are accentuated in research
focused on the application of TMS for adolescent MDD (Croarkin
and Rotenberg 2016).
The application of TMS to address an aberrantly developing
prefrontal cortex with imbalances in gamma-aminobutyric acid and
glutamatergic neurotransmission has face validity and is appealing.
However, prior clinical research that focused on the application
of TMS for adolescent MDD has a number of limitations. These
protocols most often adapt the standard, once-daily, left prefrontal,
10 Hz TMS that has been widely studied and applied to adults with
treatment-resistant depression.
This approach forgoes numerous practical and neurophys-
iological considerations in the context of neurodevelopment
(Oberman et al. 2021). For example, interventions with theta burst
stimulation and accelerated protocols may confer more beneficial
neuroplastic effects in the adolescent brain compared with standard
protocols (Elmaghraby et al. 2021; Oberman et al. 2021). However,
safety, neurophysiological, and clinical studies are lacking. Most
adolescents would likely prefer briefer treatment protocols.
Strengths of this present work include a standardized ap-
proach to TMS delivery and a murine model of depression with
prior validation (Seewoo et al. 2020). In addition, the lack of cell
death in our histological analysis is a small but important step in
addressing safety concerns. There are a number of methodological
and engineering challenges related to animal models of TMS.
Stimulation with LI-TMS has been previously validated and has
utility for informing clinical research and practice (Grehl et al.
2016).
The limitations of this study are its small sample size and the use
of only adolescent male rats, precluding the ability to study dif-
ferential sex effects. The protocol also evaluated 10 Hz dosing as
opposed to theta burst stimulation, which has increasingly been
applied in human protocols of accelerated TMS (Cole et al. 2020;
Baeken et al. 2021). The current protocol also had a briefer duration
compared with standard clinical protocols. Despite these limita-
tions, the present study demonstrated the utility of this adolescent
murine model of TMS. Future efforts will inform the development
of human adolescent TMS protocols.
Conclusions
Our findings demonstrate that accelerated LI-TMS may be more
effective than the standard protocol in reducing depression-like
behaviors in male adolescent animals and therefore provides pre-
liminary evidence supporting the use of accelerated TMS protocols
to treat depression in adolescent human patients.
Clinical Significance
Accelerated TMS protocols have the potential to provide simi-
lar or improved treatment outcomes compared with standard
once-daily dosing. Accelerated TMS protocols also may have neu-
roplastic advantages in adolescents with MDD. Accelerated TMS
protocols may provide pragmatic advantages for some patients.
The present pilot study is the first to directly compare the two
protocols in an adolescent animal model of depression.
Authors’ Contributions
B.J.S. and J.R. designed the research. B.J.S., L.A.H., L.A.J., and
L.A.M. conducted the experiments and acquired data. B.J.S. and
L.A.H. analyzed the data. B.J.S., L.A.H., P.E.C., and J.R. wrote the
article, and all authors contributed to the revisions and approved the
final article for publication.
STANDARD VS. ACCELERATED TMS 5
Dow
nloa
ded
by U
NIV
ER
SIT
Y O
F W
EST
ER
N A
UST
RA
LIA
fro
m w
ww
.lieb
ertp
ub.c
om a
t 01/
09/2
2. F
or p
erso
nal u
se o
nly.
541
Acknowledgments
The authors thank Ms. Marissa Penrose-Menz, Ms. Kerry Leg-
gett, Ms. Kaylene Schutz, Ms. Yashvi Bhatt, Mr. Parth Patel,
Ms. Sandra Goodin, and Mr. Stefan Davis at M-Block Animal Care
Services for their assistance with the behavioral experiments.
Disclosures
This research was funded by the University of Western Aus-
tralia. B.J.S. is supported by a Forrest Research Foundation Scho-
larship, an International Postgraduate Research Scholarship, and
a University Postgraduate Award. L.A.H. is supported by a Uni-
versity Postgraduate Award at the University of Western Australia,
and the Commonwealth Government’s Australian Government
Research Training Program Fees Offset. P.E.C. has received re-
search grant support from Mayo Foundation for Education and
Research, Neuronetics, Inc.; NeoSync, Inc.; National Science
Foundation, National Institute of Mental Health, and Pfizer, Inc. He
has received grant-in-kind (equipment support for research studies)
from Assurex; MagVenture, Inc.; and Neuronetics, Inc. He has
served as a consultant for Engrail Therapeutics, Myriad Neu-
roscience, Procter and Gamble, and Sunovion. J.R. was supported
by a Fellowship from Multiple Sclerosis Western Australia and the
Perron Institute for Neurological and Translational Science and a
grant from the Perpetual Foundation—The Helen Leech Endow-
ment. All other authors have nothing to disclose.
Supplementary Material
Supplementary Data
Supplementary Figure S1
References
Baeken C, van Beek V, Vanderhasselt M-A, Duprat R, Klooster D:
Cortical thickness in the right anterior cingulate cortex relates to
clinical response to left prefrontal accelerated intermittent theta
burst stimulation: An exploratory study. Neuromodulation 24:938–
949, 2021.
Boggio PS, Rocha M, Oliveira MO, Fecteau S, Cohen RB, Campanha
C, Ferreira-Santos E, Meleiro A, Corchs F, Zaghi S, Pascual-Leone A,
Fregni F: Noninvasive brain stimulation with high-frequency and low-
intensity repetitive transcranial magnetic stimulation treatment for
posttraumatic stress disorder. J Clin Psychiatry 71:992–999, 2010.
Bravo JA, Dıaz-Veliz G, Mora S, Ulloa JL, Berthoud VM, Morales P,
Arancibia S, Fiedler JL: Desipramine prevents stress-induced
changes in depressive-like behavior and hippocampal markers of
neuroprotection. Behav Pharmacol 20:273–285, 2009.
Cole EJ, Stimpson KH, Bentzley BS, Gulser M, Cherian K, Tischler
C, Nejad R, Pankow H, Choi E, Aaron H, Espil FM, Pannu J, Xiao
X, Duvio D, Solvason HB, Hawkins J, Guerra A, Jo B, Raj KS,
Phillips AL, Barmak F, Bishop JH, Coetzee JP, DeBattista C,
Keller J, Schatzberg AF, Sudheimer KD, Williams NR: Stanford
accelerated intelligent neuromodulation therapy for treatment-
resistant depression. Am J Psychiatry 177:716–726, 2020.
Croarkin PE, Elmaadawi AZ, Aaronson ST, Schrodt GR, Holbert RC,
Verdoliva S, Heart KL, Demitrack MA, Strawn JR: Left prefrontal
transcranial magnetic stimulation for treatment-resistant depression
in adolescents: A double-blind, randomized, sham-controlled trial.
Neuropsychopharmacology 46:462–469, 2021.
Croarkin PE, Rotenberg A: Pediatric neuromodulation comes of age.
J Child Adolesc Psychopharmacol 26:578–581, 2016.
Elmaghraby R, Sun Q, Ozger C, Shekunov J, Romanowicz M,
Croarkin PE: A systematic review of the safety and tolerability of
theta burst stimulation in children and adolescents. Neuromodula-
tion 2021 [Epub ahead of print]; DOI: 10.1111/ner.13455.
Fitzgerald PB, Hoy KE, Elliot D, Susan McQueen RN, Wambeek LE,
Daskalakis ZJ: Accelerated repetitive transcranial magnetic stimu-
lation in the treatment of depression. Neuropsychopharmacology
43:1565–1572, 2018.
George MS, Raman R, Benedek DM, Pelic CG, Grammer GG, Stokes
KT, Schmidt M, Spiegel C, DeAlmeida N, Beaver KL, Borckardt
JJ, Sun X, Jain S, Stein MB: A two-site pilot randomized 3 day trial
of high dose left prefrontal repetitive transcranial magnetic stimu-
lation (rTMS) for suicidal inpatients. Brain Stimul 7:421–431, 2014.
Grehl S, Martina D, Goyenvalle C, Deng Z-D, Rodger J, Sherrard
RM: In vitro magnetic stimulation: A simple stimulation device to
deliver defined low intensity electromagnetic fields. Front Neural
Circuits 10:85, 2016.
Grehl S, Viola HM, Fuller-Carter PI, Carter KW, Dunlop SA, Hool
LC, Sherrard RM, Rodger J: Cellular and molecular changes to
cortical neurons following low intensity repetitive magnetic stim-
ulation at different frequencies. Brain Stimul 8:114–123, 2015.
Heath A, Lindberg DR, Makowiecki K, Gray A, Asp AJ, Rodger J,
Choi D-S, Croarkin PE: Medium- and high-intensity rTMS reduces
psychomotor agitation with distinct neurobiologic mechanisms.
Transl Psychiatry 8:126, 2018.
Henckens MJAG, van der Marel K, van der Toorn A, Pillai AG,
Fernandez G, Dijkhuizen RM, Joels M: Stress-induced alterations
in large-scale functional networks of the rodent brain. NeuroImage
105:312–322, 2015.
Holtzheimer PE, 3rd, McDonald WM, Mufti M, Kelley ME, Quinn S,
Corso G, Epstein CM: Accelerated repetitive transcranial magnetic
stimulation for treatment-resistant depression. Depress Anxiety 27:
960–963, 2010.
Horvath JC, Mathews J, Demitrack MA, Pascual-Leone A: The
NeuroStar TMS device: Conducting the FDA approved protocol for
treatment of depression. J Visual Exp 45:2345, 2010.
Huang Y-Z, Edwards MJ, Rounis E, Bhatia KP, Rothwell JC: Theta
burst stimulation of the human motor cortex. Neuron 45:201–206,
2005.
Huang Y-Z, Rothwell JC: The effect of short-duration bursts of high-
frequency, low-intensity transcranial magnetic stimulation on the
human motor cortex. Clin Neurophysiol 115:1069–1075, 2004.
Lee T, Jarome T, Li S-J, Kim JJ, Helmstetter FJ: Chronic stress
selectively reduces hippocampal volume in rats: A longitudinal
magnetic resonance imaging study. Neuroreport 20:1554–1558,
2009.
Lisanby SH: Noninvasive brain stimulation for depression—The devil
is in the dosing. New Engl J Med 376:2593–2594, 2017.
Loo CK, Mitchell PB, McFarquhar TF, Malhi GS, Sachdev PS: A
sham-controlled trial of the efficacy and safety of twice-daily rTMS
in major depression. Psychol Med 37:341–349, 2007.
Makowiecki K, Harvey AR, Sherrard RM, Rodger J: Low-intensity
repetitive transcranial magnetic stimulation improves abnormal
visual cortical circuit topography and upregulates BDNF in mice.
J Neurosci 34:10780–10792, 2014.
McGirr A, Van den Eynde F, Tovar-Perdomo S, Fleck MPA, Berlim
MT: Effectiveness and acceptability of accelerated repetitive tran-
scranial magnetic stimulation (rTMS) for treatment-resistant major
depressive disorder: An open label trial. J Affect Disord 173:216–
220, 2015.
Modirrousta M, Meek BP, Wikstrom SL: Efficacy of twice-daily vs
once-daily sessions of repetitive transcranial magnetic stimulation
in the treatment of major depressive disorder: A retrospective study.
Neuropsychiatr Dis Treat 14:309–316, 2018.
Oberman LM, Hynd M, Nielson DM, Towbin KE, Lisanby SH, String-
aris A: Repetitive transcranial magnetic stimulation for adolescent
6 SEEWOO ET AL.
Dow
nloa
ded
by U
NIV
ER
SIT
Y O
F W
EST
ER
N A
UST
RA
LIA
fro
m w
ww
.lieb
ertp
ub.c
om a
t 01/
09/2
2. F
or p
erso
nal u
se o
nly.
542
major depressive disorder: A focus on neurodevelopment. Front
Psychiatry 12:642847, 2021.
Paxinos G, Watson C, Calabrese E, Badea A, Johnson GA: MRI/DTI
Atlas of the Rat Brain. San Diego (California), Academic Press,
2015.
Poh EZ, Harvey AR, Makowiecki K, Rodger J: Online LI-rTMS
during a visual learning task: Differential impacts on visual circuit
and behavioral plasticity in adult Ephrin-A2A5(-/-) mice. eNeuro 5:
ENEURO.0163-17.2018, 2018.
Rossi S, Hallett M, Rossini PM, Pascual-Leone A, Safety of TMSCG:
Safety, ethical considerations, and application guidelines for the use
of transcranial magnetic stimulation in clinical practice and re-
search. Clin Neurophysiol 120:2008–2039, 2009.
Santarelli L, Saxe M, Gross C, Surget A, Battaglia F, Dulawa S,
Weisstaub N, Lee J, Duman R, Arancio O, Belzung C, Hen R:
Requirement of hippocampal neurogenesis for the behavioral ef-
fects of antidepressants. Science 301:805–809, 2003.
Seewoo BJ, Feindel KW, Etherington SJ, Rodger J: Resting-state
fMRI study of brain activation using low-intensity repetitive tran-
scranial magnetic stimulation in rats. Sci Rep 8:6706, 2018.
Seewoo BJ, Feindel KW, Etherington SJ, Rodger J: Frequency-
specific effects of low-intensity rTMS can persist for up to 2 weeks
post-stimulation: A longitudinal rs-fMRI/MRS study in rats. Brain
Stimul 12:1526–1536, 2019.
Seewoo BJ, Hennessy LA, Feindel KW, Etherington SJ, Croarkin PE,
Rodger J: Validation of chronic restraint stress model in young
adult rats for the study of depression using longitudinal multimodal
MR imaging. Eneuro 7:ENEURO.0113-0120.2020, 2020.
Slattery DA, Cryan JF: Using the rat forced swim test to assess
antidepressant-like activity in rodents. Nat Protoc 7:1009, 2012.
Sonmez AI, Camsari DD, Nandakumar AL, Voort JLV, Kung S,
Lewis CP, Croarkin PE: Accelerated TMS for Depression: A sys-
tematic review and meta-analysis. Psychiatry Res 273:770–781,
2019.
Stepanichev M, Dygalo NN, Grigoryan G, Shishkina GT, Gulyaeva
N: Rodent models of depression: Neurotrophic and neuroin-
flammatory biomarkers. BioMed Res Int 2014:932757, 2014.
Tang AD, Bennett W, Hadrill C, Collins J, Fulopova B, Wills K,
Bindoff A, Puri R, Garry MI, Hinder MR, Summers JJ, Rodger J,
Canty AJ: Low intensity repetitive transcranial magnetic stimula-
tion modulates skilled motor learning in adult mice. Sci Rep 8:
4016, 2018.
Tang AD, Hong I, Boddington LJ, Garrett AR, Etherington S, Rey-
nolds JNJ, Rodger J: Low-intensity repetitive magnetic stimulation
lowers action potential threshold and increases spike firing in layer
5 pyramidal neurons in vitro. Neuroscience 335:64–71, 2016.
Ulloa JL, Castaneda P, Berrıos C, Dıaz-Veliz G, Mora S, Bravo JA,
Araneda K, Menares C, Morales P, Fiedler JL: Comparison of the
antidepressant sertraline on differential depression-like behaviors
elicited by restraint stress and repeated corticosterone administra-
tion. Pharmacol Biochem Behav 97:213–221, 2010.
Walf AA, Frye CA: The use of the elevated plus maze as an assay of
anxiety-related behavior in rodents. Nat Protoc 2:322–328, 2007.
Wang Q, Timberlake MA, 2nd, Prall K, Dwivedi Y: The recent
progress in animal models of depression. Prog Neuropsycho-
pharmacol Biol Psychiatry 77:99–109, 2017.
Wassermann EM: Risk and safety of repetitive transcranial magnetic
stimulation: Report and suggested guidelines from the International
Workshop on the Safety of Repetitive Transcranial Magnetic Sti-
mulation, June 5–7, 1996. Electroencephalogr Clin Neurophysiol
108:1–16, 1998.
Address correspondence to:
Jennifer Rodger, PhD
Experimental and Regenerative Neurosciences
School of Biological Sciences
The University of Western Australia
35 Stirling Highway
Crawley, WA 6009
Australia
E-mail: [email protected]
STANDARD VS. ACCELERATED TMS 7
Dow
nloa
ded
by U
NIV
ER
SIT
Y O
F W
EST
ER
N A
UST
RA
LIA
fro
m w
ww
.lieb
ertp
ub.c
om a
t 01/
09/2
2. F
or p
erso
nal u
se o
nly.
543
Archival Report
White Matter Changes Following ChronicRestraint Stress and Neuromodulation:A Diffusion Magnetic Resonance Imaging Studyin Young Male RatsBhedita Jaya Seewoo, Kirk Wayne Feindel, Yerim Won, Alexander Clemens Joos,Abbey Figliomeni, Lauren Anne Hennessy, and Jennifer Rodger
ABSTRACTBACKGROUND: Repetitive transcranial magnetic stimulation (rTMS), a noninvasive neuromodulation technique, is aneffective treatment for depression. However, few studies have used diffusion magnetic resonance imaging toinvestigate the longitudinal effects of rTMS on the abnormal brain white matter (WM) described in depression.METHODS: In this study, we acquired diffusion magnetic resonance imaging from young adult male Sprague Dawleyrats to investigate 1) the longitudinal effects of 10- and 1-Hz low-intensity rTMS (LI-rTMS) in healthy animals; 2) theeffect of chronic restraint stress (CRS), an animal model of depression; and 3) the effect of 10 Hz LI-rTMS in CRSanimals. Diffusion magnetic resonance imaging data were analyzed using tract-based spatial statistics and fixel-based analysis.RESULTS: Similar changes in diffusion and kurtosis fractional anisotropy were induced by 10- and 1-Hz stimulation inhealthy animals, although changes induced by 10-Hz stimulation were detected earlier than those following 1-Hzstimulation. Additionally, 10-Hz stimulation increased axial and mean kurtosis within the external capsule,suggesting that the two protocols may act via different underlying mechanisms. Brain maturation–related changesin WM, such as increased corpus callosum, fimbria, and external and internal capsule fiber cross-section, werecompromised in CRS animals compared with healthy control animals and were rescued by 10-Hz LI-rTMS.Immunohistochemistry revealed increased myelination within the corpus callosum in LI-rTMS–treated CRS animalscompared with those that received sham or no stimulation.CONCLUSIONS: Overall, decreased WM connectivity and integrity in the CRS model corroborate findings in patientsexperiencing depression with high anxiety, and the observed LI-rTMS–induced effects on WM structure suggest thatLI-rTMS might rescue abnormal WM by increasing myelination.
https://doi.org/10.1016/j.bpsgos.2021.08.006
Depression is a heterogeneous disorder affected by subject-related variables, such as sex, age, diet, and genetic back-ground (1), and up to one third of adults are treatmentresistant. Repetitive transcranial magnetic stimulation (rTMS)has been used clinically for treatment-resistant depression forover a decade (2), but its underlying mechanisms are still un-clear. While translational animal models of depression do notreplicate the full complexity of human mood disorders, theycan provide homogeneous endophenotypes of depressionthat facilitate the investigation of causal effects (e.g., geneticand environmental factors) and the efficacy of treatments suchas rTMS (3). The chronic restraint stress (CRS) depressionmodel in Sprague Dawley rats has been validated in severalpharmacological and magnetic resonance imaging (MRI)studies. Following CRS, animals exhibit changes resemblingthose found in human depression, including altered behavior(4,5), gene expression (6), and protein levels (7); dysfunctional
connectivity (8); reduced glutamate and glutamine levels (5);and hippocampal atrophy (5,9,10).
One of the least understood aspects of depression in pa-tients is related to the microstructural changes often present inthe white matter (WM). Diffusion MRI (dMRI) measures thediffusion of water and enables in vivo investigation of tissuemicrostructure and macro organization of fiber bundles. Waterdiffusion has been shown to be increased in patients withdepression (11,12) and in other animal models of depression(13,14) using several dMRI measures, including mean diffu-sivity, a global measure of water diffusion, and radial kurtosis,a measure of diffusion restriction perpendicular to axonal di-rection. These different measures that can be derived fromdMRI data are known to provide complementary and partlyoverlapping information by reflecting changes in WM integrity,specifically with respect to cell density, size, and membranepermeability. Myelin content, known to decrease in depression
ª 2021 THE AUTHORS. Published by Elsevier Inc on behalf of the Society of Biological Psychiatry. This is an open access article under theCC BY-NC-ND license (http://creativecommons.org/licenses/by-nc-nd/4.0/).
1
ISSN: 2667-1743 Biological Psychiatry: Global Open Science - -, 2021; -:-–- www.sobp.org/GOS
BiologicalPsychiatry:GOSAppendix J
544
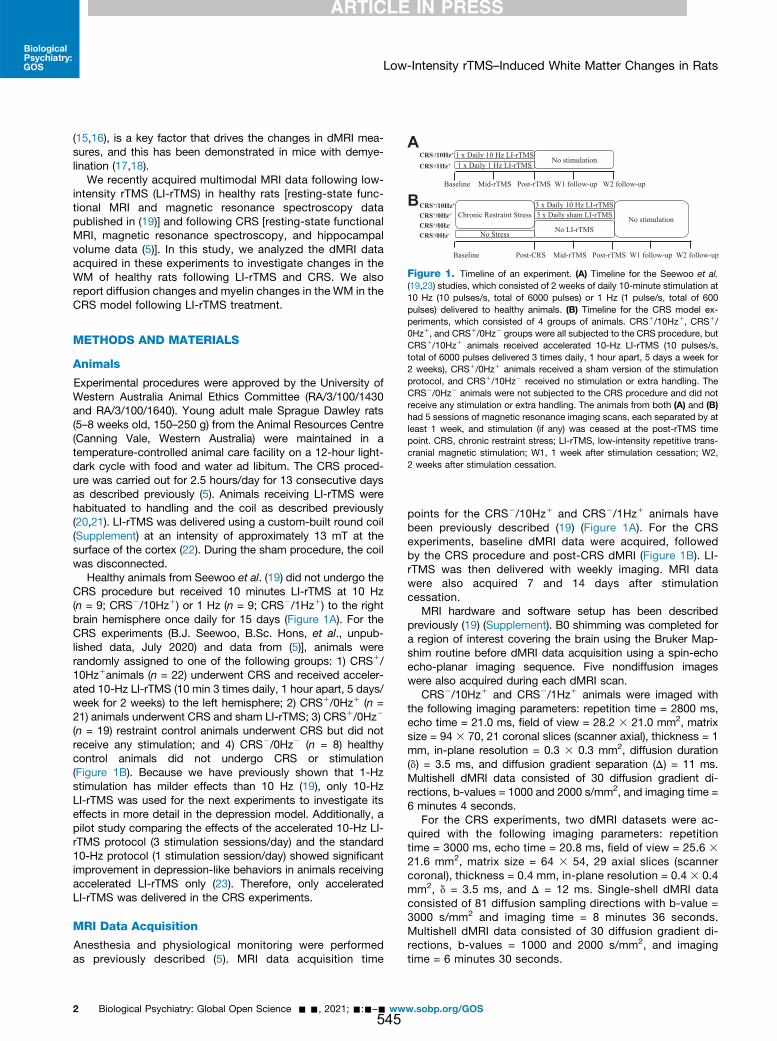
(15,16), is a key factor that drives the changes in dMRI mea-sures, and this has been demonstrated in mice with demye-lination (17,18).
We recently acquired multimodal MRI data following low-intensity rTMS (LI-rTMS) in healthy rats [resting-state func-tional MRI and magnetic resonance spectroscopy datapublished in (19)] and following CRS [resting-state functionalMRI, magnetic resonance spectroscopy, and hippocampalvolume data (5)]. In this study, we analyzed the dMRI dataacquired in these experiments to investigate changes in theWM of healthy rats following LI-rTMS and CRS. We alsoreport diffusion changes and myelin changes in the WM in theCRS model following LI-rTMS treatment.
METHODS AND MATERIALS
Animals
Experimental procedures were approved by the University ofWestern Australia Animal Ethics Committee (RA/3/100/1430and RA/3/100/1640). Young adult male Sprague Dawley rats(5–8 weeks old, 150–250 g) from the Animal Resources Centre(Canning Vale, Western Australia) were maintained in atemperature-controlled animal care facility on a 12-hour light-dark cycle with food and water ad libitum. The CRS proced-ure was carried out for 2.5 hours/day for 13 consecutive daysas described previously (5). Animals receiving LI-rTMS werehabituated to handling and the coil as described previously(20,21). LI-rTMS was delivered using a custom-built round coil(Supplement) at an intensity of approximately 13 mT at thesurface of the cortex (22). During the sham procedure, the coilwas disconnected.
Healthy animals from Seewoo et al. (19) did not undergo theCRS procedure but received 10 minutes LI-rTMS at 10 Hz(n = 9; CRS2/10Hz1) or 1 Hz (n = 9; CRS2/1Hz1) to the rightbrain hemisphere once daily for 15 days (Figure 1A). For theCRS experiments (B.J. Seewoo, B.Sc. Hons, et al., unpub-lished data, July 2020) and data from (5)], animals wererandomly assigned to one of the following groups: 1) CRS1/10Hz1animals (n = 22) underwent CRS and received acceler-ated 10-Hz LI-rTMS (10 min 3 times daily, 1 hour apart, 5 days/week for 2 weeks) to the left hemisphere; 2) CRS1/0Hz1 (n =21) animals underwent CRS and sham LI-rTMS; 3) CRS1/0Hz2
(n = 19) restraint control animals underwent CRS but did notreceive any stimulation; and 4) CRS2/0Hz2 (n = 8) healthycontrol animals did not undergo CRS or stimulation(Figure 1B). Because we have previously shown that 1-Hzstimulation has milder effects than 10 Hz (19), only 10-HzLI-rTMS was used for the next experiments to investigate itseffects in more detail in the depression model. Additionally, apilot study comparing the effects of the accelerated 10-Hz LI-rTMS protocol (3 stimulation sessions/day) and the standard10-Hz protocol (1 stimulation session/day) showed significantimprovement in depression-like behaviors in animals receivingaccelerated LI-rTMS only (23). Therefore, only acceleratedLI-rTMS was delivered in the CRS experiments.
MRI Data Acquisition
Anesthesia and physiological monitoring were performedas previously described (5). MRI data acquisition time
points for the CRS2/10Hz1 and CRS2/1Hz1 animals havebeen previously described (19) (Figure 1A). For the CRSexperiments, baseline dMRI data were acquired, followedby the CRS procedure and post-CRS dMRI (Figure 1B). LI-rTMS was then delivered with weekly imaging. MRI datawere also acquired 7 and 14 days after stimulationcessation.
MRI hardware and software setup has been describedpreviously (19) (Supplement). B0 shimming was completed fora region of interest covering the brain using the Bruker Map-shim routine before dMRI data acquisition using a spin-echoecho-planar imaging sequence. Five nondiffusion imageswere also acquired during each dMRI scan.
CRS2/10Hz1 and CRS2/1Hz1 animals were imaged withthe following imaging parameters: repetition time = 2800 ms,echo time = 21.0 ms, field of view = 28.2 3 21.0 mm2, matrixsize = 94 3 70, 21 coronal slices (scanner axial), thickness = 1mm, in-plane resolution = 0.3 3 0.3 mm2, diffusion duration(d) = 3.5 ms, and diffusion gradient separation (D) = 11 ms.Multishell dMRI data consisted of 30 diffusion gradient di-rections, b-values = 1000 and 2000 s/mm2, and imaging time =6 minutes 4 seconds.
For the CRS experiments, two dMRI datasets were ac-quired with the following imaging parameters: repetitiontime = 3000 ms, echo time = 20.8 ms, field of view = 25.6 3
21.6 mm2, matrix size = 64 3 54, 29 axial slices (scannercoronal), thickness = 0.4 mm, in-plane resolution = 0.4 3 0.4mm2, d = 3.5 ms, and D = 12 ms. Single-shell dMRI dataconsisted of 81 diffusion sampling directions with b-value =3000 s/mm2 and imaging time = 8 minutes 36 seconds.Multishell dMRI data consisted of 30 diffusion gradient di-rections, b-values = 1000 and 2000 s/mm2, and imagingtime = 6 minutes 30 seconds.
A
BBaseline Mid-rTMS Post-rTMS W1 follow-up W2 follow-up
1 x Daily 1 Hz LI-rTMSNo stimulation
Baseline Post-CRS Mid-rTMS Post-rTMS W1 follow-up W2 follow-up
Chronic Restraint Stress
3 x Daily 10 Hz LI-rTMS
No stimulation
CRS-/10Hz+
CRS-/1Hz+
1 x Daily 10 Hz LI-rTMS
No Stress
CRS+/10Hz+
No LI-rTMS
CRS+/0Hz+ 3 x Daily sham LI-rTMS
CRS+/0Hz-
CRS-/0Hz-
Figure 1. Timeline of an experiment. (A) Timeline for the Seewoo et al.(19,23) studies, which consisted of 2 weeks of daily 10-minute stimulation at10 Hz (10 pulses/s, total of 6000 pulses) or 1 Hz (1 pulse/s, total of 600pulses) delivered to healthy animals. (B) Timeline for the CRS model ex-periments, which consisted of 4 groups of animals. CRS1/10Hz1, CRS1/0Hz1, and CRS1/0Hz2 groups were all subjected to the CRS procedure, butCRS1/10Hz1 animals received accelerated 10-Hz LI-rTMS (10 pulses/s,total of 6000 pulses delivered 3 times daily, 1 hour apart, 5 days a week for2 weeks), CRS1/0Hz1 animals received a sham version of the stimulationprotocol, and CRS1/10Hz2 received no stimulation or extra handling. TheCRS2/0Hz2 animals were not subjected to the CRS procedure and did notreceive any stimulation or extra handling. The animals from both (A) and (B)had 5 sessions of magnetic resonance imaging scans, each separated by atleast 1 week, and stimulation (if any) was ceased at the post-rTMS timepoint. CRS, chronic restraint stress; LI-rTMS, low-intensity repetitive trans-cranial magnetic stimulation; W1, 1 week after stimulation cessation; W2,2 weeks after stimulation cessation.
Low-Intensity rTMS–Induced White Matter Changes in Rats
2 Biological Psychiatry: Global Open Science - -, 2021; -:-–- www.sobp.org/GOS
BiologicalPsychiatry:GOS
545

dMRI Data Analysis
dMRI data processing was carried out using the MRtrix3software package (24) and included denoising (25–27), removalof Gibbs ringing artifacts (28), and B1 field inhomogeneitycorrection (29). Skull stripping was performed using the qimaskutility from QUantitative Imaging Tools (30).
Tract-Based Spatial Statistics. Multishell dMRI datasetswere analyzed using the tract-based spatial statistics (TBSS)method (31) in the FSL (version 6.0.3) (32) and adapted forusing rodent data (Supplement). First, the preprocesseddatasets were converted to NifTI file format (https://nifti.nimh.nih.gov/). Diffusion kurtosis parameter maps for fractionalanisotropy (FA), mean diffusivity (MD), axial diffusivity (AD),radial diffusivity (RD), kurtosis fractional anisotropy, meankurtosis, mean kurtosis tensor, axial kurtosis (AK), and radialkurtosis (RK), as well as diffusion tensor parameter maps forFA, MD, AD, and RD, were then generated for each animal ateach time point using the diffusional kurtosis estimator (33).Next, the SPM12 toolbox (using MATLAB, version9.10.0.1602886 (R2021a) [The MathWorks, Inc.] compiler) wasused to convert the above parameter maps into a formatcompatible with input through the DTI-ToolKit software. DTI-ToolKit was then used to spatially normalize each dataset toa population-specific template (34) using a tensor-basedregistration formulation (35). These coregistered images wereconcatenated to create one single 4-dimensional image foreach diffusion parameter and fed into the FSL/TBSS pipeline.
The mean of all FA images was computed and used togenerate a mean FA skeleton and a skeleton mask using an FAthreshold of 0.26 (36). The mean FA and mean FA skeletonmask were used to skeletonize all parameter maps, which werethen fed into the voxelwise analysis using nonparametric per-mutation testing (FSL/randomise).
Fixel-Based Analysis. Single-shell dMRI data were used togenerate and analyze fixel-based metrics, including theapparent fiber density (AFD), fiber cross-section (FC), and thecombination of AFD and FC (FDC), using the multitissue fixel-based analysis pipeline implemented in MRtrix3 as outlinedpreviously (37–40). In this study, a population-based templatewas generated based on 50 datasets across groups and timepoints. Whole-brain tractography was performed on the tem-plate with probabilistic tracking at a cutoff of 0.2 (41).
For track-weighted imaging analysis, whole-brain tractog-raphy was performed in native space for each rat using thesame parameters outlined above and registered to the study-specific template to normalize both the length and spatiallocation of the streamlines. The normalized tractograms werethen used to generate the average pathlength map (APM),representing the average length of tracks passing througheach voxel (42), and mean curvature map, representing theaverage curvature of all tracks passing through each voxel.
Differences between time points were determined usingnonparametric permutation testing over 5000 permutations(43,44).
Statistical Analyses. Because of the longitudinal nature ofthe data presented, within-group comparisons were performed
to investigate changes over time. To quantify the amount ofchange with and without restraint, baseline and postrestrainttime points were compared using an equal number of animalsfrom the CRS2/0Hz2 and CRS1/0Hz2 groups (n = 8). For allimage analyses, all voxels in the brain were corrected using thethreshold-free cluster enhancement method with familywiseerror correction (45). Statistically significant differences formaps were visualized at a Bonferroni-corrected p value of .006(rTMS effects) and .025 (CRS effects). In addition, raw diffusionvalues from 4 regions of interest (ROIs) within the corpus cal-losum, internal capsule, external capsule, and fimbria [manu-ally drawn using ITK-SNAP 3.3.0 (46); http://www.itksnap.org]were extracted and analyzed using RStudio (version 3.6.1;RStudio Team). Analysis of variance (lmerTest package) wasutilized to test for any significant effect of animal group or timepoint. When there was an effect of both animal group and timepoint, post hoc pairwise comparisons were performed withfalse discovery rate correction (emmeans package) to deter-mine significant differences in diffusion parameters betweentime points for each group and ROI.
Brain Immunohistochemistry
At the end of the study, the rats were euthanized with anoverdose of sodium pentobarbitone (.160 mg/kg intraperito-neal) and transcardially perfused with 200 mL of 4% para-formaldehyde in 0.2M phosphate buffer. Brains were postfixedin 4% paraformaldehyde solution at 4 �C and transferred to30% sucrose in phosphate-buffered saline 48 hours beforecryosectioning into 40-mm coronal sections. Five brains fromeach of the CRS1/10Hz1, CRS1/0Hz1, and CRS1/0Hz2
groups were selected and 3 sections were chosen per brain forimmunohistochemical staining at positions 80, 88, and 97 onour MRI population template corresponding tobregma 23.11, 22.11, and 20.11 mm (47). Sections wereprocessed for immunohistochemistry (Supplement) usingrabbit anti-myelin basic protein polyclonal antibody (ab40390)and anti-NeuN monoclonal antibody (MAB377). Sections wereimaged on a Nikon confocal C2, NI-E microscope with a 103lens, captured using NIS Elements AR software using the samesettings and analyzed using FIJI (ImageJ 1.53c, National In-stitutes of Health) software by an operator blinded to condi-tions (48) (Supplement). Data were analyzed and plotted usingRStudio (version 3.6.1; RStudio Team). Analysis of variance(lmerTest package) was utilized to test for any significant effectof animal group or ROI. Post hoc Mann-Whitney two-samplerank-sum test with false discovery rate correction (rstatixpackage) was then used to determine significant differences inmyelin basic protein (MBP) intensity between groups.
RESULTS
WM Changes Following 10- and 1-Hz LI-rTMS inHealthy Rats
We first examined whether LI-rTMS-induced any changes inWM tracts in healthy rats. TBSS analysis of the 10- and 1-Hzdata revealed an increase in diffusion kurtosis imaging/diffu-sion tensor imaging (DKI/DTI) FA for both frequencies. Thisincrease was detectable at the 7 days after stimulationcessation time point in the 10-Hz group but was observed only
Low-Intensity rTMS–Induced White Matter Changes in Rats
Biological Psychiatry: Global Open Science - -, 2021; -:-–- www.sobp.org/GOS 3
BiologicalPsychiatry:GOS
546

at the 14 days after stimulation cessation time point in the 1-Hzgroup (Figure 2). In addition, only the 10-Hz group exhibited anincrease in external capsule AK, internal and external capsulekurtosis FA and mean kurtosis, and fimbria and externalcapsule mean kurtosis tensor (Figures 2 and 3). ROI-basedanalyses showed that both groups showed an increase in in-ternal capsule DTI/DKI FA, but only the 1-Hz group showed anincrease in fimbria DTI FA (Figure 3). Additionally, internalcapsule AD and fimbria RK increased in the 10-Hz group onlyand corpus callosum RK increased in both groups (Figure S1).
Rat Model of Depression: WM Changes FollowingCRS
Having demonstrated that LI-rTMS altered WM tracts inhealthy animals, it was relevant to examine the effects of LI-rTMS in a disease model. rTMS is an FDA-approved treat-ment of depression, and therefore a rat model of depression(CRS) was chosen. We first report CRS-induced WM changesin restrained animals compared with healthy unrestrainedanimals.
Changes in WM diffusion and kurtosis were observed inboth restrained and unrestrained groups, likely reflecting brainmaturation. DTI AD, DTI/DKI RD, and DTI/DKI MD decreasedsignificantly from baseline at the postrestraint time point, whileDKI AD decreased in healthy animals only and AK and DTI FAincreased in restrained animals only (Figure 4A). ROI-basedanalyses showed that both groups exhibited a significantdecrease in external capsule DTI RD and increase in externalcapsule DTI FA, while internal capsule DTI FA increased inrestrained animals only and fimbria RK increased in healthyanimals only (Figure 5A).
Following restraint, animals exhibited smaller and delayedbrain maturation–related changes in WM FC and morphologycompared with unrestrained animals. Unrestrained animalsshowed a greater increase in internal capsule FC and FDC andcorpus callosum and fimbria FDC compared with restrainedanimals (Figure 4B). Additionally, there was a significant in-crease in AFD, APM, and mean curvature map in unrestrainedanimals only. ROI-based analyses showed a significant in-crease in internal capsule FC and corpus callosum and fimbriaFDC in both groups. Only the unrestrained animals exhibited asignificant increase in corpus callosum, fimbria and externalcapsule FC, internal capsule FDC, and external capsule andfimbria APM (Figure 5B).
Rat Model of Depression and Treatment: WMChanges Following CRS and Accelerated 10-HzLI-rTMS
Diffusion MRI. Having identified changes in WM that wereinduced by CRS, we then determined whether these changescould be rescued using LI-rTMS. Similar to changes reportedfollowing CRS, there was a significant increase in DTI FA andFC when comparing postrestraint and 14 days after stimulationcessation time points in all groups (Figure 6), suggestingongoing brain maturation. LI-rTMS and control groups showedsimilar amount of change in DTI/DKI FA overall, but only thecontrol group showed changes within the corpus callosum(Figure 7). DKI/DTI RD decreased over time in the corpuscallosum in the sham and control groups but decreased overtime in the fimbria in the LI-rTMS group (Figure 7). While FCincreased with time in all groups, there was a greater increasein FC in the internal capsule and fimbria of the LI-rTMS groupcompared with sham and control groups, suggesting a
DKI FAW1 follow-
up > Baseline
W2 follow-up > Baseline
KFA
Mid-rTMS > Baseline
W2 follow-up > Baseline
MKW2 follow-
up > Baseline
R DTI FA
AK
MKT
10 Hz 1 Hz 10 Hz 1 Hz0.2%
26%
10%
25%
21%
0%
22%
0%
0%
0%
0%
35%
0%
0%
0%
5%
20%
4%
21%
35%
Y = 70
Y = 60
P=0P=0.006
Y = 75
Y = 70
Y = 60
Y = 70
Y = 60 Y = 60
Y = 70
Y = 75
Y = 70Y = 70
Figure 2. Tract-based spatial statistics analysisshows significant changes in diffusion and kurtosisparameters following 10- or 1-Hz low-intensity rTMSin healthy rats (pBonferroni , .006). The figure illus-trates changes between baseline and 4 time points:after 1 (mid-rTMS) and 2 weeks (post-rTMS) of dailystimulation and W1 and W2 follow-up. Green rep-resents mean FA skeleton of all animals; red denotesan increase after stimulation. The percentage in thetop-right corner of the coronal slices representsthe percentage of the significant voxels relative tothe whole skeleton voxels for each parameter. Low-intensity-rTMS was delivered to the right side of thebrain (denoted by R). AK, axial kurtosis; DKI, diffu-sion kurtosis imaging; DTI, diffusion tensor imaging;FA, fractional anisotropy; KFA, kurtosis fractionalanisotropy; MK, mean kurtosis; MKT, mean kurtosistensor; rTMS, repetitive transcranial magnetic stim-ulation; W1, 1 week after stimulation cessation; W2,2 weeks after stimulation cessation.
Low-Intensity rTMS–Induced White Matter Changes in Rats
4 Biological Psychiatry: Global Open Science - -, 2021; -:-–- www.sobp.org/GOS
BiologicalPsychiatry:GOS
547

significant effect of LI-rTMS in normalizing the WM changesobserved postrestraint (Figure 6B). ROI-based analysesshowed similar changes in FC and FDC in all groups(Figure S2).
Immunohistochemistry. Given that we found a decreasein DTI and DKI RD after rTMS and that changes in RD are
related to myelination, we measured the relative immunoden-sity of the MBP fluorescent signal in the left, center, and rightregions of the corpus callosum in the CRS1/10Hz1, CRS1/0Hz1, and CRS1/0Hz2 groups (Figure 8A). A near-significantdifference was detected between groups (analysis of vari-ance, F2,12 = 3.710; p = .056). Given the small sample size (n =5/group), a post hoc Mann-Whitney two-sample rank-sum test
10 Hz 1 Hz 10 Hz 1 Hz
Internal Capsule
FimbriaInternal Capsule
Fimbria External Capsule
External Capsule
***** ⱡ * ** **ⱡ *
ⱡ * *** ⱡ * ** ** *****
* *** * ** **
***
* *** ⱡ ⱡ
Figure 3. Significant changes in DTI and DKImeasures within the internal and external capsulesand fimbria in healthy animals receiving 10- or 1-Hzlow-intensity rTMS (pFDR , .006). The boxplotsillustrate changes between baseline and 4 timepoints: after 1 week (mid-rTMS) and 2 weeks (post-rTMS) of daily stimulation and W1 and W2 follow-up.‡pFDR , .1, *pFDR , .05, **pFDR , .01, ***pFDR ,
.001. AK, axial kurtosis; DKI, diffusion kurtosis im-aging; DTI, diffusion tensor imaging; FA, fractionalanisotropy; KFA, kurtosis fractional anisotropy; MK,mean kurtosis; MKT, mean kurtosis tensor; pFDR,false discovery rate-corrected p; rTMS, repetitivetranscranial magnetic stimulation; W1, 1 week afterstimulation cessation; W2, 2 weeks after stimulationcessation.
Low-Intensity rTMS–Induced White Matter Changes in Rats
Biological Psychiatry: Global Open Science - -, 2021; -:-–- www.sobp.org/GOS 5
BiologicalPsychiatry:GOS
548

was performed. CRS1/10Hz1 animals showed greater MBPimmunodensity than CRS1/0Hz1 animals or CRS1/0Hz2 ani-mals at each ROI (Figure 8B). This difference was greater in theleft hemisphere, which received LI-rTMS (Table 1), supportingthe fixel-based analysis findings that LI-rTMS rescued thedelayed myelination caused by CRS.
DISCUSSION
To our knowledge, this study is the first to employ dMRI totrack whole-brain WM changes in healthy and CRS animalsover time and following multiple sessions of LI-rTMS. Whilecaution is needed when linking diffusion measures to micro-structural correlates, based on the current literature, our dMRIand histological findings suggest that the restorative effects ofLI-rTMS on WM are at least in part due to an increase inmyelination.
High-Frequency LI-rTMS Induces Greater andFaster Changes in the WM of Healthy Rats ThanLow-Frequency LI-rTMS
In this study, we observed extensive WM changes in healthySprague Dawley rats following 10- and 1-Hz LI-rTMS usingboth DKI and conventional DTI. The increase in anisotropyobserved following 10-Hz stimulation likely stems from theincreased axial (parallel) diffusivity observed within the internalcapsule, which in turn may result from an increase in packingdensity of fiber bundles and axons, axonal diameter increase,changes in neurofibrils, and/or increased complexity of extra-cellular matrix (49). Increased diffusion restriction perpendic-ular to axonal direction (RK) in the corpus callosum of bothgroups likely reflects increased myelination and/or number ofaxons (49). RK is thought to be more influenced by cellularmembranes and myelin sheaths, whereas AK (parallel toaxonal direction) is considered to be primarily affected by
DKI AD
DTI AD
DKI RD
DTI RD
DKI MD
DTI MD
AK
DTI FA
R 6% 0%
25% 26%
30% 55%
42% 61%
34% 48%
48% 58%
0%
CRS-/0Hz- CRS+/0Hz-
Y = 80 Y = 80
0% 1%
Y = 70
0.1%
P=0P=0.025
P=0P=0.025
CRS-/0Hz- CRS+/0Hz-
R 81 mm3 8 mm3
74 mm3
19 mm3
2 mm3
2 mm3
0 mm3
2 mm3
0 mm3
0 mm3
Y = 78Y = 78
Y = 70
Y = 80 Y = 80
FC
AFD
FDC
APM
MC
A B Figure 4. CRS results in significant changes in thewhite matter (pBonferroni , .025). (A) Results fromtract-based spatial statistics analysis. Green repre-sents the mean FA skeleton of all animals; red de-notes an increase and blue represents a reductionafter restraint. The percentage on the top-rightcorner of each coronal slice represents the per-centage of the significant voxels relative to the wholeskeleton voxels for each parameter. (B) Results fromfixel-based analysis and track-weighted imaging.Rats that underwent CRS (CRS1/0Hz2) had asmaller increase in FC, AFD, FDC, APM, and MC.Statistically significant fixels are overlaid on thepopulation template. The whole-brain templatetractogram is also overlaid on the population tem-plate for APM and MC. The number at the top-rightcorner of each coronal slice represents the volumeof significant voxels. The right side of the brain isdenoted by R. AD, axial diffusivity; AFD, apparentfiber density; AK, axial kurtosis; APM, averagepathlength mapping; CRS, chronic restraint stress;DKI, diffusion kurtosis imaging; DTI, diffusion tensorimaging; FA, fractional anisotropy; FC, fiber cross-section; FDC, combination of AFD and FC; MC,mean curvature; MD, mean diffusivity; RD, radialdiffusivity.
Low-Intensity rTMS–Induced White Matter Changes in Rats
6 Biological Psychiatry: Global Open Science - -, 2021; -:-–- www.sobp.org/GOS
BiologicalPsychiatry:GOS
549

Corpus callosum Internal capsule Fimbria
Baseline Post-CRS Baseline Post-CRS Baseline Post-CRS Baseline Post-CRS
CRS-/0Hz- CRS+/0Hz- CRS-/0Hz- CRS+/0Hz-
Baseline minus
Post-CRS
Baseline minus
Post-CRS
Baseline minus
Post-CRS
Baseline minus
Post-CRS
Fimbria External capsule
Baseline Post-CRS Baseline Post-CRS Baseline Post-CRS Baseline Post-CRS
CRS-/0Hz- CRS+/0Hz- CRS-/0Hz- CRS+/0Hz-
Baseline minus
Post-CRS
Baseline minus
Post-CRS
Baseline minus
Post-CRS
Baseline minus
Post-CRS
Baseline Post-CRS Baseline Post-CRS Baseline Post-CRS Baseline Post-CRS
CRS-/0Hz- CRS+/0Hz- CRS-/0Hz- CRS+/0Hz-
Baseline minus
Post-CRS
Baseline minus
Post-CRS
Baseline minus
Post-CRS
Baseline minus
Post-CRS
Baseline Post-CRS Baseline Post-CRS Baseline Post-CRS Baseline Post-CRS
CRS-/0Hz- CRS+/0Hz- CRS-/0Hz- CRS+/0Hz-
Baseline minus
Post-CRS
Baseline minus
Post-CRS
Baseline minus
Post-CRS
Baseline minus
Post-CRS
Baseline Post-CRS
CRS-/0Hz- CRS+/0Hz-
Baseline Post-CRS
Baseline minus
Post-CRS
Baseline minus
Post-CRS
Corpus callosum Internal capsule Fimbria External capsule
FD
CF
CA
PM
FC
AP
M
Internal capsule External capsule
DT
I F
A
DT
I F
ABaseline Post-CRS
CRS-/0Hz- CRS+/0Hz-
Baseline Post-CRS
Baseline minus
Post-CRS
Baseline minus
Post-CRS
Baseline Post-CRS
CRS-/0Hz- CRS+/0Hz-
Baseline Post-CRS
Baseline minus
Post-CRS
External capsule Fimbria
RK
DT
I R
D
Baseline minus
Post-CRS
Baseline Post-CRS
CRS-/0Hz- CRS+/0Hz-
Baseline Post-CRS
Baseline minus
Post-CRS
Baseline minus
Post-CRS
Baseline Post-CRS
CRS-/0Hz- CRS+/0Hz-
Baseline Post-CRS
Baseline minus
Post-CRS
Baseline minus
Post-CRS
A
B
C
* * *
** ***
***
* *** ** ** ** ⱡ
** * ⱡ*** ** *
* *
Pai
red
Co
hen
’s d
Pai
red
Co
hen
’s d
Pai
red
Co
hen
’s d
Pai
red
Co
hen
’s d
Pai
red
Co
hen
’s d
Pai
red
Co
hen
’s d
Low-Intensity rTMS–Induced White Matter Changes in Rats
Biological Psychiatry: Global Open Science - -, 2021; -:-–- www.sobp.org/GOS 7
BiologicalPsychiatry:GOS
550
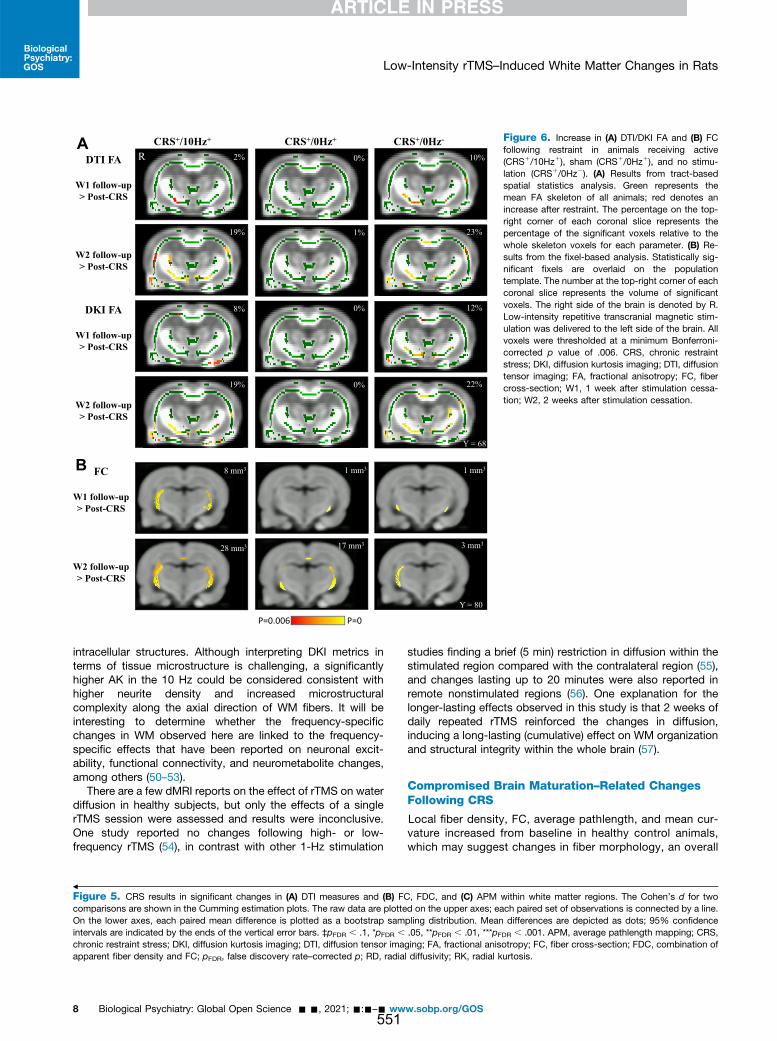
intracellular structures. Although interpreting DKI metrics interms of tissue microstructure is challenging, a significantlyhigher AK in the 10 Hz could be considered consistent withhigher neurite density and increased microstructuralcomplexity along the axial direction of WM fibers. It will beinteresting to determine whether the frequency-specificchanges in WM observed here are linked to the frequency-specific effects that have been reported on neuronal excit-ability, functional connectivity, and neurometabolite changes,among others (50–53).
There are a few dMRI reports on the effect of rTMS on waterdiffusion in healthy subjects, but only the effects of a singlerTMS session were assessed and results were inconclusive.One study reported no changes following high- or low-frequency rTMS (54), in contrast with other 1-Hz stimulation
studies finding a brief (5 min) restriction in diffusion within thestimulated region compared with the contralateral region (55),and changes lasting up to 20 minutes were also reported inremote nonstimulated regions (56). One explanation for thelonger-lasting effects observed in this study is that 2 weeks ofdaily repeated rTMS reinforced the changes in diffusion,inducing a long-lasting (cumulative) effect on WM organizationand structural integrity within the whole brain (57).
Compromised Brain Maturation–Related ChangesFollowing CRS
Local fiber density, FC, average pathlength, and mean cur-vature increased from baseline in healthy control animals,which may suggest changes in fiber morphology, an overall
8 mm3 1 mm3 1 mm3
28 mm3 17 mm3 3 mm3
Y = 80
P=0P=0.006
DTI FA
W1 follow-up > Post-CRS
W2 follow-up > Post-CRS
CRS+/10Hz+ CRS+/0Hz+ CRS+/0Hz-
R 2%
19%
8%
0%
1%
0%
10%
23%
12%DKI FA
W1 follow-up > Post-CRS
W2 follow-up > Post-CRS
19% 0% 22%
Y = 68
A
B FC
W1 follow-up > Post-CRS
W2 follow-up > Post-CRS
Figure 6. Increase in (A) DTI/DKI FA and (B) FCfollowing restraint in animals receiving active(CRS1/10Hz1), sham (CRS1/0Hz1), and no stimu-lation (CRS1/0Hz2). (A) Results from tract-basedspatial statistics analysis. Green represents themean FA skeleton of all animals; red denotes anincrease after restraint. The percentage on the top-right corner of each coronal slice represents thepercentage of the significant voxels relative to thewhole skeleton voxels for each parameter. (B) Re-sults from the fixel-based analysis. Statistically sig-nificant fixels are overlaid on the populationtemplate. The number at the top-right corner of eachcoronal slice represents the volume of significantvoxels. The right side of the brain is denoted by R.Low-intensity repetitive transcranial magnetic stim-ulation was delivered to the left side of the brain. Allvoxels were thresholded at a minimum Bonferroni-corrected p value of .006. CRS, chronic restraintstress; DKI, diffusion kurtosis imaging; DTI, diffusiontensor imaging; FA, fractional anisotropy; FC, fibercross-section; W1, 1 week after stimulation cessa-tion; W2, 2 weeks after stimulation cessation.
=
Figure 5. CRS results in significant changes in (A) DTI measures and (B) FC, FDC, and (C) APM within white matter regions. The Cohen’s d for twocomparisons are shown in the Cumming estimation plots. The raw data are plotted on the upper axes; each paired set of observations is connected by a line.On the lower axes, each paired mean difference is plotted as a bootstrap sampling distribution. Mean differences are depicted as dots; 95% confidenceintervals are indicated by the ends of the vertical error bars. ‡pFDR , .1, *pFDR , .05, **pFDR , .01, ***pFDR , .001. APM, average pathlength mapping; CRS,chronic restraint stress; DKI, diffusion kurtosis imaging; DTI, diffusion tensor imaging; FA, fractional anisotropy; FC, fiber cross-section; FDC, combination ofapparent fiber density and FC; pFDR, false discovery rate–corrected p; RD, radial diffusivity; RK, radial kurtosis.
Low-Intensity rTMS–Induced White Matter Changes in Rats
8 Biological Psychiatry: Global Open Science - -, 2021; -:-–- www.sobp.org/GOS
BiologicalPsychiatry:GOS
551
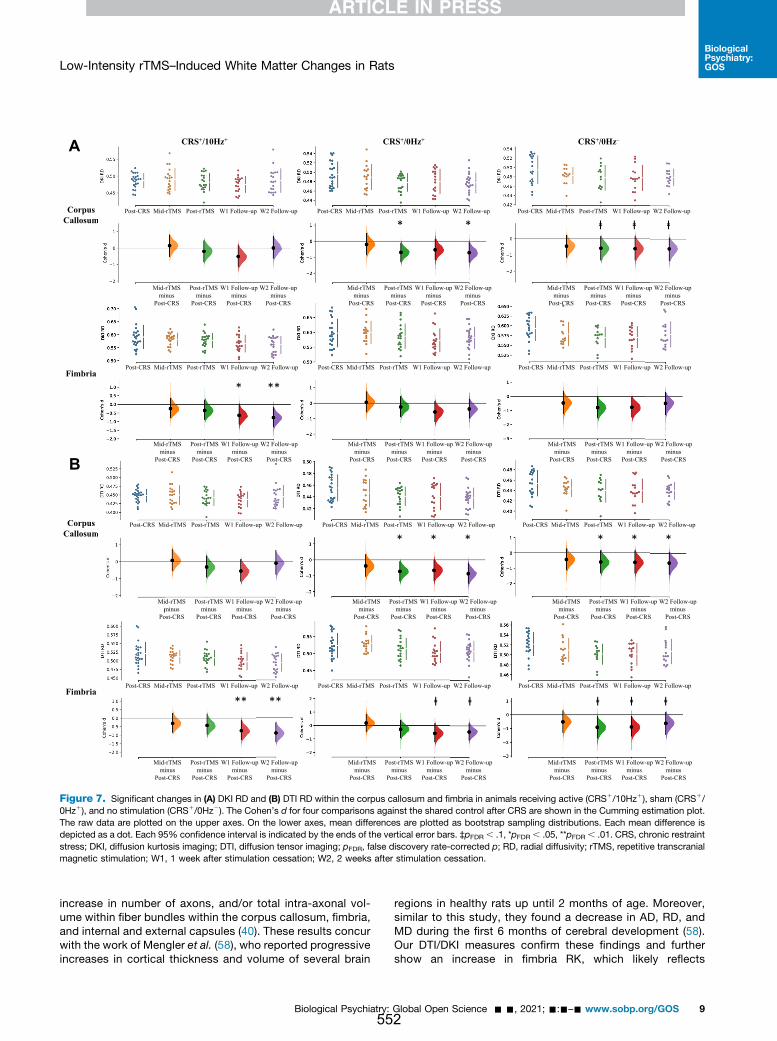
increase in number of axons, and/or total intra-axonal vol-ume within fiber bundles within the corpus callosum, fimbria,and internal and external capsules (40). These results concurwith the work of Mengler et al. (58), who reported progressiveincreases in cortical thickness and volume of several brain
regions in healthy rats up until 2 months of age. Moreover,similar to this study, they found a decrease in AD, RD, andMD during the first 6 months of cerebral development (58).Our DTI/DKI measures confirm these findings and furthershow an increase in fimbria RK, which likely reflects
A
Corpus Callosum
Fimbria
B
Corpus Callosum
Fimbria
m
m
Post-CRS Mid-rTMS Post-rTMS W1 Follow-up W2 Follow-up Post-CRS Mid-rTMS Post-rTMS W1 Follow-up W2 Follow-up Post-CRS Mid-rTMS Post-rTMS W1 Follow-up W2 Follow-up
Mid-rTMSminus
Post-CRS
Post-rTMSminus
Post-CRS
W1 Follow-up minus
Post-CRS
W2 Follow-up minus
Post-CRS
Mid-rTMSminus
Post-CRS
Post-rTMSminus
Post-CRS
W1 Follow-up minus
Post-CRS
W2 Follow-up minus
Post-CRS
Mid-rTMSminus
Post-CRS
Post-rTMSminus
Post-CRS
W1 Follow-up minus
Post-CRS
W2 Follow-up minus
Post-CRS
ⱡ
**
* * ⱡ ⱡ
* *** **
*
** ** ⱡ ⱡ ⱡⱡ ⱡ
CRS+/10Hz+ CRS+/0Hz+ CRS+/0Hz–
Figure 7. Significant changes in (A) DKI RD and (B) DTI RD within the corpus callosum and fimbria in animals receiving active (CRS1/10Hz1), sham (CRS1/0Hz1), and no stimulation (CRS1/0Hz2). The Cohen’s d for four comparisons against the shared control after CRS are shown in the Cumming estimation plot.The raw data are plotted on the upper axes. On the lower axes, mean differences are plotted as bootstrap sampling distributions. Each mean difference isdepicted as a dot. Each 95% confidence interval is indicated by the ends of the vertical error bars. ‡pFDR , .1, *pFDR , .05, **pFDR , .01. CRS, chronic restraintstress; DKI, diffusion kurtosis imaging; DTI, diffusion tensor imaging; pFDR, false discovery rate-corrected p; RD, radial diffusivity; rTMS, repetitive transcranialmagnetic stimulation; W1, 1 week after stimulation cessation; W2, 2 weeks after stimulation cessation.
Low-Intensity rTMS–Induced White Matter Changes in Rats
Biological Psychiatry: Global Open Science - -, 2021; -:-–- www.sobp.org/GOS 9
BiologicalPsychiatry:GOS
552
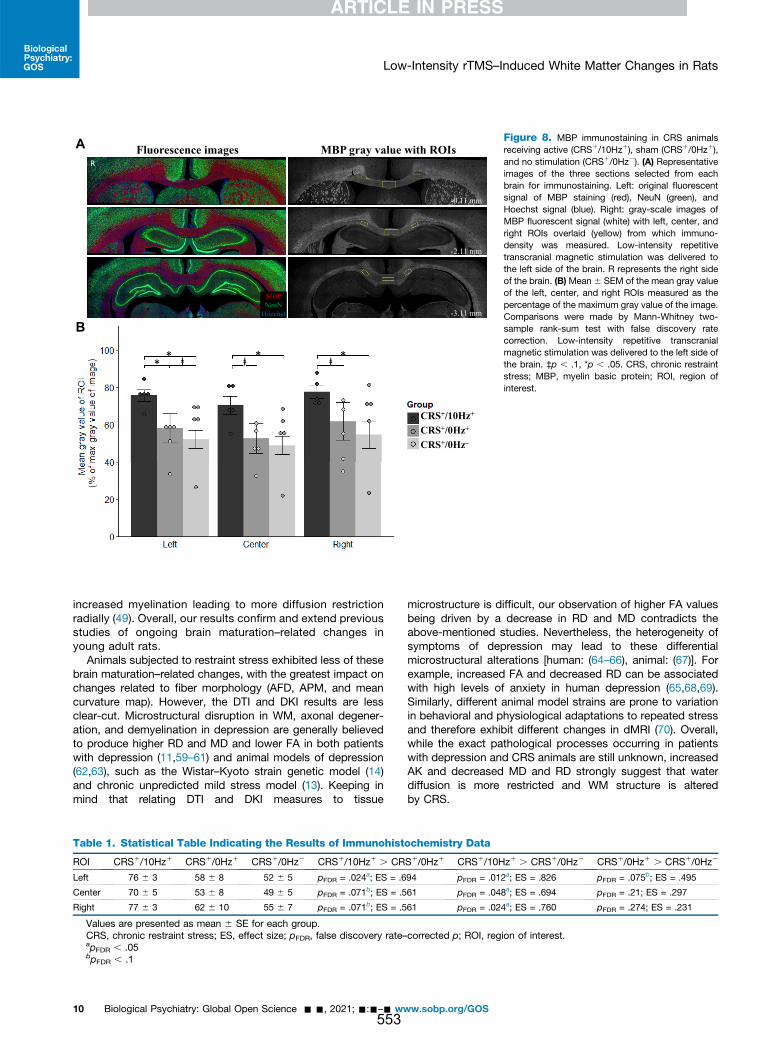
increased myelination leading to more diffusion restrictionradially (49). Overall, our results confirm and extend previousstudies of ongoing brain maturation–related changes inyoung adult rats.
Animals subjected to restraint stress exhibited less of thesebrain maturation–related changes, with the greatest impact onchanges related to fiber morphology (AFD, APM, and meancurvature map). However, the DTI and DKI results are lessclear-cut. Microstructural disruption in WM, axonal degener-ation, and demyelination in depression are generally believedto produce higher RD and MD and lower FA in both patientswith depression (11,59–61) and animal models of depression(62,63), such as the Wistar–Kyoto strain genetic model (14)and chronic unpredicted mild stress model (13). Keeping inmind that relating DTI and DKI measures to tissue
microstructure is difficult, our observation of higher FA valuesbeing driven by a decrease in RD and MD contradicts theabove-mentioned studies. Nevertheless, the heterogeneity ofsymptoms of depression may lead to these differentialmicrostructural alterations [human: (64–66), animal: (67)]. Forexample, increased FA and decreased RD can be associatedwith high levels of anxiety in human depression (65,68,69).Similarly, different animal model strains are prone to variationin behavioral and physiological adaptations to repeated stressand therefore exhibit different changes in dMRI (70). Overall,while the exact pathological processes occurring in patientswith depression and CRS animals are still unknown, increasedAK and decreased MD and RD strongly suggest that waterdiffusion is more restricted and WM structure is alteredby CRS.
Fluorescence images MBP gray value with ROIs
MBP
NeuN
Hoechst
R
-0.11 mm
-2.11 mm
-3.11 mm
A
B
CRS+/10Hz+
CRS+/0Hz+
CRS+/0Hz–
*** **ⱡⱡ **ⱡⱡⱡ
Figure 8. MBP immunostaining in CRS animalsreceiving active (CRS1/10Hz1), sham (CRS1/0Hz1),and no stimulation (CRS1/0Hz2). (A) Representativeimages of the three sections selected from eachbrain for immunostaining. Left: original fluorescentsignal of MBP staining (red), NeuN (green), andHoechst signal (blue). Right: gray-scale images ofMBP fluorescent signal (white) with left, center, andright ROIs overlaid (yellow) from which immuno-density was measured. Low-intensity repetitivetranscranial magnetic stimulation was delivered tothe left side of the brain. R represents the right sideof the brain. (B)Mean 6 SEM of the mean gray valueof the left, center, and right ROIs measured as thepercentage of the maximum gray value of the image.Comparisons were made by Mann-Whitney two-sample rank-sum test with false discovery ratecorrection. Low-intensity repetitive transcranialmagnetic stimulation was delivered to the left side ofthe brain. ‡p , .1, *p , .05. CRS, chronic restraintstress; MBP, myelin basic protein; ROI, region ofinterest.
Table 1. Statistical Table Indicating the Results of Immunohistochemistry Data
ROI CRS1/10Hz1 CRS1/0Hz1 CRS1/0Hz2 CRS1/10Hz1 . CRS1/0Hz1 CRS1/10Hz1 . CRS1/0Hz2 CRS1/0Hz1 . CRS1/0Hz2
Left 76 6 3 58 6 8 52 6 5 pFDR = .024a; ES = .694 pFDR = .012a; ES = .826 pFDR = .075b; ES = .495
Center 70 6 5 53 6 8 49 6 5 pFDR = .071b; ES = .561 pFDR = .048a; ES = .694 pFDR = .21; ES = .297
Right 77 6 3 62 6 10 55 6 7 pFDR = .071b; ES = .561 pFDR = .024a; ES = .760 pFDR = .274; ES = .231
Values are presented as mean 6 SE for each group.CRS, chronic restraint stress; ES, effect size; pFDR, false discovery rate–corrected p; ROI, region of interest.apFDR , .05bpFDR , .1
Low-Intensity rTMS–Induced White Matter Changes in Rats
10 Biological Psychiatry: Global Open Science - -, 2021; -:-–- www.sobp.org/GOS
BiologicalPsychiatry:GOS
553
Accelerated 10-Hz LI-rTMS Rescued BrainMaturation–Related Changes
Given that we have shown changes in WM linked to ongoingbrain maturation in our young rats, dissecting changes relatedto brain maturation, CRS, and LI-rTMS is difficult. For example,an increase in FA has consistently been reported in patientswith depression following repeated high-frequency rTMS(71,72) and electroconvulsive therapy (73,74). In contrast, inthis study, FA increased over time in all three CRS groups,suggesting that there was no effect of LI-rTMS on FA. How-ever, we cannot rule out that changes in FA due to LI-rTMSwere masked by ongoing maturation.
Nonetheless, some measures were specific to LI-rTMS, andthese were consistent with an increase in myelination. Myeli-nation has been positively correlated to FC in previous animalstudies combining dMRI and immunohistochemistry (75) andin human dMRI studies of demyelinating diseases (76,77). Weobserved a greater increase in FC in the active group,consistent with their higher level of MBP in the corpus cal-losum compared with sham and depression control groups.The combination of an increase in FC and myelination in thecorpus callosum (78) reflects normal cerebral development inrats, and these changes typically continue well into adulthood(3–6 mo) but were impaired in sham and depression controlanimals. It is well established that exposure to early life stressalters WM development in humans, nonhuman primates, androdents (79). In addition, abnormal myelination has been re-ported in human patients with depression and animal modelsof depression and anxiety-like behaviors (15,80). Therefore, ourresults suggest that LI-rTMS may rescue brain maturation-related and/or CRS-related changes, potentially via increasedsurvival of oligodendrocytes and/or increased myelin produc-tion (81).
Because neuronal activity is a major regulator of oligo-dendrocyte biology during development and in adulthood(81,82), brain stimulation is a compelling therapeuticapproach to promote myelin repair. Low-intensity magneticstimulation as used in this study has been shown to increasesurvival of newly generated oligodendrocytes in mice (81),which may underpin the increased myelination observed inour experiments. Low-intensity magnetic stimulation doesnot trigger action potentials (83,84) but has been shown toincrease excitability of pyramidal neurons in cortical slices(85) and alter conduction velocity of axons in the corpuscallosum (86). These changes to intrinsic neuronal propertiesmay alter the probability of neuronal firing, leading to theincreased myelination described in both studies. It ispossible that higher intensities of rTMS, such as those usedin clinical settings, might have the same outcomes; directelectrical stimulation to the corticospinal tract at supra-threshold intensities results in proliferation and differentia-tion of oligodendrocyte progenitor cells (87). Although bothstimulation protocols would ultimately increase myelination,it is interesting to note that they likely do so via differentmechanisms.
Study Limitations and Future Directions
Our study has two main limitations. First, dMRI cannot directlymeasure microstructural changes, which need to be confirmed
using invasive methods in animal studies. For example, retro-grade tract-tracing data together with immunohistochemistryof gliosis status can further verify dMRI changes. Second,older adult rats that have completed cerebral development(6 mo or older) can be used to exclude brain maturation–related changes seen in this study. Nonetheless, combiningthe use of DKI and conventional DTI along with fixel-based WMtractography improved the detection of changes induced byCRS and LI-rTMS and provided more directionally specific andcomplementary information compared with using these ap-proaches individually. These findings suggest that multiplediffusion and kurtosis parameters should be used in conjunc-tion with AFD and track-weighted imaging measures to assistin further advancing our understanding of depression diseaseprogression and rTMS treatment.
Conclusions
In conclusion, this study found evidence of delayed brainmaturation–related changes in restrained animals, but thesewere partly rescued by LI-rTMS. By integrating dMRI andimmunohistochemistry, our results raise the possibility thatLI-rTMS and potentially rTMS may exert therapeutic effects byrescuing abnormal myelination, in addition to their well-characterized effects on neuronal plasticity (50), providingnew insight into their mechanism of action and potentialtherapeutic applications.
ACKNOWLEDGMENTS AND DISCLOSURESThis research was funded by the University of Western Australia, a ForrestResearch Foundation Scholarship (to BJS), an International PostgraduateResearch Scholarship (to BJS), a University Postgraduate Award (to BJS),an Australian National Imaging Facility Fellow (a facility funded by the Uni-versity, State, and Commonwealth Governments) (to KWF), a UniversityPostgraduate Award at the University of Western Australia (to LAH), theCommonwealth Government’s Australian Government Research TrainingProgram Fees Offset (to LAH), a Fellowship from MSWA (to JR), and thePerron Institute for Neurological and Translational Science (to JR).
We thank Dr. Sarah Etherington, Ms. Marissa Penrose-Menz, Ms. KerryLeggett, Ms. Elizabeth Jaeschke-Angi, Ms. Leah Mackie, Ms. KayleneSchutz, Ms. Yasmin Arena-Foster, Ms. Michelle Carey, Ms. Katherine Fisher,Mr. Rex Edwards, Mr. Samuel Bolland, Ms. Elena Faessler, Mr. Erik Stefan,Ms. Tess Wheeler, Ms. Samantha Musgrave, Mr. David Gerard, Ms. YashviBhatt, and Mr. Parth Patel for their assistance with the experiments. We alsothank the team at University of Western Australia M Block Animal CareServices for their assistance with animal care and transport. We alsoacknowledge the facilities and scientific and technical assistance of theNational Imaging Facility, a National Collaborative Research InfrastructureStrategy capability, at the Centre for Microscopy Characterisation andAnalysis, the University of Western Australia.
The authors report no biomedical financial interests or potential conflictsof interest.
ARTICLE INFORMATIONFrom Experimental and Regenerative Neurosciences (BJS, AF, LAH, JR),School of the Biological Sciences, The University of Western Australia;Centre for Microscopy, Characterisation & Analysis (BJS, KWF, ACJ),Research Infrastructure Centres, The University of Western Australia; Schoolof Biomedical Sciences (KWF), The University of Western Australia; andSchool of Human Sciences (YW), The University of Western Australia,Crawley; Brain Plasticity Group (BJS, AF, LAH, JR), Perron Institute forNeurological and Translational Science, Nedlands; and the School of Vet-erinary and Life Sciences (AF), Murdoch University, Murdoch, WesternAustralia, Australia.
Low-Intensity rTMS–Induced White Matter Changes in Rats
Biological Psychiatry: Global Open Science - -, 2021; -:-–- www.sobp.org/GOS 11
BiologicalPsychiatry:GOS
554
Address correspondence to Jennifer Rodger, Ph.D., at [email protected].
Received May 3, 2021; revised Jul 27, 2021; accepted Aug 16, 2021.Supplementary material cited in this article is available online at https://
doi.org/10.1016/j.bpsgos.2021.08.006.
REFERENCES1. Ridding MC, Ziemann U (2010): Determinants of the induction of
cortical plasticity by non-invasive brain stimulation in healthy subjects.J Physiol 588:2291–2304.
2. O’Reardon JP, Solvason HB, Janicak PG, Sampson S, Isenberg KE,Nahas Z, et al. (2007): Efficacy and safety of transcranial magneticstimulation in the acute treatment of major depression: A multisiterandomized controlled trial. Biol Psychiatry 62:1208–1216.
3. Krishnan V, Nestler EJ (2011): Animal models of depression: Molecularperspectives. Curr Top Behav Neurosci 7:121–147.
4. Suvrathan A, Tomar A, Chattarji S (2010): Effects of chronic and acutestress on rat behaviour in the forced-swim test. Stress 13:533–540.
5. Seewoo BJ, Hennessy LA, Feindel KW, Etherington SJ, Croarkin PE,Rodger J (2020): Validation of chronic restraint stress model in youngadult rats for the study of depression using longitudinal multimodal MRimaging. eNeuro 7: ENEURO.0113-20.2020.
6. Hunter RG, Seligsohn M, Rubin TG, Griffiths BB, Ozdemir Y, Pfaff DW,et al. (2016): Stress and corticosteroids regulate rat hippocampalmitochondrial DNA gene expression via the glucocorticoid receptor.Proc Natl Acad Sci U S A 113:9099–9104.
7. Ampuero E, Luarte A, Santibañez M, Varas-Godoy M, Toledo J, Diaz-Veliz G, et al. (2015): Two chronic stress models based on movementrestriction in rats respond selectively to antidepressant drugs:Aldolase C as a potential biomarker. Int J Neuropsychopharmacol18:pyv038.
8. Henckens MJAG, van der Marel K, van der Toorn A, Pillai AG,Fernández G, Dijkhuizen RM, Joëls M (2015): Stress-induced alter-ations in large-scale functional networks of the rodent brain. Neuro-Image 105:312–322.
9. Alemu JL, Elberling F, Azam B, Pakkenberg B, Olesen MV (2019):Electroconvulsive treatment prevents chronic restraint stress-inducedatrophy of the hippocampal formation-A stereological study. BrainBehav 9:e01195.
10. Vyas A, Mitra R, Shankaranarayana Rao BS, Chattarji S (2002):Chronic stress induces contrasting patterns of dendritic remodeling inhippocampal and amygdaloid neurons. J Neurosci 22:6810–6818.
11. Ota M, Noda T, Sato N, Hattori K, Hori H, Sasayama D, et al. (2015):White matter abnormalities in major depressive disorder with melan-cholic and atypical features: A diffusion tensor imaging study. Psy-chiatry Clin Neurosci 69:360–368.
12. Kamiya K, Okada N, Sawada K, Watanabe Y, Irie R, Hanaoka S, et al.(2018): Diffusional kurtosis imaging and white matter microstructuremodeling in a clinical study of major depressive disorder. NMR Biomed31:e3938.
13. Hemanth Kumar BS, Mishra SK, Trivedi R, Singh S, Rana P, Khushu S(2014): Demyelinating evidences in CMS rat model of depression: ADTI study at 7T. Neuroscience 275:12–21.
14. Zalsman G, Weller A, Shbiro L, Barzilay R, Gutman A, Weizman A, et al.(2017): Fibre tract analysis using diffusion tensor imaging revealsaberrant connectivity in a rat model of depression. World J Biol Psy-chiatry 18:615–623.
15. Sacchet MD, Gotlib IH (2017): Myelination of the brain in majordepressive disorder: An in vivo quantitative magnetic resonance im-aging study. Sci Rep 7:2200.
16. Lehmann ML, Weigel TK, Elkahloun AG, Herkenham M (2017): Chronicsocial defeat reduces myelination in the mouse medial prefrontalcortex. Sci Rep 7:46548.
17. Guglielmetti C, Veraart J, Roelant E, Mai Z, Daans J, Van Audekerke J,et al. (2016): Diffusion kurtosis imaging probes cortical alterations andwhite matter pathology following cuprizone induced demyelinationand spontaneous remyelination. Neuroimage 125:363–377.
18. Falangola MF, Guilfoyle DN, Tabesh A, Hui ES, Nie X, Jensen JH, et al.(2014): Histological correlation of diffusional kurtosis and white mattermodeling metrics in cuprizone-induced corpus callosum demyelin-ation. NMR Biomed 27:948–957.
19. Seewoo BJ, Feindel KW, Etherington SJ, Rodger J (2019): Frequency-specific effects of low-intensity rTMS can persist for up to 2 weekspost-stimulation: A longitudinal rs-fMRI/MRS study in rats. BrainStimul 12:1526–1536.
20. Rodger J, Mo C, Wilks T, Dunlop SA, Sherrard RM (2012): Transcranialpulsed magnetic field stimulation facilitates reorganization of abnormalneural circuits and corrects behavioral deficits without disruptingnormal connectivity. FASEB J 26:1593–1606.
21. Makowiecki K, Harvey AR, Sherrard RM, Rodger J (2014): Low-in-tensity repetitive transcranial magnetic stimulation improves abnormalvisual cortical circuit topography and upregulates BDNF in mice.J Neurosci 34:10780–10792.
22. Seewoo BJ, Feindel KW, Etherington SJ, Rodger J (2018): Resting-state fMRI study of brain activation using low-intensity repetitivetranscranial magnetic stimulation in rats. Sci Rep 8:6706.
23. Seewoo B, Feindel K, Etherington S, Hennessy L, Croarkin P, Rodger J(2019): M85. Validation of the chronic restraint stress model ofdepression in rats and investigation of standard vs accelerated rTMStreatment. Neuropsychopharmacology 44:122–123.
24. Tournier JD, Smith R, Raffelt D, Tabbara R, Dhollander T, Pietsch M,et al. (2019): MRtrix3: A fast, flexible and open software framework formedical image processing and visualisation. Neuroimage 202:116137.
25. Veraart J, Novikov DS, Christiaens D, Ades-Aron B, Sijbers J,Fieremans E (2016): Denoising of diffusion MRI using random matrixtheory. Neuroimage 142:394–406.
26. Cordero-Grande L, Christiaens D, Hutter J, Price AN, Hajnal JV (2019):Complex diffusion-weighted image estimation via matrix recoveryunder general noise models. Neuroimage 200:391–404.
27. Veraart J, Fieremans E, Novikov DS (2016): Diffusion MRI noisemapping using random matrix theory. Magn Reson Med 76:1582–1593.
28. Kellner E, Dhital B, Kiselev VG, Reisert M (2016): Gibbs-ringing artifactremoval based on local subvoxel-shifts. Magn Reson Med 76:1574–1581.
29. Tustison NJ, Avants BB, Cook PA, Zheng Y, Egan A, Yushkevich PA,Gee JC (2010): N4ITK: Improved N3 bias correction. IEEE Trans MedImaging 29:1310–1320.
30. C Wood T (2018): QUIT: QUantitative imaging tools. J Open SourceSoftw 3:656.
31. Smith SM, Jenkinson M, Johansen-Berg H, Rueckert D, Nichols TE,Mackay CE, et al. (2006): Tract-based spatial statistics: Voxelwiseanalysis of multi-subject diffusion data. Neuroimage 31:1487–1505.
32. Jenkinson M, Beckmann CF, Behrens TE, Woolrich MW, Smith SM(2012). FSL. Neuroimage 62:782–790.
33. Tabesh A, Jensen JH, Ardekani BA, Helpern JA (2011): Estimation oftensors and tensor-derived measures in diffusional kurtosis imaging.Magn Reson Med 65:823–836.
34. Zhang H, Avants BB, Yushkevich PA, Woo JH, Wang S,McCluskey LF, et al. (2007): High-dimensional spatial normalization ofdiffusion tensor images improves the detection of white matter dif-ferences: An example study using amyotrophic lateral sclerosis. IEEETrans Med Imaging 26:1585–1597.
35. Zhang H, Yushkevich PA, Alexander DC, Gee JC (2006): Deformableregistration of diffusion tensor MR images with explicit orientationoptimization. Med Image Anal 10:764–785.
36. Harris NG, Verley DR, Gutman BA, Sutton RL (2016): Bi-directionalchanges in fractional anisotropy after experiment TBI: Disorganizationand reorganization? Neuroimage 133:129–143.
37. Raffelt DA, Smith RE, Ridgway GR, Tournier JD, Vaughan DN, Rose S,et al. (2015): Connectivity-based fixel enhancement: Whole-brainstatistical analysis of diffusion MRI measures in the presence ofcrossing fibres. Neuroimage 117:40–55.
38. Raffelt D, Tournier JD, Rose S, Ridgway GR, Henderson R, Crozier S,et al. (2012): Apparent Fibre Density: A novel measure for the analysis
Low-Intensity rTMS–Induced White Matter Changes in Rats
12 Biological Psychiatry: Global Open Science - -, 2021; -:-–- www.sobp.org/GOS
BiologicalPsychiatry:GOS
555
of diffusion-weighted magnetic resonance images. Neuroimage59:3976–3994.
39. Wright DK, Johnston LA, Kershaw J, Ordidge R, O’Brien TJ, Shultz SR(2017): Changes in apparent fiber density and track-weighted imagingmetrics in white matter following experimental traumatic brain injury.J Neurotrauma 34:2109–2118.
40. Raffelt DA, Tournier JD, Smith RE, Vaughan DN, Jackson G,Ridgway GR, Connelly A (2017): Investigating white matter fibre den-sity and morphology using fixel-based analysis. Neuroimage 144:58–73.
41. Tournier JD, Calamante F, Connelly A (2010): Improved probabilisticstreamlines tractography by 2nd order integration over fibre orientationdistributions. In: Proceedings of the International Society for MagneticResonance in Medicine. New Jersey: John Wiley & Sons, Inc.
42. Pannek K, Mathias JL, Bigler ED, Brown G, Taylor JD, Rose SE (2011):The average pathlength map: A diffusion MRI tractography-derivedindex for studying brain pathology. NeuroImage 55:133–141.
43. Smith SM, Nichols TE (2009): Threshold-free cluster enhancement:Addressing problems of smoothing, threshold dependence andlocalisation in cluster inference. NeuroImage 44:83–98.
44. Nichols TE, Holmes AP (2002): Nonparametric permutation tests forfunctional neuroimaging: A primer with examples. Hum Brain Mapp15:1–25.
45. Winkler AM, Ridgway GR, Webster MA, Smith SM, Nichols TE (2014):Permutation inference for the general linear model. Neuroimage92:381–397.
46. Yushkevich PA, Piven J, Hazlett HC, Smith RG, Ho S, Gee JC, Gerig G(2006): User-guided 3D active contour segmentation of anatomicalstructures: Significantly improved efficiency and reliability. Neuro-image 31:1116–1128.
47. Paxinos G, Watson C, Calabrese E, Badea A, Johnson GA (2015): MRI/DTI Atlas of the Rat Brain. San Diego: Academic Press.
48. Schindelin J, Arganda-Carreras I, Frise E, Kaynig V, Longair M,Pietzsch T, et al. (2012): Fiji: An open-source platform for biological-image analysis. Nat Methods 9:676–682.
49. Wu EX, Cheung MM (2010): MR diffusion kurtosis imaging for neuraltissue characterization. NMR Biomed 23:836–848.
50. Tang A, Thickbroom G, Rodger J (2017): Repetitive transcranialmagnetic stimulation of the brain: Mechanisms from animal andexperimental models. Neuroscientist 23:82–94.
51. Seewoo BJ, Etherington SJ, Feindel KW, Rodger J (2018): CombinedrTMS/fMRI studies: An overlooked resource in animal models. FrontNeurosci 12:180.
52. Arnone D, Mumuni AN, Jauhar S, Condon B, Cavanagh J (2015): In-direct evidence of selective glial involvement in glutamate-basedmechanisms of mood regulation in depression: Meta-analysis of ab-solute prefrontal neuro-metabolic concentrations. Eur Neuro-psychopharmacol 25:1109–1117.
53. Pell GS, Roth Y, Zangen A (2011): Modulation of cortical excitabilityinduced by repetitive transcranial magnetic stimulation: Influence oftiming and geometrical parameters and underlying mechanisms. ProgNeurobiol 93:59–98.
54. Niehaus L, Hoffmann KT, Grosse P, Röricht S, Meyer BU (2000): MRIstudy of human brain exposed to high-dose repetitive magneticstimulation of visual cortex. Neurology 54:256–258.
55. Mottaghy FM, Gangitano M, Horkan C, Chen Y, Pascual-Leone A,Schlaug G (2003): Repetitive TMS temporarily alters brain diffusion.Neurology 60:1539–1541.
56. Abe M, Fukuyama H, Mima T (2014): Water diffusion reveals networksthat modulate multiregional morphological plasticity after repetitivebrain stimulation. Proc Natl Acad Sci U S A 111:4608–4613.
57. Müller-Dahlhaus F, Vlachos A (2013): Unraveling the cellular and mo-lecular mechanisms of repetitive magnetic stimulation. Front MolNeurosci 6:50.
58. Mengler L, Khmelinskii A, Diedenhofen M, Po C, Staring M,Lelieveldt BPF, Hoehn M (2014): Brain maturation of the adolescent ratcortex and striatum: Changes in volume and myelination. NeuroImage84:35–44.
59. van Velzen LS, Kelly S, Isaev D, Aleman A, Aftanas LI, Bauer J, et al.(2020): White matter disturbances in major depressive disorder: Acoordinated analysis across 20 international cohorts in the ENIGMAMDD working group. Mol Psychiatry 25:1511–1525.
60. Tymofiyeva O, Connolly CG, Ho TC, Sacchet MD, Henje Blom E,LeWinn KZ, et al. (2017): DTI-based connectome analysis of adoles-cents with major depressive disorder reveals hypoconnectivity of theright caudate. J Affect Disord 207:18–25.
61. Chen G, Hu X, Li L, Huang X, Lui S, Kuang W, et al. (2016): Disorga-nization of white matter architecture in major depressive disorder: Ameta-analysis of diffusion tensor imaging with tract-based spatialstatistics. Sci Rep 6:21825.
62. McIntosh AL, Gormley S, Tozzi L, Frodl T, Harkin A (2017): Recentadvances in translational magnetic resonance imaging in animalmodels of stress and depression. Front Cell Neurosci 11:150.
63. Nagy SA, Vranesics A, Varga Z, Csabai D, Bruszt N, Bali ZK, et al.(2020): Stress-induced microstructural alterations correlate with thecognitive performance of rats: A Longitudinal in vivo diffusion tensorimaging study. Front Neurosci 14:474.
64. Wang T, Huang X, Huang P, Li D, Lv F, Zhang Y, et al. (2013): Early-stage psychotherapy produces elevated frontal white matter integrityin adult major depressive disorder. PLoS One 8:e63081.
65. Blood AJ, Iosifescu DV, Makris N, Perlis RH, Kennedy DN,Dougherty DD, et al. (2010): Microstructural abnormalities in subcor-tical reward circuitry of subjects with major depressive disorder. PLoSOne 5:e13945.
66. Zhao L, Wang Y, Jia Y, Zhong S, Sun Y, Zhou Z, et al. (2016): Cere-bellar microstructural abnormalities in bipolar depression and unipolardepression: A diffusion kurtosis and perfusion imaging study. J AffectDisord 195:21–31.
67. Khan AR, Chuhutin A, Wiborg O, Kroenke CD, Nyengaard JR,Hansen B, Jespersen SN (2016): Biophysical modeling of high fielddiffusion MRI demonstrates micro-structural aberration in chronic mildstress rat brain. NeuroImage 142:421–430.
68. Coloigner J, Batail JM, Commowick O, Corouge I, Robert G, Barillot C,Drapier D (2019): White matter abnormalities in depression: A cate-gorical and phenotypic diffusion MRI study. Neuroimage Clin22:101710.
69. Shizukuishi T, Abe O, Aoki S (2013): Diffusion tensor imaging analysisfor psychiatric disorders. Magn Reson Med Sci 12:153–159.
70. Magalhães R, Bourgin J, Boumezbeur F, Marques P, Bottlaender M,Poupon C, et al. (2017): White matter changes in microstructureassociated with a maladaptive response to stress in rats. TranslPsychiatry 7:e1009.
71. Kozel FA, Johnson KA, Nahas Z, Nakonezny PA, Morgan PS,Anderson BS, et al. (2011): Fractional anisotropy changes after severalweeks of daily left high-frequency repetitive transcranial magneticstimulation of the prefrontal cortex to treat major depression. J ECT27:5–10.
72. Peng H, Zheng H, Li L, Liu J, Zhang Y, Shan B, et al. (2012): High-frequency rTMS treatment increases white matter FA in the left middlefrontal gyrus in young patients with treatment-resistant depression.J Affect Disord 136:249–257.
73. Lyden H, Espinoza RT, Pirnia T, Clark K, Joshi SH, Leaver AM, et al.(2014): Electroconvulsive therapy mediates neuroplasticity ofwhite matter microstructure in major depression. Transl Psychiatry 4:e380.
74. Nobuhara K, Okugawa G, Minami T, Takase K, Yoshida T, Yagyu T,et al. (2004): Effects of electroconvulsive therapy on frontal whitematter in late-life depression: A diffusion tensor imaging study. Neu-ropsychobiology 50:48–53.
75. Malhotra A, Sepehrizadeh T, Dhollander T, Wright D, Castillo-Melendez M, Sutherland AE, et al. (2019): Advanced MRI analysis todetect white matter brain injury in growth restricted newborn lambs.Neuroimage Clin 24:101991.
76. Gajamange S, Raffelt D, Dhollander T, Lui E, van der Walt A,Kilpatrick T, et al. (2018): Fibre-specific white matter changes in mul-tiple sclerosis patients with optic neuritis. Neuroimage Clin 17:60–68.
Low-Intensity rTMS–Induced White Matter Changes in Rats
Biological Psychiatry: Global Open Science - -, 2021; -:-–- www.sobp.org/GOS 13
BiologicalPsychiatry:GOS
556

77. Storelli L, Pagani E, Preziosa P, Filippi M, Rocca MA (2021):Measurement of white matter fiber-bundle cross-section in multiplesclerosis using diffusion-weighted imaging. Mult Scler 27:818–826.
78. Nuñez JL, Nelson J, Pych JC, Kim JHY, Juraska JM (2000): Myelina-tion in the splenium of the corpus callosum in adult male and femalerats. Brain Res Dev Brain Res 120:87–90.
79. Islam R, Kaffman A (2021): White-matter repair as a novel therapeutictarget for early adversity. Front Neurosci 15:657693.
80. Liu J, Dietz K, DeLoyht JM, Pedre X, Kelkar D, Kaur J, et al. (2012):Impaired adult myelination in the prefrontal cortex of socially isolatedmice. Nat Neurosci 15:1621–1623.
81. Cullen CL, Senesi M, Tang AD, Clutterbuck MT, Auderset L,O’Rourke ME, et al. (2019): Low-intensity transcranial magnetic stim-ulation promotes the survival and maturation of newborn oligoden-drocytes in the adult mouse brain. Glia 67:1462–1477.
82. Barres BA, Raff MC (1993): Proliferation of oligodendrocyte precursorcells depends on electrical activity in axons. Nature 361:258–260.
83. Grehl S, Viola HM, Fuller-Carter PI, Carter KW, Dunlop SA, Hool LC,et al. (2015): Cellular and molecular changes to cortical neurons
following low intensity repetitive magnetic stimulation at different fre-quencies. Brain Stimul 8:114–123.
84. Tang AD, Lowe AS, Garrett AR, Woodward R, Bennett W, Canty AJ,et al. (2016): Construction and evaluation of rodent-specific rTMScoils. Front Neural Circuits 10:47.
85. Tang AD, Hong I, Boddington LJ, Garrett AR, Etherington S,Reynolds JNJ, Rodger J (2016): Low-intensity repetitive magneticstimulation lowers action potential threshold and increases spikefiring in layer 5 pyramidal neurons in vitro. Neuroscience 335:64–71.
86. Cullen CL, Pepper RE, Clutterbuck MT, Pitman KA, Oorschot V,Auderset L, et al. (2021): Periaxonal and nodal plasticities modulateaction potential conduction in the adult mouse brain. Cell Rep34:108641.
87. Li Q, Brus-Ramer M, Martin JH, McDonald JW (2010): Electricalstimulation of the medullary pyramid promotes proliferationand differentiation of oligodendrocyte progenitor cells in thecorticospinal tract of the adult rat. Neurosci Lett 479:128–133.
Low-Intensity rTMS–Induced White Matter Changes in Rats
14 Biological Psychiatry: Global Open Science - -, 2021; -:-–- www.sobp.org/GOS
BiologicalPsychiatry:GOS
557
558
Appendix K: Extra analyses
Effect of CRS and LI-rTMS on neurogenesis in the dentate gyrus of the hippocampus
A stock solution of 30 mg/ml 5-ethynyl-2'-deoxyuridine (EdU) was prepared in normal
saline solution. On the day of sixth LI-rTMS delivery (mid-treatment timepoint), rats
received a total of two intraperitoneal injections of EdU (50 mg/kg), administered eight
hours apart. EdU is a thymidine analogue and incorporates into the DNA of dividing cells.
At the end of the study, the rats were euthanised with an overdose of sodium
pentobarbitone (>160 mg/kg i.p.) and transcardially perfused with 200 ml of 4%
paraformaldehyde in 0.2M Phosphate Buffer. Animals from Chapter 6 were euthanised
after the last LI-rTMS session while those from Chapter 9 were euthanised two weeks
after the last LI-rTMS session.
Brains were post-fixed in 4% paraformaldehyde solution at 4oC and transferred to 30%
sucrose in PBS 48 hours before cryosectioning into 40 μm coronal sections. Six sections
were chosen per brain for immunohistochemical staining at Bregma -2.80 mm, -3.60 mm,
-4.30 mm, -5.20 mm, -5.60 mm and -6.04 mm (Paxinos et al., 2015). Sections were
permeabilized for 30 min in 0.5% Triton in 0.1M PBS and washed in PBS before incubating
in freshly prepared Edu development cocktail for 30 min (100 mM tris-buffered saline, 4
mM copper sulphate, 3.5 μM sulfo-cyanine-3-azide (Lumiprobe #D1330) and 100 mM
sodium ascorbate in deionised water). The sections were then washed in PBS and pre-
incubated with antibody diluent for 1h (5% normal donkey serum, 0.1% bovine serum
albumin, and 0.5% Triton in 0.1M PBS) before incubating in primary antibody (1:1000
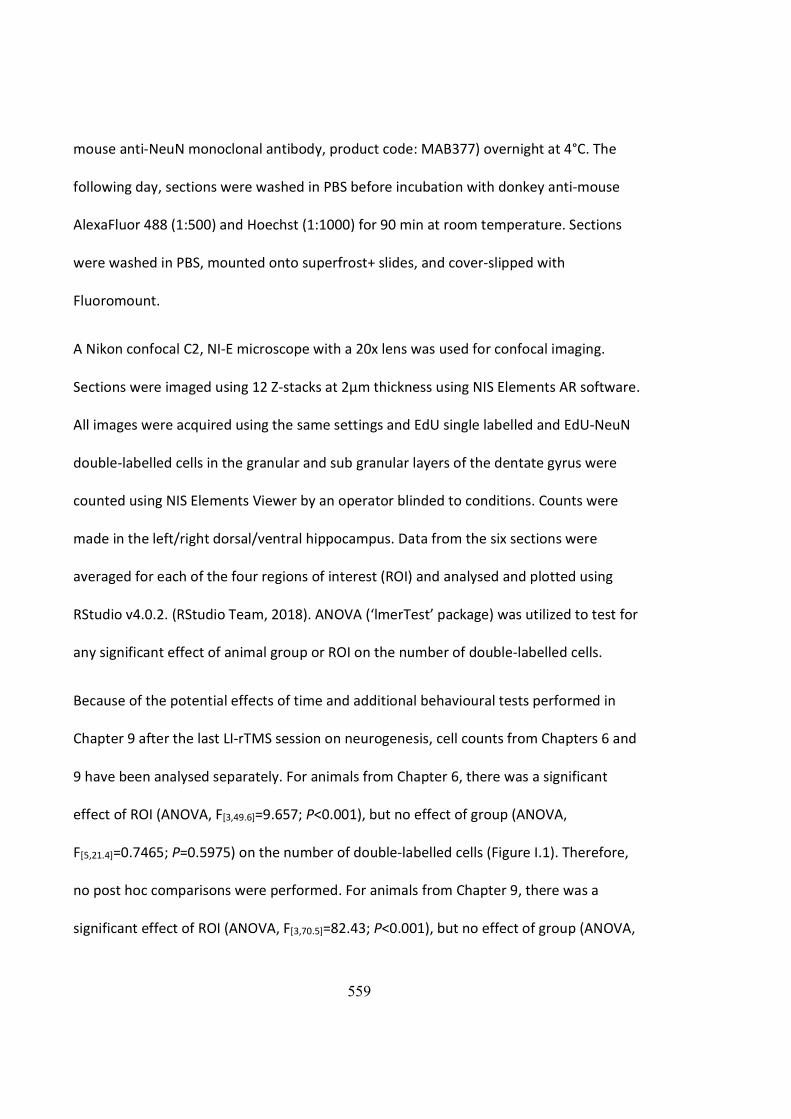
559
mouse anti-NeuN monoclonal antibody, product code: MAB377) overnight at 4°C. The
following day, sections were washed in PBS before incubation with donkey anti-mouse
AlexaFluor 488 (1:500) and Hoechst (1:1000) for 90 min at room temperature. Sections
were washed in PBS, mounted onto superfrost+ slides, and cover-slipped with
Fluoromount.
A Nikon confocal C2, NI-E microscope with a 20x lens was used for confocal imaging.
Sections were imaged using 12 Z-stacks at 2μm thickness using NIS Elements AR software.
All images were acquired using the same settings and EdU single labelled and EdU-NeuN
double-labelled cells in the granular and sub granular layers of the dentate gyrus were
counted using NIS Elements Viewer by an operator blinded to conditions. Counts were
made in the left/right dorsal/ventral hippocampus. Data from the six sections were
averaged for each of the four regions of interest (ROI) and analysed and plotted using
RStudio v4.0.2. (RStudio Team, 2018). ANOVA (‘lmerTest’ package) was utilized to test for
any significant effect of animal group or ROI on the number of double-labelled cells.
Because of the potential effects of time and additional behavioural tests performed in
Chapter 9 after the last LI-rTMS session on neurogenesis, cell counts from Chapters 6 and
9 have been analysed separately. For animals from Chapter 6, there was a significant
effect of ROI (ANOVA, F[3,49.6]=9.657; P<0.001), but no effect of group (ANOVA,
F[5,21.4]=0.7465; P=0.5975) on the number of double-labelled cells (Figure I.1). Therefore,
no post hoc comparisons were performed. For animals from Chapter 9, there was a
significant effect of ROI (ANOVA, F[3,70.5]=82.43; P<0.001), but no effect of group (ANOVA,
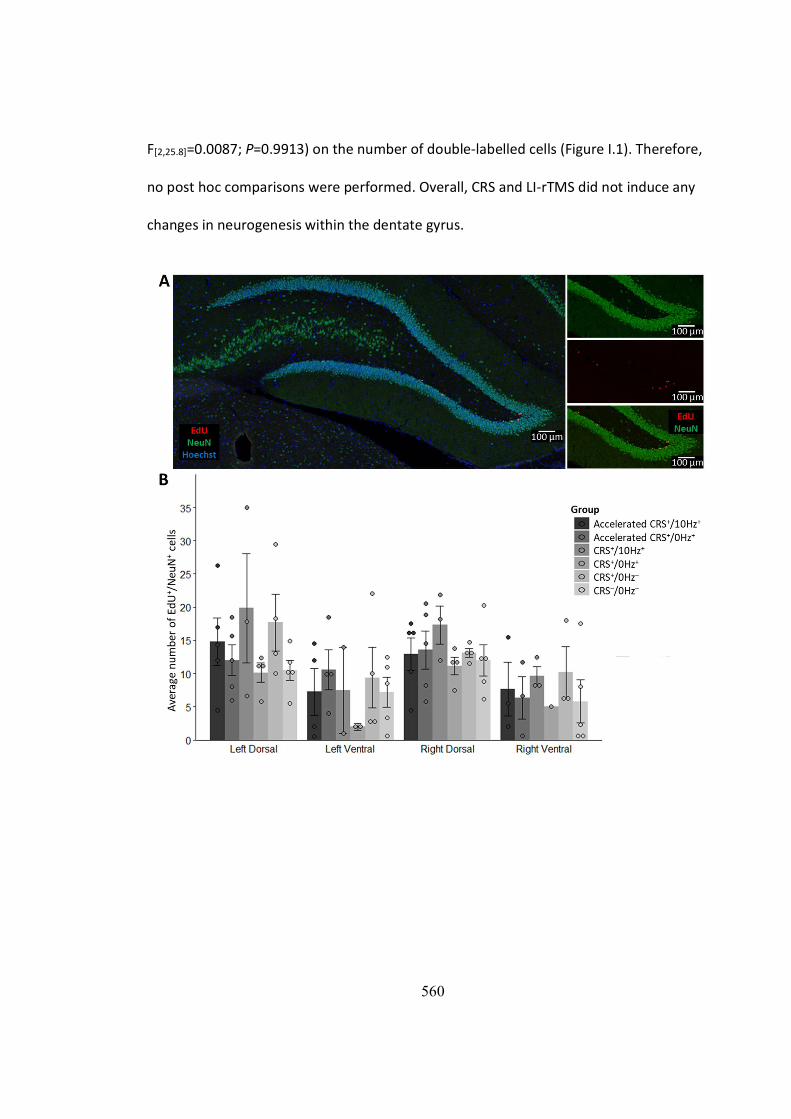
560
F[2,25.8]=0.0087; P=0.9913) on the number of double-labelled cells (Figure I.1). Therefore,
no post hoc comparisons were performed. Overall, CRS and LI-rTMS did not induce any
changes in neurogenesis within the dentate gyrus.
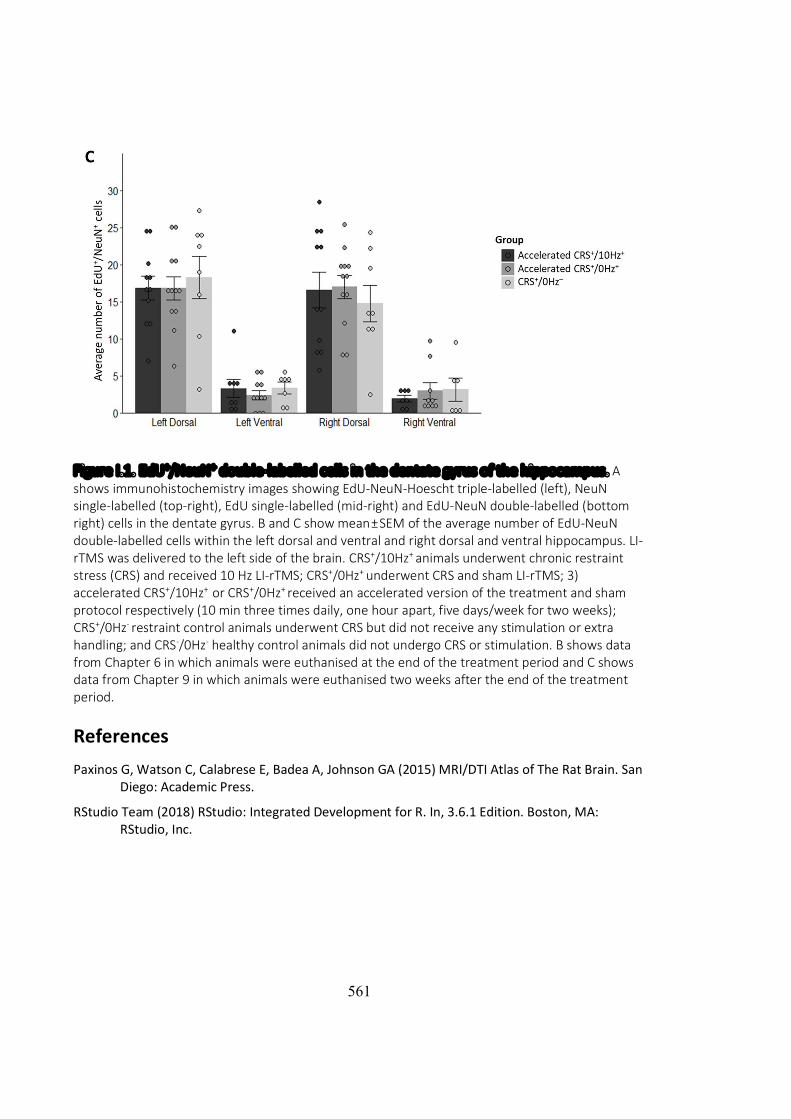
561
Figure I.1. EdU+/NeuN+ double-labelled cells in the dentate gyrus of the hippocampus. A shows immunohistochemistry images showing EdU-NeuN-Hoescht triple-labelled (left), NeuN single-labelled (top-right), EdU single-labelled (mid-right) and EdU-NeuN double-labelled (bottom right) cells in the dentate gyrus. B and C show mean ± SEM of the average number of EdU-NeuN double-labelled cells within the left dorsal and ventral and right dorsal and ventral hippocampus. LI-rTMS was delivered to the left side of the brain. CRS+/10Hz+ animals underwent chronic restraint stress (CRS) and received 10 Hz LI-rTMS; CRS+/0Hz+ underwent CRS and sham LI-rTMS; 3) accelerated CRS+/10Hz+ or CRS+/0Hz+ received an accelerated version of the treatment and sham protocol respectively (10 min three times daily, one hour apart, five days/week for two weeks); CRS+/0Hz- restraint control animals underwent CRS but did not receive any stimulation or extra handling; and CRS-/0Hz- healthy control animals did not undergo CRS or stimulation. B shows data from Chapter 6 in which animals were euthanised at the end of the treatment period and C shows data from Chapter 9 in which animals were euthanised two weeks after the end of the treatment period.
References Paxinos G, Watson C, Calabrese E, Badea A, Johnson GA (2015) MRI/DTI Atlas of The Rat Brain. San
Diego: Academic Press.
RStudio Team (2018) RStudio: Integrated Development for R. In, 3.6.1 Edition. Boston, MA: RStudio, Inc.


